world sustainable building 2014 barcelona
TRANSCRIPT
WORLD SUSTAINABLE BUILDING 2014 BARCELONA CONFERENCE
Sustainable Building: RESULTS Are we moving as quickly as we should? It’s up to us!
CONFERENCE PROCEEDINGS
VOLUME 7
This the seventh of seven volumes of the Conference Proceedings for World SB14 Barcelona, which took place in Barcelona on the 28th, 29th and 30th October 2014.
The Conference was organised by GBCe (Green Building Council España), co-promoted by iiSBE, UNEP-SBCI, CIB and FIDIC, and counted on the participation of World GBC*.
This volume gathers papers presented in the poster sessions from the Conference area “Creating New Resources”, presented as posters at World SB14 Barcelona on day 3 of the Conference. All the papers in this volume were double blind peer reviewed by the Scientific Committee of World SB14 Barcelona.
• If you wish you search for content by author or paper title, please use the Conference programme search engine.
• If you wish to search for content by topic you can guide yourself by the topic labels that you will find at the top of the Conference programme search engine.
All papers from World SB14 Barcelona have been granted the ISBN number 978-84-697-1815-5.
These Proceedings are published by GBCe, in Madrid, in November 2014.
Green Building Council España Paseo de la Castellana 114, 4º 7, puerta 7
28046 Madrid
*iiSBE: International Initiative for a Sustainable Built Enviroment UNEP-SBCI: United Nations Environment Programme - Sustainable Buildings and Climate Initiative CIB: Conseil International de Batîment FIDIC: International Federation of Consulting Engineers World GBC: World Green Building Council
INDEX
POSTER SESSION 5
Mutual Impact of Design Decisions and Environmental Considerations - Life Cycle Analysis of an Alpine Hut. 1
The potential of BIM Platform in building modernization aiming to environmental certification. 8
Sustainable building optimization – A systemic approach. 16
Social Indicators in the Sustainable Refurbishment: Calculating Quality of Life Indicator in a Residential Building in Málaga. 25
Environmental Performance of Adaptive Building Envelope Design: Urban housing in Seoul, Korea. 32
Organizational Strategies to Support Sustainability in the Construction Company. 40
Decision support for planning Sustainable Energy Management in Underground Stations. 49
Residential Energy Services Demand: Lisbon case study towards Net Zero Energy House. 56
Energy cascade in recent zero carbon/energy development. 62
ECOMETRO y las Declaraciones Ambientales del Edificio DAE. 69
A Life Cycle Based Green Building Product Labelling Scheme 79
Calculation of Carbon Footprint in Building Project. 86
Life cycle assessment of buildings – A nZEB case using streamline and conventional analysis. 93
Urban sprawl and city compactness. A proposal for regional sustainability indicators. Case study of the towns of Alcorcon and Majadahonda (Comunidad de Madrid, Spain).
100
Green Urbanism and Diffusion Issues. 108
Proposal of urban mobility model from the modal integration Santa Maria do Leme river basin: subsidies for the expansion at São Carlos city, São Paulo State, Brazil.
118
Rapid urbanisation and housing transformations in Tlokweng, Botswana. 126
Indicators for urban quality evaluation at district scale and relationships with health and wellness perception. 140
Housing plans and urban rehabilitation in Spain, 1992-2012. 147
The Study of Vegetation Effects on Reduction of Urban Heat Island in Dubai. 155
New indicator for resource accessibility assessment, based on surface land cover. 162
Design of an indicator system for habitability monitoring in the historical city of San Gabriel (Ecuador). 169
Sustainable development of three Taiwan's communities. 176
1
Mutual Impact of Design Decisions and Environmental
Considerations - Life Cycle Analysis of an Alpine Hut
Authors:
Schneider, E. Patricia 1;
Schinabeck, Judith 2;
1 Technische Universität München (TUM), Munich, Germany
2 Technische Universität München (TUM), Munich, Germany; School of Civil and
Environmental Engineering, UNSW Australia, Sydney, Australia
Abstract: This investigation about the design process of an alpine hut shows the mutual
impact of design decisions and environmental considerations using the Hochwildehaus in the
Austrian Alps as an exemplary project. Different design strategies were compared in the light
of the environmental impact of construction, maintenance, and disassembly of the building
project.
Starting with an analysis of the differences in the LCA of a remote off-grid building compared
to a regular building, four different designs are evaluated in terms of the most promising
strategies to minimize ecological impact already during the design process. Helicopter
transport and the relationship between energy standard and required technologies are taken
into account. The study shows how far global warming potential and the use of primary
energy can be reduced with designers and engineers working hand in hand.
Life Cycle Analysis, environmental impact, self-sufficient buildings, extreme environments
Introduction
Extreme environments constitute an ideal study area for sustainable architecture: independent
from an urban context, buildings in remote sites derive the framework for their design from
the surrounding conditions, such as climate and on-site materials. Resource scarcity has a
strong influence on the way such buildings are developed, as building materials often have to
be transported by helicopter and all services must be provided on-site. Therefore, material and
resource flows are more obvious to the users through the immediacy of the impact of
(un)sustainable practices. Such buildings have to distil the essence of self-sufficiency in their
design strategies.
The following investigation shows the mutual impact of design decisions and environmental
considerations using the Hochwildehaus in the Austrian Alps as a sample project. The designs
were developed by students of the Master’s program in architecture at the Technische
Universität München (TUM) in the summer of 2013. The different design strategies were
compared in the light of the environmental impacts during the entire life cycle of the building.
An interdisciplinary investigation conducted by students of the Master’s programs in
environmental engineering, civil engineering and energy efficient and sustainable building
provided the basis for this research.
ISBN: 978-84-697-1815-5
1
2
Our research was guided by one central question: how far can we reduce ecological impacts
of the building if designers and engineers work together during the design process making
sure that high quality in architectural design is achieved at the same time?
Research approach and methodology
Multiple teams of designers and engineers cooperated in calculating life cycle assessments
(LCAs) during the design process and in implementing the results into the final building
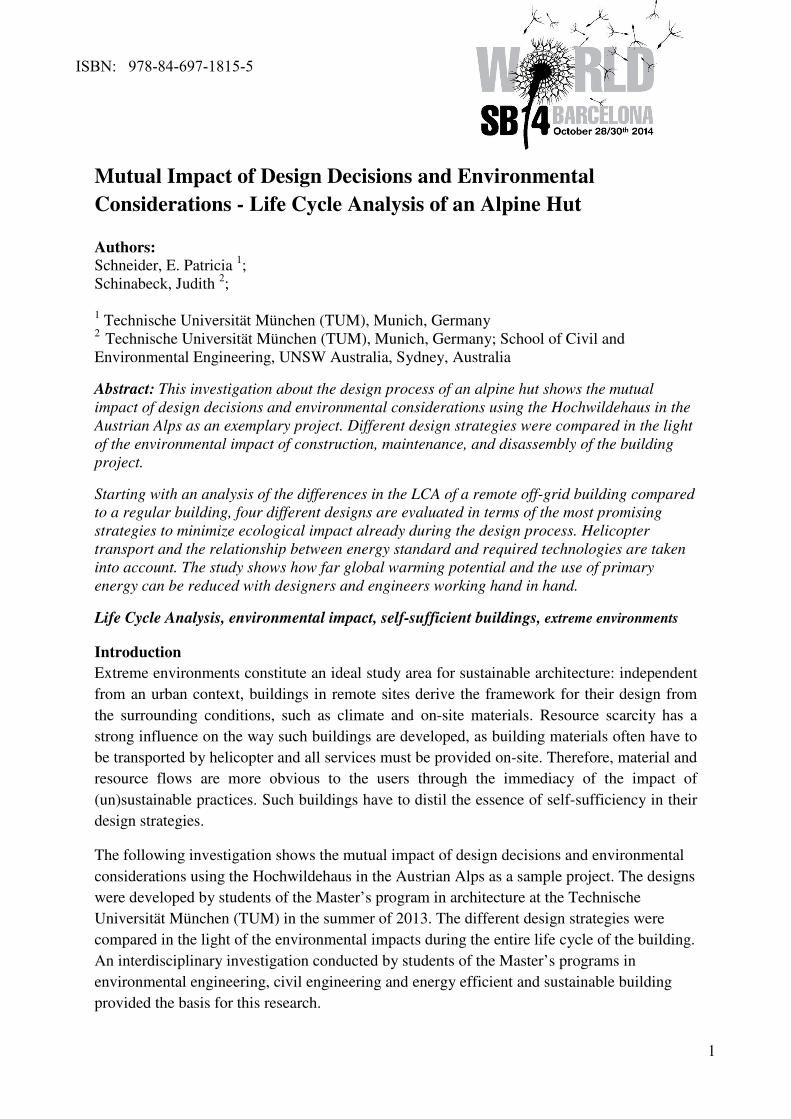
design. We chose four out of the final twelve projects to compare and evaluate optimization
strategies. We selected these designs because they represent the range of variations both in
design as well as in life cycle optimization.
Figure 1 (from left to right): Design 1, design 2, design 3 initial and redesigned, design 4 [1]
The design task was a replacement building for an existing alpine hut owned by a regional
chapter (Karlsruhe) of the German Alpine Club. The existing hut built in the 1930s needs to
be replaced as the building’s structure has become unsafe due to water damage and instability
of the foundations caused by melting permafrost. The new hut provides accommodations for
50 mountaineers, the host and staff, with a large dining room, kitchen and sanitary facilities,
all in all approximately 500 m² of gross floor area.
Operational energy for comfort conditions was calculated over the period of use of the hut
(100 days from mid-June until mid-September). For the winter months some operational
energy is required to keep the building interior above freezing temperatures.
The evaluation and comparison of the ecological impact of the different designs includes all
systems and processes directly related to the building and its operation. For example this does
not include food supply and travel of the visitors to the building. It does include all ecological
impacts caused by fabrication of the building materials and components, transport of the
materials to the site, maintenance, replacement and repair processes, operation of the building,
and disassembly of the building over a lifetime of 50 years. Life expectancies for different
building components were taken into account (e.g. 25 years for mechanical systems) by
adding the ecological impacts of replacing the different components at appropriate intervals.
Calculations were done with the online tool Sustainable Building Specifier [2], complemented
by additional spreadsheets where data was not available within the tool. The tool calculates
LCAs based on different data bases, in our case ökobau.dat 2011.
We calculated a complete set of impact categories, but gave most consideration to global
warming potential (GWP) and primary energy (PE) demand. Since energy demand and the
related global warming effect are the cause for melting permafrost, they are strongly related to
the instability of the existing hut. We contribute to building longevity directly by minimizing
ISBN: 978-84-697-1815-5
2
3
GWP and PE demand of the new hut and indirectly by setting a positive example which will
be visited by many hikers and climbers.
Comparison of life cycle phases
Typically, the results of building LCAs are highly influenced by the use phase of the building,
especially through fossil energy use. The design of this alpine hut deviates from average
buildings in several aspects: the strict use of renewable energy sources reduces the operational
energy impacts to virtually zero. On the other hand, higher energy consumption is expected
due to helicopter flights that are necessary to transport all of the building materials and
equipment to the remote building site. They are integrated in the LCA, although standard
building LCAs normally do not account for the transport from the material production site to
the construction site. These aspects shift the focus of the LCA towards the construction,
maintenance and disassembly of the hut. The results are therefore mainly influenced by the
choice of building materials.
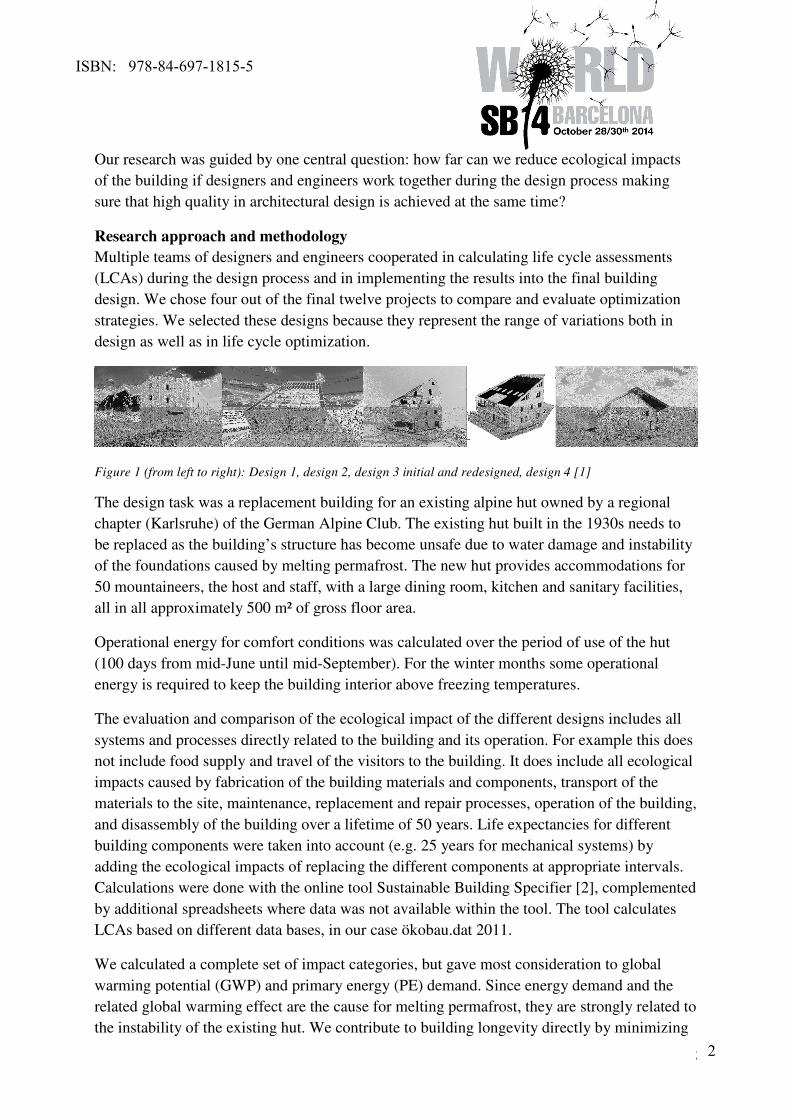
Figure 2 shows the distributions of the primary energy and the global warming potential
(GWP) over the life cycle phases of two designs representing opposite ends of the value
distribution.
Figure 2: Distributions of the primary energy and the global warming potential over the life cycle phases of the
alpine hut
The use phase, represented by maintenance in figure 2, has the lowest environmental impact.
As the designs are optimized towards durability, the bulk of the materials does not have to be
exchanged during the 50 year life cycle.
The construction materials are the main influence on the LCA, as opposed to the operational
energy for average buildings. Two main consequences for an optimized material choice result
from figure 2:
-40% -20% 0% 20% 40% 60% 80% 100%
Design 3
Design 2
Primary Energy
Transport
Construction
Maintenance
Disassembly
-40% -20% 0% 20% 40% 60% 80% 100%
Design 3
Design 2
Global Warming Potential
Transport
Construction
Maintenance
Disassembly
ISBN: 978-84-697-1815-5
3
4
1. Contrary to other LCAs, the transport has to be incorporated in this case. It accounts
for up to 30 % of the primary energy and the global warming potential respectively.
As a consequence, light-weight materials are preferred in the design of the hut.
Additionally, parts of the existing old hut can be re-used as they do not have to be
transported to the site.
2. The negative GWP values indicate optimized material choice and can only be
achieved by choosing renewable materials like wood. Alternatively, in the case of a
solid construction, an optimized re-use of the materials of the old hut can decrease the
environmental impacts.
Optimal material and supply strategies
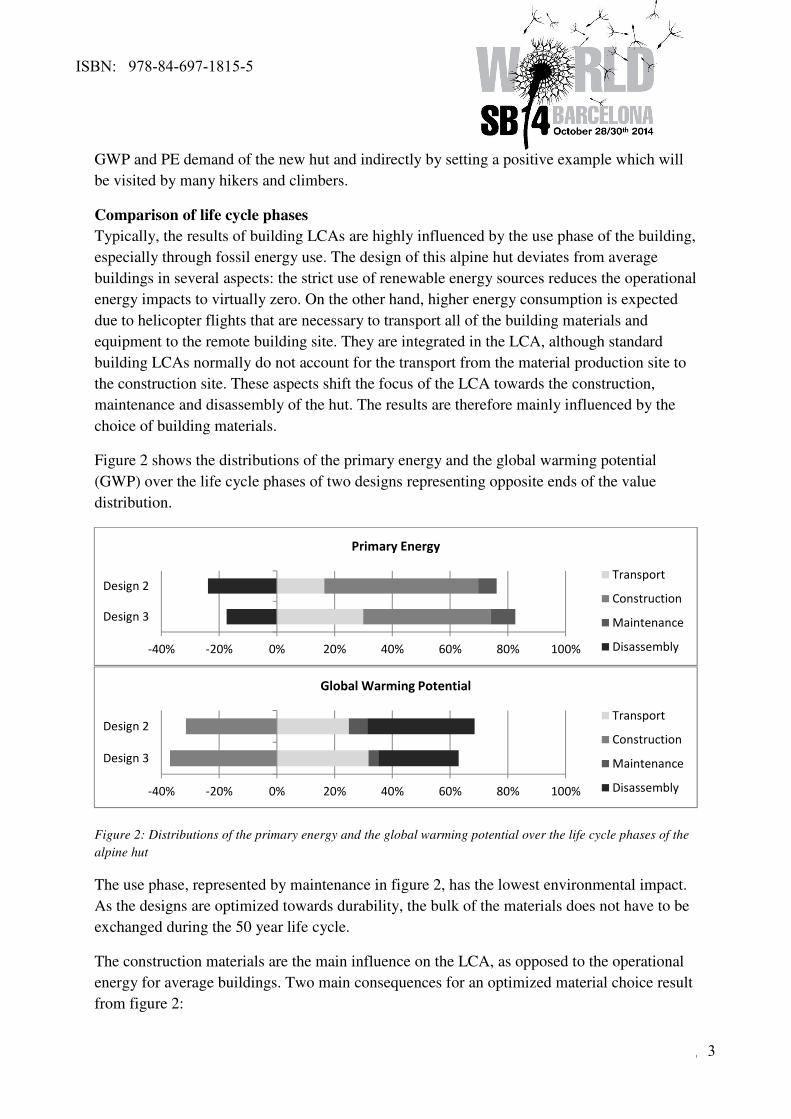
The analysis of the design data of four initial designs shows that the proposed buildings vary
greatly in volume and envelope area [figure 3]. During the following design process, two
different strategies were chosen by the interdisciplinary teams. Teams 1 and 4 decided to
concentrate on optimizing material and system choices, whereas team 2 significantly reduced
the volume of their project. Team 3 opted for a complete redesign, only marginally reducing
volume and area.
Figure 3: Envelope area and volume comparison of the four initial and final designs
Reducing building size and optimizing material choices
Design team 2 greatly reduced the volume and envelope area of the building, e.g. by changing
the accommodation spaces from rooms of hotel standard to rooms with bunk beds as they are
common in alpine huts. Circulation areas and sanitary facilities were redesigned in a less
generous fashion. Additionally, the team replaced most of the heavy building elements by
lighter materials. For example, a thermal storage wall which was initially planned to be built
out of concrete included wood and phase changing materials in the final design. These
changes resulted in a weight reduction of the building from 256 to 125 metric tons, greatly
0
500
1000
1500
Design 1 Design 2 Design 3 Design 4
Envelope Area (m²)
initial envelope area
final envelope area
0
1000
2000
3000
Design 1 Design 2 Design 3 Design 4
Volume (m³)
initial volume
final volume
ISBN: 978-84-697-1815-5
4
5
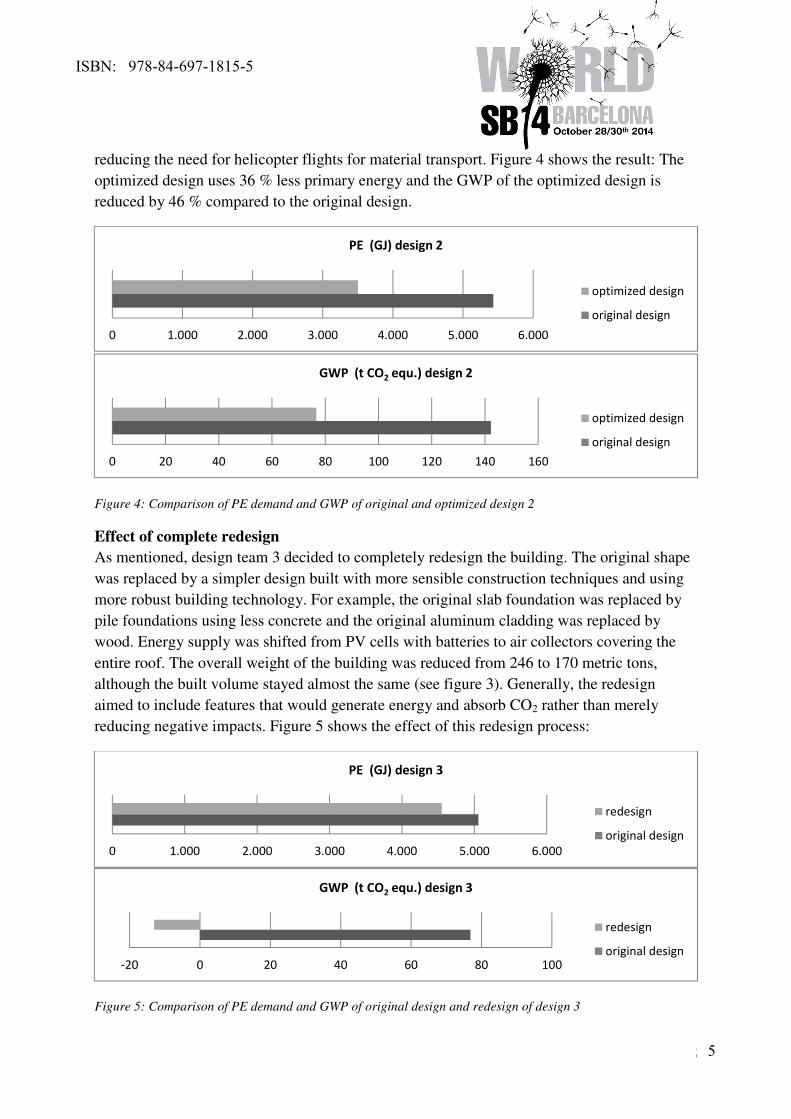
reducing the need for helicopter flights for material transport. Figure 4 shows the result: The
optimized design uses 36 % less primary energy and the GWP of the optimized design is
reduced by 46 % compared to the original design.
Figure 4: Comparison of PE demand and GWP of original and optimized design 2
Effect of complete redesign
As mentioned, design team 3 decided to completely redesign the building. The original shape
was replaced by a simpler design built with more sensible construction techniques and using
more robust building technology. For example, the original slab foundation was replaced by
pile foundations using less concrete and the original aluminum cladding was replaced by
wood. Energy supply was shifted from PV cells with batteries to air collectors covering the
entire roof. The overall weight of the building was reduced from 246 to 170 metric tons,
although the built volume stayed almost the same (see figure 3). Generally, the redesign
aimed to include features that would generate energy and absorb CO2 rather than merely
reducing negative impacts. Figure 5 shows the effect of this redesign process:
Figure 5: Comparison of PE demand and GWP of original design and redesign of design 3
0 1.000 2.000 3.000 4.000 5.000 6.000
PE (GJ) design 2
optimized design
original design
0 20 40 60 80 100 120 140 160
GWP (t CO2 equ.) design 2
optimized design
original design
0 1.000 2.000 3.000 4.000 5.000 6.000
PE (GJ) design 3
redesign
original design
-20 0 20 40 60 80 100
GWP (t CO2 equ.) design 3
redesign
original design
ISBN: 978-84-697-1815-5
5
6
Overall PE demand was reduced by 10 %, increasing the renewable part from 52 % in the
original design to 78 % in the redesign. GWP was switched from a positive value indicating
that CO2 is released into the atmosphere to a negative value showing that CO2 is absorbed.
This stems from the fact that almost exclusively wood and other renewable materials were
used.
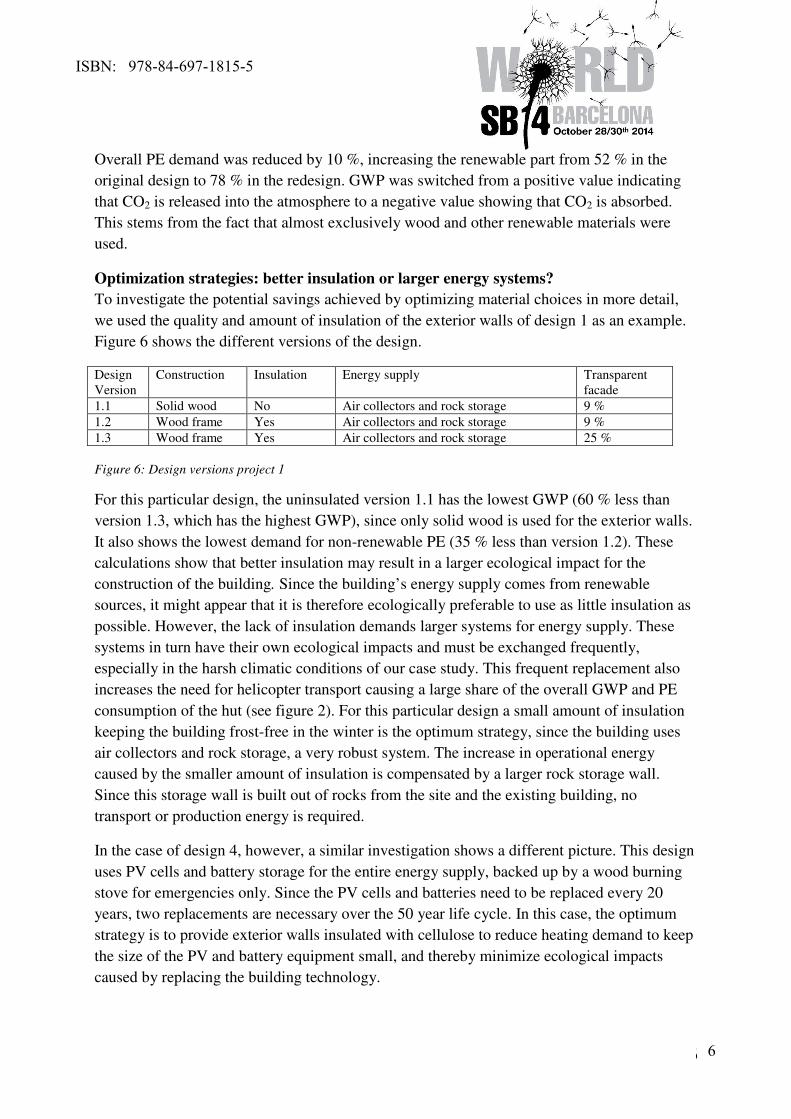
Optimization strategies: better insulation or larger energy systems?
To investigate the potential savings achieved by optimizing material choices in more detail,
we used the quality and amount of insulation of the exterior walls of design 1 as an example.
Figure 6 shows the different versions of the design.
Design
Version
Construction Insulation Energy supply Transparent
facade
1.1 Solid wood No Air collectors and rock storage 9 %
1.2 Wood frame Yes Air collectors and rock storage 9 %
1.3 Wood frame Yes Air collectors and rock storage 25 %
Figure 6: Design versions project 1
For this particular design, the uninsulated version 1.1 has the lowest GWP (60 % less than
version 1.3, which has the highest GWP), since only solid wood is used for the exterior walls.
It also shows the lowest demand for non-renewable PE (35 % less than version 1.2). These
calculations show that better insulation may result in a larger ecological impact for the
construction of the building. Since the building’s energy supply comes from renewable
sources, it might appear that it is therefore ecologically preferable to use as little insulation as
possible. However, the lack of insulation demands larger systems for energy supply. These
systems in turn have their own ecological impacts and must be exchanged frequently,
especially in the harsh climatic conditions of our case study. This frequent replacement also
increases the need for helicopter transport causing a large share of the overall GWP and PE
consumption of the hut (see figure 2). For this particular design a small amount of insulation
keeping the building frost-free in the winter is the optimum strategy, since the building uses
air collectors and rock storage, a very robust system. The increase in operational energy
caused by the smaller amount of insulation is compensated by a larger rock storage wall.
Since this storage wall is built out of rocks from the site and the existing building, no
transport or production energy is required.
In the case of design 4, however, a similar investigation shows a different picture. This design
uses PV cells and battery storage for the entire energy supply, backed up by a wood burning
stove for emergencies only. Since the PV cells and batteries need to be replaced every 20
years, two replacements are necessary over the 50 year life cycle. In this case, the optimum
strategy is to provide exterior walls insulated with cellulose to reduce heating demand to keep
the size of the PV and battery equipment small, and thereby minimize ecological impacts
caused by replacing the building technology.
ISBN: 978-84-697-1815-5
6
7
Conclusions
Our calculations show that the LCA results of this secluded alpine hut are not comparable to
LCAs done for a regular building connected to an energy supply grid and transport
infrastructure. Helicopter transports have to be included since they significantly increase the
ecological impact. The operational energy from renewable sources, on the other hand,
influences the LCA positively. This leads to an increased importance of the building materials
over the whole life cycle. Also, robust building technology should be selected; otherwise,
frequent replacements would augment the transport impacts.
The design approach has to be adapted compared to standard buildings. Basic concept
considerations and teamwork right from the start are fundamental in achieving optimized
solutions both from an ecological as well as from a design perspective. LCA calculations
should accompany the entire design process, so that building design and LCA calculations are
refined in parallel and can interact in a positive fashion. Therefore, LCA comparison of
design alternatives as well as for details such as different materials should be included in early
design stages.
Our study shows the potential of interdisciplinary teams using LCA as an ecological
optimization tool during the design process. In an interdisciplinary process primary energy
demand can be reduced by a significant amount and overall ecological impacts can be
minimized. If the entire team cooperates, it can even be achieved that CO2 is stored in the
building rather than released into the atmosphere.
Acknowledgements
We would like to thank M.Sc.Dipl.-Ing. (FH) Johannes Gantner at Fraunhofer Institute for
Building Physics IBP for his support in using the SBS tool.
References
[1] Design 1: Samuel Harm, Manuel Margesin, Agatha Link (students of architecture); Sarah
Heisig, Simon Marold
Design 2: Samuel Mora, Carolina Sepulveda (students of architecture); Carla Joas, Ursula
Kellerer (students of civil engineering)
Design 3: Mariya Georgieva, Franziska Schlenk (students of architecture); Claudia
Aderbauer, Daniela Setzer (students of civil engineering), Judith Lennartz (student of energy
efficient and sustainable building)
Design 4: Markus Bobik, Michaela Eizenberger (students of architecture); Benjamin
Kurmulis, Caroline Martner (students of civil engineering)
[2] Sustainable Building Specifier: www.sbs-onlinetool.com
ISBN: 978-84-697-1815-5
7
1
The potential of BIM Platform in building modernization aiming
to environmental certification
Speakers:
SILVA, Fabiana Dias da1; SALGADO, Mônica Santos
2; CAMPOS, Ana Beatriz Ribeiro
3
1 PETROBRAS and PROARQ/FAU/UFRJ, Architect and Doctoral Student Rio de Janeiro,
Brasil 2
PROARQ/FAU/UFRJ Associate Professor, Universidade Federal do Rio de Janeiro, Rio de
Janeiro, Brasil 3 FAU/UFRJ Undergraduate Student, Universidade Federal do Rio de Janeiro, Rio de
Janeiro, Brasil
Abstract: Changes and innovations in the design management are frequent and they are
directly proportional to the technological innovations incorporated in the civil construction
industry. Among all the innovations, the advances of information technology in the design
process management should be highlighted. The benefits of digital modeling to the building
production have already been studied by researchers. However, taking into account the large
variety of old buildings that should be modernized, it is important to evaluate the potential of
using the Building Information Modeling as an instrument for building rehabilitation design.
In this sense, this paper presents the results of a research aiming to analyse the use of BIM to
create a database for an existing building which is being rehabilitated in order to achieve the
requirements of sustainable construction through the environmental assessment method
AQUA (Brazilian method based on French HQE process). The research findings suggest that
the success in BIM implementation depends on the stakeholders’ accurate knowledge of its
functionalities, and the team engaged should review the information management system to
allow the feasibility of interoperability during design decisions.
Key words: Architectural management, sustainability, facilities management, BIM and
building modernization
Introduction
Since the 1990’s, the civil construction industry is facing different challenges regarding
innovation in both design process and construction management. In this period, the increment
in the discussions concerning sustainability in the construction production was observed, as
well, as the spread of different certification systems for “green” constructions. In general, the
tools are attempting to: achieve continuous improvement to optimize building performance
and minimize environmental impact; provide a measure of a building’s effect on the
environment; and set credible standards by which buildings can be judged objectively. (REED
et al., 2009).
The search for buildings’ production which takes into consideration internal and external
performance variables (that is, environmental comfort for its users and low environmental
impact in the region) has led professionals in the areas of design management and
ISBN: 978-84-697-1815-5
8
2
development to find alternatives to make the environmental performance simulation feasible
before the execution of the work. In this case, it was observed an increase in the use of energy
simulation software – considering that energy efficiency is one of the key points of this
discussion. However, it is necessary to recognize the need to control the environmental
performance of buildings in the use-operation and maintenance phase. In this aspect, Hensen
(2010) adds that in the next decade we will observe strong growth in the application of
building performance simulation in these activities. The two main reasons for this are (1) the
discrepancy between predicted and real energy consumption in buildings, and (2) the
emergence of new business models.
Among the possibilities offered by the information technology aiming to facilitate this
process, the BIM platform – Building Information Modeling – is highlighted, since it allows
the conjugation of all aspects involved in the design process and verification of the impact of
design decisions identifying incompatibilities.
Thus, this paper submits a case study where the BIM platform is used in the modeling of an
existing building, aiming to facilitate the incorporation process of the design characteristics to
allow the adequacy of the building to the requirements of one of the environmental
certifications – in this case, the AQUA process (adaptation of the French method HQE – High
Environmental Quality). The goal of this research is to present the opportunities offered by
the method, as well as the main difficulties faced by the teams involved in the design process.
1. Sustainable Projects and the AQUA Process
The supporting tools to the development of sustainable design were developed in different
countries, following the specificities of each region. In Brazil, considering the current reality,
it is worth observing the Labeling Program of Energy-Efficiency of Constructions, a proposal
that differs from the others by not specifically providing a method to aid the project with
environmental quality, but a proposal for certification of buildings that present satisfactory
energy performance, considering pre-established requirements. (ELETROBRAS; PROCEL,
2010 apud SALGADO et al, 2012)
Only recently, Brazil has given its first steps towards the discussion and the adoption of
methodologies which might help the production of constructions concerning the
environmental requirements. Among the foreign methods arising in the country, the French
method HQE (Haute Qualité Environnementale) was adapted originating the Brazilian AQUA
process. The AQUA process has been significantly searched by stakeholders, with 133
projects certificated up to November 2013. (FUNDAÇÃO VANZOLINI, 2014).
The AQUA process started before the design development, and takes place in two phases:
parameters definition and design conception. The first phase is related to the study of the
environmental potentialities of the land – with the help of the parameters defined by the
method - and, afterwards, the hierarchisation of the 14 targets defined by the methodology.
(SALGADO et al, 2012) The process is grounded in two documents:
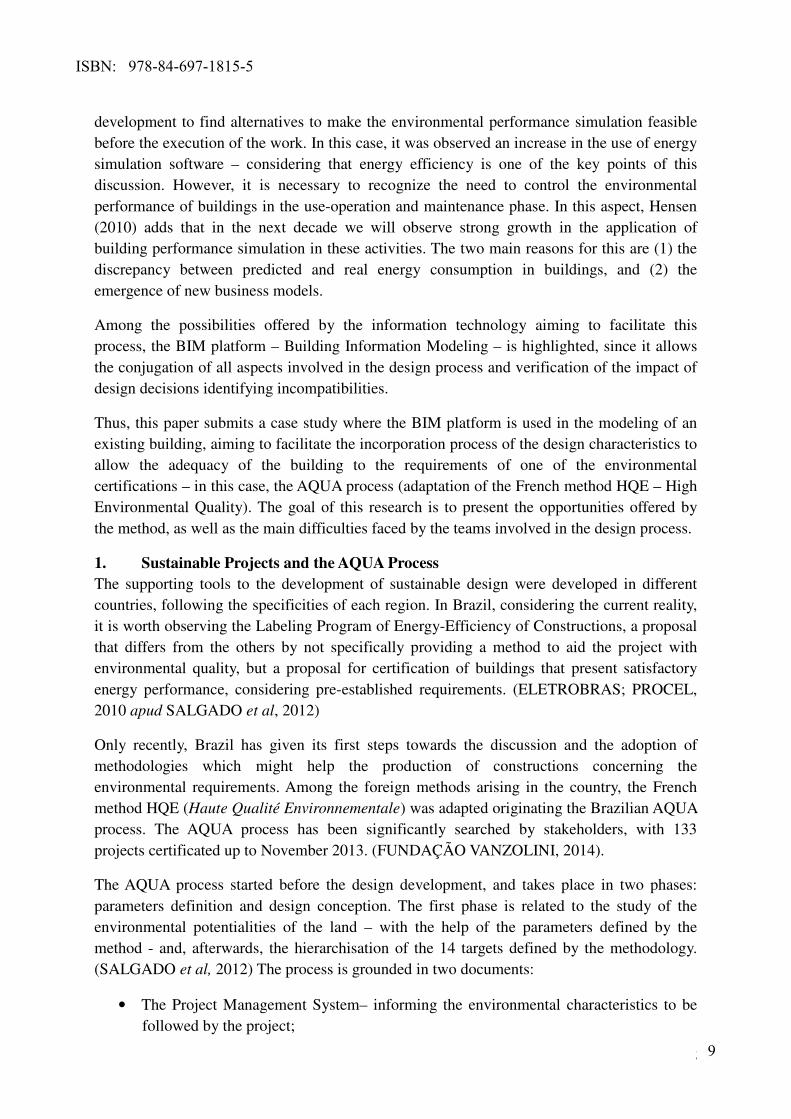
• The Project Management System– informing the environmental characteristics to be
followed by the project;
ISBN: 978-84-697-1815-5
9
3
• The Environmental Quality Building Profile (QAE), with the definition of the
environmental categories to be prioritized in the design development.
It is important to highlight the importance of the environmental certifications regardless the
preference provided by stakeholders. It is understood that the main merit of proposals is in
helping architects and engineers to re-think the design process aiming at the incorporation of
solutions which may contribute positively for the environmental quality of the building.
2. BIM platform, Sustainability and Facilities Management (FM)
The Building Information Modeling (BIM) is an anticipation of the reality that deals with
developing a set of representations (models) of the construction information. Thus, a database
is built which may be used and updated during all its life cycle. The “BIM” platform
(Building Information Modeling), emerged at late 1980´s in the United States and Europe,
mainly in Finland (MENEZES, 2011 apud RIBEIRO, 2013). The migration for the “BIM”
platform is relatively slow in Brazil, and still passes through an acceptance process by the
offices.
Survey accomplished by Ribeiro (2013) listed the main software which work in the logics
proposal by BIM, such as ArchiCAD, of the Graphisoft company, which was launched in
1984; the Building Architecture of Bentley Systems company; Revit, commercialized by
AutoDesk company; and the Vectorworks Architect of Nemetschek company.
Architecture design developed using any of those software can be exported in IFC (Industry
Foundation Classes) format– a 3-dimension-interchange – which allows the reading and
edition in any software that work in platform, therefore, there is no need to work exclusively
with only one of the software mentioned. That is, the choice of the more appropriate software
will depend on the design developed by the office.
Concerning the production of sustainable constructions, it is known that the information
related to architectural design process became even more complex, with the adoption of
innumerous environmental goals. Thus, the interoperability during the design process is
necessary, in order to select, among the set of possible solutions, the most appropriate one in
terms of high environmental quality. (SALGADO, 2011)
In this sense, it must be highlighted the research developed by Olin´s et al (2012), informing
the potential of BIM platform as a cooperation instrument, that can be used for both the
management of documents and information, for project management, budgets control,
planning, schedule, environmental simulations and to analyze variables related to feasibility,
costs, energy and environmental performance. The authors add that BIM advantages are not
limited to the conception phases of the design and construction, and they may be useful
throughout all life cycle of the building such as maintenance, revitalization, analysis of space
usage and environmental management as well as costs of the operational performance.
Thus, we evidence the potential of BIM model in the project management during all its life
cycle. Nevertheless, this approach is still unprecedented and faces some barriers. Study
ISBN: 978-84-697-1815-5
10
4
performed by Williams (2013) suggests that the Facilities Management Industry is not entirely
ready to embrace BIM, and although the opportunity of data acquisition is appealing, there are
many challenges and obstacles that can prevent BIM from being used effectively in FM.
According to the author the success of BIM for FM hinges not only technology and
information exchange, but also collaborative working practices and well defined processes,
highlighting the fact that BIM truly requires a fusion of people, process and technology.
3. Case Study in Rio de Janeiro
To provide continuity to the survey about the BIM platform potential in the management of
sustainable constructions throughout its life cycle, a case study was accomplished in a
company headquartered in the city of Rio de Janeiro. The original design of the building that
lodges the company was chosen by means of a competition organized by the company
through the Institute of Architects of Brazil (IAB-RJ), in 1967. The building conception
includes precepts of bioclimatic architecture, which should follow the main requirements
defined in the official announcement: the maximum occupation of the land with minimum of
vertical circulation; the valorization of the social contact in pleasant environments and the
desire of becoming a landmark in the city’s architecture, highlighting its landscape, but
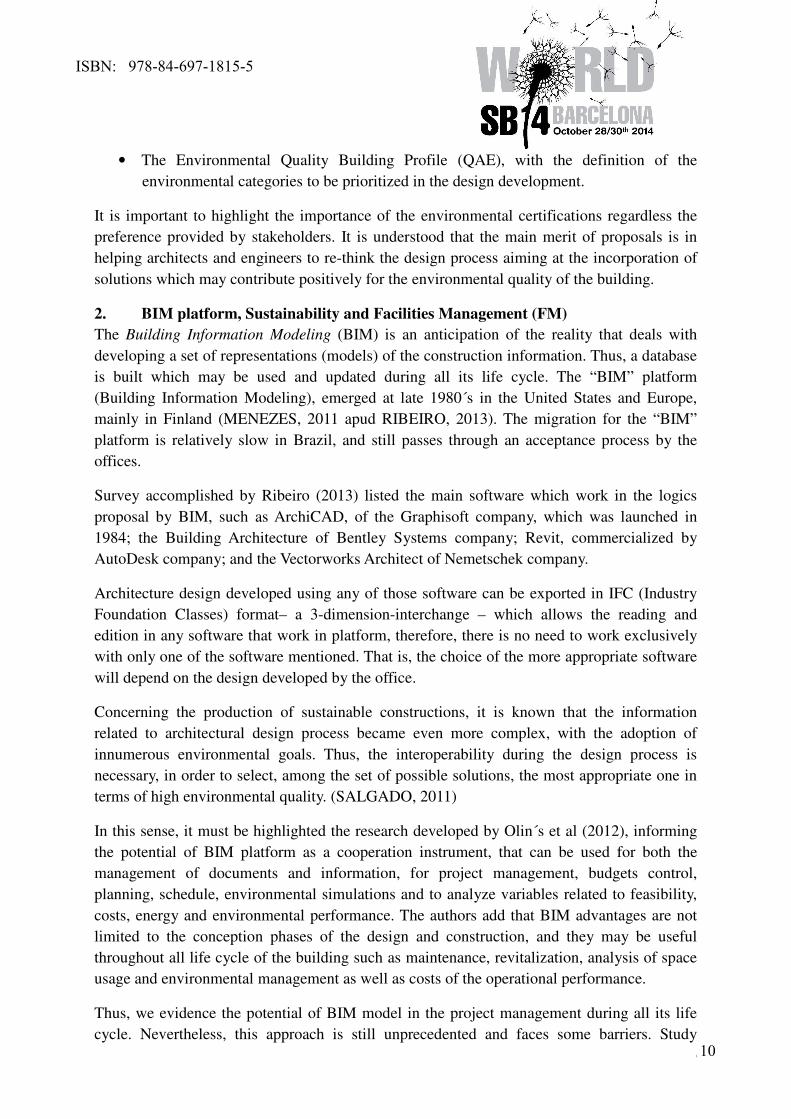
integrated with its surrounding. (GUASTI, 2008)
Photo 1: Construction and its surrounding (authors’ photo)
The winning team of the competition, headed by the architecture office Forte-Gandolffi
Associated idealized the project whose 75 x 75 m blueprint is divided into nine 25 x 25 m
modules, with 12,5 m columns comprised by pillars cross-shaped (SANTOS and ZEIN,
2009). The free space generated between the pillar and the coating houses the distributing
pipe visited of water piping, sewage and iced water for the air conditioning. The coating was
made with stainless steel plates providing a polygonal format. (GUASTI, 2008).
The building is divided into: underground, framework (ground floor, 1st and 2nd floors),
body-building (3rd
to 22th floors) and crown (23th to 26th
floors). The central module shelters
the vertical circulation and the services (restrooms, emergency stairways, power distribution
pipes and telephony, besides the elevators shaft), being this the only cluster which is repeated
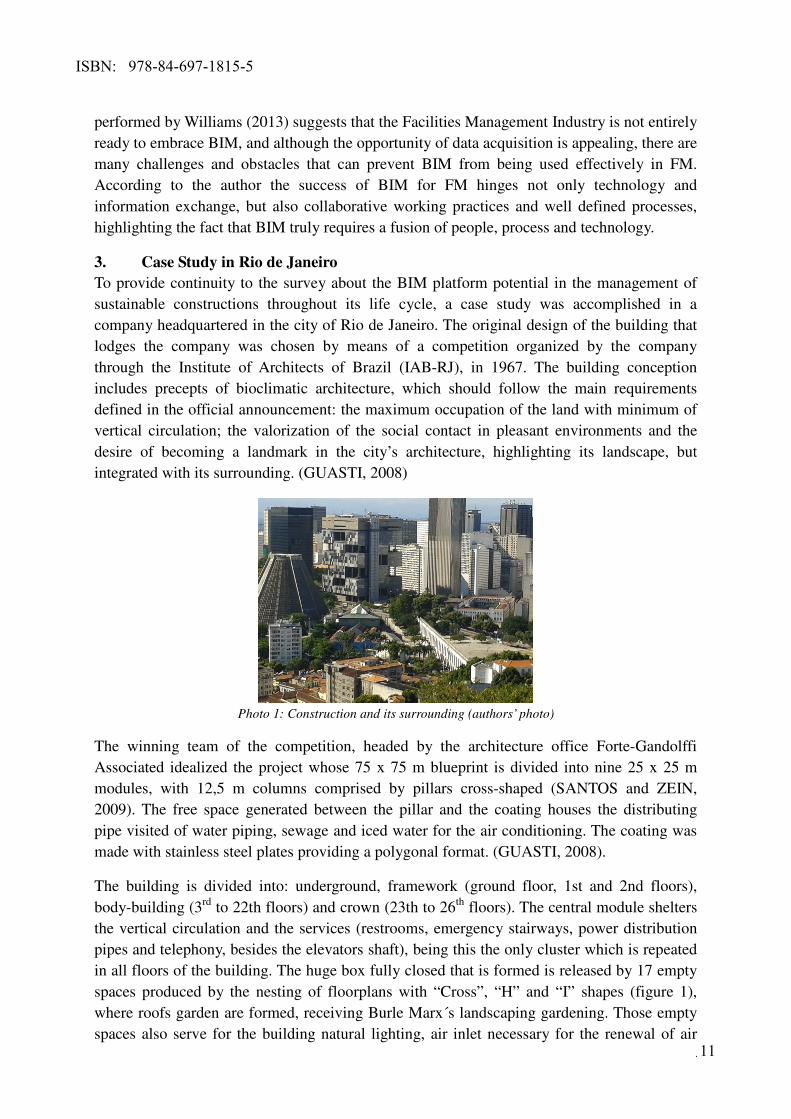
in all floors of the building. The huge box fully closed that is formed is released by 17 empty
spaces produced by the nesting of floorplans with “Cross”, “H” and “I” shapes (figure 1),
where roofs garden are formed, receiving Burle Marx´s landscaping gardening. Those empty
spaces also serve for the building natural lighting, air inlet necessary for the renewal of air
ISBN: 978-84-697-1815-5
11
5
conditioning and for the humanization of the building. (GUASTI, 2008).
Figure 1: Types of Story (authors’ image)
Around 2008, remodel works were performed in the area of air conditioning aiming at
increasing the energy saving. To check the efficiency of those new systems, the works were
performed in the 6th floor, which has been totally reformed (GUASTI, 2008). The
enhancement in this floor has oriented the development of the Basic Design for the other
floors and, in 2013, the technological update design has been initiated, aiming at the adequacy
to the current and future needs of the construction.
3.1 Process Framework of Design Development
The development of the renovation/ requalification design was divided into four stages:
Conceptual Design, Basic Design, Detailed Design and Construction. Firstly, the Basic
Design Phase was accomplished, using the conventional 2D software for design. The option
of making models using BIM platform took place in the Detailed Design due the complexity
of the design. Moreover, the interest in adapting the building to meet the requirements of
AQUA process justified even more the production of the model in BIM.
The employees of the office that was in charge of the design development supervision
prepared a document named “3D Modeling Technical Specification” which was delivered to
the contractor for the fulfillment of the Detailed Design.
The design team, thus, was comprised by the following professionals: An internal coordinator
- responsible for work follow-up developed by the external contractor. And, two external
coordinators of the contractor: 1) Design Coordinator – responsible for controlling the
changes and the documents release for the inspection team, and, 2) Modeling Coordinator – in
charge of checking conflits and overlaps between the subject in the model and submitting the
model in the meetings of design review.
3.2 Design Management in BIM
The issuance of daily reports of interferences is the procedure established for checking the
interferences and integration between the subject and the contractor. Those reports are
grounded in the parametrical model itself, by means of “clash-detection” command. Later on,
those documents are forwarded to the weekly design meeting and reviewed by the leaders of
the subject involved. For the model management, the inspection team prepares an individual
checklist for each one on the disciplines involved. Thus, the modeler shapes the element and
after that makes the checking of interferences. Therefore, the model checking is made directly
in 3D model in review meetings with technicians of all design areas of the inspection team
ISBN: 978-84-697-1815-5
12
6
performed every 2 months.
The approval of the documents by the company is performed by means of Project
Management System, which allows the documents to be analysed and commented by the
inspection team, before returning to the contractor, which makes the necessary changes.
Nonetheless, this system has specific internal procedures that demand to receive the document
in pdf. Thus, the contractor has to extract the drawings from virtual model (3D), issued in
format dwg to be finalized in Autocad (2D).
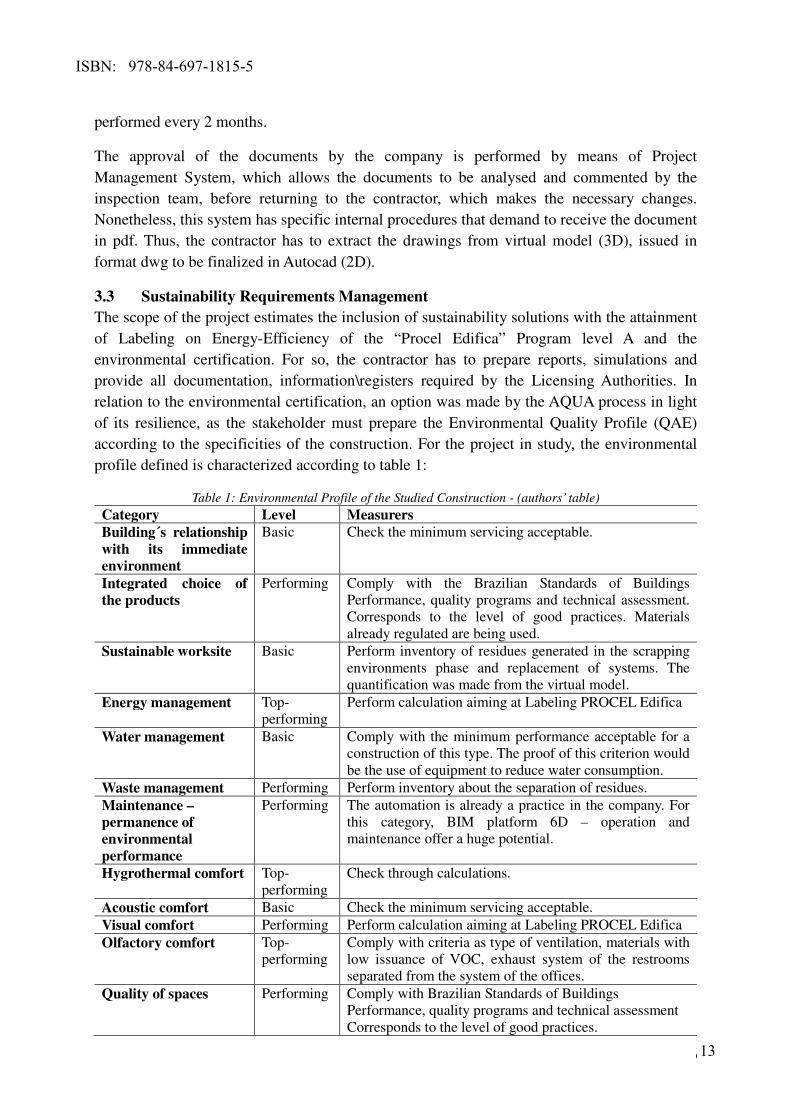
3.3 Sustainability Requirements Management
The scope of the project estimates the inclusion of sustainability solutions with the attainment
of Labeling on Energy-Efficiency of the “Procel Edifica” Program level A and the
environmental certification. For so, the contractor has to prepare reports, simulations and
provide all documentation, information\registers required by the Licensing Authorities. In
relation to the environmental certification, an option was made by the AQUA process in light
of its resilience, as the stakeholder must prepare the Environmental Quality Profile (QAE)
according to the specificities of the construction. For the project in study, the environmental
profile defined is characterized according to table 1:
Table 1: Environmental Profile of the Studied Construction - (authors’ table)
Category Level Measurers Building´s relationship
with its immediate
environment
Basic Check the minimum servicing acceptable.
Integrated choice of
the products
Performing
Comply with the Brazilian Standards of Buildings
Performance, quality programs and technical assessment.
Corresponds to the level of good practices. Materials
already regulated are being used. Sustainable worksite Basic Perform inventory of residues generated in the scrapping
environments phase and replacement of systems. The
quantification was made from the virtual model. Energy management Top-
performing
Perform calculation aiming at Labeling PROCEL Edifica
Water management Basic Comply with the minimum performance acceptable for a
construction of this type. The proof of this criterion would
be the use of equipment to reduce water consumption. Waste management Performing Perform inventory about the separation of residues. Maintenance –
permanence of
environmental
performance
Performing The automation is already a practice in the company. For
this category, BIM platform 6D – operation and
maintenance offer a huge potential.
Hygrothermal comfort Top-
performing
Check through calculations.
Acoustic comfort Basic Check the minimum servicing acceptable. Visual comfort Performing Perform calculation aiming at Labeling PROCEL Edifica Olfactory comfort Top-
performing
Comply with criteria as type of ventilation, materials with
low issuance of VOC, exhaust system of the restrooms
separated from the system of the offices. Quality of spaces Performing Comply with Brazilian Standards of Buildings
Performance, quality programs and technical assessment
Corresponds to the level of good practices.
ISBN: 978-84-697-1815-5
13
7
Table 2(continuation): Environmental Profile of the Studied Construction
Air quality and
health
Top-
performing
Perform calculation.
Water quality and
health
Basic Perform the maintenance programed in water supply system.
4. Analysis of the Outcomes
Considering the little experience of the professionals in use of all functionalities offered by
BIM platform, it was observed that the time for the development design was longer compared
to a design developed by the traditional method. Nonetheless, in light of the advantages
related to the use of BIM, as an advanced solution of interferences that could only be
identified during the construction, the company intends to use the modeling in future projects.
One of the main issues that led to the decision of BIM model construction was the possibility
of creating a database of the project. This will facilitate the operation and maintenance
activities of the building as well as the accomplishment of future reforms. Therefore, it is
necessary to enable and to familiarize the professionals that are responsible for the building
maintenance with the use of this tool, in order to keep the database always updated.
Regarding AQUA certification for existing buildings, it is worth adding that there is no need
to perform simulations, only the proof by calculation, reports, standards and inventories. In
the case studied, nevertheless, considering the parametrical modeling, it would be even
possible to perform such simulations.
It is important to highlight the potential of BIM platform for the category Maintenance and
Permanence of Environmental Performance, once this tool will allow the appropriate
management of the maintenance and operation of the building by the administrators of the
construction, during the rest of its life cycle.
5- Final Considerations
The BIM platform should be used since the beginning of the design process, allowing the use
of all possibilities offered. In the studied example, nevertheless, all resources available were
not used, as the decision happened in the mid process once the Basic Design had already been
developed in 2D (outcome of process update started in 2008).
In this experience, the design team defined a “block-pilot” to be modeled in BIM as strategy
for the work accomplishment using a platform. This strategy allowed the familiarization of
the professionals with the new technology and, simultaneously, make feasible the
identification of technical bottlenecks in the parts where there is a huge number of piping.
On the other hand, a certain overlap was observed between the assignments of the external
coordinators. In order to prevent this to happen, it is important for the participants to
understand the changes inherent to the use of BIM platform and, thus, avoid that the design
team organization still made in the former molds of the projects developed in 2D.
ISBN: 978-84-697-1815-5
14
8
The reflection on the use of BIM platform suggests the establishment of a specific sector in
the company intended exclusively to the survey and the development of technological
solutions applied to construction, generating libraries which may feed the BIM model and
become an interesting strategy to be adopted by future projects.
6- Bibliographic References:
FUNDAÇÃO VANZOLINI, [Institutional website]. Available in: <http://
http://www.vanzolini.org.br/hotsite-aqua.asp>. Access on: April 23rd, 2014.
GUASTI, Jacira M. G. (2008) Diretrizes de sustentabilidade de edifícios de escritórios: estudo de caso
do Edifício Marechal Adhemar de Queiroz, 2008 Dissertação (Mestrado em Sistemas de Gestão)
Universidade Federal Fluminense, Rio de Janeiro.
HENSEN J. M. L. (2010) Building Performance Simulation for Sustainable Buildings 3rd
Int Conf. on
Technology of Architecture and Structure / ICTAS Proceedings… Beijing: Beijing University of
Technology. Available in: <http://www.bwk.tue.nl/bps/hensen/publications/10_ictas_beijing.pdf>
Access on: April 23rd, 2014.
OLIN, J.; JYLHA, T.; JUNNILA, S. (2014) Virtuality: What does it means for FM?. In: CIB W070,
W092 & TG72 INTERNATIONAL CONFERENCE ON FACILITIES MANAGEMENT,
PROCUREMENT SYSTEMS AND PUBLIC PRIVATE PARTNERSHIP, 1, 2012, Cape Town.
Proceedings …. Cape Town: University Of Cape Town, 2012. p. 20 - 26. Available in:
<http://www.cibworld.nl>. Access on January 15th.
REED, R. et al. (2009) International Comparison of Sustainable Rating Tools. Journal of Sustainable
Real State, v. l. n. 1. Available in: <http://www.costar.com/josre/JournalPdfs/01-Sustainable-Rating-
Tools.pdf>. Access on: April 23rd, 2014.
RIBEIRO, A. B. (2013) O potencial das ferramentas de modelagem digital para a construção
sustentável. IV Colóquio do PROARQ Anais... PROARQ/FAU/UFRJ.
SALGADO, M. S. CATELET, A. FERNANDEZ, P. (2012) Produção de edificações sustentáveis:
desafios e alternativas. Revista Ambiente Construído Porto Alegre, v. 12, n. 4, p. 57-73.
SALGADO, M. S. (2011) Implementation of Quality Management System on architecture offices as a
requirement for sustainable design. CIB W096 Design Management, Proceedings … Vien: Austria,
p.295-305.
SANTOS, M. S; ZEIN, R. V. (2009) A moderna Curitiba dos anos 1960: jovens arquitetos,
concurseiros, planejadores. In: 8° Seminário Docomomo Brasil, Rio de Janeiro, Brazil.
WILLIAMS, R. (2013) Using Building Information Modeling for Facilities Management, Dissertation
submitted in part fulfilment of the Degree of Master of Science Built Environment: Facility and
Environment Management, The Bartlett School of Graduate studies University College London,
SEPTEMBER.
Acknowledgments
The authors acknowledge financial support from National Council for Research and Development -
CNPq (Research productivity, scientific initiation scholarship and Universal Edict 2012) and
PETROBRAS.
ISBN: 978-84-697-1815-5
15
1
Sustainable building optimization – A systemic approach
Helmuth KREINER1*)
, Alexander PASSER1,2
, Peter MAYDL1, Holger WALLBAUM
3
1Institute of Technology and Testing of Building Materials-Working Group Sustainability
Assessment, Graz University of Technology, Austria
2Institute of Construction and Infrastructure Management, ETH Zurich, Switzerland
3Chalmers University of Technology, Gothenburg, Sweden
Abstract:
Objective: During the last two decades various building sustainability certification systems have been
developed and established. These assessment systems are considered to be appropriate tools for the
evaluation of sustainability performance on buildings. Current building design optimisations mostly
focus on single sustainability aspects like environmental quality or economic performance,
disregarding a holistic approach. Investors strive to achieve a maximum of the assessment score on
the one hand and optimized initial costs on the other. Project stakeholders usually have different
points of view regarding project requirements and goals. Sustainable buildings – according to the
upcoming CEN/TC 350 standards - should include environmental, social and economic aspects as
well as functional and technical issues. In order to achieve a high performance concerning
sustainability-assessment due to the choice of the right optimasation measures, early planning stages
show the high potential (integral planning).
Methods: Based on the Austrian building certification system (ÖGNI/DGNB), we applied a systemic
approach for building sustainability-improvement, using a case study of a public office building in
Graz, Austria.
Results: The main part of our study describes six important steps required for systemic sustainability
optimization. The applied method allows the quantification of the relative influence and the individual
optimization potential of design options on each single assessment criterion.
Conclusion: Building certification combined with a systemic approach regarding the interdependency
between single criteria is an appropriate method for the improvement of building sustainability.
Key-words: Building sustainability assessment, design optimization, systemic approach, LCA,
LCC
1. Introduction
Stakehoders from politics and legislators at all different levels as well as in the private sector are now
aware about the importance to promote measures for the environmental protection and social justice
while pursuing economic growth and economic stability, and endeavour to implement such actions.
Transferring the principles of sustainable development (WECD 1987) into the construction sector and
the construction industry means introducing a change of paradigm with the challenge that there is no
universally accepted definition and no unique solution for sustainable buildings. The perception of
ISBN: 978-84-697-1815-5
16
2
what is a sustainable building is changing over time and depending on the location. During the last two
decades various building sustainability certification systems have been developed and established
(Cole et al. 2005; Wallhagen & Glaumann 2011; Haapio & Viitaniemi 2008). These assessment
systems are considered to be appropriate tools for the evaluation of sustainability performance on
buildings (Passer, Mach, et al. 2012; Passer et al. 2010). According to the forthcoming CEN/TC 350
standard (CEN 2010; CEN 2011; CEN 2012) sustainable buildings should fulfill environmental, social
and economic as well as functional and technical aspects. Different users and investors’ project-
preferences, often lead to trade-offs during the design phase of a project. These trade-offs are caused
by the optimization measures and their system interdependencies. A systemic approach to model and
quantify the system effects caused by different design options are generally not considered yet
(Kreiner & Passer 2012). At current no commercial tools for analyzing these interdependencies do
exist. Decisions of design options are mainly reduced on the instantaneous assessed criterion in the
assessment of buildings - this is caused by the current linear assessment approach for building
certification of singular technical measures. The interdependency of other criteria and their influence
in overall building performance is thereby often neglected, especially in early planning stages.
In contrast systemic thinking is gaining more and more interest in the last years (Hunkeler et al. 2008;
Vester 2008; Cole 2011). Different systemic approaches are described in (Dzien 2011), (Thomas &
Köhler 2011), (Girmscheid & Lunze 2010) and (Schneider 2011). In order to fulfill stakeholder
interests on the one hand and a high certification result on the other, it is very important to identify
appropriate measures, which improve the sustainability performance of buildings. Therefore good
knowledge of system effects triggered by design optimizations – according to certification systems – is
indispensable. A review of current literature does not show appropriate approaches considering both,
stakeholder interests and system effects of several measures. First steps towards a systemic
improvement are described in (Wittstock 2012), (Hafner 2011). With regard to systems thinking
therefore a new approach leading to the integration of system theory in the field of building
assessments is needed.
2. Method
The identification of the system interdependencies of different optimization measures is based on the
ÖGNI/DGNB building certification system (ÖGNI 2009). The system consists of 49 single criteria
with individual weighting. Single criteria are allocated to assessment areas that are also weighted and
finally combined to an overall ÖGNI target achievement. In complex systems – as in multicriteria
analyses – single criteria often interact with each other (Schalcher 2008). By neglecting these
interactions in building optimization process, single parameters are improved while effects on the
overall assessment remain unknown.
In the last decades many methods for improvement of building sustainability have been developed. In
this case study the sensitivity model of Vester (Vester 2008; Kreiner & Passer 2012) was applied in a
new approach towards systemic building optimization. Systemic improvement of building
sustainability should include the following steps:
1. Identification of assessment criteria role (S1)
2. Semi-quantitative building assessment (S2)
3. Matrix with possible measurements (S3)
4. Identification of system influence by several design measures (S4)
5. Systemic improvement (S5)
6. Scenario analyses (S6)
ISBN: 978-84-697-1815-5
17
3
The identification of ÖGNI assessment criteria role is conducted with the sensitivity model of Vester
(step S1), identifying the different roles of the assessment criteria. The most influening construction
measures of the case study were identified by prior semi-quantitative building assessment (step S2).
Based on step S1 as well as on step S2 appropriate design measures can be identified (S3) in general
for the subsequent systemic evaluation (step S4 and S5). Understanding criteria interactions does not
necessarily lead to an appropriate building improvement process. Rather, attending to the systemic
influence of single measures and/or system-parts of the building is quite important for the planning
process (step S4). The environment’s influence that often leads to project trade-offs must be analysed
throughout scenario analyses (step S6). This is caused by the fact that summarizing the achievement in
assessment target of single measures must not be similar with the assessment results after combining
several design options. Rather, the system of a part can be only be understood by understanding the
whole (Cole 2011), taking their interdependencies into account.
3 Case study analysed
The new approach was applied on an office building in Graz (Styria, Austria). Building owner and
operator is the Landesimmobiliengesellschaft mbH (Landesimmobilien-Gesellschaft mbH 2010). The
new office building is part of the Karmeliterhof project and was built during the renovation of the
whole complex. Tab. 1 gives an overview about the key parameters of the building.
Table 1. Key parameters of investigated office building
Size 2.300 m2 (gross floor area)
Floors 5+1
Walls Concrete, bricks
Energy certificate B (39 kWh/m2*a)
S/V ratio 0,21 (m-1)
Heating system District heating
LEK 33[-]
Mean U-value 0,565 [W/(m2*K)]
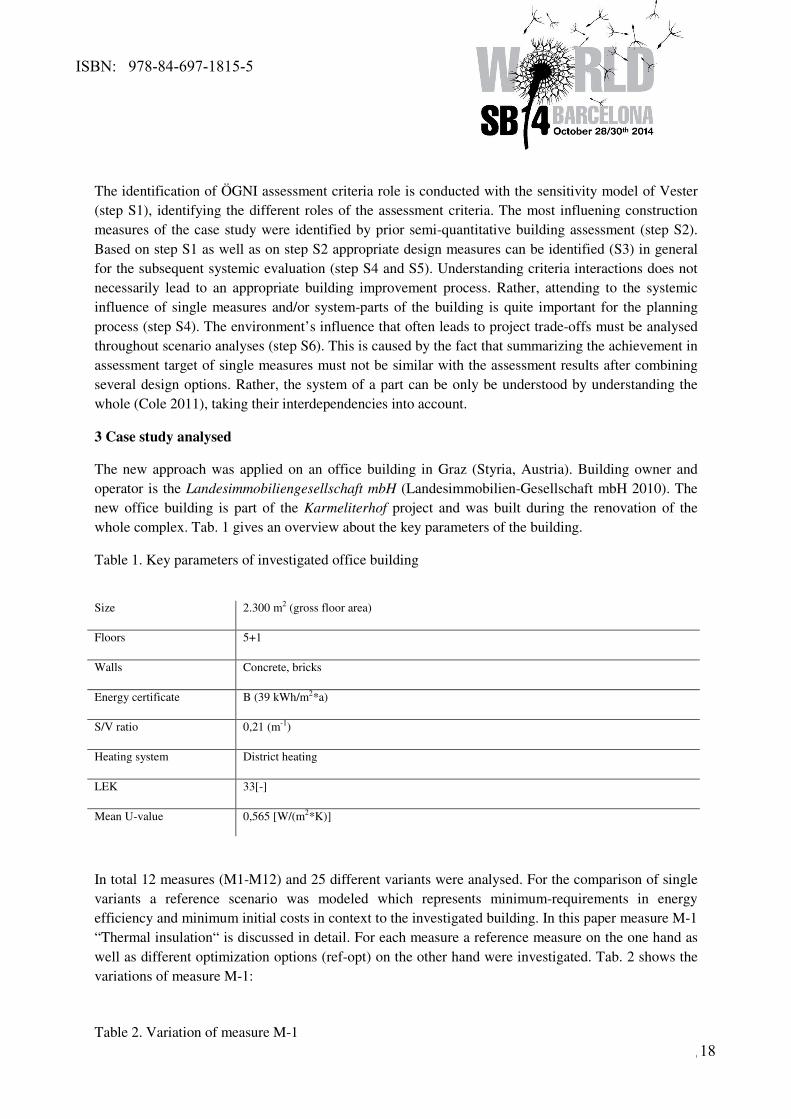
In total 12 measures (M1-M12) and 25 different variants were analysed. For the comparison of single
variants a reference scenario was modeled which represents minimum-requirements in energy
efficiency and minimum initial costs in context to the investigated building. In this paper measure M-1
“Thermal insulation“ is discussed in detail. For each measure a reference measure on the one hand as
well as different optimization options (ref-opt) on the other hand were investigated. Tab. 2 shows the
variations of measure M-1:
Table 2. Variation of measure M-1
ISBN: 978-84-697-1815-5
18
4
Measure
Reference Built Optimization
[ref] [built] [opt] [opt1] [opt2]
M1 Thermal insulation 10 cm EPS 16 cm EPS 22 cm EPS 30 cm EPS 20 cm
mineral-wool
Several parameters where chosen for a subsequent scenario analyses (Fig. 4). Parameter “LCA” is
thereby defined as the sum of ÖGNI-criteria 1-5 and 10-11. “LCCA” represents criterion 16 (life cycle
cost) in ÖGNI certification system. By summarizing ÖGNI target achievement of LCCA and measure
related criteria parameter “Use” is defined. Finally the scale of sustainability improvement is described
by parameter “Sum target achievement” for each measure.
4. Results
4.1 Single measure influence on several criteria
The evaluation of each measure was realized by separate investigation of each parameter. Quantitative
influence on parameters like energy or heating demand as well as initial or life cycle costs were
analysed. Semi-quantitative optimization potential in ÖGNI building certification system has
additionally been carried out. Each measure has an individual optimization potential allocated to the
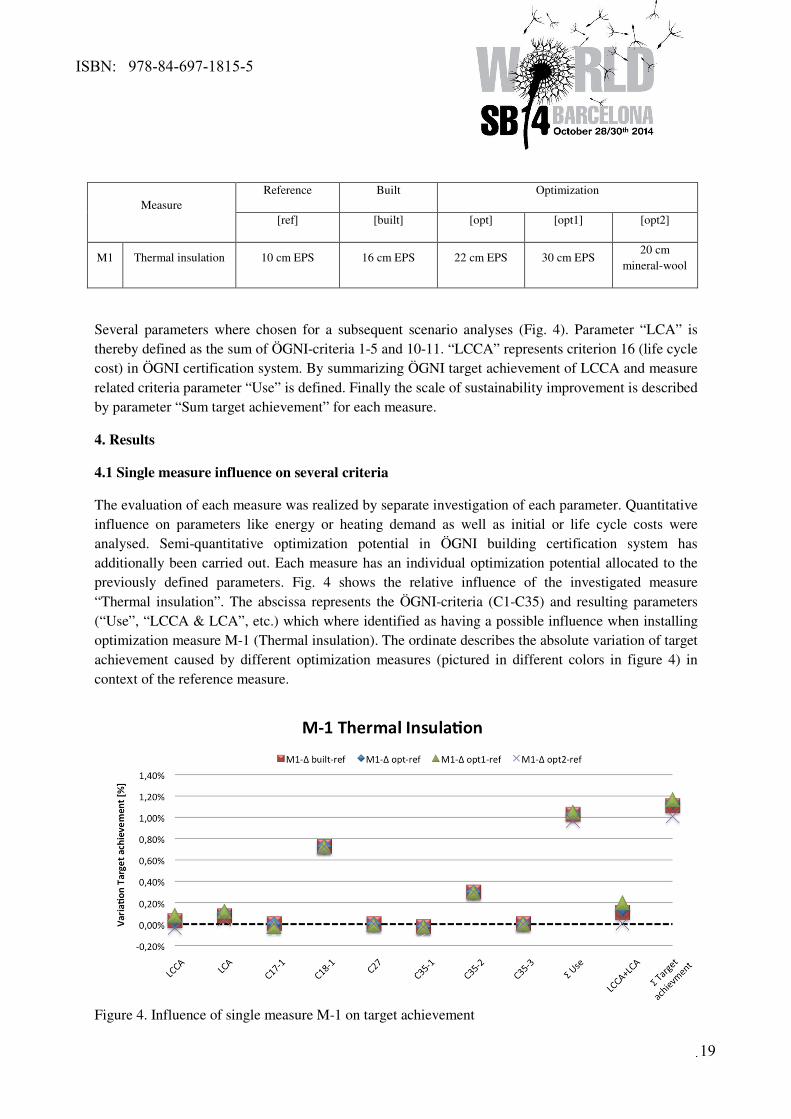
previously defined parameters. Fig. 4 shows the relative influence of the investigated measure
“Thermal insulation”. The abscissa represents the ÖGNI-criteria (C1-C35) and resulting parameters
(“Use”, “LCCA & LCA”, etc.) which where identified as having a possible influence when installing
optimization measure M-1 (Thermal insulation). The ordinate describes the absolute variation of target
achievement caused by different optimization measures (pictured in different colors in figure 4) in
context of the reference measure.
Figure 4. Influence of single measure M-1 on target achievement
ISBN: 978-84-697-1815-5
19
5
As the thickness of the thermal insulation is increasing, the heating demand decreases. A lower
heating demand has interdependency with criterion 18 (Thermal comfort in winter). At least 0,7 % of
absolute target achievement in criterion 18-1 (Operative temperature) are influenced. Further there is a
low influence on LCCA and LCA by installing measure M-1. Due to increasing gross floor area,
space-efficiency changes slightly. Because of the system interdependency between criterion 17 (value
stability) and 27 (space efficiency) the target achievement of criterion 27 also increases slightly and
criterion 35-2 (Quality of the building shell) is influenced. A 0,3% increasing of target achievement
can be reached by improving the U-Value of the facade. Influence on other concerned criteria did not
cause relevant variation of target achievement in the investigated case. Finally, system trade-offs have
to be analysed. The range between the investigated variants concerning measure M-1 can be neglected.
To summarize, by applying measure M-1 “Thermal insulation”, an improvement of ÖGNI target
achievement between 1,0% and 1,2% can be reached. Final energy demand (ÖN_H_5055 2011) can
be reduced by 2,6 to 5,4%, depending on the measure-variation which was chosen and the quantitative
impact of the relevant parameter.
4.2 System influence due to different design options
The previous investigation was carried out for several design options that were chosen based on the
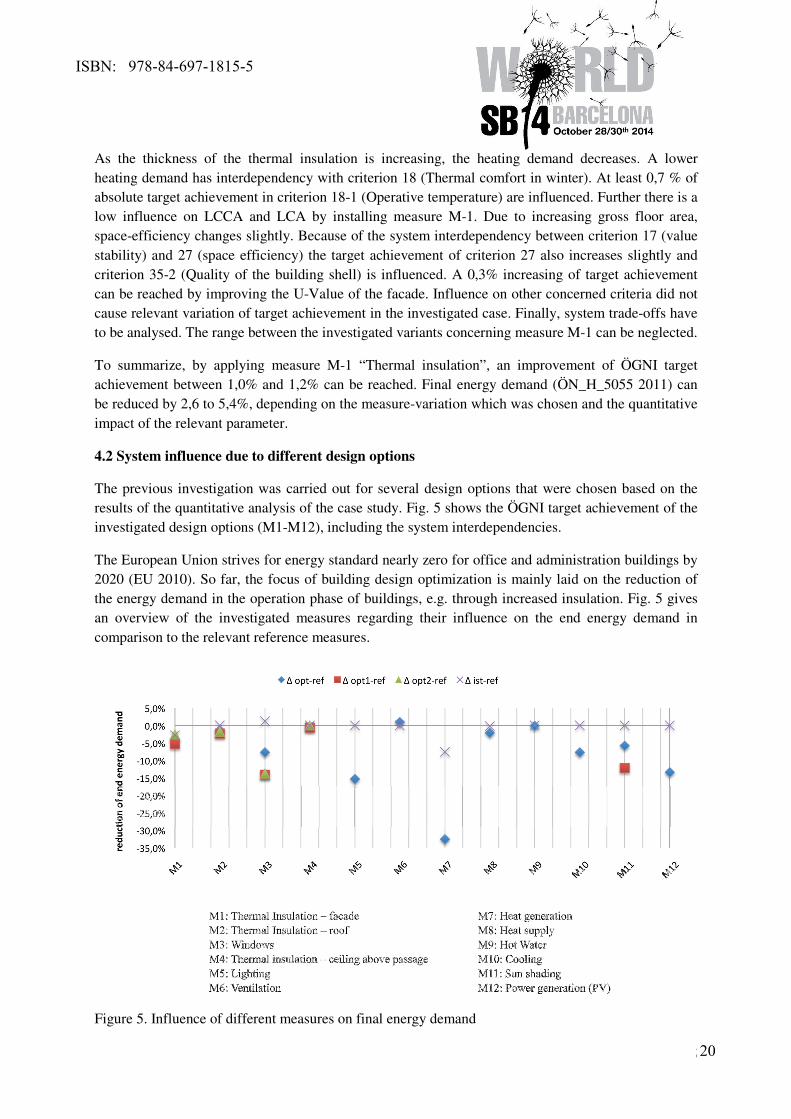
results of the quantitative analysis of the case study. Fig. 5 shows the ÖGNI target achievement of the
investigated design options (M1-M12), including the system interdependencies.
The European Union strives for energy standard nearly zero for office and administration buildings by
2020 (EU 2010). So far, the focus of building design optimization is mainly laid on the reduction of
the energy demand in the operation phase of buildings, e.g. through increased insulation. Fig. 5 gives
an overview of the investigated measures regarding their influence on the end energy demand in
comparison to the relevant reference measures.
Figure 5. Influence of different measures on final energy demand
ISBN: 978-84-697-1815-5
20
6
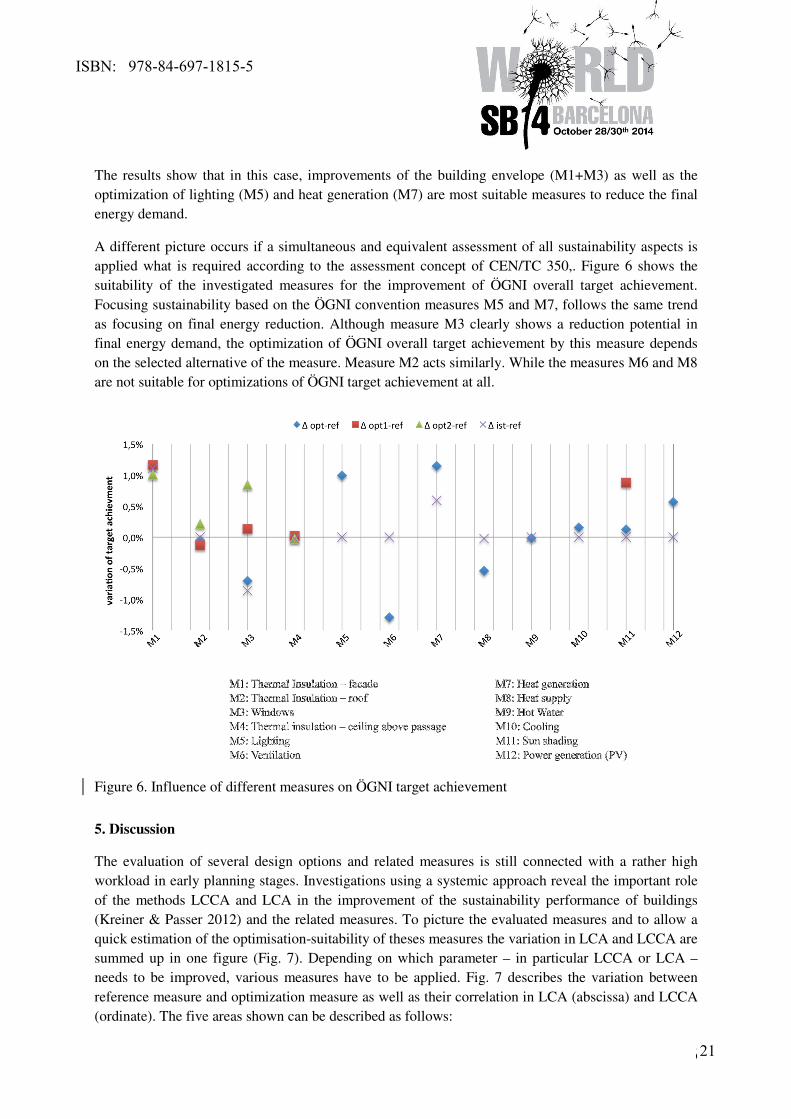
The results show that in this case, improvements of the building envelope (M1+M3) as well as the
optimization of lighting (M5) and heat generation (M7) are most suitable measures to reduce the final
energy demand.
A different picture occurs if a simultaneous and equivalent assessment of all sustainability aspects is
applied what is required according to the assessment concept of CEN/TC 350,. Figure 6 shows the
suitability of the investigated measures for the improvement of ÖGNI overall target achievement.
Focusing sustainability based on the ÖGNI convention measures M5 and M7, follows the same trend
as focusing on final energy reduction. Although measure M3 clearly shows a reduction potential in
final energy demand, the optimization of ÖGNI overall target achievement by this measure depends
on the selected alternative of the measure. Measure M2 acts similarly. While the measures M6 and M8
are not suitable for optimizations of ÖGNI target achievement at all.
Figure 6. Influence of different measures on ÖGNI target achievement
5. Discussion
The evaluation of several design options and related measures is still connected with a rather high
workload in early planning stages. Investigations using a systemic approach reveal the important role
of the methods LCCA and LCA in the improvement of the sustainability performance of buildings
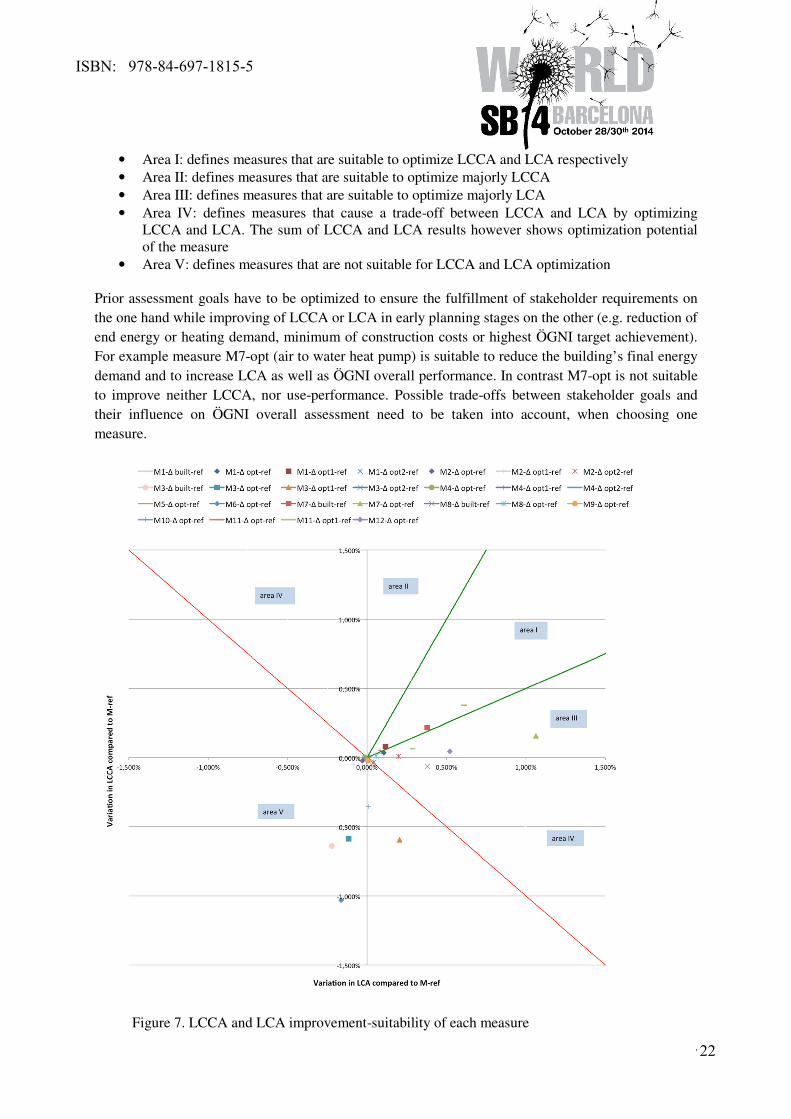
(Kreiner & Passer 2012) and the related measures. To picture the evaluated measures and to allow a
quick estimation of the optimisation-suitability of theses measures the variation in LCA and LCCA are
summed up in one figure (Fig. 7). Depending on which parameter – in particular LCCA or LCA –
needs to be improved, various measures have to be applied. Fig. 7 describes the variation between
reference measure and optimization measure as well as their correlation in LCA (abscissa) and LCCA
(ordinate). The five areas shown can be described as follows:
ISBN: 978-84-697-1815-5
21
7
• Area I: defines measures that are suitable to optimize LCCA and LCA respectively
• Area II: defines measures that are suitable to optimize majorly LCCA
• Area III: defines measures that are suitable to optimize majorly LCA
• Area IV: defines measures that cause a trade-off between LCCA and LCA by optimizing
LCCA and LCA. The sum of LCCA and LCA results however shows optimization potential
of the measure
• Area V: defines measures that are not suitable for LCCA and LCA optimization
Prior assessment goals have to be optimized to ensure the fulfillment of stakeholder requirements on
the one hand while improving of LCCA or LCA in early planning stages on the other (e.g. reduction of
end energy or heating demand, minimum of construction costs or highest ÖGNI target achievement).
For example measure M7-opt (air to water heat pump) is suitable to reduce the building’s final energy
demand and to increase LCA as well as ÖGNI overall performance. In contrast M7-opt is not suitable
to improve neither LCCA, nor use-performance. Possible trade-offs between stakeholder goals and
their influence on ÖGNI overall assessment need to be taken into account, when choosing one
measure.
Figure 7. LCCA and LCA improvement-suitability of each measure
ISBN: 978-84-697-1815-5
22
8
Further the results show the important role of technical equipment in both assessment methods –
LCCA and LCA. Due to a current lack of LCA-data the environmental impact of technical equipment
in this case study is based on a simplified assessment. However, based on the findings in Passer
(Passer, Kreiner, et al. 2012) a more detailed consideration of technical equipment is strongly
recommended for future investigations.
6. Conclusions
This paper presents a new approach to improve the sustainability performance of buildings. The
results indicate that the presented model is suitable to identify the pros and cons of several measures
for the improvement of building sustainability. Using a systemic approach also allows the highlighting
of the trade-offs between different parameters.
In order to decrease the high workload in the context with systemic building improvements, there is a
need to operationalize the presented optimization process by an appropriate IT-Tool.
Integrating a systemic approach in BIM (Building Information Modeling) could be one future way for
the improvement of the sustainability performance of buildings. Translation of existing methods –
depending on stakeholders – in a manageable form during early planning process, is an important
requirement for operationalizing the approach presented in this paper.
References
CEN, 2010. ÖNORM EN 15643-1 Sustainability of construction works - Assessment of buildings, Part 1:
General Framework.
CEN, 2011. ÖNORM EN 15643-2 Sustainability of constructionworks - Assessment of buildings, Part 2:
Framework for the assessment of the environmental performance,
CEN, 2012. ÖNORM EN 15643-4 Sustainability of constructionworks - Assessment of buildings, Part 4:
Framework for the assessment of economic performance,
Cole, R.J. et al., 2005. Building Environmental Assessment Tools: Current and Future Roles. In World
Sustainable Building Conference 2005.
Cole, R.J., 2011. Environmental Issues Past, Present & Future: Changing Priorities & Responsibilities for
Building Design. In SB11 Helsinki.
Dzien, A., 2011. Sensitivitätsanalyse des ÖGNI Nachhaltigkeitszertifizierungssytems unter Berücksichtigung der
internen Zusammenhänge der Bewertungskriterien. Available at: http://sowibib.uibk.ac.at/cgi-
bin/xhs_voll.pl?UID=&ID=94770.
EU, 2010. RICHTLINIE 2010/31/EU DES EUROPÄISCHEN PARLAMENTS UND DES RATES vom 19. Mai 2010 über die Gesamtenergieeffizienz von Gebäuden,
Girmscheid, G. & Lunze, D., 2010. Nachhaltig Optimierte Gebäude: Energetischer Baukasten, Leistungsbündel
Und Life-Cycle-Leistungsangebote,
ISBN: 978-84-697-1815-5
23
9
Haapio, A. & Viitaniemi, P., 2008. A critical review of building environmental assessment tools. Environmental
Impact Assessment Review, 28(7), pp.469–482. Available at:
http://linkinghub.elsevier.com/retrieve/pii/S0195925508000048 [Accessed March 20, 2014].
Hafner, A., 2011. Wechselwirkung Nachhaltigkeit und ( Bau- ) Qualität – Systemische Betrachtung des
Zusammenspiels von Nachhaltigkeitsaspekten und Kriterien der ( Bau- ) Qualität im Sensitivitätsmodell
und in der Analyse von beispielhaften Gebäuden Dissertation : Annette H. TU München.
Hunkeler, D.J. et al., 2008. Environmental life cycle costing,
Kreiner, H. & Passer, A., 2012. Interdependency of LCCA and LCA in the assessment of buildings. In Third
International Symposium on Life-Cycle Civil Engineering. TAYLOR and FRANCIS GROUP, pp. 1794–
1801.
Landesimmobilien-Gesellschaft_mbH, 2010. Bau- und Austattungsbeschreibung Karmeliterhof,
ÖGNI, 2009. Kriteriensteckbriefe NBV09 AUT 01,
ÖN_H_5055, 2011. Energy performance of buildings - Documents relating to the energy certificate - Findings,
expertise, advice and recommendations,
Passer, A. et al., 2010. Genormte Nachhaltigkeit. In envoa 2010. p. 10.
Passer, A., Mach, T., et al., 2012. Predictable Sustainability ? The role of building certification in the design of
innovative façades. In Advanced Buiding Skins. p. 14. Available at:
https://online.tugraz.at/tug_online/voe_main2.showMask?pPersonNr=1035&pCurrPk=65235&pVtKbz=B
KT&pStatus=A&pSiteNr=1004600.
Passer, A., Kreiner, H. & Maydl, P., 2012. Assessment of the environmental performance of buildings: A critical
evaluation of the influence of technical building equipment on residential buildings. The International
Journal of Life Cycle Assessment, 17(9), pp.1116–1130. Available at:
http://link.springer.com/10.1007/s11367-012-0435-6 [Accessed August 3, 2013].
Schalcher, H.R., 2008. Systems Engineering, Institut für Bauplanung und Baubetrieb, ETHZ.
Schneider, C., 2011. Steuerung der Nachhaltigkeit im Planungs- und Realisierungsprozess von Büro- und
Verwaltungsgebäuden. PhD, TU Darmstadt.
Thomas, E. & Köhler, A., 2011. Strategien zur Prävalenz von Kriteriensteckbriefen. Richtig investieren:
Maßnahmen für eine DGNB Zertifizierung. Greenbuilding, 10, pp.25–27.
Vester, F., 2008. Die Kunst vernetzt zu denken: Ideen und Werkzeuge für einen neuen Umgang mit Komplexität,
Wallhagen, M. & Glaumann, M., 2011. Design consequences of differences in building assessment tools: a case
study. Building Research & Information, 39, pp.16–33. Available at:
http://dx.doi.org/10.1080/09613218.2010.513210.
Wittstock, B., 2012. Methode zur Analyse und Beurteilung des Einflusses von Bauprodukteigenschaften auf die
Nachhaltigkeitsbewertung im Rahmen der Zertifizierung von Gebäuden. Stuttgart: Fraunhofer Verlag.
World Commission for Environment and Development (WECD) (1987) Our common future. United Nations,
New York
ISBN: 978-84-697-1815-5
24
1
Social Indicators in the Sustainable Refurbishment: Calculating
Quality of Life Indicator in a Residential Building in Málaga
Gallo Ormazábal, Izaskun1; González Díaz, Mª Jesús
2 y García Navarro, Justo
3
Research Group on Sustainability in Construction and Industry, Technical University of
Madrid, Spain
Abstract: How can we measure ‘quality of life’? The sustainable refurbishment goes beyond strictly
energy aspects. Sustainability indicators are needed to facilitate data collection and to provide
information which does not require too time-consuming calculations. Thus, you can offer an idea of
the extent and quality of the rehabilitation before starting the project and, also, the obtained results
can be evaluated in an agile way after the refurbishment.
From a list of social indicators gathered from different methods, sustainability assessment tools and
International and European standards, three social indicators are proposed: Users Satisfaction,
Participation Agreement and Quality of Life. This paper shows the development of Quality of Life
social indicator, the more closely related to the main objectives of Research and Development Project
“Sustainable Refurbishment”: improving energy efficiency and wellbeing of users in existing
residential buildings. Finally, this social indicator is applied to a real case study in Málaga (Spain).
Sustainability Indicators, Social Indicators, Sustainable Refurbishment, Quality of Life
Introduction
“Sustainable Refurbishment (RS)” Research and Development Project is supervised by the
Centro para el Desarrollo Tecnológico e Industrial (CDTI) from the Spanish Government.
One of its priorities is to sensitizing users about the necessity of undertaking energy
renovations. Thus, new formulas must be found to invite users to become more involved in
the general condition of their buildings and to highlight their positive aspects. The RS project
aims to develop an integrated model for sustainable rehabilitation of residential buildings
based on a scoreboard of environmental, social and economic sustainability indicators that
helps in the decision-making process of the refurbishment. The Construction Company FCC,
the leader of the project, has as a priority the ease and flexibility of use of the system of
indicators to assess the building in different phases: diagnosis, evaluation, comparison and
tracking.
The Global Social Indicator developed in RS Proiect to evaluate any residential existing
building is composed by three principal indicators: User Satisfaction, Participation
Agreement and Quality of life. This paper summarizes the development of one of them, the
social indicator called Quality of Life and the results of its application in a residential building
in Málaga (Spain), 140 dwellings in Jacinto Benavente Avenue. The application of this social
indicator allowed knowing the state of social aspects in the building and quantifying them.
Furthermore, it was useful to determinate the areas of improvement in residential buildings
from the social point of view.
ISBN: 978-84-697-1815-5
25
2
Background
When talking about sustainable refurbishment, energy efficiency is just a part of the overall
decision-making process. It is essential for the construction sector to communicate properly
the important contribution that sustainable or green buildings can offer to users’ well-being on
a long-term basis [Feifer, 2011]. There is a general agreement about sustainability indicators
as a useful tool to communicate the performance of a sustainable building on several levels,
but keeping it simple is essential to bring the science and the construction sector closer.
Indicators are useful to manage information about complex issues such as sustainability,
because they try to prioritize in an issue with multiple perspectives and they provide data to
evaluate a process in different stages. The ongoing dialogue required between all decision
makers to negotiate appropriate compromises in every stage is recognizing Key Performance
Indicators (KPIs) as a useful tool to reach consensus amongst stakeholders [Feifer, 2011].
However, the successful transformation of the individual understanding into high quality
indicators is a complex issue and more research is needed about the procedure to do
this.There is a need for sustainability indicators in order to assess progress towards a goal but
the simplification of complicated issues can be misleading and it is important to take into
account the context in which they are going to be used [Ghosh et al., 2006]. If they are too
complex or numerous they will not be understood by the non-expert population. It is also
important to consider how far they are applicable to the process of change. In order to
communicate different degrees of sustainability, we need common references that can be
understood and handled by peers, professionals, policy makers, politicians and the public in
general [Feifer, 2011] and, above all, these must be useful to drive action in the construction
sector towards the best practices in sustainable construction issues. Feifer proposes
considering the categories and indicators in the CEN TC/350 as a common denominator. They
could be a point of departure, allowing for differences of opinion and, at the same time,
giving an overall consensus framework.
The European Norm EN 15643-3:2012 [CEN/TC 350, 2012] concentrates social dimension of
sustainability on the assessment of aspects and impacts of a building expressed with
quantifiable indicators. Social performance measures will be represented through indicators
for the following social performance categories: Accessibility, Health and Comfort, Loadings
on the neighborhood, Maintenance, Safety / Security, Sourcing of Materials and Services and
Stakeholder Involvement.
The categories and criteria that include “social aspects” are not clearly defined in some of the
methods and environmental tools reviewed such as the American GREENGLOBE, the
Australian GREENSTAR or NABERS, the Japanese CASBEE or the GBTOOL. Whereas, for
example, the Spanish Valor de Eficiencia de Referencia De Edificios (VERDE), Hexálogo
ASA (Asociación Sostenibilidad y Arquitectura) or Guía de edificación sostenible para la
vivienda en la Comunidad Autónoma del País Vasco (GESVPV) are more explicit collecting
social aspects,as well as the North American LEED and some of the schemes of the British
BREEAM Communities. In general terms, social aspects in environmental tools are more
ISBN: 978-84-697-1815-5
26
3
related with town planning than with the specific building.We deduced from the criteria they
consider as social aspects which issues should be considered as “social” in this research.
Methodology
Both, bottom-up and top-down approaches were considered to develop the final list of social
indicators that compose the Quality of Life indicator. The following steps are followed:
1. Compilation of a set of 53 social indicators/subindicators. Taking into account EN 15643-3
as an overall consensus framework, we selected some of the criteria considered in the review
as ‘social’ aspects for the system of indicators established in this research, and developed
other new criteria.
2. Elaboration of a structured list (Table 1, first column). The three main indicators that are
proposed to compose Quality of Life indicator (1-Health and Comfort, 2-Universal
Accessibility and Design for All and 3-Common Services) are divided into subindicators that
deal with more specific aspects in order to facilitate its quantification. First, the regulatory
requirements of Spanish Building Code (CTE) for new buildings were analyzed in order to
adapt those criteria to existing buildings, looking for ways to implement those rules to them.
Other compulsory Spanish regulations such as Energy Efficiency Certification or Local Town
Planning Regulations were considered. Second, other criteria related to green buildings were
studied to complement compulsory requirements.
3. Establishment of an objective, a calculation method and a measurement unit for each
indicator/subindicator. The calculation methods are obtained from CTE, from sustainability
assessment tools such as VERDE [Macías 2010] or from new methods proposed by the
authors according to other references. The Universal Accessibility and Design for All
subindicator is developed from a voluntary Spanish standard UNE 17001. Finally, the
subindicator Common Services is defined following recommendations about important social
issues that were found in the literature review.
4. Definition of a benchmarking pattern to assess the degree of sustainability for every
criterion:
- 0.00 Unsustainable
- 0.25 The situation is not admissible, but not so severely as in the previous case
- 0.50 Admissible
- 0.75 Satisfactory
- 1.00 Appropriate, it reaches the target and places the building in good condition for
the future maintenance
5. Weighting of the indicators/subindicators in order to obtain a global social indicator. A first
weighting proposal was made, according to references, experience and RS priority objectives.
This proposal was agreed with FCC Company, and revised as the system of indicators
developed throughout the project.
ISBN: 978-84-697-1815-5
27
4
6. The Table 1 is completed in this way and summarizes indicator Quality of Life broken
down into 53 subindicators, their benchmarking and weighting.
7. Theorical application of the group of social indicators on Table 1 to a pilot building of RS
project. This is a building composed by 140 public housing units for rent for people with low
income in Málaga (Andalucía). There are three main types of housing A, B and C. The type A
has a terrace that has been modified and closed by users in some cases, so, two types of A
dwelling are considered: A with open terrace and Ac with enclosed terrace. For each of them
all the indicators are calculated, in order to achieve a global assessment of the whole building.
Results
Table 1 shows the breaking down of social indicator Quality of Life in subindicators, their
benchmarking and weighting.
Regarding the implementation of Quality of Life indicator in the pilot building, it reaches a
value of 0.14 in type A housing (open terrace), 0.09 in type Ac (enclosed terrace) and 0.15 in
types B and C. All of them are below 0.25, which results are Unsustainable according to the
chosen reference pattern.
As for the subindicators 1-Health and Comfort best value was for type A, B and C housing
with 0.23. In type Ac the value is lower 0.13. All of them are Unsustainable. Type A has a
better value because it is the only one that fulfills subindicators 1.4.1 Ratio of Glazing to
Room Area (*) and 1.6.1 Means of Natural Ventilation (*) which are sine qua non
requirements. B and C get 0.23 marked with an asterisk (*) that means the punctuation is not
valid until they fulfill sine qua non requirements.
The results of subindicator 2-Universal Accesibility and Design for All are the same for all the
housing types because they have been calculated at building level, and it reaches 0.04. The
results in 3-Common Services is better in B, 0.13, because of the indicator Flexibility of Use
which is better in B. A, Ac or C get 0.09 at Common Services subindicator.
This way, looking to the punctuation of all the criteria, we can decide the improvement
measures for the building. For example, existing housing type A get 0.00 at Cross Ventilation
Possibilities because it does not fulfill this criteria. If it had 1.00 at Cross Ventilation
Possibilities subindicator the Health and Comfort subindicator would be 0.27, not admissible,
but not so severely as in the previous case (0.23). The evaluation of the building and the
decision making process can be done looking to the table in an easy and flexible way.
ISBN: 978-84-697-1815-5
28
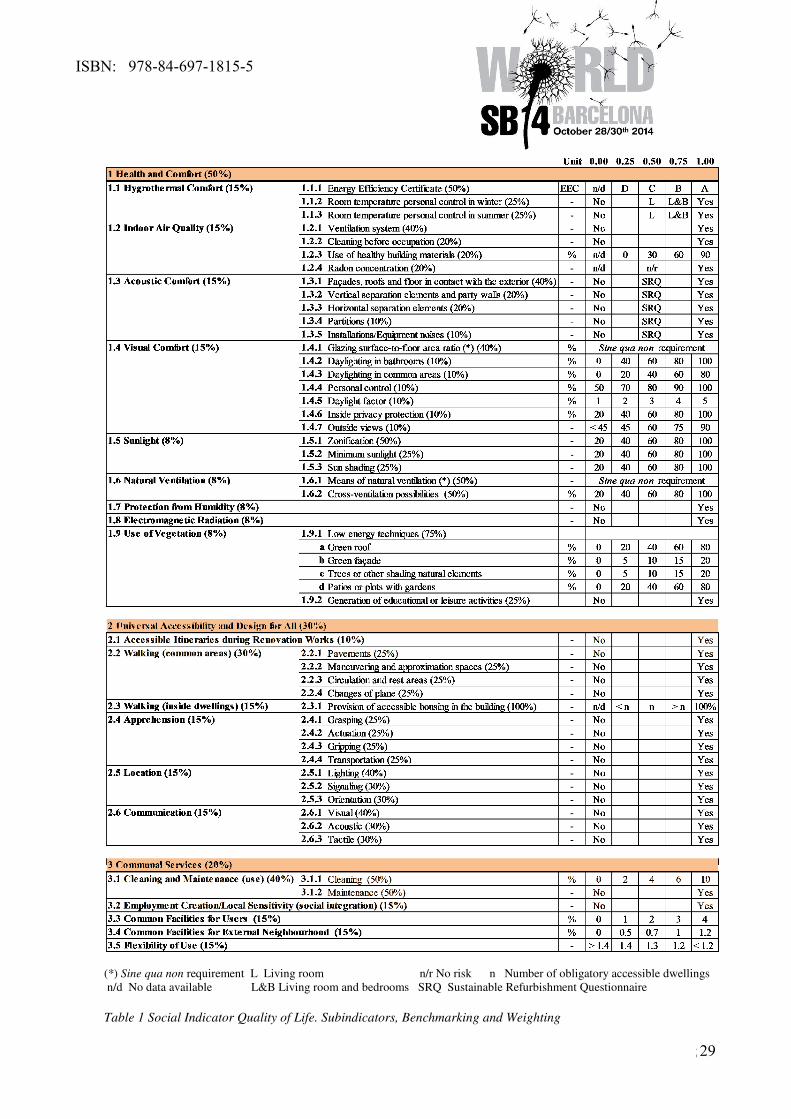
5
(*) Sine qua non requirement L Living room n/r No risk n Number of obligatory accessible dwellings
n/d No data available L&B Living room and bedrooms SRQ Sustainable Refurbishment Questionnaire
Table 1 Social Indicator Quality of Life. Subindicators, Benchmarking and Weighting
ISBN: 978-84-697-1815-5
29
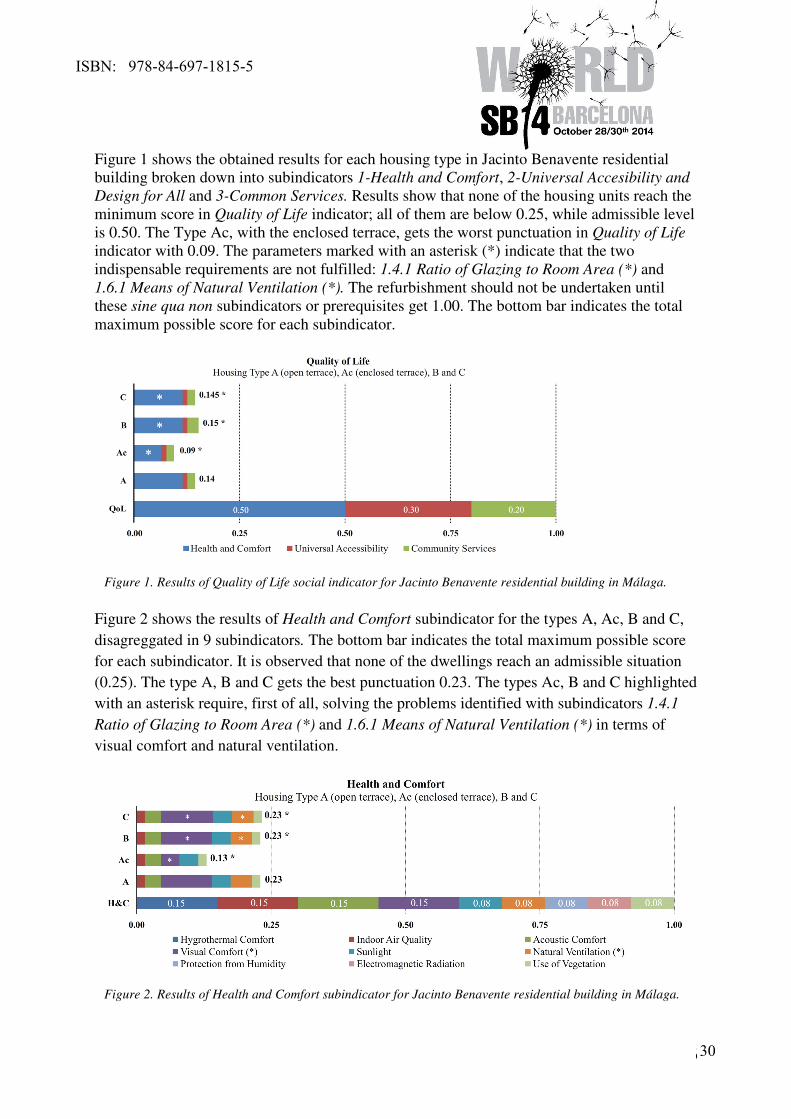
6
Figure 1 shows the obtained results for each housing type in Jacinto Benavente residential
building broken down into subindicators 1-Health and Comfort, 2-Universal Accesibility and
Design for All and 3-Common Services. Results show that none of the housing units reach the
minimum score in Quality of Life indicator; all of them are below 0.25, while admissible level
is 0.50. The Type Ac, with the enclosed terrace, gets the worst punctuation in Quality of Life
indicator with 0.09. The parameters marked with an asterisk (*) indicate that the two
indispensable requirements are not fulfilled: 1.4.1 Ratio of Glazing to Room Area (*) and
1.6.1 Means of Natural Ventilation (*). The refurbishment should not be undertaken until
these sine qua non subindicators or prerequisites get 1.00. The bottom bar indicates the total
maximum possible score for each subindicator.
Figure 2 shows the results of Health and Comfort subindicator for the types A, Ac, B and C,
disagreggated in 9 subindicators. The bottom bar indicates the total maximum possible score
for each subindicator. It is observed that none of the dwellings reach an admissible situation
(0.25). The type A, B and C gets the best punctuation 0.23. The types Ac, B and C highlighted
with an asterisk require, first of all, solving the problems identified with subindicators 1.4.1
Ratio of Glazing to Room Area (*) and 1.6.1 Means of Natural Ventilation (*) in terms of
visual comfort and natural ventilation.
Figure 1. Results of Quality of Life social indicator for Jacinto Benavente residential building in Málaga.
Figure 2. Results of Health and Comfort subindicator for Jacinto Benavente residential building in Málaga.
ISBN: 978-84-697-1815-5
30
7
Conclusion
The application of Quality of Life indicator was useful to analyze the possibilities to improve
the envelope, beyond energy aspects. This way, different solutions to improve the building
can be assessed to guide the refurbishment towards enhancing social aspects.These
subindicators are helpful to prioritize between different needs in the building and to plan a
progressive refurbishment.
Calculating the subindicators for every type of housing accelerates the building assessment;
seventeen of them were calculated for every type of housing and thirty six for the whole
building.
As results show, all the types of housing are Unsustainable. As a consequence the building
requires refurbishment to achieve a minimum level of social sustainability, beginning to solve
the problem with the sine qua non requirements Ratio of Glazing to Room Area (*) and
Means of Natural Ventilation (*).
This case study has enabled to analyze the indicators in order to reduce them for the final
scoreboard developed in RS Project.
Aknowledgement
The first author appreciates the scholarship for training research staff of the Polytechnic
University of Madrid funded by the companies that collaborate in the RS project and by the
CDTI.
References
CEN/TC 350 (2012). Sustainability of construction works — sustainability assessment of
buildings — part 3: Framework for the assessment of social performance. EN 15643-3.
Feifer, Lone. (2011). Sustainability indicators in buildings: Identifying key performance
indicators. PLEA 2011 - Architecture and Sustainable Development, Conference Proceedings
of the 27th International Conference on Passive and Low Energy Architecture, 133-138.
Ghosh, Sumita; Vale, Robert & Vale, Brenda. (2006). Indications from sustainability
indicators. Journal of Urban Design, 11(2): 263-275, doi:10.1080/13574800600644597.
Macías, Manuel y García Navarro, Justo (2010). Metodología y herramienta VERDE para la
evaluación de la sostenibilidad en edificios. Informes de la Construcción, 62(517): 87-100,
doi:10.3989/ic.08.056.
ISBN: 978-84-697-1815-5
31
1
Environmental Performance of Adaptive Building Envelope
Design: Urban housing in Seoul, Korea
Speakers:
Paek, Jeewon
Architectural Association School of Architecture, London, UK
Abstract: Since the first construction in 1962, apartment housing represented modernity and
quickly became a ubiquitous urban housing typology in the midst of Korea’s rapid economic
growth. Prominently influenced by the 1930s European rational architecture, the housing
planning for Seoul systematically multiplied into a linear urban pattern. As the city stepped
into the 21st century, the old slab typology—criticized for their lack of diversity and low
density, adapted a new model from North American urban residential schemes—the mega
glass tower. Energy consumption of the new tower typology has doubled from the slab
typology due to the increase in glazing ratio, the application of tinted green double glazing in
replacement of clear double glazing, and the irregular orientation of floor plans. This
research analyzes the environmental performance of the new tower typology in comparison to
the slab typology with the objective to improve the quality of future urban housing design in
Seoul.
Keywords: Urban Housing, Tower Typology, Passive Design, Obstruction
Introduction
In 1962, the first apartment construction began in Korea. This development represented
modernity and quickly became a ubiquitous urban housing typology in the midst of Korea’s
rapid economic growth. 1930s rational architecture from Europe prominently influenced the
housing site planning for Seoul of this time, which systematically multiplied in a linear urban
pattern. Consequently, typical urban housing layout in Seoul has the characteristics of
expanding horizontally or orthogonally in clusters. These forms of clusters follow a linear,
single orientation, slab configuration which conceptually provides a level of equality in
housing that is in line with early ideas of modernity in the realm of architecture (Kang, 2004,
p. 144-146). From a practical perspective, each unit could receive an equal amount of
daylight, cross ventilation, and views outward within this system. This idea of equality,
despite its formation of unity in the residential sector, simultaneously erased local identities of
neighborhoods to the point where eventually every development appeared the same as the
other throughout the entirety of the city. Quite recently this linear apartment development
strategy and residential culture have come under critical scrutiny. As the city stepped into the
21st century, the slab typology has been criticized for their lack of life quality, diversity, and
dynamic urbanism. As a reaction, from the demand for housing supply and its heavy reliance
on the market, the scale of developments has increased to the mega glass tower.
ISBN: 978-84-697-1815-5
32
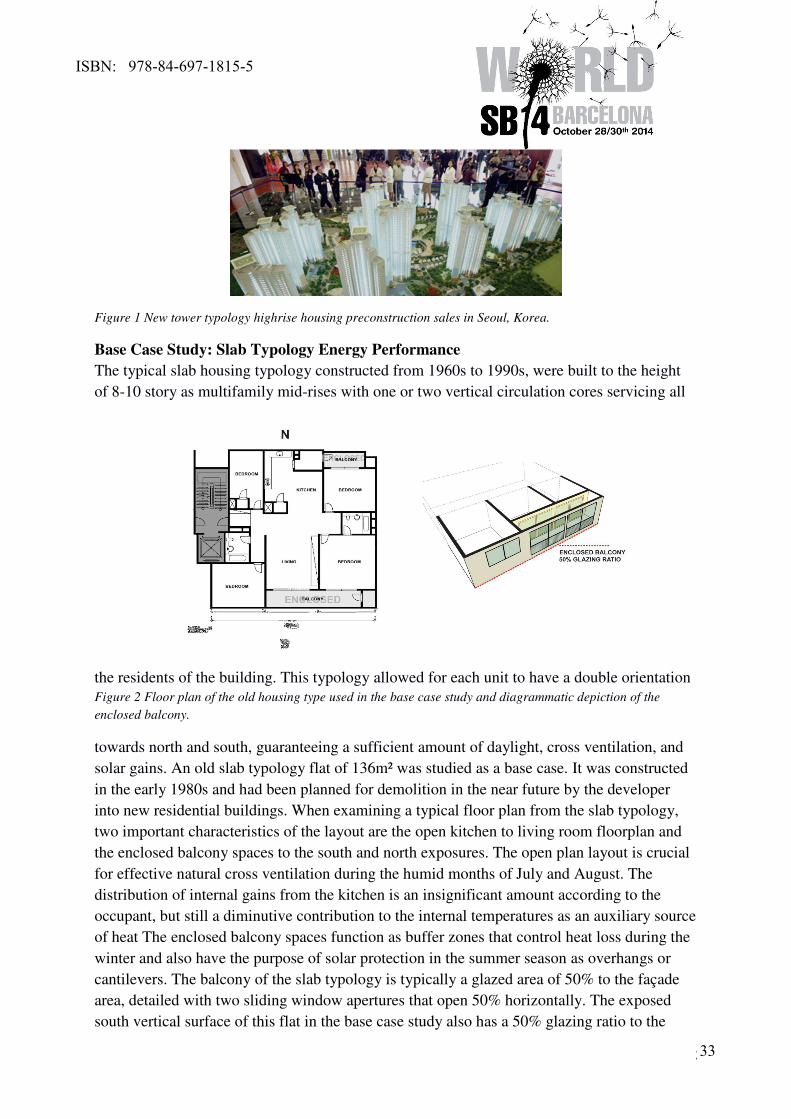
2
Figure 1 New tower typology highrise housing preconstruction sales in Seoul, Korea.
Base Case Study: Slab Typology Energy Performance
The typical slab housing typology constructed from 1960s to 1990s, were built to the height
of 8-10 story as multifamily mid-rises with one or two vertical circulation cores servicing all
the residents of the building. This typology allowed for each unit to have a double orientation
Figure 2 Floor plan of the old housing type used in the base case study and diagrammatic depiction of the
enclosed balcony.
towards north and south, guaranteeing a sufficient amount of daylight, cross ventilation, and
solar gains. An old slab typology flat of 136m² was studied as a base case. It was constructed
in the early 1980s and had been planned for demolition in the near future by the developer
into new residential buildings. When examining a typical floor plan from the slab typology,
two important characteristics of the layout are the open kitchen to living room floorplan and
the enclosed balcony spaces to the south and north exposures. The open plan layout is crucial
for effective natural cross ventilation during the humid months of July and August. The
distribution of internal gains from the kitchen is an insignificant amount according to the
occupant, but still a diminutive contribution to the internal temperatures as an auxiliary source
of heat The enclosed balcony spaces function as buffer zones that control heat loss during the
winter and also have the purpose of solar protection in the summer season as overhangs or
cantilevers. The balcony of the slab typology is typically a glazed area of 50% to the façade
area, detailed with two sliding window apertures that open 50% horizontally. The exposed
south vertical surface of this flat in the base case study also has a 50% glazing ratio to the
ISBN: 978-84-697-1815-5
33
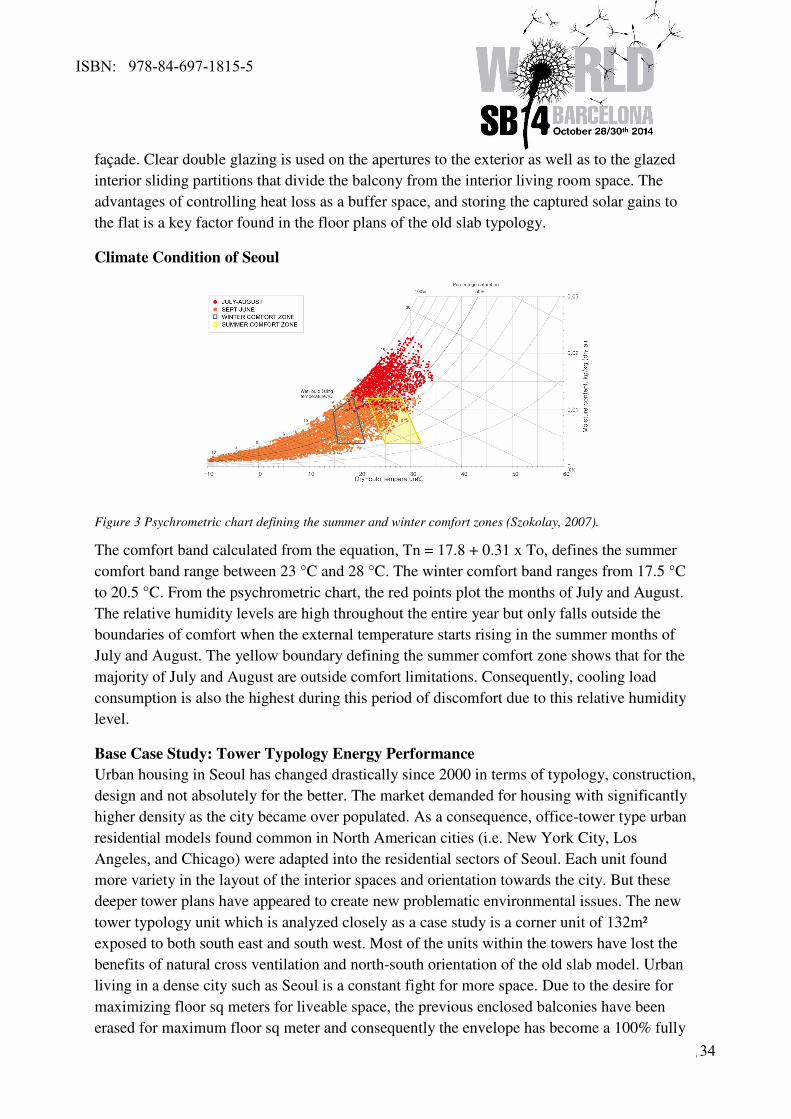
3
façade. Clear double glazing is used on the apertures to the exterior as well as to the glazed
interior sliding partitions that divide the balcony from the interior living room space. The
advantages of controlling heat loss as a buffer space, and storing the captured solar gains to
the flat is a key factor found in the floor plans of the old slab typology.
Climate Condition of Seoul
Figure 3 Psychrometric chart defining the summer and winter comfort zones (Szokolay, 2007).
The comfort band calculated from the equation, Tn = 17.8 + 0.31 x To, defines the summer
comfort band range between 23 °C and 28 °C. The winter comfort band ranges from 17.5 °C
to 20.5 °C. From the psychrometric chart, the red points plot the months of July and August.
The relative humidity levels are high throughout the entire year but only falls outside the
boundaries of comfort when the external temperature starts rising in the summer months of
July and August. The yellow boundary defining the summer comfort zone shows that for the
majority of July and August are outside comfort limitations. Consequently, cooling load
consumption is also the highest during this period of discomfort due to this relative humidity
level.
Base Case Study: Tower Typology Energy Performance
Urban housing in Seoul has changed drastically since 2000 in terms of typology, construction,
design and not absolutely for the better. The market demanded for housing with significantly
higher density as the city became over populated. As a consequence, office-tower type urban
residential models found common in North American cities (i.e. New York City, Los
Angeles, and Chicago) were adapted into the residential sectors of Seoul. Each unit found
more variety in the layout of the interior spaces and orientation towards the city. But these
deeper tower plans have appeared to create new problematic environmental issues. The new
tower typology unit which is analyzed closely as a case study is a corner unit of 132m²
exposed to both south east and south west. Most of the units within the towers have lost the
benefits of natural cross ventilation and north-south orientation of the old slab model. Urban
living in a dense city such as Seoul is a constant fight for more space. Due to the desire for
maximizing floor sq meters for liveable space, the previous enclosed balconies have been
erased for maximum floor sq meter and consequently the envelope has become a 100% fully
ISBN: 978-84-697-1815-5
34
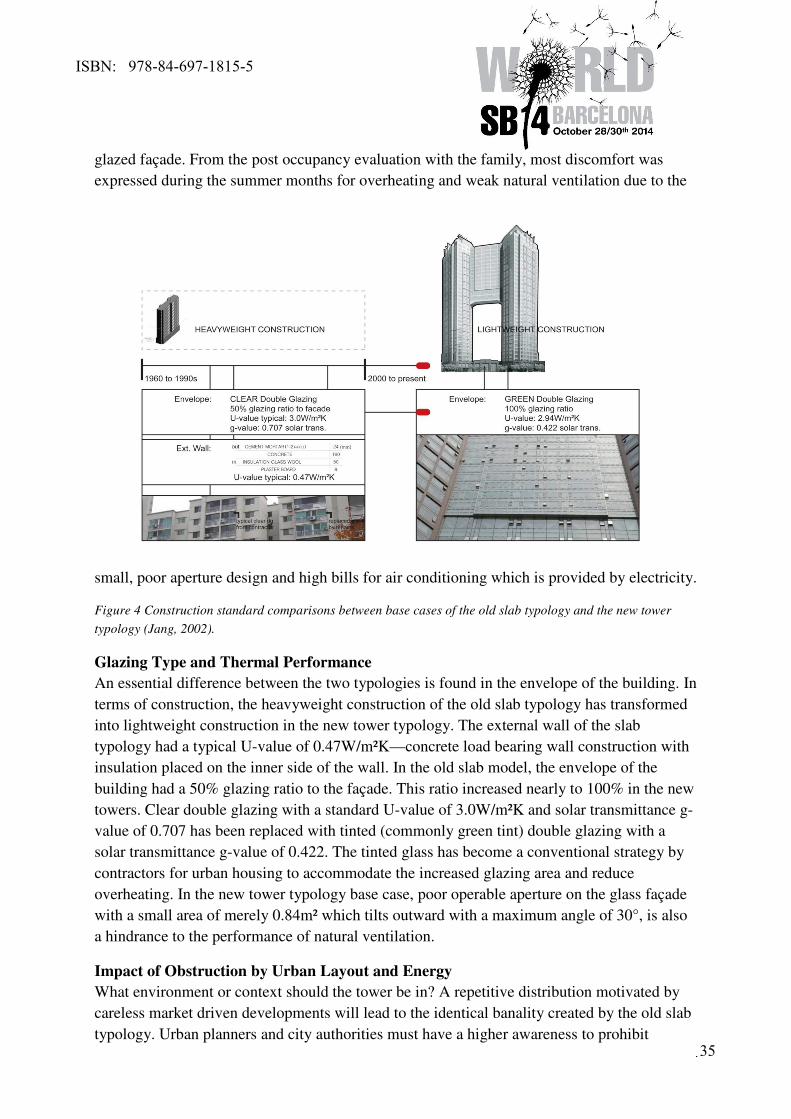
4
glazed façade. From the post occupancy evaluation with the family, most discomfort was
expressed during the summer months for overheating and weak natural ventilation due to the
small, poor aperture design and high bills for air conditioning which is provided by electricity.
Figure 4 Construction standard comparisons between base cases of the old slab typology and the new tower
typology (Jang, 2002).
Glazing Type and Thermal Performance
An essential difference between the two typologies is found in the envelope of the building. In
terms of construction, the heavyweight construction of the old slab typology has transformed
into lightweight construction in the new tower typology. The external wall of the slab
typology had a typical U-value of 0.47W/m²K—concrete load bearing wall construction with
insulation placed on the inner side of the wall. In the old slab model, the envelope of the
building had a 50% glazing ratio to the façade. This ratio increased nearly to 100% in the new
towers. Clear double glazing with a standard U-value of 3.0W/m²K and solar transmittance g-
value of 0.707 has been replaced with tinted (commonly green tint) double glazing with a
solar transmittance g-value of 0.422. The tinted glass has become a conventional strategy by
contractors for urban housing to accommodate the increased glazing area and reduce
overheating. In the new tower typology base case, poor operable aperture on the glass façade
with a small area of merely 0.84m² which tilts outward with a maximum angle of 30°, is also
a hindrance to the performance of natural ventilation.
Impact of Obstruction by Urban Layout and Energy
What environment or context should the tower be in? A repetitive distribution motivated by
careless market driven developments will lead to the identical banality created by the old slab
typology. Urban planners and city authorities must have a higher awareness to prohibit
ISBN: 978-84-697-1815-5
35
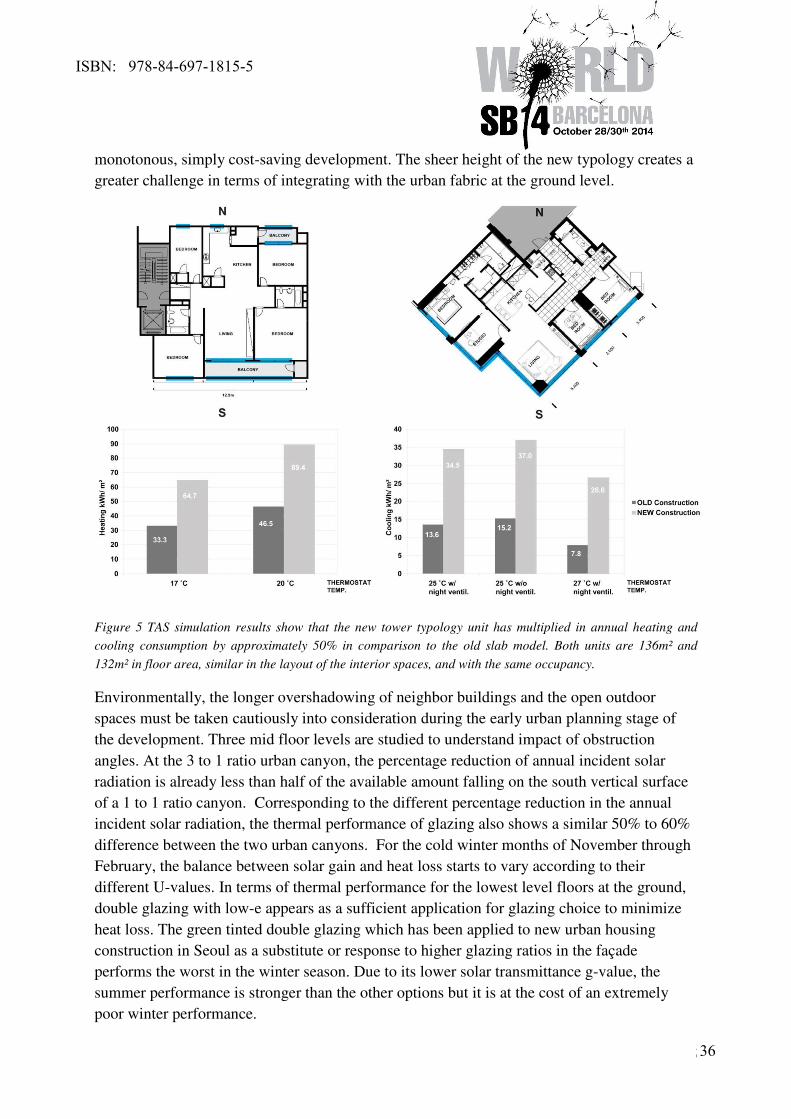
5
monotonous, simply cost-saving development. The sheer height of the new typology creates a
greater challenge in terms of integrating with the urban fabric at the ground level.
Figure 5 TAS simulation results show that the new tower typology unit has multiplied in annual heating and
cooling consumption by approximately 50% in comparison to the old slab model. Both units are 136m² and
132m² in floor area, similar in the layout of the interior spaces, and with the same occupancy.
Environmentally, the longer overshadowing of neighbor buildings and the open outdoor
spaces must be taken cautiously into consideration during the early urban planning stage of
the development. Three mid floor levels are studied to understand impact of obstruction
angles. At the 3 to 1 ratio urban canyon, the percentage reduction of annual incident solar
radiation is already less than half of the available amount falling on the south vertical surface
of a 1 to 1 ratio canyon. Corresponding to the different percentage reduction in the annual
incident solar radiation, the thermal performance of glazing also shows a similar 50% to 60%
difference between the two urban canyons. For the cold winter months of November through
February, the balance between solar gain and heat loss starts to vary according to their
different U-values. In terms of thermal performance for the lowest level floors at the ground,
double glazing with low-e appears as a sufficient application for glazing choice to minimize
heat loss. The green tinted double glazing which has been applied to new urban housing
construction in Seoul as a substitute or response to higher glazing ratios in the façade
performs the worst in the winter season. Due to its lower solar transmittance g-value, the
summer performance is stronger than the other options but it is at the cost of an extremely
poor winter performance.
ISBN: 978-84-697-1815-5
36
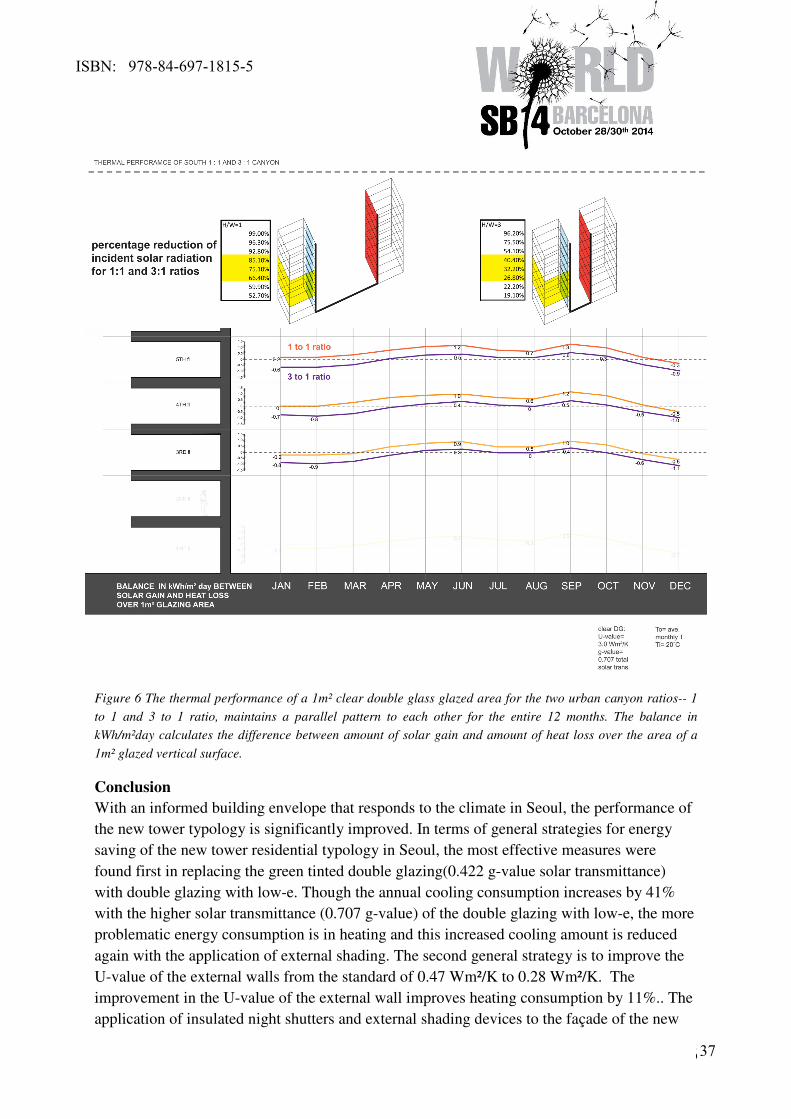
6
Figure 6 The thermal performance of a 1m² clear double glass glazed area for the two urban canyon ratios-- 1
to 1 and 3 to 1 ratio, maintains a parallel pattern to each other for the entire 12 months. The balance in
kWh/m²day calculates the difference between amount of solar gain and amount of heat loss over the area of a
1m² glazed vertical surface.
Conclusion
With an informed building envelope that responds to the climate in Seoul, the performance of
the new tower typology is significantly improved. In terms of general strategies for energy
saving of the new tower residential typology in Seoul, the most effective measures were
found first in replacing the green tinted double glazing(0.422 g-value solar transmittance)
with double glazing with low-e. Though the annual cooling consumption increases by 41%
with the higher solar transmittance (0.707 g-value) of the double glazing with low-e, the more
problematic energy consumption is in heating and this increased cooling amount is reduced
again with the application of external shading. The second general strategy is to improve the
U-value of the external walls from the standard of 0.47 Wm²/K to 0.28 Wm²/K. The
improvement in the U-value of the external wall improves heating consumption by 11%.. The
application of insulated night shutters and external shading devices to the façade of the new
ISBN: 978-84-697-1815-5
37
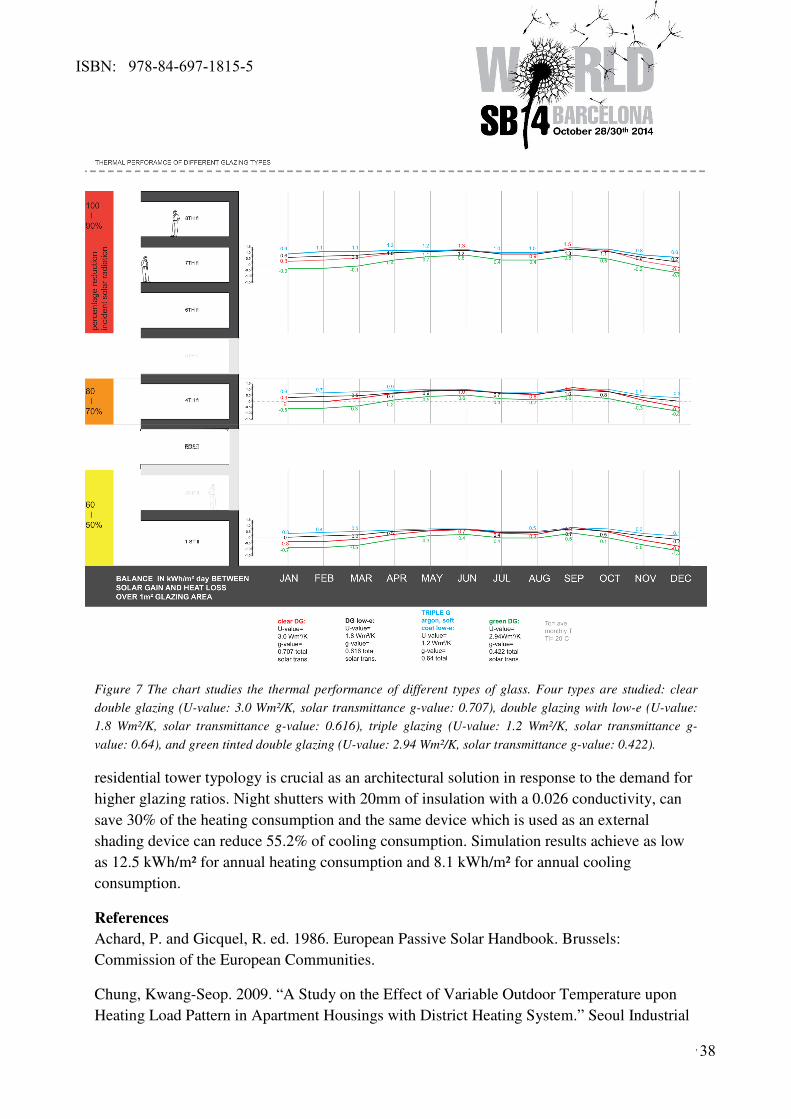
7
Figure 7 The chart studies the thermal performance of different types of glass. Four types are studied: clear
double glazing (U-value: 3.0 Wm²/K, solar transmittance g-value: 0.707), double glazing with low-e (U-value:
1.8 Wm²/K, solar transmittance g-value: 0.616), triple glazing (U-value: 1.2 Wm²/K, solar transmittance g-
value: 0.64), and green tinted double glazing (U-value: 2.94 Wm²/K, solar transmittance g-value: 0.422).
residential tower typology is crucial as an architectural solution in response to the demand for
higher glazing ratios. Night shutters with 20mm of insulation with a 0.026 conductivity, can
save 30% of the heating consumption and the same device which is used as an external
shading device can reduce 55.2% of cooling consumption. Simulation results achieve as low
as 12.5 kWh/m² for annual heating consumption and 8.1 kWh/m² for annual cooling
consumption.
References
Achard, P. and Gicquel, R. ed. 1986. European Passive Solar Handbook. Brussels:
Commission of the European Communities.
Chung, Kwang-Seop. 2009. “A Study on the Effect of Variable Outdoor Temperature upon
Heating Load Pattern in Apartment Housings with District Heating System.” Seoul Industrial
ISBN: 978-84-697-1815-5
38
8
University, February: 2-6.
Jang, Yong Mun. 2002. A Study on The Indoor Thermal Comfort Condition of Apartment
According to Remodeling of the Balcony. Yonsei University.
Kang, Gyoung-Ho. 2004. “The Development of Urban Block Housing and Application
Methods in Korea.” Joong-Ang University. Dec:140-200.
Knowles, Ralph. 1985. Sun Rhythm Form. Cambridge: MIT Press.
Littlefair, Paul. 2006. “Design for Improved Shading Control.” London: CIBSE TM37.
Szokolay, Steven. V. “Solar Geometry.” PLEA Note 1, 2007. PLEA International with
University of Queensland.
Yannas, Simos. 2000. “Solar Control.” Designing for Summer Comfort. London: AA
Graduate School.
ISBN: 978-84-697-1815-5
39
Organizational Strategies to Support Sustainability in the
Construction Company
Speakers:
Lee, Kang Hee1; Ahn, Yong Han
2; Jeon, Myunghwa
3; Suh, Min Jae
4
1 Andong National University, Andong, South Korea
2 Hangyang University, Ansan, South Korea
3 POSCO A&C CO, Ltd., Seoul, South Korea
4 Virginia Tech, Virginia, USA
Abstract: Construction stakeholders worldwide are transforming their organizational
structures to implement sustainable building practices that boost the ‘triple bottom line’ of a
building’s ecological, social, and financial performance. The goals of sustainable
construction are to reduce environmental and social problems and enhance economic
prosperity. However, the organizational structures and strategies implemented by different
companies to achieve these goals vary widely, and therefore the purpose of this study is to
identify those organizational transformational strategies that enable companies to
successfully adopt sustainability and take full advantage of its benefits. A case study research
method is utilized based on in-depth interviews with the sustainability directors and vice
presidents charged with sustainability adoption, implementation and education in three U.S.
construction companies. The study develops an Organizational Transformation Model of
Sustainability (OTMS) for the construction industry that will help companies successfully
implement sustainability throughout the construction process. The new model will serve as a
benchmark for construction companies seeking to successfully implement sustainability in
their projects and organizations.
Keywords: Sustainability, green building, green building implementation
Introduction
Sustainability in the built environment is rapidly becoming a strong force in the construction
industry after recognizing many negative environmental issues and problems (Ahn, Pearce, &
Ku, 2011; Ahn, Pearce, Wang, & G., 2013; Pearce, Ahn, & HanmiGlobal, 2012). One of
ways to achieve the goals of sustainability in built environment is to implement sustainable
design and construction that can mediate the construction industry’s negative impacts on the
natural environment, including global warming, acidification potential smog, solid waste,
ecosystem destruction, air & water pollution, and natural resource depletion (Ahn et al., 2011;
Kibert, 2008; Pearce et al., 2012). In addition, sustainable design and construction also
achieve potential economic and social benefits while preserving or enhancing the
functionality of the building (Table 1).
Due to many potential benefits (Table 1) from implementing sustainability in the built
environment, all stakeholders of buildings including contractors, subcontractors, engineers,
architects, etc. have been practiced sustainable design and construction to protect and
ISBN: 978-84-697-1815-5
40
conserve water; optimize energy performance; reduce environmental impacts; enhance indoor
environmental quality and have implemented a business approach of ‘corporate
sustainability’. In a building sector, green building rating systems including the Leadership in
Energy and Environmental Design (LEED), Green Globes, etc. were a significant factor in the
sustainable design and construction movement in the United States (Ahn & Pearce, 2007).
Due to various efforts to promote sustainable building in the United States, the value of green
buildings has significantly grown from a small, burgeoning market, of approximately 12
percent of both nonresidential and residential construction, valued at a total of $25 billion
(2008) to $64-68 billion in 2013 (McGraw Hill Construction, 2008, 2012) . In addition, the
2012 Green Outlook report published by McGraw Hill Construction estimates that green
building can reaching to $115 - $132 billion (48%-55%) in 2016 (McGraw Hill Construction,
2012). Based on this prediction, it is clear that sustainable building practices are displacing
conventional practices in the construction industry when developing new facilities and
operating and maintaining existing ones. Even though many of construction companies have
implemented sustainable design and construction through green building rating systems,
McGraw-Hill demonstrated that only 9% of construction companies actually transformed
sustainability into their organization and daily practices (McGraw Hill Construction, 2012).
Therefore, it is very important to develop organizational transformation strategies
(Organizational Transformation Model of Sustainability (OTMS)) that enable companies to
successfully adopt and implement sustainability and take full advantage of its potential
benefits. In addition, OTMS can also address sustainability in their corporate and business
practices that eventually improve their business in the competitive construction market.
Table 1. Environmental, Social, and Economical Benefits
Environmental Benefits Social Benefits Economical Benefits
• Protecting air, water, land
ecosystems
• Conserving natural resources
(fossil fuels)
• Preserving animal species
and genetic diversity
• Protecting the biosphere
• Using renewable natural
resources
• Minimizing waste production
or disposal
• Minimizing CO2 emissions
and other pollutants
• Maintaining essential
ecological processes and life
support systems
• Pursuing active recycling
• Maintaining integrity of
environment
• Preventing global warming
• Improving quality of life for
individuals, and society as a
whole
• Alleviating poverty
• Satisfying human needs
• Incorporating cultural data
into development
• Optimizing social benefits
• Improving health, comfort,
and well-being
• Having concern for inter-
generational equity
• Minimizing cultural
disruption
• Providing education services
• Promoting harmony among
human beings and between
humanity and nature
• Understanding the importance
of social and cultural capital
• Understanding
multidisciplinary
communities
• Improving economic growth
• Reducing energy
consumption and costs
• Raising real income
• Improving productivity
• Lowering infrastructure costs
• Decreasing environmental
damage costs
• Reducing water consumption
and costs
• Decreasing health costs
• Decreasing absenteeism in
organizations
• Improving Return on
Investments (ROI)
ISBN: 978-84-697-1815-5
41

First, the study identified sustainable construction practices and activities based on literature
review. Next, the study identified drivers and barriers of sustainable design and construction
at the construction project since it supports why a construction company needs to implement
sustainability in their practices. The study conducted three case studies through extensive
interview with a sustainability expert in three large construction companies to identify their
organizational transformational strategies for adopting and implementing sustainability in
their project and company. All three companies have a history of success in implementing
sustainability in their companies and are a leader of sustainability in the construction industry.
Sustainable Construction Practices and Activities
Developing organizational transformation strategies and the OTMS, it was very important to
identify and categorize key sustainable practices and activities in a construction project and
company. These sustainable practices and activities can demonstrate why a construction
company implements sustainable construction practices (Table 2).
Table 2. Sustainable practices and activities in a construction company Sustainable Practices and Activities
Corporate Level
• Sustainability goals and commitment
• Sustainability measurement framework
• Sustainability report
• Sustainability (green building) team
• Knowledge management and training (education)
Community engagement
Project Level
Project Management Best Practices
• Green procurement, logistics, and transportation
• Job site operation and trailers (green office)
• Education and training
• Green building rating systems
• Project outreach
• Subcontractor management
Construction Best Practices
• Sustainable construction practices in the green building rating system
o Site development and protection
o Temporary construction
o Green materials and specification
o Material handling and utilization
o Commissioning, testing, and balancing
• Preconstruction services
• Life Cycle Cost Analysis and Life Cycle Assessment (LCA)
In addition, it is very important to identify benefits and challenges associated with
sustainability implementation in a construction projects. These benefits of sustainability in
construction are summarized in Table 1. Challenges associated with implementing
sustainability in construction are (Ahn et al., 2013; Augenbroe & Pearce, 1999). Major
challenges associated with sustainable design and construction are:
• First cost premium of sustainable design and construction
• Tendency to maintain current practices
ISBN: 978-84-697-1815-5
42
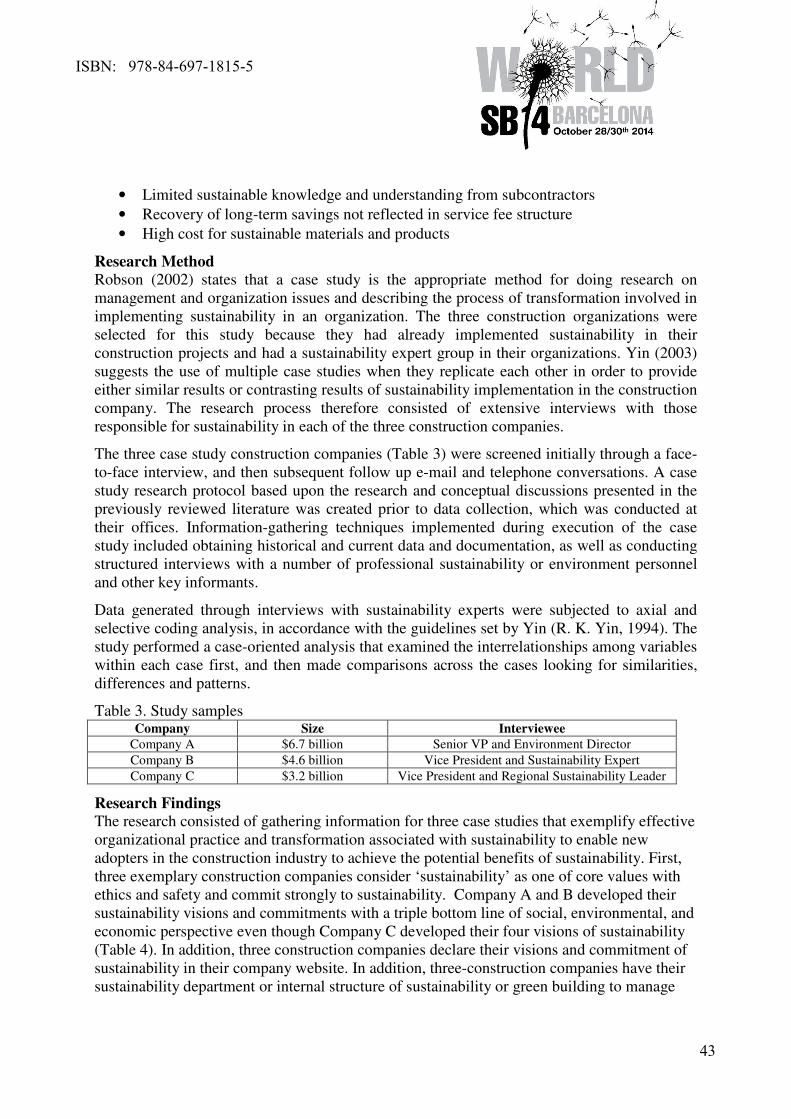
• Limited sustainable knowledge and understanding from subcontractors
• Recovery of long-term savings not reflected in service fee structure
• High cost for sustainable materials and products
Research Method
Robson (2002) states that a case study is the appropriate method for doing research on
management and organization issues and describing the process of transformation involved in
implementing sustainability in an organization. The three construction organizations were
selected for this study because they had already implemented sustainability in their
construction projects and had a sustainability expert group in their organizations. Yin (2003)
suggests the use of multiple case studies when they replicate each other in order to provide
either similar results or contrasting results of sustainability implementation in the construction
company. The research process therefore consisted of extensive interviews with those
responsible for sustainability in each of the three construction companies.
The three case study construction companies (Table 3) were screened initially through a face-
to-face interview, and then subsequent follow up e-mail and telephone conversations. A case
study research protocol based upon the research and conceptual discussions presented in the
previously reviewed literature was created prior to data collection, which was conducted at
their offices. Information-gathering techniques implemented during execution of the case
study included obtaining historical and current data and documentation, as well as conducting
structured interviews with a number of professional sustainability or environment personnel
and other key informants.
Data generated through interviews with sustainability experts were subjected to axial and
selective coding analysis, in accordance with the guidelines set by Yin (R. K. Yin, 1994). The
study performed a case-oriented analysis that examined the interrelationships among variables
within each case first, and then made comparisons across the cases looking for similarities,
differences and patterns.
Table 3. Study samples Company Size Interviewee
Company A $6.7 billion Senior VP and Environment Director
Company B $4.6 billion Vice President and Sustainability Expert
Company C $3.2 billion Vice President and Regional Sustainability Leader
Research Findings
The research consisted of gathering information for three case studies that exemplify effective
organizational practice and transformation associated with sustainability to enable new
adopters in the construction industry to achieve the potential benefits of sustainability. First,
three exemplary construction companies consider ‘sustainability’ as one of core values with
ethics and safety and commit strongly to sustainability. Company A and B developed their
sustainability visions and commitments with a triple bottom line of social, environmental, and
economic perspective even though Company C developed their four visions of sustainability
(Table 4). In addition, three construction companies declare their visions and commitment of
sustainability in their company website. In addition, three-construction companies have their
sustainability department or internal structure of sustainability or green building to manage
ISBN: 978-84-697-1815-5
43
their sustainability and green building program. The sustainability department and program in
the company is administered by a senior vice president or vice president who is responsible to
manage a company’s sustainability visions & direction, community outreach, and annual
reporting system. Company A has an EHS department that manages the Skanska
Environmental Management System (EMS) certified to ISO 14001, green building program,
green strategic indicators, and annual sustainability report. Company B has a sustainability
action plan team that is responsible to manage company’s sustainability program, the project
Sustainability Action Plan (SAP), training and education, and green building rating system.
Company C has a regional green building team that is a responsible group to implement the
company’s sustainability program as well as green building program.
All three companies have good training and education programs for sustainability and green
building. Sustainable training and education programs can be divided into three types
including overall sustainability course for all employees, green building courses based on
company’s green building best practices, and green (environmental) tool box talk for
subcontractors and workers. The purposes of those training and education courses help all
employees and workers to understand the concept of sustainability, implement green building
practices at the field, and improve efficiency of green building implementation. In addition,
three companies also have a knowledge management system for sustainable practices as well
as green building to share their best practices among all employees and subcontractors.
Three construction companies have implemented various sustainability and green building
initiatives summarized in Table 4. Those sustainability initiatives include sustainability
practices related to corporate sustainability including charitable donation and a sustainability
reporting and to project sustainability including green building rating system implementation,
less waste reduction, etc. In addition, Company A and B conducted a pilot study for LCA to
measure a carbon emission level from their construction project.
Conclusion
This study identifies how a construction company can successfully implement sustainability
in their company operation. Through implementing sustainability, a construction company
can reduce environmental and social problems and enhance economic prosperity. The study
conducted a case study of three exemplary companies, which successfully developed a
sustainability program. The study identified organizational transformational strategies that
enable companies to successfully adopt sustainability and take full advantage of its benefits.
Acknowledgement
This research was supported by a grant (11 High-tech Urban G03) from High-tech Urban
Development Program funded by Ministry of Land, Infrastructure and Transport of Korean
government.
References:
Ahn, Y. H., & Pearce, A. R. (2007). Green Construction: Contractor Experiences,
Expectations, and Perceptions. Journal of Green Building, 2(3), 106-122.
ISBN: 978-84-697-1815-5
44
Ahn, Y. H., Pearce, A. R., & Ku, K. (2011). Paradigm Shift of Green Buildings in the
Construction Industry. International Journal of Sustainable Building Technology
and Urban Development, 2(1), 52-62.
Ahn, Y. H., Pearce, A. R., Wang, Y., & G., W. (2013). Drivers and Barriers of Sustainable
Design and Construction: The Perception of Green Building Experience.
International Journal of Sustainable Building Technology and Urban Development,
4(1), 35-45.
Augenbroe, G. L. M., & Pearce, A. R. (1999). Sustainable Construction in the USA:
Perspectives to the Year 2010 Construction Industry: Changing Paradigm.
Hyderabad, India: The Icfai University Press.
Kibert, C. J. (2008). Sustainable Construction: Green Building Design and Delivery (2 ed.).
Hoboken, NJ: John Wiley & Sons.
McGraw Hill Construction. (2008). Green Outlook: Trends Driving Change Report. New
York, NY: McGraw Hill Construction.
McGraw Hill Construction. (2012). Green Outlook. New York, NY: McGraw Hill
Construction.
Pearce, A. R., Ahn, Y. H., & HanmiGlobal. (2012). Sustainable Buildings and Infrastructure:
Paths to the Future. Washington, DC: Earthscan.
Robson, C. (2002). Real World Research. Malden, MA: Blackwell Publishing.
Yin, R. K. (1994). Case Study Research: Design and Methods. Thousand Oaks Sage.
Yin, R. K. (2003). Applications OF Case Study Research. Thousand Oaks, CA: Sage
Publication, Inc. .
ISBN: 978-84-697-1815-5
45
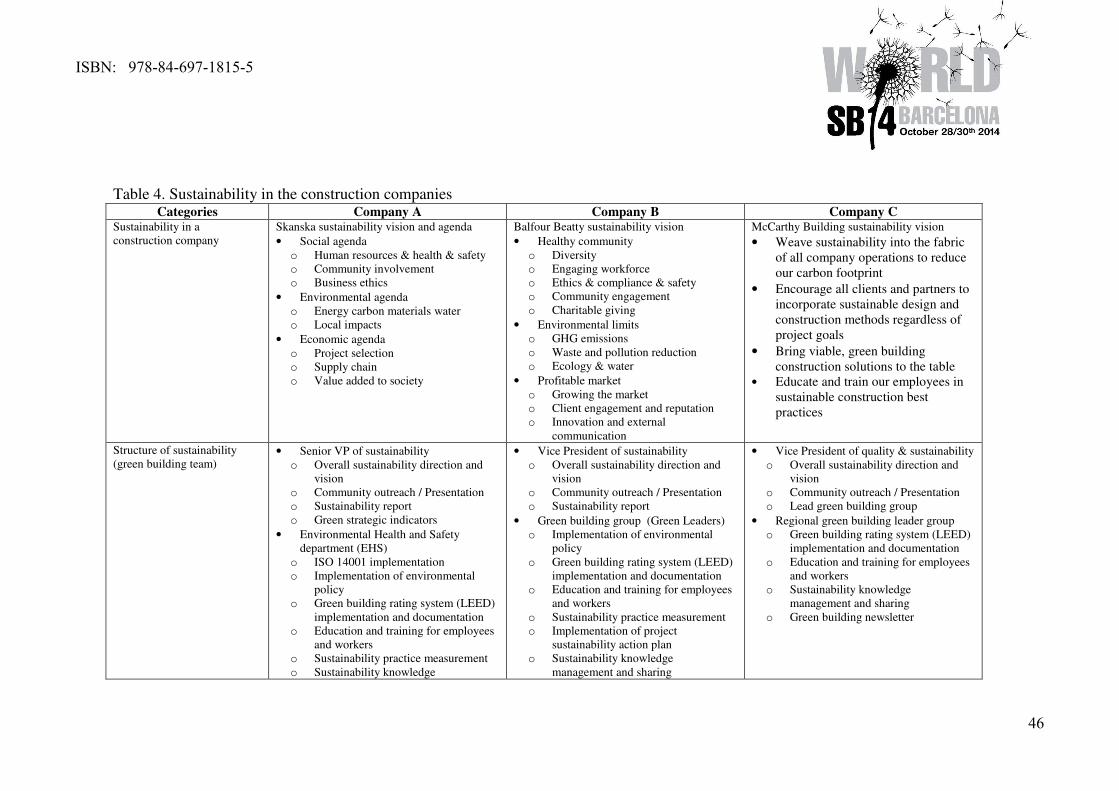
Table 4. Sustainability in the construction companies Categories Company A Company B Company C
Sustainability in a
construction company
Skanska sustainability vision and agenda
• Social agenda
o Human resources & health & safety
o Community involvement
o Business ethics
• Environmental agenda
o Energy carbon materials water
o Local impacts
• Economic agenda
o Project selection
o Supply chain
o Value added to society
Balfour Beatty sustainability vision
• Healthy community
o Diversity
o Engaging workforce
o Ethics & compliance & safety
o Community engagement
o Charitable giving
• Environmental limits
o GHG emissions
o Waste and pollution reduction
o Ecology & water
• Profitable market
o Growing the market
o Client engagement and reputation
o Innovation and external
communication
McCarthy Building sustainability vision
• Weave sustainability into the fabric
of all company operations to reduce
our carbon footprint
• Encourage all clients and partners to
incorporate sustainable design and
construction methods regardless of
project goals
• Bring viable, green building
construction solutions to the table
• Educate and train our employees in
sustainable construction best
practices
Structure of sustainability
(green building team) • Senior VP of sustainability
o Overall sustainability direction and
vision
o Community outreach / Presentation
o Sustainability report
o Green strategic indicators
• Environmental Health and Safety
department (EHS)
o ISO 14001 implementation
o Implementation of environmental
policy
o Green building rating system (LEED)
implementation and documentation
o Education and training for employees
and workers
o Sustainability practice measurement
o Sustainability knowledge
• Vice President of sustainability
o Overall sustainability direction and
vision
o Community outreach / Presentation
o Sustainability report
• Green building group (Green Leaders)
o Implementation of environmental
policy
o Green building rating system (LEED)
implementation and documentation
o Education and training for employees
and workers
o Sustainability practice measurement
o Implementation of project
sustainability action plan
o Sustainability knowledge
management and sharing
• Vice President of quality & sustainability
o Overall sustainability direction and
vision
o Community outreach / Presentation
o Lead green building group
• Regional green building leader group
o Green building rating system (LEED)
implementation and documentation
o Education and training for employees
and workers
o Sustainability knowledge
management and sharing
o Green building newsletter
ISBN: 978-84-697-1815-5
46
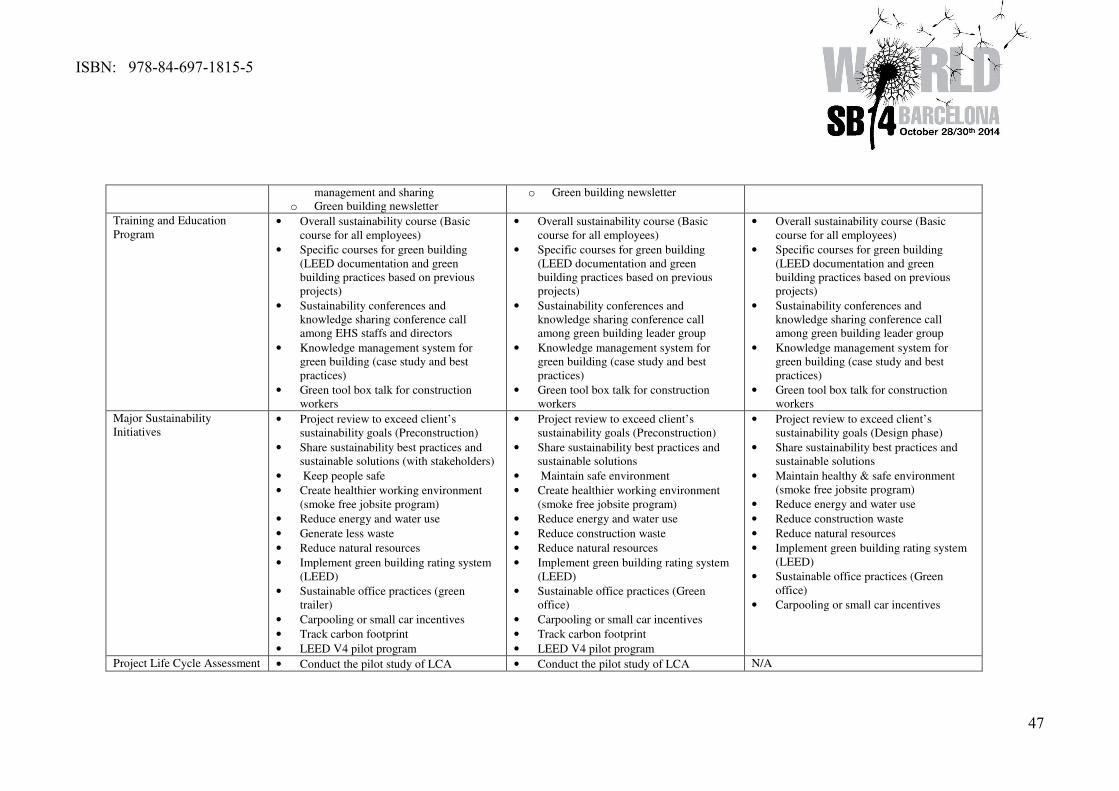
management and sharing
o Green building newsletter
o Green building newsletter
Training and Education
Program • Overall sustainability course (Basic
course for all employees)
• Specific courses for green building
(LEED documentation and green
building practices based on previous
projects)
• Sustainability conferences and
knowledge sharing conference call
among EHS staffs and directors
• Knowledge management system for
green building (case study and best
practices)
• Green tool box talk for construction
workers
• Overall sustainability course (Basic
course for all employees)
• Specific courses for green building
(LEED documentation and green
building practices based on previous
projects)
• Sustainability conferences and
knowledge sharing conference call
among green building leader group
• Knowledge management system for
green building (case study and best
practices)
• Green tool box talk for construction
workers
Major Sustainability
Initiatives • Project review to exceed client’s
sustainability goals (Preconstruction)
• Share sustainability best practices and
sustainable solutions (with stakeholders)
• Keep people safe
• Create healthier working environment
(smoke free jobsite program)
• Reduce energy and water use
• Generate less waste
• Reduce natural resources
• Implement green building rating system
(LEED)
• Sustainable office practices (green
trailer)
• Carpooling or small car incentives
• Track carbon footprint
• LEED V4 pilot program
• Project review to exceed client’s
sustainability goals (Preconstruction)
• Share sustainability best practices and
sustainable solutions
• Maintain safe environment
• Create healthier working environment
(smoke free jobsite program)
• Reduce energy and water use
• Reduce construction waste
• Reduce natural resources
• Implement green building rating system
(LEED)
• Sustainable office practices (Green
office)
• Carpooling or small car incentives
• Track carbon footprint
• LEED V4 pilot program
• Project review to exceed client’s
sustainability goals (Design phase)
• Share sustainability best practices and
sustainable solutions
• Maintain healthy & safe environment
(smoke free jobsite program)
• Reduce energy and water use
• Reduce construction waste
• Reduce natural resources
• Implement green building rating system
(LEED)
• Sustainable office practices (Green
office)
• Carpooling or small car incentives
Project Life Cycle Assessment • Conduct the pilot study of LCA • Conduct the pilot study of LCA N/A
ISBN: 978-84-697-1815-5
47
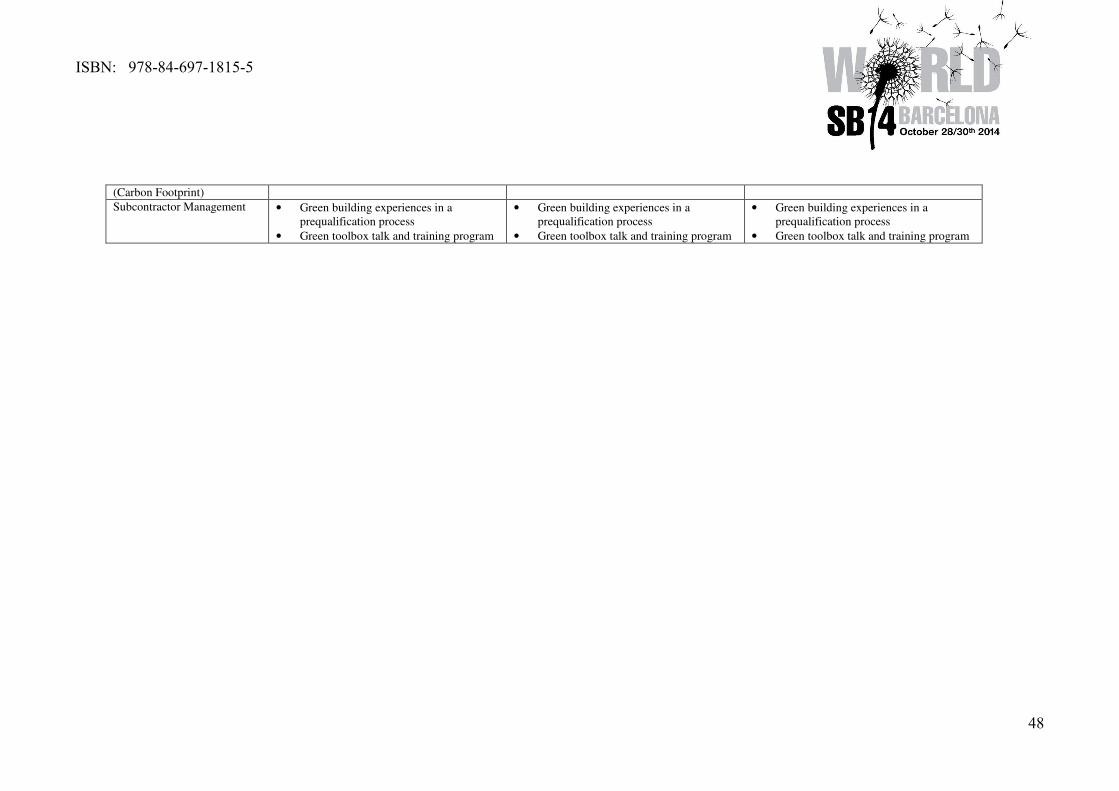
(Carbon Footprint)
Subcontractor Management • Green building experiences in a
prequalification process
• Green toolbox talk and training program
• Green building experiences in a
prequalification process
• Green toolbox talk and training program
• Green building experiences in a
prequalification process
• Green toolbox talk and training program
ISBN: 978-84-697-1815-5
48
1
Decision support for planning Sustainable Energy Management in
Underground Stations
Alberto Giretti*, Roberta Ansuini*, Miquel Casals**, Marta Gangolells**, Francesc Amoros**, Valerio
Costantini***, Giovanni Pescatori***.
* Università Politecnica delle Marche – Dipartimento di Ingegneria Civile, Edile e Architettura - via Brecce
Bianche - 60131 Ancona – Italy
** Universitat Politècnica de Catalunya, Department of Construction Engineering, Group of Construction
Research and Innovation (GRIC), C/Colom, 11, Ed. TR5, 08222 Terrassa, Barcelona, Spain
*** COFELY Italia spa, via Ostiense 333, 00146 Roma, Italy
Abstract: This paper outlines the decision support system that is being developing for the performance
and financial analysis of the SEAM4US system, concerned with the implementation of an Intelligent
Energy Management system for Underground Stations. A critical aspect for the design and
implementation of advanced sustainable solutions for the energy saving in complex buildings is the
assessment of the effectiveness of the approach in terms of both the amount of the energy saving and of
the cost benefits. The required dynamic analysis of the building behaviours under different operational
conditions makes it difficult to figure out the relevant operational scenarios. The paper describes a
scenario analysis tool that simulates the operation of an underground station in different climatic
conditions and with different system technology arrangements. The paper provides cost benefit
analysis under different operational scenarios and proposes suitable business models for the overall
technological framework.
Keywords: Optimal Control, Energy Efficiency, Cost Benefit Analysis
Introduction
Optimal energy control is one of the most desired features of contemporary smart buildings
technology (Clements-Croome 2004)(Sinopoli 2009). The achievement of optimised energy
performances in smart buildings is challenged by the uncertainty that affects the surrounding
environment. Building Energy Management Systems (BEMS) (Levermore 2000) are the
current state of the art technology for advanced energy management in buildings. Despite
their development and significant impact, standard BEMS applications still adopt sub-optimal
demand driven control polices, in which the systems’ set-points are not dynamically adapted
to the time varying boundary conditions, but simply follow predetermined schedules. Model
Predictive Control (MPC) (Maciejowski, 2002) is an advanced control technique that
implements optimal control. MPC uses predictions of systems behaviour in order to determine
the control policy that minimizes a cost function, within a set of performance constraints
(Figure 1). The MPC approach to building management guarantees performance over the full
range of conditions likely to be encountered (Clarke 2001)(Henze et al., 2005)(Oldewurtel et
al., 2010)(Mahdavi 2009)(Coffey et al. 2010). Nevertheless, the optimal control potential is
provided by MPC at the cost of highly tailored energy saving solutions.
ISBN: 978-84-697-1815-5
49
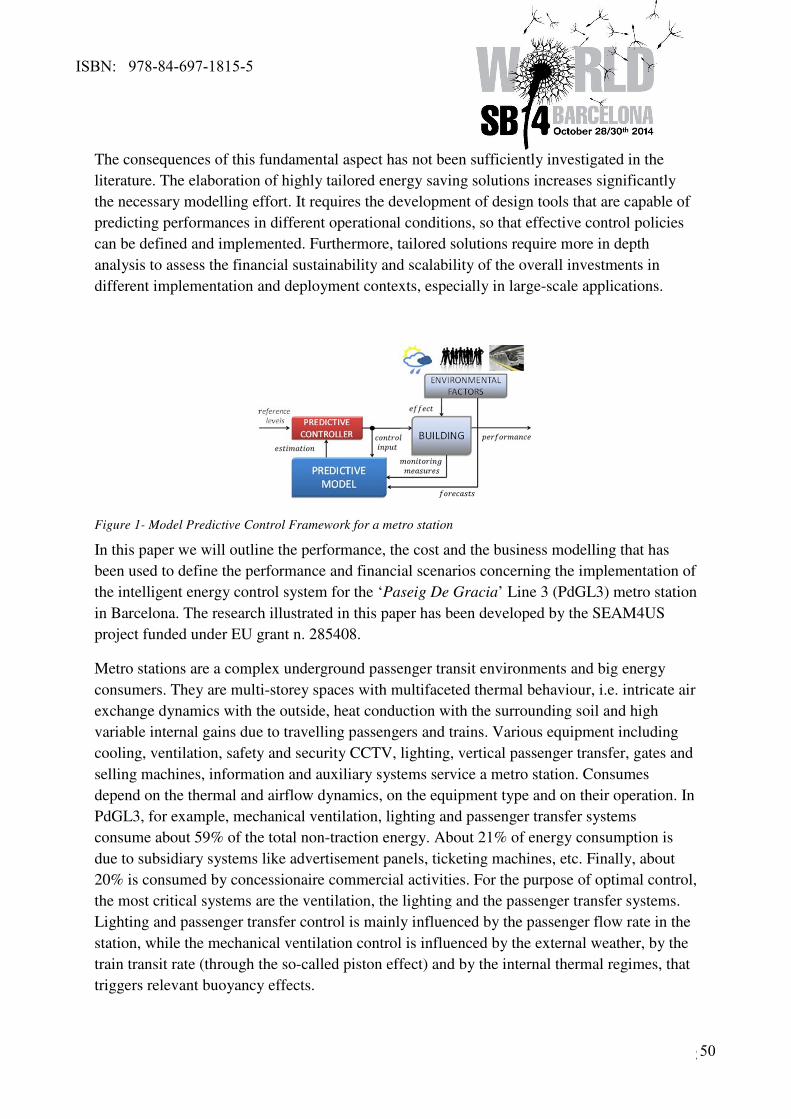
2
The consequences of this fundamental aspect has not been sufficiently investigated in the
literature. The elaboration of highly tailored energy saving solutions increases significantly
the necessary modelling effort. It requires the development of design tools that are capable of
predicting performances in different operational conditions, so that effective control policies
can be defined and implemented. Furthermore, tailored solutions require more in depth
analysis to assess the financial sustainability and scalability of the overall investments in
different implementation and deployment contexts, especially in large-scale applications.
Figure 1- Model Predictive Control Framework for a metro station
In this paper we will outline the performance, the cost and the business modelling that has
been used to define the performance and financial scenarios concerning the implementation of
the intelligent energy control system for the ‘Paseig De Gracia’ Line 3 (PdGL3) metro station
in Barcelona. The research illustrated in this paper has been developed by the SEAM4US
project funded under EU grant n. 285408.
Metro stations are a complex underground passenger transit environments and big energy
consumers. They are multi-storey spaces with multifaceted thermal behaviour, i.e. intricate air
exchange dynamics with the outside, heat conduction with the surrounding soil and high
variable internal gains due to travelling passengers and trains. Various equipment including
cooling, ventilation, safety and security CCTV, lighting, vertical passenger transfer, gates and
selling machines, information and auxiliary systems service a metro station. Consumes
depend on the thermal and airflow dynamics, on the equipment type and on their operation. In
PdGL3, for example, mechanical ventilation, lighting and passenger transfer systems
consume about 59% of the total non-traction energy. About 21% of energy consumption is
due to subsidiary systems like advertisement panels, ticketing machines, etc. Finally, about
20% is consumed by concessionaire commercial activities. For the purpose of optimal control,
the most critical systems are the ventilation, the lighting and the passenger transfer systems.
Lighting and passenger transfer control is mainly influenced by the passenger flow rate in the
station, while the mechanical ventilation control is influenced by the external weather, by the
train transit rate (through the so-called piston effect) and by the internal thermal regimes, that
triggers relevant buoyancy effects.
ISBN: 978-84-697-1815-5
50
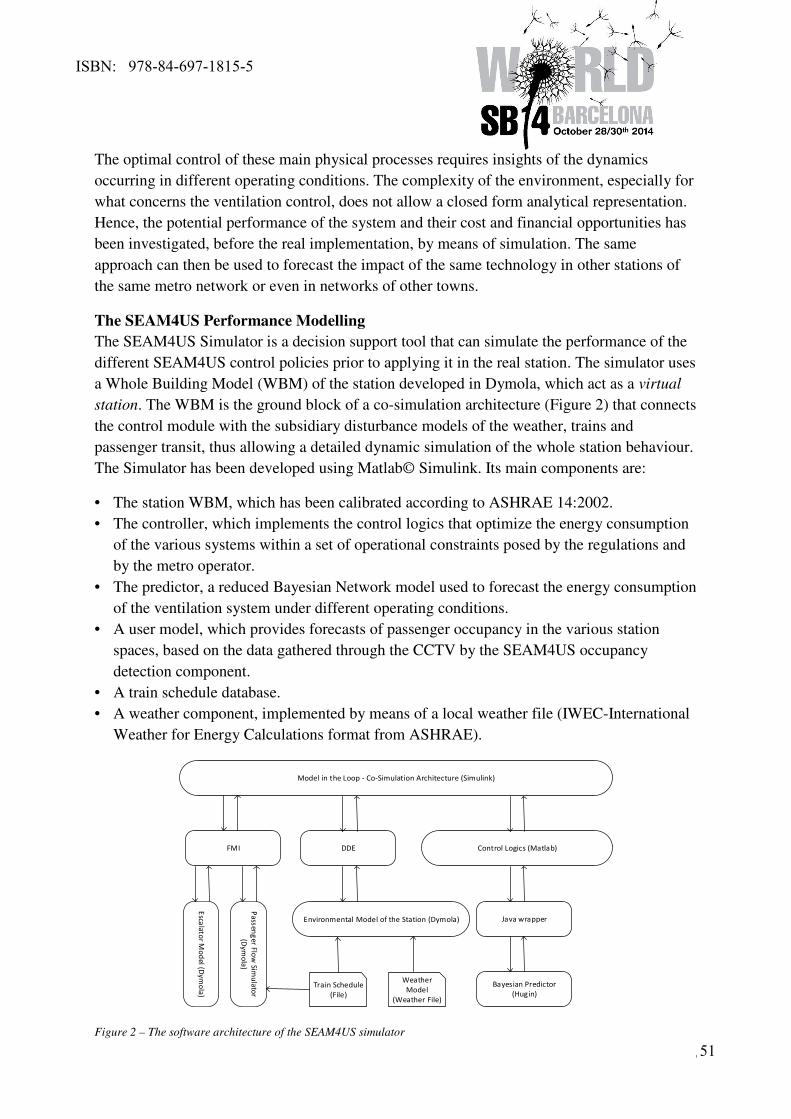
3
The optimal control of these main physical processes requires insights of the dynamics
occurring in different operating conditions. The complexity of the environment, especially for
what concerns the ventilation control, does not allow a closed form analytical representation.
Hence, the potential performance of the system and their cost and financial opportunities has
been investigated, before the real implementation, by means of simulation. The same
approach can then be used to forecast the impact of the same technology in other stations of
the same metro network or even in networks of other towns.
The SEAM4US Performance Modelling
The SEAM4US Simulator is a decision support tool that can simulate the performance of the
different SEAM4US control policies prior to applying it in the real station. The simulator uses
a Whole Building Model (WBM) of the station developed in Dymola, which act as a virtual
station. The WBM is the ground block of a co-simulation architecture (Figure 2) that connects
the control module with the subsidiary disturbance models of the weather, trains and
passenger transit, thus allowing a detailed dynamic simulation of the whole station behaviour.
The Simulator has been developed using Matlab© Simulink. Its main components are:
• The station WBM, which has been calibrated according to ASHRAE 14:2002.
• The controller, which implements the control logics that optimize the energy consumption
of the various systems within a set of operational constraints posed by the regulations and
by the metro operator.
• The predictor, a reduced Bayesian Network model used to forecast the energy consumption
of the ventilation system under different operating conditions.
• A user model, which provides forecasts of passenger occupancy in the various station
spaces, based on the data gathered through the CCTV by the SEAM4US occupancy
detection component.
• A train schedule database.
• A weather component, implemented by means of a local weather file (IWEC-International
Weather for Energy Calculations format from ASHRAE).
Figure 2 – The software architecture of the SEAM4US simulator
Model in the Loop - Co-Simulation Architecture (Simulink)
Bayesian Predictor
(Hugin)
Esca
lator M
od
el (D
ymo
la)
Environmental Model of the Station (Dymola)
Pa
ssen
ge
r Flow
Simu
lator
(Dy
mo
la)
Control Logics (Matlab)
Java wrapper
FMI DDE
Weather
Model
(Weather File)
Train Schedule
(File)
ISBN: 978-84-697-1815-5
51
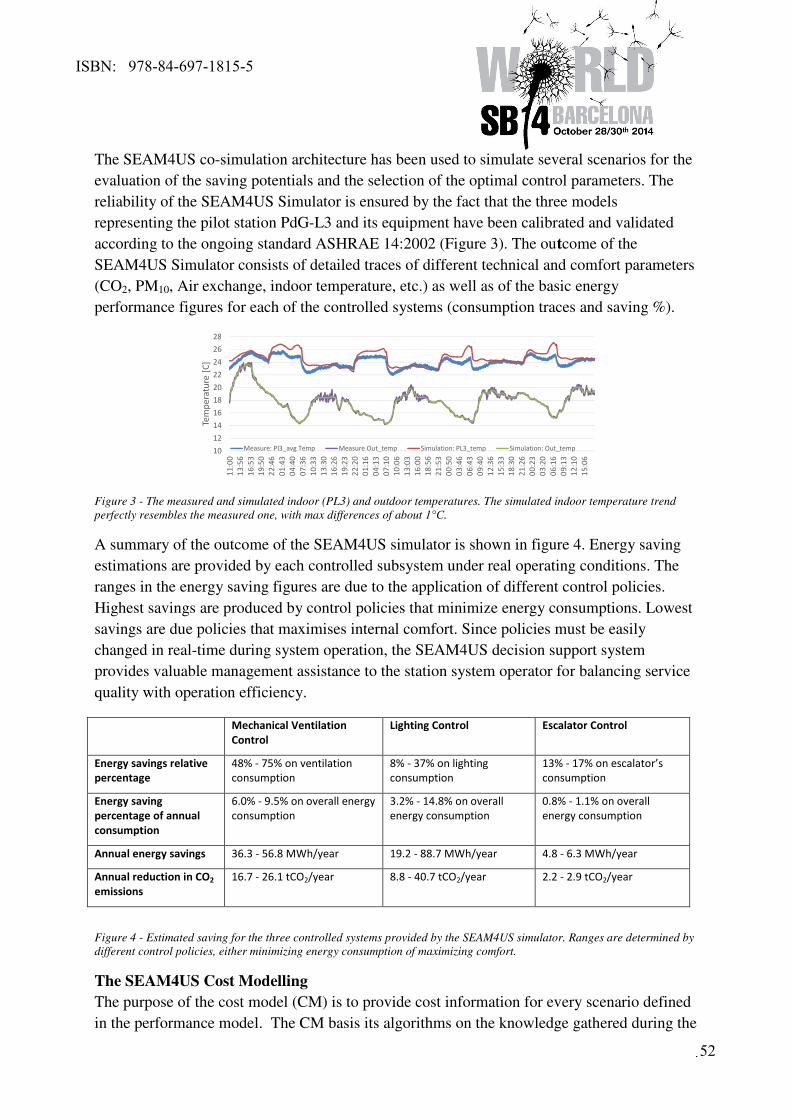
4
The SEAM4US co-simulation architecture has been used to simulate several scenarios for the
evaluation of the saving potentials and the selection of the optimal control parameters. The
reliability of the SEAM4US Simulator is ensured by the fact that the three models
representing the pilot station PdG-L3 and its equipment have been calibrated and validated
according to the ongoing standard ASHRAE 14:2002 (Figure 3). The outcome of the
SEAM4US Simulator consists of detailed traces of different technical and comfort parameters
(CO2, PM10, Air exchange, indoor temperature, etc.) as well as of the basic energy
performance figures for each of the controlled systems (consumption traces and saving %).
Figure 3 - The measured and simulated indoor (PL3) and outdoor temperatures. The simulated indoor temperature trend
perfectly resembles the measured one, with max differences of about 1°C.
A summary of the outcome of the SEAM4US simulator is shown in figure 4. Energy saving
estimations are provided by each controlled subsystem under real operating conditions. The
ranges in the energy saving figures are due to the application of different control policies.
Highest savings are produced by control policies that minimize energy consumptions. Lowest
savings are due policies that maximises internal comfort. Since policies must be easily
changed in real-time during system operation, the SEAM4US decision support system
provides valuable management assistance to the station system operator for balancing service
quality with operation efficiency.
Mechanical Ventilation
Control
Lighting Control Escalator Control
Energy savings relative
percentage
48% - 75% on ventilation
consumption
8% - 37% on lighting
consumption
13% - 17% on escalator’s
consumption
Energy saving
percentage of annual
consumption
6.0% - 9.5% on overall energy
consumption
3.2% - 14.8% on overall
energy consumption
0.8% - 1.1% on overall
energy consumption
Annual energy savings 36.3 - 56.8 MWh/year 19.2 - 88.7 MWh/year 4.8 - 6.3 MWh/year
Annual reduction in CO2
emissions
16.7 - 26.1 tCO2/year 8.8 - 40.7 tCO2/year 2.2 - 2.9 tCO2/year
Figure 4 - Estimated saving for the three controlled systems provided by the SEAM4US simulator. Ranges are determined by
different control policies, either minimizing energy consumption of maximizing comfort.
The SEAM4US Cost Modelling
The purpose of the cost model (CM) is to provide cost information for every scenario defined
in the performance model. The CM basis its algorithms on the knowledge gathered during the
10
12
14
16
18
20
22
24
26
28
12
/04
/20
13
11
:00
12
/04
/20
13
13
:56
12
/04
/20
13
16
:53
12
/04
/20
13
19
:50
12
/04
/20
13
22
:46
13
/04
/20
13
01
:43
13
/04
/20
13
04
:40
13
/04
/20
13
07
:36
13
/04
/20
13
10
:33
13
/04
/20
13
13
:30
13
/04
/20
13
16
:26
13
/04
/20
13
19
:23
13
/04
/20
13
22
:20
14
/04
/20
13
01
:16
14
/04
/20
13
04
:13
14
/04
/20
13
07
:10
14
/04
/20
13
10
:06
14
/04
/20
13
13
:03
14
/04
/20
13
16
:00
14
/04
/20
13
18
:56
14
/04
/20
13
21
:53
15
/04
/20
13
00
:50
15
/04
/20
13
03
:46
15
/04
/20
13
06
:43
15
/04
/20
13
09
:40
15
/04
/20
13
12
:36
15
/04
/20
13
15
:33
15
/04
/20
13
18
:30
15
/04
/20
13
21
:26
16
/04
/20
13
00
:23
16
/04
/20
13
03
:20
16
/04
/20
13
06
:16
16
/04
/20
13
09
:13
16
/04
/20
13
12
:10
16
/04
/20
13
15
:06
Tem
pe
ratu
re [
C]
Measure: Pl3_avg Temp Measure Out_temp Simulation: PL3_temp Simulation: Out_temp
ISBN: 978-84-697-1815-5
52
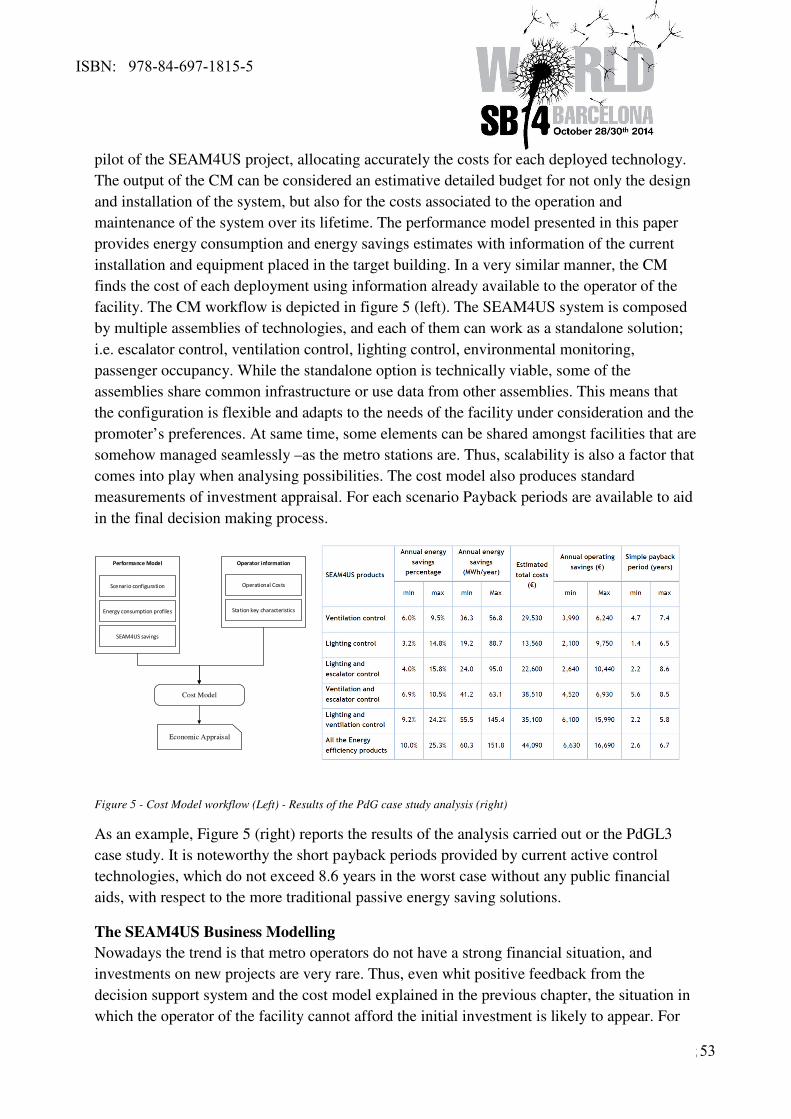
5
pilot of the SEAM4US project, allocating accurately the costs for each deployed technology.
The output of the CM can be considered an estimative detailed budget for not only the design
and installation of the system, but also for the costs associated to the operation and
maintenance of the system over its lifetime. The performance model presented in this paper
provides energy consumption and energy savings estimates with information of the current
installation and equipment placed in the target building. In a very similar manner, the CM
finds the cost of each deployment using information already available to the operator of the
facility. The CM workflow is depicted in figure 5 (left). The SEAM4US system is composed
by multiple assemblies of technologies, and each of them can work as a standalone solution;
i.e. escalator control, ventilation control, lighting control, environmental monitoring,
passenger occupancy. While the standalone option is technically viable, some of the
assemblies share common infrastructure or use data from other assemblies. This means that
the configuration is flexible and adapts to the needs of the facility under consideration and the
promoter’s preferences. At same time, some elements can be shared amongst facilities that are
somehow managed seamlessly –as the metro stations are. Thus, scalability is also a factor that
comes into play when analysing possibilities. The cost model also produces standard
measurements of investment appraisal. For each scenario Payback periods are available to aid
in the final decision making process.
Figure 5 - Cost Model workflow (Left) - Results of the PdG case study analysis (right)
As an example, Figure 5 (right) reports the results of the analysis carried out or the PdGL3
case study. It is noteworthy the short payback periods provided by current active control
technologies, which do not exceed 8.6 years in the worst case without any public financial
aids, with respect to the more traditional passive energy saving solutions.
The SEAM4US Business Modelling
Nowadays the trend is that metro operators do not have a strong financial situation, and
investments on new projects are very rare. Thus, even whit positive feedback from the
decision support system and the cost model explained in the previous chapter, the situation in
which the operator of the facility cannot afford the initial investment is likely to appear. For
Operator information
Station key characteristics
Operational Costs
Performance Model
Scenario configuration
SEAM4US savings
Energy consumption profiles
Cost Model
Economic Appraisal
ISBN: 978-84-697-1815-5
53
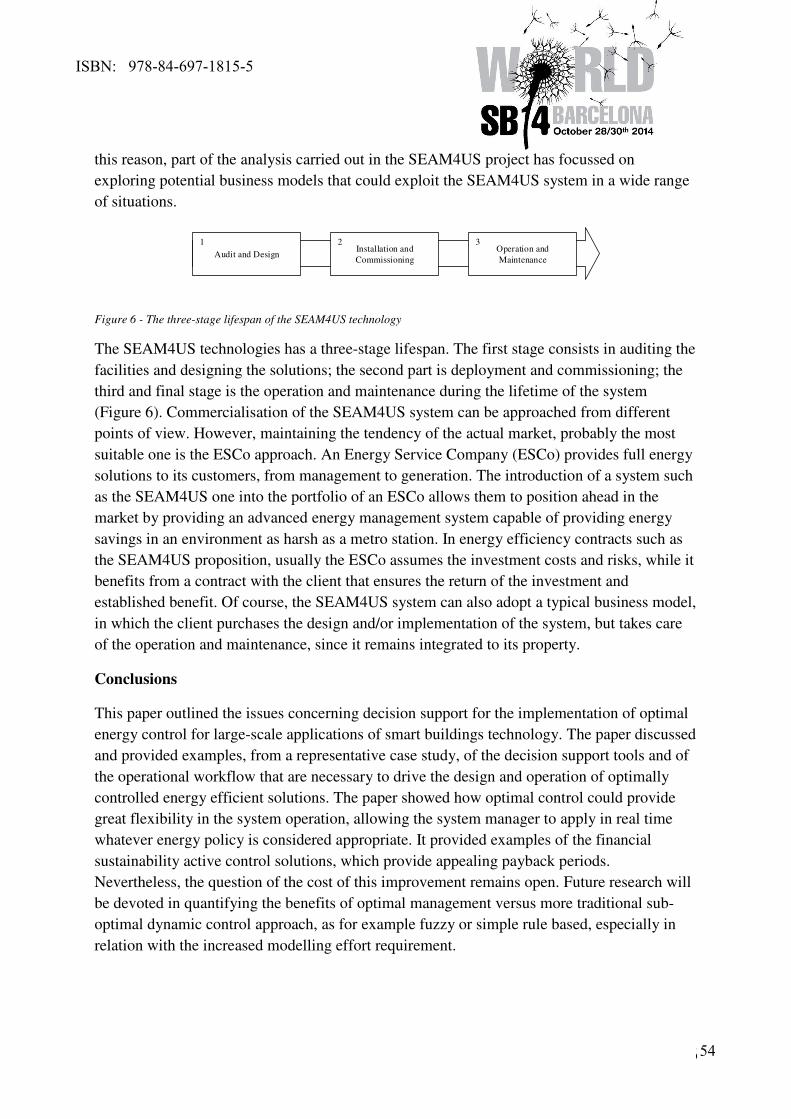
6
this reason, part of the analysis carried out in the SEAM4US project has focussed on
exploring potential business models that could exploit the SEAM4US system in a wide range
of situations.
Figure 6 - The three-stage lifespan of the SEAM4US technology
The SEAM4US technologies has a three-stage lifespan. The first stage consists in auditing the
facilities and designing the solutions; the second part is deployment and commissioning; the
third and final stage is the operation and maintenance during the lifetime of the system
(Figure 6). Commercialisation of the SEAM4US system can be approached from different
points of view. However, maintaining the tendency of the actual market, probably the most
suitable one is the ESCo approach. An Energy Service Company (ESCo) provides full energy
solutions to its customers, from management to generation. The introduction of a system such
as the SEAM4US one into the portfolio of an ESCo allows them to position ahead in the
market by providing an advanced energy management system capable of providing energy
savings in an environment as harsh as a metro station. In energy efficiency contracts such as
the SEAM4US proposition, usually the ESCo assumes the investment costs and risks, while it
benefits from a contract with the client that ensures the return of the investment and
established benefit. Of course, the SEAM4US system can also adopt a typical business model,
in which the client purchases the design and/or implementation of the system, but takes care
of the operation and maintenance, since it remains integrated to its property.
Conclusions
This paper outlined the issues concerning decision support for the implementation of optimal
energy control for large-scale applications of smart buildings technology. The paper discussed
and provided examples, from a representative case study, of the decision support tools and of
the operational workflow that are necessary to drive the design and operation of optimally
controlled energy efficient solutions. The paper showed how optimal control could provide
great flexibility in the system operation, allowing the system manager to apply in real time
whatever energy policy is considered appropriate. It provided examples of the financial
sustainability active control solutions, which provide appealing payback periods.
Nevertheless, the question of the cost of this improvement remains open. Future research will
be devoted in quantifying the benefits of optimal management versus more traditional sub-
optimal dynamic control approach, as for example fuzzy or simple rule based, especially in
relation with the increased modelling effort requirement.
Audit and DesignInstallation and
Commissioning
Operation and
Maintenance
1 2 3
ISBN: 978-84-697-1815-5
54
7
References
Clarke, J. A. (2001) Control in Building Energy Management Systems: The Role of Simulation, Seventh
International IBPSA Conference Rio de Janeiro, Brazil August 13-15.
Clements-Croome, D. (2004) Intelligent Buildings: Design, Management and Operation, Telford Publishing.
Coffey, B., Haghighat, F. (2010) A software framework for model predictive control with GenOpt, Energy and
Buildings 42 p.1084-1092.
Henze, G., Kalz, D. (2005) Experimental analysis of model-based predictive optimal control for active and
passive thermal storage inventory, HVAC&R 11(2) 189-213.
Levermore, G. J. (2000) Building Energy Management Systems: Applications to Low-energy HVAC and Natural
Ventilation Control, E & FN Spon,
Maciejowsli, J. M. (2002) Predictive Control with Constraints, Prentice Hall, England.
Mahdavi, A., Orehounig, K., Pröglhöf, C. 2009. A simulation-supported control scheme for natural ventilation in
buildings. In Proc. of the 11th IBPSA Conference, Glasgow, Scotland.
Oldewurtel, F., Parisio, A., Jones, C., Morari, M. and Gyalistras, D. (2010) Energy Efficient Building Climate
Control using Stochastic Model Predictive Control and Weather Predictions. Proceedings of the American
Control Conference, Baltimore, MD,.
Sinopoli, J.M. (2009) Smart Buildings Systems for Architects, Owners and Builders, Butterworth, USA
ISBN: 978-84-697-1815-5
55
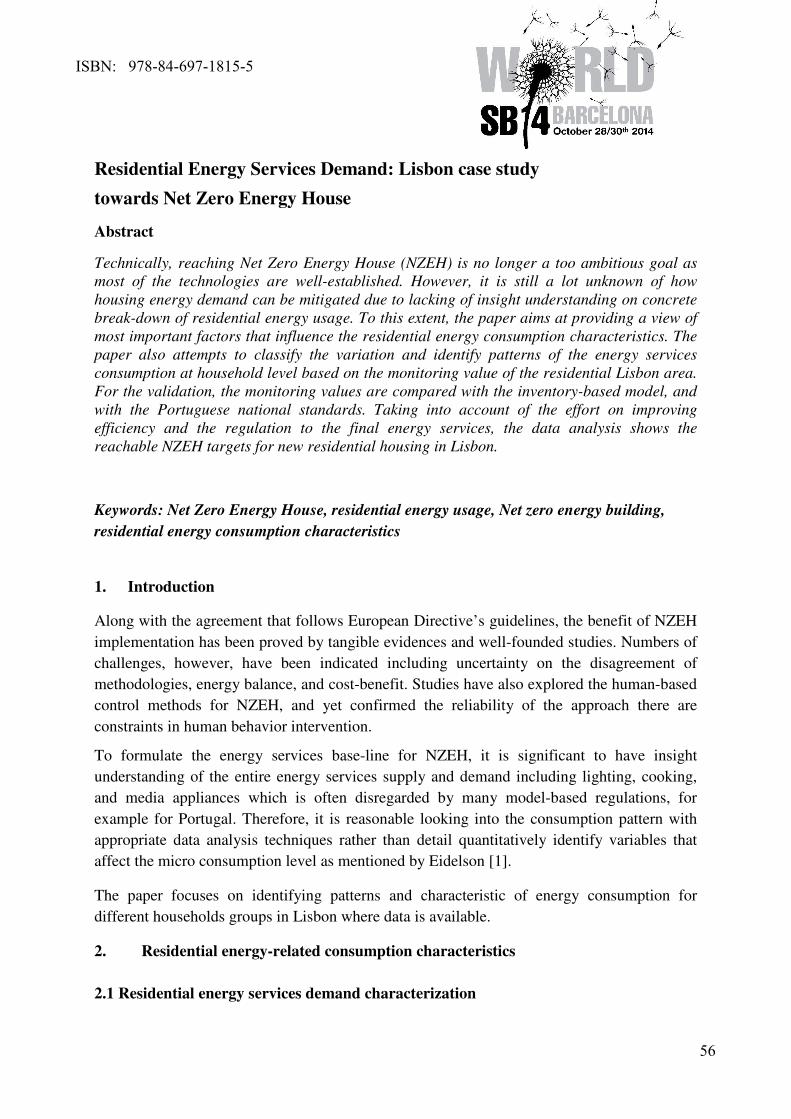
1
Residential Energy Services Demand: Lisbon case study
towards Net Zero Energy House
Abstract
Technically, reaching Net Zero Energy House (NZEH) is no longer a too ambitious goal as
most of the technologies are well-established. However, it is still a lot unknown of how
housing energy demand can be mitigated due to lacking of insight understanding on concrete
break-down of residential energy usage. To this extent, the paper aims at providing a view of
most important factors that influence the residential energy consumption characteristics. The
paper also attempts to classify the variation and identify patterns of the energy services
consumption at household level based on the monitoring value of the residential Lisbon area.
For the validation, the monitoring values are compared with the inventory-based model, and
with the Portuguese national standards. Taking into account of the effort on improving
efficiency and the regulation to the final energy services, the data analysis shows the
reachable NZEH targets for new residential housing in Lisbon.
Keywords: Net Zero Energy House, residential energy usage, Net zero energy building,
residential energy consumption characteristics
1. Introduction
Along with the agreement that follows European Directive’s guidelines, the benefit of NZEH
implementation has been proved by tangible evidences and well-founded studies. Numbers of
challenges, however, have been indicated including uncertainty on the disagreement of
methodologies, energy balance, and cost-benefit. Studies have also explored the human-based
control methods for NZEH, and yet confirmed the reliability of the approach there are
constraints in human behavior intervention.
To formulate the energy services base-line for NZEH, it is significant to have insight
understanding of the entire energy services supply and demand including lighting, cooking,
and media appliances which is often disregarded by many model-based regulations, for
example for Portugal. Therefore, it is reasonable looking into the consumption pattern with
appropriate data analysis techniques rather than detail quantitatively identify variables that
affect the micro consumption level as mentioned by Eidelson [1].
The paper focuses on identifying patterns and characteristic of energy consumption for
different households groups in Lisbon where data is available.
2. Residential energy-related consumption characteristics
2.1 Residential energy services demand characterization
ISBN: 978-84-697-1815-5
56
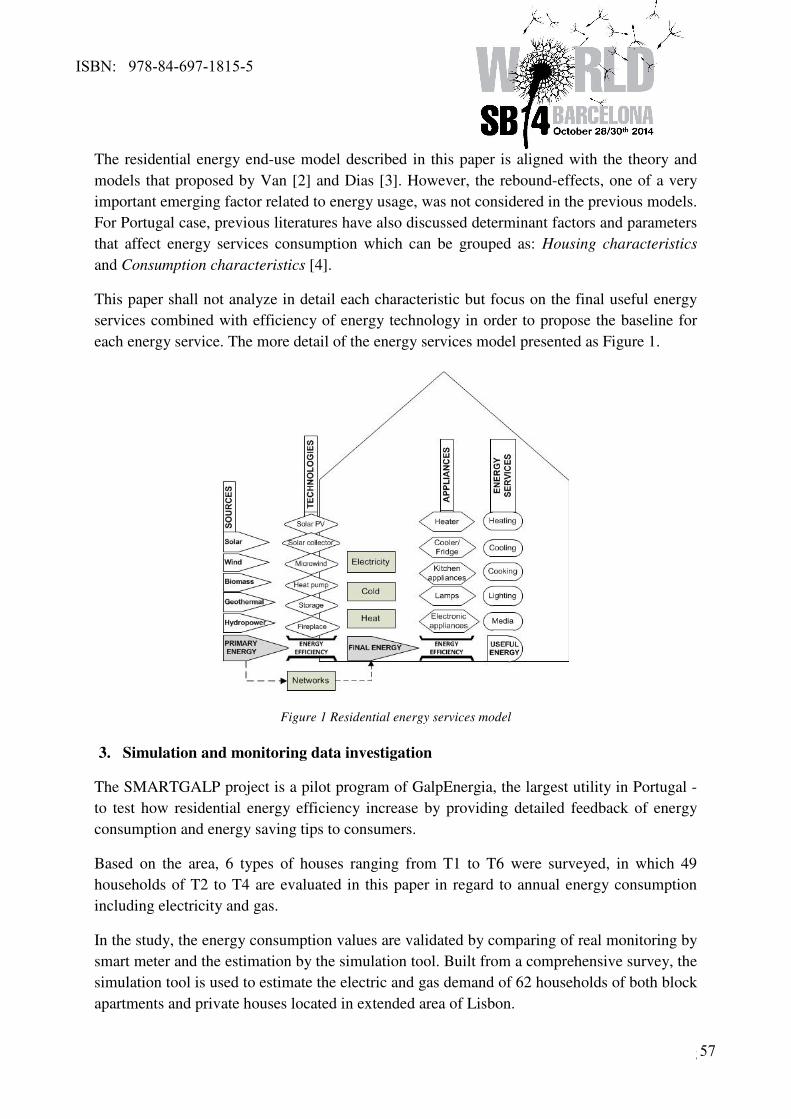
2
The residential energy end-use model described in this paper is aligned with the theory and
models that proposed by Van [2] and Dias [3]. However, the rebound-effects, one of a very
important emerging factor related to energy usage, was not considered in the previous models.
For Portugal case, previous literatures have also discussed determinant factors and parameters
that affect energy services consumption which can be grouped as: Housing characteristics
and Consumption characteristics [4].
This paper shall not analyze in detail each characteristic but focus on the final useful energy
services combined with efficiency of energy technology in order to propose the baseline for
each energy service. The more detail of the energy services model presented as Figure 1.
Figure 1 Residential energy services model
3. Simulation and monitoring data investigation
The SMARTGALP project is a pilot program of GalpEnergia, the largest utility in Portugal -
to test how residential energy efficiency increase by providing detailed feedback of energy
consumption and energy saving tips to consumers.
Based on the area, 6 types of houses ranging from T1 to T6 were surveyed, in which 49
households of T2 to T4 are evaluated in this paper in regard to annual energy consumption
including electricity and gas.
In the study, the energy consumption values are validated by comparing of real monitoring by
smart meter and the estimation by the simulation tool. Built from a comprehensive survey, the
simulation tool is used to estimate the electric and gas demand of 62 households of both block
apartments and private houses located in extended area of Lisbon.
ISBN: 978-84-697-1815-5
57
3
The survey includes extensive inventory on energy usage under the form of energy equipment
and electricity appliances used in residentials, their habit and activities schedule, when and
how the energy appliances are used according to family schedule and family profile. The
surveyed information from the survey also includes the characteristics of the houses.
3.1 Monitoring results of residential energy consumption
The reference house used for Portugal is 108m2 with 2.7 people per house. From the
monitoring, the annual consumption pattern of the electricity shows that most of the houses
have the stable final electricity consumption throughout the year which below 66.67 kWh/m2.
Only 6 out of 49 houses have the consumption exceed this amount and the exceeding started
from second week of December to the last week of February as for 11 weeks in winter.
It is worth mentioning that 23 household consumed below 22.22 kWh/m2.year as the final
useful energy. There is an observation of a peak consumed on the first week of September
after the summer holiday. This peak is reasonable by the fact that family in the survey are
from middle to high income one. Therefore, most of them have the holiday during August and
come back in September.
The observed pattern shows that the electricity demand throughout the year is independent
with the seasonal changing. The exception cases for high electricity consumption are T4
houses where the families have air-condition for heating purpose during winter.
On the gas consumption, there are two very clear groups of families, one is very high
consumed, and the other is mostly medium. In the high consumption group, there are 7 out of
49 houses have the central heating system with the consumption is larger than 88.89
kWh/m2.year. This winter peak was started from the first week of November to the last week
of February which is earlier than the winter peak of the electricity as mentioned. These houses
are either not the same house with the one using electricity for heating. It is noted that 29
houses do not have any weekly consumption that exceed 100 kWh per week or equivalent to
44.44 kWh/m2.year.
Looking at the total energy consumption, there are 19 out of 49 houses have annual
consumption below 66.67 kWh/m2.year. The group of very high consumption is mostly
caused by the gas consumption. The electricity consumption is relatively stable as mentioned.
Another fact is worth mentioning that while the size of the house ranges from T2, T3, and T4
of which 100 – 120 – 140 m2, the weekly consumption patterns show no difference between
the total energy consumption as kWh/week and the energy intensity as kWh/m2.week.
3.2 Comparison of the monitoring values with the simulation results
The breakdown of residential energy services consumption in percentage is identified and
compared between the simulation and the survey value - Table 1. The results show the
relatively match between the simulation
ISBN: 978-84-697-1815-5
58
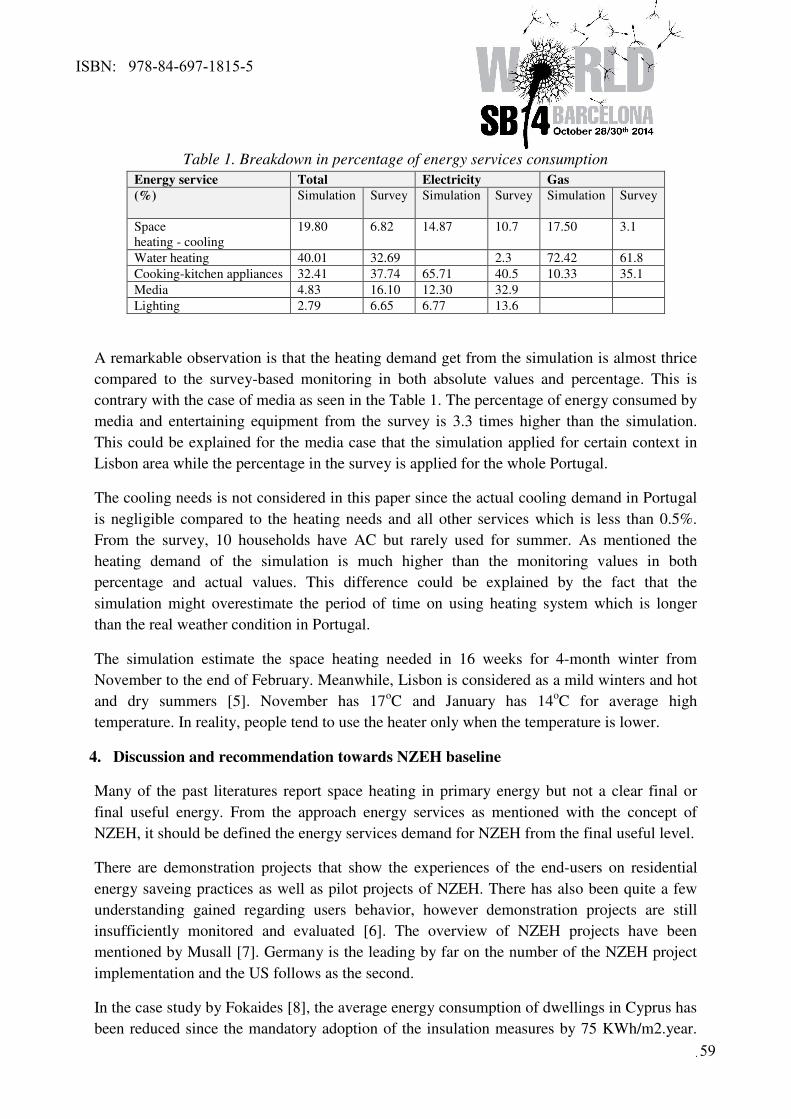
4
Table 1. Breakdown in percentage of energy services consumption
Energy service Total Electricity Gas
(%) Simulation Survey Simulation Survey Simulation Survey
Space
heating - cooling
19.80 6.82 14.87 10.7 17.50 3.1
Water heating 40.01 32.69 2.3 72.42 61.8
Cooking-kitchen appliances 32.41 37.74 65.71 40.5 10.33 35.1
Media 4.83 16.10 12.30 32.9
Lighting 2.79 6.65 6.77 13.6
A remarkable observation is that the heating demand get from the simulation is almost thrice
compared to the survey-based monitoring in both absolute values and percentage. This is
contrary with the case of media as seen in the Table 1. The percentage of energy consumed by
media and entertaining equipment from the survey is 3.3 times higher than the simulation.
This could be explained for the media case that the simulation applied for certain context in
Lisbon area while the percentage in the survey is applied for the whole Portugal.
The cooling needs is not considered in this paper since the actual cooling demand in Portugal
is negligible compared to the heating needs and all other services which is less than 0.5%.
From the survey, 10 households have AC but rarely used for summer. As mentioned the
heating demand of the simulation is much higher than the monitoring values in both
percentage and actual values. This difference could be explained by the fact that the
simulation might overestimate the period of time on using heating system which is longer
than the real weather condition in Portugal.
The simulation estimate the space heating needed in 16 weeks for 4-month winter from
November to the end of February. Meanwhile, Lisbon is considered as a mild winters and hot
and dry summers [5]. November has 17oC and January has 14
oC for average high
temperature. In reality, people tend to use the heater only when the temperature is lower.
4. Discussion and recommendation towards NZEH baseline
Many of the past literatures report space heating in primary energy but not a clear final or
final useful energy. From the approach energy services as mentioned with the concept of
NZEH, it should be defined the energy services demand for NZEH from the final useful level.
There are demonstration projects that show the experiences of the end-users on residential
energy saveing practices as well as pilot projects of NZEH. There has also been quite a few
understanding gained regarding users behavior, however demonstration projects are still
insufficiently monitored and evaluated [6]. The overview of NZEH projects have been
mentioned by Musall [7]. Germany is the leading by far on the number of the NZEH project
implementation and the US follows as the second.
In the case study by Fokaides [8], the average energy consumption of dwellings in Cyprus has
been reduced since the mandatory adoption of the insulation measures by 75 KWh/m2.year.
ISBN: 978-84-697-1815-5
59
5
According to the present analysis, class A dwellings in Cyprus consume not more than 60
kWh/m2.year. It is not completely comprehensive to compare but the case for Cyprus or Italy
[9] can be reasonable to compare as in relatively the same climate zone of Mediterranean. The
recommendation suggested by [10] for Portugal as the Mediterranean climate zone mentioned
the strategy plan but has not specified all energy services which are mentioned in this paper’s
approach. It could be said that the obtained results from both simulation and the survey for
Lisbon combined with the effort on improving energy efficiency show the reachable level of
NZEH for Lisbon and Portugal.
Gouveia et al. [11] mentioned on the sensitivity analysis of the demand increasing on
household energy services for example the space heating and cooling due to the fact that
people keep wanting for more indoor thermal comfort. This fact is also critical for Portugal
case. It is also needed considering the dynamic of all the electric appliances as discussed by
[12] for introducing more valid threshold of each energy service.
5. Conclusion
Based on the data received from the meter reading and survey of the household in Lisbon
area, the paper attempts to classify energy services, then discusses the features that determine
and influence the residential energy consumption. The total sum of energy consumption
annual values might not provide sufficient detail for planning effective interventions such as
the replacement of appliances or promoting behavioral change. The primary data investigation
has opened questions as well as suggestion for further research baseline NZEH
implementation for Portugal. For example, how could NZEH improve or encourage the
consumers on energy saving or to be more energy efficiency.
One remark is worth mentioning that results of the simulation and the actual reading show the
variation associated with the energy demand in the residential sector. The unexplained
variation is partly due to the missing values and uncompleted information during the survey.
The variation is also considerably affected by the individual lifestyle. Diverse model and
different efficient level of the appliances according to each family also create a lot of variation
that the occupant themselves can hardly know the detail.
To answer many uncertainties regarding promising behavior intervention strategies while
shifting to NZEH, pilot projects and post occupancy evaluation needed to carry out on real
implementation of NZEH. Further rigorous method is needed in data analysis on the
consumption characteristics related to family profile and other related behavior aspects.
Acknowledgements
This paper is part of the research has been done in collaboration with Instituto Superior
Técnico, Universidade de Lisboa and Aalto University funded through Erasmus Mundus Joint
Doctoral Program SELECT+, the support of which is gratefully acknowledged.
ISBN: 978-84-697-1815-5
60
6
References
[1] R. J. Eidelson, “Complex adaptive systems in the behavioral and social sciences.,” Rev.
Gen. Psychol., vol. 1, no. 1, pp. 42–71, 1997.
[2] W. F. Van Raaij and T. M. M. Verhallen, “A Behavioral Model of Residential Energy
Use,” J. Econ. Psychol., vol. 3, pp. 39–63, 1983.
[3] R. a. Dias, C. R. Mattos, and J. a. P. Balestieri, “Energy education: breaking up the
rational energy use barriers,” Energy Policy, vol. 32, no. 11, pp. 1339–1347, Jul. 2004.
[4] J. P. Gouveia, P. Fortes, and J. Seixas, “Projections of energy services demand for
residential buildings: Insights from a bottom-up methodology,” Energy, vol. 47, no. 1,
pp. 430–442, Nov. 2012.
[5] S. Oliveira, H. Andrade, and T. Vaz, “The cooling effect of green spaces as a
contribution to the mitigation of urban heat: A case study in Lisbon,” Build. Environ.,
vol. 46, no. 11, pp. 2186–2194, Nov. 2011.
[6] M. J. Brandemuehl and K. M. Field, “Effective of Variation of Occupant Behavior on
Residential Building Net Zero Energy Performance,” in 12th Conference of
International Building Performance Simulation Association, 2011, pp. 14–16.
[7] E. Musall, T. Weiss, K. Voss, and A. Lenoir, “Net Zero Energy Solar Buildings : An
Overview and Analysis on Worldwide Building Projects,” 2013, pp. 7–8.
[8] P. a. Fokaides, E. a. Christoforou, and S. a. Kalogirou, “Legislation driven scenarios
based on recent construction advancements towards the achievement of nearly zero
energy dwellings in the southern European country of Cyprus,” Energy, Jan. 2014.
[9] G. Dall’O', V. Belli, M. Brolis, I. Mozzi, and M. Fasano, “Nearly Zero-Energy
Buildings of the Lombardy Region (Italy), a Case Study of High-Energy Performance
Buildings,” Energies, vol. 6, no. 7, pp. 3506–3527, Jul. 2013.
[10] P. Taylor and A. Ferrante, “Advances in Building Energy Research Zero- and low-
energy housing for the Mediterranean climate,” no. June, pp. 37–41, 2012.
[11] J. P. Gouveia, P. Fortes, and J. Seixas, “Projections of energy services demand for
residential buildings: Insights from a bottom-up methodology,” Energy, vol. 47, no. 1,
pp. 430–442, Nov. 2012.
[12] G. Wood and M. Newborough, “Dynamic energy-consumption indicators for domestic
appliances: environment, behaviour and design,” Energy Build., vol. 35, no. 8, pp.
821–841, Sep. 2003.
ISBN: 978-84-697-1815-5
61
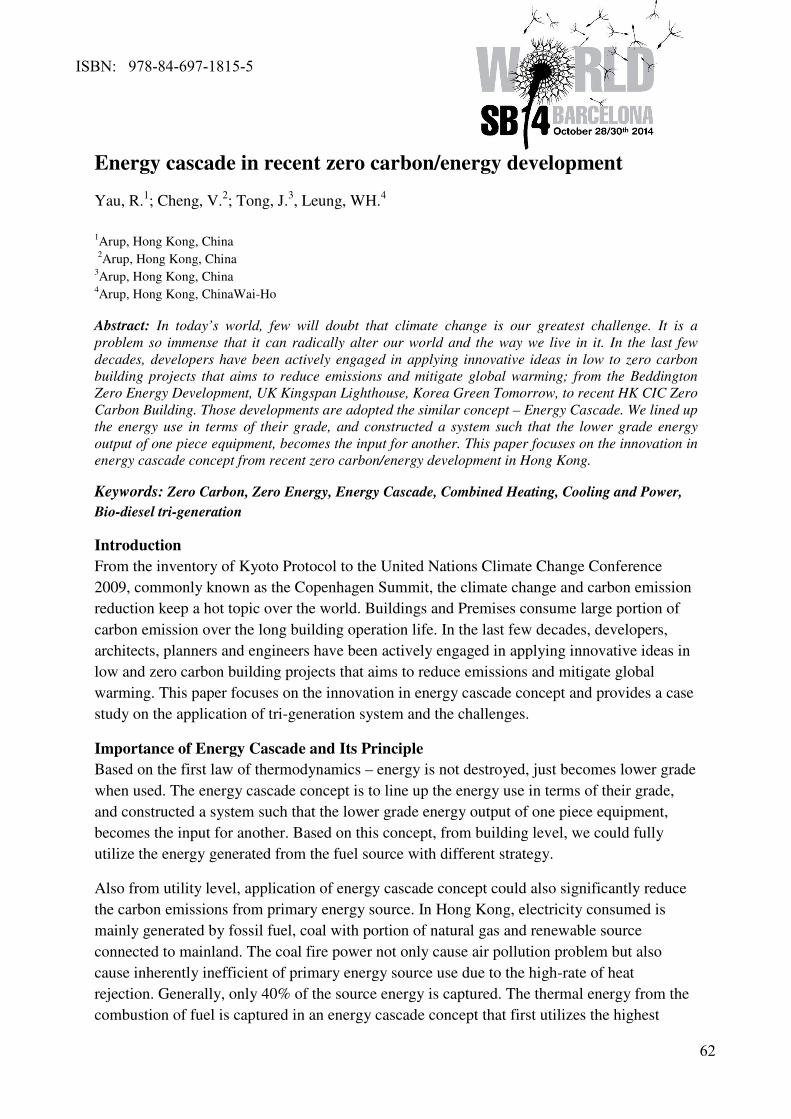
1
Energy cascade in recent zero carbon/energy development
Yau, R.1; Cheng, V.
2; Tong, J.
3, Leung, WH.
4
1Arup, Hong Kong, China
2Arup, Hong Kong, China
3Arup, Hong Kong, China
4Arup, Hong Kong, ChinaWai-Ho
Abstract: In today’s world, few will doubt that climate change is our greatest challenge. It is a
problem so immense that it can radically alter our world and the way we live in it. In the last few
decades, developers have been actively engaged in applying innovative ideas in low to zero carbon
building projects that aims to reduce emissions and mitigate global warming; from the Beddington
Zero Energy Development, UK Kingspan Lighthouse, Korea Green Tomorrow, to recent HK CIC Zero
Carbon Building. Those developments are adopted the similar concept – Energy Cascade. We lined up
the energy use in terms of their grade, and constructed a system such that the lower grade energy
output of one piece equipment, becomes the input for another. This paper focuses on the innovation in
energy cascade concept from recent zero carbon/energy development in Hong Kong.
Keywords: Zero Carbon, Zero Energy, Energy Cascade, Combined Heating, Cooling and Power,
Bio-diesel tri-generation
Introduction
From the inventory of Kyoto Protocol to the United Nations Climate Change Conference
2009, commonly known as the Copenhagen Summit, the climate change and carbon emission
reduction keep a hot topic over the world. Buildings and Premises consume large portion of
carbon emission over the long building operation life. In the last few decades, developers,
architects, planners and engineers have been actively engaged in applying innovative ideas in
low and zero carbon building projects that aims to reduce emissions and mitigate global
warming. This paper focuses on the innovation in energy cascade concept and provides a case
study on the application of tri-generation system and the challenges.
Importance of Energy Cascade and Its Principle
Based on the first law of thermodynamics – energy is not destroyed, just becomes lower grade
when used. The energy cascade concept is to line up the energy use in terms of their grade,
and constructed a system such that the lower grade energy output of one piece equipment,
becomes the input for another. Based on this concept, from building level, we could fully
utilize the energy generated from the fuel source with different strategy.
Also from utility level, application of energy cascade concept could also significantly reduce
the carbon emissions from primary energy source. In Hong Kong, electricity consumed is
mainly generated by fossil fuel, coal with portion of natural gas and renewable source
connected to mainland. The coal fire power not only cause air pollution problem but also
cause inherently inefficient of primary energy source use due to the high-rate of heat
rejection. Generally, only 40% of the source energy is captured. The thermal energy from the
combustion of fuel is captured in an energy cascade concept that first utilizes the highest
ISBN: 978-84-697-1815-5
62
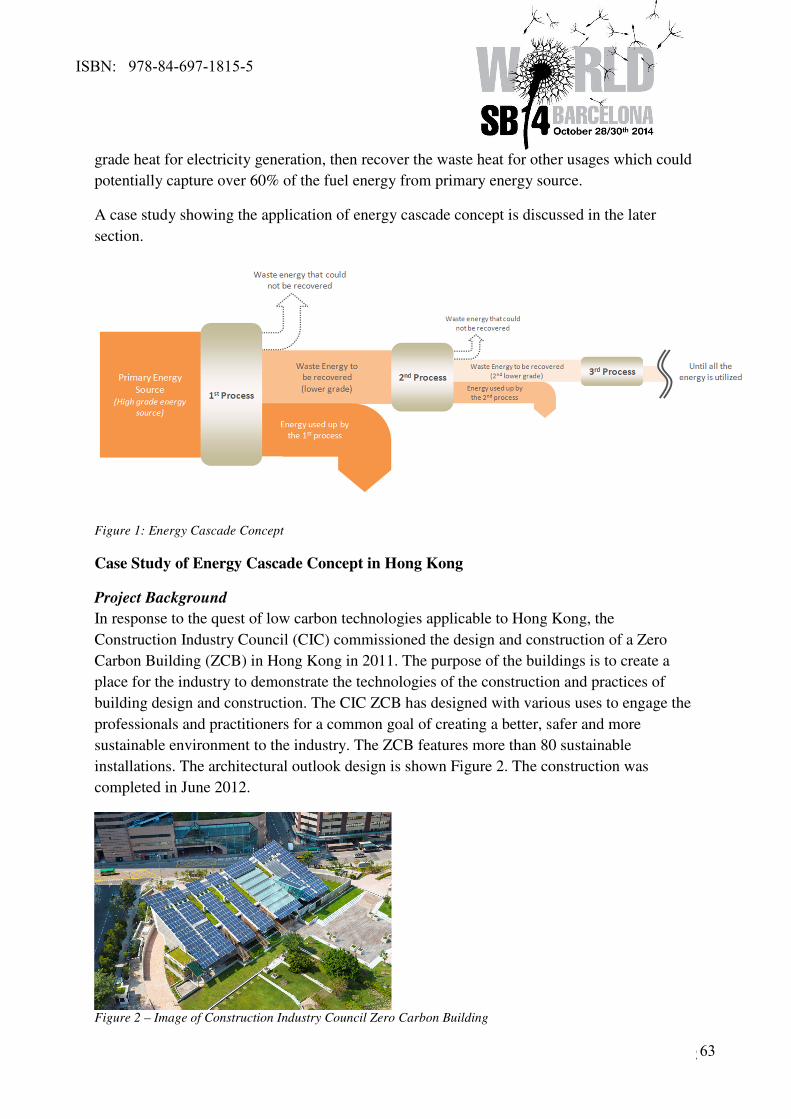
2
grade heat for electricity generation, then recover the waste heat for other usages which could
potentially capture over 60% of the fuel energy from primary energy source.
A case study showing the application of energy cascade concept is discussed in the later
section.
Figure 1: Energy Cascade Concept
Case Study of Energy Cascade Concept in Hong Kong
Project Background
In response to the quest of low carbon technologies applicable to Hong Kong, the
Construction Industry Council (CIC) commissioned the design and construction of a Zero
Carbon Building (ZCB) in Hong Kong in 2011. The purpose of the buildings is to create a
place for the industry to demonstrate the technologies of the construction and practices of
building design and construction. The CIC ZCB has designed with various uses to engage the
professionals and practitioners for a common goal of creating a better, safer and more
sustainable environment to the industry. The ZCB features more than 80 sustainable
installations. The architectural outlook design is shown Figure 2. The construction was
completed in June 2012.
Figure 2 – Image of Construction Industry Council Zero Carbon Building
ISBN: 978-84-697-1815-5
63
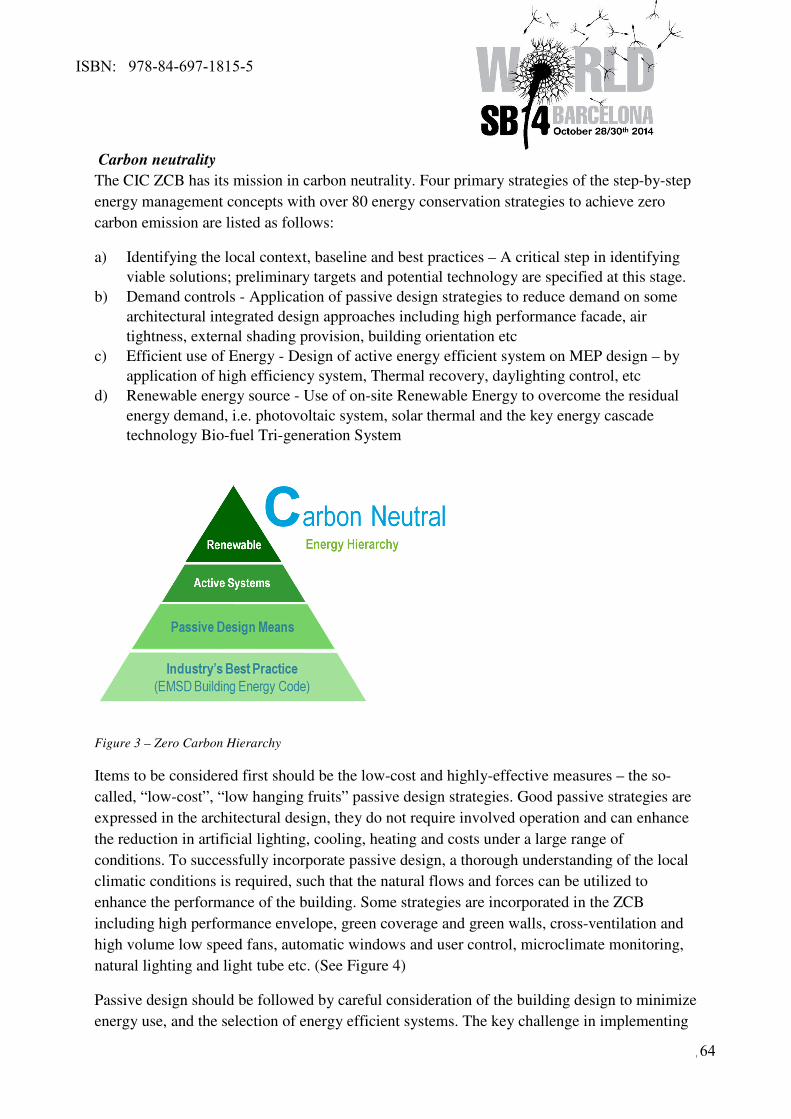
3
Carbon neutrality
The CIC ZCB has its mission in carbon neutrality. Four primary strategies of the step-by-step
energy management concepts with over 80 energy conservation strategies to achieve zero
carbon emission are listed as follows:
a) Identifying the local context, baseline and best practices – A critical step in identifying
viable solutions; preliminary targets and potential technology are specified at this stage.
b) Demand controls - Application of passive design strategies to reduce demand on some
architectural integrated design approaches including high performance facade, air
tightness, external shading provision, building orientation etc
c) Efficient use of Energy - Design of active energy efficient system on MEP design – by
application of high efficiency system, Thermal recovery, daylighting control, etc
d) Renewable energy source - Use of on-site Renewable Energy to overcome the residual
energy demand, i.e. photovoltaic system, solar thermal and the key energy cascade
technology Bio-fuel Tri-generation System
Figure 3 – Zero Carbon Hierarchy
Items to be considered first should be the low-cost and highly-effective measures – the so-
called, “low-cost”, “low hanging fruits” passive design strategies. Good passive strategies are
expressed in the architectural design, they do not require involved operation and can enhance
the reduction in artificial lighting, cooling, heating and costs under a large range of
conditions. To successfully incorporate passive design, a thorough understanding of the local
climatic conditions is required, such that the natural flows and forces can be utilized to
enhance the performance of the building. Some strategies are incorporated in the ZCB
including high performance envelope, green coverage and green walls, cross-ventilation and
high volume low speed fans, automatic windows and user control, microclimate monitoring,
natural lighting and light tube etc. (See Figure 4)
Passive design should be followed by careful consideration of the building design to minimize
energy use, and the selection of energy efficient systems. The key challenge in implementing
ISBN: 978-84-697-1815-5
64
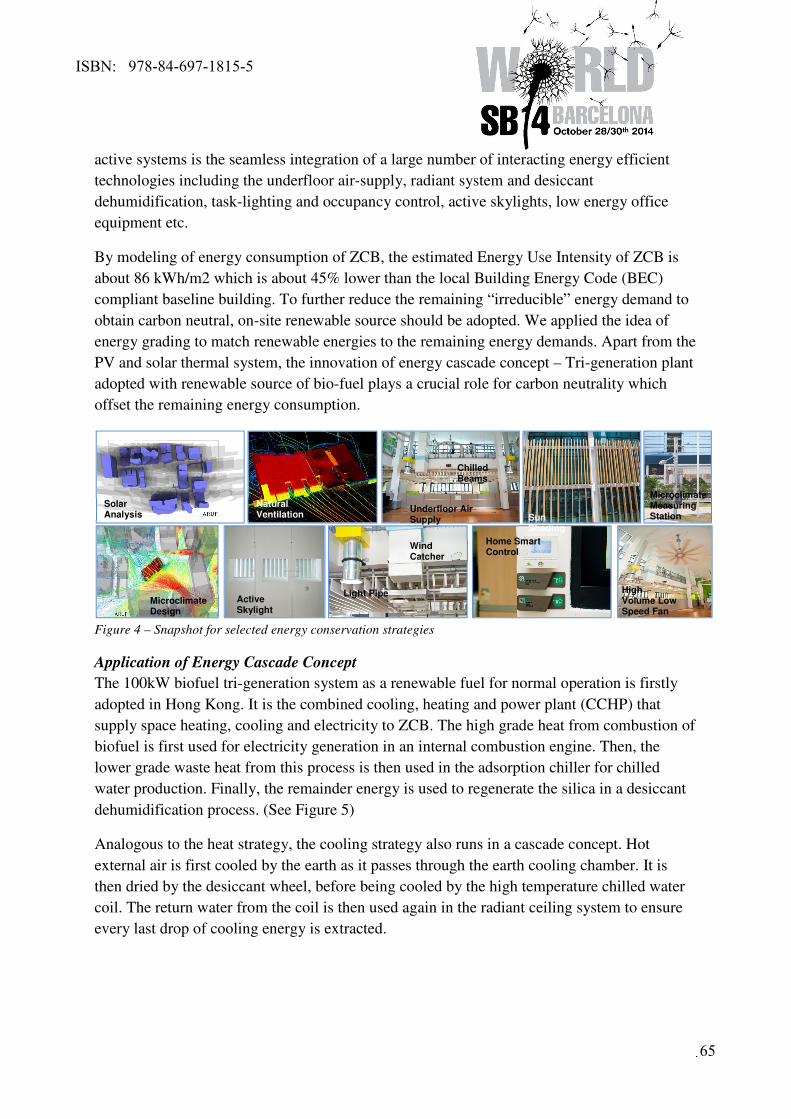
4
active systems is the seamless integration of a large number of interacting energy efficient
technologies including the underfloor air-supply, radiant system and desiccant
dehumidification, task-lighting and occupancy control, active skylights, low energy office
equipment etc.
By modeling of energy consumption of ZCB, the estimated Energy Use Intensity of ZCB is
about 86 kWh/m2 which is about 45% lower than the local Building Energy Code (BEC)
compliant baseline building. To further reduce the remaining “irreducible” energy demand to
obtain carbon neutral, on-site renewable source should be adopted. We applied the idea of
energy grading to match renewable energies to the remaining energy demands. Apart from the
PV and solar thermal system, the innovation of energy cascade concept – Tri-generation plant
adopted with renewable source of bio-fuel plays a crucial role for carbon neutrality which
offset the remaining energy consumption.
Figure 4 – Snapshot for selected energy conservation strategies
Application of Energy Cascade Concept
The 100kW biofuel tri-generation system as a renewable fuel for normal operation is firstly
adopted in Hong Kong. It is the combined cooling, heating and power plant (CCHP) that
supply space heating, cooling and electricity to ZCB. The high grade heat from combustion of
biofuel is first used for electricity generation in an internal combustion engine. Then, the
lower grade waste heat from this process is then used in the adsorption chiller for chilled
water production. Finally, the remainder energy is used to regenerate the silica in a desiccant
dehumidification process. (See Figure 5)
Analogous to the heat strategy, the cooling strategy also runs in a cascade concept. Hot
external air is first cooled by the earth as it passes through the earth cooling chamber. It is
then dried by the desiccant wheel, before being cooled by the high temperature chilled water
coil. The return water from the coil is then used again in the radiant ceiling system to ensure
every last drop of cooling energy is extracted.
Solar Analysis
Microclimate Design
Natural Ventilation
Active Skylight
Chilled Beams
Underfloor Air Supply Sun
Shading
Wind Catcher
Light Pipe
Home Smart Control
High Volume Low Speed Fan
Microclimate Measuring Station
ISBN: 978-84-697-1815-5
65
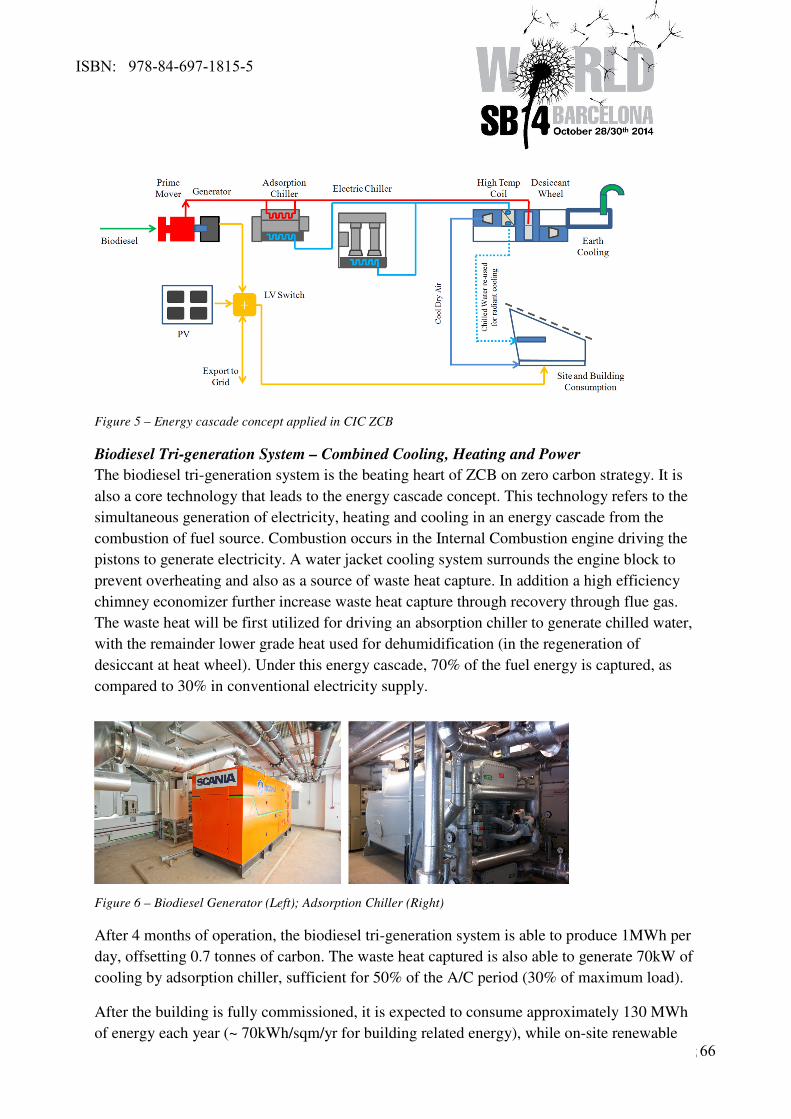
5
Figure 5 – Energy cascade concept applied in CIC ZCB
Biodiesel Tri-generation System – Combined Cooling, Heating and Power
The biodiesel tri-generation system is the beating heart of ZCB on zero carbon strategy. It is
also a core technology that leads to the energy cascade concept. This technology refers to the
simultaneous generation of electricity, heating and cooling in an energy cascade from the
combustion of fuel source. Combustion occurs in the Internal Combustion engine driving the
pistons to generate electricity. A water jacket cooling system surrounds the engine block to
prevent overheating and also as a source of waste heat capture. In addition a high efficiency
chimney economizer further increase waste heat capture through recovery through flue gas.
The waste heat will be first utilized for driving an absorption chiller to generate chilled water,
with the remainder lower grade heat used for dehumidification (in the regeneration of
desiccant at heat wheel). Under this energy cascade, 70% of the fuel energy is captured, as
compared to 30% in conventional electricity supply.
Figure 6 – Biodiesel Generator (Left); Adsorption Chiller (Right)
After 4 months of operation, the biodiesel tri-generation system is able to produce 1MWh per
day, offsetting 0.7 tonnes of carbon. The waste heat captured is also able to generate 70kW of
cooling by adsorption chiller, sufficient for 50% of the A/C period (30% of maximum load).
After the building is fully commissioned, it is expected to consume approximately 130 MWh
of energy each year (~ 70kWh/sqm/yr for building related energy), while on-site renewable
ISBN: 978-84-697-1815-5
66
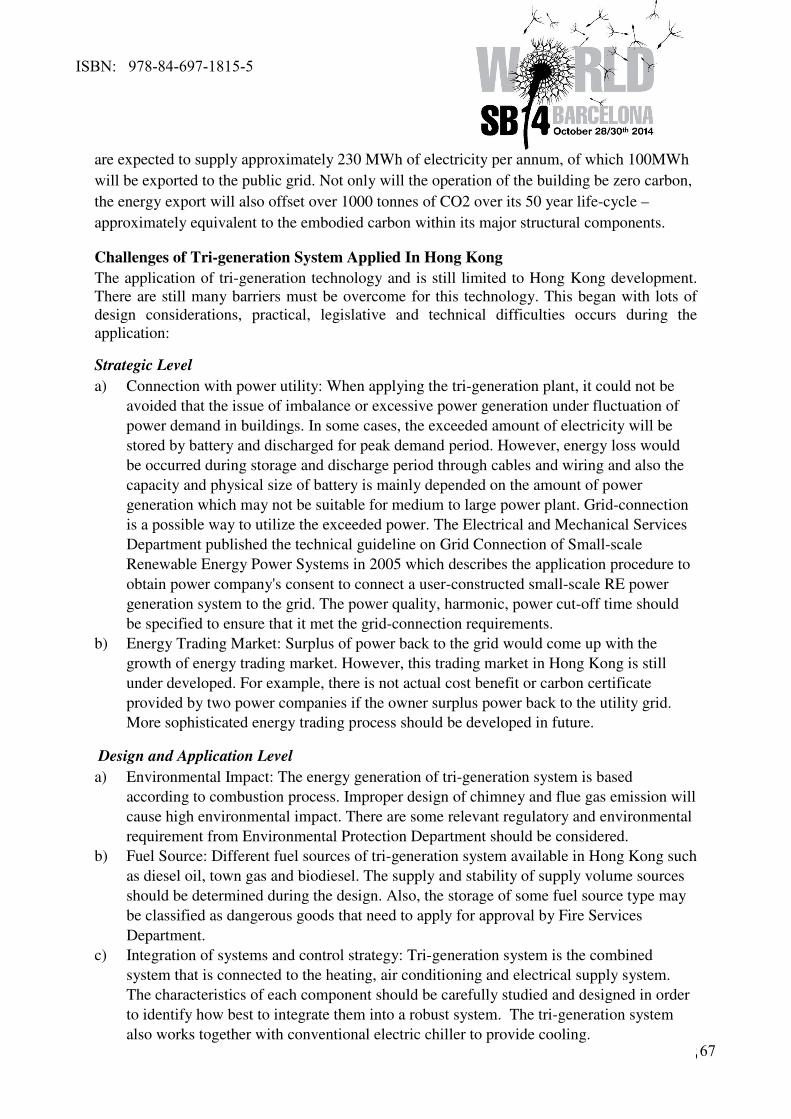
6
are expected to supply approximately 230 MWh of electricity per annum, of which 100MWh
will be exported to the public grid. Not only will the operation of the building be zero carbon,
the energy export will also offset over 1000 tonnes of CO2 over its 50 year life-cycle –
approximately equivalent to the embodied carbon within its major structural components.
Challenges of Tri-generation System Applied In Hong Kong
The application of tri-generation technology and is still limited to Hong Kong development.
There are still many barriers must be overcome for this technology. This began with lots of
design considerations, practical, legislative and technical difficulties occurs during the
application:
Strategic Level
a) Connection with power utility: When applying the tri-generation plant, it could not be
avoided that the issue of imbalance or excessive power generation under fluctuation of
power demand in buildings. In some cases, the exceeded amount of electricity will be
stored by battery and discharged for peak demand period. However, energy loss would
be occurred during storage and discharge period through cables and wiring and also the
capacity and physical size of battery is mainly depended on the amount of power
generation which may not be suitable for medium to large power plant. Grid-connection
is a possible way to utilize the exceeded power. The Electrical and Mechanical Services
Department published the technical guideline on Grid Connection of Small-scale
Renewable Energy Power Systems in 2005 which describes the application procedure to
obtain power company's consent to connect a user-constructed small-scale RE power
generation system to the grid. The power quality, harmonic, power cut-off time should
be specified to ensure that it met the grid-connection requirements.
b) Energy Trading Market: Surplus of power back to the grid would come up with the
growth of energy trading market. However, this trading market in Hong Kong is still
under developed. For example, there is not actual cost benefit or carbon certificate
provided by two power companies if the owner surplus power back to the utility grid.
More sophisticated energy trading process should be developed in future.
Design and Application Level
a) Environmental Impact: The energy generation of tri-generation system is based
according to combustion process. Improper design of chimney and flue gas emission will
cause high environmental impact. There are some relevant regulatory and environmental
requirement from Environmental Protection Department should be considered.
b) Fuel Source: Different fuel sources of tri-generation system available in Hong Kong such
as diesel oil, town gas and biodiesel. The supply and stability of supply volume sources
should be determined during the design. Also, the storage of some fuel source type may
be classified as dangerous goods that need to apply for approval by Fire Services
Department.
c) Integration of systems and control strategy: Tri-generation system is the combined
system that is connected to the heating, air conditioning and electrical supply system.
The characteristics of each component should be carefully studied and designed in order
to identify how best to integrate them into a robust system. The tri-generation system
also works together with conventional electric chiller to provide cooling.
ISBN: 978-84-697-1815-5
67
7
Comprehensive chiller plant control strategy should be developed to optimize chiller
operation sequencing so as to achieve high system efficiency and ensure cooling
performance in fast response time.
Conclusion
The energy cascade concept is strategic method on how we utilize the energy source
effectively and it is well applied in the first zero carbon building in Hong Kong. Tri-
generation system is the core technology applied for energy cascade and some design
considerations and challenges for Hong Kong situation has been discussed.
References
[1] Electrical and Mechanical Services Department, HKSAR Government. (2005).
Technical Guideline on Grid Connection of Small-scale Renewable Energy Power Systems.
Hong Kong
[2] The Hongkong Electric (2008), Connecting Renewable Energy Power System to Grid.
Hong Kong
[3] Electrical and Mechanical Services Department, HKSAR Government. (2012). Code
of Practice for Energy Efficiency of Building Services Installation. Hong Kong
[4] Environmental Bureau, HKSAR Government. (2007). Hong Kong’s Climate Change
Strategy and Action Agenda. Hong Kong
ISBN: 978-84-697-1815-5
68
1
ECOMETRO y las Declaraciones Ambientales del Edificio DAE
Speakers:
Alonso, Iñaki; Ruiz, Diego.
1 Presidente Asociación Ecómetro y Socio-Fundador Satt Ecoarquitectura, Madrid, España
2 Asociación Ecómetro, Madrid, España
Abstract: En los últimos años se ha evidenciado que el enfoque más acertado en la
determinación de las cargas ambientales es el que tiene por objeto de estudio a los bienes y
servicios y no a los procesos, especialmente cuando este análisis se realiza bajo el enfoque
del Análisis del Ciclo de Vida (ACV). La edificación no es ajena a este enfoque, al contrario,
su aplicación provee de valiosa información para la toma de decisiones por parte de los
distintos agentes del sector y permite acceder a un potencial de reducción de impactos hasta
ahora no explorado.
Es por esto que se ha realizado un esfuerzo importante por dotar de un marco normativo al
sector de la edificación en la aplicación del ACV habiéndose publicado ya normas operativas
por las que evaluar la sostenibilidad de una edificación. A este hecho ha de añadirse la
proliferación de programas de Declaraciones Ambientales de Productos (DAP) que
suministran datos ambientales de calidad basados en ciclo de vida de productos de
construcción bajo el paraguas de Reglas de Categoría de Producto con un creciente nivel de
armonización internacional.
Tal vez uno de los pasos siguientes de mayor importancia en el camino de la evaluación de la
sostenibilidad en la edificación es la de dotar a los diseñadores y prescriptores de
herramientas que faciliten el acceso tanto a la gestión y visualización de la información
ambiental de los productos usados en sus proyectos como a la evaluación final a nivel de
edificio que se derive.
El ECÓMETRO es una herramienta para el diseño, evaluación y en un futuro, certificación,
de edificios ambientalmente preferibles y está basada en criterios de conocimiento
colaborativo bajo la cultura del código libre. Por un lado desarrolla metodologías de diseño
ecológico de edificios basadas en “Ecological Desing Thinking”, y por otra parte está dotada
de una potente interfaz de Análisis de Ciclo de Vida asociada al presupuesto de ejecución del
proyecto y de una base de datos nutrida de datos genéricos de productos y de DAPs, todo ello
bajo el cumplimiento del marco normativo mencionado anteriormente.
El ECÓMETRO como herramienta de código libre para la evaluación y difusión de la
sostenibilidad ambiental en la edificación pretende hacer accesible y abierta la obtención de
información ambiental de calidad durante las etapas de proyecto, ejecución y uso que
permita tomar decisiones sobre el diseño de edificios
DAE (Declaración Ambiental de Edificio), DAP (Declaración Ambiental de Producto, ACV
(Análisis de ciclo de vida), Diseño, Código Libre
ISBN: 978-84-697-1815-5
69
2
Introducción
La construcción representa uno entre los principales responsables del consumo de energía
total. El objetivo del ECÓMETRO es la medición de los impactos derivados del diseño y la
construcción de edificios. Esto lo han hecho otros programas europeos anteriores como el
CICLOPE (2009-2010), ENERBUILCA (2010-2012), SOFIAS, ENSLIC, PRESCO,
EXTERNE, SUR EURO, etc… pero no se ha conseguido desarrollar un sistema de medición
práctico y estable que sea reconocido públicamente y usado. Las metodologías utilizadas son
complejas exigen un esfuerzo extra considerable para los técnicos. No existe una base de
datos oficial de información ambiental. El trabajo que desarrolla el ECÓMETRO junto a ASA
(Asociación de Sostenibilidad y Arquitectura), la OECC (Oficina Española de Cambio
Climático) y el IETcc (Instituto de Ciencias de la Construcción Eduardo Torroja) va
encaminado a desarrollar estas herramientas para intentar que el cálculo medioambiental en la
edificación se convierta en un ejercicio sencillo, económico y práctico.
Objetivo
La reducción de las emisiones se ha convertido en el caballo de batalla de la lucha por la
conservación del medio ambiente. Las emisiones y residuos tienen su origen en los productos
y servicios consumidos, por lo que parece razonable imputarles a ellos los impactos
ambientales y no a los procesos que los generan. Por tanto se requiere de un cambio de
perspectiva a la hora de abordar el problema, un enfoque que incida en las causas y no en las
consecuencias. Es necesario prevenir la generación de impactos en su fuente de origen a
través de procesos de mejora y reducción en los que se tomen medidas integrales que incluyan
a las etapas de diseño y desarrollo de los productos y servicios.
Esta nueva perspectiva tiene que ser complementada con un enfoque de ciclo de vida
completo ya que la interacción de los productos con la ecosfera y la tecnosfera (1) no sólo se
circunscribe a la etapa de producción sino que se produce desde el momento en que se extraen
las materias primas y se generan los recursos energéticos empleados en su producción hasta el
momento en que dejan de ser útiles y terminan en una planta de reciclaje, en una incineradora
o en un vertedero. Entre medias hay otros procesos cuyos impactos también han de ser
imputados como pueden ser la etapa de transporte de las materias primas hasta el lugar donde
se procesan o la etapa de uso.
La adopción de esta perspectiva integradora y holística en la imputación de impactos a lo
largo de todo el ciclo de vida supone una ampliación de los límites temporales y geográficos
tradicionalmente inscritos únicamente dentro de los centros de producción. Muchas iniciativas
ISBN: 978-84-697-1815-5
70
3
de reducción de impactos se centran en alguna etapa en concreto del ciclo de vida del
producto no considerando otras que pueden suponer igual o mayor afección al medio.
El análisis del ciclo de vida (ACV) es la herramienta óptima para el análisis objetivo de los
impactos asociados al proceso constructivo y que aporta información valiosa en la toma de
medidas para corregir los impactos derivados. El objetivo de esta presentación es establecer
una metodología de cálculo que sea práctica y objetiva para que la introducción de las
técnicas de ACV en la construcción sea posible, sencilla y rigurosa. Para ello primero
analizaremos el funcionamiento de la metodología del ACV en su marco normativo y su
aplicación a la construcción a través de las Declaraciones Ambientales de Producto (DAPs) y
las Reglas Categorías de Producto(RCP). En segundo lugar veremos la situación actual de las
bases de datos medioambientales y las bases de datos de precios de la construcción, para ver
cómo se pueden cruzar y obtener de una manera sencilla lo que podríamos llamar la huella
ambiental de un edificio o la declaración ambiental del edificio.
Metodología ACV
En el caso concreto de la edificación, hemos asistido durante las últimas dos décadas a
muchas iniciativas de reducción de impactos que se centran en la etapa de uso del edificio
conocidos como impactos directos (consumos en climatización y calefacción, consumo de
electricidad o de agua) olvidando o no considerando otros aspectos ambientales que pueden
suponer una fuente importante de impactos como aquellos derivados de la extracción y
producción de materiales de construcción, del mantenimiento de los productos y sistemas que
componen el edificio, del fin de vida del edificio y sus materiales, del transporte de todos
estos flujos, etc. (impactos indirectos). La interacción entre estas dos fuentes de impactos
puede ser compleja y ha de ser evaluada en su totalidad. Por ejemplo, una medida destinada a
la reducción de los impactos directos de un edificio puede suponer un incremento de los
impactos indirectos al utilizarse materiales o sistemas más tecnológicos o con un mayor nivel
de procesado o en mayor cantidad.
De otra manera, la elección y colocación (a través del diseño) de los productos y sistemas de
construcción puede afectar a la masa térmica del edificio que unido a unas determinadas
condiciones climáticas del emplazamiento modificará en mayor o menor medida los
consumos energéticos durante la etapa de uso. A su vez, el perfil de uso del edificio, o
cualquiera de sus partes, puede hacer que la elección de un material sea o no ambientalmente
preferible frente a otros. La conveniencia ambiental de un producto o material de construcción
dependerá de cuál es la función que desempeñe o de cómo se emplee.
Por otro lado, los intentos por reducir un determinado impacto ambiental global (por ejemplo
la generación de gases de efecto invernadero) pueden suponer el incremento de otros impactos
ISBN: 978-84-697-1815-5
71
4
con mayor repercusión a una escala espacial más reducida (acidificación, eutrofización, etc.).
En la imputación de cargas ambientales se hace necesario trabajar con una batería de impactos
suficientemente amplia y representativa con el fin de caracterizar adecuadamente el perfil
ambiental de las opciones evaluadas.
En el fondo de la cuestión subyace la idea de que cualquier medida que pretenda reducir el
impacto ambiental no suponga un trasvase o externalización de este impacto, ya sea en su
naturaleza, ya sea en la escala temporal o geográfica en que se produzcan.
Es necesario empezar a desterrar las soluciones ambientalmente preferibles a priori, basadas
en prejuicios o ideas preconcebidas (bajo el adjetivo de “ecológicas”), ya que en muchos
casos son producto del desconocimiento de las interacciones reales con el medio, mientras
que en otros, lo son de campañas bien orquestadas de lavado de imagen.
Sin duda, el primer paso a la hora de reducir las emisiones consiste en evaluar su cantidad y
naturaleza en el punto de partida del proceso de reducción de impactos. De esta manera, se
constata el hecho de que para reducir o mejorar hay que poder comparar, y que para comparar
se hace imprescindible medir el estado final y el de partida del proceso de mejora o de las
alternativas propuestas. Para ello se hace necesario el uso de una metodología o herramienta
que objetive ambos estados y constate dicha mejora ambiental bajo la perspectiva del ciclo de
vida.
Análisis de ciclo de vida, contexto normativo.
El ACV queda definido por la norma ISO 14040 como una herramienta para evaluar los
aspectos medioambientales y los potenciales impactos asociados a un producto mediante:
− La recopilación del inventario de entradas y salidas relevantes para los límites
del sistema bajo estudio. Se entiende por entrada cualquier recurso empleado a
lo largo de las etapas del ciclo de vida del producto, esto es, materias primas,
energía, etc. A su vez, se entiende por salidas las emisiones al aire, al agua y al
suelo, así como los residuos y los subproductos generados en cada una de estas
etapas.
− La evaluación de los impactos ambientales potenciales asociados a dichas
entradas y salidas,
− La interpretación de las dos etapas anteriores, esto es, el análisis de inventario
y la evaluación de impactos, de acuerdo con los objetivos planteados al inicio
del análisis.
A diferencia de otras metodologías o herramientas de gestión ambiental, el ACV no se centra
exclusivamente en la recopilación de los aspectos ambientales sino que va más allá al
ISBN: 978-84-697-1815-5
72
5
determinar el impacto que éstos generan. Los aspectos ambientales son las entradas y salidas
del sistema del producto, mientras que los impactos son las consecuencias que estos aspectos
generan en el medio ambiente.
La aplicación de esta metodología del ACV a un edificio está desarrollada en la Norma UNE-
EN 15978:2012 “Sostenibilidad en la construcción. Evaluación del comportamiento
ambiental de los edificios. Métodos de cálculo”. Esta norma se puede aplicar en edificios
nuevos, en edificios existentes y en proyectos de rehabilitación. La norma especifica el
método de cálculo que permite evaluar el comportamiento ambiental de un edificio e indica
cómo elaborar un informe y comunicar los resultados de la evaluación. Incluye todos los
productos, procesos y servicios de construcción relacionados con los edificios, utilizados a lo
largo del ciclo de vida del edificio. El método de evaluación tiene como datos de partida la
información obtenida a partir de Declaraciones Ambientales de Productos (DAPs) así como
de los datos de uso de materiales, productos de construcción y de energía contemplados en el
proyecto. Una Declaración Ambiental de Producto (DAP) es un documento en el que se
informa del impacto ambiental basado en ACV de un producto, un material o un servicio y
que pasa por un proceso de verificación y certificación. Las DAP han irrumpido en el sector
de la construcción, uno de los que genera mayores impactos ambientales. Las DAPs sirven
para comunicar de forma verificable, precisa y no engañosa la información ambiental de los
productos y sus aplicaciones, apoyando así una toma de decisiones justa con base científica y
desarrollando las posibilidades de mejora continua ambiental impulsadas por el mercado. Se
basa en el inventario de datos del análisis del ciclo de vida y en otras informaciones
adicionales. Cada producto de construcción pertenece a una categoría de producto, es decir, a
un grupo de productos de construcción que pueden cumplir funciones equivalentes. Para cada
categoría de producto la UNE-EN ISO 14025:2010 define las Reglas de Categoría de
Productos (RCP) como el conjunto de reglas específicas, requisitos y guías para el desarrollo
de declaraciones ambientales tipo III para una o más categoría de productos. Las RCP deben
servir para identificar e informar sobre el objetivo y el alcance de la información basada en el
ACV y las reglas para obtener información ambiental adicional. Debe determinar las etapas
del ciclo de vida a incluir, los parámetros que se cubren y la forma en que dichos parámetros
se deben recopilar e informar.
En lo referente a los productos de construcción las DAPS y RCP quedan reguladas en la
Norma UNE-EN 15804:2014 “Sostenibilidad en la construcción. Declaraciones ambientales
de producto. Reglas de categoría de producto básicas para productos de construcción”. En
esta Norma define unas categorías de impacto(2) específicas acidificación, eutrofización,
calentamiento global,agotamiento de la capa de ozono, formación de oxidantes fotoquímicos,
y agotamiento de recursos abióticos. El Comité Técnico de Normalización 198 de AENOR
“Sostenibilidad en la Construcción” y en la última reunión plenaria del CTN 198 en marzo
de 2014, se informó de que ya se están revisando las normas EN 15978 y EN 15804 para
introducir nuevos indicadores de impactos ambientales tanto a nivel de edificio (uso del
terreno, biodiversidad, ecotoxicidad y toxicidad humana) como de producto (radiaciones
ISBN: 978-84-697-1815-5
73
6
ionizantes, escasez de agua, etc). Es necesario la introducción de estas categorías de impacto
para tener un análisis medioambiental más completo y riguroso llegando de una manera más
clara a los impactos que afectan a la salud humana.
DAPs y Bases de datos medioambientales de los productos de la construcción.
Es necesaria la creación de una base de datos abierta y estable que dé rigor y homogeneidad a
los datos medioambientales que están en proceso de creación. Es cierto que estamos en un
momento de incipiente creación de metodología y de análisis de datos para poder introducirlo
en el análisis de los procesos constructivos pero no puede generar desconcierto y batallas
aisladas cuando la intención general es construir ese marco común que establezca unas reglas
claras para el análisis de la sostenibilidad en la construcción. En este contexto creemos que es
necesaria una base de datos medioambientales que sea oficial, abierta, transparente, y estable.
Esto evitará las batallas actuales que se están produciendo en el contexto de la Huella de
Carbono, con diferentes iniciativas privadas en el cálculo de Huella de Carbono pero sin una
metodología única, transparente y clara en la obtención de los datos y las metodologías de
cálculo. Estas herramientas han surgido por una demanda clara del sector de servicios de la
construcción para poder hacer un análisis del impacto en Huella de Carbono y de esta manera
poder ofrecer alternativas.
Necesitamos una base de datos nacional donde poder introducir las diferentes DAPs de los
fabricantes de producto de la construcción que las vayan desarrollando y donde también
podamos introducir valores medioambientales genéricos. En Europa podemos encontrar las
siguientes bases de datos ambientales:
-ELCD data base v.II http://eplca.jrc.ec.europa.eu/ Europa
-ECOINVENT v.3 http://www.ecoinvent.ch/ Suiza y Alemania
-IVAM LCA v4.06 http://www.ivam.uva.nl/ Holanda
-BOUSTEAD MODEL 6.0 http://www.boustead-consulting.co.uk/ U.K
-IDEMAT 2001 http://www.io.tudelft.nl/ Países Bajos
-BABI DATA BASE http://www.gabi-software.com/ Europa
-ETH-ESU http://www.uns.ethz.ch/ Suiza
-GEMIS 4.5 http://www.iinas.org/gemis-de.html Alemania
Después de haber valorado hacer una base de datos propia,abierta y gratuita, definitivamente
apuesta por la base de datos a nivel nacional que está desarrollando el Instituto de Ciencias de
la Construcción Eduardo Torroja (IETcc), un centro oficial del Consejo Superior de
Investigaciones Científicas (CSIC), perteneciente al Área de Ciencia y Tecnología de
Materiales. La base de datos IETcc será una base de datos abierta y gratuita, con información
ambiental estable y oficial, apoyada por la Oficina Española de Cambio Climático, que se
ISBN: 978-84-697-1815-5
74
7
denomina OPENDAP. Esta base de datos está en proceso de desarrollo y albergará los datos
medioambientales divididos en tres calidades de dato:
− Calidad 1: DAPs de fabricantes específicos, son los datos más objetivos.
− Calidad 2: DGs datos genéricos, son datos estimados de otras DAPs similares
− Calidad 3: VER Valores Estimados de Referencia, son datos recogidos de bases de
datos generales, a las que tenemos acceso libre pero no podemos comprobar todo su
proceso de obtención de los datos.
El futuro del análisis medioambiental de los edificios se dibuja a través de la incorporación de
las DAPs en los sistemas de medición, es decir las diferentes bases de precios, y añadiendo la
parte derivada del transporte y la vida útil de cada producto. Mientras que no se disponga de
esa base de datos de DAPs tendremos que trabajar con información de datos genéricos (DGs)
o valores estimados de referencia (VER). Se hace necesaria la creación de un marco
consensuado que permita desarrollar los estudios de ACV con un grado suficiente de rigor,
credibilidad y transparencia. Aunque se ha recorrido un largo camino en el alineamiento y
armonización internacional de las RCP de diferentes sistemas DAP, la robustez, transparencia
y veracidad sólo se alcanzará cuando éstas se conviertan en normativa de aceptación
internacional (Subramanian et al. 2012).
Bases de datos de precios de materiales de la construcción.
Las bases de datos de unidades de obra existente en el sector de la edificación en España son
numerosas y abarcan diferentes ámbitos geográficos (nacionales, provinciales y/o regionales).
Estas bases de datos miden tres conceptos básicos, mano de obra, maquinaria y materia. Para
el estudio medioambiental de un edificio de momento vamos a tener en cuenta los dos
impactos más importantes, maquinaria y materiales. La maquinaria la vamos a encontrar en
horas y los materiales los necesitamos en kilogramos. Si los materiales no están en esta
unidad debemos tener el resto de información para poder tener la unidad de masa como
referencia, es fundamental para poder asociar la información ambiental cuando no tenemos
DAPs.
Las bases de datos más importantes a nivel nacional son:
− Base de datos de CENTRO (COAAT Guadalajara) (CENTRO)
− Banco de precios de la construcción Andalucía (FCBP Sevilla)
− Base de datos de precios de la construcción. Com. Valenciana. (IVE).
− Banco BEDEC de precios de referencia y módulo gestor. Cataluña. (ITEC)
− Base de precios de la construcción de Castilla y León.
− Base de precios de la construcción de Extremadura.
Estas bases de datos son las herramientas que se utilizan cotidianamente por los técnicos
relacionados con la edificación, especialmente los arquitectos técnicos a través de software
ISBN: 978-84-697-1815-5
75
8
específico de medición y presupuestos, por esta razón consideramos que son la herramienta
necesaria para poder asociar la información medioambiental de los productos, bien con datos
genéricos o con DAPs.
Propuesta para el desarrollo de una Declaración Ambiental del Edificio
El Código Técnico de la Edificación (CTE) en su artículo 13 hace referencia a la relación de
la edificación con el medioambiente “…las obras deberán proyectarse y construirse de forma
que no supongan una amenaza para el medio ambiente, en particular como consecuencia de
fugas de gas tóxico, presencia de partículas o gases peligrosos en el aire, emisión de
radiaciones peligrosas, contaminación o envenenamiento del agua o del suelo, …”. (CTE
2009).
A pesar de esto último, en la actualidad no se dispone de herramientas claras para la medición
de esos impactos en la edificación. Hasta ahora, las iniciativas que han intentado incorporar el
ACV al proceso constructivo no han desarrollado un mecanismo que integre de manera
sencilla la evaluación de impactos del ACV con la realidad del día a día en los estudios de
arquitectura y oficinas de ingeniería. En la mayoría de los casos, estas iniciativas suponen la
creación de herramientas ajenas a las ya presentes en dichos centros de trabajo y en cuyo uso
se emplea un lenguaje ajeno al perfil del potencial usuario. Esto supone una barrera
importante para la incorporación de dichas herramientas a la realidad de los diseñadores. Por
otro lado no existe una base de datos medioambiental de materiales, productos y procesos
empleados en el sector en el sector donde se pueda acceder a información transparente,
armonizada y de rigor. Pensamos que estas son las dos razones principales para proponer el
desarrollo de un programa de cálculo de huella ambiental a pesar de los realizados hasta
ahora. suponiendo el auténtico valor añadido del ECÓMETRO.
En el ACV que se contempla en el ECÓMETRO se tiene en cuenta las partidas de obra de los
materiales y productos de construcción con mayor presencia en el mercado, su transporte
hasta obra y la vida útil de éstos así como el empleo de energía y agua en la propia etapa de
construcción del edificio. Los datos ambientales de que dispone en la actualidad el
ECÓMETRO son genéricos de la realidad productiva de Europa pero la herramienta permite
la incorporación de información ambiental procedentes de DAPs para productos y materiales
asociados a un fabricante en concreto.
De esta manera es posible calcular el impacto ambiental del edificio en su etapa de extracción
y fabricación de los productos de construcción, su transporte, la construcción del edificio y el
mantenimiento de los dichos productos durante la etapa de uso del edificio.
Las líneas de trabajo del ECÓMETRO a corto-medio plazo son:
ISBN: 978-84-697-1815-5
76
9
− Creación de una base de datos basada en DAPs y datos genéricos.
− Georeferenciación de fabricantes de materiales de la construcción a través de sistemas
de Información Geográfica.
− Desarrollar colaboración con la base de CENTRO del colegio de aparejadores de
Guadalajara para reflejar su información en formato BIM para una conexión directa
entre productos y materiales con la base de datos ambientales del ECÓMETRO.
− Incorporación al ACV de los impactos derivados de los consumos energéticos durante
la etapa de uso del edificio.
Con todos estos aspectos desarrollados, se podría calcular los impactos ambientales basados
en ACV de la construcción de forma rápida, que aporte información para la toma de
decisiones en las que se pongan en la mesas los aspectos económicos y medioambientales.De
agual modo, una vez tomadas dichas decisiones, la información ambiental qgenerada formaría
parte de lo que podríamos llamar la Declaración Ambiental del Edificio (DAE).
La aplicación del ACV a la construcción a través de las DAE introduce una nueva perspectiva
bajo la que se obtiene valiosa información que puede apoyar la toma de decisiones en la
elaboración de medidas de reducción de impactos por parte de los distintos agentes
involucrados en el sector. ¿A quién puede ayudar esta herramienta?
Para planificadores urbanísticos, asesores municipales y promotores:
− Ayudar en la planificación de estrategias a nivel municipal, regional o estatal y por
tanto en la implantación de políticas de ayudas a la construcción y a la rehabilitación,
etc.
− Definición objetiva de criterios más adecuados para la contratación y la compra
pública verde.
− Establecer prioridades para el diseño ecológico o la eco‐rehabilitación de edificios.
Para arquitectos e ingenieros:
− Identificar oportunidades de reducción de impactos ambientales considerando el ciclo
de vida completo de los edificios.
− Comparar ambientalmente distintas opciones de diseño.
− Seleccionar de proveedores de productos de construcción.
− Proporcionar datos partida de materiales a los sistemas de certificación ambiental de
edificios que muestran un creciente interés por la información obtenida mediante esta
metodología. Etiquetado de edificios.
Para fabricantes de productos de construcción el ACV permite:
− Evaluar los impactos ambientales de sus productos y oportunidades de mejora.
− Ecoetiquetado y declaraciones ambientales de sus productos (DAP).
ISBN: 978-84-697-1815-5
77
10
El pensamiento en términos de ACV es esencial para avanzar en este momento de transición
en que nos encontramos y por ello los tomamos como uno de los pilares básicos en el
ECÓMETRO. Esta perspectiva del Análisis del Ciclo de Vida, asociada a las nuevas formas
de trabajo en BIM (Building Information Modeling) puede suponer una transformación
profunda del sector de la edificación, diseño y fabricación de productos de la construcción. En
la actualidad, estamos ante una oportunidad histórica en la que el sector de la edificación
puede pasar de ser parte del problema a ser parte de la solución de las crisis medioambiental,
energética y económica que vivimos.
Referencias
[1] La ecosfera es la totalidad de seres vivos que interactúan de forma natural unos con otros,
con el medio ambiente que los rodea y con los componentes abióticos en forma de energía y
materia. Es la suma de la biosfera, hidrosfera, geosfera y la atmósfera. Este término se usa de
manera complementaria junto al de tecnosfera, que es el conjunto de medios artificiales que
soportan el desarrollo de la sociedad humana
[2] Una categoría de impacto es una clase que representa asuntos ambientales de interés a la
cual se pueden asignar los efectos derivados de emisiones de gases, de la generación de
residuos o del consumo de recursos.
Bibliografía
- Arenas 2007. El impacto ambiental en la Edificación. Criterios para una construcción
sostenible. Ed. Edisofer. Madrid.
- AUB 2014. Arbeitsgemeinschaft Umweltverträgliches Bauprodukt.
http://www.bauumwelt.com
- BRE 2014. Environmental Profiles of Construction Products. http://www.bre.co.uk/
- CTE 2009. Código Técnico de la Edificación. Documento Básico HS.
- Environdec 2014. International EPD System. http://www.environdec.com/
- FDES 2014. Fiches de Déclaration Environnementale et Sanitaire. http://www.inies.fr/
- ISO 2006a. Environmental Management - Life cycle assessment - Requirements and
guidelines ISO 14044:2006.
- ISO 2006b. Environmental Management - Life cycle assessment - Principles and
Framework (ISO 14040:2006).
- MRPI 2014. Milieu Relevante Product Informatie. http://www.mrpi.nl/
ISBN: 978-84-697-1815-5
78
1
A Life Cycle Based Green Building Product Labelling Scheme
Ng S.T.1; Wong C.T.C.
2
1 Department of Civil Engineering, The University of Hong Kong, Pokfulam, Hong Kong
2 Hong Kong Green Building Council Limited, Kowloon Tong, Hong Kong
Abstract: Buildings account for 40 per cent of the overall environmental burden in
industrialised countries. Acknowledging that thousands of building materials are available
and many might have adverse impact to the environment, careful selection of green building
products could help enhance the environmental performance of construction facilities. To
facilitate decision-makers selecting green building materials, a reliable and transparent
mechanism is needed and a green building product labelling scheme would be the way
forward. While there are various green or eco labelling schemes around the world, they are
not specifically designed for the construction market. With a desire to promote a greater
adoption of green building products in construction projects, the Hong Kong Green Building
Council has commissioned The University of Hong Kong to develop a life cycle based green
building product labelling scheme. This paper presents the key features of the green building
product labelling scheme.
Keywords: Construction materials, environmental impacts, life cycle assessment, green label
Introduction
Construction is one of the largest users of natural resources, water and energy, and it is
undeniably a formidable polluter (Horvath, 2004). In developed nations like the United States
and the European Union countries, the construction industry is responsible for about 40 per
cent of the overall environmental burden (UNEP, 1999; Sjöström, 2000). In Hong Kong,
building facilitates account for 90 per cent of electricity consumption (EPD, 2010), and this
together with the embodied energy and solid waste arising from building facilities could result
in significant impacts (EMSD, 2006). Hence, improving the environmental responsibility is
becoming a critical issue in construction projects.
Nowadays, many clients are prepared to specify and use environmental-friendly building
materials / products. Using green building materials and products is considered as a proactive
way to reduce the environmental burden (Ortiz et al., 2009). However, problems arise when
there is no unanimous definition for green building materials. The problem is aggravated as
there is no agreed method for evaluating and comparing the life cycle environmental impacts
of building materials (Curran, 2001; Guineé et al., 2001). With various alleged green building
materials in the market, it is difficult for clients and end users to delineate which is more
environmental friendly than the others. This calls for an authoritative, independent and
publicly acceptable green labelling scheme for building materials that could help portray their
life cycle environmental impacts.
While green or eco labelling schemes have been around in some countries, Hong Kong lacks
a green labelling scheme which is specifically designed for building materials to support the
ISBN: 978-84-697-1815-5
79
2
local construction industry driving towards life cycle sustainability. With continuous demand
for infrastructure and construction facilities, it is necessary to establish a transparent
environmental standard so that building materials of commendable environmental
performance would be awarded with a recognised green label. The green building product
labelling scheme should help decision-makers identifying green building materials so as to
reduce the overall environmental burdens of the construction facility.
Nevertheless, it is never an easy task to develop a green building product labelling scheme as
the properties of construction materials could vary dramatically and their environmental
impacts could therefore be very different. Moreover, the environmental impacts could be
originated from various stages of production, viz. raw material extraction, transportation,
processing, fabrication, installation, operation, reuse, recycling and disposal of the materials.
As a result, there is a need to develop a green building product labelling scheme which is
based on the entire life cycle of the building material.
In this paper, the essential characteristics of the developed green building product labelling
scheme is presented. The paper begins with the rationale for choosing the building products to
be covered by the scheme. The environmental impact categories for assessing the greenness
of building materials are exemplified. It is then followed by an introduction of the scoring
mechanism. The paper concludes by discussing how to integrate the green building labelling
scheme with other decision processes like the building environmental assessment models.
Research Method
An extensive desktop study was first conducted to examine the existing green or eco labelling
schemes both locally and internationally. The principles, scope, assessment criteria,
international standards / references adopted, benchmarking mechanism, verification methods
and implementation strategies were critically reviewed. The findings provided a very strong
foundation for the development of the green building product labelling scheme.
Since there is no agreed regime for classifying construction materials / products, it was
considered necessary to develop an appropriate product categorisation system so that green
building materials within the same category can be systematically benchmarked. To classify
the diverse construction materials used in Hong Kong, the characteristics and environmental
impacts of various construction materials and building services components were examined
by reviewing the existing green labelling schemes. Construction experts were then
interviewed to validate the material categorisation regime.
To identify the predominant building materials / products in Hong Kong in terms of their
environmental impacts, the quantities of materials used in the construction projects were
extracted from the bills of quantities. Subsequently, the life cycle environmental impacts of
the most extensively used building materials / products were analysed through the life cycle
assessment. This should help unveil the total environmental impacts and which are the most
significant impact categories for each of the identified materials. SimaPro was used to
generate the results of life cycle environmental impacts.
ISBN: 978-84-697-1815-5
80
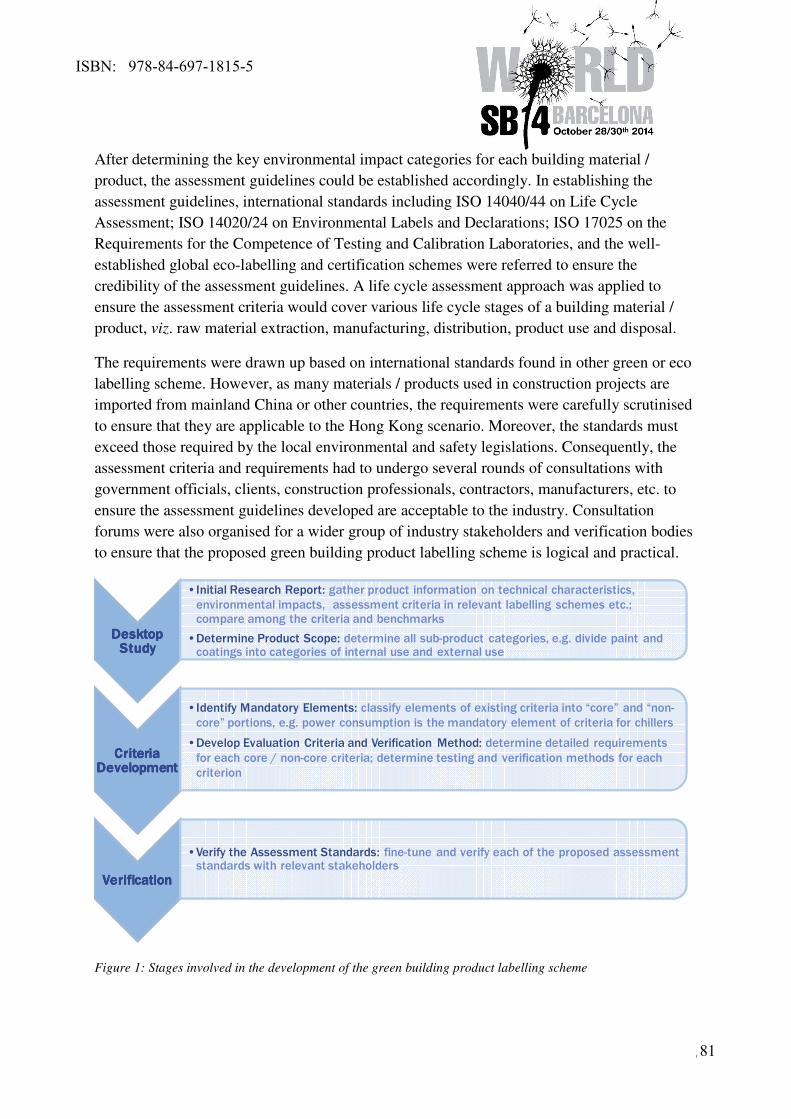
3
After determining the key environmental impact categories for each building material /
product, the assessment guidelines could be established accordingly. In establishing the
assessment guidelines, international standards including ISO 14040/44 on Life Cycle
Assessment; ISO 14020/24 on Environmental Labels and Declarations; ISO 17025 on the
Requirements for the Competence of Testing and Calibration Laboratories, and the well-
established global eco-labelling and certification schemes were referred to ensure the
credibility of the assessment guidelines. A life cycle assessment approach was applied to
ensure the assessment criteria would cover various life cycle stages of a building material /
product, viz. raw material extraction, manufacturing, distribution, product use and disposal.
The requirements were drawn up based on international standards found in other green or eco
labelling scheme. However, as many materials / products used in construction projects are
imported from mainland China or other countries, the requirements were carefully scrutinised
to ensure that they are applicable to the Hong Kong scenario. Moreover, the standards must
exceed those required by the local environmental and safety legislations. Consequently, the
assessment criteria and requirements had to undergo several rounds of consultations with
government officials, clients, construction professionals, contractors, manufacturers, etc. to
ensure the assessment guidelines developed are acceptable to the industry. Consultation
forums were also organised for a wider group of industry stakeholders and verification bodies
to ensure that the proposed green building product labelling scheme is logical and practical.
Figure 1: Stages involved in the development of the green building product labelling scheme
Desktop Desktop Desktop Desktop StudyStudyStudyStudy
•Initial Research Report: gather product information on technical characteristics,
environmental impacts, assessment criteria in relevant labelling schemes etc.; compare among the criteria and benchmarks
•Determine Product Scope: determine all sub-product categories, e.g. divide paint and coatings into categories of internal use and external use
CriteriaCriteriaCriteriaCriteriaDevelopmentDevelopmentDevelopmentDevelopment
•Identify Mandatory Elements: classify elements of existing criteria into “core” and “non-
core” portions, e.g. power consumption is the mandatory element of criteria for chillers
•Develop Evaluation Criteria and Verification Method: determine detailed requirements
for each core / non-core criteria; determine testing and verification methods for each
criterion
VerificationVerificationVerificationVerification
•Verify the Assessment Standards: fine-tune and verify each of the proposed assessment standards with relevant stakeholders
ISBN: 978-84-697-1815-5
81
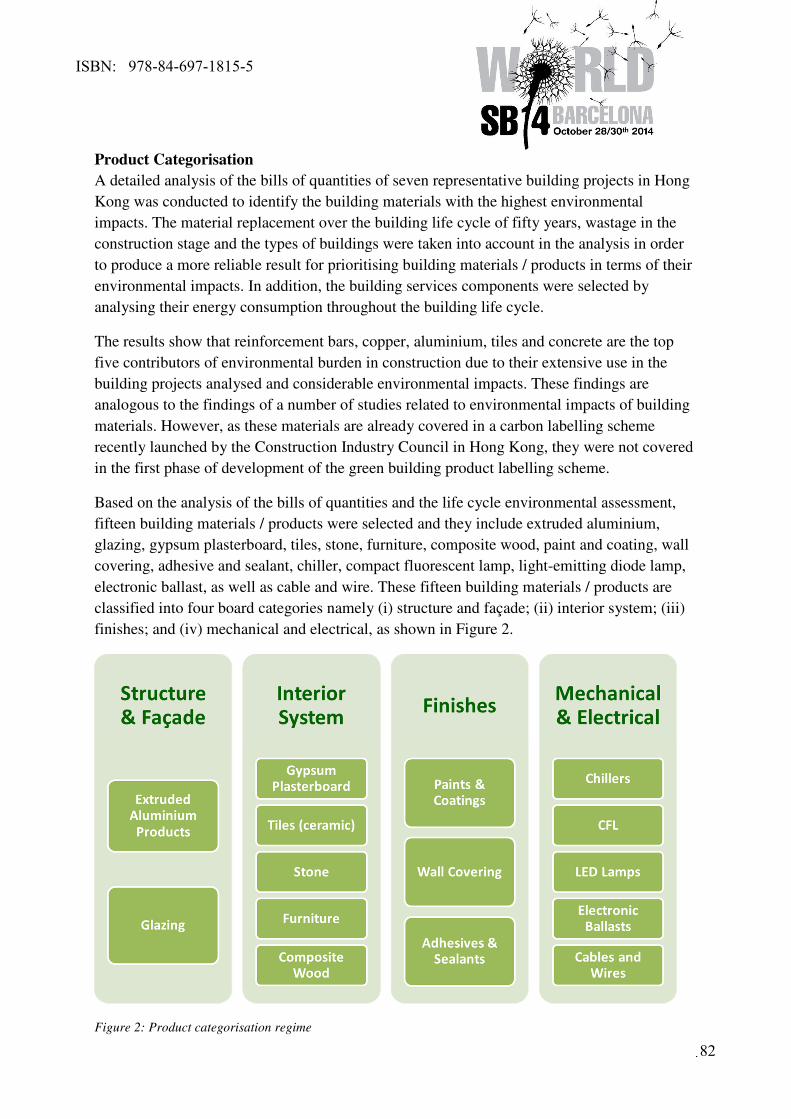
4
Product Categorisation
A detailed analysis of the bills of quantities of seven representative building projects in Hong
Kong was conducted to identify the building materials with the highest environmental
impacts. The material replacement over the building life cycle of fifty years, wastage in the
construction stage and the types of buildings were taken into account in the analysis in order
to produce a more reliable result for prioritising building materials / products in terms of their
environmental impacts. In addition, the building services components were selected by
analysing their energy consumption throughout the building life cycle.
The results show that reinforcement bars, copper, aluminium, tiles and concrete are the top
five contributors of environmental burden in construction due to their extensive use in the
building projects analysed and considerable environmental impacts. These findings are
analogous to the findings of a number of studies related to environmental impacts of building
materials. However, as these materials are already covered in a carbon labelling scheme
recently launched by the Construction Industry Council in Hong Kong, they were not covered
in the first phase of development of the green building product labelling scheme.
Based on the analysis of the bills of quantities and the life cycle environmental assessment,
fifteen building materials / products were selected and they include extruded aluminium,
glazing, gypsum plasterboard, tiles, stone, furniture, composite wood, paint and coating, wall
covering, adhesive and sealant, chiller, compact fluorescent lamp, light-emitting diode lamp,
electronic ballast, as well as cable and wire. These fifteen building materials / products are
classified into four board categories namely (i) structure and façade; (ii) interior system; (iii)
finishes; and (iv) mechanical and electrical, as shown in Figure 2.
Figure 2: Product categorisation regime
ISBN: 978-84-697-1815-5
82
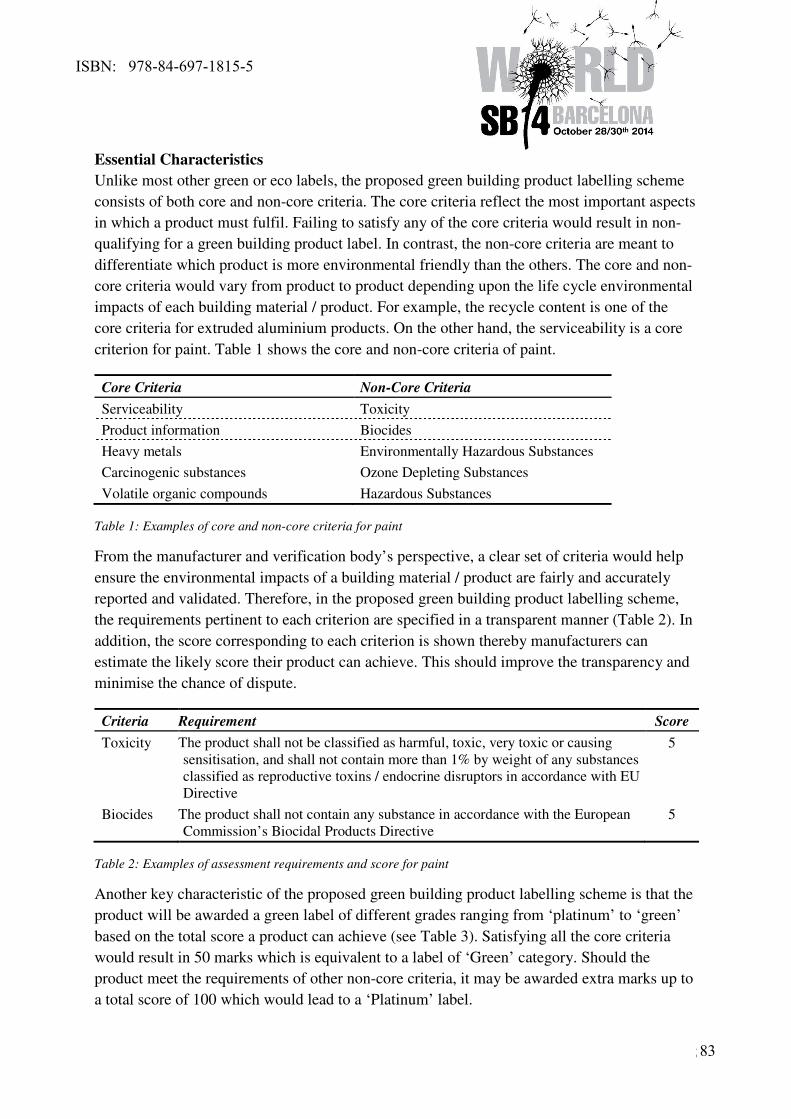
5
Essential Characteristics
Unlike most other green or eco labels, the proposed green building product labelling scheme
consists of both core and non-core criteria. The core criteria reflect the most important aspects
in which a product must fulfil. Failing to satisfy any of the core criteria would result in non-
qualifying for a green building product label. In contrast, the non-core criteria are meant to
differentiate which product is more environmental friendly than the others. The core and non-
core criteria would vary from product to product depending upon the life cycle environmental
impacts of each building material / product. For example, the recycle content is one of the
core criteria for extruded aluminium products. On the other hand, the serviceability is a core
criterion for paint. Table 1 shows the core and non-core criteria of paint.
Core Criteria Non-Core Criteria
Serviceability Toxicity
Product information Biocides
Heavy metals Environmentally Hazardous Substances
Carcinogenic substances Ozone Depleting Substances
Volatile organic compounds Hazardous Substances
Table 1: Examples of core and non-core criteria for paint
From the manufacturer and verification body’s perspective, a clear set of criteria would help
ensure the environmental impacts of a building material / product are fairly and accurately
reported and validated. Therefore, in the proposed green building product labelling scheme,
the requirements pertinent to each criterion are specified in a transparent manner (Table 2). In
addition, the score corresponding to each criterion is shown thereby manufacturers can
estimate the likely score their product can achieve. This should improve the transparency and
minimise the chance of dispute.
Criteria Requirement Score
Toxicity The product shall not be classified as harmful, toxic, very toxic or causing
sensitisation, and shall not contain more than 1% by weight of any substances
classified as reproductive toxins / endocrine disruptors in accordance with EU
Directive
5
Biocides The product shall not contain any substance in accordance with the European
Commission’s Biocidal Products Directive 5
Table 2: Examples of assessment requirements and score for paint
Another key characteristic of the proposed green building product labelling scheme is that the
product will be awarded a green label of different grades ranging from ‘platinum’ to ‘green’
based on the total score a product can achieve (see Table 3). Satisfying all the core criteria
would result in 50 marks which is equivalent to a label of ‘Green’ category. Should the
product meet the requirements of other non-core criteria, it may be awarded extra marks up to
a total score of 100 which would lead to a ‘Platinum’ label.
ISBN: 978-84-697-1815-5
83
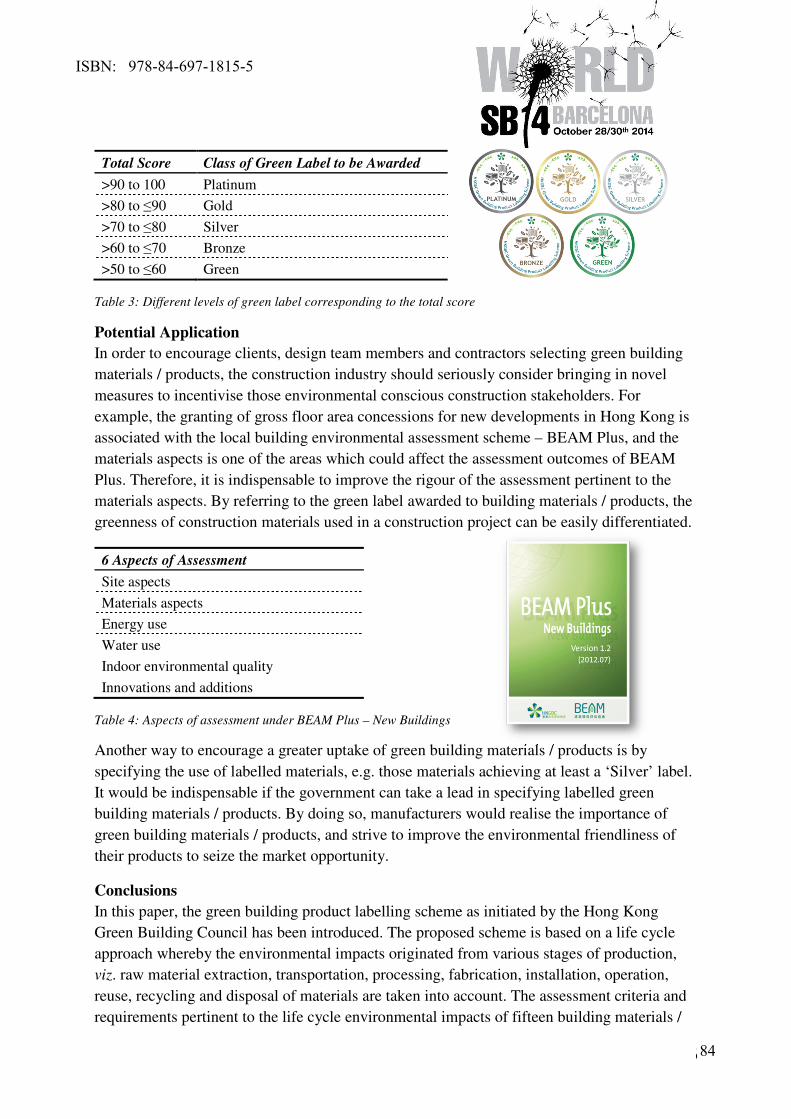
6
Total Score Class of Green Label to be Awarded
>90 to 100 Platinum
>80 to ≤90 Gold
>70 to ≤80 Silver
>60 to ≤70 Bronze
>50 to ≤60 Green
Table 3: Different levels of green label corresponding to the total score
Potential Application
In order to encourage clients, design team members and contractors selecting green building
materials / products, the construction industry should seriously consider bringing in novel
measures to incentivise those environmental conscious construction stakeholders. For
example, the granting of gross floor area concessions for new developments in Hong Kong is
associated with the local building environmental assessment scheme – BEAM Plus, and the
materials aspects is one of the areas which could affect the assessment outcomes of BEAM
Plus. Therefore, it is indispensable to improve the rigour of the assessment pertinent to the
materials aspects. By referring to the green label awarded to building materials / products, the
greenness of construction materials used in a construction project can be easily differentiated.
6 Aspects of Assessment
Site aspects
Materials aspects
Energy use
Water use
Indoor environmental quality
Innovations and additions
Table 4: Aspects of assessment under BEAM Plus – New Buildings
Another way to encourage a greater uptake of green building materials / products is by
specifying the use of labelled materials, e.g. those materials achieving at least a ‘Silver’ label.
It would be indispensable if the government can take a lead in specifying labelled green
building materials / products. By doing so, manufacturers would realise the importance of
green building materials / products, and strive to improve the environmental friendliness of
their products to seize the market opportunity.
Conclusions
In this paper, the green building product labelling scheme as initiated by the Hong Kong
Green Building Council has been introduced. The proposed scheme is based on a life cycle
approach whereby the environmental impacts originated from various stages of production,
viz. raw material extraction, transportation, processing, fabrication, installation, operation,
reuse, recycling and disposal of materials are taken into account. The assessment criteria and
requirements pertinent to the life cycle environmental impacts of fifteen building materials /
ISBN: 978-84-697-1815-5
84
7
products have been developed accordingly. The assessment criteria consist of core and non-
criteria criteria, and any products seeking the green building product label must satisfy the
requirements of the core criteria.
The life cycle based green building product labelling scheme should help clients, design team
members and contractors delineate the greenness of construction materials so as to improve
the overall environmental friendliness of their building facilities. The green building product
labelling scheme is also expected to create a market force so that manufacturers are more
prepared to invest in uplifting the environmental performance of their products. These should
help reduce the overall environmental burden caused by construction projects and thus make
the construction industry a more environmental responsible sector.
Acknowledgement
The authors would like to thank the Hong Kong Green Building Council and The University
of Hong Kong’s CRCG Seed Funding for Basic Research (Grant No.: 201111159093) for
funding this research project.
References
Curran, M. A. (2001). Developing a tool for environmentally preferable purchasing.
Environmental Management and Health, 12(3): 244-253.
EMSD (2006). Final Report of Consultancy Study on Life Cycle Energy Analysis of Building
Construction. Hong Kong. Electrical and Mechanical Services Department, Government of
HKSAR.
EPD (2010). Guidelines to Account for and Report on Greenhouse Gas Emissions and
Removals for Buildings (Commercial, Residential or Institutional Purposes) in Hong Kong,
2010 Edition. Hong Kong. Environmental Protection Department, Government of HKSAR.
Horvath, A. (2004). Construction materials and the Environment. Annual Review of
Environment and Resources, 29: 181-204.
ISO 14020 (1998) Environmental Labels and Declarations – General Principles. Geneva,
Switzerland. International Organization for Standardization.
Ortiz, O., Castells, F. and Sonnemann, G. (2009). Sustainability in the construction: a review
of recent developments based on LCA. Construction and Building Materials, 23(1): 28-39.
Sjöström, C. (2000). Challenges of sustainable construction in the 21st century. Proceedings:
International Symposium of Integrated Life Cycle Design of Materials and Structures, May
22-24. ed: A. Sarja. Helsinki, Finland, i-viii.
UNEP (1999). Energy and Cities: Sustainable Building and Construction. United Nations
Environmental Program. Nairobi, Kenya. http://www.unep.or.jp/ietc/focus/EnergyCities1.asp,
website accessed on 15 May 2014.
ISBN: 978-84-697-1815-5
85
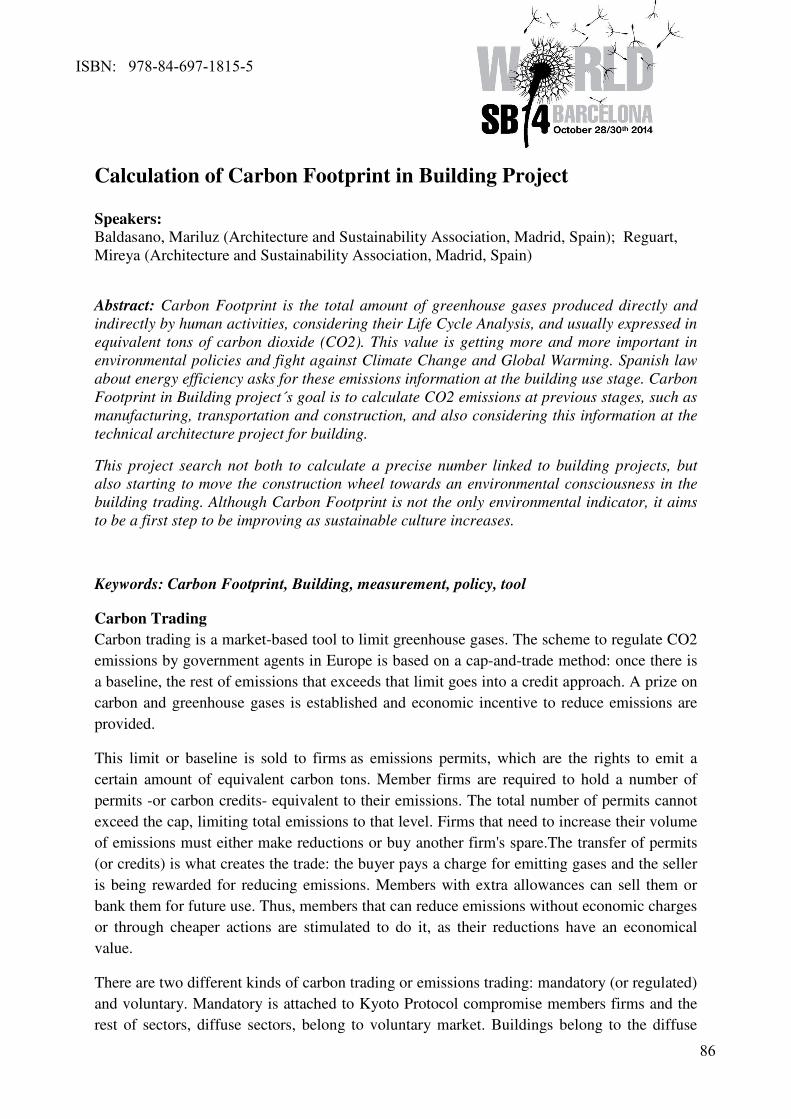
1
Calculation of Carbon Footprint in Building Project
Speakers:
Baldasano, Mariluz (Architecture and Sustainability Association, Madrid, Spain); Reguart,
Mireya (Architecture and Sustainability Association, Madrid, Spain)
Abstract: Carbon Footprint is the total amount of greenhouse gases produced directly and
indirectly by human activities, considering their Life Cycle Analysis, and usually expressed in
equivalent tons of carbon dioxide (CO2). This value is getting more and more important in
environmental policies and fight against Climate Change and Global Warming. Spanish law
about energy efficiency asks for these emissions information at the building use stage. Carbon
Footprint in Building project´s goal is to calculate CO2 emissions at previous stages, such as
manufacturing, transportation and construction, and also considering this information at the
technical architecture project for building.
This project search not both to calculate a precise number linked to building projects, but
also starting to move the construction wheel towards an environmental consciousness in the
building trading. Although Carbon Footprint is not the only environmental indicator, it aims
to be a first step to be improving as sustainable culture increases.
Keywords: Carbon Footprint, Building, measurement, policy, tool
Carbon Trading
Carbon trading is a market-based tool to limit greenhouse gases. The scheme to regulate CO2
emissions by government agents in Europe is based on a cap-and-trade method: once there is
a baseline, the rest of emissions that exceeds that limit goes into a credit approach. A prize on
carbon and greenhouse gases is established and economic incentive to reduce emissions are
provided.
This limit or baseline is sold to firms as emissions permits, which are the rights to emit a
certain amount of equivalent carbon tons. Member firms are required to hold a number of
permits -or carbon credits- equivalent to their emissions. The total number of permits cannot
exceed the cap, limiting total emissions to that level. Firms that need to increase their volume
of emissions must either make reductions or buy another firm's spare.The transfer of permits
(or credits) is what creates the trade: the buyer pays a charge for emitting gases and the seller
is being rewarded for reducing emissions. Members with extra allowances can sell them or
bank them for future use. Thus, members that can reduce emissions without economic charges
or through cheaper actions are stimulated to do it, as their reductions have an economical
value.
There are two different kinds of carbon trading or emissions trading: mandatory (or regulated)
and voluntary. Mandatory is attached to Kyoto Protocol compromise members firms and the
rest of sectors, diffuse sectors, belong to voluntary market. Buildings belong to the diffuse
ISBN: 978-84-697-1815-5
86
2
sectors. Thus, the biggest reductions we make in building, the most value we give to them as
products, not only economical but also environmental value. And more important than that:
we stimulate a more sustainable culture in the construction industry as we introduce an
environmental measurement unit, CO2 equivalent ton.
Building law in Spain and low emissions volunteer programs policies
In Spain, several official projects promoted by public administration, Ministry of Agriculture,
Food and Environment, begin to relate GHG emissions, translated into carbon, with the
building. These three projects approximate this connection from three points of view :
- Energy Efficiency Certificate: required in new buildings and in existing buildings, gives the
CO2 emissions associated to the energy consumption in the building use phase.
- The Climate Projects: are designed to draw the path of transformating the Spanish
productive system towards a low carbon model. This is starting to regulate diffuse sectors
through projects that reduce emissions in these sectors.
- Plan Pima Sun: attempts to cover the Spanish tourism sector and try to promote
improvements in the tourist housing stock by rehabilitating their buildings by rewarding
emissions reductions.
But these initiatives to ensure that the building sector is regulated is a long way to walk.
As the last GHG protocols conclusions are that “the process is heavily dependent on the
regional accuracy of databases and hampered by the one-off nature of building design and
construction, the guide notes. Government and nongovernment organizations are currently
working to refining both the databases and the software that crunches the numbers to make
sense of the reams of raw data for non-technical decision makers. The guide uses case studies
Fuente: own elaboration
ISBN: 978-84-697-1815-5
87
3
to explain the process and the many computer-aided assessment tools and databases of
product performance and regional conditions that exist now or are in development”.
The project was born from the initiative of the Association for Sustainability and Architecture
(ASA) and the Spanish Climate Change Office (OECC), Ministry of Agriculture, Food and
Environment (MAGRAMA), thanks to the economical support of the Biodiversity
Foundation, it aims to begin to study the relationship of carbon and construction for the
recently published Royal Decree 163/2014, amending the registration carbon footprint offset
projects and carbon dioxide absorption. This project will help to shape the OECC sectorial
Carbon Infrastructures Guide within the support of other two projects: the project led by
Cartif for rail infrastructure and the project led by Tecniberia for road construction.
Fuente: OECC. An example
of the recent certification that the
Spanish Climate Change Office offers
to volunteer co2 projects for whether
calculation, reduction and/or
compensation of their Carbon
Footprint.
ISBN: 978-84-697-1815-5
88
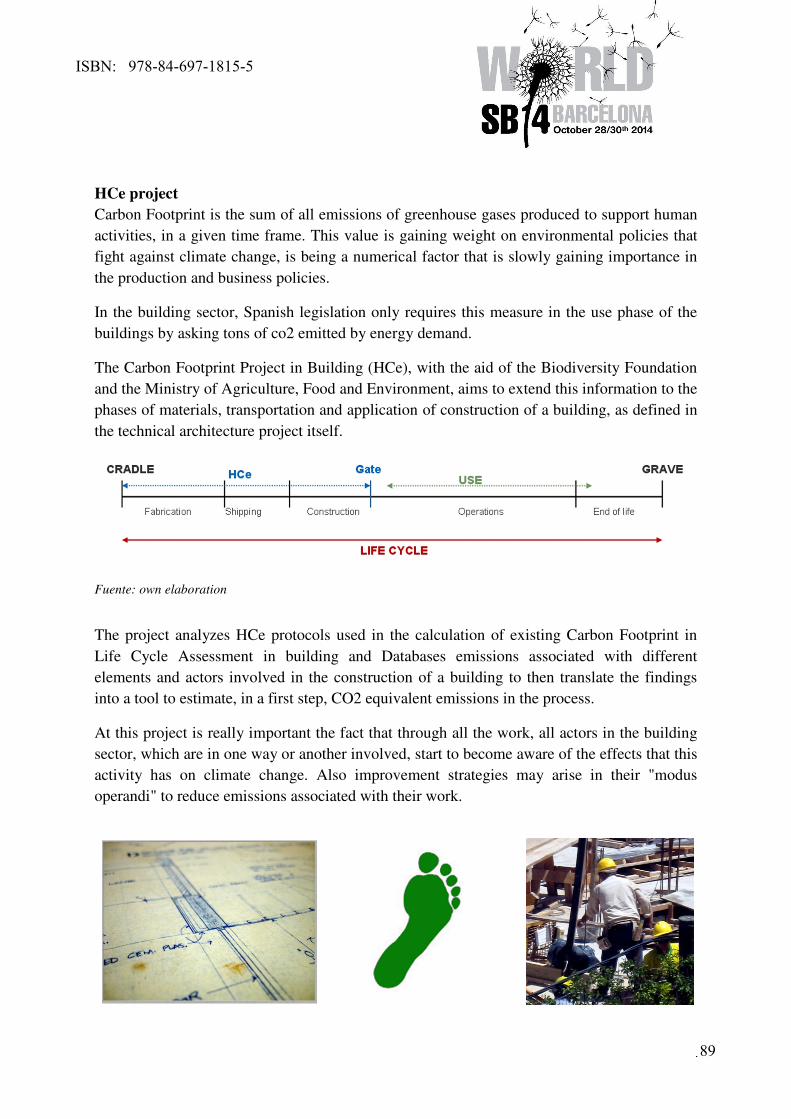
4
HCe project
Carbon Footprint is the sum of all emissions of greenhouse gases produced to support human
activities, in a given time frame. This value is gaining weight on environmental policies that
fight against climate change, is being a numerical factor that is slowly gaining importance in
the production and business policies.
In the building sector, Spanish legislation only requires this measure in the use phase of the
buildings by asking tons of co2 emitted by energy demand.
The Carbon Footprint Project in Building (HCe), with the aid of the Biodiversity Foundation
and the Ministry of Agriculture, Food and Environment, aims to extend this information to the
phases of materials, transportation and application of construction of a building, as defined in
the technical architecture project itself.
Fuente: own elaboration
The project analyzes HCe protocols used in the calculation of existing Carbon Footprint in
Life Cycle Assessment in building and Databases emissions associated with different
elements and actors involved in the construction of a building to then translate the findings
into a tool to estimate, in a first step, CO2 equivalent emissions in the process.
At this project is really important the fact that through all the work, all actors in the building
sector, which are in one way or another involved, start to become aware of the effects that this
activity has on climate change. Also improvement strategies may arise in their "modus
operandi" to reduce emissions associated with their work.
ISBN: 978-84-697-1815-5
89
5
In a regular outset of a project, main parameters to define the architectural proposal are
distribution of spaces, aesthetic or formal result (design) and cost. However, through the Life
Cycle Analysis vision by comparing the whole building and individual components, architects
and engineers can calculate co2 emissions (as an environmental impact) at the outset of a
project, and refine those calculations as the project proceeds, to show owners what the
potential is for a proposed design option to cause or mitigate global warming.
Activities
HCe project has three main working lines:
1.- Definition of a uniform and official methodology to calculate co2 emissions in
building construction, at what we could call from cradle to gate; it means that stages that are
considered are manufacturing, transportation and construction. This information allows
consumer, government agents and construction market complete the co2 information about
building, as actual mandatory rules in Spain obey to inform about co2 building emissions at
the “use and maintenance” stage. Based on this “building construction guide” for calculating
carbon footprint there is a basic calculation tool, which translates these principals into a
numerical value, getting data from the technical projects. These steps are currently taken into
this part of the HCe project:
a) Specifying an official database, open, common, accessible and stable in time, that contains
construction materials. This Data Base assigns these materials an environmental load of CO2
equivalent, linked to the energy associated with its manufacturing process and transportation
to the site. This step has a double aspect of work teams:
a.1) On one hand, coordinating the Construction Carbon Group linked to the Spanish
Office for Climate Change (OECC), along with the Construction Science Institute
Eduardo Torroja (CSIC), Architecture and Sustainability Association (ASA), Tecniberia
and Cartif. Thus, the IETcc - as a public and open entity and creator of some of the
State regulations in construction- is the agent chosen to hostel that Data Base.
ISBN: 978-84-697-1815-5
90
6
a.2) And on the other one, ASA collaborates with the Technical Architects School of
Guadalajara (COAATIE) to share information in a practical way (description of units,
coding, units of measure, etc.). This entity is the creator of one of the most used price
and constructions units’ data base in Spain, Center Price Basis in Construction. Thus,
there is another working group focused on assigning these construction units co2
information, and coordinating all the codification system towards making possible to
import the construction units and measurements in an architectural project into the HCe
tool.
All these activities are reviewed by the OECC.
b) Making the process maps associated with the calculation of the carbon footprint. These
work is being developed integrated, as much as it fits, with the international and official
standards for verification and certification of the carbon footprint (ISO 14067, ISO 14064
GHG Protocol, PAS 2050, etc..).
c) Writing a construction methodological guide that explains how co2 emissions are
calculated, what is included and what not, to achieve the building carbon footprint. This is
also reviewed by the OECC.
d) Creating a calculation tool to translate these principals into an specific architectural project,
integrating the project information and coding the construction units.
2.- Creation of online tool (HCe tool) that allows the most important data of the
measurements document from an architectural project, and integrate it with the tool obtained
in phase 1. The tool that allows designers to calculate, at the stage of the designing project,
the carbon footprint of the projected building, will be an online application which will import
all the project information concerning construction units and measurements. This tool is
conceived also to ask about certain information to be filled, such as transportation distance..
In this phase works are: studying the premises to be able to import the document
measurement tool (coding, equivalences, etc...); creating a Beta version of the tool; testing
and reviewing from real case studies; and then created the final version of the online tool.
3.- Broadcasting of this work and the principals of the methodology and the online tool.
Presentation of the HCe project, training and publication. In this phase, the initiative
launching of the HCe project (ASA) gets an leadership mission, as broadcasting is its main
activity and associated member can take part of the HCe project.
The broadcasting of the work is extremely important to acquire visibility and making
designers, architects and engineers being aware of the environmental possibilities of
architectural projects. This is the first step to achieve a real change in the involvement of the
construction sector agents, concerning the environment and climate change.
These steps are currently taken into this part of the HCe project:
ISBN: 978-84-697-1815-5
91
7
a) Generating an official annexed model document to be included in the architectural projects,
that explains the reason for the carbon content and the considerations to keep in mind when
designing and managing agents in the construction.
b) Public presentation, broadcasting and teaching teachers.
c) Book Publication.
d) Presentation, broadcasting and teaching architects.
Conclusions
¿What do we obtain with HCe project?
-introducing building and construction market as a diffuse sector in the carbon trading.
-showing and communicating consumers (and by extension to the entire chain of
stakeholders) about the importance of choosing a good construction, considering the
environmental impacts in their purchase and consumption habits.
-strengthening the field of building sustainability as an economical alternative recuperation
versus the traditional “brick culture”.
-contributing to upgrading the State legislation and allowing to accomplish international
compromises in relation to environmental improvements and job creation.
-contributing to the improvement against the effects of climate change.
-measuring environmental impacts on buildings through universal unit (eqco2ton), same
parameter as other products, companies or events in several markets.
-allowing to make important decisions at the level of design and construction, contributing
to social and environmental benefits. A job well done in a period relatively short (2 years) has
a positive impact in the long term (the useful life of the building, 75-100 years).
-creating tactics of balancing the costs and benefits of material and systems selection based on
resource consumption and pollution from fabrication, shipping, construction, operations, and
end-of-life deconstruction.
ISBN: 978-84-697-1815-5
92
1
Life cycle assessment of buildings – A nZEB case using streamline
and conventional analysis
Authors:
Partidário, P1; Martins, P
2; Frazão, R
3
1 LNEG, Lisboa, Portugal
2 LNEG, Lisboa, Portugal
3 LNEG, Lisboa, Portugal
Abstract: This paper addresses the LCA of buildings using conventional or streamlined
approaches applied to a real life-scale nZEB prototype – Solar XXI building. Results show
the use phase has the greatest impacts, and the production of materials follows in importance.
In this particular nZEB case, performance impacts of the use phase should consider the
energy efficiency options and the energy produced by renewable sources, having a lower
negative impact when compared to conventional and equivalent buildings. Though results
show that both approaches can be used, when compared in absolute terms they are
contrasting both in the production and in the use life cycle stages. In the former, there is
underestimation of effects in the streamlined approach, being solved in the frame of a new
project. In the latter, difference is due to a combined effect of boundaries simplification and
to different assumptions used to calculate energy consumption in the use stage.
Keywords: LCA, nZEB, building design, assessment tool
Introduction
Together with system thinking, Sustainability is emerging as a key planning concept, being
increasingly applied to assess the building performance and to guide product design,
manufacturing and urban development at large. In such a framework, life cycle assessment
(LCA) provides a fundamental approach to that assessment process.
Energy requirements in a building result into direct and indirect impacts in its lifecycle. In the
former case, life cycle direct impacts relate to construction, operation, rehabilitation, and
demolition at the end of life. In the latter it is the result of the production of building materials
as well as of the embodied resources (materials, energy) in the building envelope and in the
technical systems. Designing low-energy buildings enables to deliver more energy efficient
buildings than the conventional ones [1], thus leading to net benefits in the total life cycle
energy demand even though exhibiting higher embodied energy.
Increasing awareness of the impact of climate change, and the importance of sustainability,
has highlighted the urgency to address energy efficiency in buildings [2] [3]. Showing the
highest energy consumption (ca 40%), and being a main contributor to GHG emissions (ca
36% of the EU total CO2 emissions), the EU building sector is currently identified as a sector
playing a central role in mitigating energy consumption, where energy use and related carbon
ISBN: 978-84-697-1815-5
93
2
dioxide emissions need to be cut firstly in the frame of the operating energy consumption and
secondly within the embodied energy. This stresses the need for sustainable retrofit solutions.
For reducing energy consumption and increasing renewable energy use, the European Union
set a long-term strategy and consequently established common frameworks and binding
targets with the Energy Performance of Buildings Directive – EPBD, the Renewable Energy
Sources Directive and the Energy Efficiency Directive. One key aspect that emerged with
such a framework refers to nZEB – the nearly zero energy building, which is defined in
Article 2 of the EPBD as a building that has a very high energy performance with nearly zero
or very low energy use. That energy, in turn, is required to a very significant extent to be
covered by energy from renewable sources including from renewable energy produced onsite
or nearby. In buildings with a ‘zero energy’ balance in use (the energy delivered to a grid is
equal to the energy in use) the life cycle energy is solely due to the process of delivering and
maintaining the building and its components. In current practice, most common approach to
ZEB is to use the electricity grid both as a source and a sink of electricity, thus avoiding the
on-site electric storage systems. The Article 6 addresses existing buildings, and establishes
that in case a building undergoes a major renovation its energy performance or the renovated
part thereof is upgraded in order to meet the minimum energy requirements that were set
according to the Article 4 when it is technically, functionally and economically feasible.
Article 9 in the Directive states that Member States shall ensure that (a) by 31 December
2020, all new buildings are nearly zero-energy buildings; and (b) after 31 December 2018,
new buildings occupied and owned by public authorities are nearly zero-energy buildings.
Besides this leading issue to move towards new and retrofitted nearly-zero energy buildings
by 2021, and by 2019 in the case of public buildings, another key issue is the application of a
cost-optimal methodology for setting minimum requirements for both the building envelope
and the technical systems.
Within the general LCA framework [4], which is described on ISO 14040 and ISO 14044
standards, this paper addresses the LCA of buildings using the conventional or the
streamlined approaches applied to a real life-scale nZEB prototype – the LNEG’s Solar XXI
building [5]. Lowering energy intensity and the environmental impacts of buildings is
increasingly becoming a priority in energy and environmental policies. Being reasonable to
tackle priorities for improving the environmental sustainability of buildings starting from the
most intensive elements, it should be stressed the whole life cycle as a source of
environmental concern and not just the use phase because the overall environmental impacts
of buildings extend beyond the use phase as they also encompass the embodied energy and
environmental burdens related to the other three life cycle stages: resource extraction and
manufacturing, construction activities, as well as dismantling and construction waste disposal
at the end-of-life. In addition, life cycle impacts are highly interdependent, as one phase can
influence one or more of the others (e.g. building materials may reduce heat requirements, but
increase embodied energy and transport related impacts, affect service duration of the whole
building, and the end-of-life management strategy).
ISBN: 978-84-697-1815-5
94
3
Having said that, the objective of this paper is to address and discuss the LCA of buildings
using both conventional and streamlined approaches applied to a real life-scale NZEB
prototype. Having in mind the need to use life cycle thinking in order to improve the energy
performance of a building, are these two different approaches either competing or being
complementary to each other?
Materials and Methods
Two LCA studies were performed to establish the environmental profile of LNEG’s Solar
XXI building. The first study, a more detailed one, was performed using the GaBi software.
The second study was performed with a streamlined approach using EnerBuiLCA software.
In the first study a conventional quantitative assessment was performed with the software tool
GaBi version 4.4, including the extension database for construction materials and energy. The
energy mix was calculated based on data available online for Portugal in the year 20111. The
impact categories of the CML 2001 method were used to perform the life cycle impact
assessment. System boundaries considered the four life cycle stages as recommended by EN
15643-1 [6]: product stage (raw materials supply, transport and manufacturing), construction
stage (transport and construction-installation on site processes), use stage (maintenance, repair
and replacement, refurbishment, operational energy use: heating, cooling, ventilation, hot
water and lighting and operational water use), and end-of-life stage (deconstruction, transport,
recycling/re-use and disposal). The functional unit considered the service in 1 m2 of building
area, and a time life of 50 years.
In the streamlined approach, using the EnerBuiLCA software tool [7], the scope of the
quantitative analysis included both a limited measure of environmental stresses (embodied
energy, global warming) - so that it would be simple to understand by user groups (e.g.
building designers, engineers, architects), and those life cycle stages which are expected to
exhibit the highest impacts in terms of primary energy consumption and the CO2 emissions
[8]. Therefore, the EnerBuiLCA method included the production of materials and
components, the construction process, and the use phases of the life cycle. The end-of-life
stage was excluded considering its relatively minor contribution in the energy balance [9].
The EnerBuiLCA database was used in this study. This database includes specific regional
data on construction products and solutions from Portugal, Spain and France [7]. The
technical specifications and computational methods were used as described in EN 15643-1
[6], EN 15643-2 [10], EN 15804 [11] and EN 15978 [12].
The Solar XXI building (figure 1) was built in Lisbon in 2006. It is an office building
considered as a nZEB prototype [5] aiming at making extensive use of solar exposure. In its
performance, it successfully combines passive design techniques with renewable energy
technologies (PV, solar collectors). The main façade of the building faces south and contains
the majority of the glazing as well as a PV system, with heat recovery. This PV system assists
the heating system in the cold season together with the glazing arrangement, which is
1 www.erse.pt
ISBN: 978-84-697-1815-5
95
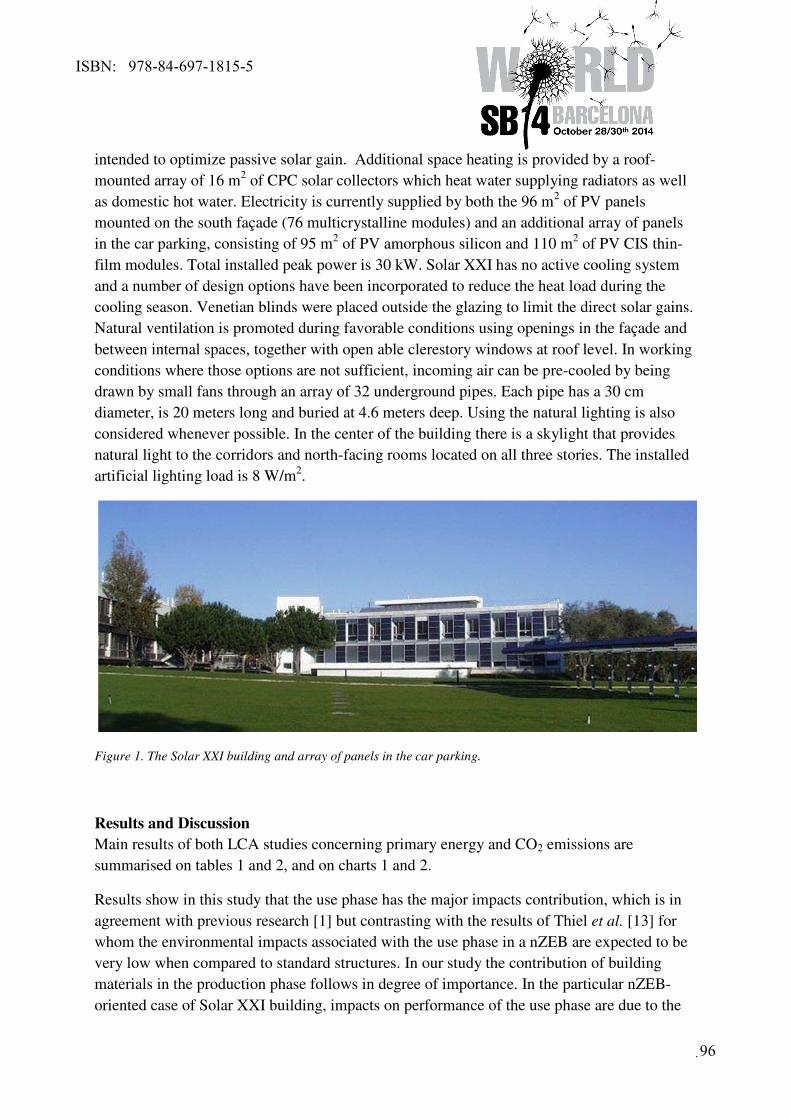
4
intended to optimize passive solar gain. Additional space heating is provided by a roof-
mounted array of 16 m2 of CPC solar collectors which heat water supplying radiators as well
as domestic hot water. Electricity is currently supplied by both the 96 m2 of PV panels
mounted on the south façade (76 multicrystalline modules) and an additional array of panels
in the car parking, consisting of 95 m2 of PV amorphous silicon and 110 m
2 of PV CIS thin-
film modules. Total installed peak power is 30 kW. Solar XXI has no active cooling system
and a number of design options have been incorporated to reduce the heat load during the
cooling season. Venetian blinds were placed outside the glazing to limit the direct solar gains.
Natural ventilation is promoted during favorable conditions using openings in the façade and
between internal spaces, together with open able clerestory windows at roof level. In working
conditions where those options are not sufficient, incoming air can be pre-cooled by being
drawn by small fans through an array of 32 underground pipes. Each pipe has a 30 cm
diameter, is 20 meters long and buried at 4.6 meters deep. Using the natural lighting is also
considered whenever possible. In the center of the building there is a skylight that provides
natural light to the corridors and north-facing rooms located on all three stories. The installed
artificial lighting load is 8 W/m2.
Figure 1. The Solar XXI building and array of panels in the car parking.
Results and Discussion
Main results of both LCA studies concerning primary energy and CO2 emissions are
summarised on tables 1 and 2, and on charts 1 and 2.
Results show in this study that the use phase has the major impacts contribution, which is in
agreement with previous research [1] but contrasting with the results of Thiel et al. [13] for
whom the environmental impacts associated with the use phase in a nZEB are expected to be
very low when compared to standard structures. In our study the contribution of building
materials in the production phase follows in degree of importance. In the particular nZEB-
oriented case of Solar XXI building, impacts on performance of the use phase are due to the
ISBN: 978-84-697-1815-5
96
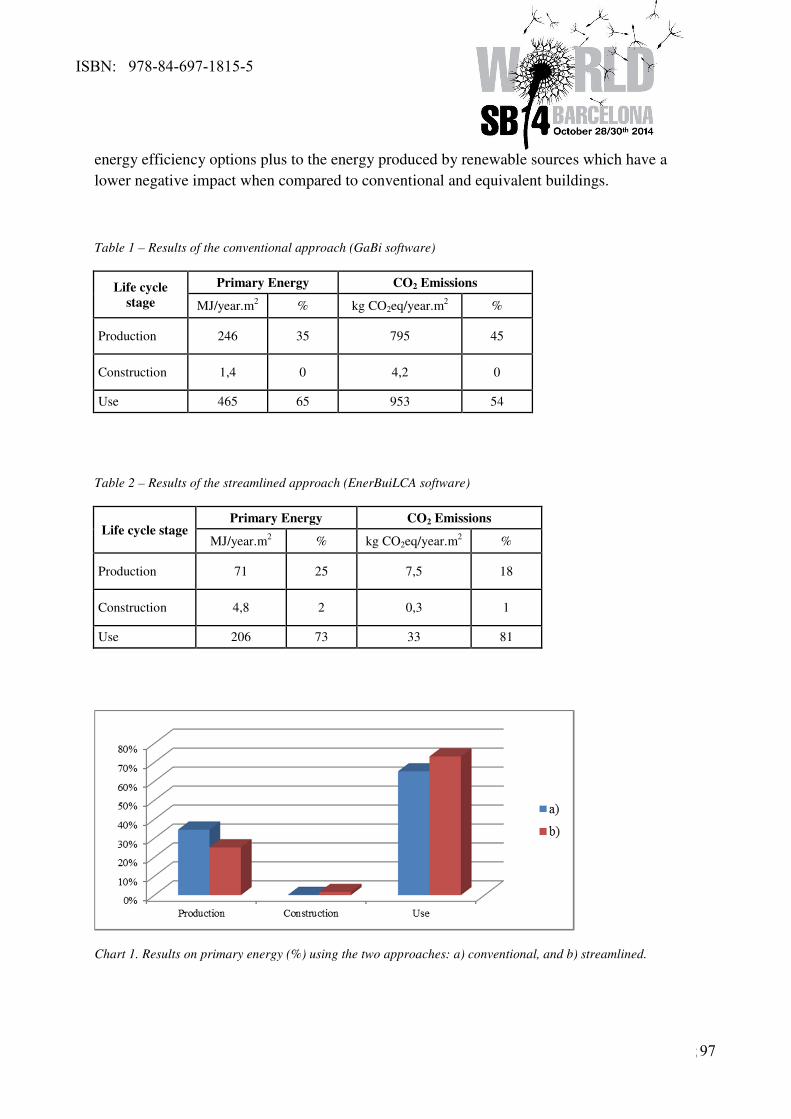
5
energy efficiency options plus to the energy produced by renewable sources which have a
lower negative impact when compared to conventional and equivalent buildings.
Table 1 – Results of the conventional approach (GaBi software)
Life cycle
stage
Primary Energy CO2 Emissions
MJ/year.m2 % kg CO2eq/year.m
2 %
Production 246 35 795 45
Construction 1,4 0 4,2 0
Use 465 65 953 54
Table 2 – Results of the streamlined approach (EnerBuiLCA software)
Life cycle stage Primary Energy CO2 Emissions
MJ/year.m2 % kg CO2eq/year.m
2 %
Production 71 25 7,5 18
Construction 4,8 2 0,3 1
Use 206 73 33 81
Chart 1. Results on primary energy (%) using the two approaches: a) conventional, and b) streamlined.
ISBN: 978-84-697-1815-5
97
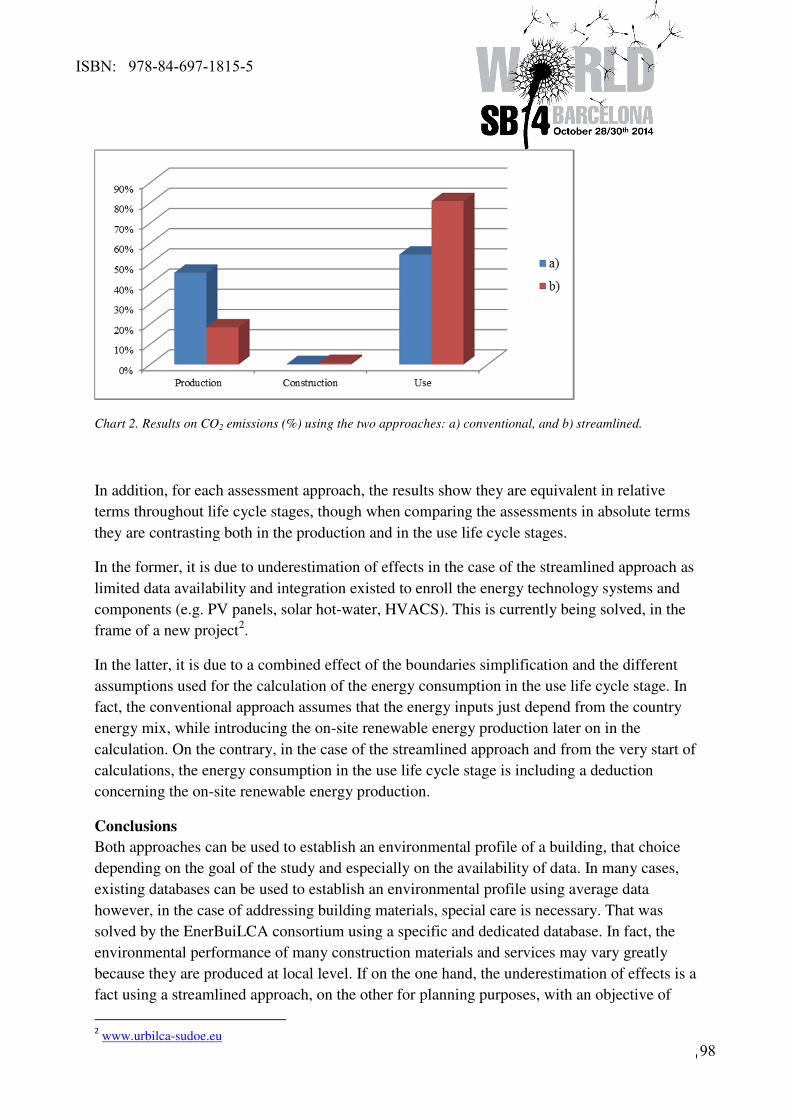
6
Chart 2. Results on CO2 emissions (%) using the two approaches: a) conventional, and b) streamlined.
In addition, for each assessment approach, the results show they are equivalent in relative
terms throughout life cycle stages, though when comparing the assessments in absolute terms
they are contrasting both in the production and in the use life cycle stages.
In the former, it is due to underestimation of effects in the case of the streamlined approach as
limited data availability and integration existed to enroll the energy technology systems and
components (e.g. PV panels, solar hot-water, HVACS). This is currently being solved, in the
frame of a new project2.
In the latter, it is due to a combined effect of the boundaries simplification and the different
assumptions used for the calculation of the energy consumption in the use life cycle stage. In
fact, the conventional approach assumes that the energy inputs just depend from the country
energy mix, while introducing the on-site renewable energy production later on in the
calculation. On the contrary, in the case of the streamlined approach and from the very start of
calculations, the energy consumption in the use life cycle stage is including a deduction
concerning the on-site renewable energy production.
Conclusions
Both approaches can be used to establish an environmental profile of a building, that choice
depending on the goal of the study and especially on the availability of data. In many cases,
existing databases can be used to establish an environmental profile using average data
however, in the case of addressing building materials, special care is necessary. That was
solved by the EnerBuiLCA consortium using a specific and dedicated database. In fact, the
environmental performance of many construction materials and services may vary greatly
because they are produced at local level. If on the one hand, the underestimation of effects is a
fact using a streamlined approach, on the other for planning purposes, with an objective of
2 www.urbilca-sudoe.eu
ISBN: 978-84-697-1815-5
98
7
improving the energy performance of a building, a streamlined approach is likely to be very
useful.
Main conclusions are the following: a) The usefulness of the streamline tool to answer both to
limited data availability and to requiring professional needs when addressing buildings and,
very likely, to district systems (e.g. timing in product design and manufacture, or assessment
of design options) thus being complementary, though with results not comparable, to the
comprehensive assessment form; b) The need to adequately explain to users the pros and cons
of using streamlined approaches.
Acknowledgements
The authors would like to acknowledge the support of the SUDOE Interreg IV B Programme
financement and of the FEDER cofounding, in the frame of both the EnerBUiLCA and the
UrbiLCA projects.
References
[1] Santori, I.; Hestnes, A.G. (2007). Energy use in the life cycle of conventional and low-energy
buildings: A review article. Energy and Buildings, 39:249-257.
[2] UNEP (2007). Buildings and Climate Change – Status, Challenges and Opportunities.
Paris. UNEP-DTIE.
[3] EC (2012). Reference Document on the Best Environmental Management Practice in the
Building and Construction Sector. Final report. JRC-IPTS. [4] Graedel, T. E. (1998). Streamlined life-cycle assessment. New Jersey. Prentice Hall Inc.
[5] Gonçalves, H.; Aelenei, L.; Rodrigues, C. (2012). Solar XXI: A Portuguese Office Building
towards Net Zero-Energy Building. REHVA Journal, March 2012: 34- 40.
[6] EN 15643-1:2010. Sustainability of construction works – Sustainability assessment of buildings –
Part 1: General framework. CEN.
[7] EnerBuiLCA (2012). Guia práctica para la applicación de la ferramienta EnerBuiLCA. Project
deliverable supported by the Interreg-SUDOE IV programme, www.enerbuilca-sudoe.eu
[8] Zabalza Bribián, I.; Usón, A.; Scarpellini, S. (2009). Life cycle assessment in buildings:
State-of-the-art and simplified LCA methodology as a complement for building
certification. Buildings and Environment, 44: 2510-2520. [9] Ramesh, T.; Prakash, R.; Shukla, K. (2010). Life cycle energy analysis of buildings: An overview.
Energy and Buildings, 42: 1592-1600.
[10] EN 15643-2:2011. Sustainability of construction works – Assessment of buildings – Part 2:
Framework for the assessment of environmental performance. CEN.
[11] EN 15804:2012. Sustainability of construction works – Environmental product declarations –
Core rules for the product category of construction products. CEN.
[12] EN 15978:2011. Sustainability of construction works – Assessment of environmental performance
of buildings – Calculation method. CEN.
[13] Thiel, C.; Campion, N.; Landis, A.; Jones, A.; Schaefer, L.; Bilec, M. (2013). A
Materials Life Cycle Assessment of a Net-Zero Energy Building. Energies 6: 1125-
1141.
ISBN: 978-84-697-1815-5
99
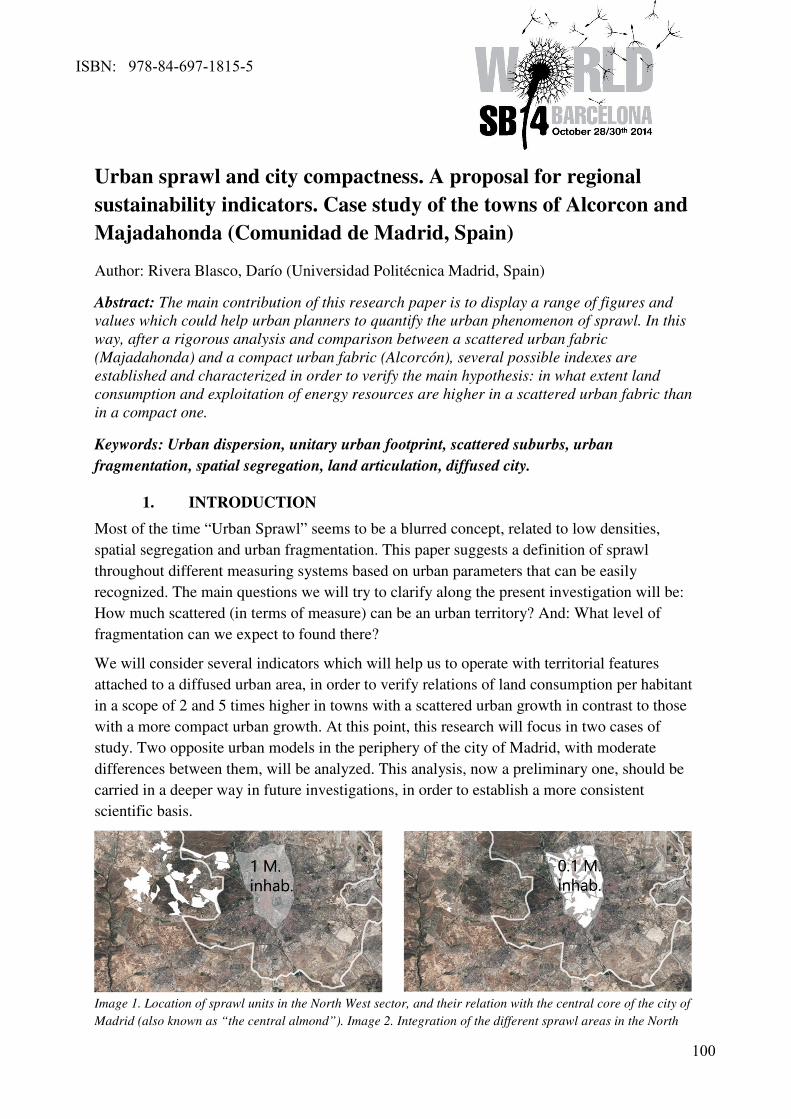
1
Urban sprawl and city compactness. A proposal for regional
sustainability indicators. Case study of the towns of Alcorcon and
Majadahonda (Comunidad de Madrid, Spain)
Author: Rivera Blasco, Darío (Universidad Politécnica Madrid, Spain)
Abstract: The main contribution of this research paper is to display a range of figures and
values which could help urban planners to quantify the urban phenomenon of sprawl. In this
way, after a rigorous analysis and comparison between a scattered urban fabric
(Majadahonda) and a compact urban fabric (Alcorcón), several possible indexes are
established and characterized in order to verify the main hypothesis: in what extent land
consumption and exploitation of energy resources are higher in a scattered urban fabric than
in a compact one.
Keywords: Urban dispersion, unitary urban footprint, scattered suburbs, urban
fragmentation, spatial segregation, land articulation, diffused city.
1. INTRODUCTION
Most of the time “Urban Sprawl” seems to be a blurred concept, related to low densities,
spatial segregation and urban fragmentation. This paper suggests a definition of sprawl
throughout different measuring systems based on urban parameters that can be easily
recognized. The main questions we will try to clarify along the present investigation will be:
How much scattered (in terms of measure) can be an urban territory? And: What level of
fragmentation can we expect to found there?
We will consider several indicators which will help us to operate with territorial features
attached to a diffused urban area, in order to verify relations of land consumption per habitant
in a scope of 2 and 5 times higher in towns with a scattered urban growth in contrast to those
with a more compact urban growth. At this point, this research will focus in two cases of
study. Two opposite urban models in the periphery of the city of Madrid, with moderate
differences between them, will be analyzed. This analysis, now a preliminary one, should be
carried in a deeper way in future investigations, in order to establish a more consistent
scientific basis.
Image 1. Location of sprawl units in the North West sector, and their relation with the central core of the city of
Madrid (also known as “the central almond”). Image 2. Integration of the different sprawl areas in the North
ISBN: 978-84-697-1815-5
100
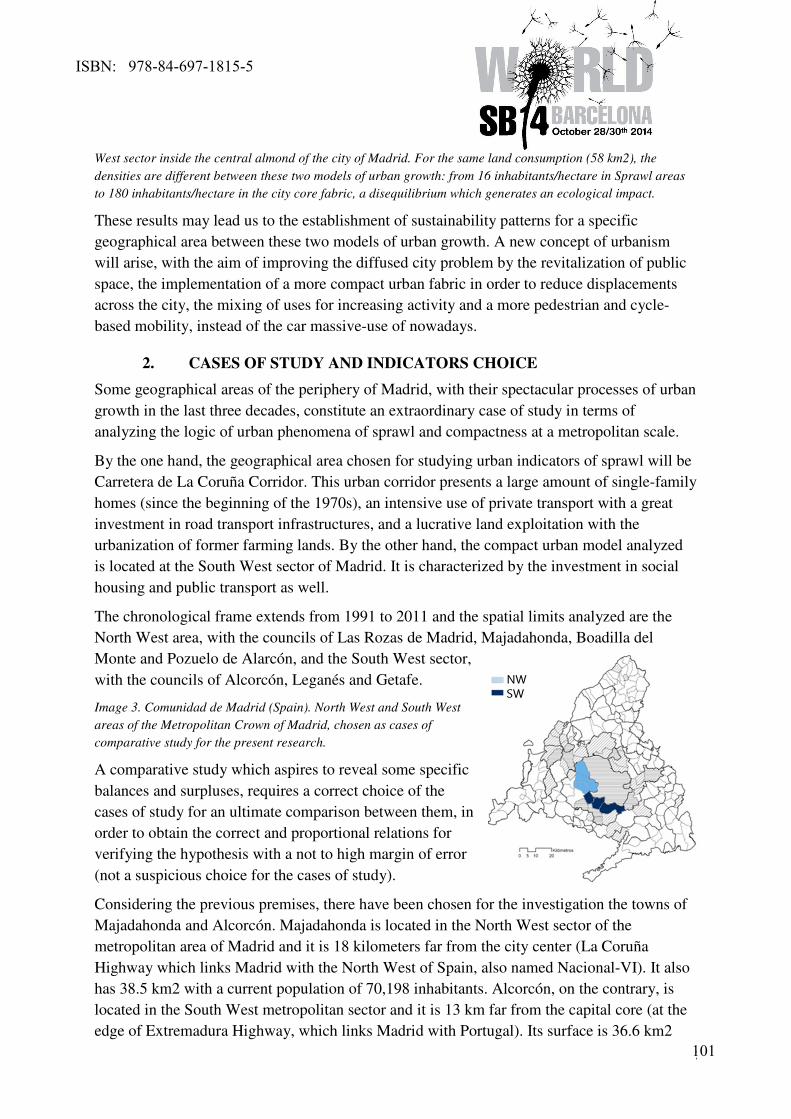
2
West sector inside the central almond of the city of Madrid. For the same land consumption (58 km2), the
densities are different between these two models of urban growth: from 16 inhabitants/hectare in Sprawl areas
to 180 inhabitants/hectare in the city core fabric, a disequilibrium which generates an ecological impact.
These results may lead us to the establishment of sustainability patterns for a specific
geographical area between these two models of urban growth. A new concept of urbanism
will arise, with the aim of improving the diffused city problem by the revitalization of public
space, the implementation of a more compact urban fabric in order to reduce displacements
across the city, the mixing of uses for increasing activity and a more pedestrian and cycle-
based mobility, instead of the car massive-use of nowadays.
2. CASES OF STUDY AND INDICATORS CHOICE
Some geographical areas of the periphery of Madrid, with their spectacular processes of urban
growth in the last three decades, constitute an extraordinary case of study in terms of
analyzing the logic of urban phenomena of sprawl and compactness at a metropolitan scale.
By the one hand, the geographical area chosen for studying urban indicators of sprawl will be
Carretera de La Coruña Corridor. This urban corridor presents a large amount of single-family
homes (since the beginning of the 1970s), an intensive use of private transport with a great
investment in road transport infrastructures, and a lucrative land exploitation with the
urbanization of former farming lands. By the other hand, the compact urban model analyzed
is located at the South West sector of Madrid. It is characterized by the investment in social
housing and public transport as well.
The chronological frame extends from 1991 to 2011 and the spatial limits analyzed are the
North West area, with the councils of Las Rozas de Madrid, Majadahonda, Boadilla del
Monte and Pozuelo de Alarcón, and the South West sector,
with the councils of Alcorcón, Leganés and Getafe.
Image 3. Comunidad de Madrid (Spain). North West and South West
areas of the Metropolitan Crown of Madrid, chosen as cases of
comparative study for the present research.
A comparative study which aspires to reveal some specific
balances and surpluses, requires a correct choice of the
cases of study for an ultimate comparison between them, in
order to obtain the correct and proportional relations for
verifying the hypothesis with a not to high margin of error
(not a suspicious choice for the cases of study).
Considering the previous premises, there have been chosen for the investigation the towns of
Majadahonda and Alcorcón. Majadahonda is located in the North West sector of the
metropolitan area of Madrid and it is 18 kilometers far from the city center (La Coruña
Highway which links Madrid with the North West of Spain, also named Nacional-VI). It also
has 38.5 km2 with a current population of 70,198 inhabitants. Alcorcón, on the contrary, is
located in the South West metropolitan sector and it is 13 km far from the capital core (at the
edge of Extremadura Highway, which links Madrid with Portugal). Its surface is 36.6 km2
ISBN: 978-84-697-1815-5
101
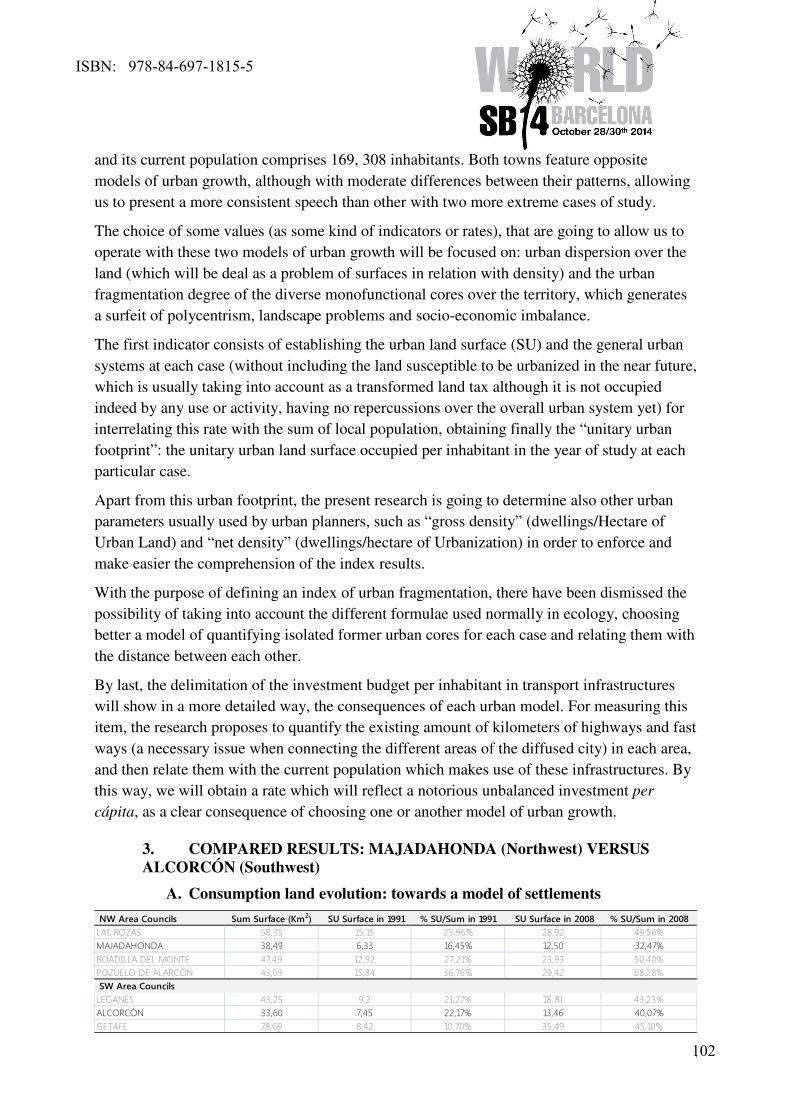
3
and its current population comprises 169, 308 inhabitants. Both towns feature opposite
models of urban growth, although with moderate differences between their patterns, allowing
us to present a more consistent speech than other with two more extreme cases of study.
The choice of some values (as some kind of indicators or rates), that are going to allow us to
operate with these two models of urban growth will be focused on: urban dispersion over the
land (which will be deal as a problem of surfaces in relation with density) and the urban
fragmentation degree of the diverse monofunctional cores over the territory, which generates
a surfeit of polycentrism, landscape problems and socio-economic imbalance.
The first indicator consists of establishing the urban land surface (SU) and the general urban
systems at each case (without including the land susceptible to be urbanized in the near future,
which is usually taking into account as a transformed land tax although it is not occupied
indeed by any use or activity, having no repercussions over the overall urban system yet) for
interrelating this rate with the sum of local population, obtaining finally the “unitary urban
footprint”: the unitary urban land surface occupied per inhabitant in the year of study at each
particular case.
Apart from this urban footprint, the present research is going to determine also other urban
parameters usually used by urban planners, such as “gross density” (dwellings/Hectare of
Urban Land) and “net density” (dwellings/hectare of Urbanization) in order to enforce and
make easier the comprehension of the index results.
With the purpose of defining an index of urban fragmentation, there have been dismissed the
possibility of taking into account the different formulae used normally in ecology, choosing
better a model of quantifying isolated former urban cores for each case and relating them with
the distance between each other.
By last, the delimitation of the investment budget per inhabitant in transport infrastructures
will show in a more detailed way, the consequences of each urban model. For measuring this
item, the research proposes to quantify the existing amount of kilometers of highways and fast
ways (a necessary issue when connecting the different areas of the diffused city) in each area,
and then relate them with the current population which makes use of these infrastructures. By
this way, we will obtain a rate which will reflect a notorious unbalanced investment per
cápita, as a clear consequence of choosing one or another model of urban growth.
3. COMPARED RESULTS: MAJADAHONDA (Northwest) VERSUS
ALCORCÓN (Southwest)
A. Consumption land evolution: towards a model of settlements
NW Area Councils Sum Surface (Km2) SU Surface in 1991 % SU/Sum in 1991 SU Surface in 2008 % SU/Sum in 2008
LAS ROZAS 58,35 15,15 25,96% 28,92 49,56%
MAJADAHONDA 38,49 6,33 16,45% 12,50 32,47%
BOADILLA DEL MONTE 47,49 12,92 27,21% 23,93 50,40%
POZUELO DE ALARCÓN 43,09 15,84 36,76% 29,42 68,28%
SW Area Councils
LEGANÉS 43,25 9,2 21,27% 18,70 43,23%
ALCORCÓN 33,60 7,45 22,17% 13,46 40,07%
GETAFE 78,69 8,42 10,70% 35,49 45,10%
ISBN: 978-84-697-1815-5
102
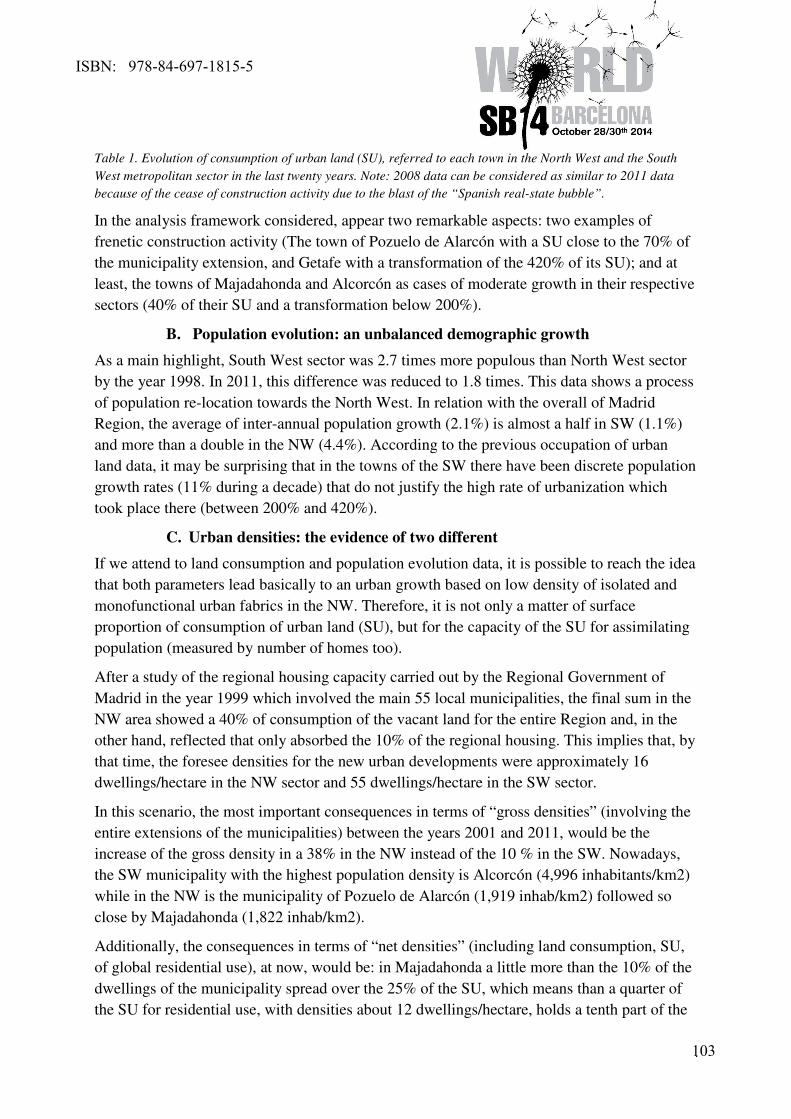
4
Table 1. Evolution of consumption of urban land (SU), referred to each town in the North West and the South
West metropolitan sector in the last twenty years. Note: 2008 data can be considered as similar to 2011 data
because of the cease of construction activity due to the blast of the “Spanish real-state bubble”.
In the analysis framework considered, appear two remarkable aspects: two examples of
frenetic construction activity (The town of Pozuelo de Alarcón with a SU close to the 70% of
the municipality extension, and Getafe with a transformation of the 420% of its SU); and at
least, the towns of Majadahonda and Alcorcón as cases of moderate growth in their respective
sectors (40% of their SU and a transformation below 200%).
B. Population evolution: an unbalanced demographic growth
As a main highlight, South West sector was 2.7 times more populous than North West sector
by the year 1998. In 2011, this difference was reduced to 1.8 times. This data shows a process
of population re-location towards the North West. In relation with the overall of Madrid
Region, the average of inter-annual population growth (2.1%) is almost a half in SW (1.1%)
and more than a double in the NW (4.4%). According to the previous occupation of urban
land data, it may be surprising that in the towns of the SW there have been discrete population
growth rates (11% during a decade) that do not justify the high rate of urbanization which
took place there (between 200% and 420%).
C. Urban densities: the evidence of two different
If we attend to land consumption and population evolution data, it is possible to reach the idea
that both parameters lead basically to an urban growth based on low density of isolated and
monofunctional urban fabrics in the NW. Therefore, it is not only a matter of surface
proportion of consumption of urban land (SU), but for the capacity of the SU for assimilating
population (measured by number of homes too).
After a study of the regional housing capacity carried out by the Regional Government of
Madrid in the year 1999 which involved the main 55 local municipalities, the final sum in the
NW area showed a 40% of consumption of the vacant land for the entire Region and, in the
other hand, reflected that only absorbed the 10% of the regional housing. This implies that, by
that time, the foresee densities for the new urban developments were approximately 16
dwellings/hectare in the NW sector and 55 dwellings/hectare in the SW sector.
In this scenario, the most important consequences in terms of “gross densities” (involving the
entire extensions of the municipalities) between the years 2001 and 2011, would be the
increase of the gross density in a 38% in the NW instead of the 10 % in the SW. Nowadays,
the SW municipality with the highest population density is Alcorcón (4,996 inhabitants/km2)
while in the NW is the municipality of Pozuelo de Alarcón (1,919 inhab/km2) followed so
close by Majadahonda (1,822 inhab/km2).
Additionally, the consequences in terms of “net densities” (including land consumption, SU,
of global residential use), at now, would be: in Majadahonda a little more than the 10% of the
dwellings of the municipality spread over the 25% of the SU, which means than a quarter of
the SU for residential use, with densities about 12 dwellings/hectare, holds a tenth part of the
ISBN: 978-84-697-1815-5
103
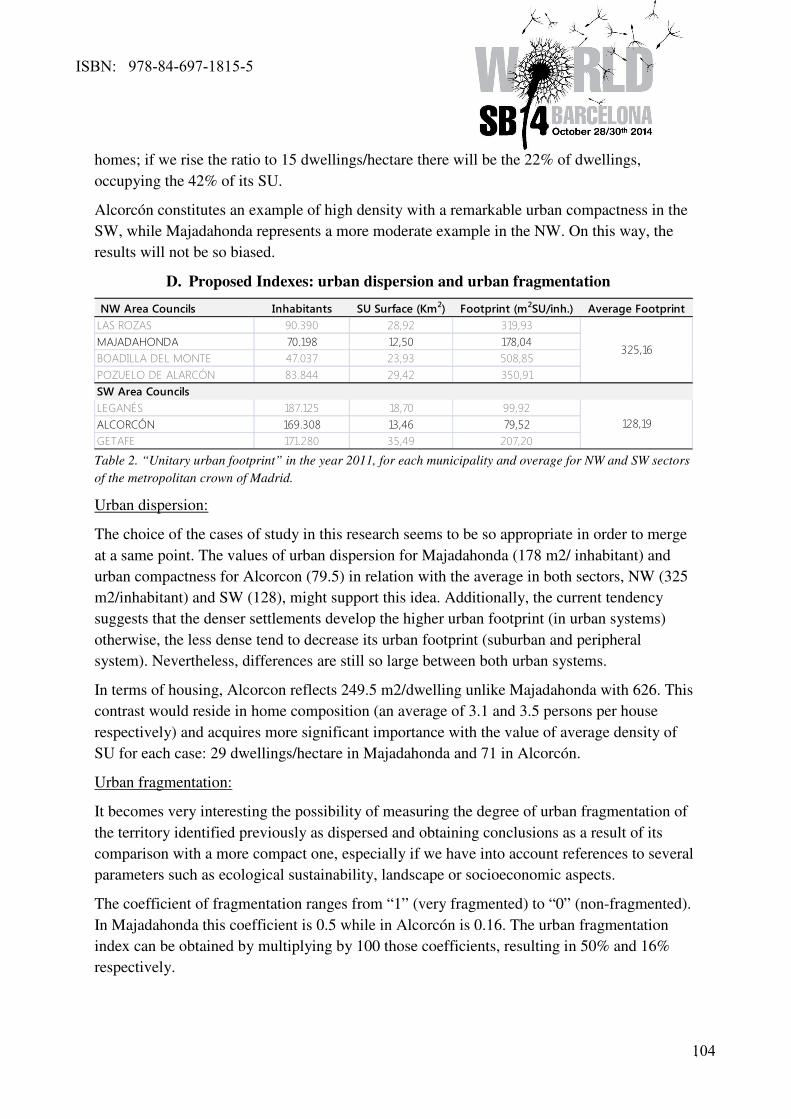
5
homes; if we rise the ratio to 15 dwellings/hectare there will be the 22% of dwellings,
occupying the 42% of its SU.
Alcorcón constitutes an example of high density with a remarkable urban compactness in the
SW, while Majadahonda represents a more moderate example in the NW. On this way, the
results will not be so biased.
D. Proposed Indexes: urban dispersion and urban fragmentation
Table 2. “Unitary urban footprint” in the year 2011, for each municipality and overage for NW and SW sectors
of the metropolitan crown of Madrid.
Urban dispersion:
The choice of the cases of study in this research seems to be so appropriate in order to merge
at a same point. The values of urban dispersion for Majadahonda (178 m2/ inhabitant) and
urban compactness for Alcorcon (79.5) in relation with the average in both sectors, NW (325
m2/inhabitant) and SW (128), might support this idea. Additionally, the current tendency
suggests that the denser settlements develop the higher urban footprint (in urban systems)
otherwise, the less dense tend to decrease its urban footprint (suburban and peripheral
system). Nevertheless, differences are still so large between both urban systems.
In terms of housing, Alcorcon reflects 249.5 m2/dwelling unlike Majadahonda with 626. This
contrast would reside in home composition (an average of 3.1 and 3.5 persons per house
respectively) and acquires more significant importance with the value of average density of
SU for each case: 29 dwellings/hectare in Majadahonda and 71 in Alcorcón.
Urban fragmentation:
It becomes very interesting the possibility of measuring the degree of urban fragmentation of
the territory identified previously as dispersed and obtaining conclusions as a result of its
comparison with a more compact one, especially if we have into account references to several
parameters such as ecological sustainability, landscape or socioeconomic aspects.
The coefficient of fragmentation ranges from “1” (very fragmented) to “0” (non-fragmented).
In Majadahonda this coefficient is 0.5 while in Alcorcón is 0.16. The urban fragmentation
index can be obtained by multiplying by 100 those coefficients, resulting in 50% and 16%
respectively.
NW Area Councils Inhabitants SU Surface (Km2) Footprint (m2SU/inh.) Average Footprint
LAS ROZAS 90.390 28,92 319,93
MAJADAHONDA 70.198 12,50 178,04
BOADILLA DEL MONTE 47.037 23,93 508,85
POZUELO DE ALARCÓN 83.844 29,42 350,91
SW Area Councils
LEGANÉS 187.125 18,70 99,92
ALCORCÓN 169.308 13,46 79,52
GETAFE 171.280 35,49 207,20
325,16
128,19
ISBN: 978-84-697-1815-5
104
6
To get a simple outline of this difference, while in Majadahonda the hinterland town roads
which link 10 fragmented settlements represents 19.95 km, in Alcorcon there are only 12.55
km linking 2 accidentally isolated settlements.
Image 4. Identification of the 10 sprawl cores in the hinterland of Majadahonda (adjacent to the center of the
city can be identified 4 in the North and 2 in the South East, the last 4 are isolated and spread over the
municipality area). Image 5. Occupation, measured in kilometres, of highways and motorways in Majadahonda.
It shows too the measure for local roads taken into account for connecting the cores of sprawl inside the
municipality borders.
E. Land articulation: an unbalanced investment per capita in the road system
In terms of length of local roads (highways and split roads), the results obtained for the two
cases of study shows 18.98 km in Majadahonda and 22.93 km in Alcorcon. This suggests a
value for the proposed indicator of 0.00027 km/inhabitant in Majadahonda versus 0.000135
km/inhabitant in Alcorcon. This difference becomes higher if we take into account the nearly
20 km of local roads for connecting the diverse fragmented cores inside the administrative
boundaries of Majadahonda.
4. CONCLUSSIONS
• The index which relates land consumption and urban densities (m2/inhabitant), that is
2.24 times higher in Majadahonda than in Alcorcon, does not represent any values to enable
the establishment of parameters for defining the social dimension of the towns analyzed, but
enables us to clearly identify an unsustainable and unavailable pattern of urban growth, at this
moment.
• The population absorption capacity is 0.38 in a dispersed urban fabric compared to a
compact one, in the cases of Majadahonda and Alcorcon respectively. Therefore, the same
consumption of ecological resources implies a higher impact over the territory and the urban
economy, supporting much less population. In this way, it is a matter of low moderate
densities versus high densities.
• Landscape impact, in terms of degree of urban fragmentation, is 3 times higher in
Majadahonda than in Alcorcon, due to the excess of isolated peripheral urbanizations which
spread over the territory disrupting ecological corridors and dividing natural areas.
• Road infrastructure investment matches with land consumption, but differences are
revealed when crossing this investment with the number of inhabitants which are served with
ISBN: 978-84-697-1815-5
105
7
these infrastructures: 2 times higher in Majadahonda than in Alcorcon. A dispersed urban
model, based in a massive car use, implies an additional economic impact due to a higher
infrastructure investment that generates a budget imbalance per inhabitant and a lack of social
justice for the local citizens regarding the compact one.
• The dispersed and fragmented urban model of Majadahonda, connected with several
speed corridors, must be re-formulated. An improvement in the uses, activities and densities
(which will provide a higher presence), would allow a better interaction among local citizens
with a fewer impact over the landscape and the socioeconomic local policy.
Future lines of research an open path:
The parameters obtained after the empirical analysis suggest interesting patterns of urban,
ecological, and socioeconomic procedures for specific urban extension models. It is necessary
to develop an analytical tool for the evaluation and comparison of the diverse factors which
drive urban density and form, with the goal of foreseeing events and helping in a better urban
planning towards physical and political aspects, always in a long-term vision. What has
happened with the land occupation model in the region of Madrid? What had been the most
influential elements from the last decades? What are the estrategic target for the current land
policy of polynucleated specialization and the subsequent high-investment in linking
infrastructures? It is necessary to focus the problem and use the adequate analytical tools in
order to obtain a full panorama of the recent urban expansion in relation with the
sustainability triangle.
REFERENCES:
Fariña, J. y Pozueta, J. (1997) Mobility in the residential fabrics of the scattered suburbs.
Universidad Politécnica de Madrid. Departamento de Urbanismo y Ordenación del Territorio.
Gutiérrez Puebla, J. y García Palomares, J.C. (2007) Espacios residenciales en la ciudad
dispersa. Homenaje al Profesor Casas Torres, 445-456. La ciudad dispersa: cambios recientes
en los espacios residenciales de la Comunidad de Madrid. Universidad Complutense de
Madrid. Departamento de Geografía Humana.
Hayden, D. (2003) Building Suburbia: Green Fields and Urban Sprawl. New York. Pantheon
Books.
Inostroza, L. (2012) Urban Sprawl and Fragmentation in Latin America: A Comparison with
European Cities. The Myth of the Diffuse Latin American City. Cambridge, MA. Lincoln
Institute of Land Policy.
López de Lucio, R. (1993) De la ciudad fragmentada y compacta a la disgregación espacial
articulada. Universitat de Valencia. Servei de Publicacions.
Muxí Martínez, Zaida (2013) Postsuburbia. Barcelona. Comanegra.
OSE. Observatorio de la Sostenibilidad en España. 2006. Cambios de ocupación del suelo en
España. Implicaciones para la sostenibilidad. OSE. Madrid.
ISBN: 978-84-697-1815-5
106

8
Ruiz, J. (2000) Planeamiento urbano territorial en Madrid. La experiencia reciente. Urban
5(14): 122-142. Universidad Politécnica de Madrid. Departamento de Urbanismo y
Ordenación del Territorio.
Santiago, E. De (2008) Madrid 'ciudad única' (II). La explosión urbana en la región madrileña
y sus efectos colaterales. Urban 13(14): 138-164. Universidad Politécnica de Madrid.
Departamento de Urbanismo y Ordenación del Territorio.
ISBN: 978-84-697-1815-5
107
1
Green Urbanism and Diffusion Issues
Manley, Karen1; Rose, Timothy M.
2
1 School of Civil Engineering and Built Environment, Science and Engineering Faculty,
Queensland University of Technology, Brisbane, Australia 2
School of Civil Engineering and Built Environment, Science and Engineering Faculty,
Queensland University of Technology, Brisbane, Australia
Abstract: This paper addresses the research question, ‘What are the diffusion determinants
for green urbanism innovations in Australia?’ This is a significant topic given the global
movement towards green urbanism. The study reported here is based on desktop research that
provides new insights through (1) synthesis of the latest research findings on green urbanism
innovations and (2) interpretation of diffusion issues through our innovation system model.
Although innovation determinants have been studied extensively overseas and in Australia,
there is presently a gap in the literature when it comes to these determinants for green
urbanism in Australia. The current paper fills this gap. Using a conceptual framework drawn
from the innovation systems literature, this paper synthesises and interprets the literature to
map the current state of green urbanism innovations in Australia and to analyse the drivers
for, and obstacles to, their optimal diffusion.
The results point to the importance of collaboration between project-based actors in the
implementation of green urbanism. Education, training and regulation across the product
system is also required to improve the cultural and technical context for implementation. The
results are limited by their exploratory nature and future research is planned to quantify
barriers to green urbanism.
Keywords: Environment, innovation, diffusion, green urbanism, Australia
INTRODUCTION
Global cities are entering a challenging period as a result of climate change, population
growth, increasing levels of urbanisation and depleting natural resources. Currently, Australia
is facing challenges in meeting global community obligations to reduce fossil fuel use and
mitigate the effects of global warming, due to high greenhouse emission levels per capita in
comparison to world standards (8). On a global scale, greenhouse gas emissions increased by
3.1% between 2000 and 2006, compared to an increase of 1.1% during the 1990’s (9). This
increase reflects the urgency for change in our approach to the built environment and the need
for humans to reduce resource consumption despite population growth and urbanisation. This
not only involves ‘technical’ sustainability actions (such as the use of sustainable and eco-
efficient materials or design features), but also ‘behavioural’ sustainability, i.e. positive
human behaviour in relation to the environment (22). These two areas of action are closely
interlinked and can heavily influence one another.
Australia’s population growth is expected to reach between 30.9 and 42.5 million people by
2056 (1). As a result of population growth, rapid urbanisation is significantly increasing
ISBN: 978-84-697-1815-5
108
2
settlement density which can negatively affect the well-being of residents and place excessive
psychological demands on them (18). This translates into unhealthy communities with higher
rates of psychological problems.
The sustainable city movement or what has been coined ‘green urbanism’ is a concept that
offers innovative approaches to dealing with rapid urban growth. A major challenge faced by
planners and policy makers in Australia is understanding the complex spatial connections that
define our built environment, particularly in urban areas. Thus, a coherent approach is
required to integrate urban spaces across global, regional, city, precinct, building and building
component levels (16). Obviously this is not an easy task, but there is an increasing need for
cities across all spatially connected levels to be developed in a sustainable way.
Integrating sustainable ‘green’ systems into new developments is easier than retrofitting
existing urban spaces and as such if ‘we [industry, policy makers, communities] can influence
planning of new towns right from the beginning, we have a great chance to get things right’
(12). This includes designing new developments that ‘can contribute both to the reduction of
emissions and delivery of zero carbon development, and to the shaping of sustainable
communities that are resilient to the climate change now excepted as inevitable’ (5).
Beatley (2) provided a significant early contribution to the Green Urbanism agenda when he
noted that there are broad design characteristics that exemplify green urbanism (p6-8), in
cities that:
• strive to live within their ecological limits, fundamentally reduce their ecological
footprint, and acknowledge their connections with and impacts on other cities and
communities and the larger planet
• are designed for and function in ways analogous to nature
• strive to achieve a circular rather than a linear metabolism, which nurtures and
develops positive symbiotic relationships with and between its hinterland (regional,
national or international)
• strive towards local and regional self-sufficiency and take full advantage of and
nurture local/regional food production, economy, power production, and many other
activities that sustain and support their populations
• facilitate (and encourage) more sustainable, healthful lifestyles, and
• emphasize a high quality of life and the creation of highly liveable neighbourhoods
and communities.
More specifically, according to the UNESCO Chair in Sustainable Urban Development for
Asia and the Pacific, there are three key components (or pillars) of ‘green urbanism’ (12) that
affect built environment sustainability, and closely interact. They are as follows:
ISBN: 978-84-697-1815-5
109
3
• Energy and materials – comprising: embodied energy, material specification, supply
chain integration, renewable energy solutions, energy sources and consumption,
construction systems, prefabrication and recycling, energy efficiency, and resource
management.
• Water and biodiversity – comprising: urban water management, water recycling and
irrigation, urban landscape typologies, maximised ecosystem biodiversity, grey water
recycling; storage of urban stormwater, climate change impact management, and
waste management.
• Urban planning and transport – comprising: urban design, social sustainability,
ecological city theory, health and walk-ability, mobility and public transport links,
infrastructure, energy efficient buildings, mixed land use, housing affordability,
reduced car dependency, and subdivision design.
In summary, green urbanism is a multi-disciplinary endeavour involving a wide range of
specialists including planners, biologists, engineers, architects, sociologists, economists and
environmentalists. The aim of the endeavour is to minimise environmental and psychological
costs through every stage of the urban lifecycle (13).
METHODS AND CONCEPTUAL BACKGROUND
This exploratory paper is based on an international review of leading peer reviewed journals,
in both technical and management fields. It draws on highly cited articles published between
2000 and 2011. The articles dealt with the adoption of green urbanism innovations in
Australia. Content analysis was employed to understand the diffusion context in view of the
conceptual framework, which is shown in Figure 1. The authors each independently allocated
the themes arising in the literature to the activities and actors shown in Figure 1. Following
this, the two sets of analysis were merged and triangulated to arrive at a consensus
understanding of the nature of key determinants. An innovation system framework was used
to understand adoption determinants. The Construction Product System framework reveals
the relationships between key activities and actors involved in the creation of the built
environment. The regulatory and institutional context shapes, and is shaped by, the supply
network, project-based firms and projects, with the technical support infrastructure playing a
similar role.
ISBN: 978-84-697-1815-5
110
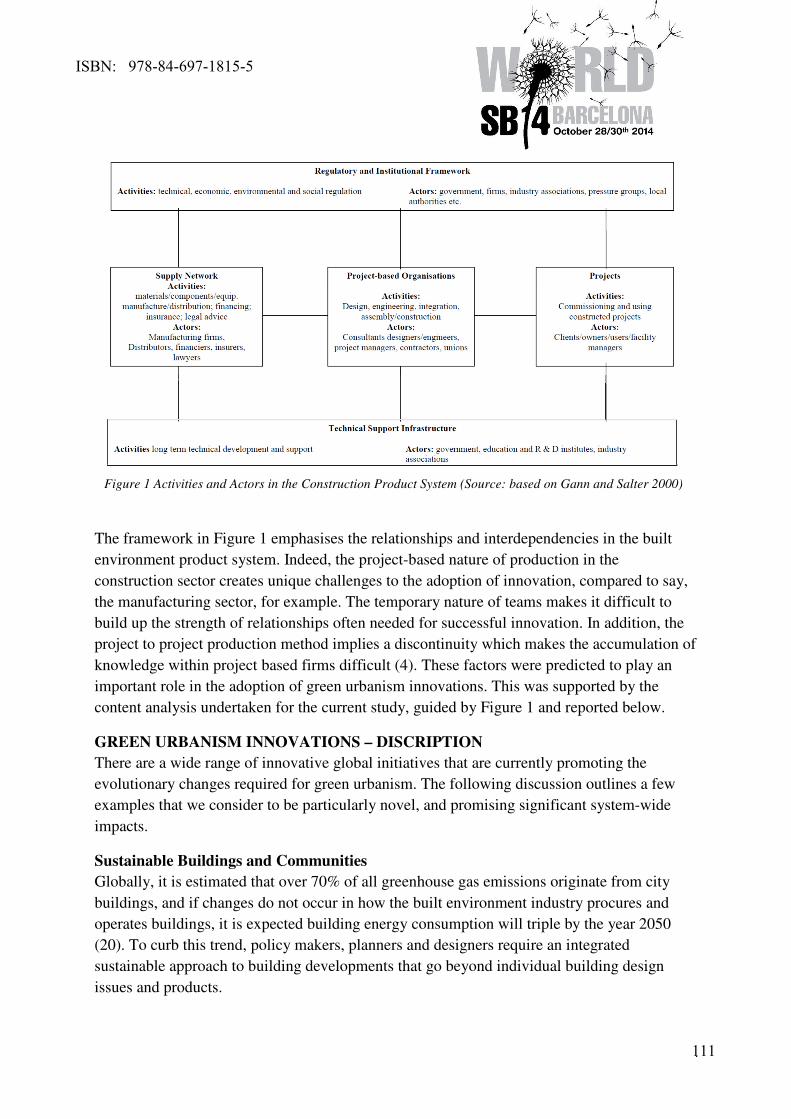
4
The framework in Figure 1 emphasises the relationships and interdependencies in the built
environment product system. Indeed, the project-based nature of production in the
construction sector creates unique challenges to the adoption of innovation, compared to say,
the manufacturing sector, for example. The temporary nature of teams makes it difficult to
build up the strength of relationships often needed for successful innovation. In addition, the
project to project production method implies a discontinuity which makes the accumulation of
knowledge within project based firms difficult (4). These factors were predicted to play an
important role in the adoption of green urbanism innovations. This was supported by the
content analysis undertaken for the current study, guided by Figure 1 and reported below.
GREEN URBANISM INNOVATIONS – DISCRIPTION
There are a wide range of innovative global initiatives that are currently promoting the
evolutionary changes required for green urbanism. The following discussion outlines a few
examples that we consider to be particularly novel, and promising significant system-wide
impacts.
Sustainable Buildings and Communities
Globally, it is estimated that over 70% of all greenhouse gas emissions originate from city
buildings, and if changes do not occur in how the built environment industry procures and
operates buildings, it is expected building energy consumption will triple by the year 2050
(20). To curb this trend, policy makers, planners and designers require an integrated
sustainable approach to building developments that go beyond individual building design
issues and products.
Figure 1 Activities and Actors in the Construction Product System (Source: based on Gann and Salter 2000)
ISBN: 978-84-697-1815-5
111
5
For example, sustainable community planning involves close connection between energy
efficient housing integrated with community planning such as recycling schemes, public
transport access, neighbourhood layout, and efficient use of public space (3). By placing
emphasis on community development and public engagement in the design of new urban
areas, a sustainable dynamic across an entire community can be encouraged. This is achieved
by integrating sustainable buildings within an environment that optimises functionality and
user satisfaction. Another aim is to provide opportunities for residents to make a cultural shift
in their behaviour towards sustainable practices – such as sustainable transport and recycling
programs.
Much sustainable community planning theory encourages ‘carbon-neutral communities’ that
produce zero carbon dioxide (CO2) emissions through efficient design and construction of
buildings, infrastructure and operations (e.g. including on-site generation of renewable
energy). According to research undertaken by RMIT on the development of carbon neutral
communities in Australia, there is a need for a large research effort to realise the potential for
carbon neutral communities and a requirement for further development of new technology to
offset CO2 emissions (10).
One step in this direction is the development of new city Master Planning technology which is
improving how buildings interact within an urban environment and can assist planners in
balancing social, environmental and economic parameters. One such technology is virtual city
modelling (an expansion on individual building modelling) that can be used to assist in
predicting the implications of future planning decisions on the urban form and function; and
measure long-term energy use (20).
Urban Informatics
Currently, 50% of the world’s population live in cities and it is expected this will increase to
80% by 2050 (19). Due to increasing urbanisation, planning will play a critical role in shaping
the urban environment to cater for these changes. Urban informatics assist urban planners in
creating spaces that improve human habitat within the urban environment. This new approach
includes the use of advanced information technology and mobile communication systems to
monitor real-time ‘performance’ of a city and improve levels of interactivity between humans
and the urban environment. This interaction is founded in the principles of urban informatics.
Urban informatics has emerged as a significant area of research over the past few years,
requiring input from a wide range of disciplines, including information technology, social
science, and built environment design (21). The premise behind urban informatics is that
cities are living organisms and function with the rapid flow of information and
communication across a wide range of infrastructure and social networks (6). Analysis of the
‘urban anatomy’ requires real-time research methods that integrate not only the levels of a
city’s infrastructure, but also provide meaning to how the various anatomic systems interact
and the interrelationships that are formed beyond its physical elements. This comprises the
analysis of information and communication networks, or what can be coined the ‘city of bits’
ISBN: 978-84-697-1815-5
112

6
(14), and most importantly, the interaction of city residents introducing socio-cultural factors
to the study of the urban environment (6).
It is this interactive environment between people, place and technology that offers significant
potential for innovation. Not only does technology offer innovative ways to communicate,
interact and way-find (positioning) in the urban environment, but it can also assist in urban
sustainability, such as information linkages between renewable energy producing devices.
Urban informatics also includes the potential development of ‘digital cities’, where software
and hardware is used to simulate urban environments through 3D visual interfaces; and
provides city residents with a virtual space to conduct business or socialise (6). A further
advancement is the concept of ‘city augmentation‘, combining both the physical built
environment with a ‘virtual’ built environment to improve urban efficiency. Such
technological advancements offer significant opportunities in the evolution of cities in coping
with environmental changes in Australia and internationally.
GREEN URBANISM INNOVATIONS – SYSTEM DYNAMICS
The application of green urbanism principles across the entire Construction Product System
offers long-term social and economic benefits, and at the global level, can contribute to the
agenda for environmental sustainability and combating climate change. In reference to Figure
1, these initiatives (in their fully integrated form), are designed to impact all the key activities
and actors in the Construction Product System. Sustainability innovations that integrate urban
spaces across global, regional, city, precinct, building and building component levels are
currently driven by 1) material, component and equipment manufacturing; 2) technical and
environmental regulations; and 3) design, construction and urban planning practice.
A key element of the promotion of green urbanism in the built environment is the interest and
relevant knowledge of the project-based actors. Project-based actors at the development level
provide the expertise to integrate complex environment systems that determine optimal ‘green
design’ solutions. Design coordination between project-based firm actors such as architects,
engineers, contractors and urban planners is currently a key challenge in promoting green
urban development, but is essential. Local government authority actors tasked with urban area
planning play a key role in this coordination process, particularly providing the linkages
between building and infrastructure system integration.
Support infrastructure actors (such as education institutes and industry associations) are
assisting in advocating the benefits that can be achieved through green urbanism and
sustainable development. They are targeting awareness and education campaigns to a range of
actors, with particular emphasis on clients and developers. One successful example of this is
the recently released EnviroDevelopment system, produced by the Urban Development
Institute of Australia (UDIA). This system aims to educate planners and designers on the
holistic assessment process required for the promotion of sustainability principles in new
residential sub division development (17). Similarly, with the development of emerging urban
modelling technologies by R&D institutes, urban planners and designers have greater
ISBN: 978-84-697-1815-5
113
7
confidence in the efficiency of their proposed urban design solutions. Such systems also have
an impact on end-product actors (government/private owners and users), as they provide the
tools for the ongoing monitoring of urban design efficiency. For example, urban informatics
offers great potential to improve the integration between people, place and technology in
urban areas.
GREEN URBANISM INNOVATIONS – DIFFUSION ISSUES
A major barrier to the implementation of innovations that promote green urbanism is a lack of
training for government and private developers on the need (and benefits that can be gained)
from sustainable development. According to Horne, Bates et al. (10), legislative and
economic instruments are powerful change promoters when applied in a consistent manner;
however, the ‘persuasive nature of carbon-based lifestyles and work practices in Australia
demands additional strategies based upon education, capacity-building and encouragement of
voluntary measures’ (p.7).
Technical support infrastructure actors have a major role to play in these processes,
particularly education institutes and industry associations. Although many educational
programmes in Australia are promoting sustainability at the individual development level,
improved coordination across all actors in the Construction Product System is required to
overcome the barriers to uptake.
At the supply network and project-based firm level, current factors that are influencing the
levels of uptake include demand for market share and shareholder perceptions towards green
initiatives. Government policy on green energy generation and carbon trading schemes are
key initiatives promoting change in demand and perceptions (10). Also, barriers to
client/consumer acceptance of sustainable practices include perceived opportunity costs,
convenience, reliability and maintenance cost, social status, perception of inferior products,
and short-term views on cost-effectiveness (10).
In addition, there is currently a need to develop further understanding of the ‘cultural’ barriers
to the uptake of green urbanism and sustainable development specifically from an Australian
perspective (15). As human behaviour is shaped by the norms and values of communities, it is
expected that responses to various community engagement and education initiatives will
require a unique approach to adapt Australian attitudes and cultural norms.
Finally, cost is a major barrier to the uptake of sustainable development in the Australian built
environment. Pinnegar, Marceau et al. (16) recommend clients should take a ‘whole of life’
cycle analysis approach to the assessment of a built asset’s cost. This includes ‘estimating the
cumulative environmental and social impacts of a building throughout its lifespan, from
construction, to use, to demolition’ (p.27). Although investment in technologies that improve
sustainability may cost more upfront, the long-term benefits (from an environmental,
economic and social perspective) can offset such costs. However, investment structures
should be set up in a way to promote the long-term benefits (and not just the economic
‘payback’ benefits) to all parties financing the upfront costs (16).
ISBN: 978-84-697-1815-5
114
8
In response to environmental degradation and global warming, Australian governments can
promote change through an integrated policy and research approach, i.e. tightening regulatory
requirements for ‘technical’ sustainability action, and investing in research and education
programmes to promote ‘behavioural’ sustainability. According to Kellett (11), the
effectiveness of government policy to promote the transition to a more sustainable future in
urban areas requires ‘innovation, negotiated partnerships with market-based utility suppliers,
novel institutions and a willingness to innovate on the part of local authorities and
developers… [and] above all, community support’ (p.395). Thus, it is critical that both the
social and financial benefits of sustainable development and green urbanism are made
obvious to all built environment stakeholders.
CONCLUSIONS
As a result of climate change, population growth, increasing levels of urbanisation and
depleting natural resources, major challenges are faced by planners and policy makers in
Australia to redefine the spatial connections that integrate growing urban areas across global,
regional, city, precinct, building and building component levels. A key part of this challenge
is in the diffusion of green innovation and technology within urban areas. Drawing on a
synthesis of literature in urban planning and innovation management fields, this paper has
profiled innovative global initiatives that are currently promoting the evolutionary changes
required for green urbanism. These innovations where interpreted through the lens of the
Construction Product System framework in order to identify the determinants of green
urbanism innovation diffusion.
Results indicate the important role to be played by project-based actors at the development
level to provide the expertise to integrate complex environment systems that determine
optimal ‘green design’ solutions. Project-based actor interest and relevant knowledge in green
design solutions and the design integration across architects, engineers, contractors and urban
planners remains a key challenge in promoting green urban development. Additionally,
results indicate local government authority actors tasked with urban area planning also play a
key role in this integration process, particularly providing the linkages between building and
infrastructure system integration. The research finding suggest a requirement to increase
training for government and private developers on the need (and benefits that can be gained)
from sustainable development initiatives.
Results also indicate the important role to be played in these processes by technical support
infrastructure actors, particularly education institutes and industry associations. Although
many educational programmes in Australia are promoting sustainability at the individual
development level, improved coordination across all actors in the Construction Product
System is required to overcome the barriers to diffusion. Additionally, there is an identified
need to develop further understanding of the ‘cultural’ barriers to the uptake of green
urbanism and sustainable development specifically from an Australian perspective. As
diffusion of green innovations are shaped by individual and cultural norms and community
values in Australia, it is expected that a tailored approach to community engagement and
ISBN: 978-84-697-1815-5
115
9
education initiatives is required to suit this specific context. Finally, the results suggest
Australian governments need to be promoting change in the green urbanism space by possibly
tightening regulatory requirements for ‘technical’ sustainability action, and investing in
research and education programmes to promote ‘behavioural’ change.
Given the significant breadth of the topic, it has been necessary to profile selected green
urbanism innovations from across the full range available. This selection has been necessarily
subjective, but is nevertheless based on the advice of subject matter experts. It is expected
future research will be able to quantify the relative promise of the profiled innovations, but as
a starting point, this paper has mapped the innovation system dynamics surrounding the
diffusion of key emerging innovations. Future empirical research is planned to build on these
exploratory findings and further quantify the barriers to the wider diffusion of green urbanism
innovation in the Australian built environment.
REFERENCES
1. Australian Bureau of Statistics (ABS) (2009). Australian social trends. Catalogue No
4102.0. Canberra, Australian Bureau of Statistics.
2. Beatley, T. (2000). Green urbanism: learning from European cities, Island Press.
3. Bergman, N. L., Whitmarsh, L and Kohler, J. (2007). Assessing transitions to sustainable
housing and communities in the UK. International Conference on Whole Life Urban
Sustainability and its Assessment, Glasgow, Scotland.
4. Blayse, A. M. and Manley, K. (2004). Key influences on construction innovation.
Construction Innovation: Information, Process, Management, 4(3): 143 – 154.
5. Department of Communities and Local Government (DCLG) (2006). Building a greener
future: Towards zero carbon development. London, Department for Communities and
Local Government UK.
6. Foth, M. (2008) Handbook of research on urban informatics: The practice and promise of
the real-time city. Idea Group.
7. Gann, D. M. and Salter, A. J. (2000). Innovation in project-based, service-enhanced firms:
the construction of complex products and systems. Research Policy 29(7-8): 955-972.
8. Garnaut, R. (2011) Garnaut Climate Change Review Report., Canberra. Garnaut Climate
Change Review.
9. Garnaut, R. (2008). Garnaut climate change review: Interim report to the Commonwealth,
State and Territory Governments of Australia. Canberra. Garnaut Climate Change Review.
10. Horne, R. E., Bates, M, Fien, J, Kellet, J. and Hamnett, S. (2007) Carbon neutral
communities: Definitions and prospects. CNC Working Paper No. 1, Centre for Design,
RMIT University and University of South Australia.
11. Kellett, J. (2007). Community-based energy policy: A practical approach to carbon
reduction. Journal of Environmental Planning and Management 50(3): 381-396.
12. Lehmann, S. (2008). Rapid urbanization in the Asia-Pacific region: A roadmap to 2015
and beyond. The Journal of Green Building 3(3): 88-96.
13. Lehmann, S. (2011) The Principles of Green Urbanism, London. Earthscan.
ISBN: 978-84-697-1815-5
116
10
14. Mitchell, W. J. (1996) City of bits: space, place, and the infobahn. Cambridge. MIT
Press.
15. Moloney, S., Maller, C and Horne, R. (2008). Housing and sustainability: bridging the
gap between technical solutions and householder behaviour. 3rd AHRC Conference:
Housing Research for a Sustainable Affordable Future. Melbourne. RMIT University.
16. Pinnegar, S., Marceau, J and Randolph, W. (2008) Innovation and the city: challenges for
the built environment industry. City Futures Research Centre: Issues Paper No. 7,
Department of Innovation, Industry, Science and Research.
17. Urban Development Institute of Australia (UDIA) (2013). EnviroDevelopment National
Technical Standards Version 2. UDIA. Retrieved 25 May, 2014, from
http://www.envirodevelopment.com.au/_dbase_upl/National_Technical_Standards_V2.p
df
18. Van den Berg, A. E., Hartig, T and Staats, H. (2007). Preference for nature in urbanized
societies: stress, restoration, and the pursuit of sustainability. Journal of Social Issues
63(1): 79-96.
19. World Economic Forum (WEF) (2008). SlimCity - Briefing 2008. SlimCity. World
Economic Forum.
20. World Economic Forum (WEF) and Arup (2009). SlimCity: Sustainable Buildings.
SlimCity, World Economic Forum and ARUP.
21. Williams, A., Robles, E and Dourish, P. (2008) Urbane-ing the City: examining and
refining the assumptions behind urban informatics. Handbook of research on urban
informatics: The practice and promise of the real-time city. M. Foth, Idea Group. 1-20.
22. Williams, K. and Dair, C. (2007). A framework of sustainable behaviours that can be
enabled through the design of neighbourhood‐scale developments. Sustainable
Development, 15(3): 160‐173.
ISBN: 978-84-697-1815-5
117
1
Proposal of urban mobility model from the modal integration
Santa Maria do Leme river basin: subsidies for the expansion at
São Carlos city, São Paulo State, Brazil
Speakers:
SOUSA, Isabel1; HANAI, Frederico Yuri
2; PERES, Renata Bovo
3;
1 UFSCar, University of The City São Carlos, São Paulo, Brazil,
2 UFSCar, University of The City São Carlos, São Paulo, Brazil
3 UFSCar, University of The City São Carlos, São Paulo, Brazil
Abstract: The appropriate solution proposals to traffic problems requires dynamic view of the
particularities of a region associated with the pursuit of innovation and good practice applied
in other locations. This project aimed to identify and analyze the current situation of the
transport on São Carlos city, located in São Paulo State, Brazil, and propose the
diversification of urban mobility searching for integration of transport modes. Currently there
is an increase in the visibility and recognition of the importance of mobility in Brazil,
evidenced by the establishment of the National Policy on Urban Mobility in January 2012
(Law No. 12,587), which aims at the integration between different modes of transport and
improving accessibility and mobility of people and loadings in the territory of the
municipality. This study aimed to obtain datas to allow current quality assessment of urban
public transport services, to develop a diagnosis and proposed actions, exposing solutions
that encourage integrated multiple modes of transportation reconciled with wide accessibility
and democratic, social inclusion. The work suggests the structuring of quality and alternative
ways, in addition to prioritization of non-motorized, collective and sustainable modes of
transport.
Keywords: Urban mobility, modal integration; transportation systems; sustainable
transport.
INTRODUCTION
The urban mobility includes the accessibility to the public transport systems, the quality of
transport services, the range of mobility possibilities, and the possibility to provide
displacement on universal bases inside a territorial area.
Great part of the configuration of existing cities is centralized in the primacy of individual
transport, overlapping the collective transportation and the non-motorized, such as bicycles
and pedestrians mobility. Such way of urban organization sets a traffic problem, where it is
common to associate the road infrastructure to individual motorization (HILDEBRAND,
2012).
ISBN: 978-84-697-1815-5
118
2
Reach a level of high range and quality of the transport systems goes through actions such as:
articulation of planning the land use and occupation, improvement of the road system and
transports, development of economic and fiscal instruments; development of studies and
analysis of the current situation; investments in new technologies; implementation of
adjustment proposals to the dwellers – present and future – demands for mobility; as well as
the availability of a range of integrated transport modes.
The resolution of the urban transport and mobility issues promotes the improvement in the
citizens’ quality of life, considering that, through this action, it is possible to: drive up the
economy (once the hours wasted in traffic jams are reverted to productivity), display the
potentialities of development for a location (considering that, once the transportation issue is
solved, actions may be directed to seek the adjustment of other problems and invest in means
of socio-economic growth), improve the esthetic aspect of the city (through the
decrease/elimination of traffic jams), and ensures the flow of people - indispensable aspect for
the promotion of urban vitality and the cultural development, providing the creation of a
singular identity for the city.
Provide the ways for people to walk around and circulate, within a diversified and
interconnected system of transport (where the citizen can decide the best way to travel, or the
best transportation to use, according to his will) is not only about having the options and
possibilities, actually, it is an individual right, an expression of freedom and social inclusion.
Obtaining the data to assess the quality of urban public transport service, as well as the
condition of the roads and other traffic areas, is relevant for mobility studies in several urban
centers, including cities in expansion process, corresponding to those located in the
countryside of São Paulo’ state, Brazil.
The city of São Carlos is one of those cities, has an area of 1,137.332 square kilometers, the
populations totalizes 221,950 inhabitants and the "Índice de Desenvolvimento Humano
Municipal" (IDHM - Municipal Index of Urban Development) value is 0.805 (IBGE, 2010).
São Carlos process of expansion has demanded challenges of studies, planning and feasibility
of the transportations modes.
The urban mobility current situation in one of the main avenues in the city (Miguel Petroni
Avenue) - located in Santa Maria do Leme watershed within this city) already demonstrate
several impacts, such as the excess of vehicles, intense flow in rush hours and the lack of
diversified infrastructure of transport modes.
Besides that, the urban mobility configuration at this avenue does not match the resolutions
and guidelines from the "Política Nacional de Mobilidade Urbana" (National Policy for Urban
Mobility) (BRASIL, 2012), and it is notable that the current organization of the existent
transportation is at odds with the paths proposed by this Policy, making it essential to present
measures which boost the resolution of mobility and circulation impasses, combining the
ISBN: 978-84-697-1815-5
119
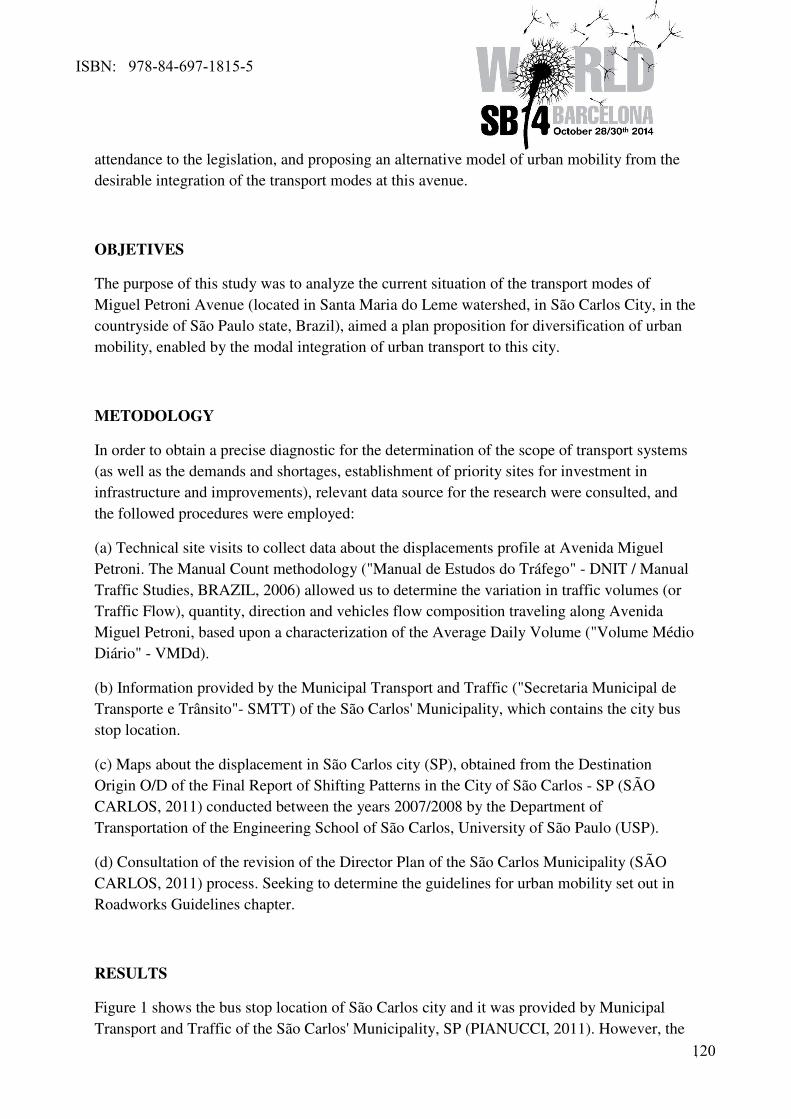
3
attendance to the legislation, and proposing an alternative model of urban mobility from the
desirable integration of the transport modes at this avenue.
OBJETIVES
The purpose of this study was to analyze the current situation of the transport modes of
Miguel Petroni Avenue (located in Santa Maria do Leme watershed, in São Carlos City, in the
countryside of São Paulo state, Brazil), aimed a plan proposition for diversification of urban
mobility, enabled by the modal integration of urban transport to this city.
METODOLOGY
In order to obtain a precise diagnostic for the determination of the scope of transport systems
(as well as the demands and shortages, establishment of priority sites for investment in
infrastructure and improvements), relevant data source for the research were consulted, and
the followed procedures were employed:
(a) Technical site visits to collect data about the displacements profile at Avenida Miguel
Petroni. The Manual Count methodology ("Manual de Estudos do Tráfego" - DNIT / Manual
Traffic Studies, BRAZIL, 2006) allowed us to determine the variation in traffic volumes (or
Traffic Flow), quantity, direction and vehicles flow composition traveling along Avenida
Miguel Petroni, based upon a characterization of the Average Daily Volume ("Volume Médio
Diário" - VMDd).
(b) Information provided by the Municipal Transport and Traffic ("Secretaria Municipal de
Transporte e Trânsito"- SMTT) of the São Carlos' Municipality, which contains the city bus
stop location.
(c) Maps about the displacement in São Carlos city (SP), obtained from the Destination
Origin O/D of the Final Report of Shifting Patterns in the City of São Carlos - SP (SÃO
CARLOS, 2011) conducted between the years 2007/2008 by the Department of
Transportation of the Engineering School of São Carlos, University of São Paulo (USP).
(d) Consultation of the revision of the Director Plan of the São Carlos Municipality (SÃO
CARLOS, 2011) process. Seeking to determine the guidelines for urban mobility set out in
Roadworks Guidelines chapter.
RESULTS
Figure 1 shows the bus stop location of São Carlos city and it was provided by Municipal
Transport and Traffic of the São Carlos' Municipality, SP (PIANUCCI, 2011). However, the
ISBN: 978-84-697-1815-5
120
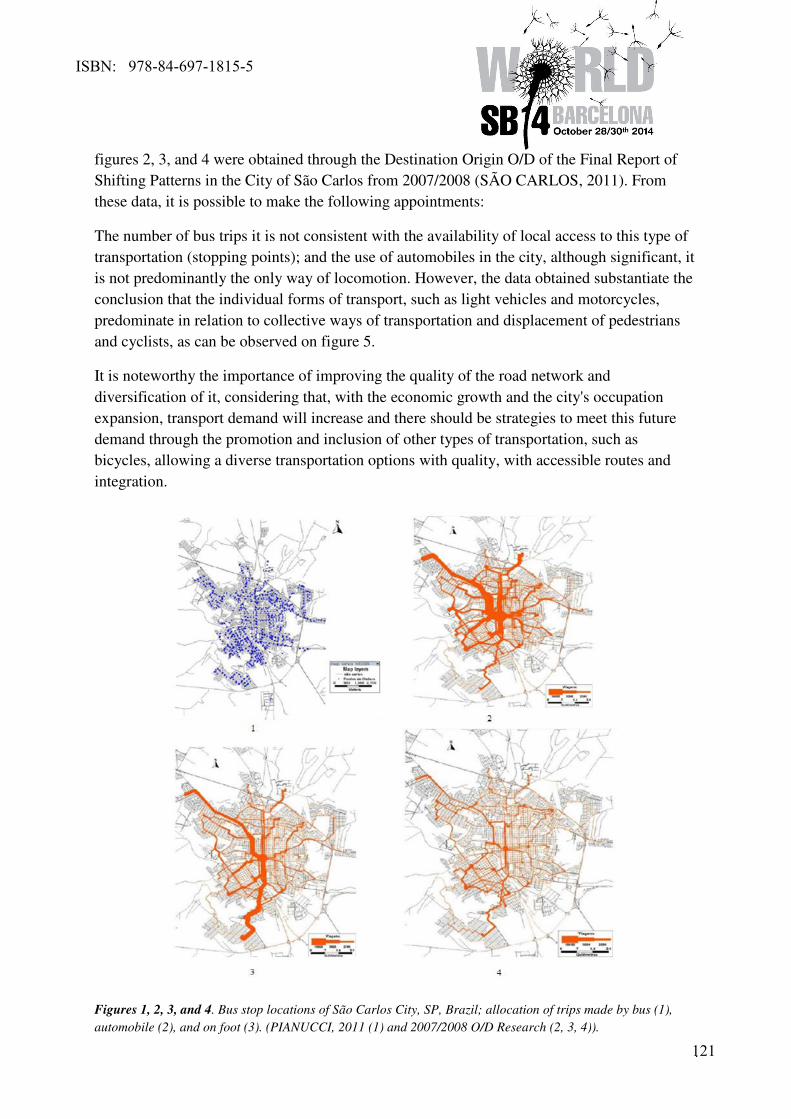
4
figures 2, 3, and 4 were obtained through the Destination Origin O/D of the Final Report of
Shifting Patterns in the City of São Carlos from 2007/2008 (SÃO CARLOS, 2011). From
these data, it is possible to make the following appointments:
The number of bus trips it is not consistent with the availability of local access to this type of
transportation (stopping points); and the use of automobiles in the city, although significant, it
is not predominantly the only way of locomotion. However, the data obtained substantiate the
conclusion that the individual forms of transport, such as light vehicles and motorcycles,
predominate in relation to collective ways of transportation and displacement of pedestrians
and cyclists, as can be observed on figure 5.
It is noteworthy the importance of improving the quality of the road network and
diversification of it, considering that, with the economic growth and the city's occupation
expansion, transport demand will increase and there should be strategies to meet this future
demand through the promotion and inclusion of other types of transportation, such as
bicycles, allowing a diverse transportation options with quality, with accessible routes and
integration.
Figures 1, 2, 3, and 4. Bus stop locations of São Carlos City, SP, Brazil; allocation of trips made by bus (1),
automobile (2), and on foot (3). (PIANUCCI, 2011 (1) and 2007/2008 O/D Research (2, 3, 4)).
ISBN: 978-84-697-1815-5
121
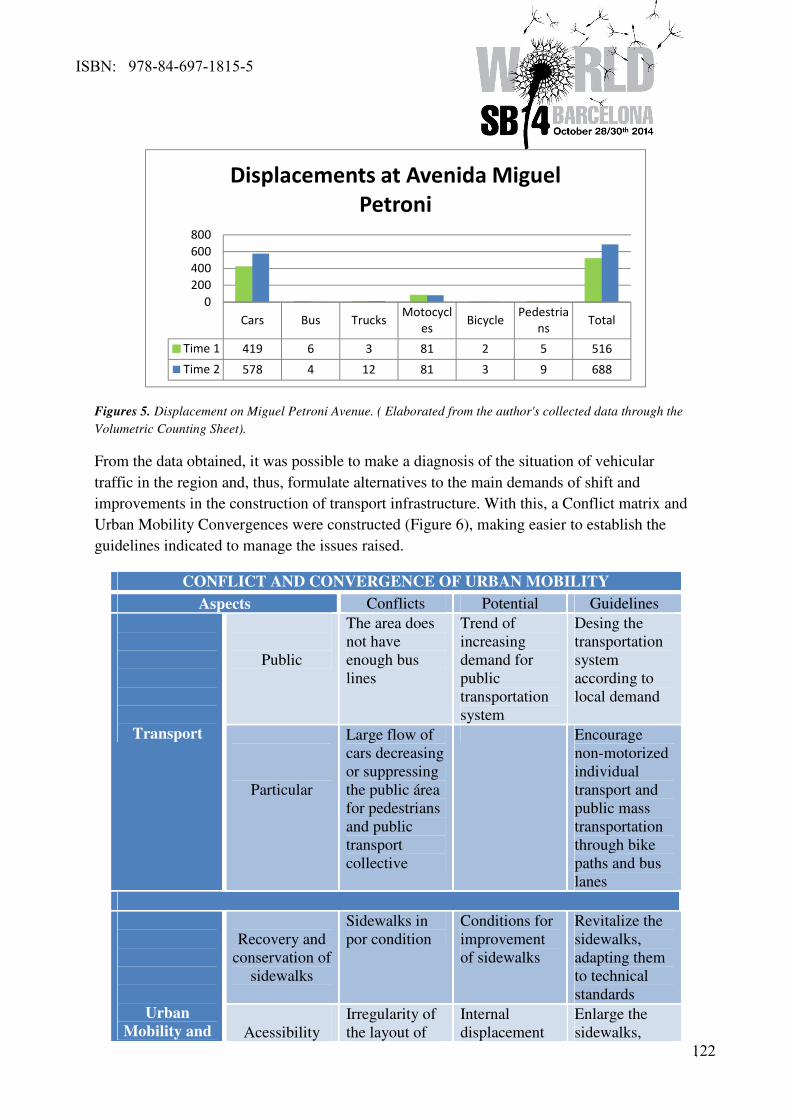
5
Figures 5. Displacement on Miguel Petroni Avenue. ( Elaborated from the author's collected data through the
Volumetric Counting Sheet).
From the data obtained, it was possible to make a diagnosis of the situation of vehicular
traffic in the region and, thus, formulate alternatives to the main demands of shift and
improvements in the construction of transport infrastructure. With this, a Conflict matrix and
Urban Mobility Convergences were constructed (Figure 6), making easier to establish the
guidelines indicated to manage the issues raised.
CONFLICT AND CONVERGENCE OF URBAN MOBILITY
Aspects Conflicts Potential Guidelines
Transport
Public
The area does
not have
enough bus
lines
Trend of
increasing
demand for
public
transportation
system
Desing the
transportation
system
according to
local demand
Particular
Large flow of
cars decreasing
or suppressing
the public área
for pedestrians
and public
transport
collective
Encourage
non-motorized
individual
transport and
public mass
transportation
through bike
paths and bus
lanes
Urban
Mobility and
Recovery and
conservation of
sidewalks
Sidewalks in
por condition
Conditions for
improvement
of sidewalks
Revitalize the
sidewalks,
adapting them
to technical
standards
Acessibility
Irregularity of
the layout of
Internal
displacement
Enlarge the
sidewalks,
Cars Bus TrucksMotocycl
esBicycle
Pedestria
nsTotal
Time 1 419 6 3 81 2 5 516
Time 2 578 4 12 81 3 9 688
0
200
400
600
800
Displacements at Avenida Miguel
Petroni
ISBN: 978-84-697-1815-5
122
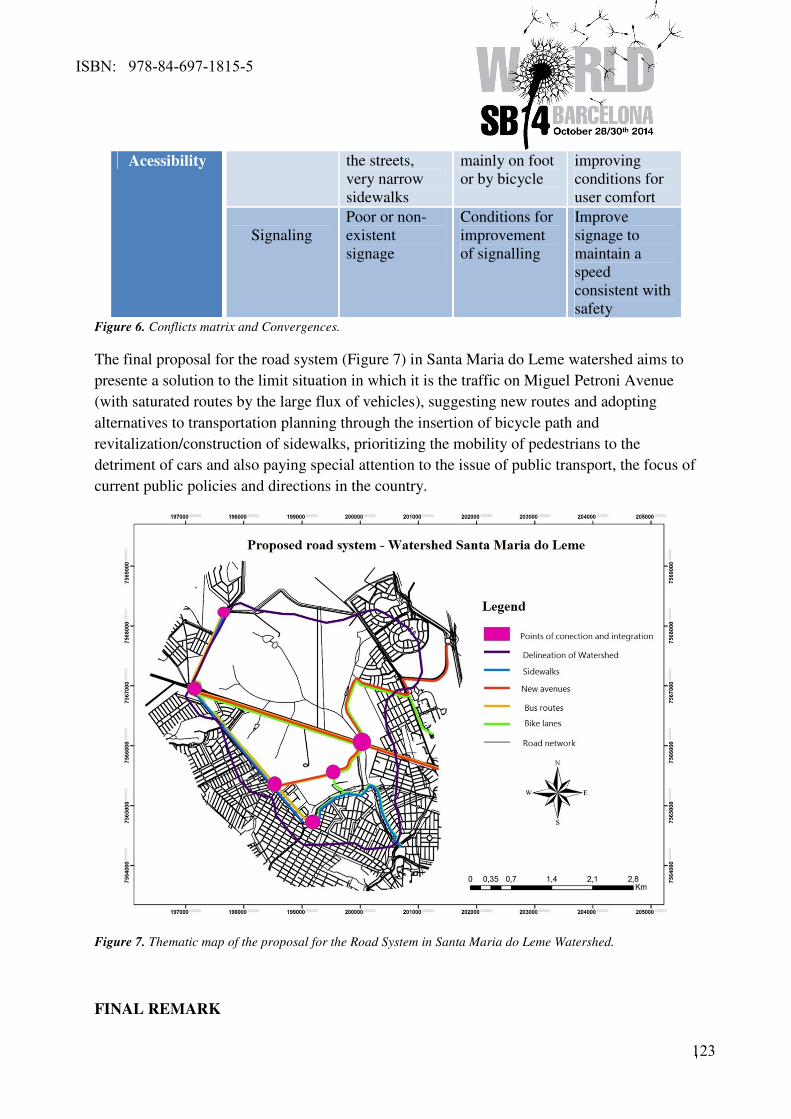
6
Acessibility the streets,
very narrow
sidewalks
mainly on foot
or by bicycle
improving
conditions for
user comfort
Signaling
Poor or non-
existent
signage
Conditions for
improvement
of signalling
Improve
signage to
maintain a
speed
consistent with
safety Figure 6. Conflicts matrix and Convergences.
The final proposal for the road system (Figure 7) in Santa Maria do Leme watershed aims to
presente a solution to the limit situation in which it is the traffic on Miguel Petroni Avenue
(with saturated routes by the large flux of vehicles), suggesting new routes and adopting
alternatives to transportation planning through the insertion of bicycle path and
revitalization/construction of sidewalks, prioritizing the mobility of pedestrians to the
detriment of cars and also paying special attention to the issue of public transport, the focus of
current public policies and directions in the country.
Figure 7. Thematic map of the proposal for the Road System in Santa Maria do Leme Watershed.
FINAL REMARK
ISBN: 978-84-697-1815-5
123
7
By promoting discussion about the current situation of the transportation at Miguel Petroni
Avenue region, there was a search for the conciliation of incentives for multiple modes of
integrated transportation with the accessibility, social inclusion, and structuring quality
alternative routes and may contribute to improvements in the transport system of the region.
The proposal presented on this project aimed to provide a short-term solution, which had as a
guiding support the urban growth and the increase in demand for transport as well as offer
new alternatives for locomotion through the expasion of the road network and improvement
of the mesh existing.
The prioritization of adequate transportation contributes to sustainability because, within this
conception, priority is given to balance the preposition of ways to optimize the existing
transportation system and identify the best ways to expand this network road without
compromising the system support ability, facilitating the application of the principles of
sustainable urban mobility.
BIBLIOGRAPHICAL REFERENCES
BRAZIL. (2012). Law No. 12,587, of January 3, 2012. Brasília, DF. Civil House. The
Undersecretary of Legal Affairs (SAJ).
BRAZIL. (2004). National Urban Development Policy. Ministry of Cities.
BRAZIL. (2005). Mobility and urban policy: subsidies for integrated management. Rio de
Janeiro. Ministry of Cities. National Secretariat of transport and urban mobility.
BRAZIL. (2013). Sustainable Mobility. Ministry of the Environment.
BRAZIL. (2006). Manual of Traffic Studies. Rio de Janeiro. Ministry of transport. National
Department of Transportation Infrastructure (NDTI).
COSTA, M. S.; RAMOS, R. A. R.; SILVA, A. N. R. (2007). Sustainable urban mobility
index for Brazilian cities. University of São Paulo-SP, São Carlos School of Engineering.
HILDEBRAND, M. (2012). Urban mobility: the construction of a model. Final graduation.
Bauru: UNESP.
IBGE. (2010). The Brazilian Institute of Geography and Statistics. São Carlos.
PIANUCCI, M. N. (2011). Analysis of the accessibility of urban public transport system.
Case study in the city of São Carlos-SP. Dissertation (master's degree postgraduate program
in transport engineering and Area of Concentration in Transport infrastructure) - São Carlos
School of Engineering, University of São Paulo.
ISBN: 978-84-697-1815-5
124

8
SÃO CARLOS. (2011). Revision of the director plan of the São Carlos Municipality. São
Carlos. São Carlos Municipal City Hall.
ISBN: 978-84-697-1815-5
125
Rapid urbanisation and housing transformations in Tlokweng,
Botswana
Speakers:
Kalabamu, Faustin1; Bolaane, Benjamin
2
1 University of Botswana, Gaborone, Botswana
2 University of Botswana, Gaborone, Botswana
Abstract: This paper seeks to explore resilience among communities threatened by rapid
urbanisation. While previous studies have identified housing transformation through construction
of outbuildings and house extensions as a popular survival strategy among the urban poor, this
paper focuses on the commoditisation and transformation of traditional homesteads into rental
accommodation in the peri-urban village of Tlokweng. It is based on qualitative data collected
largely through in-depth interviews with landlords and tenants residing in traditional compounds
within the settlement. Interviewees’ responses indicate that housing transformations in Tlokweng
have primarily been driven by the village’s proximity to the city of Gaborone, land and housing
shortages in the city and diminishing opportunities for subsistence livelihoods within the village. It
concludes by noting the role played by the transformation in alleviating shortages for rental
housing, providing alternative sources of income and decreasing urban sprawl.
Keywords: urban resilience; housing transformation; sub-letting; Tlokweng
Introduction
The main objective of this paper is to examine, explore and assess the effects of urbanisation on
traditional housing homesteads, patterns and styles in peri-urban villages such as Tlokweng,
Botswana. According to the United Nations Fund for Population Activities (UNFPA) urbanisation
is a “process of transition from a rural to a more urban society … [and which] reflects an increasing
proportion of the population living in settlements defined as urban, primarily through net rural to
urban migration” (UNFPA, 2007:6). The definition summarises four major features of
urbanisation. First, urbanisation is a dynamic process rather than an incident or a static condition.
Second, the urbanisation process affects places, people and ways of living. Third, the growth or
increases in the number, proportion or size of urban places or urban population is driven primarily
by net rural to urban migration. Despite being popular, the above definition is flawed because it
ignores or underplays the role played by in-situ urbanisation processes – a phenomenon that is
affecting numerous peri-urban villages in Africa and Asia.
In-situ urbanisation
In-situ urbanisation has been defined as a process through which technological innovations and
new modes of production, living and thinking originate in towns and cities and spread to outlying
rural settlements and populations (Brookfield et al, 1991; Qadeer, 2004); Kalabamu and Thebe,
2005; Zhu et al, 2007; Xu et al (2011)). In-situ urbanisation is governed, inter alia, by the size of
ISBN: 978-84-697-1815-5
126
the nearby city, the distance between the two centres and prevailing modes of transport. In-situ
urbanisation often emerges when villages on city fringes become sources of labour for cities as
well as dormitory towns for city migrant workers. Decentralisation initiatives by the state and/or
corporate institutions may also lead to in-situ urbanisation through the creation of industrial,
commercial, educational and other urban type work opportunities in rural areas (UNCHS, 1996;
UNCHS and DFID, 2002). Over time communities in peri-urban villages acquire cosmopolitan
behaviour, tastes, attitudes and new styles for housing and settlement patterns.
Impacts of conventional and in-situ urbanisation
According to Njoh (2003) and Macionis and Parrillo (2010: 5- 10), urbanisation - especially rapid
urbanisation - is always accompanied by numerous challenges and opportunities. While it creates
job opportunities and markets for rural produces, it fuels rural-urban population movements and
transforms everyday life by reordering existing social structures and introducing new social
stratifications, lifestyle patterns, values, attitudes and behaviour. Urbanisation may also lead to the
growth of subcultures shaped by unequal access and distribution of income, wealth, political power
and other livelihood resources. This paper highlights the impacts of rapid in-situ urbanisation on
traditional homesteads and housing styles in Tlokweng, a village on the fringes of Botswana’s
capital city, Gaborone. The paper is divided into five parts: this introduction which provides a
background on urbanisation and its impacts on people and places; the conceptual framework; study
area and methodology; findings of the study; and discussion and conclusion.
Housing transformation
As hinted above, housing transformation is one of the major impacts of all forms of urbanisation.
The term ‘housing transformation’ is used here to refer to informal, extra-legal and unplanned
processes through which home-owners extend their houses, erect additional rooms or convert part
of their homesteads into rental accommodation. It is similar to ‘rooming’ or multi-habitation – that
is, “a situation in which people who do not define themselves as one households share a living
space that is clearly not designed for multi-family purposes” (Schlyter, 2003:7).
In South Africa and Zimbabwe, the transformation takes place through construction of backyard
dwellings or shacks (Schlyter, 2003; Morange, 2002; and Lemanski, 2009). The shacks are
structures often built by occupiers on land belonging to other people. The shack occupiers pay rent
to the land owners with whom they share consumption costs for electricity, water, sanitation and
refuse collection. The shacks are often “constructed from corrugated iron, metal sheets and wooden
planks … with most comprising a single room in which residents cook, eat, sleep, wash and live”
(Lemanski, 2009:473). Lemanski notes that as of 1990 “nearly 60% of Gauteng’s township
properties hosted backyard dwellings, housing almost half (44%) of Gauteng’s Black African
population … By the late-1990s, virtually every backyard in Soweto township hosted an informal
shack …” (Lemanski, 2009:474). According to Schylter (2003:22), 60% of all residential plots in
Unit N, Chitungwiza Township, Harare, had an illegal outbuilding accommodating lodgers.
Unlike Zimbabwe and South Africa, housing transformations in Tanzania is through addition of
rooms to the primary house (Sheuya, 2009). New rooms are incrementally added to the main house
or other outbuildings such that the house can have as many as 12 rooms instead of the standard four
ISBN: 978-84-697-1815-5
127
to six (Sheuya, 2009: 85). A study by Shiferaw (1998) revealed that construction of additional
rental rooms was also the major housing delivery system in Addis Ababa, Ethiopia.
Until the 1980s, rooming was unknown in Botswana’s rural settlements although it was quite
common in Francistown, Gaborone, Lobatse and other townships (Larsson, 1990:129-132).
However, a study carried out by the same author in the early 1990s revealed that some households
in villages around Gaborone accommodated tenants in their traditional houses (Larsson, 1996:74-
75). The tenants worked in Gaborone and commuted daily to work. While most previous studies
have focused on housing transformation in townships, this paper is an attempt to explore the extent,
nature and impacts of housing transformations in traditional settlements taking Tlokweng as a case
study.
Motivation and effects of housing transformations
Housing transformation has been attributed to three major factors: restrictive or inappropriate state
policies, rapid urbanisation and failures in the formal housing delivery systems. According to
Lemanski (2009:473-474) and Morange (2002:6), backyard dwellings became increasingly popular
in South African cities during the 1960s because the government halted the construction of houses
for rural-urban migrants and/or prohibited the growth of informal settlements. Consequently, the
growing urban African population found shelter in backyard shacks where detection could be
avoided (Watson and McCarthy, 1998:51). Watson and McCarthy (1998) and Lemanski (2009)
note that the growth of backyard dwellings in the post-apartheid era has been fuelled by state and
municipal housing policies, strategies and programmes that focus on promoting homeownership
and ignore the rental housing market. Schylter, (2003), Sheuya (1998) and Shiferaw (1998)
attribute the transformation to housing shortages especially among the urban poor in Zimbabwe,
Tanzania and Ethiopia.
The transformation has been applauded on several grounds. First, it is viewed as a “solution
adopted by people themselves in circumstances where no other solutions were offered … [thereby
enabling] more people to benefit from urban services than was planned” (Schylter, 2003:9. See also
Morange, 2002:11-12). Second, the sharing of services reduces housing costs. Third, shacks and
rental rooms represent capital investments designed to generate regular income to landlords while
providing affordable shelter to low income households. Fourth, rental rooms provide working
space for home-based enterprises such as shops, salons, carpentry, poultry, laundry and telephone
services (Sheuya, 1998 and Shiferaw, 1998). Fifth, additional rooms enable house owners to create
more space for food preparation and sleeping besides subletting (Shiferaw, 1998:441). Sixth,
backyard shacks in planned areas are said to guarantee more physically and socially stable
environments than informal settlements because they are less threatening (Morange, 2002: 11).
Last, but not least in importance, backyard shacks and rental rooms provide flexible and
personalised relationships whereby tenants and landlords support each other (Morange, 2002:11).
Despite the positive contribution to housing delivery, backyard dwellings and house extensions
have been criticised for increasing housing densities (overcrowding); promoting ill health; and
compromising building regulations, standards and development control codes (Morange, 2002;
Shiferaw, 1998; Sheuya, 1998; and Schylter, 2003).
ISBN: 978-84-697-1815-5
128
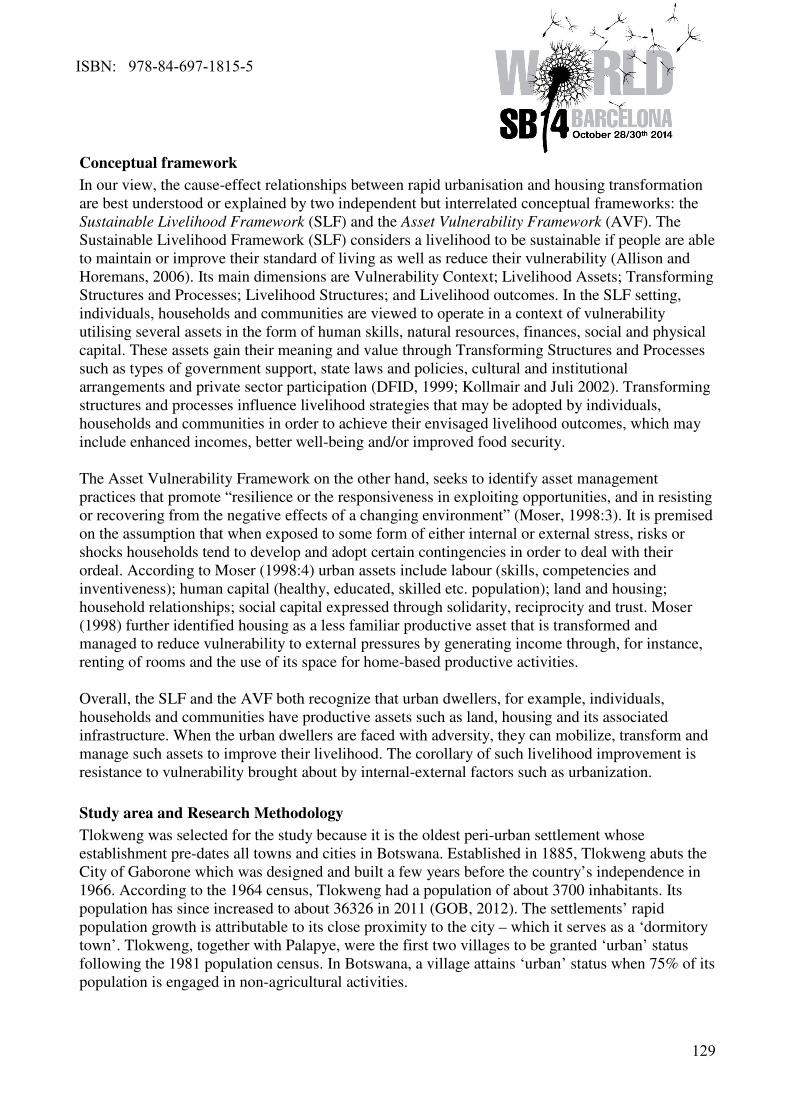
Conceptual framework
In our view, the cause-effect relationships between rapid urbanisation and housing transformation
are best understood or explained by two independent but interrelated conceptual frameworks: the
Sustainable Livelihood Framework (SLF) and the Asset Vulnerability Framework (AVF). The
Sustainable Livelihood Framework (SLF) considers a livelihood to be sustainable if people are able
to maintain or improve their standard of living as well as reduce their vulnerability (Allison and
Horemans, 2006). Its main dimensions are Vulnerability Context; Livelihood Assets; Transforming
Structures and Processes; Livelihood Structures; and Livelihood outcomes. In the SLF setting,
individuals, households and communities are viewed to operate in a context of vulnerability
utilising several assets in the form of human skills, natural resources, finances, social and physical
capital. These assets gain their meaning and value through Transforming Structures and Processes
such as types of government support, state laws and policies, cultural and institutional
arrangements and private sector participation (DFID, 1999; Kollmair and Juli 2002). Transforming
structures and processes influence livelihood strategies that may be adopted by individuals,
households and communities in order to achieve their envisaged livelihood outcomes, which may
include enhanced incomes, better well-being and/or improved food security.
The Asset Vulnerability Framework on the other hand, seeks to identify asset management
practices that promote “resilience or the responsiveness in exploiting opportunities, and in resisting
or recovering from the negative effects of a changing environment” (Moser, 1998:3). It is premised
on the assumption that when exposed to some form of either internal or external stress, risks or
shocks households tend to develop and adopt certain contingencies in order to deal with their
ordeal. According to Moser (1998:4) urban assets include labour (skills, competencies and
inventiveness); human capital (healthy, educated, skilled etc. population); land and housing;
household relationships; social capital expressed through solidarity, reciprocity and trust. Moser
(1998) further identified housing as a less familiar productive asset that is transformed and
managed to reduce vulnerability to external pressures by generating income through, for instance,
renting of rooms and the use of its space for home-based productive activities.
Overall, the SLF and the AVF both recognize that urban dwellers, for example, individuals,
households and communities have productive assets such as land, housing and its associated
infrastructure. When the urban dwellers are faced with adversity, they can mobilize, transform and
manage such assets to improve their livelihood. The corollary of such livelihood improvement is
resistance to vulnerability brought about by internal-external factors such as urbanization.
Study area and Research Methodology
Tlokweng was selected for the study because it is the oldest peri-urban settlement whose
establishment pre-dates all towns and cities in Botswana. Established in 1885, Tlokweng abuts the
City of Gaborone which was designed and built a few years before the country’s independence in
1966. According to the 1964 census, Tlokweng had a population of about 3700 inhabitants. Its
population has since increased to about 36326 in 2011 (GOB, 2012). The settlements’ rapid
population growth is attributable to its close proximity to the city – which it serves as a ‘dormitory
town’. Tlokweng, together with Palapye, were the first two villages to be granted ‘urban’ status
following the 1981 population census. In Botswana, a village attains ‘urban’ status when 75% of its
population is engaged in non-agricultural activities.
ISBN: 978-84-697-1815-5
129
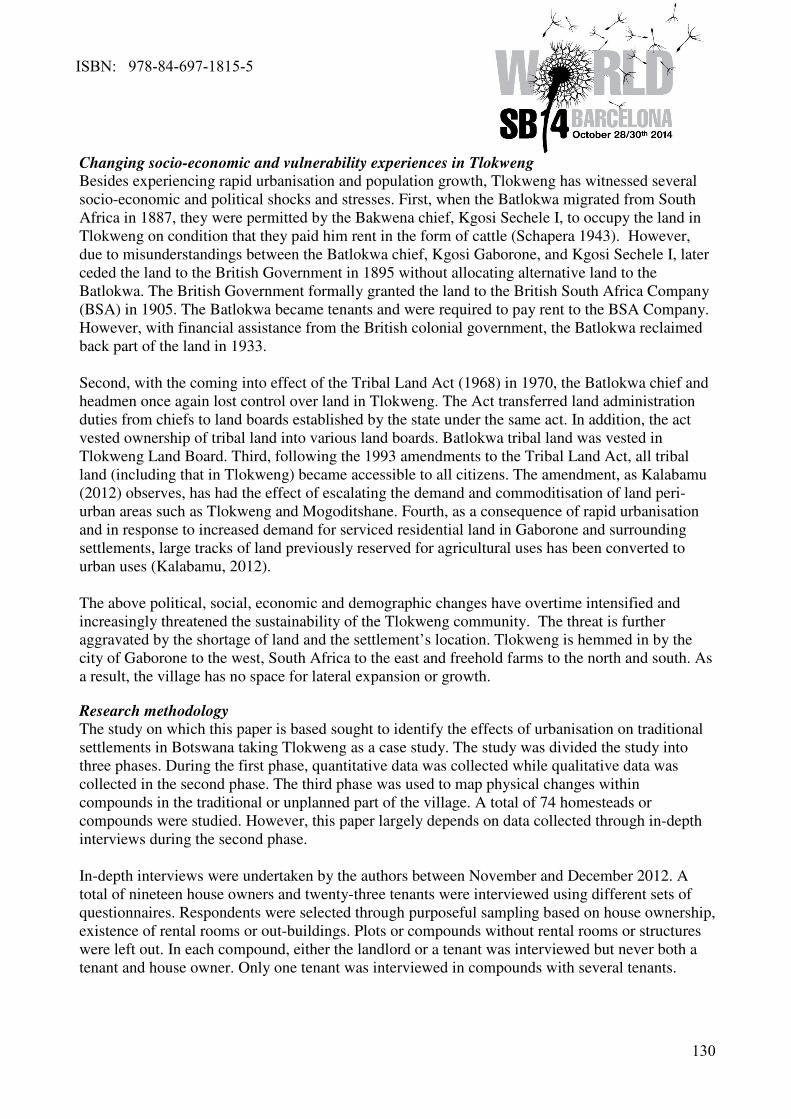
Changing socio-economic and vulnerability experiences in Tlokweng Besides experiencing rapid urbanisation and population growth, Tlokweng has witnessed several
socio-economic and political shocks and stresses. First, when the Batlokwa migrated from South
Africa in 1887, they were permitted by the Bakwena chief, Kgosi Sechele I, to occupy the land in
Tlokweng on condition that they paid him rent in the form of cattle (Schapera 1943). However,
due to misunderstandings between the Batlokwa chief, Kgosi Gaborone, and Kgosi Sechele I, later
ceded the land to the British Government in 1895 without allocating alternative land to the
Batlokwa. The British Government formally granted the land to the British South Africa Company
(BSA) in 1905. The Batlokwa became tenants and were required to pay rent to the BSA Company.
However, with financial assistance from the British colonial government, the Batlokwa reclaimed
back part of the land in 1933.
Second, with the coming into effect of the Tribal Land Act (1968) in 1970, the Batlokwa chief and
headmen once again lost control over land in Tlokweng. The Act transferred land administration
duties from chiefs to land boards established by the state under the same act. In addition, the act
vested ownership of tribal land into various land boards. Batlokwa tribal land was vested in
Tlokweng Land Board. Third, following the 1993 amendments to the Tribal Land Act, all tribal
land (including that in Tlokweng) became accessible to all citizens. The amendment, as Kalabamu
(2012) observes, has had the effect of escalating the demand and commoditisation of land peri-
urban areas such as Tlokweng and Mogoditshane. Fourth, as a consequence of rapid urbanisation
and in response to increased demand for serviced residential land in Gaborone and surrounding
settlements, large tracks of land previously reserved for agricultural uses has been converted to
urban uses (Kalabamu, 2012).
The above political, social, economic and demographic changes have overtime intensified and
increasingly threatened the sustainability of the Tlokweng community. The threat is further
aggravated by the shortage of land and the settlement’s location. Tlokweng is hemmed in by the
city of Gaborone to the west, South Africa to the east and freehold farms to the north and south. As
a result, the village has no space for lateral expansion or growth.
Research methodology
The study on which this paper is based sought to identify the effects of urbanisation on traditional
settlements in Botswana taking Tlokweng as a case study. The study was divided the study into
three phases. During the first phase, quantitative data was collected while qualitative data was
collected in the second phase. The third phase was used to map physical changes within
compounds in the traditional or unplanned part of the village. A total of 74 homesteads or
compounds were studied. However, this paper largely depends on data collected through in-depth
interviews during the second phase.
In-depth interviews were undertaken by the authors between November and December 2012. A
total of nineteen house owners and twenty-three tenants were interviewed using different sets of
questionnaires. Respondents were selected through purposeful sampling based on house ownership,
existence of rental rooms or out-buildings. Plots or compounds without rental rooms or structures
were left out. In each compound, either the landlord or a tenant was interviewed but never both a
tenant and house owner. Only one tenant was interviewed in compounds with several tenants.
ISBN: 978-84-697-1815-5
130
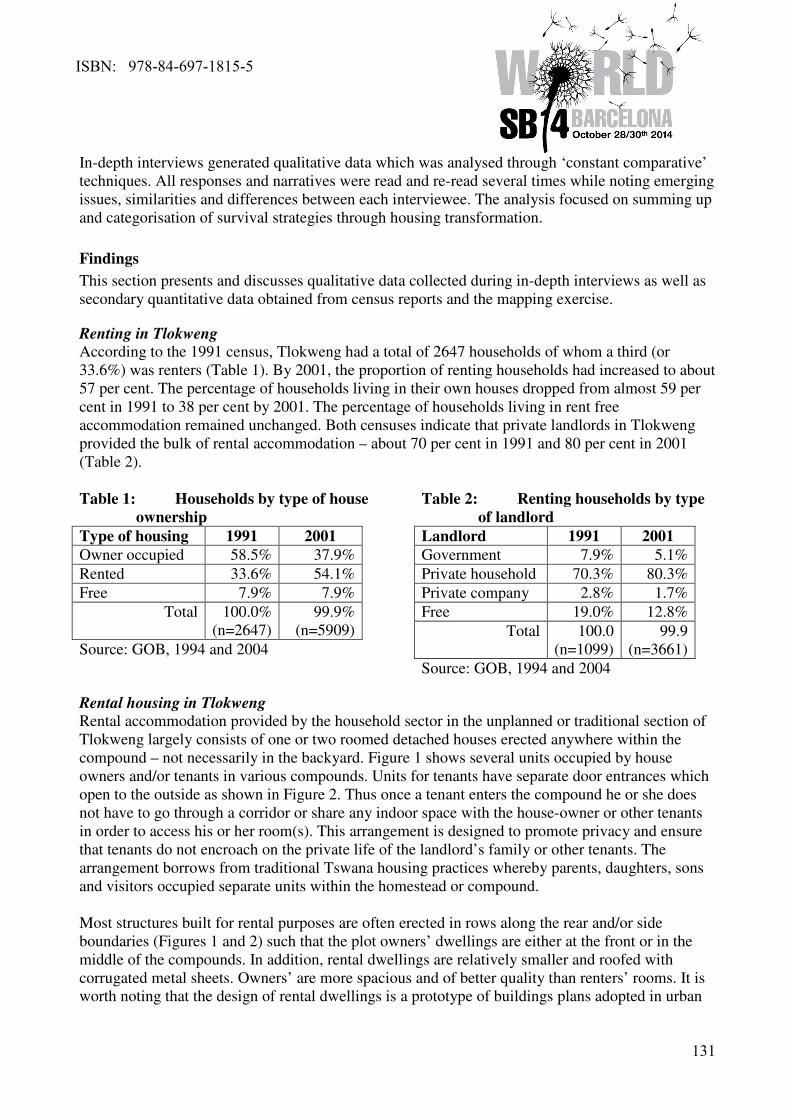
In-depth interviews generated qualitative data which was analysed through ‘constant comparative’
techniques. All responses and narratives were read and re-read several times while noting emerging
issues, similarities and differences between each interviewee. The analysis focused on summing up
and categorisation of survival strategies through housing transformation.
Findings
This section presents and discusses qualitative data collected during in-depth interviews as well as
secondary quantitative data obtained from census reports and the mapping exercise.
Renting in Tlokweng According to the 1991 census, Tlokweng had a total of 2647 households of whom a third (or
33.6%) was renters (Table 1). By 2001, the proportion of renting households had increased to about
57 per cent. The percentage of households living in their own houses dropped from almost 59 per
cent in 1991 to 38 per cent by 2001. The percentage of households living in rent free
accommodation remained unchanged. Both censuses indicate that private landlords in Tlokweng
provided the bulk of rental accommodation – about 70 per cent in 1991 and 80 per cent in 2001
(Table 2).
Table 1: Households by type of house
ownership
Type of housing 1991 2001
Owner occupied 58.5% 37.9%
Rented 33.6% 54.1%
Free 7.9% 7.9%
Total 100.0%
(n=2647)
99.9%
(n=5909)
Source: GOB, 1994 and 2004
Table 2: Renting households by type
of landlord
Landlord 1991 2001
Government 7.9% 5.1%
Private household 70.3% 80.3%
Private company 2.8% 1.7%
Free 19.0% 12.8%
Total 100.0
(n=1099)
99.9
(n=3661)
Source: GOB, 1994 and 2004
Rental housing in Tlokweng
Rental accommodation provided by the household sector in the unplanned or traditional section of
Tlokweng largely consists of one or two roomed detached houses erected anywhere within the
compound – not necessarily in the backyard. Figure 1 shows several units occupied by house
owners and/or tenants in various compounds. Units for tenants have separate door entrances which
open to the outside as shown in Figure 2. Thus once a tenant enters the compound he or she does
not have to go through a corridor or share any indoor space with the house-owner or other tenants
in order to access his or her room(s). This arrangement is designed to promote privacy and ensure
that tenants do not encroach on the private life of the landlord’s family or other tenants. The
arrangement borrows from traditional Tswana housing practices whereby parents, daughters, sons
and visitors occupied separate units within the homestead or compound.
Most structures built for rental purposes are often erected in rows along the rear and/or side
boundaries (Figures 1 and 2) such that the plot owners’ dwellings are either at the front or in the
middle of the compounds. In addition, rental dwellings are relatively smaller and roofed with
corrugated metal sheets. Owners’ are more spacious and of better quality than renters’ rooms. It is
worth noting that the design of rental dwellings is a prototype of buildings plans adopted in urban
ISBN: 978-84-697-1815-5
131
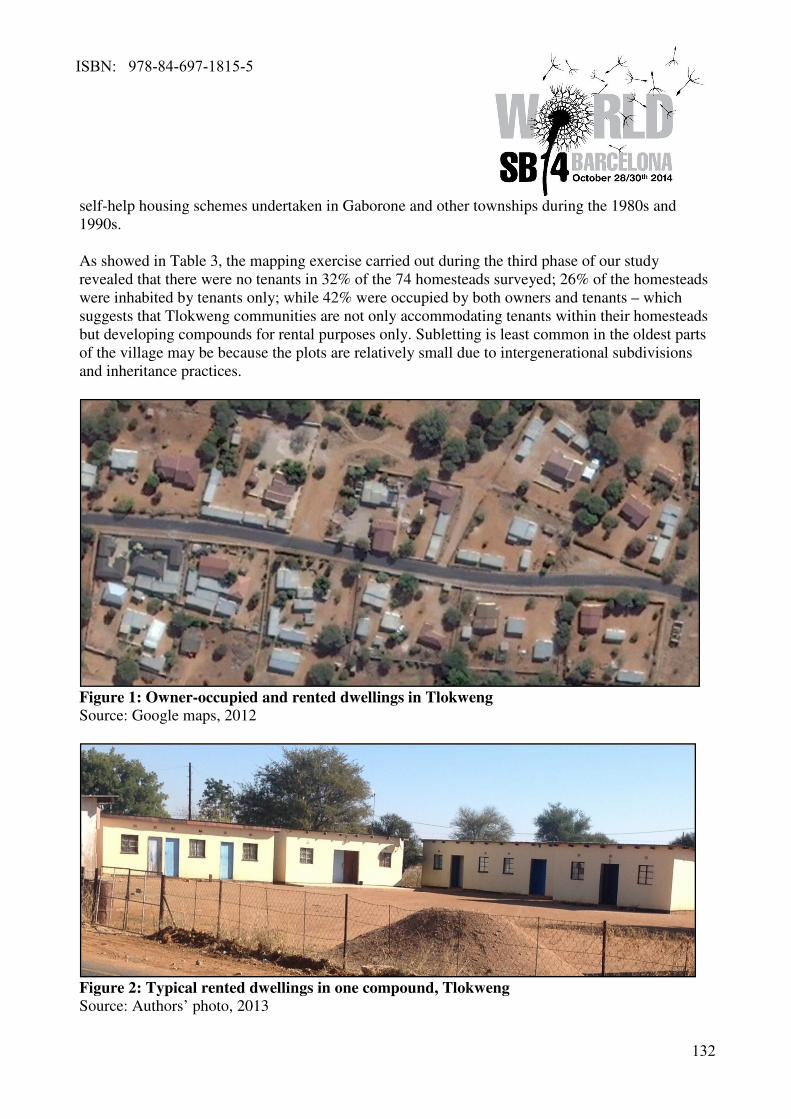
self-help housing schemes undertaken in Gaborone and other townships during the 1980s and
1990s.
As showed in Table 3, the mapping exercise carried out during the third phase of our study
revealed that there were no tenants in 32% of the 74 homesteads surveyed; 26% of the homesteads
were inhabited by tenants only; while 42% were occupied by both owners and tenants – which
suggests that Tlokweng communities are not only accommodating tenants within their homesteads
but developing compounds for rental purposes only. Subletting is least common in the oldest parts
of the village may be because the plots are relatively small due to intergenerational subdivisions
and inheritance practices.
Figure 1: Owner-occupied and rented dwellings in Tlokweng
Source: Google maps, 2012
Figure 2: Typical rented dwellings in one compound, Tlokweng
Source: Authors’ photo, 2013
ISBN: 978-84-697-1815-5
132
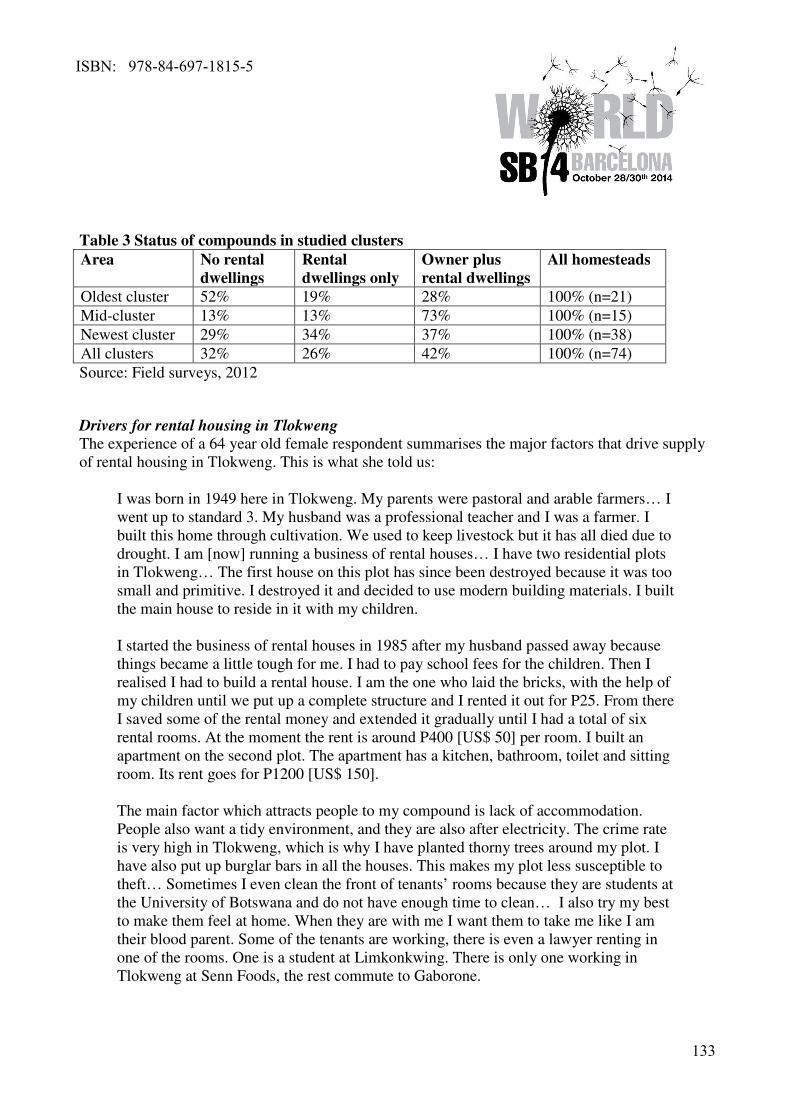
Table 3 Status of compounds in studied clusters
Area No rental
dwellings
Rental
dwellings only
Owner plus
rental dwellings
All homesteads
Oldest cluster 52% 19% 28% 100% (n=21)
Mid-cluster 13% 13% 73% 100% (n=15)
Newest cluster 29% 34% 37% 100% (n=38)
All clusters 32% 26% 42% 100% (n=74)
Source: Field surveys, 2012
Drivers for rental housing in Tlokweng The experience of a 64 year old female respondent summarises the major factors that drive supply
of rental housing in Tlokweng. This is what she told us:
I was born in 1949 here in Tlokweng. My parents were pastoral and arable farmers… I
went up to standard 3. My husband was a professional teacher and I was a farmer. I
built this home through cultivation. We used to keep livestock but it has all died due to
drought. I am [now] running a business of rental houses… I have two residential plots
in Tlokweng… The first house on this plot has since been destroyed because it was too
small and primitive. I destroyed it and decided to use modern building materials. I built
the main house to reside in it with my children.
I started the business of rental houses in 1985 after my husband passed away because
things became a little tough for me. I had to pay school fees for the children. Then I
realised I had to build a rental house. I am the one who laid the bricks, with the help of
my children until we put up a complete structure and I rented it out for P25. From there
I saved some of the rental money and extended it gradually until I had a total of six
rental rooms. At the moment the rent is around P400 [US$ 50] per room. I built an
apartment on the second plot. The apartment has a kitchen, bathroom, toilet and sitting
room. Its rent goes for P1200 [US$ 150].
The main factor which attracts people to my compound is lack of accommodation.
People also want a tidy environment, and they are also after electricity. The crime rate
is very high in Tlokweng, which is why I have planted thorny trees around my plot. I
have also put up burglar bars in all the houses. This makes my plot less susceptible to
theft… Sometimes I even clean the front of tenants’ rooms because they are students at
the University of Botswana and do not have enough time to clean… I also try my best
to make them feel at home. When they are with me I want them to take me like I am
their blood parent. Some of the tenants are working, there is even a lawyer renting in
one of the rooms. One is a student at Limkonkwing. There is only one working in
Tlokweng at Senn Foods, the rest commute to Gaborone.
ISBN: 978-84-697-1815-5
133
From the above narrative, vulnerability and threats arising from changes in livelihood resources
appear to be the primary force behind establishment of rental business. The respondent lost cattle
through drought and later regular cash income through her husband’s death. In the meantime, her
financial obligations such as payment of children’s educational fees had risen. Contributory factors
included shortage of rental accommodation in Gaborone where her tenants are studying or
working; proximity to Gaborone which enable her tenants to commute to school or work;
employment opportunities for non-resident populations; availability of infrastructure facilities
(water, electricity and transport); and modern houses. In addition, rental housing appears to be a
reliable source of income and not just a poverty reduction strategy.
Another female respondent (82 years old in 2012) also stated that she started rental business after
experiencing income and livelihood challenges. This is part of her story:
… I went to school in Tlokweng up to standard 6. I was never married. I never had a
permanent job. At one time I worked as a temporary teacher because I did not have
enough qualifications … I do not have any ploughing land or any livestock. I used to
keep chicken but they all died because of the disease outbreak. I am not running any
business. In the past I used to make and sell traditional beer and was also involved in
motshelo [loan-scheme]. I built this house [which she occupies] using motshelo when I
was still working for the council as a cleaner but after my son had graduated from
school. I built the other [tenants’] houses to earn a living because I am not working. I
once joined the destitute programme, but was cut off … So renting is my only source of
income…
The above two narratives suggest construction of rental rooms or units is initially a hard and
demanding task. The first respondent had to depend on her own and children’s labour to build her
first rental house while the second one rely on cash loans. Other respondents expressed similar
challenges. However, some respondents started rental businesses when some rooms fell vacant. “I
built that house for my daughter who later got married and moved out. So I rented it out to get
some income. I built the other two housing units in 2011 rental. Have six rental rooms in total.
They all go for P450 each”, said an 83 years old female respondent. To some, renting rooms is
undertaken to supplement salary earnings as reported by a 48 year-old man who formerly worked
for the Botswana Housing Corporation. “I started the business of rental houses in 1983 – before I
got married. I wanted to raise money for my wife and kids while they were still living with my in-
laws. I also had to take care of my parents and my salary was not enough …” he said. “After
building my own place where I could stay with my family, I built a second one around 1999. The
third one was built in 2010 with my retrenchment package. The fourth [last] one was built last year
… At this point I have 3 houses with 8 rooms in total which I rent out…” he added.
Subletting in Tlokweng has now crossed cultural boundaries. “I am renting two houses since 2006.
My children are the ones who pushed me into it. I did not want to build rental houses because I am
a pure Motswana. I don’t even want electricity and they forced me to connect. There are four
rooms in total which are for rent. They have helped me not to die of hunger” said an 87 female
from the royal family.
ISBN: 978-84-697-1815-5
134
Tenants had many reasons for wanting to rent dwellings in Tlokweng as expressed in the following
selected excerpts:
• I came to stay in Tlokweng because that is where I conduct most of my work. It is the most
convenient location because I do not have to get a bus to go to work (40 year old builder
from Zimbabwe).
• I work as a crane operator for a brick moulding company in Tlokweng ... I came to rent a
house in Tlokweng because the rent is lower and houses are relatively easy to find. I wanted
a house which has got electricity, water and flush toilets. All those things are available here.
I was also looking at the rental amount which I can afford to pay (28 year old man born at
Chadibe, near Francistown).
• Before we came here we stayed at Broadhurst [in Gaborone]. We moved from Broadhurst
because there were no flush toilets - we were using pit latrines. We wanted flush toilets
because they are tidier and we have kids. This place is clean place and the rent is
reasonable…” (37 year old woman married to a self-employed electrician from
Mahalapye).
• Before I came to Tlokweng I lived in Phase 2 [in Gaborone]. I moved because rent there is
more expensive. I was looking for a decent complete house with electricity, kitchen, toilet
and, if possible, a bathroom ... this is the kind of house I wanted although I think the rent is
too high …” (27 year old woman who has just completed her tertiary education in
Gaborone).
• I came to stay in Tlokweng because of lack of accommodation in Gaborone also because
rent in Tlokweng is lower than in Gaborone (28 year old air technology services technician
working in Gaborone).
• Work as stock packer at … in Tlokweng. I moved from White City [in Gaborone] to
Tlokweng after I found a job at … I wanted to live in Tlokweng because I am now working
in Tlokweng… (20 years old youth from Bobonong).
• I am a student at Baisago University [in Gaborone]. I came to Tlokweng [from Phakalane]
because it is still not yet that heavily populated or congested like Gaborone. I like
Tlokweng because it still has a traditional village set-up like my home. There isn’t too
much noise and hence I am able to study without being disturbed (24 year old man from
Kgagodi village).
• I work for a construction company in Gaborone … and my wife also works for a cleaning
company in Gaborone. . Before we came to stay here we were staying and working in
Palapye … I live in Tlokweng because I found a job in Gaborone and I found
accommodation here” (40 year old man from Serowe).
ISBN: 978-84-697-1815-5
135
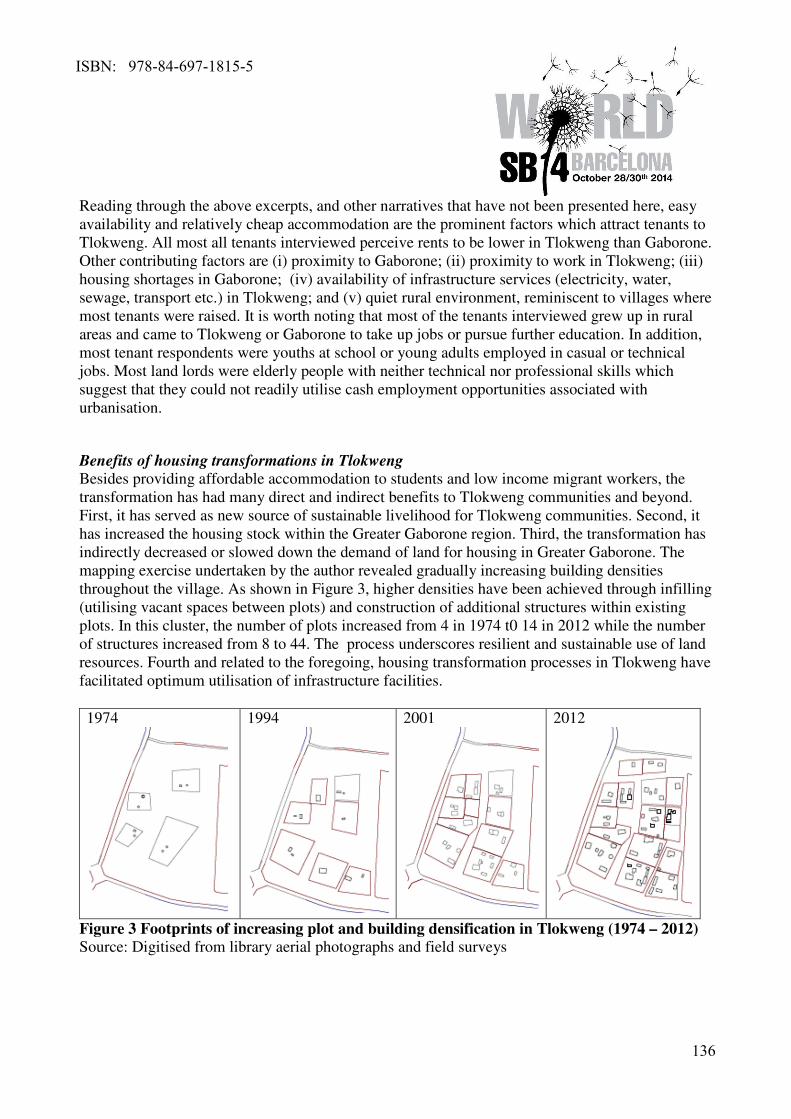
Reading through the above excerpts, and other narratives that have not been presented here, easy
availability and relatively cheap accommodation are the prominent factors which attract tenants to
Tlokweng. All most all tenants interviewed perceive rents to be lower in Tlokweng than Gaborone.
Other contributing factors are (i) proximity to Gaborone; (ii) proximity to work in Tlokweng; (iii)
housing shortages in Gaborone; (iv) availability of infrastructure services (electricity, water,
sewage, transport etc.) in Tlokweng; and (v) quiet rural environment, reminiscent to villages where
most tenants were raised. It is worth noting that most of the tenants interviewed grew up in rural
areas and came to Tlokweng or Gaborone to take up jobs or pursue further education. In addition,
most tenant respondents were youths at school or young adults employed in casual or technical
jobs. Most land lords were elderly people with neither technical nor professional skills which
suggest that they could not readily utilise cash employment opportunities associated with
urbanisation.
Benefits of housing transformations in Tlokweng Besides providing affordable accommodation to students and low income migrant workers, the
transformation has had many direct and indirect benefits to Tlokweng communities and beyond.
First, it has served as new source of sustainable livelihood for Tlokweng communities. Second, it
has increased the housing stock within the Greater Gaborone region. Third, the transformation has
indirectly decreased or slowed down the demand of land for housing in Greater Gaborone. The
mapping exercise undertaken by the author revealed gradually increasing building densities
throughout the village. As shown in Figure 3, higher densities have been achieved through infilling
(utilising vacant spaces between plots) and construction of additional structures within existing
plots. In this cluster, the number of plots increased from 4 in 1974 t0 14 in 2012 while the number
of structures increased from 8 to 44. The process underscores resilient and sustainable use of land
resources. Fourth and related to the foregoing, housing transformation processes in Tlokweng have
facilitated optimum utilisation of infrastructure facilities.
1974
1994
2001
2012
Figure 3 Footprints of increasing plot and building densification in Tlokweng (1974 – 2012)
Source: Digitised from library aerial photographs and field surveys
ISBN: 978-84-697-1815-5
136
Discussion and conclusions
In terms of the conceptual framework, we note that land shortages and tenure insecurity as well as
attainment of urban status constitute the vulnerability context in Tlokweng while the spacious yards
or homesteads are livelihood assets which communities have commoditised and transformed into
rental accommodation. The establishment and growth of Gaborone Township has provided
opportunities for non-farm income and livelihoods. As revealed by several narratives, many home-
owners interviewed once worked as maids, cleaners or labourers in the city. The narratives further
indicate that the demand for rental accommodation in Tlokweng is driven by housing shortages in
Gaborone. Rental rooms are perceived by respondents to be a more reliable, regular and
sustainable source of income and livelihood than crop and cattle farming which are tedious and
vulnerable to drought. Provision of infrastructure utilities (tarred roads, electricity, water and
sewerage) has, at the same time, promoted the transformation process by creating living
environments that are comparable to those found in the city. Thus in accordance with the
sustainable livelihood and asset vulnerability frameworks, the prevailing housing transformations
in the village of Tlokweng has managed to reduce communities’ vulnerability caused by land
shortages, tenure insecurity and urbanisation by generating new sources of incomes through rental
dwellings.
Housing transformation in Tlokweng is slightly different from processes experienced in other
countries. First, unlike South Africa, Zimbabwe, Tanzania or Ethiopia where the transformation
takes place in state sponsored urban projects, the same process is happening on customary land in a
traditional settlement where rental accommodation was previously unknown. Indigenous
communities have converted owner-occupied homesteads to include rented dwellings. Second, in
Tlokweng the demand for rental housing is exogenous – an overspill from Gaborone – whereas in
other studies it is endogenous or internal to the respective city of town. Third, unlike South Africa
where the additional accommodation is built by the lodgers, the construction of rental space is the
responsibility of the landlord – a process similar to that recorded in Tanzania and Ethiopia. Fourth,
rental dwellings in Tlokweng are generally of high quality and comparable those occupied by
landlords unlike South Africa where shacks and temporary structures are the order of the day. Fifth,
while the shacks, extensions and outbuildings in South Africa, Zimbabwe and other countries are
illegal, the rental dwellings in Tlokweng are not. Construction of additional units to meet
increasing demand in any homestead is a popular and legitimate practice in traditional Botswana
settlements.
The transformation of traditional homesteads from utilitarian to rental housing has had numerous
positive effects. The process has enabled landlords in Tlokweng to obtain sustainable sources of
income while providing cheap / affordable accommodation to low income migrants working or
studying in Gaborone. Interviewed tenants consider Tlokweng to be a safe place with quality
services and infrastructure. In addition, the process has increased housing stock in the Greater
Gaborone region and slowed down the increase in demand for residential land. In short,
experiences of housing transformation processes in Tlokweng have positive outcomes and deserve
full support by policy makers and city managers.
ISBN: 978-84-697-1815-5
137
REFERENCES
Allison, E.H. and Horemans, B. (2006), “Putting the Principles of the Sustainable Livelihood
Approach into Fisheries Development Policy and Practice”, Marine Policy, 30, pp. 757-766.
Brookfield, H., Hadi, A.S., and Mahmud, Z. (1991) The City in the Village: The In-situ
Urbanisation of Villages, Villagers and their Land Around Kuala Lumpur, Malaysia, Oxford
University Press, Singapore
DFID, Department for International Development, (1999), Sustainable Livelihoods Guidance
Sheets, DFID, London
Echevin, D. (2011), Vulnerability to asset-poverty in Sub-Saharan Africa, MPRA Paper No. 35660,
http://mpra.ub.uni-muenchen.de/35660 [accessed 06/06/2013]
GOB, Government of Botswana, (2012), 2011 Population & Housing Census: Population of
towns, villages and associated localities, Central Statistics Office, Gaborone
GOB, Government of Botswana, (1994), Summary statistics on small areas, Vol. 1, Central
Statistical Office, Gaborone
GOB, Government of Botswana, (2004), Summary statistics on small areas, Vol. 1, Central
Statistical Office, Gaborone
Kalabamu, Faustin T (2012) “Land tenure reforms and the demand for urban land in Botswana” in
Adebayo, A. A. (Ed.), Architecture and the City: mega events, spatial interventions and
housing policies, Fishwicks Printing, Durban, pp.133-172
Kalabamu, F.T. and Thebe, B. (2005) “Effects of urbanisation and changes in technology on
traditional settlements in Botswana” Botswana Journal of Technology, Vol.14 No.1, pp. 11-20
Kollmair, M. and Juli, S. (2002) The Sustainable Livelihoods Approach, an input paper for the
Integrated Training Course of NCCR North-South Aeschiried, Development Study Group,
University of Zurich, Zurich
Larsson, A. (1990), Modern Housing for Modern Life, Lund University, Lund
Larsson, A. (1996), Modernisation of Traditional Tswana Housing, Lund University, Lund
Lemanski, C. (2009), “Augmented informality: South Africa’s backyard dwellings as a by-product
of formal housing policies”, Habitat International, Vol.33, pp. 472-484
Macionis, J.J. and Parrillo, V.N. (2010), Cities and Urban Life, 5th
Edition, Pearson Boston
Morange, M. (2002), “Backyard shacks: the relative success of this housing option in Port
Elizabeth”, Urban Forum, Vol. 13 (2), pp. 3-25
ISBN: 978-84-697-1815-5
138
Moser, C.O.N (2006), Asset-Based Approaches to Poverty Reduction in a Globalised Context: An
introduction to asset accumulation policy and summary of workshop findings, Brookings
Global Economy and Development Working Paper No. 01, Washington DC
Moser, C.O.N. (1998), “The Asset Vulnerability Framework: Reassessing Urban Poverty
Reduction Strategies”, World Development, Vol. 26(1), pp. 1-19
Njoh, A.J. (2003), “Urbanization and development in sub-Saharan Africa”, Cities, Vol. 20 (3), pp.
167-174
Qadeer, M. A. (2004) ”Urbanization by implosion”, Habitat International, Vol. 28 pp. 1-12
Schapera, I. (1943), The land problem in the Batlokwa reserve (Gaborone District) of the
Bechuanaland Protectorate, Unpublished report
Schylter, A (2003), Multi-Habitation: urban housing and everyday life in Chitungwiza, Zimbabwe,
Nordic Africa Institute, Uppsala
Sheuya, S A (2009) “Urban poverty and housing transformations in informal settlements: the case
of Dar es Salaam, Tanzania”, International Development Planning Review, Vol. 31 (1), pp. 81-
108
Shiferaw, D (1998), “Self-initiated transformations of public-provided dwellings in Addis Ababa,
Ethiopia”, Cities, Vol. 15 (6), pp. 437-448
UN-Habitat and DFID, (2002) Sustainable Urbanisation: Achieving Agenda 21, United Nations
Centre for Human Settlements, and Department for Foreign and International Development,
(2002
UNCHS, United Nations Conference on Human Settlements (1996) An Urbanizing World: Global
Report on Human Settlements, Oxford University Press, Oxford
Watson, V and McCarthy, M (1998), “Rental housing policy and the role of the household rental
sector: evidence from South Africa”, Habitat International, Vol.22 (1), pp. 49-56
Xu, J., Yeh, A. and Wu, F. (2009) “Land commodification: New land development and Politics in
China since the late 1990s”, International Journal of Urban and Regional Research, Vol.
33(4) pp. 890-913
Zhu, Y., Qi, X., Shao, H. and He, K. (2007) The evolution of in situ urbanization and quasi-urban
populations and their planning and environmental implications in China: Case studies from
Quanzhou Municipality, Fujian Normal University, China
ISBN: 978-84-697-1815-5
139
1
Indicators for urban quality evaluation at district scale and
relationships with health and wellness perception
Abstract:
The paper is related with a research that was aimed to better define urban quality and sustainability
at a district scale (4000-10000 inhabitants), specifically referred to European towns and settlements.
An innovative set of indicators (72) has been developed, starting from and taking into consideration
also existing literature, both in terms of indicators and sets of indicators (OECD, UN, Agenda 21, and
existing European databases as CRISP), four “thematic” areas have been defined dealing with
architectural quality, accessibility, environment and services. Within each of these areas some macro-
indicators and micro-indicators have been defined. The aim is to translate something that is usually
considered subjective into something “objective” and finally defined with a number (0-100). Micro-
indicators and macro-indicators are weighted thanks to a mathematical method based on symmetrical
matrixes, so that there is a correct balance between different areas. Indicators are both qualitative
and quantitative, so they are not just referred to urban planning procedures. The research has been
already successfully applied to some Italian districts in towns as Lodi, Genova and Milano. The set of
indicators was needed also to work within a multi disciplinary team that has already included
engineers, architects, planners as well as doctors and physicians. As a matter of fact the results in
terms of urban quality have been compared with medical results concerning health and wellness
perception (using SF-36 international recognized questionnaires) by users (inhabitants), finding (non
linear) relationships between urban quality and well being perception by inhabitants. The results of
this research can be used to: better define design strategies (by designers) accordingly to users
wellness, or evaluate ex-post the results of design activities (by municipalities or public authorities).
Key words: urban quality, quality indicators, health, wellness perception, pre-post quality
assessment
Introduction: the meaning of urban quality and the call for sustainability
The paper is the result of a research that deals with an innovative idea of urban quality, that integrates
different ways on interpreting “quality” already existing and referred to environment, landscape or
specifically to urban landscape. The research takes into consideration the very actual and specific
normative and laws references that are set at European level as: the European Convention on
Landscape, the Resolution of the European Council “Architectural Quality of Urban and Rural
Environment”, the Environmental normative referring to the European Directive 2001/42/CEE, the
Development Scheme of the European Space (SDEC), etc. Moreover the study takes into deep
consideration the existing normative and the call for a sustainable development: one of the outcome of
the research is expected to be a methodology (design guide lines) to intervene in built environments,
both the existing settlements and the new ones.
Approaches to quality evaluation
It is possible to refer to quantitative and qualitative systems of evaluation, where quantitative research
is usually more general, is built on the base of the researcher forecasts and does not start from one
specific case study, while Qualitative research, is “multi method in focus”, “study things in their
natural settings”, involves the studied use and collection of a variety of empirical materials” (Denzin,
Lincoln). In particular, concerning the qualitative approaches, a focus importance is set in the
evaluation of landscape, accordingly to some experiences held in the UK in the sixties (Hampshire
County Council, 1968 and others). These experiences are based on direct observation and perception
of the sites made by experts. But the state of the art concerning evaluation systems can be also referred
ISBN: 978-84-697-1815-5
140
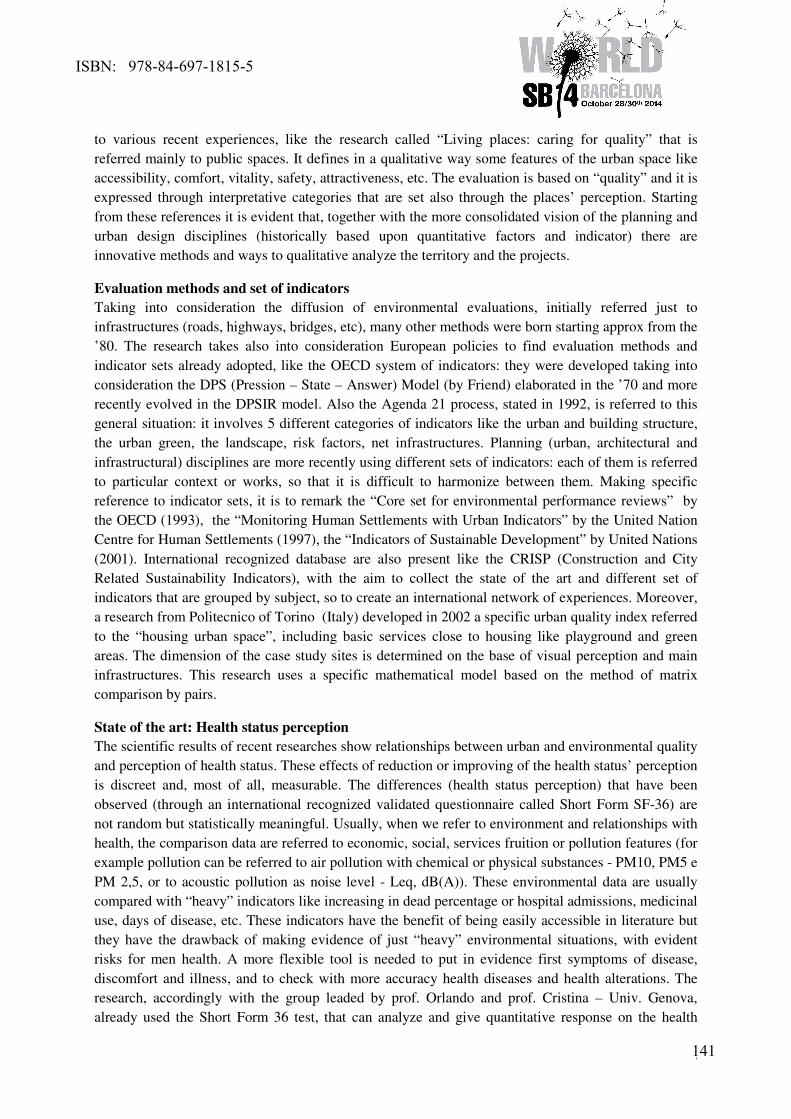
2
to various recent experiences, like the research called “Living places: caring for quality” that is
referred mainly to public spaces. It defines in a qualitative way some features of the urban space like
accessibility, comfort, vitality, safety, attractiveness, etc. The evaluation is based on “quality” and it is
expressed through interpretative categories that are set also through the places’ perception. Starting
from these references it is evident that, together with the more consolidated vision of the planning and
urban design disciplines (historically based upon quantitative factors and indicator) there are
innovative methods and ways to qualitative analyze the territory and the projects.
Evaluation methods and set of indicators
Taking into consideration the diffusion of environmental evaluations, initially referred just to
infrastructures (roads, highways, bridges, etc), many other methods were born starting approx from the
’80. The research takes also into consideration European policies to find evaluation methods and
indicator sets already adopted, like the OECD system of indicators: they were developed taking into
consideration the DPS (Pression – State – Answer) Model (by Friend) elaborated in the ’70 and more
recently evolved in the DPSIR model. Also the Agenda 21 process, stated in 1992, is referred to this
general situation: it involves 5 different categories of indicators like the urban and building structure,
the urban green, the landscape, risk factors, net infrastructures. Planning (urban, architectural and
infrastructural) disciplines are more recently using different sets of indicators: each of them is referred
to particular context or works, so that it is difficult to harmonize between them. Making specific
reference to indicator sets, it is to remark the “Core set for environmental performance reviews” by
the OECD (1993), the “Monitoring Human Settlements with Urban Indicators” by the United Nation
Centre for Human Settlements (1997), the “Indicators of Sustainable Development” by United Nations
(2001). International recognized database are also present like the CRISP (Construction and City
Related Sustainability Indicators), with the aim to collect the state of the art and different set of
indicators that are grouped by subject, so to create an international network of experiences. Moreover,
a research from Politecnico of Torino (Italy) developed in 2002 a specific urban quality index referred
to the “housing urban space”, including basic services close to housing like playground and green
areas. The dimension of the case study sites is determined on the base of visual perception and main
infrastructures. This research uses a specific mathematical model based on the method of matrix
comparison by pairs.
State of the art: Health status perception
The scientific results of recent researches show relationships between urban and environmental quality
and perception of health status. These effects of reduction or improving of the health status’ perception
is discreet and, most of all, measurable. The differences (health status perception) that have been
observed (through an international recognized validated questionnaire called Short Form SF-36) are
not random but statistically meaningful. Usually, when we refer to environment and relationships with
health, the comparison data are referred to economic, social, services fruition or pollution features (for
example pollution can be referred to air pollution with chemical or physical substances - PM10, PM5 e
PM 2,5, or to acoustic pollution as noise level - Leq, dB(A)). These environmental data are usually
compared with “heavy” indicators like increasing in dead percentage or hospital admissions, medicinal
use, days of disease, etc. These indicators have the benefit of being easily accessible in literature but
they have the drawback of making evidence of just “heavy” environmental situations, with evident
risks for men health. A more flexible tool is needed to put in evidence first symptoms of disease,
discomfort and illness, and to check with more accuracy health diseases and health alterations. The
research, accordingly with the group leaded by prof. Orlando and prof. Cristina – Univ. Genova,
already used the Short Form 36 test, that can analyze and give quantitative response on the health
ISBN: 978-84-697-1815-5
141
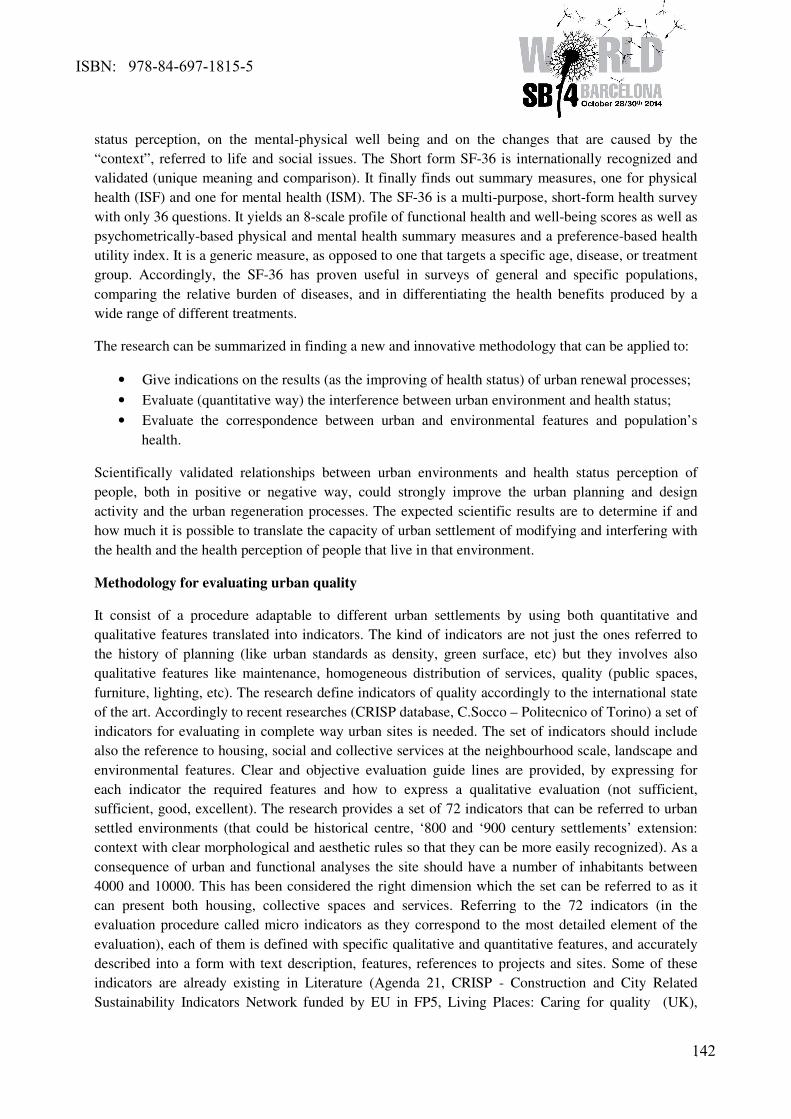
3
status perception, on the mental-physical well being and on the changes that are caused by the
“context”, referred to life and social issues. The Short form SF-36 is internationally recognized and
validated (unique meaning and comparison). It finally finds out summary measures, one for physical
health (ISF) and one for mental health (ISM). The SF-36 is a multi-purpose, short-form health survey
with only 36 questions. It yields an 8-scale profile of functional health and well-being scores as well as
psychometrically-based physical and mental health summary measures and a preference-based health
utility index. It is a generic measure, as opposed to one that targets a specific age, disease, or treatment
group. Accordingly, the SF-36 has proven useful in surveys of general and specific populations,
comparing the relative burden of diseases, and in differentiating the health benefits produced by a
wide range of different treatments.
The research can be summarized in finding a new and innovative methodology that can be applied to:
• Give indications on the results (as the improving of health status) of urban renewal processes;
• Evaluate (quantitative way) the interference between urban environment and health status;
• Evaluate the correspondence between urban and environmental features and population’s
health.
Scientifically validated relationships between urban environments and health status perception of
people, both in positive or negative way, could strongly improve the urban planning and design
activity and the urban regeneration processes. The expected scientific results are to determine if and
how much it is possible to translate the capacity of urban settlement of modifying and interfering with
the health and the health perception of people that live in that environment.
Methodology for evaluating urban quality
It consist of a procedure adaptable to different urban settlements by using both quantitative and
qualitative features translated into indicators. The kind of indicators are not just the ones referred to
the history of planning (like urban standards as density, green surface, etc) but they involves also
qualitative features like maintenance, homogeneous distribution of services, quality (public spaces,
furniture, lighting, etc). The research define indicators of quality accordingly to the international state
of the art. Accordingly to recent researches (CRISP database, C.Socco – Politecnico of Torino) a set of
indicators for evaluating in complete way urban sites is needed. The set of indicators should include
also the reference to housing, social and collective services at the neighbourhood scale, landscape and
environmental features. Clear and objective evaluation guide lines are provided, by expressing for
each indicator the required features and how to express a qualitative evaluation (not sufficient,
sufficient, good, excellent). The research provides a set of 72 indicators that can be referred to urban
settled environments (that could be historical centre, ‘800 and ‘900 century settlements’ extension:
context with clear morphological and aesthetic rules so that they can be more easily recognized). As a
consequence of urban and functional analyses the site should have a number of inhabitants between
4000 and 10000. This has been considered the right dimension which the set can be referred to as it
can present both housing, collective spaces and services. Referring to the 72 indicators (in the
evaluation procedure called micro indicators as they correspond to the most detailed element of the
evaluation), each of them is defined with specific qualitative and quantitative features, and accurately
described into a form with text description, features, references to projects and sites. Some of these
indicators are already existing in Literature (Agenda 21, CRISP - Construction and City Related
Sustainability Indicators Network funded by EU in FP5, Living Places: Caring for quality (UK),
ISBN: 978-84-697-1815-5
142
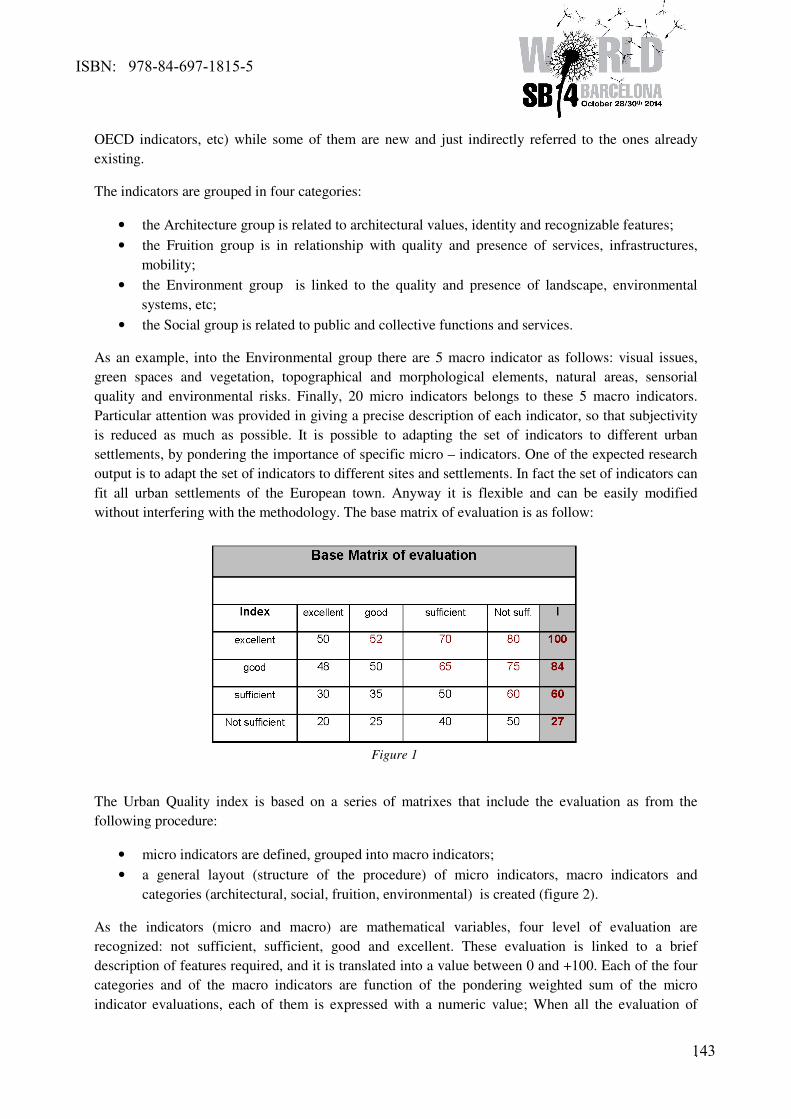
4
OECD indicators, etc) while some of them are new and just indirectly referred to the ones already
existing.
The indicators are grouped in four categories:
• the Architecture group is related to architectural values, identity and recognizable features;
• the Fruition group is in relationship with quality and presence of services, infrastructures,
mobility;
• the Environment group is linked to the quality and presence of landscape, environmental
systems, etc;
• the Social group is related to public and collective functions and services.
As an example, into the Environmental group there are 5 macro indicator as follows: visual issues,
green spaces and vegetation, topographical and morphological elements, natural areas, sensorial
quality and environmental risks. Finally, 20 micro indicators belongs to these 5 macro indicators.
Particular attention was provided in giving a precise description of each indicator, so that subjectivity
is reduced as much as possible. It is possible to adapting the set of indicators to different urban
settlements, by pondering the importance of specific micro – indicators. One of the expected research
output is to adapt the set of indicators to different sites and settlements. In fact the set of indicators can
fit all urban settlements of the European town. Anyway it is flexible and can be easily modified
without interfering with the methodology. The base matrix of evaluation is as follow:
The Urban Quality index is based on a series of matrixes that include the evaluation as from the
following procedure:
• micro indicators are defined, grouped into macro indicators;
• a general layout (structure of the procedure) of micro indicators, macro indicators and
categories (architectural, social, fruition, environmental) is created (figure 2).
As the indicators (micro and macro) are mathematical variables, four level of evaluation are
recognized: not sufficient, sufficient, good and excellent. These evaluation is linked to a brief
description of features required, and it is translated into a value between 0 and +100. Each of the four
categories and of the macro indicators are function of the pondering weighted sum of the micro
indicator evaluations, each of them is expressed with a numeric value; When all the evaluation of
Figure 1
ISBN: 978-84-697-1815-5
143
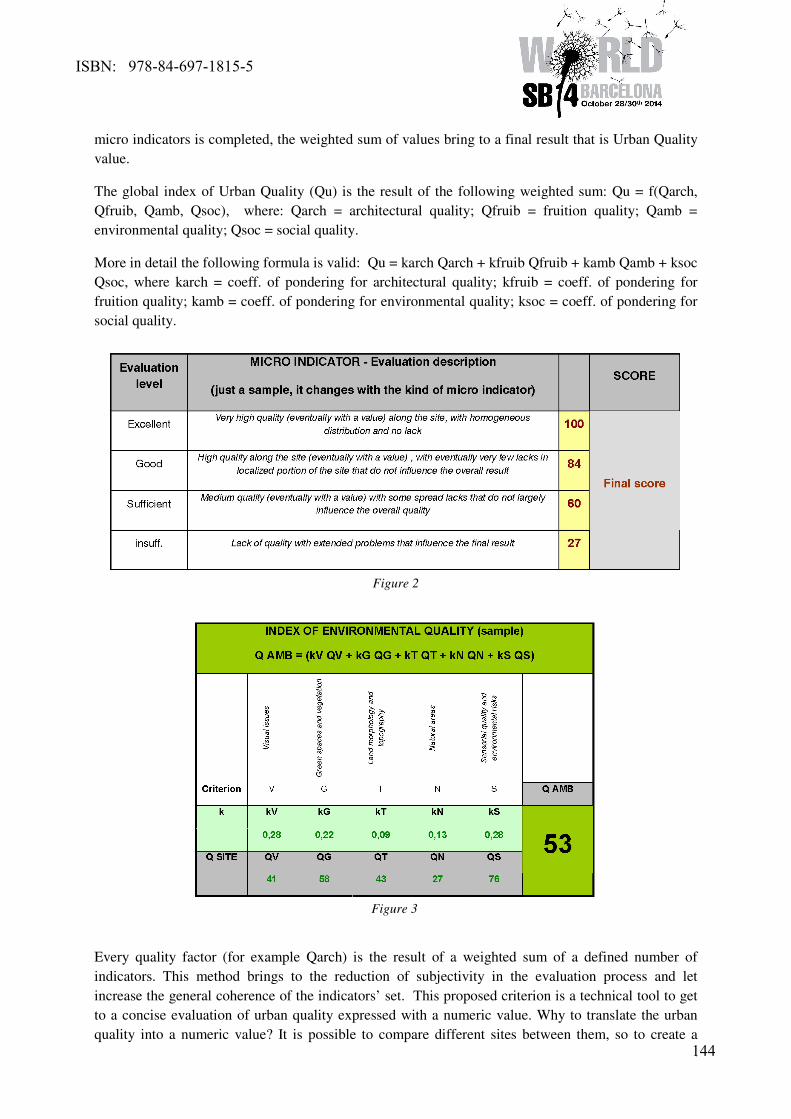
5
micro indicators is completed, the weighted sum of values bring to a final result that is Urban Quality
value.
The global index of Urban Quality (Qu) is the result of the following weighted sum: Qu = f(Qarch,
Qfruib, Qamb, Qsoc), where: Qarch = architectural quality; Qfruib = fruition quality; Qamb =
environmental quality; Qsoc = social quality.
More in detail the following formula is valid: Qu = karch Qarch + kfruib Qfruib + kamb Qamb + ksoc
Qsoc, where karch = coeff. of pondering for architectural quality; kfruib = coeff. of pondering for
fruition quality; kamb = coeff. of pondering for environmental quality; ksoc = coeff. of pondering for
social quality.
Every quality factor (for example Qarch) is the result of a weighted sum of a defined number of
indicators. This method brings to the reduction of subjectivity in the evaluation process and let
increase the general coherence of the indicators’ set. This proposed criterion is a technical tool to get
to a concise evaluation of urban quality expressed with a numeric value. Why to translate the urban
quality into a numeric value? It is possible to compare different sites between them, so to create a
Figure 3
Figure 2
ISBN: 978-84-697-1815-5
144
6
statistically meaningful database of experiences. Moreover a concise result expressed with numeric
value let us comparing different sites creating a strong reference database. This is an innovative
method of evaluation, in fact: the evaluation model can be adapted to the single case study, as the
“structure” is flexible and modifiable for future developments. It is a “open” model into which new or
updated indicators can be added. As the sum of the four categories evaluation is weighted, the
“accuracy” of the result depends on the number of indicators. A few number of indicators provide not
sufficient accuracy in evaluation, but we consider that 72 indicators was the right number of indicator
to provide an accurate evaluation of urban environments. So if the “structure” and the number of the
indicators will need to change in relationship to particular kind of environments, it will be possible to
do it very easily. The requisites of the evaluation method have been found with the aim of:
• Selecting issues of interest concerning urban and environmental features, with strong
interconnections between them;
• Select a set of indicators as much as possible complete without being useless over
dimensioned;
• Defining a methodology of evaluation as much as possible objective, with clear description of
indicators features both in qualitative and quantitative way;
• Restricting the possibility of variation (for example, with different context) by using
pondering factors, so that the system is fully flexible;
• Work out a more objective evaluation of urban quality to apply to urban settlements with a
population between 4000 and 10000 inhabitants.
The final aim is to define in an accurate and flexible procedure for evaluating urban quality in
different kind of urban settlements in European towns. The aim is not to express something it is
already known as the environmental data, but to express a complex evaluation of urban quality with a
concise output that is a mark (numeric value).
Urban quality evaluation and health status perception
Environmental indexes, urban quality evaluation and health status perception are strictly linked: in fact
in some case study the menthal health was inverse function of the environmental noise. So if the
environmental noise is increasing, the mental health is decreasing (following figure). This result is
perfectly aligned to the scientific state of the art concerning the effects of noise on health. The
accordance between these last data will confirm the initial hypothesis, as from the image below that
shows the correspondence between Global Urban quality (vertical, increasing) and the Short Form 36
evaluations (horizontal, increasing). Scientific researches already confirm the correspondence between
urban quality – evaluated with the methodology proposed – and the results of the SF-36 answers by
people who lives in the selected sites. Relationships have been found between Fruibility Quality index,
Vitality (VT) and most of all the Summary measure of Mental Health. So at increasing values of urban
quality there is correspondence of increasing value in health status perception.
Conclusion
The research can also be applied in the near future to eco-districts, by managing the set of indicators
through some pilot cases (i.e. through Horizon2020). The final goal is to improve it and find new and
better relationships between urban quality and wellness perception, maybe within renewal/retrofitting
of existing neighbourhoods (i.e. social housing districts), also in terms of cost-benefits effects.
ISBN: 978-84-697-1815-5
145
7
References
AA. VV., Living Places: Caring for quality, Londra, Ribabooks 2004.
AA.VV., Housing, space and quality of life, Aldershot, Ashgate, 2005.
AA.VV., Public Places, Urban Spaces: The Dimensions of Urban Design, Oxford, Architectural Press
2003
AA. VV., A Bibliography of Contingent Valuation Studies and Papers, Nrda Inc., La Jolla 1994.
AA.VV. The quality of urban life: social, psychological, and physical conditions, Berlin, W. de
Gruyter 1986.
AA. VV., Indicateurs d’environnement urbain, Paris, Ocde 1978.
Atkinson T., Public perceptions of the quality of life, Canada III, Perspectives 1980.
Bana E. Costa C. A. (a cura di), Readings in Multiple criteria Decision Aid, Berlin, SpringerVerlag,
1990.
Berry B.J.L., Land use, urban form and environmental quality, Chiacago, University of Chicago 1974.
Biddulph M. (Joseph Rowntree Foundation), Home Zones: A Planning and Design Handbook, York,
The Policy Press 2001.
Bosselmann P., Representation of Places: Reality and Realism in City Design, Berkeley ; Los
Angeles, London : University of California Press, c1998.
Canter L.W., Environmental Impact Assessment (2a ed.), New York: McGraw-Hill 1996.
Groat L. Wang D., Architectural research methods, New York, John Wiley & sons inc 2002.
Hanemann W.H., Theory Versus Data in the Contingent Valuation Debate, in Bjornstadt D.J. e Kahn
J.R., The Contingent Valuation of Environmental Resources, Cheltenham, E. Elgar,1996.
Île-de-France. Commission de l'habitat et du cadre de vie, L'amélioration de la qualité de vie au
quotidien et la gestion urbaine de proximité, Paris, CESR Île-de-France 2004.
Jacobs A. B., Mac Donald E., Rofe Y., The boulevard book: history, evolution, design of multiway
boulevards, Cambridge, Mass; London : The MIT Press, 2002.
Joint Centre for Urban Design, Oxford Brookes University, Analysis of responses to the discussion
document 'Quality in town and country', London, HMSO 1996.
Kahneman D. Knetscch J. L., Valuing Public Goods: The Purchase of Moral Satisfaction, in Jiournal
of Environmental Economics and Management, n 30 1992.
Merleau-Ponty M., Fenomenologia della percezione, Milano, Bompiani 2003.
Osservatorio Città Sostenibili, C. Socco, M. Montrucchio, M.Bonandini, A. Cittadino, Indice di
qualità ambientale dello spazio residenziale, Politecnico e Università di Torino, Dipartimento
Interateneo
Schneider M., The quality of life in Large American Cities: objective and subjective social indicators,
in Social Indicator Research n.1, 1975, pp 495-509.
Socco C., Città, ambiente, paesaggio, Lineamenti di progettazione urbanistica, Utet, Torino 2000.
Tobelem-Zanin C., La qualité de la vie dans les villes françaises, Rouen, Publications de l'Université
de Rouen 1995.
Terrien, S., Jugement de la qualité de vie urbaine, Nantes, Université de Nantes 2000.
Vismara R. Zavatti A., (cura di), Indicatori e scale di qualità, Pitagora editrice, Bologna 1996.
ISBN: 978-84-697-1815-5
146
1
Housing plans and urban rehabilitation in Spain, 1992-2012
Speakers:
Rodríguez-Suárez, I1; Hernández Aja, A
2
1 Department of Urban and Regional Planning (DUyOT), Technical University of Madrid
(UPM), Madrid, Spain 2
DUyOT, UPM, Madrid, Spain
Abstract: This paper explores the urban rehabilitation projects promoted by the Spanish Government
between 1992 and 2012 through housing plans. The analysis is based on the comparison of
programmes and estimations gathered in these plans with actual housing production within this
period in order to find the connection between sectoral housing planning and real estate cycles in
these last twenty years. During the period under review, six state housing plans, that were mainly
focused on the promotion of newly-constructed state-subsidised housing, were developed, including
the Areas of Integrated Rehabilitation programmes (ARI programmes). In spite of the relevance and
growing complexity of these programmes, these played a subsidiary role in the government housing
policy and were insignificant regarding the whole real estate production in this period.
Comprehensive rehabilitation areas, urban rehabilitation, urban regeneration, housing
plans, real estate production
1. Urban rehabilitation areas in housing plans
Housing plans are the main instrument of sectoral housing planning that were used by the
Spanish government to intervene in the housing market. These have a long tradition in Spain
since the beginnings of the twentieth century (1). Housing plans have traditionally been
designed to promote newly-constructed state-subsidised housing and these have been
connected with macroeconomic policies due to their ability to create employment
opportunities in the construction sector.
This research was carried out through a content analysis of royal decrees that regulated
housing plans during this period. It also includes the total amount of the intended goals in
each plan collected in the agreements signed with the autonomous communities, as well as the
computation of the real estate production, both free-market or state-subsidised housing, in this
period.
The State Housing Plan 1992-1995, the first one of the studied period, leads to the
strengthening of the sectoral housing planning system that had been previously tested during
the 1980s. This was followed by the subsequent five four-year plans developed until 2012.
The first two plans and the last two were approved by the Spanish Socialist Workers´ Party -
PSOE according to its initials in Spanish- (from 1992 to 1999 and from 2005 to 2012), while
the other two plans were approved by the People´s Party -PP according to its initials in
Spanish- (1998-2005). Two of these six plans were not completed because of a change of
government (1998 and 1999 programmes of 1996-1999 State Housing Plan and 2005
programme of 2002-2005 State Housing Plan) (2).
ISBN: 978-84-697-1815-5
147
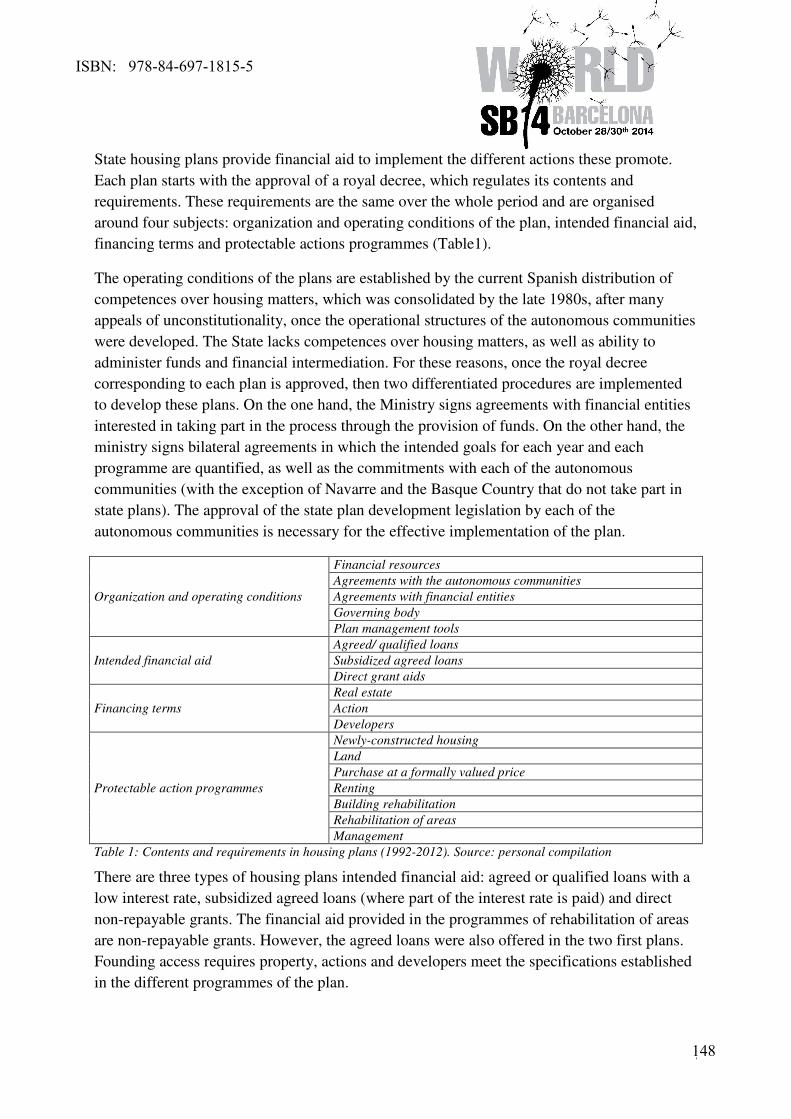
2
State housing plans provide financial aid to implement the different actions these promote.
Each plan starts with the approval of a royal decree, which regulates its contents and
requirements. These requirements are the same over the whole period and are organised
around four subjects: organization and operating conditions of the plan, intended financial aid,
financing terms and protectable actions programmes (Table1).
The operating conditions of the plans are established by the current Spanish distribution of
competences over housing matters, which was consolidated by the late 1980s, after many
appeals of unconstitutionality, once the operational structures of the autonomous communities
were developed. The State lacks competences over housing matters, as well as ability to
administer funds and financial intermediation. For these reasons, once the royal decree
corresponding to each plan is approved, then two differentiated procedures are implemented
to develop these plans. On the one hand, the Ministry signs agreements with financial entities
interested in taking part in the process through the provision of funds. On the other hand, the
ministry signs bilateral agreements in which the intended goals for each year and each
programme are quantified, as well as the commitments with each of the autonomous
communities (with the exception of Navarre and the Basque Country that do not take part in
state plans). The approval of the state plan development legislation by each of the
autonomous communities is necessary for the effective implementation of the plan.
Organization and operating conditions
Financial resources
Agreements with the autonomous communities
Agreements with financial entities
Governing body
Plan management tools
Intended financial aid
Agreed/ qualified loans
Subsidized agreed loans
Direct grant aids
Financing terms
Real estate
Action
Developers
Protectable action programmes
Newly-constructed housing
Land
Purchase at a formally valued price
Renting
Building rehabilitation
Rehabilitation of areas
Management
Table 1: Contents and requirements in housing plans (1992-2012). Source: personal compilation
There are three types of housing plans intended financial aid: agreed or qualified loans with a
low interest rate, subsidized agreed loans (where part of the interest rate is paid) and direct
non-repayable grants. The financial aid provided in the programmes of rehabilitation of areas
are non-repayable grants. However, the agreed loans were also offered in the two first plans.
Founding access requires property, actions and developers meet the specifications established
in the different programmes of the plan.
ISBN: 978-84-697-1815-5
148
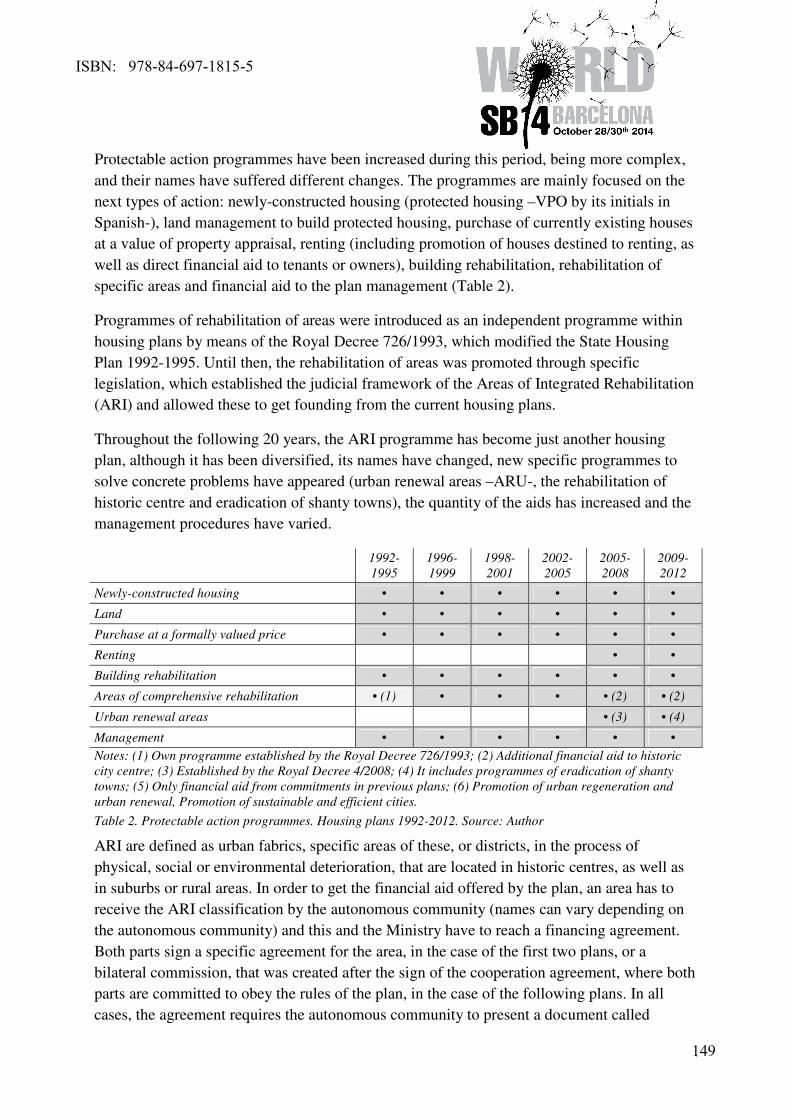
3
Protectable action programmes have been increased during this period, being more complex,
and their names have suffered different changes. The programmes are mainly focused on the
next types of action: newly-constructed housing (protected housing –VPO by its initials in
Spanish-), land management to build protected housing, purchase of currently existing houses
at a value of property appraisal, renting (including promotion of houses destined to renting, as
well as direct financial aid to tenants or owners), building rehabilitation, rehabilitation of
specific areas and financial aid to the plan management (Table 2).
Programmes of rehabilitation of areas were introduced as an independent programme within
housing plans by means of the Royal Decree 726/1993, which modified the State Housing
Plan 1992-1995. Until then, the rehabilitation of areas was promoted through specific
legislation, which established the judicial framework of the Areas of Integrated Rehabilitation
(ARI) and allowed these to get founding from the current housing plans.
Throughout the following 20 years, the ARI programme has become just another housing
plan, although it has been diversified, its names have changed, new specific programmes to
solve concrete problems have appeared (urban renewal areas –ARU-, the rehabilitation of
historic centre and eradication of shanty towns), the quantity of the aids has increased and the
management procedures have varied.
1992-
1995
1996-
1999
1998-
2001
2002-
2005
2005-
2008
2009-
2012
Newly-constructed housing • • • • • •
Land • • • • • •
Purchase at a formally valued price • • • • • •
Renting
• •
Building rehabilitation • • • • • •
Areas of comprehensive rehabilitation • (1) • • • • (2) • (2)
Urban renewal areas
• (3) • (4)
Management • • • • • •
Notes: (1) Own programme established by the Royal Decree 726/1993; (2) Additional financial aid to historic
city centre; (3) Established by the Royal Decree 4/2008; (4) It includes programmes of eradication of shanty
towns; (5) Only financial aid from commitments in previous plans; (6) Promotion of urban regeneration and
urban renewal, Promotion of sustainable and efficient cities.
Table 2. Protectable action programmes. Housing plans 1992-2012. Source: Author
ARI are defined as urban fabrics, specific areas of these, or districts, in the process of
physical, social or environmental deterioration, that are located in historic centres, as well as
in suburbs or rural areas. In order to get the financial aid offered by the plan, an area has to
receive the ARI classification by the autonomous community (names can vary depending on
the autonomous community) and this and the Ministry have to reach a financing agreement.
Both parts sign a specific agreement for the area, in the case of the first two plans, or a
bilateral commission, that was created after the sign of the cooperation agreement, where both
parts are committed to obey the rules of the plan, in the case of the following plans. In all
cases, the agreement requires the autonomous community to present a document called
ISBN: 978-84-697-1815-5
149
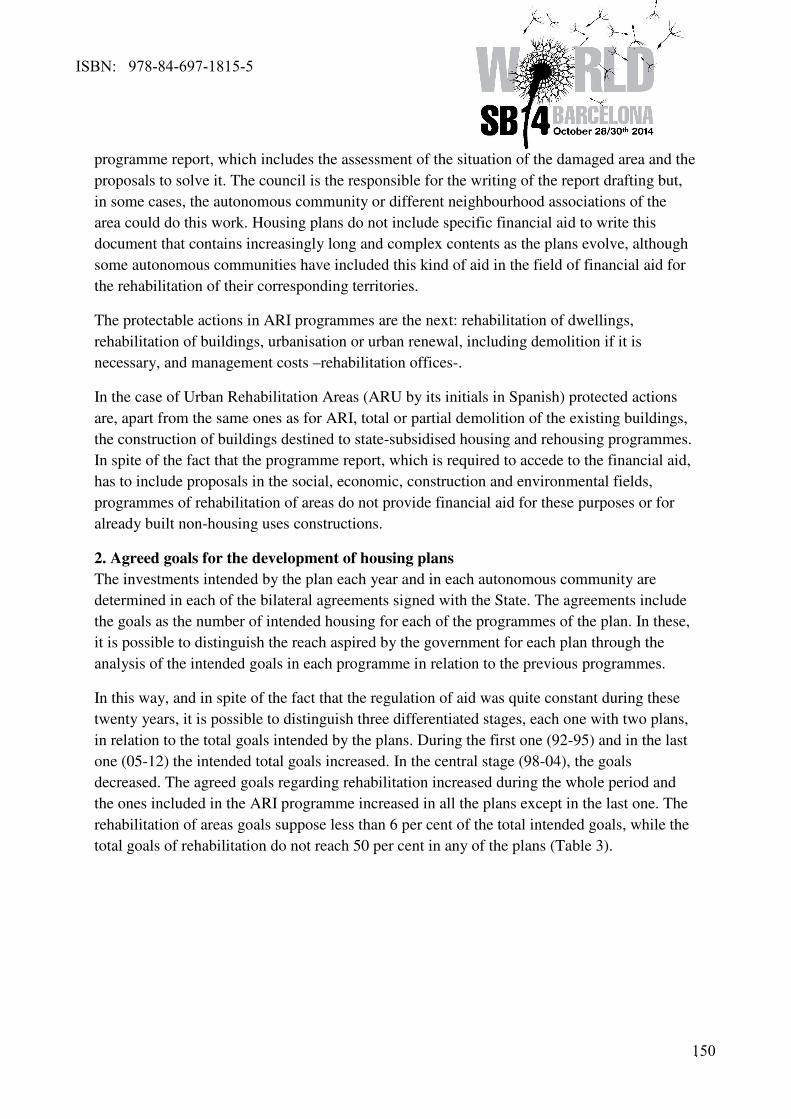
4
programme report, which includes the assessment of the situation of the damaged area and the
proposals to solve it. The council is the responsible for the writing of the report drafting but,
in some cases, the autonomous community or different neighbourhood associations of the
area could do this work. Housing plans do not include specific financial aid to write this
document that contains increasingly long and complex contents as the plans evolve, although
some autonomous communities have included this kind of aid in the field of financial aid for
the rehabilitation of their corresponding territories.
The protectable actions in ARI programmes are the next: rehabilitation of dwellings,
rehabilitation of buildings, urbanisation or urban renewal, including demolition if it is
necessary, and management costs –rehabilitation offices-.
In the case of Urban Rehabilitation Areas (ARU by its initials in Spanish) protected actions
are, apart from the same ones as for ARI, total or partial demolition of the existing buildings,
the construction of buildings destined to state-subsidised housing and rehousing programmes.
In spite of the fact that the programme report, which is required to accede to the financial aid,
has to include proposals in the social, economic, construction and environmental fields,
programmes of rehabilitation of areas do not provide financial aid for these purposes or for
already built non-housing uses constructions.
2. Agreed goals for the development of housing plans
The investments intended by the plan each year and in each autonomous community are
determined in each of the bilateral agreements signed with the State. The agreements include
the goals as the number of intended housing for each of the programmes of the plan. In these,
it is possible to distinguish the reach aspired by the government for each plan through the
analysis of the intended goals in each programme in relation to the previous programmes.
In this way, and in spite of the fact that the regulation of aid was quite constant during these
twenty years, it is possible to distinguish three differentiated stages, each one with two plans,
in relation to the total goals intended by the plans. During the first one (92-95) and in the last
one (05-12) the intended total goals increased. In the central stage (98-04), the goals
decreased. The agreed goals regarding rehabilitation increased during the whole period and
the ones included in the ARI programme increased in all the plans except in the last one. The
rehabilitation of areas goals suppose less than 6 per cent of the total intended goals, while the
total goals of rehabilitation do not reach 50 per cent in any of the plans (Table 3).
ISBN: 978-84-697-1815-5
150
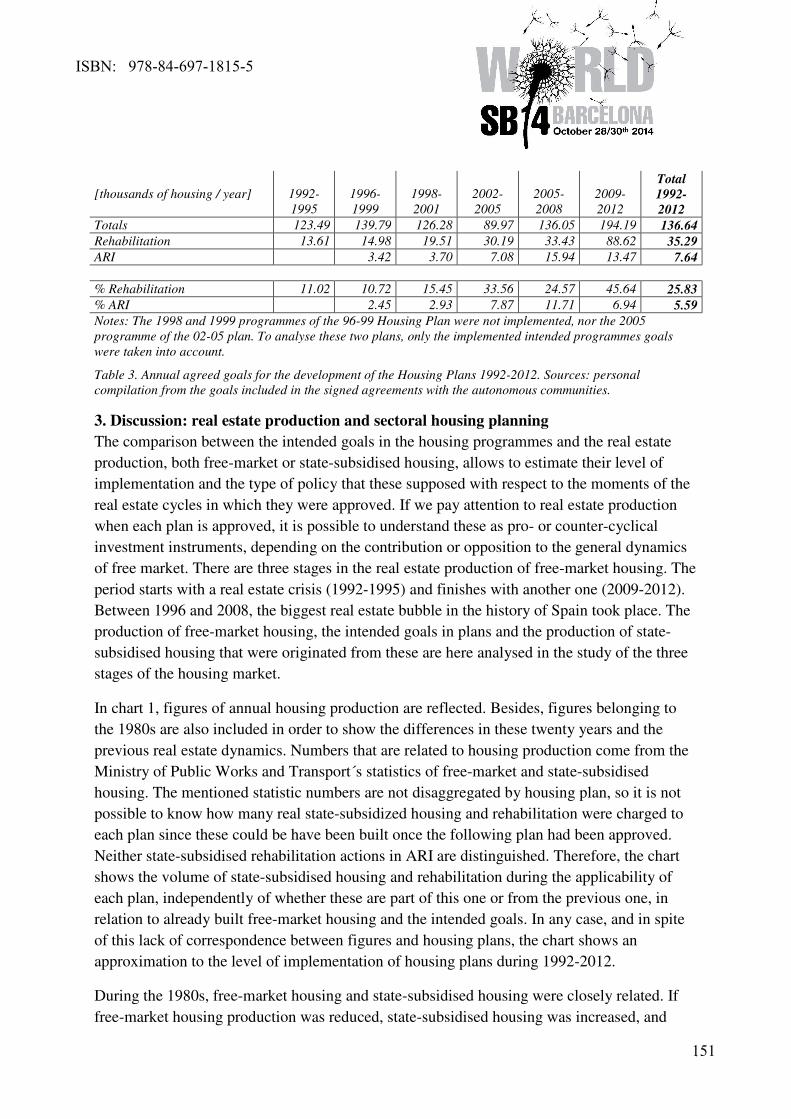
5
[thousands of housing / year] 1992-
1995
1996-
1999
1998-
2001
2002-
2005
2005-
2008
2009-
2012
Total
1992-
2012
Totals 123.49 139.79 126.28 89.97 136.05 194.19 136.64
Rehabilitation 13.61 14.98 19.51 30.19 33.43 88.62 35.29
ARI
3.42 3.70 7.08 15.94 13.47 7.64
% Rehabilitation 11.02 10.72 15.45 33.56 24.57 45.64 25.83
% ARI
2.45 2.93 7.87 11.71 6.94 5.59
Notes: The 1998 and 1999 programmes of the 96-99 Housing Plan were not implemented, nor the 2005
programme of the 02-05 plan. To analyse these two plans, only the implemented intended programmes goals
were taken into account.
Table 3. Annual agreed goals for the development of the Housing Plans 1992-2012. Sources: personal
compilation from the goals included in the signed agreements with the autonomous communities.
3. Discussion: real estate production and sectoral housing planning
The comparison between the intended goals in the housing programmes and the real estate
production, both free-market or state-subsidised housing, allows to estimate their level of
implementation and the type of policy that these supposed with respect to the moments of the
real estate cycles in which they were approved. If we pay attention to real estate production
when each plan is approved, it is possible to understand these as pro- or counter-cyclical
investment instruments, depending on the contribution or opposition to the general dynamics
of free market. There are three stages in the real estate production of free-market housing. The
period starts with a real estate crisis (1992-1995) and finishes with another one (2009-2012).
Between 1996 and 2008, the biggest real estate bubble in the history of Spain took place. The
production of free-market housing, the intended goals in plans and the production of state-
subsidised housing that were originated from these are here analysed in the study of the three
stages of the housing market.
In chart 1, figures of annual housing production are reflected. Besides, figures belonging to
the 1980s are also included in order to show the differences in these twenty years and the
previous real estate dynamics. Numbers that are related to housing production come from the
Ministry of Public Works and Transport´s statistics of free-market and state-subsidised
housing. The mentioned statistic numbers are not disaggregated by housing plan, so it is not
possible to know how many real state-subsidized housing and rehabilitation were charged to
each plan since these could be have been built once the following plan had been approved.
Neither state-subsidised rehabilitation actions in ARI are distinguished. Therefore, the chart
shows the volume of state-subsidised housing and rehabilitation during the applicability of
each plan, independently of whether these are part of this one or from the previous one, in
relation to already built free-market housing and the intended goals. In any case, and in spite
of this lack of correspondence between figures and housing plans, the chart shows an
approximation to the level of implementation of housing plans during 1992-2012.
During the 1980s, free-market housing and state-subsidised housing were closely related. If
free-market housing production was reduced, state-subsidised housing was increased, and
ISBN: 978-84-697-1815-5
151
6
vice-versa. The crisis in the early 1980s was accompanied by a rising investment in state-
subsidised housing by means of two housing plans (81-83 and 84-87). The subsidised real
estate production in 1984-1987 Housing Plan (almost 135 annual housing) was not reached by
any of the following plans. In 1988 the recovering of free-market housing started and the
State decided to leave the long-term planning (3). Then, state-subsidised housing production
was constantly reduced until 1992. During this decade, regulations of ARI (the first
regulations were established by the Royal Decree 2554/1982), as well as the multilevel
cooperation (State, autonomous communities and councils) framework were established so as
to develop the plans that would be implemented during the following twenty years.
Notes: * Between 1988 and 1991 there was no housing plan but annual financial aid programmes. 1998 and
1999 programmes of 96-99plan and 2005 programme of 02-05 housing plan were not implemented. To analyse
these two plans, only implemented programmes goals were taken into account. Figures of final state-subsidised
actions.
Chart 1. Real estate production and sectoral housing planning1981-2012. Sources: Personal compilation from
free-market and state-subsidised housing statistics of the Ministry of public works and transport and from the
goals included in the signed agreements with the autonomous communities.
From 1992, free-market housing production was reduced after the bursting of the real estate
bubble in the last 1980s (4). The State recovered long-term planning. Agreements with all the
autonomous communities were signed and, for the first time, the intended goals for all of
them were established. However, ARI programme goals were not distinguished since this was
added to the plan in 1993. State-subsidised housing production was progressively recovered
during the applicability of 1992-1995 housing plan, in spite of the drop in total figures in
ISBN: 978-84-697-1815-5
152
7
relation to the previous four years. This housing plan, apart from being the base of all the
following plans that would come next, can be considered as a counter-cyclical policy
instrument, since it tries to recover a sector suffering from a serious crisis, by means of public
investment. The number of subsidised rehabilitation actions during this period was only 12
thousand annual housing, in comparison to the total 67 thousand actions.
Since 1996, free-market housing production continuously and exponentially grew until 2008,
with rises of 100 thousand free-market housings more a year, each four years, and the figures
grew from 209 thousand housings a year during the 1996-1999 housing plan to 567 thousand
housing a year during 2005-2008 plan. The four housing plans within this period faced reality
in two different ways: the intended goals in the first one (96-99) and the last one (05-08) were
increased and it can be considered that these triggered the development of the real estate
cycle. The two central housing plans of the period (98-01 and 02-05) reduced the intended
goals in contrast to the general real estate cycle. However, state subsidised housing
production stopped following the intended goals during one of the plans that tried to reduce
production. The force of the real estate bubble was so strong in the first decade of the
twentieth century that during the 02-05 Housing Plan, which supposed a sharp fall of goals,
state subsidised housing production went with the flow given by general dynamics of the real
estate market, exceeded foresights and grew in relation to the previous period. Dealing with
state-subsidised rehabilitation, actions were continuously increased from 22 thousand housing
a year to 55 thousand, during the three first plans. During the last plan in this period (05-08),
despite the increase of the intended rehabilitation goals, actions were reduced to 45 thousand
housing a year. The goals in ARI grew during the whole period.
From 2009, the state free-market housing production dramatically decreased and the figures
went down from around 567 thousand free-market housing a year during the 2005-2008
Housing Plan to 194 thousand during 2009-2012 Housing Plan. This last plan can also be
considered as a typically counter –cyclical instrument that tries to recover the sector
increasing the intended goals in a really significant way. However, the force of the crisis and
the budgetary cuts supposed the omission of some of the programmes of the plan, so state-
subsidised housing production was under the intended goals for the period. In any case, this
supposed an increase in relation to the previous period with a result of 113 thousand housing a
year, a figure that does not reach the state-subsidised housing production of the early 1980s.
In this last plan, and in spite of the fact that it is not really significant, the intended goals for
ARI were reduced.
In this way, even though programmes of comprehensive rehabilitation of areas were
increasingly more relevant during the implementation of the plans, these have played a
subsidiary role in the promotion of programmes of newly-constructed housing and these have
been insignificant in relation to the housing production of the period. In 2013, a new stage in
this process started with the approval of the State Plan for promotion of rented housing,
building rehabilitation and urban renewal and regeneration (Plan Estatal de fomento del
alquiler de viviendas, la rehabilitación edificatoria, y la regeneración y renovación urbanas in
ISBN: 978-84-697-1815-5
153
8
Spanish), 2013-2016 (Royal Decree 233/2013). In this plan, the existing programmes are left
behind and now the focus is on renting and rehabilitation. However, the poor investment from
Administration and the previously assumed commitments are slowing the development of this
plan. At the present moment, May 2014, the agreements concerning the development of this
plan have not already been signed with the autonomous communities.
Bibliographical references
(1) Pérez, T., Rodríguez, M., Blanco, Á. (2011). Política de gasto en vivienda. España, 2010.
Papeles de Trabajo del Instituto de Estudios Fiscales, 1/2011.
(2) Hernández Aja, A., García Madruga, C. (2014). Magnitudes de 20 años de planes y
programas de rehabilitación y regeneración urbana. Ciudad y territorio: Estudios territoriales,
XLVI(179): 184-191.
(3) Fernández, A. (2004). Veinticinco años de política de vivienda en España (1976-2001):
una visión panorámica. Información Comercial Española, ICE: Revista de economía, 816:
145-161.
(4) Naredo, J.M. (2004). Perspectivas de la vivienda. Información Comercial Española, ICE:
Revista de economía, 815: 143-154.
ISBN: 978-84-697-1815-5
154
1
The Study of Vegetation Effects on Reduction of Urban Heat
Island in Dubai
Authors:
Rajabi, T 1
; Abu-Hijleh, B 2;
1 British University in Dubai, Dubai, UAE
2 British University in Dubai, Dubai, UAE
Abstract:
Rapid urbanization in the past 100 years has resulted in many environmental issues in large
cities. Urban Heat Island which is the condition of excess heat in city centers is one of these
environmental issues. Dubai which has developed tremendously in the past decade also
suffers from condition of urban heat island. This research aims to study the effects of
vegetation on reduction of urban heat island in dense and old neighborhoods of Dubai.
Computer simulation was selected as the major methodology in this research and ENVI-met
software was utilized as the main simulation tool. The investigations in this research were
performed in two parts; Part One focused on identifying the most effective strategies of
applying greenery in a simplified urban condition. In Part Two, these strategies were applied
on two urban blocks in Dubai to measure their effectiveness on real conditions. The results
from both parts of the research showed that application of trees with medium density is the
most effective strategy in tackling excess heat in urban areas. Also, it was concluded that both
grass and green roofs have negligible effects on reducing surface temperatures in the urban
areas. Based on the results, it is suggested to apply the medium density trees in compacted
forms around the built up structures in newly designed urban areas. In terms of the pre-
existing urban areas, the best strategy is to utilize available empty plots such as parking lots
to insert compacted forms of medium density trees in addition to planting along the wide
pedestrian and vehicular paths.
Key words, Vegetation, Urban heat island, Envimet, Dubai
1. Inroduction
Rapid urbanization has caused number of negative consequences in different parts of the
world. This research focuses on one of these consequeances as a phenomenon known as
Urban Heat Island. This phenomenon can be defined as a temperature variance where an
urban area (normally located at the heart of the city) features an island of warmer air and
surface temperature compared to a suburban or rural area which features a sea of cooler air
and surface temperature. There are two sources of heat gain in urban areas; sun and
anthropogenic sources. Urban areas gain heat from the sun through solar radiation while
getting heat from anthropogenic sources through people, machinery and buildings. The
mitigation strategies of UHI are directly related to the causes of this phenomenon and they
mainly deal with alteration of building materials and increasing evaporation by adding
greenery. These mitigation strategies could be categorized under three main groups:
• Cool roofs and pavements
• Green roofs
• Urban Vegetation and greenery
ISBN: 978-84-697-1815-5
155
2
All these strategies aim to focus on controlling the absorption of the heat and its release to the
environment in order to establish a balance between heating and cooling of the urban fabric.
2. Litreture Review
The body of research on urban heat island could be divided into three categories; (1) Studies
on causes of urban heat island in different cities, (2) Studies on measurement and modeling of
the extent of urban heat island in different cities, (3) Studies on application, analysis and the
effectiveness of mitigation strategies, for the purpose of this research only the last caterogy of
research body was reviewed based on four different áreas listed below:
• Studies on the mitigation effects of Small scale application of greenery
• Studies on the mitigation effects of Large scale application of greenery
• Studies on the mitigation effects of Green roofs
• Studies on the mitigation effects of Vertical greenery
Zhanga, et al. (2010) studied the relationship between surface temperature and NDVI
(Normalized Difference Vegetation Index, a numerical indicator used to study vegetation
cover on the land from satellite data) in the city of Beijing, China. In this study it was
concluded that the distribution of vegetation cover is low in center and high in the edges of
the study area while the distribution of the temperature was opposite to vegetation cover, low
at the edges and high in center; this observation revealed the significant negative relationship
between vegetation cover and surface temperature. In terms of large scale application of
greenery, Caoa , et al (2010) studied the role of urban parks characteristics such as size,
shape and land use in the amount of Park Cooling Intensity; a parameter that measures the
ability of a park to create a cooler environment within the urban fabric. The results of this
study showed that large parks had significantly lower temperatures than the rest of the city
during summer and spring however this temperature difference was lower during autumn;
therefore with increasing the park size, the PCI factor increased considerably for summer and
spring. On the other hand, Wong and Jusuf (2008) studied the effect of implementing green
roof on reduction of ambient air temperature in National University of Singapore. This study
concluded that grass and trees roof cover significantly result in cooler conditions; however
this effect is considerably increased when roof garden strategy is combined with improving
the amount of greenery on site.In terms of vertical greenery, Alexandri and Jones (2008) in
their study of the impact of the characteristics of vertical greenery and street canyon on the
microclimate showed that the amount of vegetation placed on the building envelope plays an
important role on the cooling effect in urban areas.
3. Research Importance, Aims, Objectives & Methodology
One of the most important concerns which were raised by the authorities after the massive
developments in Dubai, was Urban Heat Island phenomenon. Dubai municipality conducted
an aerial thermal survey of the city in December 2009 (Zacarias,2011); the air born thermal
images of Dubai showcased the existence of urban heat island in the city. Dense areas which
belong to the older fabric of the city such as Deira and Bur Dubai as well as the industrial
areas of Al Qouz were identified to be the hot spots within the city (Zacarias, 2011). Figure 1
shows a thermal image snapped from Deira and Bur Dubai area; the grey circles in the figure
point out the hot spots in these areas. According to Figure 1, building dominated clusters with
narrow roads have tremendously higher temperatures than the rest of the áreas. The objective
ISBN: 978-84-697-1815-5
156
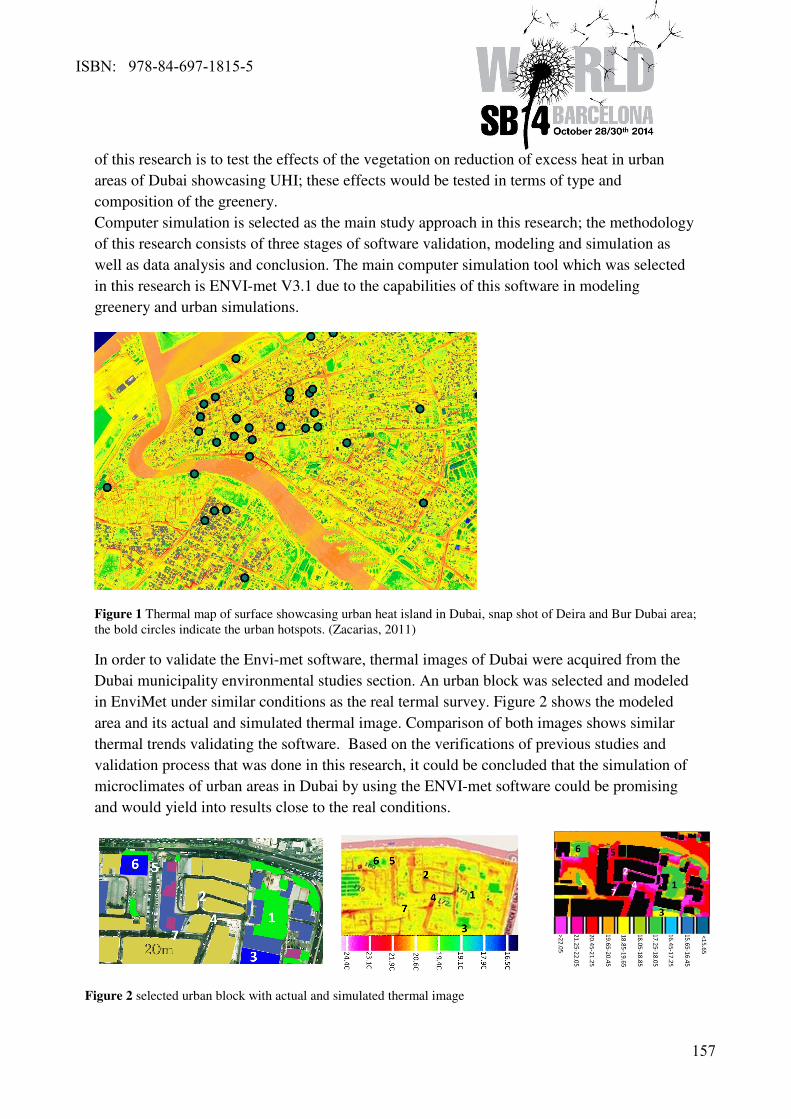
3
of this research is to test the effects of the vegetation on reduction of excess heat in urban
areas of Dubai showcasing UHI; these effects would be tested in terms of type and
composition of the greenery.
Computer simulation is selected as the main study approach in this research; the methodology
of this research consists of three stages of software validation, modeling and simulation as
well as data analysis and conclusion. The main computer simulation tool which was selected
in this research is ENVI-met V3.1 due to the capabilities of this software in modeling
greenery and urban simulations.
Figure 1 Thermal map of surface showcasing urban heat island in Dubai, snap shot of Deira and Bur Dubai area;
the bold circles indicate the urban hotspots. (Zacarias, 2011)
In order to validate the Envi-met software, thermal images of Dubai were acquired from the
Dubai municipality environmental studies section. An urban block was selected and modeled
in EnviMet under similar conditions as the real termal survey. Figure 2 shows the modeled
area and its actual and simulated thermal image. Comparison of both images shows similar
thermal trends validating the software. Based on the verifications of previous studies and
validation process that was done in this research, it could be concluded that the simulation of
microclimates of urban areas in Dubai by using the ENVI-met software could be promising
and would yield into results close to the real conditions.
Figure 2 selected urban block with actual and simulated thermal image
ISBN: 978-84-697-1815-5
157
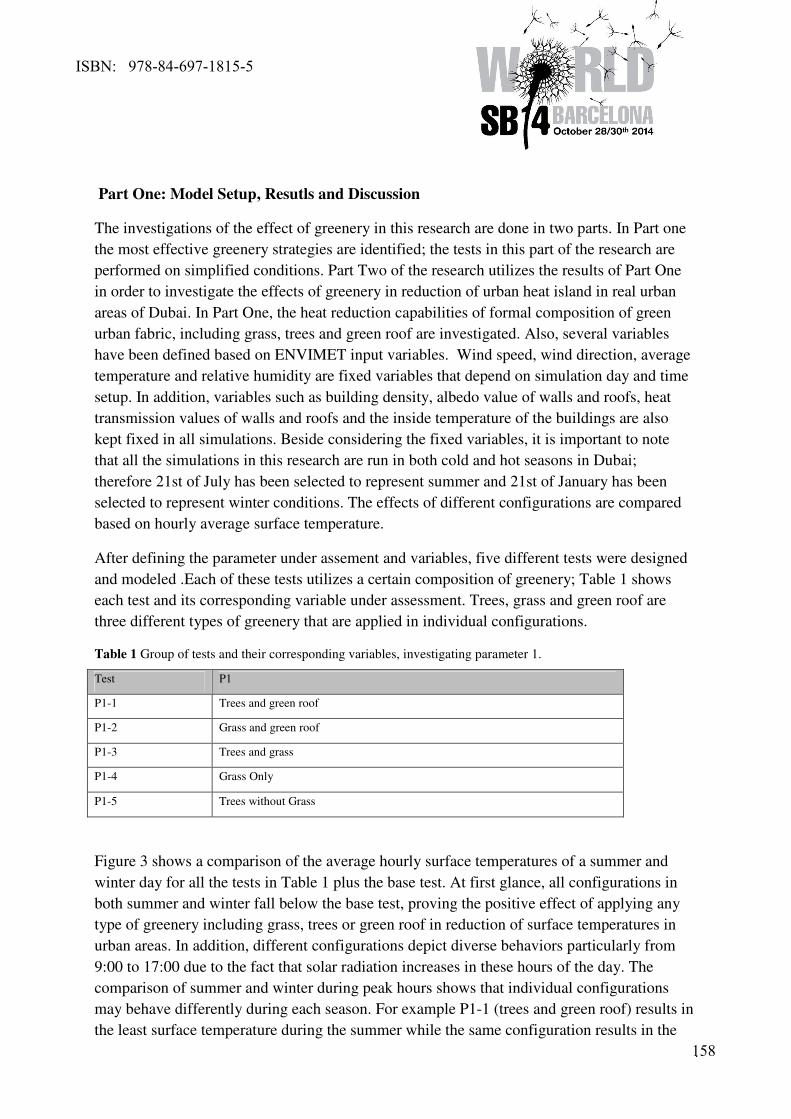
4
Part One: Model Setup, Resutls and Discussion
The investigations of the effect of greenery in this research are done in two parts. In Part one
the most effective greenery strategies are identified; the tests in this part of the research are
performed on simplified conditions. Part Two of the research utilizes the results of Part One
in order to investigate the effects of greenery in reduction of urban heat island in real urban
areas of Dubai. In Part One, the heat reduction capabilities of formal composition of green
urban fabric, including grass, trees and green roof are investigated. Also, several variables
have been defined based on ENVIMET input variables. Wind speed, wind direction, average
temperature and relative humidity are fixed variables that depend on simulation day and time
setup. In addition, variables such as building density, albedo value of walls and roofs, heat
transmission values of walls and roofs and the inside temperature of the buildings are also
kept fixed in all simulations. Beside considering the fixed variables, it is important to note
that all the simulations in this research are run in both cold and hot seasons in Dubai;
therefore 21st of July has been selected to represent summer and 21st of January has been
selected to represent winter conditions. The effects of different configurations are compared
based on hourly average surface temperature.
After defining the parameter under assement and variables, five different tests were designed
and modeled .Each of these tests utilizes a certain composition of greenery; Table 1 shows
each test and its corresponding variable under assessment. Trees, grass and green roof are
three different types of greenery that are applied in individual configurations.
Table 1 Group of tests and their corresponding variables, investigating parameter 1.
Test P1
P1-1 Trees and green roof
P1-2 Grass and green roof
P1-3 Trees and grass
P1-4 Grass Only
P1-5 Trees without Grass
Figure 3 shows a comparison of the average hourly surface temperatures of a summer and
winter day for all the tests in Table 1 plus the base test. At first glance, all configurations in
both summer and winter fall below the base test, proving the positive effect of applying any
type of greenery including grass, trees or green roof in reduction of surface temperatures in
urban areas. In addition, different configurations depict diverse behaviors particularly from
9:00 to 17:00 due to the fact that solar radiation increases in these hours of the day. The
comparison of summer and winter during peak hours shows that individual configurations
may behave differently during each season. For example P1-1 (trees and green roof) results in
the least surface temperature during the summer while the same configuration results in the
ISBN: 978-84-697-1815-5
158
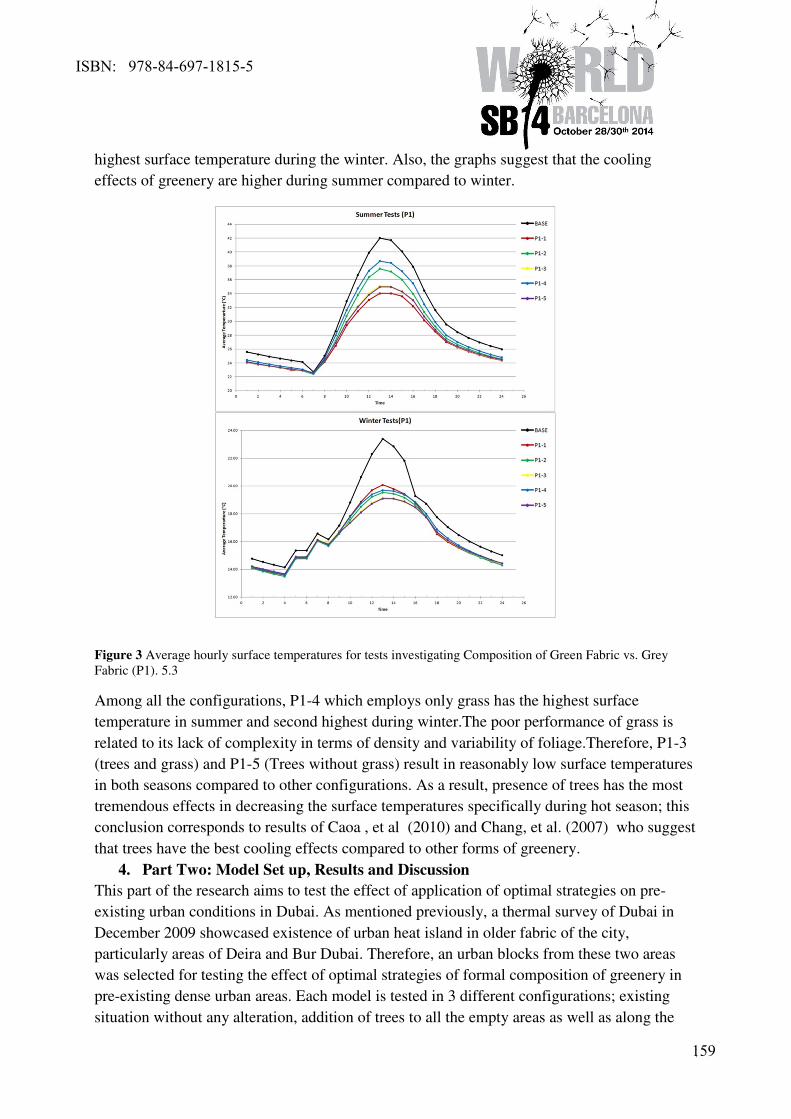
5
highest surface temperature during the winter. Also, the graphs suggest that the cooling
effects of greenery are higher during summer compared to winter.
Figure 3 Average hourly surface temperatures for tests investigating Composition of Green Fabric vs. Grey
Fabric (P1). 5.3
Among all the configurations, P1-4 which employs only grass has the highest surface
temperature in summer and second highest during winter.The poor performance of grass is
related to its lack of complexity in terms of density and variability of foliage.Therefore, P1-3
(trees and grass) and P1-5 (Trees without grass) result in reasonably low surface temperatures
in both seasons compared to other configurations. As a result, presence of trees has the most
tremendous effects in decreasing the surface temperatures specifically during hot season; this
conclusion corresponds to results of Caoa , et al (2010) and Chang, et al. (2007) who suggest
that trees have the best cooling effects compared to other forms of greenery.
4. Part Two: Model Set up, Results and Discussion
This part of the research aims to test the effect of application of optimal strategies on pre-
existing urban conditions in Dubai. As mentioned previously, a thermal survey of Dubai in
December 2009 showcased existence of urban heat island in older fabric of the city,
particularly areas of Deira and Bur Dubai. Therefore, an urban blocks from these two areas
was selected for testing the effect of optimal strategies of formal composition of greenery in
pre-existing dense urban areas. Each model is tested in 3 different configurations; existing
situation without any alteration, addition of trees to all the empty areas as well as along the
ISBN: 978-84-697-1815-5
159
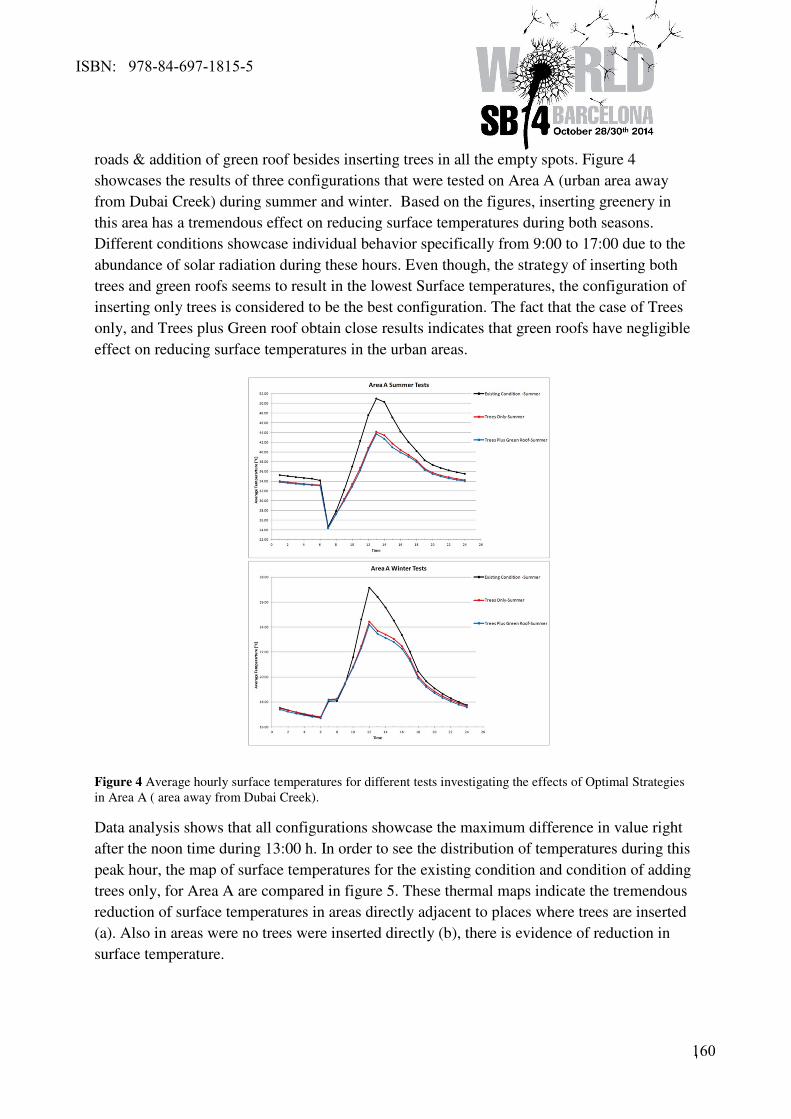
6
roads & addition of green roof besides inserting trees in all the empty spots. Figure 4
showcases the results of three configurations that were tested on Area A (urban area away
from Dubai Creek) during summer and winter. Based on the figures, inserting greenery in
this area has a tremendous effect on reducing surface temperatures during both seasons.
Different conditions showcase individual behavior specifically from 9:00 to 17:00 due to the
abundance of solar radiation during these hours. Even though, the strategy of inserting both
trees and green roofs seems to result in the lowest Surface temperatures, the configuration of
inserting only trees is considered to be the best configuration. The fact that the case of Trees
only, and Trees plus Green roof obtain close results indicates that green roofs have negligible
effect on reducing surface temperatures in the urban areas.
Figure 4 Average hourly surface temperatures for different tests investigating the effects of Optimal Strategies
in Area A ( area away from Dubai Creek).
Data analysis shows that all configurations showcase the maximum difference in value right
after the noon time during 13:00 h. In order to see the distribution of temperatures during this
peak hour, the map of surface temperatures for the existing condition and condition of adding
trees only, for Area A are compared in figure 5. These thermal maps indicate the tremendous
reduction of surface temperatures in areas directly adjacent to places where trees are inserted
(a). Also in areas were no trees were inserted directly (b), there is evidence of reduction in
surface temperature.
ISBN: 978-84-697-1815-5
160
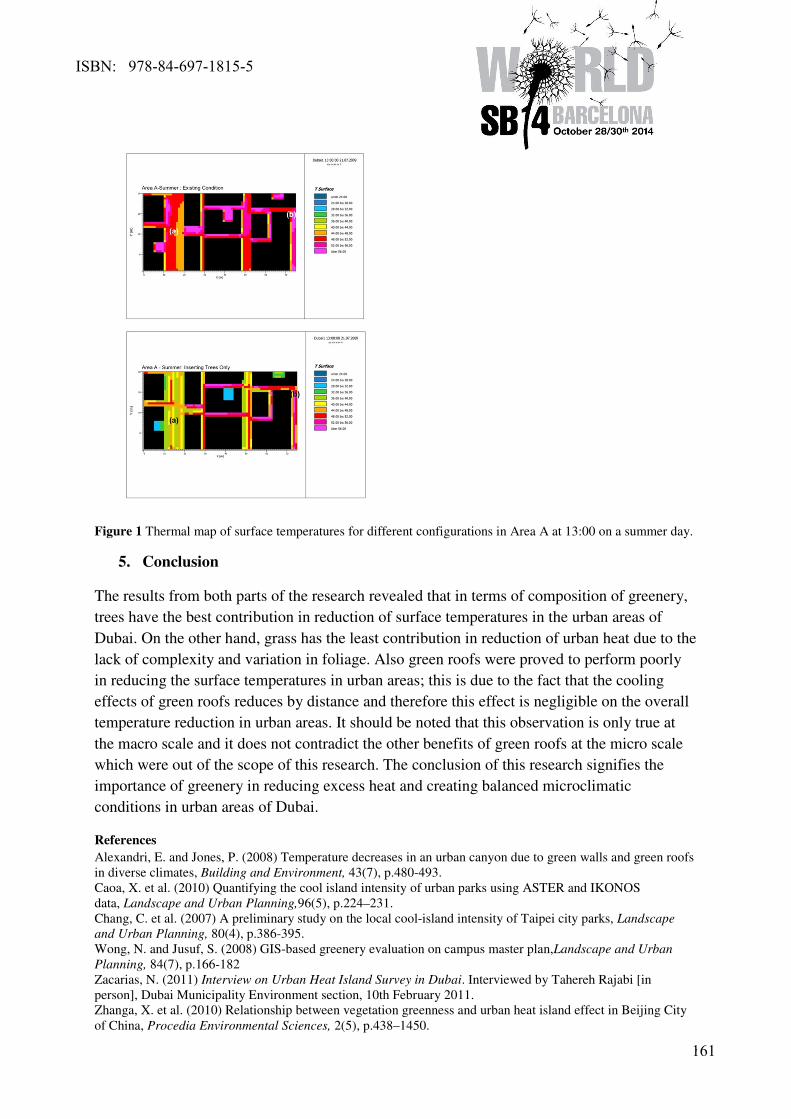
7
Figure 1 Thermal map of surface temperatures for different configurations in Area A at 13:00 on a summer day.
5. Conclusion
The results from both parts of the research revealed that in terms of composition of greenery,
trees have the best contribution in reduction of surface temperatures in the urban areas of
Dubai. On the other hand, grass has the least contribution in reduction of urban heat due to the
lack of complexity and variation in foliage. Also green roofs were proved to perform poorly
in reducing the surface temperatures in urban areas; this is due to the fact that the cooling
effects of green roofs reduces by distance and therefore this effect is negligible on the overall
temperature reduction in urban areas. It should be noted that this observation is only true at
the macro scale and it does not contradict the other benefits of green roofs at the micro scale
which were out of the scope of this research. The conclusion of this research signifies the
importance of greenery in reducing excess heat and creating balanced microclimatic
conditions in urban areas of Dubai.
References Alexandri, E. and Jones, P. (2008) Temperature decreases in an urban canyon due to green walls and green roofs
in diverse climates, Building and Environment, 43(7), p.480-493.
Caoa, X. et al. (2010) Quantifying the cool island intensity of urban parks using ASTER and IKONOS
data, Landscape and Urban Planning,96(5), p.224–231.
Chang, C. et al. (2007) A preliminary study on the local cool-island intensity of Taipei city parks, Landscape
and Urban Planning, 80(4), p.386-395.
Wong, N. and Jusuf, S. (2008) GIS-based greenery evaluation on campus master plan,Landscape and Urban
Planning, 84(7), p.166-182
Zacarias, N. (2011) Interview on Urban Heat Island Survey in Dubai. Interviewed by Tahereh Rajabi [in
person], Dubai Municipality Environment section, 10th February 2011.
Zhanga, X. et al. (2010) Relationship between vegetation greenness and urban heat island effect in Beijing City
of China, Procedia Environmental Sciences, 2(5), p.438–1450.
ISBN: 978-84-697-1815-5
161
1
New indicator for resource accessibility assessment, based on
surface land cover
Ioannidou, D.1; Nikias, V.
2; Brière, R.
3,4; Zerbi, S.
5; Habert, G.
6,7
1 Chair of Sustainable Construction, ETH Zurich, Switzerland
2 Chair of Sustainable Construction, ETH Zurich, Switzerland
3 IFSTTAR, Materials Department, Université Paris-Est, Paris, France.
4 Navier Laboratory, Ecole des Ponts ParisTech, Université Paris-Est, Marne la Vallée, France
5 hepia - Haute école du paysage, d'ingénierie et d'architecture de Genève, Rue de la Prairie 4,
1202, Geneva, Switzerland 6 IFSTTAR, Materials Department, Université Paris-Est, Paris, France.
7 Chair of Sustainable Construction, ETH Zurich, Switzerland.
Abstract: The paper describes the development of a new, easy-to-calculate, cost-efficient
indicator for evaluating local resource accessibility. This indicator tries to complement
current indicators which usually measure the physical availability of resources based on a
global resource availability and fail to accurately depict the local scarcity. The indicator
developed here takes into account the impact of other parameters, namely social and
anthropogenic factors, like the proximity to an urban area. The social factors can be a
barrier to the authorization of quarry operation and expansion and therefore to the
accessibility to a resource. Their impact on resource exploitation is expressed by the surface
competition between cities and quarries and is based on land cover data. The new indicator,
validated through case studies in France and Switzerland, allows to understand the dynamics
of the studied area in terms of human pressure on resource accessibility.
Keywords: natural resources, resource accessibility, land cover, land competition
Introduction
The issue of resource availability, especially with regard to the bulk resources such as sand
and gravel used in the construction industry, is currently widely acknowledged. In many parts
of the world, resources are becoming scarcer, with the situation being accentuated around the
metropolitan areas, such as Paris in France [1] and Geneva in Switzerland [2].
Environmental impact assessment methods such as Life Cycle Assessment (LCA) use
different indicators to evaluate resource consumption and abiotic depletion ([3], [4], [5]).
However, the indicators used fail to depict the local scarcity of resources because the methods
assume an infinite ultimate reserve of resources on a global scale [6]. Various attempts have
been directed towards complementing the existing abiotic depletion potential indicators [7].
Latest developments in the environmental assessment methods indicate the general need for a
regionalized approach that accounts for space differentiation [8]. This has led to the
development of new approaches for assessing resource availability or depletion in a specific
territory, such as the use of Geographical Information Systems [9], Material Flow Analysis
[10] and Material and Energy Flow Accounting Analysis [6].
ISBN: 978-84-697-1815-5
162
2
In addition to the importance of conducting a regional resource assessment, it is essential to
incorporate information from different data sources, such as geology, technology, economics
and human behavior to provide a comprehensive estimate [11]. Lloyd and co-authors [12]
built on the idea of a holistic assessment of the availability of resources and underlined the
importance of evaluating the accessibility to a specific resource. Scellato and co-authors [13]
mentioned the importance of accessibility in economic geography and regional planning.
Moreover, the European Commission [14] stressed the importance of taking into account all
the factors that affect the supply risks when evaluating the criticality of minerals and metals in
the European Union. The access to land and the competition between the different land uses
was deemed as a crucial parameter in terms of decision making and for the operation of the
extractive industries; however no indicator was developed by the European Commission to
account for the accessibility of resources [14].
The current study focuses on the development of a new indicator for evaluating in a very fast
and cost-efficient way the accessibility to resources on a local scale, as a result of social and
anthropogenic factors. The predominant idea is that despite the availability of resources in a
region, the proximity to an urban area or to a protected zone may affect and even prohibit the
accessibility and therefore the exploitation of these resources. Thus, space competition
between built environment and quarries, based on land cover data, should be accounted for,
hence allowing an understanding of the dynamics of the studied area in terms of human
pressure on resource accessibility. The robustness of the indicator developed is demonstrated
for France and Switzerland, since similar local contexts yield similar results. The application
of the indicator is evaluated both at a regional and a community level.
Method – Data collection
The point of departure of the research was the observation that there currently exists an
inverse relationship between urban areas and the easiness to access a resource as the urban
population resists to the opening of a quarrying facility close to an urban center. A range of
criteria, like the attitude of the population toward a quarry and the disturbance it causes
(noise, dust and rockfalls), the urbanization of the area and the priority given to another land
use, can affect a quarry operation [15]. This is the well-known NIMBY (Not In My Back
Yard) effect [16].
In order to study this relationship, we developed an easy to calculate indicator, based on the
tendencies observed:
a) The greater the population residing in the area under study is, the more difficult the
quarry operation is, given the noise, traffic and aesthetic burdens associated to a
quarry. For reasons of calculation simplicity, it was assumed that the population of an
area is proportional to the surface covered by urban area.
b) Considering that the evaluation of the size of the city can be performed based on its
surface, the larger the surface of urban settlement in a specific territory is, the more
difficult it is to open a quarry in this territory.
ISBN: 978-84-697-1815-5
163
3
c) However, the larger the area under study is, the less resistance the citizens of an urban
center exhibit to a quarry operation or expansion, as the probability that the quarry
will be close to the city decreases.
A combination of the observations above leads to the selection of two parameters which are
deemed critical for the resource accessibility assessment: the ratio of the quarrying surface
over the surface of urban areas as well as the percentage of the studied area that is occupied
by urban settlements. The calculation of the indicator is based on the expression
��������
��� � ��
(1)
where SQ is the quarrying and SC the urban settlement surface, while ST is the total surface of
observation. The term quarries here takes into account only already discovered and operating
mines and quarries, including both dimension stone quarries as well as quarries for the
extraction of construction aggregates.
The study is based on land cover data for the period 2004/2009 from the Bundesamt für
Statistik in Switzerland ([17], [18]) as well as the CORINE 2006 (Coordination of
information on the environment) land cover project of the European Union [19]. Land cover
was assumed to accurately depict the current situation of a region and incorporate the social
constraints mentioned above, as well as legislative and economic factors indirectly. For
example, an inaccessible area in the middle of the mountains may have abundant resources,
however their exploitation may currently be economically unviable, if the area is situated far
from the transportation (road, highway) network.
Validation of the calculation method
The robustness of the indicator was validated through the analysis of two countries, France
and Switzerland, by comparing the resource accessibility in the different administrative
regions. France is divided into regions (mean surface 24,726km2) and further into departments
(mean surface 5,681km2), while Switzerland is divided into cantons (mean surface 1,588km
2).
In order to enable a meaningful comparison between regions of similar size, the departmental
division of France was considered. It should be noted, however, that as the mean surface of a
department is higher than the mean size of a canton, a slight divergence in the results is
expected.
Figure 1 shows the results of the indicator for the departments of France and the cantons of
Switzerland. The horizontal axis shows the rank of the departments and cantons normalized
by the respective means for the two countries.The y axis presents the value of the Indicator in
logarithmic scale. It is observed that the shape of the distribution in the middle part of the
graph coincides for France and Switzerland (same shape of the curve for the two countries
and similar values obtained). The divergence observed at both ends of the curve for France
from the curve for Switzerland is due to the different geography and population distribution of
the two countries. Switzerland exhibits a quite homogeneous space distribution, featuring
ISBN: 978-84-697-1815-5
164
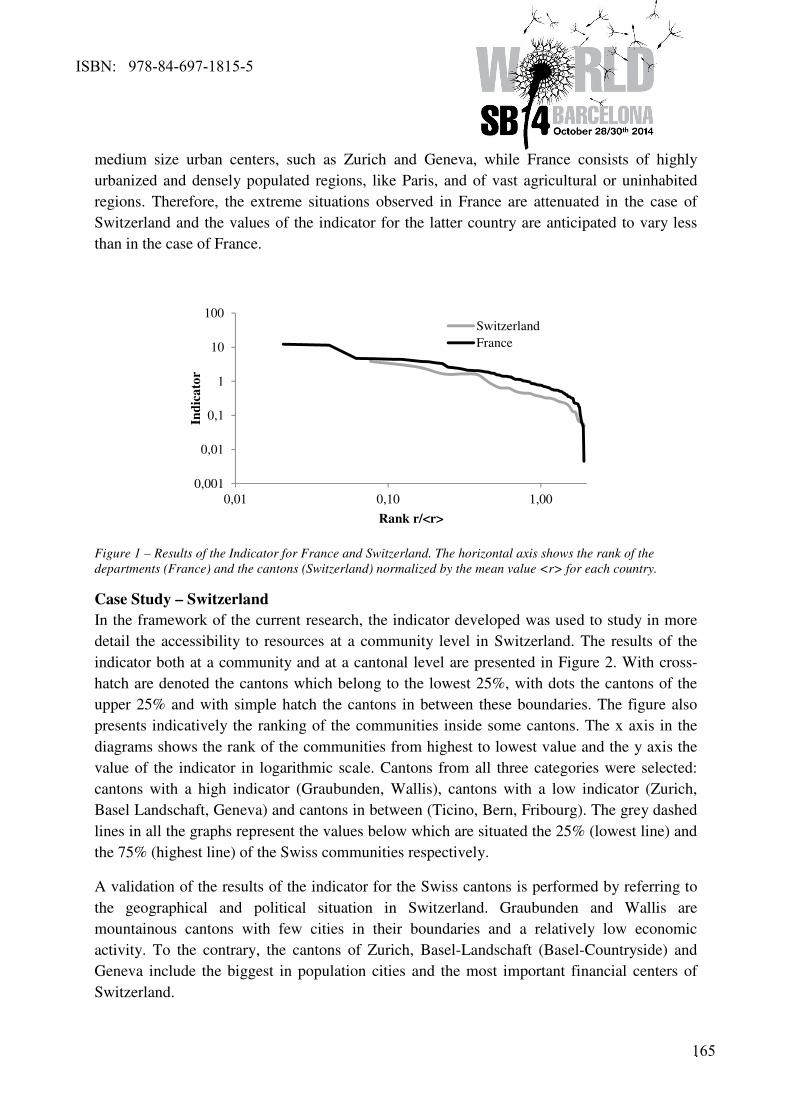
4
medium size urban centers, such as Zurich and Geneva, while France consists of highly
urbanized and densely populated regions, like Paris, and of vast agricultural or uninhabited
regions. Therefore, the extreme situations observed in France are attenuated in the case of
Switzerland and the values of the indicator for the latter country are anticipated to vary less
than in the case of France.
Figure 1 – Results of the Indicator for France and Switzerland. The horizontal axis shows the rank of the
departments (France) and the cantons (Switzerland) normalized by the mean value <r> for each country.
Case Study – Switzerland
In the framework of the current research, the indicator developed was used to study in more
detail the accessibility to resources at a community level in Switzerland. The results of the
indicator both at a community and at a cantonal level are presented in Figure 2. With cross-
hatch are denoted the cantons which belong to the lowest 25%, with dots the cantons of the
upper 25% and with simple hatch the cantons in between these boundaries. The figure also
presents indicatively the ranking of the communities inside some cantons. The x axis in the
diagrams shows the rank of the communities from highest to lowest value and the y axis the
value of the indicator in logarithmic scale. Cantons from all three categories were selected:
cantons with a high indicator (Graubunden, Wallis), cantons with a low indicator (Zurich,
Basel Landschaft, Geneva) and cantons in between (Ticino, Bern, Fribourg). The grey dashed
lines in all the graphs represent the values below which are situated the 25% (lowest line) and
the 75% (highest line) of the Swiss communities respectively.
A validation of the results of the indicator for the Swiss cantons is performed by referring to
the geographical and political situation in Switzerland. Graubunden and Wallis are
mountainous cantons with few cities in their boundaries and a relatively low economic
activity. To the contrary, the cantons of Zurich, Basel-Landschaft (Basel-Countryside) and
Geneva include the biggest in population cities and the most important financial centers of
Switzerland.
0,001
0,01
0,1
1
10
100
0,01 0,10 1,00
Ind
ica
tor
Rank r/<r>
Switzerland
France
ISBN: 978-84-697-1815-5
165
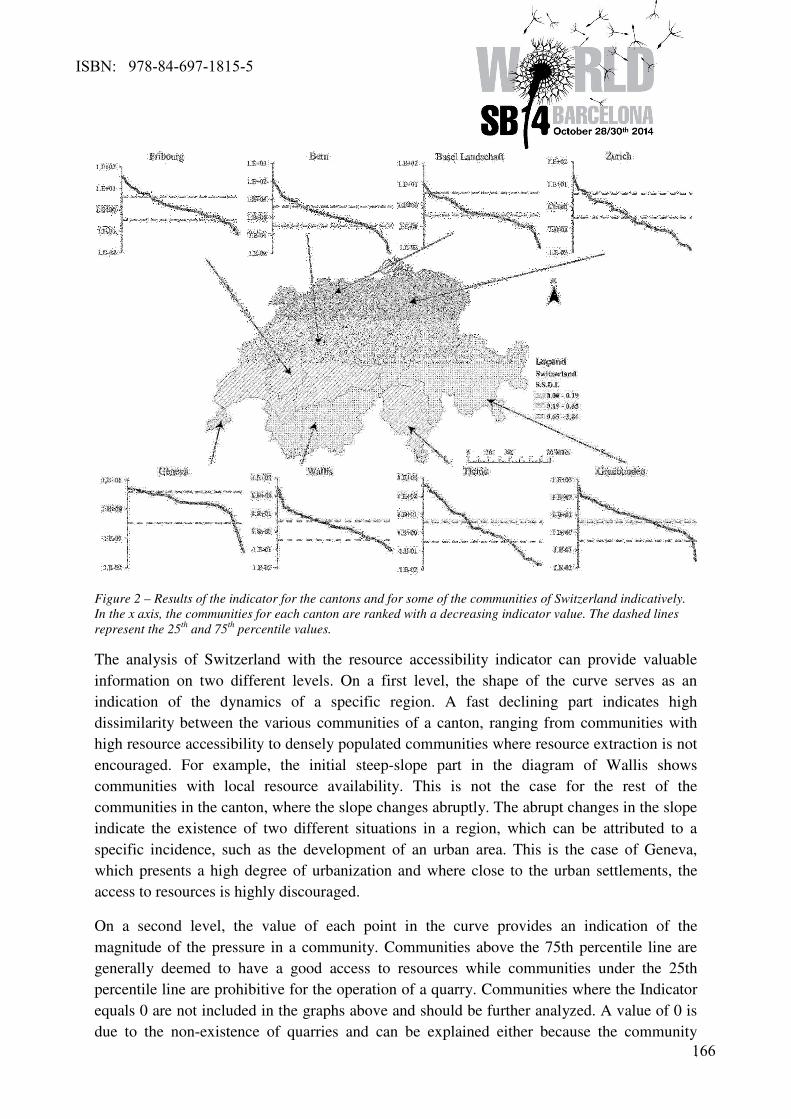
5
Figure 2 – Results of the indicator for the cantons and for some of the communities of Switzerland indicatively.
In the x axis, the communities for each canton are ranked with a decreasing indicator value. The dashed lines
represent the 25th
and 75th
percentile values.
The analysis of Switzerland with the resource accessibility indicator can provide valuable
information on two different levels. On a first level, the shape of the curve serves as an
indication of the dynamics of a specific region. A fast declining part indicates high
dissimilarity between the various communities of a canton, ranging from communities with
high resource accessibility to densely populated communities where resource extraction is not
encouraged. For example, the initial steep-slope part in the diagram of Wallis shows
communities with local resource availability. This is not the case for the rest of the
communities in the canton, where the slope changes abruptly. The abrupt changes in the slope
indicate the existence of two different situations in a region, which can be attributed to a
specific incidence, such as the development of an urban area. This is the case of Geneva,
which presents a high degree of urbanization and where close to the urban settlements, the
access to resources is highly discouraged.
On a second level, the value of each point in the curve provides an indication of the
magnitude of the pressure in a community. Communities above the 75th percentile line are
generally deemed to have a good access to resources while communities under the 25th
percentile line are prohibitive for the operation of a quarry. Communities where the Indicator
equals 0 are not included in the graphs above and should be further analyzed. A value of 0 is
due to the non-existence of quarries and can be explained either because the community
ISBN: 978-84-697-1815-5
166
6
features a highly populated urban center or because other reasons, such as environmental or
transportation issues, prohibit the authorization of a quarry operation. The latter could be the
case of a community situated in a mountainous area, with a potential reserve of resources,
which nevertheless does not have a good connection to a transportation network and therefore
the access to the resources is difficult.
It should be noted that, as mentioned above, the term quarry encompasses both dimension
stone and construction aggregate quarries. However, given the significant difference in the
size of the two quarries (dimension stone quarries being of a lower production and thus a
smaller size), a dimension stone quarry may be feasible in some regions even though the
situation is prohibitive for the opening of an aggregate quarry there. Therefore, the resource
accessibility indicator developed here can provide more valuable insight in the case of
construction aggregates, since in these quarries, due to their considerable size, social and
anthropogenic factors are decisive for their operation.
Conclusion
This study developed a fast and easy-to-use indicator in order to provide a general assessment
of the accessibility to resources in an area. Such an indicator stems from the need to evaluate
not only the availability but also the accessibility to resources, which is widely controlled by
the land competition between cities and quarries. Therefore, the indicator developed takes into
account the social factors that can inhibit a quarry operation.
The robustness of the resource accessibility indicator was evaluated at a departmental/
cantonal level for France and Switzerland respectively. Further analysis of Switzerland at a
community level revealed that the resource accessibility curve inside a canton that derives
from the indicator can provide both an indication of the dynamics of the region through its
shape as well as a measure of the pressure in the region through its value.
References
[1] UNICEM, Union Nationale des Industries de Carrières et Matériaux de Construction. (2005).
Granulats en Ile de France. Mieux prendre en compte la ressource en matériaux dans les
documents d’urbanisme. UNICEM Ile-de-France, 36pp.
[2] Kohler, F. (2010). Material flow accounts. Growth in society’s stock of materials. Swiss
Confederation, Federal Statistical Office FSO, [accessed 2014 Feb 20]. Available from:
http://www.bfs.admin.ch/bfs/portal/en/index/themen/02/22/publ.html?publicationID=3888
[3] Guinée, J. B.; Gorrée, M.; Heijungs, R.; Huppes, G.; Kleijn, R.; van Oers L. et al. (2002).
Handbook on life cycle assessment. Operational guide to the ISO standards. I: LCA in
perspective. IIa: Guide. IIb: Operational annex. III: Scientific background. Kluwer Academic
Publishers, 692pp.
[4] Jolliet, O.; Margni, M.; Charles, R.; Humbert, S.; Payet, J.; Rebitzer, G. et al. (2003). IMPACT
2002+ : A New Life Cycle Impact Assessment Methodology. Int J Life Cycle Ass, 47: 356-74.
doi: 10.1007/BF02978505
[5] Goedkoop, M.; Spriensma, R. (2001). The Eco-Indicator 99, a damage oriented method for Life
Cycle Impact Assessment, methodology report. 3rd ed. PRé Consultants B.V. 132pp.
[6] Habert, G.; Bouzidi, Y.; Chen, C.; Jullien, A. (2010). Development of a depletion indicator for
ISBN: 978-84-697-1815-5
167
7
natural resources used in concrete. Resour Conserv Recy, 54: 364-76.
doi:10.1016/j.resconrec.2009.09.002
[7] Schneider, L.; Markus, B.; Finkbeiner, M. (2011) The anthropogenic stock extended abiotic
depletion potential (AADP) as a new parameterization to model the depletion of abiotic
resources. Int J Life Cycle Ass, 16: 929-36. doi : 10.1007/s11367-011-0313-7
[8] Potting, J.; Hauschild, M. Z. (2006). Spatial Differentiation in Life Cycle Impact Assessment.A
decade of method development to increase the environmental realism of LCIA.Int J Life Cycle
Ass, 1: 11-3. doi: 10.1065/lca2006.04.005
[9] Antunes, P.; Santos, R.; Jordao, L. (2011). Theapplication of GeographicalInformationSystems to
determine environmentalimpactsignificance. Environ Impact Asses; 21: 511-35.
doi:10.1016/S0195-9255(01)00090-7
[10] Hendriks, C.; Obernosterer, R.;Müller, D.; Kytzia, S.; Baccini, P.; Brunner, P. H. (2000). Material
Flow Analysis: A tool to support environmental policy decisión making. Case-studies on the city
of Vienna and the Swiss lowlands. Local Environment: The International Journal of Justice and
Sustainability, 5 (3): 311-28. doi: 10.1080/13549830050134257
[11] Graedel, T. E.; Barr, R.; Chandler, C.; Chase, T.; Choi, J.; Christoffersen, L. et al. (2012).
Methodology of Metal Criticality Determination. Environ Sci Technol, 46: 1063-70. doi:
10.1021/es203534z
[12] Lloyd, S.; Lee, J.; Clifton, A.; Elghali, L.; France, C. (2012) Recommendations for assessing
materials criticality.ICE publishing. Waste and Resour Manage, 165:191-200. doi:
10.1680/warm.12.00002
[13] Scellato, S.; Cardillo, A.; Latora, V.; Porta, S. (2006). The backbone of a city.Eur. Phys. J. B, 50:
221-5. doi: 10.1140/epjb/e2006-00066-4
[14] European Commission. (2010). Critical Raw Materials for the EU. Report of the Ad-hoc Working
Group on defining critical raw materials.European Commission. Enterprise and Industry.
[15] Schwarz, H. (1983). Die Steinbrüche in der Schweiz. Die Entwicklung, Merkmale und Probleme
des Schweizerischen Natursteingewerbes und die Frage der Versorgung des Landes mit
Natursteinen resp. Natursteinprodukten, untersucht aus Wirtschaftsgeographischer Sicht.
Universität Zürich, 183pp.
[16] Pol, E.; Di Masso, A.; Castrechini, A.; Bonet, M.; Vidal, T. (2006) Psychological parameters to
understand and manage the NIMBY effect. Eur Rev Appl Psychol, 56: 43-51. doi:
10.1016/j.erap.2005.02.009
[17] Bundesamt für Statistik BFS. (2009). Arealstatistik nach Nomenklatur 2004 – Standard.
GEOSTAT-Datenbeschreibung. Schweizerische Eidgenossenschaft. [accessed 2014 Feb 20].
46pp. Available from: http://www.bfs.admin.ch/bfs/portal/de/index/dienstleistungen/
geostat/datenbeschreibung/arealstatistik_noas04.html
[18] Bundesamt für Statistik BFS. STAT-TAB: la banque de données statistiques interactive. [updated
2014b; accessed 2014 Feb 20]. Available from:
http://www.pxweb.bfs.admin.ch/Dialog/varval.asp?ma=px-f-02-
4A01&path=../Database/French_02%20-%20Espace%20et%20environnement/02.4%20-
%20Comptabilit%E9%20environnementale/&lang=2&prod=02&openChild=true&secprod=4
[19] Ministère de l’Écologie, du Développement Durable et de l'Énergie. Commissariat général au
Développement durable. Observation et Statistiques. Corine Land Cover. [updated 2014;
accessed 2014 Feb 20]. Available from: http://www.statistiques.developpement-
durable.gouv.fr/donnees-ligne/t/telechargement-
donnees.html?tx_ttnews[tt_news]=11263&cHash=198a579c8e605a1c967fabbd0cbc48a2
ISBN: 978-84-697-1815-5
168
1
Design of an indicator system for habitability monitoring in the
historical city of San Gabriel (Ecuador)
Speakers:
Usobiaga, E.
1 Tecnalia Research & Innovation, Bilbao, Spain
Abstract: In recent decades various sciences and disciplines have attempted to define
indicators and indicator systems in order to understand reality. However the lack of an
appropriate methodology in the selection and definition of indicators frequently results in an
inadequate selection of metrics (chosen indicators often do not closely model reality). In the
case of indicator systems the selection of numerous indicators often results in foci on different
objectives without a clear structure which affects their interpretation and understanding. This
paper presents the methodology for the definition of an indication system for the field of
habitability for the Ecuadorian city of San Gabriel. This system has been designed following
a multi-scale method based on Geographic Information Systems (GIS) and a combination of
social and spatial analytical tools. This methodology allows precision in the approach for the
analysis of the problems – habitability in its own context – the city of San Gabriel. The
application of this method results in the selection of indicators that best represent reality.
Indicators, GIS, habitability, historical cities.
Introduction
This paper is part of the PhD thesis “Heritage management focused on housing habitability in
Ecuador. A measuring and monitoring model” successfully defended in December 2013. The
objective of this paper is to show the process followed to define an applied indicators system
for a specific case study –the city of San Gabriel- with the focus on Habitability measuring.
The designed indicators system must achieve the following objectives:
• Applicibability - based on existing data.
• Reliability - use reliable and regularly updated data to assure the possibility of update
its measurement with the less economic cost.
• Representative - indicators that best represent habitability in the case study context.
• Interconectivity - statistically representative and interconnected.
The paper is structured in three sections: (1) A short review of habitability concept, (2) The
process followed to define the indicators system for San Gabriel, and, (3) Some conclusions
reached from the experience in designing this indicator system.
The study of habitability
Human beings have always been modify their environment and have adapted their habitats
according to their well-being and supported by knowledge and technical improvements [1].
ISBN: 978-84-697-1815-5
169
2
However, with the spread of epidemic diseases (like cholera in Europe) some hygienic
requirements that should be incorporated into each dwelling appeared in legistation in order to
avoid the development and spread of these diseases. These requirements, initially related to
illumination and air circulation, broaden in scope from the internal refurbishment of houses to
the redesign of cities (with the installation of sanitary sewers networks, the introduction of
green areas or the development of big projects to widen streets or roads).
From its beginning till now the concept of habitability has being evolving and opening its
scope, and nowadays can be approached from different perspectives: comfort, health, rights or
preservation, amongst others.
Habitability from legal or rights perspective considers the basic aspects or standards that
should be incorporated into a dwelling to be considered habitable. These standards are
regulated by law and may be inspired from approaches like health, safety or comfort that have
been defining basic requirements to adapt houses in order to make them more habitable.
Habitability from health perspective considers house as a health determining factor [2] for the
individual, and analyses the risks that can affect physical and psychological health [3].
Habitability from comfort or well-being considers the environmental conditions need by users
to develop ordinary activities. These conditions are usually related to thermal, acoustic and
visual aspects, and are usually focused in dwelling [2].
Habitability from preservation aims the conservation of a building from the heritage value
perspective, but also from a sustainability perspective as a way of preserve the environment
through the non-alteration of the landscape or the reuse of a building and its materials to avoid
a lack of existing resources or an additional materials or energy waste. This approach supports
the adaptation of existing houses to current needs of comfort, accessibility and functionality.
Anyway there are also additional criteria like design or aesthethics that can be taken into
account depending on the approach.
Nowadays, habitability is considered further than from its legislative aspect and broader scope
to include different aspects (house, immediate environment, neighborhood [2]) and multiple
factors (physic-spatial, psycho-social, thermal, acoustic, lighting, security, etc.) to be taken
into account. As a consequence of this, habitability should be redefined in every project
according to the desired objectives and goals.
Socio-economic development as a determining factor of habitability approach
The previously mentioned variety of approaches to habitability seems to answer the various
socio-economic situations, or address different needs. According to Maslow’s needs pyramid
–which hierarquises human needs-, after the achievement of basic human requirements,
humans develop higher needs and desires. This logic can be applied to habitability as showed
in the following graphic (Graphic 1).
ISBN: 978-84-697-1815-5
170
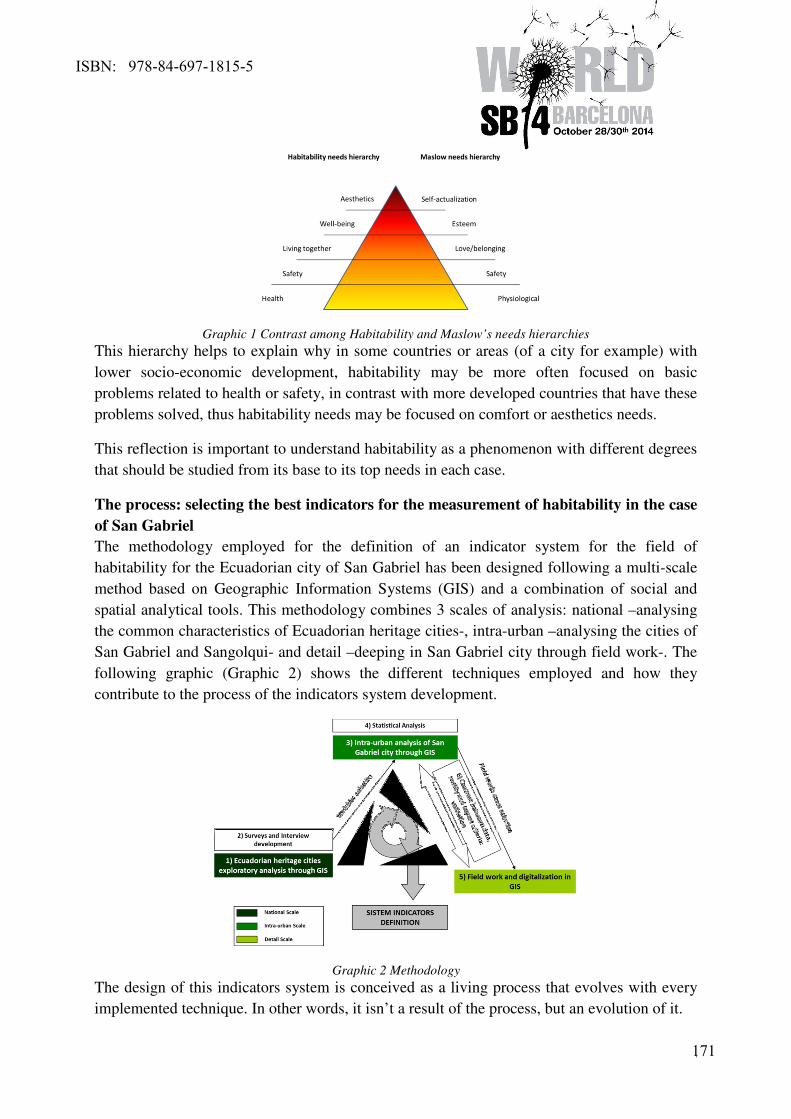
3
Graphic 1 Contrast among Habitability and Maslow’s needs hierarchies
This hierarchy helps to explain why in some countries or areas (of a city for example) with
lower socio-economic development, habitability may be more often focused on basic
problems related to health or safety, in contrast with more developed countries that have these
problems solved, thus habitability needs may be focused on comfort or aesthetics needs.
This reflection is important to understand habitability as a phenomenon with different degrees
that should be studied from its base to its top needs in each case.
The process: selecting the best indicators for the measurement of habitability in the case
of San Gabriel
The methodology employed for the definition of an indicator system for the field of
habitability for the Ecuadorian city of San Gabriel has been designed following a multi-scale
method based on Geographic Information Systems (GIS) and a combination of social and
spatial analytical tools. This methodology combines 3 scales of analysis: national –analysing
the common characteristics of Ecuadorian heritage cities-, intra-urban –analysing the cities of
San Gabriel and Sangolqui- and detail –deeping in San Gabriel city through field work-. The
following graphic (Graphic 2) shows the different techniques employed and how they
contribute to the process of the indicators system development.
Graphic 2 Methodology
The design of this indicators system is conceived as a living process that evolves with every
implemented technique. In other words, it isn’t a result of the process, but an evolution of it.
ISBN: 978-84-697-1815-5
171
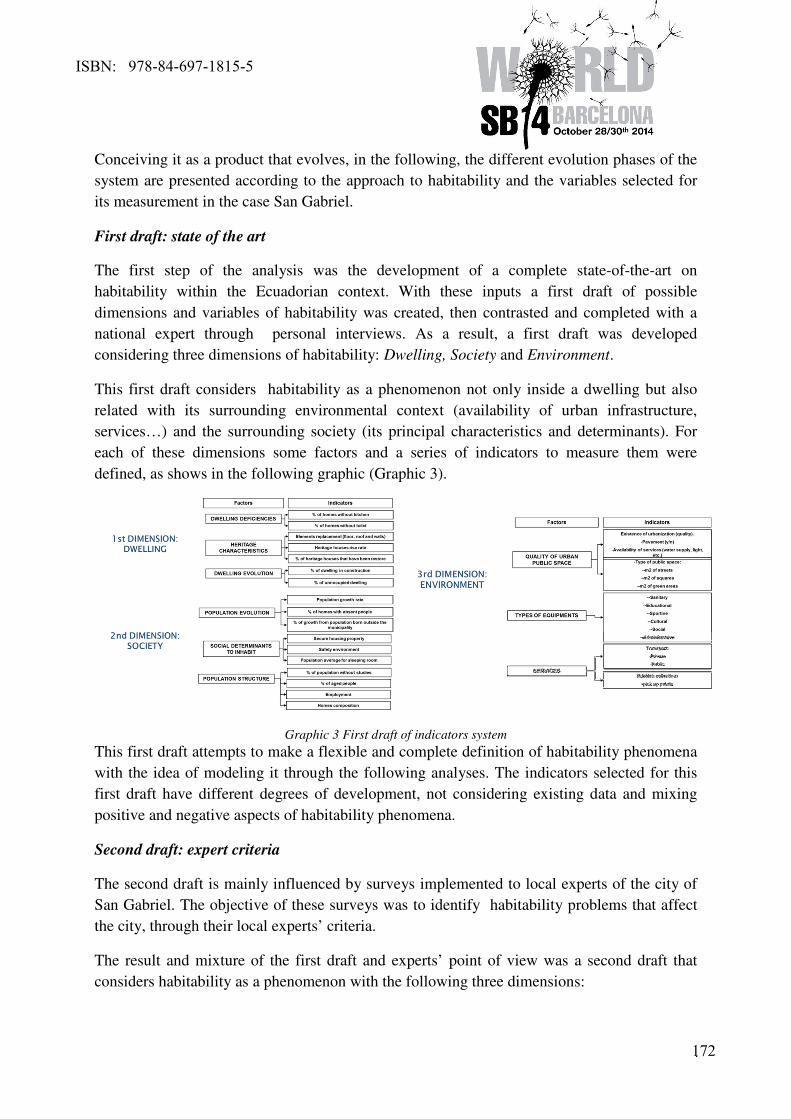
4
Conceiving it as a product that evolves, in the following, the different evolution phases of the
system are presented according to the approach to habitability and the variables selected for
its measurement in the case San Gabriel.
First draft: state of the art
The first step of the analysis was the development of a complete state-of-the-art on
habitability within the Ecuadorian context. With these inputs a first draft of possible
dimensions and variables of habitability was created, then contrasted and completed with a
national expert through personal interviews. As a result, a first draft was developed
considering three dimensions of habitability: Dwelling, Society and Environment.
This first draft considers habitability as a phenomenon not only inside a dwelling but also
related with its surrounding environmental context (availability of urban infrastructure,
services…) and the surrounding society (its principal characteristics and determinants). For
each of these dimensions some factors and a series of indicators to measure them were
defined, as shows in the following graphic (Graphic 3).
Graphic 3 First draft of indicators system
This first draft attempts to make a flexible and complete definition of habitability phenomena
with the idea of modeling it through the following analyses. The indicators selected for this
first draft have different degrees of development, not considering existing data and mixing
positive and negative aspects of habitability phenomena.
Second draft: expert criteria
The second draft is mainly influenced by surveys implemented to local experts of the city of
San Gabriel. The objective of these surveys was to identify habitability problems that affect
the city, through their local experts’ criteria.
The result and mixture of the first draft and experts’ point of view was a second draft that
considers habitability as a phenomenon with the following three dimensions:
ISBN: 978-84-697-1815-5
172
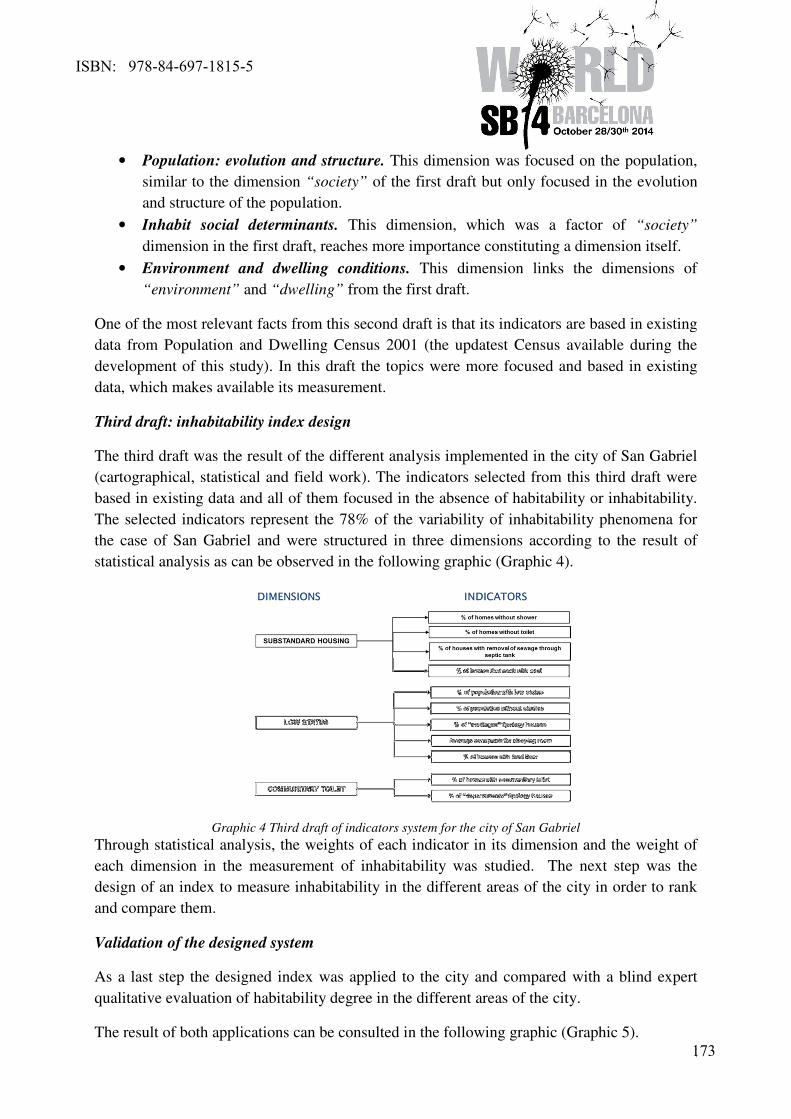
5
• Population: evolution and structure. This dimension was focused on the population,
similar to the dimension “society” of the first draft but only focused in the evolution
and structure of the population.
• Inhabit social determinants. This dimension, which was a factor of “society”
dimension in the first draft, reaches more importance constituting a dimension itself.
• Environment and dwelling conditions. This dimension links the dimensions of
“environment” and “dwelling” from the first draft.
One of the most relevant facts from this second draft is that its indicators are based in existing
data from Population and Dwelling Census 2001 (the updatest Census available during the
development of this study). In this draft the topics were more focused and based in existing
data, which makes available its measurement.
Third draft: inhabitability index design
The third draft was the result of the different analysis implemented in the city of San Gabriel
(cartographical, statistical and field work). The indicators selected from this third draft were
based in existing data and all of them focused in the absence of habitability or inhabitability.
The selected indicators represent the 78% of the variability of inhabitability phenomena for
the case of San Gabriel and were structured in three dimensions according to the result of
statistical analysis as can be observed in the following graphic (Graphic 4).
Graphic 4 Third draft of indicators system for the city of San Gabriel
Through statistical analysis, the weights of each indicator in its dimension and the weight of
each dimension in the measurement of inhabitability was studied. The next step was the
design of an index to measure inhabitability in the different areas of the city in order to rank
and compare them.
Validation of the designed system
As a last step the designed index was applied to the city and compared with a blind expert
qualitative evaluation of habitability degree in the different areas of the city.
The result of both applications can be consulted in the following graphic (Graphic 5).
ISBN: 978-84-697-1815-5
173
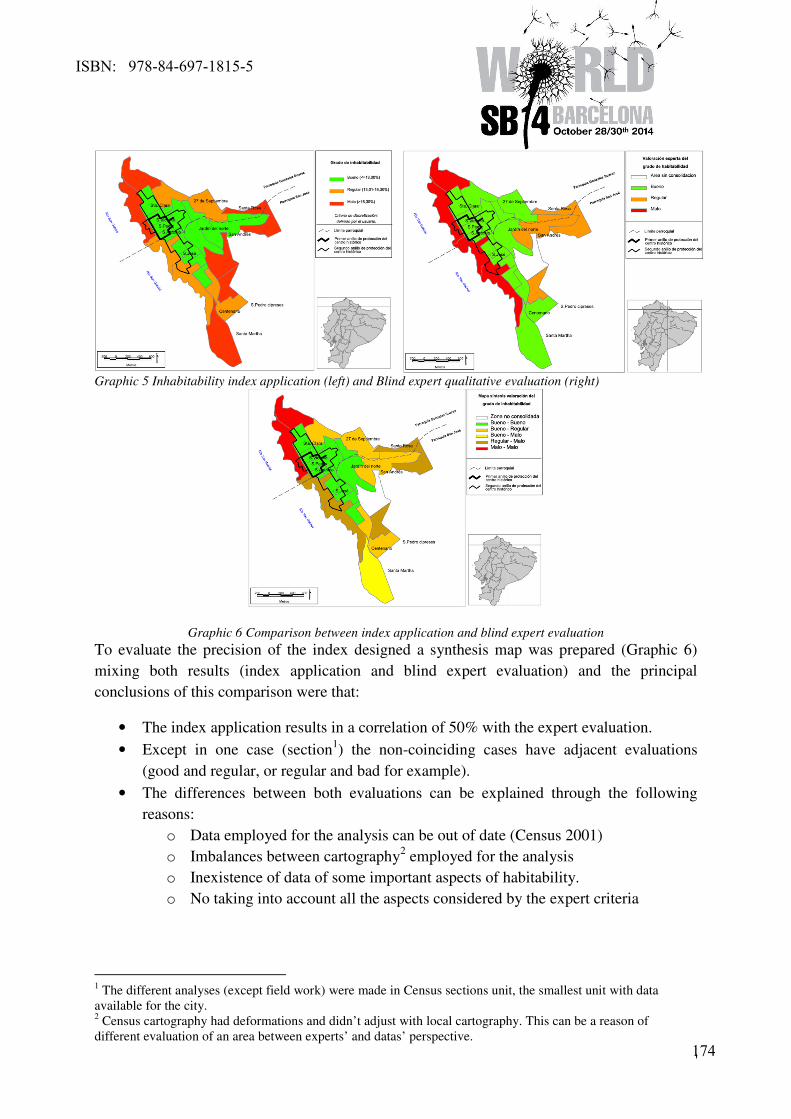
6
Graphic 5 Inhabitability index application (left) and Blind expert qualitative evaluation (right)
Graphic 6 Comparison between index application and blind expert evaluation
To evaluate the precision of the index designed a synthesis map was prepared (Graphic 6)
mixing both results (index application and blind expert evaluation) and the principal
conclusions of this comparison were that:
• The index application results in a correlation of 50% with the expert evaluation.
• Except in one case (section1) the non-coinciding cases have adjacent evaluations
(good and regular, or regular and bad for example).
• The differences between both evaluations can be explained through the following
reasons:
o Data employed for the analysis can be out of date (Census 2001)
o Imbalances between cartography2 employed for the analysis
o Inexistence of data of some important aspects of habitability.
o No taking into account all the aspects considered by the expert criteria
1 The different analyses (except field work) were made in Census sections unit, the smallest unit with data
available for the city. 2 Census cartography had deformations and didn’t adjust with local cartography. This can be a reason of
different evaluation of an area between experts’ and datas’ perspective.
ISBN: 978-84-697-1815-5
174
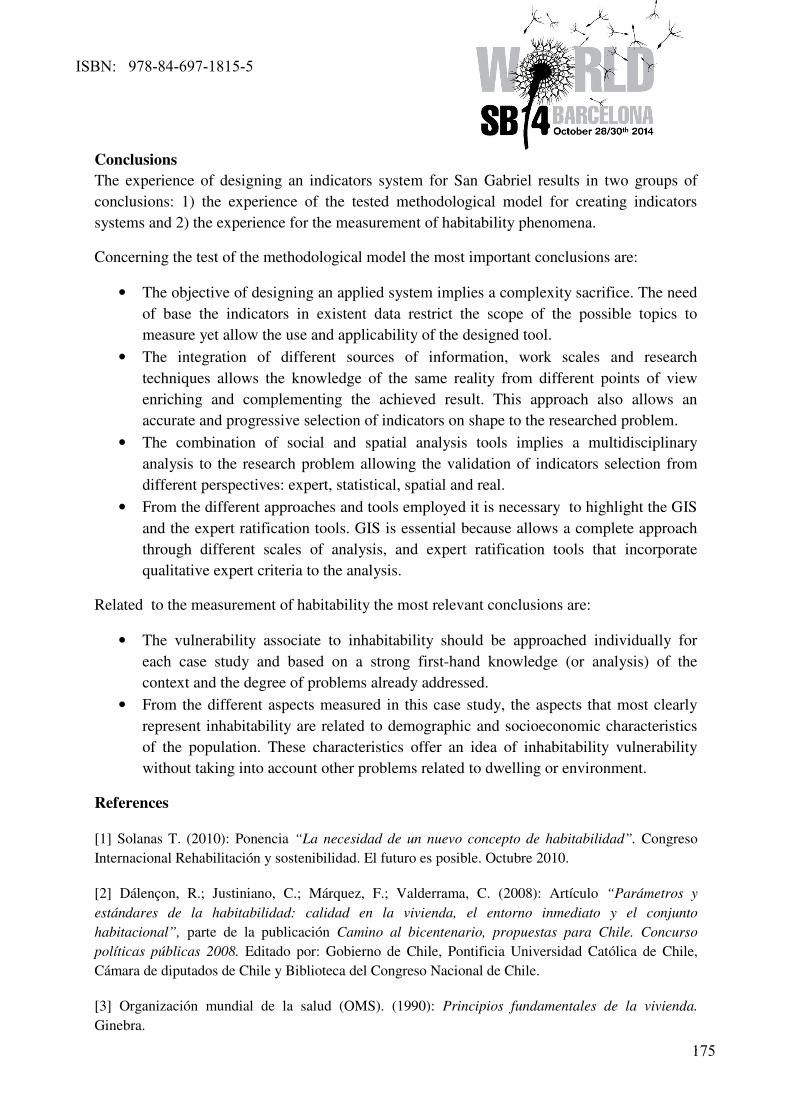
7
Conclusions
The experience of designing an indicators system for San Gabriel results in two groups of
conclusions: 1) the experience of the tested methodological model for creating indicators
systems and 2) the experience for the measurement of habitability phenomena.
Concerning the test of the methodological model the most important conclusions are:
• The objective of designing an applied system implies a complexity sacrifice. The need
of base the indicators in existent data restrict the scope of the possible topics to
measure yet allow the use and applicability of the designed tool.
• The integration of different sources of information, work scales and research
techniques allows the knowledge of the same reality from different points of view
enriching and complementing the achieved result. This approach also allows an
accurate and progressive selection of indicators on shape to the researched problem.
• The combination of social and spatial analysis tools implies a multidisciplinary
analysis to the research problem allowing the validation of indicators selection from
different perspectives: expert, statistical, spatial and real.
• From the different approaches and tools employed it is necessary to highlight the GIS
and the expert ratification tools. GIS is essential because allows a complete approach
through different scales of analysis, and expert ratification tools that incorporate
qualitative expert criteria to the analysis.
Related to the measurement of habitability the most relevant conclusions are:
• The vulnerability associate to inhabitability should be approached individually for
each case study and based on a strong first-hand knowledge (or analysis) of the
context and the degree of problems already addressed.
• From the different aspects measured in this case study, the aspects that most clearly
represent inhabitability are related to demographic and socioeconomic characteristics
of the population. These characteristics offer an idea of inhabitability vulnerability
without taking into account other problems related to dwelling or environment.
References
[1] Solanas T. (2010): Ponencia “La necesidad de un nuevo concepto de habitabilidad”. Congreso
Internacional Rehabilitación y sostenibilidad. El futuro es posible. Octubre 2010.
[2] Dálençon, R.; Justiniano, C.; Márquez, F.; Valderrama, C. (2008): Artículo “Parámetros y
estándares de la habitabilidad: calidad en la vivienda, el entorno inmediato y el conjunto
habitacional”, parte de la publicación Camino al bicentenario, propuestas para Chile. Concurso
políticas públicas 2008. Editado por: Gobierno de Chile, Pontificia Universidad Católica de Chile,
Cámara de diputados de Chile y Biblioteca del Congreso Nacional de Chile.
[3] Organización mundial de la salud (OMS). (1990): Principios fundamentales de la vivienda.
Ginebra.
ISBN: 978-84-697-1815-5
175
1
Sustainable development of three Taiwan's communities
Speakers:
Sun, Chen-Yi 1
1 Department of Land Economics, National Chengchi University, Taipei City, Taiwan
Abstract: The sustainable development becomes a very important issue, when one-half of the
world’s population could be defined as living in cities since 20th century. Urbanization in
Taiwan also increases within 50 years after economic growth. Meanwhile, non-sustainable
development in Taiwan emanating from the continuous ignorance of fragile ecosystems, and
therefore pollution and energy consumption problems seems to be the driving force behind
the eco-city or eco-community idea in regional planning research field. Lessons drawn from
the examples cited are further deconstructed in the light of their contribution to
environmental disruption reduction, which provides direction to appreciating the ‘eco-
community’ concept in Taiwan. Further, this paper attempts to unravel existing community-
based practices in Taiwan, which are boon to the local environment and invariably reduce
disaster risk. The evaluations of three communities in this research also indicated the
advantages and defects from the sustainable point of view. This paper also illustrates how
‘eco-community’ approach is inevitable in the present and future contexts not only to
preserve sustainable development gains but also to secure human well-being. Meanwhile,
some strategies were provided for achieving our ultimate goal, sustainable country.
In recent years, the concept of environmental protection in Taiwan can be compared to
developed countries, while promoting energy saving and carbon reduction is the mutual task
of both government and people. Through evaluation system and certification, communities
may move toward sustainability and ecological low carbon. However, as the evaluation
indicators should comprised of calculable, feasible and fairness, which might lead to the bias
assessment. Therefore, only the active pursue of the community on the goal of ecology, low
carbon and developing unique local features, with the assistance of public agencies to
provide techniques, budget and knowledge, Taiwan’s communities can develop into amazing
eco-communities, with people in the communities integrate low carbon implementation into
daily life. If so, Taiwan will soon be the low carbon nation.
Green building, Eco-community, low carbon, Green life
Introduction
Since sustainable deverlopment becomes a very important issue, there are a lot articles
disscussed about how to make community more sustainablilty. For instance, there is a study
creating a concerted approach for making‘Eco-city’ to ‘disaster-resilient eco-community’ in
the coastal city of Puri, India (Surjan and Shaw, 2008). On the other hand, Valentin and
Spangenberg proposed how local sustainablility indicators can be developed and how they
can help to reduce the complexity of sustainability by a research (Valentin and Spangenberg,
2000). In addition, Brugmann made a planning for sustainability at the local government level
ISBN: 978-84-697-1815-5
176
2
(Brugmann, 1996). These researches are focus on finding the good way to make more
communities become sustainable communities.
With soaring prices of goods and electricity in Taiwan, low carbon has become a trend as not
merely reducing carbon emission through various measures and helps to control the global
warming, and it symbolizes the practical advantage of saving patrol, electricity and water.
As a matter of fact, low carbon community has other similar terms such as ecological
community, sustainable community, environmental protection community, green community
or carbon zero community, and the mutual objective aims at achieving greening environment,
saving energy of building, greening transportation, recycling environment, renewable energy,
and conserving ecology. Therefore, if one community strives to work on one or two items
mentioned above, then it will move toward low-carbon community. In the past, many people
regard becoming low carbon community is a difficult task that is probably due to the
indicators judged by each sector. However, each community can be a low carbon community
if it takes many small steps, then it will make a big difference to gradually become a low
carbon community.
Eco-community implementation in countryside
As the ultimate goal of low carbon community is precisely to reduce carbon emission and
save energy, the strategy and method can be flexible and fuzzy, as the key point is to take
measures in line with circumstances. According to my visits on dozens of low carbon
communities, they can be divided into urban, village and individual type of community based
on geographical environment, characteristic and scales of city and village.
For village type, Fengtiam San Village, Hualian and Xinshi Community, Xinchu can be the
case study. Fengtiam San Village, Hualian depends on Niuli Develop Society, putting efforts
on greening the agricultural type community, recycling resources, protecting and making use
of old buildings, protecting local culture, and even providing services for old folks. After a
few years of endeavors, the community has become self-sufficient financially, and is even
able to plan for the community’s future development. While Xin-Shi Community in Xinchu
is initiated by Wen-Tong Chen couple who work for the Develop Society. They first engaged
in the community cleaning, and then developing community ecological parks, community
farms, eco pond, and the community documentary film. Recently, they have started to
explore how to combine the concept of low carbon community with the usage and cleaning of
water resource in Beishi River, becoming a riverside type community in the suburban area.
Eco-community implementation in city
On the other hand, as the urban type low carbon communities are numerous, therefore only
Chung Sheng Community, Taoyuan, Jiantan Community, Taipei and Shun-de Community are
discussed as the examples. The chief of Chung Sheng Community, Taoyuan is the one who
initiates the task, he drives the community to work on community greening, resources
recycling, low carbon temples, community farms, improving energy-efficient lightings, and
community education, which is a successful urban-type low carbon community. Besides,
ISBN: 978-84-697-1815-5
177
3
Jiantan Community located in Taipei metropolitan area and Shun-de Community are lead by
Mr. Bi and Mr. Li, chiefs of the community, and they vie for budget to undergo greening of
community, recycling resources, enhancing the energy efficiency of facilities in community
center, making use of water resources, setting up rain water collecting system, greening roads,
becoming the successful cases of low carbon communities in urban area.
Eco-community implementation in a small community
In the discussion of individual low carbon community, Yang-Ming Xue Yuan Community in
Xin Zhuang, New Taipei, proves that even a small community without public resources, can
be an impressive low carbon community. It was an ordinary and unnoticed community, but
after the efforts of Mr. Xiang, the chair of management committee, the rooftop of the
community is equipped with a garden to produce vegetable, mini rain water usage system,
mini wind power generator, solar panels, leftover composing system and other related
measures. The illumination in the stairways is energy efficient LED lightings, while the
basement has a resource recycle area which has over ten types of recycled items, LED
lighting, renewable energy charging stand, biomass emergency generator, energy saving
classroom, and LED emergency lights. These facilities are not funded by the government,
proving that the determination of becoming a low carbon community when without any
supports from outside can be feasible.
Conclusion
In recent years, the concept of environmental protection in Taiwan can be compared to
developed countries, while promoting energy saving and carbon reduction is the mutual task
of both government and people. Through evaluation system and certification, communities
may move toward sustainability and ecological low carbon. However, as the evaluation
indicators should comprised of calculable, feasible and fairness, which might lead to the bias
assessment. Therefore, only the active pursue of the community on the goal of ecology, low
carbon and developing unique local features, with the assistance of public agencies to provide
techniques, budget and knowledge, Taiwan’s communities can develop into amazing eco-
communities, with people in the communities integrate low carbon implementation into daily
life. If so, Taiwan will soon be the low carbon nation.
References
Surjan, A.K. and Shaw, R. (2008) 'Eco-city'to 'disaster-resilient eco-community': a concerted
approach in the coastal city of Puri, India. Sustainability Science, 3: 249-265.
Brugmann, J. (1996) Planning for sustainability at the local government level. Environmental
Impact Assessment Review, 16(4-6):363-379, doi: 10.1016/S0195-9255(97)81658-7.
Valentin, A. and Spangenberg, J.H. (2000) A guide to community sustainability indicators.
Environmental Impact Assessment Review, 20(3):381-392, doi: 10.1016/S0195-
9255(00)00049-4.
ISBN: 978-84-697-1815-5
178