justin bishop editor - building sustainable cities of the future
TRANSCRIPT
Green Energy and Technology
Justin Bishop Editor
Building Sustainable Cities of the Future


EditorJustin BishopUniversity of CambridgeCambridgeUK
ISSN 1865-3529 ISSN 1865-3537 (electronic)Green Energy and TechnologyISBN 978-3-319-54456-4 ISBN 978-3-319-54458-8 (eBook)DOI 10.1007/978-3-319-54458-8
Library of Congress Control Number: 2017945687
© Springer International Publishing AG 2017This work is subject to copyright. All rights are reserved by the Publisher, whether the whole or partof the material is concerned, specifically the rights of translation, reprinting, reuse of illustrations,recitation, broadcasting, reproduction on microfilms or in any other physical way, and transmissionor information storage and retrieval, electronic adaptation, computer software, or by similar or dissimilarmethodology now known or hereafter developed.The use of general descriptive names, registered names, trademarks, service marks, etc. in thispublication does not imply, even in the absence of a specific statement, that such names are exempt fromthe relevant protective laws and regulations and therefore free for general use.The publisher, the authors and the editors are safe to assume that the advice and information in thisbook are believed to be true and accurate at the date of publication. Neither the publisher nor theauthors or the editors give a warranty, express or implied, with respect to the material contained herein orfor any errors or omissions that may have been made. The publisher remains neutral with regard tojurisdictional claims in published maps and institutional affiliations.
Printed on acid-free paper
This Springer imprint is published by Springer NatureThe registered company is Springer International Publishing AGThe registered company address is: Gewerbestrasse 11, 6330 Cham, Switzerland
Contents
Introduction. . . . . . . . . . . . . . . . . . . . . . . . . . . . . . . . . . . . . . . . . . . . . . . . . 1Justin Bishop
Energy for Cities: Supply, Demand and Infrastructure Investment . . . .. . . . 5Colin J. Axon and Simon H. Roberts
Future-Proofed Design of Low-Energy Housing Developments:Case Studies from the UK and Sweden . . . . . . . . . . . . . . . . . . . . . . . . . . . 29Maria Christina Georgiadou
On the Move—or Moving On? Reimagining the Future of Travel . . . . . 57Malek Al-Chalabi
Water: An Essential Resource and a Critical Hazard . . . . . . . . . . . . . . . 75Richard A. Fenner
Health and Well-being in Urban Environments . . . . . . . . . . . . . . . . . . . . 99Anja Mizdrak and Adam John Ritchie
A Place for Food Within Sustainable Urban Masterplanning . . . . . . . . . 117Bee Farrell
Infrastructure, Equity and Urban Planning: A Just Processfor the Allocation of Benefits and Burdens . . . . . . . . . . . . . . . . . . . . . . . . 141Daniel Durrant
Sustainable Places: Delivering Adaptive Communities . . . . . . . . . . . . . . . 163Laura Mazzeo, Nick James, Gary Young and Bee Farrell
v
Contributors
Malek Al-Chalabi Transport Studies Unit, School of Geography and theEnvironment, University of Oxford, Oxford, UK
Colin J. Axon Institute of Energy Futures, Brunel University, London, UK
Justin Bishop Department of Engineering, University of Cambridge, Cambridge,UK
Daniel Durrant Bartlett School of Planning, University College London,Bloomsbury, UK
Bee Farrell Farrells, London, UK; Anciens Foodways, London, UK; AnciensFoodways, Poitiers, France
Richard A. Fenner Department of Engineering, Centre for SustainableDevelopment, University of Cambridge, Cambridge, UK
Maria Christina Georgiadou Department of Property and Construction, Facultyof Architecture and the Built Environment, University of Westminster, London, UK
Nick James Farrells, London, UK
Laura Mazzeo Farrells, London, UK
Anja Mizdrak Department of Public Health, University of Otago, Wellington,New Zealand
Adam John Ritchie The Jenner Institute and The Blavatnik School ofGovernment, University of Oxford, Oxford, UK
Simon H. Roberts Arup, London, UK
Gary Young Farrells, London, UK
vii
Introduction
Justin Bishop
In 2007, the proportion of the global population living in the urban environmentwas over 50%. Urbanisation has been underway in high-income1 countries forseveral decades. In 1950, 57% of the population of these countries lived in cities.By 2014, more than 80% of the population in each of Northern America, LatinAmerica, the Caribbean and Europe were living in the urban environment.
Not only are cities where most people live, they are also responsible for 80% ofglobal gross domestic product, two-thirds of energy use and 70% of greenhouse gas(GHG) emissions (IEA 2016). It is projected that all population growth through to2050 will occur in the urban environment (UN 2015). Therefore, this is the contextin which most future human activity will occur and the associated challenges willbe overcome.
The cities of the future are the cities of today in most cases. Therefore, there is aneed to place existing cities on a more sustainable evolution path. Cities vary insize, land area, population, climate, topography and global importance. At one endof the scale, megacities of at least 10 million inhabitants are major regional eco-nomic and financial hubs. At the other end, the largest class of city, by number andproportion of global population now and through to 2030, is the urban area of fewerthan 300,000 inhabitants (UN 2015).
Achieving sustainable cities requires some appreciation of what sustainability isand how it can be incorporated into our cities’ development. Rockström et al.(2009) proposed a ‘planetary boundaries’ framework which outlines the safeoperating space for human activity to exist within. This concept necessarily gives
J. Bishop (&)Department of Engineering, University of Cambridge,Trumpington Street, Cambridge CB2 1PZ, UKe-mail: [email protected]
1Countries with gross national income per capita of at least $12,615 are classified as high-income.See http://www.un.org/en/development/desa/policy/wesp/wesp_current/2014wesp_country_classification.pdf for further classifications and lists of countries.
© Springer International Publishing AG 2017J. Bishop (ed.), Building Sustainable Cities of the Future,Green Energy and Technology, DOI 10.1007/978-3-319-54458-8_1
1
precedence to the environment by allowing Holocene-like conditions to persist(Steffen et al. 2015). When this concept was developed, human activities wereexceeding the safe boundaries for climate change (350 parts per million greenhousegases (GHG) by volume (ppmv) and 1 W/m2 radiative forcing), rate of biodiversityloss (10 species per million annually), and interference with the nitrogen cycle(million tonnes removed from the atmosphere annually).
Climate change and biosphere integrity, which incorporates genetic diversity andbiodiversity loss, are core planetary boundaries, through which the others operate(Steffen et al. 2015). The monthly average GHG concentration exceeded 400 partsper million by volume (ppmv) in September 2016 for the first time—this concen-tration continues to rise and scientists expect we have now tipped into a new age ofhuman–climate interaction (Kahn 2016). Overall, 2016 marked the hottest year onrecord, continuing a streak of annual mean temperature increases globally (NOAA2017).
Biodiversity loss has direct impact on the existence of ecosystems. Goodecosystem functioning is required to provide the products and services that allspecies depend upon for their existence. The earth has an annual productivecapacity, known as net primary productivity (NPP), which is the total amount ofcarbon dioxide CO2 fixed by autotrophs minus that used by plants in respiration.Humans appropriate 25% of total NPP through land-use changes, agriculture andsettlements (Haberl et al. 2014). Consequently, more than 75% of the ice-free landarea has been altered significantly by human actions (Ellis and Ramankutty 2008).
The aim of this book has been to investigate how lessons and best, or ‘next’practice can be transferred across cities and how bespoke the sustainable city mustbe. The contributing authors’ mandates have been to identify the problem andchallenges, identify which cities are making progress or not towards solutions andcomment on the applicability of these solutions further afield. The chapters addressa subset of the challenges facing modern cities, focusing on both the physicalenvironment—such as transport, energy and sanitation—and how cities can meetthe human needs of food, health and equity in infrastructure planning. The authors’findings show how incorporating ‘best’ and ‘next’ practice in one sector results insecondary benefits elsewhere and is further evidence of the integrated nature ofachieving sustainability in cities.
References
Ellis EC, Ramankutty N (2008) Putting people in the map: anthropogenic biomes of the world.Front Ecol Environ. doi:10.1890/070062
Haberl H, Erb KH, Krausmann F (2014) Human appropriation of net primary production: patterns,trends, and planetary boundaries. Annu Rev Environ Resour 39(1):363–391. doi:10.1146/annurev-environ-121912-094620
IEA (2016) Energy technology perspectives 2016—towards sustainable urban energy systems.Technical report, International Energy Agency. https://www.iea.org/publications/freepublications/publication/EnergyTechnologyPerspectives2016_ExecutiveSummary_EnglishVersion.pdf
2 J. Bishop

Kahn B (2016) The world passes 400 PPM threshold. Permanently. http://www.climatecentral.org/news/world-passes-400-ppm-threshold-permanently-20738
NOAA (2017) Global analysis—annual 2016. National Oceanic and Atmospheric Administration.https://www.ncdc.noaa.gov/sotc/global/201613
Rockström J, Steffen W, Noone K, Persson Å, Chapin FS, Lambin E, Lenton TM, Scheffer M,Folke C, Schellnhuber HJ, Nykvist B, de Wit CA, Hughes T, van der Leeuw S, Rodhe H,Sörlin S, Snyder PK, Costanza R, Svedin U, Falkenmark M, Karlberg L, Corell RW, Fabry VJ,Hansen J, Walker B, Liverman D, Richardson K, Crutzen P, Foley J (2009) Planetaryboundaries: exploring the safe operating space for humanity. Ecol Soc 14(2):472–475. doi:10.1038/461472a
Steffen W, Richardson K, Rockström J, Cornell S, Fetzer I, Bennett E, Biggs R, Carpenter S(2015) Planetary boundaries: guiding human development on a changing planet. Science (NewYork, N.Y.) 348(6240):1217. doi:10.1126/science.aaa9629
UN (2015) World urbanization prospects: the 2014 revision. United Nations Department ofEconomic and Social Affairs, Population Division. https://esa.un.org/unpd/wup/Publications/Files/WUP2014-Report.pdf
Introduction 3
Energy for Cities: Supply, Demandand Infrastructure Investment
Colin J. Axon and Simon H. Roberts
Abstract Energy is essential to all activities in all regions of a country. Howeverthe density of energy use in, and our economic dependence on, cities means that itis more critical for urban areas. Nevertheless we suggest that the provision ofenergy for urban areas cannot be considered separately from the national context.We will demonstrate how to assess the ability of a nation to invest in energyinfrastructure for the benefit of cities. Our approach exploits data sets which areavailable in most industrialised countries, and we select two quite different casestudies to illustrate our method: the Colombia (Bogota) and UK (London). Ourfocus for energy sustainability in cities is quality of life and reduced fossil-fuelemissions. We will show that the main target for cities should be to improve airquality and reduce energy demand by improving energy efficiency.
1 Introduction
In all nations, the numbers and size of cities have grown since the onset of theindustrial revolution and with it the increasing demand for energy (Ayres and Warr2009; Kander et al. 2014; Wrigley 2010). Growing economies and expanding citiesare symbiotic, most likely in a system boot-strapping sense. However, it is clear thatthe economy drives the creation, expansion and ongoing existence of cities.
Much of the national economic activity can be grouped as ‘service industry’(Roberts et al. 2015), so we need to look at this industry along with intra-citytransport. Apart from cities being where jobs are, many people choose to be in citiesto access available services such as education, healthcare and entertainment. Thereis a virtuous circle of the service industry providing jobs and thus income, which in
C.J. Axon (&)Institute of Energy Futures, Brunel University, London UB8 3PH, UKe-mail: [email protected]
S.H. RobertsArup, 13 Fitzroy Street, London W1T 4BQ, UKe-mail: [email protected]
© Springer International Publishing AG 2017J. Bishop (ed.), Building Sustainable Cities of the Future,Green Energy and Technology, DOI 10.1007/978-3-319-54458-8_2
5
turn is used to pay for services. There are two main constraints on this growth. Thefirst is enterprises having to conceive new services and expand. But the mostsignificant is the physical constraint of the time taken to build more accommodationfor both the service industry and dwellings to house consumers and employees.
Until the last third of the twentieth century, settlements of all sizes needed togenerate power and heat by converting the fuel at the location of the final use. Eveninto the 1980s in the UK for instance, small (100–200 MW) electricity generatingstations were still operating in built-up areas. As the demand for electricity grew,the generating capacity of each station increased. Where possible these larger plantswere located close to coalfields—outside the city boundary—and not at the point offinal use. Schultz et al. (2013) note that the energy demand density of cities is suchthat localised renewables are mismatched in their power output density to meet thedemand. This means that if cities are sustainably to support highly dense popula-tions, the fuels must be derived and the power generated outside of the city. Relyingon renewables within urban areas to create zero-carbon cities is not an appropriatesolution. Other driving forces for this displacement in the UK were the Clean AirAct and the rising value of land in the city. As land prices rose, many industrieswith high-volume, low-value manufactured products moved out of the city too.Businesses remaining in cities became part of the burgeoning service industry. Thusthe patterns of energy have shifted, but remain governed by the behaviour of theeconomy in general.
Our analytical approach is to fuse together and mine independent national datasets which (preferably) meet international standards for collation and curation. Asan interesting case study we will compare two nations with three contrastingcharacteristics: (1) non-OECD and OECD, (2) equatorial and temperate climatesand (3) developing and developed. We chose Colombia (Bogota) and the UK(London) as comparators (Fig. 1; Table 1), both having suitable data available.Urban economic activity as measured by services is increasing for both countries,while energy use by services and number of urban dwellings is increasing only forColombia. Fuel use for urban transport by private car is decreasing for bothcountries, while bus use is increasing in the UK. The transport of goods is vital foreconomic activity. Although the majority of the distance travelled by light com-mercial vehicles and heavy good vehicles is likely to be outside of the city, theirincreasing urban energy use matches services increase. Energy demand by transporthas both direct and indirect consequences. The direct demand is for fuel, and theindirect demand is an increase in air pollution and building cooling requirementsresulting from thermal pollution from vehicle engines. In addition, transport airpollution and noise discourage the incorporation or use of natural ventilation inbuildings, exacerbating over-heating in the hot months.
An important factor affecting the ability of a city to reduce energy use is its pointin development. Established cities, such as London, have placed value in the landacross the whole area. By contrast, the sprawl of a rapidly developing city, such asBogota, through informal settlements on the periphery offers opportunities forvisionary urban planning and new buildings of high efficiency. Retrofitting of
6 C.J. Axon and S.H. Roberts
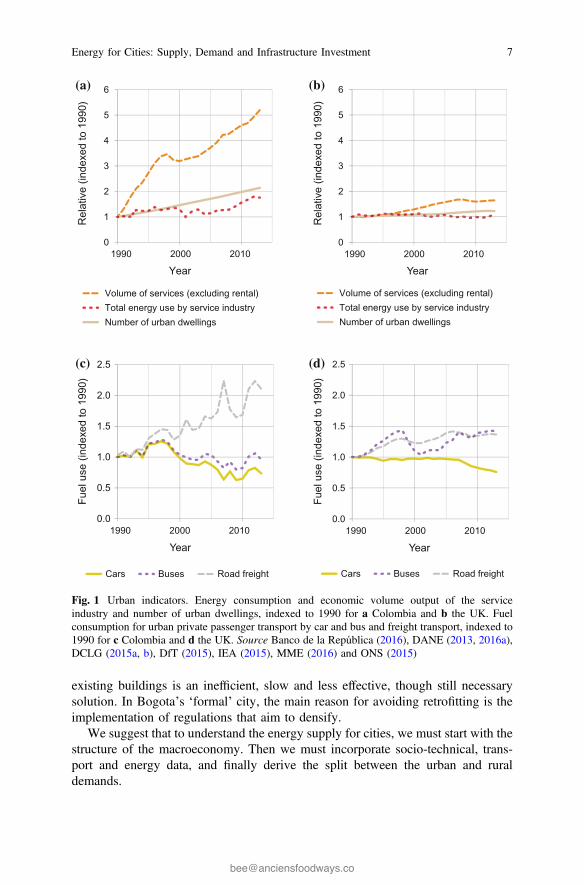
existing buildings is an inefficient, slow and less effective, though still necessarysolution. In Bogota’s ‘formal’ city, the main reason for avoiding retrofitting is theimplementation of regulations that aim to densify.
We suggest that to understand the energy supply for cities, we must start with thestructure of the macroeconomy. Then we must incorporate socio-technical, trans-port and energy data, and finally derive the split between the urban and ruraldemands.
0
1
2
3
4
5
6
1990 2000 2010
Year
Volume of services (excluding rental)Total energy use by service industryNumber of urban dwellings
Rel
ativ
e (in
dexe
d to
199
0)
0
1
2
3
4
5
6
1990 2000 2010
Rel
ativ
e (in
dexe
d to
199
0)
Year
Volume of services (excluding rental)Total energy use by service industryNumber of urban dwellings
0.0
0.5
1.0
1.5
2.0
2.5
1990 2000 2010
Fuel
use
(ind
exed
to 1
990)
Year
Cars Buses Road freight
0.0
0.5
1.0
1.5
2.0
2.5
1990 2000 2010
Fuel
use
(ind
exed
to 1
990)
Year
Cars Buses Road freight
(a) (b)
(c) (d)
Fig. 1 Urban indicators. Energy consumption and economic volume output of the serviceindustry and number of urban dwellings, indexed to 1990 for a Colombia and b the UK. Fuelconsumption for urban private passenger transport by car and bus and freight transport, indexed to1990 for c Colombia and d the UK. Source Banco de la República (2016), DANE (2013, 2016a),DCLG (2015a, b), DfT (2015), IEA (2015), MME (2016) and ONS (2015)
Energy for Cities: Supply, Demand and Infrastructure Investment 7
The key data source for economic activity is the internationally agreed System ofNational Accounts (United Nations et al. 2009). The data are available for allcountries, comprehensive, comparable and have good time granularity over thehistorical period. Additional data sources are employment, national householdsurvey, housing stock, national energy balance and transport statistics.
As a bridge from national level to urban, we define the rural/urban split in partdepending on what data are available. Dwellings are by location, households andpopulation from the census or household survey, and transport as vehicle-km byclass of road.
2 Energy and Its Changing Demands
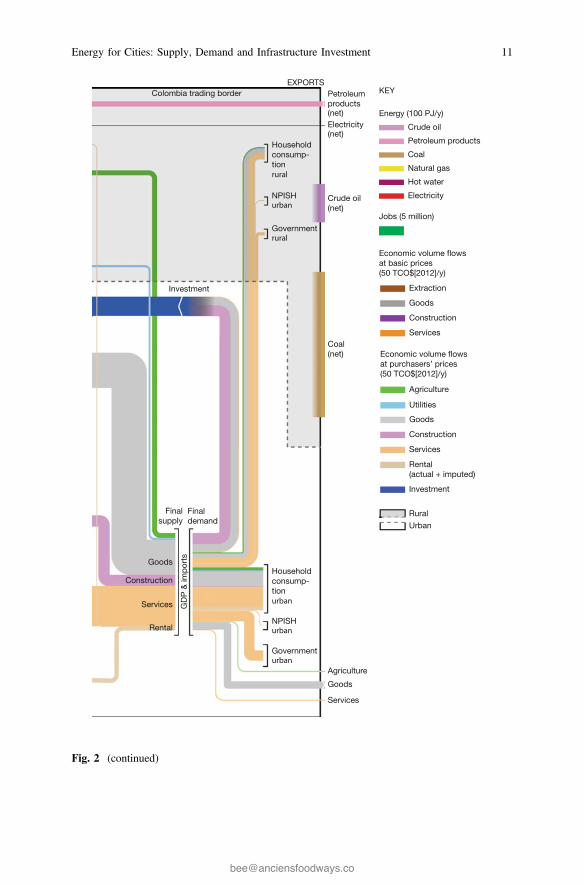
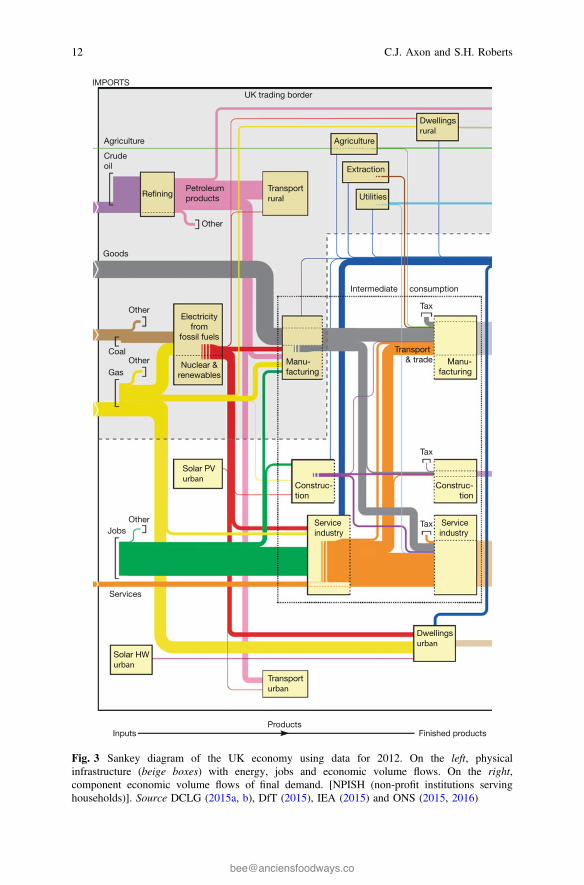
In Figs. 2 and 3 we show socio-economic and energy statistics for our case-studycountries. Although our focus for this chapter is on energy, we gain insights byrelating energy flows to the economy, investment and jobs which are included in thediagrams. Thus we can assess the ability of a nation to invest in energy infras-tructure or to mitigate the effects of energy demand in cities.
All the boxes in the left halves of Figs. 2 and 3 represent physical infrastructure,also known as fixed capital (FC). For the FC of industry we disaggregate theeconomy into six groups: agriculture, extraction, utilities, manufacturing, con-struction and the service industry (Roberts et al. 2015). We then make a simpledivision shown by the dashed line between rural above this line and urban below.We assign service industry as wholly urban because it is both labour intensive andneeds to be near the majority of the population. We assign construction also tourban because, as we show later, most construction takes place in urban areas.Dwellings are another type of FC, and we show these in the diagrams in both therural and urban sections. Since we have a focus on energy, we show some addi-tional boxes for energy-specific FC. All the FC boxes in each diagram lie within anoverall rectangle, which represents the trading border of the economy. Imports enteron the left, and exports leave on the right.
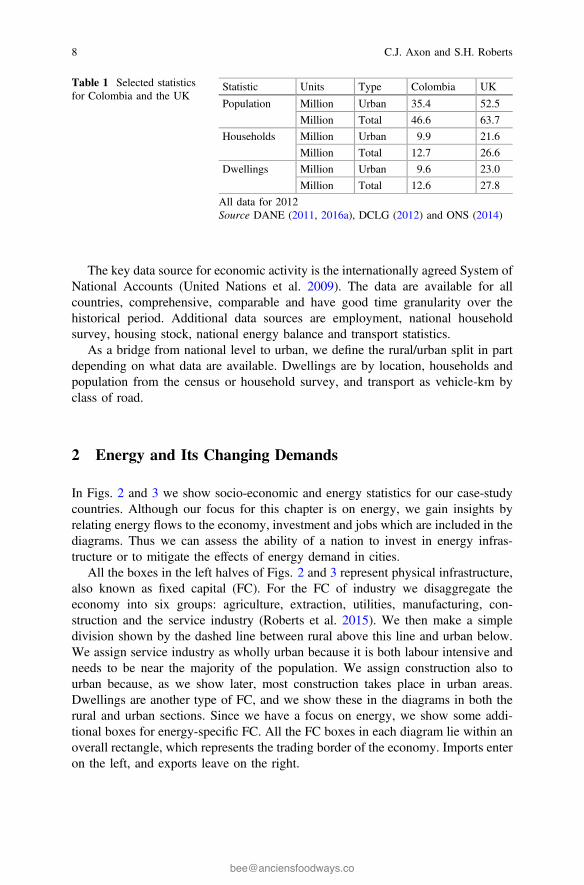
Table 1 Selected statisticsfor Colombia and the UK
Statistic Units Type Colombia UK
Population Million Urban 35.4 52.5
Million Total 46.6 63.7
Households Million Urban 9.9 21.6
Million Total 12.7 26.6
Dwellings Million Urban 9.6 23.0
Million Total 12.6 27.8
All data for 2012Source DANE (2011, 2016a), DCLG (2012) and ONS (2014)
8 C.J. Axon and S.H. Roberts
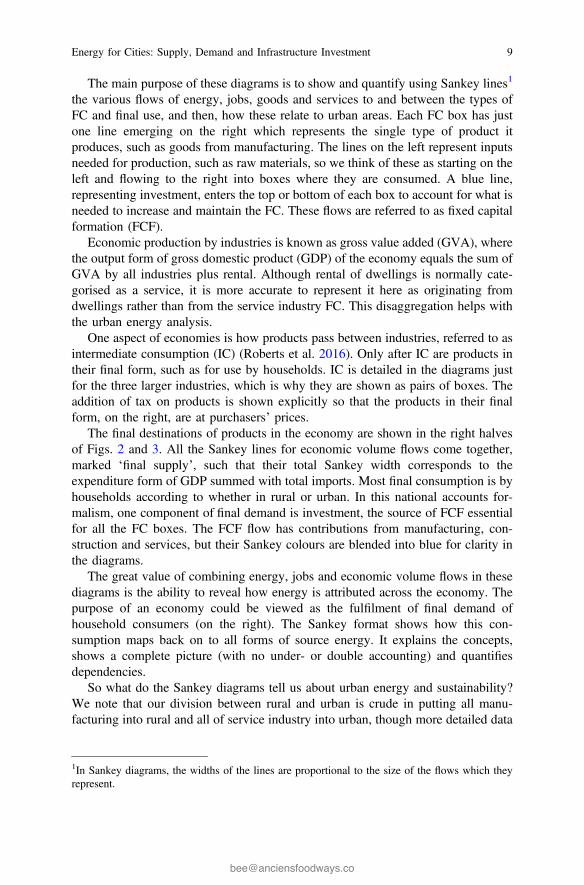
The main purpose of these diagrams is to show and quantify using Sankey lines1
the various flows of energy, jobs, goods and services to and between the types ofFC and final use, and then, how these relate to urban areas. Each FC box has justone line emerging on the right which represents the single type of product itproduces, such as goods from manufacturing. The lines on the left represent inputsneeded for production, such as raw materials, so we think of these as starting on theleft and flowing to the right into boxes where they are consumed. A blue line,representing investment, enters the top or bottom of each box to account for what isneeded to increase and maintain the FC. These flows are referred to as fixed capitalformation (FCF).
Economic production by industries is known as gross value added (GVA), wherethe output form of gross domestic product (GDP) of the economy equals the sum ofGVA by all industries plus rental. Although rental of dwellings is normally cate-gorised as a service, it is more accurate to represent it here as originating fromdwellings rather than from the service industry FC. This disaggregation helps withthe urban energy analysis.
One aspect of economies is how products pass between industries, referred to asintermediate consumption (IC) (Roberts et al. 2016). Only after IC are products intheir final form, such as for use by households. IC is detailed in the diagrams justfor the three larger industries, which is why they are shown as pairs of boxes. Theaddition of tax on products is shown explicitly so that the products in their finalform, on the right, are at purchasers’ prices.
The final destinations of products in the economy are shown in the right halvesof Figs. 2 and 3. All the Sankey lines for economic volume flows come together,marked ‘final supply’, such that their total Sankey width corresponds to theexpenditure form of GDP summed with total imports. Most final consumption is byhouseholds according to whether in rural or urban. In this national accounts for-malism, one component of final demand is investment, the source of FCF essentialfor all the FC boxes. The FCF flow has contributions from manufacturing, con-struction and services, but their Sankey colours are blended into blue for clarity inthe diagrams.
The great value of combining energy, jobs and economic volume flows in thesediagrams is the ability to reveal how energy is attributed across the economy. Thepurpose of an economy could be viewed as the fulfilment of final demand ofhousehold consumers (on the right). The Sankey format shows how this con-sumption maps back on to all forms of source energy. It explains the concepts,shows a complete picture (with no under- or double accounting) and quantifiesdependencies.
So what do the Sankey diagrams tell us about urban energy and sustainability?We note that our division between rural and urban is crude in putting all manu-facturing into rural and all of service industry into urban, though more detailed data
1In Sankey diagrams, the widths of the lines are proportional to the size of the flows which theyrepresent.
Energy for Cities: Supply, Demand and Infrastructure Investment 9

Dwellingsrural
Agriculture
Petroleum
Other
IMPORTS
Tax
Intermediate consumption
TaxBiomass
Coal
Crudeoil
Jobs
AgricultureTransport
Gas
Goods
Agriculture
Colombia trading border
Transport& trade
Other
Construc-tion
Tax
Construc-tion
Refiningrural
Electricityfrom
fossil fuels
Renewables
Agriculture
Manu-facturing
Extraction
Utilities
Manu-facturing
Serviceindustry
Dwellingsurban
Serviceindustry
Services
Inputs Finished productsProducts
Transporturban
Tax
productsTransport
Fig. 2 Sankey diagram of the Colombian economy using data for 2012. On the left, physicalinfrastructure (beige boxes) with energy, jobs and economic volume flows. On the right,component economic volume flows of final demand. [NPISH (non-profit institutions servinghouseholds), TCO$ (tera Colombian dollars)]. Source Banco de la República (2016), DANE(2015, 2016b), IEA (2015) and MME (2016)
10 C.J. Axon and S.H. Roberts
Petroleum products (net)Electricity(net)
KEY
Electricity
Jobs (5 million)
Energy (100 PJ/y)
Crude oil
Petroleum products
Coal
Natural gas
Hot water
Goods
Construction
Services
Agriculture
Utilities
Investment
Rental (actual + imputed)
Economic volume flows at purchasers’ prices (50 TCO$[2012]/y)
Goods
Construction
Services
Extraction
Economic volume flows at basic prices (50 TCO$[2012]/y)
Rural
Urban
EXPORTS
Construction
Goods
Coal (net)
Crude oil(net)
Services
Goods
Agriculture
NPISHurban
Household consump-tionurban
Investment
Colombia trading border
Governmenturban
Services
Finalsupply
Finaldemand
GD
P &
imp
orts
Rental
Household consump-tionrural
Governmentrural
NPISHurban
Fig. 2 (continued)
Energy for Cities: Supply, Demand and Infrastructure Investment 11
Dwellingsrural
Electricityfrom
fossil fuels
Nuclear &renewables
IMPORTS
Tax
Intermediate consumption
Serviceindustry
Tax
JobsOther
Gas
Goods
Services
Agriculture
UK trading border
Manu-facturing
Construc-tion
Utilities
Other
Dwellingsurban
Construc-tion
Manu-facturing
Tax
Other
Other
Inputs Finished productsProducts
Extraction
Agriculture
PetroleumRefining
Serviceindustry
Crude
Solar PVurban
Solar HWurban
Transportrural
Coal
Transporturban
Transport & trade
products
oil
Fig. 3 Sankey diagram of the UK economy using data for 2012. On the left, physicalinfrastructure (beige boxes) with energy, jobs and economic volume flows. On the right,component economic volume flows of final demand. [NPISH (non-profit institutions servinghouseholds)]. Source DCLG (2015a, b), DfT (2015), IEA (2015) and ONS (2015, 2016)
12 C.J. Axon and S.H. Roberts
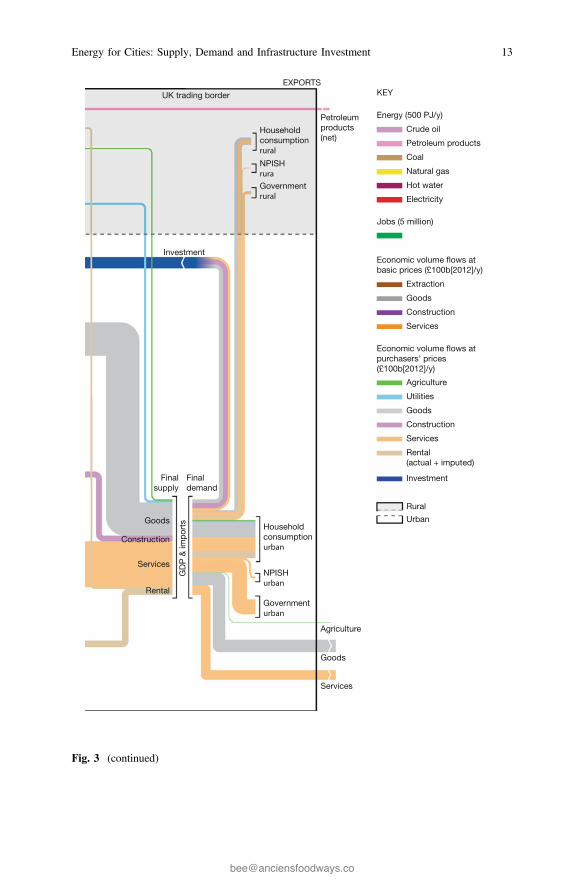
EXPORTS
Construction
Goods
Petroleum products (net)
Services
Goods
Agriculture
NPISHurban
Household consumptionurban
Investment
Governmenturban
Services
Finalsupply
Finaldemand
GD
P &
imp
orts
NPISHrura
Governmentrural
consumptionrural
UK trading border KEY
Electricity
Jobs (5 million)
Energy (500 PJ/y)
Crude oil
Petroleum products
Coal
Natural gas
Hot water
Goods
Construction
Services
Agriculture
Utilities
Investment
Rural
Rental (actual + imputed)
Economic volume flows at purchasers’ prices (£100b[2012]/y)
Goods
Construction
Services
Extraction
Economic volume flows at basic prices (£100b[2012]/y)
Urban
Rental
Household
Fig. 3 (continued)
Energy for Cities: Supply, Demand and Infrastructure Investment 13
are either not available or difficult to obtain. Despite this approach to the division,we suggest it does not devalue some key observations we now make:
• For both Colombia and the UK, most economic activity is in the service industry(the FC box) and thus urban by our assignment. Services as the product (theSankey line) include the IC of retail which is a significant proportion of goods intheir final form. The Sankey diagrams for Colombia and the UK are surprisinglysimilar within their IC dotted boxes;
• Investment, represented by the vertical blue lines, shows that most constructionis of service industry and dwellings, so mostly urban, thus appropriate that weassign construction here;
• Most jobs are in the service industry with significant numbers in construction,thus mostly urban;
• Virtually all energy is sourced, or generated (electricity), in the rural areas.Urban energy sources, e.g. solar photovoltaics and hot water (Fig. 3), are verysmall by comparison;
• For the fossil-fuel intensity of electricity, this is low in Colombia because of thehigh proportion of renewables (79%, mainly hydropower with some biomass),whereas it is a high proportion in the UK since there the contribution of nuclearand renewables is 29% only;
• Biomass delivers 13% of all thermal energy in Colombia, all from rural;• For transport, most energy use is rural (69%), but this would include passenger
travel to urban areas and between urban areas, and freight transport servingurban needs.
These observations support what is well known about urban areas as a focus forjobs, economic activity, construction and a significant proportion of transport.
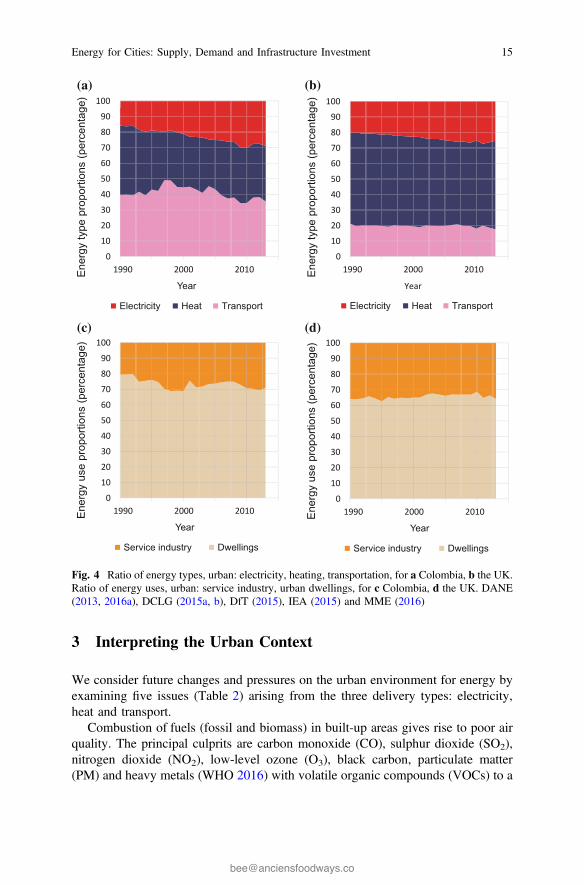
The demand for energy in the urban areas can be categorised by type of deliveryaccording to the practical use of the engineered system: electricity, heat andtransport. This typology fits well with the readily available socio-economic andenergy data where the percentage global division between these is roughly20/50/30. Figure 4 shows how these energy proportions vary, either by deliverytype or by use, as in the Sankey diagrams of service industry, dwellings andtransport. Service industry and dwellings data incorporate electricity and heat use,while transport is considered separately.
The electricity proportion is very similar between the two countries rising fromabout 20 to 30%, while the heating proportion declines by 5–10%, between 1990and 2013. At present it is not possible to fully determine whether this is due to fuelswitching or heating reduction through efficiency (biomass to gas, or better insu-lation). For urban use of heat, this is mostly by urban dwellings for space heating,cooking and hot water. Heating or cooling is rare in Bogota for housing, but coolingis used in office buildings. Transport energy demand is high in Colombia peaking at50% and only recently getting below 40%, while the UK has been stable at 20%.For both Colombia and the UK the proportion of urban energy demand forbuildings, to service industry, is comparable at about a third.
14 C.J. Axon and S.H. Roberts
3 Interpreting the Urban Context
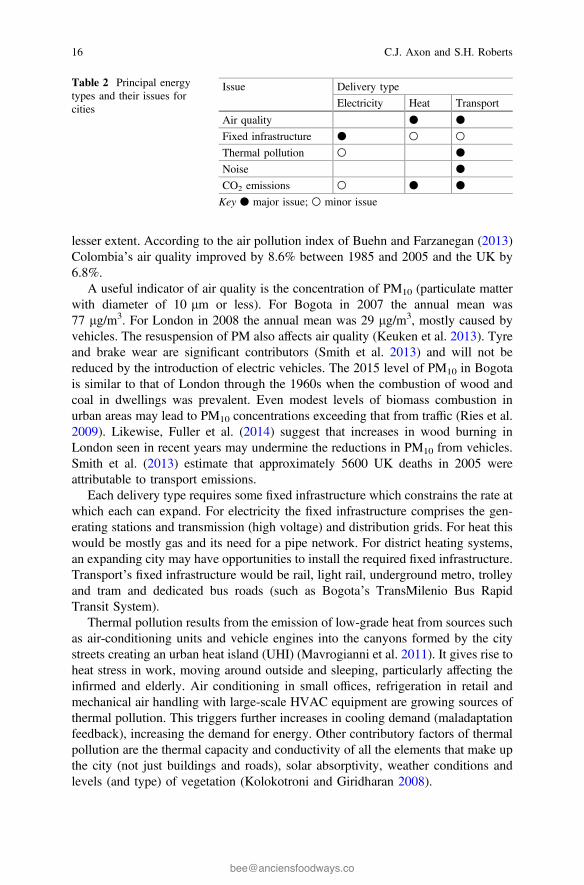
We consider future changes and pressures on the urban environment for energy byexamining five issues (Table 2) arising from the three delivery types: electricity,heat and transport.
Combustion of fuels (fossil and biomass) in built-up areas gives rise to poor airquality. The principal culprits are carbon monoxide (CO), sulphur dioxide (SO2),nitrogen dioxide (NO2), low-level ozone (O3), black carbon, particulate matter(PM) and heavy metals (WHO 2016) with volatile organic compounds (VOCs) to a
0
10
20
30
40
50
60
70
80
90
100
1990 2000 2010Ener
gy ty
pe p
ropo
rtion
s (p
erce
ntag
e)
Year
Electricity Heat Transport
0
10
20
30
40
50
60
70
80
90
100
1990 2000 2010Ener
gy ty
pe p
ropo
rtion
s (p
erce
ntag
e)
Year
Electricity Heat Transport
0
10
20
30
40
50
60
70
80
90
100
1990 2000 2010Ener
gy u
se p
ropo
rtion
s (p
erce
ntag
e)
Year
Service industry Dwellings
0
10
20
30
40
50
60
70
80
90
100
1990 2000 2010Ener
gy u
se p
ropo
rtion
s (p
erce
ntag
e)
Year
Service industry Dwellings
(a) (b)
(c) (d)
Fig. 4 Ratio of energy types, urban: electricity, heating, transportation, for a Colombia, b the UK.Ratio of energy uses, urban: service industry, urban dwellings, for c Colombia, d the UK. DANE(2013, 2016a), DCLG (2015a, b), DfT (2015), IEA (2015) and MME (2016)
Energy for Cities: Supply, Demand and Infrastructure Investment 15
lesser extent. According to the air pollution index of Buehn and Farzanegan (2013)Colombia’s air quality improved by 8.6% between 1985 and 2005 and the UK by6.8%.
A useful indicator of air quality is the concentration of PM10 (particulate matterwith diameter of 10 lm or less). For Bogota in 2007 the annual mean was77 lg/m3. For London in 2008 the annual mean was 29 lg/m3, mostly caused byvehicles. The resuspension of PM also affects air quality (Keuken et al. 2013). Tyreand brake wear are significant contributors (Smith et al. 2013) and will not bereduced by the introduction of electric vehicles. The 2015 level of PM10 in Bogotais similar to that of London through the 1960s when the combustion of wood andcoal in dwellings was prevalent. Even modest levels of biomass combustion inurban areas may lead to PM10 concentrations exceeding that from traffic (Ries et al.2009). Likewise, Fuller et al. (2014) suggest that increases in wood burning inLondon seen in recent years may undermine the reductions in PM10 from vehicles.Smith et al. (2013) estimate that approximately 5600 UK deaths in 2005 wereattributable to transport emissions.
Each delivery type requires some fixed infrastructure which constrains the rate atwhich each can expand. For electricity the fixed infrastructure comprises the gen-erating stations and transmission (high voltage) and distribution grids. For heat thiswould be mostly gas and its need for a pipe network. For district heating systems,an expanding city may have opportunities to install the required fixed infrastructure.Transport’s fixed infrastructure would be rail, light rail, underground metro, trolleyand tram and dedicated bus roads (such as Bogota’s TransMilenio Bus RapidTransit System).
Thermal pollution results from the emission of low-grade heat from sources suchas air-conditioning units and vehicle engines into the canyons formed by the citystreets creating an urban heat island (UHI) (Mavrogianni et al. 2011). It gives rise toheat stress in work, moving around outside and sleeping, particularly affecting theinfirmed and elderly. Air conditioning in small offices, refrigeration in retail andmechanical air handling with large-scale HVAC equipment are growing sources ofthermal pollution. This triggers further increases in cooling demand (maladaptationfeedback), increasing the demand for energy. Other contributory factors of thermalpollution are the thermal capacity and conductivity of all the elements that make upthe city (not just buildings and roads), solar absorptivity, weather conditions andlevels (and type) of vegetation (Kolokotroni and Giridharan 2008).
Table 2 Principal energytypes and their issues forcities
Issue Delivery type
Electricity Heat Transport
Air quality ● ●Fixed infrastructure ● ○ ○Thermal pollution ○ ●Noise ●CO2 emissions ○ ● ●Key ● major issue; ○ minor issue
16 C.J. Axon and S.H. Roberts
Noise from transport, and to a much lesser extent from the motors and fans ofair-conditioning units, affects energy use by restricting when windows can beopened. This increases the level of cooling demand met by air conditioning.
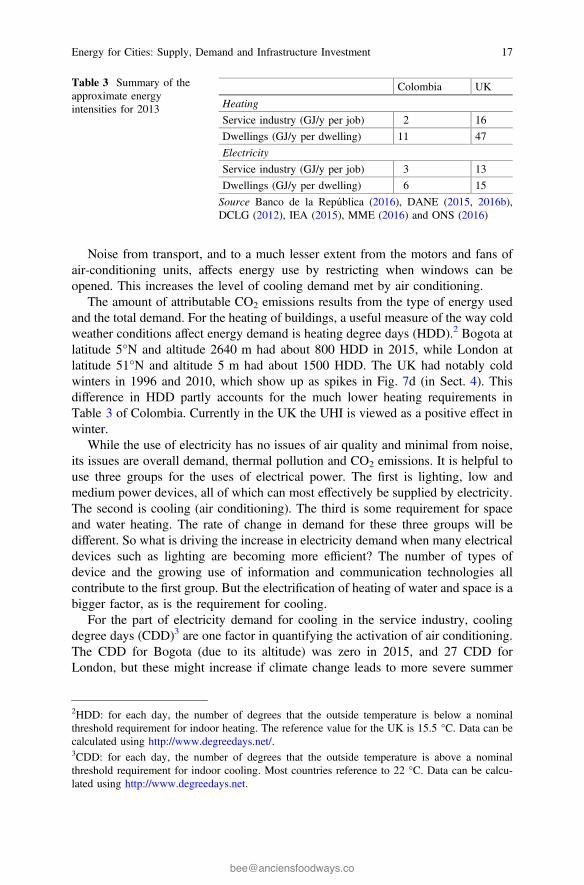
The amount of attributable CO2 emissions results from the type of energy usedand the total demand. For the heating of buildings, a useful measure of the way coldweather conditions affect energy demand is heating degree days (HDD).2 Bogota atlatitude 5°N and altitude 2640 m had about 800 HDD in 2015, while London atlatitude 51°N and altitude 5 m had about 1500 HDD. The UK had notably coldwinters in 1996 and 2010, which show up as spikes in Fig. 7d (in Sect. 4). Thisdifference in HDD partly accounts for the much lower heating requirements inTable 3 of Colombia. Currently in the UK the UHI is viewed as a positive effect inwinter.
While the use of electricity has no issues of air quality and minimal from noise,its issues are overall demand, thermal pollution and CO2 emissions. It is helpful touse three groups for the uses of electrical power. The first is lighting, low andmedium power devices, all of which can most effectively be supplied by electricity.The second is cooling (air conditioning). The third is some requirement for spaceand water heating. The rate of change in demand for these three groups will bedifferent. So what is driving the increase in electricity demand when many electricaldevices such as lighting are becoming more efficient? The number of types ofdevice and the growing use of information and communication technologies allcontribute to the first group. But the electrification of heating of water and space is abigger factor, as is the requirement for cooling.
For the part of electricity demand for cooling in the service industry, coolingdegree days (CDD)3 are one factor in quantifying the activation of air conditioning.The CDD for Bogota (due to its altitude) was zero in 2015, and 27 CDD forLondon, but these might increase if climate change leads to more severe summer
Table 3 Summary of theapproximate energyintensities for 2013
Colombia UK
Heating
Service industry (GJ/y per job) 2 16
Dwellings (GJ/y per dwelling) 11 47
Electricity
Service industry (GJ/y per job) 3 13
Dwellings (GJ/y per dwelling) 6 15
Source Banco de la República (2016), DANE (2015, 2016b),DCLG (2012), IEA (2015), MME (2016) and ONS (2016)
2HDD: for each day, the number of degrees that the outside temperature is below a nominalthreshold requirement for indoor heating. The reference value for the UK is 15.5 °C. Data can becalculated using http://www.degreedays.net/.3CDD: for each day, the number of degrees that the outside temperature is above a nominalthreshold requirement for indoor cooling. Most countries reference to 22 °C. Data can be calcu-lated using http://www.degreedays.net.
Energy for Cities: Supply, Demand and Infrastructure Investment 17
EXPORTS
Serviceindustry
Gas
Colombia trading border
Manu-facturing
Construc-tion
Petroleumproducts
Dwellingsrural
Coal
Emissions of CO2
fromfossil fuels combustion
Utilities
Extraction
Agriculture
KEY
Crude oil
Petroleum products
Coal
Natural gas
Energy (100 PJ/y)
Electricity
CO2
Emissions (10 MtCO2/y)
Transporturban
Rural
Urban
Electricityfrom
fossil fuels
Renewables
Crudeoil
Refining
Dwellingsurban
Petroleumproducts (net)
Electricity(net)
Coal (net)
Crude oil(net)
Transportrural
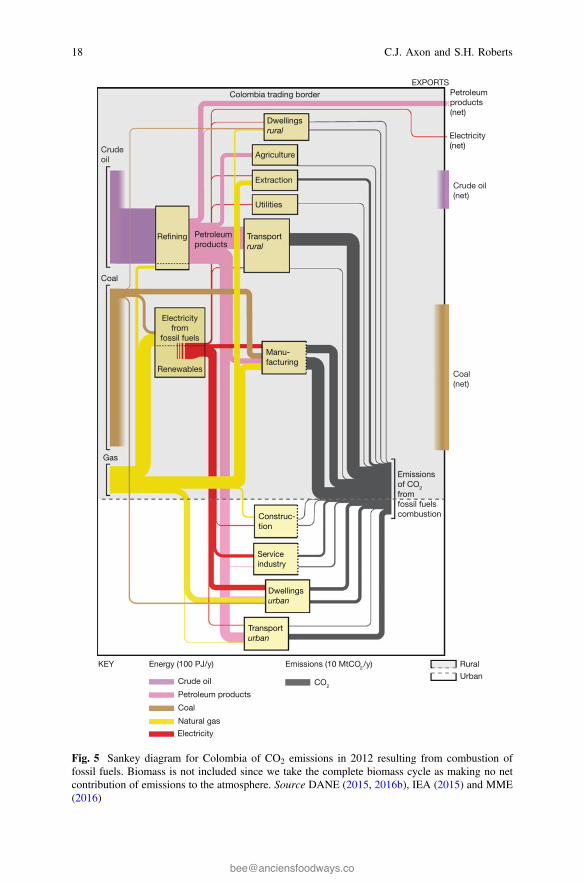
Fig. 5 Sankey diagram for Colombia of CO2 emissions in 2012 resulting from combustion offossil fuels. Biomass is not included since we take the complete biomass cycle as making no netcontribution of emissions to the atmosphere. Source DANE (2015, 2016b), IEA (2015) and MME(2016)
18 C.J. Axon and S.H. Roberts
of COfrom fossil fuelscombustion
Nuclear &renewables
2
IMPORTS
Serviceindustry
Gas
UK trading border
Manu-facturing
Construc-tion
Dwellingsurban
PetroleumRefining
Crudeoil
Solar PVurban
Electricityfrom
fossil fuels
Transportrural
Dwellingsrural
Coal
Emissions
Utilities
Extraction
Agriculture
KEY
Crude oil
Petroleum products
Coal
Natural gas
Energy (500 PJ/y)
Electricity
CO2
Emissions (50 MtCO2/y)
Transporturban
Rural
Urban
products
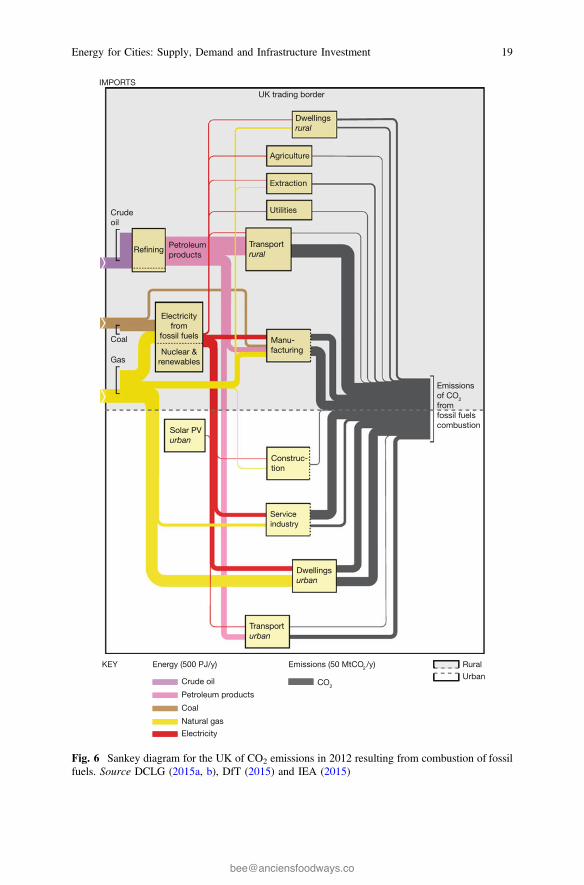
Fig. 6 Sankey diagram for the UK of CO2 emissions in 2012 resulting from combustion of fossilfuels. Source DCLG (2015a, b), DfT (2015) and IEA (2015)
Energy for Cities: Supply, Demand and Infrastructure Investment 19

heat waves and their associated health impacts (Kovats and Hajat 2008). A better—but imperfect—indicator of cooling needs is ‘weighted cooling degree hours’,which is more closely related to the likelihood of thermal discomfort than CDD(CIBSE 2014). Air temperature alone is an incomplete indicator of the humanthermal environment; Jendritzky and Kalkstein (2015) describe more suitableindices.
Overall demand for the three types of energy can be drawn together by lookingat the contribution to CO2 emissions that can be directly attributed to each urbanactivity. We show application of the Sankey format for mapping CO2 emissions toindustries, dwellings and transport in Figs. 5 (Colombia) and 6 (UK). They showurban proportions of total national emissions as 20% for Colombia and 50% for theUK. This gives a widely differing urban per capita emission of 0.49 tCO2/y forColombia and 4.7 tCO2/y for the UK.
4 Reducing the Demand for Energy and Its Impacts
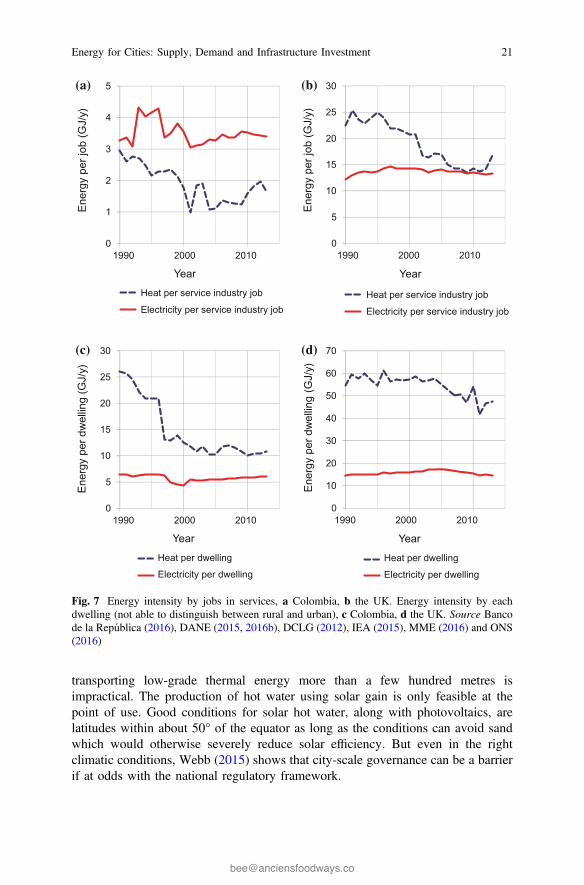
Sustainability of energy in cities is about addressing the issues in Table 2. Theprincipal solution to these is to reduce the demand for energy, followed by sub-stitution of energy type. We can see from the relationships between energy typesand their uses (Fig. 7) that some progress has been made in both Colombia and theUK. There are downward trends in both Colombia and the UK for the heatintensities per service industry job and per dwelling. However, the electricityintensities have little changed since 1990. The essential features are summarisedin Table 3. In Fig. 7 the huge reduction in heat intensity for dwellings throughoutthe 1990s for Colombia was due to replacing the use of solid fuel with gas as partof a programme of providing energy services to the poorest households(Barrera-Hernandez 2004; Grubler et al. 2012).
4.1 Dealing with the Effect of Location on Demand
The geographical context for a city has an impact on its options for energy effi-ciency and reducing energy demand. A city’s latitude and climate determine theneeds of occupants’ thermal comfort and its potential for solar generation.Furthermore, a city’s point in development affects the available options. A city withan established set of infrastructures is difficult and expensive to change, while newand growing cities have better opportunities in the master planning of the layout.For both established and new cities, standards and regulations of building efficiencyneed to be expanded in scope and enforced (IEA and United Nations 2013).
The proximity to energy sources by pipe, wire, road, rail and water is a keydeterminant of the range of actions which are possible. Having identified the needto site the main electricity generation outside of the urban environment, we note that
20 C.J. Axon and S.H. Roberts
transporting low-grade thermal energy more than a few hundred metres isimpractical. The production of hot water using solar gain is only feasible at thepoint of use. Good conditions for solar hot water, along with photovoltaics, arelatitudes within about 50° of the equator as long as the conditions can avoid sandwhich would otherwise severely reduce solar efficiency. But even in the rightclimatic conditions, Webb (2015) shows that city-scale governance can be a barrierif at odds with the national regulatory framework.
0
1
2
3
4
5
1990 2000 2010
Ener
gy p
er jo
b (G
J/y)
Year
Heat per service industry job
Electricity per service industry job
0
5
10
15
20
25
30
1990 2000 2010
Ener
gy p
er jo
b (G
J/y)
Year
Heat per service industry job
Electricity per service industry job
0
5
10
15
20
25
30
1990 2000 2010
Year
Ener
gy p
er d
wel
ling
(GJ/
y)
Heat per dwelling
Electricity per dwelling
0
10
20
30
40
50
60
70
1990 2000 2010
Ener
gy p
er d
wel
ling
(GJ/
y)
Year
Heat per dwelling
Electricity per dwelling
(a) (b)
(c) (d)
Fig. 7 Energy intensity by jobs in services, a Colombia, b the UK. Energy intensity by eachdwelling (not able to distinguish between rural and urban), c Colombia, d the UK. Source Bancode la República (2016), DANE (2015, 2016b), DCLG (2012), IEA (2015), MME (2016) and ONS(2016)
Energy for Cities: Supply, Demand and Infrastructure Investment 21
The key features of climate that affect energy demand for thermal comfort are:
• Whether the winters can be very cold or just mild;• Whether the summers are very hot or very humid;• Whether there are prevailing winds that could be harnessed for summer cooling.
A high number of HDDs mean that building regulations should focus on insu-lation of walls and windows and reduction of uncontrolled drafts so that ventilationis optimal to avoid moisture build-up and condensation. Shielding of buildings fromhigh winter winds also helps to reduce heat losses. If solar conditions are sufficientin winter, then glazing should be optimised towards the equator for solar gain. Fornew-build housing, optimal solar orientation can reduce both heating and coolingloads at minimal cost for any given size of dwelling (Hemsath 2016).
By contrast, for a city with a high number of CDDs, an obvious step is tominimise the glazing to wall area ratio and maximise solar shading of any glazingfrom the sun to avoid compounding high air temperatures. Kolokotroni et al. (2012)suggest that if internal heat gains are reduced, night cooling when available usingnatural ventilation will have a beneficial effect on energy performance. If there isprevailing wind, then buildings should have windows that open for this naturalventilation while still maintaining security and minimising incursion of noise.Where there is little wind, tall buildings can exploit the stack effect of thermalbuoyancy to drive their own natural ventilation. Increasing vegetation, parks, greenroofs and green walls will add shading and increase evaporative cooling(Kolokotroni and Giridharan 2008). At the same time, increasing the albedo ofsurfaces, cool roofs and pavements are useful additional measures (Hirano andFujita 2012). These will help to reduce the UHI effect and thus reduce the energydemand for cooling.
Mitigating the impact of heat waves should not simply mean increasing the useof air conditioning. In hot conditions the distribution cable capacity is reduced,jeopardising electrical stability (Choobineh et al. 2016) and increasing the likeli-hood of power failures, at the time of additional electricity demand (Salagnac2007). Hicks and Menne (2015) give several examples of national and regional heatwave plans for public health interventions. Recommended actions include healtheducation, contacting high-risk individuals and the opening of cooling centres(Kovats and Hajat 2008).
Transport remains in both countries mostly a single fuel user, i.e. petroleumproducts. As the rate of car ownership in Colombia is lower than the UK, it isreasonable to expect that as the Colombian economy grows, so too will the totalnumber of cars in the country and their use. It is likely too that the cheapest fuelsource will be used; thus, the provision of energy for transport will remain domi-nated by petroleum products for the near and medium terms. The infrastructure forthe internal combustion engine is entrenched in terms of both economics and skills.Improving vehicle efficiency and traffic management is of central importance toreducing energy demand (Erickson and Tempest 2014). Some potentially helpfulactions are to remove the heavy metal and SO2 at source, so promote the use of
22 C.J. Axon and S.H. Roberts
lead-free and low-sulphur fuels. Remaining tailpipe emissions such as carbonmonoxide, VOCs and NO2 can be reduced by the mandatory fitting of catalyticconverters. Reducing VOCs and NO2 will lower the rate of formation ofground-level ozone. Increased use of diesel particulate filters will reduce PM.
A transition away from petrol and diesel may be facilitated by bioliquids, liq-uefied petroleum gas (LPG), natural gas and perhaps hydrogen. But the replacementof the internal combustion engine by the electric motor is dominated by the need forinvestment in a different infrastructure. Although suggested by many, there is noserious prospect of electric vehicles (EVs) participating in the electricity grid asshort-term energy storage to offset the operating and ownership costs (Bishop et al.2016). Furthermore, there is uncertainty whether the overall lifecycle assessment forEVs is better than of the internal combustion engine (Hawkins et al. 2012). With amostly low carbon electricity generation portfolio, Hawkins et al. (2013) suggestthat CO2 and global warming potential (GWP) from using EVs may be better thanusing gasoline, but still indistinguishable from using diesel. Hawkins et al. (2013)also suggest that environmental impacts of EV battery and powertrain manufac-turing may be greater than for the internal combustion engine. Within the city,however, the potential for zero tailpipe emissions confers significant benefits for airquality with a positive knock-on effect for building energy use.
There is a clear-cut need for demand reduction of electricity and heating. Bogotahouseholds and businesses would benefit from energy efficiency measures.However, without city-wide resilient energy infrastructure, the need for new supplyremains an important requirement. For a city such as London, all buildings benefitfrom reliable power supply. Although some London households are in fuel poverty,making the housing stock more energy efficient and reducing the need for travelimproves their state and the overall state of the city (Erickson and Tempest 2014).This brings us back to the socio-economic energy modelling of the macroeconomyin Sect. 2—what, how much and how fast can a national economy support (andmaintain) growing cities? Investment represented by the vertical blue lines inFigs. 2 and 3 shows there is much construction of service industry and dwellingswith opportunities to implement new energy priorities.
5 Conclusions
We have shown that by bringing together national data sets on energy, population,transport and the economy we can gain insight to energy use in the city context.Nations need to be aware of indicators that demonstrate non-sustainable trends. Ourcase study consists of contrasting countries with some markedly different indicators,but also some surprising similarities.
One of the key differences is that the energy proportion for transport in urbanColombia is almost double that of the UK. Furthermore, the urban per capitaemissions of Colombia are a tenth that of the UK. The expected differences
Energy for Cities: Supply, Demand and Infrastructure Investment 23
according to stage of economic development are accentuated by Colombia’sparticularly high proportion of hydropower as a primary energy source.
Perhaps of more interest are the many similarities. The ratio of energy use ofservice industry to urban dwellings is 1:2 for both countries. From a sustainabilityperspective, the downward trends in heating intensities both per service industry joband per (national) dwelling are encouraging. For both Colombia and the UK theelectricity intensities per job and per dwelling are constant, meaning that totalpower demand scales with urban growth. For both economies the greatest invest-ment is in the service industry, followed by dwellings. Thus they have similaropportunities to implement more ambitious energy efficiency targets in acost-effective manner. Also similar between the two countries has been the growthin energy use for urban freight transportation. Accepting that the movement offreight is inherent to highly populated cities, the focus for freight transport needs tobe on mitigating the consequences of worsening air pollution and improving effi-ciency. The data fusion method we have used is one way to visualise the linksbetween economic activity, energy and power demand and the consequences onsociety (including CO2 emissions). Chasing the unattainable dream of zero-carboncities may lead to distorted national priorities and policy objectives. The potentialfor urban areas to generate their own energy is very low. If the climate is right forsolar input, then urban areas can make a contribution. Big energy facilities—alongwith agriculture and manufacturing—are best-suited to rural areas. However, thatdoes not absolve cities and their authorities from ‘getting their own house in order’by reducing energy demand for electricity, heat and transport. How a city goesabout this is location and climate dependent, but the key priorities for sustainabilityshould be improving air quality and reducing energy demand directly by a radicalstep-up in energy efficiency. But improving the energy efficiency of buildings andreducing the emissions from vehicles needs more stringent regulation which is thenenforced.
Mitigating the UHI is a virtuous feedback system. If the air quality is improved,then natural ventilation becomes a realistic prospect. A logical first step is to reducethe use of the internal combustion engine within the city. This also reduces thermalpollution from the engines and exhaust gases. Then anthropogenic heat emittedfrom buildings can reduce. Pursuing these objectives simultaneously addresses fuelpoverty, indoor comfort, health, infrastructure resilience and several types of pol-lution. Particular attention is needed to address heat stress without immediatelyresorting to increases in the use of air conditioning.
Understanding the sustainability implications of energy use in cities starts bydisaggregating the types of demand. Their infrastructure requires investmentover-and-above simply meeting the basic needs for increasing services, moredwellings and growing transport. But would this additional investment be affordable?
Most new economic activity is associated with the urban environment. The bluelines in the Sankey diagrams (Figs. 2 and 3) show where currently investment isbeing made. The width of the blue lines vies with household consumption as itscompeting component of final demand in the economy. Increasing total investment(for all activities) by 10% translates as a reduction in household consumption of
24 C.J. Axon and S.H. Roberts
approximately 3%. While this relatively small price to households would have asignificant leverage, any move to slow the growth or reduce household demand isdifficult politically. Reducing air pollution not only has health benefits, but also hasthe potential to enable energy demand reduction measures to be more effective.Energy use in cities can only be understood and acted upon if all of the activities incities are considered together. The essence of our approach is captured in Fig. 7.This forms the basis of identifying benchmarks to probe the potential for energydemand reduction in other urban areas.
Acknowledgements We are grateful to Luis Giovanetti and Humberto Mora for their help withthe Colombian data and the specific context of Bogota. We are grateful too for graphical design byElisa Magnini, and to Stephen Cook and Jake Hacker for helpful discussions.
References
Ayres RU, Warr B (2009) The economic growth engine: how energy and work drive materialprosperity. Edward Elgar, Cheltenham, UK
Banco de la República (2016) Gross domestic product methodology: base year 1994. Banco de laRepública, Bogota
Barrera-Hernandez L (2004) The Andes: so much energy, such little security. In: Barton B,Redgwell C, Ronne A, Zillman DN (eds) Energy security: managing risk in a dynamic legaland regulatory environment. Oxford University Press, Oxford, pp 217–251
Bishop JDK, Axon CJ, Bonilla D, Banister D (2016) Estimating the grid payments necessary tocompensate additional costs to prospective electric vehicle owners who provide vehicle-to-gridancillary services. Energy 94:715–727. doi:10.1016/j.energy.2015.11.029
Buehn A, Farzanegan MR (2013) Hold your breath: a new index of air pollution. Energy Econ37:104–113. doi:10.1016/j.eneco.2013.01.011
Choobineh M, Tabares-Velasco PC, Mohagheghi S (2016) Optimal energy management of adistribution network during the course of a heat wave. Electr Power Syst Res 130:230–240.doi:10.1016/j.epsr.2015.09.010
CIBSE (2014) Design summer years for London. The Chartered Institution of Building ServicesEngineers, London
DANE (2011) Population series 1985–2020. Departamento Administrativo Nacional de Estadstica,Bogota
DANE (2013) Cuentas económicas nacionales trimestrales—PIB [Quarterly national economicaccounts—GDP]. Departamento Administrativo Nacional de Estadstica, Bogota
DANE (2015) Gran Encuesta Integrada de Hogares 2001–2016 [Integrated household survey](No. COL-DANE-GEIH-2015). Departamento Administrativo Nacional de Estadstica, Bogota,Colombia
DANE (2016a) Cuentas anuales de bienes y servicios—Colombia Producto Interno Bruto(PIB) 2013 definitivo y 2014 provisional [Annual accounts of goods and services—ColombiaGross Domestic Product (GDP) 2013 final and 2014 provisional] (No. DIE-020-PD-01-r5_v6).Departamento Administrativo Nacional de Estadstica, Bogota, Colombia
DANE (2016b) Encuesta Nacional de Calidad de Vida [National Quality of Life Survey].Departamento Administrativo Nacional de Estadstica, Bogota, Colombia
DCLG (2012) Household projections. Department for Communities and Local Government,London, UK
DCLG (2015a) Dwelling stock (including vacants). Department for Communities and LocalGovernment, London, UK
Energy for Cities: Supply, Demand and Infrastructure Investment 25
DCLG (2015b) English housing survey: stock profile. Department for Communities and LocalGovernment, London, UK
DfT (2015) Transport statistics for Great Britain. Department for Transport, London, UKErickson P, Tempest K (2014) Advancing climate ambition: how city-scale actions can contribute
to global climate goals (No. 2014-06), SEI working paper. Stockholm Environment Institute,Stockholm, Sweden
Fuller GW, Tremper AH, Baker TD, Yttri KE, Butterfield D (2014) Contribution of wood burningto PM10 in London. Atmos Environ 87:87–94. doi:10.1016/j.atmosenv.2013.12.037
Grubler A et al (2012) Urban energy systems. In: GEA Writing Team (ed) Global energyassessment. Cambridge University Press, Cambridge
Hawkins TR, Gausen OM, Stromman AH (2012) Environmental impacts of hybrid and electricvehicles—a review. Int J Life Cycle Assess 17:997–1014. doi:10.1007/s11367-012-0440-9
Hawkins TR, Singh B, Majeau-Bettez G, Stromman AH (2013) Comparative environmental lifecycle assessment of conventional and electric vehicles. J Ind Ecol 17:53–64. doi:10.1111/j.1530-9290.2012.00532.x
Hemsath TL (2016) Housing orientation’s effect on energy use in suburban developments. EnergyBuild 122:98–106. doi:10.1016/j.enbuild.2016.04.018
Hicks R, Menne B (2015) Planning for heat events at the intraseasonal-to-seasonal scale. In:McGregor GR, Bessemoulin P, Ebi KL, Menne B (eds) Heatwaves and health: guidance onwarning-system development. World Meteorological Organization and World HealthOrganization, Geneva, p 114
Hirano Y, Fujita T (2012) Evaluation of the impact of the urban heat island on residential andcommercial energy consumption in Tokyo. Energy 37:371–383. doi:10.1016/j.energy.2011.11.018
IEA (2015) Energy balances of non-OECD countries, 2015th edn. International Energy Agency,Paris, France
IEA, United Nations (2013) modernising building energy codes, policy pathway. InternationalEnergy Agency, Paris
Jendritzky G, Kalkstein L (2015) Assessment of heat stress. In: McGregor GR, Bessemoulin P,Ebi KL, Menne B (eds) Heatwaves and health: guidance on warning-system development.World Meteorological Organization and World Health Organization, Geneva, p 114
Kander A, Malanima P, Warde P (2014) Power to the people: energy in Europe over the last fivecenturies. Princeton University Press, Princeton
Keuken MP, Moerman M, Voogt M, Blom M, Weijers EP, Rockmann T, Dusek U (2013) Sourcecontributions to PM2.5 and PM10 at an urban background and a street location. Atmos Environ71:26–35. doi:10.1016/j.atmosenv.2013.01.032
Kolokotroni M, Giridharan R (2008) Urban heat island intensity in London: an investigation of theimpact of physical characteristics on changes in outdoor air temperature during summer. SolEnergy 82:986–998. doi:10.1016/j.solener.2008.05.004
Kolokotroni M, Ren X, Davies M, Mavrogianni A (2012) London’s urban heat island: impact oncurrent and future energy consumption in office buildings. Energy Build 47:302–311. doi:10.1016/j.enbuild.2011.12.019
Kovats RS, Hajat S (2008) Heat stress and public health: a critical review. Annu Rev Public Health29:41–55. doi:10.1146/annurev.publhealth.29.020907.090843
Mavrogianni A, Davies M, Batty M, Belcher SE, Bohnenstengel SI et al (2011) The comfort,energy and health implications of London’s urban heat island. Build Serv Eng Res Technol32:35–52. doi:10.1177/0143624410394530
MME (2016) Sistema de Informacion de Petroleo y Gas Colombiano: Balance Minero Energético.Ministry of Mines and Energy, Bogota
ONS (2014) Published ad hoc data and analysis: population, requests during September 2014.Office for National Statistics, Newport
ONS (2015) United Kingdom National Accounts, The Blue Book, 2015th edn. Office for NationalStatistics, Newport
ONS (2016) JOBS02: Workforce jobs by industry. Office for National Statistics, Newport
26 C.J. Axon and S.H. Roberts
Ries FJ, Marshall JD, Brauer M (2009) Intake fraction of urban wood smoke. Environ Sci Technol43:4701–4706. doi:10.1021/es803127d
Roberts SH, Axon CJ, Foran BD, Goddard NH, Warr BS (2015) A framework for characterisingan economy by its energy and socio-economic activities. Sust Cities Soc 14:99–113. doi:10.1016/j.scs.2014.08.004
Roberts SH, Axon CJ, Goddard NH, Foran BD, Warr BS (2016) A robust data-drivenmacro-socioeconomic-energy model. Sustain Prod Consum 7:16–36. doi:10.1016/j.spc.2016.01.003
Salagnac J-L (2007) Lessons from the 2003 heat wave: a French perspective. Build Res Inf35:450–457. doi:10.1080/09613210601056554
Schultz N, Grubler A, Ichinose T (2013) Energy and air pollution densities, including heat islandeffects. In: Grubler A, Fisk D (eds) Energizing sustainable cities: assessing urban energy.Routledge, Abingdon
Smith TW, Axon CJ, Darton RC (2013) The impact on human health of car-related air pollution inthe UK, 1995–2005. Atmos Environ 77:260–266. doi:10.1016/j.atmosenv.2013.05.016
United Nations, European Commission, International Monetary Fund, Organisation for EconomicCo-operation and Development, World Bank (eds) (2009) System of national accounts 2008.United Nations, New York, USA
Webb J (2015) Urban energy governance for sustainable heat in UK cities: expectations, practicesand potential. In: Hawkey D, Webb J, Lovell H, McCrone D, Tingey M, Winskel M(eds) Sustainable urban energy policy: heat and the city. Routledge, London
WHO (2016) Health risk assessment of air pollution: general principles. WHO Regional Office forEurope, Copenhagen
Wrigley EA (2010) Energy and the English industrial revolution. Cambridge University Press,Cambridge
Energy for Cities: Supply, Demand and Infrastructure Investment 27
Future-Proofed Design of Low-EnergyHousing Developments: Case Studiesfrom the UK and Sweden
Maria Christina Georgiadou
Abstract This study examines the concept of ‘future-proofing’ the energy designof housing developments so as to achieve low levels of energy consumption andcarbon emissions over their lifecycle. This refers particularly to the selection offabric energy efficiency measures and onsite low- or zero-carbon technologies(microgeneration or local energy networks) at an early design stage. The researchadopts a multiple case study method with data gathered from two ‘best-practice’housing developments in the UK and Sweden, namely North West Cambridge(Cambridgeshire) and Välle Broar (Växjö). The research explores thefuture-proofed approaches used in the two cases in relation to a pre-establishedconceptual framework, which involves two aspects, namely adopting lifecyclethinking and accommodating risks and uncertainties. The cross-case analysisreveals that there is widespread experimentation, which demonstrates thatfuture-proofing is still in its infancy. Drivers for future-proofing mostly promptstrategies to accommodate risks and uncertainties in the UK, whereas in Sweden,they lead to the adoption of lifecycle thinking. This is due to unique context-specificgovernance and institutional factors at both national (country) and local (case study)levels. The chapter concludes with the need to transfer knowledge to mainstreamhousing construction and inform policy-making in relation to long-term perfor-mance over a project’s full lifecycle.
Keywords Energy � Future-proofing � Housing developments � Lifecycle �Uncertainty
M.C. Georgiadou (&)Department of Property and Construction, Faculty of Architecture and the Built Environment,University of Westminster, 35 Marylebone Road, London NW1 5LS, UKe-mail: [email protected]
© Springer International Publishing AG 2017J. Bishop (ed.), Building Sustainable Cities of the Future,Green Energy and Technology, DOI 10.1007/978-3-319-54458-8_3
29
1 Introduction
The building sector has the greatest potential to deliver long-term, significant andcost-effective carbon emissions reduction compared to other major emitting sectors,such as transport or industry (IPCC 2007). However, despite advances in energyefficiency of materials, components and energy systems, total resource consumptioncontinues unabated. The building sector across the world is responsible for about40% of global energy, 25% of global water, 40% of global resources, and one thirdof greenhouse gas emissions (UNEP 2009). In Europe, buildings account foraround 40% of total energy use and 30% of associated carbon emissions (BPIE2011). Housing is different from any other sector. It is the type with the longestlifecycle and one with the least available funds to apply sophisticated designapproaches. As Bosher et al. (2007, p. 28) suggest: ‘residential developers are notproactive, motivated by profits and legal aspects, possibly at the cost of resilienceand sustainability […] resilience and flexibility is left as the responsibility of theperson who will be likely to live or work in the building’.
To address the challenge of planning and designing buildings in accordance withthe principles of sustainable development (SD) and a changing climate, ‘sustainablecommunities’ have emerged as ‘best-practice’ case studies around the world. Theserefer to eco-developments of various scales, from eco-quarters, eco-neighbourhoodsor ‘green’ city districts to larger schemes, such as eco-towns or eco-cities, as part ofthe ‘compact city’ model, which demonstrate (Jenks and Jones 2010):
• low- or zero-carbon design, with energy efficient facades, use of control sys-tems, sustainable materials and construction components, and low- orzero-carbon technologies (LZCs);
• connection with eco-friendly public transportation, walking and cycling routesthat reduce motor vehicle dependence;
• flood risk management and water harvesting systems, which capture rainwaterand control run-off, such as sustainable urban drainage systems;
• domestic waste management systems, wastewater re-use and recycling, andsewage treatment processes; and
• other features, such as local employment, green and public open spaces, prox-imity to community facilities (health centres, schools and local shops), efforts tomaintain biodiversity, cultural heritage preservation, and local food supply.
Community-scale schemes drive sustainability from the bottom up and offeropportunities to disseminate ‘best-practice’ and share lessons learnt at the locallevel. Key success factors in their roll-out are: systems thinking; empowered localauthorities that generate decentralised solutions; and multidisciplinary collaborationbetween the involved stakeholders (Killip 2008; Moffatt et al. 2012). Unlikeindividual buildings, the community-level has the potential to upscale low-carbonsolutions through the integration of energy, water and waste networks, informationand communication technologies to achieve resilient and adaptable solutions(Jewell et al. 2010; Nielsen 2006). It also provides better economies-of-scale
30 M.C. Georgiadou
(technical and economic viability) for novel building solutions and sustainabilitymeasures. This is due to the ‘long-tail’ feature of the built environment; i.e. thereare many small opportunities to save carbon emissions spread across millions ofbuildings and it is increasingly difficult to achieve large reductions as the size of thedevelopment gets smaller (UN 2010; UNEP 2009).
The issue of long-term thinking in the energy design of buildings is inherent inthe SD principles (WCED 1987). Under the label ‘future-proofing’, this studyexamines the temporal component of SD as an unexplored, yet fundamentalingredient in the delivery of low-energy housing developments. ‘Future-proofed’design or ‘designing for the future’ refers to sustainable, low-energy buildings, ableto accommodate social, technological, economic, environmental, and regulatorychanges over the long-term, thus maximising lifecycle value (Jones Lang Lasalle2010; Pitts 2008). Future-proofing seeks to facilitate the selection of robust buildingsolutions that will be ‘fit-for-purpose’ under a diversity of future scenarios, espe-cially in situations of high uncertainty. Hence, a low-energy design does not nec-essarily constitute a future-proofed one, but represents a baseline from which todevelop further this concept, which is more comprehensive. Buildings are complexsystems with a slow turnover. Design solutions cannot be easily revised and theydetermine whether or not a building project will remain ‘fit-for-purpose’ or becomeprematurely obsolete (Soetanto et al. 2006; Stasinopoulos et al. 2009). Designapproaches should therefore proactively accommodate future trends and drivers,thus shifting from the current ‘build-it-now and fix-it-later’ philosophy (NHBC2013; Ravetz 2008; TCPA 2006).
The motivation for this research is rooted in the disconnect between the appealof future-proofing as a principle or ‘philosophy’ aligned with SD at a policy leveland readily available design approaches required for its effective implementation bybuilding professionals. In the UK, for example, the construction industry still barelymeets existing regulatory requirements rather than surpassing the regulatory targets.Nevertheless, future-proofed design is promoted implicitly within the increasinglystringent environmental legislation, building regulations and standards both atEuropean and national (UK) levels up to at least 2050. These include:
• the revised European Performance Building Directive 2010/31/EU, which sets atarget for all new buildings to be nearly zero-energy by 2020 (EC 2010);
• the constant tightening of Part L (Conservation of Fuel and Power) in England(DCLG 2012); and
• the Climate Change Act with a binding target of an 80% reduction in carbonemissions for the building sector by 2050 (CCC 2008; DEFRA 2007).
The gap on future-proofing in policy and construction practice has led to a numberof recent changes in the UK. In 2015, the UK Government withdrew officially theCode for Sustainable Homes (CSH). CSH was a checklist-type environmentalassessment tool for rating and certifying the performance of new dwellings inEngland, Wales and Northern Ireland (DCLG 2010). It became legally binding in2008 and it was the single national standard to drive future-proofing in the housebuilding industry. CSH was expected to be harmonised with the Part L 2016 update
Future-Proofed Design of Low-Energy Housing Developments … 31
and become the compulsory standard for all dwellings so as to meeting the target ofzero-carbon by 2016 (Al-Hassan 2009; NHBC 2014). Furthermore, in 2015, theUK target of zero-carbon new homes from 2016 onwards was also scrapped,leading to uncertainty as to what qualifies as ‘zero-carbon’ and with a widelyaccepted definition yet to be confirmed (Planning Source 2015). Key reasons for thegap in future-proofing are: (Bosher et al. 2007; Glass et al. 2013, 2008; Sahagunand Moncaster 2012):
• the fragmentation and short-term mindset of the construction industry whichdeal with the design (or, at best, construction) phase rather than the fulllifecycle;
• legislation which regulates operational energy; and• existing building environmental assessment methods focusing predominantly on
the design phase.
This study seeks to lay the foundation for an evidence base of future-proofed designapproaches and examine how these can inform the selection of building solutions.The research builds on an established conceptual framework for future-proofeddesign (Georgiadou 2014; Georgiadou et al. 2012). A case study method is adoptedwith data gathered from two ‘best-practice’ housing developments in the UK andSweden; namely, North West Cambridge (Cambridgeshire) and Välle Broar(Växjö). The research design involved analysing the two ‘best-practice’ casesagainst the conceptual framework to establish the extent to which thefuture-proofed design approaches proposed in the literature were applied in practiceand to identify any additional features that may have been used. The focus wasexplicitly on ‘best-practice’ developments, since they are most likely to containfuture-proofed design approaches and provide the best platform from which todevelop any improvements with regard to future-proofing. Analysis of the casematerial and interviews with key stakeholders provided insights which could not beobtained from the general literature and helped to ‘test’ the developed framework.Fieldwork was carried out between February 2011 to August 2012, where data wasgathered through project documentation and 23 semi-structured interviews withbuildings professionals involved in the energy design and construction of the twoprojects. ‘Appendix 1’ contains the list of interviewees, their affiliation, interviewdate, and venue; however, the responses have been kept anonymous and are cited as[interview number–interview date].
2 Future-Proofed Design Approaches
Future-proofing can be defined as ‘a design approach that entails “stress-testing”building solutions against a range of plausible futures to ensure that they remainfunctional over the lifecycle of a housing development; hence, avoiding disruptive
32 M.C. Georgiadou
refurbishments or premature decommissioning’ (Georgiadou 2014, p. 7). This is aframework with three aspects, namely (Georgiadou 2014; Georgiadou et al. 2012):
• Coverage of SD Issues: Degree to which the three sustainability ‘pillars’ (socialeconomic, environmental) and their financial implications are covered in orderto achieve a holistic energy design process;
• Adopting Lifecycle Thinking: Extent to which the implications of the energydesign are considered throughout all lifecycle stages, i.e. from ‘cradle-to-grave’(from extraction up to final disposal) or ‘cradle-to-cradle’ (future deconstruction,re-use and recycling) so as to minimise the associated environmental impacts(Ekundayo et al. 2012; Pelsmakers 2012);
• Accommodating Risks and Uncertainties: Degree to which predictable, reason-ably foreseeable, and uncertain trends and drivers that can affect the energy use areaccommodated over the long-term (Lane et al. 2005; O’Brien et al. 2009).
Existing literature addresses extensively the first aspect, which covers the thematiccomponent of SD. However, the contribution of the conceptual framework is that itintroduces two additional categories to account for the temporal aspect of sus-tainability (Table 1).
From the review of the background literature, two general categories oflong-term impacts that dwellings can cause and experience have been identified.They are often neglected or erroneously treated interchangeably in designdecision-making by building professionals. These are the:
• impacts of domestic buildings on the environment due to their long lifecycles(adopting lifecycle thinking); and
• impacts on domestic buildings due to (predictable and/or unforeseeable)high-impact social, technological, economic, environmental and policy trendsand drivers affecting the energy performance (accommodating risks anduncertainties).
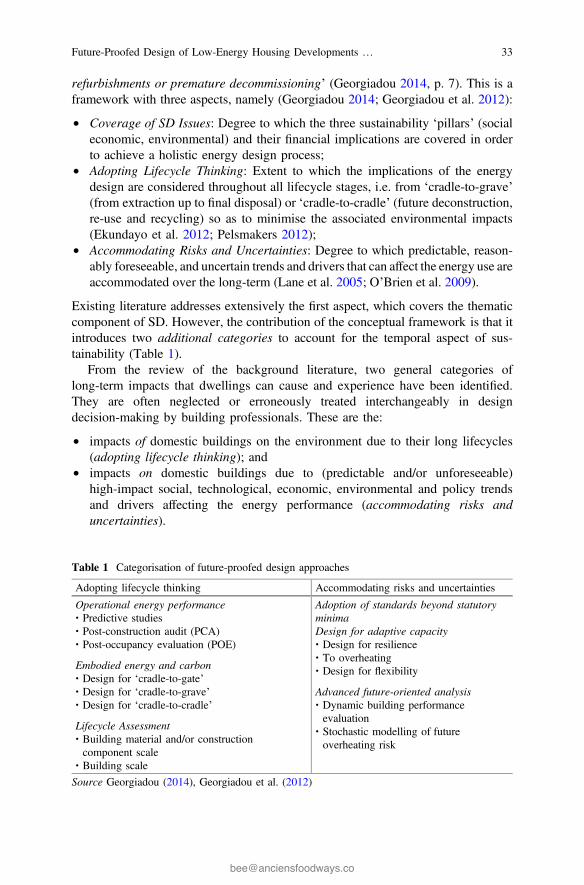
Table 1 Categorisation of future-proofed design approaches
Adopting lifecycle thinking Accommodating risks and uncertainties
Operational energy performance∙ Predictive studies∙ Post-construction audit (PCA)∙ Post-occupancy evaluation (POE)
Embodied energy and carbon∙ Design for ‘cradle-to-gate’∙ Design for ‘cradle-to-grave’∙ Design for ‘cradle-to-cradle’
Lifecycle Assessment∙ Building material and/or constructioncomponent scale
∙ Building scale
Adoption of standards beyond statutoryminimaDesign for adaptive capacity∙ Design for resilience∙ To overheating∙ Design for flexibility
Advanced future-oriented analysis∙ Dynamic building performanceevaluation
∙ Stochastic modelling of futureoverheating risk
Source Georgiadou (2014), Georgiadou et al. (2012)
Future-Proofed Design of Low-Energy Housing Developments … 33
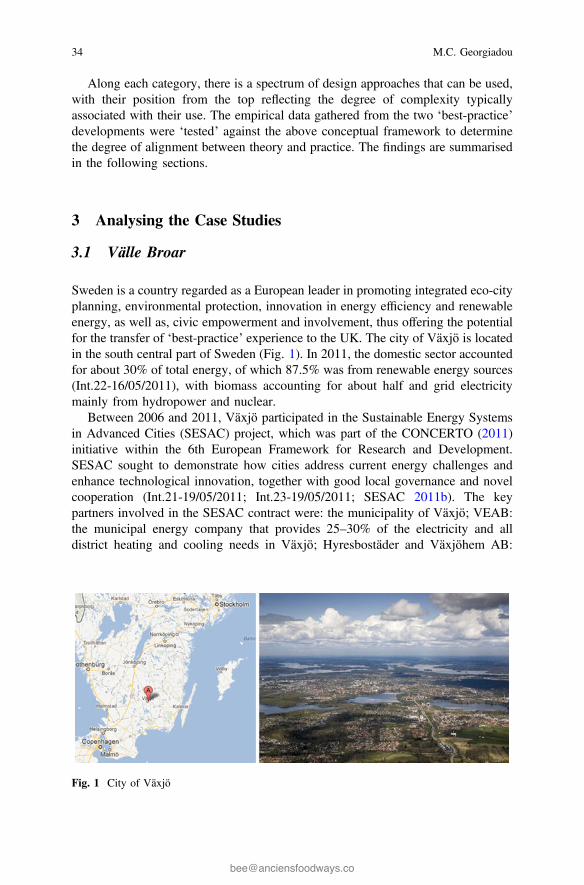
Along each category, there is a spectrum of design approaches that can be used,with their position from the top reflecting the degree of complexity typicallyassociated with their use. The empirical data gathered from the two ‘best-practice’developments were ‘tested’ against the above conceptual framework to determinethe degree of alignment between theory and practice. The findings are summarisedin the following sections.
3 Analysing the Case Studies
3.1 Välle Broar
Sweden is a country regarded as a European leader in promoting integrated eco-cityplanning, environmental protection, innovation in energy efficiency and renewableenergy, as well as, civic empowerment and involvement, thus offering the potentialfor the transfer of ‘best-practice’ experience to the UK. The city of Växjö is locatedin the south central part of Sweden (Fig. 1). In 2011, the domestic sector accountedfor about 30% of total energy, of which 87.5% was from renewable energy sources(Int.22-16/05/2011), with biomass accounting for about half and grid electricitymainly from hydropower and nuclear.
Between 2006 and 2011, Växjö participated in the Sustainable Energy Systemsin Advanced Cities (SESAC) project, which was part of the CONCERTO (2011)initiative within the 6th European Framework for Research and Development.SESAC sought to demonstrate how cities address current energy challenges andenhance technological innovation, together with good local governance and novelcooperation (Int.21-19/05/2011; Int.23-19/05/2011; SESAC 2011b). The keypartners involved in the SESAC contract were: the municipality of Växjö; VEAB:the municipal energy company that provides 25–30% of the electricity and alldistrict heating and cooling needs in Växjö; Hyresbostäder and Växjöhem AB:
Fig. 1 City of Växjö
34 M.C. Georgiadou
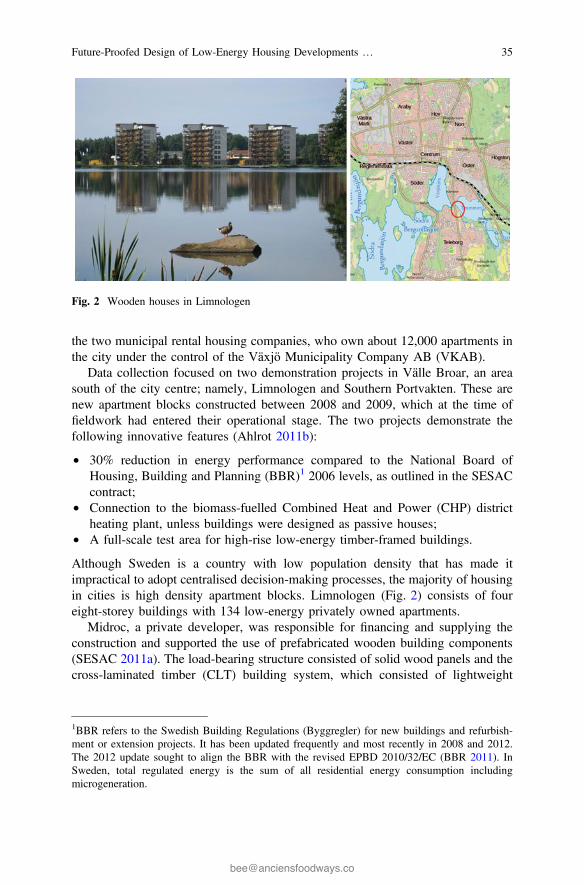
the two municipal rental housing companies, who own about 12,000 apartments inthe city under the control of the Växjö Municipality Company AB (VKAB).
Data collection focused on two demonstration projects in Välle Broar, an areasouth of the city centre; namely, Limnologen and Southern Portvakten. These arenew apartment blocks constructed between 2008 and 2009, which at the time offieldwork had entered their operational stage. The two projects demonstrate thefollowing innovative features (Ahlrot 2011b):
• 30% reduction in energy performance compared to the National Board ofHousing, Building and Planning (BBR)1 2006 levels, as outlined in the SESACcontract;
• Connection to the biomass-fuelled Combined Heat and Power (CHP) districtheating plant, unless buildings were designed as passive houses;
• A full-scale test area for high-rise low-energy timber-framed buildings.
Although Sweden is a country with low population density that has made itimpractical to adopt centralised decision-making processes, the majority of housingin cities is high density apartment blocks. Limnologen (Fig. 2) consists of foureight-storey buildings with 134 low-energy privately owned apartments.
Midroc, a private developer, was responsible for financing and supplying theconstruction and supported the use of prefabricated wooden building components(SESAC 2011a). The load-bearing structure consisted of solid wood panels and thecross-laminated timber (CLT) building system, which consisted of lightweight
Fig. 2 Wooden houses in Limnologen
1BBR refers to the Swedish Building Regulations (Byggregler) for new buildings and refurbish-ment or extension projects. It has been updated frequently and most recently in 2008 and 2012.The 2012 update sought to align the BBR with the revised EPBD 2010/32/EC (BBR 2011). InSweden, total regulated energy is the sum of all residential energy consumption includingmicrogeneration.
Future-Proofed Design of Low-Energy Housing Developments … 35
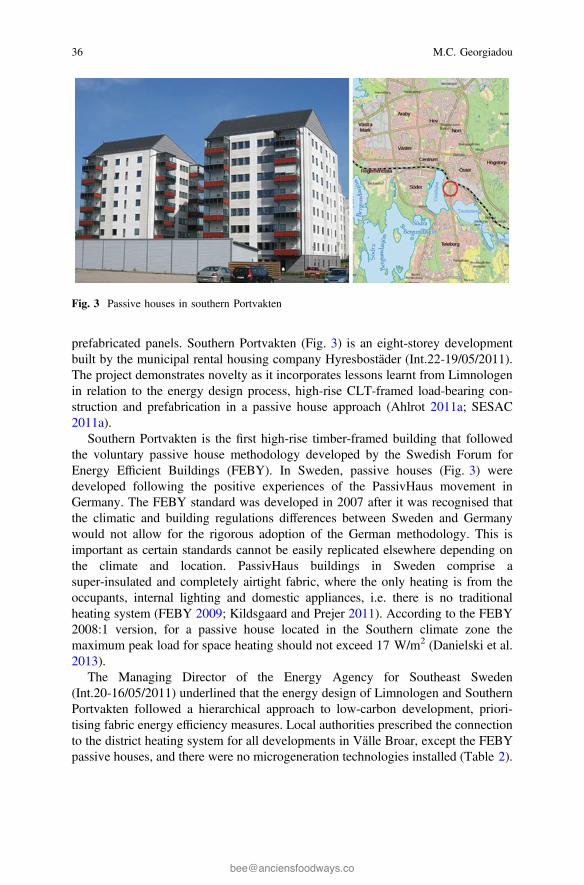
prefabricated panels. Southern Portvakten (Fig. 3) is an eight-storey developmentbuilt by the municipal rental housing company Hyresbostäder (Int.22-19/05/2011).The project demonstrates novelty as it incorporates lessons learnt from Limnologenin relation to the energy design process, high-rise CLT-framed load-bearing con-struction and prefabrication in a passive house approach (Ahlrot 2011a; SESAC2011a).
Southern Portvakten is the first high-rise timber-framed building that followedthe voluntary passive house methodology developed by the Swedish Forum forEnergy Efficient Buildings (FEBY). In Sweden, passive houses (Fig. 3) weredeveloped following the positive experiences of the PassivHaus movement inGermany. The FEBY standard was developed in 2007 after it was recognised thatthe climatic and building regulations differences between Sweden and Germanywould not allow for the rigorous adoption of the German methodology. This isimportant as certain standards cannot be easily replicated elsewhere depending onthe climate and location. PassivHaus buildings in Sweden comprise asuper-insulated and completely airtight fabric, where the only heating is from theoccupants, internal lighting and domestic appliances, i.e. there is no traditionalheating system (FEBY 2009; Kildsgaard and Prejer 2011). According to the FEBY2008:1 version, for a passive house located in the Southern climate zone themaximum peak load for space heating should not exceed 17 W/m2 (Danielski et al.2013).
The Managing Director of the Energy Agency for Southeast Sweden(Int.20-16/05/2011) underlined that the energy design of Limnologen and SouthernPortvakten followed a hierarchical approach to low-carbon development, priori-tising fabric energy efficiency measures. Local authorities prescribed the connectionto the district heating system for all developments in Välle Broar, except the FEBYpassive houses, and there were no microgeneration technologies installed (Table 2).
Fig. 3 Passive houses in southern Portvakten
36 M.C. Georgiadou
3.1.1 Välle Broar: Adopting Lifecycle Thinking
Operational Energy Performance
Detailed predictive studies entailing energy modelling of Limnologen and SouthernPortvakten were carried out at the design stage. In addition, a key focus area duringthe post-construction phase was to monitor systematically the actual energy per-formance of the two projects. This followed a two-stage process, namely(Int.18-18/05/2011; In.20-18/05/2011):
• conducting PCAs in 2009 to test apartments before and after construction toidentify weaknesses of the fabric efficiency and correct them before occupation;and
• carrying out POEs in 2010 after the first occupants moved into reveal dis-crepancies between the design and actual energy performance. For these studies,primary data was gathered from four Demand Side Management (DSM) systemsinstalled in four different apartment types, as described below.
Seventy-two apartments were set as reference, in which heating and DHW wereincorporated in the price of the rent as normal without any direct financial incentiveto save energy (Ehrlen 2011). With the objective of lowering occupants’ con-sumption patterns by 10%, four different DSM strategies were employed includinga combination of temperature sensors, displays, individual meters, and smartmeters, as follows:
Table 2 Energy design ofLimnologen and southernPortvakten
∙ Solar orientation with south-facing windows to capture asmuch solar gains and daylighting as possible, especiallyduring wintertime
∙ Super insulation, airtightness, and advanced triple glazing
∙ Timber-framed, load-bearing construction with prefabricatedbuilding components
∙ Connection to the biomass-fuelled district heating system forall heating and Domestic Hot Water (DHW) in Limnologen,and extra heating during periods of extreme cold in SouthernPortvakten
∙ A novel double-flux Flow Through heat exchanger(FTx) ventilation system
∙ Heat recovery on the wastewater systems in SouthernPortvakten
∙ Individual metering system with displays for space heating,DHW, and electricity
∙ A-labelled appliances in all apartments, specified in thecontract between the developer and local authorities
Ahlrot (2011a) and Int.10-16/05/2011
Future-Proofed Design of Low-Energy Housing Developments … 37
• Type 1 buildings have a measurement system with separate displays for elec-tricity, and DHW, showing both cost and energy consumption. The apartment isalso equipped with comfort metering, for which occupants are charged forheating based on the actual temperature in the apartment;
• Type 2 buildings have a measurement system with displays for all uses, i.e.electricity, heating, DHW, and cold water. Occupants can follow the electricityconsumption on EnergiKollen2 and consumption of heat, DHW, and cold wateron a display mounted in the apartment and pay for each energy use separately(individual billing);
• Type 4 buildings have a measurement system for electricity, heating, and DHW,and there is individual billing of energy uses. Residents can follow the elec-tricity consumption on EnergiKollen;
• Type 7 buildings have a measurement system and individual billing for elec-tricity and DHW. Residents can follow the electricity consumption onEnergiKollen and also the DHW consumption on a wall-mounted display.
Results showed electricity consumption patterns of 2–42% and DHW of 35–70%less than those of the reference apartments. Eriksson (2010) argues that the successof carrying out effective POEs was a result of:
• installing individual meters for heating, DHW, and smart meters for electricity;• charging occupants for their actual consumption instead of adding the energy
bills to the price of the rent (real-time billing);• setting up EnergiKollen and installing displays in the apartments to help
occupants understand their consumption patterns; and• the existence of municipal energy and housing companies (VEAB, VKAB) and the
overall SESAC umbrella, which ensured the provision of publicly available localstatistics. If private companies were involved, there would probably be restrictionson data transferability and sharing due to issues of data ownership and control.
Embodied Energy and Carbon
As Växjö is surrounded by abundant forests, the local forest industry could providetimber and wood waste, such as wood chips and sawdust in the construction andheating of buildings. A local timber promotion programme has also been in placefor the past 20 years (Ahlrot 2011a, b). Gustavsson et al. (2010) argue that as theoperational energy decreases, it becomes relatively more important to consider theother phases of a building’s lifecycle. The CLT-framed load-bearing constructionfeaturing in the two projects helped to reduce implicitly the embodied carbon from‘cradle-to-gate’ and from ‘cradle-to-cradle’, particularly when compared to concrete
2This is an interactive web-based service developed by the municipal energy company VEAB,where customers can log in and check energy costs and average electricity consumption overhourly, daily, monthly, or yearly periods.
38 M.C. Georgiadou
or steel (Fremrot 2011). The use of timber for construction is considered afuture-proofed design approach with the following benefits (Gustavsson et al. 2010;Int.8-10/05/2011; Int.16-17/05/2011):
• Wood is around 6% less energy- and carbon-intensive during production andassembly of prefabricated components, as compared to concrete, and also acts asa carbon sink (‘cradle-to-gate’);
• Even though most of the wooden components used were produced and trans-ported from Northern Sweden, they were prefabricated and lightweight leadingto simpler supply logistics, transport efficiency, and assembly compared toconventional onsite methods (‘cradle-to-gate’);
• Additional bio-energy can be obtained at the end of the lifecycle if wood-baseddemolition residues are reused and recovered as biofuels at the local CHP plant(‘cradle-to-cradle’).
Lifecycle Assessment
A comprehensive lifecycle assessment (LCA) was carried out by LinnaeusUniversity during operation to determine the primary energy use and carbonemissions of the wooden structure in Limnologen (Serrano 2009). The analysiscovered all lifecycle phases, namely: collection of raw materials; process of rawmaterials into building materials; construction/assembly; occupation/use;decommissioning/disassembly; and final disposal/waste management (Int.16-17/05/2011). The LCA followed a methodology discussed by Gustavsson et al. (2006),Gustavsson and Sathre (2006), and Sathre (2007). Swedish databases were used togather data on specific energy use for extraction, processing and transport ofmaterials, and forest production energy. The primary energy use was calculated bytaking into account the total material mass input (including construction waste), thespecific energy demand data for manufacturing and transportation, and the effi-ciencies of the fuel, conversion, and distribution systems. All calculations wereconducted under two scenarios: a 50-, and 100-year building lifespan. The energyuse for space heating and ventilation during the operational phase was estimated viathe ENORM, i.e. a standard Swedish energy modelling software, comparable to theUK Standard Assessment Procedure (SAP) methodology. The primary energy usedfor operation was calculated via the ENSYST modelling tool (Karlsson 2003).
3.1.2 Välle Broar: Accommodating Risks and Uncertainties
Adoption of Standards Beyond Statutory Minima
The SESAC contract required energy performance targets of around 30% lowerthan the BBR 2006 levels (Int.10-16/05/2011; Int.22-19/05/2011). This means thatthe SESAC requirements future-proofed the dwelling energy performance against
Future-Proofed Design of Low-Energy Housing Developments … 39
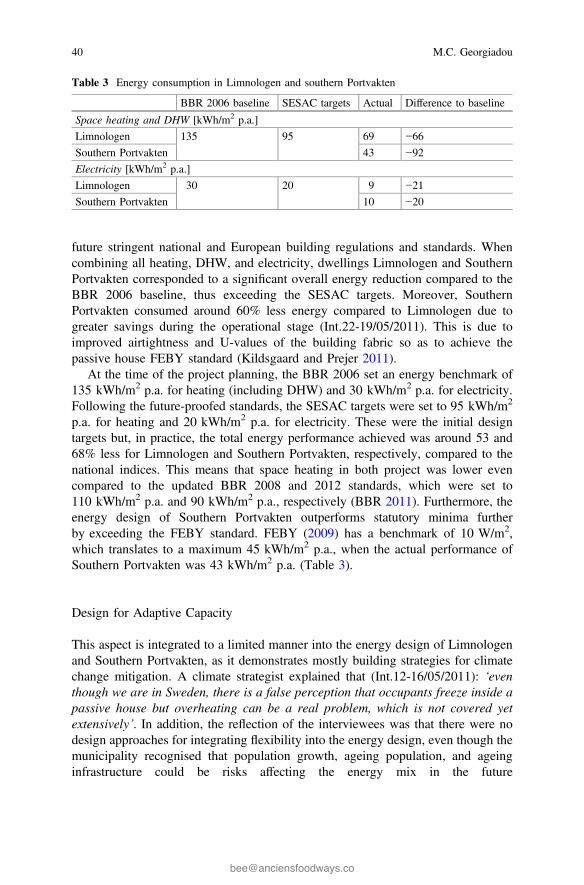
future stringent national and European building regulations and standards. Whencombining all heating, DHW, and electricity, dwellings Limnologen and SouthernPortvakten corresponded to a significant overall energy reduction compared to theBBR 2006 baseline, thus exceeding the SESAC targets. Moreover, SouthernPortvakten consumed around 60% less energy compared to Limnologen due togreater savings during the operational stage (Int.22-19/05/2011). This is due toimproved airtightness and U-values of the building fabric so as to achieve thepassive house FEBY standard (Kildsgaard and Prejer 2011).
At the time of the project planning, the BBR 2006 set an energy benchmark of135 kWh/m2 p.a. for heating (including DHW) and 30 kWh/m2 p.a. for electricity.Following the future-proofed standards, the SESAC targets were set to 95 kWh/m2
p.a. for heating and 20 kWh/m2 p.a. for electricity. These were the initial designtargets but, in practice, the total energy performance achieved was around 53 and68% less for Limnologen and Southern Portvakten, respectively, compared to thenational indices. This means that space heating in both project was lower evencompared to the updated BBR 2008 and 2012 standards, which were set to110 kWh/m2 p.a. and 90 kWh/m2 p.a., respectively (BBR 2011). Furthermore, theenergy design of Southern Portvakten outperforms statutory minima furtherby exceeding the FEBY standard. FEBY (2009) has a benchmark of 10 W/m2,which translates to a maximum 45 kWh/m2 p.a., when the actual performance ofSouthern Portvakten was 43 kWh/m2 p.a. (Table 3).
Design for Adaptive Capacity
This aspect is integrated to a limited manner into the energy design of Limnologenand Southern Portvakten, as it demonstrates mostly building strategies for climatechange mitigation. A climate strategist explained that (Int.12-16/05/2011): ‘eventhough we are in Sweden, there is a false perception that occupants freeze inside apassive house but overheating can be a real problem, which is not covered yetextensively’. In addition, the reflection of the interviewees was that there were nodesign approaches for integrating flexibility into the energy design, even though themunicipality recognised that population growth, ageing population, and ageinginfrastructure could be risks affecting the energy mix in the future
Table 3 Energy consumption in Limnologen and southern Portvakten
BBR 2006 baseline SESAC targets Actual Difference to baseline
Space heating and DHW [kWh/m2 p.a.]
Limnologen 135 95 69 −66
Southern Portvakten 43 −92
Electricity [kWh/m2 p.a.]
Limnologen 30 20 9 −21
Southern Portvakten 10 −20
40 M.C. Georgiadou
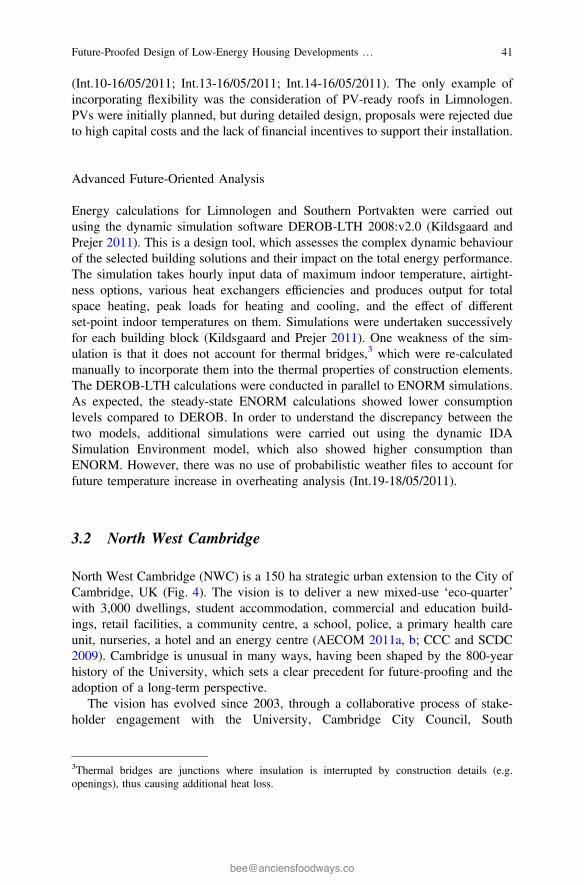
(Int.10-16/05/2011; Int.13-16/05/2011; Int.14-16/05/2011). The only example ofincorporating flexibility was the consideration of PV-ready roofs in Limnologen.PVs were initially planned, but during detailed design, proposals were rejected dueto high capital costs and the lack of financial incentives to support their installation.
Advanced Future-Oriented Analysis
Energy calculations for Limnologen and Southern Portvakten were carried outusing the dynamic simulation software DEROB-LTH 2008:v2.0 (Kildsgaard andPrejer 2011). This is a design tool, which assesses the complex dynamic behaviourof the selected building solutions and their impact on the total energy performance.The simulation takes hourly input data of maximum indoor temperature, airtight-ness options, various heat exchangers efficiencies and produces output for totalspace heating, peak loads for heating and cooling, and the effect of differentset-point indoor temperatures on them. Simulations were undertaken successivelyfor each building block (Kildsgaard and Prejer 2011). One weakness of the sim-ulation is that it does not account for thermal bridges,3 which were re-calculatedmanually to incorporate them into the thermal properties of construction elements.The DEROB-LTH calculations were conducted in parallel to ENORM simulations.As expected, the steady-state ENORM calculations showed lower consumptionlevels compared to DEROB. In order to understand the discrepancy between thetwo models, additional simulations were carried out using the dynamic IDASimulation Environment model, which also showed higher consumption thanENORM. However, there was no use of probabilistic weather files to account forfuture temperature increase in overheating analysis (Int.19-18/05/2011).
3.2 North West Cambridge
North West Cambridge (NWC) is a 150 ha strategic urban extension to the City ofCambridge, UK (Fig. 4). The vision is to deliver a new mixed-use ‘eco-quarter’with 3,000 dwellings, student accommodation, commercial and education build-ings, retail facilities, a community centre, a school, police, a primary health careunit, nurseries, a hotel and an energy centre (AECOM 2011a, b; CCC and SCDC2009). Cambridge is unusual in many ways, having been shaped by the 800-yearhistory of the University, which sets a clear precedent for future-proofing and theadoption of a long-term perspective.
The vision has evolved since 2003, through a collaborative process of stake-holder engagement with the University, Cambridge City Council, South
3Thermal bridges are junctions where insulation is interrupted by construction details (e.g.openings), thus causing additional heat loss.
Future-Proofed Design of Low-Energy Housing Developments … 41
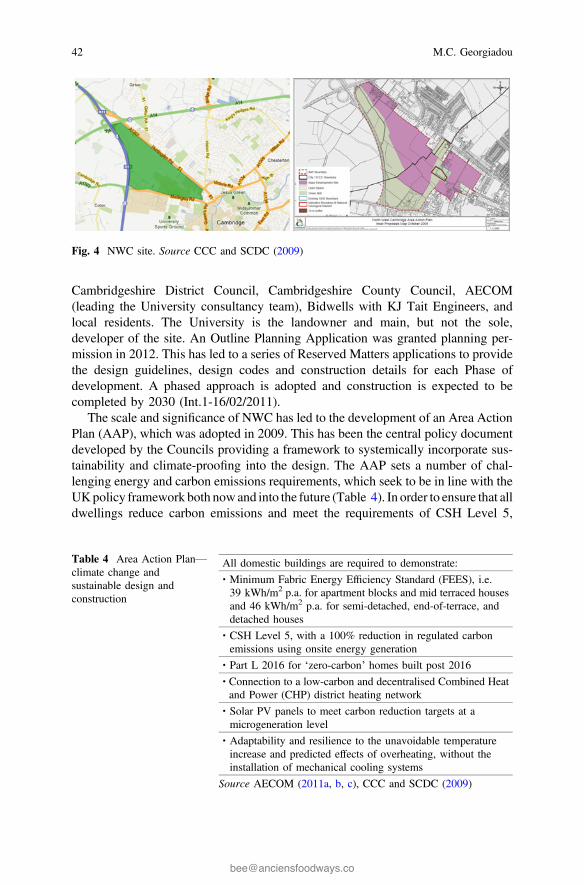
Cambridgeshire District Council, Cambridgeshire County Council, AECOM(leading the University consultancy team), Bidwells with KJ Tait Engineers, andlocal residents. The University is the landowner and main, but not the sole,developer of the site. An Outline Planning Application was granted planning per-mission in 2012. This has led to a series of Reserved Matters applications to providethe design guidelines, design codes and construction details for each Phase ofdevelopment. A phased approach is adopted and construction is expected to becompleted by 2030 (Int.1-16/02/2011).
The scale and significance of NWC has led to the development of an Area ActionPlan (AAP), which was adopted in 2009. This has been the central policy documentdeveloped by the Councils providing a framework to systemically incorporate sus-tainability and climate-proofing into the design. The AAP sets a number of chal-lenging energy and carbon emissions requirements, which seek to be in line with theUKpolicy framework both nowand into the future (Table 4). In order to ensure that alldwellings reduce carbon emissions and meet the requirements of CSH Level 5,
Fig. 4 NWC site. Source CCC and SCDC (2009)
Table 4 Area Action Plan—climate change andsustainable design andconstruction
All domestic buildings are required to demonstrate:
∙ Minimum Fabric Energy Efficiency Standard (FEES), i.e.39 kWh/m2 p.a. for apartment blocks and mid terraced housesand 46 kWh/m2 p.a. for semi-detached, end-of-terrace, anddetached houses
∙ CSH Level 5, with a 100% reduction in regulated carbonemissions using onsite energy generation
∙ Part L 2016 for ‘zero-carbon’ homes built post 2016
∙ Connection to a low-carbon and decentralised Combined Heatand Power (CHP) district heating network
∙ Solar PV panels to meet carbon reduction targets at amicrogeneration level
∙ Adaptability and resilience to the unavoidable temperatureincrease and predicted effects of overheating, without theinstallation of mechanical cooling systems
Source AECOM (2011a, b, c), CCC and SCDC (2009)
42 M.C. Georgiadou
AECOM has adopted a ‘fabric first’ approach as proposed by the Zero Carbon Hub.Building solutions that aremost likely to yield the greatest carbon emissions reductionvia maximising energy efficiency are pursued first, followed by the use of controlsystems and low- or zero-carbon technologies (ZCH 2009, 2010, 2011).
3.2.1 NWC: Adopting Lifecycle Thinking
Operational Energy Performance
The energy assessment in NWC focuses predominantly on the operational phase.The consultants modelled the energy consumption of three broad dwelling types(flats, semi-detached and detached properties), if built to the baseline Part L 2006and FEES. The total energy consumption of dwellings is expected to be around 85–113 kWh/m2 p.a. depending on the type. The University is committed to evaluatesystematically the building performance by conducting PCAs and POEs whenresidents will move into the dwellings (AECOM 2011a; Int.3-23/03/2012;Int.7-23/03/2012). Since the development will be ongoing, it is expected that thelessons learnt will inform the subsequent phases of NWC. Methods for conductingPCA studies will include thermographic imaging, co-heating tests and detailedmonitoring of thermal bridging (Int.4-03/03/2011; Int.5-03/03/2011). POE studieswill include environmental monitoring (temperature, humidity and indoor airquality sensors), electricity monitoring (whole house, circuit and appliance meters),energy monitoring associated with space and water heating and occupant surveys(Int.4-03/03/2011). Also, data from smart meters may be linked to the communityintranet to allow for centralised recording and monitoring of energy use (AECOM2011a).
Embodied Energy and Carbon
An Associate Director from AECOM (Int.4-03/03/2011) justified this prioritisationby arguing that: ‘the proportion of embodied energy is really small compared to thedetriment of the running costs, which is more significant’. Standard sustainabilitymeasures have reduced indirectly the embodied carbon, such as (AECOM 2011c, d,e):
• selection of suppliers with environmental management schemes in place tosupply certified materials based on international standards (‘cradle-to-gate’);
• the use of Modern Methods of Construction (MMCs), such as off-site manu-facturing to reduce construction waste (‘cradle-to-gate’);
• the AAP requirement for the supply of sustainable materials procured locally(‘cradle-to-gate’);
Future-Proofed Design of Low-Energy Housing Developments … 43
• use of A-rated materials based on the BRE Green Guide4 to ensure minimumenvironmental impact (‘cradle-to-grave’); and
• strategies for deconstruction that favour re-use and recycling over demolition,where possible (‘cradle-to-cradle’).
Lifecycle Assessment
Overall, buildings in NWC are designed for a lifespan of 60 years and AECOMwas briefed to consider LCA as a decision-support tool. The consultants argued thatwhere feasible, LCA might be conducted for the most commonly used constructioncomponents in the next project phases (Int.6-03/03/2012).
3.2.2 NWC: Accommodating Risks and Uncertainties
Adoption of Standards Beyond Statutory Minima
The AAP requires housing to surpass Part L at each construction period. Sinceconstruction was estimated to begin around 2013–2014, the target was to achieveCSH Level 5 from the outset for all domestic buildings, thus being one step aheadof the national trajectory, which at that time mandated Level 4 (Table 5). This was—at that time—quite ambitious given that the UK policy has currently abandonedthe 2016 zero-carbon target and abolished the CSH. There is also potential for someof the detached houses to be future-proofed by adopting the German PassivHausstandard (AECOM 2011a).
Design for Adaptive Capacity
NWC is one of the first sites in the UK where the local planning policyacknowledges the imperative for adapting the design to the adverse effects ofclimate change (Int.2-18/02/2011). Buildings will need to cope with future pre-dicted higher temperatures, which has led to a systematic approach to addressoverheating in development proposals. In particular, the AAP suggests that (CCCand SCDC 2009, p. 37): “New development will need to be resilient to overheatingwithout active cooling systems. There is much that can be achieved through passive
4The Green Guide to Specification is a tool developed by BRE to assess the environmental impact(in kg CO2 e/m2) of more than 1500 building products over a 60-year period. The Guide is anembodied carbon accounting tool from ‘cradle-to-grave’ and includes emissions from manufac-turing, initial construction, maintenance and repair to dismantling, demolition, and waste man-agement at the end-of-life stages (Anderson et al. 2009; BRE 2007, 2008; Ekundayo et al. 2012).
44 M.C. Georgiadou
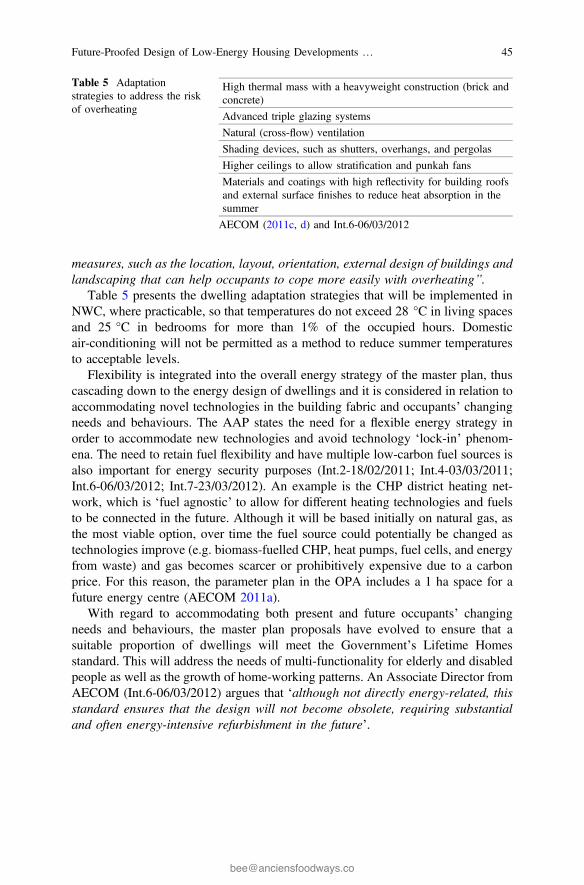
measures, such as the location, layout, orientation, external design of buildings andlandscaping that can help occupants to cope more easily with overheating”.
Table 5 presents the dwelling adaptation strategies that will be implemented inNWC, where practicable, so that temperatures do not exceed 28 °C in living spacesand 25 °C in bedrooms for more than 1% of the occupied hours. Domesticair-conditioning will not be permitted as a method to reduce summer temperaturesto acceptable levels.
Flexibility is integrated into the overall energy strategy of the master plan, thuscascading down to the energy design of dwellings and it is considered in relation toaccommodating novel technologies in the building fabric and occupants’ changingneeds and behaviours. The AAP states the need for a flexible energy strategy inorder to accommodate new technologies and avoid technology ‘lock-in’ phenom-ena. The need to retain fuel flexibility and have multiple low-carbon fuel sources isalso important for energy security purposes (Int.2-18/02/2011; Int.4-03/03/2011;Int.6-06/03/2012; Int.7-23/03/2012). An example is the CHP district heating net-work, which is ‘fuel agnostic’ to allow for different heating technologies and fuelsto be connected in the future. Although it will be based initially on natural gas, asthe most viable option, over time the fuel source could potentially be changed astechnologies improve (e.g. biomass-fuelled CHP, heat pumps, fuel cells, and energyfrom waste) and gas becomes scarcer or prohibitively expensive due to a carbonprice. For this reason, the parameter plan in the OPA includes a 1 ha space for afuture energy centre (AECOM 2011a).
With regard to accommodating both present and future occupants’ changingneeds and behaviours, the master plan proposals have evolved to ensure that asuitable proportion of dwellings will meet the Government’s Lifetime Homesstandard. This will address the needs of multi-functionality for elderly and disabledpeople as well as the growth of home-working patterns. An Associate Director fromAECOM (Int.6-06/03/2012) argues that ‘although not directly energy-related, thisstandard ensures that the design will not become obsolete, requiring substantialand often energy-intensive refurbishment in the future’.
Table 5 Adaptationstrategies to address the riskof overheating
High thermal mass with a heavyweight construction (brick andconcrete)
Advanced triple glazing systems
Natural (cross-flow) ventilation
Shading devices, such as shutters, overhangs, and pergolas
Higher ceilings to allow stratification and punkah fans
Materials and coatings with high reflectivity for building roofsand external surface finishes to reduce heat absorption in thesummer
AECOM (2011c, d) and Int.6-06/03/2012
Future-Proofed Design of Low-Energy Housing Developments … 45
Advanced Future-Oriented Analysis
There has been no systematic use of dynamic energy modelling to calculate the totalenergy consumption due to the cost and lack of relevant data required for such models(Int.6-06/03/2012). AECOM used the latest version of SAP (2010) for carrying outbuilding performance evaluation for the market and key worker housing units, whichis a steady-state tool incorporating various assumptions and leading to miscalculationof energy loads. However, AECOMundertook stochastic analysis of overheating riskso that dwellings are designed tomeet the comfort criteria predicted for 2050 and 2080temperatures under climate change (Int.6-03/03/2011; Int.7-23/03/2012). This pre-sents a shift away from current deterministic overheating analysis required by theBuilding Regulations (AECOM 2011a). Based on the UK Climate Projections(UKCP09 2010) 2050 medium and high scenarios, PROMETHEUS weather fileshave been incorporated into the IES VE (dynamic) modelling tool to assess naturalventilation strategies and inform the overheating analysis on indicative dwellingenergy design (Int.6-03/03/2011). This is an established algorithm to account forstochastic overheating analysis developed by the University of Exeter (Eames et al.,2011; Gul et al. 2012; Jenkins et al. 2011).
4 Cross-Case Analysis and Discussion
The overarching driver for future-proofed energy design differs in the twocase-studies. In NWC, it is the University’s vision to meet its long-term needsregarding key worker housing, together with the Council’s target for housingprovision and delivery of a sustainable urban development. In Sweden, the driverwas the SESAC project aiming at demonstrating European ‘best-practice’ guide-lines for sustainable local energy management, together with the objective toprovide a decision-support framework for deploying wood housing technolo-gies and demonstrating the market potential for wooden multi-storey apartmentblocks.
The case study research has revealed that the building professionals involved inthe two projects:
• endorse that future-proofing should be considered at the (very) early designstages;
• seek to design dwellings for long lifecycles (between 60 to 100 years); hence,demolition is undesirable; and
• understand that future-proofing the energy design entails considering not onlyfabric efficiency, but also accounting for occupants’ behaviour.
Evidence shows that future-proofing is still in its infancy with widespread experi-mentation in design approaches even for ‘best-practice’ schemes. None of theexamined housing developments comprehensively future-proofed the energy designand the two cases demonstrate patchy coverage of the conceptual framework,
46 M.C. Georgiadou
which, in fact, is ahead of actual practice. In fact, in the UK future-proofing istranslated mostly into design approaches that accommodate risks and uncertainties,whereas in the Swedish it is in the adoption of lifecycle thinking. Furthermore, thereis no design approach identified in the four cases that is not covered by the con-ceptual framework.
The cross-case analysis reveals that there is a strong focus on operational energy,as it is the phase that contributes the most to total energy consumption. There areembodied energy considerations in both cases and use of LCA for the woodenbuilding structure in Limnologen. However, none of the cases demonstrates com-prehensive use of an established LCA tool at a building level, which signals theneed for future work in the field. With regard to accommodating risks and uncer-tainties, both cases adopted dwelling energy performance standards beyond statu-tory minima and these future-proofed requirements derive from local planningpolicies. Design for adaptive capacity is not equally addressed between the two casestudies. NWC is among the first sites in the UK that have developed local policies(AAP) that require explicitly ‘climate-proofing’. Evidence shows that designing foradaptation is not yet seen as a priority in Välle Broar, even though local authoritieshave a strong tradition in environmental planning and climate change awareness.
This section explores the design approaches that can be transferred more widelyfrom the two cases to new conventional housing developments in the UK in order tofuture-proof their energy design. It should be underlined, however, that transfer-ability relates to the design approaches that informed decision-making not the actualbuilding solutions (e.g. choice of materials, structural system, or heating strategy).There are two types of transferable findings; namely, those transferred from a singlecase study; and those arising from the cross-country comparison. The cross-caseanalysis reveals that there is a strong alignment between the unique case- orcountry-specific drivers and the identified future-proofed design approaches. Theseshould be examined prior to considering wider application and transferability of theresearch findings. Most of them exist due to the two cases representing‘best-practice’ developments. Furthermore, the unique governance and institutionalcharacteristics present at both national and local levels in the UK and Sweden,respectively, demonstrate that the two societies operate differently when it comes tolocal planning, housing provision, construction practices, and energy consumption.Table 6 presents a summary of the unique context-specific drivers that have led tothe adoption of different future-proofed design approaches.
4.1 The General Planning and Policy Context
The wider UK energy policy prioritises resilience and flexibility for experimenta-tion and innovation in sustainable energy plans and design decision-making; while,providing energy security and reliable services (Chaudry et al. 2009; Greenwood2010, 2012). This is why NWC examines issues related to climate change, ageingpopulation, energy-intensive behaviours, and new working and living patterns.
Future-Proofed Design of Low-Energy Housing Developments … 47
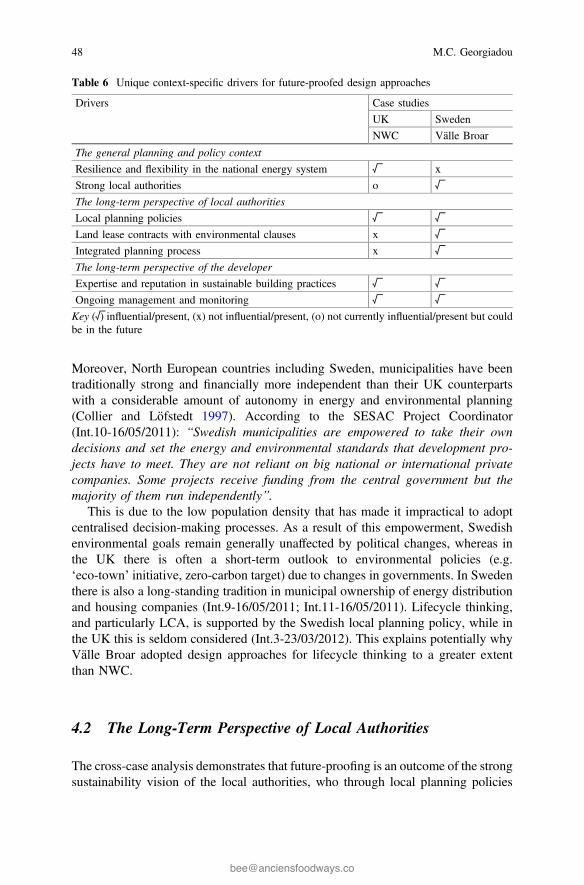
Moreover, North European countries including Sweden, municipalities have beentraditionally strong and financially more independent than their UK counterpartswith a considerable amount of autonomy in energy and environmental planning(Collier and Löfstedt 1997). According to the SESAC Project Coordinator(Int.10-16/05/2011): “Swedish municipalities are empowered to take their owndecisions and set the energy and environmental standards that development pro-jects have to meet. They are not reliant on big national or international privatecompanies. Some projects receive funding from the central government but themajority of them run independently”.
This is due to the low population density that has made it impractical to adoptcentralised decision-making processes. As a result of this empowerment, Swedishenvironmental goals remain generally unaffected by political changes, whereas inthe UK there is often a short-term outlook to environmental policies (e.g.‘eco-town’ initiative, zero-carbon target) due to changes in governments. In Swedenthere is also a long-standing tradition in municipal ownership of energy distributionand housing companies (Int.9-16/05/2011; Int.11-16/05/2011). Lifecycle thinking,and particularly LCA, is supported by the Swedish local planning policy, while inthe UK this is seldom considered (Int.3-23/03/2012). This explains potentially whyVälle Broar adopted design approaches for lifecycle thinking to a greater extentthan NWC.
4.2 The Long-Term Perspective of Local Authorities
The cross-case analysis demonstrates that future-proofing is an outcome of the strongsustainability vision of the local authorities, who through local planning policies
Table 6 Unique context-specific drivers for future-proofed design approaches
Drivers Case studies
UK Sweden
NWC Välle Broar
The general planning and policy context
Resilience and flexibility in the national energy system √ x
Strong local authorities o √
The long-term perspective of local authorities
Local planning policies √ √
Land lease contracts with environmental clauses x √
Integrated planning process x √
The long-term perspective of the developer
Expertise and reputation in sustainable building practices √ √
Ongoing management and monitoring √ √
Key (√) influential/present, (x) not influential/present, (o) not currently influential/present but couldbe in the future
48 M.C. Georgiadou
mandated the adoption of standards beyond national legislation, i.e. AAP for NWCand the SESAC project the City’s Environmental Programme in the case of VälleBroar. Another common aspect in Sweden are the Quality Programmes, i.e. leasecontracts through which municipally owned land is sold via a competitive biddingprocesswith environmental clauses that prospective (municipal or private) developersneed to meet. The Quality Programme in Välle Broar specified, among others, thelevels of energy efficiency, such asU-values, total energy performance (kWh/m2 p.a.),and connection to the district heating system (Ahlrot 2011b; Int.12-16/05/2011;Int.13-16/05/2011). The Managing Director of the Energy Agency for SoutheastSweden argued that (Int.11-16/05/2011): “The power is in owning the land and aQuality Programme is a means for driving new market conditions and educating thelocal construction industry […] it is much easier to apply sustainability requirementsin publicly owned land, which has explicitly a long-term interest […] but with thetendering processes and contractual agreements of the Quality Programmes we canmake developers comply with specific rules”.
Evidence from Välle Broar also reveals that Sweden is a leader in integratedplanning, which is a driver for future-proofed design. There is a novel cross-sectoralorganisational structure established by local authorities at two levels: within localauthorities (also called ‘the network of planners’), which refers to bringing togetherplanners from four different tiers to work on the same development phase; andbetween local authorities and the developer, contractor, and/or design teams viathe establishment of temporary interdisciplinary teams, thus facilitating a shift froma narrow focus towards integration of design themes. Integrated planning offers thefirst essential step for future-proofed design, by setting a clear and commonlyagreed vision of a low-energy home (Int.11-16/05/2011): “With the integratedplanning process you develop the soul of the project in the beginning and thisraises commitment and engagement between city officers, building companies,housing associations, architects, technical staff, and even the end-users. The initialdesign statement in Välle Broar was the most important thing, as it is very difficultto go back and change the building strategies”.
4.3 The Long-Term Perspective of the Developer
Evident in both cases is the developer’s experience in sustainable building, com-mitment to corporate social responsibility, and desire to enhance brand name andreputation. In addition, one common aspect between the two cases is the long-terminterest of the developers, who unlike speculative ones take a long-term view of thedevelopment regardless of whether they are private or municipal. In NWC, theUniversity is different from commercial developers in that it intends to retainownership and control over the long-term. An interviewee argued that(Int.6-06/03/2012): ‘the University is interested in design quality over thelong-term, unlike a typical developer who wants to dispose of or sell the site asquickly as possible […] it is almost like building on publicly-owned land’ . Usually
Future-Proofed Design of Low-Energy Housing Developments … 49
in the UK, sites of such large scale are under multiple and complex ownershipstructures, which may result in conflicting interests. The long-term ownership alsooffers the opportunity to recover the initial investment through lower operation andmaintenance costs.
4.4 Transferability and Application of Research Findings
The research has demonstrated that unique governance and institutional charac-teristics have influenced strongly the adoption of future-proofed design approachesin the two case-studies. Given the absence of the above context-specific drivers itwould be unreasonable to expect to replicate the future-proofed approaches inmainstream UK construction or elsewhere. In addition, many of the future-proofeddesign approaches explored in this research are currently not scalable due to thehigh cost of the studies, inadequate data, lack of experience, and shortage ofspecialised-resources required for their use. For instance, embodied energy isincreasingly considered in design decision-making to foster a whole life approachto carbon emissions assessment. Although lifecycle thinking is conceptually simple,it is challenging to be applied more rigorously to conventional practice due to datarequirements and high costs. LCA studies are expected to be applied mostly atbuilding material, construction component, or energy systems level rather than thebuilding or district scales.
Apart from new construction, which was the scope of this research, there issignificant potential to apply the transferable design approaches to retrofit projects.Arguably, transforming the existing housing stock should be central to any nationaldecarbonisation strategy as around 75–85% of buildings in use today are expectedto be standing in 2050 and new buildings comprise a relative small share. If theconstruction industry is to successfully address the ambitious 80% carbon reductiontarget by 2050, then it will be imperative that actions address existing dwellings.This entails a detailed understanding of how energy retrofit projects work inpractice and the barriers to driving low-energy behaviours. There is also significantpotential to apply the proposed conceptual framework in the emerging context ofstandardising PCA and POE studies. The examples of the Building InformationModelling (BIM) and Soft Landings frameworks in the UK are a starting point in aneffort to address the ‘performance gap’5 and ensure design quality in mainstreamconstruction (Leaman et al. 2010; Pelsmakers 2012; UBT 2009).
5The difference between anticipated (‘as-designed’) and actual (‘as built’) performance.
50 M.C. Georgiadou
5 Conclusions
The research has shown that a future-proofed design seeks to ensure the delivery ofresilient and adaptable low-energy buildings with the potential for sustainabilitybenefits and cost savings over the long-term. If future-proofing is viewed strate-gically during the design process, it can bring added-value, as anticipating change iscost-effective. There are three key reasons for proactively integratingfuture-proofing into the energy design of dwellings from the outset rather thanadding it as an extra later on; namely:
• anticipating future (increasingly stringent) policy requirements (environmentallegislation, building regulations and standards) related to building energyperformance;
• the need to adapt to a changing climate and, in particular, the risk of overheatingdue to predicted higher temperatures; and
• the unique features of the domestic stock, which result in long lifecycles.
The research has found that although the case-studies follow a similar approach tothe coverage of SD issues, in the UK case, future-proofing is translated into designapproaches that accommodate risks and uncertainties; whereas in Sweden it is theadoption of lifecycle thinking. Despite the fact that future-proofing is a desirabledesign ambition, the cross-case analysis revealed that future-proofing is consideredto be still a challenging task even for ‘best-practice’ schemes.
The proposed conceptual framework represents a foundation for further researchthrough the development of practical guidelines and initiatives to encouragefuture-proofing within industry practices. Many aspects are yet to be comprehen-sively defined. Time, costs and regulations are still the dominant considerations inthe energy design of housing developments; however, long lifecycles, risks anduncertainties are associated with energy consumption in buildings. In this study, thefocus has been on new housing developments, i.e. residential stock at acommunity-level. The research findings, however, have implications for both newand refurbished projects, which reach far beyond housing developments to thewider UK policy landscape and construction industry.
Further research should reveal the potential for applying the conceptual frame-work in the decision-support context for the energy design of other types, such aslow-energy commercial, public, educational, or industrial buildings and large in-frastructure projects. In addition, the research, though carried out with a holisticview of sustainability, has concentrated on only one aspect, i.e. energy. A systemsapproach to sustainability in the built environment requires consideration of, interalia, energy, water, sewage or wastewater, and waste, as there is the potential forfuture-proofing to be applied more widely to cover these other aspects. Any furtherresearch conducted would also benefit greatly from the analysis of additional‘best-practice’ housing developments. A spectrum of cases could be selected fromdifferent regions in the UK or Sweden or other countries which are also consideredto be leaders in sustainability, energy efficiency, and low-carbon development, such
Future-Proofed Design of Low-Energy Housing Developments … 51
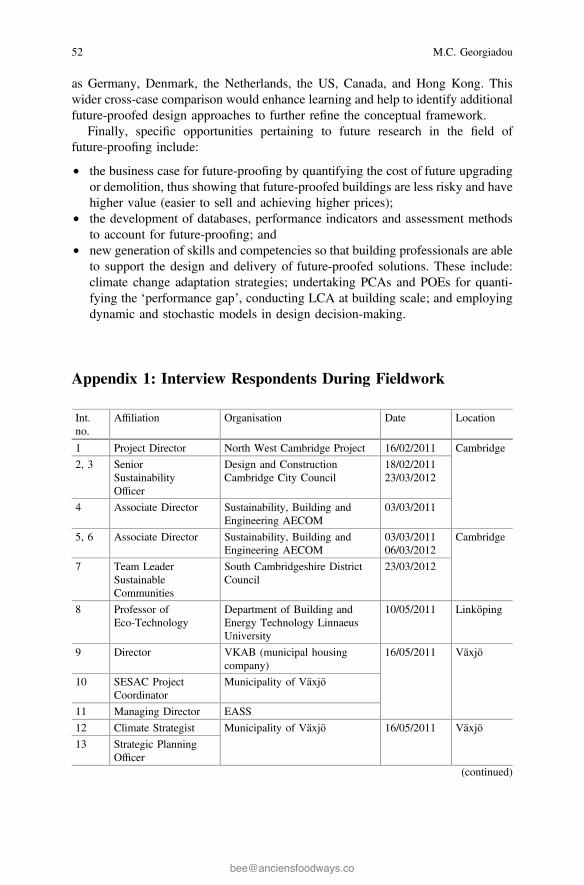
as Germany, Denmark, the Netherlands, the US, Canada, and Hong Kong. Thiswider cross-case comparison would enhance learning and help to identify additionalfuture-proofed design approaches to further refine the conceptual framework.
Finally, specific opportunities pertaining to future research in the field offuture-proofing include:
• the business case for future-proofing by quantifying the cost of future upgradingor demolition, thus showing that future-proofed buildings are less risky and havehigher value (easier to sell and achieving higher prices);
• the development of databases, performance indicators and assessment methodsto account for future-proofing; and
• new generation of skills and competencies so that building professionals are ableto support the design and delivery of future-proofed solutions. These include:climate change adaptation strategies; undertaking PCAs and POEs for quanti-fying the ‘performance gap’, conducting LCA at building scale; and employingdynamic and stochastic models in design decision-making.
Appendix 1: Interview Respondents During Fieldwork
Int.no.
Affiliation Organisation Date Location
1 Project Director North West Cambridge Project 16/02/2011 Cambridge
2, 3 SeniorSustainabilityOfficer
Design and ConstructionCambridge City Council
18/02/201123/03/2012
4 Associate Director Sustainability, Building andEngineering AECOM
03/03/2011
5, 6 Associate Director Sustainability, Building andEngineering AECOM
03/03/201106/03/2012
Cambridge
7 Team LeaderSustainableCommunities
South Cambridgeshire DistrictCouncil
23/03/2012
8 Professor ofEco-Technology
Department of Building andEnergy Technology LinnaeusUniversity
10/05/2011 Linköping
9 Director VKAB (municipal housingcompany)
16/05/2011 Växjö
10 SESAC ProjectCoordinator
Municipality of Växjö
11 Managing Director EASS
12 Climate Strategist Municipality of Växjö 16/05/2011 Växjö
13 Strategic PlanningOfficer
(continued)
52 M.C. Georgiadou
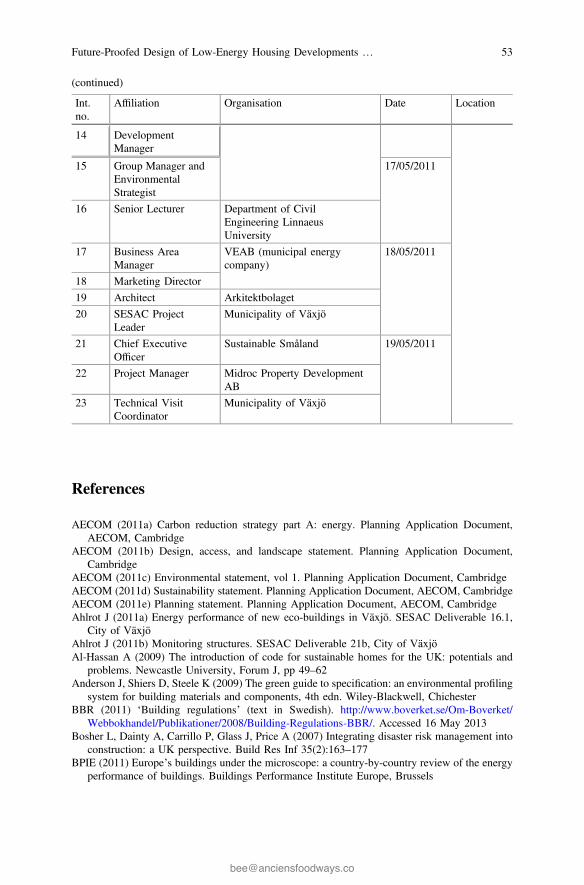
(continued)
Int.no.
Affiliation Organisation Date Location
14 DevelopmentManager
15 Group Manager andEnvironmentalStrategist
17/05/2011
16 Senior Lecturer Department of CivilEngineering LinnaeusUniversity
17 Business AreaManager
VEAB (municipal energycompany)
18/05/2011
18 Marketing Director
19 Architect Arkitektbolaget
20 SESAC ProjectLeader
Municipality of Växjö
21 Chief ExecutiveOfficer
Sustainable Småland 19/05/2011
22 Project Manager Midroc Property DevelopmentAB
23 Technical VisitCoordinator
Municipality of Växjö
References
AECOM (2011a) Carbon reduction strategy part A: energy. Planning Application Document,AECOM, Cambridge
AECOM (2011b) Design, access, and landscape statement. Planning Application Document,Cambridge
AECOM (2011c) Environmental statement, vol 1. Planning Application Document, CambridgeAECOM (2011d) Sustainability statement. Planning Application Document, AECOM, CambridgeAECOM (2011e) Planning statement. Planning Application Document, AECOM, CambridgeAhlrot J (2011a) Energy performance of new eco-buildings in Växjö. SESAC Deliverable 16.1,
City of VäxjöAhlrot J (2011b) Monitoring structures. SESAC Deliverable 21b, City of VäxjöAl-Hassan A (2009) The introduction of code for sustainable homes for the UK: potentials and
problems. Newcastle University, Forum J, pp 49–62Anderson J, Shiers D, Steele K (2009) The green guide to specification: an environmental profiling
system for building materials and components, 4th edn. Wiley-Blackwell, ChichesterBBR (2011) ‘Building regulations’ (text in Swedish). http://www.boverket.se/Om-Boverket/
Webbokhandel/Publikationer/2008/Building-Regulations-BBR/. Accessed 16 May 2013Bosher L, Dainty A, Carrillo P, Glass J, Price A (2007) Integrating disaster risk management into
construction: a UK perspective. Build Res Inf 35(2):163–177BPIE (2011) Europe’s buildings under the microscope: a country-by-country review of the energy
performance of buildings. Buildings Performance Institute Europe, Brussels
Future-Proofed Design of Low-Energy Housing Developments … 53
BRE (2007) Methodology for environmental profiles of construction products—product categoryrules for type III environmental product declaration of construction products. BuildingResearch Establishment, Watford
BRE (2008) Background to the green guide to specification. Building Research Establishment.http://www.bre.co.uk/greenguide/page.jsp?id=2069. Accessed 05 Apr 2012
CCC (2008) About us. Committee on climate change. http://www.theccc.org.uk. Accessed 03 Aug2012
CCC and SCDC (2009) North West Cambridge Area Action Plan, Local DevelopmentFramework, Development Plan Document, Cambridge City Council and SouthCambridgeshire District Council
Chaudry M, Ekins P, Ramachandran K, Shakoor A, Skea J, Strbac G, Wang X, Whitaker J (2009)Building a resilient UK energy system. Working paper under the UKERC Energy 2050 project
Collier U, Löfstedt R (1997) Think globally, act locally? Local climate change and energy policiesin Sweden and the UK. Glob Environ Change 7(1):25–40
CONCERTO (2011) Energy solutions for smart cities and communities. http://concerto.eu/concerto/. Accessed 31 Aug 2012
Danielski I, Svensson M, Fröling M (2013) Adaption of the passive house concept in northernSweden—a case study of performance. In: Proceedings of the Passivhus Norden 2013conference, Göteborg, Sweden
DCLG (2010) Code for sustainable homes: technical guide, Department of Communities andLocal Government, London
DCLG (2012) 2012 consultation on changes to the building regulations in England—summary ofresponses. Department of Communities and Local Government, London
DEFRA (2007) Draft climate change bill. Department for Environment, Food and Rural Affairs,London
EC (2010) Directive 2010/31/EU of the European Parliament and of the Council on the EnergyPerformance of Buildings (recast), European Commission DG Energy, Brussels
Ehrlen L (2011) Demand side management in Välle Broar, SESAC Deliverable 18. VEAB, VäxjöEkundayo D, Perera S, Udeaja C, Zhou L (2012) Carbon review and qualitative comparison of
selected carbon counting tools. In: Proceedings of the Royal Institution of CharteredSurveyors’ COBRA International Research Conference, Las Vegas, Nevada, USA
Eames M, Kershaw T, Coley D (2011) On the creation of future probabilistic design weather yearsfrom UKCP09. Build Serv Eng Res Technol 32(2):127–142
Eriksson M (2010) How to create energy efficient behaviour in a City such as Växjö. SESACDeliverable D2.1C, VEAB, Växjö
FEBY (2009) Positioning paper: background on implementation of passive house in Sweden.Swedish Forum for Energy Efficient Buildings, Stockholm
Fremrot G (2011) Energy performance in wooden houses. SESAC Deliverable 16.2, VKAB,Växjö
Georgiadou MC (2014) Future-proofed energy design approaches for achieving low-energyhomes: enhancing the code for sustainable homes. Buildings 4(3):488–519
Georgiadou MC, Hacking T, Guthrie P (2012) A conceptual framework for future-proofing theenergy performance of buildings. Energy Policy 47:145–155
Glass J, Dainty A, Gibb A (2008) New build: materials, techniques, skills and innovation, EnergyPolicy 36(8):4534–4538
Glass J, Dyer T, Georgopoulos C, Goodier C, Paine K, Parry T, Baumann H, Gluch P (2013)Future use of life-cycle assessment in civil engineering. Proc Inst Civil Eng Constr Mater 166(4):204–212
Greenwood D (2010) Really zero? Stakeholder perspectives on policy in England for the 2016zero carbon homes target. University of Westminster, London
Greenwood D (2012) The challenge of policy coordination for sustainable sociotechnicaltransitions: the case of the zero-carbon homes agenda in England. Environ Plan C Gov Policy30(1):162–179
54 M.C. Georgiadou
Gul M, Jenkins D, Patidar S, Banfill P, Menzies G, Gibson G (2012) Tailoring a future overheatingrisk tool for existing building design practice in domestic and non-domestic sectors, Build ServEng Res Technol 33(1):105–117
Gustavsson L, Sathre R (2006) Variability in energy and carbon dioxide balances of wood andconcrete building materials. Build Environ 41(7):940–951
Gustavsson L, Joelsson A, Sathre R (2010) Life cycle primary energy use and carbon emission ofan eight-storey wood-framed apartment building. Energy Build 42(2):230–242
Gustavsson L, Pingoud K, Sathre R (2006) Carbon dioxide balance of wood substitution:comparing concrete- and wood-framed buildings. Mitig Adapt Strat Glob Change 11(3):667–691
IPCC (2007) Fourth assessment report. Intergovernmental Panel on Climate Change, GenevaJenkins D, Patidar S, Banfill B, Gibson G (2011) Probabilistic climate projections with dynamic
building simulation: predicting overheating in dwellings. Energy Build 43(7):1723–1731Jenks M, Jones C (eds.) (2010) Issues and concepts. In: Dimensions of the sustainable city.
Springer, Netherlands, pp 1–19Jewell J, Clarkson H, Goodman J, Watt I (2010) The future climate for development: scenarios for
low income countries in a climate-changing world, forum for the future in partnership with theDepartment for International Development, London
Jones Lang LaSalle (2010) From sandbags to solar panels: future-proofing. UK Real Estate forClimate Change Resilience, London
Karlsson A (2003) ENSYST, Version 1.2. Lund UniversityKildsgaard I, Prejer E (2011) Documentation of project’s development, planning, and building
phases—building’s energy performance. IVL, StockholmKillip G (2008) Building a greener future: transforming the UK’s existing housing stock.
Environmental Change Institute, University of Oxford, OxfordLane K, Sinden G, Killip G, Peacock A, Natarajan S (2005) Background material B: foresight
scenarios for the UK domestic sector, 40% house project. Environmental Change Institute,Oxford
Leaman A, Stevenson F, Bordass B (2010) Building evaluation: practice and principles. Build ResInf 38(5):564–577
Moffatt S, Suzuki H, Iizuka R (2012) Eco2Cities guide: ecological cities as economic cities. WorldBank, Washington, DC
NHBC (2013) Designing homes for the 21st century: lessons for low energy design. NationalHouse Building Council, London
NHBC (2014) Technical extra approved document part L: 2013, Special edn. National HousingBuilding Council, London
Nielsen J (2006) On the design of buildings in relation to climate change. In: Proceedings of theworld conference for accelerating excellence in the built environment, Birmingham, UK
O’Brien G, Brodowicz D, Ratcliffe J (2009) Built environment foresight 2030: the sustainabledevelopment imperative. The Futures Academy, Dublin Institute of Technology, Dublin
Pelsmakers S (2012) The environmental design pocketbook. RIBA Publishing, LondonPitts A (2008) Future proof construction—future building and systems design for energy and fuel
flexibility. Energy Policy 36(12):4539–4543Planning Source (2015) What government’s decision to scrap the zero carbon housing goal means
for planners? http://www.planningresource.co.uk/article/1357297/governments-decision-scrap-zero-carbon-housing-goal-means-planners. Accessed 26 Jan 2016
Ravetz J (2008) State of the stock—what do we know about existing buildings and their futureprospects? Energy Policy 36(12):4462–4470
Sahagun D, Moncaster AM (2012) How much do we spend to save? Calculating the embodiedcarbon costs of retrofit. In: Proceedings of retrofit 2012 conference, University of Salford,Greater Manchester, UK
SAP (2010) Standard assessment procedure. Department of Energy and Climate Change. http://www.decc.gov.uk/en/content/cms/emissions/sap/sap.aspx. Accessed 30 Nov 2011
Future-Proofed Design of Low-Energy Housing Developments … 55
Sathre R (2007) Life-cycle energy and carbon implications of wood-based products andconstruction. Doctoral thesis, eco-technology and environmental science. Department ofEngineering, Physics and Mathematics, Mid Sweden University
Serrano E (2009) Documentation of the Limnologen project: overview and summaries of subprojects results. Faculty of Mathematics, Science and Technology, School of Technology andDesign, Växjö University, Växjö
SESAC (2011a) City report on energy performance in Växjö, City of VäxjöSESAC (2011b) Innovative sustainable construction: together for the low-energy city with a high
quality of life. SESAC Final Project Report, CONCERTOSoetanto A, Dainty A, Glass J, Price A (2006) Towards an explicit design decision process: the
case of the structural frame. Constr Manag Econ 24(6):603–614Stasinopoulos P, Smith M, Hargroves K, Desha C (2009) Whole system design: an integrated
approach to sustainable engineering. Earthscan, LondonTCPA (2006) Sustainable energy by design: a TCPA ‘by design’ guide for sustainable
communities. Town and Country Planning Association, LondonUBT (2009) The soft landings framework for better briefing, design, handover and building
performance in-use, usable buildings trust in partnership with the Building Services Researchand Information Association, London
UKCP09 (2010) What is UKCP09? UK Climate Projections, http://ukclimateprojections.defra.gov.uk/21678. Accessed 10 May 2013
UN (2010) Buildings and construction as tools for promoting more sustainable patterns ofconsumption and production, sustainable development innovation brief. United NationsDepartment of Economic and Social Affairs, New York
UNEP (2009) Buildings and climate change: summary for decision-makers, sustainable buildingsand climate initiative. United Nations Environment Programme, Paris
WCED (1987) Our common future, World commission on environment and development. OxfordUniversity Press, Oxford
ZCH (2009) Defining a fabric energy efficiency standard for zero carbon homes, task grouprecommendations. Zero Carbon Hub, London, p 20
ZCH (2010) Carbon compliance for tomorrow’s new homes—a review of the modelling tool andassumptions. Zero Carbon Hub, London
ZCH (2011) Carbon compliance—setting an appropriate limit for zero carbon new homes, findingsand recommendations. Zero Carbon Hub, London
56 M.C. Georgiadou
On the Move—or Moving On?Reimagining the Future of Travel
Malek Al-Chalabi
Abstract With rising energy demand and an increase in global population, facil-itating a sustainable energy transition in cities is of interest to many. The focus ofthis chapter is to illustrate and analyse the role that transport can play in facilitatingand enabling change. In order to do so, this chapter is compromised of the fol-lowing four parts: (1) an illustrative description of the transport challenge, whichincludes describing the impacts that transport has on society and the environment,(2) the drivers and the thinking behind transport’s high-carbon use, (3) an alter-native framing to the transport debate will be introduced alongside ‘next’ practicesfor the future, and (4) the points made in the previous three parts will be furtherillustrated through the use of relevant international case studies. Case studiesinclude Bogota, Colombia, Dubai, United Arab Emirates, and Montreal, Canada,from a supply-side and demand-side perspective. A discussion with implications forthe future is provided alongside a conclusion.
1 Introduction
A transition is upon us. Whether or not it will be sustainable remains to be seen. Itis, without question, a difficult task, and it is particularly challenging in transport.The objective of this chapter is to illustrate why.
As highlighted in previous chapters, achieving sustainability in cities is achallenge. The human impacts are known—urban environments are where over50% of the human population resides, where 75% of global energy is used, andwhere approximately 80% of all carbon dioxide is emitted. The world population isexpected to increase (Al-Chalabi 2015)—it is anticipated that the population willreach 9 billion in 2050 (United Nations 2015). This must be managed in order toachieve global sustainability.
M. Al-Chalabi (&)Transport Studies Unit, School of Geography and the Environment,University of Oxford, South Parks Road, Oxford OX1 3QY, UKe-mail: [email protected]
© Springer International Publishing AG 2017J. Bishop (ed.), Building Sustainable Cities of the Future,Green Energy and Technology, DOI 10.1007/978-3-319-54458-8_4
57
The role that transport has to play in the challenge mentioned above will beaddressed in this chapter. This will be done in four parts. First, an illustrativedescription of the challenge will be given, which includes describing the impactsthat transport has on society and the environment. Second, the drivers and thethinking behind transport’s high-carbon use will be provided. This provides asegway (no pun intended) to the third part of the chapter, where an alternativeframing to the transport debate will be given, and technological and behaviouraloptions will be introduced, alongside ‘next’ practices. Finally, an internationaloutlook that showcases relevant case studies that illustrate the points made in theprevious three parts will be provided.
It is important to highlight what this chapter does/does not cover. Part I describesthe challenge—this is primarily based on work from the International EnergyAgency (IEA) (2014) and Intergovernmental Panel on Climate Change (IPCC)(Sims et al. 2014). The framing and scope of Parts II and III are developed from theresearch of Givoni and Banister (2013a).1 Part IV is based on relevant authoritiespertaining to the respective case study. Limitations, where relevant, of theseresources are acknowledged in the chapter—supplementary material/evidence/sources will be provided where appropriate.
2 Part I: The Challenge: Impact of Transport on Societyand the Environment
The transport sector has experienced growth. The transport sector accounts for23–24% of global CO2 emissions (Sims et al. 2014), and oil is the fuel that pri-marily drives this sector. Approximately 64% of global oil consumption is attrib-uted to transport (IEA 2014). A depiction of the growth is illustrated in Fig. 1.
As the figure illustrates, demand for oil from the transport sector has grown—45% of world oil consumption was attributed to transport in 1973, in comparisonwith 64% in 2012 (IEA 2014). This is illustrated further in Fig. 2.
What Fig. 2 also illustrates is that this growth is primarily attributed to roadvehicles from 1970 to 2010. What Fig. 2 also demonstrates, less obviously, is thatgreenhouse gas emissions have more than doubled since 1970 in the transportsector. What the figure does not show is that in comparison with other sectors, thetransport sector ‘increased at a faster rate than any other energy end-use sector toreach 7.0 Gt CO2eq in 2010’ (Sims et al. 2014, p. 605). Given this, the focus of thischapter will be on urban/road transport—aviation and maritime are not.
1The rationale behind basing parts 2 and 3 on this resource is because it provides a clear andsuccinct overview of the scope outlined. The alternative option was to base these parts on variousresources (with different underlying assumptions, drivers, and scopes)—which can be quiteburdensome/unhelpful to the reader. Therefore, the limitations of this are acknowledged, andrelevant resources are cited where appropriate to overcome any gaps.
58 M. Al-Chalabi
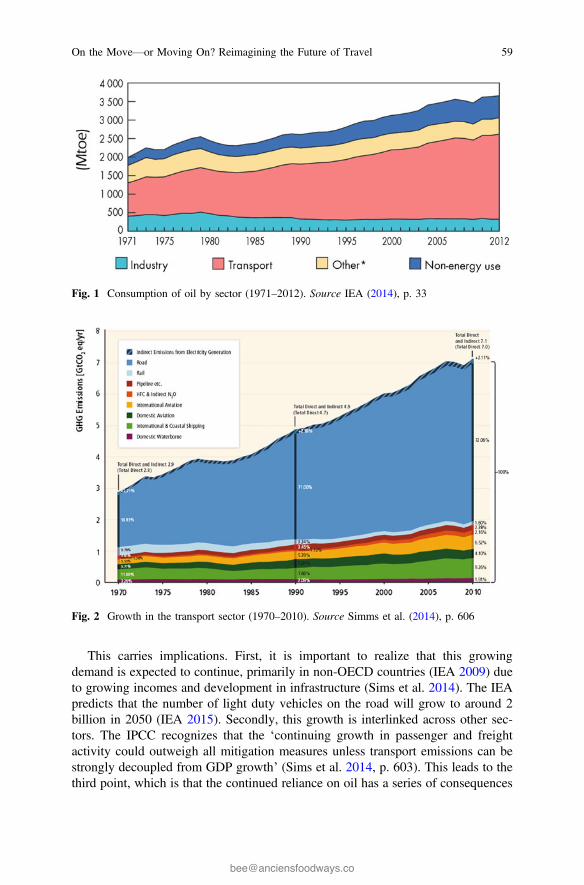
This carries implications. First, it is important to realize that this growingdemand is expected to continue, primarily in non-OECD countries (IEA 2009) dueto growing incomes and development in infrastructure (Sims et al. 2014). The IEApredicts that the number of light duty vehicles on the road will grow to around 2billion in 2050 (IEA 2015). Secondly, this growth is interlinked across other sec-tors. The IPCC recognizes that the ‘continuing growth in passenger and freightactivity could outweigh all mitigation measures unless transport emissions can bestrongly decoupled from GDP growth’ (Sims et al. 2014, p. 603). This leads to thethird point, which is that the continued reliance on oil has a series of consequences
Fig. 1 Consumption of oil by sector (1971–2012). Source IEA (2014), p. 33
Fig. 2 Growth in the transport sector (1970–2010). Source Simms et al. (2014), p. 606
On the Move—or Moving On? Reimagining the Future of Travel 59
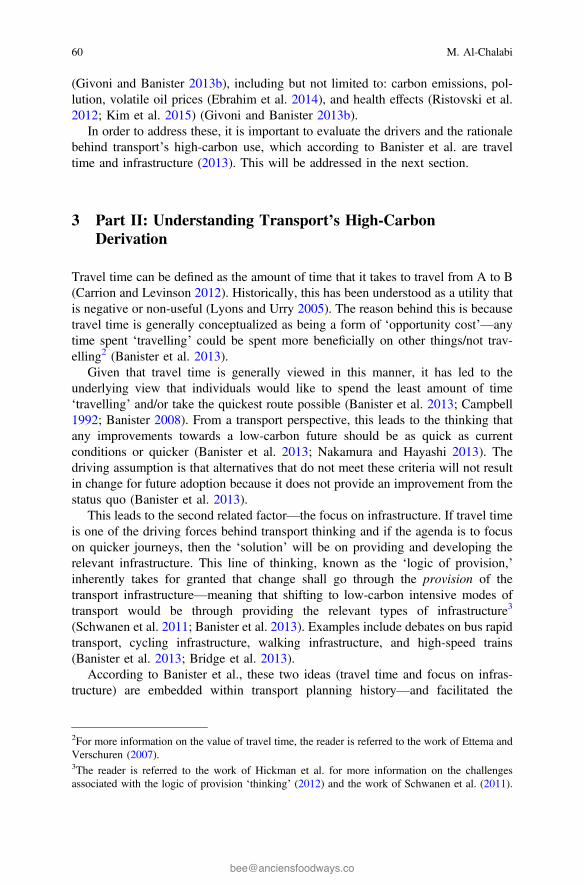
(Givoni and Banister 2013b), including but not limited to: carbon emissions, pol-lution, volatile oil prices (Ebrahim et al. 2014), and health effects (Ristovski et al.2012; Kim et al. 2015) (Givoni and Banister 2013b).
In order to address these, it is important to evaluate the drivers and the rationalebehind transport’s high-carbon use, which according to Banister et al. are traveltime and infrastructure (2013). This will be addressed in the next section.
3 Part II: Understanding Transport’s High-CarbonDerivation
Travel time can be defined as the amount of time that it takes to travel from A to B(Carrion and Levinson 2012). Historically, this has been understood as a utility thatis negative or non-useful (Lyons and Urry 2005). The reason behind this is becausetravel time is generally conceptualized as being a form of ‘opportunity cost’—anytime spent ‘travelling’ could be spent more beneficially on other things/not trav-elling2 (Banister et al. 2013).
Given that travel time is generally viewed in this manner, it has led to theunderlying view that individuals would like to spend the least amount of time‘travelling’ and/or take the quickest route possible (Banister et al. 2013; Campbell1992; Banister 2008). From a transport perspective, this leads to the thinking thatany improvements towards a low-carbon future should be as quick as currentconditions or quicker (Banister et al. 2013; Nakamura and Hayashi 2013). Thedriving assumption is that alternatives that do not meet these criteria will not resultin change for future adoption because it does not provide an improvement from thestatus quo (Banister et al. 2013).
This leads to the second related factor—the focus on infrastructure. If travel timeis one of the driving forces behind transport thinking and if the agenda is to focuson quicker journeys, then the ‘solution’ will be on providing and developing therelevant infrastructure. This line of thinking, known as the ‘logic of provision,’inherently takes for granted that change shall go through the provision of thetransport infrastructure—meaning that shifting to low-carbon intensive modes oftransport would be through providing the relevant types of infrastructure3
(Schwanen et al. 2011; Banister et al. 2013). Examples include debates on bus rapidtransport, cycling infrastructure, walking infrastructure, and high-speed trains(Banister et al. 2013; Bridge et al. 2013).
According to Banister et al., these two ideas (travel time and focus on infras-tructure) are embedded within transport planning history—and facilitated the
2For more information on the value of travel time, the reader is referred to the work of Ettema andVerschuren (2007).3The reader is referred to the work of Hickman et al. for more information on the challengesassociated with the logic of provision ‘thinking’ (2012) and the work of Schwanen et al. (2011).
60 M. Al-Chalabi
growth of car use4 (2013). This view, however, is inherently elementary andincomplete (Banister et al. 2013). The next part of the chapter will (1) illustrate whythis perspective is incomplete and provide an alternative framing to the transportdebate, (2) suggest technological and behavioural options for change, and(3) highlight potential ‘next’ practices.
4 Part III: Multidimensional Proposal
4.1 An Alternative Framing to the Transport Debate
The transport framing must move away from speed and infrastructure and adopt amore complete perspective (Banister et al. 2013). While travel time and low-carbontransport are an important part of the story, focusing on them completely would bean incomplete scope. Other areas that require consideration, but are not yet fullyintegrated into the debate are highlighted in Table 1.
Table 1 is not exhaustive—but demonstrates areas where more attention couldbe focused in the transport debate. As the table highlights, the focus on access andaccessibility should be broadened to encompass the relevant elements (Markovich2013; Banister et al. 2013). Recognizing the cultures, values, and meanings of andaround travel mobility has a role to play as they are embedded/engrained in variouselements of society (Aldred and Jungnickel 2014; Vannini 2010; Banister et al.2013). Perceived safety of certain travel modes can also enable or disable travelmode change (Taylor and Ampt 2003). Additionally, concentrating on the qualityof the travel has tremendous potential (Martens 2007; Banister et al. 2013). AsBanister et al. highlight:
“With regard to the quality of travel time, it is useful to think in terms of opportunity. Giventhat one has to travel on a certain mode of transport, what is made possible in that interval?How can the experience of that interval be made as positive as possible? The idea here isthat transport policy should make it possible for travellers to use and experience travel inways that align with their needs and preferences”
(Banister et al. 2013, p. 274).
Expanding and incorporating multidimensional aspects that include more thanspeed and transport into the transport debate can be done in many ways, includingthe use of various technological and behavioural options. Technological andbehavioural options include, but are not limited to, integrated transport, walkingand cycling, use of pricing, land use planning, and various other measures (Banisteret al. 2013).
This broader focus—incorporating accessibility, culture, safety, and quality—can give low-carbon transport modes advantages not found in their carbon-based
4The reader is referred to the work of Geels (2005), Owens (1995), and Kenworthy (2006).
On the Move—or Moving On? Reimagining the Future of Travel 61
cousins5 (Banister et al. 2013). In addition, there are also a set of ‘next’ practicesthat could be given more attention. This is the focus of the next section.
4.2 ‘Next’ Practices
There are a set of elements (based on the work of Banister et al. 2013) that aredescribed here as ‘next’ practices that can be explored in order to achieve the goalsset out (Banister et al. 2013). These are not comprehensive—but rather a selectionof choices that may be most relevant to the audience of this chapter. These aredescribed in detail first and subsequently summarized in Table 2.
First, the debate needs to highlight the advantages of low-carbon mobility and lesson the difficulties and perils of high-carbon mobility (Giddens 2009; Banister et al.2013). This will be, as highlighted earlier, able to showcase advantages of low-carbonmobility (Banister et al. 2013). The work ofMoriarty and Honnery (2008) is one suchexample—where the benefits of active and public transport are illustrated.
Secondly, there lie various opportunities where these advantages can be devel-oped in social/digital media. This includes providing up-to-date information onvarious travel services through the use of social media or developing mechanisms touse travel time more innovatively or efficiently (Banister et al. 2013). While notused in real time, Scott and Orlikowski demonstrate the value that this has shown inthe travel sector (2012).
Third, the focus of the transport system should focus less on station to station(airport to airport is another example) and more on door-to-door travel while
Table 1 Factors to incorporate into the transport debate
Factor Rationale Sources
Access andaccessibility
– Including, but not limited to, temporal,financial, physical, and organizational(Markovich 2013)
– Door-to-door travel experience
Morris et al. (1979), Lucas(2006), Fransen et al.(2015)
Culture – Recognizing the cultures of and aroundmobility
Aldred and Jungnickel(2014), Vannini (2010)
Safety – Can be an (dis)enabler for travel modechange
Weinert et al. (2007),Kenyons and Lyons (2003)
Quantityversusquality
– Moving away from quantity of travel andconcentrating on the quality of travel
– Provide opportunities to take updifferent/heterogeneous activities intravelling environments
Martens (2007)
Source Developed from Banister et al. (2013)
5The implementation and use of these tools are best illustrated through the use of examples and arethe focus of this chapter in the final part of this paper (Part IV).
62 M. Al-Chalabi
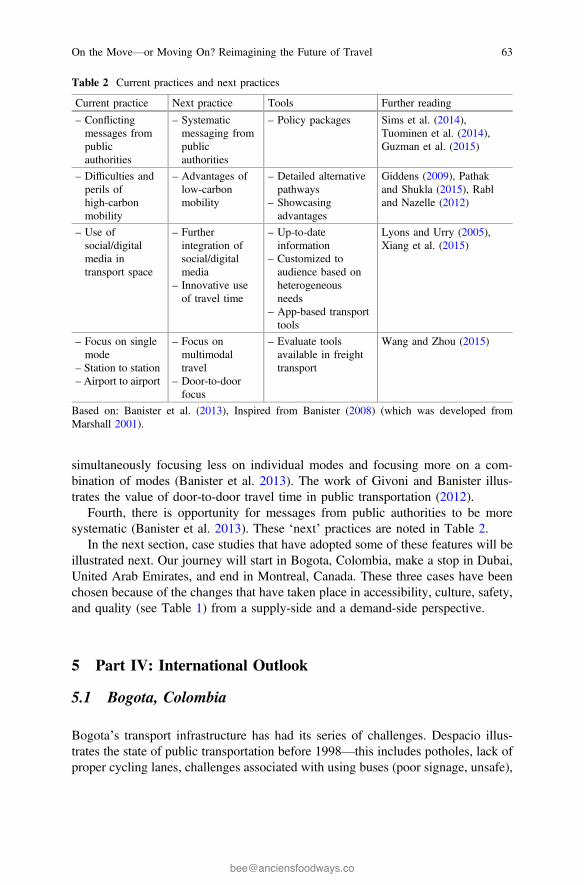
simultaneously focusing less on individual modes and focusing more on a com-bination of modes (Banister et al. 2013). The work of Givoni and Banister illus-trates the value of door-to-door travel time in public transportation (2012).
Fourth, there is opportunity for messages from public authorities to be moresystematic (Banister et al. 2013). These ‘next’ practices are noted in Table 2.
In the next section, case studies that have adopted some of these features will beillustrated next. Our journey will start in Bogota, Colombia, make a stop in Dubai,United Arab Emirates, and end in Montreal, Canada. These three cases have beenchosen because of the changes that have taken place in accessibility, culture, safety,and quality (see Table 1) from a supply-side and a demand-side perspective.
5 Part IV: International Outlook
5.1 Bogota, Colombia
Bogota’s transport infrastructure has had its series of challenges. Despacio illus-trates the state of public transportation before 1998—this includes potholes, lack ofproper cycling lanes, challenges associated with using buses (poor signage, unsafe),
Table 2 Current practices and next practices
Current practice Next practice Tools Further reading
– Conflictingmessages frompublicauthorities
– Systematicmessaging frompublicauthorities
– Policy packages Sims et al. (2014),Tuominen et al. (2014),Guzman et al. (2015)
– Difficulties andperils ofhigh-carbonmobility
– Advantages oflow-carbonmobility
– Detailed alternativepathways
– Showcasingadvantages
Giddens (2009), Pathakand Shukla (2015), Rabland Nazelle (2012)
– Use ofsocial/digitalmedia intransport space
– Furtherintegration ofsocial/digitalmedia
– Innovative useof travel time
– Up-to-dateinformation
– Customized toaudience based onheterogeneousneeds
– App-based transporttools
Lyons and Urry (2005),Xiang et al. (2015)
– Focus on singlemode
– Station to station– Airport to airport
– Focus onmultimodaltravel
– Door-to-doorfocus
– Evaluate toolsavailable in freighttransport
Wang and Zhou (2015)
Based on: Banister et al. (2013), Inspired from Banister (2008) (which was developed fromMarshall 2001).
On the Move—or Moving On? Reimagining the Future of Travel 63
and the power of the car (2008). Additionally, the political and economic elite werethe ones that owned cars (Peñalosa 2011).
In 1998, a new government had come in and had a vision that was quite unique.6
Instead of seeing separate challenges, many synergies were identified (Peñalosa2011). Instead of prolonging the status quo, the mayor (Enrique Penalosa) and thenew government put in place a variety of plans that started to build the foundationof a city that would capture the fascination of many from a transport, accessibility,equality, and cultural perspective.
Instead of promoting car use, the administration limited car use (Cevero 2005).This includes but is not limited to: (1) bollards were put in place to stop cars parkingon cycle paths/sidewalks, (2) a car-free Thursday every February (on the firstThursday) was developed, and (3) during holidays and Sundays, pedestrians, ska-ters, and cyclists are able to (for 7 hours) use the main roads, which were car-free(Cevero 2005). These initiatives not only changed the social and cultural normsaround the use of the car—but also provided a stimulus for an efficient transportsystem.
A bus rapid transit system was developed with inspiration from Brasil (Cevero2005). Cycling lanes were built.7 Within a year, there was ‘a 32% reduction inaverage travel times by bus, a 93% drop in bus accidents, a 98% passenger approvalrating, and higher property values along the busway corridor (from not onlyenhanced access but also lower crime rates and noise levels)’ (Cevero 2005, p. 26).The 250-km network of cycle paths alongside streets led to an increase in cyclingdaily trips from 0.9 to 4% (Cevero 2005).
New public spaces were built or improved upon (Cevero et al. 2009). The moneythat was not spent on traditional road development and infrastructure investmentwas instead used to fund these programmes and build nurseries, schools, libraries,and community centres (Peñalosa 2011). An insight to the vision that was adoptedcan be illustrated in the quote as follows:
“For a child from a very poor neighbourhood whose home may have a dirt floor or at best arough cement one, free access to a beautiful, almost luxurious library, where admission isnot dependent on wealth, educational attainment or social status, but simply on their rightsas a citizen, citizenship acquires real meaning. A library in a poor neighbourhood sym-bolises society’s confidence in the intelligence and capacity of the young citizens around it;just as a free food programme, despite its eventual necessity, expresses the opposite”(Peñalosa 2011, p. 95).
6As Penalosa highlights: ‘A majority of upper- and upper-middle-class citizens in developing citiespull out of their garages in the morning and may go for weeks without walking a block on a citystreet. They consider the absolute priority for government to be the construction of more andbigger roads. Which is why even in some very poor African cities where most of the populationdoes not even have access to clean water, it is still possible to find highways. Car infrastructureabsorbs most of the budget. There is a conflict for funds between the needs of the automobile andthe needs of the poor for such imperatives as schools, parks, housing or public transport. And thereis a conflict for space between cars, pedestrians, cyclists and buses’ (2011, pp. 92–93).7‘Three quarters (75%) of daily trips in the city are less than ten kilometers’ (Cevero 2005, p. 27).
64 M. Al-Chalabi
There are many reasons for Bogota’s success. As the quote has highlighted,Penalosa had a clear vision of accessibility for people. Peñalosa (2011) has notedthat ‘the fundamental criterion guiding our work was the construction of equality’(p. 91) and ‘if it works well, a city centre integrates people from all parts of the cityand all income brackets’ (p. 92). This is illustrated in his emphasis on cycling.
“As important as the safety a protected cycle path affords cyclists is its symbolic power: itenhances the cyclist’s social status, since a citizen on a $30 bicycle is as important as one ina $30,000 car”
(Peñalosa 2011, p. 95).
With the focus on accessibility and a changing cultural emphasis from the car tothe person, various features improved as outlined earlier. This emphasis changedthe culture that was associated with the car, people, and the city, which resulted invarious benefits8 (Cevero et al. 2009).
5.2 Dubai, United Arab Emirates
The United Arab Emirates is a small country located on the Arabian Gulf. It hasseven emirates, including Abu Dhabi and Dubai. The country possesses one of thetop ten proven reserves of oil and gas (EIA 2015)—most of which are found in AbuDhabi.
Since its independence in 1971, the United Arab Emirates has experiencedpopulation growth and urbanization. The population in 1971 was approximately275,000—this has grown to 1.9 million in 1991 and 8.7 million in 2011 (UnitedNations Department of Economic and Social Affairs 2015). The population isexpected to grow at 2.3% (on average) annually from 2010–2020 (Everington2013) with an urban population of 7.9 million in 2020. 84% of the population livedin cities in 2010, and it is estimated to increase to 86.7% in 2020 (Everington 2013).This has implications for transport.
There were approximately 6.2 people per car in Dubai a little over 2 decades ago(Al-Mehairi 1995). The latest figures indicate there are now two people per car(Shahbandari 2015)—a significant change in approximately 20 years. Furthermore,from 2006–2014, vehicles in Dubai have increased from 740,000 to 1.4 million inthat time span (it has doubled) (Shahbandari 2015). This has, understandably, led tocongestion and traffic (Shahbandari 2015).
As a city that is a global tourist, economic, and transportation hub, there havebeen a variety of innovative, high-tech, ‘hard’ and ‘soft’ measures that have beenput in place in Dubai that aim to decrease traffic and promote alternative modechoices. Due to the rapid amount of urbanization, the innovative technologicalsolutions that have been used, and the success at implementing the tools and
8More information on Penalosa’s vision can be found here (Penalosa 2015).
On the Move—or Moving On? Reimagining the Future of Travel 65
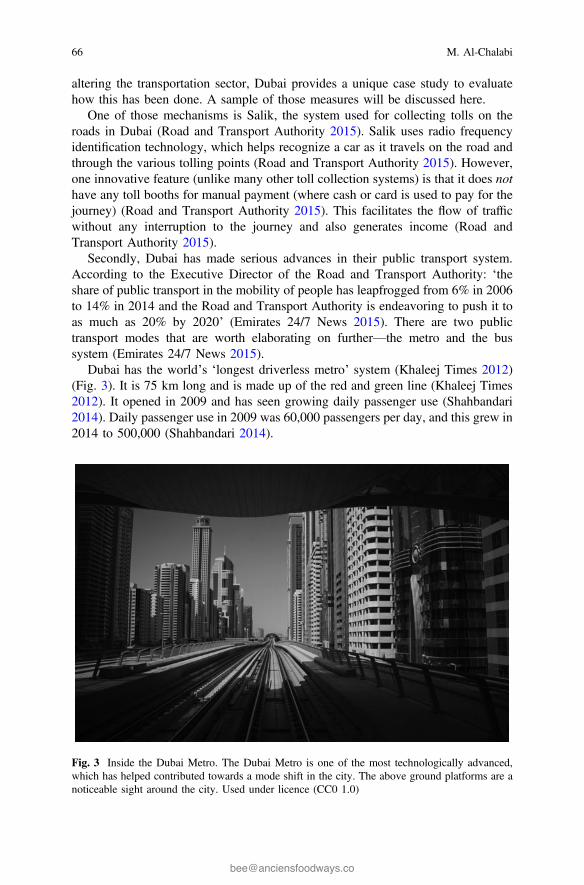
altering the transportation sector, Dubai provides a unique case study to evaluatehow this has been done. A sample of those measures will be discussed here.
One of those mechanisms is Salik, the system used for collecting tolls on theroads in Dubai (Road and Transport Authority 2015). Salik uses radio frequencyidentification technology, which helps recognize a car as it travels on the road andthrough the various tolling points (Road and Transport Authority 2015). However,one innovative feature (unlike many other toll collection systems) is that it does nothave any toll booths for manual payment (where cash or card is used to pay for thejourney) (Road and Transport Authority 2015). This facilitates the flow of trafficwithout any interruption to the journey and also generates income (Road andTransport Authority 2015).
Secondly, Dubai has made serious advances in their public transport system.According to the Executive Director of the Road and Transport Authority: ‘theshare of public transport in the mobility of people has leapfrogged from 6% in 2006to 14% in 2014 and the Road and Transport Authority is endeavoring to push it toas much as 20% by 2020’ (Emirates 24/7 News 2015). There are two publictransport modes that are worth elaborating on further—the metro and the bussystem (Emirates 24/7 News 2015).
Dubai has the world’s ‘longest driverless metro’ system (Khaleej Times 2012)(Fig. 3). It is 75 km long and is made up of the red and green line (Khaleej Times2012). It opened in 2009 and has seen growing daily passenger use (Shahbandari2014). Daily passenger use in 2009 was 60,000 passengers per day, and this grew in2014 to 500,000 (Shahbandari 2014).
Fig. 3 Inside the Dubai Metro. The Dubai Metro is one of the most technologically advanced,which has helped contributed towards a mode shift in the city. The above ground platforms are anoticeable sight around the city. Used under licence (CC0 1.0)
66 M. Al-Chalabi
There are various reasons of success. One is that it has a punctuality rate of99.8% (Shahbandari 2014). Additionally, it is one of the safest metro systems in theworld—crime and vandalism are approximately at zero—which is a unique featurecompared to other metros (Shahbandari 2014). Due to the high use of the metro anduser requests, the weekend service schedule is now open for longer, starting theservice at 10AM on Friday—it was previously 1PM (Gulf News 2015).
Public buses have seen similar increase in ridership. Average daily ridership inDubai in 2012 was 299,000, 321,000 in 2013, and 371,000 in 2014 (Emirates 24/7News 2015). Given the increased use of buses, this leads to the third innovativemeasure that has taken place, which are ‘sleepiness detectors.’ The aim of thedetector is to evaluate the bus driver and identify any indicators oftiredness/fatigue/exhaustion/etc. This is done by installing an instrument on the busthat helps evaluate those signs, and this has already been installed on fifty buses(Emirates 24/7 News 2015).
The focus on safety has led to the fourth and final innovative measure. One ofthe road safety issues that is predominate in the UAE is tailgating. In addition tolaunching awareness campaigns, high-tech radars have been installed that will beable to not only measure the distance between two cars, but will also fine any driverthat is in violation of the 5-meter rule (Twaha 2015).
These examples (Salik toll system, Dubai metro, public buses, sleepinessdetectors, and high-tech radars) contribute towards developing a multifacetedtransport system that also supports the aims and objectives of the ‘Smart Dubai’programme. The objective is to make Dubai the ‘smartest’ city on the planet, andthis programme was envisioned and developed by the Vice President, SheikhMohammed Bin Rashid Al Maktoum (Smart Dubai 2016a, b). It is built on sixdimensions, which are smart living, mobility, economy, environment, people, andgovernance9 (Smart Dubai 2016c).
Mobility examples include app-based carsharing programmes for Dubai (SmartDubai 2016d) and an innovative waste notification system, where a notification issent to a server when the waste bin can no longer accommodate any more waste andrequires disposal. As the collection will then take place when the waste bin iscompletely occupied (and not half occupied), this saves fuel, streamlines schedulesand trips across the city, and decreases carbon emissions (Smart Dubai 2016e).
While these initiatives are currently helping develop Dubai as a smart city, thereare ambitious plans for the future. Recently, there has been an announcement thatby 2030, smart/driverless transport will compromise 25% of the transportationsystem (Achkhanian 2016). This vision will aim to deliver 22 billion UAE Dirhams(almost 6 billion USD) of savings a year by removing environmental impacts,decreasing costs associated with transport, improving safety, and various otherbenefits (Achkhanian 2016).
9‘Smart Dubai’ is a multifaceted programme based on fostering partnerships with and acrossrelevant stakeholders, including government, institutions, and the private sector (Smart Dubai2016a, b).
On the Move—or Moving On? Reimagining the Future of Travel 67
These examples give a glimpse of how a transportation system that focuses onmore than just speed and infrastructure can help develop a city in the twenty-firstcentury. The emphasis on innovative mode shift and safety are tools that can helpimprove the journey experience, encourage travel mode changes, and has helpedDubai transform and continue to develop its transportation system to worktowards its twenty-first century objectives with population growth andurbanization.
5.3 Montreal, Canada
In the city of Montreal (Fig. 4), the largest source of greenhouse gas emissions is intransport (39%) (City of Montreal 2013). Public bike-sharing programmes arepopular in Europe (Fuller et al. 2011; Shaheen et al. 2010), and Montreal10 isrecognized as the ‘North American leader’ in cycling (Larsen and El-Geneidy2011) as it has been referenced as having the largest bike-sharing programme (inNorth America) (Pucher et al. 2011; Fuller et al. 2011; Shaheen et al. 2010).
BIXI which is a combination of the word ‘bicycle’ and ‘taxi’ (Bixi 2016) waslaunched in 2009 with 300 stations including 300 bicycles (Faghih-Imani et al.2014). It has since grown—there are currently 460 stations including 5200 bicyclesacross the city (Bixi 2016).
What factors played a role in the success and uptake of Montreal’s bike-sharingprogramme? There are a few, which are related to Tables 1 and 2 presented earlier.According to Bachand-Marleau et al., first was the location/accessibility to thedocking station—there was a higher likelihood to use BIXI if it was near the pointof origin for the user (2012). Secondly, the safety of the bicycle sharing system waslikely to encourage bicycle use. Interestingly enough, those who had bikes stolen orthose who were worried about bicycle safety were more likely to use BIXI as theyviewed this as a safer alternative to ownership (Bachand-Marleau et al. 2012).Thirdly, the use of BIXI was associated with being ‘trendy’ and ‘environmentallyfriendly’—which helped boost its popularity and further develop the culture aroundcycling (Bachand-Marleau et al. 2012, pp. 70, 71).
Studies have shown that the use of BIXI did contribute towards a mode shift(walking, cycling, etc.) in Montreal (Fuller et al. 2013; Fishman et al. 2013). Thereasons for this shift are supported by other sources of the literature, as noted byFishman et al. (2013). Location and accessibility near the home were found to be animportant factor (Fuller et al. 2011). As one study found in London, ‘shorterdistance to the nearest docking station was associated with making progressivelymore trips per month, as was having more docking stations within 250 m of the
10For an overview of Montreal and cycling infrastructure, the reader is referred to these sources:Pucher et al. (2011), Larsen and El-Geneidy (2011).
68 M. Al-Chalabi
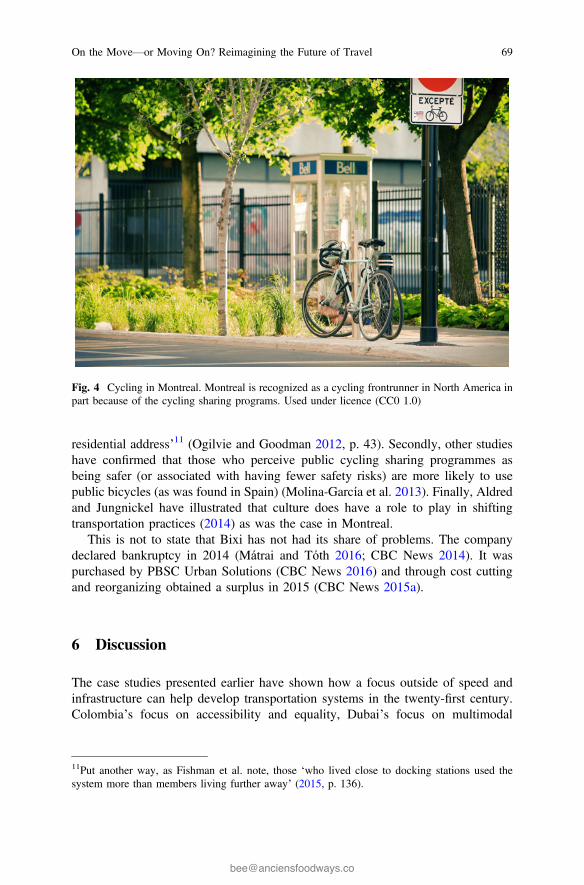
residential address’11 (Ogilvie and Goodman 2012, p. 43). Secondly, other studieshave confirmed that those who perceive public cycling sharing programmes asbeing safer (or associated with having fewer safety risks) are more likely to usepublic bicycles (as was found in Spain) (Molina-García et al. 2013). Finally, Aldredand Jungnickel have illustrated that culture does have a role to play in shiftingtransportation practices (2014) as was the case in Montreal.
This is not to state that Bixi has not had its share of problems. The companydeclared bankruptcy in 2014 (Mátrai and Tóth 2016; CBC News 2014). It waspurchased by PBSC Urban Solutions (CBC News 2016) and through cost cuttingand reorganizing obtained a surplus in 2015 (CBC News 2015a).
6 Discussion
The case studies presented earlier have shown how a focus outside of speed andinfrastructure can help develop transportation systems in the twenty-first century.Colombia’s focus on accessibility and equality, Dubai’s focus on multimodal
Fig. 4 Cycling in Montreal. Montreal is recognized as a cycling frontrunner in North America inpart because of the cycling sharing programs. Used under licence (CC0 1.0)
11Put another way, as Fishman et al. note, those ‘who lived close to docking stations used thesystem more than members living further away’ (2015, p. 136).
On the Move—or Moving On? Reimagining the Future of Travel 69
transport and safety, and Montreal’s focus on accessibility and culture (among otherfactors) demonstrate how broadening the transportation focus can link up variousparts of the city together. Cities that are able connect transport with other aspects ofthe city/life are best suited to help facilitate a transition towards low-carbontransport.
This is supported by the IPCC. The IPCC recognizes that ‘mutually supportivepolicies’ are required not only to decarbonize transport, but also for the‘co-benefits’ to be realized (Sims et al. 2014, p. 604) and policy packages12 are anexample of how this can take place. This includes working with/across in transportand non-transport arenas (including but not limited to political, social, economicspectrums), as well as health, mobility, security, and safety (Sims et al. 2014,p. 604). This will be implemented differently in different regions due to cost andpolicy contexts (Sims et al. 2014).
Major opportunities still exist around low-carbon options, particularly in thedeveloping world, as this is where most of the future urban growth will take placeas highlighted earlier (Sims et al. 2014). As demonstrated in the case studies andhighlighted in the IPCC report, ‘transport can be an agent of sustained urbandevelopment that prioritizes goals for equity and emphasizes accessibility, trafficsafety, and time-savings for the poor while reducing emissions, with minimaldetriment to the environment and human health’ (Sims et al. 2014, p. 604).
7 Conclusion
This chapter has described the impacts that transport has on society and the envi-ronment and the framing around the current ‘transport’ debate. Subsequently, analternative framing to the transport debate was provided, where a broader scope wasrationalized, technological and behavioural options were introduced, and ‘next’practices were illustrated. Examples from Bogota, Dubai, and Montreal were giventhat showcased how these can be implemented.
The role that transport has to play in achieving sustainability has been the scopeof this chapter. We have, as a society, been ‘on the move’ for a some time. Is it timeto move on?
Acknowledgements The author would like to thank the reviewers for their constructive com-ments. He would also like to thank his family and friends for their support.
12The challenge lies not only in the options that are available to use—but rather the way in whichthey are used (Banister et al. 2013). In order to address this challenge, relevant policies can beexecuted in an integrated fashion, such as a package (May and Roberts 1995; Givoni et al. 2013;Tønnesen 2015). Tønnesen defines a policy package as a ‘structure [that is] used to combinedifferent policy measures and address multiple objectives’ (2015, p. 89).
70 M. Al-Chalabi
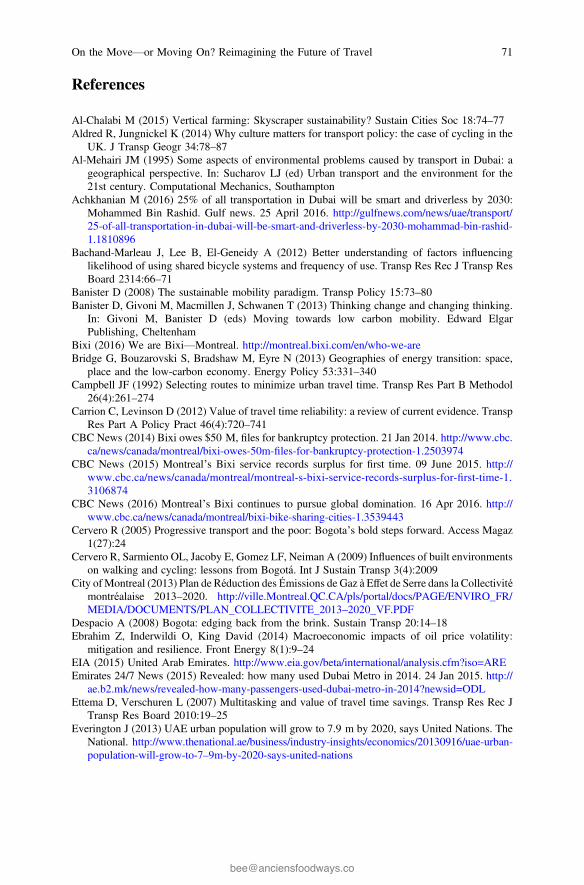
References
Al-Chalabi M (2015) Vertical farming: Skyscraper sustainability? Sustain Cities Soc 18:74–77Aldred R, Jungnickel K (2014) Why culture matters for transport policy: the case of cycling in the
UK. J Transp Geogr 34:78–87Al-Mehairi JM (1995) Some aspects of environmental problems caused by transport in Dubai: a
geographical perspective. In: Sucharov LJ (ed) Urban transport and the environment for the21st century. Computational Mechanics, Southampton
Achkhanian M (2016) 25% of all transportation in Dubai will be smart and driverless by 2030:Mohammed Bin Rashid. Gulf news. 25 April 2016. http://gulfnews.com/news/uae/transport/25-of-all-transportation-in-dubai-will-be-smart-and-driverless-by-2030-mohammad-bin-rashid-1.1810896
Bachand-Marleau J, Lee B, El-Geneidy A (2012) Better understanding of factors influencinglikelihood of using shared bicycle systems and frequency of use. Transp Res Rec J Transp ResBoard 2314:66–71
Banister D (2008) The sustainable mobility paradigm. Transp Policy 15:73–80Banister D, Givoni M, Macmillen J, Schwanen T (2013) Thinking change and changing thinking.
In: Givoni M, Banister D (eds) Moving towards low carbon mobility. Edward ElgarPublishing, Cheltenham
Bixi (2016) We are Bixi—Montreal. http://montreal.bixi.com/en/who-we-areBridge G, Bouzarovski S, Bradshaw M, Eyre N (2013) Geographies of energy transition: space,
place and the low-carbon economy. Energy Policy 53:331–340Campbell JF (1992) Selecting routes to minimize urban travel time. Transp Res Part B Methodol
26(4):261–274Carrion C, Levinson D (2012) Value of travel time reliability: a review of current evidence. Transp
Res Part A Policy Pract 46(4):720–741CBC News (2014) Bixi owes $50 M, files for bankruptcy protection. 21 Jan 2014. http://www.cbc.
ca/news/canada/montreal/bixi-owes-50m-files-for-bankruptcy-protection-1.2503974CBC News (2015) Montreal’s Bixi service records surplus for first time. 09 June 2015. http://
www.cbc.ca/news/canada/montreal/montreal-s-bixi-service-records-surplus-for-first-time-1.3106874
CBC News (2016) Montreal’s Bixi continues to pursue global domination. 16 Apr 2016. http://www.cbc.ca/news/canada/montreal/bixi-bike-sharing-cities-1.3539443
Cervero R (2005) Progressive transport and the poor: Bogota’s bold steps forward. Access Magaz1(27):24
Cervero R, Sarmiento OL, Jacoby E, Gomez LF, Neiman A (2009) Influences of built environmentson walking and cycling: lessons from Bogotá. Int J Sustain Transp 3(4):2009
City ofMontreal (2013) Plan de Réduction des Émissions de Gaz à Effet de Serre dans la Collectivitémontréalaise 2013–2020. http://ville.Montreal.QC.CA/pls/portal/docs/PAGE/ENVIRO_FR/MEDIA/DOCUMENTS/PLAN_COLLECTIVITE_2013–2020_VF.PDF
Despacio A (2008) Bogota: edging back from the brink. Sustain Transp 20:14–18Ebrahim Z, Inderwildi O, King David (2014) Macroeconomic impacts of oil price volatility:
mitigation and resilience. Front Energy 8(1):9–24EIA (2015) United Arab Emirates. http://www.eia.gov/beta/international/analysis.cfm?iso=AREEmirates 24/7 News (2015) Revealed: how many used Dubai Metro in 2014. 24 Jan 2015. http://
ae.b2.mk/news/revealed-how-many-passengers-used-dubai-metro-in-2014?newsid=ODLEttema D, Verschuren L (2007) Multitasking and value of travel time savings. Transp Res Rec J
Transp Res Board 2010:19–25Everington J (2013) UAE urban population will grow to 7.9 m by 2020, says United Nations. The
National. http://www.thenational.ae/business/industry-insights/economics/20130916/uae-urban-population-will-grow-to-7–9m-by-2020-says-united-nations
On the Move—or Moving On? Reimagining the Future of Travel 71
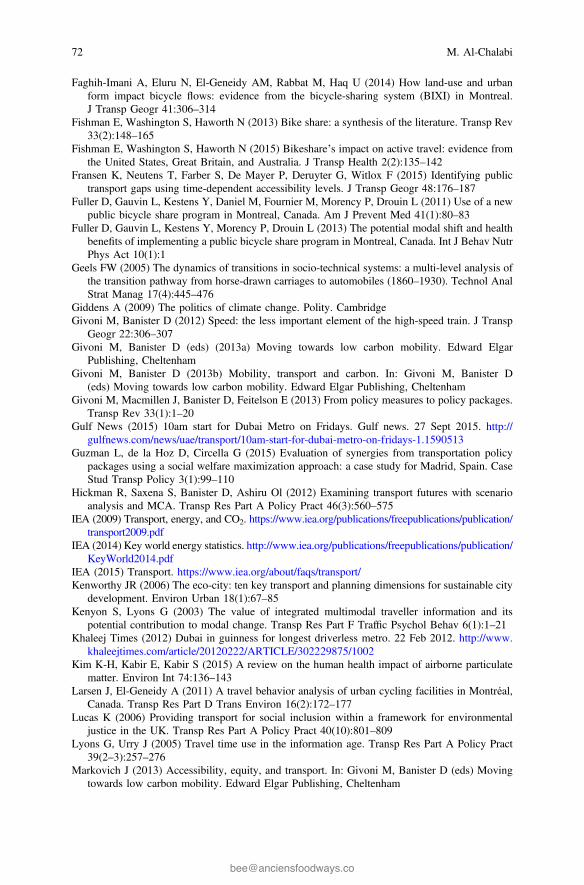
Faghih-Imani A, Eluru N, El-Geneidy AM, Rabbat M, Haq U (2014) How land-use and urbanform impact bicycle flows: evidence from the bicycle-sharing system (BIXI) in Montreal.J Transp Geogr 41:306–314
Fishman E, Washington S, Haworth N (2013) Bike share: a synthesis of the literature. Transp Rev33(2):148–165
Fishman E, Washington S, Haworth N (2015) Bikeshare’s impact on active travel: evidence fromthe United States, Great Britain, and Australia. J Transp Health 2(2):135–142
Fransen K, Neutens T, Farber S, De Mayer P, Deruyter G, Witlox F (2015) Identifying publictransport gaps using time-dependent accessibility levels. J Transp Geogr 48:176–187
Fuller D, Gauvin L, Kestens Y, Daniel M, Fournier M, Morency P, Drouin L (2011) Use of a newpublic bicycle share program in Montreal, Canada. Am J Prevent Med 41(1):80–83
Fuller D, Gauvin L, Kestens Y, Morency P, Drouin L (2013) The potential modal shift and healthbenefits of implementing a public bicycle share program in Montreal, Canada. Int J Behav NutrPhys Act 10(1):1
Geels FW (2005) The dynamics of transitions in socio-technical systems: a multi-level analysis ofthe transition pathway from horse-drawn carriages to automobiles (1860–1930). Technol AnalStrat Manag 17(4):445–476
Giddens A (2009) The politics of climate change. Polity. CambridgeGivoni M, Banister D (2012) Speed: the less important element of the high-speed train. J Transp
Geogr 22:306–307Givoni M, Banister D (eds) (2013a) Moving towards low carbon mobility. Edward Elgar
Publishing, CheltenhamGivoni M, Banister D (2013b) Mobility, transport and carbon. In: Givoni M, Banister D
(eds) Moving towards low carbon mobility. Edward Elgar Publishing, CheltenhamGivoni M, Macmillen J, Banister D, Feitelson E (2013) From policy measures to policy packages.
Transp Rev 33(1):1–20Gulf News (2015) 10am start for Dubai Metro on Fridays. Gulf news. 27 Sept 2015. http://
gulfnews.com/news/uae/transport/10am-start-for-dubai-metro-on-fridays-1.1590513Guzman L, de la Hoz D, Circella G (2015) Evaluation of synergies from transportation policy
packages using a social welfare maximization approach: a case study for Madrid, Spain. CaseStud Transp Policy 3(1):99–110
Hickman R, Saxena S, Banister D, Ashiru Ol (2012) Examining transport futures with scenarioanalysis and MCA. Transp Res Part A Policy Pract 46(3):560–575
IEA (2009) Transport, energy, and CO2. https://www.iea.org/publications/freepublications/publication/transport2009.pdf
IEA (2014) Key world energy statistics. http://www.iea.org/publications/freepublications/publication/KeyWorld2014.pdf
IEA (2015) Transport. https://www.iea.org/about/faqs/transport/Kenworthy JR (2006) The eco-city: ten key transport and planning dimensions for sustainable city
development. Environ Urban 18(1):67–85Kenyon S, Lyons G (2003) The value of integrated multimodal traveller information and its
potential contribution to modal change. Transp Res Part F Traffic Psychol Behav 6(1):1–21Khaleej Times (2012) Dubai in guinness for longest driverless metro. 22 Feb 2012. http://www.
khaleejtimes.com/article/20120222/ARTICLE/302229875/1002Kim K-H, Kabir E, Kabir S (2015) A review on the human health impact of airborne particulate
matter. Environ Int 74:136–143Larsen J, El-Geneidy A (2011) A travel behavior analysis of urban cycling facilities in Montréal,
Canada. Transp Res Part D Trans Environ 16(2):172–177Lucas K (2006) Providing transport for social inclusion within a framework for environmental
justice in the UK. Transp Res Part A Policy Pract 40(10):801–809Lyons G, Urry J (2005) Travel time use in the information age. Transp Res Part A Policy Pract
39(2–3):257–276Markovich J (2013) Accessibility, equity, and transport. In: Givoni M, Banister D (eds) Moving
towards low carbon mobility. Edward Elgar Publishing, Cheltenham
72 M. Al-Chalabi
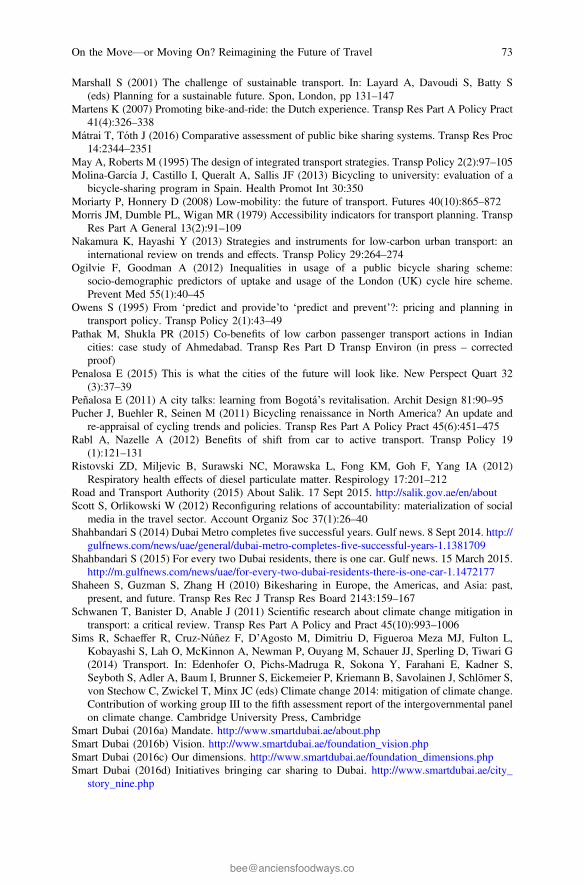
Marshall S (2001) The challenge of sustainable transport. In: Layard A, Davoudi S, Batty S(eds) Planning for a sustainable future. Spon, London, pp 131–147
Martens K (2007) Promoting bike-and-ride: the Dutch experience. Transp Res Part A Policy Pract41(4):326–338
Mátrai T, Tóth J (2016) Comparative assessment of public bike sharing systems. Transp Res Proc14:2344–2351
May A, Roberts M (1995) The design of integrated transport strategies. Transp Policy 2(2):97–105Molina-García J, Castillo I, Queralt A, Sallis JF (2013) Bicycling to university: evaluation of a
bicycle-sharing program in Spain. Health Promot Int 30:350Moriarty P, Honnery D (2008) Low-mobility: the future of transport. Futures 40(10):865–872Morris JM, Dumble PL, Wigan MR (1979) Accessibility indicators for transport planning. Transp
Res Part A General 13(2):91–109Nakamura K, Hayashi Y (2013) Strategies and instruments for low-carbon urban transport: an
international review on trends and effects. Transp Policy 29:264–274Ogilvie F, Goodman A (2012) Inequalities in usage of a public bicycle sharing scheme:
socio-demographic predictors of uptake and usage of the London (UK) cycle hire scheme.Prevent Med 55(1):40–45
Owens S (1995) From ‘predict and provide’to ‘predict and prevent’?: pricing and planning intransport policy. Transp Policy 2(1):43–49
Pathak M, Shukla PR (2015) Co-benefits of low carbon passenger transport actions in Indiancities: case study of Ahmedabad. Transp Res Part D Transp Environ (in press – correctedproof)
Penalosa E (2015) This is what the cities of the future will look like. New Perspect Quart 32(3):37–39
Peñalosa E (2011) A city talks: learning from Bogotá’s revitalisation. Archit Design 81:90–95Pucher J, Buehler R, Seinen M (2011) Bicycling renaissance in North America? An update and
re-appraisal of cycling trends and policies. Transp Res Part A Policy Pract 45(6):451–475Rabl A, Nazelle A (2012) Benefits of shift from car to active transport. Transp Policy 19
(1):121–131Ristovski ZD, Miljevic B, Surawski NC, Morawska L, Fong KM, Goh F, Yang IA (2012)
Respiratory health effects of diesel particulate matter. Respirology 17:201–212Road and Transport Authority (2015) About Salik. 17 Sept 2015. http://salik.gov.ae/en/aboutScott S, Orlikowski W (2012) Reconfiguring relations of accountability: materialization of social
media in the travel sector. Account Organiz Soc 37(1):26–40Shahbandari S (2014) Dubai Metro completes five successful years. Gulf news. 8 Sept 2014. http://
gulfnews.com/news/uae/general/dubai-metro-completes-five-successful-years-1.1381709Shahbandari S (2015) For every two Dubai residents, there is one car. Gulf news. 15 March 2015.
http://m.gulfnews.com/news/uae/for-every-two-dubai-residents-there-is-one-car-1.1472177Shaheen S, Guzman S, Zhang H (2010) Bikesharing in Europe, the Americas, and Asia: past,
present, and future. Transp Res Rec J Transp Res Board 2143:159–167Schwanen T, Banister D, Anable J (2011) Scientific research about climate change mitigation in
transport: a critical review. Transp Res Part A Policy and Pract 45(10):993–1006Sims R, Schaeffer R, Cruz-Núñez F, D’Agosto M, Dimitriu D, Figueroa Meza MJ, Fulton L,
Kobayashi S, Lah O, McKinnon A, Newman P, Ouyang M, Schauer JJ, Sperling D, Tiwari G(2014) Transport. In: Edenhofer O, Pichs-Madruga R, Sokona Y, Farahani E, Kadner S,Seyboth S, Adler A, Baum I, Brunner S, Eickemeier P, Kriemann B, Savolainen J, Schlömer S,von Stechow C, Zwickel T, Minx JC (eds) Climate change 2014: mitigation of climate change.Contribution of working group III to the fifth assessment report of the intergovernmental panelon climate change. Cambridge University Press, Cambridge
Smart Dubai (2016a) Mandate. http://www.smartdubai.ae/about.phpSmart Dubai (2016b) Vision. http://www.smartdubai.ae/foundation_vision.phpSmart Dubai (2016c) Our dimensions. http://www.smartdubai.ae/foundation_dimensions.phpSmart Dubai (2016d) Initiatives bringing car sharing to Dubai. http://www.smartdubai.ae/city_
story_nine.php
On the Move—or Moving On? Reimagining the Future of Travel 73
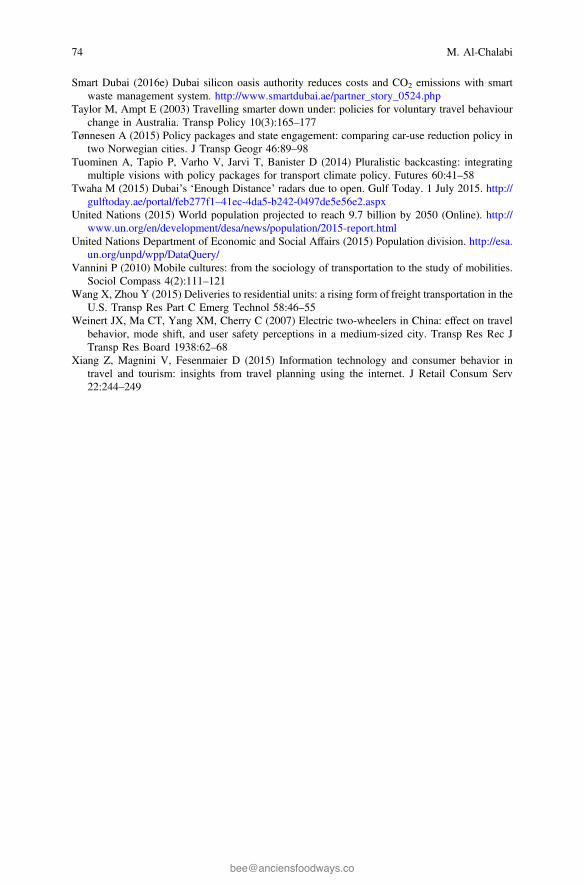
Smart Dubai (2016e) Dubai silicon oasis authority reduces costs and CO2 emissions with smartwaste management system. http://www.smartdubai.ae/partner_story_0524.php
Taylor M, Ampt E (2003) Travelling smarter down under: policies for voluntary travel behaviourchange in Australia. Transp Policy 10(3):165–177
Tønnesen A (2015) Policy packages and state engagement: comparing car-use reduction policy intwo Norwegian cities. J Transp Geogr 46:89–98
Tuominen A, Tapio P, Varho V, Jarvi T, Banister D (2014) Pluralistic backcasting: integratingmultiple visions with policy packages for transport climate policy. Futures 60:41–58
Twaha M (2015) Dubai’s ‘Enough Distance’ radars due to open. Gulf Today. 1 July 2015. http://gulftoday.ae/portal/feb277f1–41ec-4da5-b242-0497de5e56e2.aspx
United Nations (2015) World population projected to reach 9.7 billion by 2050 (Online). http://www.un.org/en/development/desa/news/population/2015-report.html
United Nations Department of Economic and Social Affairs (2015) Population division. http://esa.un.org/unpd/wpp/DataQuery/
Vannini P (2010) Mobile cultures: from the sociology of transportation to the study of mobilities.Sociol Compass 4(2):111–121
Wang X, Zhou Y (2015) Deliveries to residential units: a rising form of freight transportation in theU.S. Transp Res Part C Emerg Technol 58:46–55
Weinert JX, Ma CT, Yang XM, Cherry C (2007) Electric two-wheelers in China: effect on travelbehavior, mode shift, and user safety perceptions in a medium-sized city. Transp Res Rec JTransp Res Board 1938:62–68
Xiang Z, Magnini V, Fesenmaier D (2015) Information technology and consumer behavior intravel and tourism: insights from travel planning using the internet. J Retail Consum Serv22:244–249
74 M. Al-Chalabi
Water: An Essential Resourceand a Critical Hazard
Richard A. Fenner
Abstract Urban water managers must provide adequate water supplies to meetgrowing demands for a range of water uses (including essential drinking water)whilst mitigating the negative effects of water in the wrong place, which occur attimes of flood arising from extreme weather events. Many urban areas around theworld are becoming increasingly water stressed, and cities such as London aredeveloping solutions to address expected future shortages. As well as physicalchallenges, this chapter discusses problems of effective water governance and howdecision-making across multiple scales is needed for effective water resourcemanagement—combining both technical and non-technical innovations. Currentpractice is characterised by many unsustainable activities, with many cities lockedinto a legacy of ageing infrastructure systems developed in the past. Key charac-teristics of more sustainable water systems are presented which represent theparadigm shift that is required in how urban water is dealt with. Features of urbanwater resilience are examined which can be achieved through an iterative adaptivemanagement approach to water management. Examples are given that relate to theuse of green infrastructure to achieve water-sensitive urban design, which mitigatesthe adverse effects of storm water at locations where the rain falls, whilst simul-taneously providing a range of other benefits. Multifunctional infrastructure isdescribed where innovative engineering can deliver more than one service from asingle purpose project. The chapter concludes by stressing the need to see the urbanwater system as part of the wider urban fabric which positively adds to the layout,security and liveability of future cities.
R.A. Fenner (&)Department of Engineering, Centre for Sustainable Development, University of Cambridge,Trumpington Street, Cambridge CB2 1PZ, UKe-mail: [email protected]
© Springer International Publishing AG 2017J. Bishop (ed.), Building Sustainable Cities of the Future,Green Energy and Technology, DOI 10.1007/978-3-319-54458-8_5
75
1 The Challenge
Forty per cent of the world’s population live in regular water stressed areas (takenby UNEP to be less than 1700 cubic metres per person per year). As the uncer-tainties and extreme conditions expected under climate change unfold, and as theworld’s population continues to increase this century, the challenges surroundingwater will increase. These include meeting basic needs through the provision ofengineered services to provide safe drinking water and basic sanitation (Target 6.1of the Sustainable Development Goals (UNDP 2015)) whilst protecting life andproperty from the extremes of drought and flood. This illustrates the essentialdichotomy about water. It is both an essential resource—vital for life—and yet canform a catastrophic hazard through flood inundation and disease transmission.Evidence of how closely water resources and water hazards are interrelated can befound during the UK floods of 2007 with dramatic effects on electricity powersubstations, water and sewage treatment works, and the road and rail network. As aconsequence of the events, there was a strong possibility of the loss of power to750,000 people leading to discussions about evacuation. Drinking water was lost to350,000 people for up to 17 days. Tens of thousands of people lost power, some formore than 2 days, and tens of thousands of people were stranded as the road and railnetworks ground to a halt (The Pitt Review 2008). These events highlight thedependencies that exist between critical infrastructure.
But water is needed for more reasons than just to provide these basic services. Itis used extensively in power generation and in agriculture, and so our energy andfood systems are dependant on water too. Much thought has been given recently tothis water–energy–food nexus with a recognition that these critical resources needto be more effectively managed in an integrated and coupled way (Curmi et al.2013a), often with difficult tradeoffs between competing water uses having to bemade. Part of the balance that needs to be struck is ensuring enough water remainsin the natural environment to make sure essential ecosystem services aremaintained.
In addressing these issues, complex problems become apparent. In the devel-oping world, much needs to be done to bring water and sanitation to communitieswho have not hitherto had access to even the most basic services. In the developedworld, much of urban water in cities is managed through ageing infrastructure withpipeline and other asset failures commonplace. One water utility (Suez) has esti-mated that more than 49 billion m3 of expensively treated water is lost fromdistribution systems every year due to ageing pipes.
Ban Ki Moon (2011) captures the essence of the problem as follows: “We mustconnect the dots between climate change, water scarcity, energy shortages, globalhealth, food security and women’s empowerment. Solutions to one problem mustbe solutions for all”.
76 R.A. Fenner
1.1 A Critical Resource
In developing countries, as much as 80% of illnesses are linked to poor water andsanitation conditions (Kofi Annan UN Statement 2003) and half of the world’shospital beds are filled with people suffering from a water-related disease (UNDP2006). One out of every 5 deaths of people under the age of 5 worldwide is due to awater-related disease (WHO 2009).
Currently, 1 billion people live in water scarce regions, and by 2025, the WorldBank estimates as many as 3.5 billion people could face water shortages. Whenannual water supplies drop below 1000 m3 per person, the population faces waterscarcity, and below 500 cubic metres “absolute scarcity”. The fifth assessmentreport of the Intergovernmental Panel on Climate Change (2015) forecast that foreach degree of warming around 7% of the global population will face almost 20%decrease in renewable water resources. This is against a background of alreadyincreasing pressure. For example, since 1980 the rate of groundwater withdrawalshas increased 1% per year with some regions such as California far exceedingreplenishment rates (Curmi et al. 2013b). Around 500 million people globally livein places where water consumption is double the amount replenished by rain,making them highly vulnerable as ground water levels continue to fall.
A recent study analysed water supplies in 71 surface water-supplied cities havinga population of more than 750,000 in 39 countries (Padowski and Gorelick 2014).Twenty-five of these cities (36%) were already considered vulnerable by beingunable to meet demands from human, environmental and agricultural users to alevel of 4600 l/person per day (which includes a volume of “virtual water” toproduce and process commodities and services). The work also showed that by2040 this number is likely to grow to thirty two cities (45%), driven by increasedagricultural and urban demands. Of these vulnerable cities, the majority are riversupplied with very low mean flows. Reservoirs supply the majority of cities facingindividual future threats, revealing that constructed storage potentially providestenuous water security. Padowski and Gorelick suggest that in 2040, 13 vulnerablecities would reduce their vulnerability via reallocating water by reducing envi-ronmental flows (i.e. water left in natural watercourse to maintain ecosystemsservices) and 15 would similarly benefit by transferring water from irrigated agri-culture. This would require very difficult tradeoffs to be made. Most alarmingly, thisanalysis does not account for climate change, which is likely to significantlyinfluence future urban water supply vulnerability.
Sir John Beddington (former UK Chief Scientist) has famously referred to a“perfect storm” which we can expect by 2030 (Beddington 2009). This is driven bythe following factors coming together simultaneously with population growthdriving 40% more demand for water (Shen et al. 2008), 45% more energy (IEA2008) and 50% more food according to the UN (FAO 2008). These figures willrequire much greater reuse of water in the future.
Water: An Essential Resource and a Critical Hazard 77
1.2 Water in Cities
Water crises, however, are not restricted to low-income developing countries in hotclimates. California has had several episodes of below average precipitation in1917–1921, 1922–1926, 1928–1937, 1943–1951, 1959–1962, 1976–1977,1987–1992, 2007–2009 and most recently in 2012–2015. This most recent droughtin the last few years has led to emergency regulations requiring the imposition of animmediate 25% reduction in overall potable water use—difficult to enforce whenthe Pacific Institute estimates 30% of domestic homes do not have water meters.A 60-km water transfer tunnel estimated at costing billions of dollars is proposed tomove surface water from northern to southern California, but is being opposed onenvironmental grounds. Meanwhile, the Carlsbad Desalination plant is providingSan Diego with 230 Ml/day of drinking water and has been described as the biggestin the Western Hemisphere (Bliss 2015).
In the UK, Defra (2016) has pointed to a population increase of 10 million by2050 coinciding with increasing summer temperatures and decreasing rainfallleading to the likelihood of short-duration droughts. This situation too will requirenew water resources to safeguard public supplies. London expects a populationincrease of 40% by 2050, rising from 8 to 11 million. This will lead to demand forwater exceeding supply by 10% in 2025 and by 21% in 2040. The costs of droughtalso need to be recognised. A report by the Institution of Civil Engineers WaterPanel (Sugarman 2016) has estimated that a drought order invoking a temporaryban cutting off, for example, car washes and fountains would cost London between£4.3 million and £9.5 million a day, or approximately £300 million a month. Moreserious emergency drought orders would result in restricting other uses of water andwould lead to air conditioning being switched off (impacting on computer roomsacross the city) and could lead to the closure of London Underground if the pressureand volume of water required for firefighting could not be guaranteed. In thesecircumstances, the cost would soar to between £236 million and £330 million a dayor a vast £7 to £9 billion a month (based on A Non-Essential Use Drought Order forLondon: Economic Impact Assessment, NERA 2012). Solutions being consideredinclude water transfer from the River Severn to the Thames, industrial scale waterreuse by returning filtered water from Beckton Sewage Treatment Works to bemixed with raw water at Coppermills Water treatment plant, and a new reservoir forstoring high winter flows in the upper Thames catchment.
Problems with water do not always arise because of physical water shortages.Often water crises are a result of crises of governance, involving more thanhydrology, finance and infrastructure issues. They frequently arise because ofconfusion and conflict over who does what, at what level of government, and howand why public policies are designed and implemented. In cities around the world,there is pressing need for coordination across multiple scales, authorities and policydomains. A report by OECD (2016) reported some key challenges:
78 R.A. Fenner
• Inequality in access and affordability to services exists even in countries such asGreece, Italy and Portugal;
• 75% of 48 cities from OECD countries identify water pollution as a challenge,with further investment in wastewater treatment needed. Part of the population isconnected to primary wastewater treatment only or to a sewerage network withno treatment;
• Cities are increasingly exposed to water-related disasters with huge damagesand economic losses (e.g. floods in Copenhagen in 2011 caused about EUR 700million of damage and New York in 2012 in the aftermath of Hurricane Sandysuffered USD 19 billion of economic losses). Nearly 20% of the global popu-lation is at risk from floods by 2050, while some cities are already sufferingheavy droughts even in water-rich countries like Brazil;
• 90% of the OECD cities surveyed reported ageing or no infrastructure restrictingaccess to water and sanitation, diminishing the capacity to respond to water-related crises exacerbated by climate change, economic stress, demographicgrowth and other urban trends;
• In two-thirds of cities OECD report that lack of staff and managerial compe-tences are a challenge compounded by unstable or insufficient revenues fromlocal governments.
Water in cities is affected by decisions taken in other sectors and vice versa, inparticular with respect to energy, finance, solid waste, transport and land use.The OECD (2016) captures the challenges well: “There is a need to address publicinvestment issues including multi-level co-ordination and capacity challenges;foster cross sectoral approaches to infrastructure; adopt an approach that encom-passes multiple purposes, especially water, energy, environmental protection andspatial planning; manage tradeoffs across water users in rural and urban areas andbetween current and future generations in terms of who pays for what; and reduceinvestment needs by ensuring stable regulatory frameworks to catalyse finance andenhance efficiency”.
Furthermore, in managing water there needs to be greater cooperation betweencities and their surrounding areas, especially where administrative and hydrologicalboundaries cut across each other. Addressing scale issues is vital. The appropriatescale at which water is managed depends on the function. The local or metropolitanlevel is most suitable for water supply and sanitation, while water resources are bestaddressed at the larger sub-catchment scale and flood protection needs a catchmentwide strategy. Decision-making across multiple scales therefore needs to be com-bined for efficient use of water resources, information sharing and cost savings(OECD 2016). Forward looking management practices combining technical (e.g.smart water systems, distributed systems, green infrastructure) and non-technicalinnovations (e.g. information system, water-sensitive urban design) are required aspart of strategies for future organisation of water in cities (OECD 2015a).The OECD Principles of Water Governance (OECD 2015b) suggest that a waterresilient city is: “one that can mange water in a sustainable integrated and inclusiveway, at an acceptable cost, and in a reasonable timeframe”.
Water: An Essential Resource and a Critical Hazard 79
The way cities have evolved and are laid out spatially has a significant influenceon their water consumption, infrastructure development and water footprint. Cirilliand Veneri (2014) have shown that sprawl cities put greater pressure on theenvironment than compact cities due to land use stress, fragmentation of naturalhabitats and increasing air pollution emissions. While low-density cities are likelyto incur greater maintenance costs, they may be better at dealing with stormwaterrunoff, groundwater recharge and flood management. Conversely, compact citiesmay need lower levels of infrastructure (such as avoiding the need for longpipelines) and may be cheaper to maintain and operate water supply systems.Problems arise in such high-dense cites in relation to incorporating green infras-tructure, and retrofitting such assets as sustainable drainage systems (SuDS), whichprovide local source control for urban drainage whilst mimicking pre-developmenthydrology, can be difficult. These systems are discussed in more detail in Sect. 3.1.
2 Achieving Sustainable Urban Water Management
2.1 Unsustainable Practices
Many cities are “locked-in” to infrastructure systems that were developed in the past, insome cases as long ago as the nineteenth century. These have served many city com-munitieswell and havebeen essential in protectingpublic health in areas of high-densitylivingwhere otherwise the spread of disease would be a chronic problem. Indeed beforethe middle of the twentieth century, it was the engineered systems that deliveredfreshwater and removed the resultant wastewater for safe disposal that had by far thegreatest impact on disease reduction in urban populations, with medical science havingfar less effect (until the discovery and widespread use of antibiotics, etc).
However, such systems also gave rise to many unsustainable practices. Theseinclude the irreversible loss of land and habitat through inundation of valleys forreservoirs and water resource schemes. The trend has been towards a centralisationof facilities in high-technology solutions at the end of pipe networks, which incurshigh energy (and carbon) costs in pumping and the operation of treatment pro-cesses, as well as generating large quantities of sludges which are difficult todispose of. Moreover, the discharge of nutrients in the form of phosphorous andnitrogen from wastewater treatment plants has led to eutrophication problems in thereceiving rivers. At the same time, intermittent spills in wet weather from combinedsewer overflows have been a major source of pollution of urban watercourses.
Such watercourses are often highly modified natural streams which may have beenreplaced by concrete and steel-lined channels and culverts. These are fed by outfalls andflapvalves surroundedwith concrete, and often have their banks protectedwith concreteand steel. In cities they can be artificially straightened channelswith nomeanders, poolsor riffles and have high flood embankments, with mechanically excavated channels—with steep, sparsely vegetated banks. Such urban water courses are often cut offfrom the life of the town, hidden behind fences and walls, buried in pipes, with no
80 R.A. Fenner
public access.Most urban development excludeswatercourses, placing themat the backof buildings and gardens. There is an “out-of-sight out-of-mind” mentality whichregardswatercourses as a safety hazard and an inconvenience and frequently aremarredby refuse and litter—including large items such as shopping trolleys (SEPA 2000).Many of London’s natural rivers such as the Fleet were lost underground as Londondeveloped.
In water treatment the practice has been towards the use of chemical additivesfor the removal of colloidal solids through coagulation processes and for disin-fection, but these have been linked to Alzheimer’s disease (aluminium) and thedevelopment of carcinogens (chlorine). The rapid and efficient movement of excessstormwater through pipe networks has often given rise to downstream flooding.
Precious potable water, which carries a high embodied carbon, is used in largequantities simply as a transport medium to flush human waste through thesewerage/drainage network and often becomes contaminated with the contents ofindustrial effluents, which eventually require separation at the treatment plant.Over-abstraction of groundwater for water supply in some areas has led to criticallylow flows in rivers, while many properties remain at the risk of flooding.
2.2 Characteristics of a Sustainable Urban Water System
The key characteristics of a more sustainable water system would be one where:
• Less water is consumed;• Human waste is treated locally and recycled;• Stormwater is retained at source;• Installations and assets are climate resilient;• The corresponding energy footprint is minimised.
These changes give rise to some important challenges and have been addressed byothers. In particular, Novotny and Brown (2007) have considered water in cities ofthe future and have made suggestions for integrated sustainable water and land usemanagement. These ideas have been followed up by a vision for how watermanagement and the creation of water infrastructure might develop sustainably inthe future (Novotny et al. 2010). This envisages an urban water system with thefollowing features:
1. Water should be kept, stored, reused and rainwater infiltrated on-site or locally,with extensive use of rain gardens, and drainage dealt with mostly on thesurface;
2. A significant portion of wastewater should be treated and reclaimed locally foruse in large buildings and irrigation, and for maintaining minimum ecologicallow flows to streams and nearby watercourses;
3. Green buildings with water-saving plumbing fixtures should, where possible,incorporate green roofs and allow infiltration within their site boundary;
Water: An Essential Resource and a Critical Hazard 81
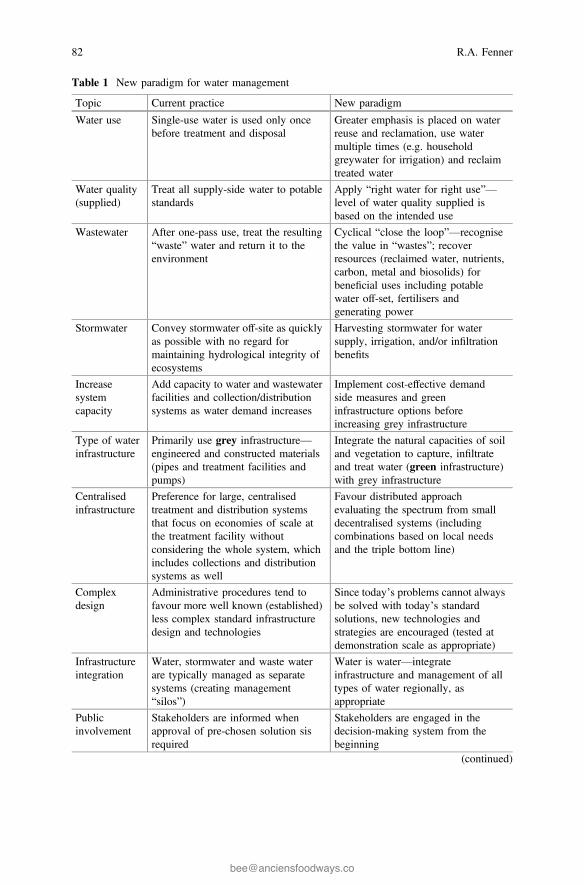
Table 1 New paradigm for water management
Topic Current practice New paradigm
Water use Single-use water is used only oncebefore treatment and disposal
Greater emphasis is placed on waterreuse and reclamation, use watermultiple times (e.g. householdgreywater for irrigation) and reclaimtreated water
Water quality(supplied)
Treat all supply-side water to potablestandards
Apply “right water for right use”—level of water quality supplied isbased on the intended use
Wastewater After one-pass use, treat the resulting“waste” water and return it to theenvironment
Cyclical “close the loop”—recognisethe value in “wastes”; recoverresources (reclaimed water, nutrients,carbon, metal and biosolids) forbeneficial uses including potablewater off-set, fertilisers andgenerating power
Stormwater Convey stormwater off-site as quicklyas possible with no regard formaintaining hydrological integrity ofecosystems
Harvesting stormwater for watersupply, irrigation, and/or infiltrationbenefits
Increasesystemcapacity
Add capacity to water and wastewaterfacilities and collection/distributionsystems as water demand increases
Implement cost-effective demandside measures and greeninfrastructure options beforeincreasing grey infrastructure
Type of waterinfrastructure
Primarily use grey infrastructure—engineered and constructed materials(pipes and treatment facilities andpumps)
Integrate the natural capacities of soiland vegetation to capture, infiltrateand treat water (green infrastructure)with grey infrastructure
Centralisedinfrastructure
Preference for large, centralisedtreatment and distribution systemsthat focus on economies of scale atthe treatment facility withoutconsidering the whole system, whichincludes collections and distributionsystems as well
Favour distributed approachevaluating the spectrum from smalldecentralised systems (includingcombinations based on local needsand the triple bottom line)
Complexdesign
Administrative procedures tend tofavour more well known (established)less complex standard infrastructuredesign and technologies
Since today’s problems cannot alwaysbe solved with today’s standardsolutions, new technologies andstrategies are encouraged (tested atdemonstration scale as appropriate)
Infrastructureintegration
Water, stormwater and waste waterare typically managed as separatesystems (creating management“silos”)
Water is water—integrateinfrastructure and management of alltypes of water regionally, asappropriate
Publicinvolvement
Stakeholders are informed whenapproval of pre-chosen solution sisrequired
Stakeholders are engaged in thedecision-making system from thebeginning
(continued)
82 R.A. Fenner
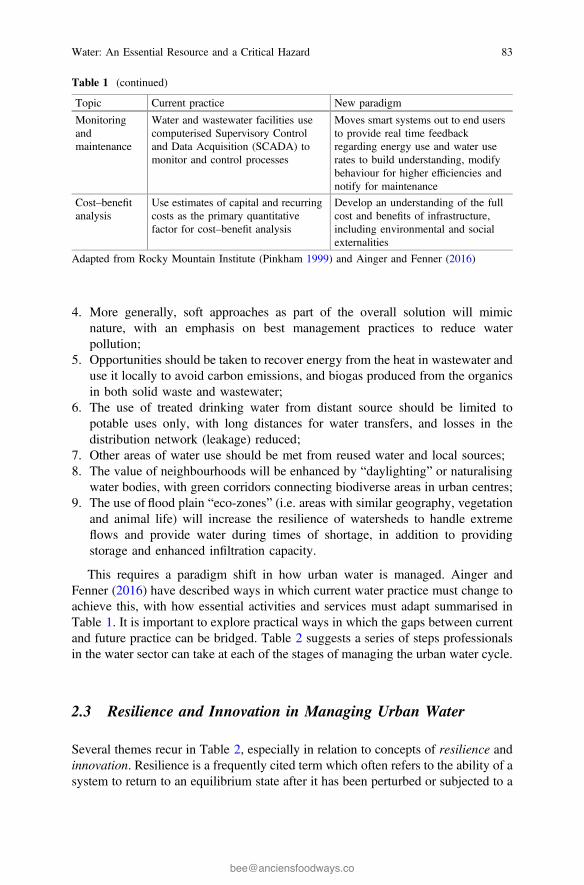
4. More generally, soft approaches as part of the overall solution will mimicnature, with an emphasis on best management practices to reduce waterpollution;
5. Opportunities should be taken to recover energy from the heat in wastewater anduse it locally to avoid carbon emissions, and biogas produced from the organicsin both solid waste and wastewater;
6. The use of treated drinking water from distant source should be limited topotable uses only, with long distances for water transfers, and losses in thedistribution network (leakage) reduced;
7. Other areas of water use should be met from reused water and local sources;8. The value of neighbourhoods will be enhanced by “daylighting” or naturalising
water bodies, with green corridors connecting biodiverse areas in urban centres;9. The use of flood plain “eco-zones” (i.e. areas with similar geography, vegetation
and animal life) will increase the resilience of watersheds to handle extremeflows and provide water during times of shortage, in addition to providingstorage and enhanced infiltration capacity.
This requires a paradigm shift in how urban water is managed. Ainger andFenner (2016) have described ways in which current water practice must change toachieve this, with how essential activities and services must adapt summarised inTable 1. It is important to explore practical ways in which the gaps between currentand future practice can be bridged. Table 2 suggests a series of steps professionalsin the water sector can take at each of the stages of managing the urban water cycle.
2.3 Resilience and Innovation in Managing Urban Water
Several themes recur in Table 2, especially in relation to concepts of resilience andinnovation. Resilience is a frequently cited term which often refers to the ability of asystem to return to an equilibrium state after it has been perturbed or subjected to a
Table 1 (continued)
Topic Current practice New paradigm
Monitoringandmaintenance
Water and wastewater facilities usecomputerised Supervisory Controland Data Acquisition (SCADA) tomonitor and control processes
Moves smart systems out to end usersto provide real time feedbackregarding energy use and water userates to build understanding, modifybehaviour for higher efficiencies andnotify for maintenance
Cost–benefitanalysis
Use estimates of capital and recurringcosts as the primary quantitativefactor for cost–benefit analysis
Develop an understanding of the fullcost and benefits of infrastructure,including environmental and socialexternalities
Adapted from Rocky Mountain Institute (Pinkham 1999) and Ainger and Fenner (2016)
Water: An Essential Resource and a Critical Hazard 83
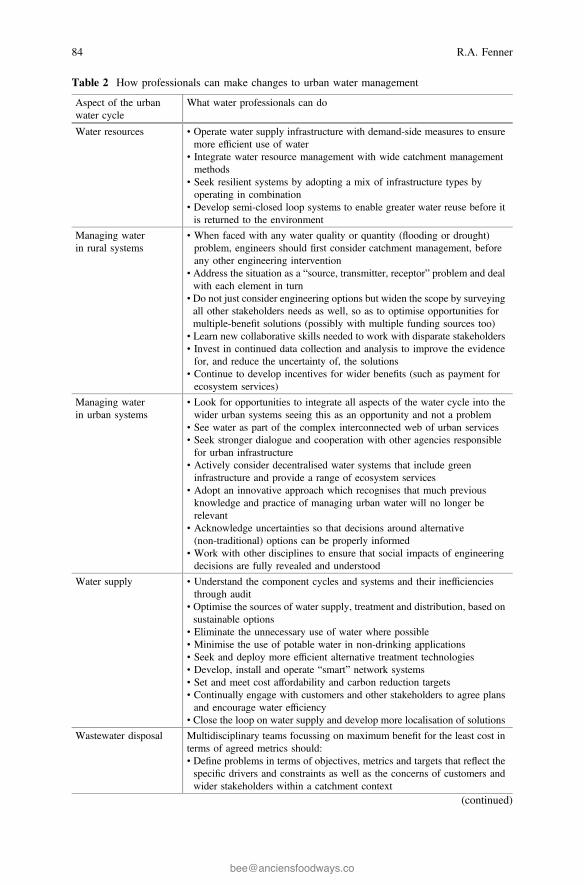
Table 2 How professionals can make changes to urban water management
Aspect of the urbanwater cycle
What water professionals can do
Water resources • Operate water supply infrastructure with demand-side measures to ensuremore efficient use of water
• Integrate water resource management with wide catchment managementmethods
• Seek resilient systems by adopting a mix of infrastructure types byoperating in combination
• Develop semi-closed loop systems to enable greater water reuse before itis returned to the environment
Managing waterin rural systems
• When faced with any water quality or quantity (flooding or drought)problem, engineers should first consider catchment management, beforeany other engineering intervention
• Address the situation as a “source, transmitter, receptor” problem and dealwith each element in turn
• Do not just consider engineering options but widen the scope by surveyingall other stakeholders needs as well, so as to optimise opportunities formultiple-benefit solutions (possibly with multiple funding sources too)
• Learn new collaborative skills needed to work with disparate stakeholders• Invest in continued data collection and analysis to improve the evidencefor, and reduce the uncertainty of, the solutions
• Continue to develop incentives for wider benefits (such as payment forecosystem services)
Managing waterin urban systems
• Look for opportunities to integrate all aspects of the water cycle into thewider urban systems seeing this as an opportunity and not a problem
• See water as part of the complex interconnected web of urban services• Seek stronger dialogue and cooperation with other agencies responsiblefor urban infrastructure
• Actively consider decentralised water systems that include greeninfrastructure and provide a range of ecosystem services
• Adopt an innovative approach which recognises that much previousknowledge and practice of managing urban water will no longer berelevant
• Acknowledge uncertainties so that decisions around alternative(non-traditional) options can be properly informed
• Work with other disciplines to ensure that social impacts of engineeringdecisions are fully revealed and understood
Water supply • Understand the component cycles and systems and their inefficienciesthrough audit
• Optimise the sources of water supply, treatment and distribution, based onsustainable options
• Eliminate the unnecessary use of water where possible• Minimise the use of potable water in non-drinking applications• Seek and deploy more efficient alternative treatment technologies• Develop, install and operate “smart” network systems• Set and meet cost affordability and carbon reduction targets• Continually engage with customers and other stakeholders to agree plansand encourage water efficiency
• Close the loop on water supply and develop more localisation of solutions
Wastewater disposal Multidisciplinary teams focussing on maximum benefit for the least cost interms of agreed metrics should:• Define problems in terms of objectives, metrics and targets that reflect thespecific drivers and constraints as well as the concerns of customers andwider stakeholders within a catchment context
(continued)
84 R.A. Fenner
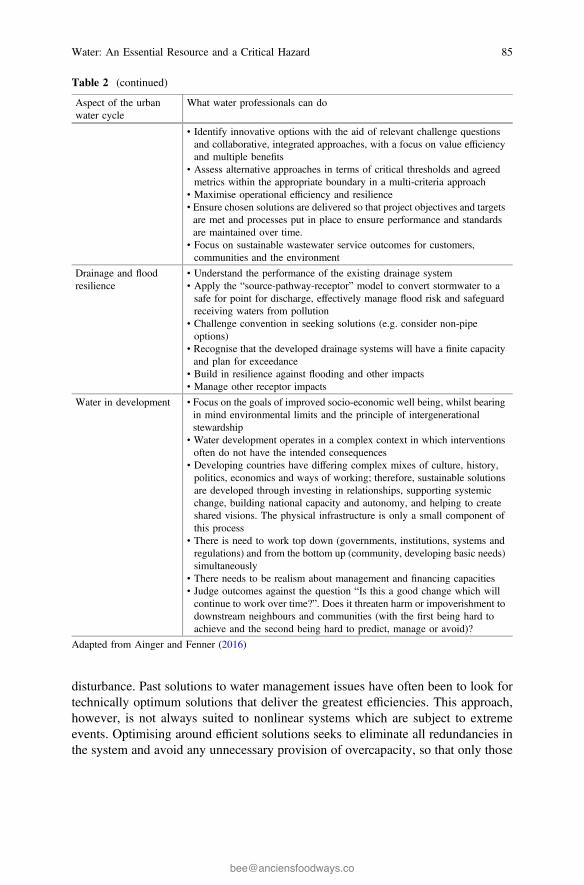
disturbance. Past solutions to water management issues have often been to look fortechnically optimum solutions that deliver the greatest efficiencies. This approach,however, is not always suited to nonlinear systems which are subject to extremeevents. Optimising around efficient solutions seeks to eliminate all redundancies inthe system and avoid any unnecessary provision of overcapacity, so that only those
Table 2 (continued)
Aspect of the urbanwater cycle
What water professionals can do
• Identify innovative options with the aid of relevant challenge questionsand collaborative, integrated approaches, with a focus on value efficiencyand multiple benefits
• Assess alternative approaches in terms of critical thresholds and agreedmetrics within the appropriate boundary in a multi-criteria approach
• Maximise operational efficiency and resilience• Ensure chosen solutions are delivered so that project objectives and targetsare met and processes put in place to ensure performance and standardsare maintained over time.
• Focus on sustainable wastewater service outcomes for customers,communities and the environment
Drainage and floodresilience
• Understand the performance of the existing drainage system• Apply the “source-pathway-receptor” model to convert stormwater to asafe for point for discharge, effectively manage flood risk and safeguardreceiving waters from pollution
• Challenge convention in seeking solutions (e.g. consider non-pipeoptions)
• Recognise that the developed drainage systems will have a finite capacityand plan for exceedance
• Build in resilience against flooding and other impacts• Manage other receptor impacts
Water in development • Focus on the goals of improved socio-economic well being, whilst bearingin mind environmental limits and the principle of intergenerationalstewardship
• Water development operates in a complex context in which interventionsoften do not have the intended consequences
• Developing countries have differing complex mixes of culture, history,politics, economics and ways of working; therefore, sustainable solutionsare developed through investing in relationships, supporting systemicchange, building national capacity and autonomy, and helping to createshared visions. The physical infrastructure is only a small component ofthis process
• There is need to work top down (governments, institutions, systems andregulations) and from the bottom up (community, developing basic needs)simultaneously
• There needs to be realism about management and financing capacities• Judge outcomes against the question “Is this a good change which willcontinue to work over time?”. Does it threaten harm or impoverishment todownstream neighbours and communities (with the first being hard toachieve and the second being hard to predict, manage or avoid)?
Adapted from Ainger and Fenner (2016)
Water: An Essential Resource and a Critical Hazard 85
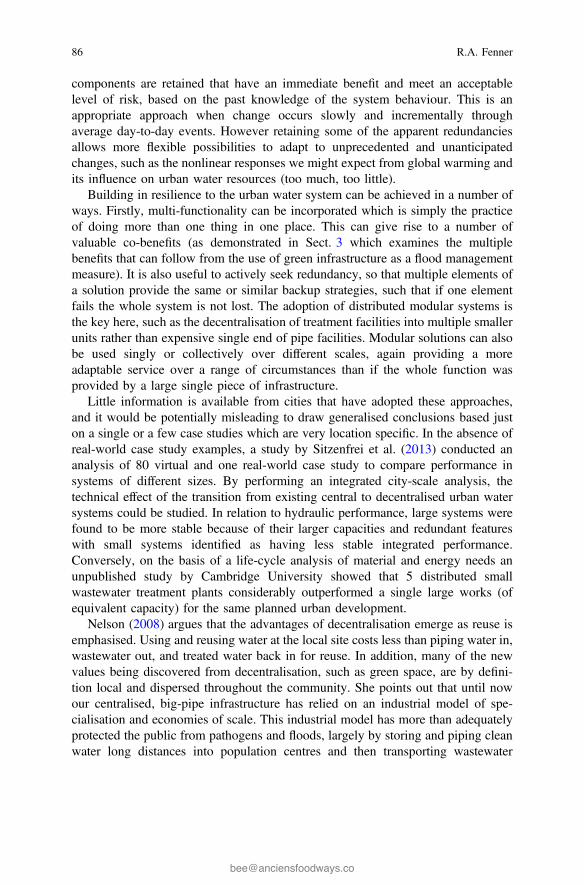
components are retained that have an immediate benefit and meet an acceptablelevel of risk, based on the past knowledge of the system behaviour. This is anappropriate approach when change occurs slowly and incrementally throughaverage day-to-day events. However retaining some of the apparent redundanciesallows more flexible possibilities to adapt to unprecedented and unanticipatedchanges, such as the nonlinear responses we might expect from global warming andits influence on urban water resources (too much, too little).
Building in resilience to the urban water system can be achieved in a number ofways. Firstly, multi-functionality can be incorporated which is simply the practiceof doing more than one thing in one place. This can give rise to a number ofvaluable co-benefits (as demonstrated in Sect. 3 which examines the multiplebenefits that can follow from the use of green infrastructure as a flood managementmeasure). It is also useful to actively seek redundancy, so that multiple elements ofa solution provide the same or similar backup strategies, such that if one elementfails the whole system is not lost. The adoption of distributed modular systems isthe key here, such as the decentralisation of treatment facilities into multiple smallerunits rather than expensive single end of pipe facilities. Modular solutions can alsobe used singly or collectively over different scales, again providing a moreadaptable service over a range of circumstances than if the whole function wasprovided by a large single piece of infrastructure.
Little information is available from cities that have adopted these approaches,and it would be potentially misleading to draw generalised conclusions based juston a single or a few case studies which are very location specific. In the absence ofreal-world case study examples, a study by Sitzenfrei et al. (2013) conducted ananalysis of 80 virtual and one real-world case study to compare performance insystems of different sizes. By performing an integrated city-scale analysis, thetechnical effect of the transition from existing central to decentralised urban watersystems could be studied. In relation to hydraulic performance, large systems werefound to be more stable because of their larger capacities and redundant featureswith small systems identified as having less stable integrated performance.Conversely, on the basis of a life-cycle analysis of material and energy needs anunpublished study by Cambridge University showed that 5 distributed smallwastewater treatment plants considerably outperformed a single large works (ofequivalent capacity) for the same planned urban development.
Nelson (2008) argues that the advantages of decentralisation emerge as reuse isemphasised. Using and reusing water at the local site costs less than piping water in,wastewater out, and treated water back in for reuse. In addition, many of the newvalues being discovered from decentralisation, such as green space, are by defini-tion local and dispersed throughout the community. She points out that until nowour centralised, big-pipe infrastructure has relied on an industrial model of spe-cialisation and economies of scale. This industrial model has more than adequatelyprotected the public from pathogens and floods, largely by storing and piping cleanwater long distances into population centres and then transporting wastewater
86 R.A. Fenner
pollutants away. But the approach is also wasteful, environmentally disruptive, andultimately not sustainable as populations increase and more and more land isdeveloped over time. Climate change-related extremes of heavy storms anddroughts will place even greater stresses on this centralised, natural-manmade watersystem that have uncritically been built piece by piece.
Achieving new ways of thinking which advocate and adopt such approachesrequires a new innovation mindset in delivery and management of water in urbanenvironments, which will be a key feature in building cities of the future. Aingerand Fenner (2016) review much good practice that already exists and summariseimportant actions that can be taken to innovate towards sustainability. This beginsby integrating and making sense of the sustainability challenges that must be met inany wider urban strategy or policy arena (specifically working within resourcelimits, improving socio-economic conditions of people, balancing present andfuture needs and recognising complexities, inter-dependencies and the feedbackloops these give rise to). To guide innovation, a future vision and clear strategy isrequired with stretching goals and targets against which performance is continuallymeasured and judged. In seeking new solutions, it is always good practice to be alittle more ambitious than may seem possible. Importantly, individuals need to beempowered to get on with innovation, from water company employees, customers,supply chains and local water users such as businesses and communities. It isimportant to understand the roles each of these stakeholder groups play, so they canbe innovation champions and leaders creating the demand and purpose for change.
An essential ingredient is to tolerate and not stigmatise failure, whilst learningfrom it. This is at the heart of an adaptive management approach to water whichallows small failures to be made in an iterative process described sometimes as“Do-Fix-Learn”. Problems need to be fully understood before solutions are gen-erated or accepted and this can be coupled with creating new measurement systemsto meet new goals (such as understanding the carbon footprint of an asset in orderto choose systems which reduce the water industry impact on global warming).Another innovation is to make the most use of current assets by actively looking forways to not build new capacity, but to be smarter about using the capacity thatalready exists. In order to make nuanced and transparent solution choices, moreeffort should be directed at understanding and quantifying uncertainty and risk.Sometimes understanding a problem in a different way can be a driver for a newapproach and avoid a risk averse barrier that holds back new thinking. Finally,opportunities exist for sharing best practice and ideas with other sectors, such as inagriculture and energy.
Overall, the most effective sustainable solutions need to improve the end users’water service, protect the environment and increase affordability. This may wellinvolve helping a water company’s customers to use less water, setting challengingcarbon emissions reduction targets (as well as cost reduction targets and seekingsolutions across the interfaces with customers and with the surrounding urban areasand catchments).
Water: An Essential Resource and a Critical Hazard 87
Ainger and Fenner (2016) conclude: “Looking at sustainability enabling action itis striking how they interact with and reinforce each other. Outcomes regulationwith collaboration can open up the problem space for more sustainable multi-benefit solutions. Measurement standardisation and new boundaries for targets likeCO2-e can widen the sustainability targets and performance driven by that regu-lation. Clever modelling and data analysis can help understanding and prediction,and thus reduce uncertainty in using management based solutions with the com-plexity of asset operations and customer interaction. Procurement innovation canbring together and incentivise the whole value chain to use all of these approaches”.
3 The Challenges for the Future
In establishing key goals which drive all of the above, the following is adapted fromthe UK Water Industry Research search for big questions which will drive the waterindustry forward to 2050 (UKWIR 2015). They represent big goals intended toinspire long-term strategy:
1. 100% universal affordable access to water and sanitation;2. Zero leakage;3. Zero unnecessary water use;4. Zero agricultural/urban pollution of into rivers, lakes and seas;5. 100% appropriate quality water for potable and other uses;6. 100% separation of surface water from foul sewage;7. Zero pollution discharge exceeding local environmental capacity;8. 100% recovery of all potential resources from sewage streams;9. Zero net carbon emissions;
10. Zero flooding risk beyond local resilience capacities;11. 100% evidence-based justification for all standards and business structures.
Achieving this will require a paradigm shift in the way water is managed in cities.Water management has always changed and evolved to meet new concerns andconstraints. In the ancient world, attention focused on basic water supply to meetlocal needs. Moving forward to the Middle Ages saw the engineered conveyance ofwater supply and runoff through early pipe systems. This seriously impacted on thequality of receiving waters, and there were widespread epidemics from waterbornediseases. From the mid-nineteenth century, faster and longer conveyance of waterbecame common, whilst treatment processes were developed to protect both publichealth and the environment. The current approach is driven by environmentalregulation and also recognises the importance of non-point source pollution andnutrient recovery. New technologies in wastewater reclamation and reuse, energyrecovery and the development of green buildings are enabling a further shift inwater management. The future lies in applying the principles of integrated resourcemanagement (IRM) where “Blue-Green” Cities and their infrastructure will com-bine drainage, landscape and receiving waters in an aesthetically desirable way.
88 R.A. Fenner
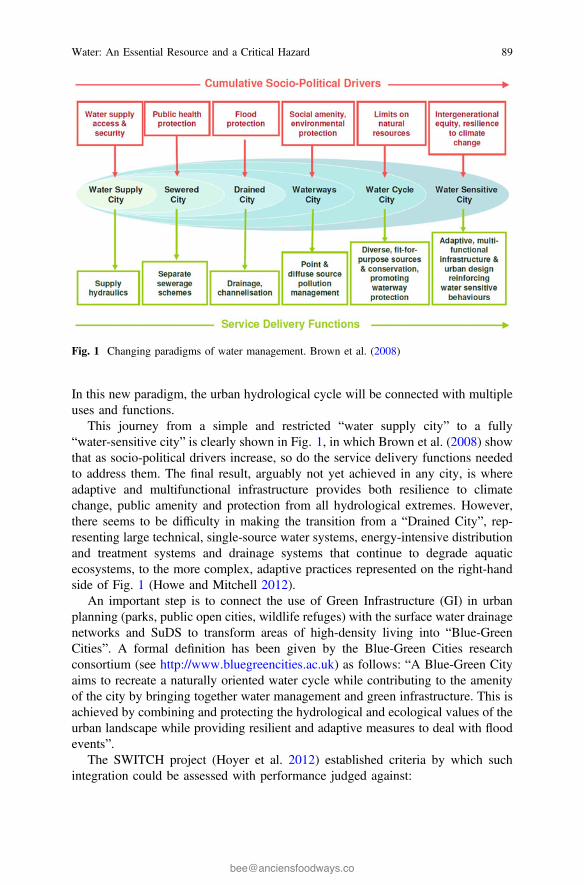
In this new paradigm, the urban hydrological cycle will be connected with multipleuses and functions.
This journey from a simple and restricted “water supply city” to a fully“water-sensitive city” is clearly shown in Fig. 1, in which Brown et al. (2008) showthat as socio-political drivers increase, so do the service delivery functions neededto address them. The final result, arguably not yet achieved in any city, is whereadaptive and multifunctional infrastructure provides both resilience to climatechange, public amenity and protection from all hydrological extremes. However,there seems to be difficulty in making the transition from a “Drained City”, rep-resenting large technical, single-source water systems, energy-intensive distributionand treatment systems and drainage systems that continue to degrade aquaticecosystems, to the more complex, adaptive practices represented on the right-handside of Fig. 1 (Howe and Mitchell 2012).
An important step is to connect the use of Green Infrastructure (GI) in urbanplanning (parks, public open cities, wildlife refuges) with the surface water drainagenetworks and SuDS to transform areas of high-density living into “Blue-GreenCities”. A formal definition has been given by the Blue-Green Cities researchconsortium (see http://www.bluegreencities.ac.uk) as follows: “A Blue-Green Cityaims to recreate a naturally oriented water cycle while contributing to the amenityof the city by bringing together water management and green infrastructure. This isachieved by combining and protecting the hydrological and ecological values of theurban landscape while providing resilient and adaptive measures to deal with floodevents”.
The SWITCH project (Hoyer et al. 2012) established criteria by which suchintegration could be assessed with performance judged against:
Fig. 1 Changing paradigms of water management. Brown et al. (2008)
Water: An Essential Resource and a Critical Hazard 89
i. water sensitivity (the extent to which management practices bring urban watercloser to the natural water cycle);
ii. aesthetics (flood water visibility in public spaces—integration into the sur-rounding area);
iii. functionality (appropriate site-specific design and maintenance and adaptableto changing baseline conditions, including climate and demographics);
iv. usability (both recreational and conservational purposes);v. public perception and acceptance (public involvement in the planning process,
and acceptable whole life costs);vi. integrative planning (combining function, aesthetics and use through inter-
disciplinary planning to improve public acceptability of Flood RiskManagement measures).
The SWITCH project also highlights many examples of best practice in urban watermanagement from cities across four continents—Lima, Santiago de Cali, Bogota,Belo Horizonte, Accra, Alexandria, Birmingham, Zaragoza, Hamburg, Lodz, TelAviv, and Beijing, which is reported by Butterworth et al. (2011). The focus is onpromoting stakeholder engagement through the creation of learning action allianceswhich can promote and hasten the transition to the new practices and approachesreviewed in this chapter.
3.1 Blue-Green Cities and Water-Sensitive Urban Design
These approaches are gaining traction around the world. In 2016 Newcastledeclared it will adopt policies which will make it the first Blue-Green City in theUK. Stakeholders in the city ranging from Newcastle Council, the EnvironmentAgency, Northumbrian Water and land owners and developers are meeting regu-larly in a Learning Action Alliance collectively to develop this vision for the city.
Portland, Oregon, has been at the forefront of such initiatives for some yearswith a “grey to green” downspout disconnection programme aimed at relievingpressure on pipe networks operating above their design capacity and alleviatingcombined sewer overflow (CSO) spills into the Willamette River. Insteadstormwater is handled at source and fed to a series of attractive street gardens,wetlands and bioswales. Bioswales are long, channelled depressions or trencheswith gently sloped sides (less than 6%) and filled with vegetation, compost and/orriprap that receive rainwater runoff (e.g. from paved parking areas) and utilisegrasses, flowering herbs, and shrubs and organic matter (such as mulch) to slowwater infiltration and filter out pollutants. Examples of street gardens and wetlandplanting in Portland are shown in Fig. 2.
Stuttgart in Germany saves costs of stormwater management through theapplication of green roofs, cisterns and pervious pavement instead of enlargingsewer system for rainwater drainage. The Augustenborg area of Malmo in Swedenhas achieved considerable socio-economic regeneration through a process of
90 R.A. Fenner
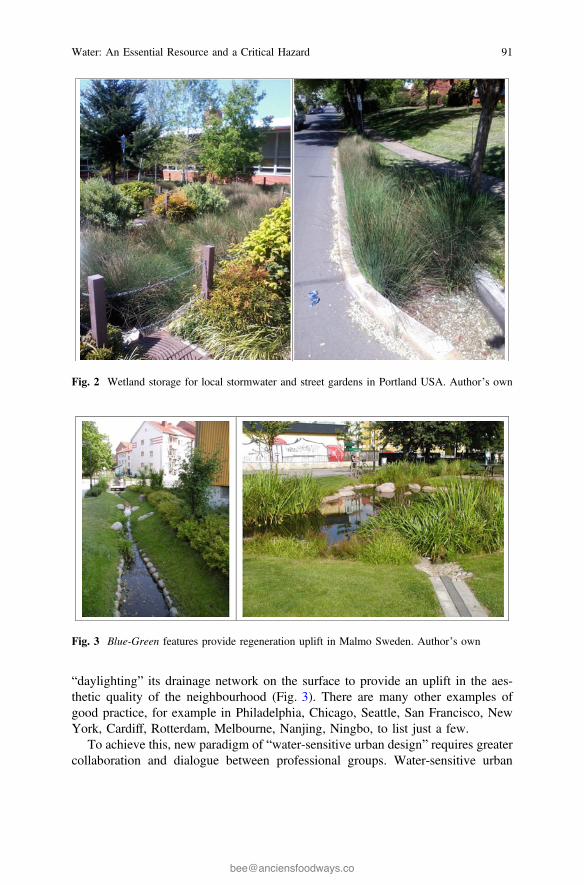
“daylighting” its drainage network on the surface to provide an uplift in the aes-thetic quality of the neighbourhood (Fig. 3). There are many other examples ofgood practice, for example in Philadelphia, Chicago, Seattle, San Francisco, NewYork, Cardiff, Rotterdam, Melbourne, Nanjing, Ningbo, to list just a few.
To achieve this, new paradigm of “water-sensitive urban design” requires greatercollaboration and dialogue between professional groups. Water-sensitive urban
Fig. 2 Wetland storage for local stormwater and street gardens in Portland USA. Author’s own
Fig. 3 Blue-Green features provide regeneration uplift in Malmo Sweden. Author’s own
Water: An Essential Resource and a Critical Hazard 91
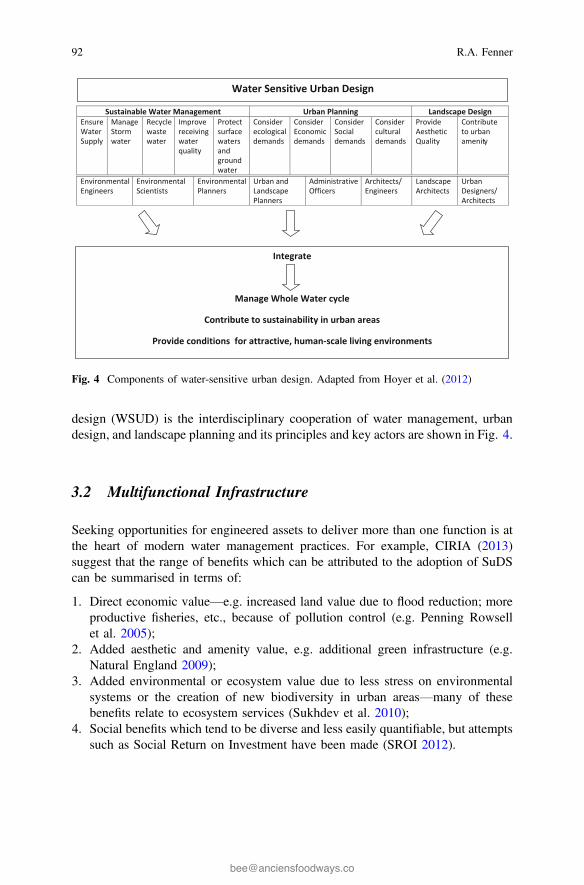
design (WSUD) is the interdisciplinary cooperation of water management, urbandesign, and landscape planning and its principles and key actors are shown in Fig. 4.
3.2 Multifunctional Infrastructure
Seeking opportunities for engineered assets to deliver more than one function is atthe heart of modern water management practices. For example, CIRIA (2013)suggest that the range of benefits which can be attributed to the adoption of SuDScan be summarised in terms of:
1. Direct economic value—e.g. increased land value due to flood reduction; moreproductive fisheries, etc., because of pollution control (e.g. Penning Rowsellet al. 2005);
2. Added aesthetic and amenity value, e.g. additional green infrastructure (e.g.Natural England 2009);
3. Added environmental or ecosystem value due to less stress on environmentalsystems or the creation of new biodiversity in urban areas—many of thesebenefits relate to ecosystem services (Sukhdev et al. 2010);
4. Social benefits which tend to be diverse and less easily quantifiable, but attemptssuch as Social Return on Investment have been made (SROI 2012).
Sustainable Water Management Urban Planning Landscape DesignEnsure WaterSupply
Manage Storm water
Recycle waste water
Improve receiving water quality
Protect surface watersand ground water
Consider ecological demands
Consider Economic demands
Consider Social demands
Consider cultural demands
Provide Aesthetic Quality
Contribute to urban amenity
Environmental Engineers
Environmental Scientists
Environmental Planners
Urban and Landscape Planners
Administrative Officers
Architects/ Engineers
Landscape Architects
Urban Designers/ Architects
Water Sensitive Urban Design
Integrate
Manage Whole Water cycle
Contribute to sustainability in urban areas
Provide conditions for attractive, human-scale living environments
Fig. 4 Components of water-sensitive urban design. Adapted from Hoyer et al. (2012)
92 R.A. Fenner
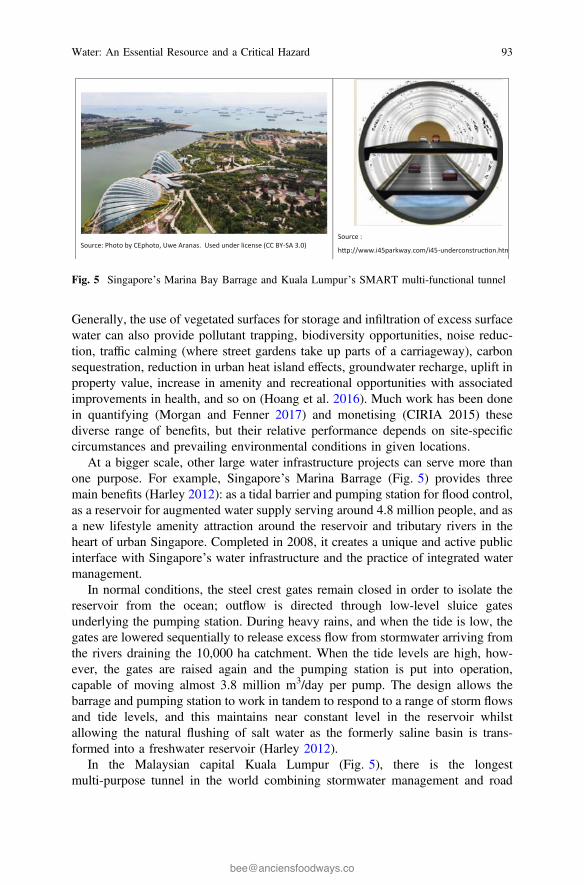
Generally, the use of vegetated surfaces for storage and infiltration of excess surfacewater can also provide pollutant trapping, biodiversity opportunities, noise reduc-tion, traffic calming (where street gardens take up parts of a carriageway), carbonsequestration, reduction in urban heat island effects, groundwater recharge, uplift inproperty value, increase in amenity and recreational opportunities with associatedimprovements in health, and so on (Hoang et al. 2016). Much work has been donein quantifying (Morgan and Fenner 2017) and monetising (CIRIA 2015) thesediverse range of benefits, but their relative performance depends on site-specificcircumstances and prevailing environmental conditions in given locations.
At a bigger scale, other large water infrastructure projects can serve more thanone purpose. For example, Singapore’s Marina Barrage (Fig. 5) provides threemain benefits (Harley 2012): as a tidal barrier and pumping station for flood control,as a reservoir for augmented water supply serving around 4.8 million people, and asa new lifestyle amenity attraction around the reservoir and tributary rivers in theheart of urban Singapore. Completed in 2008, it creates a unique and active publicinterface with Singapore’s water infrastructure and the practice of integrated watermanagement.
In normal conditions, the steel crest gates remain closed in order to isolate thereservoir from the ocean; outflow is directed through low-level sluice gatesunderlying the pumping station. During heavy rains, and when the tide is low, thegates are lowered sequentially to release excess flow from stormwater arriving fromthe rivers draining the 10,000 ha catchment. When the tide levels are high, how-ever, the gates are raised again and the pumping station is put into operation,capable of moving almost 3.8 million m3/day per pump. The design allows thebarrage and pumping station to work in tandem to respond to a range of storm flowsand tide levels, and this maintains near constant level in the reservoir whilstallowing the natural flushing of salt water as the formerly saline basin is trans-formed into a freshwater reservoir (Harley 2012).
In the Malaysian capital Kuala Lumpur (Fig. 5), there is the longestmulti-purpose tunnel in the world combining stormwater management and road
Source: Photo by CEphoto, Uwe Aranas. Used under license (CC BY-SA 3.0)Source :
h p://www.i45parkway.com/i45-underconstruc on.htm
Fig. 5 Singapore’s Marina Bay Barrage and Kuala Lumpur’s SMART multi-functional tunnel
Water: An Essential Resource and a Critical Hazard 93
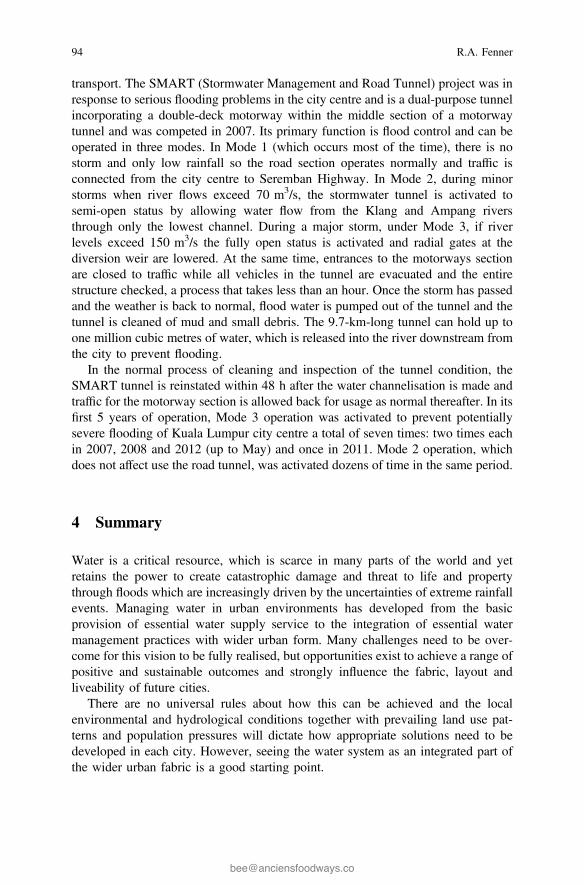
transport. The SMART (Stormwater Management and Road Tunnel) project was inresponse to serious flooding problems in the city centre and is a dual-purpose tunnelincorporating a double-deck motorway within the middle section of a motorwaytunnel and was competed in 2007. Its primary function is flood control and can beoperated in three modes. In Mode 1 (which occurs most of the time), there is nostorm and only low rainfall so the road section operates normally and traffic isconnected from the city centre to Seremban Highway. In Mode 2, during minorstorms when river flows exceed 70 m3/s, the stormwater tunnel is activated tosemi-open status by allowing water flow from the Klang and Ampang riversthrough only the lowest channel. During a major storm, under Mode 3, if riverlevels exceed 150 m3/s the fully open status is activated and radial gates at thediversion weir are lowered. At the same time, entrances to the motorways sectionare closed to traffic while all vehicles in the tunnel are evacuated and the entirestructure checked, a process that takes less than an hour. Once the storm has passedand the weather is back to normal, flood water is pumped out of the tunnel and thetunnel is cleaned of mud and small debris. The 9.7-km-long tunnel can hold up toone million cubic metres of water, which is released into the river downstream fromthe city to prevent flooding.
In the normal process of cleaning and inspection of the tunnel condition, theSMART tunnel is reinstated within 48 h after the water channelisation is made andtraffic for the motorway section is allowed back for usage as normal thereafter. In itsfirst 5 years of operation, Mode 3 operation was activated to prevent potentiallysevere flooding of Kuala Lumpur city centre a total of seven times: two times eachin 2007, 2008 and 2012 (up to May) and once in 2011. Mode 2 operation, whichdoes not affect use the road tunnel, was activated dozens of time in the same period.
4 Summary
Water is a critical resource, which is scarce in many parts of the world and yetretains the power to create catastrophic damage and threat to life and propertythrough floods which are increasingly driven by the uncertainties of extreme rainfallevents. Managing water in urban environments has developed from the basicprovision of essential water supply service to the integration of essential watermanagement practices with wider urban form. Many challenges need to be over-come for this vision to be fully realised, but opportunities exist to achieve a range ofpositive and sustainable outcomes and strongly influence the fabric, layout andliveability of future cities.
There are no universal rules about how this can be achieved and the localenvironmental and hydrological conditions together with prevailing land use pat-terns and population pressures will dictate how appropriate solutions need to bedeveloped in each city. However, seeing the water system as an integrated part ofthe wider urban fabric is a good starting point.
94 R.A. Fenner
References
Ainger C, Fenner RA (2016) Sustainable Water ICE Publishing. ISBN:978-0-7277-5773-9Ban Ki Moon (2011) Address to the 66th general assembly: “We the Peoples” secretary-general
Ban Ki-moon, General Assembly. 21 Sept 2011Beddington J (2009) Food, energy, water and the climate: a perfect storm of global events
Government Office for Science Kingsgate House, pp 66–74, Victoria Street London. http://www.webarchive.nationalarchives.gov.uk/20121212135622, http://www.bis.gov.uk/assets/goscience/docs/p/perfect-storm-paper.pdf
Bliss L (2015) A look inside the largest desalination plant in the western hemisphere see TheAtlantic City Lab at: http://www.citylab.com/tech/2015/12/a-look-inside-the-largest-desalination-plant-in-the-western-hemisphere/420501/
Brown R, Keath N, Wong T (2008) Transitioning to water sensitive cities: historical, current andfuture transition states. In: Presented at 11th international conference on urban drainage,Edinburgh, UK
Butterworth J, McIntyre, da Silva Wells C (2011) SWITCH in the city: putting urban watermanagement to the test IRC International Water and Sanitation Centre The Hague, TheNetherlands. http://www.switchurbanwater.eu/outputs/pdfs/SWITCH_in_the_city.pdf
CIRIA Research Project RP993 Demonstrating the multiple benefits of SuDS—a business case(Phase 2) Draft Literature Review (October 2013). http://www.susdrain.org/files/resources/ciria_guidance/ciria_rp993_literature_review_october_2013_.pdf
Cirilli A, Veneri P (2014) Spatial structure and a carbon dioxide (CO2) emissions due tocommuting: an analysis of Italian urban areas. Reg Stud 48:12
Curmi E, Richards K, Fenner RA, Allwood JM, Kopec G, Bajželj B (2013a) An integratedrepresentation of the services provided by global water resources. J Environ Manage 129(2013):456–462
Curmi E, Richards K, Fenner RA, Allwood JM, Kopec G, Bajželj B (2013b) Visualising astochastic model of californian water resources using Sankey diagrams. Water Resour Manag27:3035–3050. doi:10.1007/s11269-013-0331-2
Defra (2016) Creating a great place for living Enabling resilience in the water sector Department ofEnvironment, Food and Rural Affairs, UK. https://www.gov.uk/government/uploads/system/uploads/attachment_data/file/504681/resilience-water-sector.pdf
FAO (2008) Crop prospects and food situation, 3 July 2008. FAO, Rome, ItalyHarley B (2012) Singapore’s marina barrage and reservoir—changing mindsets in urban solutions.
Chapter 11 In Water Sensitive Cities ed Carol Howe and Cynthia Mitchell Cities of FutureSeries IWA Publishing, London. ISBN:9781843393641
Hoang L, Fenner R, Skenderian M (2016) A conceptual approach for evaluating the multiplebenefits of urban flooding management practice. J Flood Risk Manag. doi:10.1111/jfr3.12267
Howe CJ, Butterworth J, Smout I, Duffy AM, Vairavamoorthy K (2012) Findings from theSWITCH project 2006-2011 SWITCH sustainable water management in the city of the futureUNESCO-IHE, The Netherlands. ISBN:978-90-73445 -00 -0
Howe C, Mitchell C (2012) Water sensitive cities. cities of the future series international waterassociation. IWA Publishing, London. ISBN:9781843393641
Hoyer J, Dickhaut W, Kronawitter L, Weber B (2012) Water sensitive urban design principles andinspiration for sustainable stormwater management in the city of the future manual. SWITCHsustainable water management in the city of the future UNESCO-IHE HafenCity UniversitätHamburg (HCU). http://www.switchurbanwater.eu/outputs/pdfs/W5-1_GEN_MAN_D5.1.5_Manual_on_WSUD.pdf
IEA (2008) World energy outlook 2008. International Energy Agency, Paris, FranceIntergovernmental Panel on Climate Change (2015) Climate change 2014 Synthesis report First
Published 2015. ISBN:978-92-9169-143-2. https://www.ipcc.ch/
Water: An Essential Resource and a Critical Hazard 95
Kofi Annan UN Statement, June 2003Morgan M, Fenner RA (2017) A spatial approach to evaluating the multiple benefits of blue green
infrastructure. J Water Manag. In: Proceedings of ICE (Ahead of Print), pp. 1–14. Publishedonline June 7, 2017. https://doi.org/10.1680/jwama.16.00048
Natural England (2009) Green infrastructure guidance NE176. Natural England, York, UKNelson V (2008) New approaches in decentralized Water infrastructure. National Decentralized
Water Resources Capacity Development Project (NDWRCDP) Coalition for AlternativeWastewater Treatment, Gloucester. http://www.ndwrcdp.org/documents/04-dec-5sg/04dec5report.pdf
Novotny V, Ahern J, Brown P (2010) Water centric sustainable communities. Planning, retrofittingand building the next urban environment. Wiley, Englewood
Novotny V, Brown P (eds) (2007) Cities of the future: towards integrated sustainable water andlandscape management. IWA Publishing, London
OECD (2015a) Water and cities, ensuring sustainable futures OECD studies in water OECDPublishing, Paris. http://www.gbv.de/dms/zbw/825946514.pdf
OECD (2015b) “OECD Principles on Water Governance” brochure OECD Paris. https://www.oecd.org/gov/regional-policy/OECD-Principles-on-Water-Governance-brochure.pdf
OECD (2016) Water governance in cities OECD studies in water OECD Publishing, Paris.ISBN:978-92-64-25108-3, http://www.pseau.org/outils/ouvrages/ocde_water_governance_in_cities_2016.pdf
Padowski JC, Gorelick SM (2014) Global analysis of urban surface water supply vulnerability.Environ Res Lett 9(10):104004
Penning Rowsell E, Tapsell S, Johnson C, Wilson T (2005) Development of economic appraisalmethods for flood management and coastal erosion protection Joint Defra/EA Flood andCoastal Erosion Risk Management R&D Programme. http://www.evidence.environment-agency.gov.uk/FCERM/Libraries/FCERM_Project_Documents/FD2014_3861_TRP_pdf.sflb.ashx
Pinkham R (1999) 21st Century water systems: scenarios, visions and drivers. Rocky MountainInstitute, Snowmass
Pitt M (2008) The Pitt review: learning lessons from the 2007 floods. http://www.webarchive.nationalarchives.gov.uk/20100807034701, http://www.archive.cabinetoffice.gov.uk/pittreview/_/media/assets/www.cabinetoffice.gov.uk/flooding_review/pitt_review_full%20pdf.pdf
SEPA (2000) Watercourse in the community. A guide to the sustainable watercourse managementin urban environments. Published by Scottish Environment Agency. https://www.sepa.org.uk/media/151349/watercourses_in_the_community.pdf
Shen Y, Oki T, Utsumi N, Kanae S, Hanasaki N (2008) Projection of future world water resourcesunder SRES scenarios: water withdrawal. Hydrol Sci 53(1):11–33
Sitzenfrei R, Moderl M, Rauch W (2013) Assessing the impact of transitions from centralised todecentralised water solutions on existing infrastructures—Integrated city-scale analysis withVIBe. Water Res 47(20):7251–7263
SROI (2012) A guide to social return on investment. Cabinet Office and New EconomicsFoundation
Sugarman M (2016) Developing a new water resource in the South East region. London and SouthEast expert water panel. Institution of Civil Engineers. https://www.ice.org.uk/getattachment/near-you/uk/south-east-england/publications/new-water-resource-in-the-south-east-england/Developing-a-New-Water-Resource-in-the-South-East-Region.pdf.aspx
Sukhdev et al (2010) The economics of ecosystems and biodiversity: mainstreaming theeconomics of nature: a synthesis of the approach, conclusions and recommendations of TEEB.TEEB Team, United Nations Environment Programme for the European Commission.ISBN:978-3-98134-103-4
UKWIR (2015) Three big questions UKWIR news March 2015 Issue 74
96 R.A. Fenner

UNDP (2006) Human development report 2006: beyond scarcity: power, poverty and the GlobalWater Crisis 2006 United Nations Development Programme 1 UN Plaza, New York, NewYork, 10017, USA. ISBN:0-230-50058-7
UNDP (2015) Sustainable development goals. http://www.undp.orgWHO/UNICEF (2009) Diarrhoea: why children are dying and what can still be done. The United
Nations Children’s Fund (UNICEF)/World Health Organization (WHO). ISBN:978-92-806-4462-3 (UNICEF)
Water: An Essential Resource and a Critical Hazard 97

Health and Well-being in UrbanEnvironments
Anja Mizdrak and Adam John Ritchie
Abstract As more people move into urban environments, so grows the negativeimpacts of city living on human health. Yet we need not be passive victims of thisrelationship; governments and communities can take steps to make things workbetter and ensure improved health outcomes. This chapter explores the concept ofthe Healthy City and the scale of the global challenges being faced. It draws on casestudies from Africa, Europe, and South America that focus on successes inimproving physical activity and nutrition, to show how these challenges can beovercome.
1 Introduction
Globally, health is still improving: life expectancy at birth has increased by 6 yearssince 1990 (World Health Organisation 2011) and there has been a 48% drop inchild mortality in the same timeframe (Institute for Health Metrics and Evaluation2014). However, there is considerable variation in these patterns at regional,national, and local levels. Differing rates and natures of urbanisation influence thisvariation, with cities presenting both challenges and opportunities for health andwell-being.
Given the high and increasing proportion of the global population that live inurban areas, it is vital that cities play a positive role in promoting health andwell-being. In this chapter, we will discuss how cities influence the health of thepopulations within them. We start by arguing that cities’ impacts on health fall
A. Mizdrak (&)Department of Public Health, University of Otago, Wellington, New Zealande-mail: [email protected]
A.J. RitchieThe Jenner Institute and The Blavatnik School of Government,University of Oxford, Oxford, UKe-mail: [email protected]
© Springer International Publishing AG 2017J. Bishop (ed.), Building Sustainable Cities of the Future,Green Energy and Technology, DOI 10.1007/978-3-319-54458-8_6
99
along a continuum. At one end of this continuum are health impacts that are causedby the urban environment. At the other are health issues that are fundamental to allpeople, regardless of where they live. Understanding the nature of the impact ofcities and urbanisation on health issues along this continuum can help ensure thatwe are better able to address health challenges. We proceed by looking at theconcept of a healthy city and what this might mean for citizens. We then examinethe issues of physical inactivity and food security and how the urban environmentcan both help and hinder health promotion. Throughout, we give city-levelexamples from a range of contexts to illustrate how the urban environment could bebetter adapted to promote health.
The multitude of health risks, diversity in urban environments, and range ofsolutions available have meant that it has not been possible to cover everything. Inthis chapter, we focus mostly on the impact of urbanisation on non-communicable,physical diseases, yet infectious diseases, mental health, and social inclusion allhave major impacts on well-being in most urban centres. The World HealthOrganisation defines health as a “complete state of social, mental and physicalwell-being and not merely the absence of disease or infirmity” (World HealthOrganisation 2006), and anyone influencing the lives of urban citizens should keepthis broad definition in mind when considering the impacts of policies. We hopethat the concepts that we discuss, and the case studies we provide, will serve toillustrate the nature of the relationships between urbanisation and health beyond thespecific cases and risks discussed.
2 The Links Between Health and Urbanisation
Non-communicable diseases such as heart diseases, stroke, and cancers account for88% of deaths in developed countries and 64% in developing countries (Institute forHealth Metrics and Evaluation 2015). Overall, seventy per cent of global deathswere attributed to non-communicable diseases in 2013, an absolute increase of 13%from 1990 (Institute for Health Metrics and Evaluation 2015). The high andincreasing burden of non-communicable diseases relative to communicable diseasesis in part a reflection of the tremendous successes in addressing the latter. Theburden of communicable diseases has decreased due to improvements in livingconditions (including sanitation), widespread primary prevention through vacci-nation, improved treatments and access to healthcare.
The changing global patterns of disease are also the result of changing lifestylepatterns that are associated with increasing urbanisation and linked to increases inthe risk of non-communicable diseases (Angkurawaranon et al. 2014). Risk factorsthat contribute to the development of non-communicable diseases include poor diet(e.g. low fruit and vegetable intake, high sodium intake), smoking, low physicalactivity, overweight and obesity, high blood pressure, alcohol intake, and air pol-lution. These are consequently the risk factors that are the most important to address
100 A. Mizdrak and A.J. Ritchie
if overall improvements in health are to be maximised, though the relativeimportance of each of these, plus other location specific factors, will vary from cityto city.
The impact of cities on health has been discussed since ancient times, with thebalance and nature of these impacts varying across time and space. Ancient Greekand Roman scholars noted that living in a bad city, or in a bad location in a goodcity, could have negative health impacts (Hope and Marshall 2000). Innineteenth-century Britain, town dwellers had considerably worse health outcomesthan their rural counterparts, including a 2.2 times higher infant mortality rate(Godfrey and Julien 2005). In contrast, in the Southeast Asia region today, urbancentres generally have more positive indices of health and healthcare services andare marked by economic prosperity (World Health Organisation Regional Office forSouth-East Asia 2011). Within a city, there can be considerable variation in thehealth status of different populations. Even in modern, developed cities such asLondon, life expectancy at birth ranges from 75 to 96 across different areas(Cheshire 2012). This illustrates that cities do not have a constant impact on health,and the health impact that they have is modifiable.
Cities have a direct impact on the health of their citizens through a variety ofprocesses. Increases in population density can enable infectious disease transmis-sion (Neiderud 2015). City dwellers have a higher rate of mental health disorders(Peen et al. 2010). Urban sprawl results in an increased reliance on mechanisedtransport, reducing physical activity rates and increasing air pollution. The inade-quate separation of pedestrians, cyclists, and motorised vehicles contributes toincreased road traffic accidents, the seventh leading cause of death worldwide andthe second leading cause of death for 15–49 year olds (Institute for Health Metricsand Evaluation 2015). Associations have been observed between urban environ-ments and range of risk factors for cardiovascular disease (Sun et al. 2015). Theseexamples serve to illustrate that at one end of the continuum of the impact of citieson health there are direct, causal relationships between the urban environment andhealth risk. These direct impacts of urbanisation need not be negative: higherpopulation densities make it easier to deliver many health services, and urbanenvironments dramatically reduce transmission of some vector-borne diseases suchas malaria (Hay et al. 2005).
There is also a wide-range of health issues which are not caused by the urbanenvironment directly, but that nevertheless need to be addressed there. Access tosafe, affordable, and nutritious food is necessary to ensure healthy dietary practicesregardless of location. Basic health services such as vaccination, family planning,and screening need to be implemented universally. At this end of the continuum ofthe impact of cities on health, the city is passive and provides the environment toaddress existing health issues and practices. However, the urban environment inpart influences even these universal health needs. For example, dietary practices arelimited by the availability of food items, which in turn is partly determined by townplanning policies regarding store location, transport infrastructure, and the broadereconomic climate of an urban area.
Health and Well-being in Urban Environments 101
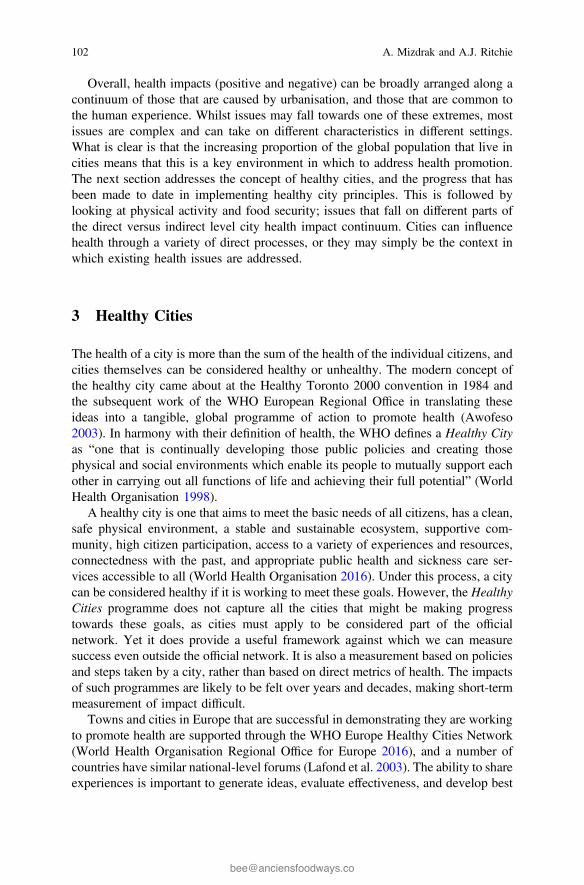
Overall, health impacts (positive and negative) can be broadly arranged along acontinuum of those that are caused by urbanisation, and those that are common tothe human experience. Whilst issues may fall towards one of these extremes, mostissues are complex and can take on different characteristics in different settings.What is clear is that the increasing proportion of the global population that live incities means that this is a key environment in which to address health promotion.The next section addresses the concept of healthy cities, and the progress that hasbeen made to date in implementing healthy city principles. This is followed bylooking at physical activity and food security; issues that fall on different parts ofthe direct versus indirect level city health impact continuum. Cities can influencehealth through a variety of direct processes, or they may simply be the context inwhich existing health issues are addressed.
3 Healthy Cities
The health of a city is more than the sum of the health of the individual citizens, andcities themselves can be considered healthy or unhealthy. The modern concept ofthe healthy city came about at the Healthy Toronto 2000 convention in 1984 andthe subsequent work of the WHO European Regional Office in translating theseideas into a tangible, global programme of action to promote health (Awofeso2003). In harmony with their definition of health, the WHO defines a Healthy Cityas “one that is continually developing those public policies and creating thosephysical and social environments which enable its people to mutually support eachother in carrying out all functions of life and achieving their full potential” (WorldHealth Organisation 1998).
A healthy city is one that aims to meet the basic needs of all citizens, has a clean,safe physical environment, a stable and sustainable ecosystem, supportive com-munity, high citizen participation, access to a variety of experiences and resources,connectedness with the past, and appropriate public health and sickness care ser-vices accessible to all (World Health Organisation 2016). Under this process, a citycan be considered healthy if it is working to meet these goals. However, the HealthyCities programme does not capture all the cities that might be making progresstowards these goals, as cities must apply to be considered part of the officialnetwork. Yet it does provide a useful framework against which we can measuresuccess even outside the official network. It is also a measurement based on policiesand steps taken by a city, rather than based on direct metrics of health. The impactsof such programmes are likely to be felt over years and decades, making short-termmeasurement of impact difficult.
Towns and cities in Europe that are successful in demonstrating they are workingto promote health are supported through the WHO Europe Healthy Cities Network(World Health Organisation Regional Office for Europe 2016), and a number ofcountries have similar national-level forums (Lafond et al. 2003). The ability to shareexperiences is important to generate ideas, evaluate effectiveness, and develop best
102 A. Mizdrak and A.J. Ritchie
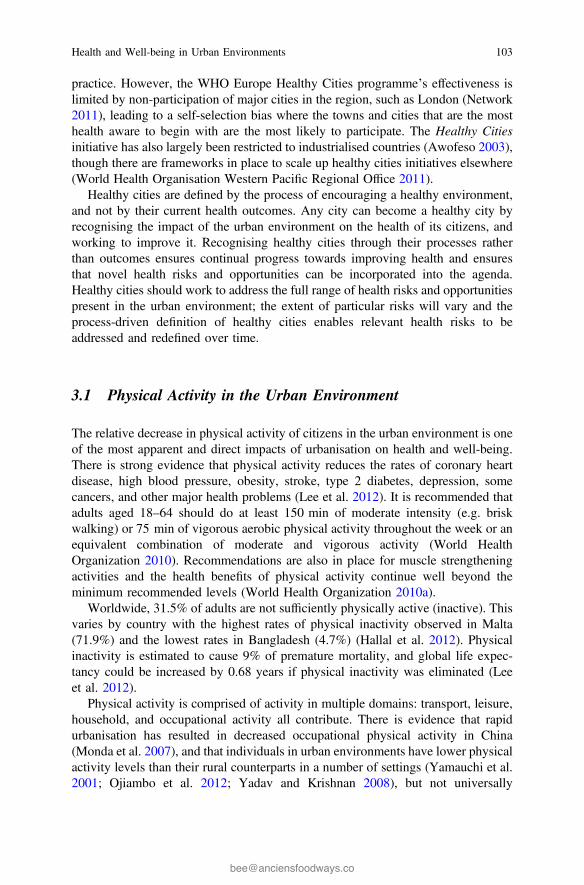
practice. However, the WHO Europe Healthy Cities programme’s effectiveness islimited by non-participation of major cities in the region, such as London (Network2011), leading to a self-selection bias where the towns and cities that are the mosthealth aware to begin with are the most likely to participate. The Healthy Citiesinitiative has also largely been restricted to industrialised countries (Awofeso 2003),though there are frameworks in place to scale up healthy cities initiatives elsewhere(World Health Organisation Western Pacific Regional Office 2011).
Healthy cities are defined by the process of encouraging a healthy environment,and not by their current health outcomes. Any city can become a healthy city byrecognising the impact of the urban environment on the health of its citizens, andworking to improve it. Recognising healthy cities through their processes ratherthan outcomes ensures continual progress towards improving health and ensuresthat novel health risks and opportunities can be incorporated into the agenda.Healthy cities should work to address the full range of health risks and opportunitiespresent in the urban environment; the extent of particular risks will vary and theprocess-driven definition of healthy cities enables relevant health risks to beaddressed and redefined over time.
3.1 Physical Activity in the Urban Environment
The relative decrease in physical activity of citizens in the urban environment is oneof the most apparent and direct impacts of urbanisation on health and well-being.There is strong evidence that physical activity reduces the rates of coronary heartdisease, high blood pressure, obesity, stroke, type 2 diabetes, depression, somecancers, and other major health problems (Lee et al. 2012). It is recommended thatadults aged 18–64 should do at least 150 min of moderate intensity (e.g. briskwalking) or 75 min of vigorous aerobic physical activity throughout the week or anequivalent combination of moderate and vigorous activity (World HealthOrganization 2010). Recommendations are also in place for muscle strengtheningactivities and the health benefits of physical activity continue well beyond theminimum recommended levels (World Health Organization 2010a).
Worldwide, 31.5% of adults are not sufficiently physically active (inactive). Thisvaries by country with the highest rates of physical inactivity observed in Malta(71.9%) and the lowest rates in Bangladesh (4.7%) (Hallal et al. 2012). Physicalinactivity is estimated to cause 9% of premature mortality, and global life expec-tancy could be increased by 0.68 years if physical inactivity was eliminated (Leeet al. 2012).
Physical activity is comprised of activity in multiple domains: transport, leisure,household, and occupational activity all contribute. There is evidence that rapidurbanisation has resulted in decreased occupational physical activity in China(Monda et al. 2007), and that individuals in urban environments have lower physicalactivity levels than their rural counterparts in a number of settings (Yamauchi et al.2001; Ojiambo et al. 2012; Yadav and Krishnan 2008), but not universally
Health and Well-being in Urban Environments 103
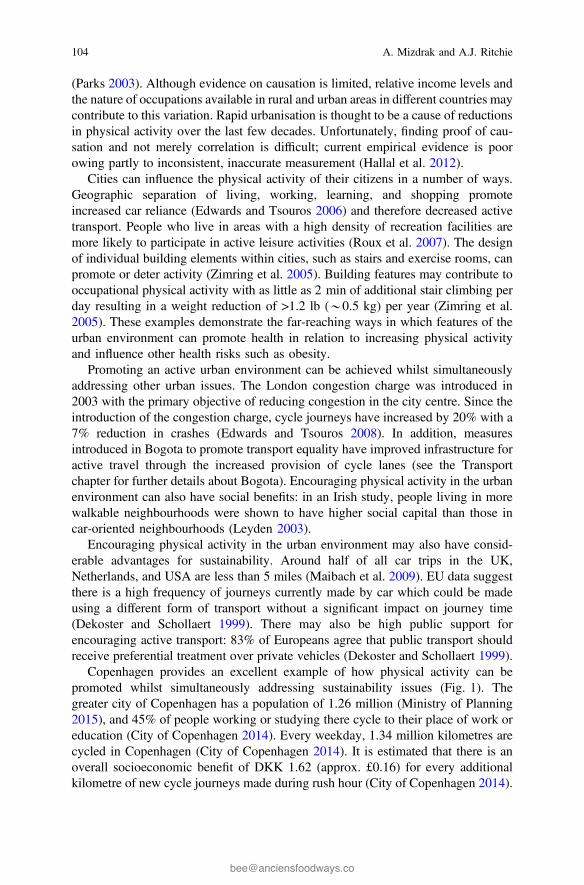
(Parks 2003). Although evidence on causation is limited, relative income levels andthe nature of occupations available in rural and urban areas in different countries maycontribute to this variation. Rapid urbanisation is thought to be a cause of reductionsin physical activity over the last few decades. Unfortunately, finding proof of cau-sation and not merely correlation is difficult; current empirical evidence is poorowing partly to inconsistent, inaccurate measurement (Hallal et al. 2012).
Cities can influence the physical activity of their citizens in a number of ways.Geographic separation of living, working, learning, and shopping promoteincreased car reliance (Edwards and Tsouros 2006) and therefore decreased activetransport. People who live in areas with a high density of recreation facilities aremore likely to participate in active leisure activities (Roux et al. 2007). The designof individual building elements within cities, such as stairs and exercise rooms, canpromote or deter activity (Zimring et al. 2005). Building features may contribute tooccupational physical activity with as little as 2 min of additional stair climbing perday resulting in a weight reduction of >1.2 lb (*0.5 kg) per year (Zimring et al.2005). These examples demonstrate the far-reaching ways in which features of theurban environment can promote health in relation to increasing physical activityand influence other health risks such as obesity.
Promoting an active urban environment can be achieved whilst simultaneouslyaddressing other urban issues. The London congestion charge was introduced in2003 with the primary objective of reducing congestion in the city centre. Since theintroduction of the congestion charge, cycle journeys have increased by 20% with a7% reduction in crashes (Edwards and Tsouros 2008). In addition, measuresintroduced in Bogota to promote transport equality have improved infrastructure foractive travel through the increased provision of cycle lanes (see the Transportchapter for further details about Bogota). Encouraging physical activity in the urbanenvironment can also have social benefits: in an Irish study, people living in morewalkable neighbourhoods were shown to have higher social capital than those incar-oriented neighbourhoods (Leyden 2003).
Encouraging physical activity in the urban environment may also have consid-erable advantages for sustainability. Around half of all car trips in the UK,Netherlands, and USA are less than 5 miles (Maibach et al. 2009). EU data suggestthere is a high frequency of journeys currently made by car which could be madeusing a different form of transport without a significant impact on journey time(Dekoster and Schollaert 1999). There may also be high public support forencouraging active transport: 83% of Europeans agree that public transport shouldreceive preferential treatment over private vehicles (Dekoster and Schollaert 1999).
Copenhagen provides an excellent example of how physical activity can bepromoted whilst simultaneously addressing sustainability issues (Fig. 1). Thegreater city of Copenhagen has a population of 1.26 million (Ministry of Planning2015), and 45% of people working or studying there cycle to their place of work oreducation (City of Copenhagen 2014). Every weekday, 1.34 million kilometres arecycled in Copenhagen (City of Copenhagen 2014). It is estimated that there is anoverall socioeconomic benefit of DKK 1.62 (approx. £0.16) for every additionalkilometre of new cycle journeys made during rush hour (City of Copenhagen 2014).
104 A. Mizdrak and A.J. Ritchie
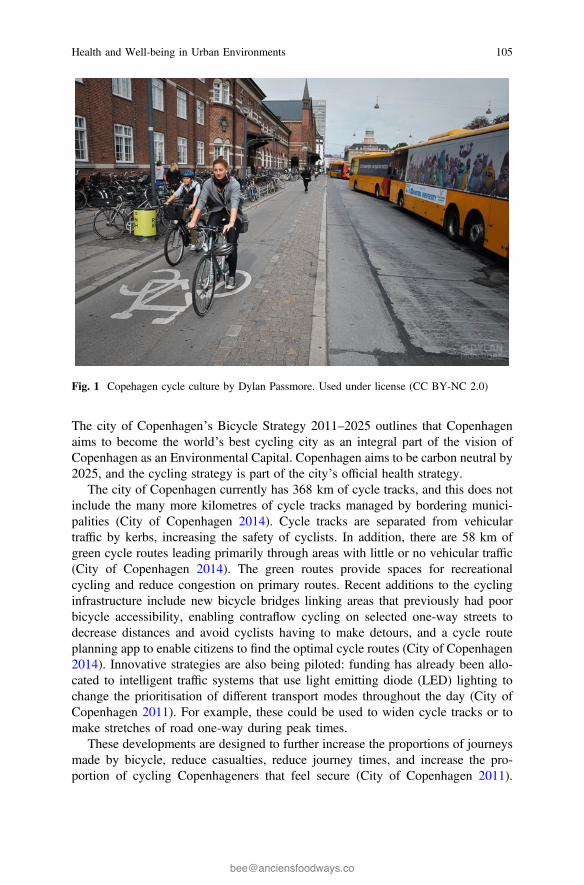
The city of Copenhagen’s Bicycle Strategy 2011–2025 outlines that Copenhagenaims to become the world’s best cycling city as an integral part of the vision ofCopenhagen as an Environmental Capital. Copenhagen aims to be carbon neutral by2025, and the cycling strategy is part of the city’s official health strategy.
The city of Copenhagen currently has 368 km of cycle tracks, and this does notinclude the many more kilometres of cycle tracks managed by bordering munici-palities (City of Copenhagen 2014). Cycle tracks are separated from vehiculartraffic by kerbs, increasing the safety of cyclists. In addition, there are 58 km ofgreen cycle routes leading primarily through areas with little or no vehicular traffic(City of Copenhagen 2014). The green routes provide spaces for recreationalcycling and reduce congestion on primary routes. Recent additions to the cyclinginfrastructure include new bicycle bridges linking areas that previously had poorbicycle accessibility, enabling contraflow cycling on selected one-way streets todecrease distances and avoid cyclists having to make detours, and a cycle routeplanning app to enable citizens to find the optimal cycle routes (City of Copenhagen2014). Innovative strategies are also being piloted: funding has already been allo-cated to intelligent traffic systems that use light emitting diode (LED) lighting tochange the prioritisation of different transport modes throughout the day (City ofCopenhagen 2011). For example, these could be used to widen cycle tracks or tomake stretches of road one-way during peak times.
These developments are designed to further increase the proportions of journeysmade by bicycle, reduce casualties, reduce journey times, and increase the pro-portion of cycling Copenhageners that feel secure (City of Copenhagen 2011).
Fig. 1 Copehagen cycle culture by Dylan Passmore. Used under license (CC BY-NC 2.0)
Health and Well-being in Urban Environments 105
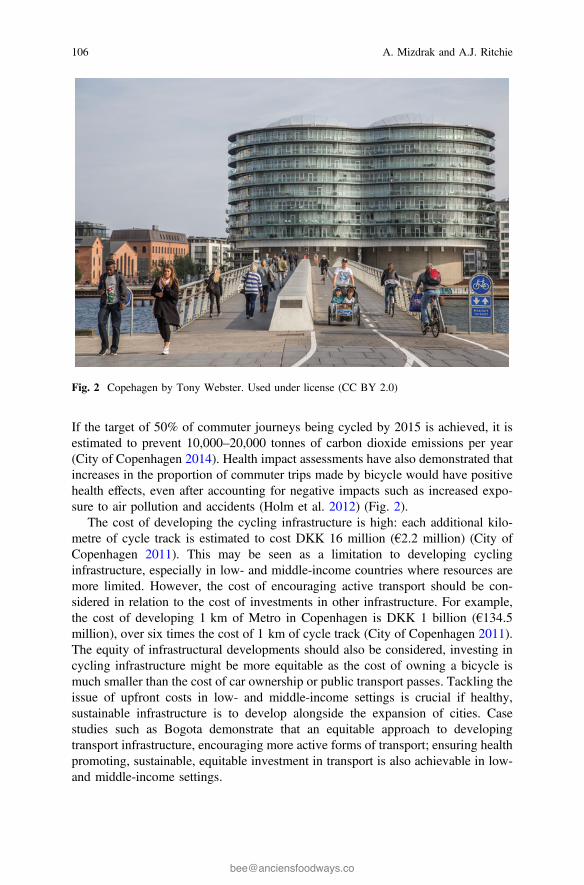
If the target of 50% of commuter journeys being cycled by 2015 is achieved, it isestimated to prevent 10,000–20,000 tonnes of carbon dioxide emissions per year(City of Copenhagen 2014). Health impact assessments have also demonstrated thatincreases in the proportion of commuter trips made by bicycle would have positivehealth effects, even after accounting for negative impacts such as increased expo-sure to air pollution and accidents (Holm et al. 2012) (Fig. 2).
The cost of developing the cycling infrastructure is high: each additional kilo-metre of cycle track is estimated to cost DKK 16 million (€2.2 million) (City ofCopenhagen 2011). This may be seen as a limitation to developing cyclinginfrastructure, especially in low- and middle-income countries where resources aremore limited. However, the cost of encouraging active transport should be con-sidered in relation to the cost of investments in other infrastructure. For example,the cost of developing 1 km of Metro in Copenhagen is DKK 1 billion (€134.5million), over six times the cost of 1 km of cycle track (City of Copenhagen 2011).The equity of infrastructural developments should also be considered, investing incycling infrastructure might be more equitable as the cost of owning a bicycle ismuch smaller than the cost of car ownership or public transport passes. Tackling theissue of upfront costs in low- and middle-income settings is crucial if healthy,sustainable infrastructure is to develop alongside the expansion of cities. Casestudies such as Bogota demonstrate that an equitable approach to developingtransport infrastructure, encouraging more active forms of transport; ensuring healthpromoting, sustainable, equitable investment in transport is also achievable in low-and middle-income settings.
Fig. 2 Copehagen by Tony Webster. Used under license (CC BY 2.0)
106 A. Mizdrak and A.J. Ritchie
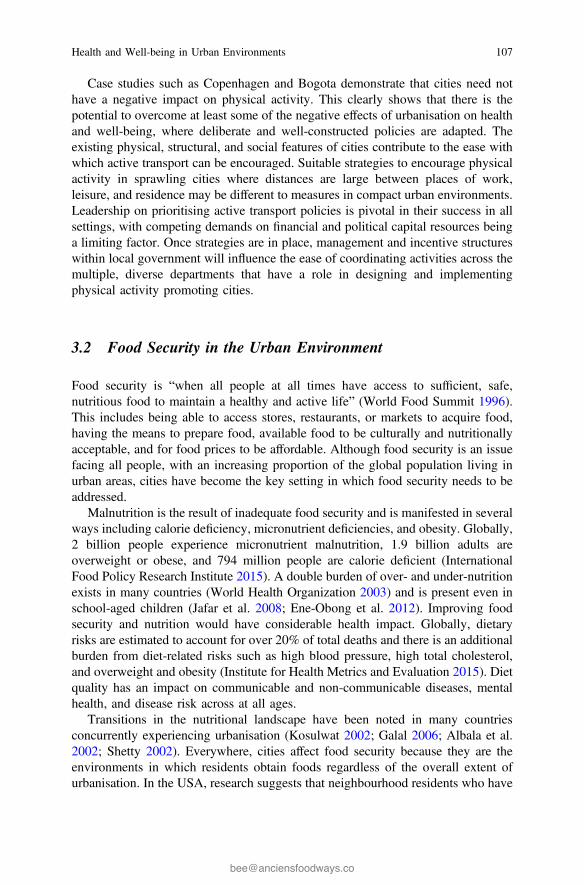
Case studies such as Copenhagen and Bogota demonstrate that cities need nothave a negative impact on physical activity. This clearly shows that there is thepotential to overcome at least some of the negative effects of urbanisation on healthand well-being, where deliberate and well-constructed policies are adapted. Theexisting physical, structural, and social features of cities contribute to the ease withwhich active transport can be encouraged. Suitable strategies to encourage physicalactivity in sprawling cities where distances are large between places of work,leisure, and residence may be different to measures in compact urban environments.Leadership on prioritising active transport policies is pivotal in their success in allsettings, with competing demands on financial and political capital resources beinga limiting factor. Once strategies are in place, management and incentive structureswithin local government will influence the ease of coordinating activities across themultiple, diverse departments that have a role in designing and implementingphysical activity promoting cities.
3.2 Food Security in the Urban Environment
Food security is “when all people at all times have access to sufficient, safe,nutritious food to maintain a healthy and active life” (World Food Summit 1996).This includes being able to access stores, restaurants, or markets to acquire food,having the means to prepare food, available food to be culturally and nutritionallyacceptable, and for food prices to be affordable. Although food security is an issuefacing all people, with an increasing proportion of the global population living inurban areas, cities have become the key setting in which food security needs to beaddressed.
Malnutrition is the result of inadequate food security and is manifested in severalways including calorie deficiency, micronutrient deficiencies, and obesity. Globally,2 billion people experience micronutrient malnutrition, 1.9 billion adults areoverweight or obese, and 794 million people are calorie deficient (InternationalFood Policy Research Institute 2015). A double burden of over- and under-nutritionexists in many countries (World Health Organization 2003) and is present even inschool-aged children (Jafar et al. 2008; Ene-Obong et al. 2012). Improving foodsecurity and nutrition would have considerable health impact. Globally, dietaryrisks are estimated to account for over 20% of total deaths and there is an additionalburden from diet-related risks such as high blood pressure, high total cholesterol,and overweight and obesity (Institute for Health Metrics and Evaluation 2015). Dietquality has an impact on communicable and non-communicable diseases, mentalhealth, and disease risk across at all ages.
Transitions in the nutritional landscape have been noted in many countriesconcurrently experiencing urbanisation (Kosulwat 2002; Galal 2006; Albala et al.2002; Shetty 2002). Everywhere, cities affect food security because they are theenvironments in which residents obtain foods regardless of the overall extent ofurbanisation. In the USA, research suggests that neighbourhood residents who have
Health and Well-being in Urban Environments 107
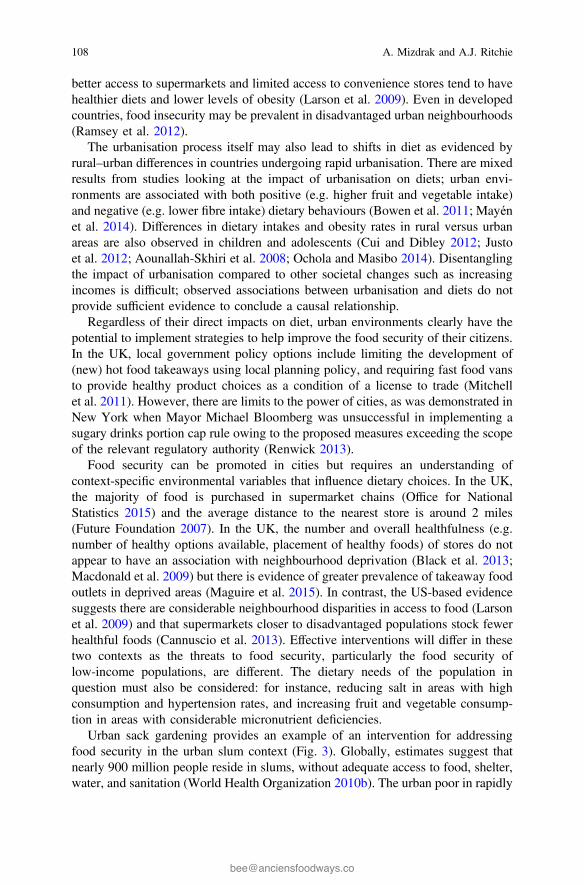
better access to supermarkets and limited access to convenience stores tend to havehealthier diets and lower levels of obesity (Larson et al. 2009). Even in developedcountries, food insecurity may be prevalent in disadvantaged urban neighbourhoods(Ramsey et al. 2012).
The urbanisation process itself may also lead to shifts in diet as evidenced byrural–urban differences in countries undergoing rapid urbanisation. There are mixedresults from studies looking at the impact of urbanisation on diets; urban envi-ronments are associated with both positive (e.g. higher fruit and vegetable intake)and negative (e.g. lower fibre intake) dietary behaviours (Bowen et al. 2011; Mayénet al. 2014). Differences in dietary intakes and obesity rates in rural versus urbanareas are also observed in children and adolescents (Cui and Dibley 2012; Justoet al. 2012; Aounallah-Skhiri et al. 2008; Ochola and Masibo 2014). Disentanglingthe impact of urbanisation compared to other societal changes such as increasingincomes is difficult; observed associations between urbanisation and diets do notprovide sufficient evidence to conclude a causal relationship.
Regardless of their direct impacts on diet, urban environments clearly have thepotential to implement strategies to help improve the food security of their citizens.In the UK, local government policy options include limiting the development of(new) hot food takeaways using local planning policy, and requiring fast food vansto provide healthy product choices as a condition of a license to trade (Mitchellet al. 2011). However, there are limits to the power of cities, as was demonstrated inNew York when Mayor Michael Bloomberg was unsuccessful in implementing asugary drinks portion cap rule owing to the proposed measures exceeding the scopeof the relevant regulatory authority (Renwick 2013).
Food security can be promoted in cities but requires an understanding ofcontext-specific environmental variables that influence dietary choices. In the UK,the majority of food is purchased in supermarket chains (Office for NationalStatistics 2015) and the average distance to the nearest store is around 2 miles(Future Foundation 2007). In the UK, the number and overall healthfulness (e.g.number of healthy options available, placement of healthy foods) of stores do notappear to have an association with neighbourhood deprivation (Black et al. 2013;Macdonald et al. 2009) but there is evidence of greater prevalence of takeaway foodoutlets in deprived areas (Maguire et al. 2015). In contrast, the US-based evidencesuggests there are considerable neighbourhood disparities in access to food (Larsonet al. 2009) and that supermarkets closer to disadvantaged populations stock fewerhealthful foods (Cannuscio et al. 2013). Effective interventions will differ in thesetwo contexts as the threats to food security, particularly the food security oflow-income populations, are different. The dietary needs of the population inquestion must also be considered: for instance, reducing salt in areas with highconsumption and hypertension rates, and increasing fruit and vegetable consump-tion in areas with considerable micronutrient deficiencies.
Urban sack gardening provides an example of an intervention for addressingfood security in the urban slum context (Fig. 3). Globally, estimates suggest thatnearly 900 million people reside in slums, without adequate access to food, shelter,water, and sanitation (World Health Organization 2010b). The urban poor in rapidly
108 A. Mizdrak and A.J. Ritchie
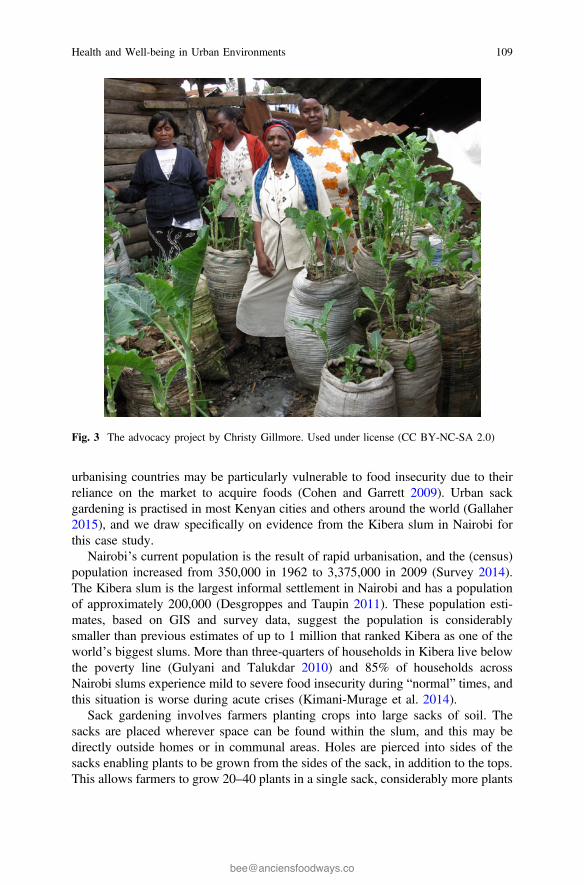
urbanising countries may be particularly vulnerable to food insecurity due to theirreliance on the market to acquire foods (Cohen and Garrett 2009). Urban sackgardening is practised in most Kenyan cities and others around the world (Gallaher2015), and we draw specifically on evidence from the Kibera slum in Nairobi forthis case study.
Nairobi’s current population is the result of rapid urbanisation, and the (census)population increased from 350,000 in 1962 to 3,375,000 in 2009 (Survey 2014).The Kibera slum is the largest informal settlement in Nairobi and has a populationof approximately 200,000 (Desgroppes and Taupin 2011). These population esti-mates, based on GIS and survey data, suggest the population is considerablysmaller than previous estimates of up to 1 million that ranked Kibera as one of theworld’s biggest slums. More than three-quarters of households in Kibera live belowthe poverty line (Gulyani and Talukdar 2010) and 85% of households acrossNairobi slums experience mild to severe food insecurity during “normal” times, andthis situation is worse during acute crises (Kimani-Murage et al. 2014).
Sack gardening involves farmers planting crops into large sacks of soil. Thesacks are placed wherever space can be found within the slum, and this may bedirectly outside homes or in communal areas. Holes are pierced into sides of thesacks enabling plants to be grown from the sides of the sack, in addition to the tops.This allows farmers to grow 20–40 plants in a single sack, considerably more plants
Fig. 3 The advocacy project by Christy Gillmore. Used under license (CC BY-NC-SA 2.0)
Health and Well-being in Urban Environments 109
than would be possible to grow on an equivalent patch of land without verticalgardening (Gallaher 2015). This is important given that there is typically little spacein slum environments to practise other forms of urban agriculture. Plants growninclude kale, Swiss chard, green onions, coriander, tomatoes, and varieties ofsquashes and pumpkins harvested for their leaves (Gallaher 2015). This practice hasbecome increasingly popular in Kibera due to support from Solidarites, a Frenchhumanitarian organisation, following post-election violence in 2008. Solidaritesprovided technical advice and free seedlings to farmers with the aim of improvingfood security between 2008 and 2012, and the practice has continued since theSolidarites programme ended. Several thousand households in Kibera are currentlythought to practise some form of sack gardening (Gallaher 2015; Gallaher et al.2013).
Interviews with residents of the Kibera slums suggest that sack gardening hasdirectly contributed to household food security (Gallaher et al. 2013). Sack gar-dening is positively associated with the diversity of vegetables consumed by ahousehold (Gallaher et al. 2013). 87% of (sack gardening) farmers stated that thepractice meant they saved money for purchase of other types of foods, and 88% feltthat their gardens provided them with extra food (Gallaher et al. 2013). Sackgardening has also resulted in an increase in social capital and therefore has anadditional, indirect, impact on food security (Gallaher et al. 2013).
Despite sack gardening taking up less space than other forms of urban agri-culture, finding adequate space remains a major challenge for Kibera sack farmers(Gallaher 2015). This lack of space has led to some sacks being placed in poten-tially unsanitary locations such as next to latrines or sewage drainage ditches(Gallaher 2015). Additional challenges noted by sack farmers were the difficultyand illegal nature of procuring soil (usually “stolen” from public land) andobtaining water for irrigation in the dry season. Whilst most of the initial seeds andseedlings for the sack gardens were provided by Solidarites, anecdotal evidencedemonstrates that farmers have begun to plant offshoots from existing plants inaddition to purchasing seeds from local markets (Gallaher 2015). This suggests thatthe intervention may be sustainable without external (humanitarian) funding, butlong-term monitoring and evaluation is required for this to be established given thebarriers outlines by current urban farmers. Urban sack gardening is unlikely to besufficient to completely meet the food needs of Kibera from a calorie andmicronutrient perspective. However, the Kibera sack gardening case studydemonstrates that local strategies in slum environments do have the potential toimprove food security for the urban poor in rapidly urbanising settings, given theright support.
Increased uptake of urban food production strategies may be required to ensurefood security globally in a world with a declining ratio of food producers to foodconsumers. Cities will need to address food security for their citizens, but theimpacts of urbanisation on the whole food system cannot be ignored. Food securityis an issue facing the whole of humanity, and one where policies in urban centreshave a major impact on the health and well-being of their citizens.
110 A. Mizdrak and A.J. Ritchie
4 Conclusion
Encouraging healthy urban environments is crucial to improving human well-being,as a large and growing proportion of the global population now reside in cities. Thehealth impacts (positive or negative) of urban environments can be arranged along acontinuum: at one end, cities directly cause health problems and create opportu-nities for health; at the other, cities have no direct impact but are the key setting inwhich universal health needs must now be met.
The healthiness of a city is more than a sum of the health of its citizens. Healthycities are those that promote and consider health in their policies, and that activelystrive to improve the mental, physical and social health of their citizens. Thehealthiness of a city can be judged by the processes and strategies that a city uses toimprove health, not just by measuring the health status of the population. The WHOEurope Healthy Cities Network provides a framework that allows member cities toshare their experiences of interventions and collectively build best practice.Regional and national networks such as the WHO Europe Healthy Cities Networkare valuable, but they need to be inclusive if they are to have sufficient reach and anoticeable and sustained positive health impact.
In this chapter, we have used physical inactivity and food security as examplesof major health issues that lie at different points along the continuum of healthimpacts that cities can have. Low physical activity is the ninth leading risk factor fordeath worldwide and contributes to high body mass index which is ranked fifth(Institute for Health Metrics and Evaluation 2015). Dietary factors are ranked as theleading risk factor for deaths worldwide (Institute for Health Metrics andEvaluation 2015). The section on physical activity demonstrates that cities havedirect impacts on health, and that city-level interventions can lead to positive healthimpacts that can counteract some of the negative impacts of urbanisation. Inaddition, the synergy between increasing physical activity and sustainable transportdemonstrates that meeting health goals can have positive impacts beyond health,such as in promoting environmental sustainability and addressing inequalities. It isimportant to note that the urbanisation process can also have decidedly positivedirect impacts on health. Many healthcare services are easier and more efficient todeliver in urban environments as a direct impact of large numbers of individualsliving in close proximity to one another.
The section on food security illustrates a fundamental health issue that needs tobe addressed in urban environments. Cities are the environment in which a growingmajority of individuals interact with the most fundamental aspects of humanexistence, such as the need for food, water, and other resources. The fundamentalnature of issues at this end of the continuum does not mean that solutions areuniversal or easily transferable. Context-specific knowledge of challenges andsolutions needs to be gathered and used in improving well-being in different urbansettings. The urbanisation process also has inevitable impacts on global networks,such as the food system, thus influencing the well-being of those outside the urbanenvironment. The health impacts of cities are clearly not restricted merely to city
Health and Well-being in Urban Environments 111
dwellers and therefore the impacts of urbanisation cannot be addressed by citiesalone; cultures and trade patterns will need to adapt to this global phenomenon.
Other chapters in this book also deal with issues relevant to health andwell-being in urban settings. For example, 10% of global deaths have beenattributed to air pollution (Institute for Health Metrics and Evaluation 2015) andimproved sanitation is vital to continuing to address the burden of waterborne andother infectious diseases as highlighted in the Water in chapter. Policies foraddressing these challenges, whilst considering health and well-being, offer the bestmechanism for moving towards health cities.
Urbanisation presents both challenges and opportunities for human health andwell-being. Cities should strive to understand their impacts and actively worktowards improving them, regardless of whether they are specific to cities or morefundamental in nature. With an understanding of their impact, cities should considerhealth and well-being in planning and policy and promote the health of theirpopulace, partly by building on good practice from similar contexts. However,cities cannot influence health alone, and national and international strategies thatacknowledge the impact of urbanisation are necessary.
References
Albala C, Vio F, Kain J, Uauy R (2002) Nutrition transition in Chile: determinants andconsequences. Public Health Nutr 5(1A):123–128
Angkurawaranon C, Jiraporncharoen W, Chenthanakij B, Doyle P, Nitsch D (2014) Urbanizationand non-communicable disease in Southeast Asia: a review of current evidence. Public Health.128(10):886–895
Aounallah-Skhiri H, Ben Romdhane H, Traissac P, Eymard-Duvernay S, Delpeuch F, Achour Net al (2008) Nutritional status of Tunisian adolescents: associated gender, environmental andsocio-economic factors. Public Health Nutr 11(12):1306–1317
Awofeso N (2003) The Healthy Cities approach—reflections on a framework for improving globalhealth. Bull World Health Organ 81(3):222–223
Black C, Moon G, Baird J (2013) Dietary inequalities: what is the evidence for the effect of theneighbourhood food environment? Heal Place. 2013/11/10 ed
Bowen L, Ebrahim S, De Stavola B, Ness A, Kinra S, Bharathi AV et al (2011) Dietary intake andrural–urban migration in India: a cross-sectional study. PLoS ONE 6(6):e14822
Cannuscio CC, Tappe K, Hillier A, Buttenheim A, Karpyn A, Glanz K (2013) Urban foodenvironments and residents’ shopping behaviors. Am J Prev Med 45(5):606–614
Cheshire J (2012) Featured graphic. Lives on the line: mapping life expectancy along the LondonTube network. Environ Plan A 44(7):1525–1528
City of Copenhagen (2011) Good, better, best: the City of Copenhagen’s bicycle strategy 2011–2025. Copenhagen
City of Copenhagen (2014) Copenhagen City of Cyclists: the bicycle account 2014. Denmark,Copenhagen, p 13
Cohen M, Garrett JL (2009) The food price crisis and urban food (in) security. Books.Google.ComCui Z, Dibley MJ (2012) Trends in dietary energy, fat, carbohydrate and protein intake in Chinese
children and adolescents from 1991 to 2009. Br J Nutr 108(7):1292–1299Dekoster J, Schollaert U (1999) Cycling: the way ahead for towns and cities. European
Commission, Luxembourg, p 63
112 A. Mizdrak and A.J. Ritchie
Desgroppes A, Taupin S (2011) Kibera: the biggest slum in Africa? Les Cah l’Afrique l’Est44:23–34
Edwards P, Tsouros A (2006) Promoting physical activity and active living in urban environments.World Health. World Health Organisation Regional Office for Europe, Copenhagen, 66 p
Edwards P, Tsouros A (2008) A healthy city is an active city: a physical activity planning guide.World Health Organisation Regional Office for Europe, Copenhagen
Ene-Obong H, Ibeanu V, Onuoha N, Ejekwu A (2012) Prevalence of overweight, obesity, andthinness among urban school-aged children and adolescents in southern Nigeria. Food NutrBull 33(4):242–250
Future Foundation (2007) Chapter 4—shopping milesGalal OM (2006) The nutrition transition in Egypt: obesity, undernutrition and the food
consumption context. Public Health Nutr 5(1a):141–148Gallaher CM (2015) Creating space: Sack gardening as a livelihood strategy in the Kibera slums of
Nairobi, Kenya 1–19Gallaher CM, Kerr JM, Njenga M, Karanja NK, WinklerPrins AMGA (2013) Urban agriculture,
social capital, and food security in the Kibera slums of Nairobi, Kenya. Agric Human Values30(3):389–404
Godfrey R, Julien M (2005) Urbanisation and health. Clin Med (Northfield Il) 5(2):137–141Gulyani S, Talukdar D (2010) Inside informality: the links between poverty, microenterprises, and
living conditions in Nairobi’s slums. World Dev 38(12):1710–1726Hallal PC, Andersen LB, Bull FC, Guthold R, Haskell W, Ekelund U (2012) Global physical
activity levels: surveillance progress, pitfalls, and prospects. Lancet 380(9838):247–257Hay SI, Guerra CA, Tatem AJ, Atkinson PM, Snow RW (2005) Urbanization, malaria
transmission and disease burden in Africa. Nat Rev Microbiol 3(1):81–90Holm AL, Glümer C, Diderichsen F (2012) Health impact assessment of increased cycling to place
of work or education in Copenhagen. BMJ Open 2(4):e001135Hope VM, Marshall W (2000) Death and disease in the ancient city. Routledge, FlorenceInstitute for Health Metrics and Evaluation (2014) Millennium development goal 4: accelerated
declines in child deaths [cited 2016 Jan 6]. Available from: http://www.healthdata.org/infographic/millennium-development-goal-4-accelerated-declines-child-deaths
Institute for Health Metrics and Evaluation (2015) GBD compare. IHME, University ofWashington, Seattle [cited 2015 May 9]. Available from: http://vizhub.healthdata.org/gbd-compare
International Food Policy Research Institute (2015) Global nutrition report 2015: actions andaccountability to advance nutrition and sustainable development. Washington
Jafar TH, Qadri Z, Islam M, Hatcher J, Bhutta ZA, Chaturvedi N (2008) Rise in childhood obesitywith persistently high rates of undernutrition among urban school-aged Indo-Asian children.Arch Dis Child BMJ Group 93(5):373–378
Justo GF, Callo GQ, Carletti L, Molina MCB (2012) Nutritional extremes among school childrenin a rural Brazilian municipality. Rural Remote Health 12(4):2220
Kimani-Murage EW, Schofield L, Wekesah F, Mohamed S, Mberu B, Ettarh R et al (2014)Vulnerability to food insecurity in urban slums: experiences from Nairobi,Kenya. J UrbanHealth. 91(6):1098–1113
Kosulwat V (2002) The nutrition and health transition in Thailand. Public Health Nutr 5(1A):183–189
Lafond LJ, Heritage Z, Farrington JL, Tsouros AD (2003) National Healthy cities networks—apowerful force for health and sustainable development in Europe. World Health Organization,Copenhagen, p 92
Larson NI, Story MT, Nelson MC (2009) Neighborhood environments: disparities in access tohealthy foods in the U.S. Am J Prev Med 36(1):74–81
Lee I-M, Shiroma EJ, Lobelo F, Puska P, Blair SN, Katzmarzyk PT (2012) Effect of physicalinactivity on major non-communicable diseases worldwide: an analysis of burden of diseaseand life expectancy. Lancet 380(9838):219–229
Health and Well-being in Urban Environments 113
Leyden KM (2003) Social capital and the built environment: the importance of walkableneighborhoods. Am J Public Health 93(9):1546–1551
Macdonald L, Ellaway A, Macintyre S (2009) The food retail environment and area deprivation inGlasgow City, UK. Int J Behav Nutr Phys Act. 6:52
Maguire ER, Burgoine T, Monsivais P (2015) Area deprivation and the food environment overtime: a repeated cross-sectional study on takeaway outlet density and supermarket presence inNorfolk, UK, 1990–2008. Health Place. 33:142–147
Maibach E, Steg L, Anable J (2009) Promoting physical activity and reducing climate change:opportunities to replace short car trips with active transportation. Prev Med (Baltim). 49(4):326–327
Mayén A-L, Marques-Vidal P, Paccaud F, Bovet P, Stringhini S (2014) Socioeconomicdeterminants of dietary patterns in low- and middle-income countries: a systematic review.Am J Clin Nutr 100(6):1520–1531
Ministry of Planning (2015) Statistical yearbook 2015. Statistics Denmark, CopenhagenMitchell C, Cowburn G, Foster C (2011) Assessing the options for local government to use legal
approaches to combat obesity in the UK: putting theory into practice. Obes Rev 12(8):660–667Monda KL, Gordon-Larsen P, Stevens J, Popkin BM (2007) China’s transition: the effect of rapid
urbanization on adult occupational physical activity. Soc Sci Med 64(4):858–870Neiderud C-J (2015) How urbanization affects the epidemiology of emerging infectious diseases.
Infect Ecol Epidemiol 24(5):27060Ochola S, Masibo PK (2014) Dietary intake of schoolchildren and adolescents in developing
countries. Ann Nutr Metab 64(Suppl 2):24–40Office for National Statistics (2015) Expenditure on food and non-alcoholic drinks by place of
purchase, 2014 United KingdomOjiambo RM, Easton C, Casajús JA, Konstabel K, Reilly JJ, Pitsiladis Y (2012) Effect of
urbanization on objectively measured physical activity levels, sedentary time, and indices ofadiposity in Kenyan adolescents. J Phys Act Health 9(1):115–123
Parks SE (2003) Differential correlates of physical activity in urban and rural adults of varioussocioeconomic backgrounds in the United States. J Epidemiol Commun Heal 57(1):29–35
Peen J, Schoevers RA, Beekman AT, Dekker J (2010) The current status of urban-rural differencesin psychiatric disorders. Acta Psychiatr Scand 121(2):84–93
Ramsey R, Giskes K, Turrell G, Gallegos D (2012) Food insecurity among adults residingin disadvantaged urban areas: potential health and dietary consequences. Public Health Nutr15(2):227–237
Renwick J (2013) New York Statewide Coalition of Hispanic Chambers of Commerce vNew York City Department of Health & Mental Hygiene. New York
Roux AVD, Evenson KR, McGinn AP, Brown DG, Moore L, Brines S et al (2007) Availability ofrecreational resources and physical activity in adults. Am J Public Health 97(3):493–499
Shetty PS (2002) Nutrition transition in India. Public Health Nutr 5(1A):175–182Sun L-Y, Lee E-W, Zahra A, Park J-H (2015) Risk factors of cardiovascular disease and their
related socio-economical, environmental and health behavioral factors: focused on low-middleincome countries—a narrative review article. Iran J Public Health. 44(4):435–444
Survey NCS (2014) Population and health dynamics in Nairobi’s informal settlementsUK Healthy Cities Network (2011) UK Healthy Cities NetworkWorld Food Summit (1996) Rome declaration on World Food Security and World Food Summit
Plan of Action. FAO, RomeWorld Health Organisation (1998) Health promotion glossary. GenevaWorld Health Organization (2003) Diet, nutrition and the prevention of chronic diseases Report of
the joint WHO/FAO expert consultation. WHO Tech Rep Ser. World Health Organization,Geneva, p 916
World Health Organisation (2006) Constitution of the World Health Organisation. World HealthOrganization, New York
World Health Organization (2010a) Global recommendations on physical activity for health.World Health Organisation, Geneva, p 60
114 A. Mizdrak and A.J. Ritchie
World Health Organization (2010b) Hidden cities: unmasking and overcoming health inequities inurban settings
World Health Organisation (2011) Life expectancy. World Health Organization [cited 2016 Jan 6].Available from: http://www.who.int/gho/mortality_burden_disease/life_tables/situation_trends_text/en/#.Vo02Z2ZZRDo.mendeley
World Health Organisation (2016) Healthy city checklist. World Health Organization [cited 2016Jan 6]. Available from: http://www.euro.who.int/en/health-topics/environment-and-health/urban-health/activities/healthy-cities/who-european-healthy-cities-network/what-is-a-healthy-city/healthy-city-checklist
World Health Organisation Regional Office for Europe (2016) WHO European Healthy CitiesNetwork. World Health Organization [cited 2016 Jan 6]. Available from: http://www.euro.who.int/en/health-topics/environment-and-health/urban-health/activities/healthy-cities/who-european-healthy-cities-network
World Health Organisation Regional Office for South-East Asia (2011) Addressing health of theurban poor in the South-East Asia region: challenges and opportunities
World Health Organisation Western Pacific Regional Office (2011) Healthy Urbanization.Regional Framework for Scaling Up and Expanding Healthy Cities in the Western Pacific2011–2015. Manila, Philippines: World Health Organisation, 32 p
Yadav K, Krishnan A (2008) Changing patterns of diet, physical activity and obesity amongurban, rural and slum populations in north India. Obes Rev 9(5):400–408
Yamauchi T, Umezaki M, Ohtsuka R (2001) Influence of urbanisation on physical activity anddietary changes in Huli-speaking population: a comparative study of village dwellers andmigrants in urban settlements. Br J Nutr 85(1):65–73
Zimring C, Joseph A, Nicoll GL, Tsepas S (2005) Influences of building design and site designon physical activity: research and intervention opportunities. Am J Prev Med 28(2 Suppl 2):186–193
Health and Well-being in Urban Environments 115
A Place for Food Within SustainableUrban Masterplanning
Bee Farrell
The production, transportation, consumption and waste of food has been a“puzzling omission” in urban masterplanning (American Planning Association,introduction, 2007). The need to provide enough food for a growing urban popu-lation, which safeguards finite resources and respects the environment, is an urgentchallenge. This chapter considers past and present consequences of food securitysolutions and advocates reflective and critical planning which recognises the fusionof historical food and ecological know-how, locally based knowledge and con-temporary technology. This approach offers “locally embedded and globallyattuned” multi-scalar food practices for a sustainable urban future (Morgan 2009,347). Urban masterplanners—working as part of interdisciplinary teams—canpowerfully contribute creative and intelligent planning and design solutions for asustainable and fair food future.
1 Why Food Matters to Sustainable UrbanMasterplanning
Food is fundamental, a biological necessity which can give social and economicsustenance. Mention food and we all have something to say. As urban dwellersliving in established industrial countries we can enthuse about a favourite restaurant
B. Farrell (&)Anciens Foodways, London, Englande-mail: [email protected]
B. FarrellAnciens Foodways, Poitiers, France
B. FarrellFarrells, 7 Hatton Street, London NW8 8PL, UK
© Springer International Publishing AG 2017J. Bishop (ed.), Building Sustainable Cities of the Future,Green Energy and Technology, DOI 10.1007/978-3-319-54458-8_7
117
and then maybe in the next conversation debate food shortages in Chad, Africa, orquestion the 2013 meat adulteration scandal.1 This range of possible responseshighlights the multi-layered relationship we have with food. Foodways consultantMillie Rahn believes, “we eat what we are” so what are we? (Rahn 2015, 374).
As of 2009, the Food and Agricultural Organization (FAO) of the United Nations(UN) confirmed we are all predominately urban dwellers (FAO 2009a, b, 8). Wemanage concurrent multi-scalar lives of local, regional, national and international,within a trans-global web of digital and transportation interconnectivity. Yet we livein closer proximity to our neighbours than ever before. It is a context destined toincrease as we move towards the nine billion population projection of 2050. Thisurban existence presents challenges and also offers opportunities to live more sus-tainably—if it also supports responsible rural and urban2 farming. Although possiblycounter-intuitive, urban living is greener than rural living:
New Yorkers individually drive, pollute, consume, and throw away much less than do theaverage residents of the surrounding suburbs, exurbs, small towns and farms, because thetightly circumscribed space in which they live creates efficiencies and reduces the possi-bility for reckless consumption. (Owen 2010, 8)
So, if urban places are more likely to sustainably meet our fundamental bio-logical, social and economic necessities and needs and our environmental respon-sibilities, then our intake and output of food and food-related waste is entrenched inthis “tightly circumscribed space”. Healthy, affordable and environmentallyresponsible food is key to healthful and secure urban places and food security. Thefact that it has been a “puzzling omission” within planning indicates that we havenot seriously thought beyond our favourite restaurant conversation (AmericanPlanning Association 2016).
Until food is seen as an issue of sustainability rather than trade, it will remain acommodity which depletes resources and widens inequalities. And if it is the “endof cheap nature”, we need to respect, replenish and wisely utilise finite resources(Moore 2015, 285). For over forty years, the environmental activist and farmerWendell Berry has held a belief that “urban people have agricultural responsibilitiesthat they should try to meet” (Berry 2002). Evidence of this responsibility isemerging, yet it needs to be developed further by the creative and lateral thinking ofplanners, architects, developers, mayors and urban dwellers. The commitment ofthese individuals and groups set within organisations, businesses and civic societycan ensure that urban dwellers eat “good, clean and fair” food (Petrini 2005). Anaim which is the key to quality of life and sustainability on a global scale.
1Chad is one of the world’s hungriest countries as measured on the International Food PolicyResearch Institute Global Hunger Map 2015. The 2013 meat adulteration scandal was a scandal inEurope; foods advertised as containing beef were found to contain undeclared or improperlydeclared horse meat and other meats such as pork.2Urban farming relates to the new spatial geometry of urbanisation and sustainable settlements inwhich the city and the countryside are considered as one space.
118 B. Farrell
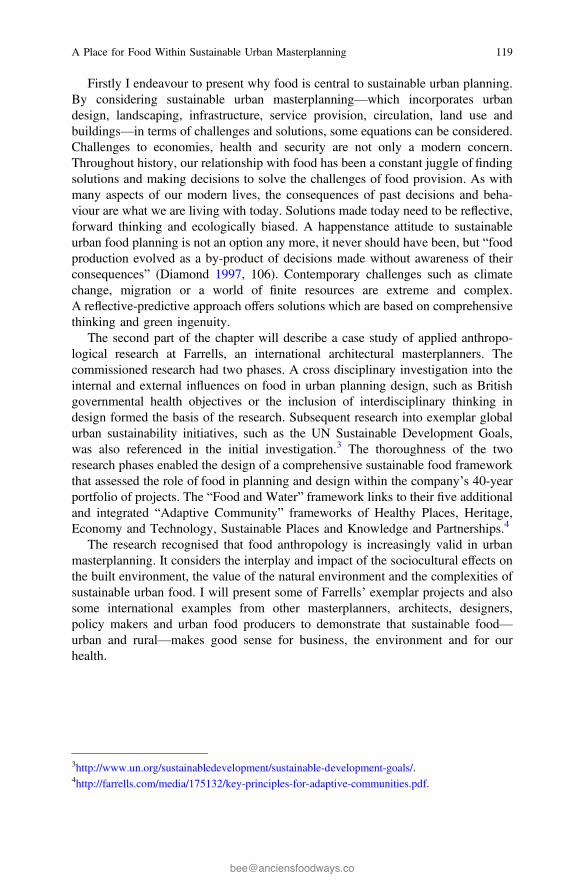
Firstly I endeavour to present why food is central to sustainable urban planning.By considering sustainable urban masterplanning—which incorporates urbandesign, landscaping, infrastructure, service provision, circulation, land use andbuildings—in terms of challenges and solutions, some equations can be considered.Challenges to economies, health and security are not only a modern concern.Throughout history, our relationship with food has been a constant juggle of findingsolutions and making decisions to solve the challenges of food provision. As withmany aspects of our modern lives, the consequences of past decisions and beha-viour are what we are living with today. Solutions made today need to be reflective,forward thinking and ecologically biased. A happenstance attitude to sustainableurban food planning is not an option any more, it never should have been, but “foodproduction evolved as a by-product of decisions made without awareness of theirconsequences” (Diamond 1997, 106). Contemporary challenges such as climatechange, migration or a world of finite resources are extreme and complex.A reflective-predictive approach offers solutions which are based on comprehensivethinking and green ingenuity.
The second part of the chapter will describe a case study of applied anthropo-logical research at Farrells, an international architectural masterplanners. Thecommissioned research had two phases. A cross disciplinary investigation into theinternal and external influences on food in urban planning design, such as Britishgovernmental health objectives or the inclusion of interdisciplinary thinking indesign formed the basis of the research. Subsequent research into exemplar globalurban sustainability initiatives, such as the UN Sustainable Development Goals,was also referenced in the initial investigation.3 The thoroughness of the tworesearch phases enabled the design of a comprehensive sustainable food frameworkthat assessed the role of food in planning and design within the company’s 40-yearportfolio of projects. The “Food and Water” framework links to their five additionaland integrated “Adaptive Community” frameworks of Healthy Places, Heritage,Economy and Technology, Sustainable Places and Knowledge and Partnerships.4
The research recognised that food anthropology is increasingly valid in urbanmasterplanning. It considers the interplay and impact of the sociocultural effects onthe built environment, the value of the natural environment and the complexities ofsustainable urban food. I will present some of Farrells’ exemplar projects and alsosome international examples from other masterplanners, architects, designers,policy makers and urban food producers to demonstrate that sustainable food—urban and rural—makes good sense for business, the environment and for ourhealth.
3http://www.un.org/sustainabledevelopment/sustainable-development-goals/.4http://farrells.com/media/175132/key-principles-for-adaptive-communities.pdf.
A Place for Food Within Sustainable Urban Masterplanning 119
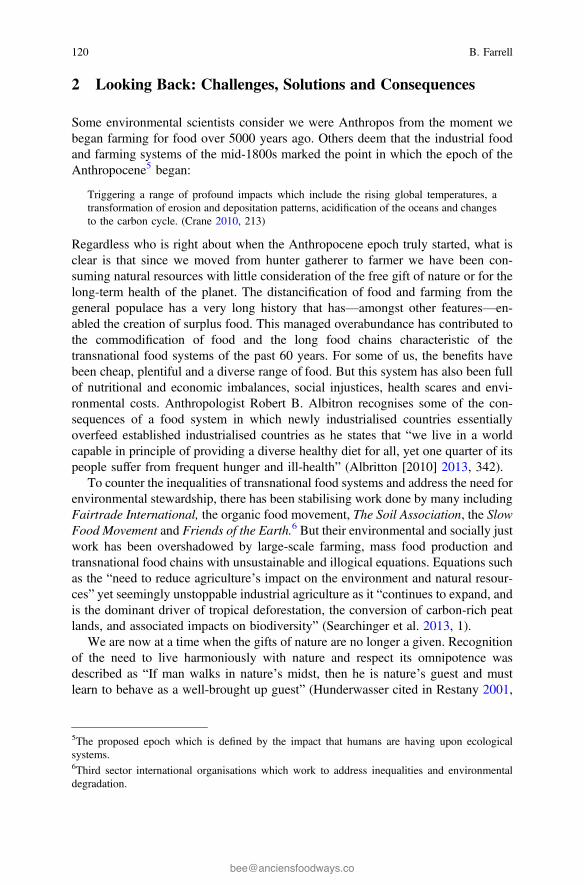
2 Looking Back: Challenges, Solutions and Consequences
Some environmental scientists consider we were Anthropos from the moment webegan farming for food over 5000 years ago. Others deem that the industrial foodand farming systems of the mid-1800s marked the point in which the epoch of theAnthropocene5 began:
Triggering a range of profound impacts which include the rising global temperatures, atransformation of erosion and depositation patterns, acidification of the oceans and changesto the carbon cycle. (Crane 2010, 213)
Regardless who is right about when the Anthropocene epoch truly started, what isclear is that since we moved from hunter gatherer to farmer we have been con-suming natural resources with little consideration of the free gift of nature or for thelong-term health of the planet. The distancification of food and farming from thegeneral populace has a very long history that has—amongst other features—en-abled the creation of surplus food. This managed overabundance has contributed tothe commodification of food and the long food chains characteristic of thetransnational food systems of the past 60 years. For some of us, the benefits havebeen cheap, plentiful and a diverse range of food. But this system has also been fullof nutritional and economic imbalances, social injustices, health scares and envi-ronmental costs. Anthropologist Robert B. Albitron recognises some of the con-sequences of a food system in which newly industrialised countries essentiallyoverfeed established industrialised countries as he states that “we live in a worldcapable in principle of providing a diverse healthy diet for all, yet one quarter of itspeople suffer from frequent hunger and ill-health” (Albritton [2010] 2013, 342).
To counter the inequalities of transnational food systems and address the need forenvironmental stewardship, there has been stabilising work done by many includingFairtrade International, the organic food movement, The Soil Association, the SlowFood Movement and Friends of the Earth.6 But their environmental and socially justwork has been overshadowed by large-scale farming, mass food production andtransnational food chains with unsustainable and illogical equations. Equations suchas the “need to reduce agriculture’s impact on the environment and natural resour-ces” yet seemingly unstoppable industrial agriculture as it “continues to expand, andis the dominant driver of tropical deforestation, the conversion of carbon-rich peatlands, and associated impacts on biodiversity” (Searchinger et al. 2013, 1).
We are now at a time when the gifts of nature are no longer a given. Recognitionof the need to live harmoniously with nature and respect its omnipotence wasdescribed as “If man walks in nature’s midst, then he is nature’s guest and mustlearn to behave as a well-brought up guest” (Hunderwasser cited in Restany 2001,
5The proposed epoch which is defined by the impact that humans are having upon ecologicalsystems.6Third sector international organisations which work to address inequalities and environmentaldegradation.
120 B. Farrell
270). It follows that a sustainable and socially just food future needs to activelyrespect the health of the environment. This needs to work on multiple scales—localto global—rural to city region and urban—newly industrialised country to indus-trially established country—and marine to coast and land. In the case of food andsustainable urban living:
Where society and nature can interact and co-evolve in a truly ecological fashion, a visionthat is indispensable to a food planning movement that aspires to be locally-embedded andglobally attuned. (Morgan 2009, 347)
3 Garden Cities of Tomorrow and UrbanAgriculture Today
Morgan describes our evolving multi-scalar ecological position as local and globalthinking, endorsed by many as profoundly important to sustainable living:
In studies of climate change issues, at least, it is clear that some of the driving forces operateon a global scale, while many of the phenomena that underlie environmental processesoperate at a local scale. (Wilbanks 2013, 31)
Ebenezer Howard’s vision advocated the need to make places which encouragedlocal social connectivity, value food chains and had potential as a national andinternational design model. His Garden City vision required 60% of the availableland to be set aside for food production surrounding the planned new settlements, tobe controlled by a trust as community land. This element of his visions was notachieved in the UK Garden Cities, and, therefore, he could not demonstratewhether the planned self-sufficiency in food could be achieved.
Young and Smart (2014) explain how new thinking on local food creates anopportunity for a call to action and a vision of future planning for local food. Theyre-evaluated the neglected importance, in Howard’s original vision of the Garden City(Fig. 1), of the land which surrounds settlements that can be used for local food pro-duction. The Food and Agriculture Organization of the UN (FAO) and others also referto this potential food-growing land in terms of “City Region Food Systems” (CRFS).7
At the Farrells Forum symposium “Shortening the Food Chain-Re-integratingFood into the City”, Gary Young presented their idea and discussed some importantquestions.8 How much land does it take to grow food for an individual? How canthis be calibrated taking into account varied locations both urban and rural? Theirdesign proposition looked at the achievability of urban food self-sufficiency, scaledup to a community level, when backed by socially sustainable groups such as foodhubs (Fig. 2).
7http://cityregionfoodsystems.org/partners/.8A Farrells’ Forum sustainable urban food symposium which was given to an interdisciplinaryaudience of industry partners.
A Place for Food Within Sustainable Urban Masterplanning 121
Fig. 1 Market Garden City, Young and Smart (2014)
Fig. 2 How much land does it take? Young and Smart (2014)
122 B. Farrell
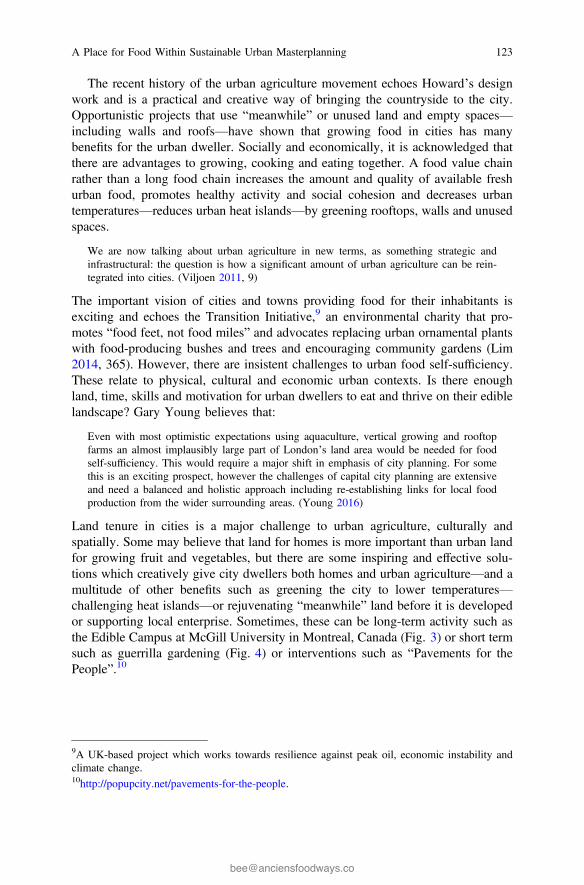
The recent history of the urban agriculture movement echoes Howard’s designwork and is a practical and creative way of bringing the countryside to the city.Opportunistic projects that use “meanwhile” or unused land and empty spaces—including walls and roofs—have shown that growing food in cities has manybenefits for the urban dweller. Socially and economically, it is acknowledged thatthere are advantages to growing, cooking and eating together. A food value chainrather than a long food chain increases the amount and quality of available freshurban food, promotes healthy activity and social cohesion and decreases urbantemperatures—reduces urban heat islands—by greening rooftops, walls and unusedspaces.
We are now talking about urban agriculture in new terms, as something strategic andinfrastructural: the question is how a significant amount of urban agriculture can be rein-tegrated into cities. (Viljoen 2011, 9)
The important vision of cities and towns providing food for their inhabitants isexciting and echoes the Transition Initiative,9 an environmental charity that pro-motes “food feet, not food miles” and advocates replacing urban ornamental plantswith food-producing bushes and trees and encouraging community gardens (Lim2014, 365). However, there are insistent challenges to urban food self-sufficiency.These relate to physical, cultural and economic urban contexts. Is there enoughland, time, skills and motivation for urban dwellers to eat and thrive on their ediblelandscape? Gary Young believes that:
Even with most optimistic expectations using aquaculture, vertical growing and rooftopfarms an almost implausibly large part of London’s land area would be needed for foodself-sufficiency. This would require a major shift in emphasis of city planning. For somethis is an exciting prospect, however the challenges of capital city planning are extensiveand need a balanced and holistic approach including re-establishing links for local foodproduction from the wider surrounding areas. (Young 2016)
Land tenure in cities is a major challenge to urban agriculture, culturally andspatially. Some may believe that land for homes is more important than urban landfor growing fruit and vegetables, but there are some inspiring and effective solu-tions which creatively give city dwellers both homes and urban agriculture—and amultitude of other benefits such as greening the city to lower temperatures—challenging heat islands—or rejuvenating “meanwhile” land before it is developedor supporting local enterprise. Sometimes, these can be long-term activity such asthe Edible Campus at McGill University in Montreal, Canada (Fig. 3) or short termsuch as guerrilla gardening (Fig. 4) or interventions such as “Pavements for thePeople”.10
9A UK-based project which works towards resilience against peak oil, economic instability andclimate change.10http://popupcity.net/pavements-for-the-people.
A Place for Food Within Sustainable Urban Masterplanning 123
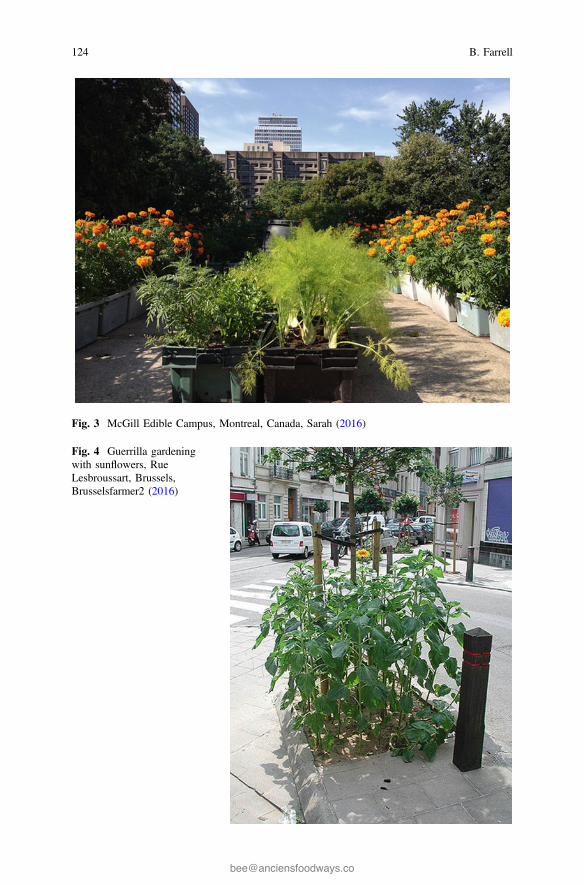
Fig. 3 McGill Edible Campus, Montreal, Canada, Sarah (2016)
Fig. 4 Guerrilla gardeningwith sunflowers, RueLesbroussart, Brussels,Brusselsfarmer2 (2016)
124 B. Farrell
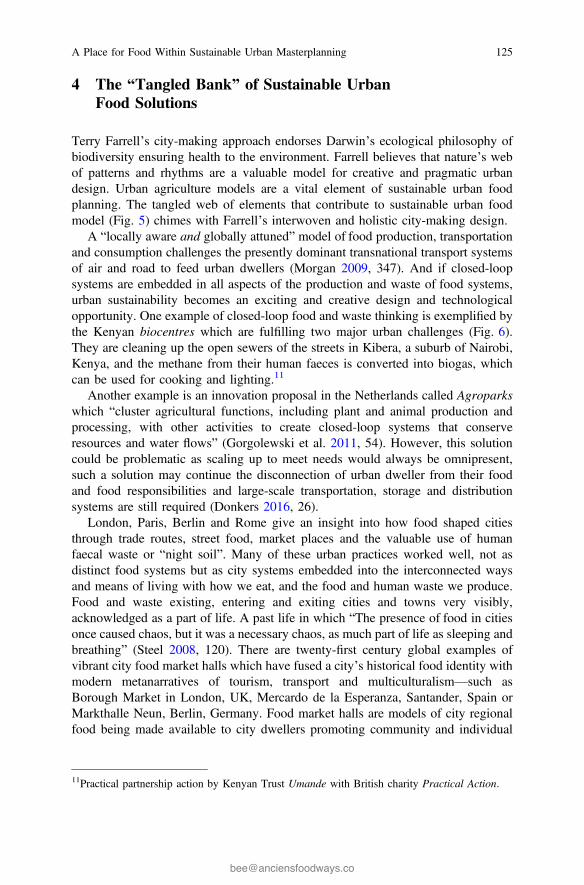
4 The “Tangled Bank” of Sustainable UrbanFood Solutions
Terry Farrell’s city-making approach endorses Darwin’s ecological philosophy ofbiodiversity ensuring health to the environment. Farrell believes that nature’s webof patterns and rhythms are a valuable model for creative and pragmatic urbandesign. Urban agriculture models are a vital element of sustainable urban foodplanning. The tangled web of elements that contribute to sustainable urban foodmodel (Fig. 5) chimes with Farrell’s interwoven and holistic city-making design.
A “locally aware and globally attuned” model of food production, transportationand consumption challenges the presently dominant transnational transport systemsof air and road to feed urban dwellers (Morgan 2009, 347). And if closed-loopsystems are embedded in all aspects of the production and waste of food systems,urban sustainability becomes an exciting and creative design and technologicalopportunity. One example of closed-loop food and waste thinking is exemplified bythe Kenyan biocentres which are fulfilling two major urban challenges (Fig. 6).They are cleaning up the open sewers of the streets in Kibera, a suburb of Nairobi,Kenya, and the methane from their human faeces is converted into biogas, whichcan be used for cooking and lighting.11
Another example is an innovation proposal in the Netherlands called Agroparkswhich “cluster agricultural functions, including plant and animal production andprocessing, with other activities to create closed-loop systems that conserveresources and water flows” (Gorgolewski et al. 2011, 54). However, this solutioncould be problematic as scaling up to meet needs would always be omnipresent,such a solution may continue the disconnection of urban dweller from their foodand food responsibilities and large-scale transportation, storage and distributionsystems are still required (Donkers 2016, 26).
London, Paris, Berlin and Rome give an insight into how food shaped citiesthrough trade routes, street food, market places and the valuable use of humanfaecal waste or “night soil”. Many of these urban practices worked well, not asdistinct food systems but as city systems embedded into the interconnected waysand means of living with how we eat, and the food and human waste we produce.Food and waste existing, entering and exiting cities and towns very visibly,acknowledged as a part of life. A past life in which “The presence of food in citiesonce caused chaos, but it was a necessary chaos, as much part of life as sleeping andbreathing” (Steel 2008, 120). There are twenty-first century global examples ofvibrant city food market halls which have fused a city’s historical food identity withmodern metanarratives of tourism, transport and multiculturalism—such asBorough Market in London, UK, Mercardo de la Esperanza, Santander, Spain orMarkthalle Neun, Berlin, Germany. Food market halls are models of city regionalfood being made available to city dwellers promoting community and individual
11Practical partnership action by Kenyan Trust Umande with British charity Practical Action.
A Place for Food Within Sustainable Urban Masterplanning 125
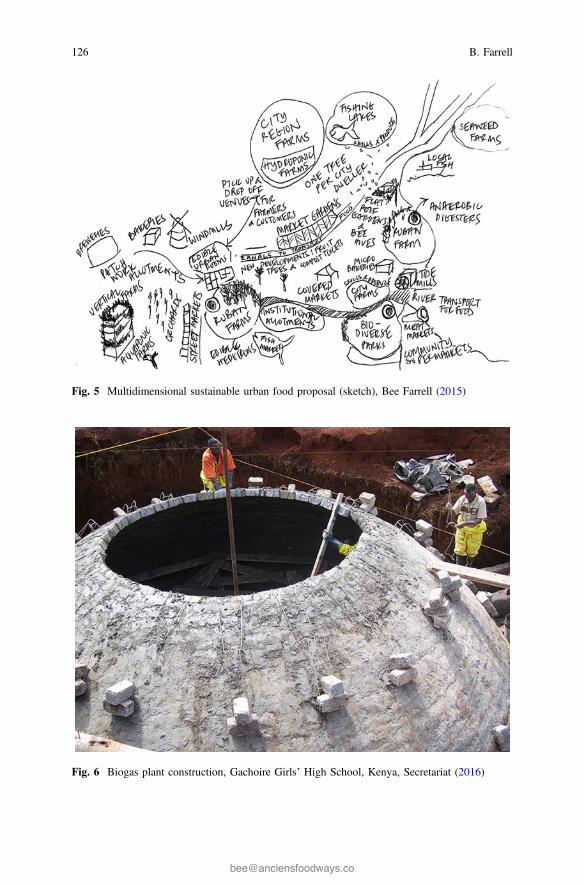
Fig. 6 Biogas plant construction, Gachoire Girls’ High School, Kenya, Secretariat (2016)
Fig. 5 Multidimensional sustainable urban food proposal (sketch), Bee Farrell (2015)
126 B. Farrell
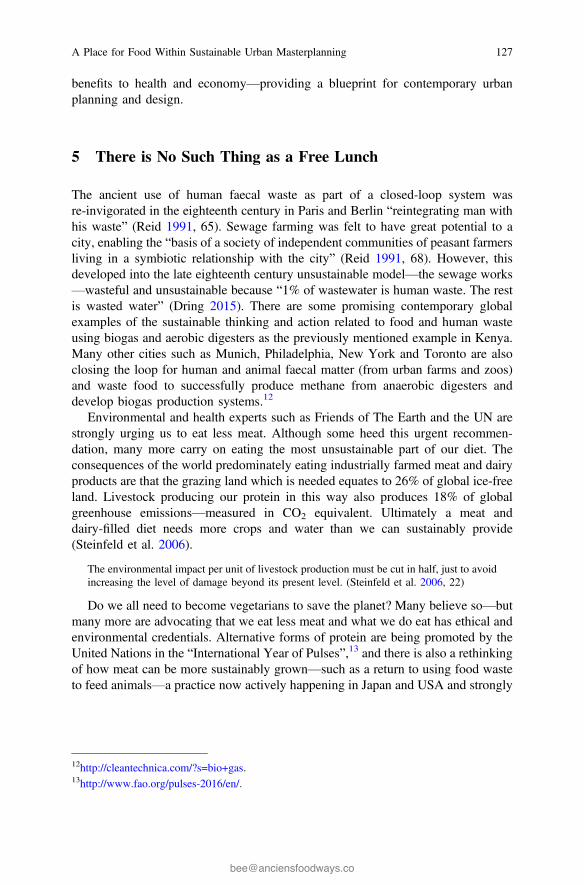
benefits to health and economy—providing a blueprint for contemporary urbanplanning and design.
5 There is No Such Thing as a Free Lunch
The ancient use of human faecal waste as part of a closed-loop system wasre-invigorated in the eighteenth century in Paris and Berlin “reintegrating man withhis waste” (Reid 1991, 65). Sewage farming was felt to have great potential to acity, enabling the “basis of a society of independent communities of peasant farmersliving in a symbiotic relationship with the city” (Reid 1991, 68). However, thisdeveloped into the late eighteenth century unsustainable model—the sewage works—wasteful and unsustainable because “1% of wastewater is human waste. The restis wasted water” (Dring 2015). There are some promising contemporary globalexamples of the sustainable thinking and action related to food and human wasteusing biogas and aerobic digesters as the previously mentioned example in Kenya.Many other cities such as Munich, Philadelphia, New York and Toronto are alsoclosing the loop for human and animal faecal matter (from urban farms and zoos)and waste food to successfully produce methane from anaerobic digesters anddevelop biogas production systems.12
Environmental and health experts such as Friends of The Earth and the UN arestrongly urging us to eat less meat. Although some heed this urgent recommen-dation, many more carry on eating the most unsustainable part of our diet. Theconsequences of the world predominately eating industrially farmed meat and dairyproducts are that the grazing land which is needed equates to 26% of global ice-freeland. Livestock producing our protein in this way also produces 18% of globalgreenhouse emissions—measured in CO2 equivalent. Ultimately a meat anddairy-filled diet needs more crops and water than we can sustainably provide(Steinfeld et al. 2006).
The environmental impact per unit of livestock production must be cut in half, just to avoidincreasing the level of damage beyond its present level. (Steinfeld et al. 2006, 22)
Do we all need to become vegetarians to save the planet? Many believe so—butmany more are advocating that we eat less meat and what we do eat has ethical andenvironmental credentials. Alternative forms of protein are being promoted by theUnited Nations in the “International Year of Pulses”,13 and there is also a rethinkingof how meat can be more sustainably grown—such as a return to using food wasteto feed animals—a practice now actively happening in Japan and USA and strongly
12http://cleantechnica.com/?s=bio+gas.13http://www.fao.org/pulses-2016/en/.
A Place for Food Within Sustainable Urban Masterplanning 127
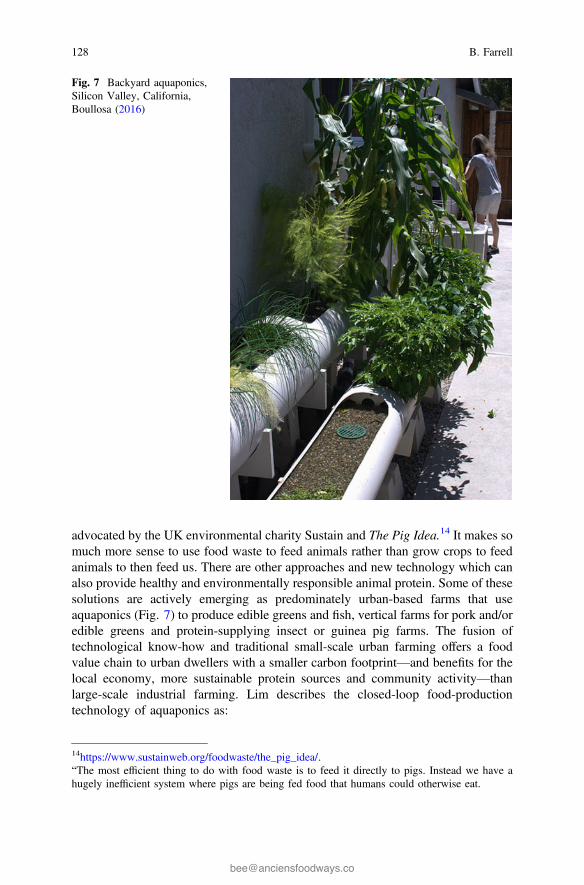
advocated by the UK environmental charity Sustain and The Pig Idea.14 It makes somuch more sense to use food waste to feed animals rather than grow crops to feedanimals to then feed us. There are other approaches and new technology which canalso provide healthy and environmentally responsible animal protein. Some of thesesolutions are actively emerging as predominately urban-based farms that useaquaponics (Fig. 7) to produce edible greens and fish, vertical farms for pork and/oredible greens and protein-supplying insect or guinea pig farms. The fusion oftechnological know-how and traditional small-scale urban farming offers a foodvalue chain to urban dwellers with a smaller carbon footprint—and benefits for thelocal economy, more sustainable protein sources and community activity—thanlarge-scale industrial farming. Lim describes the closed-loop food-productiontechnology of aquaponics as:
Fig. 7 Backyard aquaponics,Silicon Valley, California,Boullosa (2016)
14https://www.sustainweb.org/foodwaste/the_pig_idea/.“The most efficient thing to do with food waste is to feed it directly to pigs. Instead we have ahugely inefficient system where pigs are being fed food that humans could otherwise eat.
128 B. Farrell

Eliminating the need for soil and using fish to feed the plants, aquaponics farming alsoeliminates the need for chemical fertilisers, agrochemicals and pesticides. (Lim 2014, 109)
There are many successful case studies of sustainable food production andconsumption within urban food initiatives throughout the world. Each ingeniousand successful example is place and climate specific, yet can also offer far-reachingrelevant inspiration for urban planning, design and practice. Place specificity relatesto climatic and cultural characteristics. Rainfall, irrigation, temperature and soil typeall require a different approach, as does the deep-rooted range of cultural foodbehaviours of different places.
6 Urban Food Waste
Supermarkets are a worldwide phenomenon with each country operating its uniquedualism of supermarkets and independent food producers/traders. Global annual foodwaste from supermarkets is unsustainable and illogical. The FAO believe that “Thefood currently wasted in Europe could feed 200 million people” (FAO 2016a, b). Ifwe did not waste so much food, we would not need to grow somuch now and or in thefuture. Many argue that we actually grow enough food to feed everyone, but we wasteit and—the finite resources that went into growing it—water, land and labour. Thefood thrown away from supermarkets, homes and public-eating places totals a global1.3 billion tonnes of discarded edible food every year.15 This unsustainable practicedemands many changes including interdisciplinary design and planning solutionswhich support food value chains, sustainable land use and environmentalstewardship.
If only a quarter of the foods that are currently lost or wasted can be saved it will be enoughto feed the 870 million people that are hungry in the world at this moment. (FAO, vanOtterdijk 2016)
Supermarkets, strengthened by increasing worldwide legislation to challengefood waste, are beginning to take responsible action. Guided by organisations suchas Wrap and individuals such as Parisian councillor Arash Derambarsh, this changeis increasingly endorsed by consumers.16 What has food waste got to do with urbanplanning? Two distinct things are the following: land use and climate change.Annual wasted and rotting food takes up 30% of agricultural land and produces3.3G tonnes of carbon emissions, making it into the top third of carbon emissionproducers after America and China (FAO 2013).
15United Nation’s Save-Food programme www.save-food.org.16WRAP is a UK-based non-profit team working to challenge circular economies and resourceefficiency. Derambarsh is a Parisian councillor who activated new legislation to stop Frenchsupermarket food waste in 2015.
A Place for Food Within Sustainable Urban Masterplanning 129
Urban masterplanners working in multidisciplinary teams—which includesupermarkets, non-governmental organisations, global organisations, local gov-ernment councillors, academia, businesses and consumers—can embed holisticsustainable design and infrastructure which supports environmentally responsibleand fairer food, and a cleaner environment.
7 Knowledge Exchange for Sustainable Urban Food
In the twenty-first century knowledge exchange is enabling global and local goalsto be discussed, understood and met. The digital information age is providing aplatform for green and empowering opportunities to address issues of climatechange, food equality, health and sustainable urban living on a grand and smallscale. There are many global examples of integrated work which incorporates greeninfrastructure planning and green technology to ensure greater sustainability andsecurity for food. The co-joining of sustainability with development may bequestionable because formalised sustainability linked with development work maybe a reflection of the values of industrially established countries. But if sustainableplanning is place and culturally specific—it has sovereignty—then it can offerhome-grown development to support healthier and more prosperous lives.Architects and designers Snøhetta are based in Norway and America. Projects areled by their philosophy which recognises and values the importance of place andcultural specificity:
We know that with well-conceived design we can help things run more fluidly, improvepeople’s well-being, and make life more enjoyable. Every project is a unique expression ofthe ethos of its users, climate, and context. (Snøhetta 2016)
Some of these numerous global cross-disciplinary examples of sustainable fooddevelopment and knowledge are shared on the FAO digital platform “Food-For-Cities”.17 One example of the many daily connections being made is from anarchitectural student who is “researching [on] the city’s urban agriculture for a masshousing design project… aimed to accommodate recent immigrants from rural areasof Peru, offering them the possibility of farming within a metropolitan context tocreate a self-sustained community” (Food-For-Cities member, 2016). Members ofthe platform reveal and share local and global knowledge—like the example ofLima, Peru—with new initiatives to use wastewater to irrigate city trees, tax ben-efits for food producers and the re-establishment of urban Lima farms.
Another example of holistic, effective and sustainable thinking and structuring isthe holistic and environmental approach of the 2012 UK Town and CountryPlanning and Wildlife Trust (2012) which echoes the view that “Landscape asthe first infrastructure” which makes healthier and more sustainable places
17http://www.fao.org/fcit/fcit-home/en/.
130 B. Farrell
(Farrell 2004). This is coupled with a commitment to “place-making”, in which thepeople and the history of a place and its community are valued and are instrumentalto their creative and sustainable design.
The many challenges that we now face to make our cities, where the majority of thepopulation live, safe and healthy places mean that we will have to re-think the future ofurban design to include more vegetation. (Farrell 1 2015)
In 2013, Farrells commissioned a two-year applied research project to updatetheir sustainability work. This project began with a food and greening audit of alltheir UK-based projects. This led to an exhibition, panel presentation and aten-point design initial framework, “Food and Greening” which was later adapted to“Food and Water”. The framework was informed by The “Continual ProductiveUrban Landscape” framework by architects Viljoen and Bohn (2014) and otherinternational resources including New York’s Food Works,18 Milan’s NutrireMilano19 and London’s Capital Growth20 that each focus on sustainable agricultureand the provision of fair, clean and just food. The 10 determinants of the “Food andGreening” framework (below) are flexible enough for architects and masterplannersto interpret according to their specific projects, but also structured enough to giveconsistent and meaningful responses. Initially, they were predominantly used toreview and assess past projects, but were incorporated into present and futuredesign discussions and planning. The “Food and Greening” framework instigated arevision of Farrells’ sustainability principles which developed into further researchand design of Adaptive Communities (AC) framework. The AC review used its 60determinants of six integrated strands of urban sustainability: Healthy Places,Heritage, Economy and Technology, Knowledge and Partnerships, SustainablePlaces and Food and Water.
8 Food and Greening Framework
Places which give opportunities for healthy and sustainable diets;Biodiverse planting;Local food production;Short food chains;Incorporation of community food projects;Promotion of sustainable food or farming knowledge and skills;Support for food enterprises;Closed-loop solutions for food and water waste;
18http://council.nyc.gov/downloads/pdf/foodworks1.pdf.19http://imagislab.it/nutrire-milano-en.20http://www.capitalgrowth.org/.
A Place for Food Within Sustainable Urban Masterplanning 131
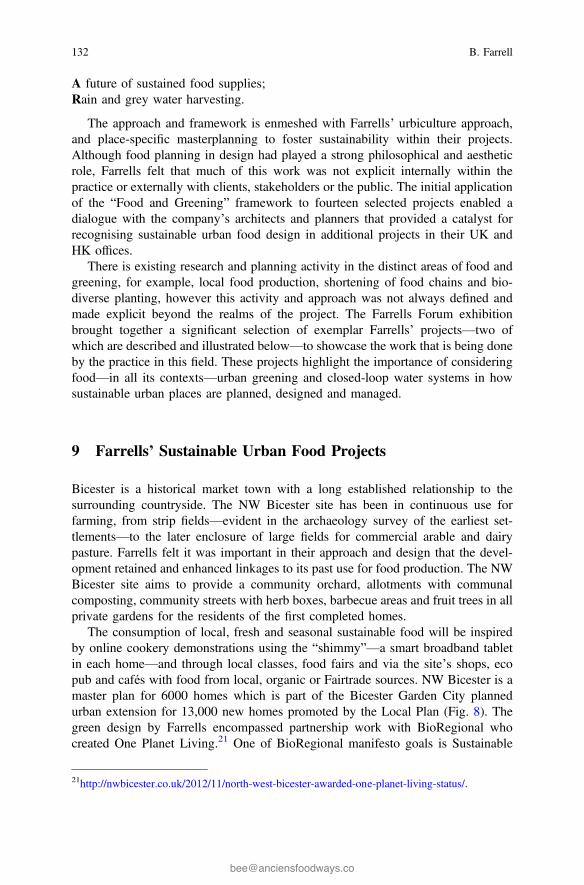
A future of sustained food supplies;Rain and grey water harvesting.
The approach and framework is enmeshed with Farrells’ urbiculture approach,and place-specific masterplanning to foster sustainability within their projects.Although food planning in design had played a strong philosophical and aestheticrole, Farrells felt that much of this work was not explicit internally within thepractice or externally with clients, stakeholders or the public. The initial applicationof the “Food and Greening” framework to fourteen selected projects enabled adialogue with the company’s architects and planners that provided a catalyst forrecognising sustainable urban food design in additional projects in their UK andHK offices.
There is existing research and planning activity in the distinct areas of food andgreening, for example, local food production, shortening of food chains and bio-diverse planting, however this activity and approach was not always defined andmade explicit beyond the realms of the project. The Farrells Forum exhibitionbrought together a significant selection of exemplar Farrells’ projects—two ofwhich are described and illustrated below—to showcase the work that is being doneby the practice in this field. These projects highlight the importance of consideringfood—in all its contexts—urban greening and closed-loop water systems in howsustainable urban places are planned, designed and managed.
9 Farrells’ Sustainable Urban Food Projects
Bicester is a historical market town with a long established relationship to thesurrounding countryside. The NW Bicester site has been in continuous use forfarming, from strip fields—evident in the archaeology survey of the earliest set-tlements—to the later enclosure of large fields for commercial arable and dairypasture. Farrells felt it was important in their approach and design that the devel-opment retained and enhanced linkages to its past use for food production. The NWBicester site aims to provide a community orchard, allotments with communalcomposting, community streets with herb boxes, barbecue areas and fruit trees in allprivate gardens for the residents of the first completed homes.
The consumption of local, fresh and seasonal sustainable food will be inspiredby online cookery demonstrations using the “shimmy”—a smart broadband tabletin each home—and through local classes, food fairs and via the site’s shops, ecopub and cafés with food from local, organic or Fairtrade sources. NW Bicester is amaster plan for 6000 homes which is part of the Bicester Garden City plannedurban extension for 13,000 new homes promoted by the Local Plan (Fig. 8). Thegreen design by Farrells encompassed partnership work with BioRegional whocreated One Planet Living.21 One of BioRegional manifesto goals is Sustainable
21http://nwbicester.co.uk/2012/11/north-west-bicester-awarded-one-planet-living-status/.
132 B. Farrell
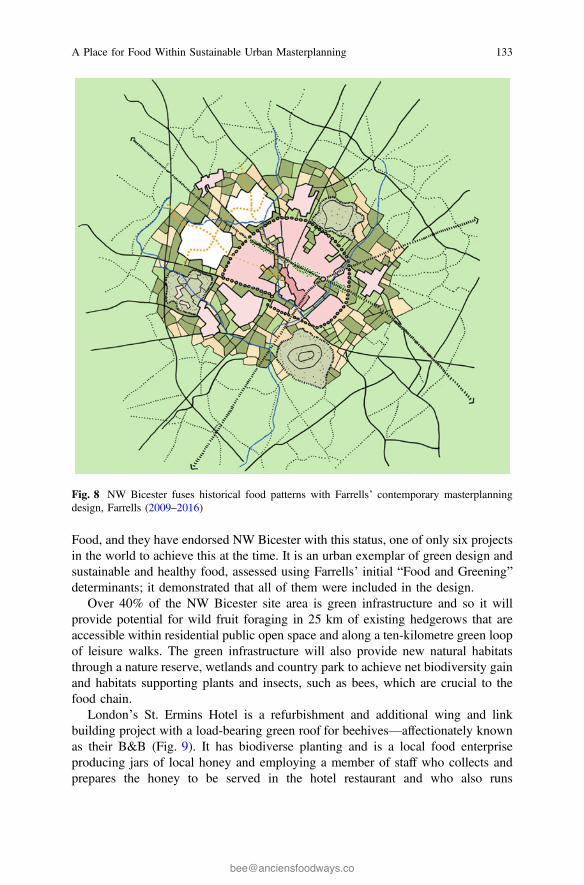
Food, and they have endorsed NW Bicester with this status, one of only six projectsin the world to achieve this at the time. It is an urban exemplar of green design andsustainable and healthy food, assessed using Farrells’ initial “Food and Greening”determinants; it demonstrated that all of them were included in the design.
Over 40% of the NW Bicester site area is green infrastructure and so it willprovide potential for wild fruit foraging in 25 km of existing hedgerows that areaccessible within residential public open space and along a ten-kilometre green loopof leisure walks. The green infrastructure will also provide new natural habitatsthrough a nature reserve, wetlands and country park to achieve net biodiversity gainand habitats supporting plants and insects, such as bees, which are crucial to thefood chain.
London’s St. Ermins Hotel is a refurbishment and additional wing and linkbuilding project with a load-bearing green roof for beehives—affectionately knownas their B&B (Fig. 9). It has biodiverse planting and is a local food enterpriseproducing jars of local honey and employing a member of staff who collects andprepares the honey to be served in the hotel restaurant and who also runs
Fig. 8 NW Bicester fuses historical food patterns with Farrells’ contemporary masterplanningdesign, Farrells (2009–2016)
A Place for Food Within Sustainable Urban Masterplanning 133
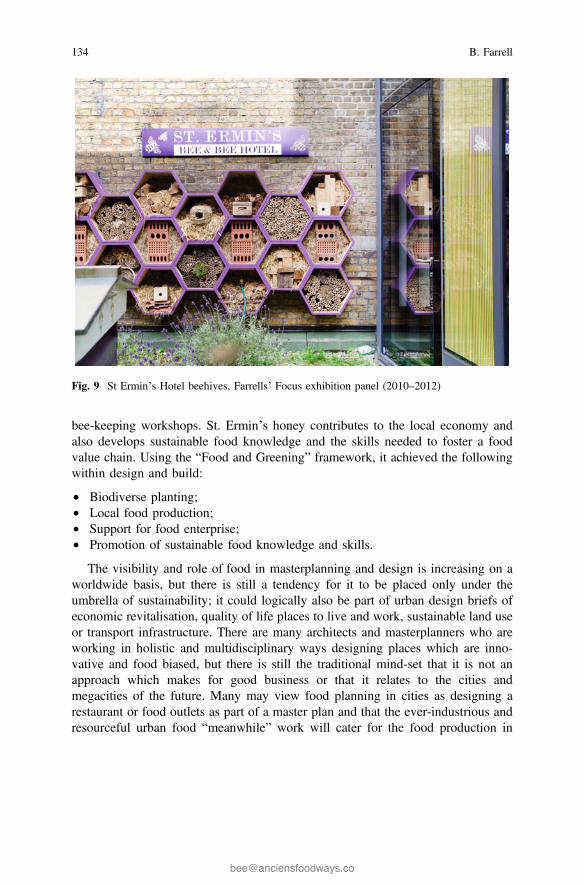
bee-keeping workshops. St. Ermin’s honey contributes to the local economy andalso develops sustainable food knowledge and the skills needed to foster a foodvalue chain. Using the “Food and Greening” framework, it achieved the followingwithin design and build:
• Biodiverse planting;• Local food production;• Support for food enterprise;• Promotion of sustainable food knowledge and skills.
The visibility and role of food in masterplanning and design is increasing on aworldwide basis, but there is still a tendency for it to be placed only under theumbrella of sustainability; it could logically also be part of urban design briefs ofeconomic revitalisation, quality of life places to live and work, sustainable land useor transport infrastructure. There are many architects and masterplanners who areworking in holistic and multidisciplinary ways designing places which are inno-vative and food biased, but there is still the traditional mind-set that it is not anapproach which makes for good business or that it relates to the cities andmegacities of the future. Many may view food planning in cities as designing arestaurant or food outlets as part of a master plan and that the ever-industrious andresourceful urban food “meanwhile” work will cater for the food production in
Fig. 9 St Ermin’s Hotel beehives, Farrells’ Focus exhibition panel (2010–2012)
134 B. Farrell
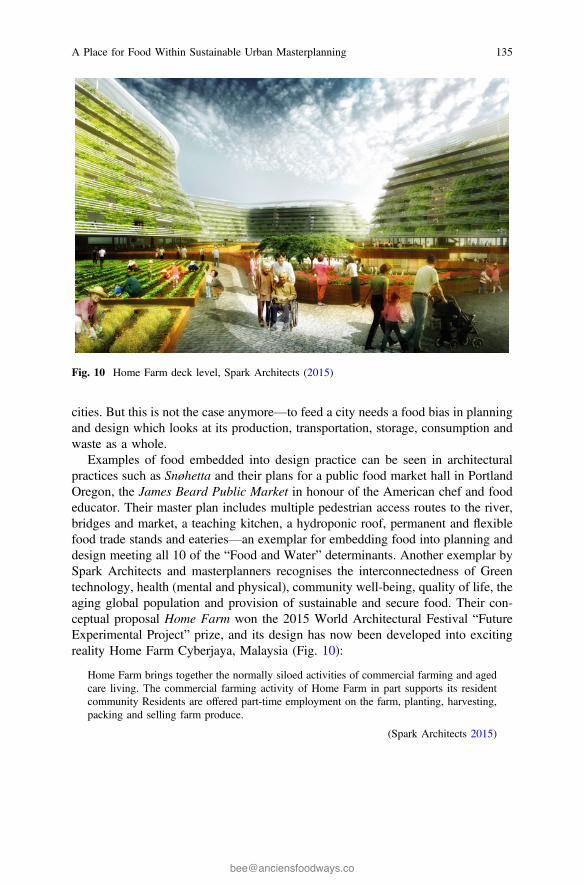
cities. But this is not the case anymore—to feed a city needs a food bias in planningand design which looks at its production, transportation, storage, consumption andwaste as a whole.
Examples of food embedded into design practice can be seen in architecturalpractices such as Snøhetta and their plans for a public food market hall in PortlandOregon, the James Beard Public Market in honour of the American chef and foodeducator. Their master plan includes multiple pedestrian access routes to the river,bridges and market, a teaching kitchen, a hydroponic roof, permanent and flexiblefood trade stands and eateries—an exemplar for embedding food into planning anddesign meeting all 10 of the “Food and Water” determinants. Another exemplar bySpark Architects and masterplanners recognises the interconnectedness of Greentechnology, health (mental and physical), community well-being, quality of life, theaging global population and provision of sustainable and secure food. Their con-ceptual proposal Home Farm won the 2015 World Architectural Festival “FutureExperimental Project” prize, and its design has now been developed into excitingreality Home Farm Cyberjaya, Malaysia (Fig. 10):
Home Farm brings together the normally siloed activities of commercial farming and agedcare living. The commercial farming activity of Home Farm in part supports its residentcommunity Residents are offered part-time employment on the farm, planting, harvesting,packing and selling farm produce.
(Spark Architects 2015)
Fig. 10 Home Farm deck level, Spark Architects (2015)
A Place for Food Within Sustainable Urban Masterplanning 135
City design and urban living needs to be part of food and [rural] agricultureplanning—these essential cross-disciplinary partnership collaborations can movefood provision away from intensive and unsustainable industrial agriculture, and itslong food chains and the distancification of the city dweller with their daily food.The UN—as well as many other environmental, health and educationnon-governmental organisations—believes that:
There is an urgent need to ensure that cities are included on the agenda of food andagriculture policy makers, planners and institutions. Likewise, it is equally urgent tointegrate food security and agriculture into the agenda of city planners and local urbanauthorities. (FAO 2016)
The impressive (opportunistic) work to date of urban food champions is a vital partof a sustainable (urban) food future in which masterplanners and architects whowork as part of multidisciplinary teams—supported financially by stakeholdersand/or governments—can reach the global and local UN food security goals.22 TheChicago Metropolitan Agency for Planning (CMAP) is an example of integratedand coordinated city region planning which encompasses the culture, character andpeople of a place, the commitment from local government, infrastructural design bymasterplanners, engineers, landscape architects and architects and thecommunity-based activities which support quality of life for residents:
A sustainable food system incorporates practices, policies, and operations that are beneficialto the three pillars of sustainability: the local, regional, and global economy; our land,water, and living resources; and our communities, including public health and our socialconnections to one another. (CMAP 2016)
Coordinated and multidisciplinary sustainable urban food planning and mas-terplanning design work responds to and relies on initiatives, resources, policy,community projects and place-specific thinking. Planning and policy strategies inAmerican and Canadian city regions such as Vancouver, Baltimore, Seattle,Toronto and Marin county have developed resources and strategies which informand influence the city planning and liveability. Baltimore sustainability plan23 hasresources such as food desert maps while Vancouver has developed a basis analysisof the city’s food system.24 Holistic planning which is food biased is happening all
22The steps in delivering safe nutritious food from the field to the urban consumer, the production,processing and marketing, are all interlinked and should mutually strengthen each other.23Baltimore City, in collaboration with Johns Hopkins Center for a Livable Future (CLF), pro-duced the 2015 Food Environment Map and Report to draw attention to food access patterns inBaltimore City’s neighbourhoods and to assist with policy development and implementation.24“By mapping Vancouver’s select physical food assets and correlating them with populationdensity, we can begin to gain a better picture of how access to food assets may vary acrossdifferent parts of the city.”
136 B. Farrell
over the world—and there are increasing numbers of exciting and creative theo-retical projects, but it has to be reality, the norm and not the exception with morecommitment given—in terms of finance, training and time—to drive an urgent needto address our food security.
10 Conclusion
The challenging spectre of a Malthusian equation of a predicted 9.6 billion globalpopulation needing a 70% increase in food production but with a scarcity of land togrow upon is overshadowing creative and resource-efficient solutions (FAO 2009a,b). If the contemporary solution to complex challenges to sustainable and securefood is the intensification of farming and the continuing disconnection of urbandwellers from food production and waste, it will result in an increasingly unsus-tainable and unjust way of feeding ourselves. There are so many alternatives which,although obvious, are not mainstream because they demand a new way of believingand behaving like a well-brought up “guest of the nature.” A well-fed guest at aglobal table will need to be ecologically and socially responsible as the UKchampion for UK food security Benton (2016) states:
How we change the food system for the better is the elephant in the room. Until we find away, as a society, to value food, value our planet, and value ourselves better, business asusual will continue and the costs will grow.
Urban masterplanners can offer design solutions that create opportunities tosupport food value chains and healthy urban food—and challenge the “elephant inthe room”. Food in masterplanning includes design for planned urban agricultureand urban infrastructure which encompasses green technology with food andclosed-loop waste-biased city living. The future of sustainable urban food ischallenging but “to be an architect you have to be an optimist-to believe in a futurethat can be better” (Pimbley 2016). The solutions will have to be new, creative andingenious, not a replicated enlargement of aforementioned unsustainable andwasteful food and farming systems. Enlightened and creative architects and urbanmasterplanners such as, Ameller, Dubois & Associés, Du Toit All Hillier, Farrells,Mithun Arhitects,25 Producktif Studio,26 Snøhetta, Spark and Young are allworking in interdisciplinary teams with food planning embedded in city regiondesign. This enlightened and exciting approach is key to urban—and rural—sus-tainability. Young believes that “food is a resource” and thus consequently it needsto be respected and replenished through green thinking, food planning, holisticdesign and urban living which is both reflective and far-reaching.
25http://mithun.com/.26http://produktif.com/.
A Place for Food Within Sustainable Urban Masterplanning 137

References
Albritton R (2013) Between obesity and hunger: the capitalist food industry. In: Counihan C, VanEsterik P (eds) Food and culture. Routledge, New York
American Planning Association (2007) https://www.planning.org/policy/guides/adopted/food.htmAmerican Planning Association (APA) (2016) APA policy guide on community and regional food
planning. Accessed 2016. https://www.planning.org/policy/guides/adopted/food.htmBenton T (2016) Roundup ready: food security from 2015 into 2016. Accessed 2016. http://www.
foodsecurity.ac.uk/blog/2016/01/roundup-ready-food-security-from-2015-into-2016/#more-2478Berry W (2002) The agrarian standard. In: Orion Magazine, Great Barrington, US. https://
orionmagazine.org/article/the-agrarian-standard/. Accessed 2016Boullasa N (2016) Backyard Aquaponics. Accessed 2016. https://www.flickr.com/photos/
faircompanies/9184675731/in/photolist-eZBS78-eZBRgP-eZQrBS-eZBNtz-eZBNjk-eZQnsA-eZQkad-eZBNgk-eZBRPB-eZQngf-eZBN5t-eZQmp3-eZBR6p-eZBP3 g-eZBWp2-eZBNJ4-eZQsz3-eZBNRB-eZQqR7-eZQq5 h-eZBNoX-eZBW46-eZQmUS-eZQmCf-eZQpxf-eZQkgh-eZQsWj-eZBVL6-eZQmw1-eZBQar-eZBRxg-eZBU5H-eZQkRY-eZBTAX-eZBPrF-eZBVB4-eZQr6U-eZQrWN-eZBSLP-eZQqB5-eZBT9r-eZQmdL
Brusselsfarmer2 (2016) Guerrilla gardening with sunflowers. Accessed 2016. https://www.flickr.com/photos/brusselsfarmer/941783653/in/photolist-84far3-74HCF8-6JMgGD-7xdHKK-6pCpTJ-8myTpp-4d9BLY-8jD3ft-6oEeUm-8jG5VJ-nnF6ZW-8jDmNg-cNvkrm-6Jcvmf-8EemCX-84bWvV-cP2kTN-nnXwUg-6t4FvB-84aZop-84aZ9 k-2rdTtc-8jCQMX-84ecSb-84eWcG-84bSDR-7xdHHD-6pCnR1-8jFwZY-8jCFG4-6Jcrub-74MstA-84bczF-84eEXC-8jFCfb-84buxP-5w3PGb-8jGoGL-84eRuU-8mC2VC-84egTy-84bABK-8mC47S-84bpa8-84eTCq-84es8A-8mzeer-84bNuR-7xhgxW-5LkJDR
CMAP (2016) Chicago Metropolitan Agency for Planning, Sustainable Cities Institute. Accessed2016. http://www.sustainablecitiesinstitute.org/topics/food-systems
Crane N (2010) Great British Journeys. Hachette, UKDiamond J (1997) Guns, germs and steel. Vintage Books, LondonDonkers H (2016) Local food for the global future. Scholar’s Press, BerlinDring R (2015) Human manure closing the loop. In: Sustainable food trust on-line magazine.
Accessed 2016. http://sustainablefoodtrust.org/articles/human-manure-closing-the-nutrient-loop/
FAO (2016) Save food: global initiative on food loss and waste reduction. Accessed 2016. http://www.fao.org/save-food/resources/keyfindings/en/
Farrell T (2004) Place: a story of modelmaking, menageries and paper rounds. Laurence King,London
Farrell T (2015) Press release for TDAG. Accessed 2016. http://www.tdag.org.uk/uploads/4/2/8/0/4280686/press_release_sir_terry_farrell_farrells__for_release.pdf
Farrells (2009–2016) NW Bicester design drawingFarrells (2015) Farrell review, Farrells and Department for Culture, Media and Sport, NLA &
Pipers, LondonFood and Agriculture Organisation for the United Nations (FAO) (2009a) Food for the Cities.
Accessed 2016 www.fao.org/fcitFood and Agriculture Organisation for the United Nations (FAO) (2009b) How to feed the world
2050. Accessed 2016. http://www.fao.org/fileadmin/templates/wsfs/docs/Issues_papers/HLEF2050_Global_Agriculture.pdf
Food and Agriculture Organisation for the United Nations (FAO) (2013) Food wastage footprint,impacts on natural resources. FAO Publications
Food and Agriculture Organisation for the United Nations, (FAO) (2016) Cities multidisciplinaryinitiative. Accessed 2016. http://www.fao.org/fcit/policy-planning-institutions/en/
Gorgolewski M, Komisar A, Nasr J (eds) (2011) Carrot City. Monacelli Press, New YorkHunderwasser F (1979–1980) Humus toilet. Accessed 2016. www.thepoopproject.org/wp-content/
uploads/2010/
138 B. Farrell
Lim CJ (2014) Food city. Routledge, New YorkMoore JW (2015) Capitalism in the web of life. Verso, LondonMorgan K (2009) Feeding the city: the challenge of urban food planning. International Planning
Studies 14(4):341–348Owen D (2010) Green metropolis: why living smaller, living closer, and driving less are the keys
to sustainability. Riverhead Books, New YorkPetrini C (2005) Slow food nation: why our food should be good, clean and fair. Rizzoli,
New YorkPimbly S (2016) Spark architects. Accessed 2016. http://www.sparkarchitects.com/2015/12/02/
sparks-home-farm-solar-orchid-projects-feature-singapores-future-us-exhibition/Rahn M (2015) Laying a place at the table: creating public foodways models from scratch. In:
Long LM (ed) Food and Folklore Reader. Bloomsbury Academic, LondonReid D (1991) Paris Sewers and Sewermen: realities and representations. Harvard University
Press, LondonRestany P (2001) Hunderwasser, the painter with the five skins. Tachen, ParisSarah OS (2016) McGill Edible Campus. Accessed 2016. https://www.flickr.com/photos/
sarahseverson/9409246494/in/photolist-fksRaQ-shFnQUSearchinger T et al. (2013) Creating a sustainable food future. The Great Balancing Act, Working
Paper, World Resources Institute, WashingtonSecretariat S (2016) Bio-gas plant construction. Accessed 2016. www.flickr.com/photos/gtzecosan/
5363265413/in/photolist-Lu7CW-9aWaiT-9aW8Xk-9aZhCS-9aZiko-9aW9hZ-9aWUMh-9aZgTG-9aWaNM-9aWUC7-9aW8ED-9aZhwS-9aZiUj-9bszw8-6Y1bs6
Snøhetta (2016) Accessed 2016. http://snohetta.com/Spark Architects (2015) Accessed 2016. http://sparkarchitects.com/2015/12/03/sparks-home-farm-
set-transform-cyberjaya-malaysia/Steel C (2008) Hungry City. Chatto & Windus, LondonSteinfeld H, Gerber P, Wassenaar T, Castel V, Rosales M, de Haan C (2006) Lifestock’s long
shadow, environmental issues and options. FAO and LEADTown and Country Planning Association and the Wildlife Trusts (2012) Planning for a healthier
environment, good practice guidance for green infrastructure and biodiversity, TCPA and TheWildlife Trusts, UK
Van Otterdijk R (2016) Accessed 2016. http://www.fao.org/news/audio-video/detail-video/en/?uid=9575
Viljoen A (2011) Foreword. In: Gorgolewski M, Komisar J, Nasr J (eds) Carrot city, creatingplaces for urban agriculture. Monacelli Press, A Division of Random House Inc, New York
Viljoen A, Bohn K (eds) (2014) Second nature urban agriculture. Routledge, New YorkWilbanks TJ (2013) How scale matters: some concepts and findings. In: Bridging scales and
knowledge systems. Island Press, WashingtonYoung G (2016) Personal Communication, March 2016Young G, Smart H (2014) Market garden city: a concept for food production in urban planning.
Accessed 2015. http://archive.higgsyoung.com/marketgardencity.com/index.htm
A Place for Food Within Sustainable Urban Masterplanning 139
Infrastructure, Equity and UrbanPlanning: A Just Process for the Allocationof Benefits and Burdens
Daniel Durrant
This chapter asks first what is infrastructure or more importantly infrastructures asthe physical artefacts and technologies are inextricably intertwined with complexeconomic, social and ecological systems. This is central to the first dimension ofequity considered, distributional equity. Infrastructures allocate different ‘goods’spatially, and to population groups therefore to understand the impacts of infras-tructures upon distributional equity it is important to understand what exactly theyare and what goods they produce. Second, planning and the planning of infras-tructures highlight the importance of procedural equity and equality of input into theprocess. The next section examines definitions of equity and their application tourban planning and urban infrastructure. This draws upon three philosophicalanalyses of the concept and ways in which it has been recently applied to developprinciples that could reshape the way infrastructure is planned and provided.A framework is developed to illustrate the ways in which the planning of urbaninfrastructure might be used to establish more equitable outcomes. This is basedupon a vertical axis along which procedural inputs influence the way the planningprocess allocates distributional outputs. These are distributed along a horizontal axisof benefits and burdens with the planning process used as a means of establishingminimum and maximum permissible thresholds. As the examples of infrastructurethat has been planned and delivered specifically to address issues of social equity arefew and far between, the chapter is interspersed with examples of where somedimensions have been addressed either explicitly or indirectly.
D. Durrant (&)Bartlett School of Planning, University College London, Central House,14 Upper Woburn Place, Bloomsbury WC1H 0NN, UKe-mail: [email protected]
© Springer International Publishing AG 2017J. Bishop (ed.), Building Sustainable Cities of the Future,Green Energy and Technology, DOI 10.1007/978-3-319-54458-8_8
141
1 Introduction
As a dimension of sustainability social equity is something of a hydra. Achievingequity in one area can see multiple inequalities rear their heads in others as urbaninfrastructure produces a multitude of potential inequalities planners must accountfor (Beatley 1988; Thomopoulos and Tight 2009). Furthermore, concepts of sus-tainability introduce additional dimensions with the need for equity between gen-erations and even species. There is no one comprehensive solution, and differentinfrastructures affect equity in different ways, indeed no single definition works inall circumstances. Definitions are dependent upon the ethical framework adopted(Beatley 1988). This chapter considers four different ethical frameworks mostrelevant to equity in infrastructure critiquing the dominant utilitarian framework andthen exploring the potential of Rawlsian, egalitarian and the Aristotelian capabilitiestheory. Appraising the consequences for social equity in government programs suchas the funding of infrastructure projects is increasingly a legal duty(Legislation.gov.uk 2010) in the UK, with the need to identify and measure theimpact on specific groups within society (Transport for London 2004) or upondifferent income groups (HM Treasury 2011). Yet as is often the case, it is theeconomic arguments and justifications that push their way to the fore. However, forsome time now a paradigm shift has been underway. The modernist assumptionsthat the comprehensive, universal provision as the route to technological progresshave ‘splintered’, in part due to the privatisation of, formally public infrastructureproviders (Graham and Marvin 2001). Since the 1980s, the global trend in publicpolicy has been towards infrastructure as an opportunity for private investment,often at the expense of its role in public provision, Britain’s first Private FinanceInitiative (PFI) funded infrastructure project, the controversial Skye Bridge, being agood example (see Monbiot 2004). However, new concepts are in the process offorming and new forms of infrastructure are called for (Brown 2014). The challengein this case is in the first instance a conceptual shift that is far from complete. Theoverarching aim of this chapter is to illustrate the inadequacies of current con-ceptions of equity still influential in urban planning and the planning of urbaninfrastructure and to introduce the reader to alternatives. Much of this work citesdevelopments in transport planning as this is one infrastructural system where theissues are visibly played out; however, concern with issues such as the ‘digitaldivide’ (van Dijk 2016) indicates concerns across a range of infrastructures. It is nottaken as given that a low carbon future is also an equitable one. Consequently, whatis called for is a clearly understood and expressed set of principles governing theplanning and provision of urban infrastructure.
142 D. Durrant
2 What is Infrastructure?
Most definitions of infrastructure take in the organisational as well as the physicalnature of the concept. The term has been traced back to its origins in French railwayplanning first entering English usage via the military (Marshall 2015). Its etymol-ogy as the basis or underlying structure of a system points towards a dual role assomething that both shapes and directs yet at the same time lacks complete visi-bility: ‘something grey behind a chain-link fence’ (Brand 2010). Yet in the trans-mission of goods, people, power and information over increasingly vast distances, ithas formed the basis of an industrial and information revolution. It underpins amodel of development supported by a financial ecosystem from the World Bankand the various development banks through to states and private investors seekingto capitalise on the benefits infrastructure investment has historically generated. It isa model that has produced huge aggregate benefits although the distribution of thesebenefits has been far from equal. Furthermore, the burdens have often fallen upongroups and environments least able to resist urbanisation and the extraction ofresources (such as urban land) and, it appears increasingly, upon future generations.
At the extreme, the burdens imposed by infrastructure include the sequestrationof land and the health consequences of externalities such as noise and air pollution.The former in contemporary societies is governed by some legal protections forlandowners although historically it has not always been the case and groups such astenants will often have fewer rights. Even today, where land use or rights are notprotected or overridden by powerful interests, large infrastructure projects such asthe Three Gorges Dam in China can be the cause of significant displacement ofpopulations (Gellert and Lynch 2003). More immediate, albeit temporary, burdenssuch as noise, pollution, community severance can be imposed during the con-struction, operation and decommissioning of urban infrastructure (Fig. 1).
If the pressing issue of the inequality between generations and species is to bemeaningfully addressed, then infrastructures and the planning of infrastructure mustplay a part in directing a shift from high to low carbon emissions and reducingresource consumption (Giddens 2011). It is beyond the scope of this chapter tocomment on the feasibility of such a challenge; instead, it focuses on the question ofwhether it can be achieved in an equitable way. This is particularly relevant aspeople are lifted out of poverty and given access to basic infrastructure questions ofequity become more rather than less important. The role played by the hardinfrastructures that provide sanitation, power, transport and communication and thesoft infrastructure that provide health, education and law and order has all beenmassively successful in raising the standards of living for the least well off in manyparts of the world, China being the prime example. It has seen the most rapid rise ineconomic and social development of any major economy, lifting more than 800million people out of poverty and achieving the Millennium Development Goals by2015 (World Bank 2016). In some ways, China has followed a similar, albeit
Infrastructure, Equity and Urban Planning: A Just Process for … 143

accelerated, path to countries in the Global North. High levels of investment ininfrastructure combine with economic development to produce widespreadincreases in the standard of living: a pattern common to other rapidly growing EastAsian Economies such as Thailand and Vietnam (Asian Development Bank 2005).Whilst there is still much to do with infrastructure deficits plaguing the GlobalSouth, this model has been largely successful, up to a point. The ‘environmentalstory’ of East Asian infrastructure development, for example, is far less positive(ibid).
Arguably, this vision of technological progress, a vision underpinned byinfrastructure, has reached its zenith as citizens are increasingly sceptical of thebenefits (Beck 1992) and averse to the burdens imposed. As the consequences of aresource intensive, fossil fuel-based model of development are widely acknowl-edged to be unacceptable, the existing forms of infrastructure that underpin thismodel will have to adapt, adjust and, in some cases, switch to something new. Inparallel to this shift is the rise of democracy, civil society and human rights, oftenenshrined in international law. This gives citizens who are asked to bear the costs of
Fig. 1 Acoustic barriers on the Tullamarine Freeway, Melbourne, Australia [photographAtlantica, used under license (CC-BY-SA 3.0)]. For some burdens such as noise, there areengineering solutions available assuming sufficient mitigation costs are included in the initialproject appraisal. Others such as the impact of automobile emissions and the particulate matterthey produce on air quality may require policy action to limit certain vehicles and to encouragemodal shift to less polluting forms of transport
144 D. Durrant
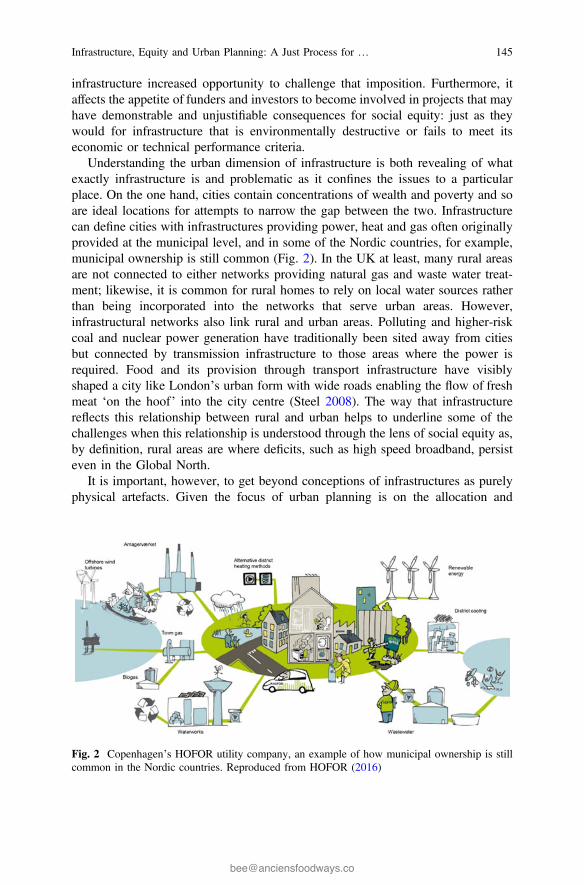
infrastructure increased opportunity to challenge that imposition. Furthermore, itaffects the appetite of funders and investors to become involved in projects that mayhave demonstrable and unjustifiable consequences for social equity: just as theywould for infrastructure that is environmentally destructive or fails to meet itseconomic or technical performance criteria.
Understanding the urban dimension of infrastructure is both revealing of whatexactly infrastructure is and problematic as it confines the issues to a particularplace. On the one hand, cities contain concentrations of wealth and poverty and soare ideal locations for attempts to narrow the gap between the two. Infrastructurecan define cities with infrastructures providing power, heat and gas often originallyprovided at the municipal level, and in some of the Nordic countries, for example,municipal ownership is still common (Fig. 2). In the UK at least, many rural areasare not connected to either networks providing natural gas and waste water treat-ment; likewise, it is common for rural homes to rely on local water sources ratherthan being incorporated into the networks that serve urban areas. However,infrastructural networks also link rural and urban areas. Polluting and higher-riskcoal and nuclear power generation have traditionally been sited away from citiesbut connected by transmission infrastructure to those areas where the power isrequired. Food and its provision through transport infrastructure have visiblyshaped a city like London’s urban form with wide roads enabling the flow of freshmeat ‘on the hoof’ into the city centre (Steel 2008). The way that infrastructurereflects this relationship between rural and urban helps to underline some of thechallenges when this relationship is understood through the lens of social equity as,by definition, rural areas are where deficits, such as high speed broadband, persisteven in the Global North.
It is important, however, to get beyond conceptions of infrastructures as purelyphysical artefacts. Given the focus of urban planning is on the allocation and
Fig. 2 Copenhagen’s HOFOR utility company, an example of how municipal ownership is stillcommon in the Nordic countries. Reproduced from HOFOR (2016)
Infrastructure, Equity and Urban Planning: A Just Process for … 145
governance of urban space, it is hardly surprising that the focus tends to be on thespatial manifestation of infrastructure. This is where it competes with other urbanland uses and has an impact on the lives of urban citizens. Since EbenezerHoward’s vision of a planned community supported by its infrastructure, there hasalways been a utopian strand in urban planning that sees the organisation of spaceas the pursuit of some greater good. In Howard’s plans, infrastructure was alwayshard (waterways and rail links) and soft (care homes and educational facilities). In aresource constrained world, there is increasing expectation that infrastructure is alsomulti-purpose. An example of this is the integration of transport and communica-tions infrastructure or waste water and community facilities (Brown 2014) that hasalways occurred to an extent; however, the expectations of this are increasing giventhe resources new infrastructure consumes. As with physical functions, the inte-gration of social infrastructures into the design of the physical artefacts adds to theoverall value of the whole infrastructural system. Beyond this, in our informationsociety infrastructures sit within infrastructures. Take, for example, micro-paymentand trading systems that sit within and depend upon mobile telephony and Internetinfrastructure. Furthermore, as the infrastructural dimensions of environmentalsystems are being acknowledged this broadens the definition of infrastructure fur-ther still.
There are good reasons for including social systems in any definition ofinfrastructure. They may be more flexible and adaptable, and in terms of equity theycan go some way towards overcoming the limitations imposed by the physicalstructures. The way that the rail operators in the UK have systems to supportdisabled access to trains through ramps and human support may not be a perfectsolution. It is second best when compared to the full disabled accessibility that isrequired for new infrastructure; however, it does enable some access to a systemwhere the resources available for upgrading facilities are limited and progress isslow. Finally, what is in many ways more significant is the way that technologies,such as those employed in infrastructural systems sit within relatively stablesocio-technical systems. These are known as ‘regimes’ (Rip and Kemp 1998) madeup of structures and actors, legislation, public and private sector institutions, theskills and knowledge necessary to produce different technologies and cruciallysocial norms and values. Rather than something that is external to social systems,infrastructural technologies can be seen to coevolve mutually shaping and beingshaped by the socio-technical regimes of which they are a part. Technologicaltransitions of the type required to shift to lower carbon forms of infrastructure canbe brought about by internal or external pressures on these wider socio-technicalregimes (Geels 2002). Pressure to change technologies can come from a widevariety of sources such as economic or demographic shifts and crucially, shifts inthe norms and values of societies (Smith et al. 2005). Understanding infrastructuresas more than just transport, communications or energy technologies are central tounderstanding how new infrastructural technologies coevolve to both produce andreflect societal shifts.
146 D. Durrant
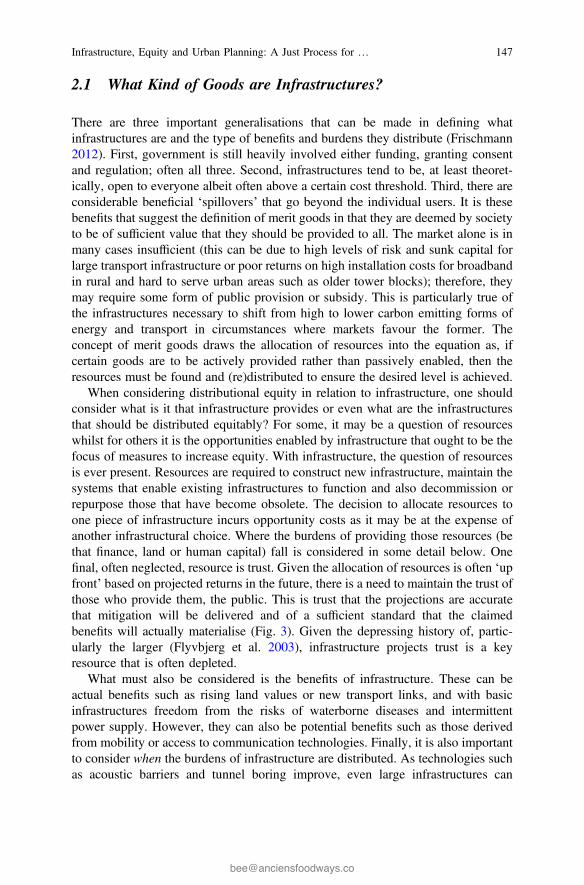
2.1 What Kind of Goods are Infrastructures?
There are three important generalisations that can be made in defining whatinfrastructures are and the type of benefits and burdens they distribute (Frischmann2012). First, government is still heavily involved either funding, granting consentand regulation; often all three. Second, infrastructures tend to be, at least theoret-ically, open to everyone albeit often above a certain cost threshold. Third, there areconsiderable beneficial ‘spillovers’ that go beyond the individual users. It is thesebenefits that suggest the definition of merit goods in that they are deemed by societyto be of sufficient value that they should be provided to all. The market alone is inmany cases insufficient (this can be due to high levels of risk and sunk capital forlarge transport infrastructure or poor returns on high installation costs for broadbandin rural and hard to serve urban areas such as older tower blocks); therefore, theymay require some form of public provision or subsidy. This is particularly true ofthe infrastructures necessary to shift from high to lower carbon emitting forms ofenergy and transport in circumstances where markets favour the former. Theconcept of merit goods draws the allocation of resources into the equation as, ifcertain goods are to be actively provided rather than passively enabled, then theresources must be found and (re)distributed to ensure the desired level is achieved.
When considering distributional equity in relation to infrastructure, one shouldconsider what is it that infrastructure provides or even what are the infrastructuresthat should be distributed equitably? For some, it may be a question of resourceswhilst for others it is the opportunities enabled by infrastructure that ought to be thefocus of measures to increase equity. With infrastructure, the question of resourcesis ever present. Resources are required to construct new infrastructure, maintain thesystems that enable existing infrastructures to function and also decommission orrepurpose those that have become obsolete. The decision to allocate resources toone piece of infrastructure incurs opportunity costs as it may be at the expense ofanother infrastructural choice. Where the burdens of providing those resources (bethat finance, land or human capital) fall is considered in some detail below. Onefinal, often neglected, resource is trust. Given the allocation of resources is often ‘upfront’ based on projected returns in the future, there is a need to maintain the trust ofthose who provide them, the public. This is trust that the projections are accuratethat mitigation will be delivered and of a sufficient standard that the claimedbenefits will actually materialise (Fig. 3). Given the depressing history of, partic-ularly the larger (Flyvbjerg et al. 2003), infrastructure projects trust is a keyresource that is often depleted.
What must also be considered is the benefits of infrastructure. These can beactual benefits such as rising land values or new transport links, and with basicinfrastructures freedom from the risks of waterborne diseases and intermittentpower supply. However, they can also be potential benefits such as those derivedfrom mobility or access to communication technologies. Finally, it is also importantto consider when the burdens of infrastructure are distributed. As technologies suchas acoustic barriers and tunnel boring improve, even large infrastructures can
Infrastructure, Equity and Urban Planning: A Just Process for … 147
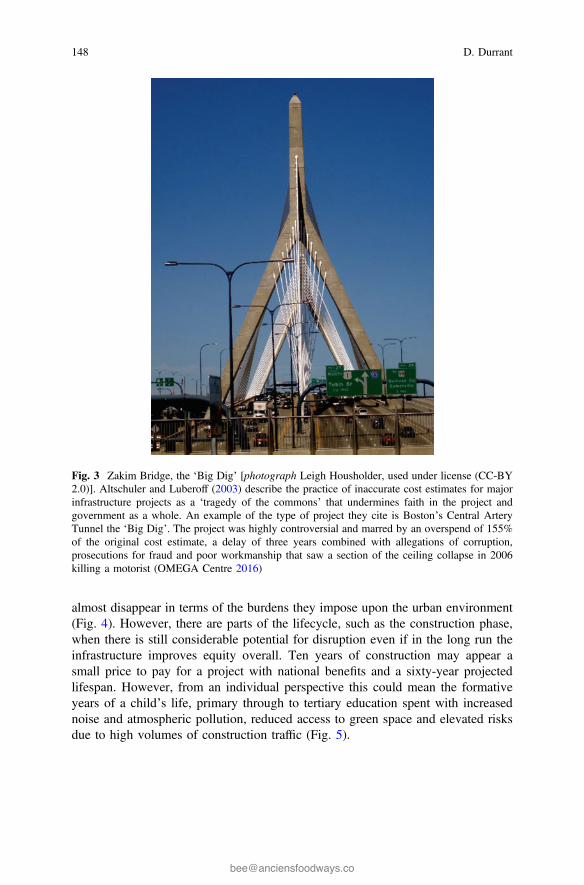
almost disappear in terms of the burdens they impose upon the urban environment(Fig. 4). However, there are parts of the lifecycle, such as the construction phase,when there is still considerable potential for disruption even if in the long run theinfrastructure improves equity overall. Ten years of construction may appear asmall price to pay for a project with national benefits and a sixty-year projectedlifespan. However, from an individual perspective this could mean the formativeyears of a child’s life, primary through to tertiary education spent with increasednoise and atmospheric pollution, reduced access to green space and elevated risksdue to high volumes of construction traffic (Fig. 5).
Fig. 3 Zakim Bridge, the ‘Big Dig’ [photograph Leigh Housholder, used under license (CC-BY2.0)]. Altschuler and Luberoff (2003) describe the practice of inaccurate cost estimates for majorinfrastructure projects as a ‘tragedy of the commons’ that undermines faith in the project andgovernment as a whole. An example of the type of project they cite is Boston’s Central ArteryTunnel the ‘Big Dig’. The project was highly controversial and marred by an overspend of 155%of the original cost estimate, a delay of three years combined with allegations of corruption,prosecutions for fraud and poor workmanship that saw a section of the ceiling collapse in 2006killing a motorist (OMEGA Centre 2016)
148 D. Durrant
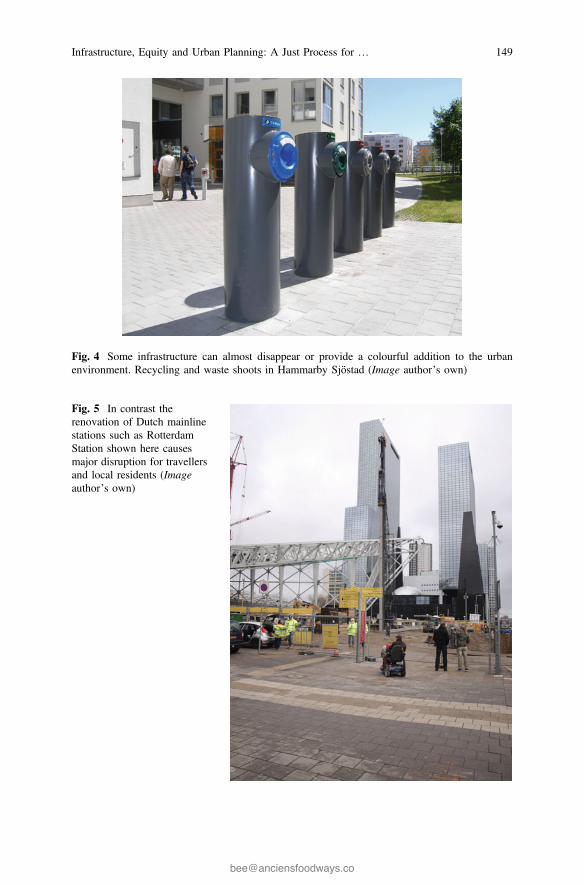
Fig. 4 Some infrastructure can almost disappear or provide a colourful addition to the urbanenvironment. Recycling and waste shoots in Hammarby Sjöstad (Image author’s own)
Fig. 5 In contrast therenovation of Dutch mainlinestations such as RotterdamStation shown here causesmajor disruption for travellersand local residents (Imageauthor’s own)
Infrastructure, Equity and Urban Planning: A Just Process for … 149
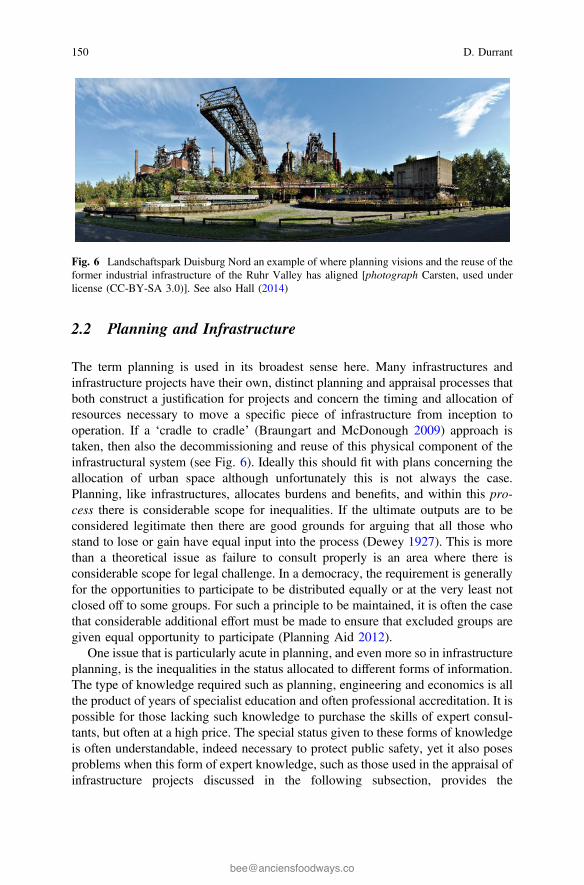
2.2 Planning and Infrastructure
The term planning is used in its broadest sense here. Many infrastructures andinfrastructure projects have their own, distinct planning and appraisal processes thatboth construct a justification for projects and concern the timing and allocation ofresources necessary to move a specific piece of infrastructure from inception tooperation. If a ‘cradle to cradle’ (Braungart and McDonough 2009) approach istaken, then also the decommissioning and reuse of this physical component of theinfrastructural system (see Fig. 6). Ideally this should fit with plans concerning theallocation of urban space although unfortunately this is not always the case.Planning, like infrastructures, allocates burdens and benefits, and within this pro-cess there is considerable scope for inequalities. If the ultimate outputs are to beconsidered legitimate then there are good grounds for arguing that all those whostand to lose or gain have equal input into the process (Dewey 1927). This is morethan a theoretical issue as failure to consult properly is an area where there isconsiderable scope for legal challenge. In a democracy, the requirement is generallyfor the opportunities to participate to be distributed equally or at the very least notclosed off to some groups. For such a principle to be maintained, it is often the casethat considerable additional effort must be made to ensure that excluded groups aregiven equal opportunity to participate (Planning Aid 2012).
One issue that is particularly acute in planning, and even more so in infrastructureplanning, is the inequalities in the status allocated to different forms of information.The type of knowledge required such as planning, engineering and economics is allthe product of years of specialist education and often professional accreditation. It ispossible for those lacking such knowledge to purchase the skills of expert consul-tants, but often at a high price. The special status given to these forms of knowledgeis often understandable, indeed necessary to protect public safety, yet it also posesproblems when this form of expert knowledge, such as those used in the appraisal ofinfrastructure projects discussed in the following subsection, provides the
Fig. 6 Landschaftspark Duisburg Nord an example of where planning visions and the reuse of theformer industrial infrastructure of the Ruhr Valley has aligned [photograph Carsten, used underlicense (CC-BY-SA 3.0)]. See also Hall (2014)
150 D. Durrant
justification for decision making. It can squeeze out or fail to acknowledge the valueof ‘local knowledge’1 (Yanow 2003) about the consequences of infrastructureprojects for those that must live with them. In addition to this, the risks of siloedapproaches and individual disciplines defining problems and solutions from a singleperspective are well known (Brown 2014) yet still persistent.
Opening up the ‘black box’ of infrastructure decision making is difficult toachieve in practice and may still be uncomfortable for some professionals. Accessto information is an important issue with confidentiality and commercial sensitivityused to restrict the important knowledge generated by infrastructure projects(OMEGA Centre 2013). On the other hand, the Internet and freedom of informationlegislation can, in some respects, equalise access to information. There is still onearea where the problems of unequal weighting applied to different forms ofknowledge within the planning process, and particularly the process of infrastruc-ture planning is much harder to address. The black box remains firmly closed withrespect to the values and assumptions contained with it. They go unacknowledgedand are presented as facts. Furthermore, these facts can constrain the optionsconsidered and shape the solutions from a limited pallet creating ‘narratives ofnecessity’ (Owens and Cowell 2011) that both the wider political decisions andshape the process of planning and infrastructure appraisal. This not only posesproblems from the perspective of equal participation but can also create consider-able risks of ‘path dependency’ (Curtis and Low 2012) locking in pathways to highcarbon emitting forms of infrastructure. This is as the values that tend to beentrenched are the ones that shape conventional approaches such as the appraisaltechniques discussed below.
2.3 Maximising Utility
There is a certain irony that one of the key mechanisms for the appraisal ofinfrastructure that is increasingly seen as a barrier to more equitable, less envi-ronmentally damaging forms of infrastructure was initially perceived as an alter-native to pork-barrel infrastructure projects (Shapiro and Schroeder 2008). Thebelief was that cost–benefit analysis (CBA) provides a rational means of ensuringthe benefits of infrastructure were distributed to society as a whole, rather than to asmall group of (sometimes corrupt) individuals. CBA is based on utilitarian prin-ciples that assume that the maximisation of individual utility will ultimately
1The attachment to certain places and landscapes identified by Patrick Devine-Wright (2013) andoften dismissed by (in this case renewable energy infrastructure) project promoters as NIMBYism(Not in My Back Yard) is an example of the type of local knowledge which if ignored can generateopposition and resulting costs and delays for project promoters. In contrast the Berger Inquiry intothe Mackenzie Valley Pipeline in Canada’s Northwest Territories is often cited (Torgeson 2003) asa positive example of the inclusion of local and indigenous knowledge.
Infrastructure, Equity and Urban Planning: A Just Process for … 151
produce equality. With CBA, this is achieved by aggregation of total benefits, thesolution that produces the most benefits for the least cost being the ideal one.
Utilitarian assumptions have long influenced urban planning (Moroni 2006), andas an appraisal methodology, CBA exerts considerable power in shaping theplanning and implementation of urban infrastructure. Whilst in many situations thegeneral principle that the benefits of infrastructure should exceed the costs is hard toargue with, the practice of CBA has been widely criticised for the inequalities itproduces. As a facet of the ‘modernist infrastructural ideal’ (Graham and Marvin2001), the practice was at least underpinned by some notion of public benefit.However, under neoliberal governance regimes, the aggregate economic benefitsare increasingly seen as public benefits regardless, of who the actual recipients are.
Three practices, in particular, monetisation of costs and benefits, discounting and(for transport projects) the emphasis on travel time savings, produce considerableinequalities in the way the benefits and burdens of infrastructures are distributed.First, the calculation of the financial costs of some elements of infrastructure pro-jects is not always problematic. Materials, labour and the purchase of land can all beestimated with a sufficient degree of certainty to ensure it is simply a matter of goodsense. Where monetisation becomes more problematic is when it is attached toprojected benefits and costs, often some time into an uncertain future. There areproblems of validity when such calculations are based upon a further set ofassumptions about willingness to pay for a resource (Naess 2006). A problem that isparticularly acute for environmental resources which are often resistant to transla-tion into monetary values. Monetisation of values can, furthermore, reinforceexisting inequalities as money itself is not evenly distributed and so a significantcost to one group may be barely noticed by another.
Alongside the monetisation of values, there is the practice of discounting whichassumes a cost incurred today is greater than one of the same monetary valueincurred sometime in the future. This can militate against intergenerational equity inthe way it legitimises the passing on of costs to future generations. For this reason, amuch lower discount rate was adopted in the influential Stern Report (Stern 2006)into the costs of climate change mitigation. The assumptions embedded within thepractice of discounting are also those of increasing prosperity and rising incomes.
Finally, the valuation of travel time savings in transport infrastructure is anotherexample of the way that the benefits of infrastructure are often unequally dis-tributed. A contemporary example of this can be found in plans for a high speed railconnection between London and Birmingham (HS2) in the UK. Benefits areunequally allocated due to a higher estimated value of business user’s time. This isdespite the majority of predicted users of the railway being non-business travellerswith 70% travelling for leisure trips and non-business related reasons (HS2Ltd/DfT2011). The consequences of this have been the design of the infrastructure has beenshaped by the need to facilitate rapid travel. This has been at the expense of theurban environment as the design requires a large amount of demolition surroundingEuston station. This particular case illustrates a further questionable practice used inCBA. It is certainly the true that with increasingly complex and interconnected
152 D. Durrant
infrastructures, the calculation of all costs and benefits is problematic. However, itis also highly political which costs are calculated. In addition to the demolition ofwhat is largely social and low-cost housing as a result of HS2, construction willcause years of disruption for local businesses. The problem is particularly acute onDrummond Street, an area characterised by predominantly Bengali owned shopsand restaurants. These are costs excluded from the CBA of what has already provedto be a contentious project. Opponents also argue that the compensation costs toproperty owners are inadequate, an indication that even when the methodologyitself is not challenged the selection of inputs into the analysis is never value free.
3 What is Equity
A further challenge when seeking to deliver more equitable forms of urbaninfrastructure is to be clear about what form of equity is desired. As the applicationof CBA shows, an assumption of equity (or more precisely the assumption that asingle conception of equity is sufficient) can lead to unjust and unequal outcomes.In the following section, alternatives to the utilitarian calculations of equity areidentified. Each has in one way or another been applied to the planning anddevelopment of urban infrastructures, and each is likely to skew that developmenttowards different ends.
3.1 Meeting the Needs of the Least Well Off: Rawls’Difference Principle
It is first useful to consider why equity ought to be an important dimension and, asis argued here, an explicit aim of any attempt to deliver more sustainable urbaninfrastructures. There is sound empirical evidence that more equal societies arebetter in terms of physical and mental health, educational attainment and trust inothers (Wilkinson and Pickett 2011). This is in the face of growing inequality(Dorling 2010) and the increasing redistribution of wealth upwards (Piketty 2014).The evidence points to equality, or at least reduced inequality, as a better state ofaffairs for all concerned. This is the argument that equality is a rational choice asseen in Rawls’ (1971) arguments for greater equality and better outcomes for theleast well off. Rawls’ argues that a rational individual would choose a more equalsociety if they were unaware of their own likely position in that society, operatingbehind what he called a ‘veil of ignorance’. This provides an argument for thereduction in inequalities yet Rawls also acknowledges the reality, indeed thedesirability of some inequality the level of which is limited by Rawls’ ‘differenceprinciple’. This states that
Infrastructure, Equity and Urban Planning: A Just Process for … 153
the higher expectations of those better situated are just if and only if they work as part of ascheme which improves the expectations of the least advantaged members of society.(Rawls 1971)
This may appear abstract yet it has been influential on public policy making andhas been effectively applied as a principle for restricting the use of the private carbeyond the point it impinges upon pedestrian accessibility (Tyler 2004). Not allbelieve Rawls’ basic principles can be applied directly as they relate to the basicinstitutions of society rather than specific policy or infrastructural decisions(Martens 2017). Others, however, argue that they can guide actions, such as effortsto minimise disruption or linking the provision of affordable housing to infras-tructure provision, whilst acknowledging their limitations in mandating action thatdirectly or exclusively, benefits the least well off (Beatley 1988). What the appli-cation of Rawlsian principles achieves is the establishment of threshold levels in thedistribution of the burdens of infrastructure below which it is not permissible to fall.
3.2 Establishing Minimum Thresholds: Capabilities
Beyond the rationalist approach adopted by Rawls, there is another, essentialistview that is important to acknowledge. This is the argument that equality in someareas is important in itself. Important here is the work of Martha Nussbaum andAmatya Sen on basic capabilities. These are a set of essential features human lifethat have a special claim to political support and protection. These include bodilyhealth, friendship, control of one’s environment and the ability to live with otherspecies (Nussbaum 1997) to select those most clearly related to the provision ofinfrastructure. These capabilities are indivisible; their essential nature means that itis not acceptable to trade them off against each other or against other desirable ends.A clear example of the type of policy this prohibits would be support for infras-tructure that trades health against wealth, even assuming the economic gain isequally distributed.2 A key feature of the capabilities approach is the way that itestablishes basic threshold levels of capabilities below which a ‘good human life’(Nussbaum 1992) is not possible.
Whilst Rawls provides limits below which actions should not fall, the capabilitiesapproach provides thresholds that compel action. They have been used as a basis forarguments about gender inequalities in the design of pedestrian and public transportinfrastructure (Robeyns 2003) inequalities facing those with disabilities (Tyler 2006)and can contribute to accessibility appraisal (van Wee and Roeser 2013). Such an
2Whilst in practice such calculations are rarely overt and can be masked behind practices such asCBA one can find examples, particularly in the Global South where little weight is given to thehealth impacts of new road infrastructure (Klopp 2012). However, in the Global North, wherearguably the need for basic economic development is less pressing there is still considerablespending on road infrastructure despite the known health and environmental costs (see Metz 2008)with action on air quality particularly slow in the UK.
154 D. Durrant
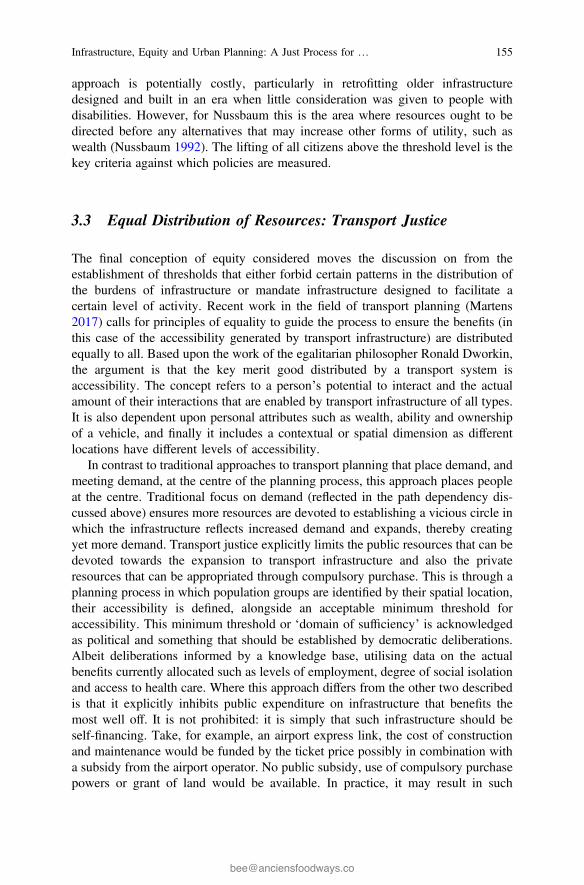
approach is potentially costly, particularly in retrofitting older infrastructuredesigned and built in an era when little consideration was given to people withdisabilities. However, for Nussbaum this is the area where resources ought to bedirected before any alternatives that may increase other forms of utility, such aswealth (Nussbaum 1992). The lifting of all citizens above the threshold level is thekey criteria against which policies are measured.
3.3 Equal Distribution of Resources: Transport Justice
The final conception of equity considered moves the discussion on from theestablishment of thresholds that either forbid certain patterns in the distribution ofthe burdens of infrastructure or mandate infrastructure designed to facilitate acertain level of activity. Recent work in the field of transport planning (Martens2017) calls for principles of equality to guide the process to ensure the benefits (inthis case of the accessibility generated by transport infrastructure) are distributedequally to all. Based upon the work of the egalitarian philosopher Ronald Dworkin,the argument is that the key merit good distributed by a transport system isaccessibility. The concept refers to a person’s potential to interact and the actualamount of their interactions that are enabled by transport infrastructure of all types.It is also dependent upon personal attributes such as wealth, ability and ownershipof a vehicle, and finally it includes a contextual or spatial dimension as differentlocations have different levels of accessibility.
In contrast to traditional approaches to transport planning that place demand, andmeeting demand, at the centre of the planning process, this approach places peopleat the centre. Traditional focus on demand (reflected in the path dependency dis-cussed above) ensures more resources are devoted to establishing a vicious circle inwhich the infrastructure reflects increased demand and expands, thereby creatingyet more demand. Transport justice explicitly limits the public resources that can bedevoted towards the expansion to transport infrastructure and also the privateresources that can be appropriated through compulsory purchase. This is through aplanning process in which population groups are identified by their spatial location,their accessibility is defined, alongside an acceptable minimum threshold foraccessibility. This minimum threshold or ‘domain of sufficiency’ is acknowledgedas political and something that should be established by democratic deliberations.Albeit deliberations informed by a knowledge base, utilising data on the actualbenefits currently allocated such as levels of employment, degree of social isolationand access to health care. Where this approach differs from the other two describedis that it explicitly inhibits public expenditure on infrastructure that benefits themost well off. It is not prohibited: it is simply that such infrastructure should beself-financing. Take, for example, an airport express link, the cost of constructionand maintenance would be funded by the ticket price possibly in combination witha subsidy from the airport operator. No public subsidy, use of compulsory purchasepowers or grant of land would be available. In practice, it may result in such
Infrastructure, Equity and Urban Planning: A Just Process for … 155
infrastructure becoming unviable or at least much conservative in their aspirationswith the potential to limit excessive resource consumption.
4 Inputs and Outputs
Part of the challenge of more equitable infrastructure provision is a shift to what arearguably more just conceptions of equity than the utility-based approach embodiedwithin CBA, the modernist paradigm and the neoliberal approach that has replacedit. The solutions above provide a conceptual and normative framework that justifiesa reallocation of resources towards more equitable forms of infrastructure provision.Based upon this framework, this penultimate section sketches out and illustrates amodel of the way in which the planning process might enable these conceptions ofequity to shape the provision of future infrastructures.
4.1 More Equitable Planning
If, as is argued here, infrastructures are reflective of the values of the societies thatproduce them, then it is the planning process, through which many of those inputsare made. Some of those values may be hidden in the assumptions of the expertsmanaging the process, whilst others may leak in from the political milieu in whichdecisions are made. Equity is a critical principle at this stage in the process if thevoices of all those who are likely to bear the burdens are to be given equal weight.This does not mean that all burdens are to be treated equally. Acceptable limits tothe burdens imposed and benefits allocated by the construction and operation ofinfrastructure is something that needs to be established by an open democraticprocess to ensure that the voices of the most vocal or most powerful do not excludeothers. An open process3 ought also to be able to tease out some of the assumptionsimplicit in the methodologies employed in project appraisal. It should also beremembered that the process itself is a burden to some and a benefit to others. Theprofessionals that manage the process, public bureaucrats and particularly the pri-vate sector consultants sometimes have a vested interest in extending the planningprocess. The same is true of groups seeking to delay outputs that they may wish toavoid. Again, equity as a principle ought to go some way to ensuring that suchstrategic behaviour is exposed for what it is.
3There is insufficient space to go into detail on what such a process might look like although inmany cases it goes beyond a simple series of public meetings or an instrumental ‘consultation’exercise. These may well form part of the process however in areas such as appraisal where thedetails are technical in nature what may be called for are citizens juries or ‘mini-publics’(Mackenzie and Warren 2012) where a smaller group of citizens is given an opportunity tointerrogate the assumptions and practices in more detail.
156 D. Durrant
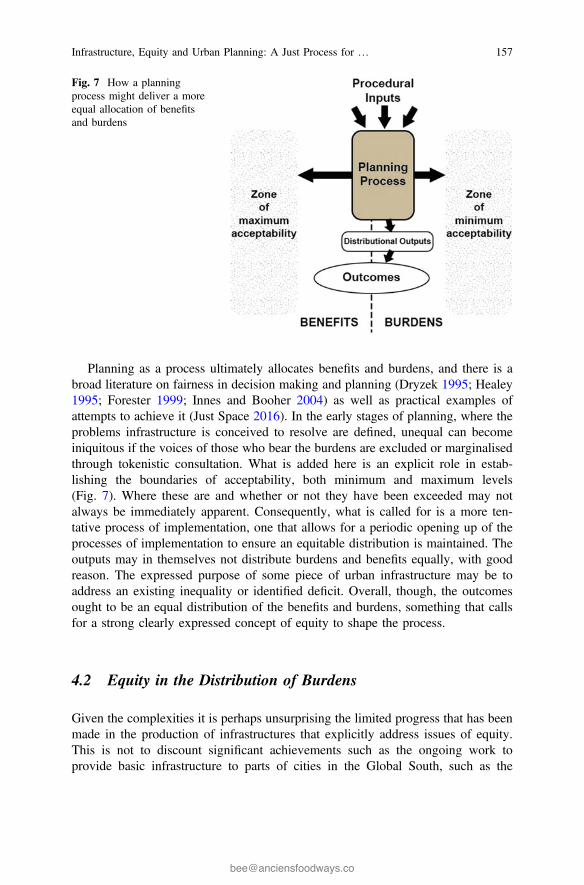
Planning as a process ultimately allocates benefits and burdens, and there is abroad literature on fairness in decision making and planning (Dryzek 1995; Healey1995; Forester 1999; Innes and Booher 2004) as well as practical examples ofattempts to achieve it (Just Space 2016). In the early stages of planning, where theproblems infrastructure is conceived to resolve are defined, unequal can becomeiniquitous if the voices of those who bear the burdens are excluded or marginalisedthrough tokenistic consultation. What is added here is an explicit role in estab-lishing the boundaries of acceptability, both minimum and maximum levels(Fig. 7). Where these are and whether or not they have been exceeded may notalways be immediately apparent. Consequently, what is called for is a more ten-tative process of implementation, one that allows for a periodic opening up of theprocesses of implementation to ensure an equitable distribution is maintained. Theoutputs may in themselves not distribute burdens and benefits equally, with goodreason. The expressed purpose of some piece of urban infrastructure may be toaddress an existing inequality or identified deficit. Overall, though, the outcomesought to be an equal distribution of the benefits and burdens, something that callsfor a strong clearly expressed concept of equity to shape the process.
4.2 Equity in the Distribution of Burdens
Given the complexities it is perhaps unsurprising the limited progress that has beenmade in the production of infrastructures that explicitly address issues of equity.This is not to discount significant achievements such as the ongoing work toprovide basic infrastructure to parts of cities in the Global South, such as the
Fig. 7 How a planningprocess might deliver a moreequal allocation of benefitsand burdens
Infrastructure, Equity and Urban Planning: A Just Process for … 157

informal settlements where it is often lacking, or the widespread improvements indisabled access. Important work on social exclusion in transport in the UK has seenthe concept operationalised and applied by regional transport providers, only to seeschemes designed to address social exclusion fall foul of the current climate of fiscalausterity due to loss of subsidy (Lucas 2012). Community ownership of energyinfrastructure offers possibilities; however, this tends to be at the margins and oftena rural phenomenon in the UK, albeit with the picture somewhat brighter incountries such as Denmark, Germany and Austria (Walker 2008). Once energyinfrastructure such as gas pipelines reverts to the national level, the problems oftechnocratic styles of governance and economic imperatives tend to reassertthemselves (Groves et al. 2013). Adaptations to the methodologies such as CBAthat govern the process suggest that it may be possible to retain, albeit within afurther layer of ethical consideration, one that is more sensitive to context andissues such as equity and fairness (van Wee and Roeser 2013). Further adaptationshave also sought to include social and environmental values within CBA, see forexample the work of Fujiwara and Campbell (2011); whereas others argue thesolution lies in alternatives such as Multi Criteria Analysis (Thomopoulos and Tight2009) that have proved successful in selecting locations for urban green infras-tructure (Gül et al. 2006).
There are some examples cited of infrastructure that does achieve some benefitin terms of social equity. Amsterdam Metro, a costly and controversial project, doesimprove transport accessibility for neighbourhoods to the North of the cityaddressing existing shortfalls (Martens 2017). As an example of a ‘disruptivetechnology’ (Flores Dewey 2016) from the field of transport planning, Bus RapidTransit (BRT, Fig. 8) appears to offer a shift away from the car-dominated urbaninfrastructure reflective of an earlier epoch. Developed in its current form in LatinAmerica, it is a clear example of a socio-technical system. It represents a hybrid ofdifferent transport, ticketing technologies and legislation to achieve segregated buslanes; and of human capital in the form of the skills to maintain and drive the lowemissions vehicles required for these high-frequency bus services. Its advocates seethis technology as facilitating a shift away from the private car and embedding
Fig. 8 Curitiba’s BRT system [photograph Morio, used under license (CC-BY-SA 3.0)]
158 D. Durrant
sustainable transport within the urban form (Munoz and Paget Seekins 2016). Incontrast to more costly fixed transport links, it is more flexible, based on re-usingthe road network, its network of high quality stations can provide complementaritywith other forms of infrastructure such as public conveniences. Furthermore, it hasthe potential, if not always realised (Flores Dewey 2016), to interact with theinformal paratransit networks often used by the poor (Sagaris 2016). Yet even herethe tendency towards a conflictual, paternalistic approach to consultation andimplementation has been noted and contrasted with the more coproductive strate-gies of civil society initiatives to promote cycling infrastructure (ibid).
5 Conclusion
If there is something to be salvaged from the modernist ideal of infrastructure(Graham and Marvin 2001), then perhaps it is the concept of comprehensiveness or,put another way, equality. In the Global North, we have come to accept the fact thatinfrastructural technologies are in place to ensure basic services such as power,clean water and sanitation are provided almost equally to all areas and individuals.The problems of equality here are less in the physical systems than in the man-agement and institutional systems that still, too often, exclude or penalise the mostvulnerable. Ensuring the parts of the world where such systems are not in place arebrought up to a minimum threshold is still a noble aim. Yet with other infras-tructures we have come to accept a level of inequality which is ultimately unjus-tifiable (Martens 2017). An indication that in the Global North there is still a way togo and even, as infrastructures such as BRT show, lessons that can be learnt fromthe Global South. The focus on urban planning in this chapter has meant theexamples drawn upon Tend to focus upon transport infrastructures as these are theones that most concern urban planning given the way they consume and also openup urban space for development. Nevertheless, the gap between digital and trans-port infrastructures is rapidly closing with the development of self-driving cars andthe increasing interest of technology companies in the management of publictransport (Harris 2016). The need for guiding principles is, if anything, increasinggiven that the emerging forms of infrastructure contain a plethora of assumptionsthat shape the way the benefits they provide and the burdens they ask the public as awhole to bear are allocated. If infrastructure underpins the form of developmentadopted by modern societies, then through the processes of planning it also reflectsthe values of the societies that produce it. In turn these values are embedded withinthe physical structures. They are projected into and shape the societies of the future.Equity, between genders, groups and those of different sexual orientations, is anincreasingly significant principle of contemporary societies. Therefore, if equalityof access is already established for some infrastructures and is theoretically possiblefor others (Martens 2017), then why should this principle not shape the infras-tructure and societies of the future?
Infrastructure, Equity and Urban Planning: A Just Process for … 159
References
Altschuler A, Luberoff D (2003) Mega-projects: the changing politics of urban public investment.The Brookings Institute, Washington
Asian Development Bank (2005) Connecting East Asia: a new framework for infrastructure, AsianDevelopment Bank, The International Bank for Reconstruction and Development/The WorldBank, and Japan Bank for International Cooperation
Beatley T (1988) Equity and distributional issues in infrastructure planning: a theoreticalperspective. In: Stein JM (ed) Public infrastructure planning and management. Sage, NewburyPark, pp 208–226
Beck U (1992) Risk society: towards a new modernity. Sage, Thousand OaksBrand R (2010) Whole earth discipline: an ecopragmatist manifesto. Atlantic Books, LondonBraungart M, McDonough W (2009) Cradle to cradle. Remaking the way we make things.
Vintage, New YorkBrown H (2014) Next generation infrastructure: principles for post-industrial public works. Island
Press, WashingtonCurtis C, Low N (2012) Institutional barriers to sustainable transport. Ashgate, FarnhamDevine-Wright P (2013) Explaining “NIMBY” objections to a power line: the role of personal,
Place attachment and project-related factors. Environ Behav 6(45):261–781Dewey J (1927) The public and its problems. George Allen and Unwin Ltd, LondonDorling D (2010) Injustice: why social inequality persists. Polity Press, BristolDryzek JS (1995) Discursive democracy: politics, policy, and political science. Cambridge
University Press, CambridgeForester J (1999) The deliberative practitioner: encouraging participatory planning processes. MIT
Press, CambridgeFlores Dewey O (2016) BRT as a tool for negotiated re-regulation. In: Munoz JC, Paget Seekins L
(eds) Restructuring public transport through Bus Rapid Transit: an international andinterdisciplinary perspective. Polity Press, Bristol, pp 51–73
Flyvbjerg B, Bruzelius N, Rothengatter W (2003) Megaprojects and risk: an anatomy of ambition.Cambridge University Press, Cambridge
Frischmann BM (2012) Infrastructure—the social value of shared resources. Oxford UniversityPress, Oxford
Fujiwara D, Campbell R (2011) Valuation techniques for social cost-benefit analysis: statedpreference, revealed preference and subjective well-being approaches a discussion of thecurrent issues. HM Treasury/Department of Work and Pensions
Geels FW (2002) Technological transitions as evolutionary reconfiguration processes: amulti-level perspective and a case-study. Res Policy 31(8–9):1257–1274. doi:10.1016/S0048-7333(02)00062-8
Gellert PK, Lynch BD (2003) Mega-projects as displacements. Int Soc Sci J 55(175):15–25Graham S, Marvin S (2001) Splintering urbanism: networked infrastructures, technological
mobilities and the urban condition. Routledge Chapman & Hall, LondonGiddens A (2011) The politics of climate change, 2nd revised edn. Polity Press, BristolGroves C, Yakovleva N, Munday M (2013) Fighting the pipe: neoliberal governance and barriers
to effective community participation in energy infrastructure planning. Environ Plan C GovPolicy 31:340–356. doi:10.1068/c11331r
Gül A, Gezer A, Kane B (2006) Multi-criteria analysis for locating new urban forests: an examplefrom Isparta. Turkey 5:57–71. doi:10.1016/j.ufug.2006.05.003
Hall P (2014) Good cities, better lives: how Europe discovered the lost art of urbanism. Routledge,Abingdon
Harris M (2016) Secretive Alphabet division funded by Google aims to fix public transit in US.https://www.theguardian.com/technology/2016/jun/27/google-flow-sidewalk-labs-columbus-ohio-parking-transit Accessed 21 Oct 2016
160 D. Durrant
Healey P (1995) Discourses of integration: making frameworks for democratic urban planning. In:Healey P, Cameron S, Davoudi S, Graham S, Mandanipour A (eds) Managing cities: the newurban context. Wiley, Hoboken, pp 251–273
HM Treasury (2011) The green book. https://www.gov.uk/government/uploads/system/uploads/attachment_data/file/220541/green_book_complete.pdf Accessed 31 Oct 2016
HOFOR (2016) HOFOR: greater Copenhagen utility. http://www.hofor.dk/wp-content/uploads/2016/09/hofor_greater_cph_utility.pdf Accessed 2 Nov 2016
HS2Ltd/DfT (2011) Economic case for HS2. The Y network and London—West MidlandsFebruary 2011. HS2 Ltd/Department for Transport
Innes JE, Booher DE (2004) Reframing public participation: strategies for the 21st century. PlanTheory Pract 5(4):419–436. doi:10.1080/1464935042000293170
Just Space (2016) https://justspace.org.uk/2014/11/06/just-space-critical-of-infrastructure-plan-2050/. Accessed 1 Nov 2016
Legislation.gov.uk (2010) Equality act 2010. http://www.legislation.gov.uk/ukpga/2010/15/contents. Accessed 22 Nov 2016
Klopp JM (2012) Towards a political economy of transportation policy and practice in Nairobi.Urban Forum 23(1):1–21. doi:10.1007/s12132-011-9116-y
Lucas K (2012) Transport and social exclusion: where are we now? Transp Policy 20:105–113.doi:10.1016/j.tranpol.2012.01.013
Mackenzie MK, Warren ME (2012) Two trust-based uses of minipublics in democratic systems.In: Parkinson J, Mansbridge J (eds) Deliberative systems. Cambridge University Press,Cambridge, pp 95–125
Marshall A (2015) Why the word ‘infrastructure’ replaced ‘public works’. http://www.governing.com/columns/eco-engines/gov-the-word-infrastructure.html. Accessed 31 Oct 2016
Martens K (2017) Transport justice: designing fair transportation systems. Routledge, AbingdonMetz D (2008) The limits to travel: how far will you go?. Earthscan, London, Stirling VAMonbiot G (2004) A scandal of secrecy and collusion. http://www.monbiot.com/2004/12/29/a-
scandal-of-secrecy-and-collusion/. Accessed 14 Nov 2016Moroni S (2006) The ethics behind evaluation: Litchfield’s approach and Utilitarianism. In:
Alexander ER (ed) Evaluation in planning. Ashgate, Farnham, pp 21–31Munoz JC, Paget Seekins L (2016) The promise of BRT. In: Munoz JC, Paget Seekins L
(eds) Restructuring public transport through Bus Rapid Transit: an international andinterdisciplinary perspective. Polity Press, Bristol, pp 1–15
Naess P (2006) Cost-benefit analysis of transportation investment: neither critical nor realistic.J Crit Realism 5(1):32–60
Nussbaum MC (1992) Human functioning and social justice: in defense of aristotelianessentialism. Political Theory 20(2):202–246
Nussbaum MC (1997) Capabilities and human rights. Fordham Law Rev 66(2):273–300OMEGA Centre (2013) Mega projects, executive summery lessons for decision-makers: an
analysis of selected international large-scale transport infrastructure projects. http://www.omegacentre.bartlett.ucl.ac.uk/wp-content/uploads/2014/11/Mega-Projects-Executive-Summary.pdf. Accessed 2 Nov 2016
OMEGA Centre (2016) Central artery tunnel project summary. http://www.omegacentre.bartlett.ucl.ac.uk/wp-content/uploads/2014/12/USA_BIG_DIG_SUMMARY.pdf. Accessed 24 Nov2016
Owens S, Cowell R (2011) Land and limits: interpreting sustainability in the planning process, 2ndedn. Routledge, London
Piketty T (2014) Capital in the twenty-first century. Harvard University Press, CambridgePlanning Aid (2012) Good practice guide to public engagement in development schemes. http://
www.rtpi.org.uk/media/6312/Good-Practice-Guide-to-Public-Engagement-in-Development-Scheme-High-Res.pdf Accessed 1 Nov 2016
Rawls J (1971) A theory of justice. Harvard University Press, CambridgeRip A, Kemp R (1998) Technological change. In: Rayner S, Malone EL (eds) Human choices and
climate. Climate change volume 2—resources and technology. Battelle, Columbus, pp 327–399
Infrastructure, Equity and Urban Planning: A Just Process for … 161
Robeyns I (2003) Sen’S capability approach and gender inequality: selecting relevant capabilities.Fem Econ 9:61–92. doi:10.1080/1354570022000078024
Sagaris L (2016) Strategic participation for change. In: Munoz JC, PagetSeekins L(eds) Restructuring public transport through Bus Rapid Transit: an international andinterdisciplinary perspective. Polity Press, Bristol, pp 101–127
Shapiro SA, Schroeder CH (2008) Beyond cost-benefit analysis: a pragmatic reorientation.Harvard Environ Law Rev 32:434–502
Smith A, Stirling A, Berkhout F (2005) The governance of sustainable socio-technical transitions.Res Policy 34(10):1491–1510. doi:10.1016/j.respol.2005.07.005
Stern N (2006) Stern review on the economics of climate change. http://webarchive.nationalarchives.gov.uk/+/http://www.hm-treasury.gov.uk/independent_reviews/stern_review_economics_climate_change/stern_review_report.cfm. Accessed 2 Nov 2016
Steel C, (2008) Hungry City: How Food Shapes Our Lives. Chatto & WindusThomopoulos N, Tight MR (2009) Incorporating equity considerations in transport infrastructure
evaluation: current practice and a proposed methodology. Eval Progr Plan 32:351–359. doi:10.1016/j.evalprogplan.2009.06.013
Torgeson D (2003) Democracy through policy discourse. In: Hajer MA, Wagenaar H(eds) Deliberative policy analysis: understanding governance in the network society.Cambridge University Press, Cambridge, pp 113–139
Transport for London (2004) Equality impact assessments (how to do them). http://content.tfl.gov.uk/eia-06-04.pdf Accessed 31 Oct 2016
Tyler N (2004) School of public policy working paper series. Working Paper 8: Justice in transportpolicy
Tyler N (2006) Capabilities and radicalism: engineering accessibility in the 21st century. TranspPlan Technol 29(5):331–358. doi:10.1080/03081060600917629
van Dijk JAGM (2016) Digital divide research, achievements and shortcomings. Poetics, (August2006). doi:10.1016/j.poetic.2006.05.004
van Wee B, Roeser S (2013) Ethical theories and the cost-benefit analysis-based ex ante evaluationof transport policies and plans. Transp Rev 33(6):743–760. doi:10.1080/01441647.2013.854281
Walker G (2008) What are the barriers and incentives for community-owned means of energyproduction and use? Energy Policy 36(12):4401–4405. doi:10.1016/j.enpol.2008.09.032
Wilkinson R, Pickett K (2011) The spirit level: why greater equality makes societies stronger.Bloomsbury Press, London
World Bank (2016) China overview. http://www.worldbank.org/en/country/china/overview.Accessed 22 Nov 2016
Yanow D (2003) Accessing local knowledge. In: Hajer MA, Wagenaar H (eds) Deliberative policyanalaysis: understanding governance in the network society. Cambridge University Press,Cambridge, pp 228–247
162 D. Durrant
Sustainable Places: Delivering AdaptiveCommunities
Laura Mazzeo, Nick James, Gary Young and Bee Farrell
1 Introduction
Delivering sustainable places as architects, urban planners and urban designers isquite a different matter from defining theoretically what constitutes sustainableurbanism.
Delivering sustainable places has led us to reflect upon the very definition ofsustainability and conclude that sustainable urbanism is first and foremost a process,rather than an outcome in and of itself. The process is, however, still driven anddirected by outcome, namely the creation of adaptive communities, but it is withinthe process that sustainable urbanism truly emerges.
Born of this understanding and the attempt to offer solutions to the challengesurban planners and architects face in practicing ‘sustainable urbanism’, is what wedescribe as the PLACE methodology. The PLACE methodology, refined overdecades of practice, is what allows us to deliver adaptive communities. It startedwith a reflection on ‘buffer thinking’—that buildings must respond to the climateand physical conditions they are built in—and has since evolved, focusing on threemain principles:
• ‘Place’ is the client;• Proactive planning is essential to creating places for the greater good of all;• Building consensus needs to shape the process.
L. Mazzeo (&) � N. James � G. Young � B. FarrellFarrells, 7 Hatton Street, London NW8 8PL, UKe-mail: [email protected]
B. FarrellAnciens Foodways, London, England
B. FarrellAnciens Foodways, Poitiers, France
© Springer International Publishing AG 2017J. Bishop (ed.), Building Sustainable Cities of the Future,Green Energy and Technology, DOI 10.1007/978-3-319-54458-8_9
163
Looking at a number of case studies in the UK of adaptive communities that ourpractice has delivered through the PLACE methodology, we will focus on thefollowing six pillars: economy and technology, healthy places, food and water,heritage, knowledge and partnerships and sustainable places. Lastly, we turn toAsia where adaptive communities have taken on different urban forms of high andeven hyper-density models capitalising on transport hubs, truly mixed-use envi-ronments, building tall or creating three-dimensional public spaces under thepressure of delivering rapid growth.
2 Part 1—Confronting Practice with Theory—SustainableUrbanism: A Process
Sustainable urbanism is a growing concept within the built environment profession,often defined as a set of solutions to be applied to a blank canvas, or a desiredoutcome to be achieved through development. The concept has repeatedly beenassociated with the latest fashionable name of the moment such as ‘smart’ or‘resilient’ cities, resulting in uncertainty as to its definition, purpose and ultimategoals. However, with more than 50 years of practice committed to advocating anddelivering sustainable places, our experience has shown us that sustainableurbanism is first and foremost a process.
Sustainable interventions were first recognised within Germany’s forestryindustry through the work of Hans Carl von Carlowitz. In his seminal book‘Sylvicultura Oeconomica’ (1713), Carlowitz advocates the practice of ‘nachhal-tende Nutzung’ (sustainable use) of forest resources, which implied maintaining abalance between harvesting old trees and ensuring that there were enough youngtrees to replace them (Van Zon 2002).
It was not until 1987 that the concept of sustainability was publically applied tothe built environment through the publication of the infamous ‘Our CommonFuture’ report. Lead by the Norwegian politician Gro Harlem Brundtland, the reportdefines a simple and oft-quoted definition of sustainable development as:
…development that meets the needs of the present without compromising the ability offuture generations to meet their own needs.
Despite a near universal recognition that sustainable cities are now a desirablepolicy goal, there is now even less certainty about what this might mean in practice(Bulkeley and Betsill 2005). It is further recognised that while environmentallysensitive design approaches are being widely adopted at the building scale, therehas been little progression in their application at the wider urban scale (Oktay2011).
164 L. Mazzeo et al.
However, with renewed interest in the world’s urban development, timelyexplorations into the roles of urban planning and urban design (Adhya 2015) haveallowed sustainable urbanism to emerge as the focus of several current debates.These include the topics of metropolitan growth versus inner-city decline, urbandesirability versus suburban liveability and, importantly, the exercise of definingsustainability versus practicing sustainability (Adhya 2015).
As such, various definitions of sustainable urbanism have emerged, includingFarr’s (2008) definition as ‘walkable and transit-served urbanism integrated withhigh-performance buildings and infrastructure’ (Adhya 2015; Adhya et al. 2010).Reflecting on this design-driven definition, we observe with Adhya (2015) thatwithin this and other form-based and outcome-driven definitions of sustainableurbanism, a number of important elements of key urban processes, such as socialdiversity, economic equity and environmental justice, are ignored.
Conversely, we advocate that sustainable urbanism should instead be defined interms of three fundamental elements; health, place specificity and social ethics(Adhya et al. 2010). Health addresses two core values of sustainability; the sus-tenance of human well-being as individuals, communities and society; and thehuman capacity to trust, cooperate and work together so as to improve the future.Place specificity and the process of placemaking refer to the manner in whichpeople transform the places they find themselves through a diversely creativeprocess (Schneekloth and Shibley 1998). Social ethics additionally relate to therecent rise towards social improvement and hope within the urban environment.
A process-oriented and profoundly human connection to sustainability is,therefore, critical to restoring the role of responsive urban design and in definingsustainable urbanism (Adhya et al. 2010). This framework and definition of sus-tainable urbanism has shaped our practice of urbanism and architecture, aiming todeliver a process-driven approach to urbanism, shaped by consensus building andhuman cooperation, place specificity and social ethics.
2.1 Desired Outcome: Adaptive Communities
Having defined our understanding of sustainable urbanism as an inherentlyhuman-focused process to developing the built environment, it is equally importantto explore how we define its desired outcome. By understanding the goals andphysical aspirations of sustainable urbanism, we aim to further shape our under-standing of the process and indeed what we are looking for from sustainability.
During the interwar period, modernist planners and architects developedinfluential ideas of highly planned greener cities that would alleviate the mistakes ofindustrialisation. These included Le Corbusier’s ‘The City of Tomorrow and ItsPlanning’ (1929) and Eliel Saarinen’s ‘The City: Its Growth, Its Decay, Its Future’
Sustainable Places: Delivering Adaptive Communities 165
(1943), both of which had a lasting impact on the design of European and NorthAmerican cities. Later, in the aftermath of the Second World War, the future citiesdiscourse was geared towards remedying cities destroyed by aerial bombing andground warfare (Mooir et al. 2014).
A plethora of terms and ideas has subsequently emerged within the ‘future city’debate. Due to the increasing urgencies of the environmental challenge experiencedglobally, the most common term to emerge has been that of the ‘sustainable city’.The model of the sustainable city focuses on the development of cities designed tominimise their environmental impact and significantly reduce their carbonconsumption.
‘Smart City’ has alternatively taken on the more digital dimensions of the builtenvironment. The term responds to the rise of new Internet technology interfacesand uses geographic information and communication technology to build cognitiveframeworks in city planning and management (Murgante and Borruso 2013).
‘Resilient City’ is a concept which is also growing in use. The term takes on adual meaning and is used in reference to both a community’s capacity to withstandexternal environmental and social shocks, as well as its economic adaptability andagility when faced with financial change. As references to resilience continued toincrease, so too have criticisms that the concept may be inappropriate (Norris et al.2008).
Reflecting on the definitions and applications of each of these models for thefuture city, we advocate that a transition must be made from the structurally staticview of resilient communities to a structurally dynamic view of adaptive commu-nities (Hollings and Gunderson 2002). We argue that rather than preserving acommunity in stasis, the challenge and ultimate design goal is to conserve theability to adapt to change and to be able to respond in a flexible way to uncertaintyand surprise. Adaptable communities should instead present the opportunity tomaintain options and variety in their design, in order to buffer disturbance whilealso creating novelty and interest (Hollings and Gunderson 2002). As Tompkinsand Adger (2004) observe, ‘all social and natural systems evolve and, in someinstances, co-evolve with each other over time’.
Adaptive communities, therefore, offer a strong and viable opportunity for ourcommunities to evolve and develop together, with the ultimate goal of creatingenduring and sustainable cities.
3 Part 2—A Methodology Born of Practice
A new era of professional, intellectual and cultural exchange between cities is emerging andour world-renowned institutions and agencies should be at the forefront of this, whilstrecognising we have much to learn from others. P. 181 Farrell Review
166 L. Mazzeo et al.
Throughout our 50 years of experience in the built environment, we have been ableto develop and refine our understanding of sustainable urbanism, establishing whatit means to us and our work, defining what its desired outcomes are and reflectivelyexploring how best to deliver it. By defining sustainable urbanism as a practicalprocess through which to deliver the future city, we have been able to establish theconcept of adaptive communities as the physical embodiment of these ideals.
Using a series of project case studies drawn from our practical experience in theUK, China and further afield, we aim to illustrate the key concepts behind, andpractical application of, the process of designing adaptive communities.
3.1 ‘Buffer Thinking’
Our experience with developing adaptive communities started in the 1980s with theconcept of ‘buffer thinking’, a term coined by Sir Terry Farrell and Ralph Lebens(Building Design June 6, 1980). This term describes a ‘conscious attitude to designbecause […] it implies application of awareness and intelligent design skill ratherthan heavy handed technology. It is an energy solution which involves the par-ticipation of the user individually and collectively’. This original thinking is verysimilar to that of today’s Passivhaus1 and more design driven sustainable concepts.The main principle behind the ‘buffer thinking’ approach was to adapt building anddevelopment forms to allow them to respond to the pressures of their climate andsurrounding environment. By adopting a highly informed and climate-drivenapproach to design, ‘buffer thinking’ allows us to create buildings and communitieswhich have the ability to respond and adapt to local, and global climate change. It isthis future thinking which has allowed us to build our understanding of adaptivecommunities and explore the building blocks with which they may be formed. Theillustrations below show how the ‘buffer thinking’ approach was applicable todifferent building types, for housing, commercial and industrial uses and recre-ational facilities (Fig. 1).
1The Passivhaus standard was developed in Germany in the early 1990s by Professors BoAdamson of Sweden and Wolfgang Feist of Germany and the first dwellings to be completed tothe Passivhaus Standard were constructed in Darmstadt in 1991: ‘A Passivhaus is a building, forwhich thermal comfort can be achieved solely by post-heating or post-cooling of the fresh airmass, which is required to achieve sufficient indoor air quality conditions—without the need foradditional recirculation of air’ (http://www.passivhaus.org.uk/, 27 July 2016).
Sustainable Places: Delivering Adaptive Communities 167
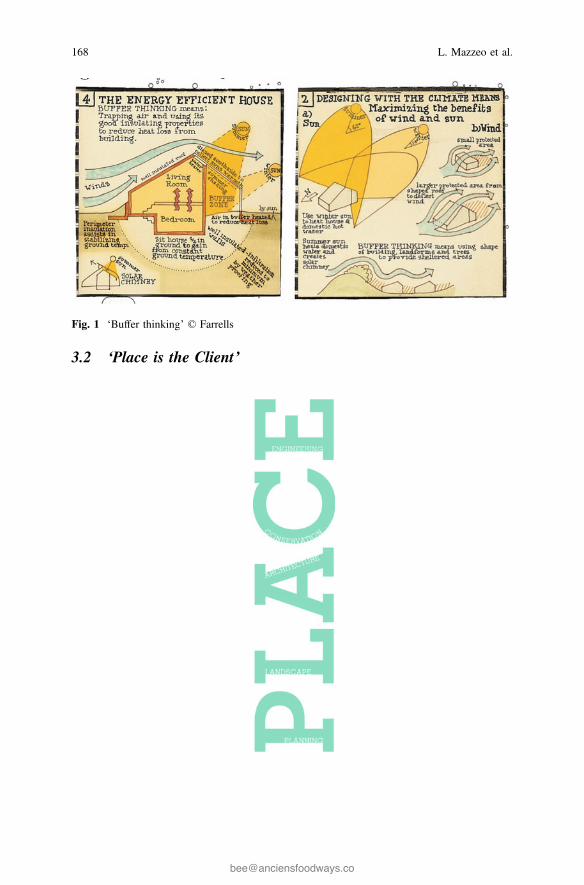
3.2 ‘Place is the Client’
Fig. 1 ‘Buffer thinking’ © Farrells
168 L. Mazzeo et al.
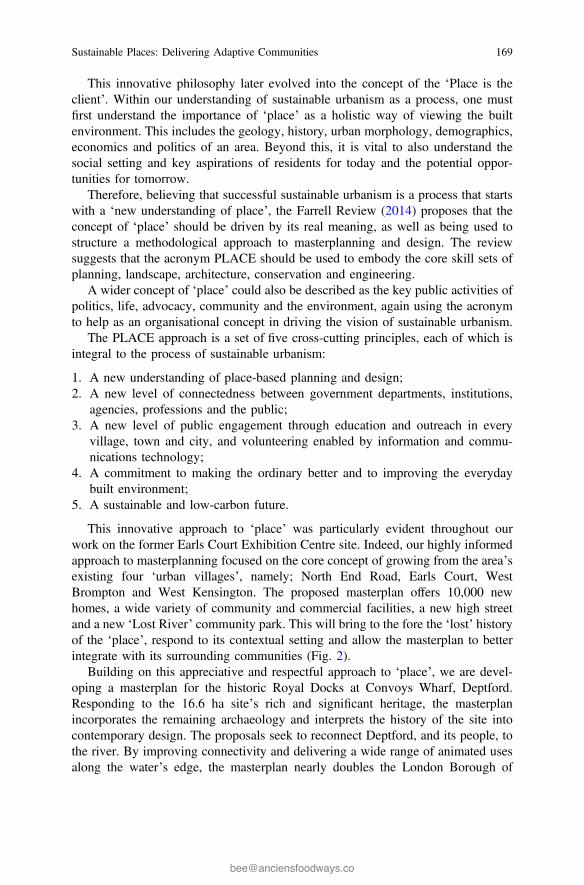
This innovative philosophy later evolved into the concept of the ‘Place is theclient’. Within our understanding of sustainable urbanism as a process, one mustfirst understand the importance of ‘place’ as a holistic way of viewing the builtenvironment. This includes the geology, history, urban morphology, demographics,economics and politics of an area. Beyond this, it is vital to also understand thesocial setting and key aspirations of residents for today and the potential oppor-tunities for tomorrow.
Therefore, believing that successful sustainable urbanism is a process that startswith a ‘new understanding of place’, the Farrell Review (2014) proposes that theconcept of ‘place’ should be driven by its real meaning, as well as being used tostructure a methodological approach to masterplanning and design. The reviewsuggests that the acronym PLACE should be used to embody the core skill sets ofplanning, landscape, architecture, conservation and engineering.
A wider concept of ‘place’ could also be described as the key public activities ofpolitics, life, advocacy, community and the environment, again using the acronymto help as an organisational concept in driving the vision of sustainable urbanism.
The PLACE approach is a set of five cross-cutting principles, each of which isintegral to the process of sustainable urbanism:
1. A new understanding of place-based planning and design;2. A new level of connectedness between government departments, institutions,
agencies, professions and the public;3. A new level of public engagement through education and outreach in every
village, town and city, and volunteering enabled by information and commu-nications technology;
4. A commitment to making the ordinary better and to improving the everydaybuilt environment;
5. A sustainable and low-carbon future.
This innovative approach to ‘place’ was particularly evident throughout ourwork on the former Earls Court Exhibition Centre site. Indeed, our highly informedapproach to masterplanning focused on the core concept of growing from the area’sexisting four ‘urban villages’, namely; North End Road, Earls Court, WestBrompton and West Kensington. The proposed masterplan offers 10,000 newhomes, a wide variety of community and commercial facilities, a new high streetand a new ‘Lost River’ community park. This will bring to the fore the ‘lost’ historyof the ‘place’, respond to its contextual setting and allow the masterplan to betterintegrate with its surrounding communities (Fig. 2).
Building on this appreciative and respectful approach to ‘place’, we are devel-oping a masterplan for the historic Royal Docks at Convoys Wharf, Deptford.Responding to the 16.6 ha site’s rich and significant heritage, the masterplanincorporates the remaining archaeology and interprets the history of the site intocontemporary design. The proposals seek to reconnect Deptford, and its people, tothe river. By improving connectivity and delivering a wide range of animated usesalong the water’s edge, the masterplan nearly doubles the London Borough of
Sustainable Places: Delivering Adaptive Communities 169
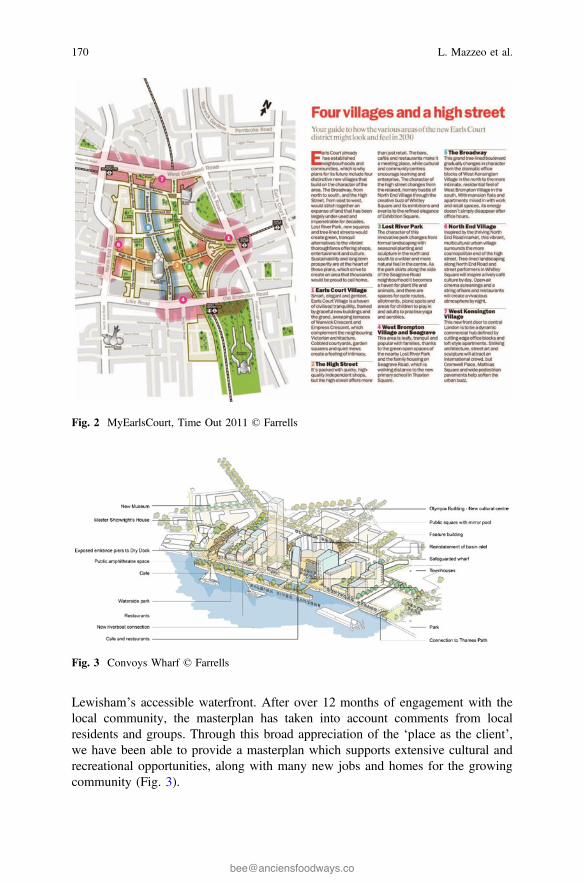
Lewisham’s accessible waterfront. After over 12 months of engagement with thelocal community, the masterplan has taken into account comments from localresidents and groups. Through this broad appreciation of the ‘place as the client’,we have been able to provide a masterplan which supports extensive cultural andrecreational opportunities, along with many new jobs and homes for the growingcommunity (Fig. 3).
Fig. 2 MyEarlsCourt, Time Out 2011 © Farrells
Fig. 3 Convoys Wharf © Farrells
170 L. Mazzeo et al.
3.2.1 Proactive Planning
Along with this holistic approach to ‘place’, we must be more proactive when plan-ning the future shape and form of our villages, towns and cities. Our planning systemhas become too reactive and relies on development control, which forces localauthority planners to spend their time firefighting rather than thinking creatively aboutthe future shape and form of villages, towns and cities. Everything is open to nego-tiation for every planning application, and as a result huge amounts of time andresources are spent on issues that could have been predetermined by a collective visionshaped in collaboration with local communities, neighbourhood forums and PLACEReview Panels. Proactive planning would free up valuable time for local authorityplanners to develop masterplans and design codes which are supported by localcommunities, while reinvigorating the planning profession and its public perception.Proactive planning does not set rules in stone but rather seeks to bring all stakeholdersto the table to identify opportunities so that they can be realised over the longer term.
Proactive planning looks to the bigger picture and seeks to create a spatialframework that is both strong in the present and flexible enough to accommodatethe needs of future generations. This forward-looking and highly advocativeapproach to planning and architecture can be seen in our study of theMarylebone-Euston Road. This explorative study looked at the potential for thisiconic road to be transformed into one of London’s greatest assets, boasting vibrantstreet life, attractive landscaping, seminal buildings and developments and majorsquares and green spaces.
This proactive approach to masterplanning presented a series of innovativevisions for the future development of the Marylebone-Euston Road. The broadprinciples behind our work were to develop an encompassing strategy aimed atresolving the road’s prominent traffic/pedestrian conflicts, while additionallyreclaiming the road’s numerous communities which have been lost to destructivetraffic engineering over the years. By far, the most successful aspect of ourapproach was seeing the road as a series of linked, linear projects, each one abite-sized piece of urban design. By establishing these links between projects, wewere able to show a creative vision for the future evolution and adaptation of thisprominent part of London, with the bonus of releasing an acre of land (Fig. 4).
At a far larger scale, we have adopted a similarly proactive approach to creatinga vision for over 500 ha of West London. The aim of this work was to explore thewider potential of the proposed Crossrail and High Speed 2 stations at Old OakCommon and to look at the economic benefits that could ensue from theirco-location. The resulting vision could generate an estimated 12,000 new homes,115,000 new jobs, a new waterside park along the Grand Union Canal and arevolutionary rapid transit system (Fig. 5).
It must be noted that proactive planning at the urban scale requires a significantamount of foresight and creativity. For example, we recognise that London is set toreach 10 million by 2030, making it Europe’s only ‘super-metropolis’ or megacity.There are currently 35 cities in the world that have a population of over 10 millionand can be called megacities. As a result of its success, London needs significantly
Sustainable Places: Delivering Adaptive Communities 171
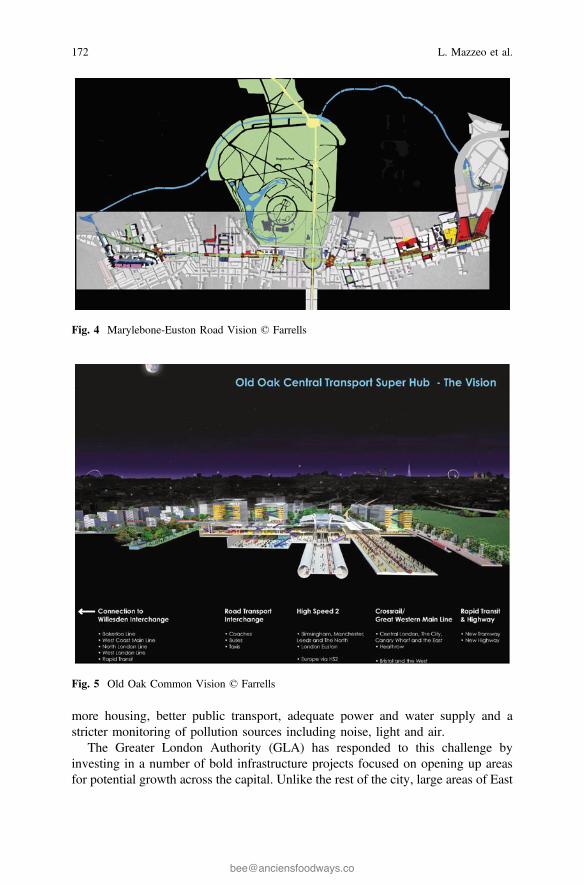
more housing, better public transport, adequate power and water supply and astricter monitoring of pollution sources including noise, light and air.
The Greater London Authority (GLA) has responded to this challenge byinvesting in a number of bold infrastructure projects focused on opening up areasfor potential growth across the capital. Unlike the rest of the city, large areas of East
Fig. 4 Marylebone-Euston Road Vision © Farrells
Fig. 5 Old Oak Common Vision © Farrells
172 L. Mazzeo et al.
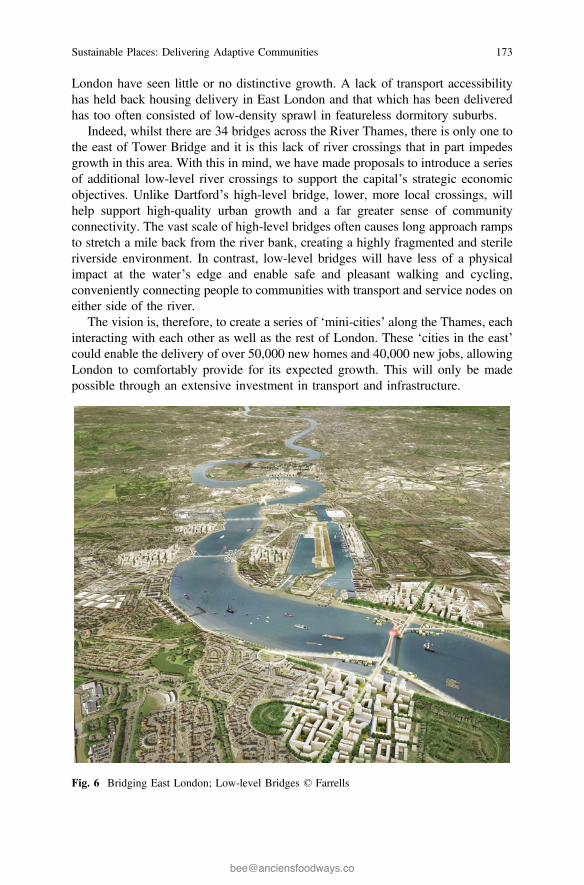
London have seen little or no distinctive growth. A lack of transport accessibilityhas held back housing delivery in East London and that which has been deliveredhas too often consisted of low-density sprawl in featureless dormitory suburbs.
Indeed, whilst there are 34 bridges across the River Thames, there is only one tothe east of Tower Bridge and it is this lack of river crossings that in part impedesgrowth in this area. With this in mind, we have made proposals to introduce a seriesof additional low-level river crossings to support the capital’s strategic economicobjectives. Unlike Dartford’s high-level bridge, lower, more local crossings, willhelp support high-quality urban growth and a far greater sense of communityconnectivity. The vast scale of high-level bridges often causes long approach rampsto stretch a mile back from the river bank, creating a highly fragmented and sterileriverside environment. In contrast, low-level bridges will have less of a physicalimpact at the water’s edge and enable safe and pleasant walking and cycling,conveniently connecting people to communities with transport and service nodes oneither side of the river.
The vision is, therefore, to create a series of ‘mini-cities’ along the Thames, eachinteracting with each other as well as the rest of London. These ‘cities in the east’could enable the delivery of over 50,000 new homes and 40,000 new jobs, allowingLondon to comfortably provide for its expected growth. This will only be madepossible through an extensive investment in transport and infrastructure.
Fig. 6 Bridging East London; Low-level Bridges © Farrells
Sustainable Places: Delivering Adaptive Communities 173
Another core consideration of ‘proactive planning’ is the basic need to supplysustainable cities and megacities with food. The very essence of sustainability isplace-specific thinking and living, set within access to global opportunities; to be‘locally embedded and globally attuned’ (Morgan 2009). Sustainably grown foodcannot be transported, stored, cooked, eaten and the waste recycled within ahomogenous megacity approach. Sustainable cities and megacities will increasinglyneed food value chains to provide environmental, cultural, economic and healthprosperity to a city and its residents. This shift in thinking from long food chains toinnovative food value webs, sustainable small developments, innovation andcommunity activity will require multidisciplinary teams to plan, design and coor-dinate cities using food as the locus for all their work.
By adopting a more proactive approach to planning and design across the builtenvironment industry, there is a distinct opportunity to design the future city to behighly conscious of its setting and to be able to instinctively plan for challenges andchange. Through this approach, we aim to create communities which are able toadapt to their ever changing environments and offer a more promising, optimisticand sustainable urban future.
3.2.2 Building Consensus
In the present political culture, big ideas such as those we promote in our practiceoften fail to get support. From an economic point of view, there is a fear thatlarge-scale, ambitious public ventures are unpopular. It is, therefore, widelyrecognised throughout the built environment profession that the largest challenge isnot in the design or practical implementation of sustainable solutions but rather inthe process of obtaining community and stakeholder buy-in (Fig. 6).
Community engagement is, therefore, at the heart of this place-orientated andproactive approach to planning and design. By engaging with the community andlocal stakeholders as early as possible in projects such as Earls Court and Old OakCommon, we can begin the highly integrated process of delivering sustainableurbanism. A sustained and intuitive approach to building consensus is core tocreating adaptive communities which are designed for the people and by the people.This conscious sense of involvement and ownership over the development of ‘their’community empowers local people, helps build strong community cohesion andenlivens their determination to be involved in the continuing transformation of thesurrounding neighbourhood and its future success.
The process of building consensus has always been a core feature of our work.Our ground-breaking work on the Thames Estuary Parklands, started in 2000 andstill ongoing, was the first time an architectural practice had consulted with such avast number of communities and interest groups throughout an area.
174 L. Mazzeo et al.
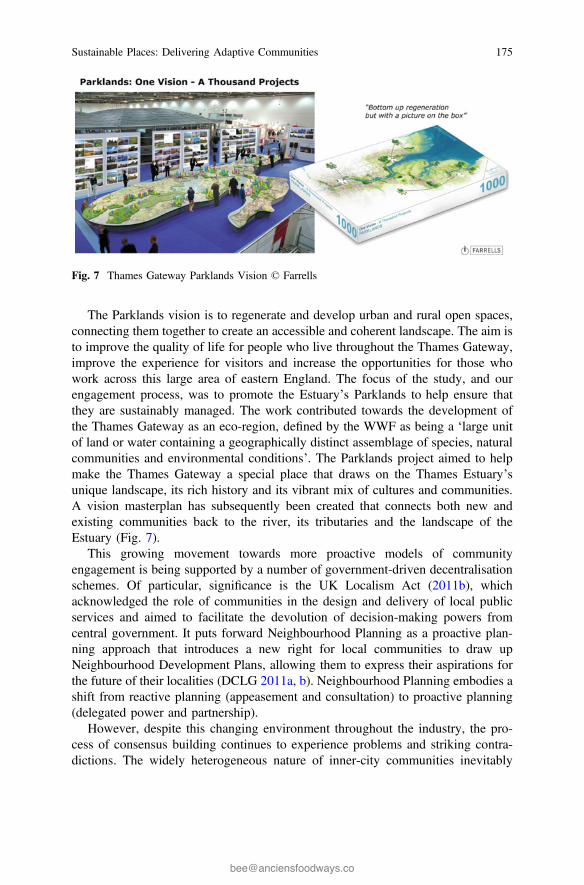
The Parklands vision is to regenerate and develop urban and rural open spaces,connecting them together to create an accessible and coherent landscape. The aim isto improve the quality of life for people who live throughout the Thames Gateway,improve the experience for visitors and increase the opportunities for those whowork across this large area of eastern England. The focus of the study, and ourengagement process, was to promote the Estuary’s Parklands to help ensure thatthey are sustainably managed. The work contributed towards the development ofthe Thames Gateway as an eco-region, defined by the WWF as being a ‘large unitof land or water containing a geographically distinct assemblage of species, naturalcommunities and environmental conditions’. The Parklands project aimed to helpmake the Thames Gateway a special place that draws on the Thames Estuary’sunique landscape, its rich history and its vibrant mix of cultures and communities.A vision masterplan has subsequently been created that connects both new andexisting communities back to the river, its tributaries and the landscape of theEstuary (Fig. 7).
This growing movement towards more proactive models of communityengagement is being supported by a number of government-driven decentralisationschemes. Of particular, significance is the UK Localism Act (2011b), whichacknowledged the role of communities in the design and delivery of local publicservices and aimed to facilitate the devolution of decision-making powers fromcentral government. It puts forward Neighbourhood Planning as a proactive plan-ning approach that introduces a new right for local communities to draw upNeighbourhood Development Plans, allowing them to express their aspirations forthe future of their localities (DCLG 2011a, b). Neighbourhood Planning embodies ashift from reactive planning (appeasement and consultation) to proactive planning(delegated power and partnership).
However, despite this changing environment throughout the industry, the pro-cess of consensus building continues to experience problems and striking contra-dictions. The widely heterogeneous nature of inner-city communities inevitably
Fig. 7 Thames Gateway Parklands Vision © Farrells
Sustainable Places: Delivering Adaptive Communities 175
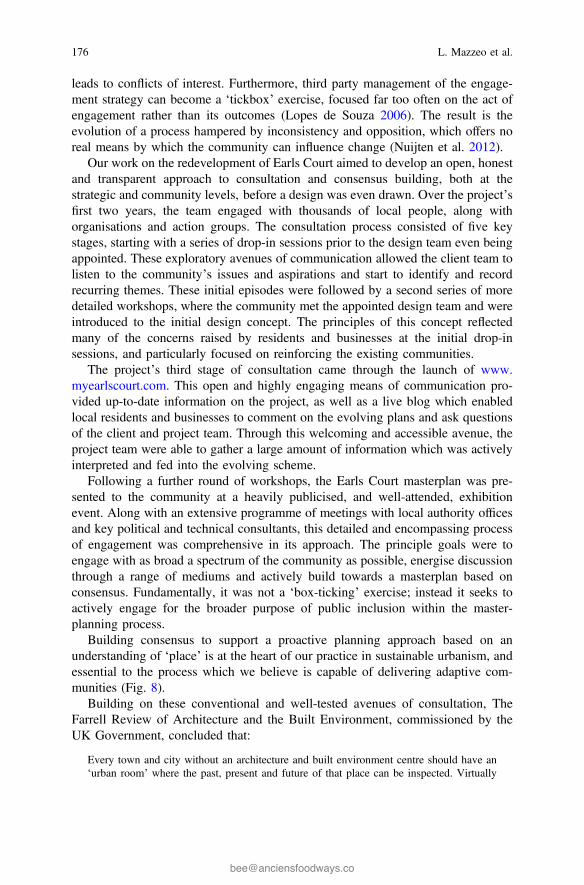
leads to conflicts of interest. Furthermore, third party management of the engage-ment strategy can become a ‘tickbox’ exercise, focused far too often on the act ofengagement rather than its outcomes (Lopes de Souza 2006). The result is theevolution of a process hampered by inconsistency and opposition, which offers noreal means by which the community can influence change (Nuijten et al. 2012).
Our work on the redevelopment of Earls Court aimed to develop an open, honestand transparent approach to consultation and consensus building, both at thestrategic and community levels, before a design was even drawn. Over the project’sfirst two years, the team engaged with thousands of local people, along withorganisations and action groups. The consultation process consisted of five keystages, starting with a series of drop-in sessions prior to the design team even beingappointed. These exploratory avenues of communication allowed the client team tolisten to the community’s issues and aspirations and start to identify and recordrecurring themes. These initial episodes were followed by a second series of moredetailed workshops, where the community met the appointed design team and wereintroduced to the initial design concept. The principles of this concept reflectedmany of the concerns raised by residents and businesses at the initial drop-insessions, and particularly focused on reinforcing the existing communities.
The project’s third stage of consultation came through the launch of www.myearlscourt.com. This open and highly engaging means of communication pro-vided up-to-date information on the project, as well as a live blog which enabledlocal residents and businesses to comment on the evolving plans and ask questionsof the client and project team. Through this welcoming and accessible avenue, theproject team were able to gather a large amount of information which was activelyinterpreted and fed into the evolving scheme.
Following a further round of workshops, the Earls Court masterplan was pre-sented to the community at a heavily publicised, and well-attended, exhibitionevent. Along with an extensive programme of meetings with local authority officesand key political and technical consultants, this detailed and encompassing processof engagement was comprehensive in its approach. The principle goals were toengage with as broad a spectrum of the community as possible, energise discussionthrough a range of mediums and actively build towards a masterplan based onconsensus. Fundamentally, it was not a ‘box-ticking’ exercise; instead it seeks toactively engage for the broader purpose of public inclusion within the master-planning process.
Building consensus to support a proactive planning approach based on anunderstanding of ‘place’ is at the heart of our practice in sustainable urbanism, andessential to the process which we believe is capable of delivering adaptive com-munities (Fig. 8).
Building on these conventional and well-tested avenues of consultation, TheFarrell Review of Architecture and the Built Environment, commissioned by theUK Government, concluded that:
Every town and city without an architecture and built environment centre should have an‘urban room’ where the past, present and future of that place can be inspected. Virtually
176 L. Mazzeo et al.
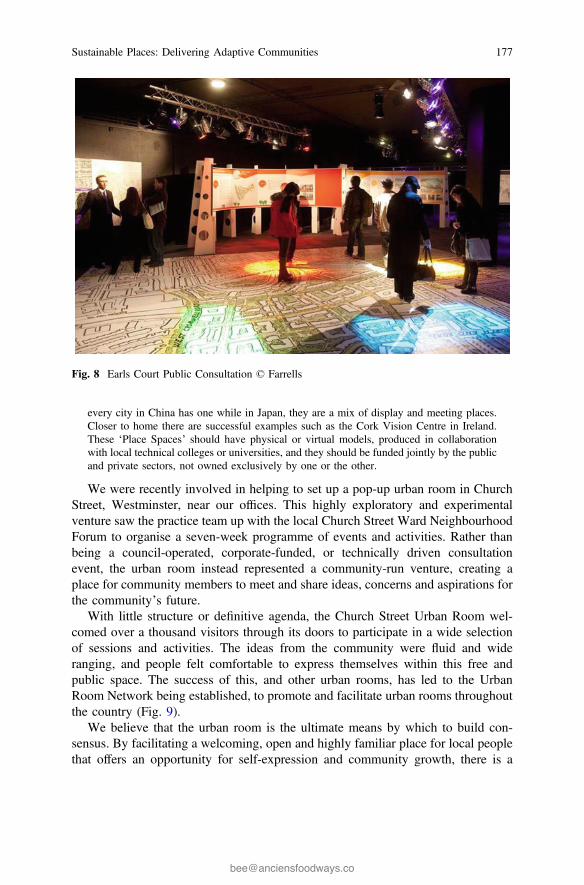
every city in China has one while in Japan, they are a mix of display and meeting places.Closer to home there are successful examples such as the Cork Vision Centre in Ireland.These ‘Place Spaces’ should have physical or virtual models, produced in collaborationwith local technical colleges or universities, and they should be funded jointly by the publicand private sectors, not owned exclusively by one or the other.
We were recently involved in helping to set up a pop-up urban room in ChurchStreet, Westminster, near our offices. This highly exploratory and experimentalventure saw the practice team up with the local Church Street Ward NeighbourhoodForum to organise a seven-week programme of events and activities. Rather thanbeing a council-operated, corporate-funded, or technically driven consultationevent, the urban room instead represented a community-run venture, creating aplace for community members to meet and share ideas, concerns and aspirations forthe community’s future.
With little structure or definitive agenda, the Church Street Urban Room wel-comed over a thousand visitors through its doors to participate in a wide selectionof sessions and activities. The ideas from the community were fluid and wideranging, and people felt comfortable to express themselves within this free andpublic space. The success of this, and other urban rooms, has led to the UrbanRoom Network being established, to promote and facilitate urban rooms throughoutthe country (Fig. 9).
We believe that the urban room is the ultimate means by which to build con-sensus. By facilitating a welcoming, open and highly familiar place for local peoplethat offers an opportunity for self-expression and community growth, there is a
Fig. 8 Earls Court Public Consultation © Farrells
Sustainable Places: Delivering Adaptive Communities 177
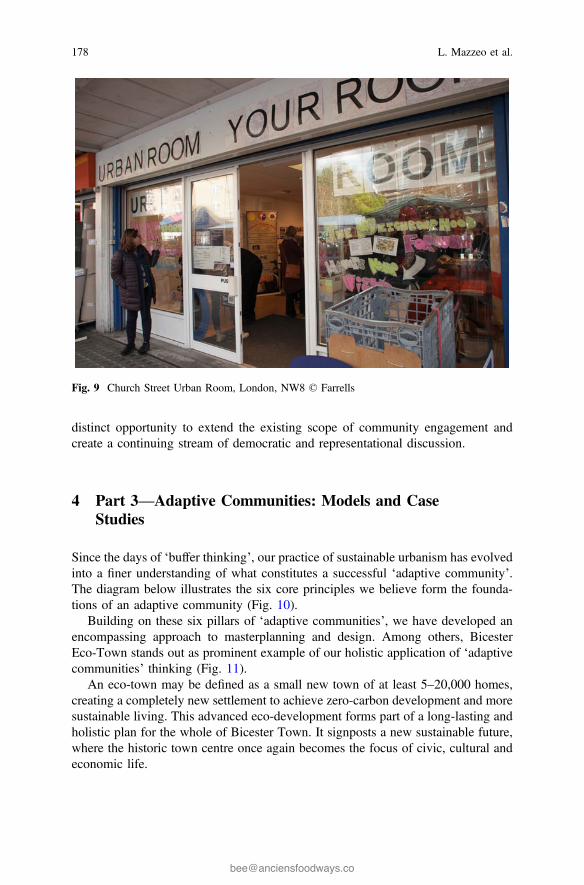
distinct opportunity to extend the existing scope of community engagement andcreate a continuing stream of democratic and representational discussion.
4 Part 3—Adaptive Communities: Models and CaseStudies
Since the days of ‘buffer thinking’, our practice of sustainable urbanism has evolvedinto a finer understanding of what constitutes a successful ‘adaptive community’.The diagram below illustrates the six core principles we believe form the founda-tions of an adaptive community (Fig. 10).
Building on these six pillars of ‘adaptive communities’, we have developed anencompassing approach to masterplanning and design. Among others, BicesterEco-Town stands out as prominent example of our holistic application of ‘adaptivecommunities’ thinking (Fig. 11).
An eco-town may be defined as a small new town of at least 5–20,000 homes,creating a completely new settlement to achieve zero-carbon development and moresustainable living. This advanced eco-development forms part of a long-lasting andholistic plan for the whole of Bicester Town. It signposts a new sustainable future,where the historic town centre once again becomes the focus of civic, cultural andeconomic life.
Fig. 9 Church Street Urban Room, London, NW8 © Farrells
178 L. Mazzeo et al.
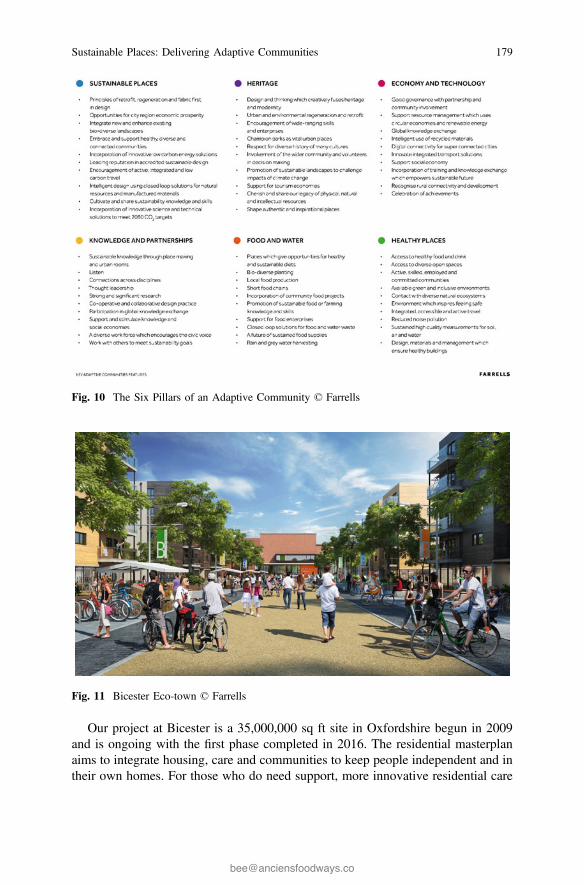
Our project at Bicester is a 35,000,000 sq ft site in Oxfordshire begun in 2009and is ongoing with the first phase completed in 2016. The residential masterplanaims to integrate housing, care and communities to keep people independent and intheir own homes. For those who do need support, more innovative residential care
Fig. 10 The Six Pillars of an Adaptive Community © Farrells
Fig. 11 Bicester Eco-town © Farrells
Sustainable Places: Delivering Adaptive Communities 179
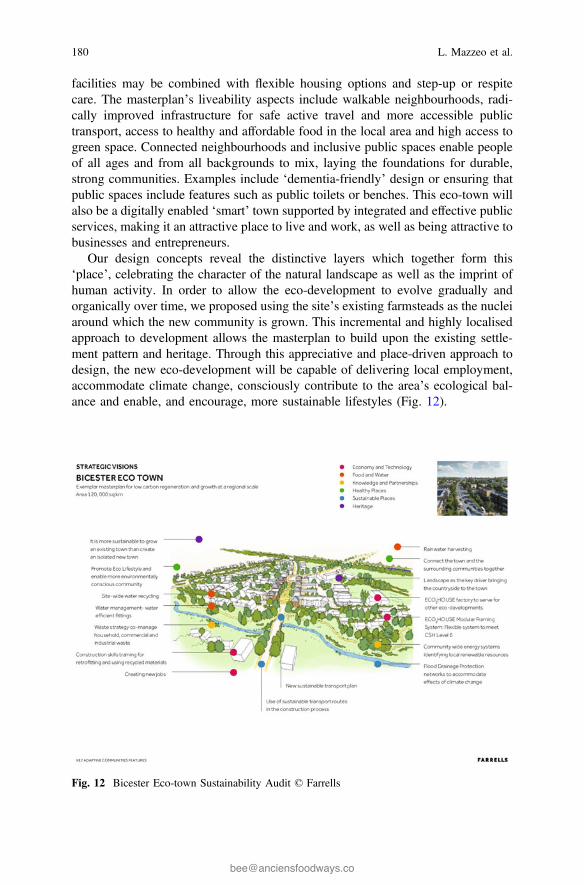
facilities may be combined with flexible housing options and step-up or respitecare. The masterplan’s liveability aspects include walkable neighbourhoods, radi-cally improved infrastructure for safe active travel and more accessible publictransport, access to healthy and affordable food in the local area and high access togreen space. Connected neighbourhoods and inclusive public spaces enable peopleof all ages and from all backgrounds to mix, laying the foundations for durable,strong communities. Examples include ‘dementia-friendly’ design or ensuring thatpublic spaces include features such as public toilets or benches. This eco-town willalso be a digitally enabled ‘smart’ town supported by integrated and effective publicservices, making it an attractive place to live and work, as well as being attractive tobusinesses and entrepreneurs.
Our design concepts reveal the distinctive layers which together form this‘place’, celebrating the character of the natural landscape as well as the imprint ofhuman activity. In order to allow the eco-development to evolve gradually andorganically over time, we proposed using the site’s existing farmsteads as the nucleiaround which the new community is grown. This incremental and highly localisedapproach to development allows the masterplan to build upon the existing settle-ment pattern and heritage. Through this appreciative and place-driven approach todesign, the new eco-development will be capable of delivering local employment,accommodate climate change, consciously contribute to the area’s ecological bal-ance and enable, and encourage, more sustainable lifestyles (Fig. 12).
Fig. 12 Bicester Eco-town Sustainability Audit © Farrells
180 L. Mazzeo et al.
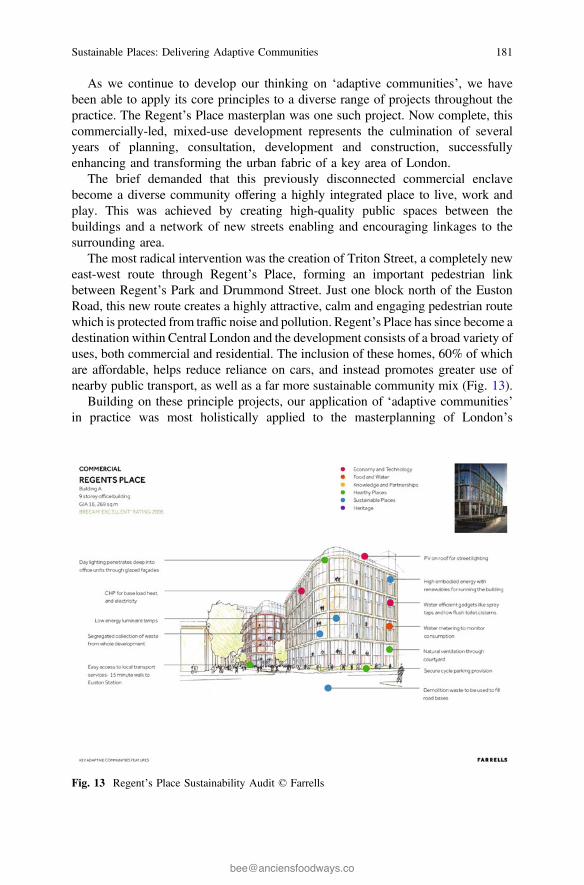
As we continue to develop our thinking on ‘adaptive communities’, we havebeen able to apply its core principles to a diverse range of projects throughout thepractice. The Regent’s Place masterplan was one such project. Now complete, thiscommercially-led, mixed-use development represents the culmination of severalyears of planning, consultation, development and construction, successfullyenhancing and transforming the urban fabric of a key area of London.
The brief demanded that this previously disconnected commercial enclavebecome a diverse community offering a highly integrated place to live, work andplay. This was achieved by creating high-quality public spaces between thebuildings and a network of new streets enabling and encouraging linkages to thesurrounding area.
The most radical intervention was the creation of Triton Street, a completely neweast-west route through Regent’s Place, forming an important pedestrian linkbetween Regent’s Park and Drummond Street. Just one block north of the EustonRoad, this new route creates a highly attractive, calm and engaging pedestrian routewhich is protected from traffic noise and pollution. Regent’s Place has since become adestination within Central London and the development consists of a broad variety ofuses, both commercial and residential. The inclusion of these homes, 60% of whichare affordable, helps reduce reliance on cars, and instead promotes greater use ofnearby public transport, as well as a far more sustainable community mix (Fig. 13).
Building on these principle projects, our application of ‘adaptive communities’in practice was most holistically applied to the masterplanning of London’s
Fig. 13 Regent’s Place Sustainability Audit © Farrells
Sustainable Places: Delivering Adaptive Communities 181
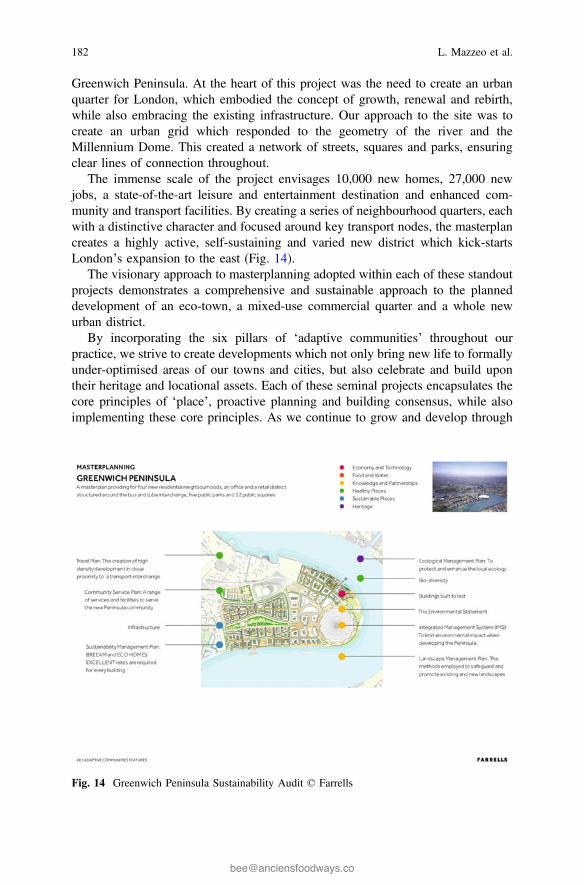
Greenwich Peninsula. At the heart of this project was the need to create an urbanquarter for London, which embodied the concept of growth, renewal and rebirth,while also embracing the existing infrastructure. Our approach to the site was tocreate an urban grid which responded to the geometry of the river and theMillennium Dome. This created a network of streets, squares and parks, ensuringclear lines of connection throughout.
The immense scale of the project envisages 10,000 new homes, 27,000 newjobs, a state-of-the-art leisure and entertainment destination and enhanced com-munity and transport facilities. By creating a series of neighbourhood quarters, eachwith a distinctive character and focused around key transport nodes, the masterplancreates a highly active, self-sustaining and varied new district which kick-startsLondon’s expansion to the east (Fig. 14).
The visionary approach to masterplanning adopted within each of these standoutprojects demonstrates a comprehensive and sustainable approach to the planneddevelopment of an eco-town, a mixed-use commercial quarter and a whole newurban district.
By incorporating the six pillars of ‘adaptive communities’ throughout ourpractice, we strive to create developments which not only bring new life to formallyunder-optimised areas of our towns and cities, but also celebrate and build upontheir heritage and locational assets. Each of these seminal projects encapsulates thecore principles of ‘place’, proactive planning and building consensus, while alsoimplementing these core principles. As we continue to grow and develop through
Fig. 14 Greenwich Peninsula Sustainability Audit © Farrells
182 L. Mazzeo et al.
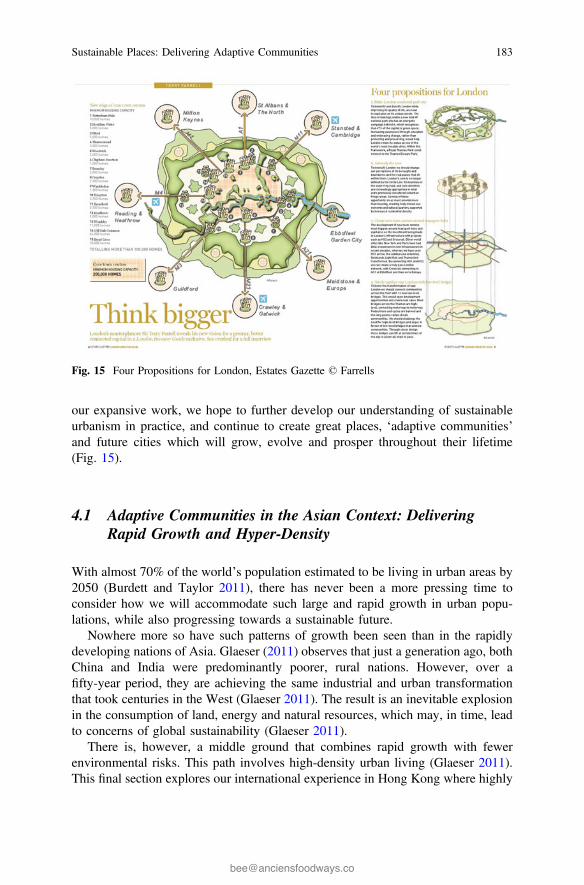
our expansive work, we hope to further develop our understanding of sustainableurbanism in practice, and continue to create great places, ‘adaptive communities’and future cities which will grow, evolve and prosper throughout their lifetime(Fig. 15).
4.1 Adaptive Communities in the Asian Context: DeliveringRapid Growth and Hyper-Density
With almost 70% of the world’s population estimated to be living in urban areas by2050 (Burdett and Taylor 2011), there has never been a more pressing time toconsider how we will accommodate such large and rapid growth in urban popu-lations, while also progressing towards a sustainable future.
Nowhere more so have such patterns of growth been seen than in the rapidlydeveloping nations of Asia. Glaeser (2011) observes that just a generation ago, bothChina and India were predominantly poorer, rural nations. However, over afifty-year period, they are achieving the same industrial and urban transformationthat took centuries in the West (Glaeser 2011). The result is an inevitable explosionin the consumption of land, energy and natural resources, which may, in time, leadto concerns of global sustainability (Glaeser 2011).
There is, however, a middle ground that combines rapid growth with fewerenvironmental risks. This path involves high-density urban living (Glaeser 2011).This final section explores our international experience in Hong Kong where highly
Fig. 15 Four Propositions for London, Estates Gazette © Farrells
Sustainable Places: Delivering Adaptive Communities 183
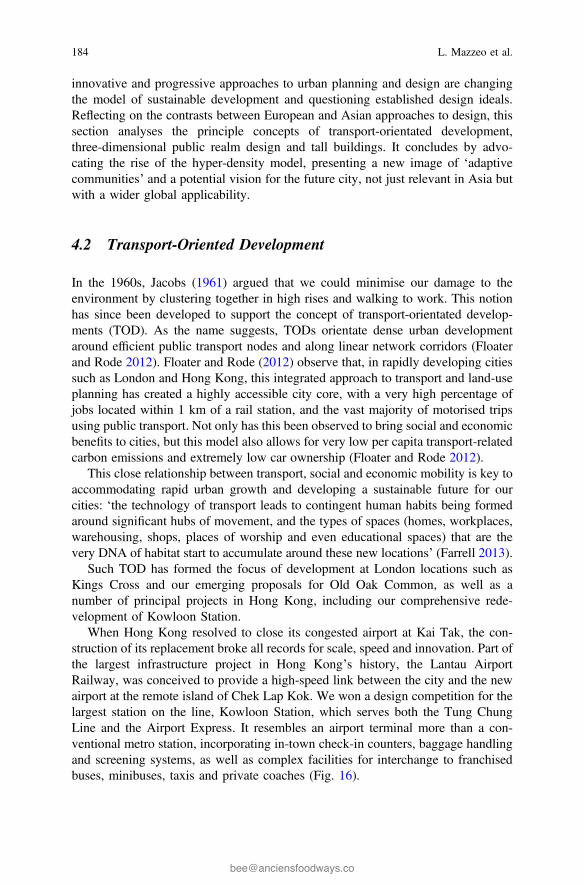
innovative and progressive approaches to urban planning and design are changingthe model of sustainable development and questioning established design ideals.Reflecting on the contrasts between European and Asian approaches to design, thissection analyses the principle concepts of transport-orientated development,three-dimensional public realm design and tall buildings. It concludes by advo-cating the rise of the hyper-density model, presenting a new image of ‘adaptivecommunities’ and a potential vision for the future city, not just relevant in Asia butwith a wider global applicability.
4.2 Transport-Oriented Development
In the 1960s, Jacobs (1961) argued that we could minimise our damage to theenvironment by clustering together in high rises and walking to work. This notionhas since been developed to support the concept of transport-orientated develop-ments (TOD). As the name suggests, TODs orientate dense urban developmentaround efficient public transport nodes and along linear network corridors (Floaterand Rode 2012). Floater and Rode (2012) observe that, in rapidly developing citiessuch as London and Hong Kong, this integrated approach to transport and land-useplanning has created a highly accessible city core, with a very high percentage ofjobs located within 1 km of a rail station, and the vast majority of motorised tripsusing public transport. Not only has this been observed to bring social and economicbenefits to cities, but this model also allows for very low per capita transport-relatedcarbon emissions and extremely low car ownership (Floater and Rode 2012).
This close relationship between transport, social and economic mobility is key toaccommodating rapid urban growth and developing a sustainable future for ourcities: ‘the technology of transport leads to contingent human habits being formedaround significant hubs of movement, and the types of spaces (homes, workplaces,warehousing, shops, places of worship and even educational spaces) that are thevery DNA of habitat start to accumulate around these new locations’ (Farrell 2013).
Such TOD has formed the focus of development at London locations such asKings Cross and our emerging proposals for Old Oak Common, as well as anumber of principal projects in Hong Kong, including our comprehensive rede-velopment of Kowloon Station.
When Hong Kong resolved to close its congested airport at Kai Tak, the con-struction of its replacement broke all records for scale, speed and innovation. Part ofthe largest infrastructure project in Hong Kong’s history, the Lantau AirportRailway, was conceived to provide a high-speed link between the city and the newairport at the remote island of Chek Lap Kok. We won a design competition for thelargest station on the line, Kowloon Station, which serves both the Tung ChungLine and the Airport Express. It resembles an airport terminal more than a con-ventional metro station, incorporating in-town check-in counters, baggage handlingand screening systems, as well as complex facilities for interchange to franchisedbuses, minibuses, taxis and private coaches (Fig. 16).
184 L. Mazzeo et al.
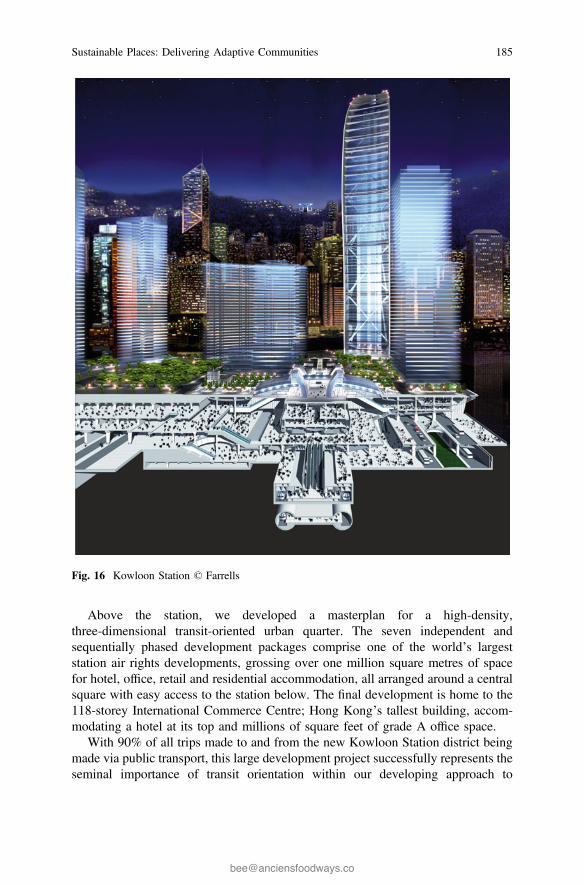
Above the station, we developed a masterplan for a high-density,three-dimensional transit-oriented urban quarter. The seven independent andsequentially phased development packages comprise one of the world’s largeststation air rights developments, grossing over one million square metres of spacefor hotel, office, retail and residential accommodation, all arranged around a centralsquare with easy access to the station below. The final development is home to the118-storey International Commerce Centre; Hong Kong’s tallest building, accom-modating a hotel at its top and millions of square feet of grade A office space.
With 90% of all trips made to and from the new Kowloon Station district beingmade via public transport, this large development project successfully represents theseminal importance of transit orientation within our developing approach to
Fig. 16 Kowloon Station © Farrells
Sustainable Places: Delivering Adaptive Communities 185
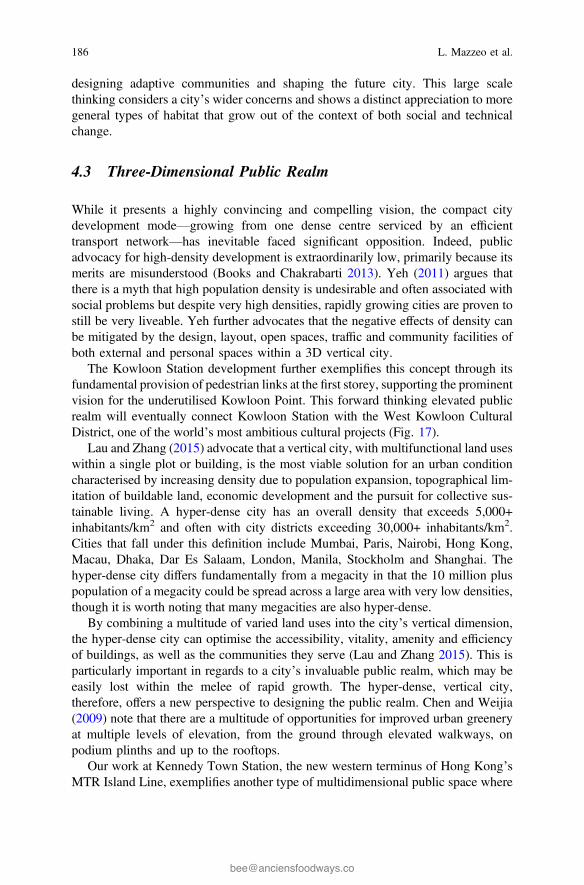
designing adaptive communities and shaping the future city. This large scalethinking considers a city’s wider concerns and shows a distinct appreciation to moregeneral types of habitat that grow out of the context of both social and technicalchange.
4.3 Three-Dimensional Public Realm
While it presents a highly convincing and compelling vision, the compact citydevelopment mode—growing from one dense centre serviced by an efficienttransport network—has inevitable faced significant opposition. Indeed, publicadvocacy for high-density development is extraordinarily low, primarily because itsmerits are misunderstood (Books and Chakrabarti 2013). Yeh (2011) argues thatthere is a myth that high population density is undesirable and often associated withsocial problems but despite very high densities, rapidly growing cities are proven tostill be very liveable. Yeh further advocates that the negative effects of density canbe mitigated by the design, layout, open spaces, traffic and community facilities ofboth external and personal spaces within a 3D vertical city.
The Kowloon Station development further exemplifies this concept through itsfundamental provision of pedestrian links at the first storey, supporting the prominentvision for the underutilised Kowloon Point. This forward thinking elevated publicrealm will eventually connect Kowloon Station with the West Kowloon CulturalDistrict, one of the world’s most ambitious cultural projects (Fig. 17).
Lau and Zhang (2015) advocate that a vertical city, with multifunctional land useswithin a single plot or building, is the most viable solution for an urban conditioncharacterised by increasing density due to population expansion, topographical lim-itation of buildable land, economic development and the pursuit for collective sus-tainable living. A hyper-dense city has an overall density that exceeds 5,000+inhabitants/km2 and often with city districts exceeding 30,000+ inhabitants/km2.Cities that fall under this definition include Mumbai, Paris, Nairobi, Hong Kong,Macau, Dhaka, Dar Es Salaam, London, Manila, Stockholm and Shanghai. Thehyper-dense city differs fundamentally from a megacity in that the 10 million pluspopulation of a megacity could be spread across a large area with very low densities,though it is worth noting that many megacities are also hyper-dense.
By combining a multitude of varied land uses into the city’s vertical dimension,the hyper-dense city can optimise the accessibility, vitality, amenity and efficiencyof buildings, as well as the communities they serve (Lau and Zhang 2015). This isparticularly important in regards to a city’s invaluable public realm, which may beeasily lost within the melee of rapid growth. The hyper-dense, vertical city,therefore, offers a new perspective to designing the public realm. Chen and Weijia(2009) note that there are a multitude of opportunities for improved urban greeneryat multiple levels of elevation, from the ground through elevated walkways, onpodium plinths and up to the rooftops.
Our work at Kennedy Town Station, the new western terminus of Hong Kong’sMTR Island Line, exemplifies another type of multidimensional public space where
186 L. Mazzeo et al.
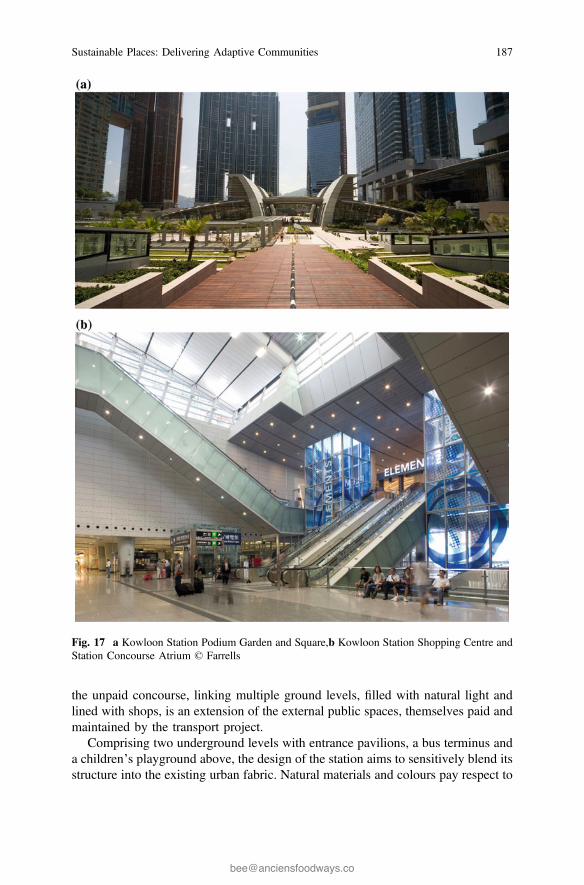
the unpaid concourse, linking multiple ground levels, filled with natural light andlined with shops, is an extension of the external public spaces, themselves paid andmaintained by the transport project.
Comprising two underground levels with entrance pavilions, a bus terminus anda children’s playground above, the design of the station aims to sensitively blend itsstructure into the existing urban fabric. Natural materials and colours pay respect to
Fig. 17 a Kowloon Station Podium Garden and Square,b Kowloon Station Shopping Centre andStation Concourse Atrium © Farrells
Sustainable Places: Delivering Adaptive Communities 187
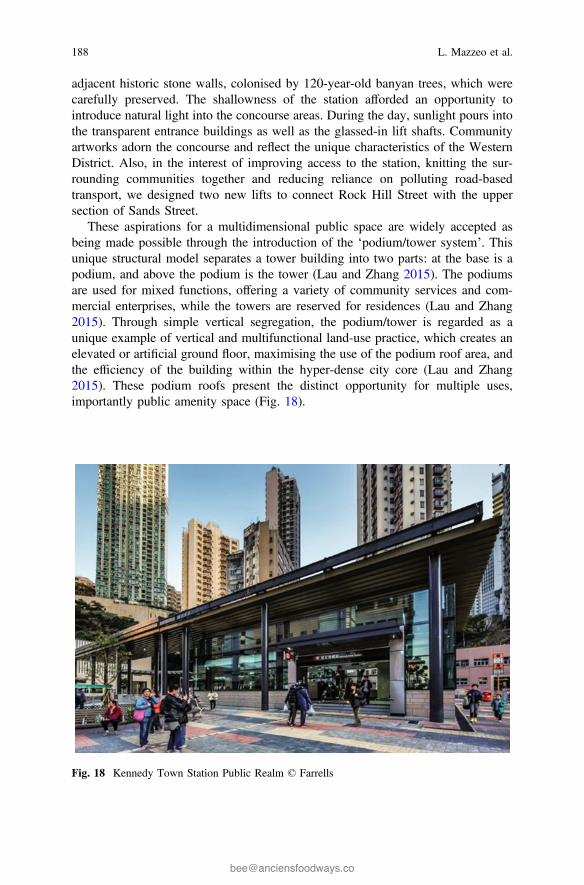
adjacent historic stone walls, colonised by 120-year-old banyan trees, which werecarefully preserved. The shallowness of the station afforded an opportunity tointroduce natural light into the concourse areas. During the day, sunlight pours intothe transparent entrance buildings as well as the glassed-in lift shafts. Communityartworks adorn the concourse and reflect the unique characteristics of the WesternDistrict. Also, in the interest of improving access to the station, knitting the sur-rounding communities together and reducing reliance on polluting road-basedtransport, we designed two new lifts to connect Rock Hill Street with the uppersection of Sands Street.
These aspirations for a multidimensional public space are widely accepted asbeing made possible through the introduction of the ‘podium/tower system’. Thisunique structural model separates a tower building into two parts: at the base is apodium, and above the podium is the tower (Lau and Zhang 2015). The podiumsare used for mixed functions, offering a variety of community services and com-mercial enterprises, while the towers are reserved for residences (Lau and Zhang2015). Through simple vertical segregation, the podium/tower is regarded as aunique example of vertical and multifunctional land-use practice, which creates anelevated or artificial ground floor, maximising the use of the podium roof area, andthe efficiency of the building within the hyper-dense city core (Lau and Zhang2015). These podium roofs present the distinct opportunity for multiple uses,importantly public amenity space (Fig. 18).
Fig. 18 Kennedy Town Station Public Realm © Farrells
188 L. Mazzeo et al.
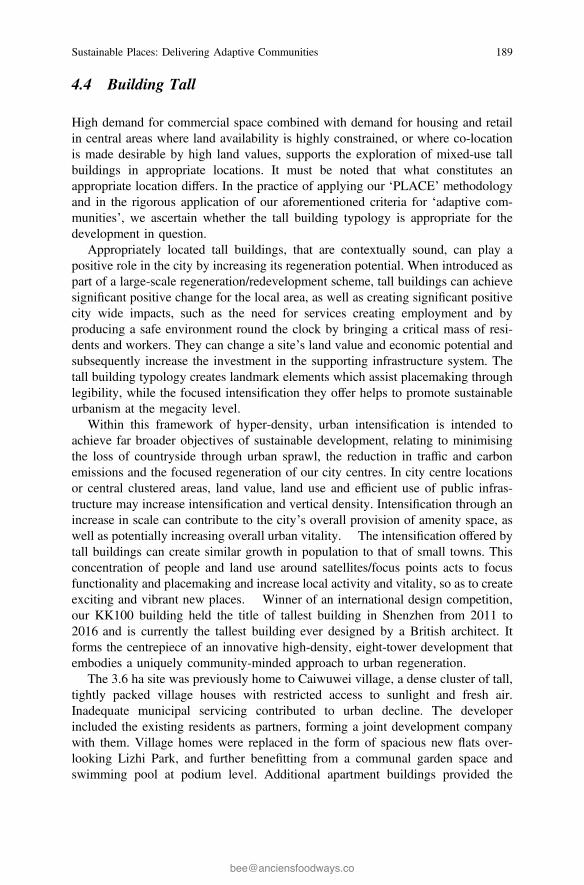
4.4 Building Tall
High demand for commercial space combined with demand for housing and retailin central areas where land availability is highly constrained, or where co-locationis made desirable by high land values, supports the exploration of mixed-use tallbuildings in appropriate locations. It must be noted that what constitutes anappropriate location differs. In the practice of applying our ‘PLACE’ methodologyand in the rigorous application of our aforementioned criteria for ‘adaptive com-munities’, we ascertain whether the tall building typology is appropriate for thedevelopment in question.
Appropriately located tall buildings, that are contextually sound, can play apositive role in the city by increasing its regeneration potential. When introduced aspart of a large-scale regeneration/redevelopment scheme, tall buildings can achievesignificant positive change for the local area, as well as creating significant positivecity wide impacts, such as the need for services creating employment and byproducing a safe environment round the clock by bringing a critical mass of resi-dents and workers. They can change a site’s land value and economic potential andsubsequently increase the investment in the supporting infrastructure system. Thetall building typology creates landmark elements which assist placemaking throughlegibility, while the focused intensification they offer helps to promote sustainableurbanism at the megacity level.
Within this framework of hyper-density, urban intensification is intended toachieve far broader objectives of sustainable development, relating to minimisingthe loss of countryside through urban sprawl, the reduction in traffic and carbonemissions and the focused regeneration of our city centres. In city centre locationsor central clustered areas, land value, land use and efficient use of public infras-tructure may increase intensification and vertical density. Intensification through anincrease in scale can contribute to the city’s overall provision of amenity space, aswell as potentially increasing overall urban vitality. The intensification offered bytall buildings can create similar growth in population to that of small towns. Thisconcentration of people and land use around satellites/focus points acts to focusfunctionality and placemaking and increase local activity and vitality, so as to createexciting and vibrant new places. Winner of an international design competition,our KK100 building held the title of tallest building in Shenzhen from 2011 to2016 and is currently the tallest building ever designed by a British architect. Itforms the centrepiece of an innovative high-density, eight-tower development thatembodies a uniquely community-minded approach to urban regeneration.
The 3.6 ha site was previously home to Caiwuwei village, a dense cluster of tall,tightly packed village houses with restricted access to sunlight and fresh air.Inadequate municipal servicing contributed to urban decline. The developerincluded the existing residents as partners, forming a joint development companywith them. Village homes were replaced in the form of spacious new flats over-looking Lizhi Park, and further benefitting from a communal garden space andswimming pool at podium level. Additional apartment buildings provided the
Sustainable Places: Delivering Adaptive Communities 189
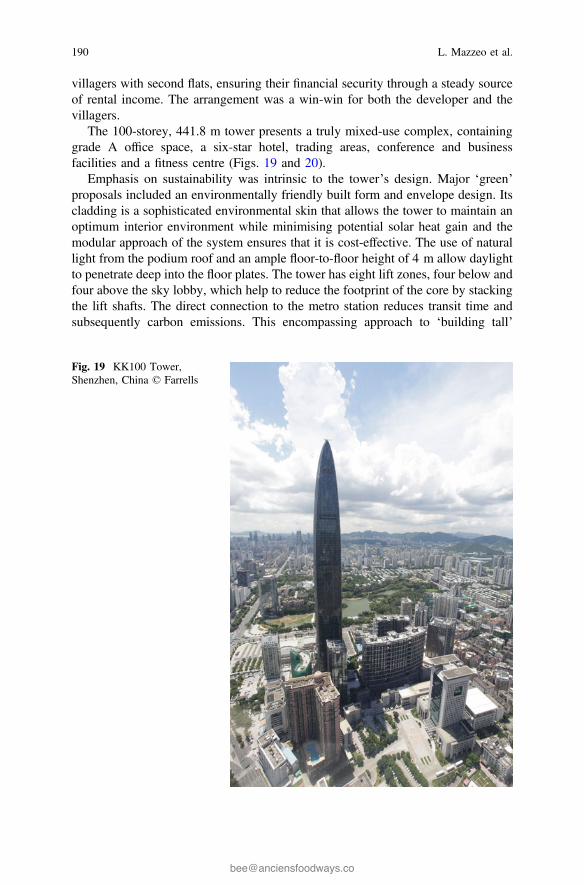
villagers with second flats, ensuring their financial security through a steady sourceof rental income. The arrangement was a win-win for both the developer and thevillagers.
The 100-storey, 441.8 m tower presents a truly mixed-use complex, containinggrade A office space, a six-star hotel, trading areas, conference and businessfacilities and a fitness centre (Figs. 19 and 20).
Emphasis on sustainability was intrinsic to the tower’s design. Major ‘green’proposals included an environmentally friendly built form and envelope design. Itscladding is a sophisticated environmental skin that allows the tower to maintain anoptimum interior environment while minimising potential solar heat gain and themodular approach of the system ensures that it is cost-effective. The use of naturallight from the podium roof and an ample floor-to-floor height of 4 m allow daylightto penetrate deep into the floor plates. The tower has eight lift zones, four below andfour above the sky lobby, which help to reduce the footprint of the core by stackingthe lift shafts. The direct connection to the metro station reduces transit time andsubsequently carbon emissions. This encompassing approach to ‘building tall’
Fig. 19 KK100 Tower,Shenzhen, China © Farrells
190 L. Mazzeo et al.
presents a compelling and highly prominent precedent for how to deliver thehyper-dense city. While we of course do not advocate that this model is universallyapplicable, it does represent an enlightened view of the potential function andbeneficial return from these vertical extensions to our city cores.
Place-based differences between UK and China developments are linked to thepoint in time in history where population density in city centres were maximised.Where London had the highest density levels in the late nineteenth century, the lackof construction methods and technology allowing taller buildings led to over-crowding and slums. In Hong Kong, and more widely across Asia, this phe-nomenon being relatively recent in comparison, typologies and technologies werealready available to respond to a growing population. However, as urbanisationrates continue to increase worldwide and populations become more and moremobile, bringing renewed growth to western capitals, these hyper-dense models andassociated environmental challenges become highly relevant globally.
Books and Chakrabarti (2013) reflect that these multifaceted approaches todesign, including TOD, 3D public realm and building tall, form a prerequisite formaking hyper-density not just liveable but enjoyable. There are, of course, anumber of distinct questions which still surround the morphology and physicalcharacteristics of the hyper-dense city, in particular the appropriate relationship
Fig. 20 KK100 Tower Conceptual Design © Farrells
Sustainable Places: Delivering Adaptive Communities 191
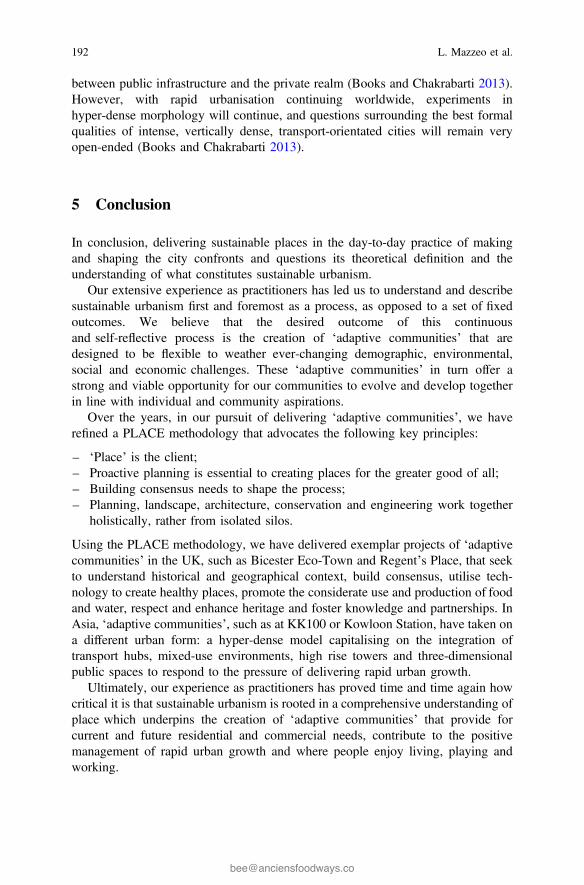
between public infrastructure and the private realm (Books and Chakrabarti 2013).However, with rapid urbanisation continuing worldwide, experiments inhyper-dense morphology will continue, and questions surrounding the best formalqualities of intense, vertically dense, transport-orientated cities will remain veryopen-ended (Books and Chakrabarti 2013).
5 Conclusion
In conclusion, delivering sustainable places in the day-to-day practice of makingand shaping the city confronts and questions its theoretical definition and theunderstanding of what constitutes sustainable urbanism.
Our extensive experience as practitioners has led us to understand and describesustainable urbanism first and foremost as a process, as opposed to a set of fixedoutcomes. We believe that the desired outcome of this continuousand self-reflective process is the creation of ‘adaptive communities’ that aredesigned to be flexible to weather ever-changing demographic, environmental,social and economic challenges. These ‘adaptive communities’ in turn offer astrong and viable opportunity for our communities to evolve and develop togetherin line with individual and community aspirations.
Over the years, in our pursuit of delivering ‘adaptive communities’, we haverefined a PLACE methodology that advocates the following key principles:
– ‘Place’ is the client;– Proactive planning is essential to creating places for the greater good of all;– Building consensus needs to shape the process;– Planning, landscape, architecture, conservation and engineering work together
holistically, rather from isolated silos.
Using the PLACE methodology, we have delivered exemplar projects of ‘adaptivecommunities’ in the UK, such as Bicester Eco-Town and Regent’s Place, that seekto understand historical and geographical context, build consensus, utilise tech-nology to create healthy places, promote the considerate use and production of foodand water, respect and enhance heritage and foster knowledge and partnerships. InAsia, ‘adaptive communities’, such as at KK100 or Kowloon Station, have taken ona different urban form: a hyper-dense model capitalising on the integration oftransport hubs, mixed-use environments, high rise towers and three-dimensionalpublic spaces to respond to the pressure of delivering rapid urban growth.
Ultimately, our experience as practitioners has proved time and time again howcritical it is that sustainable urbanism is rooted in a comprehensive understanding ofplace which underpins the creation of ‘adaptive communities’ that provide forcurrent and future residential and commercial needs, contribute to the positivemanagement of rapid urban growth and where people enjoy living, playing andworking.
192 L. Mazzeo et al.
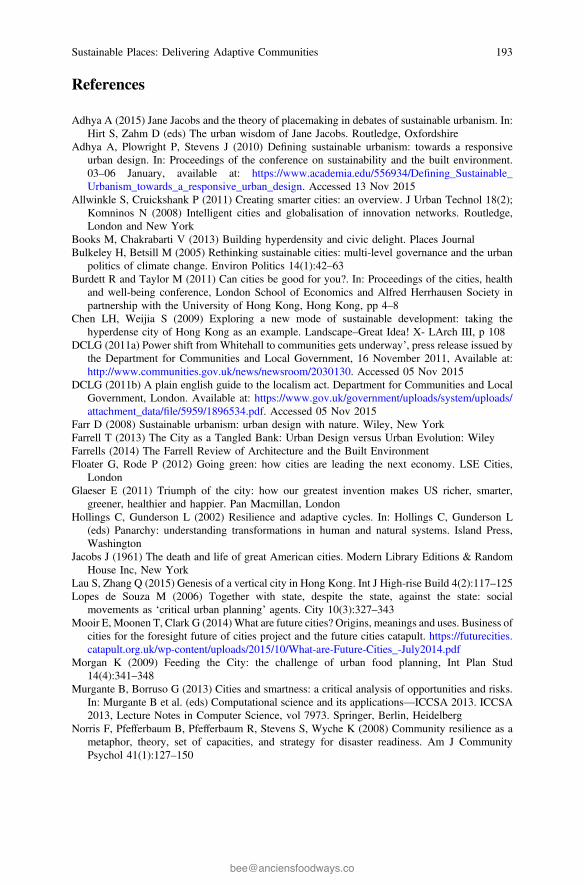
References
Adhya A (2015) Jane Jacobs and the theory of placemaking in debates of sustainable urbanism. In:Hirt S, Zahm D (eds) The urban wisdom of Jane Jacobs. Routledge, Oxfordshire
Adhya A, Plowright P, Stevens J (2010) Defining sustainable urbanism: towards a responsiveurban design. In: Proceedings of the conference on sustainability and the built environment.03–06 January, available at: https://www.academia.edu/556934/Defining_Sustainable_Urbanism_towards_a_responsive_urban_design. Accessed 13 Nov 2015
Allwinkle S, Cruickshank P (2011) Creating smarter cities: an overview. J Urban Technol 18(2);Komninos N (2008) Intelligent cities and globalisation of innovation networks. Routledge,London and New York
Books M, Chakrabarti V (2013) Building hyperdensity and civic delight. Places JournalBulkeley H, Betsill M (2005) Rethinking sustainable cities: multi-level governance and the urban
politics of climate change. Environ Politics 14(1):42–63Burdett R and Taylor M (2011) Can cities be good for you?. In: Proceedings of the cities, health
and well-being conference, London School of Economics and Alfred Herrhausen Society inpartnership with the University of Hong Kong, Hong Kong, pp 4–8
Chen LH, Weijia S (2009) Exploring a new mode of sustainable development: taking thehyperdense city of Hong Kong as an example. Landscape–Great Idea! X- LArch III, p 108
DCLG (2011a) Power shift from Whitehall to communities gets underway’, press release issued bythe Department for Communities and Local Government, 16 November 2011, Available at:http://www.communities.gov.uk/news/newsroom/2030130. Accessed 05 Nov 2015
DCLG (2011b) A plain english guide to the localism act. Department for Communities and LocalGovernment, London. Available at: https://www.gov.uk/government/uploads/system/uploads/attachment_data/file/5959/1896534.pdf. Accessed 05 Nov 2015
Farr D (2008) Sustainable urbanism: urban design with nature. Wiley, New YorkFarrell T (2013) The City as a Tangled Bank: Urban Design versus Urban Evolution: WileyFarrells (2014) The Farrell Review of Architecture and the Built EnvironmentFloater G, Rode P (2012) Going green: how cities are leading the next economy. LSE Cities,
LondonGlaeser E (2011) Triumph of the city: how our greatest invention makes US richer, smarter,
greener, healthier and happier. Pan Macmillan, LondonHollings C, Gunderson L (2002) Resilience and adaptive cycles. In: Hollings C, Gunderson L
(eds) Panarchy: understanding transformations in human and natural systems. Island Press,Washington
Jacobs J (1961) The death and life of great American cities. Modern Library Editions & RandomHouse Inc, New York
Lau S, Zhang Q (2015) Genesis of a vertical city in Hong Kong. Int J High-rise Build 4(2):117–125Lopes de Souza M (2006) Together with state, despite the state, against the state: social
movements as ‘critical urban planning’ agents. City 10(3):327–343Mooir E, Moonen T, Clark G (2014)What are future cities? Origins, meanings and uses. Business of
cities for the foresight future of cities project and the future cities catapult. https://futurecities.catapult.org.uk/wp-content/uploads/2015/10/What-are-Future-Cities_-July2014.pdf
Morgan K (2009) Feeding the City: the challenge of urban food planning, Int Plan Stud14(4):341–348
Murgante B, Borruso G (2013) Cities and smartness: a critical analysis of opportunities and risks.In: Murgante B et al. (eds) Computational science and its applications—ICCSA 2013. ICCSA2013, Lecture Notes in Computer Science, vol 7973. Springer, Berlin, Heidelberg
Norris F, Pfefferbaum B, Pfefferbaum R, Stevens S, Wyche K (2008) Community resilience as ametaphor, theory, set of capacities, and strategy for disaster readiness. Am J CommunityPsychol 41(1):127–150
Sustainable Places: Delivering Adaptive Communities 193
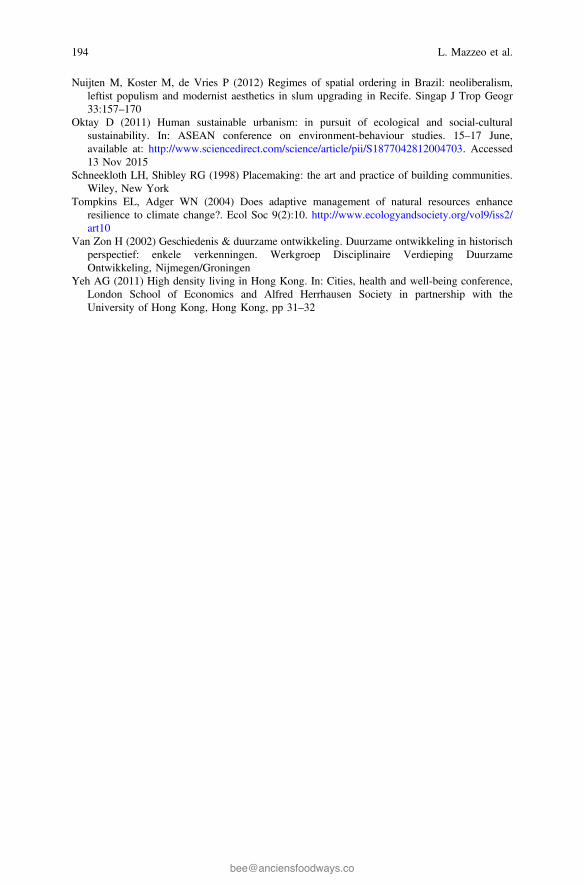
Nuijten M, Koster M, de Vries P (2012) Regimes of spatial ordering in Brazil: neoliberalism,leftist populism and modernist aesthetics in slum upgrading in Recife. Singap J Trop Geogr33:157–170
Oktay D (2011) Human sustainable urbanism: in pursuit of ecological and social-culturalsustainability. In: ASEAN conference on environment-behaviour studies. 15–17 June,available at: http://www.sciencedirect.com/science/article/pii/S1877042812004703. Accessed13 Nov 2015
Schneekloth LH, Shibley RG (1998) Placemaking: the art and practice of building communities.Wiley, New York
Tompkins EL, Adger WN (2004) Does adaptive management of natural resources enhanceresilience to climate change?. Ecol Soc 9(2):10. http://www.ecologyandsociety.org/vol9/iss2/art10
Van Zon H (2002) Geschiedenis & duurzame ontwikkeling. Duurzame ontwikkeling in historischperspectief: enkele verkenningen. Werkgroep Disciplinaire Verdieping DuurzameOntwikkeling, Nijmegen/Groningen
Yeh AG (2011) High density living in Hong Kong. In: Cities, health and well-being conference,London School of Economics and Alfred Herrhausen Society in partnership with theUniversity of Hong Kong, Hong Kong, pp 31–32
194 L. Mazzeo et al.