working capital management impact on profitability
TRANSCRIPT
Católica Lisbon School of Business and Economics
International Master of Science in Business Administration
Working Capital Management impact on Profitability
Empirical study based on Portuguese firms
Author: João Nogueira Serrasqueiro
Advisor: Professor Ricardo Reis
Dissertation submitted in the partial fulfillment of the requirements for the degree of MSc in
Business Administration at Católica Lisbon School of Business and Economics
Lisbon 2014
- 1 -
Abstract
The main objective of this dissertation is to understand the impact of working capital management on
profitability. This study comes in a period where managers are trying to push up the businesses activities
and management policies are changing, aiming to adapt to the new economic context.
The working capital management appears with relevance in several studies given the importance of the
short-term policies in the value creation for the shareholders. In the literature are present several
studies aiming to test the efficiency of working capital management and the relation with the
profitability in the firms. The authors have been studying working capital by testing within the
management policies, the size of the firm, the industry and geographical impact on the profitability.
The core difference of this dissertation comparing with the previous studies is the role of working capital
management and the impact in profitability of Portuguese firms, how firms in Portugal are managing
working capital and what relevance does it bring to actual performance.
In front of the recent economic difficulties and the struggling in credit finance experienced by
Portuguese companies, the working capital management can be an important source of credit through
an efficient management of the current assets and liabilities.
The study will be developed under descriptive and empirical statistics and the data will be collected
from Bloomberg for the period 2002-2006 in an annual basis. From the initial raw data will be excluded
the data outliers and firms without complete information. In order to proceed correctly through the
analysis, some control variables will be added and some tests will be carried out.
The data will be treated and disposed in panel data to provide an intuitive analysis and interpretation to
the reader. This dissertation will follow some papers and previous studies which tested similar
hypothesis but in different countries with different economic-cultural aspects.
- 2 -
Resumo
O principal objectivo desta dissertação é compreender o impacto da gestão do Fundo de Maneio na
rentabilidade das empresas. Este estudo aparece numa fase em que os gestores estão focados em
mudar a actividade económica que se tem vivido nos últimos tempos.
A gestão de Fundo de Maneio surge com relevância em diversos estudos dada a importância da gestão
de curto prazo na criação de valor para as diferentes partes relacionadas com as empresas. Foram
realizados diversos estudos que testam a eficiência da gestão de fundo de maneio e respectivo impacto
na rentabilidade das empresas. Dos diferentes estudos envoltos neste tema, os que mais se destacam
envolvem características onde os autores têm estudado o fundo de maneio relacionando com as
políticas de gestão, com a dimensão das empresas e a divisão geográfica.
A principal diferença desta dissertação ao comparar com os estudos anteriores focados no mesmo tema
é o facto de os resultados empíricos serem baseados em empresas Portuguesas o que, até à data de
hoje, ainda não tinha sido realizado. Este estudo foca-se em como as empresas em Portugal gerem o
fundo de maneio e que relevância essa gestão, tem para a performance dessas empresas.
As actuais dificuldades vividas em Portugal no que está relacionado com a actividade económica e a
dificuldade na obtenção de empréstimos e linhas de crédito suscitam questões para os gestores em
como financiar as actividades assim como deverá ser feita a gestão dos actuais recursos das empresas
Desta forma, este estudo procura relacionar através do uso da estática descritiva e empírica de como a
gestão de fundo de maneio influencia o retorno das empresas e de que forma as politicas mais
agressivas ou mais conservativas se relacionam com as dificuldades económicas vividas em Portugal.
A base de dados será a Bloomberg e os dados serão usados numa base anula e formarão uma amostra
de 3360 empresas entre 2002 e 2006, constituindo assim um número de observações de grande
dimensão para que as conclusões possam ser bem sustentadas. Alguns dados serão excluídos de forma a
preservar a robustez dos modelos e evitar alguns erros de análise. Serão adicionadas algumas variáveis
de controlo de forma a imputar os devidos efeitos nas variáveis em estudo.

- 3 -
O estudo empírico será realizado em panel data o que permite atribuir individualidade a cada empesas
durante os anos em estudo. Serão seguidas algumas linhas de raciocínio suportados por alguns papers e
estudos cuja as hipóteses testadas são semelhantes ao objectivo do presente trabalho.
Acknowledgments
During the preparation of this work I face some challenges that required from me the development of
different skills and a lot of work but truly rewarding at the end.
I would like to thank to Professor Ricardo Reis for the help and support every time that a needed
guidance to proceed with my work.
I would also to thank to Professor Gary Emery for the important help as a specialist in the subject of
short-term financial management.
I would thank to my co-workers and supervisor in ICP-ANACOM for the time given to work in the thesis
and for allowing me to complete the seminars necessary for the thesis program.
I have also to thank to my friend Leopoldo Gomes that taught me how to work with some specific
statistical tools that were essential for the progress of this study.
The support and patience of my family was also very important giving me the stability and support to
focus on this work.
- 4 -
Abbreviations
SME- Small and medium enterprises
EBIT- Earnings before Interests and Taxes
ROA – Return on Assets
GDP – Gross Domestic Product
GDPGR – Gross Domestic Product Annual Growth
TA – Total Assets
FA – Financial Assets
SGR- Sales Growth
DAR –Number of days of Accounts Receivable
DAP- Number of Days of Accounts Payable
DINV – number of Days of Inventory
CCC –Cash Conversion Cycle
DSAP – Number of days Sales of Accounts Payable
DSINV - Number of days Sales of Inventory
NTC – Net Trade Cycle
DSO – Days Sales Outstanding, same as DAR
DPO - Days Payable Outstanding, same as DAP

- 5 -
DIO – Days Inventory Outstanding, same as DINV
OLS – Ordinary Least Squares
RER-Random Effects Regression
FER –Fixed Effects Regression
- 6 -
Index
1. Introduction.............................................................................................................................. 8
2. Literature Review………………………......................................................................................... 10
2.1. Working Capital Management Concept ........................................................................ 10
2.2. Components of Working Capital .................................................................................. 11
2.3 Working capital as a market information source……………………………………………………….. 14
2.4. Efficiency and Profitability ............................................................................................ 14
2.5. Working Capital Management Policies............................................................ 15
3. Previous information from empirical studies ................................................................. 17
4. Research Methodology............................................................................................... 19
4.1. Data............................................................................................................................... 19
4.2. Variables ....................................................................................................................... 19
4.3. Panel Data methodology............................................................................................... 21
5. Empirical Results……………………………………………………………………………………………….................. 26
5.1. Descriptive analysis..................................................................................................... 26
5.2. Multivariate analysis..................................................................................................... 29
5.21. Correlation matrix analysis ............................................................................ 29
5.2.2. Regression Analysis........................................................................................ 31

- 7 -
6. Conclusion .............................................................................................................................. 36
8. Final Comments ..................................................................................................................... 37
9. Bibliography ............................................................................................................................... 39
- 8 -
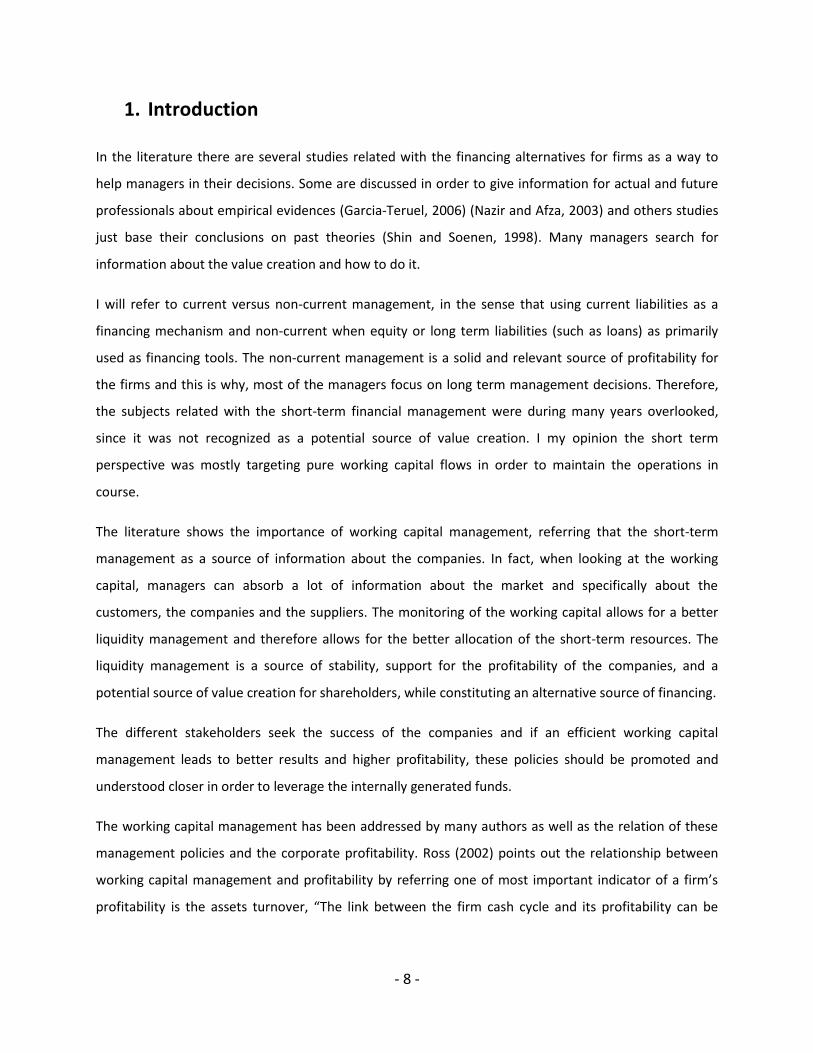
1. Introduction
In the literature there are several studies related with the financing alternatives for firms as a way to
help managers in their decisions. Some are discussed in order to give information for actual and future
professionals about empirical evidences (Garcia-Teruel, 2006) (Nazir and Afza, 2003) and others studies
just base their conclusions on past theories (Shin and Soenen, 1998). Many managers search for
information about the value creation and how to do it.
I will refer to current versus non-current management, in the sense that using current liabilities as a
financing mechanism and non-current when equity or long term liabilities (such as loans) as primarily
used as financing tools. The non-current management is a solid and relevant source of profitability for
the firms and this is why, most of the managers focus on long term management decisions. Therefore,
the subjects related with the short-term financial management were during many years overlooked,
since it was not recognized as a potential source of value creation. I my opinion the short term
perspective was mostly targeting pure working capital flows in order to maintain the operations in
course.
The literature shows the importance of working capital management, referring that the short-term
management as a source of information about the companies. In fact, when looking at the working
capital, managers can absorb a lot of information about the market and specifically about the
customers, the companies and the suppliers. The monitoring of the working capital allows for a better
liquidity management and therefore allows for the better allocation of the short-term resources. The
liquidity management is a source of stability, support for the profitability of the companies, and a
potential source of value creation for shareholders, while constituting an alternative source of financing.
The different stakeholders seek the success of the companies and if an efficient working capital
management leads to better results and higher profitability, these policies should be promoted and
understood closer in order to leverage the internally generated funds.
The working capital management has been addressed by many authors as well as the relation of these
management policies and the corporate profitability. Ross (2002) points out the relationship between
working capital management and profitability by referring one of most important indicator of a firm’s
profitability is the assets turnover, “The link between the firm cash cycle and its profitability can be
- 9 -
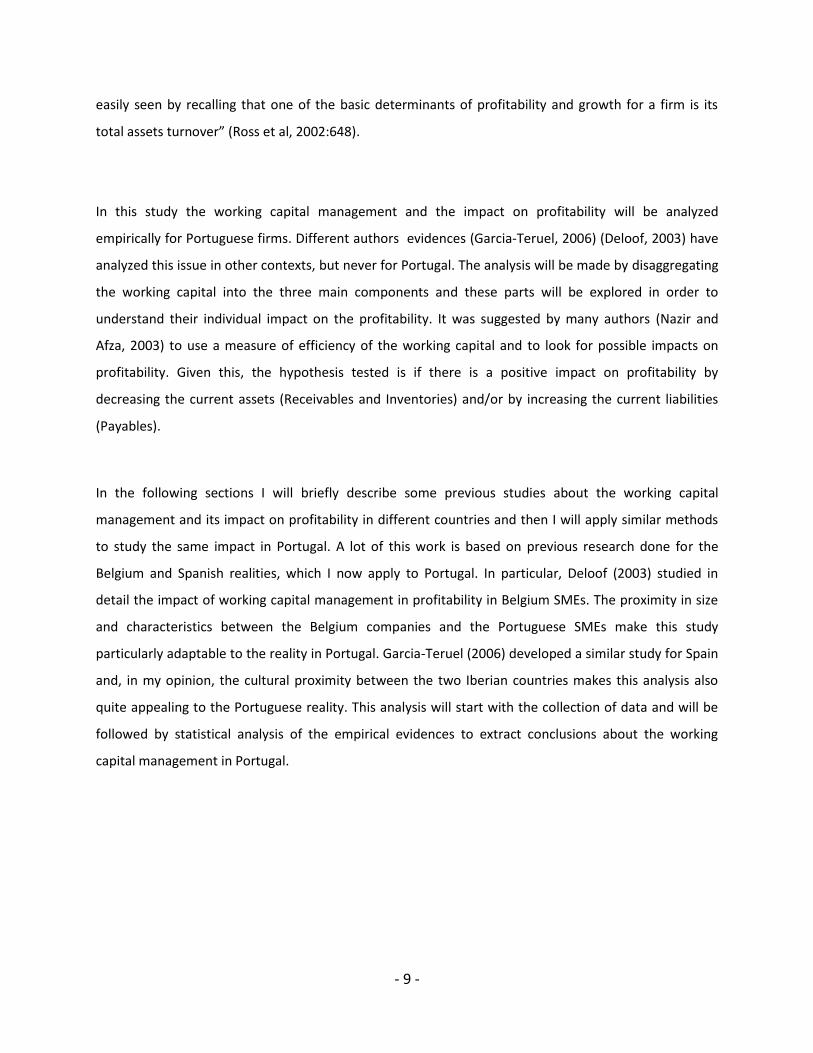
easily seen by recalling that one of the basic determinants of profitability and growth for a firm is its
total assets turnover” (Ross et al, 2002:648).
In this study the working capital management and the impact on profitability will be analyzed
empirically for Portuguese firms. Different authors evidences (Garcia-Teruel, 2006) (Deloof, 2003) have
analyzed this issue in other contexts, but never for Portugal. The analysis will be made by disaggregating
the working capital into the three main components and these parts will be explored in order to
understand their individual impact on the profitability. It was suggested by many authors (Nazir and
Afza, 2003) to use a measure of efficiency of the working capital and to look for possible impacts on
profitability. Given this, the hypothesis tested is if there is a positive impact on profitability by
decreasing the current assets (Receivables and Inventories) and/or by increasing the current liabilities
(Payables).
In the following sections I will briefly describe some previous studies about the working capital
management and its impact on profitability in different countries and then I will apply similar methods
to study the same impact in Portugal. A lot of this work is based on previous research done for the
Belgium and Spanish realities, which I now apply to Portugal. In particular, Deloof (2003) studied in
detail the impact of working capital management in profitability in Belgium SMEs. The proximity in size
and characteristics between the Belgium companies and the Portuguese SMEs make this study
particularly adaptable to the reality in Portugal. Garcia-Teruel (2006) developed a similar study for Spain
and, in my opinion, the cultural proximity between the two Iberian countries makes this analysis also
quite appealing to the Portuguese reality. This analysis will start with the collection of data and will be
followed by statistical analysis of the empirical evidences to extract conclusions about the working
capital management in Portugal.
- 10 -
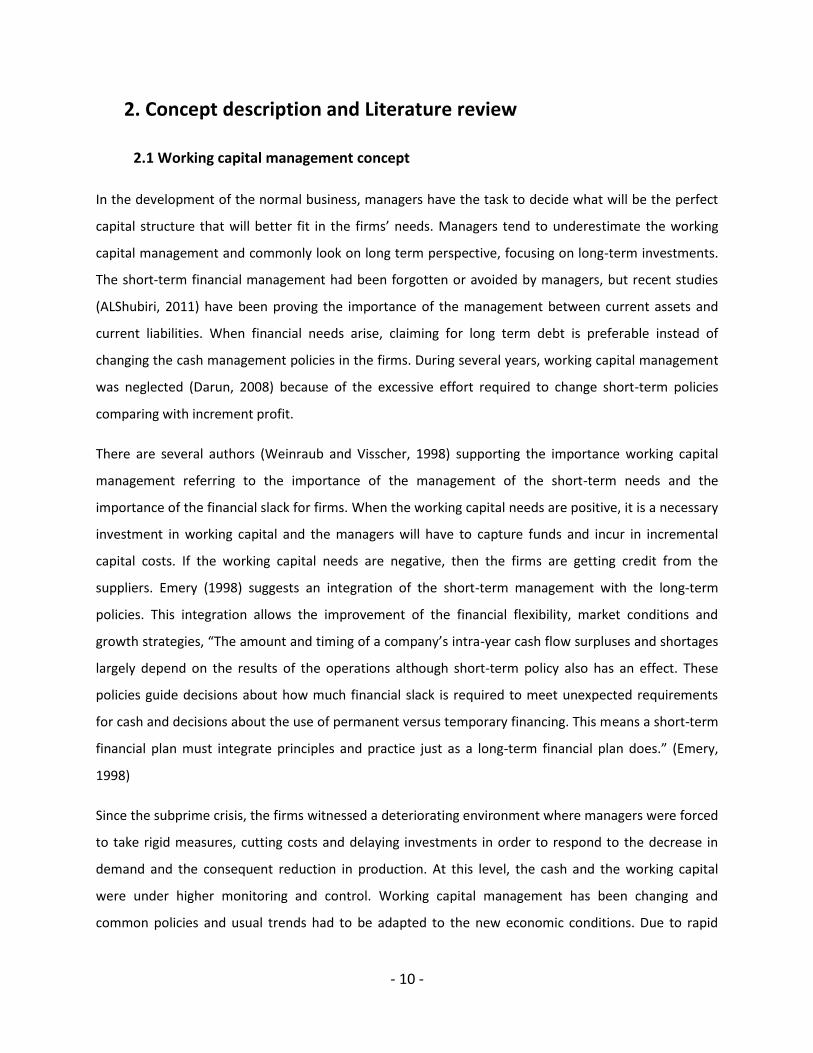
2. Concept description and Literature review
2.1 Working capital management concept
In the development of the normal business, managers have the task to decide what will be the perfect
capital structure that will better fit in the firms’ needs. Managers tend to underestimate the working
capital management and commonly look on long term perspective, focusing on long-term investments.
The short-term financial management had been forgotten or avoided by managers, but recent studies
(ALShubiri, 2011) have been proving the importance of the management between current assets and
current liabilities. When financial needs arise, claiming for long term debt is preferable instead of
changing the cash management policies in the firms. During several years, working capital management
was neglected (Darun, 2008) because of the excessive effort required to change short-term policies
comparing with increment profit.
There are several authors (Weinraub and Visscher, 1998) supporting the importance working capital
management referring to the importance of the management of the short-term needs and the
importance of the financial slack for firms. When the working capital needs are positive, it is a necessary
investment in working capital and the managers will have to capture funds and incur in incremental
capital costs. If the working capital needs are negative, then the firms are getting credit from the
suppliers. Emery (1998) suggests an integration of the short-term management with the long-term
policies. This integration allows the improvement of the financial flexibility, market conditions and
growth strategies, “The amount and timing of a company’s intra-year cash flow surpluses and shortages
largely depend on the results of the operations although short-term policy also has an effect. These
policies guide decisions about how much financial slack is required to meet unexpected requirements
for cash and decisions about the use of permanent versus temporary financing. This means a short-term
financial plan must integrate principles and practice just as a long-term financial plan does.” (Emery,
1998)
Since the subprime crisis, the firms witnessed a deteriorating environment where managers were forced
to take rigid measures, cutting costs and delaying investments in order to respond to the decrease in
demand and the consequent reduction in production. At this level, the cash and the working capital
were under higher monitoring and control. Working capital management has been changing and
common policies and usual trends had to be adapted to the new economic conditions. Due to rapid
- 11 -
changes in economy, firms are reacting and the working capital management is one of the most
important issues to lead with.
Working capital management also became an important topic because firms have been exploring
different ways to finance their activities since in the past years the cost of long term debt increased and
the new costs levels were difficult to afford. ” Working capital management is relevant in the way it
influences the firm profitability and risk” (Smith, 1980).
2.1 Components of The Working Capital
The working capital can be disaggregated into three major components and it is recurrent to measure
these components in periods of time, normally days.
The current assets can be framed into Number of Days of Accounts Receivable (DAR) and Number of
Days of Inventory (DINV) and on the side of the current liabilities the Number of Days of Accounts
Payable (DAP) can be found. These three components will be explored in the next paragraphs as well as
the measures of efficiency of the working capital currently used in the literature.
Receivables
The delay between sales and the correspondent cash-inflow, originate the accounts receivable.
Accounts receivable stands for the amount the clients have to pay to the firm on a current basis and are
related with the operating activities. A higher figure of accounts receivable, means higher short-term
loans given by the firm to the customers.
Companies which facilitate trade credit to customers have more number of days of accounts receivable
(DAR) meaning higher investment in working capital, but companies which receive the payments from
the customers close to the moment on which they deliver the product/service, have less cash invested
in working capital (ceteris paribus). Commonly, the level of investment in working capital depends on
the type of strategy of the firms which is driven by the advantages and disadvantages of the cash tied up
to the receivables.
When suppliers are allowing the customers to pay later, they usually are providing lower cost loans to
customers than they can get from other creditors. This is also consistent with the fact that suppliers can
usually conduct better credit evaluation of the customers than, say, financial institutions.
- 12 -
Payables
Accounts payable stand for an obligation to pay in a short-term period. Normally they refer to
transactions to suppliers in the operational activities which were not already paid. They correspond to
the amount due to suppliers starting from the moment the company receives the material and ending in
the exact moment the company pays for these materials. Fishman and Love (2001) found “firms in
countries with less developed financial markets use informal credit provided by their suppliers to finance
growth”.
The numbers of days of accounts payable (DAP) increase as debt to suppliers increases. Since companies
can get cheap financing by delaying payments, they can engage in deliberately delaying the payment to
suppliers as far as they can, using this financial opportunity to invest in other activities and get higher
returns
Inventory
Inventories are goods or materials waiting to be sold and to be converted in cash in the short run.
More investment in inventories means more cash tied up waiting to generate returns. Inventory
management deals with a variety of risks which can increase costs and impact on the short-term
management. The relevant costs are commonly classified as physical storage costs and management
costs. The physical storages costs depend essentially in the nature of the product and the stage of the
product. The inventory management costs can also be related to coordination and control, an dmay
include costs related to theft, depletion and shrinkage of goods, order size, length of the production
process and the availability credit from the suppliers.
Inventory increases lead to higher number of days of inventory (DINV). Normally, companies try to
mitigate as much as possible the cash tied up in inventories but sometimes, as part of the business,
companies have a lot of cash invested in inventories since the product need to mature long periods to
be finished and ready to be sold.
Given the components of the working capital, I can now understand the measures of working capital
efficiency presented in the previous empirical studies. One of the most popular measures is the cash
conversion cycle which is referred by many authors as a measure of operational liquidity, computed as
the difference between operating cycle and the DAP. The operating cycle is the sum of the DINV plus
- 13 -
DAR. Thus, one can look at the cash conversion cycle as “the time lag between the expenditure for the
purchases (…) and the collection of sales” (Deloof,2003:2). In other words, the cash conversion cycle
measures the time lag that a cash outflow takes to be converted into a higher cash inflows, “the longer
the time lag, the greater the investment in working capital, and thus, the financing needs of the firm will
be greater. Interest expense will be also higher, which leads higher default risk and lower profitability.”
(Charitou, Elfani and Lois, 2010:63)
Another popular measure of the working capital efficiency is the net trade cycle (NTC) which is the
measure of cash conversion cycle in percentage of the total sales. (Shin Soenen,1998:38)
The working capital management is in summary, a balance between the three components presented.
This concept goes through the financial and strategic approach of the firms in their supply chains
(Padachi, 2006). There are certain balances and agreements between buyers and sellers which facilitate
the business to both these sides. The relationship between buyers and sellers will close in agreements
where both parties will try to minimize the costs; a common strategy can be observed when the buyer
accepts early delivery and incurs in storage costs and the supplier accepts delayed payment and incurs
in opportunity costs (Weinraub and Visscher, 1998). On the side of the buyer, the days in inventory
increase as soon as the product is on his side and the days in accounts payable increase also on the side
of the short-term liabilities. On the other side, the seller incurs in opportunity costs by not collecting the
cash earlier but at the same time the storage costs decreased with the delivery of the product. In a
business activity where the product is specialized, the storage costs are huge and the marginal
increment of each day in inventory is sometimes unaffordable for the firms. In this situation, firms try to
split storage costs between buyers and sellers in order to sustain the activities (Fisman, and Love 2001).
2.2 Working capital as a market information source
The components of working capital are also, on their own, important indicators of quality of the
products and financial conditions in the supply chain as they can disclose the quality assurance of the
supplier. For instance when firm X buys a product from firm Y, the lag time between the delivery and the
payment of the product, allows firm X to learn about supplier’s product before paying, and at the same
time firm Y learns about buyer’s X financial condition. Deloof (2002) states in his study “delaying
payments to suppliers allows a firm to assess the quality of the products bought and can be an
inexpensive and flexible source of financing for the firm. On the other hand, late discount of invoices can
be very costly if the firm is offered a discount for early payment.”

- 14 -
2.4 Working capital: Efficiency and Profitability
The efficiency in the working capital management context is frequently measured with the cash
conversion cycle (CCC) and the Net Trade Cycle (NTC), as referred previously. Both concepts aim to
express, in time, the incidence of cash-outflows and cash-inflows in the operations of the firms in
maximizing the period during which cash is on the side of the firm. Hence, it is possible to relate
efficiency and profit with the cash related relationship between a firm, its customers and its suppliers.
Deloof (2003) argues that “firms may have an optimal level of working capital that maximizes their
value. One the one hand, large inventory and a generous trade credit policy may lead to higher sales,
larger inventory reduces the risk of a stock-out. Trade credit may stimulate sales because it allows
customers to assess product quality before paying” (Long, Malitz and Ravid, 1993; and Deloof and
Jegers, 1996). Shin and Soenen(1998) after studying listed American firms, concluded managers could
create value by achieving a realistic minimum for the net trade cycle suggesting “The shorter the NTC,
the higher the present value of the net cash flow generates by assets” (Shin and Soenen, 1998:38). A
higher present value of the net cash-flow generated by assets will allow firms to reduce its debt which
leads to a decrease in the cost of debt and as consequence it will be value created for the shareholders.
2.5 Working Capital Management Policies
The working capital management policies have direct impact on the supply chain and on the relations
between the firms the suppliers and the customers. Therefore, managers have to be aware of the
impact of such policies in the corporate profitability. Both strategies are commonly used in order to
satisfy the conditions of the business between the firm, the buyers and suppliers. In what is related with
these policies, Garcia-Teruel (2006) explains two major strategies of working capital management, “The
aggressive and conservative policies differ in the balance between weight of Current Assets and
Liabilities”. Weinraub (1998) goes in line with Garcia-Teruel (2006) defining the strategies, “Aggressive
asset management results in capital being minimized in current assets versus long-term investments.”
and on the other side “a more conservative policy places a greater proportion of capital in liquid assets”.
Weinraubc (1998) explains that the aggressive strategy “has the expectation of higher profitability but
greater liquidity risk” instead of the conservative strategy which leads to “the sacrifice of some
profitability” but lower risk. The author also recommends a methodology for the computation of the
level of aggressiveness and found that “to measure the degree of aggressiveness the current asset to
total asset ratio is used, with a lower ratio meaning a relatively more aggressive policy.” A more
- 15 -
conservative policy “uses higher cost of capital but postpones the principal repayment of debt, or avoids
it entirely by using equity, the total current liability to total asset ratio is used to measure the degree of
aggressiveness financing policy, with a high ratio being relatively more aggressive” (Weinraub and
Visscher, 1998:11)
AlShubiri (2001) also explores the implications of the two strategies. For this author the conservative
approach is related to “permanent capital being used to finance all permanent assets requirements and
also to meet some or all of the seasonal demands”, the ratio of current assets in the total assets is high
and it is reflected in lower expected profitability and lower risk. “This type of policy will also increase the
company’s net working capital situation but the firm will be short of funds to be used in other
productive sectors”.
The conservative approach requires cash to be tied up in current assets increasing the opportunity cost.
This approach implies that the company’s financing is going to be done at a relatively higher cost but at
a lower risk. This decrease in profitability is done to avoid the risk of being faced with liquidity problem,
which could result from a payment request from the suppliers. This method implies a structure of capital
where the current assets are mainly financed with long-term liabilities.
The aggressive approach asks for a different balance-sheet structure. In this method “the company
finances all of its fixed assets with long term capital but part of its permanent current assets with short-
term credit” (Van Horne, 1980). Under this policy, the firm has low or no long term capital invested in
the current assets.
Comparing the two strategies, the aggressive approach requires lower working capital investment and
expects higher profitability with a higher risk implied. “A company that uses more short-term source of
finance and less long-term source of finance will incur less cost but with a corresponding high risk. This
has the effect of increasing its profitability but with a potential risk of facing liquidity problem should
such short-term source of finance be withdrawn or renewed on unfavorable terms” (AlShubiri, 2011).
2.6. Previous information from empirical studies
Garcia-Teruel analyzed 8872 small and medium enterprises in Spain during the period 1996-2002. The
reason was the particular importance of the working capital for the non-large firms since access to
financial loans are difficult, “most of these companies’ assets are in the form of current assets” and the
main source of external finance is through current liabilities. The author found SMEs should be aware of
- 16 -
the working capital management since the impact on profitability is significant, “they can also create
value by reducing their cash conversion cycle to a minimum, as far as reasonable.” (Garcia-Teruel, 2006).
In the other hand, the results in the studies focusing on larger firms (Shin and Soenen, 1998; Deloof,
2003) went in a different direction than one on the medium and small sized firms. Garcia-Teruel (2006)
after analyzing Spanish firms, stated the relevance of working capital management on small and
medium-sized enterprises given the heaviness of the current assets to total assets, as well as, current
liabilities to total liabilities, in this specific context. Adding to this, Nazir and Afza (2009) concluded there
is a negative relationship between the degree of aggressiveness of the working capital management and
profitability (Volatile economic conditions in Pakistan) and Padachi (2006) found while studying
Mauritanian small manufacturing firms, the working capital need an organization change over time and
small firms should assure good synchronization between assets and liabilities.
In contrast, Howorth and Westhead (2003) explained that small firms are not a homogeneous group in
working capital management routines. Howorth and Westhead focused their study only on the small
firms in United Kingdom justifying the sample with the hypothesis that the working capital is more
important for small firms then for the other firms. Which was according with Peel who stated small firms
“Are generally associated with higher proportion of current assets relative to large firms, less liquidity,
volatile cash flows and reliance on short-term debt” (Peel et al.,200).
Deloof (2003) proved most of the firms dedicate huge cash amounts invested to working capital and it
has a real impact in firms profitability measures. The results refer to a shareholder value creation by
reducing the number of Days of Accounts Receivable (DAR) and number of Days of Inventory (DINV).
Deloof (2003) also states a negative relation between the number of Days of Accounts Payable (DAP)
and profitability, concluding that less profitable firms wait longer to pay to their clients. The author also
introduced measures of efficiency of the working capital, Cash Conversion Cycle. This measure was also
supported by Padachi and Garcia-Teruel in their studies. Both authors referred the cash conversion cycle
as a measure of working capital management efficiency (Deloof, 2003; Padachi,2006; Garcia-Teruel,
2007), defined by the Lag time between cash outflows and cash inflows in the short-term perspective.
Adding to these studies, Gentry, Vaidyanathan and Lee (1990) even suggest a weighted conversion cycle,
but they were unable to provide such a detailed average for lack of sufficient information.
Weinraub and Visscher (1998) explored the impact of the working capital profitability across different
industries. Their study contributed to the literature in the sense that it found that the different working
capital and the asset management policies across industries were clearly stable over periods. Filbeck and
- 17 -
Krueger (Mid-American Journal of Business, 2005) explored a different perspective providing insight to
working capital performance over time and across industries. The conclusions reveal that there are
macroeconomic factors, which impact the working capital policies and the most important are the
changes in interest rates, rates of innovation and competition.
ALShubiri (2011) investigated different policies of working capital management and their respective
effect on risk management. The author’s main findings were the negative relationship between
profitability and the level of aggressiveness of the working capital policy, “The firms yield negative
returns if they follow an aggressive working capital policy”, confirming the conclusions of Carpenter and
Johnson (1983).
This analysis gives an insight of how working capital is managed in Portugal and it adds to the literature
as research contribution for the short-term financial management, which provides empirical evidences
for managers to explore the working capital management and the respective impact on profitability.
3. Research Methodology
The purpose of this paper is to explain profitability using variables related to working capital as
explanatory variables. I will run simple regressions to test the hypothesis that efficient working capital
management leads to increased profitability, using a sample of Portuguese firms before the financial
crisis (2002-2006).
3.1 Data
The data was collected from the Bloomberg data base and it was necessary to make some adjustments
with specific criteria in order to get trustful and robust data. Initially I collected the information of all
“country domicile” Portuguese firms present in the Bloomberg data base, including “listed”, “unlisted”,
“private” and “public” country domicile Portuguese firms. I removed the financial, government and
diversified firms from the initial data base. The financial firms were removed since the observations for
components of working capital were presented with some industry specificities. The government and
diversified sectors were removed because of the undefined activities in many of these businesses. The
firms with missing values between 2002 and 2006 were also removed as well as the outliers firms
presenting values with large difference from the mean of the sector. The final selection was composed
by 3360 Portuguese firms for the period 2002-2006, with the composition presented in the Table 1.

- 18 -
Table 1
Table 1 presents the weight of each sector in the total of the firms observed for this study.
Sector Utilities 2,5%
Energy 2,1%
Consumer, non-cyclical 28,5%
Consumer, cyclical 28,1%
Communications 2,9%
Basic Materials 5,5%
Industrial 28,9%
Technology 1,5%
Total 100,0%
3.2 Variables
As suggested by Nazir and Afza (2009) the impact of the working capital in profitability is measured by
the Return on Assets, as expressed by the Earnings before Interest and Taxes over the Total Assets
(EBIT/Total Assets).
Concerning other possible measures of profitability, the gross operating income was excluded given the
scarcity of data. In relation to profitability measurements based on stock market valuation, similarly to
Deloof (2003) in Belgium, in Portugal only a limited number is listed on a stock exchange”. As such, just
like Deloof (2003) I decided to exclude these measurements in this study.
In what concerns the explanatory variables, they were chosen according with the working capital
components and the macro and microeconomic factors that could influence the Returns on Assets.
Starting with the disaggregation of the working capita I can find, the number of days accounts receivable
(DAR), number of days of inventory (DINV) and the number of days accounts payable (DAP). These three
variables explain the working capital and are fractions of the variable, Cash Conversion Cycle (CCC). The
calculation of the CCC is given by the sum of the DAR plus DINV minus DAP which results in the measure
of working capital efficiency as explained previously. What follows is a more detailed description of
these four variables and their calculations.
- 19 -
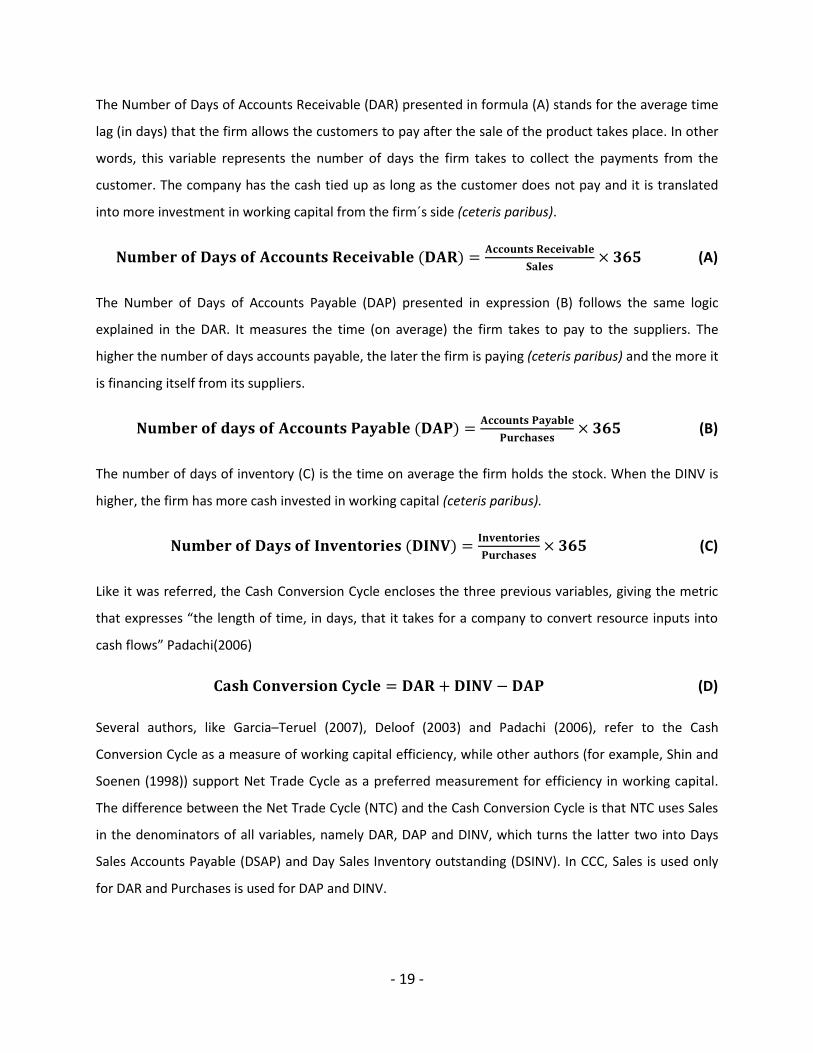
The Number of Days of Accounts Receivable (DAR) presented in formula (A) stands for the average time
lag (in days) that the firm allows the customers to pay after the sale of the product takes place. In other
words, this variable represents the number of days the firm takes to collect the payments from the
customer. The company has the cash tied up as long as the customer does not pay and it is translated
into more investment in working capital from the firm´s side (ceteris paribus).
𝐍𝐮𝐦𝐛𝐞𝐫 𝐨𝐟 𝐃𝐚𝐲𝐬 𝐨𝐟 𝐀𝐜𝐜𝐨𝐮𝐧𝐭𝐬 𝐑𝐞𝐜𝐞𝐢𝐯𝐚𝐛𝐥𝐞 (𝐃𝐀𝐑) =𝐀𝐜𝐜𝐨𝐮𝐧𝐭𝐬 𝐑𝐞𝐜𝐞𝐢𝐯𝐚𝐛𝐥𝐞
𝐒𝐚𝐥𝐞𝐬× 𝟑𝟔𝟓 (A)
The Number of Days of Accounts Payable (DAP) presented in expression (B) follows the same logic
explained in the DAR. It measures the time (on average) the firm takes to pay to the suppliers. The
higher the number of days accounts payable, the later the firm is paying (ceteris paribus) and the more it
is financing itself from its suppliers.
𝐍𝐮𝐦𝐛𝐞𝐫 𝐨𝐟 𝐝𝐚𝐲𝐬 𝐨𝐟 𝐀𝐜𝐜𝐨𝐮𝐧𝐭𝐬 𝐏𝐚𝐲𝐚𝐛𝐥𝐞 (𝐃𝐀𝐏) =𝐀𝐜𝐜𝐨𝐮𝐧𝐭𝐬 𝐏𝐚𝐲𝐚𝐛𝐥𝐞
𝐏𝐮𝐫𝐜𝐡𝐚𝐬𝐞𝐬× 𝟑𝟔𝟓 (B)
The number of days of inventory (C) is the time on average the firm holds the stock. When the DINV is
higher, the firm has more cash invested in working capital (ceteris paribus).
𝐍𝐮𝐦𝐛𝐞𝐫 𝐨𝐟 𝐃𝐚𝐲𝐬 𝐨𝐟 𝐈𝐧𝐯𝐞𝐧𝐭𝐨𝐫𝐢𝐞𝐬 (𝐃𝐈𝐍𝐕) =𝐈𝐧𝐯𝐞𝐧𝐭𝐨𝐫𝐢𝐞𝐬
𝐏𝐮𝐫𝐜𝐡𝐚𝐬𝐞𝐬× 𝟑𝟔𝟓 (C)
Like it was referred, the Cash Conversion Cycle encloses the three previous variables, giving the metric
that expresses “the length of time, in days, that it takes for a company to convert resource inputs into
cash flows” Padachi(2006)
𝐂𝐚𝐬𝐡 𝐂𝐨𝐧𝐯𝐞𝐫𝐬𝐢𝐨𝐧 𝐂𝐲𝐜𝐥𝐞 = 𝐃𝐀𝐑 + 𝐃𝐈𝐍𝐕 − 𝐃𝐀𝐏 (D)
Several authors, like Garcia–Teruel (2007), Deloof (2003) and Padachi (2006), refer to the Cash
Conversion Cycle as a measure of working capital efficiency, while other authors (for example, Shin and
Soenen (1998)) support Net Trade Cycle as a preferred measurement for efficiency in working capital.
The difference between the Net Trade Cycle (NTC) and the Cash Conversion Cycle is that NTC uses Sales
in the denominators of all variables, namely DAR, DAP and DINV, which turns the latter two into Days
Sales Accounts Payable (DSAP) and Day Sales Inventory outstanding (DSINV). In CCC, Sales is used only
for DAR and Purchases is used for DAP and DINV.
- 20 -
Since this study mains focus is not the different types of efficiency of the working capital, it was decided
only to focus on the Cash Conversion cycle (CCC) given the nature of the variables. In my opinion, DAP
and DINV are more appropriate than DSAP and DSINV since the first two variables include the purchases
as a denominator which is in the same nature that payables and inventories.
Besides the explanatory variables of the working capital, several control variables are needed to isolate
the intended effects. I used standard control variables as suggested by Nazir and Afza (2009) and
Padachi( 2006): SIZE as given by the logarithm of the Total Assets; DEBT as the debt divided by total
Assets; GDPGR is the GDP yearly growth in Portugal for the year 2002-2006; SGR is the yearly sales
growth given by Sales at t minus Sales at t-1 divided by Sales at t-1. I also control for the weight of
financial assets in total assets FA in order to avoid possible influence of this nature of assets in the total
assets. As suggested by Deloof (2003) “financial assets, which are mainly shares in other firms, are part
of total assets.”
3.3 Panel Data methodology
This study analyses the working capital management impact on profitability on firms in Portugal using
panel data methodology. The panel data allows the tracing of different variables within a time period. In
this study there are different variables being studied in a yearly metric, for different companies between
2002 and 2006.
The panel data methodology benefits from numerous qualities including the effects cross-section and
time series data, “greater capacity for capturing the complexity of human behavior than a single cross-
section or time series data [...] Controlling the impact of omitted variables. It is frequently argued that
the real reason one finds (or does not find) certain effects is due to ignoring the effects of certain
variables in one’s model specification which are correlated with the included explanatory variables.”
(Cheng Hsiao, 2006)
Panel data contain information on the individual and inter-temporal dynamics giving the possibility to
“allow to control the effects of missing or unobserved variables. Generating more accurate predictions
for individual outcomes by pooling the data rather than generating predictions of individual outcomes
using the data on the individual in question simplifying computation and statistical inference.”
- 21 -
The multiple observations also allows for “measurement errors can lead to under-identification of an
econometric model” (e.g. Aigner et al. 1984).
The analysis with panel data can be made through different regression models, the Pooled Ordinary
Least Squares Regression, the random Effects regression and the fixed effects regression models. At this
stage it is important to know what model more suitable to the study.
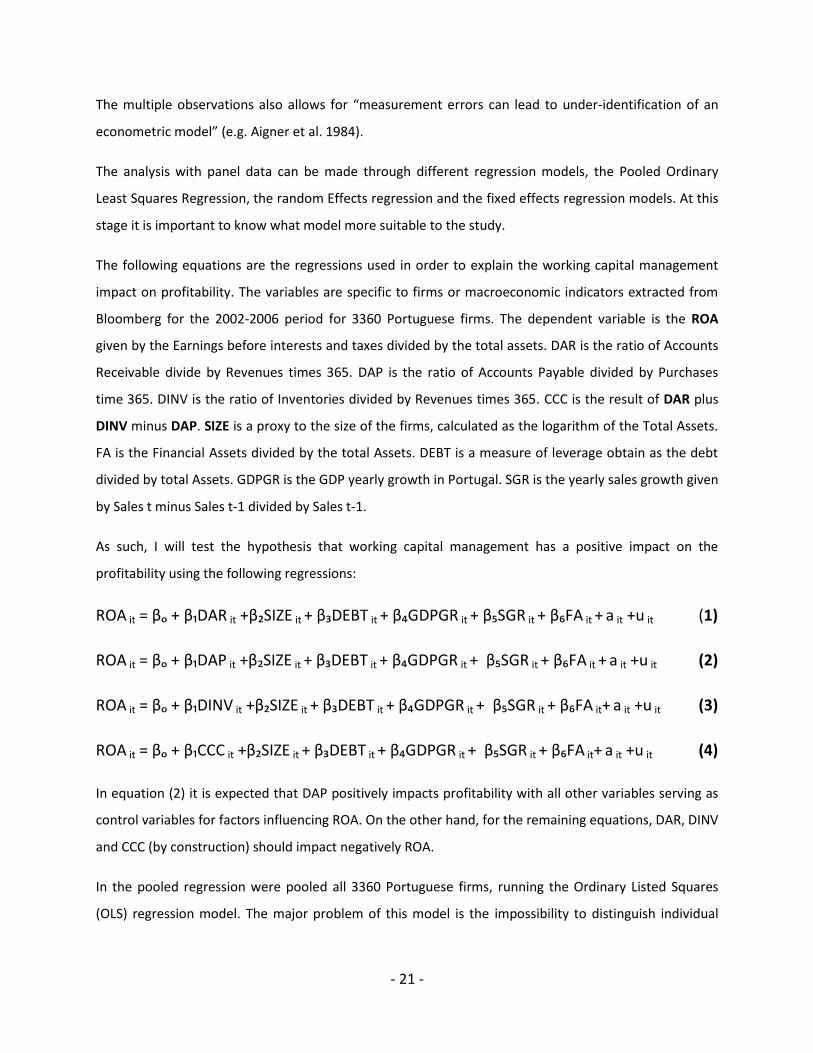
The following equations are the regressions used in order to explain the working capital management
impact on profitability. The variables are specific to firms or macroeconomic indicators extracted from
Bloomberg for the 2002-2006 period for 3360 Portuguese firms. The dependent variable is the ROA
given by the Earnings before interests and taxes divided by the total assets. DAR is the ratio of Accounts
Receivable divide by Revenues times 365. DAP is the ratio of Accounts Payable divided by Purchases
time 365. DINV is the ratio of Inventories divided by Revenues times 365. CCC is the result of DAR plus
DINV minus DAP. SIZE is a proxy to the size of the firms, calculated as the logarithm of the Total Assets.
FA is the Financial Assets divided by the total Assets. DEBT is a measure of leverage obtain as the debt
divided by total Assets. GDPGR is the GDP yearly growth in Portugal. SGR is the yearly sales growth given
by Sales t minus Sales t-1 divided by Sales t-1.
As such, I will test the hypothesis that working capital management has a positive impact on the
profitability using the following regressions:
ROA it = βₒ + β₁DAR it +β₂SIZE it + β₃DEBT it + β₄GDPGR it + β₅SGR it + β₆FA it + a it +u it (1)
ROA it = βₒ + β₁DAP it +β₂SIZE it + β₃DEBT it + β₄GDPGR it + β₅SGR it + β₆FA it + a it +u it (2)
ROA it = βₒ + β₁DINV it +β₂SIZE it + β₃DEBT it + β₄GDPGR it + β₅SGR it + β₆FA it+ a it +u it (3)
ROA it = βₒ + β₁CCC it +β₂SIZE it + β₃DEBT it + β₄GDPGR it + β₅SGR it + β₆FA it+ a it +u it (4)
In equation (2) it is expected that DAP positively impacts profitability with all other variables serving as
control variables for factors influencing ROA. On the other hand, for the remaining equations, DAR, DINV
and CCC (by construction) should impact negatively ROA.
In the pooled regression were pooled all 3360 Portuguese firms, running the Ordinary Listed Squares
(OLS) regression model. The major problem of this model is the impossibility to distinguish individual

- 22 -
effect of particular firms. This means the model denies the heterogeneity that may exist among the
firms.
A fixed and a random effect models were also used to capture this heterogeneity or individuality among
the 3360 different firms. In these cases the models do not take into consideration the possible variation
during the period 2002- 2006, except for the part captured by the GDP growth variable.
3.4 Robustness tests
In order to guarantee the correct relation between the explanatory variables and the dependent
variable it is necessary to carry out robustness tests. Endogeneity problems in this context can lead to
undesirable impacts in the final conclusions. In fact, when I am studying the impact of the working
capital management in profitability one should have in mind that profitability can lead to different
policies of working capital, but since this reverse effect is not the main focus of this study, it should be
controlled. Deloof (2003) recognizes, the possibility of his final results be biased due to endogeneity
problems. Garcia-Teruel (2006) also points out the risk of the days account receivables, days accounts
payables and the days in inventories be influenced by the dependent variable. The author refers in the
study that indeed, the negative relation between profitability and the number of days of inventory
(DINV) can, as a title of example, be explained by the falling sales lead to a stock level increase of the
firm. Less profitable firms tend also to pay later to the suppliers, which mean higher number of days in
accounts payable (DAP) when the profit is lower. In order to avoid this endogeneity problem, Garcia-
Teruel suggested to test the models with instrumental variables, using the first lag of the variables DAR,
DAP, DINV and CCC as instrument. I used a similar approach.
Further tests were performance to filter out problems in the various regression equations.
Hausman-test was done to ascertain the consistency of the estimators. Given the test’s results and I
prefer to use a fixed effect regression as a solution for the inconsistency.
Similarly the F-test also failed in the fit of the model in all 4 regressions, which also indicates the fixed
effect regression to be more appropriate. And finally I also tested for heteroscedasticity, using the
Breusch-Pagan model, and also here the regressions failed to pass the test, which suggests the usage of
random effects model for all 4 regressions.
- 23 -
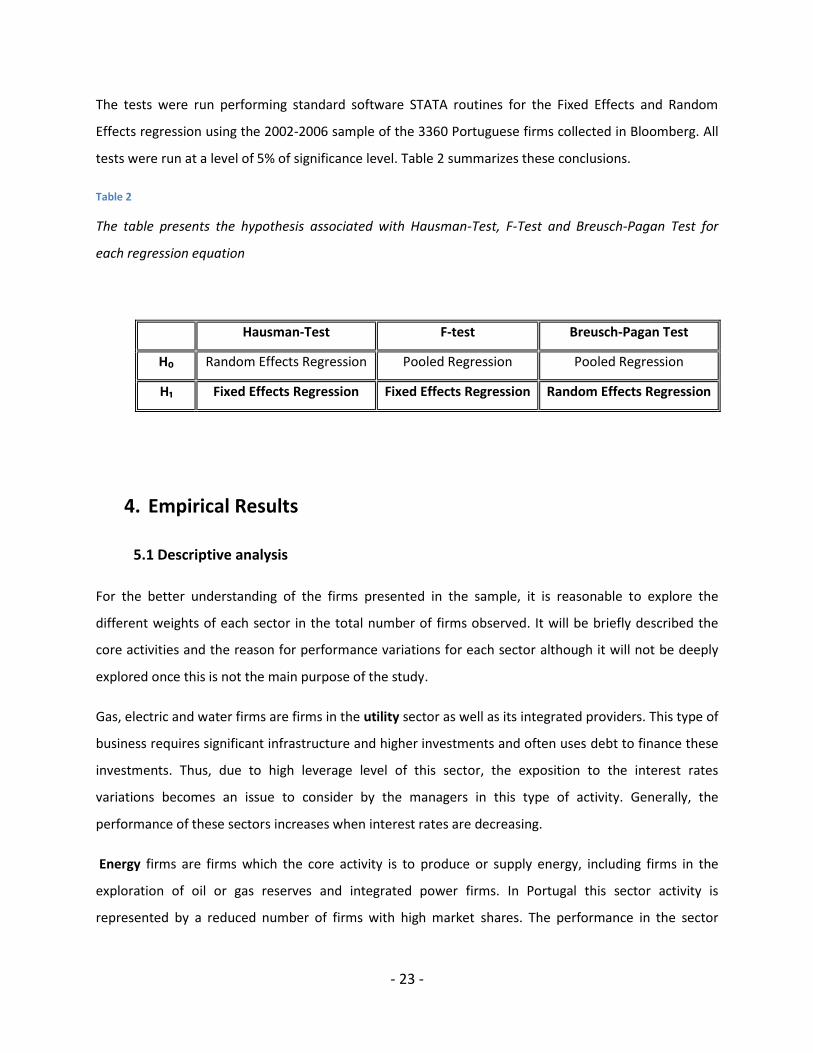
The tests were run performing standard software STATA routines for the Fixed Effects and Random
Effects regression using the 2002-2006 sample of the 3360 Portuguese firms collected in Bloomberg. All
tests were run at a level of 5% of significance level. Table 2 summarizes these conclusions.
Table 2
The table presents the hypothesis associated with Hausman-Test, F-Test and Breusch-Pagan Test for
each regression equation
4. Empirical Results
5.1 Descriptive analysis
For the better understanding of the firms presented in the sample, it is reasonable to explore the
different weights of each sector in the total number of firms observed. It will be briefly described the
core activities and the reason for performance variations for each sector although it will not be deeply
explored once this is not the main purpose of the study.
Gas, electric and water firms are firms in the utility sector as well as its integrated providers. This type of
business requires significant infrastructure and higher investments and often uses debt to finance these
investments. Thus, due to high leverage level of this sector, the exposition to the interest rates
variations becomes an issue to consider by the managers in this type of activity. Generally, the
performance of these sectors increases when interest rates are decreasing.
Energy firms are firms which the core activity is to produce or supply energy, including firms in the
exploration of oil or gas reserves and integrated power firms. In Portugal this sector activity is
represented by a reduced number of firms with high market shares. The performance in the sector
Hausman-Test F-test Breusch-Pagan Test
H₀ Random Effects Regression Pooled Regression Pooled Regression
H₁ Fixed Effects Regression Fixed Effects Regression Random Effects Regression
- 24 -
depends on the supply and demand for worldwide energy and not only of the in Portugal own demand
and supply. In fact, this sector is very sensitive to political events and oil prices.
The consumer cyclical sector is highly correlated with business cycle and economic conditions and
these factors should be taken in consideration for the present study. Thus, the performance of this
sector depends on these external factors and in periods of recession, the demand for these goods and
services decreases, and it increases in periods of economy expansion. Consumer cyclical businesses are
normally related with luxurious products with an elastic demand.
On the other hand there is the non-cyclical consumer (goods and services) sector where the business is
not highly dependent on external factors. The demand in this sector is almost constant, the firms have
business related with farming operations, manufacturers and food productions.
The activity of the basic materials is related with the development of the raw materials and chemical
products. The cost of the materials, which depends on the economic phases, will impact directly in the
performance of the sector. The basic materials sector is sensitive to changes in the business cycle.
Because the sector supplies materials for construction, it depends on a strong economy.
The industrial sector is presented with major weight in the sample, 28,9% of the firms activities are in
the industrial sector. This activity is related to the production of goods used in construction and
manufacturing. The sector also incorporates firms in cement and metal fabrication, construction and
industrial machinery. The demand and supply is directly related with the level of construction and the
respective investment in the sector, in economic retractions the level of the investment reduces and this
sector is widely affected.
The number of firms with higher weight in the sample taken for the empirical analysis, are the consumer
cyclical, the consumer non-cyclical and the industrial business, which reflects the major distribution of
the Portuguese industry.
- 25 -
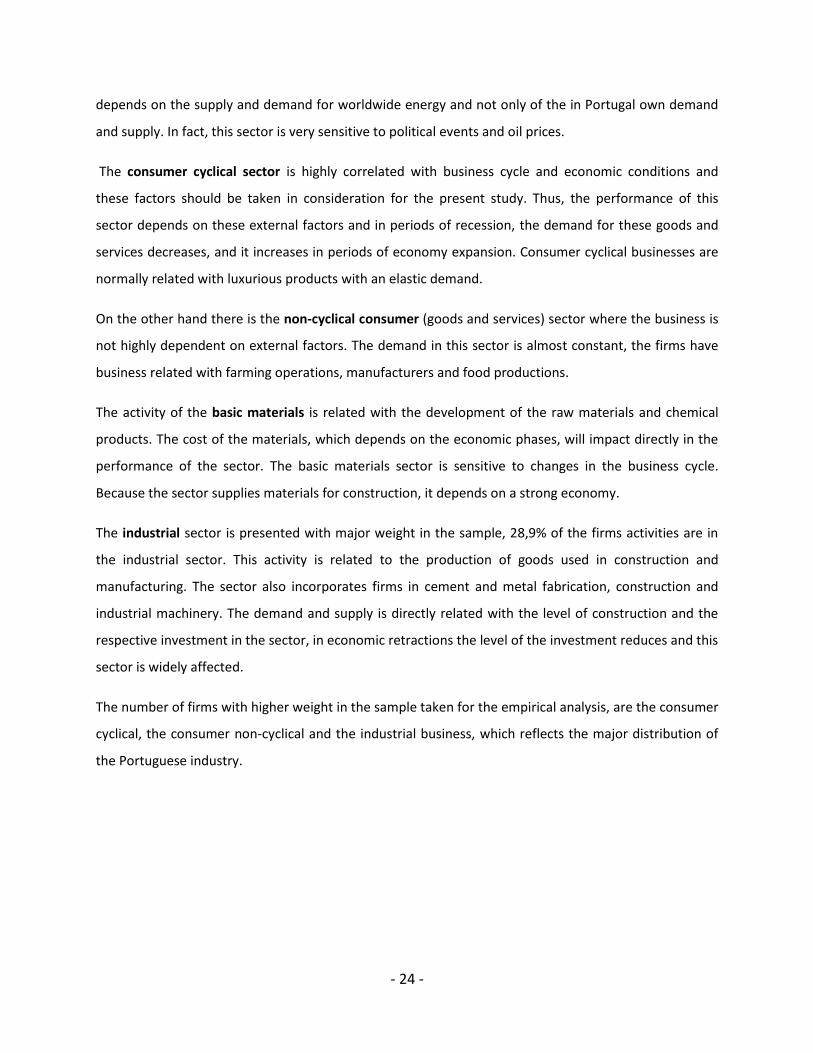
Table 3
This table presents the Mean, Standard deviation (Stdev) and the number of observations for each
variable considered in the models. The variables are specific to firms or macroeconomic indicators
extracted from Bloomberg for the 2002-2006 period in 3264 Portuguese firms sample. The dependent
variable is the ROA given by the Earnings before interests and taxes divided by the total assets. DAR is
the ratio of Accounts Receivable divide by Revenues times 365.DAP is the ratio of Accounts Payable
divided by Purchases time 365. DINV is the ratio of Inventories -divided by Revenues times 365.CCC is the
result of DAR plus DINV minus DAP. SIZE is a proxy to the size of the firms, calculated as the logarithm of
the Total Assets. FA is the Financial Assets divided by the total Assets. DEBT is a measure of leverage
obtain as the debt divided by total Assets. GDPGR is the GDP yearly growth in Portugal. SGR is the yearly
sales growth given by Sales t minus Sales t-1 divided by Sales t-1
In this section the description of these figures is useful to get in contact with the reality of the variables
studied in the models. The analysis will be made on the average of the sample’s period (2002-2006) and
dispersion of the variables used is presented for the whole sample.
At a first glance, one can look at the number observations between variables and easily find a range
within the 14150 and 14700 observations for all variables, meaning that some data was not available for
some years or that some firms just closed their activity during some periods in the sample. The
observations aggregate listed, unlisted, private or public Portuguese firms (country domicile) for the
average between of the 2002-2006 sample period as referred before (using Bloomberg’s nomenclature).
On average the gross domestic product grew 0,68% each year, which reveals a positive economic curve
trend in Portugal between 2002 and 2006.
The sales grew on average 5,10% per year, which goes in line with the positive trends that have been
followed by the gross domestic product of the country. Considering the Financial Assets (FA), the
ROA CCC DAR DAP DINV SIZE DEBT FA GDPGR SGR
Mean 2,65 30,22 94,12 183,18 122,45 2,57 15,56 0,08 0,68 5,10
Stdev 9,24 426,55 97,92 413,53 291,62 1,18 16,52 0,15 0,90 361,15
Observations 14351 14170 14442 14399 14466 14671 14671 14654 14671 14702
- 26 -
percentage of these assets in the total assets of the firms is on average 8% which reveals that financial
assets do not have an important impact on the firms’ total assets.
In what concerns the leverage ratio computed as the total debt over the total assets, on average 15,6%
of the firms’ assets are financed through debt.
Concerning the measurement of the cash conversion cycle (CCC), it expresses that the lag time between
the cash inflow and the cash outflow of the firms’ operations is on average approximately one month
(30,22 days). In this sample the CCC is positive, meaning that companies have to invest in the working
capital that will be financed with credit provided by financial institutions which as a consequence leads
to the exposure of the real economy to the capital markets.
The cash conversion cycle is disaggregated in its three components and, in this sample, the firms wait on
average 94,12 days (DAR) to receive cash related with the operations, have inventories for 122,45 days
(DINV) and pay to their suppliers in 183,18 days (DAP). In theory, for a whole closed economy the DAP
and DAR should offset each other, since the paying terms of some firms will be the receiving terms of
the others. In that case, the CCC should equal to the DINV.
However, in our sample, the DAP is on average higher than DAR by circa 3 months. Our sample does not
include the paying and receiving terms of a substantial portion of the economy, namely the final
consumers, who normally pay immediately. This would decrease the overall average of DAR.
On the other side, the DAP levels are considerable higher in relation to the other components meaning
that Portuguese firms are delaying their payments to their suppliers. There are a few possible
explanations for this result in our sample: First, I am using a relatively open economy in this sample. A
substantial number of missing paying terms refer to foreign suppliers and missing receiving terms refer
to importers. It could be the case that the reason for the difference we observe from the theoretical
results stems from these paying terms. However, Portugal’s main trading partners originate from
countries in the EU. It is likely that the importers paying terms are better than the domestic paying
terms, which will help in our results, but it is highly questionable that Europeans suppliers allow the
typical long paying terms we observe in this sample. As such, the open economy explanation must be
dismissed. The other reason that can justify such DAP levels can be the fact that in the domestic markets
the firms are not paying in the required periods to the firms outside the sample. The firms I am not
including in the sample are usually smaller and firms. This means that the paying terms to these firms
are horribly long and this practice can strongly affect the production efficiency of these firms in Portugal.
Additionally, I also have to keep in mind that I am not including the worst payer of the country: the
- 27 -
Portuguese State. These two issues together should emphasize how much of a problem this topic of
delaying payments is for the Portuguese economy.
These results show that Portuguese firms use the trade credit to finance their activities but in the other
hand do not allow delayed payments in the same proportion. Part of the credit that come from delay in
payments is used to pay costs with stocks that in the sample are relatively higher when comparing with
the other components of the working capital.
Multivariate analysis
5.2.1 Correlation matrix analysis
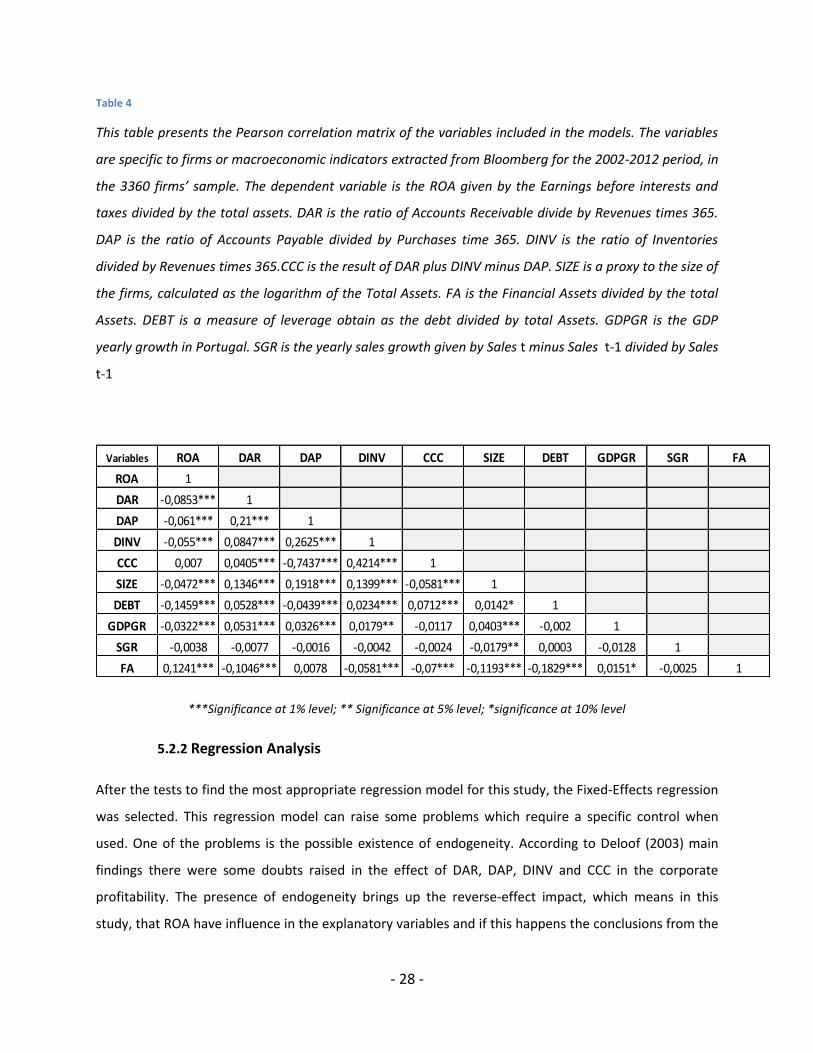
The Pearson correlation matrix shows the correlation between the variables present in the model. When
analyzing the correlation table one can realize there is a negative and significant correlation between
Profitability (ROA) and the number of days of accounts receivable (DAR). This result is consistent with
the Deloof (2003) main findings that collecting payments from customers earlier will impact positively in
profitability.
Along with Paddachi (2006) there is a significant negative correlation between days in accounts payable
(DAP) and corporate profitability. Such relation reveals that later payments to the suppliers have a
negative impact on profitability.
There is also a significant negative correlation between the number of days of inventory (DINV) and
corporate profitability (ROA), which goes in parallel with Gacia-Teruel (2007), increasing the number of
days of inventory will decrease corporate profitability meaning that keeping products in stock less time
will improve the return on assets (ROA).
All cash conversion cycle components are individually significant correlated with ROA. Padachi (2006)
and Deloof (2003) figured out negative significance correlation between Cash Conversion Cycle and the
ROA. Despite of the previous results goes in accordance with the authors results, in this study the Cash
Conversion Cycle does not have significant correlation with the corporate profitability contrasting with
the previous research.
- 28 -
Table 4
This table presents the Pearson correlation matrix of the variables included in the models. The variables
are specific to firms or macroeconomic indicators extracted from Bloomberg for the 2002-2012 period, in
the 3360 firms’ sample. The dependent variable is the ROA given by the Earnings before interests and
taxes divided by the total assets. DAR is the ratio of Accounts Receivable divide by Revenues times 365.
DAP is the ratio of Accounts Payable divided by Purchases time 365. DINV is the ratio of Inventories
divided by Revenues times 365.CCC is the result of DAR plus DINV minus DAP. SIZE is a proxy to the size of
the firms, calculated as the logarithm of the Total Assets. FA is the Financial Assets divided by the total
Assets. DEBT is a measure of leverage obtain as the debt divided by total Assets. GDPGR is the GDP
yearly growth in Portugal. SGR is the yearly sales growth given by Sales t minus Sales t-1 divided by Sales
t-1
***Significance at 1% level; ** Significance at 5% level; *significance at 10% level
5.2.2 Regression Analysis
After the tests to find the most appropriate regression model for this study, the Fixed-Effects regression
was selected. This regression model can raise some problems which require a specific control when
used. One of the problems is the possible existence of endogeneity. According to Deloof (2003) main
findings there were some doubts raised in the effect of DAR, DAP, DINV and CCC in the corporate
profitability. The presence of endogeneity brings up the reverse-effect impact, which means in this
study, that ROA have influence in the explanatory variables and if this happens the conclusions from the
Variables ROA DAR DAP DINV CCC SIZE DEBT GDPGR SGR FA
ROA 1
DAR -0,0853*** 1
DAP -0,061*** 0,21*** 1
DINV -0,055*** 0,0847*** 0,2625*** 1
CCC 0,007 0,0405*** -0,7437*** 0,4214*** 1
SIZE -0,0472*** 0,1346*** 0,1918*** 0,1399*** -0,0581*** 1
DEBT -0,1459*** 0,0528*** -0,0439*** 0,0234*** 0,0712*** 0,0142* 1
GDPGR -0,0322*** 0,0531*** 0,0326*** 0,0179** -0,0117 0,0403*** -0,002 1
SGR -0,0038 -0,0077 -0,0016 -0,0042 -0,0024 -0,0179** 0,0003 -0,0128 1
FA 0,1241*** -0,1046*** 0,0078 -0,0581*** -0,07*** -0,1193*** -0,1829*** 0,0151* -0,0025 1

- 29 -
Fixed –Effects regression model cannot be taken as valid argument. In this specific case it is possible that
the firms’ profitability impacts the working capital management and leads managers to choose different
policies. A firm with lower profitability will probably have more days in accounts payable given the lower
capacity to pay to their suppliers. To avoid this situation I controlled the Fixed Effects Regression (FER)
model with instrumental variables, as a method solve the possible reverse relation between variables in
the models. The instrumental variables used were the first lag of DAR, DAP, DINV and CCC according
with the methodology chosen by Garcia-Teruel (2007). Table 5 presents the Fixed-Effects regression
models running in STATA for the 2002-2006 sample period, while Table 6 further corrects for possible
endogeneity problems in the models.
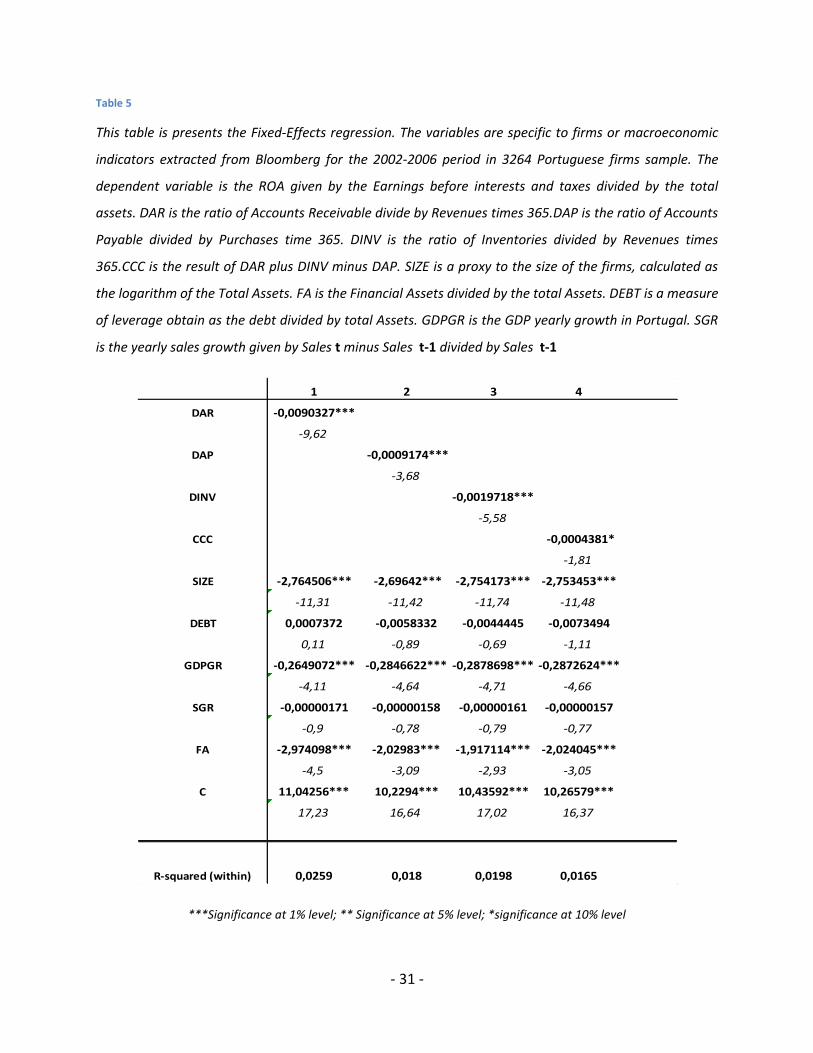
In Table 5 the models 1,2,3 and 4 are all significant at 5% significance level. The table presents these
models regressed in the Fixed Effects Model (FER). The Return on Assets of the Portuguese firms
decreases as the lag time of number of Days Accounts Receivable (DAR), Number of Days of Accounts
Payable (DAP) and the number of Days of Inventory (DINV) increases. The results found by Deloof (2003)
and Garcia-Teruel (2007) explain the same impacts of the working capital components in the corporate
profitability, which reinforces the importance of the working capital management for firms.
On one side the increase the time limit for clients to make their payments leads to credit easiness and,
as consequence, to the improvement of the sales volume. On the other side the effect of a more restrict
policy to narrow the deadline for payments will lead to an improvement of the return of assets. In the
end, the effect of the restrictive policies will prevail over the credit facility to clients in what concerns
the positive impact on profitability.
Increasing one day lag time in the payments to suppliers will impact negatively the profitability on
0,0009174. Deloof (2003) suggest that the explanation for these results is related with the fact that
usually less profitable firms pay latter to their suppliers. The negative impact on profitability could be
explained by the high cost to the suppliers when giving credit that will lead to prejudice the relationship
and decrease transactions between the both parts. The cost to the firm of not using the discounts of
prompt payment given by suppliers can also be implicit in the negative impact on profitability but the
dependent variable does not include financial costs, which allow excluding this last hypothesis.
The firm’s profitability decreases also with the increase in the number of days of the inventories. As
expected, this means that keeping inventories less time reduces costs and has a positive impact on
corporate profitability.
- 30 -
The integration of the number of days accounts receivable, days accounts payable and days of inventory
is explained with the cash conversion cycle which is significant with a level of 10% of significance
regression 4. Deloof (2003) also found a positive relation between the cash conversion cycle and the
impact in profit, but the results in this study points out that lengthening the cash conversion cycle, will
impact negatively the corporate profitability. When the cash conversion cycle (CCC) increases the
number of days of accounts receivable and inventories in relation to the number of days of accounts
payable, higher CCC means that firms wait longer to get their cash from operations converted.
Concerning the control variables SIZE, GDPGR and FA are significant. The remaining control variables,
DEBT and SGR are not significant individually for the explanation of the dependent variable. Although, all
the variables grouped are significant to explain the corporate profitability.
The variable SIZE was calculated by the logarithm of sales as suggested by Garcia-Teruel (2007) and has
a negative relation with profitability going against the theory that “larger firms seems to favor the
generation of profitability” Garcia-Teurel (2007). In this sample, smaller firm’s reports higher corporate
profitability. The sales growth has a positive impact on profitability, meaning that firms growing in their
operational activities have a positive effect in the ROA.
- 31 -
Table 5
This table is presents the Fixed-Effects regression. The variables are specific to firms or macroeconomic
indicators extracted from Bloomberg for the 2002-2006 period in 3264 Portuguese firms sample. The
dependent variable is the ROA given by the Earnings before interests and taxes divided by the total
assets. DAR is the ratio of Accounts Receivable divide by Revenues times 365.DAP is the ratio of Accounts
Payable divided by Purchases time 365. DINV is the ratio of Inventories divided by Revenues times
365.CCC is the result of DAR plus DINV minus DAP. SIZE is a proxy to the size of the firms, calculated as
the logarithm of the Total Assets. FA is the Financial Assets divided by the total Assets. DEBT is a measure
of leverage obtain as the debt divided by total Assets. GDPGR is the GDP yearly growth in Portugal. SGR
is the yearly sales growth given by Sales t minus Sales t-1 divided by Sales t-1
***Significance at 1% level; ** Significance at 5% level; *significance at 10% level
1 2 3 4
DAR -0,0090327***
-9,62
DAP -0,0009174***
-3,68
DINV -0,0019718***
-5,58
CCC -0,0004381*
-1,81
SIZE -2,764506*** -2,69642*** -2,754173*** -2,753453***
-11,31 -11,42 -11,74 -11,48
DEBT 0,0007372 -0,0058332 -0,0044445 -0,0073494
0,11 -0,89 -0,69 -1,11
GDPGR -0,2649072*** -0,2846622*** -0,2878698*** -0,2872624***
-4,11 -4,64 -4,71 -4,66
SGR -0,00000171 -0,00000158 -0,00000161 -0,00000157
-0,9 -0,78 -0,79 -0,77
FA -2,974098*** -2,02983*** -1,917114*** -2,024045***
-4,5 -3,09 -2,93 -3,05
C 11,04256*** 10,2294*** 10,43592*** 10,26579***
17,23 16,64 17,02 16,37
R-squared (within) 0,0259 0,018 0,0198 0,0165
- 32 -
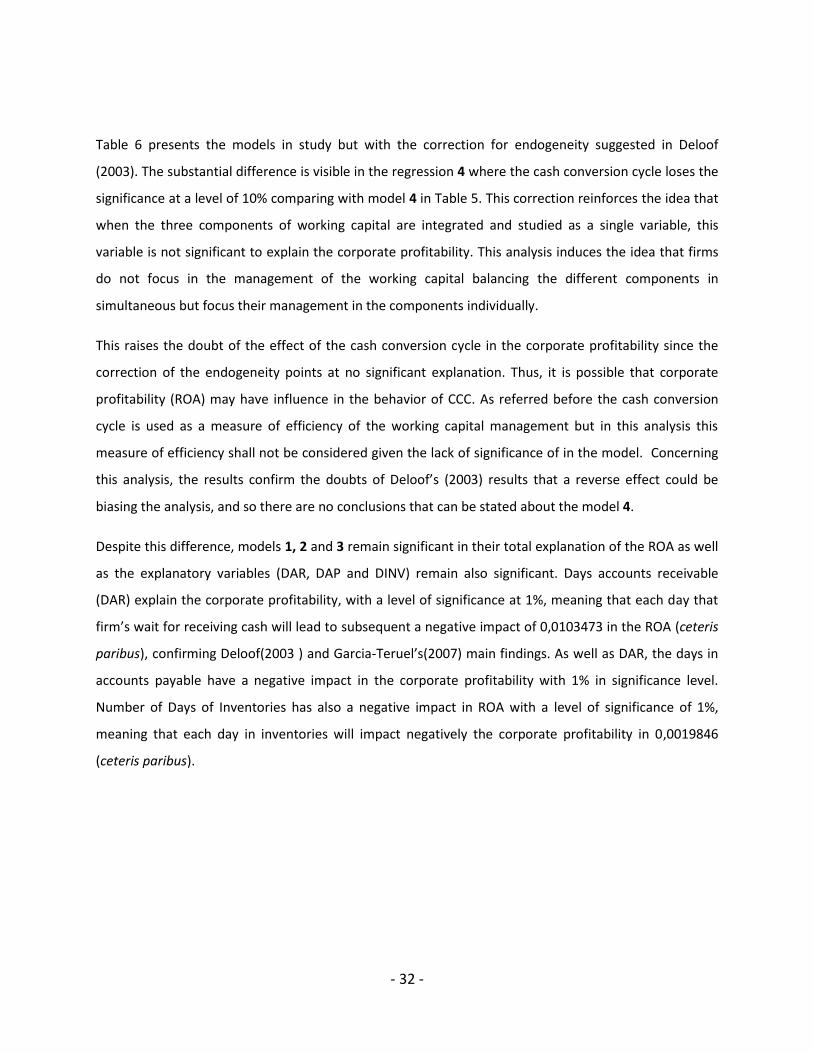
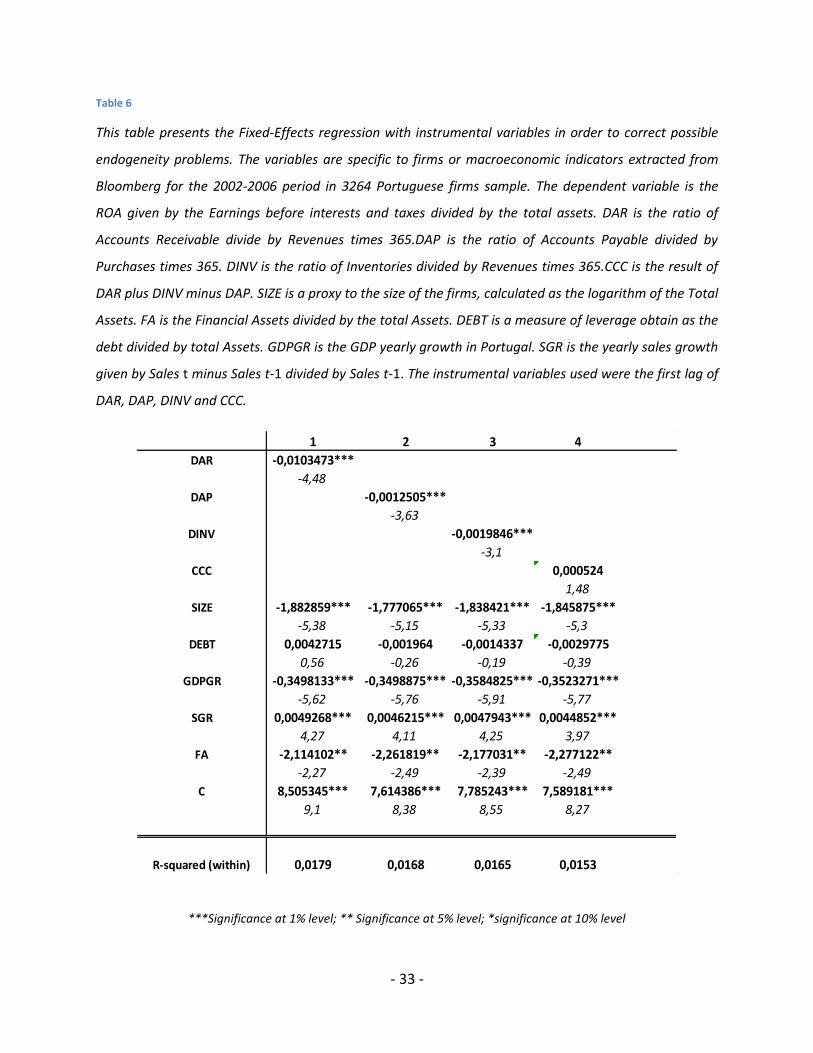
Table 6 presents the models in study but with the correction for endogeneity suggested in Deloof
(2003). The substantial difference is visible in the regression 4 where the cash conversion cycle loses the
significance at a level of 10% comparing with model 4 in Table 5. This correction reinforces the idea that
when the three components of working capital are integrated and studied as a single variable, this
variable is not significant to explain the corporate profitability. This analysis induces the idea that firms
do not focus in the management of the working capital balancing the different components in
simultaneous but focus their management in the components individually.
This raises the doubt of the effect of the cash conversion cycle in the corporate profitability since the
correction of the endogeneity points at no significant explanation. Thus, it is possible that corporate
profitability (ROA) may have influence in the behavior of CCC. As referred before the cash conversion
cycle is used as a measure of efficiency of the working capital management but in this analysis this
measure of efficiency shall not be considered given the lack of significance of in the model. Concerning
this analysis, the results confirm the doubts of Deloof’s (2003) results that a reverse effect could be
biasing the analysis, and so there are no conclusions that can be stated about the model 4.
Despite this difference, models 1, 2 and 3 remain significant in their total explanation of the ROA as well
as the explanatory variables (DAR, DAP and DINV) remain also significant. Days accounts receivable
(DAR) explain the corporate profitability, with a level of significance at 1%, meaning that each day that
firm’s wait for receiving cash will lead to subsequent a negative impact of 0,0103473 in the ROA (ceteris
paribus), confirming Deloof(2003 ) and Garcia-Teruel’s(2007) main findings. As well as DAR, the days in
accounts payable have a negative impact in the corporate profitability with 1% in significance level.
Number of Days of Inventories has also a negative impact in ROA with a level of significance of 1%,
meaning that each day in inventories will impact negatively the corporate profitability in 0,0019846
(ceteris paribus).
- 33 -
Table 6
This table presents the Fixed-Effects regression with instrumental variables in order to correct possible
endogeneity problems. The variables are specific to firms or macroeconomic indicators extracted from
Bloomberg for the 2002-2006 period in 3264 Portuguese firms sample. The dependent variable is the
ROA given by the Earnings before interests and taxes divided by the total assets. DAR is the ratio of
Accounts Receivable divide by Revenues times 365.DAP is the ratio of Accounts Payable divided by
Purchases times 365. DINV is the ratio of Inventories divided by Revenues times 365.CCC is the result of
DAR plus DINV minus DAP. SIZE is a proxy to the size of the firms, calculated as the logarithm of the Total
Assets. FA is the Financial Assets divided by the total Assets. DEBT is a measure of leverage obtain as the
debt divided by total Assets. GDPGR is the GDP yearly growth in Portugal. SGR is the yearly sales growth
given by Sales t minus Sales t-1 divided by Sales t-1. The instrumental variables used were the first lag of
DAR, DAP, DINV and CCC.
***Significance at 1% level; ** Significance at 5% level; *significance at 10% level
1 2 3 4
DAR -0,0103473***
-4,48
DAP -0,0012505***
-3,63
DINV -0,0019846***
-3,1
CCC 0,000524
1,48
SIZE -1,882859*** -1,777065*** -1,838421*** -1,845875***
-5,38 -5,15 -5,33 -5,3
DEBT 0,0042715 -0,001964 -0,0014337 -0,0029775
0,56 -0,26 -0,19 -0,39
GDPGR -0,3498133*** -0,3498875*** -0,3584825*** -0,3523271***
-5,62 -5,76 -5,91 -5,77
SGR 0,0049268*** 0,0046215*** 0,0047943*** 0,0044852***
4,27 4,11 4,25 3,97
FA -2,114102** -2,261819** -2,177031** -2,277122**
-2,27 -2,49 -2,39 -2,49
C 8,505345*** 7,614386*** 7,785243*** 7,589181***
9,1 8,38 8,55 8,27
R-squared (within) 0,0179 0,0168 0,0165 0,0153
- 34 -
5. Conclusion
This empirical study reports the impact of the different components of the working capital management
in corporate profitability for Portuguese firms in the period 2002-206. The results consistently confirm
the hypothesis that managers should care about different components of working capital in order to
manage it efficiently once this different components do have impact on corporate profitability.
The present study is a useful tool for additional research about working capital management and the
impact on profitability and it gives also insight information to financial managers about how the
components of working capital are impacting in corporate profitability in order to help in an efficient
management of the short-term assets and liabilities.
As suggested by Deloof (2003) and Padachi(2006), the efficiency measure considered is the Cash
Conversion cycle instead of the Net Trade Cycle.
The results obtained indicate that the number of days of accounts receivable (DAR) significantly explains
corporate profitability, with a level of significance at 1%, meaning that each day that firms’ give credit to
their customers will impact negatively the ROA (ceteris paribus), which goes in accordance to Deloof
(2003 ) and Garcia-Teruel’s (2007) main findings.
The number of days of inventories also has a negative impact in ROA showing that each additional day in
inventories will impact negatively the corporate profitability (ceteris paribus condition).
Additionally the number of days of accounts payable also significantly impacts the profitability positively
at 1% significance level.
The cash conversion cycle which aggregate all the three components of the working capital
management show conclusions that differ from some previous research. This variable is not significant
in the model, meaning that the balance of working capital components in simultaneous is not significant
to explain the corporate profitability. The lack of support for this results hinges on endogeneity issues,
which is consistent with Deloof (2003) analysis. In theory, one day more in the cash conversion cycle
means that firms wait longer to get their cash from operations converted and have one more day of
cash tied up in the working capital. As referred before the cash conversion cycle is used as a measure of
- 35 -
efficiency of the working capital management but in this analysis this measure of efficiency shall not be
considered given the lack of significance of in the model
6. Final comments
This study is a research contribution for the short-term financial management which provides empirical
evidences for managers to explore the working capital management and the respective impact on
profitability. This analysis is focused in a single country giving an insight of how working capital is
managed in Portugal and the relation of each variable with the return on profitability.
There were some limitations during this analysis specific to the sample and the data used in order to get
robust and consistent models. The data available in Bloomberg was very restrictive and there was also a
lot of missing information specifically in the most recent years which forced me to reduce my sample
period in order to avoid substantial sample selection problems induced by survival bias with the recent
financial and economic crisis in Portugal. The sample and the period therefore represent a limitation for
the analysis since only firms with available data were considered and so there is still some survival bias
in the sample, as a small percentage of firms were excluded because they closed their activity during the
period analyzed.
The creation of value for the shareholders depend on the several factor in which the working capital
management can be included. There have been several studies supporting the idea that the continued
attention to the accounts receivable, accounts payable and inventories can be a source of value added
for firms and as consequence a value creation for shareholders.
The limitations in this analysis can be explored and further improvements will add new literature for the
short-term financial management area. The results points out that the cash conversion cycle (CCC) is not
significant to explain corporate profitability for endogeneity issues and I suggest in future studies the
incorporation of different measures of working capital management efficiency like the net trade cycle
and its respective components.
The extension and comparison between working capital management in different countries would be
also an interest topic to explore, admitting the hypothesis that the management culture of each country
has impact on the profitability of the firms.
- 36 -
7. Bibliography
Aigner, D., C. Hsiao, A. Kapteyn and T. Wansbeek, 1984, Latent variable models in econometrics,
in: Z. Griliches and M. Intriligator, eds., Handbook of econometrics, Vol. 2 (North-Holland,
Amsterdam) 1321-1393.
ALShubiri, F. N. (2011), The Effect of Working Capital Management Practices on Risk
Management: Evidence From Jordan, Global Journal of Business Research 5(1), 39-54
Baltagi, B. H. (2005), Econometric Analysis of Panel Data. Chichester, United Kingdom, 3rd Edition:
John Wiley & Sons
Biørn 1992 ; Griliches and Hausman 1986;Wansbeek and Koning”
Brealey, R. A., and S.C. Myers (2003), Principles of Corporate Finance. New York, United States of
America, 7th Edition: McGraw-Hill International Book Company
Charitou ,MelitaStephaniu . , Elfani ., Marita . , Lois ,Petros . ( 2010 ) . The effect of WorkingCapital
Management on firms Profitability: Empirical evidence from an Emerging Market .
Darun, M.R. (2008), The Determinants of Working Capital Management Practices: a Malaysian
Perspective, Research Proposal, Commerce Degree with major in Accounting at Lincoln University
Deloof, M. (2003), Does Working Capital Management Affect Profitability of Belgian Firms?,
Journal of Business, Finance and Accounting 30, 573-587
Duffy, R. and F. Benlamlih (1997), Telecoms: A Technology Guide – BPA Group Ltd. London,
United Kingdom: FT Media & Telecoms – Pearson Professional Ltd
Emery, G.W. (1984), ‘A Pure Financial Explanation for Trade Credit’, Journal
of Financial and Quantitative Analysis, Vol. 9, No. 3, pp. 271–85
- 37 -
Filbeck, G. and T.M. Krueger (2005), An Analysis of Working Capital Management Results Across
Industries, Mid-American Journal of Business 20(2), 11-18
Fisman, R. and I. Love (2001), ‘Trade Credit, Financial Intermediary
Development and Industry Growth’, Unpublished Manuscript (Columbia
University).
Garcia-Teruel, P.J. and P. Martinez-Solano (2007), Effects of Working Capital Management on SME
Profitability, International Journal of Managerial Finance 3(2), 164-177 Working Capital Management
and Profitability: The Telecom Case 51
Gitman, L. J. (2002), Principles of Managerial Finance. New York, United States of America, 10th
Edition: Addison-Wesley
Howort, C. and P. Westhead (2003), The Focus of Working Capital Management in UK Small Firms,
Management Accounting Research 14, 94-111
La Porta, R., F. Lopez-de-Silanes, A. Shleifer and R. Vishny (1997),
‘Legal Determinants of External Finance’, Journal of Finance, Vol. 52,
pp. 1131–50.
Nazir, M.S. and T. Afza (2009), Impact of Aggressive Working Capital Management Policy on
Firm‟s Profitability, The IUP Journal of Applied Finance 15(8), 19-30
Padachi, K. (2006), Trends in Working Capital Management and its Impact on Firms‟ Performance:
An Analysis of Mauritian Small Manufacturing Firms, International Review of Business Research
Papers 2(2), 45-58 Working Capital Management and Profitability: The Telecom Case 52
Ross, S. A., R. Westerfield and B.D. Jordan (2002), Fundamentals of Corporate Finance. New York,
United States of America, 6th Edition: McGraw-Hill International Book Company
Shin, H.H. and L. Soenen (1998), Efficiency of Working Capital Management and Corporate
Profitability, Financial Practice and Education, 37-45
- 38 -
Skouby, K., A. Henten, M. Falch, R. Tadayoni and W. H. Melody, ICT Regulation Toolkit, Module
7: The Natural Monopoly Thesis, http://www.ictregulationtoolkit.org/en/Section.2478.html
Weinraub, H. J. and S. Visscher (1998), Industry Practice Relating to Aggressive Conservative
Working Capital Policies, Journal of Financial and Strategic Decisions 11(2), 11-18
Wooldridge, J. M. (2009), Introductory Econometrics – A Modern Approach. Mason, United States
of America, 4th Edition: South-Western Cengage Learning