relationship between working capital management and profitability
TRANSCRIPT

DECLARATION
This Research project is my original work and has not been presented for award of an
MBA degree in any other University or for any other award.
Signed_________________________ Date: _________________NICHOLAS KIMANZI MUMOD53/OL/14685/2009
This research project has been submitted for examination with my approval as the
university supervisor.
Signed: _________________________ Date: _________________Mr. Ngaba (Supervisor)
Department of Accounting & Finance, School of Business
For and on behalf of Kenyatta University,
Mr. Fredrick W. Ndende
Signature ___________________________ Date_______________
Chairman, Department of Accounting & Finance
Kenyatta University.
i

DEDICATION
I dedicate this research project report to my lovely family, parents, my brothers and
sisters and my friends who in one way or another assisted me.
Above all glory to God for the opportunity to be alive and healthy to partake this work.
ii

ACKNOWLEDGMENTS
The following people were key contributors to this project. First and foremost is my fam-
ily, my wife Nitah Rael Kimanzi, Son Shawn Ray Kimanzi, Daughter Iddah Mueni Ki-
manzi, Parents Mr & Mrs Mumo Kituku, Brothers Alex Kituku & Fred Sammy, and Sis-
ters Patricia Syovata & Silvia Nduku. Not forgetting my work mates and fellow class
mates. Supervisor Mr. Ngaba was fundamental in this research for his insightful advice.
I must thank God for his gift of life and peace; he deserves special thanks as well.
iii

ABSTRACT
The importance of working capital management to the profitability of a business has been
extensively studied by scholars and practitioners. The theoretical importance of the
working capital component over the profitability ratio is very clear, that is, the lesser the
time a firm needs to realize cash from its customers relative to the time it requires to pay
off its creditors, the better it is for its liquidity position and thus reduces the risk of
dependency on external and more expensive sources of capital. So firms with lesser
duration of cash conversion cycle are considered more efficient. The purpose of the study
was to establish the relationship between Working Capital Management and Profitability
of retail supermarket chains in Kenya. The research was a causal study design. The
population of this study was consisted of the 6 retail supermarket chains in Kenya these
are Nakumatt, Tuskys, Uchumi, Ukwala, Naivas, and Eastmatt. The research used data of
the selected retail chains, the data covered a five year period starting from 2007 to 2011.
The research used secondary data that was obtained from financial statements of the
companies and Multiple regression analysis was employed. The study found that there
exist a relationship between Working Capital Management and Profitability of retail
supermarket chains in Kenya. It was also established that there was a variation 100% of
the profits of supermarket in Kenya with changes in working capital management at a
confidence level of 95%. This means that 100% of the profits of supermarkets in Kenya is
attributable to working capital management. The study found that holding the working
capital variables under study to a constant zero net operating profit would be equal to
0.399. a unit increase in CCC lead to decrease by 0.002, unit increase in ACP increases
profitability by0.019. The study concludes that there exists relationship between Working
Capital Management and Profitability of retail supermarket chains in Kenya; leverage
was found to positively influence the profitability of supermarkets in Kenya. The study
recommends that future research should be conducted on the same topic with different
firms both listed and non-listed and extending the number of years of the sample. The
scope of further research may be extended to other working capital components including
cash, current ratio and marketable securities.
iv

TABLE OF CONTENTS
DECLARATION..................................................................................................................i
DEDICATION....................................................................................................................ii
ACKNOWLEDGMENTS..................................................................................................iii
ABSTRACT.......................................................................................................................iv
TABLE OF CONTENTS....................................................................................................v
LIST OF FIGURES..........................................................................................................viii
LIST OF TABLES..............................................................................................................ix
DEFINITION FOR RESEARCH TERMS..........................................................................x
LIST OF ABBREVIATIONS...........................................................................................xii
CHAPTER ONE..................................................................................................................1
1.0 Introduction....................................................................................................................1
1.1 Background....................................................................................................................1
1.1.1 Working Capital Management....................................................................................3
1.2 Statement of the Problem...............................................................................................6
1.3 Research Objectives.......................................................................................................8
1.3.1 Specific objectives......................................................................................................8
1.3.2 The research questions................................................................................................8
1.4 Significance of the Study...............................................................................................9
1.4.1To the Management of Supermarkets..........................................................................9
1.4.2To Academia................................................................................................................9
1.5 Limitations of the Study..............................................................................................10
1.6 Scope of the Study.......................................................................................................10
CHAPTER TWO...............................................................................................................11
LITERATURE REVIEW..................................................................................................11
2.1 Introduction..................................................................................................................11
2.2 Theoretical Framework................................................................................................11
2.3 Working Capital Management.....................................................................................142.3.1 Cash Management....................................................................................................14
2.3.2 Inventory Management.............................................................................................16
v
2.3.3 Accounts Receivable Management...........................................................................18
2.3.4 Accounts Payable Management................................................................................20
2.4 Working Capital Management Policies.......................................................................21
2.5 Measures of working capital management..................................................................23
2.6 Strategies for Improving Working Capital Management............................................26
2.7 Empirical Review........................................................................................................27
2.8 Conceptual Framework................................................................................................33
CHAPTER THREE...........................................................................................................35
RESEARCH METHODOLOGY......................................................................................35
3.0 Introduction..................................................................................................................35
3.1 Research Design..........................................................................................................35
3.2 The target population...................................................................................................36
3.3 Sampling......................................................................................................................36
3.4 Data Collection............................................................................................................36
3.5 Data Analysis...............................................................................................................36
3.5.1 Model Specifications................................................................................................37
CHAPTER FOUR.............................................................................................................39
DATA ANALYSIS AND INTERPRETATION OF THE RESULTS..............................39
4.0 Introductions................................................................................................................39
4.1 Descriptive Statistics for Selected Measures of Working Capital Management and Profitability........................................................................................................................39
4.1.1 Comparative means of various WCM ratios and NOP for each of the supermarkets...........................................................................................................................................40
4.2 Comparative Means Of Various WCM Ratios And NOP For The Years Under Re-view....................................................................................................................................41
4.3 Correlation analysis.....................................................................................................42
4.4 Regression Analysis.....................................................................................................43
4.4.1 Regression Results For 2007....................................................................................43
4.4.2 Regression Results For 2008....................................................................................45
4.4.3 Regression Results For 2009....................................................................................47
4.4.4 Regression Results For 2010....................................................................................48
4.4.5 Regression Results For 2011....................................................................................50
vi
CHAPTER FIVE:..............................................................................................................52
DISCUSSIONS, CONCLUSIONS AND RECOMMENDATIONS.................................52
5.0 Introduction..................................................................................................................52
5.1 Discussions..................................................................................................................52
5.2 Conclusions..................................................................................................................55
5.3 Recommendations for further Research......................................................................55
REFERENCES..................................................................................................................56
vii

LIST OF FIGURES
Figure 1. 1 Conceptual Framework..................................................................................34
viii

LIST OF TABLES
Table 4. 1 Descriptive Statistics......................................................................................39Table 4. 2 Comparative means of various WCM ratios and NOP for each of the supermarkets....................................................................................................................41Table 4. 3 Correlation Analysis.......................................................................................42Table 4. 4 Regression Model Summary For 2007...........................................................43Table 4. 5 2007 Coefficients results................................................................................44Table 4. 6 Model Summary For 2008..............................................................................45Table 4. 7 Coefficients Results For 2008.........................................................................46Table 4. 8 Model Summary for 2009...............................................................................47Table 4. 9 Coefficients For 2009.....................................................................................47Table 4. 10 Model Summary For 2010............................................................................48Table 4. 11 Coefficients For 2010...................................................................................49Table 4. 12 Model Summary For 2011............................................................................50Table 4. 13 Coefficients For 2011...................................................................................50
ix

DEFINITION FOR RESEARCH TERMS
Working capital management: Padachi, (2008) defines this as a managerial accounting
strategy focusing on maintaining efficient levels of both components of working capital,
current assets and current liabilities, in respect to each other. It ensures a company has
sufficient cash flow in order to meet its short-term debt obligations and operating
expenses.
Profitability: The ability of the firm to earn a profit. Profitability can also be labeled as a
measurement of business success where a company is able to generate profits from its
operations (Keane & Wang, 1995).
Cash conversion cycle: Shin & Soenen, (1998) define the cash conversion cycle as the
continuing cash flow from suppliers to inventory to accounts receivable and back into
cash.
Trade receivables: The term trade receivables refer to the amounts due to a business
following the sale of goods or services to another company (Brealey, 2004).
Trade payables: are also known as accounts payable and refers to money owed to
creditors, lenders, vendors or suppliers for products or services rendered (Brealey, 2004).
Net-trade cycle: it’s similar to cash conversion cycle but only differs in the manner
where Net Trade Cycle shows how long the cash is tied up in the trade cycle before
coming back out as cash again (Deloof, 2003).
x

Return on assets (ROA): measures how profitable a company is relative to its total
assets, In turn, it measures how efficiently a company uses its assets. Normally, ROA is
used to compare companies in the same industry. Everything else being equal, a higher
ROA is better, as it means that a company is more efficient about using its assets (Nazir
& Afza, 2007).
Return on equity: Nazir & Afza, (2007), the ratio of net profit to shareholders' equity
also called book value, net assets or net worth, expressed as a percentage. A measure of
how well a company uses shareholders' funds to generate a profit.
Return on net assets (RONA): is a comparison of net income with fixed assets and net
working income. This is a metric of financial performance of a company that takes into
account earnings of a company with regard to fixed assets and net working income (Nazir
& Afza, 2007).
xi
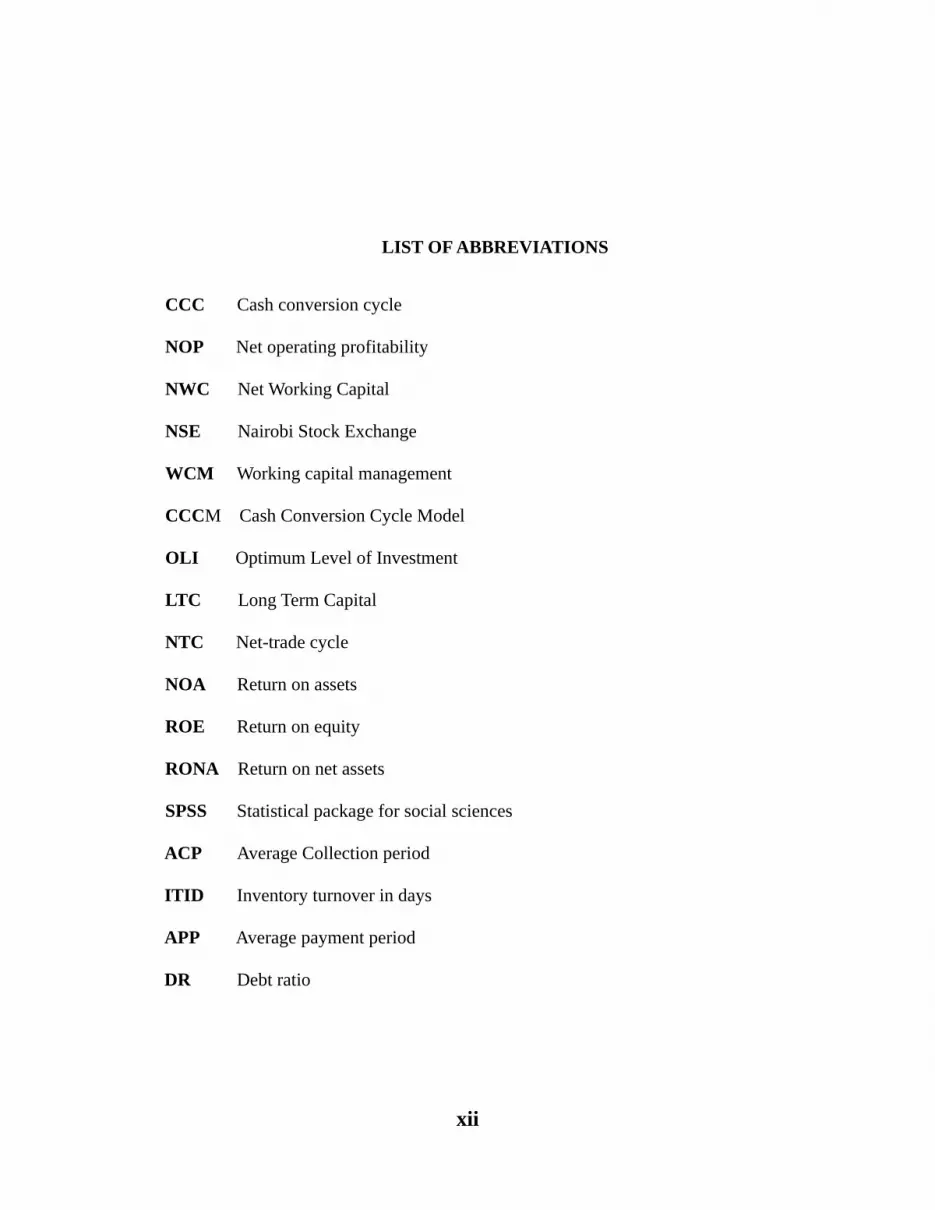
LIST OF ABBREVIATIONS
CCC Cash conversion cycle
NOP Net operating profitability
NWC Net Working Capital
NSE Nairobi Stock Exchange
WCM Working capital management
CCCM Cash Conversion Cycle Model
OLI Optimum Level of Investment
LTC Long Term Capital
NTC Net-trade cycle
NOA Return on assets
ROE Return on equity
RONA Return on net assets
SPSS Statistical package for social sciences
ACP Average Collection period
ITID Inventory turnover in days
APP Average payment period
DR Debt ratio
xii

CHAPTER ONE
1.0 Introduction
This chapter contains the overall overview of the research project. It basically contains:
the background of the study, statement of the problem, objectives of the study, research
questions, significance of the study, limitations of the study and scope of the study.
1.1 Background
Working capital management, which consists of current assets and current liabilities
management, is the main function of financial managers in all corporations. While the
working capital management takes up a major part of executive manager’s attention and
time, there is a deserved attention to working capital management in finance literature
(Jose, Lancaster, & Stevens, 1996; Deloof, 2003; Ŝen & Oruč, 2009). The utmost
important component of working capital related to inventories, accounts receivables and
accounts payables (Ross, Westerfield, & Jaffe, 2002). Financial executives have to make
different decisions about the level of these components in order to get best results. The
dynamic nature of short-term business emporium, the daily need to substituting current
assets, and liquidation current liabilities help to clarify the importance of working capital
management and financial executive duties. The direct effect of working capital
management on profitability and liquidity position of firms also refers to the importance
of working capital management (Nobanee, Abdullatif, & Al Hajjar, 2011). Firms may
face to bankruptcy if they select and use improper working capital strategies, even though
they experience positive profitability (Śamiloġlo & Demirgũneş, 2008).
1

Management of these current assets and current liabilities is important in creating value
for shareholders (Nazir and Afza, 2009). If a firm can minimize its investment tied up in
current assets, the resulting funds can be invested in value-creating projects, thereby
increasing the firm’s growth opportunities and shareholders’ return (Eramus, 2010).
However, management can also confront liquidity problems due to underinvestment in
working capital (Nazir and Afza, 2009). As pointed out by Filbeck and Krueger (2005),
the ability of financial managers to effectively manage receivables, inventories, and
payables has a significant impact on the success of the business (Nazir and Afza, 2009).
If capital invested in cash, trade receivables, or inventories is not sufficient, the firm may
have difficulty in carrying out its daily business operations (Eramus, 2010). This may
result in declining sales and, in the end, a reduction in profitability (Deloof, 2003). Smith
(1980) emphasized the trade-off between liquidity and profitability when he argued that
working capital management can play an essential role not only in a firm’s profitability
and risk, but also in its value. Decisions regarding an increase in profitability are likely to
involve increased risk, and risk-reducing decisions are likely to result in a reduction in
profitability (Garcia-Teruel and Martínez-Solono, 2007). An accepted measure of
working capital management is the cash conversion cycle (Abuzayed, 2012) which
represents the average number of days between the day the firm begins paying its
suppliers and the day it starts to receive cash for products sold (Deloof, 2003). Longer
cash conversion cycles mean more time between cash expenditure and cash retrieval
(Deloof, 2003). Previous research has used the cash conversion cycle as a measure of
working capital management to analyze whether reducing the time allowed for this cycle
2

has positive or negative effects on corporate profitability (Garcia-Teruel and Martínez-
Solono, 2007; Abuzayed, 2012).
On the whole, empirical evidence related to working capital management and
profitability has substantiated the fact that managers can create value for shareholders by
shortening the cash conversion cycle to the shortest rational amount of time (Raheman,
and Nasr, 2007; Banos-Caballero et al., 2007). The objective of this study is to investigate
the relationship between working capital management, as measured through the cash
conversion cycle, and corporate profitability in Kenya. This study enriches the finance
literature on the relationship between working capital management and profitability.
1.1.1 Working Capital Management
The main objective of working capital management is to ensure that companies have
sufficient cash flow to continue normal operations in such a way that minimize risk of
inability to pay short-term commitment. Moreover, managers should try to avoid from
unnecessary investment in working capital. While, more investment in working capital
may reduce the risk of liquidity, insufficient amount of working capital may cause
shortages and problems in daily operations. However, more investment in working capital
means more funds tied up to business operation and would increase the opportunity cost
of investment especially when firms rely on external financing to finance working
capital. Therefore, efficiency of working capital management depends on balances
between liquidity and profitability (Filbeck, Krueger, & Preece, 2007; Faulkender &
Wang, 2006). The profound understanding of the role of working capital and its effect on
firm’s profitability would help managers to look for strategic plans for management of
working capital.
3

One of the standard performance measures to evaluate how well a firm does managing
the working capital is Cash Conversion Cycle (CCC) that was introduced by Richards
and Laughlin (1980). It refers to time-period between buying raw material, convert to
finished goods, sales products, and collect account receivables. Firms with Shorter cash
conversion cycle have less investment in working capital and as a result the cost of
financing is less for these firms. The importance of cash conversion cycle was well
pointed out by a study that was conducted by Shin & Soenen (1998). They compared two
corporations with the same capital structure, Kmart and Wal-Mart. The former had a CCC
of 61 days and the latter had a CCC of 40 days. The differences of 19 days in cash
conversion cycle made Kmart to face 198.3 million US dollars extra to finance their
working capital and faced more financial constraints. Consequently, shorter cash
conversion cycle would increase profitability, and would show the efficiency of
management performance in managing working capital (Deloof, 2003; Nazir et al., 2009;
Zariyawati et al, 2009). Thus, Cash conversion cycle integrates three components of
management efficiency include, production, inventory management, as well as supply
chain management (Moyer, Mcguigan, & Kretlow, 2003).
Operation cycle includes both inventory conversion period and receivables conversion
period. The length of operation cycle should be financed by corporations directly if they
buy the raw materials on cash. But majority of corporations have strong tending to use
trade credits to financing some parts of operation cycle and also suppliers are willing to
provide financial intermediary services to corporations (Niskanen & Niskanen, 2006).
Inventory conversion period refers that how long it takes a firm coverts the raw material
to finished goods. This period is just available in manufacturing firms and it cannot be
4
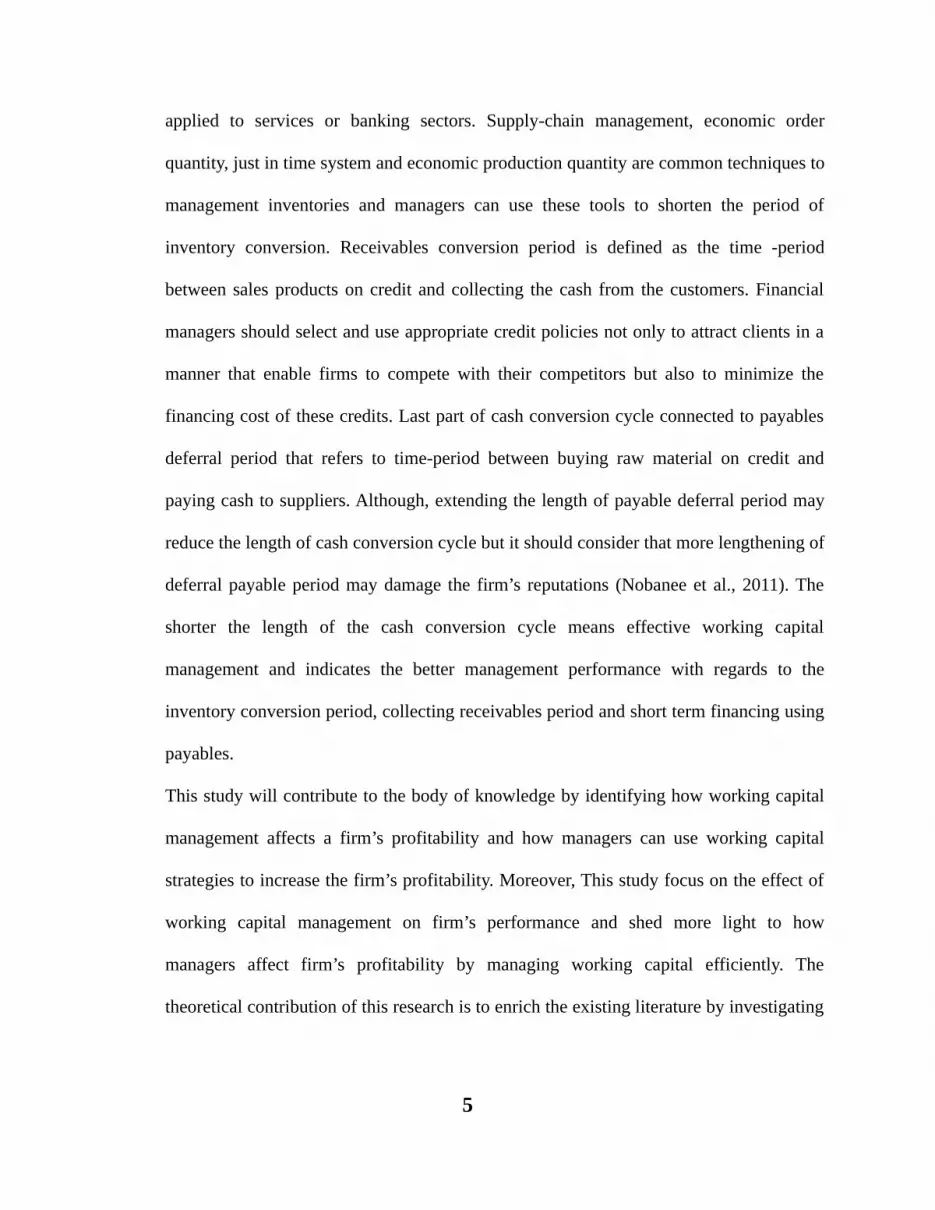
applied to services or banking sectors. Supply-chain management, economic order
quantity, just in time system and economic production quantity are common techniques to
management inventories and managers can use these tools to shorten the period of
inventory conversion. Receivables conversion period is defined as the time -period
between sales products on credit and collecting the cash from the customers. Financial
managers should select and use appropriate credit policies not only to attract clients in a
manner that enable firms to compete with their competitors but also to minimize the
financing cost of these credits. Last part of cash conversion cycle connected to payables
deferral period that refers to time-period between buying raw material on credit and
paying cash to suppliers. Although, extending the length of payable deferral period may
reduce the length of cash conversion cycle but it should consider that more lengthening of
deferral payable period may damage the firm’s reputations (Nobanee et al., 2011). The
shorter the length of the cash conversion cycle means effective working capital
management and indicates the better management performance with regards to the
inventory conversion period, collecting receivables period and short term financing using
payables.
This study will contribute to the body of knowledge by identifying how working capital
management affects a firm’s profitability and how managers can use working capital
strategies to increase the firm’s profitability. Moreover, This study focus on the effect of
working capital management on firm’s performance and shed more light to how
managers affect firm’s profitability by managing working capital efficiently. The
theoretical contribution of this research is to enrich the existing literature by investigating
5

the effect of working capital management on profitability in Kenya’s firms as a
developing market.
1.2 Statement of the Problem
A firm is required to maintain a balance between profitability while conducting its day to
day operations. While inadequate amount of working capital impairs a firm's liquidity,
holding of excess working capital results in the reduction of the profitability (Ghosh &
Maji, 2003). A firm can be very profitable if it can translate cash from operations within
the same operating cycle, otherwise the firm would need to borrow to support its
continued working capital needs. Thus, the twin objectives of profitability must be
synchronized (Brigham & Houston, 2004). Empirical results show that ineffective
management of working capital is one of the important factors causing industrial
sickness. Modern Financial management aims at reducing the level of current assets
without ignoring the risk of stock outs (Bhattacharya, 1997). Efficient management of
working capital is thus an important indicator of sound health of an organization, which
requires reduction of unnecessary blocking of capital in order to bring down the cost of
financing.
Previous research has documented that working capital management influences a firm’s
profitability (Deloof, 2003; Lazaridis & Tryfonidis, 2006; Eljelly, 2004; Wang, 2002;
Johnson & Soenen, 2003). The studies also reported that efficient working capital
management is one of the crucial characteristics of financially flourishing firms. Most of
the empirical research into the relationship between working capital management and
profitability has confirmed the notion that reducing current assets in comparison to total
assets reduces working capital investment; therefore, it would positively affect the firm’s
6

profitability. Many scholars have measured working capital using the cash conversion
cycle (Lazaridis & Tryfonidis, 2006; Raheman, &Nasr, 2007; Eljelly, 2004)
Deloof (2003) analyzed a sample of Belgian firms and found that firms can raise their
performance by shortening the periods for receivables collection and inventory
conversion. He also reported an unanticipated negative impact associated with the
number of days for accounts payable; poorer firms prolong the time to pay their debts.
Wang (2002) analyzed a sample of Japanese and Taiwanese firms, Lazaridis and
Tryfonidis (2006) examined a sample of firms listed on the Athens Stock Exchange,
Nazir and Afza (2007) investigated a sample of firms listed on the Karachi Stock
Exchange, and Abuzayed (2012) looked at a sample of firms listed on the Amman Stock
Exchange; they all found that shortening the cash conversion cycle enhances firm
performance. Shin and Soenen (1998) used a sample of US firms and Erasmus (2010)
used a sample of South African firms, and both studies employed the net trading cycle
(NTC). NTC is calculated by summing trade receivables and inventories then subtracting
accounts payable and expressing the result as a percentage of sales, as the comprehensive
measure of working capital management. The results were similar to results of studies
that used the cash conversion cycle; the researchers discovered a significant negative
relationship between NTC and profitability.
As noted in the preceding paragraphs, previous studies have studied the correlation
between efficient working capital management and profitability (e.g. Deloof, 2003; Shin
& Soenen 1998). The question arises if we can see that efficient working capital
management in Kenyan firms, with a focus at supermarkets in Kenya, would improve
corporate profitability. In addition, which are the key metrics that are used to define
7
working capital management efficiency? In other words, what drivers should companies
look to when minimizing their investment in working capital?
1.3 Research Objectives
The main objective of the study was to examine the relationship between working capital
management and profitability of supermarkets in Kenya
1.3.1 Specific objectives
The study was guided by the following specific objectives:
(i) To determine the relationship between average collection period and the
profitability of supermarkets in Kenya
(ii) To establish the relationship between inventory turnover in days and the
profitability of supermarkets in Kenya
(iii) To determine the relationship between average payment period and the
profitability of supermarkets in Kenya
(iv)To establish the relationship between cash conversion cycle and the profitability
of supermarkets in Kenya
(v) To determine the relationship between debt ratio and the profitability of
supermarkets in Kenya
1.3.2 The research questions
To fulfill the study’s objectives, the study was guided by the following research
questions:
(i) What is the relationship between average collection period and the profitability of
supermarkets in Kenya?
8

(ii) What is the relationship between inventory turnover in days and the profitability of
supermarkets in Kenya?
(iii) What is the relationship between average payment period and the profitability of
supermarkets in Kenya?
(iv) What is the relationship between cash conversion cycle and the profitability of
supermarkets in Kenya?
(v) What is the relationship between debt ratio and the profitability of supermarkets in
Kenya?
1.4 Significance of the Study
This study will be important to various stakeholders including the management of
supermarkets and companies in Kenya and to academia.
1.4.1To the Management of Supermarkets
The findings and recommendations of this study will be useful to new and existing
managers of supermarkets and other firms on the importance of capital management to
the profitability of their businesses. In addition the management will understand the ideal
capital management ration for their businesses that is ideal for profitability.
1.4.2To Academia
Knowledge seekers in the fields of economics, research methods, management, and
finance will find this research study useful. In particular, this research study will be
beneficial to the researchers with research interests in capital management and firm
profitability, by serving as a point of reference. In addition, future researchers will be able
to formulate further studies based on the recommendations of this study.
9

1.5 Limitations of the Study
Limitation for the purpose of this research was regarded as a factor that was present and
contributed to the researcher getting either inadequate information or responses or if
otherwise the response given would have been totally different from what the researcher
expected.
The main limitations of this study were; some data was not readily available. This
reduced the probability of reaching a more conclusive study. However, conclusions were
made with the available data. The small size of the sample could have limited confidence
in the results and this might limit generalizations to other situations. Time due to official
duties was a major concern.
1.6 Scope of the Study
The study focused on the relationship between working capital management and
profitability of supermarkets in Kenya and used audited and published financial
statements from supermarkets as data for analysis.
10
CHAPTER TWO
LITERATURE REVIEW
2.1 Introduction
This chapter summarises the information from other researchers who had carried out their
research in the same study on the relationship between capital management and
profitability of firms. The study specifically covers the theoretical discussions, research
gap and conceptual framework.
2.2 Theoretical Framework
The theoretical relationship between working capital and profitability has been discussed
extensively in the literature. From the perspective of working capital, firms have two
main objectives, namely maximization of profit and minimization of liquidity risk. As
pointed by Walker (1980) risk means, risk of not maintaining adequate liquidity; risk of
having too much or too little inventory to maintain production and sales; and the risk of
not granting adequate credit to support the proper level of sales.
Profitability is concerned with the overall objective of owner wealth maximization. The
problem with the dual objectives of profitability and liquidity is that they tend to conflict.
Decisions that tend to maximize profitability tend to create the problem of inadequate
liquidity and vice versa. In addition, the way in which working capital is managed can
have a significant impact on profitability and liquidity goals of the firm.Corporations can
have a best possible amount of working capital that leads to their value maximization
(Deloof, 2003). On the other hand, maintaining a huge inventory, readily granting credit
to customers, and being willing to wait a longer time to receive payment may result in
11
higher sales (Deloof, 2003). The downside of granting generous trade credit and
maintaining high levels of inventory is that money is stashed in working capital (Deloof,
2003). On the liabilities side, postponing payment to suppliers lets a firm to get the goods
prior to paying, therefore increases spontaneous financing and thus reduces the need for
costly external funding (Lasher, 2008).Efficient working capital management involves
managing short-term assets and short-term liabilities in a way that provides balance
between eliminating potential inability to cope with short-term debts and avoiding
unnecessary holdings in these assets (Eljelly, 2004). Previous research has documented
that working capital management influences a firm’s profitability (Lazaridis and
Tryfonidis, 2006), (Eljelly, 2004), (Wang, 2002)). Johnson and Soenen (2003) also
reported that efficient working capital management is one of the crucial characteristics of
financially flourishing firms.
Most of the empirical research into the relationship between working capital management
and profitability has confirmed the notion that reducing current assets in comparison to
total assets reduces working capital investment; therefore, it would positively affect the
firm’s profitability. Many scholars have measured working capital using the cash
conversion cycle (Eljelly, 2004).Deloof (2003) analyzed a sample of Belgian firms and
found that firms can raise their performance by shortening the periods for receivables
collection and inventory conversion. He also reported an unanticipated negative impact
associated with the number of days for accounts payable; poorer firms prolong the time to
pay their debts. Wang (2002) analyzed a sample of Japanese and Taiwanese firms,
Lazaridis and Tryfonidis (2006) examined a sample of firms listed on the Athens Stock
12

Exchange, Nazir and Afza (2007) investigated a sample of firms listed on the Karachi
Stock Exchange, and Abuzayed (2012) looked at a sample of firms listed on the Amman
Stock Exchange; they all found that shortening the cash conversion cycle enhances firm
performance. Shin and Soenen (1998) used a sample of US firms and Erasmus (2010)
used a sample of South African firms, and both studies employed the net trading cycle
(NTC). NTC is calculated by summing trade receivables and inventories then subtracting
accounts payable and expressing the result as a percentage of sales, as the comprehensive
measure of working capital management. The results were similar to results of studies
that used the cash conversion cycle; the researchers discovered a significant negative
relationship between NTC and profitability.To make sure the optimal level of working
capital management can be reached, there are four dimensions of working capital
management should be considered: cash management, inventory management, account
receivable management (debtor management) and account payable management (creditor
management). Each element has its own characteristics. However, managers should take
each component into consideration as a whole, since a trade-off exists in the relationship
of each component. For instance, a large inventory and a generous trade credit policy
may lead to higher sales, large inventory and a generous trade credit allows customers to
assess product quality before paying (Long, Malitz and Ravid, 1993; Deloof and Jegers,
1996). However, the flip side of granting trade credit and keeping inventory is that,
money is locked in working capital (Deloof, 2003). Therefore, having a good knowledge
on each element of working capital management can be very helpful in financial decision
making.
13

2.3 Working Capital Management
2.3.1 Cash Management
In a business, having sufficient cash is very important. Cash is like the oxygen for a com-
pany to survive, company needs cash to deal with their daily operations. Padachi (2006)
points out that just as circulation of blood is very necessary in the human body to main-
tain life, cash flow is necessary to maintain business. Akinwande (2009) also mentions in
his study that Cash is lifeblood of a business, and a manager’s key mission is to assist in
keeping it to flow and to take the advantage of the cash flow in making profit. Therefore,
maintaining sufficient cash can decide the destiny of a business. Cash management is
mainly about the decision of cash distribution, which is also the most important compo-
nent of working capital management.
Although cash does not earn profit, there are three motives for a company to hold cash:
Transaction motive: company needs certain level of cash to meeting their daily transac-
tions, such as payment for supplier, salaries and so on. Cash holding ensures company to
meet their regular cash outflow; Precautionary motives: Sometimes, cash flow is hard for
a company to predict because of the difference between the firms and industries. Cash
holding can help to relieve the problem of unexpected cash needs, for instance, raised
cost of raw material and default of third party and Speculative motives: during the busi-
ness operation, unexpected investment opportunities can raise, sufficient cash holding al-
lows the company to take advantage of these opportunities and grow in the future.
As one can see, companies can enjoy several benefits under holding sufficient cash.
However, holding excessive cash does not make good business sense, since excessive
14

cash can earn interest if they are used in the proper investment (Banjerjee, 2005). Mar-
tinez-Sola, Garcia-Teruel and Martinez-Solano (2011) tested two questions in their inves-
tigation: first, whether there is an optimal cash level that can maximize firm value, and
second whether firm value would be reduced if the cash deviates from the optimal level.
Results denote that there is a concave relationship between cash holding and firm value,
which means that optimal cash level that maximized firm value, does exist. Firm value
will be decreased if the cash holding is different from this optimal level. Trade-off theory
can also explain that there is an optimal level of cash holding which can balance the mar-
ginal benefit and cost (Saddour, 2006). These results suggest that having optimal cash
holding is the central task of cash management.
Banjerjee (2005) mentions that two constraints which decide how much cash a firm
should maintain. The First is the compensating balances, which is the cash balance re-
quired compensating for the services that are rendered by banks to the firms (p. 213). The
second is self-imposed balance, which is determined by considering factors like the need
for cash, the predictability of this need, the interest rate on marketable securities or the
borrowing rate, and the fixed cost of effecting a transfer between marketable securities
and cash or effecting a loan transaction (p.213). Saddour (2006) studies the determinants
of cash holding by using a sample of French firms. Results confirm that cash holding en-
able firms to take profitable investment opportunities, which leads to the fact that cash
holding level of growth firm is higher than the matured firms. They also find that the de-
terminants of cash holding are different between growth firms and matured firms. Cash
holdings in growth companies decrease with the raise of firms’ characteristics: size, level
15

of liquid assets and short-term debt. However, in matured firms, cash level shows a posi-
tive relationship with firm size and dividend payout and negative relationship with firms’
research and development expenses. Within a similar study, cash-holding level in firms
from Canada is strongly affected by their market to book ratio, cash flow, net working
capital leverage, and firm size (Gill and Shah, 2012). Bensoussan, Chutani and Sethi
(2009) explain the optimization problem of meeting demands for cash over time with
cash deposit in bank or invested in stock. Study shows the solutions of optimal level of
cash holding a company should have under different uncertainty by using different
model.
The value of cash holding and use of cash holding vary between good and bad-governed
firms. This can be illustrated by looking at influence on firm value by using of cash hold-
ing in different business environment: In a poorly-governed firm, 1 dollar cash is only
valued at 0.88 dollar. To be a contrast to that, in a well-governed firm, 1 dollar cash can
double its price.
Firm’s future performance in poorly corporate governance will be reduced since cash can
be dissipated very fast. On the opposite, in well-governed firms, firms’ future operating
performance will get a big improvement due to the negative impact of cash holding can
be cancelled out (Dittmar, Mahrt-Smith, 2006).
2.3.2 Inventory Management
Usually, inventory can be decomposed by three parts: raw materials, work-in-process in-
ventory and finished inventory. Just like cash management, inventory management also
has trade-off in its management system. According to Damodaran (1997), there are three
motives for a company to hold inventories. First, raw materials are held to make sure that
16

the production process goes well and not interrupted by a shortage of raw materials. Sec-
ondly, inventories of intermediate goods appear in the middle of process, it will be used
to continue process. Thirdly, holding enough finished goods is to avoid the risk of losing
sales, and to avoid the large ordering and administration cost which caused by replenish-
ing inventory. However, the down side of holding too many inventories can cause large
carrying cost, for instance, storage cost, security cost, and goods obsolescence and goods
perishing. Therefore, with an efficient inventory management, a lot of the risks and costs
can be avoided. Singh (2008) studies the relationship between inventory management and
working capital management, and he supports the importance of inventory management.
He thinks that firms with a poor inventory management can cause serious problems
which destroy the long-term profitability and firms’ survival chances. A contrary result,
with a well-thought inventory management, firm can reduce the inventory to an optimal
level which has no negative effect on production and sales. The paper also denotes that
the size of inventory directly affects the working capital and its management. Thus, in-
ventory management does attract manager’s attentions.
Considerable level of inventories is the main goal of inventory management. In order to
find the solution for optimal inventory, Swaminathan (2001) studies the how structural
reforms affects inventory management in public and private sectors in India. Findings of
this paper verify that adjusting raw material and finished goods as a component of inven-
tory is faster than the inventory as a whole to reach the reasonable level. There are some
other methods that can easily affect inventory management, such as, order quantity
method, just-in-time inventories, etc. (AutuKaite and Molay, 2011).
17

2.3.3 Accounts Receivable Management
Accounts receivable management, which is also known as debtor management, is a com-
pany giving their customers a specific credit term to pay for products or services. These
credit terms, which are called trade credit, can help ease customer’s financial frictions
(Meltzer, 1960). Customers who buy products or service on trade credit are called sundry
debtor for the company. Account receivable is a major component in business finance. In
European countries, such as Germany and Italy, account receivable is more than one
quarter of their total asset (Bougheas, Mateut and Mizen, 2009). Rajan and Zingales
(1995) study capital structure of firms. They show that in a sample of American firms,
17.8 percent of total assets are the accounts receivable. We can see that an efficient ac-
count receivable management is indispensable. Smith (1987) points out that providing
trade credit to customers is very important to suppliers whose sales or investment depend
on consumer’s financing ability. Emery (1984) uses operational and financial method to
explain the reasons that behind extending trade credit: firstly, extending trade credit is
due to pure operating flexibility. He explains that the demand of customers is irregular
since the market is imperfect. There is always a deviation from expected demand, which
may cause the excess production.
Temporary relaxations of credit terms allows account receivable account fluctuate corre-
spond to the deviation in demand, which illustrates the formation of a sale queen instead
of customer or products queen. Secondly, pure financial intermediary motive explicates
extension of trade credit. Due to the imperfect market, firms are required to maintain liq-
uid reserve for the unexpected needs of cash. Offering trade credit to customers can be
18

seen as offering loan to customers, which is also a part of liquid reserve. Ferris (1981) de-
fines trade credit as a particular type of short term loan: a loan that is tied in both timing
and value to the exchange of goods (p. 243). Therefore, firms can receive lending rate of
return from this loaned liquid reserve. Extending trade credit gives suppliers an opportu-
nity to earn a higher rate of return than the marginal return. Hill, Kelly and Lockhart
(2012) reveal that trade receivable significantly and positively affect shareholders wealth
by studying all non-financial, non- utility, and SIC classifiable firms in the period 1971-
2006. This result confirms the importance of a reasonable trade credit policy. However,
the risks behind offering trade credit to customers are: firstly, customers may default,
which causes the company to run the risk of bad debts. Secondly, company will lose the
interest between time of sale and time of payment by the customer (Damodaran, 1997).
Based on the trade-off of credit sale, controlling and managing account receivables be-
come very important. Kumar (2010) explains the meaning of debtor management as a
process of making decision which relates to the investment in the business debtors. And
the aim of debtor management is to stimulate the sales and meanwhile minimize the risk
of not receiving money from the debtors. If debtor management is in a poor condition,
working capital ratio could be stressful which causes the needs of more capital input or
increased debt (Turner Hopkins, 2009). Gillbert and Reichert (1995) find out that 59 per-
cent firms of Fortune 500 are using account receivable management model to improve
their working capital management.
In order to achieve effective account receivables management, there are two elements
should be focused. On the one hand, company needs to know which credit policy is suit
19

for their business. Credit policy gives firms a guideline about how to deal with the debtor
and how much credit they should liberalize to their customers. With a liberated credit
policy, the sale and profitability of a firm may increase largely, but the risk of bad debts
or interest foregone may also increase. With a strict credit policy, the security and liquid-
ity of a firm may rise, but profitability of the firm may go down. Obtaining the optimal
level of security and profitability is the one task of financial manager (graph 1). On the
other hand, company should know their customers well, that is what we called credit
analysis. Damodaran (1997) defines credit analysis is an analysis designed to evaluate the
creditworthiness of customer (p.378). Based on customers’ capacity analysis, company
can make their credit decision, which is whether to sell the products or service on credit.
2.3.4 Accounts Payable Management
Suppliers offer trade credit will create account receivable, opposite to that, customers ac-
cept the trade credit will generate account payable. Account payable, which occurs when
firms purchase goods or services on credit, is the payment for vendors for products, ser-
vices inventories and supplies. One merit of having trade credit from sellers is that com-
pany can reduce some investment in working capital management and save some re-
source (Damodaran, 1997). Maximizing the account payable and stretching the payment
term could be a competitive advantage for firms. In the United Kingdom, on average
there are 70 percentage of the total short-term debt. 55 percentage of these short-term
debt are recorded under account payable (Kohler et al, 2000, Guariglia and Mateut,
2006). However, the risk of maximizing account payables by having a longer credit pe-
riod from the supplier is that firms may not get a discount from their vendors or bad qual-
ity products or service may get from suppliers, which can ruin the business relationship
20

between suppliers and demanders. Finally, it will affect firm’s profitability (Ganesan,
2007). Some elements of account payable management, such as account payable policy,
implementation of the policy and monitoring result, can help manager ensure that effi-
ciency of account payable management reached (Sagner, 2011).
2.4 Working Capital Management Policies
Characteristics of each component of working capital management alert that the manage-
ment should not underestimate the importance of working capital management. Decision
of working capital management can be affected by a company’s working capital manage-
ment policy as well. Working capital management policy is a method of making invest-
ment by using current assets and financing firms’ assets by using short-term liabilities
(Bandara, and Weerakoon-Banda, 2011). Basically, there are three types of working capi-
tal policies: matching working capital policy, aggressive working capital policy and con-
servative working capital policy.
First, matching working capital policy is by using current asset to match current liability
perfectly. It implies that company will simply keep enough cash on hand to pay for their
due liabilities. Second, aggressive working capital policy is that companies usually has
low account receivable and try to pay their payable as late as possible. They invest most
of their asset into the investment and keep less cash on hand. Though this policy has high
return, the risk is high. Third, conservative working capital policy is preferred by risk
aversion. Companies under this policy usually make sure they can pay their liability on
time, and they keep extra cash on hand just for the uncertainty (Kulkarni, 2011).
Firms can minimize financial risk and improve its overall performance if firms have a
well- though working capital management policy by understanding the role and drivers of
21

working capital management (Nazir, and Afza, 2009). Weinraub and Visscher (1998) in-
vestigate the relationship between aggressive and conservative working capital practice in
ten diverse industry groups. They find out that industries do have significantly different
policies on their working capital management, and the policy in each industry keeps sta-
ble over time. Besides this, the study also denotes that industry asset and liabilities po-
lices have a significantly negative relationship. Nazir and Afza (2009) reiterate the im-
portance of working capital management policies. They discussed how working capital
management policy affects firms’ profitability. A negative relationship between prof-
itability and degree of aggressiveness of working capital policies is concluded in their re-
search. They suggest that managers can create firm value by adopting a conservative ap-
proach in working capital management.
In recent years, working capital management policy still attracts economists’ attentions.
In 2011, Bandara, and Weerakoon published their research the impact of working capital
management practices on firm value. The study indicates that working capital manage-
ment has impact on firms’ value by studying a sample of 74 companies listed in the
Colombo stock exchange. The result is similar to the result of Nazir and Afza (2009), re-
veals a significant positive relationship between conservative working capital manage-
ment policy and firm value. A significant negative relationship between aggressive work-
ing capital management and firm value proves that aggressive working capital manage-
ment policy may destroy firm value. Moreover, the study explains that firms following
match working capital management policy can generate higher value than the firms with
conversion working capital management. Al-Mwalla (2012) further validates the positive
22

relationship between conservative working capital management policy, which uses more
long-term debt to finance firms’ activities, and firms’ profitability and its value; and the
negative relationship between aggressive working capital management policy, which use
more short-term liabilities to finance firms’ activities, and firms’ profitability and value.
Thus, a well-designed working capital management policy can be a competitive advan-
tage for firms to create value for their shareholders. Furthermore, in the study of Al-Shu-
biri (2011), he confirms that there is no significant relationship between working capital
management policy and operating and financial risk.
2.5 Measures of working capital management
Since working capital management is such important for businesses, how do managers
know whether their management is efficient or not? There are several ways to assess the
efficiency of working capital management. The traditional way is by using liquidity ra-
tios, for instance, current ratio, and quick ratio. The drawback of these ratios is that they
are too general, there is not too much detailed information of working capital manage-
ment can be reached. However, the cash conversion cycle (CCC), which is defined as the
total time that a company takes from the days they bought their raw materials to the mo-
ment when they sell their finished goods, is deemed as the best measure for working capi-
tal management. A short cash conversion cycle implies that company has a good liquid-
ity. Firms have sufficient cash or capital to run their daily operation. If the duration of
cash conversion cycle is too long, it implies that company needs more cash to finance its
cycle (Mathur, 2010). Cash conversion cycle is calculated by Days Sales Outstanding
(DSO) + Days Inventory Outstanding (DIO) -Days Payable Outstanding (DPO). From
this equation, the performance of each dimension of working capital management can be
23

evaluated as well. That is one of the reasons it has been used so often as the measure of
working capital management. Following shows the calculation of each components of
cash conversion cycle.
Days Sales Outstanding (DSO) is used to measure how many days it takes a firm to col-
lect their account receivable. It is calculated by account receivable (trade) / total
revenue*365
Days Inventory Outstanding (DIO) evaluates how many days does a firm take to convert
their inventory to sales. It is calculated by Inventory/ cost of goods sold*365
Days payable Outstanding (DPO) is measuring how many days a firm needs to pay for
their vendors or supplier for the goods or service they use. It is calculated by account
payables (trade) / cost of goods sold*365
From the perspective of Days Sales Outstanding and Days Inventory Outstanding, the re-
sult are expected to be the shorter the better, since shorter Days sales outstanding and
shorter Days inventory outstanding implies that company can get cash in a short time.
Opposite to the Days Sales outstanding and Days inventory outstanding, Days Payable
Outstanding is expected to be longer. Basically, if firms can have a longer payment terms
it can help company to reduce working capital investment. However, the disadvantages of
doing this are: first, companies may lose the opportunity of discount. Second, it may
cause a bad relationship with vendors. In the research of Deloof (2003), the relationship
between three components of cash conversion cycle and firm’s profitability are also stud-
ied. The results exhibit that a negative relationship between the numbers of days account
receivable and cross-operating income. Same applied to the numbers of inventory days
24

and cross operating income in his research. The results confirm that a decrease in Days
Sales Outstanding and Days Inventory Outstanding is an improvement for companies. A
significant and negative relationship between Days Payable Outstanding and cross oper-
ating income (net operating income) is found in the research of Deloof (2003). The po-
tential reason for negative relationship between Days Payable Outstanding and profitabil-
ity is the downside of paying vendors late, such as, no discount and bad quality of ser-
vice, has more effects on the industry which Deloof (2003) used in his study. Garcia-
Teruel and Martinez-Solano (2006) focus on the impact of working capital management
on small and median firms’ profitability. Outcomes are in line with the conclusions from
Deloof (2003) that firm’s profitability is negatively related to days account receivables
and Days Inventory Outstanding. These findings mean that firms’ performance or prof-
itability can be generated by reducing the Days Sales Outstanding and Days Inventory
Outstanding. Equally, Lower cash conversion cycle implies that cash move fast around
the cycle and this can become a competitive advantage for firms (Autukaite, and Molay,
2011).
Net trade cycle (NTC), which is used in the study of Shin and Soenen (1998), is another
measure for working capital management. Basically, NTC is similar to cash conversion
cycle. Three components (account receivable, inventory and account payable) are pre-
sented as a percentage of sales (Shin and Soenen, 1998). Shin and Soenen indicate the ad-
vantage of NTC is that it provides an easy estimate for addition financing needs with re-
gard to working capital expressed as a function of the projected sales growth, and NTC is
25

also closely related to the issue of firm valuation and creation of shareholder value (p.
38).
Research in different industries would like to use different measures of working capital
management, which is proved by Filbeck and Kureger (2005). They examine the working
capital performance across industries by investigating the annul rating of working capital
performance of firms of CFO Magazine. The study illustrates the different measure of
working capital management that is used in companies cross industries, and list how of-
ten each company within an industry change their measure of working capital measure-
ment over time. They concluded that among industries, there is a significant difference
exist regarding to the proxy of working capital management and within an industry,
working capital management measures are different over time.
2.6 Strategies for Improving Working Capital Management
It is vital for leaders in treasury to know how they can improve the working capital man-
agement. Unfortunately, there is no standard solution for all firms. Features of firm de-
cide what kind of working capital management they should apply. However, the follow-
ing dimensions may give managers some insights.
Six Sigma methodologies have been recognized as a helpful method to improve working
capital management. Generally speaking, Six sigma is a disciplined, data-driven approach
and methodology for eliminating defects (driving toward six standard deviations between
the mean and the nearest specification limit) in any process-from manufacturing to trans-
actional and from product to service (six sigma, 2012). It helps companies to measure liq-
uidity and make sure the liquidity goes well in the all areas of institution. Six sigma
methodologies can decrease the Days Sales Outstanding, accelerates the payment cycle,
26
improves customer satisfaction and reduces necessary amount and costs of working capi-
tal needs (Filbeck, and Krueger, 2005). Waxer (2003) tests four companies that applied
six sigma methodologies. The result shows that costs saving are significant in these four
companies. These savings are ranged from 1.2 to 4.5 percentage of revenue. Waxer
(2003) indicates that six sigma methodologies is not a short cut that allows firms to be
profitable immediately. Six Sigma is a saving method which takes some times before
companies be profitable if companies plan properly.
Rule (2004), the director and global head of liquidity and investments in Citigroup, gives
her suggestions to improving working capital management: first, liquidity management is
an effective tool in managing working capital. Liquidity management has been concen-
trated by managers for many years, but there are two parts that are emphasized: 1. the real
time information integration is very important since it help the manager to know where
their position is in the cash cycle, and how to make their budget for next step. 2. Invest
extra money in vehicles to earn higher return instead of putting in the deposition and gen-
erate minimal interest. Second, there are some new tools, for instance, electronic invoice
presentment and payment and continuous linked settlement, which can help improving
working capital management.
2.7 Empirical Review
Various studies have analyzed the relationship of working capital management and firm
profitability in various markets. The results are quite mixed, but a majority of studies
conclude a negative relationship between WCM and firm profitability. The studies
reviewed have used various variables to analyze the relationship, with different
27

methodology such as linear regression and panel data regression. In this section, we have
presented the chronology of major studies related to our study in order to assess and
identify the research gap.
Soenen (1993) investigated the relationship between the net trade cycle as a measure of
working capital and return on investment in US firms. The results of the study indicated a
negative relationship between the duration of net trade cycle and return on assets (ROA).
Furthermore, this relationship between net trade cycle and return on assets was found to
differ across industries, depending on the type of industry. A significance relationship for
about half of the industries studied indicated that results might vary from industry to
industry. To support the results of Soenen (1993) on a large sample and with a long time
period, Jose et al. (1996) examined the relationship between profitability measures and
management of ongoing liquidity needs for a large cross section of firms over a 20-year
period. They tested the long run equilibrium relationship between the cash conversion
cycle and alternative measures of profitability, using both non-parametric and regression
analysis. The study concluded with strong evidence that aggressive working capital
policies enhance profitability. The authors found no evidence of a positive cross sectional
relationship for the CCC-profitability in any of the industries studied.
In order to examine the relationship between efficient working capital management and a
firm’s profitability Shin and Soenen (1998) used net-trade cycle (NTC) as a measure of
working capital management. The relationship was examined using correlation and
regression analysis, by industry and working capital intensity. Using a sample of 58,985
firm years covering the period 1975–94, in all cases, authors found a strong negative
28

relation between the length of the firm’s net-trade cycle and its profitability. Also, shorter
NTC were associated with higher risk-adjusted stock returns. Shin and Soenen
highlighted the importance of reducing NTC to create shareholder value.
Lyroudi and Lazaridis (2000) used the Greek food industry to examine the cash
conversion cycle as a liquidity indicator of the firms and tried to determine its
relationship with the current and the quick ratios, with its component variables. They
investigated the implications of the CCC in terms of profit- ability, indebtness and firm
size. The results of their study indicated that there is a significant positive relationship
between the cash conversion cycle and the traditional liquidity measures of current and
quick ratios.
Wang (2002) examined the relationship between liquidity management and operating
performance, and that between liquidity management and corporate value for firms in
Japan and Taiwan. The empirical findings for both Japan and Taiwan show negative
CCC–ROA and CCC–ROE relationships which are sensitive to industry factors. The
study supported the results of Jose et al., (1996) and Shin and Soenen (1998) that a lower
CCC corresponds with better operating performance. The study further revealed that
aggressive liquidity management is associated with higher corporate value for both
countries in spite of differences in structural characteristics or in the financial system of a
firm.
Deloof (2003) investigated the relationship between working capital management and
corporate profitability for a sample of 1,009 large Belgian non-financial firms for the
period 1992–96. He used trade credit policy and inventory policy as measured by number
of day’s accounts receivable, accounts payable and inventories, and the cash conversion
29

cycle as a comprehensive measure of working capital management. The results of the
study were as consistent as of Shin and Soenen (1998). Deloof found a significant
negative relation between gross operating income and the number of days accounts
receivable, inventories and accounts payable. Thus, he suggests that managers can create
value for their shareholders by reducing the number of day’s accounts receivable and
inventories to a reasonable minimum.
Eljelly (2004) empirically examined the relation between profitability and liquidity, as
measured by current ratio and cash gap (cash conversion cycle) on a sample of companies
in Saudi Arabia. Using correlation and regression analysis the study found significant
negative relation between the firm’s profit- ability and its liquidity level, as measured by
current ratio. The negative relationship was more evident in firms with high current ratios
and longer cash conversion cycles. At the industry level, however, the study found that
the cash conversion cycle or the cash gap is of more importance as a measure of liquidity
than the current ratio that affects profitability. The size variable was also found to have a
significant effect on profitability at the industry level.
Lazaridis and Tryfonidis (2006) investigated the relationship of corporate profitability
and working capital management of 131 companies listed in the Athens Stock Exchange
(ASE) for the period 2001–04. The purpose of this study was to establish a relationship
that was statistically significant, between profitability, the cash conversion cycle and its
components for listed firms in the ASE. The results of the research showed that there is a
statistical significance between profitability, measured through gross operating profit and
the cash conversion cycle. They observed that lower gross operating profit is associated
with an increase in the number of day’s accounts payables. Moreover, managers can
30

create profits for their companies by correctly handling the cash conversion cycle and
keeping each of the different components (accounts receivables, accounts payables and
inventory) to an optimum level.
Padachi (2006) analyzed the working capital management practices through a sample of
58 small manufacturing companies in Mauritius. The basic purpose of this study was to
examine the trends in working capital management and its impact on firms’ performance.
The regression results show that high investment in inventories and receivables is
associated with lower profitability. This study has also shown that the paper and printing
industry has been able to achieve high scores on the various components of working
capital and this has had a positive impact on its profitability. The findings also reveal an
increasing trend in the short-term component of working capital financing.
Raheman and Nasr (2007) provide further evidence about the relationship of working
capital management and profitability. Using variable and methodology as used by Deloof
(2003) on a sample of 94 companies listed on the Karachi Stock Exchange (KSE) for the
period 1999–2004, the results show that there is strong negative relationship between
variables of WCM and profitability of the firms. It means that as the cash conversion
cycle increases, it leads to decreasing profitability of the firm. Thus, managers can make
the shareholders’ value positive by reducing CCC to the minimum possible level. The
authors also found a positive relationship between the size of the firm and its profitability,
and a significant negative relationship between debt and profitability.
In a related study Afza and Nazir (2007) investigated the relationship between the
aggressive/conservative working capital policies of various industrial groups and a large
sample of 263 companies listed at Karachi Stock Exchange for a period of 1998–2003.
31

Using ANOVA and LSD test, the study found significant differences among the working
capital investment and financing policies across different industries. Using ordinary least
regression analysis, the authors concluded a negative relationship between the
profitability measures of firms and degree of aggressiveness of working capital
investment and financing policies.
Garcia-Teruel and Martinez-Solano (2007) for the first time examined the effect of
working capital management on profitability of small and medium sized Spanish firms.
Using panel data regression methodology, the authors revealed that managers can create
value by reducing their inventories and the number of days for which their accounts are
outstanding. The results of the study are similar to those found in previous studies that
focused on large firms (Deloof, 2003; Jose et al., 1996; Shin and Soenen, 1998; Wang,
2002). The authors further concluded that SMEs have to be concerned with working
capital management because they can also create value by reducing their cash conversion
cycle to a minimum, as far as that is reasonable.
Samiloglu and Demirgunes (2008) in their study examined the effect of working capital
management on firm profitability about companies listed at the Istanbul Stock exchange
(ISE). Using the multiple regression model, the study examined the effect of working
capital on firm profitability for the period of 1998–2007. The findings of the study show
that accounts receivables period, inventory period and lever- age affect firm profitability
negatively; while growth (in sales) affects firm profitability positively.
Zariyawati et al. (2009) used panel data of 1,628 firm years for the period between 1996–
2006 that consisted of six different economic sectors, in order to examine the relationship
between working capital management and firm profitability of the firms listed in
32

Malaysia. Results of this study found that the CCC is significantly negatively associated
with the firm profitability. They further emphasized that managers should focus on
reduction of the cash conversion period in order to create shareholder wealth. The results
of the study are consistent with that of other studies conducted in different markets. Luo
et al., (2009) find that the efficiency of a firm’s working capital management has a lasting
impact on the firm’s performance. Improvement in working capital efficiency leads to
increase in future earnings, as the market responds positively to the improvement of
working capital efficiency. Firm value increases when cash conversion cycle decreases.
Closer examination of literature on the relationship of working capital management and
profitability in general supports the fact that aggressive working capital policies enhance
firm profitability (Jose et al., 1996; Shin and Soenen, 1998 for US companies; Deloof,
2003 for Belgian firms; Wang, 2002 for Japanese and Taiwanese firms; Raheman and
Nasr, 2007 for Pakistan firms; Lazaridis and Tryfonidis, 2006 for Greek firms). This
implies that reducing working capital investment is likely to lead to higher profits.
Another point that emerges from the literature review is that the relationship has been
tested in various markets but no empirical evidence is available for the emerging
economy of India. This motivates us to explore the nature of relationship between
working capital management and profitability of Kenyan firms (supermarkets), which
forms the basis of the study.
2.8 Conceptual Framework
A concept is a basic building block that captures the essence of a thing. It refers to what
extent a researcher conceptualizes to be the relationship between contextual variables in
the study and show the relationship graphically or diagrammatically (Mugenda and Mu-
33
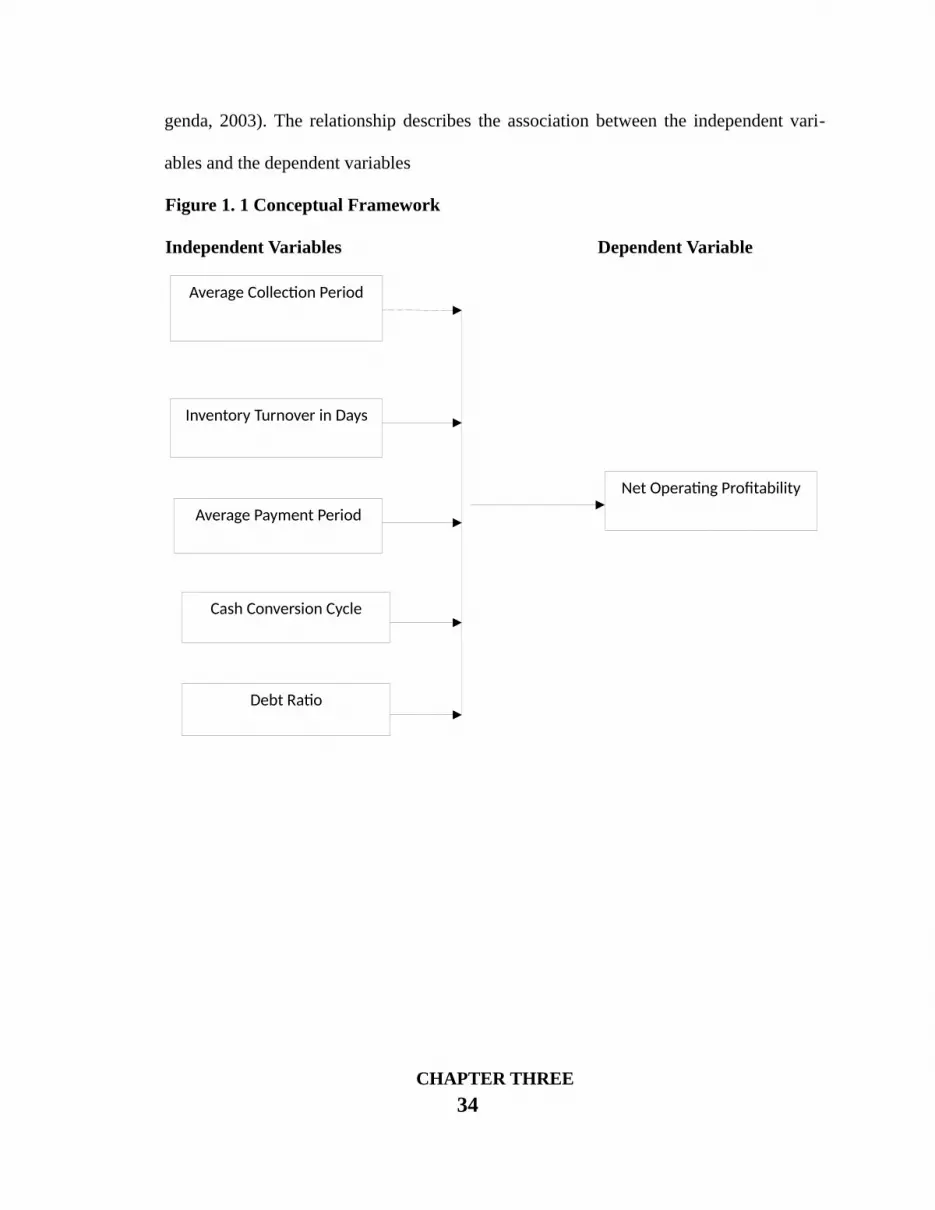
genda, 2003). The relationship describes the association between the independent vari-
ables and the dependent variables
Figure 1. 1 Conceptual Framework
Independent Variables Dependent Variable
CHAPTER THREE34
Average Collection Period
Inventory Turnover in Days
Average Payment Period
Net Operating Profitability
Cash Conversion Cycle
Debt Ratio

RESEARCH METHODOLOGY
3.0 Introduction
This chapter provides the methodology used in the research. It covers the design,
population, sampling techniques, instrumentation, reliability and validity of the
instrument, data collection and data analysis procedures.
3.1 Research Design
A research design according to (Kumar, 2005) is a plan, structure and strategy of invest-
igation so conceived as to obtain answers to research questions or problems.
Chandran(2004) describes research design as an understanding of conditions for collec-
tion and analysis of data in a way that combines their relationships with the research to
the economy of procedures. Kombo (2006) suggest that research design deals with the
detailing of procedures that are adopted to carry out a study. A research design has two
functions according to (Kumar, 2005). Through the research design, one can conceptual-
ize the research design and ensure that the procedures are adequate to obtain valid, ob-
jective and accurate answers to the research questions. Patton (2002) recommends that a
combination of both qualitative and quantitative method be employed to enrich the re-
search.
The research was a causal study design. Mugenda and Mugenda, (1999) stated that a cas-
ual study is an in depth investigation of an individual group, institution or phenomenon
whose purpose is to determine the relationship that has been caused by phenomenon of
the study. The research seeks to assess the relationship between working capital and prof-
itability of retail supermarket chains in Kenya.
35
3.2 The target population
Accordingly Ngechu (2004) a study population is a well-defined or specified set of
people, group of things, households, firms, services ,elements or events which are being
investigated. Thus, the population should fit a certain specification, which the researcher
is studying and the population should be homogenous.
The target population for this study will be the six supermarkets in Kenya; these are
Nakumatt, Tuskys, Uchumi, Ukwala, Naivas, and Eastmatt Supermarkets in Kenya with
audited accounts that are available to the public.
3.3 Sampling
At times dealing with all the numbers even of the smaller accessible population would in-
volve a tremendous amount of time and resources. It’s therefore advisable for the re-
searcher to further select a given number of members from the accessible population
(Kothari 2004). Therefore, the study selected the last five years of audited accounts from
the six supermarkets for analysis.
3.4 Data Collection
The study mainly depended on secondary data obtained from the financial statements of
the supermarkets. The study looked at the listed company’s trading data from the NSE
and the published audited accounts of the supermarkets to determine the relationship
between working capital management and profitability.
3.5 Data Analysis
The primary aim of this study was to investigate the impact of WCM on corporate profit-
ability of Kenyan firms. This is achieved by developing a methodology and empirical
36

framework as used by Nazir and Afza (2009), Zariyawati et al. (2008), Samiloglu and
Demirgunes (2008) and Garcia-Teruel and Martinez-Solano (2007).
Statistical Package for Social Sciences (SPSS) version 17 was used as an aid to analysis.
SPSS was preferred because of its ability to cover a wide range of most statistical and
graphical data analysis and is systematic. In order to understand the relationship between
working capital and profitability a linear multiple regression models was used. Coeffi-
cient of multiple regressions was computed. Multiple regression analysis enables making
of better predictions about the behaviour of dependent variable. Coefficient of multiple
regressions was computed to establish the proportion of variation in return on assets that
are explained by selected ratios.
3.5.1 Model Specifications
The general form of the regression model was:
NOP= b0 + b1 x1+b2x2+b3x3+b4x4 +…………….b n x n
where b0, b1,b2,b3,b4…………………….bn are parameters of the NOP line to be estimated.
X1X 2X3 X4 ………………Xn represents the selected ratios.
Specifically, the regression model was
NOP= b0+ b1CCC+b2ACP+b3ITID+b4APP+b5DR+e
Where;
NOP= Net Operating Profitability
ACP= Average Collection Period
ITID= Inventory Turnover in Days’
APP =Average Payment Period
CCC=Cash Conversion Cycle
37

DR = Debt Ratio
e =error
To deal with autocorrelation between the selected ratios relating to independent variables,
correlation analysis between the selected ratios relating to working capital management
and net operating profitability was computed .In event the two variables have high degree
of autocorrelation consideration was made to drop and also Durbin Watson statistic was
computed.
38
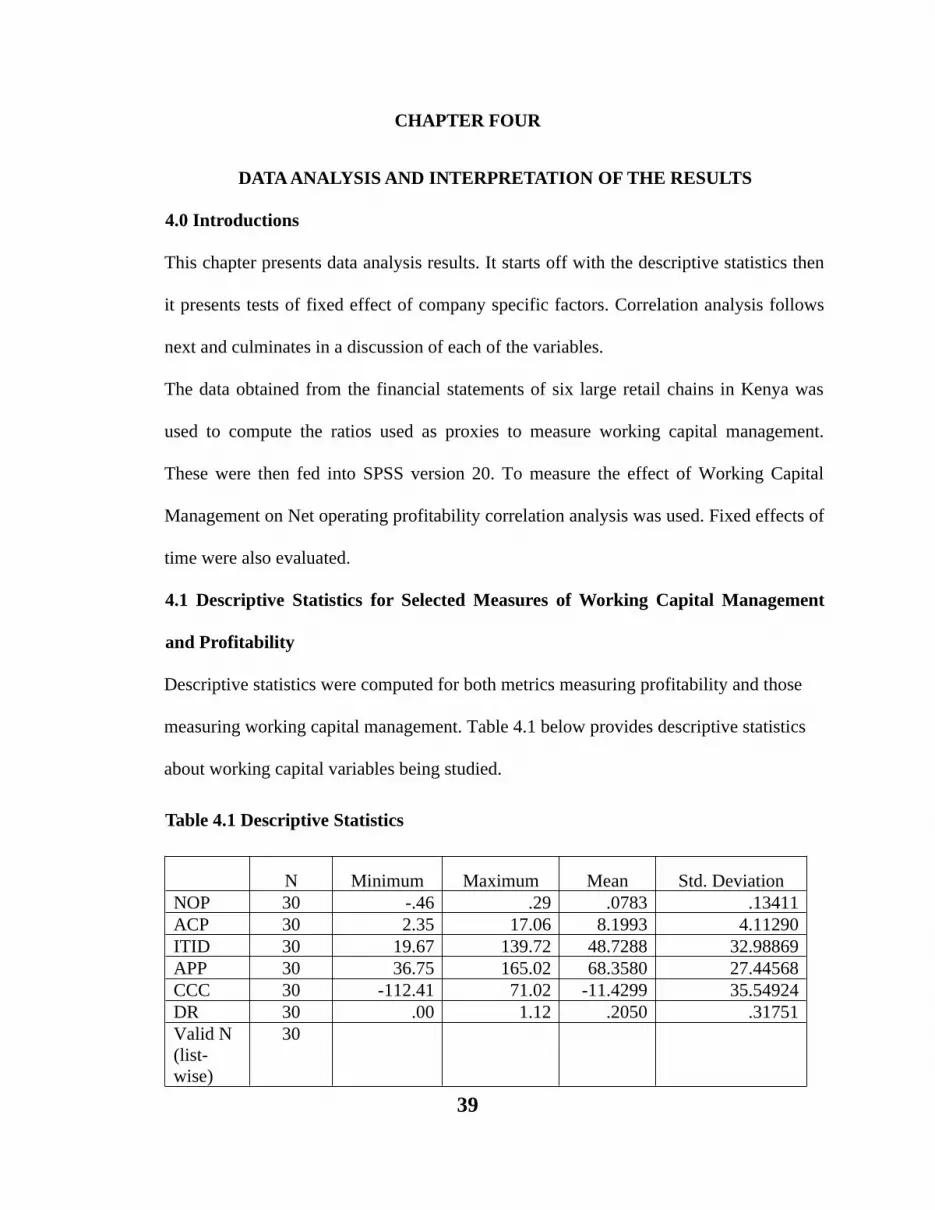
CHAPTER FOUR
DATA ANALYSIS AND INTERPRETATION OF THE RESULTS
4.0 Introductions
This chapter presents data analysis results. It starts off with the descriptive statistics then
it presents tests of fixed effect of company specific factors. Correlation analysis follows
next and culminates in a discussion of each of the variables.
The data obtained from the financial statements of six large retail chains in Kenya was
used to compute the ratios used as proxies to measure working capital management.
These were then fed into SPSS version 20. To measure the effect of Working Capital
Management on Net operating profitability correlation analysis was used. Fixed effects of
time were also evaluated.
4.1 Descriptive Statistics for Selected Measures of Working Capital Management
and Profitability
Descriptive statistics were computed for both metrics measuring profitability and those
measuring working capital management. Table 4.1 below provides descriptive statistics
about working capital variables being studied.
Table 4.1 Descriptive Statistics
N Minimum Maximum Mean Std. DeviationNOP 30 -.46 .29 .0783 .13411ACP 30 2.35 17.06 8.1993 4.11290ITID 30 19.67 139.72 48.7288 32.98869APP 30 36.75 165.02 68.3580 27.44568CCC 30 -112.41 71.02 -11.4299 35.54924DR 30 .00 1.12 .2050 .31751Valid N (list-wise)
30
39

The results show that the average Net Operating Profitability among large retail super-
market chains in Kenya is 0.0783 that is 7.8% with a standard deviation of 0.13411. Su-
permarkets have an Average Collection Period of 17 days with a standard deviation of
4.1129. The Average Inventory Turnover in Days is 48.7 days while Average Payment
Period for the firms is 68 days. The average Cash Conversion Cycle is -11 days with a
huge standard deviation of 35.7. The negative CCC is very healthy for the retail busi-
nesses as it means that they get paid 11 days earlier by their customers before they pay
their creditors. Debt Ratio on the other hand is 0.21.
4.1.1 Comparative means of various WCM ratios and NOP for each of the
supermarkets
As shown in table 4.2 below, apart from Uchumi supermarket which had a negative mean
for Net Operating Profitability of – 0.04, all the other retail chains had positive net oper-
ating profitability. The best performing in this respect was Ukwala (mean 0.13) while the
least performing was Uchumi supermarket (mean - 0.04). Naivas had the least ACP of
5.0 days while Nakumatt had the highest at 14 days. Similarly, Nakumatt had the highest
ITID of 116 days while Naivas had the lowest of 28 days. Uchumi had the highest APP
of 96 days while Eastmatt had the lowest of 41 days. The worst CCC was that of Naku-
matt of 44 days followed by Eastmatt of 1 day. All the other four supermarkets had negat-
ive cash conversion cycles with the lowest being that of Uchumi of – 48 days. These res-
ults suggest the existence of company-specific factors that potentially affect WCM and
40
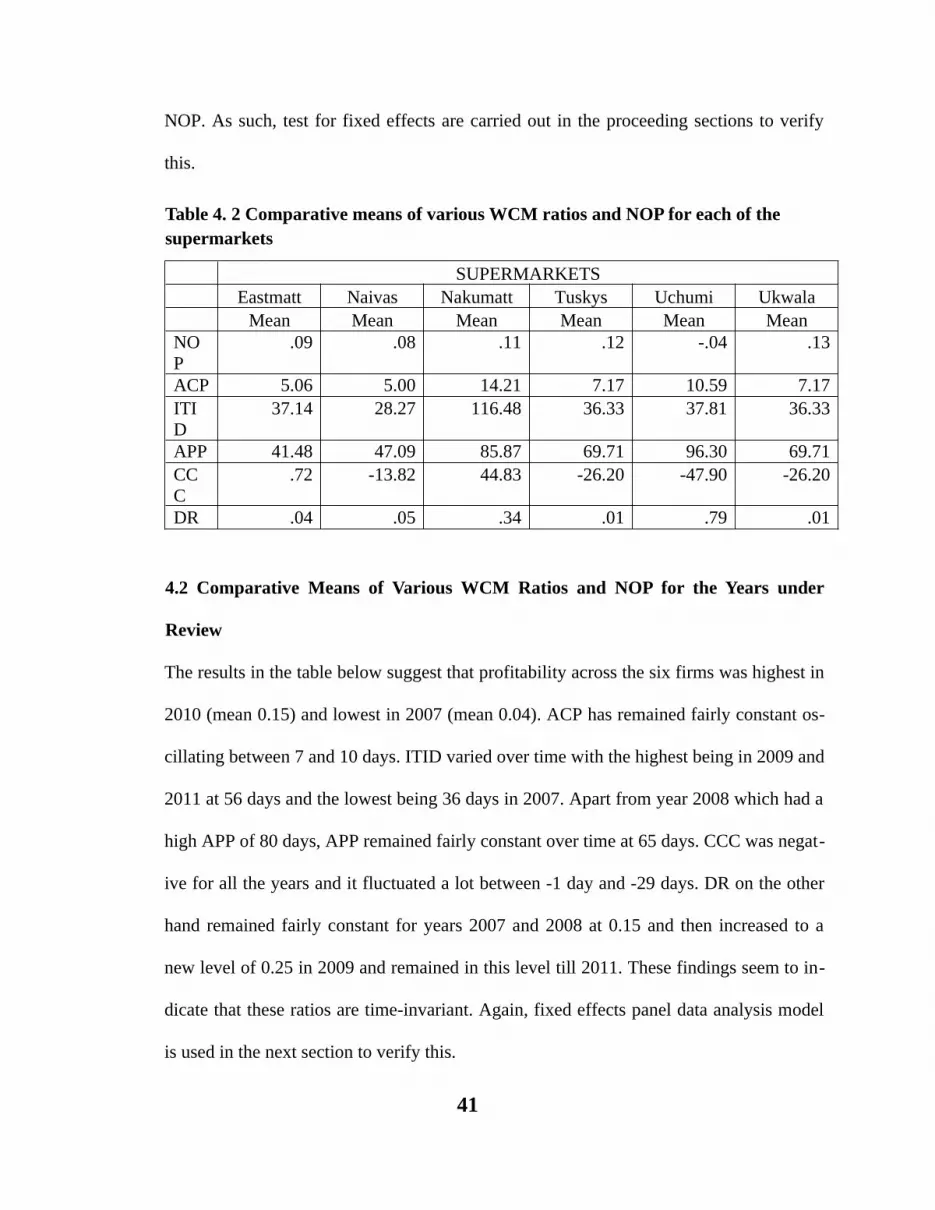
NOP. As such, test for fixed effects are carried out in the proceeding sections to verify
this.
Table 4. 2 Comparative means of various WCM ratios and NOP for each of the supermarkets
SUPERMARKETS Eastmatt Naivas Nakumatt Tuskys Uchumi Ukwala Mean Mean Mean Mean Mean Mean
NOP
.09 .08 .11 .12 -.04 .13
ACP 5.06 5.00 14.21 7.17 10.59 7.17ITID
37.14 28.27 116.48 36.33 37.81 36.33
APP 41.48 47.09 85.87 69.71 96.30 69.71CCC
.72 -13.82 44.83 -26.20 -47.90 -26.20
DR .04 .05 .34 .01 .79 .01
4.2 Comparative Means of Various WCM Ratios and NOP for the Years under
Review
The results in the table below suggest that profitability across the six firms was highest in
2010 (mean 0.15) and lowest in 2007 (mean 0.04). ACP has remained fairly constant os-
cillating between 7 and 10 days. ITID varied over time with the highest being in 2009 and
2011 at 56 days and the lowest being 36 days in 2007. Apart from year 2008 which had a
high APP of 80 days, APP remained fairly constant over time at 65 days. CCC was negat-
ive for all the years and it fluctuated a lot between -1 day and -29 days. DR on the other
hand remained fairly constant for years 2007 and 2008 at 0.15 and then increased to a
new level of 0.25 in 2009 and remained in this level till 2011. These findings seem to in-
dicate that these ratios are time-invariant. Again, fixed effects panel data analysis model
is used in the next section to verify this.
41

Year 2007 2008 2009 2010 2011 Mean Mean Mean Mean Mean
NOP .04 .06 .06 .15 .09ACP 7.02 8.36 9.96 8.25 7.42ITID 36.18 42.75 55.90 53.11 55.71APP 64.72 80.38 66.54 64.22 65.93CCC -21.52 -29.28 -.68 -2.86 -2.80DR .14 .15 .25 .25 .24
4.3 Correlation analysis
Correlation analysis was done for the various measures of working capital management.
Table 4.3 depicts the results obtained from Pearson correlation analysis for the variables.
Table 4.3 Correlation Analysis
Correlations NOP ACP ITID APP CCC DR
NOP Pearson Correla-tion
1
Sig. (2-tailed) ACP Pearson Correla-
tion-.296 1
Sig. (2-tailed) .112 ITID Pearson Correla-
tion.104 .677** 1
Sig. (2-tailed) .585 .000 APP Pearson Correla-
tion-.630** .659** .348 1
Sig. (2-tailed) .000 .000 .060 CCC Pearson Correla-
tion.548** .235 .738** -.373* 1
Sig. (2-tailed) .002 .211 .000 .042 DR Pearson Correla- -.181 .432* .295 .434* -.011 1
42

tionSig. (2-tailed) .338 .017 .113 .017 .954
The correlation analysis above shows that there are high correlations between different
measures of working capital management. The correlation between ACP and ITID is
(0.677), ACP and APP is (0.659), CCC and APP is (-0.373), CCC and ITID is (0.738).
To avoid multi-co linearity problem in the regression analysis, stepwise regression was
used so that some of those variables which are highly correlated are removed from the
model. The correlation coefficient between leverage that is financial debt ratio and net
operating profitability reveals a negative non-significant relationship between the two
variables. This implies that increase in debt utilization by the firms will reduce profitabil-
ity. Of the five WCM variables, only CCC and APP have a significant relationship with
NOP. CCC has a fairly strong significant positive correlation with NOP (Coefficient
0.548, P-Value 0.002). APP on the other hand has a negative fairly strong correlation
with NOP (Coefficient -0.63, P-Value 0.000). A multivariate regression model was ap-
plied to determine the relationship between Working Capital Management and Profitabil-
ity of retail supermarket chains in Kenya. The logistic regression used in this model is:
NOP= b0+ b1CCC+b2ACP+b3ITID+b4APP+b5DR+e
Where; NOP= Net Operating Profitability, ACP= Average Collection Period, ITID= In-
ventory Turnover in Days, APP =Average Payment Period, CCC=Cash Conversion
Cycle, DR = Debt Ratio and e =error. Regression analysis for each was done and inter-
preted.
4.4 Regression Analysis
Regression analysis was done to determine whether there is any relationship between
working capital management and profitability using five year data from 2007 to 2011.
43

4.4.1 Regression Results For 2007
Table 4.4 and 4.5 shows the results of the model and coefficients obtained using 2007
data.
Table 4.4 Regression Model Summary For 2007
Model R R Square
Adjusted R
Square
Std. Error of the Estim-
ate
1 1.000(a) 1.000 1.000 .00000000
Source, Research Data (2013)
Adjusted R2 is called the coefficient of determination and tells us how the profitability of
supermarket in Kenya varied with working capital management. From table above, the
value of adjusted R2 is 0.1. This implies that, there was a variation of 100% of profitabil-
ity of supermarket in Kenya with changes in working capital management at a confidence
level of 95%. This means that 100% of the profits of supermarket in Kenya is attributable
to working capital management. The coefficient of correlation shows that there was a
strong relationship between profitability of supermarket and various factors of working
capital management as shown by a factor of 1. Table 4.5 below shows coefficients results
using 2007 data.
Table 4.5 2007 Coefficients results
Model Unstandardized Coefficients
Standardized
Coefficients t Sig.
B Std. Error Beta
1 (Constant) -.058 .000 . .
ACP -.148 .000 -.254 . .
ITID .021 .000 .234 . .
APP .020 .000 .442 . .
CCC .003 .000 .038 . .
44

DR .924 .000 .847 . .
Source, Research Data (2013)
From the above coefficient results of year 2007 the established regression equation was;
NOP= -0.058 + 0.003 CCC – 0.148 ACP + 0.021 ITID+ 0.020APP+ 0.924 DR
From the above equation the study found that holding Average Collection Period, Invent-
ory Turnover in Days’, Average Payment Period, Cash Conversion Cycle and Debt Ratio
to a constant zero net operating profit would be equal to -0.058. A unit increase in Cash
Conversion Cycle lead to increase in profitability by a factor of 0.003, a unit increase Av-
erage Collection Period would lead to decrease in profitability by a factor of 0.148, unit
increase in Inventory Turnover in Days’ lead to increase in profitability by factor of
0.021, a unit increase in Average Payment Period leads to increase in profitability by
factors of 0.020, further unit increase in debt ratio leads to increase in profitability by
factors of 0.924.
4.4.2 Regression Results For 2008
Table 4.6 and 4.7 shows the results of the model and coefficients obtained using 2008
data.
Table 4.6 Model Summary For 2008
Mo
del R R Square
Adjusted R
Square
Std. Error of the Es-
timate
1 1.000(a) 1.000 1.000 .00000019
Source, Research Data (2013)
45
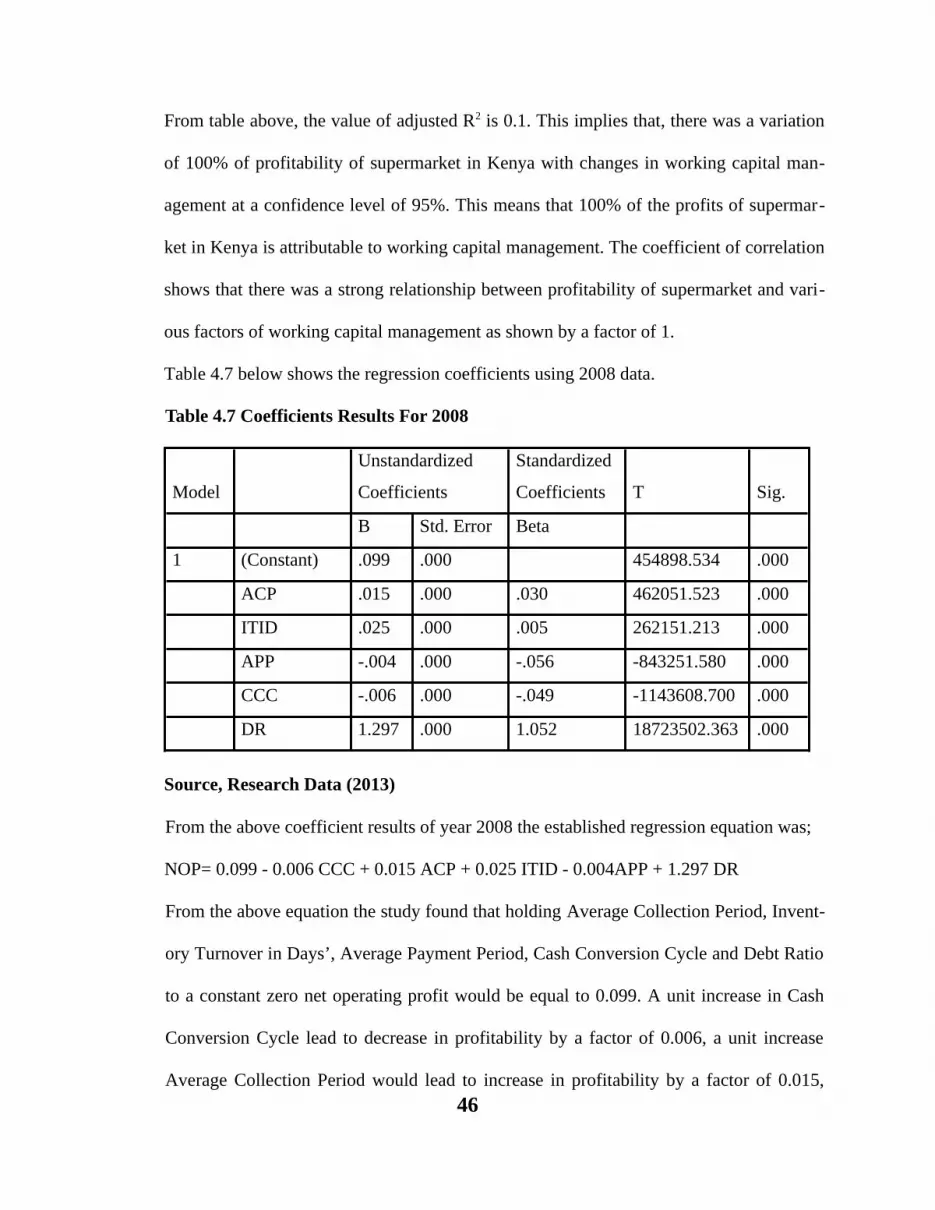
From table above, the value of adjusted R2 is 0.1. This implies that, there was a variation
of 100% of profitability of supermarket in Kenya with changes in working capital man-
agement at a confidence level of 95%. This means that 100% of the profits of supermar-
ket in Kenya is attributable to working capital management. The coefficient of correlation
shows that there was a strong relationship between profitability of supermarket and vari-
ous factors of working capital management as shown by a factor of 1.
Table 4.7 below shows the regression coefficients using 2008 data.
Table 4.7 Coefficients Results For 2008
Model
Unstandardized
Coefficients
Standardized
Coefficients T Sig.
B Std. Error Beta
1 (Constant) .099 .000 454898.534 .000
ACP .015 .000 .030 462051.523 .000
ITID .025 .000 .005 262151.213 .000
APP -.004 .000 -.056 -843251.580 .000
CCC -.006 .000 -.049 -1143608.700 .000
DR 1.297 .000 1.052 18723502.363 .000
Source, Research Data (2013)
From the above coefficient results of year 2008 the established regression equation was;
NOP= 0.099 - 0.006 CCC + 0.015 ACP + 0.025 ITID - 0.004APP + 1.297 DR
From the above equation the study found that holding Average Collection Period, Invent-
ory Turnover in Days’, Average Payment Period, Cash Conversion Cycle and Debt Ratio
to a constant zero net operating profit would be equal to 0.099. A unit increase in Cash
Conversion Cycle lead to decrease in profitability by a factor of 0.006, a unit increase
Average Collection Period would lead to increase in profitability by a factor of 0.015, 46

unit increase in Inventory Turnover in Days’ lead to increase in profitability by factor of
0.025, a unit increase in Average Payment Period leads to decrease in profitability by
factors of 0.004, further unit increase in debt ratio leads to increase in profitability by
factors of 01.297.
4.4.3 Regression Results For 2009
Table 4.8 and 4.9 shows the results of the model and coefficients obtained using 2009
data.
Table 4.8 Model Summary for 2009
Model R R Square Adjusted R Square
Std. Error of the Es-
timate
1 1.000(a) 1.000 1.000 .04418062
Source, Research Data (2013)
From table above, the value of adjusted R2 is 0.1. This implies that, there was a variation
of 100% of profitability of supermarket in Kenya with changes in working capital man-
agement at a confidence level of 95%. This means that 100% of the profits of supermar-
ket in Kenya is attributable to working capital management. The coefficient of correlation
shows that there was a strong relationship between profitability of supermarket and vari-
ous factors of working capital management as shown by a factor of 1.
Table 4.9 below shows the regression coefficients using 2009 data.
Table 4.9 Coefficients For 2009
Model
Unstandardized Coef-
ficients
Standardized
Coefficients t Sig.
B Std. Error Beta
1 (Constant) -2.626 .043 -60.583 .011
47
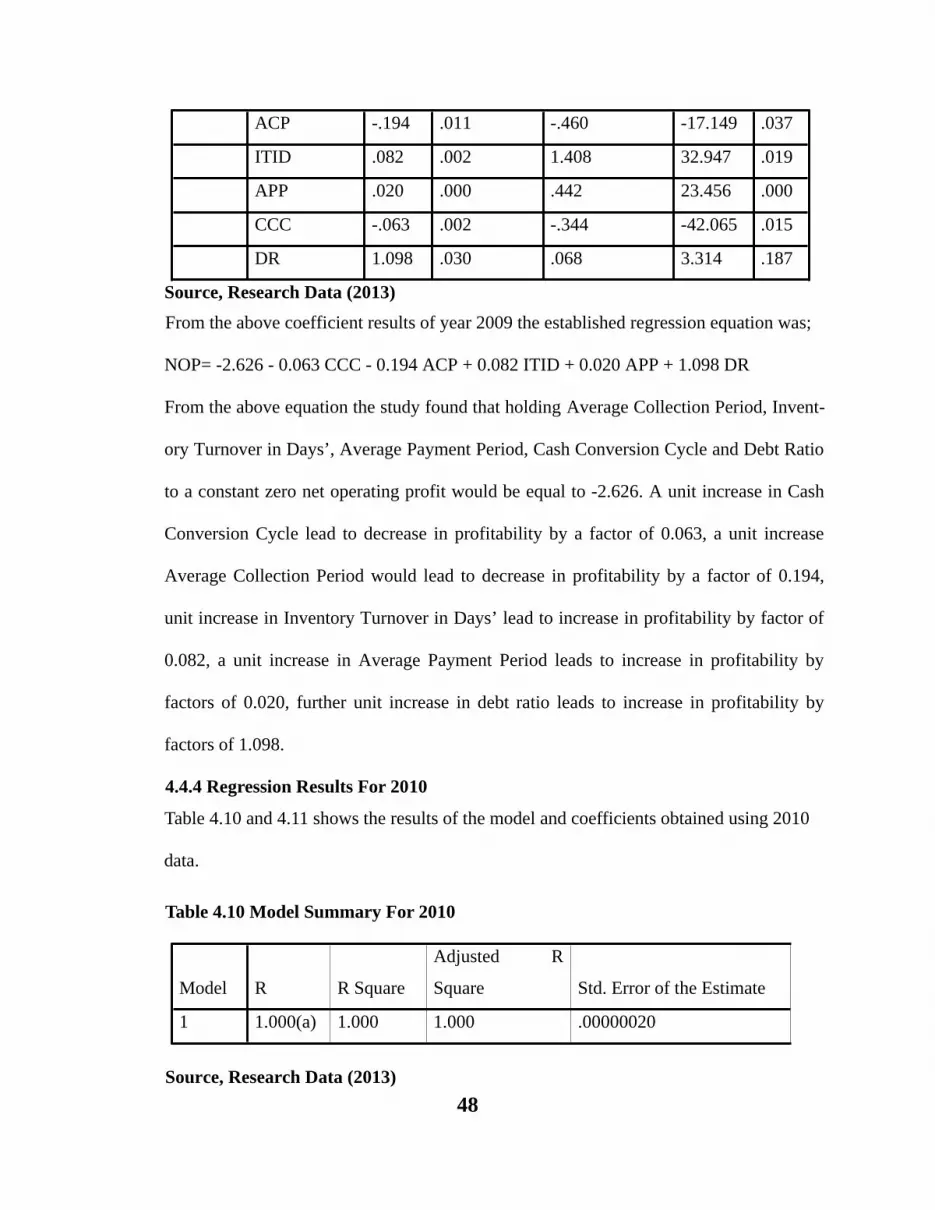
ACP -.194 .011 -.460 -17.149 .037
ITID .082 .002 1.408 32.947 .019
APP .020 .000 .442 23.456 .000
CCC -.063 .002 -.344 -42.065 .015
DR 1.098 .030 .068 3.314 .187
Source, Research Data (2013)
From the above coefficient results of year 2009 the established regression equation was;
NOP= -2.626 - 0.063 CCC - 0.194 ACP + 0.082 ITID + 0.020 APP + 1.098 DR
From the above equation the study found that holding Average Collection Period, Invent-
ory Turnover in Days’, Average Payment Period, Cash Conversion Cycle and Debt Ratio
to a constant zero net operating profit would be equal to -2.626. A unit increase in Cash
Conversion Cycle lead to decrease in profitability by a factor of 0.063, a unit increase
Average Collection Period would lead to decrease in profitability by a factor of 0.194,
unit increase in Inventory Turnover in Days’ lead to increase in profitability by factor of
0.082, a unit increase in Average Payment Period leads to increase in profitability by
factors of 0.020, further unit increase in debt ratio leads to increase in profitability by
factors of 1.098.
4.4.4 Regression Results For 2010
Table 4.10 and 4.11 shows the results of the model and coefficients obtained using 2010
data.
Table 4.10 Model Summary For 2010
Model R R Square
Adjusted R
Square Std. Error of the Estimate
1 1.000(a) 1.000 1.000 .00000020
Source, Research Data (2013)48

From table above, the value of adjusted R2 is 0.1. This implies that, there was a variation
of 100% of profitability of supermarket in Kenya with changes in working capital man-
agement at a confidence level of 95%. This means that 100% of the profits of supermar-
ket in Kenya is attributable to working capital management. The coefficient of correlation
shows that there was a strong relationship between profitability of supermarket and vari-
ous factors of working capital management as shown by a factor of 1. Table 4.11 below
shows the regression coefficients using 2010 data.
Table 4.11 Coefficients For 2010
Model
Unstandardized
Coefficients
Standardized
Coefficients T Sig.
B Std. Error Beta
1 (Constant) .081 .000 149595.329 .000
ACP .002 .000 .005 23640.398 .000
ITID -.001 .000 -.029 -382854.318 .000
APP .025 .000 .005 262151.213 .000
CCC -.006 .000 -.071 -702410.403 .000
DR 1.250 .000 .957 3943725.099 .000
Source, Research Data (2013)
From the above coefficient results of year 2010 the established regression equation was;
NOP= 0.081 - 0.006 CCC + 0.002ACP - 0.001 ITID + 0.025 APP + 1.250 DR
From the above equation the study found that holding Average Collection Period, Invent-
ory Turnover in Days’, Average Payment Period, Cash Conversion Cycle and Debt Ratio
to a constant zero net operating profit would be equal to 0.081. A unit increase in Cash
Conversion Cycle lead to decrease in profitability by a factor of 0.006, a unit increase
Average Collection Period would lead to increase in profitability by a factor of 0.002, 49
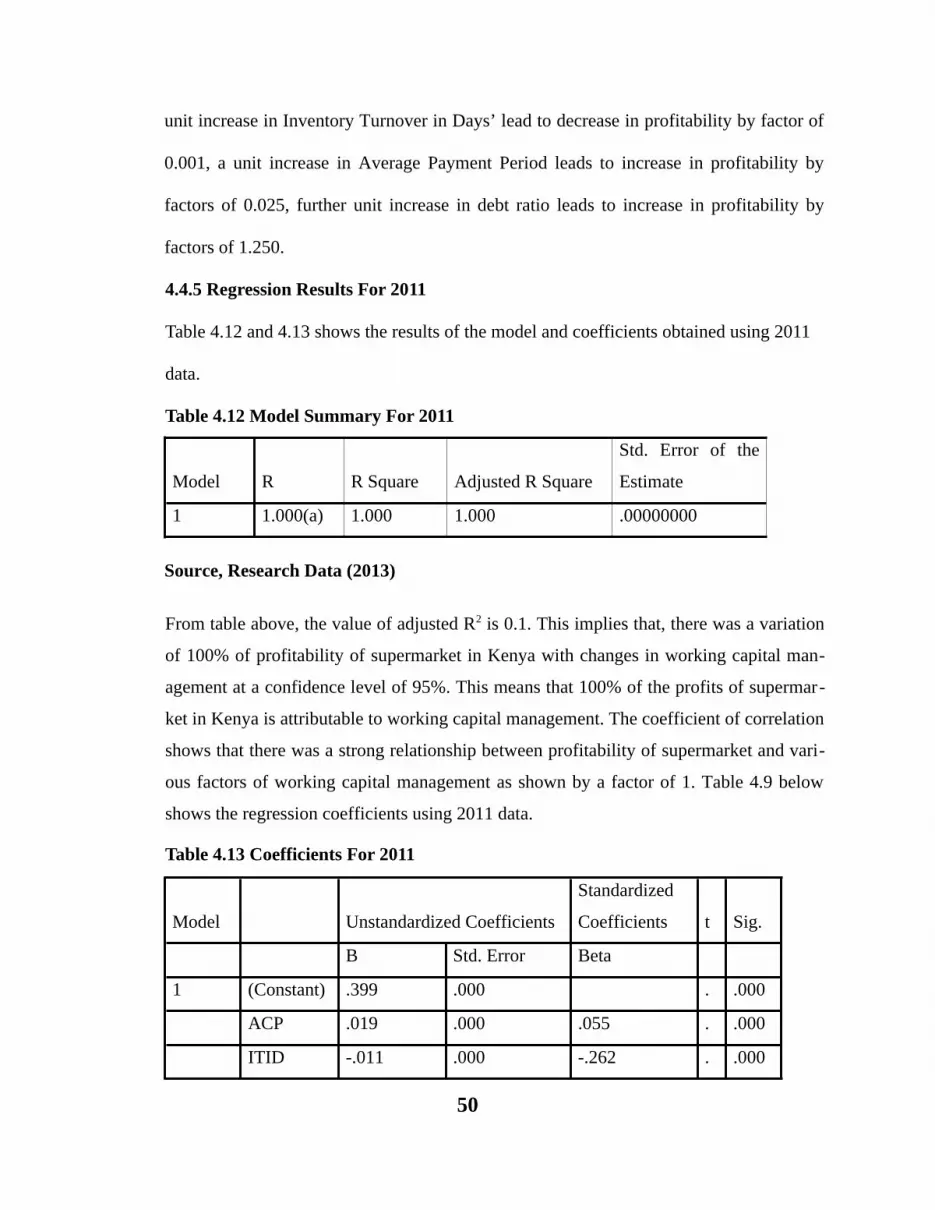
unit increase in Inventory Turnover in Days’ lead to decrease in profitability by factor of
0.001, a unit increase in Average Payment Period leads to increase in profitability by
factors of 0.025, further unit increase in debt ratio leads to increase in profitability by
factors of 1.250.
4.4.5 Regression Results For 2011
Table 4.12 and 4.13 shows the results of the model and coefficients obtained using 2011
data.
Table 4.12 Model Summary For 2011
Model R R Square Adjusted R Square
Std. Error of the
Estimate
1 1.000(a) 1.000 1.000 .00000000
Source, Research Data (2013)
From table above, the value of adjusted R2 is 0.1. This implies that, there was a variation
of 100% of profitability of supermarket in Kenya with changes in working capital man-
agement at a confidence level of 95%. This means that 100% of the profits of supermar-
ket in Kenya is attributable to working capital management. The coefficient of correlation
shows that there was a strong relationship between profitability of supermarket and vari-
ous factors of working capital management as shown by a factor of 1. Table 4.9 below
shows the regression coefficients using 2011 data.
Table 4.13 Coefficients For 2011
Model Unstandardized Coefficients
Standardized
Coefficients t Sig.
B Std. Error Beta
1 (Constant) .399 .000 . .000
ACP .019 .000 .055 . .000
ITID -.011 .000 -.262 . .000
50

APP .003 .000 .038 .000
CCC -.002 .000 -.021 . .000
DR 1.507 .000 1.174 . .000
Source, Research Data (2013)
From the above coefficient results of year 2011 the established regression equation was;
NOP= 0.399 - 0.0602 CCC + 0.019 ACP - 0.011 ITID + 0.003 APP + 1.174 DR
From the above equation the study found that holding Average Collection Period, Invent-
ory Turnover in Days’, Average Payment Period, Cash Conversion Cycle and Debt Ratio
to a constant zero net operating profit would be equal to 0.399. A unit increase in Cash
Conversion Cycle lead to decrease in profitability by a factor of 0.002, a unit increase
Average Collection Period would lead to increase in profitability by a factor of 0.019,
unit increase in Inventory Turnover in Days’ lead to increase in profitability by factor of
0.011, a unit increase in Average Payment Period leads to increase in profitability by
factors of 0.003, further unit increase in debt ratio leads to increase in profitability by
factors of 1.507.
51

CHAPTER FIVE:
DISCUSSIONS, CONCLUSIONS AND RECOMMENDATIONS
5.0 Introduction
This chapter presents the discussions drawn from the data findings analysed and presen-
ted in the chapter four. The chapter is structured into discussions, conclusions, recom-
mendations and areas for further research.
5.1 Discussions
Descriptive statistics were computed for both metrics measuring profitability and that
measuring working capital management. The study found that the Net Operating Profitab-
ility among large retail supermarket chains in Kenya is 0.08 that is 8% with a standard
deviation of 0.13. Supermarkets have an Average Collection Period of 17 days with a
standard deviation of 4.06. The Average Inventory Turnover in Days is 48 days while
Average Payment Period for the firms is 68 days. The average Cash Conversion Cycle is
-11 days with a huge standard deviation of 35.7. The negative CCC is very healthy for the
retail businesses as it means that they get paid 11 days earlier by their customers before
they pay their creditors. Debt Ratio on the other hand is 0.21.
The study found that apart from Uchumi supermarket which had a negative mean for Net
Operating Profitability of – 0.04, all the other retail chains had positive net operating
52

profitability. The best performing in this respect was Ukwala (mean 0.13) while the least
performing was Uchumi supermarket (mean - 0.04). Naivas had the least ACP of 5 days
while Nakumatt had the highest at 14 days. Similarly, Nakumatt had the highest ITID of
116 days while Naivas had the lowest of 28 days. Uchumi had the highest APP of 96
days while Eastmatt had the lowest of 41 days. The worst CCC was that of Nakumatt of
44 days followed by Eastmatt of 1 day. All the other four supermarkets had negative cash
conversion cycles with the lowest being that of Uchumi of – 48 days. These results sug-
gest the existence of company-specific factors that potentially affect WCM and NOP. As
such, test for fixed effects was carried out to verify this.
The study also found that profitability across the six firms was highest in 2010 (mean
0.15) and lowest in 2007 (mean 0.04). ACP has remained fairly constant oscillating
between 7 and 10 days. ITID varied over time with the highest being in 2009 and 2011 at
58 days and the lowest being 36 days in 2007. Apart from year 2008 which had a high
APP of 80 days, APP remained fairly constant over time at 65 days. CCC was negative
for all the years and it fluctuated a lot between -1 day and -29 days. DR on the other hand
remained fairly constant for years 2007 and 2008 at 0.15 and then increased to a new
level of 0.25 in 2009 and remained in this level till 2011. These findings seem to indicate
that these ratios are time-invariant. Again, fixed effects panel data analysis model was
used to verify this.
From the correlation analysis the study found that there are high correlations between dif-
ferent measures of working capital management. The correlation between ACP and ITID
is (0.677), ACP and APP is (0.659), CCC and APP is (-0.655), CCC and ITID is (0.738).
To avoid multi-co linearity problem in the regression analysis, stepwise regression is used
53

so that some of those variables which are highly correlated are removed from the model.
The correlation coefficient between leverage i.e. financial debt ratio and net operating
profitability reveals a negative non-significant relationship between the two variables.
This implies that increase in debt utilization by the firms will reduce profitability. Of the
five WCM variables, only CCC and APP have a significant relationship with NOP. CCC
has a fairly strong significant positive correlation with NOP (Coefficient 0.548, P-Value
0.002). APP on the other hand has a negative fairly strong correlation with NOP (Coeffi-
cient -0.63, P-Value 0.000).
The study found that the regression equation for the period 2007 to 2011 to determine the
relationship between Working Capital Management and Profitability of retail supermar-
ket chains in Kenya were:
Year 2007:
NOP= -0.058 + 0.003 CCC – 0.148 ACP + 0.021 ITID+ 0.020APP+ 0.924 DR
Year 2008:
NOP= 0.099 - 0.006 CCC + 0.015 ACP + 0.025 ITID - 0.004APP + 1.297 DR
Year 2009:
NOP= -2.626 - 0.063 CCC - 0.194 ACP + 0.082 ITID + 0.020 APP + 1.098 DR
Year 2010:
NOP= 0.081 - 0.006 CCC + 0.002ACP - 0.001 ITID + 0.025 APP + 1.250 DR
Year 2011:
NOP= 0.399 - 0.0602 CCC + 0.019 ACP - 0.011 ITID + 0.003 APP + 1.174 DR
From the above regression model for the five years, the study found that there exists a re-
lationship between Working Capital Management and Profitability of retail supermarket
54

chains in Kenya. The study found the intercept to vary though with the highest value be-
ing 0.399 and the lowest being -2.626, this mean that profitability of supermarkets would
range between -2.626 and 0.399 holding various factors of working capital management
types to a constant zero. The study also found the coefficient of Cash Conversion Cycle,
Average Collection Period, Inventory Turnover in Days’ and Average Payment Period
vary from positive to negative, Debt Ratio was found to vary on the positive having it
highest coefficient thus highest effect on profitability of supermarkets in Kenya. These
findings contradict the findings of Myers and Majlof (1984), Rajan and Zingales (1995),
shin and Soenen (1998) and Deloof (2003) who predicted a negative relationship between
leverage and profitability.
From the Adjusted R2 the study found that, there was a variation of 100% of profitability
of supermarkets in Kenya with changes in working capital management at a confidence
level of 95%. This means that 100% of the profits of supermarket in Kenya is attributable
to working capital management. The coefficient of correlation shows that there was a
strong relationship between profitability of supermarket and various factors of working
capital management as shown by a factor of 1.
5.2 Conclusions
The study concludes that there exists relationship between Working Capital Management
and Profitability of retail supermarket chains in Kenya; leverage was found to positively
influence the profitability of supermarkets in Kenya.
55

5.3 Recommendations for Further Research.
On the basis of the findings in this study, there is much to be done about working capital
management in future. Future research should be conducted on the same topic with
different firms both listed and non-listed and extending the number of years of the
sample. The scope of further research may be extended to other working capital
components including cash, current ratio and marketable securities.
REFERENCES
A. M. A. Eljelly, (2004) “Liquidity-Profitability Tradeoff: An Empirical Investigation in An Emerging Market,” International Journal of Commerce & Management, vol. 14, no. 2, pp. 48-60,
A. Raheman, and M. Nasr, (2007) “Working Capital Management and Profitability-Case of Pakistan Firms,” International Review of Business Research Papers, vol., no.1 , pp. 279-300 ,
Abdullatif and Maryam A. 2010. Cash Conversion Cycle and Firm’s Performance of Japanese Firms, journal of business management and international finance, Pg 61-67
Afza, T., & Nazir, M.S. (2007). Working capital management policies of firms: Empir-ical evidence from Pakistan. In the Proceedings of 9th South Asian Management Forum (SAMF), 24–25 February, NorthSouthUniversity, Dhaka, Bangladesh.
Akinwande, G.S. (2009), “Working Capital Management in Telecommunication Sector, A Case Study of VGC Telecoms”, School of Management, Blekinge Institute of Technology.
Al-Mwalla, M., (2012), “the impact of working capital policies on Firm’s profitability and value: the case of Jordan”, International research journal of finance and eco-nomics, ISSN 1450-2887, Issue 85, Pp.147-153
56
Al-Shubiri, F. N. (2011),” Analysis the relationship between working capital policy and operating risk: an Empirical study on Jordanian industrial companies”, HebronUniversity research Journal. Vol (6), No(1), Pp 287-306
Autukaite and Molay (2011), “ cash holding, working capital and fir value: evidence from France”, International conference of the French Finance association (AFFI), Pp11-13
B. Abuzayed, (2012) “Working capital management and firm’s performance in emerging markets: the case of Jordan,” International Journal of Managerial Finance, vol. 8, no. 2, pp. 155-179,
Bandara, R.M.S. and Weerakoon Banda Y.K., (2011), “Impact of working capital man-agement practices on firm value”, retrieved from: http://www.kln.ac.lk/uokr/ICBI2011/A&F%20140.pdf
Banjerjee, B., (2005), “ financial policy and management accounting”, prentice-Hall of India private Limited
Bensoussan, A., Chutani, A., and Sethi, S., (2009), “Optimal cash management under un-certainty”, Operation s Research Letters, Vol. 37, Pp. 425-429
Bougheas, S, Mateut, S. and Mizen, P., (2009), “Corporate trade credit and inventories: new evidence of a trade-off from account receivables and account payable”, Journal of Banking and Finance 33, Pp. 300-307
Brigham & Houston (2007), “Fundamentals of Financial Management”, 10th Edition, South Western, a part of Cengage Learning
Charitou, M, M. Elfani, and Lois, P. (2010), “The Effect of Working Capital Manage-ment on Firm's Profitability: Empirical Evidence From An Emerging Market”, Journal of Business & Economics Research, Volume 8, Number 12.
Damodaran, A., (1997), “corporate finance: Theory and Practice”, published by John Wiley &Sons, Inc, printed in the United Stated of American
Deloof, M. (2003), “Does Working Capital Management Affect Profitability of Belgian Firms?” Journal of Business Finance & Accounting, 30(3&4), 573-587
Deloof, M. (2003). Does Working Capital Management Affect Profitability of Belgian Firms?. Journal of Business Finance & Accounting , 30 (3-4), 573-588.
Deloof, M. (2003). Does Working Capital Management Affect Profitability of Belgian Firms?. Journal of Business Finance & Accounting, 30 (3-4), 573-588.
57
Dittmar A, Marth-Smith J, 2007. “Corporate governance and the value of cash holdings”, Journal of Financial Economics 83, Pp.599-634.
Dong and Su (2010), “The Relationship between Working Capital Management and Profitability: A Vietnam Case”,International Research Journal of Finance and Economics ISSN 1450-2887 Issue 49 (2010)
Erasmus, P. D. (2010), “Working Capital Management and Profitability: The Relation-ship between the Net Trade Cycle and Return on Assets”, Management Dynam-ics, Vol. 19, No. 1
Erasmus, Pierre (2010), “The Relationship Between Working Capital Management and Profitability for South African Listed Industrial Firms”, The Business Review, Cambridge, Vol. 15, Num. 1
Faulkender, M., & Wang, R. (2006). Corporate Financial policy and the Value of Cash. Journal of Finance (61), 1957-1997.
Ferris, J. S (1981), “A transactions Theory of trade credit Use”, the Quarterly journal of Economics, vol. 96. No. 2, Pp.243-270
Filbeck, G., & Krueger, T. (2005). An Analysis of Working Capital Management Results Across Industries. Mid-American Journal of Business, 20, 10-17.
Frankel J.R., Wallen N. E. (2009). Single – Subject Research. In Frankel J.R., Wallen N. E. (Eds), How to Design & Evaluate Research in Education. (7th ed.).New York, NY:
G. Filbeck and T. Krueger, (2005) “Industry Related Differences in Working Capital Management” Mid-American Journal of Business, vol. 20, no. 2, pp. 11-18,
Ganesan, V., (2007), “An analysis of working capital management efficiency in Tele-communication equipment industry”, Rivier Academic Journal, Vol 3, No.2835-2856.
Garcia-Teruel, J.P., & Martinez-Solano, P. (2007). Effects of working capital manage-ment on SME profitability. International Journal of Managerial Finance, 3(2), 164–177.
Garcia-Teruel, Pedro Juan, Solano, Pedro Martinez (2007). “Effects of Working Capital Management on SME Profitability”, International Journal of Managerial Fin-ance, Vol. 3 No. 2 pp. 164 - 177.
Gill (2010), “The Relationship Between Working Capital Management and Profitability: Evidence from the United States”, Business and Economics Journal, Vol. 2010: BEJ-10
58
Gill, A. and Shah, C. (2012), “Determinants of Corporate Cash Holdings: Evidence from Canada”, International Journal of Economics and Finance, Vol 4, No.1
Gillbert, E., and Reichert, A., (1995), “The practice of financial management among large United States corporations ”, Financial practice and Education 5 (1), Pp.16-23
Guariglia, A., and Mateut, S., (2006), “Credit channel, trade credit channel, and inventory investment: evidence from a panel of UK firms”, Journal of Banking and Fin-ance, 30(10), Pp.2
Hill, M. D. Kelly, G. W. and Lockhart, G. B., (2012), “Shareholder Returns from Supply-ing Trade Credit”, Financial Management, Vol 41, Issue 1, Pp. 255-280
I. Lazaridis and D. Tryfonidis, (2006) “Relationship Between Working Capital Manage-ment and Profitability of Listed Companies in the Athens Stock Exchange,” Journal of Financial Management and Analysis, vol. 18, no. 1, pp. 26-35,
Jose, M., Lancaster, C., & Stevens, J. (1996). Corporate Returns and Cash Conversion Cycle' Journal of Economics and Finance. 20 (1), 33-46.
Jose, M.L., Lancaster, C., & Stevens, J.L. (1996). Corporate return and cash conversion cycle. Journal of Economics and Finance, 20(1), 33–46.
Jose, M.L., Lancaster, C., & Stevens, J.L. (1996). Corporate return and cash conversion cycle. Journal of Economics and Finance, 20(1), 33–46. Lazaridis, I., & Try-fonidis, D.
K. Smith, (2007) “Profitability versus Liquidity Tradeoffs in Working Capital Manage-ment,” in Readings on the Management of Working Capital, West Pulishing Company, St. Paul, New York, 1880.
Keane, T. & Wang, P. (1995), Applications for the Lifetime Value Model in Modern Newspaper Publishing. Journal of Direct Marketing, 9(2), 59–66.
Khan and Jain (2004), “Financial Management: Text, Problems and Cases,” 4th Edition, Tata McGraw-Hill Publishing Company Limited
Kiprono D.K. (2004), “Relationship between cash flow and earnings performance measures for companies listed on Nairobi Stock Exchange” Unpublished MBA Management Research Paper, University of Nairobi.
Kohler, M., Britton, E., Yates, T., (2000), “Trade credit and the monetary transmission mechanism”, Working paper, Bank of England.
59
Kulkarni, A. (2011), “Working Capital Policies”, retrieved from: http://www.buzzle.com/articles/working-capital-policy.html
Kumar, V. (2010), “Debtor management”, accounting education, Retrieved from http://www.svtuition.org/2010/03/debtor-management-finance.html
Lazaridis and Tryfonidis (2006), “Relationship between working capital management and profitability of listed companies in the Athens Stock Exchange”, Journal of Financial Management and Analysis. Vol. 19 pp26-35.
Lazaridis, I. and Tryfonidis, D. (2006), "The Relationship between Working Capital Management and Profitability of Listed Companies in the Athens Stock Ex-change, Journal of Financial Management andAnalysis, Vol. 19, No. 1, pp. 26 – 35
Long, M.S, Malitz, I. B., and Ravid, S.A., (1993), “Trade Credit, Quality Guarantee and Product Marketability”, Financial management 22 (4), Pp.117-127
Luo, M.M., Lee, J.J., & Hwang, Y. (2009). Cash conversion cycle, firm performance and stock value Retrieved from www90.homepage.villanova.edu/michael./ML_CCC_20090420.pdf
Lyroudi, K., & Lazaridis, Y. (2000). The cash conversion cycle and liquidity analysis of the food industry in Greece. (Electronic Version) EFMA, Athens. Retrieved from http://ssrn.com/paper=236175.
M. Deloof, (2003) “Does Working Capital Management Affect Profitability of Belgian Firms?” Journal of Business Finance and Accounting, vol. 30, no. 3&4, pp. 573-587.
M. S. Nazir, and T. Afza., (2009) “Working Capital Requirements and the Determining Factors in Pakistan,” The IUP Journal of Applied Finance, vol.15, no. 4, pp. 28-38,
Mathur, S.B., (2002), “Working capital management and control: principles and prac-tice”, published by K.K. Guta for New Age International (P) Ltd
Mathuva (2007), “The Influence of Working Capital Components on Corporate Profitability: A Survey on Kenyan Listed Firms”, 2009 Academic Journals Inc
Meltzer, A. H., (1960), “ Mercantile Credit, Monetary Policy, and Size of Firms”, the re-view of Economics and Statistics 42:4, Pp. 429-437
Mugenda & Mugenda (2003), Research Methods Quantitative & Qualitative, Kenyatta University, Nairobi.
60

Nazir, M., & Afza, T. (2009). Impact of Aggressive Working Capital Management Policy on Firms’ Profitability. The IUP Journal of Applied Finance, 25 (8), 19-30.
Nazir, M.S., & Afza, T. (2009). Working capital requirements and the determining factors in Pakistan. ICFAI Journal of Applied Finance, 15(4), 28–38.
Niskanen, J., & Niskanen, M. (2006). The Determinants of Corporate Trade Credit Po-lices in a Bank-Dominated Financial Environment: The Case of Finnish Small Firms. European Financial Management , 12 (1), 81-102.
Nobanee, H., Abdullatif, M., & Asl Hajjar, M. (2011). Cash Conversion Cycle and Firm’s Performance of Japanese Firms. Asian Review of Accounting , 19 (2).
Nobanee, H., Abdullatif, M., & Asl Hajjar, M. (2011). Cash Conversion Cycle and Firm’s Performance of Japanese Firms. Asian Review of Accounting , 19 (2).
P. Eramus, (20100 “The Relationship Between Working Capital Management and Profit-ability for south African Listed Industrial Firms,” The Business Review, Cam-bridge, vol. 15, no. 1, pp. 183-188,
P. J. Garcia-Teruel and P. Martínez-Solono, “Effects of Working Capital Management on SME Profitability,” International Journal of Managerial Finance, vol. 3, no. 2, pp. 174-177,
Padachi, K. (2006). Trends in working capital management and its impact on firms’ per-formance: An analysis of Mauritian small manufacturing firms. International Re-view of Business Research Papers, 2(2),45–58.
Pandey, I.M (2004), “Financial Management”, 9th Edition, Vikas Publishing House PVT Ltd.
Raheman and Nasr (2007), “Working Capital Management and profitability – case of Pakistan Firm”, International Review Research Papers vol.3 no.1
Raheman, A., & Nasr, M. (2007). Working capital management and profitability-case of Pakistani firms. International Review of Business Research Papers, 3(1), 279–300.
Rajan, P., and Zingales, L., (1995), “what do we know about capital structure? Some evidence from international data”, Journal of Finance 50, Pp.1421-1460
Richards, V., & Laughlin, E. (1980), "A Cash Conversion Cycle Approach to Liquidity Analysis", Financial Management, 32-38.
Ross, S., Westerfield, R., & Jaffe, J. (2002). Corporate Finance (6 ed.). New York: Mc-Graw Hill.
61

Saddour, K.(2006), “The determinants and the value of cash holdings: evidence form French firms”, University Paris Dauphine, Retrieved from: http://www.cereg.dauphine.fr/cahiers_rech/cereg200606.pdf
Śamiloġlo, F., & Demirgũneş, K. (2008). The Effect of Working Capital Managemnt on Firm Profitibility: Evidence from Turkey. The International Journal of Applied Economics and Finance , 2 (1), 44-50.
Samiloglu, F., & Demirgunes, K. (2008). The effect of working capital management on firm profitability: Evidence from Turkey. The International Journal of Applied Economics and Finance, 2(1), 44–50.
Ŝen, M., & Oruč, E. (2009). Relationship between Efficiency Level of Working Capital Management and Return on Total Assets in Ise. International Journal of Business and Management , 4 (10), 109-114.
Shin, H. H. & Soenen, L. (1998), “Efficiency of working capital management and corporate profitability,” Financial Practice and Education, 8(2), 37-45
Shin, H., & Soenen, L. (1998). Efficiency of Working Capital and Corporate Profitabil-ity. Financial Practice and Education, 8 (2), 37-45.
Shin, H.H., & Soenen, L. (1998). Efficiency of working capital management and corpor-ate profitability. Financial Practice and Education, 8(2), 37–45.
Singh, P., (2008), "Inventory and Working Capital Management: An Empirical Analysis," The IUP Journal of Accounting Research and Audit Practices, IUP Publications, vol.0(2), Pp. 53-73
Six sigma, (2012), “What is six sigma”, Retrieved from:http://www.isixsigma.com/new-to-six-sigma/getting-started/what-six-sigma/
Soenen, L.A. (1993). Cash conversion cycle & corporate profitability. Journal of Cash Management, 13(4), 53–58.
Talat, A., & Sajid, N. (2008). A panel data analysis of working capital management policies. Proceedings of COMSATS International Conference on Management (CICM) 2008, 2–3 January. Organized by COMSATS Institute of Information Technology, pp. 115–123.
Uyar, A. (2009). The relationship of cash conversion cycle with firm size and profitabil-ity: An empirical investigation in Turkey. International Research Journal of Fin-ance and Economics, 24, 186–193.
62

Walker, E.W. (1980). Towards a theory of working capital. In K.V. Smith (Ed.), Read-ings on the management of working capital (pp. 22–33). Mc-Grow Hill, New York, West Publishing Company.
Wang, Y.J. (2002). Liquidity management, operating performance, and corporate value: Evidence from Japan and Taiwan. Journal of Multinational Financial Manage-ment, 12(2), 159–69.
Wang, Y.J. (2002). Liquidity management, operating performance, and corporate value: Evidence from Japan and Taiwan. Journal of Multinational Financial Manage-ment, 12(2), 159–69.
Weinraub H. J., and Visscher, S. (1998), “Industry Practice Relating to Aggressive Con-servative Working Capital Policies”, Journal of Financial and Strategic Decision, Vol. 11, No. 2, pp.11-18.
Zariyawati, M., Annuar, M., Taufiq, H., & Abdul Rahim, A. (2009). Working capital management and corporate performance: Case of Malaysia. Journal of Modern Accounting and Auditing, 5 (11), 47-54.
Zariyawati, M.A, Annuar, M.N., & Abdul Rahim A.S. (2009). Effect of working capital management on profitability of firms in Malaysia. Paper presented in Interna-tional Symposium on Finance and Accounting (ISFA), 6–8 July, Malaysia. Re-trieved from list.academic-journal.org/submissions/isfa2009_submission_13.doc
63