wireless bio-radar sensor for heartbeat and
TRANSCRIPT
Progress In Electromagnetics Research C, Vol. 5, 149–168, 2008
WIRELESS BIO-RADAR SENSOR FOR HEARTBEATAND RESPIRATION DETECTION
B.-J. Jang
Department of Electrical EngineeringKookmin University861-1 Jeongneung-dong, Seonbuk-Ku, Seoul, 136-702, Korea
S.-H. Wi and J.-G. Yook
Department of Electrical EngineeringYonsei University134 Shinchon-dong, Seodaemoon-Ku, Seoul, 120-749, Korea
M.-Q. Lee
Department of Electronic, Electrical and Computer EngineeringUniversity of Seoul90 Jeonnong-dong, Dongdaemun-Ku, Seoul, 130-743, Korea
K.-J. Lee
Department of Biomedical EngineeringYonsei University234 Maeji-ri, Heungup-myun, Wounju-si, Gangwon-do 220-710, Korea
Abstract—In this study, a wireless bio-radar sensor was designed todetect a human heartbeat and respiration signals without direct skincontact. In order to design a wireless bio-radar sensor quantitatively,the signal-to-noise ratio (SNR) in the baseband output of a sensorshould be calculated. Therefore, we analyzed the SNR of the wirelessbio-radar sensor, considering the signal power attenuation in a humanbody and all kinds of noise sources. Especially, we measured aresidual phase noise of a typical free-running oscillator and usedits value for the SNR analysis. Based on these analysis and themeasurement results, a compact, low-cost 2.4 GHz direct conversionbio-radar sensor was designed and implemented in a printed circuitboard. The demonstrated sensor consists of two printed antennas, a
150 Jang et al.
voltage-controlled oscillator, an I/Q demodulator, and analog circuits.The heartbeat and respiration signals acquired from the I/Q channelof the sensor are applied to the digital signal processing circuit usingMATLAB. ECG (electrocardiogram), and reference respiration signalsare measured simultaneously to evaluate the performance of the sensor.With an output power of 0 dBm and a free running oscillator withouta phase locked loop circuits, a detection range of 50 cm was measured.Measurement results show that the heart rate and respiration accuracywas very high. Therefore, we verified that a wireless bio-radar sensorcould detect heartbeat and respiration well without contact and ourSNR analysis could be an effective tool to design a wireless bio-radarsensor.
1. INTRODUCTION
Recently, a wireless bio-radar sensor, fabricated using Dopplertheory, has drawn a great deal of attention as a non-contactmonitoring system for human healthcare and vital-sign monitoring,such as in cardiopulmonary monitoring for sleep apnea syndromedetection [1]. To measure heartbeat and respiration signals, directcontact measurement using electrodes attached to the skin is generallypracticed. The direct contact measurement has difficulties inmeasuring bio-signals continuously and in being applied to an infantor a patient with severe burns. In addition, problems of infectionand uncomfortableness are inherent in the direct contact measurement.Therefore, a wireless bio-radar sensor needs to be designed in order tomeasure heartbeat and respiration signals without direct skin contact.
Typically, a wireless sensor transmits a continuous-wave (CW)signal and demodulates the signal reflected off of a human chest-wall. Consistent with Doppler theory, a human chest-wall has a time-varying position with net zero velocity and will reflect a signal withits phase-modulated in proportion to the position of the chest-wall.By demodulating this phase-modulated signal, heart and respirationrates could be obtained. Based on this principle, a wireless bio-radarsensor was first applied to the measurement of respiration rate andthe detection of apnea in 1975 [2]. Because of the range correlationeffect that reduces close-in phase noise, direct-conversion receiverchips with free-running oscillators were able to detect low-frequencyheartbeat and respiration without using external crystal and phase-locked loop (PLL) circuits [3, 4]. Also, the null-point issue encounteredin general wireless sensors was also avoided by using a quadraturereceiver approach [5].
Progress In Electromagnetics Research C, Vol. 5, 2008 151
However, these previous studies mainly focused on receiverarchitectures and signal processing algorithms, making it difficult toextract the system design parameters directly. In order to simplify thewireless bio-radar sensor design, a signal-to-noise ratio (SNR) analysisis needed, which is commonly used in wireless communication andradar systems. A SNR analysis uses the simple path loss value andvarious noise effects at the baseband output as design variables. ExactSNR analysis is particularly important when measuring the motion dueto heartbeat, since the information is encoded in phase modulationsof 0.1 to 10 Hz, where the phase noise is near the peak. To date,there have been few studies about the SNR analysis of a wireless bio-radar sensor. In [6], the measured flicker noise was considered as adominant noise sources without exact SNR analysis. Only in [7] wasthe exact SNR value including the phase noise of the reflected cluttersignal analyzed. However, its results did not considered various phasenoises due to antenna and mixer leakage signals as noise source.
In this paper, therefore, we show the SNR analysis including thepath loss in a human body and all kinds of noise powers. Especially, wemeasured a baseband phase noise of a typical free-running oscillatorand used this value for the SNR analysis. Based on these analysisand measurement results, we demonstrate a design example of wirelessbio-radar sensor operating at the frequency of the 2.4 GHz Industrial,Scientific, and Medical (ISM) band. We have designed the wholesystem, from antenna to baseband, to make a compact, low-cost,portable bio-radar sensor.
2. OPERATING PRINCIPLE OF A WIRELESSBIO-RADAR SENSOR
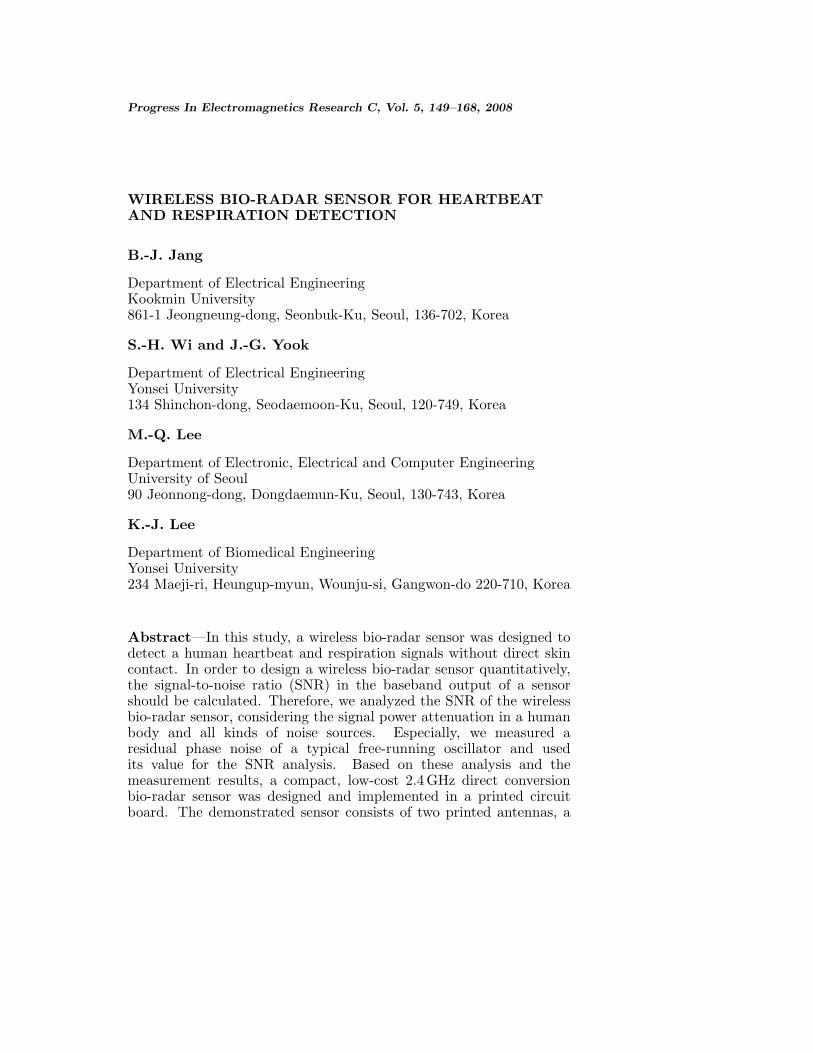
Typical wireless bio-radar sensor architecture is shown in Fig. 1. Asensor is made up of two blocks: the wireless transceiver block, whichis used to generate a CW signal and convert the reflected signal to abaseband signal, and the digital signal processing (DSP) block, whichis used to determine heart and respiration rates.
In the wireless transceiver block, a single oscillator generates boththe transmitted RF and local oscillator (LO) signals. When the CWsignal is directed at a target, it is reflected and frequency-modulatedby the target motion. If the target undergoes a periodic movementx(t) with no net velocity, the Doppler shift of the reflected signal canbe described as a phase modulation as shown in (1),
θ(t) =2f
c(2πx(t)) =
4πx(t)λ
(1)
152 Jang et al.
)(tx 0d
Wireless transceiver
LNA
LOTX Antenna
PA
RF BPF
HfLf90o
BI(t)
BQ(t)
BB BPF
RX Antenna
DSPANTη
Clutter
BackscatteredHeart Signal
Clutter
Mixη
Figure 1. Heartbeat and respiration detection using a wireless bio-radar sensor.
where f is the transmitted frequency in Hz, c is the signal propagationvelocity in m/s, and λ is the wavelength of the transmitted signal inmeters. The reflected heartbeat and respiration signals are amplifiedwith a low noise amplifier (LNA) and then down-converted to the in-phase (I) and quadrature-phase (Q) receiver chains.
As shown in Fig. 1, the LO provides two identical frequencysignals, one for the transmitter (TX) and the other for the receiver(RX). The LO signal for the receiver is further divided using a90◦ power splitter to provide two orthonormal baseband outputs.Assuming that the amplitude noise is so small as to be ignored, anLO signal can be expressed as
T (t) = cos(ωt + φ(t)) (2)
where ω is the angular frequency, and φ(t) is the phase noise of theLO. The LO signal is amplified by a power amplifier (PA), feeds intothe TX antenna, and is radiated into the air. Simultaneously, the RXantenna receives backscattered signals from the target. As shown inFig. 1, the backscattered signals picked up by the RX antenna consistof two components: one is the backscattered signal from the heart andthe other is from the stationary human body. The backscattered signalat the RX antenna, R(t), is a time-delayed version of the transmittedsignal and can be expressed as
R(t) = AR cos[ωt − 4πd0
λ− 4πx(t)
λ+ φ
(t − 2d0
c
)]
+AC cos[ωt − 4πd0
λ+ φ
(t − 2d0
c
)](3)
Progress In Electromagnetics Research C, Vol. 5, 2008 153
where AR is the reflected signal magnitude from the heart, AC is thereflected signal magnitude from the stationary human body, 2d0/c andis the round-trip delay between the antenna and human. As the targetdistance is less than one meter, the channel can be assumed as a freespace. Using the Friis electromagnetic wave propagation equation, AR
and AC can be given by
AR =
√2R0PTXGT GRλ2σhLh
(4π)3d40
(4)
AC =
√2R0PTXGT GRλ2σCLC
(4π)3d40
(5)
respectively, where R0 is the input resistance of the bio-radar’s receiver,σh and σC are radar cross sections (RCSs), and Lh and LC are reflectionlosses of the heart and human body, respectively.
As can be seen in Fig. 1, the receiver cannot totally isolate thetransmitter due to the inherent antenna mutual coupling and mixerRF-LO coupling. Therefore, the leakage signals from the TX also enterthe receiver. These TX leakage signals, L(t), can be expressed as
L(t) =√
2ηANT R0PTXGRX cos[ω(t − ∆t1) + φ(t − ∆t1)]
+√
2ηMixR0 cos[ω(t − ∆t2) + φ(t − ∆t2)] (6)
where ηANT is the TX leakage level between TX and RX antenna,ηMix is the TX leakage level due to mixer RF-LO coupling, and ∆t1and ∆t2 are the time delays between these TX leakage signals and theLO signal. Before further discussion, it is important to recognize thatφ(t) in (2), (3), and (6) is related with the phase noise from the sameLO except for time delays.
With a quadrature receiver, the received signal (3) and the LOsignal (2) are mixed, and the output is band-pass filtered. In orderto simplify the forthcoming analysis, the frequency response of theband-pass filter (BPF) is characterized approximately with an idealrectangular transfer function, and its low-end frequency and high-endcutoff frequency are denoted as fL and fH , respectively. The resultingbaseband signals will then be
BI(t) = AR
√GRX cos
[θh +
4πx(t)λ
+ ∆φh(t)]
+AC
√GRX cos[θC + ∆φc(t)]
+√
2ηANT R0PTXGRX cos[θL1 + ∆φL2(t)]
+√
2ηMixR0 cos[θL2 + ∆φL2(t)] + nT (t) + n1/f (t) (7)
154 Jang et al.
BQ(t) = AR
√GRX sin
[θh +
4πx(t)λ
+ ∆φh(t)]
+AC
√GRX sin[θC + ∆φc(t)]
+√
2ηANT R0PTXGRX sin[θL1 + ∆φL2(t)]
+√
2ηMixR0 sin[θL2 + ∆φL2(t)] + nT (t) + n1/f (t) (8)
respectively, where GRX is the receiver gain, including the conversiongain of the mixer, nT (t) is the thermal noise, including receiver noisefigure, n1/f (t) is the baseband 1/f noise from the mixer and basebandcircuits, and ∆φh(t), ∆φC(t), ∆φL1(t) and ∆φL2(t) are the residualphase noises of reflected heart signal, clutter signal, antenna leakagesignal, and mixer leakage signal, respectively. In addition, θL1 and θL2
are the constant phase shifts dependent on the time delay, ∆t1 and∆t2. Also, θh and θC are the constant phase shifts dependent on thenominal distance to the target.
θh ≈ θC =4πd0
λ+ θ0 (9)
where, θ0 is the phase shift at the reflection surface of the human body.The residual phase noises in (7) and (8) are given by
∆φh(t) ≈ ∆φC(t) = φ(t) − φ
(t − 2d0
c
)(10)
∆φL1,2(t) = φ(t) − φ(t − ∆t1,2) (11)
respectively. Now, the received signals are digitized using an analog-to-digital converter (ADC). Finally, DSP block are used to separatesuperimposed heart and respiration signals, to combine quadraturechannels, and to determine the heart rate. Generally, the heartbeatis calculated by various detection algorithms, such as zero crossing,autocorrelation, and Fourier transform [8].
3. SNR ANALYSIS
3.1. Theory
In a wireless bio-radar sensor, the backscattered signal from the heartshould be stronger than other noise sources at the receiver’s basebandoutput. This is very similar to a general radar system’s SNR concept.In order to calculate the SNR value, we should know the magnitudeof the signal and the noise power. The magnitude of the signal atthe baseband depends on the received power and phase modulation.
Progress In Electromagnetics Research C, Vol. 5, 2008 155
Noise sources include residual phase noises from the LO, additive whiteGaussian noise (AWGN), and the baseband 1/f noise of the mixer andof the baseband analog circuits.
First, the magnitude of the signal power at the baseband is givenby radar theory. For example, the signal power at the baseband Ichannel, SI , is equal to the mean squared received voltage divided bythe input impedance and can be given by
SI =A2
RGRXcos(
θh + 4πx(t)λ
)2
R0
=2PTXGT GRGRXλ2σhLhcos
(θh + 4πx(t)
λ
)2
(4π)3d40
(12)
Assuming perfect power combining and small angle approxima-tion, the signal power is given by
SI ≈ PTXGT GRGRXσhLhx2(t)2πd4
0
(13)
Next, we calculate the residual phase noise power. The residualphase noise includes the phase noise by the heart signal itself, thestationary human body reflection, the antenna leakage signal, and themixer leakage signal. Because the frequency range concerned in a bio-radar sensor system is less than 10 Hz, the phase noise itself may belarge enough to affect the signal detection. However, when the sameoscillator is used for transmitting and down-converting operations, thephase noise of the received signal is correlated with that of the LO, andthe phase noise is dramatically reduced. In radar applications, such asbio-radar, this phase noise reduction phenomenon is called the rangecorrelation effect [4].
A quantitative characterization of the relation between range andphase noise can be done in the frequency domain. The power spectraldensity (PSD) of ∆φh(t), Sφh
(f∆) at offset frequency, f∆ is given by
S∆φh(f∆) = Sφ(f∆)
[4 sin2
(2π
d0f∆
c
)](14)
where Sφ(f∆) is the PSD of the LO itself. Equation (14) indicates thatthe range correlation effect gives a high pass filter effect on phase noisewith respect to offset frequency. This effect is positive for detection in
156 Jang et al.
a bio-radar system, because the heart and respiration signals are verylow frequency signals.
Assuming that the typical values for d0 and f∆ are 50 cm and10 Hz, respectively, the value of d0f∆/c will be on the order of 10−9.Therefore, the small angle approximation is valid, and residual phasenoise is simplified by
S∆φh(f∆) ≈ Sφ(f∆)
[16π2 d0
2f∆2
c2
](15)
Since the close-in phase noise has a −30 dB/decade slope, thephase noise can be defined by the phase noise at the 1 Hz, Sφ(1), asfollows
Sφh(f∆) ≈ Sφ(1)
(1 Hz)−3f−3∆ (16)
An equation of residual phase noise can be found by combining(15) and (16),
S∆φh(f∆) ≈ Sφ(1)
(f∆
1 Hz
)−3[16π2 d0
2f∆2
c2
](17)
The mean square residual phase noise in the time domain is theintegral of the spectrum over the received frequencies,
∆φh(t)2 =∫ fH
fL
S∆φh(f∆)df∆
= 16π2(1 Hz)3Sφ(1)d2
0
c2ln
[fH
fL
](18)
Now, the residual phase noise power from received signal is givenby
N∆φh=
A2RGRXcos(∆φh(t))2
R0
≈ 2PTXGT GRGRXλ2σhLh∆φh(t)2
(4π)3d40
(19)
An equation of residual phase noise from the received signal canbe found by combining (18) and (19),
N∆φh=
PTXGT GRGRXσhLh
2πf2d20
Sφ(1) ln(
fH
fL
)(20)
Progress In Electromagnetics Research C, Vol. 5, 2008 157
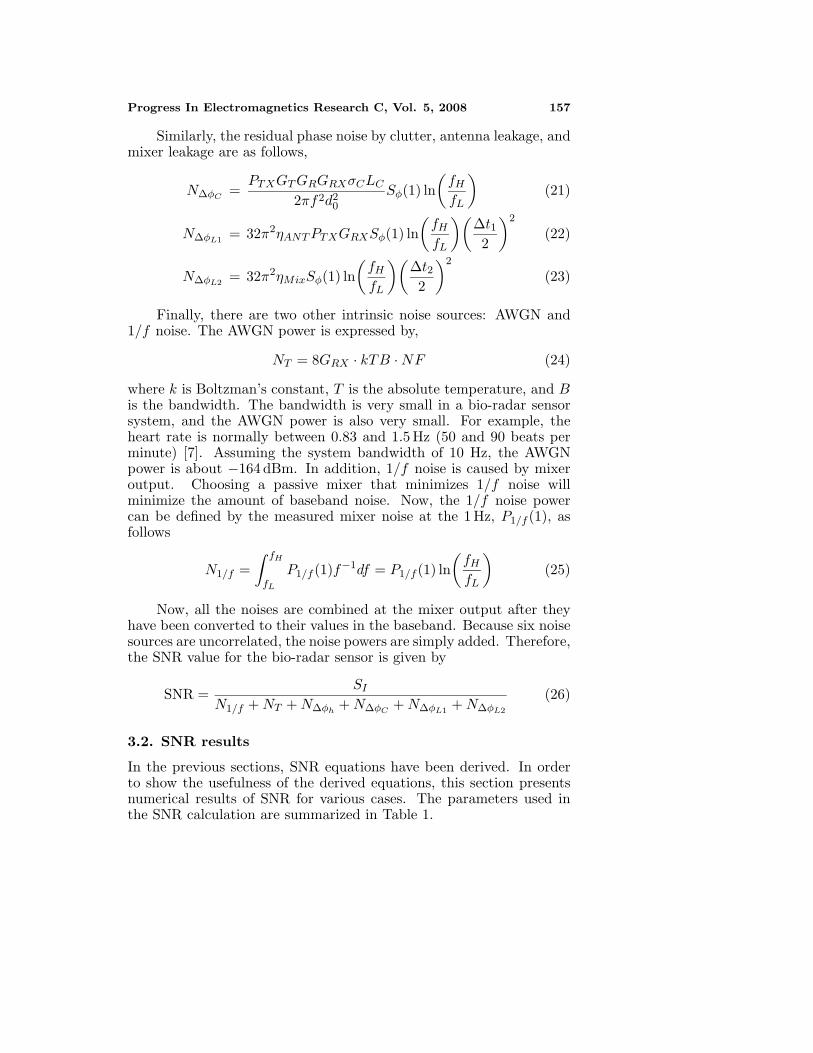
Similarly, the residual phase noise by clutter, antenna leakage, andmixer leakage are as follows,
N∆φC=
PTXGT GRGRXσCLC
2πf2d20
Sφ(1) ln(
fH
fL
)(21)
N∆φL1= 32π2ηANT PTXGRXSφ(1) ln
(fH
fL
)(∆t12
)2
(22)
N∆φL2= 32π2ηMixSφ(1) ln
(fH
fL
)(∆t22
)2
(23)
Finally, there are two other intrinsic noise sources: AWGN and1/f noise. The AWGN power is expressed by,
NT = 8GRX · kTB · NF (24)
where k is Boltzman’s constant, T is the absolute temperature, and Bis the bandwidth. The bandwidth is very small in a bio-radar sensorsystem, and the AWGN power is also very small. For example, theheart rate is normally between 0.83 and 1.5 Hz (50 and 90 beats perminute) [7]. Assuming the system bandwidth of 10 Hz, the AWGNpower is about −164 dBm. In addition, 1/f noise is caused by mixeroutput. Choosing a passive mixer that minimizes 1/f noise willminimize the amount of baseband noise. Now, the 1/f noise powercan be defined by the measured mixer noise at the 1 Hz, P1/f (1), asfollows
N1/f =∫ fH
fL
P1/f (1)f−1df = P1/f (1) ln(
fH
fL
)(25)
Now, all the noises are combined at the mixer output after theyhave been converted to their values in the baseband. Because six noisesources are uncorrelated, the noise powers are simply added. Therefore,the SNR value for the bio-radar sensor is given by
SNR =SI
N1/f + NT + N∆φh+ N∆φC
+ N∆φL1+ N∆φL2
(26)
3.2. SNR results
In the previous sections, SNR equations have been derived. In orderto show the usefulness of the derived equations, this section presentsnumerical results of SNR for various cases. The parameters used inthe SNR calculation are summarized in Table 1.
158 Jang et al.
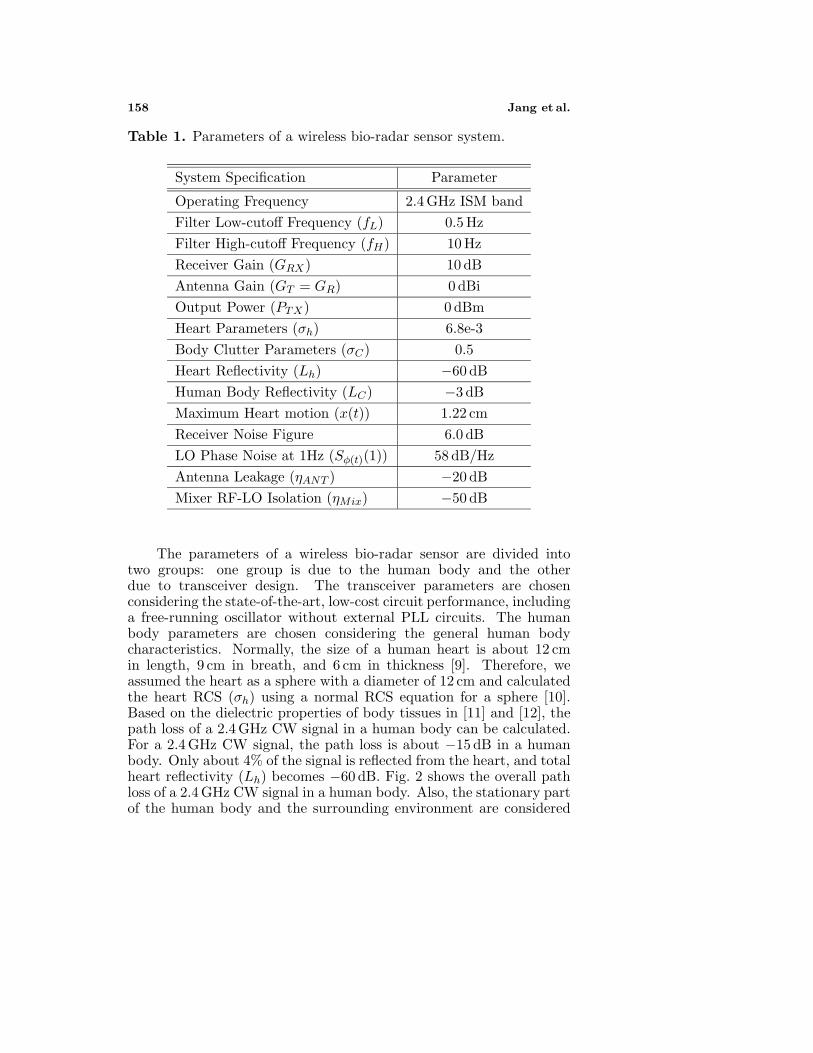
Table 1. Parameters of a wireless bio-radar sensor system.
System Specification Parameter
Operating Frequency 2.4 GHz ISM bandFilter Low-cutoff Frequency (fL) 0.5 HzFilter High-cutoff Frequency (fH) 10 HzReceiver Gain (GRX) 10 dBAntenna Gain (GT = GR) 0 dBiOutput Power (PTX) 0 dBmHeart Parameters (σh) 6.8e-3Body Clutter Parameters (σC) 0.5Heart Reflectivity (Lh) −60 dBHuman Body Reflectivity (LC) −3 dBMaximum Heart motion (x(t)) 1.22 cmReceiver Noise Figure 6.0 dBLO Phase Noise at 1Hz (Sφ(t)(1)) 58 dB/HzAntenna Leakage (ηANT ) −20 dBMixer RF-LO Isolation (ηMix) −50 dB
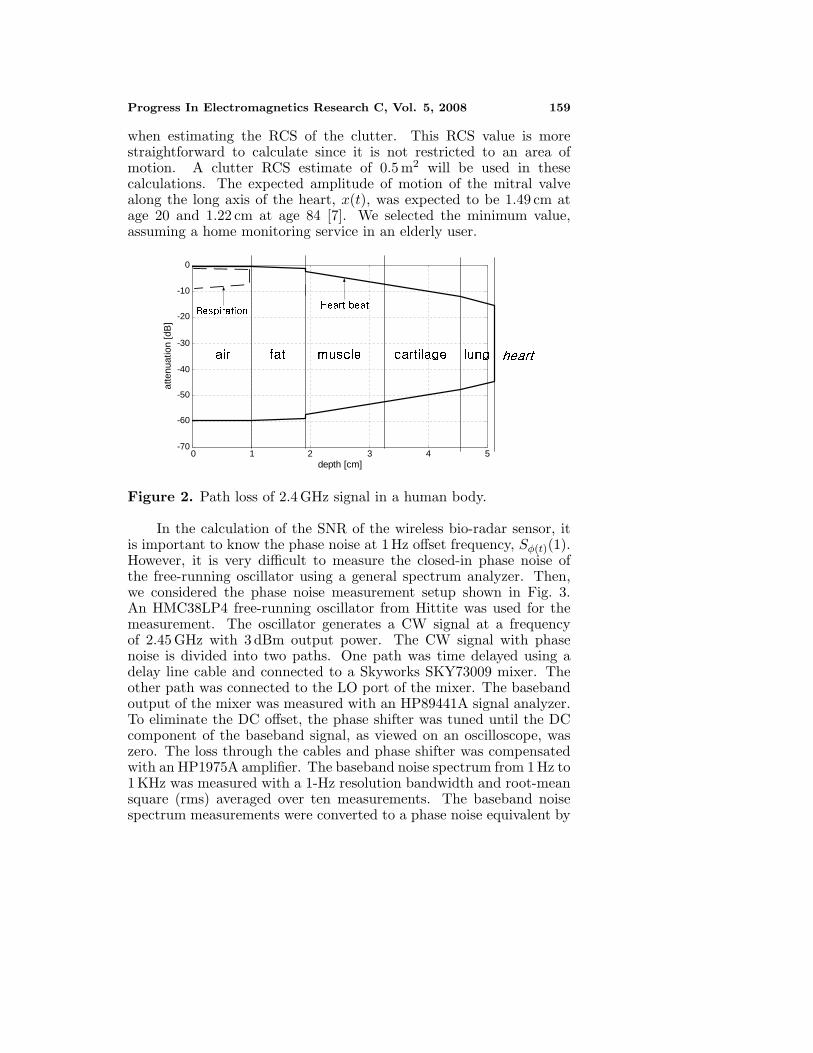
The parameters of a wireless bio-radar sensor are divided intotwo groups: one group is due to the human body and the otherdue to transceiver design. The transceiver parameters are chosenconsidering the state-of-the-art, low-cost circuit performance, includinga free-running oscillator without external PLL circuits. The humanbody parameters are chosen considering the general human bodycharacteristics. Normally, the size of a human heart is about 12 cmin length, 9 cm in breath, and 6 cm in thickness [9]. Therefore, weassumed the heart as a sphere with a diameter of 12 cm and calculatedthe heart RCS (σh) using a normal RCS equation for a sphere [10].Based on the dielectric properties of body tissues in [11] and [12], thepath loss of a 2.4 GHz CW signal in a human body can be calculated.For a 2.4 GHz CW signal, the path loss is about −15 dB in a humanbody. Only about 4% of the signal is reflected from the heart, and totalheart reflectivity (Lh) becomes −60 dB. Fig. 2 shows the overall pathloss of a 2.4 GHz CW signal in a human body. Also, the stationary partof the human body and the surrounding environment are considered
Progress In Electromagnetics Research C, Vol. 5, 2008 159
when estimating the RCS of the clutter. This RCS value is morestraightforward to calculate since it is not restricted to an area ofmotion. A clutter RCS estimate of 0.5 m2 will be used in thesecalculations. The expected amplitude of motion of the mitral valvealong the long axis of the heart, x(t), was expected to be 1.49 cm atage 20 and 1.22 cm at age 84 [7]. We selected the minimum value,assuming a home monitoring service in an elderly user.
0 1 2 3 4 5-70
-60
-50
-40
-30
-20
-10
0
depth [cm]
atte
nuat
ion
[dB
]
Figure 2. Path loss of 2.4 GHz signal in a human body.
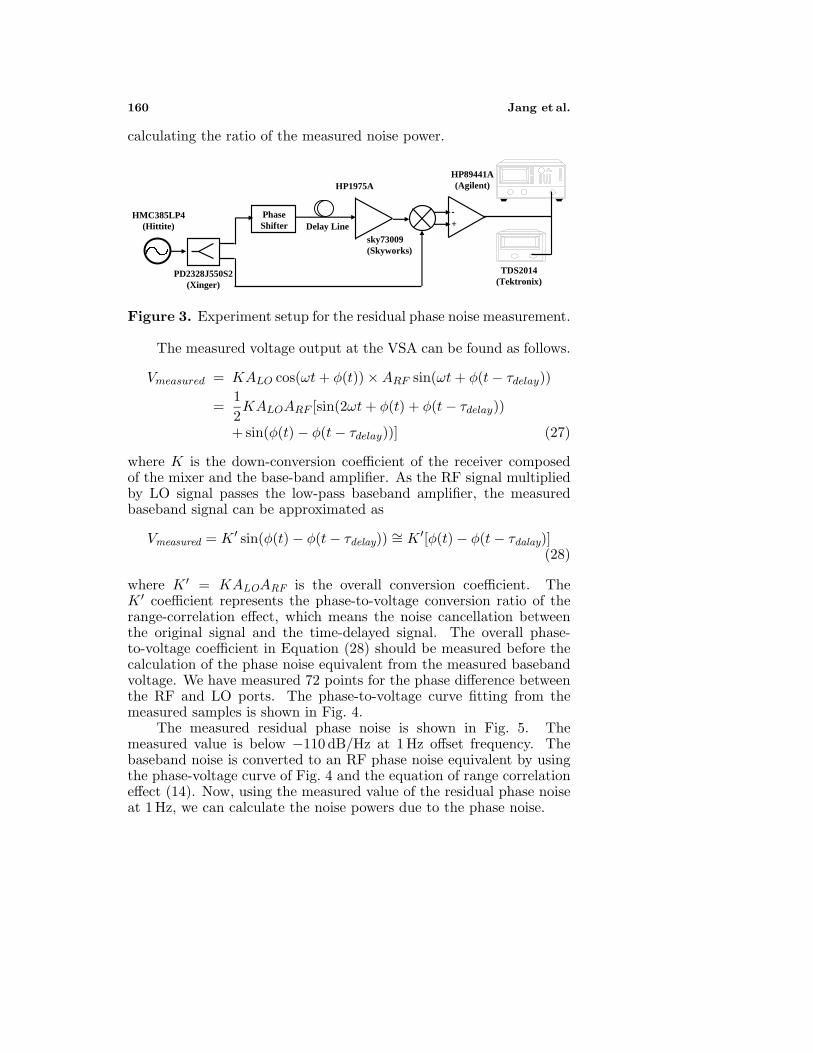
In the calculation of the SNR of the wireless bio-radar sensor, itis important to know the phase noise at 1 Hz offset frequency, Sφ(t)(1).However, it is very difficult to measure the closed-in phase noise ofthe free-running oscillator using a general spectrum analyzer. Then,we considered the phase noise measurement setup shown in Fig. 3.An HMC38LP4 free-running oscillator from Hittite was used for themeasurement. The oscillator generates a CW signal at a frequencyof 2.45 GHz with 3 dBm output power. The CW signal with phasenoise is divided into two paths. One path was time delayed using adelay line cable and connected to a Skyworks SKY73009 mixer. Theother path was connected to the LO port of the mixer. The basebandoutput of the mixer was measured with an HP89441A signal analyzer.To eliminate the DC offset, the phase shifter was tuned until the DCcomponent of the baseband signal, as viewed on an oscilloscope, waszero. The loss through the cables and phase shifter was compensatedwith an HP1975A amplifier. The baseband noise spectrum from 1 Hz to1 KHz was measured with a 1-Hz resolution bandwidth and root-meansquare (rms) averaged over ten measurements. The baseband noisespectrum measurements were converted to a phase noise equivalent by
160 Jang et al.
calculating the ratio of the measured noise power.
HMC385LP4(Hittite)
PhaseShifter Delay Line
HP1975A
sky73009(Skyworks)
PD2328J550S2(Xinger)
HP89441A(Agilent)
TDS2014(Tektronix)
-+
Figure 3. Experiment setup for the residual phase noise measurement.
The measured voltage output at the VSA can be found as follows.
Vmeasured = KALO cos(ωt + φ(t)) × ARF sin(ωt + φ(t − τdelay))
=12KALOARF [sin(2ωt + φ(t) + φ(t − τdelay))
+ sin(φ(t) − φ(t − τdelay))] (27)
where K is the down-conversion coefficient of the receiver composedof the mixer and the base-band amplifier. As the RF signal multipliedby LO signal passes the low-pass baseband amplifier, the measuredbaseband signal can be approximated as
Vmeasured = K ′ sin(φ(t) − φ(t − τdelay)) ∼= K ′[φ(t) − φ(t − τdalay)](28)
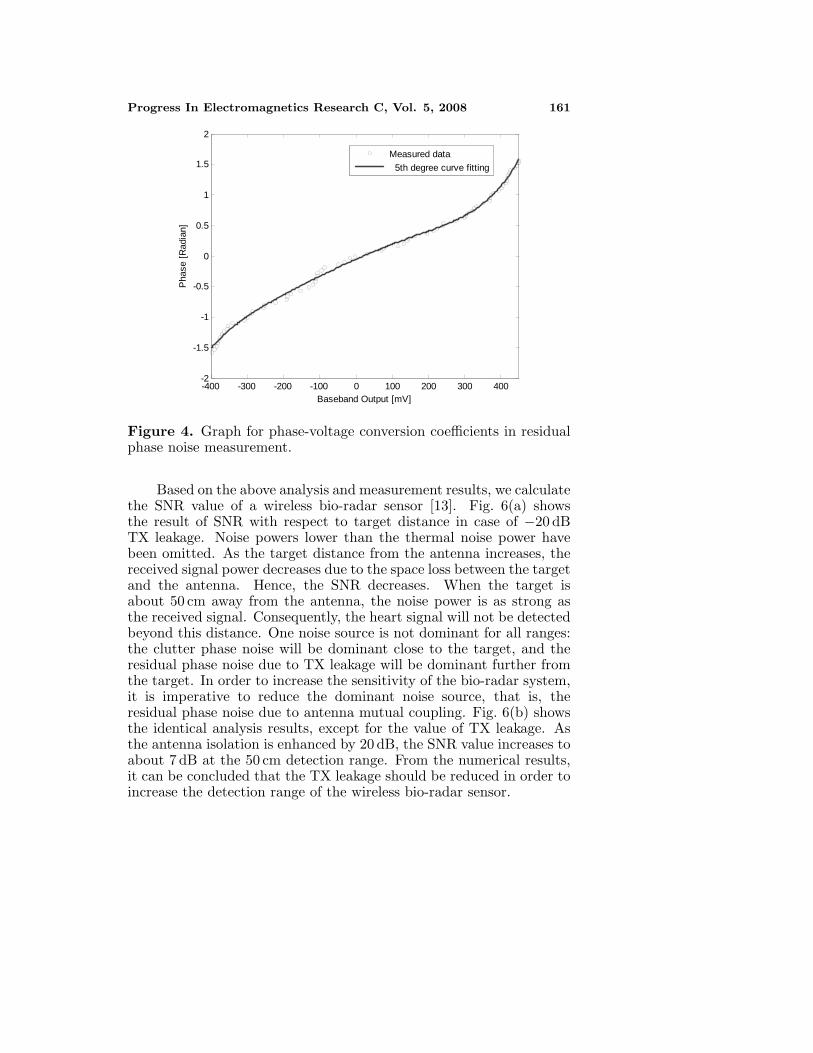
where K ′ = KALOARF is the overall conversion coefficient. TheK ′ coefficient represents the phase-to-voltage conversion ratio of therange-correlation effect, which means the noise cancellation betweenthe original signal and the time-delayed signal. The overall phase-to-voltage coefficient in Equation (28) should be measured before thecalculation of the phase noise equivalent from the measured basebandvoltage. We have measured 72 points for the phase difference betweenthe RF and LO ports. The phase-to-voltage curve fitting from themeasured samples is shown in Fig. 4.
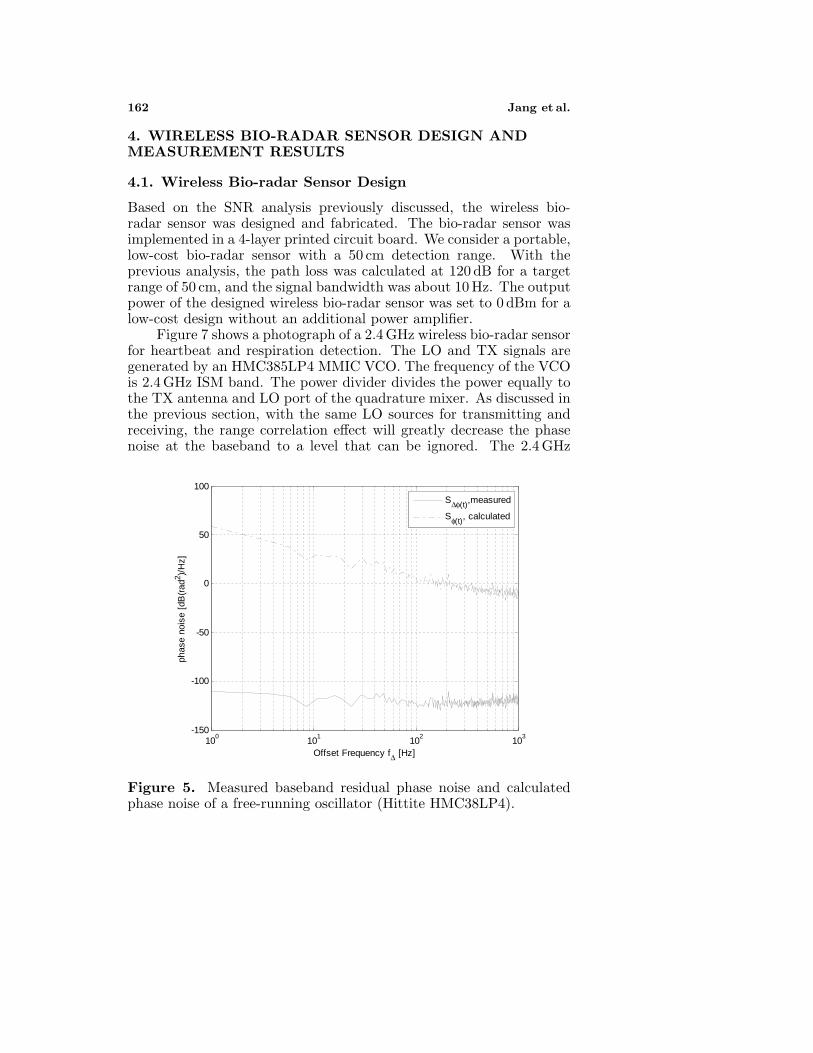
The measured residual phase noise is shown in Fig. 5. Themeasured value is below −110 dB/Hz at 1 Hz offset frequency. Thebaseband noise is converted to an RF phase noise equivalent by usingthe phase-voltage curve of Fig. 4 and the equation of range correlationeffect (14). Now, using the measured value of the residual phase noiseat 1 Hz, we can calculate the noise powers due to the phase noise.
Progress In Electromagnetics Research C, Vol. 5, 2008 161
-400 -300 -200 -100 0 100 200 300 400-2
-1.5
-1
-0.5
0
0.5
1
1.5
2
Baseband Output [mV]
Pha
se [
Rad
ian]
Measured data
5th degree curve fitting
Figure 4. Graph for phase-voltage conversion coefficients in residualphase noise measurement.
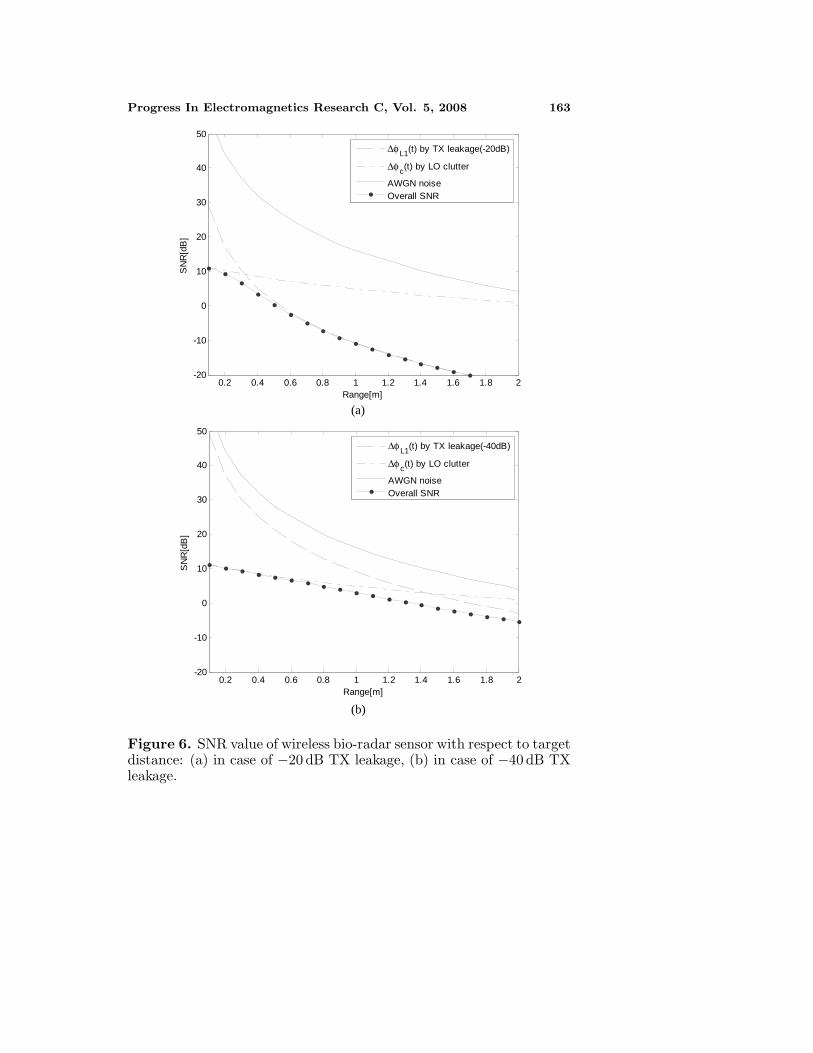
Based on the above analysis and measurement results, we calculatethe SNR value of a wireless bio-radar sensor [13]. Fig. 6(a) showsthe result of SNR with respect to target distance in case of −20 dBTX leakage. Noise powers lower than the thermal noise power havebeen omitted. As the target distance from the antenna increases, thereceived signal power decreases due to the space loss between the targetand the antenna. Hence, the SNR decreases. When the target isabout 50 cm away from the antenna, the noise power is as strong asthe received signal. Consequently, the heart signal will not be detectedbeyond this distance. One noise source is not dominant for all ranges:the clutter phase noise will be dominant close to the target, and theresidual phase noise due to TX leakage will be dominant further fromthe target. In order to increase the sensitivity of the bio-radar system,it is imperative to reduce the dominant noise source, that is, theresidual phase noise due to antenna mutual coupling. Fig. 6(b) showsthe identical analysis results, except for the value of TX leakage. Asthe antenna isolation is enhanced by 20 dB, the SNR value increases toabout 7 dB at the 50 cm detection range. From the numerical results,it can be concluded that the TX leakage should be reduced in order toincrease the detection range of the wireless bio-radar sensor.
162 Jang et al.
4. WIRELESS BIO-RADAR SENSOR DESIGN ANDMEASUREMENT RESULTS
4.1. Wireless Bio-radar Sensor Design
Based on the SNR analysis previously discussed, the wireless bio-radar sensor was designed and fabricated. The bio-radar sensor wasimplemented in a 4-layer printed circuit board. We consider a portable,low-cost bio-radar sensor with a 50 cm detection range. With theprevious analysis, the path loss was calculated at 120 dB for a targetrange of 50 cm, and the signal bandwidth was about 10 Hz. The outputpower of the designed wireless bio-radar sensor was set to 0 dBm for alow-cost design without an additional power amplifier.
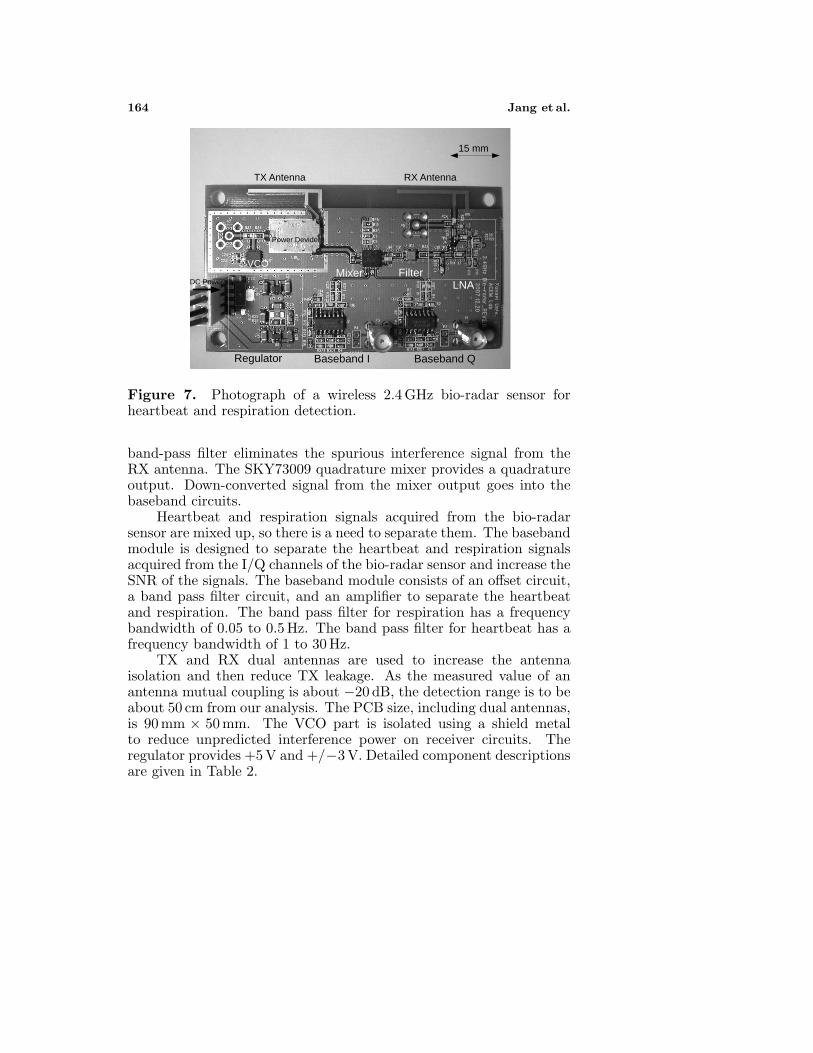
Figure 7 shows a photograph of a 2.4 GHz wireless bio-radar sensorfor heartbeat and respiration detection. The LO and TX signals aregenerated by an HMC385LP4 MMIC VCO. The frequency of the VCOis 2.4 GHz ISM band. The power divider divides the power equally tothe TX antenna and LO port of the quadrature mixer. As discussed inthe previous section, with the same LO sources for transmitting andreceiving, the range correlation effect will greatly decrease the phasenoise at the baseband to a level that can be ignored. The 2.4 GHz
100
101
102
103
-150
-100
-50
0
50
100
Offset Frequency f∆ [Hz]
phas
e no
ise
[dB
(rad
2 )/H
z]
S∆φ(t),measured
Sφ(t), calculated
Figure 5. Measured baseband residual phase noise and calculatedphase noise of a free-running oscillator (Hittite HMC38LP4).
Progress In Electromagnetics Research C, Vol. 5, 2008 163
0.2 0.4 0.6 0.8 1 1.2 1.4 1.6 1.8 2-20
-10
0
10
20
30
40
50
Range[m]
SN
R[d
B]
∆φL1(t) by TX leakage(-20dB)
∆φc(t) by LO clutter
AWGN noiseOverall SNR
0.2 0.4 0.6 0.8 1 1.2 1.4 1.6 1.8 2-20
-10
0
10
20
30
40
50
Range[m]
SN
R[d
B]
∆φL1(t) by TX leakage(-40dB)
∆φc(t) by LO clutter
AWGN noiseOverall SNR
(a)
(b)
Figure 6. SNR value of wireless bio-radar sensor with respect to targetdistance: (a) in case of −20 dB TX leakage, (b) in case of −40 dB TXleakage.
164 Jang et al.
Mixer
Regulator
15 mm
TX Antenna RX Antenna
Power Devider
VCOFilter
LNA
Baseband I Baseband Q
DC Power
Figure 7. Photograph of a wireless 2.4 GHz bio-radar sensor forheartbeat and respiration detection.
band-pass filter eliminates the spurious interference signal from theRX antenna. The SKY73009 quadrature mixer provides a quadratureoutput. Down-converted signal from the mixer output goes into thebaseband circuits.
Heartbeat and respiration signals acquired from the bio-radarsensor are mixed up, so there is a need to separate them. The basebandmodule is designed to separate the heartbeat and respiration signalsacquired from the I/Q channels of the bio-radar sensor and increase theSNR of the signals. The baseband module consists of an offset circuit,a band pass filter circuit, and an amplifier to separate the heartbeatand respiration. The band pass filter for respiration has a frequencybandwidth of 0.05 to 0.5 Hz. The band pass filter for heartbeat has afrequency bandwidth of 1 to 30 Hz.
TX and RX dual antennas are used to increase the antennaisolation and then reduce TX leakage. As the measured value of anantenna mutual coupling is about −20 dB, the detection range is to beabout 50 cm from our analysis. The PCB size, including dual antennas,is 90 mm × 50 mm. The VCO part is isolated using a shield metalto reduce unpredicted interference power on receiver circuits. Theregulator provides +5 V and +/−3 V. Detailed component descriptionsare given in Table 2.
Progress In Electromagnetics Research C, Vol. 5, 2008 165
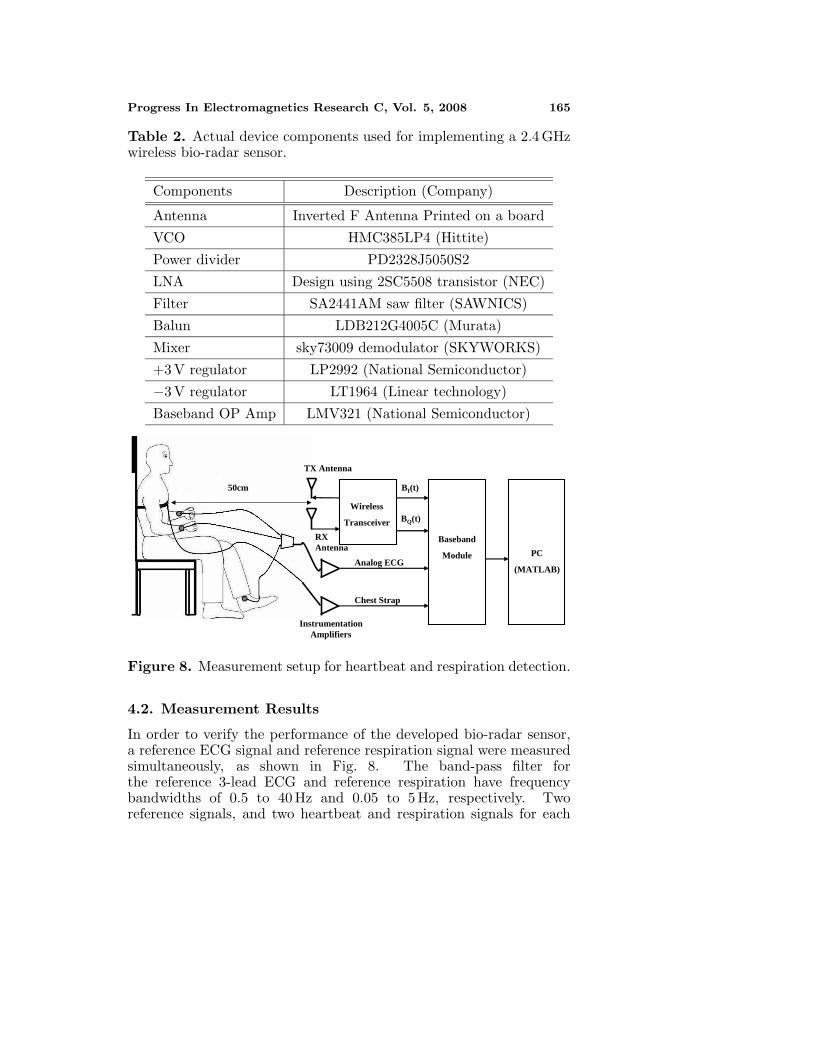
Table 2. Actual device components used for implementing a 2.4 GHzwireless bio-radar sensor.
Components Description (Company)
Antenna Inverted F Antenna Printed on a boardVCO HMC385LP4 (Hittite)Power divider PD2328J5050S2LNA Design using 2SC5508 transistor (NEC)Filter SA2441AM saw filter (SAWNICS)Balun LDB212G4005C (Murata)Mixer sky73009 demodulator (SKYWORKS)+3 V regulator LP2992 (National Semiconductor)−3 V regulator LT1964 (Linear technology)Baseband OP Amp LMV321 (National Semiconductor)
50cm
TX Antenna
BQ(t)
RX Antenna
Wireless
Transceiver
BI(t)
Baseband
ModuleAnalog ECG
Chest Strap
PC
(MATLAB)
Instrumentation Amplifiers
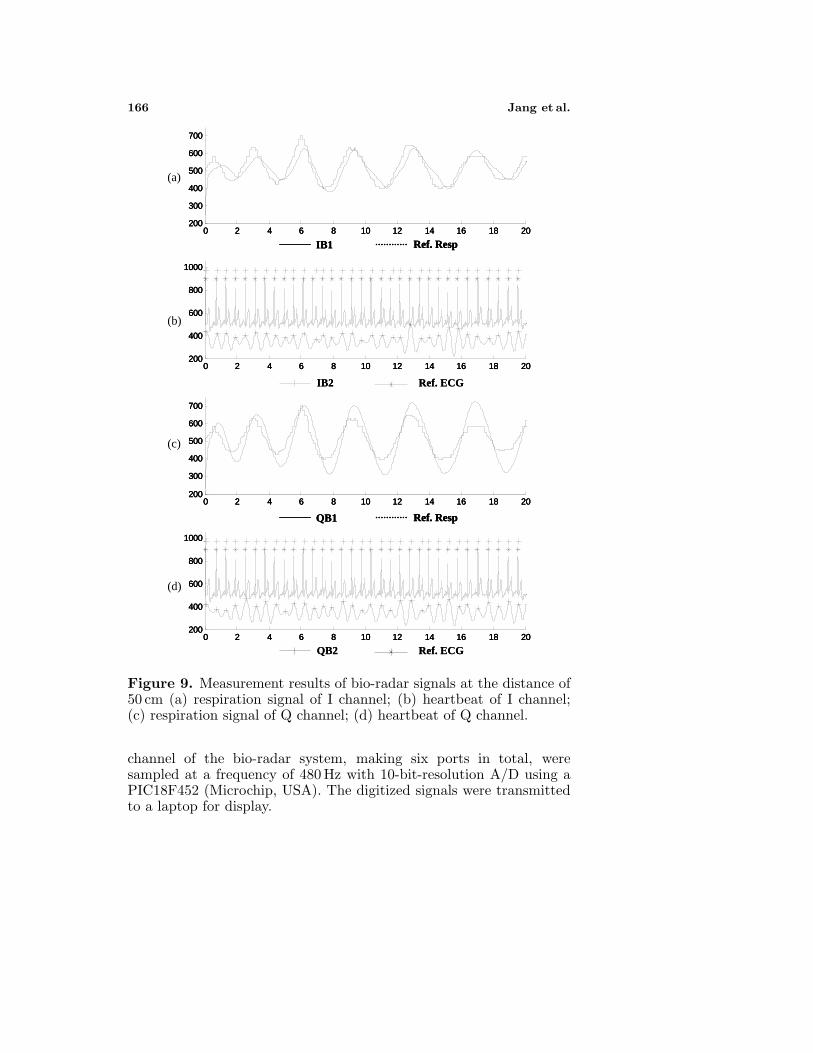
Figure 8. Measurement setup for heartbeat and respiration detection.
4.2. Measurement Results
In order to verify the performance of the developed bio-radar sensor,a reference ECG signal and reference respiration signal were measuredsimultaneously, as shown in Fig. 8. The band-pass filter forthe reference 3-lead ECG and reference respiration have frequencybandwidths of 0.5 to 40 Hz and 0.05 to 5 Hz, respectively. Tworeference signals, and two heartbeat and respiration signals for each
166 Jang et al.
0 2 4 6 8 10 12 14 16 18 20200
300
400
500
600
700
0 2 4 6 8 10 12 14 16 18 20200
300
400
500
600
700
0 2 4 6 8 10 12 14 16 18 20200
400
600
800
1000
0 2 4 6 8 10 12 14 16 18 20200
400
600
800
1000
IB1 Ref. Resp
QB1 Ref. Resp
Ref. ECGIB2
Ref. ECGQB2
0 2 4 6 8 10 12 14 16 18 20200
300
400
500
600
700
0 2 4 6 8 10 12 14 16 18 20200
300
400
500
600
700
0 2 4 6 8 10 12 14 16 18 20200
400
600
800
1000
0 2 4 6 8 10 12 14 16 18 20200
400
600
800
1000
IB1 Ref. Resp0 2 4 6 8 10 12 14 16 18 20
200
300
400
500
600
700
0 2 4 6 8 10 12 14 16 18 20200
300
400
500
600
700
0 2 4 6 8 10 12 14 16 18 20200
400
600
800
1000
0 2 4 6 8 10 12 14 16 18 20200
400
600
800
1000
IB1 Ref. Resp
QB1 Ref. RespQB1 Ref. Resp
Ref. ECGIB2
Ref. ECGQB2
(a)
(b)
(c)
(d)
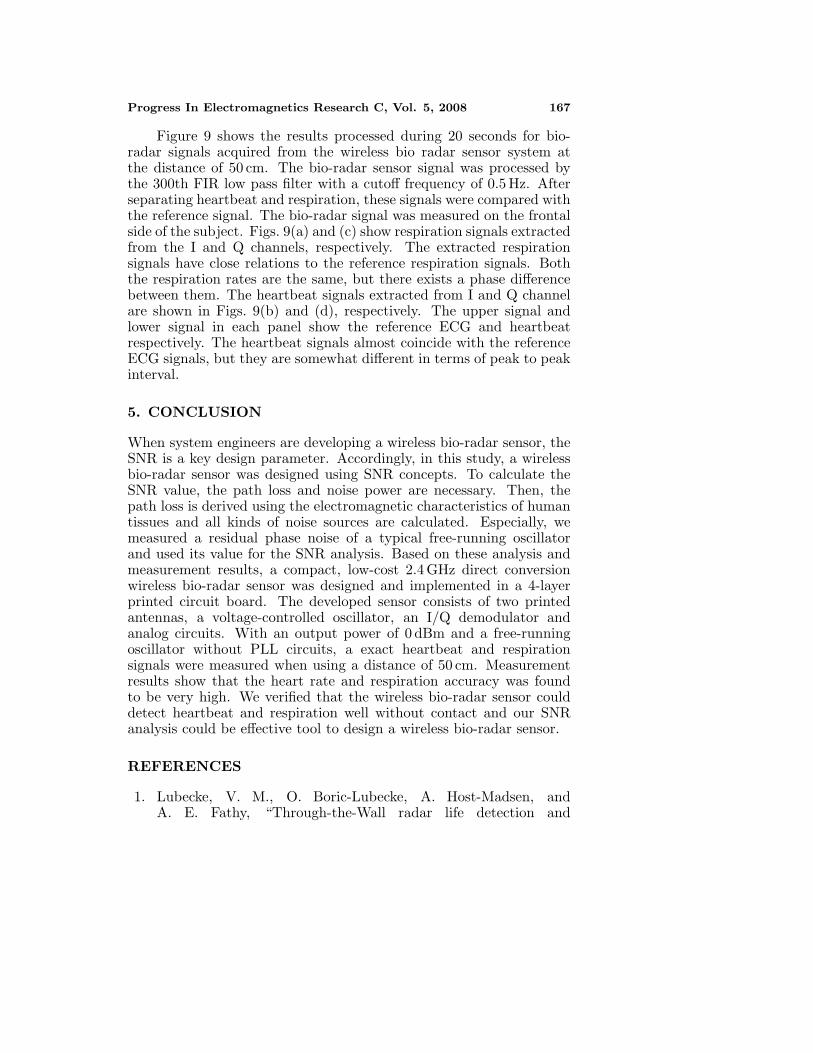
Figure 9. Measurement results of bio-radar signals at the distance of50 cm (a) respiration signal of I channel; (b) heartbeat of I channel;(c) respiration signal of Q channel; (d) heartbeat of Q channel.
channel of the bio-radar system, making six ports in total, weresampled at a frequency of 480 Hz with 10-bit-resolution A/D using aPIC18F452 (Microchip, USA). The digitized signals were transmittedto a laptop for display.
Progress In Electromagnetics Research C, Vol. 5, 2008 167
Figure 9 shows the results processed during 20 seconds for bio-radar signals acquired from the wireless bio radar sensor system atthe distance of 50 cm. The bio-radar sensor signal was processed bythe 300th FIR low pass filter with a cutoff frequency of 0.5 Hz. Afterseparating heartbeat and respiration, these signals were compared withthe reference signal. The bio-radar signal was measured on the frontalside of the subject. Figs. 9(a) and (c) show respiration signals extractedfrom the I and Q channels, respectively. The extracted respirationsignals have close relations to the reference respiration signals. Boththe respiration rates are the same, but there exists a phase differencebetween them. The heartbeat signals extracted from I and Q channelare shown in Figs. 9(b) and (d), respectively. The upper signal andlower signal in each panel show the reference ECG and heartbeatrespectively. The heartbeat signals almost coincide with the referenceECG signals, but they are somewhat different in terms of peak to peakinterval.
5. CONCLUSION
When system engineers are developing a wireless bio-radar sensor, theSNR is a key design parameter. Accordingly, in this study, a wirelessbio-radar sensor was designed using SNR concepts. To calculate theSNR value, the path loss and noise power are necessary. Then, thepath loss is derived using the electromagnetic characteristics of humantissues and all kinds of noise sources are calculated. Especially, wemeasured a residual phase noise of a typical free-running oscillatorand used its value for the SNR analysis. Based on these analysis andmeasurement results, a compact, low-cost 2.4 GHz direct conversionwireless bio-radar sensor was designed and implemented in a 4-layerprinted circuit board. The developed sensor consists of two printedantennas, a voltage-controlled oscillator, an I/Q demodulator andanalog circuits. With an output power of 0 dBm and a free-runningoscillator without PLL circuits, a exact heartbeat and respirationsignals were measured when using a distance of 50 cm. Measurementresults show that the heart rate and respiration accuracy was foundto be very high. We verified that the wireless bio-radar sensor coulddetect heartbeat and respiration well without contact and our SNRanalysis could be effective tool to design a wireless bio-radar sensor.
REFERENCES
1. Lubecke, V. M., O. Boric-Lubecke, A. Host-Madsen, andA. E. Fathy, “Through-the-Wall radar life detection and
168 Jang et al.
monitoring,” IEEE MTT-S Int. Microwave Symposium Digest,769–772, May 2007.
2. Lin, J. C., “Non-invasive microwave measurement of respiration,”Proceedings of the IEEE, Vol. 63, No. 10, 1530, 1975.
3. Droitcour, A. D., O. Boric-Lubecke, V. M. Lubecke, and J. Lin, “Amicrowave radio for Doppler radar sensing of vital signs,” IEEEMTT-S Int. Microwave Symposium Digest, 175–178, 2001.
4. Droitcour, A. D., O. Boric-Lubecke, V. M. Lubecke, J. Lin,and G. T. A. Kovac, “Range correlation and I/Q performancebenefits in single-chip silicon doppler radars for non-contactcardiopulmonary monitoring,” IEEE Transactions on MicrowaveTheory Technique, Vol. 52, 838–848, March 2004.
5. Park, B.-K., O. Boric-Lubecke, and V. M. Lubecke, “Arctangetdemodulation with dc offset compensation in quadrature Dopplerradar receiver systems,” IEEE Transactions on Microwave TheoryTechnique, Vol. 55, 1073–1079, May 2007.
6. Nguyen, D., S. Yamada, B.-K. Park, V. M. Lubecke, O. Boris-Lubecke, and A. H. Madsen, “Noise considerations for remotedetection of life signs with microwave Doppler radar,” Proceedingsof the 29th Annual International Conference of the IEEE EMBS,1667–1670, August 2007.
7. Droitcour, A., “Non-contact measurement of heart and respirationrates with a single-chip microwave doppler radar,” Ph.D. Thesis,Stanford University, June 2006.
8. Lohman, B., O. Boric-Lubecke, V. M. Lubecke, P. W. Ong,and M. M. Sondhi, “A digital signal processor for Dopplerradar sensing of vital signs,” Proceedings of IEEE 23rd AnnualEngineering in Medicine and Biology Society Conference, Vol. 4,3359–3362, 2001.
9. Henry, G., Anatomy of the Human Body, Philadelphia, Lee &Febiger, 1918.
10. Chang, K., RF and Microwave Wireless Systems, Wiley Science,2000.
11. Staderini, E. M., “UWB radar in medicine,” IEEE AESS SystemsMagazine, Vol. 17, 13–18, January 2002.
12. Gabriel, C., “Compilation of the dielectric properties of body tis-sues at RF and microwave frequencies,” http://niremf.ifac.cnr.it/.
13. Fan, Z., S. Qiao, H.-F. Jiang Tao, and L.-X. Ran, “Signaldescriptions and formulations for long range UHF RFID readers,”Progress In Electromagnetics Research, PIER 71, 109–127, 2007.