winnipeg regional health authority 2016 – 2021 strategic plan
TRANSCRIPT
2016-2021 Strategic Plan Page 1 of 23
Winnipeg Regional Health Authority
2016 – 2021 Strategic Plan
June 1, 2015
Winnipeg Regional Health Authority
2016-2021 Strategic Plan Page 2 of 23
TABLE OF CONTENTS
ContentsOverview of the Winnipeg Regional Health Authority ...................................................... 3
Mission, Vision and Values ............................................................................................. 3
Environmental Scan ........................................................................................................ 4
Prioritization Process ....................................................................................................... 7
Strategic Directions ....................................................................................................... 12
Operational Strategies ................................................................................................... 16
Performance Measures ................................................................................................. 17
Capital Planning ............................................................................................................ 18
APPENDICES
1. WRHA 2016-2021 Strategic Plan 1-pager
2. Community Health Assessment Report 2014, Volume 1: An Overview of
Community Health Across the Winnipeg Health Region
3. Staff and Public Feedback Survey Results
4. Local Health Involvement Group Summary Report
5. Health for All: Building Winnipeg’s Health Equity Action Plan
6. WRHA’s Position Statement on Health Equity
7. WRHA Performance Measurement Framework
Winnipeg Regional Health Authority
2016-2021 Strategic Plan Page 3 of 23
OverviewoftheWinnipegRegionalHealthAuthority The Winnipeg Regional Health Authority (WRHA) has existed since 1999 when the Winnipeg Health Authority and the Winnipeg Community Authority were combined into one regional health authority. The 2016-2021 strategic plan is the fourth plan developed by the Region. The WRHA is responsible for coordinating and delivering health services and promoting well-being. The health authority serves residents of the city of Winnipeg as well as the northern community of Churchill, and the rural municipalities of East and West St. Paul, representing a total population of over 700,000. The Region also provides healthcare support and specialty referral services to nearly half a million Manitobans who live beyond these boundaries, as well as residents of Northwestern Ontario and Nunavut, who often require the services and expertise available within the Region.
With an annual operating budget of nearly $2.69 billion dollars, the WRHA operates or funds over 200 health service facilities and programs, which employ approximately 28,000 people working within the Region. The Region operates under various legal structures and in close partnership and cooperation with many health and social service entities, many of whom the Region relies on to deliver various health services.
Mission,VisionandValues The mission, vision and values of the WRHA for 2016 to 2021 are: Mission To coordinate and deliver quality, caring services that promote health and well-being. Vision Healthy People. Vibrant Communities. Equitable Care for All. Values Dignity – as a reflection of the self-worth of every person Care – as an unwavering expectation of every person Respect – as a measure of the importance of every person Equity – promote conditions in which every person can achieve their full health potential (or best health possible) Accountability – as being held responsible for the decisions we make
Winnipeg Regional Health Authority
2016-2021 Strategic Plan Page 4 of 23
EnvironmentalScan The WRHA was able to conduct a multi-faceted environmental scan of which the primary source of information is the 2014 Community Health Assessment. Other key sources of information include:
Staff Strategic Planning Survey Public Strategic Planning Survey 3 meetings with staff, public and
physicians in Churchill Feedback from Patient/Public Advisory
Councils Individual meetings with COO/CEOs in
major healthcare facilities Health information and communication
technology ("ICT") strategy Feedback from Boards and Executive
of healthcare agencies/facilities Input from Health for All Coordinating
Committee regarding health equity 24 meetings with LHIGs 2015 WRHA Risk Assessment Results Accreditation Canada On-Site Results
(2013) and Supplementary Survey (2014)
Clinical Services Strategic Planning Day feedback
Community Health Assessment (CHA) The 2014 CHA describes population and community characteristics, health status, determinants of health, and healthcare access, utilization and quality across the Winnipeg Region which administratively includes the small northern community of Churchill. Volume 1 is included in appendix 2 and provides an overview of the indicators for the WRHA and health inequalities across the Region. The Region’s population has been growing over the past decades and continues to grow: the projected population will reach 1,070,300 in 2042, a 45.8% increase from the observed population in 2013 (734,187). More importantly, the senior population’s proportion (aged 65 years and older) will increase from 14% in 2012 to 20% in 2042. The Region can project increased levels of acuity, chronic disease and healthcare costs, in part resulting from an aging population. As a result, the strategic plan incorporates a focus on exploring new models of enhancing health service delivery to the elderly, improving chronic disease services and managing resources to sustain the services that will be required over the next five years and beyond.
Cancer remains one of the top five causes of death in the Region. The Region’s establishment of the InSixty project, supports the provincial Cancer Patient Journey objective while working toward further integration of programs and services within and between health sectors.
Substantial inequalities in health status remain within the Region. Factors that impact health (e.g. education, employment, income, and other socio-economic factors) are unequally distributed in communities. Generally, higher income communities have better health across the Region.
Winnipeg Regional Health Authority
2016-2021 Strategic Plan Page 5 of 23
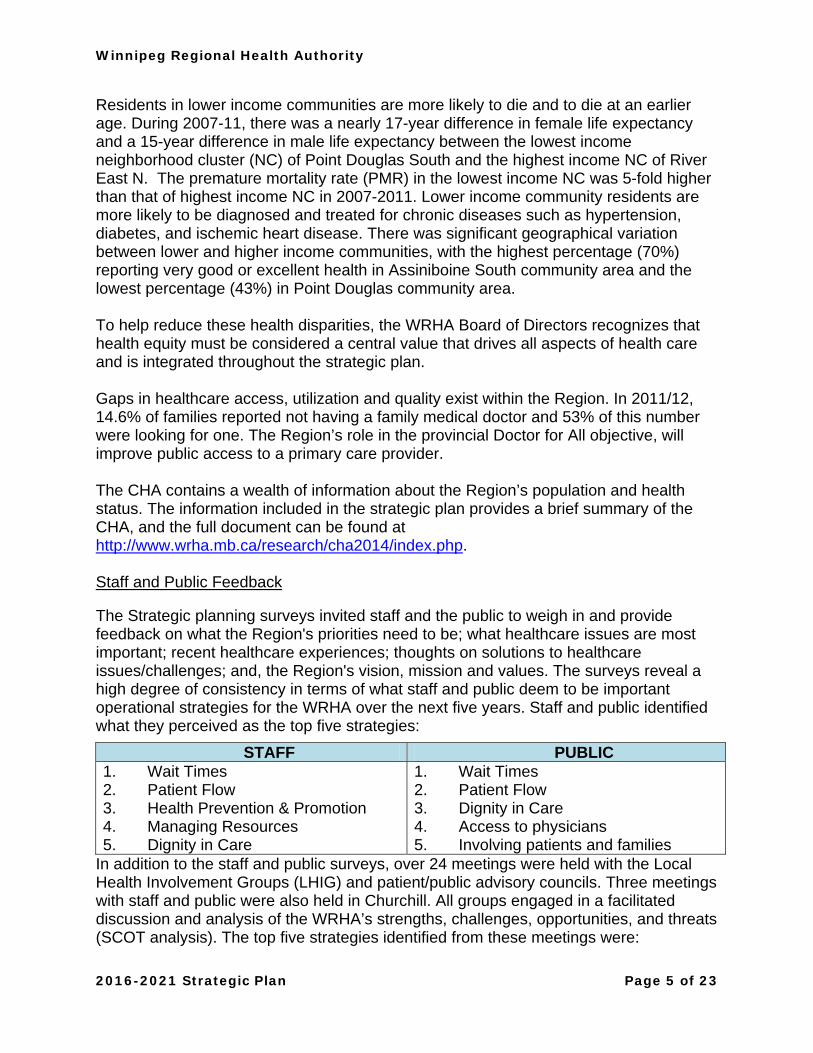
Residents in lower income communities are more likely to die and to die at an earlier age. During 2007-11, there was a nearly 17-year difference in female life expectancy and a 15-year difference in male life expectancy between the lowest income neighborhood cluster (NC) of Point Douglas South and the highest income NC of River East N. The premature mortality rate (PMR) in the lowest income NC was 5-fold higher than that of highest income NC in 2007-2011. Lower income community residents are more likely to be diagnosed and treated for chronic diseases such as hypertension, diabetes, and ischemic heart disease. There was significant geographical variation between lower and higher income communities, with the highest percentage (70%) reporting very good or excellent health in Assiniboine South community area and the lowest percentage (43%) in Point Douglas community area. To help reduce these health disparities, the WRHA Board of Directors recognizes that health equity must be considered a central value that drives all aspects of health care and is integrated throughout the strategic plan. Gaps in healthcare access, utilization and quality exist within the Region. In 2011/12, 14.6% of families reported not having a family medical doctor and 53% of this number were looking for one. The Region’s role in the provincial Doctor for All objective, will improve public access to a primary care provider. The CHA contains a wealth of information about the Region’s population and health status. The information included in the strategic plan provides a brief summary of the CHA, and the full document can be found at http://www.wrha.mb.ca/research/cha2014/index.php. Staff and Public Feedback The Strategic planning surveys invited staff and the public to weigh in and provide feedback on what the Region's priorities need to be; what healthcare issues are most important; recent healthcare experiences; thoughts on solutions to healthcare issues/challenges; and, the Region's vision, mission and values. The surveys reveal a high degree of consistency in terms of what staff and public deem to be important operational strategies for the WRHA over the next five years. Staff and public identified what they perceived as the top five strategies:
STAFF PUBLIC 1. Wait Times 2. Patient Flow 3. Health Prevention & Promotion 4. Managing Resources 5. Dignity in Care
1. Wait Times 2. Patient Flow 3. Dignity in Care 4. Access to physicians 5. Involving patients and families
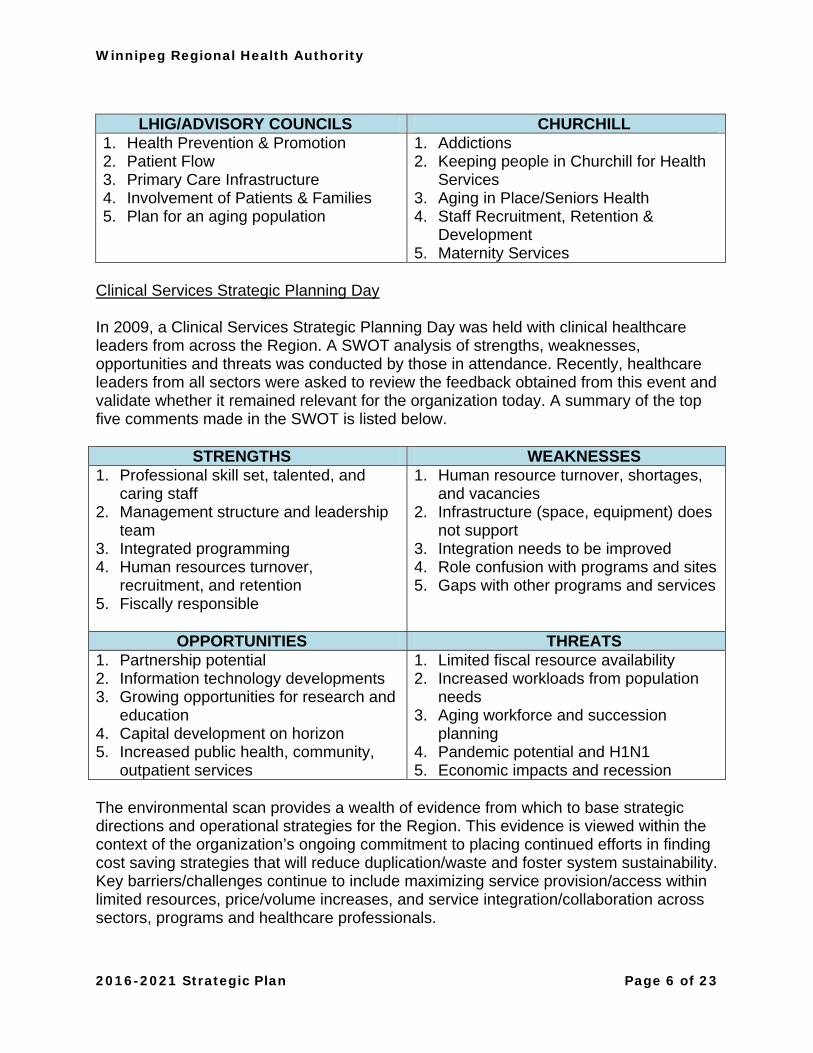
In addition to the staff and public surveys, over 24 meetings were held with the Local Health Involvement Groups (LHIG) and patient/public advisory councils. Three meetings with staff and public were also held in Churchill. All groups engaged in a facilitated discussion and analysis of the WRHA’s strengths, challenges, opportunities, and threats (SCOT analysis). The top five strategies identified from these meetings were:
Winnipeg Regional Health Authority
2016-2021 Strategic Plan Page 6 of 23
LHIG/ADVISORY COUNCILS CHURCHILL
1. Health Prevention & Promotion 2. Patient Flow 3. Primary Care Infrastructure 4. Involvement of Patients & Families 5. Plan for an aging population
1. Addictions 2. Keeping people in Churchill for Health
Services 3. Aging in Place/Seniors Health 4. Staff Recruitment, Retention &
Development 5. Maternity Services
Clinical Services Strategic Planning Day In 2009, a Clinical Services Strategic Planning Day was held with clinical healthcare leaders from across the Region. A SWOT analysis of strengths, weaknesses, opportunities and threats was conducted by those in attendance. Recently, healthcare leaders from all sectors were asked to review the feedback obtained from this event and validate whether it remained relevant for the organization today. A summary of the top five comments made in the SWOT is listed below.
STRENGTHS WEAKNESSES 1. Professional skill set, talented, and
caring staff 2. Management structure and leadership
team 3. Integrated programming 4. Human resources turnover,
recruitment, and retention 5. Fiscally responsible
1. Human resource turnover, shortages, and vacancies
2. Infrastructure (space, equipment) does not support
3. Integration needs to be improved 4. Role confusion with programs and sites5. Gaps with other programs and services
OPPORTUNITIES THREATS 1. Partnership potential 2. Information technology developments 3. Growing opportunities for research and
education 4. Capital development on horizon 5. Increased public health, community,
outpatient services
1. Limited fiscal resource availability 2. Increased workloads from population
needs 3. Aging workforce and succession
planning 4. Pandemic potential and H1N1 5. Economic impacts and recession
The environmental scan provides a wealth of evidence from which to base strategic directions and operational strategies for the Region. This evidence is viewed within the context of the organization’s ongoing commitment to placing continued efforts in finding cost saving strategies that will reduce duplication/waste and foster system sustainability. Key barriers/challenges continue to include maximizing service provision/access within limited resources, price/volume increases, and service integration/collaboration across sectors, programs and healthcare professionals.
Winnipeg Regional Health Authority
2016-2021 Strategic Plan Page 7 of 23
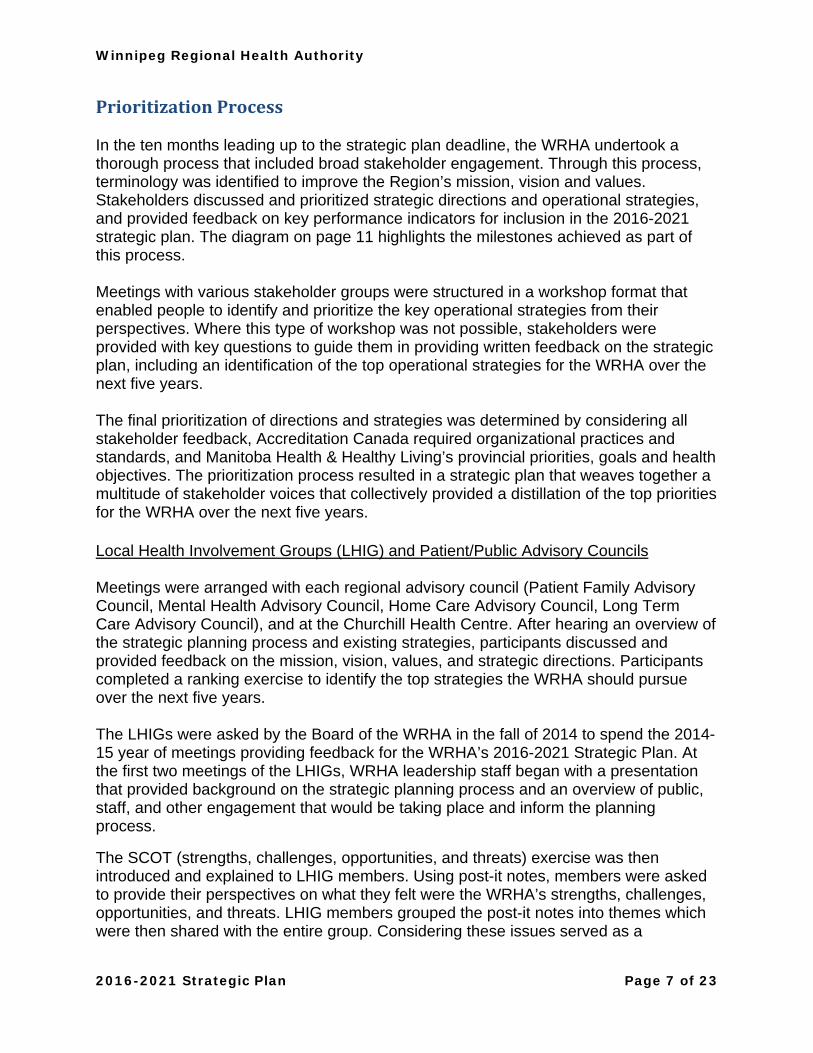
PrioritizationProcess In the ten months leading up to the strategic plan deadline, the WRHA undertook a thorough process that included broad stakeholder engagement. Through this process, terminology was identified to improve the Region’s mission, vision and values. Stakeholders discussed and prioritized strategic directions and operational strategies, and provided feedback on key performance indicators for inclusion in the 2016-2021 strategic plan. The diagram on page 11 highlights the milestones achieved as part of this process. Meetings with various stakeholder groups were structured in a workshop format that enabled people to identify and prioritize the key operational strategies from their perspectives. Where this type of workshop was not possible, stakeholders were provided with key questions to guide them in providing written feedback on the strategic plan, including an identification of the top operational strategies for the WRHA over the next five years. The final prioritization of directions and strategies was determined by considering all stakeholder feedback, Accreditation Canada required organizational practices and standards, and Manitoba Health & Healthy Living’s provincial priorities, goals and health objectives. The prioritization process resulted in a strategic plan that weaves together a multitude of stakeholder voices that collectively provided a distillation of the top priorities for the WRHA over the next five years. Local Health Involvement Groups (LHIG) and Patient/Public Advisory Councils Meetings were arranged with each regional advisory council (Patient Family Advisory Council, Mental Health Advisory Council, Home Care Advisory Council, Long Term Care Advisory Council), and at the Churchill Health Centre. After hearing an overview of the strategic planning process and existing strategies, participants discussed and provided feedback on the mission, vision, values, and strategic directions. Participants completed a ranking exercise to identify the top strategies the WRHA should pursue over the next five years. The LHIGs were asked by the Board of the WRHA in the fall of 2014 to spend the 2014-15 year of meetings providing feedback for the WRHA’s 2016-2021 Strategic Plan. At the first two meetings of the LHIGs, WRHA leadership staff began with a presentation that provided background on the strategic planning process and an overview of public, staff, and other engagement that would be taking place and inform the planning process.
The SCOT (strengths, challenges, opportunities, and threats) exercise was then introduced and explained to LHIG members. Using post-it notes, members were asked to provide their perspectives on what they felt were the WRHA’s strengths, challenges, opportunities, and threats. LHIG members grouped the post-it notes into themes which were then shared with the entire group. Considering these issues served as a

Winnipeg Regional Health Authority
2016-2021 Strategic Plan Page 8 of 23
foundational piece for the LHIGs to use when discussing and recommending strategic priorities for the WRHA’s next five years.
The main purpose of the second set of LHIG meetings was to get feedback on the current strategic priorities of the Region, invite ideas for additional priorities, and have the LHIG members participate in a ranking of operational strategies for the next plan. The meetings began with presentations by senior leadership staff overseeing the engagement and planning process. The presentations contained high level information about activities underway in the Region on the WRHA’s six strategic directions and operational strategies.
Small groups were then set up and tasked with providing feedback on the following questions about the current operational strategies:
Which strategies are still relevant? Why? Which strategies aren’t relevant anymore? Why? Are there any additional strategies that need to be added? Reasons? What equity considerations are relevant to each of these strategic directions?
For example poverty, accessibility, appropriateness (i.e. culture, faith, ethnicity, etc.)
Are there any additional considerations that need to be added to address health equity?
The current operational strategies were posted along with any additional strategies that came forward in the small group discussions. Members were then asked to participate in a ranking exercise; choosing three operational strategies they felt were most important. Results of the ranking exercise were shared with the group at the end of the meeting. A draft report highlighting the outcome of the LHIG meetings was shared with all LHIG members for their input and feedback. This report was presented by the LHIG Co-Chairs at the January 2015 meeting of the Board, and shared immediately with senior leadership staff overseeing the strategic planning process. Staff and Public Strategic Planning Surveys Two surveys were developed to obtain feedback from staff and public on what they thought the key strategies for the WRHA should be over the next five years. The surveys were available in French and English, paper copy and online, and respondent names were entered into a door prize. The WRHA received 2,237 staff responses and 802 public responses to the surveys.
Winnipeg Regional Health Authority
2016-2021 Strategic Plan Page 9 of 23
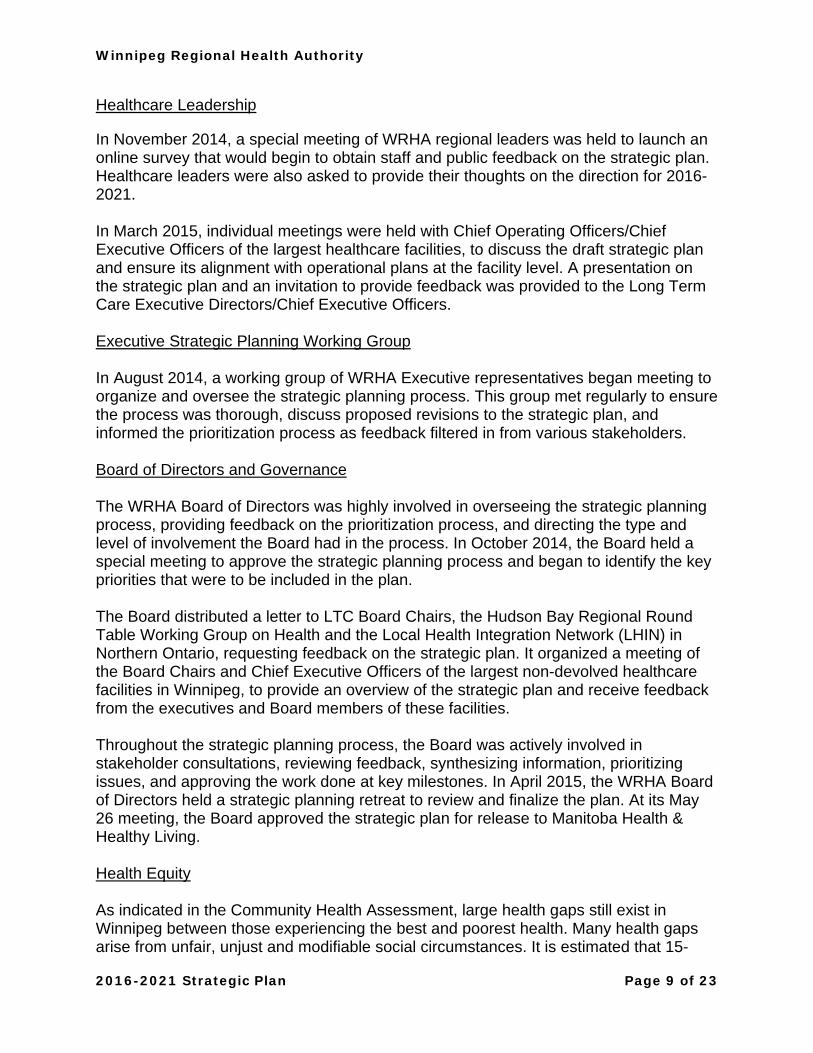
Healthcare Leadership
In November 2014, a special meeting of WRHA regional leaders was held to launch an online survey that would begin to obtain staff and public feedback on the strategic plan. Healthcare leaders were also asked to provide their thoughts on the direction for 2016-2021. In March 2015, individual meetings were held with Chief Operating Officers/Chief Executive Officers of the largest healthcare facilities, to discuss the draft strategic plan and ensure its alignment with operational plans at the facility level. A presentation on the strategic plan and an invitation to provide feedback was provided to the Long Term Care Executive Directors/Chief Executive Officers. Executive Strategic Planning Working Group In August 2014, a working group of WRHA Executive representatives began meeting to organize and oversee the strategic planning process. This group met regularly to ensure the process was thorough, discuss proposed revisions to the strategic plan, and informed the prioritization process as feedback filtered in from various stakeholders. Board of Directors and Governance The WRHA Board of Directors was highly involved in overseeing the strategic planning process, providing feedback on the prioritization process, and directing the type and level of involvement the Board had in the process. In October 2014, the Board held a special meeting to approve the strategic planning process and began to identify the key priorities that were to be included in the plan. The Board distributed a letter to LTC Board Chairs, the Hudson Bay Regional Round Table Working Group on Health and the Local Health Integration Network (LHIN) in Northern Ontario, requesting feedback on the strategic plan. It organized a meeting of the Board Chairs and Chief Executive Officers of the largest non-devolved healthcare facilities in Winnipeg, to provide an overview of the strategic plan and receive feedback from the executives and Board members of these facilities. Throughout the strategic planning process, the Board was actively involved in stakeholder consultations, reviewing feedback, synthesizing information, prioritizing issues, and approving the work done at key milestones. In April 2015, the WRHA Board of Directors held a strategic planning retreat to review and finalize the plan. At its May 26 meeting, the Board approved the strategic plan for release to Manitoba Health & Healthy Living. Health Equity As indicated in the Community Health Assessment, large health gaps still exist in Winnipeg between those experiencing the best and poorest health. Many health gaps arise from unfair, unjust and modifiable social circumstances. It is estimated that 15-

Winnipeg Regional Health Authority
2016-2021 Strategic Plan Page 10 of 23
20% of healthcare costs can be attributed to health equity disparities. The WRHA is committed to changing health equity outcomes through an increased health equity focus in the services it provides, the way it conducts its planning and operations, in providing knowledge and decision-making support to others, and in real partnerships and committed relationships outside the health care sector. Meetings were held with the Healthcare Outreach Network and the Health for All Coordinating Committee to develop language that incorporates health equity into the strategic plan. Health equity is now included as an organizational value, and woven throughout the strategic directions and operational priorities.
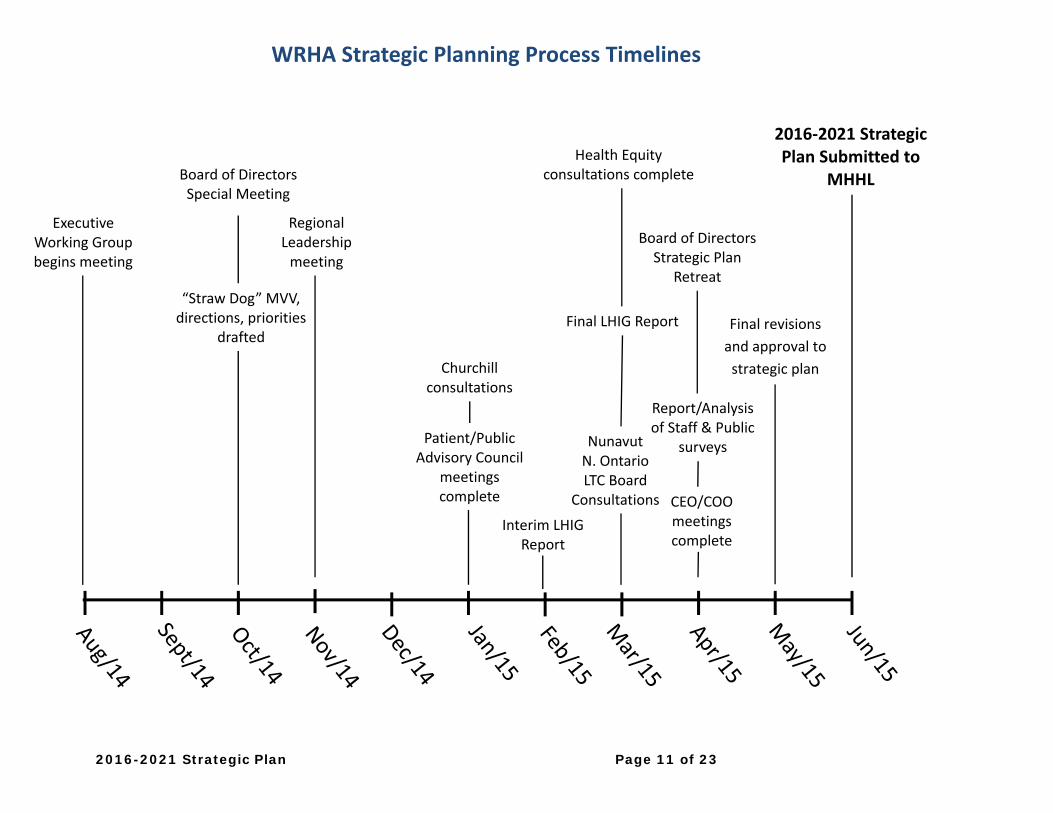
2016-2021 Strategic Plan Page 11 of 23
WRHA Strategic Planning Process Timelines
Executive Working Group begins meeting
“Straw Dog” MVV, directions, priorities
drafted
Regional Leadership meeting
Patient/Public Advisory Council
meetings complete
Health Equity consultations complete Board of Directors
Special Meeting
Final LHIG Report
Report/Analysis of Staff & Public
surveys
Churchill consultations
Interim LHIG Report
Board of Directors Strategic Plan
Retreat
2016‐2021 Strategic Plan Submitted to
MHHL
CEO/COO meetings complete
Nunavut N. Ontario LTC Board
Consultations
Final revisions
and approval to
strategic plan
2016-2021 Strategic Plan Page 12 of 23
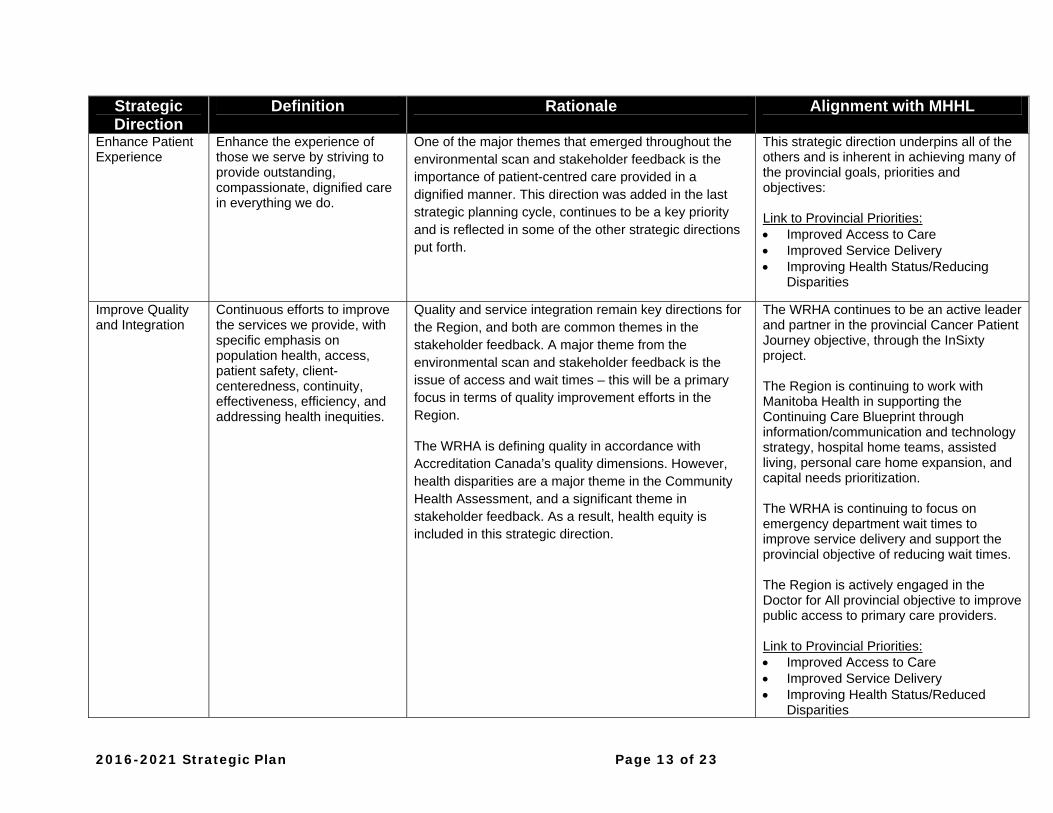
StrategicDirections The table on the next three pages outline the WRHA’s strategic directions for 2016-2021, how they align with the provincial priorities, goals and health objectives, and how they will advance the provincial plan for the health care system. A brief description of the rationale for each strategic direction is also provided. A population health approach was taken in the development of the strategic plan, both in terms of identifying the strategic directions and also when confirming the organization’s values. Population health is listed as part of the Improve Quality and Integration strategic direction. The strategic directions support and align with the WRHA mission and vision. Enhance the Patient Experience will lead to improvements in service delivery, while Involve the Public will support the mission and vision by delivering services more effectively through partnerships, and including patients/clients/residents in improvement efforts. Improve Quality and Integration will help to achieve health and well-being while providing care for all in an accessible manner. Engage Service Providers will develop and support staff and physicians to be engaged and responsive in their job. This in turn will improve care. The establishment of a diverse workforce will better equip the Region to deal with the needs of an increasingly diverse population. The Region will benefit from the development of new knowledge, innovation and the education of our healthcare providers, through the Advance Research and Education direction. Finally, Build Sustainability within the WRHA will ensure that the most appropriate level of service can be provided within limited resources.
2016-2021 Strategic Plan Page 13 of 23
Strategic Direction
Definition Rationale Alignment with MHHL
Enhance Patient Experience
Enhance the experience of those we serve by striving to provide outstanding, compassionate, dignified care in everything we do.
One of the major themes that emerged throughout the environmental scan and stakeholder feedback is the importance of patient-centred care provided in a dignified manner. This direction was added in the last strategic planning cycle, continues to be a key priority and is reflected in some of the other strategic directions put forth.
This strategic direction underpins all of the others and is inherent in achieving many of the provincial goals, priorities and objectives: Link to Provincial Priorities: Improved Access to Care Improved Service Delivery Improving Health Status/Reducing
Disparities
Improve Quality and Integration
Continuous efforts to improve the services we provide, with specific emphasis on population health, access, patient safety, client-centeredness, continuity, effectiveness, efficiency, and addressing health inequities.
Quality and service integration remain key directions for the Region, and both are common themes in the stakeholder feedback. A major theme from the environmental scan and stakeholder feedback is the issue of access and wait times – this will be a primary focus in terms of quality improvement efforts in the Region.
The WRHA is defining quality in accordance with Accreditation Canada’s quality dimensions. However, health disparities are a major theme in the Community Health Assessment, and a significant theme in stakeholder feedback. As a result, health equity is included in this strategic direction.
The WRHA continues to be an active leader and partner in the provincial Cancer Patient Journey objective, through the InSixty project. The Region is continuing to work with Manitoba Health in supporting the Continuing Care Blueprint through information/communication and technology strategy, hospital home teams, assisted living, personal care home expansion, and capital needs prioritization. The WRHA is continuing to focus on emergency department wait times to improve service delivery and support the provincial objective of reducing wait times. The Region is actively engaged in the Doctor for All provincial objective to improve public access to primary care providers. Link to Provincial Priorities: Improved Access to Care Improved Service Delivery Improving Health Status/Reduced
Disparities
Winnipeg Regional Health Authority
2016-2021 Strategic Plan Page 14 of 23
Strategic Direction
Definition Rationale Alignment with MHHL
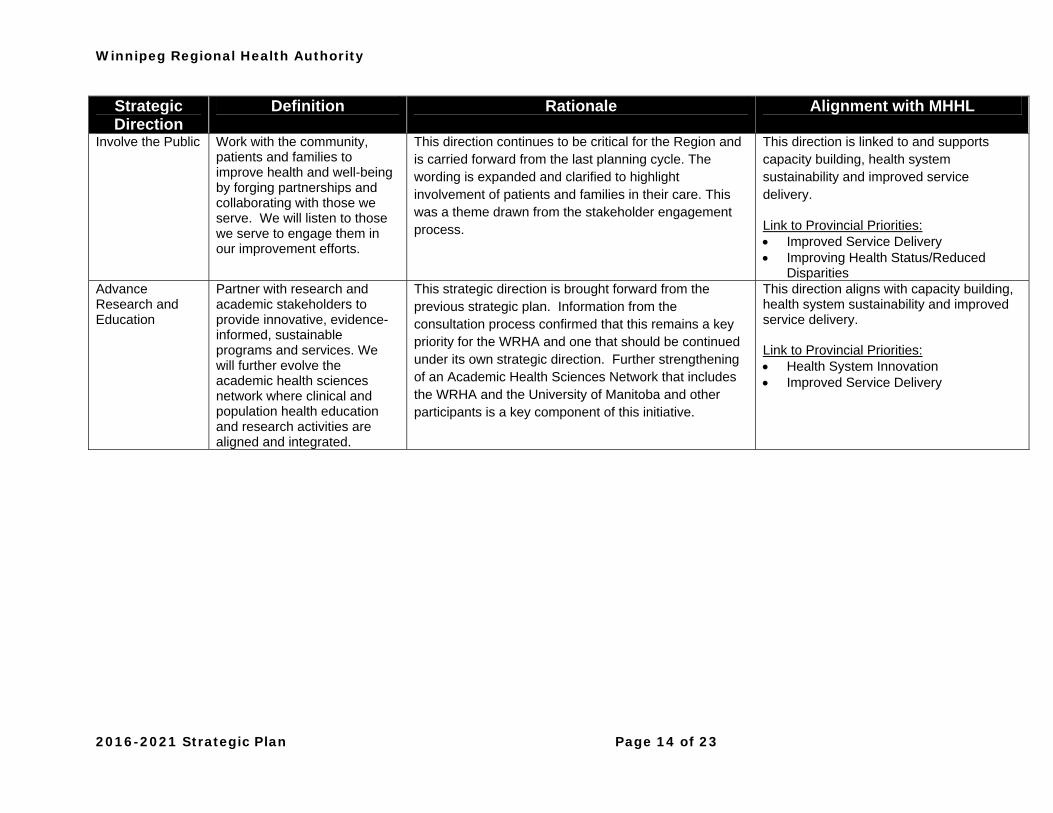
Involve the Public Work with the community, patients and families to improve health and well-being by forging partnerships and collaborating with those we serve. We will listen to those we serve to engage them in our improvement efforts.
This direction continues to be critical for the Region and is carried forward from the last planning cycle. The wording is expanded and clarified to highlight involvement of patients and families in their care. This was a theme drawn from the stakeholder engagement process.
This direction is linked to and supports capacity building, health system sustainability and improved service delivery.
Link to Provincial Priorities: Improved Service Delivery Improving Health Status/Reduced
Disparities Advance Research and Education
Partner with research and academic stakeholders to provide innovative, evidence-informed, sustainable programs and services. We will further evolve the academic health sciences network where clinical and population health education and research activities are aligned and integrated.
This strategic direction is brought forward from the previous strategic plan. Information from the consultation process confirmed that this remains a key priority for the WRHA and one that should be continued under its own strategic direction. Further strengthening of an Academic Health Sciences Network that includes the WRHA and the University of Manitoba and other participants is a key component of this initiative.
This direction aligns with capacity building, health system sustainability and improved service delivery. Link to Provincial Priorities: Health System Innovation Improved Service Delivery
Winnipeg Regional Health Authority
2016-2021 Strategic Plan Page 15 of 23
Strategic Direction
Definition Rationale Alignment with MHHL
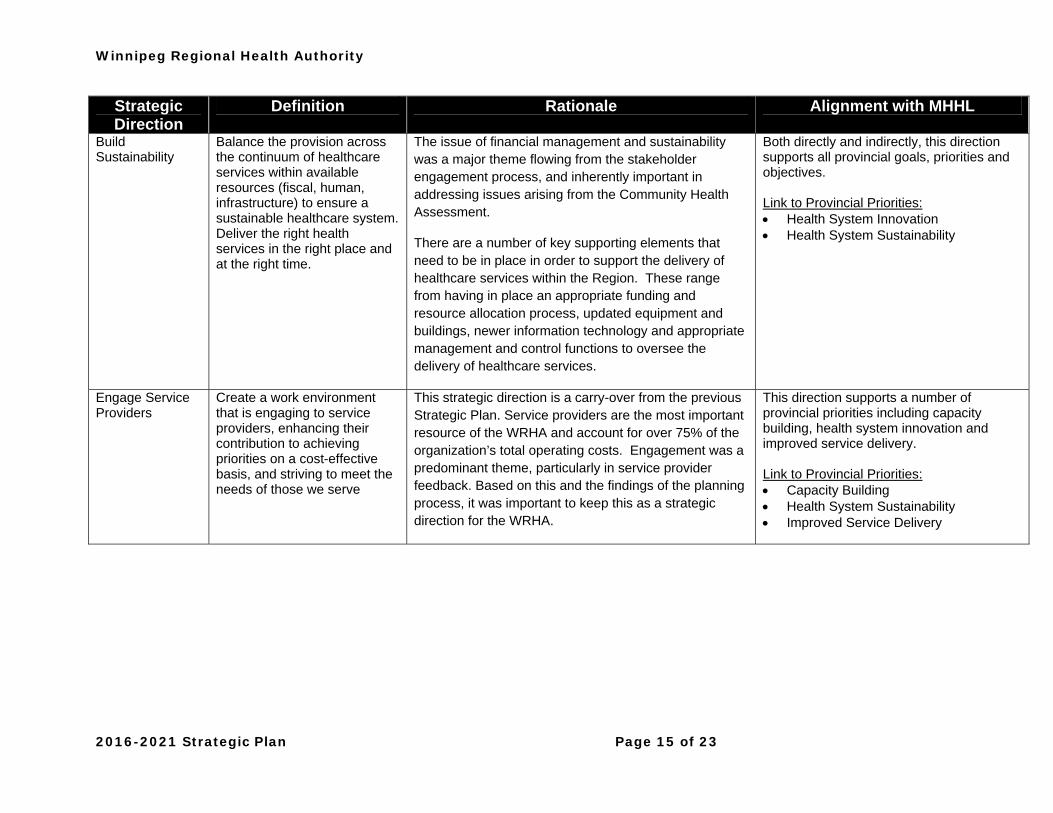
Build Sustainability
Balance the provision across the continuum of healthcare services within available resources (fiscal, human, infrastructure) to ensure a sustainable healthcare system. Deliver the right health services in the right place and at the right time.
The issue of financial management and sustainability was a major theme flowing from the stakeholder engagement process, and inherently important in addressing issues arising from the Community Health Assessment.
There are a number of key supporting elements that need to be in place in order to support the delivery of healthcare services within the Region. These range from having in place an appropriate funding and resource allocation process, updated equipment and buildings, newer information technology and appropriate management and control functions to oversee the delivery of healthcare services.
Both directly and indirectly, this direction supports all provincial goals, priorities and objectives. Link to Provincial Priorities: Health System Innovation Health System Sustainability
Engage Service Providers
Create a work environment that is engaging to service providers, enhancing their contribution to achieving priorities on a cost-effective basis, and striving to meet the needs of those we serve
This strategic direction is a carry-over from the previous Strategic Plan. Service providers are the most important resource of the WRHA and account for over 75% of the organization’s total operating costs. Engagement was a predominant theme, particularly in service provider feedback. Based on this and the findings of the planning process, it was important to keep this as a strategic direction for the WRHA.
This direction supports a number of provincial priorities including capacity building, health system innovation and improved service delivery. Link to Provincial Priorities: Capacity Building Health System Sustainability Improved Service Delivery
2016-2021 Strategic Plan Page 16 of 23
OperationalStrategies With the recent ability to link operational strategies to more than one strategic direction, the Region has increased its focus by reducing the overall number of operational strategies. Overall, the environmental scan results indicate that three operational strategies should take priority – Improve Patient Flow, Manage Resources and Improve Engagement. Improve Patient Flow, although carried over from the previous strategic plan, is expanded and remains a focus in the new plan. Improving productivity and efficiency through process improvement, is carried forward within the Manage Resources operational strategy. Increase staff engagement to strengthen workplace culture is also carried forward from the previous strategic plan, as part of the Improve Engagement strategy. The WRHA’s operational strategies are: IMPROVE PATIENT FLOW Deliver the right healthcare, in the right place, and at the right time. Engage the public in helping to shape health system design opportunities and
potential solutions. Work with other Regional Health Authorities on provincial system flow. Review the role of individual hospitals, taking into account how they function within
the context of the broader healthcare system. Advocate for and enable staffing models for service delivery 7 days/week in all
sectors. Explore new models of enhancing health service delivery to the elderly. Further integrate programs and service areas within and between health sectors
(e.g. chronic disease, care of the elderly, cancer patient journey, priority populations, mental health, and maternal/child health), and improve care between transition points.
Identify strategies, collaborations and other approaches that will demonstrate an impact in improving health equity and the consequential use of the health care system, including emphasis on health promotion strategies.
Foster a working environment that creates new knowledge through research and innovation, and encourages collaboration amongst health decision makers, policy makers, researchers, and academics in the application of new knowledge.
MANAGE RESOURCES Create an accountable financial management culture where financial implications
are considered in operational decision making. Establish a transparent resource (re)allocation methodology that includes a health
equity lens. Seek public feedback regarding resourcing priorities and choices.
Winnipeg Regional Health Authority
2016-2021 Strategic Plan Page 17 of 23
Reduce waste and improve productivity in delivery of programs and services. Implement business technologies, improve business processes, and enhance
reporting that support managers in their roles. Link population health, health system utilization, outcome, and quality data to
resources so we can become better informed in our resource (re)allocation and quality improvement efforts.
Address resource issues through effective prioritization of work in order to relieve overburden throughout the health care system.
IMPROVE ENGAGEMENT Provide support and leadership development for managers toward meeting
employee needs and fostering a work environment of engagement and accountability at all levels.
Alleviate the manager span of control problem. Continually conduct root cause analysis of lowest engagement-scoring
organizational units and resolve the root cause problems. Involve service providers to ensure they can contribute to efforts at improving flow,
managing resources and improving the overall quality of service. Participate in provincial workforce planning efforts to ensure adequate supply of
healthcare staff in anticipation of abnormally high volume of retirements. Initiate measurement of physician engagement and develop action plans responsive
to the findings.
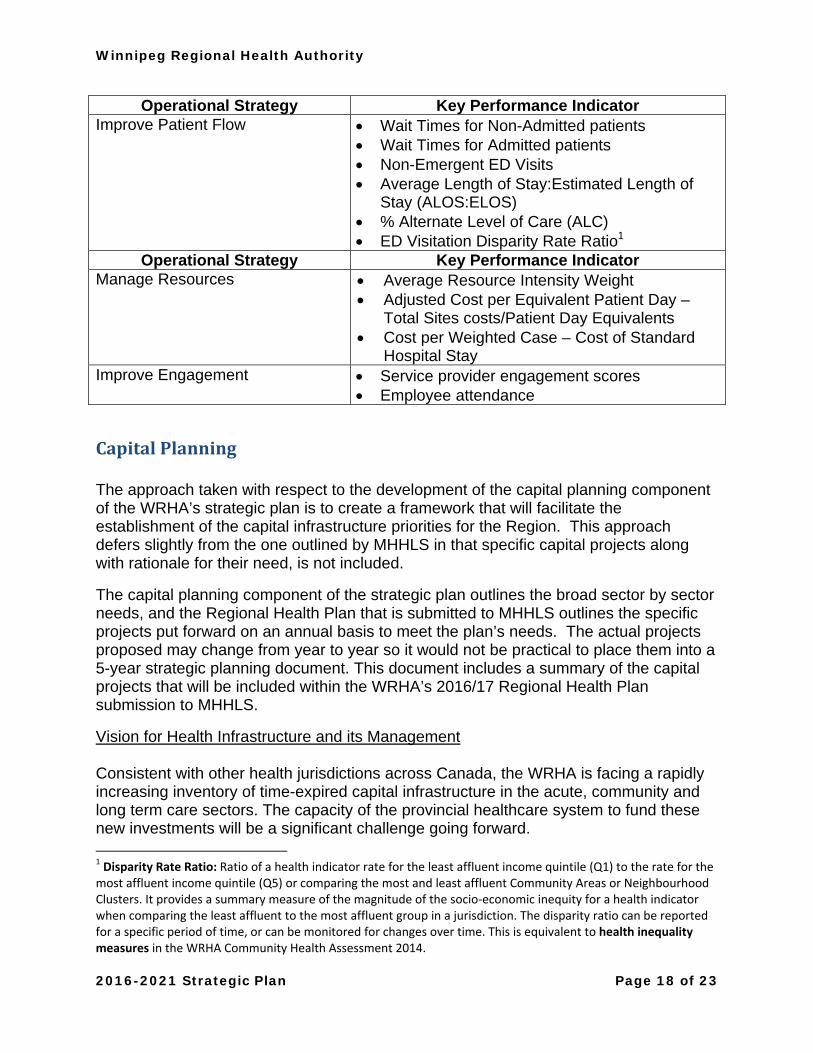
PerformanceMeasures The WRHA has developed ten “big dot” key performance indicators to monitor healthcare system performance at the public or population health level. These performance measures are listed on the next page. It is important to note that several layers of performance measures at the governance, strategic, tactical, and operational levels will exist across the Region, and will align with the strategic plan. The WRHA will continue to work with its leadership to identify incremental targets within the 5-year strategic planning cycle. The WRHA Performance Measurement Framework is developed to support this work and is included in appendix 7.
Winnipeg Regional Health Authority
2016-2021 Strategic Plan Page 18 of 23
Operational Strategy Key Performance Indicator Improve Patient Flow Wait Times for Non-Admitted patients
Wait Times for Admitted patients Non-Emergent ED Visits Average Length of Stay:Estimated Length of
Stay (ALOS:ELOS) % Alternate Level of Care (ALC) ED Visitation Disparity Rate Ratio1
Operational Strategy Key Performance Indicator Manage Resources Average Resource Intensity Weight
Adjusted Cost per Equivalent Patient Day – Total Sites costs/Patient Day Equivalents
Cost per Weighted Case – Cost of Standard Hospital Stay
Improve Engagement Service provider engagement scores Employee attendance
CapitalPlanning The approach taken with respect to the development of the capital planning component of the WRHA’s strategic plan is to create a framework that will facilitate the establishment of the capital infrastructure priorities for the Region. This approach defers slightly from the one outlined by MHHLS in that specific capital projects along with rationale for their need, is not included.
The capital planning component of the strategic plan outlines the broad sector by sector needs, and the Regional Health Plan that is submitted to MHHLS outlines the specific projects put forward on an annual basis to meet the plan’s needs. The actual projects proposed may change from year to year so it would not be practical to place them into a 5-year strategic planning document. This document includes a summary of the capital projects that will be included within the WRHA’s 2016/17 Regional Health Plan submission to MHHLS.
Vision for Health Infrastructure and its Management Consistent with other health jurisdictions across Canada, the WRHA is facing a rapidly increasing inventory of time-expired capital infrastructure in the acute, community and long term care sectors. The capacity of the provincial healthcare system to fund these new investments will be a significant challenge going forward. 1 Disparity Rate Ratio: Ratio of a health indicator rate for the least affluent income quintile (Q1) to the rate for the most affluent income quintile (Q5) or comparing the most and least affluent Community Areas or Neighbourhood Clusters. It provides a summary measure of the magnitude of the socio‐economic inequity for a health indicator when comparing the least affluent to the most affluent group in a jurisdiction. The disparity ratio can be reported for a specific period of time, or can be monitored for changes over time. This is equivalent to health inequality measures in the WRHA Community Health Assessment 2014.
Winnipeg Regional Health Authority
2016-2021 Strategic Plan Page 19 of 23
In order to provide clinically appropriate, safe and sustainable healthcare infrastructure within the region, the WRHA needed to develop and implement a framework for the ongoing management of our healthcare infrastructure needs. This framework addresses the development of new capital needs as well as the extension and ultimate replacement of existing infrastructure. Other factors considered in addition to the development of the planning framework was the review of cost saving efficiencies and alternative funding models. The ongoing management and development of healthcare infrastructure within the WRHA will be achieved by completing and/or updating the following key components on an annual basis:
1) Assessment of Capital Planning Needs 2) Prioritization of Capital Planning Needs 3) Identification of Cost Saving Efficiencies 4) Identification of Alternative Funding Models
Although there is a significant future capital cost for the infrastructure investments required for the WRHA, there is also a cost related to not addressing these needs. Factoring in time and money results in increased project costs if they are not addressed in a timely manner. There is also a significant cost related to the re-investments needed to keep the existing infrastructure operational. Over time, these re-investments simply erode the base of funding that would be available for new infrastructure. 1) Assessment of Capital Planning Needs Before beginning the process of determining its capital planning needs, WRHA Capital Planning completed a Regional Capital Master Planning Exercise. The goal of the Regional Capital Master Planning was to develop a Regional methodology to review, assess, and prioritize capital investment across all sectors over the next 20 to 25 years. The Regional Capital Planning process enables the Region to reconcile the competing facility/sector interests in a fair, transparent, and defensible manner. Individual master plans for tertiary facilities, community hospitals and hybrid facilities were completed along with Pan Am Clinic. These master plans determined the capital infrastructure requirements and strategic opportunities for each facility and include a plan and related timeline as to how these projects could be phased in over a number of years and in a cost effective manner. The master plans provide each facility with a strategic framework for planning and implementation within the context of a 25-year timeframe. The plans take into account the program plans to improve the level of service provided to the people and communities they serve. The plans will be reviewed annually and updated every 5 years to ensure they stay current and align with the WRHA strategic plan. 2) Prioritization of Capital Planning Needs The prioritization of WRHA capital priorities needs to be more strategic in order to address the challenge of limited provincial capital funding. Included as part of the Master Capital Planning process was the development of evaluation criteria that are to be used on an
Winnipeg Regional Health Authority
2016-2021 Strategic Plan Page 20 of 23
annual basis to prioritize the capital needs within the Region. This criterion was shared with the other Regional Health Authorities and there is support to use the criteria on a provincial basis. It is important to note that the regional prioritization process factors in not only the acute care sector but also long term care and community health services. Although the majority of the existing infrastructure is acute care based, we need to ensure that a similar focus is placed on the other sectors of the healthcare system. Facilities were analyzed based on current and future program requirements and infrastructure needs. The resulting framework balances and leverages overlapping opportunities of each component that achieves the following strategic objectives:
Evaluate and assess the condition of existing buildings and infrastructure. Outline and quantify our capacity for future development at existing facilities. Identify risks within the Region – aging infrastructure, safety issues and sustainability. Identify facility priorities/opportunities and align known and emerging regional
initiatives. Define and address programmatic pressures. Decommission aging infrastructure that pose risk and liability.
3) Cost Saving Efficiencies Within the overall Capital Planning process there is an opportunity to create cost saving efficiencies in terms of how capital projects are designed, approved, managed and timed. Streamlining the traditional capital planning project approval process can result in timing efficiencies by mitigating approval delays and associated project cost escalation impacts. This would assist in reducing the level of risk with respect to maintaining project scope and ensuring the project is completed within the approved budget allocation. Challenging the existing design standards and guidelines is a function that will be incorporated into the annual planning process. This will ensure that we are not overbuilding facilities in terms of the required infrastructure and that we are designing the most appropriate space possible based on emerging trends and best practices. The WRHA will continue to factor in accessibility, green building and energy management design elements into its construction projects. Cost savings can also be achieved through other activities such as working through similar projects simultaneously. Completion of multiple projects such as constructing Access Centres at the same time creates efficiencies in terms of tendering, project management and overall design. Examples of where opportunities exist would be in Access Centre development, Quick Care Clinics and personal care home development. 4) Alternative Funding Models The ability of MHHLS to fund major capital projects of the size and scope being identified as priorities by the WRHA is becoming more and more challenging. Investigation and
Winnipeg Regional Health Authority
2016-2021 Strategic Plan Page 21 of 23
consideration of alternative funding models used in other jurisdictions need to be considered. This would include, for example, the use of the P3 Model (Private/Public/Partnership). This approach would allow the Region to secure sources of capital financing beyond what is available through the existing MHHLS capital funding process. Potential shortfalls in capital funding capacity will generate significant discussion going forward around system sustainability. Issues around future divestment, consolidation and new requirements will all be enabled through the annual completion of the Master Capital Planning process. Linkage between Capital Needs and Environmental Scan The WRHA through its Capital Planning efforts has identified Proposed Capital Needs in the acute, long term care and community health services sectors. The proposed needs were identified through the completion of an environmental scan that included the following key processes:
1) Completion of WRHA Master Capital Planning exercise - The Master Capital Planning exercise facilitated the gathering of information around the entire acute care sector.
2) Review of Personal Care Home Expected Bed Capacity Study – Analysis of demographic data and research reports has determined that significant growth in the seniors’ population over the upcoming years will create a demand for personal care home Beds that exceeds existing capacity.
3) Review of Role of Hospitals Report – Opportunity exists for the initial work to be readdressed/informed, integrated and aligned with capital assessments.
4) Review of best practices, guidelines and standards 5) Review of Patient Populations – Identified significant growth trends in the areas of
bariatric, special needs and behavioral patients. 6) Discussions with service providers, other Regional Health Authorities and other
jurisdictions – Ongoing discussions with service providers such as the Community Health Agencies to stay current and identify needs within the Community Health Services sector.
Using the environmental scan data lead to the identification of broad capital project needs:
1) Acute Care Sector: a. Bed tower replacements b. Emergency department redevelopments c. Program Expansion Space
2) Long Term Care Sector:
a. Additional bed capacity b. Replacement of time expired existing bed capacity c. Elimination of multi-bedded rooms
3) Community Health Services Sector:
a. Improved community clinic space
Winnipeg Regional Health Authority
2016-2021 Strategic Plan Page 22 of 23
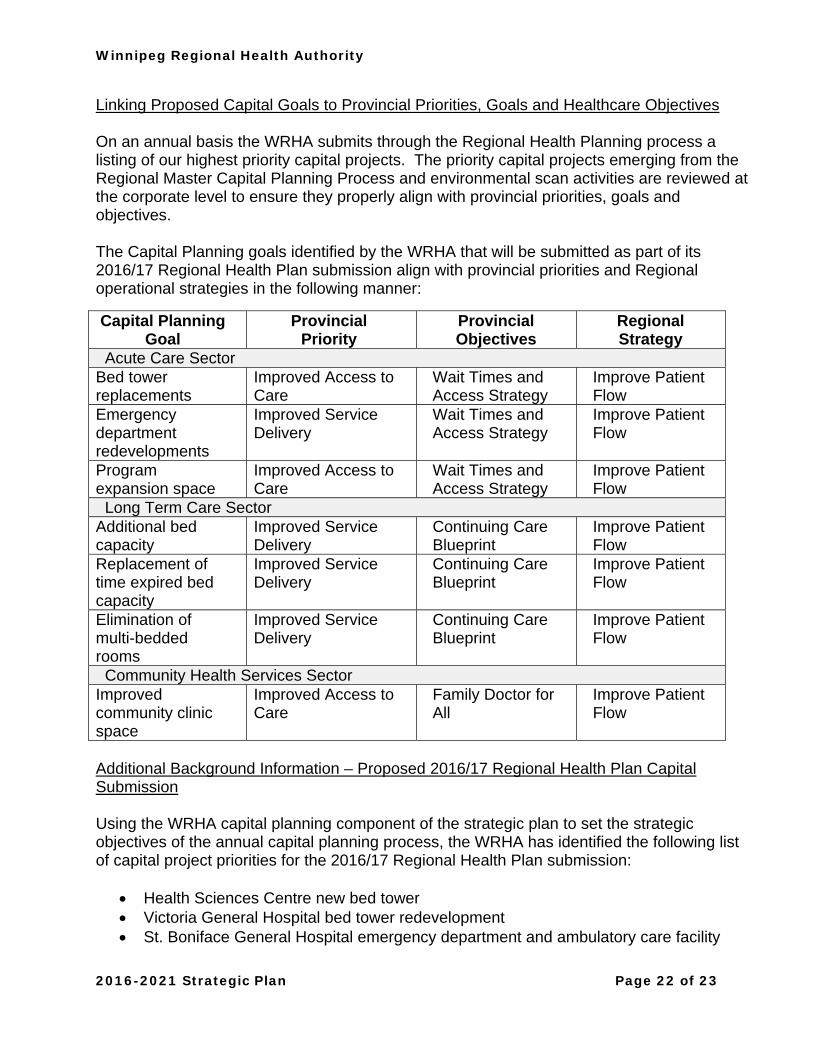
Linking Proposed Capital Goals to Provincial Priorities, Goals and Healthcare Objectives On an annual basis the WRHA submits through the Regional Health Planning process a listing of our highest priority capital projects. The priority capital projects emerging from the Regional Master Capital Planning Process and environmental scan activities are reviewed at the corporate level to ensure they properly align with provincial priorities, goals and objectives. The Capital Planning goals identified by the WRHA that will be submitted as part of its 2016/17 Regional Health Plan submission align with provincial priorities and Regional operational strategies in the following manner:
Capital Planning Goal
Provincial Priority
Provincial Objectives
Regional Strategy
Acute Care Sector Bed tower replacements
Improved Access to Care
Wait Times and Access Strategy
Improve Patient Flow
Emergency department redevelopments
Improved Service Delivery
Wait Times and Access Strategy
Improve Patient Flow
Program expansion space
Improved Access to Care
Wait Times and Access Strategy
Improve Patient Flow
Long Term Care Sector Additional bed capacity
Improved Service Delivery
Continuing Care Blueprint
Improve Patient Flow
Replacement of time expired bed capacity
Improved Service Delivery
Continuing Care Blueprint
Improve Patient Flow
Elimination of multi-bedded rooms
Improved Service Delivery
Continuing Care Blueprint
Improve Patient Flow
Community Health Services Sector Improved community clinic space
Improved Access to Care
Family Doctor for All
Improve Patient Flow
Additional Background Information – Proposed 2016/17 Regional Health Plan Capital Submission Using the WRHA capital planning component of the strategic plan to set the strategic objectives of the annual capital planning process, the WRHA has identified the following list of capital project priorities for the 2016/17 Regional Health Plan submission:
Health Sciences Centre new bed tower Victoria General Hospital bed tower redevelopment St. Boniface General Hospital emergency department and ambulatory care facility
Winnipeg Regional Health Authority
2016-2021 Strategic Plan Page 23 of 23
Health Sciences Centre existing Women’s Hospital redevelopment New personal care home capacity Replacement of Convalescent Home, Parkview Place and Poseidon Care Acquisition of National Research Council building – Dialysis, Breast Health and
Women’s Health Clinic Palliative Care Centre of Excellence
Summary of WRHA Capital Project Priorities by Sector Acute Care Sector - There are a wide variety of capital projects currently underway and planned for the acute care sector. These include the completion of a new diagnostic imaging building at the Health Sciences Centre which will assist with improving wait times related to diagnostic testing. The redevelopment of the emergency department at Grace Hospital and the addition of a new MRI at the facility will also support the provincial wait time priority. Discussions are currently underway with the Federal Government regarding the opportunity for the WRHA to lease the National Research Council building which will provide much needed capacity for dialysis, MRI and breast health programs. These projects will support the provincial priorities related to cancer patient journey and wait times. Future projects include a redeveloped emergency department and ambulatory care facility at St. Boniface General Hospital, a new bed tower at the Health Sciences Centre and a bed tower redevelopment at Victoria General Hospital. Long Term Care Sector - From a capital planning perspective the development of new and replacement personal care home capacity is a major area of focus for the Region. The Regional Health Plan submission includes the need for additional personal care home beds including the need for additional behavioral bed capacity. The Region is currently working on the construction of three new personal care homes and work is being done to complete a 20-year plan to fully map out the required bed capacity. The capital planning efforts in this area closely align with the provincial priorities related to long term care capacity and wait times. From a regional perspective they closely align with the patient flow priority. Community Care Sector - From a capital planning perspective the development of Access Centres and Quick Care Clinics continues to be a major priority for the Region. In addition to this, the replacement and/or enhancement of aging community health agency infrastructure is also a priority. The Access Centre and Quick Care Clinic development supports the Doctor for All provincial initiative and also provides a related benefit to wait times. Providing alternative service delivery models assists in removing some of the current pressure being placed on the emergency departments. Upgrading the community health agency infrastructure ensures there will be ongoing service provision in the areas of prevention and promotion that assists in treating patients in the most appropriate and cost effective environment.
!tt9b5L· м WINNIPEG REGIONAL HEALTH AUTHORITY 2016 to 2021 Strategic Plan
Mission Vision Values To coordinate and deliver quality, caring services that promote health and well-being.
Healthy People. Vibrant Communities. Equitable Care for All. Dignity - as a reflection of the self-worth of every person Care - as an unwavering expectation of every person Respect - as a measure of the importance of every person Equity - promote conditions in which every person can achieve their full health potential Accountability – as being held responsible for the decisions we make
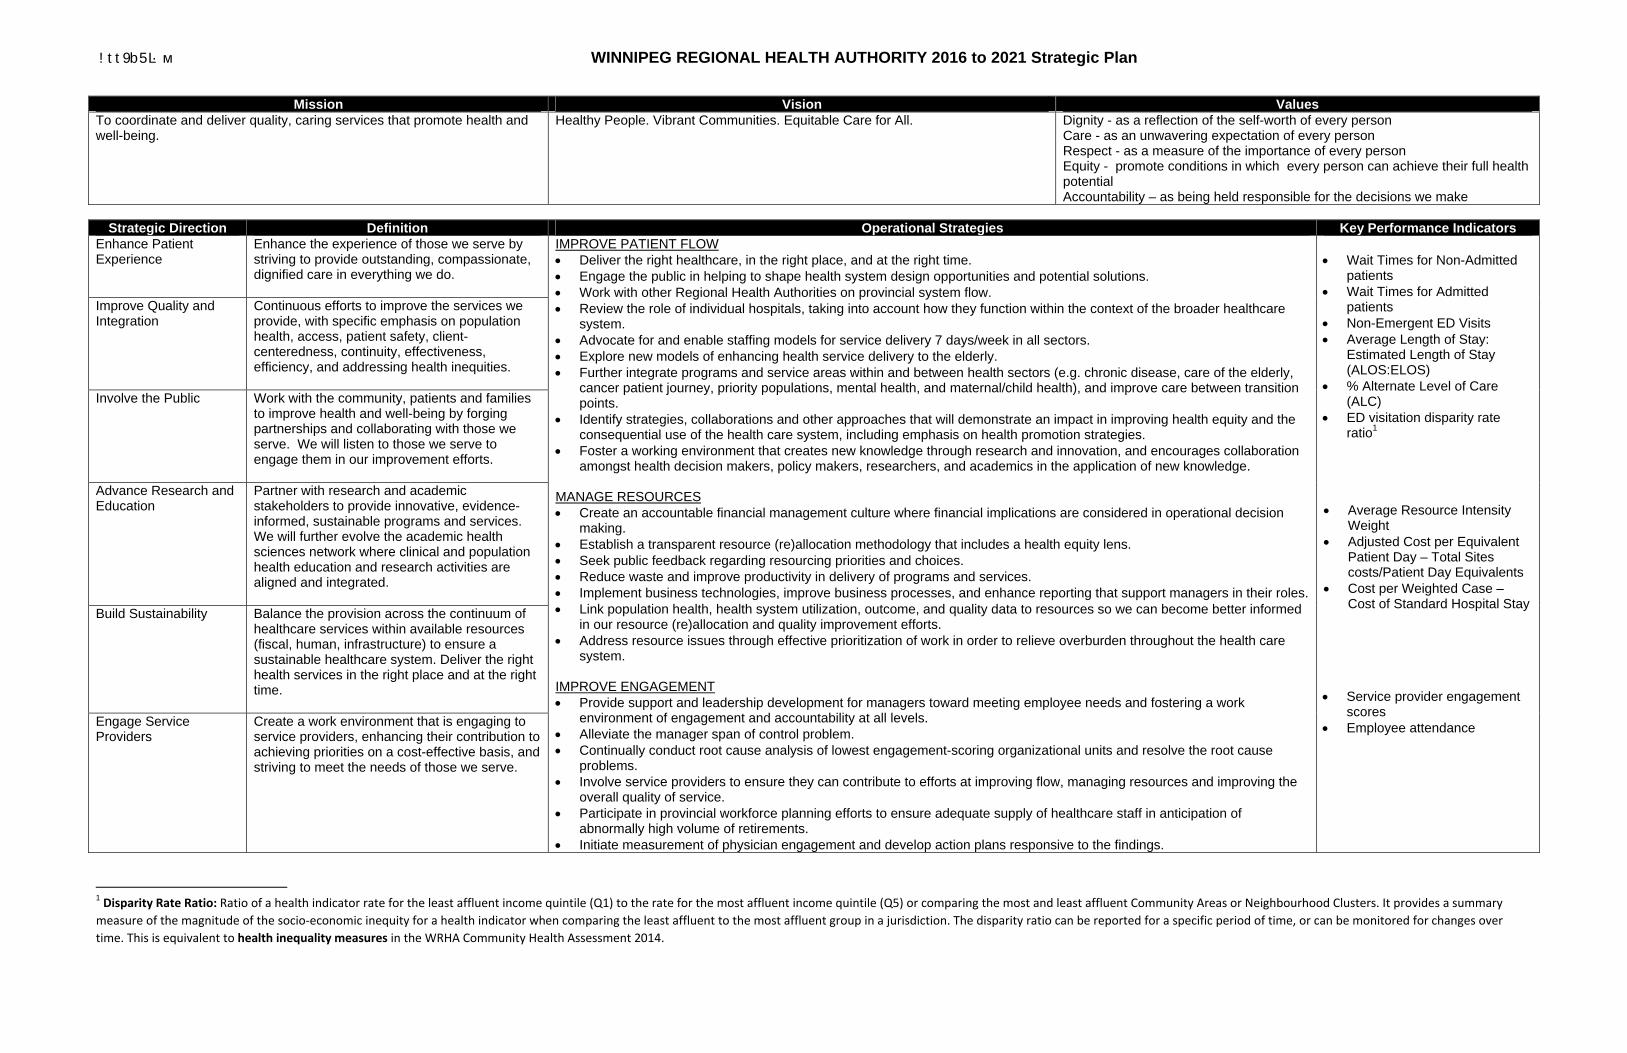
Strategic Direction Definition Operational Strategies Key Performance Indicators
Enhance Patient Experience
Enhance the experience of those we serve by striving to provide outstanding, compassionate, dignified care in everything we do.
IMPROVE PATIENT FLOW Deliver the right healthcare, in the right place, and at the right time. Engage the public in helping to shape health system design opportunities and potential solutions. Work with other Regional Health Authorities on provincial system flow. Review the role of individual hospitals, taking into account how they function within the context of the broader healthcare
system. Advocate for and enable staffing models for service delivery 7 days/week in all sectors. Explore new models of enhancing health service delivery to the elderly. Further integrate programs and service areas within and between health sectors (e.g. chronic disease, care of the elderly,
cancer patient journey, priority populations, mental health, and maternal/child health), and improve care between transition points.
Identify strategies, collaborations and other approaches that will demonstrate an impact in improving health equity and the consequential use of the health care system, including emphasis on health promotion strategies.
Foster a working environment that creates new knowledge through research and innovation, and encourages collaboration amongst health decision makers, policy makers, researchers, and academics in the application of new knowledge.
MANAGE RESOURCES Create an accountable financial management culture where financial implications are considered in operational decision
making. Establish a transparent resource (re)allocation methodology that includes a health equity lens. Seek public feedback regarding resourcing priorities and choices. Reduce waste and improve productivity in delivery of programs and services. Implement business technologies, improve business processes, and enhance reporting that support managers in their roles. Link population health, health system utilization, outcome, and quality data to resources so we can become better informed
in our resource (re)allocation and quality improvement efforts. Address resource issues through effective prioritization of work in order to relieve overburden throughout the health care
system. IMPROVE ENGAGEMENT Provide support and leadership development for managers toward meeting employee needs and fostering a work
environment of engagement and accountability at all levels. Alleviate the manager span of control problem. Continually conduct root cause analysis of lowest engagement-scoring organizational units and resolve the root cause
problems. Involve service providers to ensure they can contribute to efforts at improving flow, managing resources and improving the
overall quality of service. Participate in provincial workforce planning efforts to ensure adequate supply of healthcare staff in anticipation of
abnormally high volume of retirements. Initiate measurement of physician engagement and develop action plans responsive to the findings.
Wait Times for Non-Admitted
patients Wait Times for Admitted
patients Non-Emergent ED Visits Average Length of Stay:
Estimated Length of Stay (ALOS:ELOS)
% Alternate Level of Care (ALC)
ED visitation disparity rate ratio1
Average Resource Intensity Weight
Adjusted Cost per Equivalent Patient Day – Total Sites costs/Patient Day Equivalents
Cost per Weighted Case – Cost of Standard Hospital Stay
Service provider engagement
scores Employee attendance
Improve Quality and Integration
Continuous efforts to improve the services we provide, with specific emphasis on population health, access, patient safety, client-centeredness, continuity, effectiveness, efficiency, and addressing health inequities.
Involve the Public Work with the community, patients and families to improve health and well-being by forging partnerships and collaborating with those we serve. We will listen to those we serve to engage them in our improvement efforts.
Advance Research and Education
Partner with research and academic stakeholders to provide innovative, evidence-informed, sustainable programs and services. We will further evolve the academic health sciences network where clinical and population health education and research activities are aligned and integrated.
Build Sustainability Balance the provision across the continuum of healthcare services within available resources (fiscal, human, infrastructure) to ensure a sustainable healthcare system. Deliver the right health services in the right place and at the right time.
Engage Service Providers
Create a work environment that is engaging to service providers, enhancing their contribution to achieving priorities on a cost-effective basis, and striving to meet the needs of those we serve.
1 Disparity Rate Ratio: Ratio of a health indicator rate for the least affluent income quintile (Q1) to the rate for the most affluent income quintile (Q5) or comparing the most and least affluent Community Areas or Neighbourhood Clusters. It provides a summary measure of the magnitude of the socio‐economic inequity for a health indicator when comparing the least affluent to the most affluent group in a jurisdiction. The disparity ratio can be reported for a specific period of time, or can be monitored for changes over time. This is equivalent to health inequality measures in the WRHA Community Health Assessment 2014.
Winnipeg Regional Health Authority
COMMUNITY HEALTH ASSESSMENT 2014
COMMUNITY HEALTH ASSESSMENT 2014
THIS REPORT IS PRODUCED AND PUBLISHED BY THE EVALUATION PLATFORM, CENTRE FOR
HEALTHCARE INNOVATION (CHI), UNIVERSITY OF MANITOBA AND THE WINNIPEG REGIONAL HEALTH
AUTHORITY (WRHA).
It is also available in PDF format on the CHI & WRHA websites at:
http://www.wrha.mb.ca/research/cha/reports.php
http://chimb.ca/researchandevaluation#communityhealthassessment
Information concerning this report can be obtained by contacting:
Evaluation Platform, Centre for Healthcare Innovation
Division of Quality & System Performance
Winnipeg Regional Health Authority
753 McDermot Avenue
Winnipeg MB R3E 0W3
Telephone: 204-926-7000 (WRHA)
Email: [email protected] or [email protected]
Suggested citation:
Centre for Healthcare Innovation (CHI) & Winnipeg Regional Health Authority (WRHA). 2014 Community Health
Assessment. Winnipeg MB: WRHA & CHI Evaluation Platform, March 2015.
1WINNIPEG REGIONAL HEALTH AUTHORITY
Message from Arlene WilgoshPRESIDENT & CHIEF EXECUTIVE OFFICER
WINNIPEG REGIONAL HEALTH AUTHORITY
It’s difficult to get where you’re going if you don’t know
where you are.
Published every five years, the Community Health
Assessment provides an intensively-researched snapshot of
where our community currently stands in relation to a broad
range of key health indicators. For those of us working in
the health care sector – and for the many organizations and
programs associated with health, wellness and community
development – it provides a solid foundation for decision-
making based on the best available data.
As in past years, the Winnipeg Regional Health Authority has
taken much care in preparing this report. We have sought out
and been guided by the constructive feedback we received
following our 2009 report, with the goal of delivering a final
product that is accurate, informative, and user-friendly.
This is where we are. And now, by working together, we
can continue the work of developing evidence-informed
strategies and priorities that can help us achieve our shared
goal of building stronger, healthier communities.
May we continue to support each other on the journey.
COMMUNITY HEALTH ASSESSMENT 20142
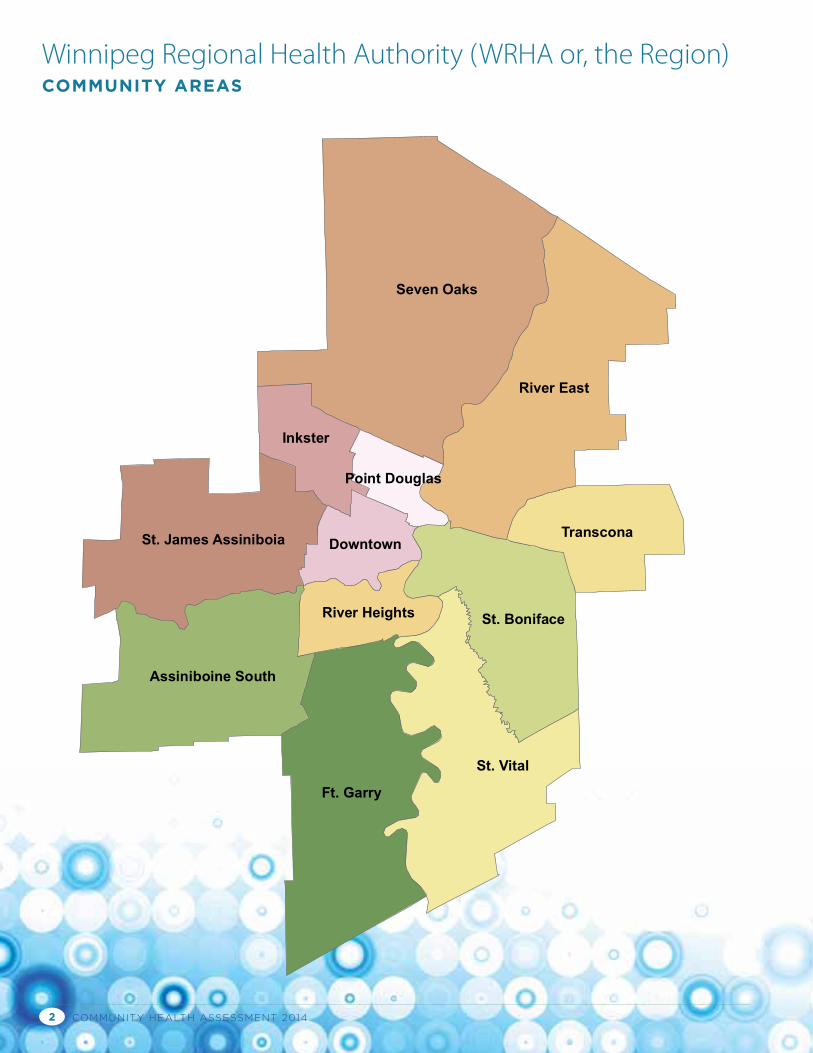
Seven Oaks
Ft. Garry
St. Vital
River East
St. Boniface
Assiniboine South
St. James Assiniboia Transcona
Inkster
Downtown
River Heights
Point Douglas
Neighborhood Cluster:
01A St. James-Assiniboia W01B St. James-Assiniboia E002 Assiniboine South03A Fort Garry N03B Fort Garry S04A St. Vital N04B St. Vital S05A St. Boniface W05B St. Boniface E006 Transcona07A River East S07B River East W07C River East E07D River East N08A Seven Oaks W08B Seven Oaks E08C Seven Oaks N09A Inkster W09B Inkster E10A Point Douglas N10B Point Douglas S11A Downtown W11B Downtown E12A River Heights W12B River Heights E
08C
002
03B
04B
07D
05B
00601A 01B
08A
03A
08B
07C07B
12A
04A
09B
11A
09A
11B
05A
12B
10A
07A10B
Winnipeg Regional Health Authority (WRHA or, the Region) COMMUNITY AREAS
3WINNIPEG REGIONAL HEALTH AUTHORITY
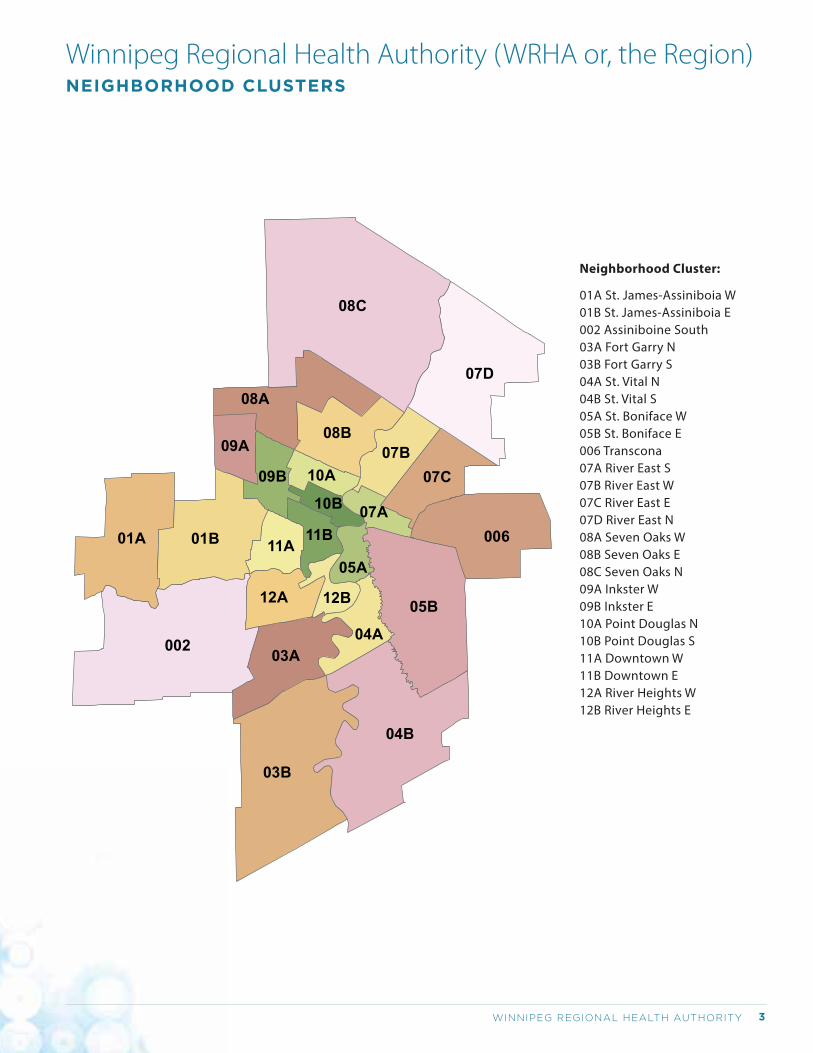
Winnipeg Regional Health Authority (WRHA or, the Region) NEIGHBORHOOD CLUSTERS
Neighborhood Cluster:
01A St. James-Assiniboia W01B St. James-Assiniboia E002 Assiniboine South03A Fort Garry N03B Fort Garry S04A St. Vital N04B St. Vital S05A St. Boniface W05B St. Boniface E006 Transcona07A River East S07B River East W07C River East E07D River East N08A Seven Oaks W08B Seven Oaks E08C Seven Oaks N09A Inkster W09B Inkster E10A Point Douglas N10B Point Douglas S11A Downtown W11B Downtown E12A River Heights W12B River Heights E
08C
002
03B
04B
07D
05B
00601A 01B
08A
03A
08B
07C07B
12A
04A
09B
11A
09A
11B
05A
12B
10A
07A10B

COMMUNITY HEALTH ASSESSMENT 20144
5WINNIPEG REGIONAL HEALTH AUTHORITY
Community Health Assessment Report 2014
VOLUME 1: AN OVERVIEW OF COMMUNITY HEALTH
ACROSS THE WINNIPEG HEALTH REGION
Winnipeg Regional Health Authority
COMMUNITY HEALTH ASSESSMENT 20146
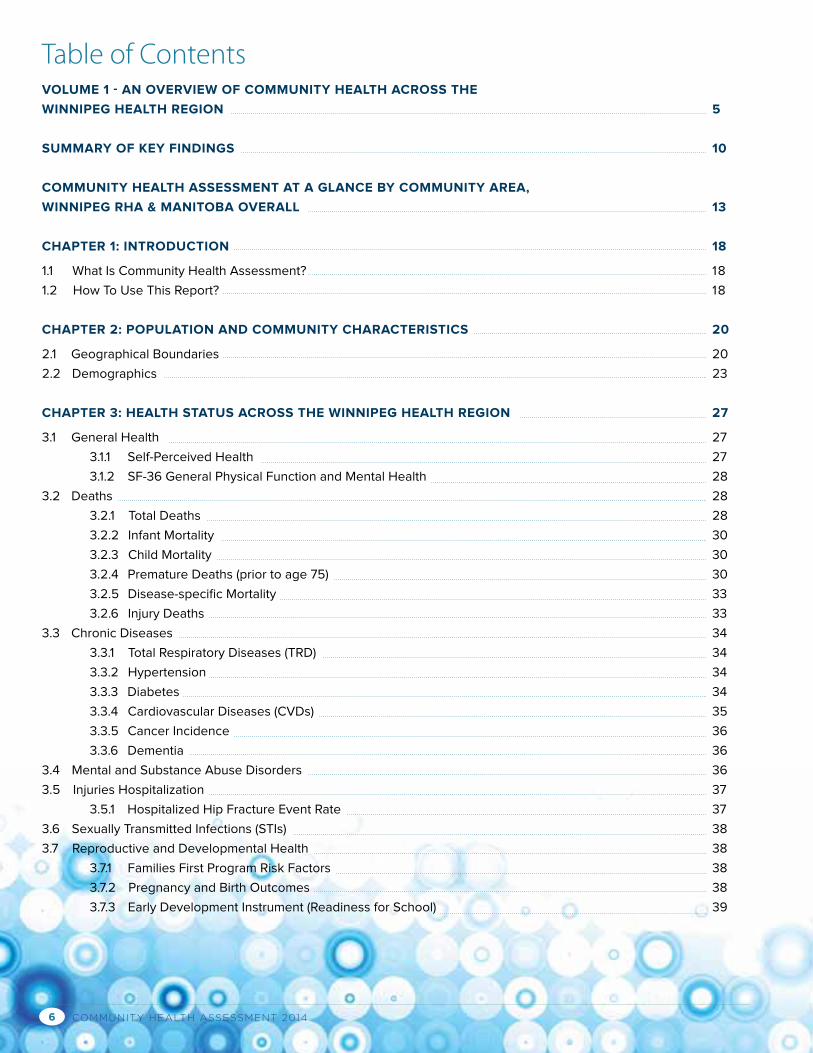
Table of ContentsVOLUME 1 - AN OVERVIEW OF COMMUNITY HEALTH ACROSS THE
WINNIPEG HEALTH REGION 5
SUMMARY OF KEY FINDINGS 10
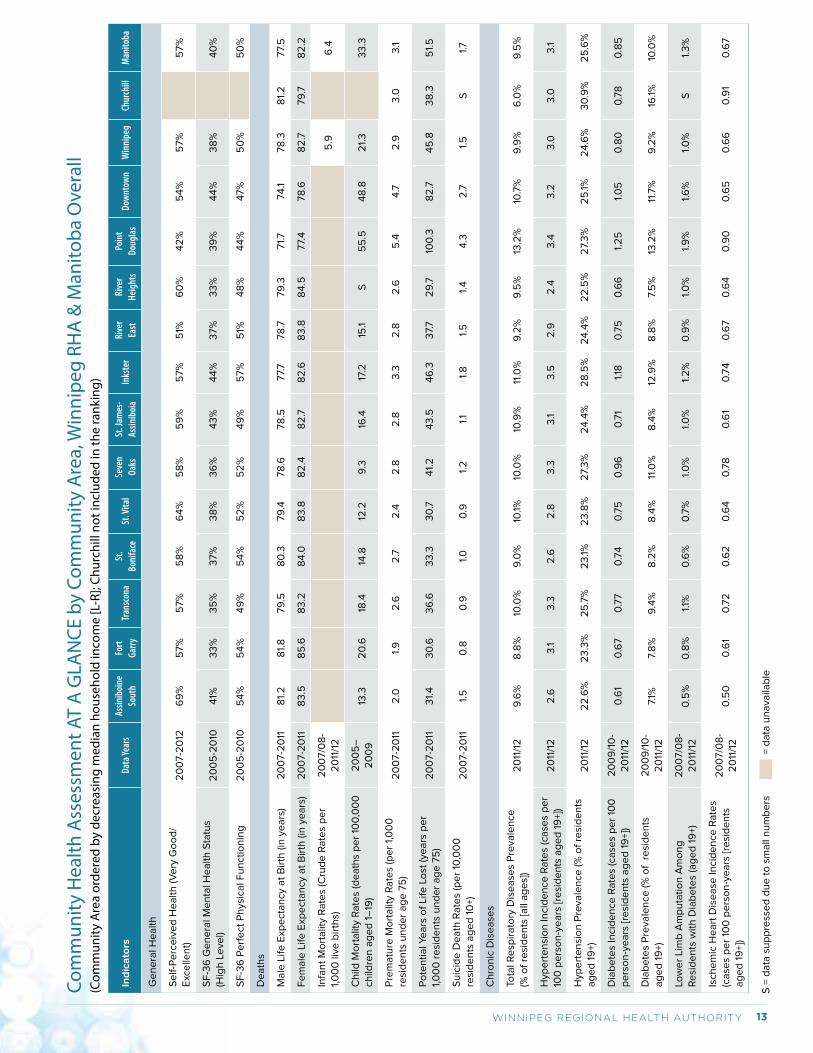
COMMUNITY HEALTH ASSESSMENT AT A GLANCE BY COMMUNITY AREA,
WINNIPEG RHA & MANITOBA OVERALL 13
CHAPTER 1: INTRODUCTION 18
1.1 What Is Community Health Assessment? 18
1.2 How To Use This Report? 18
CHAPTER 2: POPULATION AND COMMUNITY CHARACTERISTICS 20
2.1 Geographical Boundaries 20
2.2 Demographics 23
CHAPTER 3: HEALTH STATUS ACROSS THE WINNIPEG HEALTH REGION 27
3.1 General Health 27
3.1.1 Self-Perceived Health 27
3.1.2 SF-36 General Physical Function and Mental Health 28
3.2 Deaths 28
3.2.1 Total Deaths 28
3.2.2 Infant Mortality 30
3.2.3 Child Mortality 30
3.2.4 Premature Deaths (prior to age 75) 30
3.2.5 Disease-specific Mortality 33
3.2.6 Injury Deaths 33
3.3 Chronic Diseases 34
3.3.1 Total Respiratory Diseases (TRD) 34
3.3.2 Hypertension 34
3.3.3 Diabetes 34
3.3.4 Cardiovascular Diseases (CVDs) 35
3.3.5 Cancer Incidence 36
3.3.6 Dementia 36
3.4 Mental and Substance Abuse Disorders 36
3.5 Injuries Hospitalization 37
3.5.1 Hospitalized Hip Fracture Event Rate 37
3.6 Sexually Transmitted Infections (STIs) 38
3.7 Reproductive and Developmental Health 38
3.7.1 Families First Program Risk Factors 38
3.7.2 Pregnancy and Birth Outcomes 38
3.7.3 Early Development Instrument (Readiness for School) 39
7WINNIPEG REGIONAL HEALTH AUTHORITY
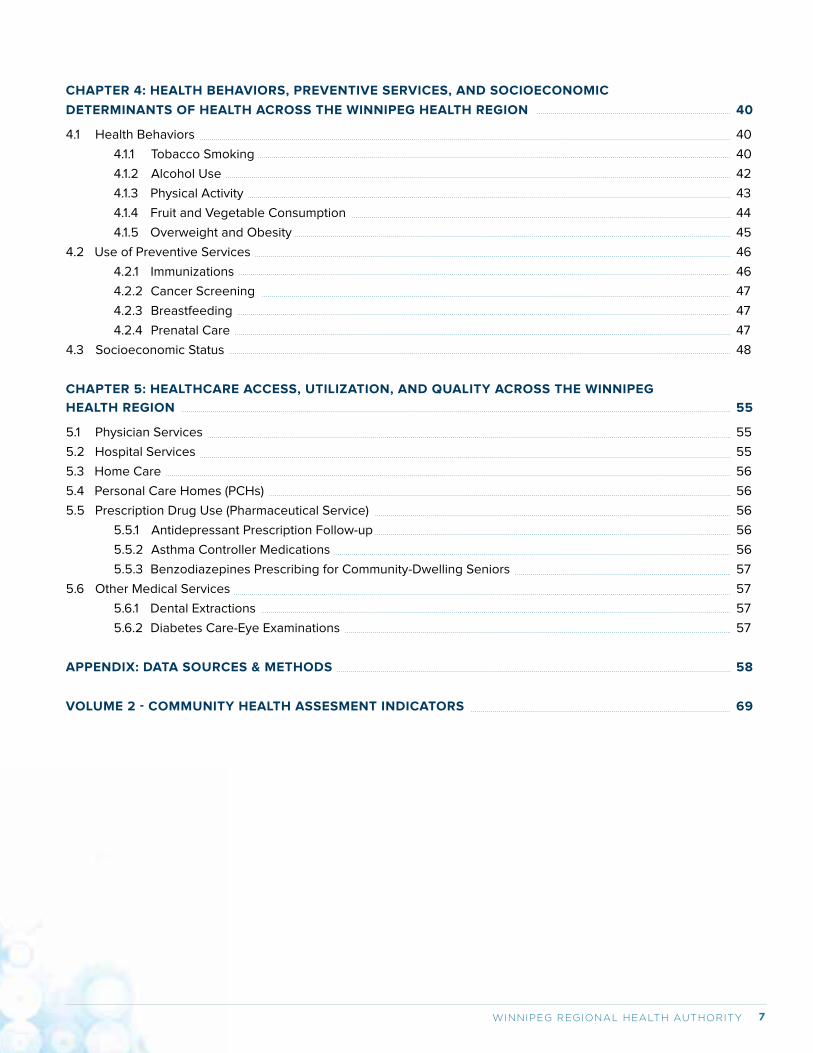
CHAPTER 4: HEALTH BEHAVIORS, PREVENTIVE SERVICES, AND SOCIOECONOMIC
DETERMINANTS OF HEALTH ACROSS THE WINNIPEG HEALTH REGION 40
4.1 Health Behaviors 40
4.1.1 Tobacco Smoking 40
4.1.2 Alcohol Use 42
4.1.3 Physical Activity 43
4.1.4 Fruit and Vegetable Consumption 44
4.1.5 Overweight and Obesity 45
4.2 Use of Preventive Services 46
4.2.1 Immunizations 46
4.2.2 Cancer Screening 47
4.2.3 Breastfeeding 47
4.2.4 Prenatal Care 47
4.3 Socioeconomic Status 48
CHAPTER 5: HEALTHCARE ACCESS, UTILIZATION, AND QUALITY ACROSS THE WINNIPEG
HEALTH REGION 55
5.1 Physician Services 55
5.2 Hospital Services 55
5.3 Home Care 56
5.4 Personal Care Homes (PCHs) 56
5.5 Prescription Drug Use (Pharmaceutical Service) 56
5.5.1 Antidepressant Prescription Follow-up 56
5.5.2 Asthma Controller Medications 56
5.5.3 Benzodiazepines Prescribing for Community-Dwelling Seniors 57
5.6 Other Medical Services 57
5.6.1 Dental Extractions 57
5.6.2 Diabetes Care-Eye Examinations 57
APPENDIX: DATA SOURCES & METHODS 58
VOLUME 2 - COMMUNITY HEALTH ASSESMENT INDICATORS 69
COMMUNITY HEALTH ASSESSMENT 20148
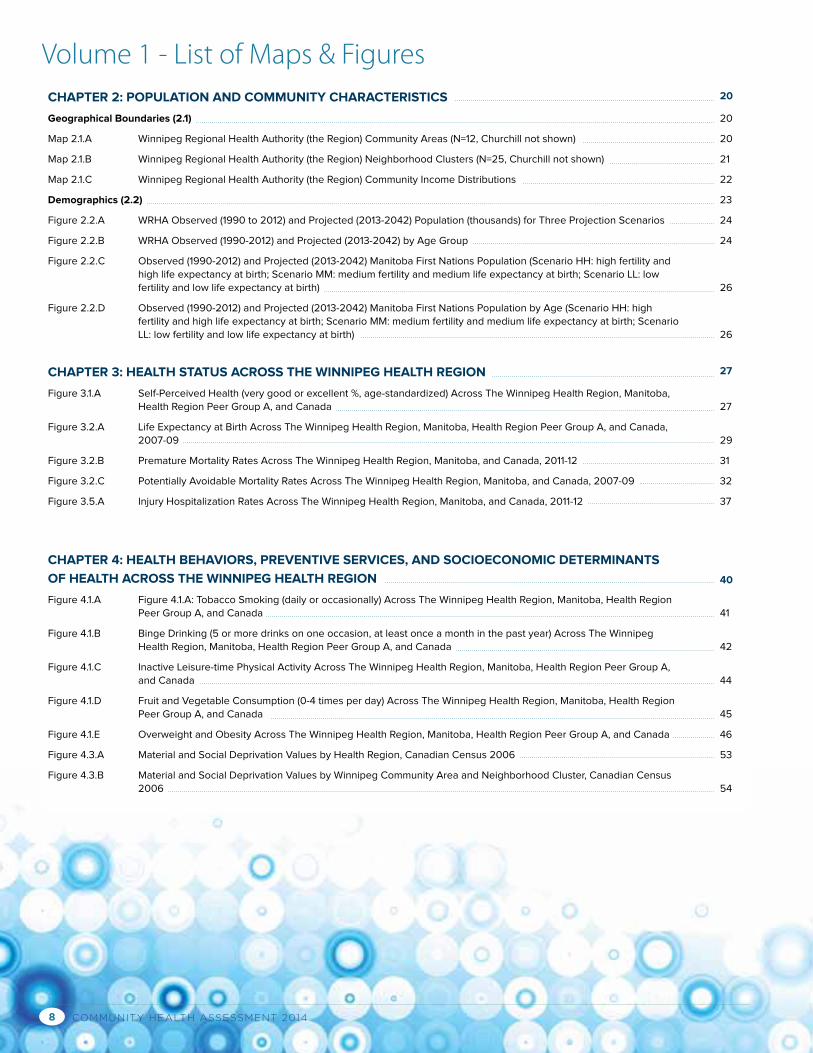
Volume 1 - List of Maps & FiguresCHAPTER 2: POPULATION AND COMMUNITY CHARACTERISTICS 20
Geographical Boundaries (2.1) 20
Map 2.1.A Winnipeg Regional Health Authority (the Region) Community Areas (N=12, Churchill not shown) 20
Map 2.1.B Winnipeg Regional Health Authority (the Region) Neighborhood Clusters (N=25, Churchill not shown) 21
Map 2.1.C Winnipeg Regional Health Authority (the Region) Community Income Distributions 22
Demographics (2.2) 23
Figure 2.2.A WRHA Observed (1990 to 2012) and Projected (2013-2042) Population (thousands) for Three Projection Scenarios 24
Figure 2.2.B WRHA Observed (1990-2012) and Projected (2013-2042) by Age Group 24
Figure 2.2.C Observed (1990-2012) and Projected (2013-2042) Manitoba First Nations Population (Scenario HH: high fertility and high life expectancy at birth; Scenario MM: medium fertility and medium life expectancy at birth; Scenario LL: low fertility and low life expectancy at birth)
26
Figure 2.2.D Observed (1990-2012) and Projected (2013-2042) Manitoba First Nations Population by Age (Scenario HH: high fertility and high life expectancy at birth; Scenario MM: medium fertility and medium life expectancy at birth; Scenario LL: low fertility and low life expectancy at birth)
26
CHAPTER 3: HEALTH STATUS ACROSS THE WINNIPEG HEALTH REGION 27
Figure 3.1.A Self-Perceived Health (very good or excellent %, age-standardized) Across The Winnipeg Health Region, Manitoba, Health Region Peer Group A, and Canada
27
Figure 3.2.A Life Expectancy at Birth Across The Winnipeg Health Region, Manitoba, Health Region Peer Group A, and Canada, 2007-09
29
Figure 3.2.B Premature Mortality Rates Across The Winnipeg Health Region, Manitoba, and Canada, 2011-12 31
Figure 3.2.C Potentially Avoidable Mortality Rates Across The Winnipeg Health Region, Manitoba, and Canada, 2007-09 32
Figure 3.5.A Injury Hospitalization Rates Across The Winnipeg Health Region, Manitoba, and Canada, 2011-12 37
CHAPTER 4: HEALTH BEHAVIORS, PREVENTIVE SERVICES, AND SOCIOECONOMIC DETERMINANTS
OF HEALTH ACROSS THE WINNIPEG HEALTH REGION
40
Figure 4.1.A Figure 4.1.A: Tobacco Smoking (daily or occasionally) Across The Winnipeg Health Region, Manitoba, Health Region Peer Group A, and Canada
41
Figure 4.1.B Binge Drinking (5 or more drinks on one occasion, at least once a month in the past year) Across The Winnipeg Health Region, Manitoba, Health Region Peer Group A, and Canada
42
Figure 4.1.C Inactive Leisure-time Physical Activity Across The Winnipeg Health Region, Manitoba, Health Region Peer Group A, and Canada
44
Figure 4.1.D Fruit and Vegetable Consumption (0-4 times per day) Across The Winnipeg Health Region, Manitoba, Health Region Peer Group A, and Canada
45
Figure 4.1.E Overweight and Obesity Across The Winnipeg Health Region, Manitoba, Health Region Peer Group A, and Canada 46
Figure 4.3.A Material and Social Deprivation Values by Health Region, Canadian Census 2006 53
Figure 4.3.B Material and Social Deprivation Values by Winnipeg Community Area and Neighborhood Cluster, Canadian Census 2006
54
9WINNIPEG REGIONAL HEALTH AUTHORITY
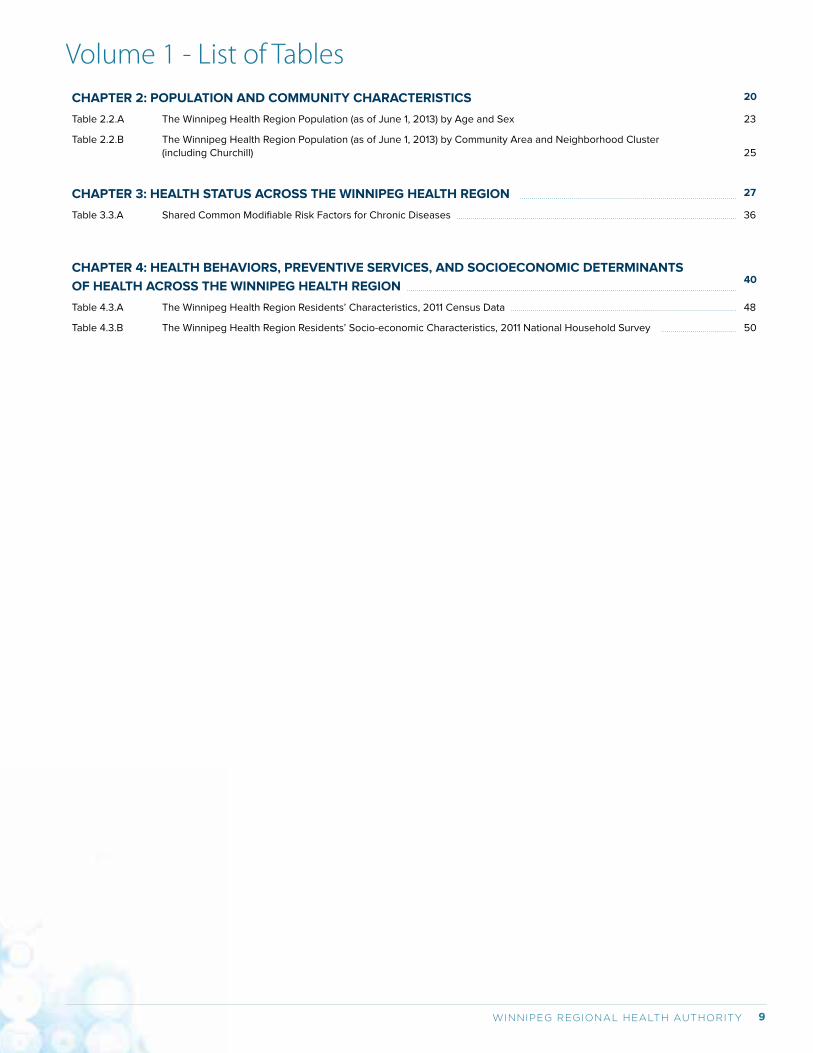
CHAPTER 2: POPULATION AND COMMUNITY CHARACTERISTICS 20
Table 2.2.A The Winnipeg Health Region Population (as of June 1, 2013) by Age and Sex 23
Table 2.2.B The Winnipeg Health Region Population (as of June 1, 2013) by Community Area and Neighborhood Cluster (including Churchill)
25
CHAPTER 3: HEALTH STATUS ACROSS THE WINNIPEG HEALTH REGION 27
Table 3.3.A Shared Common Modifiable Risk Factors for Chronic Diseases 36
CHAPTER 4: HEALTH BEHAVIORS, PREVENTIVE SERVICES, AND SOCIOECONOMIC DETERMINANTS
OF HEALTH ACROSS THE WINNIPEG HEALTH REGION
40
Table 4.3.A The Winnipeg Health Region Residents’ Characteristics, 2011 Census Data 48
Table 4.3.B The Winnipeg Health Region Residents’ Socio-economic Characteristics, 2011 National Household Survey 50
Volume 1 - List of Tables
COMMUNITY HEALTH ASSESSMENT 201410
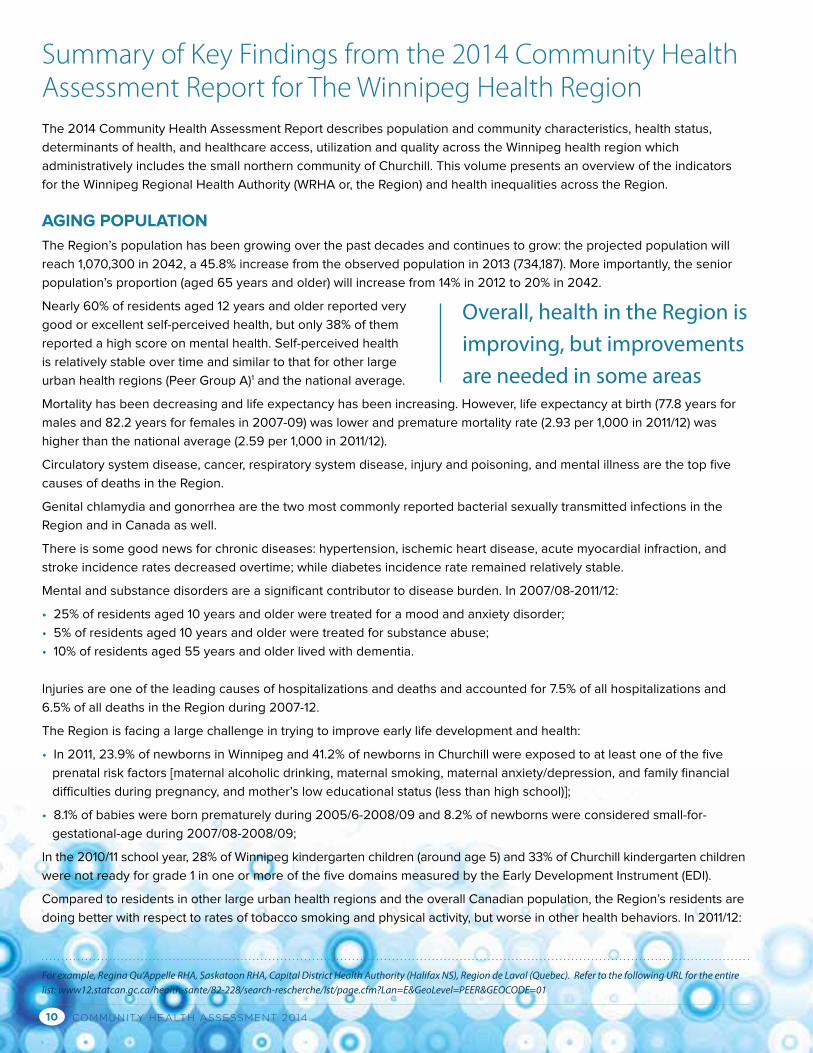
Summary of Key Findings from the 2014 Community Health Assessment Report for The Winnipeg Health RegionThe 2014 Community Health Assessment Report describes population and community characteristics, health status,
determinants of health, and healthcare access, utilization and quality across the Winnipeg health region which
administratively includes the small northern community of Churchill. This volume presents an overview of the indicators
for the Winnipeg Regional Health Authority (WRHA or, the Region) and health inequalities across the Region.
AGING POPULATION
The Region’s population has been growing over the past decades and continues to grow: the projected population will
reach 1,070,300 in 2042, a 45.8% increase from the observed population in 2013 (734,187). More importantly, the senior
population’s proportion (aged 65 years and older) will increase from 14% in 2012 to 20% in 2042.
Nearly 60% of residents aged 12 years and older reported very
good or excellent self-perceived health, but only 38% of them
reported a high score on mental health. Self-perceived health
is relatively stable over time and similar to that for other large
urban health regions (Peer Group A)1 and the national average.
Mortality has been decreasing and life expectancy has been increasing. However, life expectancy at birth (77.8 years for
males and 82.2 years for females in 2007-09) was lower and premature mortality rate (2.93 per 1,000 in 2011/12) was
higher than the national average (2.59 per 1,000 in 2011/12).
Circulatory system disease, cancer, respiratory system disease, injury and poisoning, and mental illness are the top five
causes of deaths in the Region.
Genital chlamydia and gonorrhea are the two most commonly reported bacterial sexually transmitted infections in the
Region and in Canada as well.
There is some good news for chronic diseases: hypertension, ischemic heart disease, acute myocardial infraction, and
stroke incidence rates decreased overtime; while diabetes incidence rate remained relatively stable.
Mental and substance disorders are a significant contributor to disease burden. In 2007/08-2011/12:
• 25% of residents aged 10 years and older were treated for a mood and anxiety disorder;
• 5% of residents aged 10 years and older were treated for substance abuse;
• 10% of residents aged 55 years and older lived with dementia.
Injuries are one of the leading causes of hospitalizations and deaths and accounted for 7.5% of all hospitalizations and
6.5% of all deaths in the Region during 2007-12.
The Region is facing a large challenge in trying to improve early life development and health:
• In 2011, 23.9% of newborns in Winnipeg and 41.2% of newborns in Churchill were exposed to at least one of the five
prenatal risk factors [maternal alcoholic drinking, maternal smoking, maternal anxiety/depression, and family financial
difficulties during pregnancy, and mother’s low educational status (less than high school)];
• 8.1% of babies were born prematurely during 2005/6-2008/09 and 8.2% of newborns were considered small-for-
gestational-age during 2007/08-2008/09;
In the 2010/11 school year, 28% of Winnipeg kindergarten children (around age 5) and 33% of Churchill kindergarten children
were not ready for grade 1 in one or more of the five domains measured by the Early Development Instrument (EDI).
Compared to residents in other large urban health regions and the overall Canadian population, the Region’s residents are
doing better with respect to rates of tobacco smoking and physical activity, but worse in other health behaviors. In 2011/12:
For example, Regina Qu’Appelle RHA, Saskatoon RHA, Capital District Health Authority (Halifax NS), Region de Laval (Quebec). Refer to the following URL for the entire list: www12.statcan.gc.ca/health-sante/82-228/search-rescherche/lst/page.cfm?Lan=E&GeoLevel=PEER&GEOCODE=01
Overall, health in the Region is improving, but improvements are needed in some areas
11WINNIPEG REGIONAL HEALTH AUTHORITY
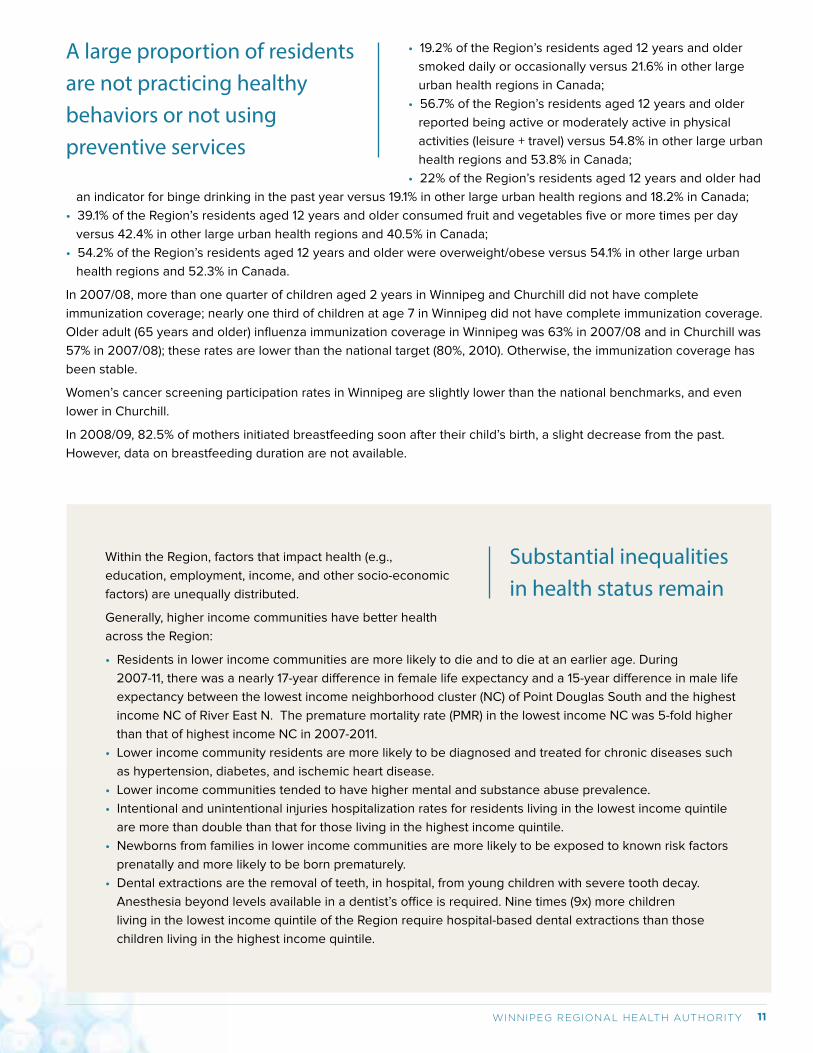
• 19.2% of the Region’s residents aged 12 years and older
smoked daily or occasionally versus 21.6% in other large
urban health regions in Canada;
• 56.7% of the Region’s residents aged 12 years and older
reported being active or moderately active in physical
activities (leisure + travel) versus 54.8% in other large urban
health regions and 53.8% in Canada;
• 22% of the Region’s residents aged 12 years and older had
an indicator for binge drinking in the past year versus 19.1% in other large urban health regions and 18.2% in Canada;
• 39.1% of the Region’s residents aged 12 years and older consumed fruit and vegetables five or more times per day
versus 42.4% in other large urban health regions and 40.5% in Canada;
• 54.2% of the Region’s residents aged 12 years and older were overweight/obese versus 54.1% in other large urban
health regions and 52.3% in Canada.
In 2007/08, more than one quarter of children aged 2 years in Winnipeg and Churchill did not have complete
immunization coverage; nearly one third of children at age 7 in Winnipeg did not have complete immunization coverage.
Older adult (65 years and older) influenza immunization coverage in Winnipeg was 63% in 2007/08 and in Churchill was
57% in 2007/08); these rates are lower than the national target (80%, 2010). Otherwise, the immunization coverage has
been stable.
Women’s cancer screening participation rates in Winnipeg are slightly lower than the national benchmarks, and even
lower in Churchill.
In 2008/09, 82.5% of mothers initiated breastfeeding soon after their child’s birth, a slight decrease from the past.
However, data on breastfeeding duration are not available.
A large proportion of residents are not practicing healthy behaviors or not using preventive services
Substantial inequalities in health status remain
Within the Region, factors that impact health (e.g.,
education, employment, income, and other socio-economic
factors) are unequally distributed.
Generally, higher income communities have better health
across the Region:
• Residents in lower income communities are more likely to die and to die at an earlier age. During
2007-11, there was a nearly 17-year difference in female life expectancy and a 15-year difference in male life
expectancy between the lowest income neighborhood cluster (NC) of Point Douglas South and the highest
income NC of River East N. The premature mortality rate (PMR) in the lowest income NC was 5-fold higher
than that of highest income NC in 2007-2011.
• Lower income community residents are more likely to be diagnosed and treated for chronic diseases such
as hypertension, diabetes, and ischemic heart disease.
• Lower income communities tended to have higher mental and substance abuse prevalence.
• Intentional and unintentional injuries hospitalization rates for residents living in the lowest income quintile
are more than double than that for those living in the highest income quintile.
• Newborns from families in lower income communities are more likely to be exposed to known risk factors
prenatally and more likely to be born prematurely.
• Dental extractions are the removal of teeth, in hospital, from young children with severe tooth decay.
Anesthesia beyond levels available in a dentist’s office is required. Nine times (9x) more children
living in the lowest income quintile of the Region require hospital-based dental extractions than those
children living in the highest income quintile.

COMMUNITY HEALTH ASSESSMENT 201412
Gaps in healthcare access, utilization, and quality exist
In 2011/12, 14.6% of families reported not having a family medical
doctor.
Overall, the utilization of ambulatory care has been relatively stable.
The availability and quality of ambulatory (primary) care in the Region
has improved, but provision of primary care remains a challenge to those living in low income communities.
In 2011/12, 5.5% of Winnipeg residents and 11.1% of Churchill residents were hospitalized at least once in a year; 7% of
hospitalized patients in Winnipeg and 9% of those in Churchill were readmitted within 30 days of discharge.
In 2011/12, 3% of Winnipeg residents aged 75 years and older were newly admitted to PCHs. The median waiting time
was 3.5 weeks for those admitted from hospital and 7 weeks for those admitted from the community.
13WINNIPEG REGIONAL HEALTH AUTHORITY
Com
mun
ity H
ealth
Ass
essm
ent A
T A
GLA
NCE
by
Com
mun
ity A
rea,
Win
nipe
g RH
A &
Man
itoba
Ove
rall
(Com
mun
ity A
rea
orde
red
by d
ecre
asin
g m
edia
n ho
useh
old
inco
me
[L-R
]; Ch
urch
ill n
ot in
clud
ed in
the
rank
ing)
Ind
ica
tors
Data
Year
sAs
sinib
oine
So
uth
Fort
Ga
rry
Tran
scon
aSt
. Bo
nifa
ceSt
. Vita
lSe
ven
Oaks
St. J
ames
-As
sinib
oia
Inks
ter
Rive
r Ea
stRi
ver
Heig
hts
Poin
t Do
ugla
sDo
wnt
own
Win
nipe
gCh
urch
illM
anito
ba
Ge
ne
ral H
ea
lth
Se
lf-P
erc
eiv
ed
He
alt
h (V
ery
Go
od
/E
xce
llen
t)
20
07-2
012
69
%5
7%
57%
58
%6
4%
58
%5
9%
57%
51%
60
%4
2%
54
%5
7%
57%
SF
-36
Ge
ne
ral M
en
tal H
ea
lth
Sta
tus
(Hig
h L
eve
l)2
00
5-2
010
41%
33
%3
5%
37%
38
%3
6%
43
%4
4%
37%
33
%3
9%
44
%3
8%
40
%
SF
-36
Pe
rfe
ct P
hys
ica
l Fu
nct
ion
ing
2
00
5-2
010
54
%5
4%
49
%5
4%
52
%5
2%
49
%5
7%
51%
48
%4
4%
47%
50
%5
0%
De
ath
s
Ma
le L
ife
Exp
ect
an
cy a
t B
irth
(in
ye
ars
) 2
00
7-2
011
81.
28
1.8
79
.58
0.3
79
.478
.678
.577.
778
.779
.371.7
74
.178
.38
1.2
77.
5
Fe
ma
le L
ife
Exp
ect
an
cy a
t B
irth
(in
ye
ars
)2
00
7-2
011
83
.58
5.6
83
.28
4.0
83
.88
2.4
82
.78
2.6
83
.88
4.5
77.
478
.68
2.7
79
.78
2.2
Infa
nt
Mo
rta
lity
Ra
tes
(Cru
de
Ra
tes
pe
r 1,
00
0 li
ve b
irth
s)2
00
7/0
8-
20
11/1
25
.96
.4
Ch
ild M
ort
alit
y R
ate
s (d
ea
ths
pe
r 10
0,0
00
ch
ildre
n a
ge
d 1
–19
)2
00
5–
20
09
13.3
20
.618
.414
.812
.29
.316
.417
.215
.1S
55
.54
8.8
21.
33
3.3
Pre
ma
ture
Mo
rta
lity
Ra
tes
(pe
r 1,
00
0
resi
de
nts
un
de
r a
ge
75
)2
00
7-2
011
2.0
1.9
2.6
2.7
2.4
2.8
2.8
3.3
2.8
2.6
5.4
4.7
2.9
3.0
3.1
Po
ten
tia
l Ye
ars
of
Life
Lo
st (ye
ars
pe
r 1,
00
0 r
esi
de
nts
un
de
r a
ge
75
)2
00
7-2
011
31.
43
0.6
36
.63
3.3
30
.74
1.2
43
.54
6.3
37.
72
9.7
100
.38
2.7
45
.83
8.3
51.
5
Su
icid
e D
ea
th R
ate
s (p
er
10,0
00
re
sid
en
ts a
ge
d 1
0+)
20
07-2
011
1.5
0.8
0.9
1.0
0.9
1.2
1.11.
81.
51.
44
.32
.71.
5S
1.7
Ch
ron
ic D
ise
ase
s
Tota
l Re
spir
ato
ry D
ise
ase
s P
reva
len
ce
(% o
f re
sid
en
ts [a
ll a
ge
s])
20
11/1
29
.6%
8.8
%10
.0%
9.0
%10
.1%10
.0%
10.9
%11
.0%
9.2
%9
.5%
13.2
%10
.7%
9.9
%6
.0%
9.5
%
Hyp
ert
en
sio
n In
cid
en
ce R
ate
s (c
ase
s p
er
100
pe
rso
n-y
ea
rs [re
sid
en
ts a
ge
d 1
9+]
)2
011
/12
2.6
3.1
3.3
2.6
2.8
3.3
3.1
3.5
2.9
2.4
3.4
3.2
3.0
3.0
3.1
Hyp
ert
en
sio
n P
reva
len
ce (%
of
resi
de
nts
a
ge
d 1
9+)
2
011
/12
22
.6%
23
.3%
25
.7%
23
.1%2
3.8
%2
7.3
%2
4.4
%2
8.5
%2
4.4
%2
2.5
%2
7.3
%2
5.1%
24
.6%
30
.9%
25
.6%
Dia
be
tes
Inci
de
nce
Ra
tes
(ca
ses
pe
r 10
0
pe
rso
n-y
ea
rs [re
sid
en
ts a
ge
d 1
9+]
)2
00
9/1
0-
20
11/1
20
.61
0.6
70
.77
0.7
40
.75
0.9
60
.71
1.18
0.7
50
.66
1.2
51.
05
0.8
00
.78
0.8
5
Dia
be
tes
Pre
vale
nce
(%
of
re
sid
en
ts
ag
ed
19
+)
20
09
/10
-2
011
/12
7.1%
7.8
%9
.4%
8.2
%8
.4%
11.0
%8
.4%
12.9
%8
.8%
7.5
%13
.2%
11.7
%9
.2%
16.1%
10.0
%
Low
er
Lim
b A
mp
uta
tio
n A
mo
ng
R
esi
de
nts
wit
h D
iab
ete
s (a
ge
d 1
9+)
2
00
7/0
8-
20
11/1
20
.5%
0.8
%1.1
%0
.6%
0.7
%1.
0%
1.0
%1.
2%
0.9
%1.
0%
1.9
%1.
6%
1.0
%S
1.3
%
Isch
em
ic H
ea
rt D
ise
ase
Inci
de
nce
Ra
tes
(ca
ses
pe
r 10
0 p
ers
on
-ye
ars
[re
sid
en
ts
ag
ed
19
+])
20
07/0
8-
20
11/1
20
.50
0.6
10
.72
0.6
20
.64
0.7
80
.61
0.7
40
.67
0.6
40
.90
0.6
50
.66
0.9
10
.67
S =
da
ta s
up
pre
sse
d d
ue
to
sm
all
nu
mb
ers
=
da
ta u
na
vaila
ble
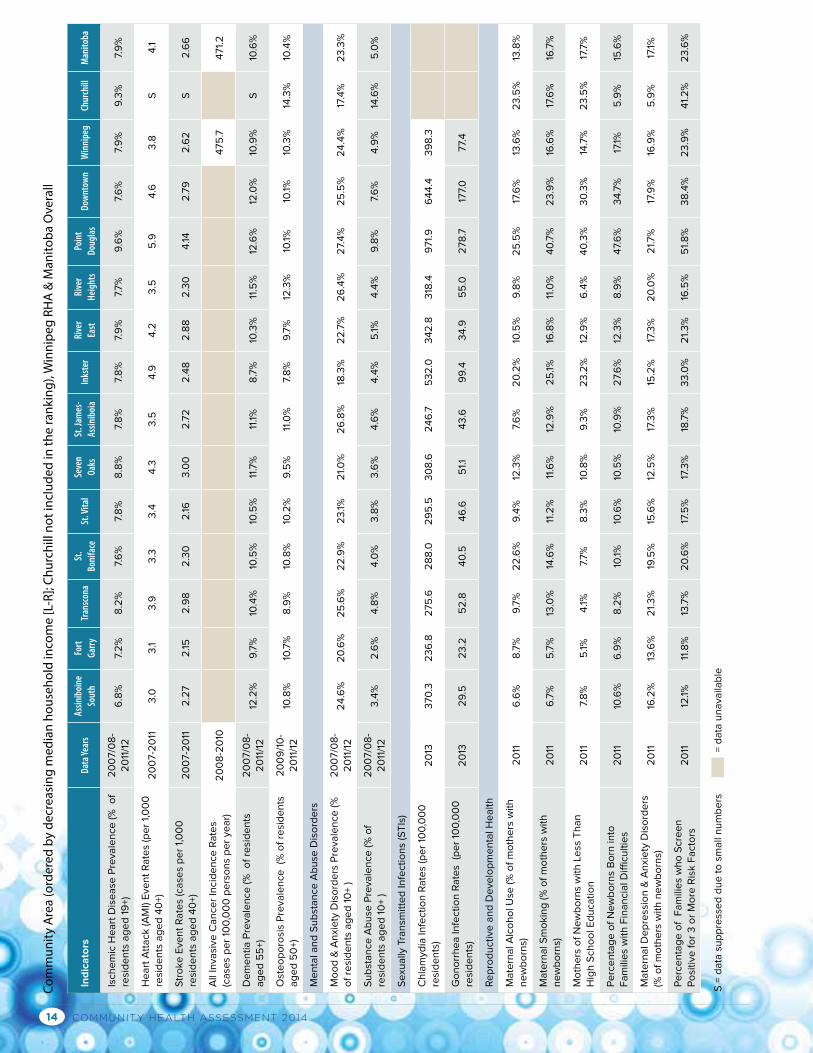
COMMUNITY HEALTH ASSESSMENT 201414
Ind
ica
tors
Data
Year
sAs
sinib
oine
So
uth
Fort
Ga
rry
Tran
scon
aSt
. Bo
nifa
ceSt
. Vita
lSe
ven
Oaks
St. J
ames
-As
sinib
oia
Inks
ter
Rive
r Ea
stRi
ver
Heig
hts
Poin
t Do
ugla
sDo
wnt
own
Win
nipe
gCh
urch
illM
anito
ba
Isch
em
ic H
ea
rt D
ise
ase
Pre
vale
nce
(%
o
f re
sid
en
ts a
ge
d 1
9+)
20
07/0
8-
20
11/1
26
.8%
7.2
%8
.2%
7.6
%7.
8%
8.8
%7.
8%
7.8
%7.
9%
7.7%
9.6
%7.
6%
7.9
%9
.3%
7.9
%
He
art
Att
ack
(A
MI)
Eve
nt
Ra
tes
(pe
r 1,
00
0
resi
de
nts
ag
ed
40
+)2
00
7-2
011
3.0
3.1
3.9
3.3
3.4
4.3
3.5
4.9
4.2
3.5
5.9
4.6
3.8
S4
.1
Str
oke
Eve
nt
Ra
tes
(ca
ses
pe
r 1,
00
0
resi
de
nts
ag
ed
40
+)2
00
7-2
011
2.2
72
.152
.98
2.3
02
.163
.00
2.7
22
.48
2.8
82
.30
4.14
2.7
92
.62
S2
.66
All
Inva
sive
Ca
nce
r In
cid
en
ce R
ate
s (c
ase
s p
er
100
,00
0 p
ers
on
s p
er
yea
r)2
00
8-2
010
475
.74
71.
2
De
me
nti
a P
reva
len
ce (%
o
f re
sid
en
ts
ag
ed
55
+)2
00
7/0
8-
20
11/1
212
.2%
9.7
%10
.4%
10.5
%10
.5%
11.7
%11
.1%8
.7%
10.3
%11
.5%
12.6
%12
.0%
10.9
%S
10.6
%
Ost
eo
po
rosi
s P
reva
len
ce
(% o
f re
sid
en
ts
ag
ed
50
+)2
00
9/1
0-
20
11/1
210
.8%
10.7
%8
.9%
10.8
%10
.2%
9.5
%11
.0%
7.8
%9
.7%
12.3
%10
.1%10
.1%10
.3%
14.3
%10
.4%
Me
nta
l an
d S
ub
sta
nce
Ab
use
Dis
ord
ers
Mo
od
& A
nxi
ety
Dis
ord
ers
Pre
vale
nce
(%
o
f re
sid
en
ts a
ge
d 1
0+
)2
00
7/0
8-
20
11/1
22
4.6
%2
0.6
%2
5.6
%2
2.9
%2
3.1%
21.
0%
26
.8%
18.3
%2
2.7
%2
6.4
%2
7.4
%2
5.5
%2
4.4
%17
.4%
23
.3%
Su
bst
an
ce A
bu
se P
reva
len
ce (%
of
resi
de
nts
ag
ed
10
+ )
20
07/0
8-
20
11/1
23
.4%
2.6
%4
.8%
4.0
%3
.8%
3.6
%4
.6%
4.4
%5
.1%4
.4%
9.8
%7.
6%
4.9
%14
.6%
5.0
%
Se
xua
lly T
ran
smit
ted
Infe
ctio
ns
(ST
Is)
Ch
lam
ydia
Infe
ctio
n R
ate
s (p
er
100
,00
0
resi
de
nts
)2
013
370
.32
36
.82
75
.62
88
.02
95
.53
08
.62
46
.75
32
.03
42
.83
18.4
971.
96
44
.43
98
.3
Go
no
rrh
ea
Infe
ctio
n R
ate
s (p
er
100
,00
0
resi
de
nts
)2
013
29
.52
3.2
52
.84
0.5
46
.65
1.14
3.6
99
.43
4.9
55
.02
78
.717
7.0
77.
4
Re
pro
du
ctiv
e a
nd
De
velo
pm
en
tal H
ea
lth
Ma
tern
al A
lco
ho
l Use
(%
of
mo
the
rs w
ith
n
ew
bo
rns)
2
011
6.6
%8
.7%
9.7
%2
2.6
%9
.4%
12.3
%7.
6%
20
.2%
10.5
%9
.8%
25
.5%
17.6
%13
.6%
23
.5%
13.8
%
Ma
tern
al S
mo
kin
g (%
of
mo
the
rs w
ith
n
ew
bo
rns)
20
116
.7%
5.7
%13
.0%
14.6
%11
.2%
11.6
%12
.9%
25
.1%16
.8%
11.0
%4
0.7
%2
3.9
%16
.6%
17.6
%16
.7%
Mo
the
rs o
f N
ew
bo
rns
wit
h L
ess
Th
an
H
igh
Sch
oo
l Ed
uca
tio
n2
011
7.8
%5
.1%4
.1%7.
7%
8.3
%10
.8%
9.3
%2
3.2
%12
.9%
6.4
%4
0.3
%3
0.3
%14
.7%
23
.5%
17.7
%
Pe
rce
nta
ge
of
Ne
wb
orn
s B
orn
into
F
am
ilie
s w
ith
Fin
an
cia
l Diffi
cult
ies
20
1110
.6%
6.9
%8
.2%
10.1%
10.6
%10
.5%
10.9
%2
7.6
%12
.3%
8.9
%4
7.6
%3
4.7
%17
.1%5
.9%
15.6
%
Ma
tern
al D
ep
ress
ion
& A
nxi
ety
Dis
ord
ers
(%
of
mo
the
rs w
ith
ne
wb
orn
s)
20
1116
.2%
13.6
%2
1.3
%19
.5%
15.6
%12
.5%
17.3
%15
.2%
17.3
%2
0.0
%2
1.7%
17.9
%16
.9%
5.9
%17
.1%
Pe
rce
nta
ge
of
Fa
mili
es
wh
o S
cre
en
P
osi
tive
fo
r 3
or
Mo
re R
isk F
act
ors
2
011
12.1%
11.8
%13
.7%
20
.6%
17.5
%17
.3%
18.7
%3
3.0
%2
1.3
%16
.5%
51.
8%
38
.4%
23
.9%
41.
2%
23
.6%
Com
mun
ity A
rea
(ord
ered
by
decr
easi
ng m
edia
n ho
useh
old
inco
me
[L-R
]; Ch
urch
ill n
ot in
clud
ed in
the
rank
ing)
, Win
nipe
g RH
A &
Man
itoba
Ove
rall
S =
da
ta s
up
pre
sse
d d
ue
to
sm
all
nu
mb
ers
=
da
ta u
na
vaila
ble
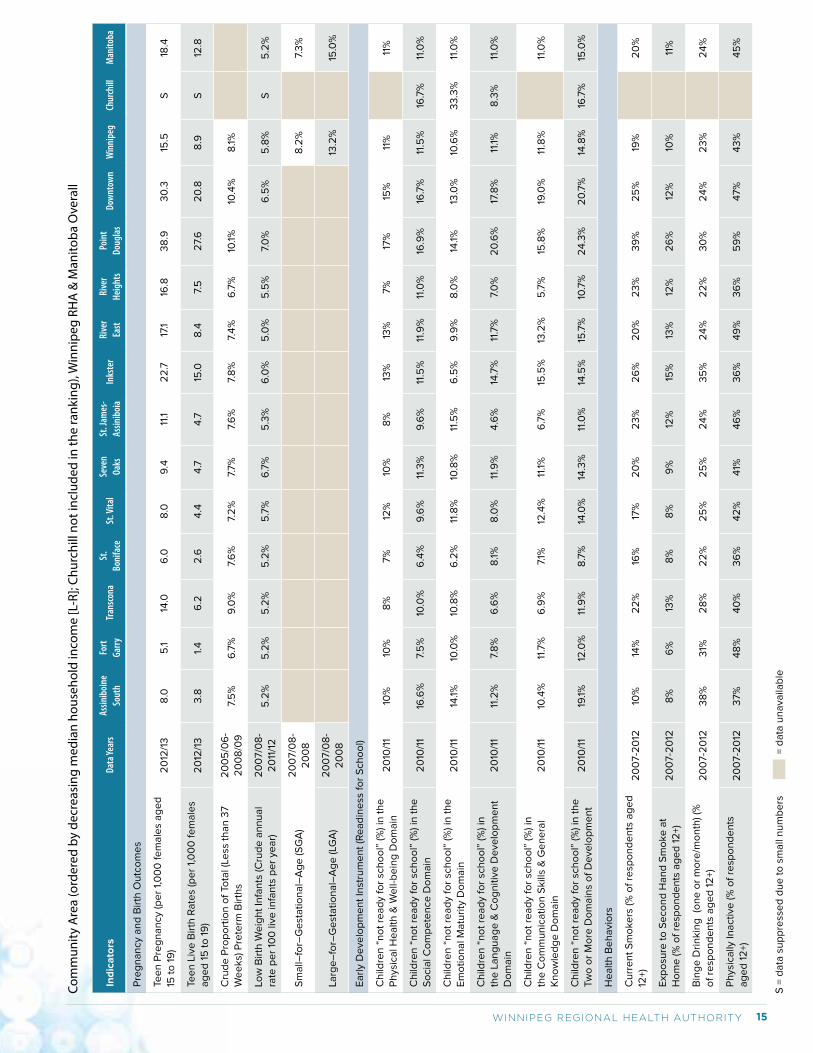
15WINNIPEG REGIONAL HEALTH AUTHORITY
Pre
gn
an
cy a
nd
Bir
th O
utc
om
es
Tee
n P
reg
na
ncy
(p
er
1,0
00
fe
ma
les
ag
ed
15
to
19
) 2
012
/13
8.0
5.1
14.0
6.0
8.0
9.4
11.1
22
.717
.116
.83
8.9
30
.315
.5S
18.4
Tee
n L
ive
Bir
th R
ate
s (p
er
1,0
00
fe
ma
les
ag
ed
15
to
19
)2
012
/13
3.8
1.4
6.2
2.6
4.4
4.7
4.7
15.0
8.4
7.5
27.
62
0.8
8.9
S12
.8
Cru
de
Pro
po
rtio
n o
f To
tal (
Less
th
an
37
We
eks)
Pre
term
Bir
ths
20
05
/06
-2
00
8/0
97.
5%
6.7
%9
.0%
7.6
%7.
2%
7.7%
7.6
%7.
8%
7.4
%6
.7%
10.1%
10.4
%8
.1%
Low
Bir
th W
eig
ht
Infa
nts
(C
rud
e a
nn
ua
l ra
te p
er
100
live
infa
nts
pe
r ye
ar)
20
07/0
8-
20
11/1
25
.2%
5.2
%5
.2%
5.2
%5
.7%
6.7
%5
.3%
6.0
%5
.0%
5.5
%7.
0%
6.5
%5
.8%
S5
.2%
Sm
all–
for–
Ge
sta
tio
na
l–A
ge
(S
GA
)2
00
7/0
8-
20
08
8.2
%7.
3%
Larg
e–
for–
Ge
sta
tio
na
l–A
ge
(LG
A)
20
07/0
8-
20
08
13.2
%15
.0%
Ea
rly
De
velo
pm
en
t In
stru
me
nt
(Re
ad
ine
ss f
or
Sch
oo
l)
Ch
ildre
n “
no
t re
ad
y fo
r sc
ho
ol”
(%
) in
th
e
Ph
ysic
al H
ea
lth
& W
ell-
be
ing
Do
ma
in2
010
/11
10%
10%
8%
7%
12%
10%
8%
13%
13%
7%
17%
15%
11%
11%
Ch
ildre
n “
no
t re
ad
y fo
r sc
ho
ol”
(%
) in
th
e
So
cia
l Co
mp
ete
nce
Do
ma
in
20
10/1
116
.6%
7.5
%10
.0%
6.4
%9
.6%
11.3
%9
.6%
11.5
%11
.9%
11.0
%16
.9%
16.7
%11
.5%
16.7
%11
.0%
Ch
ildre
n “
no
t re
ad
y fo
r sc
ho
ol”
(%
) in
th
e
Em
oti
on
al M
atu
rity
Do
ma
in
20
10/1
114
.1%10
.0%
10.8
%6
.2%
11.8
%10
.8%
11.5
%6
.5%
9.9
%8
.0%
14.1%
13.0
%10
.6%
33
.3%
11.0
%
Ch
ildre
n “
no
t re
ad
y fo
r sc
ho
ol”
(%
) in
th
e L
an
gu
ag
e &
Co
gn
itiv
e D
eve
lop
me
nt
Do
ma
in
20
10/1
111
.2%
7.8
%6
.6%
8.1%
8.0
%11
.9%
4.6
%14
.7%
11.7
%7.
0%
20
.6%
17.8
%11
.1%8
.3%
11.0
%
Ch
ildre
n “
no
t re
ad
y fo
r sc
ho
ol”
(%
) in
th
e C
om
mu
nic
ati
on
Skill
s &
Ge
ne
ral
Kn
ow
led
ge
Do
ma
in2
010
/11
10.4
%11
.7%
6.9
%7.
1%12
.4%
11.1%
6.7
%15
.5%
13.2
%5
.7%
15.8
%19
.0%
11.8
%11
.0%
Ch
ildre
n “
no
t re
ad
y fo
r sc
ho
ol”
(%
) in
th
e
Tw
o o
r M
ore
Do
ma
ins
of
De
velo
pm
en
t2
010
/11
19.1%
12.0
%11
.9%
8.7
%14
.0%
14.3
%11
.0%
14.5
%15
.7%
10.7
%2
4.3
%2
0.7
%14
.8%
16.7
%15
.0%
He
alt
h B
eh
avi
ors
Cu
rre
nt
Sm
oke
rs (%
of
resp
on
de
nts
ag
ed
12
+)2
00
7-2
012
10%
14%
22
%16
%17
%2
0%
23
%2
6%
20
%2
3%
39
%2
5%
19%
20
%
Exp
osu
re t
o S
eco
nd
Ha
nd
Sm
oke
at
Ho
me
(%
of
resp
on
de
nts
ag
ed
12
+)2
00
7-2
012
8%
6%
13%
8%
8%
9%
12%
15%
13%
12%
26
%12
%10
%11
%
Bin
ge
Dri
nkin
g (o
ne
or
mo
re/m
on
th) (%
o
f re
spo
nd
en
ts a
ge
d 1
2+)
20
07-2
012
38
%3
1%2
8%
22
%2
5%
25
%2
4%
35
%2
4%
22
%3
0%
24
%2
3%
24
%
Ph
ysic
ally
Ina
ctiv
e (%
of
resp
on
de
nts
a
ge
d 1
2+)
20
07-2
012
37%
48
%4
0%
36
%4
2%
41%
46
%3
6%
49
%3
6%
59
%4
7%
43
%4
5%
Ind
ica
tors
Data
Year
sAs
sinib
oine
So
uth
Fort
Ga
rry
Tran
scon
aSt
. Bo
nifa
ceSt
. Vita
lSe
ven
Oaks
St. J
ames
-As
sinib
oia
Inks
ter
Rive
r Ea
stRi
ver
Heig
hts
Poin
t Do
ugla
sDo
wnt
own
Win
nipe
gCh
urch
illM
anito
ba
Com
mun
ity A
rea
(ord
ered
by
decr
easi
ng m
edia
n ho
useh
old
inco
me
[L-R
]; Ch
urch
ill n
ot in
clud
ed in
the
rank
ing)
, Win
nipe
g RH
A &
Man
itoba
Ove
rall
S =
da
ta s
up
pre
sse
d d
ue
to
sm
all
nu
mb
ers
=
da
ta u
na
vaila
ble
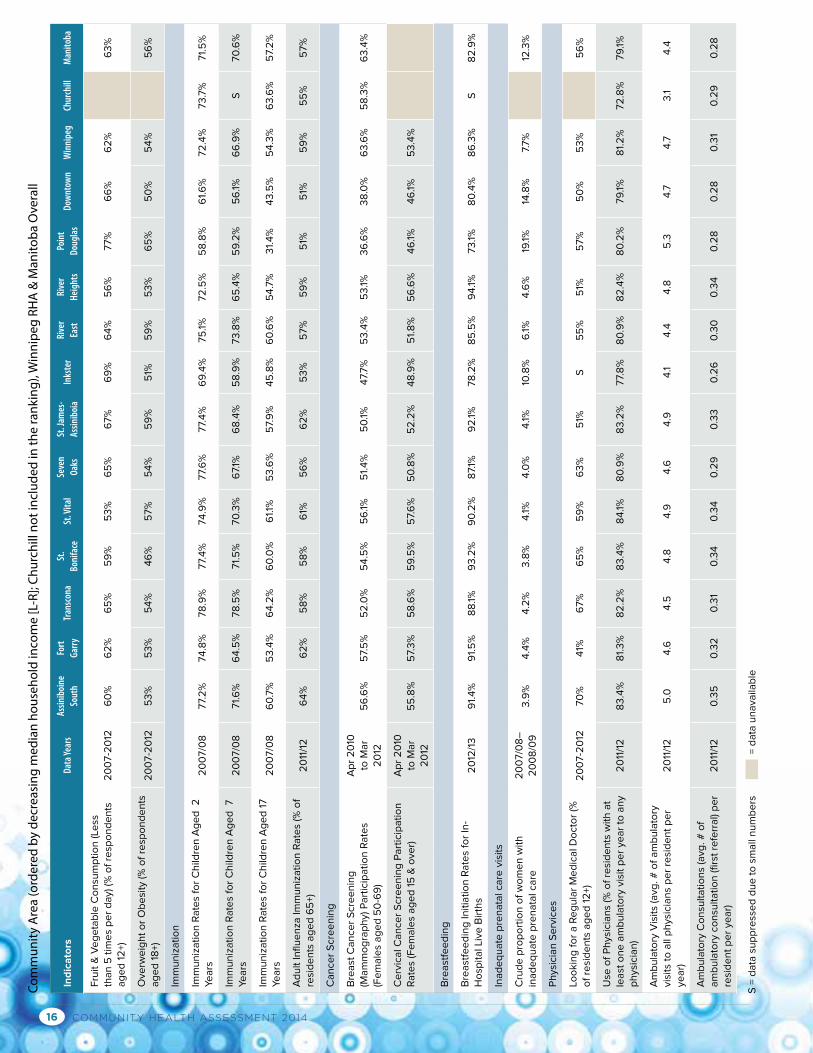
COMMUNITY HEALTH ASSESSMENT 201416
Fru
it &
Ve
ge
tab
le C
on
sum
pti
on
(Le
ss
tha
n 5
tim
es
pe
r d
ay)
(%
of
resp
on
de
nts
a
ge
d 1
2+)
20
07-2
012
60
%6
2%
65
%5
9%
53
%6
5%
67%
69
%6
4%
56
%77%
66
%6
2%
63
%
Ove
rwe
igh
t o
r O
be
sity
(%
of
resp
on
de
nts
a
ge
d 1
8+)
20
07-2
012
53
%5
3%
54
%4
6%
57%
54
%5
9%
51%
59
%5
3%
65
%5
0%
54
%5
6%
Imm
un
iza
tio
n
Imm
un
iza
tio
n R
ate
s fo
r C
hild
ren
Ag
ed
2
Ye
ars
2
00
7/0
877.
2%
74
.8%
78
.9%
77.
4%
74
.9%
77.
6%
77.
4%
69
.4%
75
.1%72
.5%
58
.8%
61.
6%
72
.4%
73
.7%
71.
5%
Imm
un
iza
tio
n R
ate
s fo
r C
hild
ren
Ag
ed
7
Yea
rs2
00
7/0
871.
6%
64
.5%
78
.5%
71.
5%
70
.3%
67.
1%6
8.4
%5
8.9
%73
.8%
65
.4%
59
.2%
56
.1%6
6.9
%S
70
.6%
Imm
un
iza
tio
n R
ate
s fo
r C
hild
ren
Ag
ed
17
Yea
rs
20
07/0
86
0.7
%5
3.4
%6
4.2
%6
0.0
%6
1.1%
53
.6%
57.
9%
45
.8%
60
.6%
54
.7%
31.
4%
43
.5%
54
.3%
63
.6%
57.
2%
Ad
ult
Influ
en
za Im
mu
niz
ati
on
Ra
tes
(% o
f re
sid
en
ts a
ge
d 6
5+)
20
11/1
26
4%
62
%5
8%
58
%6
1%5
6%
62
%5
3%
57%
59
%5
1%5
1%5
9%
55
%5
7%
Ca
nce
r S
cre
en
ing
Bre
ast
Ca
nce
r S
cre
en
ing
(M
am
mo
gra
ph
y) P
art
icip
ati
on
Ra
tes
(Fe
ma
les
ag
ed
50
-69
)
Ap
r 2
010
to
Ma
r 2
012
56
.6%
57.
5%
52
.0%
54
.5%
56
.1%5
1.4
%5
0.1%
47.
7%
53
.4%
53
.1%3
6.6
%3
8.0
%6
3.6
%5
8.3
%6
3.4
%
Ce
rvic
al C
an
cer
Scr
ee
nin
g P
art
icip
ati
on
R
ate
s (F
em
ale
s a
ge
d 1
5 &
ove
r)A
pr
20
10
to M
ar
20
125
5.8
%5
7.3
%5
8.6
%5
9.5
%5
7.6
%5
0.8
%5
2.2
%4
8.9
%5
1.8
%5
6.6
%4
6.1%
46
.1%5
3.4
%
Bre
ast
fee
din
g
Bre
ast
fee
din
g In
itia
tio
n R
ate
s fo
r In
-H
osp
ita
l Liv
e B
irth
s2
012
/13
91.
4%
91.
5%
88
.1%9
3.2
%9
0.2
%8
7.1%
92
.1%78
.2%
85
.5%
94
.1%73
.1%8
0.4
%8
6.3
%S
82
.9%
Ina
de
qu
ate
pre
na
tal c
are
vis
its
Cru
de
pro
po
rtio
n o
f w
om
en
wit
h
ina
de
qu
ate
pre
na
tal c
are
20
07/0
8–
20
08
/09
3.9
%4
.4%
4.2
%3
.8%
4.1%
4.0
%4
.1%10
.8%
6.1%
4.6
%19
.1%14
.8%
7.7%
12.3
%
Ph
ysic
ian
Se
rvic
es
Loo
kin
g f
or
a R
eg
ula
r M
ed
ica
l Do
cto
r (%
o
f re
sid
en
ts a
ge
d 1
2+)
20
07-2
012
70
%4
1%6
7%
65
%5
9%
63
%5
1%S
55
%5
1%5
7%
50
%5
3%
56
%
Use
of
Ph
ysic
ian
s (%
of
resi
de
nts
wit
h a
t le
ast
on
e a
mb
ula
tory
vis
it p
er
yea
r to
an
y p
hys
icia
n)
20
11/1
28
3.4
%8
1.3
%8
2.2
%8
3.4
%8
4.1%
80
.9%
83
.2%
77.
8%
80
.9%
82
.4%
80
.2%
79
.1%8
1.2
%72
.8%
79
.1%
Am
bu
lato
ry V
isit
s (a
vg. #
of
am
bu
lato
ry
visi
ts t
o a
ll p
hys
icia
ns
pe
r re
sid
en
t p
er
yea
r)2
011
/12
5.0
4.6
4.5
4.8
4.9
4.6
4.9
4.1
4.4
4.8
5.3
4.7
4.7
3.1
4.4
Am
bu
lato
ry C
on
sult
ati
on
s (a
vg. #
of
am
bu
lato
ry c
on
sult
ati
on
(firs
t re
ferr
al)
pe
r re
sid
en
t p
er
yea
r)2
011
/12
0.3
50
.32
0.3
10
.34
0.3
40
.29
0.3
30
.26
0.3
00
.34
0.2
80
.28
0.3
10
.29
0.2
8
Ind
ica
tors
Data
Year
sAs
sinib
oine
So
uth
Fort
Ga
rry
Tran
scon
aSt
. Bo
nifa
ceSt
. Vita
lSe
ven
Oaks
St. J
ames
-As
sinib
oia
Inks
ter
Rive
r Ea
stRi
ver
Heig
hts
Poin
t Do
ugla
sDo
wnt
own
Win
nipe
gCh
urch
illM
anito
ba
Com
mun
ity A
rea
(ord
ered
by
decr
easi
ng m
edia
n ho
useh
old
inco
me
[L-R
]; Ch
urch
ill n
ot in
clud
ed in
the
rank
ing)
, Win
nipe
g RH
A &
Man
itoba
Ove
rall
S =
da
ta s
up
pre
sse
d d
ue
to
sm
all
nu
mb
ers
=
da
ta u
na
vaila
ble
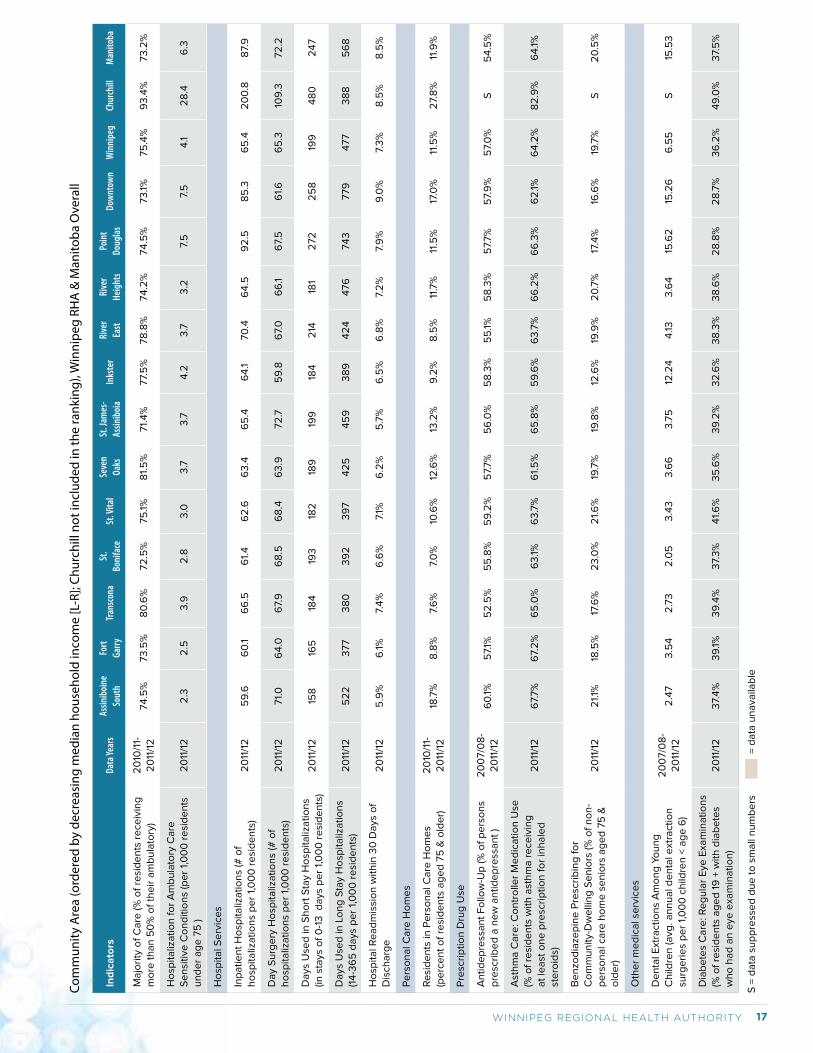
17WINNIPEG REGIONAL HEALTH AUTHORITY
Ma
jori
ty o
f C
are
(%
of
resi
de
nts
re
ceiv
ing
m
ore
th
an
50
% o
f th
eir
am
bu
lato
ry)
20
10/1
1-2
011
/12
74
.5%
73
.5%
80
.6%
72
.5%
75
.1%8
1.5
%71.
4%
77.
5%
78
.8%
74
.2%
74
.5%
73
.1%75
.4%
93
.4%
73
.2%
Ho
spit
aliz
ati
on
fo
r A
mb
ula
tory
Ca
re
Se
nsi
tive
Co
nd
itio
ns
(pe
r 1,
00
0 r
esi
de
nts
u
nd
er
ag
e 7
5 )
20
11/1
22
.32
.53
.92
.83
.03
.73
.74
.23
.73
.27.
57.
54
.12
8.4
6.3
Ho
spit
al S
erv
ice
s
Inp
ati
en
t H
osp
ita
liza
tio
ns
(# o
f h
osp
ita
liza
tio
ns
pe
r 1,
00
0 r
esi
de
nts
)2
011
/12
59
.66
0.1
66
.56
1.4
62
.66
3.4
65
.46
4.1
70
.46
4.5
92
.58
5.3
65
.42
00
.88
7.9
Da
y S
urg
ery
Ho
spit
aliz
ati
on
s (#
of
ho
spit
aliz
ati
on
s p
er
1,0
00
re
sid
en
ts)
20
11/1
271.
06
4.0
67.
96
8.5
68
.46
3.9
72
.75
9.8
67.
06
6.1
67.
56
1.6
65
.310
9.3
72
.2
Da
ys U
sed
in S
ho
rt S
tay
Ho
spit
aliz
ati
on
s (in
sta
ys o
f 0
-13
d
ays
pe
r 1,
00
0 r
esi
de
nts
)2
011
/12
158
165
184
193
182
189
199
184
214
181
272
25
819
94
80
24
7
Da
ys U
sed
in L
on
g S
tay
Ho
spit
aliz
ati
on
s (1
4-3
65
da
ys p
er
1,0
00
re
sid
en
ts)
20
11/1
25
22
377
38
03
92
39
74
25
45
93
89
42
44
76
74
3779
477
38
85
68
Ho
spit
al R
ea
dm
issi
on
wit
hin
30
Da
ys o
f D
isch
arg
e2
011
/12
5.9
%6
.1%7.
4%
6.6
%7.
1%6
.2%
5.7
%6
.5%
6.8
%7.
2%
7.9
%9
.0%
7.3
%8
.5%
8.5
%
Pe
rso
na
l Ca
re H
om
es
Re
sid
en
ts in
Pe
rso
na
l Ca
re H
om
es
(pe
rce
nt
of
resi
de
nts
ag
ed
75
& o
lde
r)2
010
/11-
20
11/1
218
.7%
8.8
%7.
6%
7.0
%10
.6%
12.6
%13
.2%
9.2
%8
.5%
11.7
%11
.5%
17.0
%11
.5%
27.
8%
11.9
%
Pre
scri
pti
on
Dru
g U
se
An
tid
ep
ress
an
t F
ollo
w-U
p (%
of
pe
rso
ns
pre
scri
be
d a
ne
w a
nti
de
pre
ssa
nt
)2
00
7/0
8-
20
11/1
26
0.1%
57.
1%5
2.5
%5
5.8
%5
9.2
%5
7.7%
56
.0%
58
.3%
55
.1%5
8.3
%5
7.7%
57.
9%
57.
0%
S5
4.5
%
Ast
hm
a C
are
: Co
ntr
olle
r M
ed
ica
tio
n U
se
(% o
f re
sid
en
ts w
ith
ast
hm
a r
ece
ivin
g
at
lea
st o
ne
pre
scri
pti
on
fo
r in
ha
led
st
ero
ids)
20
11/1
26
7.7%
67.
2%
65
.0%
63
.1%6
3.7
%6
1.5
%6
5.8
%5
9.6
%6
3.7
%6
6.2
%6
6.3
%6
2.1%
64
.2%
82
.9%
64
.1%
Be
nzo
dia
zep
ine
Pre
scri
bin
g f
or
Co
mm
un
ity-
Dw
elli
ng
Se
nio
rs (%
of
no
n-
pe
rso
na
l ca
re h
om
e s
en
iors
ag
ed
75
&
old
er)
20
11/1
22
1.1%
18.5
%17
.6%
23
.0%
21.
6%
19.7
%19
.8%
12.6
%19
.9%
20
.7%
17.4
%16
.6%
19.7
%S
20
.5%
Oth
er
me
dic
al s
erv
ice
s
De
nta
l Ext
ract
ion
s A
mo
ng
Yo
un
g
Ch
ildre
n (a
vg. a
nn
ua
l de
nta
l ext
ract
ion
su
rge
rie
s p
er
1,0
00
ch
ildre
n <
ag
e 6
)
20
07/0
8-
20
11/1
22
.47
3.5
42
.73
2.0
53
.43
3.6
63
.75
12.2
44
.133
.64
15.6
215
.26
6.5
5S
15.5
3
Dia
be
tes
Ca
re: R
eg
ula
r E
ye E
xam
ina
tio
ns
(% o
f re
sid
en
ts a
ge
d 1
9 +
wit
h d
iab
ete
s w
ho
ha
d a
n e
ye e
xam
ina
tio
n)
20
11/1
23
7.4
%3
9.1%
39
.4%
37.
3%
41.
6%
35
.6%
39
.2%
32
.6%
38
.3%
38
.6%
28
.8%
28
.7%
36
.2%
49
.0%
37.
5%
Ind
ica
tors
Data
Year
sAs
sinib
oine
So
uth
Fort
Ga
rry
Tran
scon
aSt
. Bo
nifa
ceSt
. Vita
lSe
ven
Oaks
St. J
ames
-As
sinib
oia
Inks
ter
Rive
r Ea
stRi
ver
Heig
hts
Poin
t Do
ugla
sDo
wnt
own
Win
nipe
gCh
urch
illM
anito
ba
Com
mun
ity A
rea
(ord
ered
by
decr
easi
ng m
edia
n ho
useh
old
inco
me
[L-R
]; Ch
urch
ill n
ot in
clud
ed in
the
rank
ing)
, Win
nipe
g RH
A &
Man
itoba
Ove
rall
S =
da
ta s
up
pre
sse
d d
ue
to
sm
all
nu
mb
ers
=
da
ta u
na
vaila
ble
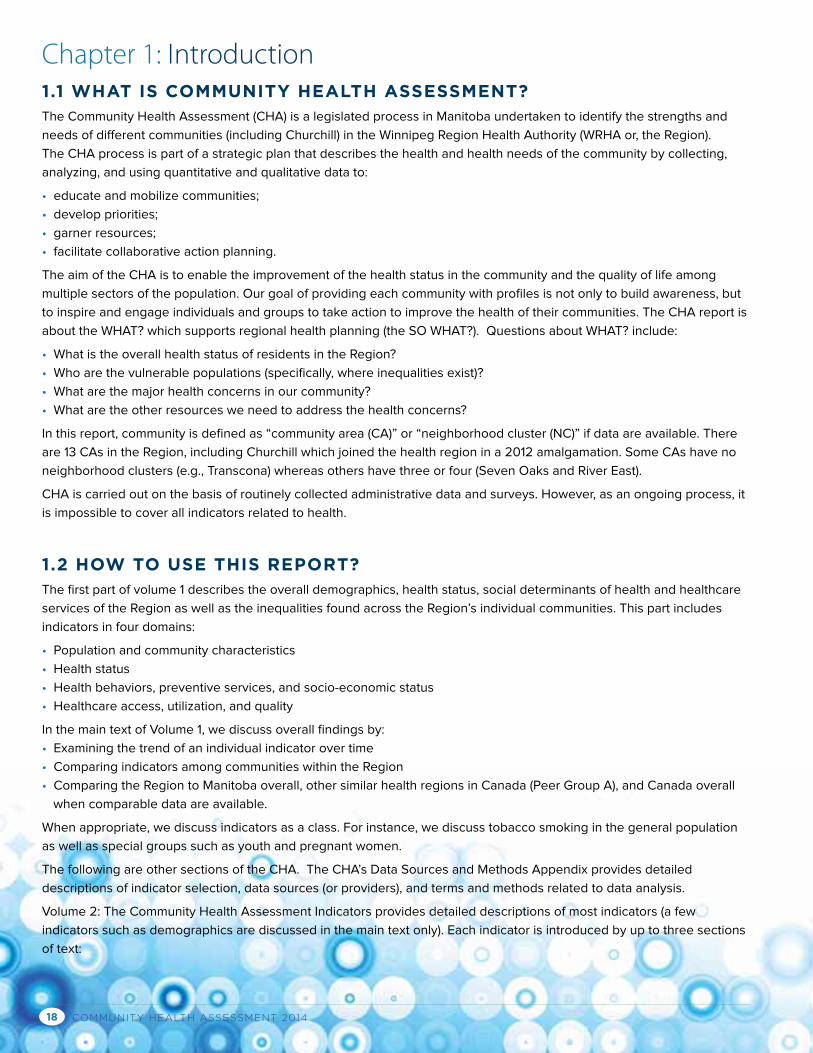
COMMUNITY HEALTH ASSESSMENT 201418
Chapter 1: Introduction1.1 WHAT IS COMMUNITY HEALTH ASSESSMENT?The Community Health Assessment (CHA) is a legislated process in Manitoba undertaken to identify the strengths and
needs of different communities (including Churchill) in the Winnipeg Region Health Authority (WRHA or, the Region).
The CHA process is part of a strategic plan that describes the health and health needs of the community by collecting,
analyzing, and using quantitative and qualitative data to:
• educate and mobilize communities;
• develop priorities;
• garner resources;
• facilitate collaborative action planning.
The aim of the CHA is to enable the improvement of the health status in the community and the quality of life among
multiple sectors of the population. Our goal of providing each community with profiles is not only to build awareness, but
to inspire and engage individuals and groups to take action to improve the health of their communities. The CHA report is
about the WHAT? which supports regional health planning (the SO WHAT?). Questions about WHAT? include:
• What is the overall health status of residents in the Region?
• Who are the vulnerable populations (specifically, where inequalities exist)?
• What are the major health concerns in our community?
• What are the other resources we need to address the health concerns?
In this report, community is defined as “community area (CA)” or “neighborhood cluster (NC)” if data are available. There
are 13 CAs in the Region, including Churchill which joined the health region in a 2012 amalgamation. Some CAs have no
neighborhood clusters (e.g., Transcona) whereas others have three or four (Seven Oaks and River East).
CHA is carried out on the basis of routinely collected administrative data and surveys. However, as an ongoing process, it
is impossible to cover all indicators related to health.
1.2 HOW TO USE THIS REPORT?The first part of volume 1 describes the overall demographics, health status, social determinants of health and healthcare
services of the Region as well as the inequalities found across the Region’s individual communities. This part includes
indicators in four domains:
• Population and community characteristics
• Health status
• Health behaviors, preventive services, and socio-economic status
• Healthcare access, utilization, and quality
In the main text of Volume 1, we discuss overall findings by:
• Examining the trend of an individual indicator over time
• Comparing indicators among communities within the Region
• Comparing the Region to Manitoba overall, other similar health regions in Canada (Peer Group A), and Canada overall
when comparable data are available.
When appropriate, we discuss indicators as a class. For instance, we discuss tobacco smoking in the general population
as well as special groups such as youth and pregnant women.
The following are other sections of the CHA. The CHA’s Data Sources and Methods Appendix provides detailed
descriptions of indicator selection, data sources (or providers), and terms and methods related to data analysis.
Volume 2: The Community Health Assessment Indicators provides detailed descriptions of most indicators (a few
indicators such as demographics are discussed in the main text only). Each indicator is introduced by up to three sections
of text:
19WINNIPEG REGIONAL HEALTH AUTHORITY
DEFINITION: States the name of the indicator, what each indicator measures, the data source for the indicator and how
and when it has been measured.
KEY FINDINGS: Includes comments on the time trend (if applicable), any significant differences in geographical
distribution (presented for each indicator in Volume 2 by figure(s), table and/or map, and health inequality measures (if
data available). The figures and tables of CAs and NCs are ordered according to the median income of households in the
geographical area being reported on. The year(s) that rates are age- and/or sex-adjusted or standardized to are given in
the definition section of each indicator.
WHAT DO THE FINDINGS MEAN TO COMMUNITIES?: In this section, we have tried to interpret the data, including
its limitations and public health implications. The interpretation is based on the perspective of a broad-based advisory
committee and does not reflect the Region’s overall organizational opinion or policy.
Please note that Figures and Tables from Volume 2 (CHA Indicators) are referenced in Volume 1’s text. The references
are bracketed, in blue and begin with the letter ‘A’. For example, A.3.1.1 refers to the indicator, Self-Perceived Health, in
Volume 2.
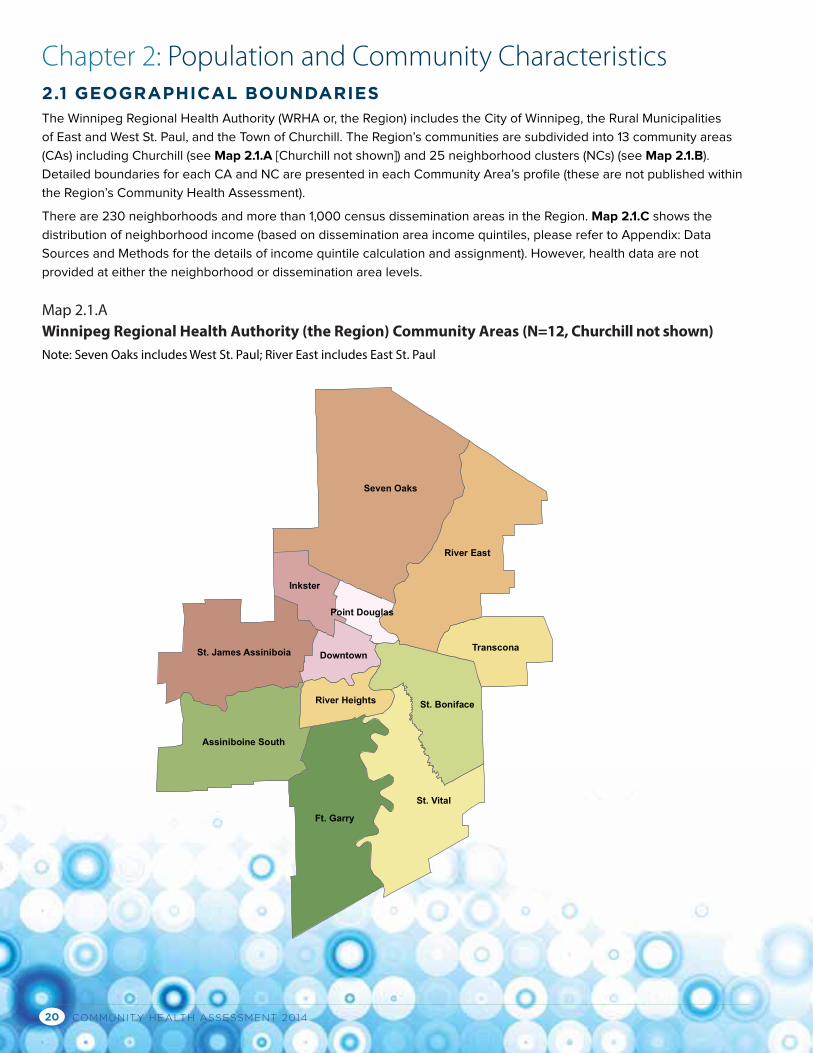
COMMUNITY HEALTH ASSESSMENT 201420
Chapter 2: Population and Community Characteristics2.1 GEOGRAPHICAL BOUNDARIESThe Winnipeg Regional Health Authority (WRHA or, the Region) includes the City of Winnipeg, the Rural Municipalities
of East and West St. Paul, and the Town of Churchill. The Region’s communities are subdivided into 13 community areas
(CAs) including Churchill (see Map 2.1.A [Churchill not shown]) and 25 neighborhood clusters (NCs) (see Map 2.1.B).
Detailed boundaries for each CA and NC are presented in each Community Area’s profile (these are not published within
the Region’s Community Health Assessment).
There are 230 neighborhoods and more than 1,000 census dissemination areas in the Region. Map 2.1.C shows the
distribution of neighborhood income (based on dissemination area income quintiles, please refer to Appendix: Data
Sources and Methods for the details of income quintile calculation and assignment). However, health data are not
provided at either the neighborhood or dissemination area levels.
Seven Oaks
Ft. Garry
St. Vital
River East
St. Boniface
Assiniboine South
St. James Assiniboia Transcona
Inkster
Downtown
River Heights
Point Douglas
Map 2.1.A Winnipeg Regional Health Authority (the Region) Community Areas (N=12, Churchill not shown) Note: Seven Oaks includes West St. Paul; River East includes East St. Paul
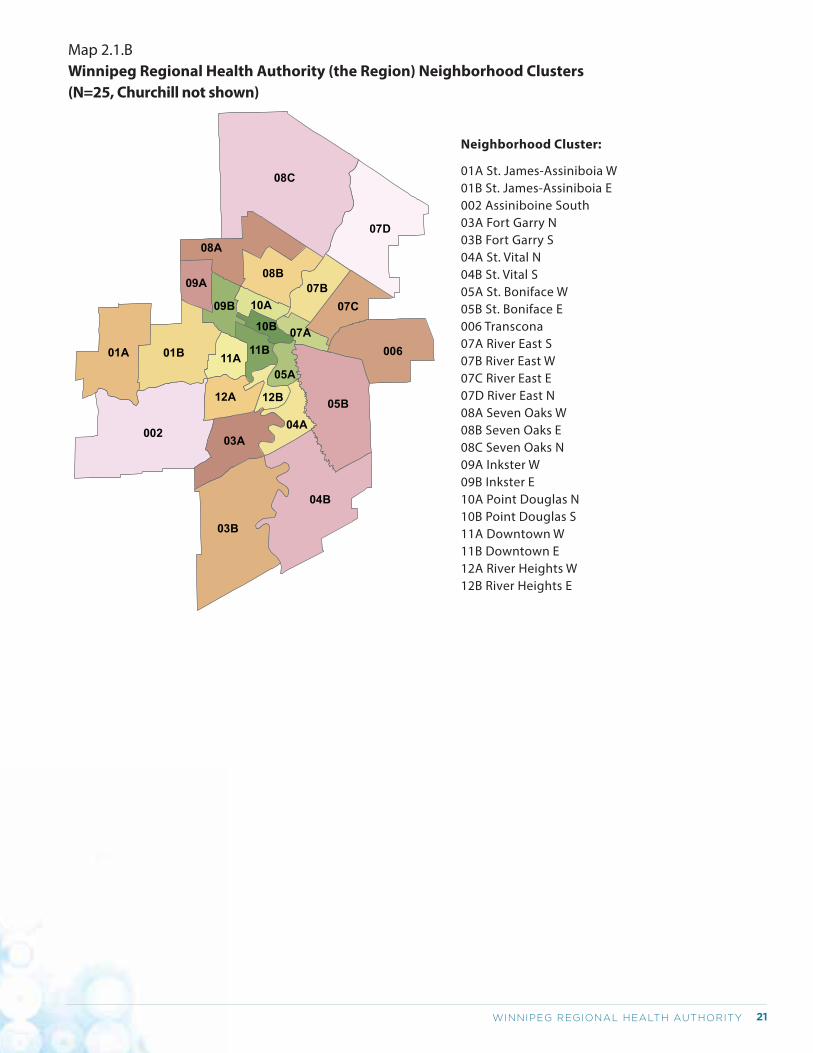
21WINNIPEG REGIONAL HEALTH AUTHORITY
Neighborhood Cluster:
01A St. James-Assiniboia W01B St. James-Assiniboia E002 Assiniboine South03A Fort Garry N03B Fort Garry S04A St. Vital N04B St. Vital S05A St. Boniface W05B St. Boniface E006 Transcona07A River East S07B River East W07C River East E07D River East N08A Seven Oaks W08B Seven Oaks E08C Seven Oaks N09A Inkster W09B Inkster E10A Point Douglas N10B Point Douglas S11A Downtown W11B Downtown E12A River Heights W12B River Heights E
Map 2.1.BWinnipeg Regional Health Authority (the Region) Neighborhood Clusters (N=25, Churchill not shown)
08C
002
03B
04B
07D
05B
00601A 01B
08A
03A
08B
07C07B
12A
04A
09B
11A
09A
11B
05A
12B
10A
07A10B
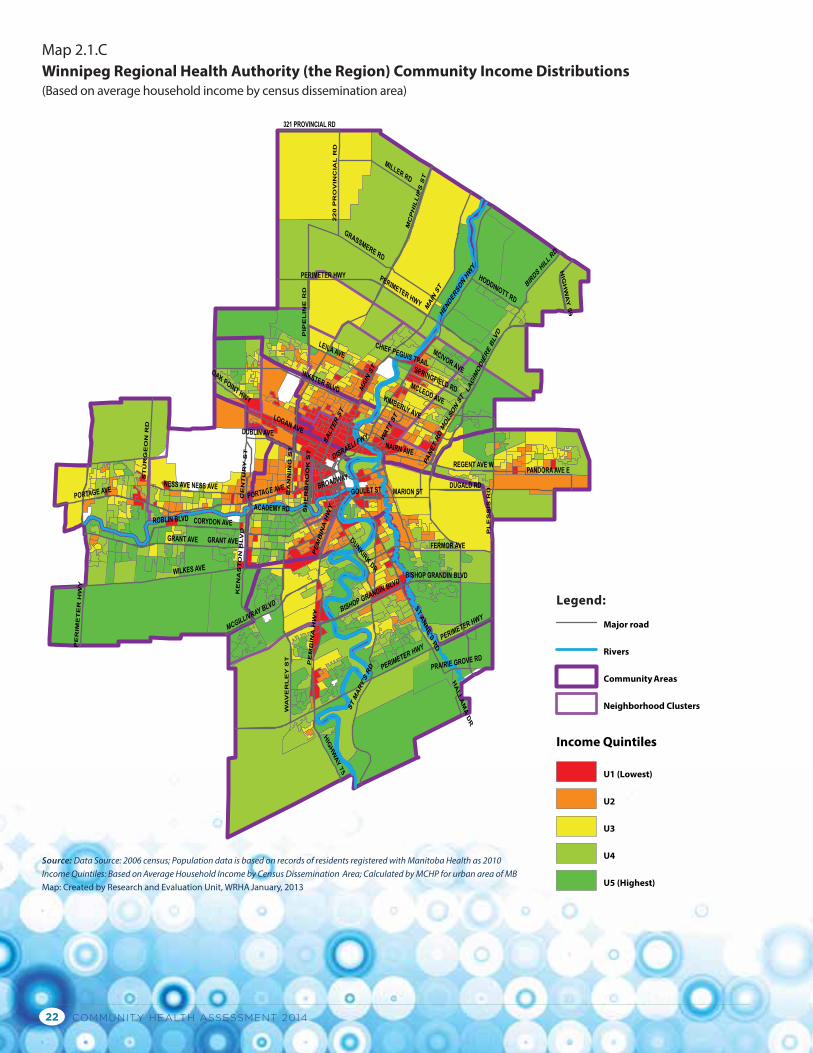
COMMUNITY HEALTH ASSESSMENT 201422
MAIN ST
GRANT AVE
WILKES AVE
PERIMETER HWY
LAGIMODIERE BLV
D
PE
MB
INA
HW
Y
PORTAGE AVE NESS AVE
FERMOR AVE
INKSTER BLVD
LOGAN AVE
GRASSMERE RD
TS
YE
LR
EV
AW
MILLER RD
MC
PH
ILL
IPS
ST
ST MARY
'S RD
CORYDON AVE
MARION STDUGALD RD
MCGILLIVRAY BLVD
HEND
ERSO
N HW
Y
PANET
RD
ST ANNE'S R
D
BIRDS H
ILL R
D
ST
UR
GE
ON
RD
NAIRN AVE
LEILA AVE MCIVOR AVE
KE
NA
ST
ON
BLV
D
MCLEOD AVE
ACADEMY RD
BISHOP GRANDIN BLVD
WAT
T ST
REGENT AVE W
DR
LAI
CNI
VO
RP
02
2
SPRINGFIELD RD
BROADWAY
DR
ENI
LE
PIP
HODDINOTT RD
CE
NT
UR
Y S
T
321 PROVINCIAL RD
MOL
SON ST
ROBLIN BLVD
HIG
HW
AY
59
HIGHWAY 75
PANDORA AVE E
SH
ER
BR
OO
K S
T
GOULET ST
DUNKIRK DR
BA
NN
ING
ST
KIMBERLY AVE
PL
ES
SIS
RD
OAK POINT HWY
DUBLIN AVE
DISRAELI FWY
PRAIRIE GROVE RD
CHIEF PEGUIS TRAILH
ALLA
MA
DR
SALTER
ST
PERIMETER HWYPE
RIM
ET
ER
HW
Y
PERIMETER HWYP
EM
BIN
A H
WY
MAIN ST
BISHOP GRANDIN BLVD
PORTAGE AVENESS AVE
GRANT AVE
PERIMETER HWY
Map 2.1.CWinnipeg Regional Health Authority (the Region) Community Income Distributions(Based on average household income by census dissemination area)
Source: Data Source: 2006 census; Population data is based on records of residents registered with Manitoba Health as 2010Income Quintiles: Based on Average Household Income by Census Dissemination Area; Calculated by MCHP for urban area of MBMap: Created by Research and Evaluation Unit, WRHA January, 2013
Legend:
Major road
Rivers
Community Areas
Neighborhood Clusters
Income Quintiles
U1 (Lowest)
U2
U3
U4
U5 (Highest)
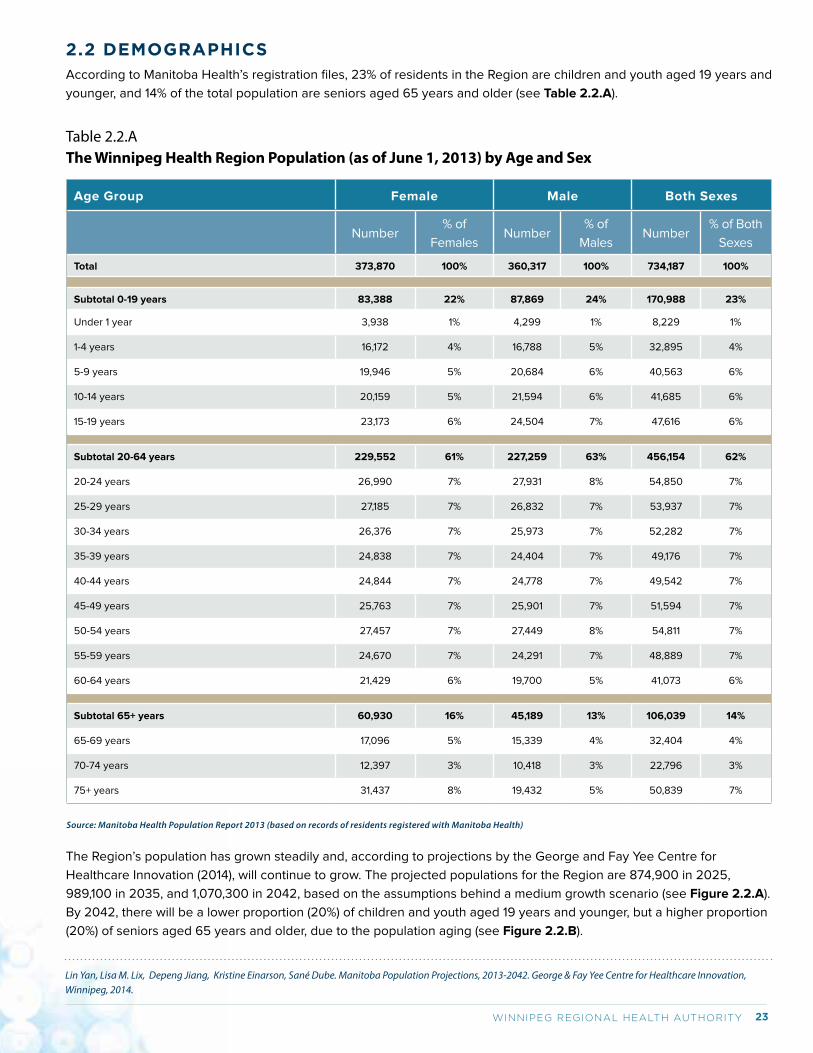
23WINNIPEG REGIONAL HEALTH AUTHORITY
2.2 DEMOGRAPHICSAccording to Manitoba Health’s registration files, 23% of residents in the Region are children and youth aged 19 years and
younger, and 14% of the total population are seniors aged 65 years and older (see Table 2.2.A).
Table 2.2.AThe Winnipeg Health Region Population (as of June 1, 2013) by Age and Sex
Age Group Female Male Both Sexes
Number% of
FemalesNumber
% of
MalesNumber
% of Both
Sexes
Total 373,870 100% 360,317 100% 734,187 100%
Subtotal 0-19 years 83,388 22% 87,869 24% 170,988 23%
Under 1 year 3,938 1% 4,299 1% 8,229 1%
1-4 years 16,172 4% 16,788 5% 32,895 4%
5-9 years 19,946 5% 20,684 6% 40,563 6%
10-14 years 20,159 5% 21,594 6% 41,685 6%
15-19 years 23,173 6% 24,504 7% 47,616 6%
Subtotal 20-64 years 229,552 61% 227,259 63% 456,154 62%
20-24 years 26,990 7% 27,931 8% 54,850 7%
25-29 years 27,185 7% 26,832 7% 53,937 7%
30-34 years 26,376 7% 25,973 7% 52,282 7%
35-39 years 24,838 7% 24,404 7% 49,176 7%
40-44 years 24,844 7% 24,778 7% 49,542 7%
45-49 years 25,763 7% 25,901 7% 51,594 7%
50-54 years 27,457 7% 27,449 8% 54,811 7%
55-59 years 24,670 7% 24,291 7% 48,889 7%
60-64 years 21,429 6% 19,700 5% 41,073 6%
Subtotal 65+ years 60,930 16% 45,189 13% 106,039 14%
65-69 years 17,096 5% 15,339 4% 32,404 4%
70-74 years 12,397 3% 10,418 3% 22,796 3%
75+ years 31,437 8% 19,432 5% 50,839 7%
Source: Manitoba Health Population Report 2013 (based on records of residents registered with Manitoba Health)
The Region’s population has grown steadily and, according to projections by the George and Fay Yee Centre for
Healthcare Innovation (2014), will continue to grow. The projected populations for the Region are 874,900 in 2025,
989,100 in 2035, and 1,070,300 in 2042, based on the assumptions behind a medium growth scenario (see Figure 2.2.A).
By 2042, there will be a lower proportion (20%) of children and youth aged 19 years and younger, but a higher proportion
(20%) of seniors aged 65 years and older, due to the population aging (see Figure 2.2.B).
Lin Yan, Lisa M. Lix, Depeng Jiang, Kristine Einarson, Sané Dube. Manitoba Population Projections, 2013-2042. George & Fay Yee Centre for Healthcare Innovation, Winnipeg, 2014.
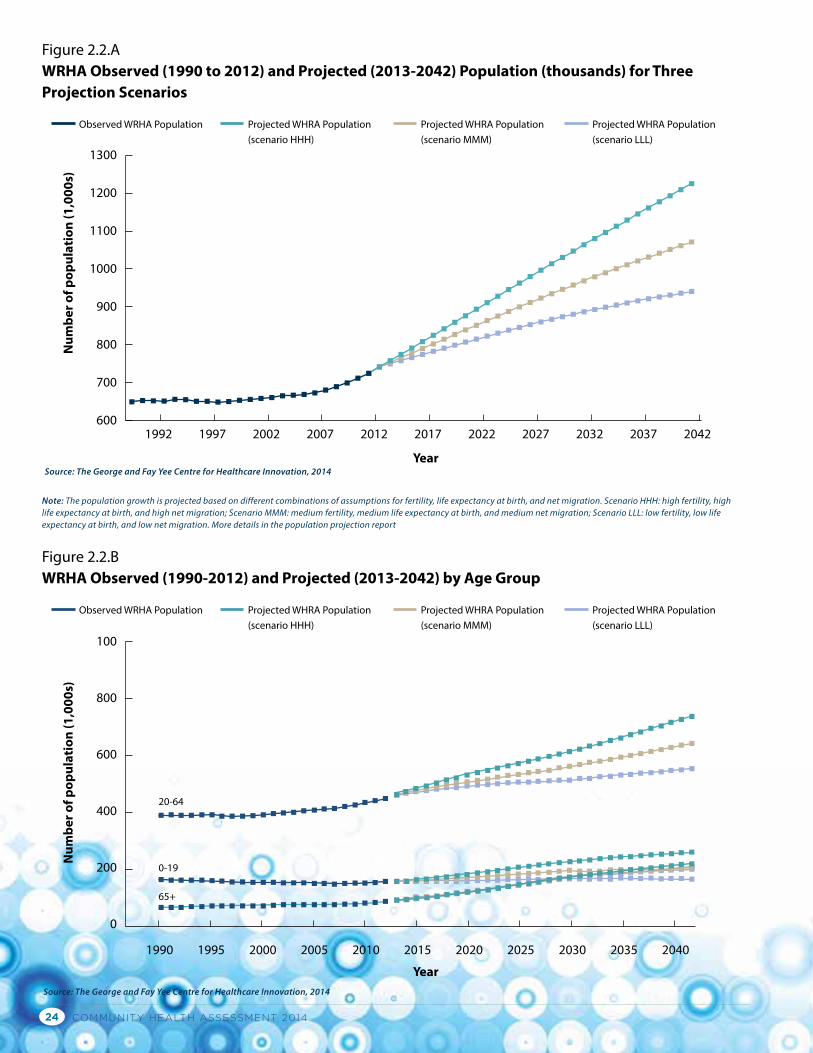
COMMUNITY HEALTH ASSESSMENT 201424
Year
Figure 2.2.AWRHA Observed (1990 to 2012) and Projected (2013-2042) Population (thousands) for Three Projection Scenarios
Observed WRHA Population Projected WHRA Population(scenario HHH)
Projected WHRA Population(scenario MMM)
Projected WHRA Population(scenario LLL)
1300
1200
1100
1000
900
800
700
6001992 1997 2002 2007 2012 2017 2022 2027 2032 2037 2042
Num
ber o
f pop
ulat
ion
(1,0
00s)
Source: The George and Fay Yee Centre for Healthcare Innovation, 2014
Year
Num
ber o
f pop
ulat
ion
(1,0
00s)
Figure 2.2.BWRHA Observed (1990-2012) and Projected (2013-2042) by Age Group
Observed WRHA Population Projected WHRA Population(scenario HHH)
Projected WHRA Population(scenario MMM)
Projected WHRA Population(scenario LLL)
100
800
600
400
200
0
1990 1995 2000 2005 2010 2015 2020 2025 2030 2035 2040
Source: The George and Fay Yee Centre for Healthcare Innovation, 2014
0-19
20-64
65+
Note: The population growth is projected based on different combinations of assumptions for fertility, life expectancy at birth, and net migration. Scenario HHH: high fertility, high life expectancy at birth, and high net migration; Scenario MMM: medium fertility, medium life expectancy at birth, and medium net migration; Scenario LLL: low fertility, low life expectancy at birth, and low net migration. More details in the population projection report
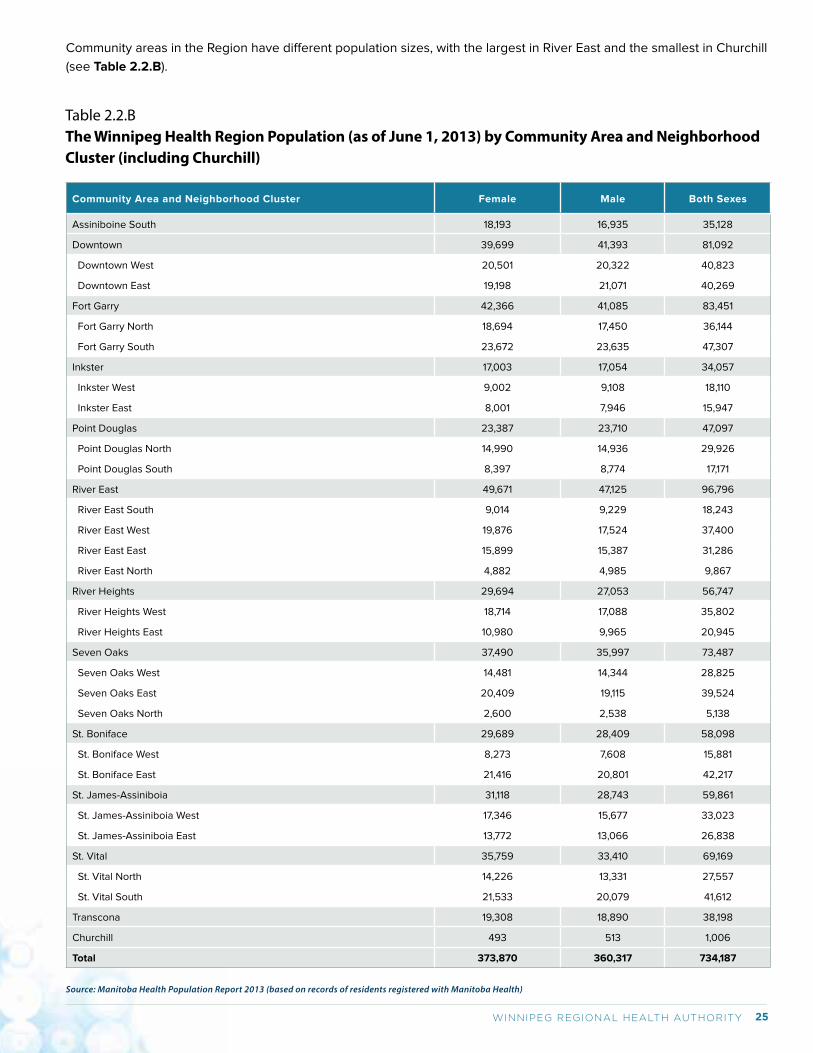
25WINNIPEG REGIONAL HEALTH AUTHORITY
Table 2.2.BThe Winnipeg Health Region Population (as of June 1, 2013) by Community Area and Neighborhood Cluster (including Churchill)
Community Area and Neighborhood Cluster Female Male Both Sexes
Assiniboine South 18,193 16,935 35,128
Downtown 39,699 41,393 81,092
Downtown West 20,501 20,322 40,823
Downtown East 19,198 21,071 40,269
Fort Garry 42,366 41,085 83,451
Fort Garry North 18,694 17,450 36,144
Fort Garry South 23,672 23,635 47,307
Inkster 17,003 17,054 34,057
Inkster West 9,002 9,108 18,110
Inkster East 8,001 7,946 15,947
Point Douglas 23,387 23,710 47,097
Point Douglas North 14,990 14,936 29,926
Point Douglas South 8,397 8,774 17,171
River East 49,671 47,125 96,796
River East South 9,014 9,229 18,243
River East West 19,876 17,524 37,400
River East East 15,899 15,387 31,286
River East North 4,882 4,985 9,867
River Heights 29,694 27,053 56,747
River Heights West 18,714 17,088 35,802
River Heights East 10,980 9,965 20,945
Seven Oaks 37,490 35,997 73,487
Seven Oaks West 14,481 14,344 28,825
Seven Oaks East 20,409 19,115 39,524
Seven Oaks North 2,600 2,538 5,138
St. Boniface 29,689 28,409 58,098
St. Boniface West 8,273 7,608 15,881
St. Boniface East 21,416 20,801 42,217
St. James-Assiniboia 31,118 28,743 59,861
St. James-Assiniboia West 17,346 15,677 33,023
St. James-Assiniboia East 13,772 13,066 26,838
St. Vital 35,759 33,410 69,169
St. Vital North 14,226 13,331 27,557
St. Vital South 21,533 20,079 41,612
Transcona 19,308 18,890 38,198
Churchill 493 513 1,006
Total 373,870 360,317 734,187
Source: Manitoba Health Population Report 2013 (based on records of residents registered with Manitoba Health)
Community areas in the Region have different population sizes, with the largest in River East and the smallest in Churchill
(see Table 2.2.B).
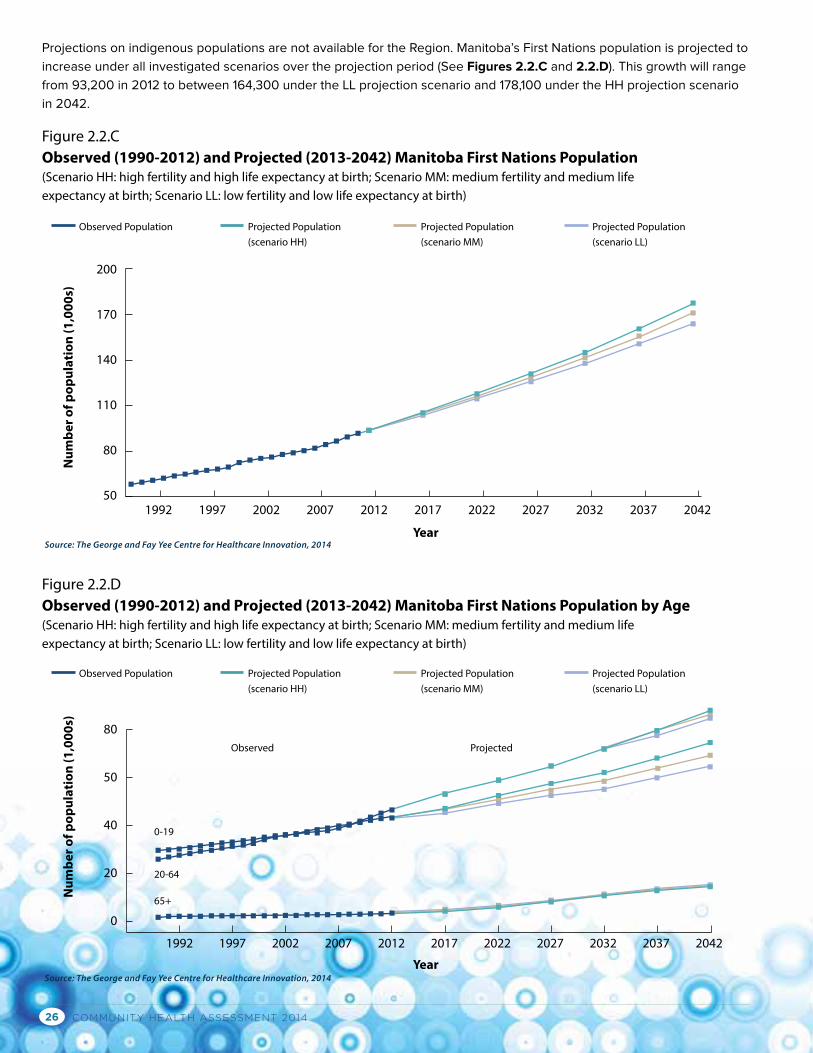
COMMUNITY HEALTH ASSESSMENT 201426
Year
Figure 2.2.CObserved (1990-2012) and Projected (2013-2042) Manitoba First Nations Population (Scenario HH: high fertility and high life expectancy at birth; Scenario MM: medium fertility and medium life expectancy at birth; Scenario LL: low fertility and low life expectancy at birth)
Observed Population Projected Population(scenario HH)
Projected Population(scenario MM)
Projected Population(scenario LL)
200
170
140
110
80
501992 1997 2002 2007 2012 2017 2022 2027 2032 2037 2042
Num
ber o
f pop
ulat
ion
(1,0
00s)
Source: The George and Fay Yee Centre for Healthcare Innovation, 2014
Year
Observed Population
Observed
0-19
20-64
65+
Projected
Projected Population(scenario HH)
Projected Population(scenario MM)
Projected Population(scenario LL)
80
50
40
20
0
1992 1997 2002 2007 2012 2017 2022 2027 2032 2037 2042
Num
ber o
f pop
ulat
ion
(1,0
00s)
Source: The George and Fay Yee Centre for Healthcare Innovation, 2014
Figure 2.2.DObserved (1990-2012) and Projected (2013-2042) Manitoba First Nations Population by Age (Scenario HH: high fertility and high life expectancy at birth; Scenario MM: medium fertility and medium life expectancy at birth; Scenario LL: low fertility and low life expectancy at birth)
Projections on indigenous populations are not available for the Region. Manitoba’s First Nations population is projected to
increase under all investigated scenarios over the projection period (See Figures 2.2.C and 2.2.D). This growth will range
from 93,200 in 2012 to between 164,300 under the LL projection scenario and 178,100 under the HH projection scenario
in 2042.
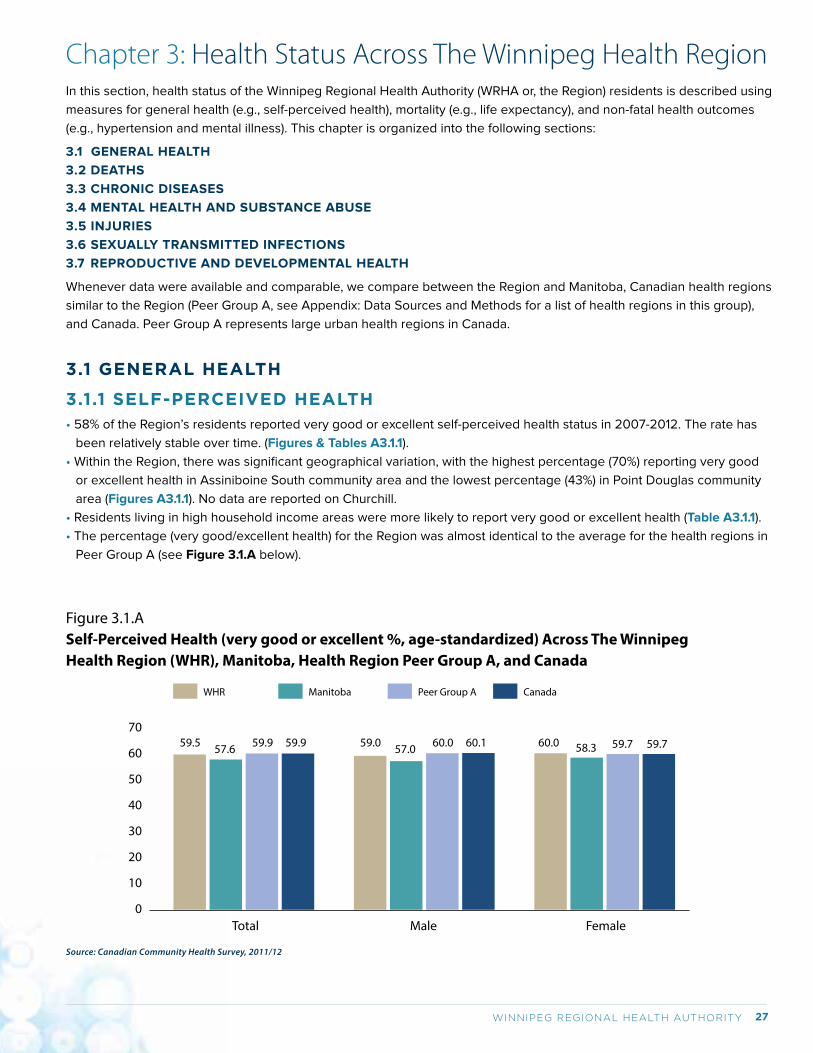
27WINNIPEG REGIONAL HEALTH AUTHORITY
Chapter 3: Health Status Across The Winnipeg Health RegionIn this section, health status of the Winnipeg Regional Health Authority (WRHA or, the Region) residents is described using
measures for general health (e.g., self-perceived health), mortality (e.g., life expectancy), and non-fatal health outcomes
(e.g., hypertension and mental illness). This chapter is organized into the following sections:
3.1 GENERAL HEALTH
3.2 DEATHS
3.3 CHRONIC DISEASES
3.4 MENTAL HEALTH AND SUBSTANCE ABUSE
3.5 INJURIES
3.6 SEXUALLY TRANSMITTED INFECTIONS
3.7 REPRODUCTIVE AND DEVELOPMENTAL HEALTH
Whenever data were available and comparable, we compare between the Region and Manitoba, Canadian health regions
similar to the Region (Peer Group A, see Appendix: Data Sources and Methods for a list of health regions in this group),
and Canada. Peer Group A represents large urban health regions in Canada.
3.1 GENERAL HEALTH
3.1.1 SELF-PERCEIVED HEALTH• 58% of the Region’s residents reported very good or excellent self-perceived health status in 2007-2012. The rate has
been relatively stable over time. (Figures & Tables A3.1.1).
• Within the Region, there was significant geographical variation, with the highest percentage (70%) reporting very good
or excellent health in Assiniboine South community area and the lowest percentage (43%) in Point Douglas community
area (Figures A3.1.1). No data are reported on Churchill.
• Residents living in high household income areas were more likely to report very good or excellent health (Table A3.1.1).
• The percentage (very good/excellent health) for the Region was almost identical to the average for the health regions in
Peer Group A (see Figure 3.1.A below).
Figure 3.1.ASelf-Perceived Health (very good or excellent %, age-standardized) Across The Winnipeg Health Region (WHR), Manitoba, Health Region Peer Group A, and Canada
Male Female Total
59.570
60
50
40
30
20
10
0
57.6 59.9 59.9 59.0 57.0 60.0 60.1 60.0 58.3 59.7 59.7
WHR Manitoba Peer Group A Canada
Source: Canadian Community Health Survey, 2011/12
COMMUNITY HEALTH ASSESSMENT 201428
Community members expressed an interest on two additional measures from the Canadian Community Health Survey
(2007-12):
• 19% of Winnipeg resident aged 15 years and older reported a high level of life stress.
• 23% of residents aged 15-75 years reported a high level of work stress in the past 12 months.
3.1.2 SF-36 GENERAL PHYSICAL FUNCTION AND MENTAL HEALTH• The SF-36 is a survey tool used to measure a person’s perceived health status. It scores general physical function and
mental health from 0 to 100 (higher is better).
• Half (50%) of the Region’s residents aged 12 years and older indicated that they had perfect physical functioning (a
score of 100). The Region’s percentage for perfect physical functioning varied from 44% in Point Douglas community
area to 57% in the Inkster community area (Figure A3.1.2.b1).
• However, only 38% of the Region’s residents reported a high score (92-100) on mental health. The percentage for good
mental health ranged from 26% in St Boniface West to 50% in Seven Oaks North (Figure A3.1.2.a2).
• No data on these measures are reported for Churchill because of small sample sizes.
3.2 DEATHS
3.2.1 TOTAL DEATHSTOTAL MORTALITY
• The total mortality (death) rate in the Region decreased slightly over the past 5 years.
• The rate varied across the Region in 2007-2011, with the highest death rates in the Point Douglas South neighborhood
cluster (17.2 deaths per 1,000 residents) and the lowest in Inkster West neighborhood cluster (4.9 deaths per 1,000
residents) in 2007-2011.
• The unexpected high total mortality rate in Seven Oaks North might be due to the large number of senior residents
living in the Middlechurch Personal Care Home.1
• The large decrease in mortality in Churchill is not statistically significant and is likely due to the natural variation seen in
such a small population (n=1,006 in 2013)
• Lower household income was associated with higher total mortality rates in urban settings (Winnipeg and Brandon) in
the province.
TOP 10 CAUSES OF MORTALITY
In 2007-2011, the top 3 and 10 causes of mortality (see below) accounted for 67% and 96% of all deaths in the Region,
respectively (Figure & Table A3.2.5.a1).
• Circulatory system
• Cancer
• Respiratory system
• Injury & poisoning
• Mental illness
• Endocrine & metabolic
• Digestive system
• Nervous system
• Genitourinary & Breast
• Infectious diseases
However, cancer is the number one cause of death among those die before age 75 years.
1 Fransoo R, Martens P, The Need To Know Team, Prior H, Burchill C, Koseva I, Bailly A, Allegro E. The 2013 RHA Indicators Atlas. Winnipeg, MB. Manitoba Centre for Health Policy, October 2013.
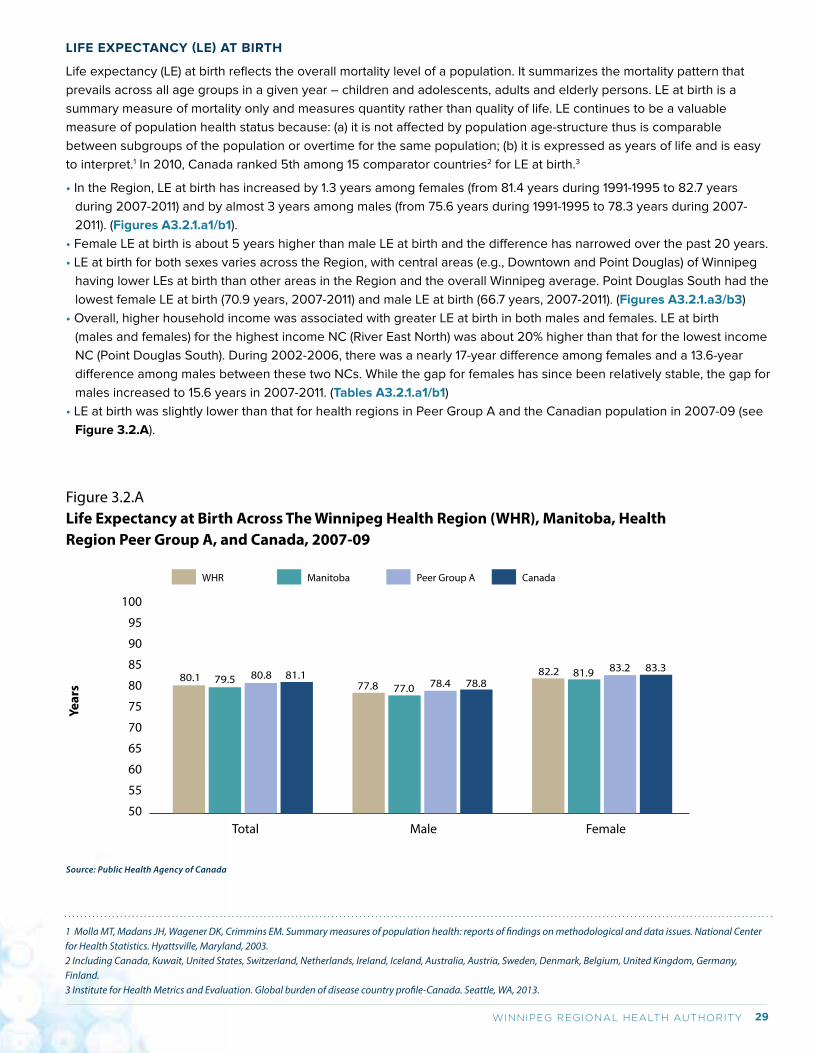
29WINNIPEG REGIONAL HEALTH AUTHORITY
LIFE EXPECTANCY (LE) AT BIRTH
Life expectancy (LE) at birth reflects the overall mortality level of a population. It summarizes the mortality pattern that
prevails across all age groups in a given year – children and adolescents, adults and elderly persons. LE at birth is a
summary measure of mortality only and measures quantity rather than quality of life. LE continues to be a valuable
measure of population health status because: (a) it is not affected by population age-structure thus is comparable
between subgroups of the population or overtime for the same population; (b) it is expressed as years of life and is easy
to interpret.1 In 2010, Canada ranked 5th among 15 comparator countries2 for LE at birth.3
• In the Region, LE at birth has increased by 1.3 years among females (from 81.4 years during 1991-1995 to 82.7 years
during 2007-2011) and by almost 3 years among males (from 75.6 years during 1991-1995 to 78.3 years during 2007-
2011). (Figures A3.2.1.a1/b1).
• Female LE at birth is about 5 years higher than male LE at birth and the difference has narrowed over the past 20 years.
• LE at birth for both sexes varies across the Region, with central areas (e.g., Downtown and Point Douglas) of Winnipeg
having lower LEs at birth than other areas in the Region and the overall Winnipeg average. Point Douglas South had the
lowest female LE at birth (70.9 years, 2007-2011) and male LE at birth (66.7 years, 2007-2011). (Figures A3.2.1.a3/b3)
• Overall, higher household income was associated with greater LE at birth in both males and females. LE at birth
(males and females) for the highest income NC (River East North) was about 20% higher than that for the lowest income
NC (Point Douglas South). During 2002-2006, there was a nearly 17-year difference among females and a 13.6-year
difference among males between these two NCs. While the gap for females has since been relatively stable, the gap for
males increased to 15.6 years in 2007-2011. (Tables A3.2.1.a1/b1)
• LE at birth was slightly lower than that for health regions in Peer Group A and the Canadian population in 2007-09 (see
Figure 3.2.A).
Figure 3.2.ALife Expectancy at Birth Across The Winnipeg Health Region (WHR), Manitoba, Health Region Peer Group A, and Canada, 2007-09
Male Female Total
80.1
100
95
90
85
80
75
70
65
60
55
50
79.5 80.8 81.177.8 77.0 78.4 78.8
82.2 81.9 83.2 83.3
WHR Manitoba Peer Group A Canada
Source: Public Health Agency of Canada
Year
s
1 Molla MT, Madans JH, Wagener DK, Crimmins EM. Summary measures of population health: reports of findings on methodological and data issues. National Center for Health Statistics. Hyattsville, Maryland, 2003.2 Including Canada, Kuwait, United States, Switzerland, Netherlands, Ireland, Iceland, Australia, Austria, Sweden, Denmark, Belgium, United Kingdom, Germany, Finland.3 Institute for Health Metrics and Evaluation. Global burden of disease country profile-Canada. Seattle, WA, 2013.
COMMUNITY HEALTH ASSESSMENT 201430
3.2.2 INFANT MORTALITY• During 2011/12, nearly 6 out of every 1,000 newborns in the Region died within 1 year, similar to the provincial average
(Figure A3.2.2.a2).
• During 2001/02-2008/09, while infant mortality rates for Downtown (7.4 deaths per 1,000) and Point Douglas (7.3 deaths
per 1,000) community areas were significantly higher than the Winnipeg average, the rate for St. Vital (1.8 deaths per
1,000) was significantly lower.1
• Lower household income was associated with higher infant mortality rates.
• Infant mortality rate is not reported for Churchill.
3.2.3 CHILD MORTALITY• In 2005-2009, age- and sex-adjusted mortality rate in children aged 1-19 years was 21.3 deaths per 100,000 children,
slightly lower than that in 2000-2004 (24.9 deaths per 100,000) (Figure A3.2.3.a1).
• In 2005-2009, age- and sex-adjusted mortality rates in children aged 1-19 years ranged from 9.3 deaths per 100,000 in
Seven Oaks community area to 55.5 deaths per 100,000 children in Point Douglas community area. (Figure A2.3.3.a2)
• In 2005-2009, injuries, neoplasms, neurological diseases, congenital abnormalities, and respiratory diseases accounted
for 61.0%, 7.0%, 5.8%, 4.0%, and 3.5%, respectively, of child deaths in Manitoba.1
• Lower household income was associated with higher child mortality rates and the inequality has increased over time.
(Figure A3.2.3.a2 & Table A3.2.3.a1)
• Injuries, neoplasms, neurological disease, congenital abnormalities, and respiratory disease are the top five causes of
morality among children (under 19 years).1
• Child mortality rate is not reported for Churchill.
3.2.4 PREMATURE DEATHS (DYING PRIOR TO AGE 75)PREMATURE MORTALITY RATE (PMR)
• PMR for the Region has declined over time from 3.5 deaths per 1,000 in 1991-1995 to 2.9 per 1,000 in 2007-2011
(Figure A3.2.4.a1).
• Residents living in central areas of the Region were more likely to die before the age of 75 years: rates in Point Douglas
South (8.3 deaths per 1,000) and Downtown East (6.1 deaths per 1,000 residents) were more than double that of the
Winnipeg average in 2007-2011 (2.9 deaths per 1,000 residents). (Figure A3.2.4.a2)
• Household income was inversely associated with PMR: (a) PMR in the lowest income NC (Point Douglas S) was 3.95-
fold higher than that of highest income NC (River East N) in 2002-2006 and 5.44-fold higher in 2007-2011; (b) PMR in
the lowest income quintile areas was 3-fold higher than that in the highest income quintile areas. (Table A3.2.4.a1)
• In 2011/12, age and sex standardized PMR in the Region was higher than the national average (see Figure 3.2.B).
1 Brownell M, Chartier M, Santos R, Ekuma O, Au W, Sarkar J, MacWilliam L, Burland E, Koseva I, Guenette W. How Are Manitoba’s Children Doing? Winnipeg, MB. Mani-toba Centre for Health Policy, October 2012.
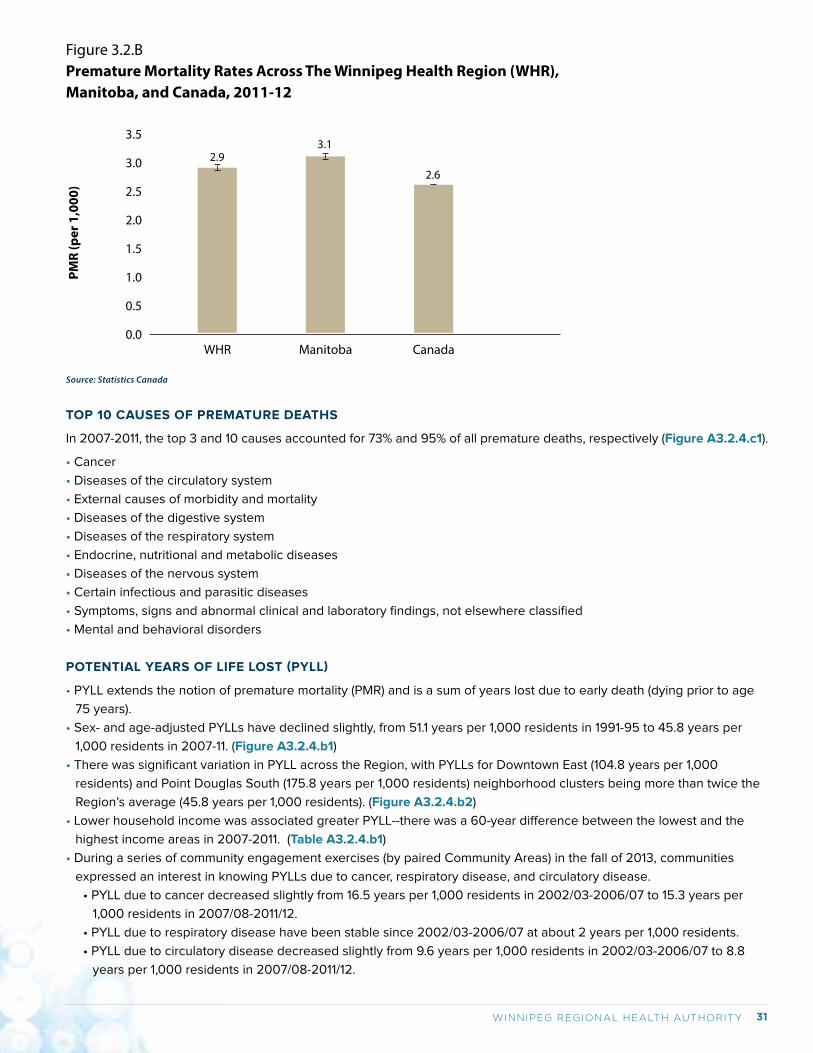
31WINNIPEG REGIONAL HEALTH AUTHORITY
TOP 10 CAUSES OF PREMATURE DEATHS
In 2007-2011, the top 3 and 10 causes accounted for 73% and 95% of all premature deaths, respectively (Figure A3.2.4.c1).
• Cancer
• Diseases of the circulatory system
• External causes of morbidity and mortality
• Diseases of the digestive system
• Diseases of the respiratory system
• Endocrine, nutritional and metabolic diseases
• Diseases of the nervous system
• Certain infectious and parasitic diseases
• Symptoms, signs and abnormal clinical and laboratory findings, not elsewhere classified
• Mental and behavioral disorders
POTENTIAL YEARS OF LIFE LOST (PYLL)
• PYLL extends the notion of premature mortality (PMR) and is a sum of years lost due to early death (dying prior to age
75 years).
• Sex- and age-adjusted PYLLs have declined slightly, from 51.1 years per 1,000 residents in 1991-95 to 45.8 years per
1,000 residents in 2007-11. (Figure A3.2.4.b1)
• There was significant variation in PYLL across the Region, with PYLLs for Downtown East (104.8 years per 1,000
residents) and Point Douglas South (175.8 years per 1,000 residents) neighborhood clusters being more than twice the
Region’s average (45.8 years per 1,000 residents). (Figure A3.2.4.b2)
• Lower household income was associated greater PYLL--there was a 60-year difference between the lowest and the
highest income areas in 2007-2011. (Table A3.2.4.b1)
• During a series of community engagement exercises (by paired Community Areas) in the fall of 2013, communities
expressed an interest in knowing PYLLs due to cancer, respiratory disease, and circulatory disease.
• PYLL due to cancer decreased slightly from 16.5 years per 1,000 residents in 2002/03-2006/07 to 15.3 years per
1,000 residents in 2007/08-2011/12.
• PYLL due to respiratory disease have been stable since 2002/03-2006/07 at about 2 years per 1,000 residents.
• PYLL due to circulatory disease decreased slightly from 9.6 years per 1,000 residents in 2002/03-2006/07 to 8.8
years per 1,000 residents in 2007/08-2011/12.
Figure 3.2.BPremature Mortality Rates Across The Winnipeg Health Region (WHR), Manitoba, and Canada, 2011-12
Manitoba CanadaWHR
2.9
PMR
(per
1,0
00)
3.5
3.0
2.5
2.0
1.5
1.0
0.5
0.0
3.1
2.6
Source: Statistics Canada
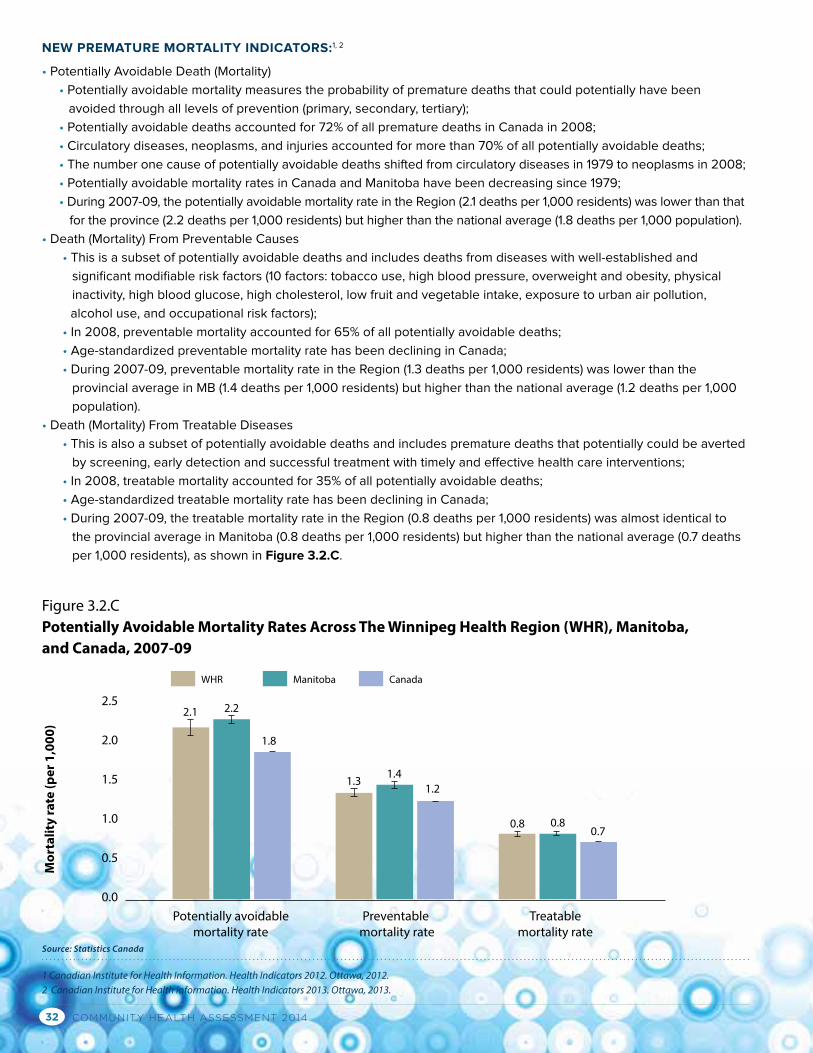
COMMUNITY HEALTH ASSESSMENT 201432
NEW PREMATURE MORTALITY INDICATORS:1, 2
• Potentially Avoidable Death (Mortality)
• Potentially avoidable mortality measures the probability of premature deaths that could potentially have been
avoided through all levels of prevention (primary, secondary, tertiary);
• Potentially avoidable deaths accounted for 72% of all premature deaths in Canada in 2008;
• Circulatory diseases, neoplasms, and injuries accounted for more than 70% of all potentially avoidable deaths;
• The number one cause of potentially avoidable deaths shifted from circulatory diseases in 1979 to neoplasms in 2008;
• Potentially avoidable mortality rates in Canada and Manitoba have been decreasing since 1979;
• During 2007-09, the potentially avoidable mortality rate in the Region (2.1 deaths per 1,000 residents) was lower than that
for the province (2.2 deaths per 1,000 residents) but higher than the national average (1.8 deaths per 1,000 population).
• Death (Mortality) From Preventable Causes
• This is a subset of potentially avoidable deaths and includes deaths from diseases with well-established and
significant modifiable risk factors (10 factors: tobacco use, high blood pressure, overweight and obesity, physical
inactivity, high blood glucose, high cholesterol, low fruit and vegetable intake, exposure to urban air pollution,
alcohol use, and occupational risk factors);
• In 2008, preventable mortality accounted for 65% of all potentially avoidable deaths;
• Age-standardized preventable mortality rate has been declining in Canada;
• During 2007-09, preventable mortality rate in the Region (1.3 deaths per 1,000 residents) was lower than the
provincial average in MB (1.4 deaths per 1,000 residents) but higher than the national average (1.2 deaths per 1,000
population).
• Death (Mortality) From Treatable Diseases
• This is also a subset of potentially avoidable deaths and includes premature deaths that potentially could be averted
by screening, early detection and successful treatment with timely and effective health care interventions;
• In 2008, treatable mortality accounted for 35% of all potentially avoidable deaths;
• Age-standardized treatable mortality rate has been declining in Canada;
• During 2007-09, the treatable mortality rate in the Region (0.8 deaths per 1,000 residents) was almost identical to
the provincial average in Manitoba (0.8 deaths per 1,000 residents) but higher than the national average (0.7 deaths
per 1,000 residents), as shown in Figure 3.2.C.
Figure 3.2.CPotentially Avoidable Mortality Rates Across The Winnipeg Health Region (WHR), Manitoba, and Canada, 2007-09
Preventable mortality rate
Treatable mortality rate
Potentially avoidable mortality rate
2.1
Mor
talit
y ra
te (p
er 1
,000
)
2.5
2.0
1.5
1.0
0.5
0.0
2.2
1.8
1.31.4
1.2
0.8 0.80.7
WHR Manitoba Canada
Source: Statistics Canada
1 Canadian Institute for Health Information. Health Indicators 2012. Ottawa, 2012.2 Canadian Institute for Health Information. Health Indicators 2013. Ottawa, 2013.
33WINNIPEG REGIONAL HEALTH AUTHORITY
3.2.5 DISEASE-SPECIFIC MORTALITY CANCER DEATHS
• In 2008-2010, age-standardized overall invasive cancer mortality was 203.3 per 100,000 in the Region; the mortality
rate has been stable (Figure A3.2.5.b1/b2 & Table A3.2.5.b1).
• Age-standardized overall cancer mortality rates for both female and male Canadians have been decreasing since 1985.1
• Of the four most common cancers (prostate, breast, colorectal, and lung), lung and colorectal cancers had relatively
lower incidence rates but higher mortality rates. Age-standardized 5-year relative survival were greater than 80% for
prostate (91.6%) and female breast cancer (85.4%), 60.3% for colorectal cancer, and only 22.8% for lung cancer.
3.2.6 INJURY DEATHS • Injury is the fourth ranked cause of death in the Region, and the contribution of injury deaths to total deaths increased
from 5.9% in 2002-06 to 6.5% in 2007-12.2
• During 2000-2012, age-standardized injury mortality rate was 48.9 deaths per 100,000 residents; unintentional injury
mortality rate remained stable around 30 deaths per 100,000 residents; and similarly intentional injury mortality rate
remained around 15 deaths per 100,000 residents.2 (Figures A3.2.6.a1/a3)
• During 2000-2012, the leading cause of injury related deaths in the Region were falls (12.2 deaths per 100,000
residents), suicides (10.9 deaths per 100,000 residents), poisoning (6.0 deaths per 100,000 residents), motor vehicle
accidents (4.7 deaths per 100,000 residents), and assaults (3.5 deaths per 100,000 residents).
• In 2012, age-standardized suicide mortality rates were 8.9, 13.7, and 11.2 per 100,000 for females, males, and both sexes
in the Region.2
• Suicide mortality rate was highest among those aged 45-54 years (16.5 deaths per 100,000 in the Region during
2000-2012). Suicide mortality rate varied across the Region, with the highest rates in Point Douglas (4.3 per 10,000) and
Downtown (2.7 per 10,000) and the lowest in Fort Garry (0.8 per 10,000) in 2007-2011.
• Suicide death rate in the Region is similar to that for other health regions in Canada and the national average.3
Special notes to mortality measures
Mortality is only one aspect of a population’s health. Summary measures of population health should combine information
on both mortality and morbidity (non-fatal health outcomes) and include two categories: health expectancy and health gap.4
Health expectancy divides expected life into healthy and unhealthy years, i.e., life expectancy weighted for health status. It
is the average number of years a person is expected to live if current patterns of mortality and morbidity continue to apply.
One commonly used health expectancy measures is health-adjusted life expectancy (HALE). HALE is calculated by using
the health utility index (HUI) to weigh years lived in good health. In 2010, Canada ranked the 4th among 15 comparator
countries5 for HALE.6 HALEs were 70.2 years for females and 66.7 years for males in Manitoba in 2001 and similar to the
Canadian averages (70.8 years for females and 68.3 years for males).7 The approximately 10-year difference between
LE and HALE in Manitoba reflects the impact of non-fatal health outcomes on expected life. No data are available at the
regional level, but it would be reasonable to assume a 10-year difference between LE and HALE in the Region.
Health gap is the lost life expectancy weighted by health status. Disability-adjusted life year (DALY) measures both
quantity and quality of life in a population and includes two dimensions: years lost due to disability (YLDs) and years of
life lost (YLLs). DALY is an indicator used by WHO and countries around the world to measure disease burden. In 2010,
Canada ranked the 3rd for age-standardized YLD rate and the 8th for age-standardized YLL.6
1 Canadian Cancer Society. Canadian Cancer Statistics 2014. Ottawa, 2014.2 Manitoba Health. Injuries Report: WRHA 2000-2012. Winnipeg, 2014.3 Canadian Institute for Health Information. Health Indicators 2013. Ottawa, 2013.4 Molla MT, Madans JH, Wagener DK, Crimmins EM. Summary measures of population health: Report of findings on methodological and data issues. National Centre for Health Statistics. Hyattsville, Maryland. 2003. 5 Including Canada, Kuwait, United States, Switzerland, Netherlands, Ireland, Iceland, Australia, Austria, Sweden, Denmark, Belgium, United Kingdom, Germany, Finland.6 Institute for Health Metrics and Evaluation. Global burden of disease country profile-Canada. Seattle, WA, 20137 Public Health Agency of Canada. Health-adjusted life expectancy in Canada: 2012. Ottawa, Ontario, 2012.
COMMUNITY HEALTH ASSESSMENT 201434
3.3 CHRONIC DISEASES
3.3.1 TOTAL RESPIRATORY DISEASES (TRD)• This indicator measures the treatment prevalence of several common respiratory diseases including asthma, chronic/
acute bronchitis, acute bronchiolitis, emphysema, and chronic airway obstruction. This should not be compared to
prevalence or treatment prevalence of individual respiratory diseases reported elsewhere.
• Total respiratory diseases prevalence in the Region has declined overtime, from 13.1% in 2000/01 to 9.9% in 2011/12
(Figures & Table A3.3.1).
• TRD prevalence rates varied across community areas (highest rates are in Point Douglas and lowest rates are in
Churchill) and neighborhood clusters (highest rates are in Point Douglas South and lowest rates are in River East North).
(Figures A3.3.1.a3)
• TRD prevalence was inversely associated with lower income.
3.3.2 HYPERTENSION • Each year, about 8,500 residents aged 19 years and older are newly diagnosed (incident cases) with hypertension or
high blood pressure. Hypertension incidence rate decreased slightly from 3.3 cases per 100 person-years in 2006/07 to
3.0 cases per 100 person-years in 2011/12 (Figure A3.3.2.a1).
• However, hypertension prevalence increased from 20% in 1993-95 to 25% in 2011-12 (Figure A3.3.2.b1). This might
reflect the lower mortality and longer life of persons living with hypertension as shown in the Canadian Chronic Disease
Surveillance System.1
• Both hypertension incidence and prevalence varied across the Region.
• Point Douglas South had the highest hypertension incidence (3.8 cases per 100 person-years) and River Height West
had the lowest (2.4 cases per 100 person-years) in 2011/12 (Figure A3.3.2.b3);
• Churchill had the highest hypertension prevalence for the periods of 2006/07 and 2011/12; communities in the
northwest sector of the Region tended to have higher hypertension prevalence; overall, community areas in the
southern sector of the Region tended to have lower hypertension prevalence.
• There were some income-related inequalities in hypertension incidence and prevalence. The lowest income NC had
39% higher incidence and 33% higher prevalence than the highest income NC in 2011/12. The inequalities remained
relatively stable during 2006/07 to 2011/12. (Tables A3.3.2.a1/b1)
• Hypertension incidence and prevalence rates in the Region were similar to that for the total Canadian population aged
20 years and older. Data from the Canadian Chronic Disease Surveillance System indicated that hypertension incidence
among residents aged 20 years and older remained stable during the period of 1998/99-2006/07.1
3.3.3 DIABETES • Each year, nearly 10,000 residents aged 19 years and older are newly diagnosed (incident cases) with diabetes.
Diabetes incidence remained stable (0.86 cases per 100 person-years in 2004/05-2006/07 and 0.80 cases per 100
person-years in 2009/10-2011/12) (Figure A3.3.3.a1). Diabetes incidence in Churchill decreased significantly from
2.36 cases per 100 person-years in 2004/05 to 0.78 cases per 100 persons-years in 2011/12. This might be partially
due to variations related to small numbers of residents, but it is important to explore other possible contributors.
(Figure A3.3.3.a2)
• Diabetes prevalence increased over time in the Region (5.8% in 1998/99-2000/01 and 9.2% in 2009/10-2011/12)
(Figure A3.3.3.b1). Diabetes prevalence in Churchill was consistently higher than that in all other community areas in
the Region.
• As for hypertension, the different time trends in diabetes incidence and prevalence may reflect longer life of diabetic
patients. (Figure A3.3.3.a1/b1)
• There were nearly 3-fold differences in diabetes incidence and prevalence across neighborhood clusters (NCs):
(Figures A3.3.3.a3/b3)
1 Public Health Agency of Canada. Report from the Canadian Chronic Disease Surveillance System: Hypertension in Canada, 2010.
35WINNIPEG REGIONAL HEALTH AUTHORITY
• Point Douglas South had the highest incidence (1.50 cases per 100 person-years 2009/10-2011/12) and prevalence
(15.8% between 2009/10-2011/12);
• River East North had the lowest incidence (0.53 cases per 100 person-years 2009/10-2011/12) and prevalence (5.8%
between 2009/10-2011/12).
• Residents living in lower income communities tended to have higher diabetes incidence and prevalence: diabetes
incidence and prevalence for residents living in the lowest income quintile was almost double that for residents
living in the highest income quintile communities
• Individuals with diabetes are more likely to be hospitalized with non-traumatic lower limb amputations, cardiovascular
diseases, and end-stage renal diseases than those without diabetes.
• 1.6% of adults with diabetes in the Region were hospitalized with lower limb amputations during 1998/99-2002/03
(Figure A3.3.3.c2);
• The percentage decreased to 1.0% in 2007/08-2011/12, but was still higher than the national average (0.2% in
2006/07) according to the National Diabetes Surveillance System;1
• Residents living in lower income neighborhoods tended to have higher lower limb amputation rates in the Region.
(Figure A3.3.3.c3 & Table A3.3.3.c1)
• Eye examination is an important step for prevention and early detection of diabetic eye problems which may lead
to visual loss or blindness. However, less than 40% of adult diabetic patients (aged 19 years and older) had an eye
examination in the past year.
3.3.4 CARDIOVASCULAR DISEASES (CVDs)• CVDs are chronic diseases caused by an interaction of genetics, health behaviors, and the environment. Ischemic heart
disease (IHD), acute myocardial infarction (AMI or heart attack), and cerebrovascular disease (or stroke) are among the
most common CVDs.
• All CVD event rates have declined overtime in the Region:
• IHD incidence rates were 0.79 cases per 100 person-years in 2002/03-2006/07 and 0.67 cases per 100 person-
years in 2007/08-2011/12 (Figure A3.3.4.a1);
• IHD prevalence rates were 9.3% in 1996/97-2000/01 and 7.9% in 2007/08-2011/12 (Figure A3.3.4.b1);
• AMI (heart attack) event rate declined from 5.3 events per 1,000 residents in 1996-2000 to 3.8 events per 1,000
residents in 2007-2011 (Figure A3.3.4.c1);
• During 2011/12, AMI event rate for the Region was lower than that for Manitoba but higher than the national average,
although the differences were not statistically significant.2
• Stroke event rate among residents aged 40 years and older decreased from 3.7 cases per 1,000 residents in
1996/97-2000/01 to 2.6 cases per 1,000 in 2002/03-2006/07 and has stabilized since (Figure A3.3.4.d1);
• During 2011/12, stroke incidence rate for the Region was lower than that for Manitoba and Canada, although the
differences were not statistically significant.
• All CVD event rates varied across the Region’s community areas. Churchill had higher IHD incidence and prevalence
rates than other community areas. No association between neighborhood income and CVD event rates was observed.
1 Public Health Agency of Canada. Report from the National Diabetes Surveillance System: Diabetes in Canada, 2009.2 Canadian Institute for Health Information. Health Indicators 2013. Ottawa, 2013.
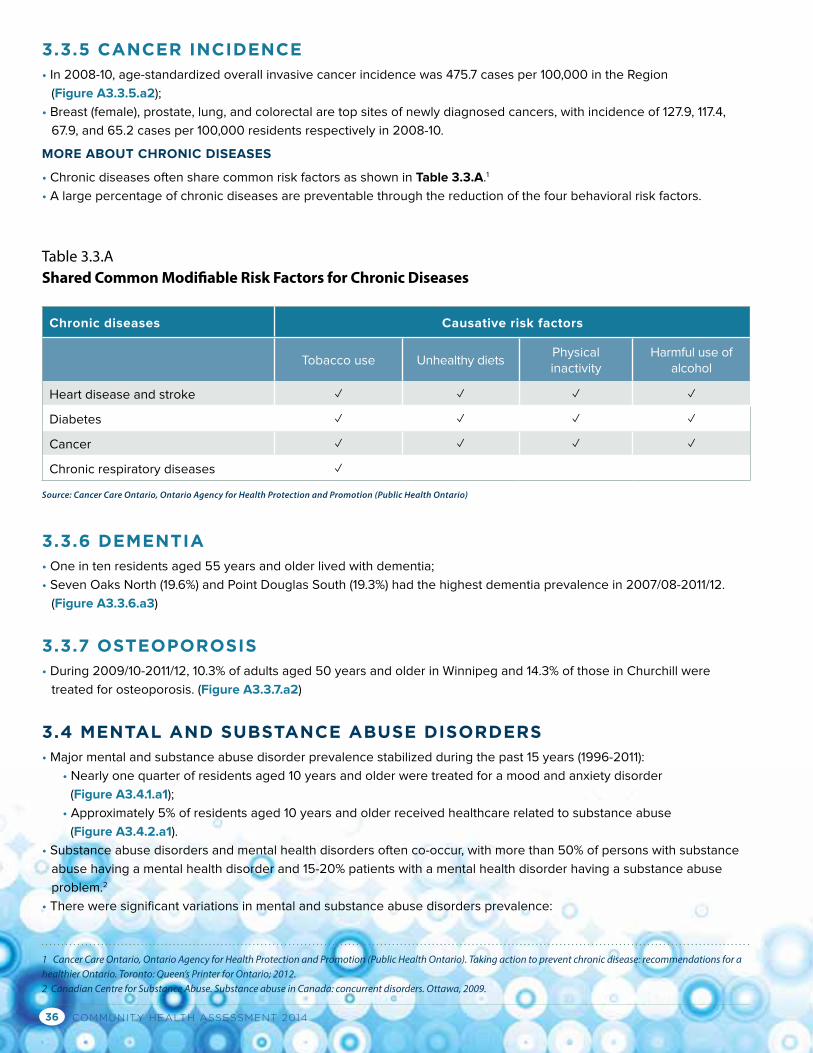
COMMUNITY HEALTH ASSESSMENT 201436
3.3.5 CANCER INCIDENCE• In 2008-10, age-standardized overall invasive cancer incidence was 475.7 cases per 100,000 in the Region
(Figure A3.3.5.a2);
• Breast (female), prostate, lung, and colorectal are top sites of newly diagnosed cancers, with incidence of 127.9, 117.4,
67.9, and 65.2 cases per 100,000 residents respectively in 2008-10.
MORE ABOUT CHRONIC DISEASES
• Chronic diseases often share common risk factors as shown in Table 3.3.A.1
• A large percentage of chronic diseases are preventable through the reduction of the four behavioral risk factors.
3.3.6 DEMENTIA • One in ten residents aged 55 years and older lived with dementia;
• Seven Oaks North (19.6%) and Point Douglas South (19.3%) had the highest dementia prevalence in 2007/08-2011/12.
(Figure A3.3.6.a3)
3.3.7 OSTEOPOROSIS• During 2009/10-2011/12, 10.3% of adults aged 50 years and older in Winnipeg and 14.3% of those in Churchill were
treated for osteoporosis. (Figure A3.3.7.a2)
3.4 MENTAL AND SUBSTANCE ABUSE DISORDERS• Major mental and substance abuse disorder prevalence stabilized during the past 15 years (1996-2011):
• Nearly one quarter of residents aged 10 years and older were treated for a mood and anxiety disorder
(Figure A3.4.1.a1);
• Approximately 5% of residents aged 10 years and older received healthcare related to substance abuse
(Figure A3.4.2.a1).
• Substance abuse disorders and mental health disorders often co-occur, with more than 50% of persons with substance
abuse having a mental health disorder and 15-20% patients with a mental health disorder having a substance abuse
problem.2
• There were significant variations in mental and substance abuse disorders prevalence:
Chronic diseases Causative risk factors
Tobacco use Unhealthy dietsPhysical inactivity
Harmful use of alcohol
Heart disease and stroke ✓ ✓ ✓ ✓
Diabetes ✓ ✓ ✓ ✓
Cancer ✓ ✓ ✓ ✓
Chronic respiratory diseases ✓
Table 3.3.AShared Common Modifiable Risk Factors for Chronic Diseases
1 Cancer Care Ontario, Ontario Agency for Health Protection and Promotion (Public Health Ontario). Taking action to prevent chronic disease: recommendations for a healthier Ontario. Toronto: Queen’s Printer for Ontario; 2012.2 Canadian Centre for Substance Abuse. Substance abuse in Canada: concurrent disorders. Ottawa, 2009.
Source: Cancer Care Ontario, Ontario Agency for Health Protection and Promotion (Public Health Ontario)
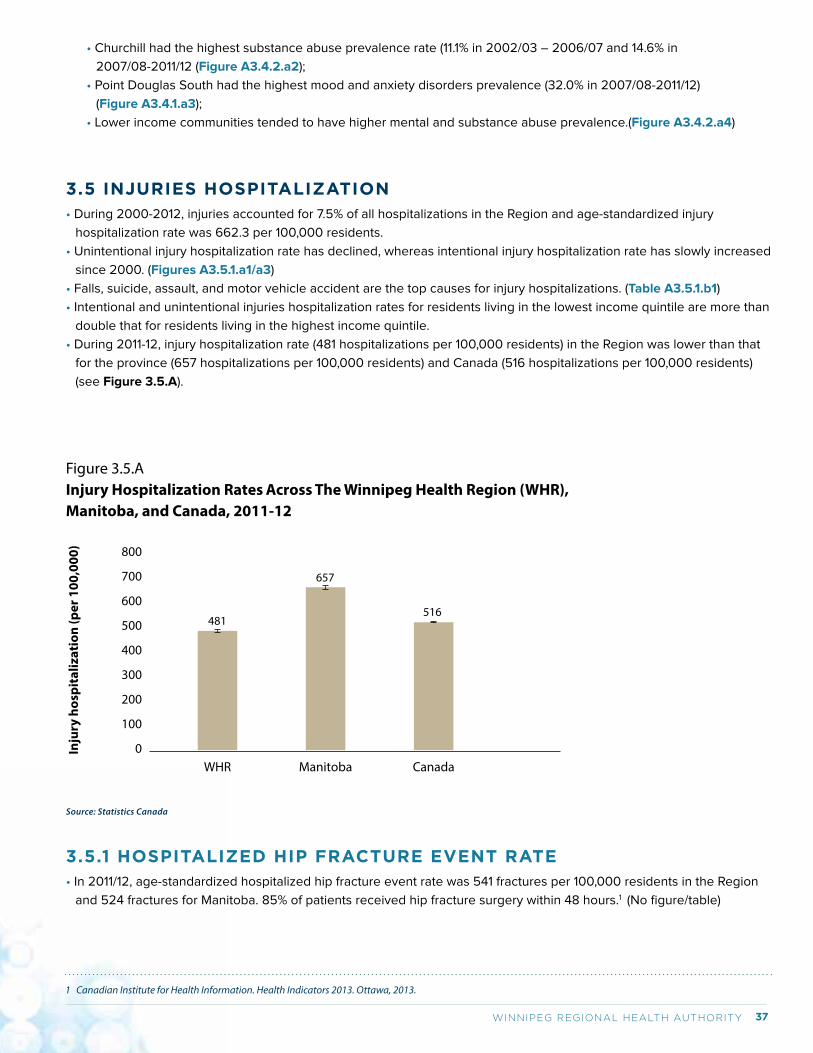
37WINNIPEG REGIONAL HEALTH AUTHORITY
• Churchill had the highest substance abuse prevalence rate (11.1% in 2002/03 – 2006/07 and 14.6% in
2007/08-2011/12 (Figure A3.4.2.a2);
• Point Douglas South had the highest mood and anxiety disorders prevalence (32.0% in 2007/08-2011/12)
(Figure A3.4.1.a3);
• Lower income communities tended to have higher mental and substance abuse prevalence.(Figure A3.4.2.a4)
3.5 INJURIES HOSPITALIZATION• During 2000-2012, injuries accounted for 7.5% of all hospitalizations in the Region and age-standardized injury
hospitalization rate was 662.3 per 100,000 residents.
• Unintentional injury hospitalization rate has declined, whereas intentional injury hospitalization rate has slowly increased
since 2000. (Figures A3.5.1.a1/a3)
• Falls, suicide, assault, and motor vehicle accident are the top causes for injury hospitalizations. (Table A3.5.1.b1)
• Intentional and unintentional injuries hospitalization rates for residents living in the lowest income quintile are more than
double that for residents living in the highest income quintile.
• During 2011-12, injury hospitalization rate (481 hospitalizations per 100,000 residents) in the Region was lower than that
for the province (657 hospitalizations per 100,000 residents) and Canada (516 hospitalizations per 100,000 residents)
(see Figure 3.5.A).
Figure 3.5.A Injury Hospitalization Rates Across The Winnipeg Health Region (WHR), Manitoba, and Canada, 2011-12
Manitoba CanadaWHR
481
Inju
ry h
ospi
taliz
atio
n (p
er 1
00,0
00) 800
700
600
500
400
300
200
100
0
657
516
Source: Statistics Canada
3.5.1 HOSPITALIZED HIP FRACTURE EVENT RATE• In 2011/12, age-standardized hospitalized hip fracture event rate was 541 fractures per 100,000 residents in the Region
and 524 fractures for Manitoba. 85% of patients received hip fracture surgery within 48 hours.1 (No figure/table)
1 Canadian Institute for Health Information. Health Indicators 2013. Ottawa, 2013.
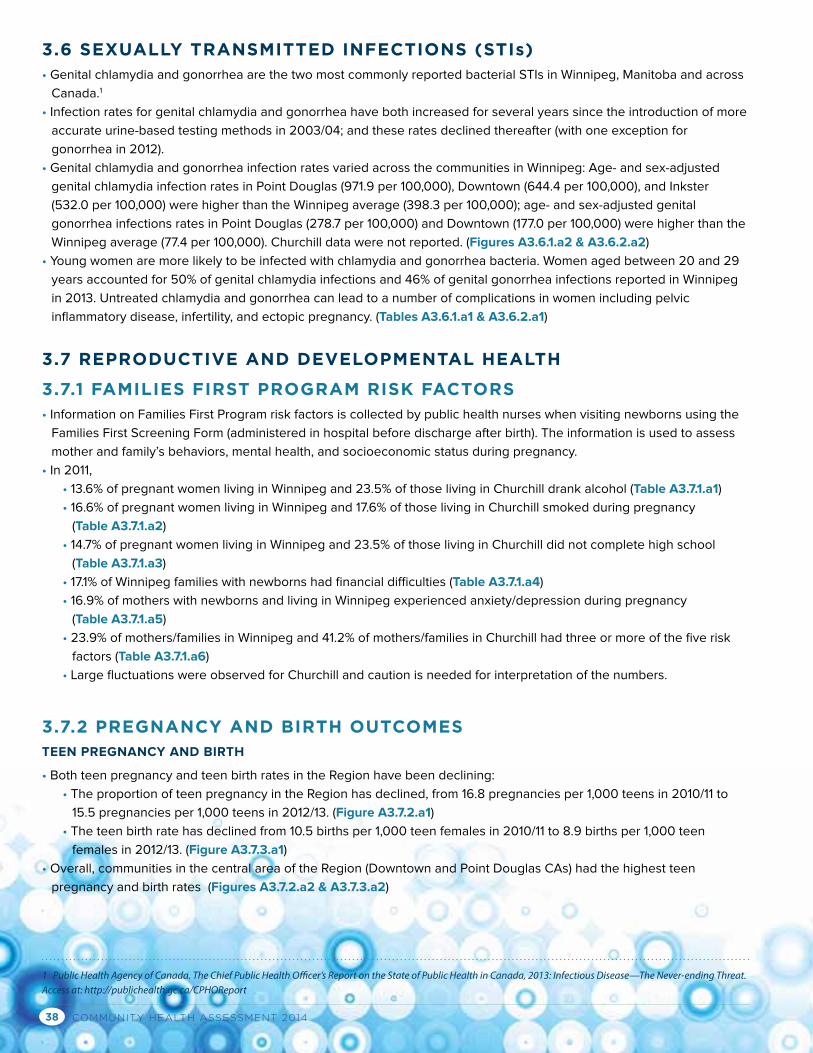
COMMUNITY HEALTH ASSESSMENT 201438
3.6 SEXUALLY TRANSMITTED INFECTIONS (STIs)• Genital chlamydia and gonorrhea are the two most commonly reported bacterial STIs in Winnipeg, Manitoba and across
Canada.1
• Infection rates for genital chlamydia and gonorrhea have both increased for several years since the introduction of more
accurate urine-based testing methods in 2003/04; and these rates declined thereafter (with one exception for
gonorrhea in 2012).
• Genital chlamydia and gonorrhea infection rates varied across the communities in Winnipeg: Age- and sex-adjusted
genital chlamydia infection rates in Point Douglas (971.9 per 100,000), Downtown (644.4 per 100,000), and Inkster
(532.0 per 100,000) were higher than the Winnipeg average (398.3 per 100,000); age- and sex-adjusted genital
gonorrhea infections rates in Point Douglas (278.7 per 100,000) and Downtown (177.0 per 100,000) were higher than the
Winnipeg average (77.4 per 100,000). Churchill data were not reported. (Figures A3.6.1.a2 & A3.6.2.a2)
• Young women are more likely to be infected with chlamydia and gonorrhea bacteria. Women aged between 20 and 29
years accounted for 50% of genital chlamydia infections and 46% of genital gonorrhea infections reported in Winnipeg
in 2013. Untreated chlamydia and gonorrhea can lead to a number of complications in women including pelvic
inflammatory disease, infertility, and ectopic pregnancy. (Tables A3.6.1.a1 & A3.6.2.a1)
3.7 REPRODUCTIVE AND DEVELOPMENTAL HEALTH
3.7.1 FAMILIES FIRST PROGRAM RISK FACTORS• Information on Families First Program risk factors is collected by public health nurses when visiting newborns using the
Families First Screening Form (administered in hospital before discharge after birth). The information is used to assess
mother and family’s behaviors, mental health, and socioeconomic status during pregnancy.
• In 2011,
• 13.6% of pregnant women living in Winnipeg and 23.5% of those living in Churchill drank alcohol (Table A3.7.1.a1)
• 16.6% of pregnant women living in Winnipeg and 17.6% of those living in Churchill smoked during pregnancy
(Table A3.7.1.a2)
• 14.7% of pregnant women living in Winnipeg and 23.5% of those living in Churchill did not complete high school
(Table A3.7.1.a3)
• 17.1% of Winnipeg families with newborns had financial difficulties (Table A3.7.1.a4)
• 16.9% of mothers with newborns and living in Winnipeg experienced anxiety/depression during pregnancy
(Table A3.7.1.a5)
• 23.9% of mothers/families in Winnipeg and 41.2% of mothers/families in Churchill had three or more of the five risk
factors (Table A3.7.1.a6)
• Large fluctuations were observed for Churchill and caution is needed for interpretation of the numbers.
3.7.2 PREGNANCY AND BIRTH OUTCOMESTEEN PREGNANCY AND BIRTH
• Both teen pregnancy and teen birth rates in the Region have been declining:
• The proportion of teen pregnancy in the Region has declined, from 16.8 pregnancies per 1,000 teens in 2010/11 to
15.5 pregnancies per 1,000 teens in 2012/13. (Figure A3.7.2.a1)
• The teen birth rate has declined from 10.5 births per 1,000 teen females in 2010/11 to 8.9 births per 1,000 teen
females in 2012/13. (Figure A3.7.3.a1)
• Overall, communities in the central area of the Region (Downtown and Point Douglas CAs) had the highest teen
pregnancy and birth rates (Figures A3.7.2.a2 & A3.7.3.a2)
1 Public Health Agency of Canada. The Chief Public Health Officer’s Report on the State of Public Health in Canada, 2013: Infectious Disease—The Never-ending Threat. Access at: http://publichealth.gc.ca/CPHOReport
39WINNIPEG REGIONAL HEALTH AUTHORITY
PRETERM BIRTHS
• During 2005/06–2008/09, 8.1% of live births were delivered prematurely, including 2.1% delivered before 33 weeks of
gestation, and 6.0% delivered between 34 and 36 weeks. (Figure A3.7.4.a1)
• Preterm birth rate varied. The rate in Fort Garry community area (6.7%) was significantly lower than the Winnipeg
average (8.1%), while the rates in Downtown (10.4%) and Point Douglas (10.1%) community areas were significantly higher.
(Figure A3.7.4.a1)
BIRTH WEIGHT
• During 2007/2008-2011/2012, 5.8% of live born infants weigh between 500 and 2,499 grams (low birth weight)
(Figure A3.7.5.a1);
• Household income was inversely associated with the proportion of infants with low birth weight (Table A3.7.5.a1);
• During 2007/08–2008/09, 8.2% of live born babies weighed under the 10th percentile of the sex–specific birth weight
for a given gestational age (small-for-gestational-age, SGA) and 13.2% of live born babies weighed above the 90th
percentile of the sex–specific birth weight for a given gestational age (large-for-gestational-age, LGA).1
3.7.3 EARLY DEVELOPMENT INSTRUMENT (READINESS FOR SCHOOL)• The Early Development Instrument (EDI) is a teacher-completed checklist for assessing children’s “readiness for school”
in five domains (i.e., physical health and well-being, social competence, emotional maturity, language and cognitive
development, and communication skills and general knowledge).
• EDI is designed to measure population-level early childhood development, but not for individual child assessment.
• In 2010/2011 school year, 29% of Winnipeg children and one-third of Churchill children were not ready for school in one
or more domains.(Figure A3.7.6.a1)
• The not-ready-for-school rates in Downtown and Point Douglas community areas were significantly higher than the
Region’s average, while the rate in St James-Assiniboine community was lower. (Figure A3.7.6.a2)
• Children born to mothers who were teenagers at their first childbirth, children in families ever on income assistance, and
children involved with Child and Family Services are at-risk groups for delayed early development.2
1 Heaman M, Kingston D, Helewa ME, Brownell M, Derksen S, Bogdanovic B, McGowan KL, Bailly A. Perinatal Services and Outcomes in Manitoba. Winnipeg, MB. Mani-toba Centre for Health Policy, November 2012.2 Santos R, Brownell M, Ekuma O, Mayer T, Soodeen R. The Early Development Instrument (EDI) in Manitoba: Linking Socioeconomic Adversity and Biological Vulnera-bility at Birth to Children’s Outcomes at Age 5. Winnipeg, MB: Manitoba Centre for Health Policy, May 2012.
COMMUNITY HEALTH ASSESSMENT 201440
Chapter 4: Health Behaviors, Preventive Services, and Socioeconomic Determinants of Health Across the Winnipeg Health RegionIn this chapter, factors increasing or decreasing health risk are described. These factors include health behaviors
(i.e., tobacco smoking, alcohol use, physical activity, fruit and vegetable consumption, and body mass index), use of
preventive services (i.e., immunization, cancer screening tests, breastfeeding), and socioeconomic status (i.e., education,
employment, income, etc.). Whenever available, data on both general population and special populations (i.e., youth,
pregnant women, seniors) are presented. Several measures may be used for one factor in order to describe different
patterns of exposure or exposures in specific subgroups. For instance, tobacco smoking can be measured using active
tobacco smoking and passive tobacco smoking (e.g., exposure to tobacco smoke at home).
4.1 HEALTH BEHAVIORS
4.1.1 TOBACCO SMOKINGACTIVE TOBACCO SMOKING IN THE GENERAL POPULATION
• 19% of residents aged 12 years and older in the Region reported smoking daily or occasionally during 2007-12, a
decline from 22% during 2001-05. (Figure A4.1.1.a1)
• Daily smokers in Manitoba smoked on average 13 cigarettes per day, but the average consumption has slightly (but
steadily) decreased since 1999.2
• 24% of male smokers and 14% of female smokers are heavy smokers (25 or more cigarettes per day) in Canada.1
• There was a four times difference in current smoking percentage across the Region, ranging from 10% in Assiniboine
South neighborhood cluster to 39% in Point Douglas North neighborhood cluster. (Figure A4.1.1.a3)
• The percentage of current smokers in the Region was similar to the average for other similar health regions (Peer Group
A) across the country and the Canadian average (see Figure 4.1.A).
• Six (6) out of 10 current smokers are seriously considering quitting in the next 6 months and nearly half of current
smokers have tried to quit in the past year.2 Nearly half of those who attempted to quit used stop-smoking medications
including nicotine replacement therapy.
1 Jan Z. Current Smoking Trends. Health at a Glance, June 2012.2 PROPEL Centre for Population Health Impact. Tobacco use in Canada: patterns and trends, 2012 Edition. Waterloo, Ontario, 2012.
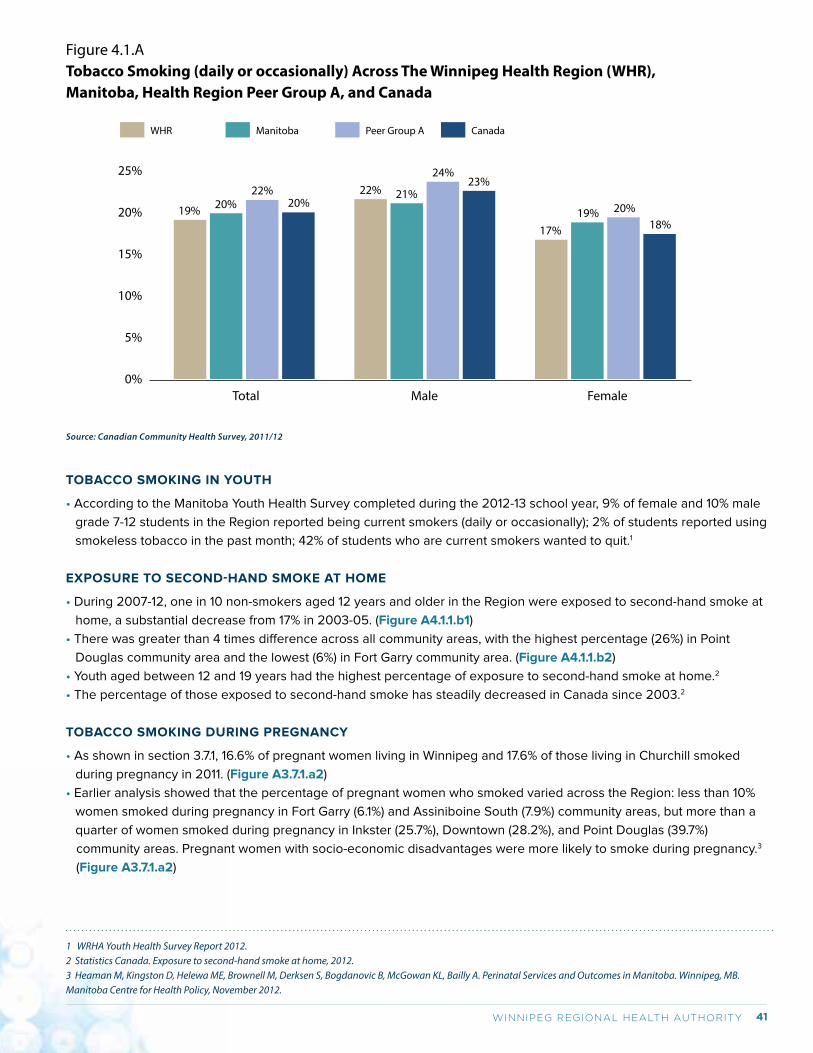
41WINNIPEG REGIONAL HEALTH AUTHORITY
TOBACCO SMOKING IN YOUTH
• According to the Manitoba Youth Health Survey completed during the 2012-13 school year, 9% of female and 10% male
grade 7-12 students in the Region reported being current smokers (daily or occasionally); 2% of students reported using
smokeless tobacco in the past month; 42% of students who are current smokers wanted to quit.1
EXPOSURE TO SECOND-HAND SMOKE AT HOME
• During 2007-12, one in 10 non-smokers aged 12 years and older in the Region were exposed to second-hand smoke at
home, a substantial decrease from 17% in 2003-05. (Figure A4.1.1.b1)
• There was greater than 4 times difference across all community areas, with the highest percentage (26%) in Point
Douglas community area and the lowest (6%) in Fort Garry community area. (Figure A4.1.1.b2)
• Youth aged between 12 and 19 years had the highest percentage of exposure to second-hand smoke at home.2
• The percentage of those exposed to second-hand smoke has steadily decreased in Canada since 2003.2
TOBACCO SMOKING DURING PREGNANCY
• As shown in section 3.7.1, 16.6% of pregnant women living in Winnipeg and 17.6% of those living in Churchill smoked
during pregnancy in 2011. (Figure A3.7.1.a2)
• Earlier analysis showed that the percentage of pregnant women who smoked varied across the Region: less than 10%
women smoked during pregnancy in Fort Garry (6.1%) and Assiniboine South (7.9%) community areas, but more than a
quarter of women smoked during pregnancy in Inkster (25.7%), Downtown (28.2%), and Point Douglas (39.7%)
community areas. Pregnant women with socio-economic disadvantages were more likely to smoke during pregnancy.3
(Figure A3.7.1.a2)
Figure 4.1.ATobacco Smoking (daily or occasionally) Across The Winnipeg Health Region (WHR), Manitoba, Health Region Peer Group A, and Canada
Male Female Total
19%
25%
20%
15%
10%
5%
0%
20%22%
20%22% 21%
24%23%
17%19% 20%
18%
WHR Manitoba Peer Group A Canada
Source: Canadian Community Health Survey, 2011/12
1 WRHA Youth Health Survey Report 2012. 2 Statistics Canada. Exposure to second-hand smoke at home, 2012. 3 Heaman M, Kingston D, Helewa ME, Brownell M, Derksen S, Bogdanovic B, McGowan KL, Bailly A. Perinatal Services and Outcomes in Manitoba. Winnipeg, MB. Manitoba Centre for Health Policy, November 2012.
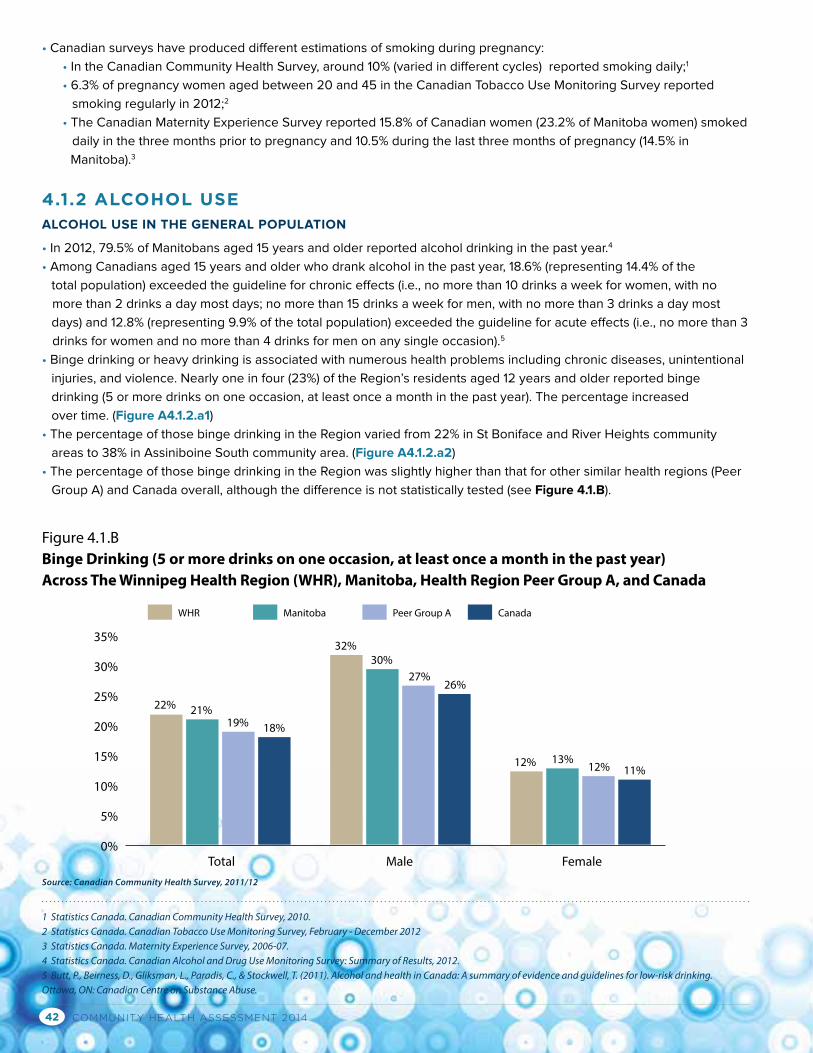
COMMUNITY HEALTH ASSESSMENT 201442
• Canadian surveys have produced different estimations of smoking during pregnancy:
• In the Canadian Community Health Survey, around 10% (varied in different cycles) reported smoking daily;1
• 6.3% of pregnancy women aged between 20 and 45 in the Canadian Tobacco Use Monitoring Survey reported
smoking regularly in 2012;2
• The Canadian Maternity Experience Survey reported 15.8% of Canadian women (23.2% of Manitoba women) smoked
daily in the three months prior to pregnancy and 10.5% during the last three months of pregnancy (14.5% in
Manitoba).3
4.1.2 ALCOHOL USEALCOHOL USE IN THE GENERAL POPULATION
• In 2012, 79.5% of Manitobans aged 15 years and older reported alcohol drinking in the past year.4
• Among Canadians aged 15 years and older who drank alcohol in the past year, 18.6% (representing 14.4% of the
total population) exceeded the guideline for chronic effects (i.e., no more than 10 drinks a week for women, with no
more than 2 drinks a day most days; no more than 15 drinks a week for men, with no more than 3 drinks a day most
days) and 12.8% (representing 9.9% of the total population) exceeded the guideline for acute effects (i.e., no more than 3
drinks for women and no more than 4 drinks for men on any single occasion).5
• Binge drinking or heavy drinking is associated with numerous health problems including chronic diseases, unintentional
injuries, and violence. Nearly one in four (23%) of the Region’s residents aged 12 years and older reported binge
drinking (5 or more drinks on one occasion, at least once a month in the past year). The percentage increased
over time. (Figure A4.1.2.a1)
• The percentage of those binge drinking in the Region varied from 22% in St Boniface and River Heights community
areas to 38% in Assiniboine South community area. (Figure A4.1.2.a2)
• The percentage of those binge drinking in the Region was slightly higher than that for other similar health regions (Peer
Group A) and Canada overall, although the difference is not statistically tested (see Figure 4.1.B).
Figure 4.1.BBinge Drinking (5 or more drinks on one occasion, at least once a month in the past year) Across The Winnipeg Health Region (WHR), Manitoba, Health Region Peer Group A, and Canada
Male Female Total
22%
35%
30%
25%
20%
15%
10%
5%
0%
21%19% 18%
32%30%
27%26%
12% 13%12% 11%
WHR Manitoba Peer Group A Canada
Source: Canadian Community Health Survey, 2011/12
1 Statistics Canada. Canadian Community Health Survey, 2010.2 Statistics Canada. Canadian Tobacco Use Monitoring Survey, February - December 20123 Statistics Canada. Maternity Experience Survey, 2006-07.4 Statistics Canada. Canadian Alcohol and Drug Use Monitoring Survey: Summary of Results, 2012.5 Butt, P., Beirness, D., Gliksman, L., Paradis, C., & Stockwell, T. (2011). Alcohol and health in Canada: A summary of evidence and guidelines for low-risk drinking. Ottawa, ON: Canadian Centre on Substance Abuse.
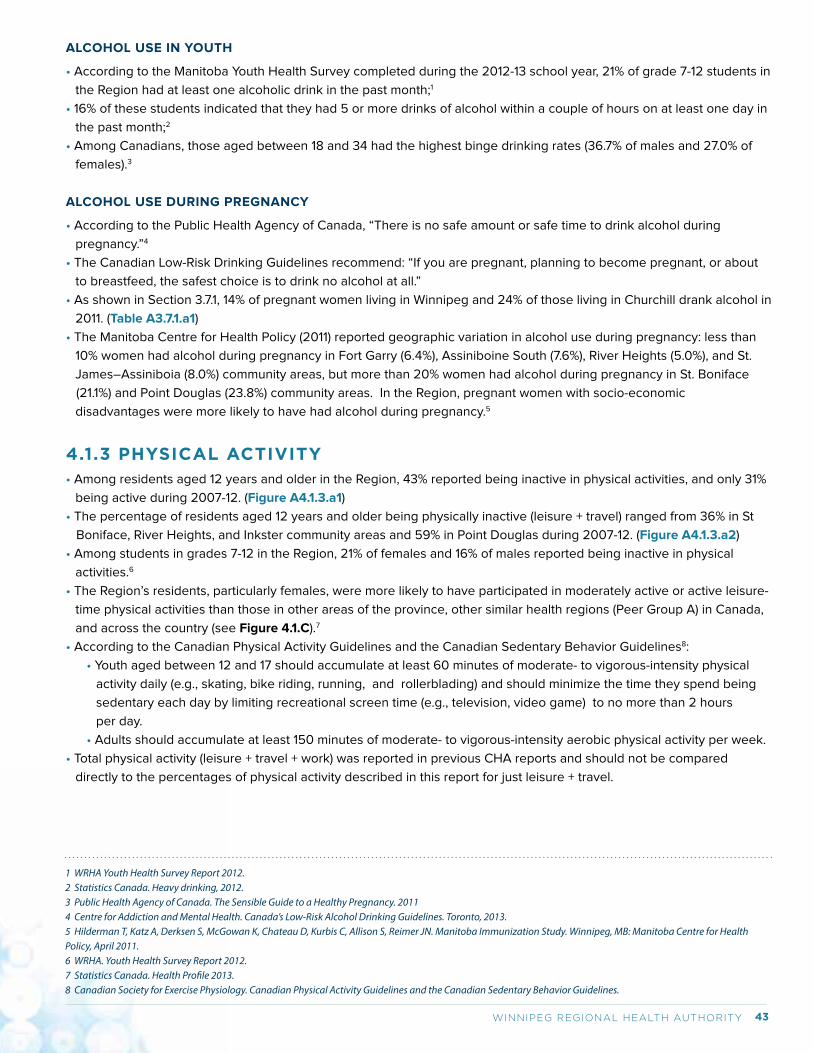
43WINNIPEG REGIONAL HEALTH AUTHORITY
ALCOHOL USE IN YOUTH
• According to the Manitoba Youth Health Survey completed during the 2012-13 school year, 21% of grade 7-12 students in
the Region had at least one alcoholic drink in the past month;1
• 16% of these students indicated that they had 5 or more drinks of alcohol within a couple of hours on at least one day in
the past month;2
• Among Canadians, those aged between 18 and 34 had the highest binge drinking rates (36.7% of males and 27.0% of
females).3
ALCOHOL USE DURING PREGNANCY
• According to the Public Health Agency of Canada, “There is no safe amount or safe time to drink alcohol during
pregnancy.”4
• The Canadian Low-Risk Drinking Guidelines recommend: “If you are pregnant, planning to become pregnant, or about
to breastfeed, the safest choice is to drink no alcohol at all.”
• As shown in Section 3.7.1, 14% of pregnant women living in Winnipeg and 24% of those living in Churchill drank alcohol in
2011. (Table A3.7.1.a1)
• The Manitoba Centre for Health Policy (2011) reported geographic variation in alcohol use during pregnancy: less than
10% women had alcohol during pregnancy in Fort Garry (6.4%), Assiniboine South (7.6%), River Heights (5.0%), and St.
James–Assiniboia (8.0%) community areas, but more than 20% women had alcohol during pregnancy in St. Boniface
(21.1%) and Point Douglas (23.8%) community areas. In the Region, pregnant women with socio-economic
disadvantages were more likely to have had alcohol during pregnancy.5
4.1.3 PHYSICAL ACTIVITY• Among residents aged 12 years and older in the Region, 43% reported being inactive in physical activities, and only 31%
being active during 2007-12. (Figure A4.1.3.a1)
• The percentage of residents aged 12 years and older being physically inactive (leisure + travel) ranged from 36% in St
Boniface, River Heights, and Inkster community areas and 59% in Point Douglas during 2007-12. (Figure A4.1.3.a2)
• Among students in grades 7-12 in the Region, 21% of females and 16% of males reported being inactive in physical
activities.6
• The Region’s residents, particularly females, were more likely to have participated in moderately active or active leisure-
time physical activities than those in other areas of the province, other similar health regions (Peer Group A) in Canada,
and across the country (see Figure 4.1.C).7
• According to the Canadian Physical Activity Guidelines and the Canadian Sedentary Behavior Guidelines8:
• Youth aged between 12 and 17 should accumulate at least 60 minutes of moderate- to vigorous-intensity physical
activity daily (e.g., skating, bike riding, running, and rollerblading) and should minimize the time they spend being
sedentary each day by limiting recreational screen time (e.g., television, video game) to no more than 2 hours
per day.
• Adults should accumulate at least 150 minutes of moderate- to vigorous-intensity aerobic physical activity per week.
• Total physical activity (leisure + travel + work) was reported in previous CHA reports and should not be compared
directly to the percentages of physical activity described in this report for just leisure + travel.
1 WRHA Youth Health Survey Report 2012.2 Statistics Canada. Heavy drinking, 2012.3 Public Health Agency of Canada. The Sensible Guide to a Healthy Pregnancy. 20114 Centre for Addiction and Mental Health. Canada’s Low-Risk Alcohol Drinking Guidelines. Toronto, 2013.5 Hilderman T, Katz A, Derksen S, McGowan K, Chateau D, Kurbis C, Allison S, Reimer JN. Manitoba Immunization Study. Winnipeg, MB: Manitoba Centre for Health Policy, April 2011.6 WRHA. Youth Health Survey Report 2012.7 Statistics Canada. Health Profile 2013. 8 Canadian Society for Exercise Physiology. Canadian Physical Activity Guidelines and the Canadian Sedentary Behavior Guidelines.
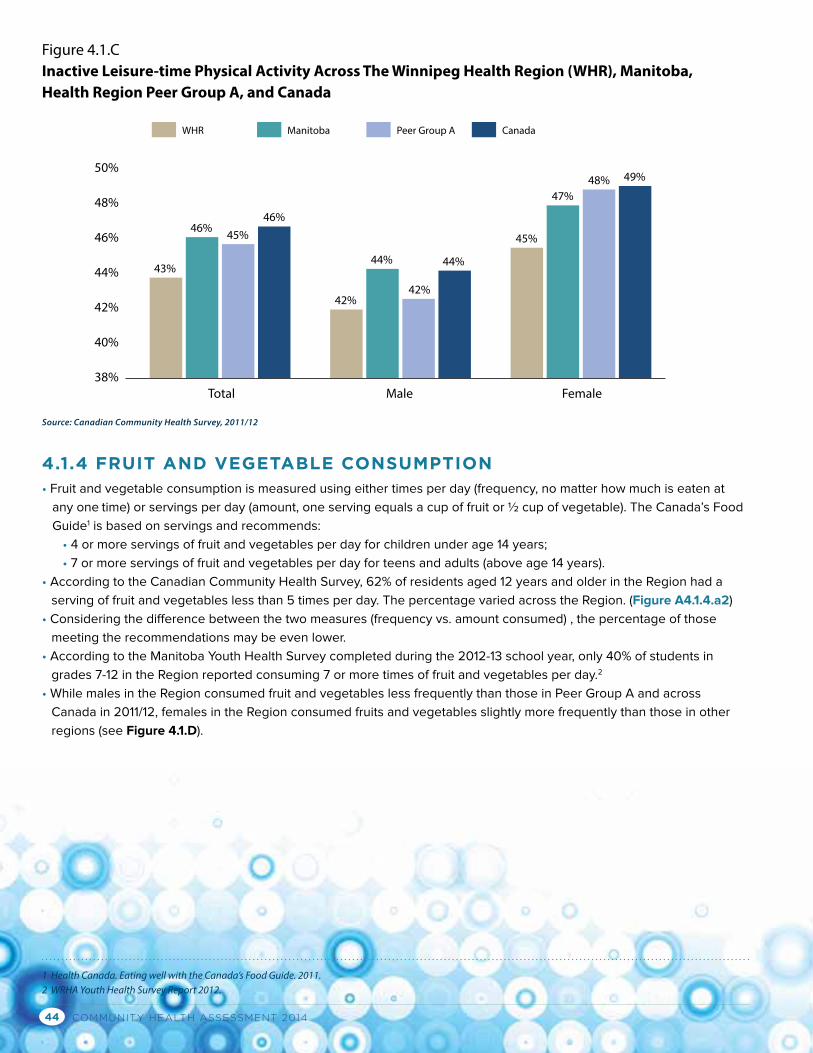
COMMUNITY HEALTH ASSESSMENT 201444
4.1.4 FRUIT AND VEGETABLE CONSUMPTION• Fruit and vegetable consumption is measured using either times per day (frequency, no matter how much is eaten at
any one time) or servings per day (amount, one serving equals a cup of fruit or ½ cup of vegetable). The Canada’s Food
Guide1 is based on servings and recommends:
• 4 or more servings of fruit and vegetables per day for children under age 14 years;
• 7 or more servings of fruit and vegetables per day for teens and adults (above age 14 years).
• According to the Canadian Community Health Survey, 62% of residents aged 12 years and older in the Region had a
serving of fruit and vegetables less than 5 times per day. The percentage varied across the Region. (Figure A4.1.4.a2)
• Considering the difference between the two measures (frequency vs. amount consumed) , the percentage of those
meeting the recommendations may be even lower.
• According to the Manitoba Youth Health Survey completed during the 2012-13 school year, only 40% of students in
grades 7-12 in the Region reported consuming 7 or more times of fruit and vegetables per day.2
• While males in the Region consumed fruit and vegetables less frequently than those in Peer Group A and across
Canada in 2011/12, females in the Region consumed fruits and vegetables slightly more frequently than those in other
regions (see Figure 4.1.D).
Figure 4.1.CInactive Leisure-time Physical Activity Across The Winnipeg Health Region (WHR), Manitoba, Health Region Peer Group A, and Canada
Male Female Total
50%
48%
46%
44%
42%
40%
38%
WHR Manitoba Peer Group A Canada
Source: Canadian Community Health Survey, 2011/12
43%
46% 45%46%
42%
44%
42%
44%
45%
47%48% 49%
1 Health Canada. Eating well with the Canada’s Food Guide. 2011.2 WRHA Youth Health Survey Report 2012.
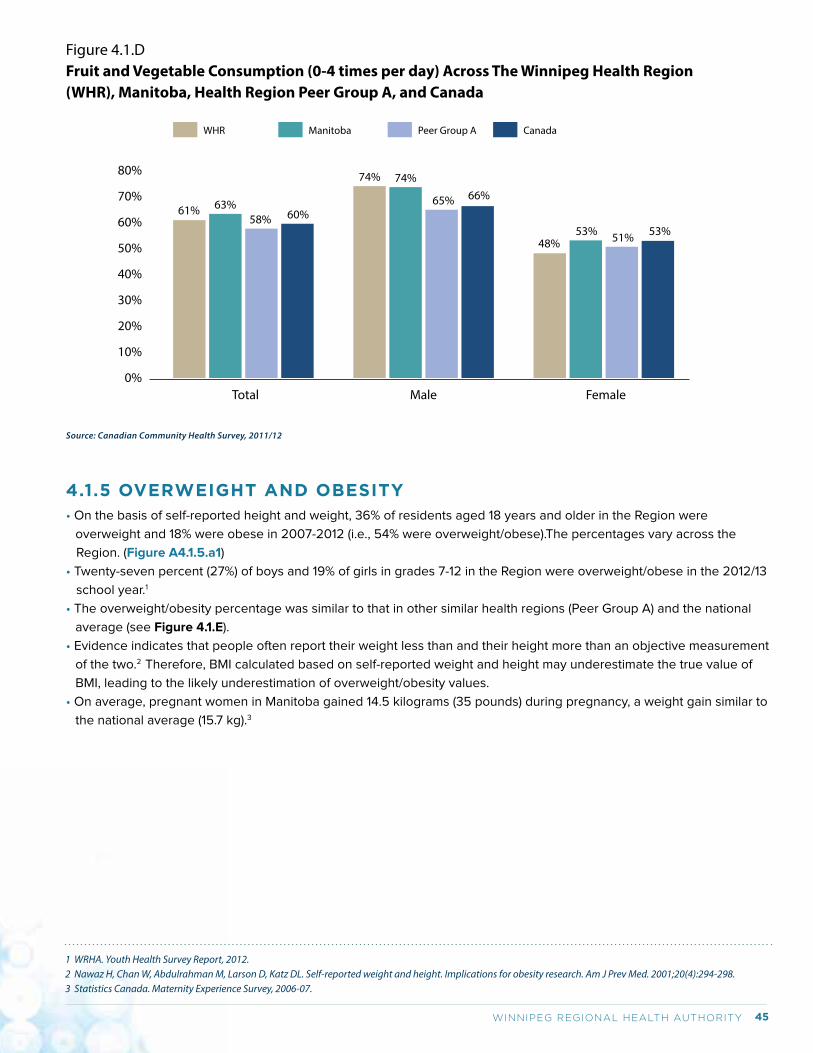
45WINNIPEG REGIONAL HEALTH AUTHORITY
Figure 4.1.DFruit and Vegetable Consumption (0-4 times per day) Across The Winnipeg Health Region (WHR), Manitoba, Health Region Peer Group A, and Canada
Male Female Total
61%
80%
70%
60%
50%
40%
30%
20%
10%
0%
63%58% 60%
74% 74%
65% 66%
48%53% 51% 53%
WHR Manitoba Peer Group A Canada
Source: Canadian Community Health Survey, 2011/12
4.1.5 OVERWEIGHT AND OBESITY• On the basis of self-reported height and weight, 36% of residents aged 18 years and older in the Region were
overweight and 18% were obese in 2007-2012 (i.e., 54% were overweight/obese).The percentages vary across the
Region. (Figure A4.1.5.a1)
• Twenty-seven percent (27%) of boys and 19% of girls in grades 7-12 in the Region were overweight/obese in the 2012/13
school year.1
• The overweight/obesity percentage was similar to that in other similar health regions (Peer Group A) and the national
average (see Figure 4.1.E).
• Evidence indicates that people often report their weight less than and their height more than an objective measurement
of the two.2 Therefore, BMI calculated based on self-reported weight and height may underestimate the true value of
BMI, leading to the likely underestimation of overweight/obesity values.
• On average, pregnant women in Manitoba gained 14.5 kilograms (35 pounds) during pregnancy, a weight gain similar to
the national average (15.7 kg).3
1 WRHA. Youth Health Survey Report, 2012.2 Nawaz H, Chan W, Abdulrahman M, Larson D, Katz DL. Self-reported weight and height. Implications for obesity research. Am J Prev Med. 2001;20(4):294-298. 3 Statistics Canada. Maternity Experience Survey, 2006-07.
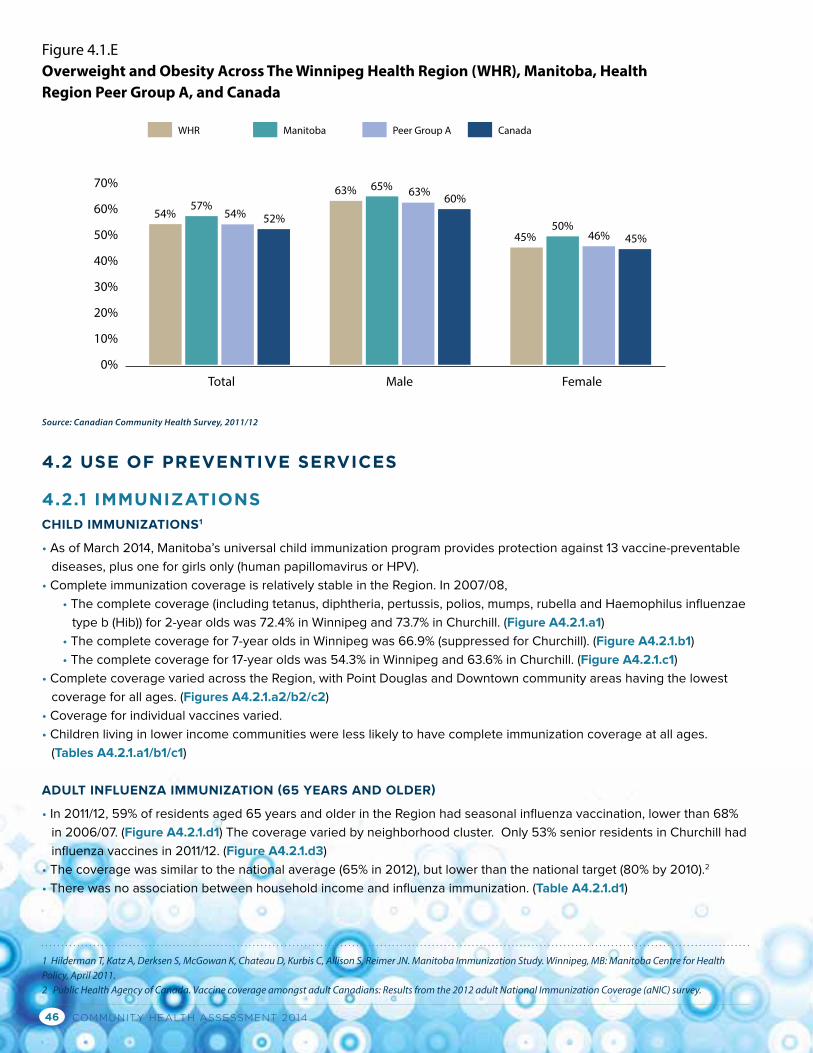
COMMUNITY HEALTH ASSESSMENT 201446
4.2 USE OF PREVENTIVE SERVICES
4.2.1 IMMUNIZATIONSCHILD IMMUNIZATIONS1
• As of March 2014, Manitoba’s universal child immunization program provides protection against 13 vaccine-preventable
diseases, plus one for girls only (human papillomavirus or HPV).
• Complete immunization coverage is relatively stable in the Region. In 2007/08,
• The complete coverage (including tetanus, diphtheria, pertussis, polios, mumps, rubella and Haemophilus influenzae
type b (Hib)) for 2-year olds was 72.4% in Winnipeg and 73.7% in Churchill. (Figure A4.2.1.a1)
• The complete coverage for 7-year olds in Winnipeg was 66.9% (suppressed for Churchill). (Figure A4.2.1.b1)
• The complete coverage for 17-year olds was 54.3% in Winnipeg and 63.6% in Churchill. (Figure A4.2.1.c1)
• Complete coverage varied across the Region, with Point Douglas and Downtown community areas having the lowest
coverage for all ages. (Figures A4.2.1.a2/b2/c2)
• Coverage for individual vaccines varied.
• Children living in lower income communities were less likely to have complete immunization coverage at all ages.
(Tables A4.2.1.a1/b1/c1)
ADULT INFLUENZA IMMUNIZATION (65 YEARS AND OLDER)
• In 2011/12, 59% of residents aged 65 years and older in the Region had seasonal influenza vaccination, lower than 68%
in 2006/07. (Figure A4.2.1.d1) The coverage varied by neighborhood cluster. Only 53% senior residents in Churchill had
influenza vaccines in 2011/12. (Figure A4.2.1.d3)
• The coverage was similar to the national average (65% in 2012), but lower than the national target (80% by 2010).2
• There was no association between household income and influenza immunization. (Table A4.2.1.d1)
Figure 4.1.EOverweight and Obesity Across The Winnipeg Health Region (WHR), Manitoba, Health Region Peer Group A, and Canada
Male Female Total
54%
70%
60%
50%
40%
30%
20%
10%
0%
57%54% 52%
63% 65% 63% 60%
45%50%
46% 45%
WHR Manitoba Peer Group A Canada
Source: Canadian Community Health Survey, 2011/12
1 Hilderman T, Katz A, Derksen S, McGowan K, Chateau D, Kurbis C, Allison S, Reimer JN. Manitoba Immunization Study. Winnipeg, MB: Manitoba Centre for Health Policy, April 2011.2 Public Health Agency of Canada. Vaccine coverage amongst adult Canadians: Results from the 2012 adult National Immunization Coverage (aNIC) survey.
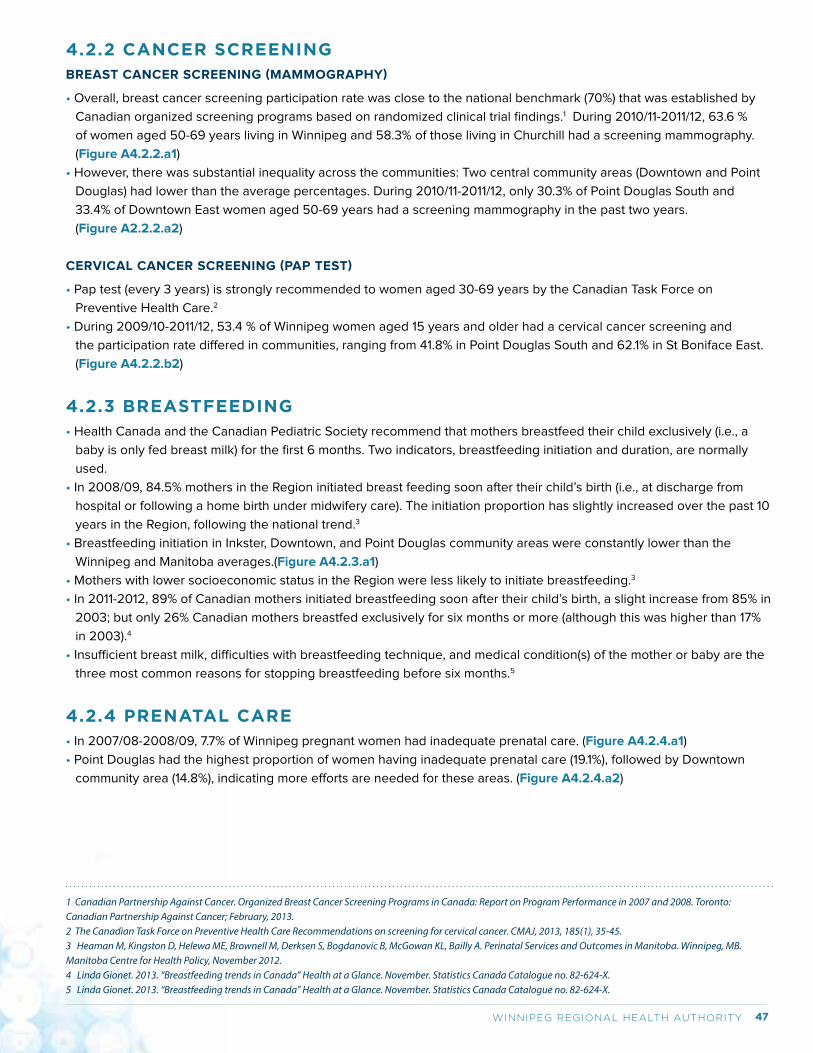
47WINNIPEG REGIONAL HEALTH AUTHORITY
4.2.2 CANCER SCREENING BREAST CANCER SCREENING (MAMMOGRAPHY)
• Overall, breast cancer screening participation rate was close to the national benchmark (70%) that was established by
Canadian organized screening programs based on randomized clinical trial findings.1 During 2010/11-2011/12, 63.6 %
of women aged 50-69 years living in Winnipeg and 58.3% of those living in Churchill had a screening mammography.
(Figure A4.2.2.a1)
• However, there was substantial inequality across the communities: Two central community areas (Downtown and Point
Douglas) had lower than the average percentages. During 2010/11-2011/12, only 30.3% of Point Douglas South and
33.4% of Downtown East women aged 50-69 years had a screening mammography in the past two years.
(Figure A2.2.2.a2)
CERVICAL CANCER SCREENING (PAP TEST)
• Pap test (every 3 years) is strongly recommended to women aged 30-69 years by the Canadian Task Force on
Preventive Health Care.2
• During 2009/10-2011/12, 53.4 % of Winnipeg women aged 15 years and older had a cervical cancer screening and
the participation rate differed in communities, ranging from 41.8% in Point Douglas South and 62.1% in St Boniface East.
(Figure A4.2.2.b2)
4.2.3 BREASTFEEDING• Health Canada and the Canadian Pediatric Society recommend that mothers breastfeed their child exclusively (i.e., a
baby is only fed breast milk) for the first 6 months. Two indicators, breastfeeding initiation and duration, are normally
used.
• In 2008/09, 84.5% mothers in the Region initiated breast feeding soon after their child’s birth (i.e., at discharge from
hospital or following a home birth under midwifery care). The initiation proportion has slightly increased over the past 10
years in the Region, following the national trend.3
• Breastfeeding initiation in Inkster, Downtown, and Point Douglas community areas were constantly lower than the
Winnipeg and Manitoba averages.(Figure A4.2.3.a1)
• Mothers with lower socioeconomic status in the Region were less likely to initiate breastfeeding.3
• In 2011-2012, 89% of Canadian mothers initiated breastfeeding soon after their child’s birth, a slight increase from 85% in
2003; but only 26% Canadian mothers breastfed exclusively for six months or more (although this was higher than 17%
in 2003).4
• Insufficient breast milk, difficulties with breastfeeding technique, and medical condition(s) of the mother or baby are the
three most common reasons for stopping breastfeeding before six months.5
4.2.4 PRENATAL CARE• In 2007/08-2008/09, 7.7% of Winnipeg pregnant women had inadequate prenatal care. (Figure A4.2.4.a1)
• Point Douglas had the highest proportion of women having inadequate prenatal care (19.1%), followed by Downtown
community area (14.8%), indicating more efforts are needed for these areas. (Figure A4.2.4.a2)
1 Canadian Partnership Against Cancer. Organized Breast Cancer Screening Programs in Canada: Report on Program Performance in 2007 and 2008. Toronto: Canadian Partnership Against Cancer; February, 2013.2 The Canadian Task Force on Preventive Health Care Recommendations on screening for cervical cancer. CMAJ, 2013, 185(1), 35-45.3 Heaman M, Kingston D, Helewa ME, Brownell M, Derksen S, Bogdanovic B, McGowan KL, Bailly A. Perinatal Services and Outcomes in Manitoba. Winnipeg, MB. Manitoba Centre for Health Policy, November 2012.4 Linda Gionet. 2013. “Breastfeeding trends in Canada” Health at a Glance. November. Statistics Canada Catalogue no. 82-624-X.5 Linda Gionet. 2013. “Breastfeeding trends in Canada” Health at a Glance. November. Statistics Canada Catalogue no. 82-624-X.
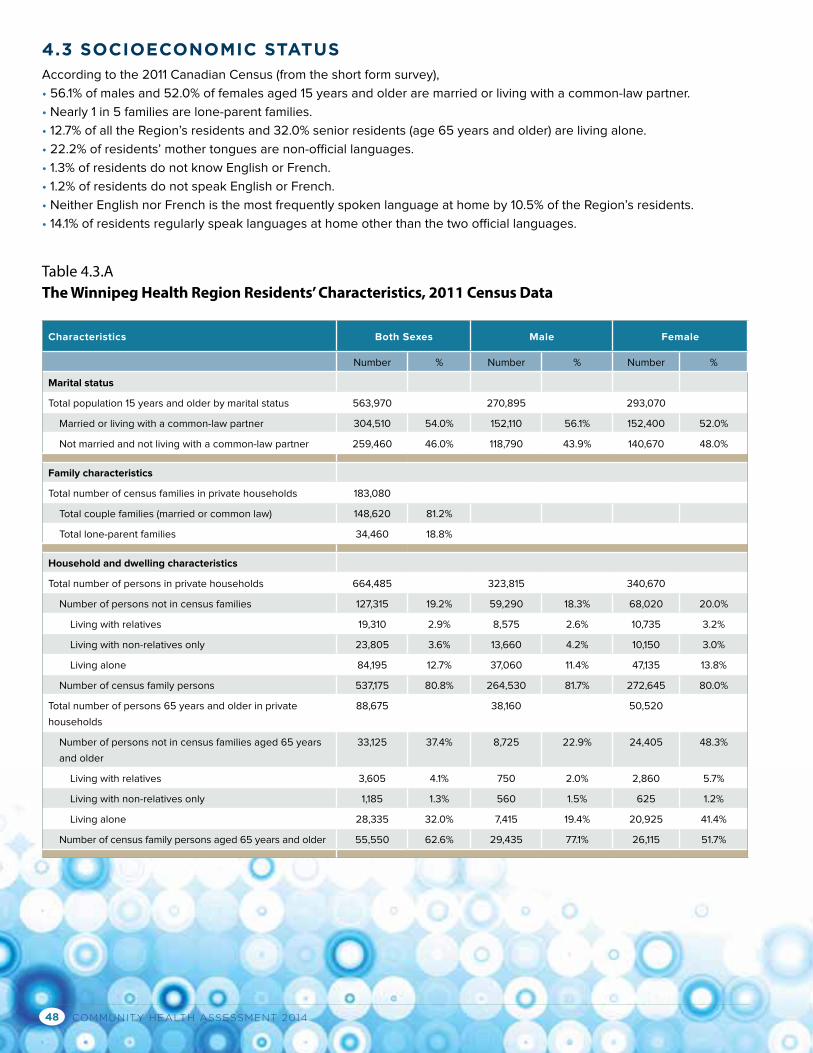
COMMUNITY HEALTH ASSESSMENT 201448
4.3 SOCIOECONOMIC STATUSAccording to the 2011 Canadian Census (from the short form survey),
• 56.1% of males and 52.0% of females aged 15 years and older are married or living with a common-law partner.
• Nearly 1 in 5 families are lone-parent families.
• 12.7% of all the Region’s residents and 32.0% senior residents (age 65 years and older) are living alone.
• 22.2% of residents’ mother tongues are non-official languages.
• 1.3% of residents do not know English or French.
• 1.2% of residents do not speak English or French.
• Neither English nor French is the most frequently spoken language at home by 10.5% of the Region’s residents.
• 14.1% of residents regularly speak languages at home other than the two official languages.
Characteristics Both Sexes Male Female
Number % Number % Number %
Marital status
Total population 15 years and older by marital status 563,970 270,895 293,070
Married or living with a common-law partner 304,510 54.0% 152,110 56.1% 152,400 52.0%
Not married and not living with a common-law partner 259,460 46.0% 118,790 43.9% 140,670 48.0%
Family characteristics
Total number of census families in private households 183,080
Total couple families (married or common law) 148,620 81.2%
Total lone-parent families 34,460 18.8%
Household and dwelling characteristics
Total number of persons in private households 664,485 323,815 340,670
Number of persons not in census families 127,315 19.2% 59,290 18.3% 68,020 20.0%
Living with relatives 19,310 2.9% 8,575 2.6% 10,735 3.2%
Living with non-relatives only 23,805 3.6% 13,660 4.2% 10,150 3.0%
Living alone 84,195 12.7% 37,060 11.4% 47,135 13.8%
Number of census family persons 537,175 80.8% 264,530 81.7% 272,645 80.0%
Total number of persons 65 years and older in private
households
88,675 38,160 50,520
Number of persons not in census families aged 65 years
and older
33,125 37.4% 8,725 22.9% 24,405 48.3%
Living with relatives 3,605 4.1% 750 2.0% 2,860 5.7%
Living with non-relatives only 1,185 1.3% 560 1.5% 625 1.2%
Living alone 28,335 32.0% 7,415 19.4% 20,925 41.4%
Number of census family persons aged 65 years and older 55,550 62.6% 29,435 77.1% 26,115 51.7%
Table 4.3.AThe Winnipeg Health Region Residents’ Characteristics, 2011 Census Data
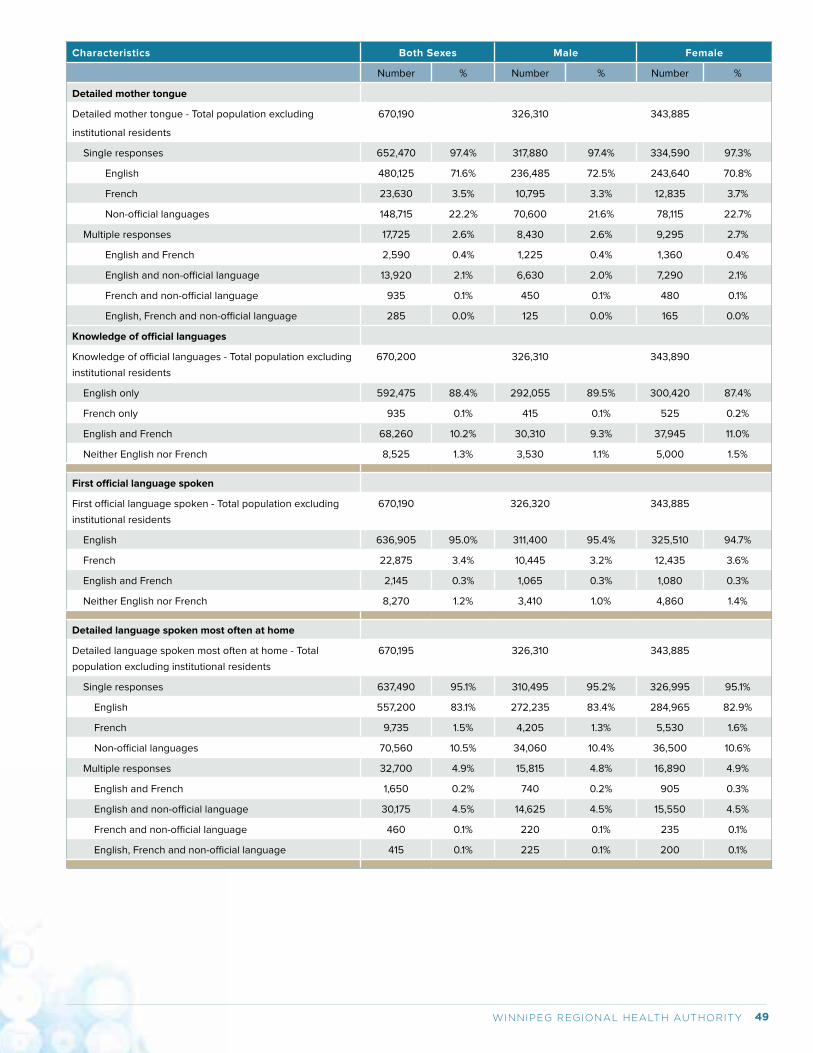
49WINNIPEG REGIONAL HEALTH AUTHORITY
Characteristics Both Sexes Male Female
Number % Number % Number %
Detailed mother tongue
Detailed mother tongue - Total population excluding
institutional residents
670,190 326,310 343,885
Single responses 652,470 97.4% 317,880 97.4% 334,590 97.3%
English 480,125 71.6% 236,485 72.5% 243,640 70.8%
French 23,630 3.5% 10,795 3.3% 12,835 3.7%
Non-official languages 148,715 22.2% 70,600 21.6% 78,115 22.7%
Multiple responses 17,725 2.6% 8,430 2.6% 9,295 2.7%
English and French 2,590 0.4% 1,225 0.4% 1,360 0.4%
English and non-official language 13,920 2.1% 6,630 2.0% 7,290 2.1%
French and non-official language 935 0.1% 450 0.1% 480 0.1%
English, French and non-official language 285 0.0% 125 0.0% 165 0.0%
Knowledge of official languages
Knowledge of official languages - Total population excluding
institutional residents
670,200 326,310 343,890
English only 592,475 88.4% 292,055 89.5% 300,420 87.4%
French only 935 0.1% 415 0.1% 525 0.2%
English and French 68,260 10.2% 30,310 9.3% 37,945 11.0%
Neither English nor French 8,525 1.3% 3,530 1.1% 5,000 1.5%
First official language spoken
First official language spoken - Total population excluding
institutional residents
670,190 326,320 343,885
English 636,905 95.0% 311,400 95.4% 325,510 94.7%
French 22,875 3.4% 10,445 3.2% 12,435 3.6%
English and French 2,145 0.3% 1,065 0.3% 1,080 0.3%
Neither English nor French 8,270 1.2% 3,410 1.0% 4,860 1.4%
Detailed language spoken most often at home
Detailed language spoken most often at home - Total
population excluding institutional residents
670,195 326,310 343,885
Single responses 637,490 95.1% 310,495 95.2% 326,995 95.1%
English 557,200 83.1% 272,235 83.4% 284,965 82.9%
French 9,735 1.5% 4,205 1.3% 5,530 1.6%
Non-official languages 70,560 10.5% 34,060 10.4% 36,500 10.6%
Multiple responses 32,700 4.9% 15,815 4.8% 16,890 4.9%
English and French 1,650 0.2% 740 0.2% 905 0.3%
English and non-official language 30,175 4.5% 14,625 4.5% 15,550 4.5%
French and non-official language 460 0.1% 220 0.1% 235 0.1%
English, French and non-official language 415 0.1% 225 0.1% 200 0.1%
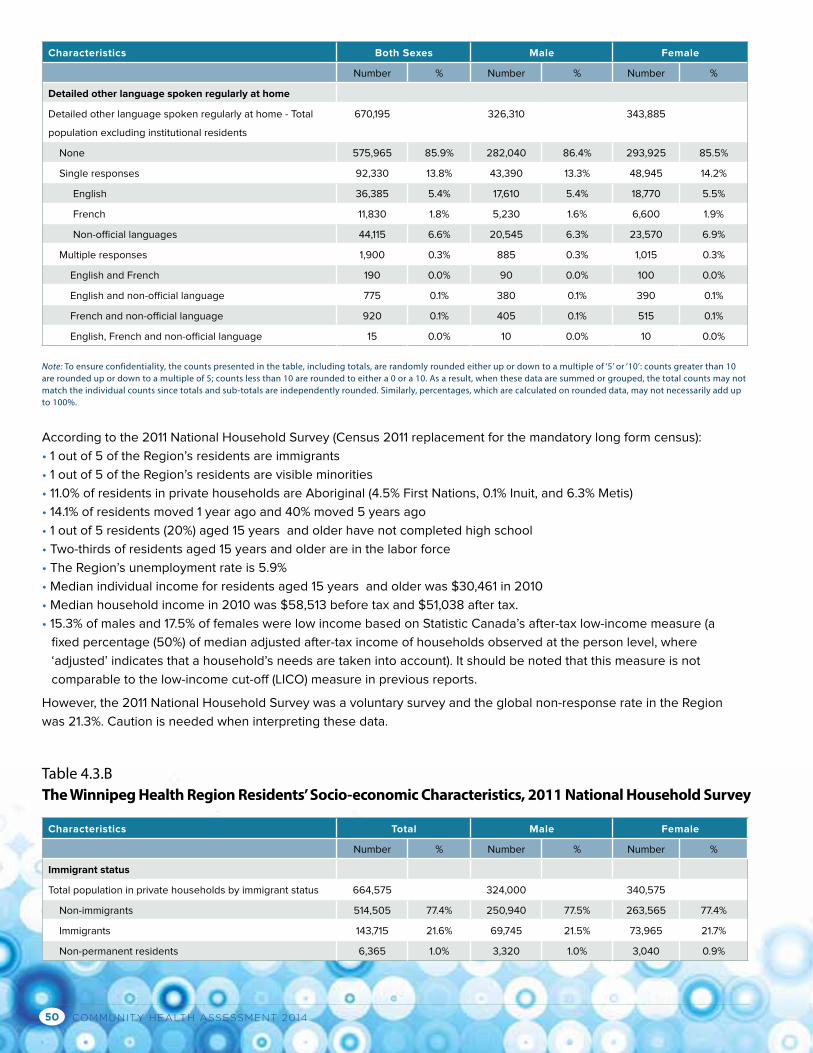
COMMUNITY HEALTH ASSESSMENT 201450
Characteristics Both Sexes Male Female
Number % Number % Number %
Detailed other language spoken regularly at home
Detailed other language spoken regularly at home - Total
population excluding institutional residents
670,195 326,310 343,885
None 575,965 85.9% 282,040 86.4% 293,925 85.5%
Single responses 92,330 13.8% 43,390 13.3% 48,945 14.2%
English 36,385 5.4% 17,610 5.4% 18,770 5.5%
French 11,830 1.8% 5,230 1.6% 6,600 1.9%
Non-official languages 44,115 6.6% 20,545 6.3% 23,570 6.9%
Multiple responses 1,900 0.3% 885 0.3% 1,015 0.3%
English and French 190 0.0% 90 0.0% 100 0.0%
English and non-official language 775 0.1% 380 0.1% 390 0.1%
French and non-official language 920 0.1% 405 0.1% 515 0.1%
English, French and non-official language 15 0.0% 10 0.0% 10 0.0%
Characteristics Total Male Female
Number % Number % Number %
Immigrant status
Total population in private households by immigrant status 664,575 324,000 340,575
Non-immigrants 514,505 77.4% 250,940 77.5% 263,565 77.4%
Immigrants 143,715 21.6% 69,745 21.5% 73,965 21.7%
Non-permanent residents 6,365 1.0% 3,320 1.0% 3,040 0.9%
According to the 2011 National Household Survey (Census 2011 replacement for the mandatory long form census):
• 1 out of 5 of the Region’s residents are immigrants
• 1 out of 5 of the Region’s residents are visible minorities
• 11.0% of residents in private households are Aboriginal (4.5% First Nations, 0.1% Inuit, and 6.3% Metis)
• 14.1% of residents moved 1 year ago and 40% moved 5 years ago
• 1 out of 5 residents (20%) aged 15 years and older have not completed high school
• Two-thirds of residents aged 15 years and older are in the labor force
• The Region’s unemployment rate is 5.9%
• Median individual income for residents aged 15 years and older was $30,461 in 2010
• Median household income in 2010 was $58,513 before tax and $51,038 after tax.
• 15.3% of males and 17.5% of females were low income based on Statistic Canada’s after-tax low-income measure (a
fixed percentage (50%) of median adjusted after-tax income of households observed at the person level, where
‘adjusted’ indicates that a household’s needs are taken into account). It should be noted that this measure is not
comparable to the low-income cut-off (LICO) measure in previous reports.
However, the 2011 National Household Survey was a voluntary survey and the global non-response rate in the Region
was 21.3%. Caution is needed when interpreting these data.
Note: To ensure confidentiality, the counts presented in the table, including totals, are randomly rounded either up or down to a multiple of ‘5’ or ‘10’: counts greater than 10 are rounded up or down to a multiple of 5; counts less than 10 are rounded to either a 0 or a 10. As a result, when these data are summed or grouped, the total counts may not match the individual counts since totals and sub-totals are independently rounded. Similarly, percentages, which are calculated on rounded data, may not necessarily add up to 100%.
Table 4.3.BThe Winnipeg Health Region Residents’ Socio-economic Characteristics, 2011 National Household Survey
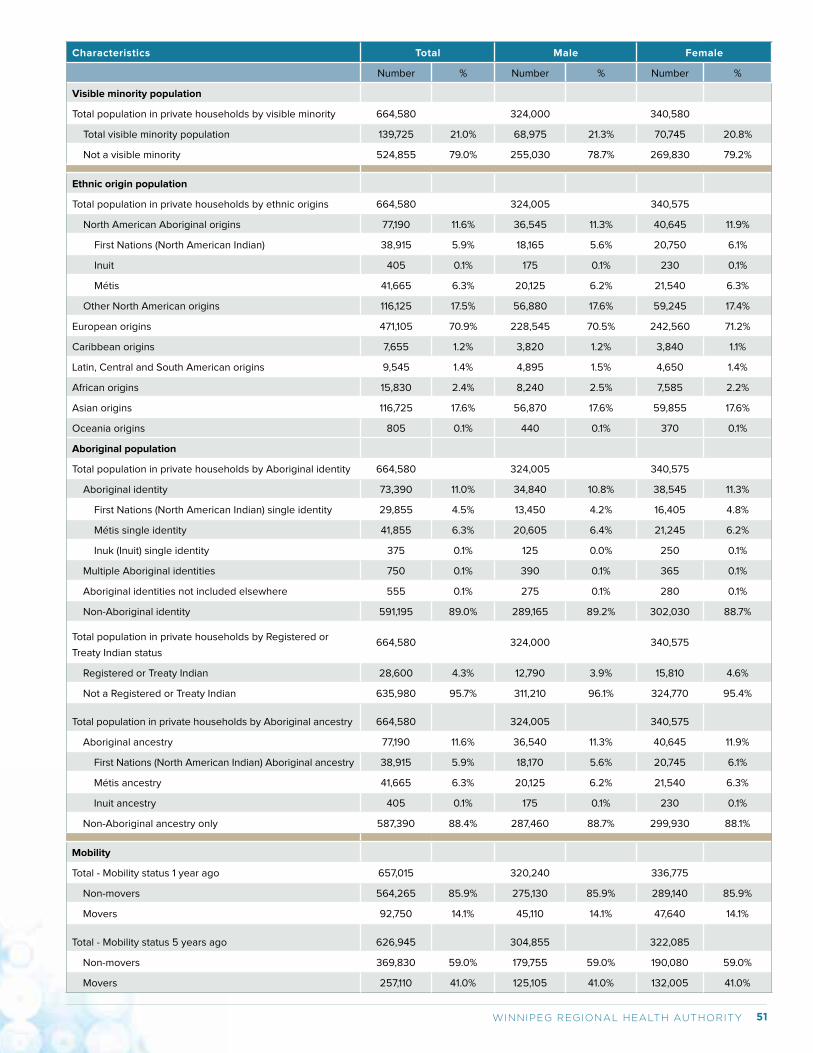
51WINNIPEG REGIONAL HEALTH AUTHORITY
Characteristics Total Male Female
Number % Number % Number %
Visible minority population
Total population in private households by visible minority 664,580 324,000 340,580
Total visible minority population 139,725 21.0% 68,975 21.3% 70,745 20.8%
Not a visible minority 524,855 79.0% 255,030 78.7% 269,830 79.2%
Ethnic origin population
Total population in private households by ethnic origins 664,580 324,005 340,575
North American Aboriginal origins 77,190 11.6% 36,545 11.3% 40,645 11.9%
First Nations (North American Indian) 38,915 5.9% 18,165 5.6% 20,750 6.1%
Inuit 405 0.1% 175 0.1% 230 0.1%
Métis 41,665 6.3% 20,125 6.2% 21,540 6.3%
Other North American origins 116,125 17.5% 56,880 17.6% 59,245 17.4%
European origins 471,105 70.9% 228,545 70.5% 242,560 71.2%
Caribbean origins 7,655 1.2% 3,820 1.2% 3,840 1.1%
Latin, Central and South American origins 9,545 1.4% 4,895 1.5% 4,650 1.4%
African origins 15,830 2.4% 8,240 2.5% 7,585 2.2%
Asian origins 116,725 17.6% 56,870 17.6% 59,855 17.6%
Oceania origins 805 0.1% 440 0.1% 370 0.1%
Aboriginal population
Total population in private households by Aboriginal identity 664,580 324,005 340,575
Aboriginal identity 73,390 11.0% 34,840 10.8% 38,545 11.3%
First Nations (North American Indian) single identity 29,855 4.5% 13,450 4.2% 16,405 4.8%
Métis single identity 41,855 6.3% 20,605 6.4% 21,245 6.2%
Inuk (Inuit) single identity 375 0.1% 125 0.0% 250 0.1%
Multiple Aboriginal identities 750 0.1% 390 0.1% 365 0.1%
Aboriginal identities not included elsewhere 555 0.1% 275 0.1% 280 0.1%
Non-Aboriginal identity 591,195 89.0% 289,165 89.2% 302,030 88.7%
Total population in private households by Registered or
Treaty Indian status664,580 324,000 340,575
Registered or Treaty Indian 28,600 4.3% 12,790 3.9% 15,810 4.6%
Not a Registered or Treaty Indian 635,980 95.7% 311,210 96.1% 324,770 95.4%
Total population in private households by Aboriginal ancestry 664,580 324,005 340,575
Aboriginal ancestry 77,190 11.6% 36,540 11.3% 40,645 11.9%
First Nations (North American Indian) Aboriginal ancestry 38,915 5.9% 18,170 5.6% 20,745 6.1%
Métis ancestry 41,665 6.3% 20,125 6.2% 21,540 6.3%
Inuit ancestry 405 0.1% 175 0.1% 230 0.1%
Non-Aboriginal ancestry only 587,390 88.4% 287,460 88.7% 299,930 88.1%
Mobility
Total - Mobility status 1 year ago 657,015 320,240 336,775
Non-movers 564,265 85.9% 275,130 85.9% 289,140 85.9%
Movers 92,750 14.1% 45,110 14.1% 47,640 14.1%
Total - Mobility status 5 years ago 626,945 304,855 322,085
Non-movers 369,830 59.0% 179,755 59.0% 190,080 59.0%
Movers 257,110 41.0% 125,105 41.0% 132,005 41.0%
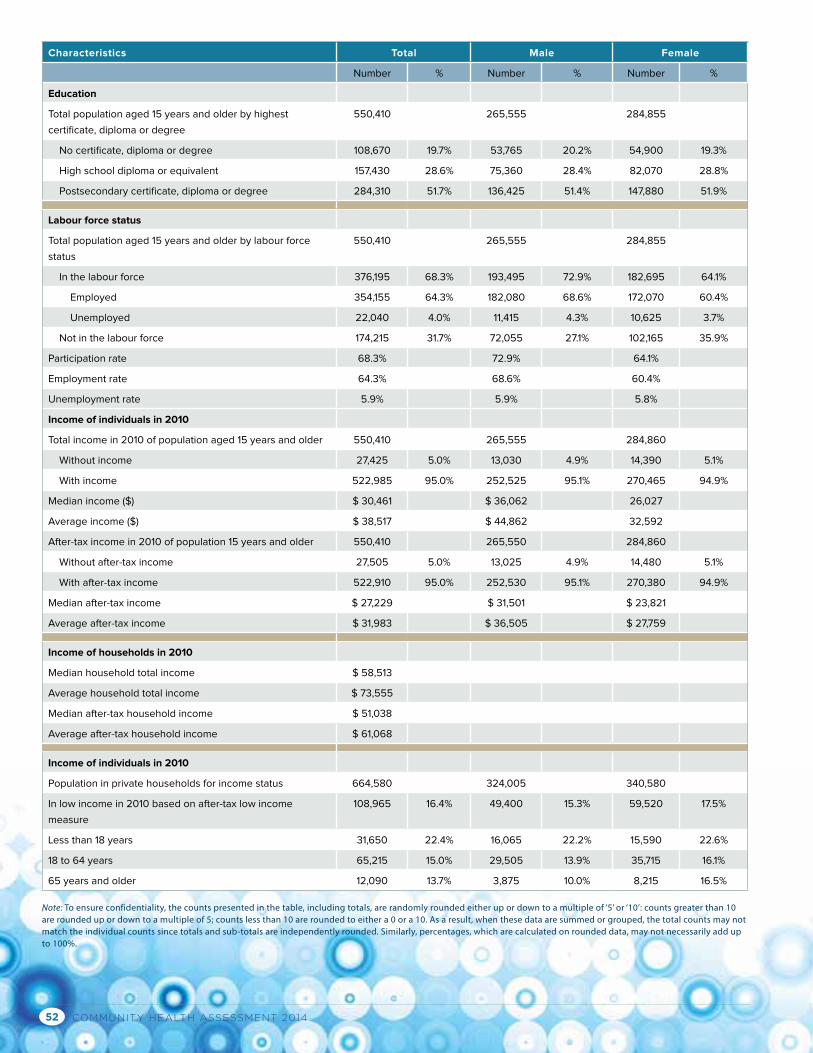
COMMUNITY HEALTH ASSESSMENT 201452
Characteristics Total Male Female
Number % Number % Number %
Education
Total population aged 15 years and older by highest
certificate, diploma or degree
550,410 265,555 284,855
No certificate, diploma or degree 108,670 19.7% 53,765 20.2% 54,900 19.3%
High school diploma or equivalent 157,430 28.6% 75,360 28.4% 82,070 28.8%
Postsecondary certificate, diploma or degree 284,310 51.7% 136,425 51.4% 147,880 51.9%
Labour force status
Total population aged 15 years and older by labour force
status
550,410 265,555 284,855
In the labour force 376,195 68.3% 193,495 72.9% 182,695 64.1%
Employed 354,155 64.3% 182,080 68.6% 172,070 60.4%
Unemployed 22,040 4.0% 11,415 4.3% 10,625 3.7%
Not in the labour force 174,215 31.7% 72,055 27.1% 102,165 35.9%
Participation rate 68.3% 72.9% 64.1%
Employment rate 64.3% 68.6% 60.4%
Unemployment rate 5.9% 5.9% 5.8%
Income of individuals in 2010
Total income in 2010 of population aged 15 years and older 550,410 265,555 284,860
Without income 27,425 5.0% 13,030 4.9% 14,390 5.1%
With income 522,985 95.0% 252,525 95.1% 270,465 94.9%
Median income ($) $ 30,461 $ 36,062 26,027
Average income ($) $ 38,517 $ 44,862 32,592
After-tax income in 2010 of population 15 years and older 550,410 265,550 284,860
Without after-tax income 27,505 5.0% 13,025 4.9% 14,480 5.1%
With after-tax income 522,910 95.0% 252,530 95.1% 270,380 94.9%
Median after-tax income $ 27,229 $ 31,501 $ 23,821
Average after-tax income $ 31,983 $ 36,505 $ 27,759
Income of households in 2010
Median household total income $ 58,513
Average household total income $ 73,555
Median after-tax household income $ 51,038
Average after-tax household income $ 61,068
Income of individuals in 2010
Population in private households for income status 664,580 324,005 340,580
In low income in 2010 based on after-tax low income
measure
108,965 16.4% 49,400 15.3% 59,520 17.5%
Less than 18 years 31,650 22.4% 16,065 22.2% 15,590 22.6%
18 to 64 years 65,215 15.0% 29,505 13.9% 35,715 16.1%
65 years and older 12,090 13.7% 3,875 10.0% 8,215 16.5%
Note: To ensure confidentiality, the counts presented in the table, including totals, are randomly rounded either up or down to a multiple of ‘5’ or ‘10’: counts greater than 10 are rounded up or down to a multiple of 5; counts less than 10 are rounded to either a 0 or a 10. As a result, when these data are summed or grouped, the total counts may not match the individual counts since totals and sub-totals are independently rounded. Similarly, percentages, which are calculated on rounded data, may not necessarily add up to 100%.
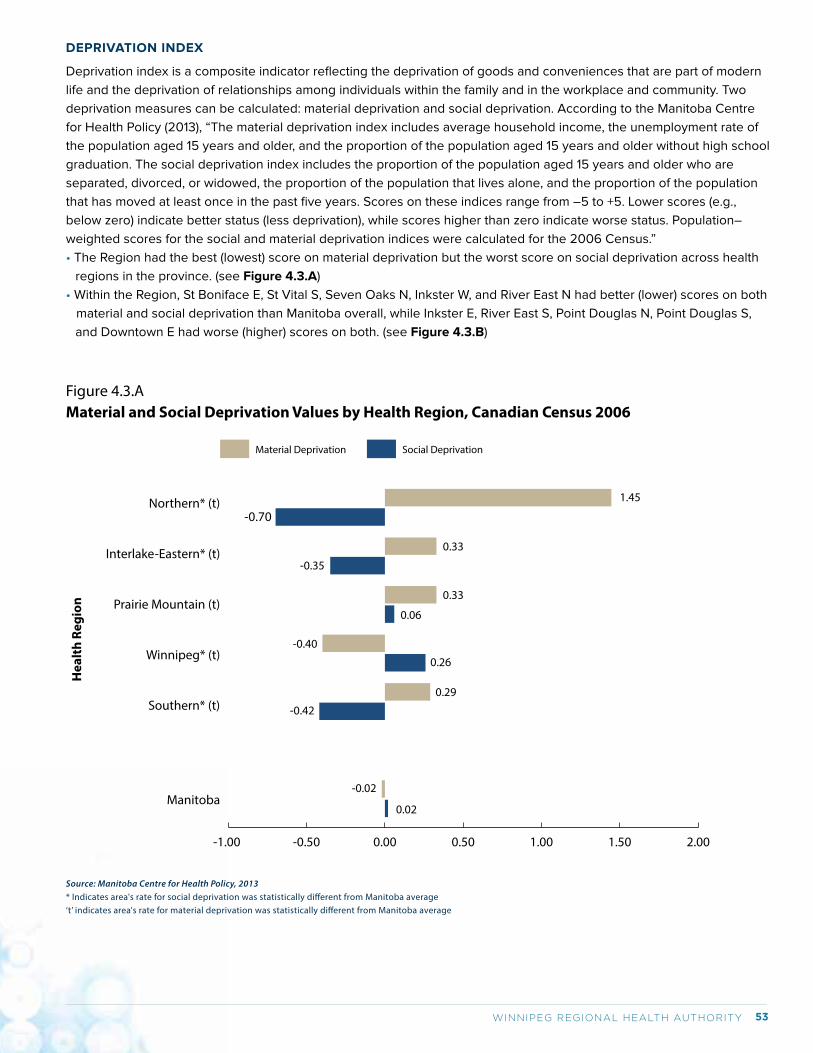
53WINNIPEG REGIONAL HEALTH AUTHORITY
DEPRIVATION INDEX
Deprivation index is a composite indicator reflecting the deprivation of goods and conveniences that are part of modern
life and the deprivation of relationships among individuals within the family and in the workplace and community. Two
deprivation measures can be calculated: material deprivation and social deprivation. According to the Manitoba Centre
for Health Policy (2013), “The material deprivation index includes average household income, the unemployment rate of
the population aged 15 years and older, and the proportion of the population aged 15 years and older without high school
graduation. The social deprivation index includes the proportion of the population aged 15 years and older who are
separated, divorced, or widowed, the proportion of the population that lives alone, and the proportion of the population
that has moved at least once in the past five years. Scores on these indices range from –5 to +5. Lower scores (e.g.,
below zero) indicate better status (less deprivation), while scores higher than zero indicate worse status. Population–
weighted scores for the social and material deprivation indices were calculated for the 2006 Census.”
• The Region had the best (lowest) score on material deprivation but the worst score on social deprivation across health
regions in the province. (see Figure 4.3.A)
• Within the Region, St Boniface E, St Vital S, Seven Oaks N, Inkster W, and River East N had better (lower) scores on both
material and social deprivation than Manitoba overall, while Inkster E, River East S, Point Douglas N, Point Douglas S,
and Downtown E had worse (higher) scores on both. (see Figure 4.3.B)
Hea
lth
Regi
on
Source: Manitoba Centre for Health Policy, 2013* Indicates area's rate for social deprivation was statistically di�erent from Manitoba average‘t’ indicates area's rate for material deprivation was statistically di�erent from Manitoba average
Figure 4.3.AMaterial and Social Deprivation Values by Health Region, Canadian Census 2006
-1.00 -0.50 0.00 0.50 1.00 1.50 2.00
Northern* (t)
Interlake-Eastern* (t)
Prairie Mountain (t)
Winnipeg* (t)
Southern* (t)
Manitoba
-0.70
-0.35
-0.40
0.29
0.26
0.06
0.33
0.33
1.45
-0.42
0.02
-0.02
Social DeprivationMaterial Deprivation
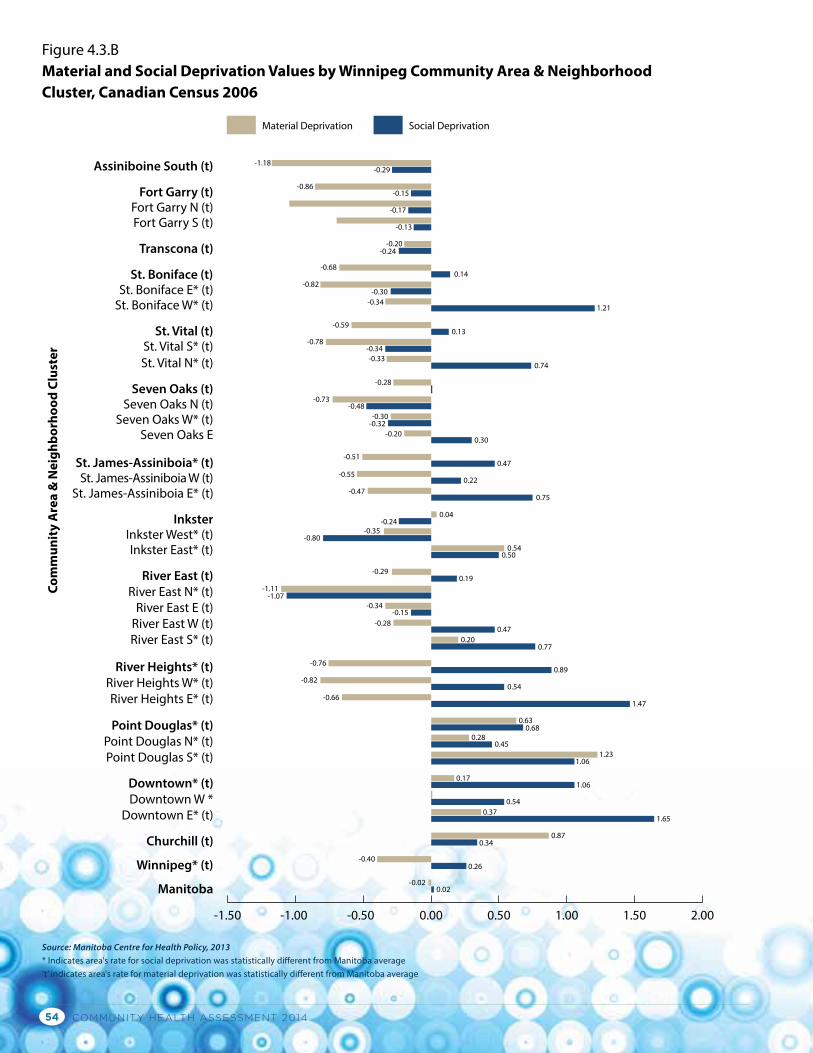
COMMUNITY HEALTH ASSESSMENT 201454
Com
mun
ity
Are
a &
Nei
ghbo
rhoo
d Cl
uste
r
Source: Manitoba Centre for Health Policy, 2013 * Indicates area's rate for social deprivation was statistically di�erent from Manitoba average‘t’ indicates area's rate for material deprivation was statistically di�erent from Manitoba average
Figure 4.3.BMaterial and Social Deprivation Values by Winnipeg Community Area & Neighborhood Cluster, Canadian Census 2006
Social DeprivationMaterial Deprivation
-1.50 -1.00 -0.50 0.00 0.50 1.00 1.50 2.00
-1.18
-0.86
-0.29Assiniboine South (t)
Fort Garry (t)Fort Garry N (t)Fort Garry S (t)
Transcona (t)
St. Boniface (t)St. Boniface E* (t)
St. Boniface W* (t)
St. Vital (t)St. Vital S* (t)St. Vital N* (t)
Seven Oaks (t)Seven Oaks N (t)
Seven Oaks W* (t)Seven Oaks E
St. James-Assiniboia* (t)St. James-Assiniboia W (t)
St. James-Assiniboia E* (t)
InksterInkster West* (t)Inkster East* (t)
River East (t)River East N* (t)
River East E (t)River East W (t)River East S* (t)
River Heights* (t)River Heights W* (t)River Heights E* (t)
Point Douglas* (t)Point Douglas N* (t)Point Douglas S* (t)
Downtown* (t)Downtown W *
Downtown E* (t)
Churchill (t)
Winnipeg* (t)
Manitoba
-0.15
-0.17
-0.13
-0.20-0.24
0.14-0.68
-0.30-0.34
-0.59
-0.78-0.34-0.33
-0.28
-0.73-0.48
-0.30-0.32
-0.20
-0.51
-0.55
-0.47
-0.24-0.35
-0.80
-0.29
-1.11-1.07
-0.34-0.15
-0.28
-0.76
-0.82
-0.66
-0.82
-0.40
-0.020.02
0.26
0.340.87
0.370.54
1.06
1.061.23
1.65
0.17
0.450.28
0.680.63
0.54
0.89
0.770.20
0.47
0.19
0.500.54
0.04
0.75
0.22
0.47
0.30
0.74
1.21
0.13
1.47
55WINNIPEG REGIONAL HEALTH AUTHORITY
Chapter 5: Healthcare Access, Utilization, and Quality Across The Winnipeg Health Region
5.1 PHYSICIAN SERVICES• In 2011/12, 14.6% of residents aged 12 years and older reported not having a regular medical doctor and 53% of them
were looking for one. (Figure A5.1.1.a1)
• Ambulatory care is health care delivered on an outpatient basis (no need for an overnight stay in hospital). The
utilization of ambulatory care is measured by: the percent of residents having at least one ambulatory visit (use of
a physician) and the number of ambulatory visits per resident in a given year.
• Overall, the utilization of ambulatory care has been relatively stable:
• The percent of residents having at least one ambulatory visit has slightly declined, from 84.7% in 2000/01 to 81.2%
in 2011/12. Considering the inclusion of prenatal visits in the most recent calculation, the decrease might have been
more significant. (Figure A5.1.2.a1)
• On average, a resident had approximately 5 ambulatory visits a year, a number slightly higher than the provincial
average. There was a trend of declining number of ambulatory visits. (Figure A5.1.3.a1)
• Of these ambulatory visits, about 5% were consultations (first referral only, or 0.31 per resident) with a specialist or a
surgeon (ambulatory consultation). This number stabilized. (Figure A5.1.4.a1)
• Virtually all Winnipeg residents (>97%) visit GPs/FPs within the city (location of visits to general and family
practitioners). (Table A5.1.5.a1)
• The majority of the Region’s residents who had 3 or more ambulatory visits received at least 50% of their care from
the same physician (majority of care): 69% in 2000/01 and 75% in 2011/12. (Figure A5.1.6.a1)
• There was little variation in ambulatory visits or consultations across the communities in the Region, although the
number of ambulatory visits and consultations in Churchill was lower than that in other community areas.
(Figures A5.1.3.a2 and A5.1.4.a2)
• The top five (5) specified reasons for ambulatory visits were respiratory, mental Illness, circulatory, and health status
and contact. (Figure A5.1.7.a1)
• Ambulatory care sensitive conditions (ACSCs) are a group of chronic conditions that usually do not need to advance
to hospitalization if they are managed appropriately through ambulatory care. “Hospitalization-for-ACSCs” is an indirect
measure of ambulatory care quality. The proportion of hospitalization-for-ACSCs among residents aged 75 years
and younger decreased over time, from 6.6 per 1,000 in 2000/01 to 4.1 per 1,000 in 2011/12, indicating an improvement
in ambulatory care in the Region. However, this remains a challenge in low income communities (i.e., Churchill, Point
Douglas South, and Downtown East) where hospitalizations-for-ACSCs are high. (Figure A5.1.8.a3)
5.2 HOSPITAL SERVICES• In 2011/12, 5.5% (crude rate) of Winnipeg residents and 11.1% (crude rate) of Churchill residents were hospitalized at least
once.1 (Figure A5.2.1.a1)
• Of all hospitalizations (sex and age adjusted) made by every 1,000 residents in 2011/12, 65.4 were inpatient
hospitalizations (ranging from 59.6 in Assiniboine South community area to 92.5 in Point Douglas community area) and
65.3 were day surgeries in Winnipeg (ranging from 59.8 in Inkster and 72.7 in St James-Assiniboina); Churchill had the
highest inpatient hospitalizations (200.8 per 1,000 residents) and the highest day surgeries (109.3 per 1,000 residents).
(Figures A5.2.1.a3 & A5.2.2.a3)
• More than 95% of Winnipeg residents went for hospitalizations in the city (hospital location). In 2011/12, 57% of Churchill
residents went to Winnipeg for hospitalizations and 5% went to hospitals in other RHAs or other province(s).
(Figure A5.2.3.a1) Many medical services and procedures are only available in Winnipeg hospitals. About one third
of patients in Winnipeg hospitals come from other RHAs in the province or from other province(s) (hospital catchment).
(Figure A5.2.4.a1)
1 Fransoo R, Martens P, The Need To Know Team, Prior H, Burchill C, Koseva I, Bailly A, Allegro E. The 2013 RHA Indicators Atlas. Winnipeg, MB. Manitoba Centre for Health Policy, October 2013.
COMMUNITY HEALTH ASSESSMENT 201456
• In Winnipeg, 199 hospital days per 1,000 WRHA residents were used for inpatient hospitalizations lasting from one to 13
days (hospital days used for short stays) while 477 days per 1,000 WRHA residents were used for those lasting for more
than 13 days (hospital days used for long stays) in 2011/12. In Churchill, 480 hospital days per 1,000 Churchill residents
were used for inpatient hospitalizations lasting from one to 13 days, while 388 days per 1,000 Churchill residents were
used for those lasting for more than 13 days.
• The most frequent reasons for inpatient hospitalizations and day surgeries (causes of hospitalizations) were digestive,
pregnancy and birth, circulatory, cancer, health status and contact (i.e., issues not necessarily connected to a specific
diagnosis or disease), genitourinary and breast, respiratory, injury and poisoning, eye disorders, musculoskeletal, ill-
defined conditions (i.e., specific problems could not be assigned to a specific disease category), and all others.
(Figure A5.2.7.a1)
• In 2011/12, 7.3% of hospitalized patients in Winnipeg and 8.5% of those in Churchill were readmitted within 30 days of
discharge (hospital readmission). Hospital readmission rate varied across the Region, ranging from 5.7% in St James-
Assiniboina and 9.0% in Downtown East and related to income. (Figure A5.2.8.a2)
5.3 HOME CARE• In 2012/13, an average of 14,683 clients received home care services each month in the Region, accounting for 60% of
the total home care clients (n=24,514) in Manitoba. (Figure A5.3.1.a1)
5.4 PERSONAL CARE HOMES (PCHs)In 2011/12, 3% of Winnipeg residents aged 75 years and older were newly admitted to PCHs (incidence).1 The median
waiting time was 3.5 weeks for those admitted from hospital and 7 weeks for those from community. Overall, the
proportion of PCH residents requiring high level care increased. In 2011/12, no residents were admitted for level 1 (the
lowest level of) care, and of those admitted to PCHs,
• 18.0% did not require close supervision (Level 2N);
• 4.5% required close supervision due to behavioral issues (Level 2Y);
• 55.6% did not require close supervision (Level 3N);
• 12.9% required close supervision due to behavioral issues (Level 3Y);
• 9.0% required the highest level care (Level 4).
Overall, 11.5% of Winnipeg residents aged 75 years and older and 27.8% of those in Churchill lived in PCHs in 2011/12
(prevalence). There was a “w” shape distribution according to the order of median household income: Assiniboine South
and Downtown had the highest percentages, followed by Seven Oaks and St. James-Assiniboine. (Figure A5.4.2.a1)
5.5 PRESCRIPTION DRUG USE (PHARMACEUTICAL SERVICE)
5.5.1 ANTIDEPRESSANT PRESCRIPTION FOLLOW-UPAlthough the association between antidepressant use and suicide remains controversial, adequate follow-up is an
important precautionary step for patient safety. However, only 57% of patients receiving antidepressants during
2007/08-2011/12 had 3 or more physician visits within four months following the prescription for an antidepressant.
(Figure A5.5.1.a1)
5.5.2 ASTHMA CONTROLLER MEDICATIONSAmong asthma patients (e.g., who receive 2 or more quick-relief medications or reliever medications), about two thirds
received long-term controller mediations which prevent asthma symptoms from occurring. (Figure A5.5.2.a1) Little
variation is seen across the communities. (Figure 5.5.2.a3)
1 Fransoo R, Martens P, The Need To Know Team, Prior H, Burchill C, Koseva I, Bailly A, Allegro E. The 2013 RHA Indicators Atlas. Winnipeg, MB. Manitoba Centre for Health Policy, October 2013.
57WINNIPEG REGIONAL HEALTH AUTHORITY
5.5.3 BENZODIAZEPINES PRESCRIBING FOR COMMUNITY-DWELLING SENIORSBenzodiazepines are a class of psychoactive drugs and are used for treating medical conditions including anxiety,
seizures, panic disorder, and alcohol dependence. Benzodiazepines are generally safe and effective in short-term use,
but there are concerns about the adverse effects of long-term use. In 2011/12, 20.5% of community-dwelling seniors (aged
65 years and older) were inappropriately prescribed for benzodiazepines, ranging from 10.2% (in Inkster West) to 27.5%
(in St Boniface West). The percentage was in the range reported elsewhere.1 (Figure A5.5.3.a3)
5.6 OTHER MEDICAL SERVICES
5.6.1 DENTAL EXTRACTIONSRemoval of teeth from the mouth in hospital is often required for young children with severe tooth decay. On average,
6.6 dental extractions were performed in 2007/08-2011/12 for every 1,000 children aged 6 years and younger - a
number only slightly lower than that in 2002/03-2006/07 (7.0). There was substantial variation across the communities
by geography (communities in the central area of the Winnipeg communities had higher numbers of dental extractions
in those aged 5 years and younger) and by income (the lower the income of the area, the higher number of dental
extractions). (Table A5.6.1.a1)
5.6.2 DIABETES CARE-EYE EXAMINATIONSRegular eye examination (i.e., every 2-3 years for persons with diabetes aged 20-64 years and annually for those aged
65 years and older2) is important for the prevention and early detection of diabetic eye problems that may lead to visual
loss or blindness. However, less than 40% of adult diabetic patients in the Region had an eye exam in 2011/12, although
the percent was higher than those in previous years. (Figure A5.6.2.a1) Residents living in high income communities were
more likely to have an eye examination. (Figure A5.6.2.a3) In Canada, the percent of adult diabetic patients having eye
examinations in the past two years was lowest in Manitoba (49%) in 2007.3
1 Tannenbaum C., Martin P., Tamblyn R., Benedetti A., Ahmed S. Reduction of Inappropriate Benzodiazepine Prescriptions Among Older Adults Through Direct Patient Education: The EMPOWER Cluster Randomized Trial. JAMA Intern Med. 2014;174(6):890-898.2 Best G., Dennis M., Lee R., Smit H, Hudson C. Care of the Patient with Diabetes: A Core Document of the Canadian Association of Optometrists. Ottawa, 2008. 3 Canadian Institute for Health Information. Diabetes care gaps and disparities in Canada. Ottawa, 2009.
COMMUNITY HEALTH ASSESSMENT 201458
Appendix: Data Sources and MethodsThis appendix outlines how Community Health Assessment (CHA) core indicators were decided on; the role of Local
Health Involvement Groups (LHIGs) in choosing other indicators important to the communities within the Winnipeg
Regional Health Authority (WRHA or, the Region); the data sources for the WRHA’s CHA (e.g., the 2013 RHA Atlas from
MCHP, the national Canadian Community Health Survey); and, how the indicator data were analyzed.
1. INDICATOR SELECTION1.1 COMMUNITY HEALTH ASSESSMENT NETWORK INDICATOR REVIEW COMMITTEE (CHAN-IRC)
Between June 2011 and February 2013, CHAN-IRC had regular meetings to select indicators for assessing community
health in Manitoba using the following five criteria:
• Importance and Relevance: the indicator reasonably reflects efforts to reduce health risks and improve health status
and health systems; and must be understandable, relevant and useful for health planning;
• Validity: the indicator actually measures what it is claiming to measure;
• Possibility: the indicator must be currently collectable at both the health authority and provincial level and supports
meaningful comparisons over time and place;
• Meaning: the phenomena being measured by the indicator is something that the health system can change; and, the
indicator must be sensitive enough to reflect changes in the phenomena it is intended to measure;
• Implications: the indicator is amenable to action and supports evidence to motivate change.
Indicators meeting all of the above criteria were defined as core indicators; these were the criteria which the Region was
obligated to reported on. Optional indicators may or may not meet all of the criteria identified above. If several indicators
meeting all criteria were available on the same topic, a decision was made on which was the best indicator for measuring
the topic and the other similar indicators not used as core were moved to the optional list. Many important CHA indicators
were not placed on the core list as the data were not available or relevant for all regions in the Province. Indicators
that did not meet all of the criteria, especially those which have no or limited relevance for regions’ CHA and are not
amenable to action were removed from the optional list.
1.2 COMMUNITY CONSULTATION
In the fall of 2013, two consultation meetings were held with each of six Community Health Advisory Committees (CHACs)
or Local Health Involvement Groups (LHIGs) with representatives from all 12 WRHA Community Areas. The primary
objective of the meetings was to seek CHAC representatives’ input in selecting optional indicators for the Region’s CHA
report. Representatives were asked to rank and choose the five (5) most important indicators from the CHAN-IRC list of
optional indicators for health status and non-medical determinants of health domains (i.e., health behaviors, prevention,
and socio-economic status).
As a result of these meetings with the LHIGs, the following optional indicators were accepted for inclusion in the WRHA’s
2014 CHA report:
Health Status
• Potential Years of Life Lost: cancer deaths
• Potential Years of Life Lost: respiratory disease deaths
• Top five causes of child mortality
• Potential Years of Life Lost: circulatory disease deaths
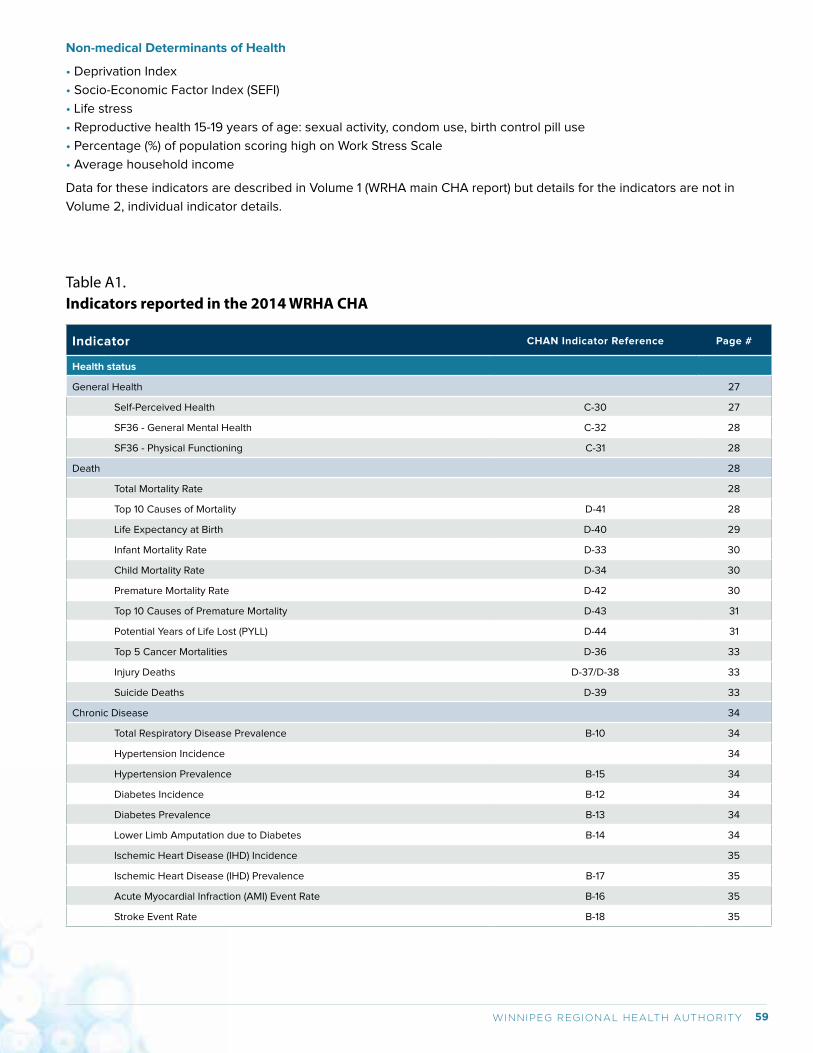
59WINNIPEG REGIONAL HEALTH AUTHORITY
Non-medical Determinants of Health
• Deprivation Index
• Socio-Economic Factor Index (SEFI)
• Life stress
• Reproductive health 15-19 years of age: sexual activity, condom use, birth control pill use
• Percentage (%) of population scoring high on Work Stress Scale
• Average household income
Data for these indicators are described in Volume 1 (WRHA main CHA report) but details for the indicators are not in
Volume 2, individual indicator details.
Table A1.Indicators reported in the 2014 WRHA CHA
Indicator CHAN Indicator Reference Page #
Health status
General Health 27
Self-Perceived Health C-30 27
SF36 - General Mental Health C-32 28
SF36 - Physical Functioning C-31 28
Death 28
Total Mortality Rate 28
Top 10 Causes of Mortality D-41 28
Life Expectancy at Birth D-40 29
Infant Mortality Rate D-33 30
Child Mortality Rate D-34 30
Premature Mortality Rate D-42 30
Top 10 Causes of Premature Mortality D-43 31
Potential Years of Life Lost (PYLL) D-44 31
Top 5 Cancer Mortalities D-36 33
Injury Deaths D-37/D-38 33
Suicide Deaths D-39 33
Chronic Disease 34
Total Respiratory Disease Prevalence B-10 34
Hypertension Incidence 34
Hypertension Prevalence B-15 34
Diabetes Incidence B-12 34
Diabetes Prevalence B-13 34
Lower Limb Amputation due to Diabetes B-14 34
Ischemic Heart Disease (IHD) Incidence 35
Ischemic Heart Disease (IHD) Prevalence B-17 35
Acute Myocardial Infraction (AMI) Event Rate B-16 35
Stroke Event Rate B-18 35
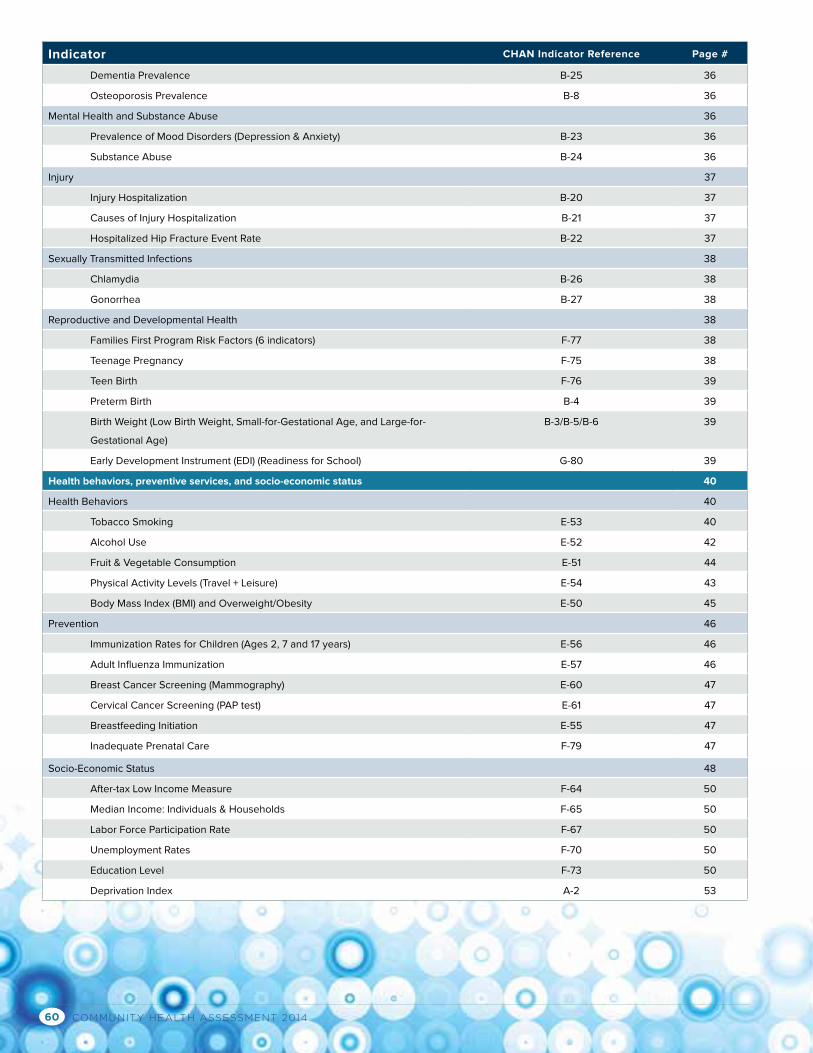
COMMUNITY HEALTH ASSESSMENT 201460
Indicator CHAN Indicator Reference Page #
Dementia Prevalence B-25 36
Osteoporosis Prevalence B-8 36
Mental Health and Substance Abuse 36
Prevalence of Mood Disorders (Depression & Anxiety) B-23 36
Substance Abuse B-24 36
Injury 37
Injury Hospitalization B-20 37
Causes of Injury Hospitalization B-21 37
Hospitalized Hip Fracture Event Rate B-22 37
Sexually Transmitted Infections 38
Chlamydia B-26 38
Gonorrhea B-27 38
Reproductive and Developmental Health 38
Families First Program Risk Factors (6 indicators) F-77 38
Teenage Pregnancy F-75 38
Teen Birth F-76 39
Preterm Birth B-4 39
Birth Weight (Low Birth Weight, Small-for-Gestational Age, and Large-for-
Gestational Age)
B-3/B-5/B-6 39
Early Development Instrument (EDI) (Readiness for School) G-80 39
Health behaviors, preventive services, and socio-economic status 40
Health Behaviors 40
Tobacco Smoking E-53 40
Alcohol Use E-52 42
Fruit & Vegetable Consumption E-51 44
Physical Activity Levels (Travel + Leisure) E-54 43
Body Mass Index (BMI) and Overweight/Obesity E-50 45
Prevention 46
Immunization Rates for Children (Ages 2, 7 and 17 years) E-56 46
Adult Influenza Immunization E-57 46
Breast Cancer Screening (Mammography) E-60 47
Cervical Cancer Screening (PAP test) E-61 47
Breastfeeding Initiation E-55 47
Inadequate Prenatal Care F-79 47
Socio-Economic Status 48
After-tax Low Income Measure F-64 50
Median Income: Individuals & Households F-65 50
Labor Force Participation Rate F-67 50
Unemployment Rates F-70 50
Education Level F-73 50
Deprivation Index A-2 53
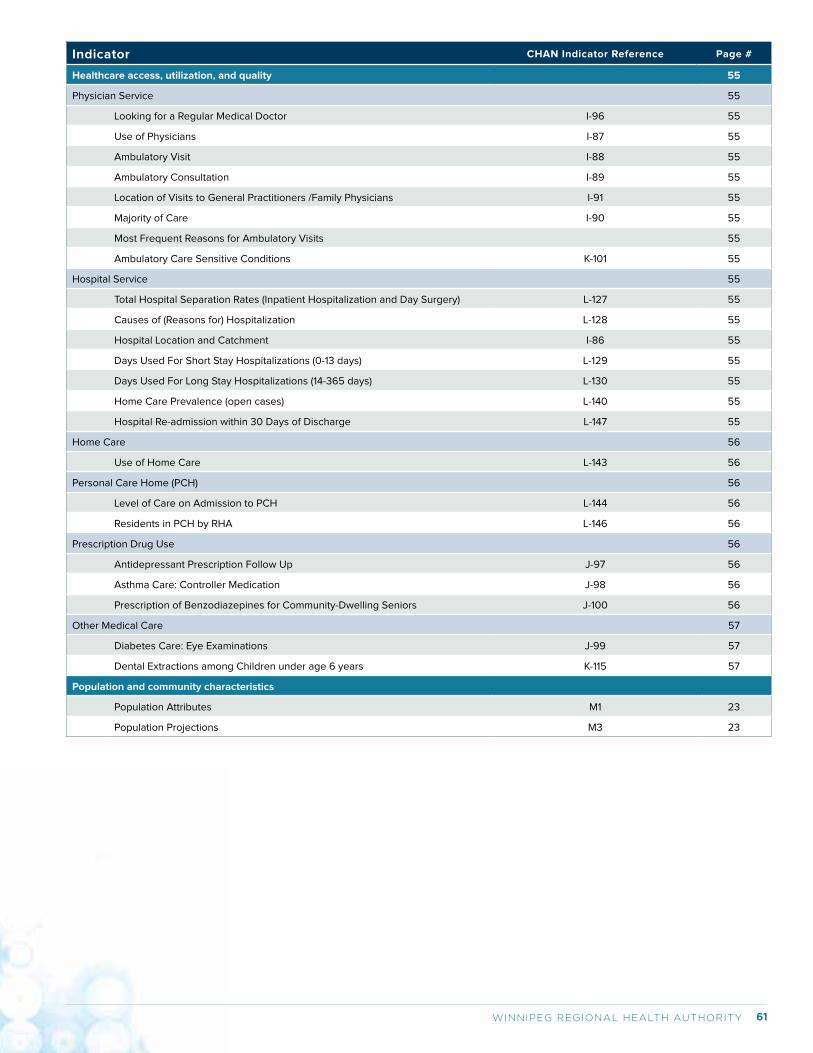
61WINNIPEG REGIONAL HEALTH AUTHORITY
Indicator CHAN Indicator Reference Page #
Healthcare access, utilization, and quality 55
Physician Service 55
Looking for a Regular Medical Doctor I-96 55
Use of Physicians I-87 55
Ambulatory Visit I-88 55
Ambulatory Consultation I-89 55
Location of Visits to General Practitioners /Family Physicians I-91 55
Majority of Care I-90 55
Most Frequent Reasons for Ambulatory Visits 55
Ambulatory Care Sensitive Conditions K-101 55
Hospital Service 55
Total Hospital Separation Rates (Inpatient Hospitalization and Day Surgery) L-127 55
Causes of (Reasons for) Hospitalization L-128 55
Hospital Location and Catchment I-86 55
Days Used For Short Stay Hospitalizations (0-13 days) L-129 55
Days Used For Long Stay Hospitalizations (14-365 days) L-130 55
Home Care Prevalence (open cases) L-140 55
Hospital Re-admission within 30 Days of Discharge L-147 55
Home Care 56
Use of Home Care L-143 56
Personal Care Home (PCH) 56
Level of Care on Admission to PCH L-144 56
Residents in PCH by RHA L-146 56
Prescription Drug Use 56
Antidepressant Prescription Follow Up J-97 56
Asthma Care: Controller Medication J-98 56
Prescription of Benzodiazepines for Community-Dwelling Seniors J-100 56
Other Medical Care 57
Diabetes Care: Eye Examinations J-99 57
Dental Extractions among Children under age 6 years K-115 57
Population and community characteristics
Population Attributes M1 23
Population Projections M3 23
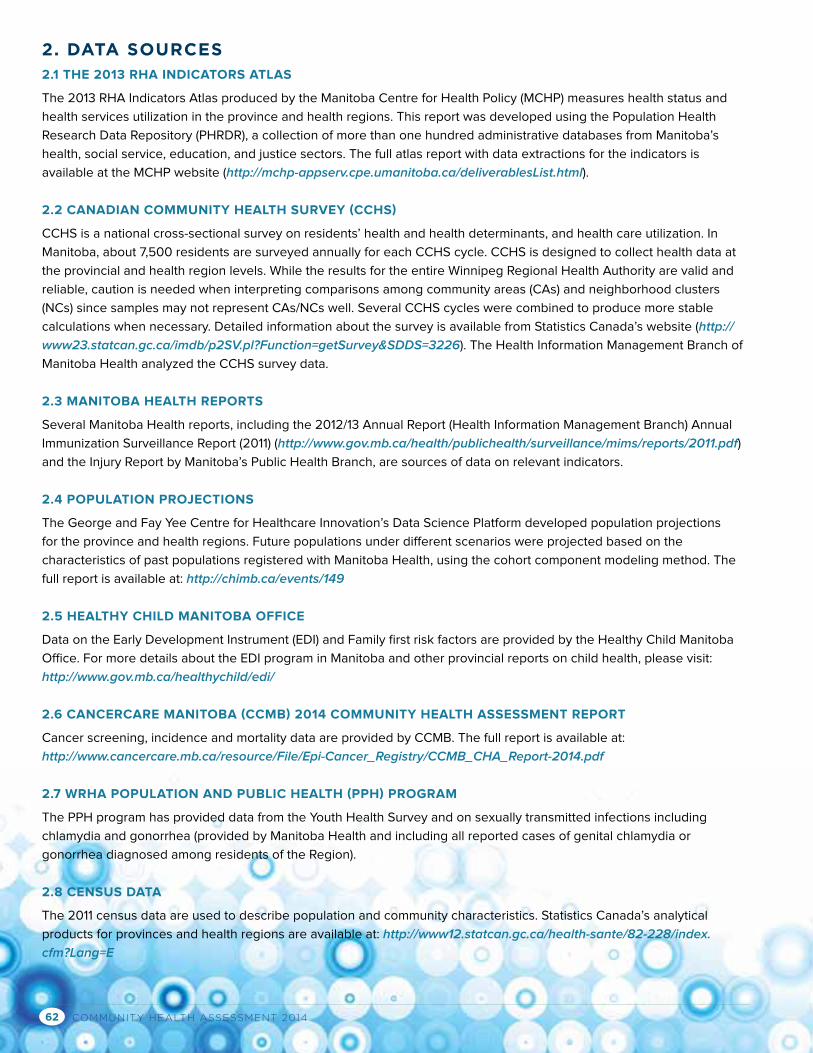
COMMUNITY HEALTH ASSESSMENT 201462
2. DATA SOURCES2.1 THE 2013 RHA INDICATORS ATLAS
The 2013 RHA Indicators Atlas produced by the Manitoba Centre for Health Policy (MCHP) measures health status and
health services utilization in the province and health regions. This report was developed using the Population Health
Research Data Repository (PHRDR), a collection of more than one hundred administrative databases from Manitoba’s
health, social service, education, and justice sectors. The full atlas report with data extractions for the indicators is
available at the MCHP website (http://mchp-appserv.cpe.umanitoba.ca/deliverablesList.html).
2.2 CANADIAN COMMUNITY HEALTH SURVEY (CCHS)
CCHS is a national cross-sectional survey on residents’ health and health determinants, and health care utilization. In
Manitoba, about 7,500 residents are surveyed annually for each CCHS cycle. CCHS is designed to collect health data at
the provincial and health region levels. While the results for the entire Winnipeg Regional Health Authority are valid and
reliable, caution is needed when interpreting comparisons among community areas (CAs) and neighborhood clusters
(NCs) since samples may not represent CAs/NCs well. Several CCHS cycles were combined to produce more stable
calculations when necessary. Detailed information about the survey is available from Statistics Canada’s website (http://
www23.statcan.gc.ca/imdb/p2SV.pl?Function=getSurvey&SDDS=3226). The Health Information Management Branch of
Manitoba Health analyzed the CCHS survey data.
2.3 MANITOBA HEALTH REPORTS
Several Manitoba Health reports, including the 2012/13 Annual Report (Health Information Management Branch) Annual
Immunization Surveillance Report (2011) (http://www.gov.mb.ca/health/publichealth/surveillance/mims/reports/2011.pdf)
and the Injury Report by Manitoba’s Public Health Branch, are sources of data on relevant indicators.
2.4 POPULATION PROJECTIONS
The George and Fay Yee Centre for Healthcare Innovation’s Data Science Platform developed population projections
for the province and health regions. Future populations under different scenarios were projected based on the
characteristics of past populations registered with Manitoba Health, using the cohort component modeling method. The
full report is available at: http://chimb.ca/events/149
2.5 HEALTHY CHILD MANITOBA OFFICE
Data on the Early Development Instrument (EDI) and Family first risk factors are provided by the Healthy Child Manitoba
Office. For more details about the EDI program in Manitoba and other provincial reports on child health, please visit:
http://www.gov.mb.ca/healthychild/edi/
2.6 CANCERCARE MANITOBA (CCMB) 2014 COMMUNITY HEALTH ASSESSMENT REPORT
Cancer screening, incidence and mortality data are provided by CCMB. The full report is available at:
http://www.cancercare.mb.ca/resource/File/Epi-Cancer_Registry/CCMB_CHA_Report-2014.pdf
2.7 WRHA POPULATION AND PUBLIC HEALTH (PPH) PROGRAM
The PPH program has provided data from the Youth Health Survey and on sexually transmitted infections including
chlamydia and gonorrhea (provided by Manitoba Health and including all reported cases of genital chlamydia or
gonorrhea diagnosed among residents of the Region).
2.8 CENSUS DATA
The 2011 census data are used to describe population and community characteristics. Statistics Canada’s analytical
products for provinces and health regions are available at: http://www12.statcan.gc.ca/health-sante/82-228/index.
cfm?Lang=E
63WINNIPEG REGIONAL HEALTH AUTHORITY
2.9 STATISTICS CANADA HEALTH PROFILES
Statistics Canada’s “Health in Canada” portal (http://www.statcan.gc.ca/eng/health/index) includes four products related
to health data: Health Indicators, Health Reports, Health Profile, and Health Trends. The Health Profile allows us to
compare a health region to its province, peer health regions, and Canada.
2.10 OTHER SOURCES
Heaman M, Kingston D, Helewa ME, Brownell M, Derksen S, Bogdanovic B, McGowan KL, Bailly A. Perinatal Services
and Outcomes in Manitoba. Winnipeg, MB. Manitoba Centre for Health Policy, November 2012 (access at: http://mchp-
appserv.cpe.umanitoba.ca/reference/perinatal_report_WEB.pdf)
Brownell M, Chartier M, Santos R, Ekuma O, Au W, Sarkar J, MacWilliam L, Burland E, Koseva I, Guenette W. How Are
Manitoba’s Children Doing? Winnipeg, MB. Manitoba Centre for Health Policy, October 2012 (access at: http://mchp-
appserv.cpe.umanitoba.ca/reference/mb_kids_report_WEB.pdf)
3. DATA ANALYSIS3.1 DISEASE OCCURRENCE MEASURES
There are several ways (i.e., rate, proportion, percentage) by which the occurrence of disease and health conditions may
be measured. It is important to understand how to interpret each in order to obtain a fair description of where need exists
so that we can make informed choices about how to meet these needs.
Incidence is the number of new cases diagnosed within a defined period of time divided by the size of the population
at the risk of experiencing the disease/condition during this period. Incidence is a rate and expressed as new cases per
person-year.
Prevalence is the proportion of the population that have a condition at a point in time (point prevalence) or over a defined
period of time (period prevalence). All prevalence estimates used in this report are estimates of period prevalence.
Prevalence does not have a dimension (or a unit) and is not a rate. For many conditions such as hypertension and
diabetes, administrative databases can only capture those conditions that have been treated and recorded in claims
data. Thus prevalence of these conditions is considered treatment prevalence, which is the proportion of the population
that received some combination of physician visits, hospitalizations, and/or prescription drugs for a given disease in
a given period of time. Because these estimates are derived using administrative databases, only those persons who
have received health services or treatment for the disease (by visiting a doctor, being admitted to a hospital or having
a prescription dispensed) are counted, but those who may have undetected disease, disease that does not require
frequent medical care, and those not receiving the care they may need for their condition are not counted. This must be
kept in mind when treatment prevalence is interpreted— proportions that change may mean that the disease is actually
getting more or less common, or it may mean that more or less people are getting diagnosed or receiving care. For
example, an increase in the treatment prevalence for hypertension could mean that more people are getting high blood
pressure or that more people are having their high blood pressure diagnosed and treated appropriately. Sometimes,
changes in physician billing or disease coding practices (e.g., when a new tariff for payment of fees is created) may also
cause treatment prevalence to change even if the disease prevalence has not changed. For these reasons, sometimes it
is not possible to be certain about the meaning of changes in treatment prevalence over time. Prevalence and treatment
prevalence values are expressed as per 1,000 population or residents (or, per 10,000 or 100,000 population or residents).
Percentage is exactly the same idea as proportion (i.e., prevalence and treatment prevalence) but is expressed as % (by
multiplying 100) and can vary between 0 and 100.
3.2 CRUDE AND ADJUSTED MEASURES
A crude measure is calculated by dividing numerator (e.g., the total number of events) by an appropriate denominator
(e.g., the total number of individuals in the population who are at risk for these events) and presented by using an
appropriate constant (e.g., per 1,000 residents), without adjusting for the underlying population structure. Crude measures
are recommended when the interest is the overall burden of disease in the population. This is usually the case for
infectious diseases.
COMMUNITY HEALTH ASSESSMENT 201464
Adjusted measures are recommended when comparing rates/proportions of health outcomes among different
populations (e.g., Winnipeg community areas) or comparing trends in a given population over time. Age- and sex-adjusted
rates/proportions are the most common adjustments because many health conditions are related to age and sex. The
process of age and sex adjustment removes differences in the age and sex compositions of two or more populations to
allow comparisons between these populations independent of their age and sex structures. Most figures shown in the
main report (Volume 1) and the individual indicators (Volume 2) use adjusted or standardized rates/proportions where
possible.
3.3 SMALL NUMBER AND SUPPRESSION
The reader will note missing data by the absence of some bars (by CA or NC) in the charts. The administrative health
and surveillance data used to describe these indicators can only be presented in aggregate form for the purposes of
reporting, and only results with cell sizes of more than 5 can be reported (counts of zero can be reported, counts of 1-5
must be suppressed). The process of suppressing data is a standard convention and is done to protect the anonymity of
individuals.
Estimation stability or reliability based on small numbers is another concern, in particular for Churchill where the size
of population is so small (about 1000 persons). In general, estimates based on large numbers provide stable estimates
of the true, underlying rates/proportions; those based on small numbers may fluctuate dramatically from year to year,
or differ considerably from one small place to another small place, even when there is no meaningful difference. We
encourage readers to keep this issue in mind when interpreting rates/proportions based on small numbers, particularly
those for Churchill.
3.4 TIME TREND TEST
Several methods (i.e., Pearson’s chi-squared test (x2), linear regression model, Poisson regression model, time series
analysis) can be used to test time trends. We chose the Pearson’s chi-squared test (x2) based on the feature of the data
used in this report (aggregated data). Since only aggregated data for a few time periods are available for this report, the
overall shape presented here may not accurately represent the trend of annual rates/proportions over a longer period of
time.
Data for time trend testing might be obtained from multiple reports produced in past years. For certain indicators, there
are time period gaps or overlaps. Case definition and calculation methods have evolved and, therefore, the temporal
differences may reflect these changes. Rates or proportions might have been standardized according to Manitoba
populations in different time periods, but we believe this has no significant impact on the standardization. However,
caution is needed for interpretation when a small but statistically significant difference over time is observed.
3.5 ORDER OF COMMUNITY AREA (CA) AND NEIGHBORHOOD CLUSTER (NC)
In the charts, CAs and NCs are ordered by median household income (2006 census data). When CAs and NCs are
presented in a single chart, NCs are placed under the corresponding CA that is ordered by median household income.
3.6 GEOGRAPHIC MAPPING
Rates/proportions were mapped using ArcGIS software by ESRI©. Rates/proportions are categorized into four (4) groups
and the highest and lowest are labeled. Values for each category are not presented since those can be found in CA/NC
charts, and the purpose of the map is to show general geographical variation.
65WINNIPEG REGIONAL HEALTH AUTHORITY
3.7 HEALTH INEQUALITY MEASURES
Rate/proportion absolute difference and ratio
There are two ways to measure differences: by determining the (1) absolute difference and (2) the relative differences.
It is recommended that both absolute and relative differences be reported. In this report, we calculated absolute
difference and relative ratio between CA/NC with the highest median household income and CA/NC with the lowest
median household income and between residents living in the highest income quintile and the lowest income quintile.
Household incomes are grouped by dissemination areas (DAs) which are specified by Statistics Canada for the collection
of census data. In turn, the median household incomes of DAs are ranked from poorest to wealthiest, and then grouped
into five income quintiles Urban (U)1 being the poorest DAs and Urban (U)5 being the wealthiest DAs. Each income
quintile subsequently contains approximately 20% of the population. The absolute difference and ratio in the distribution
of the indicator values (by geography and income) are calculated based on aggregated data from existing reports. As a
result, the significance of these measures has not been statistically tested.
3.8 COMPARE WITH OTHER HEALTH REGIONS WITHIN THE SAME PEER GROUP
Statistics Canada divides Canada’s health regions into 10 peer groups. A peer group comprises health regions that have
similar characteristics based on 24 socio-demographic variables from the 2006 Census and prominent geographic
characteristics. The 10 peer groups are identified by letters A through J. WRHA is one of the 34 health regions in peer
group A as shown in Figure A1. Whenever possible, we compared health indicators between WRHA, Manitoba, Peer
Group A, and Canada using data from Statistic Canada’s Health Profile portal.
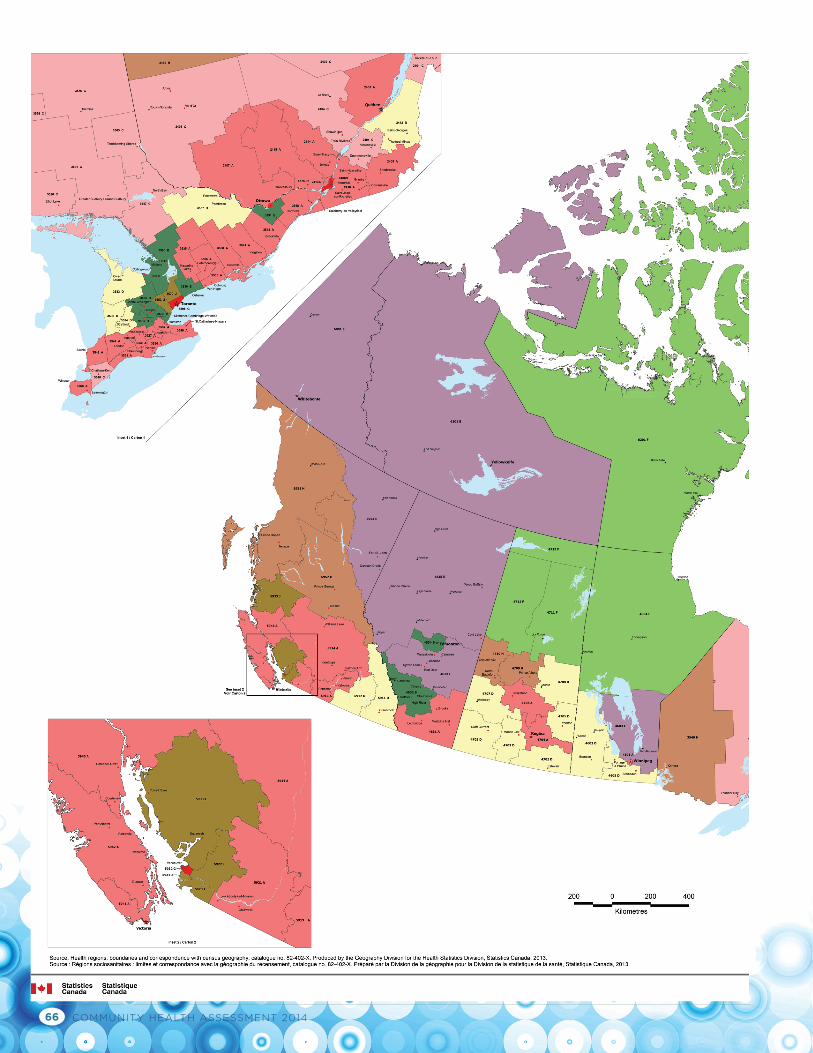
COMMUNITY HEALTH ASSESSMENT 201466
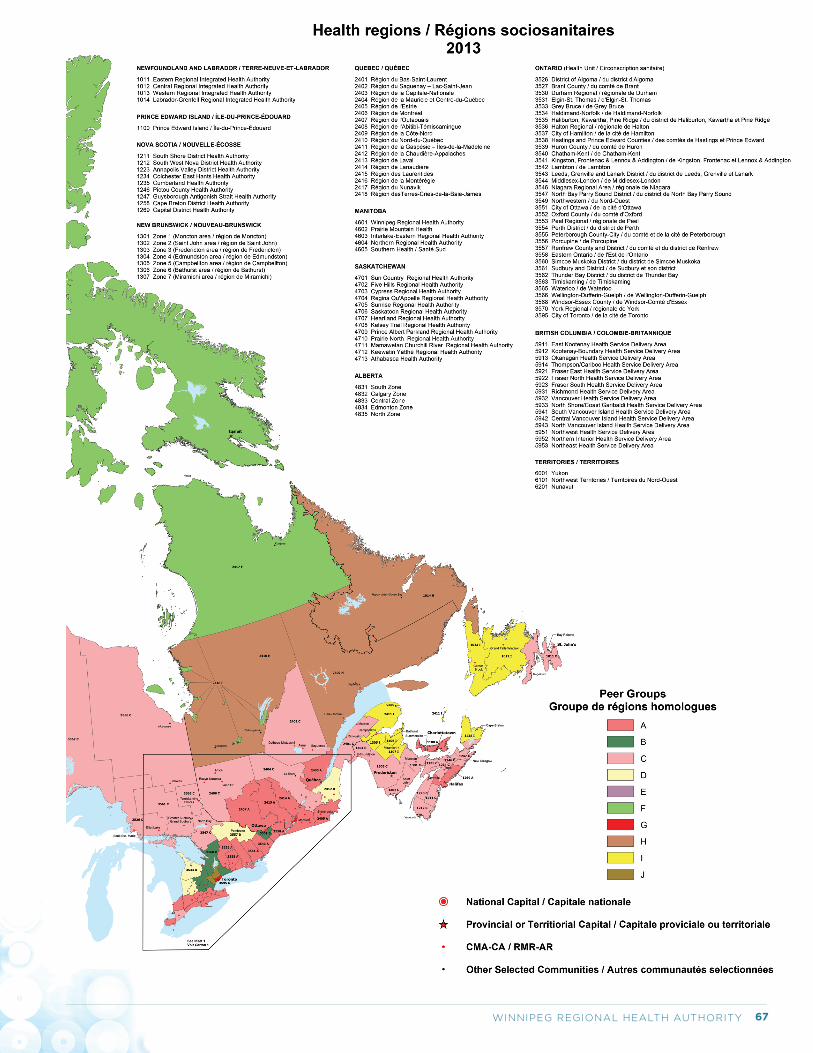
67WINNIPEG REGIONAL HEALTH AUTHORITY
Evaluation Platform George and Fay Yee Center for Healthcare Innovation GE706 - 820 Sherbrook Street, Winnipeg, MB, R3A 1R9
WRHA Strategic Planning:
A Summary Report of Public and Staff Perspectives on WRHA’s Priorities, Mission, Vision and Values
April 9, 2015
Survey Team
Executive Sponsor Dan Skwarchuk, Senior Executive Director, Division of Quality and System
Performance, (204-926-7021)
Survey Lead Kim Warner, Director Education and Projects, Quality Improvement and Patient Safety
Unit, (204-926-7176)
Survey Consultation, Support and Analysis Evaluation Platform, Centre for Healthcare Innovation,
(Dr. Paul Beaudin, Ms. Ashley Struthers, and Dr. Catherine Charette), (CHI Evaluation Platform: 204-926-7034)
1 | P a g e
Evaluation Platform
George and Fay Yee Center for Healthcare Innovation GE706 - 820 Sherbrook Street, Winnipeg, MB, R3A 1R9
I. INTRODUCTION .............................................................................................................................................. 2
II. SURVEY FRAMEWORK .................................................................................................................................... 2
III. SURVEY SUMMARY .................................................................................................................................... 3
DEMOGRAPHICS AGE: (STAFF AND PUBLIC) .................................................................................................................................................... 3 YEARS OF SERVICE: (STAFF) .................................................................................................................................................. 3 PRIMARY PLACE OF WORK: (STAFF) ....................................................................................................................................... 4 COMMUNITY AREA AS PRIMARY PLACE OF WORK: (STAFF) ......................................................................................................... 4 SPECIFIC HOSPITAL/HEALTH CENTRE AS PRIMARY PLACE OF WORK: (STAFF) ................................................................................. 5 PRIORITIES MOST IMPORTANT PRIORITIES: (STAFF AND PUBLIC) ................................................................................................................. 5 ‘OTHER’ MOST IMPORTANT PRIORITIES: (STAFF AND PUBLIC) ..................................................................................................... 7 MISSION STATEMENT DOES THE MISSION NEED TO CHANGE? (STAFF AND PUBLIC) ...................................................................................................... 9 MISSION STATEMENT CHANGE SUGGESTIONS: (STAFF AND PUBLIC) ........................................................................................... 10 VISION STATEMENT DOES THE VISION NEED TO CHANGE? (STAFF AND PUBLIC) ...................................................................................................... 11 VISION STATEMENT CHANGE SUGGESTIONS: (STAFF AND PUBLIC) .............................................................................................. 11 VALUE STATEMENT ARE THE WRHA’S VALUES RIGHT? (STAFF AND PUBLIC) .......................................................................................................... 13 VALUE STATEMENT CHANGE SUGGESTIONS: (STAFF AND PUBLIC) .............................................................................................. 13
2 | P a g e
Evaluation Platform
George and Fay Yee Center for Healthcare Innovation GE706 - 820 Sherbrook Street, Winnipeg, MB, R3A 1R9
I. Introduction The WRHA is preparing to develop the organization’s next 5 year strategic plan. A regional strategic plan is a written public document that outlines the focus of the organization for the next 5 years. The plan will be used to improve healthcare for all those who access WRHA services. Therefore, in preparation for updating and developing the next 5 year strategic plan, a survey was deployed to capture the perspectives of the general public and WRHA staff. The public and staff perspectives will be used to guide the direction of the next 5 year strategic plan. In particular, the objective of the public and staff surveys were to ask about opinions on the following three areas:
1. Healthcare priorities; 2. suggestions for improving healthcare; and 3. the WRHA’s mission, vision and values.
II. Survey Framework Survey Team:
Executive Sponsor: Dan Skwarchuk, Senior Executive Director, Division of Quality and System Performance,
(204-926-7021)
Survey Lead: Kim Warner, Director Education and Projects, Quality Improvement and Patient Safety Unit,
(204-926-7176)
Survey Consultation, Support and Analysis: Evaluation Platform, Centre for Healthcare Innovation,
(Dr. Paul Beaudin, Ms. Ashley Struthers, and Dr. Catherine Charette), (CHI Evaluation Platform: 204-926-7034)
Survey Methodology:
The survey was developed in collaboration with members of the survey team, the WRHA’s communication team, members of the regional senior management team, and the WRHA’s Board.
Separate, yet similar online surveys were developed for the public and staff. Both surveys were created in French and English. Paper copies of the survey were created and distributed to some workplace settings and were also available upon request.
All surveys were accessible via the same URL link that directed participants to the online surveys. The URL link was widely distributed using print media and electronic email distribution, as well as hosting the link on the WRHA’s internal and external websites.
The survey link went live on January 17th, 2015 and remained open until February 15th, 2015.
Completed paper copies of the survey were collected and manually entered into the online survey platform.
This report is intended to provide a summary of the survey findings for both the Public and Staff surveys.
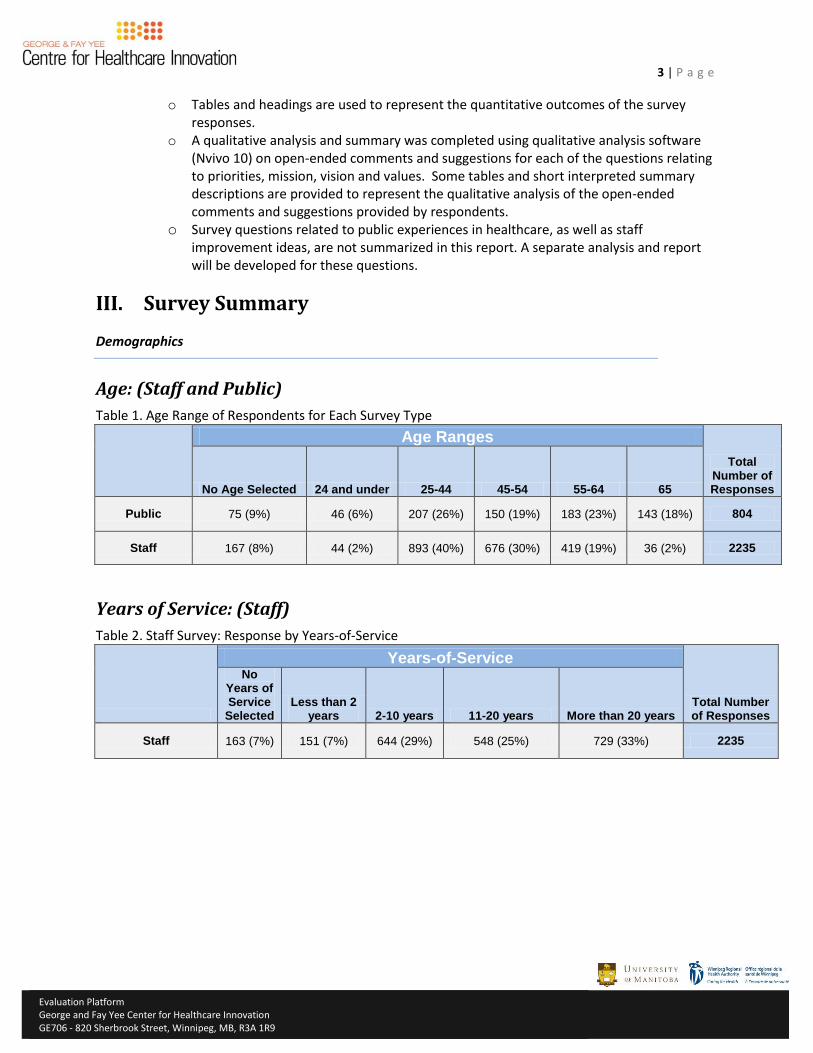
3 | P a g e
Evaluation Platform
George and Fay Yee Center for Healthcare Innovation GE706 - 820 Sherbrook Street, Winnipeg, MB, R3A 1R9
o Tables and headings are used to represent the quantitative outcomes of the survey responses.
o A qualitative analysis and summary was completed using qualitative analysis software (Nvivo 10) on open-ended comments and suggestions for each of the questions relating to priorities, mission, vision and values. Some tables and short interpreted summary descriptions are provided to represent the qualitative analysis of the open-ended comments and suggestions provided by respondents.
o Survey questions related to public experiences in healthcare, as well as staff improvement ideas, are not summarized in this report. A separate analysis and report will be developed for these questions.
III. Survey Summary
Demographics
Age: (Staff and Public)
Table 1. Age Range of Respondents for Each Survey Type
Age Ranges
Total Number of Responses No Age Selected 24 and under 25-44 45-54 55-64 65
Public 75 (9%) 46 (6%) 207 (26%) 150 (19%) 183 (23%) 143 (18%) 804
Staff 167 (8%) 44 (2%) 893 (40%) 676 (30%) 419 (19%) 36 (2%) 2235
Years of Service: (Staff)
Table 2. Staff Survey: Response by Years-of-Service
Years-of-Service
Total Number of Responses
No Years of Service
Selected Less than 2
years 2-10 years 11-20 years More than 20 years
Staff 163 (7%) 151 (7%) 644 (29%) 548 (25%) 729 (33%) 2235
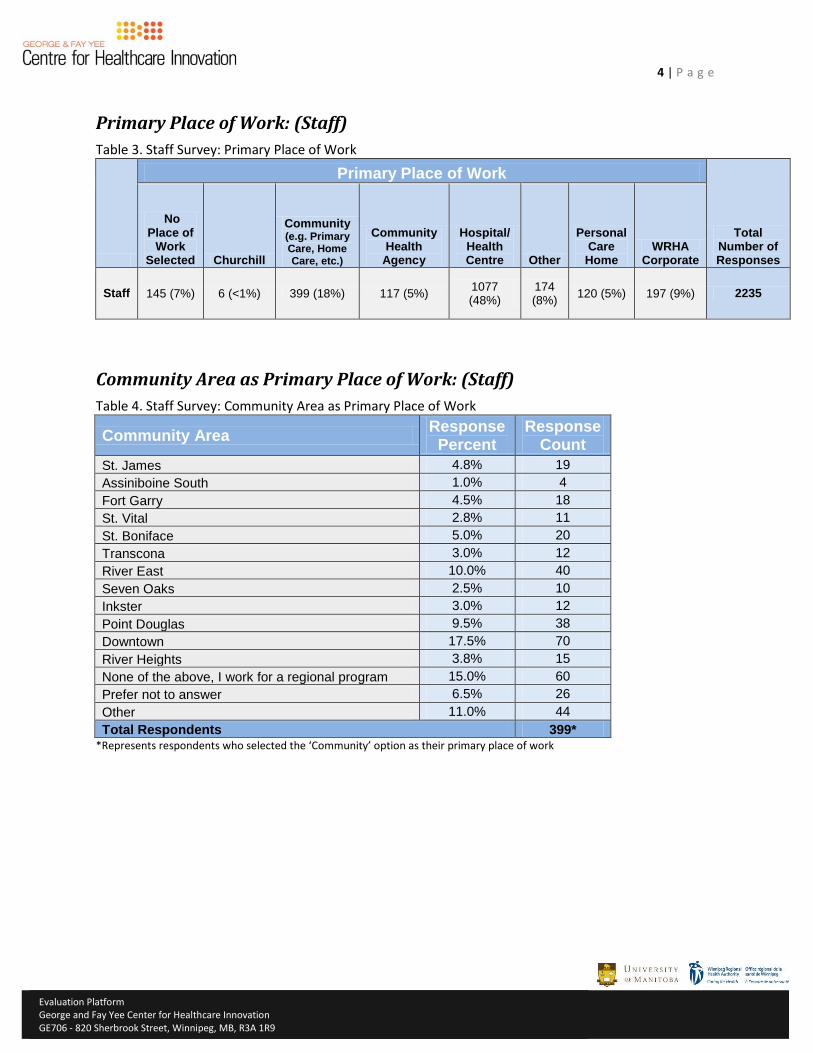
4 | P a g e
Evaluation Platform
George and Fay Yee Center for Healthcare Innovation GE706 - 820 Sherbrook Street, Winnipeg, MB, R3A 1R9
Primary Place of Work: (Staff)
Table 3. Staff Survey: Primary Place of Work
Primary Place of Work
Total Number of Responses
No Place of
Work Selected Churchill
Community (e.g. Primary Care, Home Care, etc.)
Community Health
Agency
Hospital/ Health Centre Other
Personal Care Home
WRHA Corporate
Staff 145 (7%) 6 (<1%) 399 (18%) 117 (5%) 1077 (48%)
174 (8%)
120 (5%) 197 (9%) 2235
Community Area as Primary Place of Work: (Staff)
Table 4. Staff Survey: Community Area as Primary Place of Work
Community Area Response
Percent Response
Count
St. James 4.8% 19
Assiniboine South 1.0% 4
Fort Garry 4.5% 18
St. Vital 2.8% 11
St. Boniface 5.0% 20
Transcona 3.0% 12
River East 10.0% 40
Seven Oaks 2.5% 10
Inkster 3.0% 12
Point Douglas 9.5% 38
Downtown 17.5% 70
River Heights 3.8% 15
None of the above, I work for a regional program 15.0% 60
Prefer not to answer 6.5% 26
Other 11.0% 44
Total Respondents 399* *Represents respondents who selected the ‘Community’ option as their primary place of work
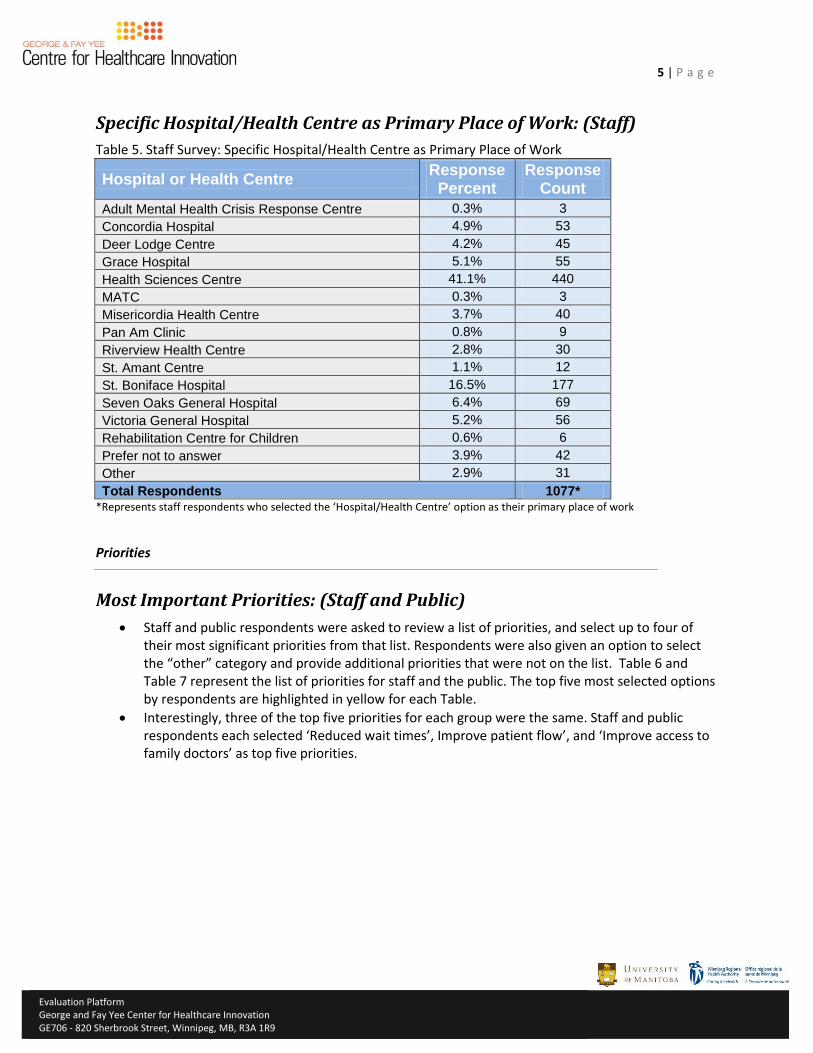
5 | P a g e
Evaluation Platform
George and Fay Yee Center for Healthcare Innovation GE706 - 820 Sherbrook Street, Winnipeg, MB, R3A 1R9
Specific Hospital/Health Centre as Primary Place of Work: (Staff)
Table 5. Staff Survey: Specific Hospital/Health Centre as Primary Place of Work
Hospital or Health Centre Response
Percent Response
Count
Adult Mental Health Crisis Response Centre 0.3% 3
Concordia Hospital 4.9% 53
Deer Lodge Centre 4.2% 45
Grace Hospital 5.1% 55
Health Sciences Centre 41.1% 440
MATC 0.3% 3
Misericordia Health Centre 3.7% 40
Pan Am Clinic 0.8% 9
Riverview Health Centre 2.8% 30
St. Amant Centre 1.1% 12
St. Boniface Hospital 16.5% 177
Seven Oaks General Hospital 6.4% 69
Victoria General Hospital 5.2% 56
Rehabilitation Centre for Children 0.6% 6
Prefer not to answer 3.9% 42
Other 2.9% 31
Total Respondents 1077* *Represents staff respondents who selected the ‘Hospital/Health Centre’ option as their primary place of work
Priorities
Most Important Priorities: (Staff and Public)
Staff and public respondents were asked to review a list of priorities, and select up to four of their most significant priorities from that list. Respondents were also given an option to select the “other” category and provide additional priorities that were not on the list. Table 6 and Table 7 represent the list of priorities for staff and the public. The top five most selected options by respondents are highlighted in yellow for each Table.
Interestingly, three of the top five priorities for each group were the same. Staff and public respondents each selected ‘Reduced wait times’, Improve patient flow’, and ‘Improve access to family doctors’ as top five priorities.
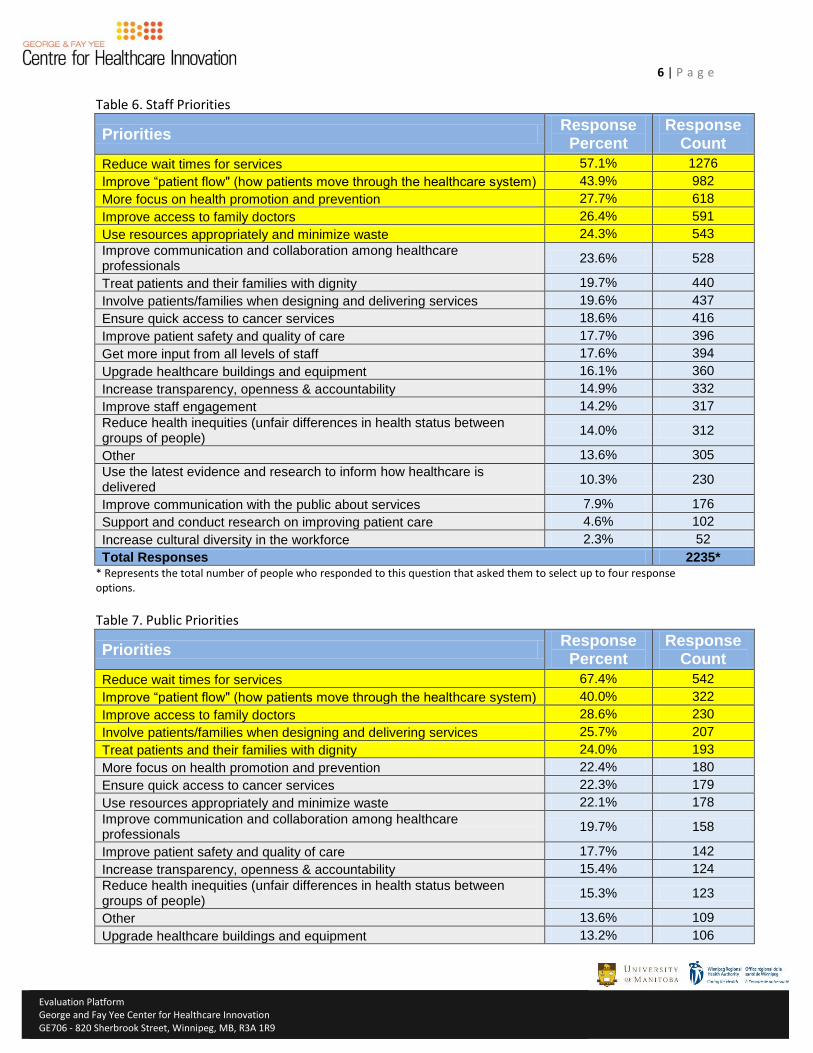
6 | P a g e
Evaluation Platform
George and Fay Yee Center for Healthcare Innovation GE706 - 820 Sherbrook Street, Winnipeg, MB, R3A 1R9
Table 6. Staff Priorities
Priorities Response
Percent Response
Count
Reduce wait times for services 57.1% 1276
Improve “patient flow" (how patients move through the healthcare system) 43.9% 982
More focus on health promotion and prevention 27.7% 618
Improve access to family doctors 26.4% 591
Use resources appropriately and minimize waste 24.3% 543
Improve communication and collaboration among healthcare professionals
23.6% 528
Treat patients and their families with dignity 19.7% 440
Involve patients/families when designing and delivering services 19.6% 437
Ensure quick access to cancer services 18.6% 416
Improve patient safety and quality of care 17.7% 396
Get more input from all levels of staff 17.6% 394
Upgrade healthcare buildings and equipment 16.1% 360
Increase transparency, openness & accountability 14.9% 332
Improve staff engagement 14.2% 317
Reduce health inequities (unfair differences in health status between groups of people)
14.0% 312
Other 13.6% 305
Use the latest evidence and research to inform how healthcare is delivered
10.3% 230
Improve communication with the public about services 7.9% 176
Support and conduct research on improving patient care 4.6% 102
Increase cultural diversity in the workforce 2.3% 52
Total Responses 2235* * Represents the total number of people who responded to this question that asked them to select up to four response options.
Table 7. Public Priorities
Priorities Response
Percent Response
Count
Reduce wait times for services 67.4% 542
Improve “patient flow" (how patients move through the healthcare system) 40.0% 322
Improve access to family doctors 28.6% 230
Involve patients/families when designing and delivering services 25.7% 207
Treat patients and their families with dignity 24.0% 193
More focus on health promotion and prevention 22.4% 180
Ensure quick access to cancer services 22.3% 179
Use resources appropriately and minimize waste 22.1% 178
Improve communication and collaboration among healthcare professionals
19.7% 158
Improve patient safety and quality of care 17.7% 142
Increase transparency, openness & accountability 15.4% 124
Reduce health inequities (unfair differences in health status between groups of people)
15.3% 123
Other 13.6% 109
Upgrade healthcare buildings and equipment 13.2% 106
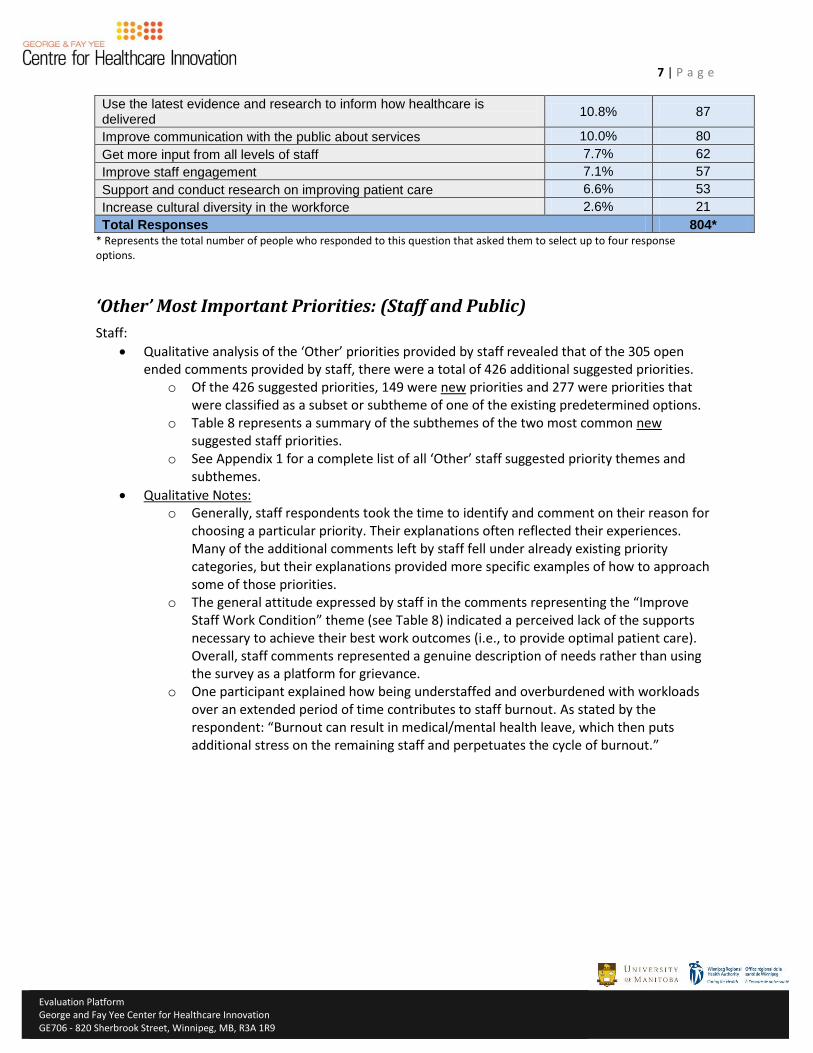
7 | P a g e
Evaluation Platform
George and Fay Yee Center for Healthcare Innovation GE706 - 820 Sherbrook Street, Winnipeg, MB, R3A 1R9
Use the latest evidence and research to inform how healthcare is delivered
10.8% 87
Improve communication with the public about services 10.0% 80
Get more input from all levels of staff 7.7% 62
Improve staff engagement 7.1% 57
Support and conduct research on improving patient care 6.6% 53
Increase cultural diversity in the workforce 2.6% 21
Total Responses 804* * Represents the total number of people who responded to this question that asked them to select up to four response options.
‘Other’ Most Important Priorities: (Staff and Public)
Staff:
Qualitative analysis of the ‘Other’ priorities provided by staff revealed that of the 305 open ended comments provided by staff, there were a total of 426 additional suggested priorities.
o Of the 426 suggested priorities, 149 were new priorities and 277 were priorities that were classified as a subset or subtheme of one of the existing predetermined options.
o Table 8 represents a summary of the subthemes of the two most common new suggested staff priorities.
o See Appendix 1 for a complete list of all ‘Other’ staff suggested priority themes and subthemes.
Qualitative Notes: o Generally, staff respondents took the time to identify and comment on their reason for
choosing a particular priority. Their explanations often reflected their experiences. Many of the additional comments left by staff fell under already existing priority categories, but their explanations provided more specific examples of how to approach some of those priorities.
o The general attitude expressed by staff in the comments representing the “Improve Staff Work Condition” theme (see Table 8) indicated a perceived lack of the supports necessary to achieve their best work outcomes (i.e., to provide optimal patient care). Overall, staff comments represented a genuine description of needs rather than using the survey as a platform for grievance.
o One participant explained how being understaffed and overburdened with workloads over an extended period of time contributes to staff burnout. As stated by the respondent: “Burnout can result in medical/mental health leave, which then puts additional stress on the remaining staff and perpetuates the cycle of burnout.”
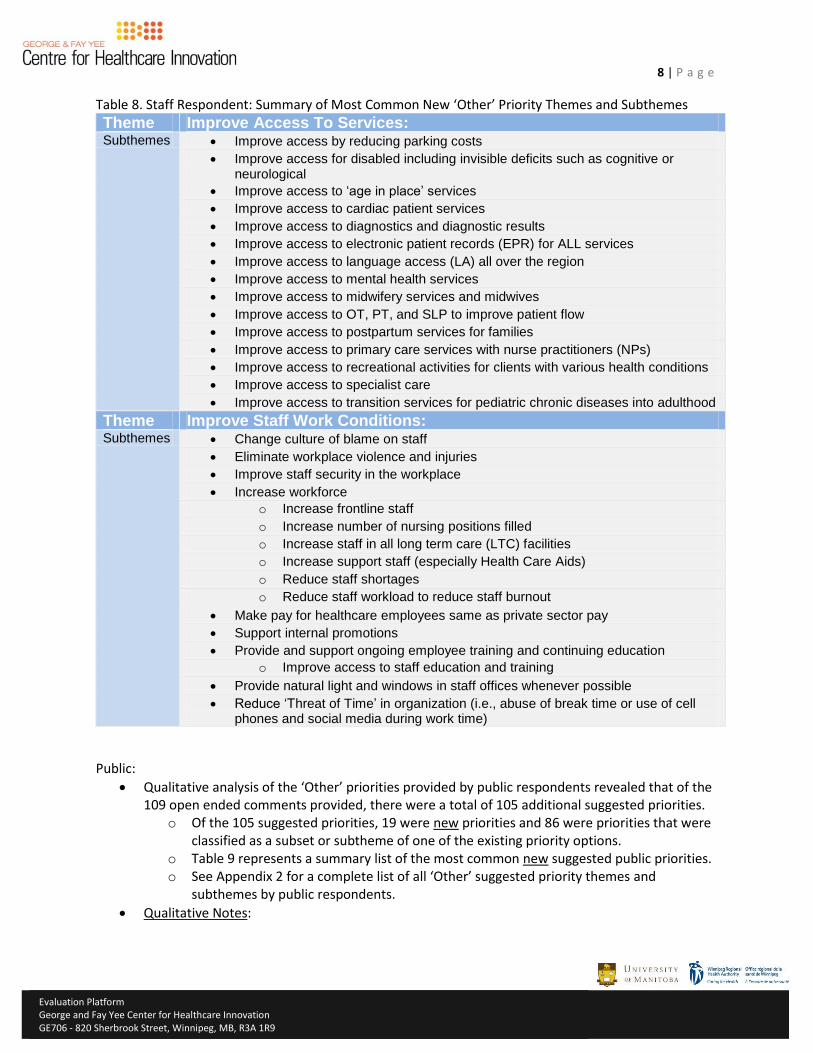
8 | P a g e
Evaluation Platform
George and Fay Yee Center for Healthcare Innovation GE706 - 820 Sherbrook Street, Winnipeg, MB, R3A 1R9
Table 8. Staff Respondent: Summary of Most Common New ‘Other’ Priority Themes and Subthemes
Theme Improve Access To Services: Subthemes Improve access by reducing parking costs
Improve access for disabled including invisible deficits such as cognitive or neurological
Improve access to ‘age in place’ services
Improve access to cardiac patient services
Improve access to diagnostics and diagnostic results
Improve access to electronic patient records (EPR) for ALL services
Improve access to language access (LA) all over the region
Improve access to mental health services
Improve access to midwifery services and midwives
Improve access to OT, PT, and SLP to improve patient flow
Improve access to postpartum services for families
Improve access to primary care services with nurse practitioners (NPs)
Improve access to recreational activities for clients with various health conditions
Improve access to specialist care
Improve access to transition services for pediatric chronic diseases into adulthood
Theme Improve Staff Work Conditions: Subthemes Change culture of blame on staff
Eliminate workplace violence and injuries
Improve staff security in the workplace
Increase workforce
o Increase frontline staff
o Increase number of nursing positions filled
o Increase staff in all long term care (LTC) facilities
o Increase support staff (especially Health Care Aids)
o Reduce staff shortages
o Reduce staff workload to reduce staff burnout
Make pay for healthcare employees same as private sector pay
Support internal promotions
Provide and support ongoing employee training and continuing education
o Improve access to staff education and training
Provide natural light and windows in staff offices whenever possible
Reduce ‘Threat of Time’ in organization (i.e., abuse of break time or use of cell phones and social media during work time)
Public:
Qualitative analysis of the ‘Other’ priorities provided by public respondents revealed that of the 109 open ended comments provided, there were a total of 105 additional suggested priorities.
o Of the 105 suggested priorities, 19 were new priorities and 86 were priorities that were classified as a subset or subtheme of one of the existing priority options.
o Table 9 represents a summary list of the most common new suggested public priorities. o See Appendix 2 for a complete list of all ‘Other’ suggested priority themes and
subthemes by public respondents.
Qualitative Notes:
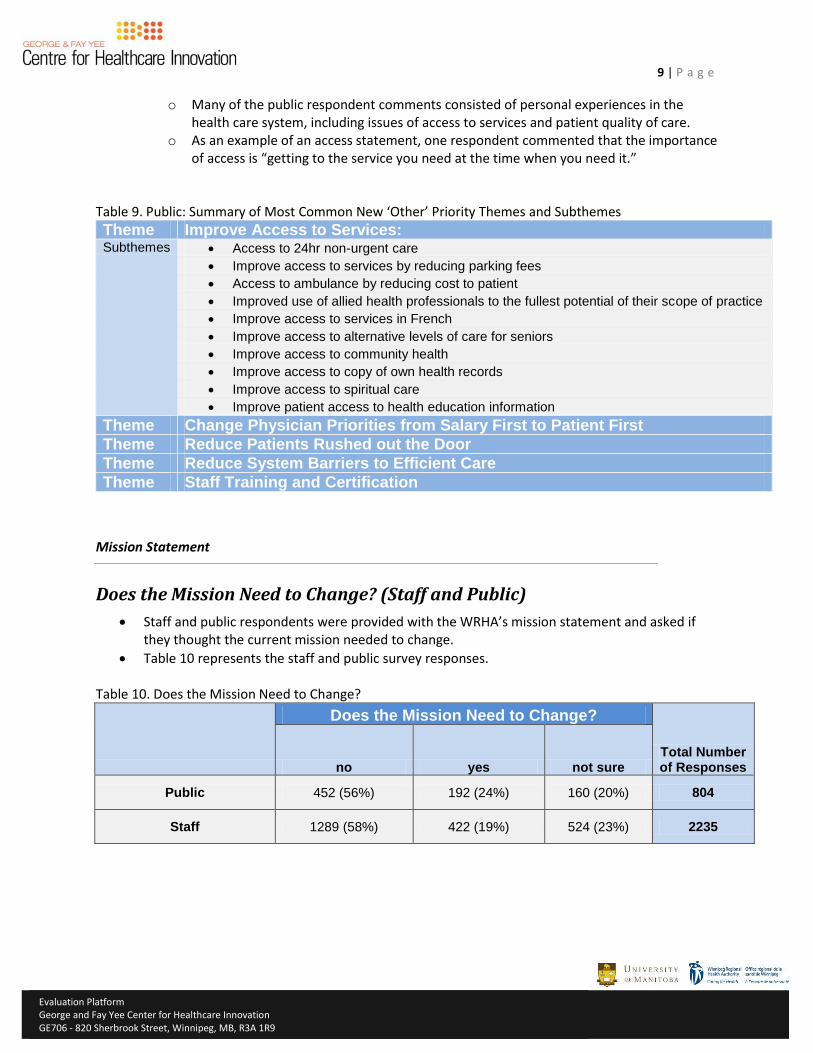
9 | P a g e
Evaluation Platform
George and Fay Yee Center for Healthcare Innovation GE706 - 820 Sherbrook Street, Winnipeg, MB, R3A 1R9
o Many of the public respondent comments consisted of personal experiences in the health care system, including issues of access to services and patient quality of care.
o As an example of an access statement, one respondent commented that the importance of access is “getting to the service you need at the time when you need it.”
Table 9. Public: Summary of Most Common New ‘Other’ Priority Themes and Subthemes
Theme Improve Access to Services: Subthemes Access to 24hr non-urgent care
Improve access to services by reducing parking fees
Access to ambulance by reducing cost to patient
Improved use of allied health professionals to the fullest potential of their scope of practice
Improve access to services in French
Improve access to alternative levels of care for seniors
Improve access to community health
Improve access to copy of own health records
Improve access to spiritual care
Improve patient access to health education information
Theme Change Physician Priorities from Salary First to Patient First
Theme Reduce Patients Rushed out the Door
Theme Reduce System Barriers to Efficient Care
Theme Staff Training and Certification
Mission Statement
Does the Mission Need to Change? (Staff and Public)
Staff and public respondents were provided with the WRHA’s mission statement and asked if they thought the current mission needed to change.
Table 10 represents the staff and public survey responses.
Table 10. Does the Mission Need to Change?
Does the Mission Need to Change?
Total Number of Responses no yes not sure
Public 452 (56%) 192 (24%) 160 (20%) 804
Staff 1289 (58%) 422 (19%) 524 (23%) 2235
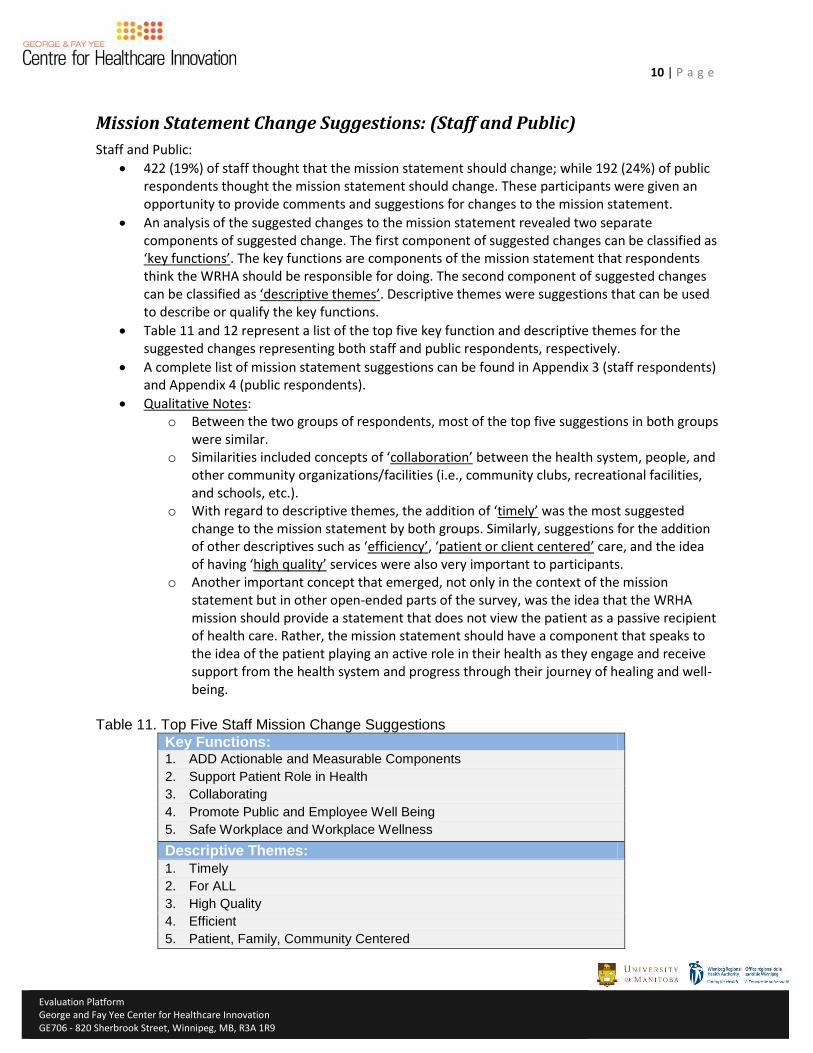
10 | P a g e
Evaluation Platform
George and Fay Yee Center for Healthcare Innovation GE706 - 820 Sherbrook Street, Winnipeg, MB, R3A 1R9
Mission Statement Change Suggestions: (Staff and Public)
Staff and Public:
422 (19%) of staff thought that the mission statement should change; while 192 (24%) of public respondents thought the mission statement should change. These participants were given an opportunity to provide comments and suggestions for changes to the mission statement.
An analysis of the suggested changes to the mission statement revealed two separate components of suggested change. The first component of suggested changes can be classified as ‘key functions’. The key functions are components of the mission statement that respondents think the WRHA should be responsible for doing. The second component of suggested changes can be classified as ‘descriptive themes’. Descriptive themes were suggestions that can be used to describe or qualify the key functions.
Table 11 and 12 represent a list of the top five key function and descriptive themes for the suggested changes representing both staff and public respondents, respectively.
A complete list of mission statement suggestions can be found in Appendix 3 (staff respondents) and Appendix 4 (public respondents).
Qualitative Notes: o Between the two groups of respondents, most of the top five suggestions in both groups
were similar. o Similarities included concepts of ‘collaboration’ between the health system, people, and
other community organizations/facilities (i.e., community clubs, recreational facilities, and schools, etc.).
o With regard to descriptive themes, the addition of ‘timely’ was the most suggested change to the mission statement by both groups. Similarly, suggestions for the addition of other descriptives such as ‘efficiency’, ‘patient or client centered’ care, and the idea of having ‘high quality’ services were also very important to participants.
o Another important concept that emerged, not only in the context of the mission statement but in other open-ended parts of the survey, was the idea that the WRHA mission should provide a statement that does not view the patient as a passive recipient of health care. Rather, the mission statement should have a component that speaks to the idea of the patient playing an active role in their health as they engage and receive support from the health system and progress through their journey of healing and well-being.
Table 11. Top Five Staff Mission Change Suggestions
Key Functions: 1. ADD Actionable and Measurable Components
2. Support Patient Role in Health
3. Collaborating
4. Promote Public and Employee Well Being
5. Safe Workplace and Workplace Wellness
Descriptive Themes:
1. Timely
2. For ALL
3. High Quality
4. Efficient
5. Patient, Family, Community Centered
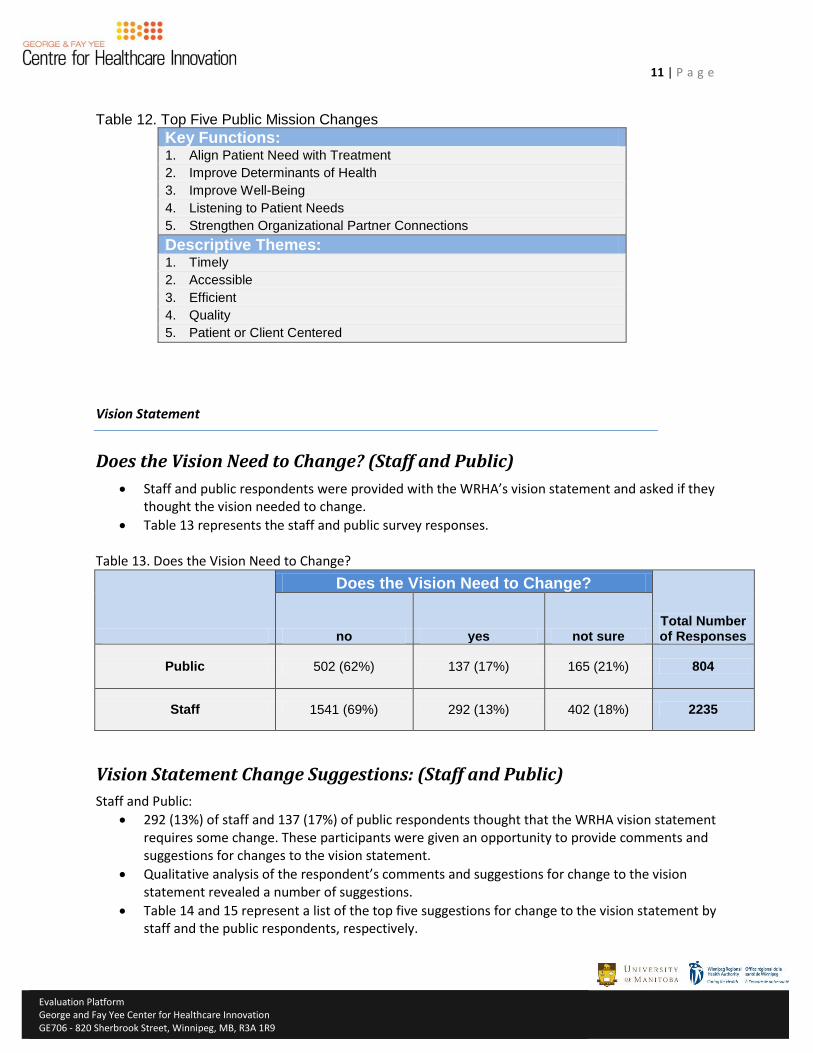
11 | P a g e
Evaluation Platform
George and Fay Yee Center for Healthcare Innovation GE706 - 820 Sherbrook Street, Winnipeg, MB, R3A 1R9
Table 12. Top Five Public Mission Changes
Key Functions: 1. Align Patient Need with Treatment
2. Improve Determinants of Health
3. Improve Well-Being
4. Listening to Patient Needs
5. Strengthen Organizational Partner Connections
Descriptive Themes: 1. Timely
2. Accessible
3. Efficient
4. Quality
5. Patient or Client Centered
Vision Statement
Does the Vision Need to Change? (Staff and Public)
Staff and public respondents were provided with the WRHA’s vision statement and asked if they thought the vision needed to change.
Table 13 represents the staff and public survey responses. Table 13. Does the Vision Need to Change?
Does the Vision Need to Change?
Total Number of Responses no yes not sure
Public 502 (62%) 137 (17%) 165 (21%) 804
Staff 1541 (69%) 292 (13%) 402 (18%) 2235
Vision Statement Change Suggestions: (Staff and Public)
Staff and Public:
292 (13%) of staff and 137 (17%) of public respondents thought that the WRHA vision statement requires some change. These participants were given an opportunity to provide comments and suggestions for changes to the vision statement.
Qualitative analysis of the respondent’s comments and suggestions for change to the vision statement revealed a number of suggestions.
Table 14 and 15 represent a list of the top five suggestions for change to the vision statement by staff and the public respondents, respectively.
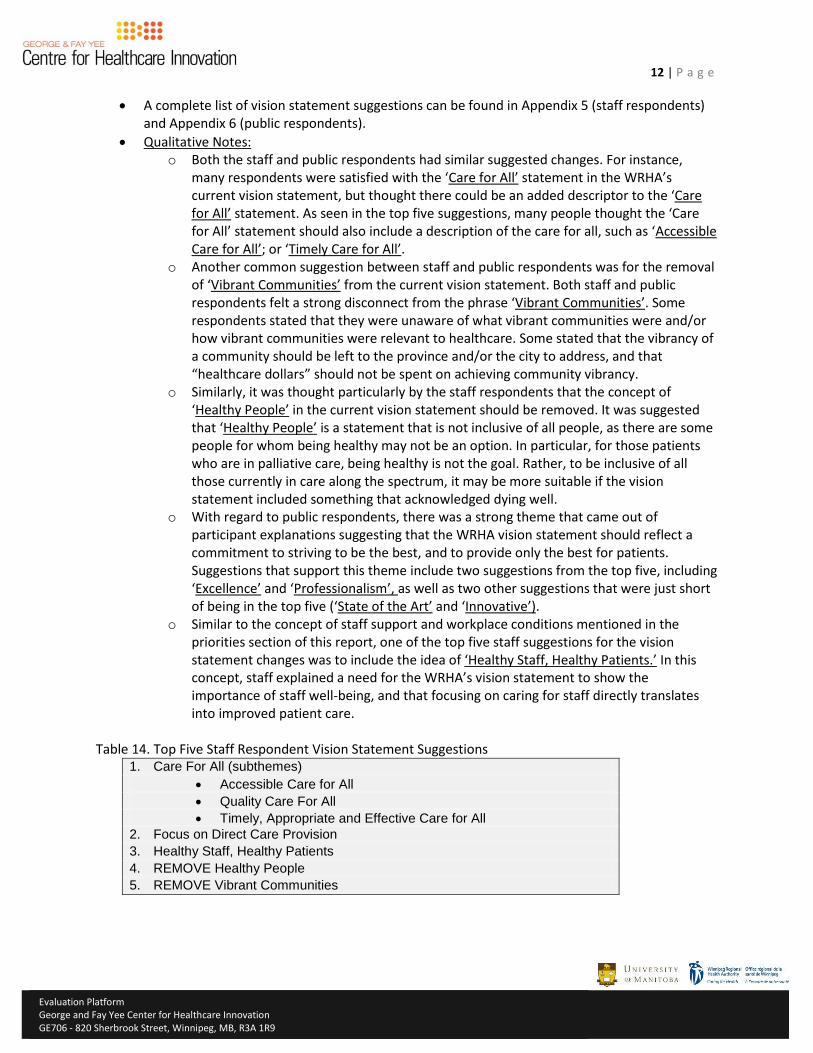
12 | P a g e
Evaluation Platform
George and Fay Yee Center for Healthcare Innovation GE706 - 820 Sherbrook Street, Winnipeg, MB, R3A 1R9
A complete list of vision statement suggestions can be found in Appendix 5 (staff respondents) and Appendix 6 (public respondents).
Qualitative Notes: o Both the staff and public respondents had similar suggested changes. For instance,
many respondents were satisfied with the ‘Care for All’ statement in the WRHA’s current vision statement, but thought there could be an added descriptor to the ‘Care for All’ statement. As seen in the top five suggestions, many people thought the ‘Care for All’ statement should also include a description of the care for all, such as ‘Accessible Care for All’; or ‘Timely Care for All’.
o Another common suggestion between staff and public respondents was for the removal of ‘Vibrant Communities’ from the current vision statement. Both staff and public respondents felt a strong disconnect from the phrase ‘Vibrant Communities’. Some respondents stated that they were unaware of what vibrant communities were and/or how vibrant communities were relevant to healthcare. Some stated that the vibrancy of a community should be left to the province and/or the city to address, and that “healthcare dollars” should not be spent on achieving community vibrancy.
o Similarly, it was thought particularly by the staff respondents that the concept of ‘Healthy People’ in the current vision statement should be removed. It was suggested that ‘Healthy People’ is a statement that is not inclusive of all people, as there are some people for whom being healthy may not be an option. In particular, for those patients who are in palliative care, being healthy is not the goal. Rather, to be inclusive of all those currently in care along the spectrum, it may be more suitable if the vision statement included something that acknowledged dying well.
o With regard to public respondents, there was a strong theme that came out of participant explanations suggesting that the WRHA vision statement should reflect a commitment to striving to be the best, and to provide only the best for patients. Suggestions that support this theme include two suggestions from the top five, including ‘Excellence’ and ‘Professionalism’, as well as two other suggestions that were just short of being in the top five (‘State of the Art’ and ‘Innovative’).
o Similar to the concept of staff support and workplace conditions mentioned in the priorities section of this report, one of the top five staff suggestions for the vision statement changes was to include the idea of ‘Healthy Staff, Healthy Patients.’ In this concept, staff explained a need for the WRHA’s vision statement to show the importance of staff well-being, and that focusing on caring for staff directly translates into improved patient care.
Table 14. Top Five Staff Respondent Vision Statement Suggestions 1. Care For All (subthemes)
Accessible Care for All
Quality Care For All
Timely, Appropriate and Effective Care for All
2. Focus on Direct Care Provision
3. Healthy Staff, Healthy Patients
4. REMOVE Healthy People
5. REMOVE Vibrant Communities
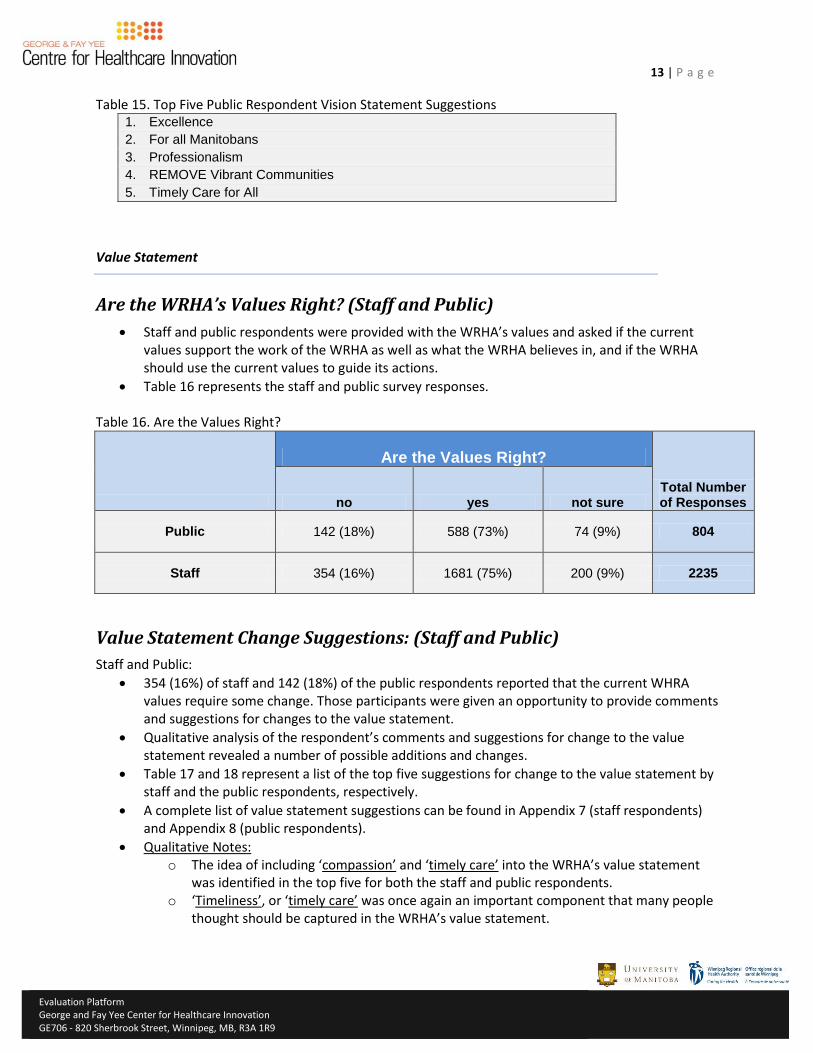
13 | P a g e
Evaluation Platform
George and Fay Yee Center for Healthcare Innovation GE706 - 820 Sherbrook Street, Winnipeg, MB, R3A 1R9
Table 15. Top Five Public Respondent Vision Statement Suggestions 1. Excellence
2. For all Manitobans
3. Professionalism
4. REMOVE Vibrant Communities
5. Timely Care for All
Value Statement
Are the WRHA’s Values Right? (Staff and Public)
Staff and public respondents were provided with the WRHA’s values and asked if the current values support the work of the WRHA as well as what the WRHA believes in, and if the WRHA should use the current values to guide its actions.
Table 16 represents the staff and public survey responses. Table 16. Are the Values Right?
Are the Values Right?
Total Number of Responses no yes not sure
Public 142 (18%) 588 (73%) 74 (9%) 804
Staff 354 (16%) 1681 (75%) 200 (9%) 2235
Value Statement Change Suggestions: (Staff and Public)
Staff and Public:
354 (16%) of staff and 142 (18%) of the public respondents reported that the current WHRA values require some change. Those participants were given an opportunity to provide comments and suggestions for changes to the value statement.
Qualitative analysis of the respondent’s comments and suggestions for change to the value statement revealed a number of possible additions and changes.
Table 17 and 18 represent a list of the top five suggestions for change to the value statement by staff and the public respondents, respectively.
A complete list of value statement suggestions can be found in Appendix 7 (staff respondents) and Appendix 8 (public respondents).
Qualitative Notes: o The idea of including ‘compassion’ and ‘timely care’ into the WRHA’s value statement
was identified in the top five for both the staff and public respondents. o ‘Timeliness’, or ‘timely care’ was once again an important component that many people
thought should be captured in the WRHA’s value statement.
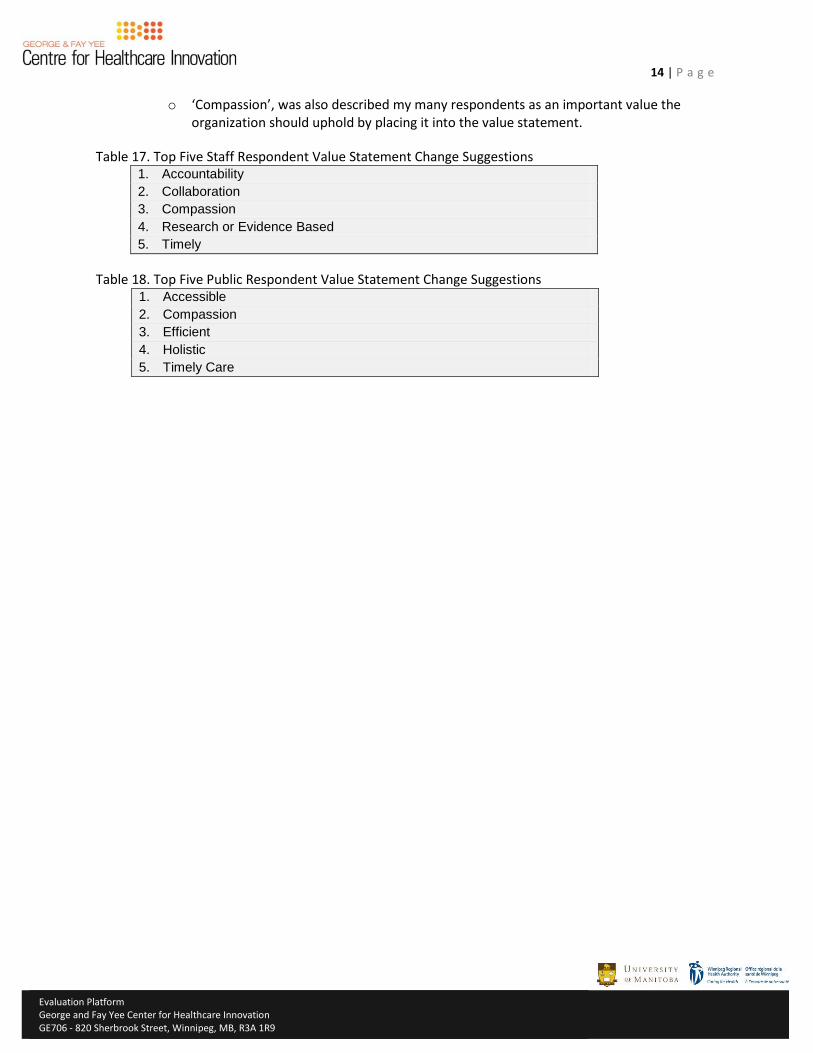
14 | P a g e
Evaluation Platform
George and Fay Yee Center for Healthcare Innovation GE706 - 820 Sherbrook Street, Winnipeg, MB, R3A 1R9
o ‘Compassion’, was also described my many respondents as an important value the organization should uphold by placing it into the value statement.
Table 17. Top Five Staff Respondent Value Statement Change Suggestions 1. Accountability
2. Collaboration
3. Compassion
4. Research or Evidence Based
5. Timely
Table 18. Top Five Public Respondent Value Statement Change Suggestions 1. Accessible
2. Compassion
3. Efficient
4. Holistic
5. Timely Care
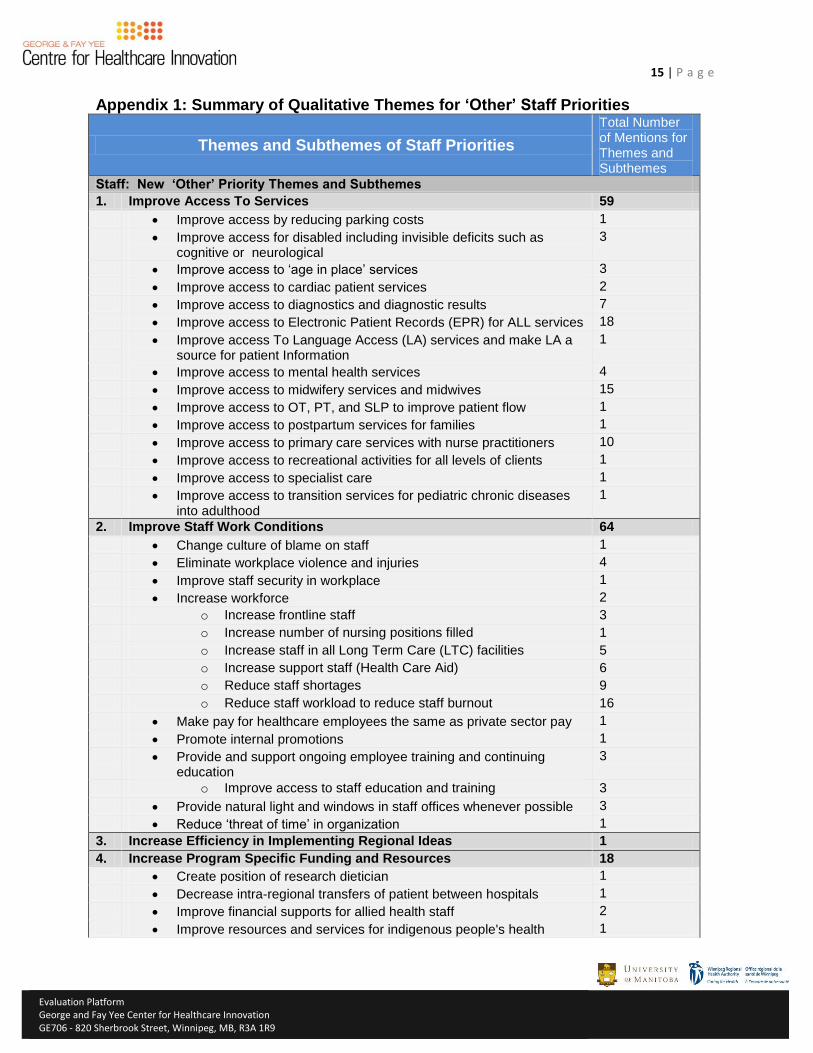
15 | P a g e
Evaluation Platform
George and Fay Yee Center for Healthcare Innovation GE706 - 820 Sherbrook Street, Winnipeg, MB, R3A 1R9
Appendix 1: Summary of Qualitative Themes for ‘Other’ Staff Priorities
Themes and Subthemes of Staff Priorities
Total Number of Mentions for Themes and Subthemes
Staff: New ‘Other’ Priority Themes and Subthemes
1. Improve Access To Services 59
Improve access by reducing parking costs 1
Improve access for disabled including invisible deficits such as cognitive or neurological
3
Improve access to ‘age in place’ services 3
Improve access to cardiac patient services 2
Improve access to diagnostics and diagnostic results 7
Improve access to Electronic Patient Records (EPR) for ALL services 18
Improve access To Language Access (LA) services and make LA a source for patient Information
1
Improve access to mental health services 4
Improve access to midwifery services and midwives 15
Improve access to OT, PT, and SLP to improve patient flow 1
Improve access to postpartum services for families 1
Improve access to primary care services with nurse practitioners 10
Improve access to recreational activities for all levels of clients 1
Improve access to specialist care 1
Improve access to transition services for pediatric chronic diseases into adulthood
1
2. Improve Staff Work Conditions 64
Change culture of blame on staff 1
Eliminate workplace violence and injuries 4
Improve staff security in workplace 1
Increase workforce 2
o Increase frontline staff 3
o Increase number of nursing positions filled 1
o Increase staff in all Long Term Care (LTC) facilities 5
o Increase support staff (Health Care Aid) 6
o Reduce staff shortages 9
o Reduce staff workload to reduce staff burnout 16
Make pay for healthcare employees the same as private sector pay 1
Promote internal promotions 1
Provide and support ongoing employee training and continuing education
3
o Improve access to staff education and training 3
Provide natural light and windows in staff offices whenever possible 3
Reduce ‘threat of time’ in organization 1
3. Increase Efficiency in Implementing Regional Ideas 1
4. Increase Program Specific Funding and Resources 18
Create position of research dietician 1
Decrease intra-regional transfers of patient between hospitals 1
Improve financial supports for allied health staff 2
Improve resources and services for indigenous people's health 1
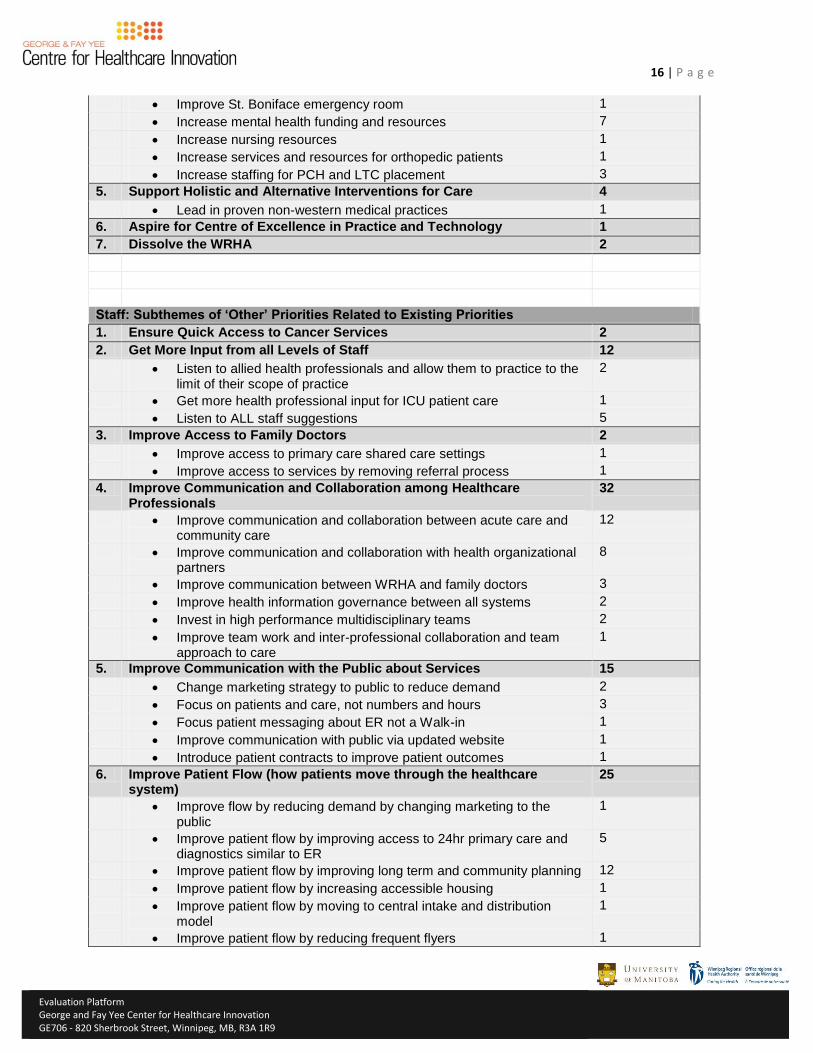
16 | P a g e
Evaluation Platform
George and Fay Yee Center for Healthcare Innovation GE706 - 820 Sherbrook Street, Winnipeg, MB, R3A 1R9
Improve St. Boniface emergency room 1
Increase mental health funding and resources 7
Increase nursing resources 1
Increase services and resources for orthopedic patients 1
Increase staffing for PCH and LTC placement 3
5. Support Holistic and Alternative Interventions for Care 4
Lead in proven non-western medical practices 1
6. Aspire for Centre of Excellence in Practice and Technology 1
7. Dissolve the WRHA 2
Staff: Subthemes of ‘Other’ Priorities Related to Existing Priorities
1. Ensure Quick Access to Cancer Services 2
2. Get More Input from all Levels of Staff 12
Listen to allied health professionals and allow them to practice to the limit of their scope of practice
2
Get more health professional input for ICU patient care 1
Listen to ALL staff suggestions 5
3. Improve Access to Family Doctors 2
Improve access to primary care shared care settings 1
Improve access to services by removing referral process 1
4. Improve Communication and Collaboration among Healthcare Professionals
32
Improve communication and collaboration between acute care and community care
12
Improve communication and collaboration with health organizational partners
8
Improve communication between WRHA and family doctors 3
Improve health information governance between all systems 2
Invest in high performance multidisciplinary teams 2
Improve team work and inter-professional collaboration and team approach to care
1
5. Improve Communication with the Public about Services 15
Change marketing strategy to public to reduce demand 2
Focus on patients and care, not numbers and hours 3
Focus patient messaging about ER not a Walk-in 1
Improve communication with public via updated website 1
Introduce patient contracts to improve patient outcomes 1
6. Improve Patient Flow (how patients move through the healthcare system)
25
Improve flow by reducing demand by changing marketing to the public
1
Improve patient flow by improving access to 24hr primary care and diagnostics similar to ER
5
Improve patient flow by improving long term and community planning 12
Improve patient flow by increasing accessible housing 1
Improve patient flow by moving to central intake and distribution model
1
Improve patient flow by reducing frequent flyers 1
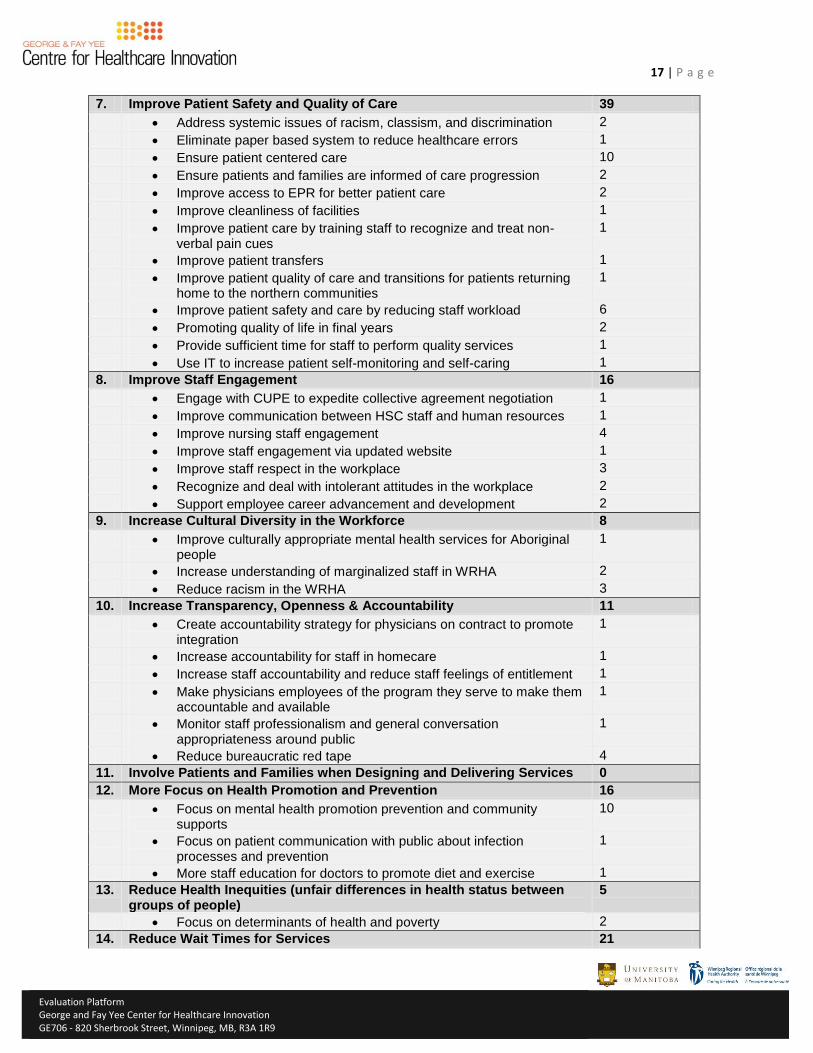
17 | P a g e
Evaluation Platform
George and Fay Yee Center for Healthcare Innovation GE706 - 820 Sherbrook Street, Winnipeg, MB, R3A 1R9
7. Improve Patient Safety and Quality of Care 39
Address systemic issues of racism, classism, and discrimination 2
Eliminate paper based system to reduce healthcare errors 1
Ensure patient centered care 10
Ensure patients and families are informed of care progression 2
Improve access to EPR for better patient care 2
Improve cleanliness of facilities 1
Improve patient care by training staff to recognize and treat non-verbal pain cues
1
Improve patient transfers 1
Improve patient quality of care and transitions for patients returning home to the northern communities
1
Improve patient safety and care by reducing staff workload 6
Promoting quality of life in final years 2
Provide sufficient time for staff to perform quality services 1
Use IT to increase patient self-monitoring and self-caring 1
8. Improve Staff Engagement 16
Engage with CUPE to expedite collective agreement negotiation 1
Improve communication between HSC staff and human resources 1
Improve nursing staff engagement 4
Improve staff engagement via updated website 1
Improve staff respect in the workplace 3
Recognize and deal with intolerant attitudes in the workplace 2
Support employee career advancement and development 2
9. Increase Cultural Diversity in the Workforce 8
Improve culturally appropriate mental health services for Aboriginal people
1
Increase understanding of marginalized staff in WRHA 2
Reduce racism in the WRHA 3
10. Increase Transparency, Openness & Accountability 11
Create accountability strategy for physicians on contract to promote integration
1
Increase accountability for staff in homecare 1
Increase staff accountability and reduce staff feelings of entitlement 1
Make physicians employees of the program they serve to make them accountable and available
1
Monitor staff professionalism and general conversation appropriateness around public
1
Reduce bureaucratic red tape 4
11. Involve Patients and Families when Designing and Delivering Services 0
12. More Focus on Health Promotion and Prevention 16
Focus on mental health promotion prevention and community supports
10
Focus on patient communication with public about infection processes and prevention
1
More staff education for doctors to promote diet and exercise 1
13. Reduce Health Inequities (unfair differences in health status between groups of people)
5
Focus on determinants of health and poverty 2
14. Reduce Wait Times for Services 21
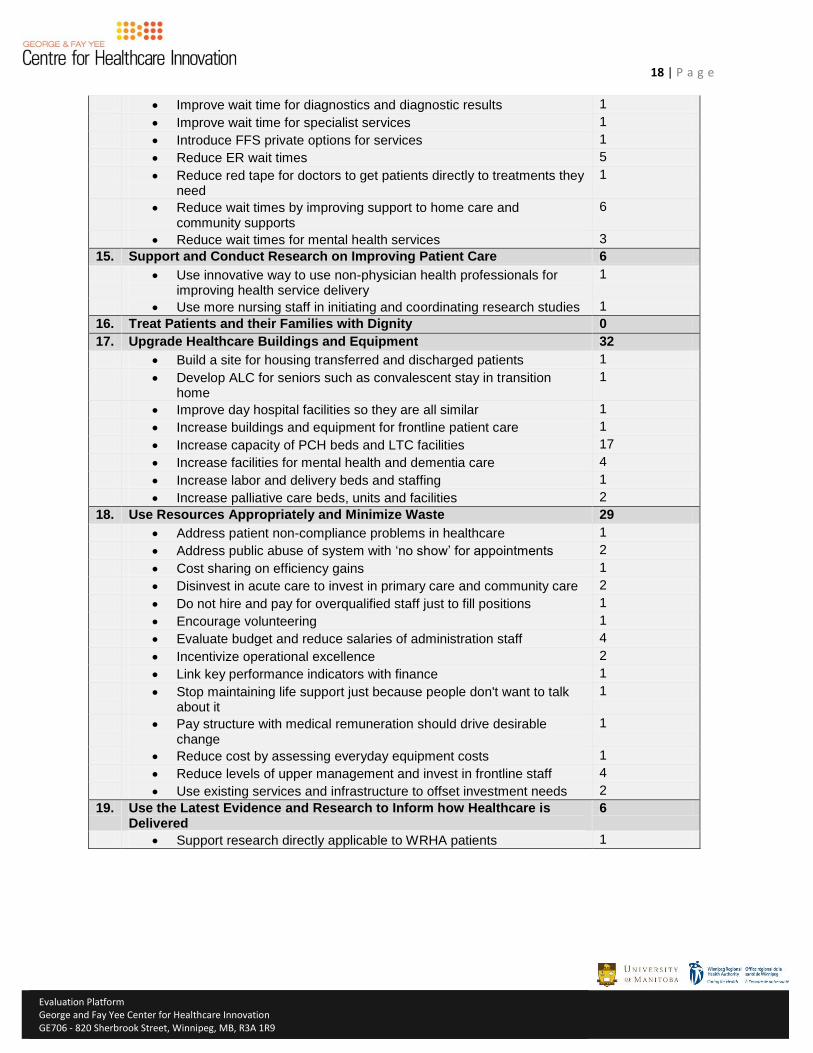
18 | P a g e
Evaluation Platform
George and Fay Yee Center for Healthcare Innovation GE706 - 820 Sherbrook Street, Winnipeg, MB, R3A 1R9
Improve wait time for diagnostics and diagnostic results 1
Improve wait time for specialist services 1
Introduce FFS private options for services 1
Reduce ER wait times 5
Reduce red tape for doctors to get patients directly to treatments they need
1
Reduce wait times by improving support to home care and community supports
6
Reduce wait times for mental health services 3
15. Support and Conduct Research on Improving Patient Care 6
Use innovative way to use non-physician health professionals for improving health service delivery
1
Use more nursing staff in initiating and coordinating research studies 1
16. Treat Patients and their Families with Dignity 0
17. Upgrade Healthcare Buildings and Equipment 32
Build a site for housing transferred and discharged patients 1
Develop ALC for seniors such as convalescent stay in transition home
1
Improve day hospital facilities so they are all similar 1
Increase buildings and equipment for frontline patient care 1
Increase capacity of PCH beds and LTC facilities 17
Increase facilities for mental health and dementia care 4
Increase labor and delivery beds and staffing 1
Increase palliative care beds, units and facilities 2
18. Use Resources Appropriately and Minimize Waste 29
Address patient non-compliance problems in healthcare 1
Address public abuse of system with ‘no show’ for appointments 2
Cost sharing on efficiency gains 1
Disinvest in acute care to invest in primary care and community care 2
Do not hire and pay for overqualified staff just to fill positions 1
Encourage volunteering 1
Evaluate budget and reduce salaries of administration staff 4
Incentivize operational excellence 2
Link key performance indicators with finance 1
Stop maintaining life support just because people don't want to talk about it
1
Pay structure with medical remuneration should drive desirable change
1
Reduce cost by assessing everyday equipment costs 1
Reduce levels of upper management and invest in frontline staff 4
Use existing services and infrastructure to offset investment needs 2
19. Use the Latest Evidence and Research to Inform how Healthcare is Delivered
6
Support research directly applicable to WRHA patients 1
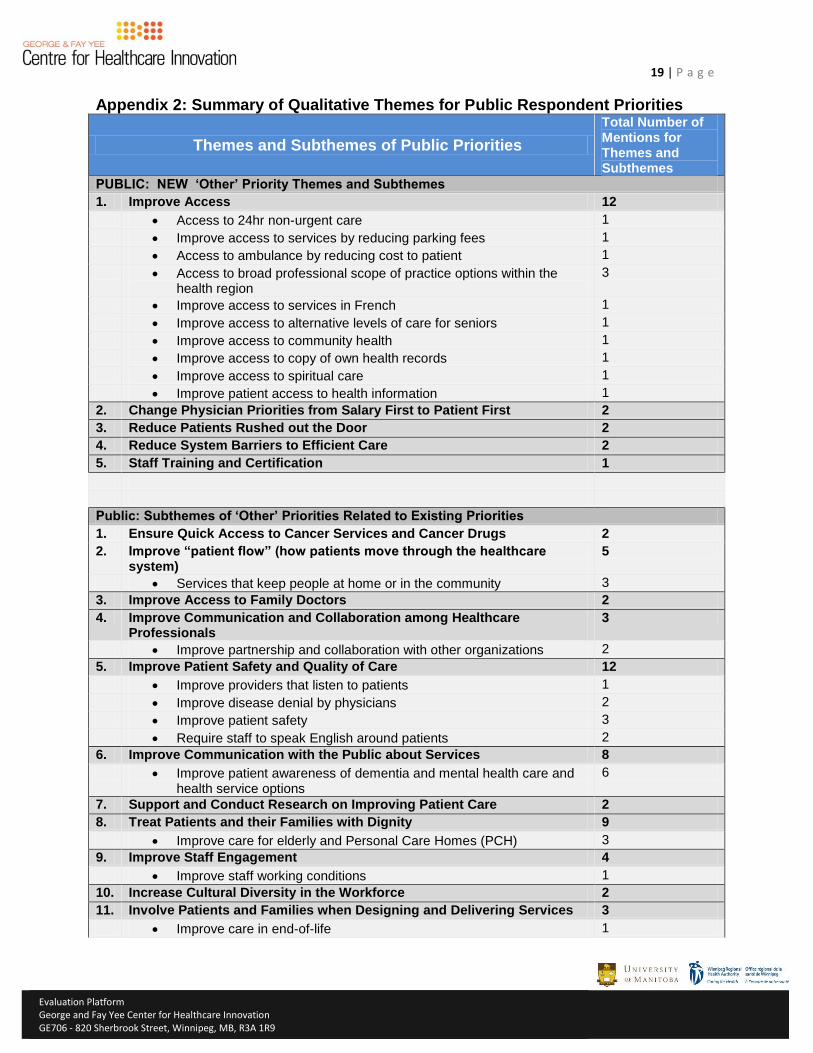
19 | P a g e
Evaluation Platform
George and Fay Yee Center for Healthcare Innovation GE706 - 820 Sherbrook Street, Winnipeg, MB, R3A 1R9
Appendix 2: Summary of Qualitative Themes for Public Respondent Priorities
Themes and Subthemes of Public Priorities
Total Number of Mentions for Themes and Subthemes
PUBLIC: NEW ‘Other’ Priority Themes and Subthemes
1. Improve Access 12
Access to 24hr non-urgent care 1
Improve access to services by reducing parking fees 1
Access to ambulance by reducing cost to patient 1
Access to broad professional scope of practice options within the health region
3
Improve access to services in French 1
Improve access to alternative levels of care for seniors 1
Improve access to community health 1
Improve access to copy of own health records 1
Improve access to spiritual care 1
Improve patient access to health information 1
2. Change Physician Priorities from Salary First to Patient First 2
3. Reduce Patients Rushed out the Door 2
4. Reduce System Barriers to Efficient Care 2
5. Staff Training and Certification 1
Public: Subthemes of ‘Other’ Priorities Related to Existing Priorities
1. Ensure Quick Access to Cancer Services and Cancer Drugs 2
2. Improve “patient flow” (how patients move through the healthcare system)
5
Services that keep people at home or in the community 3
3. Improve Access to Family Doctors 2
4. Improve Communication and Collaboration among Healthcare Professionals
3
Improve partnership and collaboration with other organizations 2
5. Improve Patient Safety and Quality of Care 12
Improve providers that listen to patients 1
Improve disease denial by physicians 2
Improve patient safety 3
Require staff to speak English around patients 2
6. Improve Communication with the Public about Services 8
Improve patient awareness of dementia and mental health care and health service options
6
7. Support and Conduct Research on Improving Patient Care 2
8. Treat Patients and their Families with Dignity 9
Improve care for elderly and Personal Care Homes (PCH) 3
9. Improve Staff Engagement 4
Improve staff working conditions 1
10. Increase Cultural Diversity in the Workforce 2
11. Involve Patients and Families when Designing and Delivering Services 3
Improve care in end-of-life 1
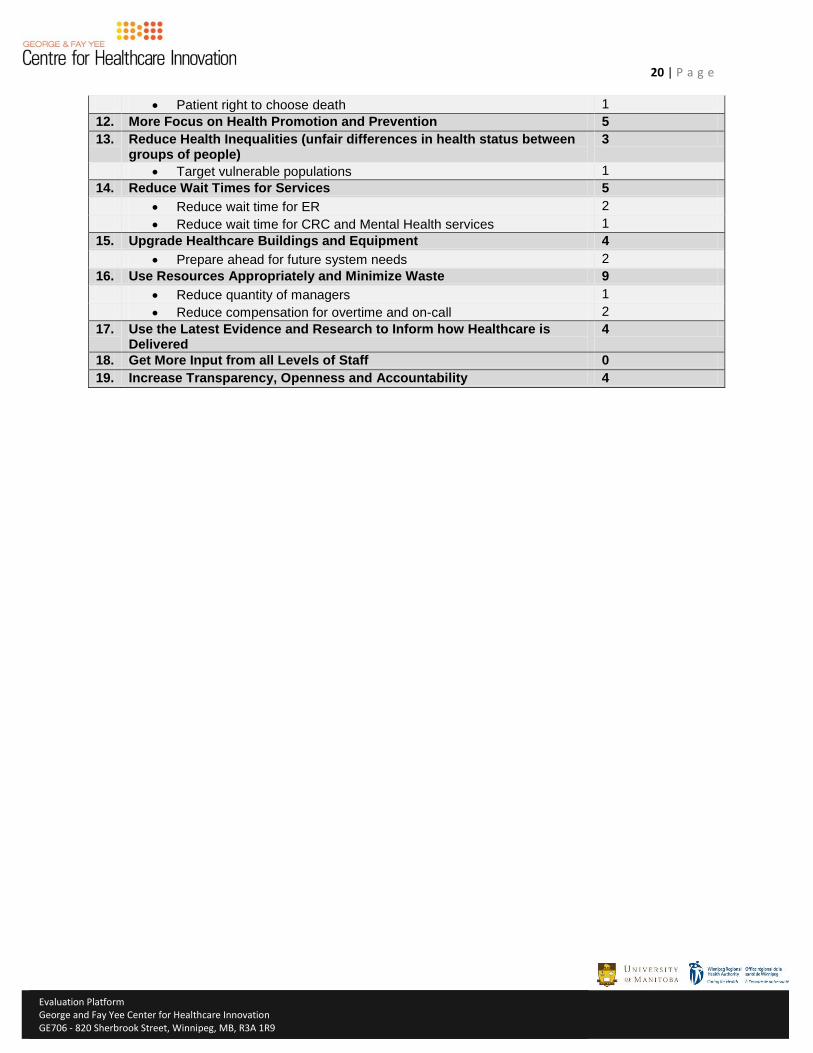
20 | P a g e
Evaluation Platform
George and Fay Yee Center for Healthcare Innovation GE706 - 820 Sherbrook Street, Winnipeg, MB, R3A 1R9
Patient right to choose death 1
12. More Focus on Health Promotion and Prevention 5
13. Reduce Health Inequalities (unfair differences in health status between groups of people)
3
Target vulnerable populations 1
14. Reduce Wait Times for Services 5
Reduce wait time for ER 2
Reduce wait time for CRC and Mental Health services 1
15. Upgrade Healthcare Buildings and Equipment 4
Prepare ahead for future system needs 2
16. Use Resources Appropriately and Minimize Waste 9
Reduce quantity of managers 1
Reduce compensation for overtime and on-call 2
17. Use the Latest Evidence and Research to Inform how Healthcare is Delivered
4
18. Get More Input from all Levels of Staff 0
19. Increase Transparency, Openness and Accountability 4
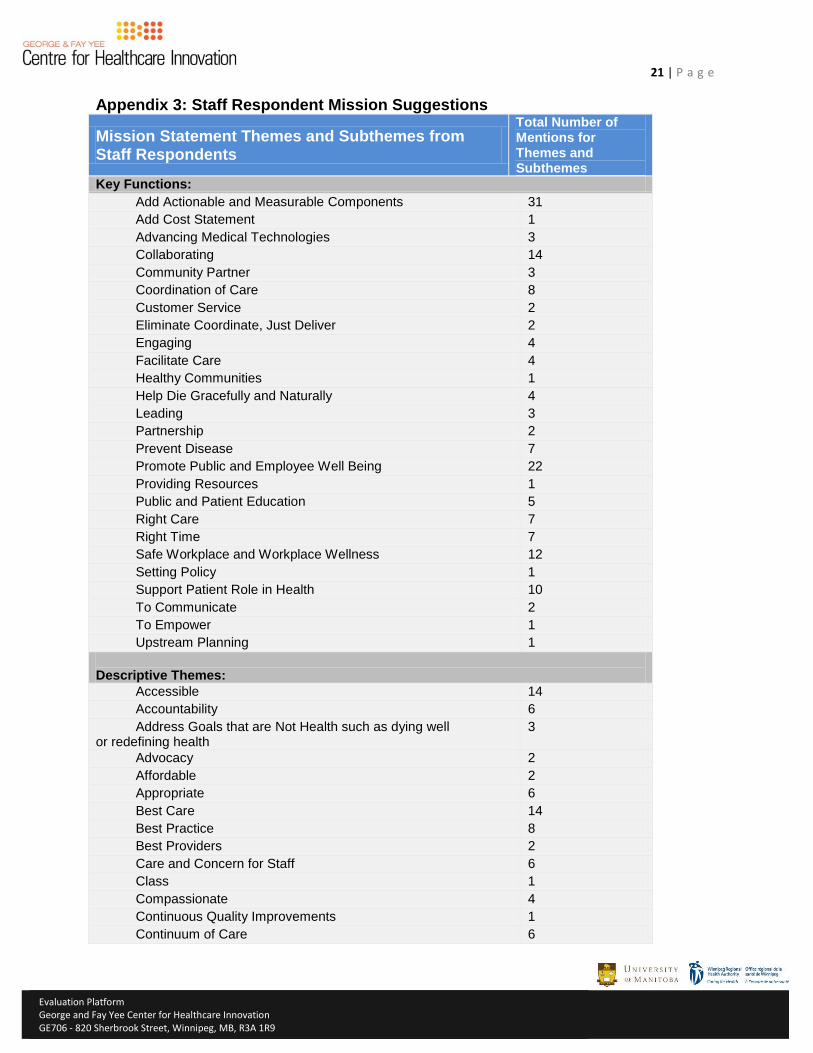
21 | P a g e
Evaluation Platform
George and Fay Yee Center for Healthcare Innovation GE706 - 820 Sherbrook Street, Winnipeg, MB, R3A 1R9
Appendix 3: Staff Respondent Mission Suggestions
Mission Statement Themes and Subthemes from Staff Respondents
Total Number of Mentions for Themes and Subthemes
Key Functions:
Add Actionable and Measurable Components 31
Add Cost Statement 1
Advancing Medical Technologies 3
Collaborating 14
Community Partner 3
Coordination of Care 8
Customer Service 2
Eliminate Coordinate, Just Deliver 2
Engaging 4
Facilitate Care 4
Healthy Communities 1
Help Die Gracefully and Naturally 4
Leading 3
Partnership 2
Prevent Disease 7
Promote Public and Employee Well Being 22
Providing Resources 1
Public and Patient Education 5
Right Care 7
Right Time 7
Safe Workplace and Workplace Wellness 12
Setting Policy 1
Support Patient Role in Health 10
To Communicate 2
To Empower 1
Upstream Planning 1
Descriptive Themes:
Accessible 14
Accountability 6
Address Goals that are Not Health such as dying well or redefining health
3
Advocacy 2
Affordable 2
Appropriate 6
Best Care 14
Best Practice 8
Best Providers 2
Care and Concern for Staff 6
Class 1
Compassionate 4
Continuous Quality Improvements 1
Continuum of Care 6
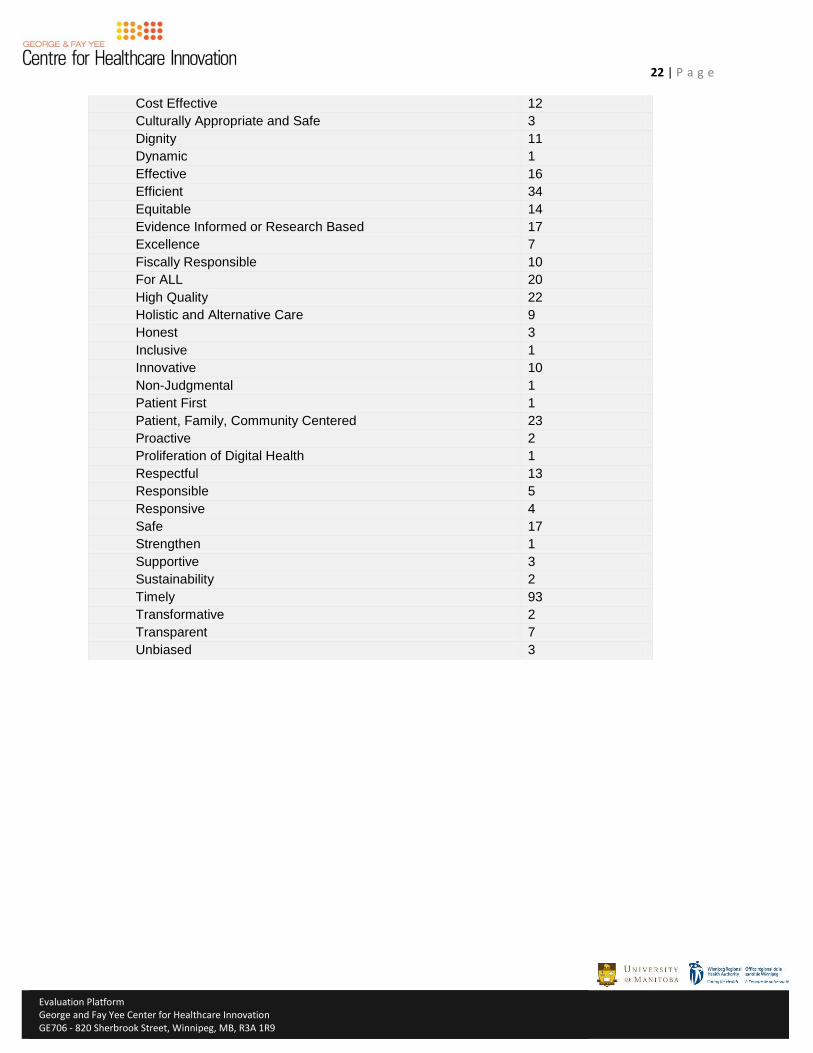
22 | P a g e
Evaluation Platform
George and Fay Yee Center for Healthcare Innovation GE706 - 820 Sherbrook Street, Winnipeg, MB, R3A 1R9
Cost Effective 12
Culturally Appropriate and Safe 3
Dignity 11
Dynamic 1
Effective 16
Efficient 34
Equitable 14
Evidence Informed or Research Based 17
Excellence 7
Fiscally Responsible 10
For ALL 20
High Quality 22
Holistic and Alternative Care 9
Honest 3
Inclusive 1
Innovative 10
Non-Judgmental 1
Patient First 1
Patient, Family, Community Centered 23
Proactive 2
Proliferation of Digital Health 1
Respectful 13
Responsible 5
Responsive 4
Safe 17
Strengthen 1
Supportive 3
Sustainability 2
Timely 93
Transformative 2
Transparent 7
Unbiased 3
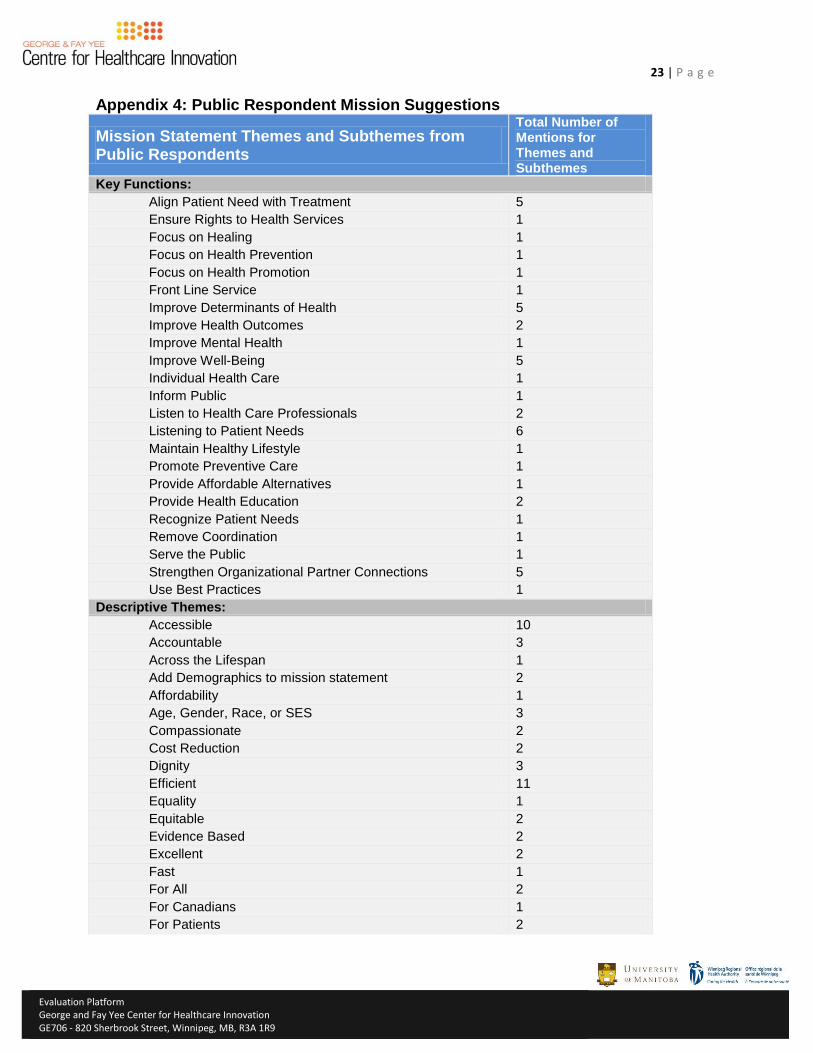
23 | P a g e
Evaluation Platform
George and Fay Yee Center for Healthcare Innovation GE706 - 820 Sherbrook Street, Winnipeg, MB, R3A 1R9
Appendix 4: Public Respondent Mission Suggestions
Mission Statement Themes and Subthemes from Public Respondents
Total Number of Mentions for Themes and Subthemes
Key Functions:
Align Patient Need with Treatment 5
Ensure Rights to Health Services 1
Focus on Healing 1
Focus on Health Prevention 1
Focus on Health Promotion 1
Front Line Service 1
Improve Determinants of Health 5
Improve Health Outcomes 2
Improve Mental Health 1
Improve Well-Being 5
Individual Health Care 1
Inform Public 1
Listen to Health Care Professionals 2
Listening to Patient Needs 6
Maintain Healthy Lifestyle 1
Promote Preventive Care 1
Provide Affordable Alternatives 1
Provide Health Education 2
Recognize Patient Needs 1
Remove Coordination 1
Serve the Public 1
Strengthen Organizational Partner Connections 5
Use Best Practices 1
Descriptive Themes:
Accessible 10
Accountable 3
Across the Lifespan 1
Add Demographics to mission statement 2
Affordability 1
Age, Gender, Race, or SES 3
Compassionate 2
Cost Reduction 2
Dignity 3
Efficient 11
Equality 1
Equitable 2
Evidence Based 2
Excellent 2
Fast 1
For All 2
For Canadians 1
For Patients 2
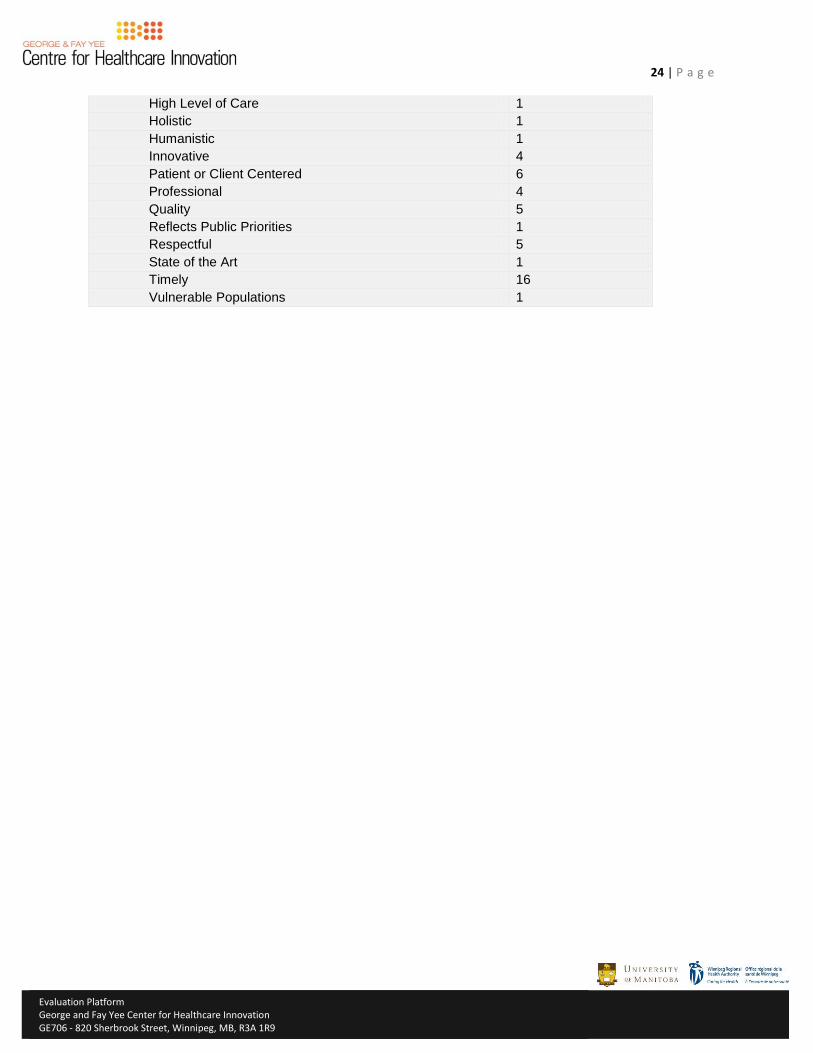
24 | P a g e
Evaluation Platform
George and Fay Yee Center for Healthcare Innovation GE706 - 820 Sherbrook Street, Winnipeg, MB, R3A 1R9
High Level of Care 1
Holistic 1
Humanistic 1
Innovative 4
Patient or Client Centered 6
Professional 4
Quality 5
Reflects Public Priorities 1
Respectful 5
State of the Art 1
Timely 16
Vulnerable Populations 1
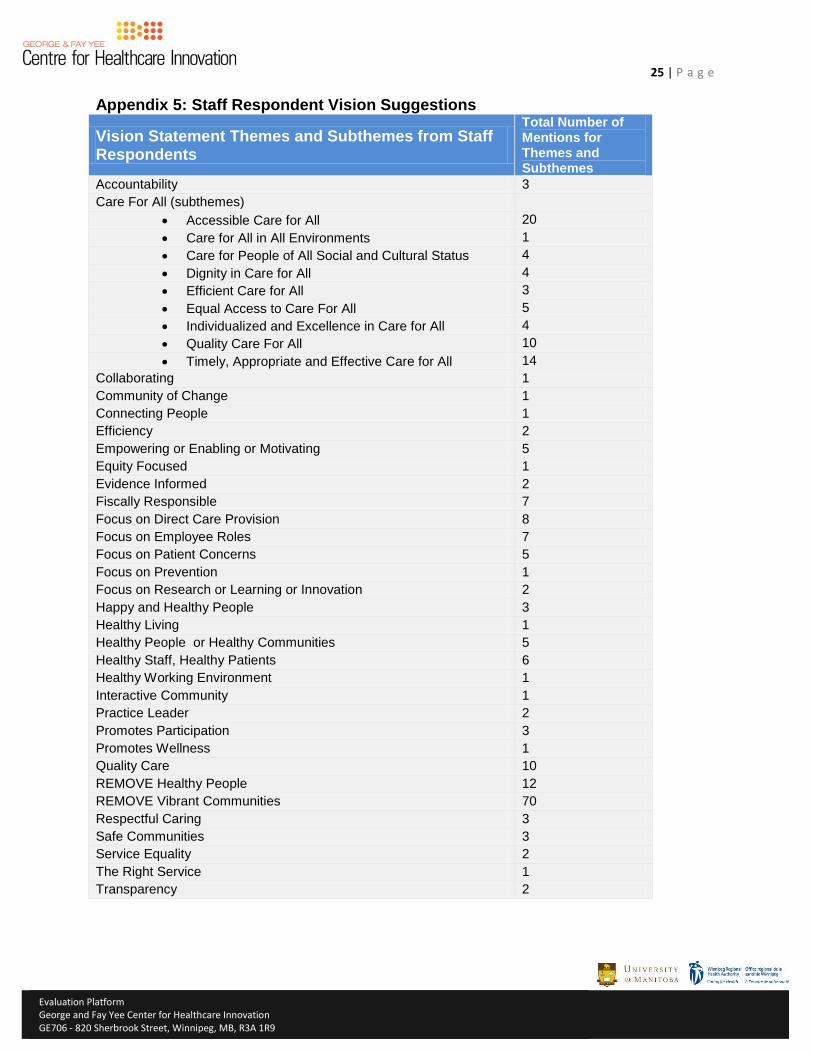
25 | P a g e
Evaluation Platform
George and Fay Yee Center for Healthcare Innovation GE706 - 820 Sherbrook Street, Winnipeg, MB, R3A 1R9
Appendix 5: Staff Respondent Vision Suggestions
Vision Statement Themes and Subthemes from Staff Respondents
Total Number of Mentions for Themes and Subthemes
Accountability 3
Care For All (subthemes)
Accessible Care for All 20
Care for All in All Environments 1
Care for People of All Social and Cultural Status 4
Dignity in Care for All 4
Efficient Care for All 3
Equal Access to Care For All 5
Individualized and Excellence in Care for All 4
Quality Care For All 10
Timely, Appropriate and Effective Care for All 14
Collaborating 1
Community of Change 1
Connecting People 1
Efficiency 2
Empowering or Enabling or Motivating 5
Equity Focused 1
Evidence Informed 2
Fiscally Responsible 7
Focus on Direct Care Provision 8
Focus on Employee Roles 7
Focus on Patient Concerns 5
Focus on Prevention 1
Focus on Research or Learning or Innovation 2
Happy and Healthy People 3
Healthy Living 1
Healthy People or Healthy Communities 5
Healthy Staff, Healthy Patients 6
Healthy Working Environment 1
Interactive Community 1
Practice Leader 2
Promotes Participation 3
Promotes Wellness 1
Quality Care 10
REMOVE Healthy People 12
REMOVE Vibrant Communities 70
Respectful Caring 3
Safe Communities 3
Service Equality 2
The Right Service 1
Transparency 2
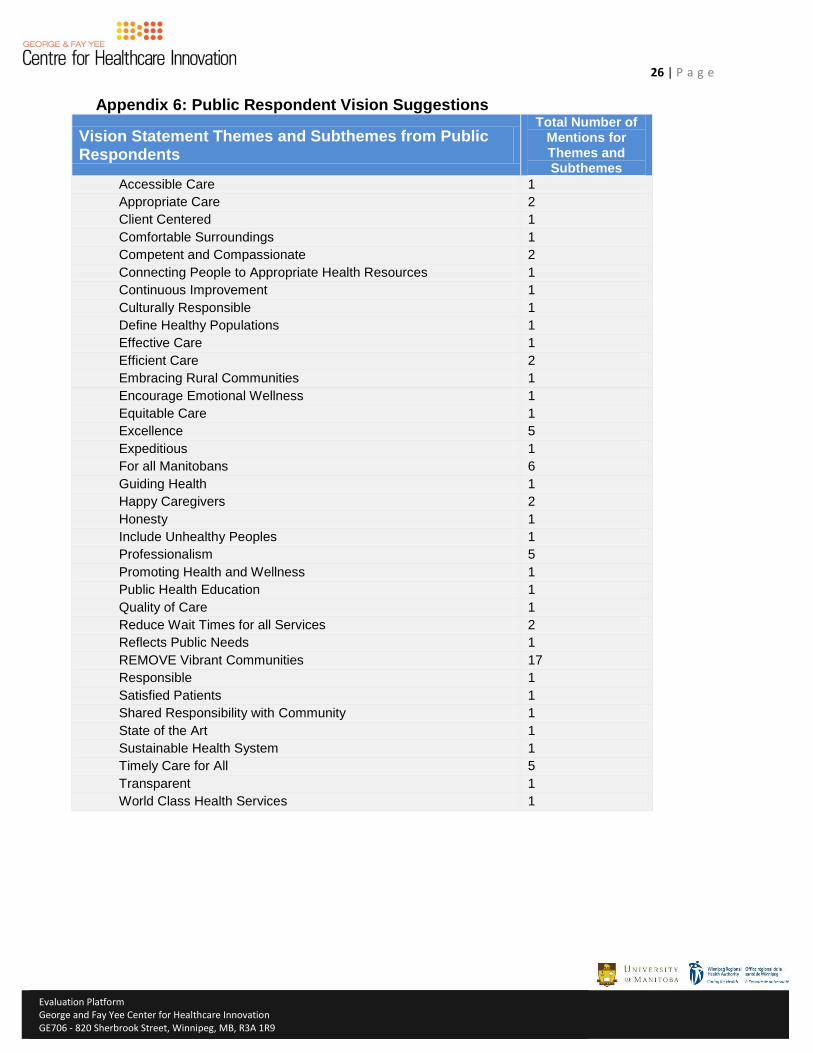
26 | P a g e
Evaluation Platform
George and Fay Yee Center for Healthcare Innovation GE706 - 820 Sherbrook Street, Winnipeg, MB, R3A 1R9
Appendix 6: Public Respondent Vision Suggestions
Vision Statement Themes and Subthemes from Public Respondents
Total Number of Mentions for Themes and Subthemes
Accessible Care 1
Appropriate Care 2
Client Centered 1
Comfortable Surroundings 1
Competent and Compassionate 2
Connecting People to Appropriate Health Resources 1
Continuous Improvement 1
Culturally Responsible 1
Define Healthy Populations 1
Effective Care 1
Efficient Care 2
Embracing Rural Communities 1
Encourage Emotional Wellness 1
Equitable Care 1
Excellence 5
Expeditious 1
For all Manitobans 6
Guiding Health 1
Happy Caregivers 2
Honesty 1
Include Unhealthy Peoples 1
Professionalism 5
Promoting Health and Wellness 1
Public Health Education 1
Quality of Care 1
Reduce Wait Times for all Services 2
Reflects Public Needs 1
REMOVE Vibrant Communities 17
Responsible 1
Satisfied Patients 1
Shared Responsibility with Community 1
State of the Art 1
Sustainable Health System 1
Timely Care for All 5
Transparent 1
World Class Health Services 1
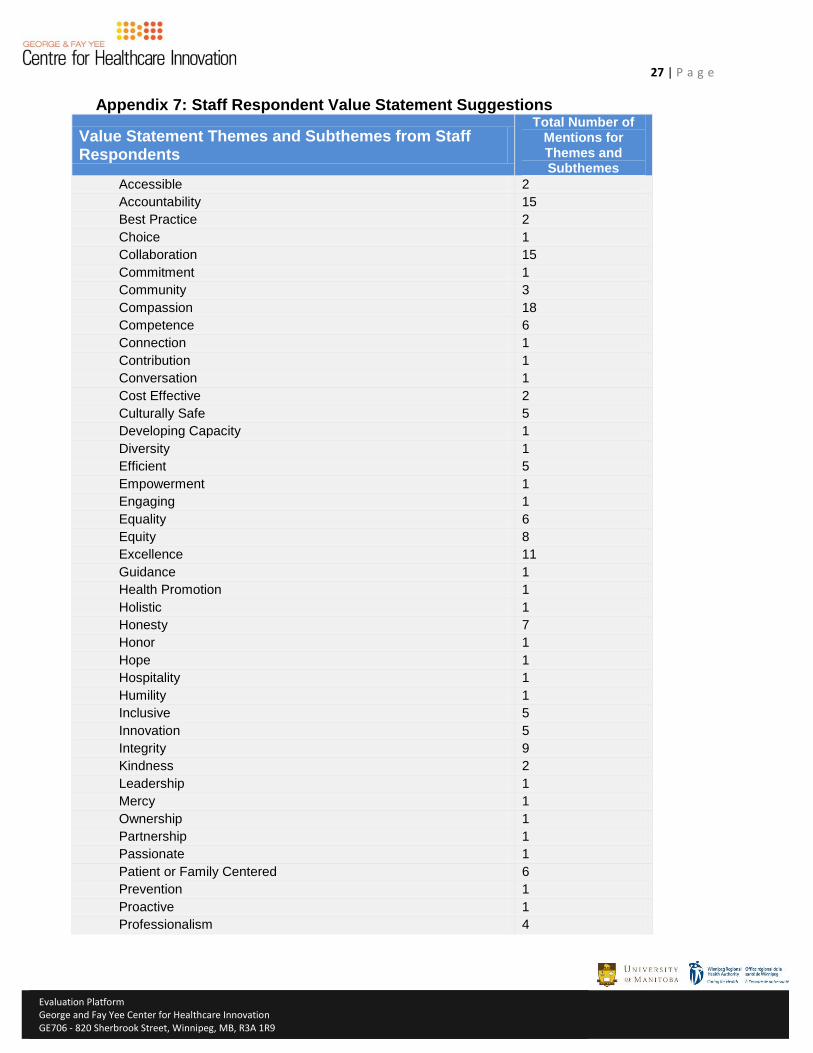
27 | P a g e
Evaluation Platform
George and Fay Yee Center for Healthcare Innovation GE706 - 820 Sherbrook Street, Winnipeg, MB, R3A 1R9
Appendix 7: Staff Respondent Value Statement Suggestions
Value Statement Themes and Subthemes from Staff Respondents
Total Number of Mentions for Themes and Subthemes
Accessible 2
Accountability 15
Best Practice 2
Choice 1
Collaboration 15
Commitment 1
Community 3
Compassion 18
Competence 6
Connection 1
Contribution 1
Conversation 1
Cost Effective 2
Culturally Safe 5
Developing Capacity 1
Diversity 1
Efficient 5
Empowerment 1
Engaging 1
Equality 6
Equity 8
Excellence 11
Guidance 1
Health Promotion 1
Holistic 1
Honesty 7
Honor 1
Hope 1
Hospitality 1
Humility 1
Inclusive 5
Innovation 5
Integrity 9
Kindness 2
Leadership 1
Mercy 1
Ownership 1
Partnership 1
Passionate 1
Patient or Family Centered 6
Prevention 1
Proactive 1
Professionalism 4
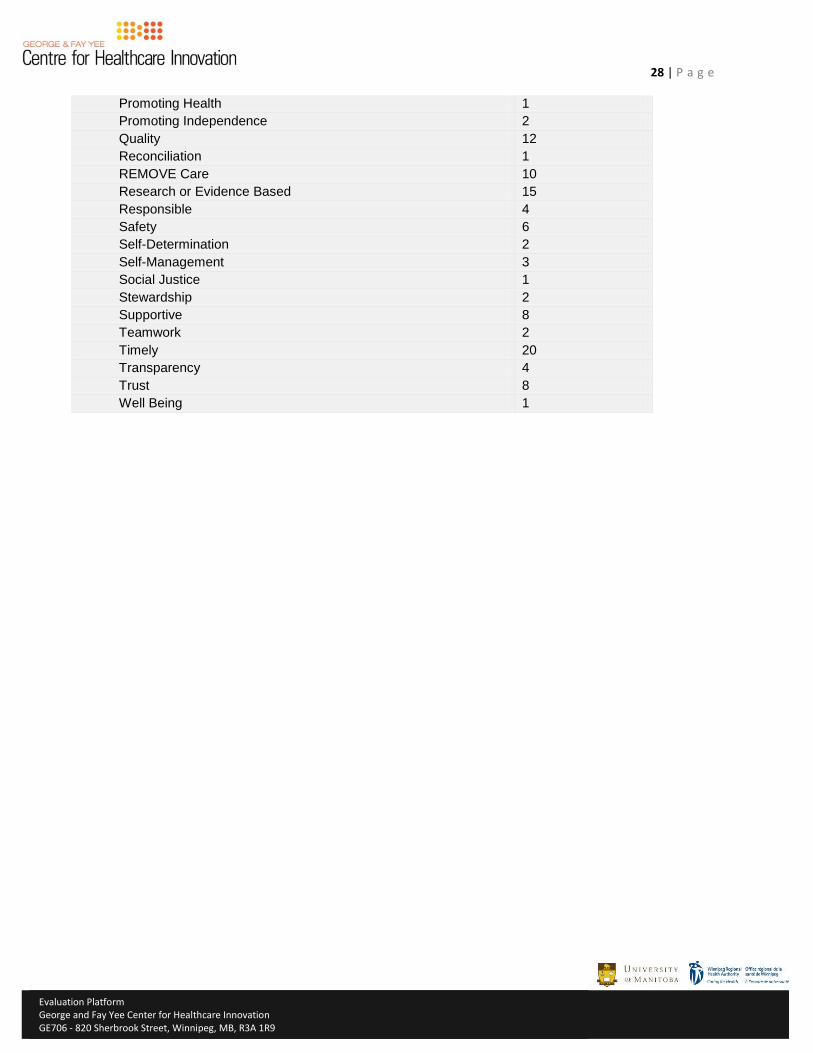
28 | P a g e
Evaluation Platform
George and Fay Yee Center for Healthcare Innovation GE706 - 820 Sherbrook Street, Winnipeg, MB, R3A 1R9
Promoting Health 1
Promoting Independence 2
Quality 12
Reconciliation 1
REMOVE Care 10
Research or Evidence Based 15
Responsible 4
Safety 6
Self-Determination 2
Self-Management 3
Social Justice 1
Stewardship 2
Supportive 8
Teamwork 2
Timely 20
Transparency 4
Trust 8
Well Being 1
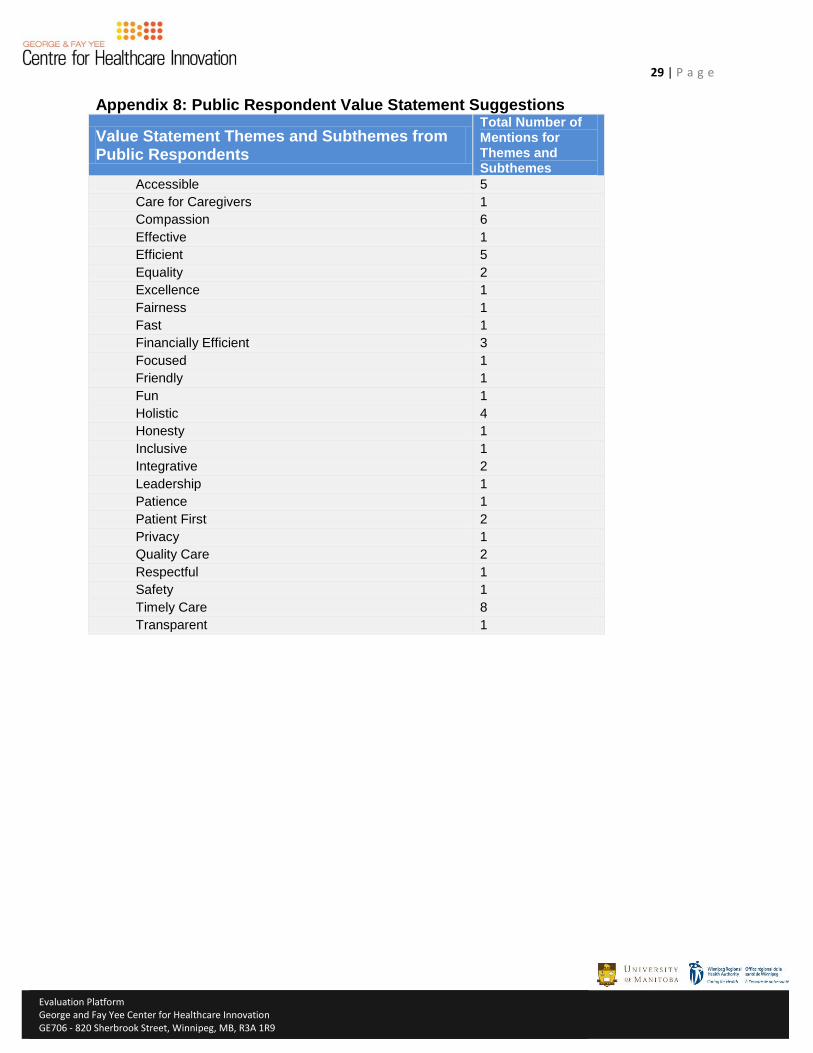
29 | P a g e
Evaluation Platform
George and Fay Yee Center for Healthcare Innovation GE706 - 820 Sherbrook Street, Winnipeg, MB, R3A 1R9
Appendix 8: Public Respondent Value Statement Suggestions
Value Statement Themes and Subthemes from Public Respondents
Total Number of Mentions for Themes and Subthemes
Accessible 5
Care for Caregivers 1
Compassion 6
Effective 1
Efficient 5
Equality 2
Excellence 1
Fairness 1
Fast 1
Financially Efficient 3
Focused 1
Friendly 1
Fun 1
Holistic 4
Honesty 1
Inclusive 1
Integrative 2
Leadership 1
Patience 1
Patient First 2
Privacy 1
Quality Care 2
Respectful 1
Safety 1
Timely Care 8
Transparent 1
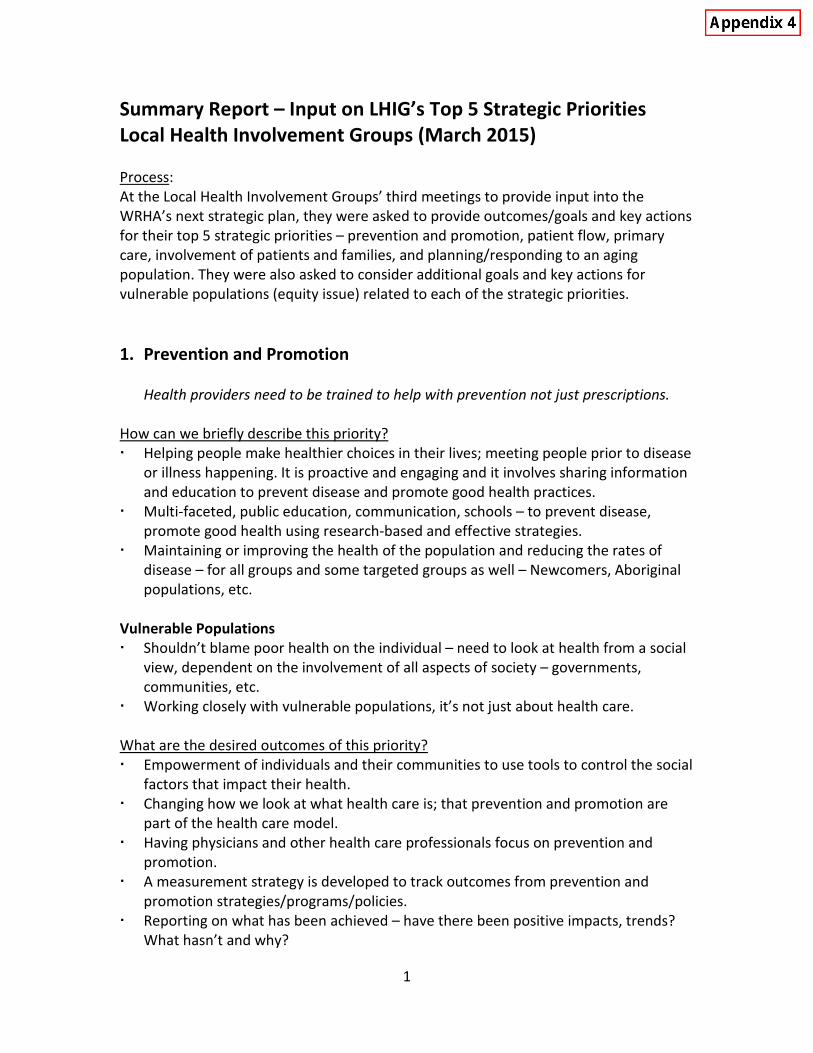
1
Summary Report – Input on LHIG’s Top 5 Strategic Priorities Local Health Involvement Groups (March 2015) Process: At the Local Health Involvement Groups’ third meetings to provide input into the WRHA’s next strategic plan, they were asked to provide outcomes/goals and key actions for their top 5 strategic priorities – prevention and promotion, patient flow, primary care, involvement of patients and families, and planning/responding to an aging population. They were also asked to consider additional goals and key actions for vulnerable populations (equity issue) related to each of the strategic priorities. 1. Prevention and Promotion
Health providers need to be trained to help with prevention not just prescriptions. How can we briefly describe this priority? Helping people make healthier choices in their lives; meeting people prior to disease
or illness happening. It is proactive and engaging and it involves sharing information and education to prevent disease and promote good health practices.
Multi-faceted, public education, communication, schools – to prevent disease, promote good health using research-based and effective strategies.
Maintaining or improving the health of the population and reducing the rates of disease – for all groups and some targeted groups as well – Newcomers, Aboriginal populations, etc.
Vulnerable Populations Shouldn’t blame poor health on the individual – need to look at health from a social
view, dependent on the involvement of all aspects of society – governments, communities, etc.
Working closely with vulnerable populations, it’s not just about health care. What are the desired outcomes of this priority? Empowerment of individuals and their communities to use tools to control the social
factors that impact their health. Changing how we look at what health care is; that prevention and promotion are
part of the health care model. Having physicians and other health care professionals focus on prevention and
promotion. A measurement strategy is developed to track outcomes from prevention and
promotion strategies/programs/policies. Reporting on what has been achieved – have there been positive impacts, trends?
What hasn’t and why?
2
What key actions do you feel is most important for the WRHA to move this priority forward? Get commitment for government for funding for this so that funding for prevention
and promotion can be increased. Research determinants of health and target these for improved health promotion.
Take real action on poverty issues – housing, income, etc. Work together with city government to increase access to healthy living
opportunities – like, subsidized recreational passes. Partner with community groups to increase numbers of exercise programs available Provide information, classes, and workshops about easy and attainable ways to stay
healthy to prevent disease (nutrition and exercise) at daycares, schools, community organizations, Access Centres, etc.
Coordinate/sponsor seniors/youth physical activity programs and events at apartment buildings, community clubs, daycares, and assisted living.
Need to be aware of community organizations – their levels of funding, etc. --they are asked to do a lot with decreasing budgets – there needs to be a commitment to funding.
Greater engagement with communities -- partner with or refer to external agencies to promote their resources/supports that promote healthy living, for example YMCA’s.
Communicate health promotion topics broadly – through media, workplaces, social media, etc.
Develop effective strategy with family doctors on their roles in prevention and promotion issues and educate physicians and medical staff about the need to promote healthy lifestyle.
Are there specific considerations for vulnerable populations? Coordinate with all levels of government on addressing the social determinants of
health. Subsidized recreational passes and better promotion of free activities. Find out what communities want, then work with them. Higher rates of social assistance are needed right now – can’t afford nutritious food,
etc. Use neighbourhood settlement workers to develop programs with immigrant
communities. Identify high risk groups – concentrate on them Ensure programs and information that is shared is culturally sensitive. Make injury prevention products (helmets, car seats, etc.) accessible for low income
families
3
2. Improve Patient Flow
Educate the public about how they can help decrease delays/improve patient flow. How can we briefly describe this priority? Patient flow is about transitions in the health system. We need to ensure that
people receive the care that they need in the right place at the right time and then continue to move through the system and receive the service that they need and when they need it.
The journey that you take through the health system. Long wait times are a symptom that something’s not working. It’s about using the system appropriately.
What is the desired outcome of this priority? The goal should be – the right care at the right place at the right time. Increased patient satisfaction. Wait times are reduced. People use the health care system appropriately – especially emergency
departments. Wait times would reflect national standards. Address issues in primary care with fee for service providers that impacts on overall
patient flow issues, i.e. people at ER’s when they could be seen at primary care providers.
Don’t overlook the perspectives of the people working in the system. What key actions do you feel is most important for the WRHA to move this priority forward? Ask staff for ideas for improvements Is the patient in the right place or should they be somewhere else? The system
should be focused on what the person needs and how to meet those needs. Should be getting feedback from “frequent” users More patient advocates. More emphasis on prevention and promotion would improve patient flow, speed
things up. Seamless care and better collaboration between health care providers – and from
site to site. Educate the public about what services they can receive at access centres, urgent
care, quick care, emergency rooms, walk-in clinics, family doctors, etc. More support to expedite panel process for long term care – so wait times are
decreased, less paperwork. At ER’s, direct less critical cases elsewhere. Use more care providers for minor issues, not just doctors Public education on how they can help decrease delays/improve patient flow.
4
WRHA needs to be more transparent about why some problems exist – like wait times and cancellation of cardiac surgeries – explain why these problems exist to the public.
Identify patients who’ve been sitting on wait lists for months and months – have a staff person who stays connected with people on waitlists to see how they’re doing, to let them know what’s happening, etc.
Continue with patient satisfaction surveys and tailor with questions about wait times, flow of process, and communication of information
Let people know about “My Right Care” website Add nurse practitioner positions in ER and urgent care to triage lower-priority cases In ER’s, there should be flipcharts that explain how triage works and information
about other services (Quick Care, etc.) so people can immediately be directed to most appropriate services within that location
Re-examine the situation of ambulances waiting at ER’s Promote access centres – explain what they are More use of patient advocates to help people navigate the system There should be follow-up with all ER patients to see what happens to them when
they get home. Continued improvement in adoption of new technologies to improve patient flow
and information flow.
Are there specific considerations for vulnerable populations? Vulnerable patients will receive a different kind of care, not getting proper care –
they won’t necessary know how to use the system, may not ask. Therefore there is a need for patient advocates.
Improve safety net, improve transition out of hospital – social work/applied health should get more involved with vulnerable patients.
May not have regular doctor or if they do – afraid to talk to doctor System should be watching for vulnerable patients and be proactive, provide
support. Culture within the system – very middle class – empathy for middle class patients. Outreach for targeted populations. Information on the health care system in more languages. Be more proactive about this, on-going and regular discussions with community
organizations that support vulnerable populations. New facilities should be located in communities where they are needed most.
5
3. Improve Primary Care Infrastructure
The primary care physician is hub of access to the health system and the most important relationship for patient.
How can we briefly describe this priority? Very much, basis from which other care begins; it needs to be dependable before
you receive other care. It’s the foundation/base of the system – performance and quality are a priority Primary care physician is hub of access to the system and the most important
relationship for patient. What is the desired outcome of this priority? Develop the right continuum and balance of primary care services within
communities so that people can access full complement of care. Work on improving primary care, especially for homeless and other at-risk
populations who do not receive follow-up care after ER visits, surgery, etc. Increased numbers of people using quick care clinics. People are using the system more appropriately and getting in when they need to. What key actions do you feel is most important for the WRHA to move this priority forward? Monitor and evaluate systems and procedures. More quick care clinics. Improve access to family doctors – many do not have availability on weekends or
evenings. Increase the number of nurse practitioners in primary care to improve access and
help patients get connected to the care that they need. Need to align Fee for Service primary care physicians with WRHA goals and
objectives. Better access to prescriptions – address financial barriers Primary care for youth – information, clinics, etc. Provide patients with print outs from appointments – with info on diagnosis,
treatment, care, etc. Team approach for addressing individuals with complex needs Importance of front-line clerks – in person and over the phone – to be helpful, give
proper direction on most appropriate care Need to be better links between primary care and prevention/promotion Monitor the % of population that does not have a family doctor and recommend
related actions. Detailed questionnaire filled out by patient about their health and reviewed by
primary care physician.
6
Are there specific considerations for vulnerable populations? Training for doctors and nurses and health care staff in issues of poverty,
oppression, and vulnerability. Provide primary care sites close to marginalized populations, could be mobile. Improve and de-stigmatize issues re: LGBTT receiving care Work on improving primary care, especially for homeless and other at-risk
populations – who do not receive follow-up care – after ER visits, surgery, etc. Mobile health care practitioners for people who are isolated or don’t have ability to
reach out. Share information about the languages that primary care doctors speak – will help
newcomers find care that is accessible. Better access to prescriptions – address financial barriers Primary care for youth – information, clinics, etc. Improve and de-stigmatize issues re: LGBTT receiving care
4. Increase Involvement of Patients and Families
Change the culture of the health care system to one where patients and families are valued and part of health team.
How can we briefly describe this priority? Important role of family in supporting patients. You can only empower patients if the philosophy of providers and the health care
system supports this. Involvement of patients and/or family has the potential to reduce health care costs. What is the desired outcome of this priority? Patient and family is part of the health team. A patient’s bill of rights is in place.
Patient is primary focus. Health care providers embrace family’s role in patient’s care.
That communication respects diversity of patients and families and their needs. Patient satisfaction increases Would feel like you’re being treated as a whole person. Improved access to own health care information. Changed culture of health care system – where patients and families are valued and
part of health team. Address issues of privacy. More programs, facilities developed for people in northern communities so that
they can receive care where they live and have support of families. Develop strategies that are respectful of wishes of patient, challenges, dynamics,
etc.
7
Families, patients involved in service and program development. Improved health outcomes with the involvement of families. What key actions do you feel is most important for the WRHA to move this priority forward? Ensuring that patient and family members understand all options for the right/
proper care/treatment and after care and provide information at a level that is appropriate for the individual and make sure that they have understood.
Routinely, providers should be asking patients which family members/friends they can share information with about their health issue, treatment, etc.
Ensure that all programs and staff understand the importance of family support. Improve representation at all levels of health care staff – that diversity of
city/province, etc. is reflected – especially for Aboriginal people Create a functional partnership between family and health care team. Ensure family members get support/respite if they are involve in caring for family
members. Help families connect with resources to be part of the solution. Burnout for family members – make processes easier, less burdensome Improve communication re: discharge from hospital to home – give families clearer
direction. Health care professionals need to be helpful in communications with families – need
to start listening and actually hear family. Post information on the WRHA website about the importance of having friends,
family accompany people to doctor appointments, etc. Family involvement should not mean off-loading on families Offer patients information in writing when appropriate Approach patient care as a discussion not a prescription (with family and patient) Ask for feedback from patient and family after discharge from hospital Allow family members to stay with patients if patient desires whenever possible –
share information with family about this Doctors and other health care providers should encourage patients to ask questions
about their health. Perhaps train doctors (or inform doctors) on how to take a couple of minutes at the
end of consult to ask patient re: their treatment option selection – understanding and compliance
Teach family to help care for patient – this is increasingly important when family member has dementia/memory loss
Allocate sufficient time with patient for questions – often doctors are in a rush and patients don’t feel comfortable asking questions
Find out what family/friends can support – and then plan (if needed) how volunteers, spiritual care, etc. – others can help
For elderly and others – have a place on the electronic medical record for approved family member, friend, or patient advocate that they can share information with.
8
Are there specific considerations for vulnerable populations? Should be advocates for those patients without families who can support them –
they need to be identified and followed up by staff. Ability to access information and services in your first language. Partner with cultural organizations/groups to share information and get feedback. People who come into Winnipeg for health care – they are vulnerable – alone,
without family, additional costs to get care. Have staff, programs to support patients without families – recreation room and
other options to socialize at hospital settings and have volunteers to accompany to appointments to help patients better understand doctor’s advice, etc.
When providing written information, need to recognize low literacy rates and language barriers.
Recognize/understand alternative, traditional, cultural practices – medicinal – First Nations
Train staff to be aware of cultural diversity/practices. Need to ensure that providers are watching for issues of elder abuse – family
shouldn’t be involved with supporting those patients People without supports --- partner with different community organizations to play
supportive, advocacy role for patients without family to support them. Need to consider special barriers – linguistic, cultural, literacy challenges. 5. Planning for an aging population
Improve how people can transition through health services as they age and their needs change.
How can we briefly describe this priority? The population is aging and there will be increasing demands on the health system,
want to ensure aging population is healthy. When their health deteriorates in the last 2 years, their needs grow quickly Connects to all other priorities. What is the desired outcome of this priority? Plan for shifting/changing demographics and address the needs of caregivers. People are more proactive about changing health care needs (their own/aging
relatives), planning for the future. Advice, assistance, support – available when needed to assist families move through
the system and access resources in a timely way. Families are aware of “red flags” that predict a relative may need a new level of care
– this information is shared. Services are available to answer individual needs. People living as well as they can for as long as they can. Aging in place.
9
What key actions do you feel is most important for the WRHA to move this priority forward? Should be thinking about facilities that are multi-purpose that can be repurposed. Don’t presume that age should limit treatment options – look at person’s overall
health before ruling out a procedure. Integrated plans and programs – aging population needs and care. Build more supportive living Tier living care facilities to assisted supportive and long term housing More family supports for aging parents. Virtual teams keeping people in their homes with family and friends helping. Improve existing programs that help seniors stay at home – ensure home
environment is safe. Saskatchewan has model of dementia care that Winnipeg should consider –
Sherbrooke Centre Improve how people can transition to services as they age. Need to promote/clarify advance care planning and health care directives There are attitudinal challenges – many seniors/elderly not getting care when they
to – their health issue worsens and they end up in ER – need to ensure the prevention and promotion part of the system is working with aging population.
More dementia supports. Make family involvement a priority, a necessity for seniors. Provide healthy living as you age workshops Disease prevention/health promotion for aging population. Use cultural or ethnic communities and organizations for seniors programming. More activities for elderly needed to keep them connected to society and continuing
to enjoy life. More respite options/facilities. Having sensitive discussions around transitioning aging family members Let public know about resources for support at home nearing the end of life. Individual long term care plan as we age – includes flu shots, health care
directives/DNR’s, living will, palliative care
Are there specific considerations for vulnerable populations? Paid advocates for vulnerable seniors Open more beds for seniors with dementia, especially high needs behavioral
patients. Address ageism within system Identify isolated, vulnerable seniors – neighbours can help with this – then get them
connected to organizations for resources. Low income seniors – may choose to not buy prescriptions because they can’t afford
to – is this being addressed? Family doctors should be watching for this, connecting to resources.
Find ways to bridge language barriers Have specific mental health strategies for this population.

10
Provide elder support groups – based on language spoken. Provide programs for newcomers – senior men Aboriginal families – want to keep elderly with them – feel that they will do better in
home environment.
health for allBuilding Winnipeg’s Health Equity Action Plan
June, 2013
The Winnipeg Regional Health Authority’s vision is “Healthy People, Vibrant Communities, Care for All.” Influenced by this vision, the health region has embraced the principles and values of Health Equity, and has embarked on an initiative titled “Health for All.”
This report outlines the problem and the strategies we intend to use, as well as identifying opportunities for action, offered for consideration to our community partners and other sectors.
“We’re all in this together” to close Winnipeg’s unnecessary health gaps and establish an equitable and sustainable health system and civil society that reaches towards “Health for all.”
Table of Contents
1 Preface2 Acknowledgements3 Why this report?4 “Health for all” – A Vision5 Health for All: Health equity and inequity - ideas and definitions
7 A look at health equity in Winnipeg
8 The health gaps picture8 • Death and length of life11 • Illness, injury and wellness13 • Health risks and behaviours15 • Early beginnings and education17 • Employment 18 What does it all mean?
19 Towards health equity action
20 Getting started20 What we did21 A framework for understanding and addressing health equity
22 Suggested considerations for action25 1. Health services considerations for action31 2. Economy considerations for action33 3. Income considerations for action36 4. Work considerations for action39 5. Childhood considerations for action42 6. Education considerations for action45 7. Environment considerations for action47 8. Community considerations for action50 9. Housing considerations for action53 10. Food considerations for action55 11. Transportation considerations for action57 12. Behaviour considerations for action59 Core components for equity action engagement
60 Conclusion
61 Special thanks62 Abbreviations used in this report
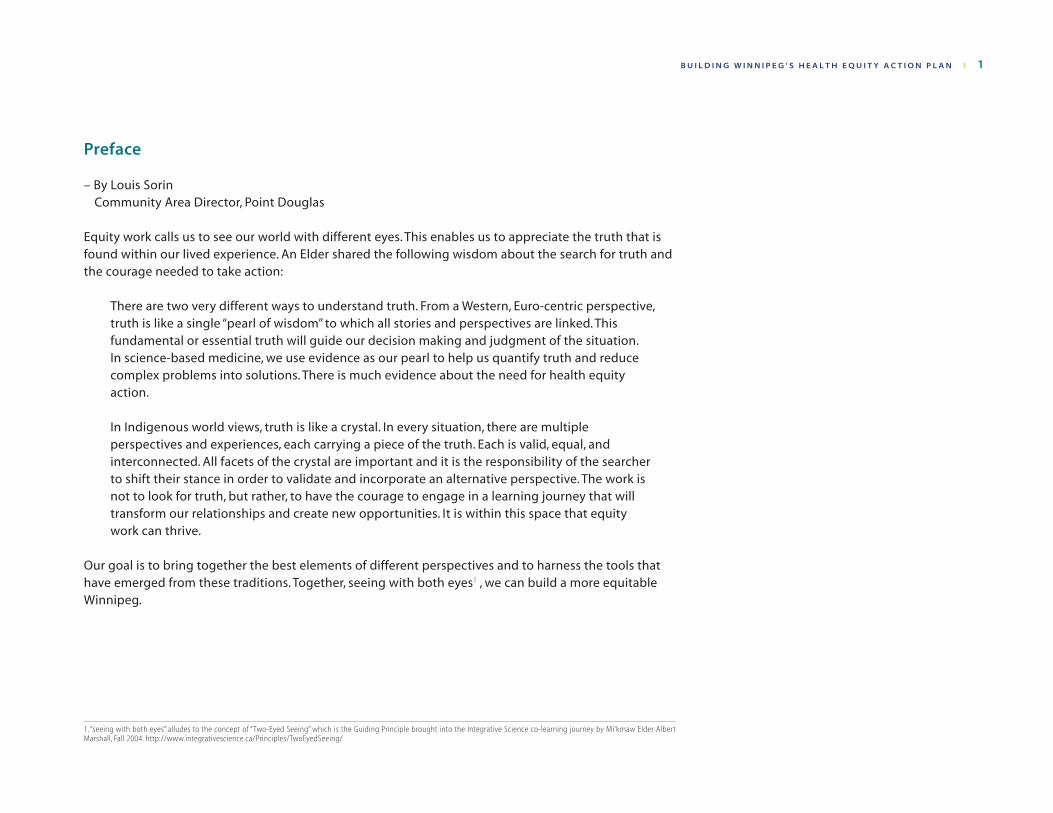
B U I L D I N G W I N N I P E G ’ S H E A L T H E Q U I T Y A C T I O N P L A N ❙ 1
Preface
– By Louis Sorin Community Area Director, Point Douglas
Equity work calls us to see our world with different eyes. This enables us to appreciate the truth that is found within our lived experience. An Elder shared the following wisdom about the search for truth and the courage needed to take action:
There are two very different ways to understand truth. From a Western, Euro-centric perspective, truth is like a single “pearl of wisdom” to which all stories and perspectives are linked. This fundamental or essential truth will guide our decision making and judgment of the situation. In science-based medicine, we use evidence as our pearl to help us quantify truth and reduce complex problems into solutions. There is much evidence about the need for health equity action.
In Indigenous world views, truth is like a crystal. In every situation, there are multiple perspectives and experiences, each carrying a piece of the truth. Each is valid, equal, and interconnected. All facets of the crystal are important and it is the responsibility of the searcher to shift their stance in order to validate and incorporate an alternative perspective. The work is not to look for truth, but rather, to have the courage to engage in a learning journey that will transform our relationships and create new opportunities. It is within this space that equity work can thrive.
Our goal is to bring together the best elements of different perspectives and to harness the tools that have emerged from these traditions. Together, seeing with both eyes1 , we can build a more equitable Winnipeg.
1. “seeing with both eyes” alludes to the concept of “Two-Eyed Seeing” which is the Guiding Principle brought into the Integrative Science co-learning journey by Mi’kmaw Elder Albert Marshall, Fall 2004. http://www.integrativescience.ca/Principles/TwoEyedSeeing/
2 ❙ B U I L D I N G W I N N I P E G ’ S H E A L T H E Q U I T Y A C T I O N P L A N
Acknowledgments
This document represents the work and consensus of a number of working groups under the direction of the Winnipeg Health Region Promoting Health Equity Oversight Committee. At least 80 people were involved in shaping this document. We thank each and every person for their engagement and thoughtful contributions.
Data used in this report mostly comes from existing reports referenced in the document, but we acknowledge the Manitoba Center for Health Policy, Healthy Child Manitoba and Manitoba Health in particular for the resources they have produced that call attention to health equity.
We also acknowledge with appreciation the many organizations and individuals who are already working on creating more equitable conditions for health in many sectors, many of whom have been dedicated to this important work for years.
Finally, and most importantly, we acknowledge many individual Winnipeggers who, despite significant barriers, strive every day to make a better life for themselves, their families and their communities. They have our respect and deserve our support.
B U I L D I N G W I N N I P E G ’ S H E A L T H E Q U I T Y A C T I O N P L A N ❙ 3
Why this report?Large gaps exist in Winnipeg between those experiencing the best and poorest health. People living in some areas of Winnipeg have nearly 19 years lower life expectancy than people living in other parts of the city. Many of the gaps arise from unfair, unjust and modifiable social circumstances. It doesn’t have to be this way. We can do something about it. Health equity asserts that all people can reach their full health potential and should not be disadvantaged from attaining it because of their social and economic status, social class, racism, ethnicity, religion, age, disability, gender, gender identity, sexual orientation or other socially determined circumstance. The notion of ‘health’ is being used here in its broadest context based on the World Health Organization’s definition: “Health is a state of complete physical, mental and social well-being, and not merely the absence of disease.”2
This report is not an answer book or a prescription. It is not yet even an action plan. Rather, it lays a foundation upon which we can collectively build Winnipeg’s health equity action plan. Health equity is dependent on a complex web of interrelated factors and there are no quick, easy, linear solutions.
2. Preamble to the Constitution of the World Health Organization as adopted by the International Health Conference, New York, 19-22 June, 1946; signed on 22 July 1946 by the representatives of 61 States (Official Records of the World Health Organization, no. 2, p. 100) and entered into force on 7 April 1948.
But when large numbers of people fall short of their full health potential, we all share the consequences one way or another. Health care providers see people every day with illnesses and injuries that didn’t need to happen. Both the human suffering and the costs could have been avoided. The health care system could run more smoothly, waitlists could be shorter, taxpayers’ dollars used more effectively. More people could flourish, reach their full potential and contribute to the community and the economy. Since we are all affected, and since the actions needed to achieve health for all do not lie solely, or even primarily, within the health care sector, we are all in this together.
Health equity has increasingly become a topic of dialogue across the world. High profile international, national and local reports are recognizing that improved health and quality of life cannot be achieved through more health care or economic growth alone. Wide gaps in social advantage result in wide health gaps. The seminal 2008 World Health Organization (WHO) report threw down the gauntlet by stating, “Achieving health equity within a generation is achievable, it is the right thing to do and now is the right time to do it.”3 Now is the right time to take up that challenge in Winnipeg.
3. Closing the gap in a generation: health equity through action on the social determinants of health. Final Report of the Commission on Social Determinants of Health, Geneva, World Health Organization, 2008.aslkdfjasfdsafdasasfsdfasdfasd asdf
…the actions needed to achieve
health for all do not lie solely, or even
primarily, within the health care sector,
we are all in this together.
4 ❙ B U I L D I N G W I N N I P E G ’ S H E A L T H E Q U I T Y A C T I O N P L A N
Health gap data for Winnipeg can be found in various reports produced by the Manitoba Centre for Health Policy and others. However, one easy-to-read description that paints an overall picture of health equity for Winnipeg by drawing on these many sources did not previously exist. Also, suggested actions by many sectors to improve health equity in Winnipeg have not previously been summarized for consideration. This report aims to do both of these things.
This report focuses on the Winnipeg Health Region (WHR) which includes the City of Winnipeg and East and West St. Paul. Churchill, which recently joined with the WHR, has not been included at this time. “Winnipeg” will be used throughout the report to mean the WHR population. We recognize that many health services are provided in Winnipeg to people who live in other parts of Manitoba as well as northwestern Ontario, Nunavut and beyond, and that people frequently move back and forth between Winnipeg and neighbouring and northern communities. And while equity needs, connections and influences beyond Winnipeg are also recognized, and collaboration with other equity efforts welcomed, the scope of this report is Winnipeg (WHR).
This report is intended to facilitate collaborative conversations so that together, we can move towards achieving greater health equity in Winnipeg. We need to set Health for All “stretch
goals”4 and boldly reach towards them. This conversation needs many voices. Please join in.
Health for All – A Vision
In a ‘perfect world’, what would an ideal, vibrant, healthy Winnipeg look like? Even though ideal circumstances are not fully attainable, creating a shared vision to reach towards helps move us closer. Imagine a Winnipeg where:
• diversity is celebrated and everyone belongs;
• people are safe, share a strong sense of community, and neighbours know and help one another;
• most adults are employed and feel their work is meaningful;
• children flourish in loving families, caring communities and stimulating schools where they develop strong friendships;
• incomes span a narrower range and even the lowest wages are sufficient to provide for healthy living;
• the city is predominantly of a mixed use urban design with little neighbourhood polarization, plentiful green spaces, architecture and built
4. Goals that cannot be achieved by incremental or small improvements but require extending oneself to the limit to be actualized. Hamel, G., & Prahalad, C. K. 1993. Strategy as stretch and leverage. Harvard Business Review, 71(2): 75–84.
This report is intended to facilitate
collaborative conversations so that
together, we can move towards achieving
greater health equity in Winnipeg.
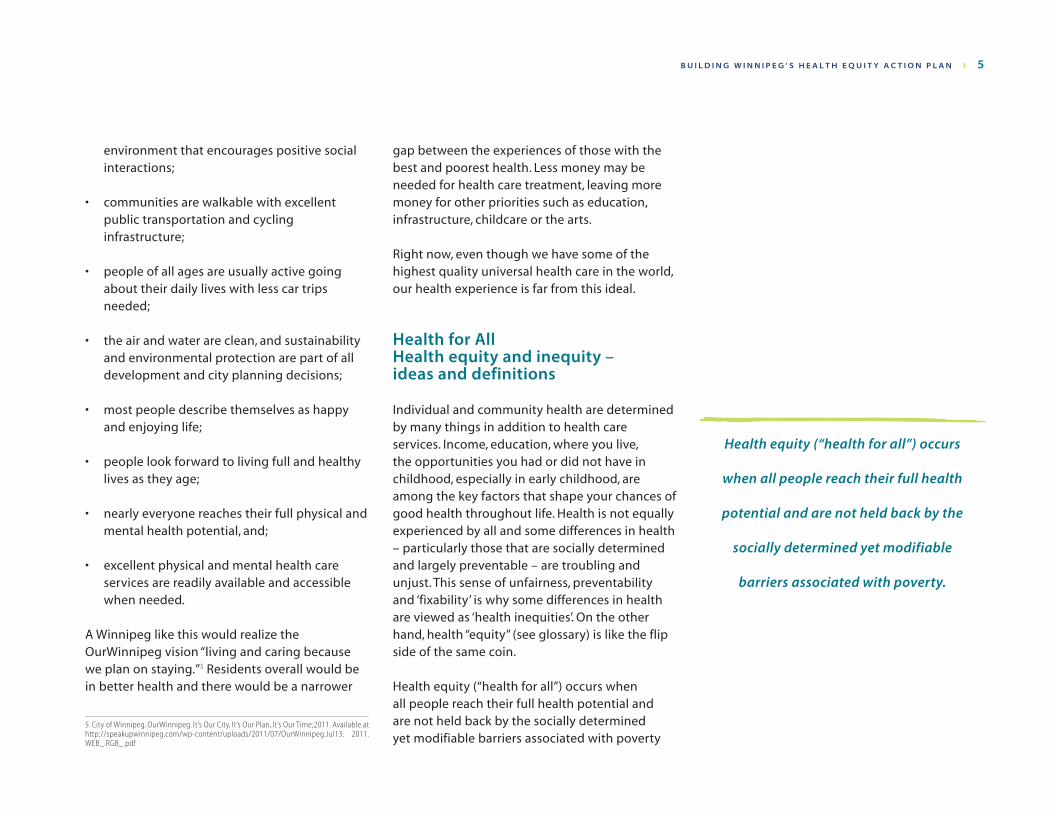
B U I L D I N G W I N N I P E G ’ S H E A L T H E Q U I T Y A C T I O N P L A N ❙ 5
environment that encourages positive social interactions;
• communities are walkable with excellent public transportation and cycling infrastructure;
• people of all ages are usually active going about their daily lives with less car trips needed;
• the air and water are clean, and sustainability and environmental protection are part of all development and city planning decisions;
• most people describe themselves as happy and enjoying life;
• people look forward to living full and healthy lives as they age;
• nearly everyone reaches their full physical and mental health potential, and;
• excellent physical and mental health care services are readily available and accessible when needed.
A Winnipeg like this would realize the OurWinnipeg vision “living and caring because we plan on staying.”5 Residents overall would be in better health and there would be a narrower
5. City of Winnipeg. OurWinnipeg. It’s Our City, It’s Our Plan, It’s Our Time;2011. Available at http://speakupwinnipeg.com/wp-content/uploads/2011/07/OurWinnipeg.Jul13. 2011.WEB_.RGB_.pdf
gap between the experiences of those with the best and poorest health. Less money may be needed for health care treatment, leaving more money for other priorities such as education, infrastructure, childcare or the arts.
Right now, even though we have some of the highest quality universal health care in the world, our health experience is far from this ideal.
Health for All Health equity and inequity – ideas and definitions
Individual and community health are determined by many things in addition to health care services. Income, education, where you live, the opportunities you had or did not have in childhood, especially in early childhood, are among the key factors that shape your chances of good health throughout life. Health is not equally experienced by all and some differences in health – particularly those that are socially determined and largely preventable – are troubling and unjust. This sense of unfairness, preventability and ‘fixability’ is why some differences in health are viewed as ‘health inequities’. On the other hand, health “equity” (see glossary) is like the flip side of the same coin.
Health equity (“health for all”) occurs when all people reach their full health potential and are not held back by the socially determined yet modifiable barriers associated with poverty
Health equity (“health for all”) occurs
when all people reach their full health
potential and are not held back by the
socially determined yet modifiable
barriers associated with poverty.
6 ❙ B U I L D I N G W I N N I P E G ’ S H E A L T H E Q U I T Y A C T I O N P L A N
(e. g., lack of quality learning or recreational opportunities in childhood, food insecurity, poor housing) or prejudice or policies that perpetuate social inequities. The multiple adverse social, economic and environmental conditions associated with poverty determine a person’s quality of health and longevity. These determinants of health are not found in health care settings but rather in the communities where we live, learn, grow, work and play every day.
When there are large gaps in health and social circumstances between those most and least advantaged, everyone is affected, not just those at the bottom.
• It affects the cost and availability of health care for everyone
• It affects crime and everyone’s sense of community safety
• It affects whether communities thrive socially and economically
• It affects tourism and our ability to attract economic investments
• It leaves less funds for other social development initiatives and public priorities
It fundamentally affects quality of life for everyone. Our individual and collective health and well-being is on the line. Social disadvantage matters… to all of us.
Social disadvantage matters…
to all of us.
A L O O K A T H E A L T H E Q U I T Y I N W I N N I P E G ❙ B U I L D I N G W I N N I P E G ’ S H E A L T H E Q U I T Y A C T I O N P L A N 7
A Look at Health Equity in WinnipegIn a city such as Winnipeg, in the heart of an affluent country with well trained health professionals providing medical care that is available to everyone, one would expect that everyone lives as long and in as good health as their genetics may permit. Sadly, this isn’t the case. Whether we look at health inequities by where people live (knowing that different areas of Winnipeg have different levels of income and social advantage) or by income quintiles where income is measured more directly, we can see a clear link between wealth and health. Although income is not the only aspect of disadvantage, it aligns well with other markers of material and social deprivation and is the main one used in this report.
Some health information can also be drawn from reports that compare the health of First Nations or Métis people living in Winnipeg to all other residents. Indicators by other ethnicities or cultural identification are not currently available.
While culture is an important determinant of health and is related to factors such as health behaviours, perceptions of illness, social supports and the extent to which people use health care services, culture or ethnicity alone do not cause health inequalities. Rather, ethnic groups and others who experience current or historical deprivation, marginalization or oppression are disproportionately affected by economic and social disadvantage which leads to health gaps.
…those who experience current or
historical deprivation, marginalization or
oppression are disproportionately affected
by economic and social disadvantage
which leads to health gaps.
8 B U I L D I N G W I N N I P E G ’ S H E A L T H E Q U I T Y A C T I O N P L A N ❙ A L O O K A T H E A L T H E Q U I T Y I N W I N N I P E G
The pattern of income distribution in Winnipeg can be seen in the maps showing Winnipeg’s urban income quintiles. Reference information on the median household incomes in Winnipeg’s 12 Community Areas (CAs) and 25 Neighbourhood Clusters (NCs) is available in the Health Equity Indicator Resource document. There is nearly a $75,000 gap in median household income (2006) between the highest and lowest income NCs in Winnipeg, which represents more than a four-fold difference.
The health gaps pictureThere is a growing body of literature around the world and a long list of local indicators that point to differences in health related to social and economic differences (see the Winnipeg Health Region Health Equity Indicators Resource companion document). The gaps are staggering. And not only is there a huge divide between the highest and lowest health status, every step down the economic ladder is associated with poorer health. This means social and economic advantage matters throughout the spectrum, with the biggest impact felt by those most disadvantaged.
Over 50 indicators from various sources have been compiled for easy access in the Health Equity Indicator Resource. Some of the most
telling indicators are highlighted below to provide a series of snapshots that illustrate the alarming pattern found.
Death and length of life
• Imagine two babies born on the same day in Winnipeg – one from an affluent neighbourhood, and the other from a neighbourhood with low average income. Based on where their families live, the latter baby can expect nearly two fewer decades of life. There is a shocking 18.6 years difference between the highest and lowest life expectancy (by neighbourhood cluster) for a baby girl (70.5 years vs. 89.1) and 18.8 years difference for a baby boy (67.2 years vs. 86.0). Higher life expectancies are found in higher income areas and the lowest life expectancies where incomes are lowest. All of Winnipeg’s new parents should be able to hold the same hope that the infant in their arms can live well into old age.
• For every funeral for a person who died before 75 in an advantaged area of Winnipeg, more than four similar funerals would occur in a disadvantaged area. The gap between the highest and lowest Premature Mortality Rate (PMR), defined as dying before the age of 75, is a 4.3 fold difference. See Figure 1.
• The ‘potential years of life lost’ (PYLL) – a measure of how many years before age 75
...not only is there a huge divide between
the highest and lowest health status,
every step down the economic ladder
is associated with poorer health.
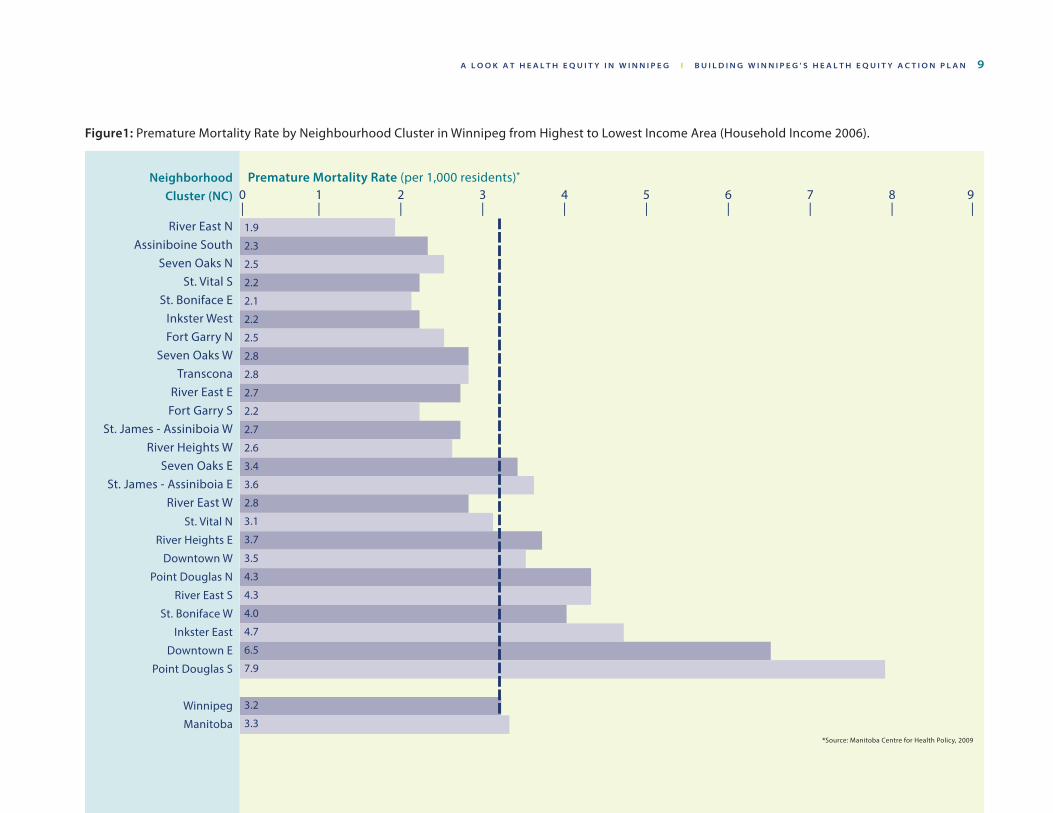
A L O O K A T H E A L T H E Q U I T Y I N W I N N I P E G ❙ B U I L D I N G W I N N I P E G ’ S H E A L T H E Q U I T Y A C T I O N P L A N 9
Figure1: Premature Mortality Rate by Neighbourhood Cluster in Winnipeg from Highest to Lowest Income Area (Household Income 2006).
Neighborhood Cluster (NC)
River East NAssiniboine South
Seven Oaks NSt. Vital S
St. Boniface EInkster WestFort Garry N
Seven Oaks WTranscona
River East EFort Garry S
St. James - Assiniboia WRiver Heights W
Seven Oaks ESt. James - Assiniboia E
River East WSt. Vital N
River Heights E
Downtown W
Point Douglas N
River East S
St. Boniface W
Inkster East
Downtown E
Point Douglas S
Winnipeg
Manitoba
Premature Mortality Rate (per 1,000 residents)* 0 1 2 3 4 5 6 7 8 9 | | | | | | | | | |
1.9
2.3
2.5
2.2
2.1
2.2
2.5
2.8
2.8
2.7
2.2
2.7
2.6
3.4
3.6
2.8
3.1
3.7
3.5
4.3
4.3
4.0
4.7
6.5
7.9
3.2
3.3*Source: Manitoba Centre for Health Policy, 2009
1 0 B U I L D I N G W I N N I P E G ’ S H E A L T H E Q U I T Y A C T I O N P L A N ❙ A L O O K A T H E A L T H E Q U I T Y I N W I N N I P E G
someone dies – is between five and seven times higher in the lowest income NC than several of the highest. Picture 75 years of expected life being like everyone getting $75 dollars to spend (one for each year). If you die at age five, you have been ‘robbed’ of $70. If you die at age 70 you have been robbed of $5. If you add up all the dollars ‘robbed’ from everyone, up to seven times as much has been taken from people living in lower income areas. In other words, people living in disadvantaged areas are dying much younger.
How can this occur in a city in Canada that has universal, publically funded health care? Because many common causes of death occur more frequently in lower income groups or lower income areas of Winnipeg. Some we hear about on the news and others are quieter killers. For example:
• Six families in lower income areas face the devastating news that a loved one they hugged hours earlier is not ever coming home again due to an injury for every one family from a higher income area facing the same news. Injury deaths are six times higher in lower income areas of Winnipeg compared to higher income areas and over three times more frequent in Winnipeg’s lowest income quintile compared to the highest.
This same pattern is seen to varying degrees across many causes of death, and it tells us a hard truth: that multiple adverse social, economic and
environmental conditions related to poverty rob Winnipeggers of years and quality of life.
Kevin had traumatic experiences in his childhood that led to difficulties coping as a youth and adult, and because of this he struggled with depression. He left school before graduating and decided to move from his home community to Winnipeg to try and find a job and hoped that the change of setting would improve his depression. With little education or support, he had difficulty finding a job and began to feel more lonely and isolated. Despite the difficulties in his life, he was always a kind and caring person who tried to do the best for his community and help anyone in need. He wanted a better life for himself and his many friends and he spoke up on issues that were impacting their ability to enjoy the lives many take for granted. He often mentioned feeling like a prisoner with limited options and opportunities. He was aware of how he and others in his public housing block with similar life situations were perceived. Eventually, he was not able to pay even his modest rent and ended up on the street. One evening he fell, scraping his shoulder, hip and knee on the concrete pavement not far from the apartment block where he had lived. A few days later he was discovered unconscious in an alley. His wounds had become infected and the infection spread throughout his body very quickly. Kevin died after three days in the ICU at the age of 52.6
6. Stories presented are based on the real experiences of Winnipeggers, but are composites of many life stories to protect individual identities. Names used are not those of any individual client or patient whose experiences contributed to the vignettes. Also, the vignettes are not meant to judge the commitments of individuals, organizations, and programs who are engaged in the lives of vulnerable individuals, families, and communities.
…multiple adverse social, economic
and environmental conditions related
to poverty rob Winnipegers of
years and quality of life.
A L O O K A T H E A L T H E Q U I T Y I N W I N N I P E G ❙ B U I L D I N G W I N N I P E G ’ S H E A L T H E Q U I T Y A C T I O N P L A N 1 1
But it didn’t have to be this way. What if conditions and supports had been different at many points along the way?
We could spend a long time examining Kevin’s story to determine the interconnection of the personal, social, economic, and environmental conditions that are exacerbated by poverty. Rather, it is important from an equity framework that the systems, organizations, and programs that were connected to Kevin throughout his life examine how they may not have best served his needs. What part of this trajectory could have been prevented if early investment had been made to protect him from experiencing childhood traumas? What could have been done during his youth to heal his emotional trauma and give him the tools to move forward? How did the health system interpret his struggle with depression and serve him when he was in crisis? What if housing with supports had been available or job training opportunities? Did he feel welcome when he reached out for help? What if…?
These are some of the questions that need to be explored if our system and its institutions want to demonstrate their commitment to equity work.
Illness, injury and wellness
It follows that if people are dying earlier and at higher rates from illnesses and injuries in lower income areas of Winnipeg, then they are also liv-ing with poorer health and more illnesses, chronic conditions and injuries throughout their lives. And this is precisely what we find. For example:
• The highest prevalence of diabetes7 (14%) in the lowest income area is nearly three times higher than the lowest rate of diabetes (5%) in a more affluent area. If we were able to include people who have diabetes but don’t yet know it, the difference could be even higher.
• Ischemic heart disease (the kind associated with narrowed or blocked arteries to the heart) is 1.6 times higher in the lowest income area of Winnipeg (11%) compared to the highest income area (7%).
• Suicide attempts are eight times higher in the lowest income area (3.6 per 1000) compared to attempts in the highest income area (0.4 per 1000).
This pattern repeats itself for many illnesses, injuries and chronic conditions, showing us that Winnipeggers living in the lowest income areas tend to become further disadvantaged by experiencing more than their fair share of health problems.
7. The prevalence of diabetes and some other chronic conditions are estimated from their prevalence of treatment. For further explanation, see the Health Equity Indicator Resource.
…Winnipeggers living in the lowest
income areas tend to become further
disadvantaged by experiencing more
than their fair share of health problems.
1 2 B U I L D I N G W I N N I P E G ’ S H E A L T H E Q U I T Y A C T I O N P L A N ❙ A L O O K A T H E A L T H E Q U I T Y I N W I N N I P E G
Ana fled to Canada from Central America with her three children after her husband was kidnapped and presumed dead. She came to Canada as a refugee looking for a better life for her children. Ana did not speak English and her university degree was not recognized so she was unable to find a good job in Winnipeg. With everything unfamiliar, Ana struggled to find a safe place to live, provide healthy food for her family, figure out transportation and send her children to school. She finally found a job as a housekeeper, working 16 hours a day for minimum wage. This was barely enough to pay for a small apartment in a low income neighbourhood. Ana had little time to spend with her children and they were not involved in any after-school activities. She worried about what was going to happen to them. Her work was difficult and she developed knee and low back pain and was diagnosed with asthma thought to be triggered by the mould in her apartment or the chemicals that she worked with. Because she couldn’t afford her prescribed medications and, with language challenges, couldn’t figure out if there were any benefits she was eligible to apply for, she ended up in the emergency department frequently.
But it didn’t have to be this way…. What if conditions and supports had been different at many points along the way?
What if conflict and corruption had not traumatized the family and caused them to flee? Could there have been support for her to upgrade her credentials to get a job in her field in Canada? What if afterschool programs had been available and easy to access for her children?
Better affordable housing could have been avai-lable and what if she was protected from expo-sures at work and not required to work such long hours. Could benefits for medication have been available and easy to understand? What if…?
When you are frequently sick or injured or living with chronic conditions and chronic stress, it follows that you don’t tend to feel well. People’s perceived health correlates very strongly with their physical and mental health. 8
• About seven out of 10 people you walk past on some of the wealthiest streets in Winnipeg are feeling healthy and ready for their day, while only about half of the people you walk by on some of the lowest income streets are likely feeling the same way. Seventy per cent of people in the most affluent CA in Winnipeg report excellent or very good health compared to 56% in a low income CA. Over twice as many people rate their health as fair or poor in the lowest income areas compared to the highest, and in the lowest income quintile compared to the highest.
• Similarly, people in middle to higher income areas report higher perceived mental health than those in the lowest income areas or income quintile.
8. Results here and for some health risks are from the Canadian Community Health Survey (CCHS) which is designed to collect health data at provincial and health region levels. While the results for the whole Winnipeg Health Region are reliable, we need to use some caution to interpret comparisons among community areas and neighborhood clusters due to small sample size.
People’s perceived health
correlates very strongly with their
physical and mental health.
A L O O K A T H E A L T H E Q U I T Y I N W I N N I P E G ❙ B U I L D I N G W I N N I P E G ’ S H E A L T H E Q U I T Y A C T I O N P L A N 1 3
Rising above difficult life circumstances and making positive changes for health often takes extra energy and determination at a time when energy reserves are low due to symptoms such as pain or fatigue from a chronic condition, recovery from an illness or injury, or mental health challenges. Thus, poor health can become a vicious cycle. Also, the health effects of chronic stress from social and psychological circumstances should not be underestimated. Living with high or compounding stress from things such as money worries, food insecurity, the experience or fear of violence, overcrowded or run down housing, racism, stigmatization or prejudice, social isolation, the feeling of having less than other people, the pain of past trauma, including generational trauma, neglect, abandonment or complicated grief profoundly affect health (i.e., physical, mental and social well-being), particularly when high stress has been a part of life since infancy.
Health risks and behaviours
Too often, health differences are attributed solely to behavioural factors seen as being within the control or ‘will power’ of individuals to change. In truth, all sorts of life conditions affect the degree of control people have over health behaviours, and these behaviours are only one of many factors, often not the most important factor, that determine health. When living in lower income environments with lower education levels and many social and economic challenges, healthier
choices are frequently not the easier choices, and often they are not even possible. Poverty is an independent risk factor for poorer health, not just a marker of poor health behaviours. Factors such as the stressors mentioned above directly affect health through a number of pathways, in addition to affecting the resiliency needed to adopt and sustain healthy behaviors.
The day-to-day decisions people make are markedly affected by their physical, social and economic environment. Health behaviors must be seen in the context of these environments considering such things as housing circum-stances, safety, access to affordable food, level of family supports, meaningful employment and level of control. These are all needed, along with motivation towards healthy behaviours, for people to create a positive future for themselves, their families and communities.
Health behaviour is always more complex than a simple path from intention to action. Let’s have a look at some health behaviours.
• The picture for physical activity may not be what many people expect. When activity at work, during transportation and from exercise are all added up, the highest rate of physical activity is found in the lowest income quintiles, with the highest income quintile being the least active. Inactivity is a problem throughout Winnipeg, where a concerning 40% of all Winnipeg adults are inactive, but some of the most inactive areas are not the
Rising above difficult life circumstances and
making positive changes for health often
takes extra energy and determination at
a time when energy reserves are low…
1 4 B U I L D I N G W I N N I P E G ’ S H E A L T H E Q U I T Y A C T I O N P L A N ❙ A L O O K A T H E A L T H E Q U I T Y I N W I N N I P E G
lowest income areas. So poorer health in lower income areas cannot be readily explained by lower levels of overall physical activity. Nevertheless, more recreation opportunities are still needed for a variety of benefits in low income areas, where physical activity tends to come from more active labour at work and reliance on walking or cycling for transportation than in higher income areas.
• Looking at fruit and vegetable consumption as a marker of good nutrition, again the pattern may be surprising. This health behaviour is remarkably low throughout Winnipeg so differences are small and hard to discern. Only just over a third of Winnipeggers report eating fruit or vegetables five or more times a day. Some of the lower income areas have rates approaching the higher income areas.The income quintile pattern does suggest some relationship with income, but the pattern is not entirely linear. While access to affordable, healthy food is an important and concerning issue in lower income neighbourhoods, more information than just fruit and vegetable consumption is needed to understand the link between poverty and nutrition.
• Smoking is one of the most important modifiable risk factors for common killers such as cancer and cardiovascular disease. Currently, just under one in five Winnipegers
smoke,9 but smoking is not evenly distributed across all income groups. People in low income areas are nearly four times more likely to smoke than Winnipegers living in higher income areas.10 Suggested explanations for higher continued smoking in lower income groups include coping with high chronic stress, feelings of relative deprivation, the role of addiction, and social network norms.
• Similarly, being exposed to second hand smoke at home is over four times higher for Winnipeggers 12 and older in lower income areas (48%) compared to the lowest rate of exposure in a high income area (11%). Smoking (addiction to nicotine) and exposure to second hand smoke is currently strongly associated with poverty in Winnipeg, as it is in most high and middle income countries.
• Binge alcohol consumption also appears to have some relationship with income. The highest rate (29%) is found in a lower income area where it is nearly four times higher than the area where binge drinking is lowest (8%) and nearly double most higher income areas. However, a simple linear pattern does not appear to exist.
• Safety-related behaviours are also associated with income. For example, bicycle helmet
9. Based on Manitoba estimates. Health Canada, Canadian Tobacco Use Monitoring Survey (CTUMS) 2011, available at http://www.hc-sc.gc.ca/hc-ps/tobac-tabac/research-recherche/stat/ctums-esutc_2011-eng.php10. These rates are based on old data 2001-2005 since that is the most recent data available by NCs in Winnipeg. We believe that the actual smoking rates are now lower, but the relative gap is similar or perhaps larger.
Poverty is an independent risk factor
for poorer health, not just a marker of
poor health behaviours.
A L O O K A T H E A L T H E Q U I T Y I N W I N N I P E G ❙ B U I L D I N G W I N N I P E G ’ S H E A L T H E Q U I T Y A C T I O N P L A N 1 5
use was nearly 16 times higher in the highest helmet wearing community areas compared to the lowest. Policy and promotion measures have the potential to close this equity gap. 11
So the picture regarding health behavior is complex and requires a more detailed examination in Winnipeg. Sometimes poverty is associated with higher risk health behaviours and sometimes it isn’t.
What is clear is that the impact of poverty on health cannot be assumed to simply be due to poor health choices by individuals. It is related to many more societal and environmental influences than that. Collaborative action to better understand and address the connections between the physical, social and economic environments and health behavior is urgently needed.
Early beginnings and education
Good beginnings early in life have profound effects on health and wellness throughout the life course. Looking at rates of teen pregnancy and birth, dramatic differences are seen across Winnipeg.
• Picture 32 babies in strollers pushed by teen mothers on some streets of Winnipeg for
11. IMPACT, the injury prevention program WRHA. Bicycle Helmet Use Among Winnipeg Cyclists. Winnipeg, MB: WRHA. January 2012 http://www.wrha.mb.ca/healthinfo/prev entinj/index.php
every one similar stroller in another area. The highest teen birth rate is astoundingly nearly 32 times higher compared to the lowest teen birth rate in a more affluent area. Similarly, there is an 18-fold difference between the birth rate in the lowest versus highest income quintile. The rate in the lowest income quintile is more than double that of even the second lowest income quintile.
• Having good prenatal care that begins early (within the first trimester) and continues throughout pregnancy is an important part of a baby’s best start. Three Winnipeg CAs have significantly more delayed initiation of prenatal care than the provincial average. Over twice the rate of delayed prenatal care occurs in lower income CAs compared to the least delay in a higher income CA.12 Delayed prenatal care is associated with income across the gradient.
• Pregnant women living in the lowest income CA are nearly five times as likely to have inadequate prenatal care (19%) compared to pregnant women living in the highest income area (4%).
Adolescents who are mature and prepared for parenthood can provide excellent nurturing, healthy environments for their babies. A pregnancy may present an opportunity for
12. Manitoba Centre for Health Policy. Perinatal Services and Outcomes in Manitoba. November 2012. Available at http://mchp-appserv.cpe.umanitoba.ca/reference/perinatal_ report_WEB.pdf
…the impact of poverty on health
cannot be assumed to simply be due to
poor health choices by individuals.
1 6 B U I L D I N G W I N N I P E G ’ S H E A L T H E Q U I T Y A C T I O N P L A N ❙ A L O O K A T H E A L T H E Q U I T Y I N W I N N I P E G
an adolescent to improve her quality of life by making sound life changes. If we value adolescents and support them as new parents, this can represent a positive life turning point. However, without adequate support, adolescents facing the responsibilities of parenthood may have difficulty taking care of themselves and providing their children with the good foundation for life they need, and health inequity is perpetuated.
Kayla’s mom was a single parent who struggled to make enough money to support Kayla and her siblings. She worked two jobs at minimum wage just to earn enough money to pay for a crowded apartment. They moved frequently. There never seemed enough money to buy food, let alone school supplies or clothing. Playing sports or an instrument was out of the question. Kayla worked hard at school and took care of her younger sisters. She hoped to be a teacher. Like many teenagers, she went to parties on the weekends where she and her friends would drink. When she was 16, Kayla got pregnant. She continued to drink until she realized she was pregnant at four months. Kayla had to drop out of high school and find a place to stay. She didn’t have a family doctor and prenatal care wasn’t a top priority as she was struggling to find a place to live. Finally, with some social assistance support she found a small place of her own by the time her baby arrived. Her son was a difficult baby and she worried he might have Fetal Alcohol Spectrum Disorder.
But it didn’t have to be this way….. What if conditions and supports had been different at many points along the way?
What if Kayla’s mom had been supported to finish her education and find a better job? Might Kayla have been able to play sports and join a music program? What if Kayla had gotten early prenatal care and support for parenting while also continuing her education? What if…?
Not only is a healthy pregnancy important, but the early years (prenatal to five) are essential in setting a sturdy foundation for good health throughout life. Readiness for school data collected with the Early Development Instrument (EDI) demonstrate that large inequities in children’s development can be detected as early as kindergarten.
• Children who come from families who self report low socio-economic status (a mix of parental income and education) can be upwards of four times more vulnerable in the areas of physical development and literacy skills than those children who come from middle to high socio-economic status families.13
• The proportion of kindergarten aged children not ready for school is nearly twice as high in some areas of Winnipeg compared to the most ready areas. About two out of five kindergarten aged children are not ready in lower income areas, compared to one out of four or five children in the most ready areas.
13. Healthy Child Manitoba. 2008/09 Provincial Report Are Our Children Ready for School? 2012. Available at http://www.gov.mb.ca/healthychild/edi/edi2008.pdf
Not only is a healthy pregnancy
important, but the early years are
essential in setting a sturdy foundation
for good health throughout life.
A L O O K A T H E A L T H E Q U I T Y I N W I N N I P E G ❙ B U I L D I N G W I N N I P E G ’ S H E A L T H E Q U I T Y A C T I O N P L A N 1 7
• Positive school experiences and level of education attained are also important for health throughout life. Overall, 79% of Winnipeg students complete high school with high graduation rates of 88-90% in high income CAs compared to only a 53% graduation rate in the lowest income area. High school graduation is strongly associated with family income with 94% of students from families in the highest income quintile completing high school compared with only 53% high school completion in the lowest income quintile. Lower educational attainment of youth in lower income areas means a higher chance of unemployment or a low paying job in the future which continues the cycle of poverty and health inequity.
Employment
Employment is linked to health and unemploy-ment is associated with poorer health.
• Overall, just over 5% of Winnipeggers aged 15 and over who are available to work do not have a job. However unemployment rates in areas of Winnipeg with the highest unemployment ( 8.7% for men and 7.9% for women) are about double areas with the lowest rates (4.0% for men and 3.9% for women).
Dennis had a good job in construction since leaving high school part way through grade 11. He owned his own house and was proud of his work. One day a beam he was helping secure slipped out of place and landed on his leg fracturing it badly. His company kept him on, but when they went out of business, Dennis couldn’t find work due to his age, injury and lack of training. Bored and lonely, he found himself drinking most days and taking more and more pain killers. Soon the bills piled up and eventually the bank took over his house. Life on the street was hard on Dennis and his pain got worse. He had smoked for years and now was humiliated to look for discarded butts to reroll to ease his cravings. He didn’t want to see family or friends until he was back on his feet again. His health declined, and his smokers cough turned into pneumonia. Lying in the hospital he wondered how he had ended up where he was, and where he would go when they wanted to send him home.
But it didn’t have to be this way… What if conditions and supports had been different at many points along the way?
What if Dennis had stayed in school and went on to get training in a trade? Perhaps better understanding of and compliance with workplace safety practices could have prevented his injury? What if he had never smoked and his fracture healed completely? What if he accessed retraining and entered another line of work? What if there had been supports for him to keep his home until he could get his finances on track? What if…?
Employment is linked to health
and unemployment is associated
with poorer health.
1 8 B U I L D I N G W I N N I P E G ’ S H E A L T H E Q U I T Y A C T I O N P L A N ❙ A L O O K A T H E A L T H E Q U I T Y I N W I N N I P E G
What does it all mean?This report connects some of the dots between social and economic circumstances and health, and challenges us to see the people and communities affected rather than numbers. A comprehensive picture of health equity in Winnipeg has not been provided, rather the nature and magnitude of local health gaps has been sketched. To view more health equity indicators, please go to the Winnipeg Health Region’s Health Equity Indicator Resource.
We must look to the lived experience of those who face inequity and who continue to be resilient despite the weight of poverty, historical marginalization, and lack of access to opportunity. They carry and share the hope that is needed to inspire, mobilize, and sustain the health and social change that is possible within our city. Collaborative and sustained action is urgently needed.
This report connects some of the
dots between social and economic
circumstances and health, and challenges
us to see the people and communities
affected rather than numbers.
T O W A R D S H E A L T H E Q U I T Y A C T I O N ❙ B U I L D I N G W I N N I P E G ’ S H E A L T H E Q U I T Y A C T I O N P L A N 1 9
Towards Health Equity ActionImagine if everyone in Winnipeg could experience the level of good health that the most advantaged Winnipeggers currently enjoy. Clearly the right and socially just thing to do is to ‘level up’ those individuals who are experiencing more than their fair share of preventable health problems. It also makes good business sense. The Manitoba Centre for Health Policy in 2004 estimated that 15% of hospital and physician costs could be eliminated if the whole population experienced the level of health that the 20% most affluent Winnipeggers do.14 Recently, the President of the Canadian Medical Association, Dr. Anna Reid, was quoted as saying that an
14. Roos NP, Sullivan K, Walld R, MacWilliam L. Potential savings from reducing inequalities in health. Can J Public Health 2004;95(6):460-464.
estimated 20% of the $200 billion Canada spends on health care each year can be attributed to socioeconomic disparities.15 Reducing disparities and leveling up in Winnipeg would help protect a sustainable, high quality health care system, contribute to a healthy workforce and improve Winnipeg’s reputation as a desirable place to live, invest and visit. While it may not be feasible to ever completely eliminate health gaps, considerably narrowing the gap is well within reach. There are many examples of effective action here in Winnipeg and around the globe. So what should we do?
15. Canadian Medical Association. Being poorer, dying faster: it’s time to end Canada’s “national disgrace,” CMA says. CMA website Feb. 5, 2013 available at http://www.cma.ca/being-poorer-dying-faster-national-disgrace.
…15% of hospital and physician costs
could be eliminated.
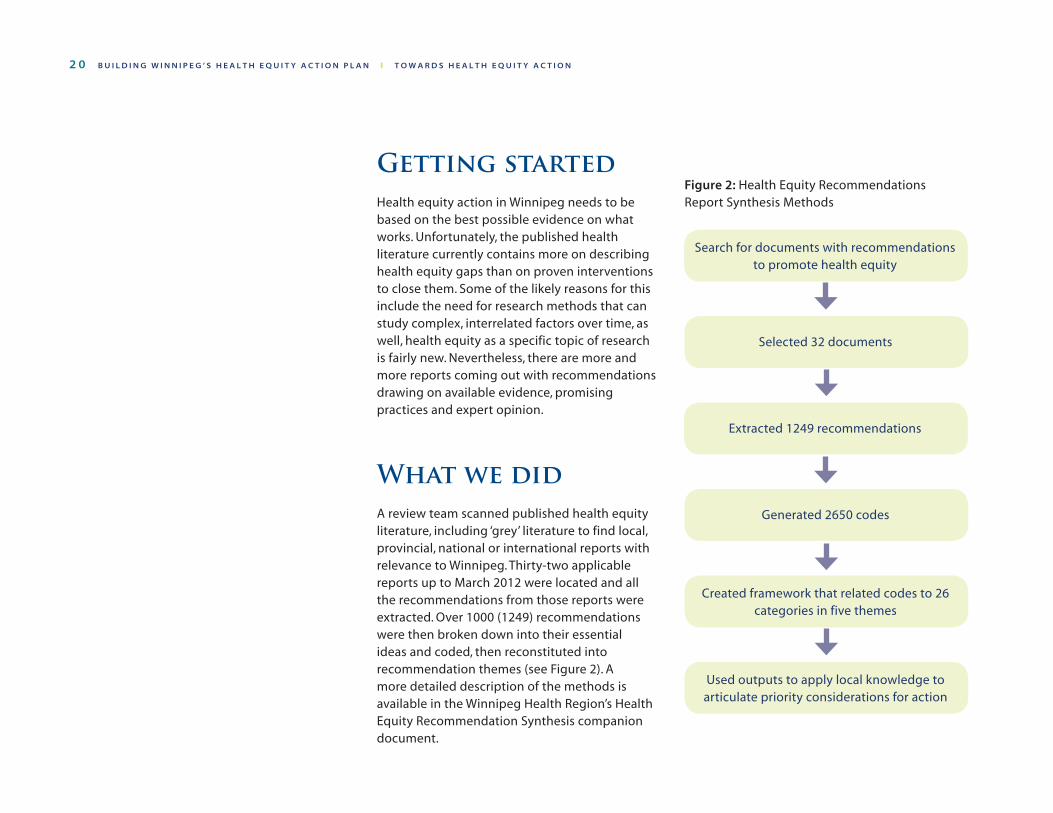
2 0 B U I L D I N G W I N N I P E G ’ S H E A L T H E Q U I T Y A C T I O N P L A N ❙ T O W A R D S H E A L T H E Q U I T Y A C T I O N
Created framework that related codes to 26 categories in five themes
Selected 32 documents
Extracted 1249 recommendations
Generated 2650 codes
Getting started Health equity action in Winnipeg needs to be based on the best possible evidence on what works. Unfortunately, the published health literature currently contains more on describing health equity gaps than on proven interventions to close them. Some of the likely reasons for this include the need for research methods that can study complex, interrelated factors over time, as well, health equity as a specific topic of research is fairly new. Nevertheless, there are more and more reports coming out with recommendations drawing on available evidence, promising practices and expert opinion.
What we did A review team scanned published health equity literature, including ‘grey’ literature to find local, provincial, national or international reports with relevance to Winnipeg. Thirty-two applicable reports up to March 2012 were located and all the recommendations from those reports were extracted. Over 1000 (1249) recommendations were then broken down into their essential ideas and coded, then reconstituted into recommendation themes (see Figure 2). A more detailed description of the methods is available in the Winnipeg Health Region’s Health Equity Recommendation Synthesis companion document.
Figure 2: Health Equity Recommendations Report Synthesis Methods
Search for documents with recommendations to promote health equity
Used outputs to apply local knowledge to articulate priority considerations for action
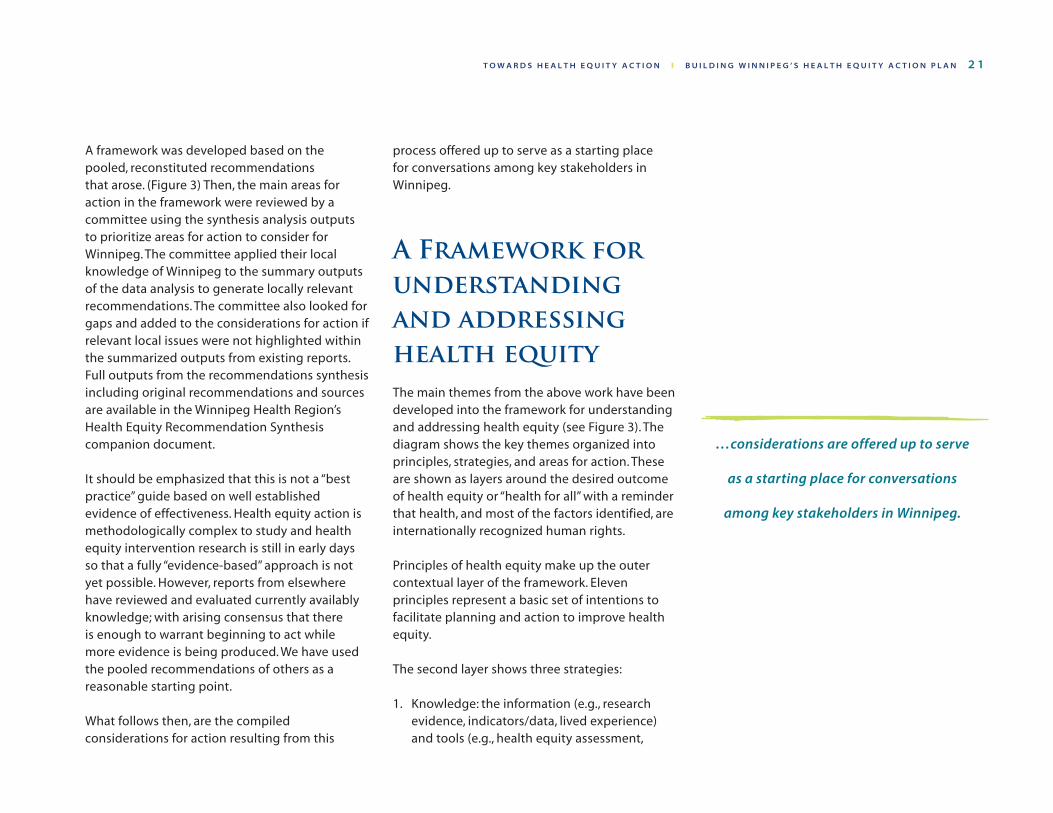
T O W A R D S H E A L T H E Q U I T Y A C T I O N ❙ B U I L D I N G W I N N I P E G ’ S H E A L T H E Q U I T Y A C T I O N P L A N 2 1
A framework was developed based on the pooled, reconstituted recommendations that arose. (Figure 3) Then, the main areas for action in the framework were reviewed by a committee using the synthesis analysis outputs to prioritize areas for action to consider for Winnipeg. The committee applied their local knowledge of Winnipeg to the summary outputs of the data analysis to generate locally relevant recommendations. The committee also looked for gaps and added to the considerations for action if relevant local issues were not highlighted within the summarized outputs from existing reports. Full outputs from the recommendations synthesis including original recommendations and sources are available in the Winnipeg Health Region’s Health Equity Recommendation Synthesis companion document.
It should be emphasized that this is not a “best practice” guide based on well established evidence of effectiveness. Health equity action is methodologically complex to study and health equity intervention research is still in early days so that a fully “evidence-based” approach is not yet possible. However, reports from elsewhere have reviewed and evaluated currently availably knowledge; with arising consensus that there is enough to warrant beginning to act while more evidence is being produced. We have used the pooled recommendations of others as a reasonable starting point.
What follows then, are the compiled considerations for action resulting from this
process offered up to serve as a starting place for conversations among key stakeholders in Winnipeg.
A Framework for understanding and addressing health equityThe main themes from the above work have been developed into the framework for understanding and addressing health equity (see Figure 3). The diagram shows the key themes organized into principles, strategies, and areas for action. These are shown as layers around the desired outcome of health equity or “health for all” with a reminder that health, and most of the factors identified, are internationally recognized human rights.
Principles of health equity make up the outer contextual layer of the framework. Eleven principles represent a basic set of intentions to facilitate planning and action to improve health equity.
The second layer shows three strategies:
1. Knowledge: the information (e.g., research evidence, indicators/data, lived experience) and tools (e.g., health equity assessment,
…considerations are offered up to serve
as a starting place for conversations
among key stakeholders in Winnipeg.
2 2 B U I L D I N G W I N N I P E G ’ S H E A L T H E Q U I T Y A C T I O N P L A N ❙ T O W A R D S H E A L T H E Q U I T Y A C T I O N
surveillance) that are necessary to inform effective health equity action
2. Governance: the authority, power and resource deployment necessary to make effective ’game changing’ health equity decisions and system changes
3. Participation: the relationships, partnerships and participatory citizen engagement required for effective and lasting health equity results
The third layer represents the areas of opportunity for action recommended. Action in each of the respective 12 areas has potential to improve health equity, and the combined effect of addressing all the inter-related factors promises the greatest impact. The 12 ‘areas for action’ identified are very similar to the established ‘social determinants of health’ However, the frame of reference here is geared towards motivating enhanced action going forward rather than explaining causation looking backwards.
This framework is offered as a tool to help understand health equity, and at the same time, to envision how to collaborate on actions towards the health equity target of “health for all.”
The remainder of this report will expand on the 12 areas for action identified in the model. More detailed considerations for action within each of those areas informed by
the recommendations synthesis work will be presented. Throughout the report, the three strategies and the underlying principles provide a backdrop to the considerations identified.
Suggested considerations for actionThrough the review and synthesis of recommendations from many health equity reports, and reflection on the local context of Winnipeg, key considerations for action are suggested below. This is intended as a starting place for conversation and action planning in all the areas involved. The WRHA respectfully recognizes it lacks expertise and authority in areas outside of health services to ‘prescribe’ action, and appreciates that related and contributory efforts in many sectors are already underway. However, the health sector has a responsibility to act as a ‘steward’ of health equity and recognizes that areas outside health services hold the greatest potential to improve health equity. More action and collaboration is urgently needed. The work done here to summarize and share potential health equity action is offered to encourage dialogue, collaboration and expanded efforts within and across many sectors.
The WRHA respectfully recognizes it lacks
expertise and authority in areas outside
of health services to ‘prescribe’ action…
…areas outside health services hold
the greatest potential to improve health
equity. More action and collaboration
is urgently needed.
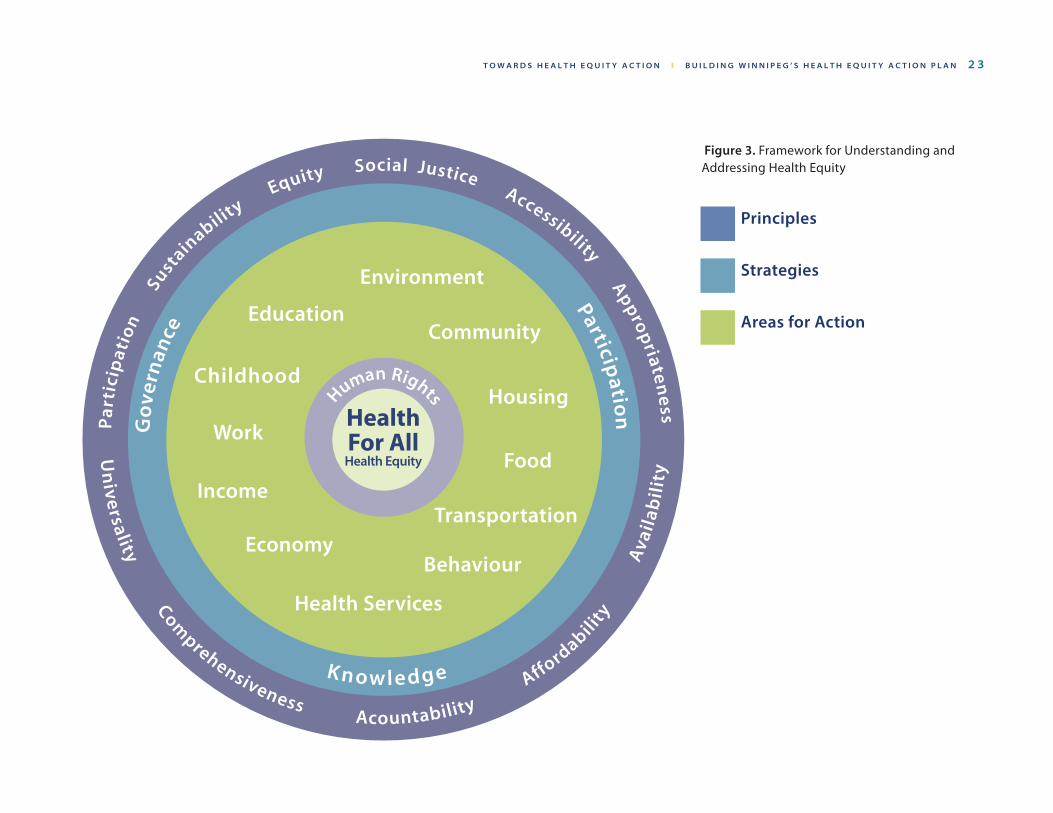
T O W A R D S H E A L T H E Q U I T Y A C T I O N ❙ B U I L D I N G W I N N I P E G ’ S H E A L T H E Q U I T Y A C T I O N P L A N 2 3
Figure 3. Framework for Understanding and Addressing Health Equity
Principles
Strategies
Areas for Action
2 4 B U I L D I N G W I N N I P E G ’ S H E A L T H E Q U I T Y A C T I O N P L A N ❙ T O W A R D S H E A L T H E Q U I T Y A C T I O N
Given that the source of the recommendations and the review process largely came from a health perspective, more detail will be noted regarding health services and some of the sector areas more familiar to health care. This is not a reflection on the relative importance of various factors, only uneven familiarity. There was no attempt to level out the amount of detail available, trusting that additional detail can be added by the relevant sectors. While some lists are lengthy, no attempt was made to further categorize or subtheme any of the listed considerations for action other than the health sector considerations. Since these are potential starting points, any sorting or priorizing would be the purview of the applicable sectors.
Additionally it should be noted that while the specific intention of action is to improve the health of those most vulnerable, some considerations are also applicable to improving the health of the whole population (e.g., urban planning for better health, increased active transportation). In fact, the ultimate goal in health gains is captured in the notion of ‘proportionate universality’ (see glossary). This means that we want everyone to reach their full health potential ‘universally’ while at the same time recognizing that greater flexibility, adaptation, reaching out or effort may be required to ensure that inequity-affected populations benefit in ‘proportion’ to their need. While not all population-wide ‘one size fits all’ initiatives benefit those most marginalized, virtually all equity-focused initiatives benefit everyone, either directly or indirectly.
What follows is a summary of
suggested considerations for each
of the 12 areas for health equity
action in the framework, starting
first in our own health services
‘back yard.’
While not all actions may be
feasible or appropriate to tackle at
this time, and other ideas may be
missing, starting a conversation
around these considerations, and
adding to efforts underway, can
build momentum and move equity
forward in Winnipeg. Small actions
in many areas building over time
can make a difference if we all ask
“what more could we do?”
T O W A R D S H E A L T H E Q U I T Y A C T I O N ❙ B U I L D I N G W I N N I P E G ’ S H E A L T H E Q U I T Y A C T I O N P L A N 2 5
1. Health Services Considerations for Action
The WRHA is committed to changing health equity outcomes by promoting health equity in leadership and governance decisions, ensuring equity in health care services, producing and translating health equity knowledge and facilitating participation to amplify health equity action in and beyond the health sector.
Health equity considerations need to be embedded throughout all aspects of the WRHA’s planning and operational decision-making- vertically and horizontally. An equity ‘lens‘ should not only be used for new program considerations, but also the ways in which we seek to improve existing services. This means not just doing the right things, but also doing the things that we do in the right way. Many improvement approaches can help address health equity; however, we need more explicit focus around this value to better contribute (e.g., process improvement, integration, quality and safety, innovation).
Health services recommendations have been sub-cate gorized, using the health equity framework, to consider action in the three strategic areas of governance/leadership, participation/partner-ships, and knowledge, as well as our own ‘core business’ of health care service delivery. It should be recognized that existing and newly developed programs and initiatives, such as Aboriginal Health Services and Cultural Proficiency and Diversity, are foundational to ensure health equity in all health care services and to demonstrate the WRHA’s commitment to align service provision with client need.
2 6 B U I L D I N G W I N N I P E G ’ S H E A L T H E Q U I T Y A C T I O N P L A N ❙ T O W A R D S H E A L T H E Q U I T Y A C T I O N
Presented below are the compiled considerations for action resulting from the recommendations review process, offered as a conversation starting place among key stakeholders regarding health services. In most areas below potential actions are for consideration by the WRHA. Considerations for broader health sector action as well as sectors outside health are included in Section 3.
1. Promote health equity in leadership and decision making (governance) in the WRHA:
a. Leadership i. Health equity must be a central value
that drives all aspects of health care; internalized, championed and acted upon from the highest levels of WRHA leadership through to every interaction with every person.
ii. The WRHA Board recognizes equity as a core value. It systematically and regularly reviews the status of, and progress toward, health equity.
iii. The WRHA ensures health equity consideration and actions are built into all operational aspects of WRHA business such as planning, finance, human resources, procurement, logistics, volunteerism, corporate citizenship.
iv. The WRHA more completely ensures a health care culture that places the person, their context and their experiences at the centre of health care, particularly for inequity-affected populations.
v. The WRHA recognizes that the following
initiatives and approaches are all interrelated and are the foundation of health equity action in health care: Cultural Proficiency, Aboriginal Health Services, Language Access, French Language Services, professionalism, interprofessional and intraprofessional practice and education, Collaborative Care, Person-centred Care, Dignity in Care, Patient and Public Engagement, Respectful Workplace, and Ethics.
b. Planningi. Use health inequity data as the base from
which to design and evaluate all current and future health initiatives. Ensure maximum transparency about use of health service and health outcome inequities.
ii. The WRHA, in collaboration with others within and outside of the health sector, sets targets for health equity action and monitors and reports on progress towards the targets.
iii. WRHA routinely uses equity focused organizational planning, management and evaluation tools including equity assessments.
c. Human Resources i. Each WRHA program allocates resources to
carry out equity planning and assessment activities and central support for regional health equity coordination is resourced.
ii. WRHA models activities to ensure workforce diversity in recruitment,
T O W A R D S H E A L T H E Q U I T Y A C T I O N ❙ B U I L D I N G W I N N I P E G ’ S H E A L T H E Q U I T Y A C T I O N P L A N 2 7
retention, mentorship, succession planning, training and education, while supporting existing programs such as the Aboriginal Health Programs Workforce Development.
iii. All WRHA human resource functions and activities are reviewed and modified to meet regional health equity objectives.
iv. WRHA strives to hire in full-time regular positions using equitable recruitment processes and provides wages and benefits that are fair.
v. The WRHA models participatory decision making and a fair, trusting, respectful, supportive and caring work environment minimizing power imbalances.
d. Finance i. The WRHA allocates sustained core
funding for:1. Human resources required for
coordination of the health equity initiative
2. Specific interventions and supports for inequity-affected populations
3. Contribution towards social actions to change systemic origins of health inequities such as poverty
ii. The WRHA demonstrates flexibility to allocate funds to equity-focused programs.
iii. WRHA procurement policies are developed and implemented that includes criteria that support health equity through improved determinants of health locally, nationally and internationally.
iv. Equity considerations are included as an
integral and routine component of WRHA risk management.
e. Continue to support universal publicly funded health care services and increase equitable access to services as needed. Continue to develop working partnerships with fee-for-service providers and private services to enhance access and equity (e.g., Primary care home partnership development).
2. Ensure health equity considerations and actions are embedded in all health care services provided in the WHR:
a. Ensure inclusive, comprehensive programs and services proportionate to need.
i. Increase acceptability and accessibility of services for inequity-affected populations based on listening to and respecting the preferences, views and self determination rights of those served and increasing cultural safety by providing culturally proficient services for all inequity-affected people.
ii. Programs/services are planned and delivered for populations that experience profound health inequity so that services are proportionate to need and that universal outcomes are achieved (proportionate universalism).
iii. The WRHA expands its efforts to reach out to those with the highest health care and health promotion and protection needs,
2 8 B U I L D I N G W I N N I P E G ’ S H E A L T H E Q U I T Y A C T I O N P L A N ❙ T O W A R D S H E A L T H E Q U I T Y A C T I O N
meeting people where they are, and in ways that are relevant and acceptable to them.
iv. WRHA adapts services for marginalized populations who may not fit into traditional community service operating hours. Flexible or extended hours and/or location of services must be considered to better reach out to those who have highest levels of health inequity.
v. Advocate for services such as vision, dental care and coverage for pharmaceuticals to be equitably accessible according to need.
b. Address the priorities of communities where people experience health inequities (e.g., low income neighbourhoods, recent immigrants, homeless persons) on the community’s terms through models of interprofessional and intersectoral practice.
c. Resource public health and promotion activities to focus on inequity-affected populations and on upstream investments in health (e.g., immunization, health behaviour change, prenatal care, intensive parenting support during early childhood, school health, tobacco reduction, harm reduction).
d. Ensure equity is a key component as primary care networks develop through key elements of access, quality and safety, patient-centred, seamless transitions in care, efficiency and sustainability.
3. Facilitate participation and partnerships with other parts of the health care system and beyond the health sector to amplify health equity action:
a. Each program develops formal, transparent, and public mechanisms to engage citizens, and civil society organizations that have an interest in the work of that program.
i. Build capacity with inequity-affected communities (community development) – using a collaborative and strength-based approach consistent with the WRHA’s Community Development Framework where community development is recognized as a process that includes organizational capacity building, intersectoral networking and local area development.
b. Advocate with or on behalf of inequity-affected populations in the community.
c. Resource and develop strong relationships with the City of Winnipeg to support planning and work on many factors in its control and within its influence that can address health inequity, fully supporting opportunities as identified in “OurWinnipeg”16.
16. City of Winnipeg. OurWinnipeg. It’s Our City, It’s Our Plan, It’s Our time. City of Winnipeg 2011: 73–78. Available at http://winnipeg.ca/interhom/CityHall/OurWinnipeg/pdf/Our Winnipeg.Jul15.2010.pdf
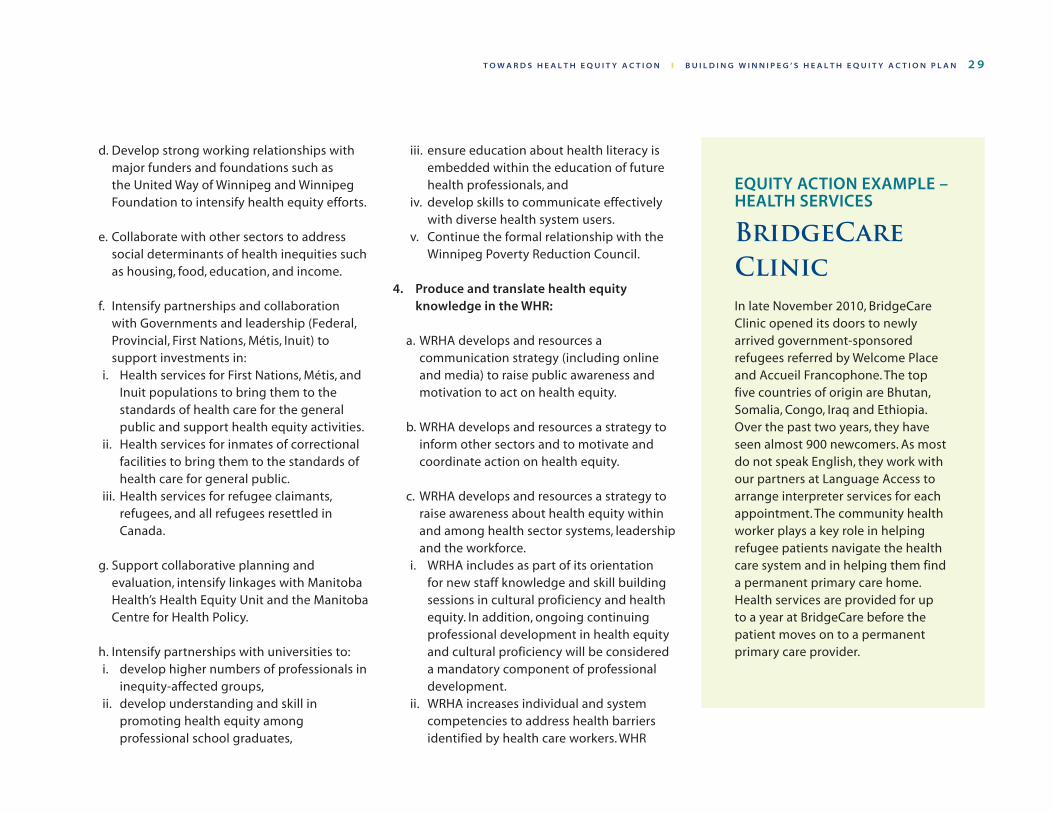
T O W A R D S H E A L T H E Q U I T Y A C T I O N ❙ B U I L D I N G W I N N I P E G ’ S H E A L T H E Q U I T Y A C T I O N P L A N 2 9
d. Develop strong working relationships with major funders and foundations such as the United Way of Winnipeg and Winnipeg Foundation to intensify health equity efforts.
e. Collaborate with other sectors to address social determinants of health inequities such as housing, food, education, and income.
f. Intensify partnerships and collaboration with Governments and leadership (Federal, Provincial, First Nations, Métis, Inuit) to support investments in:
i. Health services for First Nations, Métis, and Inuit populations to bring them to the standards of health care for the general public and support health equity activities.
ii. Health services for inmates of correctional facilities to bring them to the standards of health care for general public.
iii. Health services for refugee claimants, refugees, and all refugees resettled in Canada.
g. Support collaborative planning and evaluation, intensify linkages with Manitoba Health’s Health Equity Unit and the Manitoba Centre for Health Policy.
h. Intensify partnerships with universities to: i. develop higher numbers of professionals in
inequity-affected groups, ii. develop understanding and skill in
promoting health equity among professional school graduates,
iii. ensure education about health literacy is embedded within the education of future health professionals, and
iv. develop skills to communicate effectively with diverse health system users.
v. Continue the formal relationship with the Winnipeg Poverty Reduction Council.
4. Produce and translate health equity knowledge in the WHR:
a. WRHA develops and resources a communication strategy (including online and media) to raise public awareness and motivation to act on health equity.
b. WRHA develops and resources a strategy to inform other sectors and to motivate and coordinate action on health equity.
c. WRHA develops and resources a strategy to raise awareness about health equity within and among health sector systems, leadership and the workforce.
i. WRHA includes as part of its orientation for new staff knowledge and skill building sessions in cultural proficiency and health equity. In addition, ongoing continuing professional development in health equity and cultural proficiency will be considered a mandatory component of professional development.
ii. WRHA increases individual and system competencies to address health barriers identified by health care workers. WHR
EQUITY ACTION EXAMPLE – HEALTH SERVICES
BridgeCare ClinicIn late November 2010, BridgeCare Clinic opened its doors to newly arrived government-sponsored refugees referred by Welcome Place and Accueil Francophone. The top five countries of origin are Bhutan, Somalia, Congo, Iraq and Ethiopia. Over the past two years, they have seen almost 900 newcomers. As most do not speak English, they work with our partners at Language Access to arrange interpreter services for each appointment. The community health worker plays a key role in helping refugee patients navigate the health care system and in helping them find a permanent primary care home. Health services are provided for up to a year at BridgeCare before the patient moves on to a permanent primary care provider.
3 0 B U I L D I N G W I N N I P E G ’ S H E A L T H E Q U I T Y A C T I O N P L A N ❙ T O W A R D S H E A L T H E Q U I T Y A C T I O N
creates effective channels through established routes of organizational communication to inform and influence practice, program or policy changes to address the identified barriers.
d. WRHA develops and implements a process to describe, monitor and promote awareness of health gaps in Winnipeg including involvement by Manitoba Health.
e. WRHA establishes a strategy for a range of regional staff to develop competencies (knowledge, skills and attitudes) essential for health equity actions.
EQUITY ACTION EXAMPLE – HEALTH SERVICES
Immunization The WRHA is increasing equitable access to universal immunization programs, working in schools where there are consistently low numbers of consent forms returned. Improved rates will be achieved by making it easier for families who are not opposed to vaccination but for whom there are barriers to returning consent forms in the context of life stresses. By partnering with schools selected based on historically low consent form return rates (< 70%) and using tools such as reminder messages in multiple languages, more students who missed their routine immunization will be reached. An equity outreach component has become an integral part of the annual public health influenza immunization campaign, where approximately 4000 annual immunizations are provided in accessible community locations, including missions or shelters, to people at risk of serious complications of influenza illness who otherwise would not likely receive a flu shot.
T O W A R D S H E A L T H E Q U I T Y A C T I O N ❙ B U I L D I N G W I N N I P E G ’ S H E A L T H E Q U I T Y A C T I O N P L A N 3 1
2. Economy Considerations for Action
The economy is all the work that humans perform to produce and distribute the goods and services we need and use in our lives. The work of economies includes formal, informal, paid and voluntary arrangements within families and communities.
Presented below are the compiled considerations for action resulting from the recommendations review process, offered as a conversation starting place among key stakeholders regarding economy.
1. Organizations and businesses practice good corporate citizenship to broadly promote equity opportunities and break barriers to economic inclusion through activities such as: scholarship provision, procurement, recruitment and retention, skill development, mentorship and on the job training.
2. Economic development strategies are designed and include plans to break the cycle of the various levels and types of disadvantage. These plans are broad and inclusive (e.g., greater availability of quality affordable housing and sustainable and affordable food production and distribution). Criteria and tools are developed that imbed equity principles and paradigms into economic development approaches.
3. Local area regeneration creates opportunities for breaking the cycle of disadvantage for people who currently live or want to live
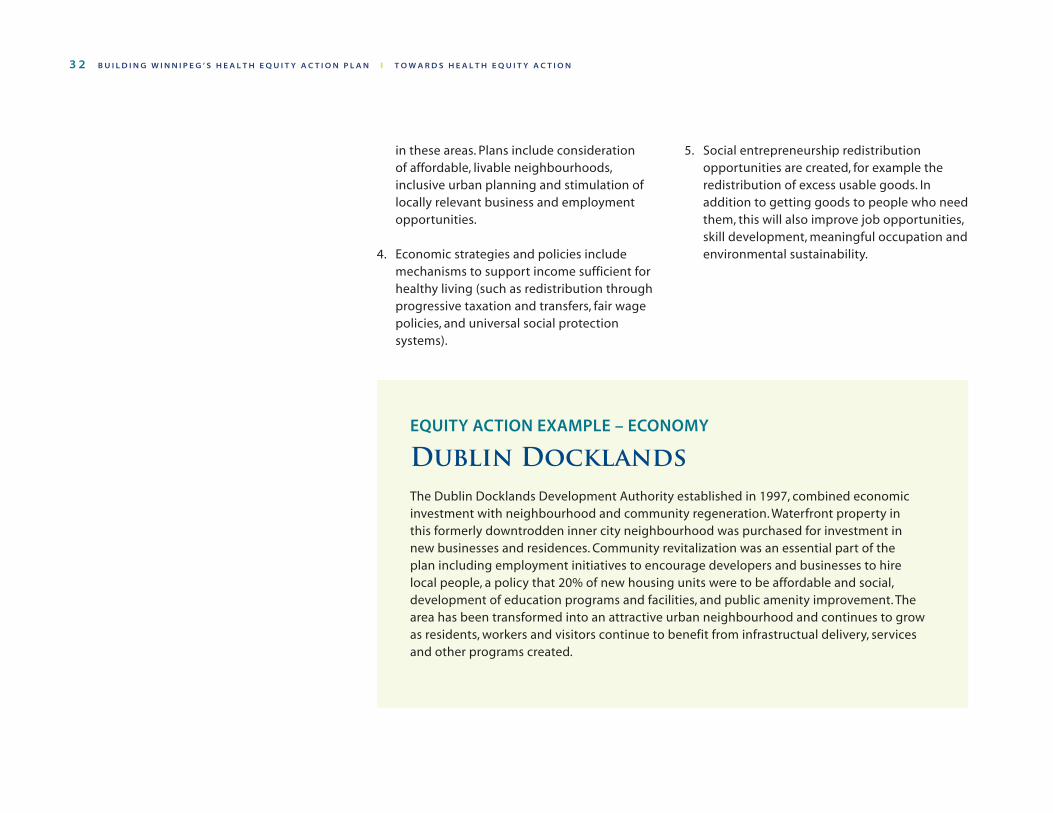
3 2 B U I L D I N G W I N N I P E G ’ S H E A L T H E Q U I T Y A C T I O N P L A N ❙ T O W A R D S H E A L T H E Q U I T Y A C T I O N
in these areas. Plans include consideration of affordable, livable neighbourhoods, inclusive urban planning and stimulation of locally relevant business and employment opportunities.
4. Economic strategies and policies include mechanisms to support income sufficient for healthy living (such as redistribution through progressive taxation and transfers, fair wage policies, and universal social protection systems).
5. Social entrepreneurship redistribution opportunities are created, for example the redistribution of excess usable goods. In addition to getting goods to people who need them, this will also improve job opportunities, skill development, meaningful occupation and environmental sustainability.
EQUITY ACTION EXAMPLE – ECONOMY
Dublin Docklands The Dublin Docklands Development Authority established in 1997, combined economic investment with neighbourhood and community regeneration. Waterfront property in this formerly downtrodden inner city neighbourhood was purchased for investment in new businesses and residences. Community revitalization was an essential part of the plan including employment initiatives to encourage developers and businesses to hire local people, a policy that 20% of new housing units were to be affordable and social, development of education programs and facilities, and public amenity improvement. The area has been transformed into an attractive urban neighbourhood and continues to grow as residents, workers and visitors continue to benefit from infrastructual delivery, services and other programs created.
T O W A R D S H E A L T H E Q U I T Y A C T I O N ❙ B U I L D I N G W I N N I P E G ’ S H E A L T H E Q U I T Y A C T I O N P L A N 3 3
3. Income Considerations for Action Income is the flow or accumulation of money or its equivalents to allow people to purchase or negotiate goods and services.
Presented below are the compiled considerations for action resulting from the recommendations review process, offered as a conversation starting place among key stakeholders regarding income.
1. Progressive tax systems are built or strengthened, enhancing progressive taxation of all real income including investment income and inherited wealth, increasing the lower limit tax exemption, supporting tax benefits for children and dependents, reviewing the system of tax credits, decreasing tax havens, and addressing tax evasion. Additional revenue is directed to breaking the cycle of poverty in children, including education, training, and employment readiness.
2. Policies are created that prioritize adequate income (upstream intervention) over addressing downstream interventions such as health care, corrections and child welfare. The policies incent business to create well-remunerated, full-time, meaningful and permanent jobs that provide a living wage (e.g., large employers could be given the option of contributing to employment in populations who are underemployed or unemployed, or paying additional taxes). Possible policies for review consider a minimum annual income for healthy living.
3 4 B U I L D I N G W I N N I P E G ’ S H E A L T H E Q U I T Y A C T I O N P L A N ❙ T O W A R D S H E A L T H E Q U I T Y A C T I O N
3. Develop, strengthen and advertise education and retirement saving incentives for socially and financially disadvantaged populations.
4. Consolidate income and disability services but ensure recognition that persons with disabilities may have unique funding, service and support needs. Base social assistance and income supplement rates on, and increases indexed to, the real cost of healthy living including housing, food, laundry/cleaning, clothing, transportation, medication, dental and vision care, health aids, telephone, loans repayment, child care and needs associated with life transitions (e.g., starting school, pregnancy). Treat people who can independently manage their money differently from those who require more support. Persons with disabilities may require different services including support for managing finances and access to health care and having their unique differences and needs addressed. Provide sufficient resources for employment and income assistance workers to provide case management support to the most vulnerable people.
5. Explore the eligibility of the working poor for income supplements and other social protection services to allow for healthy living and voluntary withdrawal from social assistance. This will entail revised income thresholds and benefits reductions as well as addressing the cliff edges faced by people moving between benefits and work and for people moving in and out of work.
6. Waive the travel loan repayment requirement for travel, travel documentation and medical exams for all refugees, resettled refugees, and in particular for large families and those experiencing employment difficulties.
T O W A R D S H E A L T H E Q U I T Y A C T I O N ❙ B U I L D I N G W I N N I P E G ’ S H E A L T H E Q U I T Y A C T I O N P L A N 3 5
Remember Ana?....with more supports Ana’s story could have unfolded differently. Imagine if….
Ana heard about the SEED (Supporting Employment & Economic Development) program from a friend. At SEED, Ana was provided with English training and financial help towards starting her own business. Through SEED’s ‘Saving Circle’, Ana saved enough money to open her own business where she now makes a reasonable living and only works 10 hours a day. The extra time, money and education has
allowed her to find a safer apartment for her family and because of this, her breathing is improving. She feels really good about herself and is no longer feeling run down. She hasn’t had to visit the emergency department in months. Her neighbourhood has a community centre where the children are able to spend a lot of their free time and she is also getting involved with being a SEED Money Management Training Facilitator to help others. Her children are thriving and she sees bright futures for them in Canada.
EQUITY ACTION EXAMPLE – INCOME
SEED WINNIPEG Supporting Employment and Economic Development (SEED) Winnipeg Inc. has a range of services and programs which provide opportunities for people with low incomes to strengthen their financial situations. SEED’s Asset Building Programs assist low-income participants to save for productive assets or household necessities through money management training classes, matched savings credits, opportunities for peer support, and one-to-one support from SEED staff. SEED’s Business Development Services help low-income individuals and groups develop or expand small business enterprises, social enterprises, and co-ops in Winnipeg through business management training and one-to-one business counselling. ‘Recognition Counts’ is a new program that provides accessible, low interest loans to assist skilled immigrants in Manitoba with qualification recognition, upgrading and/or training needed for employment in the fields for which they have obtained education and experience outside of Canada.
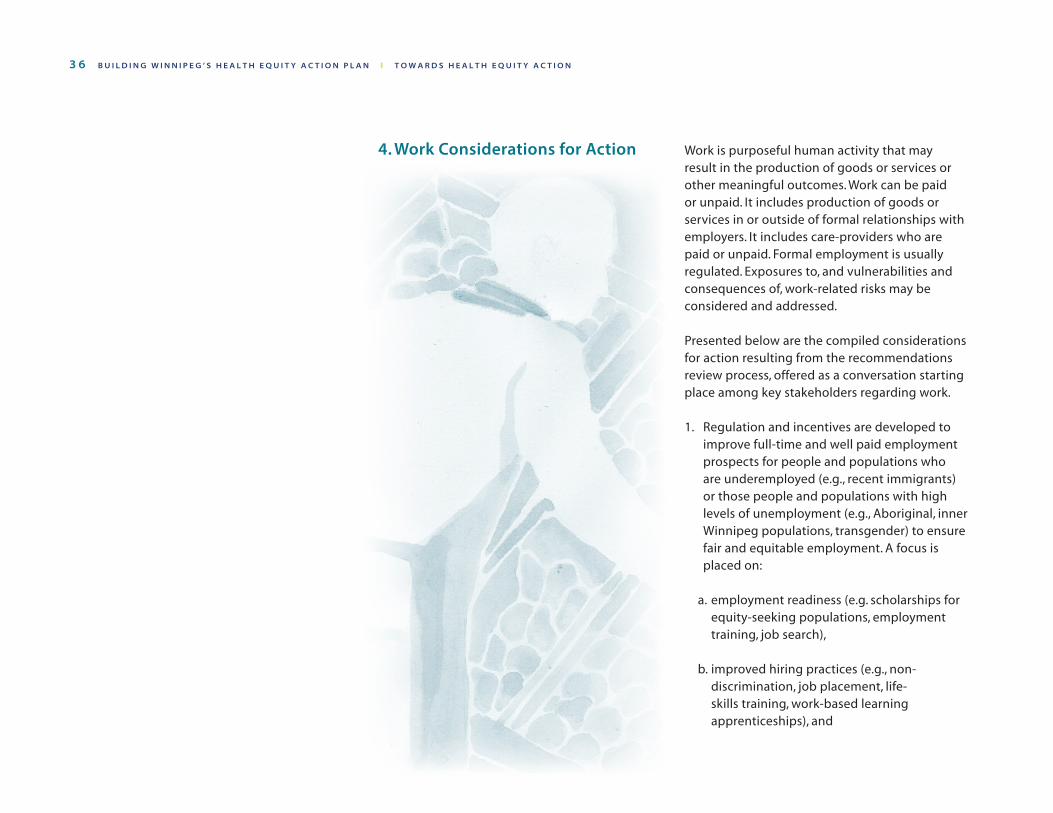
3 6 B U I L D I N G W I N N I P E G ’ S H E A L T H E Q U I T Y A C T I O N P L A N ❙ T O W A R D S H E A L T H E Q U I T Y A C T I O N
4. Work Considerations for Action Work is purposeful human activity that may result in the production of goods or services or other meaningful outcomes. Work can be paid or unpaid. It includes production of goods or services in or outside of formal relationships with employers. It includes care-providers who are paid or unpaid. Formal employment is usually regulated. Exposures to, and vulnerabilities and consequences of, work-related risks may be considered and addressed.
Presented below are the compiled considerations for action resulting from the recommendations review process, offered as a conversation starting place among key stakeholders regarding work.
1. Regulation and incentives are developed to improve full-time and well paid employment prospects for people and populations who are underemployed (e.g., recent immigrants) or those people and populations with high levels of unemployment (e.g., Aboriginal, inner Winnipeg populations, transgender) to ensure fair and equitable employment. A focus is placed on:
a. employment readiness (e.g. scholarships for equity-seeking populations, employment training, job search),
b. improved hiring practices (e.g., non-discrimination, job placement, life-skills training, work-based learning apprenticeships), and
T O W A R D S H E A L T H E Q U I T Y A C T I O N ❙ B U I L D I N G W I N N I P E G ’ S H E A L T H E Q U I T Y A C T I O N P L A N 3 7
c. job retention (e.g., addressing racism and discrimination in the workplace, specialty training services for refugees, programs to promote appreciation of diversity, job coaching, work-associated child care, and other job supports).
The community sector can play an important part as both as employer and as a provider of services for some of the recommended actions.
2. Planning, zoning, incentives, and other mechanisms are developed for highly intensive mixed use neighbourhoods to benefit job opportunities. Mixed use encourages local employment opportunities and higher job satisfaction due to decreased commuting time and increased opportunities for flexible hours of work due to the proximity of employee’s homes and services. The strongest priority for transition to mixed use neighbourhoods with associated jobs are the lowest income communities.
3. Employee’s rights, respectful workplaces and equitable work environments are assured. The labour movement plays a role contributing towards protecting and promoting these elements, addressing social and economic disparities and developing new opportunities for employment (e.g., encouraging entry level training positions to fill gaps in the workforce).
4. Policy is created to include local development targets in contracts managed by governments. Development targets would include local hiring of groups under-represented in the workforce. Criteria for creating contracts include payment of a wage sufficient for healthy living.
5. Psychological well-being is included as a workplace safety and health standard and it is supported, prioritized and optimally realized in workplaces.
3 8 B U I L D I N G W I N N I P E G ’ S H E A L T H E Q U I T Y A C T I O N P L A N ❙ T O W A R D S H E A L T H E Q U I T Y A C T I O N
Remember Dennis? … with more supports Dennis’s story could have unfolded differently. Imagine if….
Dennis managed to get connected with BUILD. This organization offered Dennis training in carpentry and hired him to help work on inner-city construction. BUILD allowed him to work shorter days as he built up his stamina and strength. He gained social connections to others who had also been through
hard times. Knowing he had something to get up for in the morning, he stopped drinking every night. He plans to quit smoking to help feel better and get stronger. Dennis is working towards his carpentry journeyman ticket and is now able to afford his own apartment and take better care of himself rather than spend all his energy just surviving. He has reconnected with family. Since his injury, he has not been back in the hospital.
EQUITY ACTION EXAMPLE – WORK
BUILD Building Urban Industries for Local Development (BUILD) performs two important roles for low income groups, both in employability to its trainees and savings in household expenses to its clients. BUILD hires Aboriginal, newcomer and inner city residents who are at a disadvantage in the job market and provides training in construction trades retrofitting households in low income neighbourhoods for water and energy efficiency. Employee trainees may be those who did not finish high school, have had contact with the criminal justice system, have a history of struggling with addictions, or face other barriers in the labour market. As of March 2012, BUILD estimates its efforts have saved recipients $1,146,933, by insulating over 875 dwellings and doing 3288 water retrofits
T O W A R D S H E A L T H E Q U I T Y A C T I O N ❙ B U I L D I N G W I N N I P E G ’ S H E A L T H E Q U I T Y A C T I O N P L A N 3 9
5. Childhood Considerations for Action
Child development, including early childhood development, includes the physical, social/emotional, and language/cognitive domains, each equally important. Early childhood experiences set the course for a child’s lifelong health, learning and development. Everything in a person’s future is affected: well-being, obesity/stunting, mental health, heart disease, competence in literacy and numeracy, criminality, and economic participation throughout life.
Presented below are the compiled considerations for action resulting from the recommendations review process, offered as a conversation starting place among key stakeholders regarding childhood.
1. Improve and optimize prenatal environments, access to prenatal care and multiple supports in lower income populations and neighbourhoods.
2. Provide multiple avenues for families to access support for positive parenting of all children with emphasis on reaching out to support parenting in families with the most challenges.
3. Promote and sustain community environments that have the capacity to enhance resilience and promote protective factors in young children and their families (e.g., child care centers, schools, family resource centres), thereby creating a foundation for positive mental health throughout the lifespan.
4 0 B U I L D I N G W I N N I P E G ’ S H E A L T H E Q U I T Y A C T I O N P L A N ❙ T O W A R D S H E A L T H E Q U I T Y A C T I O N
4. Enhance early identification and create supportive interventions where children experience vulnerabilities or developmental delays.
5. Ensure that family incomes, including social assistance, are sufficient to support healthy living for children. Particularly where children are concerned, income gaps associated with transition in income of the parents are bridged.
6. Ensure that early learning and child care is accessible for all, especially for families facing additional barriers (e.g., low income, single parents): particularly those who do not have standard working hours (e.g., service sector), are entering or reentering the workforce, are between jobs, are continuing their education to allow for employment at a wage for healthy living, or are in transition. Financial and program supports are timely and appropriate to the family and child’s needs.
7. Increase the availability of deliberate interventions to increase school readiness among the children who need most help to be ready for school. Enhance support to promote positive parenting during early childhood and the provision of quality child care. Services to families include evidence-based developmental, educational and nutritional support in a culturally safe manner.
8. Ensure that inclusive early learning and child care opportunities are available and accessible for children with disabilities or complex medical needs. Families are provided support to navigate the health care, education and family services sectors to maximize potential and minimize systemic barriers, including financial barriers. All children have equal access to the supplies and equipment they need regardless of their family or caregiver circumstances. Confusion and uncertainly about how to obtain required services and supports is eliminated by effective management and system partnership.
T O W A R D S H E A L T H E Q U I T Y A C T I O N ❙ B U I L D I N G W I N N I P E G ’ S H E A L T H E Q U I T Y A C T I O N P L A N 4 1
Remember Kayla?... with more supports Kayla’s story could have unfolded differently. Imagine if….
One of her friends told her about a public health nurse who had visited their school. Kayla borrowed money for a bus ticket and went to the public health office. The nurse there helped her apply for several government benefits such as the Canada Child Tax Benefit and the Manitoba Prenatal Benefit. More importantly, she helped connect her with a variety of different programs and services such as prenatal classes and the Families First program and a family
doctor for prenatal care. The Families First Home Visitor met with her once a week to help prepare for the birth of her baby focusing on the strengths that Kayla already showed as a future parent and building up her confidence. Kayla had a healthy baby she brought home to the apartment her social worker helped her find. There was a good child care centre near her building that Kayla was able to get subsidies for so she could return to school and get her high school diploma. Today, Kayla is applying for a university education, and her daughter is thriving in kindergarten.
EQUITY ACTION EXAMPLE – CHILDHOOD
Manidoo Gi Miini Gonaan Manidoo Gi Miini Gonaan was established in 1991. Manidoo has four locations in the Lord Selkirk Park Community: R.B. Russell Infant Centre, David Livingstone School Age Program, Lord Selkirk Park Resource Centre and most recently opened Lord Selkirk Park Child Care Centre which is a new early childhood education and care (ECEC) program which partners with Healthy Child MB to pilot the Abecedarian Project in the Lord Selkirk Park Community. Participants will benefit from the enhanced early childhood curriculum and efforts to ease accessibility and connect with the families. High quality ECEC is known to create strong foundations for those who receive it. The Lord Selkirk Park Child Care Centre program is based on the Abecedarian Project of the 1970s in which a group of pre-school aged children living in a high risk neighbourhood in the US received high quality curriculum and learning games until they were aged five. This group was found to have higher school performance in childhood and adolescence and greater professional achievements as adults compared to their peers as well as lower teen parenthood and drug use.
4 2 B U I L D I N G W I N N I P E G ’ S H E A L T H E Q U I T Y A C T I O N P L A N ❙ T O W A R D S H E A L T H E Q U I T Y A C T I O N
6. Education Considerations for Action
Education is a learning process that plays a crucial role in the development of healthy, inclusive and equitable social, psychological and physical environments. It is informed by best practice and is multi-dimensional in its design and learner-centric in its approach. It empowers individuals and communities with knowledge, motivation, skills and confidence (self-efficacy) conducive to positive societal engagement and the benefit of all.
Presented below are the compiled considerations for action resulting from the recommendations review process, offered as a conversation starting place among key stakeholders regarding education.
1. Commit to well-funded accessible early learning and child care across the income gradient including enhanced pre-school/pre-kindergarten at low or no cost for low income families.
2. Utilize engagement and outreach efforts (such as a “books at home” program) to increase uptake of these programs and services by low income children and families.
3. Improve access to primary and secondary education by identifying and augmenting efforts that improve opportunities for success and narrow the gap in educational attainment for people from equity-affected backgrounds (e.g., children in care, Aboriginal children and youth, immigrant students, sexual and
T O W A R D S H E A L T H E Q U I T Y A C T I O N ❙ B U I L D I N G W I N N I P E G ’ S H E A L T H E Q U I T Y A C T I O N P L A N 4 3
gender minority youth, children living in neighbourhoods with poor graduation rates). Current efforts should also:
a. Identify and implement ‘pull versus push’ motivators to improve relevance, engagement and attendance;
b. Improve targeting with clear and measurable goals for school readiness, attendance, children retained in school, academic achievement and graduation;
c. Ensure social and emotional learning opportunities are maximized through whole school, classroom and targeted approaches;
d. Use culturally relevant and acceptable curricula that facilitates cultural awareness and a positive attitude towards diversity;
e. Ensure that the teaching of Canadian history accurately portrays First Nations, Inuit and Métis history including the impact of residential schools, the Indian Act and the effect of colonization;
f. Implement demonstrated best practices appropriate for educational success with vulnerable learners;
g. Explicitly address active and passive prejudice in curriculum and educational environments (e.g., racism, homophobia, sexism);
h. Provide education on drugs, alcohol, tobacco, sex, sexuality and relationships, culturally based beliefs and values, physical activity, cooking, money and household management, and parenting.
4. Develop community schools in low income areas where schools could be the hub of the community. These schools:
a. Foster strong collaborative relationships with health and social services including health and social services that may be available on weekends and evenings;
b. Provide health promotion, prevention and primary care related services as needed such as immunizations and teen clinics;
c. Provide nutritious food and limit non-nutritious foods and beverages i.e. ‘junk’ food and soft-drinks;
d. Extend the role of schools in supporting families and communities while taking a ‘whole child’ approach to education. Using a community development approach, create a ‘hub’ model which integrates the following key services: public health and primary care services, early learning and child care services, family resource centres, parent-child programming, school based programming and parent education. Pay particular attention to the needs of vulnerable children and provide outreach for low income
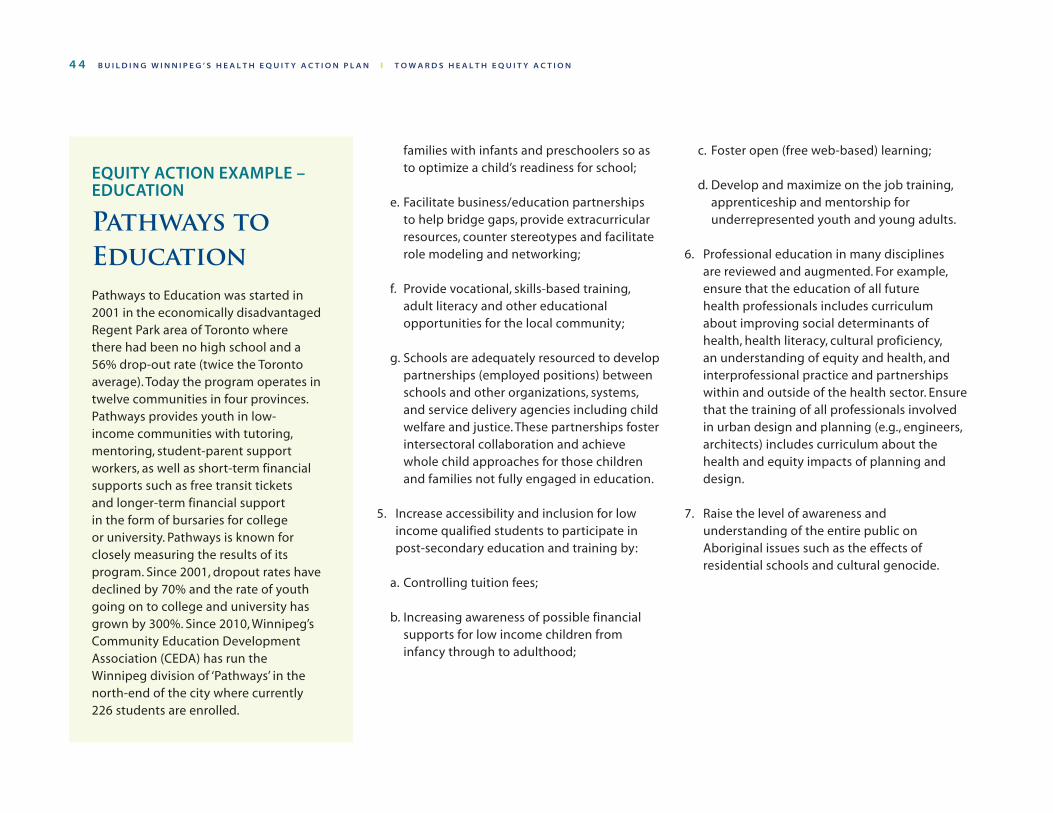
4 4 B U I L D I N G W I N N I P E G ’ S H E A L T H E Q U I T Y A C T I O N P L A N ❙ T O W A R D S H E A L T H E Q U I T Y A C T I O N
families with infants and preschoolers so as to optimize a child’s readiness for school;
e. Facilitate business/education partnerships to help bridge gaps, provide extracurricular resources, counter stereotypes and facilitate role modeling and networking;
f. Provide vocational, skills-based training, adult literacy and other educational opportunities for the local community;
g. Schools are adequately resourced to develop partnerships (employed positions) between schools and other organizations, systems, and service delivery agencies including child welfare and justice. These partnerships foster intersectoral collaboration and achieve whole child approaches for those children and families not fully engaged in education.
5. Increase accessibility and inclusion for low income qualified students to participate in post-secondary education and training by:
a. Controlling tuition fees;
b. Increasing awareness of possible financial supports for low income children from infancy through to adulthood;
c. Foster open (free web-based) learning;
d. Develop and maximize on the job training, apprenticeship and mentorship for underrepresented youth and young adults.
6. Professional education in many disciplines are reviewed and augmented. For example, ensure that the education of all future health professionals includes curriculum about improving social determinants of health, health literacy, cultural proficiency, an understanding of equity and health, and interprofessional practice and partnerships within and outside of the health sector. Ensure that the training of all professionals involved in urban design and planning (e.g., engineers, architects) includes curriculum about the health and equity impacts of planning and design.
7. Raise the level of awareness and understanding of the entire public on Aboriginal issues such as the effects of residential schools and cultural genocide.
EQUITY ACTION EXAMPLE – EDUCATION
Pathways to Education Pathways to Education was started in 2001 in the economically disadvantaged Regent Park area of Toronto where there had been no high school and a 56% drop-out rate (twice the Toronto average). Today the program operates in twelve communities in four provinces. Pathways provides youth in low-income communities with tutoring, mentoring, student-parent support workers, as well as short-term financial supports such as free transit tickets and longer-term financial support in the form of bursaries for college or university. Pathways is known for closely measuring the results of its program. Since 2001, dropout rates have declined by 70% and the rate of youth going on to college and university has grown by 300%. Since 2010, Winnipeg’s Community Education Development Association (CEDA) has run the Winnipeg division of ‘Pathways’ in the north-end of the city where currently 226 students are enrolled.
T O W A R D S H E A L T H E Q U I T Y A C T I O N ❙ B U I L D I N G W I N N I P E G ’ S H E A L T H E Q U I T Y A C T I O N P L A N 4 5
7. Environment Considerations for Action
The physical environment consists of two main components - the natural environment (air, water and soil) and the built environment (housing, indoor air quality, community design, transportation, and food systems).
Presented below are the compiled considerations for action resulting from the recommendations review process, offered as a conversation starting place among key stakeholders regarding environment.
1. Engage in built environment and urban planning discussions with the City of Winnipeg and other stakeholders to support planning, design, resource allocation and collaboration to promote health equity through urban environmental design.
a. Recognize and support the health equity promoting aspects of the longer term Our Winnipeg plan such as complete commu-nities that focus on a diverse range of house-hold types, easily accessible amenities (inclusive of all the venues for daily life such as child care and schools, recreation, restau rants, grocery stores, retail stores, spiritual settings, etc.), a range of sustainable trans portation options, and opportunities for local employ-ment. Prioritize zoning, develop ment, redevelop ment, and maintenance of mixed use, sustainable, highly dense commu nities that minimize residential/industrial con flict. Priority spaces for planning and redevelop-ment are low income neighbourhoods.
4 6 B U I L D I N G W I N N I P E G ’ S H E A L T H E Q U I T Y A C T I O N P L A N ❙ T O W A R D S H E A L T H E Q U I T Y A C T I O N
b. Consider the impact on health equity in day-to-day urban planning decisions in all areas through local area development plans, variance allowances, rezoning, and design of infrastructure. With health equity in mind, these decisions have the ability to foster social interaction, enhance inclusiveness and diversity, address environmental sustainability, provide public and active transportation options, and expand affordable housing. Conduct health equity impact assessments where applicable.
c. Create safer neighborhoods throughout Winnipeg through combined approaches of environmental design, maintenance, policy and community engagement. Support the directions identified in “OurWinnipeg” to collaborate to make safe communities.17
d. Authentic engagement of local community groups by the WRHA, the City of Winnipeg, and the government of Manitoba is integral to addressing health equity through urban planning. Adequately allocating financial and human resources is key in supporting these relationships and the directions they recommend.
e. Planners, decision-makers and local community members experiment with, learn and share successful community based
17. City of Winnipeg. OurWinnipeg. It’s Our City, It’s Our Plan, It’s Our time. City of Winnipeg 2011: 42–45. Available at http://winnipeg.ca/interhom/CityHall/OurWinnipeg/pdf/Our Winnipeg.Jul15.2010.pdf
projects originating in Winnipeg and other jurisdictions. A major focus is to create a sense of neighborhood ownership where people live, play and work.
2. Ensure that available environmental services include:
• Effective routine and bulk waste garbage pickup in all neighbourhoods, especially lower income where more frequent or extra (bulk pick up) may be needed
• Boulevard and green space maintenance
• Maintaining clean and pleasant surroundings (street cleaning, graffiti prevention and clean up)
• Public health inspection and by-law enforcement
3. Recognize that the maintenance of natural ecosystems plays a role in sustaining air, water and soil quality throughout the city and that this is a contributor to good health. Local environment issues, such as air quality and offensive odours, are minimized by addressing residential/industrial conflict.
EQUITY ACTION EXAMPLE – BUILT ENVIRONMENT
Peel Health Region Public Health is building a relationship with planners and engineers with the aim of including consideration of health impacts into new development. Recognizing that rising chronic disease has a link with decreased physical activity due to city design that makes walking and cycling too difficult especially for the disadvantaged, Peel Public Health is working towards urban design where all residents can use active transport easily to access daily needs. Their work has already led to some policy changes in local planning, influencing transportation studies and integrating health promoting elements into urban design guidelines.
T O W A R D S H E A L T H E Q U I T Y A C T I O N ❙ B U I L D I N G W I N N I P E G ’ S H E A L T H E Q U I T Y A C T I O N P L A N 4 7
8. Community Considerations for Action
Community arises from the nature and quality of relationships between people with common-alities such as place, culture, experience, interests, beliefs, values and/or norms. Some aspects of community include sharing, commitment, availability, friendliness, cohesion, safety, connection and participation. People can belong to many communities. Within communities there may be considerable diversity.
Presented below are the compiled considerations for action resulting from the recommendations review process, offered as a conversation starting place among key stakeholders regarding community.
1. Multiple approaches are explored to facilitate socially cohesive local communities that are vibrant, inclusive, safe, friendly, co-operative and where people can rely on each other. Safe communities should be free from hazards, violence, or fear of violence.
2. Foster multiple dimensions of social well-being including social integration, social acceptance, social contribution, social coherence and social actualization.
3. Build capacity with inequity-affected com-mun ities using a collaborative, strength-based community development approach consistent with the WRHA’s Community Development Framework where community development is recognized as a process that includes orga-nizational capacity building, intersectoral networking and local area development.
4 8 B U I L D I N G W I N N I P E G ’ S H E A L T H E Q U I T Y A C T I O N P L A N ❙ T O W A R D S H E A L T H E Q U I T Y A C T I O N
4. Enhance or create social situations that draw people together around things that are meaningful, affordable, accessible and welcoming (e.g., coffee drop-ins, after school programming, community gardens, walking groups).
5. Encourage participation in physical and social activities that facilitate social integration.
6. All organizations and civil society develop community inclusion policies or approaches that ensure community voice and authentic engagement in decisions that affect community members and in delivering and evaluating services. This will enhance community ownership, democratic and transparent decision making, accountability, collective action, relationships and inclusion.
7. Invest in policing and justice systems that engage the community and build trust (e.g., restorative justice).
8. Organizations actively reach out to people in vulnerable situations proportionate to their need. Ways to reach out should be appropriate and acceptable to the population (e.g., use of peers, local or mobile services, home visiting and social media).
9. Organizations accept and celebrate diversity and multiculturalism. Provide settlement services for those coming to Winnipeg from reserves, rural and northern areas, and
from foreign countries. A sufficient quantity and range of settlement services including immediate access to long term, full-time language training should be available.
10. Increase the number and range of opportunities for people to interact with each other in a positive way that fosters a sense of belonging and connection to their local community and the larger society.
11. Recognize the integral role urban design and built environment play in fostering inclusive, engaging, safe and complete communities.
12. Intentional collaboration, partnerships, and alignment with Indigenous people and groups should occur, building on the strengths that exist in Indigenous communities.
13. More media stories intentionally focus on positive public engagement in community activities, supporting and celebrating diversity. Organizations proactively encourage media to become aware of stories that support these goals.
14. Enhance access and remove barriers to free internet connectively to facilitate social inclusion and access to online communities. (e.g., more public or city-wide access to Wi-Fi).
15. Neighbourhood improvement plans go beyond beautification and avoid the displacement of residents.
T O W A R D S H E A L T H E Q U I T Y A C T I O N ❙ B U I L D I N G W I N N I P E G ’ S H E A L T H E Q U I T Y A C T I O N P L A N 4 9
EQUITY ACTION EXAMPLE – COMMUNITY
Meet Me at the Bell Tower (MM@BT) Meet Me at the Bell Tower (MM@BT) is a grassroots, youth-led anti-violence movement that brings together many facets of the community in Winnipeg’s North End. It was started by Aboriginal Youth Opportunities (AYO) in November 2011 as a positive stand in response to a violent incident in the community. Everyone is invited to meet at the Bell Tower on Friday nights at 6:00 to ring the bell, march and have their voices heard. They have met every Friday night now for over a year. In between meetings, MM@BT uses facebook, twitter and blogs to stay connected and spread messages of hope, change and community activism. The media has picked up on this positive story. Beyond the initial goal of anti-violence, this group provides role modeling opportunities for children and youth where confidence is built as they take on responsibility through meaningful participation. The movement not only empowers people to stand together against violence but offers a supportive and safe environment to deal with the grief and suffering brought by violence and despair. MM@BT is a dependable constant for community members of all ages, where gifts and strengths are celebrated and fear is overcome.
New Brunswick Economic & Social Inclusion PlanRecognizing that poverty reduction needed broad cooperation across the population, the Overcoming Poverty Together: The New Brunswick Economic and Social Inclusion Plan was developed after a thorough consultation process with all sectors of society while carried out at the community level. The funding is centralized, and the Community Inclusion Networks (CINs), submit to ESIC funding requests based upon their regional plan. Funds are then distributed to the CINs for the approved projects for the regions. This process emphasizes social inclusion, consultation and that local needs are best understood by local government, community and private sector working together.
5 0 B U I L D I N G W I N N I P E G ’ S H E A L T H E Q U I T Y A C T I O N P L A N ❙ T O W A R D S H E A L T H E Q U I T Y A C T I O N
9. Housing Considerations for Action Housing is any permanent or temporary building or other structure in which people live. Housing structures will have varying qualities; may be self-contained or shared; may be permanent or transient; and may or may not be owned, rented, or occupied without legal rights. Housing is a subset of environment, but warrants specific considerations given the magnitude of impact on health and equity.
Presented below are the compiled considerations for action resulting from the recommendations review process, offered as a conversation starting place among key stakeholders regarding housing.
1. Resource strategies and policy levers to ensure that a full spectrum of affordable housing and social housing options are available (e.g., rental, cooperative, owner-occupied) with a focus on supporting those in core housing need (families or individuals who spend more than 30% of their income on housing). Consideration is given to: single room occupancy hotel strategies, subsidized housing, investing a portion of all development funds in inner-city housing, designating surplus land for affordable housing projects, inclusionary zoning, improving the speed of approval for affordable housing, tax abatements for affordable housing projects or units, stopping rental unit conversion to condominiums until there is a sufficient supply of new affordable rental units, encouraging cooperative housing, transition from renting to home ownership
T O W A R D S H E A L T H E Q U I T Y A C T I O N ❙ B U I L D I N G W I N N I P E G ’ S H E A L T H E Q U I T Y A C T I O N P L A N 5 1
e.g. ‘rent to own’, micro-financing and land trusts.
2. Create policies and programs for households on low incomes and increase incentives and subsidies to:
a. Reclaim and retrofit older housing stock for low income residents and reduce energy loss costs;
b. Create affordable adaptations so that low income people can age in place, including those in rental units;
c. Promote adaptable construction (e.g., modular multinunit dwellings) to allow for flexibility and sustainability and to facilitate both ‘aging in place’ and mixed demographics neighbourhoods;
3. Increase shelter allowance of social assistance to 75% of median market rent to allow for better access to the housing market of those on social assistance, tying annual increases to the cost of living. Other basic needs (food, transportation) should also be sufficiently funded to avoid diversion of funds from housing to other needs.
4. Increase the capacity of support programs and targeted supportive housing options to help people who are homeless (particularly those experiencing longstanding homelessness) and people who are marginally housed to find and
maintain stable tenancies. Support plans to end homelessness.
5. Increase the accessibility of stable housing options across the lifespan. Develop and implement innovative models of community-based quality, affordable housing with integrated support services for individuals with complex needs to maximize independence and support personal choice, while reducing reliance on hospital or other institutional settings.
6. Develop a process to deal with difficult public health housing situations that are not clearly addressed by any one program or agency, empowering people to address issues with landlords, or solve owner occupied housing issues.
7. Enhance connections and partnerships between housing providers (landlords and developers) and housing and health support service providers recognizing that community-based housing with supports requires collaborative inter-sectoral approaches.
5 2 B U I L D I N G W I N N I P E G ’ S H E A L T H E Q U I T Y A C T I O N P L A N ❙ T O W A R D S H E A L T H E Q U I T Y A C T I O N
EQUITY ACTION EXAMPLE – HOUSING
Vancouver’s Secured Market Rental Housing Policy Vancouver’s incentive based initiative supports the development of affordable rental units. The Rental 100: Secured Market Rental Housing Policy supports projects where 100% of the residential units are rental and are secured as such for 60 years, or for the life of the building. Affordability is achieved primarily through the tenure (renting is less expensive than owning), through reduced parking, modest size, limited on-site common amenities, level of finishing, and other design considerations. Vancouver’s affordable rental market includes a one-for-one rental unit replacement policy for any new rental builds. Manitoba has announced legislative amendments that would give municipalities the authority to encourage or require new residential developments to include homes that are affordable to low- and moderate-income households. This includes zoning by-law provisions, incentive-based affordable housing, and development agreements that protect affordable housing.
Bell Hotel Supportive Housing Project The Bell Hotel Supportive Housing Project provides permanent housing with supports for 42 individuals who have experienced homelessness. The project is led by Main Street Project and The Bell Steering Committee including community, business and government partners. The goal is to provide affordable housing with supports to maintain tenancy and address a range of needs. The project utilizes a housing first approach, harm reduction practices and tenant-centred planning. Tenants are assisted to address the underlying causes of their homelessness, which may include mental health and addictions, from the security of a home. Early findings are encouraging. Health experts note an initial 70-80% reduction in tenants’ utilization of emergency health services. Tenants have been supported to gain improved access to community health and social service resources, education, employment and recreational services. Permanent funding has been allocated in support of continued success.
T O W A R D S H E A L T H E Q U I T Y A C T I O N ❙ B U I L D I N G W I N N I P E G ’ S H E A L T H E Q U I T Y A C T I O N P L A N 5 3
10. Food Considerations for Action Food security exists when all people, at all times, have physical and economic access to sufficient, safe and nutritious food to meet their dietary needs and food preferences for an active and healthy life.
Presented below are the compiled considerations for action resulting from the recommendations review process, offered as a conversation starting place among key stakeholders regarding food.
1. Schools and child care centres are adequately funded and required to:
a. Ensure all school age children who may otherwise not be provided with nutritious meals are provided with the option of at least two nutritious meals a day in schools, year round.
b. Educate children in budgeting and cooking skills (e.g., recipe reading).
c. Offer opportunities for families and adults to gain skills in budgeting and cooking (e.g., menu planning, label reading, recipe use).
d. Encourage families with young children to accept and choose nutritious food starting at a very early age.
2. Base the food portion of social assistance rates on the real costs of a healthy food basket and keep it tied to these costs. Ensure adequate funding of a healthy diet, including support
5 4 B U I L D I N G W I N N I P E G ’ S H E A L T H E Q U I T Y A C T I O N P L A N ❙ T O W A R D S H E A L T H E Q U I T Y A C T I O N
EQUITY ACTION EXAMPLE – FOOD
Neechi Foods Co-op Ltd Since 1990, Neechi Foods Co-op Ltd has filled a neighbourhood void in Winnipeg’s North End by selling healthy, locally harvested or made food including traditional foods and providing a range of economical food services. Their diabetes prevention work has been recognized by the Canadian Diabetes Association and Reh-Fit Centre. An expansion to the new Neechi Commons Community Business Complex opened in March 2013. It is a community hub that includes a neighbourhood supermarket, cafeteria-style restaurant, farmer’s market that features local fruits and vegetables, a bakery, speciality boutiques and an Aboriginal arts centre. The worker owned and operated cooperative will give neighbourhood residents a chance to be entrepreneurs; 60 new jobs are expected to be created and they will also be coordinating employment and training opportunities with local high schools.
for access to a full-service grocery store, to increase availability of nutritious and better quality perishable foods, as well as availability of basic cooking equipment (e.g., knives). Ensure sufficient funding of other basic needs (rent, transportation) to avoid diversion of funds from food to other needs.
3. Require simpler and more understandable labeling on all packaged foods, ban trans-fats, reduce sodium and fat, restrict advertisements and sales of junk foods, implement subsidy programs and regulate the cost of nutritional foods (e.g., fruits and vegetables) and determine the need for additional nutrient fortification.
4. Develop non-stigmatized ways of redeploying nutritious and safe surplus food, including related entrepreneurship opportunities.
5. Ensure zoning, bylaws and incentives are in place to:
• Locate quality affordable retail food outlets within easy walking distance in all neighbourhoods but particularly in low income neighbourhoods.
• Create edible landscapes, gardens, boulevards, urban agriculture, farmers’ markets, community kitchens, and community storage options.
T O W A R D S H E A L T H E Q U I T Y A C T I O N ❙ B U I L D I N G W I N N I P E G ’ S H E A L T H E Q U I T Y A C T I O N P L A N 5 5
11. Transportation Considerations for Action
Transportation is the movement of people or goods. Transportation may be accomplished through human power, motor vehicles or other methods. Transportation-related risks such as injury, noise and pollution can be mitigated. Concerns include affordability and accessibility.
Presented below are the compiled considerations for action resulting from the recommendations review process, offered as a conversation starting place among key stakeholders regarding transportation.
1. Promote and invest in safe active transportation including walking, cycling and other modes of human powered transportation. Escalate the development of active transportation options including: cycling infrastructure, sidewalks, crosswalks and related lighting, well-engineered and enforced traffic calming (40km on residential streets, and 30km near schools and playgrounds). Private business and schools encourage walking school buses and safe bicycle storage. Snow clearing is prioritized for sidewalks, bus shelters and cycling infrastructure to allow immediate and safe human-powered access (including wheeled mobility devices) to destinations.
2. Promote and invest in convenient, affordable public transportation infrastructure and services including no or low cost non-stigmatized bus transportation especially for low income large families. Employment and
5 6 B U I L D I N G W I N N I P E G ’ S H E A L T H E Q U I T Y A C T I O N P L A N ❙ T O W A R D S H E A L T H E Q U I T Y A C T I O N
income assistance adequately supports all transportation needs. Other basic needs (food, housing) are also sufficiently funded to avoid diversion of funds from transportation to other needs.
3. Bus design and transit policy allows for capacity to transport luggage, bicycles and strollers at all times of the day. Affordable, flexible Handi-Transit includes reaching out to high need users, particularly those who have social or mental health challenges and may require higher levels of assistance. Special lenience is needed in winter months. Engage bus and taxi services in mitigation strategies to address the transfer of nuisance pests and/or infection control strategies.
4. Develop and implement a sustainable transportation plan that considers not only active and public transportation systems, but also the location and density of venues of daily life such as child care centres and schools, work, recreation, residential, restaurants, grocery stores, retail stores, spiritual settings, creating neighbourhoods and social norms that do not require reliance on vehicles.
5. Consider disincentives for automobile use concurrent with promoting active and public transportation to make them the preferred alternative over automobiles for everyone, normalizing and de-stigmatizing public and active transportation use.
6. Explore the development of car cooperatives to make vehicles accessible and affordable in low income neighbourhoods.
7. Ensure affordable access to transportation related safety equipment such as bicycle helmets, cycling safety equipment (lights/reflectors), appropriate motor vehicle child restraint equipment (e.g., car seats, booster seats) considering a variety of mechanisms such as loan, low cost purchase, tax-free, tax-rebate, redistribution or free programs.
EQUITY ACTION EXAMPLE – TRANSPORTATION
Victoria BC and Calgary AB Community Social Planning Council of Victoria BC and Fair Fares Calgary are examples of two groups that have made access to public transit easier and affordable for people with low-income. In Victoria an arrangement has come to exist between the transit authority, the Community Social Planning Council and its 65 local agency community partners whereby ticket or passes are purchased by the community local agencies then matched 1:1 by the transit authority and this is facilitated by the Council. In Calgary, the advocacy work of ‘Fair Fares Calgary’ is largely behind the existence of the city’s low income transit passes since 2005. A survey by Calgary Transit and Vibrant Communites Calgary of 401 recipients of the passes found that the passes were important for finding and maintaining employment (55% and 49% respondent respectively), attending education/training (55%), volunteering (49%) and that overall their lives were positively affected (97%).
T O W A R D S H E A L T H E Q U I T Y A C T I O N ❙ B U I L D I N G W I N N I P E G ’ S H E A L T H E Q U I T Y A C T I O N P L A N 5 7
12. Behaviour Considerations for Action
The social and physical environment is essential to support and encourage healthy behaviour. Behaviour is any personal action that influences health. Behaviour includes but is not limited to substance use including tobacco, sexual risk-taking and physical activity. Behaviour also includes personal actions associated with other factors that influence health (i.e., food, transportation, housing, environment, community, childhood, education, work, income, economy, health services).
Presented below are the compiled considerations for action resulting from the recommendations review process, offered as a conversation starting place among key stakeholders regarding behaviour.
1. Make healthy choices the easier choices through environmental and social mechanisms such as incentives, disincentives, and supportive social and physical environments.
2. Maximize use of health behaviour change skills in all health care professionals and other support systems where fostering self-efficacy, resiliency and emotional well-being is seen as foundational for behaviour change.
3. Increase opportunities for children to learn effective problem solving, self-control and emotional regulation skills and for adults to further develop those skills throughout life.
5 8 B U I L D I N G W I N N I P E G ’ S H E A L T H E Q U I T Y A C T I O N P L A N ❙ T O W A R D S H E A L T H E Q U I T Y A C T I O N
4. Make active transportation the easy choice. Invest in safe infrastructure for active transportation ensuring connectivity to work and key services and destinations.
5. Many people face barriers to participation in physical activity, sport or recreation. Make physical activity, sports and recreation opportunities available for everyone.
6. Make a full range of harm reduction, behaviour change, and treatment services and programs widely available.
7. Ensure a full range of appropriate tobacco reduction activities are available to specifically
address psychological, social and economic issues underlying tobacco use in low income areas.
8. Promote and empower people of all sexual orientations and gender identities to live a healthy sexual life.
9. Create and support peer-based promotion of healthy living, particularly in low income and disadvantaged areas.
10. Promote the availability, accessibility and requirement for the use of safety items such as smoke alarms or home safety equipment for children.
EQUITY ACTION EXAMPLE – BEHAVIOUR
Commit to Quit (C2Q) Smoking Cessation Commit to Quit (C2Q), delivered out of Mt. Carmel Clinic, is a free group smoking cessation program that also provides no-cost nicotine replacement therapy (NRT) to persons who may not be able to easily afford it. Participants attend group counseling for six weeks and set quit dates to occur between the 4th and 5th week of the program. Weekly follow up for up to 12 weeks occurs with a pharmacist or nurse to assess progress, receive support and adjust NRT dose. Follow up is flexible with walk-in accommodated to make participation easier. People living on lower incomes generally have more difficulty quitting smoking, but the success rate for C2Q at Mt. Carmel Clinic is about equivalent to group programs overall.
T O W A R D S H E A L T H E Q U I T Y A C T I O N ❙ B U I L D I N G W I N N I P E G ’ S H E A L T H E Q U I T Y A C T I O N P L A N 5 9
Core components for equity action
A number of recommendations were identified that are not stand alone, separate areas for equity action, but rather common approaches that need to be part of effective action throughout all equity promotion work. The following considerations apply to most equity action areas.
1. Reaching out: all sectors need to provide services that reach out to those with unmet needs. Vulnerable people frequently do not seek or engage with services that may be helpful. Outreach is the process of finding vulnerable people not already connected to services who would benefit most from them, creating trusting relationships and providing services meaningful to them in their own environments.
2. Dignity, respect and cultural proficiency: those working with vulnerable people must exemplify an inclusive, respectful, reflective, culturally proficient and participatory approach.
3. Integrated services: develop teams that include providers of various services (e.g., recreation, libraries, arts and culture, education, police, health) delivering services to families and local communities.
4. Locally-based services: integrated service teams should foster development of local relationships, local leadership, resident
identification of local strengths and needs, resident participation in decision making and evaluation of local services. Provide services in local neighbourhood venues (e.g., schools) to the extent possible. Neighbourhood teams will also support and coordinate resolution of disputes and cultural conflicts, community building (e.g., neighbourhood watch) and other types of volunteerism. Service providers should to the extent possible reflect the population served. Prioritize implementation in low income neighbourhoods.
5. Equity impact assessment: all major WRHA, City and Provincial policies should be based on equity impact assessments.
Remember Kevin?... with more supports Kevin’s story could have unfolded differently. Perhaps he did not have to die at the age of 52. Imagine if…
Kevin heard about the Bell Hotel and applied to live there. The Bell Hotel provides housing to people whose histories include homelessness, mental health and/or addiction using a housing first approach. Kevin moved into the Bell while he worked on therapy for his depression, allowing him to focus on his mental health while knowing he was safe and cared for. He also reached out to others and organized social events for all the residents. The staff at the Bell Hotel connected Kevin with the Urban Circle Training Centre, which not only provided him with essential employment skills but also helped him identify with his First Nations roots where he sought healing and embraced his background with pride. Kevin’s natural compassion and leadership eventually led to him being recognized as an elder, and he is still mentoring youth and young adults with addictions or mental health concerns.
6 0 B U I L D I N G W I N N I P E G ’ S H E A L T H E Q U I T Y A C T I O N P L A N ❙ T O W A R D S H E A L T H E Q U I T Y A C T I O N
Conclusion“Health for All,” closing the health equity gap in Winnipeg, is a bold stretch goal, but one we must reach. Creating conditions for the highest attainable health is not optional: it is a basic human right. And it is possible through the accumulation of small but sustained efforts by many people acting in diverse sectors. It is unlikely to happen to the required scale spontaneously without deliberate planning, and a concerted, collaborative effort to turn the tide. Hope is essential, but hope alone is not enough. It will take bold, innovative, pragmatic action as we mobilize efforts across the domains of knowledge, governance and participation to develop action plans in the multiple areas where action is urgently needed.
It will also take a willingness to look at Winnipeg through new eyes. Through both eyes. Through loving eyes. We need to see each person in Winnipeg with the compassion that comes from knowing that we are more the same than we are different: we all want our parents, our grandparents, our siblings, our children and our grandchildren to be healthy and thrive, to have the opportunity to dream and realize.
We will need courage to recognize how some of our old thinking, views and systems may unintentionally perpetuate limited opportunity. It will take honesty to acknowledge where we can do better. We will need humility and respect
to genuinely listen to each other, to be willing to shift our frames of reference and points of view to include the perspectives and truths of many. We will need pearls of wisdom and multiple views through facets of the crystal to inform our way forward.
Let’s set our sights on a vibrant, healthy Winnipeg where diversity is celebrated and everyone is valued and feels that they belong. Where most people are resilient and describe themselves as happy and everyone reaches their full physical and mental health potential. Let’s transform our relationships and create new opportunities. Lets “…dream of a fairer world, but take the pragmatic steps necessary to achieve it”18 Let’s start a conversation. Let’s work together. Because we’re all in this together.
18 Preface to Social Determinants of Health- What Doctors Can Do. Sir Michael Marmot. British Medical Association, October 2011. Available at bma.org.uk/-/.../Improving%20health/socialdeterminantshealth.pdf
T O W A R D S H E A L T H E Q U I T Y A C T I O N ❙ B U I L D I N G W I N N I P E G ’ S H E A L T H E Q U I T Y A C T I O N P L A N 6 1
Special thanks
Thank you to the following organizations, programs, or initiatives that agreed to allow their work to be profiled in this report:
• WRHA Population and Public Health Program Immunization program area
• BridgeCare Clinic
• Dublin Docklands
• Supporting Employment and Economic Development (SEED) Winnipeg
• Building Urban Industries for Local Development (BUILD)
• Manidoo Gi Miini Gonaan Early Childhood Education and Care programs
• Pathways to Education
• Peel Heath Region Built Environment
• Meet me at the Bell Tower (MM@BT)
• New Brunswick Economic and Social Inclusion Plan
• Bell Hotel Supportive Housing Project
• Victoria Community Social Planning Council
• Fair Fares Calgary
• Neechi Foods Co-op Ltd
• Commit to Quit (C2Q) Smoking Cessation at Mount Carmel Clinic
6 2 B U I L D I N G W I N N I P E G ’ S H E A L T H E Q U I T Y A C T I O N P L A N ❙ T O W A R D S H E A L T H E Q U I T Y A C T I O N
Abbreviations used in this report
BUILD Building Urban Industries for Local Development
CA Community Area(s)
ECEC Early Childhood Education and Care
EDI Early Development Instrument
NC Neighbourhood Cluster
PMR Premature Mortality Rate
PYLL potential years of life lost
SEED Supporting Employment and Economic Development
WHO World Health Organization
WHR Winnipeg Health Region
WRHA Winnipeg Regional Health Authority
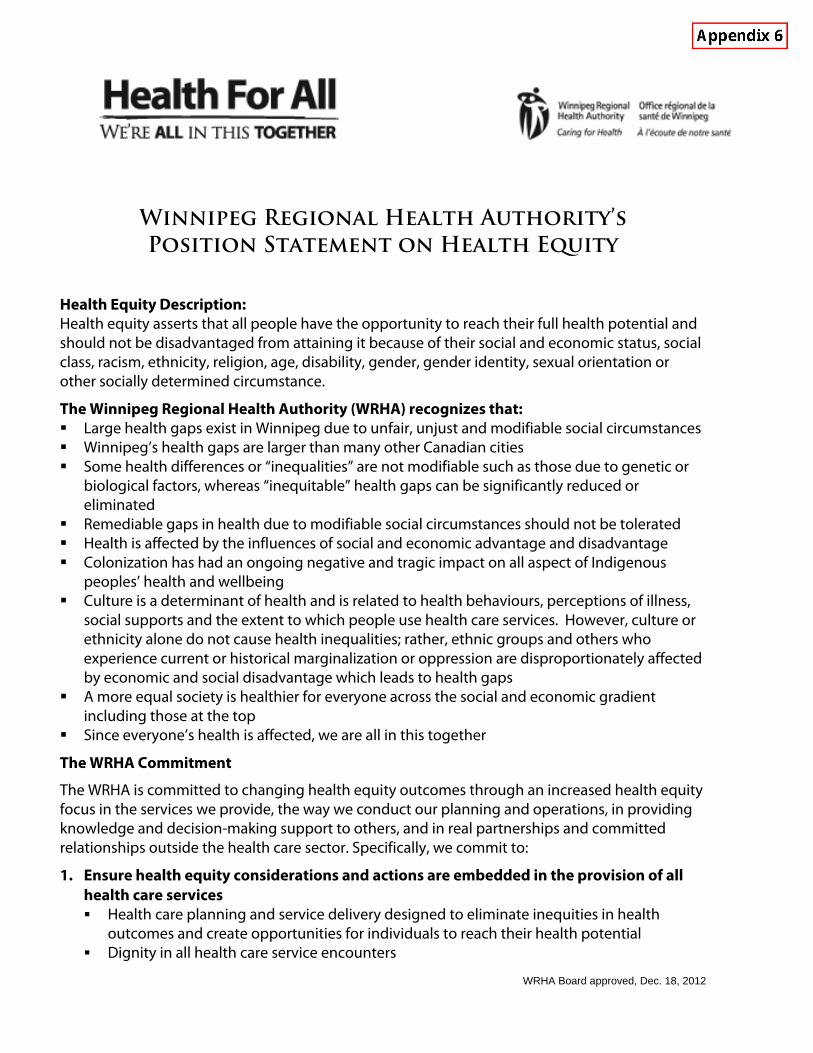
WRHA Board approved, Dec. 18, 2012
Winnipeg Regional Health Authority’s
Position Statement on Health Equity
Health Equity Description: Health equity asserts that all people have the opportunity to reach their full health potential and should not be disadvantaged from attaining it because of their social and economic status, social class, racism, ethnicity, religion, age, disability, gender, gender identity, sexual orientation or other socially determined circumstance.
The Winnipeg Regional Health Authority (WRHA) recognizes that: Large health gaps exist in Winnipeg due to unfair, unjust and modifiable social circumstances Winnipeg’s health gaps are larger than many other Canadian cities Some health differences or “inequalities” are not modifiable such as those due to genetic or
biological factors, whereas “inequitable” health gaps can be significantly reduced or eliminated
Remediable gaps in health due to modifiable social circumstances should not be tolerated Health is affected by the influences of social and economic advantage and disadvantage Colonization has had an ongoing negative and tragic impact on all aspect of Indigenous
peoples’ health and wellbeing Culture is a determinant of health and is related to health behaviours, perceptions of illness,
social supports and the extent to which people use health care services. However, culture or ethnicity alone do not cause health inequalities; rather, ethnic groups and others who experience current or historical marginalization or oppression are disproportionately affected by economic and social disadvantage which leads to health gaps
A more equal society is healthier for everyone across the social and economic gradient including those at the top
Since everyone’s health is affected, we are all in this together
The WRHA Commitment
The WRHA is committed to changing health equity outcomes through an increased health equity focus in the services we provide, the way we conduct our planning and operations, in providing knowledge and decision-making support to others, and in real partnerships and committed relationships outside the health care sector. Specifically, we commit to:
1. Ensure health equity considerations and actions are embedded in the provision of all health care services Health care planning and service delivery designed to eliminate inequities in health
outcomes and create opportunities for individuals to reach their health potential Dignity in all health care service encounters
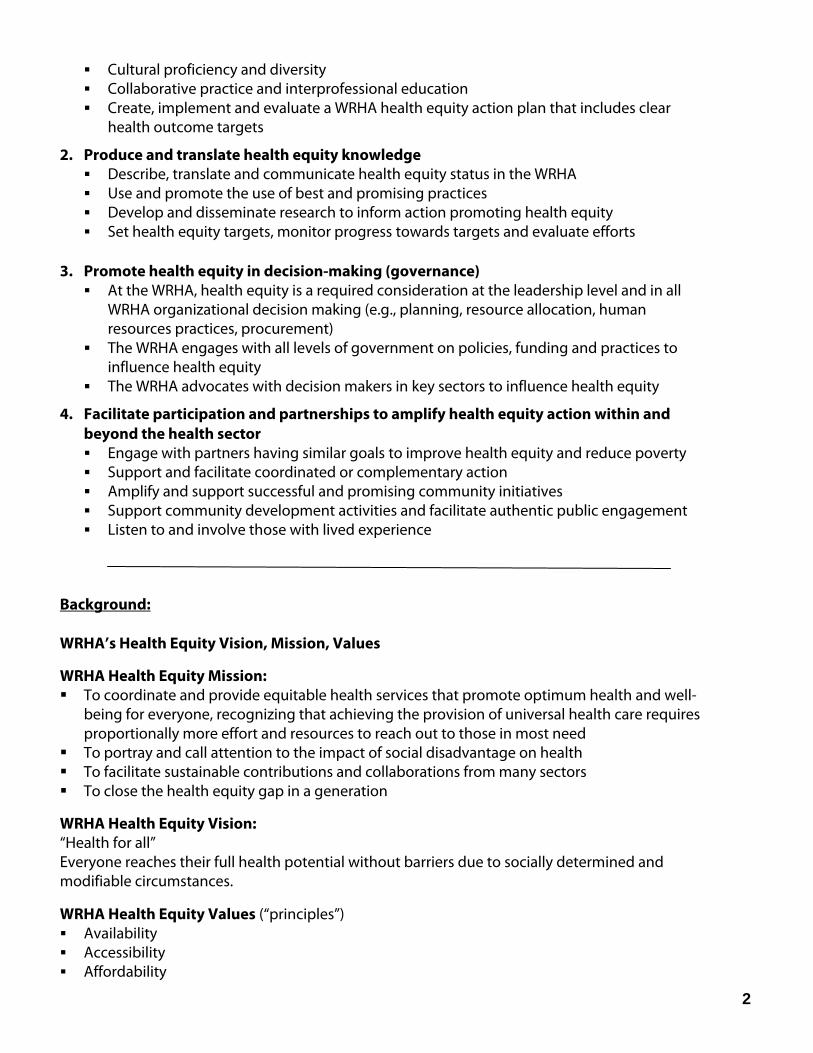
2
Cultural proficiency and diversity Collaborative practice and interprofessional education Create, implement and evaluate a WRHA health equity action plan that includes clear
health outcome targets
2. Produce and translate health equity knowledge Describe, translate and communicate health equity status in the WRHA Use and promote the use of best and promising practices Develop and disseminate research to inform action promoting health equity Set health equity targets, monitor progress towards targets and evaluate efforts
3. Promote health equity in decision-making (governance) At the WRHA, health equity is a required consideration at the leadership level and in all
WRHA organizational decision making (e.g., planning, resource allocation, human resources practices, procurement)
The WRHA engages with all levels of government on policies, funding and practices to influence health equity
The WRHA advocates with decision makers in key sectors to influence health equity
4. Facilitate participation and partnerships to amplify health equity action within and beyond the health sector Engage with partners having similar goals to improve health equity and reduce poverty Support and facilitate coordinated or complementary action Amplify and support successful and promising community initiatives Support community development activities and facilitate authentic public engagement Listen to and involve those with lived experience
Background: WRHA’s Health Equity Vision, Mission, Values
WRHA Health Equity Mission: To coordinate and provide equitable health services that promote optimum health and well-
being for everyone, recognizing that achieving the provision of universal health care requires proportionally more effort and resources to reach out to those in most need
To portray and call attention to the impact of social disadvantage on health To facilitate sustainable contributions and collaborations from many sectors To close the health equity gap in a generation
WRHA Health Equity Vision: “Health for all” Everyone reaches their full health potential without barriers due to socially determined and modifiable circumstances.
WRHA Health Equity Values (“principles”) Availability Accessibility Affordability
3
Appropriateness Accountability Comprehensiveness Equity Participation Social Justice Sustainability Universality
WRHA’s Mission, Vision, Values, Commitments WRHA Mission To co-ordinate and deliver safe and caring services that promote health and well-being. WRHA Vision Healthy People. Vibrant Communities. Care for All. WRHA Values
Dignity - as a reflection of the self-worth of every person Care - as an unwavering expectation of every person Respect - as a measure of the importance of every person
WRHA Commitments Innovation - that fosters improved care, health and well-being Excellence - as a standard of our care and service
Stewardship - of our resources, knowledge and care
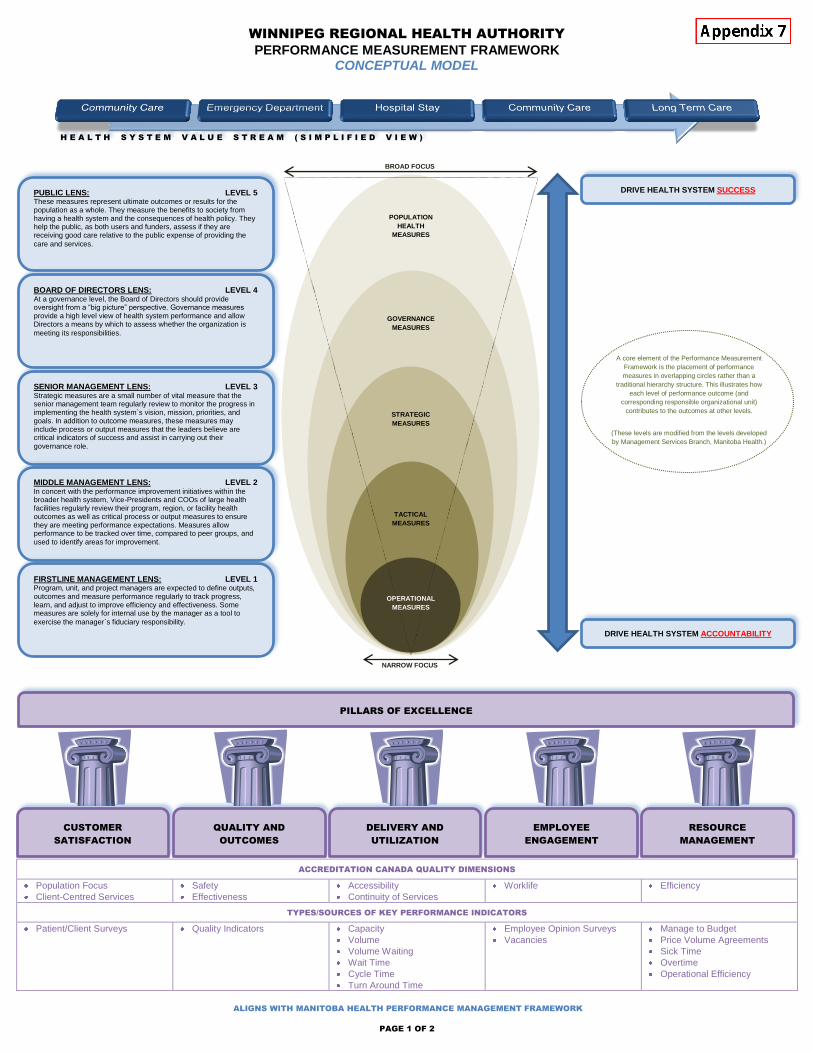
PAGE 1 OF 2
WINNIPEG REGIONAL HEALTH AUTHORITY
PERFORMANCE MEASUREMENT FRAMEWORK CONCEPTUAL MODEL
ACCREDITATION CANADA QUALITY DIMENSIONS
Population Focus
Client-Centred Services
Safety
Effectiveness
Accessibility
Continuity of Services
Worklife Efficiency
TYPES/SOURCES OF KEY PERFORMANCE INDICATORS
Patient/Client Surveys Quality Indicators Capacity
Volume
Volume Waiting
Wait Time
Cycle Time
Turn Around Time
Employee Opinion Surveys
Vacancies
Manage to Budget
Price Volume Agreements
Sick Time
Overtime
Operational Efficiency
H E A L T H S Y S T E M V A L U E S T R E A M ( S I M P L I F I E D V I E W )
POPULATION
HEALTH
MEASURES
GOVERNANCE
MEASURES
STRATEGIC
MEASURES
TACTICAL
MEASURES
OPERATIONAL
MEASURES
BROAD FOCUS
NARROW FOCUS
DRIVE HEALTH SYSTEM SUCCESS
DRIVE HEALTH SYSTEM ACCOUNTABILITY
A core element of the Performance Measurement
Framework is the placement of performance
measures in overlapping circles rather than a
traditional hierarchy structure. This illustrates how
each level of performance outcome (and
corresponding responsible organizational unit)
contributes to the outcomes at other levels.
(These levels are modified from the levels developed
by Management Services Branch, Manitoba Health.)
SENIOR MANAGEMENT LENS: LEVEL 3 Strategic measures are a small number of vital measure that the senior management team regularly review to monitor the progress in implementing the health system`s vision, mission, priorities, and goals. In addition to outcome measures, these measures may include process or output measures that the leaders believe are critical indicators of success and assist in carrying out their
governance role.
MIDDLE MANAGEMENT LENS: LEVEL 2 In concert with the performance improvement initiatives within the broader health system, Vice-Presidents and COOs of large health facilities regularly review their program, region, or facility health outcomes as well as critical process or output measures to ensure they are meeting performance expectations. Measures allow performance to be tracked over time, compared to peer groups, and
used to identify areas for improvement.
FIRSTLINE MANAGEMENT LENS: LEVEL 1 Program, unit, and project managers are expected to define outputs, outcomes and measure performance regularly to track progress, learn, and adjust to improve efficiency and effectiveness. Some measures are solely for internal use by the manager as a tool to
exercise the manager`s fiduciary responsibility.
PUBLIC LENS: LEVEL 5 These measures represent ultimate outcomes or results for the population as a whole. They measure the benefits to society from having a health system and the consequences of health policy. They help the public, as both users and funders, assess if they are receiving good care relative to the public expense of providing the
care and services.
BOARD OF DIRECTORS LENS: LEVEL 4 At a governance level, the Board of Directors should provide oversight from a “big picture” perspective. Governance measures provide a high level view of health system performance and allow Directors a means by which to assess whether the organization is
meeting its responsibilities.
CUSTOMER
SATISFACTION
QUALITY AND
OUTCOMES
DELIVERY AND
UTILIZATION
EMPLOYEE
ENGAGEMENT
RESOURCE
MANAGEMENT
PILLARS OF EXCELLENCE
ALIGNS WITH MANITOBA HEALTH PERFORMANCE MANAGEMENT FRAMEWORK
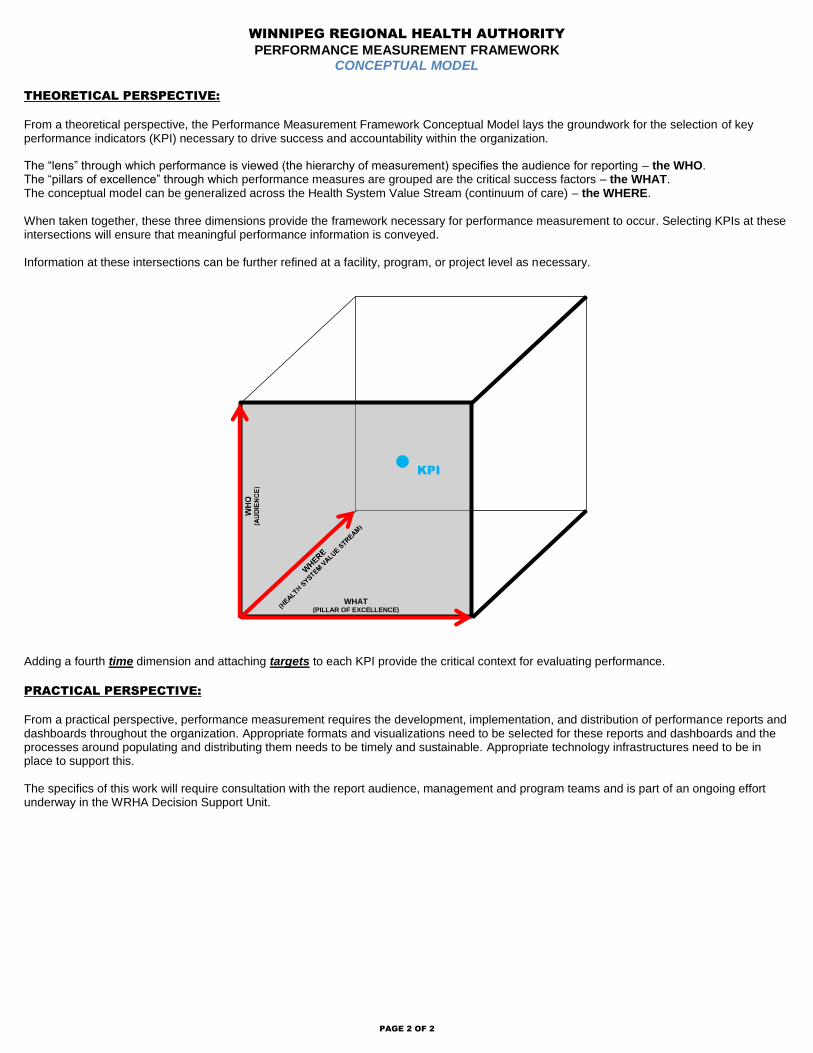
PAGE 2 OF 2
WINNIPEG REGIONAL HEALTH AUTHORITY
PERFORMANCE MEASUREMENT FRAMEWORK CONCEPTUAL MODEL
THEORETICAL PERSPECTIVE:
From a theoretical perspective, the Performance Measurement Framework Conceptual Model lays the groundwork for the selection of key performance indicators (KPI) necessary to drive success and accountability within the organization. The “lens” through which performance is viewed (the hierarchy of measurement) specifies the audience for reporting – the WHO. The “pillars of excellence” through which performance measures are grouped are the critical success factors – the WHAT. The conceptual model can be generalized across the Health System Value Stream (continuum of care) – the WHERE.
When taken together, these three dimensions provide the framework necessary for performance measurement to occur. Selecting KPIs at these intersections will ensure that meaningful performance information is conveyed. Information at these intersections can be further refined at a facility, program, or project level as necessary. Adding a fourth time dimension and attaching targets to each KPI provide the critical context for evaluating performance.
PRACTICAL PERSPECTIVE:
From a practical perspective, performance measurement requires the development, implementation, and distribution of performance reports and dashboards throughout the organization. Appropriate formats and visualizations need to be selected for these reports and dashboards and the processes around populating and distributing them needs to be timely and sustainable. Appropriate technology infrastructures need to be in place to support this. The specifics of this work will require consultation with the report audience, management and program teams and is part of an ongoing effort underway in the WRHA Decision Support Unit.
KPI
WHAT (PILLAR OF EXCELLENCE)