table of contents - pcag - university of winnipeg
TRANSCRIPT
Prairie Perspectives: Geographical Essays (Vol: 14)
ISSN 1911-5814 i
TABLE OF CONTENTS
Preface ..................................................................................................................................................................................ii
School mapping in education micro-planning: a case study of Union Council Chak 84/15L,District Khanewal, PakistanT. I. Shah, S. Bell, M. Elahi .....................................................................................................................................................1
A report on an undergraduate educational initiative that uses multimedia to present howclimate and land use are interrelated: an overview of the Communicating Climate Changeprogram at the University of North DakotaL.B. Munski, A.P. Kirilenko, F.M. Remer, G.L. Mullendore, M.E. Baker ..................................................................................10
“Digital Youth”: ICT use by young people in rural southwestern ManitobaM. Lemoine, D. Ramsey.......................................................................................................................................................17
The messy side of tourism: secondary impacts of waste in Puerto Vallarta, MexicoD. Tousignant, D. Eberts, R.E. Sanchez .................................................................................................................................25
Closer settlement revisited at Kendenup, Western Australia: a historical geographyJ. Selwood, M. Tonts, R. Jones ..............................................................................................................................................34
Can satellite imagery evaluate the pre-condition of a grazing experiment?X. Yang, J.F. Wilmshurst, M. Fitzsimmons, X. Guo .................................................................................................................45
Critical erosion velocity for natural shale gravels: an empirical studyE.L. Blais, R.A. McGinn ........................................................................................................................................................51
Edited byDrs. Alec Aitken, Mohammad Kamal and Bob Patrick
Department of Geography and PlanningUniversity of Saskatchewan, Saskatoon, Saskatchewan, Canada
Prairie Perspectives: Geographical Essays (Vol: 14)
ISSN 1911-5814 ii
Preface
Prairie Perspectives: Geographical Essays is an annual peer-reviewed publication of the Prairie Division of the Canadian As-sociation of Geographers (PCAG). The scholarly manuscripts included in each volume are a selection of those presented at the PCAG annual meetings, as well as contributions pertaining to the geography of the Western Interior solicited from, or submit-ted by, members of the Canadian Association of Geographers.
The 34th annual meeting of the PCAG was held in North Battleford, Saskatchewan on September 24-26, 2010. The con-ference and Annual General Meeting was hosted by the Depart-ment of Geography and Planning, University of Saskatchewan, and held at the Tropical Inn, North Battleford.
A total of 34 papers were presented in 8 concurrent sessions covering topics in physical geography, human geography and remote sensing. In addition, eleven posters were presented in a dedicated poster session. A total of 22 graduate and undergradu-ate students were among the presenters.
The paper and poster sessions took place on Saturday morn-ing. A field trip took place in the afternoon. Despite, the absence of our tour bus, the seventy conference delegates still managed to enjoy a lunchtime barbeque prepared by Yvonne Michnik at the Fort Battleford National Historic Site. After lunch, a walk-ing tour of the Fort was guided by Scott Whiting from Parks Canada. Afterward we visited the Allen Sapp Gallery and the Battlefords Wildlife Federation Interpretive Centre and Look-out with volunteer Ben Clauson.
Another conference highlight was the annual banquet din-ner in the Tropical Inn Ballroom. The guest speaker was Doug
Cuthand, a freelance writer and member of Little Pine First Nation. The title of Mr. Cuthand’s talk was “A First Nations’ Perspective on 1885”. The talk complemented the stories told earlier that day at Fort Battleford about the 1885 Northwest Re-bellion.
This volume contains seven papers, all double-blind, peer reviewed. The papers reflect well upon the broad scope of ge-ography and include topics in human and physical geography as well as remote sensing. Incredibly, the authors represent five countries and eleven institutions across academia and govern-ment. This statistic reflects the diversity within PCAG.
The editors wish to thank the authors of the manuscripts that make up this volume. In addition, we gratefully acknowl-edge the hard work of the reviewers without whom this volume would not have been possible.
Finally, we once again recognize the efforts and contribu-tions made by Weldon Hiebert and the Department of Geog-raphy at the University of Winnipeg for providing the techni-cal expertise and resources for the publication of Volume 14 of Prairie Perspectives. At this time Weldon is especially congratu-lated for taking Prairie Perspectives into the digital world!
We hope you enjoy the papers that follow.
Drs. Alec Aitken, Mohammad Kamal and Bob Pat rick, Department of Geography and PlanningUniversity of Saskatchewan
Prairie Perspectives: Geographical Essays (Vol: 14)
ISSN 1911-5814 1
School mapping in education micro-planning: a case study of Union Council Chak 84/15L, District Khanewal, Pakistan
Tayyab I. ShahDepartment of Geography and Planning, University of Saskatchewan, Saskatoon SK Canada S7M 5C8 [email protected]
Scott BellDepartment of Geography and Planning, University of Saskatchewan, Saskatoon SK Canada S7M 5C8 [email protected]
Mehboob ElahiDepartment of Sociology, University of the Punjab, Lahore, Pakistan
Abstract
This research took place in the Union Council Chak 84/15L, Khanewal District, Pakistan. Pakistan is a developing coun-try with a large and rapidly growing population; it faces many challenges and as a result socio-economic indicators tend not to show positive trends. In developing countries school mapping (SM), a normative approach to the micro-planning of school locations, is often used to create the necessary conditions for achieving universal primary and secondary educa-tion (UPE and USE). With the introduction of a new local government system, development planning is carried out by the district governments with a focus on local priorities and needs. The objective of this research was to identify the poten-tial school sites at the local level by mapping and analyzing the existing inequalities in access and distribution of schools based on reliable spatial and aspatial baseline data. Community maps were updated to identify the scattered population sites and school locations with the help of internet resources (Google Earth, Wikimapia) and by community participa-tion. A household survey was conducted to gather baseline data including out-of-school children and the illiterate popu-lation. The results provide some practical guidelines for the identification of locations where schools are to be opened. Key words: School Mapping, Universal primary education, Education micro-planning
Prairie Perspectives: Geographical Essays (Vol: 14)
ISSN 1911-5814 2
IntroductionPakistan is a developing country with a large and rapidly
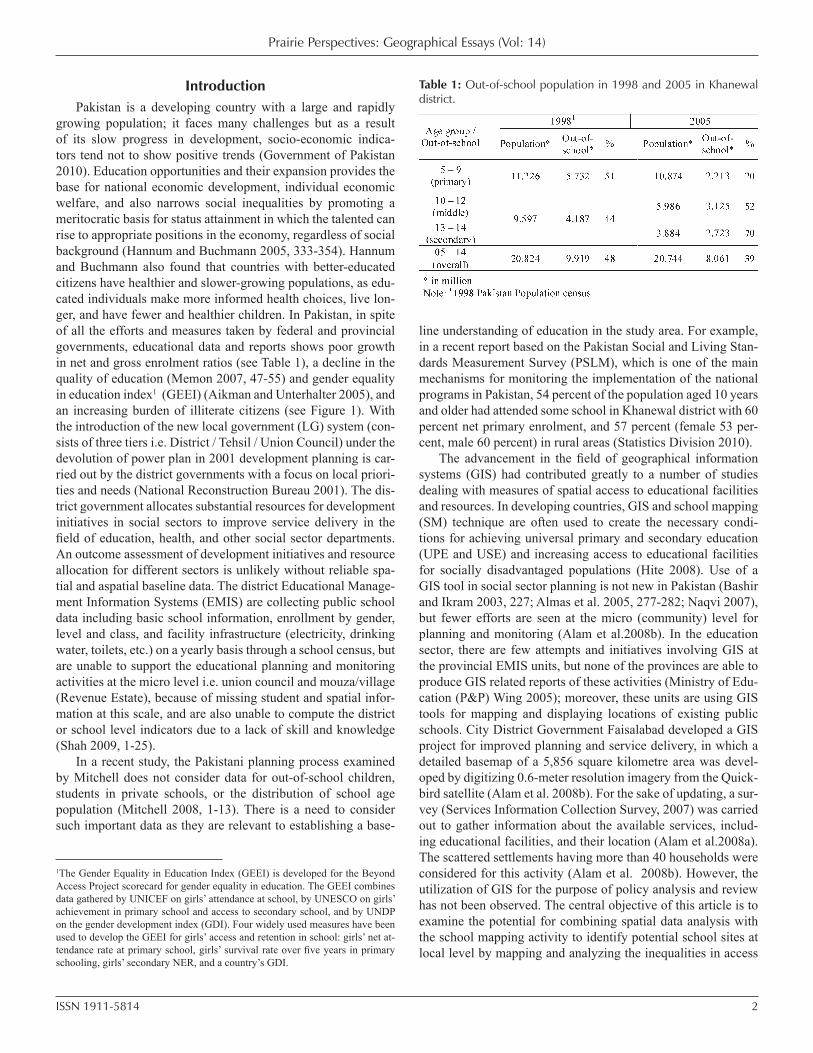
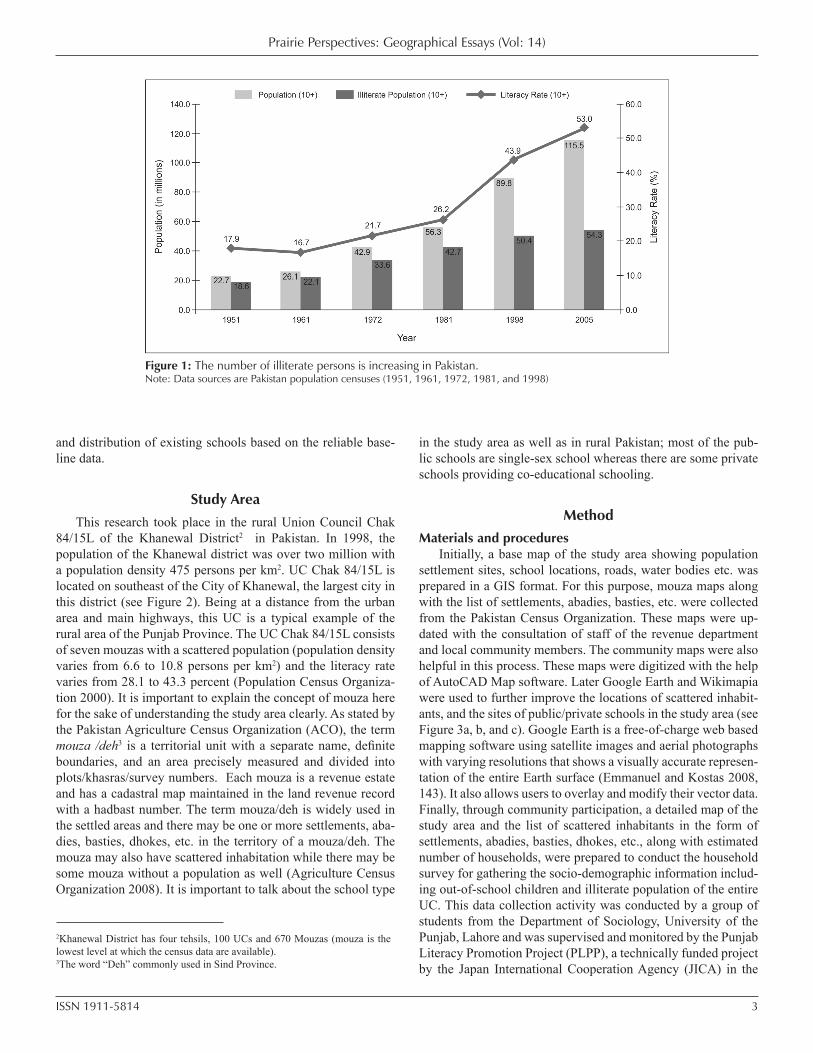
growing population; it faces many challenges but as a result of its slow progress in development, socio-economic indica-tors tend not to show positive trends (Government of Pakistan 2010). Education opportunities and their expansion provides the base for national economic development, individual economic welfare, and also narrows social inequalities by promoting a meritocratic basis for status attainment in which the talented can rise to appropriate positions in the economy, regardless of social background (Hannum and Buchmann 2005, 333-354). Hannum and Buchmann also found that countries with better-educated citizens have healthier and slower-growing populations, as edu-cated individuals make more informed health choices, live lon-ger, and have fewer and healthier children. In Pakistan, in spite of all the efforts and measures taken by federal and provincial governments, educational data and reports shows poor growth in net and gross enrolment ratios (see Table 1), a decline in the quality of education (Memon 2007, 47-55) and gender equality in education index1 (GEEI) (Aikman and Unterhalter 2005), and an increasing burden of illiterate citizens (see Figure 1). With the introduction of the new local government (LG) system (con-sists of three tiers i.e. District / Tehsil / Union Council) under the devolution of power plan in 2001 development planning is car-ried out by the district governments with a focus on local priori-ties and needs (National Reconstruction Bureau 2001). The dis-trict government allocates substantial resources for development initiatives in social sectors to improve service delivery in the field of education, health, and other social sector departments. An outcome assessment of development initiatives and resource allocation for different sectors is unlikely without reliable spa-tial and aspatial baseline data. The district Educational Manage-ment Information Systems (EMIS) are collecting public school data including basic school information, enrollment by gender, level and class, and facility infrastructure (electricity, drinking water, toilets, etc.) on a yearly basis through a school census, but are unable to support the educational planning and monitoring activities at the micro level i.e. union council and mouza/village (Revenue Estate), because of missing student and spatial infor-mation at this scale, and are also unable to compute the district or school level indicators due to a lack of skill and knowledge (Shah 2009, 1-25).
In a recent study, the Pakistani planning process examined by Mitchell does not consider data for out-of-school children, students in private schools, or the distribution of school age population (Mitchell 2008, 1-13). There is a need to consider such important data as they are relevant to establishing a base-
line understanding of education in the study area. For example, in a recent report based on the Pakistan Social and Living Stan-dards Measurement Survey (PSLM), which is one of the main mechanisms for monitoring the implementation of the national programs in Pakistan, 54 percent of the population aged 10 years and older had attended some school in Khanewal district with 60 percent net primary enrolment, and 57 percent (female 53 per-cent, male 60 percent) in rural areas (Statistics Division 2010).
The advancement in the field of geographical information systems (GIS) had contributed greatly to a number of studies dealing with measures of spatial access to educational facilities and resources. In developing countries, GIS and school mapping (SM) technique are often used to create the necessary condi-tions for achieving universal primary and secondary education (UPE and USE) and increasing access to educational facilities for socially disadvantaged populations (Hite 2008). Use of a GIS tool in social sector planning is not new in Pakistan (Bashir and Ikram 2003, 227; Almas et al. 2005, 277-282; Naqvi 2007), but fewer efforts are seen at the micro (community) level for planning and monitoring (Alam et al.2008b). In the education sector, there are few attempts and initiatives involving GIS at the provincial EMIS units, but none of the provinces are able to produce GIS related reports of these activities (Ministry of Edu-cation (P&P) Wing 2005); moreover, these units are using GIS tools for mapping and displaying locations of existing public schools. City District Government Faisalabad developed a GIS project for improved planning and service delivery, in which a detailed basemap of a 5,856 square kilometre area was devel-oped by digitizing 0.6-meter resolution imagery from the Quick-bird satellite (Alam et al. 2008b). For the sake of updating, a sur-vey (Services Information Collection Survey, 2007) was carried out to gather information about the available services, includ-ing educational facilities, and their location (Alam et al.2008a). The scattered settlements having more than 40 households were considered for this activity (Alam et al. 2008b). However, the utilization of GIS for the purpose of policy analysis and review has not been observed. The central objective of this article is to examine the potential for combining spatial data analysis with the school mapping activity to identify potential school sites at local level by mapping and analyzing the inequalities in access
1The Gender Equality in Education Index (GEEI) is developed for the Beyond Access Project scorecard for gender equality in education. The GEEI combines data gathered by UNICEF on girls’ attendance at school, by UNESCO on girls’ achievement in primary school and access to secondary school, and by UNDP on the gender development index (GDI). Four widely used measures have been used to develop the GEEI for girls’ access and retention in school: girls’ net at-tendance rate at primary school, girls’ survival rate over five years in primary schooling, girls’ secondary NER, and a country’s GDI.
Table 1: Out-of-school population in 1998 and 2005 in Khanewal district.
Prairie Perspectives: Geographical Essays (Vol: 14)
ISSN 1911-5814 3
and distribution of existing schools based on the reliable base-line data.
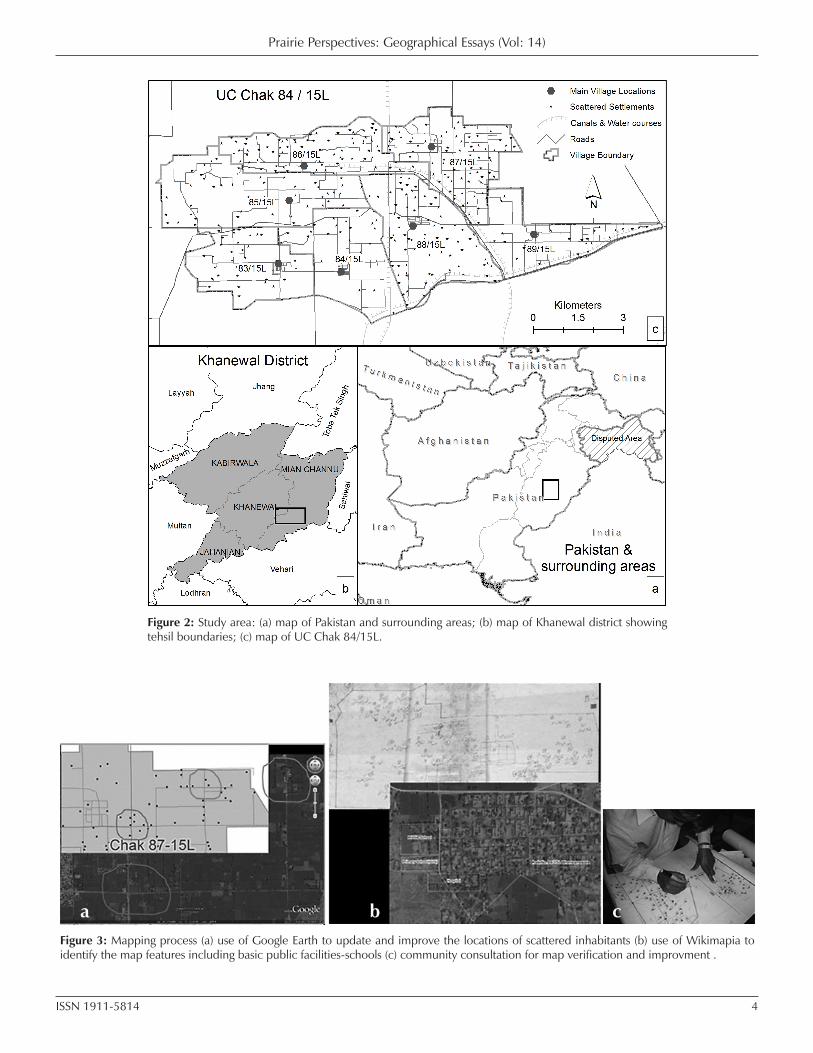
Study AreaThis research took place in the rural Union Council Chak
84/15L of the Khanewal District2 in Pakistan. In 1998, the population of the Khanewal district was over two million with a population density 475 persons per km2. UC Chak 84/15L is located on southeast of the City of Khanewal, the largest city in this district (see Figure 2). Being at a distance from the urban area and main highways, this UC is a typical example of the rural area of the Punjab Province. The UC Chak 84/15L consists of seven mouzas with a scattered population (population density varies from 6.6 to 10.8 persons per km2) and the literacy rate varies from 28.1 to 43.3 percent (Population Census Organiza-tion 2000). It is important to explain the concept of mouza here for the sake of understanding the study area clearly. As stated by the Pakistan Agriculture Census Organization (ACO), the term mouza /deh3 is a territorial unit with a separate name, definite boundaries, and an area precisely measured and divided into plots/khasras/survey numbers. Each mouza is a revenue estate and has a cadastral map maintained in the land revenue record with a hadbast number. The term mouza/deh is widely used in the settled areas and there may be one or more settlements, aba-dies, basties, dhokes, etc. in the territory of a mouza/deh. The mouza may also have scattered inhabitation while there may be some mouza without a population as well (Agriculture Census Organization 2008). It is important to talk about the school type
in the study area as well as in rural Pakistan; most of the pub-lic schools are single-sex school whereas there are some private schools providing co-educational schooling.
MethodMaterials and procedures
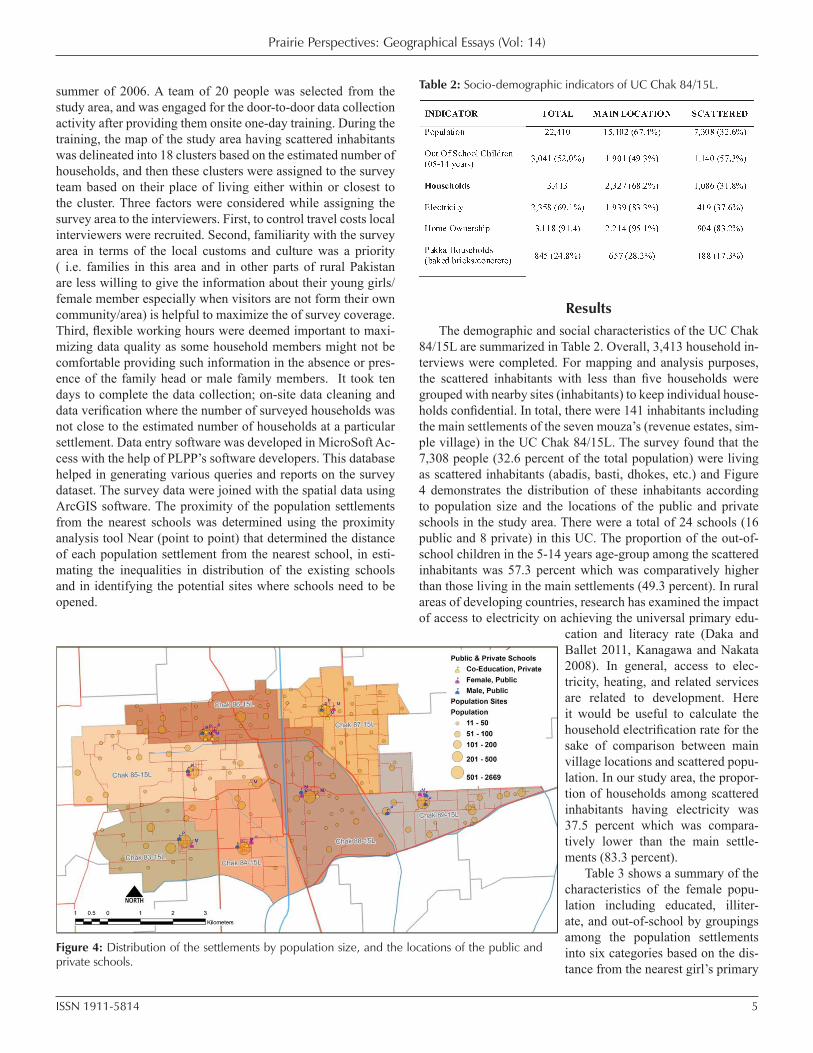
Initially, a base map of the study area showing population settlement sites, school locations, roads, water bodies etc. was prepared in a GIS format. For this purpose, mouza maps along with the list of settlements, abadies, basties, etc. were collected from the Pakistan Census Organization. These maps were up-dated with the consultation of staff of the revenue department and local community members. The community maps were also helpful in this process. These maps were digitized with the help of AutoCAD Map software. Later Google Earth and Wikimapia were used to further improve the locations of scattered inhabit-ants, and the sites of public/private schools in the study area (see Figure 3a, b, and c). Google Earth is a free-of-charge web based mapping software using satellite images and aerial photographs with varying resolutions that shows a visually accurate represen-tation of the entire Earth surface (Emmanuel and Kostas 2008, 143). It also allows users to overlay and modify their vector data. Finally, through community participation, a detailed map of the study area and the list of scattered inhabitants in the form of settlements, abadies, basties, dhokes, etc., along with estimated number of households, were prepared to conduct the household survey for gathering the socio-demographic information includ-ing out-of-school children and illiterate population of the entire UC. This data collection activity was conducted by a group of students from the Department of Sociology, University of the Punjab, Lahore and was supervised and monitored by the Punjab Literacy Promotion Project (PLPP), a technically funded project by the Japan International Cooperation Agency (JICA) in the
2Khanewal District has four tehsils, 100 UCs and 670 Mouzas (mouza is the lowest level at which the census data are available).3The word “Deh” commonly used in Sind Province.
Figure 1: The number of illiterate persons is increasing in Pakistan.Note: Data sources are Pakistan population censuses (1951, 1961, 1972, 1981, and 1998)
Prairie Perspectives: Geographical Essays (Vol: 14)
ISSN 1911-5814 4
Figure 2: Study area: (a) map of Pakistan and surrounding areas; (b) map of Khanewal district showing tehsil boundaries; (c) map of UC Chak 84/15L.
Figure 3: Mapping process (a) use of Google Earth to update and improve the locations of scattered inhabitants (b) use of Wikimapia to identify the map features including basic public facilities-schools (c) community consultation for map verification and improvment .
a b c
Prairie Perspectives: Geographical Essays (Vol: 14)
ISSN 1911-5814 5
summer of 2006. A team of 20 people was selected from the study area, and was engaged for the door-to-door data collection activity after providing them onsite one-day training. During the training, the map of the study area having scattered inhabitants was delineated into 18 clusters based on the estimated number of households, and then these clusters were assigned to the survey team based on their place of living either within or closest to the cluster. Three factors were considered while assigning the survey area to the interviewers. First, to control travel costs local interviewers were recruited. Second, familiarity with the survey area in terms of the local customs and culture was a priority ( i.e. families in this area and in other parts of rural Pakistan are less willing to give the information about their young girls/female member especially when visitors are not form their own community/area) is helpful to maximize the of survey coverage. Third, flexible working hours were deemed important to maxi-mizing data quality as some household members might not be comfortable providing such information in the absence or pres-ence of the family head or male family members. It took ten days to complete the data collection; on-site data cleaning and data verification where the number of surveyed households was not close to the estimated number of households at a particular settlement. Data entry software was developed in MicroSoft Ac-cess with the help of PLPP’s software developers. This database helped in generating various queries and reports on the survey dataset. The survey data were joined with the spatial data using ArcGIS software. The proximity of the population settlements from the nearest schools was determined using the proximity analysis tool Near (point to point) that determined the distance of each population settlement from the nearest school, in esti-mating the inequalities in distribution of the existing schools and in identifying the potential sites where schools need to be opened.
ResultsThe demographic and social characteristics of the UC Chak
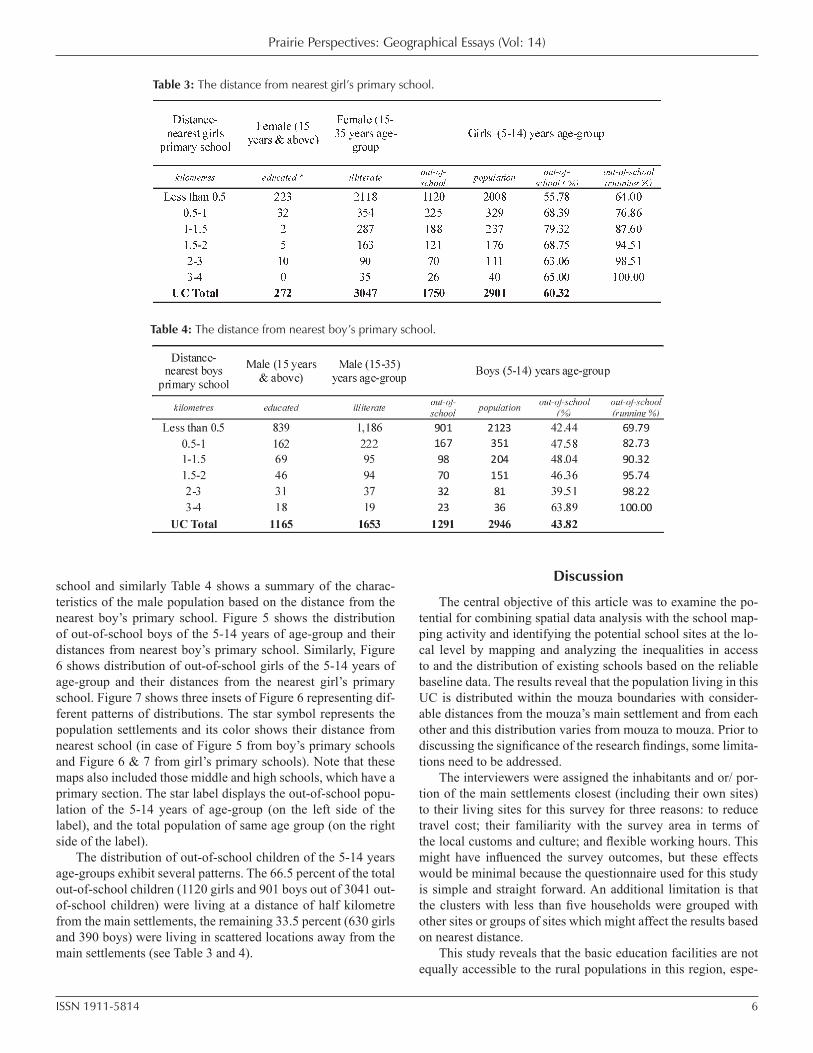
84/15L are summarized in Table 2. Overall, 3,413 household in-terviews were completed. For mapping and analysis purposes, the scattered inhabitants with less than five households were grouped with nearby sites (inhabitants) to keep individual house-holds confidential. In total, there were 141 inhabitants including the main settlements of the seven mouza’s (revenue estates, sim-ple village) in the UC Chak 84/15L. The survey found that the 7,308 people (32.6 percent of the total population) were living as scattered inhabitants (abadis, basti, dhokes, etc.) and Figure 4 demonstrates the distribution of these inhabitants according to population size and the locations of the public and private schools in the study area. There were a total of 24 schools (16 public and 8 private) in this UC. The proportion of the out-of-school children in the 5-14 years age-group among the scattered inhabitants was 57.3 percent which was comparatively higher than those living in the main settlements (49.3 percent). In rural areas of developing countries, research has examined the impact of access to electricity on achieving the universal primary edu-
cation and literacy rate (Daka and Ballet 2011, Kanagawa and Nakata 2008). In general, access to elec-tricity, heating, and related services are related to development. Here it would be useful to calculate the household electrification rate for the sake of comparison between main village locations and scattered popu-lation. In our study area, the propor-tion of households among scattered inhabitants having electricity was 37.5 percent which was compara-tively lower than the main settle-ments (83.3 percent).
Table 3 shows a summary of the characteristics of the female popu-lation including educated, illiter-ate, and out-of-school by groupings among the population settlements into six categories based on the dis-tance from the nearest girl’s primary
Table 2: Socio-demographic indicators of UC Chak 84/15L.
Figure 4: Distribution of the settlements by population size, and the locations of the public and private schools.
Prairie Perspectives: Geographical Essays (Vol: 14)
ISSN 1911-5814 6
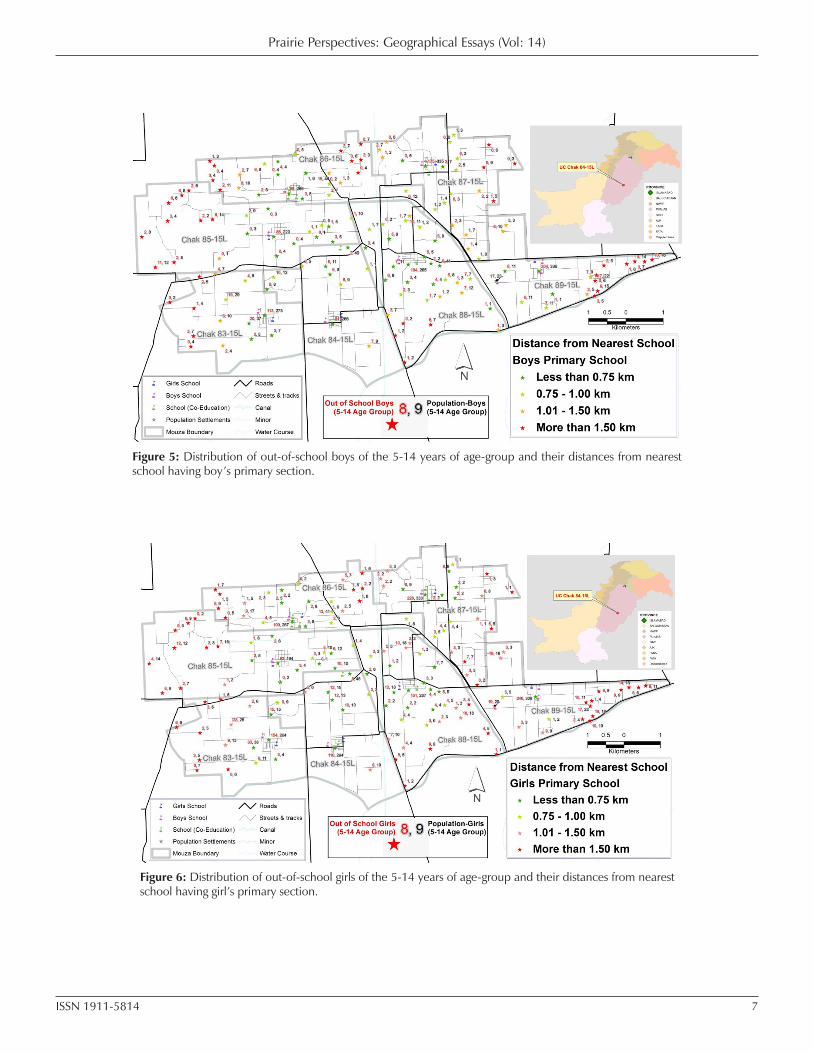
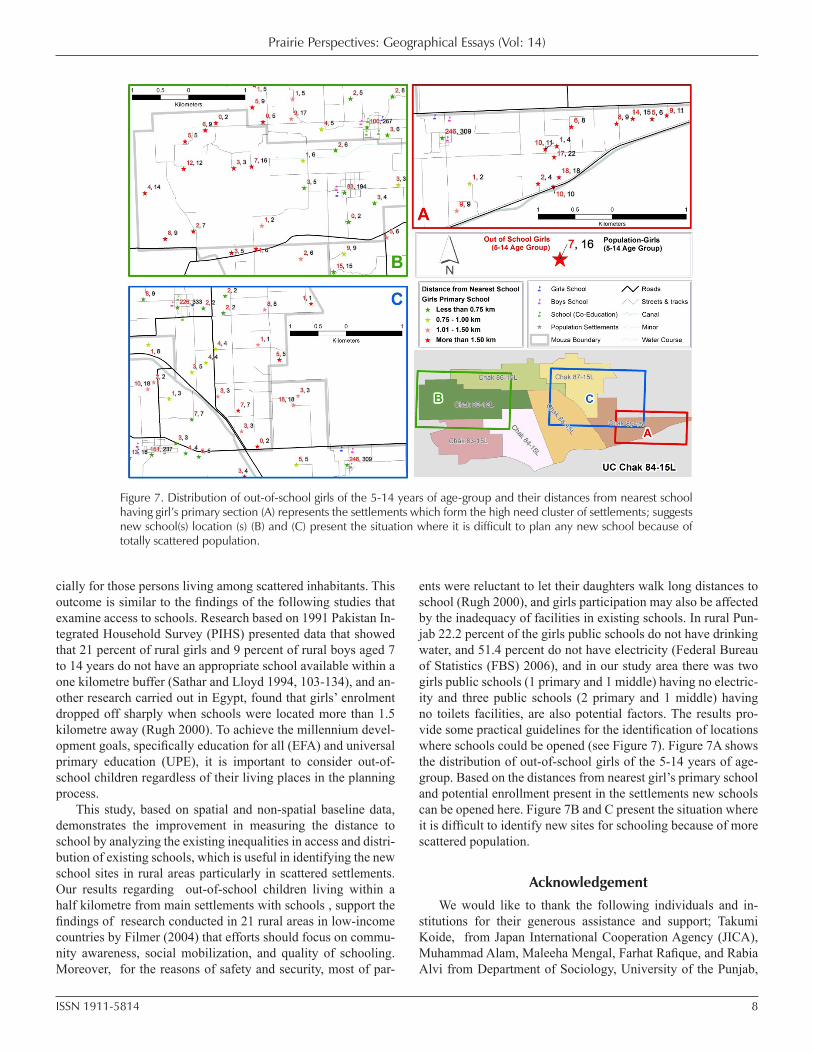
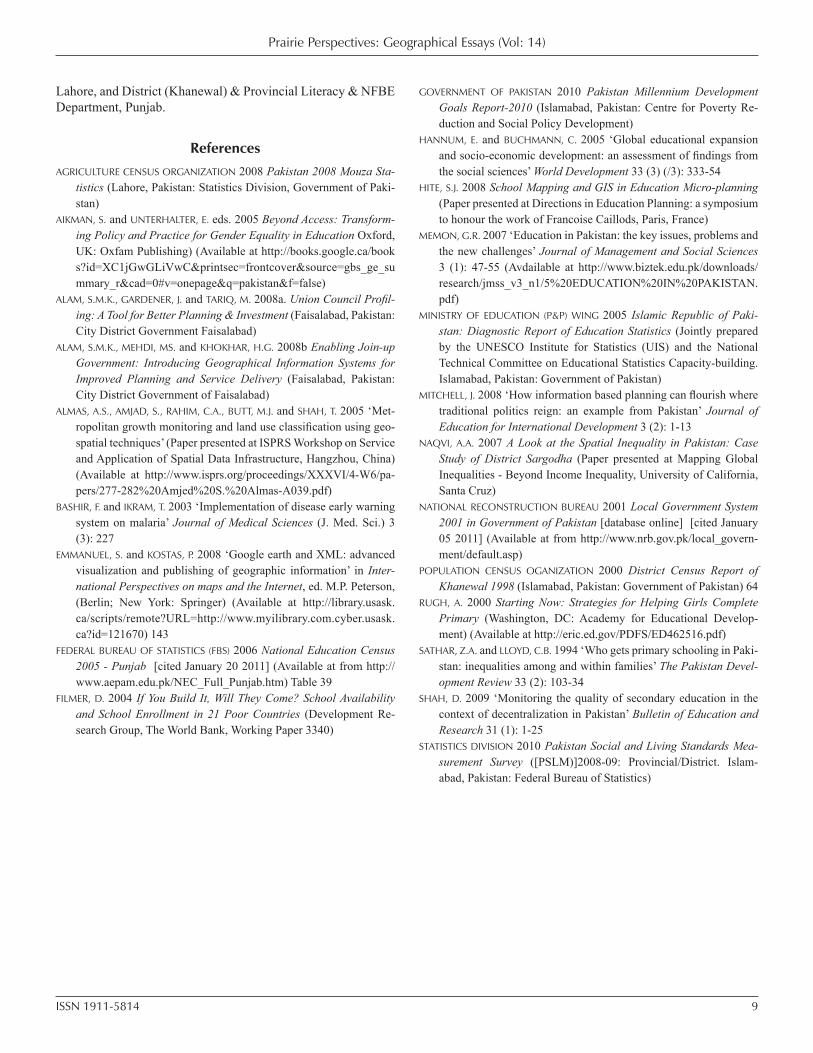
school and similarly Table 4 shows a summary of the charac-teristics of the male population based on the distance from the nearest boy’s primary school. Figure 5 shows the distribution of out-of-school boys of the 5-14 years of age-group and their distances from nearest boy’s primary school. Similarly, Figure 6 shows distribution of out-of-school girls of the 5-14 years of age-group and their distances from the nearest girl’s primary school. Figure 7 shows three insets of Figure 6 representing dif-ferent patterns of distributions. The star symbol represents the population settlements and its color shows their distance from nearest school (in case of Figure 5 from boy’s primary schools and Figure 6 & 7 from girl’s primary schools). Note that these maps also included those middle and high schools, which have a primary section. The star label displays the out-of-school popu-lation of the 5-14 years of age-group (on the left side of the label), and the total population of same age group (on the right side of the label).
The distribution of out-of-school children of the 5-14 years age-groups exhibit several patterns. The 66.5 percent of the total out-of-school children (1120 girls and 901 boys out of 3041 out-of-school children) were living at a distance of half kilometre from the main settlements, the remaining 33.5 percent (630 girls and 390 boys) were living in scattered locations away from the main settlements (see Table 3 and 4).
Discussion
The central objective of this article was to examine the po-tential for combining spatial data analysis with the school map-ping activity and identifying the potential school sites at the lo-cal level by mapping and analyzing the inequalities in access to and the distribution of existing schools based on the reliable baseline data. The results reveal that the population living in this UC is distributed within the mouza boundaries with consider-able distances from the mouza’s main settlement and from each other and this distribution varies from mouza to mouza. Prior to discussing the significance of the research findings, some limita-tions need to be addressed.
The interviewers were assigned the inhabitants and or/ por-tion of the main settlements closest (including their own sites) to their living sites for this survey for three reasons: to reduce travel cost; their familiarity with the survey area in terms of the local customs and culture; and flexible working hours. This might have influenced the survey outcomes, but these effects would be minimal because the questionnaire used for this study is simple and straight forward. An additional limitation is that the clusters with less than five households were grouped with other sites or groups of sites which might affect the results based on nearest distance.
This study reveals that the basic education facilities are not equally accessible to the rural populations in this region, espe-
Table 3: The distance from nearest girl’s primary school.
Table 4: The distance from nearest boy’s primary school.
Prairie Perspectives: Geographical Essays (Vol: 14)
ISSN 1911-5814 7
Figure 5: Distribution of out-of-school boys of the 5-14 years of age-group and their distances from nearest school having boy’s primary section.
Figure 6: Distribution of out-of-school girls of the 5-14 years of age-group and their distances from nearest school having girl’s primary section.
Prairie Perspectives: Geographical Essays (Vol: 14)
ISSN 1911-5814 8
cially for those persons living among scattered inhabitants. This outcome is similar to the findings of the following studies that examine access to schools. Research based on 1991 Pakistan In-tegrated Household Survey (PIHS) presented data that showed that 21 percent of rural girls and 9 percent of rural boys aged 7 to 14 years do not have an appropriate school available within a one kilometre buffer (Sathar and Lloyd 1994, 103-134), and an-other research carried out in Egypt, found that girls’ enrolment dropped off sharply when schools were located more than 1.5 kilometre away (Rugh 2000). To achieve the millennium devel-opment goals, specifically education for all (EFA) and universal primary education (UPE), it is important to consider out-of-school children regardless of their living places in the planning process.
This study, based on spatial and non-spatial baseline data, demonstrates the improvement in measuring the distance to school by analyzing the existing inequalities in access and distri-bution of existing schools, which is useful in identifying the new school sites in rural areas particularly in scattered settlements. Our results regarding out-of-school children living within a half kilometre from main settlements with schools , support the findings of research conducted in 21 rural areas in low-income countries by Filmer (2004) that efforts should focus on commu-nity awareness, social mobilization, and quality of schooling. Moreover, for the reasons of safety and security, most of par-
ents were reluctant to let their daughters walk long distances to school (Rugh 2000), and girls participation may also be affected by the inadequacy of facilities in existing schools. In rural Pun-jab 22.2 percent of the girls public schools do not have drinking water, and 51.4 percent do not have electricity (Federal Bureau of Statistics (FBS) 2006), and in our study area there was two girls public schools (1 primary and 1 middle) having no electric-ity and three public schools (2 primary and 1 middle) having no toilets facilities, are also potential factors. The results pro-vide some practical guidelines for the identification of locations where schools could be opened (see Figure 7). Figure 7A shows the distribution of out-of-school girls of the 5-14 years of age-group. Based on the distances from nearest girl’s primary school and potential enrollment present in the settlements new schools can be opened here. Figure 7B and C present the situation where it is difficult to identify new sites for schooling because of more scattered population.
AcknowledgementWe would like to thank the following individuals and in-
stitutions for their generous assistance and support; Takumi Koide, from Japan International Cooperation Agency (JICA), Muhammad Alam, Maleeha Mengal, Farhat Rafique, and Rabia Alvi from Department of Sociology, University of the Punjab,
Figure 7. Distribution of out-of-school girls of the 5-14 years of age-group and their distances from nearest school having girl’s primary section (A) represents the settlements which form the high need cluster of settlements; suggests new school(s) location (s) (B) and (C) present the situation where it is difficult to plan any new school because of totally scattered population.
Prairie Perspectives: Geographical Essays (Vol: 14)
ISSN 1911-5814 9
GOVERNMENT OF PAKISTAN 2010 Pakistan Millennium Development Goals Report-2010 (Islamabad, Pakistan: Centre for Poverty Re-duction and Social Policy Development)
HANNUM, E. and BUCHMANN, C. 2005 ‘Global educational expansion and socio-economic development: an assessment of findings from the social sciences’ World Development 33 (3) (/3): 333-54
HITE, S.J. 2008 School Mapping and GIS in Education Micro-planning (Paper presented at Directions in Education Planning: a symposium to honour the work of Francoise Caillods, Paris, France)
MEMON, G.R. 2007 ‘Education in Pakistan: the key issues, problems and the new challenges’ Journal of Management and Social Sciences 3 (1): 47-55 (Avdailable at http://www.biztek.edu.pk/downloads/research/jmss_v3_n1/5%20EDUCATION%20IN%20PAKISTAN.pdf)
MINISTRY OF EDUCATION (P&P) WING 2005 Islamic Republic of Paki-stan: Diagnostic Report of Education Statistics (Jointly prepared by the UNESCO Institute for Statistics (UIS) and the National Technical Committee on Educational Statistics Capacity-building. Islamabad, Pakistan: Government of Pakistan)
MITCHELL, J. 2008 ‘How information based planning can flourish where traditional politics reign: an example from Pakistan’ Journal of Education for International Development 3 (2): 1-13
NAQVI, A.A. 2007 A Look at the Spatial Inequality in Pakistan: Case Study of District Sargodha (Paper presented at Mapping Global Inequalities - Beyond Income Inequality, University of California, Santa Cruz)
NATIONAL RECONSTRUCTION BUREAU 2001 Local Government System 2001 in Government of Pakistan [database online] [cited January 05 2011] (Available at from http://www.nrb.gov.pk/local_govern-ment/default.asp)
POPULATION CENSUS OGANIZATION 2000 District Census Report of Khanewal 1998 (Islamabad, Pakistan: Government of Pakistan) 64
RUGH, A. 2000 Starting Now: Strategies for Helping Girls Complete Primary (Washington, DC: Academy for Educational Develop-ment) (Available at http://eric.ed.gov/PDFS/ED462516.pdf)
SATHAR, Z.A. and LLOYD, C.B. 1994 ‘Who gets primary schooling in Paki-stan: inequalities among and within families’ The Pakistan Devel-opment Review 33 (2): 103-34
SHAH, D. 2009 ‘Monitoring the quality of secondary education in the context of decentralization in Pakistan’ Bulletin of Education and Research 31 (1): 1-25
STATISTICS DIVISION 2010 Pakistan Social and Living Standards Mea-surement Survey ([PSLM)]2008-09: Provincial/District. Islam-abad, Pakistan: Federal Bureau of Statistics)
Lahore, and District (Khanewal) & Provincial Literacy & NFBE Department, Punjab.
References AGRICULTURE CENSUS ORGANIZATION 2008 Pakistan 2008 Mouza Sta-
tistics (Lahore, Pakistan: Statistics Division, Government of Paki-stan)
AIKMAN, S. and UNTERHALTER, E. eds. 2005 Beyond Access: Transform-ing Policy and Practice for Gender Equality in Education Oxford, UK: Oxfam Publishing) (Available at http://books.google.ca/books?id=XC1jGwGLiVwC&printsec=frontcover&source=gbs_ge_summary_r&cad=0#v=onepage&q=pakistan&f=false)
ALAM, S.M.K., GARDENER, J. and TARIQ, M. 2008a. Union Council Profil-ing: A Tool for Better Planning & Investment (Faisalabad, Pakistan: City District Government Faisalabad)
ALAM, S.M.K., MEHDI, MS. and KHOKHAR, H.G. 2008b Enabling Join-up Government: Introducing Geographical Information Systems for Improved Planning and Service Delivery (Faisalabad, Pakistan: City District Government of Faisalabad)
ALMAS, A.S., AMJAD, S., RAHIM, C.A., BUTT, M.J. and SHAH, T. 2005 ‘Met-ropolitan growth monitoring and land use classification using geo-spatial techniques’ (Paper presented at ISPRS Workshop on Service and Application of Spatial Data Infrastructure, Hangzhou, China) (Available at http://www.isprs.org/proceedings/XXXVI/4-W6/pa-pers/277-282%20Amjed%20S.%20Almas-A039.pdf)
BASHIR, F. and IKRAM, T. 2003 ‘Implementation of disease early warning system on malaria’ Journal of Medical Sciences (J. Med. Sci.) 3 (3): 227
EMMANUEL, S. and KOSTAS, P. 2008 ‘Google earth and XML: advanced visualization and publishing of geographic information’ in Inter-national Perspectives on maps and the Internet, ed. M.P. Peterson, (Berlin; New York: Springer) (Available at http://library.usask.ca/scripts/remote?URL=http://www.myilibrary.com.cyber.usask.ca?id=121670) 143
FEDERAL BUREAU OF STATISTICS (FBS) 2006 National Education Census 2005 - Punjab [cited January 20 2011] (Available at from http://www.aepam.edu.pk/NEC_Full_Punjab.htm) Table 39
FILMER, D. 2004 If You Build It, Will They Come? School Availability and School Enrollment in 21 Poor Countries (Development Re-search Group, The World Bank, Working Paper 3340)
Prairie Perspectives: Geographical Essays (Vol: 14)
ISSN 1911-5814 10
A report on an undergraduate educational initiative that uses multimedia to present how climate and land use are interrelated: an overview of the Communicating Climate Change program at the University of North Dakota
Laura B. MunskiScience Center, Grand Forks, ND 58206
Andrei P. Kirilenko, Fred M. Remer, Gretchen L. Mullendore, and Mary E. BakerUniversity of North Dakota, Grand Forks, ND 58202
Abstract
The University of North Dakota (UND) has implemented the Communicating Climate Change program funded by the National Aeronautics and Space Administration (NASA) Global Climate Change Education program. Funding provid-ed summer internships for regional undergraduates to learn the fundamentals of climate change and to complete re-search using GIS data and weather modeling. The 2010 internship participants were primarily from non-research-intensive universities with a wide array of majors, and included both women and Native American students. Pre/post-assessment activities demonstrated significant increases in their understanding of how climate and environment influ-ence one another. The second year of this program involves the development of middle school level curriculum to com-plement the undergraduate produced webcasts. The educational module consisting of the web casts, curriculum, and inquiry-based activities will be disseminated via the Internet and the Dakota Science Center (DSC) PowerOn! Rural Sci-ence, Technology, Engineering, and Mathematics (STEM) K-12 Educational Outreach program which serves rural schools. Keywords: climate, environment, webcasts
Introduction
The Upper Midwest region is lagging behind other regions of the country in offering undergraduate education opportuni-ties in studying climate change. The Communicating Climate Change project provided undergraduates with an opportunity to learn about climate plus the fundamentals of climate change and climate change impacts as well as the opportunity to com-plete a research project using NASA observational and model data during a summer internship at UND. An integral part of the learning process included training in modern media technol-ogy (webcasts) and the production of a webcast to share their investigations of climate change using NASA data. During the second year, graduate students enrolled in the Teaching and Learning Department at UND will develop middle school level curriculum to accompany the webcasts. Middle school educa-
tors will fine-tune the curriculum and design capstone projects at a summer workshop. The curriculum will be used by these edu-cators and incorporated into the DSC PowerOn! program. This report on the Communicating Climate Change project shows a successful interdisciplinary collaboration of Geography, Earth System Science and Atmospheric Science.
RationaleThe UND Communicating Climate Change project proposes
to fill the current gap in Upper Midwest climate education by providing research and outreach opportunities to undergradu-ate students from around the region and sustaining that outreach through existing educational frameworks. A survey of resource and community managers from North Dakota (Romsdahl 2009) showed that many individuals in a position to make change are
Prairie Perspectives: Geographical Essays (Vol: 14)
ISSN 1911-5814 11
overwhelmed by climate change reports and are unclear on how to proceed. A subset of the respondents felt that climate change was over-hyped and that no adjustments needed to be made in this region. Discussions with undergraduate students at UND re-flect the same confusion and doubt. Dissemination of the facts, powered by the youth of STEM fields, is a crucial need in the Upper Midwest.
Project DevelopmentThe NASA Global Climate Change Education project is
based on the recommendations of the National Research Coun-cil report entitled Earth Science and Applications from Space: National Imperatives for the Next Decade and Beyond (National Research Council of the National Academies 2007). The study specifies that the acquisition of knowledge about the Earth sys-tem and the use of Earth observation data are equally impor-tant in meeting the complex challenges of global change. The NASA Global Climate Change Education project is centered on the improvement of global climate change and earth system sci-ence education at the K-12 and undergraduate levels. The UND Communicating Climate Change program was funded under the NASA Global Climate Change Education project. Funding pro-vided the following: summer internships for regional undergrad-uates to learn the fundamentals of climate change and to com-plete research using GIS data and weather modeling; a graduate research assistant position for the development of curriculum; a teacher workshop; and module teaching materials.
Project ResultsThe 10 internship participants were primarily from non-re-
search-intensive universities with a wide array of majors, and in-cluded both women and Native American students. The summer undergraduate internship began on May 19, 2010 and ended on July 13, 2010. During the first three weeks, Dr. Andrei Kirilenko taught the basics of climate change and Mr. Fred Remer taught the basics of media production. Interns practiced storyboard techniques and presentation strategies by creating a trial webcast during the first three weeks. The interns used Windows Movie Maker editing software and had access to studio time at Aero-Space Network (ASN), the distance-learning arm of the UND College of Aerospace. A team of ASN professional camera op-erators and technicians provided high-end production assistance to each intern research group, helping the interns perform jobs in front of and behind the camera. Building on this acquired skill set, each team of interns created a webcast to share their research with a middle school-aged audience (http://people.aero.und.edu/~gretchen/gcce_ccc/ and/or http://www.youtube.com/user/GCCEUND). Dr. Mullendore and Mr. Remer evaluated prelimi-nary drafts of the webcasts in order to make recommendations prior to the final edit. Editing of the final production was done by the interns with the ASN team assisting with problems that arose. Dr. Laura Munski presented the webcasts to educators at the North Dakota Northeast Education Services Cooperative Winter In-Service: GPS in the 21st Century Grant Program. The
educators in attendance gave the webcasts their approval and encouraged the additional development of high school level cur-riculum.
The interns took numerous field trips, including visiting the local National Weather Service office, touring the University of North Dakota Atmospheric Science Research Aircraft, and a special tour of the United States Geological Society Earth Resources Observation and Science Center located near Sioux Falls, South Dakota. Interns were shown how Landsat data is processed and archived at the center. Every Friday throughout the internship the students were provided with a presentation by Dr. Munski regarding the regional historic, cultural and geo-graphic landscape with a list of suggested excursions for the in-terns to consider. The interns took regional excursions as well as international excursions to Manitoba, Canada.
The basics of a scientific notebook and journaling were taught by Dr. Munski during the first week of the internship. The interns kept a scientific notebook of their research and were given the last hour of each day to journal. The journals were col-lected after the third week to determine research interests and for the ongoing qualitative assessment of the program.
The students were assigned to one of four research tracks. Dr. Gretchen Mullendore led the research team that studied land use change using Landsat data. Dr. Andrea Kirilenko led the re-search team that used NASA Goddard Institute for Space Stud-ies (GISS) data to look at projected climate variability. Mr. Fred Remer led the research team that studied surface temperature trends using MODIS and surface observations. Ms. Andrea Neu-mann, a UND Department of Atmospheric Sciences graduate student, led the research team that used AMSR-E data to study surface ice cover change over time. The interns had five weeks to conduct their research, create a presentation, produce a web cast, and compile additional resources to be used for curriculum development. The interns gave a public presentation of their re-search on July 13, 2010. Dr. Mullendore and Mr. Remer used a dress rehearsal to evaluate the content of the presentations and to prepare the interns for questions from the audience. Dr. Mun-ski evaluated interns on audience eye contact, facial expression, natural hand gestures, posture, enthusiasm, vocalized pauses, topic clarification to the audience, time frame, completeness of content, and maintaining audience attention. By presenting to the Greater Grand Forks community, the interns gained expe-rience talking about their research and communicating climate change in a live setting.
Graduate students from the UND Department of Atmospher-ic Sciences mentored the interns and were available during the last hour of each day to answer their questions. Mr. Dan Koller helped teach the media classes and mentored the interns with production of advanced graphics for their presentations and web casts. Ms. Andrea Neumann taught the interns the basics of sat-ellite operations. Undergraduate Ms. Erin Bertschi assisted with editing and studio filming for the web casts.
Dr. Munski led the assessment and evaluation of the Com-municating Climate Change program. The qualitative final as-sessment showed that the mentoring aspect of the program bolstered the interns’ self confidence and their consideration of
Prairie Perspectives: Geographical Essays (Vol: 14)
ISSN 1911-5814 12
a graduate level degree. The Undergraduate Research Student Self-Assessment (http://www.colorado.edu/eer/research/under-gradfaqs.html) tool was used. This on-line survey instrument is designed to assess student outcomes of undergraduate research using both multi-choice and open-ended items. Pre/post-assess-ment demonstrated significant increases in their understanding of how climate and environment influence one another. Selected results from the assessment show that: 100 percent reported moderate-great gains in “Confidence in my ability to contribute to science”; 60 percent cited great gains in “Understanding what everyday research work is like”; 50 percent reported “Extremely more likely” to enroll in a graduate program and one student commented, “My experience showed me that graduate school is something that is obtainable”.
Future PlansDr. Mary Baker, UND Department of Teaching and Learn-
ing will be working with a graduate research assistant for one semester to develop curriculum for the web casts. A one-week in-school curriculum will accompany each web cast with ad-ditional curriculum options for both out-of-school and summer school programming. Students will apply their acquired skill set to a capstone research project that will require the use of geospa-tial technology including satellite imagery, aerial photos, maps, data layering, data representation, and field data collection. The capstone projects will allow students to apply their newly-ac-quired skills to local and regional research questions. Students will study the geographic theme of human-environment interac-
tion regarding the effect of climatic trends on land management, the movement of population, and the influence of the energy in-dustry on land use over time. The landscape of North Dakota has been influenced by the development of infrastructure to support the energy industry and by climatic precipitation trends. Tenta-tively three main capstone research tracks are under develop-ment: water basin management, habitat management and energy industrial land-use. Each track will provide students with an op-portunity to expand their knowledge of how the variability of climate trends, human energy needs and agricultural demands influence this region. The context of these tracks are explained below.
Water basin managementThe 1944 Flood Control Act led to the construction of the
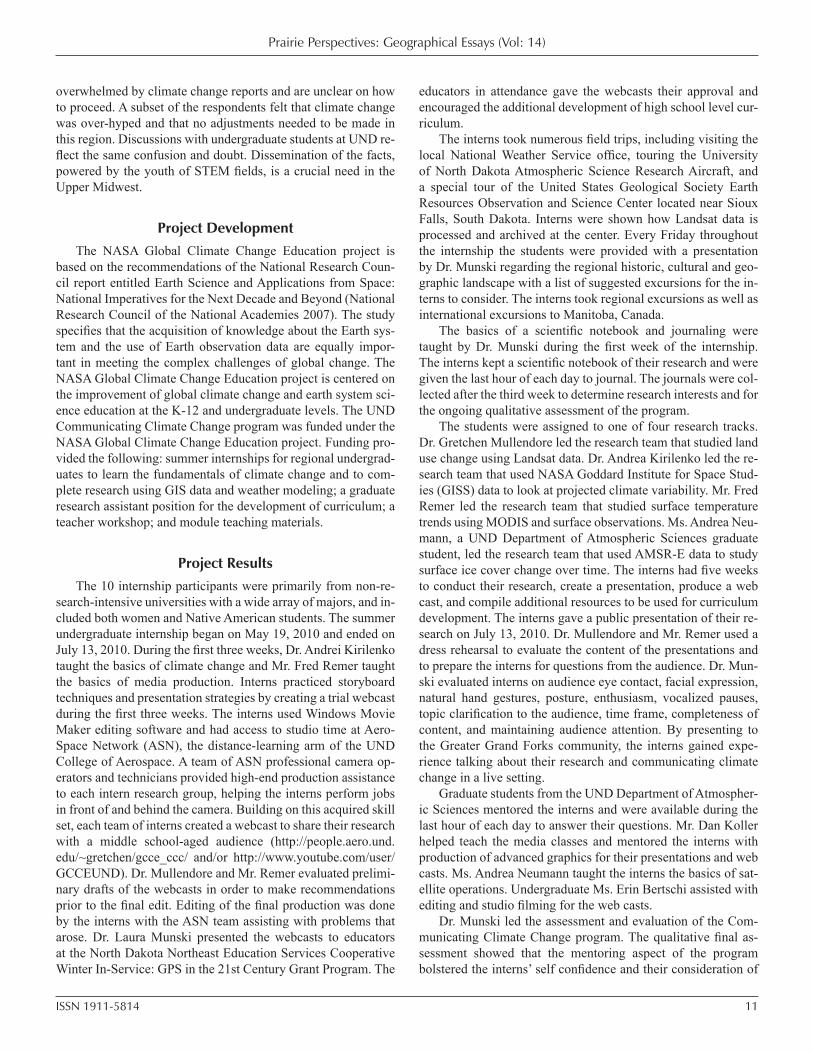
Garrison Dam which was completed in the early 1950’s. The purpose of the dam is to generate hydroelectric power, regulate the water flow of the Missouri River for barge traffic and serve as a water management tool. The Garrison Diversion project was initially intended to divert water from the Missouri River Basin to the Red River Basin for drought relief and to irrigate agricultural land. Construction began in the 1940’s with only 120 miles of canals and a few pumping stations being complet-ed. The scope of the project has changed due to financial and en-vironmental concerns. Twenty-eight counties are included in the project and have representation on the water management board of the Garrison Diversion Conservancy District. (Figure 1).
Students will use historic maps, aerial photos, climate trend data and stream flow measurements to study the effect of the
Figure 1: Garrison Diversion (Garrison Diversion Conservancy District).
Prairie Perspectives: Geographical Essays (Vol: 14)
ISSN 1911-5814 13
Garrison Dam on the Missouri River Basin. Students will also study how the implementation of Garrison Diversion Conser-vancy District water management plans have influenced the landscape over time. There are two branches to this capstone re-search track: human-environment interaction and climate trend variability.
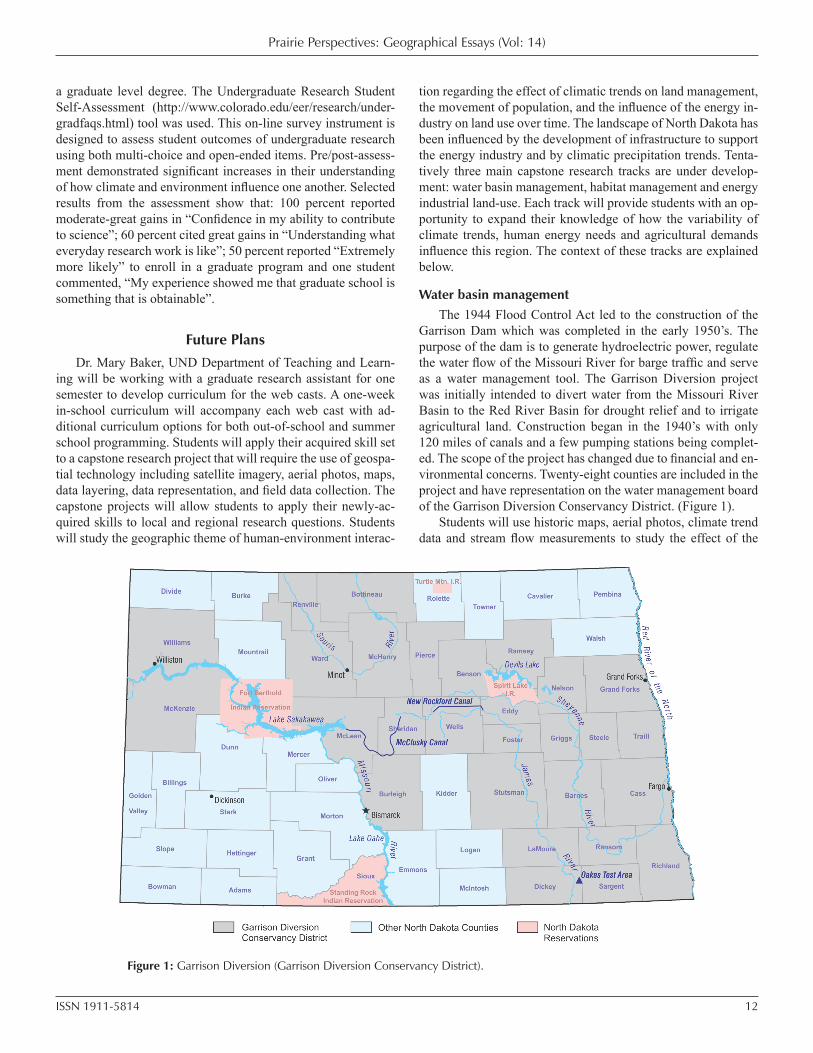
To study water basin management is to study human-envi-ronment interaction. The history of every community along the Red River includes flooding. The Red River Basin has a drain-age area of 17, 250 square miles (Figure 2). The principal river of the basin is the Red River which begins at the confluence of the Ottertail and Bois de Sioux Rivers at Wahpeton, North Dakota, and Breckenridge, Minnesota. The Red River mean-ders northerly nearly 555 river miles to Lake Winnipeg in the province of Manitoba, Canada (North Dakota State Water Com-mission 1993). The drop in elevation from Wahpeton to Lake Winnipeg is only 233 feet (Krenz & Leitch 1993). The U. S. tributaries of the Red River include the Rabbit, Ottertail, Buf-falo, Wild Rice, Marsh, Red Lake, Grand Marais Creek, Snake, Two Rivers North Branch, Two Rivers South Branch, Joe, Ro-seau, Sheyenne, Maple, Rush, Elm, Goose, Turtle, Forest, Park,
Tongue, and Pembina Rivers. The Canadian tributaries include the La Salle, Seine, Rat, Roseau, Marais, Pembina, and Assini-boine Rivers. The Red River flows through the bed of glacial Lake Agassiz which has a mainly flat topography. During sea-sonal high water, the Red River leaves the river bed and spreads overland (North Dakota State Water Commission 1993). There are four lakes in Canada that are remnants of Lake Agassiz: Lake Winnipeg, Lake Winnipegosis, Lake Manitoba, and Lake Nipigon. Lake of the Woods, shared by Canada and the United States, is also a remnant of Lake Agassiz. The Upper and Lower Red Lakes are remnants of Lake Agassiz in the United States (Krenz & Leitch 1993).
The Minnesota source of the Red River is the Ottertail River which drains to the south through Elbow, Many Point, Round, Height of Land, Little Pine, Pine, and Rush Lakes to Ottertail Lake. The Ottertail River travels 42 miles west of Ottertail Lake to its junction with the Bois de Sioux at Breckenridge, Minne-sota. Traverse and Wilkin Counties are the drainage basin area of the Bois de Sioux River as it flows north to Breckenridge (U.S. Geological Survey 1896).
The secondary river of the Red River Basin is the Sheyenne River. The Sheyenne River Basin covers 16 counties. The prin-
cipal tributaries are Baldhill Creek, with a drainage area of 730 square miles, the Maple River with a drain-age area of 1572 square miles, and the Rush River with a drainage area of 236 square miles. The meandering Sheyenne River travels 506 river miles before its confluence with the Red River of the North at Fargo, North Dakota. (U.S. Army Corps of Engineers, 1968). The Sheyenne River has one flood control dam, Lake Ashtabula, located north of Valley City, North Dakota. The Lake Ashtabula reservoir has a maximum storage of 116,300 acre-feet (North Dakota State Water Com-mission 1993).
Devils Lake is the largest natural lake in North Da-kota, with a drainage area of 3580 square miles (North Dakota State Water Commission 1993). The Devils Lake Basin is a subbasin of the Red River Basin and is usually a closed basin. The water level of Devils Lake has been rising since the 1940s and has risen more than 25 feet since 1993. Devils Lake began flowing along the 6–mile journey through the Jerusalem Outlet into Stump Lake in 1999. For the first time in 180 years, Stump Lake became Stump Bay in September of 2007, when its elevation equaled that of Devils Lake at 1447.15 feet above sea level. Stump Bay drains into the Sheyenne River when it reaches 1459 feet above sea level (Bonham 2007).
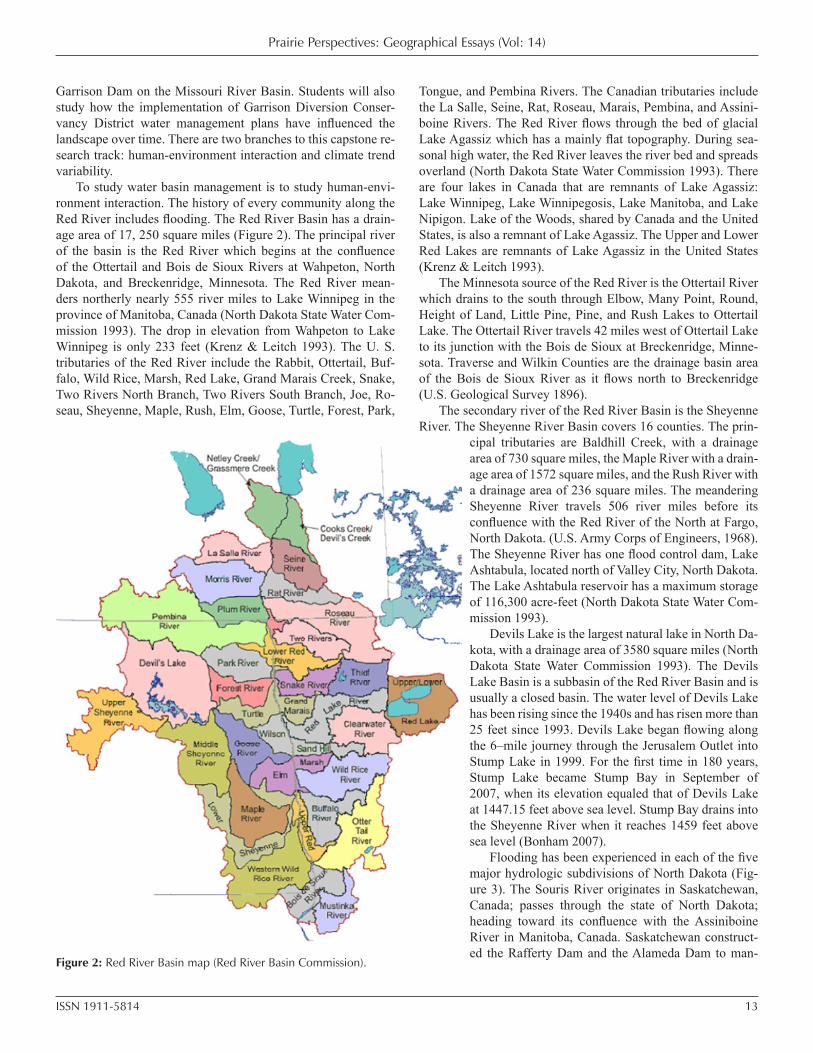
Flooding has been experienced in each of the five major hydrologic subdivisions of North Dakota (Fig-ure 3). The Souris River originates in Saskatchewan, Canada; passes through the state of North Dakota; heading toward its confluence with the Assiniboine River in Manitoba, Canada. Saskatchewan construct-ed the Rafferty Dam and the Alameda Dam to man-
Figure 2: Red River Basin map (Red River Basin Commission).
Prairie Perspectives: Geographical Essays (Vol: 14)
ISSN 1911-5814 14
age the water flow of the Souris River. North Dakota has four major water management systems: the Sheyenne River Flood Control Project, the Southwest Pipeline Project, the Souris River Flood Control Project, and the Garrison Diversion. Water flow is regulated using 14 reservoirs: Ashtabula, Bowman-Haley, Camel Hump, Crown Butte, Darling, Des Lacs, Homme, Ilo, Jim, LaMoure, Oahe, Patterson, Pipestem and Sakakawea. Nu-merous low-head dams are supervised by county water boards (North Dakota State Water Commission 1993).
Students will use historic maps, aerial photos, climate trend data and stream flow measurements to study the effect of climate variability on the movement of human population and water ba-sin management both regional and international.
Habitat managementThe North Dakota Game and Fish Department collaborates
with the United States Fish and Wildlife Service and sportsman organizations, such as Ducks Unlimited to facilitate habitat res-toration, habitat maintenance and to provide public access to private land through the use of cost-share programs. The overall management program is the Conservation Private Land Open to Sportsmen (PLOTS) which has eight sub-programs: Habi-tat PLOT - a 10-20 year land rental contract; Food PLOT – a short term contract to produce wildlife food; Private Forest Conservation – a multi-year rental contract; Conservation Re-serve Program – cost-sharing habitat restoration; Wetlands Re-serve Program - cost-sharing habitat restoration; Working Lands Program – farm and ranch land management is evaluated and a value assigned for a rental agreement; Waterfowl Rest Area Access – rental agreement of grains fields and small sloughs near waterfowl staging areas; and Tree Planting Cost-Sharing
– financial assistance for tree planting (North Dakota Game and Fish Department, 2010). This capstone research tract will have four branches: the influence of climatic trends on PLOTS par-ticipation, the influence of external factors such as the commod-ity market on PLOTS participation, the relationship of climate on habitat restoration, and the effect of PLOTS participation on land use over time.
The energy industryThe Great Plains Synfuels Plant is the only commercial coal
gasification project in the United States and is located north of Beulah, North Dakota. Lignite is transformed into natural gas with agricultural fertilizers, petrochemicals, rare gases and car-bon dioxide produced as byproducts. Federally mandated land reclamation is a major part of the process and will be a capstone land use research track.
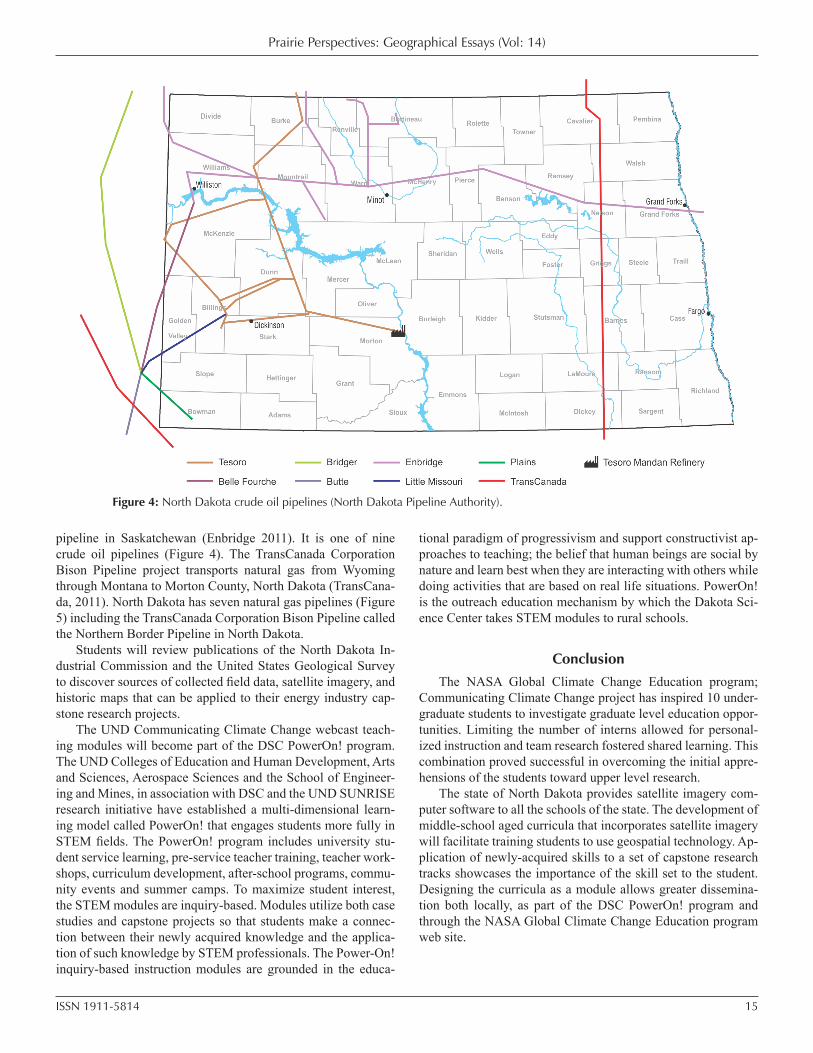
Energy industry infrastructure continues to change the land-scape of North Dakota. The state has four coal mining opera-tions, six lignite-based electric generating stations, one subbi-tuminous-based electric generating station, one ethanol-based electric generating station, and nine wind farms (Basin Electric 2010). The regional energy industry infrastructure will provide a variety of capstone research projects with a focus on human-en-vironment interaction: coal/oil exploration, extraction and trans-portation; wind farm construction; and pipeline construction and maintenance. The Enbridge North Dakota Pipeline System is a 950-mile crude oil pipeline that transverses North Dakota.
It consists of a 330-mile pipeline used to collect crude oil from the Williston Basin (located in eastern Montana and west-ern North Dakota) and a 620-mile main transportation line that connects to the Minnesota pipeline system and the Canadian
Figure 3: North Dakota’s five major hydrologic subdivisions.
Prairie Perspectives: Geographical Essays (Vol: 14)
ISSN 1911-5814 15
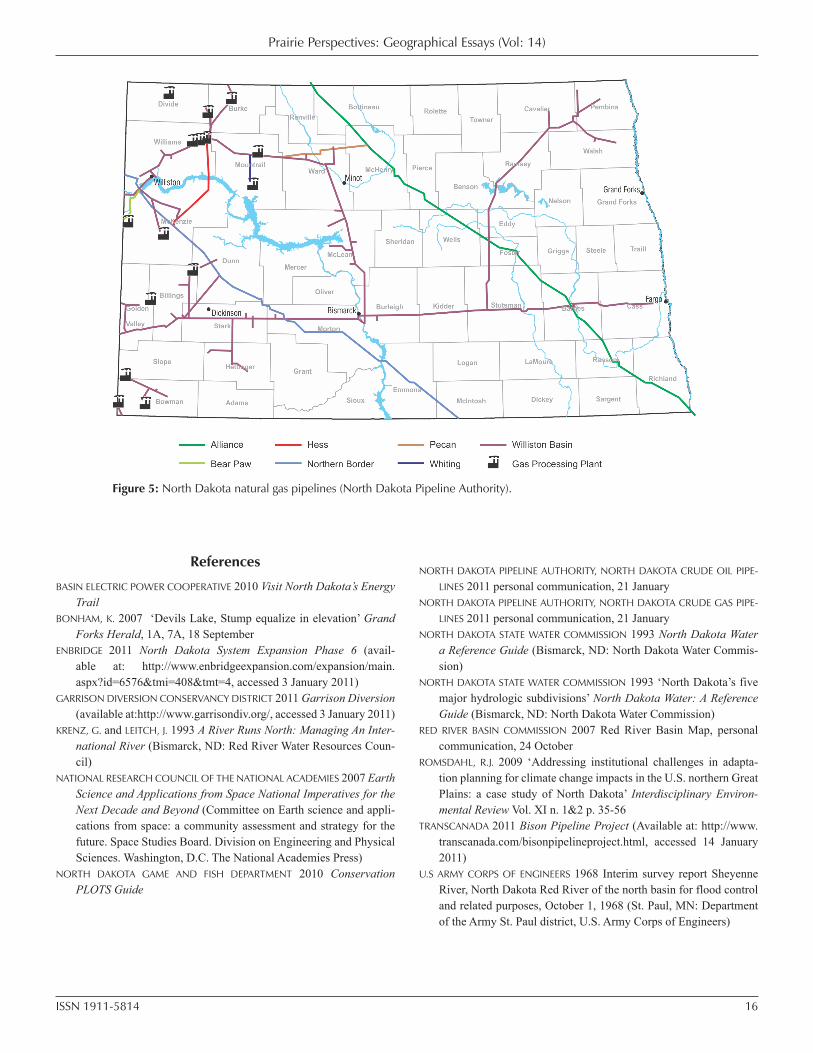
pipeline in Saskatchewan (Enbridge 2011). It is one of nine crude oil pipelines (Figure 4). The TransCanada Corporation Bison Pipeline project transports natural gas from Wyoming through Montana to Morton County, North Dakota (TransCana-da, 2011). North Dakota has seven natural gas pipelines (Figure 5) including the TransCanada Corporation Bison Pipeline called the Northern Border Pipeline in North Dakota.
Students will review publications of the North Dakota In-dustrial Commission and the United States Geological Survey to discover sources of collected field data, satellite imagery, and historic maps that can be applied to their energy industry cap-stone research projects.
The UND Communicating Climate Change webcast teach-ing modules will become part of the DSC PowerOn! program. The UND Colleges of Education and Human Development, Arts and Sciences, Aerospace Sciences and the School of Engineer-ing and Mines, in association with DSC and the UND SUNRISE research initiative have established a multi-dimensional learn-ing model called PowerOn! that engages students more fully in STEM fields. The PowerOn! program includes university stu-dent service learning, pre-service teacher training, teacher work-shops, curriculum development, after-school programs, commu-nity events and summer camps. To maximize student interest, the STEM modules are inquiry-based. Modules utilize both case studies and capstone projects so that students make a connec-tion between their newly acquired knowledge and the applica-tion of such knowledge by STEM professionals. The Power-On! inquiry-based instruction modules are grounded in the educa-
tional paradigm of progressivism and support constructivist ap-proaches to teaching; the belief that human beings are social by nature and learn best when they are interacting with others while doing activities that are based on real life situations. PowerOn! is the outreach education mechanism by which the Dakota Sci-ence Center takes STEM modules to rural schools.
ConclusionThe NASA Global Climate Change Education program;
Communicating Climate Change project has inspired 10 under-graduate students to investigate graduate level education oppor-tunities. Limiting the number of interns allowed for personal-ized instruction and team research fostered shared learning. This combination proved successful in overcoming the initial appre-hensions of the students toward upper level research.
The state of North Dakota provides satellite imagery com-puter software to all the schools of the state. The development of middle-school aged curricula that incorporates satellite imagery will facilitate training students to use geospatial technology. Ap-plication of newly-acquired skills to a set of capstone research tracks showcases the importance of the skill set to the student. Designing the curricula as a module allows greater dissemina-tion both locally, as part of the DSC PowerOn! program and through the NASA Global Climate Change Education program web site.
Figure 4: North Dakota crude oil pipelines (North Dakota Pipeline Authority).
Prairie Perspectives: Geographical Essays (Vol: 14)
ISSN 1911-5814 16
References
BASIN ELECTRIC POWER COOPERATIVE 2010 Visit North Dakota’s Energy Trail
BONHAM, K. 2007 ‘Devils Lake, Stump equalize in elevation’ Grand Forks Herald, 1A, 7A, 18 September
ENBRIDGE 2011 North Dakota System Expansion Phase 6 (avail-able at: http://www.enbridgeexpansion.com/expansion/main.aspx?id=6576&tmi=408&tmt=4, accessed 3 January 2011)
GARRISON DIVERSION CONSERVANCY DISTRICT 2011 Garrison Diversion (available at:http://www.garrisondiv.org/, accessed 3 January 2011)
KRENZ, G. and LEITCH, J. 1993 A River Runs North: Managing An Inter-national River (Bismarck, ND: Red River Water Resources Coun-cil)
NATIONAL RESEARCH COUNCIL OF THE NATIONAL ACADEMIES 2007 Earth Science and Applications from Space National Imperatives for the Next Decade and Beyond (Committee on Earth science and appli-cations from space: a community assessment and strategy for the future. Space Studies Board. Division on Engineering and Physical Sciences. Washington, D.C. The National Academies Press)
NORTH DAKOTA GAME AND FISH DEPARTMENT 2010 Conservation PLOTS Guide
Figure 5: North Dakota natural gas pipelines (North Dakota Pipeline Authority).
NORTH DAKOTA PIPELINE AUTHORITY, NORTH DAKOTA CRUDE OIL PIPE-
LINES 2011 personal communication, 21 January NORTH DAKOTA PIPELINE AUTHORITY, NORTH DAKOTA CRUDE GAS PIPE-
LINES 2011 personal communication, 21 JanuaryNORTH DAKOTA STATE WATER COMMISSION 1993 North Dakota Water
a Reference Guide (Bismarck, ND: North Dakota Water Commis-sion)
NORTH DAKOTA STATE WATER COMMISSION 1993 ‘North Dakota’s five major hydrologic subdivisions’ North Dakota Water: A Reference Guide (Bismarck, ND: North Dakota Water Commission)
RED RIVER BASIN COMMISSION 2007 Red River Basin Map, personal communication, 24 October
ROMSDAHL, R.J. 2009 ‘Addressing institutional challenges in adapta-tion planning for climate change impacts in the U.S. northern Great Plains: a case study of North Dakota’ Interdisciplinary Environ-mental Review Vol. XI n. 1&2 p. 35-56
TRANSCANADA 2011 Bison Pipeline Project (Available at: http://www.transcanada.com/bisonpipelineproject.html, accessed 14 January 2011)
U.S ARMY CORPS OF ENGINEERS 1968 Interim survey report Sheyenne River, North Dakota Red River of the north basin for flood control and related purposes, October 1, 1968 (St. Paul, MN: Department of the Army St. Paul district, U.S. Army Corps of Engineers)
Prairie Perspectives: Geographical Essays (Vol: 14)
ISSN 1911-5814 17
“Digital Youth”: ICT use by young people in rural southwestern Manitoba
Michelle LemoineDepartment of Geography, Brandon University, Brandon Manitoba, Canada R7A 6A9
Doug RamseyDepartment of Geography, Brandon University, Brandon Manitoba, Canada R7A 6A9
Abstract
Rural Canada continues to struggle to maintain its population base, and in particular to retain or attract young people who wish to seek economic and social opportunities in urban Canada. As Information and Communications Technologies (ICTs) become more advanced, communities become more reliant upon them. With access to high quality ICTs now a requirement for society, cellular phones and the Internet, for example, have become a part of life for business and personal use. This study set out to measure the use of ICTs by young people living in rural communities in southwestern Manitoba to ascertain whether access to ICTs influence decisions of youth in rural Manitoba. A survey (n=73) was conducted of students from seven high schools in rural southwestern Manitoba who attended a career conference in Souris, Manitoba in February 2010. Students were asked which ICTs they utilized and how often, what their career plans were, and whether they felt there was an advantage between rural and urban Manitoba with respect to ICT access. The study provides a picture of how youth in rural Manitoba utilize ICTs and whether or not they feel their rural living has disadvantaged them in terms of their ability to communicate through outlets such as Facebook, Twitter, text messaging, e-mail, MSN Chat, on-line gaming, and Skype. The paper concludes by setting a stage for a larger study that encompasses youth across Manitoba, including urban, rural and remote settings.
Introduction
Almost 80% of Canadians live in urban centres (Statistics Canada 2008a). While this proportion has somewhat stabilized over the past decade, many regions of rural Canada continue to see declines, including Manitoba (Statistics Canada 2008b). The Canadian prairie is one such region. Rural communities com-pete with the educational and employment opportunities offered in urban Canada. Accompanying this situation is the perception and reality of urban Canada providing better (or at least more) amenities and services than rural Canada. One such aspect of amenity and service is access to Information and Communica-tions Technologies (ICTs). As ICTs become more sophisticated in their form and ubiquitous in their use, communities have be-come more reliant on them. ICTs such as cellular phones and the Internet are crucial for businesses and have become a part of life for citizens.
This study set out to measure the use of ICTs by young peo-ple living in rural communities in southwestern Manitoba. The study illustrates how young people in rural communities are us-ing ICTs and assesses whether or not they feel their rural living is a disadvantage to them in terms of their ability to effectively communicate through these means. The findings are based on a survey of students from high schools in rural southwestern Man-itoba who participated in the Rural Opportunities Youth Con-ference on Feb. 11th, 2010, in Souris, Manitoba. Students from nine schools attended, seven of which participated in the survey. All students under the age of 18 were required to obtain written parental consent prior to the conference in order to participate.
Rural youth in southwestern Manitoba are a vital component to the future success of many economic practices within rural Manitoba, and their use of ICTs has not yet been studied or re-corded in any detail. Therefore, along with measuring the use of ICTs by these youth, the study also measured the probability
Prairie Perspectives: Geographical Essays (Vol: 14)
ISSN 1911-5814 18
of these youth remaining, or at least returning if they plan to leave, in rural Manitoba and their anticipated career path. The objective of examining this combination of factors is to give an idea of how the economy of rural southwestern Manitoba may be structured in years to come and to decipher if there is a per-ceived disadvantage for youth in rural areas with regard to their ability to access ICTs. The hypothesis of the study was that those students who utilize ICTs more will have a greater likeli-hood to stay in rural Manitoba based on the assumption that they feel less hindered by their rurality, in part because of greater ac-cessibility of ICTs. As there have been many initiatives in recent years to remove this communication barrier and lessen the rural/urban divide (Thompson-James 1999; Mclaren 2002; Manitoba Government 2002; Industry Canada N.D.; Cameron et al. 2005; Mckeown et al. 2007), this study provides a glimpse into percep-tions of young people living in rural Manitoba related to access to ICTs. In particular, given that ICTs are often viewed as central to providing opportunity, youth perceptions were gauged.
Literature ReviewWhile ICTs are often viewed as necessary for the survival
and growth of rural areas; all forms of media and communica-tions are important (Bruce et al. 2006; Ramsey and Moss 2009). The contribution and impact of ICTs to rural economic and so-cial well-being are not new (Daniels 2004; Andrew and Petkov 2003; Oakes 2004; Ramirez 2007), nor is the impact of ICTs on rural space and place (e.g. Kirsch 1995; Graham 1998; Lægren 2002). While some authors have argued ICTs offer a way for rural areas to “overcome the friction of distance” as they have so often been “characterized in terms of their economic and so-cial peripheriality {sic}” (Valentine and Holloway 2001, 384), others have cautioned that the benefits of ICTs for economic growth and development may not necessarily be evenly distrib-uted (Scott-Dixon 2005). A similar notion was put forward by Ramírez (2007, 85) who argued that broadband-based ICTs have “the potential to reduce the friction of distance that rural and remote communities experience.” Critics, however, note that ICTs, and in particular Internet usage, could in fact create envi-ronments where collectivity becomes dominated by individual-ism (e.g. Bennett 1998; Althaus and Tewksbury 2000; Shah et al. 2001; Anderson 2006).
Much of the literature on ICTs has focused on access with respect to policy planning (e.g. Andrew and Petkov 2003), education (e.g. Emke 2003; Salinas and Sanchez 2009; Dlod-lo 2009), access (e.g. Corbett and Willms 2002), and business (e.g. Alampay 2008; Galliano et al. 2001; Greller and Mackay 2002; Grimes 2005). Exceptions, however, can be found. Læ-gran (2002), for example, explores unique rural spaces, petrol stations and Internet cafés as offering ICT access opportunities for youth living in rural and remote regions in Norway. More recently, emerging technologies, such as WI-FI have been ex-plored within a rural context (Puel et al. 2007). Several stud-ies have highlighted similar issues in a Canadian context (e.g. Beesley, et al. 1998; Borins 2002; Looker and Thiessen 2003; Cameron et al. 2005). Cameron et al. (2005) detail the difficul-
ties in securing universally available broadband Internet access in rural and remote Manitoba. At that time, Industry Canada es-timated that there were approximately 4,200 small communities in Canada lacking broadband access (Cameron et al. 2005).
The study reported in this paper builds upon this work with the purpose of better understanding whether, how, and how much rural youth use ICTs in their daily lives. It builds on re-search that has examined issues of exclusivity in ICT use (Had-don 2000), notions of communities as place (Flora 1998; Emke 2003), identity as fostered by ICT use (Duxbury 2002), and the importance of ICTs to rural areas (Martz and Sanderson 2006; Romanow and Bruce 2006). The focus on rural areas provides an interesting context to understand perceptions of difference.
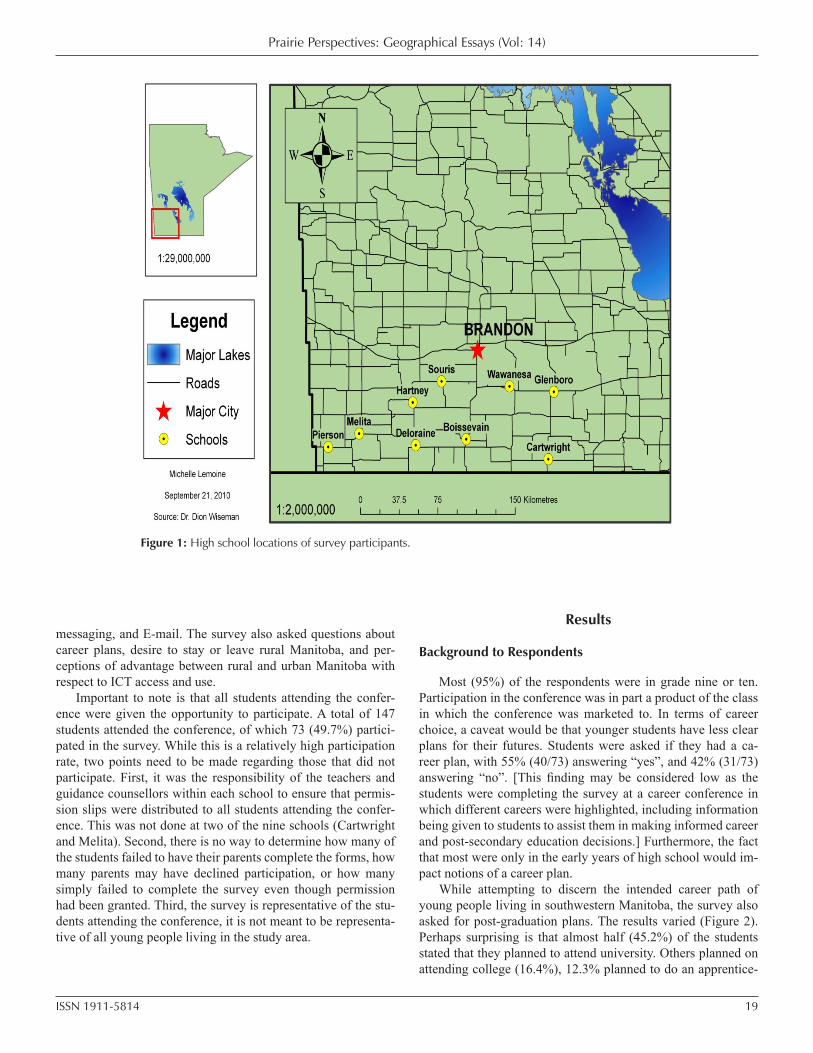
Methodology and Study AreaThe study area (Figure 1) was defined by the nine high
schools invited to participate in the Rural Opportunities Youth Conference on Feb. 11th, 2010, in Souris, Manitoba. The survey was conducted at the conference. The schools were located in Wawanesa, (n=8), Glenboro (n=4), Hartney (n=17), Deloraine (n=14), Pierson (n=16), Souris (n=11), and Boissevain (n=3). The conference was organized by Souris-Glenwood Community Development Corporation which operates in Souris, Manitoba. While the school boards gave permission for all schools to par-ticipate, permission slips were not distributed to students in the Cartwright and Melita schools and thus they could not partici-pate at the conference (see below for reasons). To provide a con-text of the rurality of the communities in the study area with the participating high schools, Table 1 provides the populations of each community and lists the respective schools boards.
A survey method was employed by this study. A question-naire comprised of open and closed-ended statements and ques-tions was developed in December 2009. It was designed for self-administration. The instrument and survey method was ap-proved by the Brandon University Research Ethics Committee. The survey was distributed to students at the career conference with a 73 students completing the survey, including 16 grade nine students, 51 grade ten students, and 3 grade twelve stu-dents. The survey contained general questions concerning where each student uses ICTs most frequently, what their service type is (e.g. Broadband, Dial-Up), whether the individual planned on continuing to reside in rural Manitoba, and how often they would typically use specific ICTs such as Facebook, Twitter, text
Table 1: Schools and community populations.
Prairie Perspectives: Geographical Essays (Vol: 14)
ISSN 1911-5814 19
messaging, and E-mail. The survey also asked questions about career plans, desire to stay or leave rural Manitoba, and per-ceptions of advantage between rural and urban Manitoba with respect to ICT access and use.
Important to note is that all students attending the confer-ence were given the opportunity to participate. A total of 147 students attended the conference, of which 73 (49.7%) partici-pated in the survey. While this is a relatively high participation rate, two points need to be made regarding those that did not participate. First, it was the responsibility of the teachers and guidance counsellors within each school to ensure that permis-sion slips were distributed to all students attending the confer-ence. This was not done at two of the nine schools (Cartwright and Melita). Second, there is no way to determine how many of the students failed to have their parents complete the forms, how many parents may have declined participation, or how many simply failed to complete the survey even though permission had been granted. Third, the survey is representative of the stu-dents attending the conference, it is not meant to be representa-tive of all young people living in the study area.
Results
Background to Respondents
Most (95%) of the respondents were in grade nine or ten. Participation in the conference was in part a product of the class in which the conference was marketed to. In terms of career choice, a caveat would be that younger students have less clear plans for their futures. Students were asked if they had a ca-reer plan, with 55% (40/73) answering “yes”, and 42% (31/73) answering “no”. [This finding may be considered low as the students were completing the survey at a career conference in which different careers were highlighted, including information being given to students to assist them in making informed career and post-secondary education decisions.] Furthermore, the fact that most were only in the early years of high school would im-pact notions of a career plan.
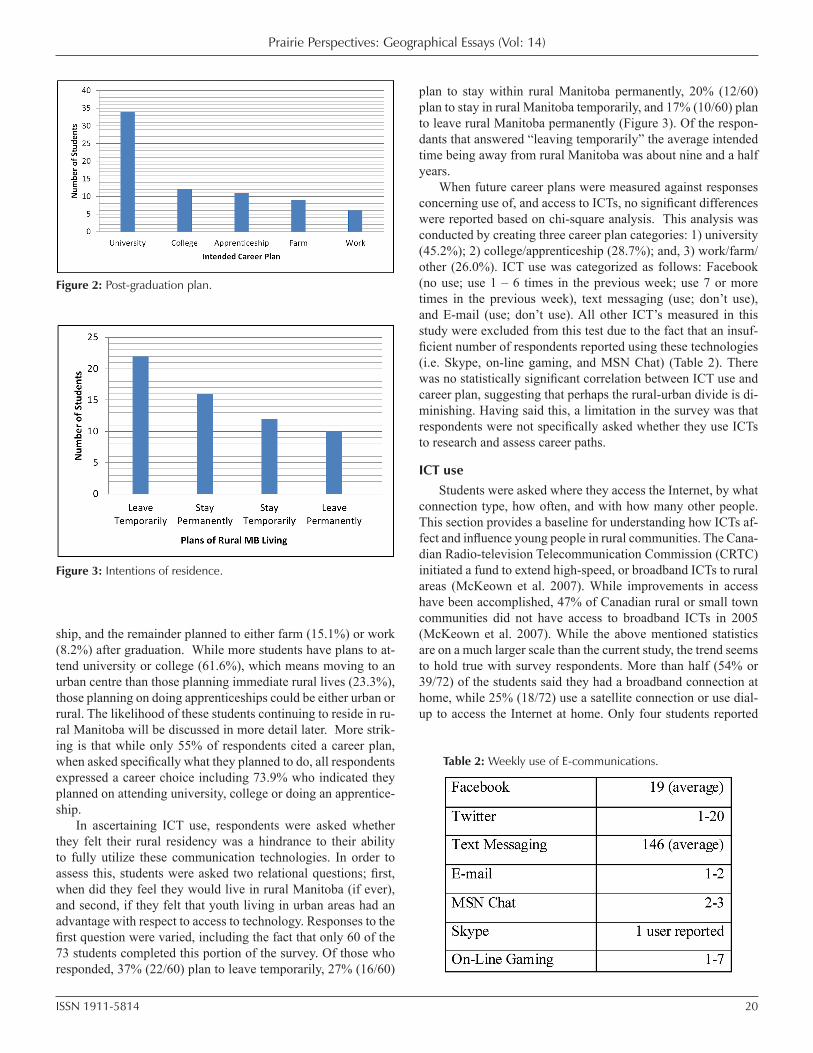
While attempting to discern the intended career path of young people living in southwestern Manitoba, the survey also asked for post-graduation plans. The results varied (Figure 2). Perhaps surprising is that almost half (45.2%) of the students stated that they planned to attend university. Others planned on attending college (16.4%), 12.3% planned to do an apprentice-
Figure 1: High school locations of survey participants.
Prairie Perspectives: Geographical Essays (Vol: 14)
ISSN 1911-5814 20
ship, and the remainder planned to either farm (15.1%) or work (8.2%) after graduation. While more students have plans to at-tend university or college (61.6%), which means moving to an urban centre than those planning immediate rural lives (23.3%), those planning on doing apprenticeships could be either urban or rural. The likelihood of these students continuing to reside in ru-ral Manitoba will be discussed in more detail later. More strik-ing is that while only 55% of respondents cited a career plan, when asked specifically what they planned to do, all respondents expressed a career choice including 73.9% who indicated they planned on attending university, college or doing an apprentice-ship.
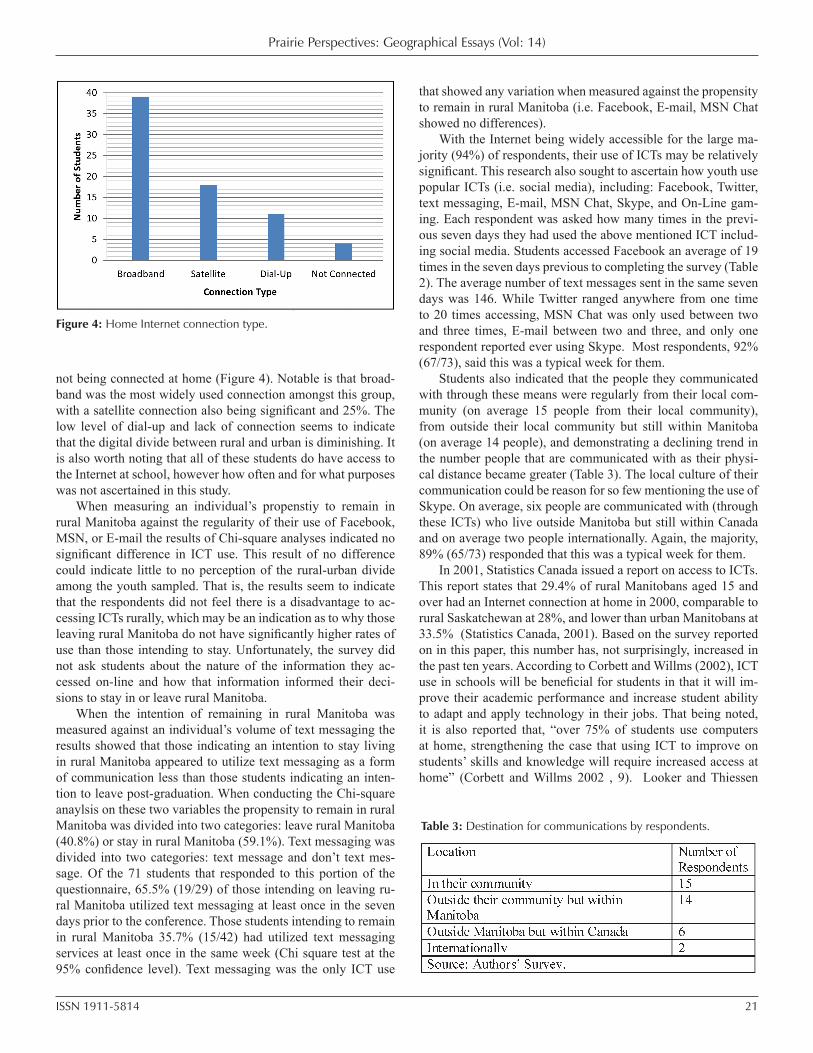
In ascertaining ICT use, respondents were asked whether they felt their rural residency was a hindrance to their ability to fully utilize these communication technologies. In order to assess this, students were asked two relational questions; first, when did they feel they would live in rural Manitoba (if ever), and second, if they felt that youth living in urban areas had an advantage with respect to access to technology. Responses to the first question were varied, including the fact that only 60 of the 73 students completed this portion of the survey. Of those who responded, 37% (22/60) plan to leave temporarily, 27% (16/60)
plan to stay within rural Manitoba permanently, 20% (12/60) plan to stay in rural Manitoba temporarily, and 17% (10/60) plan to leave rural Manitoba permanently (Figure 3). Of the respon-dants that answered “leaving temporarily” the average intended time being away from rural Manitoba was about nine and a half years.
When future career plans were measured against responses concerning use of, and access to ICTs, no significant differences were reported based on chi-square analysis. This analysis was conducted by creating three career plan categories: 1) university (45.2%); 2) college/apprenticeship (28.7%); and, 3) work/farm/other (26.0%). ICT use was categorized as follows: Facebook (no use; use 1 – 6 times in the previous week; use 7 or more times in the previous week), text messaging (use; don’t use), and E-mail (use; don’t use). All other ICT’s measured in this study were excluded from this test due to the fact that an insuf-ficient number of respondents reported using these technologies (i.e. Skype, on-line gaming, and MSN Chat) (Table 2). There was no statistically significant correlation between ICT use and career plan, suggesting that perhaps the rural-urban divide is di-minishing. Having said this, a limitation in the survey was that respondents were not specifically asked whether they use ICTs to research and assess career paths.
ICT useStudents were asked where they access the Internet, by what
connection type, how often, and with how many other people. This section provides a baseline for understanding how ICTs af-fect and influence young people in rural communities. The Cana-dian Radio-television Telecommunication Commission (CRTC) initiated a fund to extend high-speed, or broadband ICTs to rural areas (McKeown et al. 2007). While improvements in access have been accomplished, 47% of Canadian rural or small town communities did not have access to broadband ICTs in 2005 (McKeown et al. 2007). While the above mentioned statistics are on a much larger scale than the current study, the trend seems to hold true with survey respondents. More than half (54% or 39/72) of the students said they had a broadband connection at home, while 25% (18/72) use a satellite connection or use dial-up to access the Internet at home. Only four students reported
Figure 2: Post-graduation plan.
Figure 3: Intentions of residence.
Table 2: Weekly use of E-communications.
Prairie Perspectives: Geographical Essays (Vol: 14)
ISSN 1911-5814 21
not being connected at home (Figure 4). Notable is that broad-band was the most widely used connection amongst this group, with a satellite connection also being significant and 25%. The low level of dial-up and lack of connection seems to indicate that the digital divide between rural and urban is diminishing. It is also worth noting that all of these students do have access to the Internet at school, however how often and for what purposes was not ascertained in this study.
When measuring an individual’s propenstiy to remain in rural Manitoba against the regularity of their use of Facebook, MSN, or E-mail the results of Chi-square analyses indicated no significant difference in ICT use. This result of no difference could indicate little to no perception of the rural-urban divide among the youth sampled. That is, the results seem to indicate that the respondents did not feel there is a disadvantage to ac-cessing ICTs rurally, which may be an indication as to why those leaving rural Manitoba do not have significantly higher rates of use than those intending to stay. Unfortunately, the survey did not ask students about the nature of the information they ac-cessed on-line and how that information informed their deci-sions to stay in or leave rural Manitoba.
When the intention of remaining in rural Manitoba was measured against an individual’s volume of text messaging the results showed that those indicating an intention to stay living in rural Manitoba appeared to utilize text messaging as a form of communication less than those students indicating an inten-tion to leave post-graduation. When conducting the Chi-square anaylsis on these two variables the propensity to remain in rural Manitoba was divided into two categories: leave rural Manitoba (40.8%) or stay in rural Manitoba (59.1%). Text messaging was divided into two categories: text message and don’t text mes-sage. Of the 71 students that responded to this portion of the questionnaire, 65.5% (19/29) of those intending on leaving ru-ral Manitoba utilized text messaging at least once in the seven days prior to the conference. Those students intending to remain in rural Manitoba 35.7% (15/42) had utilized text messaging services at least once in the same week (Chi square test at the 95% confidence level). Text messaging was the only ICT use
that showed any variation when measured against the propensity to remain in rural Manitoba (i.e. Facebook, E-mail, MSN Chat showed no differences).
With the Internet being widely accessible for the large ma-jority (94%) of respondents, their use of ICTs may be relatively significant. This research also sought to ascertain how youth use popular ICTs (i.e. social media), including: Facebook, Twitter, text messaging, E-mail, MSN Chat, Skype, and On-Line gam-ing. Each respondent was asked how many times in the previ-ous seven days they had used the above mentioned ICT includ-ing social media. Students accessed Facebook an average of 19 times in the seven days previous to completing the survey (Table 2). The average number of text messages sent in the same seven days was 146. While Twitter ranged anywhere from one time to 20 times accessing, MSN Chat was only used between two and three times, E-mail between two and three, and only one respondent reported ever using Skype. Most respondents, 92% (67/73), said this was a typical week for them.
Students also indicated that the people they communicated with through these means were regularly from their local com-munity (on average 15 people from their local community), from outside their local community but still within Manitoba (on average 14 people), and demonstrating a declining trend in the number people that are communicated with as their physi-cal distance became greater (Table 3). The local culture of their communication could be reason for so few mentioning the use of Skype. On average, six people are communicated with (through these ICTs) who live outside Manitoba but still within Canada and on average two people internationally. Again, the majority, 89% (65/73) responded that this was a typical week for them.
In 2001, Statistics Canada issued a report on access to ICTs. This report states that 29.4% of rural Manitobans aged 15 and over had an Internet connection at home in 2000, comparable to rural Saskatchewan at 28%, and lower than urban Manitobans at 33.5% (Statistics Canada, 2001). Based on the survey reported on in this paper, this number has, not surprisingly, increased in the past ten years. According to Corbett and Willms (2002), ICT use in schools will be beneficial for students in that it will im-prove their academic performance and increase student ability to adapt and apply technology in their jobs. That being noted, it is also reported that, “over 75% of students use computers at home, strengthening the case that using ICT to improve on students’ skills and knowledge will require increased access at home” (Corbett and Willms 2002 , 9). Looker and Thiessen
Figure 4: Home Internet connection type.
Table 3: Destination for communications by respondents.
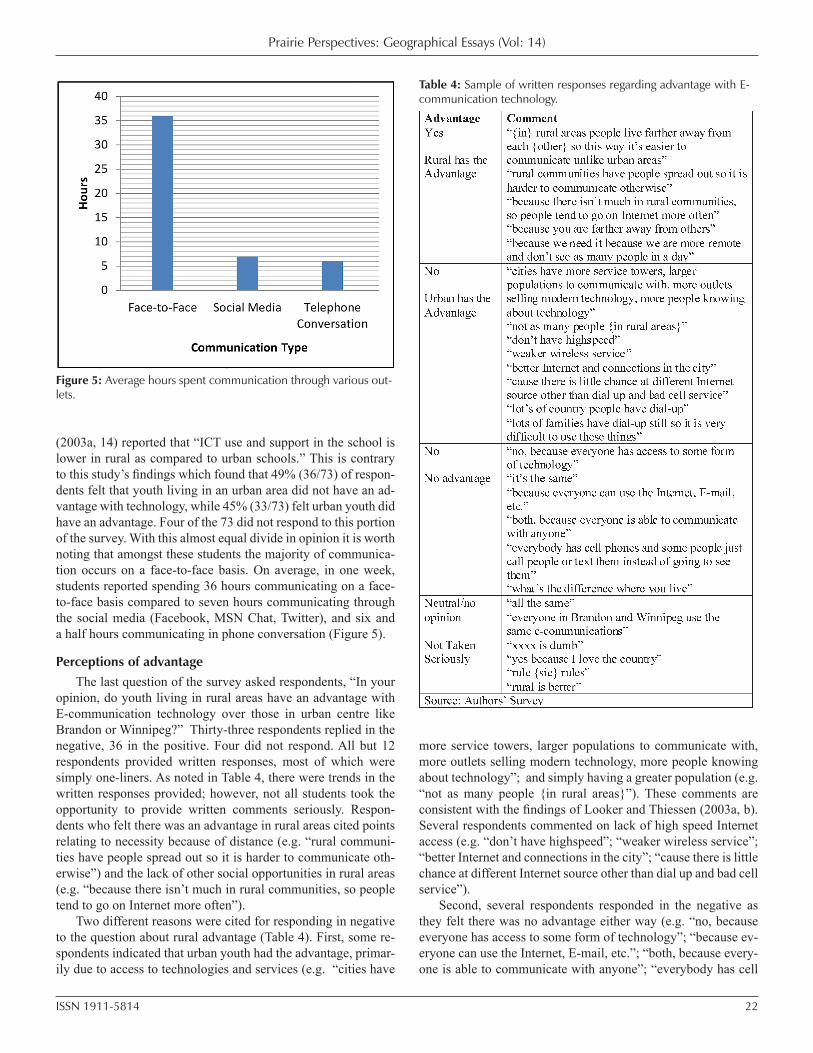
Prairie Perspectives: Geographical Essays (Vol: 14)
ISSN 1911-5814 22
(2003a, 14) reported that “ICT use and support in the school is lower in rural as compared to urban schools.” This is contrary to this study’s findings which found that 49% (36/73) of respon-dents felt that youth living in an urban area did not have an ad-vantage with technology, while 45% (33/73) felt urban youth did have an advantage. Four of the 73 did not respond to this portion of the survey. With this almost equal divide in opinion it is worth noting that amongst these students the majority of communica-tion occurs on a face-to-face basis. On average, in one week, students reported spending 36 hours communicating on a face-to-face basis compared to seven hours communicating through the social media (Facebook, MSN Chat, Twitter), and six and a half hours communicating in phone conversation (Figure 5).
Perceptions of advantageThe last question of the survey asked respondents, “In your
opinion, do youth living in rural areas have an advantage with E-communication technology over those in urban centre like Brandon or Winnipeg?” Thirty-three respondents replied in the negative, 36 in the positive. Four did not respond. All but 12 respondents provided written responses, most of which were simply one-liners. As noted in Table 4, there were trends in the written responses provided; however, not all students took the opportunity to provide written comments seriously. Respon-dents who felt there was an advantage in rural areas cited points relating to necessity because of distance (e.g. “rural communi-ties have people spread out so it is harder to communicate oth-erwise”) and the lack of other social opportunities in rural areas (e.g. “because there isn’t much in rural communities, so people tend to go on Internet more often”).
Two different reasons were cited for responding in negative to the question about rural advantage (Table 4). First, some re-spondents indicated that urban youth had the advantage, primar-ily due to access to technologies and services (e.g. “cities have
more service towers, larger populations to communicate with, more outlets selling modern technology, more people knowing about technology”; and simply having a greater population (e.g. “not as many people {in rural areas}”). These comments are consistent with the findings of Looker and Thiessen (2003a, b). Several respondents commented on lack of high speed Internet access (e.g. “don’t have highspeed”; “weaker wireless service”; “better Internet and connections in the city”; “cause there is little chance at different Internet source other than dial up and bad cell service”).
Second, several respondents responded in the negative as they felt there was no advantage either way (e.g. “no, because everyone has access to some form of technology”; “because ev-eryone can use the Internet, E-mail, etc.”; “both, because every-one is able to communicate with anyone”; “everybody has cell
Figure 5: Average hours spent communication through various out-lets.
Table 4: Sample of written responses regarding advantage with E-communication technology.
Prairie Perspectives: Geographical Essays (Vol: 14)
ISSN 1911-5814 23
phones and some people just call people or text them instead of going to see them”) (Table 4). As one respondent noted, “what’s the difference where you live?” This last comment is perhaps reflective of improvements in access to cell phone service and broadband networks. Together, the written comments, while brief, do illustrate a divide among youth regarding the advantag-es and disadvantages of living in rural versus urban Manitoba. As issues of ICT access in remote Manitoba have been high-lighted elsewhere (e.g. Cameron et al., 2005), these comments also provide a context for further studying this issue by obtain-ing the perceptions of young people from across Manitoba, in-cluding urban, rural, and remote.
ConclusionYoung people living in rural southwestern Manitoba have
seen great improvements in their accessibility to ICTs in recent years. However, it would be beneficial for this survey to have a relatable comparison to a nearby urban centre such as Bran-don, Manitoba. This survey’s findings have been significant in assessing the ability of rural youth to access to ICT and also in determining how the social media influences the lives of these youth. With young people spending approximately one hour each day communicating through these outlets, the social media has become a more important outlet for young people living in rural Manitoba to stay connected to friends near and far. Future research could include a large-scale survey to broader commu-nities, rural, remote, small town, and cities would be useful to more comprehensively understand the similarities and differ-ences in perceptions of ICT use. Such a study would need to explore specifically how youth use social media to inform their decisions about career paths and intentions to reside in or move away from rural communities.
This study highlighted several key aspects to ICT use among young people. First, it appears that rural youth are engaged in several types of ICTs. Perhaps surprising was the lack of in-volvement with Skype and on-ling gaming. This could be due to the sample (e.g. not interested; few people to communicate with in this regard) but could also be a reflection of the limita-tions of the ICTs available in their particular communities (e.g. broadband). Second, students were very mixed about whether there was an advantage or disadvantage to being from a rural or urban community with many feeling there was no advantage either way. Third, while the respondents were primarily in ju-nior grades (9 and 10), it is perhaps enlightening that such a high percentage have plans to either stay, or at some point return, to rural Manitoba. A larger study, and one that ensured better representation across high school grades, would provide a better benchmark of use, advantage, and future goals with respect to living in rural Manitoba. While some research has addressed as-pects of ICT use, and limitation, across Canada (e.g. Cameron et al. 2005; Looker and Thiessen 2003; Ramsey and Moss 2009), a broader study is needed that reflects the urban, rural, and remote makeup of Canada.
ReferencesALAMPAY, E.E. 2008 ‘Filipino entrepreneurs on the Internet: when social
networking websites meet mobile commerce’ Science, Technology and Society 13(2): 211-231
ALTHAUS, S. and TEWKSBURY, D. 2000 ‘Patterns of Internet and tradi-tional news media use in a networked community’ Political Com-munication 17(1), 21-45
ANDERSON, B. 2006 Imagined Communities: Reflections on the Origin and Spread of Nationalism (London: Verso)
ANDREW, T. and PETKOV, D. 2003 ‘The need for a systems thinking ap-proach to the planning of rural telecommunications infrastructure’ Telecommunications Policy 27, 75-93
BEESLEY, K.E., BRUCE, D., RAMSEY, R.D. and SUFFRON, S. 1998 Household Use of Information Technology in Rural Maritime Canada (Re-search Paper No. 29, Rural Research Centre, Nova Scotia Agricul-tural College, Truro, NS)
BENNETT, W.L. 1998 ‘De Sola Pool lecture: the uncivic culture: commu-nication, identity, and the rise of lifestyle politics’ Political Science and Politics 31(4), 740-761
BORINS, S. 2002 ‘On the frontiers of electronic governance: a report on the United States and Canada’ International Review of Administra-tive Sciences 68, 199-211
BRUCE, D., K. ELLIS and DELURY, N. 2006 ‘The role and impact of com-munity newsletters in fostering social cohesion and community development’ Journal of Rural and Community Development 2(1), 176-185
CAMERON, S., ANNIS, R. and EVERITT, J. 2005 ‘Internet connectivity: a Churchill, Manitoba case study’ Journal of Rural and Community Development 1(1): 32-45
CORBETT, B. and WILLMS, J. 2002 ‘Information and communication tech-nology: access and use’ Education Quarterly Review 8(4), 4-13
DANIELS, P. W. 2004 ‘Reflections on the ‘old’ economy, ‘new’ economy, and services’ Growth and Change 35(2), 115-138
DLODLO, N. 2009 ‘Access to ICT education for girls and women in rural South Africa: a case study’ Technology in Society 31(2):168-175
DUXBURY, N. 2002 ‘Introduction – making connections: cultural and social cohesion in the new millennium’ Canadian Journal of Com-munication 27(2-3), 121-132
EMKE, I. 2003 ‘Convergence in the classroom: using communications technology to build human capital and community capacity’ in Op-portunities and Actions in the New Rural Economy Rural and Small Town Programme, eds. D. Bruce and G. Lister (Mount Allison University, Sackville, New Brunswick), 67-96
FLORA, J. L. 1998 ‘Social capital and communities of place’ Rural Soci-ology 63(4), 481-506
GALLIANO, D., ROUX, P. and FILLIPI, M. 2001 ‘Organisational and spatial determinants of ICT adoption: the case of French industrial firms’ Environment and Planning A 33(9), 1643-1663
GRAHAM, S. 1998 ‘The end of geography or the explosion of place? Conceptualizing space, place and information technology’ Prog-ress in Human Geography 22, 165-185
GRELLER, W. and MACKAY, M. 2002 ‘The future of ICT-related small and medium sized enterprises in remote Scottish Islands’ Development 45(4), 64-68
GRIMES, S. 2005 ‘How well are Europe’s rural businesses connected to the digital economy?’ European Planning Studies 13(7), 1063-1081
Prairie Perspectives: Geographical Essays (Vol: 14)
ISSN 1911-5814 24
HADDON, L. 2000 ‘Social exclusion and information and communica-tion technologies’ New Media and Society 2(4), 387-406
INDUSTRY CANADA No date Broadband- High-capacity for all Cana-dian Communities, Frequently Asked Questions (Retrieved Sep-tember 2, 2005 from http://broadband.gc.ca/pub/faqs/index.html)
KIRCH, S. 1995 ‘The incredible shrinking world? Technology and the production of space’ Environment and Planning D: Society and Space 13, 529-555
LÆGRAN, A.S. 2002 ‘The petrol station and the Internet café: rural tech-nospaces for youth’ Journal of Rural Studies 18, 157-168
LOOKER, D. and THIESSEN, V. 2003 ‘Beyond the digital divide in Cana-dian schools: from access to competency in the use of information technology’ Social Science Computer Review 21, 475-490
MCKEOWN, L., A. NOCE and CZERNY, P. 2007 ‘Factors associated with In-ternet use: does rurality matter? Statistics Canada, Rural and Small Town Canada Analysis Bulletin
MANITOBA GOVERNMENT 2002 New Infrastructure Investment by Prov-ince to Facilitate Future Rural and Northern High-Speed Tele-communications Access (Retrieved January 19, 2011, available at: www.gov.mb.ca/chc/press/top/2002/05/2002-05-14-01.html)
MARTZ, D. and SANDERSON, K. 2006 ‘The economic and social contribu-tion of the public sector to rural Saskatchewan’ Journal of Rural and Community Development 2(1), 91-113
MCLAREN, L. 2002 ‘Information and communication technologies’ in Rural Canada Rural and Small Town Canada Analysis Bulletin 3(5). Catalogue no. 21-006-KIE
OAKES, S. 2004 ‘The Internet and regional inequality’ Geography Re-view 8(2), 24-29
PUEL, G., FERNANDEZ, V. and FAUTRERO, V. 2007 ‘Alternative technolo-gies for rural areas - what about the ‘alternative’ dimension of Wi-Fi?’ Geojournal 68(1), 41-53
RAMSEY, D. and MOSS, A. 2009 ‘The use of the traditional media in the new rural economy’ Zeitschrift für Kanada-Studien 29(2), 107-131
RAMIREZ, R. 2007 ‘Appreciating the contribution of broadband ICT with rural and remote communities: stepping stones toward an alterna-tive paradigm’ The Information Society 23, 85-94
ROMANOW, P. and BRUCE, D. 2006 ‘Communications and capacity building: exploring clues from the literature for rural community development’ Journal of Rural and Community Development 2(1), 131-154
SALINAS, A. and SANCHEZ, J. 2009 ‘Digital inclusion in Chile: Internet in rural schools’ International Journal of Educational Development 29(6), 573-582
SCOTT-DIXON, K. 2005 ‘From digital binary to analog continuum: mea-suring gendered IT labor – notes toward multidimensional method-ologies’ Frontiers 26(1), 24-42
SHAH, D.V., N. KWAK and HOLBERT, R. 2001 ‘‘Connecting’ and ‘discon-necting’ with civic life: patterns of Internet use and the production of social capital’ Political Communication 18, 141-162
STATISTICS CANADA 2001 Overview: Access to and Use of Information Communication Technology (Catalogue no. 56-505-XIE Minister of Industry, Ottawa)
STATISTICS CANADA 2008a Census of Population – Canada (Available at http://www40.statcan.gc.ca/l01/cst01/agrc42a-eng.htm), Site ac-cessed October 12, 2011
STATISTICS CANADA 2008b Census of Population – Manitoba (Available at http://www40.statcan.gc.ca/l01/cst01/agrc42h-eng.htm), Site ac-cessed October 12, 2011
THEODORI, G.L. 2000 ‘Levels of analysis and conceptual clarification in community attachment and satisfaction research: connections to community development’ Journal of the Community Development Society 31(1), 35-58
THOMPSON-JAMES, M. 1999 Computer Use and Internet Use by Mem-bers of Rural Households, Working Paper #40 (Catalogue no. 21-601-MIE99040) Agriculture Division, Statistics Canada, Ottawa
VALENTINE, G and HOLLOWAY, S.L. 2001 ‘A window on the wider world? Rural children’s use of information and communication technolo-gies’ Journal of Rural Studies 17, 383-394
Prairie Perspectives: Geographical Essays (Vol: 14)
ISSN 1911-5814 25
The messy side of tourism: secondary impacts of waste in Puerto Vallarta, Mexico
Deandra TousignantDepartment of Geography, Brandon University, Brandon Manitoba, Canada R7A 6A9 [email protected]
Derrek EbertsDepartment of Geography, Brandon University, Brandon Manitoba, Canada R7A 6A9 [email protected]
Rodrigo Espinoza SanchezUniversidad de Guadalajara, Centro Universitario de la Costa (campus Puerto Vallarta), Puerto Vallarta, Jalisco State, Mexico [email protected]
Abstract
While tourism in Mexico remains a significant economic sector, the waste generated from the thousands of tourists has inevitably put stress on several communities’ waste management systems. In the case of Puerto Vallarta, Mexico, tourism accounts for ap-proximately half of the total waste stream, and it is likely that this has an impact on the lives of local residents. This paper will attempt to examine the impact of the 350 tonnes of garbage that is processed and scavenged through daily at a dump located within the city. The results from a survey conducted in four neighbourhoods at differing proximities from the dump, and key informant in-terviews, suggest a negative relationship between the waste generated by tourists in Puerto Vallarta and residential quality of life. Keywords: tourism, garbage, quality of life
Introduction
Tourism remains a significant economic sector for many countries around the world. The impacts generated from tour-ism can be both positive and negative, and vary in magnitude across host communities. This paper suggests that in addition to the direct impacts of tourism, such as economic development, environmental degradation, and cultural exposure and loss, tourism can have secondary or indirect impacts on a commu-nity. In analysing the current literature surrounding tourism and its impacts, it is apparent that the secondary impacts of tourism are rarely addressed. This study examines the ways in which the waste generated by tourism, a secondary impact, affects the host community’s residents. Furthermore, this study contributes to several areas of geographical inquiry, principally: tourism, waste management and geographical quality of life studies. To
illustrate the intersection of these three geographical literatures, a case study of Puerto Vallarta, Mexico is presented, where the fundamental question for analysis is whether residents perceive the garbage generated by tourism to have an impact on their resi-dential quality of life.
Literature ReviewWhile the literature that relates to tourism is diverse, we
are particularly interested in those studies that relate to the im-pacts of tourism. Existing research focuses on three domains of impacts: economic, physical environment, and socio-cultural (Mathieson and Wall 1982; Hall and Lew 2009). When looking particularly at the economic impacts of tourism, research has tended to assume, and therefore seek to account for, the posi-tive contribution of tourism to the local economy (Lea 1988;
Prairie Perspectives: Geographical Essays (Vol: 14)
ISSN 1911-5814 26
Archer and Cooper 1994; Williams 1998; Hall and Page 2002; Dove 2004). These effects have both direct and secondary di-mensions, principally accounted for by increases in employment across sectors both directly and indirectly related to tourism. More sophisticated approaches include discussion surrounding cost-benefit analysis and the differing economic models that are used to quantify the economic impacts of tourism. For in-stance, it has been suggested by Tyrrell and Johnston (2010: 5) that “economic impact analysis is but one of the many available tools that may shed light into economic aspects of travel and tourism”. While much of this literature on impacts deals with large-scale quantitative economic analysis (national or global economies), there have been a number of case studies that exam-ine how tourism impacts the local economy in particular tourism destinations. In this literature, tourism has been associated with generating tax revenues, employment opportunities for the local people, and infrastructural development. Conversely, Andereck et al. (2005) argue that it has also been associated with the cre-ation of tax burdens, inflation and local governmental debt. Some literature suggests that the nature of the impacts depends on the type of tourism development and how involved the local community is in the development process. For instance, Mbaiwa (2003) illustrates that tourism development that is run by foreign investors has a tendency to generate minimal economic impacts for the host community. Taking a more qualitative approach to economic tourism impacts, some studies have focused on how the host community perceives the economic impacts of tourism. For example, Andereck et al., (2005) found that although local residents may not fully understand the tourist sector, they nev-ertheless have recognize both positive and negative impacts on their communities.
Although tourism has been utilized as an economic develop-ment tool, there is a substantial literature that suggests that the economic impacts of tourism do not come without some cost to the host community, whether it be cultural or environmental. The literature that discusses how tourism impacts the environment is comprised mainly of case studies done in places with vulner-able ecosystems. In this literature there is a significant emphasis on the negative impact of tourism on local environments and the concept of a tourist carrying capacity (Lea 1988; Archer and Cooper 1994; Shaw and Williams 1994; Williams1998; Wong 2004). Conversely, some authors do suggest that tourism can have positive impacts on the environment (Dove 2004). For example, natural sites with potential to attract tourists may be protected from alternative development such as industry or ur-ban expansion, and the revenue generated by tourism may be invested in environmental preservation or restoration. Addi-tionally, there is a significant portion of literature that discusses environmentally sustainable development of tourism (Shaw and Williams 1994; Mercer 2004). For instance, Brown et al. (1995) discuss how policy can be developed to adhere to the carrying capacity of the community’s natural resources. Additionally, Domroes (2001) illustrates how the government can play an ac-tive role in developing tourism policy that can help protect the integrity of the environment. However, in this case study, even strict government policy does not sufficiently minimize environ-
mental impact, as much of the environmental degradation comes from the “tourists’ lack of awareness of the fragility of the ma-rine ecosystem” (Domroes 2001: 13). In addition, other studies such as Mbaiwa (2003) have discussed how tourists’ consump-tive behaviour and littering, along with the lack of proper waste disposal facilities can contribute to environmental degradation in the tourist destination. Conversely, Shekhar Silori (2004) sug-gests that a narrow focus on environmental concerns and tourist impacts can lead to a situation in which local economic live-lihoods are neglected. In this paper, Shekhar Silori illustrates how a ban placed on tourism in the Nanda Devi Biosphere Re-serve, in response to exacerbated environmental impacts, led to migration of residents out of the area to find employment and in turn threatened the preservation of community culture.
Lastly the influence that tourism has on the host commu-nity’s culture has received notable attention within the tourism literature. Within the discussion concerning the social impacts of tourism there is emphasis on the impacts on host community residents and the host-visitor relationship (Archer and Cooper 1994; Pearce 1998; Williams 1998; Hall and Page 2002; Dove 2004; Hinch 2004). It has been suggested that “social-cultural impacts of tourism destination areas are associated with changes in traditional ideas and values, norms and identities of the local people” (Glasson et al. 1995 in Mbaiwa 2003: 455). In addi-tion to Shekhar Silori’s case study on the Biosphere Reserve in the Himalayas and the social consequences that resulted from the loss of the tourism sector, there have been other studies that illustrate how the implementation of tourism development can have negative impacts on the host community’s culture. Mbaiwa (2003) discusses how the development of road infrastructure to a remote community in Okavango Delta, Botswana, resulted in the loss of traditional language and dress, and higher incidences of prostitution and crime. Alternatively, there have also been studies that illustrate how tourism can positively impact culture through cultural preservation and understanding. Grünewald (2002) provides a case study that exemplifies how tourism in Porto Seguro, Brazil, has promoted cultural revival for the Pa-taxo Indians, as well as facilitated cultural understanding among other locals.
Although the literature on tourism is quite comprehensive in relation to the various direct impacts tourism can have on the host community or region, (Brown et al. 1995; Gormsen 1997; Domroes 2001; Mbaiwa 2003) there is a significant gap in litera-ture that addresses the indirect or secondary impacts of tourism. Relevant to this study, the garbage generated from tourism has only been identified in a handful of cases, and in those, only as a direct impact on the environment. There does not appear to be any research on the indirect impact of garbage, and the waste management system, from tourism on the host community.
Turning to literature that links waste management and its impact on residential health and quality of life, there are studies, such as Giusti (2009), which discuss the relationship between the various pollutants generated at waste management sites and the impacts on health, as well as how they vary according to type of waste disposal practise. Incineration, for example, leads to more air borne pollutants while landfilling increases the risks of
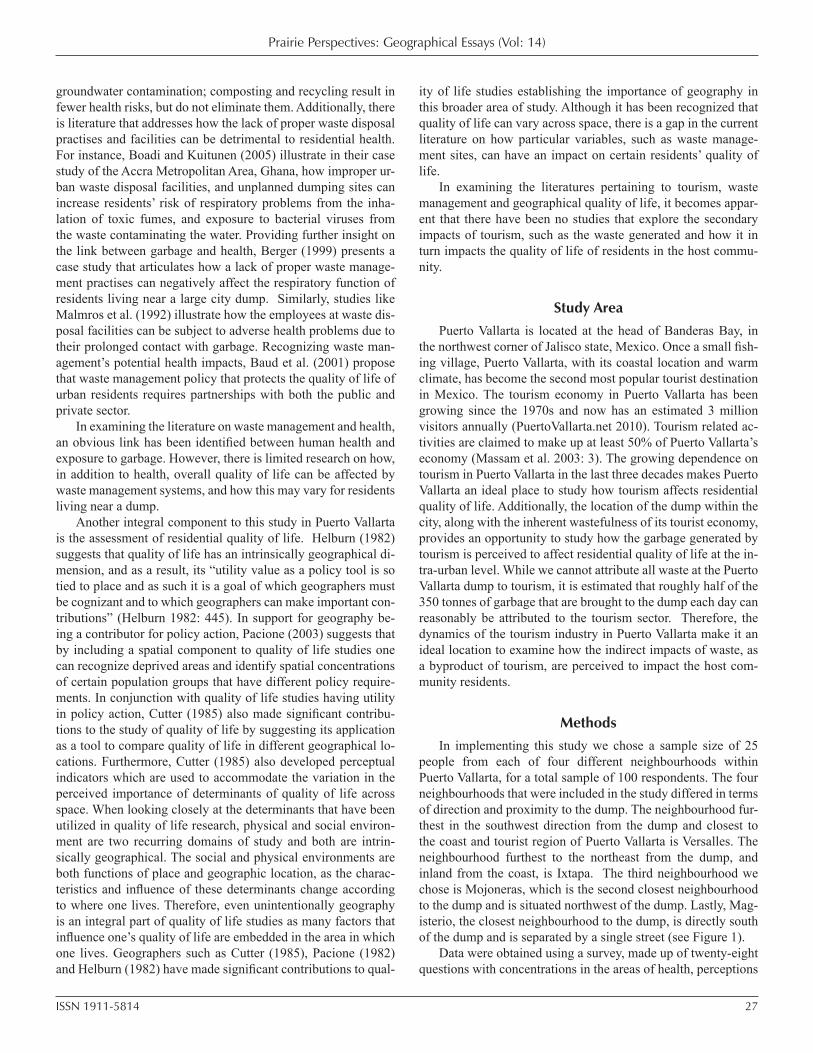
Prairie Perspectives: Geographical Essays (Vol: 14)
ISSN 1911-5814 27
groundwater contamination; composting and recycling result in fewer health risks, but do not eliminate them. Additionally, there is literature that addresses how the lack of proper waste disposal practises and facilities can be detrimental to residential health. For instance, Boadi and Kuitunen (2005) illustrate in their case study of the Accra Metropolitan Area, Ghana, how improper ur-ban waste disposal facilities, and unplanned dumping sites can increase residents’ risk of respiratory problems from the inha-lation of toxic fumes, and exposure to bacterial viruses from the waste contaminating the water. Providing further insight on the link between garbage and health, Berger (1999) presents a case study that articulates how a lack of proper waste manage-ment practises can negatively affect the respiratory function of residents living near a large city dump. Similarly, studies like Malmros et al. (1992) illustrate how the employees at waste dis-posal facilities can be subject to adverse health problems due to their prolonged contact with garbage. Recognizing waste man-agement’s potential health impacts, Baud et al. (2001) propose that waste management policy that protects the quality of life of urban residents requires partnerships with both the public and private sector.
In examining the literature on waste management and health, an obvious link has been identified between human health and exposure to garbage. However, there is limited research on how, in addition to health, overall quality of life can be affected by waste management systems, and how this may vary for residents living near a dump.
Another integral component to this study in Puerto Vallarta is the assessment of residential quality of life. Helburn (1982) suggests that quality of life has an intrinsically geographical di-mension, and as a result, its “utility value as a policy tool is so tied to place and as such it is a goal of which geographers must be cognizant and to which geographers can make important con-tributions” (Helburn 1982: 445). In support for geography be-ing a contributor for policy action, Pacione (2003) suggests that by including a spatial component to quality of life studies one can recognize deprived areas and identify spatial concentrations of certain population groups that have different policy require-ments. In conjunction with quality of life studies having utility in policy action, Cutter (1985) also made significant contribu-tions to the study of quality of life by suggesting its application as a tool to compare quality of life in different geographical lo-cations. Furthermore, Cutter (1985) also developed perceptual indicators which are used to accommodate the variation in the perceived importance of determinants of quality of life across space. When looking closely at the determinants that have been utilized in quality of life research, physical and social environ-ment are two recurring domains of study and both are intrin-sically geographical. The social and physical environments are both functions of place and geographic location, as the charac-teristics and influence of these determinants change according to where one lives. Therefore, even unintentionally geography is an integral part of quality of life studies as many factors that influence one’s quality of life are embedded in the area in which one lives. Geographers such as Cutter (1985), Pacione (1982) and Helburn (1982) have made significant contributions to qual-
ity of life studies establishing the importance of geography in this broader area of study. Although it has been recognized that quality of life can vary across space, there is a gap in the current literature on how particular variables, such as waste manage-ment sites, can have an impact on certain residents’ quality of life.
In examining the literatures pertaining to tourism, waste management and geographical quality of life, it becomes appar-ent that there have been no studies that explore the secondary impacts of tourism, such as the waste generated and how it in turn impacts the quality of life of residents in the host commu-nity.
Study Area Puerto Vallarta is located at the head of Banderas Bay, in
the northwest corner of Jalisco state, Mexico. Once a small fish-ing village, Puerto Vallarta, with its coastal location and warm climate, has become the second most popular tourist destination in Mexico. The tourism economy in Puerto Vallarta has been growing since the 1970s and now has an estimated 3 million visitors annually (PuertoVallarta.net 2010). Tourism related ac-tivities are claimed to make up at least 50% of Puerto Vallarta’s economy (Massam et al. 2003: 3). The growing dependence on tourism in Puerto Vallarta in the last three decades makes Puerto Vallarta an ideal place to study how tourism affects residential quality of life. Additionally, the location of the dump within the city, along with the inherent wastefulness of its tourist economy, provides an opportunity to study how the garbage generated by tourism is perceived to affect residential quality of life at the in-tra-urban level. While we cannot attribute all waste at the Puerto Vallarta dump to tourism, it is estimated that roughly half of the 350 tonnes of garbage that are brought to the dump each day can reasonably be attributed to the tourism sector. Therefore, the dynamics of the tourism industry in Puerto Vallarta make it an ideal location to examine how the indirect impacts of waste, as a byproduct of tourism, are perceived to impact the host com-munity residents.
MethodsIn implementing this study we chose a sample size of 25
people from each of four different neighbourhoods within Puerto Vallarta, for a total sample of 100 respondents. The four neighbourhoods that were included in the study differed in terms of direction and proximity to the dump. The neighbourhood fur-thest in the southwest direction from the dump and closest to the coast and tourist region of Puerto Vallarta is Versalles. The neighbourhood furthest to the northeast from the dump, and inland from the coast, is Ixtapa. The third neighbourhood we chose is Mojoneras, which is the second closest neighbourhood to the dump and is situated northwest of the dump. Lastly, Mag-isterio, the closest neighbourhood to the dump, is directly south of the dump and is separated by a single street (see Figure 1).
Data were obtained using a survey, made up of twenty-eight questions with concentrations in the areas of health, perceptions
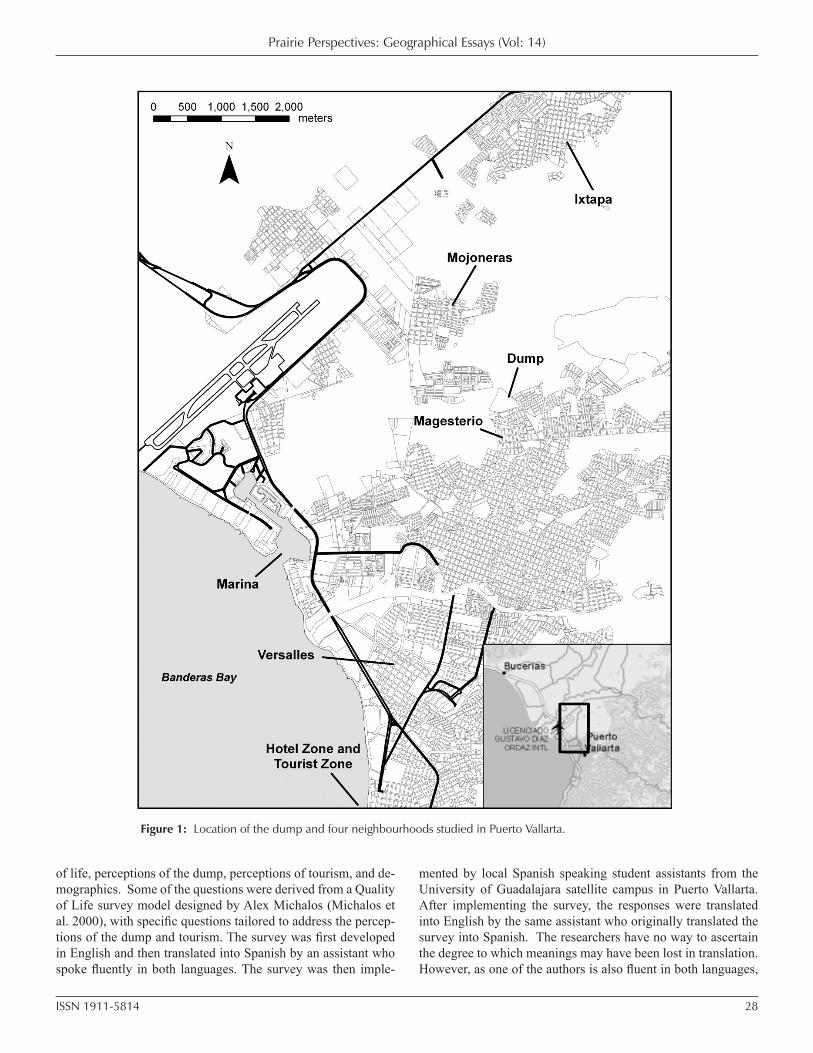
Prairie Perspectives: Geographical Essays (Vol: 14)
ISSN 1911-5814 28
of life, perceptions of the dump, perceptions of tourism, and de-mographics. Some of the questions were derived from a Quality of Life survey model designed by Alex Michalos (Michalos et al. 2000), with specific questions tailored to address the percep-tions of the dump and tourism. The survey was first developed in English and then translated into Spanish by an assistant who spoke fluently in both languages. The survey was then imple-
mented by local Spanish speaking student assistants from the University of Guadalajara satellite campus in Puerto Vallarta. After implementing the survey, the responses were translated into English by the same assistant who originally translated the survey into Spanish. The researchers have no way to ascertain the degree to which meanings may have been lost in translation. However, as one of the authors is also fluent in both languages,
Figure 1: Location of the dump and four neighbourhoods studied in Puerto Vallarta.
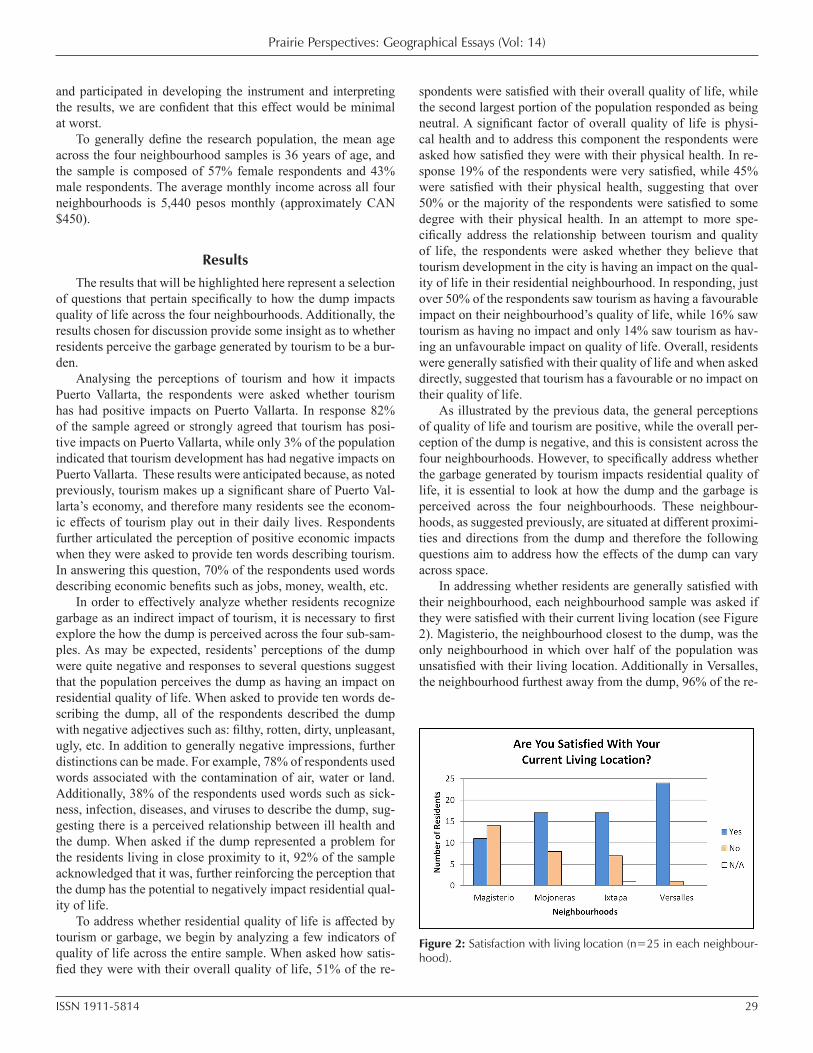
Prairie Perspectives: Geographical Essays (Vol: 14)
ISSN 1911-5814 29
and participated in developing the instrument and interpreting the results, we are confident that this effect would be minimal at worst.
To generally define the research population, the mean age across the four neighbourhood samples is 36 years of age, and the sample is composed of 57% female respondents and 43% male respondents. The average monthly income across all four neighbourhoods is 5,440 pesos monthly (approximately CAN $450).
ResultsThe results that will be highlighted here represent a selection
of questions that pertain specifically to how the dump impacts quality of life across the four neighbourhoods. Additionally, the results chosen for discussion provide some insight as to whether residents perceive the garbage generated by tourism to be a bur-den.
Analysing the perceptions of tourism and how it impacts Puerto Vallarta, the respondents were asked whether tourism has had positive impacts on Puerto Vallarta. In response 82% of the sample agreed or strongly agreed that tourism has posi-tive impacts on Puerto Vallarta, while only 3% of the population indicated that tourism development has had negative impacts on Puerto Vallarta. These results were anticipated because, as noted previously, tourism makes up a significant share of Puerto Val-larta’s economy, and therefore many residents see the econom-ic effects of tourism play out in their daily lives. Respondents further articulated the perception of positive economic impacts when they were asked to provide ten words describing tourism. In answering this question, 70% of the respondents used words describing economic benefits such as jobs, money, wealth, etc.
In order to effectively analyze whether residents recognize garbage as an indirect impact of tourism, it is necessary to first explore the how the dump is perceived across the four sub-sam-ples. As may be expected, residents’ perceptions of the dump were quite negative and responses to several questions suggest that the population perceives the dump as having an impact on residential quality of life. When asked to provide ten words de-scribing the dump, all of the respondents described the dump with negative adjectives such as: filthy, rotten, dirty, unpleasant, ugly, etc. In addition to generally negative impressions, further distinctions can be made. For example, 78% of respondents used words associated with the contamination of air, water or land. Additionally, 38% of the respondents used words such as sick-ness, infection, diseases, and viruses to describe the dump, sug-gesting there is a perceived relationship between ill health and the dump. When asked if the dump represented a problem for the residents living in close proximity to it, 92% of the sample acknowledged that it was, further reinforcing the perception that the dump has the potential to negatively impact residential qual-ity of life.
To address whether residential quality of life is affected by tourism or garbage, we begin by analyzing a few indicators of quality of life across the entire sample. When asked how satis-fied they were with their overall quality of life, 51% of the re-
spondents were satisfied with their overall quality of life, while the second largest portion of the population responded as being neutral. A significant factor of overall quality of life is physi-cal health and to address this component the respondents were asked how satisfied they were with their physical health. In re-sponse 19% of the respondents were very satisfied, while 45% were satisfied with their physical health, suggesting that over 50% or the majority of the respondents were satisfied to some degree with their physical health. In an attempt to more spe-cifically address the relationship between tourism and quality of life, the respondents were asked whether they believe that tourism development in the city is having an impact on the qual-ity of life in their residential neighbourhood. In responding, just over 50% of the respondents saw tourism as having a favourable impact on their neighbourhood’s quality of life, while 16% saw tourism as having no impact and only 14% saw tourism as hav-ing an unfavourable impact on quality of life. Overall, residents were generally satisfied with their quality of life and when asked directly, suggested that tourism has a favourable or no impact on their quality of life.
As illustrated by the previous data, the general perceptions of quality of life and tourism are positive, while the overall per-ception of the dump is negative, and this is consistent across the four neighbourhoods. However, to specifically address whether the garbage generated by tourism impacts residential quality of life, it is essential to look at how the dump and the garbage is perceived across the four neighbourhoods. These neighbour-hoods, as suggested previously, are situated at different proximi-ties and directions from the dump and therefore the following questions aim to address how the effects of the dump can vary across space.
In addressing whether residents are generally satisfied with their neighbourhood, each neighbourhood sample was asked if they were satisfied with their current living location (see Figure 2). Magisterio, the neighbourhood closest to the dump, was the only neighbourhood in which over half of the population was unsatisfied with their living location. Additionally in Versalles, the neighbourhood furthest away from the dump, 96% of the re-
Figure 2: Satisfaction with living location (n=25 in each neighbour-hood).
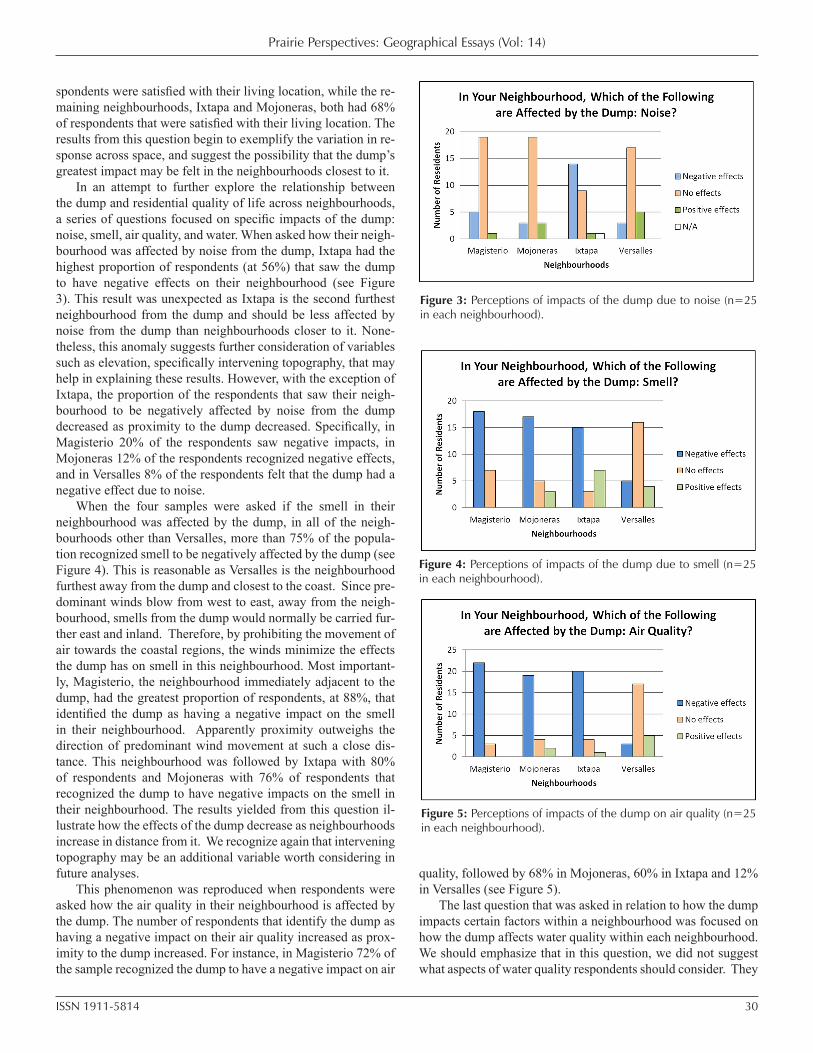
Prairie Perspectives: Geographical Essays (Vol: 14)
ISSN 1911-5814 30
spondents were satisfied with their living location, while the re-maining neighbourhoods, Ixtapa and Mojoneras, both had 68% of respondents that were satisfied with their living location. The results from this question begin to exemplify the variation in re-sponse across space, and suggest the possibility that the dump’s greatest impact may be felt in the neighbourhoods closest to it.
In an attempt to further explore the relationship between the dump and residential quality of life across neighbourhoods, a series of questions focused on specific impacts of the dump: noise, smell, air quality, and water. When asked how their neigh-bourhood was affected by noise from the dump, Ixtapa had the highest proportion of respondents (at 56%) that saw the dump to have negative effects on their neighbourhood (see Figure 3). This result was unexpected as Ixtapa is the second furthest neighbourhood from the dump and should be less affected by noise from the dump than neighbourhoods closer to it. None-theless, this anomaly suggests further consideration of variables such as elevation, specifically intervening topography, that may help in explaining these results. However, with the exception of Ixtapa, the proportion of the respondents that saw their neigh-bourhood to be negatively affected by noise from the dump decreased as proximity to the dump decreased. Specifically, in Magisterio 20% of the respondents saw negative impacts, in Mojoneras 12% of the respondents recognized negative effects, and in Versalles 8% of the respondents felt that the dump had a negative effect due to noise.
When the four samples were asked if the smell in their neighbourhood was affected by the dump, in all of the neigh-bourhoods other than Versalles, more than 75% of the popula-tion recognized smell to be negatively affected by the dump (see Figure 4). This is reasonable as Versalles is the neighbourhood furthest away from the dump and closest to the coast. Since pre-dominant winds blow from west to east, away from the neigh-bourhood, smells from the dump would normally be carried fur-ther east and inland. Therefore, by prohibiting the movement of air towards the coastal regions, the winds minimize the effects the dump has on smell in this neighbourhood. Most important-ly, Magisterio, the neighbourhood immediately adjacent to the dump, had the greatest proportion of respondents, at 88%, that identified the dump as having a negative impact on the smell in their neighbourhood. Apparently proximity outweighs the direction of predominant wind movement at such a close dis-tance. This neighbourhood was followed by Ixtapa with 80% of respondents and Mojoneras with 76% of respondents that recognized the dump to have negative impacts on the smell in their neighbourhood. The results yielded from this question il-lustrate how the effects of the dump decrease as neighbourhoods increase in distance from it. We recognize again that intervening topography may be an additional variable worth considering in future analyses.
This phenomenon was reproduced when respondents were asked how the air quality in their neighbourhood is affected by the dump. The number of respondents that identify the dump as having a negative impact on their air quality increased as prox-imity to the dump increased. For instance, in Magisterio 72% of the sample recognized the dump to have a negative impact on air
quality, followed by 68% in Mojoneras, 60% in Ixtapa and 12% in Versalles (see Figure 5).
The last question that was asked in relation to how the dump impacts certain factors within a neighbourhood was focused on how the dump affects water quality within each neighbourhood. We should emphasize that in this question, we did not suggest what aspects of water quality respondents should consider. They
Figure 3: Perceptions of impacts of the dump due to noise (n=25 in each neighbourhood).
Figure 4: Perceptions of impacts of the dump due to smell (n=25 in each neighbourhood).
Figure 5: Perceptions of impacts of the dump on air quality (n=25 in each neighbourhood).
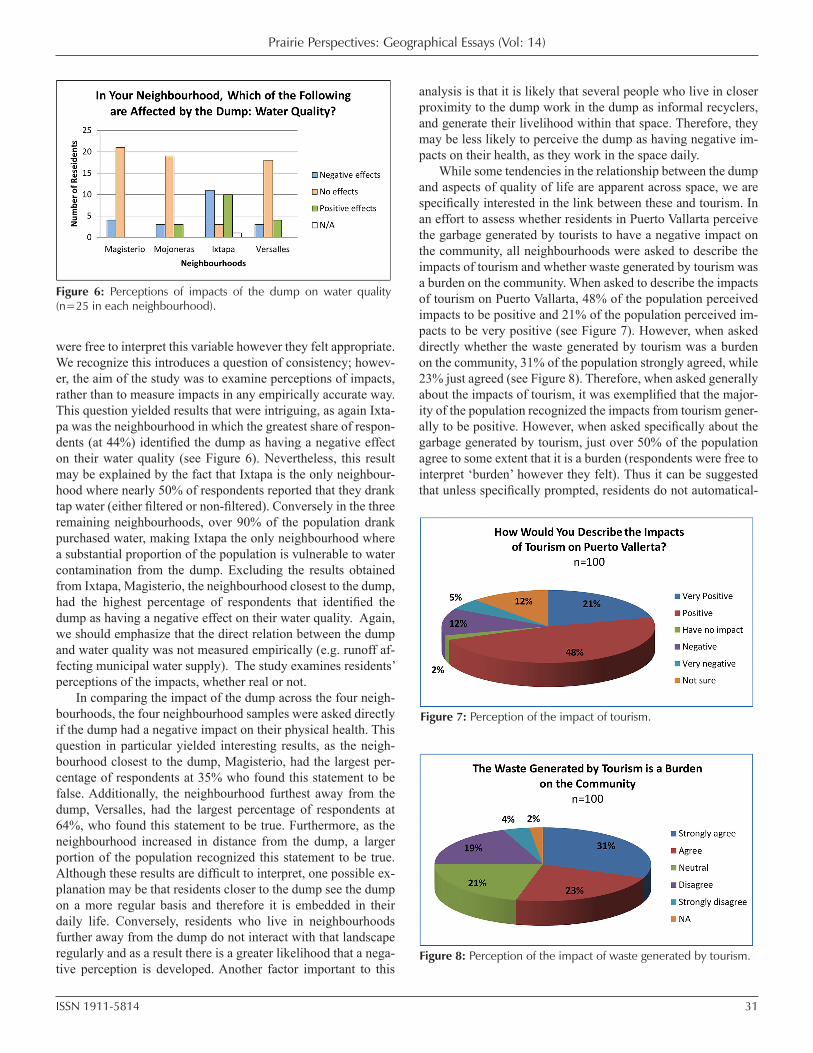
Prairie Perspectives: Geographical Essays (Vol: 14)
ISSN 1911-5814 31
were free to interpret this variable however they felt appropriate. We recognize this introduces a question of consistency; howev-er, the aim of the study was to examine perceptions of impacts, rather than to measure impacts in any empirically accurate way. This question yielded results that were intriguing, as again Ixta-pa was the neighbourhood in which the greatest share of respon-dents (at 44%) identified the dump as having a negative effect on their water quality (see Figure 6). Nevertheless, this result may be explained by the fact that Ixtapa is the only neighbour-hood where nearly 50% of respondents reported that they drank tap water (either filtered or non-filtered). Conversely in the three remaining neighbourhoods, over 90% of the population drank purchased water, making Ixtapa the only neighbourhood where a substantial proportion of the population is vulnerable to water contamination from the dump. Excluding the results obtained from Ixtapa, Magisterio, the neighbourhood closest to the dump, had the highest percentage of respondents that identified the dump as having a negative effect on their water quality. Again, we should emphasize that the direct relation between the dump and water quality was not measured empirically (e.g. runoff af-fecting municipal water supply). The study examines residents’ perceptions of the impacts, whether real or not.
In comparing the impact of the dump across the four neigh-bourhoods, the four neighbourhood samples were asked directly if the dump had a negative impact on their physical health. This question in particular yielded interesting results, as the neigh-bourhood closest to the dump, Magisterio, had the largest per-centage of respondents at 35% who found this statement to be false. Additionally, the neighbourhood furthest away from the dump, Versalles, had the largest percentage of respondents at 64%, who found this statement to be true. Furthermore, as the neighbourhood increased in distance from the dump, a larger portion of the population recognized this statement to be true. Although these results are difficult to interpret, one possible ex-planation may be that residents closer to the dump see the dump on a more regular basis and therefore it is embedded in their daily life. Conversely, residents who live in neighbourhoods further away from the dump do not interact with that landscape regularly and as a result there is a greater likelihood that a nega-tive perception is developed. Another factor important to this
analysis is that it is likely that several people who live in closer proximity to the dump work in the dump as informal recyclers, and generate their livelihood within that space. Therefore, they may be less likely to perceive the dump as having negative im-pacts on their health, as they work in the space daily.
While some tendencies in the relationship between the dump and aspects of quality of life are apparent across space, we are specifically interested in the link between these and tourism. In an effort to assess whether residents in Puerto Vallarta perceive the garbage generated by tourists to have a negative impact on the community, all neighbourhoods were asked to describe the impacts of tourism and whether waste generated by tourism was a burden on the community. When asked to describe the impacts of tourism on Puerto Vallarta, 48% of the population perceived impacts to be positive and 21% of the population perceived im-pacts to be very positive (see Figure 7). However, when asked directly whether the waste generated by tourism was a burden on the community, 31% of the population strongly agreed, while 23% just agreed (see Figure 8). Therefore, when asked generally about the impacts of tourism, it was exemplified that the major-ity of the population recognized the impacts from tourism gener-ally to be positive. However, when asked specifically about the garbage generated by tourism, just over 50% of the population agree to some extent that it is a burden (respondents were free to interpret ‘burden’ however they felt). Thus it can be suggested that unless specifically prompted, residents do not automatical-
Figure 6: Perceptions of impacts of the dump on water quality (n=25 in each neighbourhood).
Figure 7: Perception of the impact of tourism.
Figure 8: Perception of the impact of waste generated by tourism.
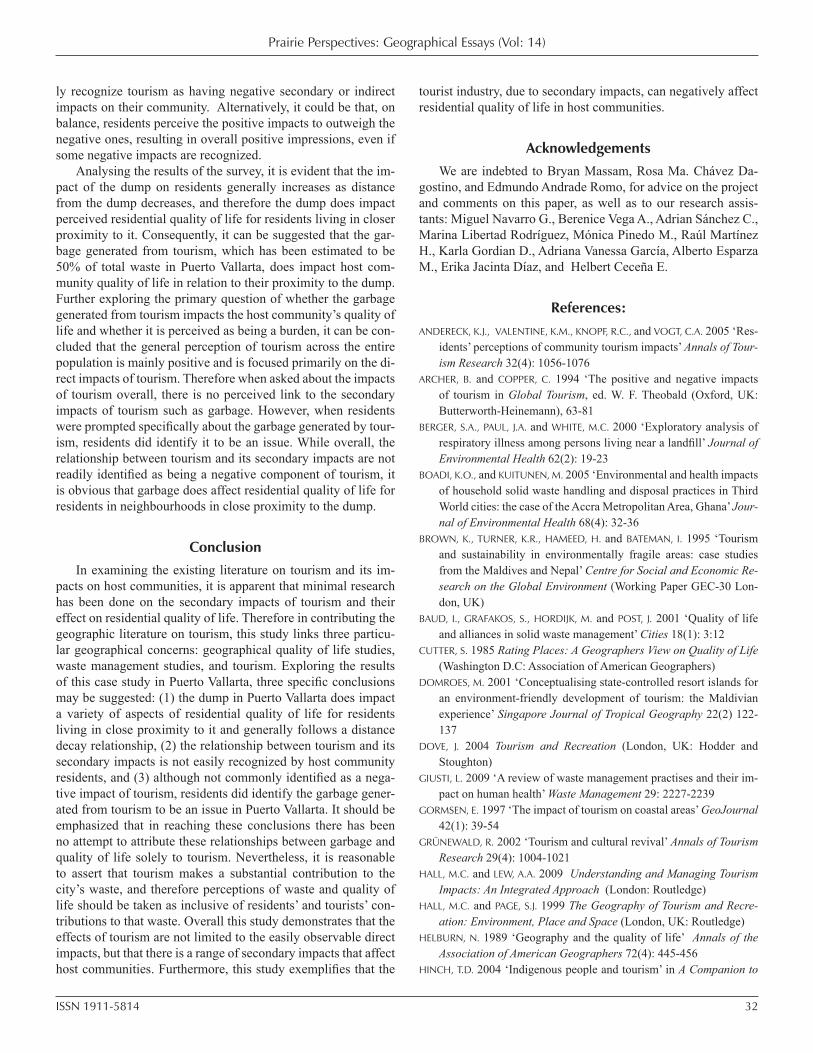
Prairie Perspectives: Geographical Essays (Vol: 14)
ISSN 1911-5814 32
ly recognize tourism as having negative secondary or indirect impacts on their community. Alternatively, it could be that, on balance, residents perceive the positive impacts to outweigh the negative ones, resulting in overall positive impressions, even if some negative impacts are recognized.
Analysing the results of the survey, it is evident that the im-pact of the dump on residents generally increases as distance from the dump decreases, and therefore the dump does impact perceived residential quality of life for residents living in closer proximity to it. Consequently, it can be suggested that the gar-bage generated from tourism, which has been estimated to be 50% of total waste in Puerto Vallarta, does impact host com-munity quality of life in relation to their proximity to the dump. Further exploring the primary question of whether the garbage generated from tourism impacts the host community’s quality of life and whether it is perceived as being a burden, it can be con-cluded that the general perception of tourism across the entire population is mainly positive and is focused primarily on the di-rect impacts of tourism. Therefore when asked about the impacts of tourism overall, there is no perceived link to the secondary impacts of tourism such as garbage. However, when residents were prompted specifically about the garbage generated by tour-ism, residents did identify it to be an issue. While overall, the relationship between tourism and its secondary impacts are not readily identified as being a negative component of tourism, it is obvious that garbage does affect residential quality of life for residents in neighbourhoods in close proximity to the dump.
ConclusionIn examining the existing literature on tourism and its im-
pacts on host communities, it is apparent that minimal research has been done on the secondary impacts of tourism and their effect on residential quality of life. Therefore in contributing the geographic literature on tourism, this study links three particu-lar geographical concerns: geographical quality of life studies, waste management studies, and tourism. Exploring the results of this case study in Puerto Vallarta, three specific conclusions may be suggested: (1) the dump in Puerto Vallarta does impact a variety of aspects of residential quality of life for residents living in close proximity to it and generally follows a distance decay relationship, (2) the relationship between tourism and its secondary impacts is not easily recognized by host community residents, and (3) although not commonly identified as a nega-tive impact of tourism, residents did identify the garbage gener-ated from tourism to be an issue in Puerto Vallarta. It should be emphasized that in reaching these conclusions there has been no attempt to attribute these relationships between garbage and quality of life solely to tourism. Nevertheless, it is reasonable to assert that tourism makes a substantial contribution to the city’s waste, and therefore perceptions of waste and quality of life should be taken as inclusive of residents’ and tourists’ con-tributions to that waste. Overall this study demonstrates that the effects of tourism are not limited to the easily observable direct impacts, but that there is a range of secondary impacts that affect host communities. Furthermore, this study exemplifies that the
tourist industry, due to secondary impacts, can negatively affect residential quality of life in host communities.
Acknowledgements We are indebted to Bryan Massam, Rosa Ma. Chávez Da-
gostino, and Edmundo Andrade Romo, for advice on the project and comments on this paper, as well as to our research assis-tants: Miguel Navarro G., Berenice Vega A., Adrian Sánchez C., Marina Libertad Rodríguez, Mónica Pinedo M., Raúl Martínez H., Karla Gordian D., Adriana Vanessa García, Alberto Esparza M., Erika Jacinta Díaz, and Helbert Ceceña E.
References:ANDERECK, K.J., VALENTINE, K.M., KNOPF, R.C., and VOGT, C.A. 2005 ‘Res-
idents’ perceptions of community tourism impacts’ Annals of Tour-ism Research 32(4): 1056-1076
ARCHER, B. and COPPER, C. 1994 ‘The positive and negative impacts of tourism in Global Tourism, ed. W. F. Theobald (Oxford, UK: Butterworth-Heinemann), 63-81
BERGER, S.A., PAUL, J.A. and WHITE, M.C. 2000 ‘Exploratory analysis of respiratory illness among persons living near a landfill’ Journal of Environmental Health 62(2): 19-23
BOADI, K.O., and KUITUNEN, M. 2005 ‘Environmental and health impacts of household solid waste handling and disposal practices in Third World cities: the case of the Accra Metropolitan Area, Ghana’ Jour-nal of Environmental Health 68(4): 32-36
BROWN, K., TURNER, K.R., HAMEED, H. and BATEMAN, I. 1995 ‘Tourism and sustainability in environmentally fragile areas: case studies from the Maldives and Nepal’ Centre for Social and Economic Re-search on the Global Environment (Working Paper GEC-30 Lon-don, UK)
BAUD, I., GRAFAKOS, S., HORDIJK, M. and POST, J. 2001 ‘Quality of life and alliances in solid waste management’ Cities 18(1): 3:12
CUTTER, S. 1985 Rating Places: A Geographers View on Quality of Life (Washington D.C: Association of American Geographers)
DOMROES, M. 2001 ‘Conceptualising state-controlled resort islands for an environment-friendly development of tourism: the Maldivian experience’ Singapore Journal of Tropical Geography 22(2) 122-137
DOVE, J. 2004 Tourism and Recreation (London, UK: Hodder and Stoughton)
GIUSTI, L. 2009 ‘A review of waste management practises and their im-pact on human health’ Waste Management 29: 2227-2239
GORMSEN, E. 1997 ‘The impact of tourism on coastal areas’ GeoJournal 42(1): 39-54
GRÜNEWALD, R. 2002 ‘Tourism and cultural revival’ Annals of Tourism Research 29(4): 1004-1021
HALL, M.C. and LEW, A.A. 2009 Understanding and Managing Tourism Impacts: An Integrated Approach (London: Routledge)
HALL, M.C. and PAGE, S.J. 1999 The Geography of Tourism and Recre-ation: Environment, Place and Space (London, UK: Routledge)
HELBURN, N. 1989 ‘Geography and the quality of life’ Annals of the Association of American Geographers 72(4): 445-456
HINCH, T.D. 2004 ‘Indigenous people and tourism’ in A Companion to
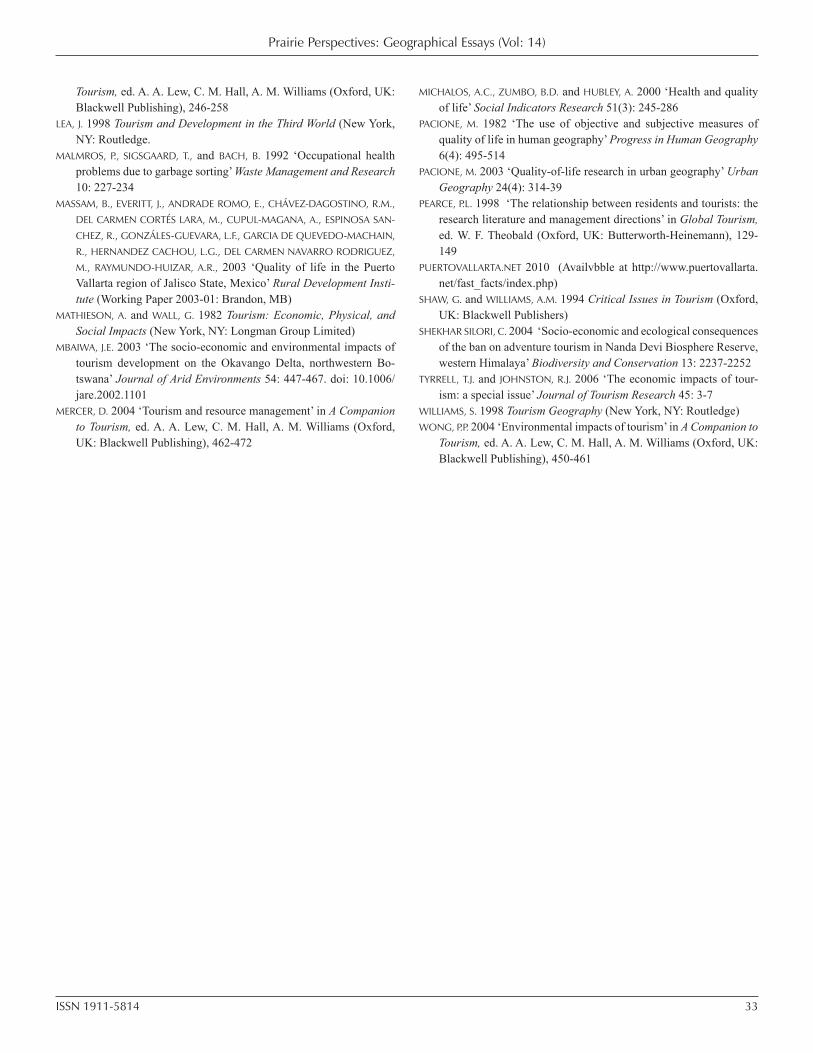
Prairie Perspectives: Geographical Essays (Vol: 14)
ISSN 1911-5814 33
Tourism, ed. A. A. Lew, C. M. Hall, A. M. Williams (Oxford, UK: Blackwell Publishing), 246-258
LEA, J. 1998 Tourism and Development in the Third World (New York, NY: Routledge.
MALMROS, P., SIGSGAARD, T., and BACH, B. 1992 ‘Occupational health problems due to garbage sorting’ Waste Management and Research 10: 227-234
MASSAM, B., EVERITT, J., ANDRADE ROMO, E., CHÁVEZ-DAGOSTINO, R.M., DEL CARMEN CORTÉS LARA, M., CUPUL-MAGANA, A., ESPINOSA SAN-
CHEZ, R., GONZÁLES-GUEVARA, L.F., GARCIA DE QUEVEDO-MACHAIN,
R., HERNANDEZ CACHOU, L.G., DEL CARMEN NAVARRO RODRIGUEZ,
M., RAYMUNDO-HUIZAR, A.R., 2003 ‘Quality of life in the Puerto Vallarta region of Jalisco State, Mexico’ Rural Development Insti-tute (Working Paper 2003-01: Brandon, MB)
MATHIESON, A. and WALL, G. 1982 Tourism: Economic, Physical, and Social Impacts (New York, NY: Longman Group Limited)
MBAIWA, J.E. 2003 ‘The socio-economic and environmental impacts of tourism development on the Okavango Delta, northwestern Bo-tswana’ Journal of Arid Environments 54: 447-467. doi: 10.1006/jare.2002.1101
MERCER, D. 2004 ‘Tourism and resource management’ in A Companion to Tourism, ed. A. A. Lew, C. M. Hall, A. M. Williams (Oxford, UK: Blackwell Publishing), 462-472
MICHALOS, A.C., ZUMBO, B.D. and HUBLEY, A. 2000 ‘Health and quality of life’ Social Indicators Research 51(3): 245-286
PACIONE, M. 1982 ‘The use of objective and subjective measures of quality of life in human geography’ Progress in Human Geography 6(4): 495-514
PACIONE, M. 2003 ‘Quality-of-life research in urban geography’ Urban Geography 24(4): 314-39
PEARCE, P.L. 1998 ‘The relationship between residents and tourists: the research literature and management directions’ in Global Tourism, ed. W. F. Theobald (Oxford, UK: Butterworth-Heinemann), 129-149
PUERTOVALLARTA.NET 2010 (Availvbble at http://www.puertovallarta.net/fast_facts/index.php)
SHAW, G. and WILLIAMS, A.M. 1994 Critical Issues in Tourism (Oxford, UK: Blackwell Publishers)
SHEKHAR SILORI, C. 2004 ‘Socio-economic and ecological consequences of the ban on adventure tourism in Nanda Devi Biosphere Reserve, western Himalaya’ Biodiversity and Conservation 13: 2237-2252
TYRRELL, T.J. and JOHNSTON, R.J. 2006 ‘The economic impacts of tour-ism: a special issue’ Journal of Tourism Research 45: 3-7
WILLIAMS, S. 1998 Tourism Geography (New York, NY: Routledge)WONG, P.P. 2004 ‘Environmental impacts of tourism’ in A Companion to
Tourism, ed. A. A. Lew, C. M. Hall, A. M. Williams (Oxford, UK: Blackwell Publishing), 450-461
Prairie Perspectives: Geographical Essays (Vol: 14)
ISSN 1911-5814 34
Closer settlement revisited at Kendenup, Western Australia: a historical geography
John SelwoodUniversity of Western Australia, Crawley, Western Australia, Australia 6009 [email protected]
Matthew TontsUniversity of Western Australia, Crawley, Western Australia, Australia 6009 [email protected]
Roy JonesCurtin University, Perth, Western Australia, Australia 6102 [email protected]
Abstract
In the early 1920s a Victorian entrepreneur, C. J. (Jack) De Garis, purchased a large estate at Kendenup in the south-west of Western Australia where he established a comprehensive settlement scheme based on his earlier experiences in Mildura, Victoria, and Pyap, South Australia. De Garis’ plan was to found a model community based on intensive production from the more than 1000 blocks he had subdivided and marketed to buyers throughout Australia and overseas. He also laid out a townsite, installed infrastructure and built a dehydration plant to process and market products from the farms. But the scheme failed, resulting in much of the land lying idle for decades. However, the properties have recently been ‘rediscov-ered’ and marketed as a less costly alternative for people seeking smaller, country holdings than those available in higher amenity locations nearer the coast. This paper has two principal objectives: first to discuss the original settlement scheme and its aftermath and, second, to address the more recent land developments and their implications for future planning. Key words: historical geography, rural settlement, counter urbanization, planning, community development
IntroductionOnce Australia had been firmly established as a British
possession, it became a high priority initially for the colonial governments and subsequently for the Australian and state gov-ernments to consolidate their presence and achieve levels of eco-nomic development that would allow them to become essential-ly self-sufficient. An integral part of this strategy, bolstered by a perceived need to solve the mother country’s overpopulation, was to encourage immigration into Australia and establish an agricultural population in those of the country’s interior regions that were thought to be able to support such a policy. Through the late nineteenth and twentieth centuries then, various gov-ernments embarked on a large number of schemes designed to
achieve those objectives. In Western Australia, as in other parts of the country, large expanses of territory, often several thousand hectares in each in area, were released to individuals and agen-cies deemed have wealth enough to attract capital into the coun-try. However, these schemes had a generally poor rate of success and in many instances led to vast tracts of land being turned over to extensive agricultural practices or even abandoned as own-ers or leaseholders struggled with the harsh environment, lack of knowledge, or limited capital resources. In response to such failures, governments turned to a variety of schemes seeking to encourage the migration of larger numbers of people whose principal resource was their labour and to place them on smaller properties destined for more intensive production. These poli-
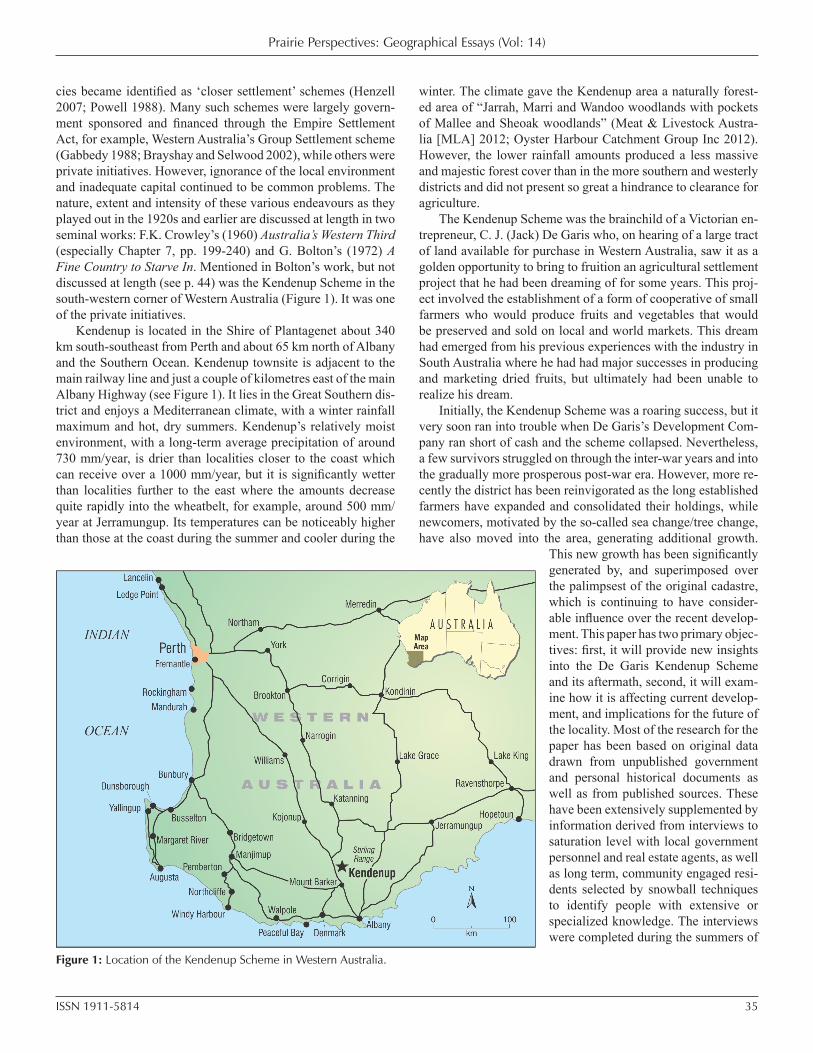
Prairie Perspectives: Geographical Essays (Vol: 14)
ISSN 1911-5814 35
cies became identified as ‘closer settlement’ schemes (Henzell 2007; Powell 1988). Many such schemes were largely govern-ment sponsored and financed through the Empire Settlement Act, for example, Western Australia’s Group Settlement scheme (Gabbedy 1988; Brayshay and Selwood 2002), while others were private initiatives. However, ignorance of the local environment and inadequate capital continued to be common problems. The nature, extent and intensity of these various endeavours as they played out in the 1920s and earlier are discussed at length in two seminal works: F.K. Crowley’s (1960) Australia’s Western Third (especially Chapter 7, pp. 199-240) and G. Bolton’s (1972) A Fine Country to Starve In. Mentioned in Bolton’s work, but not discussed at length (see p. 44) was the Kendenup Scheme in the south-western corner of Western Australia (Figure 1). It was one of the private initiatives.
Kendenup is located in the Shire of Plantagenet about 340 km south-southeast from Perth and about 65 km north of Albany and the Southern Ocean. Kendenup townsite is adjacent to the main railway line and just a couple of kilometres east of the main Albany Highway (see Figure 1). It lies in the Great Southern dis-trict and enjoys a Mediterranean climate, with a winter rainfall maximum and hot, dry summers. Kendenup’s relatively moist environment, with a long-term average precipitation of around 730 mm/year, is drier than localities closer to the coast which can receive over a 1000 mm/year, but it is significantly wetter than localities further to the east where the amounts decrease quite rapidly into the wheatbelt, for example, around 500 mm/year at Jerramungup. Its temperatures can be noticeably higher than those at the coast during the summer and cooler during the
winter. The climate gave the Kendenup area a naturally forest-ed area of “Jarrah, Marri and Wandoo woodlands with pockets of Mallee and Sheoak woodlands” (Meat & Livestock Austra-lia [MLA] 2012; Oyster Harbour Catchment Group Inc 2012). However, the lower rainfall amounts produced a less massive and majestic forest cover than in the more southern and westerly districts and did not present so great a hindrance to clearance for agriculture.
The Kendenup Scheme was the brainchild of a Victorian en-trepreneur, C. J. (Jack) De Garis who, on hearing of a large tract of land available for purchase in Western Australia, saw it as a golden opportunity to bring to fruition an agricultural settlement project that he had been dreaming of for some years. This proj-ect involved the establishment of a form of cooperative of small farmers who would produce fruits and vegetables that would be preserved and sold on local and world markets. This dream had emerged from his previous experiences with the industry in South Australia where he had had major successes in producing and marketing dried fruits, but ultimately had been unable to realize his dream.
Initially, the Kendenup Scheme was a roaring success, but it very soon ran into trouble when De Garis’s Development Com-pany ran short of cash and the scheme collapsed. Nevertheless, a few survivors struggled on through the inter-war years and into the gradually more prosperous post-war era. However, more re-cently the district has been reinvigorated as the long established farmers have expanded and consolidated their holdings, while newcomers, motivated by the so-called sea change/tree change, have also moved into the area, generating additional growth.
This new growth has been significantly generated by, and superimposed over the palimpsest of the original cadastre, which is continuing to have consider-able influence over the recent develop-ment. This paper has two primary objec-tives: first, it will provide new insights into the De Garis Kendenup Scheme and its aftermath, second, it will exam-ine how it is affecting current develop-ment, and implications for the future of the locality. Most of the research for the paper has been based on original data drawn from unpublished government and personal historical documents as well as from published sources. These have been extensively supplemented by information derived from interviews to saturation level with local government personnel and real estate agents, as well as long term, community engaged resi-dents selected by snowball techniques to identify people with extensive or specialized knowledge. The interviews were completed during the summers of
Figure 1: Location of the Kendenup Scheme in Western Australia.
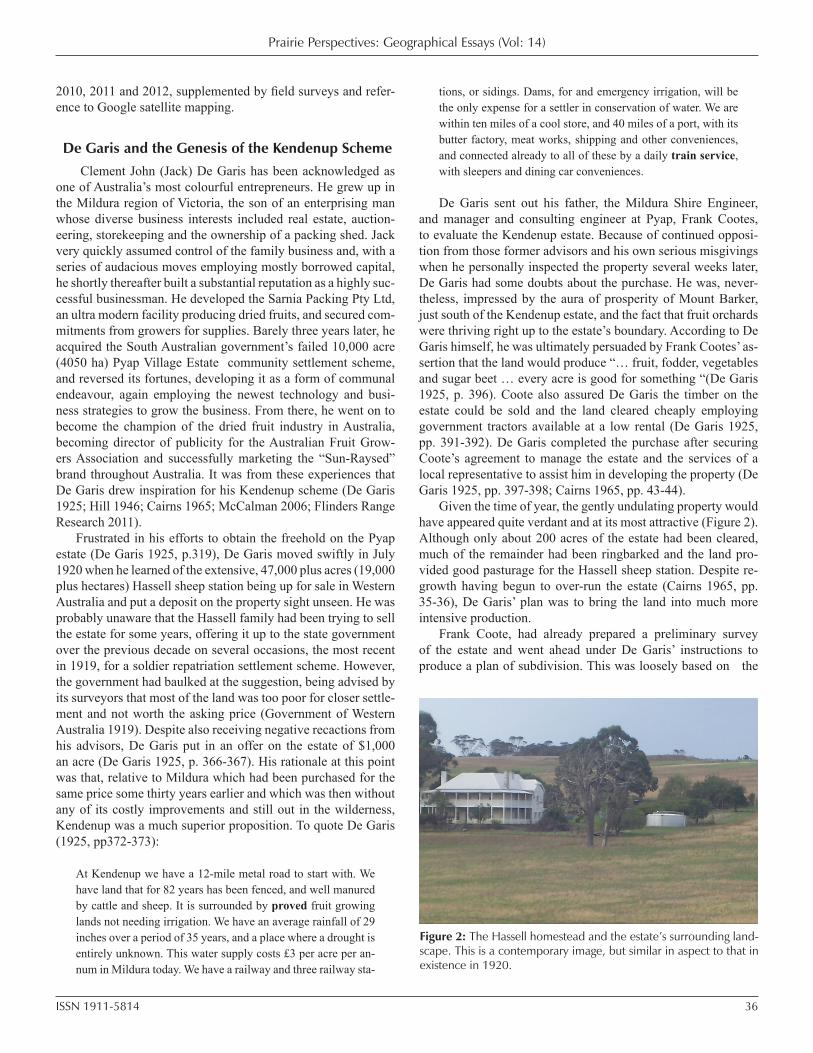
Prairie Perspectives: Geographical Essays (Vol: 14)
ISSN 1911-5814 36
2010, 2011 and 2012, supplemented by field surveys and refer-ence to Google satellite mapping.
De Garis and the Genesis of the Kendenup Scheme Clement John (Jack) De Garis has been acknowledged as
one of Australia’s most colourful entrepreneurs. He grew up in the Mildura region of Victoria, the son of an enterprising man whose diverse business interests included real estate, auction-eering, storekeeping and the ownership of a packing shed. Jack very quickly assumed control of the family business and, with a series of audacious moves employing mostly borrowed capital, he shortly thereafter built a substantial reputation as a highly suc-cessful businessman. He developed the Sarnia Packing Pty Ltd, an ultra modern facility producing dried fruits, and secured com-mitments from growers for supplies. Barely three years later, he acquired the South Australian government’s failed 10,000 acre (4050 ha) Pyap Village Estate community settlement scheme, and reversed its fortunes, developing it as a form of communal endeavour, again employing the newest technology and busi-ness strategies to grow the business. From there, he went on to become the champion of the dried fruit industry in Australia, becoming director of publicity for the Australian Fruit Grow-ers Association and successfully marketing the “Sun-Raysed” brand throughout Australia. It was from these experiences that De Garis drew inspiration for his Kendenup scheme (De Garis 1925; Hill 1946; Cairns 1965; McCalman 2006; Flinders Range Research 2011).
Frustrated in his efforts to obtain the freehold on the Pyap estate (De Garis 1925, p.319), De Garis moved swiftly in July 1920 when he learned of the extensive, 47,000 plus acres (19,000 plus hectares) Hassell sheep station being up for sale in Western Australia and put a deposit on the property sight unseen. He was probably unaware that the Hassell family had been trying to sell the estate for some years, offering it up to the state government over the previous decade on several occasions, the most recent in 1919, for a soldier repatriation settlement scheme. However, the government had baulked at the suggestion, being advised by its surveyors that most of the land was too poor for closer settle-ment and not worth the asking price (Government of Western Australia 1919). Despite also receiving negative recactions from his advisors, De Garis put in an offer on the estate of $1,000 an acre (De Garis 1925, p. 366-367). His rationale at this point was that, relative to Mildura which had been purchased for the same price some thirty years earlier and which was then without any of its costly improvements and still out in the wilderness, Kendenup was a much superior proposition. To quote De Garis (1925, pp372-373):
At Kendenup we have a 12-mile metal road to start with. We have land that for 82 years has been fenced, and well manured by cattle and sheep. It is surrounded by proved fruit growing lands not needing irrigation. We have an average rainfall of 29 inches over a period of 35 years, and a place where a drought is entirely unknown. This water supply costs £3 per acre per an-num in Mildura today. We have a railway and three railway sta-
tions, or sidings. Dams, for and emergency irrigation, will be the only expense for a settler in conservation of water. We are within ten miles of a cool store, and 40 miles of a port, with its butter factory, meat works, shipping and other conveniences, and connected already to all of these by a daily train service, with sleepers and dining car conveniences.
De Garis sent out his father, the Mildura Shire Engineer, and manager and consulting engineer at Pyap, Frank Cootes, to evaluate the Kendenup estate. Because of continued opposi-tion from those former advisors and his own serious misgivings when he personally inspected the property several weeks later, De Garis had some doubts about the purchase. He was, never-theless, impressed by the aura of prosperity of Mount Barker, just south of the Kendenup estate, and the fact that fruit orchards were thriving right up to the estate’s boundary. According to De Garis himself, he was ultimately persuaded by Frank Cootes’ as-sertion that the land would produce “… fruit, fodder, vegetables and sugar beet … every acre is good for something “(De Garis 1925, p. 396). Coote also assured De Garis the timber on the estate could be sold and the land cleared cheaply employing government tractors available at a low rental (De Garis 1925, pp. 391-392). De Garis completed the purchase after securing Coote’s agreement to manage the estate and the services of a local representative to assist him in developing the property (De Garis 1925, pp. 397-398; Cairns 1965, pp. 43-44).
Given the time of year, the gently undulating property would have appeared quite verdant and at its most attractive (Figure 2). Although only about 200 acres of the estate had been cleared, much of the remainder had been ringbarked and the land pro-vided good pasturage for the Hassell sheep station. Despite re-growth having begun to over-run the estate (Cairns 1965, pp. 35-36), De Garis’ plan was to bring the land into much more intensive production.
Frank Coote, had already prepared a preliminary survey of the estate and went ahead under De Garis’ instructions to produce a plan of subdivision. This was loosely based on the
Figure 2: The Hassell homestead and the estate’s surrounding land-scape. This is a contemporary image, but similar in aspect to that in existence in 1920.
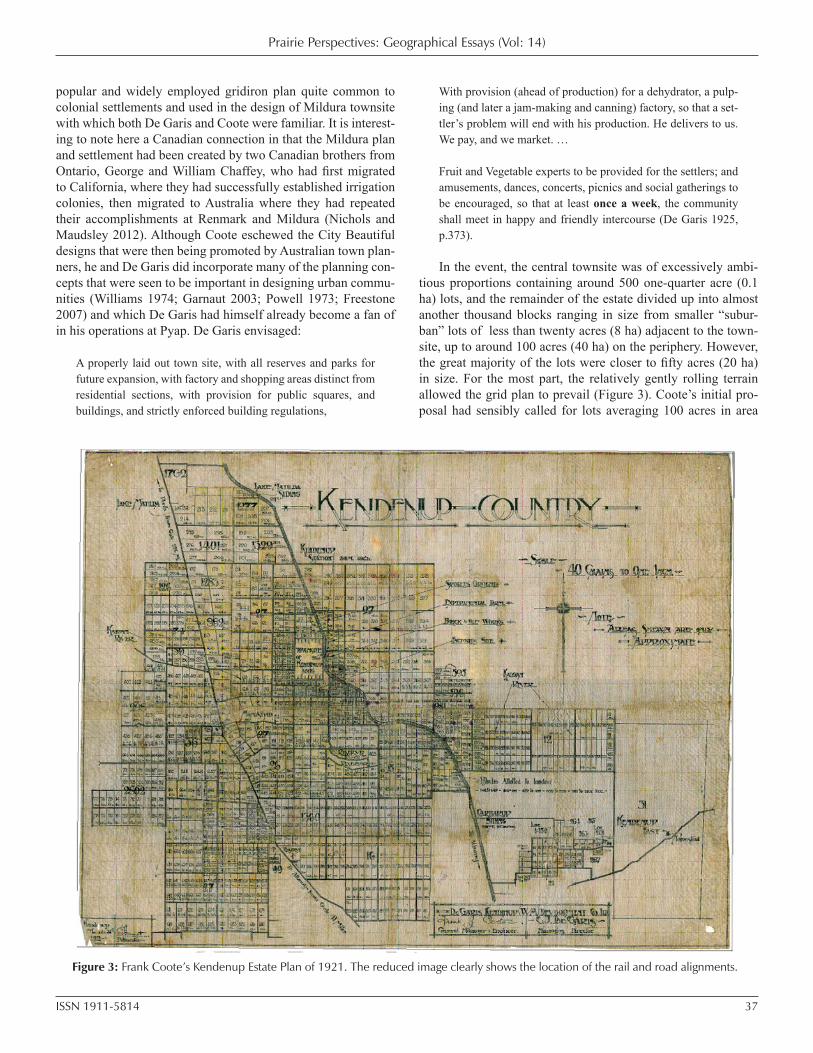
Prairie Perspectives: Geographical Essays (Vol: 14)
ISSN 1911-5814 37
popular and widely employed gridiron plan quite common to colonial settlements and used in the design of Mildura townsite with which both De Garis and Coote were familiar. It is interest-ing to note here a Canadian connection in that the Mildura plan and settlement had been created by two Canadian brothers from Ontario, George and William Chaffey, who had first migrated to California, where they had successfully established irrigation colonies, then migrated to Australia where they had repeated their accomplishments at Renmark and Mildura (Nichols and Maudsley 2012). Although Coote eschewed the City Beautiful designs that were then being promoted by Australian town plan-ners, he and De Garis did incorporate many of the planning con-cepts that were seen to be important in designing urban commu-nities (Williams 1974; Garnaut 2003; Powell 1973; Freestone 2007) and which De Garis had himself already become a fan of in his operations at Pyap. De Garis envisaged:
A properly laid out town site, with all reserves and parks for future expansion, with factory and shopping areas distinct from residential sections, with provision for public squares, and buildings, and strictly enforced building regulations,
With provision (ahead of production) for a dehydrator, a pulp-ing (and later a jam-making and canning) factory, so that a set-tler’s problem will end with his production. He delivers to us. We pay, and we market. …
Fruit and Vegetable experts to be provided for the settlers; and amusements, dances, concerts, picnics and social gatherings to be encouraged, so that at least once a week, the community shall meet in happy and friendly intercourse (De Garis 1925, p.373).
In the event, the central townsite was of excessively ambi-tious proportions containing around 500 one-quarter acre (0.1 ha) lots, and the remainder of the estate divided up into almost another thousand blocks ranging in size from smaller “subur-ban” lots of less than twenty acres (8 ha) adjacent to the town-site, up to around 100 acres (40 ha) on the periphery. However, the great majority of the lots were closer to fifty acres (20 ha) in size. For the most part, the relatively gently rolling terrain allowed the grid plan to prevail (Figure 3). Coote’s initial pro-posal had sensibly called for lots averaging 100 acres in area
Figure 3: Frank Coote’s Kendenup Estate Plan of 1921. The reduced image clearly shows the location of the rail and road alignments.
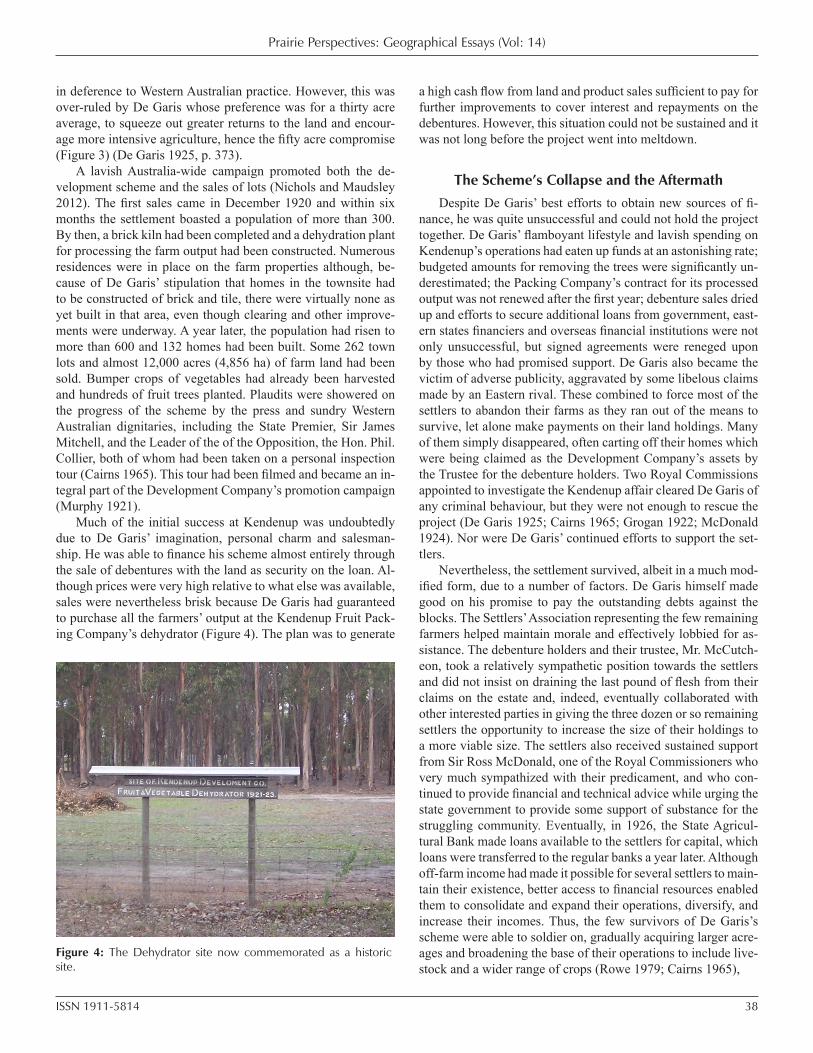
Prairie Perspectives: Geographical Essays (Vol: 14)
ISSN 1911-5814 38
in deference to Western Australian practice. However, this was over-ruled by De Garis whose preference was for a thirty acre average, to squeeze out greater returns to the land and encour-age more intensive agriculture, hence the fifty acre compromise (Figure 3) (De Garis 1925, p. 373).
A lavish Australia-wide campaign promoted both the de-velopment scheme and the sales of lots (Nichols and Maudsley 2012). The first sales came in December 1920 and within six months the settlement boasted a population of more than 300. By then, a brick kiln had been completed and a dehydration plant for processing the farm output had been constructed. Numerous residences were in place on the farm properties although, be-cause of De Garis’ stipulation that homes in the townsite had to be constructed of brick and tile, there were virtually none as yet built in that area, even though clearing and other improve-ments were underway. A year later, the population had risen to more than 600 and 132 homes had been built. Some 262 town lots and almost 12,000 acres (4,856 ha) of farm land had been sold. Bumper crops of vegetables had already been harvested and hundreds of fruit trees planted. Plaudits were showered on the progress of the scheme by the press and sundry Western Australian dignitaries, including the State Premier, Sir James Mitchell, and the Leader of the of the Opposition, the Hon. Phil. Collier, both of whom had been taken on a personal inspection tour (Cairns 1965). This tour had been filmed and became an in-tegral part of the Development Company’s promotion campaign (Murphy 1921).
Much of the initial success at Kendenup was undoubtedly due to De Garis’ imagination, personal charm and salesman-ship. He was able to finance his scheme almost entirely through the sale of debentures with the land as security on the loan. Al-though prices were very high relative to what else was available, sales were nevertheless brisk because De Garis had guaranteed to purchase all the farmers’ output at the Kendenup Fruit Pack-ing Company’s dehydrator (Figure 4). The plan was to generate
a high cash flow from land and product sales sufficient to pay for further improvements to cover interest and repayments on the debentures. However, this situation could not be sustained and it was not long before the project went into meltdown.
The Scheme’s Collapse and the AftermathDespite De Garis’ best efforts to obtain new sources of fi-
nance, he was quite unsuccessful and could not hold the project together. De Garis’ flamboyant lifestyle and lavish spending on Kendenup’s operations had eaten up funds at an astonishing rate; budgeted amounts for removing the trees were significantly un-derestimated; the Packing Company’s contract for its processed output was not renewed after the first year; debenture sales dried up and efforts to secure additional loans from government, east-ern states financiers and overseas financial institutions were not only unsuccessful, but signed agreements were reneged upon by those who had promised support. De Garis also became the victim of adverse publicity, aggravated by some libelous claims made by an Eastern rival. These combined to force most of the settlers to abandon their farms as they ran out of the means to survive, let alone make payments on their land holdings. Many of them simply disappeared, often carting off their homes which were being claimed as the Development Company’s assets by the Trustee for the debenture holders. Two Royal Commissions appointed to investigate the Kendenup affair cleared De Garis of any criminal behaviour, but they were not enough to rescue the project (De Garis 1925; Cairns 1965; Grogan 1922; McDonald 1924). Nor were De Garis’ continued efforts to support the set-tlers.
Nevertheless, the settlement survived, albeit in a much mod-ified form, due to a number of factors. De Garis himself made good on his promise to pay the outstanding debts against the blocks. The Settlers’ Association representing the few remaining farmers helped maintain morale and effectively lobbied for as-sistance. The debenture holders and their trustee, Mr. McCutch-eon, took a relatively sympathetic position towards the settlers and did not insist on draining the last pound of flesh from their claims on the estate and, indeed, eventually collaborated with other interested parties in giving the three dozen or so remaining settlers the opportunity to increase the size of their holdings to a more viable size. The settlers also received sustained support from Sir Ross McDonald, one of the Royal Commissioners who very much sympathized with their predicament, and who con-tinued to provide financial and technical advice while urging the state government to provide some support of substance for the struggling community. Eventually, in 1926, the State Agricul-tural Bank made loans available to the settlers for capital, which loans were transferred to the regular banks a year later. Although off-farm income had made it possible for several settlers to main-tain their existence, better access to financial resources enabled them to consolidate and expand their operations, diversify, and increase their incomes. Thus, the few survivors of De Garis’s scheme were able to soldier on, gradually acquiring larger acre-ages and broadening the base of their operations to include live-stock and a wider range of crops (Rowe 1979; Cairns 1965),
Figure 4: The Dehydrator site now commemorated as a historic site.
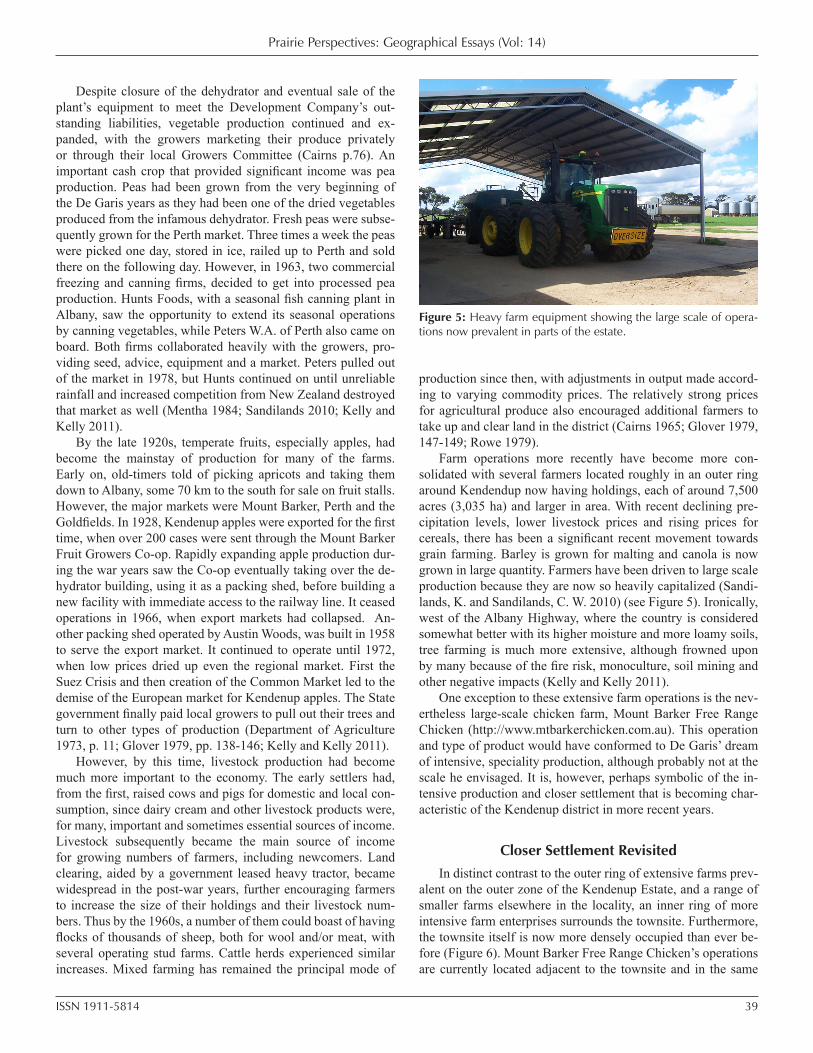
Prairie Perspectives: Geographical Essays (Vol: 14)
ISSN 1911-5814 39
Despite closure of the dehydrator and eventual sale of the plant’s equipment to meet the Development Company’s out-standing liabilities, vegetable production continued and ex-panded, with the growers marketing their produce privately or through their local Growers Committee (Cairns p.76). An important cash crop that provided significant income was pea production. Peas had been grown from the very beginning of the De Garis years as they had been one of the dried vegetables produced from the infamous dehydrator. Fresh peas were subse-quently grown for the Perth market. Three times a week the peas were picked one day, stored in ice, railed up to Perth and sold there on the following day. However, in 1963, two commercial freezing and canning firms, decided to get into processed pea production. Hunts Foods, with a seasonal fish canning plant in Albany, saw the opportunity to extend its seasonal operations by canning vegetables, while Peters W.A. of Perth also came on board. Both firms collaborated heavily with the growers, pro-viding seed, advice, equipment and a market. Peters pulled out of the market in 1978, but Hunts continued on until unreliable rainfall and increased competition from New Zealand destroyed that market as well (Mentha 1984; Sandilands 2010; Kelly and Kelly 2011).
By the late 1920s, temperate fruits, especially apples, had become the mainstay of production for many of the farms. Early on, old-timers told of picking apricots and taking them down to Albany, some 70 km to the south for sale on fruit stalls. However, the major markets were Mount Barker, Perth and the Goldfields. In 1928, Kendenup apples were exported for the first time, when over 200 cases were sent through the Mount Barker Fruit Growers Co-op. Rapidly expanding apple production dur-ing the war years saw the Co-op eventually taking over the de-hydrator building, using it as a packing shed, before building a new facility with immediate access to the railway line. It ceased operations in 1966, when export markets had collapsed. An-other packing shed operated by Austin Woods, was built in 1958 to serve the export market. It continued to operate until 1972, when low prices dried up even the regional market. First the Suez Crisis and then creation of the Common Market led to the demise of the European market for Kendenup apples. The State government finally paid local growers to pull out their trees and turn to other types of production (Department of Agriculture 1973, p. 11; Glover 1979, pp. 138-146; Kelly and Kelly 2011).
However, by this time, livestock production had become much more important to the economy. The early settlers had, from the first, raised cows and pigs for domestic and local con-sumption, since dairy cream and other livestock products were, for many, important and sometimes essential sources of income. Livestock subsequently became the main source of income for growing numbers of farmers, including newcomers. Land clearing, aided by a government leased heavy tractor, became widespread in the post-war years, further encouraging farmers to increase the size of their holdings and their livestock num-bers. Thus by the 1960s, a number of them could boast of having flocks of thousands of sheep, both for wool and/or meat, with several operating stud farms. Cattle herds experienced similar increases. Mixed farming has remained the principal mode of
production since then, with adjustments in output made accord-ing to varying commodity prices. The relatively strong prices for agricultural produce also encouraged additional farmers to take up and clear land in the district (Cairns 1965; Glover 1979, 147-149; Rowe 1979).
Farm operations more recently have become more con-solidated with several farmers located roughly in an outer ring around Kendendup now having holdings, each of around 7,500 acres (3,035 ha) and larger in area. With recent declining pre-cipitation levels, lower livestock prices and rising prices for cereals, there has been a significant recent movement towards grain farming. Barley is grown for malting and canola is now grown in large quantity. Farmers have been driven to large scale production because they are now so heavily capitalized (Sandi-lands, K. and Sandilands, C. W. 2010) (see Figure 5). Ironically, west of the Albany Highway, where the country is considered somewhat better with its higher moisture and more loamy soils, tree farming is much more extensive, although frowned upon by many because of the fire risk, monoculture, soil mining and other negative impacts (Kelly and Kelly 2011).
One exception to these extensive farm operations is the nev-ertheless large-scale chicken farm, Mount Barker Free Range Chicken (http://www.mtbarkerchicken.com.au). This operation and type of product would have conformed to De Garis’ dream of intensive, speciality production, although probably not at the scale he envisaged. It is, however, perhaps symbolic of the in-tensive production and closer settlement that is becoming char-acteristic of the Kendenup district in more recent years.
Closer Settlement RevisitedIn distinct contrast to the outer ring of extensive farms prev-
alent on the outer zone of the Kendenup Estate, and a range of smaller farms elsewhere in the locality, an inner ring of more intensive farm enterprises surrounds the townsite. Furthermore, the townsite itself is now more densely occupied than ever be-fore (Figure 6). Mount Barker Free Range Chicken’s operations are currently located adjacent to the townsite and in the same
Figure 5: Heavy farm equipment showing the large scale of opera-tions now prevalent in parts of the estate.
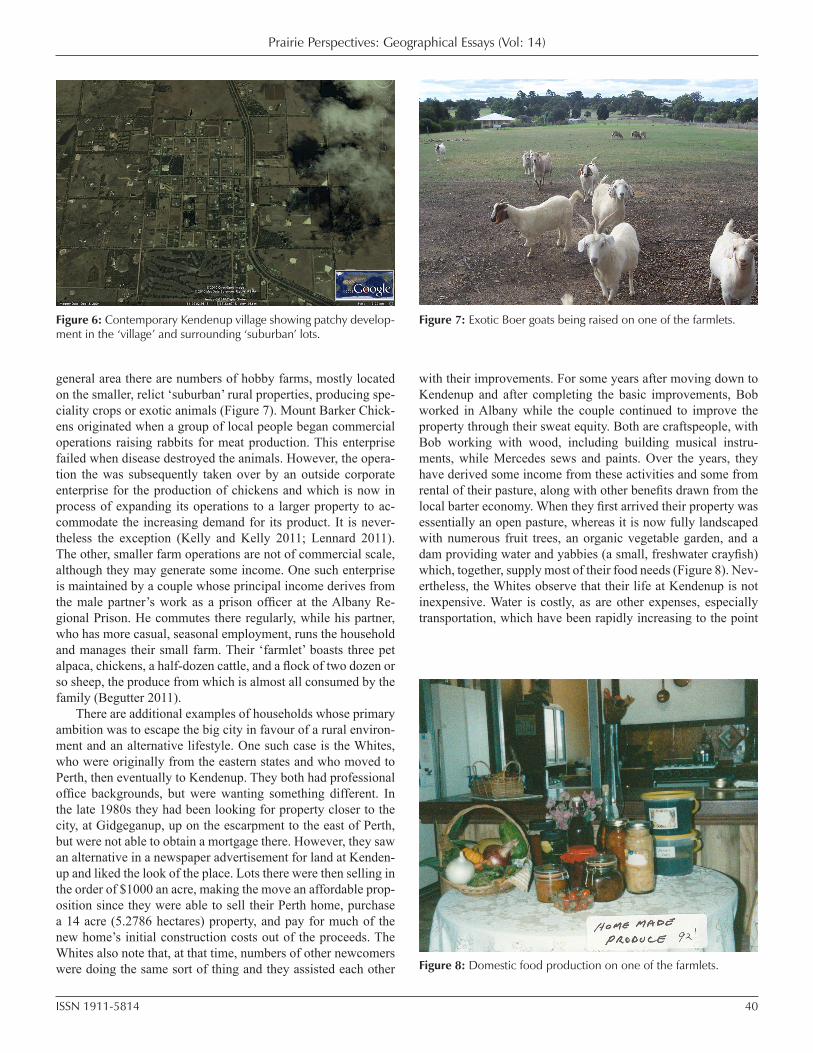
Prairie Perspectives: Geographical Essays (Vol: 14)
ISSN 1911-5814 40
general area there are numbers of hobby farms, mostly located on the smaller, relict ‘suburban’ rural properties, producing spe-ciality crops or exotic animals (Figure 7). Mount Barker Chick-ens originated when a group of local people began commercial operations raising rabbits for meat production. This enterprise failed when disease destroyed the animals. However, the opera-tion the was subsequently taken over by an outside corporate enterprise for the production of chickens and which is now in process of expanding its operations to a larger property to ac-commodate the increasing demand for its product. It is never-theless the exception (Kelly and Kelly 2011; Lennard 2011).The other, smaller farm operations are not of commercial scale, although they may generate some income. One such enterprise is maintained by a couple whose principal income derives from the male partner’s work as a prison officer at the Albany Re-gional Prison. He commutes there regularly, while his partner, who has more casual, seasonal employment, runs the household and manages their small farm. Their ‘farmlet’ boasts three pet alpaca, chickens, a half-dozen cattle, and a flock of two dozen or so sheep, the produce from which is almost all consumed by the family (Begutter 2011).
There are additional examples of households whose primary ambition was to escape the big city in favour of a rural environ-ment and an alternative lifestyle. One such case is the Whites, who were originally from the eastern states and who moved to Perth, then eventually to Kendenup. They both had professional office backgrounds, but were wanting something different. In the late 1980s they had been looking for property closer to the city, at Gidgeganup, up on the escarpment to the east of Perth, but were not able to obtain a mortgage there. However, they saw an alternative in a newspaper advertisement for land at Kenden-up and liked the look of the place. Lots there were then selling in the order of $1000 an acre, making the move an affordable prop-osition since they were able to sell their Perth home, purchase a 14 acre (5.2786 hectares) property, and pay for much of the new home’s initial construction costs out of the proceeds. The Whites also note that, at that time, numbers of other newcomers were doing the same sort of thing and they assisted each other
with their improvements. For some years after moving down to Kendenup and after completing the basic improvements, Bob worked in Albany while the couple continued to improve the property through their sweat equity. Both are craftspeople, with Bob working with wood, including building musical instru-ments, while Mercedes sews and paints. Over the years, they have derived some income from these activities and some from rental of their pasture, along with other benefits drawn from the local barter economy. When they first arrived their property was essentially an open pasture, whereas it is now fully landscaped with numerous fruit trees, an organic vegetable garden, and a dam providing water and yabbies (a small, freshwater crayfish) which, together, supply most of their food needs (Figure 8). Nev-ertheless, the Whites observe that their life at Kendenup is not inexpensive. Water is costly, as are other expenses, especially transportation, which have been rapidly increasing to the point
Figure 6: Contemporary Kendenup village showing patchy develop-ment in the ‘village’ and surrounding ‘suburban’ lots.
Figure 7: Exotic Boer goats being raised on one of the farmlets.
Figure 8: Domestic food production on one of the farmlets.
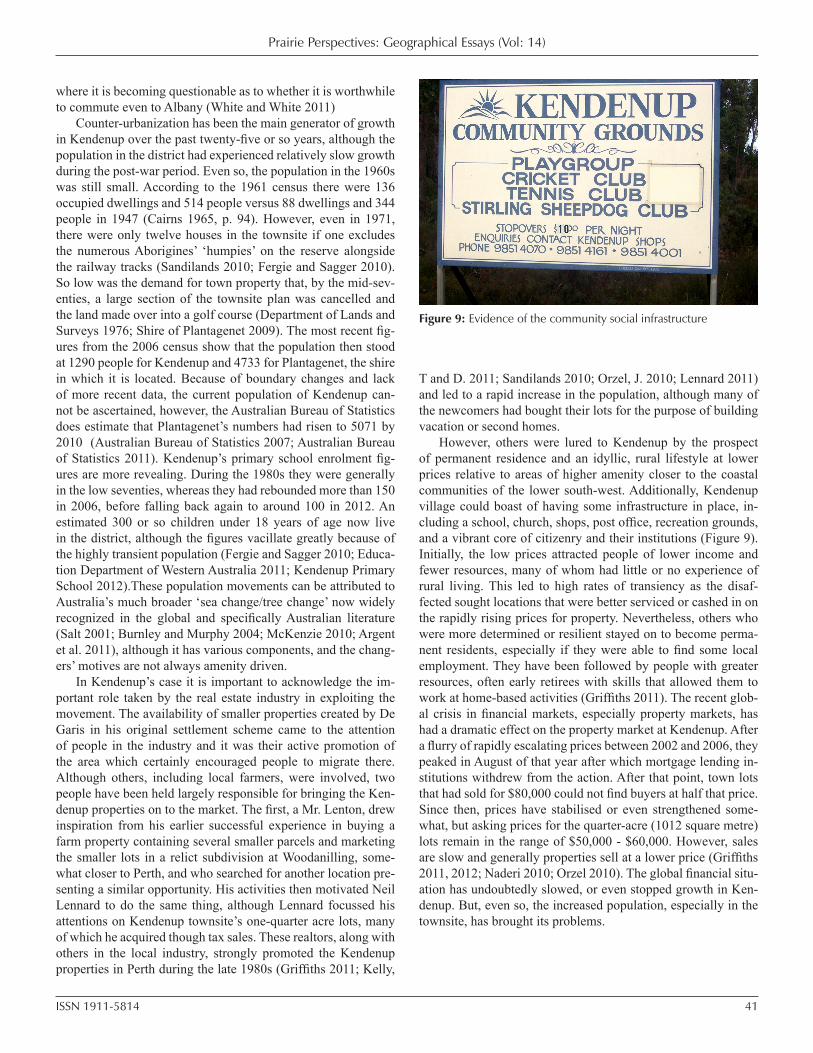
Prairie Perspectives: Geographical Essays (Vol: 14)
ISSN 1911-5814 41
where it is becoming questionable as to whether it is worthwhile to commute even to Albany (White and White 2011)
Counter-urbanization has been the main generator of growth in Kendenup over the past twenty-five or so years, although the population in the district had experienced relatively slow growth during the post-war period. Even so, the population in the 1960s was still small. According to the 1961 census there were 136 occupied dwellings and 514 people versus 88 dwellings and 344 people in 1947 (Cairns 1965, p. 94). However, even in 1971, there were only twelve houses in the townsite if one excludes the numerous Aborigines’ ‘humpies’ on the reserve alongside the railway tracks (Sandilands 2010; Fergie and Sagger 2010). So low was the demand for town property that, by the mid-sev-enties, a large section of the townsite plan was cancelled and the land made over into a golf course (Department of Lands and Surveys 1976; Shire of Plantagenet 2009). The most recent fig-ures from the 2006 census show that the population then stood at 1290 people for Kendenup and 4733 for Plantagenet, the shire in which it is located. Because of boundary changes and lack of more recent data, the current population of Kendenup can-not be ascertained, however, the Australian Bureau of Statistics does estimate that Plantagenet’s numbers had risen to 5071 by 2010 (Australian Bureau of Statistics 2007; Australian Bureau of Statistics 2011). Kendenup’s primary school enrolment fig-ures are more revealing. During the 1980s they were generally in the low seventies, whereas they had rebounded more than 150 in 2006, before falling back again to around 100 in 2012. An estimated 300 or so children under 18 years of age now live in the district, although the figures vacillate greatly because of the highly transient population (Fergie and Sagger 2010; Educa-tion Department of Western Australia 2011; Kendenup Primary School 2012).These population movements can be attributed to Australia’s much broader ‘sea change/tree change’ now widely recognized in the global and specifically Australian literature (Salt 2001; Burnley and Murphy 2004; McKenzie 2010; Argent et al. 2011), although it has various components, and the chang-ers’ motives are not always amenity driven.
In Kendenup’s case it is important to acknowledge the im-portant role taken by the real estate industry in exploiting the movement. The availability of smaller properties created by De Garis in his original settlement scheme came to the attention of people in the industry and it was their active promotion of the area which certainly encouraged people to migrate there. Although others, including local farmers, were involved, two people have been held largely responsible for bringing the Ken-denup properties on to the market. The first, a Mr. Lenton, drew inspiration from his earlier successful experience in buying a farm property containing several smaller parcels and marketing the smaller lots in a relict subdivision at Woodanilling, some-what closer to Perth, and who searched for another location pre-senting a similar opportunity. His activities then motivated Neil Lennard to do the same thing, although Lennard focussed his attentions on Kendenup townsite’s one-quarter acre lots, many of which he acquired though tax sales. These realtors, along with others in the local industry, strongly promoted the Kendenup properties in Perth during the late 1980s (Griffiths 2011; Kelly,
T and D. 2011; Sandilands 2010; Orzel, J. 2010; Lennard 2011) and led to a rapid increase in the population, although many of the newcomers had bought their lots for the purpose of building vacation or second homes.
However, others were lured to Kendenup by the prospect of permanent residence and an idyllic, rural lifestyle at lower prices relative to areas of higher amenity closer to the coastal communities of the lower south-west. Additionally, Kendenup village could boast of having some infrastructure in place, in-cluding a school, church, shops, post office, recreation grounds, and a vibrant core of citizenry and their institutions (Figure 9). Initially, the low prices attracted people of lower income and fewer resources, many of whom had little or no experience of rural living. This led to high rates of transiency as the disaf-fected sought locations that were better serviced or cashed in on the rapidly rising prices for property. Nevertheless, others who were more determined or resilient stayed on to become perma-nent residents, especially if they were able to find some local employment. They have been followed by people with greater resources, often early retirees with skills that allowed them to work at home-based activities (Griffiths 2011). The recent glob-al crisis in financial markets, especially property markets, has had a dramatic effect on the property market at Kendenup. After a flurry of rapidly escalating prices between 2002 and 2006, they peaked in August of that year after which mortgage lending in-stitutions withdrew from the action. After that point, town lots that had sold for $80,000 could not find buyers at half that price. Since then, prices have stabilised or even strengthened some-what, but asking prices for the quarter-acre (1012 square metre) lots remain in the range of $50,000 - $60,000. However, sales are slow and generally properties sell at a lower price (Griffiths 2011, 2012; Naderi 2010; Orzel 2010). The global financial situ-ation has undoubtedly slowed, or even stopped growth in Ken-denup. But, even so, the increased population, especially in the townsite, has brought its problems.
Figure 9: Evidence of the community social infrastructure
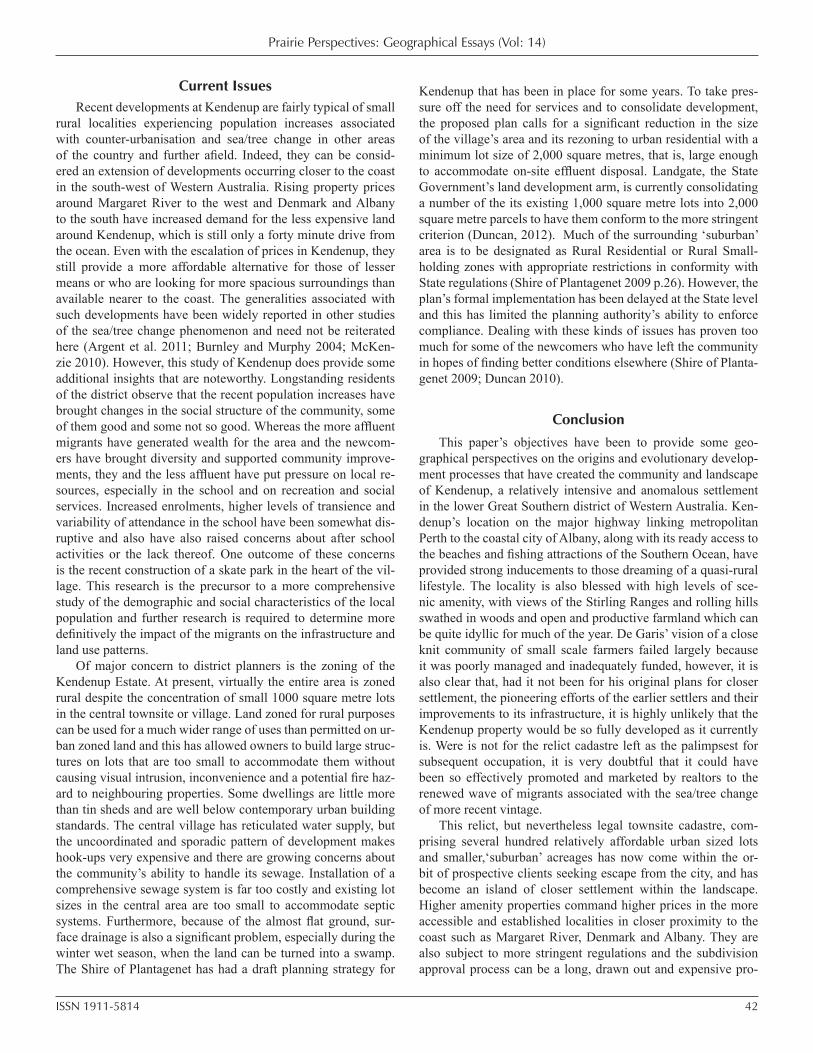
Prairie Perspectives: Geographical Essays (Vol: 14)
ISSN 1911-5814 42
Current Issues Recent developments at Kendenup are fairly typical of small
rural localities experiencing population increases associated with counter-urbanisation and sea/tree change in other areas of the country and further afield. Indeed, they can be consid-ered an extension of developments occurring closer to the coast in the south-west of Western Australia. Rising property prices around Margaret River to the west and Denmark and Albany to the south have increased demand for the less expensive land around Kendenup, which is still only a forty minute drive from the ocean. Even with the escalation of prices in Kendenup, they still provide a more affordable alternative for those of lesser means or who are looking for more spacious surroundings than available nearer to the coast. The generalities associated with such developments have been widely reported in other studies of the sea/tree change phenomenon and need not be reiterated here (Argent et al. 2011; Burnley and Murphy 2004; McKen-zie 2010). However, this study of Kendenup does provide some additional insights that are noteworthy. Longstanding residents of the district observe that the recent population increases have brought changes in the social structure of the community, some of them good and some not so good. Whereas the more affluent migrants have generated wealth for the area and the newcom-ers have brought diversity and supported community improve-ments, they and the less affluent have put pressure on local re-sources, especially in the school and on recreation and social services. Increased enrolments, higher levels of transience and variability of attendance in the school have been somewhat dis-ruptive and also have also raised concerns about after school activities or the lack thereof. One outcome of these concerns is the recent construction of a skate park in the heart of the vil-lage. This research is the precursor to a more comprehensive study of the demographic and social characteristics of the local population and further research is required to determine more definitively the impact of the migrants on the infrastructure and land use patterns.
Of major concern to district planners is the zoning of the Kendenup Estate. At present, virtually the entire area is zoned rural despite the concentration of small 1000 square metre lots in the central townsite or village. Land zoned for rural purposes can be used for a much wider range of uses than permitted on ur-ban zoned land and this has allowed owners to build large struc-tures on lots that are too small to accommodate them without causing visual intrusion, inconvenience and a potential fire haz-ard to neighbouring properties. Some dwellings are little more than tin sheds and are well below contemporary urban building standards. The central village has reticulated water supply, but the uncoordinated and sporadic pattern of development makes hook-ups very expensive and there are growing concerns about the community’s ability to handle its sewage. Installation of a comprehensive sewage system is far too costly and existing lot sizes in the central area are too small to accommodate septic systems. Furthermore, because of the almost flat ground, sur-face drainage is also a significant problem, especially during the winter wet season, when the land can be turned into a swamp. The Shire of Plantagenet has had a draft planning strategy for
Kendenup that has been in place for some years. To take pres-sure off the need for services and to consolidate development, the proposed plan calls for a significant reduction in the size of the village’s area and its rezoning to urban residential with a minimum lot size of 2,000 square metres, that is, large enough to accommodate on-site effluent disposal. Landgate, the State Government’s land development arm, is currently consolidating a number of the its existing 1,000 square metre lots into 2,000 square metre parcels to have them conform to the more stringent criterion (Duncan, 2012). Much of the surrounding ‘suburban’ area is to be designated as Rural Residential or Rural Small-holding zones with appropriate restrictions in conformity with State regulations (Shire of Plantagenet 2009 p.26). However, the plan’s formal implementation has been delayed at the State level and this has limited the planning authority’s ability to enforce compliance. Dealing with these kinds of issues has proven too much for some of the newcomers who have left the community in hopes of finding better conditions elsewhere (Shire of Planta-genet 2009; Duncan 2010).
ConclusionThis paper’s objectives have been to provide some geo-
graphical perspectives on the origins and evolutionary develop-ment processes that have created the community and landscape of Kendenup, a relatively intensive and anomalous settlement in the lower Great Southern district of Western Australia. Ken-denup’s location on the major highway linking metropolitan Perth to the coastal city of Albany, along with its ready access to the beaches and fishing attractions of the Southern Ocean, have provided strong inducements to those dreaming of a quasi-rural lifestyle. The locality is also blessed with high levels of sce-nic amenity, with views of the Stirling Ranges and rolling hills swathed in woods and open and productive farmland which can be quite idyllic for much of the year. De Garis’ vision of a close knit community of small scale farmers failed largely because it was poorly managed and inadequately funded, however, it is also clear that, had it not been for his original plans for closer settlement, the pioneering efforts of the earlier settlers and their improvements to its infrastructure, it is highly unlikely that the Kendenup property would be so fully developed as it currently is. Were is not for the relict cadastre left as the palimpsest for subsequent occupation, it is very doubtful that it could have been so effectively promoted and marketed by realtors to the renewed wave of migrants associated with the sea/tree change of more recent vintage.
This relict, but nevertheless legal townsite cadastre, com-prising several hundred relatively affordable urban sized lots and smaller,‘suburban’ acreages has now come within the or-bit of prospective clients seeking escape from the city, and has become an island of closer settlement within the landscape. Higher amenity properties command higher prices in the more accessible and established localities in closer proximity to the coast such as Margaret River, Denmark and Albany. They are also subject to more stringent regulations and the subdivision approval process can be a long, drawn out and expensive pro-
Prairie Perspectives: Geographical Essays (Vol: 14)
ISSN 1911-5814 43
cedure in those localities. For these reasons, the convenience of relatively available property on the Kendenup estate has become an attractive proposition for those wanting to adopt a perma-nent alternative lifestyle, or to establish a second home in an area of higher amenity while hoping to escape perceived higher living costs. Our research has thrown more light on the origins and evolution of the Kendenup settlement scheme. It provides additional insights into the nature and processes of the sea/tree change as they are occuring in Western Australia. It highlights the development problems inherent in adapting to a relict settle-ment cadastre and brings this case study into the geographical literature on planning and settlement. .
AcknowledgementsThe authors wish to thank residents of Kendenup and district
for their contributions to this paper, to the Universities of Cur-tin and Western Australia for their financial support and to two anonymous reviewers for their helpful suggestions.
ReferencesARGENT, N., TONTS, M., JONES, R. and HOLMES, J. 2011 ‘Amenity-led mi-
gration in rural Australia: a new driver of local demographic and environmental change?’ Demographic Change in Australia’s Ru-ral Landscapes (Netherlands: Springer Science+Business Media B.V.), pp. 23-44
AUSTRALIAN BUREAU OF STATISTICS 2007 (Available at http://www.cen-susdata.abs.gov.au/ABSNavigation/prenav/LocationSearch?locationLastSearchTerm=kendenup&locationSearchTerm=kendenup&newarea=SSC54331&submitbutton=View+QuickStats+%3E&mapdisplay=on&collection=Census&period=2006&areacode=SSC54331&geography=&method=Place+of+Usual+Residence&productlabel=&producttype=QuickStats&topic=&navmapdisplayed=true&javascript=true&breadcrumb=PLWL&topholder=0&leftholder=0¤taction=104&action=401&textversion=false&subaction=1)
AUSTRALIAN BUREAU OF STATISTICS 2011 ‘Regional population growth, estimated resident population, statistical local areas’ Western Aus-tralia (Table 5 viewed 27 February, 2012)
BEGUTTER, W. and BEGUTTER, C. 2011 pers. comm. 29 MarchBOLTON, G. C. 1972 A Fine Country to Starve In (Nedlands:University
of Western Australia Press)BRAYSHAY, M and SELWOOD, J. 2002 ‘Dreams, propaganda and harsh
realities: landscapes of group settlement in the forest districts of Western Australia in the 1920s’ Landscape Research 27(1) pp. 81-101
BURNLEY, I. and MURPHY, P. 2004 Sea Change: Movement from Metro-politan to Arcadian Australia (Sydney: University of New South Wales Press)
CAIRNS, D.C. 1965 A History of Kendenup: A Resume of the Growth and Development from the First Explorers to the Present Time (Teach-ers’ Higher Certificate Optional Thesis, Perth, Unpub.)
CROWLEY, F.K. 1960 Australia’s Western Third (London: MacMillan & Co. Ltd)
DE GARIS, C.J. 1925 The Victories of Failure (Melbourne: Modern Print-ing Company)
DEPARTMENT OF LANDS AND SURVEYS, WESTERN AUSTRALIA 1976 “Kend-enup Sheet 1” [Tally No. 504531] State Records Office of Western Australia, Con. 5698, Ser. 2168 “Townsite Plans”
DUNCAN, P. 2010 Shire Planner, Plantagenet. pers. comm. 11 MarchDUNCAN, P. 2012 Shire Planner, Plantagenet. pers. comm. 3 MarchEDUCATION DEPARTMENT OF WESTERN AUSTRALIA 2011 Kendenup Pri-
mary School (Available at http://www.det.wa.edu.au/schoolson-line/main_page.do, accessed 27 February)
FERGIE, H. and SAGGER, V. 2010 Farmers. pers. comm. 8 AprilFLINDERS RANGE RESEARCH 2011 Village Settlements (Available at www.
southaustralianhistory.com.au/village.htm, accessed 14 April)FREESTONE, R. 2007 Designing Australia’s Cities: Culture, Commerce
and the City Beautiful, 1900-1930 (Sydney: UNSW Press)GABBEDY, J. 1988 Group Settlement (Nedlands: University of Western
Australia Press)GARNAUT, C. 2003 ‘Making modern (river) towns: town planning and
the expension of the Upper Murray irrigation area’ Journal of the Historical Society of South Australia 31, pp. 69-84
GLOVER, R. 1979 Plantagenet: A History of the Shire of Plantagenet, Western Australia (Nedlands: University of Western Australia Press)
GOVERNMENT OF WESTERN AUSTRALIA, DEPARTMENT OF LANDS AND
SURVEYS 1919 Kendenup Estate (State Records of Western Austra-lia Cons. 1632.15935/10)
GRIFFITHS, H. 2011 Realtor. pers. comm. 30 March HENZELL, T. 2007 Australian Agriculture: Its History and Challenges
(Collingwood: CSIRO Publishing).HILL, E. 1946 Water into Gold (Melbourne: Robertson & Mullens) 7th
ed.KELLY, T. and KELLY, D. 2011 Farmers. pers. comm. 30th MarchKENDENUP PRIMARY SCHOOL 2012 Enrolment History – Kendenup Pri-
mary School, 1982-2012 (Unpublished manuscript)LENNARD, N. 2011 Businessman, pers. com. 29 AprilMCCALMAN, J. 2006 ‘De Garis, Clement John (Jack) (1884 - 1926)’
Australian Dictionary of Biography, online edition (Australian Na-tional University, available at http://www.adb.online.anu.edu.au/references/A080289r.htm)
MCKENZIE, F. 2010 ‘Sea change, second homes and planning in West-ern Australia’ in Planning Perspectives from Western Australia: A Reader in Theory and Practice, eds. I.Alexander, S.Greive & D.Hedgcock (North Fremantle, Western Australia: Fremantle Press), 104-120
MEAT & LIVESTOCK AUSTRALIA (MLA) 2012 (Available at http://weather.mla.com.au/climate-history/wa/, accessed 16 February)
MENTHA, S 1984 Kendenup Pea Industry: 21 Years (Albany: Albany Advertiser)
MURPHY, F. 1921 Kendenup, W.A. film clip (State Records of Western Australia)
NADERI, P. 2010 Realtor. Pers. Comm. 10 MarchNICHOLS, D. and MAUDSLEY, A. 2012 ‘The colonial grid in Mildura and
Kendenup’ in Proceedings of the 11th Australasian Urban His-tory/Planning Conference, eds. A. Gaynor, E. Gralton, J. Gregory, and S. McQuade (Nedlands: University of Western Australia), pp. 217-232
Prairie Perspectives: Geographical Essays (Vol: 14)
ISSN 1911-5814 44
ORZEL, J. 2010 Realtor. Pers. Comm. 10 MarchOYSTER HARBOUR CATCHMENT GROUP INC. 2012 (Available at http://
www.ohcg.org.au/catchment.php, accessed 16 February) POWELL, J.M. 1973 ‘Arcadia and Back: “village settlement” in Victoria,
1894- 1913’ Australian Geographical Studies 11(2) pp. 134-49 POWELL, J.M. 1988 An Historical Geography of Modern Australia The
Restive Fringe (Cambridge: Cambridge University Press)ROWE, C.W. 1979 Autobiography of Frederick Walton Rowe (Battye Li-
brary Oral History Programme), OH 213/3-5
SALT, B. 2001The Big Shift (South Yarra: Hardie Grant Books)SANDILANDS, K. and SANDILANDS, C. W. (2010) Farmers. pers. comm.
7 AprilSHIRE OF PLANTAGENET 2009 ‘Draft local planning strategy: Appen-
dix 2’ Kendenup Rural Village (Mount Barker, Western Australia: Shire of Plantagenet)
WILLIAMS, M. 1974 The Making of the South Australian Landscape (London: Academic Press)
Prairie Perspectives: Geographical Essays (Vol: 14)
ISSN 1911-5814 45
Can satellite imagery evaluate the pre-condition of a grazing experiment?
Xiaohui Yang Department of Geography and Planning, University of Saskatchewan Saskatoon, SK, S7N [email protected]
John F. WilmshurstEcosystem science coordinator, Jasper National Park of Canada, Parks Canada, Jasper AB, T0E 1E0 [email protected]
Michael Fitzsimmons Ecosystem scientist, Grasslands National Park, Val Marie, SK., S0N [email protected]
Xulin Guo*Department of Geography and Planning, University of Saskatchewan Saskatoon, SK, S7N [email protected]
Abstract
Most studies on grazing effects are based on the assumption that vegetation conditions at experiment sites that are sub-ject to different grazing treatments, are the same prior to grazing, which may not be true. The pre-existing differences in vegetation may be wrongly attributed to the influence of grazing if pre-validation of vegetation conditions at the site is not performed. In this paper, the assumption stated above was verified by comparing vegetation condition between nine ex-periment units (pastures) in a grazing experiment site set up by Grasslands National Park (GNP) before grazing treatment started. The leaf area index (LAI) was applied to represent vegetation conditions within the grazing experiment site. The vegetation conditions between the nine pastures were compared at different scales and vegetation growing stages. Results in-dicate that vegetation conditions measured with 1m2 sampling scale showed a significant difference among the nine pastures (p<0.1). No significant differences were observed when measurements were conducted with 100m2 and 400m2 sampling scales (p>0.1). Variation of vegetation conditions of the nine pastures in peak and late growing stages were very consistent. These results indicate that sampling scale plays an important role in vegetation condition assessment. Remote sensing of-fers data in multi-spatial resolution which provides an efficient way for investigating vegetation condition at different scales. Keywords: grazing experiment validation, atmosphere transformed soil adjusted vegetation index, leaf area index, mixed grass prairie
Prairie Perspectives: Geographical Essays (Vol: 14)
ISSN 1911-5814 46
IntroductionGrasslands, covering nearly one fifth of the earth’s land, are
primarily used for livestock production. More than 37.5 million km2 (Dregene 1983) or about 61% of the arid regions of the world are used for ranching (UNEP 1992). One of the primary challenges in rangeland studies has been to understand the ef-fects of herbivore grazing on ecological processes and biophysi-cal factors (Briske et al. 2003). Grazing effects are usually iden-tified by comparing the vegetation response variables (i.e. plant community composition, productivity, forage quality and many others) in sites that are being grazed to those in areas without any disturbances. However, grasslands are inherently heteroge-neous because of vegetation characteristics (i.e. productivity, diversity, and composition) that are highly variable across mul-tiple scales (Ludwig and Tongway 1995). These variations are related to different ecological processes such as topography, soil pattern, microclimate and precipitation (Levin 1978; Urban et al. 1987; Crawley 1996; He et al. 2006). Small scale variation in vegetation is related to the heterogeneity of soil (Reynolds et al. 1997). At a large scale, variations of vegetation are controlled by topography or landforms (Sebastiá 2004). These pre-existing variations in grazing response variables may confound interpre-tation of grazing effects. To reduce the influence of outside fac-tors, other than grazing on vegetation, most of the studies on grazing effects attempt to select sites with similar vegetation and environmental conditions and assume similarity of these condi-tions in grazed and ungrazed sites prior to the grazing experi-ment (Fisher et al. 2009).
However, from 1919 to present, none of the grazing trials which looked at variable rate grazing conducted in mixed- and short grass prairie of North American had incorporated a be-fore-treatment sampling period to test whether the vegetation conditions of these sites were the same before the experiment started (Koper et al. 2008). Since the effects of grazing on veg-etation depend upon the interaction between the spatial pattern of grazing and pre-existing spatial pattern of vegetation (Adler 2001), assessing before-treatment variation is important to iden-tify post-treatment effects.
Recently, a large manipulative grazing experiment designed to study the ecological integrity of mixed grasslands was started in Grasslands National Park of Canada (GNP). The mixed grass-lands located in GNP had been protected from grazing and other disturbances since the land was acquired in the mid 1990s (Hen-derson 2005). The experiment was set up in 2007 and cattle were introduced into the experiment site in June 2008. This provides a unique pre-treatment period for examining the pre-existing en-vironmental patterns in the experiment site and help further the understanding of grazing effects on this area in future studies.
The primary objective of this study is to verify the assump-tion proposed for most grazing studies that vegetation condi-tions are same among experiment units through examining the vegetation conditions in experiment area in GNP prior to graz-ing treatment. To achieve this goal, LAI is measured and used as an indicator of vegetation condition in the experiment site. LAI, defined as one-half the total green leaf area per unit of ground surface area (Chen and Black 1992), determines canopy water
interception and carbon gas exchange between vegetation and the environment. Past researches have found that LAI highly correlates with many vegetation biophysical properties such as biomass, canopy height and ground cover (Guo et al. 2005; He et al. 2009) and is also an indicator of vegetation vertical structure. Thus, it has been broadly used to describe or quantify vegetation condition. On the other hand, considering the scale dependence of vegetation conditions, it is essential to examine vegetation condition at multiple scales. To quantify vegetation conditions at a smaller scale, field methods are feasible; however, it is com-monly recognized as a time-consuming and expensive when applied to measure vegetation conditions at a large scale. LAI can be easily derived from remote sensing providing an efficient way to quantify vegetation conditions at a large scale. In this study, conditions of vegetation between pastures, at different scales, is assessed by comparing LAI collected from different sampling scales. Small scale LAI is measured with field method and large scale LAI is derived from remote sensing image. Veg-etation condition at different growing stages is also investigated through comparing LAI collected in peak and late stages.
Methods
Experimental site description
The study was conducted in the East Block of GNP in Sas-katchewan, Canada (lat 49°01΄00˝N, long 107°49΄00˝W), which is located in southern Saskatchewan along the Canada-United States border (Figure1). This area falls within the Great Plain which is characterized by semiarid climate with approximately 350mm of annual precipitation and 347mm of annual evapo-transpiration (Coupland 1992; Kottek et al. 2006). The experi-mental area is 26.5km2 in size, comprising nine experiment units (pastures) which were constructed specifically for the ex-periment. Each pasture occupies nearly 300ha and incorporates similar landscapes, vegetation communities and natural water source locations. (Henderson 2005). Four major vegetation types are found at the experiment site: upland, slope and valley grasslands along with riparian shrub communities. Experiment pastures are dominated by upland and valley grasslands with some riparian shrub and slope grasslands also present but to a lesser extent (Michalsky and Ellis 1994). The upland grasslands is composed primarily of grass or sedges and low percentage of shrub. The dominant native grass species in the uplands are nee-dle-and-thread (Stipa comate Trin. & Rupr), blue grama grass (Bouteloua gracilis (HBK) Lang. ex Steud) and western wheat-grass (Pascopyrum smithii Rydb) (Fargey et al. 2000). Valley grassland is characterized by a high abundance of shrub such as silver sagebrush (Artemisia cana) and snowberry (Symphoricar-pos albus) as well as grass including wheatgrass (Pascopyrum spp.) and bluegrass (Poa spp.). The major soil type in the experi-ment site is Chernozemic or typical grassland soil commonly associated with solonetzic or saline soils (Zhang and Guo 2007). The surface horizon of grassland soil is dark and fertile due to accumulations of organic matter over time from grass and herb roots (Westworth and Associated Ltd 1994). In June 2008, cows
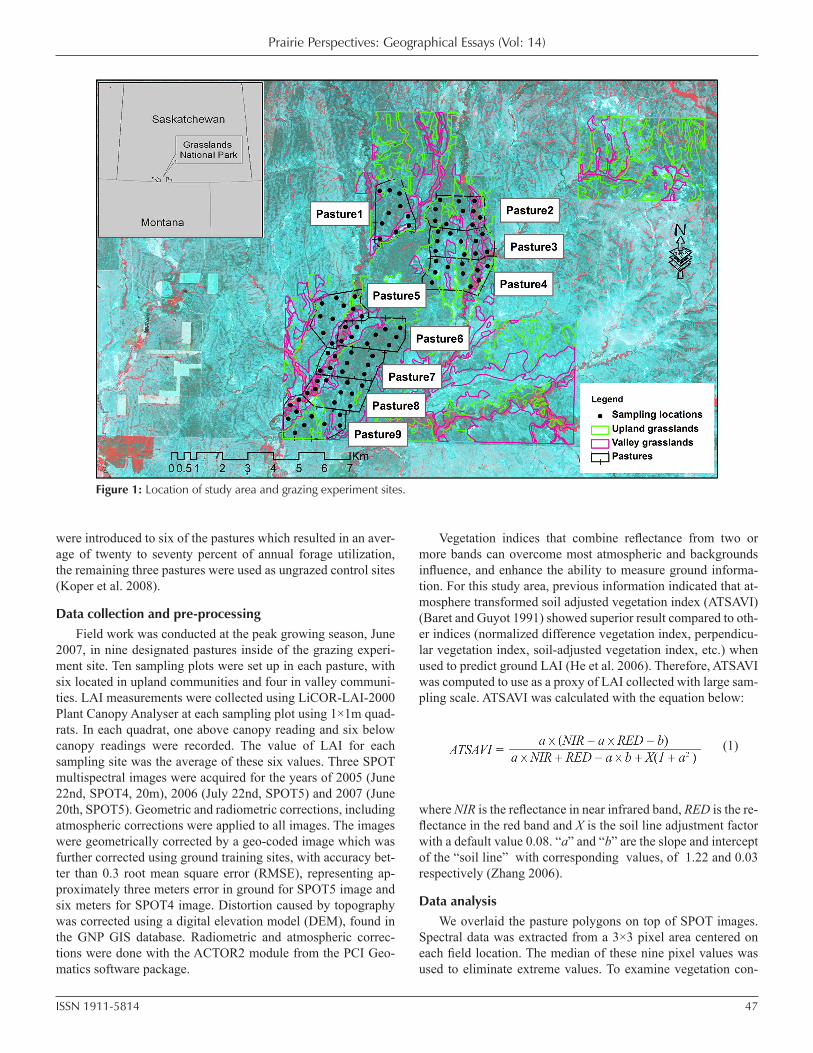
Prairie Perspectives: Geographical Essays (Vol: 14)
ISSN 1911-5814 47
were introduced to six of the pastures which resulted in an aver-age of twenty to seventy percent of annual forage utilization, the remaining three pastures were used as ungrazed control sites (Koper et al. 2008).
Data collection and pre-processing Field work was conducted at the peak growing season, June
2007, in nine designated pastures inside of the grazing experi-ment site. Ten sampling plots were set up in each pasture, with six located in upland communities and four in valley communi-ties. LAI measurements were collected using LiCOR-LAI-2000 Plant Canopy Analyser at each sampling plot using 1×1m quad-rats. In each quadrat, one above canopy reading and six below canopy readings were recorded. The value of LAI for each sampling site was the average of these six values. Three SPOT multispectral images were acquired for the years of 2005 (June 22nd, SPOT4, 20m), 2006 (July 22nd, SPOT5) and 2007 (June 20th, SPOT5). Geometric and radiometric corrections, including atmospheric corrections were applied to all images. The images were geometrically corrected by a geo-coded image which was further corrected using ground training sites, with accuracy bet-ter than 0.3 root mean square error (RMSE), representing ap-proximately three meters error in ground for SPOT5 image and six meters for SPOT4 image. Distortion caused by topography was corrected using a digital elevation model (DEM), found in the GNP GIS database. Radiometric and atmospheric correc-tions were done with the ACTOR2 module from the PCI Geo-matics software package.
Vegetation indices that combine reflectance from two or more bands can overcome most atmospheric and backgrounds influence, and enhance the ability to measure ground informa-tion. For this study area, previous information indicated that at-mosphere transformed soil adjusted vegetation index (ATSAVI) (Baret and Guyot 1991) showed superior result compared to oth-er indices (normalized difference vegetation index, perpendicu-lar vegetation index, soil-adjusted vegetation index, etc.) when used to predict ground LAI (He et al. 2006). Therefore, ATSAVI was computed to use as a proxy of LAI collected with large sam-pling scale. ATSAVI was calculated with the equation below:
(1)
where NIR is the reflectance in near infrared band, RED is the re-flectance in the red band and X is the soil line adjustment factor with a default value 0.08. “a” and “b” are the slope and intercept of the “soil line” with corresponding values, of 1.22 and 0.03 respectively (Zhang 2006).
Data analysisWe overlaid the pasture polygons on top of SPOT images.
Spectral data was extracted from a 3×3 pixel area centered on each field location. The median of these nine pixel values was used to eliminate extreme values. To examine vegetation con-
Figure 1: Location of study area and grazing experiment sites.
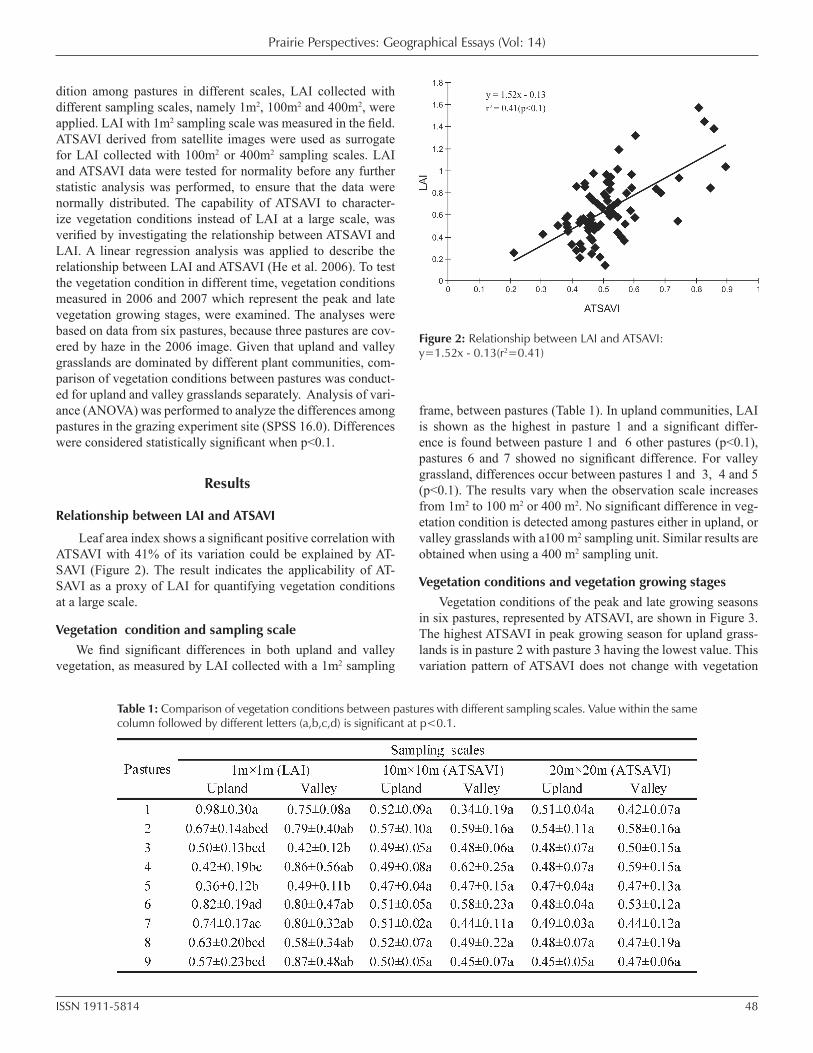
Prairie Perspectives: Geographical Essays (Vol: 14)
ISSN 1911-5814 48
dition among pastures in different scales, LAI collected with different sampling scales, namely 1m2, 100m2 and 400m2, were applied. LAI with 1m2 sampling scale was measured in the field. ATSAVI derived from satellite images were used as surrogate for LAI collected with 100m2 or 400m2 sampling scales. LAI and ATSAVI data were tested for normality before any further statistic analysis was performed, to ensure that the data were normally distributed. The capability of ATSAVI to character-ize vegetation conditions instead of LAI at a large scale, was verified by investigating the relationship between ATSAVI and LAI. A linear regression analysis was applied to describe the relationship between LAI and ATSAVI (He et al. 2006). To test the vegetation condition in different time, vegetation conditions measured in 2006 and 2007 which represent the peak and late vegetation growing stages, were examined. The analyses were based on data from six pastures, because three pastures are cov-ered by haze in the 2006 image. Given that upland and valley grasslands are dominated by different plant communities, com-parison of vegetation conditions between pastures was conduct-ed for upland and valley grasslands separately. Analysis of vari-ance (ANOVA) was performed to analyze the differences among pastures in the grazing experiment site (SPSS 16.0). Differences were considered statistically significant when p<0.1.
Results
Relationship between LAI and ATSAVI
Leaf area index shows a significant positive correlation with ATSAVI with 41% of its variation could be explained by AT-SAVI (Figure 2). The result indicates the applicability of AT-SAVI as a proxy of LAI for quantifying vegetation conditions at a large scale.
Vegetation condition and sampling scaleWe find significant differences in both upland and valley
vegetation, as measured by LAI collected with a 1m2 sampling
frame, between pastures (Table 1). In upland communities, LAI is shown as the highest in pasture 1 and a significant differ-ence is found between pasture 1 and 6 other pastures (p<0.1), pastures 6 and 7 showed no significant difference. For valley grassland, differences occur between pastures 1 and 3, 4 and 5 (p<0.1). The results vary when the observation scale increases from 1m2 to 100 m2 or 400 m2. No significant difference in veg-etation condition is detected among pastures either in upland, or valley grasslands with a100 m2 sampling unit. Similar results are obtained when using a 400 m2 sampling unit.
Vegetation conditions and vegetation growing stages Vegetation conditions of the peak and late growing seasons
in six pastures, represented by ATSAVI, are shown in Figure 3. The highest ATSAVI in peak growing season for upland grass-lands is in pasture 2 with pasture 3 having the lowest value. This variation pattern of ATSAVI does not change with vegetation
Figure 2: Relationship between LAI and ATSAVI: y=1.52x - 0.13(r2=0.41)
Table 1: Comparison of vegetation conditions between pastures with different sampling scales. Value within the same column followed by different letters (a,b,c,d) is significant at p<0.1.
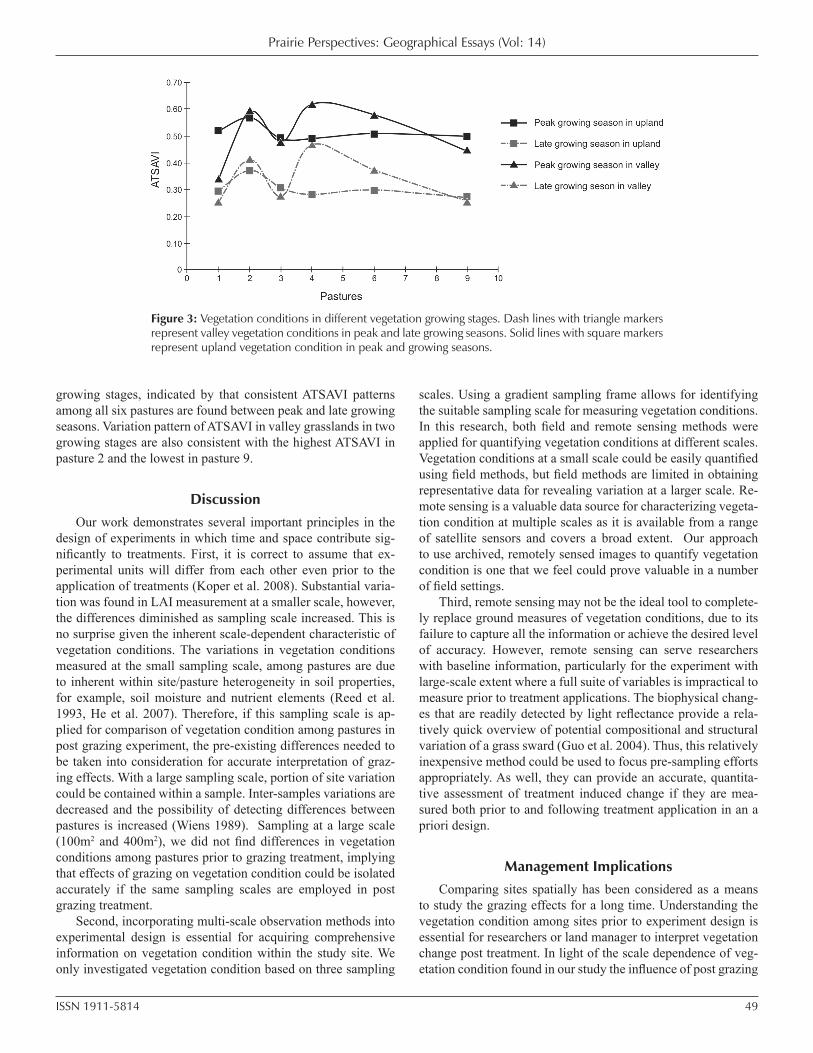
Prairie Perspectives: Geographical Essays (Vol: 14)
ISSN 1911-5814 49
growing stages, indicated by that consistent ATSAVI patterns among all six pastures are found between peak and late growing seasons. Variation pattern of ATSAVI in valley grasslands in two growing stages are also consistent with the highest ATSAVI in pasture 2 and the lowest in pasture 9.
DiscussionOur work demonstrates several important principles in the
design of experiments in which time and space contribute sig-nificantly to treatments. First, it is correct to assume that ex-perimental units will differ from each other even prior to the application of treatments (Koper et al. 2008). Substantial varia-tion was found in LAI measurement at a smaller scale, however, the differences diminished as sampling scale increased. This is no surprise given the inherent scale-dependent characteristic of vegetation conditions. The variations in vegetation conditions measured at the small sampling scale, among pastures are due to inherent within site/pasture heterogeneity in soil properties, for example, soil moisture and nutrient elements (Reed et al. 1993, He et al. 2007). Therefore, if this sampling scale is ap-plied for comparison of vegetation condition among pastures in post grazing experiment, the pre-existing differences needed to be taken into consideration for accurate interpretation of graz-ing effects. With a large sampling scale, portion of site variation could be contained within a sample. Inter-samples variations are decreased and the possibility of detecting differences between pastures is increased (Wiens 1989). Sampling at a large scale (100m2 and 400m2), we did not find differences in vegetation conditions among pastures prior to grazing treatment, implying that effects of grazing on vegetation condition could be isolated accurately if the same sampling scales are employed in post grazing treatment.
Second, incorporating multi-scale observation methods into experimental design is essential for acquiring comprehensive information on vegetation condition within the study site. We only investigated vegetation condition based on three sampling
scales. Using a gradient sampling frame allows for identifying the suitable sampling scale for measuring vegetation conditions. In this research, both field and remote sensing methods were applied for quantifying vegetation conditions at different scales. Vegetation conditions at a small scale could be easily quantified using field methods, but field methods are limited in obtaining representative data for revealing variation at a larger scale. Re-mote sensing is a valuable data source for characterizing vegeta-tion condition at multiple scales as it is available from a range of satellite sensors and covers a broad extent. Our approach to use archived, remotely sensed images to quantify vegetation condition is one that we feel could prove valuable in a number of field settings.
Third, remote sensing may not be the ideal tool to complete-ly replace ground measures of vegetation conditions, due to its failure to capture all the information or achieve the desired level of accuracy. However, remote sensing can serve researchers with baseline information, particularly for the experiment with large-scale extent where a full suite of variables is impractical to measure prior to treatment applications. The biophysical chang-es that are readily detected by light reflectance provide a rela-tively quick overview of potential compositional and structural variation of a grass sward (Guo et al. 2004). Thus, this relatively inexpensive method could be used to focus pre-sampling efforts appropriately. As well, they can provide an accurate, quantita-tive assessment of treatment induced change if they are mea-sured both prior to and following treatment application in an a priori design.
Management ImplicationsComparing sites spatially has been considered as a means
to study the grazing effects for a long time. Understanding the vegetation condition among sites prior to experiment design is essential for researchers or land manager to interpret vegetation change post treatment. In light of the scale dependence of veg-etation condition found in our study the influence of post grazing
Figure 3: Vegetation conditions in different vegetation growing stages. Dash lines with triangle markers represent valley vegetation conditions in peak and late growing seasons. Solid lines with square markers represent upland vegetation condition in peak and growing seasons.
Prairie Perspectives: Geographical Essays (Vol: 14)
ISSN 1911-5814 50
treatment may be expressed at different levels of organizations (landscape, community, population and individual) (Fuhlen-dorf and Smeins 1997, 1998). We do suggest that multi-scale observations should be applied both before and after treatment to better understand the grazing effects. Given consideration of expenses, time and accuracy, remote sensing methods appear to be a better choice for detecting multi-scale vegetation change especially in sites with a broad extent.
Acknowledgements Research was funded by the Parks Canada, Engineering Re-
search Council of Canada (NSERC) and Department of Geogra-phy and Planning, University of Saskatchewan.
ReferencesADLER, P.B., RAFF, D.A. and LAUENROTH, W.K. 2001 ‘The effect of graz-
ing on the spatial heterogeneity of vegetation’ Oecologia 128(4): 465-479
BARET, F. and GUYOT, G. 1991 ‘Potential and limits of vegetation indices for LAI and APAR assessment’ Remote Sensing of Environment 35:161-173
BRISKE, D.D., FUHLENDORF, S.D. and SMEINS, F.E. 2003 ‘Vegetation dy-namics on rangelands: a critique of the current paradigms’ Jour-nal of Applied Ecology 40 (4): 601-614 doi: 10.1046/j.1365-2664.2003.00837.x
CHEN, J.M. and BLACK, T.A. 1992 ‘Defining leaf area index for non-flat leaves’ Plant, Cell and Environment 15(4): 421-429 doi: 10.1111/j.1365-3040.1992.tb00992.x
COUPLAND, R.T. 1992 ‘Mixed Prairie’ in Ecosystem of the World: Nat-ural Grasslands, Introduction and Western Hemisphere, ed. R.T. Coupland (New York: Elsevier Science publishers) 152-153
CRAWLEY, M.J. 1996 ‘The structure of plant communities’ in Plant Ecol-ogy, ed. M. J. Crawle (London: Blackwell Science) 475-531
DREGNE, H.E. 1983 Desertification of Arid Lands (New York: Harwood Academic Publisher) 242
FARGEY, K.S., LARSON, S.D., GRANT, S.J., FARGEY, P., and SCHMIDT, C., 2000 Grassland National Park Field Guide (Val Marie: Prairie wind & silver sage-friends of grasslands Inc.)
FISHER, J.K., COLE, L. and ANDERSON, R.S. 2009 ‘Using packrat middens to assess grazing effects on vegetation change’ Journal of Arid En-vironments 73(10): 937-948 doi:10.1016/j.jaridenv.2009.04.006
FUHLENDORF, S.D. and SMEINS, F.E. 1997 ‘Long-term vegetation dy-namics mediated by herbivores, weather and fire in a Juniperus-Quercus savanna’ Journal of Vegetation Science 8 (6): 819-828 doi:10.2307/3237026
FUHLENDORF, S.D. and SMEINS, F.E. 1998 ‘The influence of soil depth on plant species response to grazing within a semi-arid savanna’ Plant Ecology 138:89-96
GUO, X., ZHANG, C., WILMSHURST, J.F. and SISSONS, R. 2005 ‘Monitoring grassland health with remote sensing approaches’ Prairie Perspec-tives 8:11-22
GUO, X., WILMSHURST, J.F., MCCANNY, S., FARGEY, P.J., and RICHARD, P. 2004 ‘Measuring spatial and vertical heterogeneity of grassland us-
ing remote sensing techniques’ Journal of Environmental Informat-ics 3 (1):24-32
HE, Y., GUO, X. and WILMSHURST, J.F. 2006 ‘Studying mixed grassland ecosystem I: suitable hyperspectral vegetation indices’ Canadian Journal of Remote Sensing 32(2):98-107
HE, Y., GUO, X. and SI, B. 2007 ‘Detecting grassland spatial variation by a wavelet approach’ International Journal of Remote Sensing 28(7):1527-1545
HE, Y., GUO, X. and WILMSHURST, J.F. 2009 ‘Reflectance measures of grassland biophysical structure’ International Journal of Remote Sensing 30(10):2509-2521
HENDERSON, D.C. 2005 Restoration of Grazing-induced Heterogene-ity: Large Scale Experiment and Long-term Monitoring Plan for Grasslands National Park, Canada (Western Canada Service Cen-tre, Parks Canada,Winnipeg, MB)
KOPER, N., HENDERSON, D.C., WILMSHURST, J.F., FARGEY, P.J. and SISSONS,
R.A. 2008 ‘Design and analysis of rangeland experiments along continuous gradients’ Rangeland Ecology Management 61 (6): 605-613. doi: 10.2111/08-046.1
KOTTEK, M., GRIESER, J., BECK, C. and RUDDLF, B. 2006 ‘World map of the Köppen-Geiger climate classification updata’ Meteorologische Zeitschrift 15(3): 259-263
LEVIN, S.A. 1978 ‘Pattern formation in ecological communities’ in Spa-tial Pattern in Plankton Communities, ed. J. S. Steele (New York: USA Plenum Press) 433-465
LOBO, A., MOLONEY, K., CHIC, O. and CHIARIELLO, N. 1998 ‘Analysis of fine-scale spatial pattern of a grassland from remotely-sensed im-agery and field collected data’ Landscape Ecology 13(2):111-131. doi: 10.1023/A:1007938526886
LUDWIG, J.A. and TONGWAY, D.J. 1995 ‘Spatial organization of land-scapes and its function in semi-arid woodlands, Australia’ Land-scape Ecology 10(1):51-63
MICHALSKY, S.J. and ELLISE, R.A. 1994 Vegetation of Grasslands National Parks (Calgary: D. A. Westworth and Associates Ltd.)
REED, R.A., PEET, R.K., PALMER, M.W. M. and WHITE, P.S. 1993 ‘Scale de-pendence of vegetation environment correlations: a case study of North Carolina piedmont woodland’ Journal of Vegetation Science 4(3):329-340. doi:10.2307/3235591
SEBASTIA, M.T. 2004 ‘Role of topography and soil in grassland struc-turing at the landscape and community scales’ Basic and Applied Ecology 5 : 331-346. doi: 10.1016/j.base.2003.10.001
UNEP 1992 World Atlas of Desertification (London: Edward Arnold) 69 URBAN, D.L., O’NEILL, R. and SGUGART, H. Jr. 1987 ‘Landscape ecology: a
hierarchical perspective can help scientists understand spatial pat-terns’ Bioscience 37:119-127
WESTWORTH, D.A. and ASSOCIATES LTD. 1994 Vegetation of Grasslands National Park: Summary Report
WIENS, J.A. 1989 ‘Spatial scaling in ecology’ Functional Ecology 3:385-397
ZHANG, C. and GUO, X. 2007 ‘Measuring biological heterogene-ity in the northern mixed prairie: a remote sensing approach’ The Canadian Geographer 51(4): 462-474. doi: 10.1111/j.1541-0064.2007.00192x
ZHANG, C. 2006 Monitoring Biological Heterogeneity in a Northern Mixed Prairie Using Hierarchical Remote Sensing Methods (PhD thesis, University of Saskatchewan, Saskatchewan)
Prairie Perspectives: Geographical Essays (Vol: 14)
ISSN 1911-5814 51
Critical erosion velocity for natural shale gravels: an empirical study
E.L. BlaisAECOM, Winnipeg, Manitoba, Canada R3P [email protected]
R.A. McGinnDepartment of Geography, Brandon University, Brandon Manitoba, Canada R7A 6A9 [email protected]
Abstract
The objective of this study is to compare critical erosion velocity power function models (V* = cDn) derived for gravel size bed material (spheroids with a relative density equal to 2.65), to one derived for naturally occurring shale bed material which is atypical in shape and relative density. The relative density of the shale was found to be 1.80. On the basis of the mean triaxial dimensions the shale gravels can be described as discoid, platy and/or bladed. The flume used in this study was 11.5m long, 30.7cm wide, with a maximum depth of 30.0cm. Seven bed samples were prepared and categorized according to mean par-ticle size (D). A known discharge (Q) was passed through the flume and flow depth (d) gradually decreased until velocities were sufficient to initiate particle movement. Critical erosion velocity (Vmc) was operationally defined as the mean cross-sectional velocity (Q/AX) causing sufficient particle motion such that the bed packing arrangement failed and the bed became mobile. The result of each run was plotted. A curvilinear relationship between critical erosion velocity (Vmc) and grain size (D) was noted. Data were subsequently transformed to logarithms and the least squares regression line calcu-lated to be Vmc = 0.293D0.5. In natural shale gravels the compensating effects of low relative density and atypi-cal shape result in a critical erosion velocity function similar to those produced by similar experimental studies. Key words: Critical erosion velocity, shale gravels
IntroductionIncipient particle motion occurs when the shear stress as-
sociated with stream flow over the bed attains or exceeds a criti-cal value (Simmons and Senturk 1977 p399). Simply stated, a threshold condition exists for each particle where the forces promoting movement overcome the specific particle’s resis-tance to movement. Stelczer (1981) refers to this threshold as the “critical condition.” Researchers in fluvial hydraulics prefer to use the term introduced by Du Boys in1879 “critical trac-tive force” as a measure of the critical condition (Shields 1936; White 1940; Vanoni et al. 1966). Geomorphologists and clas-sical flume modelers have employed the various critical erosion velocity terms (Hjulstrom 1935, 1939; Rubey 1937; Bagnold
1954; Novak 1973). Other researchers favour Bagnold’s (1966, 1980) concept of stream power (Yang 1976; Knighton 1999; Pe-tit et al. 2005).
In 1940 White presented a simplified model which theoreti-cally analyzes the fluid forces acting on a spherical particle lying on a horizontal stream bed. The model equates the resistance to movement (the moment of weight, Mw) to the forces required for movement; critical tractive force, itself simplified to fluid drag forces or the moment of drag (Md). Consequently, the critical condition in White’s model may be summarized as an equality Mw = Md. Although White’s model and similar critical tractive force models such as Shields (1936), Gessler (1965) and Hel-ley (1969) are supported by numerous laboratory experiments,
Prairie Perspectives: Geographical Essays (Vol: 14)
ISSN 1911-5814 52
applications to stream channels have not been that successful (Lane and Carlson 1953; Leliavsky, 1966; Baker and Ritter 1975; Stelczer 1981). Carson (1971) cites the general assump-tion of average conditions employed in theoretical models as a possible explanation for the variety of experimental results. Also, Carson points out that some tractive force models assume that the lift component of critical tractive force is very small (White 1940), whereas Chepil (1961) and Colman (1969, 1972) have demonstrated that lift and drag forces may be of equal magnitude. The American Society of Civil Engineers acknowl-edges that “Lift is of a considerable importance in entraining sediment” (ASCE 1975 p104).
Hjulstrom (1935) produced an empirically derived diagram which relates particle size to critical erosion velocity (CEV) or, as Morisawa (1968 p47) suggests, the velocity at which a criti-cal tractive force operates on a given particle on a given slope. This geomorphological concept, “fluid impact theory” has been investigated by several researchers (Rubey 1937; Bogardi and Yen 1938, Velinkanov 1931, 1948; Bagnold 1955; Sundborg 1956; Neill 1967; Galay 1971; Novak 1973). The results of Ga-lay’s and Novak’s empirical studies involving natural channels deviate from those predicted by the controlled flume modelling experiments such as Bogardi and Yen (1938), Hallmark and Smith (1965) and Neill (1967). Novak (1973) suggests that the discrepancies may be due to several factors:
1. Various operational definitions of erosion velocity, for ex-ample, the bottom velocity (Bogardi and Yen 1938; Stelczer 1981) and the mean cross-section velocity (Hjulstrom 1935; Neill 1967).
2. The effect of depth of flow on velocity gradients and associ-ated shear stresses (Neill 1967);
3. the effects of suspended sediment load (Lane 1955 and Sun-dborg 1956), channel pavements (Izbash 1936), and various bedforms (Sundborg 1956); and
4. the general use of uniform size spheroid shaped bed mate-rial in the flume studies (Simons and Senturk 1977).
In addition, Novak (1973) proposes that the difference be-tween naturally observed erosion velocities and comparable CEV measured in flume experiments (the bottom velocity or the mean cross-sectional velocity) is even more significant when gravel-size material is taken into account. Stelczer (1981) in-dicates that the dimensions of the experimental flumes in coarse gravel-size experiments impose limitations on particle diameters and flow depth/roughness ratios and points out that bottom flow velocity is affected by flume width. Bogardi (1978), consider-ing the inaccuracies and uncertainties affecting the estimation of bottom velocity, advocates the use of the, equally inaccurate but more easily measured, mean cross-sectional velocity.
Galay (1971) compared the experimental results of Izbash (1936), Hallmark and Smith (1965), and Bhowmik and Simons (1970) with respect to critical mean cross-sectional velocities (Vmc) and particle size (D). He found that the empirical relation-ships demonstrated by these studies are of the general form Vmc is approximated by D0.5, where D represents the median size of
uniform spheroid gravels. Assuming a spherical particle shape, the general relationship can be expresses as Vmc = cDn. Galay (1971) points out that these studies employ flume experiments and predicts that natural stream conditions will result in signifi-cantly different results.
Bogardi (1978) reviewed the flume experiments investi-gating the relationship between various erosion velocities (V*) and particle size (D); (Bogardi and Yen 1938, Kalmar 1952, and Neill 1967). His findings support the use of the power function V* = cDn as a model for extending the Hjulstrom curve to in-clude gravel size materials. Bogardi (1978) however, indicates that the regression constant (c) varies considerably in these ex-periments and suggests that the deviations from the mean value (c = 0.267 ± 0.048) reflect different particle relative densities (specific gravities), variations in the operational definition of erosion velocity and different flow depths within the flumes. Galay (1971), Novak (1973) and Bogardi (1978), stress that fur-ther studies of erosion velocity for natural riverine gravels are required.
The Study ObjectiveThe objective of this study is to compare the published CEV
formulae derived for typical gravel size bed material (spheroids with a relative density (RD) equal to approximately 2.65), to one derived for naturally occurring bed material which is atypical in shape and relative density.
Materials and MethodologyShale was selected as the sample bed material. The small
watersheds draining the eastern slopes of the Manitoba Escarp-ment provide an accessible source of riverine shale gravels. The gravels originate in the Odanah Member of the Pierre Forma-tion. Odanah Shale is hard olive-grey siliceous shale that forms the cap rock of the Manitoba Escarpment. It is underlain by a softer olive grey clayey shale; the Millwood Member.
Triaxial dimensions of gravel size Odanah Shale plot on a Zingg diagram in the oblate/discoid and/or triaxial/bladed re-gions (Figure 1a). Plotted on a spherical ternary diagram the shale shapes are classified as very-platy or very-bladed/very-elongated (Figure 1b). Mean ASCE (Corey) Shape Factor (c/ab0.5) for the discs is 0.257 ± 0.014; for blades, 0.296 ± 0.064. The prominent disc and blade shapes are the results of hydration weathering the natural fissility of the shale and fluvial abrasion. The relative density (RD) of Odanah Shales was found to be 1.80.
Flume experiments were conducted at the University of Manitoba, Faculty of Engineering Hydraulics Laboratory. The flume used in this study was 11.5 m long, 0.307 m wide, with a functional maximum depth of 0.30 m. The flume has a design sediment bed working space one metre long by 0.06 m deep. Observations were restricted to the central third of the sediment bed to avoid the influence of higher flow velocities associated with the smooth flume bed upstream.
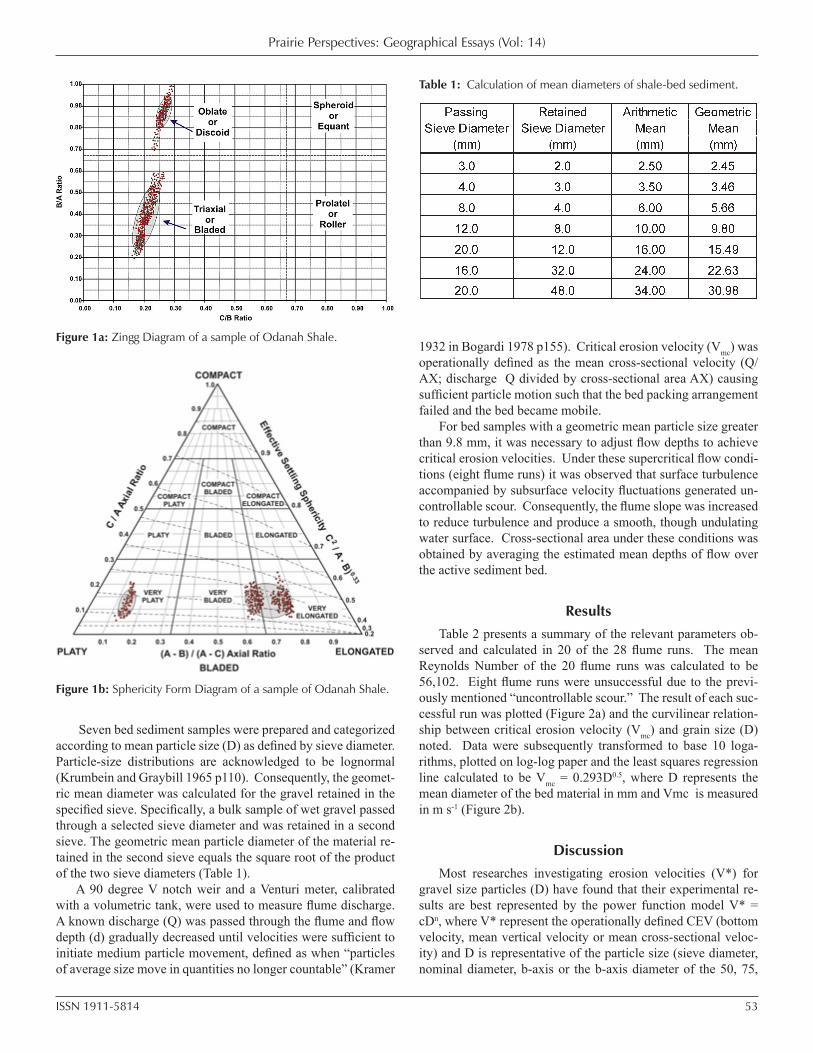
Prairie Perspectives: Geographical Essays (Vol: 14)
ISSN 1911-5814 53
Seven bed sediment samples were prepared and categorized according to mean particle size (D) as defined by sieve diameter. Particle-size distributions are acknowledged to be lognormal (Krumbein and Graybill 1965 p110). Consequently, the geomet-ric mean diameter was calculated for the gravel retained in the specified sieve. Specifically, a bulk sample of wet gravel passed through a selected sieve diameter and was retained in a second sieve. The geometric mean particle diameter of the material re-tained in the second sieve equals the square root of the product of the two sieve diameters (Table 1).
A 90 degree V notch weir and a Venturi meter, calibrated with a volumetric tank, were used to measure flume discharge. A known discharge (Q) was passed through the flume and flow depth (d) gradually decreased until velocities were sufficient to initiate medium particle movement, defined as when “particles of average size move in quantities no longer countable” (Kramer
1932 in Bogardi 1978 p155). Critical erosion velocity (Vmc) was operationally defined as the mean cross-sectional velocity (Q/AX; discharge Q divided by cross-sectional area AX) causing sufficient particle motion such that the bed packing arrangement failed and the bed became mobile.
For bed samples with a geometric mean particle size greater than 9.8 mm, it was necessary to adjust flow depths to achieve critical erosion velocities. Under these supercritical flow condi-tions (eight flume runs) it was observed that surface turbulence accompanied by subsurface velocity fluctuations generated un-controllable scour. Consequently, the flume slope was increased to reduce turbulence and produce a smooth, though undulating water surface. Cross-sectional area under these conditions was obtained by averaging the estimated mean depths of flow over the active sediment bed.
ResultsTable 2 presents a summary of the relevant parameters ob-
served and calculated in 20 of the 28 flume runs. The mean Reynolds Number of the 20 flume runs was calculated to be 56,102. Eight flume runs were unsuccessful due to the previ-ously mentioned “uncontrollable scour.” The result of each suc-cessful run was plotted (Figure 2a) and the curvilinear relation-ship between critical erosion velocity (Vmc) and grain size (D) noted. Data were subsequently transformed to base 10 loga-rithms, plotted on log-log paper and the least squares regression line calculated to be Vmc = 0.293D0.5, where D represents the mean diameter of the bed material in mm and Vmc is measured in m s-1 (Figure 2b).
DiscussionMost researches investigating erosion velocities (V*) for
gravel size particles (D) have found that their experimental re-sults are best represented by the power function model V* = cDn, where V* represent the operationally defined CEV (bottom velocity, mean vertical velocity or mean cross-sectional veloc-ity) and D is representative of the particle size (sieve diameter, nominal diameter, b-axis or the b-axis diameter of the 50, 75,
Figure 1a: Zingg Diagram of a sample of Odanah Shale.
Figure 1b: Sphericity Form Diagram of a sample of Odanah Shale.
Table 1: Calculation of mean diameters of shale-bed sediment.
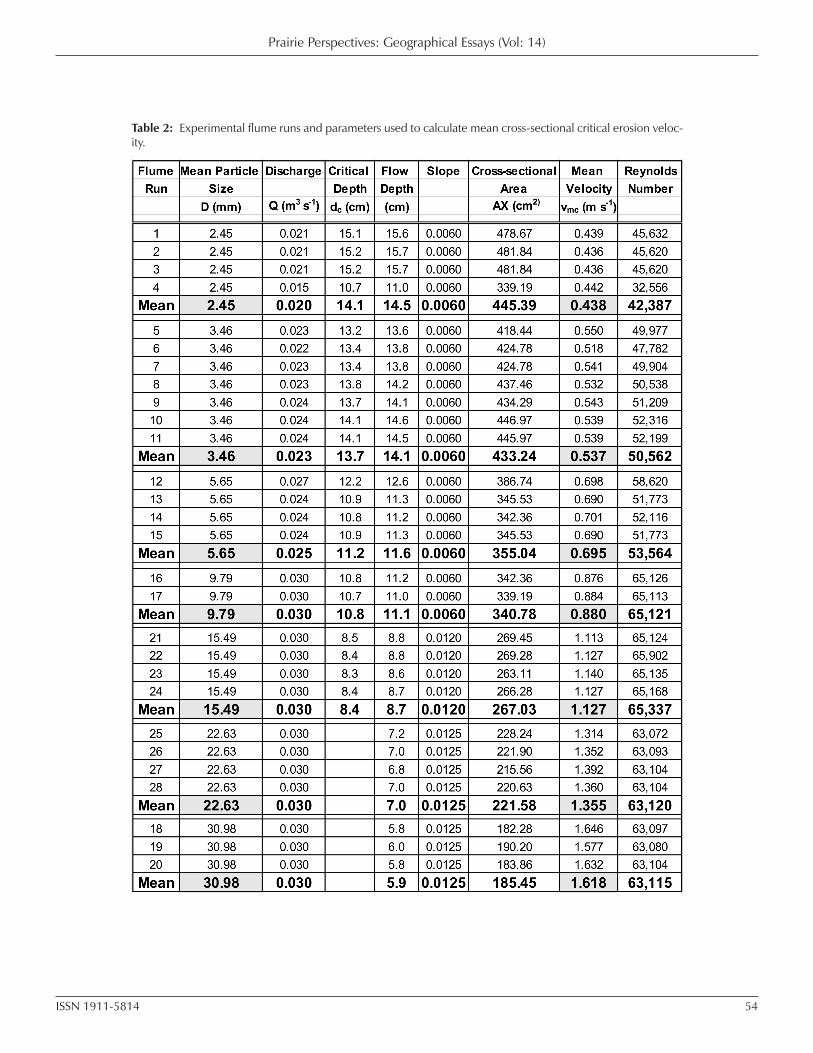
Prairie Perspectives: Geographical Essays (Vol: 14)
ISSN 1911-5814 54
Table 2: Experimental flume runs and parameters used to calculate mean cross-sectional critical erosion veloc-ity.
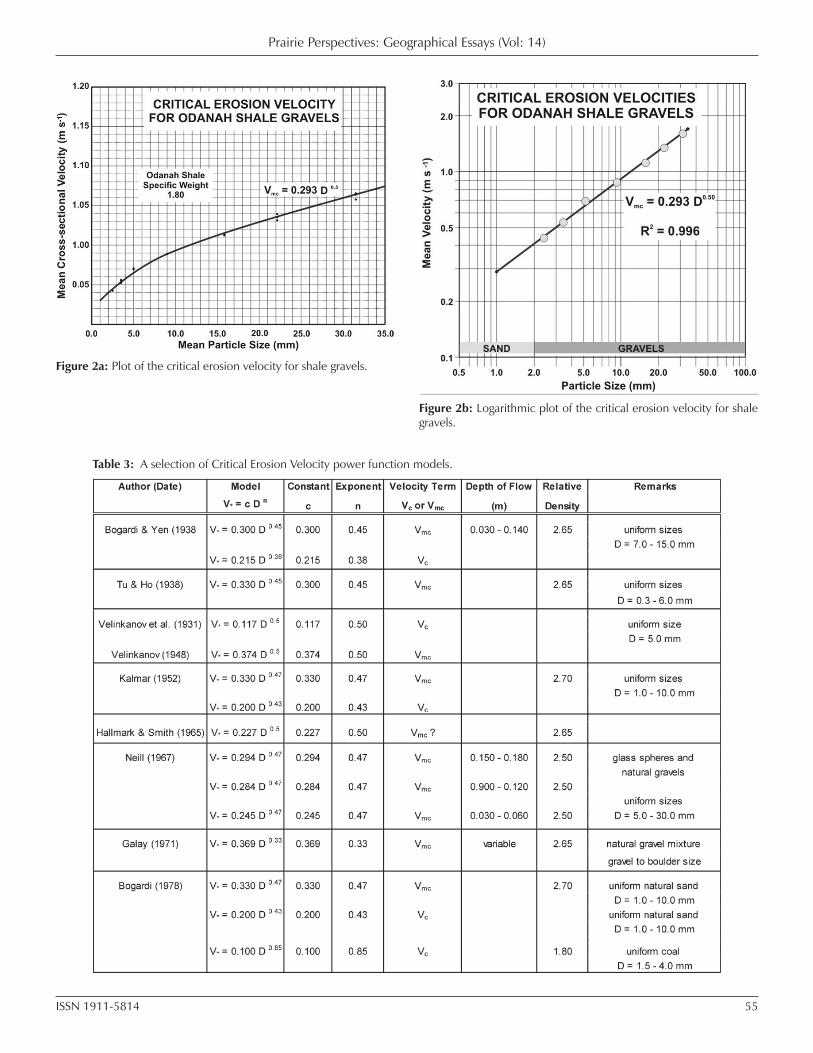
Prairie Perspectives: Geographical Essays (Vol: 14)
ISSN 1911-5814 55
Figure 2a: Plot of the critical erosion velocity for shale gravels.
Figure 2b: Logarithmic plot of the critical erosion velocity for shale gravels.
Table 3: A selection of Critical Erosion Velocity power function models.
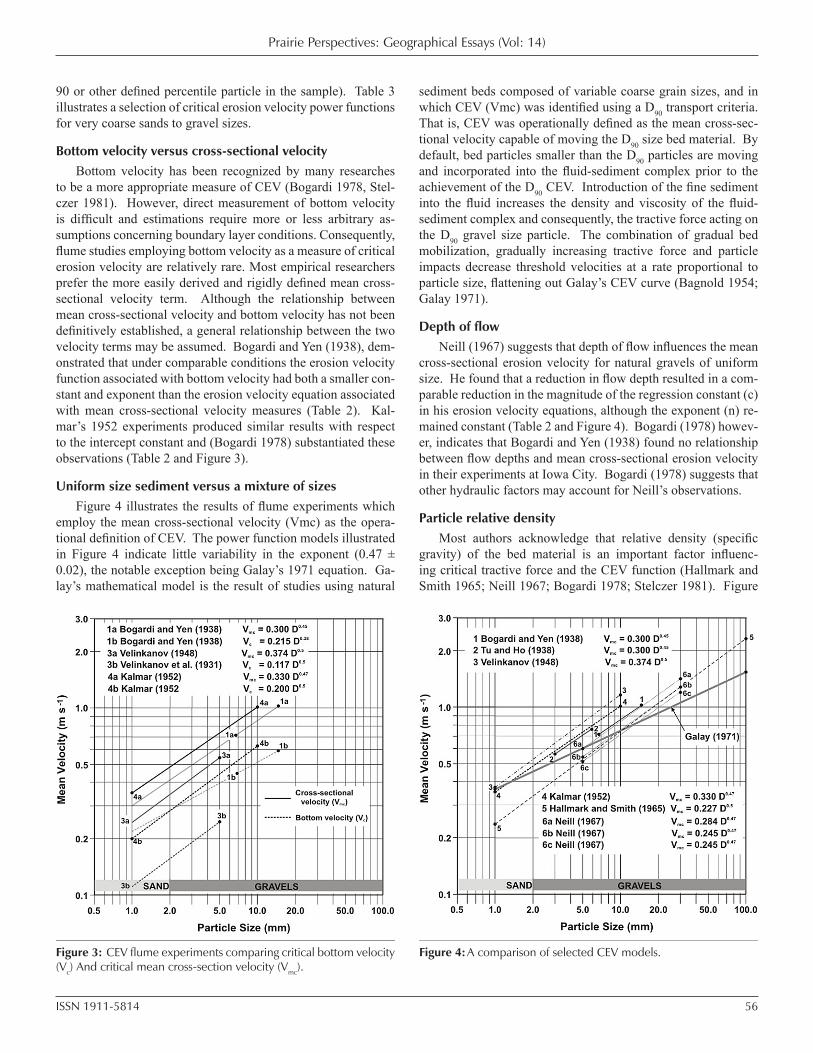
Prairie Perspectives: Geographical Essays (Vol: 14)
ISSN 1911-5814 56
90 or other defined percentile particle in the sample). Table 3 illustrates a selection of critical erosion velocity power functions for very coarse sands to gravel sizes.
Bottom velocity versus cross-sectional velocity Bottom velocity has been recognized by many researches
to be a more appropriate measure of CEV (Bogardi 1978, Stel-czer 1981). However, direct measurement of bottom velocity is difficult and estimations require more or less arbitrary as-sumptions concerning boundary layer conditions. Consequently, flume studies employing bottom velocity as a measure of critical erosion velocity are relatively rare. Most empirical researchers prefer the more easily derived and rigidly defined mean cross-sectional velocity term. Although the relationship between mean cross-sectional velocity and bottom velocity has not been definitively established, a general relationship between the two velocity terms may be assumed. Bogardi and Yen (1938), dem-onstrated that under comparable conditions the erosion velocity function associated with bottom velocity had both a smaller con-stant and exponent than the erosion velocity equation associated with mean cross-sectional velocity measures (Table 2). Kal-mar’s 1952 experiments produced similar results with respect to the intercept constant and (Bogardi 1978) substantiated these observations (Table 2 and Figure 3).
Uniform size sediment versus a mixture of sizesFigure 4 illustrates the results of flume experiments which
employ the mean cross-sectional velocity (Vmc) as the opera-tional definition of CEV. The power function models illustrated in Figure 4 indicate little variability in the exponent (0.47 ± 0.02), the notable exception being Galay’s 1971 equation. Ga-lay’s mathematical model is the result of studies using natural
sediment beds composed of variable coarse grain sizes, and in which CEV (Vmc) was identified using a D90 transport criteria. That is, CEV was operationally defined as the mean cross-sec-tional velocity capable of moving the D90 size bed material. By default, bed particles smaller than the D90 particles are moving and incorporated into the fluid-sediment complex prior to the achievement of the D90 CEV. Introduction of the fine sediment into the fluid increases the density and viscosity of the fluid-sediment complex and consequently, the tractive force acting on the D90 gravel size particle. The combination of gradual bed mobilization, gradually increasing tractive force and particle impacts decrease threshold velocities at a rate proportional to particle size, flattening out Galay’s CEV curve (Bagnold 1954; Galay 1971).
Depth of flowNeill (1967) suggests that depth of flow influences the mean
cross-sectional erosion velocity for natural gravels of uniform size. He found that a reduction in flow depth resulted in a com-parable reduction in the magnitude of the regression constant (c) in his erosion velocity equations, although the exponent (n) re-mained constant (Table 2 and Figure 4). Bogardi (1978) howev-er, indicates that Bogardi and Yen (1938) found no relationship between flow depths and mean cross-sectional erosion velocity in their experiments at Iowa City. Bogardi (1978) suggests that other hydraulic factors may account for Neill’s observations.
Particle relative density Most authors acknowledge that relative density (specific
gravity) of the bed material is an important factor influenc-ing critical tractive force and the CEV function (Hallmark and Smith 1965; Neill 1967; Bogardi 1978; Stelczer 1981). Figure
Figure 4: A comparison of selected CEV models.Figure 3: CEV flume experiments comparing critical bottom velocity (Vc) And critical mean cross-section velocity (Vmc).
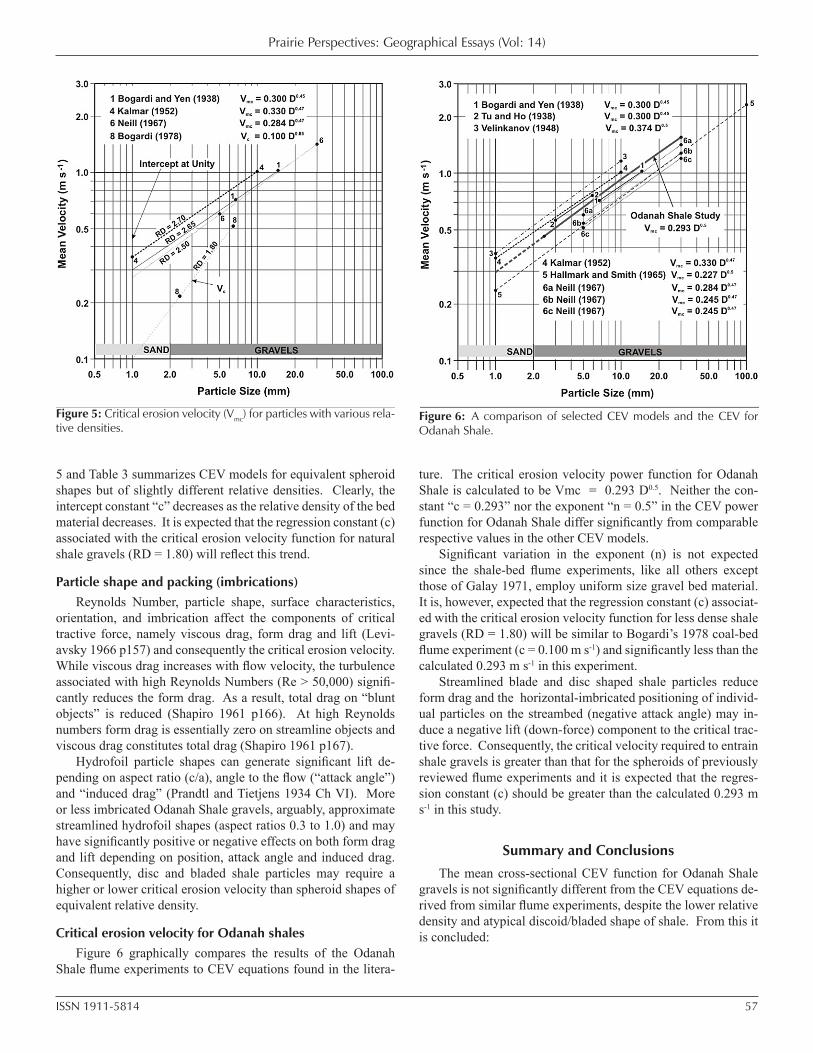
Prairie Perspectives: Geographical Essays (Vol: 14)
ISSN 1911-5814 57
5 and Table 3 summarizes CEV models for equivalent spheroid shapes but of slightly different relative densities. Clearly, the intercept constant “c” decreases as the relative density of the bed material decreases. It is expected that the regression constant (c) associated with the critical erosion velocity function for natural shale gravels (RD = 1.80) will reflect this trend.
Particle shape and packing (imbrications)Reynolds Number, particle shape, surface characteristics,
orientation, and imbrication affect the components of critical tractive force, namely viscous drag, form drag and lift (Levi-avsky 1966 p157) and consequently the critical erosion velocity. While viscous drag increases with flow velocity, the turbulence associated with high Reynolds Numbers (Re > 50,000) signifi-cantly reduces the form drag. As a result, total drag on “blunt objects” is reduced (Shapiro 1961 p166). At high Reynolds numbers form drag is essentially zero on streamline objects and viscous drag constitutes total drag (Shapiro 1961 p167).
Hydrofoil particle shapes can generate significant lift de-pending on aspect ratio (c/a), angle to the flow (“attack angle”) and “induced drag” (Prandtl and Tietjens 1934 Ch VI). More or less imbricated Odanah Shale gravels, arguably, approximate streamlined hydrofoil shapes (aspect ratios 0.3 to 1.0) and may have significantly positive or negative effects on both form drag and lift depending on position, attack angle and induced drag. Consequently, disc and bladed shale particles may require a higher or lower critical erosion velocity than spheroid shapes of equivalent relative density.
Critical erosion velocity for Odanah shalesFigure 6 graphically compares the results of the Odanah
Shale flume experiments to CEV equations found in the litera-
ture. The critical erosion velocity power function for Odanah Shale is calculated to be Vmc = 0.293 D0.5. Neither the con-stant “c = 0.293” nor the exponent “n = 0.5” in the CEV power function for Odanah Shale differ significantly from comparable respective values in the other CEV models.
Significant variation in the exponent (n) is not expected since the shale-bed flume experiments, like all others except those of Galay 1971, employ uniform size gravel bed material. It is, however, expected that the regression constant (c) associat-ed with the critical erosion velocity function for less dense shale gravels (RD = 1.80) will be similar to Bogardi’s 1978 coal-bed flume experiment (c = 0.100 m s-1) and significantly less than the calculated 0.293 m s-1 in this experiment.
Streamlined blade and disc shaped shale particles reduce form drag and the horizontal-imbricated positioning of individ-ual particles on the streambed (negative attack angle) may in-duce a negative lift (down-force) component to the critical trac-tive force. Consequently, the critical velocity required to entrain shale gravels is greater than that for the spheroids of previously reviewed flume experiments and it is expected that the regres-sion constant (c) should be greater than the calculated 0.293 m s-1 in this study.
Summary and ConclusionsThe mean cross-sectional CEV function for Odanah Shale
gravels is not significantly different from the CEV equations de-rived from similar flume experiments, despite the lower relative density and atypical discoid/bladed shape of shale. From this it is concluded:
Figure 5: Critical erosion velocity (Vmc) for particles with various rela-tive densities.
Figure 6: A comparison of selected CEV models and the CEV for Odanah Shale.
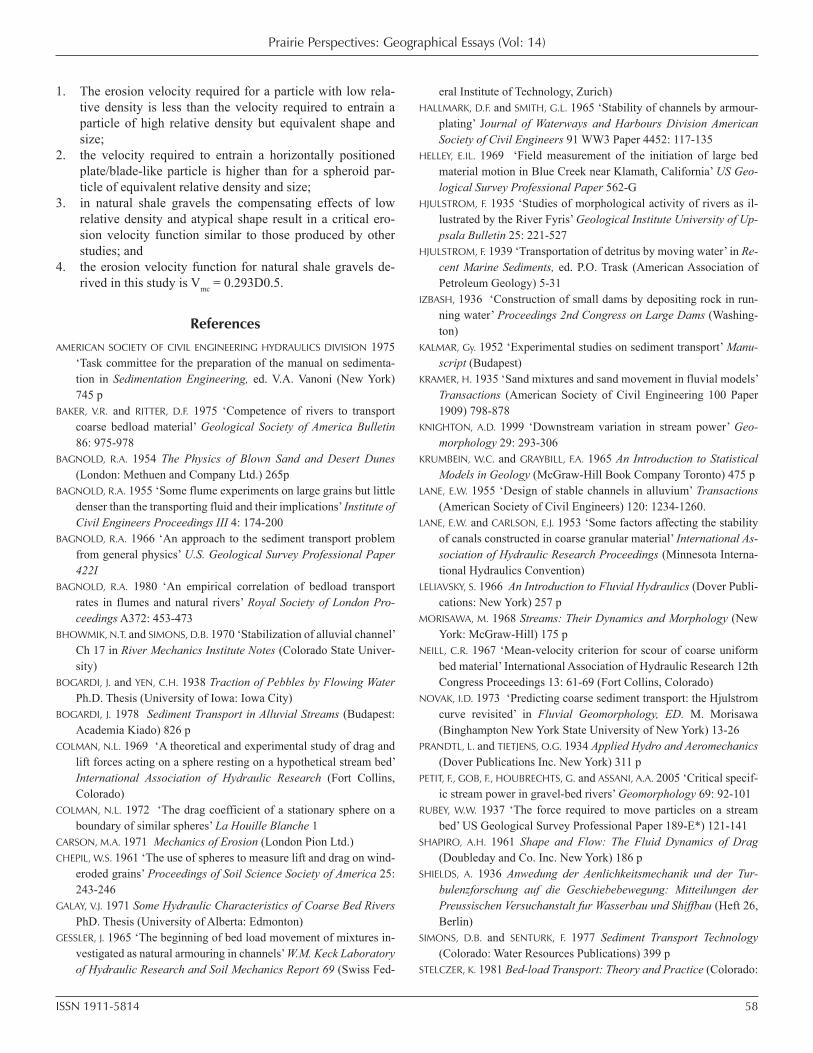
Prairie Perspectives: Geographical Essays (Vol: 14)
ISSN 1911-5814 58
1. The erosion velocity required for a particle with low rela-tive density is less than the velocity required to entrain a particle of high relative density but equivalent shape and size;
2. the velocity required to entrain a horizontally positioned plate/blade-like particle is higher than for a spheroid par-ticle of equivalent relative density and size;
3. in natural shale gravels the compensating effects of low relative density and atypical shape result in a critical ero-sion velocity function similar to those produced by other studies; and
4. the erosion velocity function for natural shale gravels de-rived in this study is Vmc = 0.293D0.5.
ReferencesAMERICAN SOCIETY OF CIVIL ENGINEERING HYDRAULICS DIVISION 1975
‘Task committee for the preparation of the manual on sedimenta-tion in Sedimentation Engineering, ed. V.A. Vanoni (New York) 745 p
BAKER, V.R. and RITTER, D.F. 1975 ‘Competence of rivers to transport coarse bedload material’ Geological Society of America Bulletin 86: 975-978
BAGNOLD, R.A. 1954 The Physics of Blown Sand and Desert Dunes (London: Methuen and Company Ltd.) 265p
BAGNOLD, R.A. 1955 ‘Some flume experiments on large grains but little denser than the transporting fluid and their implications’ Institute of Civil Engineers Proceedings III 4: 174-200
BAGNOLD, R.A. 1966 ‘An approach to the sediment transport problem from general physics’ U.S. Geological Survey Professional Paper 422I
BAGNOLD, R.A. 1980 ‘An empirical correlation of bedload transport rates in flumes and natural rivers’ Royal Society of London Pro-ceedings A372: 453-473
BHOWMIK, N.T. and SIMONS, D.B. 1970 ‘Stabilization of alluvial channel’ Ch 17 in River Mechanics Institute Notes (Colorado State Univer-sity)
BOGARDI, J. and YEN, C.H. 1938 Traction of Pebbles by Flowing Water Ph.D. Thesis (University of Iowa: Iowa City)
BOGARDI, J. 1978 Sediment Transport in Alluvial Streams (Budapest: Academia Kiado) 826 p
COLMAN, N.L. 1969 ‘A theoretical and experimental study of drag and lift forces acting on a sphere resting on a hypothetical stream bed’ International Association of Hydraulic Research (Fort Collins, Colorado)
COLMAN, N.L. 1972 ‘The drag coefficient of a stationary sphere on a boundary of similar spheres’ La Houille Blanche 1
CARSON, M.A. 1971 Mechanics of Erosion (London Pion Ltd.) CHEPIL, W.S. 1961 ‘The use of spheres to measure lift and drag on wind-
eroded grains’ Proceedings of Soil Science Society of America 25: 243-246
GALAY, V.J. 1971 Some Hydraulic Characteristics of Coarse Bed Rivers PhD. Thesis (University of Alberta: Edmonton)
GESSLER, J. 1965 ‘The beginning of bed load movement of mixtures in-vestigated as natural armouring in channels’ W.M. Keck Laboratory of Hydraulic Research and Soil Mechanics Report 69 (Swiss Fed-
eral Institute of Technology, Zurich) HALLMARK, D.F. and SMITH, G.L. 1965 ‘Stability of channels by armour-
plating’ Journal of Waterways and Harbours Division American Society of Civil Engineers 91 WW3 Paper 4452: 117-135
HELLEY, E.IL. 1969 ‘Field measurement of the initiation of large bed material motion in Blue Creek near Klamath, California’ US Geo-logical Survey Professional Paper 562-G
HJULSTROM, F. 1935 ‘Studies of morphological activity of rivers as il-lustrated by the River Fyris’ Geological Institute University of Up-psala Bulletin 25: 221-527
HJULSTROM, F. 1939 ‘Transportation of detritus by moving water’ in Re-cent Marine Sediments, ed. P.O. Trask (American Association of Petroleum Geology) 5-31
IZBASH, 1936 ‘Construction of small dams by depositing rock in run-ning water’ Proceedings 2nd Congress on Large Dams (Washing-ton)
KALMAR, Gy. 1952 ‘Experimental studies on sediment transport’ Manu-script (Budapest)
KRAMER, H. 1935 ‘Sand mixtures and sand movement in fluvial models’ Transactions (American Society of Civil Engineering 100 Paper 1909) 798-878
KNIGHTON, A.D. 1999 ‘Downstream variation in stream power’ Geo-morphology 29: 293-306
KRUMBEIN, W.C. and GRAYBILL, F.A. 1965 An Introduction to Statistical Models in Geology (McGraw-Hill Book Company Toronto) 475 p
LANE, E.W. 1955 ‘Design of stable channels in alluvium’ Transactions (American Society of Civil Engineers) 120: 1234-1260.
LANE, E.W. and CARLSON, E.J. 1953 ‘Some factors affecting the stability of canals constructed in coarse granular material’ International As-sociation of Hydraulic Research Proceedings (Minnesota Interna-tional Hydraulics Convention)
LELIAVSKY, S. 1966 An Introduction to Fluvial Hydraulics (Dover Publi-cations: New York) 257 p
MORISAWA, M. 1968 Streams: Their Dynamics and Morphology (New York: McGraw-Hill) 175 p
NEILL, C.R. 1967 ‘Mean-velocity criterion for scour of coarse uniform bed material’ International Association of Hydraulic Research 12th Congress Proceedings 13: 61-69 (Fort Collins, Colorado)
NOVAK, I.D. 1973 ‘Predicting coarse sediment transport: the Hjulstrom curve revisited’ in Fluvial Geomorphology, ED. M. Morisawa (Binghampton New York State University of New York) 13-26
PRANDTL, L. and TIETJENS, O.G. 1934 Applied Hydro and Aeromechanics (Dover Publications Inc. New York) 311 p
PETIT, F., GOB, F., HOUBRECHTS, G. and ASSANI, A.A. 2005 ‘Critical specif-ic stream power in gravel-bed rivers’ Geomorphology 69: 92-101
RUBEY, W.W. 1937 ‘The force required to move particles on a stream bed’ US Geological Survey Professional Paper 189-E*) 121-141
SHAPIRO, A.H. 1961 Shape and Flow: The Fluid Dynamics of Drag (Doubleday and Co. Inc. New York) 186 p
SHIELDS, A. 1936 Anwedung der Aenlichkeitsmechanik und der Tur-bulenzforschung auf die Geschiebebewegung: Mitteilungen der Preussischen Versuchanstalt fur Wasserbau und Shiffbau (Heft 26, Berlin)
SIMONS, D.B. and SENTURK, F. 1977 Sediment Transport Technology (Colorado: Water Resources Publications) 399 p
STELCZER, K. 1981 Bed-load Transport: Theory and Practice (Colorado:
Prairie Perspectives: Geographical Essays (Vol: 14)
ISSN 1911-5814 59
Water Resources Publications Littleton) 295 pSUNDBORG, A. 1956 ‘The River Klaralven: A study of fluvial processes’
Geografiska Annaler 38: 125-316VANONI, V.A., BENEDICT, P.C., NOVAK, I.D., BOUDURANT, D.C., McKEE,
J.E., PIEST, R.F. and SMALLSHAW, J. 1966 ‘Sediment transportation mechanics:initiation of motion Proceedings (American Society of Civil Engineers) 92 (HY2): 291-314
VELINKANOV, M.A. 1948 ‘Dvizhenie nanosov’ (Movement of sediment) (Izd. Minrechflota USSR, Moscow) in Bogardi 1978.
VELINKANOV, M.A., BOTSHKOV, N.N. and SHWEYKOVSKYI, N.T. 1931 ‘Research in scouring velocities’ Collection of papers in Stelczer 1981
WHITE, C.H. 1940 ‘The equilibrium of grains on the bed of a stream’ Proceedings (Royal Society of London) 174A: 322-338
YANG, C.T. 1976 ‘Minimum unit stream power and fluvial hydraulics.’ Journal of Hydraulics Division 102, 7: 919-934