wind turbine performance under icing conditions
TRANSCRIPT

Wind Turbine Performance under Icing ConditionsClement Hochart, Guy Fortin* and Jean Perron, Université du Québec à Chicoutimi, Anti-Icing Mate-rials International Laboratory, 555 boulevard de l’université, Saguenay, Quebec G7H 2B1, CanadaAdrian Ilinca, Université du Québec à Rimouski, Wind Energy Group, 300 allée des Ursulines, Rimouski, Quebec G5L 3A1, Canada
The wind energy market is in full growth in Quebec but technical difficulties due to cold climate conditions have occurred for most of the existing projects. Thus, icing simulations were carried out on a 0.2 m NACA 63 415 blade profile in the refrigerated wind tunnel of the Anti-icing Materials International Laboratory (AMIL). The shapes and masses of the ice deposits were measured, as well as the lift and drag forces of the iced profiles. Scaling was carried out based on the 1.8 MW–Vestas V80 wind turbine technical data, for three differ-ent radial positions and two in-fog icing conditions measured at the Murdochville wind farm in the Gaspé Peninsula. For both icing events, the mass of ice accumulated on the blade profile increased with an increase in the radial position. In wet regime testing (first icing event), glaze formed mostly near the leading edge and on the pressure side. It also accumulated by run-off on the trailing edge of the outer half of the blade. In dry-regime testing (second icing event), rime mostly accreted on the leading edge and formed horns. For both icing events, when glaze or rime accreted on the blade profile, lift decreased and drag increased. A load calculation using the blade element theory shows that drag force on the entire blade becomes too large compared to lift, leading to a negative torque and the stop of the wind turbine. Torque reduction is more significant on the outer third of the blade. Setting up a de-icing system only on the outer part of the blade would enable sig-nificant decrease of heating energy costs. Copyright © 2007 John Wiley & Sons, Ltd.
Received 30 January 2007; Revised 28 August 2007; Accepted 6 September 2007
WIND ENERGYWind Energ. 2008; 11:319–333Published online 29 October 2007 in Wiley Interscience (www.interscience.wiley.com) DOI: 10.1002/we.258
Research Article
* Correspondence to: G. Fortin, Université du Québec à Chicoutimi, Anti-Icing Materials International Laboratory, 555 boulevard de l’université, Saguenay, Quebec G7H 2B1, Canada.E-mail: [email protected]/grant sponsor: Economic Development Canada. Contract/grant sponsor: NSERC and FQRNT.
IntroductionSince 1995, wind energy has been in full growth worldwide. The 30% economic growth is mainly due to technological advancement in wind turbines, but also to awareness on the part of consumers, as well as govern-ment regulation to reduce greenhouse gas emissions by promoting or making compulsory the use of renewable energy. This is favourable to local wind energy markets, as in the province of Quebec, where the demand for wind energy comes principally from Hydro-Quebec with two invitations to tender, one for a 1000 MW wind farm in the Gaspé Peninsula in 2000, and another for a 2000 MW province-wide project in 2005. The Gaspé Peninsula has enormous wind potential, better than other exceptional sites in Germany, Denmark and Spain but, unfortunately, this northern location is often subjected to problems caused by freezing temperatures and atmospheric icing.
Key words: ice accretion; icing simulation; wind tunnel tests; NACA 63 415 rotor blade profi le; aerodynamic scale; lift; drag; power losses
Copyright © 2007 John Wiley & Sons, Ltd.

320 C. Hochart et al.
Copyright © 2007 John Wiley & Sons, Ltd. Wind Energ 2008; 11:319–333 DOI: 10.1002/we
During icing events, ice accumulates on the rotor blades, thus reducing the aerodynamic effi ciency and torque, leading to power losses. A light icing event can produce enough surface roughness to considerably reduce aerodynamic effi ciency.1 But when the icing event is more severe,2 torque drops to zero, the turbine stops and a complete loss of production ensues. Wind turbines can also stop rotating due to heavy vibrations under uneven ice cover.3 These vibrations can cause chunks of ice to detach and, during the accretion–expulsion process vibration intensity can increase, leading to the collapse of the wind turbine if it is not stopped. In some cases, when large chunks of ice are ejected, the wind turbine must be shut down to protect the other turbines on the farm, as well as nearby residents.4 The wind park operated by the 3Ci company near Murdochville, Quebec, is a good example of the severe effects of Nordic climate on wind turbines. The park comprises 60 Vestas 1.8 MW turbines5 (Figure 1) and is located between 850 and 950 m of elevation. During the 2004–2005 winter and spring, a meteorological station at 610 m of elevation, operated by the Wind Energy TechnoCentre, located near the wind park of Murdochville, recorded 13 icing events.6 Of those 13 events, fi ve were considered severe and a hazard for the wind farm. Two events among the fi ve were selected for wind-tunnel simulation to study their effects on the Vestas-V80 wind turbines, through a quantitative study of ice-accretion shape, lift reduction and drag increase.
The two icing events selected for the simulations were in-fog icing conditions as shown in Table I. They were characterized by their liquid water content (LWC), median volume diameter (MVD) of the supercooled droplets, air speed (V∞), air temperature (T∞) and duration of the event (t).
Figure 1. Vestas 1·8 MW wind turbines in Murdochville
Table I. Characteristics of wind-tunnel simulated in-fog icing
Fog LWC (g m−3) MVD (mm) V∞ (m s−1) T∞ (ºC) t (h)
1 0.218 38.3 8.8 −1.4 6.02 0.242 40.5 4.2 −5.7 4.4

Wind Turbine Performance under Icing Conditions 321
Copyright © 2007 John Wiley & Sons, Ltd. Wind Energ 2008; 11:319–333 DOI: 10.1002/we
A load calculation based on the blade element theory7 was used to estimate the effects of icing on the driving and bending forces, as well as torque. The resulting data were used as a basis to determine the best position for a heating-element de-icing system for wind turbine blades.
Generally, the shapes of ice deposits used in wind-tunnel aerodynamic simulations are measured directly on blades during icing events, or calculated by ice-accretion simulation software. An artifi cial deposit is then moulded and glued along the blade profi le to simulate the 2D run-off on an iced blade profi le. Seifert and Richert8 presented experimental measurements of lift and drag on a blade profi le, the leading edge of which was covered with artifi cial ice deposits shaped from actual deposits collected from a small, horizontal-axis wind turbine during different icing periods. Jasinski et al.9 made the same measurements, but used artifi cial ice shapes created with the LEWICE ice-accretion simulation software at NASA. The special feature of the experiments described in this paper resides in the way the ice deposits on the blade profi le were derived, that is to say by simulating in a wind tunnel the meteorological and operating conditions of the wind turbine during in-fog icing. The simulations were carried out in two phases: one phase of ice accretion on the blade profi le and one phase of aerodynamic effi ciency tests on the iced blade profi le.
Experimental MethodThe simulations were carried out in the Anti-icing Materials International Laboratory (AMIL) refrigerated wind tunnel (Figure 2) at the University of Quebec in Chicoutimi (UQAC). The tunnel operates as a closed-loop, recirculation system. The test section is 1.5 m long, 0.5 m wide and 0.6 m high.
In-fog icing is produced using an oscillating spray-nozzle assembly located upwind from the convergent. The spray nozzles are set to produce water droplets with a diameter of 27.6 mm. The lift and drag forces are measured using an aerodynamic scale made up of two aluminium arms linked together by a bearing. A load cell is placed at the end of each arm to record the lift and drag forces created by the aerodynamic blade profi le in the test section.
The Vestas-V80 wind turbine blade is composed of a NACA 63 XXX blade profi le between the blade tip and its centre, and an FFA W3 XXX blade profi le between the centre of the blade and the hub.5 Because the exact blade profi le confi guration was unknown, a 0.2 m (chord) × 0.5 m (width) NACA 63 415 blade profi le
Figure 2. The AMIL refrigerated wind tunnel
322 C. Hochart et al.
Copyright © 2007 John Wiley & Sons, Ltd. Wind Energ 2008; 11:319–333 DOI: 10.1002/we
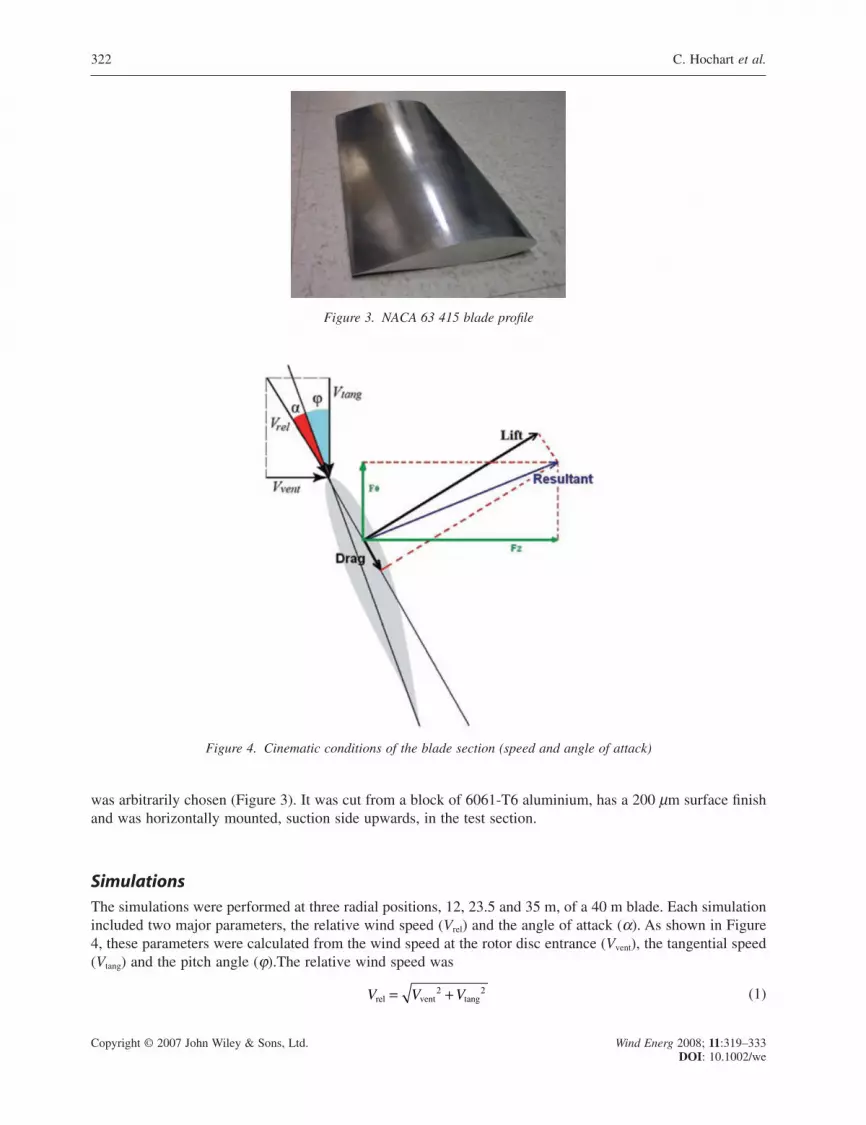
was arbitrarily chosen (Figure 3). It was cut from a block of 6061-T6 aluminium, has a 200 mm surface fi nish and was horizontally mounted, suction side upwards, in the test section.
SimulationsThe simulations were performed at three radial positions, 12, 23.5 and 35 m, of a 40 m blade. Each simulation included two major parameters, the relative wind speed (Vrel) and the angle of attack (a). As shown in Figure 4, these parameters were calculated from the wind speed at the rotor disc entrance (Vvent), the tangential speed (Vtang) and the pitch angle (j).The relative wind speed was
V V Vrel vent tang= +2 2 (1)
Figure 3. NACA 63 415 blade profi le
Figure 4. Cinematic conditions of the blade section (speed and angle of attack)

Wind Turbine Performance under Icing Conditions 323
Copyright © 2007 John Wiley & Sons, Ltd. Wind Energ 2008; 11:319–333 DOI: 10.1002/we
and the angle of attack (a) was
α ϕ=
−arctanV
Vvent
tang
(2)
The wind speed at the rotor disc entrance (Vvent) was calculated using the actuator disc concept,7
V V avent = −( )∞ 1 (3)
and the tangential speed (Vtang) of the blade section was derived from the rotor disk theory.7
V r atang = + ′( )ω 1 (4)
The axial induction factor, noted a, was assumed to be 1/3. This is an optimal value for the wind turbine power coeffi cient (Cp), according to the actuator disc concept. The tangential induction factor was assumed to be very weak (a′ << 1) and tip corrections were not included. The twist angle was calculated for an optimal lift to drag ratio along the blade with a free stream speed (V∞) of 8 m s−1. These assumptions, as explained in the blade element theory,7 are usually good approximations for fairly well-designed wind turbines in normal conditions (without ice). Therefore, they were considered acceptable to the aim of this work, which is not to accurately calculate airfl ow or aerodynamic forces along the blade but only to emphasize the difference between iced and non-iced situations.
The meteorological conditions for the two in-fog icing conditions selected were scaled down to wind-tunnel dimensions. The method described by Anderson10 was used. The fi xed variables for scaling were the model chord, 0.2 m, and the MWD of the water droplets, 27.6 mm. The imposed variable was the air speed in the wind tunnel, which corresponds to the relative air speed at the radial position tested. The free variables were the LWC, air temperature and duration of the event. The simulation parameters for the six tests are shown in Table II. They are the radial position (r), angle of attack (a), LWC, MWD of the supercooled water droplets, relative air speed (Vrel), experimental Reynolds numbers (Re), wind-tunnel temperature (T∞), and duration of the event (t).
The LWC was calibrated using the rotating cylinder method,11 which consists in accreting ice on a rotat-ing cylinder 5 cm in diameter for 1 h. The spray nozzles were adjusted to yield, at a given speed, the desired LWC.
The experimental method for the simulations consisted in positioning the blade profi le at the desired angle of attack; setting the speed, temperature and LWC in the test section; accreting ice on the blade profi le for a specifi ed duration; measuring the lift and drag coeffi cients; weighing the blade profi le to determine the mass of accreted ice; and noting the ice deposit shape at the centre of the blade profi le. Each simulation was repeated once to ensure conformity of results.
ResultsThe results of the six simulations for ice mass, ice-deposit shape, lift reduction and drag increase are described in this section.
Table II. Wind-tunnel simulation parameters
Test Fog r (m) a (º) LWC (g m−3) MVD (mm) Vrel (m s−1) Re T∞ (ºC) t (min)
1 1 11.9 13 0.37 27.6 19.9 2.65 × 1005 −1.4 14.82 1 23.4 13 0.48 27.6 38.0 5.07 × 1005 −1.4 15.13 1 34.8 13 0.48 27.6 56.0 7.47 × 1005 −1.4 24.84 2 11.8 3 0.37 27.6 18.7 2·49 × 1005 −5.7 10.65 2 23.3 7 0.48 27.6 36.7 4.89 × 1005 −5.7 11.86 2 35.0 9 0.48 27.6 55.0 7.33 × 1005 −5.7 19.6
324 C. Hochart et al.
Copyright © 2007 John Wiley & Sons, Ltd. Wind Energ 2008; 11:319–333 DOI: 10.1002/we
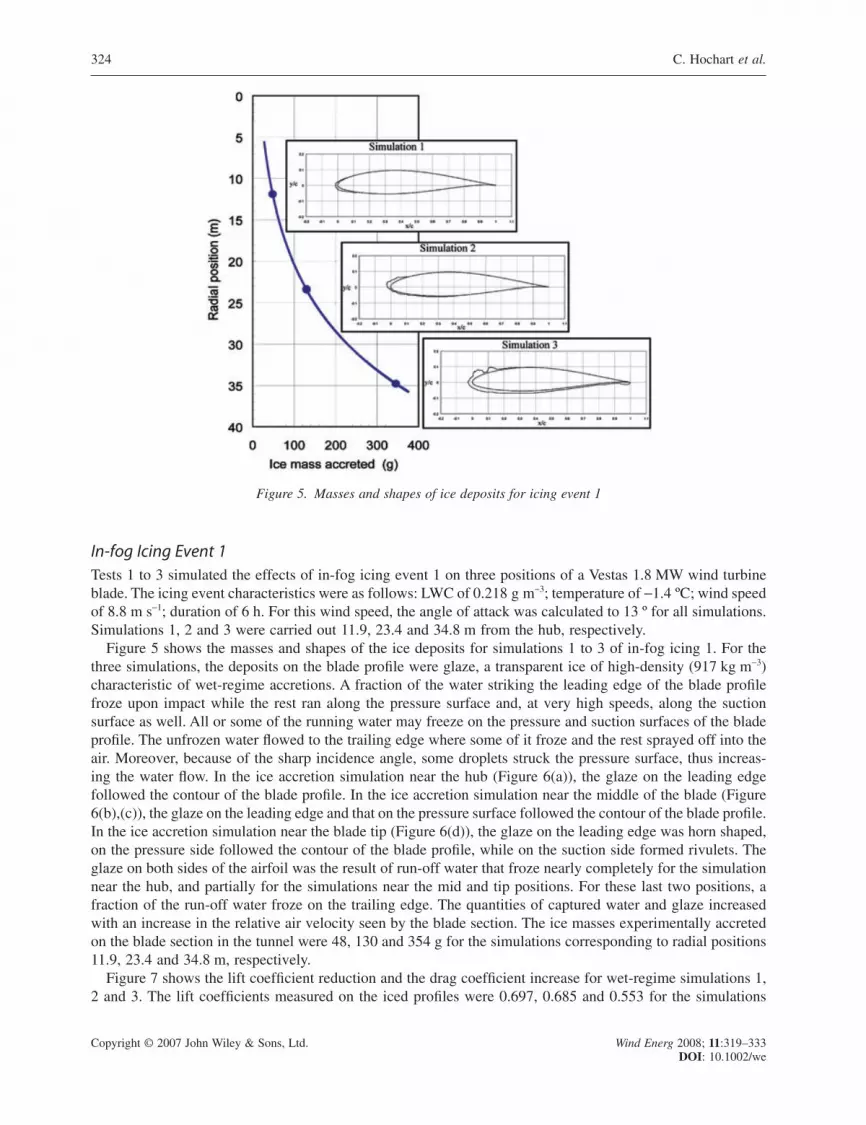
In-fog Icing Event 1Tests 1 to 3 simulated the effects of in-fog icing event 1 on three positions of a Vestas 1.8 MW wind turbine blade. The icing event characteristics were as follows: LWC of 0.218 g m−3; temperature of −1.4 ºC; wind speed of 8.8 m s−1; duration of 6 h. For this wind speed, the angle of attack was calculated to 13 º for all simulations. Simulations 1, 2 and 3 were carried out 11.9, 23.4 and 34.8 m from the hub, respectively.
Figure 5 shows the masses and shapes of the ice deposits for simulations 1 to 3 of in-fog icing 1. For the three simulations, the deposits on the blade profi le were glaze, a transparent ice of high-density (917 kg m−3) characteristic of wet-regime accretions. A fraction of the water striking the leading edge of the blade profi le froze upon impact while the rest ran along the pressure surface and, at very high speeds, along the suction surface as well. All or some of the running water may freeze on the pressure and suction surfaces of the blade profi le. The unfrozen water fl owed to the trailing edge where some of it froze and the rest sprayed off into the air. Moreover, because of the sharp incidence angle, some droplets struck the pressure surface, thus increas-ing the water fl ow. In the ice accretion simulation near the hub (Figure 6(a)), the glaze on the leading edge followed the contour of the blade profi le. In the ice accretion simulation near the middle of the blade (Figure 6(b),(c)), the glaze on the leading edge and that on the pressure surface followed the contour of the blade profi le. In the ice accretion simulation near the blade tip (Figure 6(d)), the glaze on the leading edge was horn shaped, on the pressure side followed the contour of the blade profi le, while on the suction side formed rivulets. The glaze on both sides of the airfoil was the result of run-off water that froze nearly completely for the simulation near the hub, and partially for the simulations near the mid and tip positions. For these last two positions, a fraction of the run-off water froze on the trailing edge. The quantities of captured water and glaze increased with an increase in the relative air velocity seen by the blade section. The ice masses experimentally accreted on the blade section in the tunnel were 48, 130 and 354 g for the simulations corresponding to radial positions 11.9, 23.4 and 34.8 m, respectively.
Figure 7 shows the lift coeffi cient reduction and the drag coeffi cient increase for wet-regime simulations 1, 2 and 3. The lift coeffi cients measured on the iced profi les were 0.697, 0.685 and 0.553 for the simulations
Figure 5. Masses and shapes of ice deposits for icing event 1

Wind Turbine Performance under Icing Conditions 325
Copyright © 2007 John Wiley & Sons, Ltd. Wind Energ 2008; 11:319–333 DOI: 10.1002/we
a)
b) d)
c)
Figure 6. Iced blade profi les at the end of the simulations: (a) simulation 1, view from below; (b) simulation 2, view from above; (c) simulation 2, view from below; (d) simulation 3, view from below
0
0.1
0.2
0.3
0.4
0.5
0.6
0.7
0.8
0.9
0
r(m)
Lift
Coe
ffici
ent
0
0.05
0.1
0.15
0.2
0.25
0.3
Dra
g C
oeffi
cien
tLift Coefficient Clean Airfoil Lift Coefficient Iced AirfoilDrag Coefficient Clean Airfoil Drag Coefficient Iced Airfoil
5 10 15 20 25 30 35 40
Figure 7. Lift and drag coeffi cients for icing event 1

326 C. Hochart et al.
Copyright © 2007 John Wiley & Sons, Ltd. Wind Energ 2008; 11:319–333 DOI: 10.1002/we
corresponding to radial position 11.9, 23.4 and 34.8 m, respectively. The drag coeffi cients measured for the same simulations were 0.068, 0.090 and 0.195, respectively.
In-fog Icing Event 2Tests 4 to 6 simulated the effects of in-fog icing event 2 on three positions of a Vestas 1.8 MW wind turbine blade. The icing event characteristics were as follows: LWC of 0.242 g m−3; temperature of −5.7 ºC; wind speed of 4.2 m s−1; duration of 4 h and 24 min. Simulation 4 was carried out 11.8 m from the hub at an angle of attack of 3º, simulation 5, 23.3 m at 7º, and simulation 6, 34.8 m at 9º.
Figure 8 shows the masses and shapes of the ice deposits for simulations 4 to 6 of in-fog icing event 2. For the three simulations, the deposits on the blade profi le were rime, opaque ice of lower density than glaze due to the air bubbles trapped in the ice. This is characteristic of dry-regime accretions. Ice density was estimated to be between 850 and 900 kg m−3. All the water striking the leading edge and the blade profi le froze upon impact. For the simulation corresponding to the cross section closest to the hub (Figure 9(a)), the rime on the leading edge, pressure surface, and suction surface partially followed the contour of the blade profi le and formed slight protrusions. For the cross section near the middle of the blade (Figure 9(b)) and closest to the tip (Figure 9(c),(d)), the rime on the leading edge had a double-horn shape, and that on the pressure and suction side partially followed the contour of the blade profi le and exhibited protrusions. The rime was oriented in the direction of the water droplets incidence angle, creating zones of shadow with little accretion, leading to the formation of protrusions. The quantity of accreted rime increased with an increase in the relative air velocity seen by the blade section, due to the proportional increase of captured water, as follows: 24, 91 and 220 g for the simulations at radial positions 11.8, 23.3 and 35 m, respectively.
Figure 10 shows the lift coeffi cient reduction and the drag coeffi cient increase for wet-regime simulations 4, 5 and 6. The lift coeffi cient measured on the iced blade profi le was 0.227 for the cross section nearest to the hub (radial position of 11.8 m and angle of attack of 9º), it was 0.491 for the cross section near the middle of
Figure 8. Masses and shapes of ice deposits for icing event 1

Wind Turbine Performance under Icing Conditions 327
Copyright © 2007 John Wiley & Sons, Ltd. Wind Energ 2008; 11:319–333 DOI: 10.1002/we
Figure 9. Iced blade profi les at the end of the simulations: (a) simulation 4, view from below; (b) simulation 5, side view and from below; (c) simulation 6, view from above; (d) simulation 6, view from below
0
0.1
0.2
0.3
0.4
0.5
0.6
0.7
0.8
0 5 10 15 20 25 30 35 40
r(m)
Lift
Coe
ffici
ent
0
0.05
0.1
0.15
0.2
0.25
0.3
Dra
g C
oeffi
cien
tLift Coefficient Clean Airfoil Lift Coefficient Iced AirfoilDrag Coefficient Clean Airfoil Drag Coefficient Iced Airfoil
Figure 10. Lift and drag coeffi cients for icing event 2

328 C. Hochart et al.
Copyright © 2007 John Wiley & Sons, Ltd. Wind Energ 2008; 11:319–333 DOI: 10.1002/we
the blade (radial position of 23.3 m and angle of attack of 7º) and 0.506 for the cross section near the blade tip (radial position of 35 m and angle of attack of 9º). The drag coeffi cients for the same simulations were 0.033, 0.063 and 0.130, respectively.
AnalysisThe dry-regime simulations (icing event 2) were easier to carry out than those in wet regime (icing event 1) because they have better reproducibility. Each simulation was repeated once. Tables III, IV and V show the mean values and the standard deviations of ice mass, lift coeffi cient and drag coeffi cient for the two simula-tions carried for each regime. Standard deviations are based on the two average values measured during the experiments and not on the signals in time.
As shown in Figures 5 and 8, in both wet (icing event 1) and dry (icing event 2) regimes, because of local cinematic conditions, the ice mass accreted on the profi le increases as the cross section moves from the hub to the blade tip. In order to show dimensionless results (Table VI), the accreted ice masses on the experimental blade profi le have been revaluated for the six simulations considering a standard 1 m (chord) × 1 m (width)
Table III. Average values and standard deviations of ice mass
Icing event Wet regime (event 1) Dry regime (event 2)
Radial position (m) 11.9 23.4 34.8 11.8 23.3 35.0Average mass of ice (g) 48 130 354 24 91 220Standard deviation (g) 0.25 9.25 4.5 1.75 0.25 5.5Standard deviation (%) 0.52 7.07 1.27 7.36 0.28 2.5
Table IV. Average values and standard deviations of lift coeffi cient
Icing event Wet regime (event 1) Dry regime (event 2)
Radial position (m) 11.9 23.4 34.8 11.8 23.3 35.0Average lift coeffi cient 0.697 0.685 0.553 0.227 0.491 0.226Standard deviation 0.021 0.011 0.088 0.004 0.012 0.016Standard deviation (%) 3.04 1.54 15.9 1.87 2.39 3.2
Table V. Average values and standard deviations of drag coeffi cient
Icing event Wet regime (event 1) Dry regime (event 2)
Radial position (m) 11.9 23.4 34.8 11.8 23.3 35.0Average drag coeffi cient 0.068 0.09 0.195 0.033 0.063 0.13Standard deviation 0.01 0.017 0 0.0026 0.0017 0.009Standard deviation (%) 14.7 18.4 0 7.9 2.8 6.9
Table VI. Average values of ice mass, dimensionless 1 m (chord) × 1 m (width) profi le
Icing event Wet regime (event 1) Dry regime (event 2)
Radial position (m) 11.9 23.4 34.8 11.8 23.3 35.0Average mass of ice (g) 2,400 6,500 17,700 1,200 4,550 11,000

Wind Turbine Performance under Icing Conditions 329
Copyright © 2007 John Wiley & Sons, Ltd. Wind Energ 2008; 11:319–333 DOI: 10.1002/we
NACA 63 415 blade profi le and the six ice shapes of Figures 5 and 8. In the real case, the blade chord length decreases with the radial position from the hub to the blade tip. Considering this chord size variation, it is in the median zone of the full-size blade that the largest quantity of ice accretes, as shown in Figure 11. The total mass of accreted ice is estimated to 709 kg for event 1 (11% of the blade initial mass, which is 6500 kg) and 434 kg for event 2 (6.7% of the blade initial mass).
In both dry and wet regimes, the lift and drag coeffi cients are more affected as we move from the hub to the blade tip. In Figures 7 and 10 it is illustrated how the lift coeffi cient decreases and drag coeffi cient increases with the radial position on the blade. The drag coeffi cient variation with radius follows approximately a power law. Especially between the middle and the blade tip, drag coeffi cient increased considerably and, combined with lift decreases, lead to a signifi cant reduction of lift to drag ratio. In wet regime (icing event 1), we esti-mated that drag coeffi cient increased 7.7% at 11.9 m, 45.7% at 23.4 m and 220% at 34.8 m, according to the test results corresponding to the respective positions on the real blade. Using the same assumptions, the lift coeffi cient decreased 11.2% at 11.9 m, 6.8% at 23.4 m and 27.2% at 34.8 m. The drag coeffi cient increase at the blade tip (40 m) is estimated to 365% and the lift coeffi cient reduction to 40%. In dry regime (icing event 2), drag coeffi cient increased 5.5% at 11.8 m, 61.3% at 23.3 m and 190% at 35.0 m, according to the test results corresponding to the respective positions on the real blade. Lift coeffi cient decreased 19.8% at 11.8 m, 10.7% at 23.3 m and 24.8% at 34.8 m. The drag coeffi cient increase at the blade tip (40 m) was estimated to 250% and the lift coeffi cient reduction to 37%.
In order to assess the effect of ice on the aerodynamic forces on the full-size rotor, a load calculation based on the blade element theory7 has been used. The orthoradial force component, which generates rotor torque, is called driving force and noted as Fq. The force component perpendicular to Fq, noted as FZ, is oriented in the direction of the rotor axis and serves to estimate the bending force applied to the blade. The formulas for dFq and dFZ are
d dvent L vent DF r c r V r C r V C r r rθ ρ ω ω( ) = ( ) +( ) ( ) − ( )( )12
2 2 2 (5)
d dvent L D ventF r c r V r C r r C r V rZ( ) = ( ) +( ) ( ) + ( )( )12
2 2 2ρ ω ω (6)
Here, r is the radial position in metres, r the air density in kg m−3, c the blade profi le chord in metres, wr the tangential speed in m s−1, and Vvent the wind speed in m s−1 at the rotor disc entrance. The driving (dFq) and bending force (dFZ) variations along the blade span are shown on Figures 12 and 13.
0
5
10
15
20
25
0 5 10 15 20 25 30 35 40
r (m)
Rea
l ice
mas
s di
strib
utio
n al
ong
the
blad
e (k
g/m
)
Icing Event 1 Icing Event 2
Figure 11. Mass of ice accumulated along the full-size rotor blade

330 C. Hochart et al.
Copyright © 2007 John Wiley & Sons, Ltd. Wind Energ 2008; 11:319–333 DOI: 10.1002/we
Figure 14 shows the torque distribution (r × dFq) along the blade which has been linearly interpolated over the entire blade length in order to estimate the total torque. During both wet and dry accretion regimes, the driving and bending forces acting on the blade decrease, leading to a drastic torque reduction. In both cases, the drag force becomes so large compared to lift, that a negative torque occurs leading to rotor deceleration and possible stop.
-300
-250
-200
-150
-100
-50
0
50
100
150
0 5 10 15 20 25 30 35 40
r(m)
dFθ
(N/m
)
Clean Blade Event 1 Iced Blade Event 1Clean Blade Event 2 Iced Blade Event 2
Figure 12. Distribution along the full-size blade of the driving force per length unit dFq
0
200
400
600
800
1000
1200
1400
1600
0 5 10 15 20 25 30 35 40
r(m)
dFz(
N/m
)
Clean Blade Event 1 Iced Blade Event 1
Clean Blade Event 2 Iced Blade Event 2
Figure 13. Distribution along the full-size blade of the bending force per length unit dFZ

Wind Turbine Performance under Icing Conditions 331
Copyright © 2007 John Wiley & Sons, Ltd. Wind Energ 2008; 11:319–333 DOI: 10.1002/we
Torque reduction is more signifi cant on the outer third of the blade so that the effi ciency of a de-icing system would be increased in that region. In Figure 15 we illustrate the variation of the total torque produced by the blade with the length of the de-icing system. The de-icing system is installed over a given length starting from the blade tip, and the lift and drag coeffi cients of the clean airfoil are used where the de-icing system is operational. We notice again that the most effi cient zone to be de-iced is near the blade tip as approximately 90% of the torque penalty compared to the clean blade is recuperated with only 30% length de-iced.
-12000
-10000
-8000
-6000
-4000
-2000
0
2000
4000
0 5 10 15 20 25 30 35 40
r(m)
r*dF
θ (N
.m/m
)
Clean Blade Event 1 Iced Blade Event 1Clean Blade Event 2 Iced Blade Event 2
Figure 14. Distribution along the full-size blade of the torque per length unit r*dFq
-80000
-60000
-40000
-20000
0
20000
40000
60000
80000
0 5 10 15 20 25 30 35 40
Deicing length (m)
Tot
al to
rque
of o
ne b
lade
(N
.m)
Icing Event 1 Icing event 2
Figure 15. Blade torque as function of de-icing length, starting from the blade tip
332 C. Hochart et al.
Copyright © 2007 John Wiley & Sons, Ltd. Wind Energ 2008; 11:319–333 DOI: 10.1002/we
ConclusionThe simulations allow to experimentally assess the impact of glaze (icing event 1, wet regime) and rime (icing event 2, dry regime) on a wind turbine blade. The LWC for glaze accretion was 0.218 kg m−3, at −1.4 ºC and 8.8 m s−1 wind speed, while the LWC for rime accretion was 0.242 kg m−3, at −5.7 ºC and 4.2 m s−1 wind speed. In wet regime (icing event 1), the angles of attack along the blade were 13º in average and glaze formed mostly at the leading edge and on the pressure side. Some ice accreted by run-off on the trailing edge for cin-ematic conditions corresponding to the blade profi les located at the centre and blade tip. In dry regime (icing event 2), the angles of attack were below 9º and rime accreted mostly on the leading edge and partially on the pressure side for cinematic conditions of the blade profi les located between the middle and the blade tip. The rime accreted on the leading edge was horn shaped, which considerably increased the surface rough-ness. The total mass of accumulated glaze on the blade was estimated to 709 kg (11% of the blade initial mass, which is 6500 kg) and the total mass of accumulated rime was estimated to 434 kg (6.7% of the blade initial mass). When glaze or rime accreted on the blade profi le, lift decreased and drag increased. In both dry and wet regimes the lift reduction varied only slightly on the fi rst two thirds of the blade, 9%, but increased to 25% on the last third, near the tip. The lift reduction at the blade tip was estimated to 40% for both events. Drag increased along the blade following approximately a power law. The increase at the blade tip was in the order of 365% for glaze and 250% for rime. The amount by which lift decreased or drag increased depended on the quality, shape and position of the ice. Finally, based on blade element model estimations, for both icing conditions the lift reduction and drag increase lead to a decrease in the bending and driving forces, and consequently a decrease in torque. The drag force becomes so important compared to lift that the torque is negative, resulting in rotor deceleration and stop. Torque reduction is more signifi cant on the outer third of the blade. Setting up a de-icing system on the last third of the blade only, would enable to decrease equipment and heating energy costs while maintaining 90% of the aerodynamic performance of the clean blade.
Future WorkBased on the results of this study, a heating-element de-icing system will be fi ne tuned in order to maximize the ratio of lift and drag coeffi cients over the entire length of the blade, using a minimum of power to operate the de-icing system.
AcknowledgementsThis study was completed thanks to the fi nancial support of the Wind Energy TechnoCentre Gaspésie-Les Îles through a grant from Economic Development Canada, by the Wind Energy Group at Université du Québec à Rimouski, and the Anti-icing Materials International Laboratory at the Université du Québec à Chicoutimi. The authors kindly acknowledge the fi nancial support from NSERC and FQRNT through research grants.
Appendix: Nomenclaturea axial fl ow induction factora′ tangential fl ow induction factorCD drag coeffi cientCL lift coeffi cientD drag force NFZ bending force on the blade NFq driving force on the blade NL lift force N

Wind Turbine Performance under Icing Conditions 333
Copyright © 2007 John Wiley & Sons, Ltd. Wind Energ 2008; 11:319–333 DOI: 10.1002/we
LWC liquid water content kg m−3
MVD median volume diameter of water droplets mmr radial position on the blade mt duration of the icing event sVrel relative wind speed at profi le m s−1
Vtang tangential wind speed due to blade rotation m s−1
Vvent wind speed at the rotor disc entrance m s−1
V∞ infi nite wind speed (free stream speed) m s−1
a angle of attack ºj pitch angle ºw rotation speed of the rotor rad s−1
rair air density kg m−3
tAc ice accumulation rate s−1
References 1. Laakso T, Peltola E. Review on blade heating technology and future prospects. 2005 BOREAS VII Conference, Saarislkä,
Finland, 7–8 March 2005. 2. Laakso T, Holttinen H, Ronsten G, Tallhaug L, Horbaty R, Baring-Gould I, Lacroix A, Peltola E, Tammelin B. State-
of-the-art of wind energy in cold climates. IEA R&D Wind, Wind Energy in Cold Climates, April 2003; 33. 3. Seifert H. Technical requirements for rotor blades operating in cold climate. DEWI Magazin Nr 24, February 2004. 4. Seifert H, Westerhellweg A, Kröning J. Risk analysis of ice thrown from wind turbines. BOREAS VI Conference, Pyhä,
Finland, April 2003. 5. Anonymous. V80-1.8MW Pitch regulated wind turbine with OptiSlip and OptiTip. General Specifi cation. Technical
document, Vestas, February 2004. 6. Fortin G, Perron J, Ilinca A. A study of icing events at Murdochville: conclusions for the wind power industry. Colloque
international <<énergie éolienne et sites éloignés>>, Îles de la Madeleine, 19–21 October 2005. 7. Burton T, Sharpe D, Jenkins N, Bossanyi E. Wind Energy Handbook. John Wiley & Sons, Ltd: Chichester, UK,
2001. 8. Seifert H, Richert F. Aerodynamics of iced airfoils and their infl uence on loads and power production. European Wind
Energy Conference, Dublin Castle, Ireland, October, 1997. 9. Jasinski W, Noe SC, Selig M, Bragg M. Wind turbine performance under icing conditions. 35th AIAA, Aerospace
Sciences Meeting & Exhibit, Reno, NV, 6–9 January 1997.10. Anderson DN. Manual of Scaling Methods, NASA/CR-2004-212875. Ohio Aerospace Institute: Brook Park, OH, 2004.11. Stallabrass JR. An appraisal of the single rotating cylinder method of liquid water content measurement. Canadian
Research Council Report, LTR-L T-92, November 1978.