shake table testing of a utility-scale wind turbine
TRANSCRIPT

Case Study
Shake Table Testing of a Utility-Scale Wind TurbineIan Prowell, P.E., M.ASCE1; Chia-Ming Uang, M.ASCE2; Ahmed Elgamal, M.ASCE3;
J. Enrique Luco, M.ASCE4; and Lanhui Guo5
Abstract: Shake table tests were undertaken on a full-scale wind turbine (65-kW rated power, 22.6-m hub height, and 16-m rotor diameter)using the Network for Earthquake Engineering Simulation Large High Performance Outdoor Shake Table at the University of California,San Diego. Structural response characteristics and modal parameters are presented for base shaking imparted in two configurations, bothparallel (configuration 1) and perpendicular (configuration 2) to the axis of rotation of the rotor. Results are summarized for a series ofprogressively stronger motions imparted in configuration 1, with analysis identifying damage sources leading to an overall loss in stiffness.Two sources of observed softening are identified and quantified: (1) degradation of grout at the tower base, and (2) loss of bolt torque at theconnections between tower segments. Results showed that the two configurations had little difference in structural response and demandparameters. For the tested turbine, with appropriate consideration of boundary conditions and modal characteristics, linear theory for a singledegree-of-freedom system can explain most of the observed dynamics. Although not significant for the tested turbine, it was observed thathigher mode behavior may be important for large turbines. DOI: 10.1061/(ASCE)EM.1943-7889.0000391. © 2012 American Society ofCivil Engineers.
CE Database subject headings: Renewable energy; Earthquakes; Seismic effects; Shake table tests; Turbines.
Author keywords: Renewable energy; Green energy; Earthquake; Seismic; Shake table; Wind turbine.
Introduction
In 2009, roughly 10 GW of new turbine capacity was installedwith an investment of over $21 billion in the United States alone.In addition to growth in number of installations, turbine height israpidly increasing, with an average of 120 m at the highest point(Wiser and Bolinger 2010). Of the turbines installed in 2009,1.5 GW are located on the U.S. West Coast, which is known tohave high-risk seismic conditions. The interest in addressing seis-mic loading considerations has increased as a result of this growth,coupled with provisions that were recently added to certificationguidelines (GL 2003; IEC 2005). Further, these taller and largerturbines have become long-period structures, and seismic loadeffects may govern the design (ICC 2006; Agbayani 2002).
In response to the new trends and design challenges, researchersare investigating different aspects of the implications of seismicloads on wind turbine design. Early numerical investigations(Bazeos et al. 2002; Lavassas et al. 2003) of wind turbines focusedon the tower, using models that lumped the nacelle and rotor as a
point mass. Detailed finite-element (FE) models were developed toinvestigate the tower stresses and potential stress concentration/buckling scenarios. Bazeos et al. (2002) also provided a thoroughcomparison of dynamic response, employing full shell-element,simpler beam-column, and single degree-of-freedom modelapproaches.
More recent work used models that explicitly simulated the ro-tor along with the turbine tower (Ritschel et al. 2003; Witcher 2005;Haenler et al. 2006). In addition, equivalent springs and damperswere included at the model base to simulate the effects of soil—structure interaction (Bazeos et al. 2002; Zhao and Maisser 2006).Ishihara and Sawar (2008) completed a study using numerical andsemi-analytical approaches to understand the seismic demands fortwo different sizes of wind turbines with 400-kWand 2-MW powerratings. A more comprehensive review of existing literature ofsimulating the seismic response of wind turbines was compiledby Prowell and Veers (2009), along with a simplified seismic de-mand assessment approach for tower heights ranging from 24 m(50-kW rated power output) to 90 m (5-MW rated power output).
Outside of efforts conducted at the University of California,San Diego (UCSD), there are no known projects to experimentallycharacterize the seismic response of wind turbines. However, anumber of investigations exist to experimentally characterize windturbine dynamic response. Early testing conducted at SandiaNational Laboratories focused on characterization of dynamicproperties (mode shapes, natural frequencies, and damping) for ver-tical axis wind turbines (VAWTs). Initial tests were conductedthrough measuring the impulse response of the turbine (Laufferet al. 1988), but in an effort to understand the variation in propertiesdepending on operational state, the Natural Excitation Technique(NExT) was applied to a parked and operating VAWT (James et al.1992). Of particular note is a series of tests, similar in scale to thosereported here, conducted using the National Aeronautics and SpaceAdministration (NASA) Ames wind tunnel to characterize aerody-namic performance of a 2-bladed 20-kW horizontal axis windturbine (Schreck et al. 2001). This wind tunnel test was augmented
1Assistant Professor, Dept. of Civil, Architectural, and EnvironmentalEngineering, Missouri Univ. of Science and Technology, Rolla, MO 65409.
2Professor, Dept. of Structural Engineering, Univ. of California,San Diego, La Jolla, CA 92093-0085 (corresponding author). E-mail:[email protected]
3Professor, Dept. of Structural Engineering, Univ. of California,San Diego, La Jolla, CA 92093-0085.
4Professor, Dept. of Structural Engineering, Univ. of California,San Diego, La Jolla, CA 92093-0085.
5Assistant Professor, Harbin Institute of Technology, School of CivilEngineering, Nan’gang District, Harbin 150090, P. R. China.
Note. This manuscript was submitted on March 1, 2011; approved onDecember 16, 2011; published online on December 20, 2011. Discussionperiod open until December 1, 2012; separate discussions must be sub-mitted for individual papers. This paper is part of the Journal of Engineer-ing Mechanics, Vol. 138, No. 7, July 1, 2012. ©ASCE, ISSN 0733-9399/2012/7-900–909/$25.00.
900 / JOURNAL OF ENGINEERING MECHANICS © ASCE / JULY 2012
J. Eng. Mech. 2012.138:900-909.
Dow
nloa
ded
from
asc
elib
rary
.org
by
Har
bin
Inst
itute
of
Tec
hnol
ogy
on 0
3/17
/14.
Cop
yrig
ht A
SCE
. For
per
sona
l use
onl
y; a
ll ri
ghts
res
erve
d.
by field testing of the same turbine at the National RenewableEnergy Laboratory’s NationalWind Technology Center (Hand et al.2001). More recent investigations studied structural health monitor-ing of wind turbine towers and blades (Rolfes et al. 2007; Adamset al. 2011). Because of the tendency of the wind industry to treatexperimental research as proprietary, dynamic characterizationresults of horizontal axis wind turbines are only sparsely available(Molinari et al. 2010; Prowell et al. 2009; Prowell et al. 2010).
Scope of Research
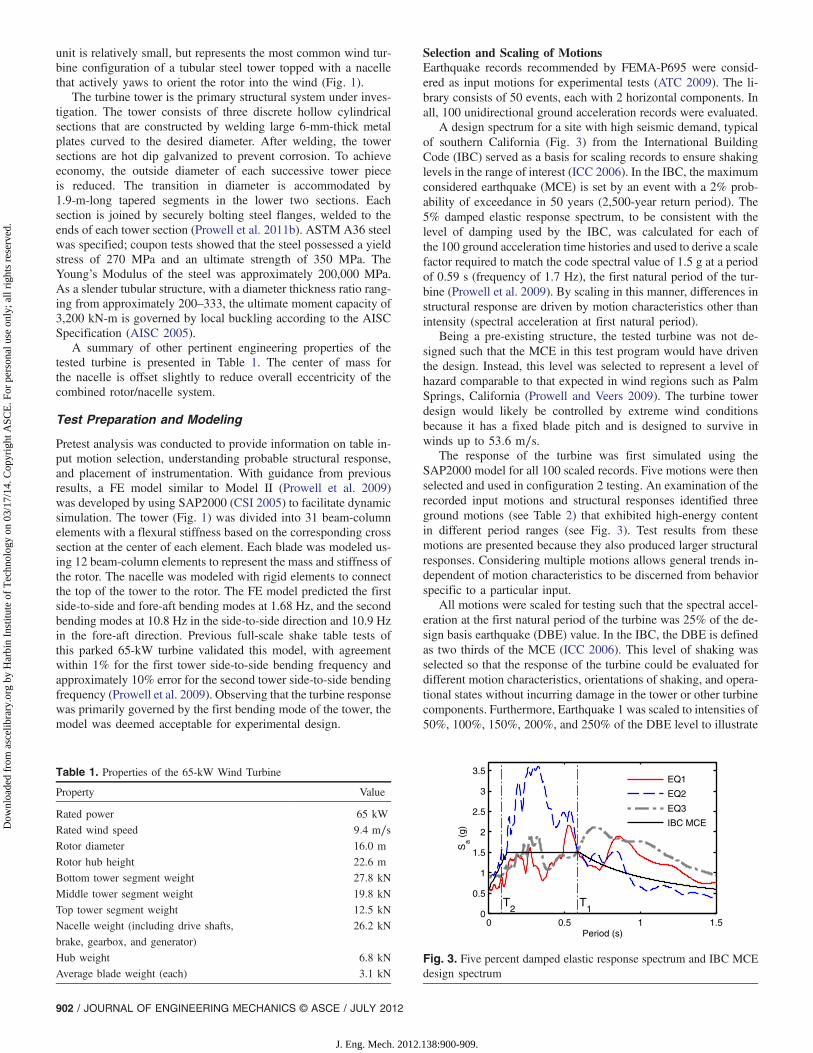
In late 2004, a full-scale shake table test was conducted at theUCSD, using the Network for Earthquake Engineering Simulation(NEES) Large High Performance Outdoor Shake Table (LHPOST)to ascertain a preliminary understanding of the seismic responsecharacteristics of a wind turbine with a rated power output of65 kW (Prowell et al. 2009). Shaking was imparted perpendicularto the axis of rotation of the rotor [Figs. 1 and 2(b)] and recorded byan array of 4 uniaxial direct current—coupled accelerometers in-stalled along the height of the tower, in the direction of shaking.
The first model (Model I) of the two calibrated beam-column FEmodels developed consists of a vertical column of elements with alumped mass at the top that accounts for the nacelle and the rotor.Additional beam-column elements are included in the secondmodel (Model II) to explicitly represent the geometric configura-tion of the nacelle and the rotor. It was found that the more realisticmodel provided better agreement with observed dynamic character-istics and response to base shaking, especially at higher frequen-cies. For small utility scale turbines, analysis using only the firstmode response was shown to provide a reasonable approximationfor seismic response. Results suggested that for larger modernturbines, higher modes might play a more significant role in theseismic response (Prowell et al. 2009).
The research presented here aimed to further clarify questionsraised by wind energy experts regarding the implications oforientation of shaking, operational state, and damage mechanisms.To characterize higher resolution structural response, dense
instrumentation was deployed to measure in-plane and out-of-planeresponse of the test specimen. Shaking was imparted both parallel[configuration 1; Fig. 2(a)] and perpendicular [configuration 2;Fig. 2(b)] to the axis of rotation of the rotor. By characterizationof these two loading configurations, a real scenario with bidirec-tional loading can be understood as a combination of the twoperpendicular components for a predominantly linear response.For these two configurations, the turbine was tested with the rotorparked and also with the rotor spinning. After extensive low-leveltests in both configurations, a final series of progressively strongersimulated earthquake tests were performed using configuration 1 inan attempt to evaluate the damage limit states. Between every earth-quake test, a band-limited white noise motion (0.25–25 Hz) with aRMS amplitude of 0.05 g was run as a control excitation to infernatural frequencies, mode shapes, and equivalent viscous damping.
Results of the test regimen for the parked configuration are an-alyzed to evaluate (1) the observed dynamic characteristics, (2) theimplications of orientation and intensity of shaking, (3) the effec-tiveness of spectral acceleration as an indicator of maximumdisplacement demand, (4) the relation between displacement andshear demand at various levels of shaking, and (5) the sources ofreduction in system stiffness. Analysis of the spinning results areomitted to maintain focus on these objectives. Overall trends andimportant results are discussed with consideration of large modernturbines. Full experimental results will be publically distributedthrough the NEES Project Warehouse (http://nees.org/warehouse).
Testing Program
Description of Test Specimen
Having sustained no identifiable damage from earlier testingin 2004, the previously used 65-kW turbine, donated by OakCreek Energy Systems (Mojave, California), was identified as arepresentative turbine for testing (Fig. 2). The tested turbine wasmanufactured in Denmark by Nordtank. A 65-kW turbine is nearthe lowest power rating used in 1980s era utility scale wind farms.In comparison with modern megawatt-level machines, the tested
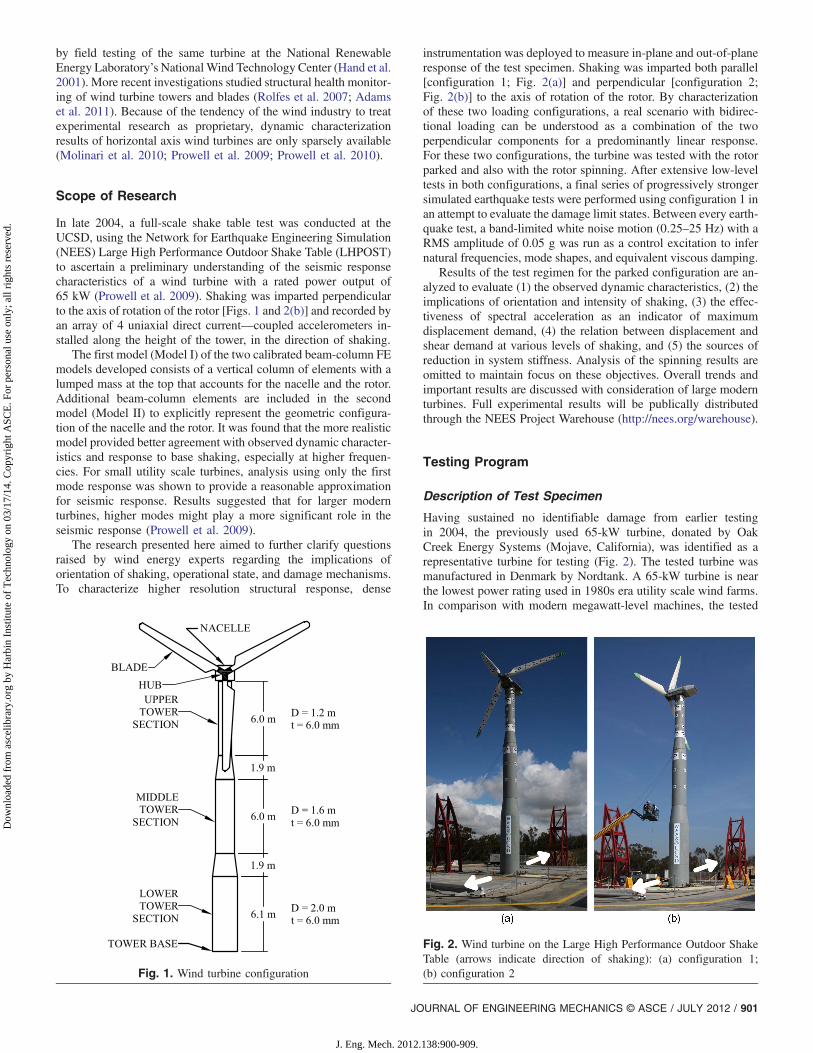
Fig. 1. Wind turbine configuration
Fig. 2. Wind turbine on the Large High Performance Outdoor ShakeTable (arrows indicate direction of shaking): (a) configuration 1;(b) configuration 2
JOURNAL OF ENGINEERING MECHANICS © ASCE / JULY 2012 / 901
J. Eng. Mech. 2012.138:900-909.
Dow
nloa
ded
from
asc
elib
rary
.org
by
Har
bin
Inst
itute
of
Tec
hnol
ogy
on 0
3/17
/14.
Cop
yrig
ht A
SCE
. For
per
sona
l use
onl
y; a
ll ri
ghts
res
erve
d.
unit is relatively small, but represents the most common wind tur-bine configuration of a tubular steel tower topped with a nacellethat actively yaws to orient the rotor into the wind (Fig. 1).
The turbine tower is the primary structural system under inves-tigation. The tower consists of three discrete hollow cylindricalsections that are constructed by welding large 6-mm-thick metalplates curved to the desired diameter. After welding, the towersections are hot dip galvanized to prevent corrosion. To achieveeconomy, the outside diameter of each successive tower pieceis reduced. The transition in diameter is accommodated by1.9-m-long tapered segments in the lower two sections. Eachsection is joined by securely bolting steel flanges, welded to theends of each tower section (Prowell et al. 2011b). ASTM A36 steelwas specified; coupon tests showed that the steel possessed a yieldstress of 270 MPa and an ultimate strength of 350 MPa. TheYoung’s Modulus of the steel was approximately 200,000 MPa.As a slender tubular structure, with a diameter thickness ratio rang-ing from approximately 200–333, the ultimate moment capacity of3,200 kN-m is governed by local buckling according to the AISCSpecification (AISC 2005).
A summary of other pertinent engineering properties of thetested turbine is presented in Table 1. The center of mass forthe nacelle is offset slightly to reduce overall eccentricity of thecombined rotor/nacelle system.
Test Preparation and Modeling
Pretest analysis was conducted to provide information on table in-put motion selection, understanding probable structural response,and placement of instrumentation. With guidance from previousresults, a FE model similar to Model II (Prowell et al. 2009)was developed by using SAP2000 (CSI 2005) to facilitate dynamicsimulation. The tower (Fig. 1) was divided into 31 beam-columnelements with a flexural stiffness based on the corresponding crosssection at the center of each element. Each blade was modeled us-ing 12 beam-column elements to represent the mass and stiffness ofthe rotor. The nacelle was modeled with rigid elements to connectthe top of the tower to the rotor. The FE model predicted the firstside-to-side and fore-aft bending modes at 1.68 Hz, and the secondbending modes at 10.8 Hz in the side-to-side direction and 10.9 Hzin the fore-aft direction. Previous full-scale shake table tests ofthis parked 65-kW turbine validated this model, with agreementwithin 1% for the first tower side-to-side bending frequency andapproximately 10% error for the second tower side-to-side bendingfrequency (Prowell et al. 2009). Observing that the turbine responsewas primarily governed by the first bending mode of the tower, themodel was deemed acceptable for experimental design.
Selection and Scaling of MotionsEarthquake records recommended by FEMA-P695 were consid-ered as input motions for experimental tests (ATC 2009). The li-brary consists of 50 events, each with 2 horizontal components. Inall, 100 unidirectional ground acceleration records were evaluated.
A design spectrum for a site with high seismic demand, typicalof southern California (Fig. 3) from the International BuildingCode (IBC) served as a basis for scaling records to ensure shakinglevels in the range of interest (ICC 2006). In the IBC, the maximumconsidered earthquake (MCE) is set by an event with a 2% prob-ability of exceedance in 50 years (2,500-year return period). The5% damped elastic response spectrum, to be consistent with thelevel of damping used by the IBC, was calculated for each ofthe 100 ground acceleration time histories and used to derive a scalefactor required to match the code spectral value of 1.5 g at a periodof 0.59 s (frequency of 1.7 Hz), the first natural period of the tur-bine (Prowell et al. 2009). By scaling in this manner, differences instructural response are driven by motion characteristics other thanintensity (spectral acceleration at first natural period).
Being a pre-existing structure, the tested turbine was not de-signed such that the MCE in this test program would have driventhe design. Instead, this level was selected to represent a level ofhazard comparable to that expected in wind regions such as PalmSprings, California (Prowell and Veers 2009). The turbine towerdesign would likely be controlled by extreme wind conditionsbecause it has a fixed blade pitch and is designed to survive inwinds up to 53:6 m∕s.
The response of the turbine was first simulated using theSAP2000 model for all 100 scaled records. Five motions were thenselected and used in configuration 2 testing. An examination of therecorded input motions and structural responses identified threeground motions (see Table 2) that exhibited high-energy contentin different period ranges (see Fig. 3). Test results from thesemotions are presented because they also produced larger structuralresponses. Considering multiple motions allows general trends in-dependent of motion characteristics to be discerned from behaviorspecific to a particular input.
All motions were scaled for testing such that the spectral accel-eration at the first natural period of the turbine was 25% of the de-sign basis earthquake (DBE) value. In the IBC, the DBE is definedas two thirds of the MCE (ICC 2006). This level of shaking wasselected so that the response of the turbine could be evaluated fordifferent motion characteristics, orientations of shaking, and opera-tional states without incurring damage in the tower or other turbinecomponents. Furthermore, Earthquake 1 was scaled to intensities of50%, 100%, 150%, 200%, and 250% of the DBE level to illustrate
Table 1. Properties of the 65-kW Wind Turbine
Property Value
Rated power 65 kW
Rated wind speed 9:4 m∕sRotor diameter 16.0 m
Rotor hub height 22.6 m
Bottom tower segment weight 27.8 kN
Middle tower segment weight 19.8 kN
Top tower segment weight 12.5 kN
Nacelle weight (including drive shafts,
brake, gearbox, and generator)
26.2 kN
Hub weight 6.8 kN
Average blade weight (each) 3.1 kN
0 0.5 1 1.50
0.5
1
1.5
2
2.5
3
3.5
Period (s)
Sa (
g)
T1
T2
EQ1
EQ2
EQ3
IBC MCE
Fig. 3. Five percent damped elastic response spectrum and IBC MCEdesign spectrum
902 / JOURNAL OF ENGINEERING MECHANICS © ASCE / JULY 2012
J. Eng. Mech. 2012.138:900-909.
Dow
nloa
ded
from
asc
elib
rary
.org
by
Har
bin
Inst
itute
of
Tec
hnol
ogy
on 0
3/17
/14.
Cop
yrig
ht A
SCE
. For
per
sona
l use
onl
y; a
ll ri
ghts
res
erve
d.

the effect of shaking intensity on the turbines structural response.The sequence of reported test runs is shown in the first fourcolumns of Table 3. For parked tests, the measured wind speedsvaried but were generally low, approximately 2� 4 m∕s (Prowellet al. 2011b).
Before installation of the turbine on the shake table, standardtuning/training protocol of the shake table was followed for eachmotion at every desired level of shaking to improve reproduction oftarget earthquake motions (Luco et al. 2010). The attained tablemotions with the turbine installed on the platen for Earthquakes 1,2, and 3 for the 25% DBE level are shown in Fig. 4. Posttest analy-sis found that, particularly for low-level tests (25% DBE), the
LHPOST characteristics produced higher than desired responsein the 10–11 Hz frequency range due to the oil column frequencyof the table. For Earthquakes 2 and 3, the discrepancy resulted inconsiderably greater excitation in this range compared with that ofEarthquake 1. The discrepancy decreased with increasing intensityof shaking, resulting in a better agreement between the desired andrealized response spectrum for higher intensity motions. For refer-ence, pertinent intensity measures for each of the tests are reportedin Table 3 with a comparison with targeted intensity. The errorbetween the target and measured values of Sa (f ¼ 1:7 Hz and 5%damping) for Earthquake 1 at different levels range from �14:3%to �3:5%, with an average of �10:7%.
Table 2. Selected Earthquake Ground Motion Records
ID Mag. Year Name Station and component MCE scale factor Epicentral dist. (km)
EQ1 6.7 1994 Northridge 14145 Mulholland Dr.–009 1.39 13.4
EQ2 7.3 1992 Landers Coolwater–LN 3.28 82.1
EQ3 6.5 1979 Imperial Valley El Centro Array #7–140 2.66 27.6
Note: EQ, earthquake; Mag, magnitude; MCE, maximum considered earthquake.
−1
0
1
Acc
el. (
m/s
2)
EQ1
−10−5
05
Vel
. (cm
/s)
0 10 20
−2
0
2
Dis
p. (
cm)
Time (s)
EQ2
0 10 20Time (s)
EQ3
0 10 20Time (s)
Fig. 4. Recorded table response for motions scaled to 25% design basis earthquake (DBE) level [from test indexes 1 (Earthquake 3), 2 (Earthquake 1)and 3 (Earthquake 2)]
Table 3. Test Sequence and Intensity Measures
Index Motion Test config.Level
(% of DBE)
Measured intensity parameters
PGD (cm) PGV (cm∕s) PGA (m∕s2)
Sa
Damping
1% (m∕s2) 5% (m∕s2)
1 EQ3 2 25 3.7 15.1 1.5 2.7 2.2 (2.45a)
2 EQ1 2 25 2.2 10.2 1.2 3.7 2.0 (2.45a)
3 EQ2 2 25 1.4 9.5 1.6 2.8 2.2 (2.45a)
4 EQ1 1 25 2.0 9.5 1.2 4.0 2.1 (2.45a)
5 EQ2 1 25 1.5 9.3 1.6 2.8 2.2 (2.45a)
6 EQ3 1 25 3.2 15.3 1.8 2.9 2.4 (2.45a)
7 EQ1 1 50 4.1 19.4 1.8 8.0 4.2 (4.90a)
8 EQ1 (DBE) 1 100 8.3 36.7 3.6 16.3 8.5 (9.81a)
9 EQ1 (MCE) 1 150 12.4 55.2 5.1 26.6 14.2 (14.71a)
10 EQ1 1 200 16.6 73.2 7.0 33.4 17.6 (19.61a)
11 EQ1 1 250 21.9 96.3 8.9 42.7 22.4 (24.52a)
Note: DBE, design basis earthquake; EQ, earthquake; MCE, maximum considered earthquake; PGA, peak ground acceleration; PGD, peak grounddisplacement; PGV, peak ground velocity.aTarget value.
JOURNAL OF ENGINEERING MECHANICS © ASCE / JULY 2012 / 903
J. Eng. Mech. 2012.138:900-909.
Dow
nloa
ded
from
asc
elib
rary
.org
by
Har
bin
Inst
itute
of
Tec
hnol
ogy
on 0
3/17
/14.
Cop
yrig
ht A
SCE
. For
per
sona
l use
onl
y; a
ll ri
ghts
res
erve
d.

Turbine Installation
A 50-mm-thick square steel adapter plate was fabricated with a holepattern corresponding to that of the LHPOST, which allowed 21post-tensioned threadbars (35-mm nominal bar size) to attachthe plate to the platen. To attach the turbine tower base to theadapter plate, thirty 30-mm-diameter threaded studs were filletwelded to the adapter plate to match the hole pattern in the bottomflange of the base tower section. These studs mimic anchor rodsused in field installations that would extend into the foundation.The base tower section was installed and leveled approximately50 mm above the adapter plate with the access door facing east.To simulate as-built field conditions and provide full support underthe base flange, grout was used to fill the gap between the adapterplate and the tower flange (Fig. 5).
Instrumentation
In all, 59 uniaxial accelerometers (MEAS model 4000A) were in-stalled to monitor vibration response during testing. In the tower,accelerometers were placed at 14 approximately evenly distributedelevations with an additional level located in the nacelle to providehigh spatial resolution with a minimum of 2 accelerometers at eachelevation (oriented to capture in-plane and out-of-plane vibration).Seven rosette and eight uniaxial strain gauges were installed at sixelevations (two elevations per tower section). Displacement of thetower was measured through string potentiometers attached fromthe top of each tower section to a fixed instrumentation tower.Visual targets were placed on the tower and all three blades totrack motion through video photogrammetry (Prowell et al. 2011a).At the tower base, LVDTs were used to capture base rocking andsliding relative to the table platen. Prowell et al. (2011b) containsfull details regarding instrumentation of the test specimen.
Dynamic Characterization
System Modal Properties at Low Excitation Level
Data from the white noise motions that were run before and aftereach imparted 25% DBE earthquake ground motion were used forsystem characterization. With a 300-s long stationary input andassuming linear response, estimates of the complex frequency re-sponse of the transfer functions between the measured input accel-eration and other response accelerations were calculated. Welch’smethod was used with 50% overlapping segments of approximately64 s in length to calculate these estimates (Welch 1967). Beforeprocessing, a Kaiser window was applied to each data segmentto reduce frequency leakage in the fast-Fourier transform (Harris1978). These parameters were selected to provide a balance offrequency resolution (0.0156 Hz) and suppression of measurementnoise. A sample of the amplitude of the frequency response of thetransfer function is shown in Fig. 6. Using both the amplitude andphase of the estimates, natural frequencies and mode shapes were
identified through peak picking. Damping at each naturalfrequency was calculated using half-power bandwidth of theamplitude (Chopra 2006).
Because it is known that turbines have closely spaced modes,care was taken to successfully identify these modes. In configura-tion 1, the excitation resulted in a significantly higher responsefor the fore-aft modes compared with the side-to-side modes,although in configuration 2, the opposite was true for relative ac-tivity of the modes. By tailoring the input in this manner, each ofthe closely spaced modes could be observed and quantified inde-pendently (see Fig. 7). As such, results from configuration 1 servedto estimate the fore-aft modes [Figs. 8(a) and 9(b)], whereas theside-to-side modes were derived from data collected in configura-tion 2 [Figs. 8(b) and 9(c)]. One coupled mode was excited in bothconfigurations 1 and 2 [Fig. 9(a)]. A summary of the naturalfrequencies and damping of the identified modes is presented inTable 4.
0 5 10 15
1
10
40
Am
plitu
de
Freq. (Hz)
Fig. 6. Amplitude of the transfer function at 16-m elevation in thedirection of shaking from configuration 1
Fig. 8. Observed tower first mode shapes: (a) fore-aft at 1.70 Hz;(b) side-to-side at 1.71 Hz
1.5 1.6 1.7 1.8 1.9
1
10
40
Am
plitu
de
Freq. (Hz)
Configuration 1Configuration 2
Fig. 7. Comparison of results near first fore-aft and side-to-sidefrequencies at 16-m elevation in the direction of shaking forconfigurations 1 and 2
Platen Surface
Post-TensionedThreadbar
50 mm Grout50 mm Adapter Plate
Tower Base SectionStud
Tower BaseFlange
Fig. 5. Connection detail between tower base and table platen
904 / JOURNAL OF ENGINEERING MECHANICS © ASCE / JULY 2012
J. Eng. Mech. 2012.138:900-909.
Dow
nloa
ded
from
asc
elib
rary
.org
by
Har
bin
Inst
itute
of
Tec
hnol
ogy
on 0
3/17
/14.
Cop
yrig
ht A
SCE
. For
per
sona
l use
onl
y; a
ll ri
ghts
res
erve
d.

Peak picking and half-power bandwidth, a frequency-domainidentification method, is known to have trouble differentiatingclosely spaced modes and providing reliable damping estimates.To provide secondary verification of results, subspace identifica-tion, a time-domain method, was used (Van Overschee and DeMoor 1996). For efficiency, signals were downsampled to 64 Hzand used to estimate state matrices. The resulting frequency anddamping values are reported in Table 4. Natural frequency esti-mates results agreed with 1% for all reported modes. Dampingresults generally agreed with the exception of the first fore-aftmode, which was 0.4% lower in absolute terms (40% relativereduction). This variability between identification methods is sim-ilar to that observed by others and supports reliability of the results(He et al. 2009).
Almost no variation between tests was observed in natural fre-quency or damping for primary bending mode results from bothmethods (Table 4). Higher modes showed more variability, but stillremained relatively constant. This consistency in modal parameterssuggests that, as expected, the 25% DBE level shaking did notcause damage to the turbine.
Degradation of Structural and Support Properties
Once stronger shaking events were initiated, the white noise testsbetween seismic tests of increasing amplitudes showed a reductionof the apparent frequency of the system. Methods developed to iso-late the effects of soil—structure interaction in structural response(e.g., Luco 1980; Luco et al. 1987) were used to investigate whetherthe change in apparent system frequency was due to loss of stiffnessin the turbine structure, degradation of the tower base connection,or both. The basic relation is
1~ω21
¼ 1ω21
þ 1ω2R
ð1Þ
where ~ω1 = observed system frequency; ω1 = fixed-base fundamen-tal frequency of the turbine; and ωR = rocking frequency associated
with flexibility of the base. To determine ω1 and ωR from theobserved data, a second relation [Eq. (2)] involving a ratio ofthe bending deformation at the top of the tower (Ub), the baserocking angle (θs), and the tower height (H) is used:
Ub
HθS≈
�β1H1
H
��ωR
ω1
�2
ð2Þ
The terms β1 and H1 are given by
β1 ¼fΨ1gT ½M�f1gfΨ1gT ½M�fΨ1g
ð3Þ
H1 ¼fΨ1gT ½M�fhgfΨ1gT ½M�f1g ð4Þ
where fΨ1g = the first mode shape; [M] = the mass matrix;fhg = the column vector of the heights; and {1} = a column vectorof ones. For the turbine under study, β1 ¼ 1:2, H1 ¼ 20:3 m,and H ¼ 22:0 m. Rearranging Eqs. (1) and (2) shows that thefixed-base and rocking frequencies can be written as
ω1
~ω1¼
�1þ
�β1H1
H
��HθSUb
��1∕2
ð5Þ
ωR
~ω1¼
�1þ
�H
β1H1
��Ub
HθS
��1∕2
ð6Þ
which involve known or measured quantities (~ω1, β1, H1, Ub, andθs). From the mean of the low-level tests in configuration 1 (testindexes 4 through 6 in Table 3), the undamaged frequencies areestimated at the observed system frequency of ~ω1 ¼ 10:7 rad∕s(1.70 Hz) to be ω1 ¼ 11:1 rad∕s (1.77 Hz) for the fixed-base fre-quency and ωR ¼ 40:2 rad∕s (6.40 Hz) for the rocking frequency.
Results from the white noise motions imparted between strongermotions indicated a progressive loss in fixed base and rockingfrequencies, starting with test no. 8 (see Table 3). By tracking
Fig. 9. Observed tower second mode shapes: (a) coupled at 11.3 Hz; (b) fore-aft at 11.9 Hz; (c) side-to-side at 12.4 Hz
Table 4. Summary of Modal Properties While Parked (25% Design Basis Earthquake)
Tower modetype Direction
Frequency (Hz) Damping (%)
Peak picking Subspace ID Peak picking Subspace ID
Mean Range Mean Range Mean Range Mean Range
1st FA 1.70 1.70–1.70 1.70 1.69–1.70 1.0 0.9–1.0 0.6 0.5–0.6SS 1.71 1.71–1.72 1.71 1.71–1.72 1.1 0.9–1.4 0.9 0.8–0.9
2nd Coupled 11.3 11.2–11.3 11.3 11.3–11.3 1.5 1.2–1.8 1.5 1.4–1.6FA 11.9 11.8–12.0 11.8 11.8–11.9 1.5 1.2–1.9 1.5 1.4–1.8SS 12.4 12.3–12.6 12.4 12.4–12.4 2.2 1.7–2.8 2.5 2.3–2.6
Note: FA, fore-aft; SS, side-to-side.
JOURNAL OF ENGINEERING MECHANICS © ASCE / JULY 2012 / 905
J. Eng. Mech. 2012.138:900-909.
Dow
nloa
ded
from
asc
elib
rary
.org
by
Har
bin
Inst
itute
of
Tec
hnol
ogy
on 0
3/17
/14.
Cop
yrig
ht A
SCE
. For
per
sona
l use
onl
y; a
ll ri
ghts
res
erve
d.

the progression of the parameters ~ω1, ω1, and ωR as a percentage ofthe low-level means (Fig. 10), it was apparent that there was a 14%reduction of the final fixed-base frequency, which translated into a26% reduction of the fixed-base tower stiffness. Inspection aftertest no. 11 showed that torque in 4–6 of the connecting bolts ateach splice joint was below specified levels (Prowell et al. 2011b),which likely accounts for the observed loss in tower stiffness. Therocking frequency degraded by 40%, which implied a 64% reduc-tion of the rocking stiffness. For higher level tests (test no. 8 andabove), rocking resulted in separation of the base flange from thegrout and subsequent impact. Asymmetry in the vertical displace-ment between the platen and tower base for strong shaking eventsclearly showed this behavior (Fig. 11). The observed reduction inrocking stiffness can be explained by the ensuing deterioration ofthe grout. Furthermore, an increase in observed damping up to afinal value of approximately 1.5% was noted at the first apparentsystem frequency (~ω1).
Results of Simulated Earthquake Shaking
Selected experimental results for the three earthquake motions at25% DBE level are presented in Fig. 12 for configuration 1, withconfiguration 2 showing similar results (Prowell et al. 2011b).
To investigate the implications of orientation of shaking, maxi-mum moment demand at the base of the tower is compared for thetwo configurations. The maximum moment is taken as the squareroot of the sum of the squares (SRSS) of the two horizontal com-ponents at each time step. A summary of the maximum momentsfor the 25% DBE motions is shown in Table 5. The observed de-mand is approximately 15% of the 3,200 kN-m predicted nominalby the AISC Specification using a load factor resistance design(LRFD) approach (AISC 2005). Results show variation betweenearthquakes and orientation, which is due in part to variabilityin the input motion (Table 3). Slight differences in fore-aft and
side-to-side modal properties also contribute somewhat to thediscrepancies. As shown in Table 5, the out-of-plane maximummo-ment is delayed from the in-plane maximum moment. Because ofthis lag, maximum SRSS moment demand was primarily caused bythe contribution from vibration in the direction of shaking.
The acceleration (Fig. 13) envelopes are considered to assessthe relative contribution of modes to the dynamic response of theturbine. The motions that are richer in higher frequency energy,Earthquakes 2 and 3 (Fig. 3), show more second-mode participa-tion in the acceleration envelope in configuration 1 [Fig. 13(a)],but only Earthquake 3 shows notable second mode activity in con-figuration 2 [Fig. 13(b)]. When considered in conjunction withmass distribution, structural demand from the second mode isminimal, but this is evidence that higher modes are excited by baseshaking and can play a role in the seismic response of a turbine,particularly larger modern turbines, where the frequency of these
NA 4.0 2.8 2.9 8.0 16.3 26.6 33.4 42.7
60
70
80
90
100
Sa (damping=1% and f=1.7 Hz, m/s2)
Per
cent
of M
ean
Fro
mLo
w L
evel
Tes
ts (
%)
Fig. 10. Variation in observed, fixed base, and rocking frequency forconfiguration 1 tests (calculated Sa shown from test before white noseexcitation)
0
0.1
0.2
Dis
p. (
cm)
EQ1 at 25% DBE
0 5 10 15 20
0
0.1
0.2
Time (s)
EQ1 at 100% DBE
Fig. 11. Vertical displacement of tower base
-303
Rel
ativ
eT
opD
isp.
(cm
)
EQ1
-303
Top
Abs
olut
eA
ccel
.(m
/s2 )
0 10 20-25
0
25
Bas
eS
hear
(kN
)
Time (s)
EQ2
0 10 20Time (s)
EQ3
0 10 20Time (s)
Fig. 12. Key response parameters for configuration 1 (25% designbasis earthquake input level)
Table 5. Maximum Base Moment Demand (25% Design BasisEarthquake)
Test
In-planemoment(kN-m)
Out-of-planemoment(kN-m)
SRSSmoment(kN-m)
Config. 1: EQ1 584 at 10.3 s 103 at 13.6 s 588 at 10.3 s
Config. 2: EQ1 509 at 10.1 s 101 at 14.0 s 509 at 10.1 s
Config. 1: EQ2 445 at 8.4 s 86 at 15.0 s 445 at 8.4 s
Config. 2: EQ2 414 at 8.4 s 65 at 14.7 s 414 at 8.4 s
Config. 1: EQ3 466 at 11.2 s 95 at 12.7 s 469 at 11.2 s
Config. 2: EQ3 491 at 11.0 s 118 at 10.9 s 492 at 11.0 s
Note: EQ, earthquake; SRSS, square root of the sum of the squares.
−5 0 50
5
10
15
20
Ele
vatio
n (m
)
Absolute Accel. (m/s2)
EQ1EQ2EQ3
−5 0 5Absolute Accel. (m/s2)
(a) (b)
Fig. 13. Absolute acceleration envelope for 25% design basisearthquake tests: (a) configuration 1; (b) configuration 2
906 / JOURNAL OF ENGINEERING MECHANICS © ASCE / JULY 2012
J. Eng. Mech. 2012.138:900-909.
Dow
nloa
ded
from
asc
elib
rary
.org
by
Har
bin
Inst
itute
of
Tec
hnol
ogy
on 0
3/17
/14.
Cop
yrig
ht A
SCE
. For
per
sona
l use
onl
y; a
ll ri
ghts
res
erve
d.

higher modes fall into ranges of significant seismic input energy(Haenler et al. 2006; Ishihara and Sawar 2008; Prowell et al. 2009).
As discussed earlier, the white noise test results show that thehigher level shaking induced progressive softening (damage) of theturbine tower and base connection as evidenced by a shift inthe natural frequency of the first fore-aft mode (Fig. 10). Thereduction in the fixed-base frequency (ω1) can be attributed tothe bolt loosening, as previously mentioned. In production configu-rations, bolt torque is maintained by a second nut, and inspectionroutines normally specify verification of bolt torque to prevent asimilar loss in stiffness. However, the portion of softening due todeterioration of the grout reinforces the importance of proper con-nection detailing for the tower base. Repairing the foundationwould be more expensive and difficult than retorquing connectingbolts.
Using 1% of critical damping and the natural frequency ob-served for the first bending mode from the white noise excitationbefore each test (~ω1), the spectral acceleration for each recording ofthe platen motion was calculated and compared with the maximumtower top displacement (Fig. 14). For lower levels of spectral ac-celeration, up to approximately 1 g, a linear relationship with lateraldisplacement is observed for both configurations. At the higher lev-els of shaking, the linear correlation of spectral acceleration andmaximum tower top displacement does not appear to be maintained[Fig. 14(a)], with greater displacement than a linear trend wouldpredict. This deviation can be explained by accounting for the rock-ing of the tower base in relation to the table platen. As analyzedearlier, the observed rocking is due to deformation and deteriora-tion of the components connecting the tower to the platen. Once therigid body contribution from base rocking is removed from mea-sured displacement, the results continue to follow the linear trendestablished by lower level tests (Fig. 14).
The spectral displacement can be related to spectral accelerationas follows (Chopra 2006):
Sd ¼Saω2 ¼
Sað2πf Þ2 ð7Þ
For the first mode of the tested turbine, it was shown in Eq. (3)that the modal participation factor was β1 ¼ 1:2 in the fore-aftdirection (Prowell et al. 2009). Therefore, the predicted maximumdisplacement of the tower is
Δmax ¼ 1:2Sd ¼1:2Sað2πf Þ2 ð8Þ
Observed agreement between Eq. (8) and maximum measureddisplacement corrected for base rocking (Fig. 14) suggests that
such a simple approximation is useful for estimation of seismicallyinduced relative displacement for similar turbines.
As expected from elastic response, for small tower top displace-ments (< 10 cm) a linear trend is observed between tower toprelative displacement and base shear (Fig. 15). In configuration2, shaking levels were not strong enough to observe any deviationfrom this trend. For large displacements, it appears that base sheardemand reduces. However, closer inspection reveals that the fore-aft stiffness in the first mode (proportional to the square of thefirst natural frequency, Fig. 7) was progressively reduced as thedeviation from the linear shear versus displacement relation in-creased. It is expected that, as observed, a decrease in stiffnessfor a bending structure will lead to greater relative displacementfor the same applied shear. These overall linear trends shown inFigs. 14 and 15 indicate, for the tested turbine, that 1% dampedspectral acceleration may serve as an indicator of the expected levelof tower top displacement or, with consideration of lateral stiffness,tower base shear demand.
As in lower level tests, out-of-plane moment is observed frominertial measurements (Fig. 16) in configuration 1 [Fig. 2(a)] for thehigher levels of shaking. At the highest level of shaking, maximummoment demand at the base, 3,300 kN-m, slightly exceeded the3,200 kN-m nominal capacity, indicating that buckling of the towerwas likely imminent (AISC 2005). Displacement-moment profilesfor the strong shaking also show effectively linear behavior(Fig. 17). Analysis of hysteresis loops suggest that for strongshaking, fore-aft damping may be higher than that (approximately2–3%) found from white noise identification. With appropriate con-sideration of observed bolt loosing and base rocking, the testedturbine performed well, even for very strong earthquake shaking.
−20 0 20−200
−100
0
100
200
Rel. Disp. (cm)
Max
. Bas
e S
hear
(kN
)
−20 0 20Rel. Disp. (cm)
Un−correctedCorrected
(a) (b)
Fig. 15. Maximum base shear versus tower top relative displacementrelationship: (a) configuration 1; (b) configuration 2
0 1000 2000 3000 40000
5
10
15
20
Ele
vatio
n (m
)
Moment (kN−m)0 1000 2000 3000 4000
Moment (kN−m)
AISC25%50%100%150%200%250%
(a) (b)
Fig. 16.Moment envelope for earthquake 1 strong events: (a) in-plane;(b) out-of-plane
0 1 2 30
5
10
15
20
25
30
Sa (g)
Max
. Rel
. Dis
p. (
cm)
0 1 2 3S
a (g)
Un−correctedCorrectedEq. 7
(a) (b)
Fig. 14. Maximum tower top relative displacement versus 1%damped spectral acceleration relationship: (a) configuration 1;(b) configuration 2
JOURNAL OF ENGINEERING MECHANICS © ASCE / JULY 2012 / 907
J. Eng. Mech. 2012.138:900-909.
Dow
nloa
ded
from
asc
elib
rary
.org
by
Har
bin
Inst
itute
of
Tec
hnol
ogy
on 0
3/17
/14.
Cop
yrig
ht A
SCE
. For
per
sona
l use
onl
y; a
ll ri
ghts
res
erve
d.

Discussion
The experimental results presented here support the followingobservations:1. The experimentally derived first side-to-side frequency, mode
shape, and damping estimates reinforce previous test results(Prowell et al. 2009). With the higher density and out-of-planeinstrumentation, both fore-aft and side-to-side vibration modeswere identified. Additionally, the previously observed band ofhigher resonance was resolved into three second bending typemodes (Table 4): a coupled mode at 11.2 Hz, a fore-aft mode at11.9 Hz, and a side-to-side mode at 12.5 Hz.
2. White noise shaking between each test run provided a consis-tent method to identify system dynamic characteristics (Fig. 7).Observed consistency showed that, as expected, the 25% DBEmotions did not damage the turbine. When the specimen char-acteristics changed, this methodology allowed identificationand quantification of the extent of structural softening.
3. Observed deterioration of the grout at the turbine base showedthat connection detailing at the tower base was important toseismic performance. Damage at the level observed wouldremove the turbine from service and requires time consumingrepairs to the foundation.
4. Out-of-plane response was observed at a similar level for bothorientations of shaking. Although peak moment demand re-ported here was not significantly impacted by out-of-planecoupling, it may be an important consideration for situationswhere shaking occurs in multiple directions, as well as situa-tions when wind and operational loads are present. Further,it was found that torsion was not significantly impacted bythe orientation of shaking.
5. In agreement with previous findings (Ishihara and Sawar 2008;Prowell et al. 2009), the seismic response of smaller turbineswas primarily governed by the first mode response. A simpleprocedure was suggested to estimate maximum relativedisplacement for a parked turbine similar to the tested unit.However, the acceleration envelope for motions that werericher in high frequency energy showed excitation of highermodes. For large turbines, where frequencies of higher modesfall into the maximum acceleration range of earthquake excita-tion and design spectra, demand parameters may have a sig-nificant higher mode contribution (ICC 2006; Haenler et al.2006). Due to this coincidence, it is important that highermodes, in addition to the first tower bending mode, areincluded in simulating the response to seismic excitation formodern wind turbines.
6. The turbine was able to accommodate base motions with Sa( f ¼ 1:7 Hz and 5% damping) of the order of 2.04 g withoutexceeding the moment capacity of 3,200 kN-m. This level is36% higher than the assumed MCE level of 1.5 g and exceedsthe maximum MCE level in the United States considered by
the IBC (ICC 2006), except in the immediate vicinity of knownactive faults (excluding consideration of modification for localsoil conditions).
Conclusions
Experimental results from this full-scale test of a 65-kW turbinewere presented and analyzed. The test protocol was designed withinput from wind energy experts to augment the results from a pre-vious test. Key additions were: various test motions at multipleintensities, more extensive in-plane and additional out-of-planeinstrumentation, multiple test configurations, and operationalstates. The results reinforced past experimental and numerical find-ings. For turbines similar to the tested unit, a simple procedure wassuggested to estimate tower top displacement and, with knowledgeof lateral stiffness, base shear demand. With a proper considerationof the base rocking, the measured reduction in global stiffness wassplit into contributions from structural softening and loss of stiff-ness in the base connection. Degradation of the connection betweenthe tower and foundation was identified as a possible and undesir-able damage mechanism. In addition, higher mode response,important for seismic loading of larger turbines, was successfullycaptured and illustrated.
Acknowledgments
The authors extend their gratitude to the National Science Founda-tion (NSF) for funding this work as part of a George E. Brown Jr.NEES Research project (NSF NEESR-II grant No. CMMI0830422). Contributions, in the form of the donation of the testedturbine, guidance, and work hours, from Oak Creek EnergySystems (Hal Romanowitz, J. Edward Duggan, Vaughn Johnson,Michael Burns, and many others) are most appreciated. Shake tabletesting would not have been possible without the hard work of theNEES@UCSD team (Robert Beckley, Lawrence Berman, AndrewGunthardt, Darren McKay, Richard Whalen, Alex Sherman,Michael Dyson, Lawton Rodriguez, Paul Greco, and Chris Latham)headed by Dan Radulescu. Thanks are also due to Dr. Paul Veersand the Sandia National Laboratories Wind Energy TechnologyDepartment for providing the first author with a summer internship.
References
Adams, D., White, J., Rumsey, M., and Farrar, C. (2011). “Structural healthmonitoring of wind turbines: method and application to a HAWT.”WindEnergy, 14(4), 603–623.
Agbayani, N. A. (2002). “Design challenges in international wind powerprojects: From foreign codes to computer coding in a small officesetting.” Proc., 2002 Structural Engineers Association of California(SEAOC) Convention, SEAOC, Sacramento, CA, 117–132.
−20000
2000
25%
−20000
2000
Mom
ent (
kN−
m)
50%
−20 0 20
−20000
2000
Disp. (cm)
100%
150%
200%
−20 0 20Disp. (cm)
250%
Fig. 17. Tower top relative displacement-moment relationship for earthquake 1 strong shaking tests
908 / JOURNAL OF ENGINEERING MECHANICS © ASCE / JULY 2012
J. Eng. Mech. 2012.138:900-909.
Dow
nloa
ded
from
asc
elib
rary
.org
by
Har
bin
Inst
itute
of
Tec
hnol
ogy
on 0
3/17
/14.
Cop
yrig
ht A
SCE
. For
per
sona
l use
onl
y; a
ll ri
ghts
res
erve
d.

American Institute for Steel Construction (AISC). (2005). Steelconstruction manual, 13th Edition, AISC, Chicago.
Applied Technology Council (ATC). (2009). “Quantification of buildingseismic performance factors.” Rep. No. FEMA, Federal EmergencyManagement Agency, Washington, DC, 695.
Bazeos, N., Hatzigeorgiou, G. D., Hondros, I. D., Karamaneas, H.,Karabalis, D. L., and Beskos, D. E. (2002). “Static, seismic and stabilityanalyses of a prototype wind turbine steel tower.” Eng. Struct., 24(8),1015–1025.
Chopra, A. K. (2006). Dynamics of structures: Theory and application toearthquake engineering, Prentice-Hall, Upper Saddle River, NJ.
Computers and Structures, Inc. (CSI). (2005). User’s manual, version 10,Computers and Structures, Inc., Berkeley, CA.
Germanischer Lloyd (GL). (2003). Guidelines for the certification of windturbines, GL, Hamburg, Germany.
Haenler, M., Ritschel, U., and Warnke, I. (2006). “Systematic modelling ofwind turbine dynamics and earthquake loads on wind turbines.”European Wind Energy Conf. Exhibition, European Wind EnergyAssociation, Brussels, Belgium, 1–6.
Hand, M. M., Simms, D. A., Fingersh, L. J., Jager, D. W., and Cotrell, J. R.(2001). “Unsteady aerodynamics experiment phase V: test configura-tion and available data campaigns.” Rep. No. NREL/ TP-500-29491,National Renewable Energy Laboratory, Golden, CO.
Harris, F. (1978). “On the use of windows for harmonic analysis with thediscrete Fourier transform.” Proc. IEEE, 66(1), 51–83.
He, X., Moeveni, B., Conte, J. P., Elgamal, A., and Masri, S. F. (2009).“System identification of Alfred Zampa Memorial Bridge usingdynamic field test data.” J. Struct. Eng., 135(1), 54–66.
International Code Council (ICC). (2006). International building code2006, ICC, Country Club Hills, IL.
International Electrotechnical Commission (IEC). (2005). IEC 61400-1Ed. 3: Wind turbines—Part 1: Design requirements, IEC, Geneva,Switzerland.
Ishihara, T., and Sawar, M. W. (2008). “Numerical and theoretical study onseismic response of wind turbines.” European Wind Energy Conf.Exhibition, European Wind Energy Association, Brussels, Belgium,1–5.
James, G. H., III, Carne, T. G., and Lauffer, J. P. (1992). “The NaturalExcitation Technique (NExT) for modal parameter extraction fromoperating wind turbines.” Rep. No. SAND92-1666, UC-261, SandiaNational Laboratories, Albuquerque, NM.
Lauffer, J. P., Carne, T. G., and Ashwill, T. D. (1988). “Modal testing in thedesign evaluation of wind turbines.” Rep. No. SAND87-2461, SandiaNational Laboratories, Albuquerque, NM.
Lavassas, I., Nikolaidis, G., Zervas, P., Efthimiou, E., Doudoumis, I. N.,and Baniotopoulos, C. C. (2003). “Analysis and design of theprototype of a steel 1-MW wind turbine tower.” Eng. Struct., 25(8),1097–1106.
Luco, J. E. (1980). “Soil-structure interaction and identification ofstructural models.” Proc., 2nd ASCE Specialty Conf. Civil Engineeringand Nuclear Power, ASCE, Reston, VA.
Luco, J. E., Ozcelik, O., and Conte, J. P. (2010). “Acceleration tracking
performance of the UCSD-NEES shake table.” J. Struct. Eng., 136(5),481–490.
Luco, J. E., Trifunac, M. D., and Wong, H. L. (1987). “On the apparentchange in dynamic behavior of a nine-story reinforced concretebuilding.” Bull. Seismol. Soc. Am., 77(6), 1961–1983.
Molinari, M., Pozzi, M., Zonta, D., and Battisti, L. (2010). “In-field testingof a steel wind turbine tower.” Proc., IMAC-XXVIII, Society forExperimental Mechanics, Inc., Bethel, CT, 1–10.
Prowell, I., Elgamal, A., Romanowitz, H., Duggan, J. E., and Jonkman, J.(2010). “Earthquake response modeling for a parked and operatingmegawatt-scale wind turbine.” Rep. No. NREL/TP-5000-48242,National Renewable Energy Laboratory, Golden, CO.
Prowell, I., Schmidt, T., Elgamal, A., Uang, C., Romanowitz, H., andDuggan, J. E. (2011a). “Measuring global response of a wind turbineto earthquake shaking assisted by point tracking videogrammetry.”52nd AIAA/ASME/ASCE/ASC Structures, Structural Dynamics andMaterials Conf., American Institute of Aeronautics and Astronautics,Reston, VA.
Prowell, I., Uang, C. M., and Elgamal, A. (2011b). “Shake table test of autility-scale wind turbine.” Rep. No. SSRP-10-06, Dept. of StructuralEngineering, Univ. of California, San Diego, CA.
Prowell, I., and Veers, P. (2009). “Assessment of wind turbine seismicrisk: Existing literature and simple study of tower moment demand.”Rep. No. SAND2009-1100, Sandia National Laboratories, Albuquerque,NM.
Prowell, I., Veletzos, M., Elgamal, A., and Restrepo, J. (2009). “Experi-mental and numerical seismic response of a 65 kW wind turbine.”J. Earthquake Eng., 13(8), 1172–1190.
Ritschel, U., Warnke, I., Kirchner, J., and Meussen, B. (2003). “Windturbines and earthquakes.” 2nd World Wind Energy Conf., World WindEnergy Association, Cape Town, South Africa, 1–8.
Rolfes, R., Zerbst, S., Haake, G., Reetz, J., and Lynch, J. P. (2007).“Integral SHM-System for offshore wind turbines using smart wirelesssensors.” 6th Int. Workshop on Structural Health Monitoring, StanfordUniv., Palo Alto, CA, 1–8.
Schreck, S. J., Robinson, M. C., Hand, M. M., and Simms, D. A. (2001).“Blade dynamic stall vortex kinematics for a horizontal axis windturbine in yawed conditions.” J. Sol. Energy Eng., 123(4), 272–281.
Van Overschee, P., and De Moor, B. (1996). Subspace identification forlinear systems: theory-implementation-applications, Kluwer AcademicPublishers, Norwell, MA.
Welch, P. (1967). “The use of fast Fourier transform for the estimation ofpower spectra: A method based on time averaging over short, modifiedperiodograms.” IEEE Trans. Audio Electroacoust., 15(2), 70–73.
Wiser, R., and Bolinger, M. (2010). “2009 wind technologies marketreport.” Rep. No. LBNL-3716E; DOE/GO-102010-3107, LawrenceBerkeley National Laboratory, Berkeley, CA.
Witcher, D. (2005). “Seismic analysis of wind turbines in the time domain.”Wind Energy, 8(1), 81–91.
Zhao, X., and Maisser, P. (2006). “Seismic response analysis of windturbine towers including soil-structure interaction.” Proc. Inst. Mech.Eng., Part K, 220(1), 53–61.
JOURNAL OF ENGINEERING MECHANICS © ASCE / JULY 2012 / 909
J. Eng. Mech. 2012.138:900-909.
Dow
nloa
ded
from
asc
elib
rary
.org
by
Har
bin
Inst
itute
of
Tec
hnol
ogy
on 0
3/17
/14.
Cop
yrig
ht A
SCE
. For
per
sona
l use
onl
y; a
ll ri
ghts
res
erve
d.