wind tunnel study on fluctuating internal pressure of open
TRANSCRIPT
Wind and Structures, Vol. 32. No. 2 (2021) 105-114 DOI: https://doi.org/10.12989/was.2021.32.2.105 105
Copyright © 2021 Techno-Press, Ltd. http://www.techno-press.com/journals/was&subpage=7 ISSN: 1226-6116 (Print), 1598-6225 (Online)
1. Introduction
Previous investigations of wind disasters have shown
that windborne debris is one of the major sources of
building damage during severe storms (Minor 1994, Behr
and Minor 1994). The envelopes of buildings, such as doors
and windows, are vulnerable to the impact of windborne
debris. After the building envelope is perforated, an
originally sealed building turns into an open building, and
then the internal pressures of the building can increase
significantly and resonant response may also occur
(Shanmugasundaram et al. 2000, Lee and Wills 2002),
which may cause considerable damage to the building. Although a lot of research has extensively investigated
wind-induced internal pressures of buildings with openings,
most of it has generally focused on the internal pressures
induced by flow normal to the opening (Holmes 1980,
Stathopoulos et al. 1979, Kopp et al. 2008). However, the
fluctuating internal pressures induced by tangential flow
over openings from oblique wind directions are very
unsteady and may be more dangerous (Ai and Mak 2014).
Sharma and Richards (2003) stated that under tangential
Corresponding author, Ph.D. Professor E-mail: [email protected]
aPh.D. Student
E-mail: [email protected] bPh.D. Professor
E-mail: [email protected]
flow, excitation of the internal pressures at the resonant
frequency is affected by the “eddy dynamics” at the
opening. If the frequency of the “eddy dynamics” is matched to the Helmholtz resonance frequency, much
stronger resonance can be expected to take place. Guha et
al. (2011) investigated the internal pressures of opening
buildings by using a covariance integration approach, and
the results show that the internal pressure resonance at wind
angles of ±80 - 90° was driven by eddy at the opening due
to tangential flow excitation. Both of the above publications
suggest that the eddy of the incoming flow takes place at
the opening. However, if the eddy of the incoming flow did
emanate at the opening, the internal pressures of buildings
with a dominant opening would be affected similarly for all wind directions, which contradicts the phenomenon that the
internal pressure resonance is only excited at a particular
range of oblique angles, resulting in an increase in the
fluctuating internal pressures. In this paper, the term
“dominant opening” is understood to mean that the opening
in one face has an area at least twice the total area of the
openings in the other faces. Thus, the mechanism that
causes highly fluctuating internal pressures at some oblique
wind angles needs to be studied further.
In addition, the internal pressure of buildings with
openings is expected to be influenced by many other
factors, such as turbulence intensity (Iu), wind angle, opening location, background porosity and so on (Ginger et
al. 2008, 2013, Guha et al. 2013, Sabareesh et al. 2018).
There is still very little research being conducted to
determine the influence of these factors on the phenomenon
of the increase in fluctuating internal pressures observed
Wind tunnel study on fluctuating internal pressure of open building induced by tangential flow
Sheng Chen1a, Peng Huang1 and Richard G.J. Flay2b
1State Key Laboratory of Disaster Reduction in Civil Engineering. Tongji University. Shanghai 200092. China 2Department of Mechanical Engineering. The University of Auckland. Private Bag 92019. Auckland 1142. New Zealand
(Received October 3. 2020. Revised January 8. 2021. Accepted February 5. 2021)
Abstract. This paper describes a wind tunnel test on a 1:25 scale model of TTU building with several adjustable openings in
order to comprehensively study the characteristics of fluctuating internal pressures, especially the phenomenon of the increase in fluctuating internal pressures induced by tangential flow over building openings and the mechanism causing that. The effects of
several factors, such as wind angle, turbulence intensity, opening location, opening size, opening shape and background porosity on the fluctuating internal pressures at oblique wind angles are also described. It has been found that there is a large increase in
the fluctuating internal pressures at certain oblique wind angles (typically around 60° to 80°). These fluctuations are greater than those produced by the flow normal to the opening when the turbulence intensity is low. It is demonstrated that the internal
pressure resonances induced by the external pressure fluctuations emanating from flapping shear layers on the sidewall downstream of the windward corner are responsible for the increase in the fluctuating internal pressures. Furthermore, the test
results show that apart from the opening shape, all the other factors influence the fluctuating internal pressures and the internal pressure resonances at oblique wind angles to varying degrees.
Keywords: fluctuating internal pressure; opening building; wind tunnel test; oblique wind angle; external pressure fluctuations; internal pressure resonance
Sheng Chen, Peng Huang and Richard G.J. Flay
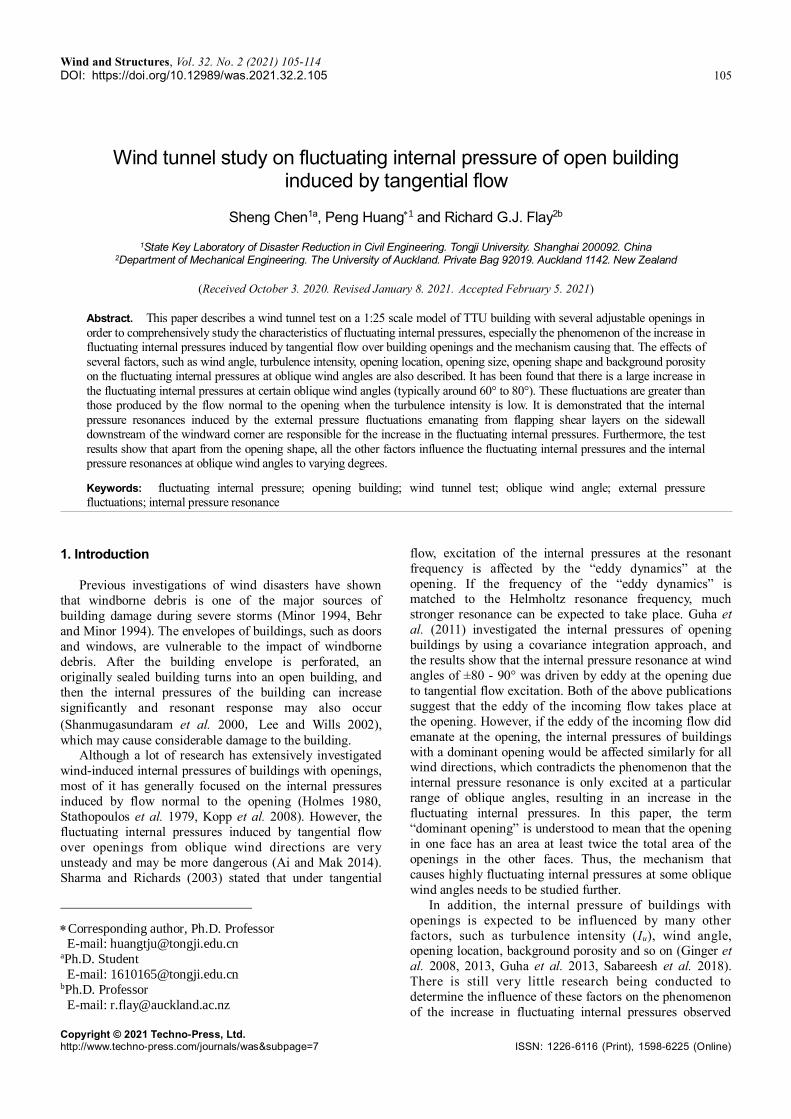
Fig. 1 Photograph of the rigid test model - TTU test
building, scale: 1:25
Fig. 2 Definition of wind directions
when there is tangential flow across the opening., Such
actions will increase the kinetic energy of the internal pressures, thus their ability to cause damage and this is
potentially a great threat to the safety of buildings.
Therefore, a detailed study of the fluctuating internal
pressure responses, including the internal pressure
resonances induced by tangential flow over building
openings is important to ensure the safety of buildings with
dominant openings in wind storms.
In this paper, the wind tunnel tests were carried out on a
rigid model of TTU building with several kinds of
openings. The phenomenon of the increase in the
fluctuating internal pressures under tangential flow and the mechanism causing that were investigated in detail. In
addition, the influencing factors on the fluctuating internal
pressures and their resonant responses, such as turbulence
intensity, opening location, opening size, opening shape and
background porosity of the building, were systematically
determined for a range of wind directions.
2. Wind tunnel tests
2.1 Test model procedure The wind tunnel tests were conducted in the TJ-2
atmospheric boundary layer wind tunnel at Tongji
University. It is a closed return-flow wind tunnel with a
rectangular test section. The Texas Tech University (TTU)
building of WERFL (Texas Tech Wind Engineering
Research Field Laboratory) is a typical low-rise building
and many previous researchers have used it as the prototype
to study the wind-induced internal pressures of buildings
with openings (Levitan and Mehta 1992, Ginger 2000,
Guha et al. 2013). Thus, the TTU WERFL building was
also adopted as the full-scale prototype for the wind tunnel rigid model discussed in this paper so that the present
findings could be compared with previously published
findings. The geometric scale of the model is 1:25 and the
Table 1 Model configurations tested in the wind tunnel
Designation A31 A53 A68 A81 A37 A74 As
Opening width
× height (mm×mm)
31×31 53×53 68×68 81×81 37×74 74×37 53×53
Opening fraction
1% 3% 5% 7% 3% 3% 3%
Opening aspect ratio
1:1 1:1 1:1 1:1 1:2 2:1 1:1
Opening location
center center center center center center side
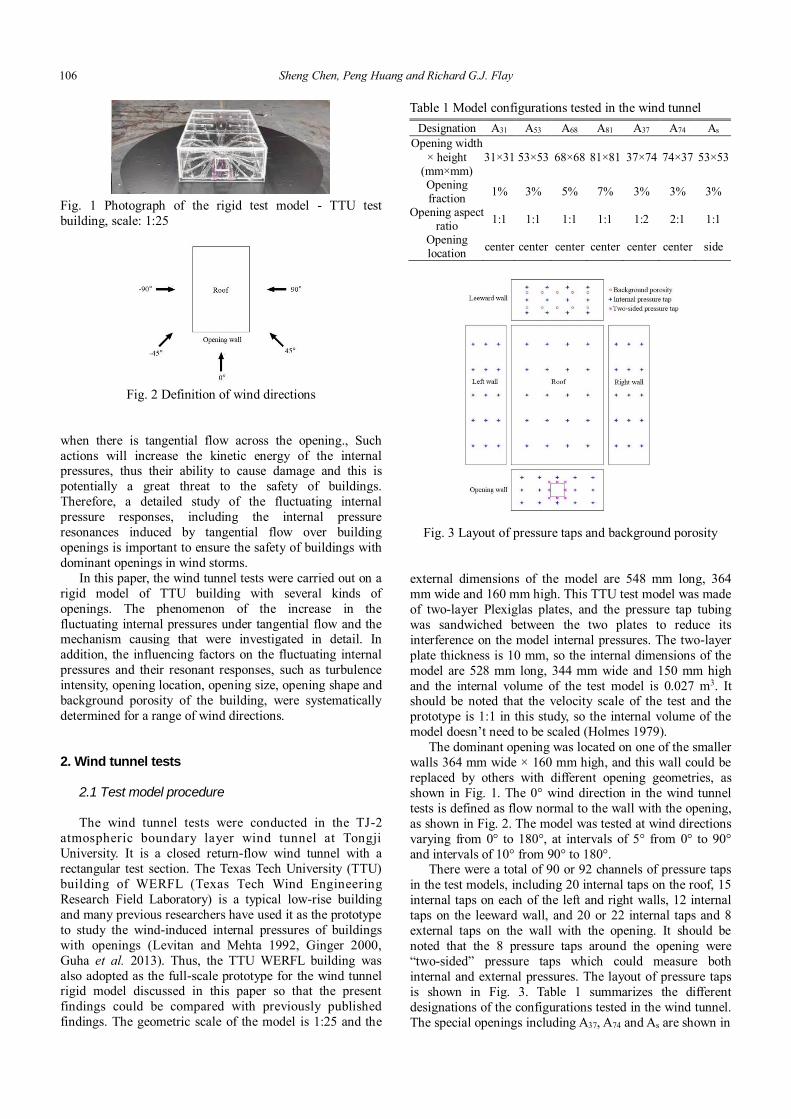
Fig. 3 Layout of pressure taps and background porosity
external dimensions of the model are 548 mm long, 364
mm wide and 160 mm high. This TTU test model was made
of two-layer Plexiglas plates, and the pressure tap tubing
was sandwiched between the two plates to reduce its
interference on the model internal pressures. The two-layer
plate thickness is 10 mm, so the internal dimensions of the
model are 528 mm long, 344 mm wide and 150 mm high
and the internal volume of the test model is 0.027 m3. It should be noted that the velocity scale of the test and the
prototype is 1:1 in this study, so the internal volume of the
model doesn’t need to be scaled (Holmes 1979).
The dominant opening was located on one of the smaller
walls 364 mm wide × 160 mm high, and this wall could be
replaced by others with different opening geometries, as
shown in Fig. 1. The 0° wind direction in the wind tunnel
tests is defined as flow normal to the wall with the opening,
as shown in Fig. 2. The model was tested at wind directions
varying from 0° to 180°, at intervals of 5° from 0° to 90°
and intervals of 10° from 90° to 180°. There were a total of 90 or 92 channels of pressure taps
in the test models, including 20 internal taps on the roof, 15
internal taps on each of the left and right walls, 12 internal
taps on the leeward wall, and 20 or 22 internal taps and 8
external taps on the wall with the opening. It should be
noted that the 8 pressure taps around the opening were
“two-sided” pressure taps which could measure both
internal and external pressures. The layout of pressure taps
is shown in Fig. 3. Table 1 summarizes the different
designations of the configurations tested in the wind tunnel.
The special openings including A37, A74 and As are shown in
106
Wind tunnel study on fluctuating internal pressure of open building induced by tangential flow
(a) A37
(b) A74
(c) As
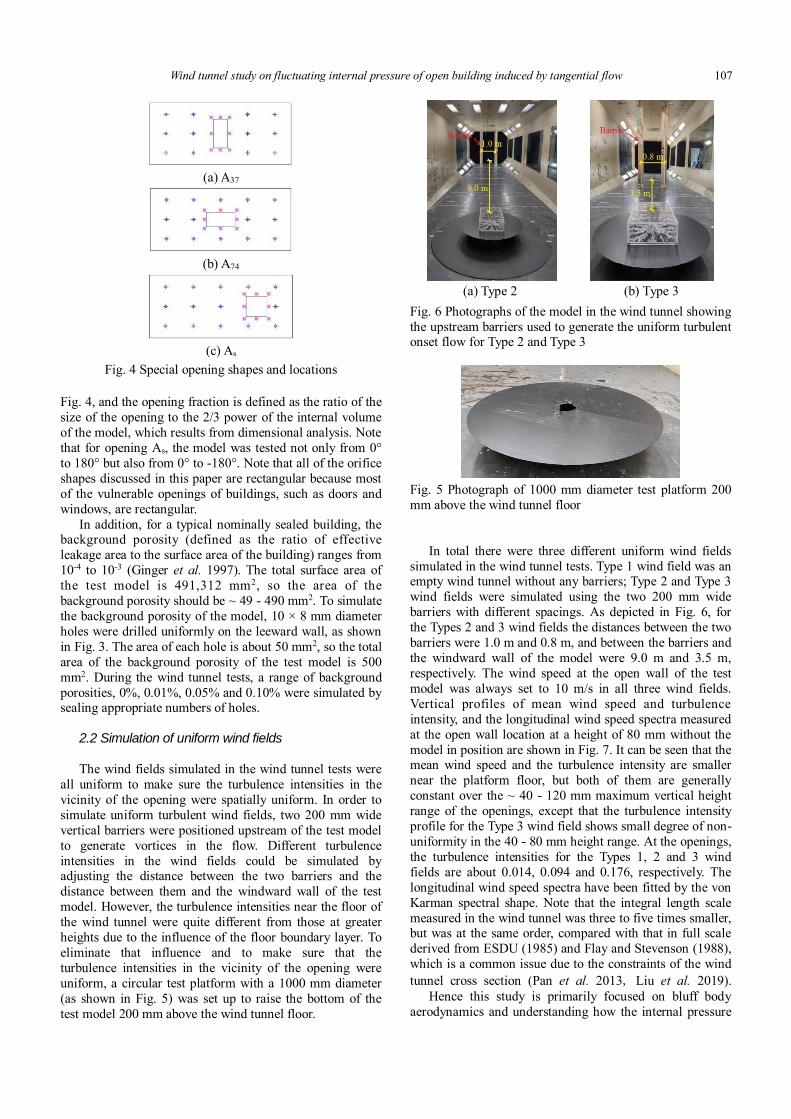
Fig. 4 Special opening shapes and locations
Fig. 4, and the opening fraction is defined as the ratio of the
size of the opening to the 2/3 power of the internal volume
of the model, which results from dimensional analysis. Note
that for opening As, the model was tested not only from 0°
to 180° but also from 0° to -180°. Note that all of the orifice
shapes discussed in this paper are rectangular because most
of the vulnerable openings of buildings, such as doors and
windows, are rectangular.
In addition, for a typical nominally sealed building, the background porosity (defined as the ratio of effective
leakage area to the surface area of the building) ranges from
10-4 to 10-3 (Ginger et al. 1997). The total surface area of
the test model is 491,312 mm2, so the area of the
background porosity should be ~ 49 - 490 mm2. To simulate
the background porosity of the model, 10 × 8 mm diameter
holes were drilled uniformly on the leeward wall, as shown
in Fig. 3. The area of each hole is about 50 mm2, so the total
area of the background porosity of the test model is 500
mm2. During the wind tunnel tests, a range of background
porosities, 0%, 0.01%, 0.05% and 0.10% were simulated by sealing appropriate numbers of holes.
2.2 Simulation of uniform wind fields
The wind fields simulated in the wind tunnel tests were
all uniform to make sure the turbulence intensities in the
vicinity of the opening were spatially uniform. In order to
simulate uniform turbulent wind fields, two 200 mm wide
vertical barriers were positioned upstream of the test model
to generate vortices in the flow. Different turbulence
intensities in the wind fields could be simulated by adjusting the distance between the two barriers and the
distance between them and the windward wall of the test
model. However, the turbulence intensities near the floor of
the wind tunnel were quite different from those at greater
heights due to the influence of the floor boundary layer. To
eliminate that influence and to make sure that the
turbulence intensities in the vicinity of the opening were
uniform, a circular test platform with a 1000 mm diameter
(as shown in Fig. 5) was set up to raise the bottom of the
test model 200 mm above the wind tunnel floor.
(a) Type 2 (b) Type 3
Fig. 6 Photographs of the model in the wind tunnel showing
the upstream barriers used to generate the uniform turbulent onset flow for Type 2 and Type 3
Fig. 5 Photograph of 1000 mm diameter test platform 200
mm above the wind tunnel floor
In total there were three different uniform wind fields
simulated in the wind tunnel tests. Type 1 wind field was an empty wind tunnel without any barriers; Type 2 and Type 3
wind fields were simulated using the two 200 mm wide
barriers with different spacings. As depicted in Fig. 6, for
the Types 2 and 3 wind fields the distances between the two
barriers were 1.0 m and 0.8 m, and between the barriers and
the windward wall of the model were 9.0 m and 3.5 m,
respectively. The wind speed at the open wall of the test
model was always set to 10 m/s in all three wind fields.
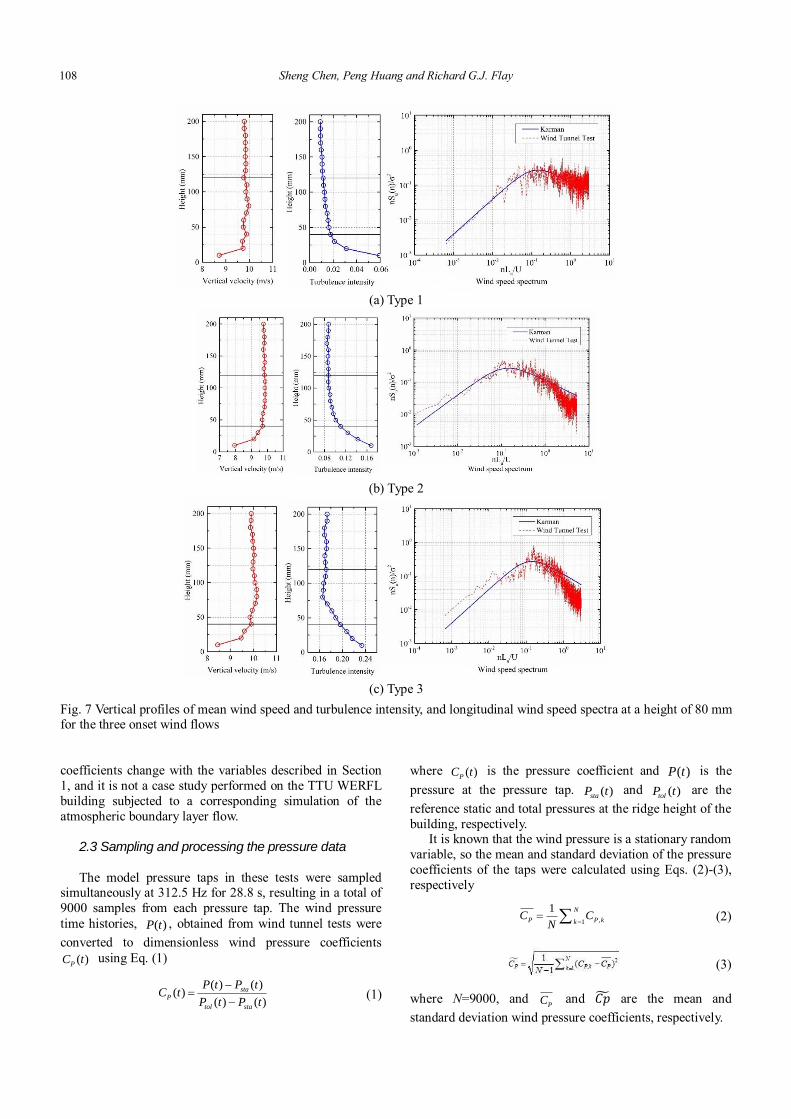
Vertical profiles of mean wind speed and turbulence
intensity, and the longitudinal wind speed spectra measured
at the open wall location at a height of 80 mm without the
model in position are shown in Fig. 7. It can be seen that the mean wind speed and the turbulence intensity are smaller
near the platform floor, but both of them are generally
constant over the ~ 40 - 120 mm maximum vertical height
range of the openings, except that the turbulence intensity
profile for the Type 3 wind field shows small degree of non-
uniformity in the 40 - 80 mm height range. At the openings,
the turbulence intensities for the Types 1, 2 and 3 wind
fields are about 0.014, 0.094 and 0.176, respectively. The
longitudinal wind speed spectra have been fitted by the von
Karman spectral shape. Note that the integral length scale
measured in the wind tunnel was three to five times smaller, but was at the same order, compared with that in full scale
derived from ESDU (1985) and Flay and Stevenson (1988),
which is a common issue due to the constraints of the wind
tunnel cross section (Pan et al. 2013, Liu et al. 2019).
Hence this study is primarily focused on bluff body
aerodynamics and understanding how the internal pressure
107
Sheng Chen, Peng Huang and Richard G.J. Flay
coefficients change with the variables described in Section
1, and it is not a case study performed on the TTU WERFL
building subjected to a corresponding simulation of the
atmospheric boundary layer flow.
2.3 Sampling and processing the pressure data
The model pressure taps in these tests were sampled simultaneously at 312.5 Hz for 28.8 s, resulting in a total of
9000 samples from each pressure tap. The wind pressure
time histories, ( )P t , obtained from wind tunnel tests were
converted to dimensionless wind pressure coefficients
( )PC t using Eq. (1)
where ( )PC t is the pressure coefficient and ( )P t is the
pressure at the pressure tap. ( )staP t and ( )tolP t are the
reference static and total pressures at the ridge height of the
building, respectively. It is known that the wind pressure is a stationary random
variable, so the mean and standard deviation of the pressure
coefficients of the taps were calculated using Eqs. (2)-(3),
respectively
,1
1 N
P P kkC C
N (2)
(3)
where N=9000, and PC and 𝐶�̃� are the mean and
standard deviation wind pressure coefficients, respectively.
(a) Type 1
(b) Type 2
(c) Type 3
Fig. 7 Vertical profiles of mean wind speed and turbulence intensity, and longitudinal wind speed spectra at a height of 80 mm for the three onset wind flows
( ) ( )( )
( ) ( )
staP
tol sta
P t P tC t
P t P t
(1)
108

Wind tunnel study on fluctuating internal pressure of open building induced by tangential flow
Fig. 9 Internal pressure coefficient spectra at wind angles of
60° and 70° for Iu=0.014
3. Discussion of wind tunnel test results
3.1 Increase in fluctuating internal pressures
The external and the internal pressures in this paper are
derived from the average values of all the relevant external
and internal pressure taps. The variations of fluctuating
internal pressure coefficients of the test model as a function
of wind direction in the three uniform wind fields with
turbulence intensities of 0.014, 0.094 and 0.176 are depicted in Fig. 8. The size of the opening in the model used for
these results is 53 × 53 mm (A53) and the test wind speed is
10 m/s. It should be noted that in this figure and
subsequently, the term “fluctuating internal pressure
coefficient” refers to the “standard deviation of the pressure
coefficient time history”.
It can be seen that the turbulence in the incoming flow is
one of the main excitation sources for the fluctuating
internal pressures in this model as higher turbulence leads
to higher internal pressure fluctuations and vice versa.
Evidently, there is an increase in the fluctuating internal
Fig. 10 Internal and external pressure coefficient spectra at a wind angle of 70° for Iu=0.014
pressure coefficients at oblique wind angles from about 60°
to 90° in all three wind fields. When the turbulence
intensity is relatively high (0.094 and 0.176), the peak value
of the fluctuating internal pressure occurs when the flow is
normal to the face, i.e., at 0°. However, at the lower
turbulence intensity of 0.014, the peak value of the
fluctuating internal pressures occurs at 80°, and is therefore
excited by flow that is essentially tangential to the opening,
resulting in a fluctuating internal pressure coefficient that is 2.5 times higher than that from flow normal to the face with
the opening. Thus, it can be concluded that under tangential
flow, there is an increase in the fluctuating internal
pressures, and the increased fluctuations at oblique angles
may be much higher than those from angles normal to the
opening when the turbulence intensity is low.
The results shown in Fig. 8 suggest that compared to the
fluctuating internal pressure resulting from flow normal to
the face with the opening, the most significant increase in
the fluctuating internal pressures takes place in the wind
field with a low turbulence intensity of 0.014 at oblique wind angles from 60° to 80°. Therefore, the results
discussed below are all for the lowest turbulence intensity
Type 1 wind field with Iu=0.014.
The internal pressure coefficient spectra for the wind
directions of 60° and 70° are compared in Fig. 9 to try to
determine the mechanism causing the increase in the
fluctuating internal pressure coefficients at oblique wind
angles. It shows that the energy in the frequency region of
0~100 Hz for the 70° wind direction data is significantly
greater than that for the 60° direction. Also, there are two
obvious resonant peaks in the 70° results (at frequencies of about 30 Hz and 65 Hz), while there is only one smaller
resonant peak at 60° (at about 65 Hz). According to
previous research, it is generally accepted that a building
with a dominant opening can be treated as a Helmholtz
acoustic resonator (Holmes 1979, Vickery and Bloxham
1992), so the resonant peak at 60° and one of the resonant
peaks at 70° may be generated by internal pressure
Helmholtz effect. The Helmholtz resonance frequency can
be calculated from Eq. (4) (Liu and Saathoff 1981)
0
0
1
2
aH
a e
cA Pf
L V
(4)
Fig. 8 Fluctuating internal pressure coefficients as a function of wind direction for the three turbulent wind
fields
109

Sheng Chen, Peng Huang and Richard G.J. Flay
Fig. 11 Internal pressure coefficient spectra in three
different turbulence intensities at 70°
Fig. 12 Fluctuating internal pressure coefficients of the
model with different opening locations as a function of
wind direction
in which =1.4 is the ratio of specific heats for air; 0A is
the opening area; aP is the ambient pressure;
a is the air
density; 0 0e IL L C A is the effective length of the air
slug at the opening, where 0L is the length of the opening
and IC =0.886;
0V is the internal volume of the building;
c =0.6~1.0 is the discharge coefficient for the opening.
Based on Eq. (4), the Helmholtz frequency of the test
model with the A53 opening is 56.35 - 72.75 Hz, which
indicates that the peak at the higher frequency (about 65
Hz) in the 70° data is generated by Helmholtz resonance,
and the resonance at the lower frequency (about 30 Hz) is excited by something else, perhaps “eddy dynamics” of the
external flow (Sharma and Richards 2003). It is worth
noting that the peak in the spectrum for the wind direction
of 60° is also generated by Helmholtz resonance, but it is
much smaller than that for the wind direction of 70°.
In order to determine the cause of the resonance at the
lower frequency of 30 Hz in the 70° data, internal pressure
coefficient spectrum and external pressure coefficient
spectrum from pressure taps near the opening are plotted in
Fig. 13 Internal pressure coefficient spectra for different
opening locations for a wind direction of 70°
Fig. 14 Internal pressure coefficient spectra for different
opening locations for a wind direction of 80°
Fig. 10. It shows that there is also a resonant peak at about
30 Hz in the external pressure coefficient spectrum. This
indicates that the resonance at about 30 Hz in the internal pressure coefficient spectrum at 70° is excited by the
external flow fluctuations, which have been transmitted
through the orifice by the pulsating flow. However, the
source of the external pressure fluctuations needs to be
studied further. They may emanate from eddies at the
opening, or from flapping shear layers on the side of the
building downstream of the windward corner.
Furthermore, in order to evaluate the influence of
turbulence intensity on these resonant responses of the
internal pressures, Fig. 11 compares internal pressure
coefficient spectra from the three different wind fields at the wind angle of 70°. It can be seen that in the low frequency
region (<25 Hz), the spectra in different turbulent wind
fields vary greatly, and the fluctuating energy of the internal
pressures increases with increase in the turbulence intensity.
However, in the high frequency region (>25 Hz), the spectra
show little difference, especially at the Helmholtz resonant
peak at about 50 – 60 Hz. In addition, the resonant peak at
about 30 Hz, which is induced by the external pressure
fluctuations is also nearly unchanged by turbulence
110
Wind tunnel study on fluctuating internal pressure of open building induced by tangential flow
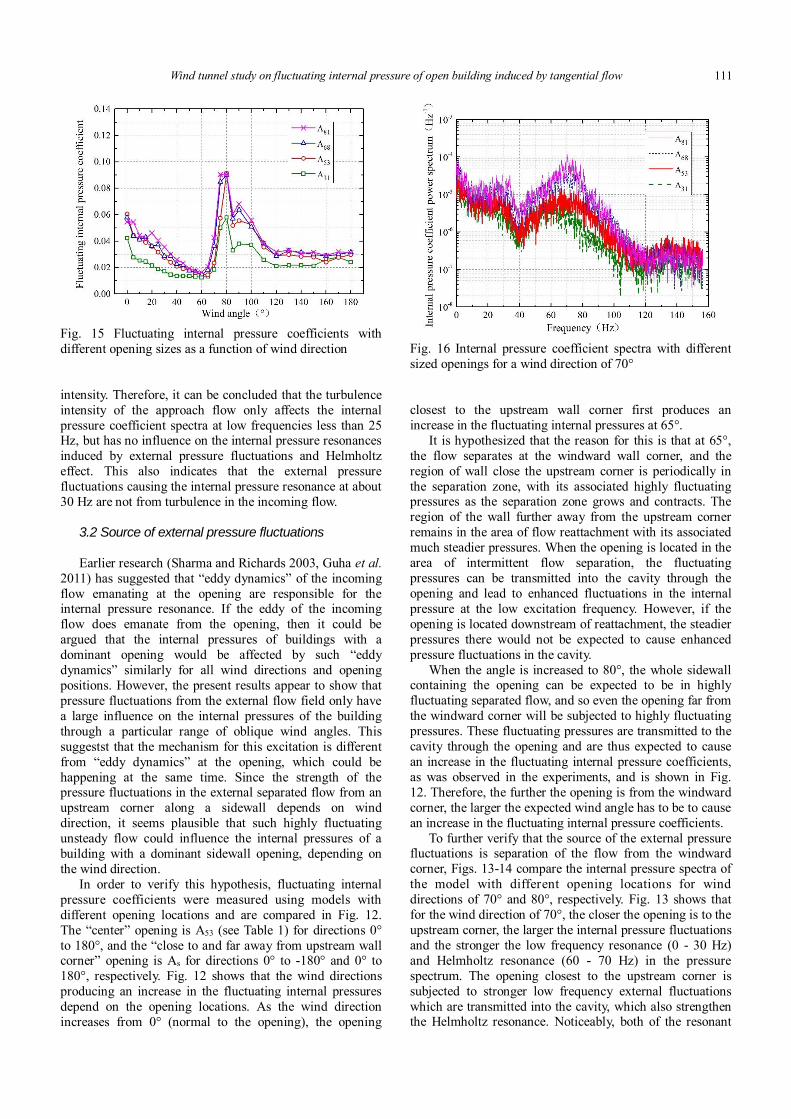
Fig. 15 Fluctuating internal pressure coefficients with
different opening sizes as a function of wind direction
intensity. Therefore, it can be concluded that the turbulence
intensity of the approach flow only affects the internal
pressure coefficient spectra at low frequencies less than 25 Hz, but has no influence on the internal pressure resonances
induced by external pressure fluctuations and Helmholtz
effect. This also indicates that the external pressure
fluctuations causing the internal pressure resonance at about
30 Hz are not from turbulence in the incoming flow.
3.2 Source of external pressure fluctuations
Earlier research (Sharma and Richards 2003, Guha et al.
2011) has suggested that “eddy dynamics” of the incoming
flow emanating at the opening are responsible for the internal pressure resonance. If the eddy of the incoming
flow does emanate from the opening, then it could be
argued that the internal pressures of buildings with a
dominant opening would be affected by such “eddy
dynamics” similarly for all wind directions and opening
positions. However, the present results appear to show that
pressure fluctuations from the external flow field only have
a large influence on the internal pressures of the building
through a particular range of oblique wind angles. This
suggestst that the mechanism for this excitation is different
from “eddy dynamics” at the opening, which could be
happening at the same time. Since the strength of the pressure fluctuations in the external separated flow from an
upstream corner along a sidewall depends on wind
direction, it seems plausible that such highly fluctuating
unsteady flow could influence the internal pressures of a
building with a dominant sidewall opening, depending on
the wind direction.
In order to verify this hypothesis, fluctuating internal
pressure coefficients were measured using models with
different opening locations and are compared in Fig. 12.
The “center” opening is A53 (see Table 1) for directions 0°
to 180°, and the “close to and far away from upstream wall corner” opening is As for directions 0° to -180° and 0° to
180°, respectively. Fig. 12 shows that the wind directions
producing an increase in the fluctuating internal pressures
depend on the opening locations. As the wind direction
increases from 0° (normal to the opening), the opening
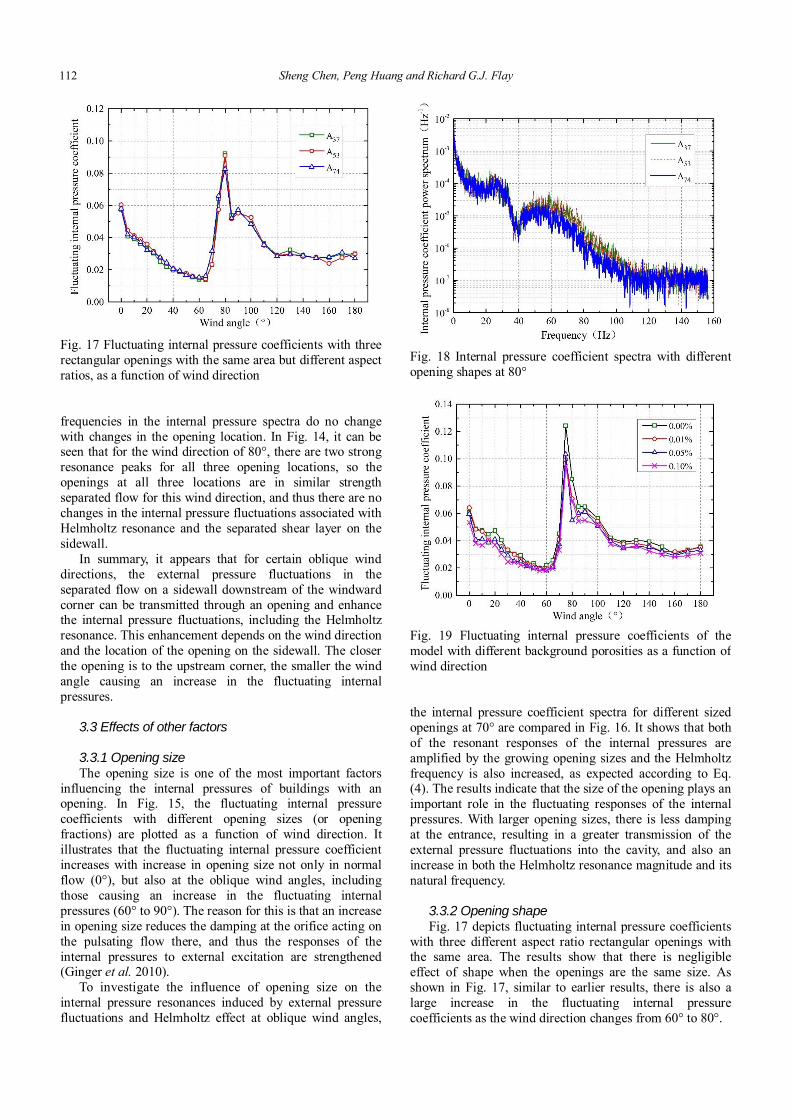
Fig. 16 Internal pressure coefficient spectra with different
sized openings for a wind direction of 70°
closest to the upstream wall corner first produces an
increase in the fluctuating internal pressures at 65°.
It is hypothesized that the reason for this is that at 65°,
the flow separates at the windward wall corner, and the
region of wall close the upstream corner is periodically in
the separation zone, with its associated highly fluctuating pressures as the separation zone grows and contracts. The
region of the wall further away from the upstream corner
remains in the area of flow reattachment with its associated
much steadier pressures. When the opening is located in the
area of intermittent flow separation, the fluctuating
pressures can be transmitted into the cavity through the
opening and lead to enhanced fluctuations in the internal
pressure at the low excitation frequency. However, if the
opening is located downstream of reattachment, the steadier
pressures there would not be expected to cause enhanced
pressure fluctuations in the cavity.
When the angle is increased to 80°, the whole sidewall containing the opening can be expected to be in highly
fluctuating separated flow, and so even the opening far from
the windward corner will be subjected to highly fluctuating
pressures. These fluctuating pressures are transmitted to the
cavity through the opening and are thus expected to cause
an increase in the fluctuating internal pressure coefficients,
as was observed in the experiments, and is shown in Fig.
12. Therefore, the further the opening is from the windward
corner, the larger the expected wind angle has to be to cause
an increase in the fluctuating internal pressure coefficients.
To further verify that the source of the external pressure fluctuations is separation of the flow from the windward
corner, Figs. 13-14 compare the internal pressure spectra of
the model with different opening locations for wind
directions of 70° and 80°, respectively. Fig. 13 shows that
for the wind direction of 70°, the closer the opening is to the
upstream corner, the larger the internal pressure fluctuations
and the stronger the low frequency resonance (0 - 30 Hz)
and Helmholtz resonance (60 - 70 Hz) in the pressure
spectrum. The opening closest to the upstream corner is
subjected to stronger low frequency external fluctuations
which are transmitted into the cavity, which also strengthen the Helmholtz resonance. Noticeably, both of the resonant
111
Sheng Chen, Peng Huang and Richard G.J. Flay
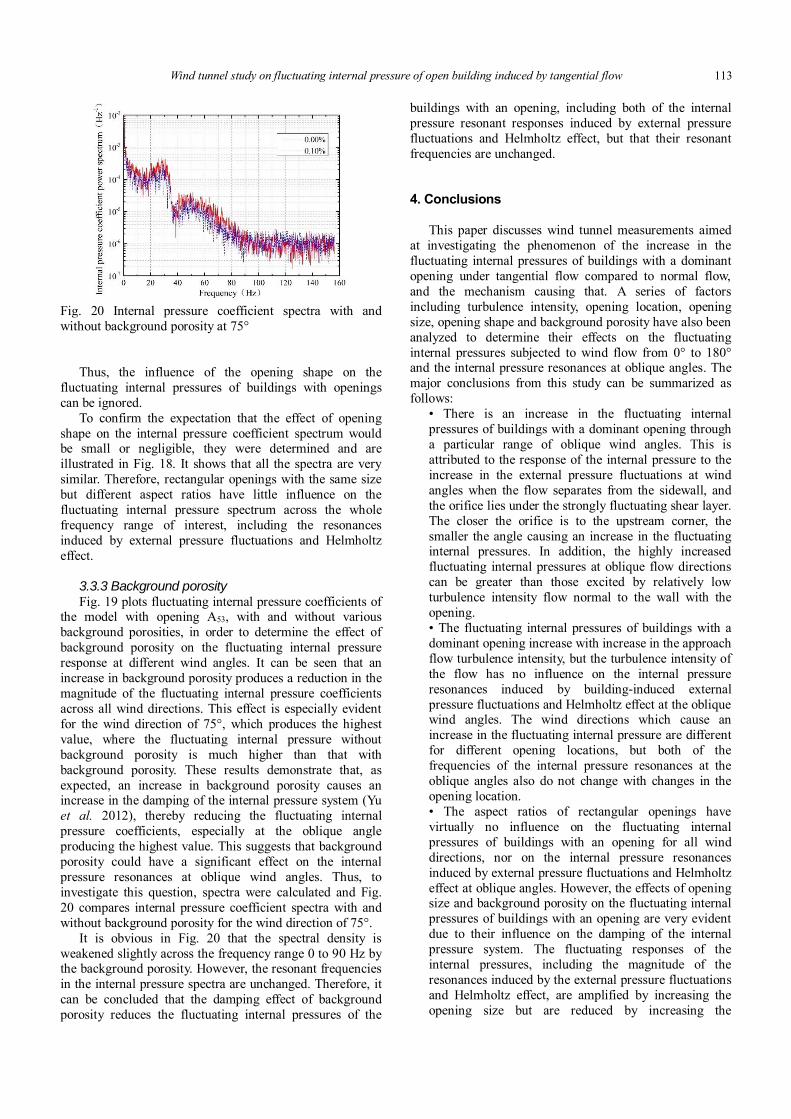
Fig. 17 Fluctuating internal pressure coefficients with three
rectangular openings with the same area but different aspect
ratios, as a function of wind direction
frequencies in the internal pressure spectra do no change
with changes in the opening location. In Fig. 14, it can be seen that for the wind direction of 80°, there are two strong
resonance peaks for all three opening locations, so the
openings at all three locations are in similar strength
separated flow for this wind direction, and thus there are no
changes in the internal pressure fluctuations associated with
Helmholtz resonance and the separated shear layer on the
sidewall.
In summary, it appears that for certain oblique wind
directions, the external pressure fluctuations in the
separated flow on a sidewall downstream of the windward
corner can be transmitted through an opening and enhance the internal pressure fluctuations, including the Helmholtz
resonance. This enhancement depends on the wind direction
and the location of the opening on the sidewall. The closer
the opening is to the upstream corner, the smaller the wind
angle causing an increase in the fluctuating internal
pressures.
3.3 Effects of other factors
3.3.1 Opening size The opening size is one of the most important factors
influencing the internal pressures of buildings with an opening. In Fig. 15, the fluctuating internal pressure
coefficients with different opening sizes (or opening
fractions) are plotted as a function of wind direction. It
illustrates that the fluctuating internal pressure coefficient
increases with increase in opening size not only in normal
flow (0°), but also at the oblique wind angles, including
those causing an increase in the fluctuating internal
pressures (60° to 90°). The reason for this is that an increase
in opening size reduces the damping at the orifice acting on
the pulsating flow there, and thus the responses of the
internal pressures to external excitation are strengthened (Ginger et al. 2010).
To investigate the influence of opening size on the
internal pressure resonances induced by external pressure
fluctuations and Helmholtz effect at oblique wind angles,
Fig. 18 Internal pressure coefficient spectra with different
opening shapes at 80°
Fig. 19 Fluctuating internal pressure coefficients of the
model with different background porosities as a function of
wind direction
the internal pressure coefficient spectra for different sized
openings at 70° are compared in Fig. 16. It shows that both
of the resonant responses of the internal pressures are
amplified by the growing opening sizes and the Helmholtz
frequency is also increased, as expected according to Eq. (4). The results indicate that the size of the opening plays an
important role in the fluctuating responses of the internal
pressures. With larger opening sizes, there is less damping
at the entrance, resulting in a greater transmission of the
external pressure fluctuations into the cavity, and also an
increase in both the Helmholtz resonance magnitude and its
natural frequency.
3.3.2 Opening shape Fig. 17 depicts fluctuating internal pressure coefficients
with three different aspect ratio rectangular openings with the same area. The results show that there is negligible
effect of shape when the openings are the same size. As
shown in Fig. 17, similar to earlier results, there is also a
large increase in the fluctuating internal pressure
coefficients as the wind direction changes from 60° to 80°.
112
Wind tunnel study on fluctuating internal pressure of open building induced by tangential flow
Fig. 20 Internal pressure coefficient spectra with and
without background porosity at 75°
Thus, the influence of the opening shape on the
fluctuating internal pressures of buildings with openings
can be ignored.
To confirm the expectation that the effect of opening
shape on the internal pressure coefficient spectrum would be small or negligible, they were determined and are
illustrated in Fig. 18. It shows that all the spectra are very
similar. Therefore, rectangular openings with the same size
but different aspect ratios have little influence on the
fluctuating internal pressure spectrum across the whole
frequency range of interest, including the resonances
induced by external pressure fluctuations and Helmholtz
effect.
3.3.3 Background porosity Fig. 19 plots fluctuating internal pressure coefficients of
the model with opening A53, with and without various
background porosities, in order to determine the effect of
background porosity on the fluctuating internal pressure
response at different wind angles. It can be seen that an
increase in background porosity produces a reduction in the
magnitude of the fluctuating internal pressure coefficients
across all wind directions. This effect is especially evident
for the wind direction of 75°, which produces the highest
value, where the fluctuating internal pressure without
background porosity is much higher than that with
background porosity. These results demonstrate that, as
expected, an increase in background porosity causes an increase in the damping of the internal pressure system (Yu
et al. 2012), thereby reducing the fluctuating internal
pressure coefficients, especially at the oblique angle
producing the highest value. This suggests that background
porosity could have a significant effect on the internal
pressure resonances at oblique wind angles. Thus, to
investigate this question, spectra were calculated and Fig.
20 compares internal pressure coefficient spectra with and
without background porosity for the wind direction of 75°.
It is obvious in Fig. 20 that the spectral density is
weakened slightly across the frequency range 0 to 90 Hz by the background porosity. However, the resonant frequencies
in the internal pressure spectra are unchanged. Therefore, it
can be concluded that the damping effect of background
porosity reduces the fluctuating internal pressures of the
buildings with an opening, including both of the internal
pressure resonant responses induced by external pressure
fluctuations and Helmholtz effect, but that their resonant
frequencies are unchanged.
4. Conclusions
This paper discusses wind tunnel measurements aimed
at investigating the phenomenon of the increase in the
fluctuating internal pressures of buildings with a dominant
opening under tangential flow compared to normal flow,
and the mechanism causing that. A series of factors
including turbulence intensity, opening location, opening
size, opening shape and background porosity have also been
analyzed to determine their effects on the fluctuating
internal pressures subjected to wind flow from 0° to 180° and the internal pressure resonances at oblique angles. The
major conclusions from this study can be summarized as
follows:
• There is an increase in the fluctuating internal
pressures of buildings with a dominant opening through
a particular range of oblique wind angles. This is
attributed to the response of the internal pressure to the
increase in the external pressure fluctuations at wind
angles when the flow separates from the sidewall, and
the orifice lies under the strongly fluctuating shear layer.
The closer the orifice is to the upstream corner, the
smaller the angle causing an increase in the fluctuating internal pressures. In addition, the highly increased
fluctuating internal pressures at oblique flow directions
can be greater than those excited by relatively low
turbulence intensity flow normal to the wall with the
opening.
• The fluctuating internal pressures of buildings with a
dominant opening increase with increase in the approach
flow turbulence intensity, but the turbulence intensity of
the flow has no influence on the internal pressure
resonances induced by building-induced external
pressure fluctuations and Helmholtz effect at the oblique wind angles. The wind directions which cause an
increase in the fluctuating internal pressure are different
for different opening locations, but both of the
frequencies of the internal pressure resonances at the
oblique angles also do not change with changes in the
opening location.
• The aspect ratios of rectangular openings have
virtually no influence on the fluctuating internal
pressures of buildings with an opening for all wind
directions, nor on the internal pressure resonances
induced by external pressure fluctuations and Helmholtz
effect at oblique angles. However, the effects of opening size and background porosity on the fluctuating internal
pressures of buildings with an opening are very evident
due to their influence on the damping of the internal
pressure system. The fluctuating responses of the
internal pressures, including the magnitude of the
resonances induced by the external pressure fluctuations
and Helmholtz effect, are amplified by increasing the
opening size but are reduced by increasing the
113

Sheng Chen, Peng Huang and Richard G.J. Flay
background porosity. In addition, the Helmholtz
resonance frequency also increases with larger opening
sizes, as expected, but remains unchanged with changes
in background porosity.
Acknowledgments
The research described in this paper was financially
supported by the Chinese National Natural Science
Foundation (51678452) and the Ministry of Science and
Technology of China (Grant No. SLDRCE19-B-12).
References Ai, Z.T. and Mak, C.M. (2014), “Analysis of fluctuating
characteristics of wind-induced airflow through a single opening using LES modeling and the tracer gas technique”, Build. Environ., 80, 249-258. https://doi.org/10.1016/j.buildenv.2014.06.002.
Behr, R.A. and Minor, J.E. (1994), “A survey of glazing system
behavior in multi‐story buildings during hurricane Andrew”,
Struct. Des. Tall Build., 3(3), 143-161. https://doi.org/10.1002/tal.4320030302.
ESDU (1985), Characteristics of atmospheric turbulence near the ground: Part2 - Single point data for strong winds (Neutral atmosphere), Data Item 85020, Engineering Science Data Unit; London, U.K.
Flay, R.G.J. and Stevenson, D.C. (1988), “Integral length scales in strong winds below 20 m”, J. Wind Eng. Ind. Aerod., 28(1-3),
21-30. https://doi.org/10.1016/0167-6105(88)90098-0. Ginger, J.D. (2000), “Internal pressures and cladding net wind
loads on full-scale low-rise building”, J. Struct. Eng., 126(4), 538-543. https://doi.org/10.1061/(ASCE)0733-9445(2000)126:4(538).
Ginger, J.D., Holmes, J.D. and Kim P.Y. (2010), “Variation of Internal Pressure with Varying Sizes of Dominant Openings and Volumes”, J. Struct. Eng., 136(10), 1319-1326.
https://doi.org/10.1061/(ASCE)ST.1943-541X.0000225. Ginger, J.D., Holmes, J.D. and Kopp, G.A. (2008), “Effect of
building volume and opening size on fluctuating internal pressures”, Wind Struct. Int. J., 11(5), 361-376. https://doi.org/10.12989/was.2008.11.5.361.
Ginger, J.D., Mehta, K.C. and Yeatts, B.B. (1997), “Internal pressures in a low-rise full-scale building”, J. Wind Eng. Ind. Aerod., 72(1), 163-174. https://doi.org/10.1016/S0167-
6105(97)00241-9. Guha, T.K., Sharma, R.N. and Richards, P.J. (2011), “Influence
factors for wind induced internal pressure in a low rise building with a dominant opening”, J. Wind Eng., 8(2), 1-17.
Guha, T.K., Sharma, R.N. and Richards, P.J. (2013), “Internal pressure dynamics of a leaky and quasi-statically flexible building with a dominant opening”, Wind Struct. Int. J., 16(1), 61-91. https://doi.org/10.12989/was.2013.16.1.061.
Guha, T.K., Sharma, R.N. and Richards, P.J. (2013), “Wind
induced internal pressure overshoot in buildings with opening”, Wind Struct. Int. J., 16(1), 1-23. http://dx.doi.org/10.12989/was.2013.16.1.001.
Holmes, J.D. (1979), “Mean and fluctuating internal pressures induced by wind”, Proceedings of the 5th International Conference on Wind Engineering, Fort Collins, Colorado, U.S.A, July.
Holmes, J.D. (1980), “Mean and fluctuating internal pressures
induced by wind”, Wind Eng., 435-450.
https://doi.org/10.1016/B978-1-4832-8367-8.50046-2. Kim, P.Y. and Ginger, J.D. (2013), “Internal pressures in buildings
with a dominant opening and background porosity”, Wind Struct. Int. J., 16(1), 47-60. http://dx.doi.org/10.12989/was.2013.16.1.047.
Kopp, G.A., Oh, J.H. and Inculet, D.R. (2008), “Wind-induced internal pressures in houses”, J. Struct. Eng., 134(7), 1129-1138. https://doi.org/10.1061/(ASCE)0733-9445(2008)134:7(1129).
Lee, B.E. and Wills, J. (2002), “Vulnerability of fully glazed high-rise buildings in tropical cyclones”, J. Archit. Eng., 8(2), 42-48. https://doi.org/10.1061/(ASCE)1076-0431(2002)8:2(42).
Levitan, M.L. and Mehta, K.C. (1992), “Texas Tech field
experiments for wind loads part 1: building and pressure measuring system”, J. Wind Eng. Ind. Aerod., 43(1-3), 1565-1576. https://doi.org/10.1016/0167-6105(92)90372-H.
Liu, H. and Saathoff, P.J. (1981), “Building internal pressure: Sudden change”, J. Eng. Mech. Div., 107(2), 309-321.
Liu, Z., Zheng, C., Wu, Y., Flay, R.G.J. and Zhang, K. (2019), “Wind tunnel simulation of wind flows with the characteristics of thousand-meter high ABL”, Build. Environ., 152, 74-86.
http://dx.doi.org/10.1016/j.buildenv.2019.02.012. Minor, J.E. (1994), “Windborne debris and the building
envelope”, J. Wind Eng. Ind. Aerod., 53(1-2), 207-227. https://doi.org/10.1016/0167-6105(94)90027-2.
Pan, F., Cai, C.S. and Zhang W. (2013), “Wind-induced internal pressures of buildings with multiple openings”, J. Eng. Mech., 139(3), 376-385. https://doi.org/10.1061/(ASCE)EM.1943-7889.0000464.
Sabareesh, G.R., Cao, S., Wang, J., Matsui, M. and Tamura Y.
(2018), “Effect of building proximity on external and internal pressures under tornado-like flow”, Wind Struct. Int. J., 26(3), 163-177. http://dx.doi.org/10.12989/was.2018.26.3.163.
Shanmugasundaram, J., Arunachalam, S., Gomathinayagam, S., Lakshmanan, N. and Harikrishna, P. (2000), “Cyclone damage to buildings and structures-a case study”, J. Wind Eng. Ind. Aerod., 84(3), 369-380. https://doi.org/10.1016/S0167-6105(99)00114-2.
Sharma, R.N. and Richards, P.J. (1997), “Computational modelling in the prediction of building internal pressure gain functions”, J. Wind Eng. Ind. Aerod., 67, 815-825. https://doi.org/10.1016/S0167-6105(97)00121-9.
Sharma, R.N. and Richards, P.J. (2003), “The influence of Helmholtz resonance on internal pressures in a low-rise building”, J. Wind Eng. Ind. Aerodyn., 91(6), 807-828. https://doi.org/10.1016/S0167-6105(03)00005-9.
Sharma, R.N., Mason, S. and Driver, P. (2010), “Scaling methods for wind tunnel modelling of building internal pressures induced through openings”, Wind Struct. Int. J., 13(4), 363-374. http://dx.doi.org/10.12989/was.2010.13.4.363.
Stathopoulos, T., Surry, D. and Davenport, A.G. (1979). “Internal pressure characteristics of low-rise buildings due to wind action”, Proceedings of the 5th International Conference on Wind Engineering, Fort Collins, Colorado, July.
Vickery, B.J. and Bloxham, C. (1992), “Internal pressure dynamics with a dominant opening”, J. Wind Eng. Ind. Aerod., 41(1-3), 193-204. https://doi.org/10.1016/0167-6105(92)90409-4.
Yu, X., Quan, Y. and Gu, M. (2012), “Responses of wind-induced internal pressure in a two-compartment building with a dominant opening and background porosity Part 1: Theoretical formulation and experimental verification”, J. Cent. South Univ., 19(10), 2940-2948. http://dx.doi.org/10.1007/s11771-
012-1399-1.
FR
114