wind power ramp event prediction with support vector machines
TRANSCRIPT
Wind Power Ramp Event Prediction
with Support Vector Machines
Oliver Kramer, Nils Andre Treiber, and Michael Sonnenschein
Computational Intelligence GroupDepartment of Computing ScienceUniversity of Oldenburg, Germany
Abstract. Wind energy is playing an important part for ecologicallyfriendly power supply. Important aspects for the integration of windpower into the grid are sudden and large changes known as wind powerramp events. In this work, we treat the wind power ramp event detectionproblem as classification problem, which we solve with support vectormachines. Wind power features from neighbored turbines are employedin a spatio-temporal classification approach. Recursive feature selectionillustrates how the number of neighbored turbines affects this approach.The problem of imbalanced training and test sets w.r.t. the number ofno-ramp events is analyzed experimentally and the implications on prac-tical ramp detection scenarios are discussed.
1 Introduction
Increasing natural energy resources, the reduction of emissions, climate changeand rising energy costs lead to a change from classic carbon or nuclear-basedpower supply to a concentration on renewable energy resources. The movementto a system with a growing amount of renewables is a multidisciplinary objec-tive. It affords the development and optimization of technologies, but also theirintegration and intelligent combination. Data mining and machine learning areimportant technologies in such smart power grids. The growing infrastructureof wind turbines and solar panels can also be seen as huge sensor system thatallows monitoring and prediction of the renewable resources.
In case of wind power, its volatileness renders the integration to a difficulttask. For the prediction of ramp events, there are many challenges from thedata mining perspective, e.g., modeling of spatio-temporal wind time series assupervised learning problem and the necessity of real-time capabilities.
In this work, we concentrate on the challenge to predict the most criticalaspects when integrating wind, i.e., ramp events that are sudden changes ofwind power. Wind power ramp events can threaten the stability of the powergrid. Ramp-up events have to be detected in order to save expensive reserveenergy. As an example, at 2012/12/24 the feed-in of wind energy converters inthe German power grid increased from 4 GW to 19 GWwithin eight hours [2], thedifference is approximately 25% of the total average power demand of Germany.
M. Policarpou et al. (Eds.): HAIS 2014, LNAI 8480, pp. 37–48, 2014.c© Springer International Publishing Switzerland 2014

38 O. Kramer, N.A. Treiber, and M. Sonnenschein
Ramp-down events are also very critical, if no reserve energy is available thatcan compensate sudden drop outs. Prediction of ramps in the power supply fromwind energy converters becomes an import aspect for grid stability and hencean important issue for operators in grid control centers [17].
In the past, we employed a spatio-temporal approach for the prediction ofwind power for short time ranges based on support vector regression (SVR) [10].We extend this approach to classification of wind power ramp events with sup-port vector machines (SVMs). SVMs are very successful classification methodsfor non-linear data. Further, we extend the approach by preprocessing the high-dimensional patterns with dimensionality reduction (DR) methods. The intro-duced methods are part of WindML, a framework that connects wind energydata bases to data mining and machine learning methods.
The paper is structured as follows. In Section 2, we introduce the frameworkand data sets our analysis is based on. After an overview of related articleson wind power ramp event prediction in Section 4, ramps are introduced anddefined in Section 5. We analyze the ramp prediction problem experimentallyin Section 6 with an emphasis on ramp separation, prediction, and a discussionon imbalanced data sets. Further, we present hybrid approaches that combineSVMs with DR methods for preprocessing. Conclusions are drawn in Section 7.
2 WindML
The wind power ramp prediction module is part of the wind and data miningframeworkWindML that offers specialized techniques and easy-to-use data min-ing and machine learning methods based on Python and scikit-learn [12].Classification, regression, clustering, and DR methods allow solving various pre-diction, planning, and optimization problems. We aim at minimizing the ob-stacles for research in the wind power domain. Numerous steps like accessingdifferent data bases via interfaces, preprocessing, parameterizations of appro-priate methods, and the statistical evaluation of the results can be automatizedwith WindML. With a framework that bounds specialized mining algorithms todata sets of a particular domain, frequent steps of the data mining process chaincan be re-used and simplified. Modules of WindML for power prediction, visu-alization or statistical programs are illustrated with text and graphical outputon the WindML website1.
In our experimental study, we employ the NREL Western Wind data set thatconsists of wind energy time-series data of 32,043 wind turbines, each holdingten 3MW turbines over a timespan of three years in 10-minute resolution. Thedata is based on a numerical weather prediction model, whose output has beenmodified with statistical methods in such a way, that the ramping characteristicsare more comparable with those observed in reality [13]. WindML loads thedata for the requested turbines and time range. Once the data is downloaded,the modules can re-use them and load them from the client’s cache. Patternsare stored on the user’s hard drive in the Numpy [18] binary file format, which
1 http://www.windML.org/

Wind Power Ramp Event Prediction with Support Vector Machines 39
allows an efficient storage and fast reading. The data set interface allows theencapsulation of different data sources, resulting in a flexible and enhanceableframework.
3 Support Vector Machines
We treat the prediction of wind power ramp events as classification problem. Theclassifiers we employ are SVMs [16] that belong to the state-of-the art techniquesin machine learning. SVMs are based on optimizing a linear discriminant functionbased on a normal vector w with shift w0 in data space. Given pattern x ∈ R
d
from a d-dimensional data space and label information y ∈ {+1,−1}, an SVMis seeking for the decision boundary that maximizes the distance to its closestpatterns. This distance is also known as margin. Let (x1, y1), . . . , (xN , yN) be theset of pattern-label pairs the SVM has to learn. Slack variables ξi ≤ 0 store thedeviation from the margin. The SVM optimization problem with slack variablesbecomes:
Lp =1
2‖w‖2 + C
N∑
i=1
ξi (1)
subject to the constraints
yi(wTxi + w0) ≥ 1− ξi (2)
The optimization problem directly yields an error for the number of misclassifi-cation, which is |{ξi > 0}|. The soft error is defined via
∑Ni=1 ξi. Equation (1)
can be transformed into the dual optimization problem employing the methodof Lagrange multipliers:
Ld =
N∑
i=1
αi − 1
2
N∑
i=1
N∑
j=1
αiαjyiyjxTi (3)
with∑N
i=1 αiyi = 0 and 0 ≤ αi ≤ C, ∀i. The penalty factor C is regularizationparameter trading off complexity (L2 norm of w) and data misfit (number ofnon separable patterns). Patterns on the correct side of the boundary vanishwith αi = 0, while support vectors have αi > 0 and define w. Those supportvectors with α < C are on the margin and can be used to compute w0.
4 Related Work
Although state-of-the-art techniques in machine learning have already been ap-plied to the domain of wind energy forecasting, the results are often limited tosimplified case-studies. Mohandes et al. [11] compared an SVR approach for windspeed prediction to a multi-layer perceptron. The prediction is based on meandaily wind speed data from Saudi Arabia. Shi et al. [14] proposed an approachthat combines an evolutionary algorithm for parameter tuning with SVR-based

40 O. Kramer, N.A. Treiber, and M. Sonnenschein
prediction. The technique allows a six hour ahead prediction, and is experi-mentally evaluated on wind data from North China. Recently, Zhao et al. [19]compared SVR models to backpropagation for a ten minutes prediction of windspeed. Kramer et al. [10] employed SVR-based prediction with a spatio-temporalapproach to the NREL data for the first time. Most related work in ramp eventprediction is based on numerical weather prediction (NWP) models [4,5]. Onlyfew approaches concentrate on forecasts based on data mining methods. An ex-ample is the work of Zareipour et al. [9], who analyze the recognition of rampson the Albert wind power data set that consists of wind time-series data from apark near the Rocky Mountains. The model takes into account univariate inputvariables and neglects the problem of unbalanced data sets.
5 Wind Power Ramp Events
A critical aspect for power grid stability when integrating wind is the occurrenceof ramp events, i.e., sudden changes of wind power (up or down). In this section,we give a definition of ramp events and introduce the ramp event predictionproblem as classification problem. In the experimental part of this work, we willconcentrate on three reference turbines, i.e., in Tehachapi (CA, ID 4155), inPalm Springs (CA, ID 1175) and a turbine near Reno (NV, ID 11600).
In literature, ramps are not clearly defined [4,8] and may vary from turbine toturbine depending on locations and sizes (for parks respectively). Let y(t) be thewind power time-series of the target turbine, for which we determine the forecast.A ramp event is defined as a wind energy change from time step t ∈ N to timestep t+ λ with λ ∈ N by ramp height θ ∈ (0, ymax], i.e., for a ramp-up event, itholds y(t+ λ)− y(t) > θ, for a ramp-down event it holds y(t+ λ)− y(t) < −θ.
p(t+
1) [M
W]
30
25
20
15
10
5
0
p(t) [MW]0 5 10 30252015
(a) λ = 1
p(t+
1) [M
W]
30
25
20
15
10
5
0
p(t) [MW]0 5 10 30252015
(b) λ = 3
p(t+
1) [M
W]
30
25
20
15
10
5
0
p(t) [MW]0 5 10 30252015
(c) λ = 6
Fig. 1. Plot of wind energy changes of reference turbine in Tehachapi for the threetime ranges λ = 1, 3, 6
Figure 1 visualizes the differences of time-series of a test wind turbine inTehachapi. The wind energy y(t) at time t is plotted against y(t + λ). If the
Wind Power Ramp Event Prediction with Support Vector Machines 41
wind does not change, dots are plotted on the main diagonal. Stable wind sit-uations, i.e., dots near the main diagonal, occur more often than larger windchanges. Ramp events with height θ larger than 15% of the maximum power arecomparably rare. The number of ramps increases with the time horizon λ, as aramp event may appear multiple times. This holds for short time horizons, as aramp-down may be followed by a ramp-up event over a longer horizon.
We define the ramp prediction problem as the task to predict, whether a ramp-up or a ramp-down event starts at time t, i.e., an energy change from time t totime t+ λ. This problem can be defined as classification problem, for which weconstruct a pattern xi ∈ R
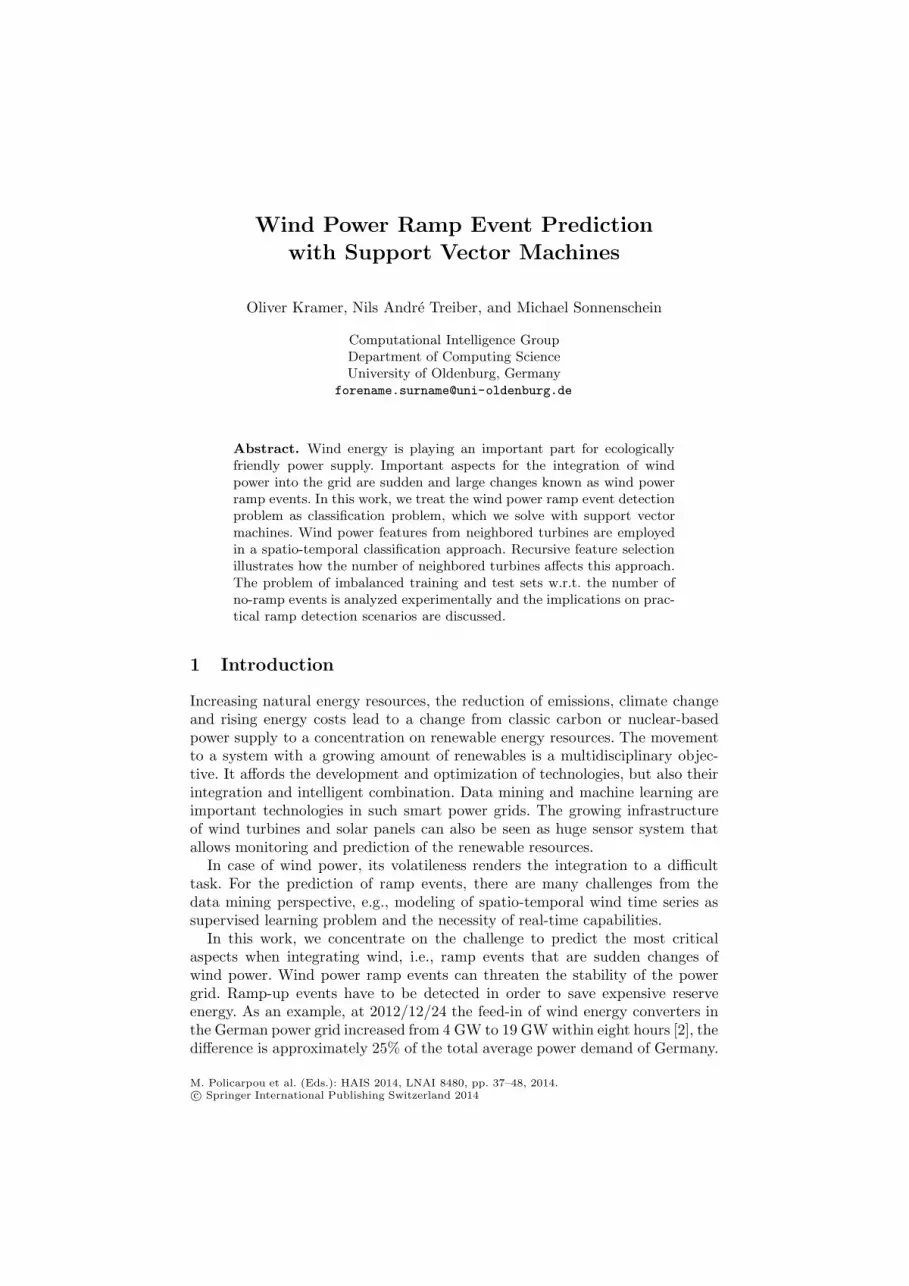
d from the wind power features of the target turbineand the surrounding turbines like introduced for the regression approach in [10].The ramp event serves as label (e.g., 0 for no-ramp, +1 for ramp-up, and −1for ramp-down). Figure 2 shows the construction of a pattern xi based on theradius r around the target turbine.
r
target turbineturbine for patternnot employed
Fig. 2. Illustration of feature construction based on d turbines in a radius r aroundthe target turbine resulting in a pattern xi ∈ R
d of wind power measurements
If we have observed a training set of such observations over a period of Ntime steps, i.e., {(xi, yi)}Ni=1, we train a classifier and predict the ramp for anunknown observation x′. In the experimental section, we will employ an SVMas classifier. An alternative kind of way to predict ramps is to treat the problemas regression problem by determining ramps of the continuous power predictionof a target turbine.
Besides the classifier accuracy δ =∑N
i=1 I(f(xi) = yi)/N , i.e., the rate ofcorrect classifications using indicator function I to compare model output andlabel, we will employ two quality measures to evaluate the quality of a rampprediction method. We define the following quality parameters:
1. ft is the number of true ramp forecasts ([f(xi) = +1 ∧ yi = +1] ∨ [f(xi) =−1 ∧ yi = −1])
2. ff is the number of false forecasts (f(xi) = ±1 ∧ yi = 0)3. rm is the number of missed ramps (f(xi) = 0 ∧ yi = ±1)
Then, fa = ft/(ft + ff ) is the forecast accuracy, which is an indicator for theability of the model to be correct in case of predicting a ramp. Another useful
42 O. Kramer, N.A. Treiber, and M. Sonnenschein
measure is the ramp capture rc = ft/(ft + rm), which is an indicator for theability of the model to hit each ramp.
6 Ramp Prediction
In this section, we treat the prediction of wind power ramp events as classificationproblem, which is solved with SVMs [16].
6.1 Ramp Separation
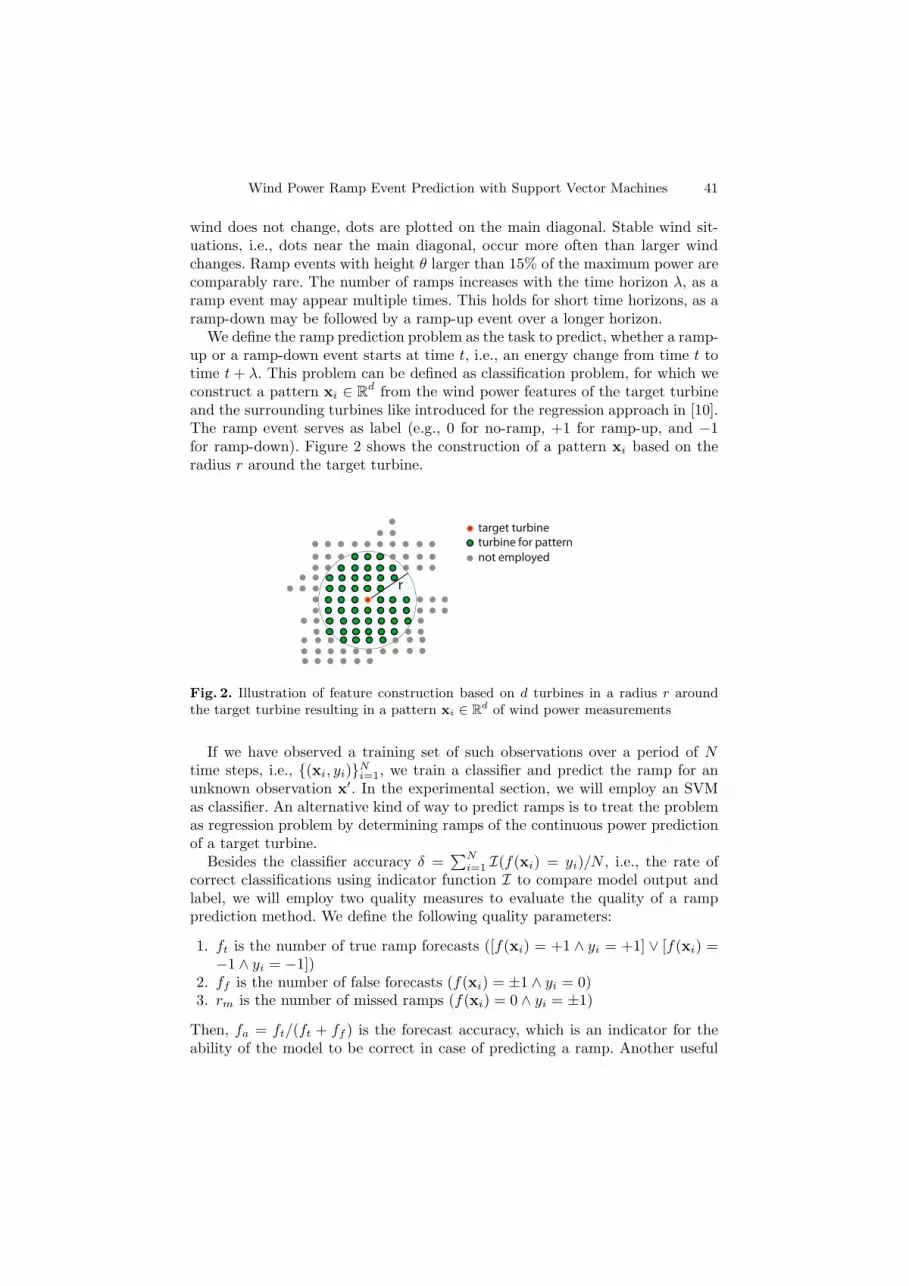
As first step, we learn a classifier that separates ramp-up from ramp-down events,i.e., we consider a two-class classification problem. For our reference turbines,ramp-up and ramp-down events of different heights, i.e., θ = 10, 15 [MW ] aredetected. The left part of Table 1 shows the number of ramp events (up, down,no ramps) for each data set, i.e., wind turbines in Tehachapi, Palm Springs, andReno. Further, the table shows the achieved classifier accuracy δ achieved by theSVM. We define a pattern as the wind energy of the neighbored turbines andthe reference turbines within a radius of r = 10 km at time t and t − 1. Pa-rameter d is the input pattern dimensionality and corresponds to the number ofneighbored wind turbines that are taken into account for the prediction process.The employed labels are +1 for ramp-up and −1 for ramp-down events.
Table 1. Left part: Ramp separation: ramp-up vs. ramp-down and classification accu-racy, forecast horizon λ = 2, right part: ramp recognition: ramp-up vs. ramp-down vs.no-ramps and classification accuracy, forecast horizon λ = 1
park separation recognition
location height d up down no δ up down no δ fa rcTeha 10 132 139 93 0 0.93 40 28 75 0.76 0.81 0.77Teha 15 132 50 42 0 0.96 13 13 28 0.74 0.82 0.88
Palm Sp. 10 84 140 90 0 0.92 38 18 54 0.75 0.86 0.64Palm Sp. 15 84 48 20 0 0.95 13 3 14 0.73 0.90 0.63
Reno 10 120 158 168 0 0.90 50 55 78 0.65 0.82 0.58Reno 15 120 48 56 0 0.98 10 13 32 0.73 0.87 0.62
The SVM is trained with grid search and 5-fold cross-validation (CV) onhalf of the data set. A linear kernel with regularization parameter C and anRBF kernel with C and kernel bandwidth σ are chosen from the set C, σ ∈{10−20, . . . , 1020}. Search in the parameter space of C is reasonable for unbal-anced data sets. The other half of the data is employed for evaluation. The ex-perimental results are summarized in Table 1 showing the classification accuracyδ. The results show that the classifiers are able to distinguish between ramp-upand ramp-down events with a comparatively high accuracy. The parameter tun-ing process chose an RBF-kernel in most of the trails. Ramp separation as firststep to approach the ramp prediction problem can be solved satisfactorily.
Wind Power Ramp Event Prediction with Support Vector Machines 43
6.2 Ramp Recognition
We enhance the classification problem to a three-class problem considering no-ramp patterns. We employ the same settings like in the previous section, i.e.,5-fold CV and the search in the parameter space specified above. The right partof Table 1 shows the description of training and test set and the experimentalresults. The classifier accuracy δ decreases to values between 0.65 and 0.76. Butthe forecast accuracy fa is comparatively high with values over 0.8 and up to 0.9.The results for ramp capture depend on the turbine location. For Tehachapi,better ramp capture results are achieved than for Palm Springs and Reno.
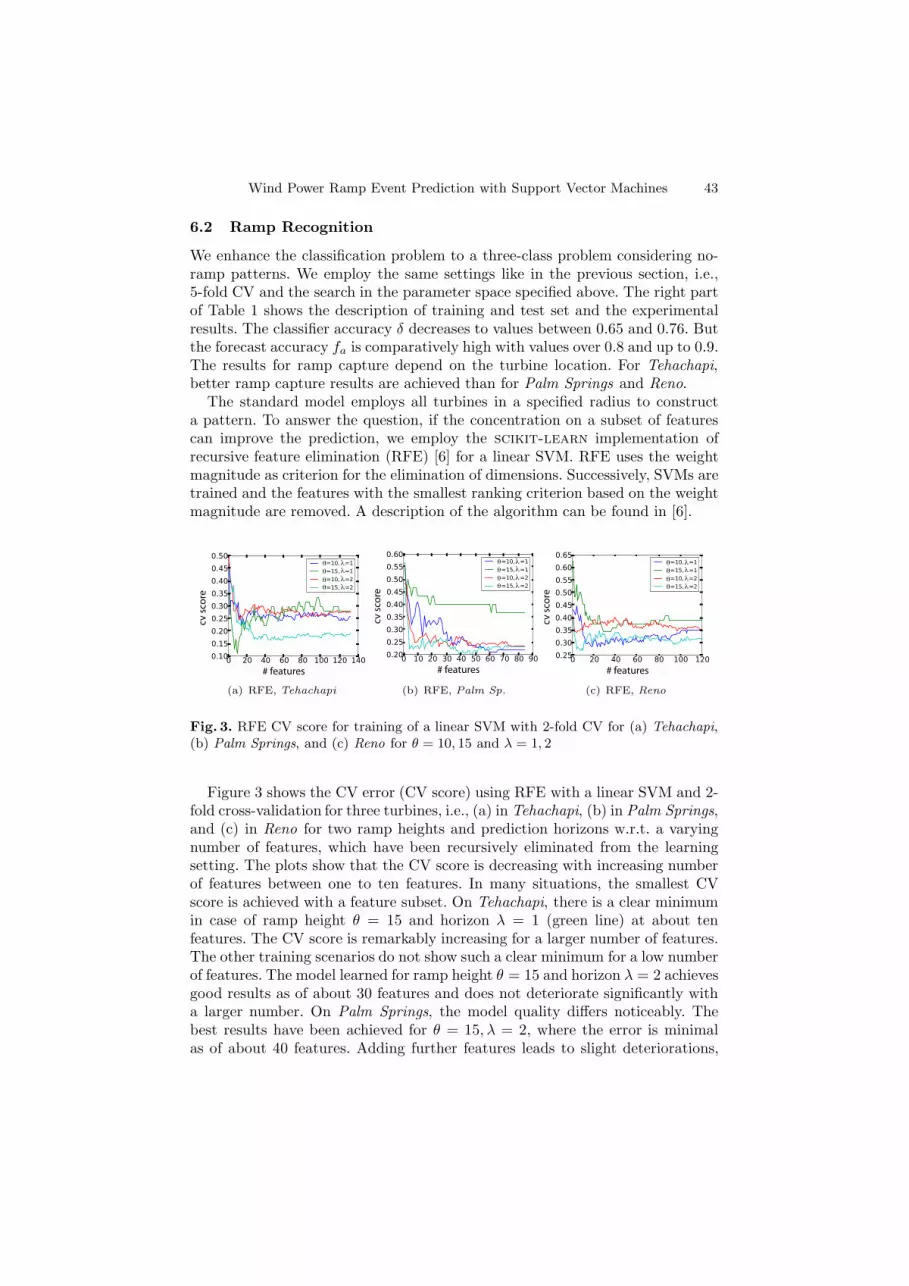
The standard model employs all turbines in a specified radius to constructa pattern. To answer the question, if the concentration on a subset of featurescan improve the prediction, we employ the scikit-learn implementation ofrecursive feature elimination (RFE) [6] for a linear SVM. RFE uses the weightmagnitude as criterion for the elimination of dimensions. Successively, SVMs aretrained and the features with the smallest ranking criterion based on the weightmagnitude are removed. A description of the algorithm can be found in [6].
cv s
core
# features
λθλλλ
θθθ
(a) RFE, Tehachapi
cv s
core
# features
λθλλλ
θθθ
(b) RFE, Palm Sp.
cv s
core
# features
λθλλλ
θθθ
(c) RFE, Reno
Fig. 3. RFE CV score for training of a linear SVM with 2-fold CV for (a) Tehachapi,(b) Palm Springs, and (c) Reno for θ = 10, 15 and λ = 1, 2
Figure 3 shows the CV error (CV score) using RFE with a linear SVM and 2-fold cross-validation for three turbines, i.e., (a) in Tehachapi, (b) in Palm Springs,and (c) in Reno for two ramp heights and prediction horizons w.r.t. a varyingnumber of features, which have been recursively eliminated from the learningsetting. The plots show that the CV score is decreasing with increasing numberof features between one to ten features. In many situations, the smallest CVscore is achieved with a feature subset. On Tehachapi, there is a clear minimumin case of ramp height θ = 15 and horizon λ = 1 (green line) at about tenfeatures. The CV score is remarkably increasing for a larger number of features.The other training scenarios do not show such a clear minimum for a low numberof features. The model learned for ramp height θ = 15 and horizon λ = 2 achievesgood results as of about 30 features and does not deteriorate significantly witha larger number. On Palm Springs, the model quality differs noticeably. Thebest results have been achieved for θ = 15, λ = 2, where the error is minimalas of about 40 features. Adding further features leads to slight deteriorations,
44 O. Kramer, N.A. Treiber, and M. Sonnenschein
i.e., there exists an optimal subset of features that is remarkably smaller thanthe maximum number of considered wind turbines. Also on Reno, there is aminimum for two of four models (λ = 2), while the CV error is again increasingand later approximately constant for a larger number of features. For time criticalapplications, the reduction of the number of relevant features is an importantaspect and can sufficiently be detected with RFE.
6.3 Imbalanced Training and Test Sets
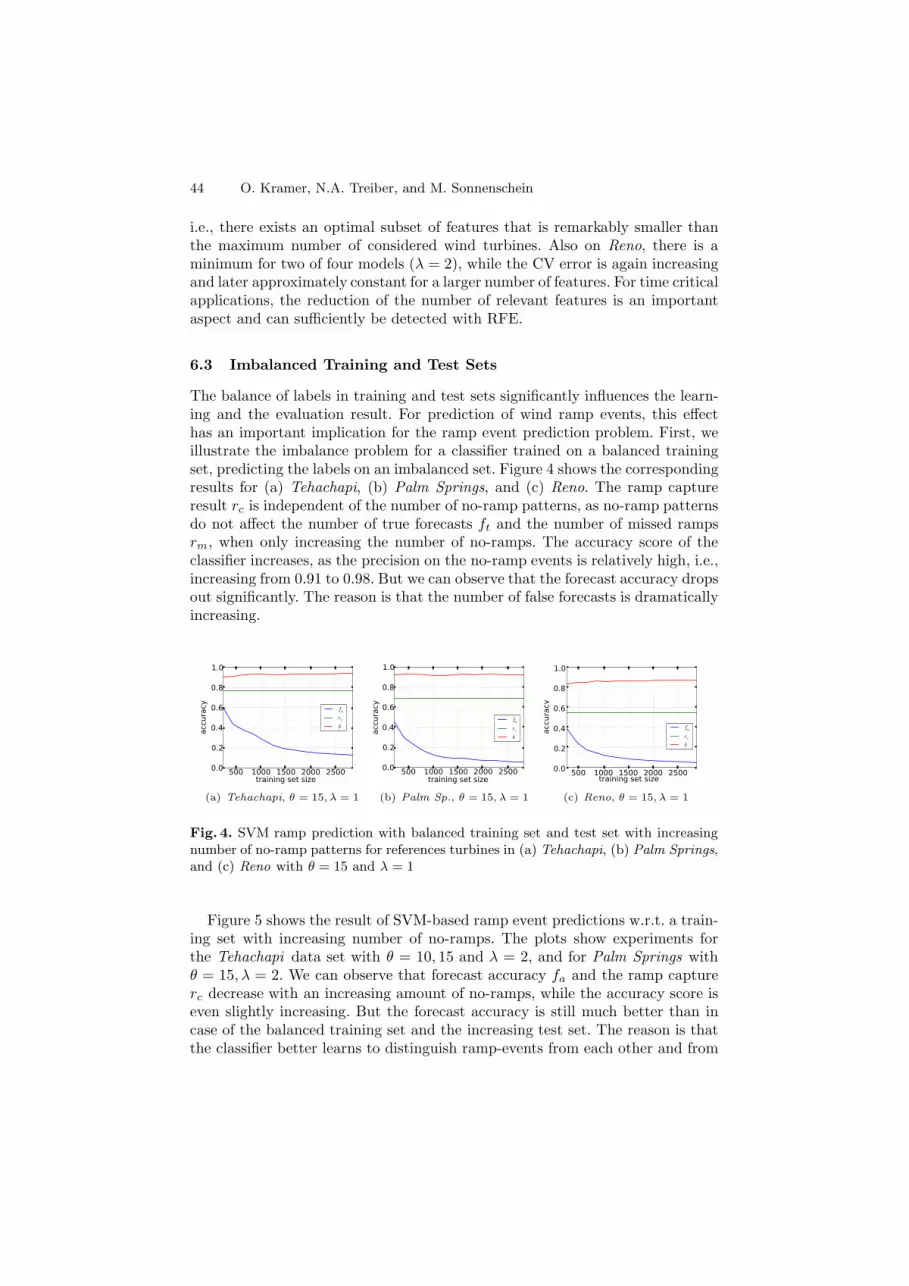
The balance of labels in training and test sets significantly influences the learn-ing and the evaluation result. For prediction of wind ramp events, this effecthas an important implication for the ramp event prediction problem. First, weillustrate the imbalance problem for a classifier trained on a balanced trainingset, predicting the labels on an imbalanced set. Figure 4 shows the correspondingresults for (a) Tehachapi, (b) Palm Springs, and (c) Reno. The ramp captureresult rc is independent of the number of no-ramp patterns, as no-ramp patternsdo not affect the number of true forecasts ft and the number of missed rampsrm, when only increasing the number of no-ramps. The accuracy score of theclassifier increases, as the precision on the no-ramp events is relatively high, i.e.,increasing from 0.91 to 0.98. But we can observe that the forecast accuracy dropsout significantly. The reason is that the number of false forecasts is dramaticallyincreasing.
(a) Tehachapi, θ = 15, λ = 1 (b) Palm Sp., θ = 15, λ = 1 (c) Reno, θ = 15, λ = 1
Fig. 4. SVM ramp prediction with balanced training set and test set with increasingnumber of no-ramp patterns for references turbines in (a) Tehachapi, (b) Palm Springs,and (c) Reno with θ = 15 and λ = 1
Figure 5 shows the result of SVM-based ramp event predictions w.r.t. a train-ing set with increasing number of no-ramps. The plots show experiments forthe Tehachapi data set with θ = 10, 15 and λ = 2, and for Palm Springs withθ = 15, λ = 2. We can observe that forecast accuracy fa and the ramp capturerc decrease with an increasing amount of no-ramps, while the accuracy score iseven slightly increasing. But the forecast accuracy is still much better than incase of the balanced training set and the increasing test set. The reason is thatthe classifier better learns to distinguish ramp-events from each other and from

Wind Power Ramp Event Prediction with Support Vector Machines 45
(a) Tehachapi, θ = 10, λ = 2 (b) Tehachapi, θ = 15, λ = 2 (c) Palm Sp., θ = 15, λ = 2
Fig. 5. SVM ramp prediction with unbalanced training sets, i.e., increasing numberof no-ramp patterns in Tehachapi with (a) θ = 10, λ = 2 and (b) θ = 15, λ = 2, and(c) Palm Springs with θ = 15, λ = 2
no-ramp events with more examples in the training set. But the cost that hasto be paid is the ramp capture rc, as the number of true forecasts ft decreases.
The imbalance of class labels has a dramatic implication on the ramp predic-tion problem. Although SVMs turn out to be comparatively strong classifiers,the achieved accuracy may not be high enough to avoid false alarms. The num-ber of false positives is too large in case of a strongly unbalanced test data set.In practical recognition scenarios, the number of no-ramps is significantly larger(about 150 to 300 times assuming 10-minute time steps) than the number oframp events. Consequently, the accuracy of a classifier would have to exceedabout δ = 1 − 365/52560 ≈ 0.995 to allow at most one false alarm a day. Thespatio-temporal model based on the turbine infrastructure is not sufficient toachieve such an accuracy rate, and more explaining features must be added.
6.4 Dimensionality Reduction Preprocessing
The hybridization of methods has shown to be very successful to overcome lim-itation of individual techniques [3,1]. In this section, we analyze the prepro-cessing with DR methods, which is a successful procedure in machine learningto speed up SVM learning and to improve classification results. In the follow-ing, we compare principal component analysis (PCA) [7] and isometric mapping(ISOMAP) [15] as preprocessing methods. After the DR process, the patternsx1, . . . ,xN ∈ R
d are reduced to low-dimensional representations x1, . . . , xN ∈ Rq
with target dimensionality q < d. Figure 6 shows the experimental results onthe data set Tehachapi with ramp height θ = 10 and prediction horizon λ = 2.In comparison to the results without DR preprocessing, see Figure 5(a), PCAwith q = 25 and q = 50 achieves similar results. The accuracy δ stays high withlarger training sets, while the ramp capture rc deteriorates moderately. This sit-uation changes for q = 5, where valuable information is lost that is importantfor a high ramp capture accuracy. For ISOMAP, we choose the neighborhoodsize K = 30. The ISOMAP results for all target dimensions q = 5, 25, 50 areslightly worse than the PCA results and more fluctuating. In particular, theramp capture is not satisfying for larger dimensions q. As ISOMAP is usually

46 O. Kramer, N.A. Treiber, and M. Sonnenschein
(a) PCA, q = 50 (b) PCA, q = 25 (c) PCA, q = 5
(d) ISOMAP, q = 50 (e) ISOMAP, q = 25 (f) ISOMAP, q = 5
Fig. 6. SVM ramp prediction with PCA and ISOMAP preprocessing to three dimen-sionalities (q = 5, 20, 50) for wind time series of Tehachapi, θ = 10, λ = 2
computationally more expensive, we recommend to employ the PCA-SVM hy-brid for ramp prediction.
7 Conclusion
Objective of this paper is to show that soft margin SVMs are appropriate meth-ods for learning wind power ramp events. The combination of PCA and SVMsturned out to be the most promising hybridization in ramp prediction, which isalso comparatively robust w.r.t. ramp accuracy. Although a high precision hasbeen achieved in the classification process, the precision is not sufficient to reducethe number of false ramp event forecasts in practical applications. The reason isthat ramp events are rare, which leads to an imbalanced data set. Ramp eventsmay accidentally be predicted in normal situations. The only solution to thisproblem is a further increase of forecast accuracies, which – to our mind – can-not be achieved with the data available in the Western Wind data set. Instead,more data is necessary, e.g., with higher spatial and temporal resolutions. Thecombination with physical simulations, i.e., numerical weather predictions mayalso be a possibility to increase the classifier accuracy. With these attempts, itmay be possible to improve the classifiers in order to reduce the number of falsepositive classifications to one a day, which seems to be tolerable for practicalapplications.
Further prospective future work is the prediction of wind ramp events basedon regression. The spatio-temporal regression model for wind prediction [10] caneasily be used for prediction of ramps. An ensemble of the classification with theregression approach might improve the prediction quality.

Wind Power Ramp Event Prediction with Support Vector Machines 47
Acknowledgment. We thank the Prasidium of the Carl-von-Ossietzky Uni-versity of Oldenburg and the EWE research institute NextEnergy for partlysupporting this work. Further, we thank NREL for the Western Wind data set.
References
1. Abraham, A.: Special issue: Hybrid approaches for approximate reasoning. Journalof Intelligent and Fuzzy Systems 23(2-3), 41–42 (2012)
2. Bundesnetzagentur. Bericht zum Zustand der leitungsgebundenen Energiever-sorgung im Winter 2012/13 (2013)
3. Diz, M.L.B., Baruque, B., Corchado, E., Bajo, J., Corchado, J.M.: Hybrid neuralintelligent system to predict business failure in small-to-medium-size enterprises.Int. J. Neural Syst. 21(4), 277–296 (2011)
4. Focken, U., Lange, M.: Wind power forecasting pilot project in alberta. In: Energy& Meteo Systems (2008)
5. Greaves, B., Collins, J., Parkes, J., Tindal, A.: Temporal forecast uncertainty forramp events. In: Proceedings of the European Wind Energy Conference & Exhibi-tion, EWEC (2009)
6. Guyon, I., Weston, J., Barnhill, S., Vapnik, V.: Gene selection for cancer classifi-cation using support vector machines. Machine Learning 46(1-3), 389–422 (2002)
7. Jolliffe, I.: Principal component analysis. Springer series in statistics. Springer, NewYork (1986)
8. Kamath, C.: Understanding wind ramp events through analysis of historical data.In: Proceedings of the IEEE PES Transmission and Distribution Conference andExpo, pp. 1–6 (2010)
9. Kamath, C., Fan, Y.J.: Using data mining to enable integration of wind resourceson the power grid. Stat. Anal. Data Min. 5(5), 410–427 (2012)
10. Kramer, O., Gieseke, F., Satzger, B.: Wind energy prediction and monitoring withneural computation. Neurocomputing 109, 84–93 (2013)
11. Mohandes, M., Halawani, T., Rehman, S., Hussain, A.A.: Support vector machinesfor wind speed prediction. Renewable Energy 29(6), 939–947 (2004)
12. Pedregosa, F., Varoquaux, G., Gramfort, A., Michel, V., Thirion, B., Grisel, O.,Blondel, M., Prettenhofer, P., Weiss, R., Dubourg, V., Vanderplas, J., Passos, A.,Cournapeau, D., Brucher, M., Perrot, M., Duchesnay, E.: Scikit-learn: Machinelearning in Python. Journal of Machine Learning Research 12, 2825–2830 (2011)
13. Potter, C.W., Lew, D., McCaa, J., Cheng, S., Eichelberger, S., Grimit, E.: Creatingthe dataset for the western wind and solar integration study (u.s.a.). In: 7th Inter-national Workshop on Large Scale Integration of Wind Power and on TransmissionNetworks for Offshore Wind Farms (2008)
14. Shi, J., Yang, Y., Wang, P., Liu, Y., Han, S.: Genetic algorithm-piecewise supportvector machine model for short term wind power prediction. In: Proceedings of the8th World Congress on Intelligent Control and Automation, pp. 2254–2258 (2010)
15. Tenenbaum, J.B., Silva, V.D., Langford, J.C.: A global geometric framework fornonlinear dimensionality reduction. Science 290, 2319–2323 (2000)
16. Vapnik, V.N.: The nature of statistical learning theory. Springer, New York (1995)

48 O. Kramer, N.A. Treiber, and M. Sonnenschein
17. Waldl, H.-P., Brandt, P.: Anemos.rulez: Extreme event prediction and alarmingto support stability of energy grids. In: Proceedings of the Annual EWEA 2011Conference (2011)
18. van der Walt, S., Colbert, S.C., Varoquaux, G.: The numpy array: A structurefor efficient numerical computation. Computing in Science and Eng. 13(2), 22–30(2011)
19. Zhao, P., Xia, J., Dai, Y., He, J.: Wind speed prediction using support vectorregression. In: Industrial Electronics and Applications (ICIEA), pp. 882–886 (2010)