statistical process control using support vector machines: a case study
TRANSCRIPT

Statistical Process Control using Support Vector Machines A Case Study
Taken from The International Journal for Quality and Standards Page 1 of 17 www.bsieducation.org/ijqs Walid Gani, Hassen Taleb, Mohamed Limam
Statistical Process Control using Support Vector Machines: A Case Study
Walid Gani * Hassen Taleb Mohamed Limam
LARODEC §
ISG, University of Tunis
Abstract: Control limits in traditional Multivariate Quality Control Charts (MQCC), such as Hotelling's T2 control chart, Multivariate Cumulative Sum (MCUSUM) and Multivariate Exponentially-Weighted Moving Average (MEWMA) control charts are based on multivariate normal assumption. This assumption is not usually satisfied, especially in real life applications. The purpose of a control chart based on support vector machines (SVM) can alleviate the dependence of multivariate control charts to normality assumption, and provides an efficient Statistical Process Control (SPC) tool, with a high ability to deal with real data problem. Consequently, Sun and Tsung (2003) proposed a "kernel-distance-based control chart", also known as the "k-chart". Thus, the k-chart, drawn from Statistical Learning Theory, could be seen as a new approach in SPC. This paper focuses on the application of the k-chart to an industrial process. An assessment of the k-chart is analyzed by comparing it to T2 control chart. This comparison is based on the Average Run Length (ARL) criterion. Keywords: k-chart, industrial process, Hotelling’s T2, ARL.
1. Introduction: In recent years, quality control becomes an important task in manufacturing industries, due to the importance of quality concept for both producers and consumers. SPC and particularly controls charts are one of the most applied tools in quality control. In manufacturing industries, several quality variables may be controlled simultaneously and MQCC are most appropriate for such situations. In fact, traditional MQCC, such as T2 control chart, MCUSUM control charts and MEWMA control charts, require that quality characteristics follow a multivariate normal distribution. However, this may not be reasonable in many real-life applications, where the process distribution is unknown. Following Polansky (2001), in many processes the distribution of quality variables is unknown and is not easily estimated accurately, especially when the number of samples
* Corresponding author-Email: [email protected]. § Agress : LARODEC laboratory, Institut Supérieur de Gestion de Tunis, 41 rue de la liberté, 2000 Bardo, University of Tunis, Tunisia.

Statistical Process Control using Support Vector Machines A Case Study
Taken from The International Journal for Quality and Standards Page 2 of 17 www.bsieducation.org/ijqs Walid Gani, Hassen Taleb, Mohamed Limam
is not large enough. To overcome this problem, several nonparametric control charts were developed. Thissen et al. (2005) employed a combination of mixture modelling and multivariate SPC as a method for process monitoring in case of non-normality. Chakrabotis et al. (2001) noted that, although parametric multivariate SPC methods are important, multivariate nonparametric statistical process techniques are efficiently developed and many research works were conducted in this area. In this way, the purpose of a control chart motivated by SVM can alleviate the dependence of control charts to normality assumption and provides an efficient SPC tool, with a high ability to deal with real data. Consequently, control charts based on statistical learning theory become an interesting research field. Indeed, there are many applications of SVM in SPC. In fact, Tax and Duin (1999) applied SVM to machine diagnosis in order to detect fault in machine function. Also, Chinnam (2002) used SVM to recognize shifts in both correlated and uncorrelated processes and concluded that SVM is an efficient tool in detecting process shifts. Besides, Rebeiro (2005) applied SVM in a plastic injection molding process and Cortez et al. (2006) used SVM to assess lamb meat quality. Finally, Sun and Tsung (2003) proposed the "kernel-distance-based multivariate control charts", known as the "k-chart", based on SVM principles and characterized by its ability to deal with a high dimension data. The goal of this paper is to apply the k-chart to a real industrial process and to evaluate its performance. This paper is organized as follows. Section 2 gives a background on SVM as a technique for classification tasks. Section 3 is an overview on the k-chart as a control chart based on SVM principle. Section 4 presents a real industrial case showing the different steps for k-chart design. To study the effectiveness of the k-chart, a comparison study between the k-chart and the T2 control chart, based on the ARL criterion, is conducted in Section 5. Finally, a discussion about strengths and shortcomings of the k-chart are given in Section 6. 2. Background on SVM: 2.1. SVM for binary class: SVM are a supervised statistical learning algorithm. They are essentially binary classifiers, designed to separate two classes from each other and can be generalized to multi-class problem. SVM belong to the class of maximum margin classifiers. They perform pattern recognition between two classes by finding a decision surface that has maximum distance to the closest points in the training set, which are termed Support Vectors (SV). Figure 1 shows the mechanism of SVM for linear separation.
The concept of SVM was inspired by Statistical Learning Theory, a learning theory providing generalization error bounds for the learned model. As Scholkopf (1998) denoted, SVM method is very useful with two respects. Firstly, they are quite satisfying

Statistical Process Control using Support Vector Machines A Case Study
Taken from The International Journal for Quality and Standards Page 3 of 17 www.bsieducation.org/ijqs
from a theoretical point of view. Secondly, they can lead to high performances in practical applications. Thus, SVM have been used for solving a variety of problems, including classification, patterns recognition, regression and time series forecasting tasks. Suppose l training examples (xi, yi), for i=1,2...l , where xi is the feature vector in n dimensional feature space, yi is the class label [-1 , +1] (positive or negative) of xi . Assume that data is linearly separable; therefore there exists a linear function f(x) separating the two classes given by:
f (x) = .x + b, (1) Tω Where T is the transpose operator of ω, ω is normal to the hyperplane and b is a threshold. This function satisfies:
0)x(f i ≥ for yi = +1, and (2)
0)x(f i ≤ for yi = -1, (3) Mathematically, the optimal hyperplane can be found by minimizing the following quadratic programming:
Minimize f( i,ξω ) = ∑=
ξ+ωl
1ii
2 C21 , (4)
Subject to: , iiT
i 1)bx(y ξ−≥+ω 0i ≥ξ , i=1, 2,…l. (5) The specific problem formulation mentioned in Equation (4), is useful in practice because the training data may not be completely separable by a hyperplane. In this case, slack variables, denoted by ξi can be introduced to relax the separability constraint in (5). The variables ξ are a vector containing all the slack variables ξi, i= 1,2,...,l. The constant C > 0, determines the trade-off between the empirical error and the complexity term.
Walid Gani, Hassen Taleb, Mohamed Limam

Statistical Process Control using Support Vector Machines A Case Study
Taken from The International Journal for Quality and Standards Page 4 of 17 www.bsieducation.org/ijqs
Figure 1: An optimal hyperplane with maximum margin in linear binary separable case.
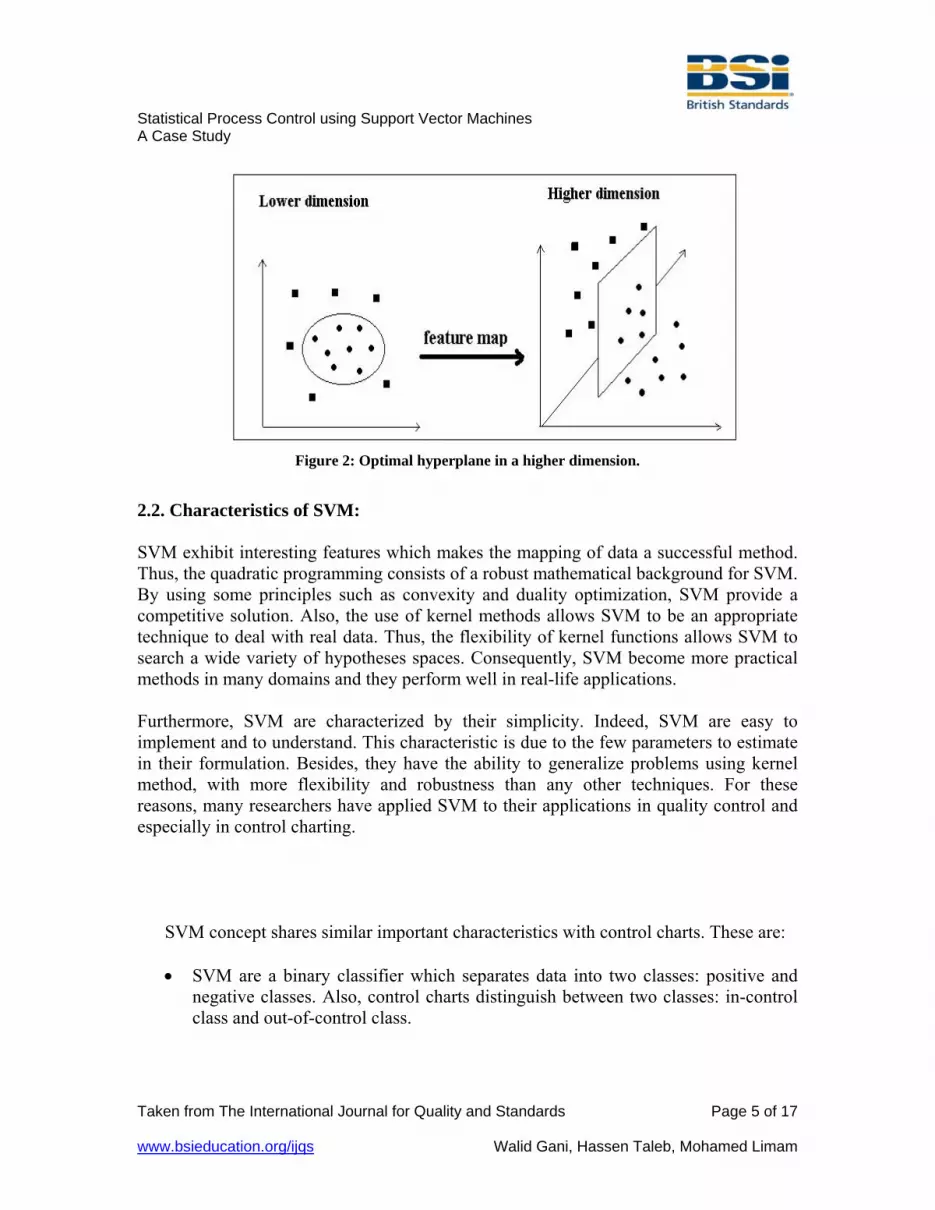
In most cases, linear separation in input space is a restrictive hypothesis to be of practical use. Fortunately, the theory can be extended to nonlinear separating surfaces by mapping the input space into feature space and looking for the optimal separating hyperplane in the corresponding feature space. Furthermore, mapping into a high-dimensional space can give arise to computational difficulties, since the size of the sample required to approximate a nonparametric function increases exponentially with the dimension of the space. Mapping can be implicitly done using kernel functions in the input space and the possibility to obtain an optimal hyperplane increase. In fact, the kernel function, in SVM, plays the central role of mapping the input vector, through an inner product, into a high-dimensional feature space. The fundamental concept of the kernel method consists on a transformation of the vector space to a higher dimensional space. Figure 2 shows the mapping of data into a high-dimensional space.
Walid Gani, Hassen Taleb, Mohamed Limam
Statistical Process Control using Support Vector Machines A Case Study
Taken from The International Journal for Quality and Standards Page 5 of 17 www.bsieducation.org/ijqs
Figure 2: Optimal hyperplane in a higher dimension.
2.2. Characteristics of SVM: SVM exhibit interesting features which makes the mapping of data a successful method. Thus, the quadratic programming consists of a robust mathematical background for SVM. By using some principles such as convexity and duality optimization, SVM provide a competitive solution. Also, the use of kernel methods allows SVM to be an appropriate technique to deal with real data. Thus, the flexibility of kernel functions allows SVM to search a wide variety of hypotheses spaces. Consequently, SVM become more practical methods in many domains and they perform well in real-life applications. Furthermore, SVM are characterized by their simplicity. Indeed, SVM are easy to implement and to understand. This characteristic is due to the few parameters to estimate in their formulation. Besides, they have the ability to generalize problems using kernel method, with more flexibility and robustness than any other techniques. For these reasons, many researchers have applied SVM to their applications in quality control and especially in control charting.
SVM concept shares similar important characteristics with control charts. These are: • SVM are a binary classifier which separates data into two classes: positive and
negative classes. Also, control charts distinguish between two classes: in-control class and out-of-control class.
Walid Gani, Hassen Taleb, Mohamed Limam
Statistical Process Control using Support Vector Machines A Case Study
Taken from The International Journal for Quality and Standards Page 6 of 17 www.bsieducation.org/ijqs Walid Gani, Hassen Taleb, Mohamed Limam
• Control charts determine a control limit separating the two states (in-control/out-of-control class). Accordingly, control limit in SVM, is determined by the support vectors (positive/negative class).
• Both control charts and SVM are commonly based on a decision function using statistical principles, minimization of the structural risk in SVM and statistical control limits in control charts.
3. Control charts based on SVM: 3.1. Overview of the k-chart: The control chart based on SVM is a nonparametric control chart since it does not require assumptions about process distribution. This chart uses the notion of one-class classification based on SVM principles. In one-class classification, one class of data called the target class describes and characterizes the data, while the other classes are not. Tax and Duin (2004) proposed Support Vector Data Description (SVDD) as one-class classifier based on SVM principles. The main idea of SVDD is to envelop samples by a sphere containing the maximum of data with a smallest volume, as shown in Figure 3. Sun and Tsung (2003) used SVDD technique to propose a control chart based on SVM called: "kernel-distance-based multivariate control chart", also known as the "k-chart". The idea of the k-chart is similar to T2 control chart for monitoring two quality variables. When monitoring two independent variables following a bivariate normal distribution, the control limit is shaped as an ellipse with vertical or horizontal axes (Sun and Tsung, 2003). Generally, in real-life problems, the control limit may be not obligatory elliptical, but can be adapted to real data, giving a more flexible form adjusted to any situation. Based on this idea, the k-chart can exploit SVM principles, by using support vectors to construct a control limit. This depends on the nature of real data using kernel method rather than variables distribution. By definition, the k-chart gives the minimum volume closed spherical boundary around the in-control process data. It measures the distance between the Kernel centre and the incoming new sample to be monitored, which can be calculated using support vectors methods. The k-chart uses SVDD method to construct a sphere containing the maximum of data. Any point outside the sphere is considered as out-of-control.

Statistical Process Control using Support Vector Machines A Case Study
Taken from The International Journal for Quality and Standards Page 7 of 17 www.bsieducation.org/ijqs
Figure 3: SVDD classifier: moving from a spherical form (left) in lower dimension to a hypersphere
(right) in a higher dimension, to get a good data description using kernel functions.
3.2. The design of the k-chart: The design of the k-chart requires the determination of the kernel centre and the construction of the control limit. In fact, the objective of the k-chart is to find the centre of the hypersphere necessary, to control the state of the new samples, solving the following quadratic programming:
Maximize (6) )x.x(K.)x.x(K jij
l
1j,iiii
l
1ii αα−α ∑∑
==
Subject to: 0i ≥α (7)
1l
1ii =α∑
=
. (8)
Indeed, to determine if a new sample z is in-control or out-of-control, a distance d between z and a, the centre of the hypersphere, should be computed. This is given by the following equation:
d = )az()az( ' −− . (9)
If d is larger than the radius R, the sample z may be considered to be out-of-control, and if d is smaller than the R, the sample z may be considered to be in-control.
Using kernel functions, the kernel distance (kd) can be determined using the following expression:
Walid Gani, Hassen Taleb, Mohamed Limam

Statistical Process Control using Support Vector Machines A Case Study
Taken from The International Journal for Quality and Standards Page 8 of 17 www.bsieducation.org/ijqs
kd = )x.x(K)x.z(K2z.z jiSj,i
jiiSi
i' ∑∑
∈∈
αα+α− , (10)
Where S is the set of numbers corresponding to the support vectors. The kd represents the upper control limit (UCL) for the k-chart used to monitor new sample z. This can be illustrated by the following hypothesis test:
H0: distance (z) = kd vs H1: distance (z) > kd,
Under H0 the sample z is considered as in-control and under H1 the sample z is considered as out-of-control. 3.3. The k-chart scheme: In phase I, data set are used as training set to determine the kernel distance and detect outliers, to construct the boundary that envelops target data. The parameter estimation is the result of a quadratic programming solution. In phase I, practioners should verify that data are independent and identically distributed the fundamental assumption for SVM. In phase II, the k-chart determines, if new samples are in-control or out-of-control by comparing the distance of each sample to the kernel distance. Any sample that has a distance greater than the kernel distance will be considered as an out-of-control state and vice versa. The k-chart scheme is shown in Figure 4. The control charting in the k-chart is represented by the kernel distance. An important assumption about the data is that they must be independent and identically distributed. Besides, the control limit in the k-chart is a boundary based on support vectors. This control limit is appropriate to real data and can take any form depending on the case. The centre line of the k-chart is represented by the kernel centre. In addition, there are no restricted assumptions about process distribution, because the k-chart accepts any known or unknown assumption. In SPC literature, the two most important measures in monitoring processes are the process central tendency and the process dispersion. The sample mean is a widely used measure for central tendency, while the statistical parameter that describes variability in observed data is the sample range and the sample standard deviation. Like multivariate SPC methods, the discussed k-chart measures central tendency as well as dispersion in a multidimensional space using kernel distance measure. Given that the k-chart deals with univariate and multivariate processes and jointly monitors location and dispersion measures, the k-chart is considered as a useful new tool in SPC.
Walid Gani, Hassen Taleb, Mohamed Limam

Statistical Process Control using Support Vector Machines A Case Study
Taken from The International Journal for Quality and Standards Page 9 of 17 www.bsieducation.org/ijqs
Figure 4: Illustration of the k-chart scheme.
4. A real case study: Our illustration concerns an industrial company specialized in manufacturing household electrical appliances, Montblanc, with refrigerators as their main product. In this study, a metal sheet is controlled where four quality characteristics are simultaneously monitored. These are width type 1, width type 2, pleat type 1 and pleat type 2. Figure 5 illustrates the metal sheet process fabrication.
Walid Gani, Hassen Taleb, Mohamed Limam

Statistical Process Control using Support Vector Machines A Case Study
Taken from The International Journal for Quality and Standards Page 10 of 17 www.bsieducation.org/ijqs
Figure 5: A metal sheet process fabrication.
The preparation of a metal sheet for a refrigerator is done on 2 steps as shown in Figure 5. In the first step, the sheet is pleated and two widths called “Pleat 1” and “Width 1” are obtained, respectively. In the second step, the sheet is pleated again yielding two other widths called “Pleat 2” and “Width 2”, respectively. In this way, 4 measured quality characteristics, expressed in millimetre, are obtained. A sample of 134 observations is taken, with a sampling frequence of 30 minutes.
The construction of the k-chart requires 3 important steps: Step 1: The data set is analyzed using PCA to overcome the problem of correlation
among variables. Step 2: The principal components (PC) resulted from Step 1 analysis are classified into
one-class using SVDD method. At this step, the one class will be optimized by choosing optimal value of SVDD parameters, namely the fraction rejection and the width. The first criterion, on which this optimization is based, is the number of SV which is an important indicator for a good target class construction. In fact, the contribution of SV on the computation of error on target class is defined by:
NSV.Nb)]error(P[E = ,
Walid Gani, Hassen Taleb, Mohamed Limam

Statistical Process Control using Support Vector Machines A Case Study
Taken from The International Journal for Quality and Standards Page 11 of 17 www.bsieducation.org/ijqs Walid Gani, Hassen Taleb, Mohamed Limam
Where Nb.SV is the number of SV and N is the number of observations. The second criterion is the volume of the hypersphere. It is an important indicator, because the objective of SVDD method is to envelop the maximum of data with a minimum hypersphere volume. The first 130 observations are used to construct the target class. In fact, to obtain a good data description using SVDD, the data size should be large enough to get an accurate measure. Step 3: The optimal one-class obtained from phase 2 is used to design the k-chart by
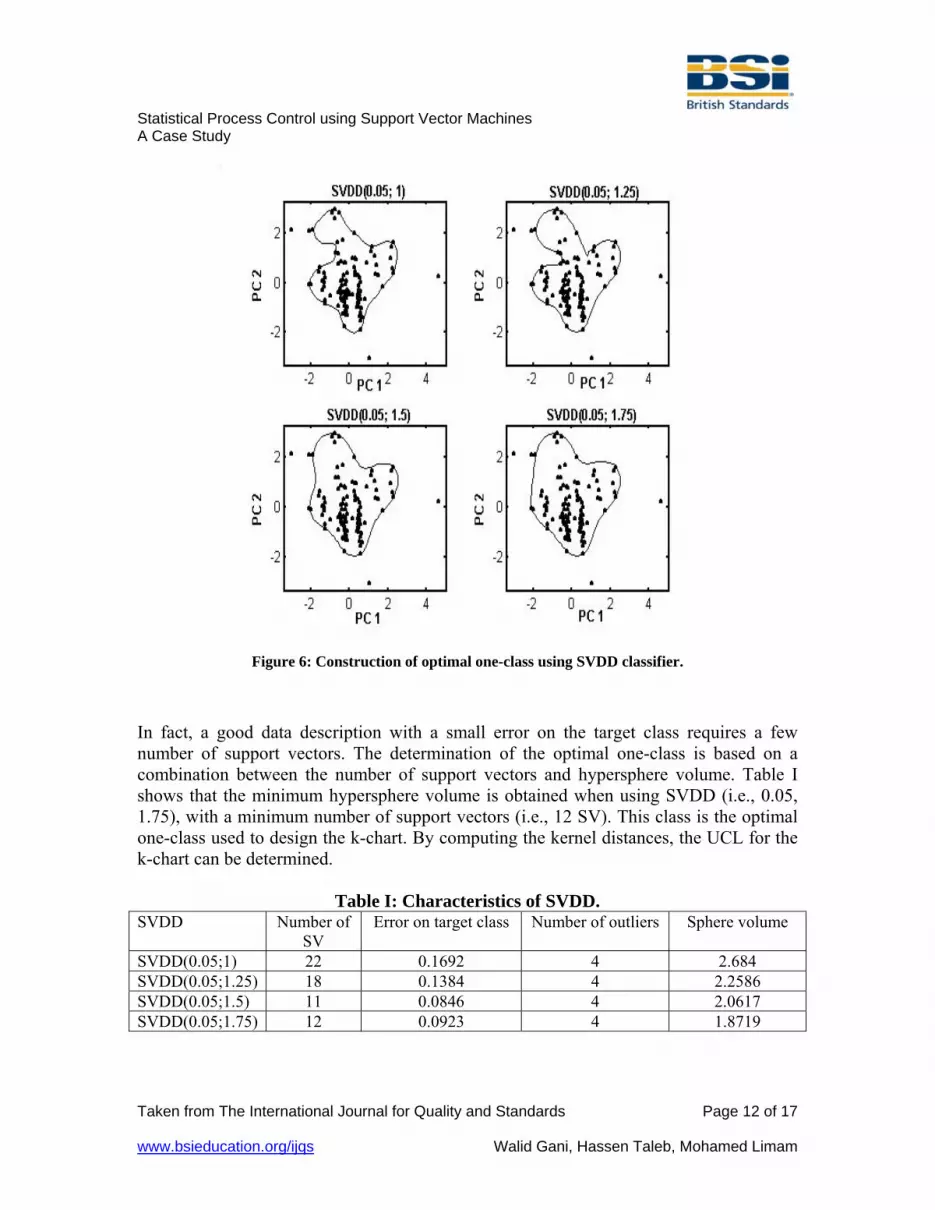
computing the control limit based on support vectors determined by SVDD method. At this step, the last 4 observations are used to detect out-of-control signals. The construction of the one-class requires two parameters, the fraction rejection f and the width (σ) of the Radius Basis Function (RBF). In fact, f is considered as the fraction of data to be rejected from target class. In other way, f represents the type I error in one-class classification. The RBF width determines the shaped form of the one-class to be constructed. In this case study, f = 0.05 is used to construct target class. The same value is used for the comparison study, where the T2 chart will be constructed with a type I error equal to 0.05. For f = 0.05, 4 types of σ are used: σ = 1; 1.25; 1.5 and 1.75. The 4 last observations are used to detect outliers. As shown in Figure 6, different forms of classes are obtained. For each class, 4 outliers are detected. When using σ = 1, we obtain a one-class based on 22 support vectors. However, with σ = 1.25, only 18 support vectors are used to construct one-class. The minimum number of support vectors is obtained when using σ = 1.5 and σ = 1.75. The numbers are 11 and 12, respectively.
Statistical Process Control using Support Vector Machines A Case Study
Taken from The International Journal for Quality and Standards Page 12 of 17 www.bsieducation.org/ijqs
Figure 6: Construction of optimal one-class using SVDD classifier.
In fact, a good data description with a small error on the target class requires a few number of support vectors. The determination of the optimal one-class is based on a combination between the number of support vectors and hypersphere volume. Table I shows that the minimum hypersphere volume is obtained when using SVDD (i.e., 0.05, 1.75), with a minimum number of support vectors (i.e., 12 SV). This class is the optimal one-class used to design the k-chart. By computing the kernel distances, the UCL for the k-chart can be determined.
Table I: Characteristics of SVDD.
SVDD Number of SV
Error on target class Number of outliers Sphere volume
SVDD(0.05;1) 22 0.1692 4 2.684 SVDD(0.05;1.25) 18 0.1384 4 2.2586 SVDD(0.05;1.5) 11 0.0846 4 2.0617 SVDD(0.05;1.75) 12 0.0923 4 1.8719
Walid Gani, Hassen Taleb, Mohamed Limam

Statistical Process Control using Support Vector Machines A Case Study
Taken from The International Journal for Quality and Standards Page 13 of 17 www.bsieducation.org/ijqs
In Phase I, data set is used to construct the in-control phase for the k-chart. In fact, for f = 0.05, the UCL = 0.7719. This UCL is based on 12 support vectors. In Phase II, the 4 new incoming observations are used to detect out-of-control signals. Any observation having a kernel distance greater than the distance from the boundary of the one-class, is considered as out-of-control observations. On the other hand, observations with a kernel distance smaller than the boundary limit are considered as in-control observations. Figure 7 shows the k-chart for Phase II.
Figure 7: the k-chart for Phase II.
Figure 7 shows that 131, 132, 133 and 134 are out-of-control. They exceed the limit. The T2 control chart for Phase II is given by Figure 8. Observations 131, 132, 133 and 134 are out-of-control. They exceed the UCL which equals to 10.1197.
Walid Gani, Hassen Taleb, Mohamed Limam

Statistical Process Control using Support Vector Machines A Case Study
Taken from The International Journal for Quality and Standards Page 14 of 17 www.bsieducation.org/ijqs
Figure 8: T2 control chart for Phase II.
5. Comparison between k-chart and T2 control chart: In order to evaluate its performance, the k-chart is compared to the T2 control chart. This comparison is based on the ARL criterion. The ARL is computed using simulation technique. In this way, 4 multivariate normal variables are generated. Each variable is composed of 10000 observations. To study the sensitivity of both k-chart and T2 control chart, 3 types of mean shifts are proposed: small shifts, medium shifts and large shifts.
Table II: ARL for k-chart and T2 control chart.
Shifts ARL for k-chart ARL for T2 chart Small 5.8858 8.4388 Medium 3.3069 4.8591 Large 1 1
Table II shows that k-chart is more sensitive than T2 for both small and medium shifts in mean vector. However, for large shifts in mean vector, the two charts yield the same ARL. In fact, the difference in sensitivity level between the k-chart and T2 chart can be explained by the nature of distance given by the two methods. The kernel distance used with k-chart, generates a compact distance in comparison with the Malhanobis distance used with the T2 chart. Another factor that may explain the sensitivity of the k-chart is the
Walid Gani, Hassen Taleb, Mohamed Limam

Statistical Process Control using Support Vector Machines A Case Study
Taken from The International Journal for Quality and Standards Page 15 of 17 www.bsieducation.org/ijqs Walid Gani, Hassen Taleb, Mohamed Limam
nature of control limit based on support vectors, which are very sensitive to any change in kernel width. 6. Discussion: This industrial application showed the way to design the k-chart using real data. The fact that the control limits are based on support vectors, this makes it more flexible to real data and more sensitive to small shifts in vector mean as shown in the case study. In fact, the k-chart exhibits some important advantages. The first one is that the k-chart does not make any assumption about the data distribution, which is a fundamental restriction for other charts. The second feature of the k-chart is its ability to deal with a large number of variables without loosing effectiveness. Following Montgomery (2001), when the dimensionality of the variables grows, most multivariate SPC loose efficiency with regard to shift detection. The capacity of the k-chart to treat a large number of variables is due to the kernel methods. Despite having many advantages, several weaknesses are associated to the k-chart. Thus, the main critic addressed to the k-chart is the determination of an in-control process. In fact, our case study demonstrated that it is not easier to construct an in-control state with the k-chart or to verify that the process is in-control. The problem is due to the determination of the optimal target class which constitutes the basis of the in-control state for the k-chart. This target class may include outliers if the SVDD classifier parameters are not chosen carefully. For this reason, the optimal target class requires further optimization to ensure that it represents effectively the in-control process. Another issue associated to the k-chart concerns essentially the control limits. The fact that control limits are based on support vectors, allows the possibility to a support vector to be an outlier. This may be explained by the fact that the kernel centre is a linear combination of support vectors. Besides, the number of support vectors needed to construct control limits represents another issue necessitating more investigation. Concerning SVDD classifier, this requires between 50 and 100 observations to get a good data description. Taking into account that this number of observations is used to construct the in-control state, it may cause a problem of bias in the selection of observations, in comparison with traditional control charts which need between 15 and 25 samples to construct the in-control process.

Statistical Process Control using Support Vector Machines A Case Study
Taken from The International Journal for Quality and Standards Page 16 of 17 www.bsieducation.org/ijqs Walid Gani, Hassen Taleb, Mohamed Limam
7. Conclusion: The k-chart is a nonparametric control chart exhibiting important advantages. In fact, the k-chart is an appropriate control chart for real data applications. By using support vectors, the determination of control limits can be possible with known and unknown process distribution. In addition, the k-chart deals with a high number of variables using kernel functions. Furthermore, our real case study showed that the k-chart is more sensitive to small shifts in the mean vector than T2 control chart. The fact that the k-chart is based on the kernel distance increases its sensitivity. However, the main disadvantage with k-chart is the determination of the in-control state for Phase I. Thus, the determination of optimal one-class, which is the basis for k-chart, makes it difficult to determine which samples are in control. In fact, a good data description for SVDD classifiers requires a large number of samples, which can increase the probability to obtain out-of-control samples in Phase I. Despite the advantages of the k-chart as a control chart motivated by supervised machine learning, the k-chart requires further research especially the determination of the optimal one-class needed for the construction of the control limit.

Statistical Process Control using Support Vector Machines A Case Study
Taken from The International Journal for Quality and Standards Page 17 of 17 www.bsieducation.org/ijqs Walid Gani, Hassen Taleb, Mohamed Limam
References: 1- CHAKRABORTI, S., VAN DER LAAN, P., and BAKIR, S.T., 2001, Nonparametric control charts: an overview and some results, Journal of Quality Technology, 33, 304-315. 2- CHINNAM, R.B., 2002, Support vector machines for recognizing shifts in correlated and other manufacturing processes, International Journal of Production Research, 40, 4449-4466. 3- CORTEZ, P., et al., 2006, Lamb meat quality assessment by support vector machines, Neural Processing Letters, Springer. 4- POLANSKY, A.M., 2001, A smooth non parametric approach to multivariate process capability, Technometrics, 43,199-211. 5- MONTGOMERY, D.C., ed., 2001, Introduction to statistical quality control, John Wiley, New York. 6- RIBEIRO, B., 2005, Support Vector Machines for quality monitoring in a Plastic Injection Molding Process, IEEE Transactions on Systems, MAN, and Cybernetics-Part C: Applications and Reviews, 35. 7- SCHOLKOPF, B., 1998, SVMs-A practical consequences of learning theory, IEEE Intelligent Systems, 13, 18-21. 8- SUN, R., and TSUNG., F., 2003, A Kernel-distance-based multivariate control charts using support vector methods, International Journal of Production Research, 41, 2975-2989. 9- TAX, D., and DUIN, R., 1999, Support vector domain description, Pattern recognition Letters, 20, 1191-1199. 10- TAX, D., and DUIN, R., 2004, Support vector data description, Machine Learning, 54, 45-66. 11- THISESEN, U., et al., 2005, Multivariate statistical process control using mixture modelling, Journal of Chemometrics, 19, 23-31. 12- VAPNIK, V., ed., 1995, The nature of statistical learning theory, New York, Springer.