wind energy resources assessment for yanbo, saudi arabia
TRANSCRIPT
Wind energy resources assessment for Yanbo, Saudi Arabia
Shafiqur Rehman *
Center for Engineering Research, Research Institute, King Fahd University of Petroleum and Minerals, KFUPM Box # 767, Dhahran 31261, Saudi Arabia
Received 2 August 2003; accepted 12 November 2003
Abstract
The paper presents long term wind data analysis in terms of annual, seasonal and diurnal variations at Yanbo, which is located on the west coast of Saudi Arabia. The wind speed and wind direction hourly data for a period of 14 years between 1970 and 1983 is used in the analysis. The analysis showed that the seasonal and diurnal pattern of wind speed matches the electricity load pattern of the location. Higher winds of the order of 5.0 m/s and more were observed during the summer months of the year and noon hours (09:00 to 16:00 h) of the day. The wind duration availability is discussed as the percent of hours during which the wind remained in certain wind speed intervals or bins. Wind energy calculations were performed using wind machines of sizes 150, 250, 600, 800, 1000, 1300, 1500, 2300 and 2500 kW rated power. Wind speed is found to remain above 3.5 m/s for 69% of the time during the year at 40, 50, 60, and 80 m above ground level. The energy production analysis showed higher production from wind machines of smaller sizes than the bigger ones for a wind farm of 30 MW installed capacity. Similarly, higher capacity factors were obtained for smaller wind machines compared to larger ones. © 2003 Elsevier Ltd. All rights reserved.
Keywords: Wind; Wind farm; Frequency distribution; Wind power; Wind energy; Wind machine; Wind power curve; Wind rose; Capacity factor
Energy Conversion and Management 45 (2004) 2019–2032www.elsevier.com/locate/enconman
Wind energy resources assessment for Yanbo, Saudi Arabia
Shafiqur Rehman *
Center for Engineering Research, Research Institute, King Fahd University of Petroleum and Minerals,
KFUPM Box # 767, Dhahran 31261, Saudi Arabia
Received 2 August 2003; accepted 12 November 2003
Abstract
The paper presents long term wind data analysis in terms of annual, seasonal and diurnal variations at
Yanbo, which is located on the west coast of Saudi Arabia. The wind speed and wind direction hourly data
for a period of 14 years between 1970 and 1983 is used in the analysis. The analysis showed that the
seasonal and diurnal pattern of wind speed matches the electricity load pattern of the location. Higher
winds of the order of 5.0 m/s and more were observed during the summer months of the year and noon
hours (09:00 to 16:00 h) of the day. The wind duration availability is discussed as the percent of hoursduring which the wind remained in certain wind speed intervals or bins. Wind energy calculations were
performed using wind machines of sizes 150, 250, 600, 800, 1000, 1300, 1500, 2300 and 2500 kW rated
power. Wind speed is found to remain above 3.5 m/s for 69% of the time during the year at 40, 50, 60, and
80 m above ground level. The energy production analysis showed higher production from wind machines of
smaller sizes than the bigger ones for a wind farm of 30 MW installed capacity. Similarly, higher capacity
factors were obtained for smaller wind machines compared to larger ones.
� 2003 Elsevier Ltd. All rights reserved.
Keywords: Wind; Wind farm; Frequency distribution; Wind power; Wind energy; Wind machine; Wind power curve;
Wind rose; Capacity factor
1. Introduction
In this era of technological advances and materialistic life style, energy has become an essentialentity for inhabitants of the planet. Sorrowfully, in this modern world, there are more than abillion people who have no access to electricity in various parts of the globe. Most of these
* Tel.: +966-3-860-3802; fax: +966-3-860-3996.
E-mail address: [email protected] (S. Rehman).
URL: http://staff.kfupm.edu.sa/ri/srehman
0196-8904/$ - see front matter � 2003 Elsevier Ltd. All rights reserved.
doi:10.1016/j.enconman.2003.11.009
2020 S. Rehman / Energy Conversion and Management 45 (2004) 2019–2032
unfortunate people are living in developing countries. Beyond doubt, we can and must use energymore efficiently. In the coming times the developing world will need more energy to address itsessential needs. The challenge that all of us are facing is how to meet this growing demand ofenergy while at the same time addressing the equally urgent threat of climate change.To address the pollution problem, green sources of energy like solar, hydropower, wind, tidal,
biogas, wave energy, etc. are being encouraged. Of these green sources, the usage of wind as asource of energy is increasing in different parts of the globe due to rapid technology advancement.Wind energy utilization is also becoming competitive compared to traditional sources of energy.Other reasons that are responsible for the speedy development of wind energy utilization includeits cleanliness, job creation, abundance in nature, no physical boundaries, affordability, inex-haustibility, environmentally friendly and its elegancy.This paper presents the detailed wind data analysis and wind availability at Yanbo, an
industrial city on the west coast of Saudi Arabia.
2. Motivation and objectives of the study
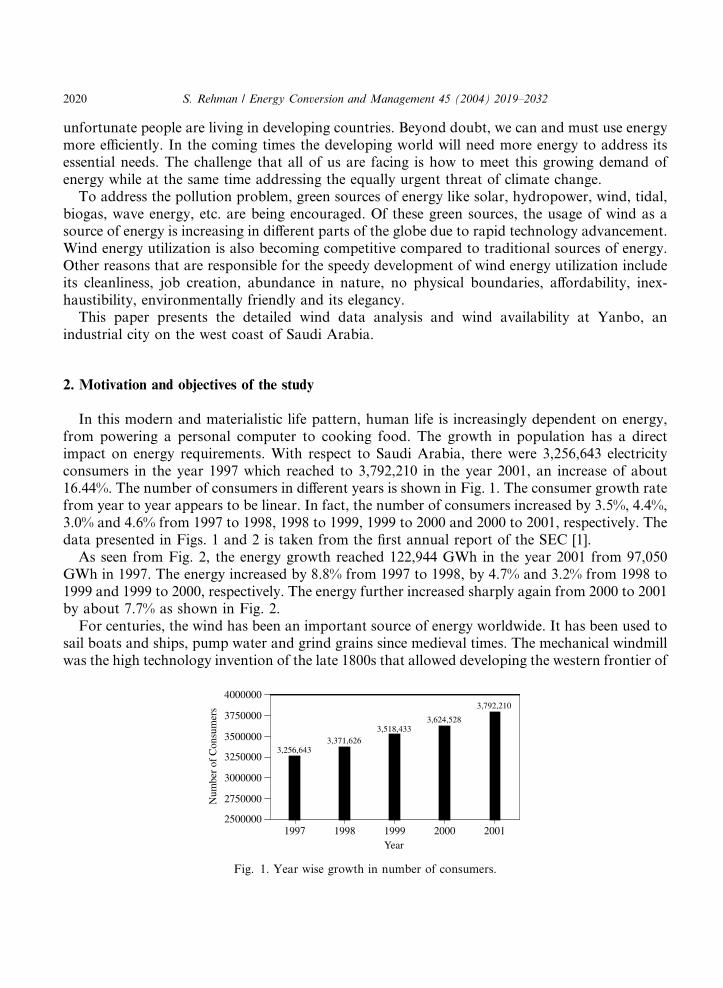
In this modern and materialistic life pattern, human life is increasingly dependent on energy,from powering a personal computer to cooking food. The growth in population has a directimpact on energy requirements. With respect to Saudi Arabia, there were 3,256,643 electricityconsumers in the year 1997 which reached to 3,792,210 in the year 2001, an increase of about16.44%. The number of consumers in different years is shown in Fig. 1. The consumer growth ratefrom year to year appears to be linear. In fact, the number of consumers increased by 3.5%, 4.4%,3.0% and 4.6% from 1997 to 1998, 1998 to 1999, 1999 to 2000 and 2000 to 2001, respectively. Thedata presented in Figs. 1 and 2 is taken from the first annual report of the SEC [1].As seen from Fig. 2, the energy growth reached 122,944 GWh in the year 2001 from 97,050
GWh in 1997. The energy increased by 8.8% from 1997 to 1998, by 4.7% and 3.2% from 1998 to1999 and 1999 to 2000, respectively. The energy further increased sharply again from 2000 to 2001by about 7.7% as shown in Fig. 2.For centuries, the wind has been an important source of energy worldwide. It has been used to
sail boats and ships, pump water and grind grains since medieval times. The mechanical windmillwas the high technology invention of the late 1800s that allowed developing the western frontier of
1997 1998 1999 2000 2001Year
2500000
2750000
3000000
3250000
3500000
3750000
4000000
Num
ber
of C
onsu
mer
s
3,256,6433,371,626
3,518,4333,624,528
3,792,210
Fig. 1. Year wise growth in number of consumers.
1997 1998 1999 2000 2001Year
0
20000
40000
60000
80000
100000
120000
140000
Ene
rgy
Gro
wth
(G
Wh)
97,050105,611 110,611 114,161
122,944
Fig. 2. Year wise energy growth.
S. Rehman / Energy Conversion and Management 45 (2004) 2019–2032 2021
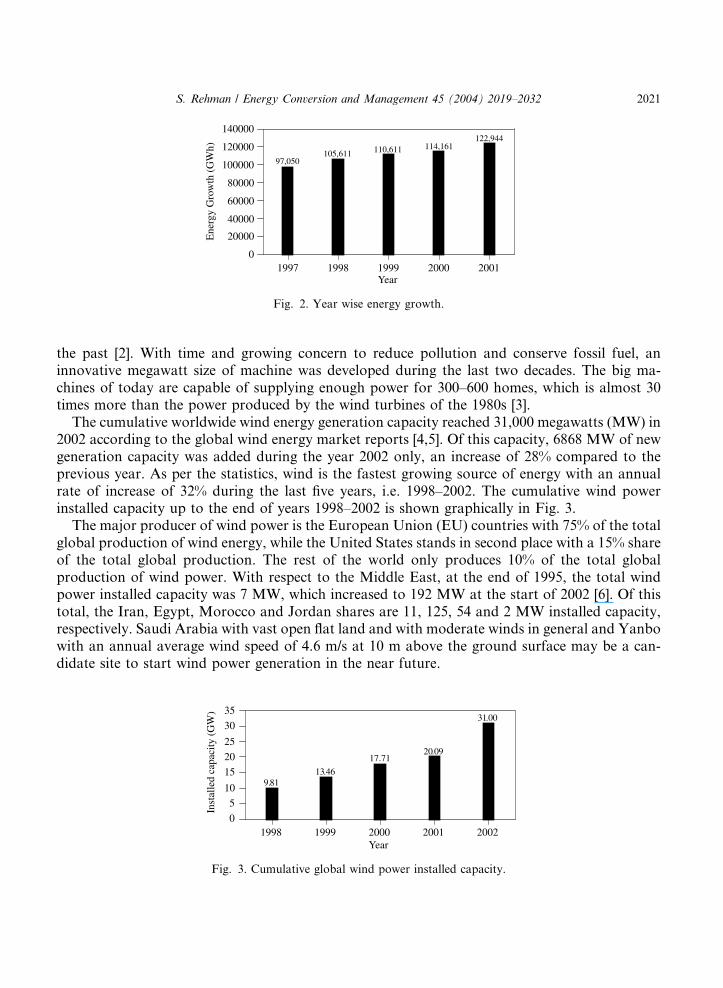
the past [2]. With time and growing concern to reduce pollution and conserve fossil fuel, aninnovative megawatt size of machine was developed during the last two decades. The big ma-chines of today are capable of supplying enough power for 300–600 homes, which is almost 30times more than the power produced by the wind turbines of the 1980s [3].The cumulative worldwide wind energy generation capacity reached 31,000 megawatts (MW) in
2002 according to the global wind energy market reports [4,5]. Of this capacity, 6868 MW of newgeneration capacity was added during the year 2002 only, an increase of 28% compared to theprevious year. As per the statistics, wind is the fastest growing source of energy with an annualrate of increase of 32% during the last five years, i.e. 1998–2002. The cumulative wind powerinstalled capacity up to the end of years 1998–2002 is shown graphically in Fig. 3.The major producer of wind power is the European Union (EU) countries with 75% of the total
global production of wind energy, while the United States stands in second place with a 15% shareof the total global production. The rest of the world only produces 10% of the total globalproduction of wind power. With respect to the Middle East, at the end of 1995, the total windpower installed capacity was 7 MW, which increased to 192 MW at the start of 2002 [6]. Of thistotal, the Iran, Egypt, Morocco and Jordan shares are 11, 125, 54 and 2 MW installed capacity,respectively. Saudi Arabia with vast open flat land and with moderate winds in general and Yanbowith an annual average wind speed of 4.6 m/s at 10 m above the ground surface may be a can-didate site to start wind power generation in the near future.
1998 1999 2000 2001 2002Year
0
5
10
15
20
25
30
35
Inst
alle
d ca
paci
ty (
GW
)
9.8113.46
17.7120.09
31.00
Fig. 3. Cumulative global wind power installed capacity.
2022 S. Rehman / Energy Conversion and Management 45 (2004) 2019–2032
In Saudi Arabia, more attention was paid to solar energy related work like establishment ofsolar radiation and sunshine duration recording stations, photovoltaic electric generation facilityto supply power to a village on the outskirts of the capital city of Riyadh, usage of water heaters inhousing complexes, photovoltaic cells to supply energy to highway telephones, remote monitoringfacilities and communication towers. Meteorological data collection stations were erected in theyear 1970 throughout the Kingdom in the vicinity of airports to get weather related information.In recent years, work on wind speed data analysis such as Weibull parameter determination
and distribution, wind speed prediction using different methods such as auto-regression andneural network, wind power generation cost determination and so on has been reported in theliterature. The first work, in the form of a wind atlas was reported by Ansari et al. [7] in 1986.Rehman et al. [8] calculated the Weibull parameters for ten anemometer locations in SaudiArabia and found that the wind speed was well represented by the Weibull distributionfunction. Rehman and Halawani [9] presented the statistical characteristics of wind speed andits diurnal variation. The auto-correlation coefficients were found to match the actual diurnalvariation of the hourly mean wind speed for most of the locations used in the study. Mo-handes et al. [10] used the neural networks method for prediction of the daily mean values ofwind speed ahead of time. They concluded that the performance of the neural network modelwas much better than the performance of the traditionally used method of an auto-regressionmodel.Recently, Rehman et al. [11] presented the methodology for calculation of the cost of each
kilowatt hour of electricity produced using long term hourly mean wind speed data at 20 locationsin the Kingdom of Saudi Arabia. The authors developed wind duration curves over the entireperiod of data collection and used wind power curves for wind machines of 600 kW, 1.3 MW and2.5 MW and all cost elements to calculate the cost of electricity production. Their analysis showedthat the minimum cost (US$ 0.0234) of electricity production was found for Yanbo, while the nextbest site was Qaisumah, with electricity production cost of US$ 0.0256 per kWh.Hence, the growing need for energy, participation of Middle East countries in wind power
generation, existing long term wind speed and wind direction data at various locations in thecountry, globally decreasing cost of wind power generation and growing awareness of usage ofgreen energy sources are some of the motivating factors for conducting detailed wind analyses atrelatively windy sites in the country. The specific objectives of the study include seasonal anddiurnal variability, wind availability in different wind speed bins, effect of hub height on energyproduction and capacity factor determination.
3. Site and data description
Yanbo is the second largest industrial city after Jubail in the eastern region of the Kingdom ofSaudi Arabia and is situated on the west coast of the country. The latitude and longitude of thelocation of data collection are 24�200 and 38�030, respectively. It is only 6 m above mean sea level.The meteorological data collection activity was started in 1970. The measured parameters in-cluded wind speed, wind direction, temperature, relative humidity, pressure, visibility, rain andmany others at 10 m above the ground surface. The data included in the study covers the period of14 years from 1970 to 1983. The data was missing for a complete year in 1976 and partly in
S. Rehman / Energy Conversion and Management 45 (2004) 2019–2032 2023
various months of other years. A total of 86,601 hourly records of wind speed and direction wereused.At Yenbo, like any other city in Saudi Arabia, only two seasons, viz. summer and winter are
prevalent. The summer stretches between March and September, and winter starts in October andcontinues till February. With regard to general weather conditions, the temperature varies from aminimum of 6.8 �C to a maximum of 47.6 �C and an average of 27.09 �C. The surface pressurechanges from 994.4 to 1024.1 mb with a mean value of 1008.47 mb. The relative humidity variesbetween 3% and 100% with an average value of 57%. The wind speed is found to reach a maxi-mum of 25.65 m/s, while the average remained 4.63 m/s at 10 m above the ground surface.
4. Results and discussion
This section covers the long term annual, seasonal and diurnal variation of mean wind speed;the wind availability in terms of frequency distribution, energy calculations using NORDEX windmachines of different rated powers and capacity factor estimation and its variation with windmachine size and hub height. Lastly, the energy output from a wind farm of 30 MW installedcapacity is discussed with wind size and hub height.
4.1. Long term wind speed variation
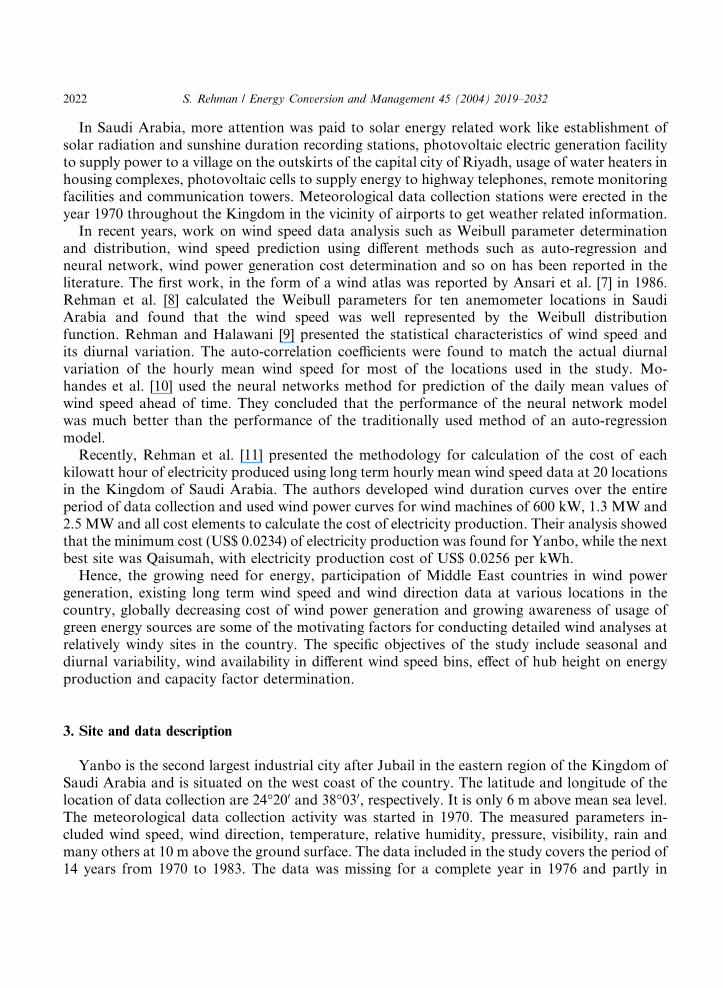
The long term yearly variation of wind speed provides an understanding of the long termpattern of wind speed and also confidence to an investor on the availability of wind power incoming years. In order to study the annual behavior of the wind speed, daily mean values of windspeed were used to get yearly mean values for a period of 14 years, between 1970 and 1983. Theyear-to-year change in the mean wind speed at 10 m above the ground is shown in Fig. 4. Thisfigure shows that the mean wind speed was above 6.0 m/s during 1970–1972, while in decreased toabout 5.0 m/s during 1973–1975. It became 5.5 m/s in 1977, while again, it decreased to 4.5 m/sand continued to be almost the same till 1980.The seasonal change in mean wind speed provides an insight into the availability of suitable
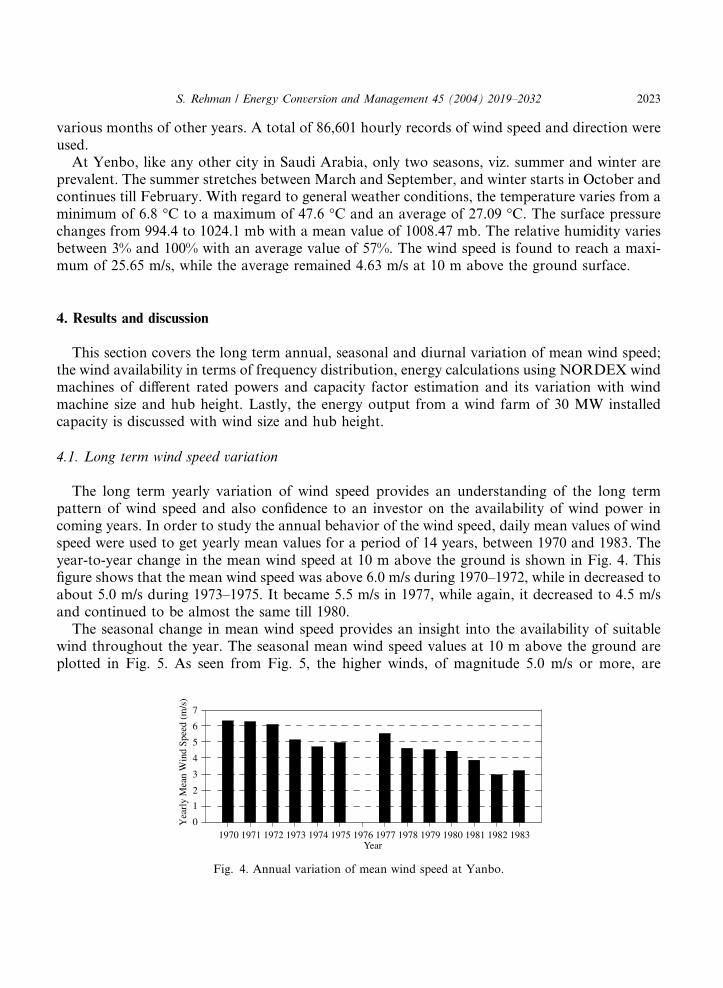
wind throughout the year. The seasonal mean wind speed values at 10 m above the ground areplotted in Fig. 5. As seen from Fig. 5, the higher winds, of magnitude 5.0 m/s or more, are
1970 1971 1972 1973 1974 1975 1976 1977 1978 1979 1980 1981 1982 1983Year
0
1
2
3
4
5
6
7
Yea
rly
Mea
n W
ind
Spee
d (m
/s)
Fig. 4. Annual variation of mean wind speed at Yanbo.
1 2 3 4 5 6 7 8 9 10 11 12Month
0
1
2
3
4
5
6
Mon
thly
Mea
n W
ind
Spee
d (m
/s)
Fig. 5. Monthly variation of mean wind speed at Yanbo (average of 14 years data from 1970 to 1983).
2024 S. Rehman / Energy Conversion and Management 45 (2004) 2019–2032
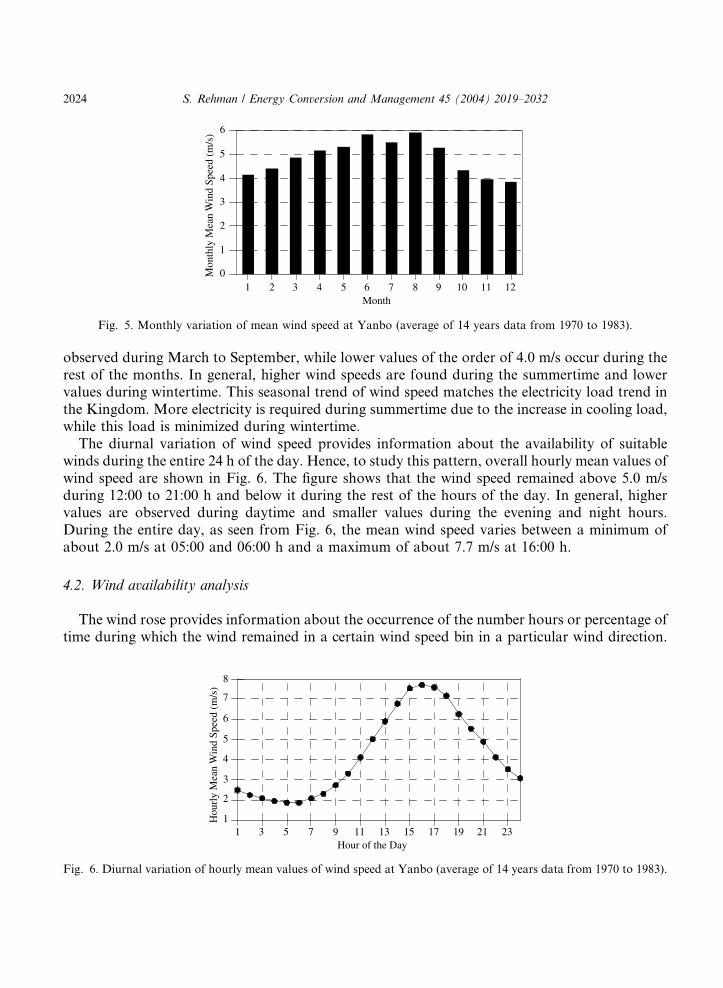
observed during March to September, while lower values of the order of 4.0 m/s occur during therest of the months. In general, higher wind speeds are found during the summertime and lowervalues during wintertime. This seasonal trend of wind speed matches the electricity load trend inthe Kingdom. More electricity is required during summertime due to the increase in cooling load,while this load is minimized during wintertime.The diurnal variation of wind speed provides information about the availability of suitable
winds during the entire 24 h of the day. Hence, to study this pattern, overall hourly mean values ofwind speed are shown in Fig. 6. The figure shows that the wind speed remained above 5.0 m/sduring 12:00 to 21:00 h and below it during the rest of the hours of the day. In general, highervalues are observed during daytime and smaller values during the evening and night hours.During the entire day, as seen from Fig. 6, the mean wind speed varies between a minimum ofabout 2.0 m/s at 05:00 and 06:00 h and a maximum of about 7.7 m/s at 16:00 h.
4.2. Wind availability analysis
The wind rose provides information about the occurrence of the number hours or percentage oftime during which the wind remained in a certain wind speed bin in a particular wind direction.
1 3 5 7 9 11 13 15 17 19 21 23Hour of the Day
1
2
3
4
5
6
7
8
Hou
rly
Mea
n W
ind
Spee
d (m
/s)
Fig. 6. Diurnal variation of hourly mean values of wind speed at Yanbo (average of 14 years data from 1970 to 1983).
S. Rehman / Energy Conversion and Management 45 (2004) 2019–2032 2025
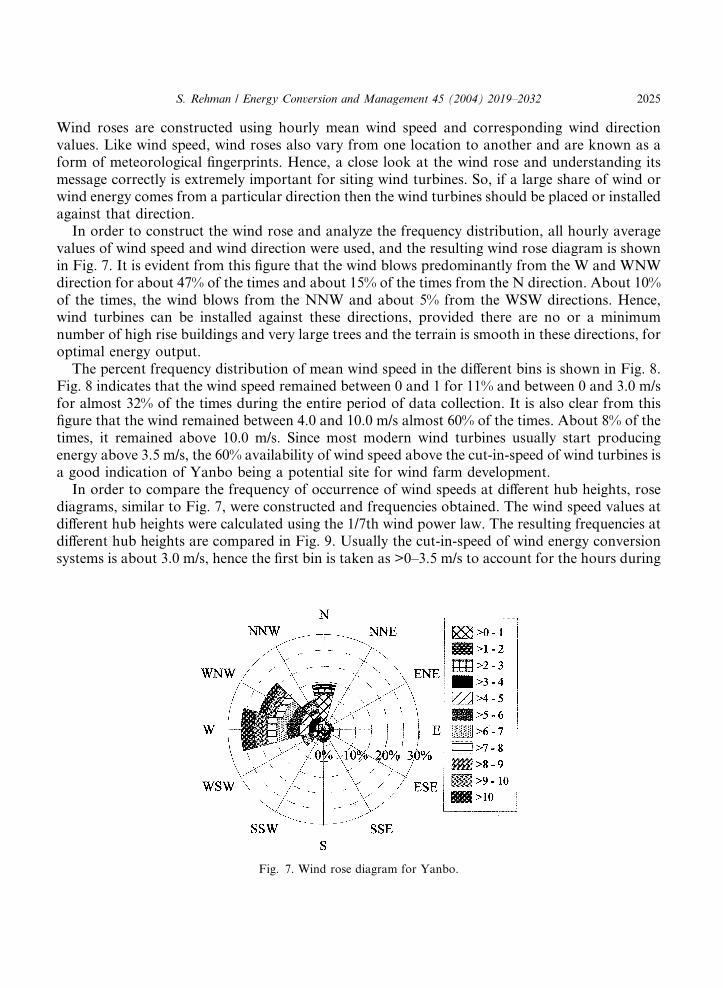
Wind roses are constructed using hourly mean wind speed and corresponding wind directionvalues. Like wind speed, wind roses also vary from one location to another and are known as aform of meteorological fingerprints. Hence, a close look at the wind rose and understanding itsmessage correctly is extremely important for siting wind turbines. So, if a large share of wind orwind energy comes from a particular direction then the wind turbines should be placed or installedagainst that direction.In order to construct the wind rose and analyze the frequency distribution, all hourly average
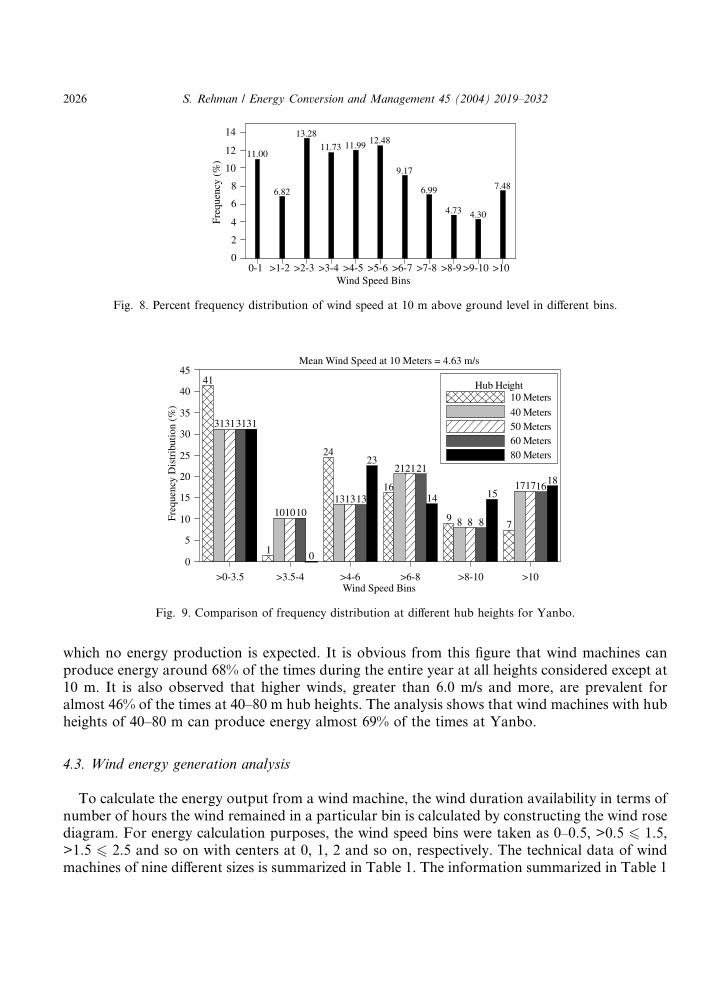
values of wind speed and wind direction were used, and the resulting wind rose diagram is shownin Fig. 7. It is evident from this figure that the wind blows predominantly from the W and WNWdirection for about 47% of the times and about 15% of the times from the N direction. About 10%of the times, the wind blows from the NNW and about 5% from the WSW directions. Hence,wind turbines can be installed against these directions, provided there are no or a minimumnumber of high rise buildings and very large trees and the terrain is smooth in these directions, foroptimal energy output.The percent frequency distribution of mean wind speed in the different bins is shown in Fig. 8.
Fig. 8 indicates that the wind speed remained between 0 and 1 for 11% and between 0 and 3.0 m/sfor almost 32% of the times during the entire period of data collection. It is also clear from thisfigure that the wind remained between 4.0 and 10.0 m/s almost 60% of the times. About 8% of thetimes, it remained above 10.0 m/s. Since most modern wind turbines usually start producingenergy above 3.5 m/s, the 60% availability of wind speed above the cut-in-speed of wind turbines isa good indication of Yanbo being a potential site for wind farm development.In order to compare the frequency of occurrence of wind speeds at different hub heights, rose
diagrams, similar to Fig. 7, were constructed and frequencies obtained. The wind speed values atdifferent hub heights were calculated using the 1/7th wind power law. The resulting frequencies atdifferent hub heights are compared in Fig. 9. Usually the cut-in-speed of wind energy conversionsystems is about 3.0 m/s, hence the first bin is taken as >0–3.5 m/s to account for the hours during
Fig. 7. Wind rose diagram for Yanbo.
>0-3.5 >3.5-4 >4-6 >6-8 >8-10 >10Wind Speed Bins
0
5
10
15
20
25
30
35
40
45
Freq
uenc
y D
istr
ibut
ion
(%)
41
1
24
16
97
31
1013
21
8
17
31
1013
21
8
17
31
1013
21
8
16
31
0
23
14 1518
Hub Height10 Meters
40 Meters50 Meters60 Meters80 Meters
Mean Wind Speed at 10 Meters = 4.63 m/s
Fig. 9. Comparison of frequency distribution at different hub heights for Yanbo.
0-1 >1-2 >2-3 >3-4 >4-5 >5-6 >6-7 >7-8 >8-9 >9-10 >10Wind Speed Bins
0
2
4
6
8
10
12
14
Freq
uenc
y (%
)
11.00
6.82
13.28
11.73 11.99 12.48
9.17
6.99
4.73 4.30
7.48
Fig. 8. Percent frequency distribution of wind speed at 10 m above ground level in different bins.
2026 S. Rehman / Energy Conversion and Management 45 (2004) 2019–2032
which no energy production is expected. It is obvious from this figure that wind machines canproduce energy around 68% of the times during the entire year at all heights considered except at10 m. It is also observed that higher winds, greater than 6.0 m/s and more, are prevalent foralmost 46% of the times at 40–80 m hub heights. The analysis shows that wind machines with hubheights of 40–80 m can produce energy almost 69% of the times at Yanbo.
4.3. Wind energy generation analysis
To calculate the energy output from a wind machine, the wind duration availability in terms ofnumber of hours the wind remained in a particular bin is calculated by constructing the wind rosediagram. For energy calculation purposes, the wind speed bins were taken as 0–0.5, >0.5 6 1.5,>1.5 6 2.5 and so on with centers at 0, 1, 2 and so on, respectively. The technical data of windmachines of nine different sizes is summarized in Table 1. The information summarized in Table 1
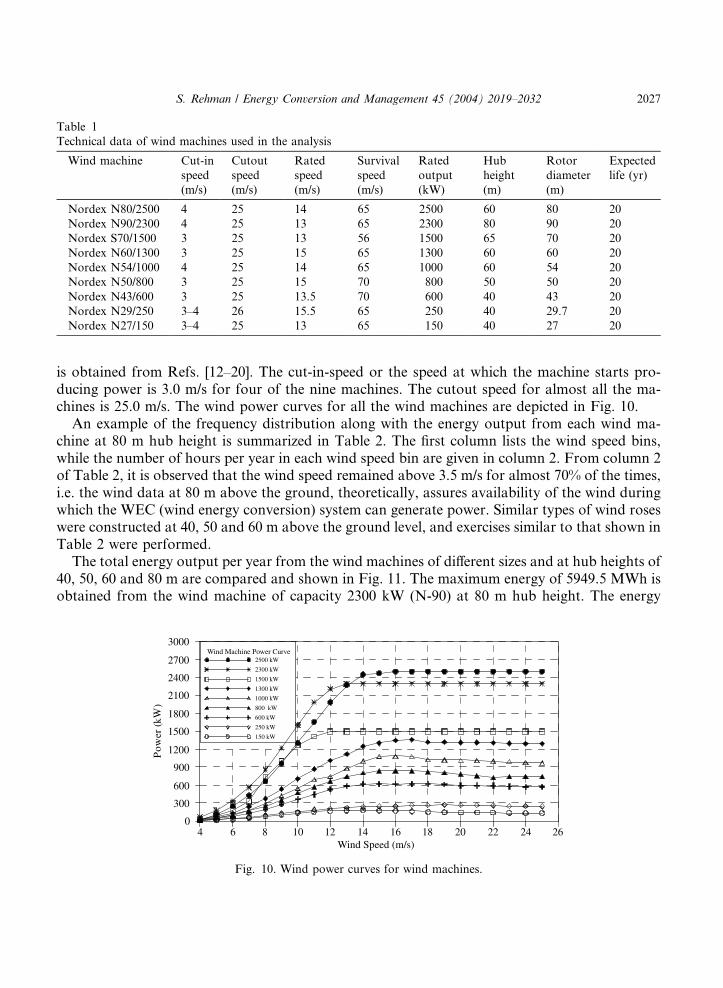
Table 1
Technical data of wind machines used in the analysis
Wind machine Cut-in
speed
(m/s)
Cutout
speed
(m/s)
Rated
speed
(m/s)
Survival
speed
(m/s)
Rated
output
(kW)
Hub
height
(m)
Rotor
diameter
(m)
Expected
life (yr)
Nordex N80/2500 4 25 14 65 2500 60 80 20
Nordex N90/2300 4 25 13 65 2300 80 90 20
Nordex S70/1500 3 25 13 56 1500 65 70 20
Nordex N60/1300 3 25 15 65 1300 60 60 20
Nordex N54/1000 4 25 14 65 1000 60 54 20
Nordex N50/800 3 25 15 70 800 50 50 20
Nordex N43/600 3 25 13.5 70 600 40 43 20
Nordex N29/250 3–4 26 15.5 65 250 40 29.7 20
Nordex N27/150 3–4 25 13 65 150 40 27 20
S. Rehman / Energy Conversion and Management 45 (2004) 2019–2032 2027
is obtained from Refs. [12–20]. The cut-in-speed or the speed at which the machine starts pro-ducing power is 3.0 m/s for four of the nine machines. The cutout speed for almost all the ma-chines is 25.0 m/s. The wind power curves for all the wind machines are depicted in Fig. 10.An example of the frequency distribution along with the energy output from each wind ma-
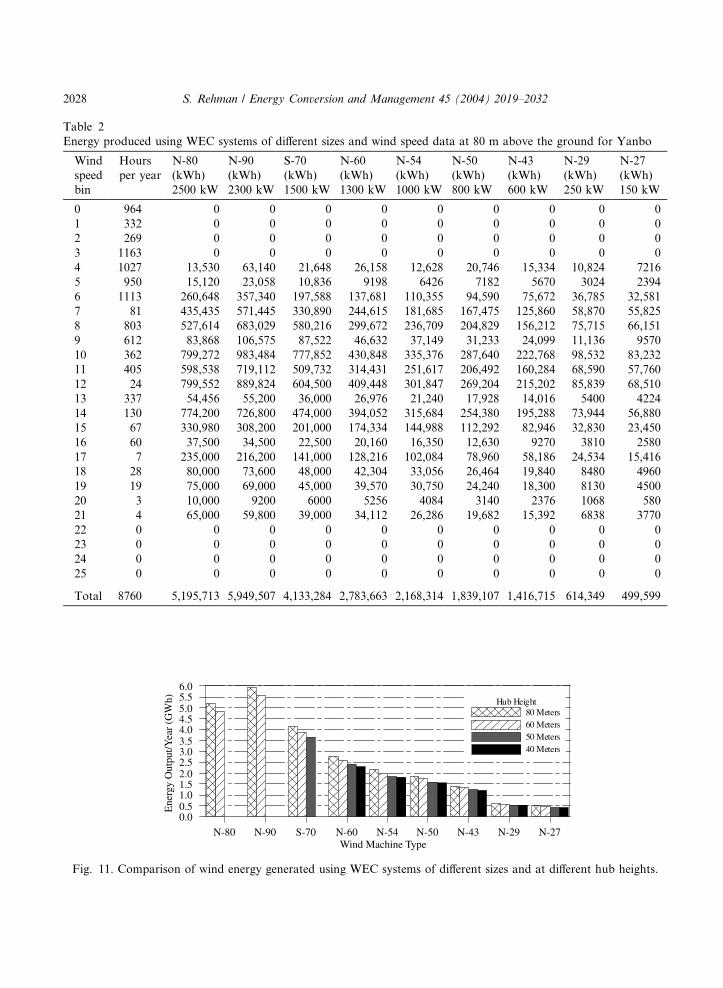
chine at 80 m hub height is summarized in Table 2. The first column lists the wind speed bins,while the number of hours per year in each wind speed bin are given in column 2. From column 2of Table 2, it is observed that the wind speed remained above 3.5 m/s for almost 70% of the times,i.e. the wind data at 80 m above the ground, theoretically, assures availability of the wind duringwhich the WEC (wind energy conversion) system can generate power. Similar types of wind roseswere constructed at 40, 50 and 60 m above the ground level, and exercises similar to that shown inTable 2 were performed.The total energy output per year from the wind machines of different sizes and at hub heights of
40, 50, 60 and 80 m are compared and shown in Fig. 11. The maximum energy of 5949.5 MWh isobtained from the wind machine of capacity 2300 kW (N-90) at 80 m hub height. The energy
4 6 8 10 12 14 16 18 20 22 24 26Wind Speed (m/s)
0
300
600
900
1200
1500
1800
2100
2400
2700
3000
Pow
er (
kW)
Wind Machine Power Curve 2500 kW
2300 kW
1500 kW
1300 kW
1000 kW
800 kW
600 kW
250 kW
150 kW
Fig. 10. Wind power curves for wind machines.
N-80 N-90 S-70 N-60 N-54 N-50 N-43 N-29 N-27Wind Machine Type
0.00.51.01.52.02.53.03.54.04.55.05.56.0
Ene
rgy
Out
put/Y
ear
(GW
h) Hub Height80 Meters60 Meters50 Meters40 Meters
Fig. 11. Comparison of wind energy generated using WEC systems of different sizes and at different hub heights.
Table 2
Energy produced using WEC systems of different sizes and wind speed data at 80 m above the ground for Yanbo
Wind
speed
bin
Hours
per year
N-80
(kWh)
2500 kW
N-90
(kWh)
2300 kW
S-70
(kWh)
1500 kW
N-60
(kWh)
1300 kW
N-54
(kWh)
1000 kW
N-50
(kWh)
800 kW
N-43
(kWh)
600 kW
N-29
(kWh)
250 kW
N-27
(kWh)
150 kW
0 964 0 0 0 0 0 0 0 0 0
1 332 0 0 0 0 0 0 0 0 0
2 269 0 0 0 0 0 0 0 0 0
3 1163 0 0 0 0 0 0 0 0 0
4 1027 13,530 63,140 21,648 26,158 12,628 20,746 15,334 10,824 7216
5 950 15,120 23,058 10,836 9198 6426 7182 5670 3024 2394
6 1113 260,648 357,340 197,588 137,681 110,355 94,590 75,672 36,785 32,581
7 81 435,435 571,445 330,890 244,615 181,685 167,475 125,860 58,870 55,825
8 803 527,614 683,029 580,216 299,672 236,709 204,829 156,212 75,715 66,151
9 612 83,868 106,575 87,522 46,632 37,149 31,233 24,099 11,136 9570
10 362 799,272 983,484 777,852 430,848 335,376 287,640 222,768 98,532 83,232
11 405 598,538 719,112 509,732 314,431 251,617 206,492 160,284 68,590 57,760
12 24 799,552 889,824 604,500 409,448 301,847 269,204 215,202 85,839 68,510
13 337 54,456 55,200 36,000 26,976 21,240 17,928 14,016 5400 4224
14 130 774,200 726,800 474,000 394,052 315,684 254,380 195,288 73,944 56,880
15 67 330,980 308,200 201,000 174,334 144,988 112,292 82,946 32,830 23,450
16 60 37,500 34,500 22,500 20,160 16,350 12,630 9270 3810 2580
17 7 235,000 216,200 141,000 128,216 102,084 78,960 58,186 24,534 15,416
18 28 80,000 73,600 48,000 42,304 33,056 26,464 19,840 8480 4960
19 19 75,000 69,000 45,000 39,570 30,750 24,240 18,300 8130 4500
20 3 10,000 9200 6000 5256 4084 3140 2376 1068 580
21 4 65,000 59,800 39,000 34,112 26,286 19,682 15,392 6838 3770
22 0 0 0 0 0 0 0 0 0 0
23 0 0 0 0 0 0 0 0 0 0
24 0 0 0 0 0 0 0 0 0 0
25 0 0 0 0 0 0 0 0 0 0
Total 8760 5,195,713 5,949,507 4,133,284 2,783,663 2,168,314 1,839,107 1,416,715 614,349 499,599
2028 S. Rehman / Energy Conversion and Management 45 (2004) 2019–2032
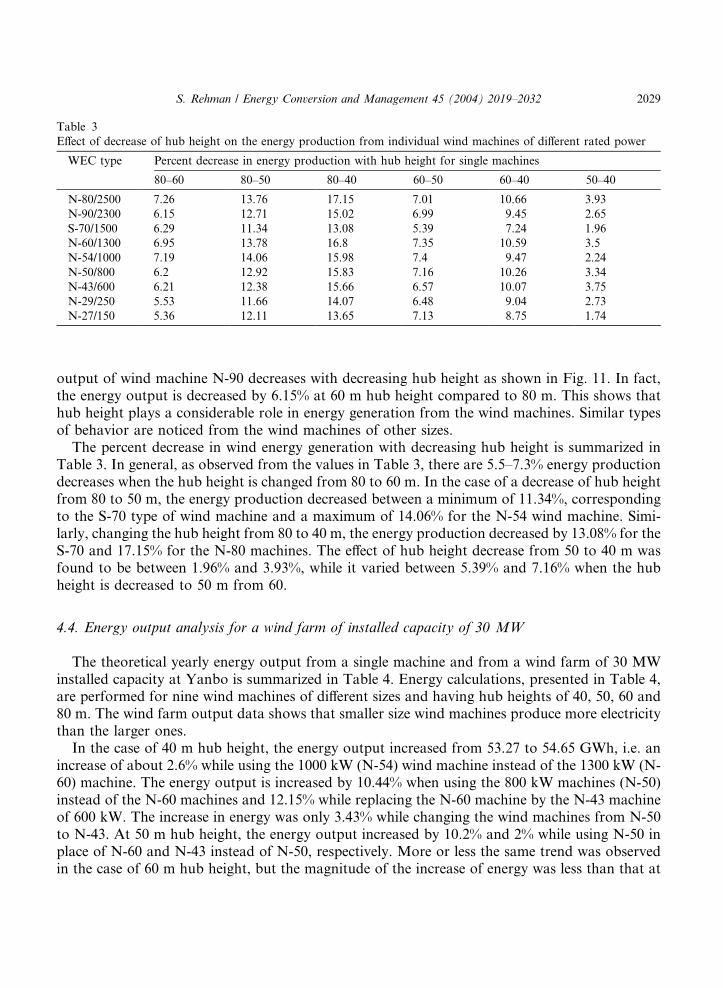
Table 3
Effect of decrease of hub height on the energy production from individual wind machines of different rated power
WEC type Percent decrease in energy production with hub height for single machines
80–60 80–50 80–40 60–50 60–40 50–40
N-80/2500 7.26 13.76 17.15 7.01 10.66 3.93
N-90/2300 6.15 12.71 15.02 6.99 9.45 2.65
S-70/1500 6.29 11.34 13.08 5.39 7.24 1.96
N-60/1300 6.95 13.78 16.8 7.35 10.59 3.5
N-54/1000 7.19 14.06 15.98 7.4 9.47 2.24
N-50/800 6.2 12.92 15.83 7.16 10.26 3.34
N-43/600 6.21 12.38 15.66 6.57 10.07 3.75
N-29/250 5.53 11.66 14.07 6.48 9.04 2.73
N-27/150 5.36 12.11 13.65 7.13 8.75 1.74
S. Rehman / Energy Conversion and Management 45 (2004) 2019–2032 2029
output of wind machine N-90 decreases with decreasing hub height as shown in Fig. 11. In fact,the energy output is decreased by 6.15% at 60 m hub height compared to 80 m. This shows thathub height plays a considerable role in energy generation from the wind machines. Similar typesof behavior are noticed from the wind machines of other sizes.The percent decrease in wind energy generation with decreasing hub height is summarized in
Table 3. In general, as observed from the values in Table 3, there are 5.5–7.3% energy productiondecreases when the hub height is changed from 80 to 60 m. In the case of a decrease of hub heightfrom 80 to 50 m, the energy production decreased between a minimum of 11.34%, correspondingto the S-70 type of wind machine and a maximum of 14.06% for the N-54 wind machine. Simi-larly, changing the hub height from 80 to 40 m, the energy production decreased by 13.08% for theS-70 and 17.15% for the N-80 machines. The effect of hub height decrease from 50 to 40 m wasfound to be between 1.96% and 3.93%, while it varied between 5.39% and 7.16% when the hubheight is decreased to 50 m from 60.
4.4. Energy output analysis for a wind farm of installed capacity of 30 MW
The theoretical yearly energy output from a single machine and from a wind farm of 30 MWinstalled capacity at Yanbo is summarized in Table 4. Energy calculations, presented in Table 4,are performed for nine wind machines of different sizes and having hub heights of 40, 50, 60 and80 m. The wind farm output data shows that smaller size wind machines produce more electricitythan the larger ones.In the case of 40 m hub height, the energy output increased from 53.27 to 54.65 GWh, i.e. an
increase of about 2.6% while using the 1000 kW (N-54) wind machine instead of the 1300 kW (N-60) machine. The energy output is increased by 10.44% when using the 800 kW machines (N-50)instead of the N-60 machines and 12.15% while replacing the N-60 machine by the N-43 machineof 600 kW. The increase in energy was only 3.43% while changing the wind machines from N-50to N-43. At 50 m hub height, the energy output increased by 10.2% and 2% while using N-50 inplace of N-60 and N-43 instead of N-50, respectively. More or less the same trend was observedin the case of 60 m hub height, but the magnitude of the increase of energy was less than that at
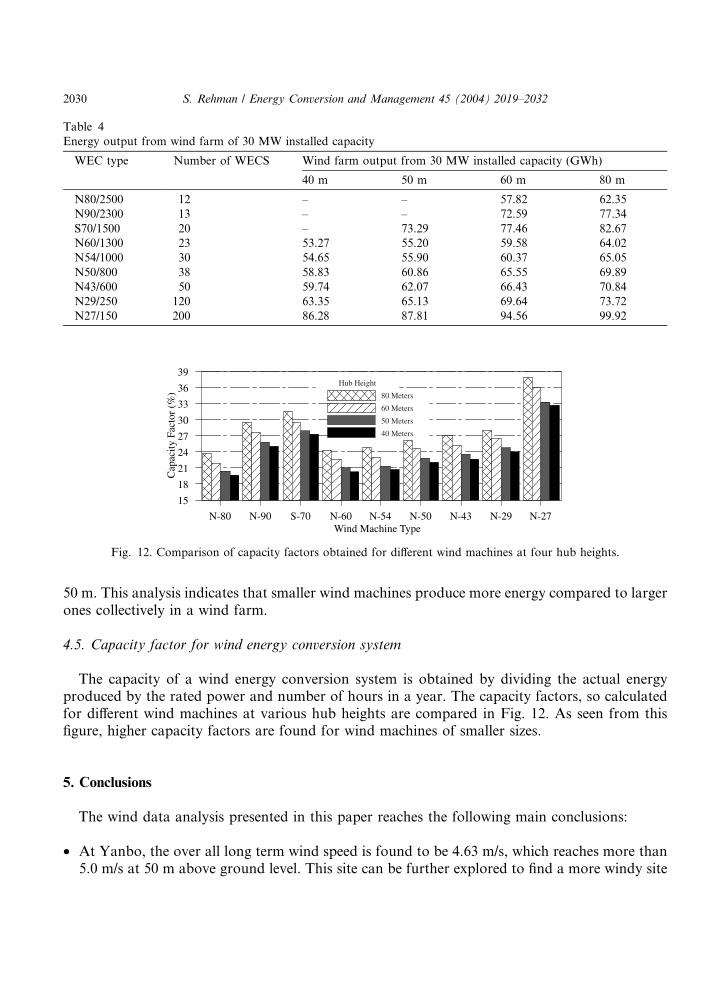
Table 4
Energy output from wind farm of 30 MW installed capacity
WEC type Number of WECS Wind farm output from 30 MW installed capacity (GWh)
40 m 50 m 60 m 80 m
N80/2500 12 – – 57.82 62.35
N90/2300 13 – – 72.59 77.34
S70/1500 20 – 73.29 77.46 82.67
N60/1300 23 53.27 55.20 59.58 64.02
N54/1000 30 54.65 55.90 60.37 65.05
N50/800 38 58.83 60.86 65.55 69.89
N43/600 50 59.74 62.07 66.43 70.84
N29/250 120 63.35 65.13 69.64 73.72
N27/150 200 86.28 87.81 94.56 99.92
N-80 N-90 S-70 N-60 N-54 N-50 N-43 N-29 N-27Wind Machine Type
15
18
21
24
27
30
33
36
39
Cap
acity
Fac
tor
(%)
Hub Height
80 Meters
60 Meters
50 Meters
40 Meters
Fig. 12. Comparison of capacity factors obtained for different wind machines at four hub heights.
2030 S. Rehman / Energy Conversion and Management 45 (2004) 2019–2032
50 m. This analysis indicates that smaller wind machines produce more energy compared to largerones collectively in a wind farm.
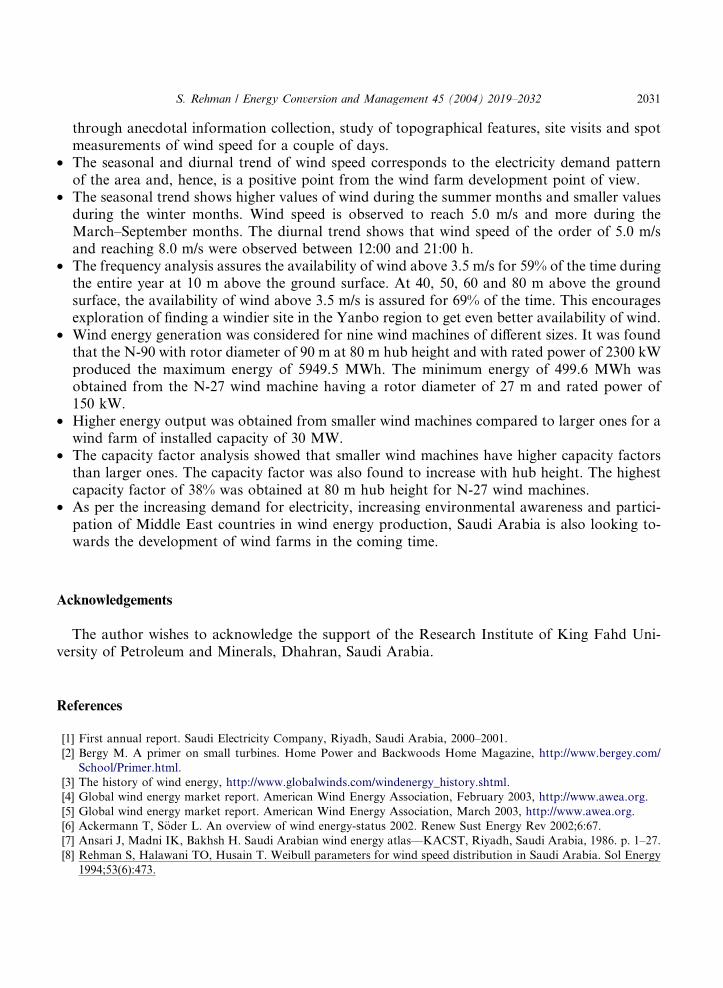
4.5. Capacity factor for wind energy conversion system
The capacity of a wind energy conversion system is obtained by dividing the actual energyproduced by the rated power and number of hours in a year. The capacity factors, so calculatedfor different wind machines at various hub heights are compared in Fig. 12. As seen from thisfigure, higher capacity factors are found for wind machines of smaller sizes.
5. Conclusions
The wind data analysis presented in this paper reaches the following main conclusions:
• At Yanbo, the over all long term wind speed is found to be 4.63 m/s, which reaches more than5.0 m/s at 50 m above ground level. This site can be further explored to find a more windy site
S. Rehman / Energy Conversion and Management 45 (2004) 2019–2032 2031
through anecdotal information collection, study of topographical features, site visits and spotmeasurements of wind speed for a couple of days.
• The seasonal and diurnal trend of wind speed corresponds to the electricity demand patternof the area and, hence, is a positive point from the wind farm development point of view.
• The seasonal trend shows higher values of wind during the summer months and smaller valuesduring the winter months. Wind speed is observed to reach 5.0 m/s and more during theMarch–September months. The diurnal trend shows that wind speed of the order of 5.0 m/sand reaching 8.0 m/s were observed between 12:00 and 21:00 h.
• The frequency analysis assures the availability of wind above 3.5 m/s for 59% of the time duringthe entire year at 10 m above the ground surface. At 40, 50, 60 and 80 m above the groundsurface, the availability of wind above 3.5 m/s is assured for 69% of the time. This encouragesexploration of finding a windier site in the Yanbo region to get even better availability of wind.
• Wind energy generation was considered for nine wind machines of different sizes. It was foundthat the N-90 with rotor diameter of 90 m at 80 m hub height and with rated power of 2300 kWproduced the maximum energy of 5949.5 MWh. The minimum energy of 499.6 MWh wasobtained from the N-27 wind machine having a rotor diameter of 27 m and rated power of150 kW.
• Higher energy output was obtained from smaller wind machines compared to larger ones for awind farm of installed capacity of 30 MW.
• The capacity factor analysis showed that smaller wind machines have higher capacity factorsthan larger ones. The capacity factor was also found to increase with hub height. The highestcapacity factor of 38% was obtained at 80 m hub height for N-27 wind machines.
• As per the increasing demand for electricity, increasing environmental awareness and partici-pation of Middle East countries in wind energy production, Saudi Arabia is also looking to-wards the development of wind farms in the coming time.
Acknowledgements
The author wishes to acknowledge the support of the Research Institute of King Fahd Uni-versity of Petroleum and Minerals, Dhahran, Saudi Arabia.
References
[1] First annual report. Saudi Electricity Company, Riyadh, Saudi Arabia, 2000–2001.
[2] Bergy M. A primer on small turbines. Home Power and Backwoods Home Magazine, http://www.bergey.com/
School/Primer.html.
[3] The history of wind energy, http://www.globalwinds.com/windenergy_history.shtml.
[4] Global wind energy market report. American Wind Energy Association, February 2003, http://www.awea.org.
[5] Global wind energy market report. American Wind Energy Association, March 2003, http://www.awea.org.
[6] Ackermann T, S€oder L. An overview of wind energy-status 2002. Renew Sust Energy Rev 2002;6:67.
[7] Ansari J, Madni IK, Bakhsh H. Saudi Arabian wind energy atlas––KACST, Riyadh, Saudi Arabia, 1986. p. 1–27.
[8] Rehman S, Halawani TO, Husain T. Weibull parameters for wind speed distribution in Saudi Arabia. Sol Energy
1994;53(6):473.
2032 S. Rehman / Energy Conversion and Management 45 (2004) 2019–2032
[9] Rehman S, Halawani TO. Statistical characteristics of wind in Saudi Arabia. Renew Energy 1994;4(8):949.
[10] Mohandes MA, Rehman S, Halawani TO. A neural network approach for wind speed prediction. Renew Energy
1998;3(3):345.
[11] Rehman S, Halawani TO, Mohandes M. Wind power cost assessment at twenty locations in the Kingdom of Saudi
Arabia. Renew Energy 2003;28:573.
[12] Nordex Publication, N80 technical description document, Rev. 5.0, 2001, http://www.nordex-online.com/_e/
produkte_und_service/index.html.
[13] Nordex Publication, N60 technical description document, Rev. 5.0, 2001, http://www.nordex-online.com/_e/
produkte_und_service/index.html.
[14] Nordex Publication, N50 technical description document, Rev. 5.0, 2001, http://www.nordex-online.com/_e/
produkte_und_service/index.html.
[15] Nordex Publication, N43 technical description document, Rev. 5.0, 2001, http://www.nordex-online.com/_e/
produkte_und_service/index.html.
[16] Nordex Publication, S70 technical description document, Rev. 5.0, 2001, http://www.nordex-online.com/_e/
online_service/download/_dateien/S70_77.pdf.
[17] Nordex Publication, N90 technical description document, Rev. 5.0, 2001, http://www.nordex-online.com/pdf/
produktbroschueren/n80_en.pdf.
[18] Nordex Publication, N54 technical description document, Rev. 5.0, 2001, http://www.nordex-online.com/pdf/
produktbroschueren/n54_en.pdf.
[19] Nordex Publication, N29 technical description document, Rev. 5.0, 2001, http://www.nordex-online.com/pdf/
produktbroschueren/n29_en.pdf.
[20] Nordex Publication, N27 technical description document, Rev. 5.0, 2001, http://www.nordex-online.com/pdf/
produktbroschueren/n27_en.pdf.