water resources development in riyadh, saudi arabia
TRANSCRIPT
Desah~tion, 64 (1987) 193-202 193 Else&r Science Publishers B.V., Amsterdam - Printed in The Netherlands
WATER RESOURCES DEVELOPMENT IN RIYADH, SAUDI ARABIA
IBRAHIM S. AL-MUTAZ
Chemical Engineering Department, King Saud University, P. 0. Box BOO Riyadh 11421, Saudi Arabia
ABSTRACT
The water demand in the Saudi Arabian capital, Riyadh, is growing in accor-
ding with the vast population growth. The principal source of water in Riyadh
is Minjur aquifier, a sandstone aquiter more than 1200 meter below ground. It
has high hardness, sulphate and salinity. There are numbers of reverse osmosis
plants to supply fresh water to the city with a total capacity of about 192,000
cubic meter per day. By 1981, fresh water was delivered from Al&bail desali-
nation plant through twin pipelines each is one meter and half in diameter and
about 930,000 meter long. These pipelines are capable of delivering approxima-
tely 830,000 cubic meter of fresh water per day from Al-Jubail to Riyadh. The
prementioned population growth at an approximate rate of 50,000 per year and
the enlargement of social and industrial activities require an increase in the
water supply. This paper analyzes the water demand and supply in Riyadh. It
also outlines the possible water resources including the processed water to
satisfy the increasing rate of water consumption.
INTRODUCTION
Saudi Arabia is a dry country. It has scarce surface water resources. Hydro-
logical investigations pointed to the large resources of underground water of
two types, replenishable and non-replenishable. Replenishable ground water with
an average age of 10 years has a volume of more than 200 million m3. It is
mainly found in the central part of Saudi Arabia where the capital, Riyadh, is
located. A proven reserve of 338 billion m3 of non-renewable subsurface water
is estimated which may be formed some 20,000 years ago.
Instead of exploiting these ground waters, the government planned to rep-
lenish it by constructing large number of dams with a total storage capacity of
248s463*ooo "5(l). Digging wells are illegal in the country without the per-
mission of the Ministry of Agriculture to minimize the unnecessary utilization
of the ground water reserve.
OOll-9164/87/$03.50 0 1987 Elsevier Science Publishers B.V.
194
Water consumption in Saudi Arabia in general and in the capital city,Riyadh,
in particular increases rapidly in the last few years. Population in Riyadh was
about 170,000 in 1964, 665,000 in 1974. Nowadays, it approaches one million. In
the following sections, the major sources of water in Riyadh together with the
consumptions and uses are reviewed in order to present an example of the Saudi
water resources program.
WATER RESOURCES IN RIYAOH
The main sources of water in Riyadh are the shallow wells in Wadi Nisah,
Wadi Namar and Wadi Hayir and the deep wells of Minjur formation. In 1964, the
principal Riyadh water sources are(l)
- 9 deep wells tapping the Mijur formation.
- 18 shallow wells; Wadi Nisah 5 wells, Wadi Namar 7 wells, Wadi Hayir 6 wells.
These wells produced about 80,000 m3/day which was sufficient for the whole
city. A dramatic increase in the water demand was observed due to the rapid
development and growth of Riyadh in the past decade. The population growth was
at an approximate rate of 50,000 per year. So many of the shallow wells were
exhausted. At present, the following are considered the main sources of water
in Riyadh(2):
- Wadi Hanifa and its tributaries.
- Byad-Wasia aquifer, (Wadi Nisah well field)
- The deep-lying Minjur aquifer (about 2000 m below ground).
- Delivery of fresh water from Al-Jubail II desalination plant.
About 830,000 m3/dsy of fresh is delivered from Al-Jubail, at the eastern
part of Saudi Arabia to Riyadh. This massive amount of water is transported by
twin 60 inch in diameter pipelines of 930 Km total length. It is part of 3
million meters of pipelines capable of delivering 2 million d/day from
Al-Jubail to cities and villages in the Red Sea and Arabian Gulf, as well as in
the interior of the country. The design capacity of Al-Jubail II plant is
960,000 m3/day (253.5 mgdl.
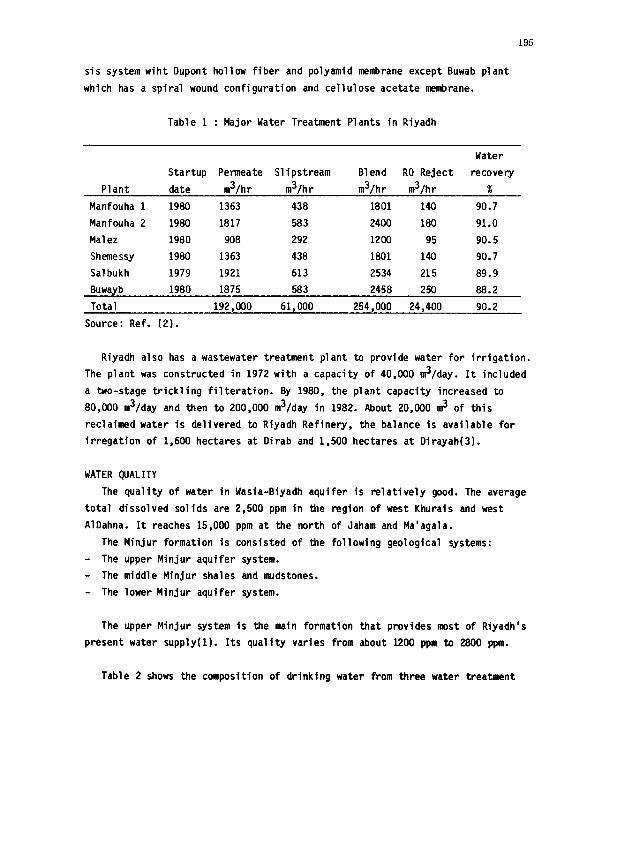
Anyhow, Minjur aquifer is the source of Riyadh desalination plants. Table 1
shows the major treatment plants in Rfyadh. All these plants use reverse osmo-
195
sis system wiht DuPont hollow fiber and polyamid membrane except Buwab plant
which has a spiral wound configuration and cellulose acetate membrane.
Table 1 : Major Water Treatment Plants in Riyadh
Water
Startup Permeate Slipstream Blend RO Reject recovery
Plant date m3/hr m3/hr m3/hr m3/hr %
Manfouha 1 1980 1363 438 iaoi 140 90.7
Manfouha 2 I980 1817 583 2400 I80 91.0
Malez I980 908 292 1200 95 90.5
Shemessy I980 1363 438 IaoI I40 90.7
Salbukh 1979 1921 613 2534 215 89.9
Buwayb I980 I875 583 2458 250 88.2
Total 192,000 61,000 254,000 24,400 90.2
Source: Ref. (2).
Riyadh also has a wastewater treatment plant to provide water for irrigation.
The plant was constructed in 1972 with a capacity of 40,000 m3/day. It included
a two-stage trickling filteration. By 1980, the plant capacity increased to
80,000 m3/day and then to 200,000 m3/day in 1982. About 20.000 m3 of this
reclaimed water is delivered to Riyadh Refinery, the balance is available for
irregation of 1.600 hectares at Dirab and 1,500 hectares at Dirayah(31.
WATER QDALITY
The quality of water in Wasia-Biyadh aquifer is relatively good. The average
total dissolved solids are 2,500 ppm in the
AlDahna. It reaches 15,000 ppm at the north
The Minjur formation is consisted of the
- The upper Minjur aquifer system.
- The middle Minjur shales and mudstones.
- The lower Minjur aquifer system.
region of west Khurais and west
of Jaham and Ma'agala.
following geological systems:
The upper Minjur system is the main formation that provides most of Riyadh's
present water supply(l). Its quality varies from about 1200 ppm to 2800 ppm.
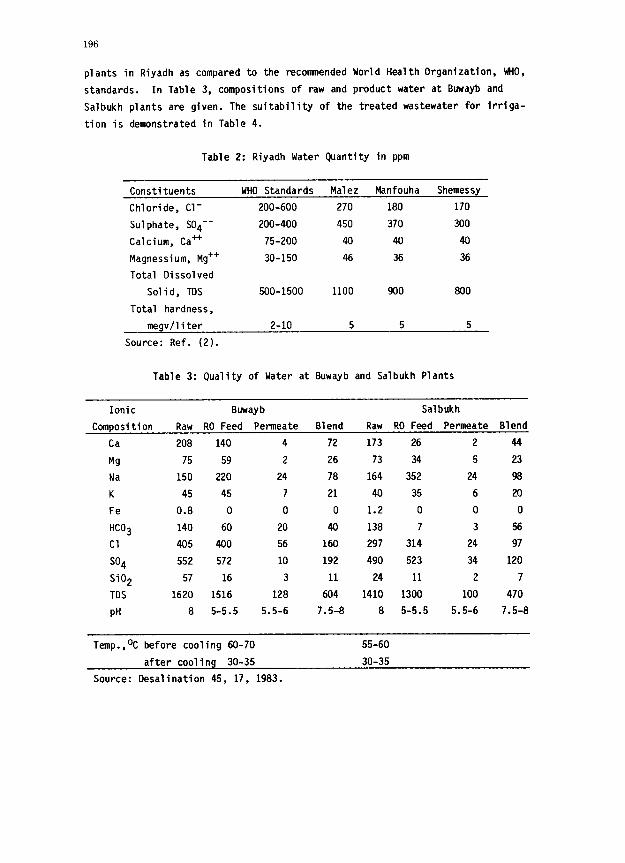
Table 2 shows the composition of drinking water from three water treatment
196
plants in Riyadh as compared to the recommended World Health Organization, WHO,
standards. In Table 3, compositions of raw and product water at Buwayb and
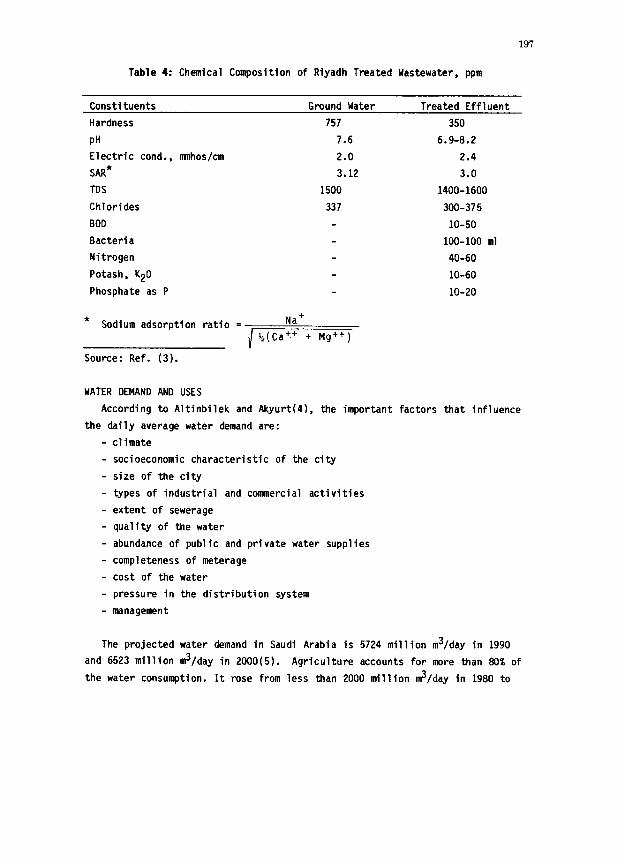
Salbukh plants are given. The suitability of the treated wastewater for irriga-
tion is demonstrated in Table 4.
Table 2: Riyadh Water Quantity in ppm
Constituents WHO Standards Malez Manfouha Shemessy
Chloride, Cl- 200-600 270 180 170
Sulphate, S04-- 200-400 450 370 300
Calcium, Ca++ 75-200 40 40 40
Magnessium, Mg++ 30-150 46 36 36
Total Dissolved
Solid, TOS 500-1500 1100 900 800
Total hardness,
megv/liter 2-10 5 5 5
Source: Ref. (2).
Table 3: Quality of Water at Buwayb and Salbukh Plants
Ionic Buwayb Salbukh
Composition Raw RO Feed Permeate Blend Raw RO Feed Permeate Blend
Ca 208 140 4 72 173 26 2 44
Mg 75 59 2 26 73 34 5 23
Na 150 220 24 78 164 352 24 98
K 45 45 7 21 40 35 6 20
Fe 0.8 0 0 0 1.2 0 0 0
HC03 140 60 20 40 138 7 3 56
Cl 405 400 56 160 297 314 24 97
SO4 552 572 10 192 490 523 34 120
Si02 57 16 3 11 24 11 2 7
TDS 1620 1516 128 604 1410 1300 100 470
PH 8 5-5.5 5.5-6 7.5-8 8 5-5.5 5.5-6 7.5-8
Temp.,OC before cooling 60-70
after cooling 30-35
Source: Desalination 45, 17, 1983.
55-60
30-35
197
Table 4: Chemical Composition of Riyadh Treated Wastewater, ppm
Constituents Ground Water Treated Effluent
Hardness
PH
Electric cond., mnhos/cm
SAR*
TDS
Chlorides
BOD
Bacteria
Nitrogen
Potash, K20
Phosphate as P
757
7.6
2.0
3.12
1500
337
350
6.9-8.2
2.4
3.0
1400-1600
300-375
10-50
100-100 ml
40-60
lo-60
IO-20
* Sodium adsorption ratio = Na+
k!Ca*+ + Mg++)
Source: Ref. (3).
WATER DEMAND AND USES
According to Altinbilek and Akyurt(4). the important factors that influence
the daily average water demand are:
climate
socioeconomic characteristic of the city
size of the city
types of industrial and connaercial activities
extent of sewerage
quality of the water
abundance of public and private water supplies
completeness of meterage
cost of the water
pressure in the distribution system
management
The projected water demand in Saudi Arabia is 5724 million m3/day in 1990
and 6523 million m3/day in 2000(5). Agriculture accounts for more than 80% of
the water consumption. It rose from less than 2000 million d/day in 1980 to
198
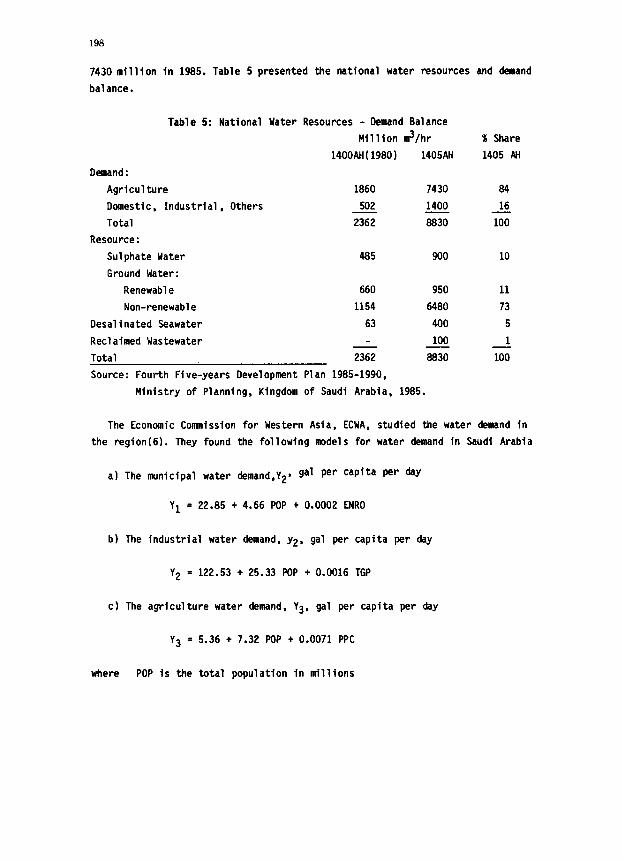
7430 million in 1985. Table 5 presented the national water resources and demand
balance.
Table 5: National Water Resources - Demand Balance
Million m3/hr
14OOAH(1980) 1405AH
Demand:
Agriculture 1860 7430
Domestic, Industrial, Others 502 1400
Total 2362 8830
Resource:
Sulphate Water 485 900
Ground Water:
Renewable 660 950
Non-renewable 1154 6480
Desalinated Seawater 63 400
Reclaimed Wastewater 100
Total 2362 8830
Source: Fourth Five-years Development Plan 1985-1990,
Ministry of Planning, Kingdom of Saudi Arabia, 1985.
% Share
1405 AH
84
16
loo
10
11
73
5
1
loo
The Economic Coasafssion for Western Asia, ECWA, studied the water demand in
the region(6). They found the following models for water demand in Saudi Arabia:
a) The municipal water demand.Y2* gal per capita per day
Y1 = 22.85 + 4.66 POP + 0.0002 ENRO
b) The industrial water demand, y2, gal per capita per day
Y2 = 122.53 + 25.33 POP + 0.0016 TGP
c) The agriculture water demand, Y3, gal per capita per day
Y3 = 5.36 + 7.32 POP + 0.0071 PPC
where POP is the total population in millions
ENRO is the total student
in thousands
TGP is the total natural
PPC is the production of
199
enrolment by all levels of education available,
gas production in millions of cubic meters
principal crops in thousands of metric tons
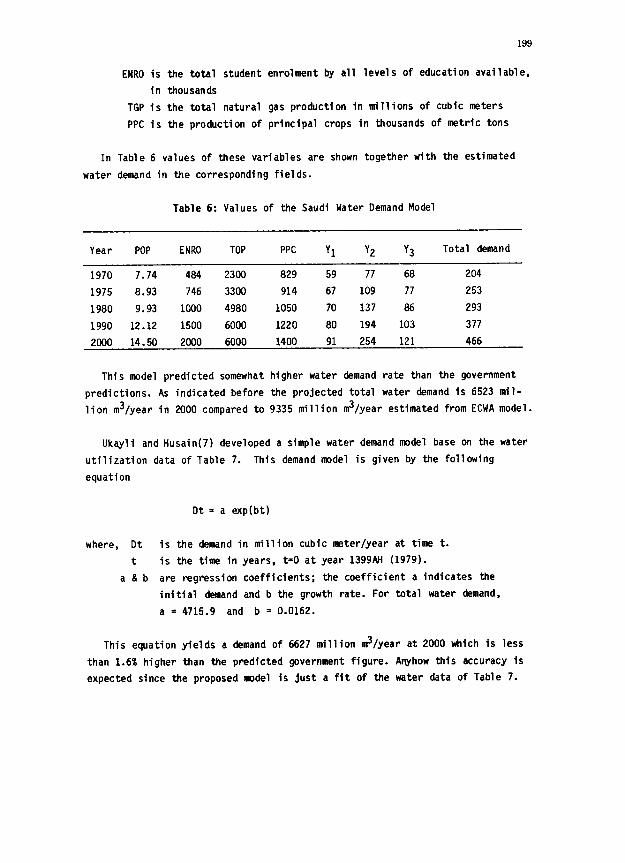
In Table 6 values of these variables are shown together with the estimated
water demand in the corresponding fields.
Table 6: Values of the Saudi Water Demand Model
Year POP ENRO TOP PPC YI Y2 Y3 Total demand
1970 7.74 484 2300 829 59 77 68 204
1975 8.93 746 3300 914 67 109 77 253
1980 9.93 1000 4980 1050 70 137 86 293
1990 12.12 1500 6000 1220 80 194 103 377
2000 14.50 2000 6000 1400 91 254 121 466
This model predicted somewhat higher water demand rate than the government
predictions. As indicated before the projected total water demand is 6523 mil-
lion m3/year in 2000 compared to 9335 million m3/year estimated from ECWA model.
Ukayli and Husain(7) developed a simple water demand mdel base on the water
utilization data of Table 7. This demand model is given by the following
equation
Dt = a exp(bt1
where, Dt is the demand in million cubic meter/year at time t.
t is the time in years, t=D at year 1399AJi (1979).
a & b are regression coefficients; the coefficient a indicates the
initial demand and b the growth rate. For total water demand,
a = 4715.9 and b = 0.0162.
This equation yields a demand of 6627 million m3/year at 2000 which is less
than 1.6% higher than the predicted government figure. Anyhow this accuracy is
expected since the proposed model is just a fit of the water data of Table 7.
200
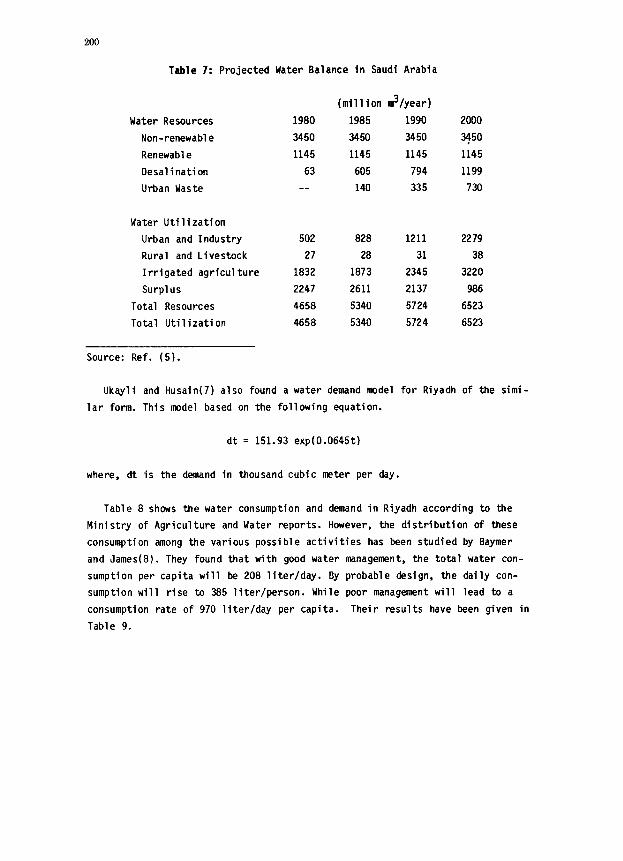
Table 7: Projected Water Balance in Saudi Arabia
Water Resources
Non-renewable
Renewable
Desalination
Urban Waste
Water Utilization
Urban and Industry
Rural and Livestock
Irrigated agriculture
Surplus
Total Resources
Total Utilization
(million g/year)
1980 1985 1990
3450 3450 3450
1145 1145 1145
63 605 794
__ 140 335
502 828 1211
27 28 31
1832 1873 2345
2247 2611 2137
4658 5340 5724
4658 5340 5724
3450
1145
1199
730
2279
38
3220
986
6523
6523
Source: Ref. (5).
Ukayli and Husain(7) also found a water demand model for Riyadh of the simi-
lar form. This model based on the following equation.
dt = 151.93 exp(0.0645t)
where, dt is the demand in thousand cubic meter per day.
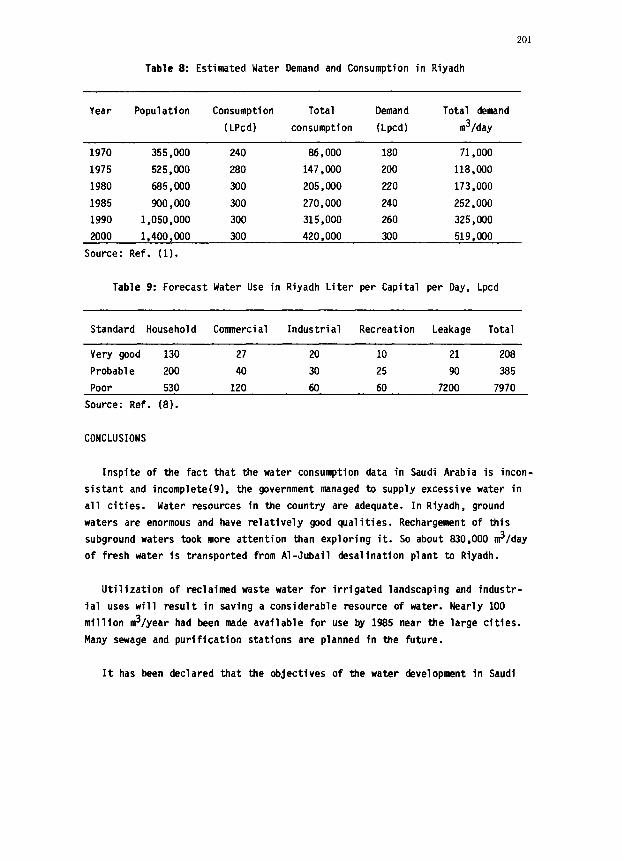
Table 8 shows the water consumption and demand in Riyadh according to the
Ministry of Agriculture and Water reports. However, the distribution of these
consumption among the various possible activities has been studied by Baymer
and James(8). They found that with good water management, the total water con-
sumption per capita will be 208 liter/dqy. By probable design, the daily con-
sumption will rise to 385 liter/person. While poor management will lead to a
consumption rate of 970 liter/day per capita. Their results have been given in
Table 9.
201
Table 8: Estimated Water Demand and Consumption in Riyadh
Year Population Consumption Total Demand Total demand
(LPcd) consumption (Lpcdl m3/day
1970 355,000 240 86,000 180 71,000
1975 525,000 280 147,000 200 118,000
1980 685,000 300 205,000 220 173,000
1985 900, COO 300 270,000 240 252,000
1990 1,050,000 300 315,000 260 325.000
2000 1,400,000 300 420,000 300 519,000
Source: Ref. (1).
Table 9: Forecast Water Use in Riyadh Liter per Capital per Day, Lpcd
Standard Household Conaaercial Industrial Recreation Leakage Total
Very good 130 27 20 10 21 208
Probable 200 40 30 25 90 385
Poor 530 120 60 60 7200 7970
Source: Ref. (8).
CONCLUSIONS
Inspite of the fact that the water consumption data in Saudi Arabia is incon-
sistant and incomplete(91, the government managed to supply excessive water in
all cities. Water resources in the country are adequate. In Riyadh, ground
waters are enormous and have relatively good qualities. Rechargement of this
subground waters took more attention than exploring it. So about 830.000 m3/day
of fresh water is transported from Al-Jubail desalination plant to Riyadh.
Utilization of reclaimed waste water for irrigated landscaping and industr-
ial uses will result in saving a considerable resource of water. Nearly 100
million m3/year had been made available for use by 1985 near the large cities.
Many sewage and purification stations are planned in the future.
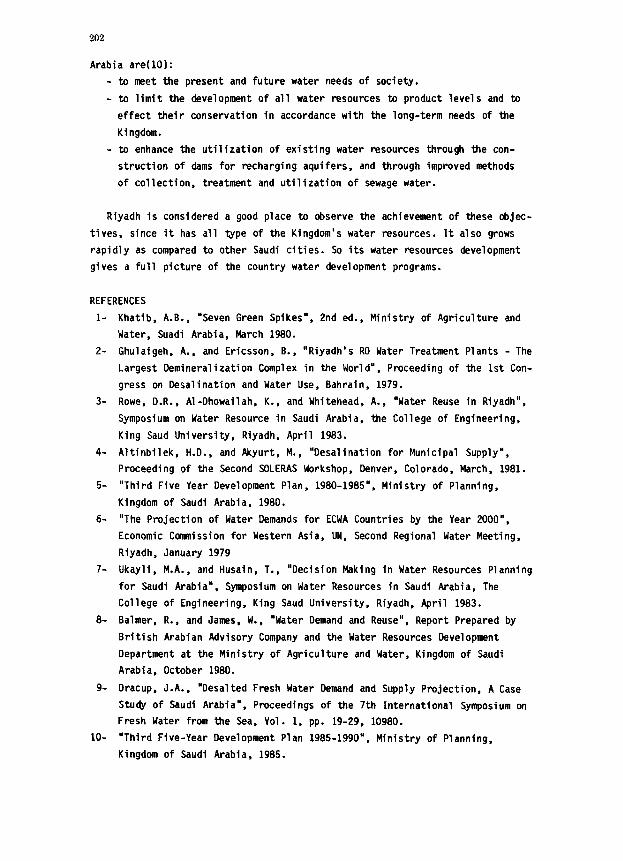
It has been declared that the objectives of the water development in Saudi
202
Arabia are(l0):
- to meet the present and future water needs of society.
- to limit the development of all water resources to product levels and to
effect their conservation in accordance with the long-term needs of the
Kingdom.
- to enhance the utilization of existing water resources through the con-
struction of dams for recharging aquifers, and through improved methods
of collection, treatment and utilization of sewage water.
Riyadh is considered a good place to observe the achievement of these objec-
tives, since it has all type of the Kingdom's water resources. It also grows
rapidly as compared to other Saudi cities. So its water resources development
gives a full picture of the country water development programs.
REFERENCES
l-
2-
3-
4-
5-
6-
7-
8-
9-
lo-
Khatib, A.B., "Seven Green Spikes", 2nd ed., Ministry of Agriculture and
Water, Suadi Arabia, March 1980.
Ghulaigeh, A., and Ericsson, B., "Riyadh's RO Water Treatment Plants - The
Largest Demineralization Complex in the World", Proceeding of the 1st Con-
gress on Desalination and Water Use, Bahrain, 1979.
Rowe, D.R.. Al-Dhowailah, K., and Whitehead, A., "Water Reuse in Riyadh",
Symposium on Water Resource in Saudi Arabia, the College of Engineering,
King Saud University, Riyadh, April 1983.
Altinbilek, H.D., and Akyurt, M., "Desalination for Municipal Supply",
Proceeding of the Second SOLERAS Workshop, Denver, Colorado, March, 1981.
"Third Five Year Development Plan, 1980-1985", Ministry of Planning,
Kingdom of Saudi Arabia, 1980.
"The Projection of Water Demands for ECWA Countries by the Year 2000".
Economic Conanission for Western Asia, UN, Second Regional Water Meeting,
Riyadh, January 1979
Ukayli, M.A., and Husain, T., "Decision Making in Water Resources Planning
for Saudi Arabia", Symposium on Water Resources in Saudi Arabia, The
College of Engineering, King Saud University, Riyadh, April 1983.
Balmer, R., and James, W., "Water Demand and Reuse", Report Prepared by
British Arabian Advisory Company and the Water Resources Development
Department at the Ministry of Agriculture and Water, Kingdom of Saudi
Arabia, October 1980.
Dracup, J.A., "Desalted Fresh Water Demand and Supply Projection, A Case
Study of Saudi Arabia", Proceedings of the 7th International Symposium on
Fresh Water from the Sea, Vol. 1, pp. 19-29, 10980.
"Third Five-Year Development Plan 1985-1990". Ministry of Planning,
Kingdom of Saudi Arabia, 1985.