rainfall-altitude relationship in saudi arabia
TRANSCRIPT

Hindawi Publishing CorporationAdvances in MeteorologyVolume 2013 Article ID 363029 14 pageshttpdxdoiorg1011552013363029
Research ArticleRainfall-Altitude Relationship in Saudi Arabia
Khalid Al-Ahmadi1 and Sharaf Al-Ahmadi2
1 King Abdulaziz City for Science and Technology PO Box 6086 Riyadh 11442 Saudi Arabia2 Taibah University PO Box 344 Madinah 30001 Saudi Arabia
Correspondence should be addressed to Khalid Al-Ahmadi alahmadikacstedusa
Received 24 December 2012 Revised 23 February 2013 Accepted 26 February 2013
Academic Editor Harry D Kambezidis
Copyright copy 2013 K Al-Ahmadi and S Al-Ahmadi This is an open access article distributed under the Creative CommonsAttribution License which permits unrestricted use distribution and reproduction in any medium provided the original work isproperly cited
Relations between rainfall and the altitude of the terrain can have significant implications for rainfall-runoff studies in hydrologyThe aim of this paper is to report on a study of relationships between annual and seasonal rainfall and the altitude of the terrain inSaudi Arabia (SA) using global ordinary least square (OLS) and local geographically weighted regression (GWR) methods Resultsusing the OLS method showed a significant correlation between altitude and spring rainfall with a coefficient of determination of1199032= 054119875 lt 05 but no significant correlation for the annual and other seasonsrsquo rainfallsThe relationships weremore pronounced
whenGWR local analysis was performedwith coefficients of determination of 1199032 = 078 064 083 082 and 071 for annual winterspring summer and fall rainfalls respectively There was some variation in the parameter estimates derived with GWR but themajority of the estimates indicated a positive association Results from this study corroborate those of selected other studies inwhich rainfall and altitude were found to be correlated spatially The authors concluded that the use of a nonstationary local modelsuch as GWR enabled them to provide a deeper explanation of relations between rainfall and the altitude of the terrain than a globalmodel such as OLS in terms of spatial estimation and prediction
1 Introduction
Understanding estimating and predicting spatial patternsand amounts of rainfall are potentially important for a diver-sity of human social economic hydrological and ecologicalactivities such as agricultural planning water resourcesmanagement flood prevention groundwater recharge forestmanagement industry and the welfare of the human popula-tion and the national economy [1ndash3]The spatial and seasonalpatterns and total amounts of rainfall are key factors in thewater balance equation of Saudi Arabia [4]
Many scientists have studied associations between thespatial and temporal distributions of rainfall and topographicfactors such as altitude [5ndash11] geographic location [8 9]slope [5 7ndash10] aspect [5 7 10 11] proximity to moisturesources such as seas oceans or lakes [6 7] and exposure [5 78] These topographic features have been applied as factorsto explore the relationships between topography and thespatial distribution of mean annual seasonal and monthlyrainfall totals in different parts of the world using univariateand multiple regression models and geostatistical methods
These studies found that the spatial variability of meanannual and mean monthly rainfall are best captured by suchtopographic variables but results indicated that there werevarying degrees of success For example Sevruk et al [8]considered altitude as the best overall predictor of rainfalldistribution Basist and Bell [5] found that exposure andthe product of elevation and exposure variables were relatedto spatial variability of annual and mean rain falls whileelevation and slope were the weakest predictors Konrad [7]found that altitude was strongly correlated with light rainfallevents but exposure and proximity to water sources wereassociated with heavy rainfall events Al-Ahmadi et al [12]explored the spatial variations between topography andmeanannual and seasonal rainfalls in the south-west of SaudiArabia using Kruskal-Wallis One-Way Analysis of Variance(ANOVA) The topographic factors included physiographicfeatures (topography) altitude slope proximity to a ridge orcrest ofmountains and proximity to the Red SeaWhen thesefactors were processed the results showed that they werestatistically significant for estimating annual and seasonalrainfalls
2 Advances in Meteorology
Rainfall distribution often differs on the windward andleeward sides of mountain ranges In Saudi Arabia theamount of rainfall on the western or windward slopes of theAsirMountain Escarpment decreases in a northerly directiondue to the prevalence of winter monsoonal cloud formationThe eastern or leeward slopes of the Mountains have lowerrainfall than the western side due to the Asir Mountainsblocking the westerly and north westerly winds carryingmoisture from nearby water bodies [13] Hayward and Clarke[6] analyzed the association between rainfall altitude anddistance from the sea usingmultiple regression analysisTheirresults showed differences between ocean-facing and rain-shadow stations The associations between monthly rainfalland altitude were more pronounced for rain-shadow stationsthan for ocean-facing stations Also rainfall in themonsoonalmonths increased with altitude and decreased with proximityto the sea Hatzianastassiou et al [14] investigated the spatialand temporal distribution of precipitation in Greece andreported a difference between the wetter western (windward)and the drier eastern Greece (leeward) whereas there wasvery little precipitation over the Greek islands chiefly in thesouthern parts of Greece
This study focused solely on the altitude factor as it wasthe major factor and there was considerable complexity inapplying all of the known factors in a study of the huge geo-graphical area of Saudi ArabiaThere is a well-known physicalrelationship between altitude and rainfall [15 16] which hasbeen studied by many scientists working in different partsof the world [3 5 10 11 17ndash23] Several authors have foundhowever that using the mean altitude of the terrain withina circle centered on the location of the rain-gauge stationand with a radius of a few kilometers improves the fit of therelationmore than using the altitude of the station itself [7 2425] Pedgley [26] found that precipitation in the midlatitudesis associated most strongly with smooth topography nearthe rain-gauge Chaun and Lockwood [24] used the meanaltitude of the rain-gauge within an 8 km radius about themetrological station Hill et al [25] considered the averagealtitude of 4 km grid squares Konrad [7] adopted the meanelevation within a 10 times 10 km2 grid Johansson and Chen [27]resampled elevations taken from 50 times 50m2 into a windowof a 4 times 4 km2 grid Gouvas and Sakellariou [28] found thatthe variable taking into account the surrounding altitudeof the adjacent mountains improved the description of theincreased rainfall in mountainous areas when compared tousing the altitude of the station itself Alijani [11] calculatedthe mean altitude of the terrain within a circle with a radiusof 25 km about a recording station More recently Gouvas etal [3] suggested that the variable Z1015840 which takes into accountthe altitude within a radius of 25 km around the recordingstation improved the predictive performance of the modeland can be used in the interpolation procedure
Classical global modeling techniques such as ordinaryleast squares (OLS) linear regression or spatial regressionmethods assume a rendering process which is regarded asbeing stationary that is spatially invariant or homogeneousThis presupposes that the process runs similarly over theentire area of study and that there are no local variationsin the associations between the dependent and explanatory
variables [29] Thus a single set of global parameters isused to describe the process Applying such techniquesmay however obscure regional variations in the associationsbetween predictors and the outcome variable The OLSmethod addresses neither the issue of the nonstationaritynor the occurrence of spatial autocorrelation among residuals[30] yet it is progressively apparent that local variationsbetween the independent and dependent variables can playsignificant exploratory and explanatory roles in the analysisof spatial data [29] Geographically weighted regression(GWR) is a local spatial statistical technique used to analyzespatial nonstationarity where the relationships between thevariables can differ from location to location [31] Mapsgenerated from the application of such analyses can play a keyrole in exploring and interpreting spatial nonstationarity [32]
Rainfall exhibits nonstationary processes as it differs intype frequency and amount from one location to anotherThis feature of spatial phenomena might be stated as regionalvariation or spatial drift Thus the rainfall-altitude associa-tion can be considered as a nonstationary relationshipWhilethere does not appear to have been many scientific studiesreported in the literature on the use of GWR to assess rainfall-altitude relationships Brunsdon et al [33] used GWR toexplore the association between rainfall and altitude in GreatBritainThey studied the relationship between annual rainfalltotals and rain-gauge elevations over Great Britain and foundthat such analysis allowed the spatial drift of regressionparameters to be identified estimated and mapped Lloyd[34] used nonstationary models namely moving windowregression (MWR) and GWR to explore the spatial varia-tion concerning the relation between altitude and monthlyrainfall amounts in the United Kingdom and concluded thatglobal models masked widespread local variation and thatlocal models increased prediction accuracy Lloyd [34] alsoconcluded that the association between elevation and rainfallis complex as are spatial variations of rainfalls and methodssuch as GWR and MWR offer a great opportunity to exploreand understand these variations
The present study aims to explore and understand thespatial variation in the relationship betweenmean annual andmean seasonal rainfalls and the altitude of rain-gauge stationsin Saudi Arabia using globalOLS and local GWRmodels withmonthly rainfall data over the years from 1971 to 2005
2 Materials and Methods
21 Study Area Saudi Arabia lies between 15∘ and 30∘north of the equator and between 37∘ and 52∘ east of theGreenwich meridian (Figure 1) It is surrounded by the RedSea (2250 km) to the west and the Arabian Gulf (500 km) tothe east which are considered as the main sources of watervapour in Saudi Arabia The topography of the country canbe divided into regions of coastal plains theWesternHeightstheWestern plateau theNajd plateau the Eastern plateau theNorthern plateau and the Empty Quarter desert (Figure 2)The coastal plains include the Tihama coast to the west ofthe western mountains which is about 1800 km long andthe eastern coastal plain on the Arabian Gulf which is some
Advances in Meteorology 3
500 km long The Western Heights has one of the notabletopographic features of Saudi Arabia which is called theHijaz-Asir Scarp It extends parallel to the western coastalplains for some 1700 km and the elevation rises to 2990mIts width ranges from 120 km to 200 km narrower at thenorth and wider in the center and south The slope of themountains is relatively steep towards the sea in the west butless steep towards the east The Najd plateau at the center ofSaudiArabia rises to between 800 and 1100mand includes theTuwayq Mountains which form a range spanning 800 kmThe elevation of the Eastern plateau ranges between 170mand 400m [35]
22 Rainfall and Altitude Data This study used data from180 rainfall stations with 35 years of monthly records from1971 to 2005 The data were supplied by the HydrologyDepartment of the Ministry of Water and Electricity Themonthly rainfall data were categorized into four seasonsnamely winter (DecemberndashFebruary) spring (MarchndashMay)summer (JunendashAugust) and fall (SeptemberndashNovember)From the monthly rainfall data the authors calculated themeans of the annual and seasonal rainfalls The altitude datawas derived from an ASTER DEM with 30 meters spatialresolution [36]
23 Geographically Weighted Regression (GWR) Ordinaryleast squares (OLS) or linear least squares is a global methodfor estimating the association between a dependent variableand a set of one or more independent variables and can bewritten as [37]
119910119894= 120573119874+sum
119896
120573119896119909119894119896+ 120576119894 (1)
GWR extends the conventional OLS regression structureby permitting local rather than global parameters to beidentified and estimated so that the model is rewritten as [31]
119910119894= 120573119874(119906119894 V119894) +sum
119896
120573119896(119906119894 V119894) 119909119894119896+ 120576119894 (2)
where the dependent variable 119910 is regressed on a set of inde-pendent variables each denoted by 119909
119896and the parameters
are allowed to vary over space Herein (119906119894 V119894) denotes the
longitude and latitude coordinates of the 119894th point in spaceand 120573
119896(119906119894 V119894) is a realization of the continuous surface of
parameter values and measurements of this surface taken ata set of points to denote the spatial variability of the surface[31 38]
GWR is a local spatial statistical method used to examineand determine the spatial nonstationarity when the relation-ships among variables vary from location to location [31]The spatial influences among neighborhoods can be assessedby applying GWR however this cannot be assessed using aconventional OLS approach which only produces a singleregression equation to summarize global associations amongthe dependent and explanatory variables [31 39] The GWRproduces spatial data that explain the spatial variation in theassociations among variables The hypothesis is that features
(observations) adjacent to one another have a greater effecton one anotherrsquos parameter estimates than features fartherapart [32] In order to specify the geographical weightingstructure in theGWRmodel this requires the specification ofa kernel shape and a bandwidth Overall if the observationsare regularly distributed in the study area then a kernel with afixed bandwidth is an appropriate choice If the observationsare clustered and not regularly spaced then kernel with anadaptive bandwidth can be selected The bandwidth can bespecified using three methods user-supplied minimizingthe cross-validation function or minimizing the AkaikeInformation Criterion (AIC) The goodness of fit that hasbeen used broadly inGWR is the correctedAIC [37]TheAICcriterion in GWR is computed as [40]
AIC119888= 2119899log
119890() + 119899log
119890(2120587) + 119899
119899 + tr (119878)119899 minus 2 minus tr (119878)
(3)
where 119899 is the number of observations in the dataset is theestimate of the standard deviation of the residuals and tr(119878)is the trace of the hat matrixTheAIC can be used to comparemodels of the same independent variable and can also be usedto compare the global OLS model with a local GWR model[37] The coefficient of determination (1199032) and the AIC areused in this study to compare the goodness of fit for the OLSand GWRmodels
GWR models will be used to build a local regressionequation for each rainfall station in the study area in orderto examine the relationship between rainfall and altitudeWheeler [41] noted however that when the coefficientestimates for the altitude variable correlate locally and acrossspace there may be problems with local collinearity whichcan be assessed for predictor variables by computing thecondition number [42]The condition number is a diagnosticof how sensitive a linear equation solution is to small changesin matrix coefficients Results associated with conditionnumbers larger than 30 may be unreliable and be a signof collinearity problems [43] Another issue in the GWRmodel is that over- and underpredictions for a well specifiedregressionmodel should be randomly distributed Clusteringof over- andor underpredictions is evidence that at least onekey explanatory variable is missing The spatial autocorrela-tion (Moranrsquos I) method can be used to examine whether ornot the GWR model residuals exhibit statistically significantspatial clustering The Global Moranrsquos I statistic provides ameasure of the degree of spatial autocorrelation based onboth the locations of events and the values associated withthe events at the same time It indicates the degree of spatialconcentration or dispersion for a given point pattern [44]The index 119868 is calculated as follows
119868 =
119899
119878119874
sum119899
119894=1sum119899
119895=1120596119894119895119885119894119885119895
sum119899
119894=11198852
119894
(4)
where 119885119894is the deviation of an attribute for feature 119868 from
its mean (119909119894minus 119883) 120596
119894119895is the spatial weight between feature
119894 and 119895 119899 is equal to the total number of features finally119878119874
is the aggregate of all the spatial weights Statisticallysignificant clustering of high andor low residuals (model
4 Advances in Meteorology
Iran
Sudan
Saudi Arabia
Iraq
Egypt
Ethiopia
Yemen
Oman
Somalia
Syria
Eritrea
UAE
JordanPalestine
Djibouti
Kuwait
Qatar
CyprusLebanon
Bahrain
Study areaCountries boundaries
Arabian Sea
Arabian Gulf
Red Sea
Mediterranean Sea
Gulf of Oman
0 350 700175
Kilometers
W
N
E
S
30∘09984000998400998400E 45
∘09984000998400998400E 60
∘09984000998400998400E
15∘09984000998400998400N
30∘09984000998400998400N
Figure 1 Study area
35∘09984000998400998400E 40
∘09984000998400998400E 45
∘09984000998400998400E 50
∘09984000998400998400E 55
∘09984000998400998400E
20∘09984000998400998400N
25∘09984000998400998400N
30∘09984000998400998400N
High 2990mLow 0
Northern Plateaus
Eastern Plateaus
Eastern Plateaus
Najd Plateaus
Eastern Coastal Plain
TuwayqMountains
Tihama Coast
Empty Quarter Desert
Hijaz and Asir Scarp
0 150 300 600
Kilometers
W
N
E
S
Figure 2 Digital elevation model of Saudi Arabia
Advances in Meteorology 5
under- and overpredictions) indicates that the GWR modelis misclassified [45]
24 Climate and Rainfall in Saudi Arabia According toKoppen-Geiger climatic types Saudi Arabia is classified ashot dry desert climate coded as BWh where ldquoBrdquo indicatesthat the land area is arid ldquoWrdquo indicates desert precipitationfalling mainly in the winter season and ldquohrdquo indicates a hotdry climate [46] with the exception of the southwesternhighlands Most of Saudi Arabia falls under the dominantinfluence of the subtropical high-pressure system causing sig-nificant variation in temperature and humidityThe climate isaffected by the various airmassmovements local topographyand proximity to moisture sources The topography hasa distinct influence on temperature and rainfall The AsirMountains in the southwestern region exhibit moderatetemperatures and high average annual rainfall while averageannual rainfall is very low for the rest of the country andirregular The temperature is high and humidity is low withthe exception of small strips of coastal areas [47 48]
The climate of Saudi Arabia can be explained by con-sidering the different air mass movements which influencethe rainfall distribution [49] There are three major fronts ofmoisture flowing into the Kingdom including
(i) maritime tropical air masses (monsoon type) whichoriginate from the Indian Ocean and the ArabianSea bringing warm and moist air which produceslarge amounts of rainfall in the south southwestand southeast This front prevails during late fall andsummer
(ii) continental tropical air masses from the AtlanticOcean through the middle and north of the Africancontinent which bring warm and moist air to thewestern coast and prevail in the winter season pro-ducing moderate to low amounts of rainfall
(iii) maritime polar air masses which originate from theeastern Mediterranean Sea and affect the north andnorthwest area of Saudi Arabia They prevail in thewinter season and produce high tomoderate amountsof rainfall [48ndash51]
Average annual rainfall in Saudi Arabia is generallylow and falls chiefly during winter and spring except inthe southwestern region where the average annual rainfallis relatively high and occurs throughout the year due tothe monsoonal conditions during summer and the northwesterly Mediterranean air masses during winter [35] InSaudi Arabia rainfall during spring contributes the largestamount of total annual rainfall (3711) followed by winter(2314) and fall (2221) while the lowest contribution isduring summer (1727)Themaximummean annual rainfalloccurs during fall (212mm) and summer (208mm) followedby spring (180mm) and winter (113mm)
Figure 4 shows the mean annual and seasonal rainfalldistribution in Saudi Arabia between 1971 and 2005 Duringthewinter period rainfall is influenced chiefly by the cyclonicsystem and the highest rainfalls (43ndash113mm) occur in thesouthwest and northeast The former can be attributed to
the maritime polar air mass from the Mediterranean Sea andAtlantic Ocean which is combined with local effects of theRed Sea and the Hijaz-Asir Escarpment where orographicrainfall occurs while the latter can be attributed to frontsfrom the Mediterranean which bring moist and cool airmasses to produce convective rainfalls [52]Moderate rainfall(26ndash42mm) occurs in the central part and low rainfall inthe north and the central south (0ndash25mm) During springthe highest rainfall (71ndash180mm) occurs in the southwest dueto the effect of the monsoonal moist air penetration fromthe Indian Ocean This region is also affected largely by theescarpment of the Asir MountainsThere is moderate rainfall(39ndash70mm) in the central part while the west north andeast regions receive the lowest rainfall (0ndash38mm) due tothe dry northern air masses During summer the highestrainfall (45ndash208mm) occurs in the southwest which is aresult of the convectional instabilities in the airThemoisturecontinues to be supplied from the southwesterly flow ofmonsoonal air which produces thunder-storms in the southand along the Red Sea escarpment [4] During fall high andmoderate rainfall (45ndash208mm and 33ndash56mm) occurs in thesouthwest region and in the south part of the west regionwhile low rainfall (14ndash32mm) occurs in the west and in partsof the central and eastern regions The lowest rainfall (0ndash13mm) is in the north central-south and on the east (leeward) side of the Asir Mountains During this season thesouthwesterly air flow diminishes and the westerly air fromthe Mediterranean brings air moisture which gives way totropical winter conditions The southern area comes underthe influence of a combination of the Red Sea trough and theMediterranean depression causing rainfall [53]
3 Results and Discussion
This study set out to explore and understand the spatialvariation in the relations between altitude and annual andseasonal rainfalls in Saudi Arabia using global OLS andlocal GWRmodels The analyses were performed using ESRIArcGIS software (v101) In the GWR model the adaptivekernel with AIC estimated bandwidth was selected that isthe bandwidth was found by minimizing the AIC value Theadaptive kernel rather than the fixed kernel was selectedbecause the rainfall stations are not regularly positioned inthe study area that is they are inhomogeneous and clusteredin some areas
As mentioned earlier several scientific studies reportedin the literature have shown that smoothed altitude valuesof rainfall stations (ie mean altitude around the station)can produce much better results than the absolute altitude atthe rainfall station site itself Firstly OLS and GWR analyseswere performed using different smoothing window sizesfor annual and seasonal rainfalls to assess the performancethrough the coefficient of determination (1199032) In order toassess the influence of the smoothing window size on therelationship between altitude and rainfall and to decide onthe most appropriate window size six spatial smoothingwindow sizes were tested against the annual and seasonalrainfalls The mean altitude of rainfall stations was computed
6 Advances in Meteorology
0 150 300 600
Kilometers
W
N
E
S
0ndash279m280ndash598599ndash875
876ndash15011502ndash2457
Saudi Arabia
35∘09984000998400998400E 40
∘09984000998400998400E 45
∘09984000998400998400E 50
∘09984000998400998400E 55
∘09984000998400998400E
20∘09984000998400998400N
25∘09984000998400998400N
30∘09984000998400998400N
Figure 3 Rainfall stations with corresponding altitude
within six square windows ranging in dimension from 1 times1 to 5 times 5 10 times 10 15 times 15 20 times 20 and 25 times 25 km2as well as the source ASTER DEM data at 30 times 30m2resolution
Figure 5 shows the global coefficient of determination(1199032) derived with OLS models against different smoothing
window sizes of mean altitude values Generally the globalOLS model explained about 50 of the variation for springrainfall while for annual winter summer and fall themodelrsquos explanations of the rainfall variations are less than10 This might be attributed to the fact that the largestproportion of annual rainfall (3711) occurred during springand the highest rainfall totals (71ndash180mm) during this seasonoccurred in the south-west region of the area of studywhere rainfall is affected largely by the escarpment of theAsir Mountains and the effect of the monsoonal moist airpenetration from the Indian Ocean Orographic rainfalloccurs regularly in the Asir Mountains while convectiverainfall usually occurs in the foothills of these highlandsAlthough both orographic and convective rainfalls occurafter the influence by altitude the former are affected to amuch greater degree than the latter
In terms of window sizes the spring rainfall is highlyrelated to altitude using 1 km windows (1199032 = 055 119875 lt 005)followed by 30m 5 km and 10 km (1199032 = 054 119875 lt 005)while 20 km and 25 km windows showed the lowest relation(1199032 = 034 and 36 119875 lt 005) The average 1199032 for annual andseasonal OLS models for each window size are 014 for 30m1 km 5 km and 10 km 013 for 15 km 011 for 20 km and 009for 25 km
Figure 6 shows the local coefficient of determination(1199032) derived with GWR models against different smoothingwindow sizes of mean altitude values Note that the annualand seasonal rainfalls were spatially associated with altitudeby using the seven smoothing windows with 1199032 rangingbetween 059 and 085 The average 1199032 = 074 using 30mand 1 km 1199032 = 075 using 5 km and 10 km 1199032 = 076 using15 km and 20 km and 1199032 = 073 using 25 km window size Asthe average of the coefficient of determination (1199032) was low(009ndash014) using OLS and high (059ndash085) using GWR themean altitude window size was selected based on the GWRresults The selected window size in this study will be 15 kmas it produced the highest value of 1199032 value using the GWRmodel
Comparisons of the coefficients of determination (1199032)and AIC for both global OLS and local GWR models usingthe selected window size 15 km are shown in Table 1 andFigure 7 The OLS models explained 11 4 54 1 andminus001 of the spatial variation of the annual winter springsummer and fall rainfalls respectively The only acceptablefit was during spring (54) The GWR models explained78 64 83 82 and 71 of the spatial variation for theannual winter spring summer and fall rainfalls respectivelyAs suggested by Burnham and Anderson [54] the differenceof AICs between two models is considered significant if it isgreater than 6 The difference in the AICs between the OLSand GWR models ranged between 82 and 212 and showedstrong evidence of an improvement in the fit of the modelto the data for the GWR The result implies that the GWR
Advances in Meteorology 7
Spring
0ndash60mm61ndash121122ndash213
214ndash316
Annual
0ndash12mm13ndash2526ndash42
43ndash6667ndash113
Winter
45ndash7879ndash208
Summer
N
0 500 1000
(km)
Fall
0ndash13mm14ndash3233ndash56
57ndash100101ndash212
17ndash3839ndash70
71ndash111112ndash180
0ndash7mm8ndash2223ndash44
0ndash16 mm317ndash592
Figure 4 Mean annual and seasonal rainfall distribution in Saudi Arabia (1971ndash2005)
models explained muchmore of the variations in the relationbetween altitude and rainfall than did the OLS models TheOLSmodels failed to account for most of the spatial variationof rainfall during all seasons except spring as the 1199032 andAICsvalues show so the GWRmodel was used to fit themodel andthe results are presented and discussed below
The resultswere comparable to those foundby [33 34 55]For example Lloyd [55] found that using monthly precip-itation of Great Britain in 1999 the relationship betweenelevation and precipitation using the OLS seemed to beweakly related (1199032 = 0110) while the relationship improvedusing GWR (1199032 = 0599) In a different field of researchMandal et al [56] found that the relationship between breastcancer in females and prostate cancer in males at the countylevel in the United States was more pronounced when theyperformed GWR analysis (1199032 = 0552) compared to OLS(1199032 = 0332) Lin and Wen [57] examined the relationshipbetween dengue-mosquito and dengue-human relationships
Table 1 Coefficient of determination (1199032) and AICs derived by OLSand GWRmodels
Seasons OLS(1199032)
GWR(1199032) Δ (1199032) AIC for
OLSAIC forGWR ΔAIC
Annual 011lowast 078 minus067 2165 2007 158lowastlowast
Winter 004lowast 064 minus060 1581 1499 82lowastlowast
Spring 054lowast 083 minus029 1687 1589 98lowastlowast
Summer 001lowast 082 minus081 1803 1591 212lowastlowast
Fall minus0001 071 minus070 1784 1658 126lowastlowastlowastSignificance level at level 119875 lt 005lowastlowastSignificant Difference where ΔAIC greater than 6
and found that GWR (adjusted 1199032 = 059) detected thegeographical heterogeneity much better than OLS (adjusted1199032= 004) Potential reasons as to whyGWRperformedmuch
better than global OLS in this study could be attributed to
8 Advances in Meteorology
Table 2 Coefficient of determination (1199032) derived by GWR percentage of over- and under estimated rainfall stations and percentage ofrainfall stations with positive parameter estimate
Seasons GWR (1199032) No of overestimatedstationstotal ()
No of underestimatedstationstotal ()
No of stations with positiveparameter estimatetotal ()
Annual 078lowastlowastlowast 2180 (111) 4180 (222) 153180 (85)Winter 064lowastlowastlowast 3180 (166) 3180 (166) 114180 (63)Spring 083lowastlowastlowast 2180 (111) 4180 (222) 166180 (92)Summer 082lowastlowastlowast 3180 (166) 4180 (222) 139180 (77)Fall 071lowastlowastlowast 4180 (222) 3180 (166) 125180 (69)lowastRandom standardized residuals (minus196 lt 119911-score lt 196) lowastlowastCondition number lt 30
WinterSpring
FallMean
0
02
04
06
08
1
Annual Summer
30m 1km 5km 10km 15km 20km 25km
1198772
Figure 5 Coefficient of determination (1199032) derived by OLS modelagainst different smoothing window size of mean altitude values
WinterSpring
FallMean
Annual Summer
0
02
04
06
08
1
30m 1km 5km 10km 15km 20km 25km
1198772
Figure 6 Coefficient of determination (1199032) derived by GWRmodelagainst different smoothing window size of mean altitude values
the former model distinguishing spatial variation in the rela-tionships between altitude and rainfall while the latter globalmodel masked such variations Also as the observed spatialand temporal distributions of rainfall are nonstationary thatis they vary from one location to another the global OLSmodel would probably not have detected a large proportionof the local variations This might explain the poor result ofthe global OLS model
011004
054
001 0001014
078
064
083 082071 0756
0
02
04
06
08
1
Annual Winter Spring Summer Fall Mean
OLSGWR
1198772
Figure 7 Coefficient of determination (1199032) derived by OLS andGWRmodels
Generally as shown inTable 2 theGWRmodel replicatedand fitted the data reasonably well as the altitude explained78 of the spatial variation of the annual rainfall (1199032 =078) in Saudi Arabia As for seasonal rainfall the mostpredictable seasonal rainfall was in spring (1199032 = 083)and in summer (1199032 = 082) which implied a very strongspatial correlation between altitude and rainfall during thesetwo seasons Fall (1199032 = 071) and winter (1199032 = 064)results accounted for the least but still indicated strongcorrelations GWR models built a local regression equationfor each rainfall station in the study area However whenthe values for the altitude variable cluster spatially there arelikely to be problems with local collinearity Results becomeunstable and the model becomes unreliable in the presenceof local collinearity which is tested using condition number(CN) and Moranrsquos I As can be seen from Table 2 all CNnumbers are less than 30 indicating that no local collinearityis violated Another appropriate test statistic is Moranrsquos Iwhich is used to measure the level of spatial autocorrelationin the residuals Given that the z-score was less than minus165 orgreater than 165 for annual and seasonal rainfalls indicatingthat the pattern of the standardized residual did not appearto be statistically different than random there is no spatialdependency The residuals were approximately normal andfewer than 25 (5180) of the rainfall stations which hadstandardized residuals greater than 3 standard deviationsabove or below the mean (Table 2) However the rainfall sta-tions with these extreme residuals were scattered throughoutSaudi Arabia and were not clustered in a particular area
Advances in Meteorology 9
0ndash007008ndash01902ndash034
035ndash051052ndash076
0ndash005006ndash013014ndash023
024ndash03904ndash063
0ndash013014ndash032033ndash056
057ndash076077ndash093
0ndash006007ndash01902ndash036
037ndash06061ndash083
0ndash008009ndash02021ndash035
036ndash055056ndash087
N
0 500 1000
SpringAnnual Winter
Summer Fall
(km)
Figure 8 Locally weighted coefficients of determination (1199032) of GWR models for annual and seasonal rainfalls
The authors deduced from this that the GWR models fittedthe data reasonably with no local collinearity and spatialdependency
The locally weighted coefficients of determination (1199032)that quantify the model performance between the observedand fitted rainfall values were mapped in Figure 8 forannual and seasonal rainfalls The values of 1199032 were nothomogenously distributed in Saudi ArabiaThe overall GWRregression fitted best in the southwest and central west of theKingdom for annual and spring rainfall in the southwest dur-ing winter in the central west during summer and in smallparts of the southwest region during fallThe authors deducedfrom this that the model performed well and took account ofthe spatial variations in rainfall in the complex physiographicterrain of the Arabian Shield (western half of Saudi Arabia)which included the Hijaz and Asir escarpments the westernand eastern slopes of the escarpments foothills and theTihama (coastal plain) Although the amounts of averageannual rainfall varied spatially in this complex topographythe model took account of this variation reasonably well
The GWRmodel also fitted the east and northeast duringwinter and summer As for winter the result produced amoderate fitting of an inverse relationship (high rainfall in
low altitude) as rainfall in this season is mainly due tothe effect of the Mediterranean Sea depressions In summerthe results produced a moderate fitting of a weak positiverelationship (low rainfall in low altitude) as average annualrainfall during this season is low The model did not produceresults that correspond well in the central northern andnortheastern regions for annual and all seasonsrsquo rainfall inthe eastern region for annual spring and fall rainfall and inthe southwest during summer and fall The authors deducedfrom this that much of the variance remained unexplained inthose areas and other variables would have to be included inthemodel specification such as proximity tomoisture sourceair mass movements temperature and pressure
The spatial variation of the GWR parameter estimationfor altitude is shown in Figure 9 Where the altitude param-eter estimation values are large the authors deduced thata small increase in altitude corresponds to a large increasein rainfall amount During annual and seasonal rainfallsthe relationship between rainfall and altitude showed thatincreased rainfalls would be strongly related to increasedaltitude in the southern and southwestern area of the Red SeaThe reason for this can be attributed to the local topographyand air mass movement According to Figures 2 and 3 it can
10 Advances in Meteorology
N
minus0159ndashminus00010001ndash00250026ndash0063
0064ndash01140115ndash01910192ndash0482
minus0043ndashminus00040ndash00060007ndash0016
0017ndash0029003ndash00440045ndash0065
minus003ndashminus00040001ndash00170018ndash0034
0035ndash00510052ndash0079008ndash0137
minus0066ndash00ndash00030004ndash0012
0013ndash0039004ndash01070108ndash0158
minus009ndash00ndash00050006ndash001
0011ndash00160017ndash00430044-0142
0 500 1000
SpringAnnual Winter
Summer Fall
(km)
Figure 9 GWR parameter estimation of the altitude for annual and seasonal rainfalls
be noted that the escarpment ridge of the Asir Mountains isdivided in the southwestern region into two distinct zonesnamely the western and the eastern slopes The latter arecharacterized by gentle slopes but the former by very steepslopes
The authors felt that this implies that the altitude onthe western slopes decreased rapidly forming the westernfoothills while on the eastern slopes altitude decreasedmoregradually forming the plateau The western slopes receivedmore rainfall than did the eastern slopes as the former werelocated on the windward side while the latter were on theleeward side As the western slopes are in close proximity tothe water bodies of the Red Sea and the coastal area is locatedin close proximity to the foothills of the western slopestopographic and climatic influences promote the upliftingmechanisms of the moist air to the Asir highlands
The central western coast and the area along the TuwayqMountains showed a moderate positive relationship betweenaltitude and rainfall during annual as well as seasonal
rainfalls The relationship between rainfall and altitude isquite limited in the northern half of Saudi Arabia Higheraltitude areas do not necessarily receive more rainfall butsome locations with high altitude receive low rainfall (inverserelationship) such as the eastern slopes in the southwestregion particularly during summer and fall This can beattributed to the monsoon front during late fall and summerthat originates from the Indian Ocean and Arabian Sea car-rying warm and moist air Additionally inverse relationshipbetween altitude and rainfall can be apparent in the centraleast and northeast areas of Saudi Arabia during winter Inthe eastern area at low altitudes (eastern coast) high rainfalloccurs in winter while in the central and the northeast areasat moderate altitude there is low rainfall
The spatial variation of the GWRparameter estimation ofthe intercept is shown in Figure 10 The map of the interceptrepresents the distribution of rainfall when altitude equalszero that is where the intercept values are large whichreveals that rainfall amounts are high irrespective of the
Advances in Meteorology 11
minus442ndashminus249minus248ndash4647ndash109
236ndash517minus81ndashminus34minus33ndash1516ndash29
30ndash4647ndash75
minus192ndashminus101minus100ndash910ndash30
31ndash5051ndash94
13ndash43
44ndash8687ndash179
minus29ndash34ndash2223ndash58
59ndash118119ndash217
N
0 500 1000
minus123ndashminus58minus57ndash12
SpringAnnual Winter
Summer Fall
(km)
110ndash235
Figure 10 GWR parameter estimation of the intercept for annual and seasonal rainfalls
Table 3 Observed versus estimated mean amount of annual and seasonal rainfalls (1971ndash2005) using GWR
Season Observed Estimated Observed minus EstimatedMin Max Stand Dev Min Max Stand Dev ΔMin ΔMax ΔStand Dev
Annual 5 592 104 20 464 84 15 128 20Winter 2 113 20 6 81 13 4 32 7Spring 1 180 38 2 158 33 1 22 5Summer 0 208 36 1 159 31 1 49 5Fall 0 211 34 1 102 26 1 109 8
altitude In general it can be seen that intercept values tend tobe positive and large in parts of the southwestern region forannual and seasonal rainfall Additionally positive and largeintercept values occurred in the central east and northeastregions during winter and in the central areas during springwhile during summer and fall large values occurred onlyin the southwest region The interpretation of the altitudeparameter estimation supports the assumption that the areasat lower elevations might receive high rainfall while those athigher elevations might receive low rainfall due to the localtopography as a result of proximity to sources of moist airand seasonal air mass movements
Table 3 shows the descriptive statistics of the observedversus the estimated mean amounts of rainfall in addition tothe spatial and temporal variation of the estimated amountof rainfall in Figure 11 Note that the overall spatiotemporalvariation and the pattern of rainfall distribution are esti-mated reasonably well compared to the observed patternHowever there is variation in the maximum and minimumamounts of rainfall The minimum mean amounts of rainfallare overestimated (small range) while the maximum meanamounts were underestimated (large range) for both annualand seasonal rainfalls The differences between the observedand the estimated minimum amounts of mean rainfall
12 Advances in Meteorology
Winter SpringAnnual
Summer Fall
20ndash58 mm59ndash114115ndash191
192ndash278279ndash464
6ndash17 mm18ndash27 28ndash38
39ndash5354ndash81
2ndash18 mm19ndash35 36ndash62
63ndash97 98ndash158
1ndash7 mm8ndash22 23ndash47
48ndash82 83ndash159
1ndash10 mm11ndash22 23ndash40
41ndash7273ndash120
N
0 500 1000
(km)
Figure 11 Estimation of mean annual and seasonal rainfalls in Saudi Arabia (1971ndash2005) using GWR
(ΔMin) are small ranging between 1 and 4mm for seasonalrainfalls and 15mm for annual rainfallThe largest differencesbetween the maximum observed and predicted mean rainfall(ΔMax) are for annual (128mm) and fall (102mm) followedby summer (49mm) Winter and spring show the lowestdifferences with 32mm and 22mm respectively As for thelarge underestimation of the maximum values (ΔMax) thisis not surprising since the peak value of the observedmaximum mean rainfalls is extreme and represents one ortwo rainfall stations among the 180 stations during summerand fall and the difference would be lower without theextreme stations The lowest maximum difference (ΔMax)during spring suggests that spring rainfalls are predictedwell for both the spatiotemporal pattern and average annualrainfall
4 Conclusions
In this research the relationships between rainfall and alti-tude of the terrain in Saudi Arabia were analyzed usingthe global ordinary least square (OLS) and the local geo-graphically weighted regression (GWR) methods using a
geographical information system The monthly rainfall databetween 1971 and 2005 for 180 rainfall stations were modeledusing these methods and the results were compared andcritically evaluated The smoothed altitude values for rainfallstations were reported as producing results that gave a betteraccount of the results than did using the absolute altitude atthe rainfall station sites In this study different smoothingwindow sizes were used and assessed and the 15 km windowsize was selected because it produced the highest value of thecoefficient of determination and showed improvements in theresulting regression equations
One the one hand the OLS results could account forabout 54 of the variation for spring rainfall while theresults were unsatisfactory for the annual and other seasonaldata only accounting for less than 11 of the variationOn the other hand the GWR could account much betterfor the spatial variation of the annual and seasonal rainfallwith results of 64 to 83 Analyses showed that thepositive association between rainfall and altitude was mostpronounced in the south-west part along the escarpmentridge of the Asir Mountains in the west part along the HijazEscarpment and through a moderate relationship along theTuwayq Mountains The model was not such a good fit in
Advances in Meteorology 13
the central northern and north-eastern areas because muchof the variance remained unexplained in those areas andother variables would have to be introduced into the modelto obtain improved results The results showed that higheraltitudes do not always receive more rainfall some locationswith low altitude receivemore rainfall such as the eastern andnorth-eastern parts during winter where the rainfall is chieflydue to the effect of the passage of depressions emanating fromthe Mediterranean Sea
The physical characterizations of the altitude variableused in the GWRmodels produced regression equations thatreturned satisfactory values of the coefficient of determina-tionwith random standardized residualsThe local regressionequations could be fitted to other periods in Saudi Arabia toestimate the mean annual and seasonal rainfalls Moreoverthe altitude variables used in this study can be derivedautomatically from digital elevation model data which is freeand available online As the GWR derived a local regressionequation for each rainfall station one can use the altitudeas a covariate variable in spatial interpolation for producingrainfall maps particularly for those stations and areas withhigh coefficients of determination The authors concludedthat using a nonstationary local model such as GWR gavea much better account than using a global model such asOLS in terms of spatial estimation and prediction It was alsoconcluded that the results could have significant implicationsfor rainfall-runoff studies in the country Further research onthis topic in Saudi Arabia should therefore focus on includingmore independent variables such as proximity to moisturesource airmassmovements andwind direction temperatureand pressure
Conflict of Interests
The authors declare that they have no conflicts relevant ormaterial financial interests that relate to the research des-cribed or trademarks mentioned in this paper
References
[1] M A Abdullah andM A Al-Mazroui ldquoClimatological study ofthe southwestern region of Saudi ArabiamdashI Rainfall analysisrdquoClimate Research vol 9 no 3 pp 213ndash223 1998
[2] A M Subyani ldquoTopographic and seasonal influences on pre-cipitation variability in southwest Saudi Arabiardquo Journal of KingAbdulaziz University vol 11 pp 89ndash102 1999
[3] M Gouvas N Sakellariou and F Xystrakis ldquoThe relation-ship between altitude of meteorological stations and averagemonthly and annual precipitationrdquo Studia Geophysica et Geo-daetica vol 53 no 4 pp 557ndash570 2009
[4] M S Alyamani and Z Sen ldquoRegional variations of monthlyrainfall amounts in the Kingdom of Saudi Arabiardquo Journal ofKing Abdulaziz University vol 6 pp 113ndash133 1993
[5] A Basist and G D Bell ldquoStatistical relationships betweentopography and precipitation patternsrdquo Journal of Climate vol7 pp 1305ndash1315 1994
[6] D Hayward and R T Clarke ldquoRelationship between rainfallaltitude and distance from the sea in the Freetown Peninsula
Sierra Leonerdquo Hydrological Sciences Journal vol 41 no 3 pp377ndash384 1996
[7] C E Konrad ldquoRelationships between precipitation event typesand topography in the southern blue ridge mountains of thesoutheastern USArdquo International Journal of Climatology vol 16no 1 pp 49ndash62 1996
[8] B Sevruk K Matokova-Sadlonova and L Toskano ldquoTopogra-phy effects on small-scale precipitation variability in the Swisspre-Alpsrdquo IAHS-AISH Publication vol 248 pp 51ndash58 1998
[9] POettli andP Camberlin ldquoInfluence of topography onmonthlyrainfall distribution over East Africardquo Climate Research vol 28no 3 pp 199ndash212 2005
[10] W Buytaert R Celleri PWillems BD Bievre andGWyseureldquoSpatial and temporal rainfall variability in mountainous areasa case study from the south Ecuadorian Andesrdquo Journal ofHydrology vol 329 no 3-4 pp 413ndash421 2006
[11] B Alijani ldquoEffect of the Zagros Mountains on the spatialdistribution of precipitationrdquo Journal of Mountain Science vol5 no 3 pp 218ndash231 2008
[12] K Al-Ahmadi S Al-Ahmadi and L See ldquoSpatio-temporalvariations in rainfall-topographic features relationships in theSouthwest Region of Saudi Arabiardquo Arabian Journal of Geo-sciences In press
[13] M J Abdulrazzak A U Sorman H Onder and A M Al-SarildquoFlood estimation and impact southwestern region of SaudiArabiardquo Final report AR-10-51 KACST Riyadh Saudi Arabia1995
[14] N Hatzianastassiou B Katsoulis J Pnevmatikos and VAntakis ldquoSpatial and temporal variation of precipitation inGreece and surrounding regions based on Global PrecipitationClimatology Project datardquo Journal of Climate vol 21 no 6 pp1349ndash1370 2008
[15] V P Schermerhorn ldquoRelations between topography and annualprecipitation in western Oregon and Washingtonrdquo WaterResources Research vol 3 pp 707ndash711 1967
[16] B Raab and H Vedin Eds SwedenrsquoS National Atlas ClimateLakes and Waters Bokforlaget Bra Bocker 1995
[17] G L Johnson andC L Hanson ldquoTopographic and atmosphericinfluences on precipitation variability over a mountainouswatershedrdquo Journal of AppliedMeteorology vol 34 no 1 pp 68ndash87 1995
[18] C Prudhomme and D W Reed ldquoRelationships betweenextreme daily precipitation and topography in a mountainousregionrdquo International Journal of Climatology vol 18 pp 1439ndash1453 1998
[19] C Prudhomme and D W Reed ldquoMapping extreme rainfall ina mountainous region using geostatistical techniquesrdquo Interna-tional Journal of Climatology vol 19 pp 1337ndash1356 1999
[20] P C Kyriakidis J Kim and N L Miller ldquoGeostatistical map-ping of precipitation from rain gauge data using atmosphericand terrain characteristicsrdquo Journal of Applied Meteorology vol40 no 11 pp 1855ndash1877 2001
[21] G Drogue J Humbert J Deraisme N Mahr and N Fres-lon ldquoA statistical-topographic model using an omnidirectionalparameterization of the relief for mapping orographic rainfallrdquoInternational Journal of Climatology vol 22 no 5 pp 599ndash6132002
[22] S Naoum and I K Tsanis ldquoA multiple linear regression GISmodule using spatial variables to model orographic rainfallrdquoJournal of Hydroinformatics vol 6 pp 39ndash56 2004
14 Advances in Meteorology
[23] S Naoum and I K Tsanis ldquoOrographic precipitation modelingwith multiple linear regressionrdquo Journal of Hydrologic Engineer-ing vol 9 no 2 pp 79ndash102 2004
[24] G K Chaun and J G Lockwood ldquoAn assessment of topo-graphical controls on the distribution of rainfall in the centralPenninesrdquoMeteorological Magazine vol 103 pp 275ndash287 1974
[25] F F Hill K A Browning andM J Bader ldquoRadar and raingaugeobservations of orographic rain over south Walesrdquo QuarterlyJournal Royal Meteorological Society vol 107 no 453 pp 643ndash670 1981
[26] D E Pedgley ldquoHeavy rainfalls over Snowdoniardquo Weather vol25 pp 340ndash350 1970
[27] B Johansson and D Chen ldquoThe influence of wind and topogra-phy on precipitation distribution in Sweden statistical analysisandmodellingrdquo International Journal of Climatology vol 23 no12 pp 1523ndash1535 2003
[28] M Gouvas and N Sakellariou ldquoRelation of the altitude ofthe meteorological stations to the average annual and monthlyrainfall amountrdquo in Proceedings of 7th Pan-Hellenic Interna-tional Conference of Meteorology Climatology and AtmosphericPhysics pp 765ndash771 Nicosia Cyprus 2004
[29] A Paez ldquoAnisotropic variance functions in geographicallyweighted regression modelsrdquoGeographical Analysis vol 36 no4 pp 299ndash314 2004
[30] A Getis and J K Ord ldquoThe analysis of spatial association byuse of distance statisticsrdquoGeographical Analysis vol 24 pp 189ndash206 1992
[31] A S Fotheringham C Brunsdon and M Charlton Geograph-ically Weighted Regression the Analysis of Spatially VaryingRelationships Wiley Chichester UK 2002
[32] J Mennis ldquoMapping the results of geographically weightedregressionrdquo Cartographic Journal vol 43 no 2 pp 171ndash1792006
[33] C Brunsdon J McClatchey and D Unwin ldquoSpatial variationsin the average rainfall-altitude relationships in Great Britainan approach using geographically weighted regressionrdquo Inter-national Journal of Climatology vol 21 pp 455ndash466 2001
[34] C D Lloyd ldquoNonstationary models for exploring and mappingmonthly precipitation in the United kingdomrdquo InternationalJournal of Climatology vol 30 no 3 pp 390ndash405 2010
[35] WASAWaterAtlas of SaudiArabiaMinistry ofAgriculture andWater Riyadh Saudi Arabia 1988
[36] ASTER GDEM ldquoASTER Global Digital Elevation Model (AS-TER GDEM)rdquo 2010 httpwwwjspacesystemsorjpersdacGDEME
[37] M Charlton and A S Fotheringham Geographically WeightedRegression National Centre For Geocomputation National Uni-versity of Ireland Maynooth Maynooth CoKildare Ireland20092009
[38] A S Fotheringham M E Charlton and C BrundsdonldquoGeographically weighted regression a natural evolution of theexpansion method for spatial data analysisrdquo Environment andPlanning A vol 30 no 11 pp 1905ndash1927 1998
[39] A S Fotheringham C Bunsden andM CharltonQuantitativeGeography Sage London 2000
[40] C M Hurvich J S Simonoff and C L Tsai ldquoSmoothingparameter selection in nonparametric regression using animproved Akaike information criterionrdquo Journal of the RoyalStatistical Society Series B vol 60 no 2 pp 271ndash293 1998
[41] D C Wheeler ldquoDiagnostic tools and a remedial method forcollinearity in geographically weighted regressionrdquo Environ-ment and Planning A vol 39 no 10 pp 2464ndash2481 2007
[42] C BrunsdonM Charlton and PHarris ldquoLivingwith collinear-ity in local regression modelsrdquo in Proceedings of the 10thInternational Symposium on Spatial Accuracy Assessment inNatural Resources and Environmental Sciences Florianopolis-SC Brazil 2012
[43] D Belsey E Kuh and R Welsch Regression DiagnosticsIdentifying Influential Data and Sources of Collinearity WileyHoboken NJ USA 2004
[44] L M Scott and M V Janikas ldquoSpatial statistics in ArcGISrdquo inHandbook of Applied Spatial Analysis Software Tools Methodsand Application M M Fischer and A Getis Eds Springer2010
[45] A Mitchell The ESRI Guide to GIS Analysis Spatial Measure-ments and Statistics ESRI Redlands Calif USA 2005
[46] MC Peel B L Finlayson andTAMcMahon ldquoUpdatedworldmap of the Koppen-Geiger climate classificationrdquo Hydrologyand Earth System Sciences Discussions vol 4 no 2 pp 439ndash4732007
[47] B Y M Ahmed ldquoClimatic classification of Saudi Arabia anapplication of factor cluster analysisrdquo Geo Journal vol 41 pp69ndash84 1997
[48] Z Sen ldquoHydrology of Saudi Arabiardquo in Proceedings of theSymposium on Water Resources in Saudi Arabia pp A68ndashA94Scientific Publishing Centre King Saud University RiyadhSaudi Arabia 1983
[49] M S Alyamani ldquoIsotopic composition of rainfall and ground-water recharge in the western province of Saudi Arabiardquo Journalof Arid Environments vol 49 no 4 pp 751ndash760 2001
[50] MacLaren International Limited ldquoWater and agriculturaldevelopment studies-Arabian Shield-Southrdquo inHydrogeologicalInvestigations Annex 3 Ministry of Agriculture and WaterRiyadh Saudi Arabia 1979
[51] M D Al-Qurashi Synoptic climatology of the rainfall in thesouthwest region of Saudi Arabia [Master Dissertation] Depart-ment of Geography University of Western Michigan 1981
[52] Z Sen and K Al-Subarsquoi ldquoHydrological considerations for damsiting in arid regions a Saudi Arabian studyrdquo HydrologicalSciences Journal vol 47 no 2 pp 173ndash186 2002
[53] A M Subyani A A Al-Modayan and F S Al-Ahmadi ldquoTopo-graphic seasonal and aridity influences on rainfall variability inwestern Saudi Arabiardquo Journal of Environmental Hydrology vol18 pp 1ndash11 2010
[54] K P Burnham and D R AndersonModel Selection and Multi-model Inference A Practical Information-Theoretical ApproachSpringer New York NY USA 2nd edition 2002
[55] C D Lloyd Local Models for Spatial Analysis CRC Press BocaRaton Fla USA 2011
[56] R Mandal S St-Hilaire J G Kie and D Derryberry ldquoSpatialtrends of breast and prostate cancers in the United Statesbetween 2000 and 2005rdquo International Journal of Health Geo-graphics vol 8 no 1 article 53 2009
[57] C H Lin and T H Wen ldquoUsing geographically weightedregression (GWR) to explorespatial varying relationships ofimmature mosquitoes andhuman densities with the incidenceof denguerdquo International Journal of Environmental Research andPublic Health vol 8 no 7 pp 2798ndash2815 2011
Submit your manuscripts athttpwwwhindawicom
Hindawi Publishing Corporationhttpwwwhindawicom Volume 2014
ClimatologyJournal of
EcologyInternational Journal of
Hindawi Publishing Corporationhttpwwwhindawicom Volume 2014
EarthquakesJournal of
Hindawi Publishing Corporationhttpwwwhindawicom Volume 2014
Hindawi Publishing Corporationhttpwwwhindawicom
Applied ampEnvironmentalSoil Science
Volume 2014
Mining
Hindawi Publishing Corporationhttpwwwhindawicom Volume 2014
Journal of
Hindawi Publishing Corporation httpwwwhindawicom Volume 2014
International Journal of
Geophysics
OceanographyInternational Journal of
Hindawi Publishing Corporationhttpwwwhindawicom Volume 2014
Journal of Computational Environmental SciencesHindawi Publishing Corporationhttpwwwhindawicom Volume 2014
Journal ofPetroleum Engineering
Hindawi Publishing Corporationhttpwwwhindawicom Volume 2014
GeochemistryHindawi Publishing Corporationhttpwwwhindawicom Volume 2014
Journal of
Atmospheric SciencesInternational Journal of
Hindawi Publishing Corporationhttpwwwhindawicom Volume 2014
OceanographyHindawi Publishing Corporationhttpwwwhindawicom Volume 2014
Advances in
Hindawi Publishing Corporationhttpwwwhindawicom Volume 2014
MineralogyInternational Journal of
Hindawi Publishing Corporationhttpwwwhindawicom Volume 2014
MeteorologyAdvances in
The Scientific World JournalHindawi Publishing Corporation httpwwwhindawicom Volume 2014
Paleontology JournalHindawi Publishing Corporationhttpwwwhindawicom Volume 2014
ScientificaHindawi Publishing Corporationhttpwwwhindawicom Volume 2014
Hindawi Publishing Corporationhttpwwwhindawicom Volume 2014
Geological ResearchJournal of
Hindawi Publishing Corporationhttpwwwhindawicom Volume 2014
Geology Advances in
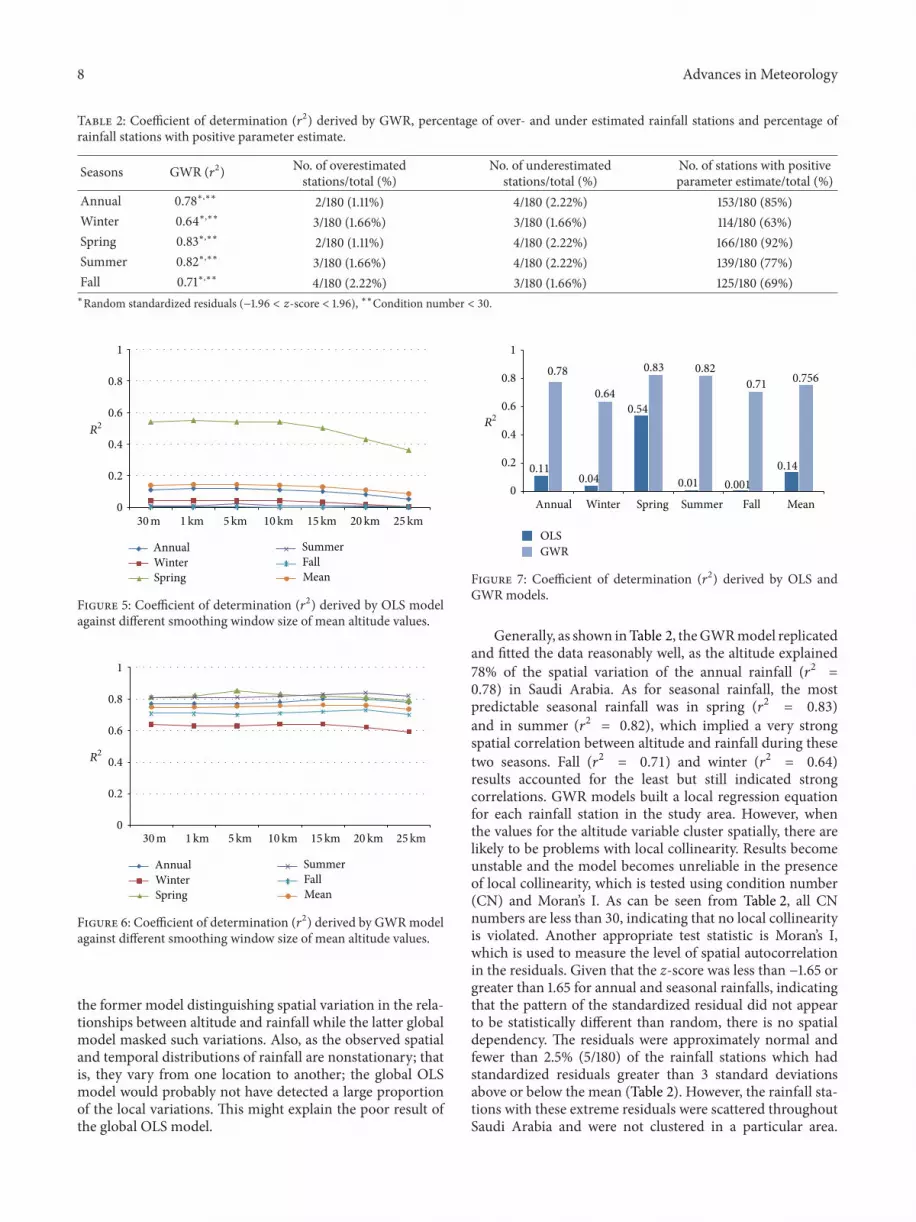