wind energy modeling over west africa
TRANSCRIPT

OPEN JOURNAL OF RENEWABLE ENERGY AND SUSTAINABLE DEVELOPMENTIn Press
OPEN JOURNAL OF RENEWABLE ENERGY AND SUSTAINABLE DEVELOPMENT
Wind Energy Modeling over West AfricaDoaa M.Saleh1*, Gamal El Afandi1,2, Rokaya M. Hassan1
1College of Agriculture, Environment and Nutrition Sciences , Tuskegee University, Tuskegee Al, USA.2Department of Astronomy and Meteorology, Faculty of Science Al Azhar University, Cairo Egypt.
*Corresponding author: [email protected]
Abstract:Wind Energy remains one of the few bright spots in renewable energy in the 21stCentury. Windfarms can provide clean, renewable energy to homes, businesses and the agricultural sector.Though Wind energy is the fastest growing component of renewable energy sources, it is highlyfluctuating in time and space due to the intermittent nature of near-surface winds. Understandingof uncertainties in short-term prediction of wind energy is becoming increasingly important for avariety of issues, such as integration into an electricity supply system, local energy balancing,and management of energy resources. To overcome the shortfall of high resolution in-situregional wind observations for wind resources assessment in West Africa, the wind conditionshave been estimated utilizing the next-generation mesoscale numerical weather predictionsystem, the Weather Research and Forecasting (WRF) Model. The main aim of this studyis to evaluate the performance of (WRF) Model in wind prediction over two regions in WestAfrica. The present case study shows that the model has performed reasonably well over Dakar,Senegal. On the other hand, the model performance over Ouagadougou, Burkina Faso wasunsatisfactory.
Keywords:Modeling; West Africa; Wind energy; WRF
1. INTRODUCTION
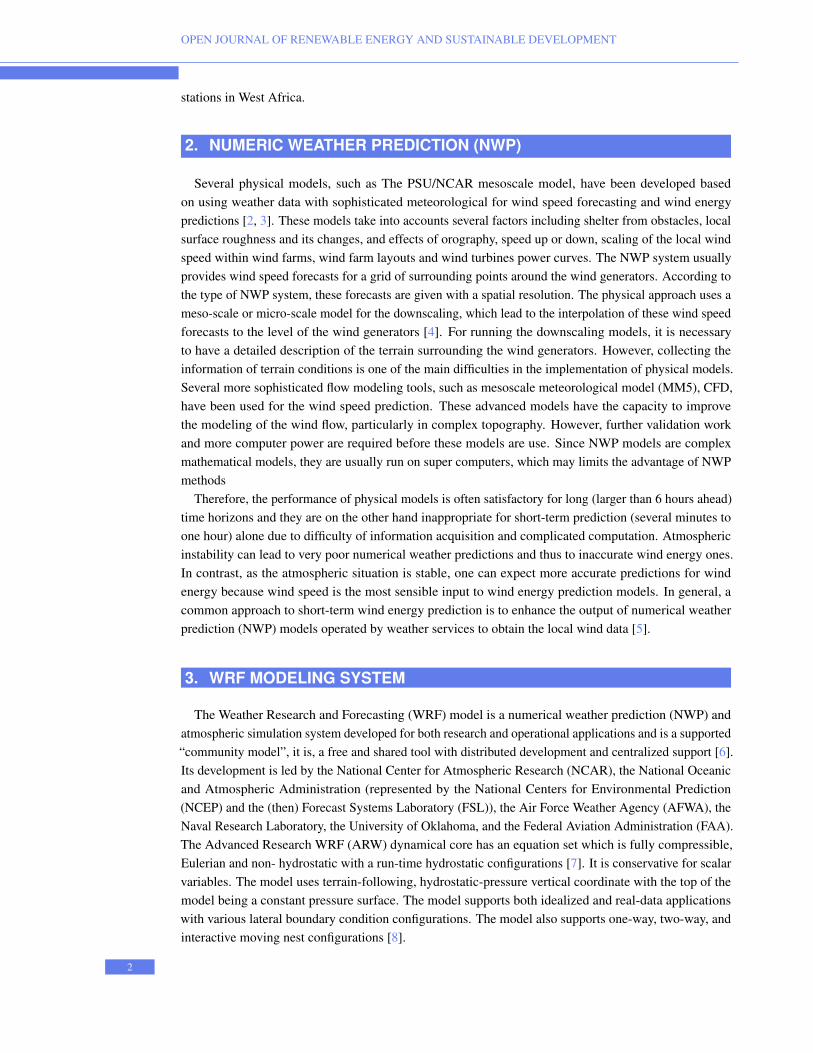
West Africa, a region larger than Western Europe, and with a population of almost 300M people, is oneof the most power-deficient regions of the world. The developing countries of Africa are popular locationsfor the application of renewable energy technology. In the present time, many countries already havesmall-scale solar and wind, providing energy to urban and rural areas. These types of energy productionare especially useful in remote locations because of the expensive cost of transporting electricity fromlarge-scale power stations. The implementation of renewable energy industry has the potential to resolvemany of the problems that face Africans every day. Though a high resolution in-situ regional windobservations are required for the assessment of wind resources in order to get access to wind energyas Wind energy is highly fluctuating in time and space due to the intermittent nature of near-surfacewinds [1], There is a shortfall of high resolution in-situ regional wind observations data in West Africa(Figure 1).The objective of this study is to estimate the wind component , utilizing the next-generationmesoscale numerical weather prediction system, the Weather Research and Forecasting (WRF) Model.The estimated modeled wind has been validated against observed wind data obtained from two weather
1
OPEN JOURNAL OF RENEWABLE ENERGY AND SUSTAINABLE DEVELOPMENT
stations in West Africa.
2. NUMERIC WEATHER PREDICTION (NWP)
Several physical models, such as The PSU/NCAR mesoscale model, have been developed basedon using weather data with sophisticated meteorological for wind speed forecasting and wind energypredictions [2, 3]. These models take into accounts several factors including shelter from obstacles, localsurface roughness and its changes, and effects of orography, speed up or down, scaling of the local windspeed within wind farms, wind farm layouts and wind turbines power curves. The NWP system usuallyprovides wind speed forecasts for a grid of surrounding points around the wind generators. According tothe type of NWP system, these forecasts are given with a spatial resolution. The physical approach uses ameso-scale or micro-scale model for the downscaling, which lead to the interpolation of these wind speedforecasts to the level of the wind generators [4]. For running the downscaling models, it is necessaryto have a detailed description of the terrain surrounding the wind generators. However, collecting theinformation of terrain conditions is one of the main difficulties in the implementation of physical models.Several more sophisticated flow modeling tools, such as mesoscale meteorological model (MM5), CFD,have been used for the wind speed prediction. These advanced models have the capacity to improvethe modeling of the wind flow, particularly in complex topography. However, further validation workand more computer power are required before these models are use. Since NWP models are complexmathematical models, they are usually run on super computers, which may limits the advantage of NWPmethods
Therefore, the performance of physical models is often satisfactory for long (larger than 6 hours ahead)time horizons and they are on the other hand inappropriate for short-term prediction (several minutes toone hour) alone due to difficulty of information acquisition and complicated computation. Atmosphericinstability can lead to very poor numerical weather predictions and thus to inaccurate wind energy ones.In contrast, as the atmospheric situation is stable, one can expect more accurate predictions for windenergy because wind speed is the most sensible input to wind energy prediction models. In general, acommon approach to short-term wind energy prediction is to enhance the output of numerical weatherprediction (NWP) models operated by weather services to obtain the local wind data [5].
3. WRF MODELING SYSTEM
The Weather Research and Forecasting (WRF) model is a numerical weather prediction (NWP) andatmospheric simulation system developed for both research and operational applications and is a supported“community model”, it is, a free and shared tool with distributed development and centralized support [6].Its development is led by the National Center for Atmospheric Research (NCAR), the National Oceanicand Atmospheric Administration (represented by the National Centers for Environmental Prediction(NCEP) and the (then) Forecast Systems Laboratory (FSL)), the Air Force Weather Agency (AFWA), theNaval Research Laboratory, the University of Oklahoma, and the Federal Aviation Administration (FAA).The Advanced Research WRF (ARW) dynamical core has an equation set which is fully compressible,Eulerian and non- hydrostatic with a run-time hydrostatic configurations [7]. It is conservative for scalarvariables. The model uses terrain-following, hydrostatic-pressure vertical coordinate with the top of themodel being a constant pressure surface. The model supports both idealized and real-data applicationswith various lateral boundary condition configurations. The model also supports one-way, two-way, andinteractive moving nest configurations [8].
2
Wind Energy Modeling over West Africa
Table 1. Statistical evaluation of Maximum wind simulations, Dakar
Date 19-21/012012 27-29/04/2012 27-29/07/2012 13-15/11/2012RMSE 1.54 0.97 2.15 1.21
r 0.65 0.74 -0.05 0.5
FB -0.095 -0.049 -0.136 -0.071
Table 2. Statistical evaluation of Minimum wind speed simulations, Dakar
Date 08-10/01/2012 20-22/04/2012 17-19/07/2012 09-11/11/2012RMSE 1.03 0.96 1.2 1.4
r 0.66 0.73 0.63 0.7
FB -0.03 -0.07 0.2 -0.16
Table 3. Statistical evaluation of Maximum wind speed simulations, Ouagadougou
Date 05-07/02/2012 24-26/05/2012 20-22/06/2012 03-05/12/2012RMSE 1.4 0.09 2.4 1.37
r 0.41 0.17 -0.37 0.43
FB -0.062 0.09 -0.13 -0.15
Table 4. Statistical evaluation of Minimum wind speed simulations, Ouagadougou
Date 6-8/02/2012 5-7/4/2012 24-26/08/2012 17-19/12/2012RMSE 1.3 2.1 1.3 1.1
r 0.5 0.4 0.4 0.26
FB -0.31 -0.17 -0.14 -0.12
Figure 1. the location of the worlds key weather stations shows huge areas where information is not gathered
3
OPEN JOURNAL OF RENEWABLE ENERGY AND SUSTAINABLE DEVELOPMENT
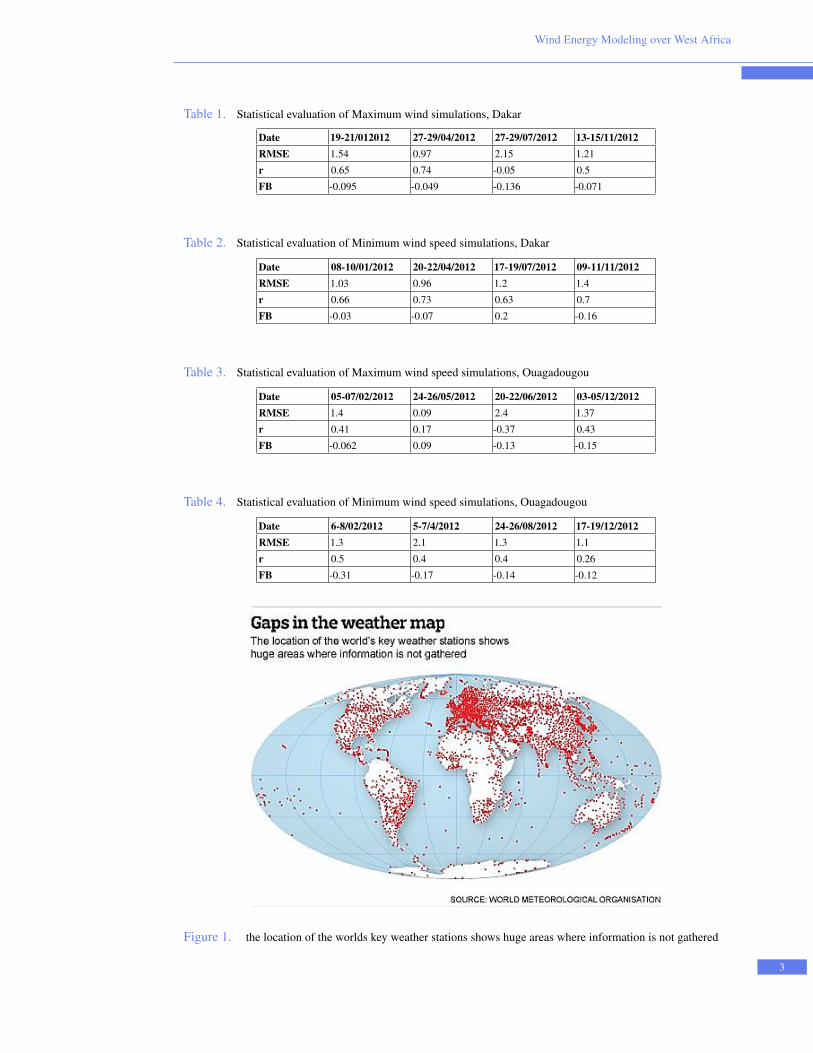
Dakar, Senegal(14.3N,17.63W) Ouagadougou, Burkina Faso (12.35N, 1.51W)
Figure 2. Three nested domains
4. EXPERIMENT DESIGN AND MODEL SETUP
The WRF model (version 3.4.1) will be configured with three domains using two-way nesting with ahorizontal resolution of 9KM at the first domain, 3 KM at the second domain and 1km at third domain asshown in (Figure 2) http://www.mmm.ucar.edu/wrf/users/downloads.htm
The initial and lateral boundary meteorological data, used to run the model, have been downloadedfrom the National Centers for Environmental Prediction (NCEP), global final analyses on 1◦×1◦ degreefrom Global Forecasting
System (GFS) and it is updated every six hours. http://rda.ucar.edu/datasets/ds083.2In the present study a 72 hours wind simulation using WRF has been produced, the maximum and
minimum daily wind speed and the maximum daily wind have been simulated four times during the year2012 for each site with a total of 576 hours of simulation for each of the selected sites;
1- Coastal station; Dakar, Senegal (14.3N, 17.63W).2- Inland station; Ouagadougou, Burkina Faso (12.35N, 1.51W).The data used for validation of surface wind is derived from: The observations are taken using standards
techniques and practices as laid out by WMO [9].http://www.ncdc.noaa.gov
5. STUDY AREA
1) First site (DAKAR-Senegal); it is located on the Cap-Vert Peninsula on the Atlantic coast and is thewesternmost city on the African mainland (14.3N, 17.63W). Its elevation above sea level is 24 meters.Dakar has a hot semi-arid climate with a short rainy season and a lengthy dry season. Dakar’s wet seasonlasts from July to October while the dry season covers the remaining eight months. The climate of Dakaris very much influenced by the marine trade winds and the monsoon which respectively blow in the regionfrom November to June and from July to October in the direction of N-NW and S.SE [10].
2) Second site (Ouagadougou-Burkina Faso); it is located on the central plateau (12.35◦ N 1.5◦ W).Its elevation above sea level is 306 meters. The climate of Ouagadougou consists of a dry period fromOctober to April with wind blowing in from the Sahara in the north and north-east, and a wet period fromMay to September with an average of 700 mm of rain. Average daily temperatures range from 25◦C to
4
Wind Energy Modeling over West Africa
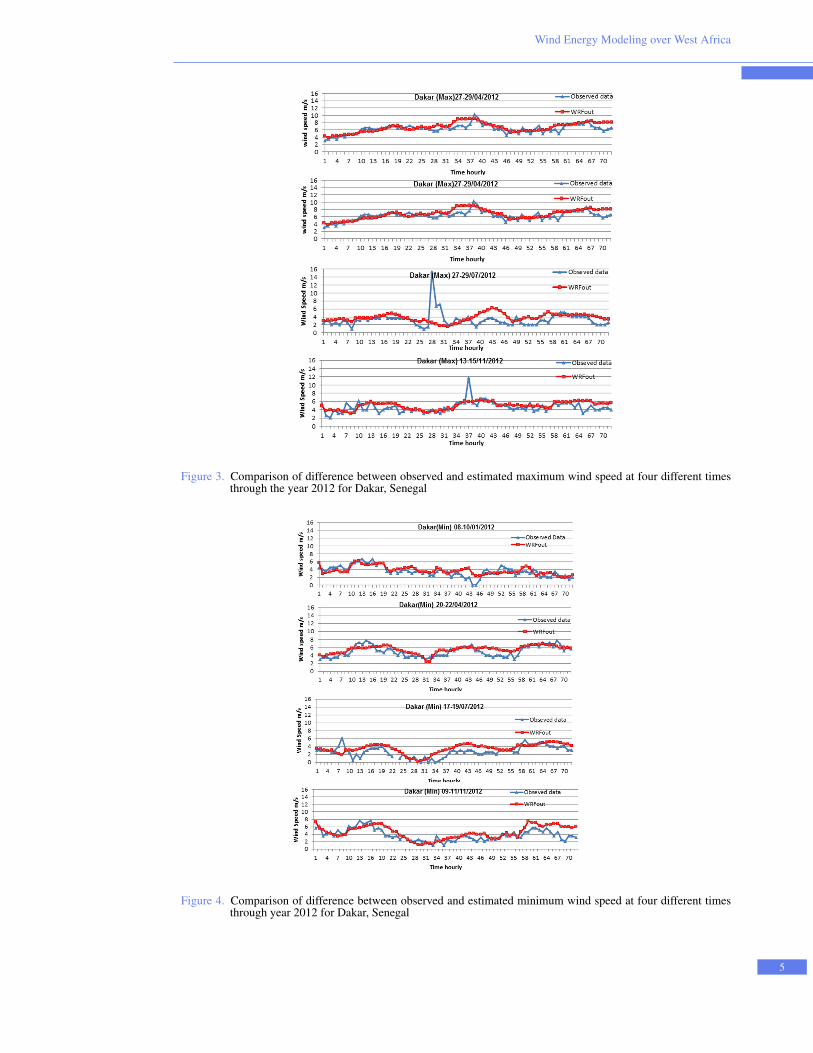
Figure 3. Comparison of difference between observed and estimated maximum wind speed at four different timesthrough the year 2012 for Dakar, Senegal
Figure 4. Comparison of difference between observed and estimated minimum wind speed at four different timesthrough year 2012 for Dakar, Senegal
5
OPEN JOURNAL OF RENEWABLE ENERGY AND SUSTAINABLE DEVELOPMENT
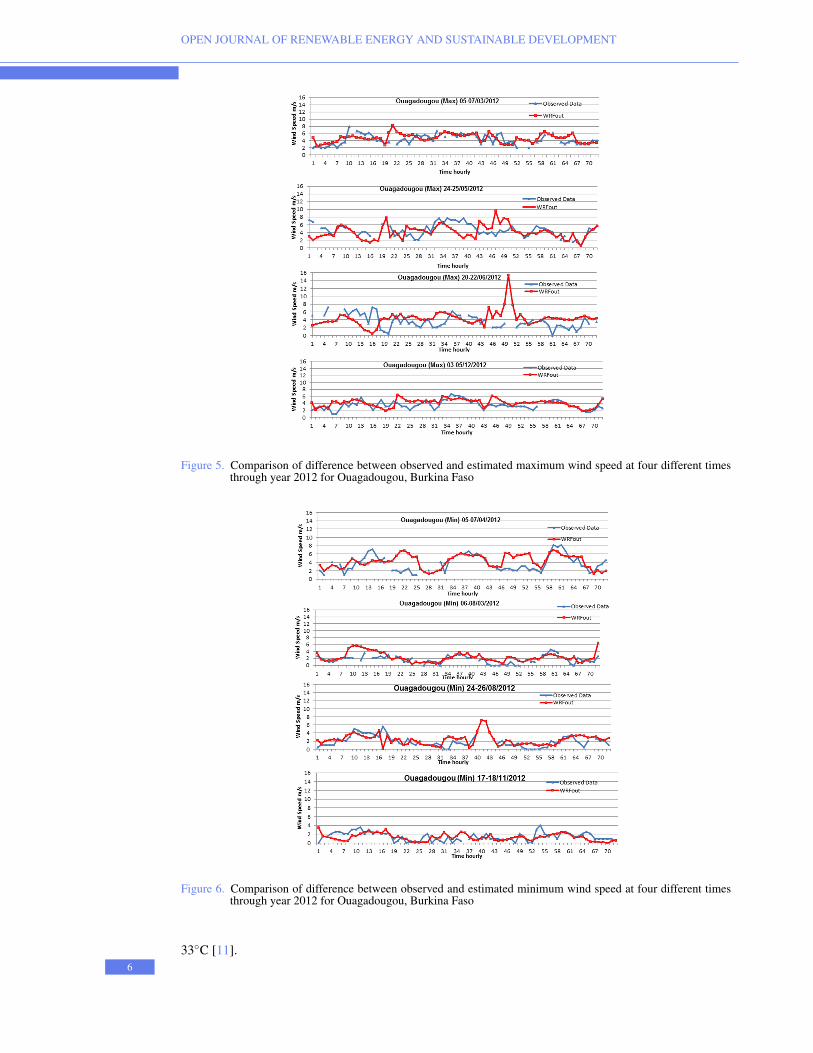
Figure 5. Comparison of difference between observed and estimated maximum wind speed at four different timesthrough year 2012 for Ouagadougou, Burkina Faso
Figure 6. Comparison of difference between observed and estimated minimum wind speed at four different timesthrough year 2012 for Ouagadougou, Burkina Faso
33◦C [11].6
Wind Energy Modeling over West Africa
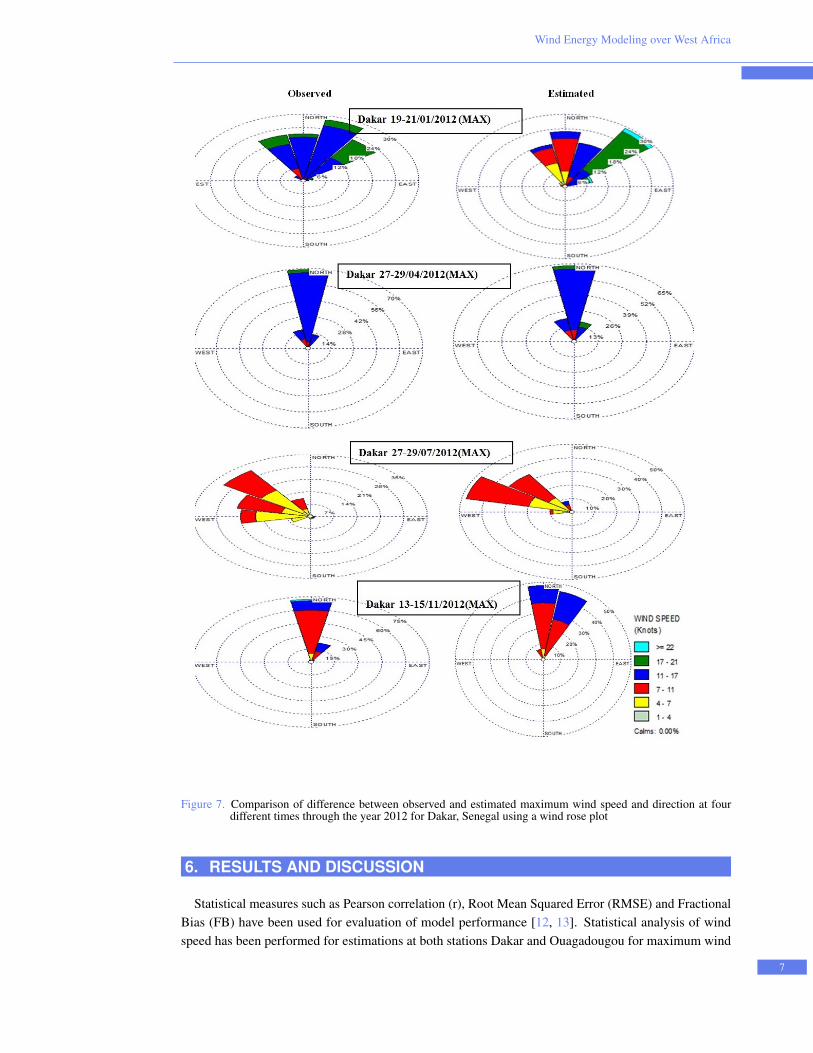
Figure 7. Comparison of difference between observed and estimated maximum wind speed and direction at fourdifferent times through the year 2012 for Dakar, Senegal using a wind rose plot
6. RESULTS AND DISCUSSION
Statistical measures such as Pearson correlation (r), Root Mean Squared Error (RMSE) and FractionalBias (FB) have been used for evaluation of model performance [12, 13]. Statistical analysis of windspeed has been performed for estimations at both stations Dakar and Ouagadougou for maximum wind
7

OPEN JOURNAL OF RENEWABLE ENERGY AND SUSTAINABLE DEVELOPMENT
Figure 8. Comparison of difference between observed and estimated minimum wind speed and direction at fourdifferent times through the year 2012 for Dakar, Senegal using a wind rose plot
conditions in Table 1 and Table 3 and minimum wind conditions Table 2 and Table 4, general tendencyby the model to over predict wind speed is observed in all the different times through the year whichhas also been observed in many earlier studies [14–16]. Performance of WRF is Satisfactory over Dakar(Figure 3 and Figure 4)with acceptable to good correlation (r) and RMSE performance regarding windspeed except in the case of 27-29/07/2012-Table 1, where the WRF model has a poor correlation due tosporadic wind in that day where the wind speed exceeds 15m/s for only one observation which can be
8
Wind Energy Modeling over West Africa
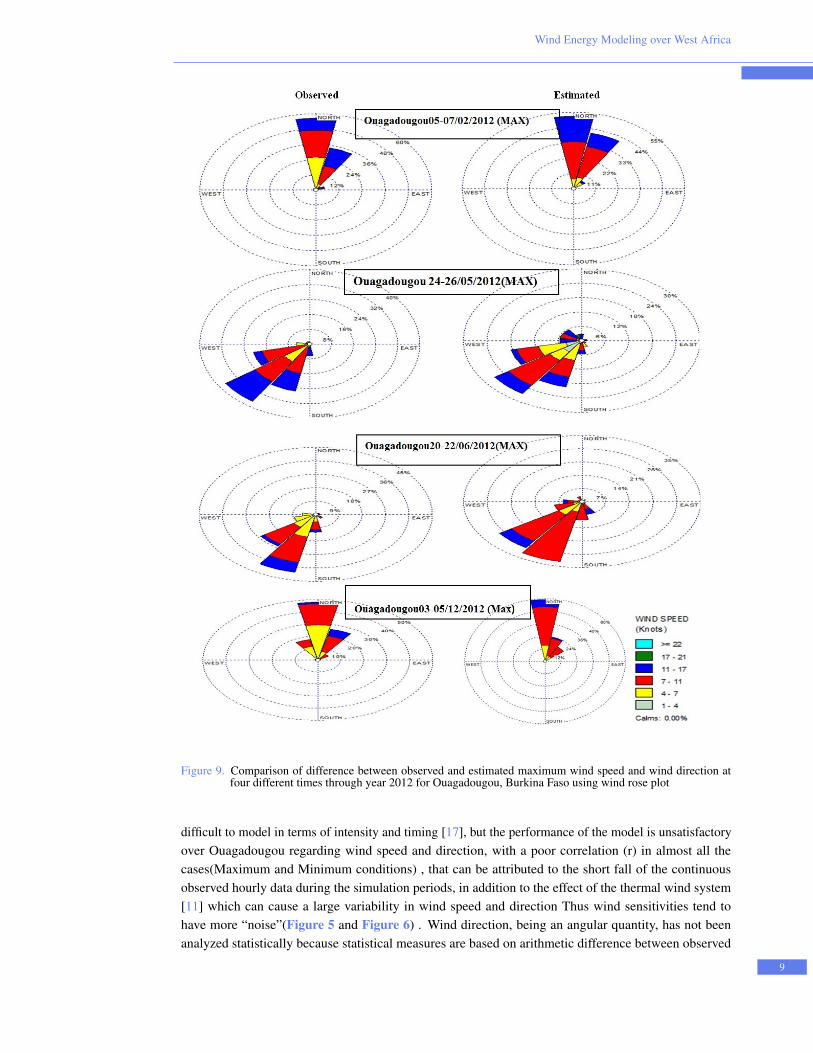
Figure 9. Comparison of difference between observed and estimated maximum wind speed and wind direction atfour different times through year 2012 for Ouagadougou, Burkina Faso using wind rose plot
difficult to model in terms of intensity and timing [17], but the performance of the model is unsatisfactoryover Ouagadougou regarding wind speed and direction, with a poor correlation (r) in almost all thecases(Maximum and Minimum conditions) , that can be attributed to the short fall of the continuousobserved hourly data during the simulation periods, in addition to the effect of the thermal wind system[11] which can cause a large variability in wind speed and direction Thus wind sensitivities tend tohave more “noise”(Figure 5 and Figure 6) . Wind direction, being an angular quantity, has not beenanalyzed statistically because statistical measures are based on arithmetic difference between observed
9
OPEN JOURNAL OF RENEWABLE ENERGY AND SUSTAINABLE DEVELOPMENT
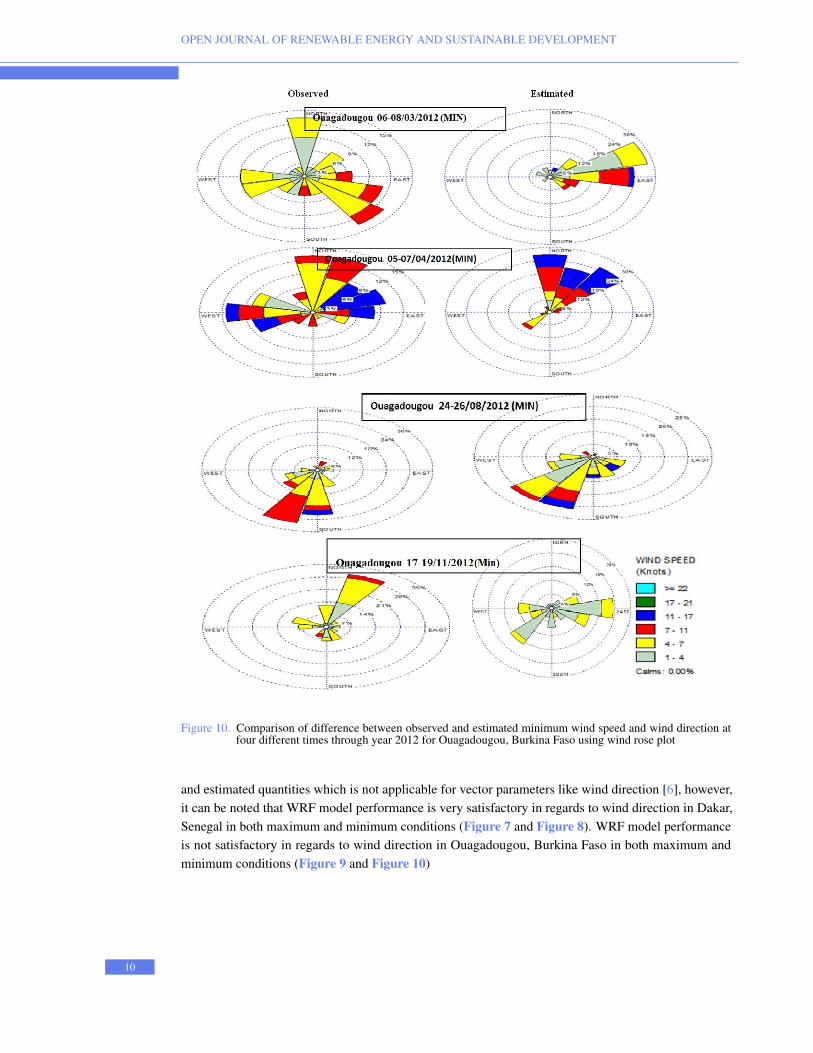
Figure 10. Comparison of difference between observed and estimated minimum wind speed and wind direction atfour different times through year 2012 for Ouagadougou, Burkina Faso using wind rose plot
and estimated quantities which is not applicable for vector parameters like wind direction [6], however,it can be noted that WRF model performance is very satisfactory in regards to wind direction in Dakar,Senegal in both maximum and minimum conditions (Figure 7 and Figure 8). WRF model performanceis not satisfactory in regards to wind direction in Ouagadougou, Burkina Faso in both maximum andminimum conditions (Figure 9 and Figure 10)
10
Wind Energy Modeling over West Africa
7. CONCLUSION
The present case study shows that the model performance is satisfactory over Dakar, Senegal. Further-more, with more studies conducted, model biases can be determined and adjusted for, as in any forecastingtool. Performance over Ouagadougou, Burkina Faso is unsatisfactory due to the effect of the accompaniedthermal wind system .More studies with different physics options applicable in WRF model may lead tobetter agreement between both modeled and observed wind Data.
ABBREVIATIONS AND ACRONYMS
WRF Weather Research and Forecasting ModelNWP Numerical Weather PredictionPSU/NCAR PENNSYLVANIA STATE UNIVERSITY / NATIONAL CENTER FOR ATMOSPHERICRESEARCHMM5 The Fifth-Generation Penn State/NCAR Mesoscale ModelCFD Computational Fluid DynamicsNCEP National Centers for Environmental PredictionFSL Forecast Systems LaboratoryAFWA The Air Force Weather AgencyFAA The Federal Aviation AdministrationARW The Advanced Research WRF dynamical coreWMO Weather Meteorological Organization
ACKNOWLEDGMENTS
The authors wish to extend their gratitude to NOAAs National Climatic Data Center (NCDC) foroffering a free access for data used in the model validation. The computations were performed on AlabamaSuper Computer (ASC) with eight parallel processors. The authors also wish to thank the anonymousreviewers for their valuable comments on the manuscript.
References
[1] G. Giebel, J. Badger, L. Landberg, H. A. Nielsen, T. S. Nielsen, H. Madsen, K. Sattler, H. Feddersen,H. Vedel, J. Tøfting, et al., Wind Power Prediction using Ensembles. Riso National Laboratory.Ris-R-1527, 2005.
[2] L. Landberg, “A Mathematical Look at a Physical Power Prediction Model,” Wind Energy, vol. 1,no. 1, pp. 23–28, 1998.
[3] J.-S. Hong, “Evaluation of the high-resolution model forecasts over the Taiwan area during GIMEX,”Weather & Forecasting, vol. 18, no. 5, pp. 836–846, 2003.
[4] G. Kariniotakis, P. Pinson, N. Siebert, G. Giebel, R. Barthelmie, et al., “The State of the Art inShort-term Prediction of Wind Power -From an Offshore Perspective,” in Proceedings of of 2004SeaTechWeek, Brest, France, 20-21Oct, pp. 20–21, 2004.
[5] K. Gnana Sheela, “Computing models for wind speed prediction in renewable energy systems,” IJCASpecial Issue on Computational Science, New Dimensions & Perspectives NCCSE, 2011.
11
OPEN JOURNAL OF RENEWABLE ENERGY AND SUSTAINABLE DEVELOPMENT
[6] M. Mohan and S. Bhati, “Analysis of WRF model performance over subtropical region of Delhi,India,” Advances in Meteorology, vol. 2011, 2011.
[7] R. Borge, V. Alexandrov, J. Jose del Vas, J. Lumbreras, and E. Rodrıguez, “A comprehensivesensitivity analysis of the WRF model for air quality applications over the Iberian Peninsula,”Atmospheric Environment, vol. 42, no. 37, pp. 8560–8574, 2008.
[8] N. C. for Atmospheric Research (NCAR), “ARW Version 3 Modeling Systems Users Guide,” 2010.[9] WMO, “Guide to Meteorological Instruments and Methods of Observation,” http:
//www.wmo.int/pages/prog/www/IMOP/publications/CIMO-Guide/CIMO_
Guide-7th_Edition-2008.html.[10] http://www.unep.org/dewa/water/groundwater/africa/english/
reports/CountrySummaries/Senegal/Eng-Senegal-Summary.pdf.[11] J. Linden, “Nocturnal cool island and a thermal wind-systemtwo features of the local climate in
Ouagadougou, Burkina Faso,” in The seventh International Conference on Urban Climate. Yokohama,Japan, 2009.
[12] J. Cassano and M. Higgins, “Development of a regional arctic climate system model: performanceof WRF for regional pan-Arctic atmospheric simulations,” in Proceedings of the 11th WRF Users’Workshop National Center for Atmospheric Research, Boulder, Colo, USA, 2010.
[13] T. Prabha and G. Hoogenboom, “Evaluation of the Weather Research and Forecasting model for twofrost events,” Computers and electronics in agriculture, vol. 64, no. 2, pp. 234–247, 2008.
[14] R. Borge, V. Alexandrov, J. Jose del Vas, J. Lumbreras, and E. Rodrıguez, “A comprehensivesensitivity analysis of the WRF model for air quality applications over the Iberian Peninsula,”Atmospheric Environment, vol. 42, no. 37, pp. 8560–8574, 2008.
[15] J. H. Kwun, Y.-K. Kim, J.-W. Seo, J. H. Jeong, and S. H. You, “Sensitivity of MM5 and WRFmesoscale model predictions of surface winds in a typhoon to planetary boundary layer parameteri-zations,” Natural hazards, vol. 51, no. 1, pp. 63–77, 2009.
[16] J. J. Ruiz, C. Saulo, and J. Nogues-Paegle, “WRF model sensitivity to choice of parameterizationover South America: validation against surface variables,” Monthly Weather Review, vol. 138, no. 8,pp. 3342–3355, 2010.
[17] K. T. Clifford, WRF-model performance for wind power forecasting in the coast ranges of centralCalifornia. San Jose State University, 2011.
12