west africa built environment research (waber
TRANSCRIPT
WEST AFRICA BUILT
ENVIRONMENT RESEARCH
(WABER) CONFERENCE
24-26 July 2012
Abuja, Nigeria
PROCEEDINGS
(Volume 1)
Editors
Dr Samuel Laryea
Dr Sena A. Agyepong
Dr Roine Leiringer
Professor Will Hughes
Proceedings of the West Africa Built Environment Research (WABER) Conference 2012
(Volume 1)
Abuja, Nigeria, 24-26 July 2012
Editors
Dr Samuel Laryea, University of Reading, UK
Dr Sena A. Agyepong, Ashesi University College, Ghana
Dr Roine Leiringer, University of Hong Kong, Hong Kong
Professor Will Hughes, University of Reading, UK
First published 2012
ISBN 978-0-9566060-1-3
Published by
West Africa Built Environment Research (WABER) Conference
C/o Dr Samuel Laryea
School of Construction Management and Engineering
University of Reading
PO Box 219, Reading, UK
RG6 6AW
Email: [email protected]
© The copyright for papers in this publication belongs to authors of the papers.
Correspondence
All correspondence relating to the WABER Conference should be addressed to:
Dr Sena A. Agyepong
Ashesi University College
Accra, Ghana
Email: [email protected]
Please visit www.waberconference.com for more information
Declaration
All papers in this publication have been through a review process involving initial screening
of abstracts, review by at least two referees, reporting of comments to authors, modifications
of papers by authors and re-evaluation of re-submitted papers to ensure quality of content.
i
FOREWORD
A big welcome to every participant at this WABER 2012 Conference. Our first three
conferences, 2009-11, took place in Accra, Ghana. Nigeria is hosting the WABER Conference
for the first time, 24-26 July 2012, and it is a delight to be in this beautiful city of Abuja. Thank
you for coming and we hope you enjoy the conference.
Time really flies! I still have a vivid recollection of our first event in Accra on 2-3 June 2009.
So soon we are having a 4th WABER Conference already. Every credit for the rapid
development of the WABER Conference in the last four years should really go to those of you
who have participated in the past as well as those attending the conference this year. In the past
four years, many of us have become friends through WABER. Many young academics and
researchers have also been helped to develop their research work and skills through WABER and
thereby found an opportunity to move their careers and ideas forward. The story of WABER just
goes to show that we are stronger when we come together and there is nothing we cannot achieve
when we work together and support each other. With most of the countries in Africa pushing for
development, the WABER Conference provides an essential channel for bringing built
environment academics, researchers and practitioners together for the generation of knowledge,
interaction and leadership on the key issues that we need to tackle in order to address our
challenges and opportunities of the 21st century particularly in relation to the construction sector
and built environment.
Since 2009, WABER has brought together more than 500 built environment academics,
researchers and practitioners to work together towards the development of the built environment
field in Africa. We strive to: support young built environment researchers in West Africa (WA)
especially to develop their research work and skills through constructive face-to-face interaction
with their peers and experienced international academics; supply a platform for more senior
academics to network and share ideas on their current research work; and serve as a vehicle for
developing the built environment field in Africa.
In addition to the 500+ people involved in WABER, we also have about 60 institutions in the
WABER Conference network, comprising mainly of universities and polytechnics. This network
of people has enabled us to develop a new textbook on “Construction in West Africa” which will
be launched at this conference in Abuja. The WABER Book was written by ten academics of
West African origin based in six different countries. This contribution is another example of what
we can collectively achieve when we work together and combine our ideas. A big thank you to all
authors and our partners who have supported us and helped to publish the book.
We have engaged in some outreach activities within the past year. In January 2011, some
members of our team visited built environment departments in six polytechnics and two
universities in Ghana to interact with lecturers and postgraduate students and deliver research
workshops. We also donated textbooks to some departmental libraries as a means of supporting
students and teaching and learning activities. In August 2011, visits to six universities in Nigeria
enabled us to interact directly with staff and students in built environment departments. These
visits continue to foster closer interaction with our friends in various institutions. I would like to
express our sincere thanks to colleagues in all institutions visited for your warm hospitality.
This year’s conference proceedings consist of 125 papers. We initially received and screened 278
abstracts with the help of our Scientific Committee. 182 full papers were eventually submitted
and each went through a peer review process. Thus, the papers accepted for publication represent
around 68% of full papers received. We congratulate the authors of papers that made it into the
proceedings for a job well done. We also thank the 56 members of our Scientific Committee and
84 members of our Review Panel for your expertise and input into the quality of this conference.
The published papers cover a wide array of topics including: Building services, Construction
design and technology, Construction economics, Construction finance, Contract law, Contracting,
Contract administration, Decision support systems, Economic development, Engineering, Energy,

ii
Environment, Facilities Management, Health and safety, Housing, Human resources and skills,
Information technology, Materials science, Procurement, Project management, Quantity
surveying, Real estate and planning, Risk management, Supply chain management, Sustainable
technologies, Urban development. As such they reflect various areas of socio-economic
development aspirations of countries in West Africa. With most countries in Africa pushing for
development, some of the research findings here can play an important role in helping to realize
the development aspirations of African economies.
An important and impressive statistic is that the 329 authors of the papers in this year’s
conference proceedings come from 87 different institutions and 10 different countries. This
provides plenty of scope for cross-boundary learning. It also provides for a rich intellectual,
international and multicultural blend and platform for networking and developing new knowledge
and longer-term collaborations. We hope that all delegates at this conference will make good use
of this opportunity. Going forward into the future WABER will develop strategic initiatives for
helping more people to develop their work and achieve their potential. The Micheletti & Co. Ltd
Prize for Best Masters Research Dissertation is a scheme to recognise and encourage younger
researchers.
On that note, we wish to record our thanks and gratitude to a number of individuals and
organizations who have supported us in various ways: Vector Morrison Ghana Ltd; A-Kon
Consults Limited (Ghana); Oladele Construction Ltd (Nigeria); K+H Limited (Ghana); HLB Ltd
(Ghana); Laurus Development Partners; PPMC Ltd (Ghana); Micheletti and Co. Ltd; Mr. Michael
Kwadwo Frimpong (President of the Africa Association of Quantity Surveyors (AAQS)); Mr.
Afolabi Abdulsalam Dania (University of Reading, UK); Professor Kabir Bala (Ahmadu Bello
University, Nigeria); Professor Stella Zubairu and a number of our colleagues in Nigeria.
A common tradition at academic conferences is to have keynote speakers. We are blessed this
year to have some really experienced international academics who will be speaking to us:
Professor Roger Flanagan (University of Reading, UK); Dr Roine Leiringer (University of Hong
Kong, Hong Kong); Dr Chris Harty (University of Reading, UK); Professor Stella Zubairu
(Federal University of Technology, Minna, Nigeria) and Professor Will Hughes (University of
Reading, UK). It is great to have these academics contributing a keynote to the conference.
I wish to express appreciation to Dr Sena Agyepong, our Regional Organising Director, and
members of our LOC particularly Mr Oladele Ishaq for your hard work and capable management
of local organising arrangements. Above all, many thanks to all those of you who have come to
take part in this conference. Enjoy Abuja and have a safe journey back home.
Dr Samuel Laryea
School of Construction Management and Engineering
University of Reading, UK
July 2012

iii
SCIENTIFIC COMMITTEE
Prof Will Hughes, University of Reading, UK
Prof Kabir Bala, Ahmadu Bello University, Nigeria
Prof Stella Zubairu, Federal University of Technology, Minna, Nigeria
Prof George Ofori, National University of Singapore, Singapore
Prof Chimay Anumba, Pennsylvania State University, USA
Prof Bola Babalola, Obafemi Awolowo University, Nigeria
Prof K.T. Odusami, University of Lagos, Nigeria
Prof Anny Nathaniel Aniekwu, University of Benin, Nigeria
Prof Roger Flanagan, University of Reading, UK
Arc Rita Obiozo, Enugu State University of Science and Technology, Nigeria
Prof D.R. Ogunsemi, Federal University of Technology, Akure, Nigeria
Prof Paul Alagidede, Rhodes University, South Africa
Dr Johan Nyström, VTI, Sweden
Dr Jasper Mbachu, Massey University, Auckland, New Zealand
Dr Chris Harty, University of Reading, UK
Dr Emmanuel Essah, University of Reading, UK
Prof Emmanuel Achuenu, University of Jos, Nigeria
Dr Scott Fernie, Loughborough University, UK
Prof Leke Oduwaye, University of Lagos, Nigeria
Dr Graeme Larsen, University of Reading, UK
Dr Abdullahi Ahmed, Coventry University, UK
Dr Franklin Obeng-Odoom, University of Sydney, Australia
Dr Ahmed Doko Ibrahim, Ahmadu Bello University, Nigeria
Dr Yingbin Feng, University of Western Sydney, Australia
Dr Norhayati Mahyuddin, University of Malaya, Malaysia
Dr Richard Nyuur, Northumbria University, UK
Dr Emmanuel Adinyira, KNUST, Ghana
Dr Martin Tuuli, Loughborough University, UK
Cathy Hughes, University of Reading, UK
Prof Raymond Nkado, University of the Witwatersrand, South Africa
Prof Denis Cioffi, George Washington University, USA
Dr Ola Uduku, Edinburgh College of Art School of Architecture, Scotland
Mrs. Paula Cardellino, Universidad ORT Uruguay, Montevideo, Uruguay
Dr Felix Hammond, University of Wolverhampton, UK
Dr Nii Ankrah, University of Wolverhampton, UK
Prof G.W.K. Intsiful, KNUST, Kumasi, Ghana
Rev. Dr. Frank Fugar, KNUST, Kumasi, Ghana
Mr. Sarfo Mensah, Kumasi Polytechnic, Ghana
Prof Joshua Ayarkwa, KNUST, Ghana
Prof Ahmed Abdalla Khogeli, University of Khartoum, Sudan
Dr Ajibade Aibinu, University of Melbourne, Australia
Dr Simon Smith, University of Edinburgh, UK
Dr Göran Lindahl, Chalmers University of Technology, Sweden
Dr Nongiba Kheni, Tamale Polytechnic, Ghana
Dr Moshood Fadeyi, British University in Dubai, UAE
Prof Wellington Thwala, University of Johannesburg, South Africa
Dr Per-Erik Eriksson, Luleå University of Technology, Sweden

iv
Dr Gabriel Nani, KNUST, Kumasi, Ghana
Dr Tyler Frazier, Technische Universität Berlin, Germany
Dr Sena Agyepong, Ashesi University College, Ghana
Dr Stefan Christoffer Gottlieb, Aalborg University, Denmark
Dr Roine Leiringer, University of Hong Kong, Kong Kong
Dr Peter Raisbeck, University of Melbourne, Australia
Prof Abiodun Olukayode Olotuah, Federal University of Technology, Akure, Nigeria
Dr Noah K Karley, Heriot-Watt University, UK
Dr Samuel Laryea, University of Reading, UK
v
THEME LEADERS
We are grateful to the following academics for leading the refereeing process for papers
relating to their research areas:
Dr Per-Erik Eriksson, Luleå University of Technology, Sweden
Dr Emmanuel Essah, University of Reading
Dr Scott Fernie, Loughborough University, UK
Cathy Hughes, University of Reading, UK
Prof Will Hughes, University of Reading, UK
Dr Graeme D. Larsen, University of Reading, UK
Dr Taibat Lawanson, University of Lagos, Nigeria
Dr Roine Leiringer, University of Hong Kong, Kong Kong
Dr Jasper Mbachu, Massey University, UK
Dr Immaculata Nwokoro, University of Lagos, Nigeria
Dr Richard B. Nyuur, Northumbria University, UK
Prof Koleola Odusami, University of Lagos, Nigeria
Dr Martin Tuuli, Loughborough University, UK
Dr Ola Uduku, University of Edinburgh, UK

vii
REVIEW PANEL
The peer review process for an international conference of this nature requires the expertise and
contribution of a number of international academics. We wish to thank the following people who
carried out the review of abstracts and papers for the WABER 2012 conference in addition to the
members of our Scientific Committee. Thank you for your contribution.
Prof Denis F. Cioffi, George Washington University, USA Dr Cath Jackson, University of Sheffield, UK
Dr Li Shan, NUS, School of Design and Environment,
Building Department, UK
Prof. Refaat Hassan Abdel-Razek, Zagazig University,
Egypt
Dr Kemi Adeyeye, University of Brighton, UK Josip Sertic, University of Zagreb, Croatia
Joseph Buertey, Pentecost University College, Ghana Håkan Norberg, Luleå University of Technology, Sweden
Ekaterina Osipova, Luleå University of Technology,
Sweden
Funmilayo Rotimi Ebun, Auckland University of
Technology, New Zealand
Dr. Ezekiel A Chinyio, University of Wolverhampton, UK Dr. Szymon Kaczmarek, Newcastle Business School, UK
Dr Steven Devaney, University of Aberdeen, UK Dr Simon Smith, University of Edinburgh, UK
Dr Angelique Chettiparamb, University of Reading, UK Dr Anupam Nanda, University of Reading, UK
Adebola Ajayi Mary, Federal University of Technology,
Akure, Nigeria
Dr Bekithemba Mpofu, The College of Estate
Management, UK
Dr Franklin Obeng-Odoom, University of Sydney,
Australia
Dr Haruna Musa Moda, Manchester Metropolitan
University, UK
Dr Mark Adom-Asamoah, KNUST Kumasi, Ghana Dr Jian Zuo, University of South Australia, Australia
Dr. Muhammad Sohail, Loughborough University, UK Dr Joseph Amankwah-Amoah, University of Bristol, UK
Dr Folake Isaacs-Sodeye, University College London, UK Dr Felix Hammond, University of Wolverhampton, UK
Mr. John Boon, UNITEC Institute of Technology, New
Zealand
Prof. Swee Eng Chen, Holmesglen Institute of TAFE,
Australia
Dr. Peter J Edwards, RMIT University, Australia Ms. Caroline T W Chan, City University of Hong Kong
Dr De-Graft Owusu Manu, KNUST, Kumasi, Ghana Afolabi A. Dania, University of Reading, UK
Prof. Douglas D Gransberg, University of Oklahoma, USA Dr Divine Ahadzie, KNUST, Kumasi, Ghana
Mr Nikolaos Nikolaidis, University of Aegean, Greece Mr. Marcus Ahadzi, Heriot-Watt University, UK
Dr Tyler James Frazier, Technische Universität, Berlin,
Germany
Prof. Akintola Akintoye, University of Central
Lancashire, UK
Mr. Sungmin Yun, University of Texas at Austin Dr. Gary Painter, University of Southern California
Felix Omole, Federal University of Technology, Akure,
Nigeria
Dr. Craig Furneaux, Queensland University of
Technology
Dr. Ruben Favié, Eindhoven University of Technology Dr Nii Ankrah, University of Wolverhampton, UK
Emmanuel Bamfo-Agyei, Cape Coast Polytechnic, Ghana Dr Noah K Karley, Heriot Watt University, UK
Naa Adjeley Ashiboe-Mensah, KNUST, Ghana J. A. Babalola, University Of Lagos, Nigeria
John M. Kakitahi, Lund University, Sweden Dr Johan Nyström, VTI, Sweden
John Meiling, Luleå University of Technology, Sweden Dr. Richard Boser, Illinois State University, USA
Dr Emmanuel Adinyira, KNUST, Kumasi, Ghana Prof Will Hughes, University of Reading, UK
Dr Ajibade Ayodeji Aibinu, University of Melbourne,
Australia
Moshood Olawale Fadeyi, British University in Dubai,
UAE
Bayode Olumuyiwa, University of the Witwatersrand,
South Africa
Clinton Aigbavboa, University of Johannesburg, South
Africa
Damilola Ekundayo, University of Northumbria, UK Collins Ameyaw, Kumasi Polytechnic, Ghana
Dr Samuel Laryea, University of Reading, UK Dr. Gonzalo Lizarralde, Université de Montréal, Canada
Dr Shu-Ling Lu, University of Reading, UK Dr. Matthew Hallowell, University of Colorado, USA
Jackson G.K. Abankwa, Central University College, Ghana Dr Peter Mbiti, Kenya
Peter Raisbeck, University of Melbourne, Australia Jenny Berger, University of Reading, UK
Peter Wallström, Luleå University of Technology, Sweden Tobore Ekwevugbe, De Montfort University, UK

viii
Prof Anny Nathaniel Aniekwu, University of Benin,
Nigeria
Prof Abiodun Olotuah, Federal University of
Technology, Akure, Nigeria
Prof Joshua Ayarkwa, KNUST, Kumasi, Ghana Prof George W. K. Intsiful, KNUST, Kumasi, Ghana
Samuel K. Ansah, Cape Coast Polytechnic, Ghana Rev Dr Frank Fugar, KNUST, Kumasi, Ghana
Prof George Ofori, National University of Singapore,
Singapore
Professor Richard Reed, Deakin University, Melbourne,
Australia
Sarfo Mensah, Kumasi Polytechnic, Ghana Satish Kumarswamy, University of Edinburgh, UK
Thomas Olofsson, Luleå University of Technology,
Sweden
Prof Wellington Thwala, University of Johannesburg,
South Africa
Sally Shahazad, University of Edinburgh, UK Yingbin Feng, University of Western Sydney, Australia
Dr Norhayati Mahyuddin, University of Malaya, Malaysia Dauda Dan-Asabe, University of Reading, UK

ix
SPONSORS AND PARTNERS
We wish to express our profound gratitude to the following sponsors and partners for
WABER 2012 Conference.
More information about our sponsors and partners is available on our website
www.waberconference.com
CONSTRUCTIONAL ENGINEERS
AND CONTRACTORS
K + H LIMITED

xi
INDUSTRY FOCUS
A-KON CONSULTS CELEBRATES ITS 10TH
ANNIVERSARY
A-Kon Consults Ltd is today one of the leading Chartered Quantity Surveying (QS) firms
in Ghana and West Africa. Internationally, the firm is accredited by both the Royal
Institution of Chartered Surveyors (RICS) and the Chartered Institute of Building (CIOB).
Our success in the past ten years has been mainly driven by our commitment to delivering
exceptional value – by using the most modern, sophisticated tools and techniques,
providing dedicated focus to clients and executing with excellence. We are involved in
virtually every facet of the construction industry. We conduct cost management, assessing
life cycle costs at all project stages; project management, planning, organising,
controlling and forecasting for projects; construction management, professional handling
of new buildings and refurbishment, and consultancy services to support clients and
projects.
HUMBLE BEGINNINGS
A-Kon Consults Ltd opened its doors for business on 21st October, 2002. After starting
the company from his dining table, Samuel Asare-Konadu used all the capital he had to
pay for the rent of a small 20 m² office space for $2,200. The first five years was a slow
but steady walk to building a brand presence and reputation in the industry. The company
often took on unpaid jobs by small contractors until the first big contract for a residential
apartments’ project in an exclusive suburb of Accra. Since then, we have experienced
rapid, profitable growth and expansion in projects and services.
OUR PROJECTS
Our portfolio of completed projects include the Accra Sports Stadium, Cargill cocoa
processing factory, office buildings for Maersk Line, Ericsson, and several residential real
estate projects. Currently, A-Kon Consults Ltd is partnering with Davis Langdon, the
world’s leading quantity surveyors on the first green building in Ghana, the One Airport
Square project, valued at $45 million. This affirms our reputation as one the leading firms
in Ghana with the capacity to deliver on innovative and environmentally sustainable
designs for the built environment.
Our team has diverse skills and experience in design and project management,
commercial property development, and engineering, in addition to our core competence
in quantity surveying to deliver on projects and our range of services offered. This
“Our firm is about delivery. It’s about the
quality of work we do and the services we
provide to satisfy our clients”
Mr Samuel Asare-Konadu, Founder and Managing
Director, A-Kon Consults Ltd

xii
expertise is reflected in the firm’s technical excellence and dedicated pursuit of
exceptional value to clients.
CORPORATE SOCIAL RESPONSIBILITY
Infrastructure is essential to a developing economy which in turn is based on the
development of knowledge and skills in construction and engineering. A-Kon Consult
thus focuses on education as its vehicle of social impact. The company supports
programmes that seek to advance the training and continuous professional development
of students, quantity surveyors and other stakeholders in the construction industry.
OUR FUTURE
A-Kon Consults Ltd is proud to be celebrating 10 years and rises to the challenge of
shaping a sustainable future due to technological changes and evolution of the industry,
by innovating and executing on improved solutions for its clients.
CONTACT US
A warm welcome awaits you if you would like to contact us through any of the following
coordinates:
Location: No. 4, Saflo Link Abelenkpe, Accra
Telephone: +233 (030) 276 7994/ (0) 54 958 349
Fax: +233 (030) 276 8134
Email: [email protected]
Website: www.a-konconsults.com
We are delighted to be part of the 4th WABER Conference taking place in Abuja, Nigeria
on 24-26 July 2012. As a firm we always strive to drive high standards, professionalism
and development of the construction industry. A vibrant and well organised construction
industry can create growth and opportunity for our people. A lot of those participating in
this year’s WABER Conference are future leaders of the construction industry either as
academics, researchers or practitioners. You have ideas. We need your ideas and
innovations to develop the industry and regional economy and take it forward to the next
level. That is why we are happy to be part of this conference during the celebration of our
10th
Anniversary.
Samuel Asare-Konadu
Managing Director
B.Sc. (Hons), MRICS, MCIOB, MGhIS
Email: [email protected]
xiii
LAURUS DEVELOPMENT PARTNERS
Proud sponsor of one of the Keynotes at WABER 2012 Conference
Laurus Development Partners develop environmentally sustainable, quality projects that
deliver enduring value to their community, investors and end users.
Contact information
Laurus Development Partners (Ghana - Headoffice)
39 Josiah Tongogara Street Labone, PMB CT413-Cantonments, Accra-Ghana
Telephone: +233 (0) 302 769213, +233 (0) 302 769214
Fax: +233 (0) 302 769215
Laurus Development Partners (Nigeria)
Plot 5 Chief Yesuf Abiodun Street Off Ligali Ayorinde Street, Victoria Island, Lagos-Nigeria
Telephone: +234 (0) 1 295 4892
Fax: +234 (0) 1 295 4923
Website: http://laurusdp.com/index.php

xv
CONTENTS
SECTION 1: KEYNOTES
The business of construction procurement: selecting, defining and managing procurement - Will
Hughes 1
The importance of evaluation and sustainability in the built environment - Stella Zubairu 9
SECTION 2: CONFERENCE PAPERS
Effects of curing conditions on compressive strength development of high strength concrete - A.E.
Abalaka and O. G. Okoli 17
Assessing the structural integrity of existing building structures - A. D. Abdul’Azeez; I. K. Zubairu; D.
Dahiru and U. A. Ahmed 25
Perception of educators and practitioners on the relevance of architectural curriculum of Nigerian
universities to the building industry - Abdullahi Abubakar 35
Investigating the Practice of Cash flow forecasting by Contractors in Nigeria - Mustapha AbdulRazaq,
Yahaya Makarfi Ibrahim and Ahmed Doko Ibrahim 47
Assessment of development of technicians/technologists in the built environment disciplines in Nigeria
- Emmanuel Achuenu, Bulus Gwom Pam and Stella Ache Achuenu 55
Multi-skilling barriers in the construction industry in North-Western Nigeria - Nasiru Adamu,
Mohammed Hassan Nensok and Adefemi Aka 67
Evaluation of involvement of built environment professionals in housing transformation processes in
three government housing estates in South- Western, Nigeria - Victor Olufemi Adegbehingbe83
Slum development in 3rd world countries: causes, effect and way out. 91
Examining the effect of quality management practices used on construction project performance -
Ademeso Olatunji, Windapo Abimbola and Fasina Nureni 99
Analysis of spatial types and social space in Ile-Ife domestic architecture - C O Adeokun 109
Assessment of contractors’ cost control practices in Metropolitan Lagos - Afeez Olalekan Sanni and
Olufemi Daniel Durodola 125
Client perspective for the implementation of lean construction in Nigerian construction industry -
Ograbe Ahiakwo, David Oloke, Subashini Suresh and Jamal Khatib 133
An exploration of the use of Delphi methodology in housing satisfaction studies -Clinton Aigbavboa
and Wellington Thwala 147
Morphing the rules: advanced adaptations of mud in Nigerian buildings - Stephen Babatunde Ajadi 163
Effect of crude oil impacted sand on the properties of concrete - Wasiu Olabamiji Ajagbe, O A Agbede
and B I O Dahunsi 177
Sustainable housing development and communal provision of infrastructures in Asuwamo residential
estate Akure, Nigeria - Mary Adebola Ajayi and Felix Kayode Omole 191
Impact of risk on performance of design and build projects in Lagos State, Nigeria - O M Ajayi, O E
Ogunsanmi, O A Salako and B A Mafimidiwo 203
Durability characteristics of concrete produced with date seed as light weight aggregate - A Aka, N
Adamu and M H Nensok 217
Impact of total quality management (TQM) on Nigerian construction firms - J. A. Akinola, O. F.
Akinradewo and S. O. Olatunji 225
Relevance of Hernando De Soto’s principle of land titling to Lagos Metropolis - Emmanuel Adesina
Aladeloba 237
Rational design of concrete mixes using uncrushed aggregates - T. O Alao 251
Causes of financial loss to contractors in the Uganda construction industry - Christopher Semyalo,
Henry Alinaitwe and Anthony Kerali 263
xvi
Minimization of heat gains in buildings: the case of domestic buildings in cape coast metropolis –
Ghana - Samuel K. Ansah and Emmanuel Bamfo-Agyei 275
Strength performance of laterized concrete at elevated temperatures - J. A. Apeh and E.O Ogunbode 289
Effect of packing densities of aggregates on the workability and compressive strength of concrete -
Chinwuba Arum 299
A need to re-define the status of professional valuation: The Nigerian perspective - Thomas A Ashaolu313
Evaluation of public private partnership (PPP) as alternative procurement route for infrastructure
development: Case of Nigeria mega city - Oluwaseyi A. Awodele, Stephen O. Ogunlana and
Olusola F. Akinradewo 329
Sustained beautification of Nigerian cities through landscaping: The case of Akure - Dorcas A Ayeni
and Charles A Olalusi 345
Success factors for implementation of private public partnerships in the construction industry in
Uganda - Henry Alinaitwe, Robert Ayesiga and Albert Rugumayo 355
Assessment and management of stormwater drainage facilities in residential areas of Enugu city -
Kevin Ejike Chukwu and B. O. Uwadiegwu 367
An assessment of housing sanitation and waste management practices in the residential core areas of
Osogbo, Osun State Nigeria - Hezekiah A. Ayoola, A. F. Lawal and M.L. Akinluyi 377
Benefit of conducting energy calculations in the built environment of Nigeria - Amina Batagarawa 389
Effect of climate change on construction project planning in Nigeria - Wasiu A. Bello, R. A. Adekunle
and O. E. Ogunsanmi 399
Estimating cost contingency for construction projects: The challenge of systemic and project specific
risk - Joseph Ignatius Teye Buertey, Emmanuel Abeere-Inga and Theophilus Adjei Kumi 413
Assessment of the rental values of residential properties in urban slums: The case of Osogbo, Osun
state Nigeria – I.D. Dabara, A.S. Okunola, A.G. Odewande and A. Okorie 427
Evaluation of the pozzolanic activity of Kajuru pumice tuff as sustainable Cementitious materials for
cement blending - D W Dadu, A M Stanley, K S N Gora and P E Ehoche 441
Assessment of Public-Private-Partnership Regulatory Framework for Infrastructure Development in
Nigeria - Alhassan Dahiru 451
An evaluation of the concrete production in typical construction sites in Nigeria - Dauda Dahiru and
Nasiru Shehu 463
Quantity and quality assessment of artificial lighting system of buildings in Nigeria - Dalhatu
Abdulsalam, Yunusa M Saleh, Abdullahi A Mati and Aliyu Suleiman Shika 473
The preference of Ghanaian contractors in providing occupational health and safety items; an
exploratory study - Frederick Owusu Danso, Edward Badu and Divine Kwaku Ahadzie 483
The reach and limits of architectural theory in practice: Interpretations from a Nigerian perspective -
Elizabeth T Dassah, Erepitan O. Ola-Adisa and Michael C. Odoala 495
Using indoor climatic measurements for occupancy monitoring - Tobore Ekwevugbe, Neil Brown and
Denis Fan 507
Urban open spaces; luxury or necessity - Augusta Ifeoma Emenike 521
A case for the construction of green buildings in Lesotho - F.A. Emuze, W.M. Shakantu and K.
Ntsihlele 523
Efforts in Rural Development by African Governments; Focus on Nigeria’s Niger Delta - Prince E.
England and A A Yakub 535
Determinants of vacancy rate in shopping centres in Akure, Nigeria - N B Ezeokoli, V A Bello and O S
Adebisi 551
Assessment of bid evaluation strategies for construction projects in Lagos State, Nigeria - I. O.
Famakin, I. O. Aje. and O. Olajide 563
Contributing factors of delay in the Nigerian construction industry: A comparative analysis with other
selected countries - Emmanuel O Fatoye 575
The kitchen in domestic space: A comparative study of kitchens cooking and culinary practice in Ile-
Ife, Nigeria - Folake Isaacs-Sodeye 589
Mass housing in Nigeria, customize the brief: Provide a desired house - Folaranmi Adedayo Olatunde607
xvii
The Use of Laterite-Cement-Enhanced Bricks in the Provision of Public Infrastructure: A Case Study
of Osun State University Bukateria Complex, Osogbo, Osun State, Nigeria - M.B Gasu ; A. O.
Ajayi and E Ogunjumo 619
Greening Accra: The use of landscape architecture to enhance the city’s environment - Karen Evans
Halm 627
Mitigating construction project risk using Building Information Modeling (BIM) - D.B. Hammad; A.
G. Rishi and M. B. Yahaya 643
Public-Private Partnerships (PPPs) in Housing Provision in Ogun State, Nigeria: Opportunities and
Challenges - Eziyi O. Ibem and Egidario B. Aduwo 653
Foundation for a decision support framework for optimal sequencing of emissions savings
refurbishment options in non-domestic buildings - Taofeeq Ibn-Mohammed , R.Greenough;
S.Taylor; L. Ozawa-Meida and A. Acquaye 663
Improving Labour Productivity in Masonry Work in Nigeria: The Application of Lean Management
Techniques - John Ebhohimen Idiake and Kabir Bala 677
An analysis of contractors’ approaches to risk management practices in Lagos state, Nigeria -
Irewolede Ijaola 687
Bridging the cultural gap between traditional and modern building designs - Oluwatosin Olufunto
Ijatuyi and Abraham Adeniyi Taiwo 697
Effect of used oil on the strength and compressibility behavior of lateritic soil - Ijimdiya, T S and
Igboro, T 709
INDEX OF AUTHORS 719
INDEX OF KEYWORDS 721


SECTION 1: KEYNOTES

Hughes, W. (2012) The business of construction procurement: selecting, defining and managing
procurement In: Laryea, S., Agyepong, S., Leiringer, R. and Hughes, W. (Eds) Procs 4th
West Africa
Built Environment Research (WABER) Conference, 24-26 July 2012, Abuja, Nigeria, 1- 7.
1
THE BUSINESS OF CONSTRUCTION PROCUREMENT:
SELECTING, DEFINING AND MANAGING
PROCUREMENT
Professor Will Hughes1
School of Construction Management and Engineering, University of Reading, PO Box 219, Reading,
RG6 6AW, UK
INSTITUTIONAL PERSPECTIVES
At one level, procurement means buying – or even more simply, obtaining something.
Most organizations of any size seem to have a procurement department to manage the
purchasing of the supplies required in the day-to-day business. The purchasing of
things other than raw materials and means of production is sometimes referred to as
indirect procurement in the business literature. Construction procurement seems to be
a special case of indirect procurement when it comes to commercial clients, for
example. It is rarely mentioned in the literature on purchasing and supply. However,
it is difficult to see whether it is a means of production or an indirect supply, because
it does not fit into either of the definitions. It has successfully been described by some
researchers as the procurement of a complex system, which may help to offer insights
from the procurement of other types of complex systems, such as defence and IT.
One thing is clear – it is difficult to characterize construction procurement
unambiguously.
There are some important characteristics that explain why construction is difficult to
deal with. First, it is organizationally very complex, involving hundreds of
specialized contractors, sub-contractors, consultants and advisors, as illustrated in an
in-depth analysis of roles and responsibilities in construction projects (Hughes and
Murdoch 2001). Second, construction projects are large and expensive, typically
representing a significant part of the buyer’s and seller’s annual turnover. This makes
the risks of non-performance very hazardous indeed, with potential losses being
sufficiently large to bankrupt the contractor or the client. Third, construction projects
typically occupy years, with the need for extensive professional work prior to design,
during design and in parallel with construction. It is not unusual for construction
projects to extend over more than a decade from inception to completion. Finally, the
high degree of specialization in design disciplines and construction disciplines leads
to serious fragmentation of the process, with highly differentiated tasks being carried
out in different firms, locations and times creating a strong demand for very
sophisticated project management and co-ordination functions. Thus, construction can
be thought of as a complex, expensive, time-consuming, fragmented process.
Typically, there are many different institutions and organizations who each have
different views about how various participants might or should become involved in
the process. One question that is raised by this phenomenon is whose interests are
served by professional institutions (Hughes 2003)?
Hughes
2
FRAGMENTED SUPPLY CHAINS
Construction supply chains are fragmented in many ways, for different reasons. In
each construction project, various roles are offered by particular specialists:
developers (owners, investors)
design consultants (architects, engineers)
advisory consultants (quantity surveyors, lawyers)
co-ordination and management (contractors, project managers)
installation (trade contractors, sub-contractors)
manufacture (materials and components)
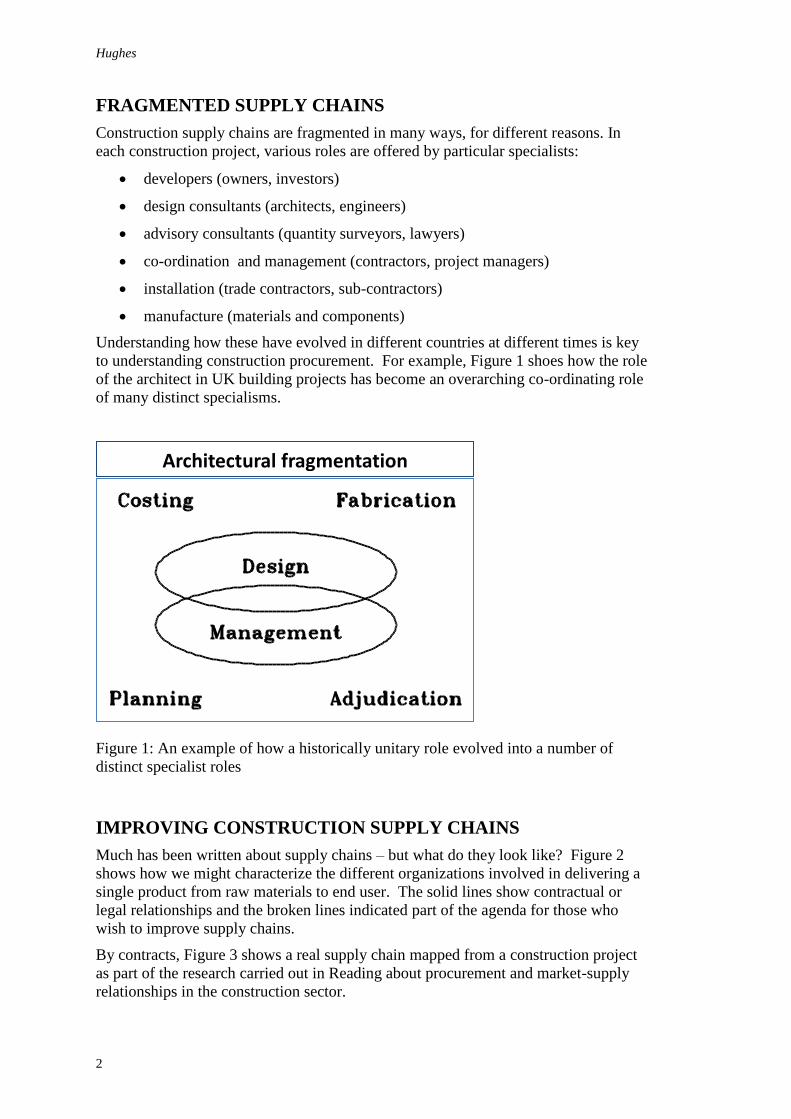
Understanding how these have evolved in different countries at different times is key
to understanding construction procurement. For example, Figure 1 shoes how the role
of the architect in UK building projects has become an overarching co-ordinating role
of many distinct specialisms.
Figure 1: An example of how a historically unitary role evolved into a number of
distinct specialist roles
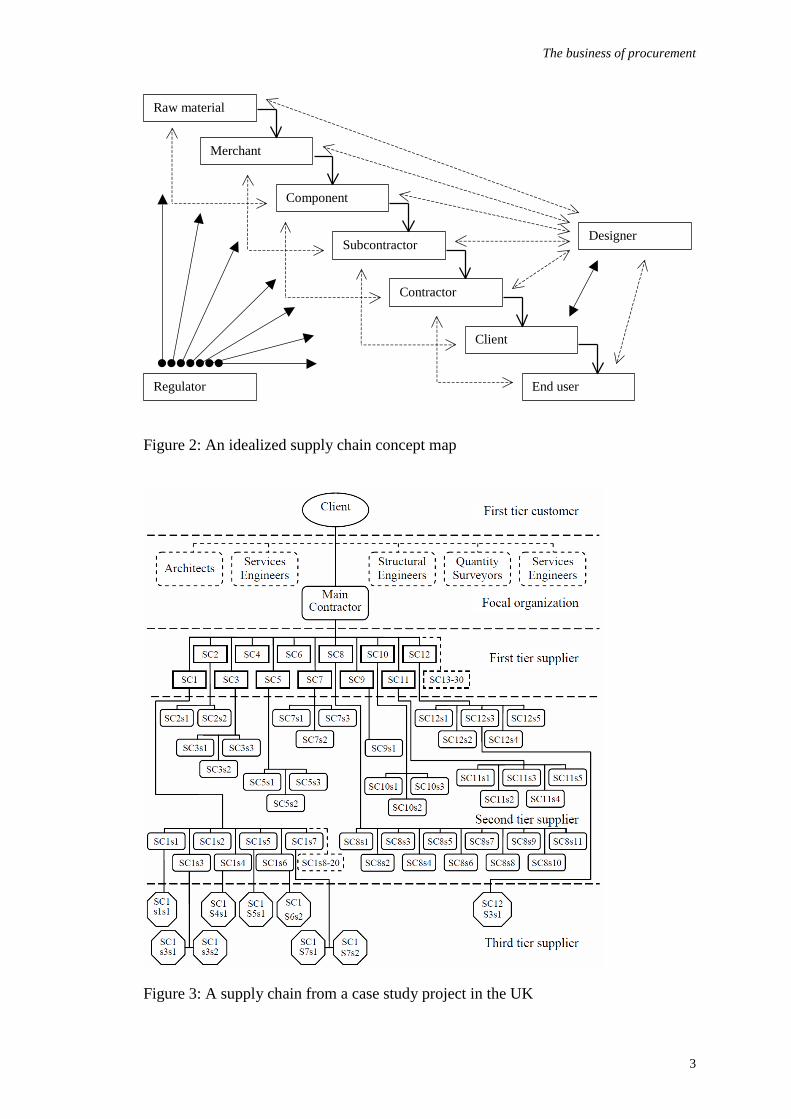
IMPROVING CONSTRUCTION SUPPLY CHAINS
Much has been written about supply chains – but what do they look like? Figure 2
shows how we might characterize the different organizations involved in delivering a
single product from raw materials to end user. The solid lines show contractual or
legal relationships and the broken lines indicated part of the agenda for those who
wish to improve supply chains.
By contracts, Figure 3 shows a real supply chain mapped from a construction project
as part of the research carried out in Reading about procurement and market-supply
relationships in the construction sector.
Architectural fragmentation
The business of procurement
3
Raw material
Merchant
Component
Subcontractor
Contractor
Designer
Client
End userRegulator
Figure 2: An idealized supply chain concept map
Figure 3: A supply chain from a case study project in the UK
Hughes
4
CONSTRUCTION PROCUREMENT ISSUES
The transformation and development of construction procurement raise a series of
issues that were discussed in an essay regarding the future of the built environment
professions (Hughes 2003), as summarized in this list:
Institutionalism or professionalism?
Managerialism or public service?
Knowledge or judgement?
Capital acquisition or service rental?
Partnering or integration?
Customization or original design?
Product/service development or cutting corners?
Supply-side or demand-side innovation?
CONSTRUCTION PROCUREMENT ROUTES: INSTITUTIONAL
VIEW
Most descriptions of construction procurement tend to focus on the roles of the key
supply chain partners. Any construction audience would recognize most of the terms
in this list:
General contracting
Design-build
Construction management
Management contracting
Partnering
Private finance initiative (design, build, finance, operate)
Engineer, procure and construct
Performance-based contracting
The key thing about this list is that it has little meaning out of the construction sector
context. You need to understand how the industry currently works in order to make
sense of this list. Worse, each item differs from the others on a unique basis. They
are not at the same level of focus, and are not exclusive categories. Therefore, the list
could be extended indefinitely.
WHAT IS CONSTRUCTION PROCUREMENT?
Thus, the question is how can we distinguish types of procurement with a few key
variables? What are the minimum necessary and sufficient characteristics or variables
that could usefully describe any procurement method? (Even those that have not yet
been invented!)
Some years ago, Masterman (1992) among others, pointed out that the typical process
for selecting a procurement method is so unstructured and haphazard as to lead to
The business of procurement
5
inappropriate approaches to procurement being selected. This problem has been
echoed more recently by many writers on the topic.
Luu, Ng and Chen (2003) suggest that the problem of inappropriate procurement
decision can be overcome by using a common list of 34 procurement selection
parameters that were derived from a close examination of previous research papers in
this field. A survey of 84 practitioners provided them with some reflections on their
list, and analysis of the results enabled them to trim their list to 25 parameters. In a
later paper (2005), they develop this into a decision support tool using case-based
reasoning. Drawing on 14 previously published papers, they categorize, group and
filter a large number of procurement selection criteria. From their work it would seem
that every writer in this topic develops his or her own set of criteria. Their proposal
for a decision-support system using case-based reasoning may produce an answer to
the question, which procurement system, based on what has worked in the past. But
rather than enter data into such a system, surely, it would be better to help people to
understand how to put together a procurement strategy?
CONSTRUCTION PROCUREMENT ROUTES: FUNCTIONAL
VIEW
Rather than try to create a set of procurement methods that overlap, describe different
levels of analysis and heap confusion on to confusion, the functional view begins with
the questions that a client might ask when considering how best to organize the
process. The following list delineates the basic six variables that arise from an
analysis of the wide range of procurement routes in existence, giving example of each
variable in turn.
Source of funding: Owner-financed, public sector-financed, developer-
financed, PFI, PPP
Selection method: Negotiation, partnering, frameworks, selective
competition, open competition
Price basis: Work and materials as in bill of quantities (approx or full), whole
building, managed facility, performance
Responsibility for design: Architect, engineer, contractor, novation, in-house
design teams
Responsibility for management: Client, lead designer, principal contractor,
management contractor, JV
Supply chain integration: single-source, integrated, fragmented, competitive,
collaborative
This list provides five examples for each of six variables, explains the complexity of
procurement more generally, such that anyone who is familiar with business could
understand the options, without needing a BSc in s construction-related discipline.
Moreover, there are 15,625 permutations of the items in this list. This explains a lot
of different procurement routes in a little space!
ROUTINES AND STANDARDS
Traditionally in construction, routines and standards have been institutional and
fundamentally protectionist often designed to ensure continuing workload for
professionals. However, the collaborative working agenda has driven interest groups
Hughes
6
together, outside traditional stakeholder boundaries. As a result, all of the various
guidance documents have started to converge on a widely accepted understanding of
what constitutes good business practice in construction. Thus, codes of practice and
standards are emerging for processes rather than for products. Two examples follow:
ISO 10845: CONSTRUCTION PROCUREMENT
Fair: Impartial and providing simultaneous and timely information. Not
prejudicing interests of the parties.
Equitable: Non-award to a compliant bidder only if restrictions from doing
business, incapability or incapacity, legality, conflicts of interest.
Transparent: Procurement process and criteria publicized. Decisions
publicly available with reasons, and verifiable.
Competitive: System provides for appropriate competition to ensure cost-
effective and best value outcomes.
Cost-effective: Processes standard with flexibility to attain best value
outcomes in respect of quality, timing and price.
Promotion of other objectives: (SMEs, poverty, job creation, local economic
development, etc) permit qualified tenders, criteria measurable, quantifiable
and monitored.
BS 8534: CONSTRUCTION PROCUREMENT POLICIES,
STRATEGIES AND PROCEDURES – CODE OF PRACTICE
Procurement policy (cross-ref to ISO 10845)
Initiation: business need, roles, responsibilities, objectives, outcomes, scope,
stakeholder identification…
Procurement strategy: client brief, procurement routes, work packages,
market engagement, control, approvals…
Procurement tactics: contracts, selection, liability, pre-quals, award,
performance, progress, evaluation …
Exit strategies: discharging contractual obligations, settling disputes, signing
off, moving on …
CONCLUSIONS – AGENDA FOR RESEARCH
This outline of problem areas in construction procurement provides an interesting
agenda for future research, which may be a healthy testing ground for theories about
business economics and organizational behaviour, among other things. For example:
Construction procurement as a complex process
What features does construction procurement share with other forms of
complex procurement like defence and IT?
How does the business context of construction help us to understand
processes?
Do routines and standards provide a rational and economic response to
complexity?
The business of procurement
7
Can flexibility and standardization co-exist?
How does the value of constructed assets affect the ability of the supply chain
to innovate collaboratively?
REFERENCES
Hughes, W P (2003) Technological scenario: de-professionalized, automated construction
procurement. In: Foxell, S (Ed.), The professionals’ choice: the future of the built
environment professions, pp. 82-98. London: Building Futures (a joint initiative of
RIBA and CABE).
Hughes, W P and Murdoch, J R (2001) Roles in construction projects: analysis and
terminology. Birmingham: Construction Industry Publications.
Luu, D T, Ng, S T and Chen, S E (2003) Parameters governing the selection of procurement
system: an empirical survey. Engineering, Construction and Architectural
Management, 10(3), 209-18.
Luu, D T, Ng, S T and Chen, S E (2005) Formulating procurement selection criteria through
case-based reasoning approach. Journal of Computing in Civil Engineering, 19(3),
269-76.
Masterman, J W E (1992) An introduction to building procurement systems. London: Spon.

Zubairu, S. (2012) The importance of evaluation and sustainability in the built environment In: Laryea,
S., Agyepong, S., Leiringer, R. and Hughes, W. (Eds) Procs 4th
West Africa Built Environment
Research (WABER) Conference, 24-26 July 2012, Abuja, Nigeria, 9-13.
9
THE IMPORTANCE OF EVALUATION AND
SUSTAINABILITY IN THE BUILT ENVIRONMENT
Professor Stella Zubairu1
Dean Postgraduate School, Federal University of Technology, Minna, Niger State, Nigeria
It is with great pleasure that I welcome participants to the 4th
WABER conference
which is taking place in Nigeria for the first time. Nigerians are known for their
hospitality so we aim to make you feel at home. In this keynote address, I would like
to focus on some aspects of the built environment that I feel deserve the attention of
researchers. The first is the importance of evaluating buildings after they have been
occupied and this is called Post-Occupancy Evaluation. The second is the very topical
issue of sustainable buildings.
Keywords: post-occupancy evaluation, sustainability, sustainable buildings
POST-OCCUPANCY EVALUATION
Introduction
Buildings are an important necessity to provide for human needs for shelter and
support for operations and equipment. Therefore by understanding how existing
buildings affect occupants, designers can minimise problems and capitalise on
successful design features. Evaluation and feedback are known to be cornerstones for
the continuous improvement in building procurement. Thus, for an effective feedback
system there is a need for Post Occupancy Evaluation (POE). Post Occupancy
Evaluation involves systematic evaluation of opinion about buildings in use, through
careful analysis of buildings from all relevant viewpoints, particularly the users of the
buildings. It is equally a tool used by facilities managers to account for building
quality, most especially when planning refurbishment of existing buildings. It helps
clarify perceived strengths and weaknesses in order to focus resources where they are
needed.
From past researches carried out (Brill, Wilson and Decker, 1984; Ellis, 1988;
Wolfgang, Harvey and Edward, 1988; Van Wagenberg, 1989; Zubairu and Olagunju.
2003), the participation by the users has been found to generate greater commitment to
solutions and more willingness of users/owners to accept shortcomings. Consequently,
POE of existing buildings involves relevant groups such as architects, engineers,
estate surveyors, developers, manufacturers but predominantly users. There is growing
global desire to assess and investigate performance of buildings after being occupied
due to its enormous influence on the occupants’ health, safety, performance in the
workplace and stakeholders’ needs.
Zubairu
10
THE PROCESS OF POST-OCCUPANCY EVALUATION
Post-occupancy Evaluation is a method of measuring the performance of a building in
use, with respect to the brief, the goals of the design team, and the activities and
feelings of the users (Van Wagenberg, 1989; Zubairu, 2006). The building’s
occupants evaluate the suitability of the building to meet their particular needs
(Barrett, 1995). The term Post Occupancy Evaluation (POE) was coined over 25 years
ago and comprises all activities that originate out of an interest in learning how a
building performs once it is built and occupied, including if and how well it has met
expectations and how satisfied building users are with the environment that has been
created. Precisely, Post Occupancy Evaluation involves systematic evaluation of
opinions about buildings in use, from the perspective of the people who use them.
Preiser, Rabinowitz and White (1988) further defined POE as a process of evaluating
buildings in a systematic and rigorous manner after they have been built and occupied
for some time. Many actors participate in the use of buildings, they include investors,
owners, operators, maintenance staff, and perhaps most important of all, the end users.
Post Occupancy Evaluation (POE) differs significantly from conventional surveys and
market research. It uses the direct, unmediated experiences of building users as the
basis for evaluating how a building works for its intended purpose.
There are three levels of POE: Indicative, investigative and diagnostic. The indicative
POE is the first level carried out in a short period of time to determine whether there
are serious problems in the building. The next level is the investigative POE which is
carried out after an indicative POE has identified issues that need further
investigation. The third level is the diagnostic POE which may take from several
months to a year and the results are long-term oriented to improve not only a
particular facility but also the state of the art in a given building type.
Post occupancy evaluation involves measuring the suitability and convenience of
facilities through the following:
(i) Systematic consideration of opinions of users about buildings in use
(ii) Onsite inspection of existing infrastructure
(iii) Prescribing possible means of improvement of these facilities
Equally, POEs are used for many purposes including;
(a) Developing new facilities
(b) Managing and improving on existing buildings
(c) Establishing better building and maintenance standards.
In conclusion, as in every endeavour in life, it is important for one to stop, look back
and assess or evaluate his or her performance over a period of time, it is necessary to
evaluate buildings to determine their strengths and weaknesses. All buildings are
substantial investments and their effective functioning is often critical to success of
businesses in office environments, while the safety and comfort of users is critical to
optimum performance by the users. Therefore the importance of Post-occupancy
evaluation in the area of research in the built environment cannot be overemphasised.
The next topic I want to briefly discuss is sustainable buildings.
SUSTAINABLE BUILDINGS
One of the Millennium Development Goals (MDGs) is to ensure environmental
sustainability. In the building construction sector, most often the environment is
adversely affected – trees are cut down, bushes and grasses are cleared, soils are
excavated, and the construction process generates air and noise pollution (Gonchar,
Evaluation and sustainability
11
2007; Jimoh and Banuso, 2008). Raw materials extraction for building, leads to
depletion of natural resources which are often not replenished. Decisions made at the
drawing board stage have long-term environmental consequences. Building
professionals, as the designers of buildings, have to be aware of the importance of the
design of sustainable buildings. Sustainable buildings are buildings which are
environmentally friendly, that is, buildings which have minimal adverse effect on the
environment, utilizing renewable sources of energy and as much of re-cycled
materials as possible. Passive use of solar and wind energy can be achieved if the
building is properly designed and oriented. With the poor power generation and
distribution in Nigeria, the design of energy efficient buildings becomes even more
imperative. This can also be achieved in sustainable buildings (Zubairu, 2009).
The average Nigerian is not aware of the importance of sustaining the environment.
This lack of awareness needs to be addressed in universities where both lecturers and
students need to be made more conscious of the dire need for sustainability of the
environment.
WHAT ARE SUSTAINABLE BUILDING MATERIALS?
Sustainable building materials, also known as ‘green’ or environmentally friendly
building materials, are materials which can be easily replenished or re-cycled, have
lower toxicity and higher energy efficiency. Building construction consumes 40% of
the raw stone, gravel and sand used globally each year; it consumes 25% of the wood,
40% of energy and 16% of water used worldwide (Rodman and Lenssen, 1995).
Timber for example, is a common and frequently used building material. As trees are
cut down to provide timber for building and other purposes, are new trees being
planted to replace those cut down? Building professionals have a responsibility to
ensure that the materials we specify are environmentally friendly or sustainable. This
knowledge must be imparted to students of environmental sciences so that it becomes
a basic part of their thinking process.
Building professionals may ask what attributes make a building material sustainable?
How can environmental sustainability of a building material be measured? This is
where research institutions like universities and research centres come in. Such
important issues require in depth and continuous research.
Research into sustainable building materials was carried out by Dr Jong-Jin Kim and
his research team from the University of Michigan in the United States of America.
They determined that the presence of one or more of the following features would
help in determining a building material’s relative sustainability (Kim, Rigdon and
Graves, 1998):
Pre-building Phase: Manufacture
1. Waste Reduction
2. Pollution Prevention
3. Recycled Content
4. Embodied Energy Reduction
5. Use of Natural Materials
Building Phase: Use
1. Energy Efficiency
2. Water Resistance
3. Use of non- or less-toxic Materials
4. Renewable Energy Systems
Zubairu
12
5. Longer Life
Post-building Phase – Disposal
1. Biodegradability
2. Recyclability
3. Reusability
The survey results indicated that positive gains have been made in the production of
sustainable building materials but less emphasis has been given to the post-building
stage i.e. how degradable is the building material, can it be re-cycled or re-used after
the building has exhausted its life span? These are questions which building
professionals also need to look into.
RESEARCH AND TEACHING OF ENVIRONMENTAL
SUSTAINABILITY IN ARCHITECTURE
Dr Kim also carried out a survey of architectural educators to determine the extent of
environmental education in the field. The survey involved all accredited schools of
Architecture in the United States and Canada. The results indicated that there was a
significant shortage of teaching materials designed specifically for sustainable
architecture.
I have carried out a survey of schools of Architecture in Nigeria (Zubairu, 2007) and
have discovered that there is no school of Architecture with an environmental
laboratory to enable staff and students to carry out various tests on building materials
to ascertain their environmental sustainability. Some departments of Building have
laboratories but they focus more on concrete tests such as slump test and crushing
tests for bricks and sandcrete blocks. Research students in Architecture and Building
should be able to subject natural materials such as timber to various tests to determine
its behaviour under specific environmental conditions in specific parts of the country.
What is the anticipated life span of for example, a brick building exposed to constant
harmattan dust as opposed to such a building in the Niger Delta area of Nigeria?
These are the types of experiments that can be conducted and the results will enable
researchers to produce a compendium of sustainable building materials indicating the
life spans of various building materials under different environmental conditions. Re-
cycling tests can also be carried out as well as biodegradability tests. From the results
of such experiments, the possible innovations in material use are numerous.
CONCLUSION
Sustaining the environment in which we live is very crucial to the survival of man on
this planet. Every individual must be an active participant in ensuring this
sustainability. Building professionals, as active participants in the built environment,
are expected to lead the way in this global concern. Research into sustainable building
materials and sustainable buildings should be accorded the importance it deserves.
Adequate funding is essential and research institutions in West Africa should initiate
an aggressive drive to seek for funds to facilitate the research process. Researchers
should make environmental sustainability an integral part of their thinking process;
this process should be continued in practice so that every building professional will
focus on sustainability in the construction industry.
On this note, I wish all the participants at this conference a very fruitful discourse and
it is my hope that the final research findings of these scholars will result in
improvements in the quality of the built environment in West Africa in particular and
the whole world in general.
Evaluation and sustainability
13
REFERENCES
Barrett, P. (1995). Facilities Management Towards best practice, London: Blackwell Science
Ltd.
Brill, M., Wilson, S. and Decker, F.(1984). Using Office Design to increase Productivity,
vol.1, Buffalo, New York: Workplace Design and Productivity Inc.
Ellis, P., (1988). Post-occupancy Evaluation: Evaluating for the future, Facilities,Jan, 6(1)7-9.
Gonchar, J. (2007). “Safety and Security without the Fortress Look,” Architectural Record,
New York: McGraw-Hill, October, pp 159-166
Jimoh, R.A. and Banuso, O.R.(2008). “Towards a sustainable built Environment, Book of
Proceedings of 2nd Annual conference of the School of Environmental
Technology,Federal University of Technology, Minna,pp70-74.
Kim, J, Rigdon, B. and Graves, J. (1998). “Pollution prevention in Architecture,” Centre for
Sustainable Systems, University of Michigan, [email protected]. Retrieved 25th
April 2009.
Preiser, W., Rabinowitz, H. and White, E. T., Eds, (1988). Post Occupancy Evaluation, New
York: Van Nostrand Reinhold Co.
Rodman, D. and Lenssen, N. (1995). “A Building Revolution: How Ecology and Health
Concerns are transforming construction, Worldwatch paper, Washington D.C.
Van Wagenberg, A. F.(1989). Post-Occupancy Evaluation for General Hospitals, paper
Presented at first International Symposium on Facility Management, Washington
D.C., May 10-12.
Wolfgang, F.E.P., Harvey, Z.R., and Edward, T.W., (1988). Post-occupancy Evaluation,New
York: Van Nostrand Reinhold Co.
Zubairu, S.N., and Olagunju. R.E., (2003). A Study of Space Planning in private and
Government office buildings in Abuja and Minna, unpublished research work, Federal
University of Technology, Minna, Nigeria.
Zubairu, S.N. (2006). Participatory Design – Community and user input in design,
AARCHESJ –Journal of the Association of Architectural Educators in Nigeria,
Nigeria: March,5(1) 55-58.
Zubairu, S. N. (2007) “Management of Facilities in Schools of Architecture in Nigeria,”
AARCHES J -Journal of the Association of Architectural Educators in Nigeria, vol 6, no.2,
June, pp 32-38
Zubairu, S.N. (2009). “The Role of Universities in developing and promoting the use of
Sustainable building materials in Nigeria, paper presented at the Biennial General Meeting
and Conference of the Nigerian Institute of Architects, Yar’adua Conference Centre,
Abuja,19th -21
st November.


15
SECTION 2: CONFERENCE PAPERS

Abalaka, A.E. and Okoli, O.G. (2012) Effects of curing conditions on compressive strength
development of high strength concrete In: Laryea, S., Agyepong, S.A., Leiringer, R. and Hughes, W.
(Eds) Procs 4th West Africa Built Environment Research (WABER) Conference, 24-26 July 2012,
Abuja, Nigeria, 17-23.
17
EFFECTS OF CURING CONDITIONS ON
COMPRESSIVE STRENGTH DEVELOPMENT OF HIGH
STRENGTH CONCRETE
A.E. Abalaka1 and O. G.
Okoli
2
1Department of Building, Federal University of Technology, Minna, Nigeria
2Department of Building, Ahmadu Bello University, Zaria, Nigeria
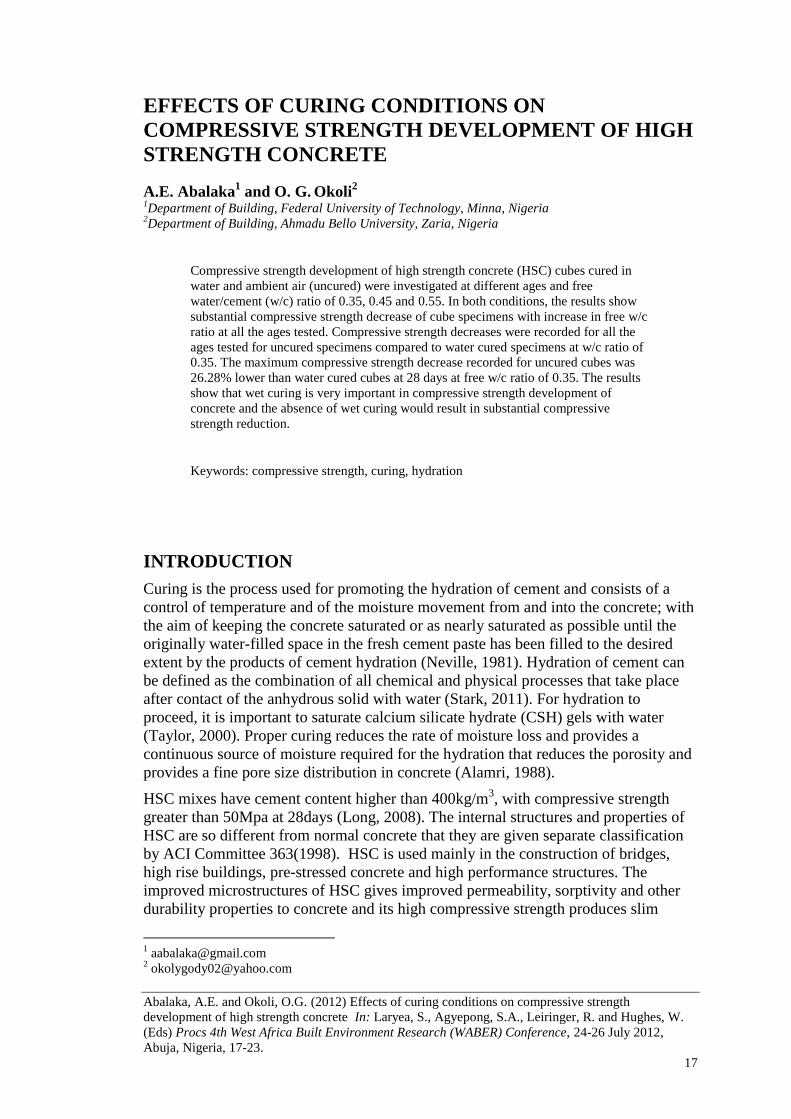
Compressive strength development of high strength concrete (HSC) cubes cured in
water and ambient air (uncured) were investigated at different ages and free
water/cement (w/c) ratio of 0.35, 0.45 and 0.55. In both conditions, the results show
substantial compressive strength decrease of cube specimens with increase in free w/c
ratio at all the ages tested. Compressive strength decreases were recorded for all the
ages tested for uncured specimens compared to water cured specimens at w/c ratio of
0.35. The maximum compressive strength decrease recorded for uncured cubes was
26.28% lower than water cured cubes at 28 days at free w/c ratio of 0.35. The results
show that wet curing is very important in compressive strength development of
concrete and the absence of wet curing would result in substantial compressive
strength reduction.
Keywords: compressive strength, curing, hydration
INTRODUCTION
Curing is the process used for promoting the hydration of cement and consists of a
control of temperature and of the moisture movement from and into the concrete; with
the aim of keeping the concrete saturated or as nearly saturated as possible until the
originally water-filled space in the fresh cement paste has been filled to the desired
extent by the products of cement hydration (Neville, 1981). Hydration of cement can
be defined as the combination of all chemical and physical processes that take place
after contact of the anhydrous solid with water (Stark, 2011). For hydration to
proceed, it is important to saturate calcium silicate hydrate (CSH) gels with water
(Taylor, 2000). Proper curing reduces the rate of moisture loss and provides a
continuous source of moisture required for the hydration that reduces the porosity and
provides a fine pore size distribution in concrete (Alamri, 1988).
HSC mixes have cement content higher than 400kg/m3, with compressive strength
greater than 50Mpa at 28days (Long, 2008). The internal structures and properties of
HSC are so different from normal concrete that they are given separate classification
by ACI Committee 363(1998). HSC is used mainly in the construction of bridges,
high rise buildings, pre-stressed concrete and high performance structures. The
improved microstructures of HSC gives improved permeability, sorptivity and other
durability properties to concrete and its high compressive strength produces slim
Abalaka and Okoli
18
concrete sections. These improvements in properties of HSC facilitate the construction
of structures with long service lifespan and low life cycle maintenance cost.
Earlier works by Gonnerman and Shuman (1928), Price (1951), show that concrete
continuously uncured in air had lower compressive strength compared to water cured
concrete at all the ages tested. The work of Soroka and Baum (1994) showed that at
28 days, compressive strength of concrete cube specimens continuously wet cured was
40% higher than those uncured and at 90days specimens continuously moisture cured
had compressive strength 20% higher than those of uncured cubes. Increase in
compressive strength and other mechanical properties of concrete by continuous water
curing are attributable to improved gel/space ratio in concrete (Neville 1981).
Guneyisi et al. (2005) reported compressive strength loss of 10-20% of concrete cubes
that were ambient air cured compared to cubes that were wet cured. Compressive
strength losses were recorded at ages of 28, 90 and 180 days for cube specimens that
were air cured compared to wet cured cubes. Wet curing was reported to be more
effective in improving compressive strength at later ages for higher w/c ratio specimen
than lower w/c ratio specimen.
Alizadeh et al. (2008) reported compressive strength increases of concrete cubes cured
in water compared to air cured cubes at 7 and 28 days using Portland cement at
cement content of 400kg/m3. Bushlaibi and Alshamsi (2002) reported substantial
strength reduction only at 270 days for air cured cubes relative to water cured cubes in
HSC in arid environment.
The degree of hydration of cement is dependent on the vapour pressure. The work of
Powers (1947) shows that the degree of hydration is negligible at a vapour pressure
below 0.3 of the saturation pressure and low hydration occurs at a vapour pressure of
0.8 of the saturation pressure. Spears (1983) opined that cement hydration does not
improve when cured at relative humidity below 80%. This shows the importance of
saturating concrete by continuous wetting with water to saturate the pores, thus
promoting cement hydration. When concrete is not cured by continuous immersion in
water, the vapour pressure in the pores would drop below saturation pressure and
compressive strength reduction would occur. Furthermore, only half of the water
present in paste can be used for chemical combination, even if this is less than that
required for combination (Powers 1947, Neville 2006). The quantity of uncombined
water is also known to affect microscopic pores in concrete. Measurements by
Friedemann et al. (2006) using nuclear magnetic resonance shows that total volume of
capillary pores and their size increases with increase in w/c ratio. These indicate that
w/c ratio of a concrete mix would affect vapour pressure and ultimately it’s
compressive strength; particularly when addition external water was not provided as
exemplified in uncured cubes and the aim of this study was to determine the effect of
w/c ratio on compressive strength development of concrete that was continuously
cured and uncured.
Standard concrete specifications are usually based on 28days strength of concrete
cubes continuously cured in water. In practice, site concrete rarely have the benefit of
the continuous wet curing method used in the laboratory, due to technical difficulties
in providing continuous wet curing for concrete elements. Though ACI 305
recommends continuous water curing for at least the first few days when concreting in
hot weather when moisture loss could be high, this is particularly difficult in site
concrete practice for vertical elements. In this study, the compressive strength
development of HSC cube specimens continuously cured in water and those stored
Compressive strength of concrete
19
ambient in air in the laboratory in Zaria, Nigeria was investigated. In the strict sense
of curing, cube specimens stored on the laboratory floor would be uncured. The
ambient air curing simulates practical concrete production since site concrete elements
are not usually subjected to continuous water curing. An understanding of the effects
of uncured and wet curing conditions on compressive strength development of HSC is
important in developing good concrete practice for this class of concrete. This is
particularly important in concrete specifications and practice in the Nigerian
environment.
MATERIALS AND METHOD
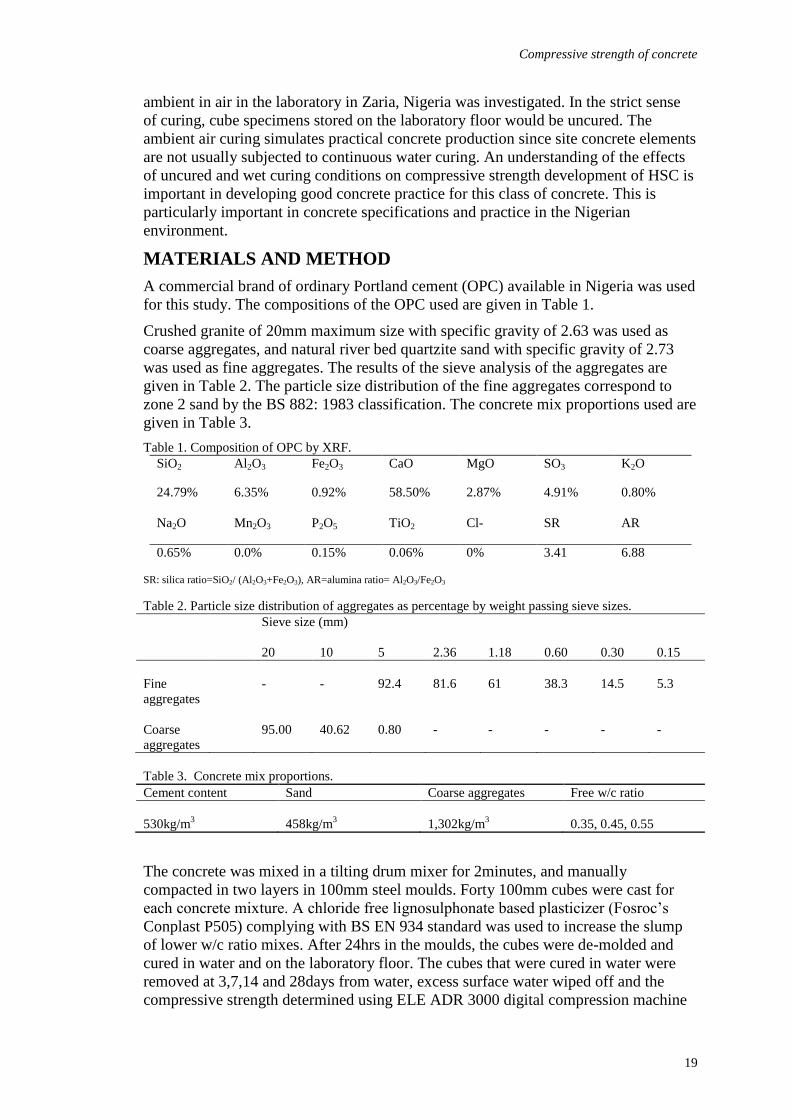
A commercial brand of ordinary Portland cement (OPC) available in Nigeria was used
for this study. The compositions of the OPC used are given in Table 1.
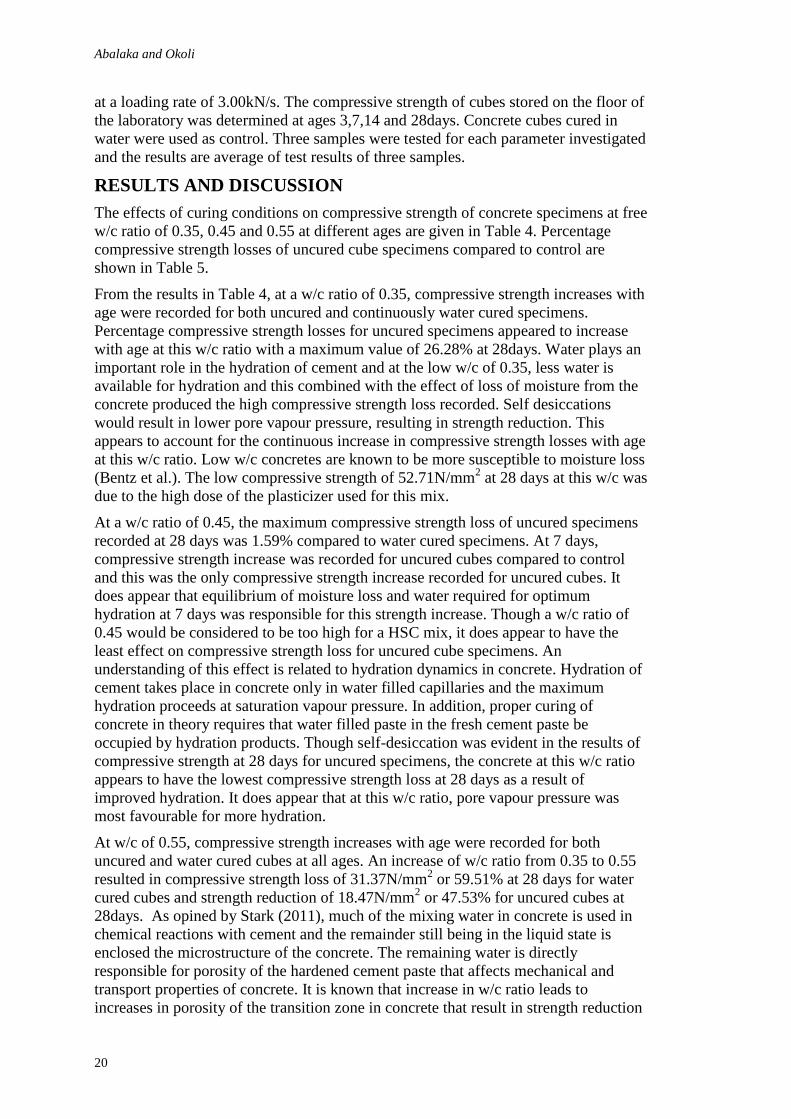
Crushed granite of 20mm maximum size with specific gravity of 2.63 was used as
coarse aggregates, and natural river bed quartzite sand with specific gravity of 2.73
was used as fine aggregates. The results of the sieve analysis of the aggregates are
given in Table 2. The particle size distribution of the fine aggregates correspond to
zone 2 sand by the BS 882: 1983 classification. The concrete mix proportions used are
given in Table 3.
Table 1. Composition of OPC by XRF.
SiO2 Al2O3 Fe2O3 CaO MgO SO3 K2O
24.79% 6.35% 0.92% 58.50% 2.87% 4.91% 0.80%
Na2O Mn2O3 P2O5 TiO2 Cl- SR AR
0.65% 0.0% 0.15% 0.06% 0% 3.41 6.88
SR: silica ratio=SiO2/ (Al2O3+Fe2O3), AR=alumina ratio= Al2O3/Fe2O3
Table 2. Particle size distribution of aggregates as percentage by weight passing sieve sizes.
Sieve size (mm)
20 10 5 2.36 1.18 0.60 0.30 0.15
Fine
aggregates
-
-
92.4
81.6
61
38.3
14.5
5.3
Coarse
aggregates
95.00
40.62
0.80
-
-
-
-
-
Table 3. Concrete mix proportions.
Cement content Sand Coarse aggregates Free w/c ratio
530kg/m3
458kg/m3
1,302kg/m3
0.35, 0.45, 0.55
The concrete was mixed in a tilting drum mixer for 2minutes, and manually
compacted in two layers in 100mm steel moulds. Forty 100mm cubes were cast for
each concrete mixture. A chloride free lignosulphonate based plasticizer (Fosroc’s
Conplast P505) complying with BS EN 934 standard was used to increase the slump
of lower w/c ratio mixes. After 24hrs in the moulds, the cubes were de-molded and
cured in water and on the laboratory floor. The cubes that were cured in water were
removed at 3,7,14 and 28days from water, excess surface water wiped off and the
compressive strength determined using ELE ADR 3000 digital compression machine
Abalaka and Okoli
20
at a loading rate of 3.00kN/s. The compressive strength of cubes stored on the floor of
the laboratory was determined at ages 3,7,14 and 28days. Concrete cubes cured in
water were used as control. Three samples were tested for each parameter investigated
and the results are average of test results of three samples.
RESULTS AND DISCUSSION
The effects of curing conditions on compressive strength of concrete specimens at free
w/c ratio of 0.35, 0.45 and 0.55 at different ages are given in Table 4. Percentage
compressive strength losses of uncured cube specimens compared to control are
shown in Table 5.
From the results in Table 4, at a w/c ratio of 0.35, compressive strength increases with
age were recorded for both uncured and continuously water cured specimens.
Percentage compressive strength losses for uncured specimens appeared to increase
with age at this w/c ratio with a maximum value of 26.28% at 28days. Water plays an
important role in the hydration of cement and at the low w/c of 0.35, less water is
available for hydration and this combined with the effect of loss of moisture from the
concrete produced the high compressive strength loss recorded. Self desiccations
would result in lower pore vapour pressure, resulting in strength reduction. This
appears to account for the continuous increase in compressive strength losses with age
at this w/c ratio. Low w/c concretes are known to be more susceptible to moisture loss
(Bentz et al.). The low compressive strength of 52.71N/mm2 at 28 days at this w/c was
due to the high dose of the plasticizer used for this mix.
At a w/c ratio of 0.45, the maximum compressive strength loss of uncured specimens
recorded at 28 days was 1.59% compared to water cured specimens. At 7 days,
compressive strength increase was recorded for uncured cubes compared to control
and this was the only compressive strength increase recorded for uncured cubes. It
does appear that equilibrium of moisture loss and water required for optimum
hydration at 7 days was responsible for this strength increase. Though a w/c ratio of
0.45 would be considered to be too high for a HSC mix, it does appear to have the
least effect on compressive strength loss for uncured cube specimens. An
understanding of this effect is related to hydration dynamics in concrete. Hydration of
cement takes place in concrete only in water filled capillaries and the maximum
hydration proceeds at saturation vapour pressure. In addition, proper curing of
concrete in theory requires that water filled paste in the fresh cement paste be
occupied by hydration products. Though self-desiccation was evident in the results of
compressive strength at 28 days for uncured specimens, the concrete at this w/c ratio
appears to have the lowest compressive strength loss at 28 days as a result of
improved hydration. It does appear that at this w/c ratio, pore vapour pressure was
most favourable for more hydration.
At w/c of 0.55, compressive strength increases with age were recorded for both
uncured and water cured cubes at all ages. An increase of w/c ratio from 0.35 to 0.55
resulted in compressive strength loss of 31.37N/mm2 or 59.51% at 28 days for water
cured cubes and strength reduction of 18.47N/mm2 or 47.53% for uncured cubes at
28days. As opined by Stark (2011), much of the mixing water in concrete is used in
chemical reactions with cement and the remainder still being in the liquid state is
enclosed the microstructure of the concrete. The remaining water is directly
responsible for porosity of the hardened cement paste that affects mechanical and
transport properties of concrete. It is known that increase in w/c ratio leads to
increases in porosity of the transition zone in concrete that result in strength reduction

Compressive strength of concrete
21
(Elrahman et al. 2011, Prokopski and Langier 2000). Higher w/c ratio has been
associated with larger pore size in cement hydration (Friedemann et al. 2006). The
maximum compressive strength loss recorded at 28 days for uncured cubes at this w/c
ratio was 4.45% compared to control. The results recorded at this w/c ratio indicate a
general reduction in percentage compressive strength loss of uncured cubes with age.
This percentage reduction of compressive strength loss with age of uncured specimens
compared to the values recorded at a lower w/c ratio of 0.35 can be attributed to
addition water available for hydration at a higher w/c ratio to compensate for moisture
loss in the concrete. However the use of higher w/c in concrete leads to lower
compressive strength and reduction in durability properties (Abalaka et al. 2010,
Abalaka et al. 2011).
Table 4. Effects of curing conditions on compressive strength development of HSC. Free
w/c
ratio
Plasticizer
(l/m3)
Slump
(mm)
Uncured
Compressive strength (N/mm2)
Wet cured
Compressive strength (N/mm2)
3days 7days 14days 28days 3days 7days 14days 28days
0.35
5.7
90
29.03
34.24
36.64
38.86
35.42
41.68
45.73
52.71
0.45 1.1 200 22.13 29.96 31.00 33.40 23.82 27.68 33.69 33.94
0.55 0 200 13.29 16.25 18.56 20.39 15.20 16.99 21.01 21.34
Table 5. Percentage compressive strength losses with age of uncured cubes.
Free
w/c
ratio
Percentage compressive strength losses of uncured
cubes relative to control
3days 7days 14days 28days
0.35
-18.04
-17.85
-19.88
-26.28
0.45 -7.09 +8.24 -7.98 -1.59
0.55 -12.57 -4.36 -11.66 -4.45
The results in Tables 4 and 5 have shown the importance of w/c ratio in compressive
strength development of concrete. Higher w/c ratio could reduce compressive of HSC
concrete mix to that of normal strength concrete. The results further shows that the
low w/c ratio mixes were more susceptible to moisture losses that could adversely
affect compressive strength at 28 days. Increase in compressive strength of water
cured cubes relative to uncured cubes is due to continuous hydration resulting from
the saturation of concrete pores with water. By saturating the concrete pores with
water by continuous water curing, the growth of CSH gels that are responsible for
strength of concrete would be promoted; this effectively improves the gel/space ratio.
Self-desiccation of concrete resulting in compressive strength loss could be arrested
by providing adequate curing to hardened concrete.
CONCLUSIONS
The relatively low values of compressive strength recorded for the HSC mix used for
this study at all the ages of cubes tested at w/c ratio of 0.35 and 0.45 was due to the
high dose of the plasticizer used.
The results of this study show that while low w/c is very important in achieving high
compressive strength in concrete mixes, it could result in higher compressive strength
losses if moisture loss was not controlled. The results also show the importance of
water curing in continuous hydration of calcium silicate hydrate gels in concrete,
Abalaka and Okoli
22
particularly at low w/c ratio. Though practical concreting would not permit complete
water immersion curing method used in laboratory research work, practical curing
methods like continuous water spraying and application of membrane-forming curing
compound to fresh concrete are very important in optimizing compressive strength
development. The results in this study have shown that when proper curing is not
provided substantial compressive strength reductions would result particularly at low
w/c ratio mixes.
REFERENCES
Abalaka A.E, Okoli O.G, Garba M.M, Zubairu I.K. (2010). Properties of normal strength
concrete with rice husk ash. International journal of architecture and environment.
Vo.2.1, pp 70-76.
Abalaka A.E, Okoli O.G, Garba M.M, Zubairu I.K. (2011). Effects of Nigerian rice husk ash
produced using a charcoal fired incinerator on properties of cement mortar and
concrete: Preliminary results In: Laryea, S., Leiringer, R. and Hughes, W. (Eds) Procs
West Africa Built Environment Research (WABER) Conference, 19-21 July 2011,
Accra, Ghana, pp 379-389.
ACI Committee 305, (1991). Hot Weather Concreting, American Concrete Institute, Detroit,
MI.
ACI Committee 363. (1998). State-of-art report on high strength concrete. (ACI 363 R-92/97).
In: Manual of concrete practice ACI: 55p.
Alamri A.M. (1988). Influence of curing on the properties of concrete and mortars in hot
climates, PhD thesis, Leeds University, U.K. 1988.
Alizadeh R, Ghods P, Chini M, Hoseini M, Ghalibafian M, and Shekarchi M. (2008). Effect
of curing conditions on the service life design of RC structures in the Persian Gulf
region. Journal of materials in civil engineering. Vol.1.2. 0899-1561.
Bentz D.P. Snyder K.A. and Stutzman P.E. Hydration of Portland cement: The effects of
curing conditions. Available at http://fire.nist.gov/bfrlpubs/build97/PDF/b97002.pdf
[accessed 16 Feb. 2012]
British Standards Institution. (1983). Specification for aggregates from natural sources for
concrete. London.
Bushlaibi A. H, Alshamsi A. M (2002). Efficiency of curing on partially exposed high-
strength concrete in hot climate. Cement and concrete research. Vol. 32, pp 949-953.
Elrahman MAA, Imam M.A. Reheem A. H.A. and Tahwia A.M. (2011). Production and
properties of superplasticized concrete. Journal of Civil Engineering and Architecture.
Vol.5, 4 (41), pp. 341-352.
Friedemann K, Stallmach F, Kärger J. (2006). NMR diffusion and relaxation studies during
cement hydration—A non-destructive approach for clarification of the mechanism of
internal post curing of cementitious materials. Cement and concrete research. Vol. 36,
pp 817-826.
Gonnerman, H.F and Shuman, E.C. (1928). Flexure and tension tests of plain concrete. Major
series 171, 209 and 210. Report of the director of research. Portland cement
association, pp 149 &163.
Guneyisi E, Ozturan T, Gesoglu M. 2005. A study on reinforcement corrosion and related
properties of plain and blended cement concretes under different curing conditions.
Cement and concrete composites. Vol 27, pp 449-461.
Long T.P. (2008). High strength concrete at high temperature- an overview. [Cited 2012
January 20]. Available from http://fire.nist.gov/bfrlpubs/build02/pdf/b02171.pdf
Compressive strength of concrete
23
Neville A. M. (1981). Properties of concrete. Third edition. Longman scientific and technical.
England, pp 307-318.
Powers T.C. (1947). A discussion of cement hydration in relation to the curing of concrete.
Proceedings of highway research board. Vol.27, pp 177-88.
Price H.W. (1951). Factors influencing concrete strength. Journal of American concrete
institute. Vol. 47, pp. 417-32.
Prokopski G and Langier B. (2000). Effect of water/cement ratio and silica fume addition on
the fracture toughness and morphology of fractured surfaces of gravel concretes.
Cement and concrete research. Vol. 30 (9), pp 1427-1433.
Sokora I, Baum H. (1994). Influence of specimens size on effect of curing regime on concrete
compressive strength. Journal of materials in civil engineering. ASCE. 6(1), pp15-22
Spears R.E (1983). The 80 percent solution to inadequate curing problems. Concrete
international. Vol. 5, pp 15-18.
Stark J (2011). Recent advances in the field of cement hydration and microstructure analysis.
Cement and concrete research. Vol. 41, pp 666-678.
Taylor G.D. (2000). Materials in construction, an introduction. Third edition. Pearson
education limited. England. U.K, pp 50-51.
Tuan N. V, Ye G, Breugel K, Copuroglu O. (2011). Hydration and microstructure of ultra
high performance concrete incorporating rice husk ash. Cement and concrete research.
Vol. 41, pp 1104-1111.

Abdul’Azeez, A. D., Zubairu, I. K., Dahiru, D. and Ahmed, U. A. (2012) Assessing the Structural
Integrity of existing building structures In: Laryea, S., Agyepong, S.A., Leiringer, R. and Hughes, W.
(Eds) Procs 4th West Africa Built Environment Research (WABER) Conference, 24-26 July 2012,
Abuja, Nigeria, 25-34.
25
ASSESSING THE STRUCTURAL INTEGRITY OF
EXISTING BUILDING STRUCTURES
A. D. Abdul’Azeez1, I. K. Zubairu, D. Dahiru and U. A. Ahmed
Department of Building, Ahmadu Bello University, Zaria, Nigeria
Generally building structures are often exposed to several factors that lead to their
decay. It is therefore necessary to periodically establish their integrity, safety and
reliability in order to ensure their serviceability. Thus, this paper presents the results
of condition assessment of selected building structures in Ahmadu Bello University,
Zaria, Nigeria with a view to establishing structural adequacy, safety and reliability.
Visual inspection and detailed condition assessment to obtained general information
of the buildings and structural defects, damages, distress, deformation and/or material
deterioration was carried using some of the non-destructive test (NTD) techniques. A
total of eight buildings were considered and in each building three structural elements
(each) namely columns, beams and slabs were studied. Results show that although
deterioration was observed which was mainly due to environmental factors, and lack
of regular maintenance. The result of the study shows that all the buildings examined
have a mean compressive strength, ranging between 51N/mm2 and 57.3N/mm
2, which
is well over and above the minimum provided by British Standards of 21N/mm2. This
is very important in view of the fact that emphasis is made on sustainability in almost
all development activities. Thus, this research would enable authorities/management
to take an informed decision of maintaining these structures, instead of demolishing
them. It also enables users of such buildings to have rest of mind – that the structural
integrity of the buildings are, indeed, intact; as such, no need for apprehension.
Keywords: building structure, non-destructive test, structural integrity
INTRODUCTION
Buildings are structures, which serve as shelters for man, his properties and activities
(Ayininuola and Olalusi, 2004). Building structures are just like people, they get older
with time, requires check-ups, becomes sick, requires treatment when ill, and can be
placed on life-support. On the other hand, building structures can maintain their good
health with age if properly cared for, examined and treated when needed (Robert,
2009). The dependability of a structural system is a comprehensive concept that, by
definition, describes the quality of the system as its ability to perform as expected in a
way that can justifiably be trusted. One of the attributes of dependability is integrity,
which can be interpreted as the absence of improper alterations of the structural
configuration. According to the Cambridge based company in United Kingdom TWI
Ltd structural integrity service (2004), Structural integrity is the safe design,
assessment and operation of components and structures under load. It integrates
aspects of stress analysis, materials behaviours and the mechanisms of failure into the
engineering design process. The assessment of the integrity during the whole life-
cycle can be carried out efficiently by implementing a monitoring system able to

Abdul’Azeez et al.
26
detect and diagnose any fault at its onset. Structural failure does not necessarily imply
structural collapse but in most cases manifest the loss of structural serviceability, as
characterized by concrete spalling and the excessive deflection of concrete members
(Broomfield 1997, Chaker 1992, Schiessl 1988). Practical experience (Dhir and
McCarthy, 1999) and experimental observation (li 2003) suggest that corrosion
affected concrete structures deteriorate at different rates as measured by strength and
serviceability with the latter deteriorating faster.
Rehabilitation offers relief to structures through repairs and restoration. The decision
to repair or replace a structure or its component can be taken only after consideration
of likely service life of the structure based on technical and economical evaluation.
Once a decision based on preliminary investigation is taken to carry out the repair,
proper diagnosis, identification and extent of distress in structural members has to be
correctly assessed (Imre, 2002). A detailed methodology should be developed which
should include available method of repair and repair materials.
Non-destructive test (NDT) is generally defined as a method of test that does not
impair the intended performance of element or member under investigation (Chai,
1996). It can be done during and after construction, in-service, maintenance. The main
objective of the non-destructive test, for the former are for quality control and
monitoring of strength at long term development, the latter are to establish structural
adequacy and material deterioration against time and environment. This method offers
a lot of advantages as there are wider and far reaching aspects of concrete that can be
investigated using these techniques. In addition, it is faster, cheaper and little or no
damage is done to the building structure being tested.
INTERPRETATION OF REBOUND VALUE
The National disaster management division, ministry of home affairs, Government of
India, New Delhi, in 2007 prepared a methodology for Condition Assessment of
Building in which the quality of concrete is interpreted in relation to the average
rebound number as shown in table 1. Locations having very low rebound numbers
indicate weak surface concrete and may be affected by corrosion.
Table 1: Average Rebound Number and Quality of Concrete
Average Rebound Number Quality of Concrete
>40 Very good hard surface
30 to 40 Good layer
20 to 30 Fair
<20 Poor concrete
0 Delaminated
Source: The National disaster management division, ministry of home affairs,
Government of India, New Delhi, in (2007)
EVALUATION OF CONCRETE STRENGTH
The determination of concrete strength can be divided into two; individual evaluation
and sampling evaluation. The usual sequence is as follows: first set the strength of test
zone, then the strength of test specimen, and then the strength of member and the
strength of the whole structure. On general condition, individual member are used as
the basic units for evaluation the strength of concrete on the basis of evaluating for
whole structure can be carried out.
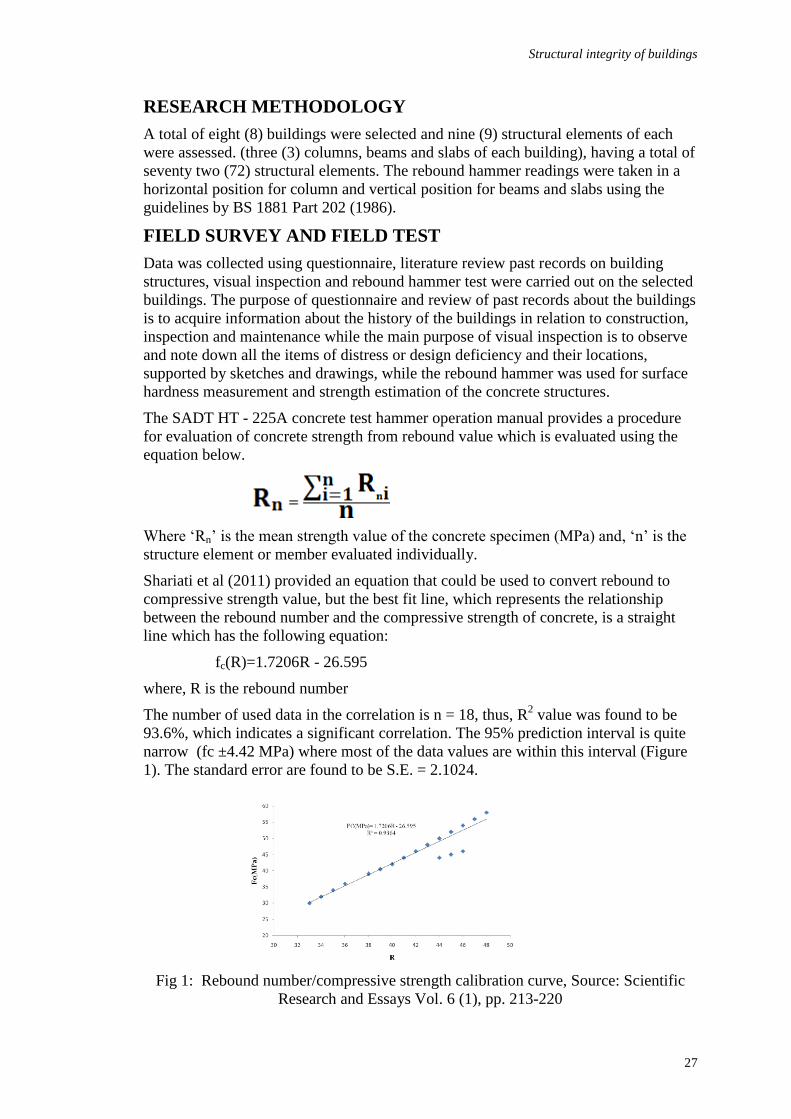
Structural integrity of buildings
27
RESEARCH METHODOLOGY
A total of eight (8) buildings were selected and nine (9) structural elements of each
were assessed. (three (3) columns, beams and slabs of each building), having a total of
seventy two (72) structural elements. The rebound hammer readings were taken in a
horizontal position for column and vertical position for beams and slabs using the
guidelines by BS 1881 Part 202 (1986).
FIELD SURVEY AND FIELD TEST
Data was collected using questionnaire, literature review past records on building
structures, visual inspection and rebound hammer test were carried out on the selected
buildings. The purpose of questionnaire and review of past records about the buildings
is to acquire information about the history of the buildings in relation to construction,
inspection and maintenance while the main purpose of visual inspection is to observe
and note down all the items of distress or design deficiency and their locations,
supported by sketches and drawings, while the rebound hammer was used for surface
hardness measurement and strength estimation of the concrete structures.
The SADT HT - 225A concrete test hammer operation manual provides a procedure
for evaluation of concrete strength from rebound value which is evaluated using the
equation below.
Where ‘Rn’ is the mean strength value of the concrete specimen (MPa) and, ‘n’ is the
structure element or member evaluated individually.
Shariati et al (2011) provided an equation that could be used to convert rebound to
compressive strength value, but the best fit line, which represents the relationship
between the rebound number and the compressive strength of concrete, is a straight
line which has the following equation:
fc(R)=1.7206R - 26.595
where, R is the rebound number
The number of used data in the correlation is n = 18, thus, R2 value was found to be
93.6%, which indicates a significant correlation. The 95% prediction interval is quite
narrow (fc ±4.42 MPa) where most of the data values are within this interval (Figure
1). The standard error are found to be S.E. = 2.1024.
Fig 1: Rebound number/compressive strength calibration curve, Source: Scientific
Research and Essays Vol. 6 (1), pp. 213-220
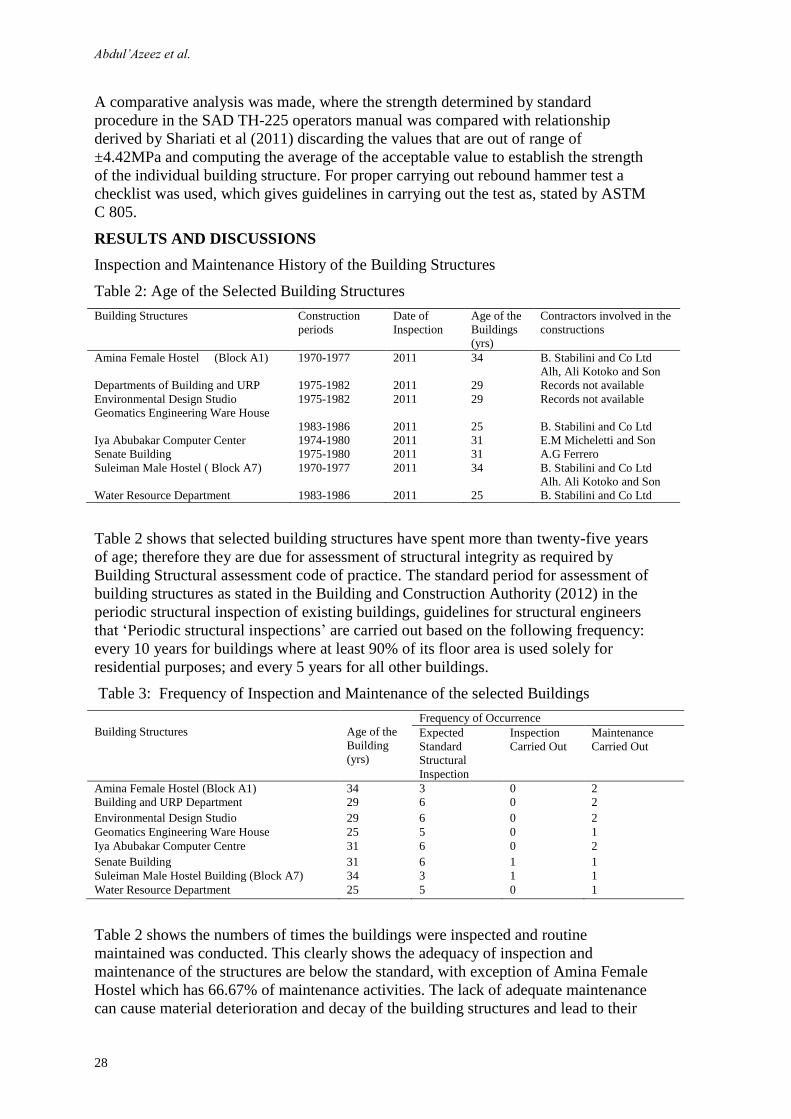
Abdul’Azeez et al.
28
A comparative analysis was made, where the strength determined by standard
procedure in the SAD TH-225 operators manual was compared with relationship
derived by Shariati et al (2011) discarding the values that are out of range of
±4.42MPa and computing the average of the acceptable value to establish the strength
of the individual building structure. For proper carrying out rebound hammer test a
checklist was used, which gives guidelines in carrying out the test as, stated by ASTM
C 805.
RESULTS AND DISCUSSIONS
Inspection and Maintenance History of the Building Structures
Table 2: Age of the Selected Building Structures
Building Structures Construction
periods
Date of
Inspection
Age of the
Buildings
(yrs)
Contractors involved in the
constructions
Amina Female Hostel (Block A1) 1970-1977 2011 34 B. Stabilini and Co Ltd
Alh, Ali Kotoko and Son
Departments of Building and URP 1975-1982 2011 29 Records not available
Environmental Design Studio 1975-1982 2011 29 Records not available
Geomatics Engineering Ware House
1983-1986
2011
25
B. Stabilini and Co Ltd
Iya Abubakar Computer Center 1974-1980 2011 31 E.M Micheletti and Son
Senate Building 1975-1980 2011 31 A.G Ferrero
Suleiman Male Hostel ( Block A7) 1970-1977 2011 34 B. Stabilini and Co Ltd
Alh. Ali Kotoko and Son
Water Resource Department 1983-1986 2011 25 B. Stabilini and Co Ltd
Table 2 shows that selected building structures have spent more than twenty-five years
of age; therefore they are due for assessment of structural integrity as required by
Building Structural assessment code of practice. The standard period for assessment of
building structures as stated in the Building and Construction Authority (2012) in the
periodic structural inspection of existing buildings, guidelines for structural engineers
that ‘Periodic structural inspections’ are carried out based on the following frequency:
every 10 years for buildings where at least 90% of its floor area is used solely for
residential purposes; and every 5 years for all other buildings.
Table 3: Frequency of Inspection and Maintenance of the selected Buildings
Building Structures
Age of the
Building
(yrs)
Frequency of Occurrence
Expected
Standard
Structural
Inspection
Inspection
Carried Out
Maintenance
Carried Out
Amina Female Hostel (Block A1) 34 3 0 2
Building and URP Department 29 6 0 2
Environmental Design Studio 29 6 0 2
Geomatics Engineering Ware House 25 5 0 1
Iya Abubakar Computer Centre 31 6 0 2
Senate Building 31 6 1 1
Suleiman Male Hostel Building (Block A7) 34 3 1 1
Water Resource Department 25 5 0 1
Table 2 shows the numbers of times the buildings were inspected and routine
maintained was conducted. This clearly shows the adequacy of inspection and
maintenance of the structures are below the standard, with exception of Amina Female
Hostel which has 66.67% of maintenance activities. The lack of adequate maintenance
can cause material deterioration and decay of the building structures and lead to their
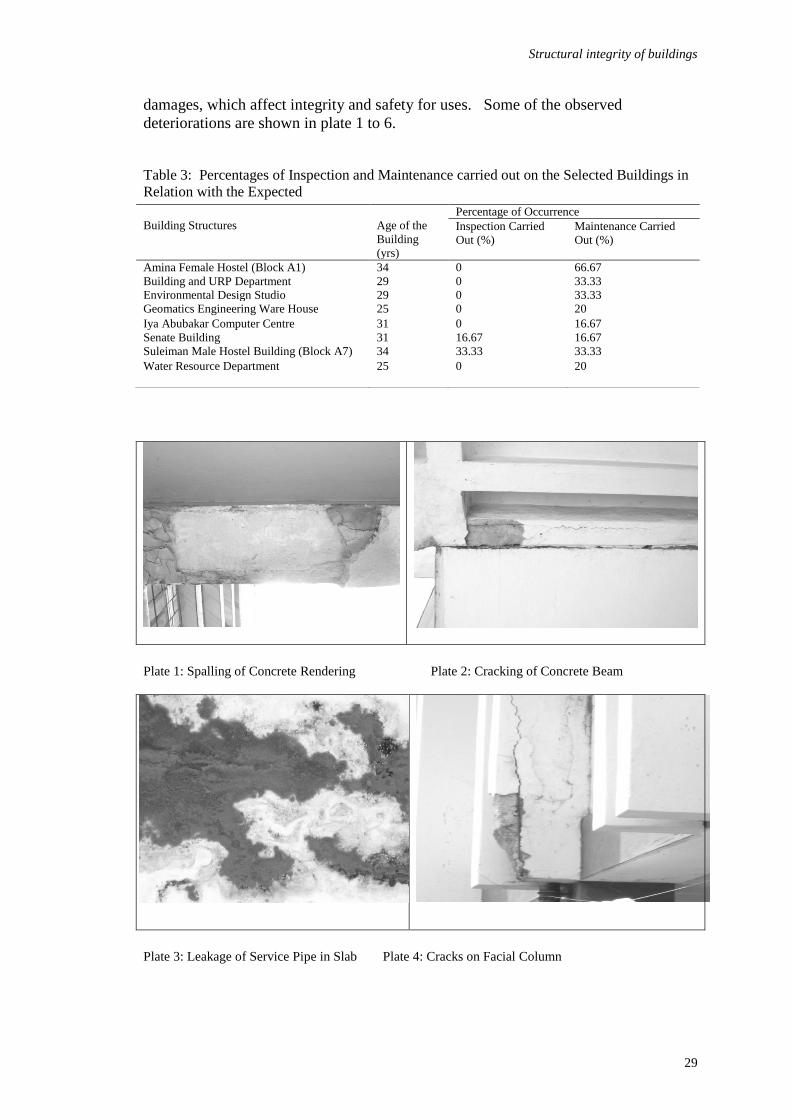
Structural integrity of buildings
29
damages, which affect integrity and safety for uses. Some of the observed
deteriorations are shown in plate 1 to 6.
Table 3: Percentages of Inspection and Maintenance carried out on the Selected Buildings in
Relation with the Expected
Plate 1: Spalling of Concrete Rendering Plate 2: Cracking of Concrete Beam
Plate 3: Leakage of Service Pipe in Slab Plate 4: Cracks on Facial Column
Building Structures
Age of the
Building
(yrs)
Percentage of Occurrence
Inspection Carried
Out (%)
Maintenance Carried
Out (%)
Amina Female Hostel (Block A1) 34 0 66.67
Building and URP Department 29 0 33.33
Environmental Design Studio 29 0 33.33
Geomatics Engineering Ware House 25 0 20
Iya Abubakar Computer Centre 31 0 16.67
Senate Building 31 16.67 16.67
Suleiman Male Hostel Building (Block A7) 34 33.33 33.33
Water Resource Department 25 0 20
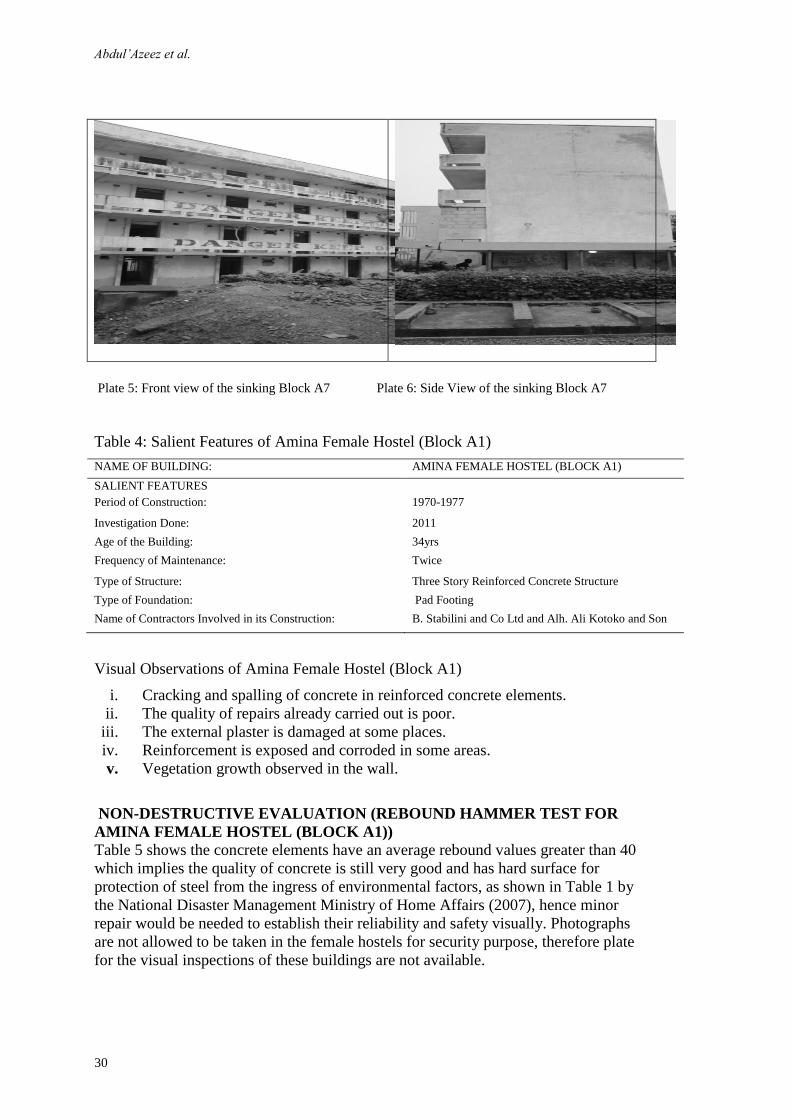
Abdul’Azeez et al.
30
Plate 5: Front view of the sinking Block A7 Plate 6: Side View of the sinking Block A7
Table 4: Salient Features of Amina Female Hostel (Block A1)
NAME OF BUILDING: AMINA FEMALE HOSTEL (BLOCK A1)
SALIENT FEATURES
Period of Construction: 1970-1977
Investigation Done: 2011
Age of the Building: 34yrs
Frequency of Maintenance: Twice
Type of Structure: Three Story Reinforced Concrete Structure
Type of Foundation: Pad Footing
Name of Contractors Involved in its Construction: B. Stabilini and Co Ltd and Alh. Ali Kotoko and Son
Visual Observations of Amina Female Hostel (Block A1)
i. Cracking and spalling of concrete in reinforced concrete elements.
ii. The quality of repairs already carried out is poor.
iii. The external plaster is damaged at some places.
iv. Reinforcement is exposed and corroded in some areas.
v. Vegetation growth observed in the wall.
NON-DESTRUCTIVE EVALUATION (REBOUND HAMMER TEST FOR
AMINA FEMALE HOSTEL (BLOCK A1))
Table 5 shows the concrete elements have an average rebound values greater than 40
which implies the quality of concrete is still very good and has hard surface for
protection of steel from the ingress of environmental factors, as shown in Table 1 by
the National Disaster Management Ministry of Home Affairs (2007), hence minor
repair would be needed to establish their reliability and safety visually. Photographs
are not allowed to be taken in the female hostels for security purpose, therefore plate
for the visual inspections of these buildings are not available.
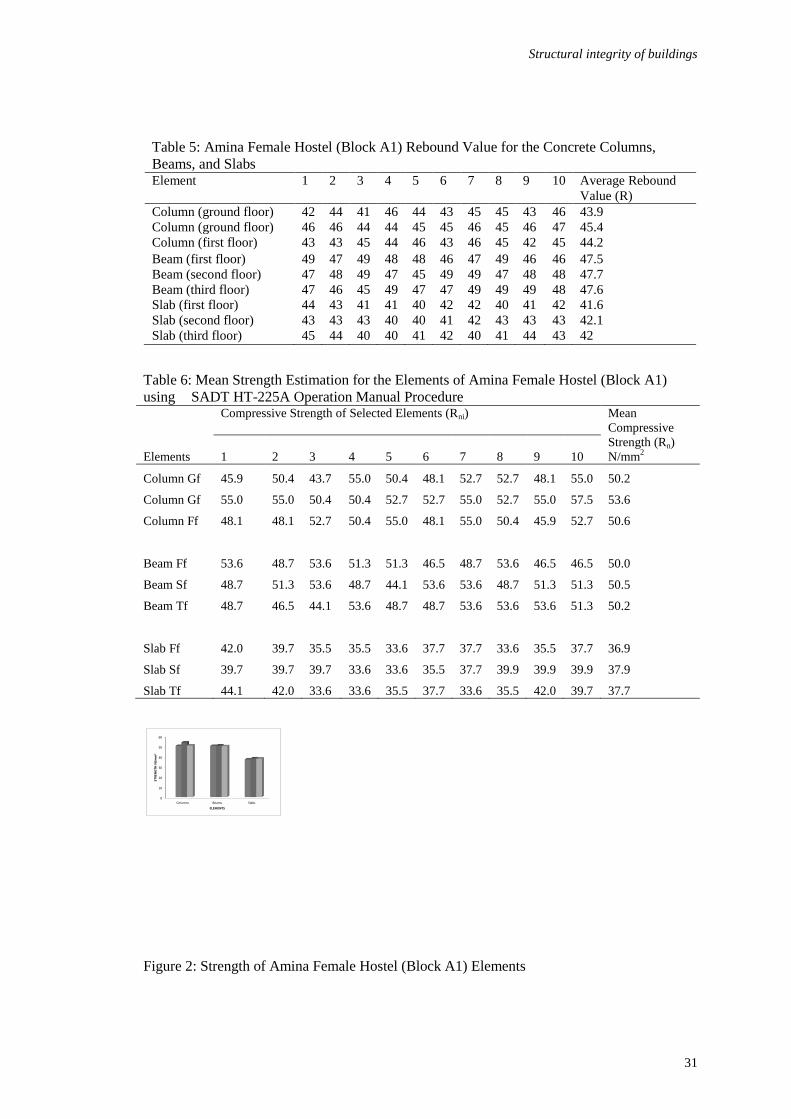
Structural integrity of buildings
31
Table 5: Amina Female Hostel (Block A1) Rebound Value for the Concrete Columns,
Beams, and Slabs Element 1 2 3 4 5 6 7 8 9 10 Average Rebound
Value (R)
Column (ground floor) 42 44 41 46 44 43 45 45 43 46 43.9
Column (ground floor) 46 46 44 44 45 45 46 45 46 47 45.4
Column (first floor) 43 43 45 44 46 43 46 45 42 45 44.2
Beam (first floor) 49 47 49 48 48 46 47 49 46 46 47.5
Beam (second floor) 47 48 49 47 45 49 49 47 48 48 47.7
Beam (third floor) 47 46 45 49 47 47 49 49 49 48 47.6
Slab (first floor) 44 43 41 41 40 42 42 40 41 42 41.6
Slab (second floor) 43 43 43 40 40 41 42 43 43 43 42.1
Slab (third floor) 45 44 40 40 41 42 40 41 44 43 42
Table 6: Mean Strength Estimation for the Elements of Amina Female Hostel (Block A1)
using SADT HT-225A Operation Manual Procedure
Elements
Compressive Strength of Selected Elements (Rni)
Mean
Compressive
Strength (Rn)
N/mm2 1 2 3 4 5 6 7 8 9 10
Column Gf 45.9 50.4 43.7 55.0 50.4 48.1 52.7 52.7 48.1 55.0 50.2
Column Gf 55.0 55.0 50.4 50.4 52.7 52.7 55.0 52.7 55.0 57.5 53.6
Column Ff 48.1 48.1 52.7 50.4 55.0 48.1 55.0 50.4 45.9 52.7 50.6
Beam Ff 53.6 48.7 53.6 51.3 51.3 46.5 48.7 53.6 46.5 46.5 50.0
Beam Sf 48.7 51.3 53.6 48.7 44.1 53.6 53.6 48.7 51.3 51.3 50.5
Beam Tf 48.7 46.5 44.1 53.6 48.7 48.7 53.6 53.6 53.6 51.3 50.2
Slab Ff 42.0 39.7 35.5 35.5 33.6 37.7 37.7 33.6 35.5 37.7 36.9
Slab Sf 39.7 39.7 39.7 33.6 33.6 35.5 37.7 39.9 39.9 39.9 37.9
Slab Tf 44.1 42.0 33.6 33.6 35.5 37.7 33.6 35.5 42.0 39.7 37.7
0
10
20
30
40
50
60
Columns Beams Slabs
STR
ENG
TH N
/mm
2
ELEMENTS
Figure 2: Strength of Amina Female Hostel (Block A1) Elements
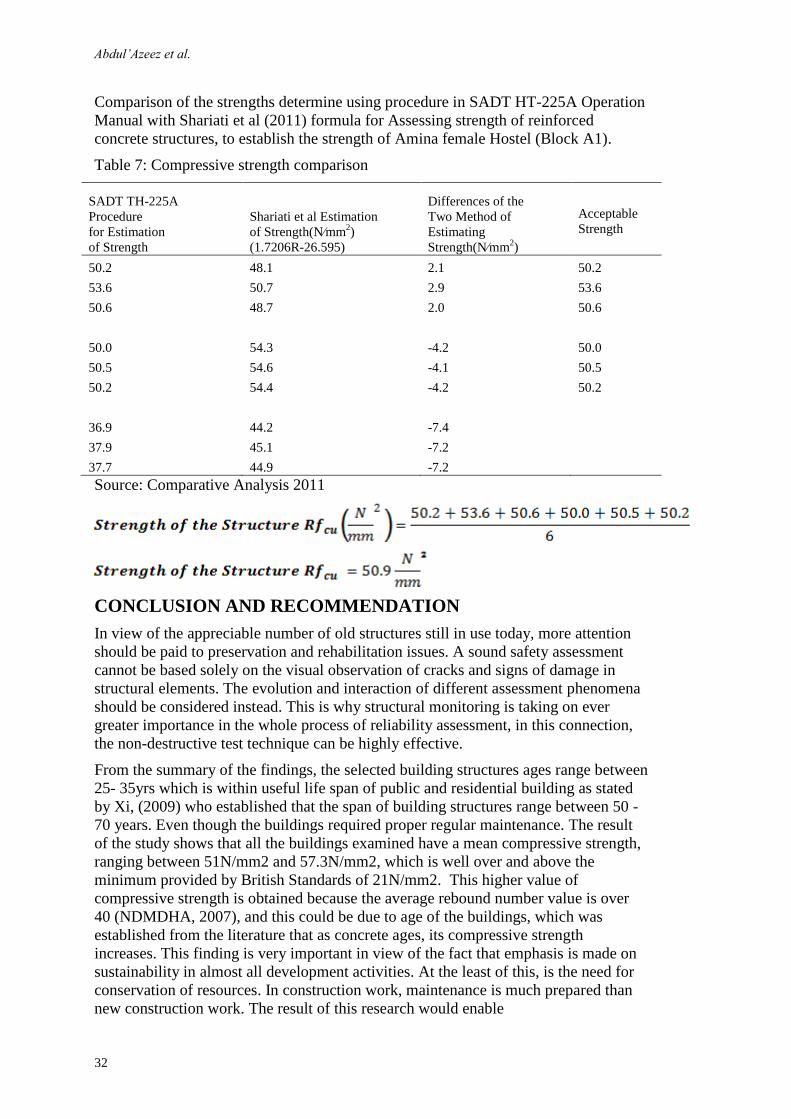
Abdul’Azeez et al.
32
Comparison of the strengths determine using procedure in SADT HT-225A Operation
Manual with Shariati et al (2011) formula for Assessing strength of reinforced
concrete structures, to establish the strength of Amina female Hostel (Block A1).
Table 7: Compressive strength comparison
SADT TH-225A
Procedure
for Estimation
of Strength
Shariati et al Estimation
of Strength(N⁄mm2)
(1.7206R-26.595)
Differences of the
Two Method of
Estimating
Strength(N⁄mm2)
Acceptable
Strength
50.2 48.1 2.1 50.2
53.6 50.7 2.9 53.6
50.6 48.7 2.0 50.6
50.0 54.3 -4.2 50.0
50.5 54.6 -4.1 50.5
50.2 54.4 -4.2 50.2
36.9 44.2 -7.4
37.9 45.1 -7.2
37.7 44.9 -7.2
Source: Comparative Analysis 2011
CONCLUSION AND RECOMMENDATION
In view of the appreciable number of old structures still in use today, more attention
should be paid to preservation and rehabilitation issues. A sound safety assessment
cannot be based solely on the visual observation of cracks and signs of damage in
structural elements. The evolution and interaction of different assessment phenomena
should be considered instead. This is why structural monitoring is taking on ever
greater importance in the whole process of reliability assessment, in this connection,
the non-destructive test technique can be highly effective.
From the summary of the findings, the selected building structures ages range between
25- 35yrs which is within useful life span of public and residential building as stated
by Xi, (2009) who established that the span of building structures range between 50 -
70 years. Even though the buildings required proper regular maintenance. The result
of the study shows that all the buildings examined have a mean compressive strength,
ranging between 51N/mm2 and 57.3N/mm2, which is well over and above the
minimum provided by British Standards of 21N/mm2. This higher value of
compressive strength is obtained because the average rebound number value is over
40 (NDMDHA, 2007), and this could be due to age of the buildings, which was
established from the literature that as concrete ages, its compressive strength
increases. This finding is very important in view of the fact that emphasis is made on
sustainability in almost all development activities. At the least of this, is the need for
conservation of resources. In construction work, maintenance is much prepared than
new construction work. The result of this research would enable

Structural integrity of buildings
33
authorities/management to take an informed decision of maintaining these structures,
instead of demolishing them. It also enables users of such buildings to have rest of
mind – that the structural integrity of the buildings are, indeed, intact; as such, no need
for apprehension. Additionally, the result of this research would serve as a viable
option for testing the structural integrity of buildings using the core (coring) test,
which is non-destructive in nature.
RECOMMENDATION
Proper record keeping of documents about the buildings should be ensured and
maintenance officers of various building structures should be trained to ensure they
have knowledge about the buildings they are maintaining, so that thorough knowledge
and application of method to employ in carrying out investigation and maintenance is
enhanced.
Proper diagnosis and inspection of buildings should be carried out before any kind of
repair or rehabilitation is carried out on them.
Users of building structures should be trained on the use of various types of buildings
and their facilities so as to reduce damages, deterioration and decay of components
due to usage especially student hostels.
Provision should be made for periodic inspection of building structures as stated in
standard and codes.
1. Buildings should be properly maintained to increase their life expectance.
REFEREENECES
Ayininuola, G. M. and Olalusi, O. O., (2004), “Assessment of building failures in Nigeria:
Lagos and Ibadan case study,” African Journal of Science and Technology (AJST)
Science and Engineering Series, Vol. 5, No. 1, , pp. 73 – 78.
British Standards Institution (1986). BS1881Part 202 Recommendations for surface hardness
tests by the rebound hammer.
Broomfield J., (1997), “Corrosion of steel in concrete, understanding investigating and repair”
E and EN spon, London.
Building Construction and Authority (2012), Periodic Structural Inspection of Existing
Buildings Guidelines for Structural Engineers, January 2012.
Bungey, J. H., (1989), “Testing of Concrete in Structures”, 2nd Ed., Chapman and Hall, New
York, pp 228.
Chai, K. N., (1996), “Reliability of integrating non-destructive result of concrete structures”.
Chaker, V., (Ed) (1992), “Corrosion forms and control for infrastructure”, ASTM STM 1137
Philadelphia.
Dhir, R. K. and McCarthy, M. J. (Eds), (1999), “Concrete durability and repair technology”,
Thomas tenfold, London.
Imre L., (2002), Rehabilitation Retrofitting Methods, Hand Book of Repair and Rehabilitation
of Reinforced Concrete Structures.

Abdul’Azeez et al.
34
Shariati, M., Nor H., Mohammad, M., Arabnejad K. H., Payam S. and Hamid S., (2011) “Assessing the Strength of Reinforced Concrete Structures through Ultrasonic Pulse
Velocity and Schmidt Rebound Hammer tests” Scientific Research and Essays Vol.
6(1), pp. 213-220, 4 Available online at http://www.academicjournals.org/SRE ISSN
1992-2248 ©2011 Academic Journals.
National Disaster Management Division Ministry of Home Affairs, (2007) Government of
India New Delhi, “Condition Assessment of Buildings for Repair and Upgrading”
prepared under Goi-undp disaster, risk management programme.
Li C. Q., (2003), “Life cycle modelling of corrosion affected concrete structures
propagation”, journal of structural engineering ACSE 129, (6), 753- 761.
Robert, T. R., (2009), “Structural Condition Assessment: Why? What? How?” ASCE
Structural Engineering Conference Iowa Section of the American Society of Civil
Engineers and Iowa State University Ames, Iowa.
SADT HT-225A Rebound Hammer Operation Manual www.ndtzone.com/SADT- HT-225A-
User-manual-pdf.
Schiessl, P., (1988) “Corrosion of steel in concrete”, report of the technical committee 60-
CSC RILEM, London chapman and hall.
Xi W., (2009), Average Life Span of a Building in Beijing Radio free Asia created: January
22, 2009 last updated: January 22, 2009.

Abubakar, A. (2012) Perception of educators and practitioners on the relevance of architectural
curriculum of Nigerian universities to the building industry In: Laryea, S., Agyepong, S.A., Leiringer,
R. and Hughes, W. (Eds) Procs 4th West Africa Built Environment Research (WABER) Conference, 24-
26 July 2012, Abuja, Nigeria, 35-45.
35
PERCEPTION OF EDUCATORS AND PRACTITIONERS
ON THE RELEVANCE OF ARCHITECTURAL
CURRICULUM OF NIGERIAN UNIVERSITIES TO THE
BUILDING INDUSTRY
Abdullahi Abubakar1
Department of Architecture, Kano University of Science and Technology, Wudil, Kano State
Architectural educators and practitioners have on different occasions questioned the
relevance of architectural curriculum used by the Nigerian schools of architecture to
the building industry. The main aim of this study is therefore to assess the perception
of the educators on the relevance of the architectural curriculum to the Nigerian
Building industry. In order to achieve this aim Survey research method was
employed. A total of 322 questionnaires were administered on lecturers, lecturer-
practitioners and practitioners, out of which 277 (86%) were returned/retrieved. Based
on the total responses, 63% of respondents are of the opinion that the current
curriculum as taught by the schools of architecture is still relevant to the needs of the
building industry, while 37% responded in the negative. Areas like ICT, Management
and Entrepreneurship have been identified as some of the areas for improvement in
the architectural curriculum. Finally, some of the recommendations made are that i)
the National Universities Commission (NUC) in conjunction with the Nigerian
Institute of Architects (NIA)/ Architects Registration Council of Nigeria (ARCON)
should use the study findings as a guide in improving the architectural curriculum
and; ii) the government should provide adequate funding to facilitate beeping up the
existing human and material resources for the effective implementation of the
improved curriculum in order to facilitate the continued relevance of the architectural
curriculum to the Nigerian building industry.
Keywords: architectural curriculum, building industry, educator, perception,
practitioner
INTRODUCTION
Architectural training in Nigeria started in the University College Ibadan in 1952, but
was later transferred to the Ahmadu Bello University, Zaria in 1955; it is important to
note that the Zaria School of Architecture was established based on the English
Architectural Philosophy in collaboration with the Architectural Association London.
This was later followed with the establishment of both school of Architecture in the
University of Nigeria, Nsukka in 1963 and University of Lagos, in 1970 based on the
American architectural philosophy. These marked the beginning of two sets of
architectural philosophy in the training of architecture in Nigeria and later on these
schools of architecture were headed by Nigerian architectural educators trained abroad
Abubakar
36
in these philosophies and who continued implementing a curriculum which does not
take cognizance of the socio-cultural values of Nigeria (Chukwali, 2001).
Ummene (1991) as cited by Uji (2001:114) categorises the development of
architectural education in Nigeria into three periods as follows:
1952 – 1962: this is the period when architectural education was at an inception stage.
During this period only diploma was awarded after graduation and the intention of the
colonial government was to produce architectural technicians that could assist them in
running the Public Works Department. Throughout the period both the administrators
and the educators were 100 percent British. And then, the emphasis was on training
rather than education.
1963 – 1979: this period marked a significant transition, although at the beginning of
this period in the sixties the only school of architecture (ABU, Zaria) was dominated
by Britons. However, this was later changed, especially in the 1970s when Nigerian
educators came on board. With the establishment of more schools of architecture more
Nigerians came in and Britons were replaced with indigenes, asians and educators
from the Eastern Europe. This period witnessed the commencement of Nigerians
managing the affairs of schools of architecture, although most of them were trained
abroad (Chukwuali, 2001:145).
1980 – Date: this is the period in which the total management of schools of
architecture is by Nigerians, and within this period, associations like the Association
of Architectural Educators were launched and since then a lot of issues have been
raised on how the training and education of architects would take cognizance of local
and cultural values.
From the time architectural training started to date, there exist some changes in the
development of the country, but, same cannot be said of the training of architects in
Nigeria (Amole, 2004). This is to say that the training failed to adjust to the need of
contemporary Nigeria. This is certainly a problem as life is dynamic and anything
existing to serve human needs should be dynamic in as much as it is going to be
relevant , especially architectural training as it is the concept/philosophy of the
training that determines the outcome of the nature of architectural practice or else it is
going to be obsolete.
Adeyemi (2004), confirmed that the present circumstances architects and architectural
practice find themselves is because of the deficiency of architectural training in the
country; or which lack focus, is confined to visual design and as such is not yielding
to the yearnings of contemporary Nigeria. This is to say that confinement of
specialization to visual design constitute a problem. As all graduates of architecture
will tend to seek for employment either in the private sector or public sector as project
architects working in the studios or designing and supervising of public projects,
thereby restricting the work of the architect to specialisation that is visual design-
based. And other areas of specialisation like the project management, landscape
Architecture curriculum
37
architecture, specialization in the manufacturing sector will be left unattended as
architect are not trained to effectively participate in those areas.
According to Abdulkarim and Badiru (2004: 49) the products of Nigerian Schools of
Architecture are not prepared for the role they are expected to play in contemporary
practice; Chukwu-Uchegu (2002:21), corroborates this as she observes that many
graduates of architecture from the schools are now roaming about the street without
job as the curriculum did not adequately prepare them to face the challenges posed by
the 21st Century.
It is not an understatement to say that the 21st century is the century of information
technology and as such any discipline that does not restructure its curriculum to fit in
information technology may lose relevance. According to Sherif, Sherif and Mostafa
(2008:390), globalization of architectural practice asserted the need for architectural
education to respond to its needs and fill the gap that exists between the profession
and schools of architecture. Hence, there is the need for schools of architecture to
renew their programs towards advancing “the implementation of Information and
Communication Technology (ICT) in architecture while being balance with special
consideration to local culture, heritage and contextual aspect on one side and
globalization on the other”. Shaik (2004:4) summarizes this as follows:
The world has turned into a global village; new ideas and information are pouring in
like a stream. It is, therefore, imperative to update our curricula regularly by
introducing the recent developments in the relevant fields of knowledge.
In Nigeria today, very few schools of architecture can boast of having their own
computer laboratories for practicum (Abubakar, 2001). That is to say that to this
moment graduates of architecture are not fully equipped with the knowledge and skills
required of an architect in Computer Aided Design (CAD). Meaning that for them to
fit into practice they may have to remedy such deficiency either formally or through
on- the job-training. In order words, there is the feeling that graduates of architectural
education serve not local needs, not to talk of international needs, which requires more
in terms of professional competencies for the graduates to adequately compete.
From commencement to date, Nigerian schools of architecture have produced
architects who are serving in various capacities in both the public and private sector. It
is obvious that architectural education in Nigeria has contributed immensely to the
development of architects and infrastructure. However, there seems to be an outcry by
architectural educators on the relevance or otherwise of the curriculum of architectural
education in the Nigerian universities.
It should also be noted that with the changing ecology of architectural practice as a
result of the emerging trends, which Sa’ad (2001) identified as democratization of
decision making (globalization); technological innovation (especially information and
communication technology); concern for the environment (sustainability) and
financial management, the schools’ curricula fall short of the current trend especially
compared to schools of architecture in the developed nations, where trends are
Abubakar
38
influencing not only architectural practice but architectural education as well, most
especially in the area of curriculum development. Though local needs play a major
role in curriculum development, with the current trends of globalization, graduates of
architectural schools should be equipped with the desired competencies that will
enable them practice not only within their locality, but fit into the global arena. This
begins with the curriculum development.
As educators have observed, curriculum review is part of curriculum development,
and is best carried out if it is based on feedback that is based on curriculum
evaluation/assessment (Onwuka, 1996). The evaluation is usually in the form of any
or a combination of the three major types of evaluation (formative, summative and
ultimate evaluation), depending on the goal/aim or objectives of the study/studies that
are set to be achieved. However, there has been no empirical study to ensure that the
review is justified, which is a pre-requisite for any purposive curriculum review to be
achieved. Although the Nigerian Institute of Architects/Architects Registration
Council of Nigeria (NIA/ARCON) and National Universities Commission (NUC) are
currently working towards modifying the architectural curriculum, it is not based on
the outcome of a product/progrmme evaluation (Abubakar, 2011). This study
therefore aimed at assessing the perception of architectural educators and
practitioners on the relevance of architectural curriculum of Nigerian universities to
the building industry with particular emphasis on Northern Nigeria; to serve as part of
the feedback from some of the stakeholders that could justify the curriculum renewal
and as well suggest areas of improvement in the Architectural Curriculum.
To achieve the aforementioned aim, the specific objectives of the study were to:
Assess the architectural educators and practitioners (stakeholders) responses on the
relevance of Architectural Curriculum to the building industry.
Identify the direction of change, if the need for the curriculum renewal has been
ascertained.
Based on the objectives, the following research questions were drawn. These were:
What are the stakeholders’ opinions with respect to the relevance of the architectural
curriculum in the building industry?
If the curriculum is to be renewed, what direction of change will it take?
This study was designed on the assumption that as all architectural curricula of the
Nigerian schools of architecture are now modelled in line with the 1989 NUC
Minimum Standard, there exist no major differences between the schools curricula.
Also, the location of the stakeholder has no effect on their perception as the
characteristics of the industry remain the same in Nigeria as a whole. Therefore,
findings of this study could have general application across the country.
METHODOLOGY
Survey research method was employed in carrying out this study. A researcher-made
questionnaire was used for collection of data from the respondents. A total of 322
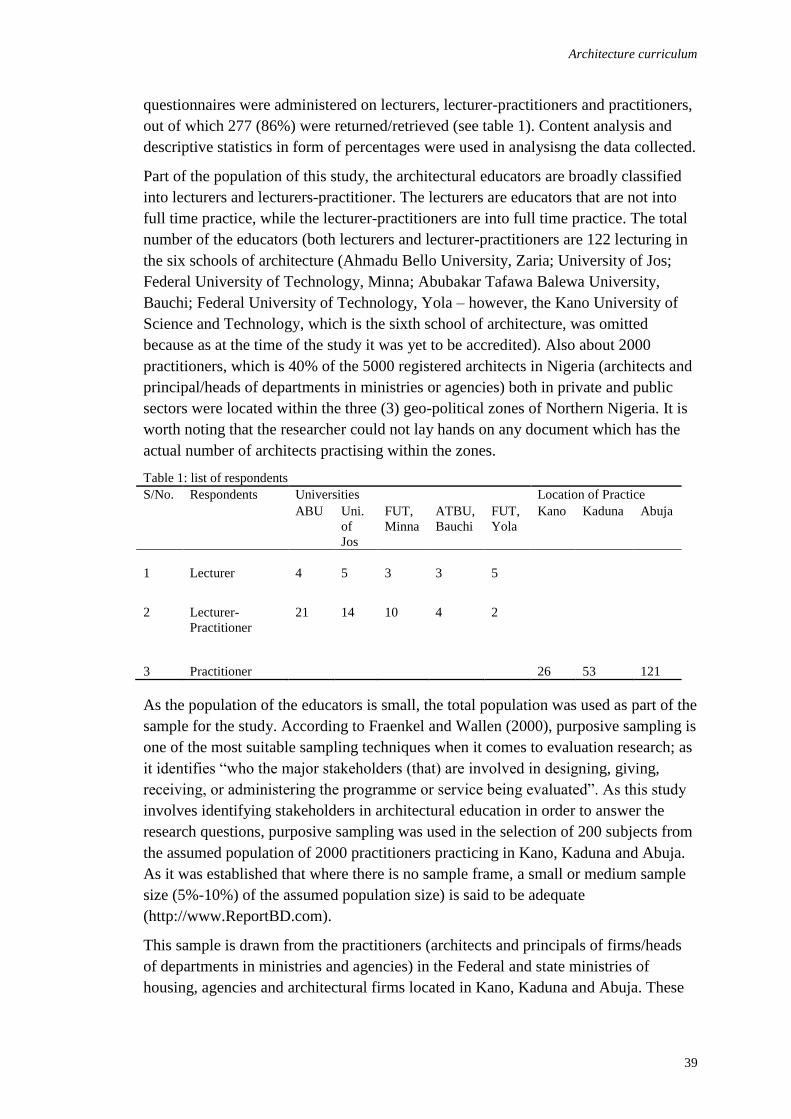
Architecture curriculum
39
questionnaires were administered on lecturers, lecturer-practitioners and practitioners,
out of which 277 (86%) were returned/retrieved (see table 1). Content analysis and
descriptive statistics in form of percentages were used in analysisng the data collected.
Part of the population of this study, the architectural educators are broadly classified
into lecturers and lecturers-practitioner. The lecturers are educators that are not into
full time practice, while the lecturer-practitioners are into full time practice. The total
number of the educators (both lecturers and lecturer-practitioners are 122 lecturing in
the six schools of architecture (Ahmadu Bello University, Zaria; University of Jos;
Federal University of Technology, Minna; Abubakar Tafawa Balewa University,
Bauchi; Federal University of Technology, Yola – however, the Kano University of
Science and Technology, which is the sixth school of architecture, was omitted
because as at the time of the study it was yet to be accredited). Also about 2000
practitioners, which is 40% of the 5000 registered architects in Nigeria (architects and
principal/heads of departments in ministries or agencies) both in private and public
sectors were located within the three (3) geo-political zones of Northern Nigeria. It is
worth noting that the researcher could not lay hands on any document which has the
actual number of architects practising within the zones.
Table 1: list of respondents
S/No. Respondents Universities Location of Practice
ABU Uni.
of
Jos
FUT,
Minna
ATBU,
Bauchi
FUT,
Yola
Kano Kaduna Abuja
1 Lecturer
4 5 3 3 5
2 Lecturer-
Practitioner
21 14 10 4 2
3 Practitioner 26 53 121
As the population of the educators is small, the total population was used as part of the
sample for the study. According to Fraenkel and Wallen (2000), purposive sampling is
one of the most suitable sampling techniques when it comes to evaluation research; as
it identifies “who the major stakeholders (that) are involved in designing, giving,
receiving, or administering the programme or service being evaluated”. As this study
involves identifying stakeholders in architectural education in order to answer the
research questions, purposive sampling was used in the selection of 200 subjects from
the assumed population of 2000 practitioners practicing in Kano, Kaduna and Abuja.
As it was established that where there is no sample frame, a small or medium sample
size (5%-10%) of the assumed population size) is said to be adequate
(http://www.ReportBD.com).
This sample is drawn from the practitioners (architects and principals of firms/heads
of departments in ministries and agencies) in the Federal and state ministries of
housing, agencies and architectural firms located in Kano, Kaduna and Abuja. These

Abubakar
40
two states and Abuja were chosen because most of the architects and practitioners are
located within these locations.
Self-administered questionnaire was used as the research instrument in conducting this
study. Questionnaire was chosen as it allows the collection of extensive amount of
information such as demographic, behavioural habits, opinions, attitudes and so on
from a large number of people within a limited time (Fowler, 2002), the instrument
used was designed in line with the objectives of the study.
Therefore, a questionnaire was designed for the architectural educators (lecturers and
lecturer-practitioners) and practitioners. The questionnaire was designed to enable the
researcher find out perception of the respondents in respect to the relevance of the
architectural curriculum to the building industry. The questionnaire was made up of
two sections: section A was designed to elucidate bio-data of the respondents; while
sections B was designed in an open-ended format to elucidate data on the main subject
matter of the study in order to answer the research questions in the open ended
question format.
To achieve the first objective and as well answer research question one, content
analysis was employed in form of coding and summarization of responses and
descriptive statistics in the form of percentages in ascertaining the relevance of the
architectural curricular to the Nigerian building industry.
For the second objective (research question two), content analysis was used in
unfolding information from the questionnaire and descriptive statistics was used in
the form of percentages in summarizing the data collated to ascertain the direction of
change, if the curriculum is to be renewed.
DATA ANALYSIS AND FINDINGS
Research Question One
What are the stakeholders’ opinions with respect to the relevance of the architectural
curriculum in the building industry?Stakeholders responses to the question concerning
the relevance of the architectural curriculum were analyse by summarizing the
responses using percentages as shown below in table 2.
Table 2: Stakeholders response on the relevance of the curriculum
Question Respondents Response
YES NO
Freq. R. Freq. Freq R. Freq.
Do you consider the current
curriculum as taught in Nigerian
Universities relevant to the needs of
the Industry?
Lecturers 15 75% 5 25%
Lecturer-Practitioners 25 49% 26 51%
Practitioners 128 64% 67 36%
Total
168 61% 98 39%
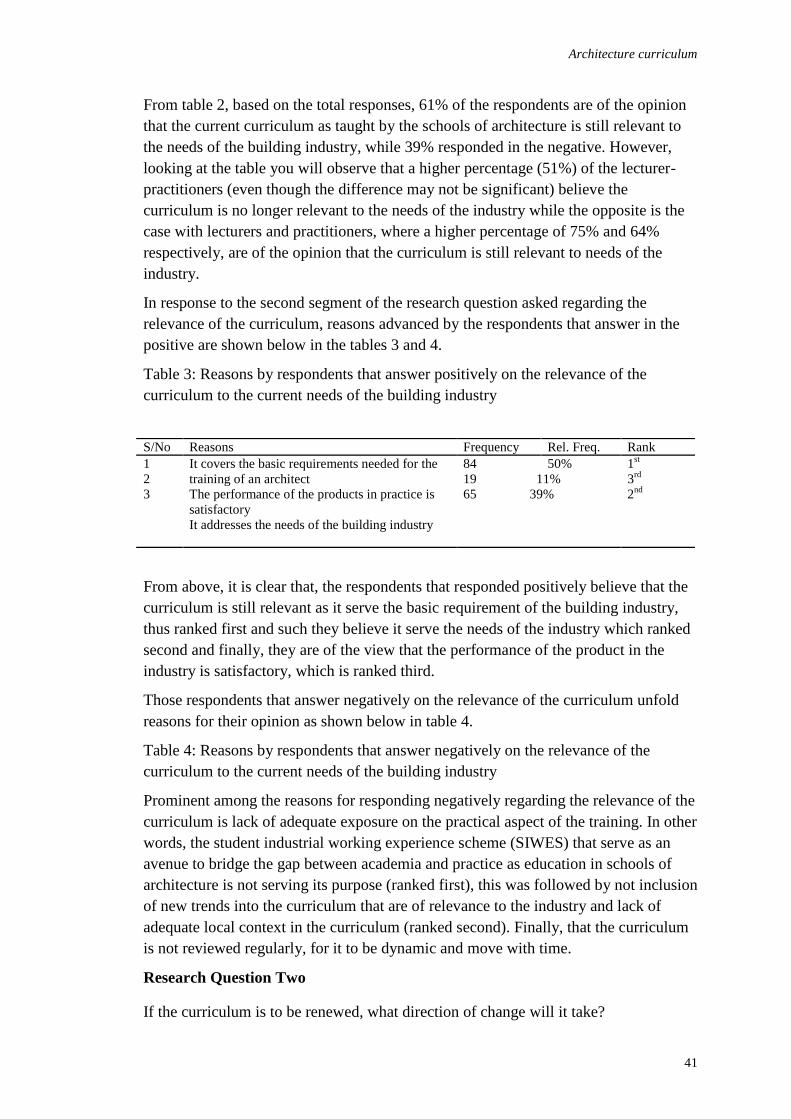
Architecture curriculum
41
From table 2, based on the total responses, 61% of the respondents are of the opinion
that the current curriculum as taught by the schools of architecture is still relevant to
the needs of the building industry, while 39% responded in the negative. However,
looking at the table you will observe that a higher percentage (51%) of the lecturer-
practitioners (even though the difference may not be significant) believe the
curriculum is no longer relevant to the needs of the industry while the opposite is the
case with lecturers and practitioners, where a higher percentage of 75% and 64%
respectively, are of the opinion that the curriculum is still relevant to needs of the
industry.
In response to the second segment of the research question asked regarding the
relevance of the curriculum, reasons advanced by the respondents that answer in the
positive are shown below in the tables 3 and 4.
Table 3: Reasons by respondents that answer positively on the relevance of the
curriculum to the current needs of the building industry
From above, it is clear that, the respondents that responded positively believe that the
curriculum is still relevant as it serve the basic requirement of the building industry,
thus ranked first and such they believe it serve the needs of the industry which ranked
second and finally, they are of the view that the performance of the product in the
industry is satisfactory, which is ranked third.
Those respondents that answer negatively on the relevance of the curriculum unfold
reasons for their opinion as shown below in table 4.
Table 4: Reasons by respondents that answer negatively on the relevance of the
curriculum to the current needs of the building industry
Prominent among the reasons for responding negatively regarding the relevance of the
curriculum is lack of adequate exposure on the practical aspect of the training. In other
words, the student industrial working experience scheme (SIWES) that serve as an
avenue to bridge the gap between academia and practice as education in schools of
architecture is not serving its purpose (ranked first), this was followed by not inclusion
of new trends into the curriculum that are of relevance to the industry and lack of
adequate local context in the curriculum (ranked second). Finally, that the curriculum
is not reviewed regularly, for it to be dynamic and move with time.
Research Question Two
If the curriculum is to be renewed, what direction of change will it take?
S/No Reasons Frequency Rel. Freq. Rank
1
2
3
It covers the basic requirements needed for the
training of an architect
The performance of the products in practice is
satisfactory
It addresses the needs of the building industry
84 50% 1st
3rd
2nd
19 11%
65 39%
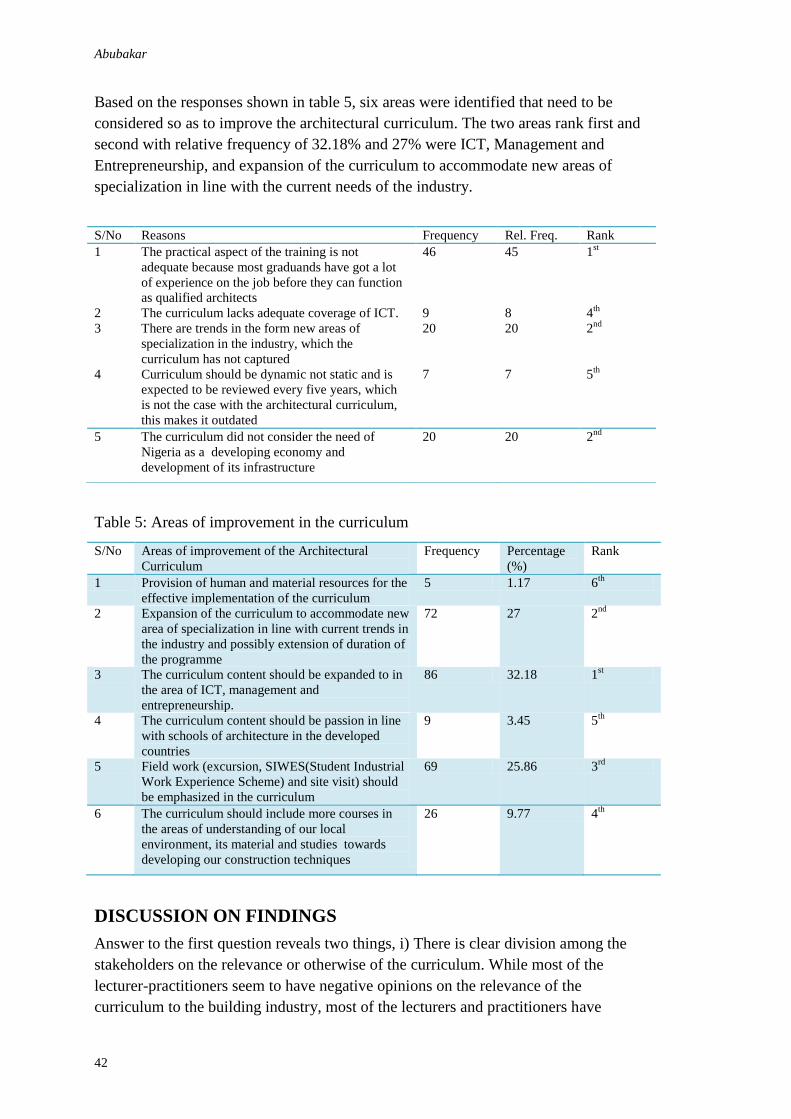
Abubakar
42
Based on the responses shown in table 5, six areas were identified that need to be
considered so as to improve the architectural curriculum. The two areas rank first and
second with relative frequency of 32.18% and 27% were ICT, Management and
Entrepreneurship, and expansion of the curriculum to accommodate new areas of
specialization in line with the current needs of the industry.
Table 5: Areas of improvement in the curriculum
S/No Areas of improvement of the Architectural
Curriculum
Frequency Percentage
(%)
Rank
1 Provision of human and material resources for the
effective implementation of the curriculum
5 1.17 6th
2 Expansion of the curriculum to accommodate new
area of specialization in line with current trends in
the industry and possibly extension of duration of
the programme
72 27 2nd
3 The curriculum content should be expanded to in
the area of ICT, management and
entrepreneurship.
86 32.18 1st
4 The curriculum content should be passion in line
with schools of architecture in the developed
countries
9 3.45 5th
5 Field work (excursion, SIWES(Student Industrial
Work Experience Scheme) and site visit) should
be emphasized in the curriculum
69 25.86 3rd
6 The curriculum should include more courses in
the areas of understanding of our local
environment, its material and studies towards
developing our construction techniques
26 9.77 4th
DISCUSSION ON FINDINGS
Answer to the first question reveals two things, i) There is clear division among the
stakeholders on the relevance or otherwise of the curriculum. While most of the
lecturer-practitioners seem to have negative opinions on the relevance of the
curriculum to the building industry, most of the lecturers and practitioners have
S/No Reasons Frequency Rel. Freq. Rank
1 The practical aspect of the training is not
adequate because most graduands have got a lot
of experience on the job before they can function
as qualified architects
46 45 1st
2 The curriculum lacks adequate coverage of ICT. 9 8 4th
3 There are trends in the form new areas of
specialization in the industry, which the
curriculum has not captured
20 20 2nd
4 Curriculum should be dynamic not static and is
expected to be reviewed every five years, which
is not the case with the architectural curriculum,
this makes it outdated
7 7 5th
5 The curriculum did not consider the need of
Nigeria as a developing economy and
development of its infrastructure
20 20 2nd

Architecture curriculum
43
positive responses on the relevance of the curriculum in the industry. However, this is
a pointer that all is not well; there is need for further assessment of the curriculum.
This finding has confirmed the views of the Nigerian architectural educators
(Adeyemi, 2004; Chukwu-Uchegu, 2002; 2004) most of whom fall under the category
of lecturer-practitioners, that earlier opined that the curriculum need to be reviewed.
The second question confirms the yearnings of scholars on the areas that require
improvement in the architectural curriculum. Especially in the areas of ICT,
Management and Entrepreneurship ( Chukwu-Uchegu, 2002); fieldwork and adequate
exposure to practice while in school; areas of specialization (Adeyemi, 2004);
understanding of local environment (Chukwuali, 2001) and adequate provision of
human and material resources for the effective implementation of the curriculum.
Consequently, if the curricula have to be improved upon, who are those that will be
given the responsibility of improving the curricula in Nigerian schools of architecture?
What curriculum development model is to be adopted/adapted in order to come up
with the desired curricula that could address the contemporary challenges of the
Nigerian building industry? What methods of implementation are we to adopt/adapt?
What measures do we need to have in place that will ensure successful
implementation of the curricula by both the schools and other evaluation agencies that
are responsible for the effective running of the schools of architecture? How do we
ensure that adequate funding is provided to schools with a view to effective
implementation in the schools? What strategies need to be put in place that will
facilitate continuous evaluation of the curricula? Not only formative and summative
evaluation but also ultimate evaluation/product evaluation in practice is required to be
carried out from time to time to ensure continuous review of the curricula so as to
continue to make our graduates relevant to the needs of the building industry. These
are some of the questions that require follow-up studies so as to ensure the curricula of
the Nigerian universities continue serving the need of the building industry.
CONCLUSION AND RECOMMNEDATIONS
Majority of the respondents are of the view that the architectural curriculum is still
relevant to the building industry. However, with about 1/3 of the respondents having
an opinion that the curriculum is not relevant to the building industry; it is a pointer
that there is need for the curriculum to be revisited. Therefore, it requires some kind of
reform even though it may not be a holistic reform as earlier highlighted. The main
areas which according the study requires reform are ICT, Management and
Entrepreneurship. Incorporation of these areas into the curricular will not only
enhance the performance of the architects in the building industry, it will also add to
their confidence and probably serve as one of the strategies in curbing the leadership
challenge by other allied professionals they are currently facing.
In order to effectively utilize findings of this study to improve the content and
implementation of the architectural curricular to enhance its relevance in the Nigerian
building industry the following recommendations are offered.
Abubakar
44
There is need for the National Universities Commission (NUC) in collaboration with
the Architects Registration Council of Nigeria (ARCON)/ Nigerian Institute of
Architects (NIA) to organize a conference for the stakeholders in architectural
education where areas identified for improvement in this study will be presented to
them for further deliberations with a view to carrying everybody along as the first
stage of the curriculum renewal process.
Feedback from stakeholders should always be giving consideration by the NUC,
NIA/ARCON and schools of architecture when reforming the architectural curriculum
for it to effectively serve the need of the industry.
REFERENCES
Abdulkarim, M. and Badaru, Y. Y. (2004). Architectural education and practice in the 21st
century. AARCHES, Journal of the Association of Architectural Educators in Nigeria,
3 (1).
Abubakar, A. (2011). An assessment of architectural curricula of selected Nigerian
universities and its relevance to the building industry. Unpublished PhD dissertation
submitted to Postgraduate School, Ahmadu Bello University, Zaria.
Adeyemi, E. A. (2004). The NIA strategic choice for the new millennium. In the proceedings
of the NIA Annual General Meeting, November, 2004.
Amole, S. A. (2004). Challenges of architectural education in Nigeria. In the proceedings of
the NIA Annual General Meeting, November, 2004.
Chukwuali, B. C. (2001). The basic problems of architectural education in Nigeria. In
Nkogwu, V. O. (ed). Architects and architecture in Nigeria.
Deshpande, J. D. (2008). Restructuring architectural education: a review of the curriculum,
objectives and outcomes. In Roaf, S. and Baistow, A. (eds). The Oxford Conference:
A re-evaluation of education in architecture. UK: WIT Press.
Fowler, J. F. (2002). Survey Research Methods (3rd
ed). London: Sage Publication Ltd.
Fraenkel, J. R. and Wallen, N. E. (2000). How to Design and Evaluate Research in Education
(4th
ed.). United States of America: McGraw-Hil Higher Education.
Onwuka, U. (1996). Curriculum Development for Africa. Onistha-Nigeria: AFRICANA- FEP
PUBLISHERS LTD.
Osuala, E. C. (2001). Introduction to Research Methodology (3rd
ed.). Onitsha-Nigeria:
AFRICANA-FEP PUBLISHERS LTD
Oyediran, O. A. (1998). Architectural education in Nigerian future prospects and
Development. In ForumII: Architectural Education for the 3rd
millennium, a
conference proceedings organised by Eastern Mediterranean University
(EMU) and Istanbul Technical University, held between 22nd
– 24th April, 1998,
Gazmaqusa, North Cyprus.
Roaf, S. and Baistow, A. (eds). The Oxford Conference: A re-evaluation of education in
architecture. UK: WIT Press.
Research Methods – Non probability sampling techniques. Retrieved December 23, 2011,
from http://www.ReportBD.com.
Sa’ad, H. T. (2004). The changing role of the architect and architecture in the context of the
ever-changing technological, socio-economic and political global
environment. In Nkogwu V. O. (ed). Architects and architecture in Nigeria.
Association of Architectural Educators in Nigeria, Pp 12-13

Architecture curriculum
45
Shaikh, A. A. G. (2004). Curriculum of architecture. Higher Education Islamabad, pp.4.
Sheriff, A., Sherif, N. and Mostafa, M. (2008). Developing a new architecture curriculum:
achieving educational goals within program constraints. In Roaf, S. and Baistow, A.
(eds). The Oxford Conference: A re-evaluation of education in architecture. UK: WIT
Press.
Uji, Z. A. (2001). Beyond the critique of the curriculum of architectural education in Nigeria.
In Nkogwu V. O. (ed). Architects and architecture in Nigeria. Association of
Architectural Educators in Nigeria, P 114.

AbdulRazaq, M., Ibrahim, Y.M. and Ibrahim, A.D. (2012) Investigating the Practice of Cash flow
forecasting by Contractors in Nigeria In: Laryea, S., Agyepong, S.A., Leiringer, R. and Hughes, W.
(Eds) Procs 4th West Africa Built Environment Research (WABER) Conference, 24-26 July 2012,
Abuja, Nigeria, 47-54.
47
INVESTIGATING THE PRACTICE OF CASH FLOW
FORECASTING BY CONTRACTORS IN NIGERIA
Mustapha AbdulRazaq1, Yahaya Makarfi Ibrahim and Ahmed Doko Ibrahim
Department of Quantity Surveying, Ahmadu Bello University, Zaria, Nigeria
Previous researches have shown that delayed payment is one of the major reasons for
abandonment of construction projects in Nigeria. Despite this, there is a dearth of
literature on the practice of cash flow forecasting, a fundamental step in curtailing
delayed payment, by Contractors in Nigeria. This report is a pilot study that will form
part of a larger on-going research seeking to develop a cash flow forecasting model
suitable for use by contractors in Nigeria. The study was undertaken to investigate
cash flow forecasting practices by construction contractors in Nigeria. A qualitative
approach was used for this purpose. Contractors engaged by the Central Bank of
Nigeria (CBN) were interviewed for the purpose of the study. The study revealed that
the practice of cash flow forecasting depends on the contractors’ background.
Indigenous contractors do not have a formal practice while semi-indigenous
contractors and multinational corporations practice formal cash flow forecasting even
if not in conformity with existing literature.
Keywords: cash flow, forecast, Nigeria
BACKGROUND
The success of any construction company depends largely on the ability of its
management to foresee and prepare for the future. One area of great challenge is that
of managing present and future financial requirements. An essential component of
financial management is that of forecasting cash flow. Cash flow in construction
contracts is concerned with the timing of payments, receipts of payments and the
consequent balance of cash remaining due to these transactions. Construction
Contractors know that there can be a significant lapse in time from the point at which
they are granted a project, incur labour, material and other costs, to the time they are
actually paid for completed work. Consequently, an inability to properly plan for the
inflow and outflow of cash during the life span of a project may well result in the
abandonment of a project. Cash flow in construction consists of the following layers
(Kenley, 2003):
Gross cash flow- consisting of inward cash flow and outward cash flow. Founded on
the relationship between time and cost, gross cash flow allies with models for the
time-cost relationship
Net cash flow- consisting of the balance between inward and outward cash flow
Organisational cash flow- consisting of the overlaying of the organisation’s individual
project net cash flows
AbdulRazaq, Ibrahim and Ibrahim
48
Strategic Management of cash flow- consisting of the policy and strategic framework
for managing the cash flow for the entire organisation, including non-construction
projects or investments
Gross cash flow and net cash flow deal with cash flow on projects. Organisational
cash flow and strategic management of cash flow deal with cash flow at the level of
the organisation.
Several factors affect cash flow to a contractor working on a project. These factors
include (i) duration of the project (ii) retention conditions (iii) times for receiving
payments from employers (iv) credit arrangement with suppliers, equipment rentals
(v) times of payment to subcontractors (Park et al, 2005; Buertey et al, 2010) etc.
Other factors include the size of the project, the procurement route, type of the project
(Kaka and Khosrowshahi, 1996) among others. Thus the need for forecasting the cash
requirement of a project at the right time, in order to determine when and where to
borrow or redirect funds cannot be over emphasised.
In an attempt to assist contractors and employers forecast their cash requirements,
several researchers have made efforts to develop cash flow forecasting models. These
attempts became popular over thirty years ago within the construction industry. The
approach of early studies may be characterised as nomothetic, given that they
attempted to discover general laws and principles across categorised or non
categorised groups of construction projects (Kenley, 2003). Some of the techniques
used for modelling cash flow forecasts include polynomial regression (Balkau, 1975;
Bromilow, 1978; Peer, 1992), Weibull-linear model (Tucker, 1986), Logit models
(Kenley and Wilson, 1986, 1989) and the neural network (Boussabaine and Kaka,
1998; Boussabaine et al, 1999). The nomothetic approach adopted by early
researchers has gained fewer acceptances because of several short comings which
resulted in the inability of the models to produce typical value curves. These short
comings emanated as a result of the uniqueness of construction projects arising from
difference in payment conditions (Chen et al, 2005), time lag between billing and
actual payment (Park et al, 2005), type of project (Boussabaine et al, 1999),
procurement route (Kaka and Khosrowshahi, 1996; Kaka and Price, 1991), type of
client and several other factors. This has paved way for the introduction of the
idiographic approach- the search for specific laws pertaining to individual projects.
In Nigeria, authors have likened project abandonment to delays associated with
payments (Aibinu and Jagboro, 2002; Olawale and Ming, 2009; Yekini and Onohaebi
2010, Olusegun and Michael, 2011). These delays, according to the authors, were
caused by cash flow management problems and other factors like procurement route,
availability of credit facilities, interest rates, retention rates, time lags between billing
and actual payment, project type, type of client (public or private) etc. Thus a proper
cash flow management strategy which should begin with an effective forecast by
construction contractors will impact positively on the timely completion of projects.
Despite these reports, no literature seems to exist on cash flow forecasting carried out
in Nigeria. This paper reports a pilot study to explore current practice of Contractors
in Nigeria with respect to cash flow forecasting. The aim of the study is to provide
background as to the manner in which contractors in Nigeria forecast
payments/expenditure on projects given that literature seem not to have reported same.
Since the late 1990s, the Central bank of Nigeria (CBN), Nigeria’s apex bank, in
response to the general concern about the decaying infrastructure in first generation
universities, has been making attempts to provide/improve key infrastructure under

Cash flow forecasting
49
the Nigerian Universities Capacity Building Programme. The projects carried out
under this capacity building programme include the construction of administrative
blocks, lecture halls, laboratories, health centres, and the likes. For the purpose of
uniformity (the idiographic paradigm) and availability of data, construction
contractors engaged by the CBN were approached for this study.
RELATED STUDIES
Several researchers have made attempts at modelling standard value/cost flow curves.
They were mainly part of a general attempt to assist contractors or clients forecast
their cash flow on an individual project level (Kaka, 1996) or on a company level
(Kaka, 1995). Other issues relating but not directly connected to cash flow models
have also received attention (Kaka et al, 2007; Cui et al, 2010; Olawale and Sun, 2010
etc).
Ashley and Teicholz (1977) and McCaffer (1979) proposed an early model utilising
standard delays. McCaffer refined the approach using forecast income schedules
based on network analysis. However, both researchers did not use the standard
sigmoid (s) curve as their base.
Kaka and Price (1993) attempted to compare standard cost commitment curves with
the types of contracts and procurement routes. They concluded that typical standard
curve cannot be used for cash flow forecasting and thus they proposed the
development of standard curves for contracts based on similar characteristics (i.e. size,
procurement etc). In a similar attempt Khosrowshahi (1997) made efforts to derive
optimum project duration and cost curve for Hong Kong public housing projects. The
work proposed a general set of mathematical expressions for the relationships between
project cost and duration. Data collected for the research included location, size,
technology, construction method, procurement method etc for 24 housing projects
with uniformity in data and similarity in characteristics.
Kirkham et al (2002) collected data on the consumption of electricity in an National
Health Services (NHS) acute care hospital building in the UK. They found that by
using expert judgement alongside statistical tests, an increase in accuracy of projection
was achieved. The authors concluded that the result could be used in whole life cycle
cost model for forecasting electricity cost. In the same direction Blyth et al (2004)
opined that a framework can be developed for the standardisation of programme of
works for construction activities irrespective of size, cost and function. The research
proved that frame work for standardised programme of work can be produced. The
classification of buildings into sizes, functions, storey heights etc gave the work wide
coverage of activities in construction viewed from different perspectives. The
application of the result in cash flow forecasting is questionable though, due to the
difficulty associated with standardising all aspects of construction activities.
Park et al (2005) proposed a model for forecasting cash flow which considered time
lag between cost incurred and value earned by the contractor during the construction
stage depending on payment conditions. The model took cognisance of monthly actual
costs incurred against planned costs during the construction stage. Similarly Chan et al
AbdulRazaq, Ibrahim and Ibrahim
50
(2005) discussed and showed that payment conditions are significant to cash flow
predictions.
Blyth and Kaka (2006) developed a multiple linear regression model for forecasting S-
curves at the pre tender stage of a project. They classified and standardised activities
for 50 construction projects. The projects were classified into various criteria based
upon project function. Logit transformation and linear regression were then used to
develop the proposed model. The research was able to emphasise the idiographic
approach to forecasting (emphasis on individual rather than grouped projects).
Odeyinka and Ojo (2006) developed a conceptual framework for assessing risk
impacts on clients’ cash flow. The framework proposed a step-by-step approach for
developing a model to predict clients’ risks in relation to cash flow. The extent of risk
occurrence responsible for variations between actual and forecasted cash flow will
then be determined at different completion stages of the projects. Similarly, Odeyinka
et al (2008) carried out a survey of small, medium and large size construction firms in
the United Kingdom in order to find out their perception of the frequency of
occurrence and impact of risk factors affecting cash flow forecasts. They discovered
11 risk factors that were critical to cash flow forecasts. However, the research was
conducted in the UK and only the perception of contractors was sought.
Kaka et al (2007) made an attempt to assist stake holders in the construction industry
select an appropriate pricing system for construction projects. This they did by
identifying 17 decision making factors crucial to the selection of different pricing
systems (these they called Project Objectives (PO)) and five different pricing systems
(PS). The 17 POs were reduced to 7 via a survey of construction firms, public practice
and consultants. The POs were evaluated alongside the PSs with the use of Analytical
Hierarchical Process (AHP) to determine which pricing system was more appropriate
for the 7 project objectives. The research was aimed at improving stake holders’
appreciation of new payment systems that will assist in more collaborative works. The
research also reiterated the importance of payment systems to the success of
construction projects.
Kaka and Khosrowshahi (2008) developed a mathematical based model which sought
to address the difficulties encountered by large companies when collecting data for
use in computer based models. The research assumed that future works start at the
middle of each year and by using a standard value build-up curve, average duration
and total value of work needed, models for forecasting turn over and working capital
required by Contractors at company level were proposed. The hypothetical models
were tested using a previously developed and tested computer based model. However,
the research did not capture how on-going works can be incorporated into the model.
Neither was it able to address forecasting at individual project level.
Cui et al (2010) developed a model for the system analysis of cash flow management
strategies. The strategies studied included front-end loading, back-end loading,
overbilling, and underbilling and trade credits. The study concluded that by using an
overbilling and underbilling strategy a project management team could reduce project
Cash flow forecasting
51
overdraft balance by as much as 11.4%. In a related study Olawale and Sun (2010)
adopted both quantitative and qualitative approach to find out factors inhibiting cost
and time control of construction projects at the same time proposing mitigating
measures. A questionnaire survey was followed by semi- structured interviews for the
same group of respondents. The research discovered the top 5 inhibiting factors to be
design changes, risks and uncertainties, inaccurate evaluation of project time/duration,
complexity of works and non-performance of subcontractors for both cost and time. It
also suggested that the mitigating measures include preventive, predictive, corrective
and organisational in a broad sense.
The attempts by these various researchers in the field of cash flow
forecasting/modelling and related issues emphasise the relevance and diversity in
approaches through which cash flow forecasting can be tackled. However, not much
has been reported on the practice of cash flow forecasting by stake holders in the
construction industry. This paper seeks to address this absence particularly in Nigeria
where cash flow related problems have been reported to result in project
abandonment. The paper presents preliminary results of an ongoing research aimed at
developing a cash flow forecasting model for construction contractors in Nigeria. It is
worth noting that researches are available in the wider area of cash flow forecasting
models which is closely related to, but not exactly pointed at the focus of this paper.
RESEARCH METHOD
The study adopted the structured interview approach with guiding questions derived
from literature (see appendices 1 and 2). The interviews covered areas including the
background of the contractors, knowledge of cash flow forecasting technique(s) and
difficulties involved with the use of the current techniques. The interviews were tape-
recorded and transcribed verbatim. Using content analysis method, the data was
analysed and emerging themes identified. Interviews therefore formed an important
source of evidence in this study as they helped to focus directly on the topic and
provided more insightful information (Fellows and Liu, 2007).
The contractors that participated in this research, as at the time of the study, had
contracts to construct high rise building projects for educational institutions with the
Central Bank of Nigeria as sponsor, were conveniently accessible and had over five
years experience as contractors for the apex bank. The projects cover works with
contract sums of not less than two billion naira each. The contract periods were
originally for two years with a possible extension of another one year. The two year
contract had about five months left and the contractors were keen to secure the
extension. Appointments were booked with the contractors over the phone
highlighting why they had been approached and what they could expect at the
interview. The appointment also provided assurances of confidentiality.
Five contractors were interviewed. Three of the contractors were completely
indigenous, run their businesses as sole proprietors, have annual turnover of less than
5 billion naira, have no managerial relationship with non Nigerians and operate in
Nigeria only. The fourth contractor, also a sole proprietor, is a Non-Nigerian who has

AbdulRazaq, Ibrahim and Ibrahim
52
been residing and doing business in Nigeria for over forty years (operates within
Nigeria only) and has an annual turnover of less than 5 billion naira. While the fifth
contractor is a multi-national corporation that has been involved in businesses within
and outside Nigeria for over thirty years with an annual turnover of over 100 billion
naira.
RESULTS/DISCUSSIONS
Result of the interviews shows a disparity of practices along the three categories of
contractors interviewed- contractors who are completely indigenous, expatriates who
run indigenous businesses and multi-national corporations who run their businesses
within and outside the country.
The indigenous contractors conceded that they kept electronic information of their
payment receipts/costs incurred. The information are kept for the purpose of “keeping
the records straight”, “raising claims arising from variation instructions”, “writing
financial reports for the consumption of management” and “for use in the future as
reference for similar projects”. The indigenous contractors do not practice cash flow
forecasting as a policy. The practice of forecasting is entirely informal. The practice is
for the Managing Director (or an appointed representative) to give a projection of
expected payments/expenditures based on personal experience and intuition as it
relates to the Client-organisation. This system, they claim has been producing at most
40% efficiency. The contractors all agree that a more informed system based on
empirical data rigorously analysed would improve efficiency.
Expatriates running indigenous construction companies have one form of formal
forecasting method or the other embedded in their company policy. Generally, they
seemed to be more aware of the existence of models available for forecasting both
expenditure and expected payments. Records were more readily available and about
45% efficiency was reported. This category also agrees that a localised forecasting
model based on empirical data generated and analysed locally is likely to produce
more efficiency.
The response from the multi-national corporation show thoroughness and painstaking
use of both formal models and those generated within the organisations based on their
experiences over the years. This category practice cash flow forecasting as a strict
policy for every “major” project. The efficiency recorded is generally high (about
60%). The respondent also agreed that an independent assessment aimed at
forecasting cash flow with more diverse data would make a more realistic reference
material.
The informal nature of the practice by the indigenous contractors may be traced to the
background of the contractors, who are business men involved in any profitable
venture and generally lack background in the construction industry. Even when
advised by employees who are trained as construction experts, this category never
take expert advice seriously as long as cash is available from within the project or
from another source. The most important thing is to finish the project, pursue
Cash flow forecasting
53
payments and wait for the next opportunity irrespective of the risk involved. Contrary
to Odeyinka et al’s (2008) assertion that contractors need to assess risk impact on cash
flows. The complete lack of regard for formal cash flow policy is also a violation of
suggestions by Bromilow (1960), Hudson and Maunick (1974), Blyth and Kaka
(2006), who insist that a pre-tender cash flow analysis is crucial to the long term
survival of any construction company.
Even for the expatriate and multinational contractors who practice cash flow
forecasting as a policy, mainly because of their exposure, it is clear that the practices
are not entirely as suggested by recent researches. Researchers have reported the need
for contractors to adopt a forecasting practice along different trades (Sing and Phua,
1984), procurement routes (Kaka and Price, 1993), project types (Kenley and Wilson,
1986) and even Clients (Kirkham et al, 2002). The practice rather dwells on using a
system that “has been working for us” over the years. Thus models that could have
given better results are not explored.
CONCLUSIONS
Cash flow forecasting is an essential practice for any construction contractor who
wishes to survive in today’s competitive construction business. A proper cash flow
management strategy based on a well articulated forecast is always eminent to the
successful completion of construction projects. This study examined the practices of
cash flow forecasting by contractors in Nigeria. Result of the study revealed that the
practice of cash flow forecasting by contractors in Nigeria depend on the background
and nature of the contractor. The practice of cash flow forecasting by contractors in
Nigeria is not consistent- those who practice it do not have an appropriate way of
doing it, while others do not seem to think it deserves thorough consideration. This
implies that contractors in Nigeria do not practice cash flow forecasting in the correct
manner. Most contractors interviewed showed nonchalant attitude towards the practice
as no formal policy is embedded in their company policy to forecast cash flow. Those
who engage in the practice as a company policy do not adhere strictly to suggestions
by researchers to streamline practices along defined activities, which is crucial to the
accuracy of cash flow forecasts.
REFERENCES
Ashley, D. B. and Teicholz, P. M. (1977). Pre-estimate Cash Flow analysis. Journal of the
Construction Division, American society of Civil Engineers, Proc. Paper 13213 103
(CO3). 369-379
Balkau, B. J. (1975). A Financial Model for Public Works Programmes. National ASOR
Conference, Sydney, ASOR.
Blyth, K., and Kaka, A. P. (2006). A novel multiple linear regression model for forecasting S-
curves. Engineering, Constructrion and Architectural management, 13(1), 82-95.
Bromilow, F. J. (1978). Multi project Planning and Control in Construction Authorities.
Building Economist (March). 208-213.
AbdulRazaq, Ibrahim and Ibrahim
54
Boussabaine, A. H., Thomas, R., and Elhag, T. (1999). Modelling cost-flow forecasting for
water pipeline projects using neural networks. Engineering, Construction and
Architectural management, 6(3), 212-224.
Buertey, J. T. I., Adjei-Kumi, T., and Amoah, P. (2010). construction Cash flow Prediction
Model in Ghana: A case Study of the district asembly common funded project. In
Laryea, S., Leiringer, R. and Hughes, W. (Ed.), West African Built Environment
Research (WABER) (pp. 235-245). Accra, Ghana.
Chen, H.-L., O’Brien, W. J., and Herbsman, Z. J. (2005). Assessing the accuracy of cash flow
models: the significance of payment conditions. ASCE Journal of Construction
Engineering and Management 131(6), 669-676.
Cui, Q., Hastak, M., and Halpin, D. (2010). System analysis of project cash flow management
strategies. Construction Management and Economics 28(1), 361-376.
Fellows, R. F., and Liu, A. (1997). Research methods for construction. Oxford: Blackwell
Science Ltd.
Kaka, A. P. (1995). Incorporating Risk into Contractors Cash Flow Forecasting and Planning.
Financial Management of Property and Construction Conference, Newcastle,
Northern Ireland. 468-478.
Kaka, A. P. (1996). Towards more Flexible and Accurate Cash Flow Forecasting.
Construction Management and Economics, 14, 35-44.
Kaka, A. P., and Price, A. D. F. (1991). Net Cash Flow Forecasting Models: Are they
Reliable? Construction Management and Economics, 9, 291-308.
Kaka, A. P., and Khosrowshahi, F. (1996). Effect of Different Procurement routes
Contractors’ Cash Flows. Engineering, Construction and Architectural Management,,
3((1, 2)), 133-145.
Kaka, A. P., Wong, C., Fortune, C., and Langford, D. (2007). Cultutre change through the use
of appropriate pricing systems. Engineering, Constructrion and Architectural
management, 15(1), 66-77.
Kenley, R and Wilson, O. D. (1986). A Construction Project Cash Flow Model-an idiographic
Approach. Construction Management and Economics,4, 21 3-232.
Kenley, R and Wilson, O. D. (1989). A Construction Project Net Cash Flow Model.
Construction Management and Economics, 7, 3-18.
McCaffer, R. (1979). Cash Flow Forecasting. Quantity Surveying (August): 22-26.
Odeyinka, H. A., and Ojo, G. K. (2006). A conceptual framework for assessing risk impacts
on clients'cash flow. construction management and economics, 15, 371-380.
Park, H. K., Han, S. H., and Russel, J. S. (2005). Cash flow forecasting model for general
contractors using moving weight of cost categories. Journal of management in
engineering, 21(4), 164-172.
Peer, S (1992). Application of Cost flow forecasting models. Journal of Construction
Division, Proceeding of the American society of Civil Engineers, 107 CO2
Tucker, S. N. (1996). Formulating Construction Cash Flow Curves Using Reliability Theory
Analogy, Construction Management and Economics, 4(3), 179-188.
Achuenu, E. and Achuenu, S.A. (2012) Assessment of development of technicians/technologists in the
built environment disciplines in Nigeria In: Laryea, S., Agyepong, S.A., Leiringer, R. and Hughes, W.
(Eds) Procs 4th West Africa Built Environment Research (WABER) Conference, 24-26 July 2012,
Abuja, Nigeria, 55-65.
55
ASSESSMENT OF DEVELOPMENT OF
TECHNICIANS/TECHNOLOGISTS IN THE BUILT
ENVIRONMENT DISCIPLINES IN NIGERIA
Emmanuel Achuenu1 and Stella Ache Achuenu
2
1Department of Building, University of Jos, Nigeria
2Department of Geography and Planning, University of Jos, Nigeria
This research work evaluates the development of technicians/technologists for the
built environment disciplines in Nigeria. It carried out a comprehensive review of
development of National and Higher National Diploma products in the built
environment disciplines in Nigeria with particular reference to the military era from
1993 to 2000. Two methods were used in collecting the data used for the analysis.
The first part involved the data collected from the records of National Board for
Technical Education (NBTE) headquarters, Kaduna. It consists of output by
programme from 1993 to 2000. The second part involved the use of questionnaires to
obtain information from the graduates who are now in various areas and the
employers and the teachers. From the study it was revealed that 32% of the
technicians/technologists handle projects under little or no supervision while 54%
under medium supervision and 12% with strict supervision. It was also reported that
at least 80.6% of the ND and HND graduates who work as technicians and
technologists have fairly good theoretical background. 90% percent of the lecturers
opined that reports received on employers’ rating of diplomats from the industry
confirmed the performance of their products to be good. It is recommended that more
improvement in the area of provision for learning facilities in the polytechnics be
made to enable more practical works to be carried out in the institutions during the
period of study.
Keywords: built environment, discipline, professional, technologists
INTRODUCTION
The built environment refers to the human-made surroundings that provide the setting
for human activity, ranging in scale from personal shelter and buildings to
neighbourhoods and cities that can often include their supporting infrastructure, such
as water supply or energy networks. The built environment is a material, spatial and
cultural product of human labour that combines physical elements and energy in forms
for living, working and playing. According to Puerto (2011) built environment is
defined broadly to include land use patterns, the transportation system, and design
features that together provide opportunities for travel and physical activity. Land use
patterns refer to the spatial distribution of human activities. The transportation system
refers to the physical infrastructure and services that provide the spatial links or
connectivity among activities. Design refers to the aesthetic, physical, and functional
Achuenu and Achuenu
56
qualities of the built environment, such as the design of buildings and streetscapes,
and relates to both land use patterns and the transportation system.
In practice, the term is typically used to describe the interdisciplinary field which
addresses the design, construction, management and use of man-made surroundings as
an interrelated whole as well as their relationship to human activities over time (rather
than a particular element in isolation or at a single moment in time). The field is
generally not regarded as a traditional profession or academic discipline in its own
right, instead drawing upon areas such as economics, law, public policy, management,
geography, design, technology, and environmental sustainability.
According to Chynoweth (2006), the Built Environment subject area is now
established as a recognised field of study by the international academic community.
However, its identity has traditionally been defined in terms of the traditional
construction and property professions from which it has emerged (Haigh and
Amaratunga (2010) and more recently, by the cultural and behavioural aspects of its
international research activities.
Although there is broad acceptance that the field is multidisciplinary, there has been
little attempt to define the cognitive nature of its knowledge base, or to consider the
implications of this for research and teaching practice (Chynoweth, 2006). Studies of
the field are few in number (for example, Temple 2004) and tend to be characterised
by a pragmatic and issue-driven approach to the subject, with little attempt to
understand its underlying academic base.
According to Chapman (2009), Built environment disciplines span a wide diversity of
concerns and actions, from the realisation and management of development and places
through to spatial planning at great territorial scales. Each is concerned with the
development and management of our living environments. Places where, “interactions
between population, human activities, and the environment...for a secure, just, and
environmentally sustainable future are among the most complex and interdependent
issues with which society must deal”. Thus the responsibilities resting upon built
environment disciplines are great, and the need to secure real synergy and added-value
from the combined results of our actions is imperative (Cortese, 2003:16). The
question as opined by Chapman (2009) is, are we up to the challenges? While each of
the disciplines involved is inextricably linked, they each work at quite different spatial
and temporal scales; use different approaches and instruments for action; and in some
ways are guided by quite different values.
The challenges of developing interdisciplinary skills in the built environment were
also explored by Gann and Salter (1999) who took their perspective from the
engineering discipline. Gann and Salter (1999) noted that the challenges of practice do
not present themselves in disciplines and that interdisciplinary skills are critical to
problem solving in the conditions presented in the built environment where many
variables, together with significant levels of uncertainty and risk are found. While
Gann and Salter (1999) did not identify specific ways to promote greater
interdisciplinary issues, two forms of interdisciplinary concerns worthy of noting were
identified. The first was found to be between different domains within a discipline,
which in their study was within engineering. The second was found between the
engineering and built environment disciplines and the social science and humanities.
According to Chapman (2009), despite this rather narrow perspective, Gann and Salter
(1999) went on to draw the critical conclusion that “…interdisciplinary thinking
requires an appreciation of different methods and approaches to problem definition
Development of technologists
57
and solving”. An approach that they see as “...encouraging integration of different
perspectives into a unified whole” by selecting “...concepts, methods and techniques
that transcend rather than reproduce the boundaries set by formal (academic)
disciplines”.
Conceptualisations of multidisciplinary, interdisciplinary and trans-disciplinary
relations can be varied. Chapman noted that these terms are generally taken to follow
the perspective suggested by Winder (2003) in which, multidisciplinary studies are
seen as a ‘patchwork’ led by a well defined discipline; interdisciplinary studies are
seen to require intellectual synergies across disciplinary boundaries; and where trans-
disciplinary issue is seen to include a wider community of interests beyond the
academic and professional. The challenge for education in the built environment is to
prepare the students by developing curricula and learning activities that enable them to
develop new knowledge through active learning and shared explorations: between
disciplines, and in the context of the wider environmental and socio-economic
interests. Before going on to explore how this could be achieved it is important to
consider the fundamental relationships in time, scale and purpose that exist between
disciplines in practice, as it is these that set the context. In this paper, the disciplines
considered amongst other are Architecture, Building, Civil Engineering, Estate
Management, Land Surveying, Quantity Surveying and Urban and Regional Planning.
One important means for effecting an improvement in the quality of life for people is
technology, and it provides the means for doing what is thought desirable in the world
of men. Technology is sometimes embodied in a physical reality in a piece or a
collection of physical things. Equally it may be embodied in a method, a technique or
collection of techniques, a methodology or know how. Basically, technology is one of
the products of human rationality. It results from the rational problems-solving effort
required to produce a means with which to meet some societal goal or need in the built
environment. For effective manpower planning, the technology to be acquired has to
be specified and the technological processes involved identified. The skills required
in the operation and maintenance of the different technological processes also have to
be identified in respect of different levels, whether managerial, supervisory or just
plain skilled technical personnel. These terms are used in many ways by different
occupations and in different regions/countries. Technicians and technologists usually
work in a team with other professionals. They are usually involved with the
application or adaptation of technology. Performance as a certified technician or
technologist requires the application of principles, methods and techniques appropriate
to a field of technology. Practical knowledge of the construction, application,
properties, operation and limitations of engineering systems, processes, structures,
machinery, devices or materials, is usually required. A technician is a professional,
who through academic training and experience in the application of engineering or
scientific principles, is capable of assuming responsibility and of exercising
independent judgement in a specialized practice within a field of engineering or
applied science technology. A technician works under general supervision.
Technologist also is a professional, who through academic training and experience in
the application of engineering or scientific principles is capable of assuming
responsibility and exercising independent judgement in the practice of engineering or
applied science technology. A technologist carries out a wide range of complex work,
either independently or under general direction. Technician and technologist are two
different terms. However, these two terms are interrelated. Most people think that
these terms mean the same but, when one looks a bit closer, one will find that they are

Achuenu and Achuenu
58
different in many aspects. A technician and a technologist differ in their educational
levels and responsibilities.
A technologist has a greater role than a technician. A technician is just a person with a
practical understanding of technology. A technician has a good knowledge of the
general principles of the field he is in, whereas, a technologist is a person who is
completely aware of various technologies. A technician works under a technologist. A
technologist’s position is above that of the technician.
First of all, when comparing their education, a technologist will have an engineering
degree or higher diploma, whereas, a technician will have ordinary diploma
certificate. Generally, a technician course will last for one to two years, whereas a
technologist will have to undergo a course that lasts for four to five years. When
talking about the duties of a technologist, he has a wider range of duties when
compared to a technician. The technologist is the team leader, and his duties include
research, analysing, designing, conducting studies, resolving problems, interpreting
situations, evaluating situations, developing prototypes and guiding the technicians.
On the other hand, a technician is the person who is involved with duties like
maintenance, repairs and troubleshooting.
Another difference that can be seen is that a technologist is solely responsible for
innovative ideas, and the technician is responsible for the application of those ideas.
Unlike technicians, technologists handle most of the more complex work.
Development is the systematic use of scientific and technical knowledge to meet
specific objectives or requirements. It is an extension of the theoretical or practical
aspects of a concept, design, discovery, or invention. It is also the process of economic
and social transformation that is based on complex cultural and environmental factors
and their interactions. Development is also a complex meta-process-the goal of which
is an improvement in the quality of life for people. This general process is composed
of a number of sub-processes” each identified by an adjective, there is economic
development, educational development, manpower development, industrial
development, technological development and others. Each relates to a particular facet
of that total system which is of primary interest, that is, the societal system consisting
of human beings in the built environment.
Kolawole and Frank (1999) states that there is need to have a survey carried out to
determine the available manpower in the country and how best to utilize this available
manpower. The ultimate objective of a country’s development policy is the
improvement in the standard of living of the masses of its citizen and professional
disciplines play dominant role in the process of modifying the built environment
(Fafunwa, 1991). This makes it imperative that developments associated with the
disciplines in the built environment should be available in the right mix.
The Nigerian Society of Engineers (NSE) (1986) presents a memorandum to the
Federal Military government on the structure and role of the Engineering profession.
NSE noted the dynamic nature of Engineering and proposed a registration procedure
and cadres within the profession which took care of the middle-level manpower viz.
Title Academic Qualification
The Engineer University degree or equivalent
The Engineering Technologist HND or equivalent
The Engineering Technician OND or equivalent
The engineering Craftsman Diploma or Technical Colleges or equivalent.
Development of technologists
59
This was done to boost the morale of technicians who have over the years been
complaining of lack of recognition within the profession of engineering; however,
they can only be registered when they pass the examinations appropriate for the level
of registration as in Australia (Llyod, 1990).. This entails that Polytechnics would
have to include in their curricula the syllabi of the professional examination to enable
their graduates enter the professional body. In this research work, technicians are
graduates of polytechnics or equivalent who possess National Diploma certificates
while technologists are those with Higher National Diplomas.
Salawu (1986) asserts that education and training in the various sciences and
technologies relevant to the built environment needs of the country must be
undertaken if the development of the appropriate technicians/technologists is to be
achieved.
There can be no significant progress in the field of technology without a well
conceived and coordinated research and development strategy (Maloney and
McFilten, 1986 and Kuroshi and Achuenu, 2005) . In this critical period when there is
shortage of manpower in most technological endeavours, it is necessary to re-evaluate
the quality of technicians/technologists produced and their ability to provide solutions
to urgent national built environment problems. Contributing to technological
problems in the built environment in Nigeria, Akinrele (1990) observes that Nigeria
presents a case of large untapped natural resources with a big internal market but
constrained by poor technology diffusion and cash trapped economy. With the
number of Polytechnics, there is of course the need to reshape the curricular to address
current emerging issues in areas such as creative design, appropriate technology,
materials technology and tero-technology (Eni, 1990). According to Akinrele (1990),
engineers and technologists play a crucial role in the attainment of progress in our
industrialization drive; hence manpower development in that regard cannot be over-
emphasized.
As earlier stated, there are several disciplines responsible for the development of the
built environment. This work is restricted to studying technicians and technologists in
Architecture, Building, Estate Management, Land Surveying, Quantity Surveying,
Town and Regional Planning and Civil Engineering. This is because they are the most
predominant professions in Nigerian Institutions within the period under study.
The main aim of this paper is to study the development of technicians/technologists in
the built environment disciplines in Nigeria by evaluating the output of polytechnics
from 1993 to 2000 (military era) in terms of National and Higher National Diploma
graduates produced and their performance after graduation.
METHODOLOGY
In carrying out the research, an extensive review of relevant literature was made. Two
methods were used in collecting the data used for the analysis.
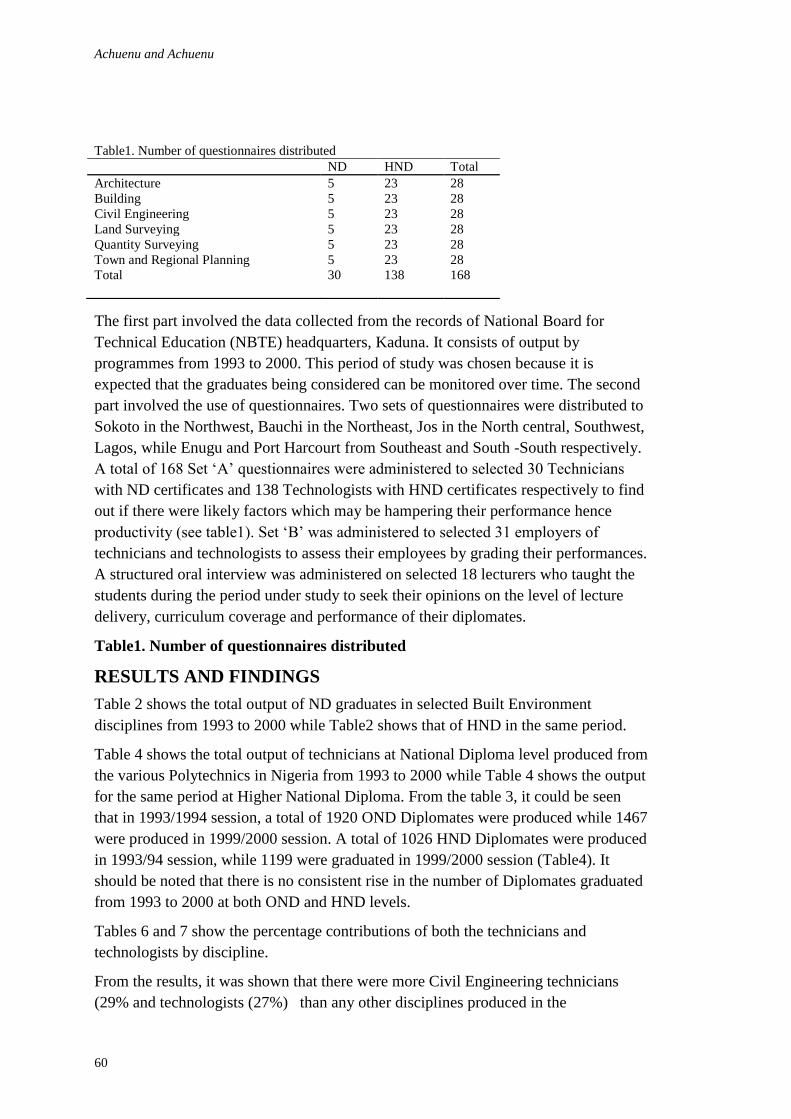
Achuenu and Achuenu
60
The first part involved the data collected from the records of National Board for
Technical Education (NBTE) headquarters, Kaduna. It consists of output by
programmes from 1993 to 2000. This period of study was chosen because it is
expected that the graduates being considered can be monitored over time. The second
part involved the use of questionnaires. Two sets of questionnaires were distributed to
Sokoto in the Northwest, Bauchi in the Northeast, Jos in the North central, Southwest,
Lagos, while Enugu and Port Harcourt from Southeast and South -South respectively.
A total of 168 Set ‘A’ questionnaires were administered to selected 30 Technicians
with ND certificates and 138 Technologists with HND certificates respectively to find
out if there were likely factors which may be hampering their performance hence
productivity (see table1). Set ‘B’ was administered to selected 31 employers of
technicians and technologists to assess their employees by grading their performances.
A structured oral interview was administered on selected 18 lecturers who taught the
students during the period under study to seek their opinions on the level of lecture
delivery, curriculum coverage and performance of their diplomates.
Table1. Number of questionnaires distributed
RESULTS AND FINDINGS
Table 2 shows the total output of ND graduates in selected Built Environment
disciplines from 1993 to 2000 while Table2 shows that of HND in the same period.
Table 4 shows the total output of technicians at National Diploma level produced from
the various Polytechnics in Nigeria from 1993 to 2000 while Table 4 shows the output
for the same period at Higher National Diploma. From the table 3, it could be seen
that in 1993/1994 session, a total of 1920 OND Diplomates were produced while 1467
were produced in 1999/2000 session. A total of 1026 HND Diplomates were produced
in 1993/94 session, while 1199 were graduated in 1999/2000 session (Table4). It
should be noted that there is no consistent rise in the number of Diplomates graduated
from 1993 to 2000 at both OND and HND levels.
Tables 6 and 7 show the percentage contributions of both the technicians and
technologists by discipline.
From the results, it was shown that there were more Civil Engineering technicians
(29% and technologists (27%) than any other disciplines produced in the
Table1. Number of questionnaires distributed
ND HND Total
Architecture 5 23 28
Building 5 23 28
Civil Engineering 5 23 28
Land Surveying 5 23 28
Quantity Surveying 5 23 28
Town and Regional Planning 5 23 28
Total 30 138 168
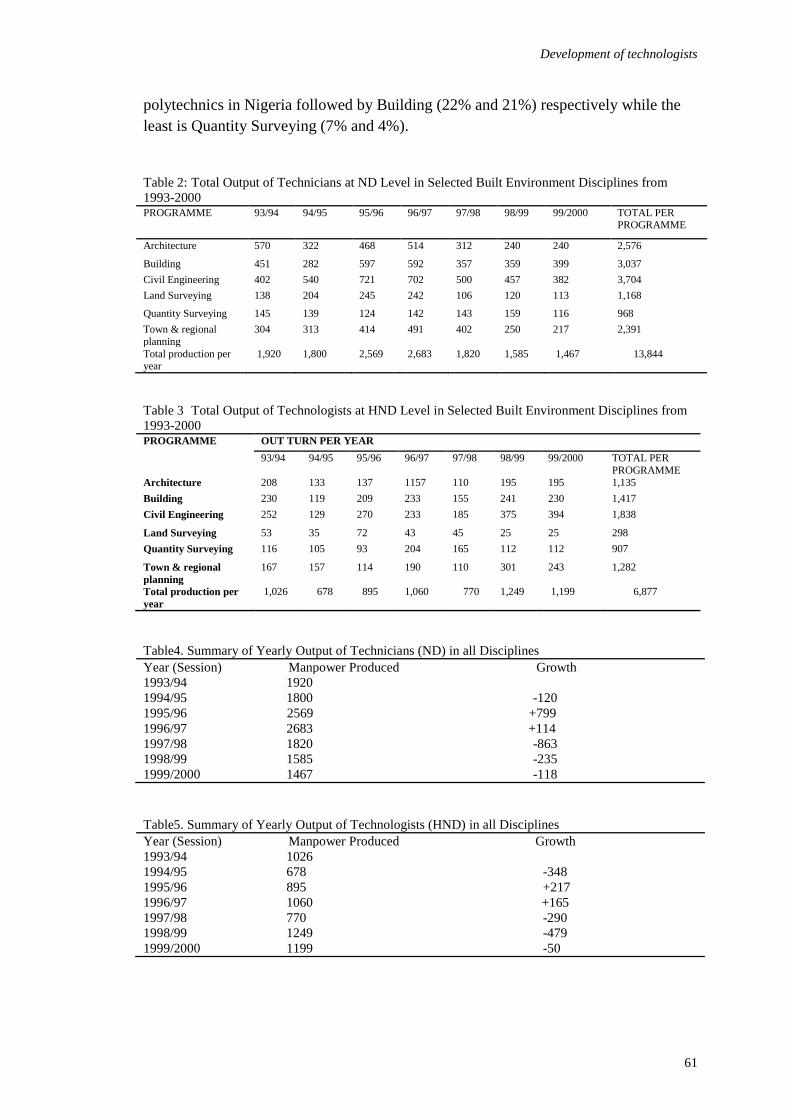
Development of technologists
61
polytechnics in Nigeria followed by Building (22% and 21%) respectively while the
least is Quantity Surveying (7% and 4%).
Table 2: Total Output of Technicians at ND Level in Selected Built Environment Disciplines from
1993-2000 PROGRAMME 93/94 94/95 95/96 96/97 97/98 98/99 99/2000 TOTAL PER
PROGRAMME
Architecture 570 322 468 514 312 240 240 2,576
Building 451 282 597 592 357 359 399 3,037
Civil Engineering 402 540 721 702 500 457 382 3,704
Land Surveying 138 204 245 242 106 120 113 1,168
Quantity Surveying 145 139 124 142 143 159 116 968
Town & regional
planning
304 313 414 491 402 250 217 2,391
Total production per year
1,920 1,800 2,569 2,683 1,820 1,585 1,467 13,844
Table 3 Total Output of Technologists at HND Level in Selected Built Environment Disciplines from
1993-2000 PROGRAMME OUT TURN PER YEAR
93/94 94/95 95/96 96/97 97/98 98/99 99/2000 TOTAL PER
PROGRAMME
Architecture 208 133 137 1157 110 195 195 1,135
Building 230 119 209 233 155 241 230 1,417
Civil Engineering 252 129 270 233 185 375 394 1,838
Land Surveying 53 35 72 43 45 25 25 298
Quantity Surveying 116 105 93 204 165 112 112 907
Town & regional
planning
167 157 114 190 110 301 243 1,282
Total production per
year
1,026 678 895 1,060 770 1,249 1,199 6,877
Table4. Summary of Yearly Output of Technicians (ND) in all Disciplines
Year (Session) Manpower Produced Growth
1993/94 1920
1994/95 1800 -120
1995/96 2569 +799
1996/97 2683 +114
1997/98 1820 -863
1998/99 1585 -235
1999/2000 1467 -118
Table5. Summary of Yearly Output of Technologists (HND) in all Disciplines
Year (Session) Manpower Produced Growth
1993/94 1026
1994/95 678 -348
1995/96 895 +217
1996/97 1060 +165
1997/98 770 -290
1998/99 1249 -479
1999/2000 1199 -50

Achuenu and Achuenu
62
Table6. % Contribution of Technicians by Discipline
Disciplines % Contribution
Civil Engineering 29
Building 22
Architecture 20
Town and Regional Planning 15
Land Surveying 7
Quantity Surveying 7
Table 7. % Contribution of Technologists by Discipline
Disciplines % Manpower Contribution
Civil Engineering 27
Building 21
Architecture 18
Town and Regional Planning 16
Land Surveying 14
Quantity Surveying 4
Assessment of the Performance of Technicians/ Technologists in the Built
Environment Disciplines
Theoretical Background
In the study questionnaire, employers were asked to grade their
Technicians/Technologists theoretical backgrounds in their fields of practice. From
the results, 9.7% were adjudged to be very good while 41.9% are good, 38.7% fair and
9.7% poor. This means at least 80.6% are fairly good.
Performance of Technicians/Technologists
The employers reported that only 9.7% were very good in their performance in the
early stages of their practice after school, 41.9% good, 41.9% fair while 6.5% were
not good. This follows that a total of 83.8% of the employers either good or fair
implying they have acceptable practical training while in school. However, there is
still need for more practical training to improve on the performance of the diplomates
after graduation.
After putting some years from service according to the employers’ rating, 45.2% were
adjudged to be very good while 41.9% were good. This improvement is attributable
more to practical field experience than abilities learnt from school.
Level of Employer’s Supervision of Technicians/Technologists
The level of supervision a technician/technologist requires to handle assigned projects
is crucial to the general performance of an organisation. The less time an employer
spends on supervising his technicians/technologists the more time he has for other
aspect of the organisation and vice versa. 32% of the respondents said their
technicians/technologists handle projects under little or no supervision while 54%
under medium supervision and 12% with strict supervision.
Technicians/Technologists Reporting Skills
Development of technologists
63
Technical reporting being very essential in the business of construction, respondents
were asked to select from 3 options the degree with which their technicians
communicate technical matters in the process of their work. 25.8% of the
technicians/technologists according to the respondents write superb reports in good
technical manner, 64.5% write reports with few corrections while 9.7% were not good
in technical reporting. It follows that 90.3% write good reports.
Job Specification and Scope for Technicians/Technologists
The research established that there are certain jobs Technicians/Technologists were
not allowed to do as confirmed by 61.3%.
Factors affecting Technicians/Technologists Performance
Questionnaires were administered to a total of one hundred and sixty eight (168)
Technicians/Technologists which sought to identify the problems that were likely to
affect their performance. Out of the 168 respondents, 30 were National Diploma
Holders and 138 Higher National Diplomas.
Professional Segregation
From the responses, 71.4% were of the opinion that they were being marginalised in
the work field. Some of the problems highlighted include:
When placed side by side with their University counterparts, they are considered
inferior.
They cannot head their various departments in the ministries
They cannot sign payment certificates for contractors.
From the above, it quite clear that most of the respondents went to the institutions
without actually being aware of the general policy on education. This follows that
there is need for more enlightenment. It was also observed from the respondents that
the graduates from the various disciplines do not seem to operate as one family as
some of the respondents feel that other graduates from other disciplines were
considered more superior than them. This corroborates the argument by Gann and
Salter (1999), Chynoweth (2006) and Chapman (2009) that most built environment
disciplines are not properly integrated.
Dissent for the Qualification Possessed
All the respondents feel that they would probably not face any professional
segregation if they had obtained University degrees. 60.7% respondents were of the
opinion that given a repeat chance, they would not opt for HND certificate.
Promotion Problem
53.6% of the respondents experience problems in their promotions. Of the respondents
who face promotion problems, 38.5% of the 53.6% said that lack of promotion affects
their performance while 61.5% of them reported that it does not affect their
performance.
Job Specification

Achuenu and Achuenu
64
42.9% of the respondents said there were tasks they can do but were not allowed to do
while 57% reported otherwise.
Curriculum evaluation
Teachers who taught the students within the period under study were asked to
comment on the extent of lecture delivery and its impact on the students. From the
responses obtained from selected 18 lecturers who still teach in the selected
polytechnics, 67% reported that the curriculum used were adequate for the
programmes while 80% said that the syllabi were properly covered. 67% of the
lecturers opined that the practical content were adequate for the studies. However, all
the lecturers reported that the curricular have been reviewed in recent times to
accommodate recent developments. Most lecturers interviewed agreed that the
interactions among the disciplines need more improvement as suggested by Chapman
(2009) as every profession consider their disciplines more important even with the
introduction of the National Building Code in Nigeria. 90% percent of the lecturers
stated that they have received employers rating of diplomates from the industry which
confirmed the performance of their products to be good. All the respondent lecturers
confirmed that there is still room for improvement in the area of provision for learning
facilities.
CONCLUSIONS
It can be concluded that there is no consistent rise in the number of Diplomates
graduated from 1993 to 2000 at both ND and HND levels. From the results, 9.7%
were adjudged to be very good while 41.9% are good, 38.7% fair and 9.7% poor. This
means that at least 80.6% are fairly good. 90% percent of the lecturers said that
reports received on employers’ rating of diplomates from the industry confirmed the
performance of their products to be good.
In order that Nigeria achieves the much needed Technological leap forward, the
Federal Government must take immediate steps to get an accurate (or nearly so) stock
of manpower already produced in the six (6) Built Environment disciplines. This will
help in future planning for the Built Environment. The result shows that some of the
disciplines like land surveying and quantity surveying do not produce graduates at ND
HND levels as others such as Civil Engineering, Building and Architecture. The
implication of this is that the contribution of these very important disciplines to the
development of the built environment is dwindling and needs urgent attention in order
to attract young men and women.
From the study there is still room for improvement in the area of provision for
learning facilities in the polytechnics to enable more practical works to be carried out
in the institutions as stated by the lecturers. There is also need for more harmonious
relationship among the built environment disciplines considered in this study.
REFERENCES
Akinrele, M.O.(1990). Industrialization Policy for 1990’s. Strategy Options. The Nigerian
Society of Engineers, Proceedings of the National Conference.
Development of technologists
65
Chapman, D.W. (2009). Knowing our Places? Contexts and Edges in Integrating Disciplines
in Built Environment Education. Journal for Education in the Built Environment,
4(2): 9-28 (20) (December 2009)
Chynoweth, P. (2006). The Built Environment Interdiscipline: A Theoretical Model for
Decision Makers in Research and Teaching, Proccedings of the CIB Working
Commission (W089) Building Education and Research Conference, Kowloon Sangri
La Hotel, Hong Kong, 10-13 April, 2006.
Cortese, A. D. (2003). The critical role of Higher Education in creating a sustainable future,
Planning for Higher Education, 31 (3), 15-22.
Eni, C.(1990). Conflicts in Architectural Education Curricula in Nigeria: Polytechnics versus
Universities. Journal of the Association of Architectural Educators in Nigeria, 1(1):
48-50
Fafunwa, A.B. (1991). Policy Options for a Sound Engineering Education. Engineering
Focus. 49-52
Gann, D. and Salter, A. (1999). Interdisciplinary skills for built environment professionals.
London: The Ove Arup Foundation
Haigh R. and Amaratunga D. (2010). "An integrative review of the built environment
discipline's role in the development of society's resilience to disasters", International
Journal of Disaster Resilience in the Built Environment, 1(1):11 – 24
Kolawole, J.O and Frank, F.N.(1999). Manpower Development in the Building and
Construction Industry. Nigerian Journal of Construction Technology and
Management, 2(1):97-101
Kuroshi, P.A. and Achuenu, E.(2005). Building Research and Development in Nigeria in the
Context of Sustainability Principles. Proceedings of the 2nd
National Conference on
“Towards a Sustainable Built Environment”. Ahmadu Bello University, Zaria, 21st -
23rd
September. 159-169.
Llyod, B.(1990). From Trades Person to Engineer. Engineers-Australia NBP(1628): 16-18
Maloney, W.F. and McFilten, (1986). Research Needs in Construction Worker Performance.
Journal Construction Engineering and Management, ASCE, 112(1): 122-136
Puerto C. L. (2011). The Influence of the Built Environment on Graduate Student Perception
of Graduate School Experience. Journal for Education in the Built Environment, 6(2)
Salawu, R.I.(1986). Strategies for Technological take off of the Country The Nigerian Society
of Engineers Proceedings of the National Conference.
Temple, M. (2004) Studying the Built Environment. Basingstoke: Palgrave Macmillan.
The Nigerian Society of Engineers (NSE) (1986). The Structure and Role of the Engineering
Profession in Nigeria. Memorandum Presented to the Federal Government.
Transportation Research Board Institute of Medicine of the National Academies. (2005) Does
the built environment influence physical activity? Examining the evidence. URL:
Winder, N. (2003). Successes and problems when conducting interdisciplinary or
transdisciplinary (= integrative) research. In: Tress, G., Tress, B., van der Valk, A. and Fry,
G.(Eds.). Interdisciplinary and transdisciplinary landscape studies: Potential and
limitations. Wageningen: Delta Series 2, pp. 74-90.

Adamu, N., Nensok, M.H. and Aka, A. (2012) Multi-skilling barriers in the construction industry in
North-Western Nigeria In: Laryea, S., Agyepong, S.A., Leiringer, R. and Hughes, W. (Eds) Procs 4th
West Africa Built Environment Research (WABER) Conference, 24-26 July 2012, Abuja, Nigeria, 67-
82.
67
MULTI-SKILLING BARRIERS IN THE
CONSTRUCTION INDUSTRY IN NORTH-WESTERN
NIGERIA
Nasiru Adamu1, Mohammed Hassan Nensok
2 and Adefemi Aka
3
Department of Quantity Surveying, Waziri Umaru Federal Polytechnic, Birnin Kebbi. Nigeria
Department of Building, Waziri Umaru Federal Polytechnic, Birnin Kebbi, Nigeria
The need to improve productivity and cost effectiveness has made some companies to
adopt a multi-skilling labour strategy where workers can work across their traditional
occupational boundaries. The study assessed the problems and barriers of multi-
skilling using a cross-sectional survey of construction workers in some selected cities
in north-western Nigeria. Descriptive statistics was used in the analysis. Results show
that lack of training and limit on human skill retention by workers are among the
major barriers of multi-skilling. It was concluded that multi-skilling can lead to
improved productivity and cost effectiveness if these barriers are minimised. It was
recommended that construction companies should provide adequate training for their
workers so that they can be multi-skilled.
Keywords: construction industry, multi-skilling, productivity
INTRODUCTION
Two of the most critical challenges facing the construction industry are the limited
availability of skilled labour and the increasing need for productivity and cost
effectiveness (Hegazy et al. 2000). One potential solution already being used by some
companies is multiskilling (Dada and Ekpe, 2006). It is argued that if labour workers
are properly trained to fit into a variety of roles in the construction processes (that is,
to become multiskilled), it will increase their skill repertoire and enable them to
acquire the capacity to work across traditionally distinct occupational boundaries
(Cordery, 1989). A multiskilled construction trade worker is an individual who
possesses or acquires a range of skills and knowledge and applies them to work tasks
that may fall outside the traditional boundaries of his or her original trade. In a
construction context, this does not necessarily mean that a worker obtains or possesses
mastery level skills in multiple trade areas. However, based on the flexible application
of skills the worker already possesses or is willing to acquire, the worker can be an
effective and productive contributor to the work output of several traditional trade
disciplines (Construction Industry Institute (CII), 1998).
Research results have indicated that multiskilling can increase the productivity,
quality, and continuity of work, while providing for a safer site and providing
managers more flexibility in assigning tasks (Williamson 1992; Cross 1996; Burleson
Adamu, Nensok and Aka
68
et al. 1998). Field studies have also indicated that multiskilling may benefit workers.
Such benefits include longer employment duration, better qualifications resulting in
increased employability, and increased job satisfaction (Stanley 1997; Rodriguez
1998; Carley 1999).
Despite these reported benefits, Dada and Ekpe (2006 ) have identified some barriers
to the use of multiskilling in the construction industry, such as lack of training,
resistance to change and difficulty in meeting licensing requirements. Other barriers
included limit on human skill retention and pride of craft association. The purpose of
this paper was to critically examine the barriers to effective use of multiskilling
strategy in north-western Nigeria. It is believed that uncovering these barriers would
increase current understanding and provide a useful guide to managers in formulating
appropriate policies of utilising current workforce more effectively in order to boost
productivity.
LITERATURE REVIEW
The Concept of Multiskilling in the Construction Industry
The construction industry is unique in the way it manages and organizes human
resources. Unlike manufacturing or process industries, each construction project is
different in terms of staffing, organization, strategy and management. Projects vary
greatly - from small office renovations to large complex construction works. Each
project requires a different labour force and as the work on site proceeds, the various
work teams that have gradually been integrated during the course of work have to
break up and re-adjust themselves in different groups on different sites (Odusami,
Oyediran and Oseni, 2007). Consequently, every project presents its own challenges
and requires a unique complement of tradespeople during various construction phases
(Dada and Ekpe, 2006).
Construction industry analysts and practitioners have focused their attention on skilled
labour availability for many years now. Falling numbers of new trade entrants and low
construction unemployment rates increasingly indicate that there are not enough
skilled workers to meet rising demand. Part of the problem in meeting demand is the
unstable and short-duration job assignments. New entrants into the work force are
seeking better job stability. It is believed that the solution to the skilled labour
shortage is to look for ways to better utilize the skilled workers already in the industry
and to improve job stability. Multiskilled labour utilization strategies have been
successfully implemented in many industries and many countries. In these instances, a
multiskilled work force has been identified as a contributing factor to economic
development, improved international competitiveness, and increased profitability (CII,
1998).
A multiskilled workforce is one in which the workers possess a range of skills that
allow them to participate in more than one work process (Lill, 2008). Because craft
boundaries are blurred using multiskilling, a multiskilled workforce can be organized
in such a way that workers are employed for longer durations at the site while the total
project hiring requirements are reduced. A worker may be selected to participate in
any activity in which he or she is proficient and may be rotated to another activity, if
Multi-skilling barriers
69
necessary, rather than being replaced by an additional worker (Gomar et.al., 2002).
Multiskilling is therefore the acquisition of skills, knowledge, competency, and
experience which enable an individual to perform tasks outside the immediate job
requirements, thereby providing the organisation with a flexible and adaptable worker,
and a pool of skilled human resources (Davids, 2004).
Dimensions of multiskilling
According to Anderson, (2010), multiskilling can be considered in terms of three
dimensions;
1. Vertical multiskilling – this is where the employee takes on supervisory or
administrative tasks such as overseeing or leading a self-managed team. This has the
potential of empowering an employee with managerial aspirations and demonstrates a
greater level of trust in the individual.
2. Horizontal multiskilling – this is where the employee takes on another task at
the same level of his or her original task. For instance, a block/brick layer taking on
the work of a plasterer.
3. Depth multiskilling – where a set of complex skills are acquired within the
same job function in order to offer a better overall service.
It is worth noting that there is no universal ‘best practice’ in multiskilling, since the
type of job being performed, the individual employee and the organisational structure
of the company will determine what is best. In most cases, the ideal solution will be a
combination of all three dimensions (Andersen, 2010).
Advantages to the employer
The main benefits of multiskilling to the employer are lower costs and increased
flexibility. Personnel costs probably constitute the most cited and well-documented
arguments in favour of multiskilling (Andersen, 2010). Overall personnel costs are
reduced through layoffs due to better utilisation of existing personnel and lower
temporary personnel recruitment costs, as employees will be better able to stand in for
each other (Andersen, 2010). One documented benefit is that flexibility results in
increased client satisfaction and enhanced work quality (Haas et al., 2001). The ability
of multiskilled employees to perform a larger portion of the work has led to an
observed increase in productivity by decreasing idle time and transition time between
job areas or work groups (CII, 1998). Multiskilling provides an environment where
duration in employee assignment increases and therefore individual break-in periods
are reduced. Project site safety is improved due to increased employment duration on
the site. Previous studies have shown that most accidents occur in the first months on
a new site (Burleson et al., 1998).
Additional benefits include higher income and increased employability of the
workforce. To take full advantage of these benefits, the workforce strategy and the
planning and scheduling processes of a construction project must be adapted to use
multiskilling effectively and efficiently (Haas et al., 2001).
Adamu, Nensok and Aka
70
Advantages to the employee
From the employee’s perspective, the main benefits are better use of skills, increased
job variety, higher pay and increased job motivation (CII, 1998). The employees may
receive higher pay as a result of the company’s increased productivity and higher
profit on multiskill contracts. Employee promotion prospects often improve as the
employee receives more training and often supervisory and management training
where vertical multiskilling is introduced (Andersen, 2010).
Haas et al. (2001) argues that organisational changes are inevitable when multiskilling
is introduced. Some employees will see colleagues lose their jobs; new jobs and job
titles will be introduced; and employees will be assigned to work with new colleagues.
Interestingly, multiskilling may even be demanded by employees in the future. Today,
work is central to employees’ professional and personal identity and multiskilling is
one way of improving the status of a job and hence quality of life. The current
challenge is to make employees feel emotionally attached to the job as much as to the
company, and multiskilling does just that (Andersen, 2010).
Limitations of multiskilling
De Vero and Martins (2010) assert that, from productivity perspective, specialised
workers have a productivity advantage over multiskilled workers because their expert
knowledge in a given skill makes them better at adapting to changing demand. That is,
specialisation gives workers deep expertise that enables them to innovate and rapidly
tailor products and services to the changing specifications demanded by clients. This
ability to innovate, deriving from intensively specialising in one area, is lacking in
multiskilled workers who are “jacks of all trades and masters of none.”
Training costs may likely outweigh the benefits of the increased flexibility provided
through multiskills. Without proper training, quality will decrease, thus reducing
client’s satisfaction. The employees are also likely to experience reduced job
satisfaction if they are asked to do jobs without having the requisite skills (Andersen,
2010).
Organisational changes are equally inevitable when multiskilling is introduced. To
utilise a multiskilled labour strategy, employers will have to alter their screening and
hiring, compensation, staffing, and project management practices. In some sectors,
owner practices that are designed around traditional craft definitions will have to be
modified to fully utilise a multiskilling labour strategy (CII, 1998). A robust and
efficient planning, organising and coordination is thus required if the strategy is to
succeed.
RESEARCH METHODS
Research setting and procedure
In line with Kamya et al.’s (2010) assertion that analytical surveys are recommended
for descriptive studies that involved establishing the opinions of respondents, a cross-
sectional survey using structured questionnaire was used to generate data for the study
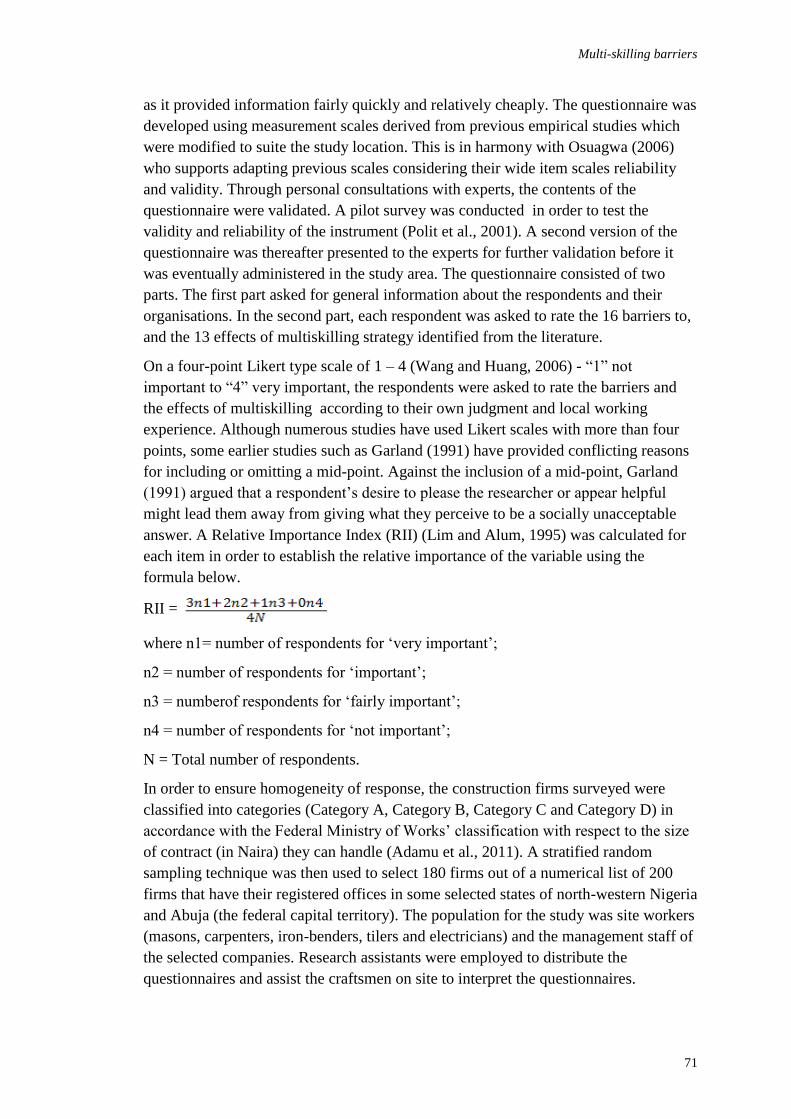
Multi-skilling barriers
71
as it provided information fairly quickly and relatively cheaply. The questionnaire was
developed using measurement scales derived from previous empirical studies which
were modified to suite the study location. This is in harmony with Osuagwa (2006)
who supports adapting previous scales considering their wide item scales reliability
and validity. Through personal consultations with experts, the contents of the
questionnaire were validated. A pilot survey was conducted in order to test the
validity and reliability of the instrument (Polit et al., 2001). A second version of the
questionnaire was thereafter presented to the experts for further validation before it
was eventually administered in the study area. The questionnaire consisted of two
parts. The first part asked for general information about the respondents and their
organisations. In the second part, each respondent was asked to rate the 16 barriers to,
and the 13 effects of multiskilling strategy identified from the literature.
On a four-point Likert type scale of 1 – 4 (Wang and Huang, 2006) - “1” not
important to “4” very important, the respondents were asked to rate the barriers and
the effects of multiskilling according to their own judgment and local working
experience. Although numerous studies have used Likert scales with more than four
points, some earlier studies such as Garland (1991) have provided conflicting reasons
for including or omitting a mid-point. Against the inclusion of a mid-point, Garland
(1991) argued that a respondent’s desire to please the researcher or appear helpful
might lead them away from giving what they perceive to be a socially unacceptable
answer. A Relative Importance Index (RII) (Lim and Alum, 1995) was calculated for
each item in order to establish the relative importance of the variable using the
formula below.
RII =
where n1= number of respondents for ‘very important’;
n2 = number of respondents for ‘important’;
n3 = numberof respondents for ‘fairly important’;
n4 = number of respondents for ‘not important’;
N = Total number of respondents.
In order to ensure homogeneity of response, the construction firms surveyed were
classified into categories (Category A, Category B, Category C and Category D) in
accordance with the Federal Ministry of Works’ classification with respect to the size
of contract (in Naira) they can handle (Adamu et al., 2011). A stratified random
sampling technique was then used to select 180 firms out of a numerical list of 200
firms that have their registered offices in some selected states of north-western Nigeria
and Abuja (the federal capital territory). The population for the study was site workers
(masons, carpenters, iron-benders, tilers and electricians) and the management staff of
the selected companies. Research assistants were employed to distribute the
questionnaires and assist the craftsmen on site to interpret the questionnaires.
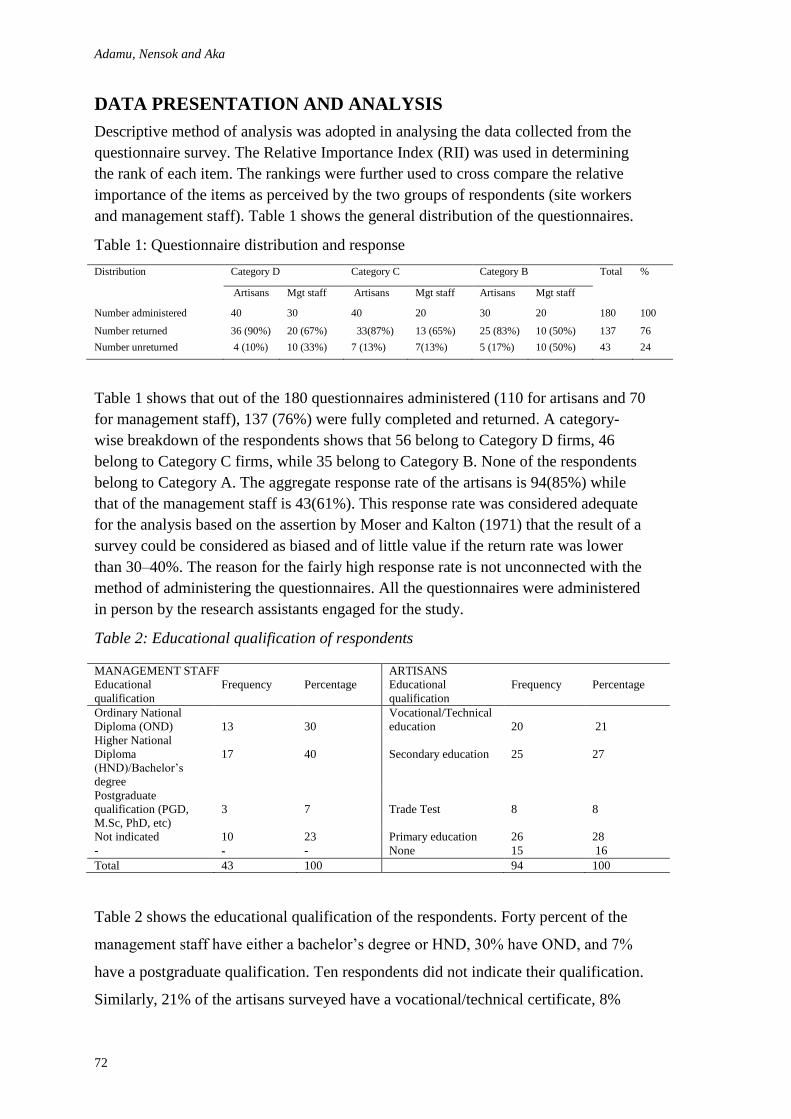
Adamu, Nensok and Aka
72
DATA PRESENTATION AND ANALYSIS
Descriptive method of analysis was adopted in analysing the data collected from the
questionnaire survey. The Relative Importance Index (RII) was used in determining
the rank of each item. The rankings were further used to cross compare the relative
importance of the items as perceived by the two groups of respondents (site workers
and management staff). Table 1 shows the general distribution of the questionnaires.
Table 1: Questionnaire distribution and response
Distribution Category D Category C Category B Total %
Artisans Mgt staff Artisans Mgt staff Artisans Mgt staff
Number administered 40 30 40 20 30 20 180 100
Number returned 36 (90%) 20 (67%) 33(87%) 13 (65%) 25 (83%) 10 (50%) 137 76
Number unreturned 4 (10%) 10 (33%) 7 (13%) 7(13%) 5 (17%) 10 (50%) 43 24
Table 1 shows that out of the 180 questionnaires administered (110 for artisans and 70
for management staff), 137 (76%) were fully completed and returned. A category-
wise breakdown of the respondents shows that 56 belong to Category D firms, 46
belong to Category C firms, while 35 belong to Category B. None of the respondents
belong to Category A. The aggregate response rate of the artisans is 94(85%) while
that of the management staff is 43(61%). This response rate was considered adequate
for the analysis based on the assertion by Moser and Kalton (1971) that the result of a
survey could be considered as biased and of little value if the return rate was lower
than 30–40%. The reason for the fairly high response rate is not unconnected with the
method of administering the questionnaires. All the questionnaires were administered
in person by the research assistants engaged for the study.
Table 2: Educational qualification of respondents
MANAGEMENT STAFF ARTISANS
Educational
qualification
Frequency Percentage Educational
qualification
Frequency Percentage
Ordinary National
Diploma (OND)
13
30
Vocational/Technical
education
20
21
Higher National
Diploma
(HND)/Bachelor’s
degree
17
40
Secondary education
25
27
Postgraduate
qualification (PGD,
M.Sc, PhD, etc)
3
7
Trade Test
8
8
Not indicated 10 23 Primary education 26 28
- - - None 15 16
Total 43 100 94 100
Table 2 shows the educational qualification of the respondents. Forty percent of the
management staff have either a bachelor’s degree or HND, 30% have OND, and 7%
have a postgraduate qualification. Ten respondents did not indicate their qualification.
Similarly, 21% of the artisans surveyed have a vocational/technical certificate, 8%
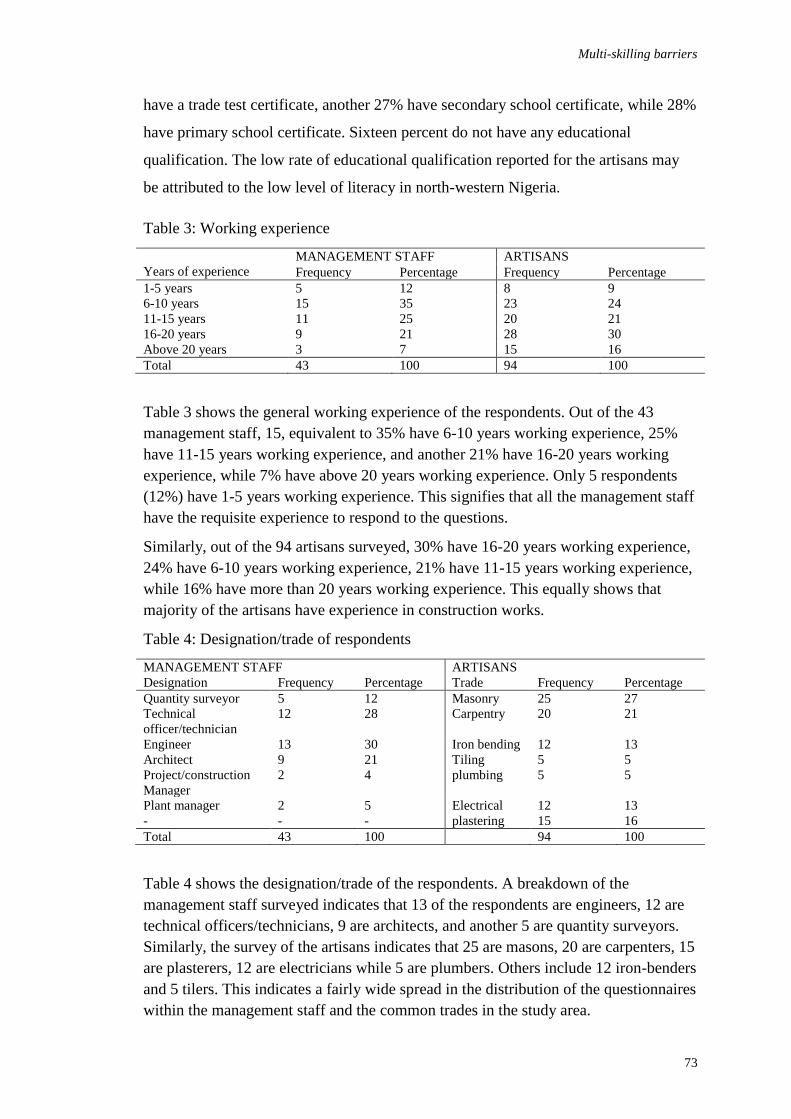
Multi-skilling barriers
73
have a trade test certificate, another 27% have secondary school certificate, while 28%
have primary school certificate. Sixteen percent do not have any educational
qualification. The low rate of educational qualification reported for the artisans may
be attributed to the low level of literacy in north-western Nigeria.
Table 3: Working experience
Years of experience
MANAGEMENT STAFF ARTISANS
Frequency Percentage Frequency Percentage
1-5 years 5 12 8 9
6-10 years 15 35 23 24
11-15 years 11 25 20 21
16-20 years 9 21 28 30
Above 20 years 3 7 15 16
Total 43 100 94 100
Table 3 shows the general working experience of the respondents. Out of the 43
management staff, 15, equivalent to 35% have 6-10 years working experience, 25%
have 11-15 years working experience, and another 21% have 16-20 years working
experience, while 7% have above 20 years working experience. Only 5 respondents
(12%) have 1-5 years working experience. This signifies that all the management staff
have the requisite experience to respond to the questions.
Similarly, out of the 94 artisans surveyed, 30% have 16-20 years working experience,
24% have 6-10 years working experience, 21% have 11-15 years working experience,
while 16% have more than 20 years working experience. This equally shows that
majority of the artisans have experience in construction works.
Table 4: Designation/trade of respondents
MANAGEMENT STAFF ARTISANS
Designation Frequency Percentage Trade Frequency Percentage
Quantity surveyor 5 12 Masonry 25 27
Technical
officer/technician
12 28 Carpentry 20 21
Engineer 13 30 Iron bending 12 13
Architect 9 21 Tiling 5 5
Project/construction
Manager
2 4 plumbing 5 5
Plant manager 2 5 Electrical 12 13
- - - plastering 15 16
Total 43 100 94 100
Table 4 shows the designation/trade of the respondents. A breakdown of the
management staff surveyed indicates that 13 of the respondents are engineers, 12 are
technical officers/technicians, 9 are architects, and another 5 are quantity surveyors.
Similarly, the survey of the artisans indicates that 25 are masons, 20 are carpenters, 15
are plasterers, 12 are electricians while 5 are plumbers. Others include 12 iron-benders
and 5 tilers. This indicates a fairly wide spread in the distribution of the questionnaires
within the management staff and the common trades in the study area.

Adamu, Nensok and Aka
74
Table 5: Barriers to multiskilling strategy
Table 5 presents the analysis of the barriers to multiskilling strategy as perceived by
both groups (management staff and artisans). Starting with the response of
management staff, the table shows that the biggest barrier to the strategy is “lack of
adequate training” with a rank of 1 and Relative Importance Index (RII) of 0.634. This
is followed by “limit to human skill retention” with a rank of 2 and an RII of 0.547,
followed by “high cost of training” with an RII of 0.529 and a rank of 3. However, the
lowest ranked barriers are “the need for change in project and company systems to
support multiskilling as a competitive strategy” and “Difficulty in modifying already
established single skilled labour management policies to accommodate multiskilling
strategy” with ranks of 15 and 16 respectively.
Similarly, the responses of the artisan (Table 5) show that “lack of adequate training”
has been found to be the biggest barrier to multiskilling with a rank of 1 and an RII of
0.652, followed by “difficulty in developing suitable compensation policies to match
the level of skills acquired” with an RII of 0.495. This is followed by “limit to human
skill retention” and “difficulty in assigning workers to appropriate tasks and
S/N
Barriers
Management staff (N =
43)
Artisans
(N = 94)
Average RII of
both
groups
Mean
R I I
Rank
Mean
R I I
Rank
R I I
Overall Rank
1 Lack of adequate training 3.51 0.634 1 3.62 0.652 1 0.643 1 2 Resistance to change 2.93 0.482 5 2.65 0.412 7 0.447 5
3 Licensing requirement 2.93 0.483 4 2.50 0.375 10 0.429 8
4 Limit on human skill retention 3.19 0.547 2 2.88 0.472 3 0.509 2
5 Pride of craft association 2.60 0.401 9 2.85 0.463 5 0.432 7
6 High training cost 3.17 0.529 3 3.13 0.352 12 0.441 6
7
Jurisdictional disputes between different crafts unions
2.26
0.320
11
2.60
0.399
8
0.360
11
8
Unsuitable for complex tasks
2.91
0.477
6
3.12
0.428
6
0.453
4
9
Difficulty in developing multiskilled craft tests
2.14
0.285
13
1.74
0.186
14
0.236
14
10
Difficulty in developing suitable compensation
policies to match the level of skills acquired
2.65
0.413
7
2.98
0.495
2
0.454
3
11
Difficulty in recruiting and accessing adequate
information regarding the skills of workers
2.63
0.407
8
2.51
0.378
9
0.393
10
12
The need to change organisational structure of
company to accommodate multiskilling strategy
2.28
0.321
10
1.21
0.319
13
0.320
12
13
Difficulty in modifying already established
single skilled labour management policies to
accommodate multiskilling strategy
2.84
0.171
16
2.43
0.356
11
0.264
13
14
The need for change in project and company
systems to support multiskilling as a competitive strategy
1.95
0.238
15
1.66
0.165
16
0.202
16
15
Difficulty in assigning workers to appropriate tasks and organizing effective crews
2.30
0.318
12
2.49
0.471
4
0.395
9
16 Complexity of maintaining a multiskilled workforce
2.05 0.262 14 1.70 0.176 15 0.219 15

Multi-skilling barriers
75
organizing effective crews” with ranks of 3 and 4 respectively. The lowest ranked
barriers are “complexity of maintaining a multiskilled workforce” and “the need for
change in project and company systems to support multiskilling as a competitive
strategy” with ranks of 15 and 16 respectively.
However, the overall ranking of the barriers shows that “lack of adequate training of
workers” is the biggest barrier with a rank of 1. Reasons for this could be the high cost
of providing training and the high mobility of construction workers as a result of
unattractive image, unsafe work place, irregularity of the workload, lack of respect
and opportunities for training (Lill, 2008). The second ranked barrier is “limit to
human skill retention” and the third is “difficulty in developing suitable compensation
policies to match the level of skills acquired”.
It is worth noting that the two groups have different opinions on the importance of
some of the barriers to multiskilling. For instance, item 10 in Table 5 (difficulty in
developing suitable compensation policies to match the level of skills acquired) is
ranked 7th
by the management (which may mean fairly important), but the same item
is ranked 2nd
(very important) by the artisans. This shows that artisans place high
premium on compensation policies as it determines their increased wage earning
potential. Similarly, item 6 (high training cost) is ranked 3rd
by the management but
12th
by the artisans. This is not surprising because high training cost implies more
expenses for the organisation. Therefore management will be more interested in
matters that have financial implication like training than the artisans. However, it is
believed that the cost of multiskill training can be offset by a reduction in the per
worker training costs as workers carry many fundamental skills from their primary
craft into secondary skill areas (CII, 1998). Again, item 3 (licensing requirement) is
ranked 4th
by management staff, but 10th
by the artisans. This suggests that
management are more conscious of licensing requirements than the workers. This may
influence their decision on the extent to which they will adopt the strategy.
Table 6 shows the perception of the management staff and artisans on the effects of
multiskilling. According to the management staff, “improved employability of
workers” ranked 1st with an RII of 0. 465, followed by “increased training cost of
workers” with an RII of 0.390. The third ranked effect is “enhancement of
productivity” with an RII of 0.378. On the other hand, the artisans are of the opinion
that the biggest effect of multiskilling is it “hinders specialisation”.
This is followed by “enhancement of productivity” with a rank of 2 and an RII of
0.460. “Increased training cost” was ranked 3rd
with an RII of 0.431. “Layoffs due to
better utilisation of existing personnel” and “reduction of efficiency” are ranked 12th
and 13th
respectively.
However, in the overall ranking, “improved employability of workers” is ranked 1st.
This result is justified because with multiskilling, workers are trained to perform
multiple tasks which guarantees steady employment through many phases of a project,
thus resulting in less time spent unemployed (CII, 1998). The second effect is
“hindered specialisation”. This is not unexpected because specialisation is only
achieved when same operation is frequently repeated. The third ranked effect is
“enhanced productivity”. This is equally justified because multiskilling promotes
flexibility in labour allocation; i.e., workers will be able to quickly switch from one
job to another, thereby enabling large portion of work to be performed by one crew.

Adamu, Nensok and Aka
76
This has been observed to increase productivity by decreasing idle time and transition
time between job areas or work groups (Burleson et al., 1998).
Table 6: Effects of multiskilling
S/N
Effects
Management staff
(N = 43)
Artisans
(N = 94)
Average RII of
both
groups
Mean
R I I
Rank
Mean
R I I
Rank
R I I
Overall RANK
1 Hinders specialization 2.488 0.372 5 2.87 0.468 1 0.420 2
2 Improves employability of workers 2.860 0.465 1 2.68 0.420 7 0.443 1
3 Enhances productivity 2.512 0.378 3 2.84 0.460 2 0.419 3
4 Reduces idle time of workers 2.349 0.337 8 2.71 0.428 4 0.383 6
5 Makes workers more useful 2.512 0.377 4 2.54 0.386 9 0.382 7
6 Reduces efficiency 2.256 0.302 11 2.12 0.279 13 0.291 12
7
Disruption of work flow due to constant movement of workers from one trade to
another
1.791
0.285
12
2.62
0.378
10
0.332
11
8
Enhances better understanding of integrated
construction activities
2.651 0.338 7 2.681 0.426 5 0.381 8
9
Project site safety is improved due to increased employment duration on the site
2.418
0.355
6
2.691
0.423
6
0.389
5
10 Creates role conflict between workers 2.302 0.320 10 2.660 0.415 8 0.368 9
11 Layoffs due to better utilisation of existing personnel
1.953 0.238 13 2.298 0.324 12 0.281 13
12 Increased job satisfaction and motivation 2.349 0.336 9 2.404 0.351 11 0.344 10
13 Increased training cost of workers 2.558 0.390 2 2.723 0.431 3 0.411 4
DISCUSSION OF RESULTS
This section discusses the major findings from the results shown in Tables 5 and 6. In
line with Pareto rule that the highest ranked have the greatest influence (Alinaitwe, et
al., 2007), discussion is made on the five highest ranked barriers and effects within the
overall ranking. According to the overall RII ranking, the five highest ranked barriers
are; lack of adequate training, limit on human skill retention, difficulty in developing
suitable compensation policies to match the level of skills acquired; unsuitability of
multiskilling for complex works and resistance to change.
Lack of adequate training of the workers has been found to be the biggest barrier to
multiskilling. This agrees with the assertion of Dada and Ekpe (2006) that lack of
training hampers the utilisation of multiskilling. Reasons for this apathy to additional
training can be attributed to the high cost of training and increasing use of labour-only
subcontractors which has reduced the commitment and investment in training
(Alinaitwe, 2008). Growth in self-employment is also another reason, as it is very rare
that a formal training is provided by the self-employed themselves because of
insufficient facilities, funds or will for training (Crowley et al., 1997). In addition,
Kazaz et al. (2008) opine that since workforce in construction is generally highly
mobile, contractors are often reticent to invest capital to train those who may soon be
someone else’s employees. This finding is not at all surprising because many
employers of labour in the construction industry are yet to fully adopt the concept of
multiskilling (Ejowhomu et al., 2006), and do not therefore equate its’ benefits to the
importance of providing additional training to workers. The implication of this is that,
the construction workforce’s average capability level will not develop and the
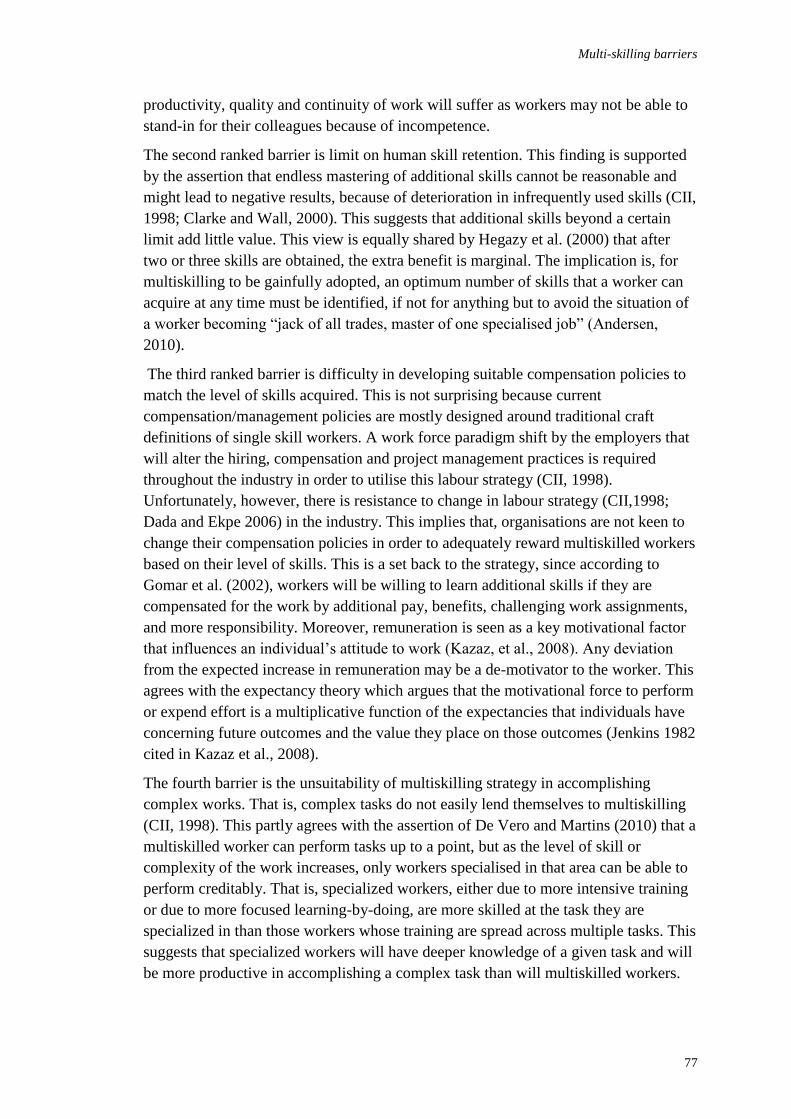
Multi-skilling barriers
77
productivity, quality and continuity of work will suffer as workers may not be able to
stand-in for their colleagues because of incompetence.
The second ranked barrier is limit on human skill retention. This finding is supported
by the assertion that endless mastering of additional skills cannot be reasonable and
might lead to negative results, because of deterioration in infrequently used skills (CII,
1998; Clarke and Wall, 2000). This suggests that additional skills beyond a certain
limit add little value. This view is equally shared by Hegazy et al. (2000) that after
two or three skills are obtained, the extra benefit is marginal. The implication is, for
multiskilling to be gainfully adopted, an optimum number of skills that a worker can
acquire at any time must be identified, if not for anything but to avoid the situation of
a worker becoming “jack of all trades, master of one specialised job” (Andersen,
2010).
The third ranked barrier is difficulty in developing suitable compensation policies to
match the level of skills acquired. This is not surprising because current
compensation/management policies are mostly designed around traditional craft
definitions of single skill workers. A work force paradigm shift by the employers that
will alter the hiring, compensation and project management practices is required
throughout the industry in order to utilise this labour strategy (CII, 1998).
Unfortunately, however, there is resistance to change in labour strategy (CII,1998;
Dada and Ekpe 2006) in the industry. This implies that, organisations are not keen to
change their compensation policies in order to adequately reward multiskilled workers
based on their level of skills. This is a set back to the strategy, since according to
Gomar et al. (2002), workers will be willing to learn additional skills if they are
compensated for the work by additional pay, benefits, challenging work assignments,
and more responsibility. Moreover, remuneration is seen as a key motivational factor
that influences an individual’s attitude to work (Kazaz, et al., 2008). Any deviation
from the expected increase in remuneration may be a de-motivator to the worker. This
agrees with the expectancy theory which argues that the motivational force to perform
or expend effort is a multiplicative function of the expectancies that individuals have
concerning future outcomes and the value they place on those outcomes (Jenkins 1982
cited in Kazaz et al., 2008).
The fourth barrier is the unsuitability of multiskilling strategy in accomplishing
complex works. That is, complex tasks do not easily lend themselves to multiskilling
(CII, 1998). This partly agrees with the assertion of De Vero and Martins (2010) that a
multiskilled worker can perform tasks up to a point, but as the level of skill or
complexity of the work increases, only workers specialised in that area can be able to
perform creditably. That is, specialized workers, either due to more intensive training
or due to more focused learning-by-doing, are more skilled at the task they are
specialized in than those workers whose training are spread across multiple tasks. This
suggests that specialized workers will have deeper knowledge of a given task and will
be more productive in accomplishing a complex task than will multiskilled workers.
Adamu, Nensok and Aka
78
The fifth ranked barrier is resistance to change. This tallies with the findings of CII
(1998) and Dada and Ekpe (2006) that workers and perhaps management, tend to
show some resistance to broad changes in labour strategy within the organisation. For
instance, superior officers who are critical of the lower productivity encountered at the
beginning of each rotation, may be unwilling to release employees as and when due.
Similarly, resistance can arise on the part of employees who might refuse to give up a
job in which they feel at home, thanks to the nature of their work, their colleagues, or
their superiors, because they are afraid the demands made on them might be too great
(Friederich et al., 1998).
From the overall ranking of the effects of multiskilling, the five highest ranked effects
in descending order are; improved employability of workers, hindered specialization,
enhanced productivity, increased training cost of workers and improved project site
safety due to increased employment duration on the site.
Improved employability of workers has been found to be the most important effect of
multiskilling. This finding is supported by Carley (1999) and Dada and Ekpe (2006)
that multiskilling reduces workers’ idle time and enhances employability. This implies
that, as workers become multiskilled, their versatility, skills and experience increase
thereby expanding their career options throughout their construction careers. In this
regard, multiskilling can be seen as the panacea to skill shortages and high labour
turnover rates.
The second effect of multiskilling is it hinders specialisation. This is in line with Dada
and Ekpe’s (2006) finding that multiskilling hinders specialisation. This is not
unexpected because specialisation is only achieved when same operation is frequently
repeated. This suggests that specialized workers will have deeper knowledge of a
given task and will be more productive at it than will multiskilled workers. This
supports the assertion of Lill (2009) that the higher the level of specialisation, the
higher the quality of work and the higher the productivity that can be achieved. It
should however, be noted that, the efficiency of specialisation is primarily guaranteed
by the necessary quantity of work. Where workers are not provided with work,
efficiency may fall or even yield opposite results (Lill 2009). The implication of this is
that, a balance must be struck between multiskilling and specialisation if high
productivity is to be realised.
The third effect is enhanced productivity. This agrees with the works of Fox and Yuen
(2004) and Dada and Ekpe (2006) that multiskilling improves productivity. Enhanced
productivity is achieved by longer employment duration, ability to switch quickly
from one job to another and reduced idle time (Haas et al., 2001; Gomar et al., 2002).
The fourth effect is increased training cost of workers. This is to be expected because
the effectiveness of multiskilling is predicated on further additional training of
workers to fit into a variety of roles in the construction processes, and this comes at a
cost to the employers. The higher the breadth and depth of workforce training, the
higher the cost of the training programme.
Multi-skilling barriers
79
The fifth effect is improved project site safety due to increased employment duration
on the site. This is not surprising because previous studies have shown that most
accidents occur in the first months on a new site (Burleson et al., 1998).
CONCLUSIONS AND RECOMMENDATIONS
The main objective of the study was to determine the major barriers to, and the effects
of multiskilling strategy on the employees and employers of labour in the construction
industry in north-western Nigeria. To this end, a questionnaire survey was conducted
to achieve this. From the results, lack of adequate training was found to be the biggest
barrier to multiskilling, followed by limit on human skill retention and then difficulty
in developing suitable compensation policies to match the level of skills acquired.
Similarly, improved employability, hindered specialisation and enhanced productivity
were found to be the most important effects of multiskilling strategy to the workers
and the organisation. In order for the strategy to be effectively implemented, the
identified barriers and some of the negative effects such as hindrance to specialisation
must be properly addressed.
The following recommendations can be made from the results
1.Employers should provide training, as well as encourage craftsmen to acquire
additional skills in order to enable them become multiskilled so as to improve their
employability potentials.
2.Government should assist in the training needs of the industry through subsidies or
other incentive schemes to the employers, employees and the self-employed. This will
mitigate the overall cost of training and motivate craftsmen in their qualification
improvement
3.Comprehensive compensation/management policies should be evolved by
employers in order to adequately reward multiskilled workers.
4.Although multiskilling strategy has been shown to improve employability and
project site safety, it should however, be adopted with caution because it hinders
specialisation. A balance should therefore be struck between multiskilling and
specialisation if high productivity is to be realised.
5.Sensitisation and awareness campaign on the benefits of the strategy should be
embarked upon by organisations willing to adopt the strategy so that resistance to
broad changes in labour strategy within organisations can be reduced to the minimum.
6.Organisations willing to adopt the strategy should evolve a formal skills assessment
procedure in order to ensure that tasks are not assigned outside worker capabilities.
LIMITATIONS OF THE RESEARCH
Like any other research study, this study has some limitations to consider. The
findings of this study cannot be generalised statistically to all of Nigeria because it is
geographically constrained, with respondents only drawn from a sample of
construction firms in north-western Nigeria. The study further acknowledges the
limitation that pertains to the use of surveys as method of data collection. Surveys can
only show the strength of statistical association between variables and they provide no
basis to expect that the respondents correctly interpret the questions. However, the

Adamu, Nensok and Aka
80
effect of this has been reduced by the rigorous process that was undertaken in
preparing the questionnaire.
REFERENCES
Adamu, N., Zubairu, I. K., Ibrahim, Y. M., and Ibrahim, A. M. (2011). Evaluating the impact
of product diversification on financial performance of Selected Nigerian construction
firms. Journal of Construction in Developing Countries. 16(2): 91–114
Alinaitwe, H. M., Mwakali, J. A., and Hansson, B. (2007). Factors affecting the productivity
of building craftsmen – studies of Uganda. Journal of Civil Engineering and
Management, 13(3): 169–176
Alinaitwe, H. M. (2008). An assessment of clients’ performance in having an efficient
building process in Uganda. Journal of Civil Engineering and Management 14(2):
73–78.
Andersen M. K. (2010). Multiskilling and Job satisfaction in outsourcing. Aspector White
Paper June, 2010.
Burleson, R. C., Hans, C. T., Tucker, R. L., and Stanley, A. (1998). Multiskilled labour
utilization strategies in construction. Journal of Construction Engineering and
Management 124(6): 480–489.
Carley, L. A. (1999). Worker’s attitudes toward and experiences with multiskilling.
Unpublished M.Sc Thesis, University of Texas at Austin, Austin, Texas
Clarke, L. and Wall, C. (2000). Craft versus industry: the devision of labour in European
housing construction. Construction Management and Economics, 18: 689–698.
Construction Industry Institute (1997). Multiskilling labor strategies in construction:
Experiences with multiskilling labor strategies in the construction industry.
http://constructioninstitute.org/services/catalog/more/rr137_12_more.cfm.Retrieved
February 22, 2010
Construction Industry Institute (CII) (1998). An Analysis of Multiskilled Labor Strategies in
Construction. Research Summary 137-1, Austin, Texas
Cordery, J. 1989). Multi-skilling: a discussion of proposed benefits of new approaches to
labour flexibility within enterprises. Personnel Review, 18 (3), 13-22
Cross, M. (1996). Multi-skilling brings cost and productivity benefits. Proc., Training Plant
Management: 11th National Maintenance Engineering Conf., U.K.
Crowley, L. G., Lutz, J. D. and Burleson, R. C. (1997). Functional illiteracy in construction
industry. Journal of Construction Engineering and Management – ASCE 123(2):
162–170.
Dada, M.O. and Ekpe, J. (2006). The Place of Multi-Skilling in the Nigerian construction
industry: a pilot study. Proceedings of the 3rd International Built and Human
Environment Research Week. Vol.1, Delft University of Technology, Amsterdam
Davids, Z. (2004). Aspects of multi-skilling contributing to quality service provision within
academiclibraries.http://libwww.syr.edu/information/strategicplan/progressreports/cro
sstrain/finalreport.pdf Retrieved October 22, 2011
DeVaro, J. and Martin F. (2010).Two Perspectives on Multiskilling and Product Market
Volatility.:http://libwww.syr.edu/information/strategicplan/progressreports/crosstrain/
finalreport.pdf RetrievedNovember11,2011

Multi-skilling barriers
81
Ejowhomu, O A., Proverbs, D. G. and Olomolaiye, P. (2006). Multiskilling: a UK
construction and building services perspective. In: Boyd, D (Ed) Procs 22nd Annual
ARCOM Conference, 4-6 September 2006, Birmingham, UK, Association of
Researchers in Construction Management, 885-894
Fox, P. and Yuen, R. (2004). Multiskilling as a Response to Globalization In: Ogunlana, S.O.,
Charoenngam, C., Herabat, P., Hadikusumo, B.H.W. (Eds.) Proceedings of
International
Symposium on Globalisation and Construction. AIT& CIB: Thailand pp. 249 – 260.
Friederich, A., Kabst, R., Weber, W. and Rodehuth, M. (1998). Functional flexibility: merely
reacting or acting strategically? Employee Relations, 20 (5): 504-523
Garland, R. (1991). The mid-point on a rating scale: is it desirable? Research Note 3.
Marketing Bulletin, 2: 66-70
Gomar, J. E., Haas, C. T. and Morton, D. P. (2002). Assignment and allocation optimization
of partially multiskilled workforce. Journal of Construction Engineering and
Management, 128(2): 103-109
Haas, C. T., Rodriguez, A.M., Glover, R., and Goodrum, P. M. (2001). Planning and
scheduling of a multiskilled workforce, Center for construction industry studies
(CCIS). http://www.ce.utexas.edu/prof/hass/a_text_multiskill.pdf. Retrieved
September 28, 2011
Haas, C. T., Tucker, R. L., Glover, R. W., and John, D. (2002). Craft workers’ experiences
with multiskilling and attitudes towards multiskilling, Center for construction
industry studies (CCIS). http://www.ce.utexas.edu/prof/haas/a_text_craftwe.pdf
Retrieved on September 28, 2011
Hegazy, T., Shabeeb, A. K., Elbeltagi, E. and Cheema, T. (2000). Algorithm for scheduling
with multiskilled constrained resources. Journal of Construction Engineering and
Management – ASCE 126(6): 414–421.
Kamya, M. T., Ntayi, J. M. and Ahiauzu, A. (2010). Knowledge management and competitive
advantage: The interaction effect of market orientation. African Journal of Business
Management, 4(14): 2971-2980.
Kazaz, A., Manisali, E. and Ulubeyli, S. (2008). Effect of basic motivational factors on
construction workforce productivity in Turkey. Journal of Civil Engineering and
Management, 14(2): 95–106
Lill I. (2008). Sustainable management of construction labour. The 25th International
Symposium on Automation and Robotics in Construction (ISARC), 26th -29
th June
2008
Lill I. (2009). Multiskilling in construction – a strategy for stable employment. Technological
and Economic Development of Economy 15(4): 540–560.
Lim, E.C., and Alum, J. (1995). Construction productivity: issues encountered by contractors
in Singapore. International Journal of Project Management, 13(1): 51–8.
Moser, C.A. and Kalton, G. (1971). Survey Methods in Social Investigation.UK: Heinemann
Educational
Odusami, K.T., Oyediran, O.S. and Oseni, A.O. (2007). Training needs of construction site
managers. Emirates Journal for Engineering Research, 12 (1): 73-81
Osuagwa, L. (2006). Market orientation in Nigerian companies, Mark. Intelligence. Planning.,
24(6): 608-631
Polit, D.F, Beck C.T, and Hungler, B.P. (2001). Essentials of Nursing Research: Methods,
Appraisal and Utilization, 5th edition, Philadelphia, Lippincott Williams and Wilkins.

Adamu, Nensok and Aka
82
Rodriguez, A. (1998). Planning and scheduling a multiskilled workforce. Unpublished M.Sc
Thesis, University of Texas at Austin, Austin, Tex.
Stanley, A. (1997). Benefits, impediments, and limitations to multiskilling in construction.
Unpublished M.Sc Thesis, University of Texas at Austin, Austin, Texas
Wang, X. and Huang, J. (2006). The relationships between key stakeholders project
performance and project success: Perceptions of Chinese construction supervising
engineers. International Journal of Project Management, 24, 253–260
Williamson, R. M. (1992). Optimum performance through multi-skill maintenance. AIPE
Facilities, 2(8), 34-42.
Adegbehingbe, V.O. (2012) Evaluation of involvement of built environment professionals in housing
transformation processes in three government housing estates in South- Western, Nigeria In: Laryea,
S., Agyepong, S.A., Leiringer, R. and Hughes, W. (Eds) Procs 4th West Africa Built Environment
Research (WABER) Conference, 24-26 July 2012, Abuja, Nigeria, 83-89.
83
EVALUATION OF INVOLVEMENT OF BUILT
ENVIRONMENT PROFESSIONALS IN HOUSING
TRANSFORMATION PROCESSES IN THREE
GOVERNMENT HOUSING ESTATES IN SOUTH-
WESTERN, NIGERIA
Victor Olufemi Adegbehingbe1
Department of Architecture, Federal University of Technology, Akure, Nigeria
Residential buildings in government estates in Nigeria are often transformed by
addition of structures or modifications of existing spaces, since these buildings do not
in most cases conform to the expectations of occupants. Residential buildings were
often built without consultations with the end-users, who usually indulge in
transforming the houses. This paper discusses the level of involvement of Built
Environment Professionals (Architect, Engineers, Quantity Surveyors and Town
Planners) in Housing transformation process in three government estates. The three
oldest estates in three out of the six states that make up of South-Western, Nigeria
were selected for the study. Data for the study was collected through structured
questionnaires administered on 87 built environment professionals. Variables
investigated include:- design, construction and management of transformed buildings,
finding solutions to problems encountered; rating of aesthetic standards and
quantifying transformed buildings. Results from the survey were analyzed using
descriptive statistics. Findings indicated that one out of every four of the respondents
(22.98%) carried out the construction of transformed buildings, while one out of
every three of the respondents (27.58%) carried out design of transformed buildings.
94.2% rated aesthetic standard after transformation processes as Good/Very Good.
51.7% of the problems encountered were found to be inadequate cash flow while
delay of approval of drawings was identified as a major problem (26.4%). This is
against a prior that lack of cash flow will be the most prominent problem. The need to
address the causes of delay of approval of drawings is one major recommendation
emphasized in the study
Keywords: built environment professional, housing transformation, aesthetic standard
INTRODUCTION
Residents of government housing estates in developing countries are in the habit of
transforming their buildings, since these houses do not confirm to their expectations
(Triple 2000). The residential buildings in government housing estates often times
were built without consultation with users, who usually indulged in unauthorized
alterations, since the house did not conform to their expectations (Tipple 2000).
Habraken (1975) asserted that no one could live satisfactorily within a fixed
environment in which they had no input .Previous studies had revealed that there was
shortage of government residential buildings in Akure, Ibadan and
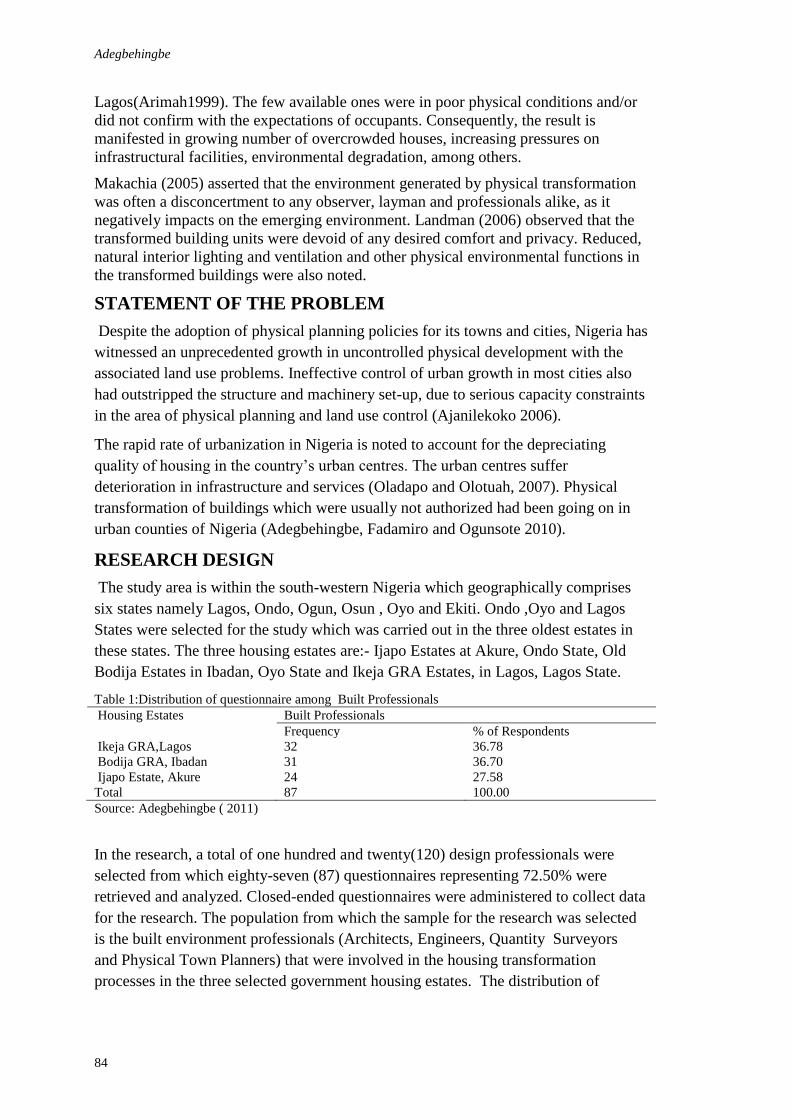
Adegbehingbe
84
Lagos(Arimah1999). The few available ones were in poor physical conditions and/or
did not confirm with the expectations of occupants. Consequently, the result is
manifested in growing number of overcrowded houses, increasing pressures on
infrastructural facilities, environmental degradation, among others.
Makachia (2005) asserted that the environment generated by physical transformation
was often a disconcertment to any observer, layman and professionals alike, as it
negatively impacts on the emerging environment. Landman (2006) observed that the
transformed building units were devoid of any desired comfort and privacy. Reduced,
natural interior lighting and ventilation and other physical environmental functions in
the transformed buildings were also noted.
STATEMENT OF THE PROBLEM
Despite the adoption of physical planning policies for its towns and cities, Nigeria has
witnessed an unprecedented growth in uncontrolled physical development with the
associated land use problems. Ineffective control of urban growth in most cities also
had outstripped the structure and machinery set-up, due to serious capacity constraints
in the area of physical planning and land use control (Ajanilekoko 2006).
The rapid rate of urbanization in Nigeria is noted to account for the depreciating
quality of housing in the country’s urban centres. The urban centres suffer
deterioration in infrastructure and services (Oladapo and Olotuah, 2007). Physical
transformation of buildings which were usually not authorized had been going on in
urban counties of Nigeria (Adegbehingbe, Fadamiro and Ogunsote 2010).
RESEARCH DESIGN
The study area is within the south-western Nigeria which geographically comprises
six states namely Lagos, Ondo, Ogun, Osun , Oyo and Ekiti. Ondo ,Oyo and Lagos
States were selected for the study which was carried out in the three oldest estates in
these states. The three housing estates are:- Ijapo Estates at Akure, Ondo State, Old
Bodija Estates in Ibadan, Oyo State and Ikeja GRA Estates, in Lagos, Lagos State.
Table 1:Distribution of questionnaire among Built Professionals
Housing Estates Built Professionals
Frequency % of Respondents
Ikeja GRA,Lagos 32 36.78
Bodija GRA, Ibadan 31 36.70
Ijapo Estate, Akure 24 27.58
Total 87 100.00
Source: Adegbehingbe ( 2011)
In the research, a total of one hundred and twenty(120) design professionals were
selected from which eighty-seven (87) questionnaires representing 72.50% were
retrieved and analyzed. Closed-ended questionnaires were administered to collect data
for the research. The population from which the sample for the research was selected
is the built environment professionals (Architects, Engineers, Quantity Surveyors
and Physical Town Planners) that were involved in the housing transformation
processes in the three selected government housing estates. The distribution of
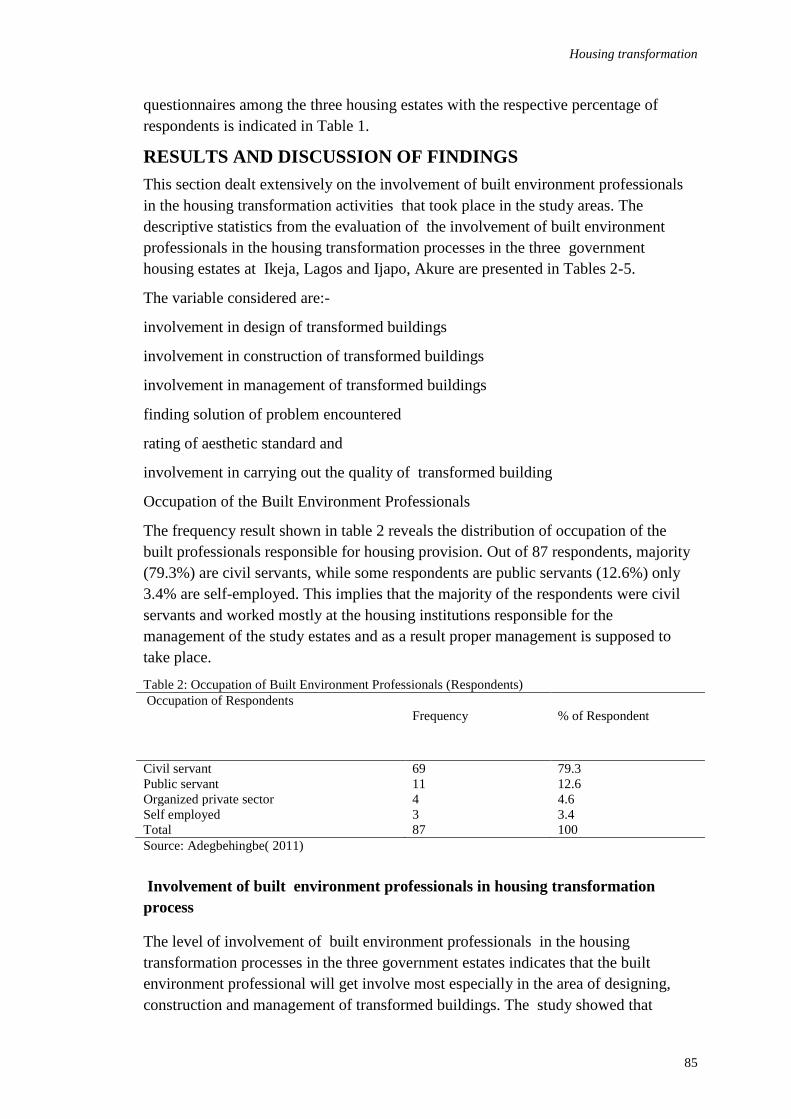
Housing transformation
85
questionnaires among the three housing estates with the respective percentage of
respondents is indicated in Table 1.
RESULTS AND DISCUSSION OF FINDINGS
This section dealt extensively on the involvement of built environment professionals
in the housing transformation activities that took place in the study areas. The
descriptive statistics from the evaluation of the involvement of built environment
professionals in the housing transformation processes in the three government
housing estates at Ikeja, Lagos and Ijapo, Akure are presented in Tables 2-5.
The variable considered are:-
involvement in design of transformed buildings
involvement in construction of transformed buildings
involvement in management of transformed buildings
finding solution of problem encountered
rating of aesthetic standard and
involvement in carrying out the quality of transformed building
Occupation of the Built Environment Professionals
The frequency result shown in table 2 reveals the distribution of occupation of the
built professionals responsible for housing provision. Out of 87 respondents, majority
(79.3%) are civil servants, while some respondents are public servants (12.6%) only
3.4% are self-employed. This implies that the majority of the respondents were civil
servants and worked mostly at the housing institutions responsible for the
management of the study estates and as a result proper management is supposed to
take place.
Table 2: Occupation of Built Environment Professionals (Respondents)
Occupation of Respondents
Frequency
% of Respondent
Civil servant 69 79.3
Public servant 11 12.6
Organized private sector 4 4.6
Self employed 3 3.4
Total 87 100
Source: Adegbehingbe( 2011)
Involvement of built environment professionals in housing transformation
process
The level of involvement of built environment professionals in the housing
transformation processes in the three government estates indicates that the built
environment professional will get involve most especially in the area of designing,
construction and management of transformed buildings. The study showed that
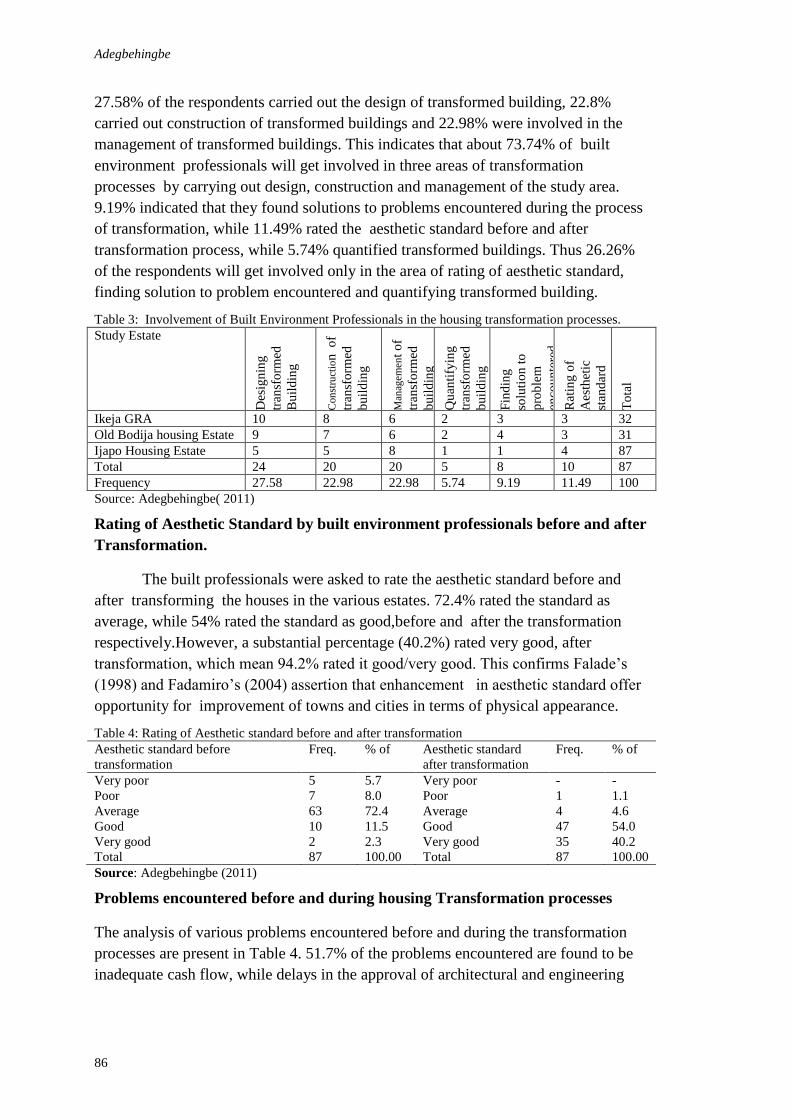
Adegbehingbe
86
27.58% of the respondents carried out the design of transformed building, 22.8%
carried out construction of transformed buildings and 22.98% were involved in the
management of transformed buildings. This indicates that about 73.74% of built
environment professionals will get involved in three areas of transformation
processes by carrying out design, construction and management of the study area.
9.19% indicated that they found solutions to problems encountered during the process
of transformation, while 11.49% rated the aesthetic standard before and after
transformation process, while 5.74% quantified transformed buildings. Thus 26.26%
of the respondents will get involved only in the area of rating of aesthetic standard,
finding solution to problem encountered and quantifying transformed building.
Table 3: Involvement of Built Environment Professionals in the housing transformation processes.
Study Estate
Des
ign
ing
tran
sfo
rmed
Bu
ild
ing
Con
stru
ctio
n o
f
tran
sfo
rmed
bu
ild
ing
Man
agem
ent
of
tran
sfo
rmed
bu
ild
ing
Qu
anti
fyin
g
tran
sfo
rmed
bu
ild
ing
Fin
din
g
solu
tio
n t
o
pro
ble
m
enco
un
tere
d
Rat
ing
of
Aes
thet
ic
stan
dar
d
To
tal
Ikeja GRA 10 8 6 2 3 3 32
Old Bodija housing Estate 9 7 6 2 4 3 31
Ijapo Housing Estate 5 5 8 1 1 4 87
Total 24 20 20 5 8 10 87
Frequency 27.58 22.98 22.98 5.74 9.19 11.49 100
Source: Adegbehingbe( 2011)
Rating of Aesthetic Standard by built environment professionals before and after
Transformation.
The built professionals were asked to rate the aesthetic standard before and
after transforming the houses in the various estates. 72.4% rated the standard as
average, while 54% rated the standard as good,before and after the transformation
respectively.However, a substantial percentage (40.2%) rated very good, after
transformation, which mean 94.2% rated it good/very good. This confirms Falade’s
(1998) and Fadamiro’s (2004) assertion that enhancement in aesthetic standard offer
opportunity for improvement of towns and cities in terms of physical appearance.
Table 4: Rating of Aesthetic standard before and after transformation
Aesthetic standard before
transformation
Freq. % of Aesthetic standard
after transformation
Freq. % of
Very poor 5 5.7 Very poor - -
Poor 7 8.0 Poor 1 1.1
Average 63 72.4 Average 4 4.6
Good 10 11.5 Good 47 54.0
Very good 2 2.3 Very good 35 40.2
Total 87 100.00 Total 87 100.00
Source: Adegbehingbe (2011)
Problems encountered before and during housing Transformation processes
The analysis of various problems encountered before and during the transformation
processes are present in Table 4. 51.7% of the problems encountered are found to be
inadequate cash flow, while delays in the approval of architectural and engineering
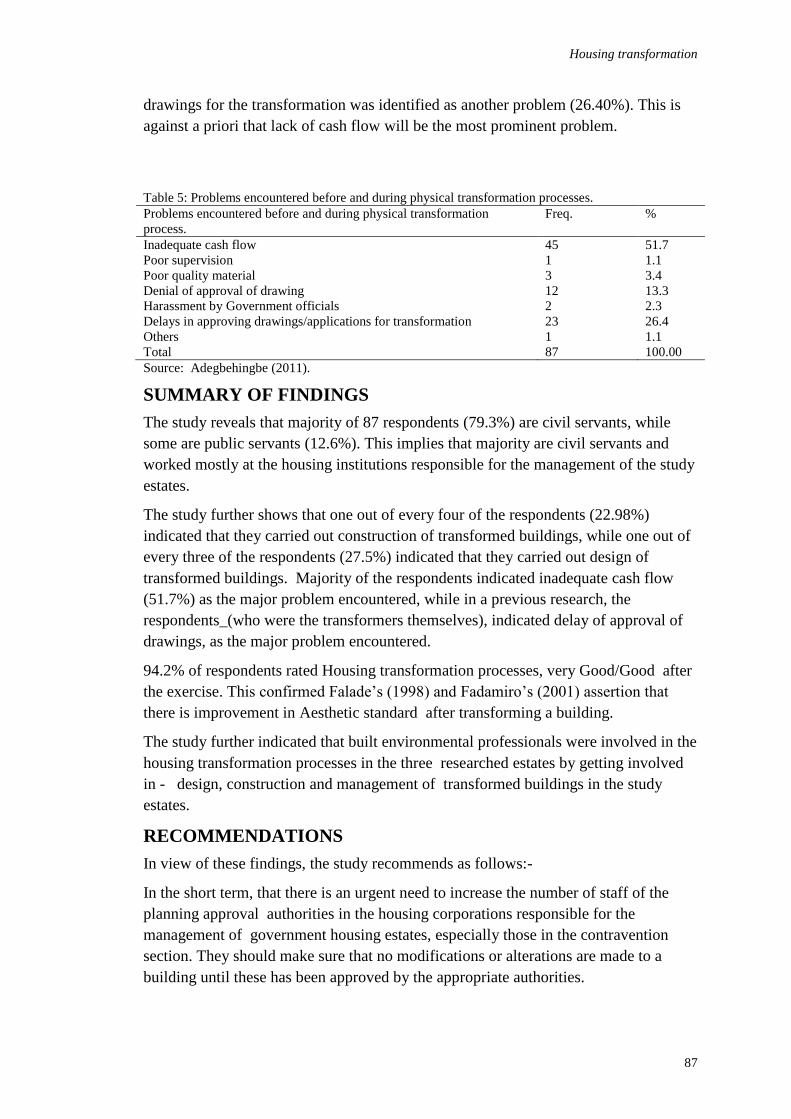
Housing transformation
87
drawings for the transformation was identified as another problem (26.40%). This is
against a priori that lack of cash flow will be the most prominent problem.
Table 5: Problems encountered before and during physical transformation processes.
Problems encountered before and during physical transformation
process.
Freq. %
Inadequate cash flow 45 51.7
Poor supervision 1 1.1
Poor quality material 3 3.4
Denial of approval of drawing 12 13.3
Harassment by Government officials 2 2.3
Delays in approving drawings/applications for transformation 23 26.4
Others 1 1.1
Total 87 100.00
Source: Adegbehingbe (2011).
SUMMARY OF FINDINGS
The study reveals that majority of 87 respondents (79.3%) are civil servants, while
some are public servants (12.6%). This implies that majority are civil servants and
worked mostly at the housing institutions responsible for the management of the study
estates.
The study further shows that one out of every four of the respondents (22.98%)
indicated that they carried out construction of transformed buildings, while one out of
every three of the respondents (27.5%) indicated that they carried out design of
transformed buildings. Majority of the respondents indicated inadequate cash flow
(51.7%) as the major problem encountered, while in a previous research, the
respondents_(who were the transformers themselves), indicated delay of approval of
drawings, as the major problem encountered.
94.2% of respondents rated Housing transformation processes, very Good/Good after
the exercise. This confirmed Falade’s (1998) and Fadamiro’s (2001) assertion that
there is improvement in Aesthetic standard after transforming a building.
The study further indicated that built environmental professionals were involved in the
housing transformation processes in the three researched estates by getting involved
in - design, construction and management of transformed buildings in the study
estates.
RECOMMENDATIONS
In view of these findings, the study recommends as follows:-
In the short term, that there is an urgent need to increase the number of staff of the
planning approval authorities in the housing corporations responsible for the
management of government housing estates, especially those in the contravention
section. They should make sure that no modifications or alterations are made to a
building until these has been approved by the appropriate authorities.
Adegbehingbe
88
The built environment professionals in housing corporations responsible for the
management of the estates should not get themselves involved in the design and
construction of transformed buildings in government housing estates rather they
should ensure the use of functional architectural designs and enforcement of
appropriate legislative controls.
Built environment professionals should regularly conduct technical audits of all
structures in the government housing estates to ascertain their structural stability.
Buildings, - like human beings,- have life, therefore ,-there should be more stringent
measures to ensure that those showing signs of failure are promptly brought down to
make way for new ones.
Land uses within government housing estates should be reviewed to meet domestic
and socio-economic needs of the residents from time to time to avoid undue
transformation.
CONCLUSION:
The study concluded that built environment professionals must ensure that land uses
within the study estate should be reviewed from time to time and should not get
themselves involved in designing and construction activities during transformation
processes taking place in the study estates in order to ensure proper management.
REFERENCES
Adegbehingbe,V.O.(2011). Analysis of Physical transformation of Residential Building in
selected Government Estates in South Western, Nigeria. Unpublished Ph.D Thesis,
Federal University of Technology, Akure, Nigeria 125-128.
Adegbehingbe,V.O; Fadamiro, J.A.& Ogunsote, O.O (2010). Reducing the need for Housing
Transformation in South Western, Nigeria by Addressing the Causative Agents. A
paper presented in an International Conference organized by School of Environment
Technology, Federal University of Technology, Akure, Nigeria, 25-27 October.
Ajanilekoko J.O.(2006). Sustainable Housing Development in Nigeria: The Financial
Development in Nigeria: The Financial overview paper presented at shelter Africa
2000- Fourth International Conference on Housing, Nicon Hilton Hotel,Abuja,
Nigeria,2-6 October.
Arimah, B.C.(1999). User modifications in Public Housing Estates: Some findings from the
Nigerian Scene. In Awotona, A (Ed). Housing Provision and Bottom – up
approaches. Family Case Studies from Africa, Asia and South –America, Ashgate,
Aldershot, 43-86
Fadamiro, J.A.(2001). An Analytical study of the open space and the Implications for
Landscape planning in Akure, Nigeria. Unpublished Ph.D Thesis Federal University,
Akure. 22-69.
Falade, J.B.(1998). Public Acquisition of Land for Landscaping and open space management.
Journal of Nigeria institute of Town Planners, (XI)1-13.
Habraken, N.J(1975). Supports: An Alternative to Mass Housing, Architectural Press.
Landman, K (2006). Socio-Spatial transformation in Africa. A framework to map the process
and guide the planning of future cities. A paper delivered at the conference- Planning
Africa 2006- Cape Town, 22-24 March.

Housing transformation
89
Makachia, P.A(2005). Influence of House form of Dweller: Initiated Transformation in
Urban Housing XXXIII IAHS, September 29-30, Pretoria, South Africa.
Oladapo, R.A& Olotuah, O.A.(2007). Appropriate Real Estate Laws and Policies for
Sustainable Development in Nigeria. Structural Survey (Special Issues) 25 (3/4)
330-338 Emerald Publication, UK.
Tipple, A.G(1991) Self Help Transformation in Low cost Housing. An Introductory Study.
CARDO in Association with the International Urban Press, New Castle Upon Tyre
55-76.
Tipple, A.G (2000) Extending Themselves: Users Initiated Transformation of Government
Built housing in developing countries. Liverpool University Press, Liverpool, 20-48.

Ayoade, A.A., Olurotimi, K. and Babatunde, A. A. (2012) Slum development in 3rd world countries:
Causes, effect and way out. A case study of Ibadan South East local government, Nigeria In: Laryea,
S., Agyepong, S.A., Leiringer, R. and Hughes, W. (Eds) Procs 4th West Africa Built Environment
Research (WABER) Conference, 24-26 July 2012, Abuja, Nigeria, 91-98.
91
SLUM DEVELOPMENT IN 3RD WORLD COUNTRIES:
CAUSES, EFFECT AND WAY OUT. A CASE STUDY OF
IBADAN SOUTH EAST LOCAL GOVERNMENT,
NIGERIA
Adeniran Ayoade A1, Kemiki Olurotimi
2 and Ayoola A. Babatunde
3
1Department of Estate Management, Federal Polytechnic, Ado Ekiti, Nigeria
Department of Estate Management, Federal University of Technology, Minna, Nigeria
Slums and squatting areas accommodate the majority of the population of cities in
developing countries and it is estimated to be home to over 800million people, which
is predicted by the UN-Habitat (2003) to grow to between 1 and 2 billion by 2020.
This case of slum development is not alien to Nigeria. This study considers the case
of Ibadan Metropolis. The major factors as discovered, contributing to slum
development include rural-urban migration, unplanned neighborhood, over-
population, non-compliance with laid down rules and illiteracy. The resultant effects
of this are overcrowding, outbreak of diseases, loss of man hours, insecurity of life,
and decline in property values amongst others. To get out of this web which keeps
entangling us like a vicious cycle, the government at all levels have a major role to
play by providing and implementing enabling laws and regulations, improving waste
disposal, drainage and sanitary system as well as implement urban renewal.
Keywords: cause, development, effect, Ibadan, slum
INTRODUCTION
Urbanization emanated through human invention as a way of organizing and re-
organizing his existence and this unprecedented invention which is a process has
resulted into congestion, pandemic, health hazard among others Slum development is
not limited to remote areas but it has become an urban problem and these slums are
inhabited by the less privileged and poor people and the area is characterized by
dearth of/inadequate and deficient facilities, obsolete building, filthy environment etc.
All these represent a substantial drag in the rate of economic development of a country
(Egunjobi and Moruf, 2007).
This is attested to by a recent estimate by UN-Habitat (2003), 72% of the population
in sub-Saharan Africa or 166 million people, live in slums or informal settlements.
These settlements are characterized by housing of poor quality and with such come
inadequate provision for water sanitation and drainage which all put the lives and
health of the residents under continuous dangers. Many places where poor people live,
present multiple disadvantages that include not only missing and inadequate
infrastructure and services but also unfavorable geography, vulnerability to
Ayoade et al.
92
environmental shocks and seasonal exposure (Narayan et al 2000). The urban poor are
in some places even worse-off than their rural counterparts (Department for
International Development, 2004) within the many cities in Nigeria. The cities
incorporate a mix of well-planned areas with modern facilities as well as poorly built
and obsolete buildings which makes living standard deplorable.
Meanwhile, in spite of several strategies, policies and analysis on slum development,
the situation had been on the decline. This had propelled the researchers into unveiling
why there had been no improvements in the in the largest black African city, Ibadan.
To achieve this, the concept of slum as well as development will be examined, factors
contributing to slum development will be evaluated, the effects of slum development
on economic development will assessed and actionable recommendations will be
made at reducing if not totally eradicating the rate of slum development.
CONCEPTUAL FRAMEWORK AND LITERATURE REVIEW
Healthy City (HC) concept as defined in the World Health Organizations (WHO)
constitution on Urban Health (2012), is the state of complete physical, mental and
social well-being and not merely the absence of uniformity. Also, WHO extended the
conception of health to include sense of well-being and security (Agbola and Kassim,
2007). However cities are defined by WHO as large and important group of houses,
buildings with a centre where amusements can be found and where business goes on
(UN-Habitat, 1996).
Hence, cities are the result of an enormous range of investments of capitals, expertise
and time by individuals, households’ communities, voluntary organizations and
NGO’s as well as by private enterprises investors and government agencies (Agbola
and Kassim, 2007). Barra (1997) describes cities as centers of concentration of wealth,
productivity and creativity. Agbola (1996) affirms that, cities could also be viewed in
terms of artifacts which bear imprints of humanities institutions by virtue of the
attendant features, cities are eco-systems which have structures that are patterned
towards particular ways. The rate of urbanization bringing about massive movement
of people from rural to urban area in Nigeria has led to environmental problems
characterized by inadequate supply of water, lack of drainage facilities, problems of
refuse disposal, poor road conditions, erratic power supply and unbalanced
economy(Olotuah, 2005). These accompanying social problems have manifested
themselves in form of juvenile delinquency drug abuse, prostitution, murder,
alcoholism, suicide and widespread of infections or diseases.
According to Giroult (1996) the HC concept was developed by Prof. Leonard Duhl
from Berkley University to curb short comings inherent in the contemporary urban
environment. In their first HC paper, Hancock and Duhl (1998), define a healthy city
as one that is continually creating and improving those physical and social
environments and expanding those community resources that enable people to
mutually support one another in performing all functions of life and in developing to
their maximum potentials.
In an attempt to gain insight into the initiation, adoption and diffusion of the HC
concept, the phenomenon of urbanization emerges as the underlying factor.
Urbanization has been recognized as the vehicle for economic growth and
development and the existence of cities and mega-cities which implies large
concentrations of population, facilities and services. The global community is thus
being presented with two faces of the city, the beautiful and the unsightly. It may not
Slum development
93
however be late as Agbola (1996) noted that the HC concept is a learning process
whose lessons would be learned and applied over a long term. The HC project
challenges cities to take seriously, the process of developing healthy enhancing public
policies that create physical and social environments which supports healthy and
strengthen community action to health.
Noel and Sylvia (1964) opined that slum has many connotations as it has different
meanings to different people. The term, slum, has limited value for sociological and
ecological analysis but one way of viewing this is from the point of an area
characterized by deteriorating/deteriorated properties, densely occupied by improvised
people whose way of life standard of conduct are often at variance with those people
on higher socio-economic levels (Carr, 2004).
Slums are usually run-down housing in order, established and legally built parts of the
city. Some institutional housing projects can be included within this category when
their maintenance and upkeep have been neglected to such an extent that they have
turned into slums. Rapid urbanization has been a characteristics feature of
development process since the industrial revolution. Among the contemporary
developing countries of the world, including Nigeria, however, it has almost always
been accompanied by equally rapid growth of uncontrolled settlements. This
phenomenon has provoked a number of responses. In some instances of some parts of
Nigeria, where old settlements have been in existence, governments have over the past
fifteen years, periodically undertaken renewal programmes aimed at improving the
living condition in these areas (Agbola 2005).
The way of looking at the uncontrolled development was reflected in the work of
centre for housing, building and planning which began in the middle of the 1960’s
among which was to sponsor slum upgrading programmes. By the end of the decade,
other United Nation agencies had accumulated considerable experience in this field
and in 1970, the United Nations and the Government of Colombia jointly sponsored
an inter-regional seminar on the improvement on slum settlements.
The approach to the program of the city slums through urban community
development enacted by Marshall (1971) involves the following elements, which are
helpful at improving the core areas of Ibadan most especially, the case study area.
These are:
Creation of sense of social cohesion on a neighborhood basis and
strengthening of group interrelationship.
Encouragement and stipulation of self-help through the initiative of the
individuals in the community.
Stimulation by outside agencies when initiative for self-help is lacking
Identification and development of local leadership.
Development of civic consciousness and acceptance of civic responsibility.
Coordination of city services to meet neighborhood needs and problem.
The most significant technical program confronting policy makers, however, is the
overwhelming deficiency of data on housing and related variables (Agbola, 2005).
Essential, this situation is caused by the difficulties of measurement, which act as an
impediment of the collection and development of an adequate and statically accurate
data based for describing and analysis issues regarding human settlements. The
problem is compounded by the limited technical administrative and institutional
resources on which most governments can rely on to fill this gap and is further
compounded by a general lack of experience with data gathering and analysis even in

Ayoade et al.
94
those instance where data on hu8man settlement actually exist, they are frequently
ether not at the disposal of the relevant policy makers and planners.
However, the worst that can be said on any particular type of urban slum is that at any
time, certain ranges of household types and situation, sets of housing services and
locality characteristics will be dominating for policy formation, the concept is most
useful because the different kinds of residential situations that can be found mixed
localities require different solutions to bring about their improvement.
From the foregoing, it could be inferred that cities in developing countries in this
millennium will have two possible immerse proportional growth healthy urban future
and unhealthy urban future. Meanwhile, the choices made today by governments and
her agencies will be a major influence on which types of urban futures become a
reality in this millennium as the Ibadan metropolis which is growing in its leaps and
bounds has so many slum developments. Hence, it is the ultimate aim of this paper to
critically assess slum development in Ibadan South Local Government with a view to
identifying the causes, effects and work out sustainable recommendations.
RESEARCH METHODOLOGY
The National Population Commission (NPC) 2006 Population Census puts the
population of Ibadan South East Local Government at 266,046. Applying a growth
rate of 3.2 percent and using the formula Pr = Po(1+r/100)n, where Pr = Required
population, Po = Initial population, r = population growth rate and n = Time interval,
2008 projected figure was arrived at as 283,345. The household size for the study area
was an average of 4.0 (NPC, 2008) given a total household size of 70,836. The sample
size was determined by using the formula:
S = N
1 + N(e)2
Where, N= Total population, e = degree of freedom.(Israel, 2009). This generated a
sample size of 400. A set of 400 questionnaires were prepared. Spreading this across
the 13 wards in the study area, an average of 30 questionnaires were randomly
administered per ward. Out of the 400 questionnaires prepared, we were able to
administer only 260 as subsequent visits were rebuffed by the residents due to the
service of tenement rate by government which fell at about the same time. Out of the
260 questionnaires successfully administered, 135 questionnaires were retrieved. The
data were analysed descriptively using percentage and tables.
FINDINGS
Variables such as number of people per room, facilities and amenities provided to
residents at the study area have been analysed below.
Table 1: number of people per room
No of People/Room No. of Resp. %
1 – 3
4 – 7
above 7
27
85
23
20%
63%
17%
135 100
Source: Field Survey March 2008
Despite the several regulations and the level of education, many of the buildings are
densely populated as 80% of the respondents said that they are more than 3 in a room.
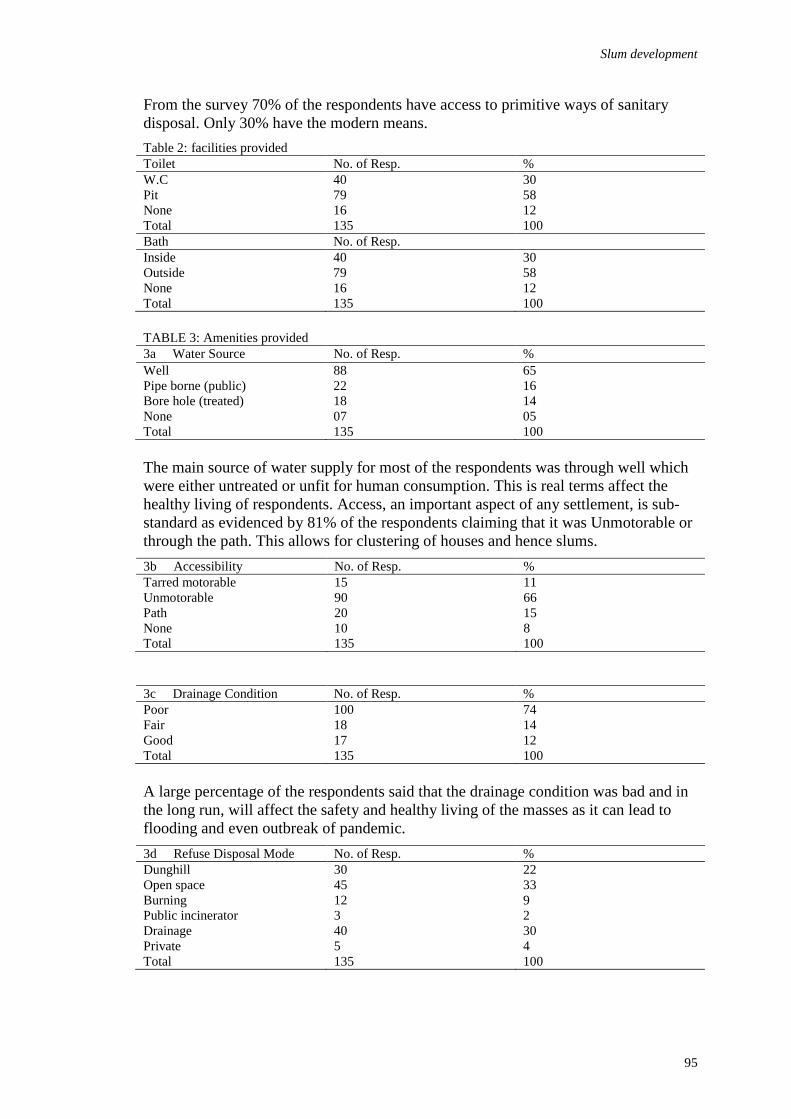
Slum development
95
From the survey 70% of the respondents have access to primitive ways of sanitary
disposal. Only 30% have the modern means.
Table 2: facilities provided
Toilet No. of Resp. %
W.C
Pit
None
40
79
16
30
58
12
Total 135 100
Bath No. of Resp.
Inside
Outside
None
40
79
16
30
58
12
Total 135 100
TABLE 3: Amenities provided
3a Water Source No. of Resp. %
Well
Pipe borne (public)
Bore hole (treated)
None
88
22
18
07
65
16
14
05
Total 135 100
The main source of water supply for most of the respondents was through well which
were either untreated or unfit for human consumption. This is real terms affect the
healthy living of respondents. Access, an important aspect of any settlement, is sub-
standard as evidenced by 81% of the respondents claiming that it was Unmotorable or
through the path. This allows for clustering of houses and hence slums.
3b Accessibility No. of Resp. %
Tarred motorable
Unmotorable
Path
None
15
90
20
10
11
66
15
8
Total 135 100
3c Drainage Condition No. of Resp. %
Poor
Fair
Good
100
18
17
74
14
12
Total 135 100
A large percentage of the respondents said that the drainage condition was bad and in
the long run, will affect the safety and healthy living of the masses as it can lead to
flooding and even outbreak of pandemic.
3d Refuse Disposal Mode No. of Resp. %
Dunghill
Open space
Burning
Public incinerator
Drainage
Private
30
45
12
3
40
5
22
33
9
2
30
4
Total 135 100

Ayoade et al.
96
Refuse Disposal which should be done in a proper manner but in real terms, its
disposal is done arbitrarily and this affects the environment and the settlement.
DISCUSSION OF FINDINDINGS
The study area is densely populated as 80% of the respondents affirmed that they are
more than 3 in a room. This is definitely not health friendly and there is possibility of
facilities being overstressed. Residents have access to poor facilities. Only 30% of the
respondents are using W.C. for their toilet. The rest are majorly pit latrine or not
available at all. This, in addition to the fact that only 30% are having access to
portable water, readily portrays a deplorable housing condition. There is
environmental facilities failure in the area as 81% of the respondents opined that the
road was Unmotorable, poor drainage system and uncoordinated refuse disposal
system.
SUMMARY OF FINDINGS
Inaccessibility - some areas are actually accessible through footpath and a few
motorable roads are either tarred or otherwise with potholes that are as big as craters
here and there.
In addition, it was noticed that the most prominent source of water is from shallow
wells which are located close to soak away pits and at times pit latrines, it is certain
that the water in the well may be seepages from the pits and hence the water may be
“unsafe” for consumption.
Furthermore, most of the houses as observed are traditional and obsolete and the ones
termed “modern” lack the necessary facilities cum services that make life comfortable
such as sanitary conveniences, room size/density per room etc.
The resultant effect of these developments is overcrowding, congestion, outbreak of
diseases, unnecessary traffic hold ups, loss in man hours/manpower, decline in
properly values, nasty and poor living conditions, insecurity of lives and pandemic
inter alia.
RECOMMENDATIONS
If slums would continue to be on the prowl and be the cankerworm eating up our
cities, then how do we achieve the Health related issues of the Millennium
Development Goal’s as third world countries. It is pertinent to note that both the
government and the masses have a prominent role to play in the fight against this
avoidable development.
First and foremost, government has the responsibility of carrying the people along as
many of the sanitation laws made by them have not yielded any concrete result. The
situation seems to be a high degree of participation and control by the public over the
decision affecting their lives health and well being. This is with a view to building a
strong, mutually supportive and non-exploitative community.
Government should provide an enabling environment which would allow private
developers provide mass housing as housing contributes highly to the development to
any economy.
When legislations are to be made, there has to be a connection with the socio-cultural
and biological heritage of city dwellers, groups and individuals.
Slum development
97
Also, government should be challenged to take very seriously the process of
improving health by enhancing public policies that can create physical and social
environments that can support, promote and protect health and strengthen community
participation in health care.
Another way out is that Town Planning Authority should enforce to the letter
development taking place within its jurisdiction to be in conformity with laid down
regulations towards achieving aesthetics, convenience and orderliness.
The government should also make the facilities which are magnetizing the people in
rural areas to the urban areas available to them, these will reduce, if not eliminate the
rural urban drift which causes over population.
Finally, government should carry out urban renewal measures in areas that a blighted
or are fast developing into slums and resettle the residents elsewhere. This should not
be done with a view to paving way for the few rich because if this is the basis, it may
not achieve the desired result, of the United Nations Millennium Development Goals.
CONCLUSION
In the introductory part of this paper, as deduced from previous literatures, it was
mentioned that slum development is not only common in Nigeria urban centers and
this therefore, necessitated this study in order to examine the causes and the way
forward. From the study, slum development has reached an alarming state in the study
area thereby reducing the value of the area, poor living condition, inharmonious and
conflicting uses of land, environmental degradation, and congestion among others.
Sequel to the foregoing, it is recommended that government, individual property
owners and the Town Planning Authorities play their various constitutional roles to
abate to some extent if not totally eradicated slum development and hence put a stop
to nuisance, environmental degradation and neglect.
REFERENCES
Agbola, T (1996). “The Meaning, Origin and Challenges: The Healthy Cities Approach” in
Agbola S.B. and Egunjobi Layi (eds.) Environmental Health and the Potentials of
healthy city Approach in Nigeria. Proceedings of the First Healthy City Conference in
Nigeria, 14-16 June 1993. PP 7-18 Ibadan; Centre for Urban and Regional Planning,
University of Ibadan.
Agbola, T (2005). “The Housing Debacle”. Paper of the inaugural lecture delivered at the
University of Ibadan, August 2005.
Agbola, T and Kassim, F (2007): Conceptual and Theoretical Issues in Housing in Tunde
Agbola et al eds., Housing Development and Management: Book of Readings,
Department of Urban And Regional Planning, University of Ibadan.
Barra, O (1997), “Do Poor Urban Children Matter”? The Urban Age, 5/1: 3-4.
Carr, D (2004). Improving the Health of the World’s Poorest People, Washington D.C.
Population Reference Bureau Department for International Development (2004).
www.dfid.govuk
Egunjobi, L and Moruf, A (2007). Achieving Health for all in Nigeria: The Challenges of the
Healthy Cities Approach in Agbola S.B and Egunjobi Layi (eds) Environmental
Health and the Potential of the Healthy City Approach in Nigeria. Proceedings of the
First Healthy City Conference in Nigeria, 14-16 June 1993. Pp 7-18 Ibadan; Centre
for Urban and Regional Planning, University of Ibadan.
Ayoade et al.
98
Giroult, E. (1996). “The Healthy City Concept: Process Development and project
Composition in Agbola S.B. and Egunjobi Layi (eds.) Environmental Health and the
Potentials of healthy city Approach in Nigeria. Proceedings of the First Healthy City
Conference in Nigeria, 14-16 June 1993. Pp 7-18 Ibadan; Centre for Urban and
Regional Planning, University of Ibadan.
Hancock, T and Duhl, L (1998). Promoting Health in Urban Context. Copenhagen; FADL
Publishers.
Israel, G.D (2009). Determining Sample Size, PEOD6 Doc., One of the Series of the
Agricultural Education and Communication Department, Florida Cooperative Extension
Service,
Institute of Food and Agricultural Sciences, University of Florida. EDIS Website at
http://edis.ifas.ufl.edu.
Marshall,T.H et al (1971). Social Class and Social Identity, Leeds.
Narayan, D et al (2000). Voices of the Poor: Can anyone hear us? Oxford and New York
Press for the World Bank.
Noel, P.G and Sylvia, F.F (1964). Urban Society. Crowell Publishers.
NPC (2008). National Economic Empowerment and Development Strategy. Abuja:
National Planning Commission
Olotuah, P (2005). “The Global Housing Crisis- is there a solution? Watchtower Bible and
tract society, New York, September 22, 2005, 2-9
United Nations Centre for Human Settlements (UN-Habitat). (1996). The City Summit.
Habitat II, Istanbul, Turkey, June 3-4, 1996. Nairobi, Habitat.
UN-Habitat (2003). Monitoring Housing Rights, UNHRP Working Paper, No.1, Nairobi.
WHO Constitution on Urban Health (2012). Housing and Health: Technical Consultation on
the Analysis of Evidence. Report of a World Health Organization Meeting, Berlin.
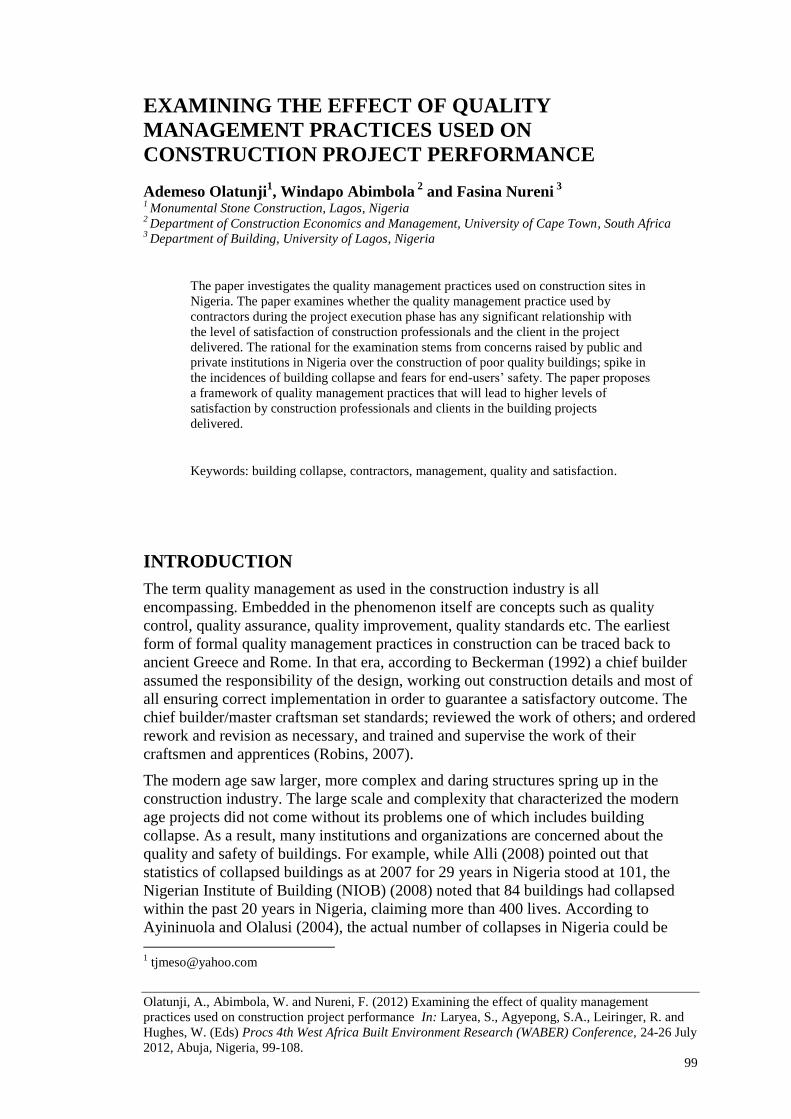
Olatunji, A., Abimbola, W. and Nureni, F. (2012) Examining the effect of quality management
practices used on construction project performance In: Laryea, S., Agyepong, S.A., Leiringer, R. and
Hughes, W. (Eds) Procs 4th West Africa Built Environment Research (WABER) Conference, 24-26 July
2012, Abuja, Nigeria, 99-108.
99
EXAMINING THE EFFECT OF QUALITY
MANAGEMENT PRACTICES USED ON
CONSTRUCTION PROJECT PERFORMANCE
Ademeso Olatunji1, Windapo Abimbola
2 and Fasina Nureni
3
1 Monumental Stone Construction, Lagos, Nigeria
2 Department of Construction Economics and Management, University of Cape Town, South Africa
3 Department of Building, University of Lagos, Nigeria
The paper investigates the quality management practices used on construction sites in
Nigeria. The paper examines whether the quality management practice used by
contractors during the project execution phase has any significant relationship with
the level of satisfaction of construction professionals and the client in the project
delivered. The rational for the examination stems from concerns raised by public and
private institutions in Nigeria over the construction of poor quality buildings; spike in
the incidences of building collapse and fears for end-users’ safety. The paper proposes
a framework of quality management practices that will lead to higher levels of
satisfaction by construction professionals and clients in the building projects
delivered.
Keywords: building collapse, contractors, management, quality and satisfaction.
INTRODUCTION
The term quality management as used in the construction industry is all
encompassing. Embedded in the phenomenon itself are concepts such as quality
control, quality assurance, quality improvement, quality standards etc. The earliest
form of formal quality management practices in construction can be traced back to
ancient Greece and Rome. In that era, according to Beckerman (1992) a chief builder
assumed the responsibility of the design, working out construction details and most of
all ensuring correct implementation in order to guarantee a satisfactory outcome. The
chief builder/master craftsman set standards; reviewed the work of others; and ordered
rework and revision as necessary, and trained and supervise the work of their
craftsmen and apprentices (Robins, 2007).
The modern age saw larger, more complex and daring structures spring up in the
construction industry. The large scale and complexity that characterized the modern
age projects did not come without its problems one of which includes building
collapse. As a result, many institutions and organizations are concerned about the
quality and safety of buildings. For example, while Alli (2008) pointed out that
statistics of collapsed buildings as at 2007 for 29 years in Nigeria stood at 101, the
Nigerian Institute of Building (NIOB) (2008) noted that 84 buildings had collapsed
within the past 20 years in Nigeria, claiming more than 400 lives. According to
Ayininuola and Olalusi (2004), the actual number of collapses in Nigeria could be
Olatunji, Abimbola and Nureni
100
higher than what is on record since the figures published are based only on reported
cases. It is often concluded that deficiencies in buildings are as a result of poor
architectural or structural designs, participation of quacks parading themselves as
professionals, use of substandard materials and lack of sufficient technical expertise
on the part of builders (Leadership, 2008). All pointing to largely unexamined
assumptions of poor quality management practices used in the project procurement
process in Nigeria.
Wong (1999) opined that construction companies are increasingly adopting total
quality management as an initiative to solve quality problems in the construction
industry and to meet the needs of the client and end-user. This study therefore
examines the quality management practices used on construction sites in Nigeria. To
do this, the paper will first of all present an overview of quality management practices,
project performance and existing theories of relationship between quality management
practices used on sites and performance. Secondly, the paper will present the results of
an empirical study into the quality management practices used on selected
construction sites in Nigeria and relationships with project performance. Thirdly, the
paper will discuss the implications of these findings and finally, propose a framework
of quality management practices for use on construction projects as a quality
implementation tool.
This work is significant in that it will reveal the quality management practices used in
project procurement in the Nigerian construction industry, determine if it is adequate
or if it can be linked to project performance. This work relates to previous work and
theories developed by Garvin (1987), Samson and Terziocski (1999), Dow, et al.
(1999), Cimcil (2000) and Kaynak (2003).
QUALITY MANAGEMENT PRACTICES
Quality management practices include all the means employed by managers in an
effort to implement their quality policies. These activities include quality planning,
quality control, quality assurance and quality improvement (Harris and McCaffer,
2001).
Quality has remained in the forefront amongst factors used to determine the degree of
success or failure of a project. This long term development has made it imperative for
all parties involved in construction projects to strive at all times to produce
commendable structures (Feigenbaum, 1993). The quality management practices
identified by past researchers and which can be adapted to the construction industry
and project scenario, and assigned to the three main role players in project
procurement are presented in Table 1.
Table 1 reveals that while Cimcil (2000) proposed a non-conventional approach to
project quality and project success involving seven quality management practices,
Dow et al. (1999) identified nine key quality practice dimensions from an empirical
study of manufacturing sites in Australia and New Zealand. Samson and Terziovski
(1999) identified six Total Quality Management (TQM) elements and Kaynak (2003)
identified eight TQM practices from measurement studies conducted by Saraph et al.
(1989), Flynn et al. (1994), Ahire et al. (1996) and Black and Porter (1996). These
practices are assigned in Table 1 to the building team member who is considered best
to use the practice during the project procurement process.

Quality management
101
According to Cimcil (2000), the idea of partnering indicates resulting improvements
in project quality and mutual benefits from project partners. Under the aspect of
collaboration, Cimcil (2000) discovered that service orientation in the management of
projects brings the customer closer to product design and introduces the notion of a
project being an unbounded, open system, in constant interplay with the environment
and responsive to changes.
Table 1: Quality Management Practices identified in literature
Quality Management Practices Study Contracting
Enterprise
Consultant Client
Collaboration: customer-supplier
collaboration, shared vision
Cimcil (2000), Dow et
al. (1999)
√ - √
Service orientation of supplier,
customer focus
Cimcil (2000), Dow et
al (1999), Samson and
Terziovski (1999)
√ - -
Identification of internal and
external customer supply chains
Cimcil (2000) √ - -
Communication, focus on error
and rework prevention
Cimcil (2000) √ - -
Inter-professional concurrence
and concurrent engineering
Cimcil (2000) √ √ -
Use of project quality systems
such as ISO 9000 family, or other
customised forms of project
Quality Assurance Systems
Cimcil (2000), Kaynak
(2003)
√ √ -
Human resource development /
training
Cimcil (2000), Kaynak
(2003), Samson and
Terziovski (1999)
√ - -
Employee commitment and
relations
Dow et al. (1999),
Kaynak (2003)
√ - -
Benchmarking Dow et al. (1999) √ √ √
Cellular work teams Dow et al. (1999) √ - -
Use of advanced manufacturing
technologies
Dow et al. (1999) √ - -
Quality management leadership Kaynak (2003),
Samson and Terziovski
(1999)
√ √ -
Quality data and reporting;
planning and information analysis
Kaynak (2003),
Samson and Terziovski
(1999)
√ √ -
Supply quality management Kaynak (2003) √ √ √
Product/service design Kaynak (2003) - √ √
Process management Kaynak (2003),
Samson and Terziovski
√ √ √
PROJECT QUALITY PERFORMANCE MEASUREMENT
Performance on a global level represents results of activities. Performance of a project
is measured as its ability to deliver the building at the right time, cost and quality as
well as achieving a high level of client satisfaction (Naoum, 1994). Quality
performance in construction is results oriented, and seeks evidence of quality
awareness within the operations and output of a building team. Quality performance is
also defined over the long term for the effect to be permanent (Yasamis, Arditi and
Mahammadi, 2002). In other words, quality performance improvements are expected
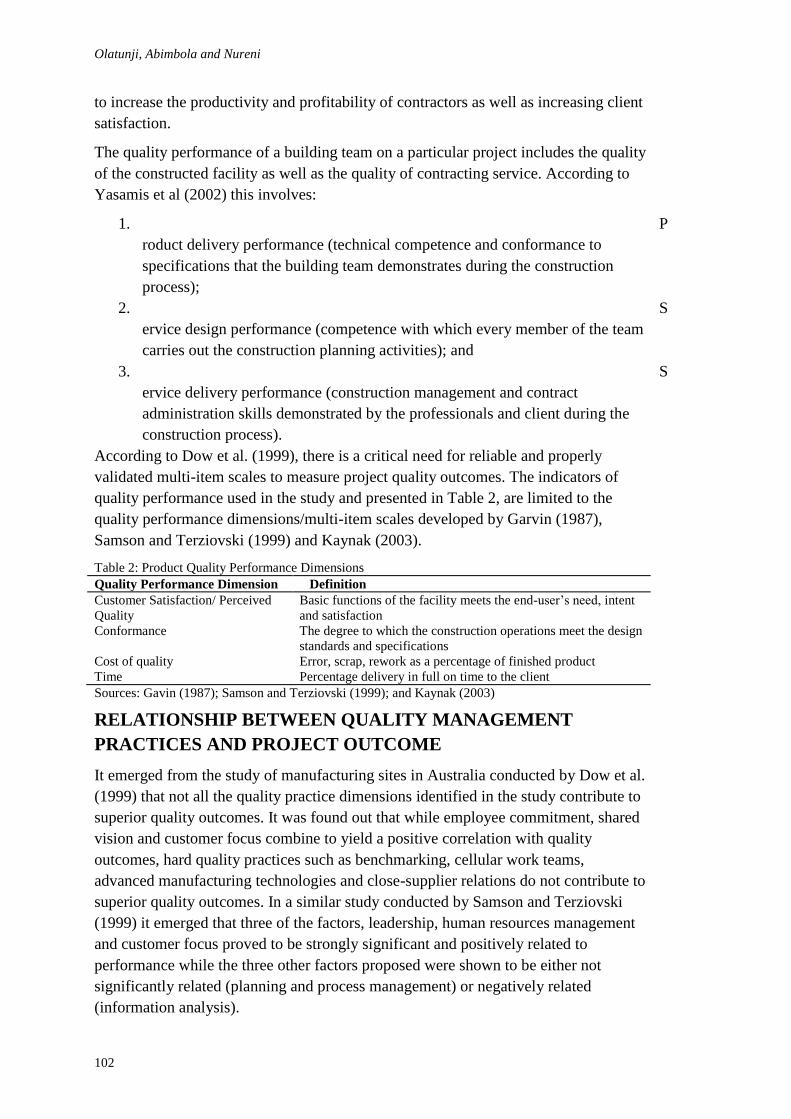
Olatunji, Abimbola and Nureni
102
to increase the productivity and profitability of contractors as well as increasing client
satisfaction.
The quality performance of a building team on a particular project includes the quality
of the constructed facility as well as the quality of contracting service. According to
Yasamis et al (2002) this involves:
1. P
roduct delivery performance (technical competence and conformance to
specifications that the building team demonstrates during the construction
process);
2. S
ervice design performance (competence with which every member of the team
carries out the construction planning activities); and
3. S
ervice delivery performance (construction management and contract
administration skills demonstrated by the professionals and client during the
construction process).
According to Dow et al. (1999), there is a critical need for reliable and properly
validated multi-item scales to measure project quality outcomes. The indicators of
quality performance used in the study and presented in Table 2, are limited to the
quality performance dimensions/multi-item scales developed by Garvin (1987),
Samson and Terziovski (1999) and Kaynak (2003).
Table 2: Product Quality Performance Dimensions
Quality Performance Dimension Definition
Customer Satisfaction/ Perceived
Quality
Basic functions of the facility meets the end-user’s need, intent
and satisfaction
Conformance The degree to which the construction operations meet the design
standards and specifications
Cost of quality Error, scrap, rework as a percentage of finished product
Time Percentage delivery in full on time to the client
Sources: Gavin (1987); Samson and Terziovski (1999); and Kaynak (2003)
RELATIONSHIP BETWEEN QUALITY MANAGEMENT
PRACTICES AND PROJECT OUTCOME
It emerged from the study of manufacturing sites in Australia conducted by Dow et al.
(1999) that not all the quality practice dimensions identified in the study contribute to
superior quality outcomes. It was found out that while employee commitment, shared
vision and customer focus combine to yield a positive correlation with quality
outcomes, hard quality practices such as benchmarking, cellular work teams,
advanced manufacturing technologies and close-supplier relations do not contribute to
superior quality outcomes. In a similar study conducted by Samson and Terziovski
(1999) it emerged that three of the factors, leadership, human resources management
and customer focus proved to be strongly significant and positively related to
performance while the three other factors proposed were shown to be either not
significantly related (planning and process management) or negatively related
(information analysis).
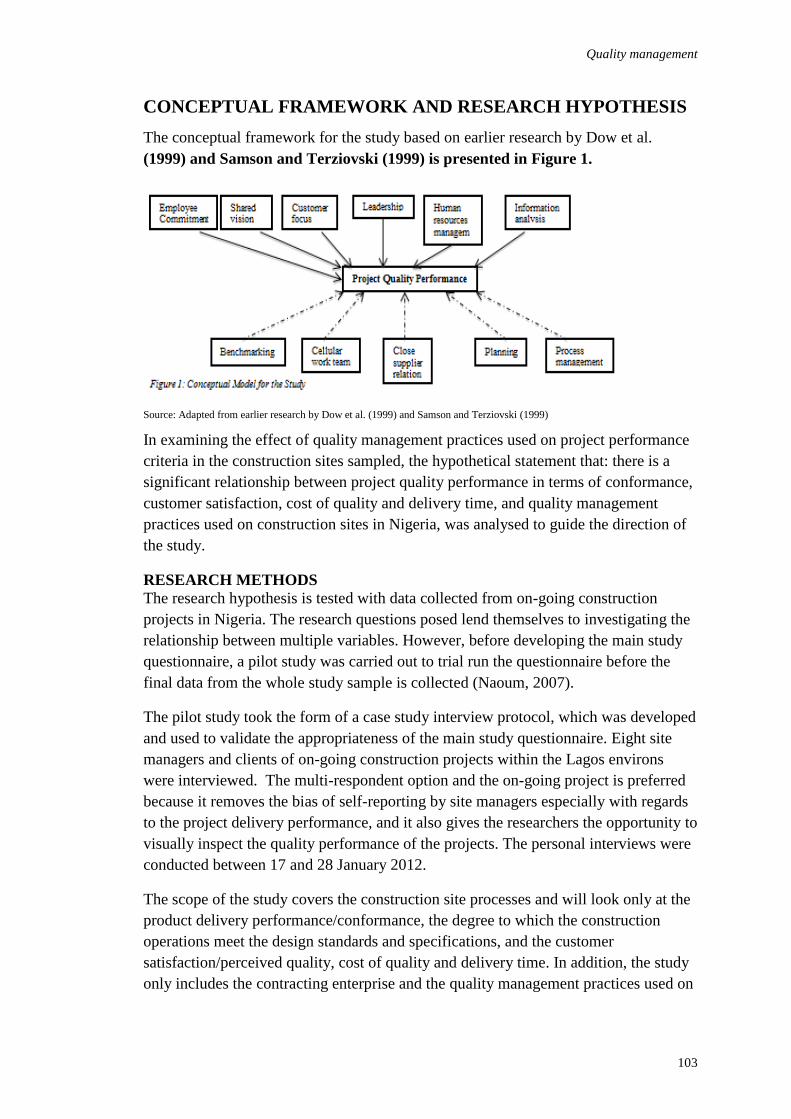
Quality management
103
CONCEPTUAL FRAMEWORK AND RESEARCH HYPOTHESIS
The conceptual framework for the study based on earlier research by Dow et al.
(1999) and Samson and Terziovski (1999) is presented in Figure 1.
Source: Adapted from earlier research by Dow et al. (1999) and Samson and Terziovski (1999)
In examining the effect of quality management practices used on project performance
criteria in the construction sites sampled, the hypothetical statement that: there is a
significant relationship between project quality performance in terms of conformance,
customer satisfaction, cost of quality and delivery time, and quality management
practices used on construction sites in Nigeria, was analysed to guide the direction of
the study.
RESEARCH METHODS
The research hypothesis is tested with data collected from on-going construction
projects in Nigeria. The research questions posed lend themselves to investigating the
relationship between multiple variables. However, before developing the main study
questionnaire, a pilot study was carried out to trial run the questionnaire before the
final data from the whole study sample is collected (Naoum, 2007).
The pilot study took the form of a case study interview protocol, which was developed
and used to validate the appropriateness of the main study questionnaire. Eight site
managers and clients of on-going construction projects within the Lagos environs
were interviewed. The multi-respondent option and the on-going project is preferred
because it removes the bias of self-reporting by site managers especially with regards
to the project delivery performance, and it also gives the researchers the opportunity to
visually inspect the quality performance of the projects. The personal interviews were
conducted between 17 and 28 January 2012.
The scope of the study covers the construction site processes and will look only at the
product delivery performance/conformance, the degree to which the construction
operations meet the design standards and specifications, and the customer
satisfaction/perceived quality, cost of quality and delivery time. In addition, the study
only includes the contracting enterprise and the quality management practices used on
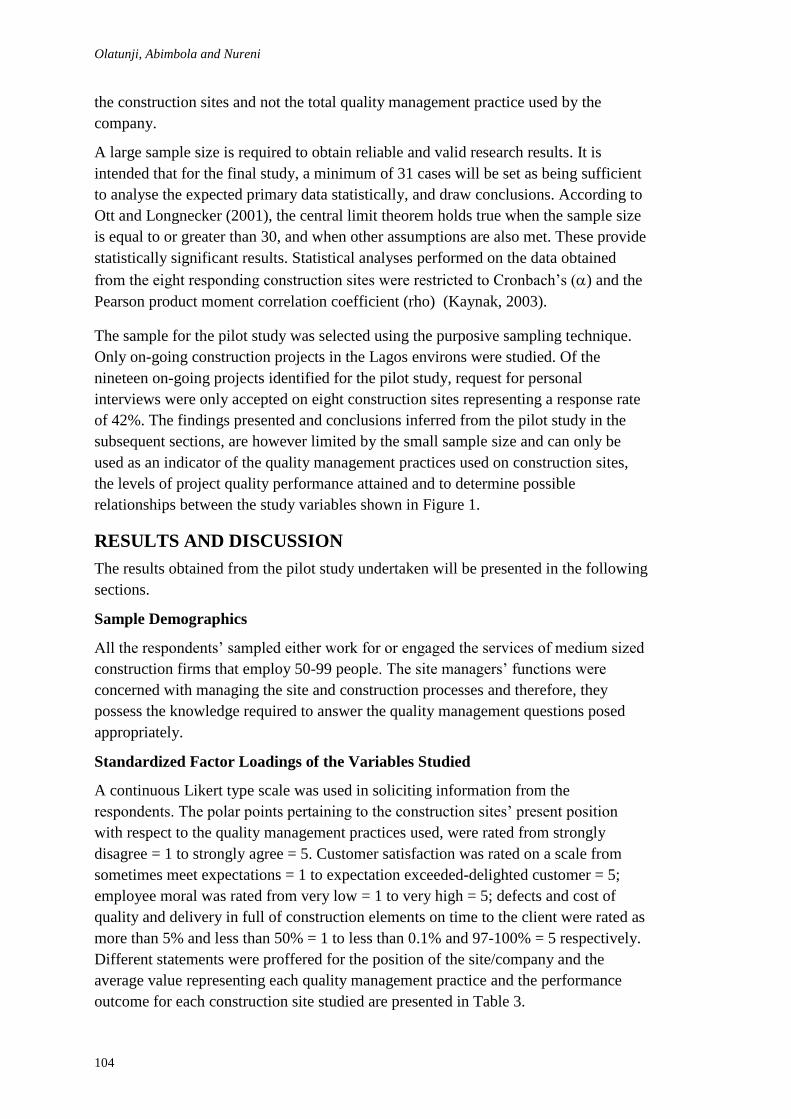
Olatunji, Abimbola and Nureni
104
the construction sites and not the total quality management practice used by the
company.
A large sample size is required to obtain reliable and valid research results. It is
intended that for the final study, a minimum of 31 cases will be set as being sufficient
to analyse the expected primary data statistically, and draw conclusions. According to
Ott and Longnecker (2001), the central limit theorem holds true when the sample size
is equal to or greater than 30, and when other assumptions are also met. These provide
statistically significant results. Statistical analyses performed on the data obtained
from the eight responding construction sites were restricted to Cronbach’s () and the
Pearson product moment correlation coefficient (rho) (Kaynak, 2003).
The sample for the pilot study was selected using the purposive sampling technique.
Only on-going construction projects in the Lagos environs were studied. Of the
nineteen on-going projects identified for the pilot study, request for personal
interviews were only accepted on eight construction sites representing a response rate
of 42%. The findings presented and conclusions inferred from the pilot study in the
subsequent sections, are however limited by the small sample size and can only be
used as an indicator of the quality management practices used on construction sites,
the levels of project quality performance attained and to determine possible
relationships between the study variables shown in Figure 1.
RESULTS AND DISCUSSION
The results obtained from the pilot study undertaken will be presented in the following
sections.
Sample Demographics
All the respondents’ sampled either work for or engaged the services of medium sized
construction firms that employ 50-99 people. The site managers’ functions were
concerned with managing the site and construction processes and therefore, they
possess the knowledge required to answer the quality management questions posed
appropriately.
Standardized Factor Loadings of the Variables Studied
A continuous Likert type scale was used in soliciting information from the
respondents. The polar points pertaining to the construction sites’ present position
with respect to the quality management practices used, were rated from strongly
disagree = 1 to strongly agree = 5. Customer satisfaction was rated on a scale from
sometimes meet expectations = 1 to expectation exceeded-delighted customer = 5;
employee moral was rated from very low = 1 to very high = 5; defects and cost of
quality and delivery in full of construction elements on time to the client were rated as
more than 5% and less than 50% = 1 to less than 0.1% and 97-100% = 5 respectively.
Different statements were proffered for the position of the site/company and the
average value representing each quality management practice and the performance
outcome for each construction site studied are presented in Table 3.
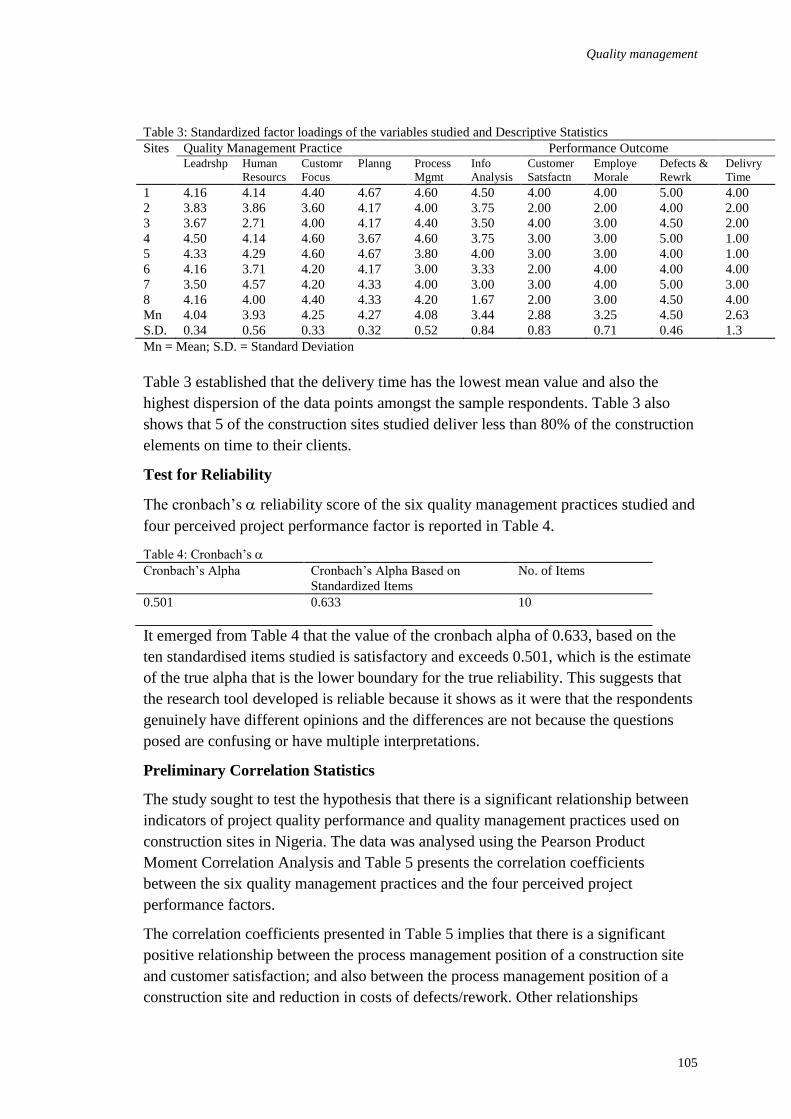
Quality management
105
Table 3: Standardized factor loadings of the variables studied and Descriptive Statistics
Sites Quality Management Practice Performance Outcome Leadrshp Human
Resourcs
Customr
Focus
Planng Process
Mgmt
Info
Analysis
Customer
Satsfactn
Employe
Morale
Defects &
Rewrk
Delivry
Time
1 4.16 4.14 4.40 4.67 4.60 4.50 4.00 4.00 5.00 4.00
2 3.83 3.86 3.60 4.17 4.00 3.75 2.00 2.00 4.00 2.00
3 3.67 2.71 4.00 4.17 4.40 3.50 4.00 3.00 4.50 2.00
4 4.50 4.14 4.60 3.67 4.60 3.75 3.00 3.00 5.00 1.00
5 4.33 4.29 4.60 4.67 3.80 4.00 3.00 3.00 4.00 1.00
6 4.16 3.71 4.20 4.17 3.00 3.33 2.00 4.00 4.00 4.00
7 3.50 4.57 4.20 4.33 4.00 3.00 3.00 4.00 5.00 3.00
8 4.16 4.00 4.40 4.33 4.20 1.67 2.00 3.00 4.50 4.00
Mn 4.04 3.93 4.25 4.27 4.08 3.44 2.88 3.25 4.50 2.63
S.D. 0.34 0.56 0.33 0.32 0.52 0.84 0.83 0.71 0.46 1.3
Mn = Mean; S.D. = Standard Deviation
Table 3 established that the delivery time has the lowest mean value and also the
highest dispersion of the data points amongst the sample respondents. Table 3 also
shows that 5 of the construction sites studied deliver less than 80% of the construction
elements on time to their clients.
Test for Reliability
The cronbach’s reliability score of the six quality management practices studied and
four perceived project performance factor is reported in Table 4.
Table 4: Cronbach’s
Cronbach’s Alpha Cronbach’s Alpha Based on
Standardized Items
No. of Items
0.501 0.633 10
It emerged from Table 4 that the value of the cronbach alpha of 0.633, based on the
ten standardised items studied is satisfactory and exceeds 0.501, which is the estimate
of the true alpha that is the lower boundary for the true reliability. This suggests that
the research tool developed is reliable because it shows as it were that the respondents
genuinely have different opinions and the differences are not because the questions
posed are confusing or have multiple interpretations.
Preliminary Correlation Statistics
The study sought to test the hypothesis that there is a significant relationship between
indicators of project quality performance and quality management practices used on
construction sites in Nigeria. The data was analysed using the Pearson Product
Moment Correlation Analysis and Table 5 presents the correlation coefficients
between the six quality management practices and the four perceived project
performance factors.
The correlation coefficients presented in Table 5 implies that there is a significant
positive relationship between the process management position of a construction site
and customer satisfaction; and also between the process management position of a
construction site and reduction in costs of defects/rework. Other relationships
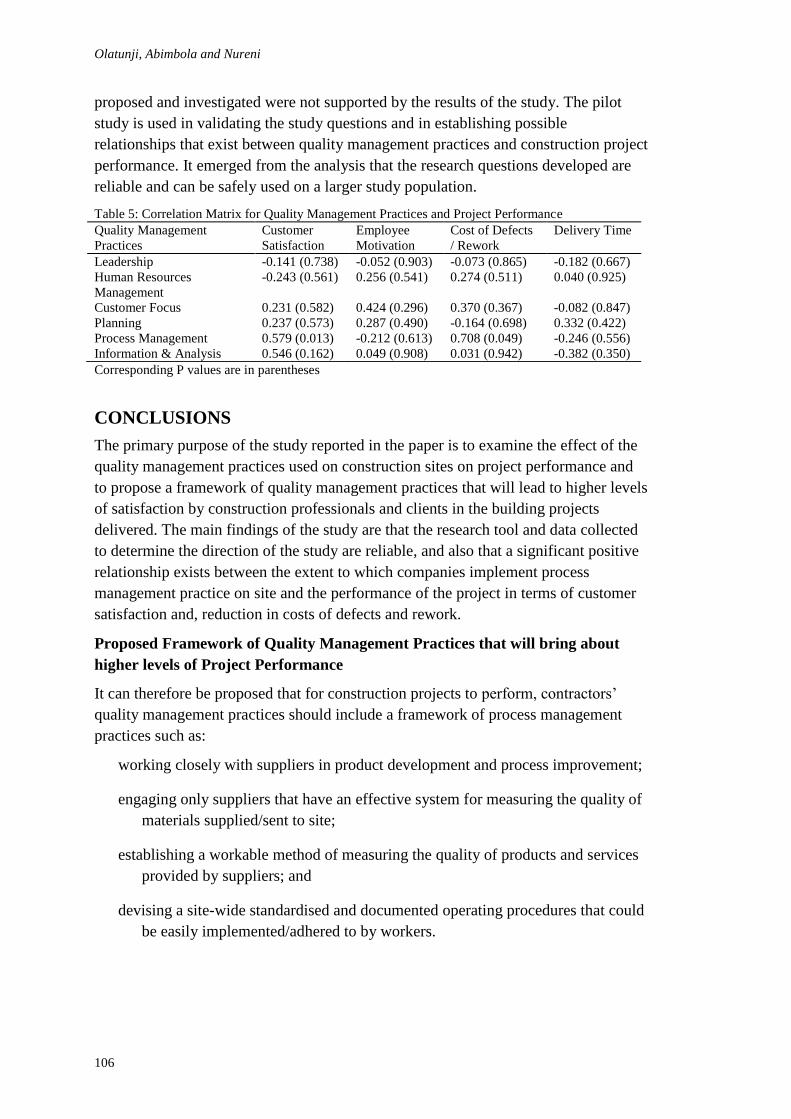
Olatunji, Abimbola and Nureni
106
proposed and investigated were not supported by the results of the study. The pilot
study is used in validating the study questions and in establishing possible
relationships that exist between quality management practices and construction project
performance. It emerged from the analysis that the research questions developed are
reliable and can be safely used on a larger study population.
Table 5: Correlation Matrix for Quality Management Practices and Project Performance
Quality Management
Practices
Customer
Satisfaction
Employee
Motivation
Cost of Defects
/ Rework
Delivery Time
Leadership -0.141 (0.738) -0.052 (0.903) -0.073 (0.865) -0.182 (0.667)
Human Resources
Management
-0.243 (0.561) 0.256 (0.541) 0.274 (0.511) 0.040 (0.925)
Customer Focus 0.231 (0.582) 0.424 (0.296) 0.370 (0.367) -0.082 (0.847)
Planning 0.237 (0.573) 0.287 (0.490) -0.164 (0.698) 0.332 (0.422)
Process Management 0.579 (0.013) -0.212 (0.613) 0.708 (0.049) -0.246 (0.556)
Information & Analysis 0.546 (0.162) 0.049 (0.908) 0.031 (0.942) -0.382 (0.350)
Corresponding P values are in parentheses
CONCLUSIONS
The primary purpose of the study reported in the paper is to examine the effect of the
quality management practices used on construction sites on project performance and
to propose a framework of quality management practices that will lead to higher levels
of satisfaction by construction professionals and clients in the building projects
delivered. The main findings of the study are that the research tool and data collected
to determine the direction of the study are reliable, and also that a significant positive
relationship exists between the extent to which companies implement process
management practice on site and the performance of the project in terms of customer
satisfaction and, reduction in costs of defects and rework.
Proposed Framework of Quality Management Practices that will bring about
higher levels of Project Performance
It can therefore be proposed that for construction projects to perform, contractors’
quality management practices should include a framework of process management
practices such as:
working closely with suppliers in product development and process improvement;
engaging only suppliers that have an effective system for measuring the quality of
materials supplied/sent to site;
establishing a workable method of measuring the quality of products and services
provided by suppliers; and
devising a site-wide standardised and documented operating procedures that could
be easily implemented/adhered to by workers.
Quality management
107
However, it should be noted that these are preliminary findings and that a larger
sample size still needs to be examined in order to obtain reliable and valid research
results, from which generalizable conclusions can be made.
Lessons Learnt about Quality Management Practices from the Pilot Study
Lessons learnt from the pilot study include the fact that process management is the
key to construction project performance that is, client satisfaction and reduction in the
costs of defects/rework on the construction sites studied. These findings differ
significantly from the findings of earlier studies by Dow et al. (1999) and Samson and
Terziocski (1999), who found out that process management is not significantly related
to project performance. However, this might not be unconnected with the fact that
these researchers studied manufacturing sites and not construction sites, which is the
focus of the research reported in this paper.
REFERENCES
Ahire, S. L., Golhar, D. Y., and Waller, M. A. (1996) Development and Validation of TQM
implementation constructs, Decision Sciences, 27, 23-56.
Alli, T. F. (2008) Rising incidence of building collapse in Nigeria, available:
http://leadershiponline.com, [assessed on: 15 August 2008]
Ayininuola, G. M., and Olalusi, O. O. (2004) Assessment of Building Failures in Nigeria:
Lagos and Ibadan Case Study, African Journal of Science and Technology, 5, 1, 73-
78.
Beckerman, P. (1992) The Economics of High Inflation, New York: Macmillan.
Black, S. A., and Porter, L. J. (1996) Identification of the critical factors of TQM, Decision
Sciences, 27, 1-21.
Cimcil, S. (2000) Quality in project environments: a non-conventional agenda, International
Journal of Quality and Reliability Management, 17, 4/5, 554-570.
Dow, D., Samson, D., and Ford, S. (1999) Exploding the Myth: Do all Quality Management
Practices contribute to Superior Quality Performance? Production and Operations
Management, 8, 1-27
Feigenbaum, A. V. (1993) Total Quality Control, 3rd
Ed., New York: McGraw Hill.
Flynn, B. B., Schroeder, R. G., and Sakaibara, S. (1994) A framework for Quality
Management Research and an associated Measurement Instrument, Journal of
Operations Management, 11, 339-366.
Garvin, D. A. (1987) Competing on the eight dimensions of quality, Harvard Business
Review, 65, 6, 101-109.
Harris, F., and McCaffer, R. (2001) Modern Construction Management, 5th Ed., Oxford:
Wiley-Blackwell Publishing Company.
Kaynak, H. (2003) The relationship between Total Quality Management Practices and their
effects on firms’ performance, Journal of Operations Management, 21, 405-435.
Leadership (2008) Quality control in construction, leadershipnigeria.com, available:
http://leadershipnigeria.com/environment, [accessed on 15 August 2008].
Naoum, S. G. (2007) Dissertation Research and Writing for Construction Students, Oxford:
Butterworth-Heinemann.
Olatunji, Abimbola and Nureni
108
Naoum, S. G. (1994) Critical analysis of time and cost of management and traditional
contracts, ASCE, Journal of Construction Engineering and Management, 120, 687-
705.
NIOB (2008) Report on Building Collapse, Lagos: Nigerian Institute of Building
Ott, R. L., and Longnecker, M. (2001) An introduction to statistical methods and data
analysis, Calif: Duxbury, Pacific Grove.
Robins, S. P. (2007) Organizational Behaviour, available: http://faculty.tcc.edu, [accessed on
15 August 2008].
Samson, D., and Terziocski, M. (1999) The relationship between total quality management
practices and operational performance, Journal of Operations Management, 17, 393-
409.
Saraph, J. V., Benson, G. P., and Schroeder, R. G. (1989) An instrument for measuring the
critical factors of Quality Management, Decision Sciences, 20, 810-829.
Wong, A. (1999) Total Quality Management in the Construction Industry in Hong Kong: A
supply chain management perspective, Total Quality management, 10, 2, 199-208.
Yasamis, F., Arditi, D., and Mahammadi, J. (2002) Assessing Contractor Quality
Performance, Construction Management and Economics, 20, 211-223.
Adeokun, C.O. (2012) Analysis of spatial types and social space in Ile-Ife domestic architecture In:
Laryea, S., Agyepong, S.A., Leiringer, R. and Hughes, W. (Eds) Procs 4th West Africa Built
Environment Research (WABER) Conference, 24-26 July 2012, Abuja, Nigeria, 109-124.
109
ANALYSIS OF SPATIAL TYPES AND SOCIAL SPACE
IN ILE-IFE DOMESTIC ARCHITECTURE
C. O Adeokun 1
Department of Architecture, Covenant University, College of Science and Technology, Ota, Ogun State,
Nigeria
This paper focuses on the diachronic development of spatial morphologies in Yoruba
domestic architecture (SW Nigeria) and the social rules implicit in domestic space
use, utilizing data about the households, and activity and object locations. The results
presented revolve around how activities (and objects) ‘spill over’ designated
boundaries within the domestic space, the impact of activities and objects on the
specialized or non-specialized use of space, and the intensity of focus on each space
label as the conventional location for activities and objects. Six spatial types were
identified, and a ‘core’ set of function/space labels was found in each type, although
these have ‘expanded’ in the newer types, partly in response to new connotations of
privacy. Many activities and objects were consistently shown to have flexible
boundaries, thereby having an effect on space specialization. Newer geometric types
were characterized by slightly increased specialized use of certain space labels
(although the prevalent pattern was non-specialization), and a modest reduction in the
degree of extensibility, and intensity of focus. The study demonstrated that there are
stronger points of continuity than difference between the spatial types.
Keywords: architecture, Ile-Ife, social space, spatial, domestic
INTRODUCTION
The analysis of the domestic space is on one hand about the physical space, but it is
also about ideals and social contexts that influence space use. Many studies have
focused on transformations in spatial typology and morphology over time, but only a
few e.g. Hillier and Hanson (1984), Kent (1990), Rapoport (1990) have been based on
the premise that space morphology possesses built-in social and contextual meaning.
Other researchers have focused on the relationships between everyday
activities/objects and their meanings, and on social relations between household
inhabitants e.g. Csikzentmihalyi and Rochberg-Halton (1981), Korosec-Serfaty
(1985), Kent (1990), Miller (2001), but while these studies have yielded significant
insight into the organization of normative aspects of the domestic world, they have
rarely combined spatial analysis with the investigation of domestic space use.
Physical space is not an inert thing solely defined by its dimensions and geometry, and
the process of explaining physical (domestic) space, ought to be in conjunction with
space use analysis. Consequently, this study adopted a combined approach to gain
insight into the diachronic development of spatial morphologies, and to analyse social
‘rules’ implicit in domestic space use in a sample of Yoruba households.
Adeokun
110
The idea that identifiable motives underline object and activity locations, points
towards the presence of underlying rules. Rules by definition exist in different forms;
either as what Wieder (1970) describes as a)‘game-theoretic’ rules that formally
constitute and prescribe, b) methodical procedures (as in the case of mathematical
formulas) or c) in the sense of habit or routine. Giddens (1984) and Wood and Beck
(1994) also describe rules as tending to be about a practical competence of space use.
It is argued that rules in the domestic setting are more interpretative, and may be
applied, modified, or even suspended to integrate with individual motivations. Rules
within this study therefore were seen as flexible properties within which individuals
make choices, create habits or routines.
LITERATURE REVIEW
The decision to analyse physical spaces, and the objects and activities together, was
based on the premise that domestic space is more than its geometric entity,
fundamental as that is. Tversky (2003) describes space (physical space) as a place of
negotiations of social relations as well as a space of navigation for activities and
similarly for Lefebvre (1974,1991), there is no sectioning between these kinds of
‘spaces’, although visible boundaries (e.g. walls) give an appearance of separation.
Physical Space
The analysis of physical space, its typology, and morphology focused primarily on
theories and methodologies developed as a means of analysing physical space
objectively, whilst paying cognizance to the ‘social’ dimension of space. Hillier and
Hanson’s (1984) space syntax theory and methodologies were also adopted for this
reason. But, the results presented here focus on the analysis of typology based on
criteria also considered to be fundamental aspects of domestic space morphology;
mainly spatial properties that can be shown to be typical of a given type, particularly
in relation to space geometries and adjacencies [Stiny, (1980, 1994), Heitor et. Al.
(2003), and Colakoglu (2005)]. This process of geometric typing did not constitute a
description of every detailed aspect of the plans, but a sum of its generic nature. Van
Leusen (1996) highlighted that the process of identifying a typology of dwelling
arrangements is a potentially powerful way of condensing architectural knowledge
and this process, whilst dependent on perception, can yield useful insight by careful
consideration of empirical data in relation to theory.
The discussion of geometric typing here, owes much of its approach to ideas about
shape grammars and description grammars. Description grammars, defined by Stiny
(1980,1984) [also explored by Colakoglu (2005)], account for features of the design
not covered by investigations about the shape of dwellings. Description grammars
cover a variety of contextual, typological, and morphological features, that are
considered relevant to the internal arrangement of spaces in the dwelling, according to
some criteria of interest, which can also evolve/change. Of key interest here, were:-
a) the interface between the interior and exterior as a threshold issue, and b) how the
inhabitant-visitor interface is resolved within the dwelling; that is, the degree of
separation between spaces usually accessible to visitors, and the more private areas
e.g. bedrooms.
Domestic architecure
111
Social Space
Even if we accept the idea previously raised that physical space has a social
dimension, social space is worth defining because it is not a collection of things. For
Lefebvre (1974,1991), social space embraces a multitude of intersections and is both a
‘thing’, and a process. It has a realm of a) social relations of reproduction, that is, the
relations between sexes and age groups along with the organisation of the family and
b) relations of production, that is, to the division of labour and hierarchy of social
functions that manifest as social practices, at the individual and urban levels. Social
space is highly relevant in that it ensures continuity, implies a given level of
competency via repeated enactment of social practices, as it is about change via the
manipulation of rules. His main hypothesis is that each mode of production (or
society) has its own particular space, and the shift from one mode of production to
another entails the production of a new ‘space’ and that examining transitions between
modes of production will reveal that a fresh (physical) space is generated during such
changes. The idea that changes in the mode of production will be manifested in
transformations of the spatial practices of a region, is arguably a process that has also
taken place in Nigeria, in her transition from agrarian into the wider capitalist
economy was tested in this study.
Social space for Bourdieu (1984) is also multi-dimensional, comprising acquired and
inherited social, economic and cultural capital and this set of useable resources and
power plays a significant role in the realm of perception. For him, social space is
constructed via the volume of capital, the composition of the capital (the proportions
of the three types of capital that is present in the individual), and how the composition
of capital change over time. These forms of capital according to Bourdieu (1984) are
reproduced primarily via inheritance law and custom (cultural and economic capital),
the labour market (economic capital), the educational system (cultural capital).
Generally, increased schooling has the effect of increasing cultural capital and in this
study, also of increasing economic capital. For Bourdieu (1984), individual choices
are rarely completely free from social and cultural capital. Social space therefore is
the realm in which daily activities demonstrate the balance that has struck between
how people might want to live and the limitations of the physical space.
There is also a strong connection between activities and objects because in both
instances, space and time are the main elements being utilised. Kent (1990) and
Rapoport (1990) argue that activities are an aspect of culture most likely to influence
the use of space and it is the patterning of activities that is crucial and not the single
activity reconstructions. Kent (1990) explores ideas about the connection between
mode of production, the relationships between domestic activities, and how they
manifest spatially. Her thesis is that the greater the degree of socio-political
complexity, the higher the functional restriction, the level of compartmentalisation
(use of solid walls), and the greater the functional homogeneity within each
compartment. This idea though, also supported by Rapoport (1990), is suggestive of
the idea of a hierarchy of cultures which could be quite controversial. Her ideas about
the role of temporal separation were more viable, as she claims that spaces that appear
Adeokun
112
to be multi-functional only appear to be so, because of minute time intervals that
cannot usually be distinguished. She describes the effect on the physical space as
either a) functional restriction (specialised) or generic functions (non-specialised). In
summary, social space exists in tandem with physical space, and both are influenced
by perception induced by personal values created from social identity, thereby
reproducing a specific way of life.
AIM AND SCOPE OF THIS STUDY
Understanding the internal spatial organization of Yoruba domestic architecture, and
space use patterns of individual households by analysing the relationship between the
location of everyday domestic objects and activities was the primary aim of this
research. A single stage sample was taken from Ile-Ife, Nigeria. The areas and
dwellings chosen included traditional Yoruba dwellings dating back to the nineteenth
century, and more recently built contemporary accommodation. Ile-Ife was stratified
on the basis of socio-economic character and period of construction into three zones,
and one area each from two socio-economic strata, and two from the third stratum
were chosen.
RESEARCH METHODOLOGY
Structured interviews via an administered questionnaire, and floor plans and object
location maps prepared on-site were adopted to maximise accuracy and depth in the
results. The primary sampling unit is the household and 40 households were sampled
in each of the four areas. Only one member of each household was interviewed, and
only one household was surveyed in multiple-household dwellings.
The four areas surveyed are:
a) Enuwa, which is in the oldest existing quarter in Ile-Ife next to the palace of the
king (Ooni of Ife) and the main central market (Enuwa market) is mostly occupied by
extended families with many dwellings that go back to the 1890s. The housing unit
predominant in the area is the family house (agbo’le). Consequently, the majority of
dwellings in the area are owner occupied.
b) Akarabata Layout is the earliest planned housing area in Ile-Ife on what was the
outskirts of the town, developed between 1954-1962. The plots were allocated for
private development and as a result of a local government stipulation, most of the
buildings were constructed between 1955-1962. The area mostly contains rented
multi-household dwellings.
c) The privately developed Estates are located on the current periphery of Ile-Ife along
major inter-town links and were developed between 1970’s to early 1990’s. The area
contains mainly rented, single household accommodation targeted at middle-income
earners.
d) The university staff campus, which has been at its current site since 1967 is on the
outskirts of Ile-Ife. The campus was designed by a combination of expatriate and local
Domestic architecure
113
architects and most of the domestic dwellings were constructed between 1966 to early
1970’s and between the late 1970s to early 1980s.
The rental accommodation is for senior and junior staff. Samples from the campus,
and the estates were chosen because they are contemporary housing both in layout and
aesthetic intentions aimed mainly at middle income earners, although the estates
housing are for a speculative market. Akarabata was chosen for its older multi-
household housing, while Enuwa was chosen for its traditional extended-family
dwellings.
Structure and Design of Questionnaire
The main advantages of the questionnaire based interview were the ability to record
information from illiterate respondents, and to prepare the floor plan at the time of the
interview. Respondents were asked to inventory their own spaces for activities and
objects, as this yielded more detailed information. Open-ended questions were
included to elicit more in-depth responses, while a few close-ended questions served
to cross check information from open-ended questions. The concepts explored in the
questionnaire were: space use, storage, meaning, threshold, and socio-economic
issues.
Spatial Analysis Methodology
Six geometric types were identified based on the following criteria. The first criterion
dealt with the grouping of activities into recognisable spatial cores of activities that
are related. The cores identified are: - a) the living core (living room, dining room or
space and kitchen), b) the sleeping core: - bedrooms (main, children, guest) and, c) the
service core: - (toilets, bathroom and shower) or a variation on the service core– toilet,
bathroom, shower and kitchen. These cores relate to ideas about sectoring of the
dwelling identified by Amorim (1999). The use of sectoring can lead to the creation
of an identifiable axis of separation between the living and sleeping cores. The
second criterion assessed how elaborate the threshold between the exterior and the
main interior spaces is. This relates to whether there are transition spaces like lobbies,
veranda, terrace and hall between the front approach to the domestic space and the
main reception space, or whether the front door opens directly into the main reception
space. The third criterion is the separation between visitors and household pathways
within the domestic plan. It refers to the manner in which the interface with visitors is
resolved. Some plans have the main visitor entrance opening directly to the living
room/parlour, with inhabitants being able to negotiate between the interior and the
exterior spaces, without going through the living room. This interface was a
distinguishable plan feature.
The final consideration was whether the main cores of the plan were linked by a
transition space like a corridor, or by a function space (e.g. orowa). It measured
increased reliance on the use of transition spaces (T) for movement between different
parts of the dwelling rather than circulation directly from a function space (F) to
another. This assessment is linked to a space syntax measure of the T:F ratio; the ratio
of transition spaces to function spaces in a floor plan. These four aspects were
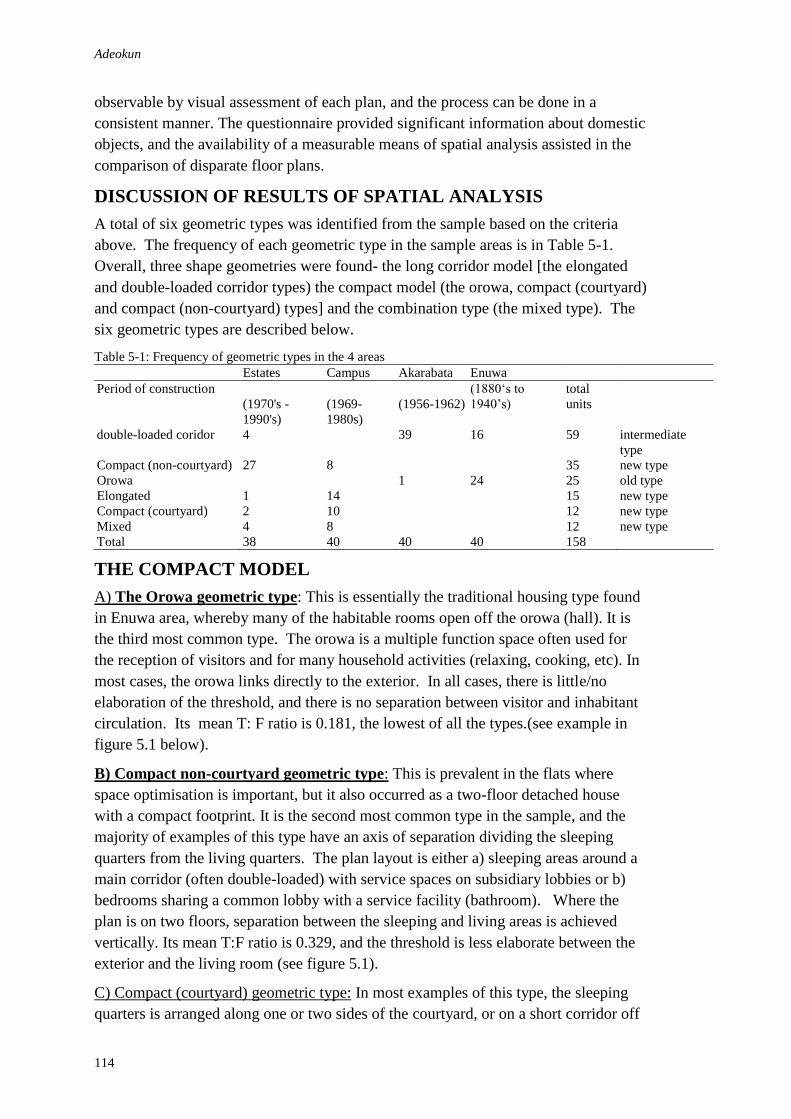
Adeokun
114
observable by visual assessment of each plan, and the process can be done in a
consistent manner. The questionnaire provided significant information about domestic
objects, and the availability of a measurable means of spatial analysis assisted in the
comparison of disparate floor plans.
DISCUSSION OF RESULTS OF SPATIAL ANALYSIS
A total of six geometric types was identified from the sample based on the criteria
above. The frequency of each geometric type in the sample areas is in Table 5-1.
Overall, three shape geometries were found- the long corridor model [the elongated
and double-loaded corridor types) the compact model (the orowa, compact (courtyard)
and compact (non-courtyard) types] and the combination type (the mixed type). The
six geometric types are described below.
Table 5-1: Frequency of geometric types in the 4 areas
Estates Campus Akarabata Enuwa
Period of construction
(1970's -
1990's)
(1969-
1980s)
(1956-1962)
(1880‘s to
1940’s)
total
units
double-loaded coridor 4 39 16 59 intermediate
type
Compact (non-courtyard) 27 8 35 new type
Orowa 1 24 25 old type
Elongated 1 14 15 new type
Compact (courtyard) 2 10 12 new type
Mixed 4 8 12 new type
Total 38 40 40 40 158
THE COMPACT MODEL
A) The Orowa geometric type: This is essentially the traditional housing type found
in Enuwa area, whereby many of the habitable rooms open off the orowa (hall). It is
the third most common type. The orowa is a multiple function space often used for
the reception of visitors and for many household activities (relaxing, cooking, etc). In
most cases, the orowa links directly to the exterior. In all cases, there is little/no
elaboration of the threshold, and there is no separation between visitor and inhabitant
circulation. Its mean T: F ratio is 0.181, the lowest of all the types.(see example in
figure 5.1 below).
B) Compact non-courtyard geometric type: This is prevalent in the flats where
space optimisation is important, but it also occurred as a two-floor detached house
with a compact footprint. It is the second most common type in the sample, and the
majority of examples of this type have an axis of separation dividing the sleeping
quarters from the living quarters. The plan layout is either a) sleeping areas around a
main corridor (often double-loaded) with service spaces on subsidiary lobbies or b)
bedrooms sharing a common lobby with a service facility (bathroom). Where the
plan is on two floors, separation between the sleeping and living areas is achieved
vertically. Its mean T:F ratio is 0.329, and the threshold is less elaborate between the
exterior and the living room (see figure 5.1).
C) Compact (courtyard) geometric type: In most examples of this type, the sleeping
quarters is arranged along one or two sides of the courtyard, or on a short corridor off

Domestic architecure
115
the courtyard. There are clearly recognisable cores for the sleeping, living and
services, but the separation of living area from sleeping area is not strongly
demarcated. The most common form of separation is for the service areas to have a
separate corridor from the sleeping quarters. Visitor access does not conflict with the
sleeping areas and the issue of threshold elaboration is well developed in about half of
the examples in the form of a series of transition spaces (porch/veranda, hall) before
getting to the living room. The mean T:F ratio for the type is 0.343; the highest of the
geometric types(see figure 5.2).
Figure 5.1: Orowa type [above] and compact (non-courtyard) type [below]
Figure 5.2: double-loaded corridor type (left) and compact courtyard type (right).
The Long-Corridor Model: -
D) Double-loaded corridor geometric type: This is the most common type in the
sample and they are mostly tenements. Only the service core is separated from the
rest of the dwelling usually to the rear of the house. The living and sleeping spaces
usually open onto the central corridor, which may be shared with other households in
the tenement. There is only a partial elaboration of the threshold between the front
entrance and the household’s habitable rooms, because the front door opens directly to
the central corridor, or occasionally to a front veranda. There is no separation
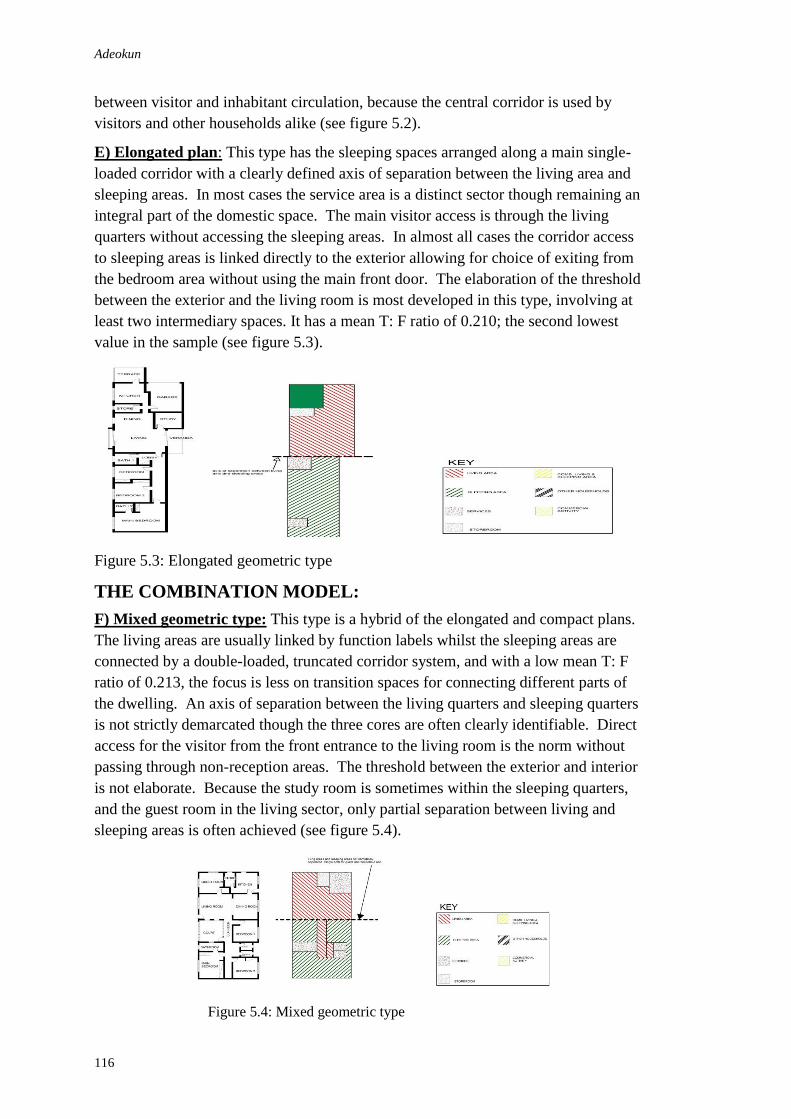
Adeokun
116
between visitor and inhabitant circulation, because the central corridor is used by
visitors and other households alike (see figure 5.2).
E) Elongated plan: This type has the sleeping spaces arranged along a main single-
loaded corridor with a clearly defined axis of separation between the living area and
sleeping areas. In most cases the service area is a distinct sector though remaining an
integral part of the domestic space. The main visitor access is through the living
quarters without accessing the sleeping areas. In almost all cases the corridor access
to sleeping areas is linked directly to the exterior allowing for choice of exiting from
the bedroom area without using the main front door. The elaboration of the threshold
between the exterior and the living room is most developed in this type, involving at
least two intermediary spaces. It has a mean T: F ratio of 0.210; the second lowest
value in the sample (see figure 5.3).
Figure 5.3: Elongated geometric type
THE COMBINATION MODEL:
F) Mixed geometric type: This type is a hybrid of the elongated and compact plans.
The living areas are usually linked by function labels whilst the sleeping areas are
connected by a double-loaded, truncated corridor system, and with a low mean T: F
ratio of 0.213, the focus is less on transition spaces for connecting different parts of
the dwelling. An axis of separation between the living quarters and sleeping quarters
is not strictly demarcated though the three cores are often clearly identifiable. Direct
access for the visitor from the front entrance to the living room is the norm without
passing through non-reception areas. The threshold between the exterior and interior
is not elaborate. Because the study room is sometimes within the sleeping quarters,
and the guest room in the living sector, only partial separation between living and
sleeping areas is often achieved (see figure 5.4).
Figure 5.4: Mixed geometric type
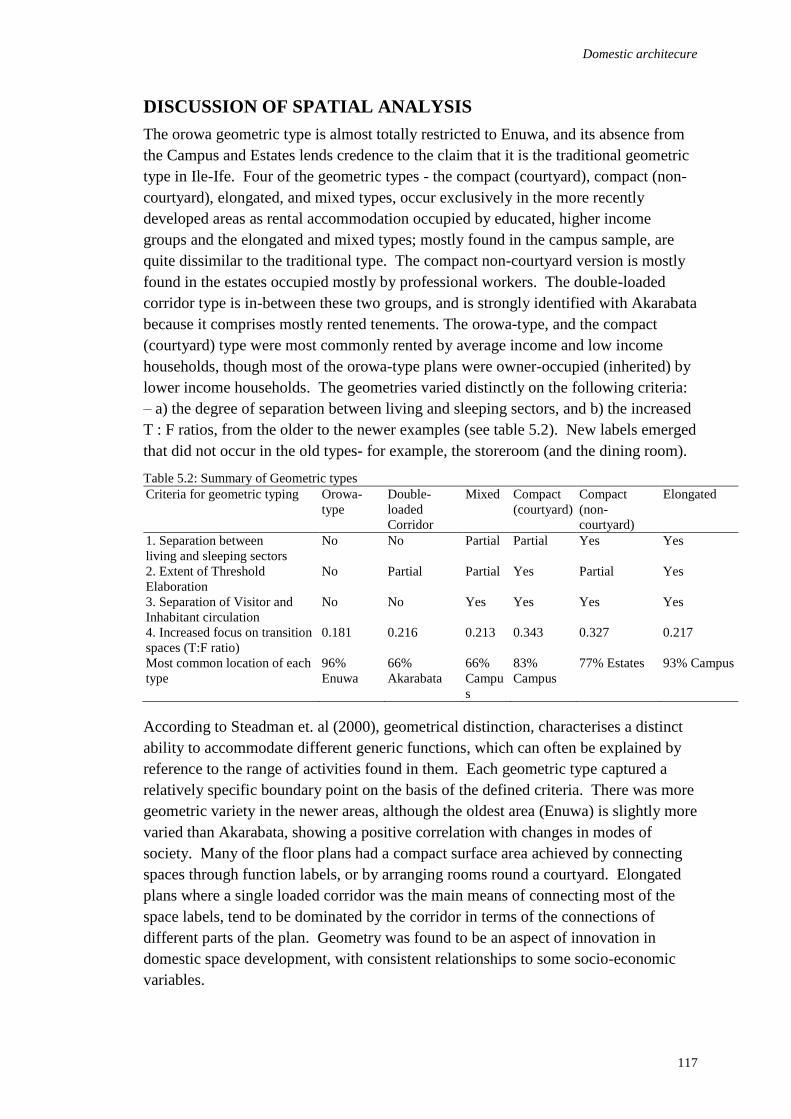
Domestic architecure
117
DISCUSSION OF SPATIAL ANALYSIS
The orowa geometric type is almost totally restricted to Enuwa, and its absence from
the Campus and Estates lends credence to the claim that it is the traditional geometric
type in Ile-Ife. Four of the geometric types - the compact (courtyard), compact (non-
courtyard), elongated, and mixed types, occur exclusively in the more recently
developed areas as rental accommodation occupied by educated, higher income
groups and the elongated and mixed types; mostly found in the campus sample, are
quite dissimilar to the traditional type. The compact non-courtyard version is mostly
found in the estates occupied mostly by professional workers. The double-loaded
corridor type is in-between these two groups, and is strongly identified with Akarabata
because it comprises mostly rented tenements. The orowa-type, and the compact
(courtyard) type were most commonly rented by average income and low income
households, though most of the orowa-type plans were owner-occupied (inherited) by
lower income households. The geometries varied distinctly on the following criteria:
– a) the degree of separation between living and sleeping sectors, and b) the increased
T : F ratios, from the older to the newer examples (see table 5.2). New labels emerged
that did not occur in the old types- for example, the storeroom (and the dining room).
Table 5.2: Summary of Geometric types
Criteria for geometric typing Orowa-
type
Double-
loaded
Corridor
Mixed Compact
(courtyard)
Compact
(non-
courtyard)
Elongated
1. Separation between
living and sleeping sectors
No No Partial Partial Yes Yes
2. Extent of Threshold
Elaboration
No Partial Partial Yes Partial Yes
3. Separation of Visitor and
Inhabitant circulation
No No Yes Yes Yes Yes
4. Increased focus on transition
spaces (T:F ratio)
0.181 0.216 0.213 0.343 0.327 0.217
Most common location of each
type
96%
Enuwa
66%
Akarabata
66%
Campu
s
83%
Campus
77% Estates 93% Campus
According to Steadman et. al (2000), geometrical distinction, characterises a distinct
ability to accommodate different generic functions, which can often be explained by
reference to the range of activities found in them. Each geometric type captured a
relatively specific boundary point on the basis of the defined criteria. There was more
geometric variety in the newer areas, although the oldest area (Enuwa) is slightly more
varied than Akarabata, showing a positive correlation with changes in modes of
society. Many of the floor plans had a compact surface area achieved by connecting
spaces through function labels, or by arranging rooms round a courtyard. Elongated
plans where a single loaded corridor was the main means of connecting most of the
space labels, tend to be dominated by the corridor in terms of the connections of
different parts of the plan. Geometry was found to be an aspect of innovation in
domestic space development, with consistent relationships to some socio-economic
variables.
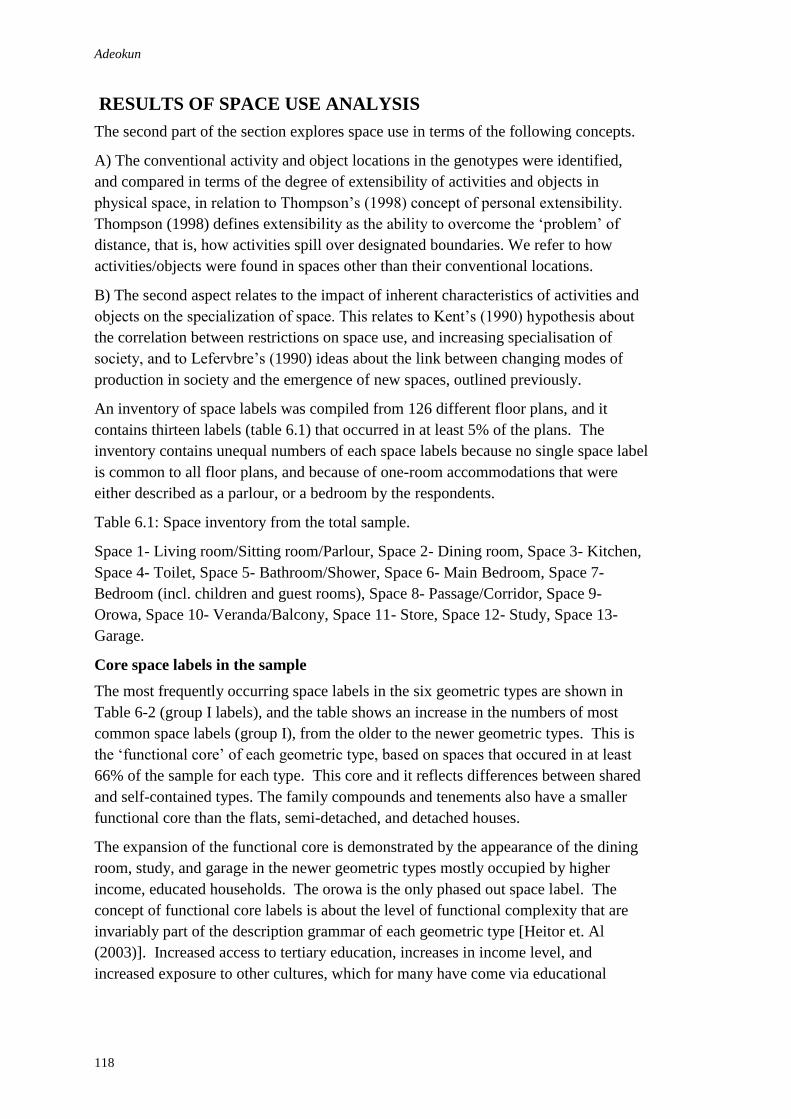
Adeokun
118
RESULTS OF SPACE USE ANALYSIS
The second part of the section explores space use in terms of the following concepts.
A) The conventional activity and object locations in the genotypes were identified,
and compared in terms of the degree of extensibility of activities and objects in
physical space, in relation to Thompson’s (1998) concept of personal extensibility.
Thompson (1998) defines extensibility as the ability to overcome the ‘problem’ of
distance, that is, how activities spill over designated boundaries. We refer to how
activities/objects were found in spaces other than their conventional locations.
B) The second aspect relates to the impact of inherent characteristics of activities and
objects on the specialization of space. This relates to Kent’s (1990) hypothesis about
the correlation between restrictions on space use, and increasing specialisation of
society, and to Lefervbre’s (1990) ideas about the link between changing modes of
production in society and the emergence of new spaces, outlined previously.
An inventory of space labels was compiled from 126 different floor plans, and it
contains thirteen labels (table 6.1) that occurred in at least 5% of the plans. The
inventory contains unequal numbers of each space labels because no single space label
is common to all floor plans, and because of one-room accommodations that were
either described as a parlour, or a bedroom by the respondents.
Table 6.1: Space inventory from the total sample.
Space 1- Living room/Sitting room/Parlour, Space 2- Dining room, Space 3- Kitchen,
Space 4- Toilet, Space 5- Bathroom/Shower, Space 6- Main Bedroom, Space 7-
Bedroom (incl. children and guest rooms), Space 8- Passage/Corridor, Space 9-
Orowa, Space 10- Veranda/Balcony, Space 11- Store, Space 12- Study, Space 13-
Garage.
Core space labels in the sample
The most frequently occurring space labels in the six geometric types are shown in
Table 6-2 (group I labels), and the table shows an increase in the numbers of most
common space labels (group I), from the older to the newer geometric types. This is
the ‘functional core’ of each geometric type, based on spaces that occured in at least
66% of the sample for each type. This core and it reflects differences between shared
and self-contained types. The family compounds and tenements also have a smaller
functional core than the flats, semi-detached, and detached houses.
The expansion of the functional core is demonstrated by the appearance of the dining
room, study, and garage in the newer geometric types mostly occupied by higher
income, educated households. The orowa is the only phased out space label. The
concept of functional core labels is about the level of functional complexity that are
invariably part of the description grammar of each geometric type [Heitor et. Al
(2003)]. Increased access to tertiary education, increases in income level, and
increased exposure to other cultures, which for many have come via educational

Domestic architecure
119
opportunities abroad, have influenced the educated elite, via changes in their
perception of what ought to be standard provision in the domestic space.
The new spaces also accommodate activities previously crammed in with other
activities in traditional geometric types e.g. the dining room for eating, previously
done in the orowa, as well as accommodate new activities like reading/studying,
lending some support to Kent (1990); and Rapoport (1990), hypothesis of the link
between space use and society.
Table 6-2: Functional core of the geometric types based on spaces that occur in at least 66% of each
type
Orowa type Double-loaded
Corridor
Compact (Non-
courtyard)
Elongated Compact
(courtyard)
Mixed
Living
rm/palour
Bedroom living rm living rm Living room living room
bedroom Corridor kitchen kitchen dining room kitchen
orowa toilet toilet kitchen toilet
shower room shower room toilet shower rm
bedroom main bedrm shower room main bedroom
corridor bedroom main bedroom bedroom
veranda corridor bedroom corridor
store corridor garage
study veranda
garage
CONVENTION OF ACTIVITY LOCATIONS: DEGREE OF
EXTENSIBILITY AND THE GEOMETRIC TYPES
An inventory of twenty activities was built up from the respondents’ answers (see
Table 6-3 overleaf). The process of establishing the convention of locations involved
listing all activities found within the ‘boundary’ of each space label for the total
sample (and respective geometric types), and identifying the most common locations
for each activity. There were lots of similarities in activity locations across the
geometric types. For instance, family living, general storing, reading/studying have a
wide extensibility across board, while hosting social events, water collecting, bathing,
toileting and sewing, have limited extensibility within the dwellings. Just a few
activities behaved differently across the types- ironing, food preparation, eating,
reading/studying- amongst others.
Cooking and food preparation are much more restricted in location in the newer
geometric types, and the wide extensibility for eating as an activity evident in the total
sample, is dictated by its many locations in the enduring type, but is strongly
identified with just one location in the new types. Overall the newer geometric types
have the most restricted extensibility. Activities that are concentrated in just one/two
locations are more normative, e.g. religious activity, retailing, laundry, bathing, and
toileting, while general storing, eating and reading/studying had a wide extensibility in
their locations. In between these were - family living, entertainment, cooking, and
food preparation.
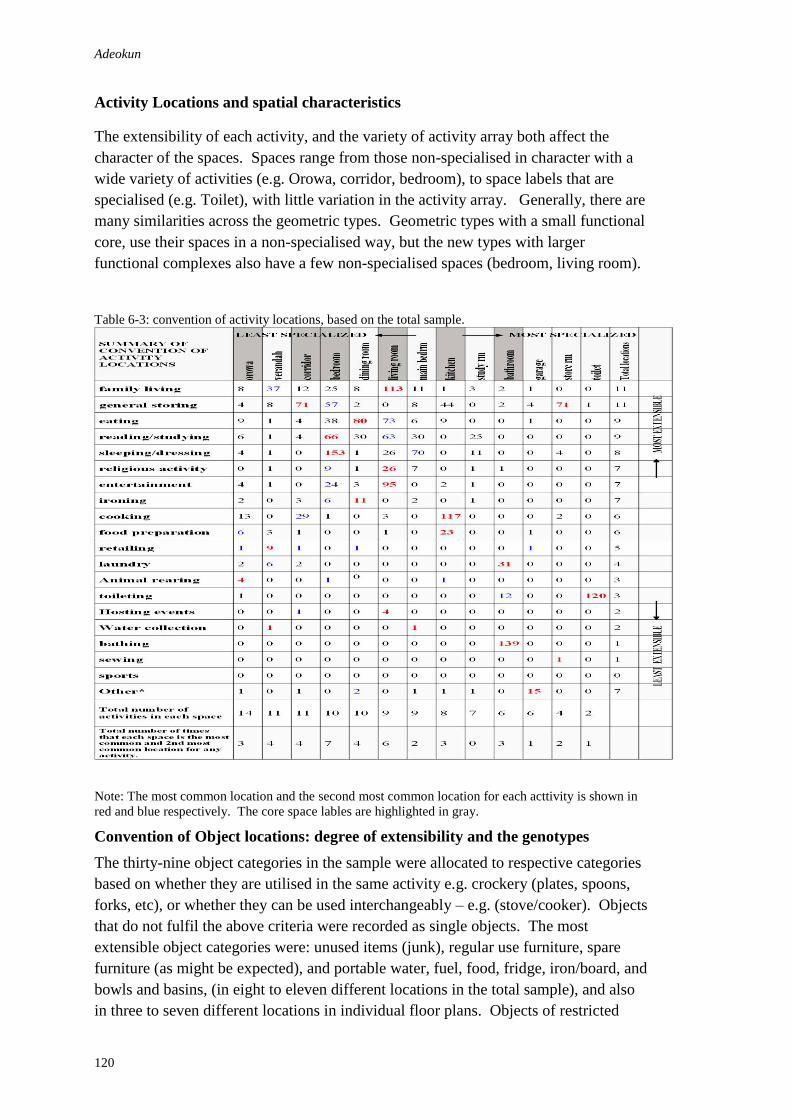
Adeokun
120
Activity Locations and spatial characteristics
The extensibility of each activity, and the variety of activity array both affect the
character of the spaces. Spaces range from those non-specialised in character with a
wide variety of activities (e.g. Orowa, corridor, bedroom), to space labels that are
specialised (e.g. Toilet), with little variation in the activity array. Generally, there are
many similarities across the geometric types. Geometric types with a small functional
core, use their spaces in a non-specialised way, but the new types with larger
functional complexes also have a few non-specialised spaces (bedroom, living room).
Table 6-3: convention of activity locations, based on the total sample.
Note: The most common location and the second most common location for each acttivity is shown in
red and blue respectively. The core space lables are highlighted in gray.
Convention of Object locations: degree of extensibility and the genotypes
The thirty-nine object categories in the sample were allocated to respective categories
based on whether they are utilised in the same activity e.g. crockery (plates, spoons,
forks, etc), or whether they can be used interchangeably – e.g. (stove/cooker). Objects
that do not fulfil the above criteria were recorded as single objects. The most
extensible object categories were: unused items (junk), regular use furniture, spare
furniture (as might be expected), and portable water, fuel, food, fridge, iron/board, and
bowls and basins, (in eight to eleven different locations in the total sample), and also
in three to seven different locations in individual floor plans. Objects of restricted
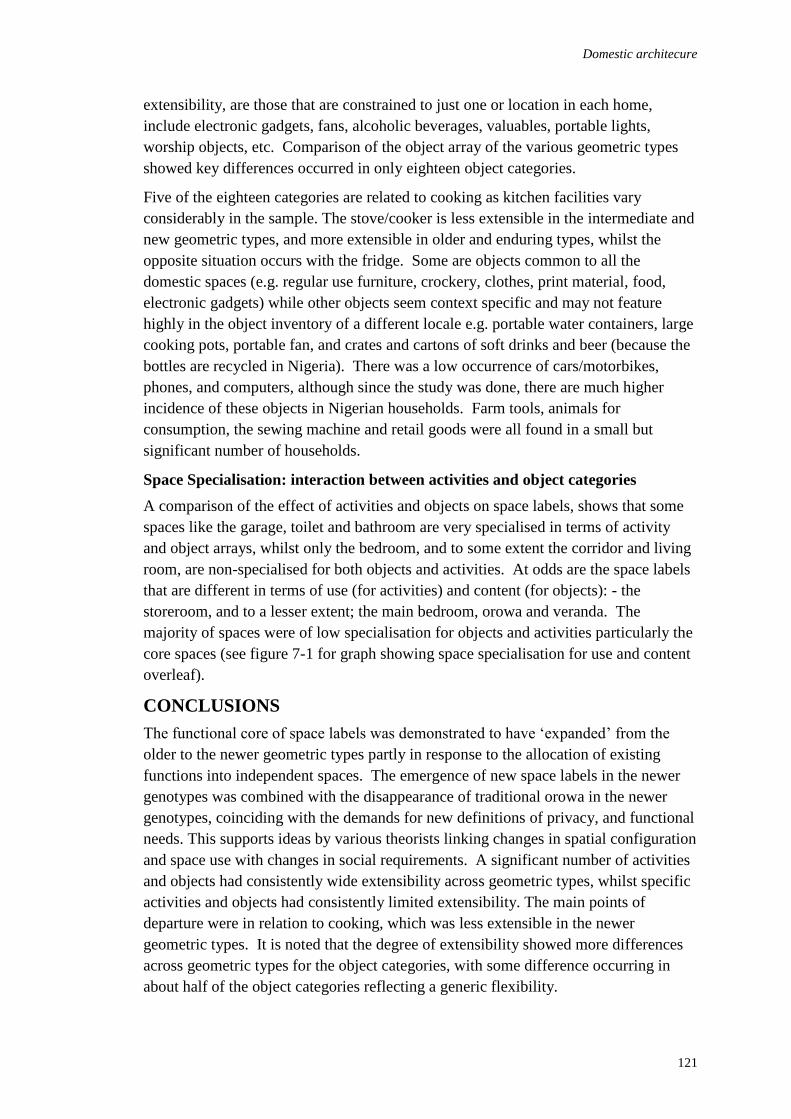
Domestic architecure
121
extensibility, are those that are constrained to just one or location in each home,
include electronic gadgets, fans, alcoholic beverages, valuables, portable lights,
worship objects, etc. Comparison of the object array of the various geometric types
showed key differences occurred in only eighteen object categories.
Five of the eighteen categories are related to cooking as kitchen facilities vary
considerably in the sample. The stove/cooker is less extensible in the intermediate and
new geometric types, and more extensible in older and enduring types, whilst the
opposite situation occurs with the fridge. Some are objects common to all the
domestic spaces (e.g. regular use furniture, crockery, clothes, print material, food,
electronic gadgets) while other objects seem context specific and may not feature
highly in the object inventory of a different locale e.g. portable water containers, large
cooking pots, portable fan, and crates and cartons of soft drinks and beer (because the
bottles are recycled in Nigeria). There was a low occurrence of cars/motorbikes,
phones, and computers, although since the study was done, there are much higher
incidence of these objects in Nigerian households. Farm tools, animals for
consumption, the sewing machine and retail goods were all found in a small but
significant number of households.
Space Specialisation: interaction between activities and object categories
A comparison of the effect of activities and objects on space labels, shows that some
spaces like the garage, toilet and bathroom are very specialised in terms of activity
and object arrays, whilst only the bedroom, and to some extent the corridor and living
room, are non-specialised for both objects and activities. At odds are the space labels
that are different in terms of use (for activities) and content (for objects): - the
storeroom, and to a lesser extent; the main bedroom, orowa and veranda. The
majority of spaces were of low specialisation for objects and activities particularly the
core spaces (see figure 7-1 for graph showing space specialisation for use and content
overleaf).
CONCLUSIONS
The functional core of space labels was demonstrated to have ‘expanded’ from the
older to the newer geometric types partly in response to the allocation of existing
functions into independent spaces. The emergence of new space labels in the newer
genotypes was combined with the disappearance of traditional orowa in the newer
genotypes, coinciding with the demands for new definitions of privacy, and functional
needs. This supports ideas by various theorists linking changes in spatial configuration
and space use with changes in social requirements. A significant number of activities
and objects had consistently wide extensibility across geometric types, whilst specific
activities and objects had consistently limited extensibility. The main points of
departure were in relation to cooking, which was less extensible in the newer
geometric types. It is noted that the degree of extensibility showed more differences
across geometric types for the object categories, with some difference occurring in
about half of the object categories reflecting a generic flexibility.
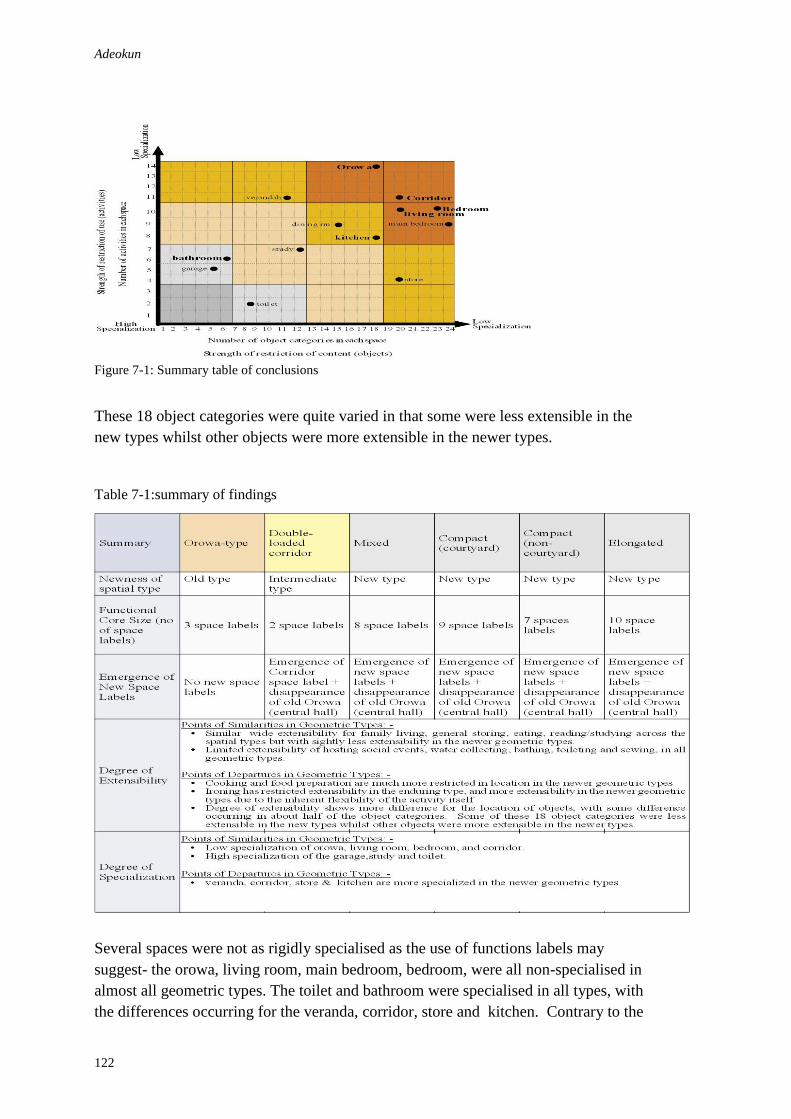
Adeokun
122
Figure 7-1: Summary table of conclusions
These 18 object categories were quite varied in that some were less extensible in the
new types whilst other objects were more extensible in the newer types.
Table 7-1:summary of findings
Several spaces were not as rigidly specialised as the use of functions labels may
suggest- the orowa, living room, main bedroom, bedroom, were all non-specialised in
almost all geometric types. The toilet and bathroom were specialised in all types, with
the differences occurring for the veranda, corridor, store and kitchen. Contrary to the
Domestic architecure
123
notion of multi-functionality versus mono-functionality, what was in operation is a
high degree of non-specialisation (multi-functionality) though less pronounced in the
newer geometric types. While spaces that are quite specialised in terms of numbers of
activities in the spaces are distinct, fewer spaces seem to be specialised in terms of
objects, suggesting that higher value is placed on the location of an activity, with the
location of objects being more amenable to individual choice. Overall, there were
more points of continuity between the old and the new geometric types than expected,
but the points of departure point partly to consequences of inadequate facilities, as
well as real differences in lifestyles.
ACKNOWLEDGEMENTS:
I wish to thank Prof J. Hanson (Ph.d Supervisor) at UCL Bartlett school of Graduate
Studies, and the Ile-Ife respondents who kindly gave up their time, and allowed their
homes and lives to be a part of this study. I also wish to thank the HOD of
Department of Architecture, Covenant University for the support to participate in the
2012 Waber conference.
REFERENCES:
Adeokun C. O. (2007) Continuity and Change in Yoruba Domestic Architecture; (Lifestyle
patterns, and degree of consonance with spatial types) Unpublished thesis, Bartlett
Graduate school of Architecture. London, University College London.
Amorim, L. (1999). The Sectors' Paradigm: a study of the spatial and functional nature of
modernist housing in Northeast Brazil. Unpublished thesis, Bartlett Graduate school
of Architecture. London, University College London.
Bourdieu, P. (1979, 1984). Distinction: Asocial critique of the judgement of taste. Paris,
London, Routledge and Kegan Paul Ltd.
Colakoglu, B. (2005). "Design by grammar: an interpretation and generation of vernacular
hayat houses in contemporary context." Environment and Planning B: Planning and
Design 32: 141-149.
Csikzentmihalyi, M. and E. Rochberg-Halton (1981). The meaning of things; Domestic
symbols and the self. Cambridge, Cambridge University Press.
Giddens, A. (1984). The Constitution of Society.
Heitor, t., J. P. Duarte, et al. (2003). Combining grammars and Space syntax: Formulating,
evaluating and generating designs. Fourth International Space Syntax Symposium,
London.
Hillier, B. and J. Hanson (1984). The Social Logic of Space. Cambridge, Cambridge
University Press.
Kent, S. (1990). Activity areas and architecture: an interdisciplinary view of the relationship
between use of space and domestic built environments. Domestic Architecture and the
use of space: An interdisciplinary cross-cultural study. S. Kent: 1-8.
Korosec-Serfaty, P. (1985). Experience and Use of the Dwelling. Home Environments. I.
Altman and C. M. Werner. New York, Plenum Press: 65-83.
Lefebvre, H. (1974,1991). The Production of Space, Blackwell Publishing.
Miller, D. (2001). Behind closed doors. Home Possessions: Material Culture behind closed
doors. D. Miller, Berg: 1-19.

Adeokun
124
Rapoport, A. (1990). Systems of activities and systems of settings. Domestic Architecture and
the use of space: An interdisciplinary cross-cultural study. S. Kent: 9-20.
Steadman, P., Peter A. Rickaby and Frank E. Brown (2000). "A classification of built forms."
Environment and Planning B: Planning and Design 27: 73-91.
Tversky, B. (2003). "Structures of mental spaces: how people think about space."
Environment and Behaviour 35(1): 62-80.
Van Leusen, M. (1996). "A typology of dwelling arrangements." Environment and Planning
B: Planning and Design 23: 143-164.
Wieder, D. L. (1970). On Meaning by Rule. Understanding Everyday Life. J. D. Douglas.
London, Routledge and Kegan Paul Ltd: 107-135.
D. Wood, and R. J. Beck (1994). Home Rules: Culture, Environment and the American
Family. Baltimore: The Johns Hopkins University Press Ltd.
Sanni, A.O. and Durodola, O.D. (2012) Assessment of contractors’ cost control practices in
Metropolitan Lagos In: Laryea, S., Agyepong, S.A., Leiringer, R. and Hughes, W. (Eds) Procs 4th
West Africa Built Environment Research (WABER) Conference, 24-26 July 2012, Abuja, Nigeria, 125-
132.
125
ASSESSMENT OF CONTRACTORS’ COST CONTROL
PRACTICES IN METROPOLITAN LAGOS
Afeez Olalekan Sanni1 and Olufemi Daniel Durodola
2
1Department of Quantity Surveying, Bells University of Technology, Ota, Nigeria
2Department of Estate Management, School of Environmental Sciences, College of Science and
Technology, Covenant University, Ota, Nigeria
A survey was conducted on probabilistically determined seventy medium sized
indigenous contracting organizations in metropolitan Lagos with specific objective of
assessing the degree of effectiveness of their cost control practices. Data were
collected from the contracting organizations’ quantity surveyors. Systematic sampling
method was used while sample size of seventy was determined using Nwanna (1981)
proposition that if a population is in few hundreds, forty percent or more could serve
as a good sample. Data analysis was executed using descriptive statistical and relative
importance index. The result showed that the majority of the contractors applied the
use of cost control mechanics in their management of construction works but the
benefits were not being felt on their overall performance due to the poor
implementation of those methods. It is recommended that the contractors should
annex the opportunities of the information technology in their cost control practices.
Keywords: budgeting, cost control, post contract stage, cost monitoring
INTRODUCTION
The construction industry is seen as a focal point in the economy of any nation since it
is an important contributor to the process of development (Ogunsemi and Aje, 2005).
Construction has a strong linkage with many economic activities and whatever
happens to the industry will directly or indirectly influence other industries and
ultimately the wealth of the country. Ogunlana, Siddiqi, Yisa and Olomolaiye (2002)
opined that the rapid technological developments of the last hundred years have
resulted in a growing number of construction projects of enormously complex nature
which also requires proactive management. In contracting, cost control is an element
of financial control in that it supplements managerial control process in the
organization.
It is observed that most indigenous contractors in Nigeria do not survive after their
promoters due to the fact good management personnels are being put in place while
some promoters use their organization as a bridge for acquiring wealth and move on to
engage in other activities outside the industry. Cost control should be seen as an
important management tool that is crucial to the survival of a construction company.
The need to control cost is important in order to eliminate the unnecessary wastages of
resources. It is vital for the contractors to operate an effective cost control procedure
during the post contract stage of project to keep the cost of the scheme within the
Sanni and Durodola
126
building budget. In order to address those problems, this research is aimed at assessing
the degree of effectiveness of the contractors’ cost control practices.
There is also potential bonus because any savings engendered by better building can
be spent on building more facilities. The construction industry is one of the largest
sources of employment in a country, and then relatively small increases in efficiency
can create many jobs, including those in semi-skilled sector, thus helping with the
program of poverty alleviation (Spedding, 2005).
LITERATURE REVIEW
According to Ashworth (1999) contractors are not sometimes concerned only with
profit or turnover but they consider the assessment of the worth of the company. For
the contractor to be able to sustain its construction operations, it needs to improve
upon on the system of controlling its construction cost. Tah, Thorpe and McCaffer
(1994), stated that the primary objectives of contracting organizations include
survival, growth and profitability within an increasing competitive industrial
environment. These objectives can only be achieved by ensuring that an effective cost
management system is put in place within the structure of the organization.
Tianji (cited in Hwee 2002) concluded that the profit margin in this fiercely
competitive industry is usually very tight and is exposed to many uncertainties during
the construction phase. Pilcher (1992) stated that it is necessary to project the costs
into the future and to estimate or re-estimate the cost of the work to be completed. In
some contracting organization where the required funds are not adequately provided
to execute the job on site, it would greatly affect the progress of work and the
company may not be able to deliver as expected. This could result to low performance
for the organization. According to Ashworth et al (2002), the scope of the surveyor’s
involvement during the post-contract stage of a project will generally require the
preparation of interim valuation, the preparation and agreement of the final account
and the management of project costs throughout. They opined that successful
execution and completion of the post-contract procedures and the final account very
much depend on cooperation between the client’s quantity surveyor and that of the
contractor quantity surveyor. Charoenngam and Sriprasert (2001) wrote that
contractors in Thailand perceive cost control as a prerequisite towards profit
maximization. According to Ashworth et al (2002), the contractor, having priced the
project successfully enough to win the contract through tendering, must now ensure
that the work can be completed for the estimated cost. Kwakye (1997) stated that
budget serves as a yardstick against which actual production of a project can be
measured. Site costing provides management with feedback of the efficiency of past
decisions, thus enabling them to introduce appropriate corrective measures (Kwakye,
1997). Hore et al (1997) stated that this practice is concerned with collecting cost data
and breaking it down so as to compare the data with the budget costs. According to
them, the budget costs are those values included in the bill of quantities or other priced
document after deduction of profit.
According to Hwee (2002), when a construction project is in progress, its cash flow is
the most important factor that can affect the profitability. So it would be beneficial to
Cost control practices
127
the contractor if prior knowledge on trend of cash flow on a project is available. He
stated that contractor’s cash flow forecasting is essential at the tendering and
construction stages for all contractors. He said that it provides contractors with
information regarding the amount of capital required and the amount of interest that
needs to be paid to support an overdraft and the evaluation of different tendering
strategies. He concluded that it serves as a cost control tool during the construction
phase.
Ashworth et al (2002) wrote that contractors are not mainly concerned with profit or
turnover but also consider other factors in assessing the worth of a company or the
viability of a new project. They stated that contractors have become aware of the need
to maintain a flow of cash for the company, since cash is important for the day-to-day
existence. Some contractors according to them have suffered liquidation or
bankruptcy not because their work was unprofitable but because of cash flow
problems in the short term. They concluded that a correct balance between the
objectives of cash flow, profit, return and turnover is required. Perera and Imriyas
(2004) stated that there was no past research that developed an effective integrated
system for contractors, which encompassed estimating, scheduling, cost control,
resource costing and financial control using general software. Such an effort could
result in a cost effective, transient and easy-to-use system.
In the Thailand contractors’ perspective an accurate and realistic estimate is vital only for
wining a contract with the chance of achieving maximum profit but also serving as an
effective plan for cost control (Charoenngan and Sriprasert, 2001). Monitoring seems to be
most difficult function to be accomplished. Primary cost data at the work face must be
monitored by field personnel who are actually facing the day-to-day dynamic construction
operations. Work progress or earned value of each work item must be monitored so as to
enable the identification of cost status at a given progress. As the monitoring process gets
involved with a huge amount of data from many different sources or parties, well-established
standard procedures can help smoothen the progress as well as guarantee completeness of data
(Charoenngam and Sriprasert, 2001).
The causes of variance such as mistakes from estimation, change orders, rework, price
fluctuation and excessive waste should be specified so as to facilitate decision making
(Charoenngam and Sripert, 2001). The effective analysis of the construction cost by
the contractors’ quantity surveyors could bring about the effectiveness in practice of
cost control in the industry. Ashwarth and Hogg (2002) opined that the initial estimate
of variations to the contract is likely to be of a budgetary nature and it is important
that such estimates be progressively updated as more detailed information becomes
available in the form of measurements quotations or day work records. Charoenngam
and Sriprasert (2001) recommended that as decision support systems, they must
provide all levels of management with updated information about various aspects of
project performance. Besides, exception reports can enhance the management’s
productivity by focusing on the most critical subset of performance information.
According to Moselhi et al (2004), the earned-value method is widely used for
reporting project status with consideration of two performance indicators (time and
Sanni and Durodola
128
cost) in an integrated manner. The competency of the critical staff in the contractors
organization need be high in construction cost control systems and activities. The
more efficient they are, the better the company. Pries et al (2004) stated that the
business today is about fulfilling client satisfaction through efficient production. So if
the contractor’s staff are very efficient, it will lead to the efficient production in the
organization.
RESEARCH METHOD
The contractors’ quantity surveyors working in different construction companies in Lagos
were chosen for the research. About 750 medium sized contractors are during business in
Lagos, Nigeria with the information obtained from Lagos State Ministries of Works and
Housing. Systematic sampling method was used while sample size of seventy was determined
using Nwanna (1981) proposition that if a population is in few hundreds, 40% or more could
serve as a good sample. Data analysis was executed using descriptive statistical and relative
importance index.
A total of seventy questionnaires were distributed to the respondents out of which only forty
three were completed and returned. The return rate of sixty one percent was considered
adequate and representative enough for the population under study. So the total of forty three
questionnaires were used for the analysis of the contractors cost control system and practices.
The structured questionnaire with closed-ended method was adopted as well as personal
interview of the key staff of the organizations. The structured questionnaire was designed in
such a way that the respondents are restricted to some response options. The rating used
assigns numerical scale of 5 for highest and 1 for lowest. For this type of data, the mean and
standard deviation were calculated using SPSS for determining the overall ranking for the
factors. Also, the weighted average for each factor was calculated and then it was divided by
the upper scale of the measurement resulting in what is referred to as an importance index.
THE RESULTS AND DISCUSSION
The results were analyzed based on the opinions of the quantity surveyors working with
contractors on the usage of cost control methods and their assessment of those methods were
presented in this section. The degrees of responses were calculated in terms of importance
index and ranked from the highest to the lowest. The majority of the respondents specialized
in Building construction. Seventy nine percent of them specialized in building works. Those
contractors’ organizations that generated an annual average turnover of above N500 million
represented thirty percent. Those with the turnover of between N50million and N200million
represented an approximate of forty percent. It shows that are very busy in the construction
works.
The contractors cost control experts that participated in the study were asked to indicate how
frequent they make use of the cost control methods that were presented to them in the
questionnaire. They indicated that some cost control methods are being used frequently than
others. The establishments of working budget was ranked number one with the highest
importance index of 89.00. The monitoring of labour cost was ranked number two with
importance index of 87.50. The material cost was ranked as number three with importance
index of 86.50. While analyzing report, keep historical data and generating report are rated
lowest as being frequently used methods as shown in Table 1.

Cost control practices
129
In considering the factors that are responsible for effective cost control practices in Nigeria
construction industry, the contractors were asked to rate these factors as they affect their
methods. They rated availability of experience staff as the number one with importance index
of 95.50. The experience in such a project was ranked second with importance index of 94.40.
The completeness of the documents as the method was then ranked third with important index
of 84.50 as being responsible for effective cost control systems. General overhead, risk
involved in the investment and job related contingency were regarded as being least
responsible for the effective cost control as shown in Table 2.
It could be noted that the majority of the respondents were not making use of the most
of the methods. The researchers also on their part had carried out little studies into the
practices of the contractors in controlling of construction cost. This could be noticed
in the explanation of Cornick and Osbon (1994) that little had been written about the
contractor’s quantity surveyor. The quantity surveyors are major professionals that
involve in the cost control systems. Perera and Imriyas (2004) also supported the
opinion that no past research had developed effective integrated cost control system
for contractors which encompassed estimating, scheduling, cost control, resource
costing and financial control using general software.
The findings showed that the most frequently used and being most effective method is
the establishment of working budget. A much earlier study by Halpin (1985, sited in
Cheroenngam and Sriprasert, 2001) support the result by referring to the budget as a
device through which planning and control can be integrated. Harris and McCaffer
(2005) also explained that budgetary control involves setting targets, monitoring
progress and taking corrective action when necessary. The method looks like being
encompassing all other methods. Hore et al (1997) concluded that budget is a planned
result that a company aims to attain. According to the findings, the engagement of
experienced staff was considered as a factor that most responsible for effective cost
control practices while engagement of inexperienced staff was regarded as the highest
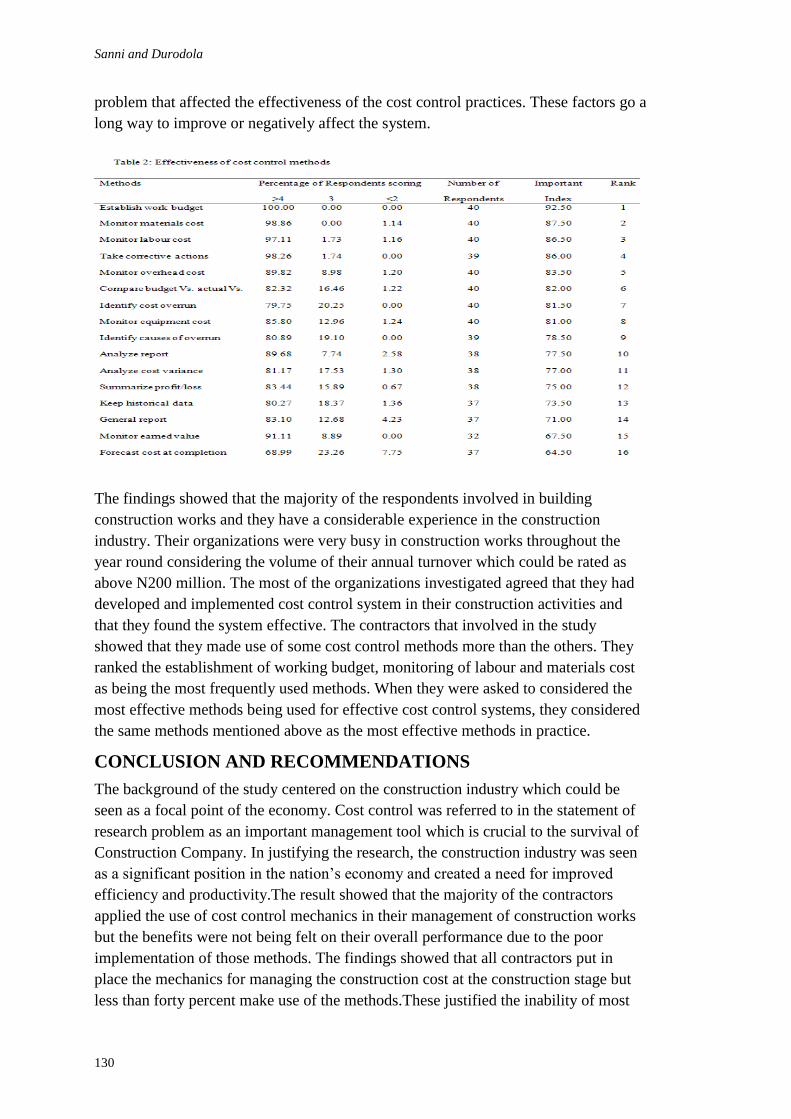
Sanni and Durodola
130
problem that affected the effectiveness of the cost control practices. These factors go a
long way to improve or negatively affect the system.
The findings showed that the majority of the respondents involved in building
construction works and they have a considerable experience in the construction
industry. Their organizations were very busy in construction works throughout the
year round considering the volume of their annual turnover which could be rated as
above N200 million. The most of the organizations investigated agreed that they had
developed and implemented cost control system in their construction activities and
that they found the system effective. The contractors that involved in the study
showed that they made use of some cost control methods more than the others. They
ranked the establishment of working budget, monitoring of labour and materials cost
as being the most frequently used methods. When they were asked to considered the
most effective methods being used for effective cost control systems, they considered
the same methods mentioned above as the most effective methods in practice.
CONCLUSION AND RECOMMENDATIONS
The background of the study centered on the construction industry which could be
seen as a focal point of the economy. Cost control was referred to in the statement of
research problem as an important management tool which is crucial to the survival of
Construction Company. In justifying the research, the construction industry was seen
as a significant position in the nation’s economy and created a need for improved
efficiency and productivity.The result showed that the majority of the contractors
applied the use of cost control mechanics in their management of construction works
but the benefits were not being felt on their overall performance due to the poor
implementation of those methods. The findings showed that all contractors put in
place the mechanics for managing the construction cost at the construction stage but
less than forty percent make use of the methods.These justified the inability of most
Cost control practices
131
contracting organizations in Nigeria growing to the level of competing with
international organizations and most of them do not grow beyond their owners.
Therefore, cost management is seen as an important system for an organization to
grow. It is recommended that the contractors should annex the opportunities of the
information technology in their cost control practices.
REFERENCES
Adebayo, M.O., (2006) Quantity Surveying in a Restructuring Economy: Challenges and
Prospects. Lagos QS Newsletter, March edition
Ashworth, A. (1999) Cost studies of buildings. Third Edition. Longman Group Ltd, England.
Ashworth, A. (1994) Cost studies of buildings. Second Edition. Longman Group Ltd,
England.
Ashworth,A.(2002) Contractual Procedures in the construction Industry. Pearson Education
Ltd. England.
Ashworth, A. and Hogg, K. (2002) Practice and Procedure for the Quantity Surveyors.
Blackwell Science Ltd. Oxford.
Asika N. (1991). Research Methodology in the Behavioural Sciences. Longman Nigeria
Plc.Lagos
Bent, A.J. (2005) Are Today’s Project Cost Professionals a Bunch of Bean Counters? The
Quantity Surveyor,50(1),26-30
Charoenngam, C. and Sriprasert, E. (2001) Assessment of cost control system: a case study of
Thai construction organizations. Engineering, Construction and Architectural
Management. 8 (5/6), 368-380.
Cornick, T. and Osbon, K. (1994) A Study of the Contractor’s Quantity Surveying Practice
during the Construction Process. Construction Management and Economics, 12, 107-
111
Dainty, A. R. J., Cheng, M., and Moore, D.R., (2004). A competency-based performance
model for construction project managers. Construction Management and Economics.
22, 877-886.
Durbrin, A.J. (2000) Essentials of Management. South-Western College Publishing. London.
Flanagan, R. and Tate, B. (1997) Cost control in building design. Blackwell Science Ltd.
Oxford.
Haris, F. and McCaffer, R. (2005) Modern Construction Management. Blackwell Science Ltd.
Oxford.
Hore, A.V., Kehoe, J.G., McMillan, R. and Penton, M.R. (1997) Construction Management
Finance and Measurement. Macmillan Press Ltd.London
Hwee, N.G. and Tiong, L.K. (2002) Model on cash flow forecasting and risk analysis for
contracting firms. International Journal of Project Management. 20, 351-363.
Kairu, A.M. (2003) Quantity surveying techniques-New Directions, the challenges and the
response. The Quantity Surveyor. 43, (2), 2-5
Kwakwye, A. A. (1997) Construction Project Administration Practice. Addisson Wesley
Longman Ltd. England.
Moselhi, O., Li, J., and Alkass, S. (2004). Web-based integrated project control system.
Construction Management and Economics, 22, 35-46
Sanni and Durodola
132
Ogunlana, S. Siddiqui, Z., Yisa, S., and Olomolaiye, P., (2002) Factors and Procedures used
in Matching Project Managers to Construction Project in Bangkok. International
Journal of Project Management, 20, 150-162
Ogunsemi, D.R. and Aje, I.O. (2005) A Model for Contractors’ Selection in Nigeria, The
Quantity Surveyor, 50(1), 2-7
Perera, A.A.D.A.J and Imriyas, k. (2004), An Integrated construction project cost information
system using MS Access and MS Project, Construction Management and Economics.
22,203-211
Pilcher, R. (1992) Principles of Construction Management. McGraw. Hill Book Company
Europe. England.
Pries, F. Doree, A., Van der Veen, B., and Vrijhoef, R. (2004). The role of leaders’ paradigm
in construction industry change. Construction Management and Economics 22, 7-10.
Seeley, I.H. (1996) Building Economics. Macmillan Press Ltd, London.
Spedding, A., (2005) Management Information and Private Sector Financing in Social
Projects – the Role of the Quantity Surveyor. The Quantity Surveyor, 53(4),12-15.
Tah, J.H.M, Thorpe, A. and McCaffer, R. (1994) A survey of indirect cost estimating in
practice. Construction management and Economics. 12, 31-36.
Ward, P.A, (1979) Organization and Procedures in the Construction Industry. Macdonold
and Evans Ltd. Plymouth.
Ahiakwo, O., Suresh, S., Oloke, D. and Khatib, J. (2012) Client perspective for the implementation of
lean construction in Nigerian construction industry In: Laryea, S., Agyepong, S.A., Leiringer, R. and
Hughes, W. (Eds) Procs 4th West Africa Built Environment Research (WABER) Conference, 24-26 July
2012, Abuja, Nigeria, 133-146.
133
CLIENT PERSPECTIVE FOR THE IMPLEMENTATION
OF LEAN CONSTRUCTION IN NIGERIAN
CONSTRUCTION INDUSTRY
Ograbe Ahiakwo1, Subashini Suresh
2, David Oloke
3 and Jamal Khatib
4
1,2,3,4 Built Environment, School of Technology; University of Wolverhampton, City Campus, Wulfruna
Street, Wolverhampton WV1 1LY, UK
The concept of lean construction offers very valuable techniques that can be used to
successfully manage construction in terms of workflow processes and waste
minimization and it is already being practised in some developed and developing
countries like the UK, US, Germany, Australia and Singapore etc. Lean construction
was developed from lean production system where it accounted for huge successes in
the manufacturing industry. This paper however, examines the level of client
awareness and their perspective of this relatively new paradigm ‘Lean’. The paper
also discusses the potential and measureable benefits of ‘Lean’ in the Nigerian
construction industry – an industry which is currently characterised by delays in
project completion, cost overruns and poor quality work. The findings from this
review paper reveal the level to which clients within the industry perceive ‘lean’ or
are even aware of the lean principles. However, the main idea behind the lean concept
is to maximise the client value whilst minimizing waste within the processes. This
review paper forms part of an on-going PhD research and it is on this basis that
further research on this topic is being proposed.
Keywords: client, industry, lean construction, waste minimization, work flow
INTRODUCTION
The concept of lean thinking first sprang up in the Toyota production system and was
thus introduced in production; The Machine that changed the world (Womack et al,
1990). Lean as applied in construction was initiated in 1992 by Lauri Koskela to
improve the quality and efficiency of the construction industry (Koskela, 1992). This
improvement was in the area of eliminating waste and creating value for the client
(Koskela et al, 2002; Pasquire and Conally, 2002; Abdelhamidet al, 2008). However,
the lean principle has been criticised and linked to a number of problems; ranging
from unexpected shortage of materials, human exploitation of workers and hazardous
events (increased pollution to the environment) occurring and even the 1996 Kobe
earth quake in Japan was linked to the effects of lean production (Green 2002; Lewis
2000; Pheng and Tan 1998; Williams et al 1995; Cusumano 1994; Berggren 1993).
Regardless, Womack and Jones (1996) observed that lean construction involves
specifying value for the client and lining up value creating steps in the best sequence
by applying five lean principles: value, value stream, flow, pull and pursuit of
perfection. Mossman (2008) further stated that value is assessed based on the concerns
Ahiakwo et al.
134
of the client. However, clients are only likely to be satisfied when their concerns in
terms of objectives are met (Barrett and Stanley, 1999; Watson and Asher, 1994;
Othman 2007). Thus, clients are usually the driving force of the industry (Latham,
1994; Egan, 1998; Othman, 2004). This implies that for any reasonable change to
occur within the industry, it is pertinent to examine how much clients are aware of
available improvement tools and how willing they are aware to apply them.
On the other hand, the Nigerian construction industry has been performing far below
standards in the way capital infrastructural projects are handled (Moavenzadeh, and
Dantata, 2007; Dantata, 2008; Olusegun and Michael, 2011) and this has a direct
influence on the economy of the country as most projects are abandoned, poorly
completed or not completed within budget.
Thus this current research being an exploratory research involves a review of available
literature and employs an inductive approach from existing works in this field. The
study examines how lean thinking has been applied in Nigerian construction industry
and the level to which clients are aware of this new paradigm. The study further
describes the current state of the industry and finally discusses the potential and
measurable benefits of applying lean within the industry.
This paper is organised as follows: the first section provides an introduction of the
work; the second section briefly describes client perspectives of lean while the third
section presents the concept of lean construction and its benefits. It also discusses the
implementation of lean within the Industry.
NIGERIAN CONSTRUCTION CLIENTS
The Nigerian construction industry has seen a declining investment over the last three
decades (Oluwakiyesi, 2011). This trend is expected to continue as the industry is yet
to realise its potential in the mist of gigantic infrastructure the country possesses. In
Nigeria, the construction industry is characterised by small and medium-sized local
contractors who in most cases engage in residential projects for private clients
(Dantata, 2008).
A formal definition of a client is given by the Business Dictionary (2011) as the
customer of any professional service provider or the principal of any agent or
contractor. The client is the one who pays for the goods or services and makes use of
the goods as the case may be (Vennstrom, 2008). In a nutshell, Vennstrom (2008)
identified the construction client as a customer. For the purposes of this research
however, a client is identified as the party that assigns others to carry out demolition
and or construction. They are grouped into two major categories namely; public sector
clients and private sector clients (Othman, 2011; Kelly and Male, 1993).
Public sector clients are made up of Corporations, National public, State public and
Local public parastatal within Nigeria that engage in construction projects (Othman,
2011; Dantata, 2008). On the other hand, the private sector clients are made up of
individual domestic, individual commercial, cooperate commercial, corporate
industrial and corporate developer who engage in construction projects in Nigeria
(Othman, 2011). This group constitute the vast majority engaging in construction
projects within Nigeria (Suresh et al, 2012).
Lean construction
135
Irrespective of the type of client; whether public or private and in spite of the kind of
organisation; big or small, regular or one-off, clients generally have their unique
requirements and value systems (Dantata, 2008; Vennstrom, 2008). This is usually
driven by the client’s organisational configuration, business and or social needs
(Othman, 2011; Kelly and Male, 1993).
In his work Olatunji (2008) interviewed a total of 10 clients made up of five private
and five public companies within Nigeria. Some of the questions centred on the level
of awareness of lean principles and techniques and the rate of implementation of lean
within construction in Nigeria. The study revealed that the level of awareness of lean
principles and tools was very low. Only two of the 10 respondents reported that they
had heard about ‘lean thinking’ and were aware that it could improve efficiency and
productivity within a process.
It was also revealed from the research that although lean is not currently implemented
in the Nigerian construction process at all, some clients are interested in adopting lean
techniques within their projects (Olatunji, 2008).
Suresh et al (2012) also identified from interviewing four private clients from a
sample size of 32 made up of four clients, four architects, four contractors and 20 sub-
contractors. These clients had an average of 10 years working experience in
construction activities within Nigeria and were involved in both residential and
commercial building projects. It was revealed that they did not apply lean principles,
tools or techniques during either the design or construction phases of their project and
some of them were not even aware of the lean principles. It was also revealed from the
research that clients proceeded to the construction stage without structural drawings,
or full detailed engineering drawings and bills of quantities. This posed a risk of
misinterpreting the designs; and design decisions were left in the hands of tradesmen.
The research also revealed that clients did not adopt building regulations and
standards while carrying out their projects.
There are major barriers to the successful implementation of lean as identified by
Suresh et al (2012) they include:
1. Shortage of technical, professional and skilled workers.
2. Pitiable wages and salaries
3. Poor organisational structures and management
4. Poor government control and enforcement of regulations and
5. Poor documentation
The above stated barriers are as a result of the industry being characterised with
uncompleted projects, poor quality work, delays in project completion and cost over
runs (Oyewobi et al, 2011; Idrus and Sodangi, 2010; Odeh and Battaineh, 2002;
Odusami et al, 2001; Okuwoga, 1998; Mansfield et al, 1994; Dlakwa and Culpin,
1990; Olomolaiye, 1987; Aniekwu and Okpala, 1988).
Ahiakwo et al.
136
In the same vein, Oyewobi et al, (2011) in their research observed that the Nigerian
construction industry is vulnerable to ethical problems and that corruption has its roots
in all the stages of construction right from planning to construction. It was also
perceived from the survey carried out by Oyewobi et al, (2011) that clients do not
adopt ‘lean thinking’ within their projects.
Oke and Ogunsemi (2011) stated that the Nigerian construction clients should adopt
value management on their projects since clients who are the most important member
of the construction team and also the driving force for improvement are not aware of
an innovative improvements tools such as ‘lean thinking’.
Likewise, Aibinu and Jagboro, (2002) observed that construction delays on project
delivery in Nigeria are usually client related. This was attributed to poor procurement
and storage facilities amongst others. It was perceived however, that clients were not
aware of improved inventory systems. Nevertheless, if lean tools such as Just-in-time
delivery systems can be adopted it would reduce inventory within the process.
It was also observed by Olusegun and Michael, (2011) that the causes of abandoned
project within Nigerian construction industry include: inadequate or poor project
planning, variation of project scope, faulty designs and wrong estimates. However, if
clients undertook adequate project planning and control of their projects using
improved planning process improvement tools that lean techniques offers, the issue of
abandoned project would be minimised. It was also identified that clients were
ignorant of lean tools like value streaming and last planner that can be used to
continuously improve a system and reduce waste.
Nevertheless, lean construction has been criticised on being immature and has been
promoted from a one sided positive view (Green 1999, 2000, 2002, Green and May
2005). Stuart D. Green a major critic of ‘lean’ has questioned its promotion is a
number of his publications by highlighting how the application of lean practices
within construction sector has paid little attention to its implications to human
resources allegations in its application within production (Green 2002, Green and May
2005).
Green’s debate has been seen to be self-consciously and overly critical (Howell and
Ballard 1999) and one of his criticisms (Green 1999) received a direct response from
Howell and Ballard (1999). It was argued there that the respect of people was inherent
in the value of lean construction. Lean construction was also perceived to build up the
skills of workers by encouraging active participation of the work force in
understanding how work is configured and organised to yield value.
Lean champions argue that the negative impacts of lean production do not necessarily
transfer to lean construction. It was argued that opposite to lean production, some of
the techniques used within construction offers a different solution an example is Just-
in-Time system of production which is supposed to eliminate by removing buffers.
Whereas, the last planner system which is attributed to lean construction uses buffers
strategically to reduce workflow variability thereby increasing predictability and plan

Lean construction
137
reliability (Ballard, 2000; Ballard et al 2002; Alarcon et al 2005).However the
construction industries of most developed countries currently adopting lean tools has
recorded different improvements and benefits.
APPLICATION OF LEAN CONSTRUCTION
The concept of lean construction has already been adopted by the construction
industry in some countries like Brazil, Finland, Germany, Japan, Korea, Singapore,
UK and USA (Abdullah et al, 2009; Johansen and Walter, 2007; Ballard and Howell,
2004). This has resulted in complementing traditional construction management
approaches and producing successful capital projects within these countries
(Mossman, 2009; Salem et al, 2005, Lehman and Reiser, 2004). Some of the benefits
that have been experienced by these countries are listed in Table 1.
Table 1: The Benefits of lean construction s/n Benefits of Lean Construction Countries References
1. Improving project delivery
methods
Japan, UK, USA Mossman, 2008; Gehbaner, 2008; Chin
and Russell, 2008; Howell, 1999
2. Supporting the development of
team work and transfer the
responsibility on the supply
chain.
Finland, Japan,
Korea, USA
Bjornfor, 2008; Kim and Jang 2005; Lee
et al, 1999; Howell, 1999
3. Managing uncertainties in
supply
Brazil, Finland,
Japan, UK
Anderson et al, 2008; Bjornfor, 2008;
Howell, 1999; Santos et al, 1999.
4. Continuous improvement within
projects
Germany,
Singapore, UK
Mossman, 2009; Ballard, 2008;
Roelandt, 2008; Johansen and Walter,
2007; Lehman and Reiser, 2004;
Womack et al, 1990.
5. Efficient use of resources Brazil Mossman, 2009; Lehman and Reiser,
2004; Forbes et al, 2002, Howell and
Ballard, 1999.
6. Delivery of products and
services that enable clients goals
to be met
Korea Mossman, 2009; Chin and Rusell, 2008;
Olatunji, 2008; Kim and Jang 2005;
Lehman and Reiser, 2004.
7. Delivery of products and
services on time and within
budget
Finland, Germany,
Singapore
Alsahaimi and Koskela, 2008; Bjornfor,
2008; Johansen and Walter, 2007; Lee et
al, 1999
8. Delivery of custom products
instantly without waste
Brazil, Finland,
UK
Olatunji, 2008; Bjornfor, 2008; Santos
and Powell, 1999; Lee et al, 1999
9. Reduction on direct cost and
time in transportation and
communication
Brazil, UK Santos and Powell, 1999; Lee et al, 1999
10. Well informed business case
design at all project level
USA Ballard, 2008, Lee et al, 1999
11. Improved quality control and
minimisation of risks
Korea Hofacter et al, 2008; Leong and Tilley,
2008; Kim and Jang 2005; Forbes et al,
2002
12. Minimisation of conflicts that
can dramatically change budget
and schedule
Germany,
Singapore, UK
Anderson et al, 2008; Johansen and
Walter, 2007
13. Improved reliability,
accountability, certainty and
honesty within the project
environment
Germany,
Singapore, UK
Anderson et al. 2008; Chin and Rusell,
2008; Johansen and Walter, 2007; Al-
Sudairi et al, 1999.
According to Al-Sudairi et al, (1999) Lean construction is dedicated to managing and
reducing variability and uncertainty for clients. Besides, ‘lean thinking’ is applied in
Ahiakwo et al.
138
all stages of construction; from design, supply up to construction. This is achieved
through lean designs, lean supply and lean assembly (Ballard, 2000). It is thus inferred
that if lean fits into all stages of any construction project; and all projects irrespective
of the type of construction activity involves a repetition of processes which forms the
life cycle of the project (Koskela et al 2002). Construction projects are thus prototypes
in their totality, implying that the life cycle of any construction project remains the
same or similar (Johansen and Walter, 2007). Lean can thus be applied within the
following stages of any project.
Project Definition Stage: Project definition consists of the client’s needs in terms of
what the client identifies as value, the design criteria and conceptual design of the
project. This generally involves collecting information and documentation to reflect
the client’s requirements (Ballard, 2000).
Lean Design Stage: Lean design generally consists of the conceptual design of the
project, the project and product design (Ballard, 2000). The conceptual designs are
made to reflect what the client values so it could be translated as the clients need. The
product design on the other hand determines the finished product while the process
design determines how to produce the product (Koskela et al, 2002; Ballard, 2000).
Value from lean design is generated by identifying client’s requirements and wastes
are reduced through process designs (Othman, 2004).
Lean Supply Stage: Lean supply generally consists of logistics, the product design
and the detailed engineering designs. It also consists of the purchasing of materials
components, fabrications and all the logistics involved for the delivery of the product
(Ballard, 2000). The main focus of lean supply is to reduce inventory in terms of the
movement of products, temporary storage and the provision of timely information for
the project participants (Johansen and Walter, 2007; Koskela et al, 2002).
Lean Assembly Stage: Lean assembly generally consists of the fabrication and
logistics of materials and components, the installation and commissioning of the
facility (Koskela et al, 2002). It consists of delivery of tools, materials, components
and labour and it encourages the incorporation of first run studies, multi-skilling,
continuous improvement, preassembly, Just-in-time deliveries and one touch handling
(Koskela et al, 2002; Ballard, 2000; Howell and Ballard, 1999).
Based on the above assessment of the lean process identified in Ballard (2000), a road
map is thus proposed; to show the relationship between the lean process and the
traditional system of procurement. This system of procurement as identified by
Ibiyemi et al, (2008) is predominantly being practised in Nigeria.
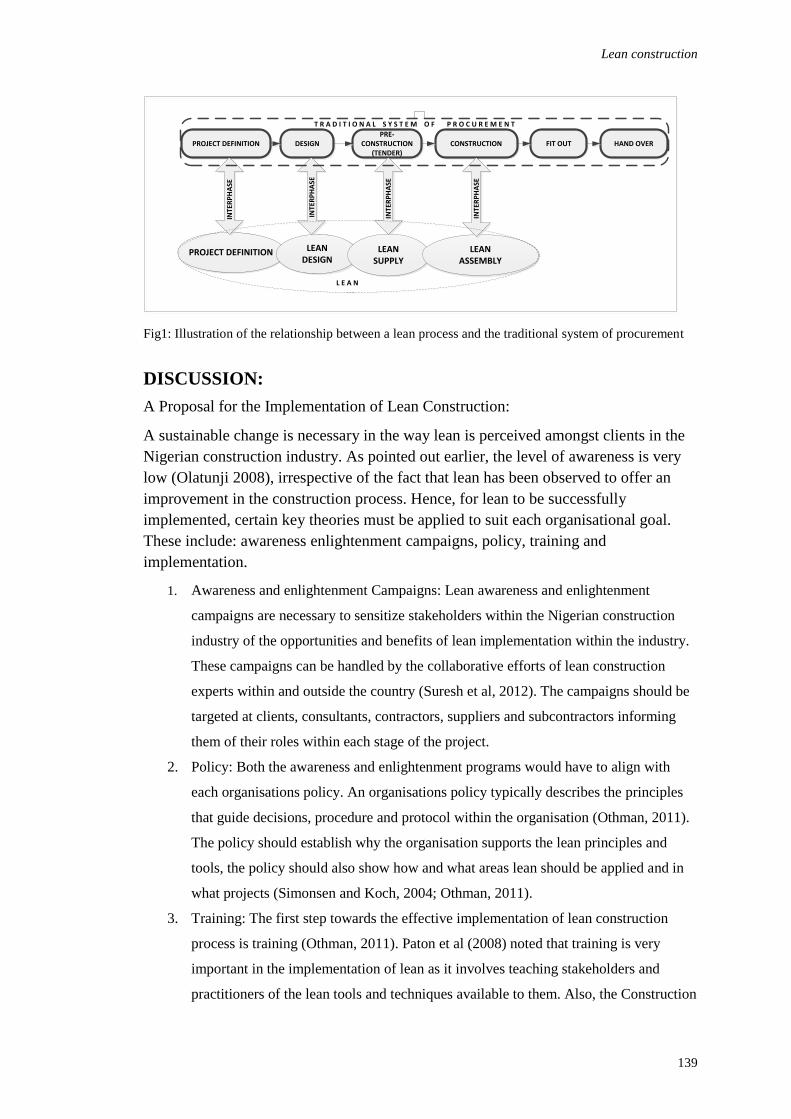
Lean construction
139
PROJECT DEFINITION
PROJECT DEFINITION DESIGNPRE-
CONSTRUCTION (TENDER)
CONSTRUCTION FIT OUT HAND OVER
LEANDESIGN
LEANSUPPLY
LEAN ASSEMBLY
L E A N
T R A D I T I O N A L S Y S T E M O F P R O C U R E M E N T
INTE
RP
HA
SE
INTE
RP
HA
SE
INTE
RP
HA
SE
INTE
RP
HA
SE
Fig1: Illustration of the relationship between a lean process and the traditional system of procurement
DISCUSSION:
A Proposal for the Implementation of Lean Construction:
A sustainable change is necessary in the way lean is perceived amongst clients in the
Nigerian construction industry. As pointed out earlier, the level of awareness is very
low (Olatunji 2008), irrespective of the fact that lean has been observed to offer an
improvement in the construction process. Hence, for lean to be successfully
implemented, certain key theories must be applied to suit each organisational goal.
These include: awareness enlightenment campaigns, policy, training and
implementation.
1. Awareness and enlightenment Campaigns: Lean awareness and enlightenment
campaigns are necessary to sensitize stakeholders within the Nigerian construction
industry of the opportunities and benefits of lean implementation within the industry.
These campaigns can be handled by the collaborative efforts of lean construction
experts within and outside the country (Suresh et al, 2012). The campaigns should be
targeted at clients, consultants, contractors, suppliers and subcontractors informing
them of their roles within each stage of the project.
2. Policy: Both the awareness and enlightenment programs would have to align with
each organisations policy. An organisations policy typically describes the principles
that guide decisions, procedure and protocol within the organisation (Othman, 2011).
The policy should establish why the organisation supports the lean principles and
tools, the policy should also show how and what areas lean should be applied and in
what projects (Simonsen and Koch, 2004; Othman, 2011).
3. Training: The first step towards the effective implementation of lean construction
process is training (Othman, 2011). Paton et al (2008) noted that training is very
important in the implementation of lean as it involves teaching stakeholders and
practitioners of the lean tools and techniques available to them. Also, the Construction

Ahiakwo et al.
140
Lean Awareness Workshop (CLAW) which is held in most developed countries
should be encouraged. CLAW has proven to be vital in helping companies understand
the advantages and opportunities of lean construction and they have also been
involved in hands on training with operatives, staff and management of companies on
lean tools (BRE, 2011).
4. Application: The implementation of lean techniques within organisations requires
high level commitment and involvement of the organisations management (Alarcon
and Segnel, 2002). Thus its implementation calls for a high degree of participation
between clients and all the stakeholders in creating conditions and policies that would
encourage and support its practical implementation. This can be achieved by engaging
downstream players in upstream processes and vice versa (Howell 2011).
CONCLUSION
Within the construction industry, clients are the driving force for the improvement of
the industry. However, from this review work, it was observed that there is very little
awareness of lean principles amongst clients in the Nigerian construction industry.
The current state of the industry also supports this fact; abandoned projects, cost and
time overruns, poor quality work and very low productivity.
This paper however also identified the potential benefits of lean in spite of its
criticisms and suggested implementation strategies. To successfully implement lean
within Nigeria, the research suggests that there should be an awareness and
enlightenment programme in place for stakeholders; align company policies to support
lean, training employees and the practical implementation of lean. On the other hand,
further research is suggested on the applicability of these lean tools within the
industry.
REFERENCE
Abdelhamid, T.S., El-Gafy, M., and Salem, O. (2008). “Lean Construction: Fundamentals and
Principles.” American Professional Constructor Journal.
Abdullah, S., Abdul Razak, A., Bakar, A., Hassan, A. and Sarrazin, I. (2009) Towards
Producing Best Practice in the Malaysian Construction Industry: The Barriers in
Implementing the Lean Construction Approach.
Aibinu, A. and Jagboro, G. (2002) The effects of construction delays on project delivery in
Nigerian construction industry. International Journal of Project Management, 20(8),
pp. 593-599 .
Akintoye, A., McIntosh, G. and Fitzgerald, E. (2000) A survey of supply chain collaboration
and management in the UK construction industry. European Journal of Purchasing
and Supply Management 6(3-4), pp.159-168
Alan Mossman (2009) Creating Value: A sufficient way to eliminate waste in lean design and
production. pp.13 - 23 .
Alarcon, L. F. and Seguel, L. (2002) Developing incentive strategies for implementation of
lean construction Proceedings International Group of Lean Construction 10th Annual
Conference, Universidad Federal de Rio Grande do Sul. pp.6-8.
Lean construction
141
Al-Hakim, L. (2000) Waste identification: a supply chain strategy perspective. Business.
Alsehaimi, A and KoskelaL (2008) What Can Be Learned From Studies On Delay In
Construction? Proceedings of IGLC16 16th Annual Conference July 16-18 2008,
Manchester, England
Al-Sudairi,A. A., Diekmann,J. E., Songer,A. D. and Brown,H. M. (1999) Simulation of
construction processes: traditional practices versus lean principles Proceedings IGLC.
pp.39.
Andersen, B; Bølviken T; Hege Skårbekk Dammerud and Sol Skinnarland
(2008)Approaching Construction as a Logistical, Economical and Social
Process.Proceedings of IGLC16 16th Annual Conference July 16-18 2008,
Manchester, England
Aniekwu, A. and Okpala, D. (1988) Contractual arrangements and the performance of the
Nigerian construction industry (the structural component). Construction Management
and Economics , 6(1), pp. 3-11 .
Ayarkwa,J., Agyekum,K. and Adinyira,E. (2011) Barriers to Sustainable Implementation of
Lean Construction in the Ghanaian Building Industry The Sixth Built Environment
Conference Johannesburg South Africa 31 July–2 August 2011. pp.67-71.
Ballard, G. (2000) Lean project delivery system. White paper .8.
Ballard, G. (2008) The lean project delivery system: An update. Lean Construction Journal,
4pp. 1-19 .
Ballard, G. and Howell, G.A. (2004) Competing construction management paradigms. Lean
Construction Journal, 1(1), pp. 38-45 .
Barrett, P. and Stanley, C. (1999) Better construction briefing . Blackwell Science Oxford.
Bashir,A. M; Suresh,S; Proverbs,D. G and Gameson,R. (2010) Barriers Towards The
Sustainable Implementation of Lean Construction In The United Kingdom
Construction Organisations Arcom Doctoral Workshop. pp.1.
Berggren, C (1993) Lean Production – The End of History? Work, Employment and Society,
Vol. 7920, pp.163-188
Björnfot, A (2008). An Engineering Perspective on Lean Construction Theory. Proceedings of
IGLC16 16th Annual Conference July 16-18 2008, Manchester, England
BRE (2011) Construction Lean Awareness Workshop. http://www.bre.co.uk/ construction
lean awareness workshop [online] (accessed 28th December 2011)
Business Dictionary (2011). [Online] available from: http://www.businessdictionary.com. (Accessed
23 December 2011)
Cain, C.T. (2004) Profitable Partnering for Lean Construction .Hoboken: Wiley-Blackwell..
p. 255.
Cakanyildirim, M. (2004) All You Ever Wanted to Know About Supply Chains: Supply
Chain Management by S. Chopra and P. Meindl.
Chin Chang-Sun and Russell J. S. (2008). Improving Performance of Process Flows.
Proceedings of IGLC16 16th Annual Conference July 16-18 2008, Manchester,
England
Cox, A. and Ireland, P. (2002) Managing construction supply chains: the common sense
approach.Engineering Construction and Architectural Management (Blackwell
Publishing Limited) [online], 9(5), pp. 409-418.
Cusumano, M.A. (1994) The limits of “Lean”. Sloan Management Review. Summer 1994, pp.
27-32.

Ahiakwo et al.
142
Dainty, A.R.J., Millett, S.J. and Briscoe, G.H. (2001) New perspectives on construction
supply chain integration. Supply Chain Management: An International Journal
[online], 6(4), pp. 163-173 .
Dantata, S.A. (2008) General Overview of the Nigerian Construction Industry.Msc Thesis in
Massachusetts Institute of Technology 2008
Dlakwa, M. and F Culpin, M. (1990) Reasons for overrun in public sector construction
projects in Nigeria. International Journal of Project Management, 8(4), pp. 237-241 .
Egan, J. 1998, Rethinking Construction, Report of the Construction Task Force on the Scope
for Improving the Quality and Efficiency of UK Construction, Department of the
Environment, Transport and the Regions, London. Department of the Environment,
Transport and the Regions, London, UK.
Elliman, T. and Orange, G. (2000) Electronic commerce to support construction design and
supply-chain management: a research note.International Journal of Physical
Distribution and Logistics Management, 30(3/4), pp. 345-360 .
Forbes, L., Ahmed, S. and Barcala, M. (2002) Adapting lean construction theory for practical
application in developing countries.Proceedings of the first CIB W, 107.
Forsman, S., Bystedt, A. and Öhman, M. Interaction in the construction process—System
effects for a joinery-products supplier. Sort, 20(50), pp. 100 .
Ganeshan, R. (1999) Managing supply chain inventories: A multiple retailer, one warehouse,
multiple supplier model1. International Journal of Production Economics, 59(1-3),
pp. 341-354 .
Gehbauer F (2008) Lean Organization: Exploring Extended Potentials of the Last Planner
System. Proceedings of IGLC16 16th Annual Conference July 16-18 2008,
Manchester, England
Green, S. D. (2000). The future of Lean Construction – A Brave new world. In: Proceedings
for Annual Conference on Lean Construction (IGLC-8). Brighton, UK.
Green, S., (1999). “The Missing Arguments of Lean Construction”, Construction
Management and Economics , Vol. 17, No. 2, 1999, pp. 133 – 137.
Green, S., (2002). “The Human Resource Management Implications for Lean Construction:
Critical Perspectives and Conceptual Chasms”, Journal of Construction Research,
Vol. 3, No. 1, pp. 147 – 166.
Green, S., and May, S., (2005). “Lean Construction: Arenas of Enactment, Models of
Diffusion and the meaning of ‘Leanness’”, Building Research and Information, Vol.
33, No. 6, 2005, pp. 498 – 511.
Hicks, B. (2007) Lean information management: Understanding and eliminating waste.
International Journal of Information Management , 27(4), pp. 233-249 .
Hofacker A., B. Fernandes De Oliveira, F. Gehbauer, M. D. Carmo Duarte Freitas, R. Mendes
Jr, A. Santos and J. Kirsch(2008) Rapid Lean Construction-Quality Rating Model
(LCR). Proceedings of IGLC16 16th Annual Conference July 16-18 2008,
Manchester, England
Howell, G. (2011) Book Review: Build Lean: Transforming construction using Lean Thinking
by Adrian Terry and Stuart Smith.
Howell,G. A. (1999) What is lean construction-1999 Proceedings IGLC. pp.1.
Howell,G. and Ballard,G. (1999) Bringing light to the dark side of lean construction: a
response to Stuart Green Proc. 7th Ann. Conf. Intl. Group for Lean Constr. pp.33-37.
Lean construction
143
Hughes, W. (2003) A comparison of two editions of the RIBA Plan of Work.Engineering,
Construction and Architectural Management .10(5), pp. 302-311 .
Ibiyemi, A; Adenuga, A and Odusami, K.(2008) Comparative Analysis of Design and Build
and the Traditional Procurement methods in Lagos, Nigeria.
Idrus, A. and Sodangi, M. (2010) Framework for Evaluating Quality Performance of
Contractors in Nigeria.International Journal of Civil and Environmental Engineering,
10(1), pp. 34-39 .
Johansen, E. and Walter, L. (2007) Lean Construction: Prospects for the German construction
industry. Lean Construction Journal 3.
Kagioglou, M., Aouad, G., Wu, S., Lee, A., Fleming, A. and Cooper, R. (2006) Process
management for concurrent life cycle design and construction. Also available from
Taylor and Francis pp. 98 .
Kagioglou, M., Cooper,R., Aouad,G., Sexton,M., Hinks,J. and Sheath,D. (1998) Cross-
industry learning: the development of a generic design and construction process based
on stage/gate new product development processes found in the manufacturing
industry Engineering Design Conference. pp.595-602.
Kelly, J. and Male, S. (1993) Value Management in Design and Construction: the economic
management of projects. Taylor and Francis.
Kim, Y and Jang, J (2005) Case Study: Applicationof Last Planner to Heavy Civil
Construction in Korea, Proceeding of the 13th IGLC Conferency Sydney.
Koskela, L. (1997) Lean production in construction.Lean Construction pp. 1–9.
Koskela, L. and Center for Integrated Facility Engineering (1992) Application of the new
production philosophy to construction . Stanford university Stanford, California.
Koskela, L., Howell, G., Ballard, G., and Tommelein, I. (2002). “The Foundations of Lean
Construction.” Design and Construction: Building in Value, R. Best, and G. de
Valence, eds., Butterworth-Heinemann, Elsevier, Oxford, UK.
Lambert, D.M. and Cooper, M.C. (2000) Issues in supply chain management.Industrial
marketing management, 29(1), pp. 65-83.
Lambert, D.M., Cooper, M.C. and Pagh, J.D. (1998) Supply chain management:
implementation issues and research opportunities. International Journal of Logistics
Management, The, 9(2), pp. 1-20 .
Latham, M. (1994) Constructing the team: final report of the government/industry review of
procurement and contractual arrangements in the UK construction industry.The
Stationery Office, London .
Lee, S. H., Diekmann,J. E., Songer,A. D. and Brown,H. (1999) Identifying waste: applications
of construction process analysis Proceedings of the Seventh Annual Conference of the
International Group for Lean Construction. pp.63-72.
Lehman, T., Reiser, P., 2004, “Maximizing Value and Minimizing Waste: Value Engineering
and Lean Construction”, SAVE Knowledge Bank Database, Available: http://www.value-eng.org/knowledge-bank/
Leong M.S. and Tilley P (2008),A Lean Strategy to Performance Measurement – Reducing
Waste by Measuring ‘Next’ Customer Needs. Proceedings of IGLC16 16th Annual
Conference July 16-18 2008, Manchester, England
Lewis, M.A (2000) Lean Production and sustainable competitive advantage. International
Journal of operations and production Management, Vol. 20(8), pp. 959-978
Long, D.C. (2003) International logistics: global supply chain management .Springer.
Ahiakwo et al.
144
Lummus, R.R. and Vokurka, R.J. (1999) Defining supply chain management: a historical
perspective and practical guidelines. Industrial Management and Data Systems, 99(1),
pp. 11-17 .
Lummus, R.R., Krumwiede, D.W. and Vokurka, R.J. (2001) The relationship of logistics to
supply chain management: developing a common industry definition. Industrial
Management and Data Systems, 101(8), pp. 426-432 .
Mansfield, N., Ugwu, O. and Doran, T. (1994) Causes of delay and cost overruns in Nigerian
construction projects. International Journal of Project Management,12(4), pp. 254-
260 .
Moavenzadeh, F. and Dantata, S. (2007) General overview of the Nigerian construction
industry
Mossman, A. (2008) More than materials. Managing whats needed to creat value in
Constuction, 2nd
on European Conference on Construction Logistics
Mossman, A. (2009) Why isn’t the UK construction industry going lean with gusto? Lean
Construction Journal, 5(1), pp. 24-36 .
Niu, Y. (2006) Investigation Into the Supply Chain System Integration for Building
Technologies Cluster
O’Brien,W. J. (1999) Construction Supply-Chain Management: a vision for advanced
coordination, costing, and control NSF Berkeley-Stanford Construction Research
Workshop.. California: Stanford Univ, .
Odeh, A.M. and Battaineh, H.T. (2002) Causes of construction delay: traditional
contracts.International Journal of Project Management, 20(1), pp. 67-73 .
Odusami, K., Iyagba, R. and Omirin, M. (2003) The relationship between project leadership,
team composition and construction project performance in Nigeria. International
Journal of Project Management , 21(7), pp. 519-527 .
Oke, A.E. and Ogunsemi, D.R. (2011) Value Management in the Nigerian Construction
Industry: Militating Factors and the Perceived Benefits.
Olatunji. J O (2008) Lean –In- Nigerian Construction: State, Barriers, Strategies and “Goto-
Gemba” Approach. Proceedings of IGLC16 16th Annual Conference July 16-18
2008, Manchester, England
Olomolaiye, P., Wahab, K. and Price, A. (1987) Problems influencing craftsmen's
productivity in Nigeria.Building and Environment 22(4), pp. 317-323.
Olusegun, A.E. and Michael, A.O. (2011) Abandonment of Construction Projects in Nigeria:
Causes and Effects. Journal of Emerging Trends in Economics and Management
Sciences (JETEMS2(2), pp. 142-145 .
Oluwakiyesi, T (2011) Construction Industry Report:A Haven of Opportunities- Vetiv
Resarch construction sector
Othman, A.A.E. (2004) Value and risk management for dynamic brief development in
construction.
Othman, A.A.E. (2007) Generating Sustainable Values and Achieving Client Satisfaction in
Construction Projects through Maintenance Management: The Case of Housing
Projects in Abu Dhabi, United Arab Emirates. Architectural Engineering and Design
Management , 3(3), pp. 145-159 .
Othman, A. A. E. (2011) Lean Principles as a Strategic Option for Delivering Innovative
Sustainable Construction Projects: A Client Value Driven Approach THE SIXTH
BUILT ENVIRONMENT CONFERENCE JOHANNESBURG SOUTH AFRICA 31
JULY–2 AUGUST 2011. pp.17.
Lean construction
145
Oyewobi, L; O Ganiyu, B; A Oke, A; W Ola-awo, A. and Shittu, A. (2011) Determinants of
Unethical Performance in Nigerian Construction Industry. Journal of Sustainable
Development [online], 4(4), pp. p175
Pasquire, C. L. and Connolly, G. E. (2002) Leaner construction through off-site
manufacturing Proceedings of IGLC 10 th Annual Conference. pp.163-176.
Paton, R.A., Paton, R. and McCalman, J. (2008) Change management: A guide to effective
implementation .Sage Publications Ltd.
Pheng, L. S., and Tan, S. K. L., (1998). “How `Just-In-Time’ Wastages Can Be Quantified:
Case Study of a Private Condominium Project”, Construction Management and
Economics, Vol. 16, No. 6, 1998, pp. 621 – 635.
Pryke, S. (2009) Construction supply chain management: concepts and case studies
.Blackwell Pub.
Roelandt, K. F (2008), Implementing Lean Construction in a South African Construction
Company. Proceedings of IGLC16 16th Annual Conference of July 16-18 2008,
Manchester, England
Salem, O; Solomon, J; Genaidy, A. and Luegring, M. (2005) Site implementation and
assessment of lean construction techniques.Lean Construction Journal, 2(2), pp. 1-21
Sandesten and Bergdahl (2006) Swedish Construction Clients Forum 2006: The Role and
Mission of the Construction Client. Byggherreforum. Stockholm
Santos, A. and Powell,J. (1999) Potential of poka-yoke devices to reduce variability in
construction Proceedings IGLC. pp.51.
Simonsen, R and Koch, C. (2004) Shaping Lean Construction in Project Based Organisations
Proceedings for 12th conference in International Group for Lean Construction,
Denmark.
Skjøtt-Larsen, T. (2006) Battle of the Supply Chains. European Business Forum(24), pp. 43-
48 .
Stadtler, H. (2005) Supply chain management—an overview.Supply chain management and
advanced planning pp. 9-35 .
Suresh, S; Bashir, A. M and Olomolaiye, P. O (2012). “A protocol for lean construction in
developing countries.” Contemporary Issues in Construction in Developing Countries.
In G, Ofori Ed; Spon Press
Tan, K.C. (2001) A framework of supply chain management literature.European Journal of
Purchasing and Supply Management, 7(1), pp. 39-48 .
Thomas, D.J. and Griffin, P.M. (1996) Coordinated supply chain management. European
Journal of Operational Research, 94(1), pp. 1-15
Vennström, A. (2008) The Construction Client as a Change Agent. Sage Publications Ltd.
Vrijhoef, R. and Koskela, L. (2000) The four roles of supply chain management in
construction. European Journal of Purchasing and Supply Management 6(3-4), pp.
169-178 .
Watson, P. and Asher, H. (1999) Implementation of value management in construction.
Construction Information Quarterly, 1(2), pp. 1-9 .
Westland, J. (2006) The project management life cycle. Kogan Page, Limited , 2pp. 41-65 .
Williams, K., Haslam, C., Johal, S., Williams, J., Adcroft, A and Willis, R. (1995)
Management Practice or Structural Factors: The Case of America versus Japan in the
Car Industry. Economic and Industrial Democracy, Vol. !6, pp.9-37

Ahiakwo et al.
146
Womack, J.P., Jones, D.T. and Roos, D. (1990) The machine that changed the world: based
on the Massachusetts Institute of Technology 5-million dollar 5-year study on the
future of the automobile .
Womack, J.P.J. and Jones, D. DT (1996) Lean Thinking-Banish Waste and Create Wealth in
Your Corporation.
Xue, X., Li, X., Shen, Q. and Wang, Y. (2005) An agent-based framework for supply chain
coordination in construction. Automation in Construction,14(3), pp. 413-430.
Aigbavboa, C. and Thwala, W. (2012) An exploration of the use of Delphi methodology in housing
satisfaction studies In: Laryea, S., Agyepong, S.A., Leiringer, R. and Hughes, W. (Eds) Procs 4th West
Africa Built Environment Research (WABER) Conference, 24-26 July 2012, Abuja, Nigeria, 147-161.
147
AN EXPLORATION OF THE USE OF DELPHI
METHODOLOGY IN HOUSING SATISFACTION
STUDIES
Clinton Aigbavboa1 and Wellington Thwala
2
School of Civil Engineering and the Built Environment, University of Johannesburg, Doornfontein
Campus, Johannesburg, 2028, South Africa
The Delphi technique has become generally accepted in the past decade by a broad
range of institutions, government departments, and policy research organizations. The
Delphi method was originally developed in the 50s by the RAND Corporation after a
series of studies in Santa Monica, California. This approach consists of a survey
conducted in two or more rounds and affords the participants in the second round with
the results of the first so that they can alter the original assessments if they want to -
or stick to their previous opinion. It is commonly presumed that the method makes
better use of group interaction whereby the questionnaire is the medium of
interaction. The Delphi method is especially useful for long-range forecasting, as
expert opinions are the only source of information available. The objective of this
paper is to outline how the Delphi technique process was used to predict and to
understand issues encircling housing satisfaction in South Africa low-income
housing. The paper objective is based on the premise that the technique has never
been used to study housing satisfaction amongst the low income group in South
Africa despite the numerous empirical studies that has been conducted; hence the
framework. This is because the Delphi approach solicits expert’s view on subjects
surrounded with confusion. The methodological approach adopted for the study was a
content analysis of published peer reviewed journal articles with regards to the use of
the techniques in housing studies. The Delphi technique is discussed because it is an
approved and credible research technique which helps to overcome experts’
disagreement with issues.
Keywords: Delphi technique, methodology, housing studies, low-income housing
INTRODUCTION
The Delphi technique was originally developed in the 1950s as a tool for forecasting
and problem solving of complex topics at the Rand Corporation by Helmer and
Dalkey (Buckley, 1995). It was named after the ancient Greek temple where the oracle
could be found. According to Greek mythology, the oracle at Delphi was consulted to
forecast the future so that correct and timely decisions could be made before
embarking upon a major course of action, such as waging war. The method adopted
by the research team at Rand was that subject-matter experts could be solicited for
their opinion about the likelihood of future events or scenarios.
The Delphi technique is part of a group of decision-making (policymaking) techniques
that includes the nominal group technique (NGT) and interacting group method
(IGM). The Delphi technique differs in various ways from NGT and IGM 1 [email protected]
Aigbavboa and Thwala
148
respectively, but primarily due to the fact that Delphi is individual based, anonymous
and independent. The element of group interaction is eliminated from the technique
and feedbacks to questionnaires are in written format (Loo, 2002). According to Loo
(2002), the Delphi process is mostly used when investigating policy-making or policy-
evaluation strategies that will set the future direction for public or private sector
respectively. The thesis adopting this method was aimed at setting a future direction
for residential satisfaction with low-income public housing in South Africa.
Furthermore, the technique is a qualitative methodology seeking to produce a
consensus of a group of experts on an issue of concern (Miller, 2001) through a survey
consisting of rounds. The method is based on structural surveys and makes use of the
intuitive available information of the participants, who are mainly experts. The
method provides qualitative as well as quantitative results and has beneath its
explorative, predictive and even normative elements (Cuhls, 2003). There is an
agreement that Delphi is an expert survey in two or more ‘rounds’ in which the second
and later rounds of the survey (the results) of the previous round are given as
feedback. That is, the participant’s answers from the second round under the influence
of the other experts opinions. Thus, the Delphi method is a relatively strongly
controlled group communication process, in which matters, on which naturally unsure
and incomplete knowledge is available, are judged upon by experts’ (Häder and
Häder, 1995). The technique requires knowledgeable and expert contributors
individually responding to questions and submitting the results to a central coordinator
or a researcher conducting the study. The coordinator (researcher) processes the
responses, looking for central and extreme tendencies, and their validations (Grisham,
2006). The results are then fed back to the input provided by the coordinator
(researcher). The experts are then asked to resubmit their opinions, aided by the input
provided by the coordinator (researcher). This process continues until the coordinator
sees that a consensus has been formed.
The technique removes the bias that is possible when diverse groups of experts meet
together which is common with other method of decision making. In the Delphi
method, the experts do not know who the other experts are during the process. Hence,
the Standard-Delphi-Method is a survey which is directed by a coordinator
(researcher) as already stated, comprises several rounds with a group of experts, who
are anonymous among each other and for whose subjective-intuitive prognoses a
consensus is aimed at (Cuhls, 2003). After each survey round, a standard feedback
about the statistical group judgement calculated from median and interquartile range
of single projections is given and if possible, the arguments and counter arguments of
the extreme answers are fed back. In the Delphi process, nobody ‘looses face’ because
the study is done anonymously using a questionnaire. Rowe and Wright (1999) and
Häder and Häder (1995) informs that it is commonly assumed that the method makes
better use of group interaction whereby the questionnaire is the medium of interaction.
The method is especially useful for long-range forecasting, as expert opinions are the
only source of information available.
Over time, the method has gained popularity across many scientific disciplines as a
method of inquiry. Czinkota and Ronkainen (2005) indicate that the Delphi method
has gained considerable approval across disciplines. They inform that it has been used
as a study instrument in the fields of library and information science (Buckley, 1995),
in the medical disciplines (Linstone and Turoff, 1975), in multi country studies of
communications in Europe (www.feiea.org.uk, 2003), and by actuaries to predict
economic conditions (SOA, 1999). Czinkota and Ronkainen further report that those
Housing satisfaction
149
experienced with the Delphi technique report that the method produces valuable
results which are accepted and supported by the majority of the expert community.
Similarly, in the business field, the technique has been rated highly by some as a
systematic thinking tool, but has been challenged in its ability to serve as an identifier
of strategic issues (Schoemaker, 1993). Mitchell (1991) in the review of the use of the
Delphi techniques, found in an earlier study (Rieger, 1986) that PhD candidates that
used Delphi increased from 61 (1970-1974) to 441 (1980-1984), and that they
included an incredibly wide range of disciplines and topics. Hence the thesis that
adopted this technique was aimed to attract a wide spectrum of inputs form various
geographically dispersed experts in South Africa, the Delphi technique is well suited
as a research approach and method.
Delphi as a research method has had it fair share of criticism, support and debate on
epistemology (Mullen, 2003). Foremost amongst the criticism is Delphi’s alleged
failure to follow accepted scientific procedures, in particular the lack of psychometric
validity (Sackman, 1974). In respond to the criticism, Coates (1975) states that if it is
believed that the Delphi technique is of value not in the search for public knowledge,
but in the search for public wisdom; not in the search for individual data but in the
search for deliberative judgement, one can only conclude that Sackman missed the
point. However, it should be noted that the approach deals with areas that do not lend
themselves to traditional scientific approaches; hence Helmer (1983) argues that the
forecasting tendency, one of the major applications of the Delphi, is inevitably
conducted in a domain of what might be called ‘soft data’ and ‘soft law’. Helmer
further posit that standard operations research techniques should be augmented by
judgemental information and that the Delphi method cannot be legitimately attacked
for using mere opinion and for violating the rules of random sampling in the ‘polling
of experts’. Such criticism Helmer argued that they rest on a gross misunderstanding
of what Delphi is; it should be pointed out that a Delphi inquiry is not an ‘opinion
poll’. As all the above definitions illustrated, in no instance is reaching a majority
opinion the ultimate goal in a typical Delphi studies; it is rather the reaching of
agreement. According to Buckley (1995), Delphi is a tool for discovering agreement
and identifying differences rather than forcing consensus. Buckley (1995) further
informs that: in principle, agreement alone is not a sufficient condition for arguing the
Delphi is acceptable. But as with the majority of research methods, the method of use
and application has an enormous influence on the eventual success of the inquiry.
Hence, where no agreement develops, the Delphi still helps to clarify the issue been
investigated. Thus Linestone and Turoff (2002) assert that one of the common reasons
for failure in a Delphi is ignoring and not exploring disagreement or point of
departure, which the research that adopting the technique embraced. In addition to the
above criticism of the Delphi technique, different authors also state different
weaknesses of the Delphi Technique (Lang, 1995). Notable amongst them include:
It has not been shown consistently that the results from the Delphi method are any
better than those achieved through other structured judgmental techniques (Rowe,
Wright and Bolger 1991);
The Delphi study is at the mercy of the world view and biases of the coordinating or
monitors team (researcher), who choose the experts, interpret the returned information
and structure the questions. There is an enormous debate whether the experts should
be chosen from within or outside the organisation initiating the study and whether
they should be experienced in the subject area of the study in question (Masini 1993);
Aigbavboa and Thwala
150
Another limitation according to Linstone (1978) is on the way the process and
questionnaire is structured, which Linstone believes can lead to a bias (like IQ tests),
which assume a certain cultural background. Hence, the experts may give responses
they think the monitoring group wants to hear, or they may not respond at all.
Consequently, the cultural background of respondents will impact upon the results;
Likewise, Simmonds (1977) debates that one of the key flaws in the Delphi technique
is that certain questions are not asked as they do not seem important when the study
begins. Nonetheless, once the study begins, new questions cannot be added, which in
turn can weaken the study considerably;
Also, Lang (1995) states that the process of choosing the panellists is often not
considered seriously enough. Yet, it is the calibre of the panellists which determines
the quality of the outcomes of the study (Lang, 1995). A major consideration was
given to this particular criticism, hence a list of criteria was set for the panellist to
fulfil;
In the process of achieving consensus, extreme points of views run the risk of being
suppressed, when in fact they may provide important new information or insights
(Lang, 1995);
The flexibility of the technique means it can be adapted to a whole range of situations
which in turn can make it vulnerable to misrepresentation and sloppy execution
(Amara 1975); and
Garrod (2008) found that the Delphi technique can be extremely sensitive to: the level
of panellists’ expertise; the composition of the panel; clarity of the questions; the way
the research or coordinator reports reasons for outliers and the administration of the
questionnaire
Despite the limitations noted above from different scholars, Brill et al. (2006) describe
the Delphi as a particularly good research method for developing consensus among a
group of entities having expertise on a particular topic where information required is
subjective and where participants are separated by physical distance (Linstone and
Turoff, 1975). Brill et al. further states that the Delphi method has been validated in
the literature as a reliable empirical method for consensus reaching in a number of
areas. Amongst these areas include distance education (Thach and Murphy, 1995),
journalism (Smith, 1997), visual literacy (Brillet al., 2000), electronic commerce
(Addison, 2003), health care (Whitman, 1990) and others. Beside these areas, the
method has also been used in many other disciplines such as in information
technology (IT) research to identify and rank key issues for management attention
(Delbecq et al., 1975; Keil et al., 1998); scientific study of GIS (Hatzichristos and
Giaoutzi, 2005), quality management (Saizarbitoria, 2006), terrorism (Parente et al.,
2005), banking (Beales, 2005), social sciences (Landeta, 2006), privatization of
utilities (Critcher and Gladstone, 1998), education (Yousuf, 2007), amongst others.
The above instance proves that the Delphi method in research is an accepted practice.
However, as discussed above, it is not appropriate for all research activities.
Consequently, the objective of this paper is to analyse how the Delphi technique was
used to predict and to understand issues encircling housing satisfaction in South
Africa low-income housing. This was done in order to determine the attributes that
predict housing satisfaction. The paper describes the Delphi technique by
investigating its advantages and disadvantages, before illustrating the process of
execution. The paper commences by describing the technique through an investigation
Housing satisfaction
151
of its advantages and disadvantages, before illustrating the process of execution. This
was followed by a brief statement on the epistemological approach of the Delphi
techniques for the study; when to use the method; components of the techniques and
the process of execution of the technique for the referenced study.
Epistemological approach towards the Delphi design
The variance amongst the various group techniques and the definition of the Delphi
method as complied by various scholars and cognisance of the various criticisms
forms the epistemological foundation for defining the approach towards a typical
Delphi study design. Amongst these include reducing the effects of personal bias. This
is done by assuring that all expert feedback is anonymous. Through this, the technique
captures the opinions, experience, and knowledge of each panel member. Personal
knowledge is harvested and interpersonal interaction biases are stripped away.
According to Scheele (2002), the concreteness of the framework of the Delphi design
is vital in researching the overall objective of the study. The basic premises of the
Delphi research design towards a typical housing study designed, is entrenched in
some form of general agreement and consensus regarding the core ingredients and
components of the subsequent framework. Given the current status of low-income
housing in South Africa and the absence of generally agreed housing issues, the search
for consensus and a point of departure in issues on housing policy that will better
serve the low-income group is therefore justified through the use of the technique.
Hence the objective of the Delphi design for this study is to obtain the most reliable
consensus of opinion of a group of experts in the specific field being studied.
According to Lang (1995), the Delphi technique is mostly used to solicit the opinions
of experts to determine the timing and possible occurrence of future events. It is a
method that is best used where there is little past data available applicable to
extrapolate from, and where social, economic, ethical and moral considerations are
pre-eminent. Considering the outcome of literature review of the current research
(there is no structured research so far carried out which has adopted the technique with
regards to a housing study for the low-income group in South Africa) and definition,
function and nature of Delphi technique, it is justified that, Delphi technique was the
best method to explore the subject of the research and to achieve the aim and
objectives.
When to use the Delphi technique
The Delphi method is mainly used when long-term issues have to be assessed such as
the subject of the current research. This is because it is a procedure used to identify
statements (topics) that are relevant for the future; it reduces the tacit and complex
knowledge to a single statement and makes it possible to judge upon (Cuhls, 2003).
Hence the use in combination with other methodologies like survey design can be
interesting. On the other hand, in more complex issues, when the themes cannot be
reduced that much or when thinking and discussions in alternatives are the major
target. It is also suitable if there is the (political) attempt to involve many persons in
Aigbavboa and Thwala
152
processes (Eto, 2003). Hence, Linstone and Turoff (2002) argue that one or more of
the following properties could lead to the need for the use of the Delphi technique:
When the problem of inquiry does not lend itself to precise analytical techniques but
can benefit from subjective judgments on a collective basis (Buckley, 1994);
The research need to contribute to the examination of a broad or complex problem
with no history of adequate communication and may represent diverse backgrounds
with respect to experience or expertise, which was a major premise of the research;
More individuals are needed than can effectively interact in a face-to-face exchange;
Time and cost to make frequent group meetings is limited;
The efficiency of face-to-face meetings can be increased by a supplemental group
communication process;
Disagreements among individuals are so severe or politically unpalatable that the
communication process must be refereed and/or anonymity assured;
The heterogeneity of the participants must be preserved to assure validity of the
results, such as the avoidance of domination by quantity or by strength of personality
called the “bandwagon effect”.
According to Cuhls (2003) the Delphi method as a foresight tool seems to possess
certain degrees of invariance to survive in the changing challenges of the past 50
years. Hence the process could serve different understandings of predicting or
premonition and is probably understood by the users as being relevant for covering
technical perspectives, organisational perspectives, but also personal perspectives.
Cuhls further emphasis that what the users of the Delphi technique especially like are
the sets of data about the future that are collected. Writing down future topics seems to
have an immense psychological effect because it transfers implicit to tacit knowledge
to the more visible, explicit, and therefore transferable knowledge (Cuhls, 2003).
RESEARCH METHODOLOGY
The research was conducted with reference to existing theoretical literature, published
and unpublished literatures with a deep exploration of their context in order to meet
the research objectives. The study is mainly a literature review and looks at how the
Delphi technique can be used to predict and to understand issues encircling housing
satisfaction in South Africa low-income housing. This is presented through the
discussion of how the Delphi technique was employed in the study. This approach was
adopted in other to overcome the confusion surrounding the constructs that brings
about residential satisfaction in South Africa subsidised low-income housing; because
the Delphi approach solicit expert’s view on issues in a systematic approach.
Components of the Delphi technique
The main components of the Delphi technique according to Loo (2002), consists of
five major characteristics, which was also adopted in the study:
Housing satisfaction
153
The study should consists of a panel of carefully selected experts representing a broad
spectrum of opinion on the topic or issue being examined;
The participants are usually anonymous;
The coordinator (researcher) constructs a structured questionnaires and feedback
reports for the panel over the course of the Delphi;
It is an iterative process often involving three to four iterations called ‘rounds’ of
questionnaires and feedback reports;
There is an output, typically in form of a research report containing the Delphi results,
the forecasts, policy and program options (with their strengths and weaknesses),
recommendations to senior management and possibly an action plan for developing
and implementing the policies programs.
Likewise, Hasson et al. (2000) recommended that the following research guidelines
for using the Delphi technique be addressed in designing a Delphi approach: Research
problem identification; Understanding the process; Selection of experts; Informing /
invitation to experts; Data analysis; and Presentation and interpretation.
Therefore, given the nature of the research, it was further believed that the Delphi
technique is well suited to obtain credible inputs from experts in industry, academics,
government and NGOs to serve as key input towards the research objectives. The next
sections provide an overview of how the Delphi technique was used in this study.
DESIGNING, CONSTRUCTING AND EXECUTING THE DELPHI
STUDY
Given the rationale behind the Delphi technique and the main features explained
above, the design, construction and execution of the Delphi study for the current
research followed a sequential process as suggested by Loo (2002). According to Loo,
four vital planning and execution activities was followed, which are: Problem
definition; Panel selection; Determining the panel size; and Conduction the Delphi
iterations. Supporting Loo (2002) approach, Delbecq et al. (1975) suggest a basic
Delphi methodology that includes distinct stages such as, Delphi question
development (objective), expert panel selection, sample size, first questionnaire, first
questionnaire analysis and follow-up questionnaires. This methodology forms the
basis of the research study and is explained in the subsequent sections. Figure 1 gives
a summary of the Delphi design, construction and execution.
Stage 1 – Delphi question development
The formulation of the Delphi question is vital to the whole process. It is paramount
that the panel of experts understand the broad context within which the questionnaire
is designed. I order to achieve the objectives of the study, key questions were asked.
The basis of constructing the questions for this study was based on the guidelines
given in Table 1, with corresponding wording and phrasing given for this study.
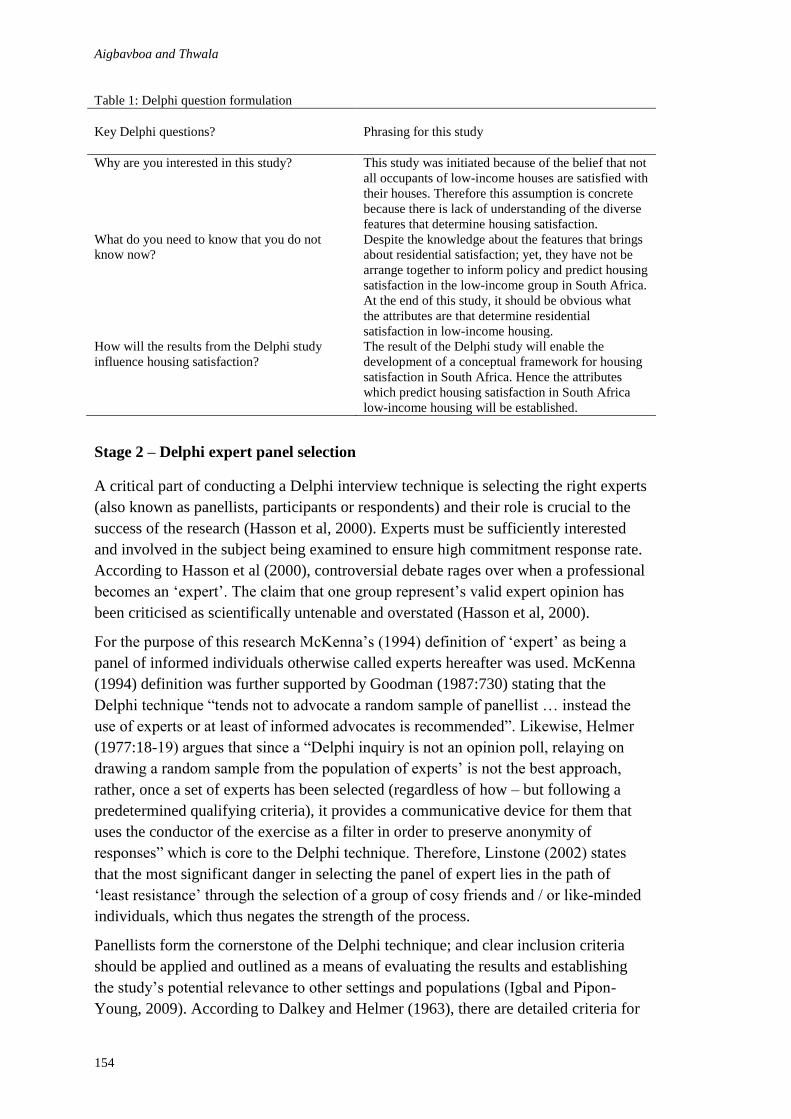
Aigbavboa and Thwala
154
Table 1: Delphi question formulation
Key Delphi questions?
Phrasing for this study
Why are you interested in this study? This study was initiated because of the belief that not
all occupants of low-income houses are satisfied with
their houses. Therefore this assumption is concrete
because there is lack of understanding of the diverse
features that determine housing satisfaction.
What do you need to know that you do not
know now?
Despite the knowledge about the features that brings
about residential satisfaction; yet, they have not be
arrange together to inform policy and predict housing
satisfaction in the low-income group in South Africa.
At the end of this study, it should be obvious what
the attributes are that determine residential
satisfaction in low-income housing.
How will the results from the Delphi study
influence housing satisfaction?
The result of the Delphi study will enable the
development of a conceptual framework for housing
satisfaction in South Africa. Hence the attributes
which predict housing satisfaction in South Africa
low-income housing will be established.
Stage 2 – Delphi expert panel selection
A critical part of conducting a Delphi interview technique is selecting the right experts
(also known as panellists, participants or respondents) and their role is crucial to the
success of the research (Hasson et al, 2000). Experts must be sufficiently interested
and involved in the subject being examined to ensure high commitment response rate.
According to Hasson et al (2000), controversial debate rages over when a professional
becomes an ‘expert’. The claim that one group represent’s valid expert opinion has
been criticised as scientifically untenable and overstated (Hasson et al, 2000).
For the purpose of this research McKenna’s (1994) definition of ‘expert’ as being a
panel of informed individuals otherwise called experts hereafter was used. McKenna
(1994) definition was further supported by Goodman (1987:730) stating that the
Delphi technique “tends not to advocate a random sample of panellist … instead the
use of experts or at least of informed advocates is recommended”. Likewise, Helmer
(1977:18-19) argues that since a “Delphi inquiry is not an opinion poll, relaying on
drawing a random sample from the population of experts’ is not the best approach,
rather, once a set of experts has been selected (regardless of how – but following a
predetermined qualifying criteria), it provides a communicative device for them that
uses the conductor of the exercise as a filter in order to preserve anonymity of
responses” which is core to the Delphi technique. Therefore, Linstone (2002) states
that the most significant danger in selecting the panel of expert lies in the path of
‘least resistance’ through the selection of a group of cosy friends and / or like-minded
individuals, which thus negates the strength of the process.
Panellists form the cornerstone of the Delphi technique; and clear inclusion criteria
should be applied and outlined as a means of evaluating the results and establishing
the study’s potential relevance to other settings and populations (Igbal and Pipon-
Young, 2009). According to Dalkey and Helmer (1963), there are detailed criteria for
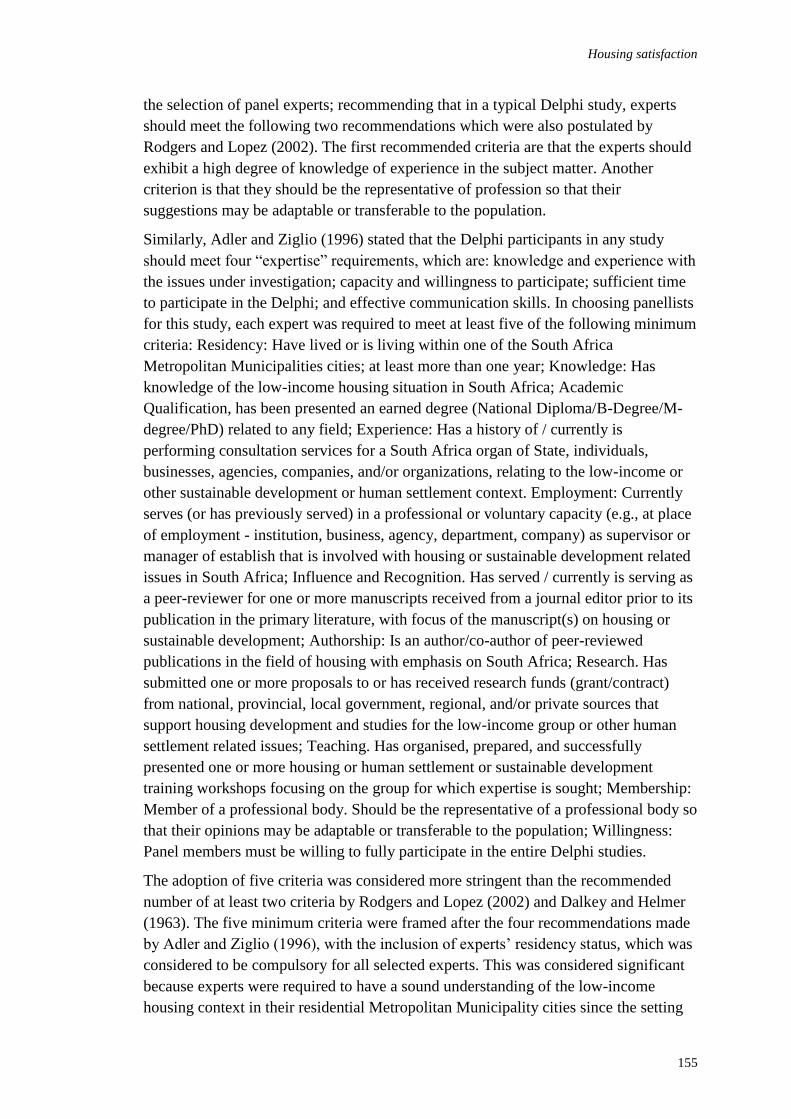
Housing satisfaction
155
the selection of panel experts; recommending that in a typical Delphi study, experts
should meet the following two recommendations which were also postulated by
Rodgers and Lopez (2002). The first recommended criteria are that the experts should
exhibit a high degree of knowledge of experience in the subject matter. Another
criterion is that they should be the representative of profession so that their
suggestions may be adaptable or transferable to the population.
Similarly, Adler and Ziglio (1996) stated that the Delphi participants in any study
should meet four “expertise” requirements, which are: knowledge and experience with
the issues under investigation; capacity and willingness to participate; sufficient time
to participate in the Delphi; and effective communication skills. In choosing panellists
for this study, each expert was required to meet at least five of the following minimum
criteria: Residency: Have lived or is living within one of the South Africa
Metropolitan Municipalities cities; at least more than one year; Knowledge: Has
knowledge of the low-income housing situation in South Africa; Academic
Qualification, has been presented an earned degree (National Diploma/B-Degree/M-
degree/PhD) related to any field; Experience: Has a history of / currently is
performing consultation services for a South Africa organ of State, individuals,
businesses, agencies, companies, and/or organizations, relating to the low-income or
other sustainable development or human settlement context. Employment: Currently
serves (or has previously served) in a professional or voluntary capacity (e.g., at place
of employment - institution, business, agency, department, company) as supervisor or
manager of establish that is involved with housing or sustainable development related
issues in South Africa; Influence and Recognition. Has served / currently is serving as
a peer-reviewer for one or more manuscripts received from a journal editor prior to its
publication in the primary literature, with focus of the manuscript(s) on housing or
sustainable development; Authorship: Is an author/co-author of peer-reviewed
publications in the field of housing with emphasis on South Africa; Research. Has
submitted one or more proposals to or has received research funds (grant/contract)
from national, provincial, local government, regional, and/or private sources that
support housing development and studies for the low-income group or other human
settlement related issues; Teaching. Has organised, prepared, and successfully
presented one or more housing or human settlement or sustainable development
training workshops focusing on the group for which expertise is sought; Membership:
Member of a professional body. Should be the representative of a professional body so
that their opinions may be adaptable or transferable to the population; Willingness:
Panel members must be willing to fully participate in the entire Delphi studies.
The adoption of five criteria was considered more stringent than the recommended
number of at least two criteria by Rodgers and Lopez (2002) and Dalkey and Helmer
(1963). The five minimum criteria were framed after the four recommendations made
by Adler and Ziglio (1996), with the inclusion of experts’ residency status, which was
considered to be compulsory for all selected experts. This was considered significant
because experts were required to have a sound understanding of the low-income
housing context in their residential Metropolitan Municipality cities since the setting
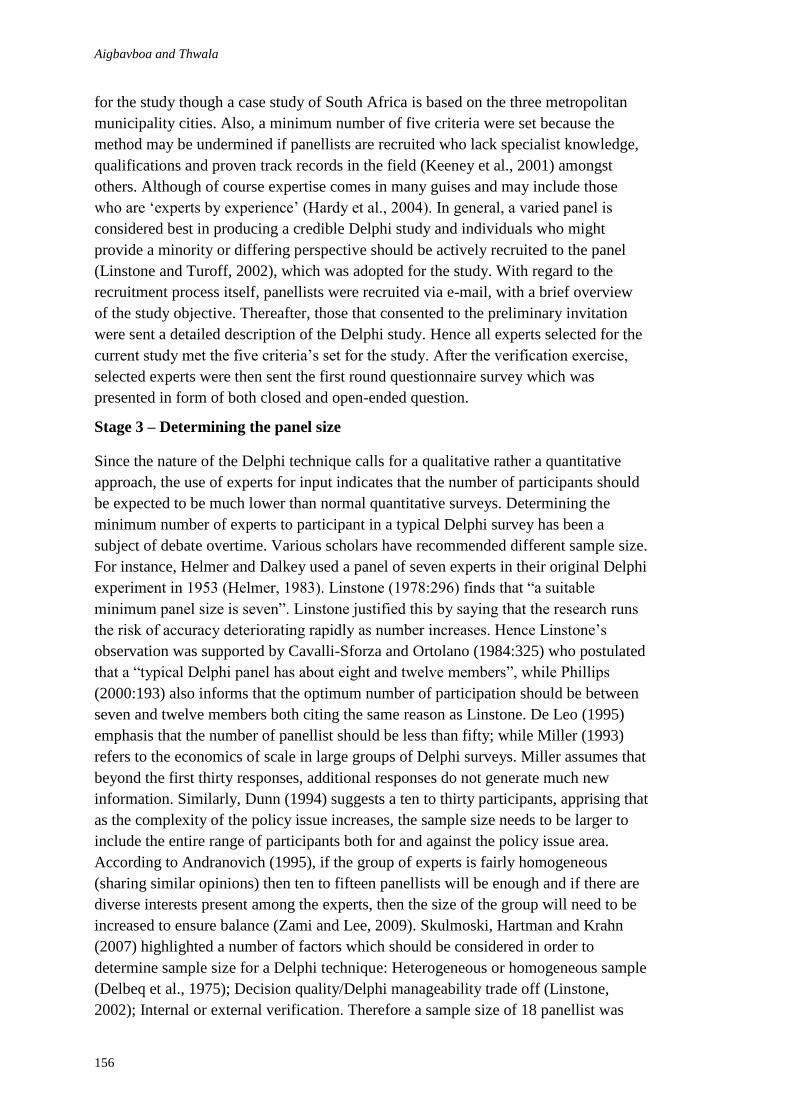
Aigbavboa and Thwala
156
for the study though a case study of South Africa is based on the three metropolitan
municipality cities. Also, a minimum number of five criteria were set because the
method may be undermined if panellists are recruited who lack specialist knowledge,
qualifications and proven track records in the field (Keeney et al., 2001) amongst
others. Although of course expertise comes in many guises and may include those
who are ‘experts by experience’ (Hardy et al., 2004). In general, a varied panel is
considered best in producing a credible Delphi study and individuals who might
provide a minority or differing perspective should be actively recruited to the panel
(Linstone and Turoff, 2002), which was adopted for the study. With regard to the
recruitment process itself, panellists were recruited via e-mail, with a brief overview
of the study objective. Thereafter, those that consented to the preliminary invitation
were sent a detailed description of the Delphi study. Hence all experts selected for the
current study met the five criteria’s set for the study. After the verification exercise,
selected experts were then sent the first round questionnaire survey which was
presented in form of both closed and open-ended question.
Stage 3 – Determining the panel size
Since the nature of the Delphi technique calls for a qualitative rather a quantitative
approach, the use of experts for input indicates that the number of participants should
be expected to be much lower than normal quantitative surveys. Determining the
minimum number of experts to participant in a typical Delphi survey has been a
subject of debate overtime. Various scholars have recommended different sample size.
For instance, Helmer and Dalkey used a panel of seven experts in their original Delphi
experiment in 1953 (Helmer, 1983). Linstone (1978:296) finds that “a suitable
minimum panel size is seven”. Linstone justified this by saying that the research runs
the risk of accuracy deteriorating rapidly as number increases. Hence Linstone’s
observation was supported by Cavalli-Sforza and Ortolano (1984:325) who postulated
that a “typical Delphi panel has about eight and twelve members”, while Phillips
(2000:193) also informs that the optimum number of participation should be between
seven and twelve members both citing the same reason as Linstone. De Leo (1995)
emphasis that the number of panellist should be less than fifty; while Miller (1993)
refers to the economics of scale in large groups of Delphi surveys. Miller assumes that
beyond the first thirty responses, additional responses do not generate much new
information. Similarly, Dunn (1994) suggests a ten to thirty participants, apprising that
as the complexity of the policy issue increases, the sample size needs to be larger to
include the entire range of participants both for and against the policy issue area.
According to Andranovich (1995), if the group of experts is fairly homogeneous
(sharing similar opinions) then ten to fifteen panellists will be enough and if there are
diverse interests present among the experts, then the size of the group will need to be
increased to ensure balance (Zami and Lee, 2009). Skulmoski, Hartman and Krahn
(2007) highlighted a number of factors which should be considered in order to
determine sample size for a Delphi technique: Heterogeneous or homogeneous sample
(Delbeq et al., 1975); Decision quality/Delphi manageability trade off (Linstone,
2002); Internal or external verification. Therefore a sample size of 18 panellist was
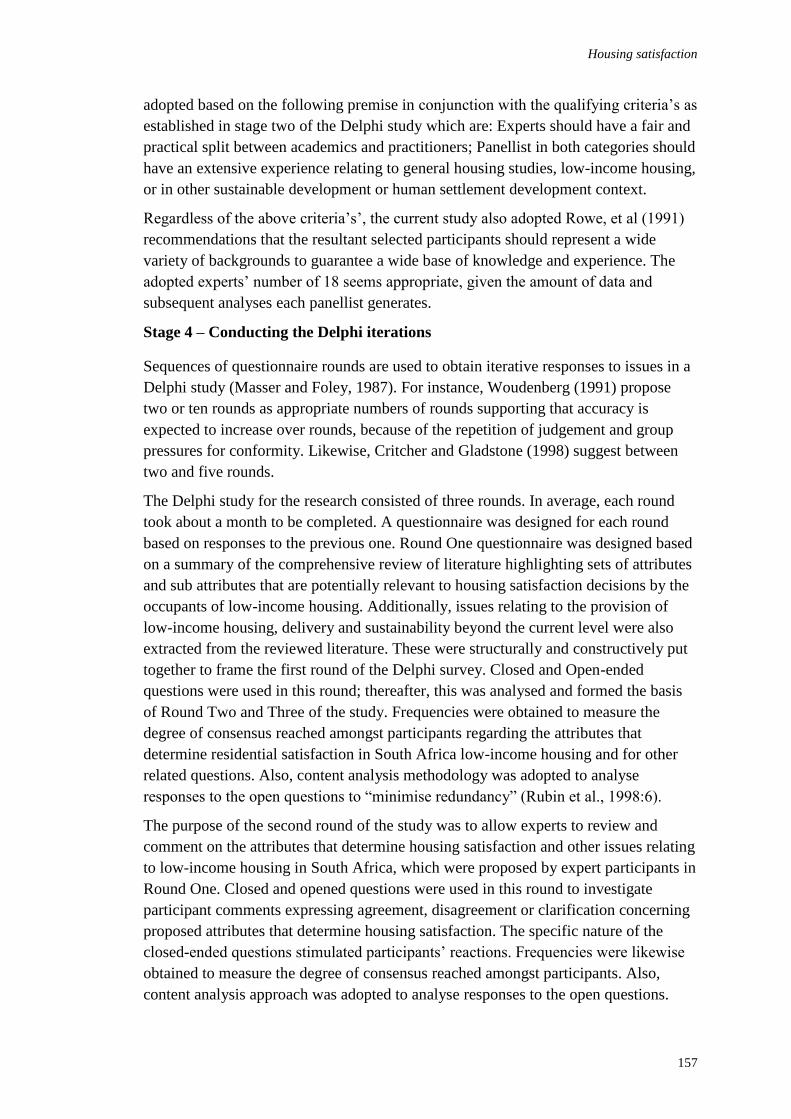
Housing satisfaction
157
adopted based on the following premise in conjunction with the qualifying criteria’s as
established in stage two of the Delphi study which are: Experts should have a fair and
practical split between academics and practitioners; Panellist in both categories should
have an extensive experience relating to general housing studies, low-income housing,
or in other sustainable development or human settlement development context.
Regardless of the above criteria’s’, the current study also adopted Rowe, et al (1991)
recommendations that the resultant selected participants should represent a wide
variety of backgrounds to guarantee a wide base of knowledge and experience. The
adopted experts’ number of 18 seems appropriate, given the amount of data and
subsequent analyses each panellist generates.
Stage 4 – Conducting the Delphi iterations
Sequences of questionnaire rounds are used to obtain iterative responses to issues in a
Delphi study (Masser and Foley, 1987). For instance, Woudenberg (1991) propose
two or ten rounds as appropriate numbers of rounds supporting that accuracy is
expected to increase over rounds, because of the repetition of judgement and group
pressures for conformity. Likewise, Critcher and Gladstone (1998) suggest between
two and five rounds.
The Delphi study for the research consisted of three rounds. In average, each round
took about a month to be completed. A questionnaire was designed for each round
based on responses to the previous one. Round One questionnaire was designed based
on a summary of the comprehensive review of literature highlighting sets of attributes
and sub attributes that are potentially relevant to housing satisfaction decisions by the
occupants of low-income housing. Additionally, issues relating to the provision of
low-income housing, delivery and sustainability beyond the current level were also
extracted from the reviewed literature. These were structurally and constructively put
together to frame the first round of the Delphi survey. Closed and Open-ended
questions were used in this round; thereafter, this was analysed and formed the basis
of Round Two and Three of the study. Frequencies were obtained to measure the
degree of consensus reached amongst participants regarding the attributes that
determine residential satisfaction in South Africa low-income housing and for other
related questions. Also, content analysis methodology was adopted to analyse
responses to the open questions to “minimise redundancy” (Rubin et al., 1998:6).
The purpose of the second round of the study was to allow experts to review and
comment on the attributes that determine housing satisfaction and other issues relating
to low-income housing in South Africa, which were proposed by expert participants in
Round One. Closed and opened questions were used in this round to investigate
participant comments expressing agreement, disagreement or clarification concerning
proposed attributes that determine housing satisfaction. The specific nature of the
closed-ended questions stimulated participants’ reactions. Frequencies were likewise
obtained to measure the degree of consensus reached amongst participants. Also,
content analysis approach was adopted to analyse responses to the open questions.

Aigbavboa and Thwala
158
The final round three, was specifically aimed to: Inform the experts of the findings of
the analysis of responses to the questionnaire of Round Two; Request their final
affirmation / comments on attributes and issues that did not receive any consensus in
Round Two. The questionnaire of Round Three was designed based on the findings of
content analysis and measures of frequencies responses to the questionnaire of Round
Two. Closed and opened questions were also used and frequencies were obtained to
indicate consensus reached among experts regarding attributes that determine housing
satisfaction and on other low-income housing issues as presented in the study. Where
consensus was not research, the reason for the disagreement were noted and reported
in the findings section of the study.
Over the three round Delphi survey, consensus was reached regarding most of the
attributes that determine housing satisfaction and on other low-income housing related
issues in South Africa. Based on the findings of the analyses of responses to the
Delphi rounds, a list of attributes that determine housing satisfaction was prepared
which informs the conceptual framework for the broader study, while issues
surrounding low-income housing in South Africa were highlighted which responded
accordingly to the set objective of the Delphi study. The Delphi survey was conducted
via electronic mail, and follow-up emails were used to encourage prompt responses to
the questionnaires.
CONCLUSION
The paper discussed the Delphi technique as an approved and credible research
technique, with participants or expert panel members responding to a series of
questionnaires (three rounds) to achieve a consensus in identifying the attributes that
predict housing satisfaction in order to determine features that influence South Africa
low-income housing satisfaction and other related housing issues in South Africa.
The technique was adopted as a preliminary investigation to the wider research to
determine factors that predict housing satisfaction because it intended to remove the
bias that is possible when diverse groups of experts meet together which is common
with other method of decision making. Therefore, based on the premise of the outlined
process, it is therefore recommended that when the Delphi technique is to be adopted
as a research tool for housing studies, the questions for the experts should be well
formulated because questions are vital to the whole process. It is also paramount that
the panel of experts understand the broad context within which the questionnaire is
designed. Also, in the selection of experts, stringent measures should be adopted that
will not compromise the process. Likewise, in determining the panel size, it should be
ensured that selected participants represent a wide variety of backgrounds to guarantee
a wide base of knowledge and experience.
REFERENCES
Addison, T. (2003). E-commerce project development risks: evidence from a Delphi survey.
International Journal of Information Management 23(1): 25-40.
Adler, M. and Z. E. (1996). Gazing into the oracle: The Delphi Method and its application to
social policy and public health. London, Jessica Kingsley Publishers

Housing satisfaction
159
Amara, R. (1975). Some Methods of Futures Research. Menlo Park, Institute for the Future.
Andranovich, G. (1995). Developing community participation and consensus: the Delphi
technique. Partnerships in education and research, WREP 131. Department of
Political Science. Los Angeles, California State University
Beales, R. (2005). Delphi creates fresh CDS challenge: a new cash-settlement method for
simplifying credit derivatives faces a stern test with the latest bankruptcy, writes
Richard Beales (capital markets and commodities). The Financial Times 43.
Brill, J., M. Bishop, et al. (2006). The competencies and characteristics required of an
effective project manager: a web-based Delphi study. Educational Technology
Research and Development 54(2): 115-40.
Brill, J. M., D. Kim, et al. (2000). Visual literacy defined: the results of a Delphi study: can
IVLA (operationally) define visual literacy? International Visual Literacy
Association, Ames, IA.
Buckley, C. (1995). Delphi: a methodology for preferences more than predictions. Library
Management 16(7): 16-19.
Buckley, C. C. (1994). Delphi technique supplies the classic result? Australian Library Journal
43(3): 158-64.
Cavalli-Sforza, V. and L. Ortolano (1984). Delphi forecasts of land use - transportation
interactions. Journal of Trnasportation Engineering 110(3): 324-39.
Coates, J. F. (1975). Review of Sackman Report Technological Forecasting and Social
Change - Vol. 7 No. 2. New York, American Elsevier Publishing Co.
Critcher, C. and B. Gladstone (1998). Utilizing the Delphi technique in policy discussion: a
case study of a privatized utility in Britain. Public Administration 76(3): 431-49.
Cuhls, K. (2003). Delphi method. Retrieved 26 October, 2011, from
http://www.unido.org/fileadmin/import/16959_DelphiMethod.pdf.
Czinkota, M. R. and I. A. Ronkainen (1992). Global marketing 2000: a marketing survival
guide. Marketing Management January/February: 37-44.
Dalkey, N. C. and O. Helmer (1963). An Experimental Application Of The Del-phi-Method
To The Use Of Experts. Journal of the Institute of Management Sciences 9: 458-467.
Delbecq, A. L., A. H. Van de Ven, et al. (1975). Group Techniques for Program Planning.
Glenview, IL, Scott.
Dunn, W. N. (1994). Public policy analysis: An introduction. Englewood Cliffs, NJ,
PrenticeHall.
Eto, H. (2003). The suitability of technology forecasting/ foresight methods for decision
systems and strategy. A Japanese view, in: Technological Forecasting and Social
Change, no. 70: 231-249.
Goodman, C. M. (1987). The Delphi technique: a critique. Journal of Advanced Nursing 12:
729-734.
Grisham, T. (2006). Cross cultural leadership, Doctor of Project Management, School of
Property, Construction and Project Management , RMIT, Melbourne.
Häder, M. and S. Häder (1995). "Delphi und Kognitionspsychologie: Ein Zugang zur
theoretischen Fundierung der Delphi-Methode." ZUMA-Nachrichten 37(19): 12.
Hardy, J. D., A. P. O’Brien, et al. (2004). Practical application of the Delphi technique in a
bicultural mental health nursing study in New Zealand. Journal of Advanced Nursing
46(1): 95-109.
Aigbavboa and Thwala
160
Hasson, F., S. Keeney, et al. (2000). Research guidelines for the Delphi survey technique.
Journal of Advanced Nursing 32(4): 1008-15.
Hatzichristos, T. and M. Giaoutzi (2005). Landfill siting using GIS, fuzzy logic and the
Delphi method (author abstract). International Journal of Environmental Technology
and Management 6(1/2): 218.
Helmer, O. (1977). Problems in futures research: Delphi and causal cross-impact analysis
Future 9(1): 25-52.
Helmer, O. (1983). Looking Forward: A Guide to Futures Research. Beverly Hills, Sage
Publications.
Iqbal, S. and L. Pipon-Young (2009). The Delphi method. Psychologist 22: 598-601.
Keeney, S., F. Hasson, et al. (2001). A critical review of the Delphi technique as a research
methodology for nursing. International Journal of Nursing Studies 38(2): 195-200.
Keil, M., P. E. Cule, et al. (1998). A framework for identifying software project risks.
Communications of the ACM 41(11): 76-83.
Landeta, J. (Current validity of the Delphi method in social sciences). Technological
Forecasting and Social Change. 73 5(467-82).
Lang, T. (1995). An Overview of Four Futures Methodologies (Delphi, Environmental
Scanning, Issues Management and Emerging Issue Analysis). The Manoa Journal of
Fried and Half-Fried Ideas (about the future) 7 (Occasional Paper Number Seven) -
Hawaii Research Center for Futures Studies, Honolulu.
Linstone, A. and M. Turoff (1975). The Delphi method: techniques and applications. Reading,
MA, Addison-Wesley.
Linstone, H. A. (1978). The Delphi technique. Handbook of futures research. J. Fowlers.
Westport, CT, Greenwood Press: 273-300.
Linstone, H. A. and M. Turoff. (2002). The Delphi method: techniques and applications.
Retrieved 12 December, 2011, from www.is.njit.edu/pubs.php.
Loo, R. (2002). The delphi method: a powerful tool for strategic management, policing. An
international journal of police strategies and management 25(4): 762-769.
Masini, E. (1993). Why Futures Studies? London, Grey Seal.
Masser, I. and P. Foley (1987). Delphi Revisited: Expert Opinion in Urban Analysis. Urban
Studies 24(3): 217-224.
McKenna, H. (1994). The Delphi technique: A worthwhile research approach for nursing?
Journal of Advanced Nursing 19(6): 1221-1225
Miller, G. (2001). The development of indicators for sustainable tourism: Results of a Delphi
survey of tourism researchers. Tourism Management 22: 351-362.
Miller, M. M. (1993). Enhancing regional analysis with the Delphi method. Review of
Regional Studies 23(2): 191-212.
Mitchell, V. M. (1991). The Delphi technique: an exposition and application. Technology
Analysis and Strategic Management 3(4): 333.
Muller, P. (2003). Delphi: Myths and Reality. Journal of Health Organisation and
Management 17(1): 37-52.
Parente, R. J., T. N. Hiob, et al. (2005). The Delphi method, impeachment and terrorism:
accuracies of short-range forecasts for volatile world events. Technological
Forecasting and Social Change 72(4): 401-11.
Phillips, R. (2000). New applications for the Delphi technique. Annual San Diego
Housing satisfaction
161
Pfeiffer and Company. 2: 191-196.
Rieger, W. G. (1986). Directions in Delphi developments: dissertations and their quality.
Technological Forecasting and Social Change 29: 195-204.
Rogers, M. R. and E. C. Lopez (2002). Identifying critical cross-cultural school psychology
competencies’. Journal of school psychology 40(2): 115-141.
Rowe, G. and G. Wright (1999). The Delphi technique as a forecasting tool: Issue and
analysis. Int. Journal of Forecast 15(7): 1-23.
Rowe, G., G. Wright, et al. (1991). Delphi - A Reevaluation of Research and Theory.
Technological Forecasting and Social Change 39: 238-251.
Sackman, H. (1974). Delphi Assessment: Expert Opinion, Forecasting, and Group Process.
Santa Monica, CA, Rand Corporation.
Saizarbitoria, I. H. (2006). How quality management models influence company results –
conclusions of an empirical study based on the Delphi method (ISO 9000 And EFQM
quality management standards of Europe). Total Quality Management and Business
Excellence 17(6): 775-94.
SAO. (1999). Final report of the 1999 Delphi study. Retrieved 16 January, 2012, from
www.soa.org.
Scheele, D. S. (2002). Reality construction as a product of Delphi interaction. The Delphi
Method: Techniques and Applications Retrieved 14 December, 2011, from
http://is.njit.edu/pubs/delphibook.
Schoemaker, P. J. H. (1993). Multiple scenario development: its conceptual and behavioral
foundation. Strategic Management Journal 14(3): 193-213.
Simmonds, C. (1977). The Nature of Futures Problems” in Futures Research: New Directions.
H. Linstone and C. Simmonds. London, Addison-Wesley Publishing Company.
Skulmoski, G. J., F. T. Hartman, et al. (2007). The Delphi method for graduate research.
Journal of Information Technology Education 6.
Smith, M. A. (1997). Perceptions of quality in journalism and communications education: a
Delphi study. Journal of the Association for Communication Administration 1(32-50).
Thach, E. C. and K. L. Murphy (1995). Training via distance learning. Training and
Development 49(12): 44.
Whitman, N. I. (1990). The committee meeting alternative: using the Delphi technique. The
Journal of Nursing Administration 51(1): 57-68.
Woudenberg, F. (1991). An evaluation of Delphi. Technological forecasting and social change
40: 131-150.
Yousuf, M. I. (2007). The Delphi technique. Essays in Education 20: 80-9.
Zami, S. M. and A. Lee (2009). A review of the Delphi technique: to understand the factors
influencing adoption of stabilised earth construction in low cost urban housing. The
Built and Human Environment Review 2: 37-50.

Ajadi, S.B. (2012) Morphing the rules: advanced adaptations of mud in Nigerian buildings In: Laryea,
S., Agyepong, S.A., Leiringer, R. and Hughes, W. (Eds) Procs 4th West Africa Built Environment
Research (WABER) Conference, 24-26 July 2012, Abuja, Nigeria, 163-175.
163
MORPHING THE RULES: ADVANCED ADAPTATIONS
OF MUD IN NIGERIAN BUILDINGS
Stephen Babatunde Ajadi1
Department of Building Engineering, College of Advanced and Professional Studies, PMB 102211,
Makurdi, Nigeria
Mud is a ubiquitous building material in Nigeria, perhaps this is the reason why it is
hardly seen as the outright building material that it is. The most popular contribution
of mud to Nigerian architecture can only be seen in the ancient traditional huts all
over the country. Although still a building material in the suburbs of the country, mud
is seen as a relic of the past, a symbol of a primitive tale of Nigerian building
construction. The primary effort here is to redefine mud as a 'skin' with infinite
possibilities of imagery and texture, rather than its typical application as a wall in
Nigerian architecture. Mud is attempted to be expressed via a new geometric
vocabulary by re-evaluating its surreptitious properties including its ability to behave
like a formally defined NURBS2 surface. The properties of mud and clay are
unconventionally simulated in computer modelling and analysis software to
understand the ways in which it can optimized for advanced building applications.
Streamlined calculations and algorithmic calculations serve as tools to discover the
NURBS-propensity of Mud. This provides a whole new low-cost construction
opportunity for the building of irregularly flowing structures.
Keywords: morph, mud, skin, spline, texture
INTRODUCTION
Over the past three decades (especially in the last ten years), there has been a
significantly increasing curiosity to the studies of the nature and behaviour of mud
(ICOMOS, 2004), these studies have spawned a gargantuan amount of new
information that is practically intriguing and thought provoking. A noticeable number
of architects, engineers, scientists and artists have fully researched the characteristics
of mud, both collectively and individually (Schreckenbach, 1985). Research has
ranged from the analysis of its physical characteristics, mechanical and chemical
properties, to even its trado-medical therapeutic values. Especially in the past decade,
there have been numerous instances where the prospects of applying mud in a vast
array of functions have been dogmatically exploited. Looking closely at Nigeria for
example; states of the middle belt like Benue and Kogi have engaged mud in a variety
of ways, from molding them into benches to building entire estates out of them. In
Benue state, even in the small but developed city of Makurdi, it is not uncommon to
find mud benches and huts of varying undulations in clusters of social gatherings. The
growth of flowers in their beds and the spread of shrubs are also guided by
interlocking modules of iterated clay bricks that are almost unique to each
neighbourhood. These 'clay shells' shield the plants from the intrusion of ruminant
2 NURBS - Non Uniform Rational Basis Spline
Ajadi
164
animals like goats and sheep. Mud3 has been applied as different types of building
materials, ceramic furniture, and art forms. However, typically in Nigeria, mud on the
other hand has enjoyed a more variegated approach from the contemporary designers
and artists than it has from the mainstream architects and planners. Over the past few
years, Nigerian artists like Ato arinze (a well-known Nigerian sculptor) and Peju
Alatise (an architect and an artist) amongst others have really demonstrated that an
oeuvre of applications of mud is possible in terms of form and its relationship with
other materials. The most outstanding user and engager of mud/clay in Nigeria
however, can arguably be said to be Yakubu Levi, a master ceramist whose work
transcends beyond conventional pottery to high grade technologically influenced4 in-
grain systems of ceramic 'coating'. Levi has exhibited in almost every international
ceramic exhibition; his work also earned him the 2011 Grand prix prize for ceramics,
the highest possible award in the field. This kind of dogmatic motive of research,
giving rise to multifaceted uses of clay and mud seems to be weak within the circles of
design. Currently in design, the primary motive for researching into the prospects of
mud has been the aim to reduce the cost of buildings and constructions, and to gear
towards a more sustainable and eco-friendly approach of the practise of environmental
science. In the midst of all the scientific frenzy generated by the sudden green motive
for research into the nature and applications of bamboo and mud, relatively little effort
has been made to research certain adaptations of mud. With the world of design
already tilted towards being aided by the computer, it is only curious for one to ask if
mud possesses certain physical mimetic propensities with the new primitives for
design and drafting. It is already obvious that the league of avant garde architecture
and design is consistently and vigorously exploring the X, Y and Z axes, new
primitives of design have evolved over the years; design is now aided by what in this
study will be called Comganisms5. Comganisms like the Spline, the B-spline and the
NURBS now seem to hold centre stage in contemporary design. The motive of this
study effort is not to go through the already busy intellectual and highly experimental
super-highway of the chemical and mechanical properties of mud, but to pave a new
but definite street into how mud can be mutated and adapted to behave like a
membrane, a skin, and a medium of functioning textural capabilities. Mud can also be
redefined to adapt to and mimic the new primitives in computer aided design. This
brand of information can allow simulation of material behaviour and conceptual
design to be carried out simultaneously. It also gives architects in developing
countries like Nigeria a valid, realistic and cost effective chance of further exploring
the welter of functionalities in more free-form design generated via non uniform
3 Clay, mud and adobe will often be used in lieu of each other since the character
under consideration is common to the three types of earth forms.
4 This advanced system of coating clay actually goes beyond 'coating' but engages a
high class chemical and mechanical system that allows the colours or 'coat' to be
grafted on the clay at an almost molecular level making fading and scratching
impossible on the finished work.
5 A blend of the words 'computer' and 'organisms' to mean computer organisms, this
can be described as a single functioning entity capable of independent existence
within the interface of a computer, especially in computer aided design. Comganisms
are capable of articulated grouping and regrouping, to form autopoietic and (or) semi-
autopoietic generated systems and models.
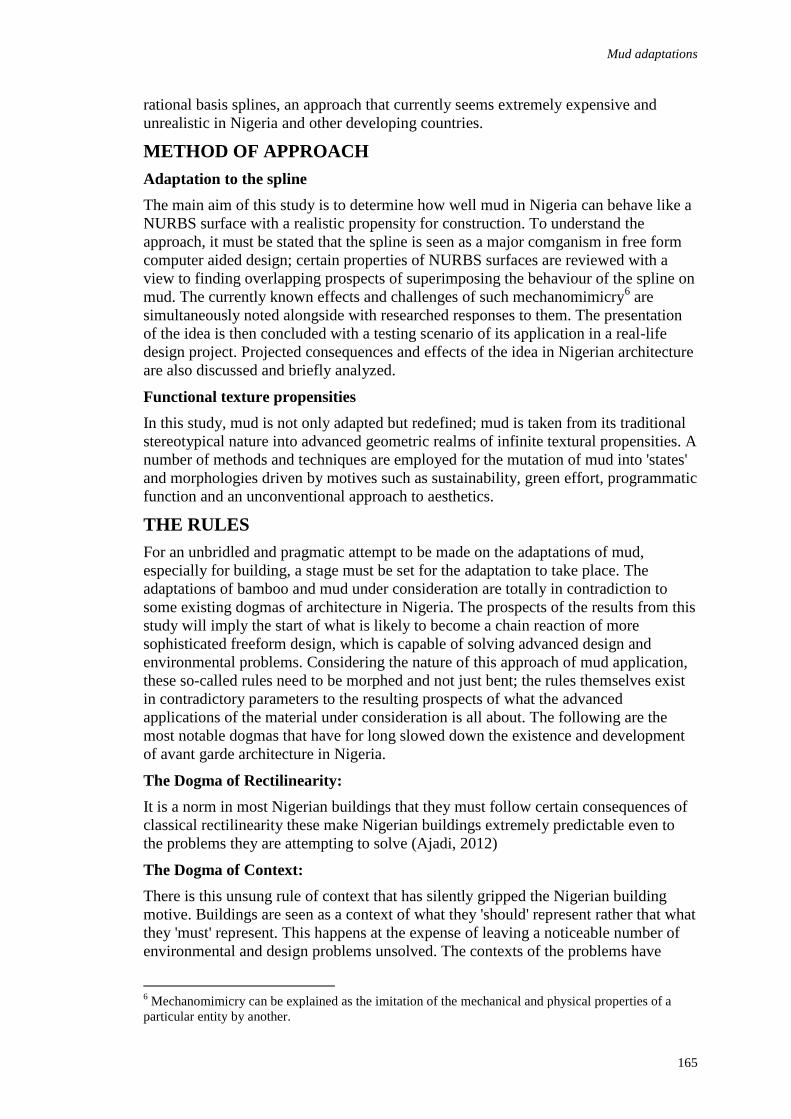
Mud adaptations
165
rational basis splines, an approach that currently seems extremely expensive and
unrealistic in Nigeria and other developing countries.
METHOD OF APPROACH
Adaptation to the spline
The main aim of this study is to determine how well mud in Nigeria can behave like a
NURBS surface with a realistic propensity for construction. To understand the
approach, it must be stated that the spline is seen as a major comganism in free form
computer aided design; certain properties of NURBS surfaces are reviewed with a
view to finding overlapping prospects of superimposing the behaviour of the spline on
mud. The currently known effects and challenges of such mechanomimicry6 are
simultaneously noted alongside with researched responses to them. The presentation
of the idea is then concluded with a testing scenario of its application in a real-life
design project. Projected consequences and effects of the idea in Nigerian architecture
are also discussed and briefly analyzed.
Functional texture propensities
In this study, mud is not only adapted but redefined; mud is taken from its traditional
stereotypical nature into advanced geometric realms of infinite textural propensities. A
number of methods and techniques are employed for the mutation of mud into 'states'
and morphologies driven by motives such as sustainability, green effort, programmatic
function and an unconventional approach to aesthetics.
THE RULES
For an unbridled and pragmatic attempt to be made on the adaptations of mud,
especially for building, a stage must be set for the adaptation to take place. The
adaptations of bamboo and mud under consideration are totally in contradiction to
some existing dogmas of architecture in Nigeria. The prospects of the results from this
study will imply the start of what is likely to become a chain reaction of more
sophisticated freeform design, which is capable of solving advanced design and
environmental problems. Considering the nature of this approach of mud application,
these so-called rules need to be morphed and not just bent; the rules themselves exist
in contradictory parameters to the resulting prospects of what the advanced
applications of the material under consideration is all about. The following are the
most notable dogmas that have for long slowed down the existence and development
of avant garde architecture in Nigeria.
The Dogma of Rectilinearity:
It is a norm in most Nigerian buildings that they must follow certain consequences of
classical rectilinearity these make Nigerian buildings extremely predictable even to
the problems they are attempting to solve (Ajadi, 2012)
The Dogma of Context:
There is this unsung rule of context that has silently gripped the Nigerian building
motive. Buildings are seen as a context of what they 'should' represent rather that what
they 'must' represent. This happens at the expense of leaving a noticeable number of
environmental and design problems unsolved. The contexts of the problems have
6 Mechanomimicry can be explained as the imitation of the mechanical and physical properties of a
particular entity by another.
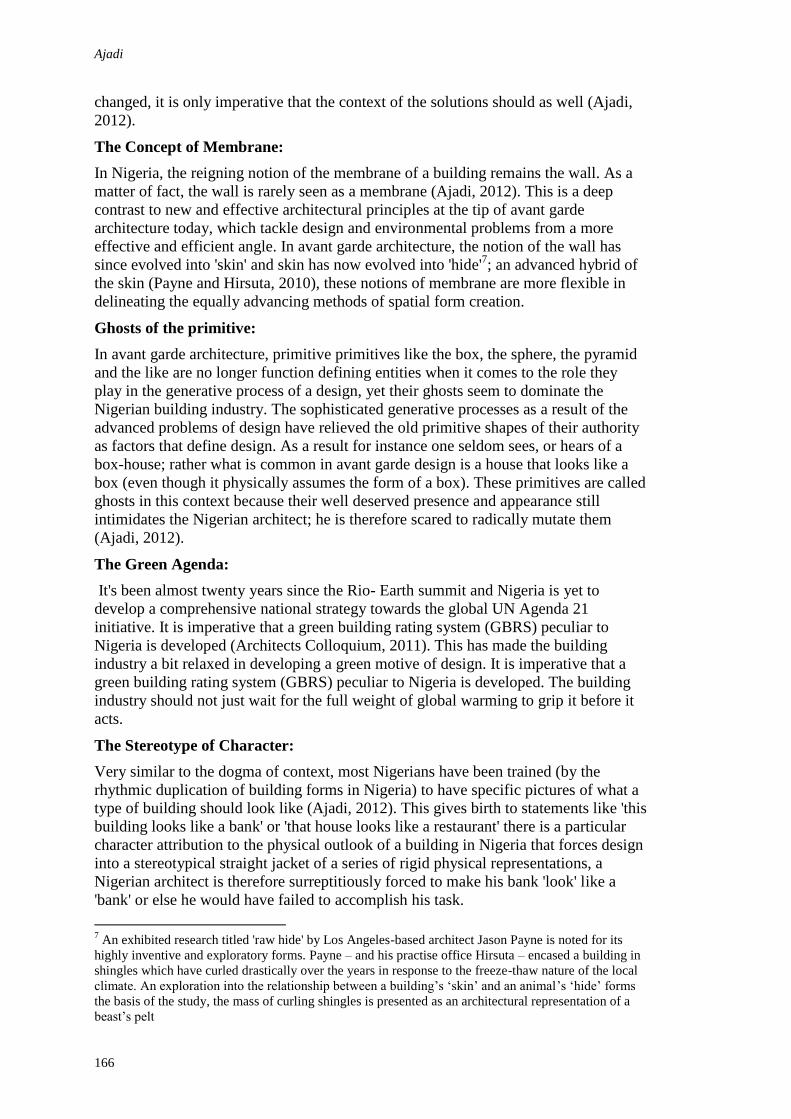
Ajadi
166
changed, it is only imperative that the context of the solutions should as well (Ajadi,
2012).
The Concept of Membrane:
In Nigeria, the reigning notion of the membrane of a building remains the wall. As a
matter of fact, the wall is rarely seen as a membrane (Ajadi, 2012). This is a deep
contrast to new and effective architectural principles at the tip of avant garde
architecture today, which tackle design and environmental problems from a more
effective and efficient angle. In avant garde architecture, the notion of the wall has
since evolved into 'skin' and skin has now evolved into 'hide'7; an advanced hybrid of
the skin (Payne and Hirsuta, 2010), these notions of membrane are more flexible in
delineating the equally advancing methods of spatial form creation.
Ghosts of the primitive:
In avant garde architecture, primitive primitives like the box, the sphere, the pyramid
and the like are no longer function defining entities when it comes to the role they
play in the generative process of a design, yet their ghosts seem to dominate the
Nigerian building industry. The sophisticated generative processes as a result of the
advanced problems of design have relieved the old primitive shapes of their authority
as factors that define design. As a result for instance one seldom sees, or hears of a
box-house; rather what is common in avant garde design is a house that looks like a
box (even though it physically assumes the form of a box). These primitives are called
ghosts in this context because their well deserved presence and appearance still
intimidates the Nigerian architect; he is therefore scared to radically mutate them
(Ajadi, 2012).
The Green Agenda:
It's been almost twenty years since the Rio- Earth summit and Nigeria is yet to
develop a comprehensive national strategy towards the global UN Agenda 21
initiative. It is imperative that a green building rating system (GBRS) peculiar to
Nigeria is developed (Architects Colloquium, 2011). This has made the building
industry a bit relaxed in developing a green motive of design. It is imperative that a
green building rating system (GBRS) peculiar to Nigeria is developed. The building
industry should not just wait for the full weight of global warming to grip it before it
acts.
The Stereotype of Character:
Very similar to the dogma of context, most Nigerians have been trained (by the
rhythmic duplication of building forms in Nigeria) to have specific pictures of what a
type of building should look like (Ajadi, 2012). This gives birth to statements like 'this
building looks like a bank' or 'that house looks like a restaurant' there is a particular
character attribution to the physical outlook of a building in Nigeria that forces design
into a stereotypical straight jacket of a series of rigid physical representations, a
Nigerian architect is therefore surreptitiously forced to make his bank 'look' like a
'bank' or else he would have failed to accomplish his task.
7 An exhibited research titled 'raw hide' by Los Angeles-based architect Jason Payne is noted for its
highly inventive and exploratory forms. Payne – and his practise office Hirsuta – encased a building in
shingles which have curled drastically over the years in response to the freeze-thaw nature of the local
climate. An exploration into the relationship between a building’s ‘skin’ and an animal’s ‘hide’ forms
the basis of the study, the mass of curling shingles is presented as an architectural representation of a
beast’s pelt
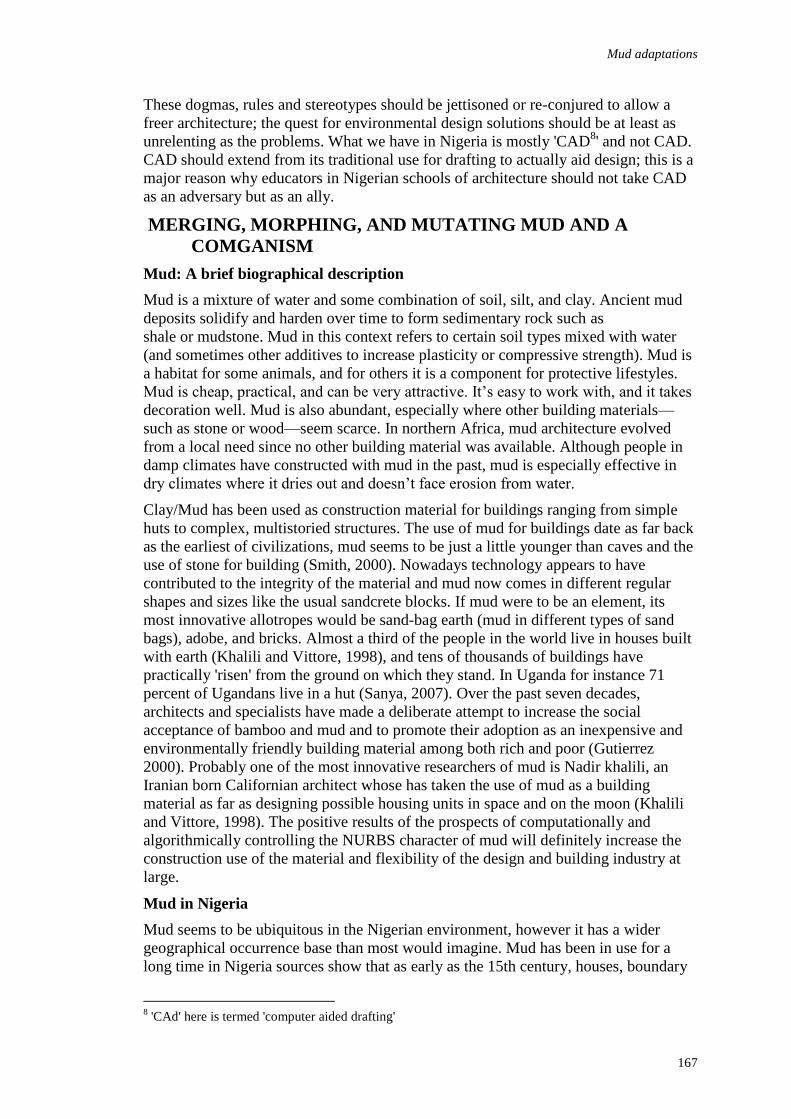
Mud adaptations
167
These dogmas, rules and stereotypes should be jettisoned or re-conjured to allow a
freer architecture; the quest for environmental design solutions should be at least as
unrelenting as the problems. What we have in Nigeria is mostly 'CAD8' and not CAD.
CAD should extend from its traditional use for drafting to actually aid design; this is a
major reason why educators in Nigerian schools of architecture should not take CAD
as an adversary but as an ally.
MERGING, MORPHING, AND MUTATING MUD AND A
COMGANISM
Mud: A brief biographical description
Mud is a mixture of water and some combination of soil, silt, and clay. Ancient mud
deposits solidify and harden over time to form sedimentary rock such as
shale or mudstone. Mud in this context refers to certain soil types mixed with water
(and sometimes other additives to increase plasticity or compressive strength). Mud is
a habitat for some animals, and for others it is a component for protective lifestyles.
Mud is cheap, practical, and can be very attractive. It’s easy to work with, and it takes
decoration well. Mud is also abundant, especially where other building materials—
such as stone or wood—seem scarce. In northern Africa, mud architecture evolved
from a local need since no other building material was available. Although people in
damp climates have constructed with mud in the past, mud is especially effective in
dry climates where it dries out and doesn’t face erosion from water.
Clay/Mud has been used as construction material for buildings ranging from simple
huts to complex, multistoried structures. The use of mud for buildings date as far back
as the earliest of civilizations, mud seems to be just a little younger than caves and the
use of stone for building (Smith, 2000). Nowadays technology appears to have
contributed to the integrity of the material and mud now comes in different regular
shapes and sizes like the usual sandcrete blocks. If mud were to be an element, its
most innovative allotropes would be sand-bag earth (mud in different types of sand
bags), adobe, and bricks. Almost a third of the people in the world live in houses built
with earth (Khalili and Vittore, 1998), and tens of thousands of buildings have
practically 'risen' from the ground on which they stand. In Uganda for instance 71
percent of Ugandans live in a hut (Sanya, 2007). Over the past seven decades,
architects and specialists have made a deliberate attempt to increase the social
acceptance of bamboo and mud and to promote their adoption as an inexpensive and
environmentally friendly building material among both rich and poor (Gutierrez
2000). Probably one of the most innovative researchers of mud is Nadir khalili, an
Iranian born Californian architect whose has taken the use of mud as a building
material as far as designing possible housing units in space and on the moon (Khalili
and Vittore, 1998). The positive results of the prospects of computationally and
algorithmically controlling the NURBS character of mud will definitely increase the
construction use of the material and flexibility of the design and building industry at
large.
Mud in Nigeria
Mud seems to be ubiquitous in the Nigerian environment, however it has a wider
geographical occurrence base than most would imagine. Mud has been in use for a
long time in Nigeria sources show that as early as the 15th century, houses, boundary
8 'CAd' here is termed 'computer aided drafting'

Ajadi
168
walls and roofs in northern towns were built of mud (Ogunsote, 2006). In Nigeria,
mud seems to be used everywhere from the sun baked north to the rain infested south,
mud has represented a traditional means of building in Nigeria as far back as the
history of traditional architecture goes (Anslem and Ojonigu, 2010; Dmochowski,
1990; Moughtin, 1985; Rikko and Gwatau, 2011). Although the use of the material
varies slightly in its preparation and method of engagement among different cultures,
houses in rectangular and circular plans are the most common. In Nigeria, mud is still
widely used via the wattle and dub technique up till today. The most admirable thing
about mud architecture in Nigeria perhaps is the conservative love for the building
material; in fact it is not strange to find an array of mud huts very close to an urban
settlement with modern architecture. However, as much as Nigerians respect the use
of mud for building, it is common to find a lot of them very reluctant to try it out in its
most innovative form in modern buildings. A big exception of this however is Benue
state, where one out of every three residential building is built of burnt mud bricks9
Mechanical properties10
Only the mechanical properties with close relationship to the current adaptation are
experimentally confirmed and mentioned here. The most popular building standard
code for earth in Africa remains the Zimbabwe Standard Code of Practice for
Rammed Earth Structures (SAZS 724:2001, 2001).
Bending Strength
In the absence of direct experimental data, the design characteristic bending strength
of rammed earth should normally be taken as zero (Standards Australia, 2002).
Modulus of Elasticity
In the absence of direct experimental data the New Zealand Standard (NZS
4297:1998, 1998) takes the modulus of elasticity for earth wall construction as three
hundred times the characteristic compressive strength value.
Compressive strength
The compressive strength of earth is delineated in the Zimbabwe standard practice
code as rammed earth:
Table 1: compressive strength requirements of the Zimbabwe Standard Code of Practice for Rammed
Earth Structures (SAZS 724:2001, 2001)
Mechanical property Bungalow One
storey
walls
Two storey
walls
compressive strength(N/mm2) 1.5 1.5 2.0
Major centres of rammed earth construction include North Africa, Australasia, regions
of North and South America, China and Europe, including France, Germany and
Spain (Maniatidis and Walker, 2003).
9 The mentioned statistical information is based on a statistical research carried out by
Stephen Ajadi in Benue state (2012) as part of an ongoing research into mud
architecture in Benue state.
10 A reasonable effort will be made to avoid the detailed numerical delineation of the
mechanical properties of mud, this is because the primary aim here is to adapt the
material and not to analyze its properties.

Mud adaptations
169
The Puzzle Method11
This method is devised by the author to turn patches of mud into ceramic control
polygons on a NURBS surface. The idea is synonymous to a broken mug being glued
back together. This method relies on the behavioural integrity of the spline, and the
ease at which fluid clay can be adapted to achieve G0,G1, and G2 continuity levels
even in the most complex NURBS surfaces, since all that is needed is only a mould of
the surface to be adapted to. The spline remains one of the most basic and integral
new primitives of the CAD age, almost all free form diagrams and figures are
secondary to it. NURBS curves and surfaces are generalizations of both B-
splines and Bézier curves and surfaces, the main difference however is the weighting
of the control points which makes NURBS curves 'rational' (non-rational B-splines are
a special case of rational B-splines). Where Bézier curves evolve into only one
parametric direction, usually designated s or u, NURBS surfaces evolve into two
parametric directions, called s and t or u and v. The NURBS curve can be represented
in Cartesian two- or three-dimensional space. This is because it is possible to
regenerate a polynomial function ( the basic function of splines) in a polar form
through what Lyle Ramshaw (1986) refers to as a unique systemic multi affine
function (Ramshaw,1987) in this way, by evaluating a NURBS surface at various
values of the two parameters, the surface can be represented in Cartesian space. This
interesting possibility makes it easier to locate connected patches of NURBS surfaces
(control polygons) in space. These patches joined together like an organized puzzle at
different levels of continuity can be isolated and individually casted out via basic
methods of ceramics, and then reassembled to achieve a clay version of the NURBS
surface (see Fig 1-3). The thickness of the source will depend on the mechanical
requirements of the characteristics of clay with respect to the form of the surface. This
can be simulated along with the generative process of the NURBS surface. As seen in
the illustrations below, a case is studied in which two absolutely identical NURBS
surfaces are generated via CAD and divided into 67 identical polygons. To delineate
the idea of the puzzle method, some regions of the NURBS surface are aggregated and
highlighted (see Fig. 1). The selected aggregates of the control polygons are then
isolated in a simple fragmentation of the surface. These aggregates of controls
polygons are then extruded along their surface to generate a surface with thickness
(called a slablet) Molds for the slablets can then be generated via CAM12
and mud
versions of the aggregate polygons can subsequently be manufactured via simple but
elaborate techniques of ceramics to fabricate the NURBS surface. The mold for the
slablets will include a joint piece in form of a tongue and groove joint; this is decided
as an effective fastening method in order to achieve a monolithic feel. Adequate
joineries can then be filled into the grooves created by the joints as the surface comes
into being. Further finishing techniques can be employed such as glazing and spray
polishing to bring out a water-proof glassy impression.
Concerns
The structural implications of the surfaces are of great importance in the puzzle
method of mud adaptation. Careful calculations need to be made in order to generate
11
Here the mathematics of the spline, b-spline, and NURBS will be dealt with based
on an assumption that the reader has a prior knowledge of them, reading of papers and
materials on the introduction to splines is therefore encouraged.
12 CAM: Computer Aided Manufacturing
Ajadi
170
surfaces that will pose minimum structural concern. The reinforcement of mud can
also spawn greater possibilities of surface achievements. It must not be ignored that as
it is with the case of almost any construction of free form surfaces with impressive
continuity levels, CAM cannot be ruled out in order to make the construction process
accurate, time efficient and easy. In this case, CAM will be a suitable method for the
fabrication of molds for the polygon aggregates. It must also be noted that for less
complex surfaces, the polygons can be fabricated individually instead of in hybrid
aggregates. Due to the fledgling stage of this method, small to medium size surfaces
should first be attempted, with preference as interior design components until more is
learnt about the prospects and weaknesses of the method.
Fig. 1: Two identical NURBS surfaces divided each into 67 control polygons showing 6
selected aggregates
Fig. 2: The puzzle method of converting control polygons to mud slabs.
Fig. 3: A typical joinery method of a slab of burnt mud in the puzzle method.
MUD: MOLDING MORPHOLOGIES
Here, mud is experimented on in terms of thermal comfort and its use as a building
membrane that is not wall-like. Though slightly different; clay and mud are looked at
here from the perspective of their texture, a surreptitious reason why most builders
and architects avoid building with it. It has this rough 'old school-village' feel and it
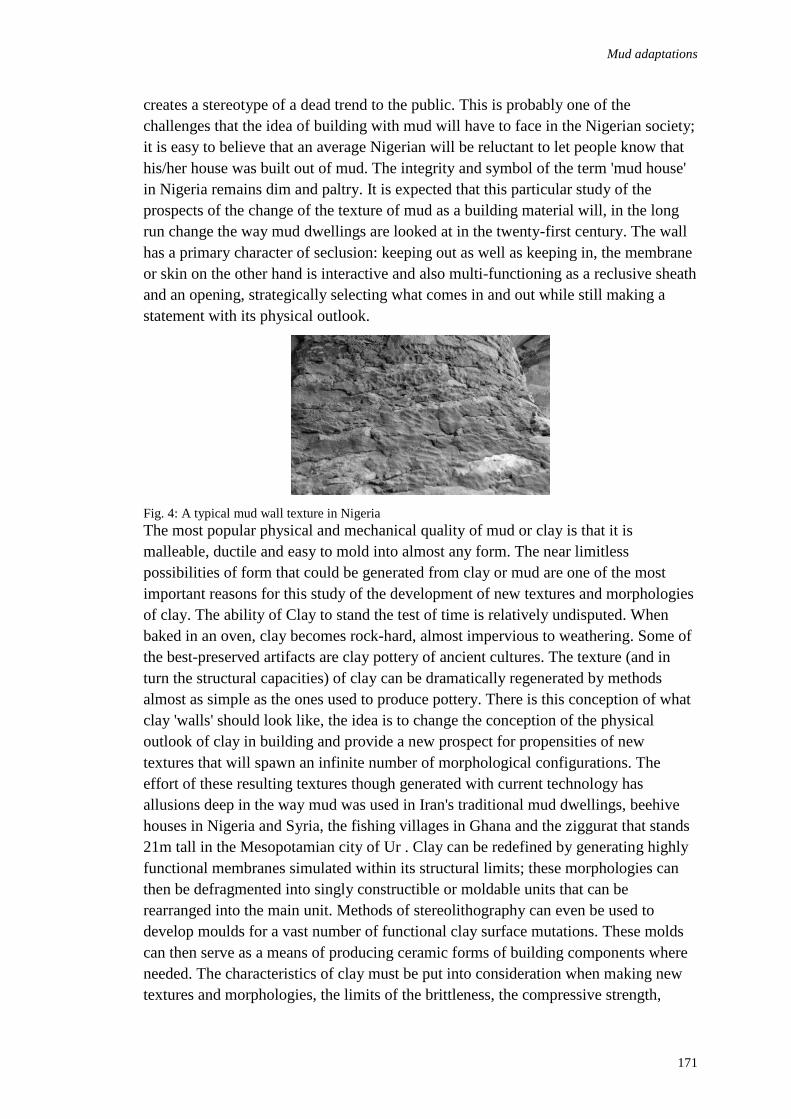
Mud adaptations
171
creates a stereotype of a dead trend to the public. This is probably one of the
challenges that the idea of building with mud will have to face in the Nigerian society;
it is easy to believe that an average Nigerian will be reluctant to let people know that
his/her house was built out of mud. The integrity and symbol of the term 'mud house'
in Nigeria remains dim and paltry. It is expected that this particular study of the
prospects of the change of the texture of mud as a building material will, in the long
run change the way mud dwellings are looked at in the twenty-first century. The wall
has a primary character of seclusion: keeping out as well as keeping in, the membrane
or skin on the other hand is interactive and also multi-functioning as a reclusive sheath
and an opening, strategically selecting what comes in and out while still making a
statement with its physical outlook.
Fig. 4: A typical mud wall texture in Nigeria
The most popular physical and mechanical quality of mud or clay is that it is
malleable, ductile and easy to mold into almost any form. The near limitless
possibilities of form that could be generated from clay or mud are one of the most
important reasons for this study of the development of new textures and morphologies
of clay. The ability of Clay to stand the test of time is relatively undisputed. When
baked in an oven, clay becomes rock-hard, almost impervious to weathering. Some of
the best-preserved artifacts are clay pottery of ancient cultures. The texture (and in
turn the structural capacities) of clay can be dramatically regenerated by methods
almost as simple as the ones used to produce pottery. There is this conception of what
clay 'walls' should look like, the idea is to change the conception of the physical
outlook of clay in building and provide a new prospect for propensities of new
textures that will spawn an infinite number of morphological configurations. The
effort of these resulting textures though generated with current technology has
allusions deep in the way mud was used in Iran's traditional mud dwellings, beehive
houses in Nigeria and Syria, the fishing villages in Ghana and the ziggurat that stands
21m tall in the Mesopotamian city of Ur . Clay can be redefined by generating highly
functional membranes simulated within its structural limits; these morphologies can
then be defragmented into singly constructible or moldable units that can be
rearranged into the main unit. Methods of stereolithography can even be used to
develop moulds for a vast number of functional clay surface mutations. These molds
can then serve as a means of producing ceramic forms of building components where
needed. The characteristics of clay must be put into consideration when making new
textures and morphologies, the limits of the brittleness, the compressive strength,
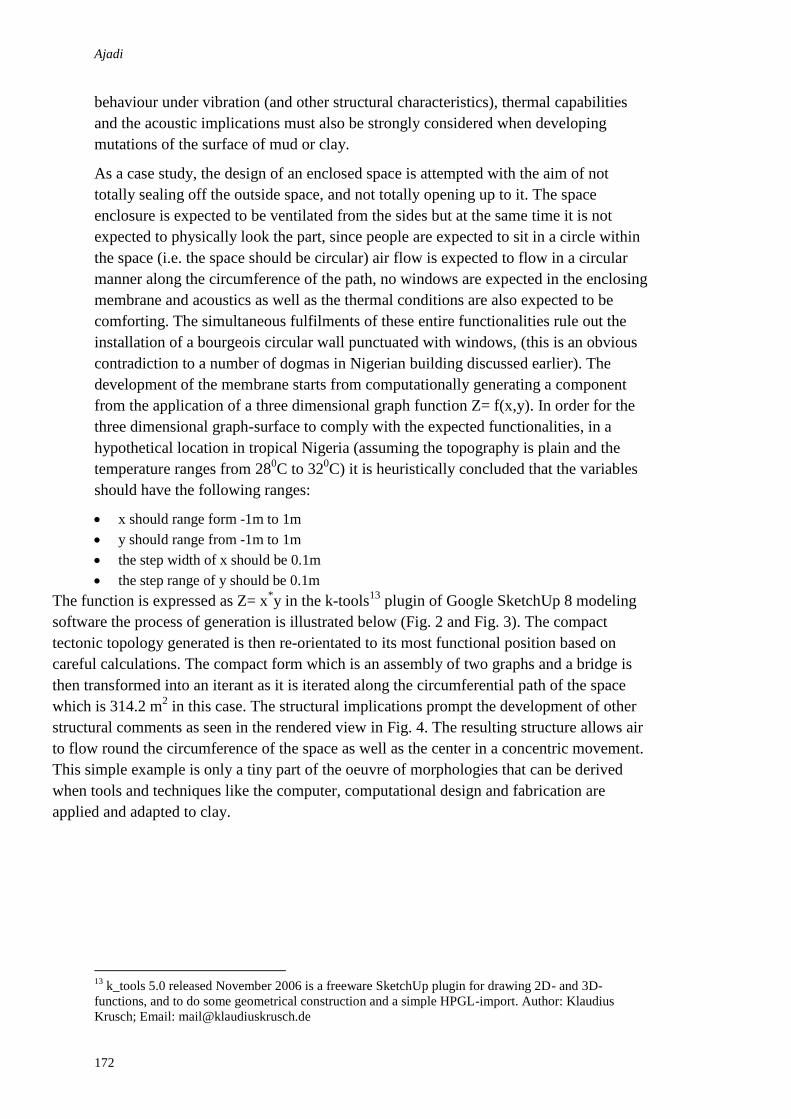
Ajadi
172
behaviour under vibration (and other structural characteristics), thermal capabilities
and the acoustic implications must also be strongly considered when developing
mutations of the surface of mud or clay.
As a case study, the design of an enclosed space is attempted with the aim of not
totally sealing off the outside space, and not totally opening up to it. The space
enclosure is expected to be ventilated from the sides but at the same time it is not
expected to physically look the part, since people are expected to sit in a circle within
the space (i.e. the space should be circular) air flow is expected to flow in a circular
manner along the circumference of the path, no windows are expected in the enclosing
membrane and acoustics as well as the thermal conditions are also expected to be
comforting. The simultaneous fulfilments of these entire functionalities rule out the
installation of a bourgeois circular wall punctuated with windows, (this is an obvious
contradiction to a number of dogmas in Nigerian building discussed earlier). The
development of the membrane starts from computationally generating a component
from the application of a three dimensional graph function Z= f(x,y). In order for the
three dimensional graph-surface to comply with the expected functionalities, in a
hypothetical location in tropical Nigeria (assuming the topography is plain and the
temperature ranges from 280C to 32
0C) it is heuristically concluded that the variables
should have the following ranges:
x should range form -1m to 1m
y should range from -1m to 1m
the step width of x should be 0.1m
the step range of y should be 0.1m
The function is expressed as Z= x*y in the k-tools
13 plugin of Google SketchUp 8 modeling
software the process of generation is illustrated below (Fig. 2 and Fig. 3). The compact
tectonic topology generated is then re-orientated to its most functional position based on
careful calculations. The compact form which is an assembly of two graphs and a bridge is
then transformed into an iterant as it is iterated along the circumferential path of the space
which is 314.2 m2 in this case. The structural implications prompt the development of other
structural comments as seen in the rendered view in Fig. 4. The resulting structure allows air
to flow round the circumference of the space as well as the center in a concentric movement.
This simple example is only a tiny part of the oeuvre of morphologies that can be derived
when tools and techniques like the computer, computational design and fabrication are
applied and adapted to clay.
13
k_tools 5.0 released November 2006 is a freeware SketchUp plugin for drawing 2D- and 3D-
functions, and to do some geometrical construction and a simple HPGL-import. Author: Klaudius
Krusch; Email: [email protected]
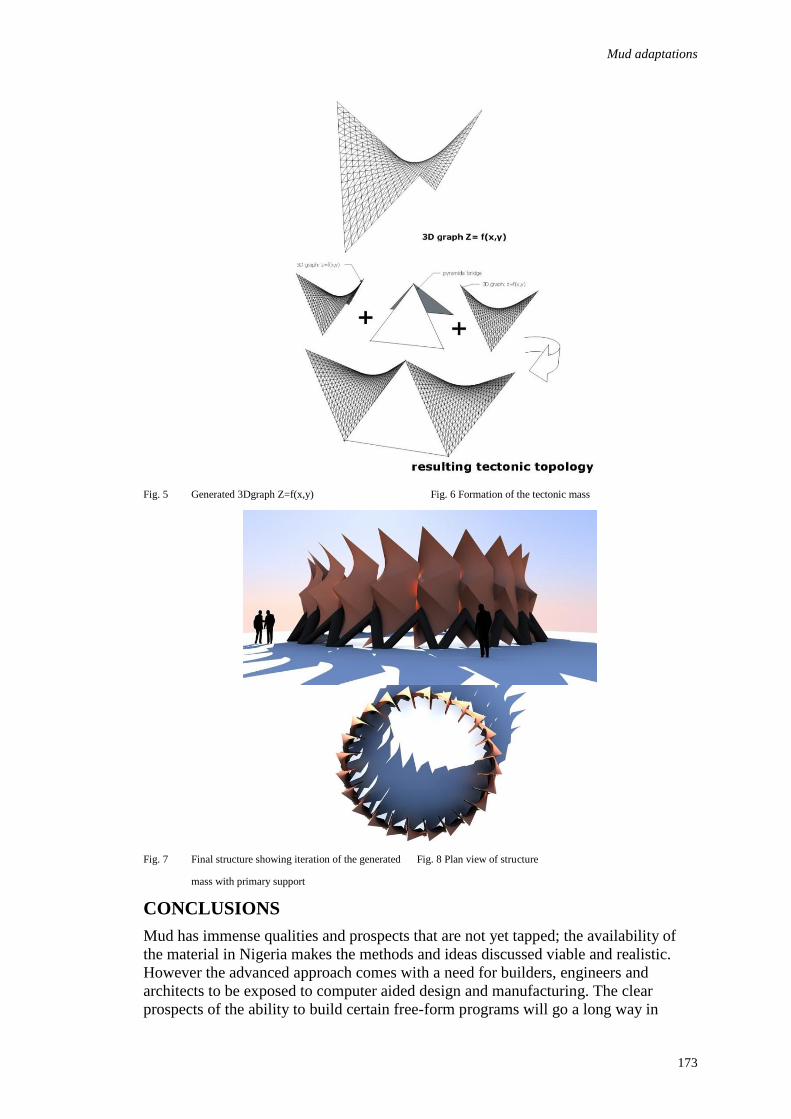
Mud adaptations
173
Fig. 5 Generated 3Dgraph Z=f(x,y) Fig. 6 Formation of the tectonic mass
Fig. 7 Final structure showing iteration of the generated Fig. 8 Plan view of structure
mass with primary support
CONCLUSIONS
Mud has immense qualities and prospects that are not yet tapped; the availability of
the material in Nigeria makes the methods and ideas discussed viable and realistic.
However the advanced approach comes with a need for builders, engineers and
architects to be exposed to computer aided design and manufacturing. The clear
prospects of the ability to build certain free-form programs will go a long way in
Ajadi
174
helping the twenty-first century Nigerian architect rise to the impending challenges in
the Nigerian building and design industry. Design must evolve to encompass
computational design and computer aided manufacturing (CAM) and fabrication, via
empirical and advanced 3D printing as well as advanced sterolithography amongst
others. The Nigerian architect must be fearless in his/her search for advanced
alternative options of design and planning. High class research must be encouraged in
the schools of architecture from the grass root level. There is very little manual
drafting can do in the development of advanced proto-design systems and biomimetic
architecture for instance. Students must also learn to solve foreign architecture
problems in different countries in order for them to gain a global perspective on the
problems facing design. This will give future architects a more rigid intellectual
stamina in dealing with the design problems of Nigeria. It is obvious that an avant
garde approach to architecture comes with a price, but Nigeria is well capable of
handling the cost of making her cities and villages a better and safer place to live in. If
we can spend a lot of money on our clothes, our cars, and the salaries of our
statesmen, it is only logical, ethical and absolutely moral to spend on the motive of
creating a place where all these can thrive.
REFERENCES
Ajadi S. (2012) " Ghosts of the Primitives: The Predicament of X, Y, Z in Nigerian
Architecture" Sun National Newspaper April 1, Volume 6. NO. 468, Lagos, Aba,
Abuja, ISSN 0795-7475. p.46
Anselm E.O. and Ojonigu F.A "The Influence of Rainfall on Hausa Traditional Architecture"
Research Journal of Applied Sciences, Engineering and Technology Volume 2(8),
ISSN: 2040-7467. pp: 695-702.
Architects Colloquium (2011), "Architecture and the Nigerian Development Agenda IV-
Sustainable Built Environment." Comprehensive Report of proceedings. ARCON,
Nigeria.
Dmochowski, Z.R.(1990). "An Introduction to Nigerian Architecture - Northern Nigeria."
Ethnographica Ltd., London. pp: 4-10.
Gutierrez, J.A. (2000). "Structural Adequacy of Traditional Bamboo Housing in Latin
America". INBAR Technical Report No. 19. International Network for Bamboo and
Rattan, Beijing, China.
ICOMOS (2004) "International council on monuments and sites", documentation, earth
architecture, bibliography, Paris. Retrieved March-09-2012 from
< http://www.international.icomos.org/18thapril/earth-bibl.pdf />.
Khalili N. and Vittore P., (1998) "Earth Architecture and Ceramics: the sandbag/super adobe
and super block construction system." Building Standards, California. Retrieved
March-09-2012 from <http://building standards_septoct98_calearth.pdf>
Maniatidis V. and Walker P. (2003) "Review of Rammed Earth Construction for DTi Partners
in Innovation Project: Developing Rammed Earth for UK Housing "Natural Building
Technology Group, Bath, University of Bath.
Moughtin, J.C., 1985. Hausa Architecture. Ethnographica Ltd., London, pp: 1-12.
NZS 4297:1998 (1998) "New Zealand Standard. Engineering Design of Earth Buildings".
Standard New Zealand, Wellington, New Zealand.
Ogunsote .B. (2006), ''Classification of Nigerian Architecture''. AARCHES Journal
Volume1,No. 6, Michigan, Michigan press, pp. 48-56

Mud adaptations
175
Payne J. and Hirsuta (2011),"Rawhide: The New shingle Style" SCI-ARC gallery exhibition
July 29 – September 11, South California Institute of Architecture.
Ramshaw L. (1987) "Blossoming: A connect-the-dots approach to splines", Research Report
19, Compaq Systems Research Center, Palo Alto, CA.
Rikko L.S. and Gwatau D. (2011) " The Nigerian architecture: The trend in housing
development" Journal of Geography and Regional Planning Vol. 4(5), May, ISSN
2070-1845. pp. 273-278. Also retrievable from:
http://www.academicjournals.org/JGRP
Sanya T. (2007), "Living in Earth: the sustainability of earth architecture in Uganda" Doctoral
Thesis at The Oslo School of Architecture and Design, Unipub AS: Oslo p.110
SAZS 724:2001 (2001), "Zimbabwe Standard. Rammed Earth Structures." Standards
Association of Zimbabwe, Harare, Zimbabwe.
Schreckenbach H. (1985), "Mud as a building material in developing countries- Primitive or
appropriate?" GTZ GATE Ed. Worner B., Deutsche Gesellschaft, ISSN 0823-
2225.Retrieved March-28-2012 from:
http://collections.infocollections.org/ukedu/uk/d/Jgq851e/3.2.html
Smith M. (2000), "The History of Cob" Retrieved March-28-2012 from:
http://www.networkearth.org/naturalbuilding/history.html
Standards Australia (2002) "The Australian earth building handbook". Standards Australia,
Sydney, Australia.
United Nations (1964) "Soil-cement, its use in building". United Nations Publications, New
York, USA.

Ajagbe, W.O., Agbede, O.A. and Dahunsi, B.I.O. (2012) Effect of crude oil impacted sand on the
properties of concrete In: Laryea, S., Agyepong, S.A., Leiringer, R. and Hughes, W. (Eds) Procs 4th
West Africa Built Environment Research (WABER) Conference, 24-26 July 2012, Abuja, Nigeria, 177-
189.
177
EFFECT OF CRUDE OIL IMPACTED SAND ON THE
PROPERTIES OF CONCRETE
Wasiu Olabamiji Ajagbe1, O A Agbede and B I O Dahunsi
Department of Civil Engineering, University of Ibadan, Ibadan, Nigeria
This study investigates the effect of Crude Oil Impacted Sand (COIS) on some
engineering properties of fresh and hardened concrete. Total Petroleum Hydrocarbon
(TPH) test was carried out on samples from the study area to determine the level of
crude oil contamination. Based on the test results, six levels (2.5%, 5%, 10%, 15%,
20% and 25%) of artificial contaminated sand were prepared and engineering
properties including slump, compacting-factor, flow-table, compressive-strength,
flexural-strength, water-absorption, linear-shrinkage, surface-resistivity, and fire-
resistance were determined using standard methods. Predictive models were
developed and concrete mixes were designed using COIS for reinforced concrete
stuctures. TPH of the soil samples varied from 8.6 to 14.1%. The slump, compacting-
factor, flow-table, and surface-resistivity of the COIS concrete increased with levels
of contamination. Compressive-strength, flexural-strength, shrinkage, water-
absorption and fire-resistance of the COIS concrete reduced with increased level of
contamination. Coefficient of determination, R2, of the models ranged from 0.823 to
0.998. Mix ratio of 1: 1.6 : 2.4 of cement : COIS: coarse aggregate was found to be
appropriate at 0.45 w/c. The Crude Oil Impacted Sand concrete with not more than
10% contamination is suitable for use in low strength structures.
Keywords: crude oil, contaminated sand, concrete, compressive strength,
durability
INTRODUCTION
For over three decades Nigeria has continued to experience remarkable increase in
operational activities in her oil and gas exploration and exploitation. Oil spills occur
during this process also by pipeline vandalism and leakages. Inadequate care on oil
production operation and transportation which centered on Niger-Delta region has
been mired by various degrees of environmental pollution problems including
contaminated sand (Ukoli, 2001).
The amount of crude oil contamination of soil and the environment has continually
increased, and presently it constitutes a significant fraction of waste materials in the
environment.
The presence of contaminant in large degree in aggregates does not only affect the
appearance of concrete (in terms of colour and odour) but also the strength and
durability developed by the concrete (British Cement Association, 2001). The effect
of crude oil on some properties of concrete in a crude oil environment had been
considered by some authors (Matti, 1976; Faiyadh, 1980; Onabolu, 1989; Abdul-Ahad
Ajayi and Omole
178
and Muhammed, 2000; Ejeh and Uche, 2009). In respect of compressive strength,
Abdul-Ahad and Muhammed (2000) observed there was high reduction in the
compressive strength and about 11% reduction in splitting-tensile strength of concrete
when soaked in crude oil. Ejeh and Uche (2009) also observed about 23% reduction in
compressive strength of concrete in undiluted crude oil medium. Similarly, effect of
some other hydrocarbons on concrete indicated a reduction in the compressive
strength of concrete (Wilson et al, 2000, Bilal et al, 2003).
This paper, however, focuses on crude oil as a contaminant of fine aggregate and
investigated the effect it has on the fresh and hardened properties of ordinary Portland
cement concrete. This actually modeled the condition in the Niger Delta area of
Nigeria where oil spillage is a regular occurrence contaminating soil and water. Many
oil spill incidents had occurred in the past (Nwilo and Badejo, 2001) and persist till
date due to pipeline vandalisms. In some areas, it may be difficult to obtain sufficient
quantities of uncontaminated aggregates but contaminated aggregates are available.
Therefore, the occasional use of contaminated aggregates for construction purposes,
particularly by local contractors, has to be considered. This forms the basis for this
study.
MATERIALS AND METHODS
Materials
The cement used for the investigation was the Ordinary Portland Cement and clean
potable water was used for concreting.
Coarse crushed aggregate used had a maximum size of 10 mm (BS 1881-Pt. 108,
1983) and was obtained from Ladson quarry in Ibadan. Fine aggregate was natural
sand obtained in Ibadan, Oyo state. Both the fine and coarse aggregates were air dried
to obtain saturated surface dry condition to ensure that water /cement ratio is not
affected. Coarse and fine aggregates conform to BS 882 (1983) specification. In this
study, sieve analysis was initially carried out to obtain the particle grading curve of
fine aggregate and its percentage passing 600 µm sieve for concrete mix design. Sieve
analyses for the aggregates were conducted in accordance to BS 812 (1989).
The crude oil was obtained in gallons from Bomu oil field in Rivers state, Nigeria.
Contaminated sand
Samples of contaminated sands were obtained from three different crude oil polluted
sites for preliminary analysis. This was intended to determine the grading of the soil
of the area and the percentage crude oil contamination of the soil in order to serve as
basis for choosing the sand type and the percentage crude oil contamination for the
research. The three sites are located at Bodo-city, Bomu, and B-Dere in Gokana LGA
of River state. The samples were obtained at an average depth of 1000 mm below the
ground level and then transported in sacks to the laboratory.
METHODS
Preliminary testing of materials
Both the fine and coarse aggregates were graded using sieve analysis, while the TPH
test was conducted on the contaminated sand to determine the amount of crude oil
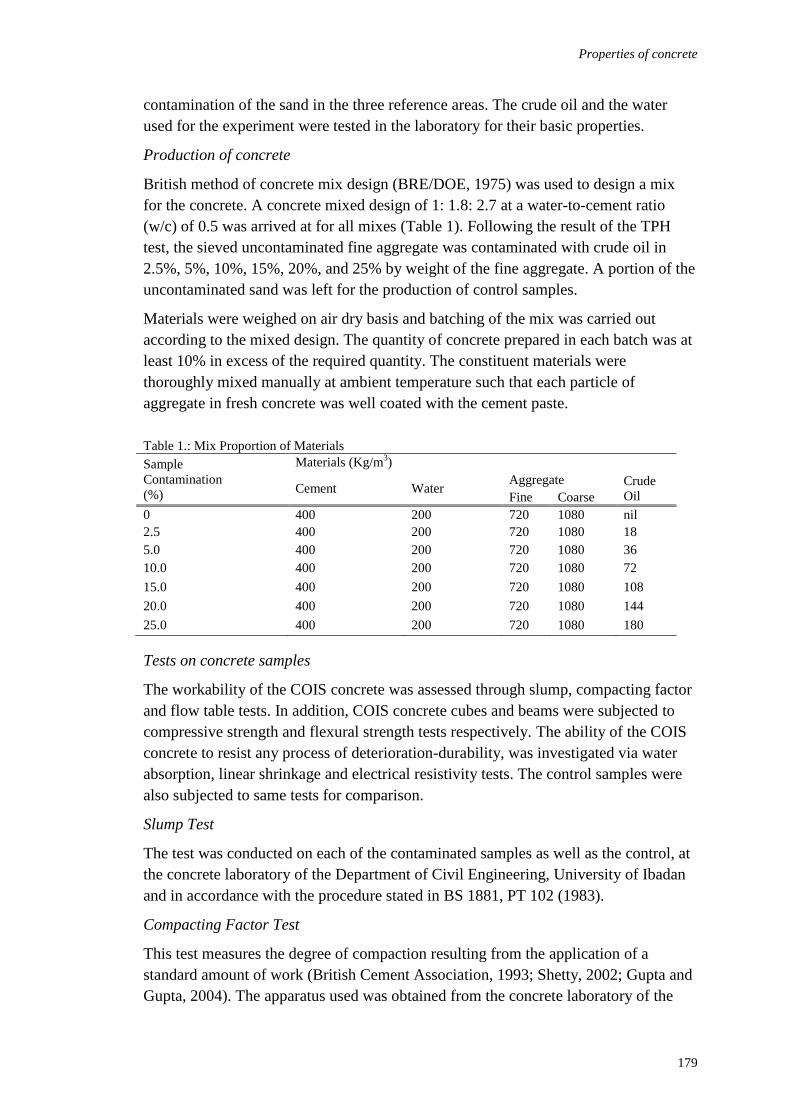
Properties of concrete
179
contamination of the sand in the three reference areas. The crude oil and the water
used for the experiment were tested in the laboratory for their basic properties.
Production of concrete
British method of concrete mix design (BRE/DOE, 1975) was used to design a mix
for the concrete. A concrete mixed design of 1: 1.8: 2.7 at a water-to-cement ratio
(w/c) of 0.5 was arrived at for all mixes (Table 1). Following the result of the TPH
test, the sieved uncontaminated fine aggregate was contaminated with crude oil in
2.5%, 5%, 10%, 15%, 20%, and 25% by weight of the fine aggregate. A portion of the
uncontaminated sand was left for the production of control samples.
Materials were weighed on air dry basis and batching of the mix was carried out
according to the mixed design. The quantity of concrete prepared in each batch was at
least 10% in excess of the required quantity. The constituent materials were
thoroughly mixed manually at ambient temperature such that each particle of
aggregate in fresh concrete was well coated with the cement paste.
Table 1.: Mix Proportion of Materials
Sample
Contamination
(%)
Materials (Kg/m3)
Cement Water Aggregate Crude
Oil Fine Coarse
0 400 200 720 1080 nil
2.5 400 200 720 1080 18
5.0 400 200 720 1080 36
10.0 400 200 720 1080 72
15.0 400 200 720 1080 108
20.0 400 200 720 1080 144
25.0 400 200 720 1080 180
Tests on concrete samples
The workability of the COIS concrete was assessed through slump, compacting factor
and flow table tests. In addition, COIS concrete cubes and beams were subjected to
compressive strength and flexural strength tests respectively. The ability of the COIS
concrete to resist any process of deterioration-durability, was investigated via water
absorption, linear shrinkage and electrical resistivity tests. The control samples were
also subjected to same tests for comparison.
Slump Test
The test was conducted on each of the contaminated samples as well as the control, at
the concrete laboratory of the Department of Civil Engineering, University of Ibadan
and in accordance with the procedure stated in BS 1881, PT 102 (1983).
Compacting Factor Test
This test measures the degree of compaction resulting from the application of a
standard amount of work (British Cement Association, 1993; Shetty, 2002; Gupta and
Gupta, 2004). The apparatus used was obtained from the concrete laboratory of the
Ajayi and Omole
180
Department of Civil Engineering, University of Ibadan. The test was conducted in
accordance with the procedure stated in BS 1881 PT 103 (1983) for each of the
contaminated mixes and the control.
Flow table Test
This method gives an indication of the concrete consistency and cohesiveness and also
proneness to segregation by measuring the spread of a pile of concrete subjected to
jolting. The test was conducted in accordance with the procedure stated in BS 1881
PT 105 (1983) for each of the contaminated mixes and the control.
Concrete Compressive and Flexural Strengths Tests
One hundred and forty-seven concrete cubes (100 x 100 x 100 mm) comprised of 21
controls and 126 crude oil contaminated specimens were produced in accordance to
BS 1881: Part 1(1983). The cubes were demoulded after 24hrs of casting and cured in
a water tank. The compressive strength gained was observed at ages 3, 7, 14, 28, 56,
84, and 168 days (BS 1881-116, 1983).
For the flexural strength test, 21 numbers 100 x 100 x 500 mm beams (3 No. control
and 18 No. contaminated samples) were cast and test for flexure using central point
loading test in accordance with EN 12390-5 (2000).
Water absorption test
The test was conducted on 21 (3 No. control and 18 No. contaminated samples), 100
mm concrete cubes and in accordance with BS 1881 Part 122 (1983) at the department
of Civil Engineering, University of Ibadan materials’ laboratory.
Shrinkage test
100 mm cubes were considered in this test based on ASTM C 157 recommendation.
The mould preparation was done in reference to paragraph 3.6 of ASTM C 157, and
casting of 21 (3 No. control and 18 No. contaminated samples) 100 mm concrete
cubes in reference to paragraph 3.7 ASTM C 157. As per the code requirement, the
samples were cured in lime-saturated water for 27 days and other procedures were
followed accordingly.
Concrete resistivity as an electrical indicator of its permeability
Locally fabricated Surface resistivity meter (0 to 100 KOhm-cm range, resolution of
0.1 KOhm-cm and an accuracy of +/- 3% of reading) with a Wenner linear four-probe
array, and 100 x 200 mm (4.0 x 8.0 inches) cylindrical moulds meeting the
requirements of ASTM C-470 were the major apparatus used to conduct the test
according to ASTM C-192 or ASTM C-31. A total of 21 (3 control and 18
contaminated samples) 100 x 200 mm concrete cylinders were cast for the test with
three samples cast for each of the percentage contamination and all specimens were
moist cured in accordance to ASTM-192. Using the resistivity meter, the resistance of
the concrete specimens to the flow of current were measured following the procedure
stated in the reference code and the average readings for the different categories were
recorded and used to characterize the permeability of the different specimens.
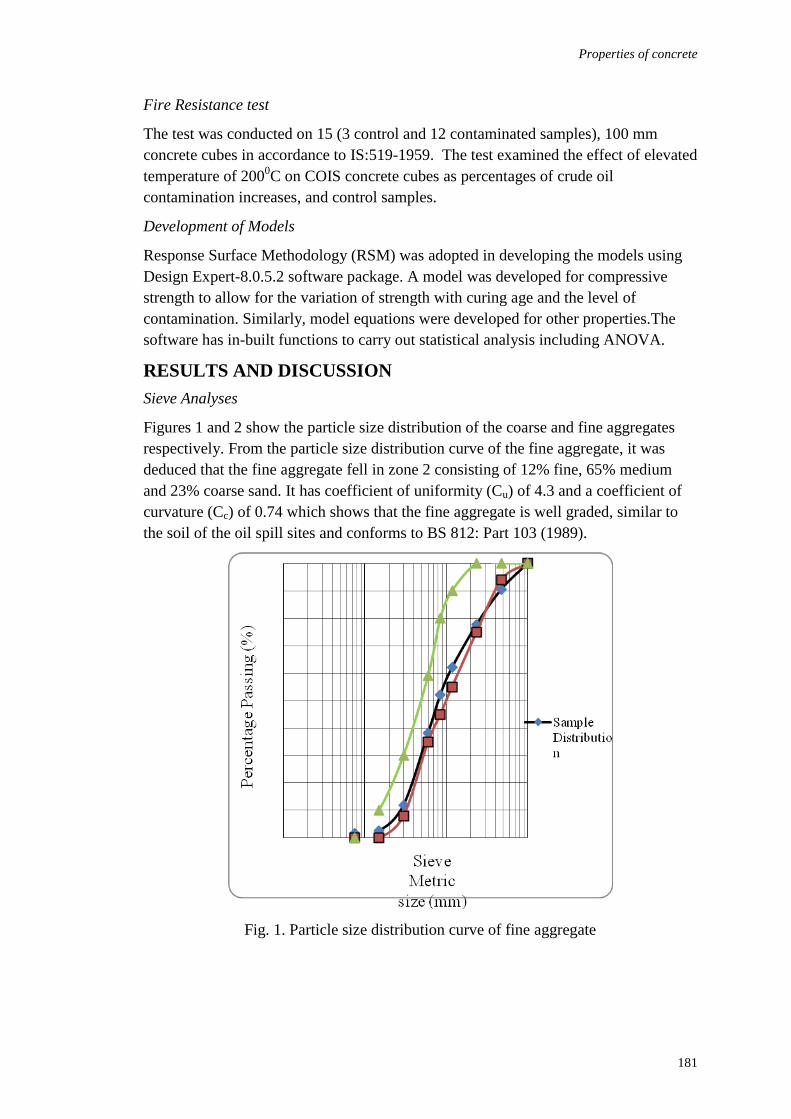
Properties of concrete
181
Fire Resistance test
The test was conducted on 15 (3 control and 12 contaminated samples), 100 mm
concrete cubes in accordance to IS:519-1959. The test examined the effect of elevated
temperature of 2000C on COIS concrete cubes as percentages of crude oil
contamination increases, and control samples.
Development of Models
Response Surface Methodology (RSM) was adopted in developing the models using
Design Expert-8.0.5.2 software package. A model was developed for compressive
strength to allow for the variation of strength with curing age and the level of
contamination. Similarly, model equations were developed for other properties.The
software has in-built functions to carry out statistical analysis including ANOVA.
RESULTS AND DISCUSSION
Sieve Analyses
Figures 1 and 2 show the particle size distribution of the coarse and fine aggregates
respectively. From the particle size distribution curve of the fine aggregate, it was
deduced that the fine aggregate fell in zone 2 consisting of 12% fine, 65% medium
and 23% coarse sand. It has coefficient of uniformity (Cu) of 4.3 and a coefficient of
curvature (Cc) of 0.74 which shows that the fine aggregate is well graded, similar to
the soil of the oil spill sites and conforms to BS 812: Part 103 (1989).
Fig. 1. Particle size distribution curve of fine aggregate
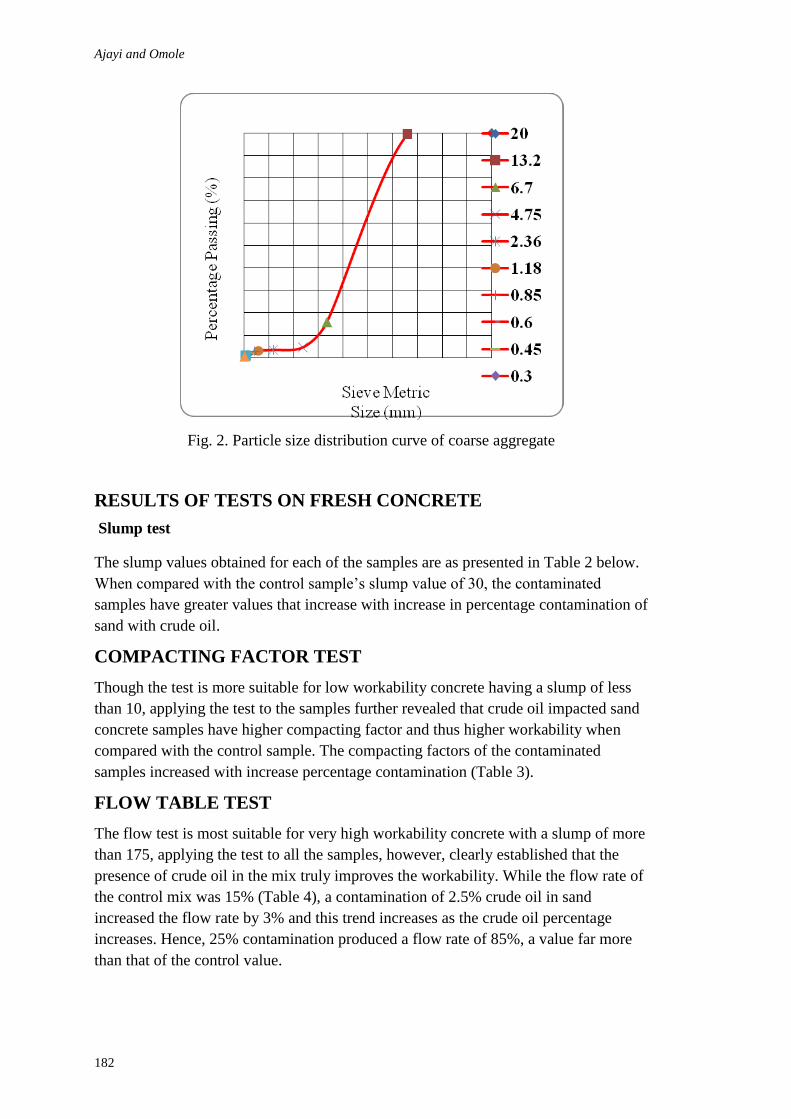
Ajayi and Omole
182
Fig. 2. Particle size distribution curve of coarse aggregate
RESULTS OF TESTS ON FRESH CONCRETE
Slump test
The slump values obtained for each of the samples are as presented in Table 2 below.
When compared with the control sample’s slump value of 30, the contaminated
samples have greater values that increase with increase in percentage contamination of
sand with crude oil.
COMPACTING FACTOR TEST
Though the test is more suitable for low workability concrete having a slump of less
than 10, applying the test to the samples further revealed that crude oil impacted sand
concrete samples have higher compacting factor and thus higher workability when
compared with the control sample. The compacting factors of the contaminated
samples increased with increase percentage contamination (Table 3).
FLOW TABLE TEST
The flow test is most suitable for very high workability concrete with a slump of more
than 175, applying the test to all the samples, however, clearly established that the
presence of crude oil in the mix truly improves the workability. While the flow rate of
the control mix was 15% (Table 4), a contamination of 2.5% crude oil in sand
increased the flow rate by 3% and this trend increases as the crude oil percentage
increases. Hence, 25% contamination produced a flow rate of 85%, a value far more
than that of the control value.
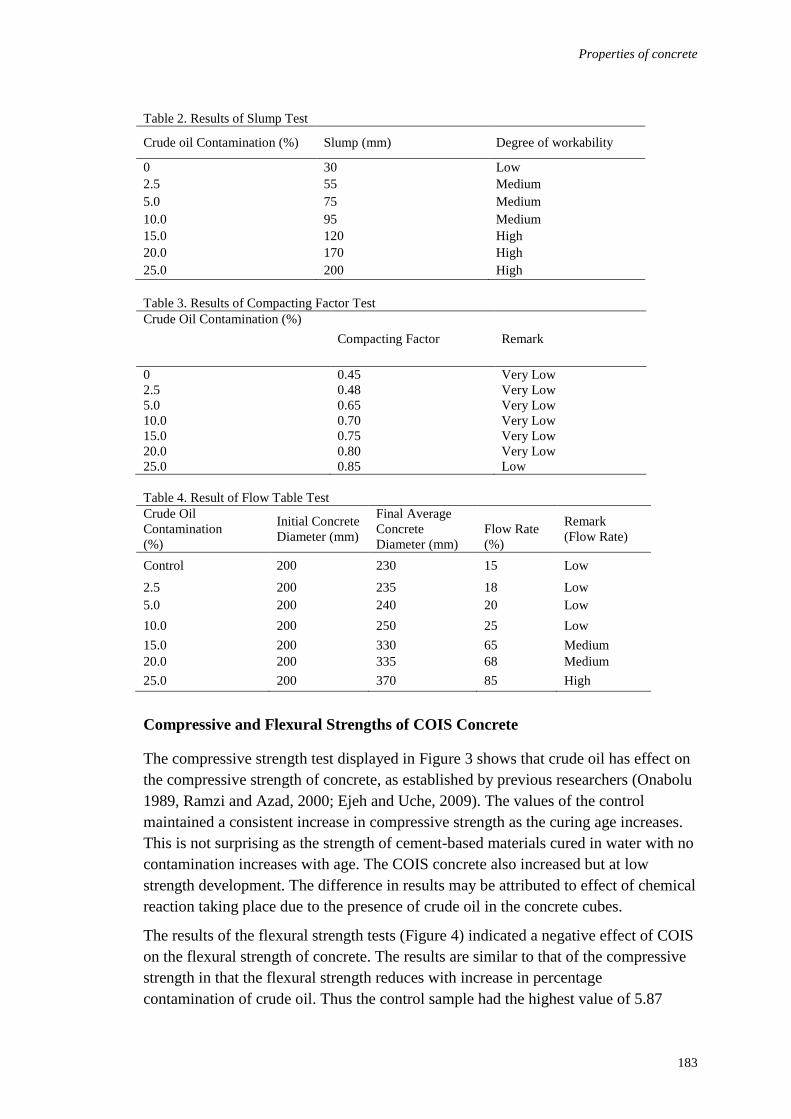
Properties of concrete
183
Table 2. Results of Slump Test
Crude oil Contamination (%) Slump (mm) Degree of workability
0 30 Low
2.5 55 Medium
5.0 75 Medium
10.0 95 Medium
15.0 120 High
20.0 170 High
25.0 200 High
Table 3. Results of Compacting Factor Test
Crude Oil Contamination (%)
Compacting Factor Remark
0 0.45 Very Low
2.5 0.48 Very Low
5.0 0.65 Very Low
10.0 0.70 Very Low
15.0 0.75 Very Low
20.0 0.80 Very Low
25.0 0.85 Low
Table 4. Result of Flow Table Test
Crude Oil
Contamination
(%)
Initial Concrete
Diameter (mm)
Final Average
Concrete
Diameter (mm)
Flow Rate
(%)
Remark
(Flow Rate)
Control 200 230 15 Low
2.5 200 235 18 Low
5.0 200 240 20 Low
10.0 200 250 25 Low
15.0 200 330 65 Medium
20.0 200 335 68 Medium
25.0 200 370 85 High
Compressive and Flexural Strengths of COIS Concrete
The compressive strength test displayed in Figure 3 shows that crude oil has effect on
the compressive strength of concrete, as established by previous researchers (Onabolu
1989, Ramzi and Azad, 2000; Ejeh and Uche, 2009). The values of the control
maintained a consistent increase in compressive strength as the curing age increases.
This is not surprising as the strength of cement-based materials cured in water with no
contamination increases with age. The COIS concrete also increased but at low
strength development. The difference in results may be attributed to effect of chemical
reaction taking place due to the presence of crude oil in the concrete cubes.
The results of the flexural strength tests (Figure 4) indicated a negative effect of COIS
on the flexural strength of concrete. The results are similar to that of the compressive
strength in that the flexural strength reduces with increase in percentage
contamination of crude oil. Thus the control sample had the highest value of 5.87
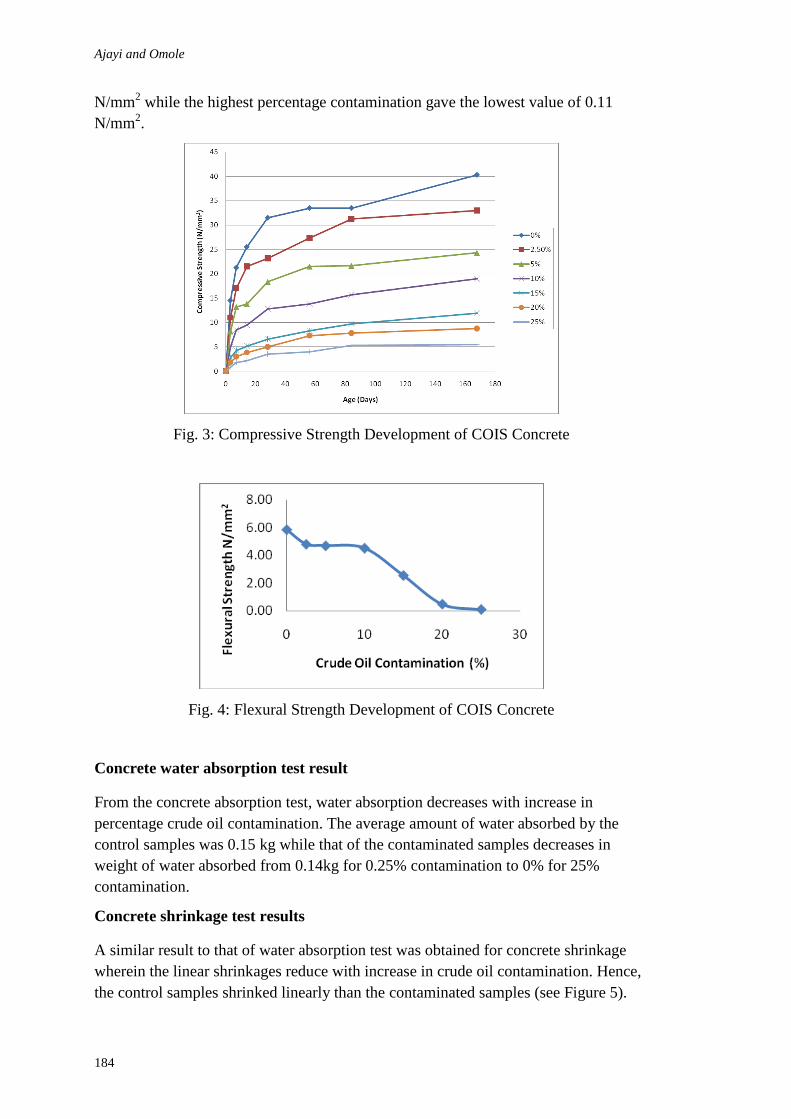
Ajayi and Omole
184
N/mm2 while the highest percentage contamination gave the lowest value of 0.11
N/mm2.
Fig. 3: Compressive Strength Development of COIS Concrete
Fig. 4: Flexural Strength Development of COIS Concrete
Concrete water absorption test result
From the concrete absorption test, water absorption decreases with increase in
percentage crude oil contamination. The average amount of water absorbed by the
control samples was 0.15 kg while that of the contaminated samples decreases in
weight of water absorbed from 0.14kg for 0.25% contamination to 0% for 25%
contamination.
Concrete shrinkage test results
A similar result to that of water absorption test was obtained for concrete shrinkage
wherein the linear shrinkages reduce with increase in crude oil contamination. Hence,
the control samples shrinked linearly than the contaminated samples (see Figure 5).

Properties of concrete
185
Concrete Electrical Resistivity as an electrical indication of its permeability
The control samples offered less resistance to the passage of electric voltage when
compared with the contaminated samples, ranging from about 24.00 to 25.50 KΩ-cm.
the implication of the resistance values could be obtained by referencing the
International Standard Surface Resistivity-Permeability.
Fig. 5: Concrete linear shrinkage
FIRE RESISTANCE TEST RESULT
The compressive strength of sample cubes subjected to elevated temperature of
200ºC was used as an indication of the fire resistance of the samples. Significant
decrease in compressive strength of heated concrete cubes were observed with
increased in percentage contamination. The compressive strength decreased from 21.2
N/mm2 (control) to 3.33 N/mm
2 for 15% contamination. By these results, fire
resistance of concrete decreases as the crude oil contamination level in the fine
aggregate increases.
Derived Models
The result of the derived models in this research is presented, along with the
correlation coefficients and the relative significance, in Table 5. Statistical analysis for
compressive strength indicated that the sixth order polynomial model with coefficient
of correlation R2 of 0.9982 compared with other response models for linear, 2FI (Two
Factors Interaction), quadratic, cubic, quartic and fifth order polynomial models, was
adequate and the best fit. It possesses less significant lack of fit than other models.
The high correlation coefficient of the response shows good correlations that
considered at least 95% of the measured values can be accounted for by the proposed
model. The final model, after a base 10 logarithm transformation, for the compressive
strength as determined by the above analysis is presented below.
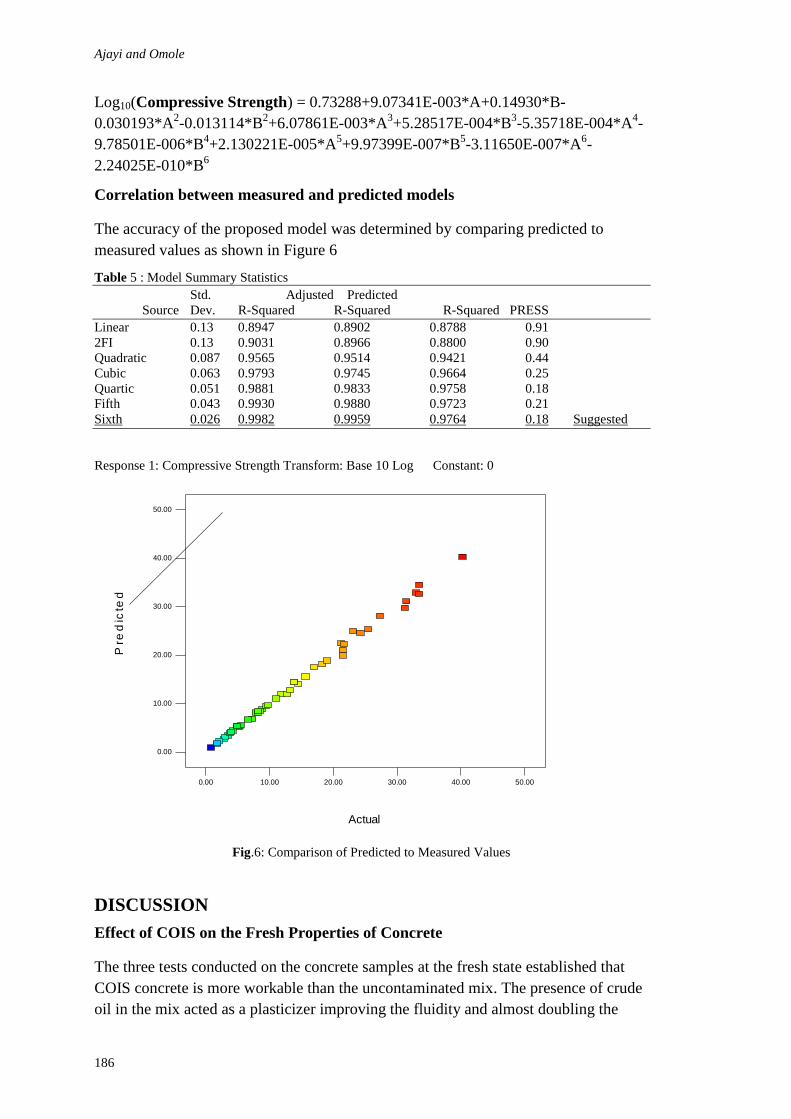
Ajayi and Omole
186
Log10(Compressive Strength) = 0.73288+9.07341E-003*A+0.14930*B-
0.030193*A2-0.013114*B
2+6.07861E-003*A
3+5.28517E-004*B
3-5.35718E-004*A
4-
9.78501E-006*B4+2.130221E-005*A
5+9.97399E-007*B
5-3.11650E-007*A
6-
2.24025E-010*B6
Correlation between measured and predicted models
The accuracy of the proposed model was determined by comparing predicted to
measured values as shown in Figure 6
Table 5 : Model Summary Statistics
Std. Adjusted Predicted
Source Dev. R-Squared R-Squared R-Squared PRESS
Linear 0.13 0.8947 0.8902 0.8788 0.91
2FI 0.13 0.9031 0.8966 0.8800 0.90
Quadratic 0.087 0.9565 0.9514 0.9421 0.44
Cubic 0.063 0.9793 0.9745 0.9664 0.25
Quartic 0.051 0.9881 0.9833 0.9758 0.18
Fifth 0.043 0.9930 0.9880 0.9723 0.21
Sixth 0.026 0.9982 0.9959 0.9764 0.18 Suggested
Response 1: Compressive Strength Transform: Base 10 Log Constant: 0
Design-Expert® SoftwareCompressive Strength
Color points by value ofCompressive Strength:
40.3
0.83
Actual
Pre
dic
ted
Predicted vs. Actual
0.00
10.00
20.00
30.00
40.00
50.00
0.00 10.00 20.00 30.00 40.00 50.00
Fig.6: Comparison of Predicted to Measured Values
DISCUSSION
Effect of COIS on the Fresh Properties of Concrete
The three tests conducted on the concrete samples at the fresh state established that
COIS concrete is more workable than the uncontaminated mix. The presence of crude
oil in the mix acted as a plasticizer improving the fluidity and almost doubling the
Properties of concrete
187
slump of the concrete mix at 2.5% contamination. Also, crude oil plasticize fresh
concrete mixtures by reducing the surface tension of water and thus reduces the
quantity of water required for cement hydration. This implies that COIS concrete is
more easily transported, placed and compacted when compared with the
uncontaminated concrete.
Effect of COIS on the Hardened Properties of Concrete
While the effect of COIS was negative on both the compressive and flexural strength
tests, the durability of COIS concrete is better compared with uncontaminated
concrete. The values of the control maintained a consistent increase in compressive
strength as the curing age increases. This is not surprising as the strength of cement-
based materials cured in water with no contamination increases with age. The crude
oil contaminated concrete cubes also increases but at lower strength development. The
reduction in strength can be related to the varying percentages of crude oil
contamination in the concrete which may lead to loss of water content/moisture and
preventing water from entering the concrete cube when curing in water which has
effect on the hydration of cement present in the concrete cubes. The contamination of
fine aggregate with crude oil which forms part of the microstructure of the matrix of
concrete may have caused dilation of the gel and weakening of the cohesive forces in
the paste and hence low strength development of the concrete cubes cast with COIS.
The outcome of this research as per compressive strength reduction on the adverse
effect of hydrocarbons on concrete, is in agreement with the findings of past
researchers (Onabolu, 1989; Ramzi, 2000; Ejeh and Uche, 2009).
The large losses in compressive strength imply that crude oil percentages above 10%
would not be suitable for most structural applications where high compressive
strengths are required (Ajagbe et al., 2011). However, this type of concrete could be
used in low-strength-concrete applications e.g. sidewalks, blocks, etc. Due to the low
strength of COIS concrete which would not be acceptable for reinforced concrete in
most cases, the research was thereafter extended to improve on the strengths of 5%
and 10% contaminated COIS concrete by reducing the water cement ratio and the
addition of plasticizer to assist the concrete in workability at low water/cement ratio.
However, with respect to the durability tests conducted in this research, it was obvious
that the presence of crude oil in the sand of the concrete improves the resistance of the
COIS concrete to water and chloride penetrability. These two attributes greatly
increases the durability of the concrete by preventing the corrosion of steel and other
substances that may affect the durability of concrete. The use of COIS concrete can
thus be extended to the production of concrete products wherein the absorption of
water affects the aesthetics as is the case in roof tiles, and reduces the passage of water
in liquid retainning structures such as septic tank etc. In addition, the reduction of
water absorption by COIS concrete makes it a better choice as damp proof courses in
a water logged area to reduce seepage.

Ajayi and Omole
188
The low resistance to fire of the COIS concrete will not compromise the durability of
the concrete when adopted in the liquid retaining structures and damp proof courses as
suggested. Furthermore, the exhibition of good durability properties by the COIS
confirmed the recommendations by Al-Mutairi and Eid (1997) of the suitability of the
material for use in the production of asphalt concrete mixes for use in secondary
roads, road beds, impermeable layers for landfill and containment facilities, or as
stabilizers for steep embarkments.
CONCLUSIONS AND RECOMMENDATIONS
CONCLUSIONS
Based on the tests and analysis carried out, the following conclusions are made:
Concrete made with crude oil contaminated sand undergoes changes in physical
appearance or characteristic evident in colour, texture, odour and also in chemical
composition observed in bond strength between water – cement ratio and aggregate.
The research revealed that concrete made with high percentage of crude oil
contaminated sand offered more resistance to concrete shrinkage, absorption and
chloride ion permeability.
In addition, there is an obvious reduction in strength of concrete made with crude oil
contaminated sand as can be seen that for the same quantity of cement, a lower
amount actually reacted with water, to produce the hardened concrete with desirable
strength.
RECOMMENDATION
Crude oil impacted sand made concrete would be a suitable construction materials in
water-logged areas or areas of high water table, and in high humid areas where
moisture encourages undesired growth on concrete thus making it unaesthetic.
However, more durability tests should be conducted on the COIS concrete over a
longer period of time than considered in this research.
ACKNOWLEDGEMENT
The authors gratefully acknowledge the support of McArthur Foundation, University
of Ibadan and Academic Staff Union of Universities (ASUU) for research grants
provided towards the success of the research. Also appreciated is Segun Labiran and
Associates for allowing the use of her concrete laboratory.
REFERENCES
Abdul-Ahad R. B. and Muhammed A. A. (2000). Compressive and Tensile Strength of
Concrete loaded and Soaked in Crude Oil. Engineering Journal of the University of
Qatar, Vol. 13, pp 123-140.
Ajagbe W. O., Omokehinde S. O., Agbede O. A., and Alade G. A. (2011) Effect of Crude Oil
Impacted Sand on Compressive Strength of Concrete. Construction and Building
Materials. Vol. 26, Issue 1. Pp 9-12.

Properties of concrete
189
Al-Mutairi, N.M. (1995). Kuwait Oil-based Pollution: Effect on building material. Journal of
Materials in Civil Engineering. Vol. 7. No. 3. pp. 154 – 160. Retrieved Nov. 19, 2006,
from http://www.pubs.asce.org/.
Bilal SH, Ahmad AR, and Mutassem E (2003). Effect of used engine oil on properties of fresh
and harden concrete. Construction and Building Materials, vol 17, Pp 311-318.
British Cement Association, (2001). Computer Aided Learning for concrete. Version 2.3.
BS 1881: Part 1 (1983). Method for Making Test Cubes from Fresh Concrete. London: British
Standard Institution.
BS 1881: Part 116 1983. Method for Determination of Compressive Strength of Concrete
Cubes. London: British Standard Institution.
BS 812: Part 103. (1989). Method of Determination of Particle Size Distribution. London.
BS 882: (1983). Aggregates from Natural Sources for Concrete. London: British Standard
Institution.
Ejeh S. P. and Uche O. A. U. (2009). Effect of crude oil spill on compressive strength of
concrete materials. J Appl Sci Res:17, 56–61.
engineering, American University of Beirut. Constr Build Mater; 17:311–8.
Faiyad, F. I. (1980) The Properties of Oil Saturated Concrete. Phd Thesis , Sheffield
University, U.K. pp: 203.
Gupta, B. L. and Gupta, A. (2004). “Concrete Technology”. Standard publishers Distributors.
Delhi.
Matti, M. A. (1976) Some Properties and Permeability of Concrete in Direct Contact with
Crude Oil. Phd Thesis , Sheffield University, U.K. pp: 230.
Nwilo, P.C. and Badejo, O.T. (2001). Impacts of oil spill pollution along the Nigerian coast.
Journal of Environmental Assessment and Remediation, 10(1), 1-5.
Onabolu O. A. (1989) Some properties of crude oil soaked concrete exposure at ambient
temperature. ACI Mater J:150–8.
Shetty, M. S. (2002).” Concrete Technology: Theory and Practice”. 5th ed. India: Rajendra
Ravindra Printers. Pp 521
Ukoli, M.K. (2001). Environmental Factors in The Management of The Oil and Gas Industry
in Nigeria Posted in Web. Retrieved on February 15, 2011 from
http://www.warmafloor.co.uk/pages/environmentalpdfbrochure.pdf.
Wilson, S.A., Langdon, N.J. and Walden, P.J. (2001). The effects of hydrocarbon
contamination on concrete strength. Proceedings of the Institution of Civil Engineers.
Geotechnical Engineering. Vol. 149. Issue 3, pp. 189 – 193. Retrieved Nov. 18, 2006,
from http://www.thomastelford.com/journals.

Ajayi, M.A. and Omole, F.K. (2012) Sustainable housing development and communal provision of
infrastructures in Asuwamo residential estate Akure, Nigeria In: Laryea, S., Agyepong, S.A.,
Leiringer, R. and Hughes, W. (Eds) Procs 4th West Africa Built Environment Research (WABER)
Conference, 24-26 July 2012, Abuja, Nigeria, 191-201.
91
SUSTAINABLE HOUSING DEVELOPMENT AND
COMMUNAL PROVISION OF INFRASTRUCTURES IN
ASUWAMO RESIDENTIAL ESTATE AKURE, NIGERIA
Mary Adebola Ajayi 1
and Felix Kayode Omole 2
Department of Estate Management, Federal University of Technology, Akure, Nigeria
Department of Urban and Regional Planning, Federal University of Technology, Akure, Nigeria
The provision of adequate housing to the citizenry has been a major challenge to
governments in both developed and developing nations of the world. Housing is a
combination of characteristics for the purpose of providing a unique home within a
given neighbourhood, thus, it is an array of economic, social and psychological
phenomenon. This paper examines the development of housing units in a residential
neighbourhood in Akure, Nigeria and the provision of infrastructures with a view to
ascertaining the sustainability of the housing environment. Questionnaires were
administered in 40% of the houses in the Estate to 63 homeowners using systematic
random sampling technique. The study revealed that for housing development to be
sustainable, basic infrastructures such as electricity, water supply and waste disposal
system had to be put in place. Considering the different models against which to
measure the sustainability of the housing environment, there is still a lot to be
achieved in the study area in the provision of basic infrastructures. The study
recommends that the communal efforts in infrastructural provision need to be
enhanced by the government by planning ahead for the adequate provision of
infrastructures as the city grows.
Keywords: Akure, community development, housing development, infrastructure,
sustainable home
INTRODUCTION
The state of housing available to the people in any nation is a fairly accurate reflection
of the quality of life in that country. It is a very important facet of the national
economy and an important element for increasing productivity and domestic capital
formation. It provides employment and fosters desirable social attitudes. Also housing
confers honour and social dignity on the owners. Housing units like other urban
projects constitute a reduction in the natural environment and the energy consumption
contributes certain percentage to the depletion of the ozone layer. This paper
examines the sustainability of housing development in a residential estate by
comparing some codes for measuring sustainable homes. It provides an overview of
the situation in Nigeria in terms of provision of housing and infrastructures by
individual, communal and governmental participation. The paper encapsulates the
need for housing infrastructure in a residential estate in order to ensure the
sustainability of the housing environment.
Ajayi and Omole
192
HOUSING DEVELOPMENT AND INFRASTRUCTURAL PROVISION IN
NIGERIA
The housing condition of a country is a pointer to the health motivation, economic
well-being and the social circumstances of her citizens. Housing touches on the life of
an individual as it provides the space for protection, privacy, economic activities,
recreation and livelihood. To most groups, housing means shelter but to others it
means more as it serves as one of the best indicators of a person’s standard of living
and his or her place in the society (Nubi, 2003) Adequate supply of housing has
remained a mirage to all cadres of the society in Nigeria. Rapid growth in population
creates demand pressure towards shelter and efficient supply and distribution of basic
utilities and services for city dwellers. In most urban centres, the problem of housing
is not only restricted to quantity but to the poor quality of available housing units.
Nigeria is perhaps the fastest urbanizing country in the African continent. The rapid
growth rate of urban population in Nigeria since the early seventies was mainly due to
immigration induced by the concentration of the gains from the oil sector in the urban
areas. The phenomenal rise in population, number and size of cities over the past few
years have manifested in the acute shortage of dwelling units which resulted in
overcrowding, high rents, poor urban living conditions, and low infrastructure services
and indeed high crime rates. One major aspect of urban problem with respect to
housing is the poor state of the infrastructures (Ajanlekoko, 2001). A study of housing
situation in Nigeria put existing housing stock at 23 per 1000 inhabitant and housing
deficit is put at 15 million houses (Mabogunje, 2002). Research has shown that 75%
of urban housing is situated in slum conditions and indeed the quality of the housing is
poor and clearly an affront to human dignity (Olotuah, 1997; Agbola and Olatubara,
2003). An important challenge facing the country is the provision of affordable
housing and basic infrastructures. As more and more Nigerians make towns and cities
their homes, the resulting social, economic, environmental and political challenges
need to be urgently addressed (Raji, 2008).
Various authorities have proffered strategies for improving housing delivery in
Nigeria. Fasakin (1998) suggested the cooperative housing model while Omole (2001)
suggested affordable financing model. It has been observed that house ownership is
one of the first priorities for most households and it represents the largest single
investment for most people, taking up between 50% and 70% of household income.
Many developing countries, particularly in Africa, accord relatively low priority to
housing in their overall scheme of national development, and the volume of
construction generally falls short of housing demands (Van Vliet, 1990). The
approach to housing policy in Nigeria has tended to oscillate between the ‘welfare
mixed economy’ and the ‘free market model’. The conventional wisdom is that
“government has no business building houses”, and that governments should focus on
providing favourable investment climates, infrastructure and mortgage facilities to low
and middle income families (Akeju, 2007). It has been reported that majority of rental
housing units in Nigeria which provide accommodation for majority of city-dwellers
belong to the informal private sector (Salau, 1992). This contrasts with other areas of
Sustainable housing development
193
social policy such as education and health, where governments have applied a much
more comprehensive and universal approach. The production of housing in Nigeria is
primarily the function of the private market; approximately 90% of urban housing is
produced by private developers (Nubi, 2008).
Nigerian cities are largely characterised by the public provision of urban
infrastructural services such as electricity, water supply, drainage, sewage, access road
and solid waste collection and disposal. The three tiers of government federal, state
and local are often involved in one way or the other in the provision of these services
in the urban centres (Nubi, 2003). For instance, constitutionally, local government
councils are responsible for the construction and maintenance of some categories of
roads, street drains, installation of street lighting and waste disposal. In practice,
however, the state government sometimes steps in to complement the effort of local
government councils especially in those cities that are state capitals. Power supply
lies exclusively with the Federal government through its agency, the Power Holding
Company of Nigeria (PHCN). Although the provision of infrastructures such as roads
and power supply lies with the government, communal efforts are still put together to
fast track the process of making the infrastructures reach the people. Sometimes it is
preferable not to wait for the government due to administrative bottlenecks and
sometimes corruption by government officials.
CONCEPT OF SUSTAINABILITY IN HOUSING DEVELOPMENT
In general terms, sustainability refers to the capacity of socio-ecological systems to
persist unimpaired into the future (Raskin, Chadwick, Jackson and Leach, 1996).
Sustainable development is a notion, a movement, and an approach which has
developed into a global wave of concerns, study, political mobilization and
organization around the twin issues of environmental protection and economic
development. In the words of the Brundtland Report, it is development that “meets the
needs of the present without compromising the ability of the future generations to
meet their own needs” (World Commission on Environment and Development, 1987).
There is increasing global attention on the environment in the development discourse
and environmental concerns are now regarded as critical factors in socio-economic
development (Pasqual and Souto, 2003; Haque, 2000).
Urban infrastructure and housing provision are interwoven. Without infrastructures,
housing cannot be sustainable and hence should be treated integrally (Otegbulu and
Adewumi, 2008). An ideal urban neighbourhood should be provided with good roads,
drainage networks, electricity and portable water supply, good waste management
system and security. The condition of these services in Nigeria urban neighbourhoods
contradicts the principle of sustainability in urban housing. A sustainable housing
development would not only have environment friendly and energy efficient
buildings, it would also have access to employment, schools, shops, places of
entertainment, primary health care, and it would be accessible by public transport. It
would also be mixed in terms of tenures, incomes and age groups. Residential
development which is designed to contribute to sustainability will provide not only
Ajayi and Omole
194
warm, dry and healthy homes and reduce the need to travel, but also a setting which
enhances quality of life from generation to generation and which integrates people
into society at large. It will maximise the effectiveness of housing investment and be
crucial to the building of cohesive communities.
Housing development is a system that can be defined, and its sustainability assessed,
if the definition of sustainability presented by Gilman (1992) is adopted. Gilman
stated that sustainability is the ability of a society, ecosystem, or any such ongoing
system to continue functioning into the indefinite future without being forced into
decline through exhaustion or overloading of key resources on which the system
depends. Using Gilman’s definition, Foley, Daniell and Warner (2003) outline that for
a system to be sustainable; all of the resources upon which the system relies must be
managed appropriately, including natural, financial, social, and man-made
(infrastructure) resources. Appropriate management requires knowledge relating to the
system boundary, system resources, interactions between adjacent systems and
allowable limits, or thresholds, for each resource. Each of these elements will be
unique to the particular system under consideration, and each system must be assessed
on its own merits. However, the process of assessment should be consistent for every
system. This general systems approach to sustainability can be applied more
specifically to an urban development by viewing each urban housing development as a
unique system. Considering a complex urban housing development system, the key
resources, processes and interrelations of a housing development can be defined in
terms of six interrelated models, namely water, carbon dioxide (CO2), waste,
ecosystem health, economic, and social.
the water model incorporates all the water related processes of the development,
including rainfall runoff, infiltration, and potable and non-potable water use;
the CO2 model accounts for both embodied and operational energy use, calculated as
an equivalent mass of CO2, which incorporates the effects of building materials,
infrastructure, electricity and gas use, and occupant transport use;
the waste model accounts for all solid and liquid waste, both produced on site, and
leaving the site, including sewage, compost, waste to be recycled, and waste sent to
landfill;
the ecosystem health model encompasses environmental aspects of the development
such as biodiversity and land use changes, as well as air and water quality;
the economic model accounts for both the microeconomic processes of each
household based on income, expenditure and corresponding levels of debt, as well as
the macroeconomic processes which affect the housing development, such as inflation
and interest rates; and
the social model incorporates levels of occupant satisfaction relating to comfort, living
conditions, access to services (transport, health, education, shopping), employment, as
well as equity amongst occupants.
The Code for sustainable homes employed in the UK measures the sustainability of a
home against design categories, rating the ‘whole home’ as a complete package. The
design categories included within the Code are: energy/CO2, pollution, water, health
Sustainable housing development
195
and well-being, materials, management, ecology and waste (Department for
Communities and Local Government, London, 2006). Sustainability of the housing
environment in the Nigerian context with regard to these models will be assessed
using the study area as a case study.
THE STUDY AREA AND RESEARCH METHODOLOGY
Akure is a city in south western Nigeria and capital of Ondo state. It lies between
latitude7o 13’ and 7
o 15’ North of the Equator and longitude 5
o 10’ and 5
o 12’ East of
the Greenwich Meridian. The city is surrounded by extensive tracts of tropical forest
reserves and supports a large timber industry. Agricultural products include palm oil,
cocoa, cassava, and wood products (Stock, 2007). The population of the city
according to the 2006 Population Census is 353,211 (Federal Republic of Nigeria,
2007). The population increase in Akure in the past three decades could be attributed
to its administrative function as the state capital, location of tertiary institutions of
learning, discovery of mineral deposits in parts of the state, increased banking and
commercial activities. The pattern of land use in Akure is changing rapidly and
includes a transformation of the old dwelling units at the city centre to commercial
properties such as banks, shopping complexes and fast food restaurants. At the
suburban periphery, land use pattern is being changed from agricultural to residential
land use by new entrants such as government workers, bankers and business men and
women.
The selected neighbourhood for this study is Asuwamo Residential Estate, Aule which
is a rapidly urbanising private residential estate located at the suburban periphery of
Akure. The Estate consists majorly of owner- occupied houses due to its distance from
the city centre. It was the cocoa farmland of the Asuwamo’s family which was
transformed to a residential estate due to increased demand for housing units.
Through communal efforts, access roads within the Estate are graded but not tarred
and with no drainage. The power supply is being provided by the government while
the maintenance and distribution are done through communal efforts. Each landlord at
the time of packing to the house has to pay a compulsory community development fee
of N21,000 which is meant for road upgrading, purchase of poles and wires for
connecting to the electricity supply from the Power Holding Company of Nigeria
(PHCN) and for any future repairs of damaged electric poles and wires by rainstorm.
The occupied houses in the estate are at different stages of completion; only few
houses are finished to taste. The building material employed in housing construction
in the study area as in other parts of western Nigeria are hollow sandcrete blocks
which have the advantage of reducing the heat radiation into buildings. Corrugated
iron sheets are common although alloyed aluminium roofing sheets are now gaining
popularity because of its heat reduction and aesthetics. The roofs of most houses are
designed in a way to gather rain water run offs to augment their household water need.
These building materials and methods contribute to the sustainability of the housing
environment with respect to water and heat emission. Primary data were collected
through the use of structured questionnaires that were administered to 63
homeowners. There were 155 plots of land in the Estate out of which approximately
40% had been developed and inhabited accounting for the 63 respondents. The data
got are presented in the next section.
DISCUSSION OF RESULTS
Data from respondents through questionnaires include their socio-economic status
(occupation and income), sources of housing finance, length of housing project, state
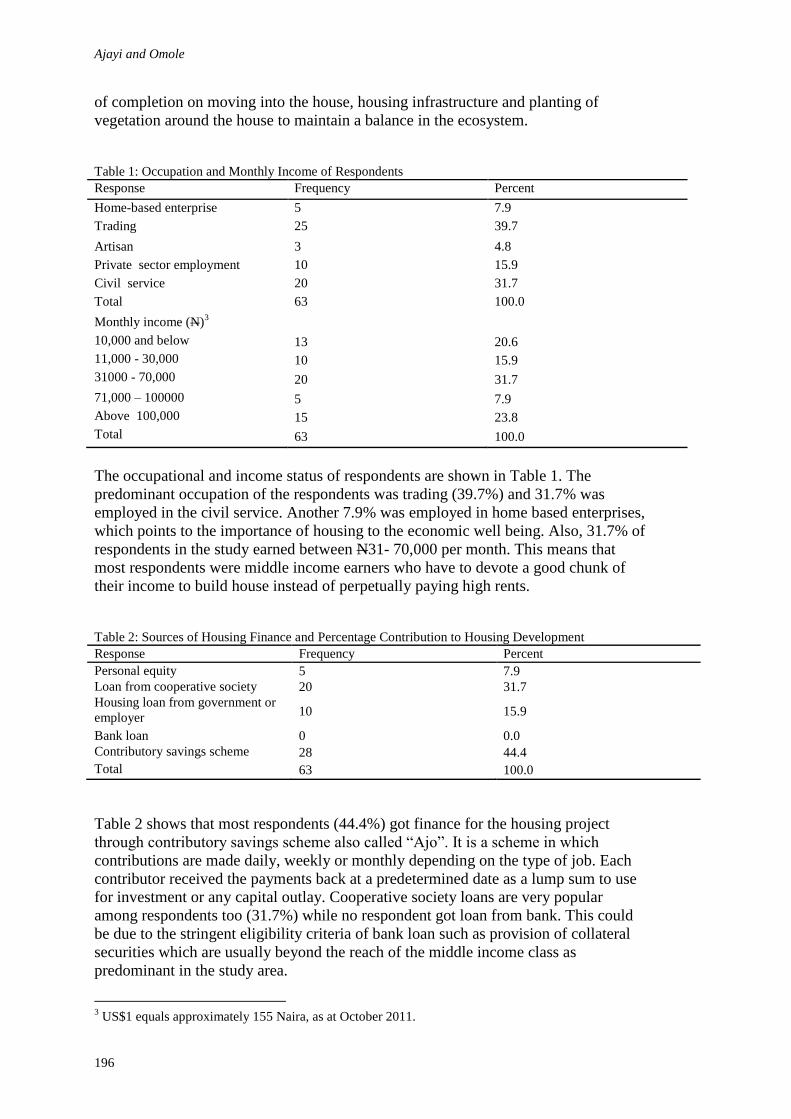
Ajayi and Omole
196
of completion on moving into the house, housing infrastructure and planting of
vegetation around the house to maintain a balance in the ecosystem.
Table 1: Occupation and Monthly Income of Respondents
Response Frequency Percent
Home-based enterprise 5 7.9
Trading 25 39.7
Artisan 3 4.8
Private sector employment 10 15.9
Civil service 20 31.7
Total 63 100.0
Monthly income (N)3
10,000 and below 13 20.6
11,000 - 30,000 10 15.9
31000 - 70,000 20 31.7
71,000 – 100000 5 7.9
Above 100,000 15 23.8
Total 63 100.0
The occupational and income status of respondents are shown in Table 1. The
predominant occupation of the respondents was trading (39.7%) and 31.7% was
employed in the civil service. Another 7.9% was employed in home based enterprises,
which points to the importance of housing to the economic well being. Also, 31.7% of
respondents in the study earned between N31- 70,000 per month. This means that
most respondents were middle income earners who have to devote a good chunk of
their income to build house instead of perpetually paying high rents.
Table 2: Sources of Housing Finance and Percentage Contribution to Housing Development
Response Frequency Percent
Personal equity 5 7.9
Loan from cooperative society 20 31.7
Housing loan from government or
employer 10 15.9
Bank loan 0 0.0
Contributory savings scheme 28 44.4
Total 63 100.0
Table 2 shows that most respondents (44.4%) got finance for the housing project
through contributory savings scheme also called “Ajo”. It is a scheme in which
contributions are made daily, weekly or monthly depending on the type of job. Each
contributor received the payments back at a predetermined date as a lump sum to use
for investment or any capital outlay. Cooperative society loans are very popular
among respondents too (31.7%) while no respondent got loan from bank. This could
be due to the stringent eligibility criteria of bank loan such as provision of collateral
securities which are usually beyond the reach of the middle income class as
predominant in the study area.
3 US$1 equals approximately 155 Naira, as at October 2011.
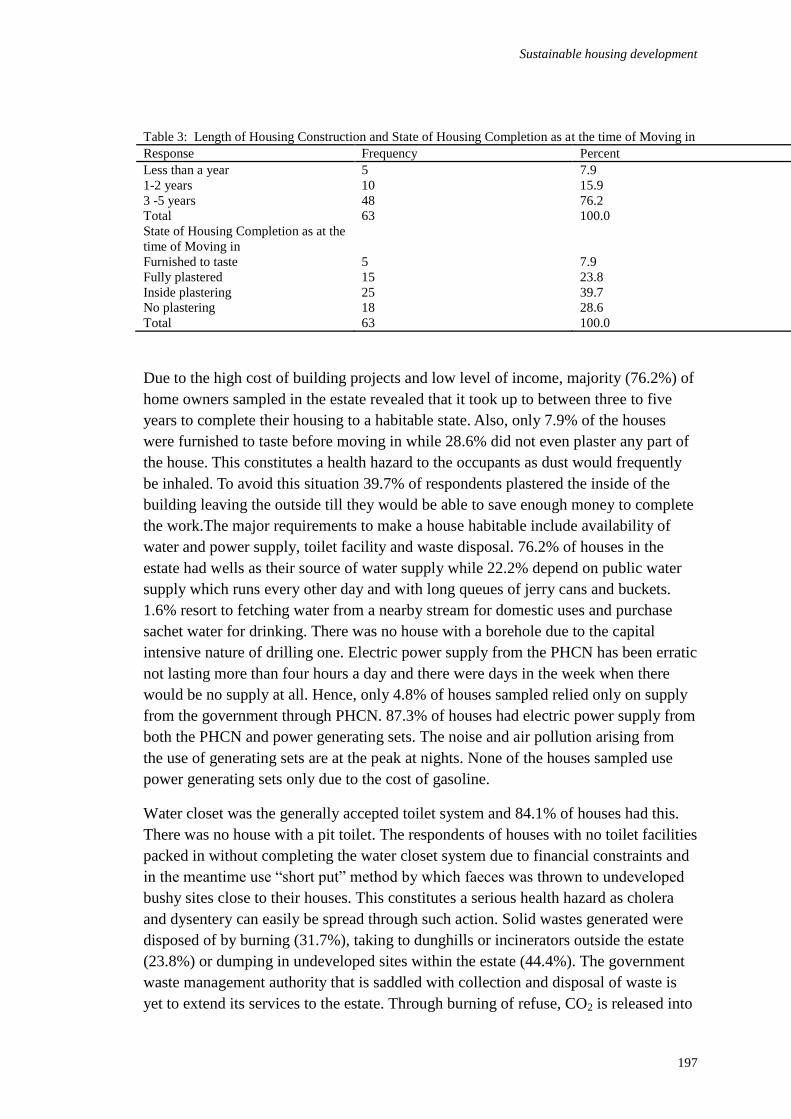
Sustainable housing development
197
Table 3: Length of Housing Construction and State of Housing Completion as at the time of Moving in
Response Frequency Percent
Less than a year 5 7.9
1-2 years 10 15.9
3 -5 years 48 76.2
Total 63 100.0
State of Housing Completion as at the
time of Moving in
Furnished to taste 5 7.9
Fully plastered 15 23.8
Inside plastering 25 39.7
No plastering 18 28.6
Total 63 100.0
Due to the high cost of building projects and low level of income, majority (76.2%) of
home owners sampled in the estate revealed that it took up to between three to five
years to complete their housing to a habitable state. Also, only 7.9% of the houses
were furnished to taste before moving in while 28.6% did not even plaster any part of
the house. This constitutes a health hazard to the occupants as dust would frequently
be inhaled. To avoid this situation 39.7% of respondents plastered the inside of the
building leaving the outside till they would be able to save enough money to complete
the work.The major requirements to make a house habitable include availability of
water and power supply, toilet facility and waste disposal. 76.2% of houses in the
estate had wells as their source of water supply while 22.2% depend on public water
supply which runs every other day and with long queues of jerry cans and buckets.
1.6% resort to fetching water from a nearby stream for domestic uses and purchase
sachet water for drinking. There was no house with a borehole due to the capital
intensive nature of drilling one. Electric power supply from the PHCN has been erratic
not lasting more than four hours a day and there were days in the week when there
would be no supply at all. Hence, only 4.8% of houses sampled relied only on supply
from the government through PHCN. 87.3% of houses had electric power supply from
both the PHCN and power generating sets. The noise and air pollution arising from
the use of generating sets are at the peak at nights. None of the houses sampled use
power generating sets only due to the cost of gasoline.
Water closet was the generally accepted toilet system and 84.1% of houses had this.
There was no house with a pit toilet. The respondents of houses with no toilet facilities
packed in without completing the water closet system due to financial constraints and
in the meantime use “short put” method by which faeces was thrown to undeveloped
bushy sites close to their houses. This constitutes a serious health hazard as cholera
and dysentery can easily be spread through such action. Solid wastes generated were
disposed of by burning (31.7%), taking to dunghills or incinerators outside the estate
(23.8%) or dumping in undeveloped sites within the estate (44.4%). The government
waste management authority that is saddled with collection and disposal of waste is
yet to extend its services to the estate. Through burning of refuse, CO2 is released into
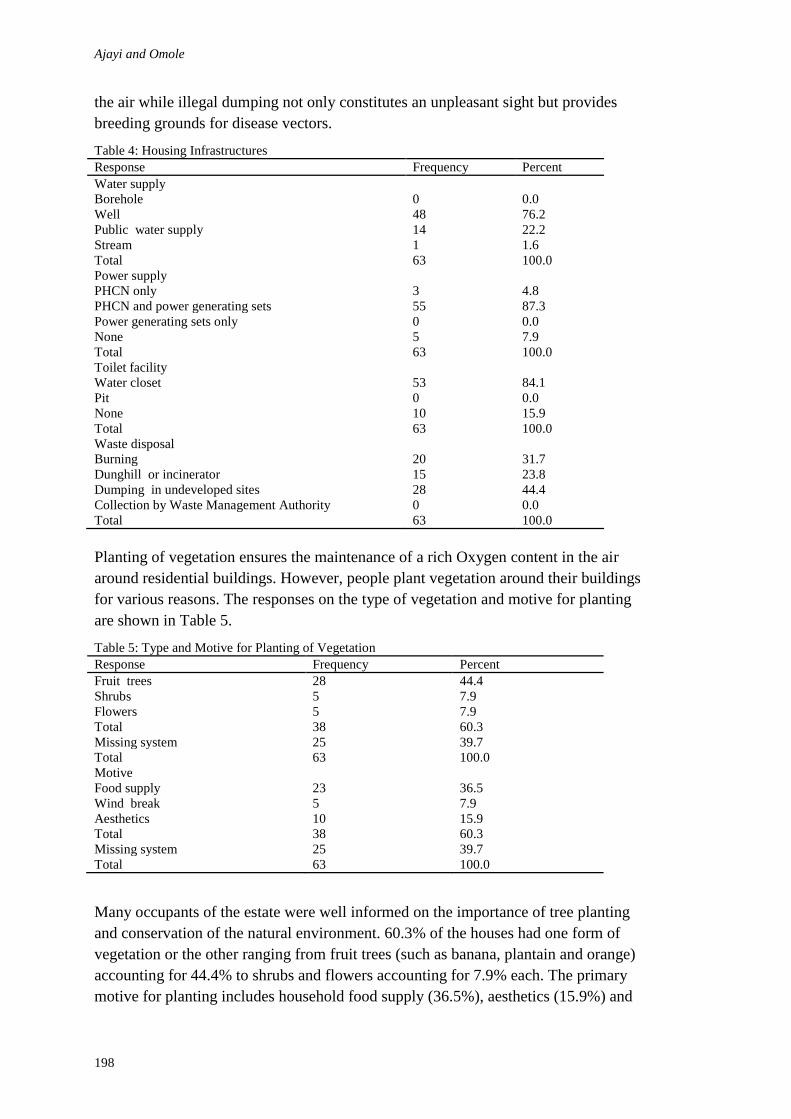
Ajayi and Omole
198
the air while illegal dumping not only constitutes an unpleasant sight but provides
breeding grounds for disease vectors.
Table 4: Housing Infrastructures
Response Frequency Percent
Water supply
Borehole 0 0.0
Well 48 76.2
Public water supply 14 22.2
Stream 1 1.6
Total 63 100.0
Power supply
PHCN only 3 4.8
PHCN and power generating sets 55 87.3
Power generating sets only 0 0.0
None 5 7.9
Total 63 100.0
Toilet facility
Water closet 53 84.1
Pit 0 0.0
None 10 15.9
Total 63 100.0
Waste disposal
Burning 20 31.7
Dunghill or incinerator 15 23.8
Dumping in undeveloped sites 28 44.4
Collection by Waste Management Authority 0 0.0
Total 63 100.0
Planting of vegetation ensures the maintenance of a rich Oxygen content in the air
around residential buildings. However, people plant vegetation around their buildings
for various reasons. The responses on the type of vegetation and motive for planting
are shown in Table 5.
Table 5: Type and Motive for Planting of Vegetation
Response Frequency Percent
Fruit trees 28 44.4
Shrubs 5 7.9
Flowers 5 7.9
Total 38 60.3
Missing system 25 39.7
Total 63 100.0
Motive
Food supply 23 36.5
Wind break 5 7.9
Aesthetics 10 15.9
Total 38 60.3
Missing system 25 39.7
Total 63 100.0
Many occupants of the estate were well informed on the importance of tree planting
and conservation of the natural environment. 60.3% of the houses had one form of
vegetation or the other ranging from fruit trees (such as banana, plantain and orange)
accounting for 44.4% to shrubs and flowers accounting for 7.9% each. The primary
motive for planting includes household food supply (36.5%), aesthetics (15.9%) and
Sustainable housing development
199
wind break (7.9%). Plantain and banana trees especially serve as good wind break
because of the broad leaves.
POLICY GUIDELINE AND CONCLUSION
Since majority of the respondents were low income earners, it is recommended that
more government empowerment programmes be extended to them directly and
government should get more involved in the provision of basic infrastructures such as
road and water among others on which parts of the income of the respondents were
being spent. The study has established that the major sources of housing finance were
contributory saving schemes and loans from cooperative societies. Available funds in
the cover of these agencies are usually low and not readily available. Along this line,
an indirect involvement of the government should be sought to increase available
funds, payable over a long period of time. The paper has revealed that for housing
development to be sustainable, basic infrastructures such as electricity, water, waste
disposal system had to be put in place. Considering the different models against which
to measure the sustainability of the housing environment, there is still a lot to achieve
in the study area. In countries where sustainability codes were introduced into housing
development, the government is at the forefront in such drives through provision of
basic infrastructures especially good access roads with drainage, electricity, water
supply and good waste disposal system. The communal efforts in infrastructural
provision need to be enhanced by the government by planning ahead for the adequate
provision of infrastructures as the city grows.
REFERENCES
Agbola, T. and Olatubara, C.O. (2003) “Private Sector Driven Housing Delivery (in Nigeria):
Issues, Constraints, Challenges and Prospects”, a lead paper presented at the 2nd
Annual
National Workshop on Private sector Driven Housing Delivery in Nigeria, University of
Lagos, Lagos.
Ajanlekoko, J. S. (2001) Sustainable Housing Development in Nigeria – The
Financial and Infrastructural Implication International Conference on Spatial
Information for Sustainable Development Nairobi, Kenya.
Akeju, A.A. (2007) “Challenges to Providing Affordable Housing in Nigeria”, Paper
presented at the 2nd Emerging Urban Africa International Conference on
Housing Finance in Nigeria, Abuja.
Department for Communities and Local Government, London, (2006) “Code for
Sustainable Homes: A Step-Change in Sustainable Homebuilding Practice”
available at
www.planningportal.gov.uk/uploads/code_for_sust_homes.pdf.
Fasakin, J.O. (1998) “Cooperative Housing: The Concept, Experience and Applicability to
Nigeria’s Socio-Economic Milieu”. Seminar paper presented at the Federal University of
Technology, Akure, Nigeria.
Ajayi and Omole
200
Federal Republic of Nigeria (2007) “Legal Notice on Publication of the Details of the
Breakdown of the National and State Provisional Totals 2006 Census. Federal
Government Printer: Lagos, Nigeria.
Foley, B.A., Daniell, T.M. and Warner, R.F. (2003)“What is Sustainability and can it
be measured?”
Australian Journal of Multidisciplinary Engineering, Vol. 1, No. 1, pp.1-8.
Gilman, R. (1992) “Sustainability”, from the 1992 UIA/AIA, Call for Sustainable
Community
Solutions. Available at:http://www.context.org/ICLIB/DEFS/AIADef.html.
Haque, M. S. ( 2000) “The Environmental Discourse and Sustainable Development:
Linkages and Limitations”, Ethics and the Environment, Vol.5, No.1, pp.3-21.
Mabogunje, A. (2002) “Housing Delivery Problems in Nigeria”. Punch, Wednesday,
May.
Nubi, O.T. (2003) “Procuring, Management and Financing Urban infrastructure:
Towards an
Integrated Approach”, in Omirin M.M (ed.) Land Management and Property Tax
Reform in Nigeria, Department of Estate Management, University of Lagos,
Nigeria.
Nubi, O.T. (2008) Affordable Housing Delivery in Nigeria. The South African Foundation
International Conference and Exhibition. Cape town, pp.1-18.
Olotuah, A.O. (1997) The House: Accessibility and Development-A critical evaluation of the
Nigerian situation. Proceedings of National Symposia on Housing in Nigeria. Obafemi
Awolowo University Ile Ife, pp. 312-317.
Omole, F.K. (2001) Basic Issues in Housing Development, Femobless Publications, Ondo,
Nigeria.
Otegbulu, A and Adewumi, Y. (2008) “Evaluating the Sustainability of Urban
Housing in Nigeria through Innovative Infrastructural Management”,
International Journal of Housing Markets and Analysis, Vol. 2, No. 4, pp.
334-346.
Pasqual, J. and Souto, G. (2003) “Sustainability in Natural Resource Management”
Ecological Economics, Vol.46, No.1, pp.47-59.
Raji, O. (2008) “Public and Private Developers as Agents in Urban Housing Delivery
in Sub-Saharan Africa, the Situation in Lagos State, Humanity of Social
Sciences Journal, Vol.3, No.2, pp.143-150.
Raskin, R., Chadwick, M., Jackson, T., and Leach, G. (1996) The Sustainability
Transition: Beyond Conventional Development, Stockholm: Stockholm
Environment Institute.
Salau, A. T. (1992) “Urbanisation, Housing and Social Services in Nigeria: The
Challenge of Meeting Basic Needs”, in Porter R. B. and Salau A. T. (eds)
Cities and Development in the Third World, England: Magnet Publishers.
Sokomba, M. J. (1987) The Role of Women in Rural Housing and Development in
Nigeria, National Seminar on Rural Housing Development, Abuja.

Sustainable housing development
201
Stock, R. (2007) “Nigeria”. Microsoft Student 2008 (DVD). Redmond WA: Microsoft
Corporation
Van Vliet, W. (ed.) (1990) International Handbook of Housing Policies and
Practices, Westport, CT: Greenwood Press.
World Commission on Environment and Development (1987) “Our Common Future”,
Oxford: Oxford University Press.

Ajayi, O.M., Ogunsanmi, O.E., Salako, O.A. and Mafimidiwo, B.A. (2012) Impact of risk on
performance of design and build projects in Lagos State, Nigeria In: Laryea, S., Agyepong, S.A.,
Leiringer, R. and Hughes, W. (Eds) Procs 4th West Africa Built Environment Research (WABER)
Conference, 24-26 July 2012, Abuja, Nigeria, 203-215.
203
IMPACT OF RISK ON PERFORMANCE OF DESIGN
AND BUILD PROJECTS IN LAGOS STATE, NIGERIA
O.M. Ajayi 1
, O.E. Ogunsanmi2, O.A. Salako
3 and B.A. Mafimidiwo
4
1-3University of Lagos, Faculty of Environmental Sciences, Department of Building, Akoka-Yaba,
Lagos State, Nigeria
4Yaba college of Technology, Faculty of Environmental Studies, Department of Quantity Surveying,
Lagos State, Nigeria
Design and Build procurement method was first developed in 1960,but is now a
common and preferred procurement methods used for complex construction projects
in Nigeria by developers in order to minimize risk especially when such projects
involved numerous parties and organisation. It shows that despite the advantages of
this method of procurement there are numerous risks been involved, hence this study
intends to identify the risk inherent in design and build and evaluate the impact of the
identified risks on project performance. A cross-sectional and explanatory research
survey is used for this study. Snowballing and convenience sampling technique was
adopted via the used of questionnaires. The population entails contracting
organization, consultant and clients’ organization involved in design and build
projects. A total of 39 questionnaires were distributed and 27 were returned and used
for the analysis. Statistical package for social scientist was used for analyzing the data
collected using mean item score and chi-square. The most prominent risk is change in
quantity/scope of work in terms of cost related risk while in term of time related risk,
the most prominent is design changes. Errors or omission during construction is the
risk prominent in term of quality. In conclusion risk in design and build procurement
can be group under cost, time and quality standard as such each of the risk identified
in these categories must be well defined.
Keywords: building project, design, impact, procurement, risk
INTRODUCTION
Design and Build is a method of project delivery in which one entity(Design and
Builder) undertakes a single contract with the owner to provide for
architectural/engineering design services and construction services(DBIA,2006).It
method of procurement has gained increased market share in the last few
years(Banik,2001;Arditi and Lee,2003;Igberaese,2006;and Dada,Ojo and
Aibinu,2007). It facilitates innovative and flexible approaches such as phased
construction, improves the ability to manage risk because there is a single point of
responsibility, allows managers to take advantage of new materials and new
technologies, and encourages the development of innovative practices that support
energy, efficiency and sustainability, shortened project delivery time and reduce
project costs(Banik,2001).Construction industry is plagued of risks and it had lead to
poor performance such as inability of completing projects within time, cost and
quality standard. Risk is a variable in the process of construction whose occurrence

Ajayi et al.
204
results in measurable uncertainty as to the final performance of the construction
project. The high level of risk and uncertainty in the industry compounds the
characteristics of the industry(Perry and Hayes,1985;Tar and
Carr,1999;Odeyinka,Oladapo and Akindele,2006).Construction project is a high risk
activity, but the ability to identify potential risks and step to be taken to avoid them
are important aspects of project management(Stewart and Fortune,1995).According to
Dada et al(2007) contractors in developing countries have insufficient experience and
knowledge to manage risk effectively but financial mark-ups are used by contractors
to cover the risk associated with construction projects. However margins are tighter
and so contractors must increase their awareness of risks and adopt proactive
strategies in order to assess, model, analyse and mitigate risks. Most contractors are
not familiar with these risk factors and are inexperienced in managing them
effectively and so it could lead to failure of the project as opposed to Baloi, Andrew
and Price (2001) and Wagner (2006) that effective risk management lead to success of
a project .Therefore risk need to be shared between the parties involved, identified,
registered and controlled throughout the project. Risk can be transferred, accepted,
managed, minimized or shared but cannot be ignored (Kwaraswamy and Rahman,
2002).Design and Build projects also involve risk which can be shared between the
parties involved in the project.Okmen(2004) stressed that design and build provides
various advantages though entailing the contractor carrying out the responsibility of
constructing and designing the project. However this is a risky form of procurement
for both owners and contractors unless the risk are identified, analysed and managed
throughout the project. They also opined that common construction project risks
increase their intensity under design and build system in developing countries. It
therefore becomes necessary that risk analysis and management are important tools
for successful performance of design and build projects. The purpose of this study is
to identify the risk inherent in design and build projects and assess the impact of these
risks on project performance in terms of time, cost and quality standard. Such study is
expected to be of benefit to academicians, researchers and industrial practitioners in
exploring the risk inherent in design and build and also in comparison with other
developed countries.
Concept of Design and Build
A number of construction agencies have been researching on a wide variety of
innovative project delivery strategies aimed at lowering cost, time and quality (Tsai
and Yang, 2010). One of these strategies is design and builds project delivery. Design
and build was first developed in 1960.It is now a common and preferred procurement
method used by developers to minimize risk in complex construction projects
involving numerous parties and organisation.Oztas and Okmen(2004) opined design
and build as a popular contract system in recent years because it has been discovered
to be most effective in meeting most project objectives when compared with design-
bid-build(DBB) and construction management(CM) which are the other forms of
procurement of project(Mastermann,1992;Hore,Kehoe,Mumullan and
penton,1997;Banik,2000;Ashworth and Hogg,2002,Oztas and Okmen,2004;El-
Sayegh,2008).Design and Build is a system where one person, company or
organization provides comprehensive service from the design to construction of the
project with all the human resources secured in house(Ayanwutaku,1992).Other
researcher definition of design and build entails a contract in which the design and
Design and build
205
build of the project is taken by a single
entity(Mastermann,1992;Friedlander,2003).Because it involves a single entity, it thus
enable some part of construction work to begin before the final design is completed. It
result to shorten project duration and reduction of administration and inspection cost.
It also reduces variation and claims.
There are various variants of design and build. It includes develop and construct,
enhanced design and build, traditional design and build and Engineering-Procurement-
Construction (EPC).
Risk associated with Design and Build projects
Boehm and Port (2006) opined that risks and events can cause a project to fail to meet
its goals. They range in impact from trivial to fatal and in likelihood from certain to
improbable. Since risk considerations dictate the path a development must take, it is
important that those risks be catalogued candidly and completely. Every building
procurement method has basic characteristics that define its framework. When a
particular method is selected for a specific project, the characteristics dictate the risk
and level of uncertainties involved. Irrespective of the procurement method, it is
important to identify and assess the inherent risks so as to structure the risk
management techniques to be adopted (Dada et al, 2007). Design and build is a risky
system of project delivery for both owners and contractors expect if the risk is
identified, analysed and managed throughout the project (Oztas and Okmen, 2004)
and determined how the risk should be shared among the parties
involved(Banik,2001).According to USDOT (2006) the managers of design and build
projects estimated that design and build project delivery reduced the overall duration
of their projects by 14%, total cost by 30% depending on the type, complexity and
size of the projects. They also maintained the same level of quality as compared with
design bid build. Therefore risk analysis and management is an important tool for the
success of design and build project. Risk management involves risk identification, risk
estimation, risk evaluation, risk response and risk monitoring (Baker, Ponniah and
Smith, 1999).
Professional liability underwriters have perceived design and build procurement as the
most hazardous construction-related professional liability exposure due to the
combination of design activity, on-site supervisory presence and active participation
in the actual construction and the degree of control on the entire construction project
(XL Capital, 2009) and so the contractor bear all the risk in a design and build project.
The impact of risk on design and build project therefore result to cost overrun, time
overrun, unsatisfactory quality standard (Ahmed, Ahmad and Saram, 1999; Banik,
2001).Yet, design and build is widely used by developer to minimized the risk in
complex construction projects especially when it involved numerous parties and
organisations(Friedlander,2003).
Ajayi et al.
206
RESEARCH METHOD
The population of the study consist of construction professionals involved in the
building construction design and build (DB) projects and on organisations that are
involved in DB projects. The population therefore comprises of client, consultant and
contractors who are into the practice of DB procurement and based in Lagos
metropolis in Nigeria. The construction professionals in these organisations are
mainly Quantity surveyors, Architects, Engineers and contractors. This study make
use of cross-sectional research survey and explanatory design using the expertise of
the construction professionals already named above to collate information required
through the use of questionnaire/interview and archival sources. The identify risks
affecting the performance of DB projects was achieved through literature and field
survey while the effect of the identified risks on the performance indicators(cost, time
and quality) was achieved through field survey in form of questionnaires. This study
employs snowballing technique and convenience sampling technique. The sampling
size cannot be formulated because there is no registered organisation that coordinates
DB procurement practitioners. An opinion –based questionnaires was used and a
closed ended questionnaire format was used for this study. Chi-square was used to test
the level of impact of time, cost and quality factors on performance of design and
build projects. Mean item score (MIS) was used to analyse the data using this formula
MIS= 5n5 +4n4 +3n3+2n2+n1
5(n5+n4+n3+n2+n1)
Where:
N5=no of respondents with very high impact
N4= no of respondents with high impact
N3= no of respondents with average impact
N2= no of respondents with low impact
N1= no of respondents with no impact
That is: 5-very high impact, 4-high impact,3-average impact,2-low impact,1-no
impact
ANALYSIS AND RESULTS
Background Information
Table 4.1 shows that 31% of the respondents are Quantity Surveyors,27% are
Architects,19% Civil Engineers,12% Builders,8% Mechanical/Electrical Engineers
and 3% are Accountant. It shows that majority of the respondents are quantity
surveyors and architects. From the table (4.1) also 31% of the respondents are member
of NIA, 27% are NSE, 23% are member of NIQS, 4% are NIOB member and 15%
does not belong to any professional body. It show that 85% are members of a
particular professional bodies and so are able to provide vital information on the
objectives of this research.58% of the respondents have been in the construction
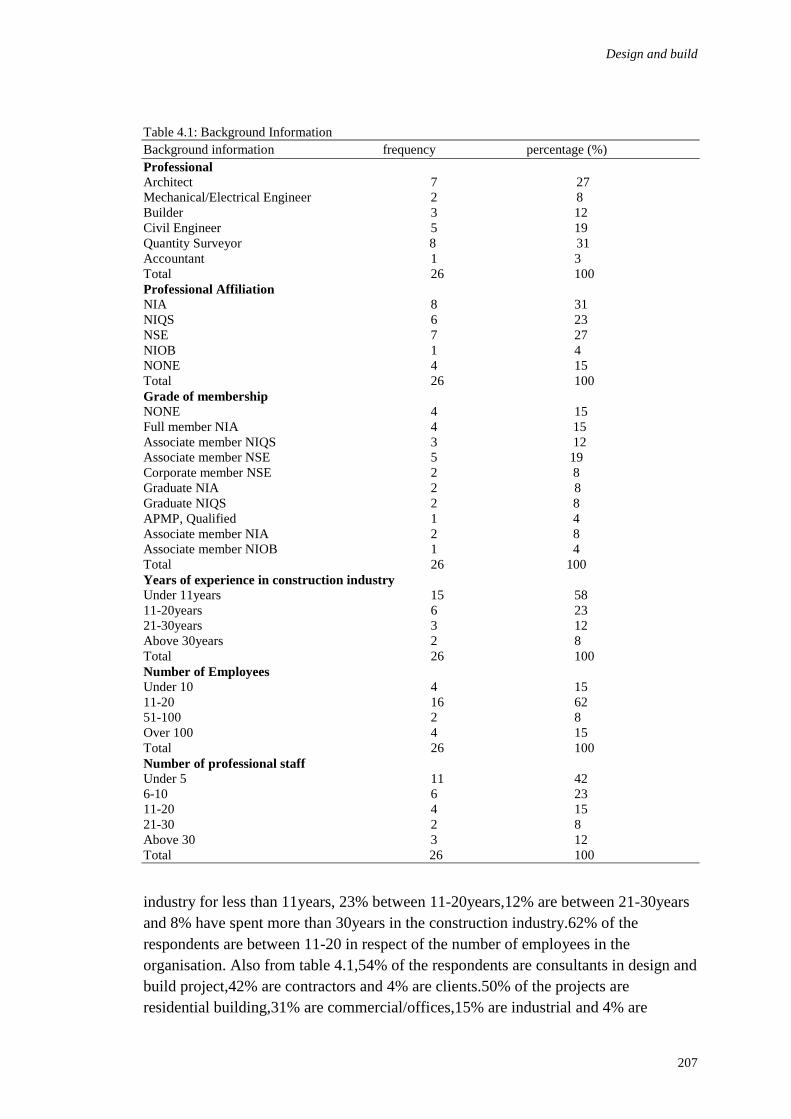
Design and build
207
Table 4.1: Background Information
Background information frequency percentage (%)
Professional
Architect 7 27
Mechanical/Electrical Engineer 2 8
Builder 3 12
Civil Engineer 5 19
Quantity Surveyor 8 31
Accountant 1 3
Total 26 100
Professional Affiliation
NIA 8 31
NIQS 6 23
NSE 7 27
NIOB 1 4
NONE 4 15
Total 26 100
Grade of membership
NONE 4 15
Full member NIA 4 15
Associate member NIQS 3 12
Associate member NSE 5 19
Corporate member NSE 2 8
Graduate NIA 2 8
Graduate NIQS 2 8
APMP, Qualified 1 4
Associate member NIA 2 8
Associate member NIOB 1 4
Total 26 100
Years of experience in construction industry
Under 11years 15 58
11-20years 6 23
21-30years 3 12
Above 30years 2 8
Total 26 100
Number of Employees
Under 10 4 15
11-20 16 62
51-100 2 8
Over 100 4 15
Total 26 100
Number of professional staff
Under 5 11 42
6-10 6 23
11-20 4 15
21-30 2 8
Above 30 3 12
Total 26 100
industry for less than 11years, 23% between 11-20years,12% are between 21-30years
and 8% have spent more than 30years in the construction industry.62% of the
respondents are between 11-20 in respect of the number of employees in the
organisation. Also from table 4.1,54% of the respondents are consultants in design and
build project,42% are contractors and 4% are clients.50% of the projects are
residential building,31% are commercial/offices,15% are industrial and 4% are

Ajayi et al.
208
institutional buildings. It shows that design and build projects are used for various
types of projects.39% of the clients’ who owns the projects are private individuals31%
are corporate bodies,15% are manufacturing companies and 4% are international
organization, religious body, private sector organization and educational organization.
Table 4.2: Background Information (continued)
Background information frequency percentage (%)
Types of respondent
Client 1 4
Contractor 11 42
Consultant 14 54
Total 26 100
Types of project
Residential 13 50
Commercial/Offices 8 31
Industrial 4 15
Institutional 1 4
Total 26 100
Category of client Private individual 10 38
Manufacturing company 4 15
Corporate body 8 31
International organization 1 4
Religious body 1 4
Private sector organization 1 4
Educational institution 1 4
Total 26 100
Cost related risk factors and effect on design and build performance
Table 4.2 shows that 11% of the cost related risk factors in design and build projects
pertains to changes in quantity/scope of work,19% of the risks relate to inflation,8%
of the risks are in exchange rate, while 2% of the risks emanate from safety and
accidents and 1% are from financial failure and catastrophes. In testing the level of
impact of cost related factors on design and build, mean item score was calculated and
rank. It was realized that changes in quantity/scope of work rank highest, follow by
inflation, exchange rate fluctuation owner and contractor experience, quality control
and assurance and the least rank is catastrophes.
Hypothesis 1:
Null Hypothesis (H0): changes in quantity/scope of work, inflation, owner and
contractor experience, exchange rate fluctuation/devaluation, quality control and
assurance, difficulties/delays in availability of materials, equipment and labour,
contract and award method, warranty of facility performance, errors or omissions
revealed during construction, differing site condition and owner delayed payment are
not the prominent cost risk factors affecting the performance of design and build
projects.
Table 4.3 shows the level of significance of cost related risk factors on performance of
design and build projects using chi-square. Changes in quantity/scope of work,
inflation,owner and contractor experience, contract and award method errors or
omissions revealed during construction, and owner delayed payment are the most
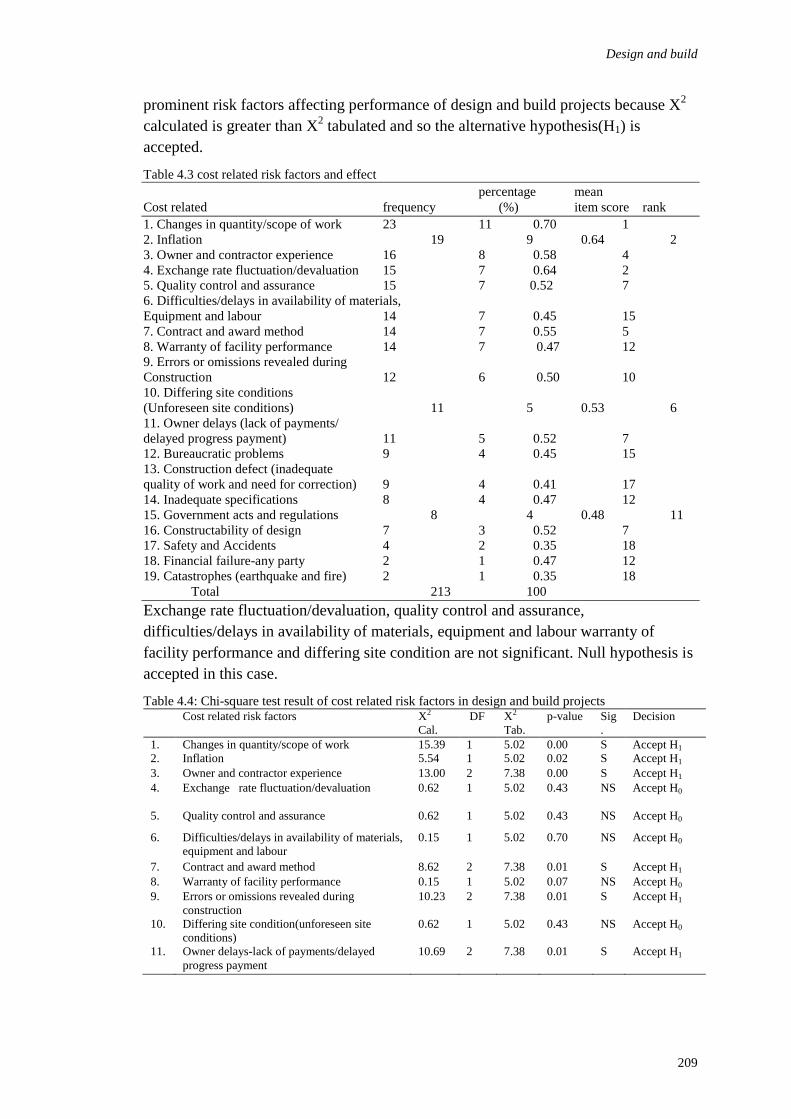
Design and build
209
prominent risk factors affecting performance of design and build projects because X2
calculated is greater than X2 tabulated and so the alternative hypothesis(H1) is
accepted.
Table 4.3 cost related risk factors and effect
percentage mean
Cost related frequency (%) item score rank
1. Changes in quantity/scope of work 23 11 0.70 1
2. Inflation 19 9 0.64 2
3. Owner and contractor experience 16 8 0.58 4
4. Exchange rate fluctuation/devaluation 15 7 0.64 2
5. Quality control and assurance 15 7 0.52 7
6. Difficulties/delays in availability of materials,
Equipment and labour 14 7 0.45 15
7. Contract and award method 14 7 0.55 5
8. Warranty of facility performance 14 7 0.47 12
9. Errors or omissions revealed during
Construction 12 6 0.50 10
10. Differing site conditions
(Unforeseen site conditions) 11 5 0.53 6
11. Owner delays (lack of payments/
delayed progress payment) 11 5 0.52 7
12. Bureaucratic problems 9 4 0.45 15
13. Construction defect (inadequate
quality of work and need for correction) 9 4 0.41 17
14. Inadequate specifications 8 4 0.47 12
15. Government acts and regulations 8 4 0.48 11
16. Constructability of design 7 3 0.52 7
17. Safety and Accidents 4 2 0.35 18
18. Financial failure-any party 2 1 0.47 12
19. Catastrophes (earthquake and fire) 2 1 0.35 18
Total 213 100
Exchange rate fluctuation/devaluation, quality control and assurance,
difficulties/delays in availability of materials, equipment and labour warranty of
facility performance and differing site condition are not significant. Null hypothesis is
accepted in this case.
Table 4.4: Chi-square test result of cost related risk factors in design and build projects
Cost related risk factors X2
Cal.
DF X2
Tab.
p-value Sig
.
Decision
1. Changes in quantity/scope of work 15.39 1 5.02 0.00 S Accept H1
2. Inflation 5.54 1 5.02 0.02 S Accept H1
3. Owner and contractor experience 13.00 2 7.38 0.00 S Accept H1
4. Exchange rate fluctuation/devaluation 0.62 1 5.02 0.43 NS Accept H0
5. Quality control and assurance 0.62 1 5.02 0.43 NS Accept H0
6. Difficulties/delays in availability of materials,
equipment and labour
0.15 1 5.02 0.70 NS Accept H0
7. Contract and award method 8.62 2 7.38 0.01 S Accept H1
8. Warranty of facility performance 0.15 1 5.02 0.07 NS Accept H0
9. Errors or omissions revealed during
construction
10.23 2 7.38 0.01 S Accept H1
10. Differing site condition(unforeseen site
conditions)
0.62 1 5.02 0.43 NS Accept H0
11. Owner delays-lack of payments/delayed
progress payment
10.69 2 7.38 0.01 S Accept H1
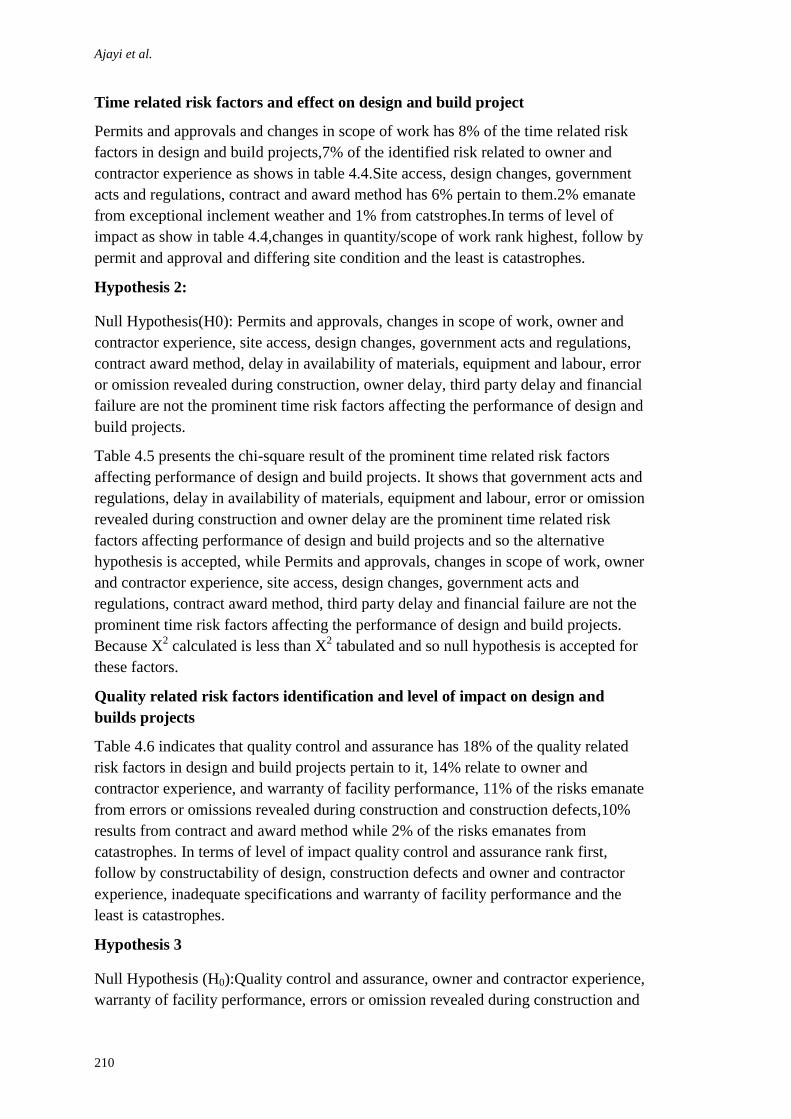
Ajayi et al.
210
Time related risk factors and effect on design and build project
Permits and approvals and changes in scope of work has 8% of the time related risk
factors in design and build projects,7% of the identified risk related to owner and
contractor experience as shows in table 4.4.Site access, design changes, government
acts and regulations, contract and award method has 6% pertain to them.2% emanate
from exceptional inclement weather and 1% from catstrophes.In terms of level of
impact as show in table 4.4,changes in quantity/scope of work rank highest, follow by
permit and approval and differing site condition and the least is catastrophes.
Hypothesis 2:
Null Hypothesis(H0): Permits and approvals, changes in scope of work, owner and
contractor experience, site access, design changes, government acts and regulations,
contract award method, delay in availability of materials, equipment and labour, error
or omission revealed during construction, owner delay, third party delay and financial
failure are not the prominent time risk factors affecting the performance of design and
build projects.
Table 4.5 presents the chi-square result of the prominent time related risk factors
affecting performance of design and build projects. It shows that government acts and
regulations, delay in availability of materials, equipment and labour, error or omission
revealed during construction and owner delay are the prominent time related risk
factors affecting performance of design and build projects and so the alternative
hypothesis is accepted, while Permits and approvals, changes in scope of work, owner
and contractor experience, site access, design changes, government acts and
regulations, contract award method, third party delay and financial failure are not the
prominent time risk factors affecting the performance of design and build projects.
Because X2 calculated is less than X
2 tabulated and so null hypothesis is accepted for
these factors.
Quality related risk factors identification and level of impact on design and
builds projects
Table 4.6 indicates that quality control and assurance has 18% of the quality related
risk factors in design and build projects pertain to it, 14% relate to owner and
contractor experience, and warranty of facility performance, 11% of the risks emanate
from errors or omissions revealed during construction and construction defects,10%
results from contract and award method while 2% of the risks emanates from
catastrophes. In terms of level of impact quality control and assurance rank first,
follow by constructability of design, construction defects and owner and contractor
experience, inadequate specifications and warranty of facility performance and the
least is catastrophes.
Hypothesis 3
Null Hypothesis (H0):Quality control and assurance, owner and contractor experience,
warranty of facility performance, errors or omission revealed during construction and
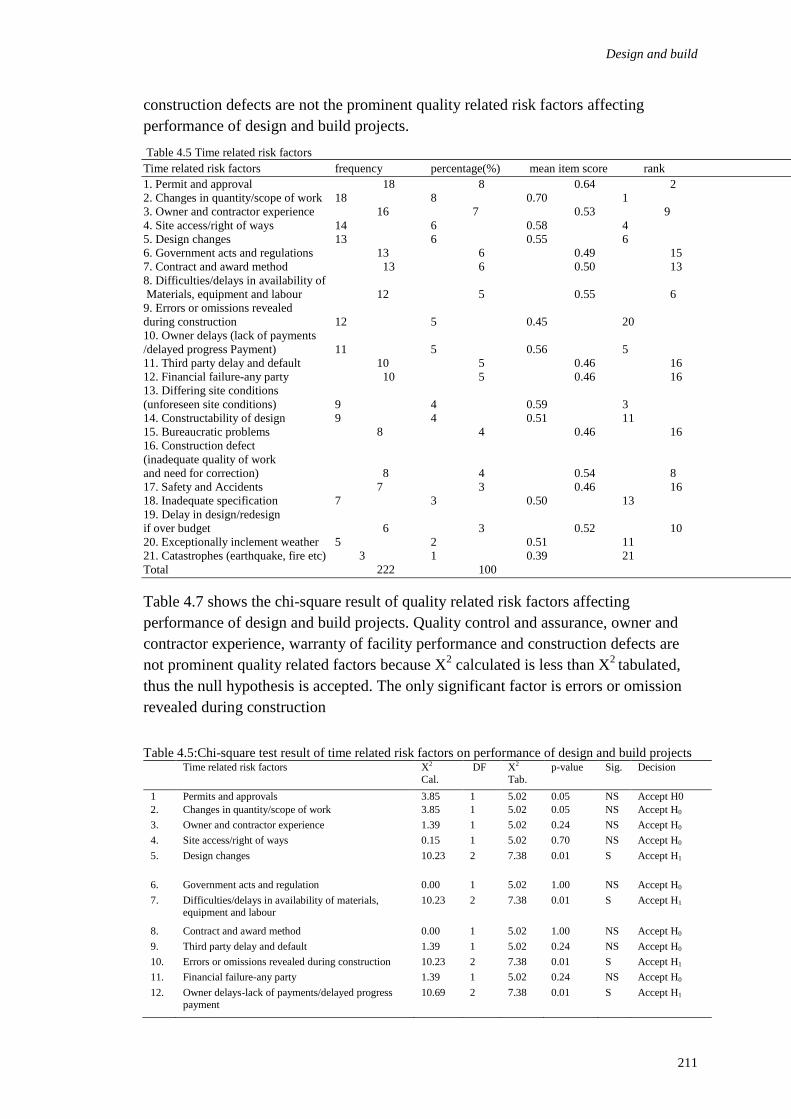
Design and build
211
construction defects are not the prominent quality related risk factors affecting
performance of design and build projects.
Table 4.5 Time related risk factors
Time related risk factors frequency percentage(%) mean item score rank
1. Permit and approval 18 8 0.64 2
2. Changes in quantity/scope of work 18 8 0.70 1
3. Owner and contractor experience 16 7 0.53 9
4. Site access/right of ways 14 6 0.58 4
5. Design changes 13 6 0.55 6
6. Government acts and regulations 13 6 0.49 15
7. Contract and award method 13 6 0.50 13
8. Difficulties/delays in availability of
Materials, equipment and labour 12 5 0.55 6
9. Errors or omissions revealed
during construction 12 5 0.45 20
10. Owner delays (lack of payments
/delayed progress Payment) 11 5 0.56 5
11. Third party delay and default 10 5 0.46 16
12. Financial failure-any party 10 5 0.46 16
13. Differing site conditions
(unforeseen site conditions) 9 4 0.59 3
14. Constructability of design 9 4 0.51 11
15. Bureaucratic problems 8 4 0.46 16
16. Construction defect
(inadequate quality of work
and need for correction) 8 4 0.54 8
17. Safety and Accidents 7 3 0.46 16
18. Inadequate specification 7 3 0.50 13
19. Delay in design/redesign
if over budget 6 3 0.52 10
20. Exceptionally inclement weather 5 2 0.51 11
21. Catastrophes (earthquake, fire etc) 3 1 0.39 21
Total 222 100
Table 4.7 shows the chi-square result of quality related risk factors affecting
performance of design and build projects. Quality control and assurance, owner and
contractor experience, warranty of facility performance and construction defects are
not prominent quality related factors because X2 calculated is less than X
2 tabulated,
thus the null hypothesis is accepted. The only significant factor is errors or omission
revealed during construction
Table 4.5:Chi-square test result of time related risk factors on performance of design and build projects
Time related risk factors X2
Cal.
DF X2
Tab.
p-value Sig. Decision
1 Permits and approvals 3.85 1 5.02 0.05 NS Accept H0
2. Changes in quantity/scope of work 3.85 1 5.02 0.05 NS Accept H0
3. Owner and contractor experience 1.39 1 5.02 0.24 NS Accept H0
4. Site access/right of ways 0.15 1 5.02 0.70 NS Accept H0
5. Design changes 10.23 2 7.38 0.01 S Accept H1
6. Government acts and regulation 0.00 1 5.02 1.00 NS Accept H0
7. Difficulties/delays in availability of materials, equipment and labour
10.23 2 7.38 0.01 S Accept H1
8. Contract and award method 0.00 1 5.02 1.00 NS Accept H0
9. Third party delay and default 1.39 1 5.02 0.24 NS Accept H0
10. Errors or omissions revealed during construction 10.23 2 7.38 0.01 S Accept H1
11. Financial failure-any party 1.39 1 5.02 0.24 NS Accept H0
12. Owner delays-lack of payments/delayed progress payment
10.69 2 7.38 0.01 S Accept H1
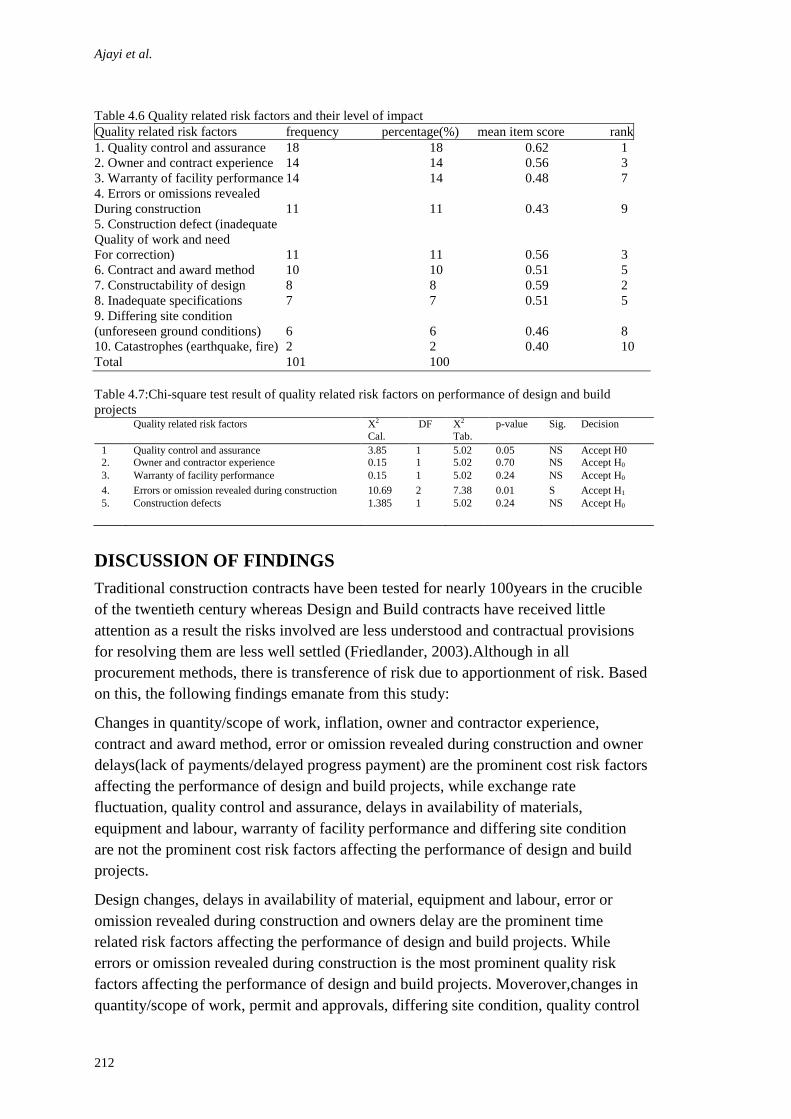
Ajayi et al.
212
Table 4.6 Quality related risk factors and their level of impact
Quality related risk factors frequency percentage(%) mean item score rank
1. Quality control and assurance 18 18 0.62 1
2. Owner and contract experience 14 14 0.56 3
3. Warranty of facility performance 14 14 0.48 7
4. Errors or omissions revealed
During construction 11 11 0.43 9
5. Construction defect (inadequate
Quality of work and need
For correction) 11 11 0.56 3
6. Contract and award method 10 10 0.51 5
7. Constructability of design 8 8 0.59 2
8. Inadequate specifications 7 7 0.51 5
9. Differing site condition
(unforeseen ground conditions) 6 6 0.46 8
10. Catastrophes (earthquake, fire) 2 2 0.40 10
Total 101 100
Table 4.7:Chi-square test result of quality related risk factors on performance of design and build
projects Quality related risk factors X2
Cal.
DF X2
Tab.
p-value Sig. Decision
1 Quality control and assurance 3.85 1 5.02 0.05 NS Accept H0 2. Owner and contractor experience 0.15 1 5.02 0.70 NS Accept H0
3. Warranty of facility performance 0.15 1 5.02 0.24 NS Accept H0
4. Errors or omission revealed during construction 10.69 2 7.38 0.01 S Accept H1
5. Construction defects 1.385 1 5.02 0.24 NS Accept H0
DISCUSSION OF FINDINGS
Traditional construction contracts have been tested for nearly 100years in the crucible
of the twentieth century whereas Design and Build contracts have received little
attention as a result the risks involved are less understood and contractual provisions
for resolving them are less well settled (Friedlander, 2003).Although in all
procurement methods, there is transference of risk due to apportionment of risk. Based
on this, the following findings emanate from this study:
Changes in quantity/scope of work, inflation, owner and contractor experience,
contract and award method, error or omission revealed during construction and owner
delays(lack of payments/delayed progress payment) are the prominent cost risk factors
affecting the performance of design and build projects, while exchange rate
fluctuation, quality control and assurance, delays in availability of materials,
equipment and labour, warranty of facility performance and differing site condition
are not the prominent cost risk factors affecting the performance of design and build
projects.
Design changes, delays in availability of material, equipment and labour, error or
omission revealed during construction and owners delay are the prominent time
related risk factors affecting the performance of design and build projects. While
errors or omission revealed during construction is the most prominent quality risk
factors affecting the performance of design and build projects. Moverover,changes in
quantity/scope of work, permit and approvals, differing site condition, quality control
Design and build
213
and assurance among others have an impact on the cost, time and quality performance
of design and build projects.
CONCLUSION
This study has critically examined and evaluates the issues surrounding the effect of
risk on performance of design and build projects in Lagos state, Nigeria. The results of
the study can been seen as another plus to the fact that risk is involve in every
construction project irrespective of the framework adopted in its actualization and this
is due to the fact that every procurement method has its own peculiar risks. According
to Ashcraft et al, (2002) design and build entails a lot of risks but a clear
understanding of the risks and risk management, the risks can be rewarding. Thus the
followings are the conclusion draw from this study:
1. Design and build has a lot of inherent, unresolved and undefined cost related factors
that result into risk that will affect the procurement.
2. Design and build is encumbered with unsettled issues and inadequate preparation
before proceeding to construction phase which result into risks that are triggered-off
by time related risk factors that will affect the procurement
3.Design and build acquires additional works/issues which are not pre-empt at the
initial stage for adequate incorporation into the design factors hence it result into
quality related risk factors that will affect procurement.
4. Cost performance of design and build is dependent on changes in quantity/scope of
work cost related factor.
5. Design and build absorbs time related risk factors thus preventing its impact on the
time performance.
6. Quality related risk factors have impact on design and build due to inability of the
owner to exercise control over design and build.
Risk is highly related to cost and time, while risk factors at construction are due to
planning and design at the inception stage of the project. To therefore manage these
risks, the design and build engineers must adopt a new and more aggressive approach
to job site safety.
REFERENCES
Ashcraft, H.W., Vlahos, H.B.M. and Rudy, LLP (2002).Understanding Design/Build Risk.
The New Legal Environment, February, pp1-8.www.terrarrg.com/images
Ahmed, S.M., Ahmad, R. and Saram, D.D. (1999).Risk management trend in Hong Kong
construction industry: A comparison of contractors and owners perception.
Engineering construction and architectural management, 6(3), pp225-234.
Ashworth, A. and Hogg, K. (2002).Willis’s procedure for the Quantity Surveyors.Oxford,
Blackwell Sciences Ltd.
Anyawutaku, C.N. (1992).Design and Build venture: New challenges for Nigerian Architects.
Construction Digest, pp 18-20.

Ajayi et al.
214
Arditi, D. and Lee, D. (2003).Assessing the corporate service quality performance of design-
build contractors using quality function deployment.IN: Taylor and Francis
Ltd.Construction management and economics.Spon press, Taylor and Francis group,
21, pp 175-185.
Baloi, D., Andrew, D.F. and Price, A.D.F. (2001).Evaluation of global risk factors affecting
cost performance in Mozambique. COBRA, 2001, Glasgow Canadian
University.www.rics-foundation.org.
Banik, G.A.(2001).Risk allocation in Design-Build contracts. In ASC proceedings of the 37th
annual conference, University of Denver, Denver, Colorado.April 4th-7
th,2001. pp
125-136.
Baker, S., Ponniah, D.and Smith, S. (1999).Risk Response Techniques employed currently for
major projects. In E and FN Spon,pp 205-213.
Dada, J.O., Ojo, G.K. and Aibinu, A.A. (2003).An assessment of risk factors in the
procurement of building projects in Nigeria. Globalization, Culture and the Nigeria
Built Environment. Proceeding conference at Obafemi Awolowo University, Ile-Ife,
Osun state.
Design –Build Institute of America DBIA (2006).Publication on Design and Build. Retrieved
on 8th May, 2006 from http:/www.dbia.org/pubs/pd intro.htm
Design-build effectiveness study (2006).USDOT-Federal Highway Administration. Jan,
2006.Retrived from www.fhwa.dot.gov/reports/design builds
El-Sayegh, S.M. (2008).Evaluating the effectiveness of project delivery methods Journal of
construction management and economics, 23(5),pp 457-465.
Friedlander, M.C. (2003).Risk allocation in Design-Build construction project. Schiff harden
LLp 6600 Sears Tower Chicago, Illinois 60606.
Hore, A.V., Kehoe, J.G., MuMullan, R. and Penton, M.R. (1997).Construction 1:
Management Finance Measurement.London, Macmillan Press Ltd.
Igberaese, D.A. (2004).A comparative study of the performance of traditional and Design&
build procurement methods in Lagos State. An unpublished master of project
management dissertation submitted to the department of building, University of
Lagos, Lagos.
Jagboro,G.O. and Ojo,G.K.(2003).A study of relationship between contract period and tender
sum of building projects in Southern Western,Nigeria.The Hong Kong institute of
Surveyors Journals,14(1),pp 49-53.
Kumaraswamy, M.M. and Rahman, M.M. (2002).Risk management trends in the construction
industry: moving towards joint risk management. Journal of Engineering
Construction and Management, 9(2), pp131-151.
Mastermann, J.W.E. (1992).An introduction to building procurement systems.London, E &PN
Spon publishers.
Odeyinka, H.A., Oladapo, A.A. and Akindele, O. (2006).Assessing risk impacts on
construction cost. In conference proceeding of the Royal institute of chartered
surveyors for construction and building research (COBRA, 2006).University of
London, 7th-8th Sept., www.rics-foundation.org.
Oztas, A. and Okmen, O. (2004).Risk analysis in fixed-price design-build construction
projects. Building and Environment, 39(2), pp 229-237.
Perry, J.G. and Hayes, R.W. (1985).Risk management and its management in construction
projects In UMIST, The institute of civil Engineers Proceedings. Engineering and
Management Group, pp 499-521.

Design and build
215
Stewart, R.W. and Fortune, J. (1995).Application of system thinking to the identification:
avoidance and prevention of risk. International journal of project management, 13(5),
pp 279-286.
Tsai,Tsung-Chieh and Yang,Min-Lan(2010).Risk assessment of design-bid-build and design-
build building projects. Journal of the operations research society of Japan, 53(1),pp
20-39.
Wagner, H. (2006).Risk evaluation and control in underground construction. International
symposium on underground excavation and tunneling,2-4,Bangkok,Thailand.
XL Capital (2009).Design/Build: Recognising and managing risk. Retrieved on 23rd
December,2009 from http://www.
.

Aka, A., Adamu, N. and Nensok, M.H. (2012) Durability characteristics of concrete produced with date
seed as light weight aggregate In: Laryea, S., Agyepong, S.A., Leiringer, R. and Hughes, W. (Eds)
Procs 4th West Africa Built Environment Research (WABER) Conference, 24-26 July 2012, Abuja,
Nigeria, 217-224.
217
DURABILITY CHARACTERISTICS OF CONCRETE
PRODUCED WITH DATE SEED AS LIGHT WEIGHT
AGGREGATE
A. Aka1, N. Adamu
2 and M.H. Nensok
3
Department of Building Technology, Waziri Umar Federal Polytechnic Birnin Kebbi Kebbi State,
Nigeria
Department of Quantity Surveying, Waziri Umar Federal Polytechnic Birnin Kebbi Kebbi State,
Nigeria
In conventional concrete production, coarse aggregate (crushed granite) plays an
essential role in the resulting functional properties of concrete. However due to the
high cost of coarse aggregate and its scarcity in some areas in Nigeria, this research
investigated the suitability of Date Seeds (DS) as light weight aggregate in concrete
production. This was achieved by producing lightweight concrete using cement, sand
(fine aggregate) and DS (coarse aggregate) in the ratio 1:2:4. Samples of concrete
with Crushed Granite (CG) as coarse aggregate were equally produced and served as
control. For the purpose of the research, (15) concrete cubes were produced with DS
and 15 concrete cubes with crushed granite. Water- cement ratio of 0.6 was used for
the two specimens. The concretes produced (6) from each specimen were immersed in
chemical concentrated solutions of 5% Magnesium Sulphate (MgSO4) and 5%
Sulphuric Acid (H2SO4) for 28 days. The remaining concrete Specimens (9) from
each specimen were equally immersed in ordinary water for 28, 56 and 84 days.
Specimens in chemicals were crushed at 28 days while those in ordinary water were
crushed at 28, 56 and 84 days curing periods. At 28 days, there was a significant
difference in the damaging effects of MgSO4 on DS concrete when compared with
that of CG concrete. Increase in strength was observed in DS concrete at 56 and 84
days in ordinary water. The research concluded that DS can be used as an alternative
material to Crushed Granite (CG) in production of lightweight concrete in an area
where there is scarcity of CG. The research recommended that DS concrete should
not be exposed to sulphates having concentration close to 5% or more.
Keywords: aggregate, concrete, characteristic, date seed, durability
INTRODUCTION
Shelter is one of the most important needs, in fact second to food in every human
being. Yet, housing remains one of the crucial problems of our time. The World Book
Encyclopaedia (1976) claimed that one-quarter of the world population live in non-
durable dwellings while some 100 million are homeless. Although acute shortage of
housing has long been recognised by the government since independence in 1960, yet
housing situation today is still characterised by a lot of problems. According to
Oluremi (1990), one of these problems is the high cost of conventional or classical
building materials. The costs of conventional or classical building material are
Aka, Adamu and Nensok
218
considerably beyond the capacity of average Nigeria. In an attempt to stem the over
dependence on conventional building materials, it was discovered that efforts have to
be directed towards the local sourcing of alternative building material.
Neville (1983) opined that concrete is the most widely used construction materials
these days and as such, efforts have been made by many researchers to reduce the cost
of its production. This is achieved by reducing the cost of aggregate which is the most
expensive constituent’s part of the concrete. One of the ways of reducing the
aggregate cost is by partially replacing it with some cheaper materials. Numerous
works have been conducted by many researchers to study how possible construction
materials can be developed from locally alternative materials, agro-industrial waste or
by-products which are abundantly available. Some of these researchers are: Okpala
(1990); Ekainu (1991); Achuenu et. al (2005) and Job (1994). Ndoke (2006) and
Okpala (1990) assessed the performance of palm kernel shells as a partial replacement
for coarse aggregate in asphalt concrete, while Falade (1992) investigated the
suitability of palm kernel shells as aggregates in light and dense concrete for structural
and non-structural purposes. Adewuyi and Adegoke (2008); Achuenu et. al (2005) and
Job (1994) investigated the performance of periwinkle shell as coarse aggregate in
concrete production. Ekainu (1991) carried out work on the properties of concrete
produced with Olive Seed (OS) and his work revealed that OS is a light weight
material which can be used to produce lightweight aggregate concrete. As part of the
solution to the high cost of construction materials, this research was carried out on
Date Seed (DS) to investigate its suitability as light weight aggregate material in
concrete production.
DS is obtained from date palm (Phoenix dactylifera), tree of the palm family
(Arecaceae or Palmae) which can be found in Canary Islands, northern Africa, the
Middle East, Pakistan, India, and the U.S. state of California. The date palm grows
about 23 metres (75 feet) tall. Its stem is strongly marked with the pruned stubs of old
leaf bases, terminates in a crown of graceful, shining, pinnate leaves about 5 metres
(16 feet) long. Floral spikes branch from the axils of leaves that emerged the previous
year. Male and female flowers are borne on separate plants. Under cultivation the
female flowers are artificially pollinated. The date is a one-seeded fruit or berry
usually oblong but varying much in shape, size, colour, quality, and consistency of
flesh, according to the conditions of culture. More than 1,000 dates may appear on a
single bunch weighing 8 kg (18 pounds) or more. The dried fruit is more than 50
percent sugar by weight and contains about 2 percent each of protein, fat, and mineral
matter. Dates are small, sweet fruits that grow in large bunch on date palm trees. Dried
dates have a very high amount of sugar-at least half of their total weight. They are
highly cultivated for animals and human consumptions (Date Palm Encyclopaedia,
1976).
Information is lacking as to the estimated quantity of this material, however personal
visit by the researcher to some northern parts of the country such as Sokoto, Zamfara
and Kebbi States revealed that large quantity of Date is available in the areas for
human consumptions. After consumption, the seeds (DS) served as nothing but
contribute as wastes and littered the whole environments. It was against this
background that research was carried out on DS material if it would find an
application in building construction which might contribute immensely to housing
delivery, most especially in the areas where it is abundantly available and
consequently, reduce the wastes in the societies.

Durability characteristics of concrete
219
As opined by Neville and Brooke 2002, one of the several methods of testing the
durability of Ordinary Portland Cement (OPC) concrete is by determine its resistance
to sulphates attack. Sulphates are one of the major compounds that affect the
durability of concrete. They cause cracks, deterioration and crumbling of
infrastructure in concrete. Sulphate is present in the soil, ground water and sea water.
When concrete comes in contact with sulphate, it reacts with both Ca (OH)2 and C3A
present in cement to form CaSO4 and 3CaO.Al2O3.3CaSO4.32H2O (Calcium
Sulfoaluminate) known as enttringite. These compounds occupy greater volume than
the compounds which they replaced thereby, causing expansion of hardened concrete.
The consequence of sulphates attack includes not only the disruptive expansion and
cracking, but also loss of strength of concrete due to cohesion in the hydrated cement
paste and of adhesion between it and the aggregate particles. The extent of sulphate
attack on concrete is a function of the concentration of the sulphate and the
permeability of the concrete specimen. The commonest sulphates present in the soil,
ground water and sea water are Na2SO4 and MgSO4. Saturated solution of MgSO4
leads to serious deterioration of concrete (Neville and Brooks, 2002).
Work carried out by Job 2008 on durability of light weight concrete revealed that the
percentage concentration of most sulphates in the soil is in the range of 0.34 to 1.59.
Furthermore, ASTM C 1012 recommends 5% sulphate concentration to carry out
concrete chemical attack test in the laboratory. In the light of the above, this research
investigated the durability of concrete produced with DS as lightweight aggregate if
exposed to chemical solutions of 5% MgSO4 and 5% H2SO4 at 28 days
MATERIALS AND METHODS
Materials
The materials used for the research work are: cement (Dangote brand which was used
for the research due to it availability in the studied area), naturally occurring clean
river sand (fine aggregate), Crushed Granite (CG) which was obtained from a single
quarry site in Birnin Kebbi, Kebbi State, Date Seeds sourced within Birnin Kebbi
Town, ordinary water, MgSO4 and H2SO4.
Methods
The research started in the laboratory by determining some of the physical properties
of DS and CG. Properties such as bulk density, specific gravity, water absorption,
porosity, crushing value, impact value and workability were thus investigated. Two
concrete design mixes in ratio 1:2:4 were prepared for the research. The first one
contains DS as coarse aggregate while the second mix contains crushed granite. Mix
design with crushed granite served as control and w/c ratio of 0.6 was used for the two
design mix. This was obtained from the result of preliminary design mix that was first
carried out. Absolute volume method of calculation was adopted to determine the
quantities of materials required for the production of each specimen. The tests that
were conducted on the two specimens were in two stages; the chemical test and
ordinary water test. For chemical test, six (6) concrete cubes were produced for each
specimen, while nine (9) concrete cubes were produced for each specimen for water
test.

Aka, Adamu and Nensok
220
Preparation of Chemical Aggressions
The chemical aggressions used for the experimental work were 5% H2SO4 and 5%
MgSO4. They were prepared in accordance to ASTM C 1012 recommendation. ASTM
C 1012 recommends 5% Sulphate solution to carry out sulphate attack on OPC
concrete. The chemicals were prepared in the laboratory by method of chemical-water
dissolution (MgSO4) and chemical water addition.
Testing Procedures in Aggressive Media
Specimens (DS and CG concretes) were completely immersed in chemical solutions
of 5% H2SO4 and 5% MgSO4. At 28 days immersions, three concrete cubes from each
specimen were removed. They were thoroughly rinsed with clean tap water and air-
dried in the laboratory for one hour and tested to determine their 28 days compressive
strength.
Testing Procedures in Ordinary Water
Specimens (DS and CG concretes) were completely immersed in ordinary water for
28, 56 and 84 days. At 28 days immersions, three concrete cubes from each specimen
were removed and air-dried in the laboratory for one hour and tested to determine
their 28 days compressive strength. This was also repeated at 56 and 84 days
respectively.
RESULTS AND DISCUSSION
Physical Properties of the Materials Used for the Research
The Bulk Density test carried out on the samples of material used for the research was
in accordance with the provisions of BS 812: Part 2: (1975). The results are shown in
Table 1.
The ratio of the loose bulk density to the compacted bulk density of DS was 0.88. This
value is between 0.87 and 0.96 specified by the code as reported by Neville and
Brooks (2002).The specific gravity of the materials was determined in accordance
with the requirement of BS 812: Part 2: (1975).The specific gravity of DS was
observed to be 1.39. This is less than the values recorded by Neville and Brooks
(2002) for natural aggregate which is between 2.6 to 2.7. The water absorption of the
materials was carried out in accordance to the provision of BS 812: Part 2: (1975) and
DS water absorption was observed to be 8.10. The value obtained is similar to the
value obtained by Achuanu et.al (2005) and Job (2008) on periwinkle shell which was
found to be 7.18 and 12.8 % respectively.
Porosity is the volume occupied by void to the volume of the material. It is usually
expressed in percentage (Neville 1981). The porosity of DS was found to be 19.5%.
The value obtained was excessively higher than that of CG used for the research. The
impact values of materials sample was carried out in accordance with the provision of
BS 812 Part 110 (1990) and was obtained to be 22% for DS and 13% for CG
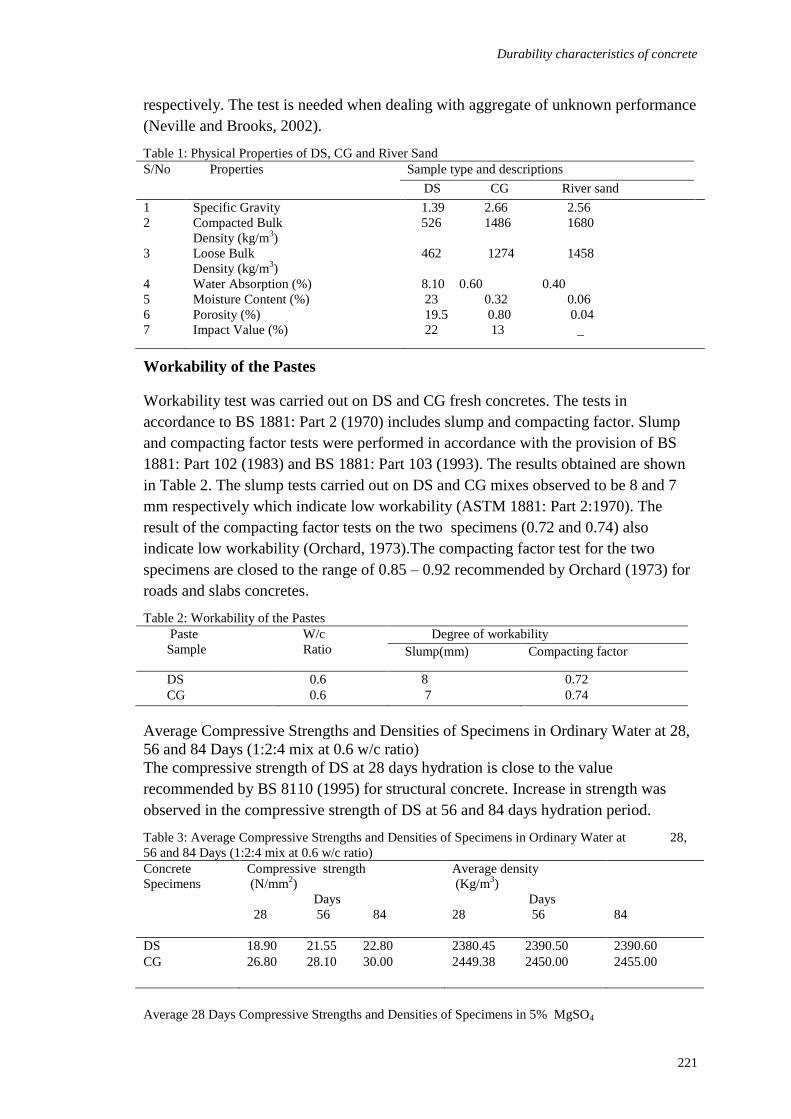
Durability characteristics of concrete
221
respectively. The test is needed when dealing with aggregate of unknown performance
(Neville and Brooks, 2002).
Table 1: Physical Properties of DS, CG and River Sand
S/No Properties Sample type and descriptions
DS CG River sand
1 Specific Gravity 1.39 2.66 2.56
2 Compacted Bulk
Density (kg/m3)
526 1486 1680
3 Loose Bulk
Density (kg/m3)
462 1274 1458
4
5
6
7
Water Absorption (%)
Moisture Content (%)
Porosity (%)
Impact Value (%)
8.10 0.60 0.40
23 0.32 0.06
19.5 0.80 0.04
22 13 _
Workability of the Pastes
Workability test was carried out on DS and CG fresh concretes. The tests in
accordance to BS 1881: Part 2 (1970) includes slump and compacting factor. Slump
and compacting factor tests were performed in accordance with the provision of BS
1881: Part 102 (1983) and BS 1881: Part 103 (1993). The results obtained are shown
in Table 2. The slump tests carried out on DS and CG mixes observed to be 8 and 7
mm respectively which indicate low workability (ASTM 1881: Part 2:1970). The
result of the compacting factor tests on the two specimens (0.72 and 0.74) also
indicate low workability (Orchard, 1973).The compacting factor test for the two
specimens are closed to the range of 0.85 – 0.92 recommended by Orchard (1973) for
roads and slabs concretes.
Table 2: Workability of the Pastes
Paste
Sample
W/c
Ratio
Degree of workability
Slump(mm) Compacting factor
DS 0.6 8 0.72
CG 0.6 7 0.74
Average Compressive Strengths and Densities of Specimens in Ordinary Water at 28,
56 and 84 Days (1:2:4 mix at 0.6 w/c ratio)
The compressive strength of DS at 28 days hydration is close to the value
recommended by BS 8110 (1995) for structural concrete. Increase in strength was
observed in the compressive strength of DS at 56 and 84 days hydration period.
Table 3: Average Compressive Strengths and Densities of Specimens in Ordinary Water at 28,
56 and 84 Days (1:2:4 mix at 0.6 w/c ratio)
Concrete
Specimens
Compressive strength
(N/mm2)
Days
28 56 84
Average density
(Kg/m3)
Days
28 56
84
DS 18.90 21.55 22.80 2380.45 2390.50 2390.60
CG 26.80 28.10 30.00 2449.38 2450.00 2455.00
Average 28 Days Compressive Strengths and Densities of Specimens in 5% MgSO4
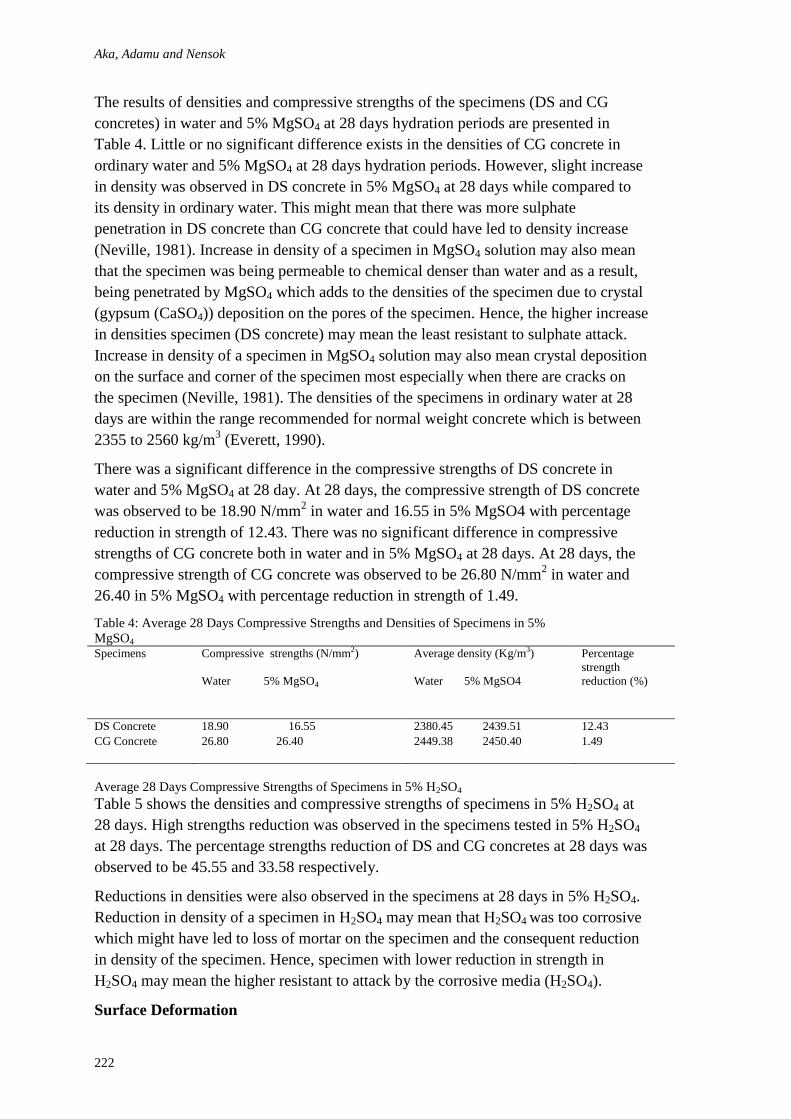
Aka, Adamu and Nensok
222
The results of densities and compressive strengths of the specimens (DS and CG
concretes) in water and 5% MgSO4 at 28 days hydration periods are presented in
Table 4. Little or no significant difference exists in the densities of CG concrete in
ordinary water and 5% MgSO4 at 28 days hydration periods. However, slight increase
in density was observed in DS concrete in 5% MgSO4 at 28 days while compared to
its density in ordinary water. This might mean that there was more sulphate
penetration in DS concrete than CG concrete that could have led to density increase
(Neville, 1981). Increase in density of a specimen in MgSO4 solution may also mean
that the specimen was being permeable to chemical denser than water and as a result,
being penetrated by MgSO4 which adds to the densities of the specimen due to crystal
(gypsum (CaSO4)) deposition on the pores of the specimen. Hence, the higher increase
in densities specimen (DS concrete) may mean the least resistant to sulphate attack.
Increase in density of a specimen in MgSO4 solution may also mean crystal deposition
on the surface and corner of the specimen most especially when there are cracks on
the specimen (Neville, 1981). The densities of the specimens in ordinary water at 28
days are within the range recommended for normal weight concrete which is between
2355 to 2560 kg/m3 (Everett, 1990).
There was a significant difference in the compressive strengths of DS concrete in
water and 5% MgSO4 at 28 day. At 28 days, the compressive strength of DS concrete
was observed to be 18.90 N/mm2 in water and 16.55 in 5% MgSO4 with percentage
reduction in strength of 12.43. There was no significant difference in compressive
strengths of CG concrete both in water and in 5% MgSO4 at 28 days. At 28 days, the
compressive strength of CG concrete was observed to be 26.80 N/mm2 in water and
26.40 in 5% MgSO4 with percentage reduction in strength of 1.49.
Table 4: Average 28 Days Compressive Strengths and Densities of Specimens in 5%
MgSO4 Specimens Compressive strengths (N/mm2)
Water 5% MgSO4
Average density (Kg/m3)
Water 5% MgSO4
Percentage
strength
reduction (%)
DS Concrete 18.90 16.55 2380.45 2439.51 12.43
CG Concrete 26.80 26.40 2449.38 2450.40 1.49
Average 28 Days Compressive Strengths of Specimens in 5% H2SO4
Table 5 shows the densities and compressive strengths of specimens in 5% H2SO4 at
28 days. High strengths reduction was observed in the specimens tested in 5% H2SO4
at 28 days. The percentage strengths reduction of DS and CG concretes at 28 days was
observed to be 45.55 and 33.58 respectively.
Reductions in densities were also observed in the specimens at 28 days in 5% H2SO4.
Reduction in density of a specimen in H2SO4 may mean that H2SO4 was too corrosive
which might have led to loss of mortar on the specimen and the consequent reduction
in density of the specimen. Hence, specimen with lower reduction in strength in
H2SO4 may mean the higher resistant to attack by the corrosive media (H2SO4).
Surface Deformation
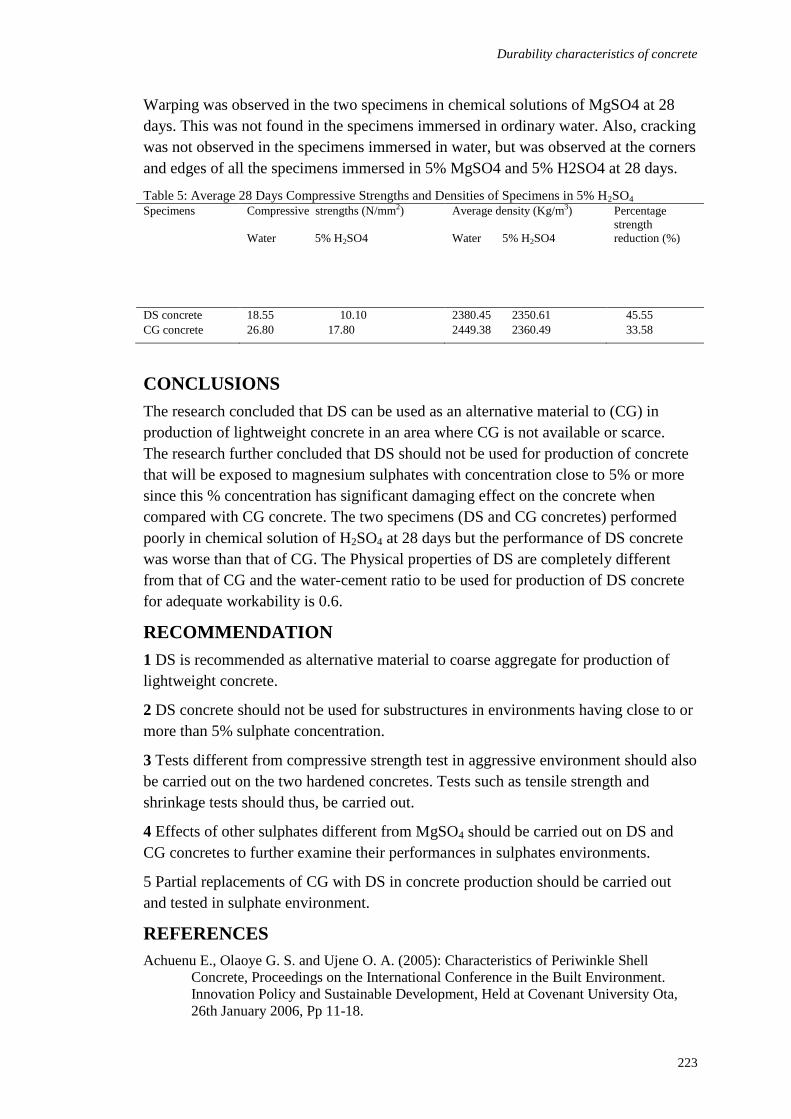
Durability characteristics of concrete
223
Warping was observed in the two specimens in chemical solutions of MgSO4 at 28
days. This was not found in the specimens immersed in ordinary water. Also, cracking
was not observed in the specimens immersed in water, but was observed at the corners
and edges of all the specimens immersed in 5% MgSO4 and 5% H2SO4 at 28 days.
Table 5: Average 28 Days Compressive Strengths and Densities of Specimens in 5% H2SO4 Specimens Compressive strengths (N/mm2)
Water 5% H2SO4
Average density (Kg/m3)
Water 5% H2SO4
Percentage
strength
reduction (%)
DS concrete 18.55 10.10 2380.45 2350.61 45.55
CG concrete 26.80 17.80 2449.38 2360.49 33.58
CONCLUSIONS
The research concluded that DS can be used as an alternative material to (CG) in
production of lightweight concrete in an area where CG is not available or scarce.
The research further concluded that DS should not be used for production of concrete
that will be exposed to magnesium sulphates with concentration close to 5% or more
since this % concentration has significant damaging effect on the concrete when
compared with CG concrete. The two specimens (DS and CG concretes) performed
poorly in chemical solution of H2SO4 at 28 days but the performance of DS concrete
was worse than that of CG. The Physical properties of DS are completely different
from that of CG and the water-cement ratio to be used for production of DS concrete
for adequate workability is 0.6.
RECOMMENDATION
1 DS is recommended as alternative material to coarse aggregate for production of
lightweight concrete.
2 DS concrete should not be used for substructures in environments having close to or
more than 5% sulphate concentration.
3 Tests different from compressive strength test in aggressive environment should also
be carried out on the two hardened concretes. Tests such as tensile strength and
shrinkage tests should thus, be carried out.
4 Effects of other sulphates different from MgSO4 should be carried out on DS and
CG concretes to further examine their performances in sulphates environments.
5 Partial replacements of CG with DS in concrete production should be carried out
and tested in sulphate environment.
REFERENCES
Achuenu E., Olaoye G. S. and Ujene O. A. (2005): Characteristics of Periwinkle Shell
Concrete, Proceedings on the International Conference in the Built Environment.
Innovation Policy and Sustainable Development, Held at Covenant University Ota,
26th January 2006, Pp 11-18.
Aka, Adamu and Nensok
224
American Standard for Testing Method C 143-78: Specification for Concrete Slump.
American Standard for Testing Method C 1881:2: (1970): Specification for Concrete Slump.
American Standard for Testing Method C 1012: Method for Testing Sulphates Attack on OPC
Concrete.
British Standard Institute BS 812: 2 (1975): “Specification for Bulk Density of Materials.”
London, United Kingdom.
British Standard Institute BS 1881: 2 (1970): “Method for Determination of Concrete
Slump”. London, United Kingdom.
British Standard Institute BS 1881: 102 (1983): “Method for Determination of Concrete
Workability”. London, United Kingdom.
British Standard Institute BS 1881:10 2 (1993): “Compacting Factor Test on Concrete.
London, United Kingdom.
British Standard Institute BS 1377: 2 (1970): “Method for Determination of the Specific
Gravity of Aggregates.” London, United Kingdom.
British Standard Institute BS 8110: 2 (1985): “Recommendation for Minimum Strength of
Concrete”. London, United Kingdom.
British Standard Institute BS 812 Part 110 (1990): “Method for Determination of Aggregate
Crushing Value. London, United Kingdom.
British Standard Institute BS 812 Part 112 (1990): “Method for Determination of Aggregate
Impact Value. London, United Kingdom.
Date Palm (2011): Inc Encyclopædia Britannica. Retrieved from
http://www.britannica.com/EBchecked/topic/152224/date-palm
Ekainu (1991): Properties of Concrete Produced With Olive Seeds as Lightweight Aggregate
Leonardo Electronic Journal of Practical and Technology. 8 (1):55-70.
Everret, P.j (1990): Building Material Practice Hall, U.K Pp 20-200.
Job O. F (1994): Properties of Periwinkle Shell Concrete, Unpublished MSc work,
Department of Building, University of Jos Nigeria.
Job O. F (2008): The Durability Characteristics of Periwinkle Shell Concrete, Unpublished
PhD work, Department of Building, University of Jos Nigeria.
Neville, A.M and Brooks, J.J (2002): Concrete Technology, Person Education Ltd,
Delhi, India. 2nd Edition.
Neville, A.M (1981): Properties of Concrete. Longman Group, United Kingdom. Pp.125-142
Neville, A.M (1996) Properties of Concrete, Longman Group Ltd, London, UK Pp 62-109.
Oluremi A. A (1990): Input of Local Materials in Building as a Means of Reducing the Cost
of Construction, Journal of Nigeria Institute of Quantity Surveyors Pp 12-14.
Okpala D. C (1990): The use of Palm Kernel for Production of Lightweight Aggregate
Proceedings of the Nigeria Society of Engineers Annual General Meeting.
Orchad, D.F. (1973): Concrete Technology Vol. I and II Applied Science Publisher Ltd.
London. U.K.
World Book Encyclopaedia (1976).
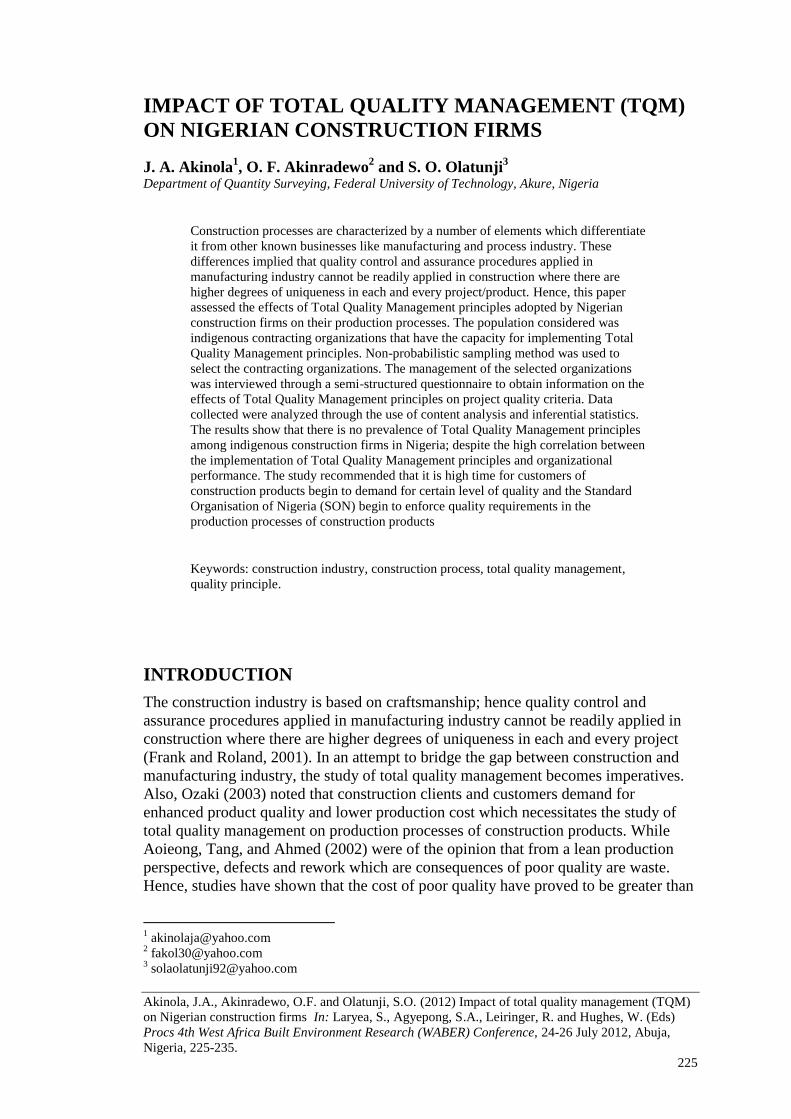
Akinola, J.A., Akinradewo, O.F. and Olatunji, S.O. (2012) Impact of total quality management (TQM)
on Nigerian construction firms In: Laryea, S., Agyepong, S.A., Leiringer, R. and Hughes, W. (Eds)
Procs 4th West Africa Built Environment Research (WABER) Conference, 24-26 July 2012, Abuja,
Nigeria, 225-235.
225
IMPACT OF TOTAL QUALITY MANAGEMENT (TQM)
ON NIGERIAN CONSTRUCTION FIRMS
J. A. Akinola1, O. F. Akinradewo
2 and S. O. Olatunji
3
Department of Quantity Surveying, Federal University of Technology, Akure, Nigeria
Construction processes are characterized by a number of elements which differentiate
it from other known businesses like manufacturing and process industry. These
differences implied that quality control and assurance procedures applied in
manufacturing industry cannot be readily applied in construction where there are
higher degrees of uniqueness in each and every project/product. Hence, this paper
assessed the effects of Total Quality Management principles adopted by Nigerian
construction firms on their production processes. The population considered was
indigenous contracting organizations that have the capacity for implementing Total
Quality Management principles. Non-probabilistic sampling method was used to
select the contracting organizations. The management of the selected organizations
was interviewed through a semi-structured questionnaire to obtain information on the
effects of Total Quality Management principles on project quality criteria. Data
collected were analyzed through the use of content analysis and inferential statistics.
The results show that there is no prevalence of Total Quality Management principles
among indigenous construction firms in Nigeria; despite the high correlation between
the implementation of Total Quality Management principles and organizational
performance. The study recommended that it is high time for customers of
construction products begin to demand for certain level of quality and the Standard
Organisation of Nigeria (SON) begin to enforce quality requirements in the
production processes of construction products
Keywords: construction industry, construction process, total quality management,
quality principle.
INTRODUCTION
The construction industry is based on craftsmanship; hence quality control and
assurance procedures applied in manufacturing industry cannot be readily applied in
construction where there are higher degrees of uniqueness in each and every project
(Frank and Roland, 2001). In an attempt to bridge the gap between construction and
manufacturing industry, the study of total quality management becomes imperatives.
Also, Ozaki (2003) noted that construction clients and customers demand for
enhanced product quality and lower production cost which necessitates the study of
total quality management on production processes of construction products. While
Aoieong, Tang, and Ahmed (2002) were of the opinion that from a lean production
perspective, defects and rework which are consequences of poor quality are waste.
Hence, studies have shown that the cost of poor quality have proved to be greater than
Akinola et al.
226
the investment for managing quality and should therefore be eliminated. (Zairi, 2000;
Tukel and Rom, 2001; Bryde, 2003)
When focusing on quality and product effectiveness, an adequate definition regarding
construction is “fitness for use” (Tam, Deng, Zeng, and Ho, 2000). That is, quality
that is determined by the customers. This affirmed the observation noted by Landin
(2000) that quality has become an important means of competition in the world
market and a strategic weapon in the fight for market shares, thereby improving
profitability. Love, Heng, Zahur and Olusegun (2000) offered two subsidiary
definitions of quality as (i) quality of design; and (ii) quality of conformance. The
quality of conformance has to do with identifying the mixture of random and chronic
problems related to customers in the course of utilizing construction products. This
has necessitated many construction firms in advanced countries to have gone a great
extent in introducing quality system as an integral part of construction management
while most of these firms have chosen to structure their quality system in accordance
with the standards contained in ISO 9000 series.
However, the construction industry in Nigeria has long been associated with poor
quality of construction products. Tam et al, (2000) opined that new construction
technology such as the mechanization and industrialization that could bring about
quality of construction products depends on the coordination of many operations and
phases of work; responsibility sharing; activity sequencing; elapse of time between
production and use; and the number of direct operators and their qualifications. All
these were invariably missing in Nigerian construction industry. Moreso, Nigerian
construction is an industry reluctant to change; for it has made little progress in
reducing cost of reworks; and defects occurs just as often as they ever did. More
importantly, the client through a contract usually stipulates that a contractor should
complete the work within a specified time, at an agreed price and at a certain standard
or quality. This implied that the contractor must deliver the project within a stipulated
time; attain the cost target as planned and meet specified quality level. However,
many contractors and project managers only focus on and place their priorities on
meeting the project time and cost at the expense of quality. Therefore this paper
appraises the initiatives adopted by construction firms in Nigeria to solve quality
problems and meet the needs or satisfaction of the customers.
NATURE OF CONSTRUCTION INDUSTRY
Construction industry is characterised by a number of elements which differentiate it
from other known business sectors like manufacturing and services (Ozaki, 2003).
These differences apply to products, technology, organization structures, market and
competition, and environmental effects. Frank and Roland (2001) stated that both
manufacturing and construction processes are complex with the major differences
between them lying in their end-products. In construction projects, the production
process ceases to exist after the project had been completed. At this point, the product
of the construction project is the actual finished facility or building.
Stylianos and George (1998) noted that construction project tends to be unique
because they are single, customized and not easily substitutable goods but built to
specifications provided by the clients and consultants. However, construction products
differ from one another; two products or buildings cannot be the same, but may only
be similar due to territorial immobility because they are produced on location of
Total quality management
227
consumption. Therefore, a construction firm has to sell products which have not been
built; under the conditions that are partly beyond its control. Such conditions include
the weather, the peculiarity of the construction site and the conflicting interest of
different parties to the project among others. This view was corroborated by Tukel and
Rom (2001) that the technology of the construction industry has always been
characterised by flexible specialization due to production process taking place at the
location of consumption. More importantly, there is high labour mobility, low capital
intensity and high entrepreneurial risk that affected performance in the construction
industry (Vouzas, 2004).
QUALITY MANAGEMENT IN PROJECT CONSTRUCTION
Modern construction projects have become so complex and interwoven that the need
to ensure quality becomes essential. Kumaraswamy and Dissanayaka (2000) stated
that there is both regional and international necessity for the introduction and
implementation of quality control systems in construction projects. This was attributed
to fierce competition, the growing needs of the project owners (customers) and the
need to comply with industry standards (quality) and environmental protection.
Aoieong et al (2002) described quality as the totality of features and characteristics of
production process that bear on its ability and capacity to satisfy the stated need or
fitness.
In construction industry, the aim of all professionals/consultants is to strife to provide
the owner/client with a product or service that will meet the standard that is intended
for; and properly built with satisfactory performance and value for money.
Furtherance to this aim, the Standard Organisation of Nigeria (SON) was put in place
by the Federal Government to ensure good quality of both materials and finished
goods/products that are produced in the country.
However, management of quality in any contracting organisation is the responsibility
of project manager who need to ensure the integration of all resources involved in the
quality control mechanism. Landin (2000) described quality management as action
taken throughout the organization to increase the effectiveness and efficiency of
activities and processes in order to provide added benefits to both the organization and
its customers. It is the integration and development of measures to contribute to
quality of product. Ozaki (2003) stated that quality management has a three-fold
meaning in construction: that is getting the job done on time; ensuring that the basic
characteristics of the final project fall within the required specifications; and getting
the job done within budget. Summarily quality management could be described as the
operational mechanism that are used to fulfill the standard set and for measuring
quality.
QUALITY ASSURANCE
Ofori et al (2000) observed that aggressive competition, both at the regional and
international levels, has imposed higher standard levels in almost all business
activities and sectors. Construction industry through ISO 9000 and ISO 14000 are also

Akinola et al.
228
actively engaged in achieving international standard level. The ISO 9000 series is a
framework for improving quality in the construction industry (Kumaraswamy and
Dissanayaka, 2000). This has led to the development of the quality assurance system
which follows a parallel orbit with that of manufacturing industry. Although, the
procedure has certain fundamental differences when compared to that of
manufacturing, but these are mainly due to the different characteristics of the
construction production process and other operational activities.
Traditionally, either the project engineer or project architect that is charged with the
responsibility for supervision and inspection on a construction site. Inspection is site is
meant to ensure that the project is constructed in accordance with the plans and
specification and in compliance with tolerances and requirements specified in the
specification. Hence, Ofori (2000) noted that quality assurance must begin from the
design phase of any project while Tam et al (2000) identified two levels at which to
consider the development and implementation of a quality assurance system as: the
organisational level and the project level. The first level sets the quality policy and
quality procedures, while the second level focuses on implementing the applicable
elements of quality assurance to each different project. ISO 8402 defined quality
assurance as ‘systematic and independent examination to determine whether quality
activities and related results comply with planned arrangement; and whether these
arrangements are implemented effectively and are suitable to achieve objectives’.
Daniel and Christopher (2005) noted that the aim of quality assurance is to improve
the quality system and provide a comprehensive control while Zairi (2000)
summarizes the objective of quality assurance as follows: (i) optimize the
performance of the quality system (ii) follow the appropriateness of original planning
(iii) monitor effectiveness of policy and procedure applications (iv) recommend and
implement system improvements (v) provide consistency among inspectors and
projects (vi) determine training needs (vii) provide information for life cycle facility
management.
TOTAL QUALITY MANAGEMENT IN CONSTRUCTION
INDUSTRY
According to ISO 8402, total quality management is a continuous search for ways to
prevent defects by doing the job right. Koh and Low (2008) described total quality
management as a system integrated into an organisational way-of-life and directed at
the continuous improvement of the organisation’s product, in order to compete in a
global economy. Tam et al (2000) noted that total quality management needs to gain
ground rapidly and become a way of life for any construction organisations. This
implied a complete turn around in corporate culture and management approach as
compared to the traditional way of top management giving orders and employees
merely obeying them. Therefore, total quality management should not be seen as a
way of life in organizations, but an end in itself (Corbett and Rastrick, 2000). It is a
means to an organisational end. This made Koh and Low (2008) to note that time are
needed in order to integrate the appropriate quality principles and techniques into the
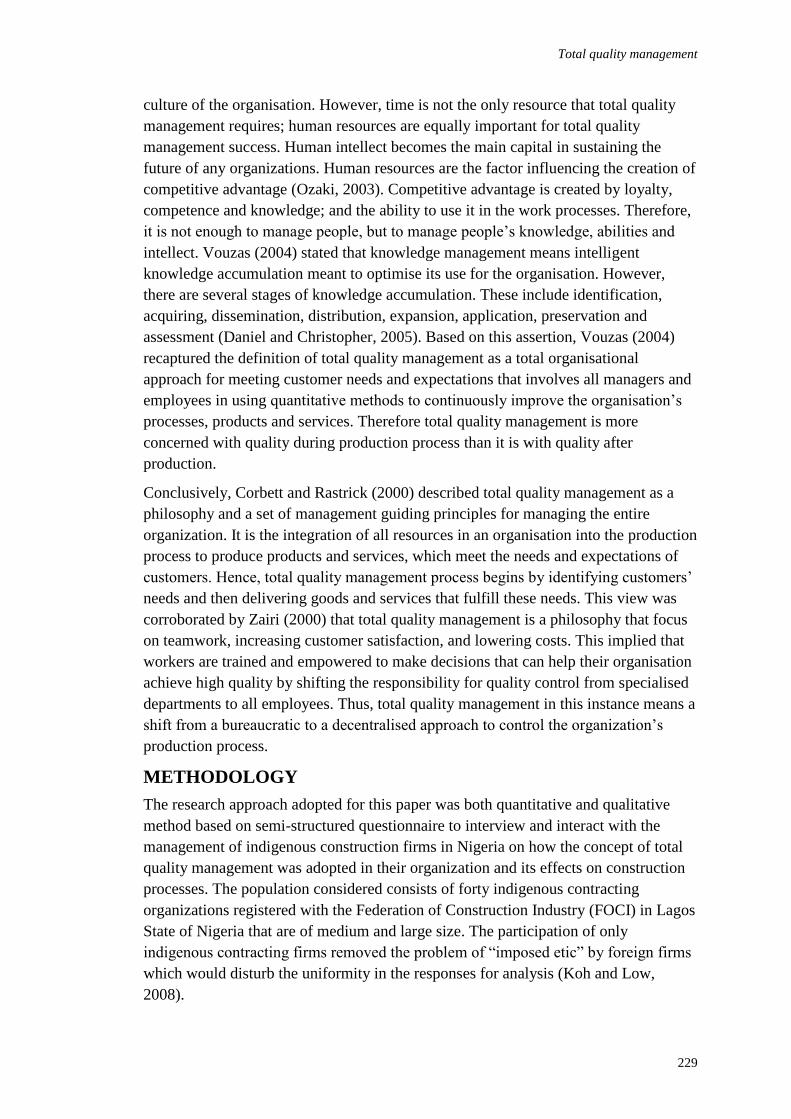
Total quality management
229
culture of the organisation. However, time is not the only resource that total quality
management requires; human resources are equally important for total quality
management success. Human intellect becomes the main capital in sustaining the
future of any organizations. Human resources are the factor influencing the creation of
competitive advantage (Ozaki, 2003). Competitive advantage is created by loyalty,
competence and knowledge; and the ability to use it in the work processes. Therefore,
it is not enough to manage people, but to manage people’s knowledge, abilities and
intellect. Vouzas (2004) stated that knowledge management means intelligent
knowledge accumulation meant to optimise its use for the organisation. However,
there are several stages of knowledge accumulation. These include identification,
acquiring, dissemination, distribution, expansion, application, preservation and
assessment (Daniel and Christopher, 2005). Based on this assertion, Vouzas (2004)
recaptured the definition of total quality management as a total organisational
approach for meeting customer needs and expectations that involves all managers and
employees in using quantitative methods to continuously improve the organisation’s
processes, products and services. Therefore total quality management is more
concerned with quality during production process than it is with quality after
production.
Conclusively, Corbett and Rastrick (2000) described total quality management as a
philosophy and a set of management guiding principles for managing the entire
organization. It is the integration of all resources in an organisation into the production
process to produce products and services, which meet the needs and expectations of
customers. Hence, total quality management process begins by identifying customers’
needs and then delivering goods and services that fulfill these needs. This view was
corroborated by Zairi (2000) that total quality management is a philosophy that focus
on teamwork, increasing customer satisfaction, and lowering costs. This implied that
workers are trained and empowered to make decisions that can help their organisation
achieve high quality by shifting the responsibility for quality control from specialised
departments to all employees. Thus, total quality management in this instance means a
shift from a bureaucratic to a decentralised approach to control the organization’s
production process.
METHODOLOGY
The research approach adopted for this paper was both quantitative and qualitative
method based on semi-structured questionnaire to interview and interact with the
management of indigenous construction firms in Nigeria on how the concept of total
quality management was adopted in their organization and its effects on construction
processes. The population considered consists of forty indigenous contracting
organizations registered with the Federation of Construction Industry (FOCI) in Lagos
State of Nigeria that are of medium and large size. The participation of only
indigenous contracting firms removed the problem of “imposed etic” by foreign firms
which would disturb the uniformity in the responses for analysis (Koh and Low,
2008).
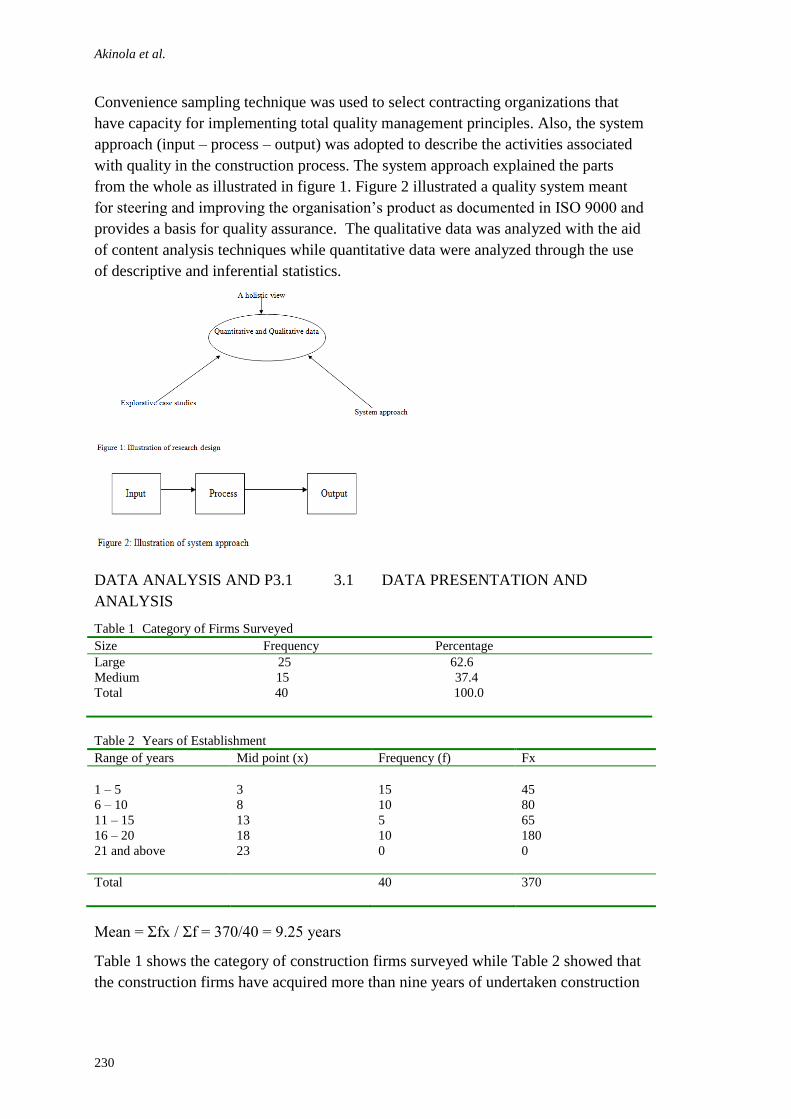
Akinola et al.
230
Convenience sampling technique was used to select contracting organizations that
have capacity for implementing total quality management principles. Also, the system
approach (input – process – output) was adopted to describe the activities associated
with quality in the construction process. The system approach explained the parts
from the whole as illustrated in figure 1. Figure 2 illustrated a quality system meant
for steering and improving the organisation’s product as documented in ISO 9000 and
provides a basis for quality assurance. The qualitative data was analyzed with the aid
of content analysis techniques while quantitative data were analyzed through the use
of descriptive and inferential statistics.
DATA ANALYSIS AND P3.1 3.1 DATA PRESENTATION AND
ANALYSIS
Table 1 Category of Firms Surveyed
Size Frequency Percentage
Large 25 62.6
Medium 15 37.4
Total 40 100.0
Table 2 Years of Establishment
Range of years Mid point (x) Frequency (f) Fx
1 – 5 3 15 45
6 – 10 8 10 80
11 – 15 13 5 65
16 – 20 18 10 180
21 and above 23 0 0
Total 40 370
Mean = Σfx / Σf = 370/40 = 9.25 years
Table 1 shows the category of construction firms surveyed while Table 2 showed that
the construction firms have acquired more than nine years of undertaken construction
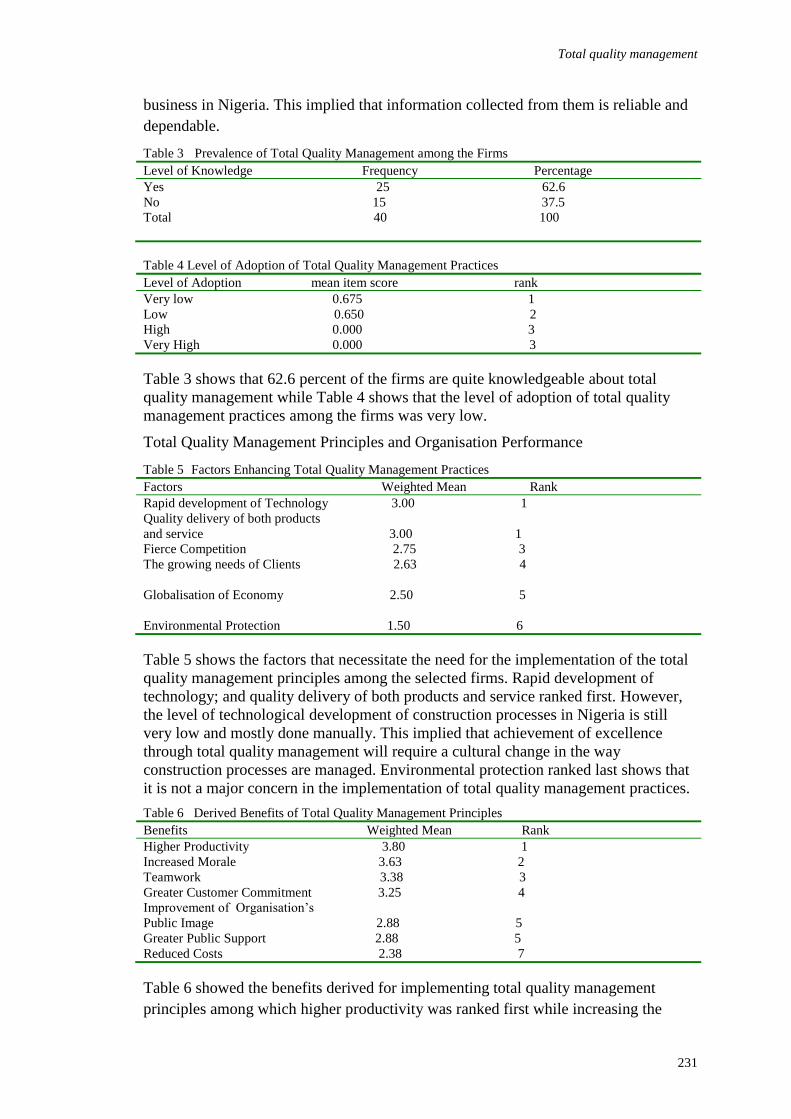
Total quality management
231
business in Nigeria. This implied that information collected from them is reliable and
dependable.
Table 3 Prevalence of Total Quality Management among the Firms
Level of Knowledge Frequency Percentage
Yes 25 62.6
No 15 37.5
Total 40 100
Table 4 Level of Adoption of Total Quality Management Practices
Level of Adoption mean item score rank
Very low 0.675 1
Low 0.650 2
High 0.000 3
Very High 0.000 3
Table 3 shows that 62.6 percent of the firms are quite knowledgeable about total
quality management while Table 4 shows that the level of adoption of total quality
management practices among the firms was very low.
Total Quality Management Principles and Organisation Performance
Table 5 Factors Enhancing Total Quality Management Practices
Factors Weighted Mean Rank
Rapid development of Technology 3.00 1
Quality delivery of both products
and service 3.00 1
Fierce Competition 2.75 3
The growing needs of Clients 2.63 4
Globalisation of Economy 2.50 5
Environmental Protection 1.50 6
Table 5 shows the factors that necessitate the need for the implementation of the total
quality management principles among the selected firms. Rapid development of
technology; and quality delivery of both products and service ranked first. However,
the level of technological development of construction processes in Nigeria is still
very low and mostly done manually. This implied that achievement of excellence
through total quality management will require a cultural change in the way
construction processes are managed. Environmental protection ranked last shows that
it is not a major concern in the implementation of total quality management practices.
Table 6 Derived Benefits of Total Quality Management Principles
Benefits Weighted Mean Rank
Higher Productivity 3.80 1
Increased Morale 3.63 2
Teamwork 3.38 3
Greater Customer Commitment 3.25 4
Improvement of Organisation’s
Public Image 2.88 5
Greater Public Support 2.88 5
Reduced Costs 2.38 7
Table 6 showed the benefits derived for implementing total quality management
principles among which higher productivity was ranked first while increasing the
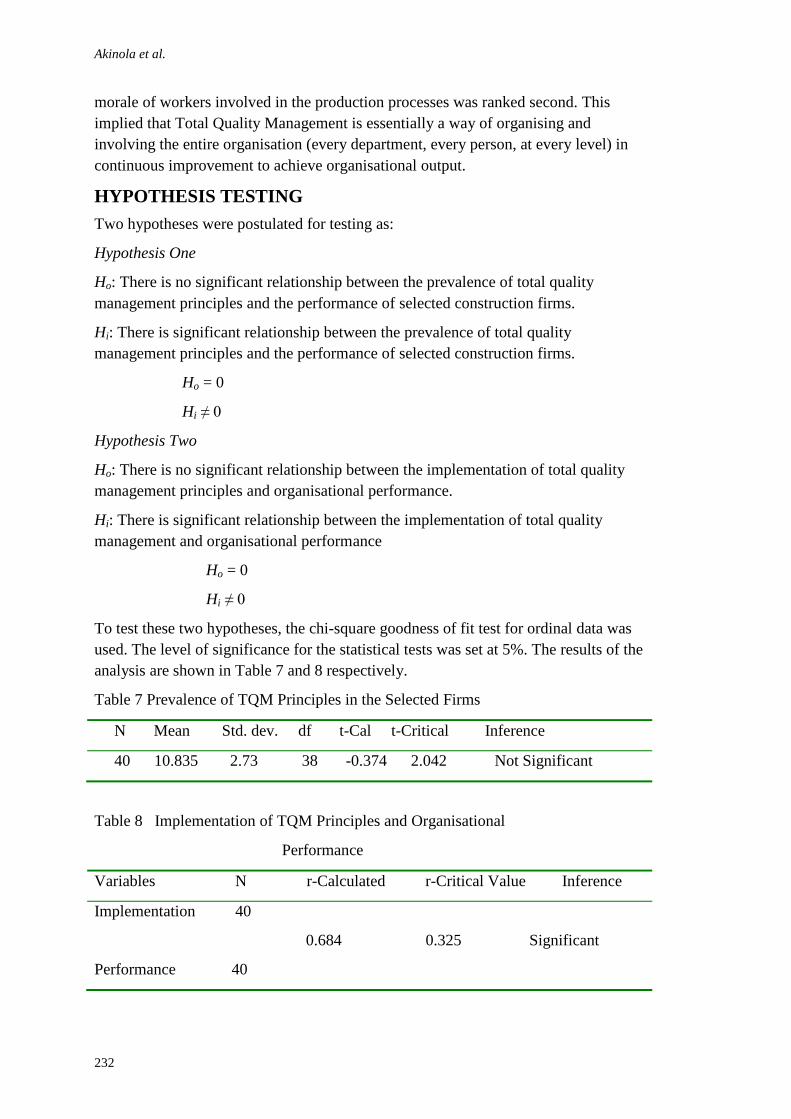
Akinola et al.
232
morale of workers involved in the production processes was ranked second. This
implied that Total Quality Management is essentially a way of organising and
involving the entire organisation (every department, every person, at every level) in
continuous improvement to achieve organisational output.
HYPOTHESIS TESTING
Two hypotheses were postulated for testing as:
Hypothesis One
Ho: There is no significant relationship between the prevalence of total quality
management principles and the performance of selected construction firms.
Hi: There is significant relationship between the prevalence of total quality
management principles and the performance of selected construction firms.
Ho = 0
Hi ≠ 0
Hypothesis Two
Ho: There is no significant relationship between the implementation of total quality
management principles and organisational performance.
Hi: There is significant relationship between the implementation of total quality
management and organisational performance
Ho = 0
Hi ≠ 0
To test these two hypotheses, the chi-square goodness of fit test for ordinal data was
used. The level of significance for the statistical tests was set at 5%. The results of the
analysis are shown in Table 7 and 8 respectively.
Table 7 Prevalence of TQM Principles in the Selected Firms
N Mean Std. dev. df t-Cal t-Critical Inference
40 10.835 2.73 38 -0.374 2.042 Not Significant
Table 8 Implementation of TQM Principles and Organisational
Performance
Variables N r-Calculated r-Critical Value Inference
Implementation 40
0.684 0.325 Significant
Performance 40
Total quality management
233
Table 7 showed that the calculated t-value of -0.374 is less than the critical tabulated t-
value of 2.042, therefore the null hypothesis, Ho, is accepted and the real hypothesis,
Hi, is rejected. Conclusively, there is no prevalence of total quality management
principles among the selected construction firms.
The result in Table 8 correlates the relationship between the implementation of total
quality management principles and organisational performances. It showed that the r-
Calculated of 0.684 is greater than r- Critical Tabulated of 0.325 and therefore
correlation co-efficient is positive. The null hypothesis, (Ho), is rejected; while the real
hypothesis (Hi) is accepted. Conclusively, there is significant relationship between the
implementation of total quality management principles and organisational
performance. This implied that when total quality management principles are
implemented, it will directly lead to organisational performance.
DISCUSSION OF FINDINGS
Table 3 shows that 62.6 percent of the construction firms surveyed are well
knowledgeable about the principles of total quality management. This finding
corroborated the assertion of Koh and Low (2008) that the acronym of total quality
management and some of its concepts and practices are well known by the
practitioners. However, Table 4 showed that the level of adopting these principles to
the operational activities of these construction firms is very low. This implies that the
firms did not practice total quality management principles. Also, Table 5 shows what
the individual construction firms need to do in order to improve their performance and
gain competitive advantage by adopting total quality management principles. Among
these are rapid development of operational technology and quality delivery of
products and services. This finding was also corroborated by Daniel and Christopher
(2005) that there is need for both cultural and behavioural change in the mind-set of
practitioners in order to improve performance; while Table 6 shows the inherent
benefits which could be derived from the adoption of total quality management
principles as increased productivity on the part of firms and increased morale on the
part of workers.
Furthermore, inference from Table 7 shows that there is no prevalence between total
quality management principles and organizational performance of the selected firms.
This further buttress the earlier finding in Table 4 that the level of adoption of total
quality management practices are very low while Table 8 shows that there is a high
correlation between the adoption of total quality management principles and
organizational performance.
SUMMARY OF FINDINGS
The results of the paper indicated that most of the firms are aware of the benefits of
total quality management and the factors enhancing its implementation, however the
level of adopting the total quality management principles are very low in Nigeria. The
analysis further showed that there is no prevalence of total quality management
principle among indigenous construction firms in Nigeria while there is a high
Akinola et al.
234
correlation between the implementation of total quality management principles and
organisational performances
CONCLUSION AND RECOMMENDATION
The benefits of total quality management are well known to construction professionals
but this is totally obscured to the end-users of construction products. This has made
the construction firms to be side-tracking or avoiding certain responsibility towards
the construction customers. Hence it is recommended that the end users or consumers
of construction products/services begin to demand for certain level of quality and that
it is high time for the Standard Organisation of Nigeria (SON) to enforce quality
requirements in the production process of construction products in Nigeria.
ACKNOWLEDGEMENT
The authors considerably appreciate the input of review panel that has improved the
quality of this paper. Many thanks for the objective comments.
REFERENCES
Aoieong, R. T.; Tang, S. L. and Ahmed, S. M (2002); A Process Approach in Measuring
Quality Costs of Construction Projects: Model Development, Journal of construction
Management and Economics, 20, 179 – 192.
Bride, D. J (2003); Modelling Project Management Perfeomance, International Journal of
Quality and Realiability Management, 20 (2), 229 – 254.
Corbett, L. and Rastrick, K. (2000); Quality Performance and Organisational Culture,
International Journal of Quality and Realibility Management, 17(1), 25 – 31.
Daniel, I. P. and Christopher, M. M. (2005); The Relationship Between Total Quality
Management and Organisational Culture, International Journal of Operations and
production Management, 25 (11), 1101 – 1122.
Frank, E. E. and Roland, L. J. (2001); Total Quality Management in the Construction
Industry, The Total Quality Management Magazine, 10 (2), 199 – 208.
Gatchalian, M (1997); People Empowerment: The Key to Total Quality Management Success,
The Total Quality Management Magazine, 9 (6), 21 – 26.
ISO 8402 (1994); Quality Management and Quality Assurance-Vocabulary.
ISO 9000 (1994); Quality Management and Quality Assurance Standard – Part 1: Guidelines
for Selection and Use.
ISO 9001 (1994); Quality Systems – Model for Quality Assurance in Design, Development,
Production, Installation and Servicing.
Koh, T. Y and Low, S. P. (2008); Organisational Culture and TQM Implementation in
Construction Firms in Singapore, Journal of Construction Management and
Economics, 26, 237 – 248.
Kumaraswamy, M. M. and Dissanayaka, S. M.(2000); ISO 9000 and Beyond: From a Hong
Kong Construction Perspective, Journal of Construction Management and
Economics, 18, 783 – 796.
Landin, A (2000); ISO 9001 within the Swedish Construction Sector, Journal of Construction
Management and Economics, 18 (5), 509-518
Total quality management
235
Love, P. E. D; Heng, L. I; Zahur, I and Olusegun, F. (2000); Total Quality Management and
the Learning Organisation: A Dialogue for Change in Construction, Journal of
Construction Management and Economics, 18, 321 – 331.
Ofori, G; Briffett, C; Gang, G and ranasinghe, M. (2000); Impact of ISO14000 on
construction Enterprises in Singapore, Journal of Construction Management and
Economics, 18, 935 – 947.
Ozaki, R (2003); Customer – focused Approaches to Innovation in House Building, Journal of
Construction Management and Economics, 21, 557 – 564.
Stylianos, Z and George, T (1998); Quality Management: A New Challenge for the Greek
Construction Industry, The Total Quality Management Magazine, 9 (7), 619.
Tam, C. M; Deng, Z. M; Zeng, S. X and Ho, C. S (2000); Quest for Continuous Quality
Improvement for Public Housing Construction in Hong Kong, Journal of
Construction Management and Economics, 18, 437 – 446.
Tukel, O. J and Rom, W. O (2001); An Empirical Investigation of Project Evaluation Criteria,
International Journal of Operations and Production Management, 21 (3), 400
– 416.
Vouzas, F (2004); HR Utilization and Quality Improvement, The Total Quality Management
Magazine, 16 (2), 125 – 135.
Zairi, M (2000); Managing Customer Satisfaction: A Best Practice Perspective, The Total
Quality Management Magazine, 12 (6), 389 – 394.

Aladeloba, E.A. (2012) Relevance of hernando de soto’s principle of land titling to Lagos Metropolis
In: Laryea, S., Agyepong, S.A., Leiringer, R. and Hughes, W. (Eds) Procs 4th West Africa Built
Environment Research (WABER) Conference, 24-26 July 2012, Abuja, Nigeria, 237-250.
237
RELEVANCE OF HERNANDO DE SOTO’S PRINCIPLE
OF LAND TITLING TO LAGOS METROPOLIS
Emmanuel Adesina Aladeloba1
School of Environmental Studies, Yaba college of Technology, Yaba, Lagos, Nigeria
Hernando De Soto’s book, “The mystery of Capital” attributed the failure of
capitalism in the third world to lack of titles on properties held by the poor. The Land
use Act meant to create relief did not ease the procedure of obtaining relevant land
documents. Lagos State situation appears to be more precarious as the authority
issuing Certificate of occupancy bears no responsibility for guaranteeing good title
under the land use Act. These situations have prompted interest in the research work:
i) identifying the benefits accruable to land formalization ii) determining the effects of
Government policies on land transactions and iii) establishing the role played by
Financial institutions. The population sample covers stakeholders who expressed
opinion on the subject. Field trips were made. Secondary data obtained from various
materials and presented using frequency tables. The outcome revealed that affected
stakeholders are resolute to revive their capital from the “dead” by obtaining
necessary titles.
Keywords: certificate of occupancy, dead capital, government policy, land use Act,
title
INTRODUCTION
Hernando De Soto is a Peruvian Economist whose book, “The mystery of Capital” has
had a major impact upon donor agency policies for third world developments. His
claim that the failure of capitalism in the third world is attributable to the lack of
property titles has greatly helped to open up the discourse on the linkages between
land titling and third world development.
He argues that property becomes useful capital only when it is recognized by a formal
legal system. He further posited that the non-existent of a legal recognition for such
property held mostly by the world’s poor qualifies them as DEAD CAPITAL.
Hernando De Soto (2000) was able to identify the potentials of dead property capital
that he compares it with nuclear fission whereby a single brick can be made to release
a huge amount of energy in the form of an atomic explosion.
The determination of the Relevance of Hernando de, soto’s principle of land titling in
Lagos metropolis vide the opinions of stakeholders will help 1) to unravel the
mystery behind the capital held by the urban poor which is described as being
immobile and out of the formal market system 2) to expose the reason the Land use
Act is unable to ease the procedure of obtaining relevant Land documents and 3) to
reveal why the Certificate of occupancy regarded as solution turned out to be
inadequate to guarantee ownership. The Government’s positive responses to the
Aladeloba
238
outcome of the above exercise will elicit a spontaneous change of attitude by the
urban poor- the sudden awareness of the potentials inherent in hitherto dead capital
will result in property market explosion. This no doubt will bring about new thoughts
which will dictate operations in the property markets. However, views of stakeholders
being sought will possibly be relative as are likely to depend on personal conviction
which often times varies. It is therefore believed that this research will help expose,
once and for all, the latent economic strength of the property being held by the urban
poor.
The relevance to Lagos situation
Nigeria, as a Country, runs a capitalist economy. Hernando De Soto’s claims cannot
be any less relevant as most of the properties, especially in the rural areas, are held by
the poor who cannot lay any legal claim to them except through family inheritance,
and simply; by their mere saying it. Unlike the urban areas where few percentages of
properties are held by the rich and with recognizable titles, the rural areas have a
considerable percentage of dead capital.
Several factors combine to inhibit the formalization of property right. These include
Land tenure system, ignorance of its benefits by the poor etc. According to Smith
(1995), the Traditional land ownership practice is synonymous with the customary
land Tenure system which is indigenous to Nigeria .The highlight of its rules is
basically that Land belongs to villages, communities or families with chief or
headman of the community as the Manager or Trustee holding the land for the use of
the whole village, community or family. Furthermore, Acquaye (1995), states that
rights in Land are vested in groups communally and Rights of individual may revert to
the larger group. Ignorance of its benefits by the poor explains why the bulk of the
world’s assets held by the poor remained untapped. The assets are painfully outside
the property mechanisms that could be used to create, produce or guarantee value in
the property market system.
Ordinarily, possession of the magic documents should have put the mind of the
purchaser of interests in real estate at rest but experience has shown that this is not
always the case. There have been instances when multiple certificates surface on the
same piece of land, thereby making the finality of such document suspect (Babatunde,
1999). The Nigerian 1978 land use Act further accentuated illegality by providing all
private transaction under section 7. This includes sales, assignments and mortgages,
carried out without the written consent of the state government. They result in
bureaucratic delays and uncertainties that pushed most land purchasers to obtain land
illegally through “unapproved private transaction”.
Land right are generally less secured under the Act as section 28 of the Act allows
rights of occupancy to be revoked at anytime for public purposes while on the other
hand, right purchased from the market without consent are always under threat of
nullification due to their illegality as provided under sector 26 of the same Act.
The demolition in 1991, of Maroko in Victoria Island, Lagos presents a good example
for discuss – The Lagos State government regarded the settlers as squatters on
Land titling
239
government land which ultimately results in their being dispersed either into new
slums or to swell existing slum while the area was taken over by high class residential
developments.
The Lagos situation appears to be more precarious in that certificates of occupancy are
advertised in National Newspaper for a statutory period of 21 days, before issuance,
and despite this, the issuing authority, under the land use Act, bears no responsibility
in guaranteeing good title (Babatunde, 1999). The land registry is also unreliable as
fake or forged certificates bearing authentic registration abound. Often times,
billboards with inscriptions reading “This house is not for sale” or sometimes “caveat
emptor” are erected on houses to forestall ugly consequence of illegal sale or dispute
on ownership of genuine document.
It is therefore not surprising that many who buy land become indifferent to seeking
registration. However, there can never be justification for the thriving informal land
market as they perform sub-optimally while efficiency is greatly compromised. Little
wonder banks and mortgage institutions shy away from granting loans for land
development.
(Omirin,1992) stated that the Bureaucratic control of transactions results in the
introduction of government tariffs which are often times out of reach of the common
man. The lack of trust in the judiciary to deliver prompt and fair judgment in the
event of disputes further encourages this position. The fact however remains that
nothing creates more insecurity on land than lack of recognized titles enforceable at
law.
Land rights and sustainable development
It is important to note that the security of the right to use land without disturbance
results from secure land tenure. Aside freehold tenure, some other forms of legal
contracts for land like community land trust (CLT) and lease agreements also provide
security of use. The type of ownership might not necessarily determine who and how
the land may be used, but the secured title. When the title is secured, thus firming up
the agreement as to which individual or group is to thereby have exclusive use right to
a clearly demarcated land, then the land can be productively used. (Hartzork 1999).
However, there have been assertions its Government policies that have brought about
poverty and not absence of land rights. Consequently, Government should be
committed to adding opportunities for families and communities in order to build
economic independence and wealth through use of communal Assets (Antar, 2005)
Formalization of property rights
Makers of policies are expected to act in consonance with constitutional requirements
in order to access necessary powers required to guide the society and individual
citizen into adoption of formalized land tenures within defined ideological,
constitutional and operational premises. Formalization results in Rights registration
which encourages the recording of all transaction thus reducing conflicts. Registration
Aladeloba
240
ultimately attracts benefits to land holders in form of ability to partake in transaction
of both formal and informal land markets and as well as unrestricted access to credit
in the formal sector. Conversely, holders of secured titles on properties attract benefits
such as tenure security and access to financial markets. Only those who can afford
and have the tenacity to undergo the procedures of securing titles are better placed to
take advantage of titling and emerging property markets. Efforts should be geared
towards solving these problems associated with titling else the situation of inequality
will be created. (Ngaido, 2005)
Tenure practices and property development
In Nigeria, the concept of ownership varies in its concrete application. There were
four sources of ownership namely communal, family, individual and state ownership.
Each of them exhibit varying degrees of acceptability. However, the state Ownership
is as a result of the Land use Act of 1978, which vested the title to all Land within the
Territory of a state in Nigeria in the Governor leaving Nigerians with only the right of
occupancy.(Kuye 2003:95).Despite the introduction of the Land Tenure law of 1962;
in the Northern region and the eventual introduction of Land use Act (cap 101) of
1978,the cost of land in most part of the country has been rather prohibitive, especially
in urban areas. The trend now is that there is a great incursion into rural areas like
Ikorodu and Ipaja in Lagos state, which are fast developing into Urban. Consequently,
according to Smith (1995) the intention of the Land use Act of 1978 to checkmate a
number of socio-economic factors militating against conferment of valid title to land,
the realization of use and enjoyment of land in Nigeria for the sustenance of Nigerians
and the effective utilization of land by private entrepreneur and the government for
purpose of development are being eroded.
Available sources of finance
One of the two main areas where finance may be required is the financing of fixed
Assets and this can be sourced either internally or externally. Internal sources are
often not enough hence they are complemented by external sources such as Bank
overdraft, Trade credit, Debt factoring, Loans, Hire purchase, Leasing, Share issues,
Mortgages, Debentures and venture capital mainly provided by merchant Banks in
returns for interest and part ownership of the Business. However, according to
Brindley and Buckley (2008) informed choice will match the duration of the need
with the duration of the source of finance and criteria such as availability, flexibility,
duration, risk as well as the cost of borrowing must be considered in making the final
choice. Of all the different sources, loans and or Mortgage finance appeared to be
more relevant in property or Real Estate development.
Banks requirement for loans
The recent recapitalization directive from the Central Bank of Nigeria to all categories
of banks ordinarily was to accentuate the issuance of loan, for developments and other
purpose. It is reasoned that if banks have access to excess liquidity, it will generate
stiff competition for investment and lending rate will drop. Certain other purposes like
Land titling
241
stable economy, more investment opportunity etc may be achieved. Banks need to be
more careful in issuance of loans for developments. Request for collateral had been a
long time practice. The fact that properties are not always easy to dispose-off
informed the more rigid stance of most banks before development loans are granted.
The Federal Government, in solving some of these development finance problems,
established a two tier housing finance system. Act 58 of 1989 transformed the Federal
Mortgage Bank of Nigeria into the Apex mortgage bank while the retail mortgage
outfit remains the Primary Mortgage Institution (PMI). The idea was to make
mortgage finance more accessible to the populace. The PMI’s helped to facilitate and
support the processing of mortgage loan application from the public.
Also, Act No 3 of 1992 created the National Housing fund (NHF) as a source of
finance for the mortgage industry. It is expected that all workers will contribute 2.5
percent of their salary to the fund which is in turn; used to grant mortgage loan to
procure their own homes. This is repayable over a period of 25 years at an interest
rate of 6%. Like most other lofty program not well executed, the NHF is moribund.
Further efforts were made by the government in the area of public – private sector
partnership. It is reasoned that the current infrastructural requirements of Nigeria are
many and the resources available to government are not enough to meet up this need,
even on the long run. The private sector is being encouraged to invest in the
development of infrastructure, such as houses, roads, bridges resorts etc. For instance,
the government provided land at highly reduces cost to encourage Real Estate
Developers in housing construction and also gets involved in site and services
programs.
However, the fact remains that all development processes are capital intensive and
usually involve funds being tied down on a long term. This has made financial
institution to be weary in granting such loans. In order to discourage some request for
loan, certain bureaucratic bottle necks are introduced as most financial institution
perceive property development as long term and highly risky and since the bulk of
their deposits are short term funds. Long term loans which are often infested with
problems like diversion of funds to personal use, non-payment for work done, erosion
of money values due to inflation, change in prevailing policies etc may create the
situation of uncertainties.
Even the condition for obtaining finance from the National housing fund is not any
better. For instance, it required that certificate of occupancy be presented before any
one can benefit from the fund. Considering the earlier discuss on the bureaucratic
difficulties and other sharp practices associated with the procurement of this
certificate, many prospective beneficiaries get discouraged ab initio.
It is also important to note that any worker with a minimum wage of say Eighteen
thousand Naira ( N18,000) is presumed to contribute 2.5 percent of his basic income
to the fund. The prevailing cost of living might make it difficult for him to do. If he
obtained a loan of five hundred thousand Naira ( N500,000), it will require monthly
repayment of about N2,000 during the first few years at a reasonable interest rate of 6
Aladeloba
242
percent per annum even with the upward review of the minimum wage from N7,500.
It is doubtful if this worker can be part of the program.
RESEARCH METHOD
Lack of titles to Land held by the poor had been a problem accentuated by myriads of
policy inconsistency on the part of Government and outright ignorance of the benefit
accruable on the part of the poor. There are other factors more often measured by
multiple items and such variables must be tested variables. An initial step was to
consult a group of property owners to identify factors hindering project development.
An inventory of 15 items questionnaire were developed for the present study. The
Items were also randomly ordered in the instrument to reduce potential response bias.
The respondents were requested to rate selected factors in terms of its level of
importance. This part is organized in the form of a priority scaling table with 5 options
5 = very, very important, 4 =very important, 3= important, 2 = Negligible and 1 = Not
important. A pilot test was administered to several property owners spread across the
20 substantive Local Government areas of Lagos state for clarifying and refining the
questionnaire. A questionnaire of two sections namely A and B was carefully
designed to address personal data and property titles respectively. Other salient
variables were also considered. Each question is presented in the most explicit
manner. The first part (section A) contains general information about the respondent’s
personal data. The second part (section B) contains questions on property ownership,
sourcing fund for property development and property documentation. Part B includes
a list of the identified components of Title documents. 35 respondents were given the
questionnaires in total and in no particular order, gender or age group but according to
Local Government of abode. 25 respondents returned completed questionnaires- 71%
of the total number given out. Data collected were analyzed using simple tables and
percentages for the reason of reaching wider audience. Nevertheless, the researcher
hopes to achieve greater sample size in subsequent works which can then be subjected
to mean item score, spearman ranking, correlation matrix, linear regression analysis,
chi-square and factor analysis for more insightful inferences on the subject where
appropriate.
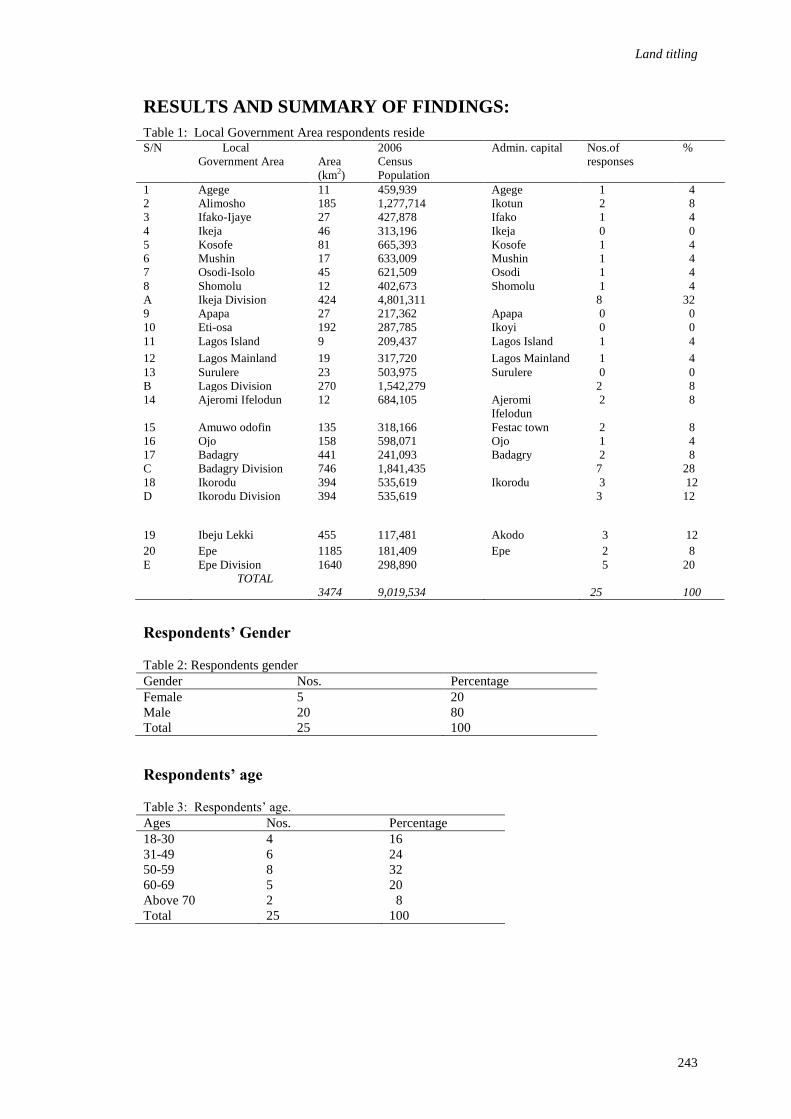
Land titling
243
RESULTS AND SUMMARY OF FINDINGS:
Table 1: Local Government Area respondents reside S/N Local
Government Area
Area
(km2)
2006
Census
Population
Admin. capital Nos.of
responses
%
1 Agege 11 459,939 Agege 1 4
2 Alimosho 185 1,277,714 Ikotun 2 8
3 Ifako-Ijaye 27 427,878 Ifako 1 4
4 Ikeja 46 313,196 Ikeja 0 0
5 Kosofe 81 665,393 Kosofe 1 4
6 Mushin 17 633,009 Mushin 1 4
7 Osodi-Isolo 45 621,509 Osodi 1 4
8 Shomolu 12 402,673 Shomolu 1 4
A Ikeja Division 424 4,801,311 8 32
9 Apapa 27 217,362 Apapa 0 0
10 Eti-osa 192 287,785 Ikoyi 0 0
11 Lagos Island 9 209,437 Lagos Island 1 4
12 Lagos Mainland 19 317,720 Lagos Mainland 1 4
13 Surulere 23 503,975 Surulere 0 0
B Lagos Division 270 1,542,279 2 8
14 Ajeromi Ifelodun 12 684,105 Ajeromi
Ifelodun
2 8
15 Amuwo odofin 135 318,166 Festac town 2 8
16 Ojo 158 598,071 Ojo 1 4
17 Badagry 441 241,093 Badagry 2 8
C Badagry Division 746 1,841,435 7 28
18 Ikorodu 394 535,619 Ikorodu 3 12
D Ikorodu Division 394 535,619 3 12
19 Ibeju Lekki 455 117,481 Akodo 3 12
20 Epe 1185 181,409 Epe 2 8
E Epe Division 1640 298,890 5 20
TOTAL
3474
9,019,534
25
100
Respondents’ Gender
Table 2: Respondents gender
Gender Nos. Percentage
Female 5 20
Male 20 80
Total 25 100
Respondents’ age
Table 3: Respondents’ age.
Ages Nos. Percentage
18-30 4 16
31-49 6 24
50-59 8 32
60-69 5 20
Above 70 2 8
Total 25 100
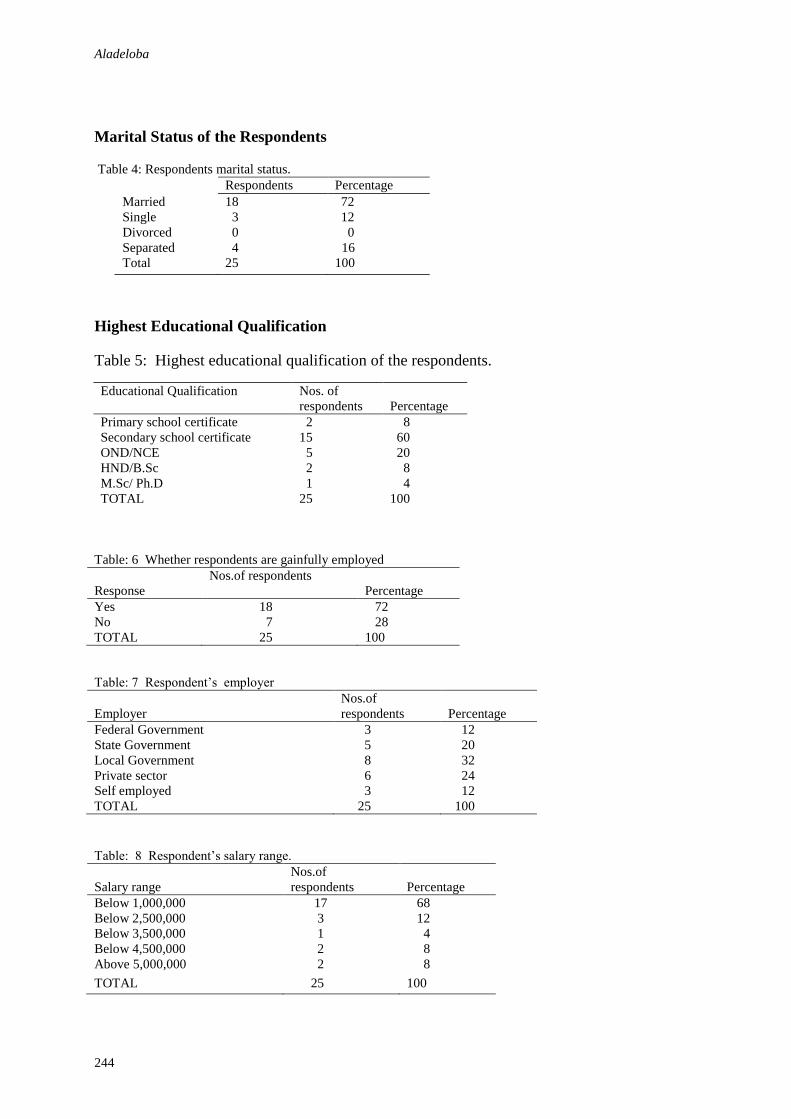
Aladeloba
244
Marital Status of the Respondents
Table 4: Respondents marital status.
Respondents Percentage
Married 18 72
Single 3 12
Divorced 0 0
Separated 4 16
Total 25 100
Highest Educational Qualification
Table 5: Highest educational qualification of the respondents.
Table: 6 Whether respondents are gainfully employed
Response
Nos.of respondents
Percentage
Yes 18 72
No 7 28
TOTAL 25 100
Table: 7 Respondent’s employer
Employer
Nos.of
respondents
Percentage
Federal Government 3 12
State Government 5 20
Local Government 8 32
Private sector 6 24
Self employed 3 12
TOTAL 25 100
Table: 8 Respondent’s salary range.
Salary range
Nos.of
respondents
Percentage
Below 1,000,000 17 68
Below 2,500,000 3 12
Below 3,500,000 1 4
Below 4,500,000 2 8
Above 5,000,000 2 8
TOTAL 25 100
Educational Qualification Nos. of
respondents
Percentage
Primary school certificate 2 8
Secondary school certificate 15 60
OND/NCE 5 20
HND/B.Sc 2 8
M.Sc/ Ph.D 1 4
TOTAL 25 100

Land titling
245
Table: 9 Question whether respondents reside in their personal house
Response
Nos. of respondents
Percentage
Yes 18 72
No 7 28
TOTAL 25 100
Table: 10 Types of property respondents reside
Response
Nos.of
respondent
Percentage
Tenement Building 4 22
Bungalow 6 33
Storey Building of 4 flats 7 39
Duplex 0 0
Detached house 1 6
TOTAL 18 100
Table: 11 Question on how respondents secure their Land
Response
Nos.of respondents
Percentage
Outright purchase 9 50
Family Inheritance 3 17
Lease arrangement 0 0
Cooperative thrift 5 28
Gift 1 5
TOTAL 18 100
Table: 12 Sourcing fund for property development
Response
Nos.of respondents
%tage
Personal savings 10 55
Loans from commercial bank 0 0
Mortgage loan 0 0
Cooperative thrift 5 28
Pension fund scheme 3 17
TOTAL 18 100
Table: 13 Types of document respondents have
Response
Respondents resident
in their house
Nos.of
respondents
Percentage
Survey plan 18 14 78
Building plan 18 12 67
Building permit 18 5 28
Certificate of occupancy(C of O) 18 3 17
Registered conveyance 18 1 6
Governor’s consent 18 0 0
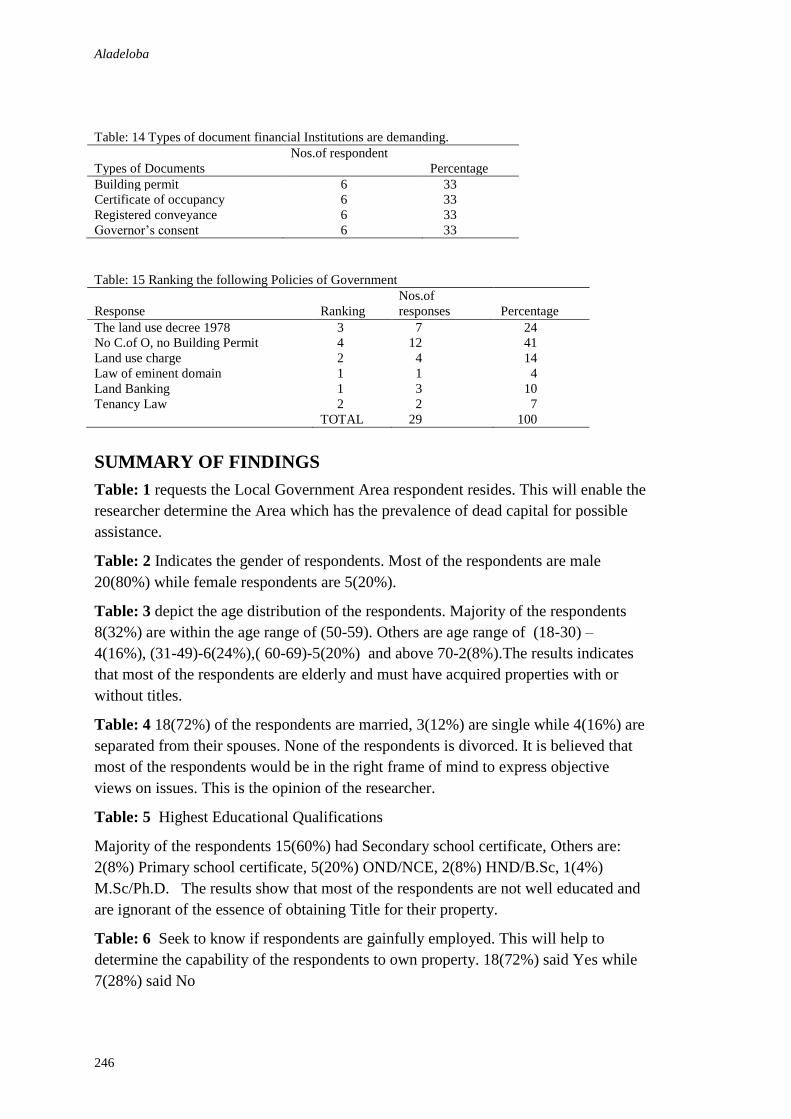
Aladeloba
246
Table: 14 Types of document financial Institutions are demanding.
Types of Documents
Nos.of respondent
Percentage
Building permit 6 33
Certificate of occupancy 6 33
Registered conveyance 6 33
Governor’s consent 6 33
Table: 15 Ranking the following Policies of Government
Response
Ranking
Nos.of
responses
Percentage
The land use decree 1978 3 7 24
No C.of O, no Building Permit 4 12 41
Land use charge 2 4 14
Law of eminent domain 1 1 4
Land Banking 1 3 10
Tenancy Law 2 2 7
TOTAL 29 100
SUMMARY OF FINDINGS
Table: 1 requests the Local Government Area respondent resides. This will enable the
researcher determine the Area which has the prevalence of dead capital for possible
assistance.
Table: 2 Indicates the gender of respondents. Most of the respondents are male
20(80%) while female respondents are 5(20%).
Table: 3 depict the age distribution of the respondents. Majority of the respondents
8(32%) are within the age range of (50-59). Others are age range of (18-30) –
4(16%), (31-49)-6(24%),( 60-69)-5(20%) and above 70-2(8%).The results indicates
that most of the respondents are elderly and must have acquired properties with or
without titles.
Table: 4 18(72%) of the respondents are married, 3(12%) are single while 4(16%) are
separated from their spouses. None of the respondents is divorced. It is believed that
most of the respondents would be in the right frame of mind to express objective
views on issues. This is the opinion of the researcher.
Table: 5 Highest Educational Qualifications
Majority of the respondents 15(60%) had Secondary school certificate, Others are:
2(8%) Primary school certificate, 5(20%) OND/NCE, 2(8%) HND/B.Sc, 1(4%)
M.Sc/Ph.D. The results show that most of the respondents are not well educated and
are ignorant of the essence of obtaining Title for their property.
Table: 6 Seek to know if respondents are gainfully employed. This will help to
determine the capability of the respondents to own property. 18(72%) said Yes while
7(28%) said No
Land titling
247
Table: 7 Show the employer of respondents. Like table 6, it will help to evaluate the
capability of the respondents as certain employers pay their employee living wage
while others don’t. 3(12%) worked with the Federal Government, 5(20%) with State
Government, 8(32%) with the Local Government probably because this tier of
Government is closer to the rural areas, 6(24%) work for private sector while 3(12%)
are self employed.
Table: 8 shows respondents’ salary range. Majority 17(68%) earn below #1,000,000;
3(12%) earn below #2,500,000; 1(4%) earn below #3,500,000; 2(8%) earn below
#4,500,000 while 2(8%) earn above #5,000,000. This implies that majority of the
respondents are within the low income group. Hence, the reason for seemingly
indifferent attitude towards securing title documents.
Table: 9 shows 18(72%) respondents are resident in their own house while 7(28%)
are not. The implication is that only 18(72%) of them is eligible to contribute to the
subject matter.
Table: 10 shows 4(22%) of respondents live in Tenement building, 6(33%) in
Bungalow, 7(39%) in a storey building of 4 flats while 1(6%) live in Detached house.
This implies that majority of respondents are within the low income group as depicted
in table 8 above.
Table: 11 shows 9(50%) of respondents bought their land out rightly, 3(17%) got
theirs through family inheritance, 5(28%) through cooperative thrift while 1(5%) got
as a gift. This factor was considered in order to determine the influence of the
activities of omo-onile (Land owners) on the decision of respondents to seek
necessary Titles.
Table: 12 shows majority 10(55%) of respondents sourced fund for property
development through personal savings, 5(28%) through cooperative thrift while
3(17%) sourced through pension fund scheme. The implication is that an appreciable
number of people could not access fund from the banks and mortgage Institutions,
probably because of the stringent measures or ignorance of its existence.
Table: 13 Shows the response pattern to question on types of documents respondents
have. 14(72%) respondents have survey plan, 12(67%) have building plan, 5(28%)
have building permit, 3(17%) have certificate of occupancy while 1(6%) have
Registered conveyance. This table exposes the thinking pattern of respondents and
perhaps their financial capability. Most respondents probably mistake Survey plan and
Building plan for the Title. The only excuse for this is ignorance.
Table: 14 shows all the financial Institutions are demanding for Building permit and
any one of certificate of occupancy, registered conveyance and Governor’s consent
before respondents can be granted access to fund. It is important to note that the Land
tenure system determines whether the title shall be ‘C of O’, Registered conveyance or
Governor’s consent. Meanwhile, only six (6) of the respondents attempted to get title
for their property. This speaks volume.

Aladeloba
248
Table: 15 shows the ranking respondents give to all the Policies of Government that
are related to property developments. 7(24%) ranked the Land use decree as-3-
Important, 12(41%) ranked “No C of O, No Building Permit” as -4-Very important,
4(14%) ranked Land use charge as -2-Negligible, 1(4%) ranked Law of eminent
domain as-1-Not important, 3(10%) ranked Land Banking as -1-Not important while
2(7%) ranked Tenancy Law as -2-Negligible. This ranking must have been informed
by the experiences of respondents with the officers responsible for executing the
policies. However, Government should do a quick appraisal of the policies and
remove the unnecessary bottle necks associated with them.
CONCLUSION
Lagos has a population estimate of 12million; notwithstanding the 2006 census
estimate of 9.019Million, constitutes 4 percent of Nigeria land area, has a swampy
terrain and limited development land and accommodates about 7 percent of the
National population. Average population in slums is estimated at 2000 persons per
hectare, 85% of the population lives in tenement building(one-room apartments) and
about 9 percent are of low income category (Ajanlekoko, 2001).
The above statistical analysis is a good ground for very stiff competition for few
available resources.This no doubt elicit the survival of the fittest instinct which often
times pushes off certain set of people up or down and sometimes off the status ladder.
With average room occupancy of 12 persons in recent times, the standard of living is
anything but good.
However, the introduction of the land use Act particularly the section 1 which vested
all land in the state governor to be held in trust and administered for common benefits
of all Nigerians, is intended to create a level playing ground for everyone and the
Governor acting as an unbiased arbiter. The reverse is the case as most government
agents and agencies create bottle necks which further take land formalization away
from the urban poor. These laws gave government cheap control of much land but the
allocation criteria are so exclusionary as to provide access to only a very small
proportion of upper income earners-particularly the educated elite, the politicians and
military personnel (Okpala 1980). Considering the fact that the procedure for
acquiring recognizable (legal) titles for properties is infested with a lot of difficulties,
the Lagos State Government may have meant well by its recent policy of no certificate
of occupancy, no development permit. This is a tacit approval of Hernando De Soto’s
theory, which underscores the fact that the acquisition of development permit does not
guarantee the right to ownership of land.
However, the seeming insensitivity to the inherent bottlenecks associated with getting
such titles may end up being an albatross to the policy. Already; the unscrupulous
ones among the civil servants are, no doubt, gearing-up to make the best use of the
new opportunity opened to them for extortion.
The Lagos State Government should move a step forward by working-out ways for
which the urban poor can access loans to procure this increasingly elusive legal
Land titling
249
document which has rendered their capital DEAD. Thank God for the micro-finance
project recently launched, though one hopes the real poor targeted will be reached. It
is also hoped that the urban poor, who have been identified to hold the bulk of the
urban capital as dead, would be considered in the megacity project. Hence the
Relevance of Hernando Desoto’s principle of land titling in Lagos State may remain
unrealizable in times to come except deliberate steps are taken to address the
following situation which are likely to occur:-
The number of people who apply for Building development permit will reduce as the
cost of procuring both certificate of occupancy (C of O) and development permit gets
out of reach.
More buildings under construction may collapse as more people will engage the
services of quacks for building procurement.
The State Government’s Internally Generated Revenue (IGR) from this sector may
dwindle.
More death will be recorded as a result of building collapse.
More C of O will be forged as people will be desperate to have one.
In the light of the foregoing; the following recommendations are suggested:-
The conditions for the acquisition of title documents for properties should be made
easier and pocket friendly.
Government should institute policies that will encourage Banks and Mortgage
Institutions to finance the procurement of title documents which would revive the
hitherto dead capital. This policy will address the consideration of the mortgagee’s
credit character, motivate his interest in owning property, ensure adequacy of his
income for obligation and promote his creditability based on informal opinion
expressed on him by people close to him.
Government should provide avenues for ascertaining the veracity of claims to
ownership before issuance of valid title documents.
Title documents should be made forge proof.
Those who are in paid employment should be encouraged through deductions from
source; the tariffs for C of O while others are made to pay by agreed arrangements.
REFERENCES
Ajanlekoko, J. (2001) Sustainable housing development in Nigeria the financial and
infrastructural complication:- presented at the International conference on spatial
information forsustainable development held in Nairobi, Kenya October 25th.
ANTAR,(2005) “Land Rights under threat” issues July,(www.antar.org.au).
Babatunde (1999) Imperatives of Tile search today (guardian law
reports) The Nigerian Guardian, October 12th.
Brindley and Buckley (2008) Business studies AS and A2,Pearson Educational Limited,
Edinburgh Gate, Essex,England
Aladeloba
250
Calvert,R.E;Bailey,G,andColes,D(2003).IntroductiontoBuildingManagement.Butterworth-
Heinemann; Oxford, Great Britain.
Hartzok,A(2000)” Land for People, Not for profit”United Nations center for human
settlements global campaign for secure tenure, July (www.earth
rights.net)Novenber,2007.
Henando De Soto(2000) The Mystery of Capital: why capitalism Triumph in the west and
fails everywhere else.1st edition,Basic books.
Home, R. K. (2003) “Land titling and urban Development.The challenges of Hernando
de soto’s mystery of capital Journal of commonwealth law and legal education”
Kuye, O (2003),Principles and Practice of property valuation,Lagos, Olusegun Kuye and
Associates.
Marwa, (2005),Repositioning for future challenge paper presented at Newton Jibunoh Annual
lecture organized by Nigerian Institute of Building.
Ngaido, T (2005) ‘Reforming Land Rights in Africa” international Food Policy Research
Institute 2020 African Conference Brief 15(www.ifpri.org).
Okpala, D. (1980) Accessibility Distribution Aspects of public land management. A Nigerian
case Habitat International.
Omirin, M. (1992) Informality illegality and market inefficiency, Acase for land market
Deregulation in Accra and Lagos.
Sibanda, S. (1999)“Raise the assets from the dead. That is thekey to economic progress”
security of Tenure campaign September.
Alao, T.O. (2012) Rational design of concrete mixes using uncrushed aggregates In: Laryea, S.,
Agyepong, S.A., Leiringer, R. and Hughes, W. (Eds) Procs 4th West Africa Built Environment
Research (WABER) Conference, 24-26 July 2012, Abuja, Nigeria, 251-261.
251
RATIONAL DESIGN OF CONCRETE MIXES USING
UNCRUSHED AGGREGATES
T. O. Alao1
Department of Building, Federal University of Technology, Minna, Nigeria
This paper presents the study carried out on naturally deposited gravel for use in the
production of concrete mixes. Physical properties of the coarse aggregates was carried
out and was found to satisfy specification requirements to produce normal grades of
20, 25 and 30 concrete with continuous grading, single size grading, natural deposit
grading, gap grading(continuous) and gap grading (single size). Also, maximum
aggregates of 10mm, 20mm and 40mm with low slump of 10 – 30mm and medium
slump of 30 – 60mm were considered. The properties of the mixes both in the plastic
and hardened states have been found to vary depending on the coarse aggregates
grading used. Based on these results, the starting estimates for the compressive
strength and approximate free-water cement requirements to give various levels of
workability for uncrushed aggregates presented in the DOE design manual have been
found to be invalid. The appropriate charts, tables and standard deviations for the
revised relationship have been re-presented, which can be used directly in designing
concrete mixes using the gravel as coarse aggregates.
Keywords: mix design, uncrushed aggregates, grading, specified strength
INTRODUCTION
Aggregates generally occupy 60 – 80 percent of the volume of normal weight concrete
and hence, their characteristics influence the properties of concretes, Neville [1]. They
are cheaper than cement and it is therefore economical to put into the mix as much of
the aggregates. Coarse aggregates also confer a considerable advantage on the
hardened concrete because it has a higher volume stability and better durability. It
should be noted that the compressive strength of concrete cannot significantly exceed
that of the major part of the aggregates contained therein. Hence, inadequate strength
of coarse aggregates represents a limitation in achieving an increased strength due to
premature fracture Alao, [2].
The uncrushed coarse aggregate of interest here is a quartz. It was sourced in and
around Share/Tsaragi area of Kwara State, Nigeria. It is roundish in shape, which
explains long transportation history by river and that visual observation within other
deposit areas show little difference in physical appearance and that it is unlikely that
physical and chemical property variation may exist, Ogunmola, [3]. It is extensive in
deposit and has been used extensively in institutional building and road construction
works.
Alao
252
For this aggregates sample, the suitability and the validity of design tables and
nomographs presented by the Department of the Environment (DOE) for the design of
normal grade concrete mixes is investigated.
EXPERIMENTAL PROCEDURE
The physical properties of the uncrushed coarse aggregates like grading, unit weight,
absorption capacity, moisture content and specific gravity were carried out. The
properties were found to satisfy specification requirements of BS 812: Parts 1-4
(1975), BS 882 and 1201 Part 2 (1973).
The mix was designed using the procedure presented by the Department of the
Environment (DOE) as presented by Teychenne et al [4]. Subsequently, constituent
proportions of water, cement, fine and coarse aggregates were obtained for the
specified slump and target mean strength criteria at 7 and 28 days respectively.
The limitation in the design for strength is the physical property of the coarse
aggregates or aggregate type to be used. This is because the strength of the hardened
concrete mixture cannot significantly exceed that of the coarse aggregates used. For
this reason, only the design for normal grade concrete is considered: they are 20, 25
and 30N/mm2 characteristic strengths suitable for reinforced concrete elements in
buildings. Mild and moderate conditions of the concrete use were considered. For this
reason, maximum expected slumps considered are 10 – 30mm and 30 – 60mm that are
suitable for reinforced concretes.
While the code of practice CP110: 1972 recognizes four maximum coarse aggregates
sizes namely: 10, 14, 20 and 40mm; the DOE method recognizes only 10, 20 and
40mm maximum and these are the maximum aggregate sizes considered here.
The fine and coarse aggregate contents were estimated based on saturated and surface
dry conditions. Adjustments are generally required and carried out for the aggregate
samples in their stockpile conditions.
Grading of the coarse aggregates.
This is a method for classifying the proportions of sizes of particles present in a
deposit expressed as fractions or percentages of the total. Grading is done by sieve
analysis. The gradings used here include:
Continuous Grading (CG): This is usually represented on the grading curve as a steep
and continuous line/curve. It contains all size variations retained on 4.75mm to the
maximum size of aggregate specified.
Gap Grading (GG): This is a grading in which one or more intermediate size fractions
are omitted. In contrast to continuously graded aggregates on the grading curve, it is
represented by a horizontal line over the range of sizes that are omitted.
Single Size Grading (SS): This consists of coarse aggregates with only one single
size. When uniform single size grading is used, there is a much lower specific surface
which suggests lower cement to coat the coarse aggregates.
Concrete mix design
253
Natural Deposit Grading (ND): This is the natural deposit of gravel containing the
range of sizes from the smallest size in microns to the largest possible size. This may
also be referred to as all-in aggregates. They are composed of both fine and coarse
aggregates and without processing it produces low grade concrete, since some of the
finer grades will contain silts and clays, Ogunmola, [3].
Neville [1] and Teychenne et al [4] suggested an alternative guide for continuous
grading and gap grading, in which the coarse aggregate content can be subdivided if
10mm, 20mm and 40mm maximum aggregate sizes are combined depending on
concrete usage, thus:
1 : 2 for combination of 10mm and 20mm material
1 : 1.5 : 3 for combination of 10mm, 20mm and 40mm material.
Variability of Concrete Strength
There are many factors, which affect the variability of concrete strengths. Teychenne
et al [4] has listed those main factors influencing both the workability and strength of
concrete that should be taken into account when designing a mix. It is probable that
these factors will change during the progress of the job and should be accounted for.
They can be made up of
variation in the quality of the materials
variation in the mix proportions due to the batching process and
variation due to sampling and testing.
Since concrete strengths follow normal distribution, it is expected that some
proportion of the results may fall below specified values. For this reason, a measure of
variability called standard deviation ‘s’ is calculated as:
1...1
2
n
mxs
where x = an individual result, n = number of results, m = mean of the n
results
Beal [5] suggested that for a set of three results, the term standard deviation is
doubtful and it is better to talk of an average result. He suggested that average within-
batch should be taken as 3N/mm2 1.5N/mm
2 from the mean and at a given level of
control, the standard deviation increases as the characteristic strength increases up to a
level, and above this level, it is independent.
It is a common practice now to adopt the characteristic strength concept for specifying
strength development of concrete mixtures, below which a specified proportion of the
test results called ‘defectives’ is expected to fall. It is on this basis of variability of
results that a margin was introduced to have a mean strength greater than the specified
characteristic strength. In other words, the designed strength should be greater than the
Alao
254
characteristic strength and that the mean strength is expected to be greater than the
specified characteristic strength. Thus:
2...ksff cm
where: fm = target mean strength, fc = specified characteristic strength
s = standard deviation, k = a constant, ks = margin.
The value ‘k’ is derived from the mathematics of normal distributions and increases as
the proportion of defective is increased. According to Beal, percentage defective is a
chance variation as there is no guarantee that the expected defective batch will
actually arrive on site. Conversely, it is also possible that 3 or 4 defective batches are
also being supplied, therefore the chances/probability of occurrence of number of
defectives can be calculated. The probability Pd of d defectives being delivered in T
batches, if they are drawn from an infinite population with an overall proportion of
P% defectives can be calculated by the formula as presented by Beal; thus:
3...!!
1!
dTd
PPTPd
ddT
Compliance with Specified Requirements
The proportion of individual test results falling below the specified characteristic
strength is most important according to the compliance criteria set out in the code of
Practice CP 110. The limit of 5 percent has been set out. The mean strength obtained
should always be greater than the characteristic strength. This implies that the limit is
actually not on minimum strength. Beal [5] strongly criticized the replacement of
‘minimum strength’ by ‘characteristic strength’. The new compliance acceptance
provides that some defective materials will be supplied and that the limit of such
material is not on minimum strength but on the maximum acceptable proportion of the
defective material, which he termed to be inappropriate and vague. However, in a
finished structure, the actual proportion of defectives is rather more important than the
amount, which was expected.
The testing plans in the code of practice CP110 and BS 5328 both impose an absolute
limit on minimum strength, yet the basic strength definition contains no such limit.
Based on this definition, suppliers of concrete are neither bound by a minimum
strength requirement nor even the limits of normal distribution provided he could
show or expect less than 5 percent defectives.
DISCUSSION OF RESULTS
Measurements on the performance of the designed mixes were carried out both in the
plastic and hardened states. Although the DOE mix design procedure specifies
adjustments in mix proportions in order to produce the desired mix, which would have
been an improvement on the properties exhibited by the first trial mix; this adjustment
was however not carried out. This is because the aggregate source and characteristic
properties will make further results obtained incompatible even with the revised
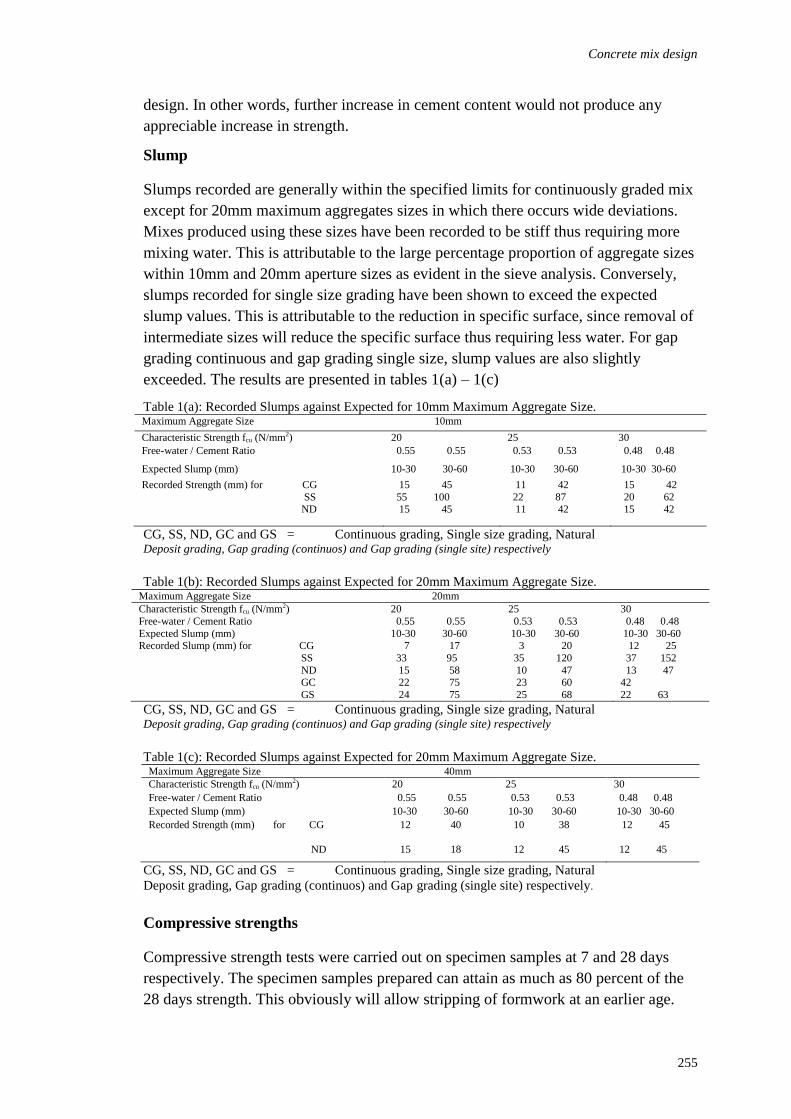
Concrete mix design
255
design. In other words, further increase in cement content would not produce any
appreciable increase in strength.
Slump
Slumps recorded are generally within the specified limits for continuously graded mix
except for 20mm maximum aggregates sizes in which there occurs wide deviations.
Mixes produced using these sizes have been recorded to be stiff thus requiring more
mixing water. This is attributable to the large percentage proportion of aggregate sizes
within 10mm and 20mm aperture sizes as evident in the sieve analysis. Conversely,
slumps recorded for single size grading have been shown to exceed the expected
slump values. This is attributable to the reduction in specific surface, since removal of
intermediate sizes will reduce the specific surface thus requiring less water. For gap
grading continuous and gap grading single size, slump values are also slightly
exceeded. The results are presented in tables 1(a) – 1(c)
Table 1(a): Recorded Slumps against Expected for 10mm Maximum Aggregate Size. Maximum Aggregate Size 10mm
Characteristic Strength fcu (N/mm2) 20 25 30
Free-water / Cement Ratio 0.55 0.55 0.53 0.53 0.48 0.48
Expected Slump (mm) 10-30 30-60 10-30 30-60 10-30 30-60
Recorded Strength (mm) for CG
SS ND
15 45
55 100 15 45
11 42
22 87 11 42
15 42
20 62 15 42
CG, SS, ND, GC and GS = Continuous grading, Single size grading, Natural Deposit grading, Gap grading (continuos) and Gap grading (single site) respectively
Table 1(b): Recorded Slumps against Expected for 20mm Maximum Aggregate Size.
Maximum Aggregate Size 20mm
Characteristic Strength fcu (N/mm2) 20 25 30
Free-water / Cement Ratio 0.55 0.55 0.53 0.53 0.48 0.48
Expected Slump (mm) 10-30 30-60 10-30 30-60 10-30 30-60 Recorded Slump (mm) for CG
SS
ND GC
GS
7 17
33 95
15 58 22 75
24 75
3 20
35 120
10 47 23 60
25 68
12 25
37 152
13 47 42
22 63
CG, SS, ND, GC and GS = Continuous grading, Single size grading, Natural Deposit grading, Gap grading (continuos) and Gap grading (single site) respectively
Table 1(c): Recorded Slumps against Expected for 20mm Maximum Aggregate Size. Maximum Aggregate Size 40mm
Characteristic Strength fcu (N/mm2) 20 25 30
Free-water / Cement Ratio 0.55 0.55 0.53 0.53 0.48 0.48
Expected Slump (mm) 10-30 30-60 10-30 30-60 10-30 30-60
Recorded Strength (mm) for CG
ND
12 40
15 18
10 38
12 45
12 45
12 45
CG, SS, ND, GC and GS = Continuous grading, Single size grading, Natural
Deposit grading, Gap grading (continuos) and Gap grading (single site) respectively.
Compressive strengths
Compressive strength tests were carried out on specimen samples at 7 and 28 days
respectively. The specimen samples prepared can attain as much as 80 percent of the
28 days strength. This obviously will allow stripping of formwork at an earlier age.
Alao
256
Average strengths recorded are generally above the specified characteristic strength
values only in grade 20 concrete for all grading types and maximum aggregate sizes.
Also, for grade 20 concrete, no individual test result falls below the specified
characteristic strength. The standard deviations obtained were 1.57, 1.61 and 4.48 for
grades 20, 25 and 30 concretes respectively. However, for grades 25 and 30 concrete,
the average strengths recorded in some cases are below the specified characteristic
strengths, which grossly violate acceptance criteria, since the margin ‘ks’ cannot be
negative. Only mixes with 10mm aggregates sizes do not exhibit aggregate breakages
and strengths produced are well above the specified characteristic strengths. The
foregoing discussion suggests that there is a higher reliability for mix designs in grade
20 concrete.
The high slumps recorded in single size grading may be partly responsible for the low
strengths recorded. Aggregate breakages are also visible as a failure mode in single
size grading and gap grading (single size). This suggests that the aggregates are weak.
It can further be concluded from the foregoing discussion that the uncrushed coarse
aggregate samples can only be used to produce normal grade mixes up to 30N/mm2
but mix designs in grade 20 concrete is more reliable. The results are presented in
tables 2(a) – 2(c)
Statistical Relationship between Strength Vs Water Cement Ratio and Free-
water Vs Slump/Maximum Aggregate Size
If there exists some inherent relationship involving the set of variables from an
underlying theory, then it is possible to arrive at the best estimate of the relationship
between the variables. Where there seems to be lack of fit between a given data and
regression equation then the problem can further be simplified by plotting the
logarithm of the inputs on some graphs to reveal clearly the model fitting that best
describes the results against the variable inputs. This however converts it to a linear
sub-problem. This explicit method of solution forms the basis of the choice of the
solution procedure adopted.
A relationship generally known to be non-linear can also be solved by fitting either a
polynomial function, power function, exponential function or a reciprocal function,
Walpole and Raymond, [6] and Draper and Smith, [7]. If there is no clear indication
about the functional form of the regression of Y on X, it is often assumed that the
underlying relationship is at least “well behaved” to the extent that it has a Taylor’s
series expansion and that the first terms of this expansion will yield a fairly good
approximation and then fit a polynomial regression.
Regression Equation Formulation
The statistical technique adopted here is the method of least squares to estimate
regression coefficients; which states that the sum of squares of the deviations between
the observations and the mean is minimum Walpole and Raymond [6], Jerath and
Kabani [8], Constantinides [9]. The following gives the minimization procedure for
estimating the parameters and the constants.
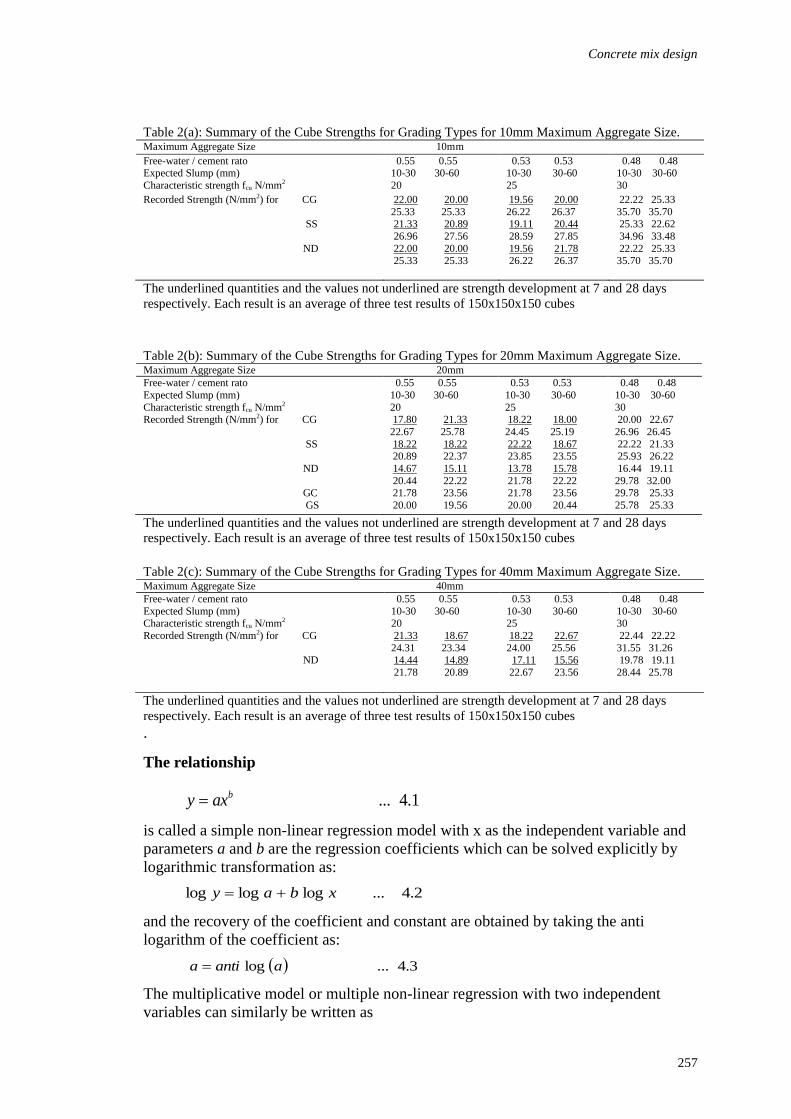
Concrete mix design
257
Table 2(a): Summary of the Cube Strengths for Grading Types for 10mm Maximum Aggregate Size. Maximum Aggregate Size 10mm
Free-water / cement rato Expected Slump (mm)
Characteristic strength fcu N/mm2
0.55 0.55 10-30 30-60
20
0.53 0.53 10-30 30-60
25
0.48 0.48 10-30 30-60
30
Recorded Strength (N/mm2) for CG
SS
ND
22.00 20.00
25.33 25.33 21.33 20.89
26.96 27.56
22.00 20.00 25.33 25.33
19.56 20.00
26.22 26.37 19.11 20.44
28.59 27.85
19.56 21.78 26.22 26.37
22.22 25.33
35.70 35.70 25.33 22.62
34.96 33.48
22.22 25.33 35.70 35.70
The underlined quantities and the values not underlined are strength development at 7 and 28 days
respectively. Each result is an average of three test results of 150x150x150 cubes
Table 2(b): Summary of the Cube Strengths for Grading Types for 20mm Maximum Aggregate Size. Maximum Aggregate Size 20mm
Free-water / cement rato
Expected Slump (mm)
Characteristic strength fcu N/mm2
0.55 0.55
10-30 30-60
20
0.53 0.53
10-30 30-60
25
0.48 0.48
10-30 30-60
30 Recorded Strength (N/mm2) for CG
SS
ND
GC
GS
17.80 21.33
22.67 25.78
18.22 18.22 20.89 22.37
14.67 15.11
20.44 22.22 21.78 23.56
20.00 19.56
18.22 18.00
24.45 25.19
22.22 18.67 23.85 23.55
13.78 15.78
21.78 22.22 21.78 23.56
20.00 20.44
20.00 22.67
26.96 26.45
22.22 21.33 25.93 26.22
16.44 19.11
29.78 32.00 29.78 25.33
25.78 25.33
The underlined quantities and the values not underlined are strength development at 7 and 28 days
respectively. Each result is an average of three test results of 150x150x150 cubes
Table 2(c): Summary of the Cube Strengths for Grading Types for 40mm Maximum Aggregate Size. Maximum Aggregate Size 40mm
Free-water / cement rato
Expected Slump (mm) Characteristic strength fcu N/mm2
0.55 0.55
10-30 30-60 20
0.53 0.53
10-30 30-60 25
0.48 0.48
10-30 30-60 30
Recorded Strength (N/mm2) for CG
ND
21.33 18.67
24.31 23.34 14.44 14.89
21.78 20.89
18.22 22.67
24.00 25.56 17.11 15.56
22.67 23.56
22.44 22.22
31.55 31.26 19.78 19.11
28.44 25.78
The underlined quantities and the values not underlined are strength development at 7 and 28 days
respectively. Each result is an average of three test results of 150x150x150 cubes
.
The relationship
1.4...baxy
is called a simple non-linear regression model with x as the independent variable and
parameters a and b are the regression coefficients which can be solved explicitly by
logarithmic transformation as:
2.4...logloglog xbay
and the recovery of the coefficient and constant are obtained by taking the anti
logarithm of the coefficient as:
3.4...log aantia
The multiplicative model or multiple non-linear regression with two independent
variables can similarly be written as
Alao
258
4.4...21
cbxaxy
where a, b, and c are called the regression coefficients. Similar transformation to a
multiple linear regression can be re-written as:
5.4...loglogloglog 21 xcxbay
and as before,
6.4...log aantia
Another model fitting involving transformation other than integer power is the
exponential model of the type:
7.4...xaby
Whose solution is obtained by writing a set of simultaneous equation as:
n
i
n
i
ii bxany1 1
8.4...logloglog
n
i
n
i
n
i
iii bxayx1 1 1
2 9.4...logloglog
and the solution is:
a = antilog (a), b = antilog (b)
The relationship between compressive strength and water/cement ratio were derived
using Equations 4.1 and 4.2 while the relationship for free-water requirement as
against expected slump and maximum aggregates size for both continuous and single
size grading were executed using Equations 4.4 and 4.5. It also gives an inference on
adequacy of the fitted model called the correlation coefficient R2, which can range
from 0 to 1, the larger the value of R2 the better the model’s fit.
Figures 1 and 2 give the relationship between compressive strength versus free-
water/cement ratio for 7 and 28 days respectively. The relations for 28 days are as
follows:
For continuously graded mix:
Water content (kg/m3) =
4.10...91%R
sizeMax.
Slump232.4952 2
0.1742
0.0714
For single size graded mix:
Water content (kg/m3) =
11.4...%6.89.
60792.219 2
2129.0
0918.0
RsizeMax
Slump
2. For continuously graded mix:
12.4...%67/
8936.7/ 2
8597.1
21 Rcw
mmNcf
For single size graded mix:
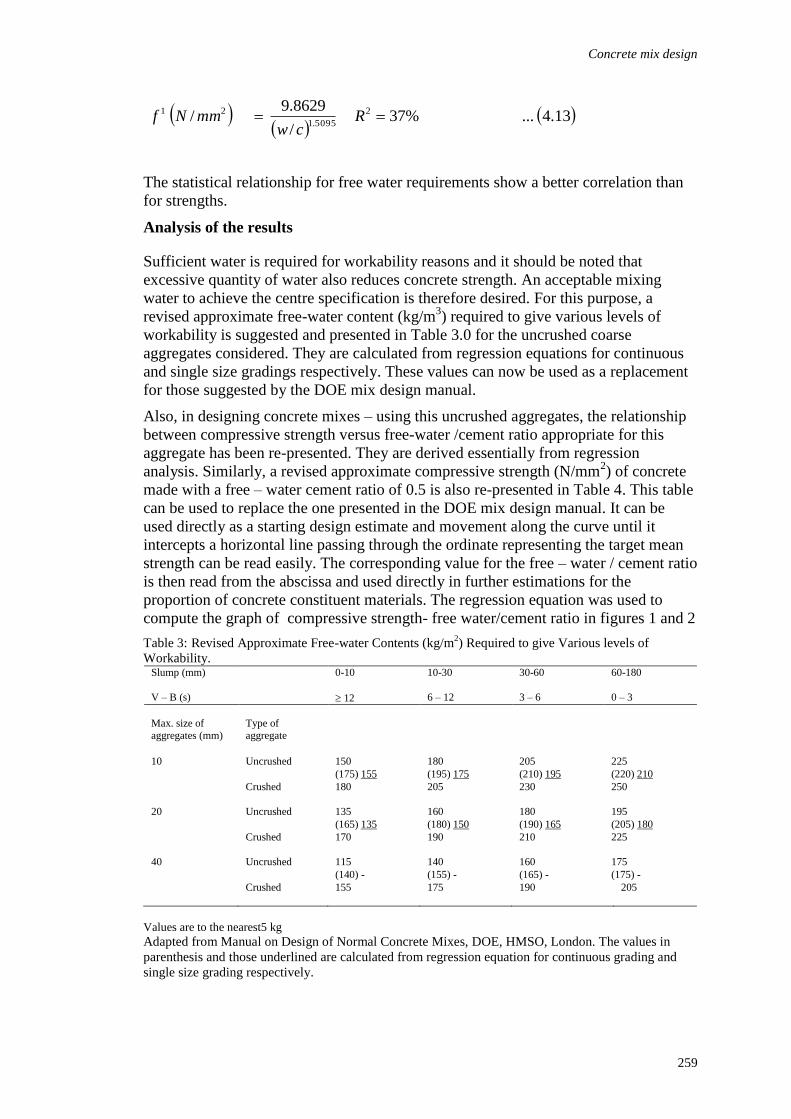
Concrete mix design
259
13.4...%37/
8629.9/ 2
5095.1
21 Rcw
mmNf
The statistical relationship for free water requirements show a better correlation than
for strengths.
Analysis of the results
Sufficient water is required for workability reasons and it should be noted that
excessive quantity of water also reduces concrete strength. An acceptable mixing
water to achieve the centre specification is therefore desired. For this purpose, a
revised approximate free-water content (kg/m3) required to give various levels of
workability is suggested and presented in Table 3.0 for the uncrushed coarse
aggregates considered. They are calculated from regression equations for continuous
and single size gradings respectively. These values can now be used as a replacement
for those suggested by the DOE mix design manual.
Also, in designing concrete mixes – using this uncrushed aggregates, the relationship
between compressive strength versus free-water /cement ratio appropriate for this
aggregate has been re-presented. They are derived essentially from regression
analysis. Similarly, a revised approximate compressive strength (N/mm2) of concrete
made with a free – water cement ratio of 0.5 is also re-presented in Table 4. This table
can be used to replace the one presented in the DOE mix design manual. It can be
used directly as a starting design estimate and movement along the curve until it
intercepts a horizontal line passing through the ordinate representing the target mean
strength can be read easily. The corresponding value for the free – water / cement ratio
is then read from the abscissa and used directly in further estimations for the
proportion of concrete constituent materials. The regression equation was used to
compute the graph of compressive strength- free water/cement ratio in figures 1 and 2
Table 3: Revised Approximate Free-water Contents (kg/m2) Required to give Various levels of
Workability. Slump (mm) 0-10 10-30 30-60 60-180
V – B (s) 12 6 – 12 3 – 6 0 – 3
Max. size of
aggregates (mm)
Type of
aggregate
10 Uncrushed 150 180 205 225
(175) 155 (195) 175 (210) 195 (220) 210
Crushed 180 205 230 250
20 Uncrushed 135 160 180 195
(165) 135 (180) 150 (190) 165 (205) 180
Crushed 170 190 210 225
40 Uncrushed 115 140 160 175
(140) - (155) - (165) - (175) -
Crushed 155 175 190 205
Values are to the nearest5 kg
Adapted from Manual on Design of Normal Concrete Mixes, DOE, HMSO, London. The values in
parenthesis and those underlined are calculated from regression equation for continuous grading and
single size grading respectively.
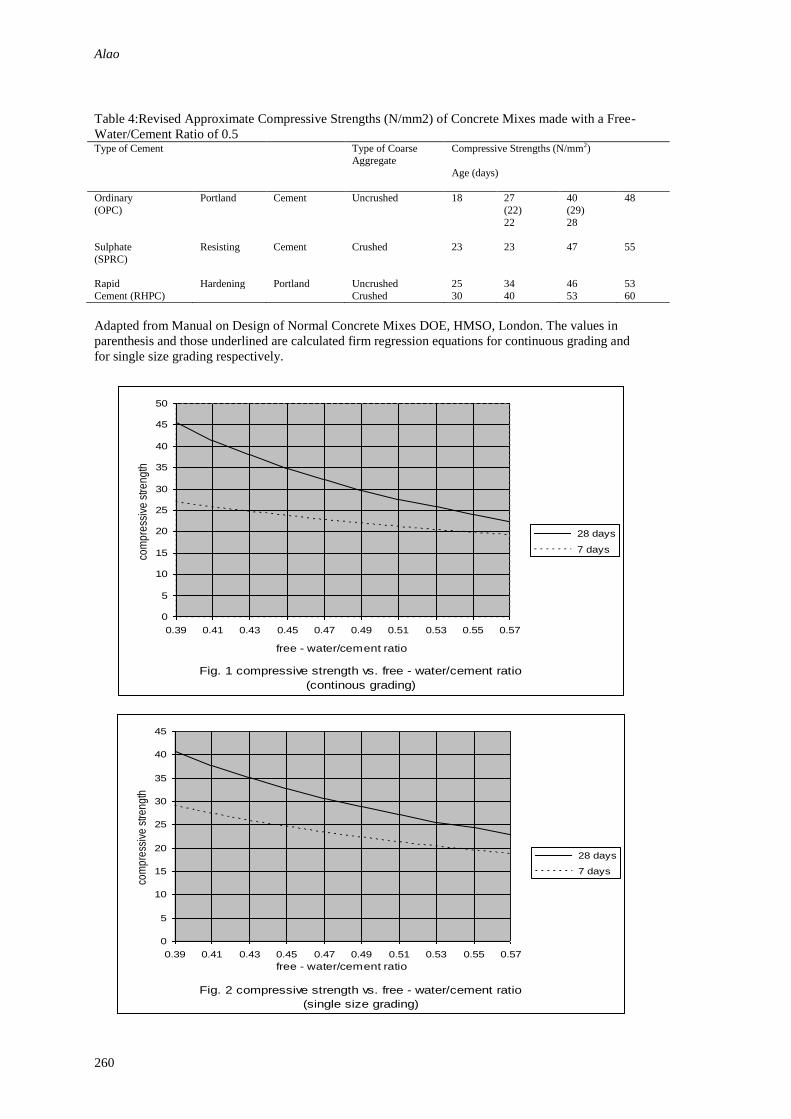
Alao
260
Table 4:Revised Approximate Compressive Strengths (N/mm2) of Concrete Mixes made with a Free-
Water/Cement Ratio of 0.5 Type of Cement Type of Coarse
Aggregate Compressive Strengths (N/mm2)
Age (days)
Ordinary Portland Cement Uncrushed 18 27 40 48
(OPC) (22) (29)
22 28
Sulphate Resisting Cement Crushed 23 23 47 55
(SPRC)
Rapid Hardening Portland Uncrushed 25 34 46 53
Cement (RHPC) Crushed 30 40 53 60
Adapted from Manual on Design of Normal Concrete Mixes DOE, HMSO, London. The values in
parenthesis and those underlined are calculated firm regression equations for continuous grading and
for single size grading respectively.
Fig. 1 compressive strength vs. free - water/cement ratio
(continous grading)
0
5
10
15
20
25
30
35
40
45
50
0.39 0.41 0.43 0.45 0.47 0.49 0.51 0.53 0.55 0.57
free - water/cement ratio
com
pre
ssiv
e s
tre
ng
th
28 days
7 days
Fig. 2 compressive strength vs. free - water/cement ratio
(single size grading)
0
5
10
15
20
25
30
35
40
45
0.39 0.41 0.43 0.45 0.47 0.49 0.51 0.53 0.55 0.57
free - water/cement ratio
com
pre
ssiv
e s
tre
ng
th
28 days
7 days
Concrete mix design
261
CONCLUSION
Although the physical properties of the coarse aggregates satisfied specification
requirements to produce normal grades concrete, premature fracture of the aggregate
has made mix design strengths above 25N/mm2 to be unreliable. From the study, the
aggregates can be used economically if this limits are adhered to. The appropriate
charts, tables and standard deviations for the revised relationship have been re-
presented, which can be used directly in designing concrete mixes using the gravel as
coarse aggregates.
REFERENCES
Neville, A. M. (1993). Properties of Concrete. Third Edition. Pitman Publishing Limited,
London.
Alao, T.O (2006). Optimising the Design of Concrete Mixes Using the DOE Method for
Uncrushed Aggregates. Journal of Research Information in Civil Engineering,
University of Ilorin Science and Engineering Periodicals. Vol. 3. No. 1
Ogunmola, S.A (1991). A Study of the Suitability of Share Gravel as Concrete Aggregate. An
Unpublished M. Eng. Thesis, Department of Civil Engineering,University of Ilorin.
Teychenne, D. C., R. E. Franklin, and H. Entroy (1975). Design of Normal Concrete Mixes.
Department of the Environment, London, H.M.S.O.
Beal, A. N. (1981). Concrete Cube Strengths – What use Are Statistics?.
Proceedings,Institution of Civil Engineers, December 1981, Part 2, Vol. 71: pp. 1037
– 1048.
Walpole, Ronald E. and Raymond. H. Myers (1972). Probability and Statistics for Engineers
and Scientists. The Macmillan Company. New York. pp. 279 – 348.
Draper, N. and H. Smith (1966). Applied Regression Analysis. John Wiley and Sons Inc.New
York. pp. 128 – 162, 263 – 301.
Sukvarsh Jerath and Isam. A. Kabani (1993). Computer – aided Concrete Mix
Proportining. Journal of the American Concrete Institute, proceedings, Vol. 80, No. 4, July –
August, pp. 312 – 317
Constantinides, A (1983). Applied Numerical Methods with Personal Computers. McGraw-
Hill Chemical Engineering Series, pp. 155 – 213.

Semyalo, C., Alinaitwe, H. and Kerali, A. (2012) Causes of financial loss to contractors in the Uganda
construction industry In: Laryea, S., Agyepong, S.A., Leiringer, R. and Hughes, W. (Eds) Procs 4th
West Africa Built Environment Research (WABER) Conference, 24-26 July 2012, Abuja, Nigeria, 263-
274.
263
CAUSES OF FINANCIAL LOSS TO CONTRACTORS IN
THE UGANDA CONSTRUCTION INDUSTRY
Christopher Semyalo, Henry Alinaitwe1 and Anthony Kerali
College of Engineering, Design, Art and Technology, Makerere University, P. O. Box 7062, Kampala
Contractors in the construction industry suffer loss to the extent that the majority of
them do not survive over a number of years. The losses incurred are of various nature,
frequency and severity. However, the industry suffers from lack of information on the
causes of financial loss. The objective of this research was to identify and analyze the
sources of financial losses experienced by local contractors during the execution of
construction contracts. The factors were mainly identified through a literature search
and rated by contractors using a Likert scale. The mean rating of the factors, their
importance index and the correlation between frequency and severity were
determined. It was found out that the most frequent, severe and important factors were
corruption, inflation and high interest rates of borrowing. It was further found out that
there is a strong correlation with a coefficient of 0.862 on the frequency and severity
of the factors. The major recommendations are that clients should pay the contractors
as stipulated in the conditions to avoid loss or else be penalized and that government
should try to the extent possible curb corruption and inflation. The findings are
important to contractors and consultants, policy makers and researchers in the
construction industry.
Keywords: contractor, financial loss, Uganda
INTRODUCTION
The construction industry world over is faced with challenges of sustainability in
business. A number of contractors run bankrupt and many others end up in litigation
processes that eventually lead to the collapse of the construction companies (Peters,
2006). In Uganda, it has been found out there is a high collapse rate of companies
(Uganda Bureau of Statistics, 2011). This can partly be explained by the fact that the
majority of them start as small and medium sized companies (SMEs). These SMEs
face challenges that often lead to poor performance in the form of poor quality work,
time over runs and cost overruns (Apolot, 2011).
In Uganda, the construction contracts commonly used include the admeasured
contracts based on information derived from drawings, specifications and bills of
quantities, and lump sum contracts. While the valuations for payment certificates for
measured contracts are based on measured quantities, the valuations for payment
certificates for lump sum contracts are based on construction stages stated in the
contract agreement and the differences in approach might in some situations lead to
financial loss. The construction industry in Uganda has not developed substantially
mainly due to a number of hindrances most notably financial losses made by
contractors. Construction business has very high risks and many contractors fail to
Semyalo et al.
264
survive and or expand due to limited capability of minimizing losses during the
execution of contracts. However, the causes of loss have not been investigated with a
view to addressing the issues and this is majorly the reason why the industry has
stagnated. The main objective of the study was to identify and analyze the main
causes of financial losses experienced by local contractors during the execution of
construction contracts.
LITERATURE REVIEW
The cost of construction projects is comprised of construction cost and mark up.
Construction cost comprises of cost of materials, plant, labour, subcontractors and site
on costs. The mark up comprises of the profit, head office overheads and risk (Neale
and Neale, 1989). According to Ramus and Birchall (2005) the causes of financial loss
to contractors may arise from any one or more of the following: inefficient
deployment of resources; excessive wastage or theft of materials; plant being allowed
to stand idle or under- utilized; adverse weather or working conditions; and under-
pricing of tender documents by assumptions in regard to labour times, types and sizes
of plant which do not equate with the realities of the construction work.
Akintola (1995) investigated the minimization of loss in construction using the just-in-
time approach and found out that the loss in construction on materials was mainly
occasioned by theft, vandalism, waste of materials, and misuse of materials. Hamzah
(1994) investigated the material management practices in Malaysia and found out that
indeed, there were great losses related to theft of materials on construction sites,
vandalism of materials and construction equipment, waste of construction materials,
and misuse of materials. Construction waste refers to waste materials generated by
construction activities, such as scrap, damaged or spoiled materials, temporary and
expendable construction materials, and waste generated by the workforce. Material
waste and spoilage have been recognized as a major problem in the construction
industry. Much of this waste is due to poor storage and handling on sites, leading to
spillage and spoilage (McDowall, 2002).
The costs of theft on a project are difficult to predict as they are somewhat random
occurrences, but projects that fall victim face substantial losses. For example, the
construction industry in United States lost nearly US $1 Billion in 2001 because of the
theft of equipment and tools (McDowall, 2002). Theft is not limited to the United
States or Uganda for that matter. According to the Japan Construction Equipment
Manufacturers Association, more than 1000 construction machines were stolen in the
year 2001 alone in Japan (Rental Equipment Registrar Magazine, 2002). It has been
estimated that 90 percent of the equipment thefts, occur on jobsites with little security
and where equipment remains idle over the weekends and there has been no
systematic method of estimating the magnitude of the problem of vandalism
among the many contractors (McDowall, 2002). Proverbs (2000) investigated the best
supply chain implications in order to reduce construction costs. It was identified that
most of the loss identified with plant came from idle plant on construction site,
breakdown of plant and depreciation and misuse of plant by the operators. Idle plant is
mainly due to lack of proper planning and management of the plant. It is also due to
Financial loss to contractors
265
adverse weather interruptions. Breakdown of plant is either due to inadequate
maintenance regime or use of old and obsolete plant and equipment. Many contractors
grapple with managing such old and obsolete equipment.
Alinaitwe (2008) investigated the loss due to unproductive workers on construction
sites in Uganda. He concluded that inefficient labour on construction sites leads to loss
of productive time of up to 35 percent of the available time. Alinaitwe (2008) further
investigated the loss to productive time by construction workers and concluded that
workers lose up to more that 39 percent of their productivity due to accidents. It was
also found out that great loss occurred due to inefficient labour and staff, accidents,
strikes/industrial action, poor quality work leading to rework, poor quality of labour
that is not well trained and the majority of whom learn on the job, and misuse of
labour by poor deployment due to inadequate supervision.
Shou et al. (2004) investigated the risks associated with construction projects in
developing countries and concluded that the major risks that lead to loss are inflation,
corruption, adverse weather conditions and underestimation on the side of the
contractors. Apolot (2011) found out that the main causes of loss could be attributed
to delays due to client or client’s consultants; delays attributed to contractors; delays
beyond the contractor and client; under measurement and late payment. Smith (2005)
investigated the causes of financial loss associated with profit and found out that due
to capital lock up, contractors suffer losses mainly due to cash shortages; seasonal
business; increase in tax; lack of Insurance; high interest rate; inflation and
disputes Transparency International (2005) found out that corruption on construction
projects causes financial loss to the clients and contractors alike: Corruption hampers
development and the world now recognises it as a major challenge to all development
programmes.
RESEARCH METHODOGY
Methods
Generally, research can be categorized as qualitative or quantitative (Fellows and Liu,
2003). The researcher adopted a pragmatic approach and used both qualitative
approaches and quantitative methods. Causes of financial loss were compiled basing
on a review of the literature, discussions with contractors and consultants. The
qualitative method was used to investigate the perceptions concerning the causes of
financial loss to contractors in Uganda. Surveys were used to quantify and rank the
factors that lead to financial losses. Surveys have some advantages, namely they are
effective means to gain a lot of data on attitudes; very few of the subjects are lost and
they are inexpensive to administer (Collis and Hussey, 2003). A questionnaire was
complied basing on the compiled list of causes after a pilot study. A pilot study was
used to improve the wording and increase the reliability of the questions. Most of the
questions were of closed type because it is faster to collect data and to analyse the
information collected. The closed ended questionnaires were rated on a 5 point Likert
scale (Kothari, 2003). These provided respondents with values to choose; that is from
1 to 5 and determined the respondent’s degree of agreement or disagreement and takes
Semyalo et al.
266
the form; Not frequent(1), slightly frequent(2), frequent(3), very frequent(4) and
extremely frequent(5) for frequency and not severe(1), slightly severe(2), severe(3),
very severe(4) and extremely severe(5) for severity. The open ended questions at the
end were used to obtain perceptions.
The study was confined to the local contractors registered with Uganda National
Association of Building and Civil Engineering Contractors (UNABCEC), generally
because their addresses were well known and these are the most serious contractors
available in the country. It was determined that all contractors who are registered with
the contractor’s association (UNABCEC) are targeted. At the national level one
recognized way of categorizing construction companies is by the UNABCEC class.
The classification from A* to E takes into account the financial strength, size and
ability to carry out contracts. Those in class A* have the highest capacity and include
some multinational companies while those in Class E are the very small ones with a
few resources at their disposal. For the purposes of this survey, the 2010 mailing list
of contractors was used and all the 148 contractors targeted. The study population
consisted of top technical managers of construction companies or their equivalents.
This was because such categories of people were believed to be knowledgeable about
the causes of financial losses incurred on construction projects.
Validity and reliability of the research instruments
Both content and construct validity were ensured by use of expert judgement to
scrutinise and critique the questionnaires (Fellows and Liu, 2003). External reliability
was not a major issue as it was obvious that factors that affect financial loss were
likely to vary with time. Internal reliability was ensured during the questionnaire
design by using expert judgement. Draft questionnaires were given to experts
including supervisors to scrutinise and critique the questions. The comments provided
were incorporated into the final questionnaires.
DATA ANALYSIS, RESULTS AND DISCUSSIONS
Analysis of the responses
A total of 148 questionnaires were sent out and 78 questionnaires were filled in and
returned by the respondents giving an overall response rate of 53%. The majority of
the respondents (44.9%) had spent between 1 and 5 years with the firms. Those that
had spent 6 to 10 years and over 10 years comprised of 20.5% and 29.5% respectively.
This indicates that the majority of the people who responded have reasonable length
of experience with the firms. It can be reasonably assumed that the responses they
presented reflect the experience they have with the firms.
The respondents were also required to give an indication of the size of jobs they are
normally involved in. The majority of the contractors (41 percent) handle contracts
between 50 and 499 million Uganda Shillings followed by those who tender for jobs
worth 500 to 999 million Uganda Shillings. Most of the firms handle contracts in the
range 50 to 499 million Uganda Shillings (20,000 USD to 200,000 USD equivalent)
followed by those who handle contracts of 500 to 999 million Uganda Shillings
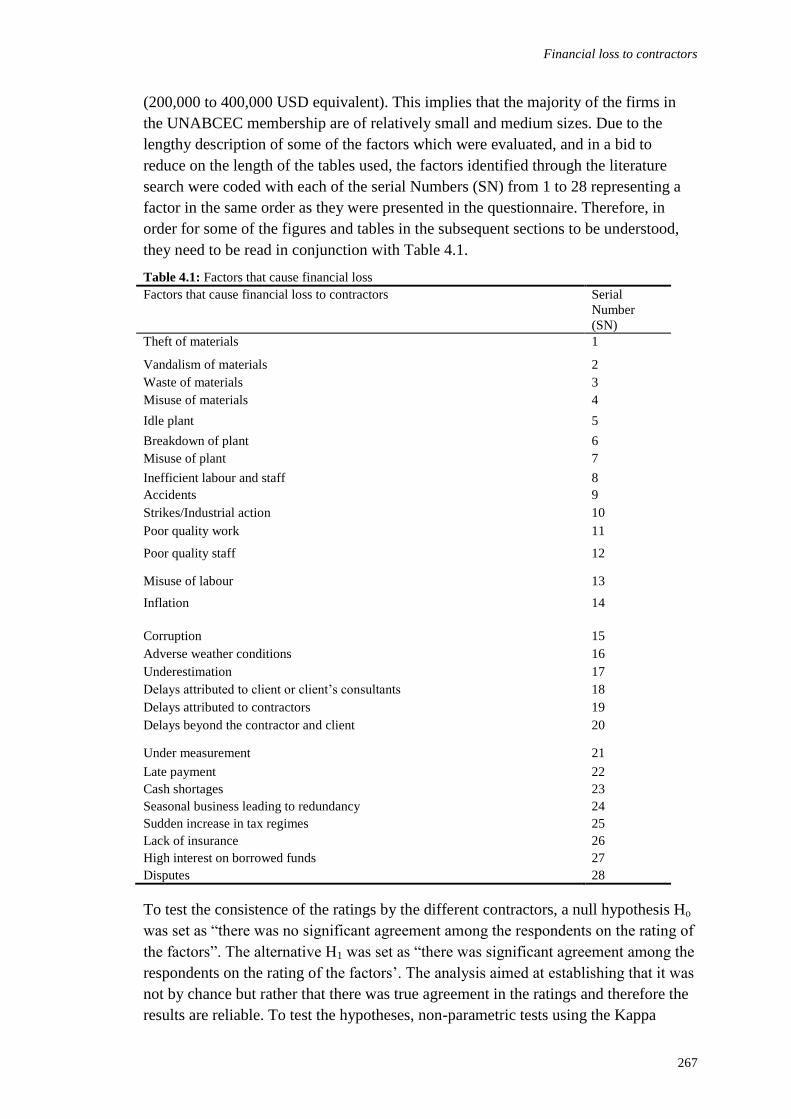
Financial loss to contractors
267
(200,000 to 400,000 USD equivalent). This implies that the majority of the firms in
the UNABCEC membership are of relatively small and medium sizes. Due to the
lengthy description of some of the factors which were evaluated, and in a bid to
reduce on the length of the tables used, the factors identified through the literature
search were coded with each of the serial Numbers (SN) from 1 to 28 representing a
factor in the same order as they were presented in the questionnaire. Therefore, in
order for some of the figures and tables in the subsequent sections to be understood,
they need to be read in conjunction with Table 4.1.
Table 4.1: Factors that cause financial loss
Factors that cause financial loss to contractors Serial
Number
(SN)
Theft of materials 1
Vandalism of materials 2
Waste of materials 3
Misuse of materials 4
Idle plant 5
Breakdown of plant 6
Misuse of plant 7
Inefficient labour and staff 8
Accidents 9
Strikes/Industrial action 10
Poor quality work 11
Poor quality staff 12
Misuse of labour 13
Inflation 14
Corruption 15
Adverse weather conditions 16
Underestimation 17
Delays attributed to client or client’s consultants 18
Delays attributed to contractors 19
Delays beyond the contractor and client 20
Under measurement 21
Late payment 22
Cash shortages 23
Seasonal business leading to redundancy 24
Sudden increase in tax regimes 25
Lack of insurance 26
High interest on borrowed funds 27
Disputes 28
To test the consistence of the ratings by the different contractors, a null hypothesis Ho
was set as “there was no significant agreement among the respondents on the rating of
the factors”. The alternative H1 was set as “there was significant agreement among the
respondents on the rating of the factors’. The analysis aimed at establishing that it was
not by chance but rather that there was true agreement in the ratings and therefore the
results are reliable. To test the hypotheses, non-parametric tests using the Kappa

Semyalo et al.
268
Coefficient of Agreement (K) were used (Siegel and Castellan, 1988). These tests do
not rely on the distribution of data, unlike most other parametric tests. The statistic is
used in a typical situation where a group of N objects, each of which is to be assigned
M categories by a group of I raters. There were 28 factors that affect financial loss in
construction to be rated on severity and frequency of loss giving a total of 56 factors,
evaluated by 78 raters each assigning each of the factors 5 rating scales. The value of
K is the ratio of the proportion of times that the rates agree (corrected for chance
agreement) to the maximum proportion of the times the raters could agree (Siegel and
Castellan, 1988).
)(1
)()(
EP
EPAPK
Equation (1)
Where P (A) is the proportion of values that the rates agree; and P (E) is the
proportion of values that the rates would be expected to agree by chance. If there was
a complete agreement among the raters, then K = 1; and if there is no agreement, other
than that which would be expected to occur by chance, then K= O.
NI
CpwherepEP
j
j
m
jj
.;)(
2
1
Equation (2)
Cj is the number of times a factor is assigned to category j. It is the sum of the column
frequencies under the rating scales.
1
1
)1(
1)(
1 1
2
In
INIAP
N
i
M
j
ij Equation (3)
Where N is the number of factors being rated = 56;
M is the number of rating scales = 5;
I is the number of raters = 78;
Nij are the scores in the rating matrix.
From Equations (2) and (3) above, the computed values, for P (A) and P (E) for the
rating matrix are 0.2715 and 0.2505 respectively. The computed value of K from
Equation (1) is equal to 0.02805.
According to Siegel and Castellan (1988), K is normally distributed with zero means
and variance, var (K) given by the equation.
2
32
)(1
)2(2)()32)(
)1(
2)var(
EP
pIEPIEPx
INIK
j
)var(K
Kz Equation (4)
Financial loss to contractors
269
Hence, the z statistic was used to test the null hypothesis Ho: K against the alternative
hypothesis, H1: K#0. The computed value var (K) is 8.8589E-05 and z is equal to
2.9803. At 5% level of significance, z = 1.645. Since the computed value is greater
than z o.o5, it can be concluded that there was significant agreement in rating the
factors and the degree of agreement is beyond that which could have occurred by
chance. The null hypothesis is therefore rejected and the ranking given has significant
agreement among the respondents.
Rating of factors
The mean rating and the student’s t-test were calculated using SPSS basing on the
rating of frequency of occurrence of the factors that lead to loss and the severity as
given in Tables 4.2 and 4.3 respectively. There are 2 ways of interpreting the results of
the t-test. The first method was to compare the test significance level against the level
of significance, which was set at 0.05(5%), following the conventional risk level and
was been used by many researchers (Al-Shumaimeri, 2001). The alternative method
was to compare the test t-statistic against the critical t value. The test value was set at
3 that correspond to the middle position of “frequent” or “severe” on the scale of 1 to
5. The value of μo was fixed at 3 because by definition ratings below are not frequent
and slightly frequent and not severe and slightly severe respectively. The null
hypothesis Ho: μ=μo against the alternative hypothesis HA: μ #μo, where μ is the
population mean and μo represents the critical rating below or above which the
attribute was considered as significant. It can be seen from Table 4.2 and 4.3 that all
the variables have significant level less than 0.05, apart from factors with serial
numbers 15, 14, and 27, in descending order for frequency. These factors are: 15 for
Corruption; 14 for inflation; and 27 for high interest on borrowed funds for frequency.
For severity, the factors are 27, 23, 15, 22 and 14 in descending order. These factors
are: 27 for high interest on borrowed funds; 23 for cash shortages; 15 for corruption;
22 for late payment; and 14 for inflation. The decision was to reject Ho for the 25
variables that have significance level less than 0.05. Alternatively, the critical value t
for 77 degrees of freedom (n–1) at α = 0.05 was approximately 1.66 by interpolation.
From Table 4.2, only corruption; inflation; and high interest on borrowed funds fall in
the rejection range of Ho. This suggests that these are the factors that are perceived to
be more frequent and have an impact on financial loss to construction companies.
From Table 4.3, only high interest on borrowed funds; cash shortages; corruption; late
payment; and inflation fall in the rejection range of Ho. This suggests that these are the
variables that are viewed by contractors as severe in causing financial loss to
construction companies. The Importance Index was calculated basing on two criteria
of frequency and severity of the factors. The mean combined importance index from
the rankings was calculated using the formula:
N
sf
NM
RRI
12
. Equation 4.5
where Rf is the rating with respect to frequency of the factor, Rs is the rating with
respect to the severity of the factor, N is the number of responses and M is the
Semyalo et al.
270
maximum value in rating which is 5. This Importance index expresses the general
combined perception on the factors based on both their frequency and severity. It was
computed using equation 4.5 which was adapted from Al-Khalil and Al Ghafly (1999,
p 645). The rationale for this index is that the importance of a frequency and severity
of financial losses in construction is a combination of the two. The five most
important factors as per the Importance index are those with serial numbers 22, 27, 14,
15, 23 and 18. These are late payment, high interest on borrowed funds, inflation,
corruption, cash shortages and delays attributed to client or client’s consultants
respectively.
The Spearman’s coefficient of rank correlation was determined for the ranks of
frequency and the degree of severity. The Spearman’s correlation coefficient was
calculated using equation 4.6 where n is the number of pairs in this case 78, and d is
the difference between the ranks.
)1(
61
2
2
nn
d
Equation 4.6
The correlation coefficient is equal to 0.862. Since the coefficient is greater than 0.7,
the factors have a very strong positive correlation between frequency of occurrence
and the severity of the factors (Benoit, 2009).
The contractors were also asked to state the financial loss they incurred on the recent
projects and to provide the contract sum for the particular projects. From the analysis,
the financial loss ranged from a few million shillings to hundreds of millions of
shillings. In order to afford comparison, the losses where expressed as percentages of
the contract sum. The percentage loss ranged from 0.1 percent as minimum to
maximum of 40 percent. Their classes in percentage were <5, 5<x<10, 10<x<15,
15<x<20, 20<x<25 and > 25 with 27, 17, 16, 5, 6, and 7 respectively. These high
percentage losses do not auger well with the contractors and could partly explain why
many contractors’ businesses end up collapsing. The causes of financial loss to the
contractors have been identified. By frequency of occurrence, the major ones are
corruption; inflation; and high interest on borrowed funds. By severity of occurrence
the major ones are high interest on borrowed funds; cash shortages; corruption; late
payment; and inflation. By the Importance Index, the major ones include late
payment, high interest on borrowed funds, inflation, corruption, cash shortages and
delays attributed to client or client’s consultants. Therefore, the three factors that are
significant and cut across the analyses are corruption, inflation and high interest on
borrowed funds. Transparency International (2005) has shown how corruption can add
up to 25% to the cost of public contracting, generating waste of public resources,
missed development opportunities, an unstable environment for business, and
therefore increasing poverty. According to Transparency International (2005), the
scale of corruption is greater in construction that in any other sector of the economy.
Indeed, several studies have concluded that corruption slows down development.
According to Uganda Bureau of Statistics ((UBOS), 2011), the rate of inflation in
Uganda at the time of the survey was in the region of 16 percent. This is rather a high
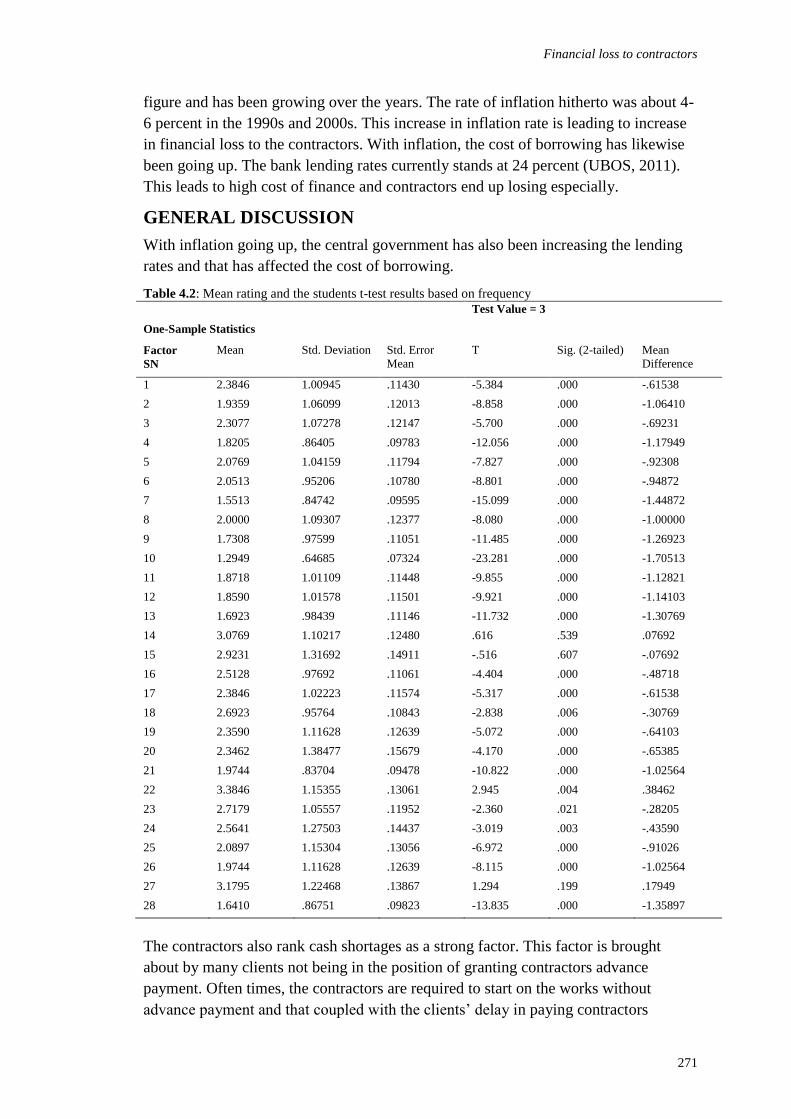
Financial loss to contractors
271
figure and has been growing over the years. The rate of inflation hitherto was about 4-
6 percent in the 1990s and 2000s. This increase in inflation rate is leading to increase
in financial loss to the contractors. With inflation, the cost of borrowing has likewise
been going up. The bank lending rates currently stands at 24 percent (UBOS, 2011).
This leads to high cost of finance and contractors end up losing especially.
GENERAL DISCUSSION
With inflation going up, the central government has also been increasing the lending
rates and that has affected the cost of borrowing.
Table 4.2: Mean rating and the students t-test results based on frequency
Test Value = 3
One-Sample Statistics
Factor
SN
Mean Std. Deviation Std. Error
Mean
T Sig. (2-tailed) Mean
Difference
1 2.3846 1.00945 .11430 -5.384 .000 -.61538
2 1.9359 1.06099 .12013 -8.858 .000 -1.06410
3 2.3077 1.07278 .12147 -5.700 .000 -.69231
4 1.8205 .86405 .09783 -12.056 .000 -1.17949
5 2.0769 1.04159 .11794 -7.827 .000 -.92308
6 2.0513 .95206 .10780 -8.801 .000 -.94872
7 1.5513 .84742 .09595 -15.099 .000 -1.44872
8 2.0000 1.09307 .12377 -8.080 .000 -1.00000
9 1.7308 .97599 .11051 -11.485 .000 -1.26923
10 1.2949 .64685 .07324 -23.281 .000 -1.70513
11 1.8718 1.01109 .11448 -9.855 .000 -1.12821
12 1.8590 1.01578 .11501 -9.921 .000 -1.14103
13 1.6923 .98439 .11146 -11.732 .000 -1.30769
14 3.0769 1.10217 .12480 .616 .539 .07692
15 2.9231 1.31692 .14911 -.516 .607 -.07692
16 2.5128 .97692 .11061 -4.404 .000 -.48718
17 2.3846 1.02223 .11574 -5.317 .000 -.61538
18 2.6923 .95764 .10843 -2.838 .006 -.30769
19 2.3590 1.11628 .12639 -5.072 .000 -.64103
20 2.3462 1.38477 .15679 -4.170 .000 -.65385
21 1.9744 .83704 .09478 -10.822 .000 -1.02564
22 3.3846 1.15355 .13061 2.945 .004 .38462
23 2.7179 1.05557 .11952 -2.360 .021 -.28205
24 2.5641 1.27503 .14437 -3.019 .003 -.43590
25 2.0897 1.15304 .13056 -6.972 .000 -.91026
26 1.9744 1.11628 .12639 -8.115 .000 -1.02564
27 3.1795 1.22468 .13867 1.294 .199 .17949
28 1.6410 .86751 .09823 -13.835 .000 -1.35897
The contractors also rank cash shortages as a strong factor. This factor is brought
about by many clients not being in the position of granting contractors advance
payment. Often times, the contractors are required to start on the works without
advance payment and that coupled with the clients’ delay in paying contractors
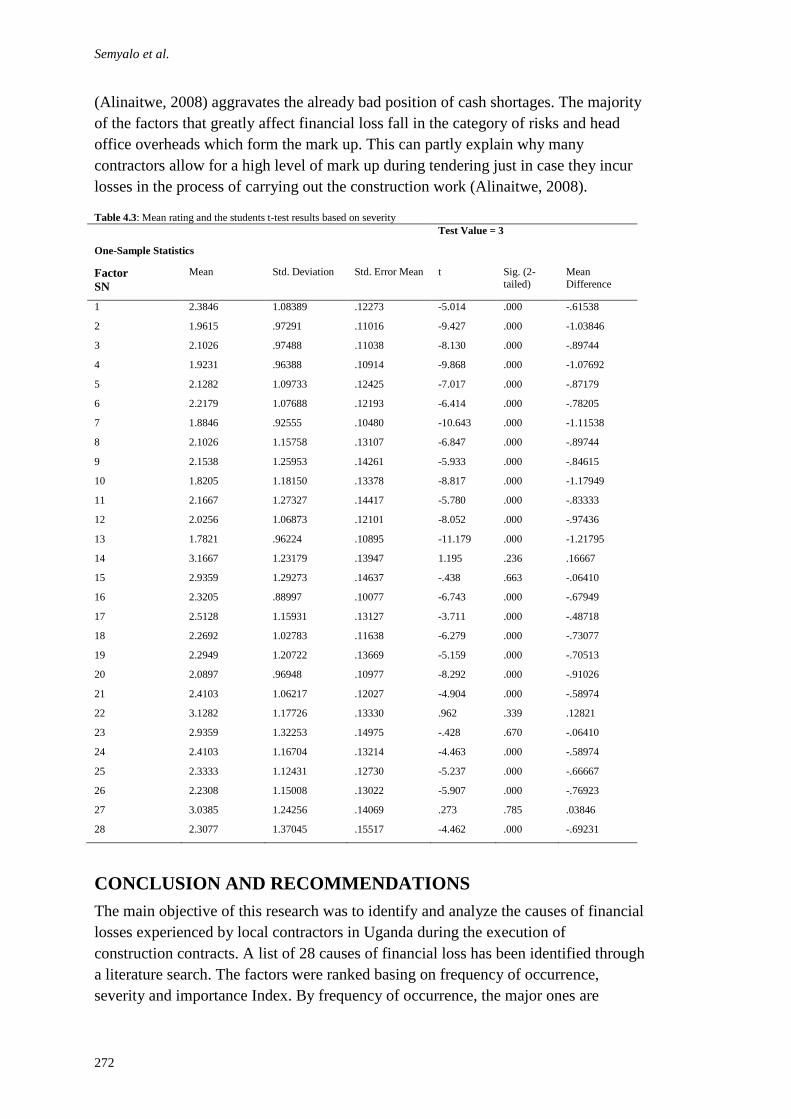
Semyalo et al.
272
(Alinaitwe, 2008) aggravates the already bad position of cash shortages. The majority
of the factors that greatly affect financial loss fall in the category of risks and head
office overheads which form the mark up. This can partly explain why many
contractors allow for a high level of mark up during tendering just in case they incur
losses in the process of carrying out the construction work (Alinaitwe, 2008).
Table 4.3: Mean rating and the students t-test results based on severity
Test Value = 3
One-Sample Statistics
Factor
SN
Mean Std. Deviation Std. Error Mean t Sig. (2-
tailed)
Mean
Difference
1 2.3846 1.08389 .12273 -5.014 .000 -.61538
2 1.9615 .97291 .11016 -9.427 .000 -1.03846
3 2.1026 .97488 .11038 -8.130 .000 -.89744
4 1.9231 .96388 .10914 -9.868 .000 -1.07692
5 2.1282 1.09733 .12425 -7.017 .000 -.87179
6 2.2179 1.07688 .12193 -6.414 .000 -.78205
7 1.8846 .92555 .10480 -10.643 .000 -1.11538
8 2.1026 1.15758 .13107 -6.847 .000 -.89744
9 2.1538 1.25953 .14261 -5.933 .000 -.84615
10 1.8205 1.18150 .13378 -8.817 .000 -1.17949
11 2.1667 1.27327 .14417 -5.780 .000 -.83333
12 2.0256 1.06873 .12101 -8.052 .000 -.97436
13 1.7821 .96224 .10895 -11.179 .000 -1.21795
14 3.1667 1.23179 .13947 1.195 .236 .16667
15 2.9359 1.29273 .14637 -.438 .663 -.06410
16 2.3205 .88997 .10077 -6.743 .000 -.67949
17 2.5128 1.15931 .13127 -3.711 .000 -.48718
18 2.2692 1.02783 .11638 -6.279 .000 -.73077
19 2.2949 1.20722 .13669 -5.159 .000 -.70513
20 2.0897 .96948 .10977 -8.292 .000 -.91026
21 2.4103 1.06217 .12027 -4.904 .000 -.58974
22 3.1282 1.17726 .13330 .962 .339 .12821
23 2.9359 1.32253 .14975 -.428 .670 -.06410
24 2.4103 1.16704 .13214 -4.463 .000 -.58974
25 2.3333 1.12431 .12730 -5.237 .000 -.66667
26 2.2308 1.15008 .13022 -5.907 .000 -.76923
27 3.0385 1.24256 .14069 .273 .785 .03846
28 2.3077 1.37045 .15517 -4.462 .000 -.69231
CONCLUSION AND RECOMMENDATIONS
The main objective of this research was to identify and analyze the causes of financial
losses experienced by local contractors in Uganda during the execution of
construction contracts. A list of 28 causes of financial loss has been identified through
a literature search. The factors were ranked basing on frequency of occurrence,
severity and importance Index. By frequency of occurrence, the major ones are

Financial loss to contractors
273
corruption; inflation; and high interest on borrowed funds. By severity of occurrence
the major ones are high interest on borrowed funds; cash shortages; corruption; late
payment; and inflation. By the Importance Index, the major ones include late
payment, high interest on borrowed funds, inflation, corruption, cash shortages and
delays attributed to client or client’s consultants. Therefore, the three factors that are
significant and cut across frequency, severity and importance are corruption, inflation
and high interest on borrowed funds. Correlation analysis between frequency of the
factors that cause financial loss and severity of the factors led to a Spearman’s Rank
correlation coefficient of 0.862 and hence the factors have a strong correlation
between frequency and severity. The implication is that generally, the same factors
that are frequent are the same ones that are severe in terms of causing financial loss.
Among the major ones are corruption in all its forms, inflation and high interest on
borrowed funds, late payment, cash shortages and delays attributed to clients or
clients’ consultants. The government should put in place measures to minimize
corruption and inflation as these inflict big losses to the contractors. Clients should be
required and educated to avoid paying the contractors late. Although late payment is
discouraged and penalizable in most of the conditions of contract, clients still default.
The government should avail funds to contractors at low interest rates. It is
recommended that future research in this area be focused on the effect of corruption,
inflation on the construction industry. The other area of study could be on the cost of
finance and the sources of finance for contractors. The findings are important to
contractors and consultants, policy makers and researchers in the construction
industry.
REFERENCES
Akintola, A. (1995) Just –in-time and implementation for building material management.
Construction Economics and Management, 13(2), 105 – 113.
Alinaitwe, H. M. (2008) Labour Productivity and Ferformance in the Uganda Building
Industry. PhD Thesis, Lund University.
Al-Khalil and Al- Ghafly, M.A. (1999). Important causes of delay in public utility projects in
Saudi Arabia, International Journal of Project Management Vol 17, Issue 2, pp 647-
655
Al-Shumaimeri, A. A. (2001) The services quality of post in Saudi Arabia. Public
Administration Journal, 41(2): 265–302
Apolot, R. (2011) Investigation Into The Causes Of Delay And Cost Overrun In
Construction Projects In Uganda’s Public Sector. Makerere University, Unpublished
Masters Dissertation
ASCBC, Agreement and schedule of conditions of building contract, 1992, 1–32.
College of Estate Management (1997) College of Estate Management, Reading, UK
Collis, J. and Hussey, R. (2003) Business Research: A practical guide for Undergraduate and
Post graduate students. 2nd ed, Palgrave Macmillan, Basingstoke, UK.
Fellows, R. and Liu, A. (2003) Research Methods for Construction, Second edition. Blackwell
Science, Oxford.
Semyalo et al.
274
Hamzah, A. (1994) A perspective of material management practices in a fast developing
economy: the case of Malaysia. Construction Economics and Management, 12(5), 413
– 422.
Kothari, C. R. (2003) Research Methodology, Methods and Techniques. Wisha Prakashan,
New Delhi
Kwakye, C. (1997) Project Management Practice on Construction Sites. New Age
Publications, London
McDowall, H. (2002) Theft on costruction site. The USA National Insurance Crime Bureau,
pg 16 – 17.
Neale, H and Neale, D. (1989) Construction Planning. Thomas Telford, London.
Peters, C. (2004) The construction Industry in Perspective. Construction Business Forum,
Vol. 25, No. 4, pp 16 – 25.
Proverbs, D. G. (2000) Reducing construction costs: European best practice supply chain
implications. European Journal of Purchasing and Supply Chain Management, 6(3/4),
149 – 158.
Ramus, J. and Birchall, S. (2005) Contract Practice for surveyors. 2nd Edition. Elsevier
Science and Technology, The University of Virginia.
Rental Equipment Registrar Magazine (2002) Construction Equipment, Rental Equipment
Registrar Magazine, 2(3), 16 – 18.
Shou, Y., Zhijun, M., Taihe, L. and Brian, P. (2004) Unique Risk Factors associated with
construction projects in developing countries. Journal of Engineering Management,
16(7), 256 – 261.
Siegel, S. and Castellan, N. J. (1988) Non-Parametric statistics For Behavioural sciences. 2nd
ed, McGraw-Hill International Editions, London.
Smith, K. (2005) Project Management for Construction. Second Edition. EJ Publishers, Hong
Kong.
Transparency International (2005) The Global Corruption Report 205, Pluto Press, London.
Uganda Bureau of Statistics, (2011), Statistical Abstract. Entebbe, Government Printery.
Ansah, S.K. and Bamfo-Agyei, E. (2012) Minimization of heat gains in buildings: the case of domestic
buildings in cape coast metropolis – Ghana In: Laryea, S., Agyepong, S.A., Leiringer, R. and Hughes,
W. (Eds) Procs 4th West Africa Built Environment Research (WABER) Conference, 24-26 July 2012,
Abuja, Nigeria, 275-288.
275
MINIMIZATION OF HEAT GAINS IN BUILDINGS: THE
CASE OF DOMESTIC BUILDINGS IN CAPE COAST
METROPOLIS – GHANA
Samuel K. Ansah1 and Emmanuel Bamfo-Agyei
2
Department of Building Technology, Cape Coast Polytechnic, P.O Box AD 50, Cape Coast, Ghana
Minimization of heat gains in buildings is a matter of great concern to designers and
engineers. This heat gain in buildings leads to room’s discomfort and to reduce this,
will call for the use of fans and air conditioners which rely on expensive artificially
generated electrical energy to operate them. This research therefore aims at
ascertaining appropriate construction designs and techniques that could be adopted to
minimize excessive heat gains in buildings. Random sampling technique was used for
selecting hundred (100) domestic buildings in each of the three densely populated
suburbs considered within the Cape Coast Metropolis in Ghana. In total, three
hundred (300) buildings were used as a sample for this study. Structured interview
and observation were used as the main research methods to obtain the necessary data
for the study objectives. The results shows that appropriate construction designed
methods and techniques were not adopted for the construction of almost all the
buildings investigated. It was also realized that majority of the occupants (96%) used
electric fans, and air conditioners to reduce the amount of heat gains in their rooms.
The study suggested that, shading techniques such as screens to walls, fixed sun
breakers and attached canopies must be encouraged in the design and construction of
buildings. The study also suggested that all buildings, yet to be constructed, should be
positioned with their longest walls facings north and south in order to reduce intense
morning and evening sun entering into the building with more window openings
accommodated in both sides of the longest walls to allow for cross-ventilation.
Keywords: Cape Coast, Ghana, heat gain, heat minimization
INTRODUCTION
Excessive heat gains in tropical buildings which call for the use of expensive
artificially generated electrical energy need to be minimized by the use of more cost
effective and equally durable construction materials and techniques (Burberry, 1993).
It is a common knowledge that heat discomforts have been a major source of worry to
many, especially occupants of dwelling houses and public buildings in hot climatic
conditions. Progress, though, has been made in finding solution to heat gains into
building within the tropics by positioning buildings to allow natural ventilation, by the
use of some materials of high resistance to heat transfers and by the use of artificial air
conditioners or fans which may require electricity and other forms of man-made
energy to operate them.
Ansah and Bamfo-Agyei
276
In cold climatic or temperate regions heat gains into buildings or into rooms is more
advantageous and desirable, but the vice versa in the tropics (Jones, 2001). In
excessive hot climates, it is necessary to reduce temperature and humidity, whiles in
excessive cold climates it becomes necessary to increase them. Therefore, there is a
definite range of temperature and humidity, within which efficiency and comfort can
obtain (Burberry, 1993). Human beings can only work and live with comfort and
efficiency within a registered set of physical conditions and when these conditions
cannot be provided, health suffers and in extreme cases epidemics occur resulting in
deaths (Faber, 1996). According to the World Health Organization (W.H.O) and
Ghana Health Service (G.H.S), one major contributing factor to human health problem
is ambient temperature (Public Health Division, G.H.S., Cape Coast). It is therefore
the duty of the designer (or the air condition engineer, where applied) to produce
efficiency and comfort conditions, in collaboration with the architect, at the lowest
cost having regard to cleanliness, convenience and appearance. Since the emergence
of modern architecture in especially the developing countries, much emphasis has
been placed on strength and durability of conventional materials and the stability of
structures more, with rather a lesser attention on construction techniques to enhance
heat reduction in the design of structures (Allard, 1998). According to Adjei et al,
(2011), many writers over the years have agreed to the fact that buildings irrespective
of their locations/positions, supposed to provide comfort, be functional, and
environmentally friendly or sustainable.
Unfortunately today, designs are inappropriate and artificial energy is widely used for
creating comfort in rooms. Construction rethinking and design options which could
counteract heat gains in domestic and institutional buildings therefore needs to be
considered in order to reduce the prevailing discomfort temperature in buildings. This
research is therefore conducted to find out the most suitable and appropriate
construction designs, techniques and materials that can significantly be used for the
construction of domestic buildings in tropic regions in order to reduce or counteract
excessive heat gains into such buildings. The specific objectives of the study are:
To find out the temperature level in each of the buildings under study.
To find out whether occupants living in various buildings are satisfy with their indoor
conditions without the use of artificial ventilation.
To find out the type of ventilation systems used by the occupants to achieve
ventilation in their rooms.
LITERATURE REVIEW
The Need for Thermal Comfort
Thermal comfort of human beings is governed by many physiological mechanisms of
the body and these vary from person to person. As intimated by Osbourn (1993),
thermal comfort is the environmental conducive hot or cold condition suitable for
human habitation and efficiency. Depending upon the climatic conditions of the
locality, a satisfactory thermal environment is an important purpose of good building
design. A satisfactory and conducive thermal environment is an important condition
for normal and healthy functioning of human system, as it allows the internally
generated body heat to dissipate by convection to obtain the normal body temperature
for continuous functioning.

Heat gain in buildings
277
Continuous stay in high temperatures, apart from the unpleasant discomfort and loss
of tone created, would cause very serious health hazards (Allard, 1998).
Uncomfortable heat in rooms causes very high rate of blood circulation, causing
excessive sweating which results in fluid and salt loss from the body. It also causes
inflammatory skin reactions and heat rashes. The condition is very much associated
with heat exhaustion, respiratory infections in minor cases. In extreme cases excessive
heat could result in heat stroke, sudden collapse and loss of consciousness (Ghana
Health Service – Public Health Division, Cape Coast).
Requirement of Buildings built in Warm Humid Climates
The requirements of buildings built in warm humid climate region has been discussed
by many writers over the years and they all agreed to the fact that buildings in this
region like all other buildings elsewhere supposed to provide comfort, be functional,
and environmentally friendly or sustainable (Adjei et al, 2011). According to
Koenisberger et al., (1980), buildings have to be opened up to breezes and oriented to
catch available air movement in order for heat to be removed from the occupants’
body into the environment. Other features that were suggested by Koenisberger et al.
(1980) are shading devices to reduce radiation from the sky.
According to Lloyd (1998), some of the important considerations for building in
tropical regions are ‘natural ventilation, mechanical ventilation, artificial cooling, free
cooling, light weight construction, day lighting and solar shading/control’.
Another writer, Stagno (2001) also suggests that in order to achieve an acceptable
level of comfort in buildings in the tropics, consideration must be given to variables
like ‘air-cooling, decreasing relative humidity levels and reduction of excessive glare
from the sun’ and existing environmental factors.
According to Bay and Ong (2006), ‘shading devices with verandas, sun breaks and
appropriate openings are always more efficient and cheaper for climatic control in
subtropical regions’.
Below are some sustainability requirements relating to the design and construction of
building envelope:
It is essential to consider the local climatic conditions (temperature, moisture, wind)
in order to know the materials for construction of the buildings envelope and the
overall energy performance of the building (Bolin, 2009).
Design to make maximum use of natural light whiles being aware of its limitations
(Bolin, 2009), (Smith, 2006).
Using Effective Solar Shading Devices especially exterior shading devices such as
overhangs, vertical fins and light shelves as energy efficiently measures (Bolin, 2009).
Providing windows that afford building occupants views outside but do not negatively
impact the visual and acoustic comfort of the work environment (Bolin 2009).
Components of the buildings envelope should adequately address issues of thermal
comfort at the building perimeter, particularly thermal and solar performance (Bolin,
2009), (Smith, 2006).
Ansah and Bamfo-Agyei
278
The potential for natural ventilation in the context of an overall climate control
strategy must be exploited while minimizing energy use and maximizing comfort.
Where appropriate, the use of operable windows for natural ventilation and occupant
control must be considered (Bolin, 2009), (Smith, 2006).
Climate Responsive Buildings
Gut and Ackerknech (1993), state that, climate responsive building is a very
comprehensive approach, dealing particularly with buildings in tropical climate zones.
It involves the application of soft measures and natural means to reduce energy
consumption by design, construction and materials appropriate for a specific climate.
This has positive consequences in terms of economy as well as in terms of proper use
of local resources. To achieve greater improvements, buildings are to be constructed
in integrated approach. This includes the settlement pattern and urban forms and the
selection of the site according to microclimatic criteria. The shape and type of
buildings and their orientation, the integration of suitable vegetation and the
arrangement of the external and internal space require careful consideration. The
correct use of building materials, designs of openings and their natural cooling, and
the well-aimed utilization of prevailing winds for ventilation are important supporting
elements. According to Gut and Ackerknech (1993), the main points to be taken into
consideration when designing a climate responsive building are:
Minimization of heat gain during daytime and maximize heat loss at night in hot
seasons, and reverse in cold seasons
Minimization of internal heat gain in the hot seasons
Selection of the site according to microclimate criteria
Controlling of solar radiation
Regulating of air circulation
Passive Climate Control
The concept of passive climate control is completely in line with the notion of
sustainable building. It concentrates on building physics and ensures that the
temperature and the relative humidity stay within acceptable ranges. According to
Burberry (1995), the creation of thermal comfort within a building by passive means,
involves the use of building elements themselves to reduce heat gains from the outside
to the inside in warmer climates. In this case the transfer of heat is regulated by the
external fabric (external walls and roofs) of a building and its prevention depend upon
thickness of the building elements, system of construction, climate of locality and the
degree of exposure (Burberry, 1995). High efficiency windows and insulation to
walls, ceiling, and floors may be used to increase the efficiency of the building
envelop (Johnson and Gibson, 2008). International comparisons show that builders
generally use structures having a small surface area with heavily insulated building
elements (walls, floors and roofs) to achieve a stable internal environment
(Christofferson, 1995).
In the design of the new building of the National Archives of Nigeria in 1958, many
practical and cheap solutions were found to control heat and humidity. Complete
Heat gain in buildings
279
ventilation is provided on all floors with standard adjustable grains-glass louvered
windows with steel bars on the inside for protection against burglars. The wings of the
building were constructed long with many doors and windows placed opposite each
other for cross ventilation. Sun protection for the external walls is provided by vertical
fins between each window and horizontal sun-breakers immediately above the
windows. Wind scoops or special screens are installed on roofs to divert the wind
through channels into the rooms to provide ventilation. This technique has been used
in certain very hot and dry parts of India for centuries (Christofferson, 1995).
DESCRIPTION OF STUDY AREA
Amanful-Idan, Gyegyem-Enyitsiwdo and Abura are three very large densely
populated suburbs in the heart of Cape Coast Metropolis in Ghana. A pre-study of
these communities revealed that a majority of buildings in these communities were put
up even before the passage of the Town and Country Planning Act (Ghana 1994).
Even after the passage of the Town and Country Planning Act in 1994, the lands in
these communities could not be demarcated for proper planning because of the way
and manner buildings have already been scattered and crammed together on these
lands. People living in these communities, because of their closed family
relationships, preferred to put up their buildings closed to each other in order to
increase or maintain their family relationship. It was also noted that majority of
building owners in these communities put up their buildings without seeking for
building permit or approval from the Cape Coast Metropolitan Assembly Authorities
and this has therefore resulted in poor buildings siting in these communities.
There are all classes of people and buildings settlement in these communities.
Majority of the residential settlers in these communities are average to low class
people with most of their buildings in relation to land and the environment, not
properly designed and not well laid out. These communities could be graded as the
slum area of township because of these communities been over populated; having less
developed housing system and ill-planned layout. Gilbert (2007) informs that ‘slum’ is
nowadays employed to describe ‘bad’ shelter. The word slum is used at a varying
scale in that a house or a large settlement can be tagged slum provided it is perceived
to be substandard and is occupied by the poor. Gilbert (2007) further informs that
‘‘every urban area in the world tend to define slums differently, even though efforts
have been made for years to establish objective measures with which to demarcate the
major problem areas’’. Furthermore, the UN-HABITAT report (2003) on ‘‘the
challenge of slums’’, defines ‘‘slum’’ as ‘‘household or group of individuals living
under the same roof that lack one or more of the following conditions: access to pipe
borne water; access to sanitation; secure tenure; durability of housing; and sufficient
living area’’. This working definition, officially adopted at a UN meeting in Nairobi
on October 2002, is ‘‘restricted to the physical and legal characteristics of
settlement,’’ and according to Kim (2008) this definition shies away from the more
difficult-to-measure social dimensions associated with slum. However, in most cases
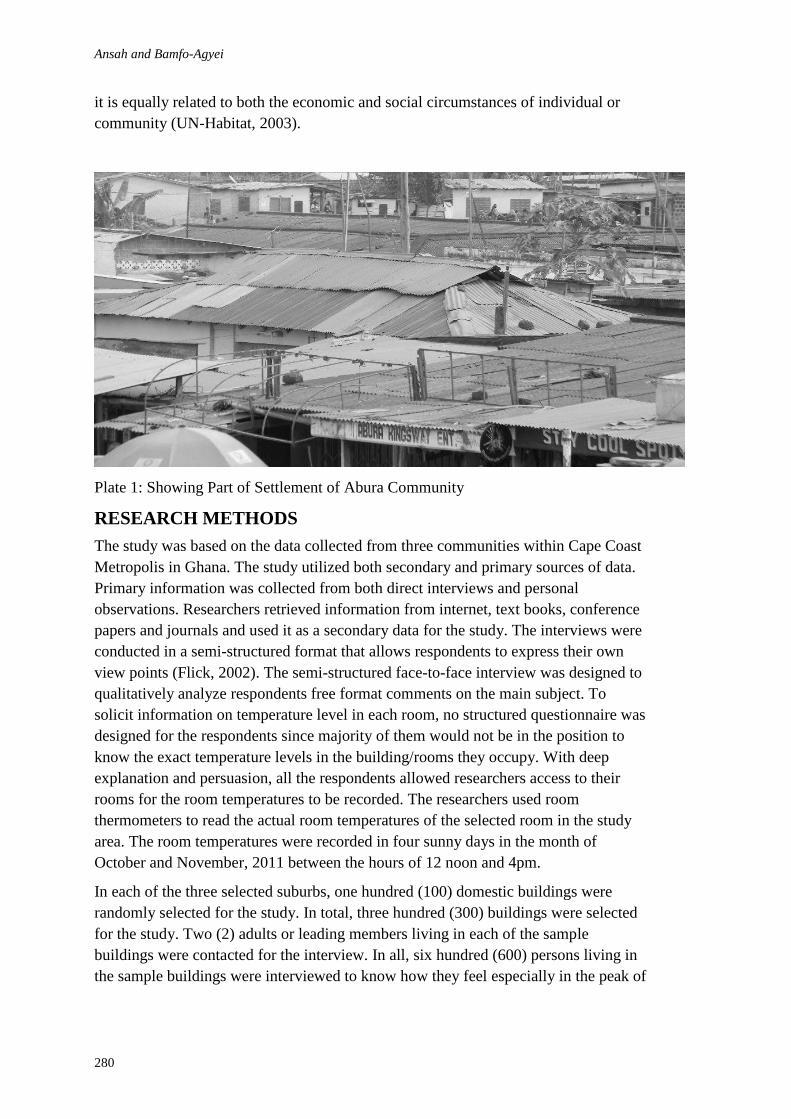
Ansah and Bamfo-Agyei
280
it is equally related to both the economic and social circumstances of individual or
community (UN-Habitat, 2003).
Plate 1: Showing Part of Settlement of Abura Community
RESEARCH METHODS
The study was based on the data collected from three communities within Cape Coast
Metropolis in Ghana. The study utilized both secondary and primary sources of data.
Primary information was collected from both direct interviews and personal
observations. Researchers retrieved information from internet, text books, conference
papers and journals and used it as a secondary data for the study. The interviews were
conducted in a semi-structured format that allows respondents to express their own
view points (Flick, 2002). The semi-structured face-to-face interview was designed to
qualitatively analyze respondents free format comments on the main subject. To
solicit information on temperature level in each room, no structured questionnaire was
designed for the respondents since majority of them would not be in the position to
know the exact temperature levels in the building/rooms they occupy. With deep
explanation and persuasion, all the respondents allowed researchers access to their
rooms for the room temperatures to be recorded. The researchers used room
thermometers to read the actual room temperatures of the selected room in the study
area. The room temperatures were recorded in four sunny days in the month of
October and November, 2011 between the hours of 12 noon and 4pm.
In each of the three selected suburbs, one hundred (100) domestic buildings were
randomly selected for the study. In total, three hundred (300) buildings were selected
for the study. Two (2) adults or leading members living in each of the sample
buildings were contacted for the interview. In all, six hundred (600) persons living in
the sample buildings were interviewed to know how they feel especially in the peak of
Heat gain in buildings
281
sunny periods regarding interior comfort/heat discomfort and how they overcome such
problems.
Personal observations were also made by the researchers to enable them assess the
degree of the problem in each case, noting the design of the buildings, the type of
buildings, position of the buildings in relation to wind flow/direction and degree of
exposure of buildings to the sun or day light.
Table 1: Name of Communities, Number of Buildings Investigated and Number of Respondents
Community Name Number of buildings investigated Number of persons interviewed
Amanful-Idan 100 200
Gyegyem-Enyitsiwdo 100 200
Abura 100 200
Total 300 600
Percentage 100% 100%
Table 2: Room Temperature taken
Approximate recorded Room
Temperature
Number of rooms (Frequency) Percentages (%)
36oc 68 22.67
35oc 121 44.33
34oc 47 15.67
33oc 45 15.00
32oc 19 6.33
Total 300 100%
Average room temperature for all the rooms = 33.6oc
Table 3: Structured interviewed response from occupants living in domestic buildings
Yes (%) No (%) Partially (%)
Staying (living) in the domestic room with
artificial ventilation?
93 4 3
Satisfaction with indoor condition of the
domestic room without artificial ventilation.
0 97 3
Using air conditioner in the room 2 92 6
Using fan in the room 82 4 14
Table 4: Types of building fabric/facade identified in the research area.
Type of building fabric Number of Building Percentage (%)
Clay bricks/Adobe walls 91 30.33
Sandcreate blocks walls 162 54.00
Concrete walls 0 0.00
Timber framed and cladded walls 5 1.67
Metal sheet 0 0.00
Glass walls 0 0.00
Combination of materials (composite)
walls
15 5
Stone walls 0 0.00
Mud buildings/Atakpame walls 27 9.00
Total 300 100%
SURVEY FINDINGS AND DISCUSSION
Out of the total number of 300 buildings investigated, 68 of the buildings
representing 22.67% of the total number of buildings recorded the highest temperature
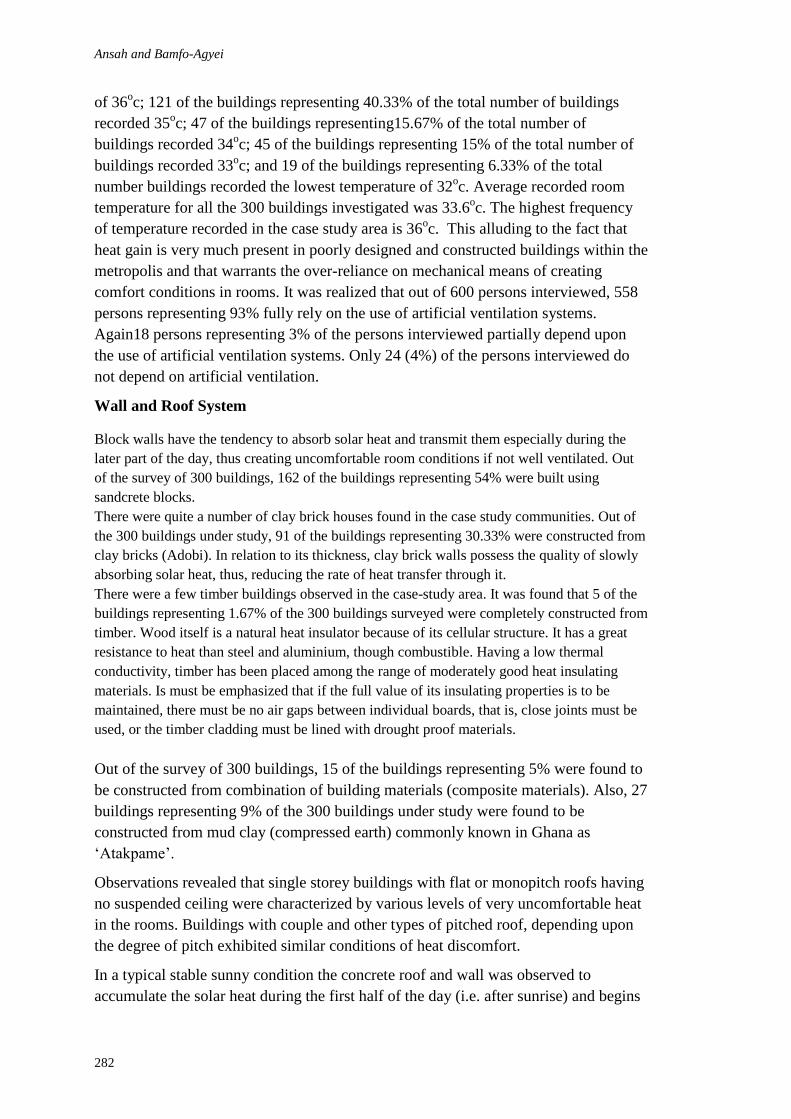
Ansah and Bamfo-Agyei
282
of 36oc; 121 of the buildings representing 40.33% of the total number of buildings
recorded 35oc; 47 of the buildings representing15.67% of the total number of
buildings recorded 34oc; 45 of the buildings representing 15% of the total number of
buildings recorded 33oc; and 19 of the buildings representing 6.33% of the total
number buildings recorded the lowest temperature of 32oc. Average recorded room
temperature for all the 300 buildings investigated was 33.6oc. The highest frequency
of temperature recorded in the case study area is 36oc. This alluding to the fact that
heat gain is very much present in poorly designed and constructed buildings within the
metropolis and that warrants the over-reliance on mechanical means of creating
comfort conditions in rooms. It was realized that out of 600 persons interviewed, 558
persons representing 93% fully rely on the use of artificial ventilation systems.
Again18 persons representing 3% of the persons interviewed partially depend upon
the use of artificial ventilation systems. Only 24 (4%) of the persons interviewed do
not depend on artificial ventilation.
Wall and Roof System
Block walls have the tendency to absorb solar heat and transmit them especially during the
later part of the day, thus creating uncomfortable room conditions if not well ventilated. Out
of the survey of 300 buildings, 162 of the buildings representing 54% were built using
sandcrete blocks.
There were quite a number of clay brick houses found in the case study communities. Out of
the 300 buildings under study, 91 of the buildings representing 30.33% were constructed from
clay bricks (Adobi). In relation to its thickness, clay brick walls possess the quality of slowly
absorbing solar heat, thus, reducing the rate of heat transfer through it.
There were a few timber buildings observed in the case-study area. It was found that 5 of the
buildings representing 1.67% of the 300 buildings surveyed were completely constructed from
timber. Wood itself is a natural heat insulator because of its cellular structure. It has a great
resistance to heat than steel and aluminium, though combustible. Having a low thermal
conductivity, timber has been placed among the range of moderately good heat insulating
materials. Is must be emphasized that if the full value of its insulating properties is to be
maintained, there must be no air gaps between individual boards, that is, close joints must be
used, or the timber cladding must be lined with drought proof materials.
Out of the survey of 300 buildings, 15 of the buildings representing 5% were found to
be constructed from combination of building materials (composite materials). Also, 27
buildings representing 9% of the 300 buildings under study were found to be
constructed from mud clay (compressed earth) commonly known in Ghana as
‘Atakpame’.
Observations revealed that single storey buildings with flat or monopitch roofs having
no suspended ceiling were characterized by various levels of very uncomfortable heat
in the rooms. Buildings with couple and other types of pitched roof, depending upon
the degree of pitch exhibited similar conditions of heat discomfort.
In a typical stable sunny condition the concrete roof and wall was observed to
accumulate the solar heat during the first half of the day (i.e. after sunrise) and begins
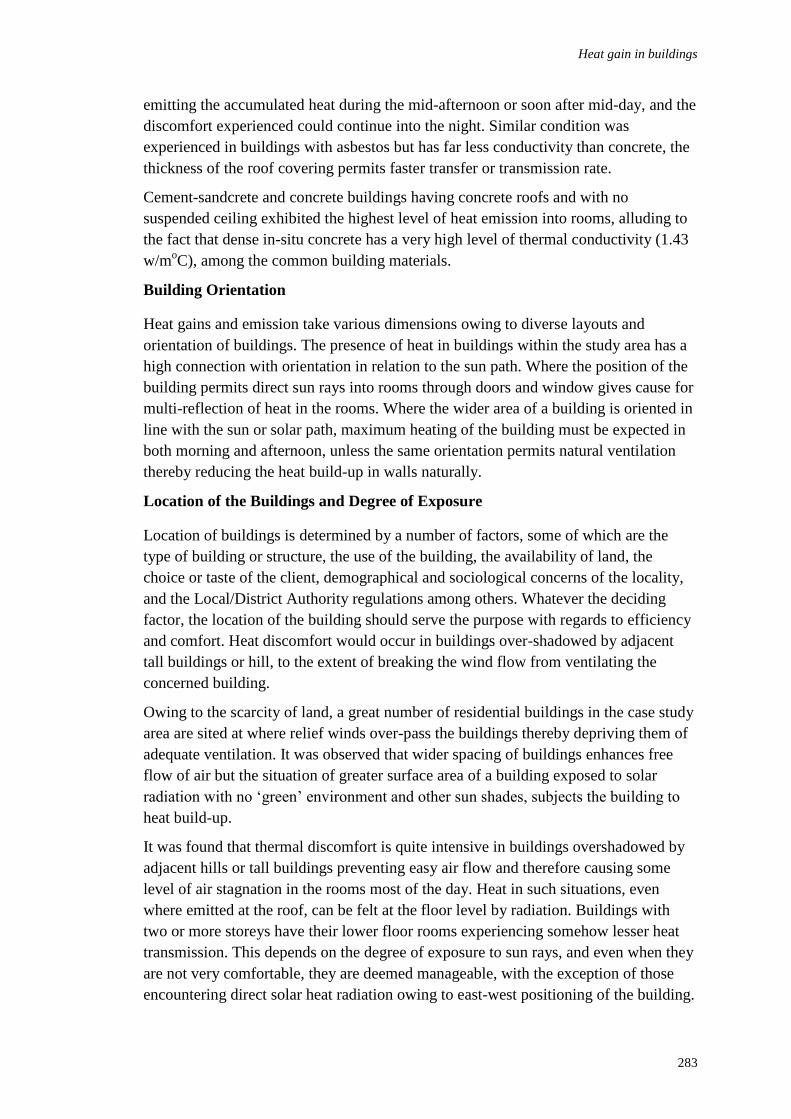
Heat gain in buildings
283
emitting the accumulated heat during the mid-afternoon or soon after mid-day, and the
discomfort experienced could continue into the night. Similar condition was
experienced in buildings with asbestos but has far less conductivity than concrete, the
thickness of the roof covering permits faster transfer or transmission rate.
Cement-sandcrete and concrete buildings having concrete roofs and with no
suspended ceiling exhibited the highest level of heat emission into rooms, alluding to
the fact that dense in-situ concrete has a very high level of thermal conductivity (1.43
w/moC), among the common building materials.
Building Orientation
Heat gains and emission take various dimensions owing to diverse layouts and
orientation of buildings. The presence of heat in buildings within the study area has a
high connection with orientation in relation to the sun path. Where the position of the
building permits direct sun rays into rooms through doors and window gives cause for
multi-reflection of heat in the rooms. Where the wider area of a building is oriented in
line with the sun or solar path, maximum heating of the building must be expected in
both morning and afternoon, unless the same orientation permits natural ventilation
thereby reducing the heat build-up in walls naturally.
Location of the Buildings and Degree of Exposure
Location of buildings is determined by a number of factors, some of which are the
type of building or structure, the use of the building, the availability of land, the
choice or taste of the client, demographical and sociological concerns of the locality,
and the Local/District Authority regulations among others. Whatever the deciding
factor, the location of the building should serve the purpose with regards to efficiency
and comfort. Heat discomfort would occur in buildings over-shadowed by adjacent
tall buildings or hill, to the extent of breaking the wind flow from ventilating the
concerned building.
Owing to the scarcity of land, a great number of residential buildings in the case study
area are sited at where relief winds over-pass the buildings thereby depriving them of
adequate ventilation. It was observed that wider spacing of buildings enhances free
flow of air but the situation of greater surface area of a building exposed to solar
radiation with no ‘green’ environment and other sun shades, subjects the building to
heat build-up.
It was found that thermal discomfort is quite intensive in buildings overshadowed by
adjacent hills or tall buildings preventing easy air flow and therefore causing some
level of air stagnation in the rooms most of the day. Heat in such situations, even
where emitted at the roof, can be felt at the floor level by radiation. Buildings with
two or more storeys have their lower floor rooms experiencing somehow lesser heat
transmission. This depends on the degree of exposure to sun rays, and even when they
are not very comfortable, they are deemed manageable, with the exception of those
encountering direct solar heat radiation owing to east-west positioning of the building.
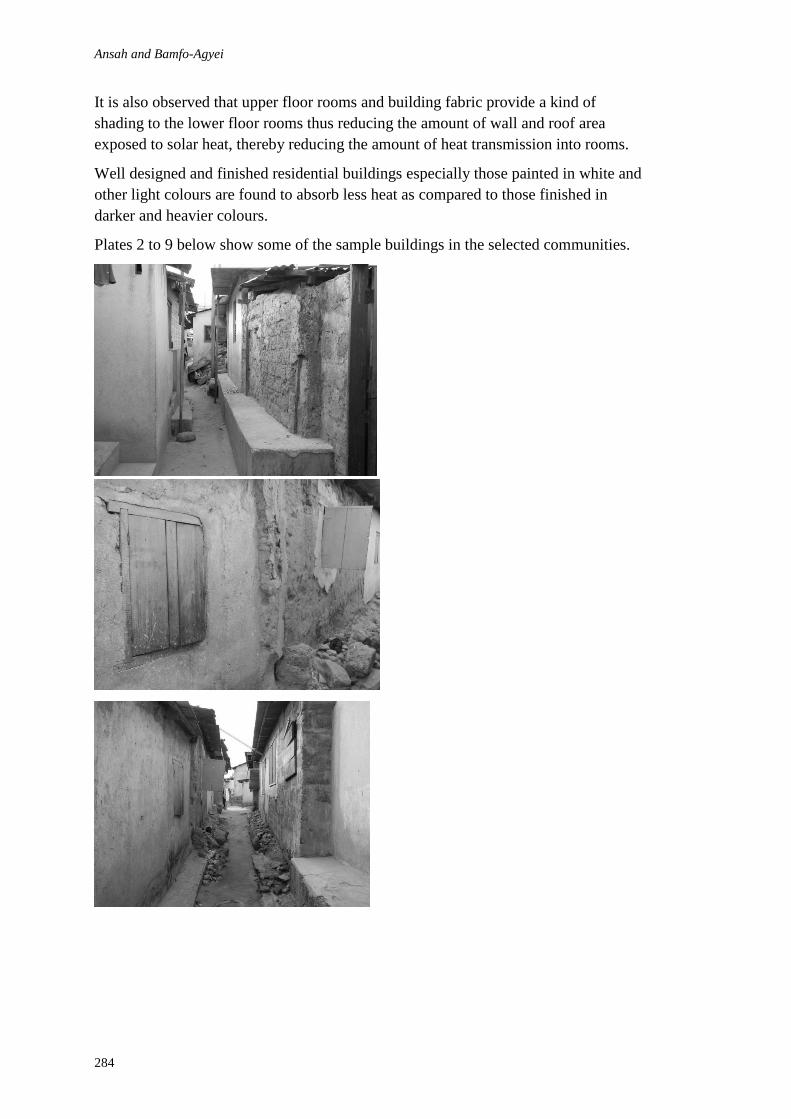
Ansah and Bamfo-Agyei
284
It is also observed that upper floor rooms and building fabric provide a kind of
shading to the lower floor rooms thus reducing the amount of wall and roof area
exposed to solar heat, thereby reducing the amount of heat transmission into rooms.
Well designed and finished residential buildings especially those painted in white and
other light colours are found to absorb less heat as compared to those finished in
darker and heavier colours.
Plates 2 to 9 below show some of the sample buildings in the selected communities.
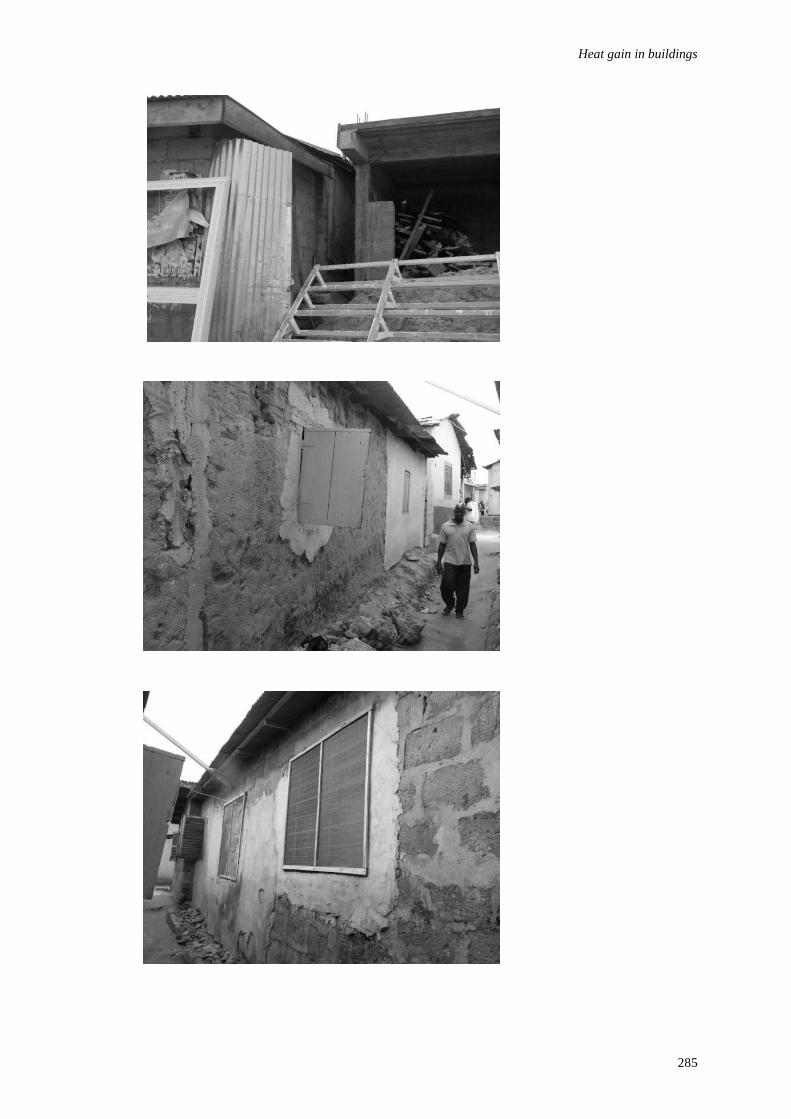
Heat gain in buildings
285

Ansah and Bamfo-Agyei
286
CONCLUSION
Buildings are built to protect their inhabitants against the extreme outdoor conditions
and create comfortable indoor conditions. It must be noted that the requirements for
buildings built in warm humid climate region like all other buildings elsewhere
supposed to provide comfort, be functional and environmentally friendly or
sustainable. The study revealed that a majority of the buildings built in the case study
area were not climate responsive buildings.
The results showed that appropriate construction design methods and techniques were
not adopted for the construction of almost all the buildings investigated. This has
resulted in excessive heat gains in the buildings, which leads to rooms discomfort and
to reduce this, it has called for the use of fans and air conditioners which rely on
expensive artificially-generated electrical energy to operate them. It was realized that
a majority of the occupants (96%) used electric fans, and air conditioners to reduce the
amount of heat gains into their rooms.
The study suggested that, shading techniques such as screens to walls, fixed sun
breakers and attached canopies must be encouraged in the design and construction of
buildings. The study also suggested that all buildings, yet to be constructed, should be
positioned with their longest walls facing north and south in order to reduce intense
morning and evening sun entering the building with more window openings
accommodated in both sides of the longest walls to allow for cross ventilation.
Heat gain in buildings
287
RECOMMENDATIONS
The following recommendations and suggested techniques are presented as measures
to overcome excessive heat gains in buildings:
Finishing to Existing Structure elements
All finished concrete roofs having persistent heat problem should be refinished with
screed and reflective chippings overlay, reflective felt or white polished ceramic tiles
overlay. Alternatively, the concrete roof should be re-designed to incorporate solar
slabs or hollow concrete blocks of about 150mm thick with 32mm water proof screed
overlay, to form insulation in the roof.
A well designed concrete roof can also be sheltered against heat by providing a thick
high class damp proof sheet membrane, and topped with at least 150mm compost soil
and carpet grass for overhead/roof greenery.
All unfinished or improperly finished buildings which have their end walls against
direct solar radiation (East-West) can have their external surfaces finished with an
attached non-load bearing hollow block or clay brick wall, or the external wall
finished with 15mm – 18mm render of rough-cast finish with reflective chippings
surface.
Ceiling
All non-ceiled asbestos and zinc or galvanized roof coverings (and concrete roofs
where possible) should be ceiled in rooms and at the eaves and verges. It is
recommended that expanded polystyrene sheets, fibre board (soft board) or coconut
fibre mats which are all common in Ghana, be incorporated in ceilings as insulation
against heat.
Ventilation
As much as possible, adequate natural ventilation of rooms and the building as a
whole must be allowed for by providing wider door and window openings.
For buildings already in place alterations can be done to create induced ventilation,
and for on-going and yet to be constructed buildings in clustered areas, Wind Tower
and Stack effect ventilation techniques can be applied.
Fanlights over doors and windows, and ventilation ducts in ceiled roofs should be
utilized as much as possible to enhance air flow in buildings and thus prevent heat
build-ups in rooms.
Orientation of Building
For all buildings yet to be constructed in the Metropolis, it is desirable that they are
oriented with their longest walls facing north and south with more window openings
incorporated opposite to each other in this longest walls to allow for cross-ventilation.
The short walls should always built to face east and west so that only the smallest wall
areas are exposed to intense morning and evening sun.

Ansah and Bamfo-Agyei
288
Shading
Shading by trees and vegetation is a very effective method of cooling the ambient hot
air and protecting the building from solar radiation. This and other shading techniques
such as by extended roof overhangs, louvers, textured façade, screens to walls,
attached canopies and fixed sun breaker must be encouraged by the projects section of
the Metropolitan assembly.
REFERENCES
Allard, F. (1998) 3rd
edition, Natural Ventilation in buildings, a design handbook; James and
James, London U.K.
Bay, Joo-Hwa and Ong, Boon Lay, Tropical sustainable architecture: Social and
Environmental dimensions. 2006 Elsevier.
Bolin, Rob (2009) Sustainability of the Building Envelope. National Institute of Building
Sciences, www.wbdg.org/design/envelope, asccessed 6th March, 2011.
Burbery, P. (1993). 2nd
Edition, Practical Thermal Design in Building.
Christofferson, L. (1995). Passive Climate controlled repositories.
Faber, O. (1996). Heat and Ventilation
Gilbert, A. (2007) The return of the Slum: Does Language Matter? International Journal
of urban and Regional Research. Volume 31.4,pp.697-713.
Gut, P. and Ackerknech D. (1993). Climate Responsive Building.
Johnston, D. and Gibson, S. (2008). Building Green; Home Publishers Press, U.S.A.
Jones, w. P. (2001). Air Conditioning Engineering; 5th edition, Butterworth-Heinemann
Publishers, Oxford, Great Britain. Kim, L. (2008) The Kijijikit: a strategy for slum
upgrading in Nairobi. Water loo, Ontario: Canada,
University of Water loo.
Koenisberger, O.H, Ingersoll T.G, Mayhew A, Szokolay S. V. (1980) Manual of
TropicalHousing and Building. Longman Group limited, London.
Lloyd, Jones David, (1998) Architecture and the Environment-Bioclimatic Building Design.
Laurence King Publishing, London.
Osbourn, D. C. (1992). Introduction to Building; Longman Singapore Pte Ltd, Singapore.
Smith, Peter F. (2006) Architecture in a climate of Change-A guide to sustainable Design
second edition. Architecture Press, Oxford.
Stagno Bruno (2001) designing and building in the tropics
(www.brunostagno.info/.../Designing %20 and %20 Building % 20
in%20the%20Tropics doc) 4th April, 2011
United Nations Human Settlements Programme (UN-HABITAT). (2003). The Challenge of
slums: Global Report on Human Settlements, London, United Kingdom: Earthscan.
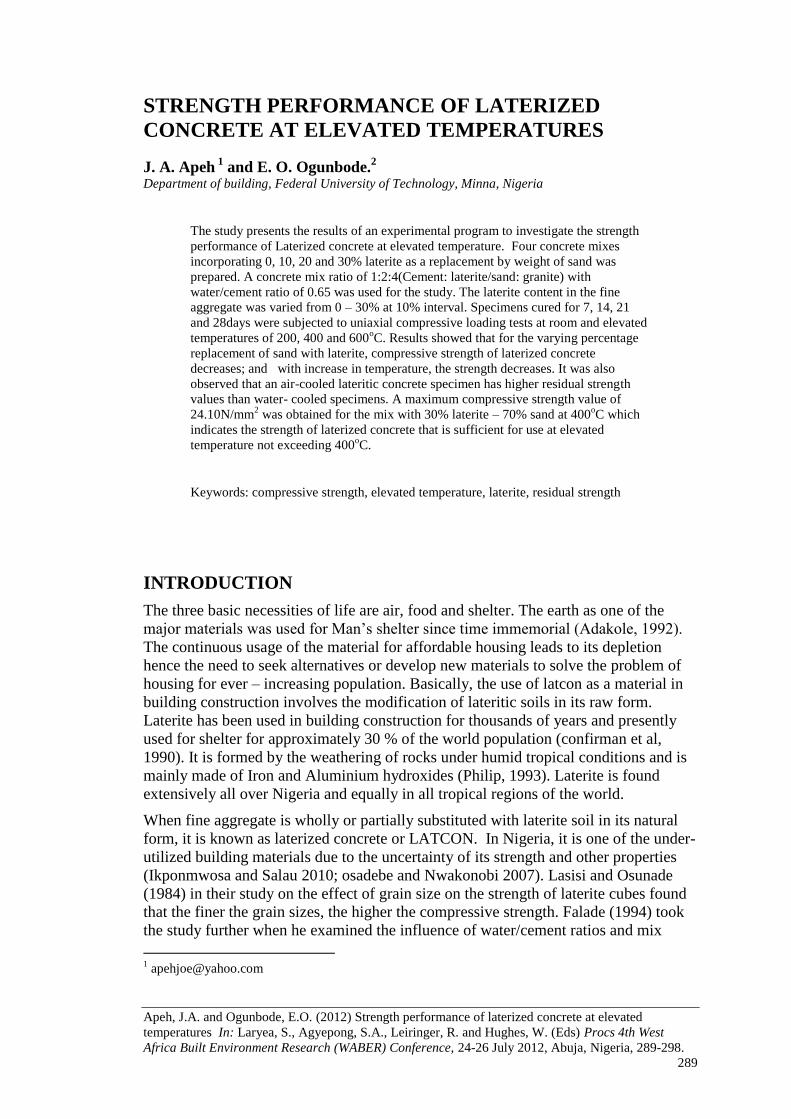
Apeh, J.A. and Ogunbode, E.O. (2012) Strength performance of laterized concrete at elevated
temperatures In: Laryea, S., Agyepong, S.A., Leiringer, R. and Hughes, W. (Eds) Procs 4th West
Africa Built Environment Research (WABER) Conference, 24-26 July 2012, Abuja, Nigeria, 289-298.
289
STRENGTH PERFORMANCE OF LATERIZED
CONCRETE AT ELEVATED TEMPERATURES
J. A. Apeh 1
and E. O. Ogunbode.2
Department of building, Federal University of Technology, Minna, Nigeria
The study presents the results of an experimental program to investigate the strength
performance of Laterized concrete at elevated temperature. Four concrete mixes
incorporating 0, 10, 20 and 30% laterite as a replacement by weight of sand was
prepared. A concrete mix ratio of 1:2:4(Cement: laterite/sand: granite) with
water/cement ratio of 0.65 was used for the study. The laterite content in the fine
aggregate was varied from 0 – 30% at 10% interval. Specimens cured for 7, 14, 21
and 28days were subjected to uniaxial compressive loading tests at room and elevated
temperatures of 200, 400 and 600oC. Results showed that for the varying percentage
replacement of sand with laterite, compressive strength of laterized concrete
decreases; and with increase in temperature, the strength decreases. It was also
observed that an air-cooled lateritic concrete specimen has higher residual strength
values than water- cooled specimens. A maximum compressive strength value of
24.10N/mm2 was obtained for the mix with 30% laterite – 70% sand at 400
oC which
indicates the strength of laterized concrete that is sufficient for use at elevated
temperature not exceeding 400oC.
Keywords: compressive strength, elevated temperature, laterite, residual strength
INTRODUCTION
The three basic necessities of life are air, food and shelter. The earth as one of the
major materials was used for Man’s shelter since time immemorial (Adakole, 1992).
The continuous usage of the material for affordable housing leads to its depletion
hence the need to seek alternatives or develop new materials to solve the problem of
housing for ever – increasing population. Basically, the use of latcon as a material in
building construction involves the modification of lateritic soils in its raw form.
Laterite has been used in building construction for thousands of years and presently
used for shelter for approximately 30 % of the world population (confirman et al,
1990). It is formed by the weathering of rocks under humid tropical conditions and is
mainly made of Iron and Aluminium hydroxides (Philip, 1993). Laterite is found
extensively all over Nigeria and equally in all tropical regions of the world.
When fine aggregate is wholly or partially substituted with laterite soil in its natural
form, it is known as laterized concrete or LATCON. In Nigeria, it is one of the under-
utilized building materials due to the uncertainty of its strength and other properties
(Ikponmwosa and Salau 2010; osadebe and Nwakonobi 2007). Lasisi and Osunade
(1984) in their study on the effect of grain size on the strength of laterite cubes found
that the finer the grain sizes, the higher the compressive strength. Falade (1994) took
the study further when he examined the influence of water/cement ratios and mix

Apeh and Ogunbode
290
proportions on workability and characteristic strength of concrete containing laterite
as fine aggregate and found that water requirement increases as laterite/ cement ratio
increases, for a given mix proportion.
Udoeyo et al, (2006) carried out an experimental investigation on some characteristics
of concrete containing laterite as partial or full replacement of fine aggregate. Test
results showed that concrete with 40% replacement of sand with laterite could attain
design strength of 20N/mm2. This fact is reinforced in the comparative study of
strength properties of unreinforced and fibre reinforced normal and laterized concrete
by Ikponmwosa and Falade (2006). Test results showed that strength increases with
age of the test specimens. Also, laterite replacing sharp sand in concrete up to 45%
produced the highest compressive strength.
Ayangade et al (2009) took the study to a new dimension when they evaluated the
effects of different curing methods on the compressive strength of terracrete (Granite
and laterite). Sixty cubes of 100 x 100 x 100mm using a mix of 1:1½:3, water/cement
ratio of 0.62 were cast and cured using four different methods of curing for up to 35
days. Test results of the various compressive strengths of the cubes showed that out of
the four curing methods, open method produced cubes with the highest compressive
strength of 10.3N/mm2 by the 35
th day. Still, in the same vein to ascertain the strength
properties of laterized concrete, Udoeyo et al, (2010) studied early prediction of
laterized concrete strength by accelerated testing using the boiling water of
accelerated strength testing to predict the 28-day compressive strength of laterized
concrete; results showed that the accelerated strength of the concrete was between 72
and 84% of its twenty- eight days strength.
Lanre and Mnse (2007) advanced the investigation further when they studied the
influence of weather on the performance of laterized concrete. This was achieved by
conditioning laterized concrete cubes to varying temperatures and alternate wetting
and drying. After curing for 28 days, the specimens were tested to determine the
compressive strength. The results showed that the compressive strength of the treated
laterized concrete decreases when subjected to alternate wetting and drying. The
specimens conditioned to a temperature range of 75 – 125oC attained compressive
strength as high as 22.52N/mm2. However, the study could not ascertain the critical
failure temperatures.
When concrete is subjected to high temperatures, it is transformed due to reactions
which causes progressive breakdown of its internal structure and thus experience loss
in its load – bearing capacity (Bazant and Kaplan, 1996; khoury, 2000; kalifa et al,
2000; Phan et al, 2001). However, the extent of loss in LATCON load – bearing
capacity was not determined and need to be ascertained. Ikponmwosa and Salau
(2010) studied the effect of heat on laterized concrete. Cube specimens were cast,
cured and subjected to elevated temperatures of 250, 500 and 750oC. The laterite
content in the fine aggregate was varied from 0 – 100% at 25% interval. Specimens
cured at 7 and 28 days were subjected to uniaxial compressive loading tests at room
and elevated temperatures. Tests results showed that normal concrete cannot
withstand large load above 250oC while laterized concrete with 25% laterite in the
fine aggregate is able to resist higher load with increase in strength at higher
temperatures. The peak compressive strength value of 30.44N/mm2 is recorded for the
mix with 25% laterite – 75% sand at 500oC.
A structural component exposed to devastating fires accidentally for long periods
(exceeding fire resistance duration) resulting in high rise of temperature and reduction
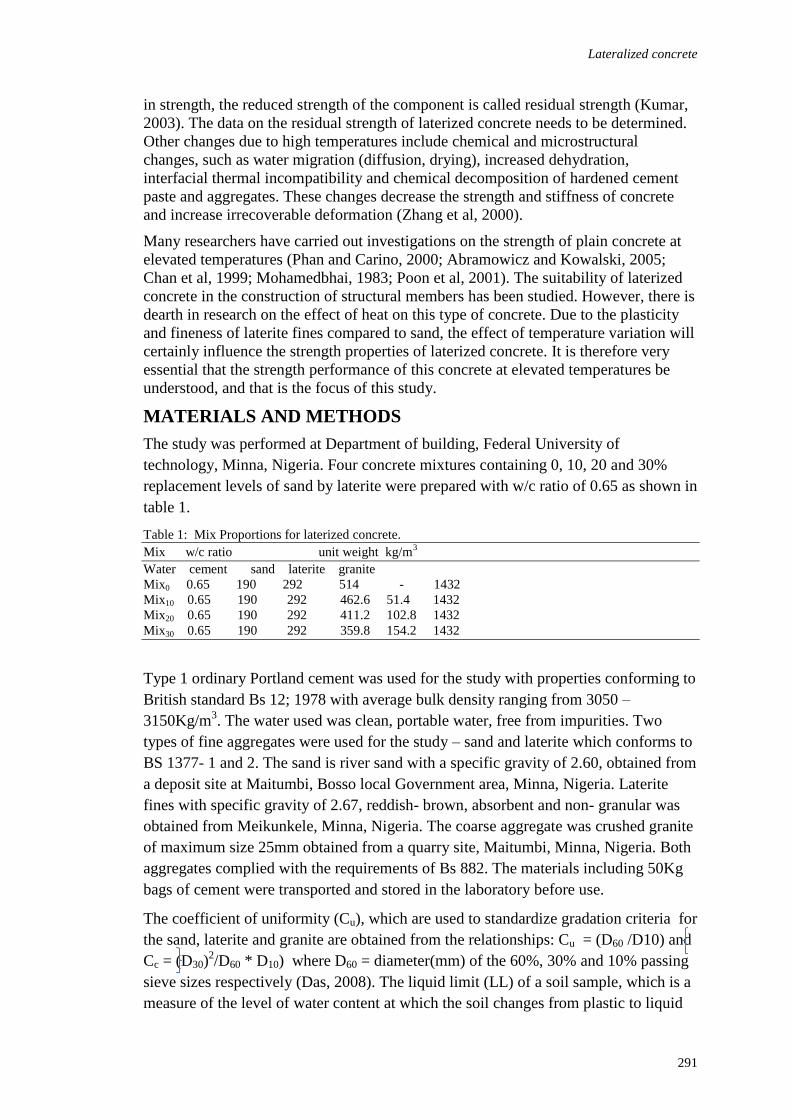
Lateralized concrete
291
in strength, the reduced strength of the component is called residual strength (Kumar,
2003). The data on the residual strength of laterized concrete needs to be determined.
Other changes due to high temperatures include chemical and microstructural
changes, such as water migration (diffusion, drying), increased dehydration,
interfacial thermal incompatibility and chemical decomposition of hardened cement
paste and aggregates. These changes decrease the strength and stiffness of concrete
and increase irrecoverable deformation (Zhang et al, 2000).
Many researchers have carried out investigations on the strength of plain concrete at
elevated temperatures (Phan and Carino, 2000; Abramowicz and Kowalski, 2005;
Chan et al, 1999; Mohamedbhai, 1983; Poon et al, 2001). The suitability of laterized
concrete in the construction of structural members has been studied. However, there is
dearth in research on the effect of heat on this type of concrete. Due to the plasticity
and fineness of laterite fines compared to sand, the effect of temperature variation will
certainly influence the strength properties of laterized concrete. It is therefore very
essential that the strength performance of this concrete at elevated temperatures be
understood, and that is the focus of this study.
MATERIALS AND METHODS
The study was performed at Department of building, Federal University of
technology, Minna, Nigeria. Four concrete mixtures containing 0, 10, 20 and 30%
replacement levels of sand by laterite were prepared with w/c ratio of 0.65 as shown in
table 1.
Table 1: Mix Proportions for laterized concrete.
Mix w/c ratio unit weight kg/m3
Water cement sand laterite granite
Mix0 0.65 190 292 514 - 1432
Mix10 0.65 190 292 462.6 51.4 1432
Mix20 0.65 190 292 411.2 102.8 1432
Mix30 0.65 190 292 359.8 154.2 1432
Type 1 ordinary Portland cement was used for the study with properties conforming to
British standard Bs 12; 1978 with average bulk density ranging from 3050 –
3150Kg/m3. The water used was clean, portable water, free from impurities. Two
types of fine aggregates were used for the study – sand and laterite which conforms to
BS 1377- 1 and 2. The sand is river sand with a specific gravity of 2.60, obtained from
a deposit site at Maitumbi, Bosso local Government area, Minna, Nigeria. Laterite
fines with specific gravity of 2.67, reddish- brown, absorbent and non- granular was
obtained from Meikunkele, Minna, Nigeria. The coarse aggregate was crushed granite
of maximum size 25mm obtained from a quarry site, Maitumbi, Minna, Nigeria. Both
aggregates complied with the requirements of Bs 882. The materials including 50Kg
bags of cement were transported and stored in the laboratory before use.
The coefficient of uniformity (Cu), which are used to standardize gradation criteria for
the sand, laterite and granite are obtained from the relationships: Cu = (D60 /D10) and
Cc = (D30)2/D60 * D10) where D60 = diameter(mm) of the 60%, 30% and 10% passing
sieve sizes respectively (Das, 2008). The liquid limit (LL) of a soil sample, which is a
measure of the level of water content at which the soil changes from plastic to liquid
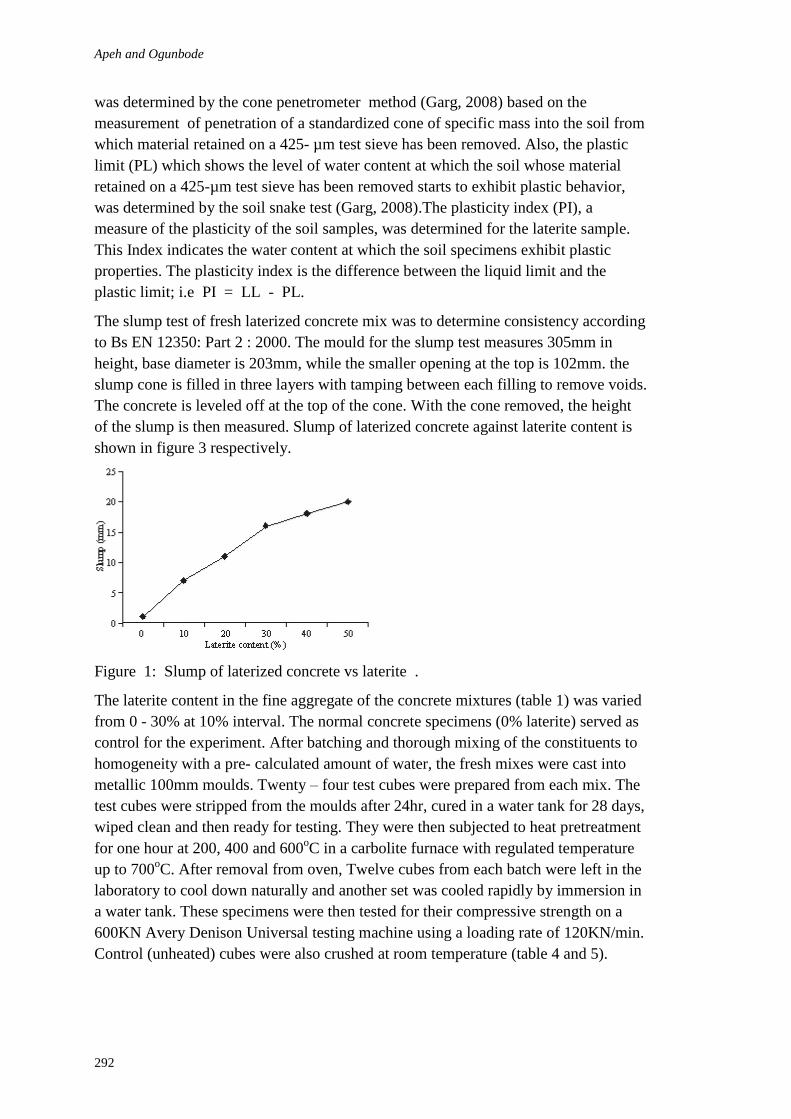
Apeh and Ogunbode
292
was determined by the cone penetrometer method (Garg, 2008) based on the
measurement of penetration of a standardized cone of specific mass into the soil from
which material retained on a 425- µm test sieve has been removed. Also, the plastic
limit (PL) which shows the level of water content at which the soil whose material
retained on a 425-µm test sieve has been removed starts to exhibit plastic behavior,
was determined by the soil snake test (Garg, 2008).The plasticity index (PI), a
measure of the plasticity of the soil samples, was determined for the laterite sample.
This Index indicates the water content at which the soil specimens exhibit plastic
properties. The plasticity index is the difference between the liquid limit and the
plastic limit; i.e PI = LL - PL.
The slump test of fresh laterized concrete mix was to determine consistency according
to Bs EN 12350: Part 2 : 2000. The mould for the slump test measures 305mm in
height, base diameter is 203mm, while the smaller opening at the top is 102mm. the
slump cone is filled in three layers with tamping between each filling to remove voids.
The concrete is leveled off at the top of the cone. With the cone removed, the height
of the slump is then measured. Slump of laterized concrete against laterite content is
shown in figure 3 respectively.
Figure 1: Slump of laterized concrete vs laterite .
The laterite content in the fine aggregate of the concrete mixtures (table 1) was varied
from 0 - 30% at 10% interval. The normal concrete specimens (0% laterite) served as
control for the experiment. After batching and thorough mixing of the constituents to
homogeneity with a pre- calculated amount of water, the fresh mixes were cast into
metallic 100mm moulds. Twenty – four test cubes were prepared from each mix. The
test cubes were stripped from the moulds after 24hr, cured in a water tank for 28 days,
wiped clean and then ready for testing. They were then subjected to heat pretreatment
for one hour at 200, 400 and 600oC in a carbolite furnace with regulated temperature
up to 700oC. After removal from oven, Twelve cubes from each batch were left in the
laboratory to cool down naturally and another set was cooled rapidly by immersion in
a water tank. These specimens were then tested for their compressive strength on a
600KN Avery Denison Universal testing machine using a loading rate of 120KN/min.
Control (unheated) cubes were also crushed at room temperature (table 4 and 5).
Lateralized concrete
293
The test used to investigate the effect of elevated temperatures on the compressive
strength of laterized concrete was the residual unstressed test, where the specimens are
heated without any load, cooled down to room temperature and then loaded to failure.
Table 4: Average compressive strength (N/mm2) of concrete specimens (Air – Cooled)
% laterite in 21o ± 0.5
oC 200
oC 400
oC 600
oC
Fine Aggregate (28 days) (28 days) (28days) (28days)
0 19.67 17.60 16.60 15.15
10 17.80 16.20 15.49 14.60
20 13.67 12.58 11.56 10.39
30 12.67 10.90 10.14 9.25
Table 5: Average compressive strength (N/mm
2) of concrete specimens (water – Cooled)
% laterite in 21o ± 0.5
oC 200
oC 400
oC 600
oC
Fine Aggregate (28 days) (28 days) (28days) (28days)
0 28.76 23.58 22.15 20.11
10 29.57 23.60 21.88 20.70
20 19.67 14.75 13.97 13.38
30 18.93 13.63 13.06 12.49
This test method is shown graphically in figure 2 below.
Figure 2: Residual property test method.
RESULTS AND DISCUSSION
Preliminary test results
Preliminary test results of the laterized concrete constituents are shown in table 2.
Table 2: Test results of variables for the laterized constituents.
Variable laterized concrete constituent.
Sand laterite coarse Agg (Granite)
Sp. Gr. 2.60 2.67 2.69
Fm 4.03 2.72 2.64
Cu 1.67 7.5 1.8
Cc 1.07 1.0 1.20
Impact value 13%
Crushed value 22.10%
Atterberg limits
LL 20.79%
PL 09.18%
PI 11.61%
The particle – size distribution of laterite and sand is shown in figure 3.
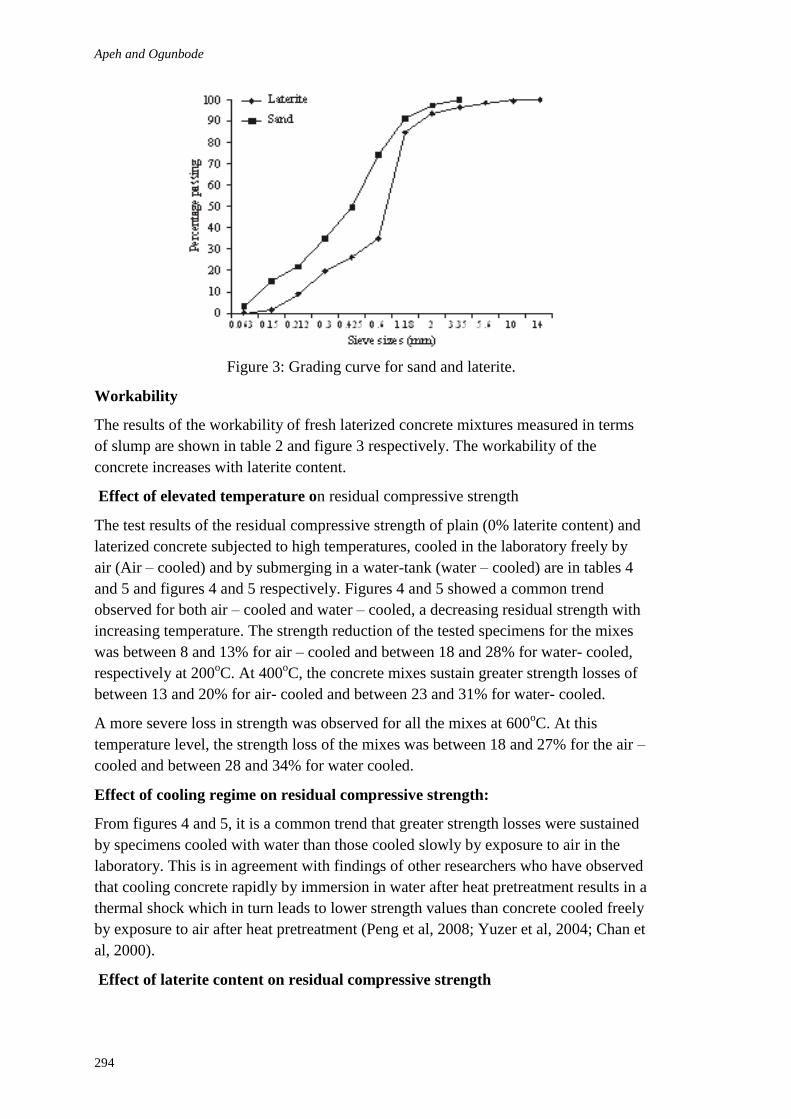
Apeh and Ogunbode
294
Figure 3: Grading curve for sand and laterite.
Workability
The results of the workability of fresh laterized concrete mixtures measured in terms
of slump are shown in table 2 and figure 3 respectively. The workability of the
concrete increases with laterite content.
Effect of elevated temperature on residual compressive strength
The test results of the residual compressive strength of plain (0% laterite content) and
laterized concrete subjected to high temperatures, cooled in the laboratory freely by
air (Air – cooled) and by submerging in a water-tank (water – cooled) are in tables 4
and 5 and figures 4 and 5 respectively. Figures 4 and 5 showed a common trend
observed for both air – cooled and water – cooled, a decreasing residual strength with
increasing temperature. The strength reduction of the tested specimens for the mixes
was between 8 and 13% for air – cooled and between 18 and 28% for water- cooled,
respectively at 200oC. At 400
oC, the concrete mixes sustain greater strength losses of
between 13 and 20% for air- cooled and between 23 and 31% for water- cooled.
A more severe loss in strength was observed for all the mixes at 600oC. At this
temperature level, the strength loss of the mixes was between 18 and 27% for the air –
cooled and between 28 and 34% for water cooled.
Effect of cooling regime on residual compressive strength:
From figures 4 and 5, it is a common trend that greater strength losses were sustained
by specimens cooled with water than those cooled slowly by exposure to air in the
laboratory. This is in agreement with findings of other researchers who have observed
that cooling concrete rapidly by immersion in water after heat pretreatment results in a
thermal shock which in turn leads to lower strength values than concrete cooled freely
by exposure to air after heat pretreatment (Peng et al, 2008; Yuzer et al, 2004; Chan et
al, 2000).
Effect of laterite content on residual compressive strength
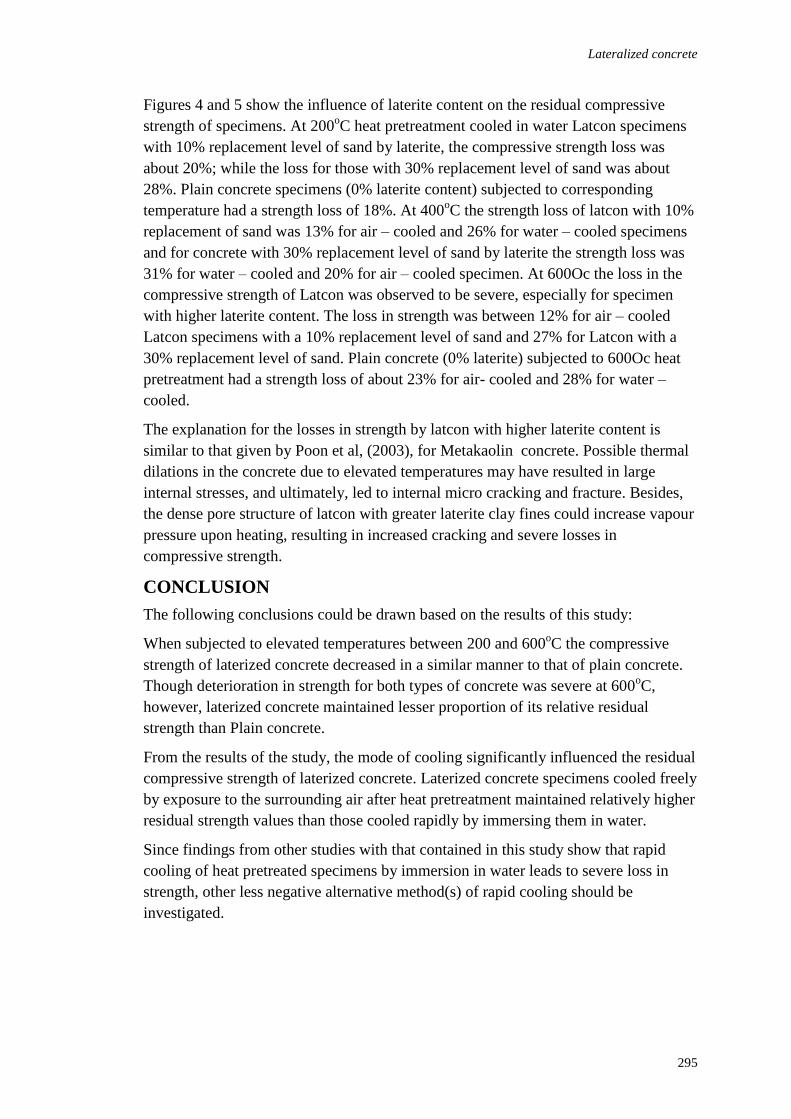
Lateralized concrete
295
Figures 4 and 5 show the influence of laterite content on the residual compressive
strength of specimens. At 200oC heat pretreatment cooled in water Latcon specimens
with 10% replacement level of sand by laterite, the compressive strength loss was
about 20%; while the loss for those with 30% replacement level of sand was about
28%. Plain concrete specimens (0% laterite content) subjected to corresponding
temperature had a strength loss of 18%. At 400oC the strength loss of latcon with 10%
replacement of sand was 13% for air – cooled and 26% for water – cooled specimens
and for concrete with 30% replacement level of sand by laterite the strength loss was
31% for water – cooled and 20% for air – cooled specimen. At 600Oc the loss in the
compressive strength of Latcon was observed to be severe, especially for specimen
with higher laterite content. The loss in strength was between 12% for air – cooled
Latcon specimens with a 10% replacement level of sand and 27% for Latcon with a
30% replacement level of sand. Plain concrete (0% laterite) subjected to 600Oc heat
pretreatment had a strength loss of about 23% for air- cooled and 28% for water –
cooled.
The explanation for the losses in strength by latcon with higher laterite content is
similar to that given by Poon et al, (2003), for Metakaolin concrete. Possible thermal
dilations in the concrete due to elevated temperatures may have resulted in large
internal stresses, and ultimately, led to internal micro cracking and fracture. Besides,
the dense pore structure of latcon with greater laterite clay fines could increase vapour
pressure upon heating, resulting in increased cracking and severe losses in
compressive strength.
CONCLUSION
The following conclusions could be drawn based on the results of this study:
When subjected to elevated temperatures between 200 and 600oC the compressive
strength of laterized concrete decreased in a similar manner to that of plain concrete.
Though deterioration in strength for both types of concrete was severe at 600oC,
however, laterized concrete maintained lesser proportion of its relative residual
strength than Plain concrete.
From the results of the study, the mode of cooling significantly influenced the residual
compressive strength of laterized concrete. Laterized concrete specimens cooled freely
by exposure to the surrounding air after heat pretreatment maintained relatively higher
residual strength values than those cooled rapidly by immersing them in water.
Since findings from other studies with that contained in this study show that rapid
cooling of heat pretreated specimens by immersion in water leads to severe loss in
strength, other less negative alternative method(s) of rapid cooling should be
investigated.
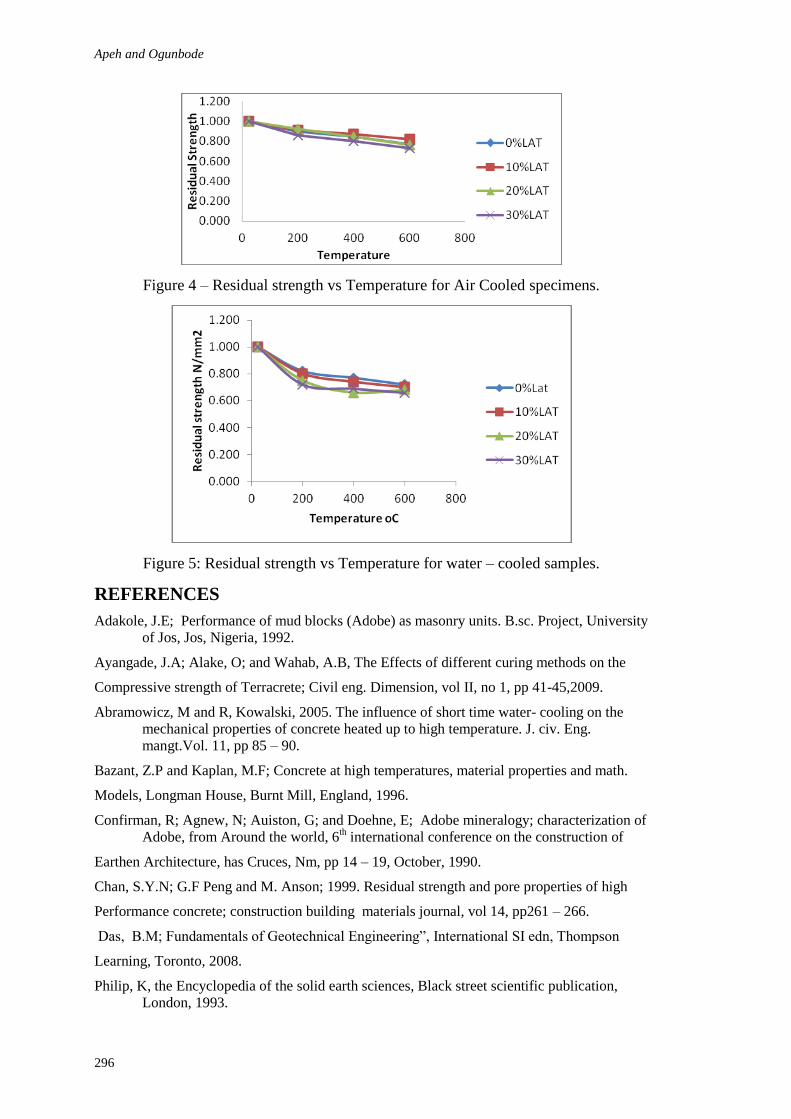
Apeh and Ogunbode
296
Figure 4 – Residual strength vs Temperature for Air Cooled specimens.
Figure 5: Residual strength vs Temperature for water – cooled samples.
REFERENCES
Adakole, J.E; Performance of mud blocks (Adobe) as masonry units. B.sc. Project, University
of Jos, Jos, Nigeria, 1992.
Ayangade, J.A; Alake, O; and Wahab, A.B, The Effects of different curing methods on the
Compressive strength of Terracrete; Civil eng. Dimension, vol II, no 1, pp 41-45,2009.
Abramowicz, M and R, Kowalski, 2005. The influence of short time water- cooling on the
mechanical properties of concrete heated up to high temperature. J. civ. Eng.
mangt.Vol. 11, pp 85 – 90.
Bazant, Z.P and Kaplan, M.F; Concrete at high temperatures, material properties and math.
Models, Longman House, Burnt Mill, England, 1996.
Confirman, R; Agnew, N; Auiston, G; and Doehne, E; Adobe mineralogy; characterization of
Adobe, from Around the world, 6th international conference on the construction of
Earthen Architecture, has Cruces, Nm, pp 14 – 19, October, 1990.
Chan, S.Y.N; G.F Peng and M. Anson; 1999. Residual strength and pore properties of high
Performance concrete; construction building materials journal, vol 14, pp261 – 266.
Das, B.M; Fundamentals of Geotechnical Engineering”, International SI edn, Thompson
Learning, Toronto, 2008.
Philip, K, the Encyclopedia of the solid earth sciences, Black street scientific publication,
London, 1993.

Lateralized concrete
297
Falade, F; (1994). Influence of water/cement ratios and mix proportions on workability and
Characteristic strength of concrete containing laterite fine aggregate, building and
Environment, Elsevier sciences, Great Britain, pp 237 – 240.
Garg, S.K, (2008). Soil Mechanics and Foundation engineering, 6th edn, india, Delhi, Khanna
Publishers.
Ikponmwosa E.E and Musbau A.S. Effect of heat on laterized concrete. Maejo international
journal of science and Technology, vol. 4. No 1, 2010, pp 33 – 42.
Ikponmwosa E.E and Falade, F.A, “ A study on the properties of fibre reinforced laterized
Concrete”; J. Raw Mater Res. 2006, vol 3, pp 46 – 55.
Ikponmwosa, O.F, and salau, M.A; Effect of short steel fibre reinforcement on laterized
concrete
Columns. Journal of sustainable Development, vol 4, no 1; February, 2011.
Kalifa, P; Mennenteau, F.D and Quenard, D; “ Spalling and pore pressure in HSC at high
Temperatures”, Cement and Concrete Research, vol. 30, no 12, 2000, pp 1915-1927
Kumar, A and V. kumar: Behaviour of RC Beams after exposure to elevated temperatures,
IE journal, vol. 84, November, 2003, pp 165 – 170.
Lasisi, F; and Osunade J.A, (1984). Effect of grain size on strength of cubes made from
laterite
Soils, Building and environment, pergamon press, Great Britain, pp 447-452.
Osadebe N.N and Nwakonobi T.U. Structural characteristics of laterized concrete at optimum
mix proportion.Nigeria journal of Technology, Nsukka, Nigeria, vol. 26, no1, pp 12 –
17.
Oluwaseyi Lanre and Mnse, M. Asce; The influence of weather on the performance of
laterized Concrete. Journal of engineering and applied sciences, vol 2,no 1, pp 129 –
135, 2007.
Phan, L.T; Lawson, J.R; and Davis, F.L; “Effects of Elevated temperature exposure on
Heating Characteristics, spalling and residual properties of high performance
concrete”, Materials And structures, vol 34, no 236, 2001, pp 83 – 91.
Phan, L.T and carino, N.J. (2000): Fire performance of high strength concrete: research needs,
Advanced technology in structural engineering. ASCE/SEI structures congress 2000,
Proceedings, may 8 – 10, Philadelphia, PA, pp1 – 9.
Poon, C.S; S. Azhor, m, Anson and Y.L, Wong, 2001, Strength and durability recovery of fire
Damaged concrete after post – fire curing. Cement concrete composition journal, vol. 31, Pp
1307 – 1318.
Peng, G.F; S.H. Bian, Z.Q; Guo; J. Zhac; X.L Peng and Y.C Jiang. (2008) Effect of thermal
Shock due to rapid cooling on residual mechanical properties of fibre concrete
exposed to High temperatures, construction building materials, journal, vol. 22, no 5,
pp 948 – 955.
Udoeyo, F,F, Iron, U and Odim, O.O (2006). Strength performance of laterized concrete
Construction and building materials; vol 20, no 10, pp 1057 – 1062.
Udoeyo, F.F, Robert Brooks, Philip Udo- Inyang &Richard O. Nsan, Early prediction of
Laterized concrete strength by accelerated testing. IJRRAS, vol 5, no 1, 2010.

Apeh and Ogunbode
298
Ukpata, J.O, Maurice E.E and Godwin A.A. Compressive strength of concrete using lateritic
sand and Quarry dust
As fine aggregate. ARPN Journal of Engineering and applied Sciences, vol.7, no1, January,
2012. pp 81-92.
Yuzer, N; F. Akoz and L.D Ozturk, 2004. Compressive strength – colour change relation in
Motars at high temperature. Cement concrete Research journals, vol. 34, pp 1803 – 1807.
Zhang, B. N, Bicanic, C.J. Pearce and G. Balabanic, 2000, Assessment of toughness of
concrete Subjected to elevated temperatures from complete load – displacement
curve- part I;
General introduction, ACI Materials journal, vol. 97, no 5, pp 550 – 557.
Arum, C. (2012) Effect of packing densities of aggregates on the workability and compressive strength
of concrete In: Laryea, S., Agyepong, S.A., Leiringer, R. and Hughes, W. (Eds) Procs 4th West Africa
Built Environment Research (WABER) Conference, 24-26 July 2012, Abuja, Nigeria, 299-312.
299
EFFECT OF PACKING DENSITIES OF AGGREGATES
ON THE WORKABILITY AND COMPRESSIVE
STRENGTH OF CONCRETE
Chinwuba Arum1
Department of Civil Engineering, The Federal University of Technology, P. M. B. 704, Akure, Nigeria
The packing densities of selected aggregates and their various combinations were
determined in the laboratory and compared. The coarse aggregates included granite
and gravel while the fine aggregates were granite dust, plaster sand and river sand.
The aggregate combinations consisted of granite plus granite dust, granite plus plaster
sand, granite plus river sand, gravel plus granite dust, gravel plus plaster sand, and
gravel plus river sand. Concrete was produced using each of the above aggregate
combinations, cast, cured and tested for compressive strength at maturity ages of 7,
14, 21 and 28 days. The results revealed that the gravel plus river sand aggregate
combination had the highest packing densities both in the loose and the compacted
states. The same combination also produced the most workable concrete at the same
water-to-cement ratio and fixed paste volume, and also the strongest concrete at a
fixed slump value. The results further indicate that for all the aggregate combinations
considered, the greater the packing density, the more workable the concrete and the
higher the compressive strength.
Keywords: packing density, compressive strength, workability, aggregate
INTRODUCTION
Aggregate is the major component of concrete and constitutes 60 to 80% of its total
volume (Rached, De Moya and Fowler, 2009).There are two important reasons for
increasing the amount of aggregate in concrete. The first is that since cement is more
expensive than aggregate, for a unit volume of concrete, an increase in the quantity of
aggregate means a decrease in the quantity of cement and therefore, a reduction in the
cost of producing concrete. The second is that for a unit volume of concrete, an
increase in the amount of aggregate which results in a decrease in cement content,
leads to a decrease in most of the durability problems of hardened concrete caused by
cement. Thus, it is known that whereas concrete shrinkage increases with increase in
cement content, aggregates reduce shrinkage and cracking thereby providing greater
volume stability. In addition, cement production is a major source of carbon dioxide
emissions and sustainable construction practice should aim at reduction of cement in
concrete. An increase in the amount of aggregate per unit volume of concrete can be
implemented by reducing the voids ratio of the aggregate. Although it has nowadays
been recognized that the binder phase can also be graded just as the aggregate phase
for the purpose of achieving tight particle packing or minimum void, research results
have shown that improvements achieved in the reduction of voids ratio are far greater
Arum
300
with the aggregate phase than with the binder phase (Jones, Zheng and Newland,
2002).
One way of increasing the solid volume fraction of the aggregates per unit volume of
concrete is by tightly packing the aggregates through smart grading such that the inter-
particle voids which are traditionally occupied by cement paste, is minimized. The
effect is that in addition to reduction in the cost of production due to reduction in the
cement content, and increased volume stability as noted earlier, there will also be an
increase in the workability of the concrete for a fixed paste volume of the concrete at
the same water / cementitious ratio or an increase in the strength of the concrete for a
reduced water / cementitious ratio at the same workability (Wong and Kwan, 2005,
2007). Although many particle packing models exist, most of them have not been
given adequate experimental verification. The objective of this research is therefore to
experimentally determine the combination of the various commonly available
aggregates in Akure, Nigeria which together with the binder, will yield a concrete
mixture of maximum achievable aggregate concentration and volume stability,
together with an increase in the workability of the concrete for a fixed paste volume of
the concrete at the same water / cementitious ratio or an increase in the strength of the
concrete for a reduced water / cementitious ratio at the same workability. The concept
of packing density will be utilized to achieve the stated objective. Although this
concept can be applied to the aggregates and the binders, this work will explore only
its application to the aggregates.
The packing density concept is a concrete proportioning method which aims to
minimize the inter-particle voids in the constituents of concrete in order to reduce the
paste demand. Packing density is the ratio of the volume of solids to the bulk volume
of the solid particles (Wong and Kwan, 2005; Quiroga and Fowler, 2004b). It may be
determined simply as the ratio of the bulk density of the material to the solid density
of the material’s particles. It avails an indirect means of measuring aggregate
geometric characteristics and a means of calculating the void content that needs to be
filled with cement paste. Aggregate gradations with higher packing density allow for
larger volumes of aggregates and lower volumes of paste. It has become well-
recognized that the performance of concrete is a function of the packing density of the
aggregate (Fung and Kwan, 2009). In fact, the single most important parameter
influencing the performance of concrete is the packing density of the aggregate (Wong
and Kwan, 2005).
The concept of packing density was therefore introduced as a fundamental principle
for the design of high performance concrete (HPC) mixes. It seems logical that the
concept can be used in optimizing the performance of a concrete mix by using the
packing densities of the aggregates and the cementitious materials as the performance
criterion (Wong and Kwan, 2005). It is now commonly acknowledged that the overall
performance of a concrete mix can be improved by adjusting the grading of the entire
range of the solid particles, including the coarse aggregate, the fine aggregate and the
cementitious materials, i.e. by maximizing the packing density of the solid particles
(Sedran, De Larrard, Hourst, and Contamines, 1996). For instance, De Larrard and
Sedran (1994) and Lange, Mortel and Rudert (1997) maximized the packing density
of cementitious materials to reduce the water / cementitious material ratio and thus
improved the strength and durability of the mortar produced. According to Li, Zhou,
Yin and Gao (2004), addition of ultra-fine fly ash (UFA) to cement paste, mortar and
concrete, resulted in higher fluidity which in turn improved the strength and the
durability of mortar and concrete produced. Recently, Kwan and Wong (2008)

Concrete
301
demonstrated by actual packing densities and flow measurements that blending of
cement with appropriate proportions of pulverized fuel ash (PFA) and condensed
silica fume (CSF) can increase the packing densities of the cementitious materials and
as a consequence increase the flowability of the paste formed. Marc, De Moya and
Fowler (2009) achieved reduction in the amount of cement in concrete by replacing
cement with fly ash. In a similar vein, Biu, Hu and Stroeven (2005) demonstrated that
due to improved packing, blending cement with rice husk ash can lead to increase in
the strength of concrete.
Packing density is influenced by shape, texture, and grading of aggregates (Quiroga
and Fowler, 2004b). Thus, Sakai, Hoshimo, Ohba and Daimon (1997) obtained a
higher wet packing density with spherical particles than with crushed particles,
resulting in lower water demand for a given workability in the case of spherical
particles. This is corroborated by Wong and Kwan (2005) who opine that the major
factors affecting the packing density of an aggregate include size range, grading,
particle shape, surface roughness, and effectiveness of the mixing and compaction
process. Thus, grading plays a central role in the packing density concept. Quiroga
and Fowler (2004b) noted that even slight changes in grading, shape, and surface
texture of aggregates can affect the characteristics of concrete mixtures. However,
grading changes are more common than shape and surface texture, in the case of a
coarse aggregate, because of its natural tendency to segregate during stockpiling,
transporting, and other forms of handling. According to Graves (2006), shape and
surface texture properties are not as likely to change and unlike grading, are not within
the direct control of the user. Grading has important influence on the paste
requirement and the workability of concrete. Well-graded combinations of aggregate
are generally believed to lead to decreased water demand, improved workability,
reduced segregation, decreased susceptibility to shrinkage, and improved long-term
performance of concrete mixtures (Instructional Memorandum 532, Iowa Department
of Transportation 2004, as cited by Graves, 2006).
Indeed all methods of concrete mix design recognize the important role played by the
grading of the aggregates into different size factions. Although many different mix
design methods exist, two of the most widely known and commonly used include the
method by the British Department of the Environment (DoE) as contained in
Teychenne et al. (1988), and the ACI method (ACI Committee 211, 1991).
Unfortunately, both are limited by the fact that they are empirically-based and can no
longer meet the ever-increasing requirements of concrete specifiers, especially with
the growing attention recently turned again to the role of particle packing in the
production of high performance concrete. Dewar (1999) argues that the traditional
procedure of making trial mixes is expensive and time consuming and has become
unnecessary in the present computer age. In the same vein, Wong and Kwan (2005)
assert that the conventional mix design methods fall short of the requirements of high
performance concrete (HPC) which often impose contradictory demands on mix
parameters, including those of strength, workability, dimensional stability and
durability.
The method of ACI 211 only partially recognises the effect of grading, shape and
texture of coarse aggregate by means of the dry rodded unit weight (DRUW) used to
select the amount of coarse aggregate. This method however does not account for the
grading, shape and texture of fine aggregates but considers the packing effects by
means of the fineness modulus of sand. Furthermore, the method does not address the
use of high microfines and does not encourage optimization of aggregate (Quiroga and
Arum
302
Fowler, 2004b). The DoE method uses the relationship between water-cement ratio
and the compressive strength of concrete depending on the type of aggregate used. It
does not explicitly consider the effects of shape and texture of coarse aggregates,
showing only partial recognition by indicating that the water contents required to give
various levels of workability are dependent on whether the aggregate is crushed
(angular) or uncrushed (gravel). This method also does not provide for high
microfines nor does it encourage optimization of aggregate. Various models have been
proposed for predicting and optimizing the packing density of aggregates for mix
design. They include the Europack (Johansen and Andersen, 1989), Theory of Particle
Mixtures (Dewar, 1999), the Compressible Packing Model (De Larrard, 1999), and
the Shilstone method (Shilstone, 1990; Quiroga and Fowler, 2004a).
The Europack is a program for calculating the packing density of a dry mixture blend
of two aggregate fractions (Johansen and Andersen, 1989; Quiroga and Fowler,
2004a). It is used to determine the relative percentages of fine and coarse aggregates
that produce the maximum or the desired packing degree. However, this technique is
not complete in itself as a mix design method because it uses a more traditional
method such as the ACI 211 for the determination of the amounts of cement and
water. Furthermore, the procedure is time consuming. Another drawback is that
Europack is designed to find the maximum packing density; this usually results in
coarse mixtures prone to segregation hence developers suggest using a little more fine
aggregate than computed using the program (Quiroga, Erdogan and Fowler, 2002)
The Theory of Particle Mixtures (Dewar, 1999; Quiroga and Fowler, 2004a) is used to
determine the percent of a given material that produces the least void or the highest
packing density when blended with other material. The void index of n fractions can
be obtained by combining two at a time. The design of a concrete mix using this
model begins by combining the finest fractions, say cement and fine aggregates, and
the mortar that emerges is combined with the coarse aggregate to obtain concrete. The
method requires the packing density in loose condition, the mean size, and the density
of each fraction. According to Dewar (1999), the method which was developed using
test data on aggregates, is based on considerations of void filling and particle
interference and involves geometrical and mathematical models as well as the analysis
of voids ratio diagrams. The major drawback of this method is that its complex
mathematical relationships make its practical implementation difficult.
The Compressible Packing Model (CPM) was developed by de Larrard (De Larrard,
1999). The author asserts that the method which is a culmination of 12 years of
research by his team, allows the user to achieve a mastery of concrete material
through the use of computer software. The model can be used to reliably predict the
packing density of any granular mixture from the packing density of each size fraction
in it, for a given compaction energy. The implementation of the method requires the
aggregate to be sieved in about ten fractions. The packing density of each fraction is
then determined. For cement and microfines the packing density is determined based
on a water demand test. The CPM based on packing concepts considers shape and
texture as well as grading.
The focus of the Shilstone method (1990) is the optimization of the grading of
aggregates. In order to ensure uniform blends without major gaps, Shilstone method
uses the coarseness chart, the 0.45 grading power chart, and the mortar factor. For the
coarseness chart, the entire aggregate phase is graded as opposed to grading the coarse
and the fine aggregates separately. Although a uniform grading should have material
retained in every sieve, Shilstone (Quiroga and Fowler, 2004a)) points out that the
Concrete
303
amount retained in a single sieve is not as important as the amounts retained in two
adjacent sieves. Consequently, sieves are grouped in clusters of two and excess
material in one sieve in a cluster can compensate for a deficiency on the other sieve of
the cluster. Shilstone classifies all minus No. 200 sieve materials as paste and the
combination of paste and fine aggregate (minus No. 8) as mortar. Thus the mortar
factor is the volume of the minus No. 8 sieve material, including aggregate, cement,
water and air. According to Shilstone, mortar is the most important part of the mixture
because it is the key to strength, durability, workability, finishability, pumpability,
wearability and cost. However, the selection of water and cement quantities is based
on ACI 211, although Shilstone takes into account the effect of shape of aggregates
and admixtures by changing the amount of water suggested by ACI 211(Quiroga,
Erdogan and Fowler, 2002).
A number of recent research works on particle packing advocate hybrid models.
Instructive in this respect are the works of Busck, De Larrard and Smith (2006) and
Fennis , Walraven and Nijland (2008). Busck, De Larrard and Smith (2006) argue that
empirical methodologies are limited when applied to product development in the field
of concrete aggregates because such methodologies increase product development
cycle time and cost, slow down specification development, slow acceptance, and lead
to duplication of effort. They therefore propose a hybrid approach which consists in
using a proven numerical model such as the Compressible Packing Model (CPM) to
predict the performance of concrete in both fresh and hardened states, and empirical
methods to fix content limits for materials that are characteristically deleterious.
Similarly, Fennis, Walraven and Nijland (2008) advocate that the results from particle
packing measurements on powders can be used as input parameters for particle
packing models such as CPM.
MATERIALS AND METHODS
MATERIALS
Consumables
The coarse aggregates used are :
(i) Granite (GNT); and (ii) Gravel (GVL)
The fine aggregates are:
(i) Stone dust, also known as Quarry dust (SD);
(ii) Plaster sand (PS); and
(iii) River sand (RS).
The aggregate combinations employed include:
(i) 75% Granite + 25% Stone dust (GNT + SD);
(ii) 75% Granite + 25% Plaster sand (GNT + PS);
(iii) 75% Granite + 25% River sand (GNT + RS);
(iv) 75% Gravel + 25% Stone dust (GVL + SD);
(v) 75% Gravel + 25% Plaster sand (GVL + PS); and
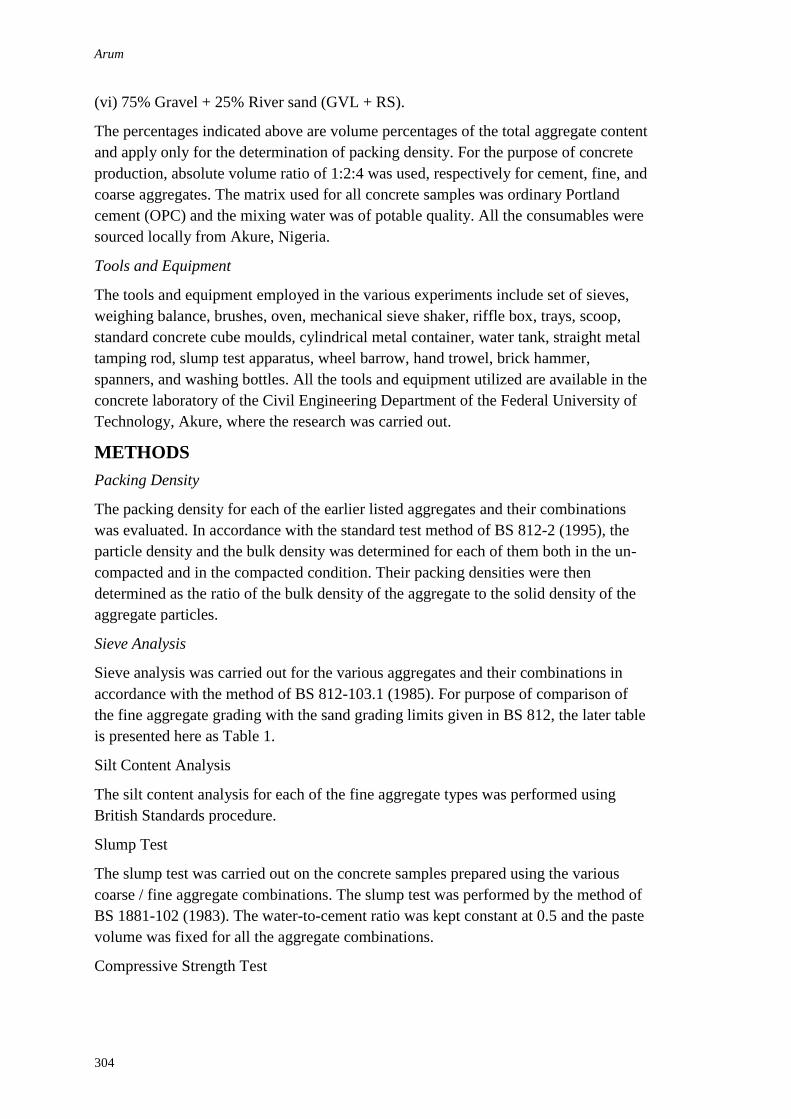
Arum
304
(vi) 75% Gravel + 25% River sand (GVL + RS).
The percentages indicated above are volume percentages of the total aggregate content
and apply only for the determination of packing density. For the purpose of concrete
production, absolute volume ratio of 1:2:4 was used, respectively for cement, fine, and
coarse aggregates. The matrix used for all concrete samples was ordinary Portland
cement (OPC) and the mixing water was of potable quality. All the consumables were
sourced locally from Akure, Nigeria.
Tools and Equipment
The tools and equipment employed in the various experiments include set of sieves,
weighing balance, brushes, oven, mechanical sieve shaker, riffle box, trays, scoop,
standard concrete cube moulds, cylindrical metal container, water tank, straight metal
tamping rod, slump test apparatus, wheel barrow, hand trowel, brick hammer,
spanners, and washing bottles. All the tools and equipment utilized are available in the
concrete laboratory of the Civil Engineering Department of the Federal University of
Technology, Akure, where the research was carried out.
METHODS
Packing Density
The packing density for each of the earlier listed aggregates and their combinations
was evaluated. In accordance with the standard test method of BS 812-2 (1995), the
particle density and the bulk density was determined for each of them both in the un-
compacted and in the compacted condition. Their packing densities were then
determined as the ratio of the bulk density of the aggregate to the solid density of the
aggregate particles.
Sieve Analysis
Sieve analysis was carried out for the various aggregates and their combinations in
accordance with the method of BS 812-103.1 (1985). For purpose of comparison of
the fine aggregate grading with the sand grading limits given in BS 812, the later table
is presented here as Table 1.
Silt Content Analysis
The silt content analysis for each of the fine aggregate types was performed using
British Standards procedure.
Slump Test
The slump test was carried out on the concrete samples prepared using the various
coarse / fine aggregate combinations. The slump test was performed by the method of
BS 1881-102 (1983). The water-to-cement ratio was kept constant at 0.5 and the paste
volume was fixed for all the aggregate combinations.
Compressive Strength Test

Concrete
305
Seventy two standard concrete cubes (twelve for each aggregate combination) were
produced and cured by complete immersion in water tank. At curing ages of 7, 14, 21
and 28 days, 3 cubes were crushed for each aggregate combination using the
compression testing machine, and the mean of their maximum load values was used
for the determination of compressive strength. Ordinary Portland cement was used
throughout as the matrix. The test cubes were prepared in accordance with the
provisions of BS 1881-108 (1983). The workability (as indicated by the slump) is kept
constant for all concrete samples prepared. The testing for compressive strength was
in accordance with the provisions of BS 1881-116 (1983). The compressive strength
was obtained by dividing the mean of the maximum loads applied to each set of 3
cubes with the cube cross sectional area.
Table 1 Grading of fine aggregate
Percentage by mass passing B.S. sieve
Sieve size (mm) Overall limits Additional limits for grading
C M F
10.00 100 - - -
5.00 89 – 100 - - -
2.36 60 – 100 60 – 100 65 – 100 80 – 100
1.18 30 – 100 30 – 90 45 – 100 70 – 100
0.60 15 – 100 15 – 54 25 – 80 55 – 100
0.30 5 – 70 5 – 40 5 – 48 5 – 70
0.15 0 – 15 - - -
Source: BS 882
Note: C is Coarse sand, M is medium sand and F is fine sand
RESULTS AND DISCUSSION
Results
Packing Density
The results of the experiments on particle density and aggregate bulk density as well
as the computed packing densities for the various aggregates and their combinations
are presented in Tables 2 and 3 respectively for un-compacted and compacted
conditions.
Table 2 Packing density of aggregates in un-compacted condition
Aggregate notation Bulk density (kg/m3) Particle density (kg/m
3) Packing density
GNT 1385 2730 0.507
GVL 1285 2600 0.494
SD 1017 2630 0.387
PS 700 2510 0.279
RS 1250 2540 0.492
GNT + SD 1333 2700 0.494
GNT + PS 1300 2660 0.489
GNT + RS 1533 2670 0.574
GVL + SD 1417 2610 0.543
GVL + PS 1350 2570 0.525
GVL + RS 1667 2580 0.646
The packing densities of aggregates and their various combinations in both their un-
compacted (Table 2) and compacted (Table 3) conditions are graphically presented in
Fig.1.

Arum
306
Table 3 Packing density of aggregates in compacted condition
Aggregate notation Bulk density (kg/m3) Particle density (kg/m
3) Packing density
GNT 1650 2730 0.604
GVL 1650 2600 0.635
SD 1617 2630 0.615
PS 1583 2510 0.631
RS 1517 2540 0.597
GNT + SD 1650 2700 0.611
GNT + PS 1733 2660 0.651
GNT + RS 1750 2670 0.655
GVL + SD 1750 2610 0.670
GVL + PS 1783 2570 0.694
GVL + RS 1850 2580 0.717
Fig.1 Packing densities of aggregates and their combinations
Sieve Analysis
The results of the sieve analysis for granite and for gravel are shown in Tables 4 and 5
respectively while those for stone dust, plaster sand, and river sand are presented in
Table 6.
Table 4 Particle size distribution of granite
Sieve size (mm) Mass retained (g) % Retained % Passing
37.5 - - 100
25 605 30 70
19 890 45 25
14 505 25 0
Table 5 Particle size distribution of gravel
Sieve size (mm) Mass retained (g) % Retained % Passing
37.5 - - 100
25 460 23 77
19 390 20 57
14 340 17 40
12 440 22 18
9.5 370
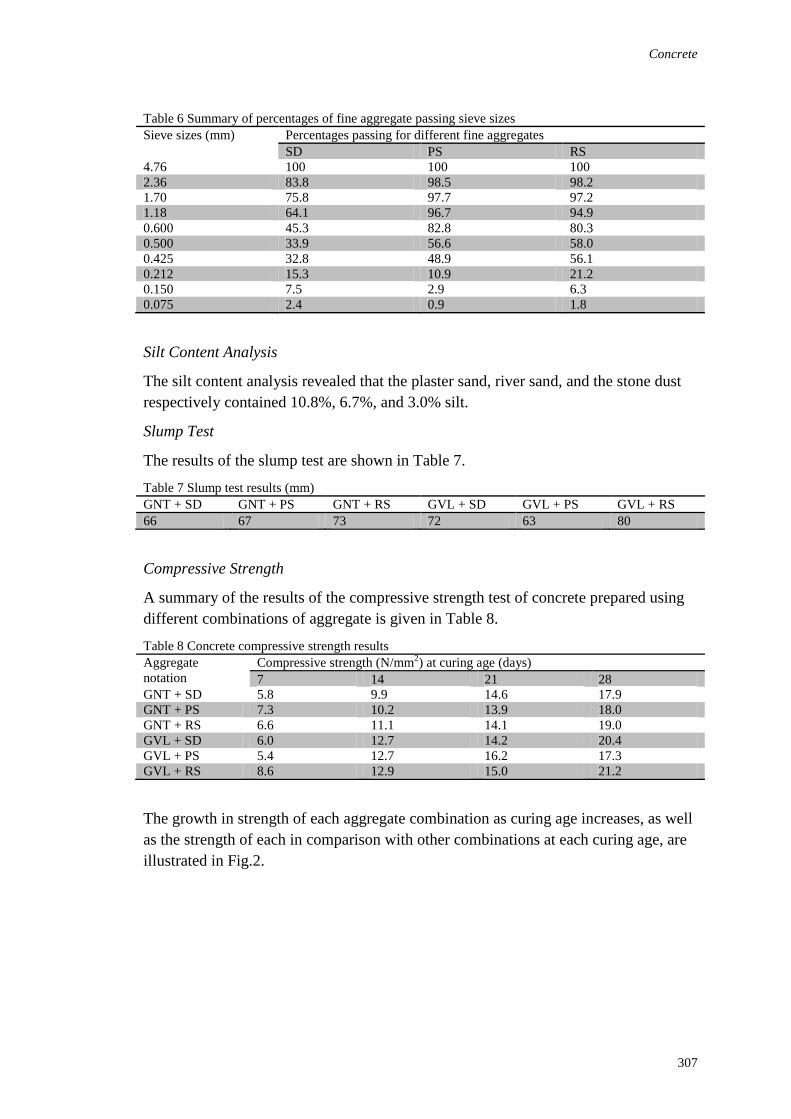
Concrete
307
Table 6 Summary of percentages of fine aggregate passing sieve sizes
Sieve sizes (mm) Percentages passing for different fine aggregates
SD PS RS
4.76 100 100 100
2.36 83.8 98.5 98.2
1.70 75.8 97.7 97.2
1.18 64.1 96.7 94.9
0.600 45.3 82.8 80.3
0.500 33.9 56.6 58.0
0.425 32.8 48.9 56.1
0.212 15.3 10.9 21.2
0.150 7.5 2.9 6.3
0.075 2.4 0.9 1.8
Silt Content Analysis
The silt content analysis revealed that the plaster sand, river sand, and the stone dust
respectively contained 10.8%, 6.7%, and 3.0% silt.
Slump Test
The results of the slump test are shown in Table 7.
Table 7 Slump test results (mm)
GNT + SD GNT + PS GNT + RS GVL + SD GVL + PS GVL + RS
66 67 73 72 63 80
Compressive Strength
A summary of the results of the compressive strength test of concrete prepared using
different combinations of aggregate is given in Table 8.
Table 8 Concrete compressive strength results
Aggregate
notation
Compressive strength (N/mm2) at curing age (days)
7 14 21 28
GNT + SD 5.8 9.9 14.6 17.9
GNT + PS 7.3 10.2 13.9 18.0
GNT + RS 6.6 11.1 14.1 19.0
GVL + SD 6.0 12.7 14.2 20.4
GVL + PS 5.4 12.7 16.2 17.3
GVL + RS 8.6 12.9 15.0 21.2
The growth in strength of each aggregate combination as curing age increases, as well
as the strength of each in comparison with other combinations at each curing age, are
illustrated in Fig.2.
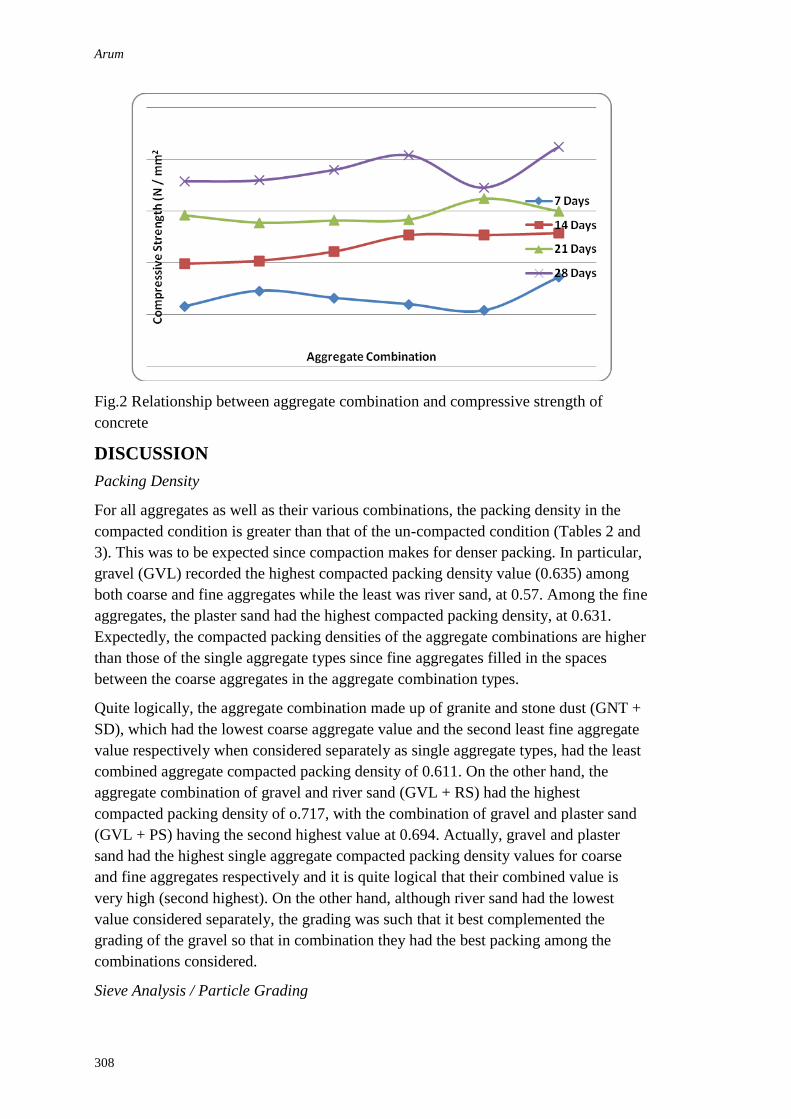
Arum
308
Fig.2 Relationship between aggregate combination and compressive strength of
concrete
DISCUSSION
Packing Density
For all aggregates as well as their various combinations, the packing density in the
compacted condition is greater than that of the un-compacted condition (Tables 2 and
3). This was to be expected since compaction makes for denser packing. In particular,
gravel (GVL) recorded the highest compacted packing density value (0.635) among
both coarse and fine aggregates while the least was river sand, at 0.57. Among the fine
aggregates, the plaster sand had the highest compacted packing density, at 0.631.
Expectedly, the compacted packing densities of the aggregate combinations are higher
than those of the single aggregate types since fine aggregates filled in the spaces
between the coarse aggregates in the aggregate combination types.
Quite logically, the aggregate combination made up of granite and stone dust (GNT +
SD), which had the lowest coarse aggregate value and the second least fine aggregate
value respectively when considered separately as single aggregate types, had the least
combined aggregate compacted packing density of 0.611. On the other hand, the
aggregate combination of gravel and river sand (GVL + RS) had the highest
compacted packing density of o.717, with the combination of gravel and plaster sand
(GVL + PS) having the second highest value at 0.694. Actually, gravel and plaster
sand had the highest single aggregate compacted packing density values for coarse
and fine aggregates respectively and it is quite logical that their combined value is
very high (second highest). On the other hand, although river sand had the lowest
value considered separately, the grading was such that it best complemented the
grading of the gravel so that in combination they had the best packing among the
combinations considered.
Sieve Analysis / Particle Grading
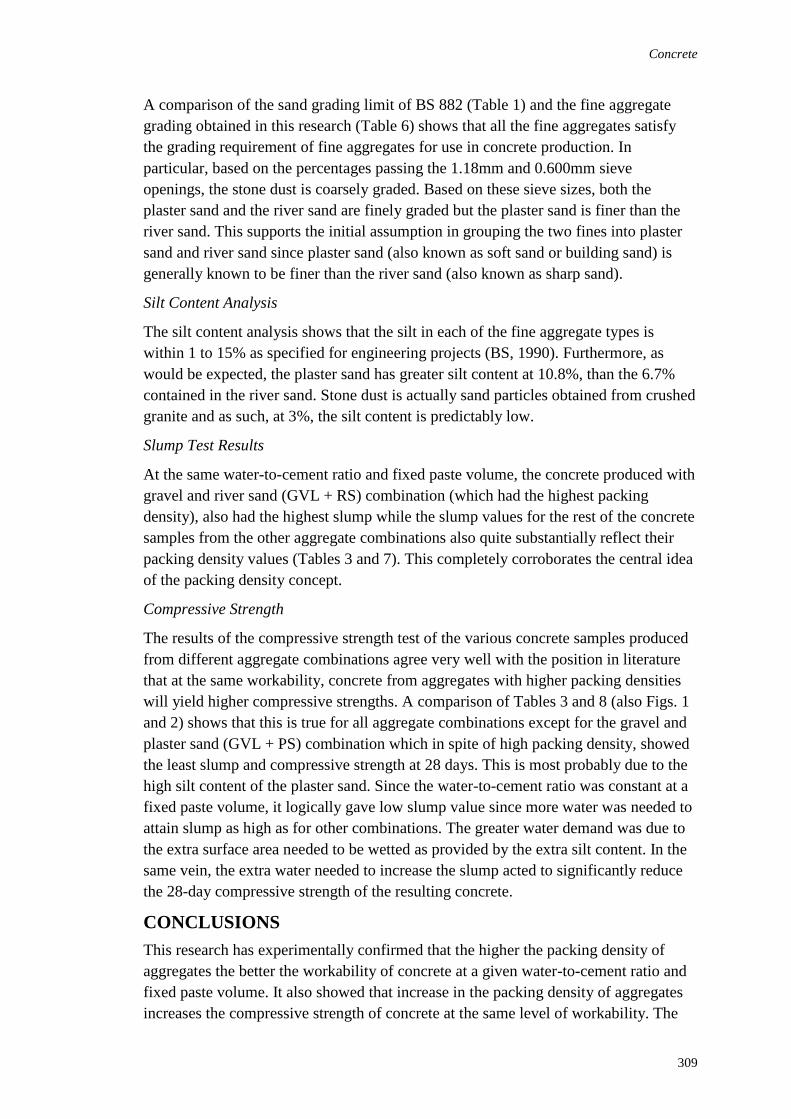
Concrete
309
A comparison of the sand grading limit of BS 882 (Table 1) and the fine aggregate
grading obtained in this research (Table 6) shows that all the fine aggregates satisfy
the grading requirement of fine aggregates for use in concrete production. In
particular, based on the percentages passing the 1.18mm and 0.600mm sieve
openings, the stone dust is coarsely graded. Based on these sieve sizes, both the
plaster sand and the river sand are finely graded but the plaster sand is finer than the
river sand. This supports the initial assumption in grouping the two fines into plaster
sand and river sand since plaster sand (also known as soft sand or building sand) is
generally known to be finer than the river sand (also known as sharp sand).
Silt Content Analysis
The silt content analysis shows that the silt in each of the fine aggregate types is
within 1 to 15% as specified for engineering projects (BS, 1990). Furthermore, as
would be expected, the plaster sand has greater silt content at 10.8%, than the 6.7%
contained in the river sand. Stone dust is actually sand particles obtained from crushed
granite and as such, at 3%, the silt content is predictably low.
Slump Test Results
At the same water-to-cement ratio and fixed paste volume, the concrete produced with
gravel and river sand (GVL + RS) combination (which had the highest packing
density), also had the highest slump while the slump values for the rest of the concrete
samples from the other aggregate combinations also quite substantially reflect their
packing density values (Tables 3 and 7). This completely corroborates the central idea
of the packing density concept.
Compressive Strength
The results of the compressive strength test of the various concrete samples produced
from different aggregate combinations agree very well with the position in literature
that at the same workability, concrete from aggregates with higher packing densities
will yield higher compressive strengths. A comparison of Tables 3 and 8 (also Figs. 1
and 2) shows that this is true for all aggregate combinations except for the gravel and
plaster sand (GVL + PS) combination which in spite of high packing density, showed
the least slump and compressive strength at 28 days. This is most probably due to the
high silt content of the plaster sand. Since the water-to-cement ratio was constant at a
fixed paste volume, it logically gave low slump value since more water was needed to
attain slump as high as for other combinations. The greater water demand was due to
the extra surface area needed to be wetted as provided by the extra silt content. In the
same vein, the extra water needed to increase the slump acted to significantly reduce
the 28-day compressive strength of the resulting concrete.
CONCLUSIONS
This research has experimentally confirmed that the higher the packing density of
aggregates the better the workability of concrete at a given water-to-cement ratio and
fixed paste volume. It also showed that increase in the packing density of aggregates
increases the compressive strength of concrete at the same level of workability. The
Arum
310
research also revealed that although the packing density of an aggregate type may be
high, if the silt content is high, a decreased compressive strength will result at the
same workability, or a reduced workability given the same water-to-cement ratio. In
particular, the research showed that among the aggregates and their combinations
considered, the combination of gravel and river sand which indicated the highest
packing density, also gave the highest compressive strength at the 28- day curing age.
RECOMMENDATION
Local concrete mixture designers from the academia and the industry in Akure and
elsewhere should exploit the obvious benefits of concrete mixture design based on the
maximization of packing densities, both of aggregates, and of cementitious materials
since this has the potential of improving not only the workability and compressive
strength of concrete, but also of helping to achieve different types of high performance
concrete (HPC).
REFERENCES
ACI Committee 211 (1991). Standard Practice for Selecting Proportions for Normal,
Heavyweight and Mass Concrete , ACI 211. 1-91, American Concrete Institute,
Farmington Hills, MI.
Biu, D.D., Hu, J. and Stroeven, P. (2005). “Particle Size Effect of Rice Husk Ash Blended
gap-graded Portland Cement Concrete”. Cement and Concrete Composites, Vol.27
(3), pp. 357 – 366.
BS 1377 (1990). Methods of Test for Soils for Civil Engineering Purposes, BSI, London.
BS 812 (1995). Testing Aggregates, Part 2: Methods for Determination of Density, BSI,
London.
BS 812 (1985). Testing Aggregates, Part 103.1: Methods for Determination of Particle Size
Distribution, Sieve Tests, BSI, London.
BS 1881 (1983). Testing Concrete, Part 102: Method for Determination of Slump, BSI,
London.
BS 1881 (1983). Testing Concrete, Part 116: Method for Determination of Compressive
Strength of Concrete Cubes, BSI, London.
BS 1881 (1983). Testing Concrete, Part 108: Method for Making Test Cubes from Fresh
Concrete, BSI, London.
Busck, C., De Larrard, F. and Smith, P. (2006). “The Application of a Scientific Approach to
the Development and Optimisation of Sand for Concrete”, 14th Annual Symposium
Research Papers, Aggregates Foundation for Technology, Research and Education
(AFTRE) and International Center for Aggregates Research (ICAR).
De Larrard, F. (1999). “Concrete Mixture Proportioning - A Scientific Approach”, E and FN
SPON, New York.
De Larrard, F. and Sedran, T. (1994). “Optimisation of Ultra-High-Performance Concrete by
the Use of Packing Model”. Cement and Concrete Research, 24(6), pp.997 – 1009,
Elsevier.
Dewar, J. D. (1999). “Computer Modelling of Concrete Mixtures”, E and FN SPON, London.
Fennis, S.A.A.M., Walraven, J.C. and Nijland, T.G. (2008). “Measuring the packing density
to lower the cement content in concrete.” In: Walraven and Stoelhorst (Eds). Tailor
Made Concrete Structures, Taylor and Francis Group, London.
Concrete
311
Fung, W.W.S. and Kwan, A.K.H. (2009). “Wet packing of crushed rock fine aggregate”,
Materials and Structures, v.42, n.5, pp.631-643, Springer Verlag Dordrecht.
Graves, R.E. (2006). “Grading, Shape, and Surface Texture”. In: Lamond, J.F. and Pielert,
J.H. (Eds). Significance of Tests and Properties of Concrete and Concrete-making
Materials STP 169D, ASTM International, West Conshohocken, USA.
Johansen, V. and Andersen, P.J. (1989). “Particle Packing and Concrete Properties”. In:
Skanly, J. and Mindess, S. (Eds). Material Science of Concrete II, American Ceramic
Society, Westerville, pp.111 – 148.
Jones, M.R., Zheng, L. and Newlands, M.D. (2002). “Comparison of particle packing models
for proportioning concrete constituents for minimum voids ratio”. Materials and
Structures, Vol.35, No.5, 301 – 309.
Kwan, A.K.H. and Mora, C.F. (2001). “Effects of various shape parameters on packing of
aggregate particles”, Magazine of Concrete Research, Vol.53, No.2, pp.91-100.
Kwan, A.K.H. and Wong, H.H.C. (2008). “Packing Density of Cementitious Materials: part 2
– packing and flow of OPC + PFA + CSF, Materials and Structures, 41 (4), pp. 773 –
784
Lange, F., Mortel, H. and Rudert, V. (1997). “Dense Packing of Cement Pastes and Resulting
Consequenses on Mortar Properties”, Cement and Concrete Research, 27 (10), pp.
1481 – 1488.
Li, Y., Zhou, S., Yin, J. and Gao, Y. (2004). “The Effect of Fly Ash on the Fluidity of Cement
Paste, Mortar and Concrete”, International Workshop on Sustainable Development
and Concrete Technology, Beijing, pp. 339 – 345.
Marc, R., De Moya, M. and Fowler, D.W. (2009). “Utilising Aggregates Characteristics to
Minimise Cement Content in Portland Cement Concrete”, International Centre for
Aggregates Research, Project No. ICAR 401.
Quiroga, P.N. and Fowler, D.W. (2004a). “The effects of aggregates characteristics on the
performance of Portland cement concrete”, Research Report ICAR – 104.1F,
Aggregates Foundation for Technology, Research and Education (AFTRE) and
International Center for Aggregates Research (ICAR).
Quiroga, P.N. and Fowler, D.W. (2004b). “Guidelines for Proportioning Optimized Concrete
Mixtures with High Microfines”. International Center for Aggregates Research Report
104-2, Austin, TX.
Quiroga, P.N., Erdogan, S. and Fowler, D.W. (2002). “The effect of mixture proportioning on
the performance of Portland cement concrete”, 10th Annual Symposium Research
Papers, Aggregates Foundation for Technology, Research and Education (AFTRE)
and International Center for Aggregates Research (ICAR).
Rached, M., De Moya, M. and Fowler, D.W. (2009). “Utilizing Aggregates Characteristics to
Minimize Cement Content in Portland Cement Concrete”, Report No.ICAR 401,
International Center for Aggregates Research (ICAR). National Technical
Information Service Springfield, Virginia 22161.
Sakai, E., Hoshimo, S., Ohba, Y. and Daimon, M. (1997). “The Fluidity of Cement Paste with
Various Types of Inorganic Powders”, Proceedings of the 10th International Congress
on the Chemistry of Cement, Sweden.
Sedran, T., De Larrard, F., Hourst, F. and Contamines, C. (1996). “Mix Design of Self-
compacting Concrete”, In: Bartos, P.J.M. and Paisley (Eds). Proceedings of
International RILEM Conference on Production Methods and Workability of
Concrete,Scotland, pp. 439 – 450.

Arum
312
Shilstone, J.M.Sr. (1990). “Concrete Mixture Optimisation”, Concrete International: Design
and Construction, Vol.12, No.6, pp. 33 – 39.
Teychenne, D.C., Nicholls, J.C., Franklin, R.E. and Hobbs, D.W. (1988). “Design of Normal
Mixes”, Building Research Establishment, Department of the Environment, Watford,
UK.
Wong, H.H.C. and Kwan, A.K.H. (2005). “Packing Density: A Key Concept for Mix Design
of High Performance Concrete”, In: Proc. Materials Science and Technology in
Engineering Conference, HKIE, Material Division, Hong Kong, May 2005, pp.1-15.
Wong, H.H.C. and Kwan, A.K.H. (2007). “Packing density of cementitious materials:part 1 –
Measurement using a wet packing method.” Materials and Structures, Vol.41, No.4,
689-701.

Ashaolu, T.A. (2012) A need to re-define the status of professional valuation: The Nigerian perspective
- In: Laryea, S., Agyepong, S.A., Leiringer, R. and Hughes, W. (Eds) Procs 4th West Africa Built
Environment Research (WABER) Conference, 24-26 July 2012, Abuja, Nigeria, 313-327.
313
A NEED TO RE-DEFINE THE STATUS OF
PROFESSIONAL VALUATION: THE NIGERIAN
PERSPECTIVE -
Thomas A Ashaolu1
Department of Estate Management, Federal Polytechnic, Ilaro, Nigeria,
While virtually all professions in the built environment are somewhat founded on
eclectic academic base, that of valuation is perhaps, most critical. Though
professional valuation has been widely taken to be a subset of real estate practice, the
scope of valuation transcends the real estate discipline. Rather, it is believed to be
both multi-disciplinary and inter-disciplinary so much so that it exhibits a porous
nature that leaves sufficient room for infiltration and abuse in practice. This paper
examined the debate on the status of valuation as an academic discipline and in
particular, the challenges confronting the curriculum definition for valuation in
Nigeria as well as the various attempts by allied professionals at wrestling core
valuation services from the professional ‘estate surveyor and valuer’. It employed a
combination of questionnaire survey of stakeholders’ perception as analysed on a 3–
point relative importance scale on one part and a perspective discourse from the
author’s experiences in theory and practice on the other. Findings include, inter alia,
that real estate has a wide coverage of services with valuation constituting a relatively
unpopular aspect, that there is stiff competition by allied professions with real estate
practitioners on valuation and that the subsisting scope of the real estate curriculum is
inadequate for full professional valuation. It was therefore concluded that professional
valuation should be separated from real estate both at the academic and practice
levels.
Keywords: body of knowledge, inter-discipline, multi-discipline, professionalism ,
valuation
INTRODUCTION
Valuation belongs to a generic family that includes ‘evaluation’, ‘assessment’ and
‘estimation’. From this perspective, it is difficult to delineate the boundaries of whom
and who cannot carry out valuation especially among professional groups like
Accountants, Engineers, Quantity Surveyors and Estate Surveyors. That this
apparently multi-disciplinary function is being held as a separate profession is not
strange but to command such status in the long run, the professional must possess
infallible sets of skills and expertise beyond the average obtainable from the allied
professions. Savage (1993) had aptly maintained that the distinguishing feature of
professionals is their possession of a core competence. Thus, this paper is set to
examine the controversy on who is a professional valuer. Specifically, it is aimed at
ascertaining the scope of services that comprise professional valuation and the
requisite skills for the practice. Pertinent research questions therefore include: ‘what is
valuation and why is it required?’; ‘what is the position of valuation among traditional
Ashaolu
314
academic body of knowledge?’; ‘Is professional valuation a subset of the real estate
profession?’; ‘Are the prevailing attacks on real estate practitioners’ competence for
professional valuation justified?’; and ‘What is the way forward?.
A study of this nature is germane to addressing the myriad of criticisms and attacks on
valuation in Nigeria coming from within and outside the profession. The bulk of
published papers within the Nigerian real estate academic have focused on various
dissatisfactions with valuation practices such as inconsistencies in bases (Ogunba,
1997 and Ajayi, 2009) and methodologies (Bello and Bello 2007), non-compliance
with reporting standards (Otegbulu, 2001), irreconcilable variance among valuers
(Ogunba and Ojo, 2007) and non-reliability of expressed values (Ogunba, 1997,
Aluko, 2007 and Ayedun, 2009). Moreover, the competence of Nigerian ‘estate
surveyors and valuers’ to value assets beyond core land and buildings is being
challenged by the Nigerian Society of Engineers which by 2010 had effectively
established a parallel body (Institute of Appraisers and Cost Engineers) to compete
with the Nigerian Institution of Estate Surveyors and Valuers (NIESV) on valuation of
industrial plant, equipment and machinery (PEM).
METHOD AND MATERIALS
Enquiries into curriculum definition of real estate have been considered difficult for
academic researches due to challenges of what hypothesis to investigate, the non-
objectivity of data and appropriateness of analytical tools (Epley, 1996). Accordingly,
this study is essentially a review of related published and conference papers both
within Nigeria and internationally, coupled with the author’s direct experiences in
practice and within the academic. A similar approach had been adopted by Hefferan
and Ross (2010). This has been complimented with questionnaire survey administered
on 15 participants (mostly heads of various departments of estate management of
Universities and Polytechnics) in a recent maiden education summit of NIESV on one
hand, and the entire 52 final year students of estate management in one of Nigerian
tertiary institutions on the other. The earlier 15 respondents constituted those that both
returned the questionnaire and with analysable responses among a total of 27
academic participants at the Summit. Issues examined included the perception of the
position of valuation within real estate profession, level of interest and proficiency in
the subject and the adequacy of real estate skills for general professional valuation
practice. The students’ interest/proficiency level in nine courses being offered were
weighed through a 3-Scale relative importance index, namely high (5points), average
(3points) and low (1point). The study has limited its respondents to the academic
community to properly encapsulate the intellectual aspect of the debate.
ACADEMIC NATURE OF VALUATION PROFESSION
There are several perceptive to classifying academic disciplines. However, according
to Wikipedia (2011), the main academic branches can be categorized into basic
sciences such as mathematics, physics and chemistry, social sciences (economics,
sociology and political science), the arts or humanities (history, philosophy and
religion) and the applied sciences (agriculture, engineering and medicine). The built
environment professions (including architecture, building, surveying and planning)
would be difficult to place within any of these as their core knowledge cut across
Professional valuation
315
different aspects this four branches. Given their multi-disciplinary nature therefore,
there is the lingering controversy as to whether fields like architecture, building and
estate surveying should be entered into by informal training as vocations or whether
definite curriculum path could be charted to give their theoretical underpinning an
academic status. As remarked by Chynoweth (2009), the different subject areas of the
built environment are vocational in orientation and consequently have poorly
developed academic knowledge base. Perhaps, a vindication of this fact is the
prevalence of informal entrants into architecture as draughtsman, building as
registered contractors and masons, estate surveying as real estate agents and brokers.
Nevertheless, while the curriculum contents for architecture and building are fairly
stable and recognizable, that of real estate has deferred any consensus globally and
over time (Black and Rabianski, 2000 and Weeks and Finch, 2003). Its evolution
within the academic community itself has depended on the historical, social, legal and
technological environment of the nation concerned. Thus, it originated as a member of
the surveying family (building, estate, land and quantity surveying) in Britain and
most of her common-wealth nations, but was substantially taken as a business and
investment/finance course in America, Canada and other nations under her historical
influence while the practice in Continental European nations were less defined but
often towing a mid-line, inter-disciplinary course and often-times as subsidiaries of
such professions as engineering, architecture and law (Schulte et al 2005). That of
valuation, taken at this stage to be a branch of real estate, is another issue. Valuation
as an academic discipline has not been any less eclectic in nature. In fact, the
profession itself defies easy identity. Vella (2005) defined ‘the valuation profession’
as group of persons who conduct valuations of business interests (including shares and
unit trusts) and quoted the Oxford Dictionary for Business World (1993) to have
defined professional valuation as ‘an assessment of the value of an asset (share,
property, stock, etc) in the balance sheet or prospectus of a company, by a person
professionally qualified to give such a valuation’. The estate valuer in turn would also
describe it as determination of current market worth of an interest in property. Both of
these are mere perceptions with orientation bias. Perhaps, the task of defining its body
of knowledge springs from the difficulty of understanding its proper conception and
scope.
SCOPE OF VALUATION
Generally, valuation is the determination of the unexhausted worth of any possession
that confers some benefits. For the purpose of this study, the worth is limited to those
quantifiable in monetary terms. Such possession may be tangible or intangible, fixed
or moveable, liquid or otherwise. Nevertheless, some of such possessions have their
monetary worth easily ascertained either directly or by simple reference to some
records and transactions in which case, no special expertise may be required. For
some other possessions (or rather assets), several types of worth may need to be
ascertained, depending on the purpose to be addressed. Hence, apart from the nature
of assets, purpose of valuation may define the necessity for expert valuation or
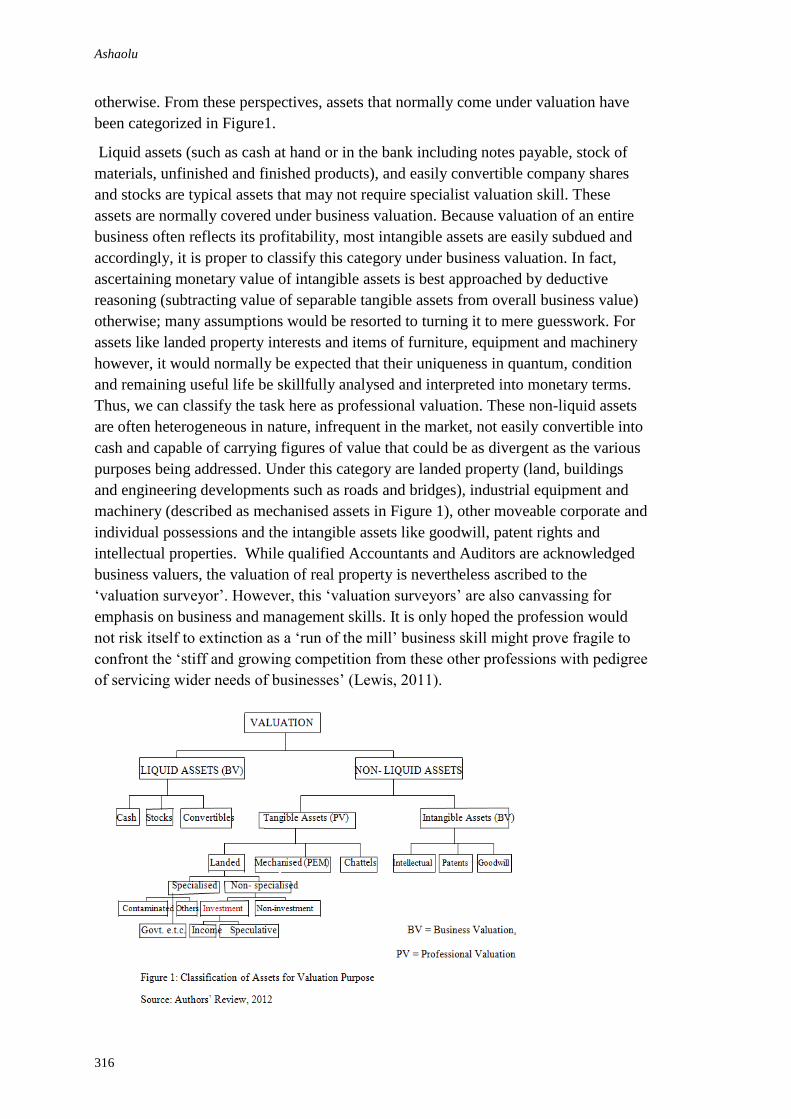
Ashaolu
316
otherwise. From these perspectives, assets that normally come under valuation have
been categorized in Figure1.
Liquid assets (such as cash at hand or in the bank including notes payable, stock of
materials, unfinished and finished products), and easily convertible company shares
and stocks are typical assets that may not require specialist valuation skill. These
assets are normally covered under business valuation. Because valuation of an entire
business often reflects its profitability, most intangible assets are easily subdued and
accordingly, it is proper to classify this category under business valuation. In fact,
ascertaining monetary value of intangible assets is best approached by deductive
reasoning (subtracting value of separable tangible assets from overall business value)
otherwise; many assumptions would be resorted to turning it to mere guesswork. For
assets like landed property interests and items of furniture, equipment and machinery
however, it would normally be expected that their uniqueness in quantum, condition
and remaining useful life be skillfully analysed and interpreted into monetary terms.
Thus, we can classify the task here as professional valuation. These non-liquid assets
are often heterogeneous in nature, infrequent in the market, not easily convertible into
cash and capable of carrying figures of value that could be as divergent as the various
purposes being addressed. Under this category are landed property (land, buildings
and engineering developments such as roads and bridges), industrial equipment and
machinery (described as mechanised assets in Figure 1), other moveable corporate and
individual possessions and the intangible assets like goodwill, patent rights and
intellectual properties. While qualified Accountants and Auditors are acknowledged
business valuers, the valuation of real property is nevertheless ascribed to the
‘valuation surveyor’. However, this ‘valuation surveyors’ are also canvassing for
emphasis on business and management skills. It is only hoped the profession would
not risk itself to extinction as a ‘run of the mill’ business skill might prove fragile to
confront the ‘stiff and growing competition from these other professions with pedigree
of servicing wider needs of businesses’ (Lewis, 2011).
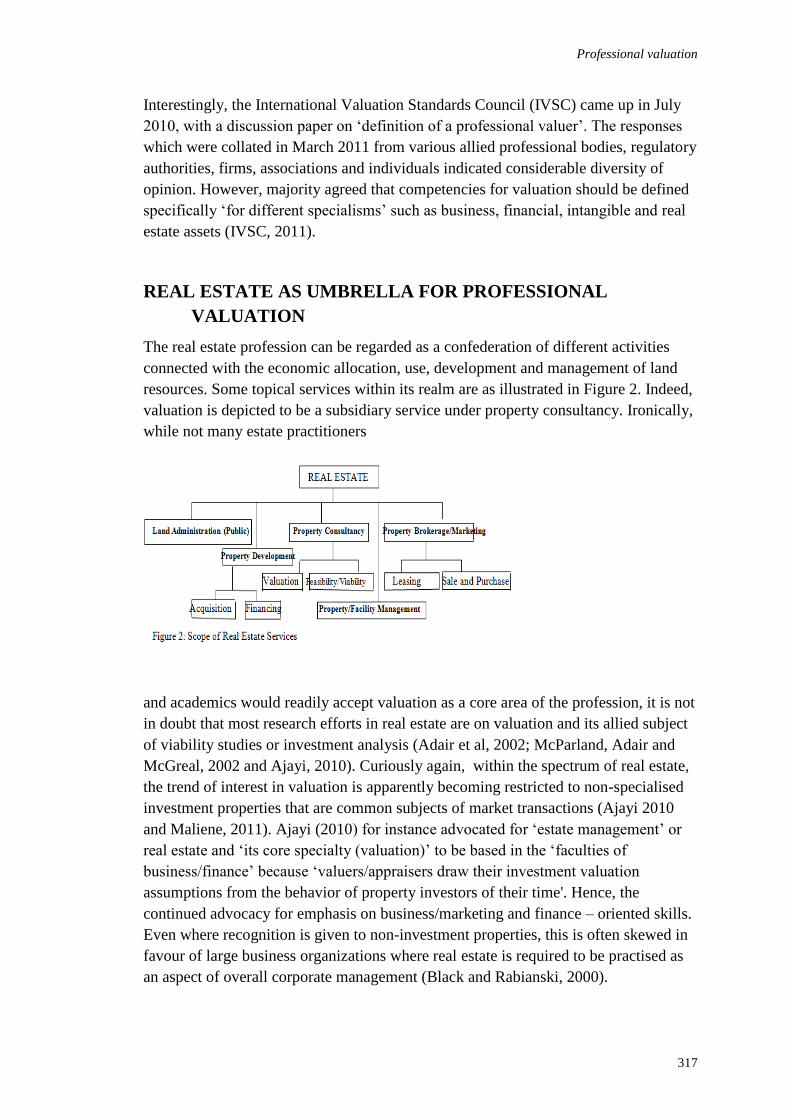
Professional valuation
317
Interestingly, the International Valuation Standards Council (IVSC) came up in July
2010, with a discussion paper on ‘definition of a professional valuer’. The responses
which were collated in March 2011 from various allied professional bodies, regulatory
authorities, firms, associations and individuals indicated considerable diversity of
opinion. However, majority agreed that competencies for valuation should be defined
specifically ‘for different specialisms’ such as business, financial, intangible and real
estate assets (IVSC, 2011).
REAL ESTATE AS UMBRELLA FOR PROFESSIONAL
VALUATION
The real estate profession can be regarded as a confederation of different activities
connected with the economic allocation, use, development and management of land
resources. Some topical services within its realm are as illustrated in Figure 2. Indeed,
valuation is depicted to be a subsidiary service under property consultancy. Ironically,
while not many estate practitioners
and academics would readily accept valuation as a core area of the profession, it is not
in doubt that most research efforts in real estate are on valuation and its allied subject
of viability studies or investment analysis (Adair et al, 2002; McParland, Adair and
McGreal, 2002 and Ajayi, 2010). Curiously again, within the spectrum of real estate,
the trend of interest in valuation is apparently becoming restricted to non-specialised
investment properties that are common subjects of market transactions (Ajayi 2010
and Maliene, 2011). Ajayi (2010) for instance advocated for ‘estate management’ or
real estate and ‘its core specialty (valuation)’ to be based in the ‘faculties of
business/finance’ because ‘valuers/appraisers draw their investment valuation
assumptions from the behavior of property investors of their time'. Hence, the
continued advocacy for emphasis on business/marketing and finance – oriented skills.
Even where recognition is given to non-investment properties, this is often skewed in
favour of large business organizations where real estate is required to be practised as
an aspect of overall corporate management (Black and Rabianski, 2000).
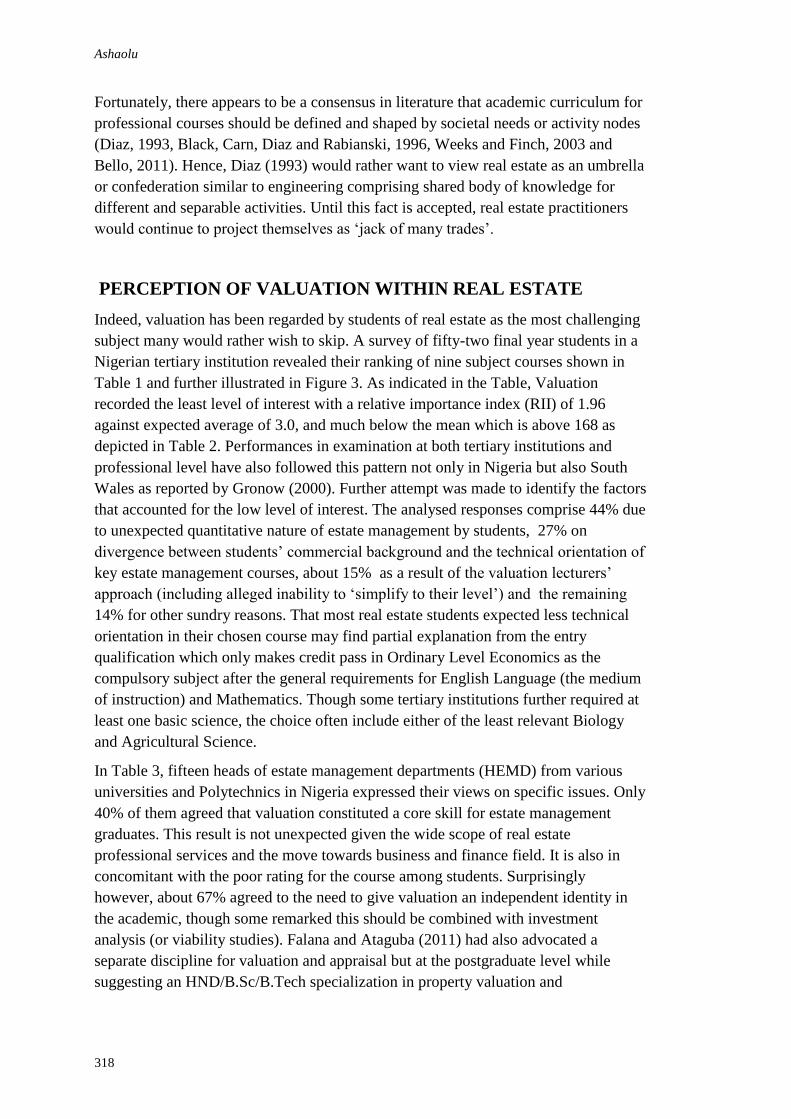
Ashaolu
318
Fortunately, there appears to be a consensus in literature that academic curriculum for
professional courses should be defined and shaped by societal needs or activity nodes
(Diaz, 1993, Black, Carn, Diaz and Rabianski, 1996, Weeks and Finch, 2003 and
Bello, 2011). Hence, Diaz (1993) would rather want to view real estate as an umbrella
or confederation similar to engineering comprising shared body of knowledge for
different and separable activities. Until this fact is accepted, real estate practitioners
would continue to project themselves as ‘jack of many trades’.
PERCEPTION OF VALUATION WITHIN REAL ESTATE
Indeed, valuation has been regarded by students of real estate as the most challenging
subject many would rather wish to skip. A survey of fifty-two final year students in a
Nigerian tertiary institution revealed their ranking of nine subject courses shown in
Table 1 and further illustrated in Figure 3. As indicated in the Table, Valuation
recorded the least level of interest with a relative importance index (RII) of 1.96
against expected average of 3.0, and much below the mean which is above 168 as
depicted in Table 2. Performances in examination at both tertiary institutions and
professional level have also followed this pattern not only in Nigeria but also South
Wales as reported by Gronow (2000). Further attempt was made to identify the factors
that accounted for the low level of interest. The analysed responses comprise 44% due
to unexpected quantitative nature of estate management by students, 27% on
divergence between students’ commercial background and the technical orientation of
key estate management courses, about 15% as a result of the valuation lecturers’
approach (including alleged inability to ‘simplify to their level’) and the remaining
14% for other sundry reasons. That most real estate students expected less technical
orientation in their chosen course may find partial explanation from the entry
qualification which only makes credit pass in Ordinary Level Economics as the
compulsory subject after the general requirements for English Language (the medium
of instruction) and Mathematics. Though some tertiary institutions further required at
least one basic science, the choice often include either of the least relevant Biology
and Agricultural Science.
In Table 3, fifteen heads of estate management departments (HEMD) from various
universities and Polytechnics in Nigeria expressed their views on specific issues. Only
40% of them agreed that valuation constituted a core skill for estate management
graduates. This result is not unexpected given the wide scope of real estate
professional services and the move towards business and finance field. It is also in
concomitant with the poor rating for the course among students. Surprisingly
however, about 67% agreed to the need to give valuation an independent identity in
the academic, though some remarked this should be combined with investment
analysis (or viability studies). Falana and Ataguba (2011) had also advocated a
separate discipline for valuation and appraisal but at the postgraduate level while
suggesting an HND/B.Sc/B.Tech specialization in property valuation and
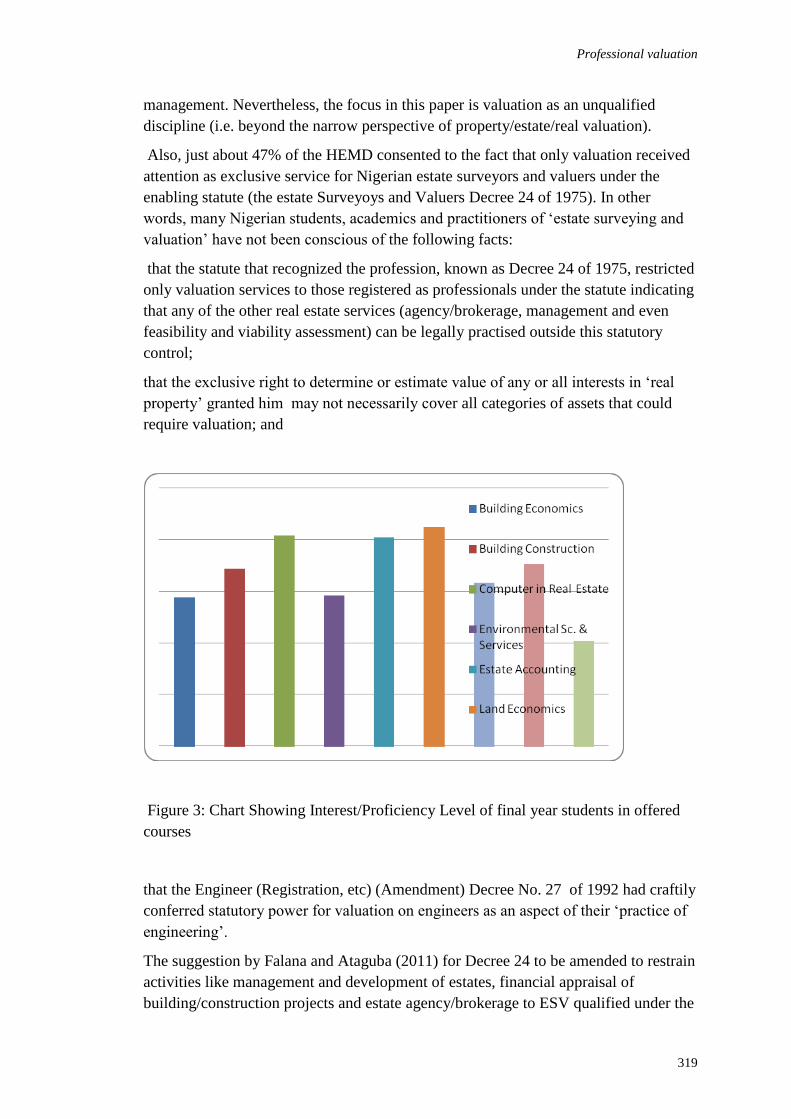
Professional valuation
319
management. Nevertheless, the focus in this paper is valuation as an unqualified
discipline (i.e. beyond the narrow perspective of property/estate/real valuation).
Also, just about 47% of the HEMD consented to the fact that only valuation received
attention as exclusive service for Nigerian estate surveyors and valuers under the
enabling statute (the estate Surveyoys and Valuers Decree 24 of 1975). In other
words, many Nigerian students, academics and practitioners of ‘estate surveying and
valuation’ have not been conscious of the following facts:
that the statute that recognized the profession, known as Decree 24 of 1975, restricted
only valuation services to those registered as professionals under the statute indicating
that any of the other real estate services (agency/brokerage, management and even
feasibility and viability assessment) can be legally practised outside this statutory
control;
that the exclusive right to determine or estimate value of any or all interests in ‘real
property’ granted him may not necessarily cover all categories of assets that could
require valuation; and
Figure 3: Chart Showing Interest/Proficiency Level of final year students in offered
courses
that the Engineer (Registration, etc) (Amendment) Decree No. 27 of 1992 had craftily
conferred statutory power for valuation on engineers as an aspect of their ‘practice of
engineering’.
The suggestion by Falana and Ataguba (2011) for Decree 24 to be amended to restrain
activities like management and development of estates, financial appraisal of
building/construction projects and estate agency/brokerage to ESV qualified under the
Ashaolu
320
decree is somewhat ambitious. Rather, the operational statute may in future, be re-
visited to recognize different specialties under which prospective real estate
professional would seek registration such that it is a matter for narrowing scope of
practice rather than expanding it. In fact, Nigerian estate surveyors are currently wary
of any demand for statutory review of its functions given the prevailing stiff
competition for the core service by the engineers that are more pervasive on the
political front. Interestingly, only 33% of the HEMD believed the subsisting
curriculum for property education would suffice for valuation of all categories of
assets.
Table 4 shows a summary of the identification and ranking of essential subject areas
for real estate education by the HEMD. Of the 15 subjects ranked, seven fell within
the Business discipline and among theses were ranked 2nd
, 3rd
, 4th
and 5th
with four
within Environmental and two each in Humanities and Engineering. One of the
Engineering subjects that would have been relevant for PEM valuation was
nevertheless ranked as of least importance. Overall, a weight of 59 points went for
Business, 35 for Environmental, 12 for Humanities and 11 for Engineering indicating
a preponderance of emphasis on business skills. But it should not be unexpected if real
estate in general must drift towards the business field. As remarked by Poon, Hoxley
and Fuchs (2010), professions world-wide have been reacting to scandals such as
Worldcom and Enron by tightening the regulation and control of their members
towards ensuring proper focus on the changing demands of clients. Thus, if the
knowledge, skill and competencies requirements for the wider services of real estate
are appropriately skewed in the direction of business, a line of divide must be drawn
on the extent of valuation services that are involved. For instance, to what extent is
valuation synonymous with pricing? How adequate is current price evidence in
reflecting the likely future prices of real estate interests? Should an estimate of likely
future price place sole emphasis on prediction of demand-supply relationship or would
it be necessary to also consider the dynamics of technological and environmental
aspects of the real estate? Are the installed non-landed assets (especially machinery in
use) to be treated as easily comparable market products? Answers to these type of
questions are necessary to determining the adequacy of real estate field in housing
professional valuation.
THE NIGERIAN EXPERIENCE
In Nigeria, formal training in estate management commenced in the defunct Nigerian
College of Arts, Science and Technology, Enugu Campus (now Enugu Campus of the
University of Nigeria) in 1957. This was to prepare candidates for the Intermediate
examinations of the Royal Institution of Chartered Surveyors (RICS) in London. By
1962 however, the University of Nigeria had mounted a degree course in Estate
Management, also designed to qualify candidates for RICS registration. Thus, the
curricula were modeled after that of Britain with a focus on the built environment and
surveying. When in 1970, the University of Ife (now Obafemi Awolowo University)
Professional valuation
321
also started its Estate Management degree programme, the Surveying field was
targeted and for more than a decade, it domiciled in its faculty of Technology
alongside engineering courses until the Faculty of Environmental Design and
Management was established in 1982 to house the allied disciplines of Architecture,
Building, Estate Management, Quantity Surveying and Urban and Regional Planning.
A detour however occurred in 1982 when the University of Lagos decided to
inaugurate an estate management course under its department of Business
Administration ostensibly, taking cue from the American tradition. This was
nevertheless resisted by the national professional body – the Nigerian Institution of
Estate Surveyors and Valuers (NIESV)- which refused to accord their first two sets of
graduates needed recognition as full-fledged graduates of estate management. The
discipline was accordingly moved to its faulty of environmental sciences alongside
Architecture, Building and Urban Planning and as obtainable in the other universities
– Enugu and Ile-Ife. Recently however, the Federal University of Technology (FUT),
Minna threw another spanner to the debate by transferring its estate management
department from Environmental Sciences to the School of Entreprenuership and
Management Technology.
In late July 2011, NIESV organized a maiden national education summit at Maizube
Farms, Minna. Expectations were high on resolving the curriculum issues and possible
areas of academic specializations in Nigerian estate management discipline. Though
papers presented fairly touched these areas, deliberations were however skewed
towards academic nomenclature, professional suffix and collaboration between theory
and practice. The relevant aspects of the communiqué issued included a change in the
name of academic discipline and department in the higher institutions from ‘estate
management’ to ‘estate management and valuation’ and the directive to ensure it
domiciled in the School/Faculty of Environmental Sciences across all such training
institutions.
In practice, it is known that in late 2010, the multi-billion naira assets under the
control of Nigerian Electricity Regulatory Council were brought up for valuation but
unfortunately, this was spearheaded and handled by engineers as the prequalification
requirements were carefully drawn up in favour of the professionals with previous
technical working experiences on these facilities. Earlier, engineering firms had been
involved in the valuation of the assets of Delta Steel Company, Aladja and defunct
National Electric Power Authority (NEPA). Although there are no celebrated judicial
cases of professional negligence against estate surveyors and valuers, the Professional
Practice Committee of NIESV had been inundated with complaints from within and
outside the profession bordering on deficiencies in valuation service delivery. This
could be understood among others, in the context for dread for valuation among
students and the prevalence of general practice in all spheres of real estate
notwithstanding the practitioner’s areas of strength and weakness. Indeed, not all these
general practitioners have interest in valuation in the first instance as many consider
the fee receivable there-from unworthy of the task involved (Ramsett, 1998 and
Ashaolu
322
Reenstierna, 2001). When the Nigerian government commenced the valuation of her
residential properties for divestment purpose under her monetization of benefits
programme, those within Lagos Metropolis were first brought up for valuation. The
author was priviledged to be involved in the co-ordination of some twenty-two
valuation firms working within the Ikeja axis in 2006/2007 and one of this firm (very
reknowned for successful practice) was reprimanded for unacceptable standards and
after some debate, had to give in to weighty evidences. Incidentally, about a year later,
the same firm was unlucky to find herself allotted to work under the author’s co-
ordinating role in a particular South-South Zonal axis during the nationwide phase of
the valuation exercise. Of course, not willing to undergo another professional grilling
under a ‘younger and relatively unknown colleague’, the hard-earned contract had to
be abandoned.
Also, a very recent case in which the author was involved is a pointer to the danger of
business approach to professional valuation. A firm was engaged about three years’
earlier in the valuation of the assets of a proposed factory for mortgage transaction
purpose. As at the date of the valuation, almost all the components for the
development and operation of the factory had been ordered and had possibly, arrived
from overseas ostensibly, to the tune of several billions of Nigerian naira but with less
than 30% assembled on site. Rather, the premises was littered with the loose materials
including about 100 of 40-footer containers yet to be off-loaded. Interestingly,
another over 100 other containers were reported to be awaiting clearance from the
seaport. The valuation firm ‘effectively’ argued in defence of their valuation based on
‘documentary evidences’ of the business investments including a reliance on the
engineering blueprint for the dream factory. Unfortunately, the mortgagee-lender (a
bank) acted on the advice and several billions of naira of advanced loan became non-
performing as the development of the factory remained stalled ever since. However,
when a re- valuation was ordered towards mortgage foreclosure, another firm
employed best practice approach of valuing ‘rebus sic stantibus’ and arrived at just
about a quarter of the original valuation figure. As at the time of writing, the probe
was still on-going as the transaction was a major contributor to the eventual collapse
of the mortgagee-bank. Though earlier studies (such as Ogunba, 1997 and Aluko,
2007) had indicated perceived non-reliability of value figures by Nigerian clients in
general, a recent work by Oluwunmi et al (2011) reported that 62% of Nigerian Banks
were satisfied with the overall content of the valuation report they received from
valuers. Notwithstanding, the true performance rating of Nigerian valuers in mortgage
valuation, the accuracy of their value estimates and the consistencies in reported value
figures across valuers are issues currently under stringent test by the Asset
Management Corporation of Nigeria (AMCON - an institution recently incorporated
to provide a soft landing for insolvent financial institutions through a buyer-over of
their mortgaged assets, including subsequent management and realization thereof).
Elsewhere, Newell (2004) had earlier found out from an Australian study that 71% of
clients believed there were significant differences in the quality and reliability of
valuation reports amongst the valuation firms and valuers available for their use.
Professional valuation
323
COMPETENCE AREAS FOR PROFESSIONAL VALUATION
Landed Property (or Real Estate)
Indeed, landed property valuation is a consultancy service under the general real estate
functions. In this light, it is logical to expect that the more versed one is in a local
property market operations, the better his estimation of the value of a property within
it would be. Hence, assignments outside the valuer’s base would often be biased by
the evidence of first local contact or idea. Beyond this however, since each property
unit is unique in many respects, proper analysis of property-specific data cannot be
compromised and the skill requirement here transcend that of estate brokerage. When
the purpose of valuation is not transaction-driven, there is likelihood that more
emphasis on valuation would be on such intrinsic qualities and condition of the
particular property which could necessitate core competences in built environment.
The valuation of contaminated land for compensation purpose is not a typical market-
transaction in focus and the valuer should be required to appreciate the different
pollutants and their effects on biosphere.
Plant, Equipment and Machinery (PEM)
Just as prospective purchaser of real estate would undertake prior fair inspection of the
physical substance as part of assessment process, so would that of PEM.
Nevertheless, much unlike the former, PEM items have not just their physical
expression but more importantly, also involve kinetic energy. Prospective purchaser of
used automobile will seldom be contented with mere physical look without knowledge
of the sound and performance of basic mechanical parts. Any one versatile with use
and driving of automobile would readily know the ‘look-out for’ parts (which may
include the sound of the engine at slow and raised levels, the nature of exhaust
materials and flame, gearing efficiency e.t.c.) otherwise the assistance of a mechanical
technician would be sought. In a similar vein, it would appear naïve for fair
assessment of any item of PEM to be undertaken without testing its mechanical
condition and performance both independently and where necessary, within the
framework of other assembled items. In other words, if a real estate valuer requires
some understanding of the variables of building design and construction/materials for
effective data collection and analysis in valuation, the PEM valuer must neither
underplay the significance of basic competence in plant design, layout and production
processes. Notwithstanding, an admittance of shortfall in competence level of estate
surveyor in PEM valuation could not justify the usurpation of his statutory role by the
allied profession through mutilated vocational approach. Rather, the latter’s actions
could only be understood as a demonstration of Nigerian moral and economic
decadence that has defied intellectual consideration.
Perhaps, in realisation of the dangers of persistent attacks on estate surveyors’
competence in valuation of PEM, NIESV had recently mounted a course tagged ‘Plant
and Machinery Valuation’ in her professional examinations curriculum and directed
all tertiary institutions to follow suit. Unfortunately however, what is found in most of
the institutions today is a 2-unit (2-hour a week) course with contents that merely

Ashaolu
324
scratched the surface: meaning of terms in PEM, purposes of PEM valuation, the
alternative bases, the methods, inventory and scheduling, and guiding standards of
reporting. The quantum of assets involved in PEM valuation cannot be underplayed. If
the preparation of a land and building valuer would require his knowledge of basic
issues on land rights, allocation and planning, development and financing, design and
construction, one wonders if basic knowledge of plant design, layout and production
processes would be too demanding for a PEM valuer. Of course, the valuer cannot be
expected to demonstrate competence in all spheres of learning where the subjects of
his valuation fall. Nevertheless, special professional competence can be built through
acquisition of minimum level of knowledge in sufficiently wide areas. The
professional valuer should be versatile enough to display basic working understanding
of subjects like buildings and manufacturing.
CONCLUDING REMARKS
In spite any seemingly statutory regulation, valuation in Nigeria is presently a multi-
disciplinary profession. The accountants do not stop at liquid and intangible assets but
are recognized for simple ‘cost and depreciation’ approach for all categories of
tangible assets until they express need for the intervention of a ‘valuation surveyor’.
The quantity surveyors are also subtly gaining prominence in insurance valuation of
property assets. Perhaps, the drift between the estate surveyor and engineer became
ignited when the latter were innocently, and in the spirit of inter-disciplinary
involvement, being engaged by the former as ancillary service provider (in PEM
condition survey) for input into the valuation report. Making ‘professional valuation’ a
multi-disciplinary practice is bound to create multiple standards and ultimately, a
disservice to the economy and end users of valuation. Though competition could
provide needed harbinger for efficient service delivery, it is also capable of generating
unhealthy rivalry, confusion and eventual loss of societal confidence and patronage.
Professional valuation should instead be taken as an interdisciplinary discipline
requiring that the various skills from the different academic branches be harnessed
into an integrated curriculum.
Accordingly, while the scope of assets being handled by accountants and auditors is
not much in doubt, there is need to harmonise the relationship between the estate
valuers and engineers in valuation of real assets. A mid-point must be created where
those willing to practice full professional valuation would be required to purse skill
contents drawn from the faculties of built environment, engineering, business and law.
The entry qualification would definitely be slightly different from the current
requirements for general real estate discipline as it could necessitate mandatory credit
passes in basic sciences and economics. The professional valuer should have sound
technical and analytical base and with flair for business rudiments. As posited by
Gronow (2000) however, much of his business skills can be developed subsequently
during practice through continuous professional development programmes.
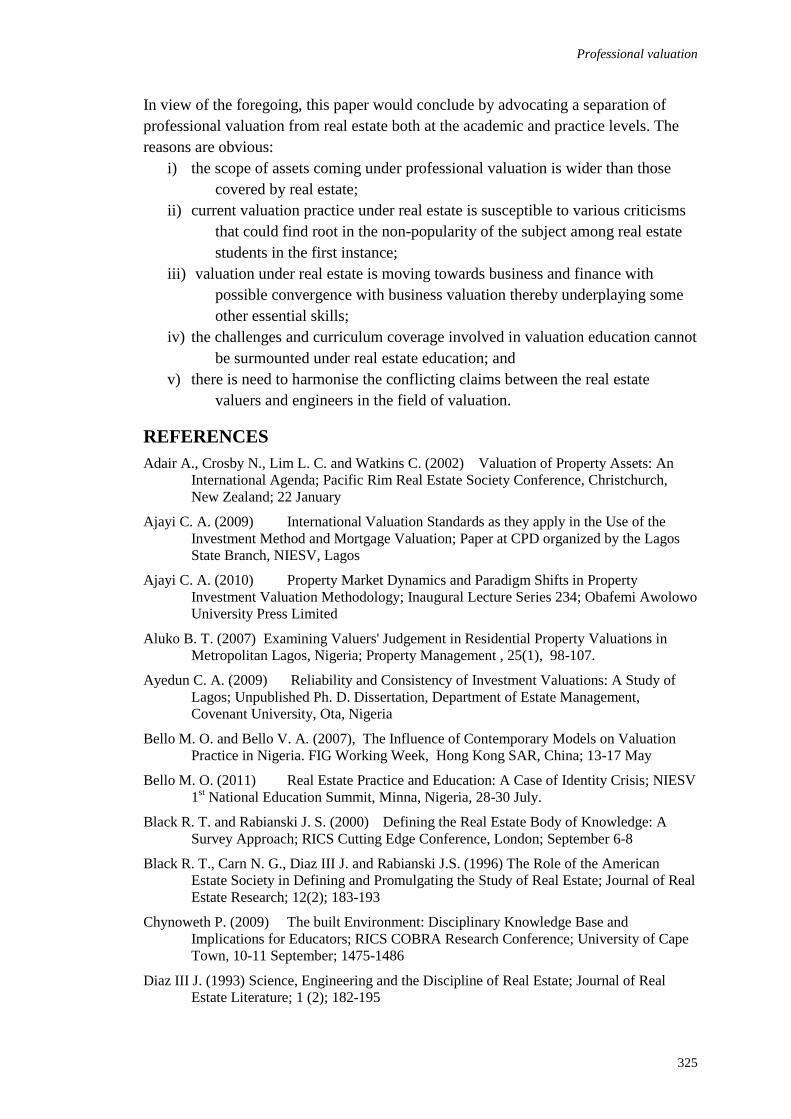
Professional valuation
325
In view of the foregoing, this paper would conclude by advocating a separation of
professional valuation from real estate both at the academic and practice levels. The
reasons are obvious:
i) the scope of assets coming under professional valuation is wider than those
covered by real estate;
ii) current valuation practice under real estate is susceptible to various criticisms
that could find root in the non-popularity of the subject among real estate
students in the first instance;
iii) valuation under real estate is moving towards business and finance with
possible convergence with business valuation thereby underplaying some
other essential skills;
iv) the challenges and curriculum coverage involved in valuation education cannot
be surmounted under real estate education; and
v) there is need to harmonise the conflicting claims between the real estate
valuers and engineers in the field of valuation.
REFERENCES
Adair A., Crosby N., Lim L. C. and Watkins C. (2002) Valuation of Property Assets: An
International Agenda; Pacific Rim Real Estate Society Conference, Christchurch,
New Zealand; 22 January
Ajayi C. A. (2009) International Valuation Standards as they apply in the Use of the
Investment Method and Mortgage Valuation; Paper at CPD organized by the Lagos
State Branch, NIESV, Lagos
Ajayi C. A. (2010) Property Market Dynamics and Paradigm Shifts in Property
Investment Valuation Methodology; Inaugural Lecture Series 234; Obafemi Awolowo
University Press Limited
Aluko B. T. (2007) Examining Valuers' Judgement in Residential Property Valuations in
Metropolitan Lagos, Nigeria; Property Management , 25(1), 98-107.
Ayedun C. A. (2009) Reliability and Consistency of Investment Valuations: A Study of
Lagos; Unpublished Ph. D. Dissertation, Department of Estate Management,
Covenant University, Ota, Nigeria
Bello M. O. and Bello V. A. (2007), The Influence of Contemporary Models on Valuation
Practice in Nigeria. FIG Working Week, Hong Kong SAR, China; 13-17 May
Bello M. O. (2011) Real Estate Practice and Education: A Case of Identity Crisis; NIESV
1st National Education Summit, Minna, Nigeria, 28-30 July.
Black R. T. and Rabianski J. S. (2000) Defining the Real Estate Body of Knowledge: A
Survey Approach; RICS Cutting Edge Conference, London; September 6-8
Black R. T., Carn N. G., Diaz III J. and Rabianski J.S. (1996) The Role of the American
Estate Society in Defining and Promulgating the Study of Real Estate; Journal of Real
Estate Research; 12(2); 183-193
Chynoweth P. (2009) The built Environment: Disciplinary Knowledge Base and
Implications for Educators; RICS COBRA Research Conference; University of Cape
Town, 10-11 September; 1475-1486
Diaz III J. (1993) Science, Engineering and the Discipline of Real Estate; Journal of Real
Estate Literature; 1 (2); 182-195
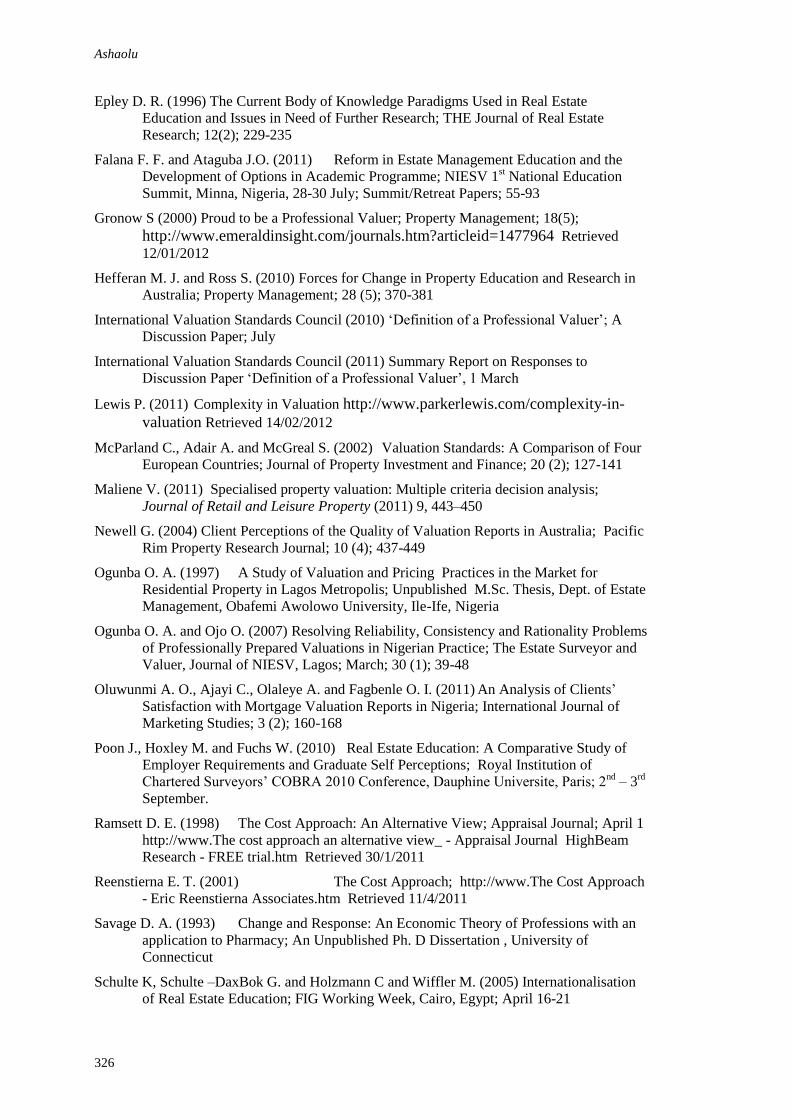
Ashaolu
326
Epley D. R. (1996) The Current Body of Knowledge Paradigms Used in Real Estate
Education and Issues in Need of Further Research; THE Journal of Real Estate
Research; 12(2); 229-235
Falana F. F. and Ataguba J.O. (2011) Reform in Estate Management Education and the
Development of Options in Academic Programme; NIESV 1st National Education
Summit, Minna, Nigeria, 28-30 July; Summit/Retreat Papers; 55-93
Gronow S (2000) Proud to be a Professional Valuer; Property Management; 18(5);
http://www.emeraldinsight.com/journals.htm?articleid=1477964 Retrieved
12/01/2012
Hefferan M. J. and Ross S. (2010) Forces for Change in Property Education and Research in
Australia; Property Management; 28 (5); 370-381
International Valuation Standards Council (2010) ‘Definition of a Professional Valuer’; A
Discussion Paper; July
International Valuation Standards Council (2011) Summary Report on Responses to
Discussion Paper ‘Definition of a Professional Valuer’, 1 March
Lewis P. (2011) Complexity in Valuation http://www.parkerlewis.com/complexity-in-
valuation Retrieved 14/02/2012
McParland C., Adair A. and McGreal S. (2002) Valuation Standards: A Comparison of Four
European Countries; Journal of Property Investment and Finance; 20 (2); 127-141
Maliene V. (2011) Specialised property valuation: Multiple criteria decision analysis;
Journal of Retail and Leisure Property (2011) 9, 443–450
Newell G. (2004) Client Perceptions of the Quality of Valuation Reports in Australia; Pacific
Rim Property Research Journal; 10 (4); 437-449
Ogunba O. A. (1997) A Study of Valuation and Pricing Practices in the Market for
Residential Property in Lagos Metropolis; Unpublished M.Sc. Thesis, Dept. of Estate
Management, Obafemi Awolowo University, Ile-Ife, Nigeria
Ogunba O. A. and Ojo O. (2007) Resolving Reliability, Consistency and Rationality Problems
of Professionally Prepared Valuations in Nigerian Practice; The Estate Surveyor and
Valuer, Journal of NIESV, Lagos; March; 30 (1); 39-48
Oluwunmi A. O., Ajayi C., Olaleye A. and Fagbenle O. I. (2011) An Analysis of Clients’
Satisfaction with Mortgage Valuation Reports in Nigeria; International Journal of
Marketing Studies; 3 (2); 160-168
Poon J., Hoxley M. and Fuchs W. (2010) Real Estate Education: A Comparative Study of
Employer Requirements and Graduate Self Perceptions; Royal Institution of
Chartered Surveyors’ COBRA 2010 Conference, Dauphine Universite, Paris; 2nd
– 3rd
September.
Ramsett D. E. (1998) The Cost Approach: An Alternative View; Appraisal Journal; April 1
http://www.The cost approach an alternative view_ - Appraisal Journal HighBeam
Research - FREE trial.htm Retrieved 30/1/2011
Reenstierna E. T. (2001) The Cost Approach; http://www.The Cost Approach
- Eric Reenstierna Associates.htm Retrieved 11/4/2011
Savage D. A. (1993) Change and Response: An Economic Theory of Professions with an
application to Pharmacy; An Unpublished Ph. D Dissertation , University of
Connecticut
Schulte K, Schulte –DaxBok G. and Holzmann C and Wiffler M. (2005) Internationalisation
of Real Estate Education; FIG Working Week, Cairo, Egypt; April 16-21
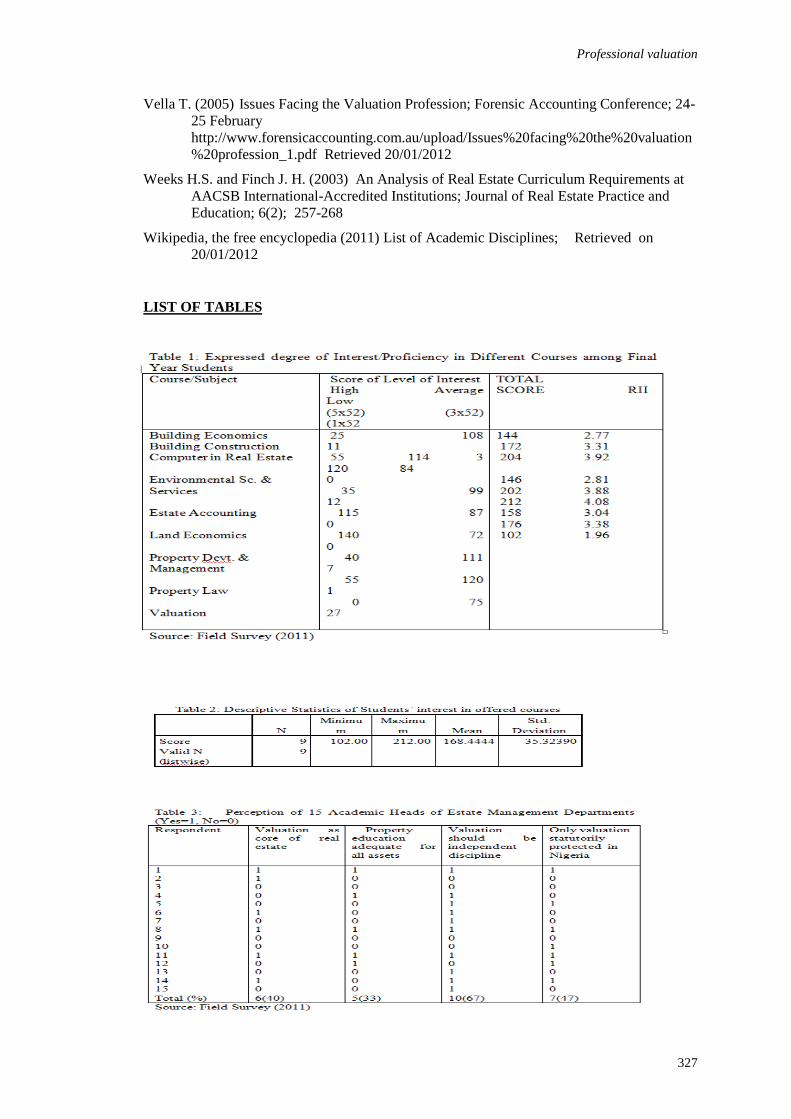
Professional valuation
327
Vella T. (2005) Issues Facing the Valuation Profession; Forensic Accounting Conference; 24-
25 February
http://www.forensicaccounting.com.au/upload/Issues%20facing%20the%20valuation
%20profession_1.pdf Retrieved 20/01/2012
Weeks H.S. and Finch J. H. (2003) An Analysis of Real Estate Curriculum Requirements at
AACSB International-Accredited Institutions; Journal of Real Estate Practice and
Education; 6(2); 257-268
Wikipedia, the free encyclopedia (2011) List of Academic Disciplines; Retrieved on
20/01/2012
LIST OF TABLES
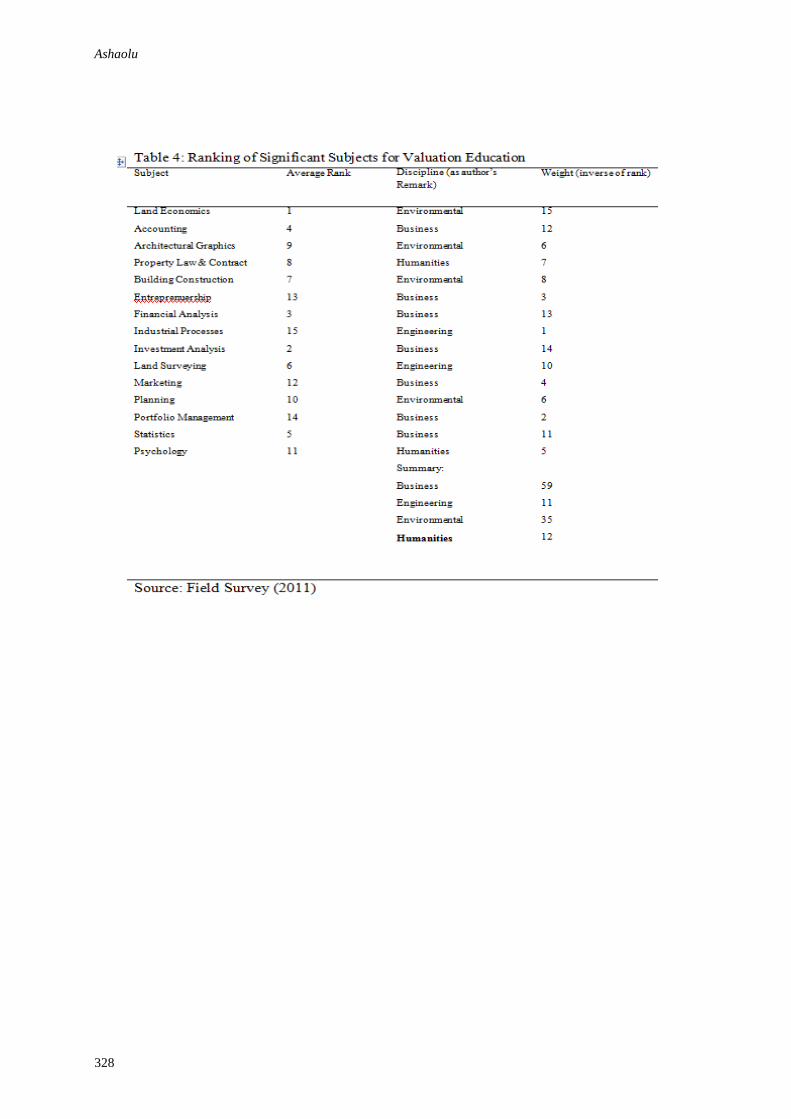
Ashaolu
328
Awodele, O.A., Ogunlana, S.O. and Akinradewo, O.F. (2012) Evaluation of public private partnership
(PPP) as alternative procurement route for infrastructure development: Case of Nigeria mega city In:
Laryea, S., Agyepong, S.A., Leiringer, R. and Hughes, W. (Eds) Procs 4th West Africa Built
Environment Research (WABER) Conference, 24-26 July 2012, Abuja, Nigeria, 329-344.
329
EVALUATION OF PUBLIC PRIVATE PARTNERSHIP
(PPP) AS ALTERNATIVE PROCUREMENT ROUTE FOR
INFRASTRUCTURE DEVELOPMENT: CASE OF
NIGERIA MEGA CITY
Oluwaseyi A. Awodele1, Stephen O. Ogunlana
2 and Olusola F. Akinradewo
3
1&2School of the Built Environment, Herriot - Watt University, Edinburgh, United Kingdom
3Department of Quantity Surveying, Federal University of Technology, Akure, Nigeria
An agglomeration of people in the urban centres world over has led to the rapid
expansion of city borders into neighbouring suburbs, resulting in the formation of
Megacities. This trend has created chronic shortage of infrastructure to cope with the
needs of the burgeoning urban population. Successive governments of countries with
megacities have directed much effort toward the provision of these much needed
infrastructure but little has been achieved due largely to the shortage of fund required
to meet the huge capital outlay. It is now common for government at various levels to
call on private investors, both local and foreign, to come to their aid in form of
partnership between the public sector and the private sector for the provision of
infrastructure through Public Private Partnership (PPP). Lagos, Nigeria has the
characteristics of a megacity. In this paper, documentary evidence has been gathered
to assess the investment needs of Lagos as a mega city. Subsequently, the suitability
and acceptability of PPPs within the purview of Lagos State government in particular
and Nigeria at large was assessed. The social, legal, economic, environmental,
political and technological (SLEEPT) approach has been adopted incorporating the
views of stakeholders within Lagos. Documentary evidence points to a huge deficit
between the investment need and current capacity of Lagos State government to fund
the investment. Emerging from the SLEEPT is the favourableness environment for
private participation in infrastructure provision both by the Federal government and
Lagos State government. It was discovered that the social, legal and political
landscape within Lagos mega city is set for the adoption of PPP and that the state is
yet to measure up to the required needs in terms of technology. Altogether, PPP
represents a good long term investment for private investors and have the potential to
deliver much needed infrastructure in a short timeframe thus improving the quality of
life of the people.
Keywords: construction investment market, mega city, public private partnership,
construction investment
INTRODUCTION
People all over the world tend to move from less industrialized regions to more
industrialized areas in search of greener pasture. Increase in rural–urban drift is not
only peculiar to the developing countries, but the increase is noticeable in both the
developed and developing countries. However, in developing countries urbanization is
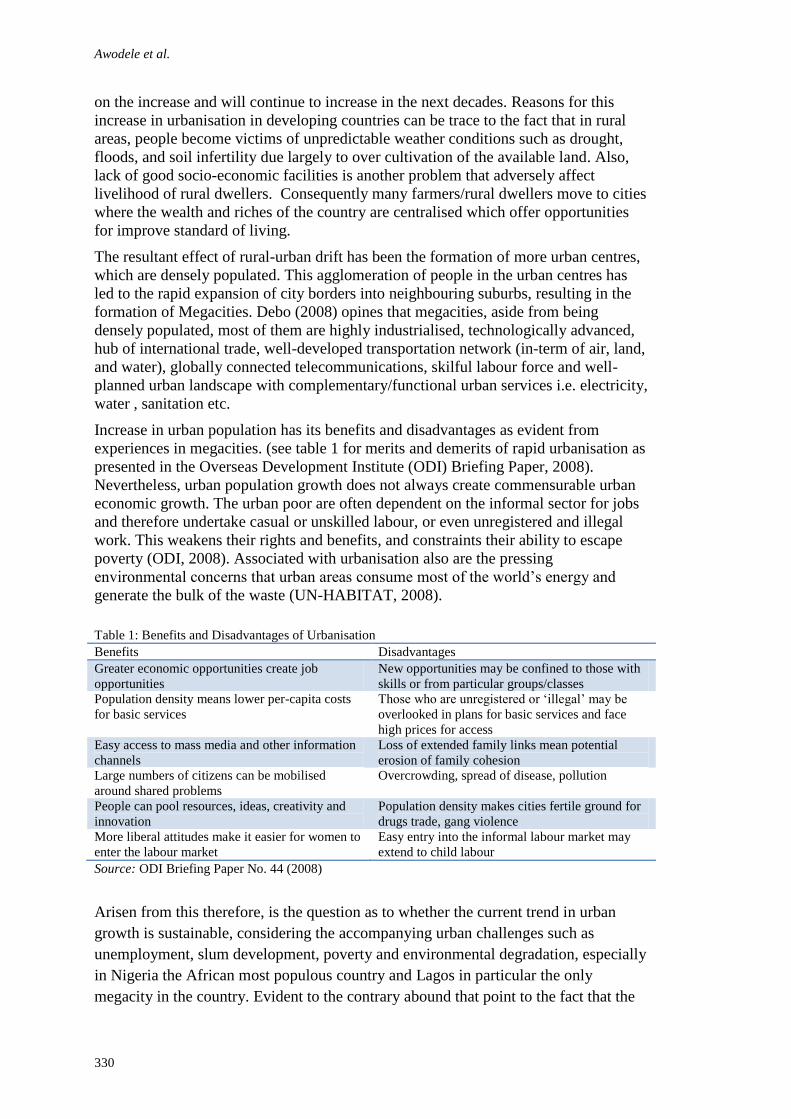
Awodele et al.
330
on the increase and will continue to increase in the next decades. Reasons for this
increase in urbanisation in developing countries can be trace to the fact that in rural
areas, people become victims of unpredictable weather conditions such as drought,
floods, and soil infertility due largely to over cultivation of the available land. Also,
lack of good socio-economic facilities is another problem that adversely affect
livelihood of rural dwellers. Consequently many farmers/rural dwellers move to cities
where the wealth and riches of the country are centralised which offer opportunities
for improve standard of living.
The resultant effect of rural-urban drift has been the formation of more urban centres,
which are densely populated. This agglomeration of people in the urban centres has
led to the rapid expansion of city borders into neighbouring suburbs, resulting in the
formation of Megacities. Debo (2008) opines that megacities, aside from being
densely populated, most of them are highly industrialised, technologically advanced,
hub of international trade, well-developed transportation network (in-term of air, land,
and water), globally connected telecommunications, skilful labour force and well-
planned urban landscape with complementary/functional urban services i.e. electricity,
water , sanitation etc.
Increase in urban population has its benefits and disadvantages as evident from
experiences in megacities. (see table 1 for merits and demerits of rapid urbanisation as
presented in the Overseas Development Institute (ODI) Briefing Paper, 2008).
Nevertheless, urban population growth does not always create commensurable urban
economic growth. The urban poor are often dependent on the informal sector for jobs
and therefore undertake casual or unskilled labour, or even unregistered and illegal
work. This weakens their rights and benefits, and constraints their ability to escape
poverty (ODI, 2008). Associated with urbanisation also are the pressing
environmental concerns that urban areas consume most of the world’s energy and
generate the bulk of the waste (UN-HABITAT, 2008).
Table 1: Benefits and Disadvantages of Urbanisation
Benefits Disadvantages
Greater economic opportunities create job
opportunities
New opportunities may be confined to those with
skills or from particular groups/classes
Population density means lower per-capita costs
for basic services
Those who are unregistered or ‘illegal’ may be
overlooked in plans for basic services and face
high prices for access
Easy access to mass media and other information
channels
Loss of extended family links mean potential
erosion of family cohesion
Large numbers of citizens can be mobilised
around shared problems
Overcrowding, spread of disease, pollution
People can pool resources, ideas, creativity and
innovation
Population density makes cities fertile ground for
drugs trade, gang violence
More liberal attitudes make it easier for women to
enter the labour market
Easy entry into the informal labour market may
extend to child labour
Source: ODI Briefing Paper No. 44 (2008)
Arisen from this therefore, is the question as to whether the current trend in urban
growth is sustainable, considering the accompanying urban challenges such as
unemployment, slum development, poverty and environmental degradation, especially
in Nigeria the African most populous country and Lagos in particular the only
megacity in the country. Evident to the contrary abound that point to the fact that the
Public private partnership
331
available infrastructural facilities in the urban centres especially in Lagos can no
longer cope with the increase population of the city occasioned by increase rural-
urban drift. This is obvious by the inability of most urban dwellers to access
sustainable means of livelihoods (Helaakoski, et al., 2001; Haider et al., 2004 and
Odufuwa, 2006).
The direct implications of this are the humanitarian crises that are now common things
in the developing nations. In Nigeria for instance, there are incessant bombing attacks,
militant attacks on oil installations in Niger Delta region of Nigeria, political and
religious crises in some part of the country, aftermath of election crises by people of
employable age (i.e. youths) to mention a few. There is a popular adage that says “an
idle hand is the devil’s workshop”. In a report published by House of Common (2009)
on urbanisation and poverty, it was stated categorically that “without a new and
comprehensive approach to urban development in Africa, a number of cities could
face a humanitarian crisis in as little as five years’ time, given the huge expansion of
their urban populations”. It is just two years now not five years yet, the humanitarian
crisis is all over the continent (occurrence in Syria, Egypt, Libya, Yemen, Ivory Coast,
Uganda, Nigeria etc. leave a lot for the leaders in the developing nations much to
think about).
In procuring these much needed infrastructural facilities, clients needs to make a
choice between the fragmented and integrated procurement option (i.e. traditional and
the collaborative options). Procurement is a combination of different methods for
purchasing construction objects and includes such variables as source of funding,
partner selection method, price basis, responsibility for design, responsibility for
management, and amount of subcontracting (Murdoch and Hughes, 2008). The
client’s choice of procurement option, i.e. a combination of the above mentioned
variables, implies different ranges of responsibilities and liabilities for the various
actors, as well as different degrees of their collaboration in the project (Love et al.,
1998; Eriksson and Westerberg, 2011). Oyegoke and Kiiras (2009) argue that
procurement route serves as lever for the re-engineering of construction project
processes and when contractual processes are in disarray, owners’ risks become bigger
and more likely. Proponents of Public Private Partnerships (PPPs) routinely argue that
this procurement method offers greater scope for harnessing competitive market
forces to secure best Value for Money (VfM) and innovation than traditional
procurement approaches (e.g, OECD 2008). However, whether this is achieved in
practice is difficult to establish and the empirical evidence is rather mixed (Hodge and
Greve 2008).
From the foregoing, therefore, it is important that we understand the complexity of
the problem confronting urban centres where we have these agglomeration of people
as occasioned by urbanisation most especially in Lagos the only mega city in
Nigeria Sub Sahara of Africa; with a view of suggesting possible ways out of the
problem. This paper therefore presents a review as well as an empirical study on the
current state of infrastructural facilities in Lagos, Nigeria’s megacity. The paper
Awodele et al.
332
assessed the infrastructure investment needs of the city cum the available fund for
infrastructure development. It went further to compare these parameters with other
megacities in the world. Finally, in comparison with other procurement options, the
paper assesses the suitability and acceptability of public private partnership (PPP) as
an alternative procurement option for infrastructure development particularly in
market development in Lagos, Nigeria.
Urbanisation and Emergence of Lagos as megacity in Nigeria
Urbanisation can be defined as the increase in the proportion of people living in towns
rather than rural areas. Urbanization happens because of the increase in the extent and
density of urban areas. The density of population in urban areas increases because of
the migration of people from less industrialized regions to more industrialized areas.
Available statistics show that the world’s population is projected to grow from 6.8
billion that it is today to over 10 billion by 2050, with almost all the growth taking
place in urban areas (UN-HABITAT, 2010). It was predicted that globally,
urbanization levels will rise dramatically in the next 40 years to 70 per cent by 2050
(UN-HABITAT, 2008). Presently more than 70 per cent of the populations of Europe,
North America and Latin America are already urban; Asia and Africa remain
predominately rural, with 41 per cent and 39 per cent of their populations living in
urban areas, respectively.
However, according to United Nation report on the state of the World’s cities in 2008,
the report assert that if the trends continue, half of Africa’s population will be urban
by 2050 with an urban population of about 1.2 billion which will be nearly a quarter
of the world’s urban population. It is not surprising then, to see an increase in the
growth rate of urban population in Nigeria the most populous country in Africa and
the ninth most populous country in the world. United Nation Department for
Economic and Social Affairs UN DESA (2009d) estimated that the population of the
country in 2010 will be 158milion and could have rising to 193 million by year 2020.
This concentration of people from different works of life, tribes, and diverse
ethnicities in the urban centres has led to the rapid expansion of city borders into
neighbouring suburbs, which led to the formation of Megacities.
A mega city according to the definition of human settlements is a city with a
minimum population of 10 million and above (UN-Habitat, 2004). Montgomery et al,
(2004) assert that as at 1950 there were only eight cities in the world with population
of 5million and there were just three mega cities in the world then (i.e. New York,
London and Tokyo). Today, on the basis of the 10million population definition by the
United Nation, Mabogunje (2008) affirms that there are 28 megacities in the world,
with 21 of them being in developing countries. He further asserts that out of the 21
megacities in the developing countries, 14 are in Asia, 5 in Latin America while there
are 2 megacities in Africa (i.e. Cairo and Lagos).
Bateman, (1995) identified nine main factors influencing the growth of mega-cities in
the world as (i) Colonial influences, (ii) Ports and trading cities, (iii) Reassignment of
Public private partnership
333
a city as a capital city, (iv) Post independence policies frequently favoured urban
areas over rural (v) Post-war modernisation and industrialisation, (vi) Declining
mortality rate as a result of modern public health measures and imported medicines,
(vii) Rural to urban migration in search of better higher standards of living and better
access to services, training and employment opportunities, (viii) Settlement laws and
(ix) Location of international production into urban areas. Although, in Africa, urban
expansion is due to natural population growth as a result of improved medical care,
better sanitation and improved food supplies, which reduce death rates and invariably
lead to populations growth. Long neglect and inadequate attention to agricultural and
rural development, infrastructure development, national policies, private sector forces,
and other powerful socio-economic and political processes, including globalisation,
drives urbanisation in Nigeria (CNP, 2010). All these, combined with the fact that
most educational and health-care facilities were disproportionately concentrated in
urban centres, resulted in a high rate of rural-urban drift (Mabogunje, 2008).
Lagos, Nigeria has the characteristics of a megacity. With a population of about 17
million out of a national estimate of 158 million Lagos is the only megacity in
Nigeria. The rate of population growth of Lagos is about 600,000 per annum with a
population density of about 4,193 persons per sq. km. In the built-up areas of
Metropolitan Lagos, the average density is over 20,000 persons per square km. The
UN estimates that at its present growth rate, Lagos state will be third largest mega
city in the world by year 2015 after Tokyo in Japan and Bombay in India (UN
DESA, 2009d). Lagos was reported to be the second largest populated city in Africa
and seventh fastest growing city in the world (UN-Habitat, 2008).
Lagos was and continued to be the capital of Nigeria all through her independence
from Britain in 1960 up to 1991 when the Federal Capital Territory was established
at the purpose-built city of Abuja. Like other mega cities in the world and due to its
strategic location (i.e. close to the Ocean and present of sea port) Lagos housed the
headquarters of many companies both private and public. Many banks, travel
agencies and hotels have their headquarters in Lagos. This explains the huge
population of the city and affirms the forecast of an increase in the population of the
city in the future.
PROSPERITY OF MEGACITIES AND THEIR CHALLENGES
Megacities have greater role to play in any national development. The UN-Habitat in
their publication “the state of World Cities 2010/2011” encapsulate this role when it
states that “the prosperity of Nations is intimately linked to the prosperity of their
cities. No country has ever achieved sustained economic growth or rapid social
development without urbanizing. Countries with the highest per capita income tend to
be more urbanized, while low income countries are the least urbanized”. From this
assertion, coupled with the merit of urbanisation as presented in table 1, it is evident
that urbanisation present a number of peculiar attributes that may contribute to rapid
national transformation. UN-Habitat (2010) and Masinde and Musungu (2010) explain

Awodele et al.
334
that high urban densities reduce transaction costs, make public spending on
infrastructure and services more economically viable, facilitate generation and
diffusion of knowledge which enhance productivity; providing new opportunities for
income generation; increasing number of livelihood options for both rural and urban
populations. UN-Habitat (2010) concludes that urbanisation play a positive role in
overall poverty reduction, particularly where supported by well-adapted policies.
However, increase in urban population comes with its own attached challenges.
Population growth results in shortage in infrastructural facilities (e.g. housing,
schools, hospital, good roads, markets, electricity, etc) as the facilities provided by
the government are to be shared among many people. This can further give rise to
inequitable distribution of wealth and resources. Coping with the huge population of
megacity therefore, with essential facilities is a big challenge. This also puts a lot of
strain on the finances of the country. In addition, due to shortage of infrastructure
facilities, cost of living in mega cities is quite high. This widens the gap between the
rich and the poor and leads to increase in crime rate in the city.
Moreover, as a result of increase population, there will be a need for increase in
number of vehicles on the roads and as most of the companies or industries has their
headquarters in the megacities, then coping with pollution (air, land and water) will
be another challenge. When this is not handled properly, environmental degradation
set in and this affects the health and well being of city dwellers.
INFRASTRUCTURE DEVELOPMENT AND INVESTMENT
NEED IN NIGERIA
Public infrastructure touches on a wide spectrum of basic amenities which enhance the
capacity of economic agents to conveniently engage in productive activities with less
stress (Oluba, 2008). These amenities include water supply and distribution system,
electricity and communication system, wastewater collection and treatment facilities,
surface transportation facilities, mass-transit facilities, airports and airway facilities,
resource recovery facilities, waterways, levees and related flood-control facilities,
docks or ports, school buildings, health facilities, shopping facilities and solid-waste
disposal facilities etc. The importance of these infrastructural facilities (whether social
or economic infrastructure), in any national development cannot be over emphasized.
Obozuwa (2010) opines that developed nations in the world jumpstarted their
economies by accelerating their infrastructure and building on it. Oluba (2008)
describes infrastructure as wheels of economic activity because of the crucial role they
play in providing the bulwark upon which production and distribution stands. Haider
et al., (2004) contend that improved accessibility to employment, education, health,
and other public services is important for the welfare of the people and the city itself.
Thus, adequate infrastructure will enhance the quality of life of individuals as well as
the city as a whole, just as the absence or outright denial of basic environmental
services constitutes absolute poverty.
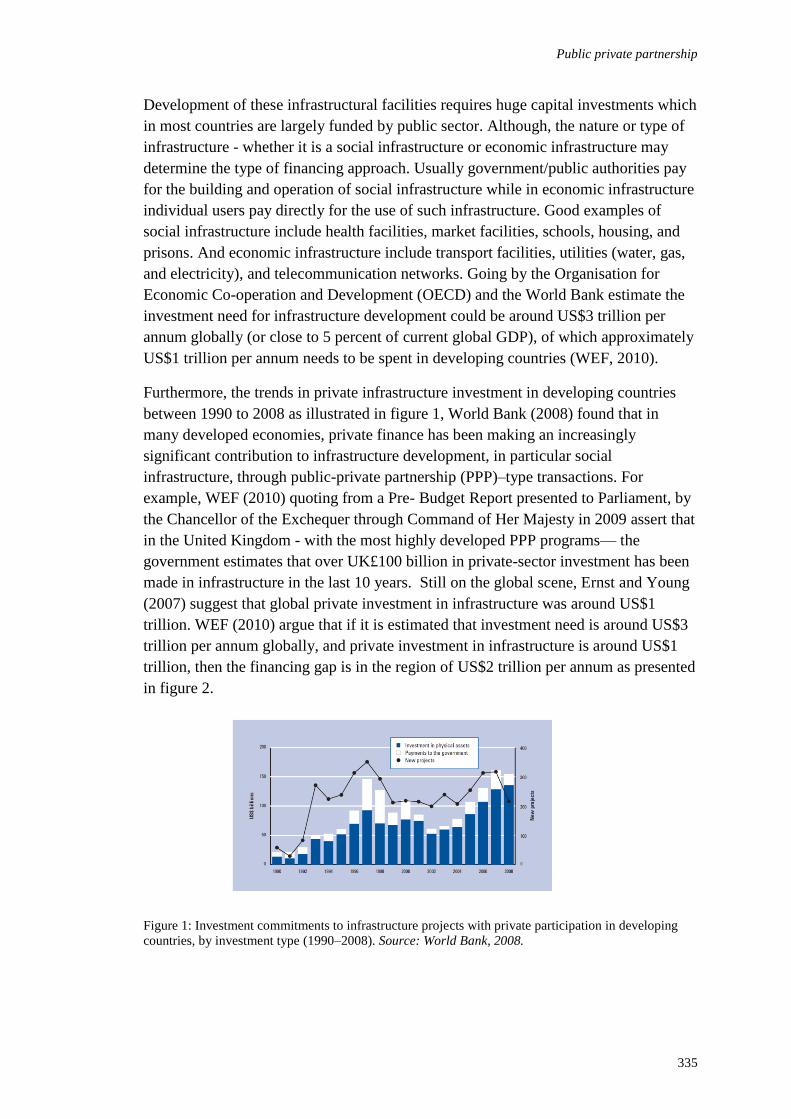
Public private partnership
335
Development of these infrastructural facilities requires huge capital investments which
in most countries are largely funded by public sector. Although, the nature or type of
infrastructure - whether it is a social infrastructure or economic infrastructure may
determine the type of financing approach. Usually government/public authorities pay
for the building and operation of social infrastructure while in economic infrastructure
individual users pay directly for the use of such infrastructure. Good examples of
social infrastructure include health facilities, market facilities, schools, housing, and
prisons. And economic infrastructure include transport facilities, utilities (water, gas,
and electricity), and telecommunication networks. Going by the Organisation for
Economic Co-operation and Development (OECD) and the World Bank estimate the
investment need for infrastructure development could be around US$3 trillion per
annum globally (or close to 5 percent of current global GDP), of which approximately
US$1 trillion per annum needs to be spent in developing countries (WEF, 2010).
Furthermore, the trends in private infrastructure investment in developing countries
between 1990 to 2008 as illustrated in figure 1, World Bank (2008) found that in
many developed economies, private finance has been making an increasingly
significant contribution to infrastructure development, in particular social
infrastructure, through public-private partnership (PPP)–type transactions. For
example, WEF (2010) quoting from a Pre- Budget Report presented to Parliament, by
the Chancellor of the Exchequer through Command of Her Majesty in 2009 assert that
in the United Kingdom - with the most highly developed PPP programs— the
government estimates that over UK£100 billion in private-sector investment has been
made in infrastructure in the last 10 years. Still on the global scene, Ernst and Young
(2007) suggest that global private investment in infrastructure was around US$1
trillion. WEF (2010) argue that if it is estimated that investment need is around US$3
trillion per annum globally, and private investment in infrastructure is around US$1
trillion, then the financing gap is in the region of US$2 trillion per annum as presented
in figure 2.
Figure 1: Investment commitments to infrastructure projects with private participation in developing
countries, by investment type (1990–2008). Source: World Bank, 2008.

Awodele et al.
336
Figure 2: Gap between need and private investment in infrastructure. Source: World Economic Forum
(WEF) (2010) Paving the way: Maximizing the Value of Private Finance in Infrastructure.
Having identified the annual investment need globally to be around 5 percent of
global GDP, or US$3 trillion (which is significantly above historical levels of
spending in many countries), it is then evidence that governments (Federal, State and
Local) will not be able to fund all infrastructure from the public purse without a
fundamental shift in budget priorities and/or an increase in taxation. This can be said
to explain the growing embrace of private sector involvement in infrastructure
development all over the world. What then is the situation of infrastructure finance in
Nigeria with special emphasis on Lagos a mega city in the country?
The situation with infrastructure in Nigeria has been a mix of daunting challenges and
boundless opportunities (Obozuwa, 2010). Although the country’s rich human and
material resources endowments gives the country potential to become Africa’s largest
economy and a major player in the global economy. However, mismanagement and
corruption have made that position to be a mirage for long. Today, there is a huge
infrastructure deficit which in turn has greatly constrained the country’s economic
growth and development, thus inhibiting the ability of the governments at all level in
the country to improve the quality of life of Nigerians. Insufficient funding by Federal
and state government is responsible for the dearth of infrastructure in Nigeria. For
example, the country’s proposed budget of N4.226trillion for year 2011 has a
projected deficit of 3.62% of the Gross Domestic Product (GDP) (Jonathan, 2010). In
the proposed budget, N542.38billion was earmarked for debt servicing, amount that is
more than 50 per cent of the amount set aside for capital projects (i.e. N1, 005.99
billion) in the budget. Moreover, other factors such as poor maintenance of the
available infrastructure, poor value for money, and over-pricing of infrastructure
among others account for the shortage of infrastructural facilities in the country.
Why the choice of market and not other infrastructure?
One may ask a question as to ‘why the choice of market project and not other
infrastructure’? The choice of market was informed by many reasons, ranging from
the importance of the infrastructure and the number of markets needed within the
Public private partnership
337
context of Lagos as a mega city as well as in Nigeria at large. Extant literature on
market development reveals that Investment in market development can be described
both as an investment in an economic institution, and also as investment in a multi-
functional institution associated with several non-economic aspects of any national
culture (Hodder, 1965, Vagale, 1974; Morgan and Walker, 1988; Guy, 1994 and
Coleman 2006). For instance, markets are part of a large, sophisticated and dynamic
industry tied into the economy of a country, its regions and districts (Coleman, 2006).
Markets reflect basic human activities, such as consuming and trading. Large
proportions of country’s workforce are employed in the retail industry. In the UK, for
example, 20% of the workforce is employed in the retail industry (British Council of
Shopping Centres Report, 2001). Aside from having socio- economic importance,
markets also serve as places where health information and religious information are
disseminated. Political rallies are also held in markets because of the strategic
location of most markets in the centre of cities, towns or villages (Awodele et al.,
2010).
In term of number needed in the country, presently in Lagos there are 389 markets and
mostly all of them are in state of disrepair. The existing facilities in some of these
markets can no longer cope with increasing population of the city. Furthermore,
borrowing from the experience of what is happening in United State of America
(USA) for example, where in the middle of the 20th
century, social and economic
circumstances have led to a dramatic growth in the number of suburban malls.
Coleman (2006) asserts that in 1945 there were only 45 malls across America, but this
has grew over sixty-fold to 2900 in 1958 a growth rate that averages over 200 new
suburban shopping centres opening a year. Some of the reasons he advanced as causes
of this dramatic expansion in the number of suburban malls were: (i) Population
growth (ii) restricted space for expansion in the urban cores (iii) universal spread of
car ownership (iv) traffic congestion in town centers (v) abundance of available and
accessible land, (vi) technology developments in ventilation, air-conditioning systems
and lighting. From the foregoing one can see the current number of markets/ shopping
centres in the country which is expected to grow considerably in the future if the
country economy is to be at par with USA economy in year 2020 as envisioned by
Nigeria government. In Lagos, the state government launched a crackdown on illegal
roadside trading and have started partnering with the private sector to construct
modern day markets. Many of these new facilities now incorporate other infrastructure
such as car parks, water supply, standby electricity and public toilets (e.g. Ikeja
Cantonment Ultra Modern Shopping Complex, Tejuosho Ultra Modern Market and
Balogun Market all in Lagos). Moreover, many of Nigeria’s markets are also being
upgraded to more modern and organised structures (e.g. Erekesan Ultra Modern
Market in Akure, Ondo State).
RESEARCH METHODOLOGY
Having reviewed extant literature on urbanisation, infrastructure challenges and
private participation in infrastructure development globally; primary data for the study
Awodele et al.
338
were collected through an in-depth investigation of a PPP market projects in Lagos.
Interviews were conducted with stakeholders on the privately financed (PF) market
projects (MPs) in the city to elicit information from them on the suitability and
acceptability of PPPs in market development in the country using their experience on
that PF MPs. A total of 6 in-depth interviews were conducted each lasting about 1hr
30minutes. The interviewees were selected from the three principal partners to the
project i.e. Lagos State government as public sector partner, ARM Properties Plc the
private partner and AZDEC ASC representing consultants. The choice of this market
project in the region was informed by the cultural and social value attached to the
market. The acceptability and suitability of PPPs in market development was gauged
using data drawing from multiple sources (such as archival records, documentation,
direct interviews with the stakeholders on that project) using the social, legal,
economic, environmental, political and technological (SLEEPT) analysis.
SLEEPT is a variant of PESTLE (i.e. Political, Economic, Sociological,
Technological, legal, Environmental) analysis, a tool that has been used extensively in
commercial organisations as part of the strategic development of a business and
marketing plan. Kotler (1998) claims that PESTLE is a useful strategic tool for
understanding market growth or decline, business position, potential and direction for
operations. He posits further that the tool provides a framework for reviewing a
situation, and can in addition to SWOT (Strengths, Weaknesses, Opportunities and
Threats) and Porter’s Five Forces models, be applied by companies to review a
strategic directions including marketing proposition. Cooper (2000) and Tsiakkiros
(2002) assert that PESTLE is just a framework that categorises environmental
influences as political, economic, sociological, technological, legal, environmental
forces and sometimes these themes can easily be subsumed in the other depending on
how they interplay with each other and the nature of the business. Cooper (2000)
affirms that the result of PESTLE analysis can be used to take advantage of
opportunity and to make contingency plans for threats when preparing business and
strategic plans.
Historically, SLEEPT mnemonic has been created by the Centre for Risk Management
Research (CRMR) at the University of Salford as a tool for separately identifying
drivers of a process or object (Eaton et al., 2007). The tool had been used to examine
the suitability of a UK PFI model within the Czech Republic, the republic of Ireland,
Palestine (Gaza-West Bank), Portugal and Turkey by Eaton et al., (2007). Moreover,
Rajput and Gunnigan (2010) used the methodology to compare Indian PPP
Construction Industry and European PPP Construction Industry. Therefore, the choice
of SLEEPT methodology was informed by these depths of usage by other researchers
and the claim of its usefulness; as a tool that help the understanding of the
environment in which business operates. The analysis was done with a view to
assessing the environment within Lagos, Nigeria. The assessment was then used to
determine the preparedness of governments at all levels to the use of PPP
arrangements and acceptability of PPPs in developing markets in the city. In the
study, no attempt is made to analyse the interdependency and co-dependency of the
SLEEPT components.
Furthermore, secondary data were sourced from the global competitiveness report
2010-2011. A report presented by WEF (2010) - that measure country’s institutional
environment; extensive and efficient infrastructure, stability of the macroeconomic
environment, health and primary education, quality higher education and training,
goods market efficiency, the efficiency and flexibility of the labour market, financial
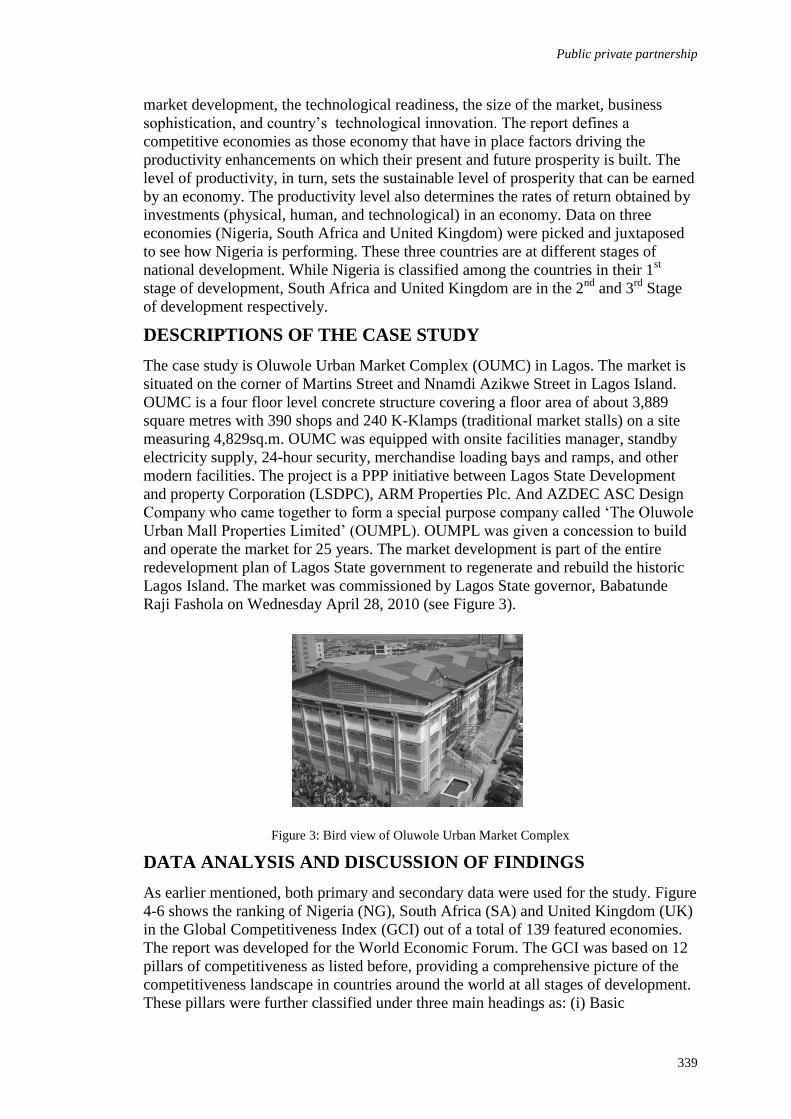
Public private partnership
339
market development, the technological readiness, the size of the market, business
sophistication, and country’s technological innovation. The report defines a
competitive economies as those economy that have in place factors driving the
productivity enhancements on which their present and future prosperity is built. The
level of productivity, in turn, sets the sustainable level of prosperity that can be earned
by an economy. The productivity level also determines the rates of return obtained by
investments (physical, human, and technological) in an economy. Data on three
economies (Nigeria, South Africa and United Kingdom) were picked and juxtaposed
to see how Nigeria is performing. These three countries are at different stages of
national development. While Nigeria is classified among the countries in their 1st
stage of development, South Africa and United Kingdom are in the 2nd
and 3rd
Stage
of development respectively.
DESCRIPTIONS OF THE CASE STUDY
The case study is Oluwole Urban Market Complex (OUMC) in Lagos. The market is
situated on the corner of Martins Street and Nnamdi Azikwe Street in Lagos Island.
OUMC is a four floor level concrete structure covering a floor area of about 3,889
square metres with 390 shops and 240 K-Klamps (traditional market stalls) on a site
measuring 4,829sq.m. OUMC was equipped with onsite facilities manager, standby
electricity supply, 24-hour security, merchandise loading bays and ramps, and other
modern facilities. The project is a PPP initiative between Lagos State Development
and property Corporation (LSDPC), ARM Properties Plc. And AZDEC ASC Design
Company who came together to form a special purpose company called ‘The Oluwole
Urban Mall Properties Limited’ (OUMPL). OUMPL was given a concession to build
and operate the market for 25 years. The market development is part of the entire
redevelopment plan of Lagos State government to regenerate and rebuild the historic
Lagos Island. The market was commissioned by Lagos State governor, Babatunde
Raji Fashola on Wednesday April 28, 2010 (see Figure 3).
Figure 3: Bird view of Oluwole Urban Market Complex
DATA ANALYSIS AND DISCUSSION OF FINDINGS
As earlier mentioned, both primary and secondary data were used for the study. Figure
4-6 shows the ranking of Nigeria (NG), South Africa (SA) and United Kingdom (UK)
in the Global Competitiveness Index (GCI) out of a total of 139 featured economies.
The report was developed for the World Economic Forum. The GCI was based on 12
pillars of competitiveness as listed before, providing a comprehensive picture of the
competitiveness landscape in countries around the world at all stages of development.
These pillars were further classified under three main headings as: (i) Basic

Awodele et al.
340
requirement (institutions, infrastructure, macroeconomic environment and health and
primary education),(ii) Efficiency Enhancers (higher education and training, goods
market efficiency, labour market efficiency, financial market development,
technological readiness, market size), and (iii) Innovation and sophistication(business
sophistication and innovation).
Analysis of secondary data
Figure 4: GCI ranking for 2010-2011, Basic Requirement.
Figure 4 shows ranking of the selected economies under basic requirements for a
competitive economy. While NG was ranked 127th
under institution, which represent
the legal and administrative framework within which individuals, firms, and
governments interact to generate income and wealth in the economy, SA was ranked
47th
and UK 17th
. In the same vein, under Infrastructure, NG was ranked 135th
, SA
63rd
and UK 8th
. Under stability of macroeconomic environment, NG has a ranking of
97th
while SA and UK has a ranking of 43rd
and 56th
respectively. Availability of
good health system and working primary education were also assessed, it is evident
from the figure that while NG was ranked 137th
, SA and UK were ranked 129th
and
19th
respectively.
Figure 5 and figure 6 equally present the ranking of these countries in the areas of
efficiency enhancers and business sophistication. The ranking of Nigeria under these
parameters especially technological readiness, innovation and business sophistication
was 104th
, 98th
and 76th
respectively. It was reported that the country will require
between $6 and $9 billion annually to these problem solve. In the GCI report, it was
argued that the deficit in infrastructure provision in NG is very much a significant
factor that contributed to the comparatively higher cost of doing business in the
country compared to SA and UK under review.
Figure 5: GCI ranking for 2010-2011, Efficiency enhancers
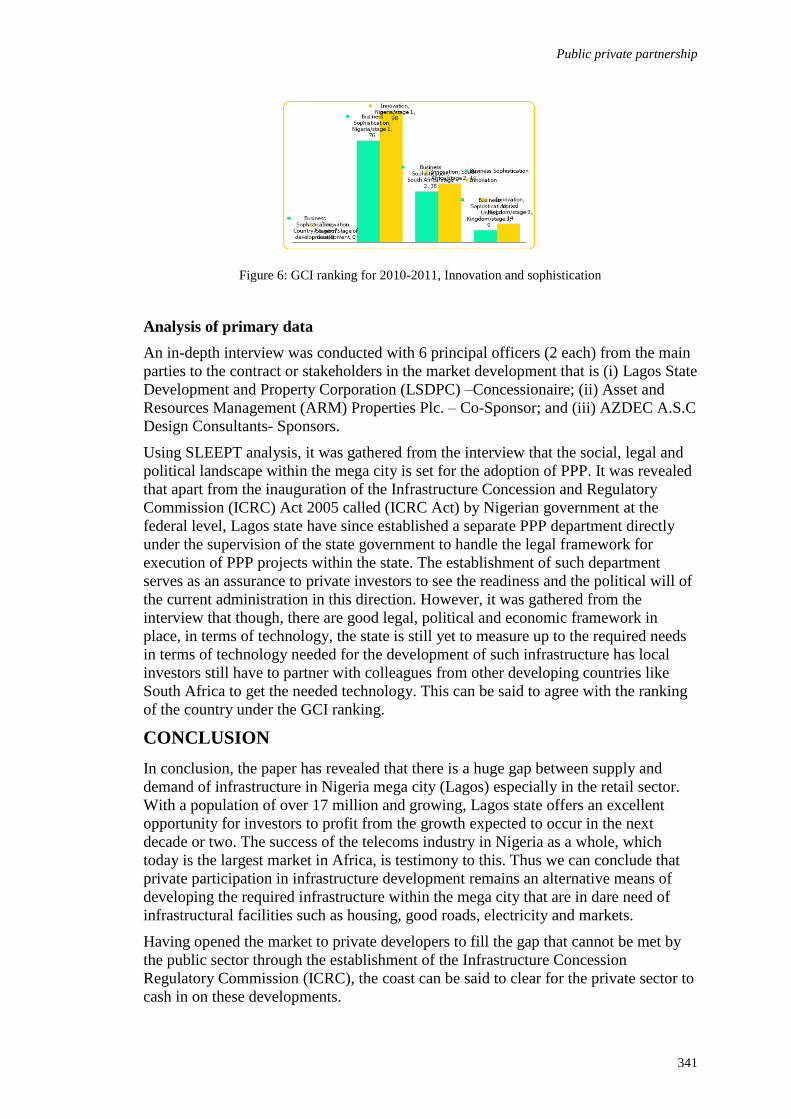
Public private partnership
341
Figure 6: GCI ranking for 2010-2011, Innovation and sophistication
Analysis of primary data
An in-depth interview was conducted with 6 principal officers (2 each) from the main
parties to the contract or stakeholders in the market development that is (i) Lagos State
Development and Property Corporation (LSDPC) –Concessionaire; (ii) Asset and
Resources Management (ARM) Properties Plc. – Co-Sponsor; and (iii) AZDEC A.S.C
Design Consultants- Sponsors.
Using SLEEPT analysis, it was gathered from the interview that the social, legal and
political landscape within the mega city is set for the adoption of PPP. It was revealed
that apart from the inauguration of the Infrastructure Concession and Regulatory
Commission (ICRC) Act 2005 called (ICRC Act) by Nigerian government at the
federal level, Lagos state have since established a separate PPP department directly
under the supervision of the state government to handle the legal framework for
execution of PPP projects within the state. The establishment of such department
serves as an assurance to private investors to see the readiness and the political will of
the current administration in this direction. However, it was gathered from the
interview that though, there are good legal, political and economic framework in
place, in terms of technology, the state is still yet to measure up to the required needs
in terms of technology needed for the development of such infrastructure has local
investors still have to partner with colleagues from other developing countries like
South Africa to get the needed technology. This can be said to agree with the ranking
of the country under the GCI ranking.
CONCLUSION
In conclusion, the paper has revealed that there is a huge gap between supply and
demand of infrastructure in Nigeria mega city (Lagos) especially in the retail sector.
With a population of over 17 million and growing, Lagos state offers an excellent
opportunity for investors to profit from the growth expected to occur in the next
decade or two. The success of the telecoms industry in Nigeria as a whole, which
today is the largest market in Africa, is testimony to this. Thus we can conclude that
private participation in infrastructure development remains an alternative means of
developing the required infrastructure within the mega city that are in dare need of
infrastructural facilities such as housing, good roads, electricity and markets.
Having opened the market to private developers to fill the gap that cannot be met by
the public sector through the establishment of the Infrastructure Concession
Regulatory Commission (ICRC), the coast can be said to clear for the private sector to
cash in on these developments.

Awodele et al.
342
However, much still needs to be done as the experience on previous PPP market
projects in the city has not been all that encouraging. This is not to say that the
adoption of PPP arrangements is a negative development, but the poor performance of
these projects has been as a result of short experience in PPP arrangements and the
lack of a risk management culture within the construction industry in Nigeria.
RECOMMENDATIONS
It is therefore recommended that government should develop an holistic framework
for attracting private investors to help in the development of these much needed
infrastructure as the public alone cannot provide the required fund for their
development. Moreover, public officers should be trained to have good
understanding of PPP concepts as most of the time their experience as a monitoring
officers are needed for the smooth execution of the partnering contracts. In the same
vein risk management concept should be integrated in the scheme so as to prevent the
occurrences of some surprises which are likely to occur and have disastrous impacts
on the project.
REFERENCES:
Akbiyikli, R. And Eaton, D. (2004), Risk Management in PFI procurement: A holistic
Approach. Paper presented at the proceedings of the 20th Annual Association of
Researchers in Construction Management (ARCOM) Conference, Heriot-Watt
University, Edinburgh, UK.
Bateman, J. (1995) Megacities, Geo Factsheet Number 37, pp. 1-5.
Clifford, Guy (1994) The Retail Development Process: Location, property and planning
Routledge, London.
Coleman, Peter (2006) Shopping Environments Evolution, Planning and Design, Architectural
Press, Elsevier Limited, Oxford, UK.
Cooper, L. (2000) Strategic marketing planning for radically new products, Journal of
marketing, 64(1), 1-15.
Debo, Adejana (2008), Real Estate Investment in Nigeria: The Lagos /Ogun Mega city
Project Available on http://deboadejana.com/2008/01/the-lagos-ogun-mega- city-
project/. Accessed on Wed. 16th March, 2011.
Eaton, D., Akbiyikli, R., Gunnigan, L., Kutanis, R.O., Casensky, M., Ladra, J. And Sawalhi,
N. (2007), An examination of the suitability of a UK PFI model within the Czech
Republic, the Republic of Ireland, Palestine (Gaza-West Bank), Portugal and Turkey.
Construction Innovation 7(1), 122-142.
Ernst and Young. (2007). “Investing in Global Infrastructure 2007: An Emerging Asset
Class.” Available at http://www.ey.com/ infrastructure.
Eriksson, P.E. and Westerberg, M. (2011) Effects of cooperative procurement procedures on
construction project performance: a conceptual framework. International Journal of
Project Management, 29(2), 197–208
Fashola B.R. (2007) A keynote address presented at the opening ceremony of the
international workshop on public private partnership initiative in Lagos State
on Monday 5th November, available
onhttp://www.fpppn.org/lagos_state_governor.html accessed on 26-08- 2010.

Public private partnership
343
Hodge, G. and C. Greve. 2008. ‘The PPP Phenomenon: Performance and Governance
Insights.’ In Collaborative Governance: A New Era in Public Policy in Australia? eds
J. O’Flynn and J. Wanna. Canberra: ANU E Press.
Hodder, B.W. (1965) Distribution of markets in Yoruba land, Scottish Geographical Journal,
81, (1), 48-58.
House of Commons International Development Committee (2009), Urbanisation and Poverty
http://www.publications.parliament.uk/pa/cm200809/cmselect/cmintdev/511/5
11i.pdf Accessed on Wed. 16th March, 2011.
Jamali, D. (2004), Success and failure mechanisms of public private partnerships (PPPs) in
developing countries Insights from the Lebanese context. International Journal of
Public Sector Management, 17(5), 414-430.
Kotler, P. (1998) Marketing Management-Analysis, Planning, Implementation, and Control,
9th Edition, Englewood Cliffs: Prentice- Hall.
Ling, Y.Y. and Hoang, V.T.P.(2010) Political, Economic, and Legal Risks Faced in
International Projects: Case Study of Vietnam Journal of Professional Issues in
Engineering Education and Practice, Vol. 136,(3), 156-164.
Ling, Y. Y. and Lim, H. K., (2007)“Foreign firms’ financial and economic risk in China.”
Eng., Constr., Archit. Manage., 14(4), 346–362.
Love, P., Skitmore, M. and Earl, G. (1998) Selecting a suitable procurement method for a
building project. Construction Management and Economics, 16(2), 221–33.
Mabogunje, A.L. (2008), The Challenges of Mobility within Nigeria’s Emerging Megacities.
A keynote address delivered at the maiden annual National Conference on Public
Transportation organised by the Lagos Metropolitan area authority on the theme:
“Integrated Transport System in Nigeria’s Emerging Megacities: Issues, Challenges
and Option” at the Lagos Sheraton Hotel and towers, Ikeja between 6th-8
th May.
Masinde, A.K and Musungu, T.A (2010) Financing Sustainability by Linking Urban Planning
to Capital Investment: The Case of Kenya, paper presented at the 46th International
Society of City and Regional Planners (ISOCARP) Congress, in Nairobi Kenya
between 19th - 23
rd September.
Morgan, P. and Walker, A. (1988) Retail Development, London: Estates Gazette
Murdoch, J. and Hughes, W. (2008) Construction Contracts: Law and Management, 4th ed.,
Taylor and Francis, Abingdon.
Nijkamp, P., Van der Burch, M., and Vidigni, G. (2002), A comparative institutional
evaluation of public private partnerships in Dutch urban land-use and revitalization
projects. Urban Studies, 39(10) 1865-1880.
ODI Briefing Paper No. 44. (“Opportunity and Exploitation in urban labour markets”).
Available on line http://www.odi.org.uk/resources/download/1969.pdf accesses
6th April,2011.
Organisation for Economic Co-operation and Development (OECD) (2006) Infrastructure to
2030: Telecom, Land Transport, Water and Electricity. Paris: OECD
OECD [Organisation for Economic Cooperation and Development]. 2008. Public-Private
Partnerships: In Pursuit of Risk Sharing and Value for Money. Paris: OECD.
Oyegoke, A. S. and Kiiras, J. (2009) Development and Application of the Specialist Task
Organisation Procurement Approach. Journal of Management in Engineering. 25(3),
131-142.

Awodele et al.
344
Pongsiri, N. (2002), Regulation and Public Private Partnerships. The International Journal of
Public Sector Management, 15(6) 487-495
Rahman, A.A. (2002), Poverty and Environment linkages: An emerging concern needs
Greater attention and focused action Newsletter of the International Human
Dimensions Programme on Global Environmental Change 4, 4-10.
Rajput, R. and Gunnigan, L. (2010) Comparison of Indian PPP Construction Industry and
European PPP Construction Industry: Process, Thresholds and Implementation.
Conference paper available on http:// arrow dit i.e /besch
Shafritz, J.M. and Hyde, A.C. (1997), Classics of Public Administration, 4th ed., Harcourt
Brace College Publishers, Orlando, FL.
Spackman, M. (2002), Public-private partnerships: Lessons from the British approach,
Economic Systems, Vol. 26, 283-301.
United Nation Department for Economic and Social Affairs (DESA) (2009d). "World
Population Prospects: The 2008 Revision". New York: Department for Economic and
Social Affairs.
World Bank. 2008. "PPI in Developing Countries Easy-to-Use Graphs on the 2008 Global
Update of the PPI Project Database." Public Private Infrastructure Advisory Facility.
Available at http://ppi.worldbank.org/
World Development Indicators database (2010) available on http://ddp-
ext.worldbank.org/ext/ddpreports/ViewSharedReport?&CF=&REPORT_ID=9
147&REQUEST_TYPE=VIEWADVANCED&HF=N/CPProfile.asp&WSP=
N accessed 13th February, 2012.

Ayeni, D.A. and Olalusi, C.A. (2011) Sustained beautification of Nigerian cities through landscaping:
The case of Akure In: Laryea, S., Agyepong, S.A., Leiringer, R. and Hughes, W. (Eds) Procs 4th West
Africa Built Environment Research (WABER) Conference, 24-26 July 2012, Abuja, Nigeria, 345-354.
345
SUSTAINED BEAUTIFICATION OF NIGERIAN CITIES
THROUGH LANDSCAPING: THE CASE OF AKURE
Dorcas A. Ayeni1 and Charles A. Olalusi
2
Department of Architecture, Federal University of Technology, Akure, Ondo State, Nigeria
Developing countries worldwide are characterised with high rate of urbanisation
which occurs as a result of several opportunities of wealth creations in cities. This
rapid growth has affected land use planning and poor environmental quality; where
inadequate planning for planting and city beautification is marked. This is particularly
true in the case of Nigeria where the urban sprawl or rapid growth has resulted in
many cities ecosystems being replaced by diverse development due to the misuse of
space; with the natural areas constantly being destroyed by man’s activities of
building, refuse dumps, squatter settlements and little being done about beautification
through landscaping. Of recent, many cities in Nigeria, are struggling to live up to the
challenges of beautification globally, and are calling for the reconstruction and
redevelopment of the disorders which emanated as a result of urbanization. This paper
examines recent landscape planning in Nigerian cities and further discussed the
ongoing construction and beautification in Akure, the Ondo State capital, Nigeria.
Unstructured face to face interview and observation methods of data collection was
used to gather information from those in authority, on the prospect of sustaining the
on going beautification. The paper concludes with suggestions on how beautification
through landscaping can be sustained.
Keywords: beautification, landscaping, Nigeria, sustainability
INTRODUCTION
In order to appreciate the concept of sustainability, it is crucially important to first
explore the concept of sustainable development. In view of the definition, sustainable
development is about meeting the needs of the present without compromising the
ability of future generations to meet their own needs (WCED, 1987; Hall, 2008;
Thompson et al, 2007). In view of this definition, Thompson et al, (2007) argued that
sustainability is meeting the needs of the present generation without diminishing the
ability of the future generation to meet their needs. Also, Gustafson et al, (2010) noted
that sustainability is based on the principles of sustainable development that
ecological, social and economical functions should be balanced in order to meet the
need of the future generations. Furthermore, Ilesanmi (2010), noted that, sustainability
attempts to achieve, simultaneously, the goals of an improved environment, a better
economy, a more just and participative society.
In the context of landscape, sustainability as argued by Leitao and Ahern (2002) is the
handling and conservation of natural resources to ensure the continuous satisfaction of
human needs for present and future generations. Ahianmba et al (2008) averred that
the physical environment is the most important part of the environment due to the fact
Ayeni and Olalusi
346
that the effects of organism, individual, community or population which are in direct
contact with it are visible and tangible. In this vein, Ozgen (2003) emphasised that
simply looking at beautiful surrounding can be inspiring and delightful; as such, good
landscaping is a powerful tool to achieve a pleasant environment (Dimuna, 2011) as
well as visual satisfaction and profound effect on psychological nature of man
(Dimuna, 2011).
As noted by Czepczynski (2008) and Ndubisi (2011), Landscaping is the art of
modifying and creating beautiful environment using various elements such as living
elements and man-made elements; It is a connection of exterior beauty and visual
arrangement of forms as well as the beautification of outdoor terrain through the
process of planting trees, flowers, shrubs and grasses. As also argued by Fadamiro
(2000), Landscaping is used for traffic control, softening of harsh Building, screening,
shading, and relief of bare spots and an integral contributor to the overall quality of
architectural environment (Adedeji, 2006). The scenic image, quality, and urban
aesthetics of a city depends on a well conceived master plan and these features,
quality landscaping and street furniture which also confers higher status on the
environment and urban aesthetics (Akingbohungbe, 2006). Unfortunately, many
Nigerian cities are faced with the challenges of defaulting in zoning, setbacks, and
even building along utility lines which has resulted to environmental degradation
Ahianmba et al (2008) While Fadamiro and Atolagbe (2006) attributes it to the misuse
and mismanagement of the urban open spaces. On the other hand, Oduwaye (1998)
argued that the neglect of landscape in the physical planning development in Nigeria
may be due to the pronounced problems such as poverty, congestion, unemployment
and poor housing.
The specific objective of this paper is to examine the recent landscape planning in
Nigerian cities and the ongoing construction and beautification in Akure, the Ondo
State capital, Nigeria. In order to suggest ways in which beautification through
landscaping can be sustained.
LANDSCAPE PLANNING IN NIGERIAN CITIES
It is generally acknowledged that cities contribute substantially to the national
economic growth and wealth (Olokesusi, 2011; Ogunsote et al, 2011). Also worthy to
note is the challenges that come with urban growth; such as slums formation,
uncontrolled urban sprawl, insecurity, limited access to basic infrastructure, pollution,
congestion, flooding and the lack of essential basic amenities (Ogunsote et al, 2011;
Ahianba et al, 2008). The unplanned and rapid urbanization has defaced many of the
Nigerian urban centres, causing environmental degradation.
As argued by Adeniji and Ogundiji (2009), as human societies develop, their
ecological and environmental influences increases steadily, which eventually results in
management problems and uncontrolled use and development of land (Uduma-Olugu
and Oduwaye, 2010). This has caused many to compete for available spaces along
major roads and environs for business and other purposes thereby lowering the quality
of many of the Nigerian cities. As argued by Aribigbola (2008), Nigerian cities are
known to be dirty and characterized by non functioning infrastructure facilities, dotted
with illegal structures and with the physical growth and development of the cities not
properly managed. Furthermore, Aribigbola (2008) suggests that these problems can
be controlled by having effective urban land control and management in tackling the
problems associated with urbanization in order to achieve sustainable city
development.
Landscaping
347
In view of the above and in order to meet up with modern standards and global
challenges in the area of beautification, efforts have been made by past and present
Government in Nigeria (Oduwaye, 1998) and significant efforts are still being made
by various State Government. Many of the States are embarking on the reconstruction
and beautification of state capitals with various landscaping elements. A city
landscape is made up of several soft and hard landscaping elements such as trees,
lawns, shrubs, flowers, fountains, paving, billboards, bus sheds, pedestrian bridges
etc; a combination of which adds value to the over all aesthetics. Chondhury in
Adedeji (2006) averred that appropriate and effective landscaping helps to improve
and maintain the functional, cultural and aesthetic values of the outdoor space. As
such providing landscaping elements play the role of beautification of cities.
Although, Oduwaye (1998) argued that, the major obstacle to landscape planning
development in Nigeria is largely economic, and the lack of public awareness of the
importance of landscaping. To this end, Ogundele (2010) suggests that if an effective
and sustainable public enlightenment programmes are embarked on, it would involve
the public which would in turn create a conducive and harmonious environment.
However, Nigerians are beginning to be aware of the need for landscaping in and
around the physical environment; as such major urban centres are currently
undergoing city beautification and reconstruction. Prominent among these are Lagos
State, Edo State, Rivers State and Ondo State, the study Area, to mention but a few.
Lagos state is situated in the southern part of Nigeria. The state was created in 1967
with its capital as Ikeja. In terms of the geographical area, it is the smallest state in
Nigeria, but population wise, it is the most populous and fastest growing city in
Nigeria (Ilesanmi, 2010; Olokesusi, 2011; Ogunsote et al, 2011), with a population of
about 18 Million (Lagos State Team, 2011) and projected by the United Nations
estimate that it will be over 25Million by the year 2015 (Olokesusi, 2011). With the
above population, Lagos is termed a mega city; a mega city is defined by UNCHS in
Ilesanmi (2010) as a continuous urbanized area with population of at least 10 Million
people.
The rapid urbanization, lead to the growth of Lagos metropolis without a plan
(Uduma-Olugu and Oduwaye, 2010) which gave rise to slums that played hosts to
unwholesome activities (Ogundare, 2010), ugly and unclean environment. However,
on assumption of office, the present Governor, Babatunde Fashola (SAN) took a bold
step by providing a decent environment through beautification and reconstruction of
the physical environment through citywide landscaping, which involved planting of
trees, grass, and shrubs along major roads, widening and redesigning of roads, street
lights, demolition of illegal structures etc. Lagos metropolis is being significantly
transformed and landscaping and beautification is on-going. The success and the
significant transformation in Lagos have geared so many other states into
redeveloping and beautifying at least the state capitals. In line with this, Akure, the
Ondo State capital is currently under going transformation, but how has the state
prepared in sustaining the changes taking place?
ON-GOING BEAUTIFICATION IN AKURE THE ONDO STATE
CAPITAL
Ondo State was created in 1976 (Aribigbola, 2008) from the western State, with
Akure as its state capital. It is located in the southern part of Nigeria and lies within
latitudes 5o 45’ and 80 15’ North and longitudes 4o 45’ and 5o 6’ East (Olajuyigbe

Ayeni and Olalusi
348
and Rotowa, 2011). The state is bounded by Osun, Edo, Kwara and Kogi states. The
population of Ondo State has grown from 2.6 Million in 1996 (Aribigbola, 2008) to
3.4 Million in 2006 (Olajuyigbe and Rotowa, 2011). The current population of akure
is 495,000 and expected to be 1.8 million by the year 2015. Akure keeps changing as
it continues to grow in population, all due to rapid urbanization and the city’s status as
the seat of both the local and State Governments and as Millennium Development
city; as such more people live in Akure than other towns in the states but not without
the attendant problems as mentioned earlier that come with urbanizations.
The environmental beautification of Ondo state, particularly, Akure the sate capital
was initiated by the present administration of Gov Olusegun Mimiko out of the desire
to transform Akure town into a modern city in order to attract investors and visitors
into the State. Part of the ongoing reconstruction and beautification include the
constructions of lay-bys, bus shelters, pedestrian walkways, dualisation of Arakale
road, the construction of new roads and rehabilitate the old roads, parking facilities,
greening, planting of trees, flowers, shrubs and general landscaping of the entire city,
channelisation of river courses and the drainage systems. Some of these projects are
completed while some are ongoing as shown in the pictures below;
Plate1: Showing Street and green along NEPA market Plate 2: Showing art works
on wall at NEPA market
Source: Researchers’ Field Survey, 2012. Source: Researchers’ Field Survey, 2012.
Plate 3 and 4: Old and Reconstructed Relaxation Area
Plate 5: Showing walkways along NEPA market road Plate 6: Showing a bus shelter along
Oba-Adesida road
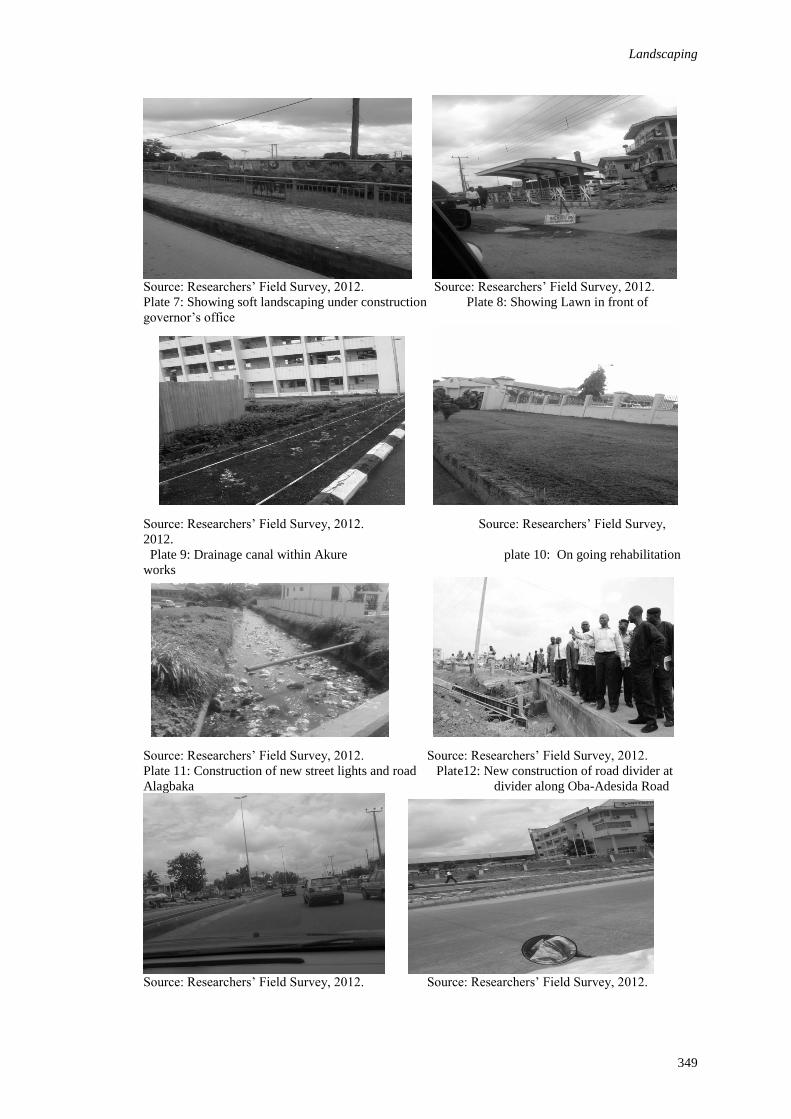
Landscaping
349
Source: Researchers’ Field Survey, 2012. Source: Researchers’ Field Survey, 2012.
Plate 7: Showing soft landscaping under construction Plate 8: Showing Lawn in front of
governor’s office
Source: Researchers’ Field Survey, 2012. Source: Researchers’ Field Survey,
2012.
Plate 9: Drainage canal within Akure plate 10: On going rehabilitation
works
Source: Researchers’ Field Survey, 2012. Source: Researchers’ Field Survey, 2012.
Plate 11: Construction of new street lights and road Plate12: New construction of road divider at
Alagbaka divider along Oba-Adesida Road
Source: Researchers’ Field Survey, 2012. Source: Researchers’ Field Survey, 2012.
Ayeni and Olalusi
350
RESEARCH METHODOLOGY
Qualitative data was collected using the observational and face to face interview
methods. Observational method involves making observations of behaviour and
systematically recording those observations in an objective manner in order to
describe the behaviour (Stangnor, 2011; Gravetter and Forzano, 2011). Observation is
a way of studying a group without affecting behaviour (experiment-resources.com)
and also as ‘the systematic description of events, behaviours and artefacts in the social
setting chosen for study (Kawulich, 2005).
The study used a direct observation of watching rather than taking part and be
unobtrusive as possible so as not to bias the observation. This method was used in
order to afford the researchers the opportunity to probe aspects not accessible by
interview. This study observed the constructions being carried out on various
landscaping sites within Akure town to get detailed information about the ongoing
beautification. And include walking around the construction sites and noting down the
types of landscaping and facilities being provided.
In order to identify the plans the government has on sustaining the beautification and
to discuss in more detail the area of landscaping and beautification, the face to face
semi-structured interview was conducted using the judgemental and snowballing
techniques on some selected government officials and construction workers in Akure.
A total of sixty people were interviewed at different times between the months of
November 2011 and January 2012. Some of the questions asked include plans put in
place for the management of the ongoing construction and beautification; the actions
the government is taking towards the sustainability and if there are funds set aside for
maintenance generally.
FINDINGS AND DISCUSSIONS
Analysis was based on researchers’ field notes from observation and interview
transcripts; done by reviewing what was witnessed and recorded. From the
observation, various landscaping features were used in the different sites visited as
noted and included both the soft landscaping features i.e. the animate and the hard
landscaping features i.e. the inanimate. As previously noted, beautification includes
amongst others, the process of planting trees, flowers, shrubs and grasses
(Czepczynski, 2008; Ndubuisi, 2011) and add value to the overall aesthetics of a city.
Some landscaping features observed on site like the Oba-Adesida road, Nepa market
leading to the government house and Alagbaka areas were lawn, shrubs, and trees.
And these can be categorised as soft landscape features. The use of plants in the
landscape will help minimise pollutants from the air, provide shades and also controls
erosion. Although, as at the time of visit, the sites were about forty percent completed
and work was still on going and an initial provision of constant watering was being
done. However, some of the plants used were not native and the soil was not tested
before use as admitted by most of the construction workers at site visits. This has the
implication of frequent watering and maintenance in order to avoid constant
replacement and on the long run cost is incurred. It is important in landscaping to use
healthy and long lived native plants to avoid constant maintenance and replacement.
One of the questions asked at the interview was the issue of sustainability. And
response from about ninety percent was that provision has been made for watering
until the rainy seasons, while the construction workers said they were only there to do
their job which they hope to sustain till they hand over to the government. This

Landscaping
351
implies that the issue of maintenance for sustainability has to be looked into.
Interviewees were not also aware if a body or committee has been set up for the
management of the city’s beautification and needs to be looked into as this will be of
benefit if done.
Other elements as observed and noted were the kerbs and paved walk paths
categorised as hard landscaping. These helps direct vehicular and pedestrian
movements as well as help reduce storm water run-offs and allow rain water to
infiltrate into the ground. They were mainly used along Oba-Adesida road, Alagbaka
and Nepa market areas and also forty percent completed as at the time of site visit and
on-going. Although, material being used were observed to be of standard and also the
concrete blinding for the kerbs were well done, however, the surface of the paved
walkways were not well compacted for even level. When interviewees were asked
about the sustainability of the features used, the interviewees affirmed that durable
and permeable materials are being used and are expected to last for a very long time.
On future funding for maintenance, most were not aware if fund will be set aside,
while some were sure the government will take into consideration the maintenance.
Bus shelters and street lights known as landscape amenities or street furniture were
also observed along Oba- Adesida road. These have also help in transforming the
streets into a unique and beautiful environment. As at the time of the study, job done
on the street furniture was about eighty five percent completed.
Bus shelters apart from beautifying the environment also serve as shelter for
passengers alighting or waiting to be commuted. From observation, standard materials
were used, with dampalon as roof covering and highly coated steel supports with
paint. Also, street lights, made with galvanized steel and supplied with stable power
supply of high voltage inverter adorn Oba-Adesida and Oyemekun Road. Many of the
interviewees believed that sustainable materials were used and were of the opinion
that the incumbent Government is trying its best by funding the projects and hope that
subsequent government would continue the laudable projects. Other features noted
were wall paintings, with art works along Nepa Market. This was one hundred percent
completed.
From the interaction with the interviewees, it appears there are no strategies put in
place for sustainability; while many also hoped that the maintenance culture in Nigeria
be improved. Sustainability of Akure beautification through landscaping must be
planned; keeping in mind the long term effects. Especially landscaping which must
balance both man-made and the natural elements bearing also in mind the
maintenance.
SUGGESTED WAYS THROUGH WHICH SUSTAINABLE CITY
BEAUTIFICATION THROUGH LANDSCAPING IN
NIGERIA CAN BE ACHIEVED
Sustainability is the ability to endure for a long time, and in line with the ethos of
sustainable development, meeting the need of the present without compromising the
ability of the future generation to meet their needs. Sustainability balances growth,
development and ecosystem and help to promote the quality of life of the people. In
the case of landscape, it include attractive environment which is in balance with the
local climate. As such, for the beatification of Akure to be sustainable, below are
some suggestions.
Ayeni and Olalusi
352
Plants used must be sustainable and should be plants that are native to the
environment and non invasive. Based on the direct observation as previously
mentioned; although a large percentage of indigenous plants were used, however, the
remaining that are not indigenous will need constant watering, maintenance and may
also need replacement at some point. By using native plants, the plants will tend to
adapt well to their environment, have the advantages to resists diseases and will need
less water. Using native plants will not need regular application of fertilizer and
pesticides to thrive and require minimal maintenance. However, the study suggests
that all plants used on the long run, need to be virtually pleasing, functional, cost
efficient and maintainable. As such, all landscaping features used will contribute
positively to the visual satisfaction and the psychological effects of the people.
Another area in which the beautification of Akure can be sustained is in the area of
management and maintenance. From the observation and interviews conducted in the
study, no plan has been put in place for management and maintenance. The
maintenance is currently being done by the contractors until completion after which
the work will be handed over to the government. The government need to involve
professional in order to maintain the standard and to avoid indiscriminate
development and dumping of refuse on roads common with some developing
countries as noted previously in the literature (Akingbohungbe, 2006; Ahianmba et al
2008; Fadamiro and Atolagbe (2006). Government should involve Professionals in the
built environment i.e. the Architects, Planners, Builders, Estate Managers and
Engineers and be made to utilise their skills in protecting the environment. This will
help protect the well being of the people both now and in the future.
As noted during the direct observation and the interview processes, there were no
other people on site such as volunteering groups with interest in planting, maintenance
and even as watch dogs other than workers from the contractors. People should be
encouraged to get involved at the various stages of the beautification. Involving the
various groups will further enhance the quality of life of the people; foster a sense of
belonging and create the spirit of community cohesion as well as protecting the
environment.
Also, in terms of the maintenance, some of the interviewees said that most of the local
people are indifferent about the on going beautification as many are more concern
with the prevailing level of poverty; as such need to be educated. Educating and
enlightening the public, through the mass media and the print; particularly the poor
majority on the importance and benefits of sustainability will help reduce unfriendly
environmental practices.
CONCLUSION
The study has demonstrated that through environmental beautification, the
environment is made to be more attractive and visually pleasing. At the same time,
unplanned growth and unhealthy environment are checked. The study revealed that
that for the beautification to be sustained there has to be strategies put in place
especially in the area of management and maintenance. Also revealed is the need for
the government to put in place appropriate funding strategies for the future. The study
further suggested ways in which the beautification can be sustained.
Landscaping
353
REFERENCES
Adedeji, Y. M. D. (2006). Outdoor Space Planning and Landscape Qualities of Religious
Centres in Akure, Nigeria. Inter-World Journal of Management And Development
Studies 2(1), 57 -67.
Adeniji, G., and Ogundiji, B. (2009). Climate Adaptation in Nigerian Cities: Regularising
Informal and Illegal Settlements in Ibadan. Paper presented at the Fifth Urban
Research Symposium 2009.
Ahianba, J. E., Dimuna, K. O., and Okogun, G. R. A. (2008). Built Environment Decay and
Urban Health in Nigeria. Human Ecology, 23(3), 259-265.
Ahimba, J. E., Dimuna, K. O., and Okogun, G. R. A. (2008). Built Environment Decay and
Urban Health in Nigeria. Human Ecology, 23(3), 259-265.
Akingbohungbe, D. O. (2006). Site Planning and Design for Contemporary Housing
Environment in Nigeria. Inter -World Journal of Science and Technology 3 (2), 156 -
161.
Arigbola, A. (2008). Improving Urban Land Use Planning and Management in Nigeria: The
Case of Akure. Theoretical and Empirical Researches in Urban Management, 3(9), 1-
14.
Czepczynski, M. (2008). Cultural Landscapes of Post-Socialist Cities. Burlington, Usa:
Ashgate Publishing Ltd.
Dimuna, K. O. (2011). The Social Effects of the Built Environment: A case Study of Selected
Buildings in Benin City. Human Ecology, 34(3), 189-196.
Experiment-Resource.com. (2012). How to choose from Different Research Methods.
Available from http://www.experiment-resources.com/different-research-
methods.html Accessed on 25/3/12
Fadamiro, J. A. (2000). Outdoor Spaces and Their Landscape Qualities: A Comparative
Analysis of Three Neighbourhoods in Lagos, Nigeria. Urban and Environmental
Research, 2(1), 55-67.
Fadamiro, J. A., and Atolagbe, A. M. O. (2006). Urban Environmental Sustainability: A
Challenge to Effective Landscaping In Nigeria. Dimensi Teknik Arsitektur, 34(1), 44-
51.
Gravetter, F. J. (2011). Research Methods for the Behavioural Sciences (4th ed.). Belmont,
USA: Wadsworth Cengage Learning.
Gustafson, S. W., Miller, K., and Zellers, R. (2010). Sustainability 'How to Guide Series' -
Sustainable Landscaping. Houston: IFMA Foundation.
Ilesanmi, A. O. (2010). Urban Sustainability in the context of Lagos Mega City. Geography
and Regional Planning, 3(10), 240-252.
Kawulich, B. B. (2005). Participant Observation as a data Collection Method. Qualitative
Social Research, 6(2), Art 43.
Leitao, A. B., and Ahern, J. (2002). Applying Ecological Concepts and Metrics In Sustainable
Landscape Planning. Landscape and Urban Planning, 59 (2), 65-93.
Ayeni and Olalusi
354
Ndubisi, N. O. (2011). Factorial and Discriminant Analyses of Environmental Sensitivity and
Initiative of Nigerian Firms. Thunderbird International Business Review 53(1), 19-36.
Oduwaye, A. O. (1998). Urban Landscape Planning Experience in Nigeria. Landscape and
Urban Planning, 43(1-3), 133-142.
Ogundare, T. (2010). Nigeria; Lagos Greenery-the People, the Benefits, Daily Champion, 6th
April, 2010.
Ogundele, O. (2011). Overview of Development Control: Challenges of Lagos. Paper
presented at the First National Conference of the Urban and Regional planning.
Theme Emerging Global Cities; the African Challenges. Feb 10th - 12th, 2010,
University of Lagos.
Ogunsote, O. O., Adedeji, Y. M. D., and Ogunsote, B. (2011). Combating Environmental
Degradation through Sustainable Landscaping in Emerging Mega Cities: A case
Study of Lagos, Nigeria. UIA 2011 Tokyo, 16-21.
Olajuyigbe , A. E., and Rotowa, O. O. (2011). Optimizing Physical Planning in the
Developing Countries – A Case Study of Ondo State, Nigeria. Journal of Sustainable
Development 4(4), 202-209.
Olukesusi, F. (2011). Lagos: The Challenges and Opportunities of an Emergent African Mega
City. Paper presented at the Paper presented at the NISER Seminar Series on 5 July,
2011.
Ozgen, S. (2003). Designing for Sustainable Tourism Development: Case Studies of Greek
Islands Paper presented at the 5th European Academy of Design Conference. Design
Wisdom. 28-30 April 2003, Barcelona. .
Stangnor, C. (2011). Research Methods for Behavioral Sciences (4th ed.). Belmont, USA:
Wadsworth Cengage Learning.
Thompson, W. Y., Sorvig, K., and Famsworth, C. D. (2007). Sustainable Landscape
Construction. A Guide to Green Building Outdoors. Washington: Island Press.
Uduma-Olugu, N., and Oduwaye, L. (2010). The Regeneration of Lagos Lagoon Waterfronts
for Recreation and Tourism. Paper presented at the Real Corp 2010, 18-20 May,
2010, Vienna.
WCED. ( 1987). World Commission on Environment And Development, Our Common
Future. Oxford. Oxford University Press.
Alinaitwe, H., Ayesiga, R. and Rugumayo, A. (2012) Success factors for implementation of private
public partnerships in the construction industry in Uganda In: Laryea, S., Agyepong, S.A., Leiringer,
R. and Hughes, W. (Eds) Procs 4th West Africa Built Environment Research (WABER) Conference, 24-
26 July 2012, Abuja, Nigeria, 355-365.
355
SUCCESS FACTORS FOR IMPLEMENTATION OF
PRIVATE PUBLIC PARTNERSHIPS IN THE
CONSTRUCTION INDUSTRY IN UGANDA
Henry Alinaitwe1, Robert Ayesiga and Albert Rugumayo
College of Engineering, Design, Art and Technology, Makerere University, P. O. Box 7062, Kampala,
Uganda
Developing countries like Uganda are in dire need of infrastructure development and
some countries are venturing into Private Public Partnerships (PPPs). In Uganda for
example, the ministry in charge of finance has been trying to find ways of
implementing projects funded using PPP arrangements. PPPs are risk sharing
investments in the provision of public goods and services, seen by governments as a
means to launch investment programs, which would not have been possible within the
available public-sector budget, within reasonable time. However, there is no in-depth
analysis of the critical factors that are likely to affect the success of PPP projects in
developing countries. The objective of the present paper is to address the
aforementioned gap and contribute to the knowledge base of success factors for PPP
projects in developing countries using Uganda as a base for data collection. Success
factors were identified from the literature and validated using interviews on the three
major stakeholders in the construction industry i.e. the contractors representing the
private sector, the financial institutions and government departments largely charged
with construction of facilities. Using questionnaire surveys, the various factors were
rated. The factors were then ranked using the Coefficient of Variation on importance
of the factors for each of the parties involved. Competitive procurement process, well
organized private sector, availability of competent personnel on PPP project
implementation, and good governance are the most important cross cutting factors
identified.
Keywords: private public partnerships, success factor, Uganda
INTRODUCTION
Developing countries like Uganda are in dire need of infrastructure development and
some countries are venturing into Private Public Partnerships (PPPs). The multi
objectives of PPPs (Bing et al., 2004), including promoting infrastructure
development, developing local economy, reducing costs, increasing construction and
operation efficiencies, and improving service quality by incorporating the private
sector’s knowledge, expertise and capital have drawn increasing interest from policy
makers, researchers and the industry practitioners. Governments believe that PPP
procurement can provide a wide variety of net benefits for society, including:
enhanced government capacity; innovation in delivering public services; reduction in
the cost and time of project implementation; and transfer of major risk to the private
sector, in order to secure value for money for taxpayers (Gruneberg et al., 2007, p.

Alinaitwe et al.
356
692). In Uganda for example, the ministry in charge of works and transport has been
yearning for development of PPP funded infrastructure projects and the government is
in the process of formulating policies and guidelines for implementation. Despite great
efforts to increase locally generated income to finance national activities for the
Nation’s Budget, full local budget financing has still remained a myth in Uganda.
Local income taxes still finance seventy five percent of the Uganda shilling 7.552
Trillion (approximately 2.8 billion United States Dollars) annual National Budget
(Ministry of Finance Planning and Economic Development, 2010) and there is a
backlog of infrastructure works to be undertaken. In Uganda, the government has been
financing the public infrastructure budget wholly while the private works are financed
by the private sector.
PPPs are risk sharing investments in the provision of public goods and services, seen
by governments as a means to launch investment programs, which would not have
been possible within the available public-sector budget, within reasonable time
(European Investment Bank, 2005). The Canadian Council for PPPs defines PPPs as
‘a cooperative venture between the public and private sectors, built on the expertise of
each partner that best meets clearly defined public needs through the appropriate
allocation of resources, risks and rewards (Grant, 1996). Each of the parties has its
own interests to accomplish from this “union for convenience”. In developed
countries, the involvement of the private sector in the development and financing of
public facilities and services has increased substantially over the past decade (Li et al.,
2005). For instance, many PPP projects in the United Kingdom and other developed
economies are regarded as successful, and the drivers of success have become a
subject for investigation (Qiao et al., 2001; Jefferies et al., 2002; Li et al., 2005).
However, less is known about the importance of the critical success factors (CSFs) for
successful implementation of PPP projects in developing countries. The objective of
the present paper is to address the aforementioned gap and contribute to the
knowledge base of critical success factors for PPP projects in developing countries
using Uganda as a base for data collection.
LITERATURE REVIEW
Akintoye et al. (2003) define PPPs as a long-term contractual arrangement between a
public sector agency and a private sector concern, whereby resources and risk are
shared for the purpose of developing a public facility. The principal aim of a PPP for
the public sector is to achieve value for money in the services provided while ensuring
that the private sector entities meet their contractual obligations properly and
efficiently (Grimsey and Lewis, 2002). Under PPP, the private sector provides more
favourable long term financing options than may be available to a government entity
and their secure the financing in a much quicker time frame (The National Council for
Public – Private Partnerships (NCPPP), 2003). Such contracts are long-term in nature
and typically 25-30 years. According to Mustafa (1999), PPPs address the common
faults that are associated with public sector procurement such as high construction
costs, construction overruns, operational inefficiencies, poor design, and community
dissatisfaction. One of the key features of the PPP which is appealing to the
government is the shift of project risks from the public sector to the consortium
involved with the project even though this requires a profit incentive to the project
consortium (Grimsey and Lewis, 2002). PPPs are being established as a cost effective
Private Public Partnership
357
method of overcoming costs associated with the provision and maintenance of
infrastructure. Duffield (2001) analysed the benefits of PPPs using the Australian
examples of the New Prisons Project in Victoria, New South Wales Schools Project
and Sydney’s Cross City Tunnel.
PPPs have multiple objectives including promoting infrastructure development,
developing the local economy, reducing costs, increasing construction and operation
efficiencies, and improving service quality by incorporating the private sector’s
knowledge, expertise and capital (Yuan et al., 2009). When PPP projects were first
launched in the UK, the government appeared to view them primarily as a way of
getting infrastructure costs of the public balance sheet, keeping investment levels up,
cutting public spending and avoiding the constraints of public sector borrowing limits
(Li et al., 2005). However, Li et al. (2005) argue that the impact of government
borrowing is much less significant than at first thought and that PPP is now seen as
essentially a new approach to risk allocation in public infrastructure projects. Li
(2003) demonstrates that the most disbenefits associated with PPP procurement are: a
lot of management time spent in the contract transaction, lengthy delays in negotiation
and high participation cost. Akintoye et al. (2001) found out that PPP procurement has
challenges of high cost of tendering, complex negotiation, cost restraints on
innovation, and differing or conflicting objectives among the project stakeholders.
According to HM Treasury (2000), there are different forms of PPPs the major ones
being: asset sales, wider market, sales of business, partnership companies, private
finance initiative (PFI), joint ventures, Build Own Operate and Transfer (BOOT),
investment partnerships and policy partnerships. The most commonly used PPP model
in the UK is the PFI (HM Treasury, 2000). The call for use of PPP in Uganda seems to
be based on the PFI model used in the United Kingdom. PFI is the most successful
and prolific form of PPP where the public sector contracts the private sector to provide
quality public services on a long-term basis, typically 25-30 years. It takes advantage
of private sector infrastructure delivery and service management skills, incentivized
by having private finance at risk. The private sector takes the responsibility and risks
for designing, financing, enhancing or constructing, maintaining and operating the
infrastructure assets to deliver the public service in accordance with the public sector's
output specification. The public sector pays for the project through a series of
performance or throughput related payments, including service delivery and return on
investment. Central Government may provide payment support to the public sector
through grants and other financial mechanisms (HM Treasury, 2000).
However, Harback et al., (1994) identified five pitfalls of PPPs as unfulfilled
expectations; un-finished business in which some elements of the partnering
arrangement are still in dispute; assumption that all parties involved in the partnering
are willing to share personal beliefs and thoughts; and adoption of a one-size- fits-all
approach to all projects. Despite this, many PPP/PFI projects have registered success,
and the drivers have become a subject for investigation (e.g. Keene, 1998; Qiao et al.,
2001; Jefferies et al., 2002).
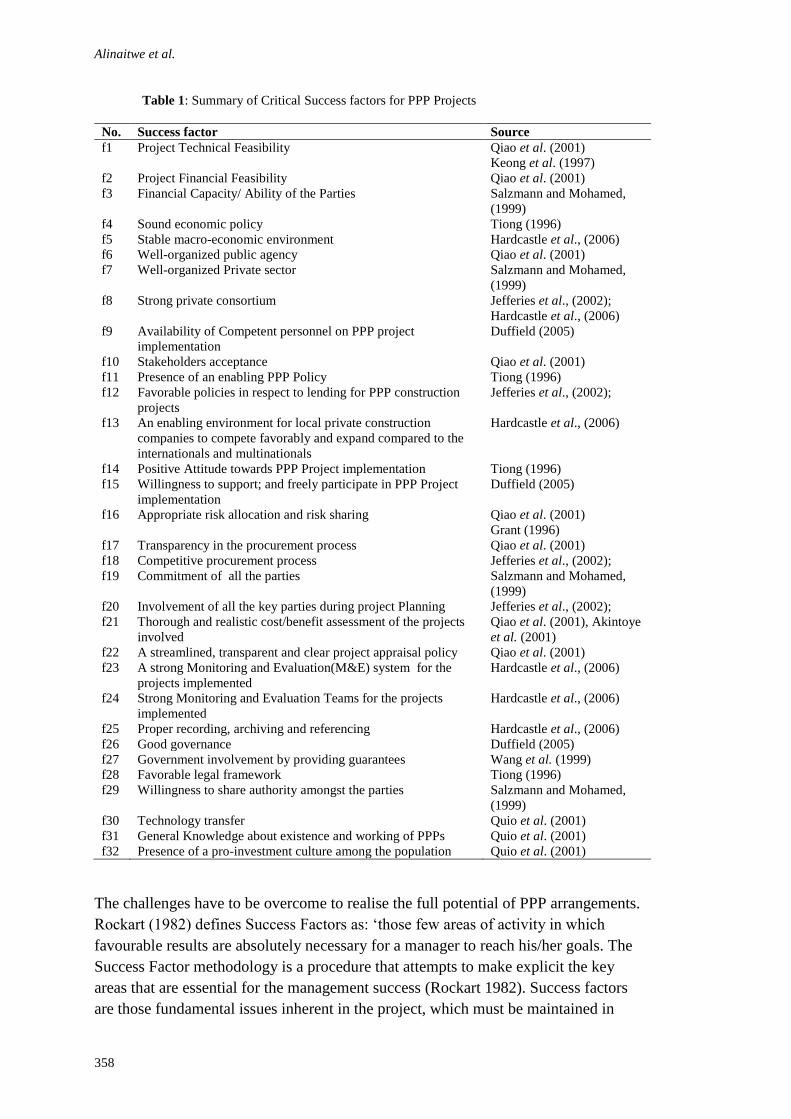
Alinaitwe et al.
358
Table 1: Summary of Critical Success factors for PPP Projects
No. Success factor Source
f1 Project Technical Feasibility Qiao et al. (2001)
Keong et al. (1997)
f2 Project Financial Feasibility Qiao et al. (2001)
f3 Financial Capacity/ Ability of the Parties Salzmann and Mohamed,
(1999)
f4 Sound economic policy Tiong (1996)
f5 Stable macro-economic environment Hardcastle et al., (2006)
f6 Well-organized public agency Qiao et al. (2001)
f7 Well-organized Private sector Salzmann and Mohamed,
(1999)
f8 Strong private consortium Jefferies et al., (2002);
Hardcastle et al., (2006)
f9 Availability of Competent personnel on PPP project
implementation
Duffield (2005)
f10 Stakeholders acceptance Qiao et al. (2001)
f11 Presence of an enabling PPP Policy Tiong (1996)
f12 Favorable policies in respect to lending for PPP construction
projects
Jefferies et al., (2002);
f13 An enabling environment for local private construction
companies to compete favorably and expand compared to the
internationals and multinationals
Hardcastle et al., (2006)
f14 Positive Attitude towards PPP Project implementation Tiong (1996)
f15 Willingness to support; and freely participate in PPP Project
implementation
Duffield (2005)
f16 Appropriate risk allocation and risk sharing Qiao et al. (2001)
Grant (1996)
f17 Transparency in the procurement process Qiao et al. (2001)
f18 Competitive procurement process Jefferies et al., (2002);
f19 Commitment of all the parties Salzmann and Mohamed,
(1999)
f20 Involvement of all the key parties during project Planning Jefferies et al., (2002);
f21 Thorough and realistic cost/benefit assessment of the projects
involved
Qiao et al. (2001), Akintoye
et al. (2001)
f22 A streamlined, transparent and clear project appraisal policy Qiao et al. (2001)
f23 A strong Monitoring and Evaluation(M&E) system for the
projects implemented
Hardcastle et al., (2006)
f24 Strong Monitoring and Evaluation Teams for the projects
implemented
Hardcastle et al., (2006)
f25 Proper recording, archiving and referencing Hardcastle et al., (2006)
f26 Good governance Duffield (2005)
f27 Government involvement by providing guarantees Wang et al. (1999)
f28 Favorable legal framework Tiong (1996)
f29 Willingness to share authority amongst the parties Salzmann and Mohamed,
(1999)
f30 Technology transfer Quio et al. (2001)
f31 General Knowledge about existence and working of PPPs Quio et al. (2001)
f32 Presence of a pro-investment culture among the population Quio et al. (2001)
The challenges have to be overcome to realise the full potential of PPP arrangements.
Rockart (1982) defines Success Factors as: ‘those few areas of activity in which
favourable results are absolutely necessary for a manager to reach his/her goals. The
Success Factor methodology is a procedure that attempts to make explicit the key
areas that are essential for the management success (Rockart 1982). Success factors
are those fundamental issues inherent in the project, which must be maintained in
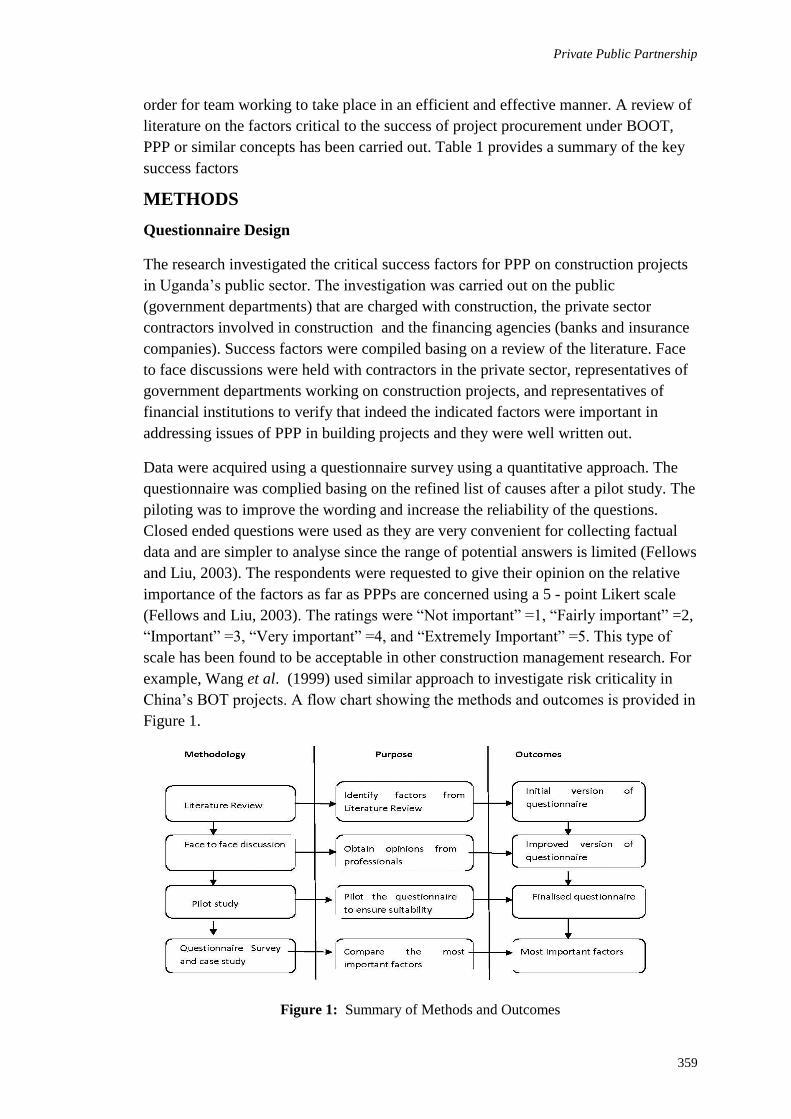
Private Public Partnership
359
order for team working to take place in an efficient and effective manner. A review of
literature on the factors critical to the success of project procurement under BOOT,
PPP or similar concepts has been carried out. Table 1 provides a summary of the key
success factors
METHODS
Questionnaire Design
The research investigated the critical success factors for PPP on construction projects
in Uganda’s public sector. The investigation was carried out on the public
(government departments) that are charged with construction, the private sector
contractors involved in construction and the financing agencies (banks and insurance
companies). Success factors were compiled basing on a review of the literature. Face
to face discussions were held with contractors in the private sector, representatives of
government departments working on construction projects, and representatives of
financial institutions to verify that indeed the indicated factors were important in
addressing issues of PPP in building projects and they were well written out.
Data were acquired using a questionnaire survey using a quantitative approach. The
questionnaire was complied basing on the refined list of causes after a pilot study. The
piloting was to improve the wording and increase the reliability of the questions.
Closed ended questions were used as they are very convenient for collecting factual
data and are simpler to analyse since the range of potential answers is limited (Fellows
and Liu, 2003). The respondents were requested to give their opinion on the relative
importance of the factors as far as PPPs are concerned using a 5 - point Likert scale
(Fellows and Liu, 2003). The ratings were “Not important” =1, “Fairly important” =2,
“Important” =3, “Very important” =4, and “Extremely Important” =5. This type of
scale has been found to be acceptable in other construction management research. For
example, Wang et al. (1999) used similar approach to investigate risk criticality in
China’s BOT projects. A flow chart showing the methods and outcomes is provided in
Figure 1.
Figure 1: Summary of Methods and Outcomes
Alinaitwe et al.
360
Surveys
Closed questions were mainly used for this research after considering the results of the
pilot studies. Field assistants were at hand to follow up the responses and also to
explain terms in the questionnaire just in case the respondents wanted clarification.
The respondents were requested to rank the 32 factors with regard to their importance
in PPPs. The key stakeholders targeted were the public sector, the private sector and
the financial institutions. Since the research was at policy level, respondents under this
category were limited to representatives of autonomous and semi autonomous
government departments and bodies that have a construction portfolio directly in their
operations as a core activity. A total of 41 government institutions and departments
were contacted. Since the research was more concerned with construction projects;
the private sector covered only Construction Contractors. There are so many
construction companies operating in Uganda but for long term PPP arrangements, it
was envisaged that government would deal with companies of repute and those that
are financially stable and capable of investing for mid-to long term durations. The
survey gathered data from chief executives of the largest building contractors who are
registered with the contractor’s association, Uganda National Association of Building
and Civil Engineering Contractors (UNABCEC). The selection of the biggest
contractors was based on the assumption that large and well established firms are
more capable of getting involved in PPP projects. It was decided that all those in
category A and A* be the source of potential participants. At the national level, one
recognized way of categorizing construction companies is by the UNABCEC class.
The classification from A to E takes into account the financial strength, size and
ability to carry out contracts. Those in class A are the biggest and undertake works of
the biggest magnitude and include some multinational companies. Owing to the
relatively small number of firms within these two categories A and A*, all the 42 civil
and building contractors in the two categories were targeted. A total of 41 financial
institutions including banks and insurance companies were contacted. Commercial
banks formed the majority followed by insurance firms. The other categories of
financial institutions including development banks and savings schemes were limited
both in numbers and accessibility. Because the research required medium to long
term durations of investments in big amounts of money, micro finance institutions
were excluded from this research. This was due to their shorter lending periods and
limited financial resources offered.
In all, 119 questionnaires were distributed and 98 were returned. Of these, 32
responses came from public sector organizations, 31 from the financial institutions
and 35 from the private sector. This was considered sufficient since for the case of
Public sector and financial institutions the populations could not be accurately
established. Responses of more than 30 were more than the minimum ten percent
required for descriptive research (Collis and Hussey, 2001). A summary of the
response rates is provided in Table 2.
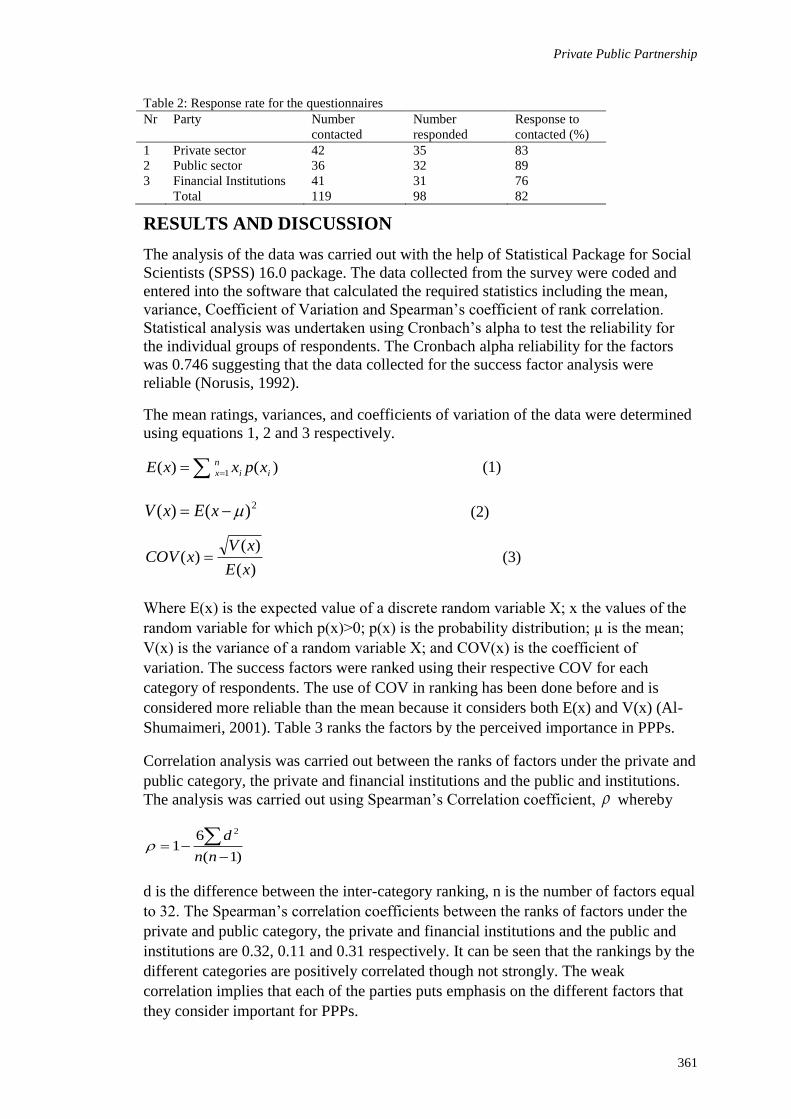
Private Public Partnership
361
Table 2: Response rate for the questionnaires
Nr Party Number
contacted
Number
responded
Response to
contacted (%)
1 Private sector 42 35 83
2 Public sector 36 32 89
3 Financial Institutions 41 31 76
Total 119 98 82
RESULTS AND DISCUSSION
The analysis of the data was carried out with the help of Statistical Package for Social
Scientists (SPSS) 16.0 package. The data collected from the survey were coded and
entered into the software that calculated the required statistics including the mean,
variance, Coefficient of Variation and Spearman’s coefficient of rank correlation.
Statistical analysis was undertaken using Cronbach’s alpha to test the reliability for
the individual groups of respondents. The Cronbach alpha reliability for the factors
was 0.746 suggesting that the data collected for the success factor analysis were
reliable (Norusis, 1992).
The mean ratings, variances, and coefficients of variation of the data were determined
using equations 1, 2 and 3 respectively.
)()( 1 ii
n
x xpxxE (1)
2)()( xExV (2)
)(
)()(
xE
xVxCOV (3)
Where E(x) is the expected value of a discrete random variable X; x the values of the
random variable for which p(x)>0; p(x) is the probability distribution; µ is the mean;
V(x) is the variance of a random variable X; and COV(x) is the coefficient of
variation. The success factors were ranked using their respective COV for each
category of respondents. The use of COV in ranking has been done before and is
considered more reliable than the mean because it considers both E(x) and V(x) (Al-
Shumaimeri, 2001). Table 3 ranks the factors by the perceived importance in PPPs.
Correlation analysis was carried out between the ranks of factors under the private and
public category, the private and financial institutions and the public and institutions.
The analysis was carried out using Spearman’s Correlation coefficient, whereby
)1(
61
2
nn
d
d is the difference between the inter-category ranking, n is the number of factors equal
to 32. The Spearman’s correlation coefficients between the ranks of factors under the
private and public category, the private and financial institutions and the public and
institutions are 0.32, 0.11 and 0.31 respectively. It can be seen that the rankings by the
different categories are positively correlated though not strongly. The weak
correlation implies that each of the parties puts emphasis on the different factors that
they consider important for PPPs.
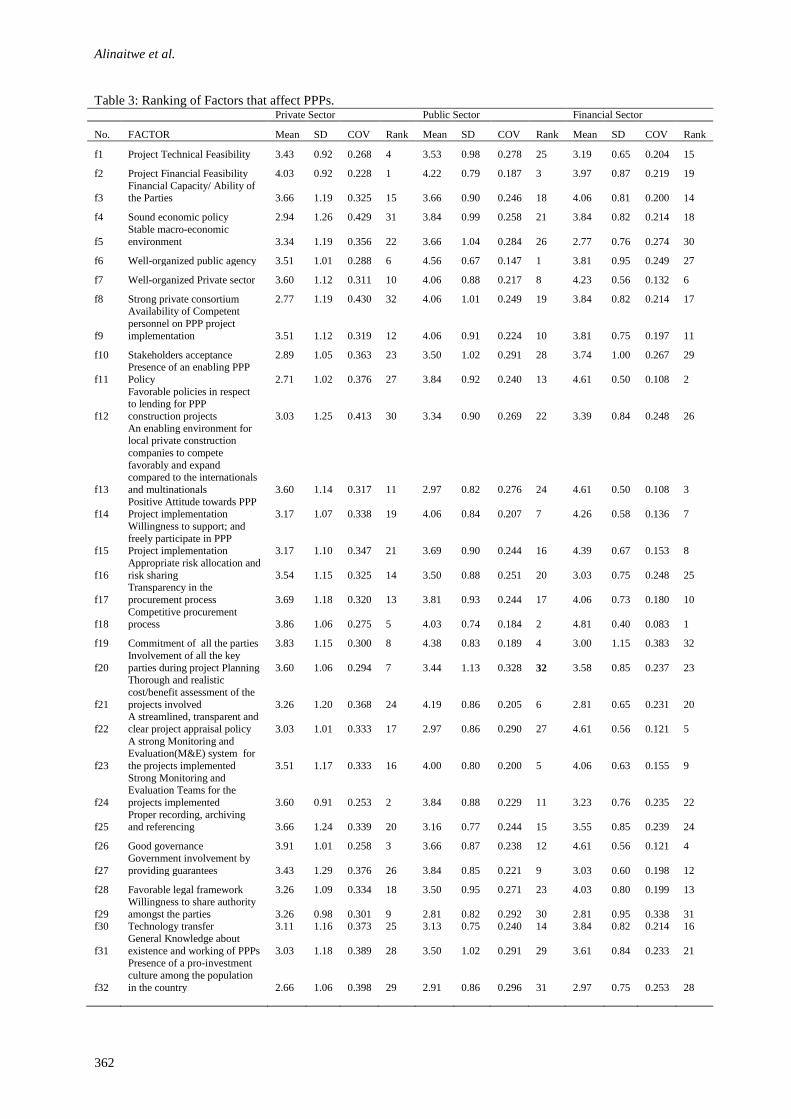
Alinaitwe et al.
362
Table 3: Ranking of Factors that affect PPPs.
Private Sector Public Sector Financial Sector
No. FACTOR Mean SD COV Rank Mean SD COV Rank Mean SD COV Rank
f1 Project Technical Feasibility 3.43 0.92 0.268 4 3.53 0.98 0.278 25 3.19 0.65 0.204 15
f2 Project Financial Feasibility 4.03 0.92 0.228 1 4.22 0.79 0.187 3 3.97 0.87 0.219 19
f3 Financial Capacity/ Ability of the Parties 3.66 1.19 0.325 15 3.66 0.90 0.246 18 4.06 0.81 0.200 14
f4 Sound economic policy 2.94 1.26 0.429 31 3.84 0.99 0.258 21 3.84 0.82 0.214 18
f5
Stable macro-economic
environment 3.34 1.19 0.356 22 3.66 1.04 0.284 26 2.77 0.76 0.274 30
f6 Well-organized public agency 3.51 1.01 0.288 6 4.56 0.67 0.147 1 3.81 0.95 0.249 27
f7 Well-organized Private sector 3.60 1.12 0.311 10 4.06 0.88 0.217 8 4.23 0.56 0.132 6
f8 Strong private consortium 2.77 1.19 0.430 32 4.06 1.01 0.249 19 3.84 0.82 0.214 17
f9
Availability of Competent
personnel on PPP project
implementation 3.51 1.12 0.319 12 4.06 0.91 0.224 10 3.81 0.75 0.197 11
f10 Stakeholders acceptance 2.89 1.05 0.363 23 3.50 1.02 0.291 28 3.74 1.00 0.267 29
f11
Presence of an enabling PPP
Policy 2.71 1.02 0.376 27 3.84 0.92 0.240 13 4.61 0.50 0.108 2
f12
Favorable policies in respect to lending for PPP
construction projects 3.03 1.25 0.413 30 3.34 0.90 0.269 22 3.39 0.84 0.248 26
f13
An enabling environment for local private construction
companies to compete
favorably and expand compared to the internationals
and multinationals 3.60 1.14 0.317 11 2.97 0.82 0.276 24 4.61 0.50 0.108 3
f14 Positive Attitude towards PPP Project implementation 3.17 1.07 0.338 19 4.06 0.84 0.207 7 4.26 0.58 0.136 7
f15
Willingness to support; and
freely participate in PPP Project implementation 3.17 1.10 0.347 21 3.69 0.90 0.244 16 4.39 0.67 0.153 8
f16
Appropriate risk allocation and
risk sharing 3.54 1.15 0.325 14 3.50 0.88 0.251 20 3.03 0.75 0.248 25
f17
Transparency in the
procurement process 3.69 1.18 0.320 13 3.81 0.93 0.244 17 4.06 0.73 0.180 10
f18 Competitive procurement process 3.86 1.06 0.275 5 4.03 0.74 0.184 2 4.81 0.40 0.083 1
f19 Commitment of all the parties 3.83 1.15 0.300 8 4.38 0.83 0.189 4 3.00 1.15 0.383 32
f20
Involvement of all the key
parties during project Planning 3.60 1.06 0.294 7 3.44 1.13 0.328 32 3.58 0.85 0.237 23
f21
Thorough and realistic
cost/benefit assessment of the
projects involved 3.26 1.20 0.368 24 4.19 0.86 0.205 6 2.81 0.65 0.231 20
f22
A streamlined, transparent and
clear project appraisal policy 3.03 1.01 0.333 17 2.97 0.86 0.290 27 4.61 0.56 0.121 5
f23
A strong Monitoring and Evaluation(M&E) system for
the projects implemented 3.51 1.17 0.333 16 4.00 0.80 0.200 5 4.06 0.63 0.155 9
f24
Strong Monitoring and Evaluation Teams for the
projects implemented 3.60 0.91 0.253 2 3.84 0.88 0.229 11 3.23 0.76 0.235 22
f25 Proper recording, archiving and referencing 3.66 1.24 0.339 20 3.16 0.77 0.244 15 3.55 0.85 0.239 24
f26 Good governance 3.91 1.01 0.258 3 3.66 0.87 0.238 12 4.61 0.56 0.121 4
f27
Government involvement by
providing guarantees 3.43 1.29 0.376 26 3.84 0.85 0.221 9 3.03 0.60 0.198 12
f28 Favorable legal framework 3.26 1.09 0.334 18 3.50 0.95 0.271 23 4.03 0.80 0.199 13
f29
Willingness to share authority
amongst the parties 3.26 0.98 0.301 9 2.81 0.82 0.292 30 2.81 0.95 0.338 31 f30 Technology transfer 3.11 1.16 0.373 25 3.13 0.75 0.240 14 3.84 0.82 0.214 16
f31
General Knowledge about
existence and working of PPPs 3.03 1.18 0.389 28 3.50 1.02 0.291 29 3.61 0.84 0.233 21
f32
Presence of a pro-investment
culture among the population
in the country 2.66 1.06 0.398 29 2.91 0.86 0.296 31 2.97 0.75 0.253 28

Private Public Partnership
363
From Table 3, it can be deduced that the five factors that are perceived to be of great
importance to the private sector are having: project financial feasibility; strong
monitoring and evaluation teams for the projects implemented; good governance;
project technical feasibility; and a competitive procurement process.
The five factors that are perceived to be of great importance to the public sector are:
well-organized public agency; competitive procurement process; project financial
feasibility; commitment of all the parties; and a strong monitoring and
evaluation(M&E) system for the projects implemented. Jefferies et al. (2002)
similarly posit that a well-organized public sector with a functional procurement
system is very crucial in PPP procurements. The five factors that are perceived to be
of great importance to the financial sector are: competitive procurement process;
presence of an enabling PPP policy; An enabling environment for local private
construction companies to compete favorably and expand compared to the
internationals and multinationals; good governance; and a streamlined, transparent and
clear project appraisal policy.
The common factors that are within the first twelve for each of the categories are:
competitive procurement process; well-organized private sector; availability of
competent personnel on PPP project implementation; and good governance.
CONCLUSION AND RECOMMENDATIONS
To the contractors and financial institutions operating in Uganda and to the
Government of Uganda, this study presents the factors and the importance of the
factors relevant to the implementation of PPP in Uganda. These factors are applicable
to construction industries in other developing countries. This study can be useful to
the stakeholders in different ways. First by identifying and evaluating the factors
affecting PPP projects, stakeholders intending to carry out PPP projects can focus
their attention and optimize the resources on the real issues. Second, by assessing the
importance of the factors, stakeholders can prioritize them in addressing the concerns.
Moreover, the study sets the foundation for further analysis of the factors. This will
enable those intending to carry out PPP projects in developing countries to get more
insights and better chances of carrying of PPP projects successfully. In that way, the
construction industries in developing countries will improve their performance. The
findings are important to contractors and consultants, policy makers and researchers in
the construction industry. The major challenge is how the players can be put to work
together considering the fragmentation of construction in Uganda.
REFERENCES
Akintoye, A., Beck, M. and Hardcastle, C. (2003), Public-Private Partnerships: Managing
Risks and Opportunities, Blackwell Science, Oxford.
Akintoye, A., Beck, M., Hardcastle, C., Chinyio, E. and Ansenova, D. (2001) Framework for
Risk Assessment and Management of Private Finance Initiative projects, Glasgow
Caledonian University, Scotland.
Alinaitwe et al.
364
Al-Shumaimeri, A. A. (2001) The services quality of post in Saudi Arabia. Public
Administration Journal, 41(2): 265–302.
Bing, L., Akintoye, A., Edwards, P. J. And Hardcastle, C. (2004) Critical success factors for
PPP/PFI projects in the UK construction industry. Construction Management and
Economics, 23, 459 – 471.
Collis, J. and Hussey, R. (2003) Business Research: A practical guide for undergraduate and
Post graduate students. 2nd
ed, Palgrave Macmillan, Basingstoke, UK.
Duffield, C.F. (2001), “An evaluation framework for privately funded infrastructure projects
in Australia”, unpublished PhD thesis, Department of Civil and Environmental
Engineering, University of Melbourne, Melbourne.
European Investment Bank (2005) Evaluation of PPP Projects funded by the EIB, EIB
Publications, available at http://www.eib.org/projects/publications/evaluation-of-ppp-
projects-financed-by-the-eib.htm
Fellows, R and Liu, A (2003), Research methods for construction, 2nd
ed. Oxford: Blackwell
science.
Grant, T. (1996) Keys to successful public-private partnerships. Canadian Business Review,
23(3), 27-8
Grimsey, D. and Lewis, M.K. (2002), “Evaluating the risks of public private partnerships for
infrastructure projects”, International Journal of Project Management, 20(2), 107-18.
Gruneberg, S., Hughes, W. and Ancell, D. (2007) Risk under performance-based contracting
in the UK construction sector. Construction Management and Economics, 25, 691–9.
Harback, H.F., Basham, D.L. and Buhts, E.R. (1994) Partnering paradigm. Journal of
Management in Engineering, January/February, 23–7.
Hardcastle, C. Edwards, P. J., Akintoye, A. and Li, B. (2006) Critical success factors for
PPP/PFI projects in the UK construction industry, a critical factor analysis approach,
in Ng T. S. (eds) Public Private Partnerships: Opportunities and challenges. Centre
for infrastructure and construction industry development, University of Hong Kong,
pp 75 – 83.
HM Treasury (2000) Public Private partnerships – the Government’s approach, HM
Treasury, London.
Jefferies, M.C., Gameson, R. and Rowlinson, S. (2002), “Critical success factors of the BOOT
procurement system: reflections from the stadium Australia case study”, Engineering,
Construction and Architectural Management, Vol. 9 No. 4, pp. 352-61.
Keene, W.O. (1998) Reengineering public–private partnerships through shared-interest
ventures. The Financier, 5(2&3), 55–9.
Keong, C.H., Tiong, R.L.K. and Alum, J. (1997), “Conditions for successful privately
initiated infrastructure projects”, Proceedings of the Institution of Civil Engineers,
Civil Engineering, Vol. 120, May, pp. 59-65.
Li, B. (2003) Risk management of PPP projects. Unpublished PhD thesis. School of the built
and natural environment. Glasgow Caledonian University. Glasgow, Scotland.
Li, B., Akintoye, A., Edwards, P. J. and Hardcastle, C. (2005) Critical success factors for
PPP/PFI projects in the UK construction industry. Construction Management and
Economics, 23, 459-471.
Ministry of Finance Planning and Economic Development (MOFPED), (2010) Government of
Uganda Budget 2011/12, Kampala, Uganda.

Private Public Partnership
365
Mustafa, A. (1999), “Public-private partnership: an alternative institutional model for
implementing the private finance initiative in the provision of transport
infrastructure”, Journal of Project Finance, 5, 64-79.
NCPPP (2003), NCPPP White Paper, The National Council for Public-Private Partnerships,
Washington, DC.
Norusis, M. J. (1992) SPSS for Windows, Professional Statistics, Release 5, SPSS Inc.,
Chicago.
Qiao, L., Wang, S. Q., Tiong, R.L.K. and Chan, T. S. (2001) Framework for critical success
factors of BOT projects in China. Journal of Project Finance, 7(1), 53 – 61.
Rockart, M. (1982) Factors affecting business growth. New York: Wiley.
Salzmann, A. and Mohamed, S. (1999), “Risk identification frameworks for international
BOOT projects”, in Ogunlana, S. (Ed.), Profitable Partnering in Construction
Procurement, CIBW92 Publication 224, pp. 475-85.
Stonehouse, J. H., Hudson, A. R. and O’keefe, M. J. (1996) Public-private partnerships: the
Toronto Hospital experience. Canadian Business Review, 23(2), 17-20.
Tiong, R. L K. (1996) CSFs in competitive tendering and negotiation model of BOT projects.
Journal of Construction Engineering and Management, ASCE, 122(3), 205 – 211.
Wang, S. Q., Tiong, R. L. K., Ting, S. K. and Ashley, D. (1999) Risk management framework
for BOT power projects in China. Journal of Project Finance, 4(4), 56 – 67.
Yuan, J., Zeng, A. Y., Skibniewski, M. J. and Li, Q. (2009) Selection of performance
objectives and key performance indicators in public-private partnership projects to
achieve value for money. Construction Management and Economics, 27, 253 – 270.

Chukwu, K.E and Uwadiegwu, B.O. (2012) Assessment and management of stormwater drainage
facilities in residential areas of Enugu city In: Laryea, S., Agyepong, S.A., Leiringer, R. and Hughes,
W. (Eds) Procs 4th West Africa Built Environment Research (WABER) Conference, 24-26 July 2012,
Abuja, Nigeria, 367-375.
367
ASSESSMENT AND MANAGEMENT OF
STORMWATER DRAINAGE FACILITIES IN
RESIDENTIAL AREAS OF ENUGU CITY
Kevin Ejike Chukwu1 and B. O. Uwadiegwu
2
Department of geography and meteorology, Enugu state university of science and technology, Nigeria
Department of environmental management, Nnamdi Azikiwe University, Nigeria
The objectives of this paper are to assess the quality of artificial drainage facilities in
residential premises of Enugu city and profer appropriate strategies for managing
them. An appraisal technique, which employs a checklist of seven simple
classifications of specified qualities, is utilized to achieve the aim. In this approach
percentage penalty points (Pp) are assigned to drainage facilities having observable
defects. A total of 366 drains in 20 residential areas of the city are appraised. The
poorest condition of drainage system is observed in Ogui Urban area with the highest
penalty points of 88% followed by Abakpa with 87.5% penalty. Only three layouts
(Ekulu, G.R.A, and Independence Layout) have less than 25% penalty points rated as
good condition of drainage. None of the residential areas in the city has excellent
drainage facilities as none scored less than 10% penalty. A more integrative
legislation on urban land use planning and management to protect the drainage
facilities against dysfunctional uses or abuse and a comprehensive urban drainage
system network coupled with proper maintenance (inspection, regular schedule of
cleaning blocked drains and repair) are strongly recommended to prevent the
hydrological consequences of unregulated storm water drainage construction in the
residential layouts of Enugu city.
Keynote: appraisal technique, drainage facility, inspection, maintenance, stormwater
INTRODUCTION
The goal of providing storm water drainage facilities in an urban environment is the
efficient disposal of the resulting surface runoff from the built up environment. Since
the approaches to designing of city drainage facilities are becoming increasingly
sophisticated, an urgent need has therefore arisen in urban hydrology and planning to
develop a more rigorous technique in assessing, managing and maintaining the quality
of the city drainage facilities in urban areas (Annan, 2001; Chukwu, 1995; 2002;
2004; DFID, 2007; Nnodu, 2008). The development of tools of analysis for urban
drainage facilities has gone beyond the filed measurement base that supports their
validity. McPherson (1981) and Chukwu (1995; 2002; 2010) have therefore
recognized the need in every part of the globe for more field observations from
representative and experimental urban areas to improve the reliability of such
analytical techniques of drainage systems.
Chukwu and Uwadiegwu
368
When a rural area becomes urbanized, the amount of pavements, artificial drainage
network and houses (the built up environment) increases with attendant increase in the
density of population (Chukwu, 2004; 2010). The stream flow in the natural drainage
systems of the city comprises four main components, viz channel precipitation,
overland flow, interflow (or through flow) and the base flow (Essagha, 2004; DFID,
2007; Chukwu, 1995; 2010). A lot of work has been done on overland flow and
flooding, the only components most likely to respond quickly to artificial drainage
systems in built up environment (McPherson, 1981; Hall, 1984; Ebisemiju, 1989;
Essagha, 2004; Chukwu 1995; 2004). In contrast, little work has been done on the
prevailing conditions and management status of the urban drainage facilities, which
influence the volume of discharge and rates of peak flow in populous urban centers.
These drainage facilities therefore require an investigation into their current features.
As a result, this calls for the adoption of an appraisal technique to assess the physical
quality of the drainage facilities in urban settlements to ascertain their prevailing
maintenance and management status. The objectives of this work are set against this
research problem in order to close the research gap.
AIMS AND OBJECTIVES OF THE PAPER
The broad aims of this work are to assess the quality characteristics of the drainage
facilities and explore appropriate management and maintenance strategies to
be adopted for their efficient services. To achieve these twin aims, the specific
objectives are designed to:
i. Evaluate the numerical strength and types of the drainage facilities in
various streets of Enugu city.
ii. Assess the current quality and maintenance status of the existing drainage
facilities in Enugu city.
iii. Explore appropriate strategies for the management and maintenance of the
drainage facilities in Enugu city.
DESCRIPTION OF THE STUDY AREA
Enugu, the political and administrative headquarters of Enugu State in Nigeria, covers
a latitudinal extent of 602’ to 6
030’N and longitudes of 7
026’ to 7
037’E. It occupies a
land area of about 182lm2.
The Enugu escarpment in the western part of the city is part of Nsukka-Okigwe cuesta
(Ofomata, 2002). Though this upland rises to a peak of about 450m above sea level in
Enugu city, which lies at the foot of the eastern escarpment at a height of about 230m
(a.s.l). the relief is characterized by groups of dome shaped and flat-topped residual
hills and ridges forming saucer shaped depressions in some places. As a result of the
constraints posed by the rugged scarpland on development westward, the direction of
urban expansion is southward towards Agbani and eastward towards Abakaliki
(Onokala, 1981; Chukwu 2004).
The scarp slopes which formed the eastern edge of the Enugu escarpment are heavily
dissected by headwaters of six main streams, which drain the entire city and flow in
the direction of low gradient more or less eastward into the Cross River plain . These
streams are Nyaba river (a sixth and the highest segment order), Ekulu river (a fifth
order), Idaw and Asata rivers (both, fourth order), Ogbete (third order) and Aria River
(second order). The stream orders, numbers and bifurcation ratios in the city are
shown on Tables 1 and 2.
Stormwater drainage facilities
369
A stream order is determined by the number of other lower stream tributaries which
flow into it. Bifurcation ratio refers to the ratio between the number of a given stream
order to the number of the next higher order. The first stream order therefore does not
have a value.
Table 1: Streams orders, numbers and bifurcation ratios in Enugu city of Nyaba drainage basin.
Stream Order (U) Number of Stream Bifurcation Ratios
1 154 -
2 52 2.96
3 9 5.78
4 4 2.25
5 2 2.00
6 1 2.00
(Source: Chukwu, 2004)
Table 2: Stream segment orders in Enugu city (Strahler system) of Nyaba drainage basin
S/N Name of Stream Stream order
1 Aria 1st
2 Ogbete 2nd
3 Asata 3rd
4 Idaw 4th
5 Ekulu 5th
6 Nyaba 6th
(Source: Chukwu, 2004)
These natural streams form the potential outfall for the urban storm water drainage
eastward of the city. The rainfall received in Enugu city is mainly of convective type.
The onset and cessation of the wet season in the city are characterized by violent
squalls and thunderstorms. The wet season (which is ushered in by the tropical
maritime air mass) lasts from mid March to October with double maxima in June/July
and September/October. The dry season is brought in by the tropical continental air
mass and it lasts from November to early March inclusive. Annual rainfall is heavy,
about 1800mm, most of which is received during the wet season. Temperature ranges
between 250C in mid wet season to about 30
0C before the on-set of the rainy season.
Thus, Enugu city is in the Koppen’s humid tropical (Aw) wet dry climate (Chukwu,
2004).
The estimated population of the city by 2010 has exceeded the 0.8 million mark
(actually 878,403 people) with high densities of about 400 persons/sq.km in some
places. These peculiar characteristics of the city call for the adoption of objective
method in appraising and maintaining the quality of the drainage facilities.
THE RESEARCH METHODOLOGY
The research design is partly survey and partly experimental. An appraisal technique
is utilized in the analysis in order to prevent bias. This technique has been utilized by
urban geographers in assessing the physical environmental quality of facilities in
residential premises of cities (Quigley 1975; Sule 1980; Chukwu 2002; 2004). In this
technique, a checklist of specified qualities, which yields seven simple classifications
for the appraisal of the current state of 366 storm water drainage facilities in 20
residential areas of the city is employed. The stratified random sampling technique is
applied in selecting the sample size. The classes are shown on Table 3. In this
approach, penalty points (in percentage) are assigned to the artificial drainage
channels having observable defects. These are numbered under classes 01, 04, 05, 06
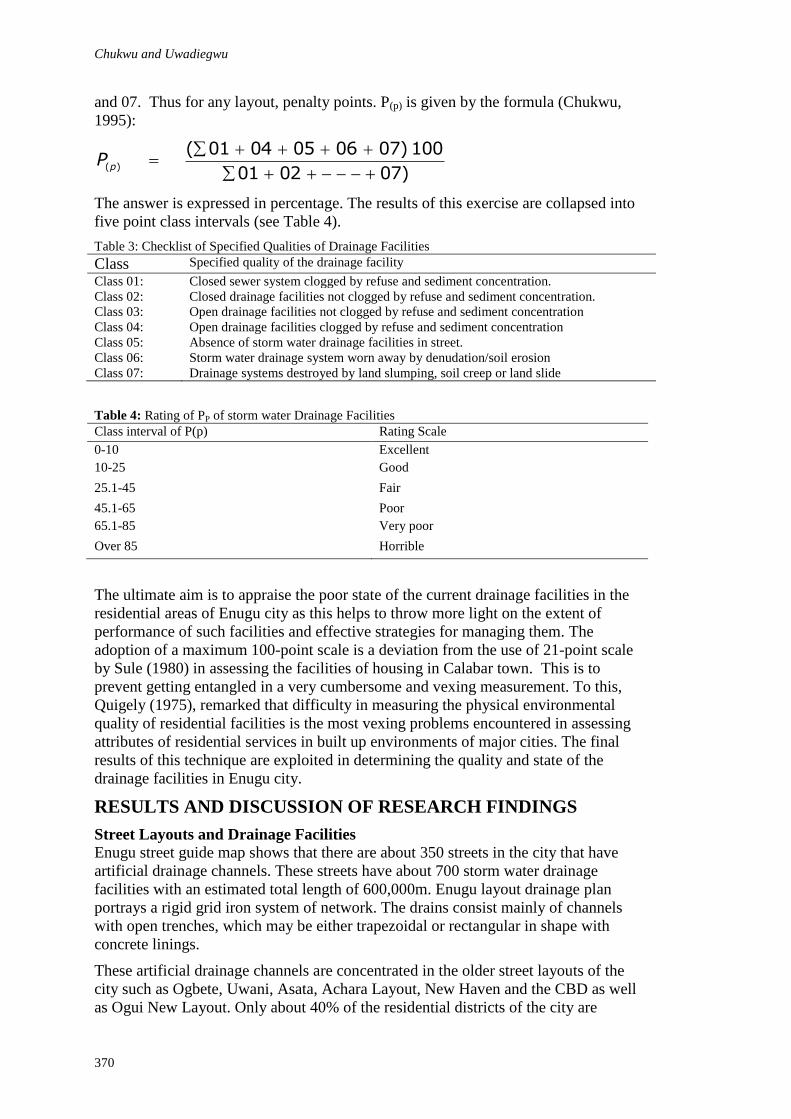
Chukwu and Uwadiegwu
370
and 07. Thus for any layout, penalty points. P(p) is given by the formula (Chukwu,
1995):
)070201
100)0706050401()(
pP
The answer is expressed in percentage. The results of this exercise are collapsed into
five point class intervals (see Table 4).
Table 3: Checklist of Specified Qualities of Drainage Facilities
Class Specified quality of the drainage facility
Class 01: Closed sewer system clogged by refuse and sediment concentration.
Class 02: Closed drainage facilities not clogged by refuse and sediment concentration.
Class 03: Open drainage facilities not clogged by refuse and sediment concentration
Class 04: Open drainage facilities clogged by refuse and sediment concentration
Class 05: Absence of storm water drainage facilities in street.
Class 06: Storm water drainage system worn away by denudation/soil erosion
Class 07: Drainage systems destroyed by land slumping, soil creep or land slide
Table 4: Rating of PP of storm water Drainage Facilities
Class interval of P(p) Rating Scale
0-10 Excellent
10-25 Good
25.1-45 Fair
45.1-65 Poor
65.1-85 Very poor
Over 85 Horrible
The ultimate aim is to appraise the poor state of the current drainage facilities in the
residential areas of Enugu city as this helps to throw more light on the extent of
performance of such facilities and effective strategies for managing them. The
adoption of a maximum 100-point scale is a deviation from the use of 21-point scale
by Sule (1980) in assessing the facilities of housing in Calabar town. This is to
prevent getting entangled in a very cumbersome and vexing measurement. To this,
Quigely (1975), remarked that difficulty in measuring the physical environmental
quality of residential facilities is the most vexing problems encountered in assessing
attributes of residential services in built up environments of major cities. The final
results of this technique are exploited in determining the quality and state of the
drainage facilities in Enugu city.
RESULTS AND DISCUSSION OF RESEARCH FINDINGS
Street Layouts and Drainage Facilities
Enugu street guide map shows that there are about 350 streets in the city that have
artificial drainage channels. These streets have about 700 storm water drainage
facilities with an estimated total length of 600,000m. Enugu layout drainage plan
portrays a rigid grid iron system of network. The drains consist mainly of channels
with open trenches, which may be either trapezoidal or rectangular in shape with
concrete linings.
These artificial drainage channels are concentrated in the older street layouts of the
city such as Ogbete, Uwani, Asata, Achara Layout, New Haven and the CBD as well
as Ogui New Layout. Only about 40% of the residential districts of the city are

Stormwater drainage facilities
371
sewered. This is so because the city lacks a comprehensive urban drainage network
plan and according to Chukwu (1995; 2002) the construction of drainage systems is
dominated by piece meal planning approach in the city.
Hydraulic structures like culverts, bridges and stormwater runoff detention facilities
are also constructed in specific locations of the residential districts like Ekulu, Ogbete,
Asata, CBD and G.R.A. They facilitate the disposal of large volumes of surface
runoff in the city and in the case of culverts and bridges afford passage for both
vehicular and pedestrian traffic across a body of stream in the city.
THE CURRENT STATE OF THE ARTIFICIAL DRAINAGE FACILITIES IN
ENUGU CITY
Although most of the existing drainage facilities in Enugu city are open systems, an
increasing number of closed and piped sewer network is being constructed especially
by private individuals, industrial and business concerns to enhance efficient disposal
of rain water around their residential and business premises.
Table 5: Distribution of observable defects and penalty points for artificial drainage systems in Enugu
city S/No Residential layout area in
Enugu
No of Defects in various classes* Total No No with
Defects
%Pp
01 02 03 04 05 06 07
1 Ogbete 5 3 1 8 0 2 1 20 16 80.0
2 Uwani 7 2 5 3 0 2 0 19 12 63.2
3 Ekulu 1 2 18 1 1 1 0 23 4 16.7
4 Ogui Urban Area 1 2 0 11 4 0 0 18 16 88.9
5 Ogui Nike Layout 2 5 8 4 0 1 0 20 7 35.0
6 G.R.A. 0 9 10 2 0 1 0 22 3 13.6
7 Ogui New Layout 4 2 3 6 0 3 0 18 13 72.2
8 Asata Layout 3 3 7 4 1 4 1 23 13 56.5
9 Abakpa 1 0 2 3 7 2 1 16 14 87.5
10 Independence Layout 1 6 10 1 2 0 0 20 4 20.0
11 C.B.D. 3 4 8 5 0 1 0 21 9 42.9
12 Awkunanaw 2 1 6 6 2 1 3 21 14 66.7
13 Emene 1 2 2 9 5 2 0 21 17 81.0
14 Achara Layout 3 2 5 4 1 2 0 17 10 58.8
15 Scarp Face 0 0 3 1 2 3 1 10 7 70.0
16 Idaw River Layout 3 2 6 7 1 1 2 22 14 63.6
17 New Haven 2 3 7 3 0 2 1 18 8 44.4
18 Obeagu 0 0 5 0 4 1 0 10 5 50.0
19 Amechi 1 1 4 1 4 0 0 11 6 54.5
20 Ugwuaji 0 1 5 1 6 1 1 15 9 60.0
Total 40 50 115 80 40 34 11 366 21 55
(Source: Field Work)
* Key to the Class Description
Stands for closed sewer system clogged by refuse/sediment
Stands for closed sewer system not clogged by refuse/ sediment
Stands for open sewer system not clogged by refuse/sediment concentrations
Stands for open sewer system clogged by refuse/sediment
Stands for absence of storm water sewerage system
Stands for storm water sewer system worn away by denudation/erosion.
Stands for storm water sewer system destroyed by land slumping, soil creep and land
slide.
The percentage penalty points for 366 artificial drainage networks in 20 residential
layouts of Enugu city are computed as shown on Table 5. This varies from less than
25% (rated as good condition of drainage system) in G.R.A., Ekulu, and Independence
layouts to 65% (rated as very poor state of stormwater drainage facilities) in Ogbete
Layout, Ogui Urban Area and Abakpa. The poorest condition of drainage facilities is

Chukwu and Uwadiegwu
372
observed in Ogui Urban Area with also the highest penalty points of 88.9% followed
by Abakpa with 87.5% penalty (see Table 5).
The condition of the facilities which have percentage penalty points ranging from 25%
to 45% is rated as fair while for other layouts, which have percentage penalty points of
65%, the condition of the sewers, is rated as poor. None of the layouts scored less than
10% penalty. This shows that none of the drainage facilities is excellent in the town.
These findings form the basis of the measures recommended for the management and
maintenance of the stormwater drainage facilities in the city.
SUSTAINABLE MEASURES FOR MANAGEMENT AND
MAINTENANCE OF THE STORMWATER DRAINAGE
FACILITIES
Management Strategies and Instruments
It is discovered that artificial drainage systems in Enugu city are probably the least
cared for, of all the infrastructural facilities and public utilities in the city (Chukwu,
2004; 2010. For instance, some artificial drainage facilities in the city are wrongly
used for commerce and light industries, as well as receptacles for refuse. This
situation calls for an urgent need to formulate and essentially to enforce a more
embracing legislation on urban land use to protect the city’s drainage facilities against
abuse. A careful attention should be paid to protecting the natural drainage systems in
an area where construction work on sewered streets are contemplated.
A law should be passed to prevent the current unregulated development along river
valleys and flood plains for building construction in the city because they are subject
to occasional extreme runoff events with associated losses due to flooding. Equally,
land suitable for recreational use and agricultural activities within the city should not
fall prey to unregulated urban expansion. This will enhance the infiltration capacity of
the urban land and hence water transmissibility capacity of the soil profile (Chukwu,
2004).
The suggested legislation should also provide that sewers may be used for no other
purpose other than for that which it was designed, prohibiting, for example, its use for
dumping refuse and solid waste as well erecting market stalls, light industries, water
borne pipes and underground electric cable line.
There should also be an ordinance to provide rules for making connections to the
storm water sewers with power to strictly enforce the regulations placed in the hands
of the liquid waste management department of Enugu State Waste Management
Authority (ESWAMA) and the sewer department of Enugu Town Planning Authority.
Such legislation is known to work well in the city of London (Babbit and Baumann,
1998).
Maintenance of Artificial Storm Water Drainage Facilities in Enugu City
The storm water drains in Enugu city should not be forgotten or disregarded as they
cannot maintain themselves. It is discovered that many of them clog or otherwise
erode or slump or simply deteriorate which explains why Chukwu (1995) has warned
that the poor level of maintenance of the storm-water drainage facilities forms one of
the principal dimensions or urban flooding. Therefore, the principal efforts should be
in the maintenance of storm water sewers in the Enugu city. Maintenance work
comprises three major activities: inspection, cleaning of the blocked drains, repair and
improvement of storm water sewers.

Stormwater drainage facilities
373
Inspection of Artificial Storm Water Drainage Facilities
There should be an inspectorate division within the ESWAMA that should specifically
carry out routine inspection of sewers to detect and prevent clogging in the channels,
to examine the condition of the structures and measure the rate of flows in the storm
sewers. Regular attention should be paid to the artificial channels with high
percentage penalty points in the residential areas of Ogui Urban Area, Asata, Ogbete
and Abakpa areas.
A record of inspection should be kept which will document the sewer conditions,
actions taken to effect maintenance, a brief description of the methods used in flow
measurement and flows observed together with the dates. Preventive maintenance
experience in Canadian and British cities shows that it is more economical to foresee
clogging of drainage channels through forecast based on records than to depend on
corrective maintenance (Babbit and Baumann, 1998).
Regular Schedule of Cleaning Blocked Drains
A regular schedule of cleaning blocked drains should be maintained by ESWAMA
and urban council workers. This is because many of the sewers in some residential
areas like Ogui Urban Area, Asata, Ogbete, Abakpa and even parts of the Central
Business District are so clogged that no free channel whatsoever remains available for
stormwater disposal. In such a situation, velocity of flow and discharge increase
around such obstructions. Unfortunately, there is currently no comprehensive drainage
plan for the city in general. As such there is no regular maintenance crew for artificial
drains in Enugu city despite the sincere efforts of the present administration of Enugu
State in the current urban beautification and renewal activities of the city. In each
urban layout, there should be adequate number of maintenance crew which should
consist of labourers, a junior engineer in charge, oilers and a truck driver with all the
essential working implements. This will be based on the size of the layouts and
number of drainages it contains. Scraping instruments which should be dragged
through sewers to loosen sludged banks, detritus, and dislodge obstructions should be
provided to the maintenance crew. Projections from the channel sides must be
removed because of their tendency to build up obstacles to free flow of storm runoff
and flood water.
Repair and Improvement of Stormwater Sewers
The Enugu urban council in collaboration with ESWAMA is strongly advised to
engaged in constant repairs and improvement of storm sewers because of their present
poor state. Common repair to these artificial drains should consist of relining eroded
concrete sewers with bricks, precast blocks and gunite. Other types of repair should
also include replacing the street inlet and covers broken by traffic flow, tightening
loose manhole covers which rattle under vehicular traffic flow – especially along Zik
Avenue Road in Uwani layout, and the stretch of the section of Agbani Road that
passes through Ogbete Layout.
Connections from the house sewers to the main channels are a common source of
drainage problem especially in Awkuanaw, Abakpa, Asata, Ogui and Ogbete areas
due to poor construction. Their construction should therefore be undertaken by
ESWAMA together with sewer department of Enugu Town Planning Authority. The
Authority is also strongly advised to construct new channels in Abakpa, Ogui Urban
Area, parts of Emene and Achara Layouts which suffer severe drainage problems due
to inadequate stormwater drainage facilities.
Chukwu and Uwadiegwu
374
Suggested Comprehensive Drainage Facility Network for Enugu City
A comprehensive urban drainage facility plan is strongly advised to replace the
present piece-meal planning approach adopted in constructing stormwater sewers in
the city. Good practice demands that a comprehensive drainage plan be designed and
implemented for the needs of the entire urban area and that sewers be constructed in
accordance with this plan as the need for them arises (Babbitt and Baumann, 1998;
Chukwu 1995; 2004).
The gross drainage network of Ekulu, Nyaba, Aria, Ogbete, Idaw and Asata Rivers
indicates a large scale solution to the storm water drainage problem of Enugu urban
area and therefore should be utilized for this purpose. An appropriate model of a
comprehensive urban drainage plan which incorporates the natural drainage network
in designing a workable comprehensive stormwater drainage system in the entire
urban area should be adopted. This is because the artificial drainage facilities and the
natural drainage system are actually extreme and complementary members of the
same continuous series. This will help to put a stop to the present haphazard
construction of storm sewers in Enugu city. Adequate capacity drainages should be
constructed especially at the locations where they are mostly needed such as Ogui
Urban Area, Emene, Abakpa and parts of Awkunanaw which will take care of their
peculiar drainage problems. There is also the urgent need to establish
hydrometeorological stations in Enugu city with the purpose of acquiring data for
research work on urban hydrology and drainage problems.
For these recommendations to work, there should be a willing co-operation from the
Enugu State Waste Management Authority, Enugu Town Planning Authority, Urban
Council, estate developers and the public in general.
CONCLUSION
This paper has shown that majority of the drainage facilities are concentrated in the
order residential districts of the coal city and are in very bad condition. The poorest
condition of drainage facilities is observed in Ogui Urban Area with the highest
penalty point. Legislation to protect the city’s drainage facilities against abuse,
inspection of drainage facilities, regular cleaning of blocked drains, repair of damaged
severs as well as plan have been recommended as sustainable measures for
management and maintenance of stormwater drainage facilities in Enugu.
Inspite of this, much more collaborative researches are required to sensitize the
appropriate government agencies and the urban dwellers on the need to develop the
culture for maintenance of the drainage facilities in residential
It is by this way that the urban hydrologists, town engineers and environmental
managers can help in sustainable management and maintenance of the city drainage
facilities to prevent the hydrological problems of extreme runoff events and associated
flood losses in residential areas of the city.
REFERENCES
Annan, K. (2001): “World Environment Day: Message From the Secretary General” Our
Planet. Vol. 12 No. 1’ pp. 15-18.
Babitt, H. E. and BAUMANN, E. R. (1988): Sewerage and Sewage Treatment. John Wiley
and Sons Inc. London.
Stormwater drainage facilities
375
Chukwu, K. E. (1995): The Influence of an Urbanized Catchment Area on Stormwater
Disposal: A Study of Enugu Urban Area. Unpublished M.Sc. Thesis University of
Nigeria, Nsukka.
Chukwu, K. E. (2002): “Appraisal and Maintenance of the quality of stormwater Drainage
facilities in Residential Districts of Enugu urban Area”. Specialist Training Workshop
Premises and Facilities Maintenance Management. Nigeria, Society of Civil
Engineers, University of Lagos, 24-26 July.
Chukwu, K. E. (2004): “Infiltration process and overland flow in a small humid tropical
watershed affected by urbanization: an investigation from Southeastern Nigeria”.
ESUT Journal of Environmental Management. Vol. 2, No. 1, August; pp 75-91.
Chukwu, K. E. (2010): Effects of Enugu Urban Environment on the Water Quality of Streams
in Nyaba Catchment Area of Southeastern Nigeria. Unpublished Ph.D Thesis. Univ.
of Nigeria, Nsukka.
OFID (2007): “Water: the Works” Developments. UK Dept. for International Development.
London; pp. 4-6.
Ebisemiju, F. S. (1989): “Patterns of Stream Channel Response to Urbanization in the Humid
Tropics and their Implications for Urban Land Use Planning: a Case Study From
Southwestern Nigeria” Applied Geography. Vol 9, No 4; pp 275-286.
Essagha, A. E. (2004): “Flood drainage and environmental management in Benin City.” ESUT
Journal of Environmental Management Vol. 2, No. 1; pp 37-45.
Hall, M. J. (1984): Urban Hydrology. Elsevier Pub. London.
Mcpherson, M. B. (1981): Summary of Symposium: Discussions”. Research on Urban
Hydrology. (21) Vol. 3 UNESCO, Paris, pp. 137-144.
Nnodu, V. C. (2008) “Urban Hydrology and Drainage Systems” in Nnodu, V. C; Okoye C. O.
and Onwuka, U. S. (eds.): Urban Environmental Problems in Nigeria. Rex Charles
and Patrick Pub., Awka; pp. 140-179.
Onokala, P. C. (1981): “Types of Data Needed for Employing Transport Related Land Use
Models in Urban Transportation Planning in Nigeria in IGBOZURIKE, M. U. (ed)
Land Use and Conservation in Nigeria. University of Nigeria Press: Nsukka; pp. 137-
150.
Ofomata, G. E.K. (2002: “Relief, drainage and landform”. In Ofomata, G. E. K. (ed): A
Survey of the Igbo Nation. Africana. First Publishers Ltd, Owerri; pp 83-98.
Quigley, J. M. (1975): “Measuring the Value of Housing Quality” Essays on Urban Spatial
Form. Mass Ballinger Pub. Co. Cambridge; pp. 261-276.
Sule, R. A. O. (1980): “Housing Problems in Calabar: A Qualitative Assessment”: in
INYANG, P.E.B. et al (eds): Calabar and Environs: Geographic studies, Dept of
Geography and Regional Planning, University of Calabar, Calabar; pp. 90-77.

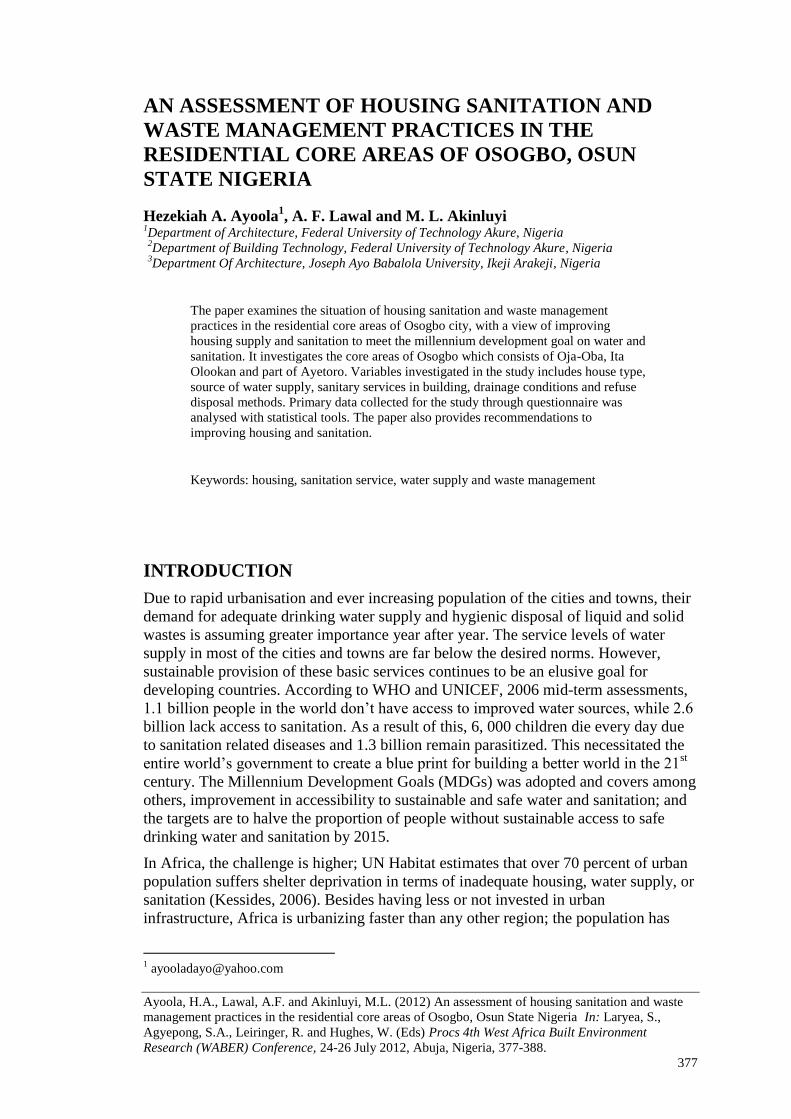
Ayoola, H.A., Lawal, A.F. and Akinluyi, M.L. (2012) An assessment of housing sanitation and waste
management practices in the residential core areas of Osogbo, Osun State Nigeria In: Laryea, S.,
Agyepong, S.A., Leiringer, R. and Hughes, W. (Eds) Procs 4th West Africa Built Environment
Research (WABER) Conference, 24-26 July 2012, Abuja, Nigeria, 377-388.
377
AN ASSESSMENT OF HOUSING SANITATION AND
WASTE MANAGEMENT PRACTICES IN THE
RESIDENTIAL CORE AREAS OF OSOGBO, OSUN
STATE NIGERIA
Hezekiah A. Ayoola1, A. F. Lawal and M. L. Akinluyi
1Department of Architecture, Federal University of Technology Akure, Nigeria
2Department of Building Technology, Federal University of Technology Akure, Nigeria
3Department Of Architecture, Joseph Ayo Babalola University, Ikeji Arakeji, Nigeria
The paper examines the situation of housing sanitation and waste management
practices in the residential core areas of Osogbo city, with a view of improving
housing supply and sanitation to meet the millennium development goal on water and
sanitation. It investigates the core areas of Osogbo which consists of Oja-Oba, Ita
Olookan and part of Ayetoro. Variables investigated in the study includes house type,
source of water supply, sanitary services in building, drainage conditions and refuse
disposal methods. Primary data collected for the study through questionnaire was
analysed with statistical tools. The paper also provides recommendations to
improving housing and sanitation.
Keywords: housing, sanitation service, water supply and waste management
INTRODUCTION
Due to rapid urbanisation and ever increasing population of the cities and towns, their
demand for adequate drinking water supply and hygienic disposal of liquid and solid
wastes is assuming greater importance year after year. The service levels of water
supply in most of the cities and towns are far below the desired norms. However,
sustainable provision of these basic services continues to be an elusive goal for
developing countries. According to WHO and UNICEF, 2006 mid-term assessments,
1.1 billion people in the world don’t have access to improved water sources, while 2.6
billion lack access to sanitation. As a result of this, 6, 000 children die every day due
to sanitation related diseases and 1.3 billion remain parasitized. This necessitated the
entire world’s government to create a blue print for building a better world in the 21st
century. The Millennium Development Goals (MDGs) was adopted and covers among
others, improvement in accessibility to sustainable and safe water and sanitation; and
the targets are to halve the proportion of people without sustainable access to safe
drinking water and sanitation by 2015.
In Africa, the challenge is higher; UN Habitat estimates that over 70 percent of urban
population suffers shelter deprivation in terms of inadequate housing, water supply, or
sanitation (Kessides, 2006). Besides having less or not invested in urban
infrastructure, Africa is urbanizing faster than any other region; the population has
Ayoola et al.
378
outgrown the urban infrastructure currently available. According to the World Health
Organization, in order to meet the established millennium development goal of
‘halving the unsaved population by 2015; urban Africa will require an 80% increase in
the numbers of people served. To achieve this objective, the various governments
must back their political will with adequate resources and action.
Nigeria lacks a comprehensive strategy on sanitation as a whole, including excreta
disposal, solid waste disposal, wastewater disposal, drainage and treatment of
wastewater. Currently, individual solutions are adopted at the household level e.g. pit
latrines, septic tanks and storage. There is very little sewerage in urban Nigeria.
Regarding solid waste, while there is some level of public and private solid waste
collection, the frequency of collection is poor. The storm water drainage system is
frequently a disposal point for solid waste. Moreover, disposal, when waste is
collected, is by dumping rather than sanitary landfill and is a major cause of water
pollution either through the storm water drainage system or seepage into the
groundwater.
In Osun State, Nigeria, where Osogbo is situated, several attempts have been made to
improve water supply and sanitation in the State. These efforts consist of the
rehabitation of the Ede dam, construction of boreholes by government, organizations
and individuals, channelization of major rivers and the re- introduction of monthly
sanitation exercise among others. Despite these efforts, access to safe water and
sanitation is still a major problem facing majority of people in the state.
This poor access to safe water and sanitation has a lot of implications for sustainable
urban development. However, to be able to achieve the MDGS target that intends to
halve the population of people without safe and basic sanitation in Africa, there is
need for a better and richer understanding of the existing water supply and sanitation
services situation, especially in relative to rapid rate of urbanization witnessed in Sub-
Sahara African countries. Consequently, this paper examines the existing water supply
and sanitation situation in Osogbo, Nigeria with a view to realising MDGs safe water
and sanitation target in 2015.
PROBLEM STATEMENT
Provision of adequate sanitation and water facilities in urban areas is an important
means of ensuring health and well-being of the people living in cities, as well as
protection of the environment. In Nigeria, Waste disposal remains a contentious issue,
and with no end in sight, refuse is dumped on roadways, pedestrian work ways or
even dropped in drainages or streams and rivers. The situation is more alarming
during the rainy season as water no longer flows freely along the gutters; it remains
stagnant, creating the conditions for mosquito to breed and also the spread of vector
borne diseases like malaria. The rapid rate of urbanization witnessed in most Nigeria
cities contributed to the high increase in waste generation which has outgrows the
capacity to evacuate them. Onibokun and Kumuyi (1999) confirm that whenever
urbanization gets out of control, it poses a big challenge to urban management and
government, with waste management inclusive.
The problem of urban waste management in Nigeria persists due to many
factors which include the rapid rate of uncontrolled and unplanned urbanization of
majority of our states. According to Onibokun and Kumuyi (1999) the government at
Sanitation and waste management
379
all levels have created various agencies to look into the problems associated with
waste management practices but most of these agencies have been less functional. The
local government saddled with the responsibility of managing sewerage and solid
waste disposal (FGN, 1979) are often ill-equipped to perform due to inadequacy of
funds. Private participation in waste management as also suffered a setback due to
lack of man power, fund and technical support.
The city of Osogbo is one of the cities which need to improve its water and sanitation
infrastructure, since the existing ones are not environmentally friendly and does not
provide its citizen with adequate services.
Appropriate waste management plays an important role towards promoting a
sustainable urban development within human settlements. With that in mind, and
knowing that in most developing countries the highest urban population growth rates
occur in the low-income areas, Osogbo will require heavy investments in the
installation of wastewater management systems both social and technical, to meet the
MDGs, target for water and sanitation.
RESEARCH QUESTIONS
It is based on these aforementioned problems that the research aims to answer the
following questions:
1. What are the waste water management technologies that are currently used in
Osogbo; and what are strengths and weaknesses of their physical functioning?
2. Does the existing water and sanitation management practice in Osogbo meet
up with the millennium development goals for water and sanitation?
3. What are institutional, policy legal frameworks that are currently governing
water supply and waste water management in Osun State and how can it be
improved?
4. What are the problems associated with poor sanitation and waste management?
AIM AND OBJECTIVES OF THE STUDY
The major aim of the study was to assess the housing sanitation and waste
management practices in the core of Osogbo, Osun State with a view of improving
housing supply and sanitation to meet the millennium development goal on water and
sanitation. Its specific objectives were:
1. The examination of the qualitative adequacy of housing stock in the study
area;
Ayoola et al.
380
2. Investigate the sanitation facilities and waste management practices in the
study area;
3. Evaluate institutions and policy responsible for water supply and sanitation in
Osun State
4. Articulate environmental and health problems associated with poor urban
environmental Infrastructure provisions (water supply, solid and waste water
management)
5. Present the potential for implementing effective sanitation systems in poor
neighbourhoods of Osogbo
A BRIEF BACKGROUND TO THE STUDY AREA
Osogbo is situated on latitude 7.70 N and longitude 5.4
0 E of Greenwich Meridian. It
was founded in the 18th century and originated as a traditional as well as cultural town
which derives its name from the proclamation by the goddess of Osun River. The
town is known for her very rich arts and cultural heritage.
Following the creation of Osun State in 1991, Osogbo assumed the status of a State
capital, It has two local governments which are Osogbo and Olorunda, Its population
based on 1991 census was 189,733 and the total land area is about 2,875sq.km before
it became the State capital. Over the years, Osogbo has witnessed tremendous growth
both spatially and in population. In recent times, the location of Osogbo as a state
capital coupled with other factors mentioned earlier has led to the influx of people
from other towns and villages, thus giving it the status of a twin city, that is, a
traditional as well as a modern city. (Jiboye,2004).
METHODOLOGY
The study employs the survey method. A semi-structured questionnaire was designed
to elicit information on the state of housing, sanitation and waste management of the
respondent.
Osogbo was divided into three areas of residential development based on the pattern
of city growth
Consequently, Oja Oba, ita-olokan and part of Ayetoro areas were selected from the
core area. In selecting the respondents, every fifth house was picked along each street
or lane in the core. Two household head were sampled in every house selected.
Consequently, a total 300 respondents were sampled. The data was analyzed using
frequencies and cross tabulation of variables.
Sanitation and waste management
381
CONCEPTUAL CONSIDERATION AND RELEVANT
LITERATURE
Concepts and theories related to this study are developed with the help of existing
literature on housing, health, sanitation, water supply and waste management.
The World Health Organization (2005) describes housing as the provision of any
physical structure usually used for shelter. It is said to include all facilities, services
and devices needed for healthy living. The role of social infrastructure, such as safe
drinking water in societal welfare and development, has long been recognized.
According to Brown (cited in Arbigbola 2010) infrastructure is regarded as “the
systematic framework which underpins community’s ability to fulfil its mission of
providing a base for its citizen to be productive and to nurture social equity”
There are a lot of linkages between water supply and sanitation and a cluster of key
sectors, including health; education, agriculture, and environment are intuitively
obvious, and documented with varying precision in different developing countries.
The World Water Council in 2005 declared that 1.1 billion people lack access to safe
drinking water; 2.6 billion people lack adequate sanitation; and 1.8 million people die
every year from diarrheal diseases, including 90% of children under 5.
Access to water is defined by the World Health Organization (WHO) as “the
availability of 20 litres per capita per day at a distance no longer than 1,000 metres”
(WHO/UNICEF, 1996).
In defining “access” it should be noted that housing is a right defined by article 25 of
the Universal Declaration of Human Rights and article 11(1) of the International
Covenant on Economic Social and Cultural Rights. The committee on Economic
Social and Cultural Rights elaborates by stating that the right to housing does not just
mean shelter viewed as a roof over one’s head or a commodity but includes, among
other things, access to basic services and facilities (UN HABITAT, 2003). Therefore
the right to housing includes access to adequate water and safe sanitation.
Access to safe sanitation should be defined in terms of both availability and type of
method. The conventional view of the flush toilet always being the ideal solution to
faecal disposal has been challenged in recent years as unsuitable for households in
poor communities and where water is scarce. The traditional pit latrine is common in
the inner core of towns and cities but these practices do not prevent faecal–oral
disease transmission.(Manda,2009)
Malaria is the predominant disease affecting the population of Africa. Many other
diseases endemic throughout the continent are generally associated with unsatisfactory
drinking water supplies, poor sanitation conditions and inadequate health
programmes. These include diarrheal, dysentery, gastro-enteritis, infectious hepatitis,
hookworm, guinea worm, and other parasitic infections.
Water and sanitation utilities in African cities and towns are very weak. They are
characterized by intermittent supplies, frequent breakdowns, inefficient operations,
poor maintenance; unqualified personnel in management and depleted finance (Cross,
Ayoola et al.
382
P., and Morel, A., 2005). The utilities are confronted with rapid urban population
growth, which make municipalities incapacitated to provide adequate services. It is
forecasted that, in less developed regions there is ongoing increase in population
densities with unforeseen saturation reaching nearly 4 billion by 2030 (Rosemarin,A.,
2005). If the situation is left the way it is, the driving forces for sanitation problems
will over stress the already stressed accommodation capacity of infrastructure and
hence aggravate sanitation problems.
Waste may be classified in many different ways, such as according to its origin (for
example, domestic, industrial, and commercial, clinical, construction, nuclear,
agricultural) or its properties (for example, inert, toxic, and inflammable). Without
suitable treatment such waste becomes a source of contamination of the environment
at large, leading to air pollution. water pollution, and oil pollution. (Microsoft Encarta,
2008).
The amount of waste produced by human activities is increasing in most parts of the
world, accompanied by problems of disposal. In developing countries where waste-
disposal facilities are minimal; people are left with no other option than to dump their
waste in sewers, public dump site, streams etc. Residents of peri-urban areas are
shown to be using methods that are not environmental in disposing of their waste.
Some plot owners dig pits on their property for the purpose of waste disposal while
others throw waste away indiscriminately (Manda,2009).
The use of open dumps creates many environmental issues. Pinnock (1998) highlights
how garbage in waste helps create ideal conditions for disease vectors to thrive. These
vectors include houseflies, rodents, mosquitoes and cockroaches. The presence of
organic compounds alongside both anaerobic and aerobic conditions results in the
uncontrolled production of methane and carbondioxide.
Whilst sanitary landfill offers the advantage of keeping leachate from waste entering
the ground they do not prevent the presence of green house gases .
In cities of developed world, during the last decade’s most of sewer pipes have been
connected to waste water treatment systems before the wastewater is discharged in
open waters (van Vliet, B., 2004). Centralized sanitation system consists of sewer
network which transport waste water from a household to a treatment plant and the
effluent is discharged in the environment. They are sometimes called conventional
sanitation systems because they have been in existence and dominant technology for
many years and most of institutions and policies that tend sanitation in cities of the
west and developing countries are based on these systems. Proponents of centralized
sanitation claim that they are more hygienic than traditional decentralized systems.
While Sewer pipes are connected in all areas of cities and towns of developed world,
most parts of cities and towns in developing countries has not been connected to
treatment systems and this results in sewer pipes discharging untreated effluent into
fresh waters in sea, lakes, natural ponds and river streams (Spaargaren, G., at al,2005).
This trend in poor countries is due to the fact that centralized or off-site networks with
Sanitation and waste management
383
treatment facilities need high investment (Krekeler, T., 2005). Most developing
countries lack financial resources therefore cannot afford centralized sanitation
systems because of the high cost of physical infrastructure which include a network of
pipes and treatment plants and the maintenance.
Consequence of Poor management of waste in urban areas where space is sometimes
at a premium affects the quality of life people have. Effective management of waste
can reduce the environmental impact and human health related effects it can have.
Institutions Responsible for Water Supply and Sanitation in Osun State
The Osun State Government has several policy instruments on housing, water and
sanitation. The players in water, sanitation and hygiene are guided by national
development policies and strategies and the Millennium Development Goals (MDGs).
There are three key institutions in Osun State that have responsibilities for water and
sanitation service delivery. These are:
Ministry of Water Resources and Rural Development
The main objectives of the ministry are as follows
Policy formulation and management of water resources
Provision of basic infrastructure
Research and development into the use of appropriate technology in the
provision of infrastructure in the rural areas of the State
Increase access of the communities in the State to safe sanitation and
Liaison with government, international donor organisations and non-
governmental organisations (NGO)
Osun State Water Corporation (OSWC)
The core objectives of OSWC are:
To ensure sustainable water supply system development in the State
To produce for distribution and consumption of the public, sufficient
potable water for World Health Organisation (WHO) standard for their
health and well being.
The OSWC is not involved in the provision of sanitation facilities in urban and semi-
urban areas in the State. The State Government has established the Rural Water
Supply and Sanitation Agency (RUWESA).
Rural Water Supply and Environmental Sanitation Agency (RUWESA)
The core objectives are:
Provision of water and sanitation facilities in the rural areas of the State;
Ayoola et al.
384
Total eradication of water and faecal borne disease
Propagate a change of attitude through non formal education and public
enlightenment use of water and within the rural communities which lead to
improved habit in domestic use and environmental sanitation.
In addition to all this state intervention, the 30 Local Government Areas and one Area
office, in Osun State were also giving mandate to promote water and sanitation in the
rural areas. The Osun State environmental Protection agency was also created in 1997
to put a stop to threat to the potential growth and sustainable development owing to
diverse environmental problems experienced across the state. It is pathetic to know
that will all this institution in place the state is still experiencing water and sanitation
problems.
RESULTS AND DISCUSSION
The housing condition variables investigated include housing condition, sources of
water supply, toilet types, method of refuse disposal and respondents health situation.
Research findings showed that most buildings in the core of Osogbo are ageing as a
result of lack of maintenance or natural ageing; this is evident in (Table 1) which
indicated that just 11.2% of the houses in the core are in sound condition. A greater
percentage of the buildings require major or minor repairs. The state of repair takes
into consideration the state of the roofs, walls, floors and foundations. Most of the
building needing repairs are characterised by leakages of roof cover, damages to door
and windows, tearing off of surface wall plaster and finishes.
Table 2 reveals the major source of water supply in the study area. About 61% of the
respondents sourced their water from hand dug wells which are kept in an unhygienic
condition; only 33% source their water through the irregular pipe borne water supply
located outside the building. Others source their water through bore holes and nearby
streams which are not treated before use. Majority of these sources of water supply do
not run within the building premises and hence contribute to the low hygienic
condition of the neighbourhood.
The implication of this is that majority of residents of the core of the city depend on
water supply from unsafe sources, thereby contributing to lowering the quality of life
and environment of the city.
The analysis of the study indicated that of the sanitation facilities available, the flush
toilet which is the most hygienic, only occurred in 37.3% of the households while the
pit latrine accounts for 54.3% of the households. 5% of the household depend on other
sources while 3.3% household had none and are likely to defecate anywhere which
can cause serious environmental problems. These conditions also expose the residents
to impending danger of outbreak of communicable diseases. The result of the study
confirms literature (Manda, 2009, Mills-Tettey, 2008) on study of sanitation in
Rwanda and Ghana respectively. Most of the core of Africa cities still uses this
Sanitation and waste management
385
unhygienic means of sewage disposal hereby causing serious health and
environmental problems. (See Table 3)
Another indicator of water and sanitation condition quality is the refuse collection and
disposal system. On the method of refuse collection and disposal in the city, the Waste
Management Authority is responsible for collection and disposal of waste from 6.2%
of all the buildings in the selected area (see Table 4). 27.3 and 43.3 percents of waste
generated in the city are disposed of by dumping them on a dump site and by burning
respectively, while a large percentage (27.3%) of the respondents pour their waste in
drainages located near them. These methods are not only unhealthy, but destroy and
pollute the environment.
Table 1: Housing condition in the core of Osogbo
HOUSING CONDITION FREQUENCY PERCENTAGE
Sound
Requiring major repairs
Requiring minor repairs
Dilapidated
33
42
195
24
11.2
14.3
66.3
8.2
Total 294 100
Source: Authors Field Work, 2010
Table 2: Source of water supply
SOURCE OF WATER
SUPPLY
FREQUENCY PERCENTAGE
Pipe Borne Water 99 33
Bore Hole 8 2.7
Well 183 61.0
Others 10 3.0
Total 300 100
Source: Authors Field Work, 2010
Table 3: Method of Sewage Disposal
SEWAGE DISPOSAL FREQUENCY PERCENTAGE
Water Closet 112 37.2
Pit latrine 163 54.2
Others 15 5.0
None 10 3.3
Missing 1 0.3
Total 300 100
Source: Authors Field Work, 2010
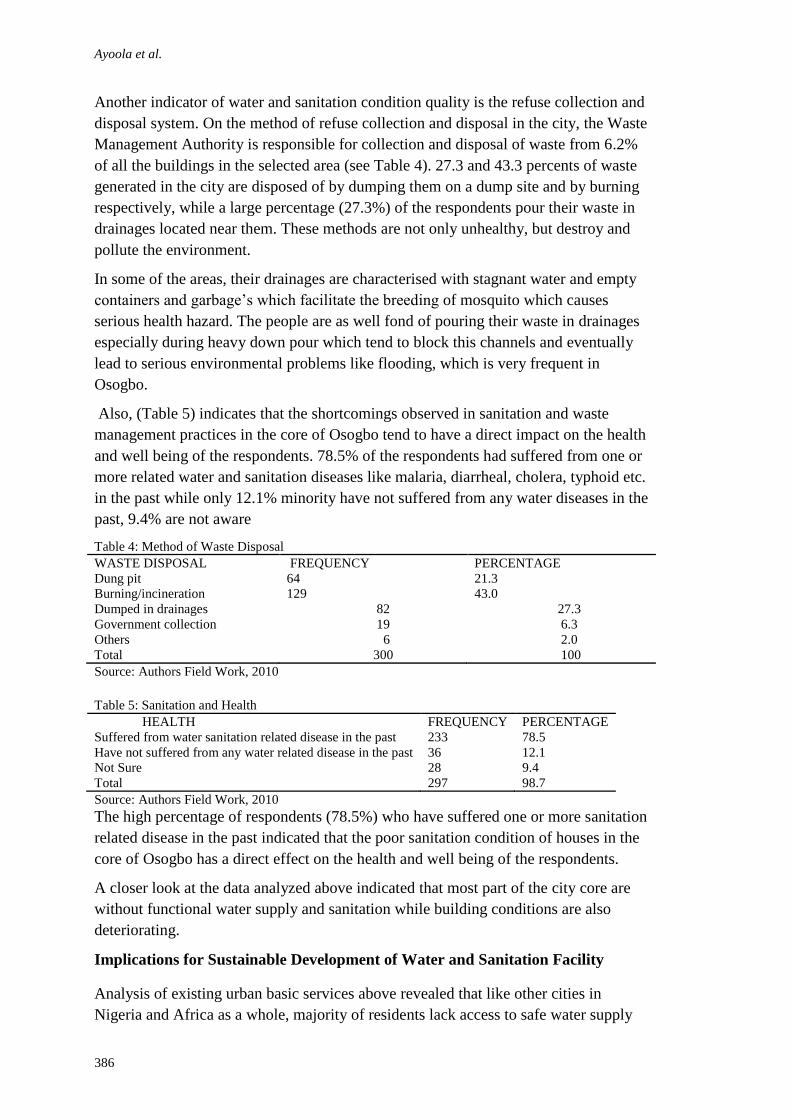
Ayoola et al.
386
Another indicator of water and sanitation condition quality is the refuse collection and
disposal system. On the method of refuse collection and disposal in the city, the Waste
Management Authority is responsible for collection and disposal of waste from 6.2%
of all the buildings in the selected area (see Table 4). 27.3 and 43.3 percents of waste
generated in the city are disposed of by dumping them on a dump site and by burning
respectively, while a large percentage (27.3%) of the respondents pour their waste in
drainages located near them. These methods are not only unhealthy, but destroy and
pollute the environment.
In some of the areas, their drainages are characterised with stagnant water and empty
containers and garbage’s which facilitate the breeding of mosquito which causes
serious health hazard. The people are as well fond of pouring their waste in drainages
especially during heavy down pour which tend to block this channels and eventually
lead to serious environmental problems like flooding, which is very frequent in
Osogbo.
Also, (Table 5) indicates that the shortcomings observed in sanitation and waste
management practices in the core of Osogbo tend to have a direct impact on the health
and well being of the respondents. 78.5% of the respondents had suffered from one or
more related water and sanitation diseases like malaria, diarrheal, cholera, typhoid etc.
in the past while only 12.1% minority have not suffered from any water diseases in the
past, 9.4% are not aware
Table 4: Method of Waste Disposal
WASTE DISPOSAL FREQUENCY PERCENTAGE
Dung pit 64 21.3
Burning/incineration 129 43.0
Dumped in drainages 82 27.3
Government collection 19 6.3
Others 6 2.0
Total 300 100
Source: Authors Field Work, 2010
Table 5: Sanitation and Health
HEALTH FREQUENCY PERCENTAGE
Suffered from water sanitation related disease in the past 233 78.5
Have not suffered from any water related disease in the past 36 12.1
Not Sure 28 9.4
Total 297 98.7
Source: Authors Field Work, 2010
The high percentage of respondents (78.5%) who have suffered one or more sanitation
related disease in the past indicated that the poor sanitation condition of houses in the
core of Osogbo has a direct effect on the health and well being of the respondents.
A closer look at the data analyzed above indicated that most part of the city core are
without functional water supply and sanitation while building conditions are also
deteriorating.
Implications for Sustainable Development of Water and Sanitation Facility
Analysis of existing urban basic services above revealed that like other cities in
Nigeria and Africa as a whole, majority of residents lack access to safe water supply

Sanitation and waste management
387
and basic sanitation facilities. Field investigations also revealed that the city has been
growing without a corresponding expansion in the provision of services and utilities.
Most parts of the city are without functional water supply and sanitation, while
housing condition is deteriorating in the city. The results of this study indicate serious
water supply and sanitation problems in the study area. It revealed that the majority of
households depend on other sources of water supply, besides piped sources, and that
the lack of adequate sanitation facility and services to cope with the population of the
city. This paper also revealed that a significant part of the city is not served by public
water main that is capable of meeting the water and sanitation needs of people in
Osogbo. It also exposes the fact that government action and policies have not
contributed much to improving water and sanitation supply to the city.
The implication of the above is that concerted efforts will need to be made to improve
water supply and sanitation services in the city to meet MDGs target in 2015.
At present, only about 33.3 percent has access to safe water. In other words, about
66.7 percent source their water from unsafe sources. Therefore, about 33.5 percent of
the population will need to be supplied water before 2015 to meet MDGs target. In the
case of sanitation, about 62.8 percent lack adequate sanitation. Thus, 31.4 percent of
the population will need to be provided sanitation before 2015.
CONCLUSION AND RECCOMMENDATIONS
The study discovered that the amount of infrastructural facilities available in the study
area is grossly
inadequate while some are not even available. Availability and adequacy of
infrastructural facilities is a major factor that determines the environmental condition
and liveability of any settlement. Therefore, efforts should be directed towards
upgrading the existing ones while those that are not available should be provided. This
could be achieved through preparation of detailed infrastructure network plan for the
community with population density being the major yardstick in determining the
adequacy. The design should allow for individual self-funded incremental service
connections and affordable capital, maintenance and user costs for services. The
government should ensure that existing laws and regulations guiding environmental
sanitation and health be reviewed and also enforced with stiffer actions in order to
make it more effective.
In order to avoid or minimize waste dumps some strategies such as more frequent
collection of waste could be implemented, while continuous educational campaigns
informing the disadvantages of a dirty area is also an important way of motivating
people to keep the community clean and this may reduce the dumping problems.
There is also the need for all actors and stakeholders to come together or be involved
in the planning, development establishment, monitoring and evaluation of sanitation
practices in the localities. The urban planners need to plan for the residential areas so
as to avoid haphazard construction of houses and hence sanitary facilities, this is
Ayoola et al.
388
needed to create a monitoring mechanism that will ensure safe and proper disposal of
both solid and liquid waste.
REFERENCES
Adesoji Jiboye, (2004) The Socio–Cultural Responsiveness of Household Size on Housing
Quality In Osogbo, Nigeria, Journal of Anthropologist, 6(3): 169-174 (2004)
Aribigbola, A, (2010).Meeting the Millennium Development Goals (MDGS) Targets for
Water and Sanitation in Urban Areas of Africa: The Example of Akure, Ondo state,
Nigeria. Journal of Sustainable Development in Africa, Clarion University of
Pennsylvania, Clarion, Pennsylvania, (Volume 12, No.3, 2010)
Brown, M. M. (2003); “Clean Water-An Agent of Change”, Choices 12 (1), 3-4
Cross, P., and A. Morel,(2005) : Pro- poor strategies for urban water supply and sanitation
services in Africa, Journal of Water science &Technology, Vol. 51 No. 8 p. 51-57
Kessides, C. (2006) The Urban transition in Sub-Saharan Africa – Implications for Economic
Growth and Poverty Reduction, Washington.
Manda, M. A. (2009). Water and sanitation in urban Malawi: Can theMillenium Development
Goals be met? London: International Institute for Environment and Development
(IIED).
Microsoft Encarta, 2008
Mills-Tettey,(2008) Urban Housing and Sanitation: A Contextual Analysis of Human Habitat
and Health, being a lecture delivered at the Faculty of Environmental Design and
Management, OAU. Ile-Ife, Nigeria
Onibokun,A.G and Kumuyi, A.J. (1996) Urban Poverty in Nigeria: Towards Sustainable
Strategies for its Alleviation. Centre for African Settlement Studies and Development,
Monograph Series 10
Onibokun A.G and Kumuyi, A.J. (1999): Ibadan, Nigeria: In Managing the Monster-Urban
Waste and Governance in Africa, Onibokun (ed) IDRC Ottawa, Canada.
Rosemarin, J. A, 2005, Journal of Water science& Technology Vol. 51 No. 8, p.109-118
Spaargaren, G., et al, (2005), Mixed Moderrnities: Towards viable urban environmental
Infrastructure development in East Africa (Position paper, Environmental Policy
group (ENP) Wageningen University, for PROVIDE Project)
UN-Habitat (2003); Water and Sanitation in the World’s Cities; Local Action for Global
Goals, Earthscan, London.
Van Vliet,B., 2004: The Sustainable transformation of Sanitation; Development of technology
and policy, p.337-353
World water Council. (2005).Solidarity to bring water to Africa.
http://www.worldwatercouncil.org/index.phd?=709.
WHO (1996) Water Supply and Sanitation Sector Monitoring Report: Sector Status as of 31
December 1994, WHO/UNICEF JMP, Geneva.
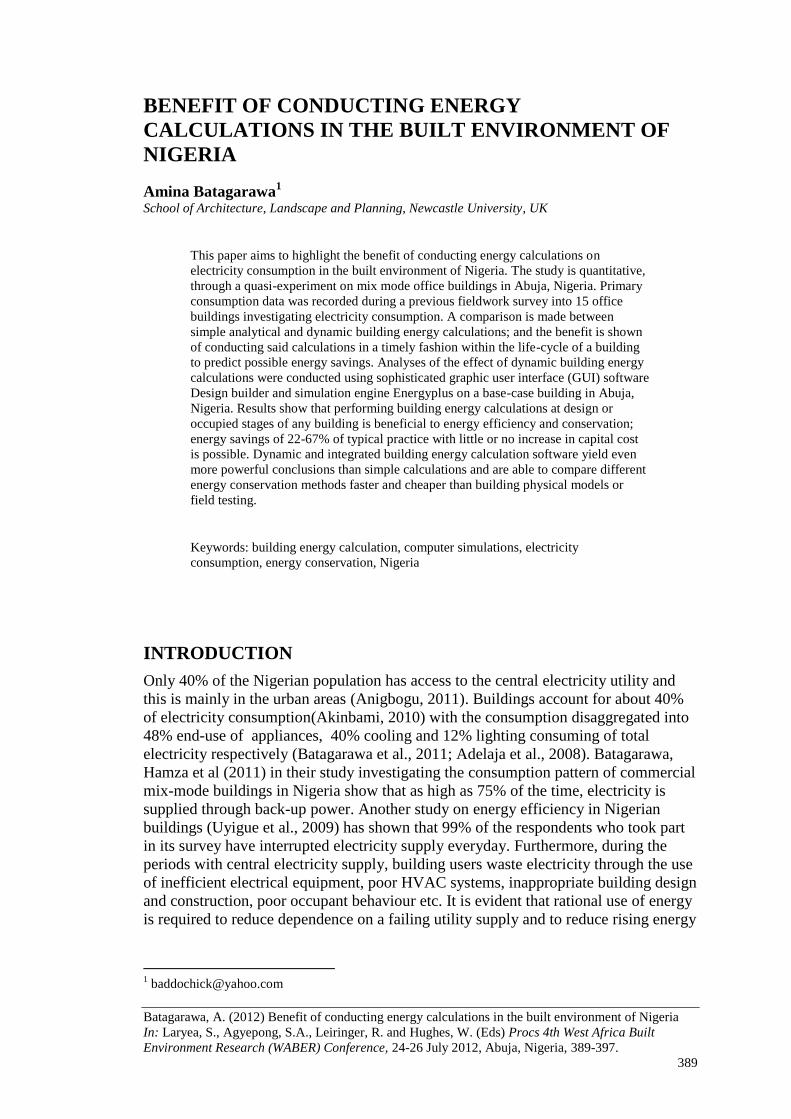
Batagarawa, A. (2012) Benefit of conducting energy calculations in the built environment of Nigeria
In: Laryea, S., Agyepong, S.A., Leiringer, R. and Hughes, W. (Eds) Procs 4th West Africa Built
Environment Research (WABER) Conference, 24-26 July 2012, Abuja, Nigeria, 389-397.
389
BENEFIT OF CONDUCTING ENERGY
CALCULATIONS IN THE BUILT ENVIRONMENT OF
NIGERIA
Amina Batagarawa1
School of Architecture, Landscape and Planning, Newcastle University, UK
This paper aims to highlight the benefit of conducting energy calculations on
electricity consumption in the built environment of Nigeria. The study is quantitative,
through a quasi-experiment on mix mode office buildings in Abuja, Nigeria. Primary
consumption data was recorded during a previous fieldwork survey into 15 office
buildings investigating electricity consumption. A comparison is made between
simple analytical and dynamic building energy calculations; and the benefit is shown
of conducting said calculations in a timely fashion within the life-cycle of a building
to predict possible energy savings. Analyses of the effect of dynamic building energy
calculations were conducted using sophisticated graphic user interface (GUI) software
Design builder and simulation engine Energyplus on a base-case building in Abuja,
Nigeria. Results show that performing building energy calculations at design or
occupied stages of any building is beneficial to energy efficiency and conservation;
energy savings of 22-67% of typical practice with little or no increase in capital cost
is possible. Dynamic and integrated building energy calculation software yield even
more powerful conclusions than simple calculations and are able to compare different
energy conservation methods faster and cheaper than building physical models or
field testing.
Keywords: building energy calculation, computer simulations, electricity
consumption, energy conservation, Nigeria
INTRODUCTION
Only 40% of the Nigerian population has access to the central electricity utility and
this is mainly in the urban areas (Anigbogu, 2011). Buildings account for about 40%
of electricity consumption(Akinbami, 2010) with the consumption disaggregated into
48% end-use of appliances, 40% cooling and 12% lighting consuming of total
electricity respectively (Batagarawa et al., 2011; Adelaja et al., 2008). Batagarawa,
Hamza et al (2011) in their study investigating the consumption pattern of commercial
mix-mode buildings in Nigeria show that as high as 75% of the time, electricity is
supplied through back-up power. Another study on energy efficiency in Nigerian
buildings (Uyigue et al., 2009) has shown that 99% of the respondents who took part
in its survey have interrupted electricity supply everyday. Furthermore, during the
periods with central electricity supply, building users waste electricity through the use
of inefficient electrical equipment, poor HVAC systems, inappropriate building design
and construction, poor occupant behaviour etc. It is evident that rational use of energy
is required to reduce dependence on a failing utility supply and to reduce rising energy
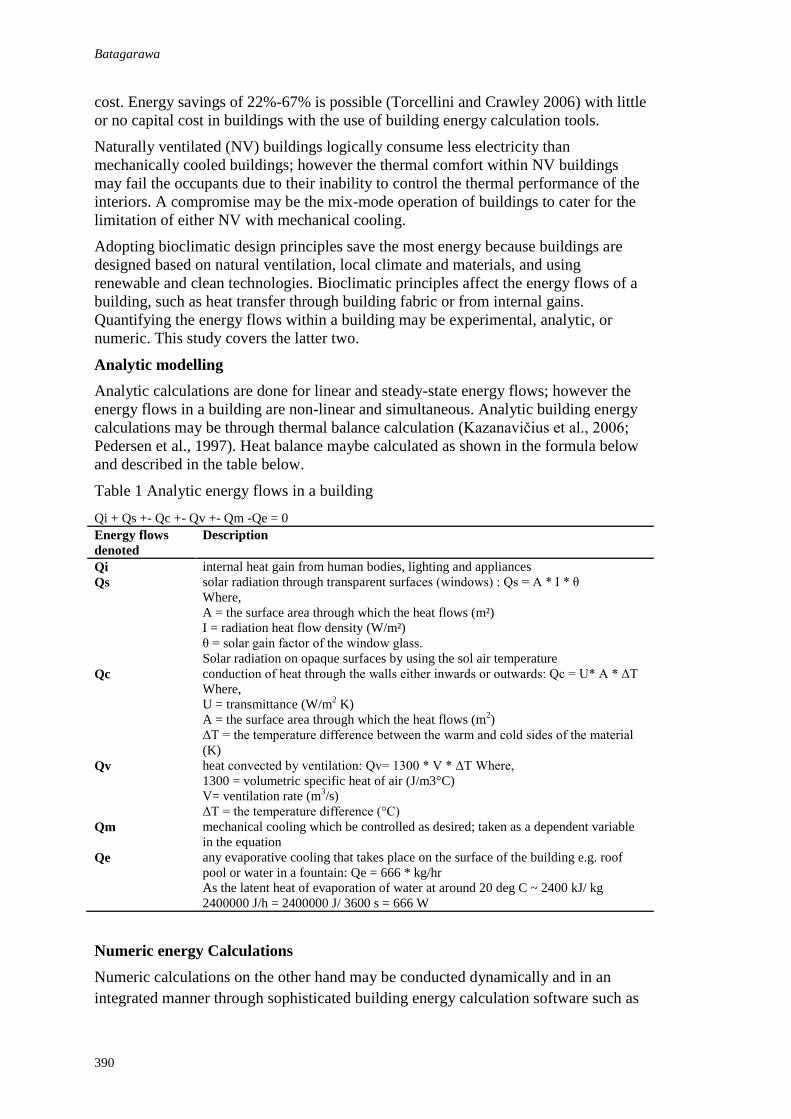
Batagarawa
390
cost. Energy savings of 22%-67% is possible (Torcellini and Crawley 2006) with little
or no capital cost in buildings with the use of building energy calculation tools.
Naturally ventilated (NV) buildings logically consume less electricity than
mechanically cooled buildings; however the thermal comfort within NV buildings
may fail the occupants due to their inability to control the thermal performance of the
interiors. A compromise may be the mix-mode operation of buildings to cater for the
limitation of either NV with mechanical cooling.
Adopting bioclimatic design principles save the most energy because buildings are
designed based on natural ventilation, local climate and materials, and using
renewable and clean technologies. Bioclimatic principles affect the energy flows of a
building, such as heat transfer through building fabric or from internal gains.
Quantifying the energy flows within a building may be experimental, analytic, or
numeric. This study covers the latter two.
Analytic modelling
Analytic calculations are done for linear and steady-state energy flows; however the
energy flows in a building are non-linear and simultaneous. Analytic building energy
calculations may be through thermal balance calculation (Kazanavičius et al., 2006;
Pedersen et al., 1997). Heat balance maybe calculated as shown in the formula below
and described in the table below.
Table 1 Analytic energy flows in a building
Qi + Qs +- Qc +- Qv +- Qm -Qe = 0
Energy flows
denoted
Description
Qi internal heat gain from human bodies, lighting and appliances
Qs solar radiation through transparent surfaces (windows) : Qs = A * I * θ
Where,
A = the surface area through which the heat flows (m²)
I = radiation heat flow density (W/m²)
θ = solar gain factor of the window glass.
Solar radiation on opaque surfaces by using the sol air temperature
Qc conduction of heat through the walls either inwards or outwards: Qc = U* A * ΔT
Where,
U = transmittance (W/m2 K)
A = the surface area through which the heat flows (m2)
ΔT = the temperature difference between the warm and cold sides of the material
(K)
Qv heat convected by ventilation: Qv= 1300 * V * ΔT Where,
1300 = volumetric specific heat of air (J/m3°C)
V= ventilation rate (m3/s)
ΔT = the temperature difference (°C)
Qm mechanical cooling which be controlled as desired; taken as a dependent variable
in the equation
Qe any evaporative cooling that takes place on the surface of the building e.g. roof
pool or water in a fountain: Qe = 666 * kg/hr
As the latent heat of evaporation of water at around 20 deg C ~ 2400 kJ/ kg
2400000 J/h = 2400000 J/ 3600 s = 666 W
Numeric energy Calculations
Numeric calculations on the other hand may be conducted dynamically and in an
integrated manner through sophisticated building energy calculation software such as
Energy calculations
391
Energyplus, IES Apache, Transys and TAS (US Department of Energy, 2011). These
are a collection of free and commercial software that have the ability to calculate
dynamic, non-linear and simultaneous energy flows to calculate total energy
consumption, greenhouse gas emissions, cost comparison between alternative fuels,
HVAC systems, thermal performance, e.t.c. Dynamic and integrated modelling
requires extensive data to be able to simulate the complicated and complex nature of
energy flows within a building.
METHODOLOGY
This study is part of a PhD thesis on energy conservation methods for commercial
buildings in warm humid climates. An earlier study was embarked on to disaggregate
electricity used in Nigerian office buildings. The study indicated that cooling
consumed an average of 40% of consumption and a reduction in this primary use will
be significant in saving electricity (Batagarawa et al., 2011).
In this study, a parametric sensitivity analysis is conducted on a hypothetical base-
case building modelled with a combination of variables. The parametric sensitivity
analysis is in form of an experiment where all variables are held constant with the
exception of the one being examined. This highlights the effect of that examined
variable on the measurement indicator. Hence, the study is showing the potential
impact of varying identified bioclimatic design principles on total annual electricity
consumption.
The modelling and simulation in this study is done by the software DesignBuilder and
EnergyPlus respectively (DesignBuilder, 2011; EnergyPlus, 2010). DesignBuilder is
a tool for checking building energy, carbon, lighting and comfort performance. In this
instance, it is used as a graphical user interface for the text based simulation engine of
EnergyPlus.
EnergyPlus is a whole building energy simulation program used to model energy and
water use in buildings. In this instance, it is used as a predictive tool; to simulate the
energy performance of the whole building with a change in a design variable. The
design variables studied were identified through a review of primary and secondary
sources. The primary source is the data collected from the field during the energy
audit mentioned above (Batagarawa et al., 2011) and shown in Table 2 below; while
those from secondary sources are through a literature review, mainly of:
Texts covering bio-climatic approaches to building design in warm climates: There
are basically three climate types within Nigeria (Ogunsote, 1991): Hot and dry, Warm
and humid and Composite between the first two. The context under discussion-
Abuja- falls within the warm humid. Abuja experiences three weather conditions
annually. A warm, humid wet season beginning from April and ends in October; and a
dry season from November to March. In between the two, there is a brief interlude of
harmattan; a harsh, dusty wind blowing from the desert. Daytime temperatures reach
as high as 30°C and night time lows can dip to 12°C. The mean annual temperature is
27oC, mean daylight hours is 12hrs and mean annual precipitation is 1221mm. The
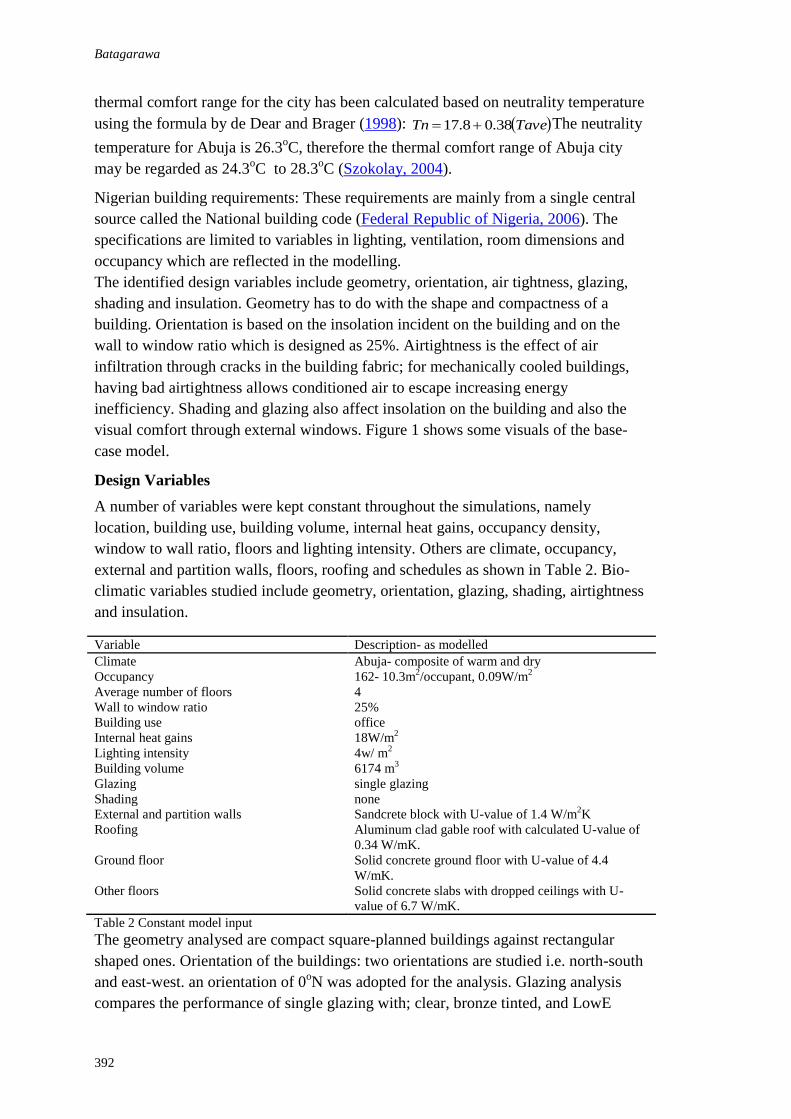
Batagarawa
392
thermal comfort range for the city has been calculated based on neutrality temperature
using the formula by de Dear and Brager (1998): TaveTn 38.08.17 The neutrality
temperature for Abuja is 26.3oC, therefore the thermal comfort range of Abuja city
may be regarded as 24.3oC to 28.3
oC (Szokolay, 2004).
Nigerian building requirements: These requirements are mainly from a single central
source called the National building code (Federal Republic of Nigeria, 2006). The
specifications are limited to variables in lighting, ventilation, room dimensions and
occupancy which are reflected in the modelling.
The identified design variables include geometry, orientation, air tightness, glazing,
shading and insulation. Geometry has to do with the shape and compactness of a
building. Orientation is based on the insolation incident on the building and on the
wall to window ratio which is designed as 25%. Airtightness is the effect of air
infiltration through cracks in the building fabric; for mechanically cooled buildings,
having bad airtightness allows conditioned air to escape increasing energy
inefficiency. Shading and glazing also affect insolation on the building and also the
visual comfort through external windows. Figure 1 shows some visuals of the base-
case model.
Design Variables
A number of variables were kept constant throughout the simulations, namely
location, building use, building volume, internal heat gains, occupancy density,
window to wall ratio, floors and lighting intensity. Others are climate, occupancy,
external and partition walls, floors, roofing and schedules as shown in Table 2. Bio-
climatic variables studied include geometry, orientation, glazing, shading, airtightness
and insulation.
Table 2 Constant model input
The geometry analysed are compact square-planned buildings against rectangular
shaped ones. Orientation of the buildings: two orientations are studied i.e. north-south
and east-west. an orientation of 0oN was adopted for the analysis. Glazing analysis
compares the performance of single glazing with; clear, bronze tinted, and LowE
Variable Description- as modelled
Climate Abuja- composite of warm and dry
Occupancy 162- 10.3m2/occupant, 0.09W/m
2
Average number of floors 4
Wall to window ratio 25%
Building use office
Internal heat gains 18W/m2
Lighting intensity 4w/ m2
Building volume 6174 m3
Glazing single glazing
Shading none
External and partition walls Sandcrete block with U-value of 1.4 W/m2K
Roofing Aluminum clad gable roof with calculated U-value of
0.34 W/mK.
Ground floor
Solid concrete ground floor with U-value of 4.4
W/mK.
Other floors Solid concrete slabs with dropped ceilings with U-
value of 6.7 W/mK.
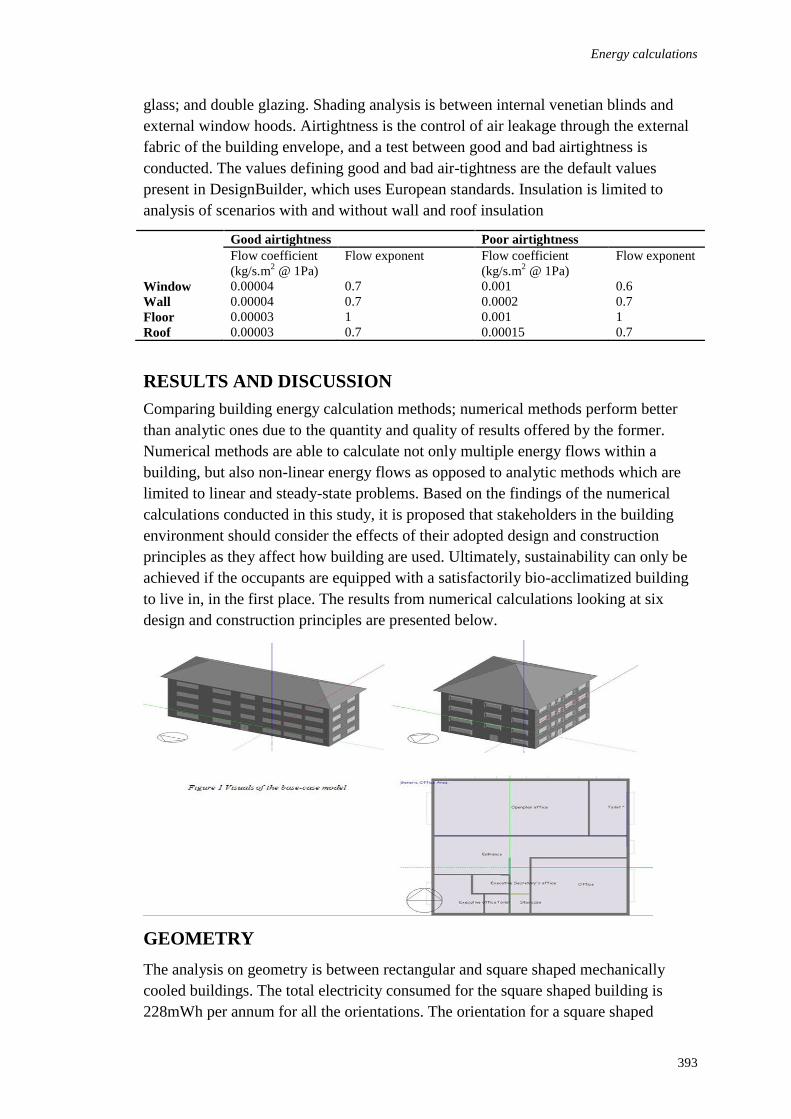
Energy calculations
393
glass; and double glazing. Shading analysis is between internal venetian blinds and
external window hoods. Airtightness is the control of air leakage through the external
fabric of the building envelope, and a test between good and bad airtightness is
conducted. The values defining good and bad air-tightness are the default values
present in DesignBuilder, which uses European standards. Insulation is limited to
analysis of scenarios with and without wall and roof insulation
Good airtightness Poor airtightness
Flow coefficient
(kg/s.m2 @ 1Pa)
Flow exponent Flow coefficient
(kg/s.m2 @ 1Pa)
Flow exponent
Window 0.00004 0.7 0.001 0.6
Wall 0.00004 0.7 0.0002 0.7
Floor 0.00003 1 0.001 1
Roof 0.00003 0.7 0.00015 0.7
RESULTS AND DISCUSSION
Comparing building energy calculation methods; numerical methods perform better
than analytic ones due to the quantity and quality of results offered by the former.
Numerical methods are able to calculate not only multiple energy flows within a
building, but also non-linear energy flows as opposed to analytic methods which are
limited to linear and steady-state problems. Based on the findings of the numerical
calculations conducted in this study, it is proposed that stakeholders in the building
environment should consider the effects of their adopted design and construction
principles as they affect how building are used. Ultimately, sustainability can only be
achieved if the occupants are equipped with a satisfactorily bio-acclimatized building
to live in, in the first place. The results from numerical calculations looking at six
design and construction principles are presented below.
GEOMETRY
The analysis on geometry is between rectangular and square shaped mechanically
cooled buildings. The total electricity consumed for the square shaped building is
228mWh per annum for all the orientations. The orientation for a square shaped
Batagarawa
394
building with uniform wall to window ratio does not affect its electricity consumption
because the walls of a square shaped building have the same surface area, and thus the
solar insolation on the building façade remains equal on all sides.
The electricity consumption of a rectangle plan building with the principal axis lying
along the east-west axis is 260 mWh and that of principal axis lying along the north-
south axis is 240 mWh. These results show that the best geometry is for the square
shaped building, saving a up to 5% electricity consumption. See Figure 2.
ORIENTATION
The analysis on orientation is between cases when the building lies along the east-
west and north-south axes. Considering the square-shaped building, the orientation is
insignificant for a building with uniform window/wall ratio as discussed above.
However, a look at the rectangular shaped building showed the electricity
consumption of a rectangle plan building with the principal axis lying along the east-
west axis is 260 mWh and that of the north-south axis is 240 mWh. The best case is
when the principal axis lies on the east-west axis saving a possible 8%.
The sun rises in the north-east and sets in the south-west in Abuja. Therefore, if the
building is positioned so that its principal axis is lying along the east-west axis, the
sun’s rays has a greater effect on the shorter sides of the building thereby reducing
heat transfer into the interior of the building through the building façade.
Based on these geometrically and orientation optimized results, the more bio-
climatically suitable square-plan building will be used for further analysis. It is worthy
of note that optimizing for naturally ventilated or mixed mode buildings may differ.
AIR-TIGHTNESS
The analysis on air-tightness is between ‘good’ and ‘bad’ with specifications as shown
in Error! Reference source not found.. The total consumptions for the building with
good and bad air-tightness are 199.23 and 216.93 mWh per annum respectively.
For mechanically cooled and mix-mode buildings, air-tightness is essential to trap the
conditioned air within the interior spaces and not leak the energy through cracks and
infiltration. Air leakage should not be mistaken for ventilation. While ventilation is
required, air leakage is not. Air-tightness may be achieved by the correct and proper
construction of building elements such as insulation, windows, doors, roofs and other
elements that have direct access to the exterior environment. Consequently
condensation, mould, rot, damp and structural damage are also limited. This ensures a
more viable protection against penetrating and unwanted air and moisture, thereby
reducing the amount of energy use in the building by up to 13%.
GLAZING
The total consumption for single glazing with; clear, bronze tinted, and LowE glass;
and double glazing is 228, 221, 226 and 222 mWh per annum respectively. The best
case is that of single but bronze tinted glazing with 221 mWh per annum.
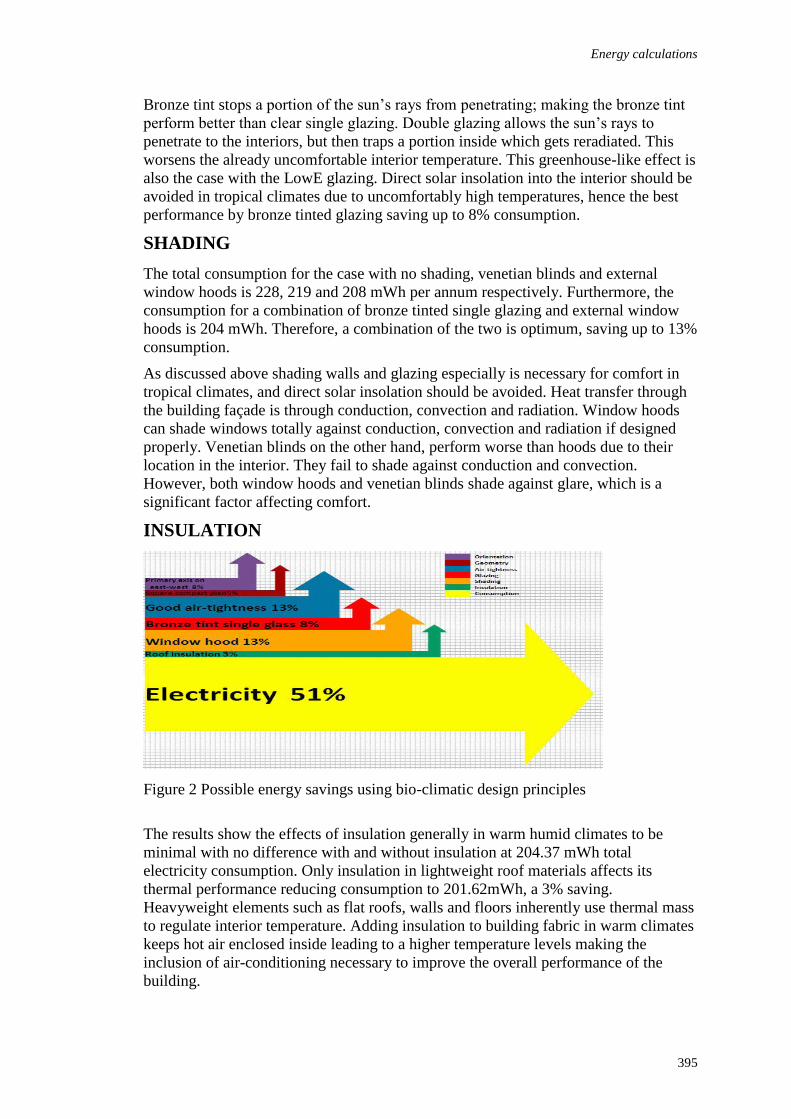
Energy calculations
395
Bronze tint stops a portion of the sun’s rays from penetrating; making the bronze tint
perform better than clear single glazing. Double glazing allows the sun’s rays to
penetrate to the interiors, but then traps a portion inside which gets reradiated. This
worsens the already uncomfortable interior temperature. This greenhouse-like effect is
also the case with the LowE glazing. Direct solar insolation into the interior should be
avoided in tropical climates due to uncomfortably high temperatures, hence the best
performance by bronze tinted glazing saving up to 8% consumption.
SHADING
The total consumption for the case with no shading, venetian blinds and external
window hoods is 228, 219 and 208 mWh per annum respectively. Furthermore, the
consumption for a combination of bronze tinted single glazing and external window
hoods is 204 mWh. Therefore, a combination of the two is optimum, saving up to 13%
consumption.
As discussed above shading walls and glazing especially is necessary for comfort in
tropical climates, and direct solar insolation should be avoided. Heat transfer through
the building façade is through conduction, convection and radiation. Window hoods
can shade windows totally against conduction, convection and radiation if designed
properly. Venetian blinds on the other hand, perform worse than hoods due to their
location in the interior. They fail to shade against conduction and convection.
However, both window hoods and venetian blinds shade against glare, which is a
significant factor affecting comfort.
INSULATION
Figure 2 Possible energy savings using bio-climatic design principles
The results show the effects of insulation generally in warm humid climates to be
minimal with no difference with and without insulation at 204.37 mWh total
electricity consumption. Only insulation in lightweight roof materials affects its
thermal performance reducing consumption to 201.62mWh, a 3% saving.
Heavyweight elements such as flat roofs, walls and floors inherently use thermal mass
to regulate interior temperature. Adding insulation to building fabric in warm climates
keeps hot air enclosed inside leading to a higher temperature levels making the
inclusion of air-conditioning necessary to improve the overall performance of the
building.

Batagarawa
396
CONCLUSION
In a world where there is increasing concern over climate change, dwindling energy
sources and energy security, using bioclimatic design principles to conserve energy is
ideal. However, some environments may not achieve comfort solely with bio-climatic
design principles and will require mechanical means to condition the interiors of
buildings. Using mechanical means should also however be optimized in terms of
design, operation and control to conserve the most energy.
For mechanically cooled buildings in Abuja - the hot and humid capital of Nigeria -
more energy is conserved with a compact geometry, the principal axis lying along
north-south, improving air-tightness, window hood shading and bronze tinting of
glazed areas, and roof insulation. Some conservation techniques tested that have no
significant effects on thermal performance are wall insulation, double glazing and
lowE glazing. These results highlight the benefit of running dynamic simulations at
any stage to compare thermal and energy performance of buildings.
A savings of 67% is possible by switching from mechanical cooling to natural
ventilation as shown by a reduction from 260mWh to 86mWh per annum for this
base-case. On the other hand, conducting preliminary simulations at the initial stage is
beneficial for a mechanically cooled building as shown by a 22% reduction in total
consumption from 260mWh to 204mWh. It is worthy of note that occupant behaviour
has not been factored into the calculations, which accounts for a large amount of
inefficiency in building energy consumption.
Finally, results show the benefit of using building energy calculation especially at
early stage of design to enable designers to make informed decisions on the electricity
use in the operational stage of the buildings. This will not only prevent poor building
performance due to electricity failure, but also adapt buildings to the endemic
electricity crisis.
REFERENCES
Adelaja, A. O., Damisa, O., Oke, S. A., Ayoola, A. B. and Ayeyemitan, A. O. (2008) 'A
survey on the energy consumption and demand in a tertiary institution', Maejo
International Journal of Science and Technology, 2, (2), pp. 331-344.
Akinbami, J.-F. K. (2010) 'Opportunities and challenges to electrical energy conservation and
CO2 emissions reduction in Nigeria's building sector ', Cities and climate change
workshop. Midrand, SA, Development Bank of Southern Africa pp.
Anigbogu, N. A. (2011) 'INTEGRATED APPROACH TO SUSTAINABLE POWER
DEVELOPMENT FOR NIGERIAN CITIES', Archibuilt forum. Abuja, Nigerian
Institute of Architects, pp.
Batagarawa, A., Hamza, N. and Dudek, S. J. (2011) 12th Conference of International Building
Performance Simulation Association, Sydney, 14-16 November. Sydney,
Australia:International building performance simulation association.
de Dear, R. and Brager, G. S. (1998) 'Developing an Adaptive Model of Thermal Comfort and
Preference', Indoor Environmental Quality (IEQ).
DesignBuilder (2011) DesignBuilder EnergyPlus Simulation Documentation for
DesignBuilder v3
Available at: http://www.designbuilder.co.uk/helpv2/ (Accessed:
EnergyPlus (2010) EnergyPlus Engineering Reference. Available at:
http://www.designbuilder.co.uk/helpv2/ (Accessed:

Energy calculations
397
Federal Republic of Nigeria. (2006) National Building Code. LexisNexis.
Kazanavičius, E., Mikuckas, A., Mikuckienė, I. and Čeponis, J. (2006) 'THE HEAT
BALANCE MODEL OF RESIDENTIAL HOUSE', INFORMATION TECHNOLOGY
AND CONTROL, 35, (4), pp. 5.
Ogunsote, O. O. (1991) Introduction to building climatology: A basic course for architecture
students. Zaria: Ahmadu Bello university Press.
Pedersen, C. O., Fisher, D. E. and Liesen, R. J. (1997) 'Development of a Heat Balance
Procedure for Calculating Cooling Loads', ASHRAE Transactions, 103, (2), pp. 459-
468.
Szokolay, S. V. (2004) Introduction to Architectural Science. Oxford: Elsevier.
US Department of Energy (2011) Buildings energy software tools directory. Available at:
http://apps1.eere.energy.gov/buildings/tools_directory/subjects_sub.cfm (Accessed:
14/02/2012).
Uyigue, E., Agho, M., Edevbaro, A., Godfrey, O. O., Uyigue, O. P. and Okungbowa, O. G.
(2009) Energy Efficiency Survey in Nigeria. Benin: Community Research and
Development Centre, Nigeria.

Bello, W.A., Adekunle, R.A. and Ogunsanmi, O.E. (2012) Effect of climate change on construction
project planning in Nigeria In: Laryea, S., Agyepong, S.A., Leiringer, R. and Hughes, W. (Eds) Procs
4th West Africa Built Environment Research (WABER) Conference, 24-26 July 2012, Abuja, Nigeria,
399-411.
399
EFFECT OF CLIMATE CHANGE ON CONSTRUCTION
PROJECT PLANNING IN NIGERIA
Wasiu A. Bello1, R. A. Adekunle
2 and O. E. Ogunsanmi
3
Department of Building, University of Lagos, Nigeria
Climate change affects the ecosystems as it creates desertification and serious
flooding, and thus, increases the risks associated with embarking on construction
project planning. The study assessed the effects of climate change at the first three
stages of "the project management cycle” otherwise regarded as project conception
planning, project design planning and construction planning. A structured
questionnaire was used to obtain responses from eighty-eight (88) construction
practitioners representing 73% response rate. Mean and repeated measure ANOVA
test was used to establish the average scores and to explore significance differences
among variables respectively. Frequent rainfall and extreme air temperatures delaying
site preparation activities is the most significant effect of climate change on project
conception planning, followed by high insurance costs on projects within flood prone
areas. Severe weather events,45 which influence the selection and specification of
construction materials, were considered as the greatest impact on project design
planning. Too much rain which interfere with construction schedule and mixing of
concrete causing newly laid concrete to be destroyed and, high wind which poses
danger to life/limbs at the construction sites on building requiring the use of scaffold
were ranked very significant effects of climate change on project construction
planning. Extreme weather events which influence the structure of site organization
plan, and extremely low temperature interference with construction work were
outranked in project conception planning and construction planning respectively. The
study has provided construction professionals and project managers with useful
information and considerations on the effects of climate change on construction
project planning.
Keywords: climate change, construction practitioner, Nigeria, project planning
INTRODUCTION
Climate change poses a serious challenge to social and economic development.
Developing countries like Nigeria are particularly vulnerable because their economies
are generally more dependent on climate-sensitive natural resources, and they are less
able to cope with the impacts of climate change (OECD, 2005). Climate change is the
result of changes in features of weather conditions, such as temperature, wind
patterns, precipitation, and relative humidity. Both natural and artificial factors
contribute to climate change but more by anthropogenic factors or human induced
activities like burning of fossil fuel, bush burning, deforestation, overgrazing
(National Research Council, 2010). In Nigeria, over time, there has been considerable
increase in population, which can be considered to have a negative effect on climate
Bello et al.
400
change. In the report of Oladapo (2010) Nigeria is party to the international effort to
reach a new post-Kyoto new climate deal and since 2007, Nigeria has been
participating in a series of climate change meetings, talks and negotiations at the
regional (Africa, G77+China, ECOWAS) and international levels. United Nations
Environment Programme, UNEP (2007) stipulates that climate change is greatly
influenced by increase in Green House Gases (GHG). The conversion of Southeast
Asian peat forests is estimated to account for 6–7 percent of the total global release of
Carbon Dioxide (CO2) into the atmosphere (UNEP, 2007). The Intergovernmental
Panel on Climate Change (IPCC) Assessment Report, California (2007) indicates that
GHG emissions increased by 70 percent between 1970 and 2004. These gases are
primarily emitted through human activities, such as the burning of fossil fuels, with
nearly half of worldwide Carbon Dioxide (CO2) emissions produced from buildings.
Increased concentration of greenhouse gases (GHGs) in the atmosphere, which traps
heat, causes global warming and subsequent rise in sea level. Climate change is a
phenomenon that poses a great threat to humanity, the built environment and
construction projects (IPCC, 2007).
Achieving construction projects require planning which is a function of management
responsible for defining the work to be managed and provide the basis for the
performance of other management functions. This according to Arditi (1985) is
considered to be the most important management function. Planning of construction
projects has been found to be one of the most significant factors for the efficient and
effective delivery of projects (Clayton, 1989). Construction project planning has been
described as the overall co-ordination and control of a construction project from
inception to completion aimed at meeting a client’s requirements in order to produce a
functionally and financially viable project that will be completed on time within
authorized cost and to the required quality standards (Hendrickson, 2008).
Climate change affects the ecosystems; the mangrove and forest zones in Nigeria are
affected immensely in that it creates desertification in the Sahel savannahs, and
coaster lines could be faced with serious flooding. Flooding makes buildings more
expensive to put up as the type of foundation to be employed on an adversely wet soil
will have high cost implications (UNEP, 2007). Also, climate change increases the
risk of embarking on construction project planning. For instance, during construction
of the built facility, extreme weather events and flood risk may hamper construction
processes causing delay and extra expense (Hertin, Berkhout, Gann and Barlow;
2003). Similarly, increased extreme weather events and air temperatures affect the
health and safety of all site workers and Laborers, particularly those working outdoors
on construction sites and this in turn will delay site construction activities and
associated costs (Carbon Disclosure Project, 2010). Also extreme weather events may
delay transport and delivery of materials affecting site programming and costs, also
availability of various construction materials will change as climate change risks,
increased regulations and carbon taxes affect the cost feasibility of some materials
more than others (CDP, 2010). Hence, this study aims at assessing the effects of
climate change on construction project planning.
LITERATURE REVIEW
The construction industry is important in the economy of every nation as it contributes
to the process of development. The construction industry comprises a wide range of
businesses involved in engineering standards, building design, and the construction of
various types of materials and structures. This sector is affected in many ways by
Project planning
401
climate change and variability as well as extreme weather events. Knowledge about
short‐term weather and longer‐term climate conditions are essential to adequately
design and successfully manage construction projects (National Oceanic and
Atmospheric Administration - NOAA, 2010). Long term climate impacts, such as sea
level rise, coastal erosion, and drought, and short term weather‐related impacts, such
as high winds and flooding influence the choice of site construction, building
techniques, and materials for construction. The potential risk of inclement weather and
climate conditions also influence planning and project completion timelines.
Construction projects that require dry conditions, such as laying roads or foundations,
may be delayed indefinitely until the weather subsides. This can cost contractors
thousands of dollars per day, if not properly planned for in advance (NOAA, 2010).
Naoum, Fong and Walker; 2004) describe project planning as one of the tools that
stakeholders use to ensure that construction projects are successfully implemented.
Hore, Kehoe, McMullan and Penton; 1997) and Faniran (2000) described project
planning as the systematic arrangement of project resources in the best way so as to
achieve project objectives. Project planning requires that project objectives are
defined first and thereafter the strategies to achieve them are formulated. Faniran
(1998) observed that the objective of project planning is project performance that is to
complete a project within a fixed time, at a previously estimated cost and to specified
standards of quality. This assertion implies that the effectiveness of project planning is
measured by project performance. Naoum (1991), Ling, Chan and Chong (2004) and
Thomas, Macken, Chung, and Kim (2002) also regard project performance as the
basis of evaluating the effectiveness of project planning. Dvir, Raz and Shenhar
(2003) identifies three levels of project planning namely:
1. The end-user level where planning focuses mainly on the functional
characteristics of the project end-product;
2. The technical level which focuses on the technical specifications of project
deliverables that are needed to support the functional requirements; and
3. The project management level which focuses on planning the activities and
processes that are needed to be carried out to ensure that the technical work
proceeds effectively.
These three levels of planning can otherwise be regarded as project conception
planning, project design planning and construction planning. Most modern
climatologists predict an unprecedented warming period during the next century and
beyond, a trend that is increasingly attributed to human-generated greenhouse gas
emissions resulting from the industrial processes, transportation, solid waste
generation, and land use patterns of the twentieth and twenty-first centuries (IPCC,
2007). Spencer (2007) defines “climate” as the average or typical weather conditions
observed over a long period of time, usually at least 30 years, for a given geographic
region. Over time, the earth‘s climate has undergone periodic ice ages and warming
periods, as observed in fossil isotopes, ice core samples, and through other
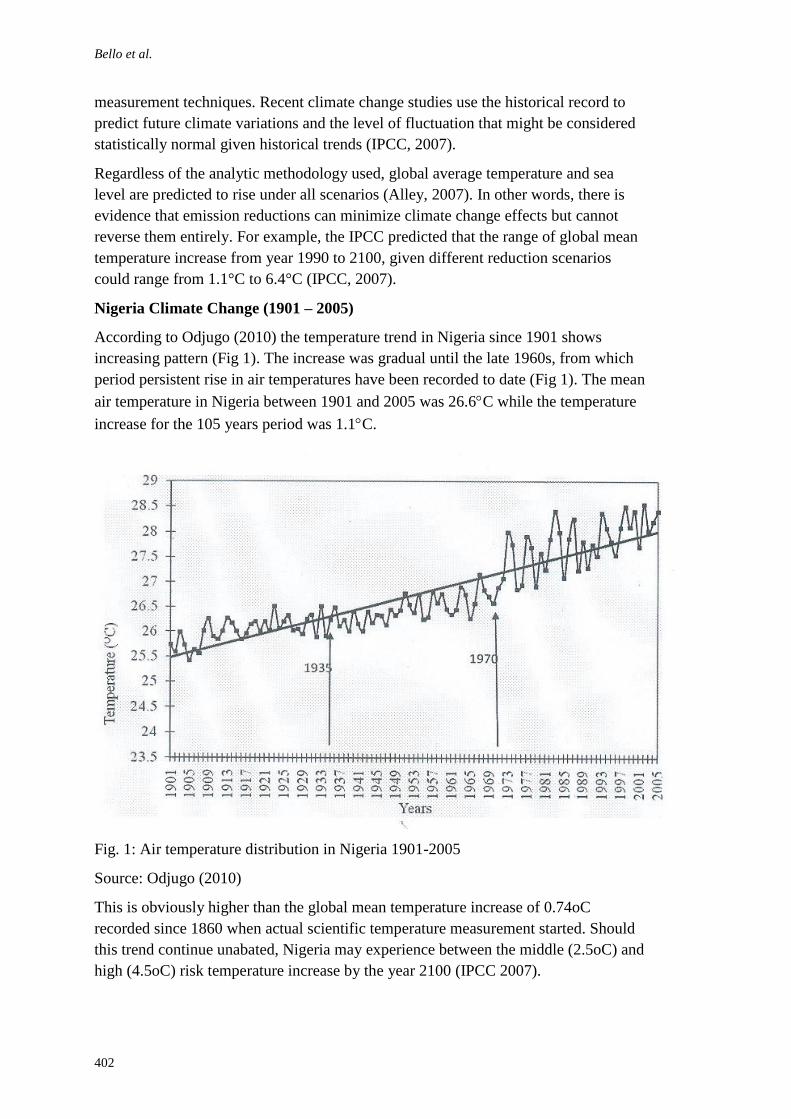
Bello et al.
402
measurement techniques. Recent climate change studies use the historical record to
predict future climate variations and the level of fluctuation that might be considered
statistically normal given historical trends (IPCC, 2007).
Regardless of the analytic methodology used, global average temperature and sea
level are predicted to rise under all scenarios (Alley, 2007). In other words, there is
evidence that emission reductions can minimize climate change effects but cannot
reverse them entirely. For example, the IPCC predicted that the range of global mean
temperature increase from year 1990 to 2100, given different reduction scenarios
could range from 1.1°C to 6.4°C (IPCC, 2007).
Nigeria Climate Change (1901 – 2005)
According to Odjugo (2010) the temperature trend in Nigeria since 1901 shows
increasing pattern (Fig 1). The increase was gradual until the late 1960s, from which
period persistent rise in air temperatures have been recorded to date (Fig 1). The mean
air temperature in Nigeria between 1901 and 2005 was 26.6C while the temperature
increase for the 105 years period was 1.1C.
Fig. 1: Air temperature distribution in Nigeria 1901-2005
Source: Odjugo (2010)
This is obviously higher than the global mean temperature increase of 0.74oC
recorded since 1860 when actual scientific temperature measurement started. Should
this trend continue unabated, Nigeria may experience between the middle (2.5oC) and
high (4.5oC) risk temperature increase by the year 2100 (IPCC 2007).

Project planning
403
Fig. 2. Rainfall distribution in Nigeria between 1901 and 2005
Source: Odjugo (2010)
Rainfall trend in Nigeria between 1901 and 2005 shows a general decline as shown in
Figure 2, as rainfall amount dropped by 81mm within the 105-year period. The
declining rainfall became critically significant from the early 1970s, and the pattern
has continued till date. This period of drastic rainfall decline corresponds with the
period of sharp temperature rise shown in (Fig 3). Odjugo (2010) corroborates IPCC
(1996) and NEST (2003) that increasing rainfall in most coastal areas and decreasing
rains in the continental interiors are notable impact of climate change. Odjugo (2005,
2007) observe that the number of rain days dropped by 53% in the north-eastern
Nigeria and 14% in the Niger-Delta Coastal areas and reported a general decrease in
rainfall in Nigeria with the coastal areas of Nigeria like Warri, Brass and Calabar
experiencing slightly increasing rainfall in recent times.
Fig.3 Decadal temperature variation in Nigeria between 1901-2005.
Source: Odjugo (2010)
Bello et al.
404
Odjugo (2005, 2007)
concluded that there are major disruptions in climatic patterns of Nigeria showing
evidence of a changing climate.
Effects of climate change on construction project planning
The construction industry may be more vulnerable to climate risk than other sectors
due to short term reactions of other stakeholders to perceived risks (Hertin et al,
2003). Risk from flooding due to changes in climate is a combination of the flood
hazard coupled with exposure and vulnerability to flooding (Clark, Priest, Treby and
Crichton; 2002). According to Clark et al (2002) in the pre-planning stage flood risk
affects the suitability of locations for planning construction projects and the conditions
under which development is permitted. Commercial viability rests upon
considerations such as: possible reduced land price; increased investment in planning
consent; increased construction costs; reduced salability, mortgaging and insurability;
and long term viability of the built facility. In the planning and design stages flood
risk affects the design of the built facility. Under planning conditions specific
drainage, building elevation, structural designs and specialized materials may be
necessitated. This may represent long term commitments for design and construction
companies and importantly their clients. In addition, there are direct financial risks to
construction project planning associated with the climate change legislation in terms
of changes to local environmental planning guidelines and building standards.
Planning guidelines in all the jurisdictions that construction projects operate globally
are being amended to reflect climate change risks and adaptation that have direct
financial impacts on the value of any construction project. As the standards become
more stringent or prescriptive, additional engineering may be required. Besides,
expensive building technologies and changes to building standards in line with climate
adaptation risks have financial implications on the design, planning and operational
costs of construction projects Carbon Disclosure Project (CDP, 2010).
The Carbon disclosure project (2010) also highlighted some of the current and/or
anticipated significant physical risks caused by climate change and their various
effects on construction project planning as follows:
Severe weather events: resulting in property damage, impact costs associated with
transport and delay delivery of construction products and materials, delay site
construction activities and programming, increase site construction costs due
to increased mitigation measures such as large scale treatment of construction
water run-off may result in indirect effects to local economies. Changing
weather conditions will also have profound effects on human health (COM,
2009). Increased extreme weather events and air temperatures will directly
affect the health and safety of all site workers and Laborers; as diseases such
as malaria are likely to have wider ranges (Oladipo, 2010), particularly those
working outdoors on construction sites and this in turn will delay site
construction activities and associated costs.
Project planning
405
Rising sea levels, coastal flooding, and erosion: may increase construction project
costs associated with additional site flood mitigation measures in either
landscaping, storm water engineering or building design, may prevent
construction project approval or undermine existing asset values due to
changed sea-level rise mapping, will result in demographic shifts which in turn
determine feasibility of construction projects.
Changes in Precipitation: Corresponding to high temperature areas, may cause
inadequate water supply. Also, access to adequate water to service
construction developments will be the key to determining the feasibility of any
proposed construction projects.
Flooding of Low Lying Areas: Flood prone or low lying land in coastal areas like
Lagos are affected by increased extreme weather events, rising sea levels,
flooding and inundation, and associated demographic shifts. This may
comprise land that was historically reclaimed from swamps and river deltas to
flood plains and harbor foreshores.
Addressing climate change requires two types of response. Firstly, and importantly,
we must reduce our greenhouse gas emissions (GHG) (i.e. take mitigation action) and
secondly we must take adaptation action to deal with the unavoidable impacts (COM,
2009). Therefore, governments and policy-makers have a responsibility to understand
these climate change impacts and to develop and implement policies that will ensure
an optimal level of adaptation.
RESEARCH METHOD
The targeted population comprises managerial staff, project managers and other key
personnel involved in project planning in construction firms, consulting firms and
client organisations including government ministries and agencies based in Lagos.
Purposive sampling technique was adopted for the study due to the comprehensive
nature of the required population and limitation on time. One hundred and twenty
(120) questionnaires were distributed to respondents, out of which only eighty-eight
(88) responses were useful from the ninety-three (93) responses received.
Respondents were requested to measure the level of significance they attach to
identified factors that determine project managers’ perception on climate change and
how it affects the planning of construction projects on a five-point Likert scale used to
determine the mean score of variables. Analysis of variance (ANOVA) test was
performed to explore significant differences in the level of opinion of the respondents.
The respondents’ backgrounds represent 17% construction project managers, 17%
Architects, 19% Builders, 21% Quantity Surveyors, 18% Civil Engineers. 8%
represented Meteorologists from the Climate Change Department of the Ministry of
Environment, and the Nigerian Meteorological Agency. Also 37 respondents
representing 42% of the sample size were consulting organization, 34% contracting
organization and 24% represents government organization. The respondents have
adequate experience in construction project as 16% of the population have 21-25
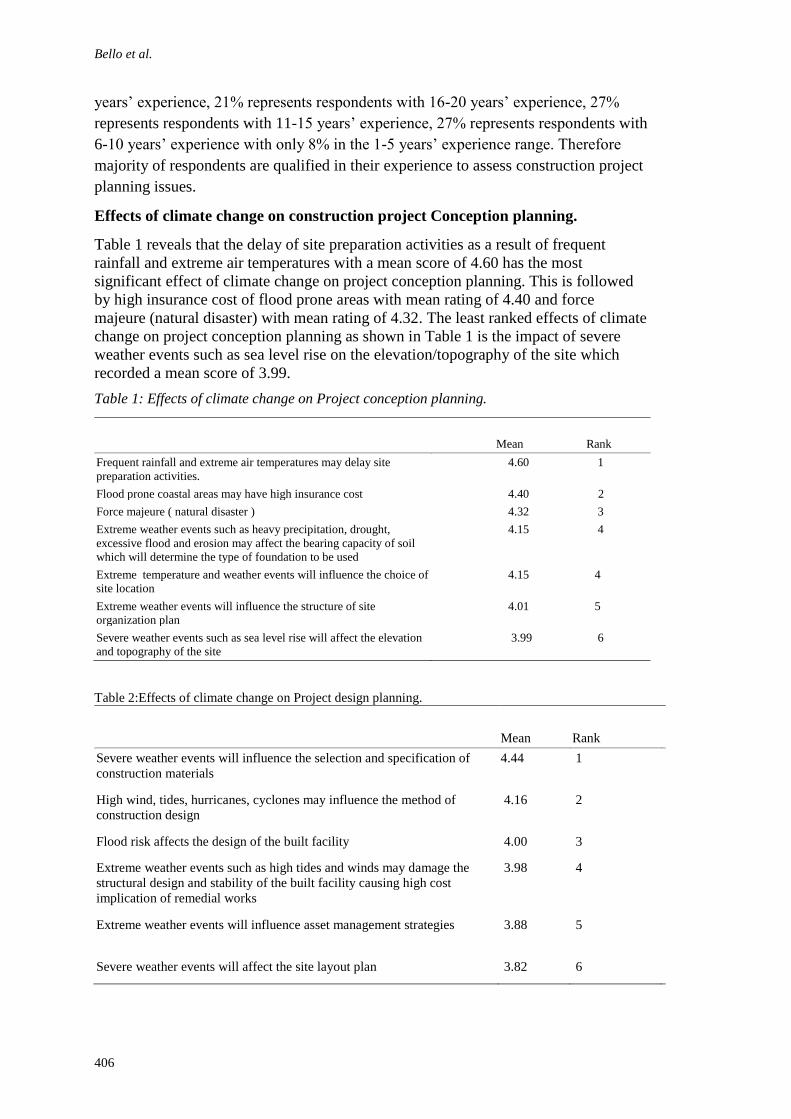
Bello et al.
406
years’ experience, 21% represents respondents with 16-20 years’ experience, 27%
represents respondents with 11-15 years’ experience, 27% represents respondents with
6-10 years’ experience with only 8% in the 1-5 years’ experience range. Therefore
majority of respondents are qualified in their experience to assess construction project
planning issues.
Effects of climate change on construction project Conception planning.
Table 1 reveals that the delay of site preparation activities as a result of frequent
rainfall and extreme air temperatures with a mean score of 4.60 has the most
significant effect of climate change on project conception planning. This is followed
by high insurance cost of flood prone areas with mean rating of 4.40 and force
majeure (natural disaster) with mean rating of 4.32. The least ranked effects of climate
change on project conception planning as shown in Table 1 is the impact of severe
weather events such as sea level rise on the elevation/topography of the site which
recorded a mean score of 3.99.
Table 1: Effects of climate change on Project conception planning.
Mean Rank
Frequent rainfall and extreme air temperatures may delay site
preparation activities.
4.60 1
Flood prone coastal areas may have high insurance cost 4.40 2
Force majeure ( natural disaster ) 4.32 3
Extreme weather events such as heavy precipitation, drought,
excessive flood and erosion may affect the bearing capacity of soil
which will determine the type of foundation to be used
4.15 4
Extreme temperature and weather events will influence the choice of
site location
4.15 4
Extreme weather events will influence the structure of site
organization plan
4.01 5
Severe weather events such as sea level rise will affect the elevation
and topography of the site
3.99 6
Table 2:Effects of climate change on Project design planning.
Mean
Rank
Severe weather events will influence the selection and specification of
construction materials
4.44 1
High wind, tides, hurricanes, cyclones may influence the method of
construction design
4.16 2
Flood risk affects the design of the built facility 4.00 3
Extreme weather events such as high tides and winds may damage the
structural design and stability of the built facility causing high cost
implication of remedial works
3.98 4
Extreme weather events will influence asset management strategies 3.88 5
Severe weather events will affect the site layout plan 3.82 6
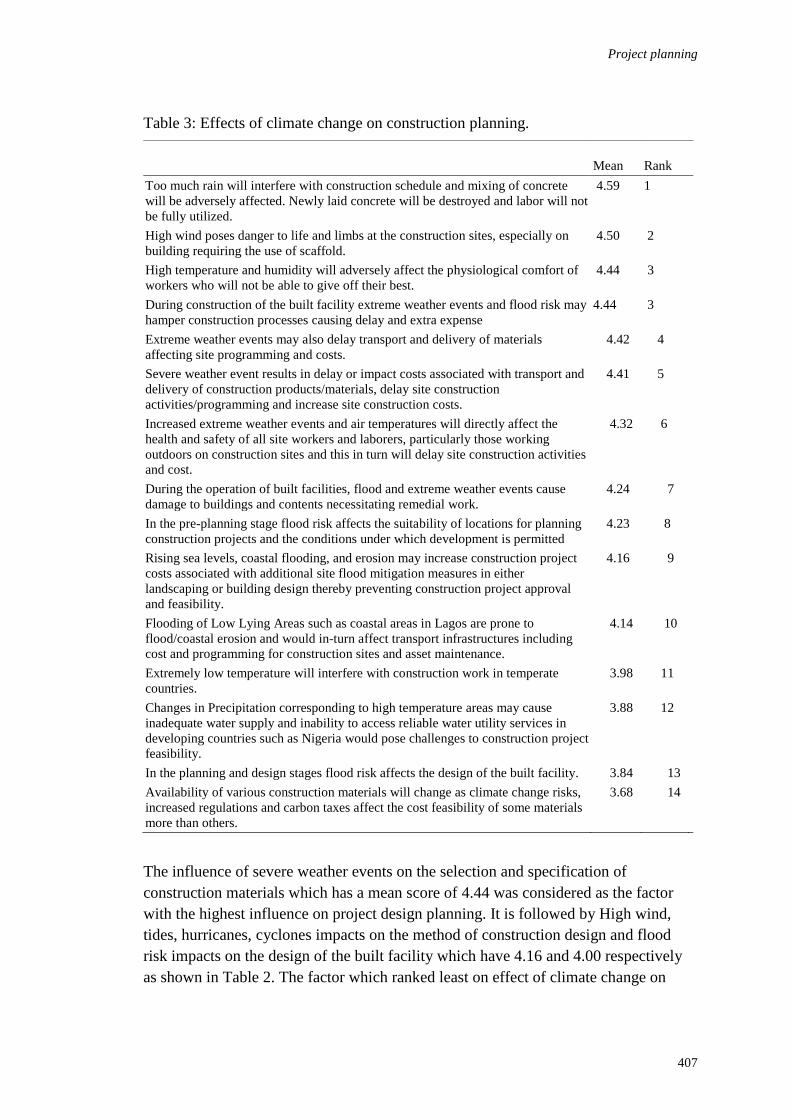
Project planning
407
Table 3: Effects of climate change on construction planning.
Mean
Rank
Too much rain will interfere with construction schedule and mixing of concrete
will be adversely affected. Newly laid concrete will be destroyed and labor will not
be fully utilized.
4.59 1
High wind poses danger to life and limbs at the construction sites, especially on
building requiring the use of scaffold.
4.50 2
High temperature and humidity will adversely affect the physiological comfort of
workers who will not be able to give off their best.
4.44 3
During construction of the built facility extreme weather events and flood risk may
hamper construction processes causing delay and extra expense
4.44 3
Extreme weather events may also delay transport and delivery of materials
affecting site programming and costs.
4.42 4
Severe weather event results in delay or impact costs associated with transport and
delivery of construction products/materials, delay site construction
activities/programming and increase site construction costs.
4.41 5
Increased extreme weather events and air temperatures will directly affect the
health and safety of all site workers and laborers, particularly those working
outdoors on construction sites and this in turn will delay site construction activities
and cost.
4.32 6
During the operation of built facilities, flood and extreme weather events cause
damage to buildings and contents necessitating remedial work.
4.24 7
In the pre-planning stage flood risk affects the suitability of locations for planning
construction projects and the conditions under which development is permitted
4.23 8
Rising sea levels, coastal flooding, and erosion may increase construction project
costs associated with additional site flood mitigation measures in either
landscaping or building design thereby preventing construction project approval
and feasibility.
4.16 9
Flooding of Low Lying Areas such as coastal areas in Lagos are prone to
flood/coastal erosion and would in-turn affect transport infrastructures including
cost and programming for construction sites and asset maintenance.
4.14 10
Extremely low temperature will interfere with construction work in temperate
countries.
3.98 11
Changes in Precipitation corresponding to high temperature areas may cause
inadequate water supply and inability to access reliable water utility services in
developing countries such as Nigeria would pose challenges to construction project
feasibility.
3.88 12
In the planning and design stages flood risk affects the design of the built facility. 3.84 13
Availability of various construction materials will change as climate change risks,
increased regulations and carbon taxes affect the cost feasibility of some materials
more than others.
3.68 14
The influence of severe weather events on the selection and specification of
construction materials which has a mean score of 4.44 was considered as the factor
with the highest influence on project design planning. It is followed by High wind,
tides, hurricanes, cyclones impacts on the method of construction design and flood
risk impacts on the design of the built facility which have 4.16 and 4.00 respectively
as shown in Table 2. The factor which ranked least on effect of climate change on
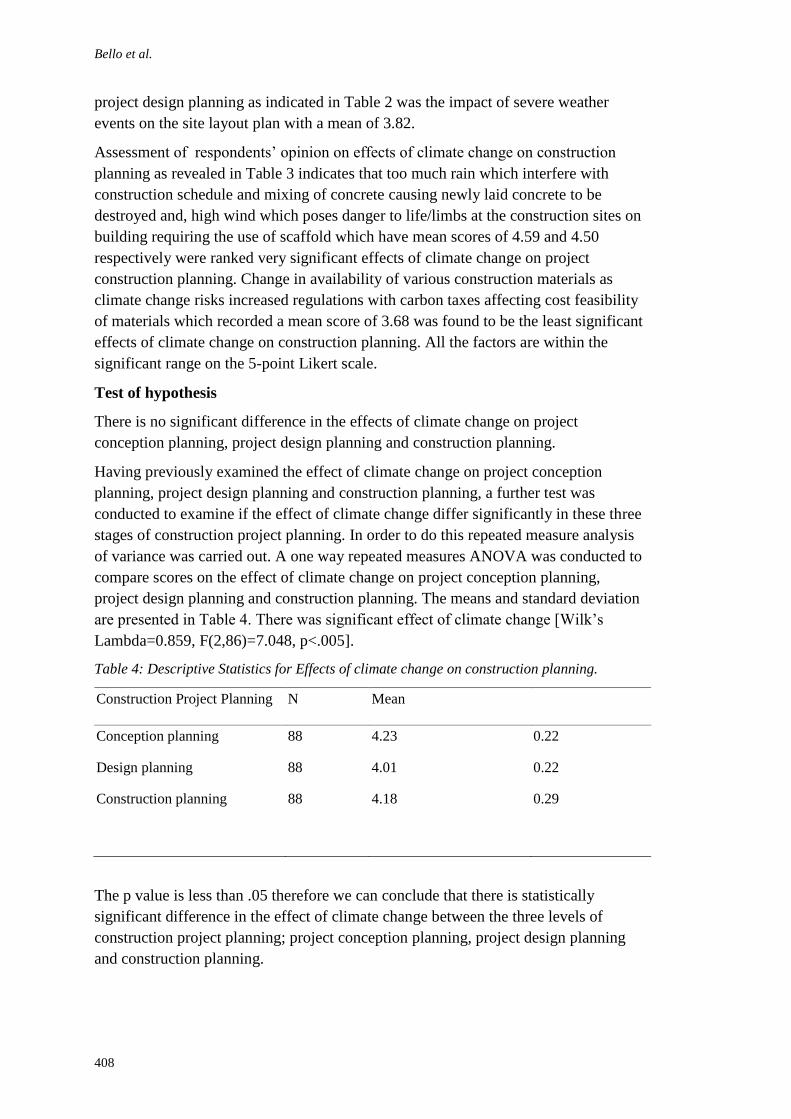
Bello et al.
408
project design planning as indicated in Table 2 was the impact of severe weather
events on the site layout plan with a mean of 3.82.
Assessment of respondents’ opinion on effects of climate change on construction
planning as revealed in Table 3 indicates that too much rain which interfere with
construction schedule and mixing of concrete causing newly laid concrete to be
destroyed and, high wind which poses danger to life/limbs at the construction sites on
building requiring the use of scaffold which have mean scores of 4.59 and 4.50
respectively were ranked very significant effects of climate change on project
construction planning. Change in availability of various construction materials as
climate change risks increased regulations with carbon taxes affecting cost feasibility
of materials which recorded a mean score of 3.68 was found to be the least significant
effects of climate change on construction planning. All the factors are within the
significant range on the 5-point Likert scale.
Test of hypothesis
There is no significant difference in the effects of climate change on project
conception planning, project design planning and construction planning.
Having previously examined the effect of climate change on project conception
planning, project design planning and construction planning, a further test was
conducted to examine if the effect of climate change differ significantly in these three
stages of construction project planning. In order to do this repeated measure analysis
of variance was carried out. A one way repeated measures ANOVA was conducted to
compare scores on the effect of climate change on project conception planning,
project design planning and construction planning. The means and standard deviation
are presented in Table 4. There was significant effect of climate change [Wilk’s
Lambda=0.859, F(2,86)=7.048, p<.005].
Table 4: Descriptive Statistics for Effects of climate change on construction planning.
Construction Project Planning N Mean
Conception planning 88 4.23 0.22
Design planning 88 4.01 0.22
Construction planning 88 4.18 0.29
The p value is less than .05 therefore we can conclude that there is statistically
significant difference in the effect of climate change between the three levels of
construction project planning; project conception planning, project design planning
and construction planning.
Project planning
409
SUMMARY AND CONCLUSIONS
Frequent rainfall and extreme air temperatures which delay site preparation activities
rank as the most significant impact on project conception planning. Severe weather
events which influence the selection and specification of construction materials have
the most significant impact on project design planning. Too much rainfall which
interfere with construction schedule and mixing of concrete causing newly laid
concrete to be destroyed and extreme weather events/flood risk which hamper
construction processes during construction of the built facility causing delay/extra
expense are identified in this study as the most significant effects of climate change on
construction planning. This corroborates CDP (2010) report that severe weather
events resulting in property damage, delay or impact costs associated with transport or
delivery of construction products/materials, delay site construction activities and
programming as the most significant effects of climate change on construction
planning. The findings of the research are obvious as climate change have significant
impact on planning of construction projects in the Victoria Island, Ikoyi and Lekki
peninsula areas in Lagos metropolis. Several developments at the Bar beach in
Victoria Island are being threatened by ocean surge. These areas are close to the
Atlantic Ocean and therefore are prone to risk of climate change. Erosion and flooding
in particular was identified by project managers as a major challenge to construction
works as it requires additional expenses. The weather elements are only fairly
predictable now with increasing rainfall and temperature. The concern about the
challenge of climate change on construction project has been manifested in this
research. This is equally observed in the efforts of the governments of Lagos State and
other States in Nigeria rising up to some of the challenges and their resolve to
participate and support global action on climate change
The study has provided construction professionals, especially project managers, with
useful information about the effects of climate change on construction project
planning to help them make guided and informed judgements, and to enable them
adopt formal and systematic approach to construction planning which would minimize
the impacts of climate change. This is collaborated by the literature review which
reiterates that knowledge about short‐term weather and longer‐term climate conditions
are essential to adequately design and successfully manage construction projects. This
will enhance the quality of the decisions and ensure that realistic and effective
construction planning methods are formulated by the professionals in adapting to
climate change. The study provides a platform on which further studies relating to
causes and impacts of climate change can be undertaken.
REFERENCES
Arditi, D. (1985). Construction productivity improvement. Journal of the Construction
Division (pp. 1-4).
Carbon Disclosure Project, CDP. (2010). Carbon Disclosure Project CDP 2010 Information
Request. Retrieved June 25, 2010 from http://www.lendlease.com/en/Group/Lend-
Lease/Worldwide/Responsibility/~/media/53D9956754124B82AE2C259CCB6D7B4
0.ashx; reaccessed 14thApril, 2012
Bello et al.
410
CEC, (2007). Inventory of California Greenhouse Gas Emissions and Sinks: 1990 to 2004.
Clark, M. J., Priest, S. J., Treby, E. J, and Crichton, D. (2002). Insurance and UK floods a
strategic reassessment. Report of the Tsunami Project. (Universities of Southampton,
Bournemouth and Middlesex).
Clayton, R. (1989). Planning is the key. Building Today, 197, (pp. 31-33).
COM (2009) 147 final, Adapting to climate change: Towards a European framework for
action:White Paper. COMMISSION OF THE EUROPEAN COMMUNITIES
Brussels, 1.4.2009
Dvir, D., Raz, T, and Shenhar, J. (2003). , D., Raz, T, and Shenhar, J. (2003). An Empirical
Analysis of the Relationship between Project Planning and Project Success.
International Journal of Project Management, 21(2), (pp. 1-7).
Faniran, O.O., Oluwoye, J. O, and Lenard, D. (1998). Interactions between Construction
Planning and Influence Factors. Journal of Construction Engineering and
Management, 124(4), pp. 245-256.
Harold, K. (2003). Project Management: A Systems Approach to Planning, Scheduling, and
Controlling (8th Ed).
Hertin, J., Berkhout, F., Gann, D. M, and Barlow, J. (2003). Climate change and the UK
house building sector: perceptions, impacts and adaptive capacity. Building Research
and Information, 31(3-4), (pp. 278-290).
Hore, A.V., Kehoe, J. G., McMullan, J, and Penton, M.R. (1997). Construction Management
Finance Measurement. (1st Ed). Macmillan Press Limited, London.
Alley, R.B. (2007). Summary for Policymakers. Contribution of Working Group I to the
Fourth Assessment Report of Intergovernmental Panel on Climate Change, IPCC,
Ling, F., Chan, S.L, and Chong, E. (2004). Predicting Performance of Design- Build and
Design-Bid-Build Projects. Journal of Construction Engineering and Management,
130(1), (pp. 10-20).
Naoum, S.G. (1991). Procurement Systems and Project Performance. Occasional Paper 45.
Chartered Institute of Building, UK.
Naoum, S., Fong, D, and Walker, G. (2004). Critical Success Factors in Project Management.
Proceedings of International Symposium on Globalization and Construction. School
of Civil Engineering, Asian Institute of Technology, Thailand.
National Oceanic and Atmospheric Administration, NOAA. (2010). US department of
commerce http://www.ncdc.noaa.gov/oa/userengagement/construction.pdf. p.1.
National Research Council, NRC. (2010). America's Climate Choices: Panel on Adapting to
the Impacts of Climate Change. Washington, D.C: The National Academies Press.
ISBN 0309145910. http://www.nap.edu/catalog.php?record_id=12783.
Odjugo, PAO. 2005. An analysis of rainfall pattern in Nigeria. Global Journal of
Environmental Science. 4(2): (pp.139-145).
Odjugo PAO 2007. The impact of climate change on water resources; global and regional
analysis. The Indonesian Journal of Geography. 39: (pp. 23-41).
Odjugo PAO 2010. General overview of climate change in Nigeria. J Hum Ecol 29(1) 47-55.
Organization for Economic Co-operation and Development, OECD (2005) Bridge over
Troubled Waters: Linking Climate Change and Development. OECD, Paris, ISBN 92-
64-01275-3, 154 p.1.

Project planning
411
Oladipo E (2010). Towards enhancing the adaptive capacity of Nigeria: A review of the
country’s state of preparedness for climate change adapatation; Report submitted to
HEINRICH BÖLL FOUNDATION NIGERIA SEPTEMBER 2010
Thomas, S.R., Macken, C.L., Chung, T. H, and Kim, I. (2002). Measuring the Impact of the
Delviery System on Project Performance: Design- Build and Design-Bid-Build.
Construction Industry Institute, Austin.
United Nations Environment Programme, UNEP. (2007). Buildings and Climate Change:
Status, Challenges and Opportunities.

Buertey, J.I.T., Abeere-Inga, E. and Kumi, T.A. (2012) Estimating cost contingency for construction
projects: The challenge of systemic and project specific risk In: Laryea, S., Agyepong, S.A., Leiringer,
R. and Hughes, W. (Eds) Procs 4th West Africa Built Environment Research (WABER) Conference, 24-
26 July 2012, Abuja, Nigeria, 413-426.
413
ESTIMATING COST CONTINGENCY FOR
CONSTRUCTION PROJECTS: THE CHALLENGE OF
SYSTEMIC AND PROJECT SPECIFIC RISK
Joseph Ignatius Teye Buertey1, Emmanuel Abeere-Inga
2 and Theophilus Adjei
Kumi3
1Pentecost University College, P.O. Box, KN 1739, Kaneshie, Accra, Ghana
2Accra Institute of Technology, Accra, Ghana
3Department of Building Technology, KNUST, Kumasi, Ghana
The challenge of poor scope definition resulting in scope creep is recognized as the
major driver for construction project and cost overruns (AACE, 2009). All
construction projects are associated with both systemic uncertainty and project
specific uncertainty. The epistemic ambiguity in risk estimation could be considered
as an opportunity or threat, a gain or loss, positive or negative; while project specific
risk are in relation to project cost which makes its estimation untoward. Out of 204
questionnaires distributed to built environment professionals to determine the impact
of systemic and project specific risk factors on the estimation of cost contingency,
118 was retrieved representing 57.8%. Data analysis using FMEA as a qualitative risk
tool and univariate statistical analysis as a quantitative risk tool revealed that systemic
risk accounted for approximately 64% of the cost drivers related of the construction
cost uncertainty whilst projects specific risk accounted for 36% of the risk impact.
Scope changes, incomplete scope definition, design status and changes in
specification were revealed as high-impact systemic risk which has a high propensity
of cost overrun effect on cost contingency. The impact of systemic risks can be
managed through a design management effort by confirming the certainty of owner
related issues during project definition and planning stage through historical based
models relying on organizational process asset. The research revealed that the effect
of project specific risk including natural and force majeure conditions and economic
indicators are beyond the prediction and stochasticity effort of the project team.
Project specific risk can be managed only through collaborative communicative effort
of the project team with simulation to enable the right construction technologies to be
selected and risk impact to be curtailed.
Keywords: contingency, epistemic uncertainty, risk, systemic risk, uncertainty.
INTRODUCTION
Perminpova et al (2008), postulate risk as an event having a negative impact on the
project outcomes, or opportunities, as events that beneficial impact on project
performance. The above is in contrast with uncertainty perceived as an event or
situation which was not expected to happen, regardless of whether it could have been
possible to consider in advance. Thus all projects are affected by a myriad of risk and
uncertainties, hence the need for contingencies to curtail the risk of cost overruns.
Hervert (2011) holds that a contingency is an amount of money that must be added to

Buertey et al.
414
a project base line to account for the impact of uncertain conditions which excludes
major scope changes, force majeure events and escalations. Thus the essence of
economic factors on the total success of infrastructural projects cannot be
overemphasized. Xuequing (2005) after studying the critical success factors of
infrastructural projects; held that most projects are abandoned at just 30% completion
way with just a few going through to completion thus meeting the stipulated contract
duration and project characteristics. Park et al (2005) posits that more than 60% of
construction contractors’ failure is due to economic factors. These economic factors
include a myriad of cost risk that are poorly perceived and scoped at the onset of the
project. A poor scope definition and scope planning results in difficulties in managing
contingencies associated with the project with the possibility of cost overruns. Hart,
(2007) holds that the subject of cost overruns is the results of poor contingency
planning and cost management. It can be established that a sound cost base line and
cost budgeting following a good risk assessment and analysis results in a coherent cost
control mechanism (Hendrickson, 2008). Most projects have historically experienced
increases resulting from persistent cost estimation and traditional deterministic
conservative approach in estimating cost contingencies (Keith, 2005).
Many factors necessitate the need to include a contingency sum in a contract. Patrascu
(1988) postulate that factors that may result in the need to include contingency are
minor design changes, lack of experience, underestimation of cost and quantities,
unanticipated price changes, corrections of some erroneous assumptions, abnormal
schedule slippage, lack of scope definition and changes in scope definition,
unforeseen regulations, safety requirement and other circumstances. Since a
contingency is the amount of funds or, budget needed above the estimate to reduce the
risk of overruns of a project objective to a level acceptable to the organization or
project team, a contingency sum may or may not include a management reserves
which allows for unplanned but potentially required changes in scope and cost.
THEORETICAL FRAMEWORK AND EMPIRICAL REVIEW
The use of theories in research work varies between its application in theory guiding
the design and collection of data, theory as an interactive process of data collection
and analysis and theory as an outcome of a case study. Two theories which hinge the
decision making process with respect to the estimating of construction cost
contingency would be detailed in this research: the decision theory and Failure Mode
Effect Analysis.
The decision theory is concern with making decisions, identifying the values,
uncertainties and other issues relevant in a given decision, its rationality and the
resulting optimal decision. Thus the decision theory focuses on some aspects of
human activity and how to use freedom; it is focused on goal-directed behaviour in the
presence of options. Mendoza (2002) states that descriptive decision making offers an
account of the way people actually make decision and a discussion on the mechanism
underlying this behaviour. Normative decision theory is concerned with principles
underlying rational decision making. It is concerned with identifying the best decision
to take assuming an ideal decision maker who is fully informed, able to compute with
perfect accuracy and fully rational. NAS (2005) observed that in decision theory, risk
is defined as variation in the distribution of possible outcomes. It was further observed

Contingency estimation
415
that in applying the decision theory, risk should be seen as probability distributions
with uncontrollable random events; risk management should synthesize individual risk
into one factor, quantify risk numerically and emphasized probability distribution over
all conceivable outcomes.
Thus based on the decision theory, it is evident that the process of estimating
construction cost contingency is undertaken freely by professionals based on their
perception, understanding of risk, enterprise environmental factors and organisational
process assets.
The Failure Mode Effect Analysis (FMEA) is a particular way in which an item fails
independent of the reason for failure. This relates to how the item fails not why the
item failed. An FMEA is a procedure by which each credential failure mode of each
item from a low indenture level to the highest is analysed to determine the effect on
the system and to classify each potential failure mode in accordance with severity of
its effect. Thus in applying FMEA, each potential contingency factor which has a
high potential of causing cost overruns when not mitigated is a potential failure mode.
The Failure mode and effect analysis (FMEA) aims at identifying the root causes of
risk which may affect the project as a whole. It is a systematic approach of risk
identification used to avoid omission of certain risk which may eventually be critical.
One’s ability to mitigate the risk is based on impact, likelihood, and
“detectability”/”hideability” of the most serious risk, these rated on a scale of 1 to 10.
Generically, FMEA is for distinguishing between high and low risk factor and for
follow-up purpose. In the use of the FMEA, the level of risk is determined
qualitatively using risk priority numbers (RPN).
The Risk Priority number (RPN) is calculated as:
RPN= P x Ix H…………………………… (1)
Whereas risk was estimated as:
Risk= P x I………………………………… (2)
With
Probability of occurrence of Risk = . Risk ………………………….. (3)
∑Overall risk
Where P is the possibility of occurrence,
I is the financial impact of the risk should it occur,
H is the hideability of the risk factor
CONCEPTUAL FRAMEWORK
According to Ali (2005) most firms have adopted a rule of thumb which is applied
during estimation to take care of risk in relation to cost on the project. Gunhan and
Arditi (2007) posits that one of the simplest methods of estimating contingency
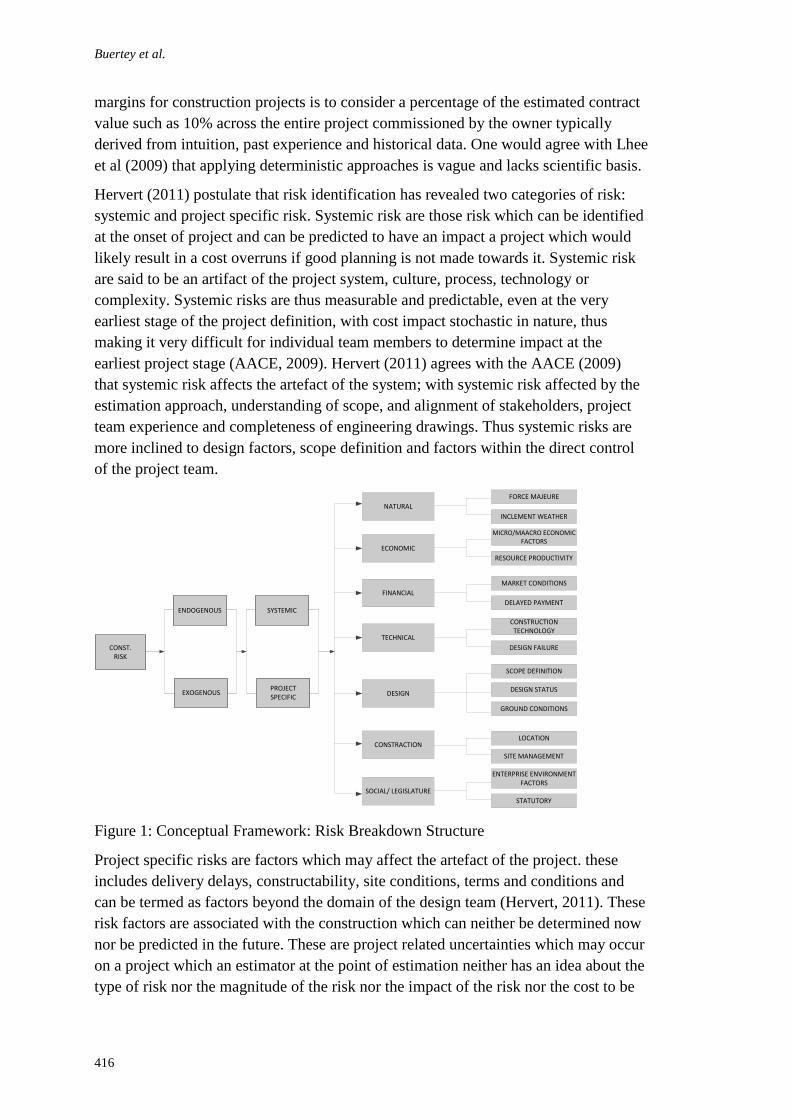
Buertey et al.
416
margins for construction projects is to consider a percentage of the estimated contract
value such as 10% across the entire project commissioned by the owner typically
derived from intuition, past experience and historical data. One would agree with Lhee
et al (2009) that applying deterministic approaches is vague and lacks scientific basis.
Hervert (2011) postulate that risk identification has revealed two categories of risk:
systemic and project specific risk. Systemic risk are those risk which can be identified
at the onset of project and can be predicted to have an impact a project which would
likely result in a cost overruns if good planning is not made towards it. Systemic risk
are said to be an artifact of the project system, culture, process, technology or
complexity. Systemic risks are thus measurable and predictable, even at the very
earliest stage of the project definition, with cost impact stochastic in nature, thus
making it very difficult for individual team members to determine impact at the
earliest project stage (AACE, 2009). Hervert (2011) agrees with the AACE (2009)
that systemic risk affects the artefact of the system; with systemic risk affected by the
estimation approach, understanding of scope, and alignment of stakeholders, project
team experience and completeness of engineering drawings. Thus systemic risks are
more inclined to design factors, scope definition and factors within the direct control
of the project team.
NATURAL
FORCE MAJEURE
INCLEMENT WEATHER
MICRO/MAACRO ECONOMIC FACTORS
RESOURCE PRODUCTIVITY
MARKET CONDITIONS
DELAYED PAYMENT
CONSTRUCTION TECHNOLOGY
DESIGN FAILURE
SCOPE DEFINITION
DESIGN STATUS
GROUND CONDITIONS
LOCATION
SITE MANAGEMENT
ENTERPRISE ENVIRONMENT FACTORS
STATUTORY
ECONOMIC
FINANCIAL
TECHNICAL
DESIGN
CONSTRACTION
SOCIAL/ LEGISLATURE
SYSTEMIC
CONST.RISK
PROJECT SPECIFIC
ENDOGENOUS
EXOGENOUS
Figure 1: Conceptual Framework: Risk Breakdown Structure
Project specific risks are factors which may affect the artefact of the project. these
includes delivery delays, constructability, site conditions, terms and conditions and
can be termed as factors beyond the domain of the design team (Hervert, 2011). These
risk factors are associated with the construction which can neither be determined now
nor be predicted in the future. These are project related uncertainties which may occur
on a project which an estimator at the point of estimation neither has an idea about the
type of risk nor the magnitude of the risk nor the impact of the risk nor the cost to be
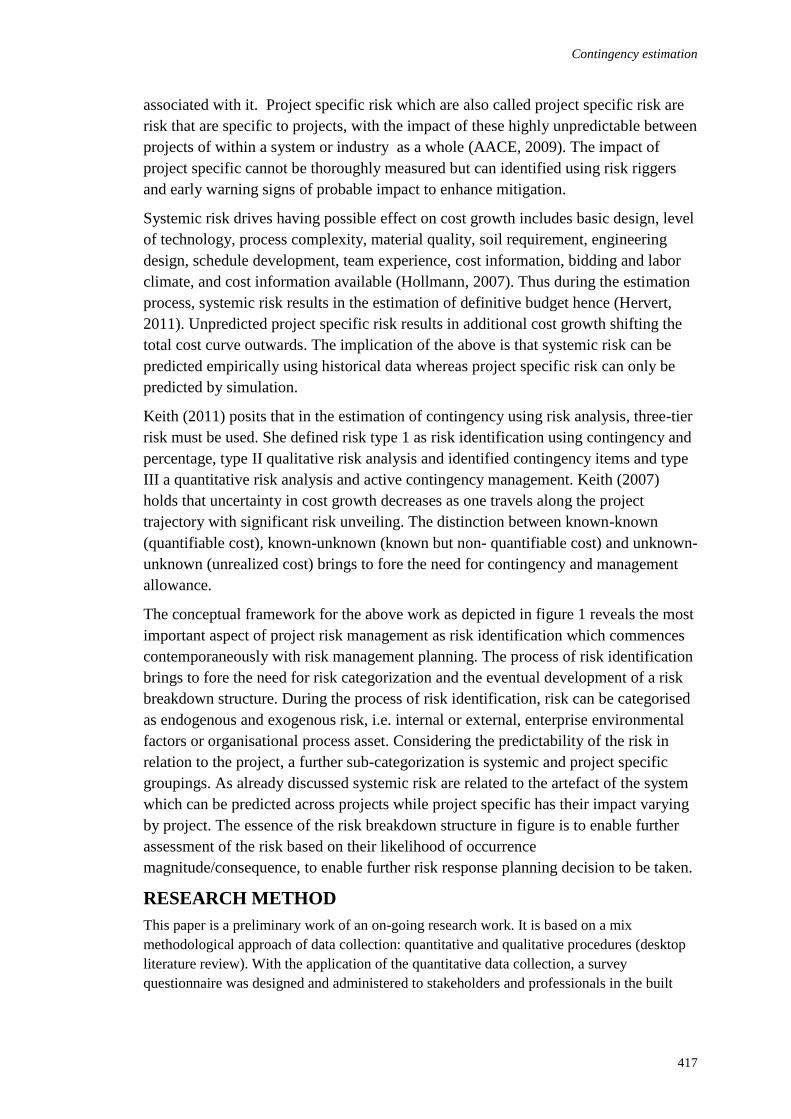
Contingency estimation
417
associated with it. Project specific risk which are also called project specific risk are
risk that are specific to projects, with the impact of these highly unpredictable between
projects of within a system or industry as a whole (AACE, 2009). The impact of
project specific cannot be thoroughly measured but can identified using risk riggers
and early warning signs of probable impact to enhance mitigation.
Systemic risk drives having possible effect on cost growth includes basic design, level
of technology, process complexity, material quality, soil requirement, engineering
design, schedule development, team experience, cost information, bidding and labor
climate, and cost information available (Hollmann, 2007). Thus during the estimation
process, systemic risk results in the estimation of definitive budget hence (Hervert,
2011). Unpredicted project specific risk results in additional cost growth shifting the
total cost curve outwards. The implication of the above is that systemic risk can be
predicted empirically using historical data whereas project specific risk can only be
predicted by simulation.
Keith (2011) posits that in the estimation of contingency using risk analysis, three-tier
risk must be used. She defined risk type 1 as risk identification using contingency and
percentage, type II qualitative risk analysis and identified contingency items and type
III a quantitative risk analysis and active contingency management. Keith (2007)
holds that uncertainty in cost growth decreases as one travels along the project
trajectory with significant risk unveiling. The distinction between known-known
(quantifiable cost), known-unknown (known but non- quantifiable cost) and unknown-
unknown (unrealized cost) brings to fore the need for contingency and management
allowance.
The conceptual framework for the above work as depicted in figure 1 reveals the most
important aspect of project risk management as risk identification which commences
contemporaneously with risk management planning. The process of risk identification
brings to fore the need for risk categorization and the eventual development of a risk
breakdown structure. During the process of risk identification, risk can be categorised
as endogenous and exogenous risk, i.e. internal or external, enterprise environmental
factors or organisational process asset. Considering the predictability of the risk in
relation to the project, a further sub-categorization is systemic and project specific
groupings. As already discussed systemic risk are related to the artefact of the system
which can be predicted across projects while project specific has their impact varying
by project. The essence of the risk breakdown structure in figure is to enable further
assessment of the risk based on their likelihood of occurrence
magnitude/consequence, to enable further risk response planning decision to be taken.
RESEARCH METHOD
This paper is a preliminary work of an on-going research work. It is based on a mix
methodological approach of data collection: quantitative and qualitative procedures (desktop
literature review). With the application of the quantitative data collection, a survey
questionnaire was designed and administered to stakeholders and professionals in the built
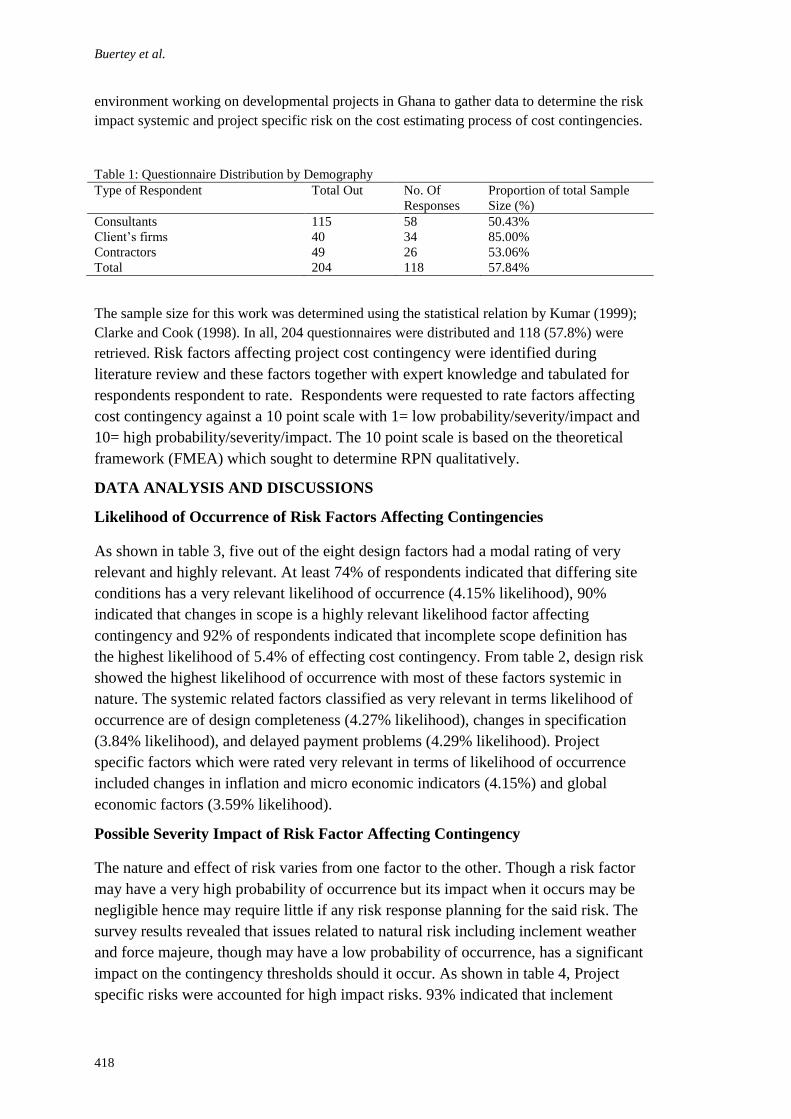
Buertey et al.
418
environment working on developmental projects in Ghana to gather data to determine the risk
impact systemic and project specific risk on the cost estimating process of cost contingencies.
Table 1: Questionnaire Distribution by Demography
Type of Respondent Total Out No. Of
Responses
Proportion of total Sample
Size (%)
Consultants 115 58 50.43%
Client’s firms 40 34 85.00%
Contractors 49 26 53.06%
Total 204 118 57.84%
The sample size for this work was determined using the statistical relation by Kumar (1999);
Clarke and Cook (1998). In all, 204 questionnaires were distributed and 118 (57.8%) were
retrieved. Risk factors affecting project cost contingency were identified during
literature review and these factors together with expert knowledge and tabulated for
respondents respondent to rate. Respondents were requested to rate factors affecting
cost contingency against a 10 point scale with 1= low probability/severity/impact and
10= high probability/severity/impact. The 10 point scale is based on the theoretical
framework (FMEA) which sought to determine RPN qualitatively.
DATA ANALYSIS AND DISCUSSIONS
Likelihood of Occurrence of Risk Factors Affecting Contingencies
As shown in table 3, five out of the eight design factors had a modal rating of very
relevant and highly relevant. At least 74% of respondents indicated that differing site
conditions has a very relevant likelihood of occurrence (4.15% likelihood), 90%
indicated that changes in scope is a highly relevant likelihood factor affecting
contingency and 92% of respondents indicated that incomplete scope definition has
the highest likelihood of 5.4% of effecting cost contingency. From table 2, design risk
showed the highest likelihood of occurrence with most of these factors systemic in
nature. The systemic related factors classified as very relevant in terms likelihood of
occurrence are of design completeness (4.27% likelihood), changes in specification
(3.84% likelihood), and delayed payment problems (4.29% likelihood). Project
specific factors which were rated very relevant in terms of likelihood of occurrence
included changes in inflation and micro economic indicators (4.15%) and global
economic factors (3.59% likelihood).
Possible Severity Impact of Risk Factor Affecting Contingency
The nature and effect of risk varies from one factor to the other. Though a risk factor
may have a very high probability of occurrence but its impact when it occurs may be
negligible hence may require little if any risk response planning for the said risk. The
survey results revealed that issues related to natural risk including inclement weather
and force majeure, though may have a low probability of occurrence, has a significant
impact on the contingency thresholds should it occur. As shown in table 4, Project
specific risks were accounted for high impact risks. 93% indicated that inclement
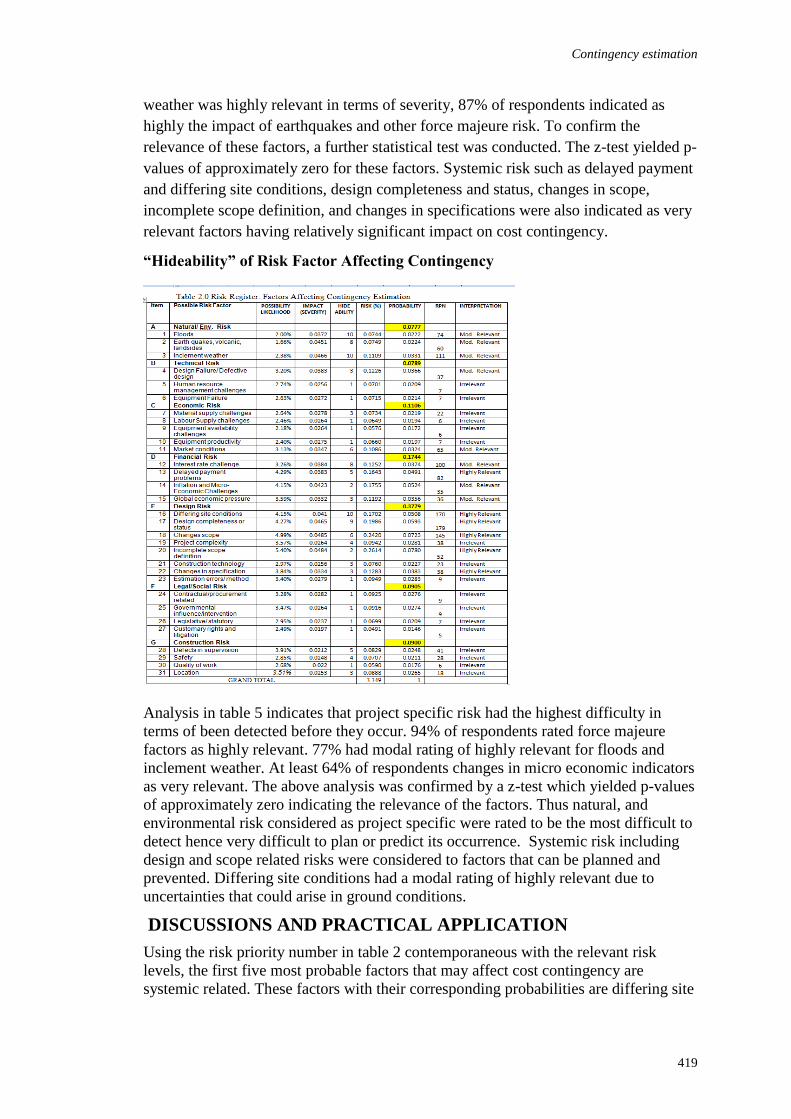
Contingency estimation
419
weather was highly relevant in terms of severity, 87% of respondents indicated as
highly the impact of earthquakes and other force majeure risk. To confirm the
relevance of these factors, a further statistical test was conducted. The z-test yielded p-
values of approximately zero for these factors. Systemic risk such as delayed payment
and differing site conditions, design completeness and status, changes in scope,
incomplete scope definition, and changes in specifications were also indicated as very
relevant factors having relatively significant impact on cost contingency.
“Hideability” of Risk Factor Affecting Contingency
Analysis in table 5 indicates that project specific risk had the highest difficulty in
terms of been detected before they occur. 94% of respondents rated force majeure
factors as highly relevant. 77% had modal rating of highly relevant for floods and
inclement weather. At least 64% of respondents changes in micro economic indicators
as very relevant. The above analysis was confirmed by a z-test which yielded p-values
of approximately zero indicating the relevance of the factors. Thus natural, and
environmental risk considered as project specific were rated to be the most difficult to
detect hence very difficult to plan or predict its occurrence. Systemic risk including
design and scope related risks were considered to factors that can be planned and
prevented. Differing site conditions had a modal rating of highly relevant due to
uncertainties that could arise in ground conditions.
DISCUSSIONS AND PRACTICAL APPLICATION
Using the risk priority number in table 2 contemporaneous with the relevant risk
levels, the first five most probable factors that may affect cost contingency are
systemic related. These factors with their corresponding probabilities are differing site
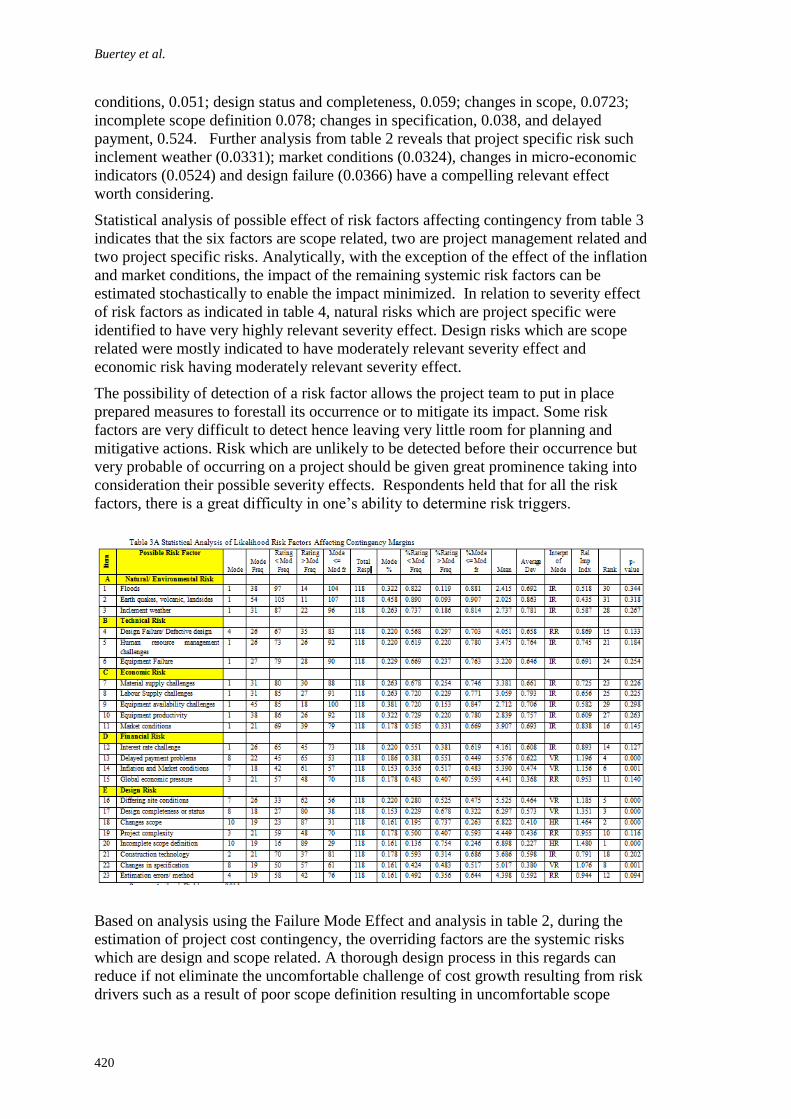
Buertey et al.
420
conditions, 0.051; design status and completeness, 0.059; changes in scope, 0.0723;
incomplete scope definition 0.078; changes in specification, 0.038, and delayed
payment, 0.524. Further analysis from table 2 reveals that project specific risk such
inclement weather (0.0331); market conditions (0.0324), changes in micro-economic
indicators (0.0524) and design failure (0.0366) have a compelling relevant effect
worth considering.
Statistical analysis of possible effect of risk factors affecting contingency from table 3
indicates that the six factors are scope related, two are project management related and
two project specific risks. Analytically, with the exception of the effect of the inflation
and market conditions, the impact of the remaining systemic risk factors can be
estimated stochastically to enable the impact minimized. In relation to severity effect
of risk factors as indicated in table 4, natural risks which are project specific were
identified to have very highly relevant severity effect. Design risks which are scope
related were mostly indicated to have moderately relevant severity effect and
economic risk having moderately relevant severity effect.
The possibility of detection of a risk factor allows the project team to put in place
prepared measures to forestall its occurrence or to mitigate its impact. Some risk
factors are very difficult to detect hence leaving very little room for planning and
mitigative actions. Risk which are unlikely to be detected before their occurrence but
very probable of occurring on a project should be given great prominence taking into
consideration their possible severity effects. Respondents held that for all the risk
factors, there is a great difficulty in one’s ability to determine risk triggers.
Based on analysis using the Failure Mode Effect and analysis in table 2, during the
estimation of project cost contingency, the overriding factors are the systemic risks
which are design and scope related. A thorough design process in this regards can
reduce if not eliminate the uncomfortable challenge of cost growth resulting from risk
drivers such as a result of poor scope definition resulting in uncomfortable scope

Contingency estimation
421
creep. Based on risk categorization for the purpose of estimating the probability of
occurrence, natural risk accounted for a probability of 0.070, whilst economic was
0.11, financial risk, 0.174; technical risk 0.079; design risk 0.378; and construction
risk 0.090. Summarily curtailed, project specific risk accounted for an accumulated
probability of 0.363 (36% impact of all risk). The corresponding cumulative
probability for systemic risk is 0.637; accounting for approximately 64% of all risk on
the projects which could hitherto be prevented.
Keith (2007) proposed with various tools, a risk management framework of risk
identification, risk analysis, risk mitigation and plan, risk allocation and risk
monitoring and control. Hollmann (2007) postulates that whereas the best approach to
measuring systemic risk is by the use of empirically based parametric models, an
expected monetary value can be deduced from Monte Carlo Simulation for the
estimation of project specific risk.
A thorough risk management framework for the estimation of project cost
contingency estimation as depicted in figure 2 below would be by the application of a
systematic risk management process as discussed below. Risk identification for the
process of contingency estimation must start as early as the project conception and
ignition stage. This would help unveil all possible risk factors incident to the project
adopting the appropriate risk categorization (exogenous and endogenous risk). Using a
coherent risk breakdown structure, all possible risk related to the project can be
discovered by the project team.
Contract treatment/
Procurement related factors
Project cost modeling
Project InitiationProject
Design
Exegenous
Project Risk
Management
Endogonous
Systemic
Project
related
Financial
Treatment
Contingency
Estimation
Contract
Sum
Management
Researve
Determination,
Prrobablist,
monte carlo Fiss
cofie, Art
neurols
Project Cost Risk
review
Figure 2: Project Risk Framework for Contingency Estimation
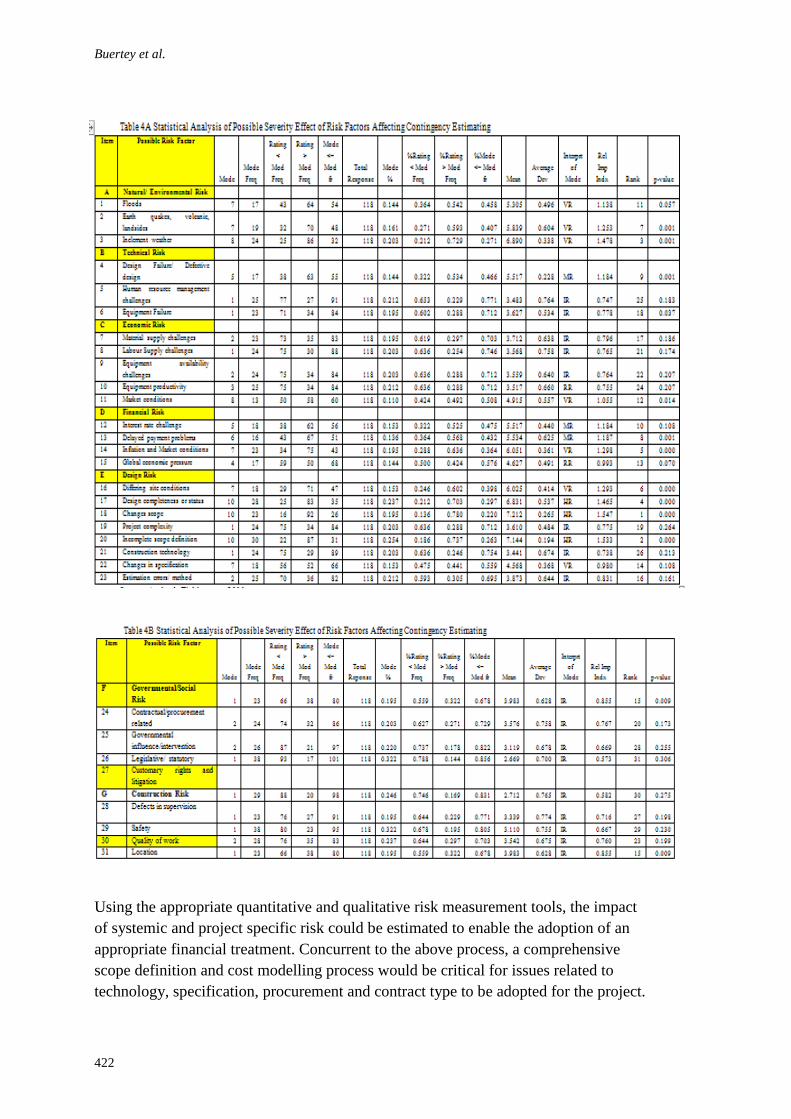
Buertey et al.
422
Using the appropriate quantitative and qualitative risk measurement tools, the impact
of systemic and project specific risk could be estimated to enable the adoption of an
appropriate financial treatment. Concurrent to the above process, a comprehensive
scope definition and cost modelling process would be critical for issues related to
technology, specification, procurement and contract type to be adopted for the project.

Contingency estimation
423
The procurement process for any construction project is not sacrosanct; every system
may have some flaws and challenges associated with it. Owners always strive to
provide adequate contingency through their representatives to address risk related
issues and to provide a safeguard for the contractor, designer and owner to complete
the project on budget.
It is interesting to note that the cost modelling process adopted by the designers is
significantly affected by the availability, reliability and quality of cost data. The
experience and skill of the estimator, organizational process asset and enterprise
environmental factors. The contingency estimation process is set in motion by the
adoption of appropriate risk management effort which together with a reliable cost
Buertey et al.
424
modelling technique allows an adequate contingency sum to be determined.
Subsequent to the above, a management reserve is estimated to allow to unknown
unknowns which are project specific risk for enhance project team confidence. During
qualitative and quantitative risk analysis process; project specific risk cannot be
predicted to allow for adequate risk response planning. These are however monitored
by risk owners using prompt risk triggers to allow prompt responses to these risks.
The monitoring of these risk by risk owners taking into consideration of the
performance of other risk allows the project team to review cost risk appropriately.
It must be argued since systemic risk can be estimated based on the scope definition
by aligning stakeholder alignment, precision and completion of engineering work, the
use of organisational process asset is critical. On the other hand, the challenge of
predicting project specific risk due its inherence with the artefact of the project
demands the need for the project tea to watch out for delivery delays, constructability,
site conditions, force majeure and unstable economic factors.
SUMMARY AND CONCLUSION
In summary, the major divers for systemic project risk are scope, technology and
complexity which whose contingency can be empirically estimated as “known-
knowns” and “known-unknowns”. Project specific uncertainties are driven by
uncertainties and events which are difficult to determine hence termed “unkown-
unkown” determinable only through simulation and a careful risk ownership. Since
design flexibility and risk management are complementary in the managing of
projects, the client and design team need to emphasize cooperation and shared goals to
reduce project uncertainty to decrease the rigidity of product designs (Gil and Tether,
2011).
This paper briefly reviews the concept of project cost contingency, the methods of
estimation of cost contingency and the effect of systemic and project specific risk on
the estimation process of cost contingency. It has been established that about 64% of
the risk factors affecting cost contingency are systemic risk which are related to the
culture, technology, complexity and project definition. It has again been shown that
five out of the eight most significant factors affecting cost contingency are as a result
of poor design and scope definition. These factors include differing site conditions,
design completeness and status, changes in scope, incomplete scope definition, and
changes in specification, the result if which is scope creep. To adequately estimate the
cost contingency of projects, thus an estimator must be able to identify the most
significant risk design factors, economic and risk factors. The impact of project
specific risk can adequately be catered for by management contingency after a through
estimation process for the systemic related risk.
REFERENCES
Ali, Rashed (2005), The Application of risk management in infrastructural construction
projects, Journal of Cost Engineering Vo. 47/No. 8 pp 20—27
Contingency estimation
425
Association for the Advancement of Cost Engineering (AACE), (1998), Construction cost
estimating working manual
Aibinu, A A., Jagboro, G.O (2002), The effects of construction delays on project delivery in
Nigerian construction industry. International Journal of Project Management, 20, 593-
599.
Baccarini, David (2004), Accuracy In Estimating Project Cost Construction Contingency- A
Statistical Analysis Cobra 2004: The Int. Construction Research Conf. of the Royal
Institution of Chartered Surveyors International conference, 7th-8th September 2004,
Leeds Metropolitan Univ. Leeds, U.K.
Chen, D and Hartman, F T (2000), A neural network approach to risk assessment and
contingency allocation. ACCE Transactions, Risk. 07.01-6.
Clark, D.E (2001). Monte Carlo analysis: ten years of experience. Cost Engineering, 43(6),
40-45.
Clark, G.M. and Cook, D. (1998). A basic course in statistics. 4th Ed, New York, Arnold.
Curran, M W (1989) Range Estimating, Cost Engineering, 31(3), 18-26.
Dey, P., Tabucanon, M T and Ogunlana, S O ((1994). Planning for project control through
risk analysis; a petroleum pipe laying project, International Journal of Project
Management, 12(1), 23-33.
Diekmann, J.E and Featherman, W.D (1998). Assessing cost uncertainty: lessons from
environmental restoration projects, Journal of Construction Engineering and
Management, 124 (6), 445-451.
Diekmann, J.E. (1983). Probabilistic estimating: mathematics and applications, Journal of
Construction Engineering and Management, 109(3), 297-308.
Gil, Nuno., Tether, R. Bruce (2011), Project risk management and design flexibility: analysing
a case and condition of complementarily, Research Policy, 40,pp 415-428.
Gunhan, S., and Arditi, D. (2007), Avoiding change orders in public school construction.
J.Profl. Issues Eng. Educ.Pract., 133(1), 67-73.
Hackney, JW (1985). Applied contingency analysis, AACE Transactions, B.1-4
Hervet, Lyle (2011), Contingency risk model, A Black and Veatch business excellence
review, Palisade @risk Conference by the AACE
Hollmann, John, (2009), Recommended Practice for Risk Analysis and cost Contingency
Estimation, Association for the Advancement of Cost Engineering (AACE), Working
Maual
Keith, R Molenaar, (2011), a risk based approach to contingency estimating in highway
project development, American Society of Civil Engineers, pp 786-795
Keith, R Molenaar, (2005), Programmatic cost risk analysis for highway megaprojects. J.
Constr. Manage,131, 343.
Keith, R Molenaar, (2007), Management practice to control transportation project cost. Cost
estimating and cost management in the planning process capacity building workshop,
Minneapolis, November 16th 2007
Kumar, R. (1999), Research methodology: A step by step guide for beginners, London, SAGE
Publications
Leach L P (2003), Schedule and cost buffer sizing: how to account for the bias between
project performance and your model. Project Management Journal, 34(2), 34-47.
Buertey et al.
426
Lorance, R B and Wendling, R V (1999), Basic techniques for analyzing and presenting cost
risk analysis, AACE Transactions, Risk. 01. 1-7
Merrow E W and Yarossi M E (1990), Assessing Project cost and schedule risk, AACE
Transactions, H.6.2-7
Moselhi O (1997), Risk assessment and contingency estimating, ACCE Transactions,
D&RM/A.06.1-6
Oberlender GD and Trost S M (2001). Predicting accuracy of early cost estimates based on
estimate quality, Journal of Construction Engineering and Management, 127(3), 173-
182
Patrascu Anghel (1998), construction cost engineering hand book, Mercel Dekker Inc, New
York
Park K. Hyung, Seung H. Han, Jeffery S. Russell (2005), “Cash Flow Prediction Model For
General Contractors Using Moving Weights Of Cost Categories”, Journal of
Management in Engineering, ASCE, 072-597X pp 164-172
Perminova, Olga., Gustafsson, Magnus., Wikstrom, Kim, (2008). Defining Uncertainty in
projects- a new perspective, Journal of Project Management, 26, 73-78.
Project Management Institute, (2009), A Guide to the Project Management Body of
Knowledge. Newton Square, PA, PMI.
Russell J.S. (1991), “Contractor’s failure”: Analysis J. perform Constr. Facility., 5(2), 163-
180
Sonmez Rifat (2007), Qualitative methodology for determination of cost contingency in
international projects, Journal of Management in Engineering, p 35-39
Touran, A. (2003), “Probability model for cost contingency.” J. Constr. Eng. Manage., 129(3),
280-284.
Williams T P (2003). Predicting final cost for competitively bid construction projects using
regression models, International Journal of Project Management, 21, 593-599
Yeo K T (1990). Risks, classification of estimates, and contingency management. Journal of
Management in Engineering, 6(4), 458-470
Xuequing Zhang, (2005), “Critical Success Factor for Public- Private Partnership in
Infrastructure”. Journal of Construction Engineering and Management, Volume 131,
Issue 1, pp 3-14.
Dabara, I.D , Okunola A.S., Odewande A.G. and Okorie A. (2012) Assessment of the rental values of
residential properties in urban slums: The case of Osogbo, Osun state Nigeria In: Laryea, S.,
Agyepong, S.A., Leiringer, R. and Hughes, W. (Eds) Procs 4th West Africa Built Environment
Research (WABER) Conference, 24-26 July 2012, Abuja, Nigeria, 427-439.
427
ASSESSMENT OF THE RENTAL VALUES OF
RESIDENTIAL PROPERTIES IN URBAN SLUMS: THE
CASE OF OSOGBO, OSUN STATE NIGERIA
Dabara I.D1, Okunola A.S²; Odewande A.G³ and Okorie A⁴
Estate Management Department, Federal Polytechnic Ede, Osun State, Nigeria
The aim of this study is to assess the rental values of residential properties in urban
slums, using Oja-Oba, Osogbo as a case study. Residential property is one of the basic
human needs. Hence, real estate investors are consistently faced with decision of the
types of property and the place to invest in. The study adopted the survey research
design to collect data from the field. The population for the study consisted of 1,375
households in Oja-Oba Osogbo and 15 practicing Estate Surveyors. Two different sets
of questionnaires (165 for tenants and 15 for Estate Surveyors) were administered on
household heads and principal Estate Surveyors of the randomly sampled population;
however, only 149 and 13 questionnaires respectively, were retrieved and used for
analysis. The data obtained was analyzed using both descriptive and inferential
statistics. The Pearson Product Moment Correlation Coefficient for rental values and
slum indicators was r = 0.709, p = 0.000(2-tailled) indicating a strong positive
correlation. The regression analysis carried out shows R = 0.814 indicating a high
positive correlation between all the variables. The ANOVA indicated that the overall
model is statistically significant [F (5,143) =56.335, p=0.000<0.05]. The study
revealed that rental values of residential properties in urban slums are low due to the
impact of slum indicators on such properties. It was recommended among others, that
all stakeholders expedite eradication of poverty through job creation for the urban
slum dwellers as well as involvement in urban slum upgrading to enhance the latent
property values in the study area.
Keywords: estate surveyor and valuer, rental value, residential property, tenant, urban
slum
INTRODUCTION
An urban slum is a run-down area of a city characterized by substandard housing and
squalor and lacking in tenure security (UN-Habitat, 2003a). The built environment in
many developing countries particularly Nigeria, is fast decaying. The factors
responsible for these can be attributed to rapid urbanization, rural-urban migration,
and decades of steady economic downturn, decay of urban infrastructure and negligent
urban housekeeping (World Bank, 2005). The global assessment of slums undertaken
by UN-HABITAT (2003a) shows that 924 million, or 32 per cent, of the world’s
urban population resides in slums (and that number is likely to double by the year
2030). In the developing world, 43 per cent of the urban population lives in slums; 6
Dabara et al.
428
per cent in Developed Regions and 78.2 per cent in the Least Developed Countries.
Within the Developing Regions, the African Continent had the largest proportion of
the urban population resident in slums (60.9 percent). Asia and Pacific Region had the
second largest proportion (42.1 percent) while Latin America and the Caribbean slum
dwellers population was the third largest (31.9 percent). Relatively, Oceania had the
lowest proportion with 24.1 percent (UN-HABITAT, 2003a). It is in recognition of
the development challenges posed by the proliferation of slums that Goal 7, Target 11
of the Millennium Development Goals (MDGs) seeks to create significant
improvement in the lives of at least 100 million slum dwellers by the year 2020 (Cities
Alliance, 2001).
Residential properties represent one of the most basic human needs and it has a
profound impact on the health, welfare and productivity of individuals (Hoesli and
MacGregor, 2000; Julius, 2010). The problem of slum development particularly
pronounced in the old, indigenous core areas of the urban setting, poses great concern
to real estate investors as it negatively affects property values (Gibbons, 2004). Many
factors interplay to create property value such as: population change, changes in
fashion and taste, institutional factors, technological factor, economic factors and
location (Bello, 2006); factors that negatively affect the value of real property, injure
ownership motives and goals. They also affect investors’ interest and discourage
subsequent investment.
The aim of this paper is to critically assess rental values of residential properties in
Oja Oba slum area of Osogbo, using data drawn from questionnaire survey in the
study area. The availability of such data provides a unique opportunity to relate urban
slum indicators to residential property values empirically. In this respect, the paper
addresses the following questions: What is the current state of rental values of
residential properties in the study area? Is there any relationship between rental values
and slum indicators in the study area? And what can be done to realize and maximize
the latent rental values of residential properties in urban slums? The answers to these
questions are central to identifying the factors inhibiting the latent value of residential
properties in urban slum areas, and providing recommendations on how to realize and
maximize the latent property values resident in residential properties situated in urban
slums. The paper is organized as follows: the next section (2) reviews related
literature, section three (3) discuses the research methodology, section four (4)
presents the summary of findings and discusses the results, Conclusion and
recommendation are contained in section five (5).
REVIEW OF RELATED LITERATURE
Weiss (1980) asserted that slums are areas of social break down and high delinquency
and that the slum areas usually house or provide homes for the locals or rural
migrants. The origin of the word slum is thought to be the Irish phrase 'S lom é (pron.
s'lum ae) meaning "it is a bleak or destitute place. A slum household is one lacking
one or more of the following slum indicators: Access to improved water, Access to
improved sanitation facilities, sufficient living area, not overcrowded, Structural
quality and durability of dwellings, and Security of tenure (UN-HABITA, 2003b).
Today 3 billion people (nearly half of the World’s population) live in cities.
According to the slum indicators, one-third are slum dwellers. Moreover, four out of
ten inhabitants in the developing world are informal settlers. They experience multiple
deprivations that are direct expressions of poverty. Many of their houses are unfit for
Rental value
429
habitation and they often lack adequate food, education health and basic services (UN-
HABITAT, 2003b).
` The African region has experienced high rates of urbanization in an
environment of consistent economic decline over the last thirty years with increasing
urban impoverishment of the population, especially the poor and marginalized
segments. It is estimated that 41 per cent of urban residents live in poverty in the
region, with two out of five of these residents living in circumstances deemed to be
life and health threatening. The most persistent poverty and widest gap remain in Sub-
Saharan Africa. On current trends, it is the only region where the number of people
living in extreme poverty will increase by more than 100 million between 1990 and
2015. (Global Poverty Report, 2002). According to a 2003 UN-HABITAT report, 327
million people live in slums in Commonwealth countries in Africa, Asia, and the
Pacific. At least eight commonwealth member states, all in Sub-Saharan Africa, have
annual slum growth rates of more than 5 % (UN-HABITAT, 2003b).
Slum formation, according to UN-HABITA (2003b) principally originated from four
types of rapid urban population expansion that were primarily triggered by: rural–
urban migration; natural growth; combinations of natural and migratory growth; or
population displacement following armed conflicts.
slums can be divided into two broad classes: 1 Slums of hope: ‘progressing’
settlements, which are characterized by new, normally self-built structures, usually
illegal (e.g. squatters) that are in, or have recently been through, a process of
development, consolidation and improvement; and 2 Slums of despair: ‘declining’
neighbourhoods, in which environmental conditions and domestic services are
undergoing a process of degeneration. According to Agbola (1994), two types of slum
exist in Nigerian cities. There are the traditional slums arising in towns from the decay
of existing structures and there are spontaneous slums created by squatters on illegally
acquired lands. About 68.2% of slums in Nigerian cities were found to be within a
radius of 1 km from the city centre (Abumere, 1987).
The characteristics associated with slums vary from place to place. Slums are usually
characterized by urban decay, high rates of poverty, illiteracy, poor sanitary
conditions, dilapidated structures, high occupancy ratio, lack of social amenities, and
unemployment (George, 2002). They are commonly seen as "breeding grounds" for
social problems such as crime, drug addiction, prostitution, alcoholism etc. In many
poor countries they exhibit high rates of disease due to unsanitary conditions,
malnutrition, and lack of basic health care. Low socioeconomic status of its residents
is another common characteristic given for a slum (Alabi, 2012; George 2002).
According to Okunola et al. (2004), residential properties are properties that provide
permanent (as distinguished from transient) housing for individuals, families or
households. They include cottages, tenement buildings, blocks of flats, duplexes,
mansions etc. Residential properties are used as dwelling accommodation, which is
otherwise known as house. Economists and Estate Surveyors normally express value
in monetary terms, which indicate the power of a commodity to command other
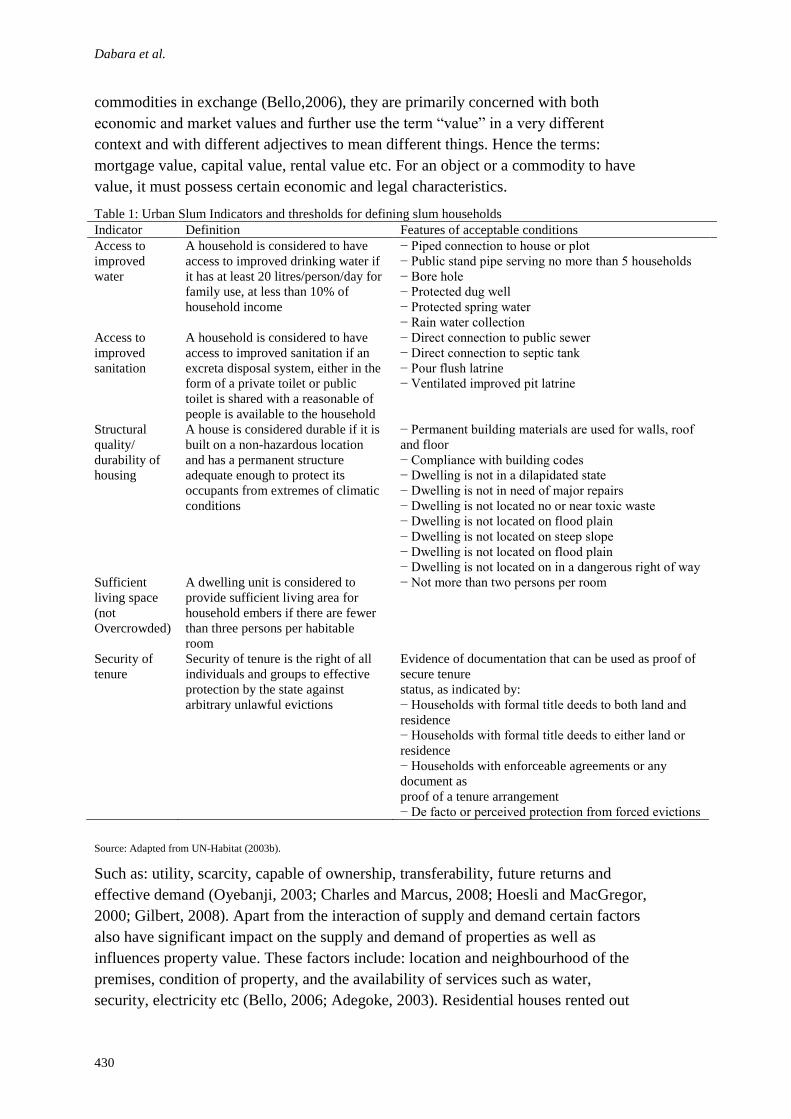
Dabara et al.
430
commodities in exchange (Bello,2006), they are primarily concerned with both
economic and market values and further use the term “value” in a very different
context and with different adjectives to mean different things. Hence the terms:
mortgage value, capital value, rental value etc. For an object or a commodity to have
value, it must possess certain economic and legal characteristics.
Table 1: Urban Slum Indicators and thresholds for defining slum households
Indicator Definition Features of acceptable conditions
Access to
improved
water
A household is considered to have
access to improved drinking water if
it has at least 20 litres/person/day for
family use, at less than 10% of
household income
− Piped connection to house or plot
− Public stand pipe serving no more than 5 households
− Bore hole
− Protected dug well
− Protected spring water
− Rain water collection
Access to
improved
sanitation
A household is considered to have
access to improved sanitation if an
excreta disposal system, either in the
form of a private toilet or public
toilet is shared with a reasonable of
people is available to the household
− Direct connection to public sewer
− Direct connection to septic tank
− Pour flush latrine
− Ventilated improved pit latrine
Structural
quality/
durability of
housing
A house is considered durable if it is
built on a non-hazardous location
and has a permanent structure
adequate enough to protect its
occupants from extremes of climatic
conditions
− Permanent building materials are used for walls, roof
and floor
− Compliance with building codes
− Dwelling is not in a dilapidated state
− Dwelling is not in need of major repairs
− Dwelling is not located no or near toxic waste
− Dwelling is not located on flood plain
− Dwelling is not located on steep slope
− Dwelling is not located on flood plain
− Dwelling is not located on in a dangerous right of way
Sufficient
living space
(not
Overcrowded)
A dwelling unit is considered to
provide sufficient living area for
household embers if there are fewer
than three persons per habitable
room
− Not more than two persons per room
Security of
tenure
Security of tenure is the right of all
individuals and groups to effective
protection by the state against
arbitrary unlawful evictions
Evidence of documentation that can be used as proof of
secure tenure
status, as indicated by:
− Households with formal title deeds to both land and
residence
− Households with formal title deeds to either land or
residence
− Households with enforceable agreements or any
document as
proof of a tenure arrangement
− De facto or perceived protection from forced evictions
Source: Adapted from UN-Habitat (2003b).
Such as: utility, scarcity, capable of ownership, transferability, future returns and
effective demand (Oyebanji, 2003; Charles and Marcus, 2008; Hoesli and MacGregor,
2000; Gilbert, 2008). Apart from the interaction of supply and demand certain factors
also have significant impact on the supply and demand of properties as well as
influences property value. These factors include: location and neighbourhood of the
premises, condition of property, and the availability of services such as water,
security, electricity etc (Bello, 2006; Adegoke, 2003). Residential houses rented out

Rental value
431
are subject to legislation in relation to rent control and security of tenure (Alabi,
2012). Landlords are legally restricted to the amount of rent they can charge for their
property, the yield contemplated by an investor will be dependent on the: age,
location/locality, type of tenant, condition of property and also, whether the property
is subject to rent control (Alabi, 2012, Gilbert, 2008).
Agbola and Jinadu (1997) and Mabogunje (1992) asserted that most urban cities in
Nigeria experiences rapid urban growth resulting from industrialization, technological
advancement and rural-urban migration. The resultant effect is that the quality of the
urban environment is compromised (due to pressure on the available infrastructure),
there by breeding problems associated with urban slums where visible forms of anti-
social behaviour and criminal damage to public and private properties is the order of
the day, these in turn negatively affects the value of properties in the area (Agbola,
1987; Gibbons, 2004; Oyebanji, 2003; Adegoke, 2003). Social Exclusion Unit (2001)
noted that areas with high slum characteristics acquire poor reputations as properties
in the areas are in bad condition and hence attracts low rental and sale values.
` According to Yahaya (2006) Slums are man-made; therefore, they could be
unmade. At the core of efforts to improve the environmental habitability of slums and
enhance economically productive activities is the need to: invest in infrastructure ( to
provide water and sanitation, electricity, access roads, footpaths and waste
management); engage in in-situ up-grading of slum communities; resettling slum
dwellers; slum clearance; supporting the livelihoods of the urban poor by enabling
urban informal-sector activities to flourish and develop; participatory slum upgrading
programmes that include urban poverty reduction objectives and implementation of
urban planning and management policies designed to prevent the emergence of slums
(UN-HABITAT, 2003a; UN-HABITAT, 2003b; Yahaya, 2006; George, 2002; Gilbert
2008).
METHODOLOGY
The study area is Oja-Oba in Osogbo Local Government Area of Osun state, located
on latitude 7046' North and longitude 4034' East of the Greenwich Meridian. It
occupies approximately 47km2 of land. Osogbo became the capital of Osun state in
1991 when the state was created. It is located within the tropical rain forest region of
Nigeria where rainfall is high throughout the year. From the 2006 National Population
Census, the population of Osogbo LGA was 155,507 persons. Today, the population is
projected to be approximately 172,472 persons, using an average growth rate of
2.09% (CIA world fact book, 2011). Being the capital city of the state, Osogbo
experiences influx of migrants, there by affecting housing need in the metropolis. The
increasing population had not been adequately housed because of the shortage in the
supply of housing units to cope with the housing needs.
In this study, questionnaire method was employed to obtain data from the field. The
questionnaire was designed to obtain data in relation to the impact of urban slum
indicators as it affects rental values of residential properties in the study area (which is
perceived to be an urban slum, using the UN-HABITAT slum indicators as a
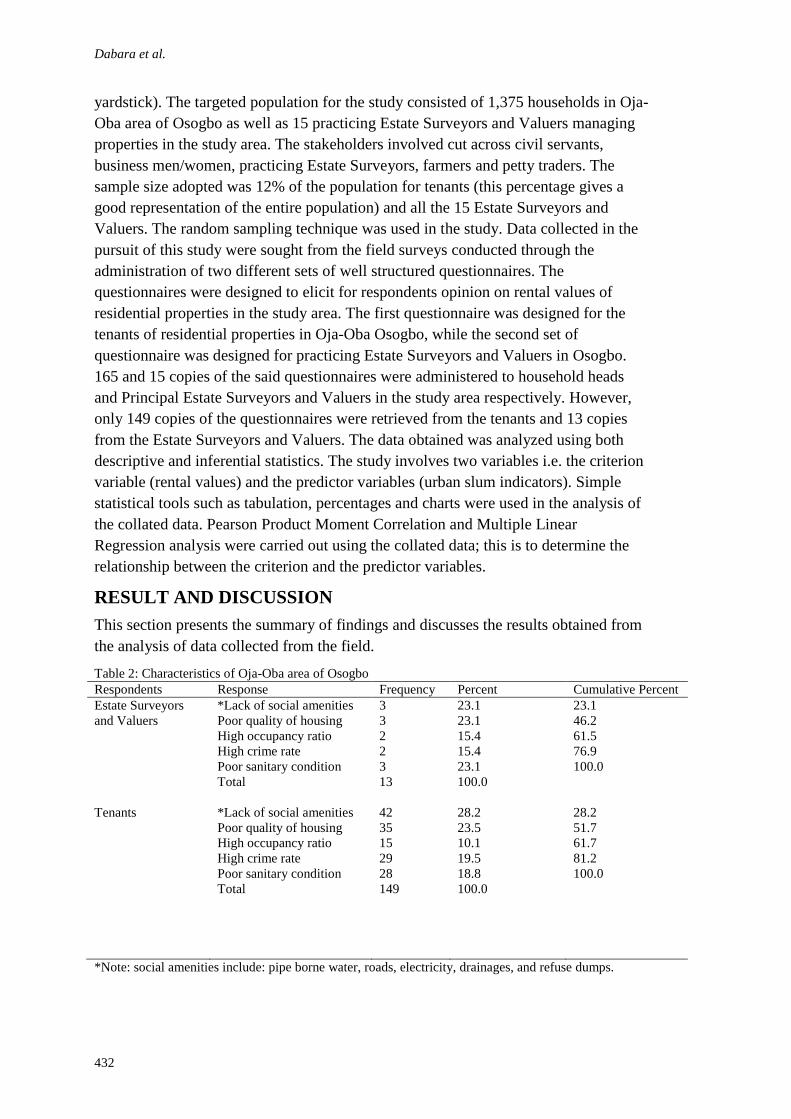
Dabara et al.
432
yardstick). The targeted population for the study consisted of 1,375 households in Oja-
Oba area of Osogbo as well as 15 practicing Estate Surveyors and Valuers managing
properties in the study area. The stakeholders involved cut across civil servants,
business men/women, practicing Estate Surveyors, farmers and petty traders. The
sample size adopted was 12% of the population for tenants (this percentage gives a
good representation of the entire population) and all the 15 Estate Surveyors and
Valuers. The random sampling technique was used in the study. Data collected in the
pursuit of this study were sought from the field surveys conducted through the
administration of two different sets of well structured questionnaires. The
questionnaires were designed to elicit for respondents opinion on rental values of
residential properties in the study area. The first questionnaire was designed for the
tenants of residential properties in Oja-Oba Osogbo, while the second set of
questionnaire was designed for practicing Estate Surveyors and Valuers in Osogbo.
165 and 15 copies of the said questionnaires were administered to household heads
and Principal Estate Surveyors and Valuers in the study area respectively. However,
only 149 copies of the questionnaires were retrieved from the tenants and 13 copies
from the Estate Surveyors and Valuers. The data obtained was analyzed using both
descriptive and inferential statistics. The study involves two variables i.e. the criterion
variable (rental values) and the predictor variables (urban slum indicators). Simple
statistical tools such as tabulation, percentages and charts were used in the analysis of
the collated data. Pearson Product Moment Correlation and Multiple Linear
Regression analysis were carried out using the collated data; this is to determine the
relationship between the criterion and the predictor variables.
RESULT AND DISCUSSION
This section presents the summary of findings and discusses the results obtained from
the analysis of data collected from the field.
Table 2: Characteristics of Oja-Oba area of Osogbo
Respondents Response Frequency Percent Cumulative Percent
Estate Surveyors
and Valuers
*Lack of social amenities
Poor quality of housing
High occupancy ratio
High crime rate
Poor sanitary condition
Total
3
3
2
2
3
13
23.1
23.1
15.4
15.4
23.1
100.0
23.1
46.2
61.5
76.9
100.0
Tenants *Lack of social amenities
Poor quality of housing
High occupancy ratio
High crime rate
Poor sanitary condition
Total
42
35
15
29
28
149
28.2
23.5
10.1
19.5
18.8
100.0
28.2
51.7
61.7
81.2
100.0
*Note: social amenities include: pipe borne water, roads, electricity, drainages, and refuse dumps.

Rental value
433
Table 2 shows the prevailing characteristics of Oja-Oba area of Osogbo. Among all
the slum indicators observed in the area, lack of social amenities ranked highest with
23.1% and 28.2% response rate from Estate Surveyors and tenants respectively;
occupancy ratio ranked lowest with 15.4% and 10.1% from Estate Surveyors and
tenants respectively. These indicators are congruent with the UN-HABITAT urban
slum indicators with the exception of tenure security.
Table 3 above shows information about the status of Oja-Oba area of Osogbo as
perceived by Estate Surveyors and Valuers and tenants (vis-à-vis the characteristics of
the study area, see Table 2). 84.6% and 86.6% of the respondents (Estate Surveyors
and tenants respectively) indicated that the area is an urban slum while 15.4% and
13.4% of the respondents (Estate Surveyors and tenants respectively) have a contrary
view. Taking into consideration the UN-HABITAT slum indicators (see Table 1), as
well as the prevailing characteristics of the study area (see Table 2), it can be
concluded that the study area is an urban slum.
Table 3: Estate Surveyor and Valuers/Tenants Perception of the Status of Oja-Oba, Osogbo
Table 4: Estate Surveyor and Valuers/Tenant’s View on Rental Value in Oja-Oba, Osogbo
Respondents Rental Value Frequency Percent Cumulative
Percent
Estate
Surveyors
and Valuers
High
Moderate
Low
Very low
Total
0
5
7
1
13
0
38.5
53.8
7.7
100.0
0
38.5
92.3
100.0
Tenants High
Moderate
Low
Very low
Total
30
75
39
5
149
20.1
50.3
26.2
3.4
100.0
20.1
70.4
96.6
100.0
Table 4 above, showed the views of both professionals (Estate Surveyors and Valuers)
and tenants in the study area with respect to the rental values of residential properties
in the area. However, the views of the practicing Estate Surveyors and Valuers is seen
as more reliable because they are professionals and should know better by virtue of
their training and experience. It can be seen that 38.5% of the Estate surveyors
indicated that rental value in the study area is moderate, while 53.8% and 7.7%
indicated that rental values in the study area are low and very low respectively. The
Respondents
Response Frequency Percent
Cumulative
Percent
Estate Surveyors
and Valuers
Slum
Non slum
Total
11
2
13
84.6
15.4
100.0
84.6
100.0
Tenants Slum
Non slum
Total
129
20
149
86.6
13.4
100.0
86.6
100.0
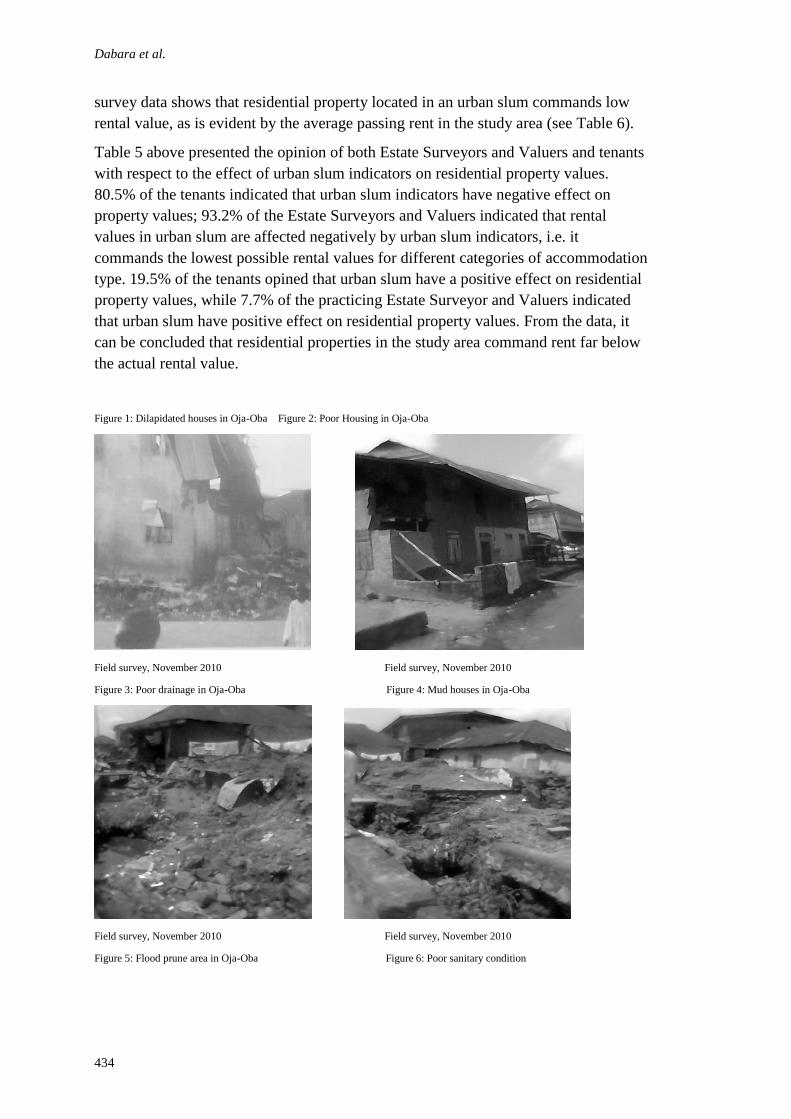
Dabara et al.
434
survey data shows that residential property located in an urban slum commands low
rental value, as is evident by the average passing rent in the study area (see Table 6).
Table 5 above presented the opinion of both Estate Surveyors and Valuers and tenants
with respect to the effect of urban slum indicators on residential property values.
80.5% of the tenants indicated that urban slum indicators have negative effect on
property values; 93.2% of the Estate Surveyors and Valuers indicated that rental
values in urban slum are affected negatively by urban slum indicators, i.e. it
commands the lowest possible rental values for different categories of accommodation
type. 19.5% of the tenants opined that urban slum have a positive effect on residential
property values, while 7.7% of the practicing Estate Surveyor and Valuers indicated
that urban slum have positive effect on residential property values. From the data, it
can be concluded that residential properties in the study area command rent far below
the actual rental value.
Figure 1: Dilapidated houses in Oja-Oba Figure 2: Poor Housing in Oja-Oba
Field survey, November 2010 Field survey, November 2010
Figure 3: Poor drainage in Oja-Oba Figure 4: Mud houses in Oja-Oba
Field survey, November 2010 Field survey, November 2010
Figure 5: Flood prune area in Oja-Oba Figure 6: Poor sanitary condition
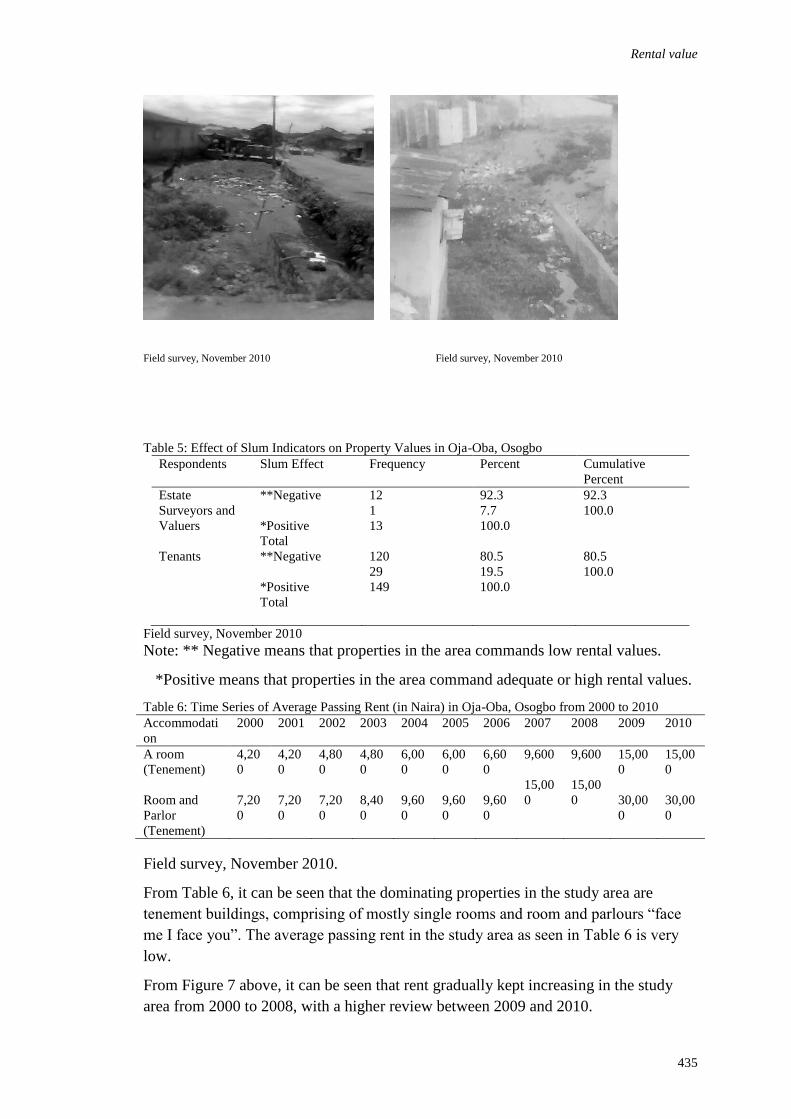
Rental value
435
Field survey, November 2010 Field survey, November 2010
Table 5: Effect of Slum Indicators on Property Values in Oja-Oba, Osogbo
Respondents Slum Effect Frequency Percent Cumulative
Percent
Estate
Surveyors and
Valuers
**Negative
*Positive
Total
12
1
13
92.3
7.7
100.0
92.3
100.0
Tenants **Negative
*Positive
Total
120
29
149
80.5
19.5
100.0
80.5
100.0
Field survey, November 2010
Note: ** Negative means that properties in the area commands low rental values.
*Positive means that properties in the area command adequate or high rental values.
Table 6: Time Series of Average Passing Rent (in Naira) in Oja-Oba, Osogbo from 2000 to 2010
Accommodati
on
2000 2001 2002 2003 2004 2005 2006 2007 2008 2009 2010
A room
(Tenement)
Room and
Parlor
(Tenement)
4,20
0
7,20
0
4,20
0
7,20
0
4,80
0
7,20
0
4,80
0
8,40
0
6,00
0
9,60
0
6,00
0
9,60
0
6,60
0
9,60
0
9,600
15,00
0
9,600
15,00
0
15,00
0
30,00
0
15,00
0
30,00
0
Field survey, November 2010.
From Table 6, it can be seen that the dominating properties in the study area are
tenement buildings, comprising of mostly single rooms and room and parlours “face
me I face you”. The average passing rent in the study area as seen in Table 6 is very
low.
From Figure 7 above, it can be seen that rent gradually kept increasing in the study
area from 2000 to 2008, with a higher review between 2009 and 2010.
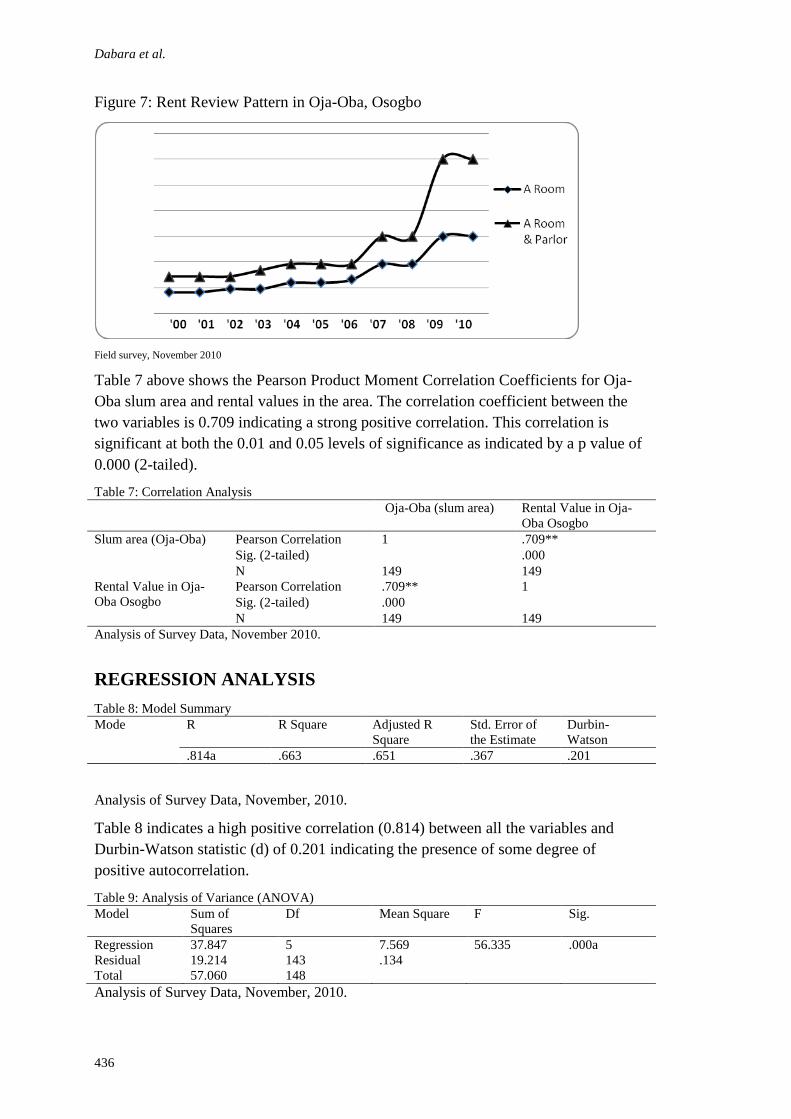
Dabara et al.
436
Figure 7: Rent Review Pattern in Oja-Oba, Osogbo
Field survey, November 2010
Table 7 above shows the Pearson Product Moment Correlation Coefficients for Oja-
Oba slum area and rental values in the area. The correlation coefficient between the
two variables is 0.709 indicating a strong positive correlation. This correlation is
significant at both the 0.01 and 0.05 levels of significance as indicated by a p value of
0.000 (2-tailed).
Table 7: Correlation Analysis
Oja-Oba (slum area) Rental Value in Oja-
Oba Osogbo
Slum area (Oja-Oba) Pearson Correlation 1 .709**
Sig. (2-tailed) .000
N 149 149
Rental Value in Oja-
Oba Osogbo
Pearson Correlation .709** 1
Sig. (2-tailed) .000
N 149 149
Analysis of Survey Data, November 2010.
REGRESSION ANALYSIS
Table 8: Model Summary
Mode R R Square Adjusted R
Square
Std. Error of
the Estimate
Durbin-
Watson
.814a .663 .651 .367 .201
Analysis of Survey Data, November, 2010.
Table 8 indicates a high positive correlation (0.814) between all the variables and
Durbin-Watson statistic (d) of 0.201 indicating the presence of some degree of
positive autocorrelation.
Table 9: Analysis of Variance (ANOVA)
Model Sum of
Squares
Df Mean Square F Sig.
Regression 37.847 5 7.569 56.335 .000a
Residual 19.214 143 .134
Total 57.060 148
Analysis of Survey Data, November, 2010.
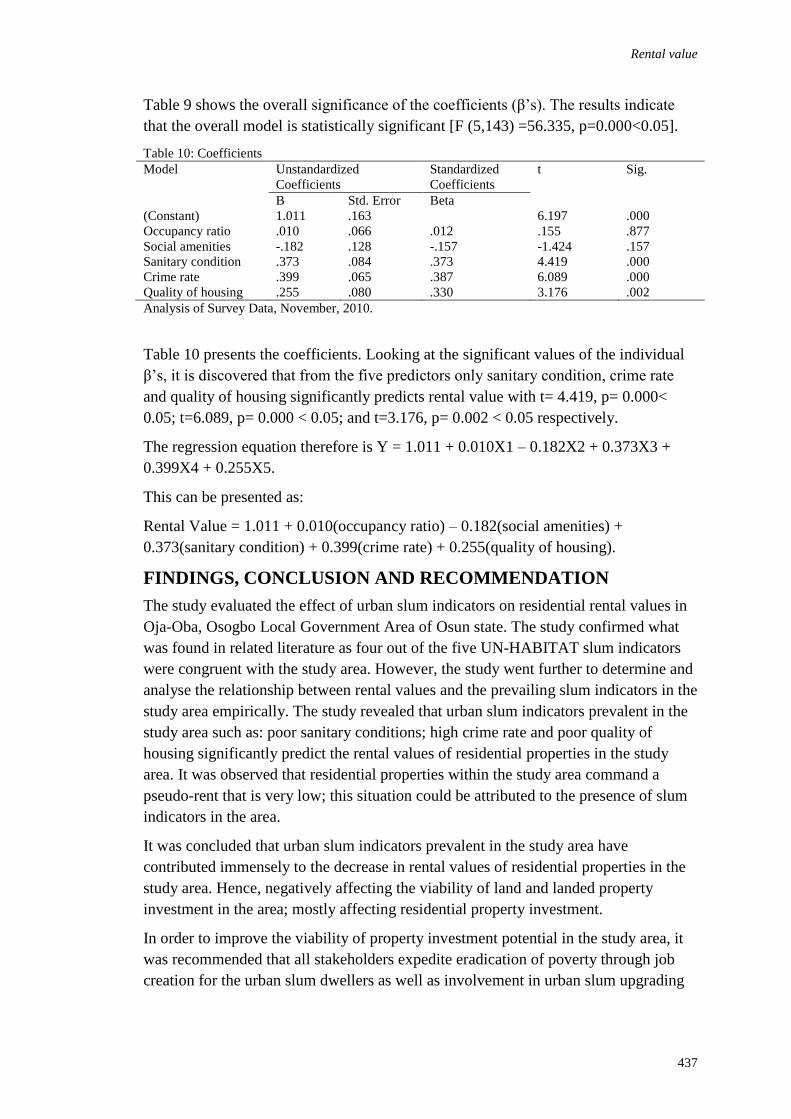
Rental value
437
Table 9 shows the overall significance of the coefficients (β’s). The results indicate
that the overall model is statistically significant [F (5,143) =56.335, p=0.000<0.05].
Table 10: Coefficients
Model Unstandardized
Coefficients
Standardized
Coefficients
t Sig.
B Std. Error Beta
(Constant) 1.011 .163 6.197 .000
Occupancy ratio .010 .066 .012 .155 .877
Social amenities -.182 .128 -.157 -1.424 .157
Sanitary condition .373 .084 .373 4.419 .000
Crime rate .399 .065 .387 6.089 .000
Quality of housing .255 .080 .330 3.176 .002
Analysis of Survey Data, November, 2010.
Table 10 presents the coefficients. Looking at the significant values of the individual
β’s, it is discovered that from the five predictors only sanitary condition, crime rate
and quality of housing significantly predicts rental value with t= 4.419, p= 0.000<
0.05; t=6.089, p= 0.000 < 0.05; and t=3.176, p= 0.002 < 0.05 respectively.
The regression equation therefore is Y = 1.011 + 0.010X1 – 0.182X2 + 0.373X3 +
0.399X4 + 0.255X5.
This can be presented as:
Rental Value = 1.011 + 0.010(occupancy ratio) – 0.182(social amenities) +
0.373(sanitary condition) + 0.399(crime rate) + 0.255(quality of housing).
FINDINGS, CONCLUSION AND RECOMMENDATION
The study evaluated the effect of urban slum indicators on residential rental values in
Oja-Oba, Osogbo Local Government Area of Osun state. The study confirmed what
was found in related literature as four out of the five UN-HABITAT slum indicators
were congruent with the study area. However, the study went further to determine and
analyse the relationship between rental values and the prevailing slum indicators in the
study area empirically. The study revealed that urban slum indicators prevalent in the
study area such as: poor sanitary conditions; high crime rate and poor quality of
housing significantly predict the rental values of residential properties in the study
area. It was observed that residential properties within the study area command a
pseudo-rent that is very low; this situation could be attributed to the presence of slum
indicators in the area.
It was concluded that urban slum indicators prevalent in the study area have
contributed immensely to the decrease in rental values of residential properties in the
study area. Hence, negatively affecting the viability of land and landed property
investment in the area; mostly affecting residential property investment.
In order to improve the viability of property investment potential in the study area, it
was recommended that all stakeholders expedite eradication of poverty through job
creation for the urban slum dwellers as well as involvement in urban slum upgrading
Dabara et al.
438
to enhance the latent property values in the study area. The three tiers of government
should be involved in in-situ urban slum upgrading through:
* The provision of basic social amenities to the area, such as pipe borne water, good
access roads, good drainage systems, electricity and refuse dumps.
* The Sanitary Health Inspectors of Osogbo Local Government Council who should
be alive to their responsibilities to ensure a sanitary environment safe for human
habitation. Hence, a regular environmental sanitation should be enforced.
* Enforcement of compliance with approved building regulations. Poor housing
condition observed in the area is mostly because of non-compliance with approved
building regulations of residential property during construction of the buildings.
Therefore, the Building Regulatory Authority among others should effectively enforce
the development control provisions of the planning laws and building regulations.
REFERENCES
Abumere, S (1987) Úrbanization and Urban Decay in Nigeria’. NISER, Ibadan.
Adegoke, S. (2003) Fundamentals of Land Economics. Multifirm Limited. Lagos.
Agbola, T (1994) “The prospect for private sector involvement in urban management
functions in Nigeria ‘Review of Urban and Regional Development Studies 6:
135-149.
Agbola, T and Jinadu, A. (1997) ‘Forced eviction and forced relocation in Nigeria:
The experience of those evicted from Maroko in 1990’ Environment and
Urbanization 9(2): 271–288.
Alabi, J., Okunola A., Dabara I., and Odewande A. (2012). Principles of Property
Development and Management. Aseda Publishing, Ibadan.
Bello, N. A (2006). The Economics of Land and Housing, The Academic
Publications, Lagos.
Charles, F. and Marcus, T. (2008) Real Estate Principles, Ninth Edition. Chicago,
Dearborn Real Financial Publishing Inc.
CIA world fact book (2011). Nigerian annual growth rate. Retrieved on 23/02/2011
From: http://www.indexmundi.com/g/g.aspx?c=niandv=24
Cities Alliance (1999) Cities Without Slums: Action Plan for Moving Slum
Upgrading to Scale. The World Bank/UNCHS (Habitat), Washington, DC,
www.citiesalliance.org
George, C. K (2002) Basic Principles and Method of Urban and Regional Planning,
Libro-Gem Books, Lagos.
Gilbert, A. (2008). Slums, tenants and home-ownership: on blindness to the obvious,
International Development Planning Review, vol. 30, no.2, pp. i-x.
Gibson, S. (2004) The Cost of Urban Property Crime. The Economic Journal, 114,
F441-F463.

Rental value
439
Global Poverty Report (2002). “Achieving the Millennium Development Goals in
Africa: Progress, Prospects and Policy Implications”, prepared by the African
Development Bank, WB in collaboration with the IMF, July 2002.
Hoesli, M. and MacGregor, B. (2000) Property Investment: Principles and Practice of
Portfolio Management. Harlow: Longman.
Julius, A. (2010) Analysis of the Relelationships of Infrastructural Facilities in the
Determination of Rental Values of Residential Properties in Akure, Nigeria.
Retrieved on 29/11/2010. From
http://astonjournals.com/manuscripts/Vol2010/ASSJ-10_Vol2010.pdf
Mabogunje, A L (1992) ‘Perspective on urban land and urban management policies in
sub-Saharan Africa’, World Bank Technical Paper 196. World Bank,
Washington, DC.
Okunola, A., Popoala O., Adegoke J,. and Ankeli I. (2004) Introduction to Estate
Management, Aseda Publishing, Ibadan.
Oyebanji, A. O. (2003) Principles of Land Economics. Lagos. SAM OUT NIGERIA
CO.
Social Exclusion Unit (2001) A new Commitment to Neighborhood Renewal,
London: Cabinet Office.
UN-HABITAT (2003a). The Challenge of Slums, Earthscan Publications Ltd. London
and Sterling. Retrieved on 8th March 2012, from:
http://www.unhabitat.org/downloads/docs/GRHS.2003.0.pdf
UN-HABITAT(2003b). Slums of the World: The Face of Urban Poverty in the New
Millennium, UN-HABITAT, Nairobi.
Weiss, M. (1980). The Origin and Legacy of Urban Renewal in Urban and Regional
Planning in Age of-del Austerity, Pergamon Press Inc. New York oxford 53-
90.
World Bank (2005) Global Strategy and Booster Programme. Annual Report.
Yahya S, 2006, ‘Unmaking the slums: Emerging rules, roles, and repertoires’, Stetson
Law Review,
vol. 36, pp. 121-147. Retrieved on 8th March 2012, from:
http://www.law.stetson.edu/lawreview/media/unmaking-the-slums-emerging-rules-
roles-and-repertoires.pdf.

Dadu, D.W., Stanley, A.M., Gora, K.S.N. and Ehoche, P.E. (2012) Evaluation of the pozzolanic
activity of Kajuru pumice tuff as sustainable Cementitious materials for cement blending In: Laryea,
S., Agyepong, S.A., Leiringer, R. and Hughes, W. (Eds) Procs 4th West Africa Built Environment
Research (WABER) Conference, 24-26 July 2012, Abuja, Nigeria, 441-449.
441
EVALUATION OF THE POZZOLANIC ACTIVITY OF
KAJURU PUMICE TUFF AS SUSTAINABLE
CEMENTITIOUS MATERIALS FOR CEMENT
BLENDING
D. W. Dadu1, A. M. Stanley,
K. S. N. Gora
and P. E. Ehoche
Department of Building, Faculty of Environmental Design, Ahmadu Bello University, Nigeria,
Nigerian Army Institutes of Technology and Environmental Studies, Markudi, Nigeria
This paper focused on a report of an evaluation of the pozzolanic activity of pumice
deposits obtained from Kajuru as potential Sustainable Supplementary Cementitious
Materials for Construction. The study investigated the chemical characteristics of the
pumice tuffs and the compressive strengths of concrete containing the pumice
materials in % addition. The Oxides analysis was carried out by means of Energy
Dispersive X-Ray Fluorescence method. The compressive strengths and the Strength
Activity Index of the concrete containing the pumice tuffs materials were evaluated.
The results of the chemical analysis indicated that the sum oxides of Silica, Alumina
and Iron were 80.87%. The evaluations of the compressive strengths of concrete
cubes containing 5% of the pumice tuffs materials at 28 days curing showed an
increased of compressive strength from 23.5 N/mm2 (cubes with Ordinary Portland
Cement only to 30.3 N/mm2. This result indicated that concrete containing 5%
pumice increased the compressive strengths of the concrete to about 29%. It is thus,
concluded that the Kajuru Pumice Tuff are potential sustainable SCMs for Cement
Blending.
Keywords: Kajuru, pumice, mineral additive
INTRODUCTION
The most widely use cement in the world today as asserted by Shetty (2005) and
Mehelcic (2003) is the Ordinary Portland Cement (OPC) manufacture from modern
pre-calcinating plants. The production of the OPC rose from less than 2 million tons in
1880 (Mehelcic, 2003) and about 2.3 billion tons in 2005 (Tailor et al, 2006). Despite
the dominance of the world cement market by OPC, its production is characterised by
intense energy demand and environmental pollutions. Dadu (2011) reported that for
the production of 1 ton of cement, about 1 barrel of fuel or ¼ ton of coal is needed for
the calcinations of the limestone. The EC (2001) affirmed that about 50% of the total
cost of producing 1 ton of Portland cement is spent on energy alone. The second major
challenge in the production of the cement is the emission of CO2 into the atmosphere.
Day (1990), Horst (2001), Detwiler et al (1996) and Naik (2005) asserted that for each
ton of OPC produced, about a ton of CO2 and other pollutants are released into the
atmosphere. There is a need therefore to reduce the cement content in concrete
mixtures. According to Detwiler et al (1996), this can be reduced by cement blending
Dadu et al.
442
with Supplementary Cementitious Materials (SCMs). Day (1990) recommended the
use of pozzolanic materials of volcanogenic origin in the concrete mixes which can
reduce energy consumption, limit CO2 release into the atmosphere, and also increase
concrete strengths and enhanced its durability.
The Kajuru pumice deposits (natural pozzolans) are therefore potential cementitious
materials for use in concrete mixes. The study accordingly aims at assessing the
pozzolanic activity of pumice materials as potential natural pozzolans for sustainable
cementitious materials in cement blending.
Cement Blending
American Society for Testing and Material (ASTM C 150, 2005) defined Blended
Cements (BC) as cement mixtures containing Portland cement and one or more
SCMs; with the potential benefits of reducing the overall concrete costs, improving
concrete workability, durability and long term strengths. Horst (2001) elucidated
further that BC as a technical term, often refers to cement products that are factory
blended by cement companies while on the site mixing with the OPC is referred to as
‘partial replacements’. As stated earlier in this report pozzolans are utilised as SCMs
in cement blending or partial replacements of the OPC in concrete mixes.
Pumice as a natural pozzolan
American Society for Testing and Material C 618 (2005) defined the pozzolans as
siliceous or siliceous and aluminous materials, which in themselves possess little or no
cementitious values but will, in finely divided form and in the presence of moisture,
chemically react with calcium hydroxide at ordinary temperatures to form compounds
possessing cementitious properties. Kurtis (2002) and Day (1990) classified the
pozzolans into Natural and Artificial; and stated that the Artificial Pozzolanas are
residues of waste industrial products such as fly ash and rice husk; while the Natural
Pozzolans (NP) are products of volcanogenic activities such as volcanic ash, volcanic
tuff, volcanic lava, pumice, shales and diatomaceous. Bhatty (1955) stated further that
there are two classes of natural pozzolans; natural pozzolan requiring energy inputs
prior to grinding (these include Metakaolin and Diatomaceous earths); and natural
pozzolan requiring no energy inputs prior to utilisation. Pumice rocks contents
amorphous siliceous and aluminous materials; and are natural pozzolan requiring no
energy inputs prior to grinding and can be used as in cement blinding to improve the
compressive strength and enhancement of the durability of concrete (Bhatty, 1955;
Azmar International; 2000; ACI, 2001).
Pozzolanic Activity of Pozzolans
Cement hydration is the result of chemical reactions that occur between water and the
chemical compounds of Dicalcium Silicate (C2S) and Tricalcium Silicate (C3S)
producing calcium silicate hydrate (C-S-H) and Ca(OH) plus water is produced -:
CaO.SiO2.H2O+ Ca (OH)2 is produced. The addition of the pozzolan to the hydrating
cement (Pozzolana + Ca(OH)2 + H2O) produces the gel of the cementitious substance
of C-S-H; 3CaO.SiO2 – 2CaO.SiO2 + H2O CaO.SiO2.H2O + Ca(OH)2
Pozzolana cement
443
This process of the gel formation as asserted by Neuwald (2004) is the Pozzolanic
Reaction of the Pozzolan. The formation of the C-S-H gel prevents water soluble
compounds from migrating out of the concrete and thus makes the cement paste
denser; and invariably a reduction in the permeability of the concrete is enhanced.
Zhanng et al (1996) averred that the Pozzolanic Reaction of the pozzolan continues
with the production of additional gels of C-S-H; and that this continuous reaction of
Ca(OH)2 with the pozzolan is termed, the Pozzolanic Activity of the pozzolana. The
Pozzolanicity of a pozzolan is thus, the degree of the chemical reactions of the active
constituents of the pozzolan at ordinary temperatures with Ca(OH)2 from cement
hydration, producing the cementitious compounds (Neville, 1998; Massazza, 1993;
Zhanng et al, 1996).
Sustainability and Environmental Benefits
The concentration of CO2 emissions in the atmosphere, reported Obada et al., (2008)
resulting from OPC manufacturing varied from 5% to 10% of the green house gases
(GHG). The World Business Council for Sustainable Development (WBCSD) thus in
2002 recommended the reduction of CO2 emissions from cement manufacture
processes by 30% by 2020; and 60% by 2050. These levels of CO2 emissions
obviously make the cement manufacturing unsustainable. Horst (2001), Lynne and
Adam (2000) and Azmar (2003) attested that these emissions problems are real; as
every ton of Portland cement produced, the CO2 released to the atmosphere by the
burning fuel is between 1 to 1.25 tons. Econoler International (2009) reported that the
cement industry accounts for about 5% of the annual global anthropogenic carbon
dioxide emissions; representing about 1,800 million tons of CO2 emissions in 2005
from the use of fossil fuels. Thus, a reduction in OPC production directly reduces the
emissions of CO2 to the atmosphere from the cement manufacturing. Consequently a
reduction of the OPC in concrete mixes will create a substantial reduction of the green
house gases (GHG) emissions.
The sustainability theory for the use of SCMs such as the pumice is that even if, it is a
small reduction of the OPC in concrete uses per ton of concrete produced; the
resultant environmental benefits are large because of the enormous quantity of
concrete consumed daily worldwide (Altwair and Kabir, 2010). Thus, a replacement
of any quantity of the OPC directly reduces the emissions of CO2 to the atmosphere.
The use of SCMs will consequently lessen the burden of the green gasses release
cement calcinations.
MATERIALS AND METHODS
The paper presentation is divided into literature review and laboratory works. The
review briefly appraise materials related characteristics pozzolans, sustainability and
benefits of cement blending. The chemical characteristics and the mechanical
properties of the volcanic deposits evaluated to ascertain its pozzolanic potentials as a
material for use in concrete.

Dadu et al.
444
THE STUDY AREA
The pumice tuffs used for the study were obtained from Kajuru, Kaduna North East
Nigeria. According to Wright (1998) this area is within the Benue Trough which the
geology is made up of Tertiary and Quaternary volcanic rocks mostly of basalt,
pumices, lava and ash deposits. The pumice are found in substantial quantities dotted
the localities.
The study evaluated the Oxides Composition and the Loss On Ignition (LOI) of the
Pumice materials. The compressive strengths and the strength activity of concrete
containing the pumice materials were also evaluated.
Oxides Composition of Kajuru Pumice Tuffs
The determination of the oxides composition of the pumice tuffs was carried out by
the use of Energy Dispersive X-Ray Fluorescence (EDXRF) techniques at the
National Metallurgical Development Centre (NMDC), Jos. The EDXRF method,
according to Simabuco and Filho (1994) is based on the measurement of x-rays
intensities emitted by components of a target sample when excited by an excitation
source. The system consists of an Excitation Source of Annular M5 CMI Cadmium
109 (109
Cd) with Silicon (Si) - Lithium (Li) semiconductor detector coupled to a
computer controlled Analog to Digital Control (ADC) Card.
The samples of the tuffs were grounded manually to powder form with an agate
mortar and pestle to grain size of less than 125 µm. A pellet of 19 mm diameter was
prepared with 0.5g of the powdered materials. Three drops of organic liquid binder
were applied and pressed afterwards with a 10 tons hydraulic press. The pellet of the
sample was introduced into the Excitation Source X-Ray Fluorescence Generator for
the analysis. The annular 25mCi 109
Cd with a Si (Li) detector source emits Ag-K X-
ray (22.1keV) in which all elements with lower characteristic excitation energies in
the sample were accessible for detection.
The quantification of the elements was then carried out using the Emission-
Transmission Method. This method involved the use of Molybdenum (Mo) as a target
material as the source of monochromatic X-rays, which is excited through the sample
by primary radiation and then penetrate on the way to the detector. The spectra for the
samples were collected with the 109
Cd source and evaluated using the analysis of X-
ray Spectra by Iterative Least Squares Fitting (AXIL); a soft ware program used for
the analysis of the oxides samples.
Loss on Ignition of Pumice Tuffs
The Loss on Ignition of the pumice sample was evaluated according to ASTM C 25
(1999) standard. A furnace capable of reaching a temperature of 1500oC was utilised.
The sample was placed in a porcelain crucible and fired at 950oC for a period of 1
hour after which it was cooled in a silica gel desicator and the weight loss of the
sample subsequently taken.
Pozzolana cement
445
Compressive Strength Determination
The pumice tuff materials were grounded manually to powder with an agate mortar
and the sieving were carried out in accordance with the ASTM C 136 (2006) until all
material passed 90µm (sieve no 170). A local brand of OPC; Dangote cement was
used for the concrete cubes. The sands used were quartzite river sands; and the
crushed granite stones were obtained from a Local Quarry. The Crushed stones and
sands met ASTM C33 (2002) specifications. Water from the public main supply was
used for the production and the curing of the concrete cubes.
The concrete cubes were prepared in 150 mm steel moulds and tested in accordance to
ASTM C 109 / 109M (2001) techniques. The ground pumice materials added to
concrete mixes in 5, 7.5 % and 10%, of the OPC in the concrete mixes. The materials
were batched by volume. The water/cement ratio of 0.55 was used for all the mixes.
The control cubes specimens were also treated identically to the test specimens and
compressive strengths of all the cubes were measured at 7, 14, 21 and 28 days curing.
Strength Activity Index
The Strength Activity Index (SAI) is the ratio of compressive strength of the mixture
with a specific replacement or addition of the OPC of the pozzolana to the strength of
the mix without the replacement or addition (Neville and Books, 2008). ASTM C 618
(2005) provides the determination as SAI = 100. ‘A’ is the average compressive
strengths of test mix cubes (N/mm2) and ‘B’ is the average compressive strengths of
control mix cubes (N/mm2).
RESULTS AND DISCUSSION
Oxides Composition of Pumice Tuffs
The result of the chemical analysis of the pumice tuffs as shown in Table.1 indicated
that the principal oxides of Silica (SIO2), Alumina (AI2O3) and Iron (FE2O3)
were substantially present in the sample investigated with the sum oxides of 85.14%.
The analyses also showed the presence of minor element of Calcium (CaO),
Potassium (K2O) and titanium (TiO2) with a summed value of 4.48 %. While the LOI
of the sample evaluated was 2.65% of the sample. ASTM C 618(2005)
recommendations are 70% minimum (for the main oxides) and 5% maximum (for the
minor oxides) by weight, for a pozzolan to be used in concrete; and a maximum LOI
of 10% for a material to be used as a pozzolana.
Table 1. Chemical Analysis of Kajuru Pumice Tuffs
Constituent SIO2 AI2O
3
FE2O3 CaO SO3 Na2
O
K2O TiO2 LOI
% by weight 39.9
0
12.9
8
19.48 12.05 ND 0.14 1.54 3.28 2.65
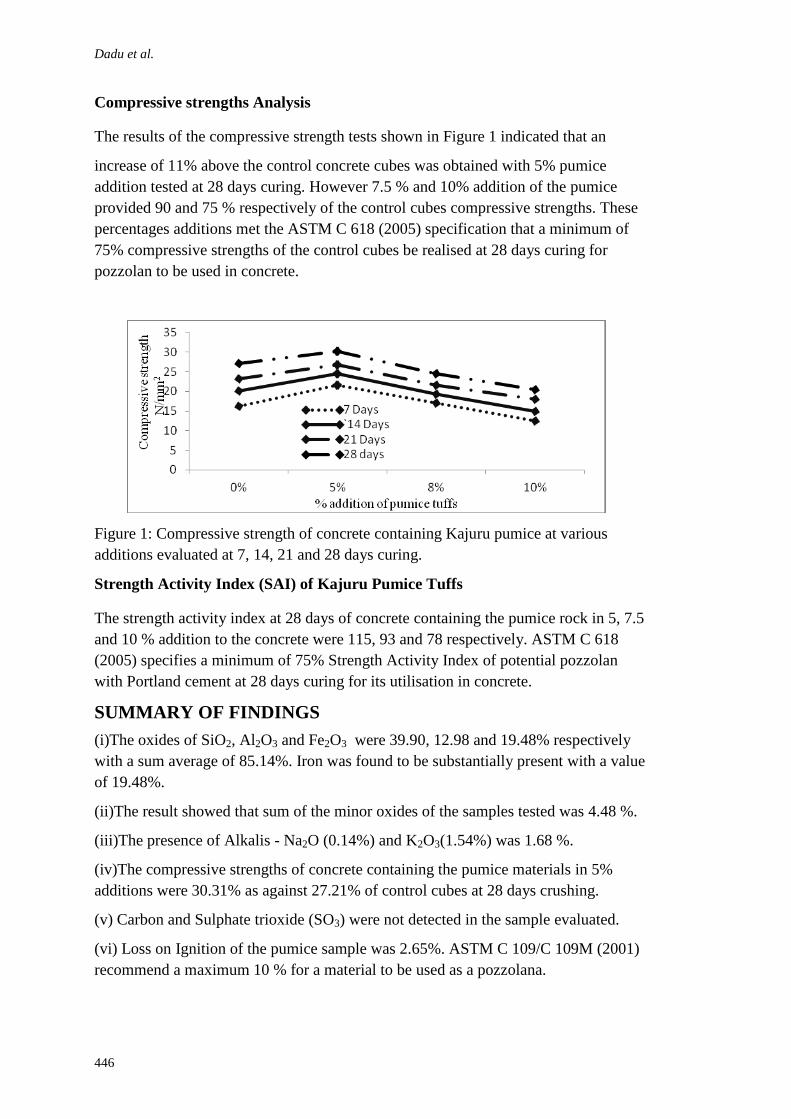
Dadu et al.
446
Compressive strengths Analysis
The results of the compressive strength tests shown in Figure 1 indicated that an
increase of 11% above the control concrete cubes was obtained with 5% pumice
addition tested at 28 days curing. However 7.5 % and 10% addition of the pumice
provided 90 and 75 % respectively of the control cubes compressive strengths. These
percentages additions met the ASTM C 618 (2005) specification that a minimum of
75% compressive strengths of the control cubes be realised at 28 days curing for
pozzolan to be used in concrete.
Figure 1: Compressive strength of concrete containing Kajuru pumice at various
additions evaluated at 7, 14, 21 and 28 days curing.
Strength Activity Index (SAI) of Kajuru Pumice Tuffs
The strength activity index at 28 days of concrete containing the pumice rock in 5, 7.5
and 10 % addition to the concrete were 115, 93 and 78 respectively. ASTM C 618
(2005) specifies a minimum of 75% Strength Activity Index of potential pozzolan
with Portland cement at 28 days curing for its utilisation in concrete.
SUMMARY OF FINDINGS
(i)The oxides of SiO2, Al2O3 and Fe2O3 were 39.90, 12.98 and 19.48% respectively
with a sum average of 85.14%. Iron was found to be substantially present with a value
of 19.48%.
(ii)The result showed that sum of the minor oxides of the samples tested was 4.48 %.
(iii)The presence of Alkalis - Na2O (0.14%) and K2O3(1.54%) was 1.68 %.
(iv)The compressive strengths of concrete containing the pumice materials in 5%
additions were 30.31% as against 27.21% of control cubes at 28 days crushing.
(v) Carbon and Sulphate trioxide (SO3) were not detected in the sample evaluated.
(vi) Loss on Ignition of the pumice sample was 2.65%. ASTM C 109/C 109M (2001)
recommend a maximum 10 % for a material to be used as a pozzolana.
Pozzolana cement
447
(vii) The strength activity index at 28 days of concrete containing the pumice in 5 %
addition was 115. ASTM C 618 (2005) specifies a minimum of 75% Strength Activity
Index of potential pozzolan
CONCLUSION
The evaluations of the chemical characteristics of the pumice deposits; and
compressive Strengths and the Strength Activity Index of concrete containing the
material Tuffs indicated that the materials met the ASTM C 618 (2005) Specifications
for a Natural Pozzolana to be use in as a Mineral Admixture in Portland Cement
Concrete. It is thus conclusive that the pumice deposits possess pozzolanic
characteristics as sustainable cementitious materials for use in cement blending.
RECOMMENDATION
(i) It is thus recommended that the pumice materials from Kajuru be used in cement
blending or for partial replacement of the OPC concrete production as sustainable
cementitious materials. This save a lot of energy as pumice require no burning of any
sort; and would curtail the CO2 release to the atmosphere.
(ii) The establishment of Blending Plants for the production of Portland Pozzolan
Cements is recommended; since there are economic, technical and environmental
benefits from the utilisation of volcanic deposits as cementitious materials in
providing cheaper housing.
REFERENCES
Altwair, N. M. and Kabir. S. (2010) “Green Concrete Structures by Replacing Cement With
Pozzolanic Materials to Reduce Greenhouse Gas Emissions for Sustainable Environment”.
6th International Engineering and Construction Conference (IECC’6), American Society of
Civil Engineers, Cairo, June 28-30, 2010.
American Concrete Institute (2001) “Use of Raw or Processed Natural Pozzolanas in
Concrete”. In; Committee Report, pp. 1-10. American Concrete Institute, Farmington Hills,
Michigan. pp. 1-19.
American Society for Testing and Material C 25 (1999), C 33 (2003) C 109/C 109M (2001),
C 136 (2006), C 150 (2005), C 618 (2005).American Society for Testing and Material,
West Conshohocken.
Azmar International, (2000). Pure Natural Pozzolana Cement; A Better Alternative.
Report of Azmar International works Pagan Island Natural Pozzolans, Texas, and United
States of America.
Bhatty, J. I. (1995) “Role of Minor Elements in Cement Manufacture and Use”, Research and
Development Bulletin RD109T, Portland cement Association, Skokie, Illinois, pp.1-35
Dadu, D. W. (2011) “Jos Plateau Volcanic Deposits as Sustainable Cementitious Materials for
Partial Replacement of Portland Cement” In Laryea, S., Leiringer, R. and Hughes, W. (Eds)
Procs West Africa Built Environment Research (WABER) Conference, 19-21 July
2010, Accra. pp. 691-701
Dadu et al.
448
Day, R. L., (1990), Pozzolans for Use in Low Cost Housing. In: Report Prepared for The
International Development Research Centre, September, 1990, Ottawa.
Detwiler, R. J., Bhatty J. I. and Bhattacharja S (1996) “Supplementary Cementing Materials
for Use in Blended Cements”. In; Research and Development Bulletin, Portland
cements Association.
Econoler International (2009) “Cement Sector Programme in Sub- Saharan Africa: Barrier To
Clean Development Mechanism Project Development in Africa’s Cement” .In; report to
World Bank Carbon Finance Assistance, April. Retrieved from
www.econolerinter.com, pp.1-135.
European Commission (2001) “Pollution Control on Best Available Techniques in the Cement
and Lime Manufacturing Industries”. In European Commission Report, pp. 10-14, Seville,
Spain.
Horst, S. (2001) “Some Basics about Substituting Pozzolans for Portland cement in
Concrete”; In:
Proc at the Council of United States of America Green Building Council Summit held
on August, 2001 at Tucson, Arizona.
Kurtis, K. (2002), Supplementary Cementitious Materials. In: Pres to Precast Concrete
Association, 2003, PCA CD 2038.
Lynne, E. and Adams C (2000) “Alternative Construction –Contemporary Natural Building
Methods”, John Wely and Sons. England.
Naik, T. R. (2005) “Sustainability of Cement and Concrete Industries; Global
Construction”, July, 2005, Dundee, Scotland.
Massazza, F. (1993) “Pozzolanic Cements”. Cement and Concrete Composites 0958-9465/94
Elsevier Science Limited, England, 11 (1981)507-18.
Mehelcic, R. (2005) “Development of Appropriate and Sustainable Construction Materials,
Michigan Technology University”. Retrieved on August 4th 2008 from: www.mtu.edu
pp1- 17.
Neuwald, A.D. (2004) “Supplementary Cementitious Material. Part 2; Pozzolanic
Cementitious Material”, In; Manufactured Concrete Magazine, app. -17.
Retrieved. www.precast.org/publicatios/mc/2005-janfeb/scm-art2.htm on 2 June, 2007.
Neville, A. M. (1998) “Properties of Concrete”, 3rd Edition. A Pitman International
London, pp.118-162.
Obada, K, N Haque N. M, And Jamal M. Khatib .J. M. (2008) “Sustainability and Emerging
Concrete Materials and Their Relevance to the Middle East”. The Open Construction and
Building Technology Journal, 2008, pp 103-110.
Shetty, M. S. (2006) “Concrete Technology; Theory and Practice”, S Chad and Company,
New Delhi, India, pp. 124-238.
Simabuco, S. M, Filho, and V. F. N. (1994) “Quantitative analysis by energy dispersive x-ray
fluorescence by the transmission method applied to geological samples”. Piracicaba,
51(2):197-206.

Pozzolana cement
449
Tailor, M., Tam. C, Gielen. D. (2006) “Energy Efficiency and CO2 Emissions from Global
Cement Industry”. In; Proc. International Energy AGENCY, 4-5, September, 2006.
Wilson, John, W and Ding, Y. C. (2007) “A Compressive Report on Pozzolanic Admixtures”;
The Cement Industry, Market and Economic Trends and Major Companies Operating
in the Far East, with reference to Pagan Island; In Report to The Secretary,
Department of Public, Lands, and Commonwealth of Northern Mariana Island.
Wright, J. B. (1989) “Volcanic Rocks in Nigeria”. In: Kogbe, C. A. (Ed), Geology of Nigeria,
2nd
Edition, Rock View (Nigeria) Limited, Jos. pp. 125– 175.
Zhanng, C., Aegina, W., Mingshu, T. and Xiaoyu, L. (1996) “Filling Role of Pozzolanic
Material: Cement and Concrete Research, 26: 943 – 947.

Dahiru, A. (2012) Assessment of Public-Private-Partnership Regulatory Framework for Infrastructure
Development in Nigeria In: Laryea, S., Agyepong, S.A., Leiringer, R. and Hughes, W. (Eds) Procs 4th
West Africa Built Environment Research (WABER) Conference, 24-26 July 2012, Abuja, Nigeria, 451-
461.
451
ASSESSMENT OF PUBLIC-PRIVATE-PARTNERSHIP
REGULATORY FRAMEWORK FOR
INFRASTRUCTURE DEVELOPMENT IN NIGERIA
Alhassan Dahiru1
Quantity Surveying Programme, School of Environmental Technology, Abubakar Tafawa Balewa
University Bauchi, Nigeria
Public-Private-Partnership (PPP) regulatory systems is a major concern in
infrastructure industries especially in Nigeria where the use of PPP project delivery
system has become imperative where often the government does not have adequate
finances to bridge the critical infrastructure gap and improve investment. Therefore an
Infrastructure Concession Regulatory Commission (ICRC) was established to regulate
PPP infrastructure arrangement in the country. This paper examines some of the key
components of the legislation and policy of the ICRC by analyzing its strengths and
weaknesses in relation to: willingness to invest; contract design; and prevention
regulatory failure. The aim is to review the regulation of PPP arrangement with a
view to encourage and support sustainable long term economic and legal
commitments in PPP contract transaction. Therefore a survey was critically conducted
on the main sections of the legislation and policy governed PPP through which Data
were collected, codified and consolidated and analyzed using effective infrastructure
regulation matrix. The paper concludes that: creation for the return on investment,
managing risks perceived by the private sector, reducing political uncertainty, getting
incentives right, and affordability problem were among the most important factors on
PPP good practice arrangement. These findings established a backbone of better
understanding of the PPP governance system in Nigeria.
Keyword: infrastructure regulatory system, infrastructure regulatory system, Nigeria,
procurement, public-private-partnership
INTRODUCTION
According to the World Bank (2006) regulation of Public-Private-Partnership (PPP) in
infrastructure delivery can produce harmful effects when it is poorly designed and
executed. Therefore regulatory system of PPP project delivery must produce better
outcomes, which are both economically desirable and politically feasible. Getting to
such a consensus is further complicated by the fact that regulatory systems are
dynamic, not static. PPP regulation exists within ever changing social and economic
conditions, and therefore, it must be both adaptable and predictable at the same time.
Furthermore, it is suggested that the best way to avoid getting poorly performing PPP
regulatory systems is to subject them to ongoing and periodic reviews to make sure
they are fully functional and reflective of social and economic realities, and help to
achieve the government’s objectives (World Bank, 2006). It is in pursuance of this
objective that the study is designed to review the Nigeria’s PPP regulatory system
with view to examine its legislation and policy governing PPP arrangement.

Dahiru
452
The Infrastructure Concession Regulatory Commission (ICRC) is the body
responsible in regulating PPP infrastructure projects development in Nigeria.
However, some elements of the legislation and policy of the ICRC are clearly good,
some are clearly bad, and others are difficult to assess (Figure 1). A good element
produces good sector outcomes, and there is no obvious change that will produce
better sector outcomes. A bad element produces bad sector outcomes, and it can
clearly be change to produce better sector outcomes. An uncertain element is an
element whose effect on sector outcomes is difficult to assess. Therefore the goal of
this study is to focus on those elements of the PPP legislation and policy that, if
clearly reviewed, would lead to better outcomes for the ICRC while taking note of the
good features that are already in place.
BACKGROUND TO THE STUDY
One of the key development challenges constraining the growth of the Nigerian
economy is the huge deficit in basic infrastructure services (National Policy on PPP,
2009). In addressing these challenges, the federal government has therefore
recognized the imperative of leveraging on private sector investment and capacity to
bridge the countries enormous infrastructure gap through an effective PPP/PFI
framework. It is in pursuance of this objective that the federal government established
the ICRC as a legal and regulatory framework on PPP to provide the requisite
regulatory framework within which all Ministries, Departments, and Agencies
(MDAs) can effectively enter in to partnership with private sector in the financing,
construction, operation and maintenance of infrastructure projects.
The regulatory framework of the ICRC is categorized in to macro and micro level
frameworks of PPP arrangement in Nigeria. The macro level framework can be
defined as the collective legislations, institutional, and policy framework that governs
all PPP in the country. Therefore, strong design at this level can effectively utilize PPP
and ultimate service delivery. However, Figure 2 shows the macro level framework of
PPP arrangement designed to guarantee effective projects delivery.
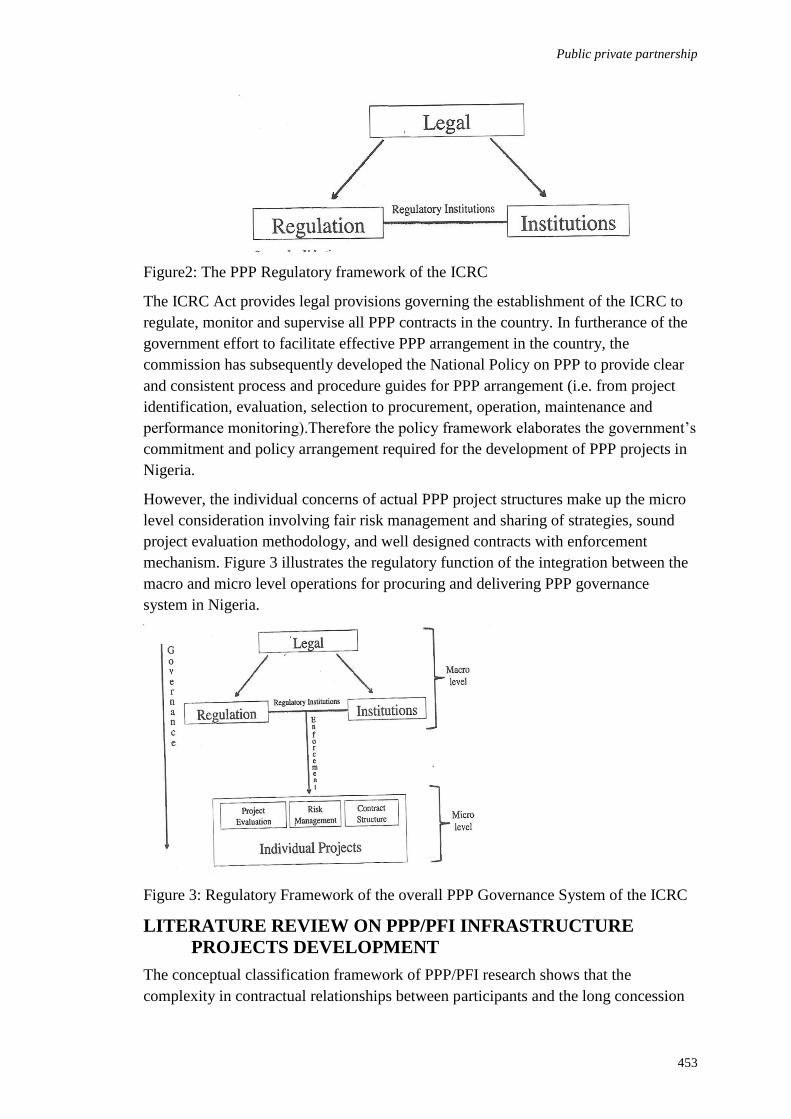
Public private partnership
453
Figure2: The PPP Regulatory framework of the ICRC
The ICRC Act provides legal provisions governing the establishment of the ICRC to
regulate, monitor and supervise all PPP contracts in the country. In furtherance of the
government effort to facilitate effective PPP arrangement in the country, the
commission has subsequently developed the National Policy on PPP to provide clear
and consistent process and procedure guides for PPP arrangement (i.e. from project
identification, evaluation, selection to procurement, operation, maintenance and
performance monitoring).Therefore the policy framework elaborates the government’s
commitment and policy arrangement required for the development of PPP projects in
Nigeria.
However, the individual concerns of actual PPP project structures make up the micro
level consideration involving fair risk management and sharing of strategies, sound
project evaluation methodology, and well designed contracts with enforcement
mechanism. Figure 3 illustrates the regulatory function of the integration between the
macro and micro level operations for procuring and delivering PPP governance
system in Nigeria.
Figure 3: Regulatory Framework of the overall PPP Governance System of the ICRC
LITERATURE REVIEW ON PPP/PFI INFRASTRUCTURE
PROJECTS DEVELOPMENT
The conceptual classification framework of PPP/PFI research shows that the
complexity in contractual relationships between participants and the long concession
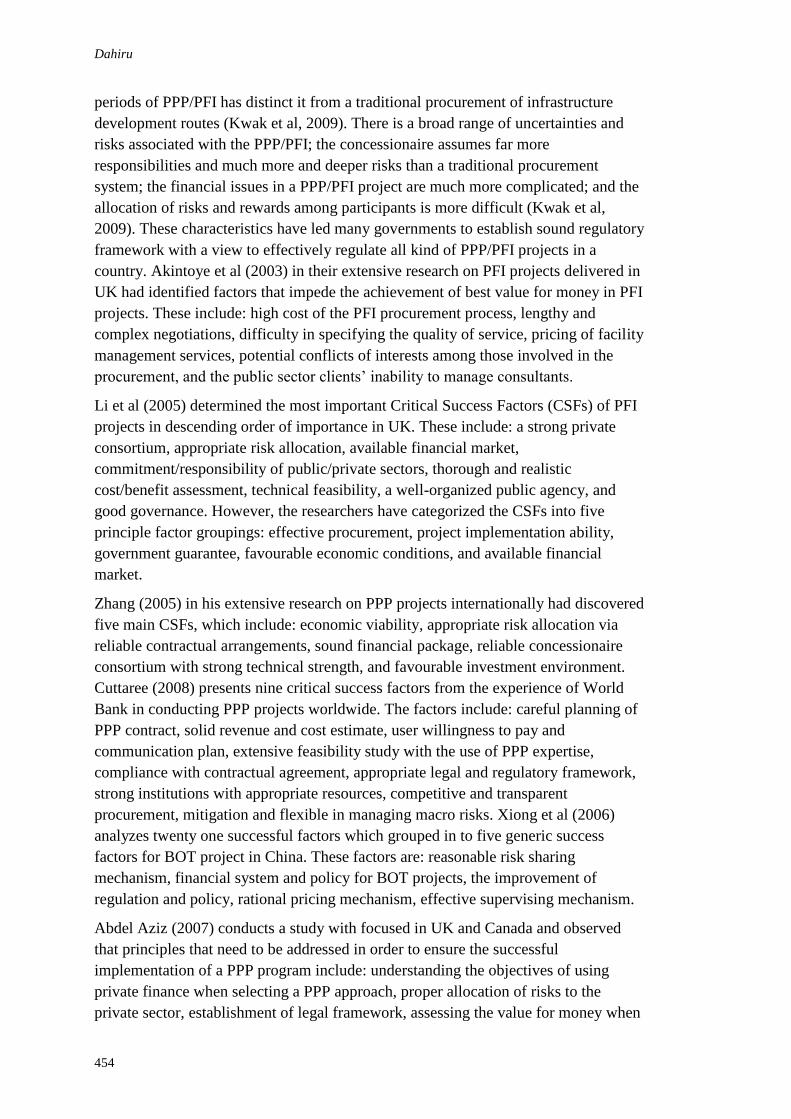
Dahiru
454
periods of PPP/PFI has distinct it from a traditional procurement of infrastructure
development routes (Kwak et al, 2009). There is a broad range of uncertainties and
risks associated with the PPP/PFI; the concessionaire assumes far more
responsibilities and much more and deeper risks than a traditional procurement
system; the financial issues in a PPP/PFI project are much more complicated; and the
allocation of risks and rewards among participants is more difficult (Kwak et al,
2009). These characteristics have led many governments to establish sound regulatory
framework with a view to effectively regulate all kind of PPP/PFI projects in a
country. Akintoye et al (2003) in their extensive research on PFI projects delivered in
UK had identified factors that impede the achievement of best value for money in PFI
projects. These include: high cost of the PFI procurement process, lengthy and
complex negotiations, difficulty in specifying the quality of service, pricing of facility
management services, potential conflicts of interests among those involved in the
procurement, and the public sector clients’ inability to manage consultants.
Li et al (2005) determined the most important Critical Success Factors (CSFs) of PFI
projects in descending order of importance in UK. These include: a strong private
consortium, appropriate risk allocation, available financial market,
commitment/responsibility of public/private sectors, thorough and realistic
cost/benefit assessment, technical feasibility, a well-organized public agency, and
good governance. However, the researchers have categorized the CSFs into five
principle factor groupings: effective procurement, project implementation ability,
government guarantee, favourable economic conditions, and available financial
market.
Zhang (2005) in his extensive research on PPP projects internationally had discovered
five main CSFs, which include: economic viability, appropriate risk allocation via
reliable contractual arrangements, sound financial package, reliable concessionaire
consortium with strong technical strength, and favourable investment environment.
Cuttaree (2008) presents nine critical success factors from the experience of World
Bank in conducting PPP projects worldwide. The factors include: careful planning of
PPP contract, solid revenue and cost estimate, user willingness to pay and
communication plan, extensive feasibility study with the use of PPP expertise,
compliance with contractual agreement, appropriate legal and regulatory framework,
strong institutions with appropriate resources, competitive and transparent
procurement, mitigation and flexible in managing macro risks. Xiong et al (2006)
analyzes twenty one successful factors which grouped in to five generic success
factors for BOT project in China. These factors are: reasonable risk sharing
mechanism, financial system and policy for BOT projects, the improvement of
regulation and policy, rational pricing mechanism, effective supervising mechanism.
Abdel Aziz (2007) conducts a study with focused in UK and Canada and observed
that principles that need to be addressed in order to ensure the successful
implementation of a PPP program include: understanding the objectives of using
private finance when selecting a PPP approach, proper allocation of risks to the
private sector, establishment of legal framework, assessing the value for money when
Public private partnership
455
selecting a delivery system, creating a PPP unit for policy development and
implementation, maintaining transparency in the contract selection process,
standardizing the procurement procedures, and the use performance specifications.
To ascertain the success of any PPP project throughout the concession period, there
are certain conditions that must be met. These conditions according to Durchslag et al
(1994) include: to ensure government commitment and support, to maximize
transparency and minimize the scope for discretionary decision making to ensure the
integrity of the process; to minimize government provision of guarantees, incentives
and credit; empower a small committee of carefully selected individuals to oversee the
privatization process across all sectors of the economy; to develop a comprehensive
legal and regulatory framework for the sector before conducting any actual
privatization; to ensure the integrity of the restructuring process; and to encourage
competition.
Koch and Buser (2006) had identified the roles of the Denmark government in
managing PPP projects and these include: establishment of a central counseling unit;
development of a set of guidelines, tools, and standard of contracts; selection of a set
of pilot projects; subsidizing feasibility studies; and investigating the potential sectors
for PPPs approach. Furthermore, Kumaraswamy and Zhang (2001) have collectively
suggested some issues that governments need to deal with for the PPP scheme to work
smoothly. These include: to establish adequate legal and regulatory framework, to
provide stable political environment, to develop domestic capital market, to ensure a
fair and competitive bidding, to provide adequate government assistance and
guarantees, to conduct project feasibility study, to select the most suitable
concessionaire, and to continuous assess project progress and performance.
Private Finance Initiative (PFI) is another form of PPP option and was initially
introduced in the UK in 1992 by Prime Minister John Major’s government. It is an
innovative means of financing social infrastructure by inducing private capital to
invest in infrastructure projects such as hospital, schools, roads and housing. PFI is
ideologically attempts to increase the efficiency of the public sector through the
introduction of managerial skills, entrepreneurship, expertise, etc. all drawn from the
private sector. As an approach to financing and delivering public services, the use of
PFI has begun to spread to other countries around the glob. An authorizing PFI Act
was enacted and currently operating in various governmental departments in both
developed and developing countries such as Canada, Netherlands, France, Germany,
China, Brazil, India and South Africa.
Kee (2002) highlighted the three critical success factors of PFI projects delivery. First,
government must be able to define, over a considerable length of time, the
infrastructure facilities that it is purchasing. This will obviously be easier for some
services than others. Second, an appropriate understanding and allocation of the
various risks, to the public sector and the private sector, is essential. Third, the public
sector may need to help create a competitive market to produce the service and to
manage effectively that market development activity. If these problems can be solved,
Dahiru
456
PPP/PFI can provide public official and managers with an optional approach to the
production of cost-effective government services. Therefore the above literature is
enough to illustrate the relevance of the regulatory framework of PPP/PFI governance
systems for effective project delivery.
CRITIQUE OF THE LEGISLATION AND POLICY GOVERNED
THE PPP REGULATION
The study places a considerable focus on a critical analysis of the strengths and
weaknesses of the legislation and the policy of the ICRC governing PPP regulation
especially in the areas that can guarantee protection of contract right, procedural
fairness, non discrimination, government support and transparency in concession
agreement. A number of important issues related to strict and uniform regulations of
PPP concession agreement have been addressed especially sections 4 (3), 6, 10, 12,
13, and 36 of the legislation involving: consequences when PPP projects are
abandoned before the end of the concession period; duration of private ownership and
operation; project supervision; the right to use land, construction and operation
services; key requirements for the construction, operation and maintenance of the
project.
However, section 20 of the legislation, which provides the ICRC to take custody of
every concession agreement and monitor the compliance with the terms and
conditions of the agreement entered in to by the government. The section failed to
capture other issues such as: environmental protection measures; provisions of tariffs,
fees, tolls and other charges during operation of the projects; transfer of technology;
assurance of compliance by the project company; use of national services and goods;
and minimum requirement for allocation of risks between the project company and the
government. These according to UNCITRAL (2001), should be provided along side
with the specific types of PPP concession agreement. This is due to its long term
contractual obligations coupled with complex organisational structure.
METHODOLOGY
In the course of undertaking this study, desk study on the regulation, theory and
practice of PPP arrangement were used and interviews and consultations with key
stakeholders. Two documents were studied and reviewed in this study, most of which
provided valuable information on the subject of PPP regulatory framework. Key to
those documents reviewed was the ICRC legislation and policy governed PPP
transaction in Nigeria. The author held consultations with members of the private
sector and specialists in the field of built environment with the aim of obtaining
current information especially on the progress towards implementation of several laws
pertinent to PPP transaction in Nigeria. Therefore a survey was critically conducted
on the main sections of the legislation and the policy governed PPP transaction
through which Data were collected, codified and consolidated and analyzed using
effective infrastructure regulation matrix (Table 1). This matrix was found to be
effective in measuring the effectiveness of PPP/PFI regulatory systems of any country
engaged in the development of PPP/PFI infrastructure projects (Dong, 2009). The

Public private partnership
457
matrix was developed by Koppenjan and Enserink (2009) in an intensive search for
effective PPP/PFI regulatory systems that can guarantee long tern economic and legal
commitment throughout the PPP/PFI contract transaction in any country.
Table 1: Effective Infrastructure Regulation matrix for assessing good and bad practice of policy governed PPP in a country
Key issues Good practices Bad practices
Wil
lin
gn
ess
to i
nves
t
Creating the prospects
for return on
investment
Developing project that create
positive cash flow, which pay
attention to affordability and efficient allocation of scare resources
Using private know-how to identify
projects with cash flow potential Early private involvement
Involvement stakeholders and users
Little attention to affordability problems
and efficient use of resources resulting in
unequal access to public services and inefficient use of scare resources
Not use private business expertise in
project identification and preparation No early private involvement
No stakeholders and users involvement
Managing project scope and externalities
Cross subsidizing of profitable and unprofitable project parts
Internationalizing positive
externalities and package deals
Missing opportunities for reconciling business opportunities lacking scope
management
No attention to preventing cherry picking
Managing risks
perceived by private
parties
Preventing transfer of commercial
risks to government
Guarding a minimal level of competition
Private parties shift risks and costs to
government, taxpayers and users
Creation of private monopolies
Reducing political
uncertainty
Regulator at arm length of politics by
public-public coordination
Clear and coordinated institutional framework
Lack of measures to coordinate
government activities
Absence of stable and coordinated policies, legal and institutional framework
Con
trac
t des
ign
Form of contract Adequate forms of PPP fit for specific
project technology, strategy and institutional setting in specific sector
Some forms applied for all projects
Getting incentives
right
Price regulation, service quality
standards and coverage target
Provisions for modifying tariffs, service levels, technologies and
renegotiation during long-term
operation
Adoption of monopoly leading to market
failures
Rigid contract: practice of unanticipated ex post renegotiation and hold-up
Affordability problem Income measures and credit facilities
Differentiation of tariffs, services and
management solutions
Setting the ceiling for tariffs which do not
pay attention to market price and project
cost recovery
Process of contract design
Competitive bidding or negotiation Early private involvement
Involvement stakeholders and users
One single bid or negotiated contract No early private involvement
Lack of mechanism to articulate interest
Preventing regulatory capture
Build regulatory capacity; get the right mix of expertise
Provide resources, guidelines, training
program and knowledge exchange
Lack of regulatory capacity by improper mix of skills and expertise in regulator’s
office
Lack of in-house expertise and knowledge and expertise exchange
Pre
ven
tion
regu
lato
ry
Fai
lure
Preventing regulatory
rent seeking
Enhance transparency and
accountability mechanism
Regulator and staff purse their own
personal goals due to warm relationship with private partners
Source: Adapted from Koppenjan and Enserink, 2009
ANALYSIS AND FINDINGS
The study reviewed the Nigeria’s PPP regulatory framework and assessed using
infrastructure regulatory matrix (Table 2) to outline its strength and weaknesses in
terms of creating the prospects for return on investment; managing project scope and
externalities; managing risks perceived by the private parties; and other factors that
can reduce political uncertainty. Potential sectors that can guarantee the return on
investment in PPP projects were clarified as shown in Table 2. These will definitely
open door for foreign investors to participate actively in line with the appropriate
outline sectors. Certainly private sectors were giving opportunities to meet the range
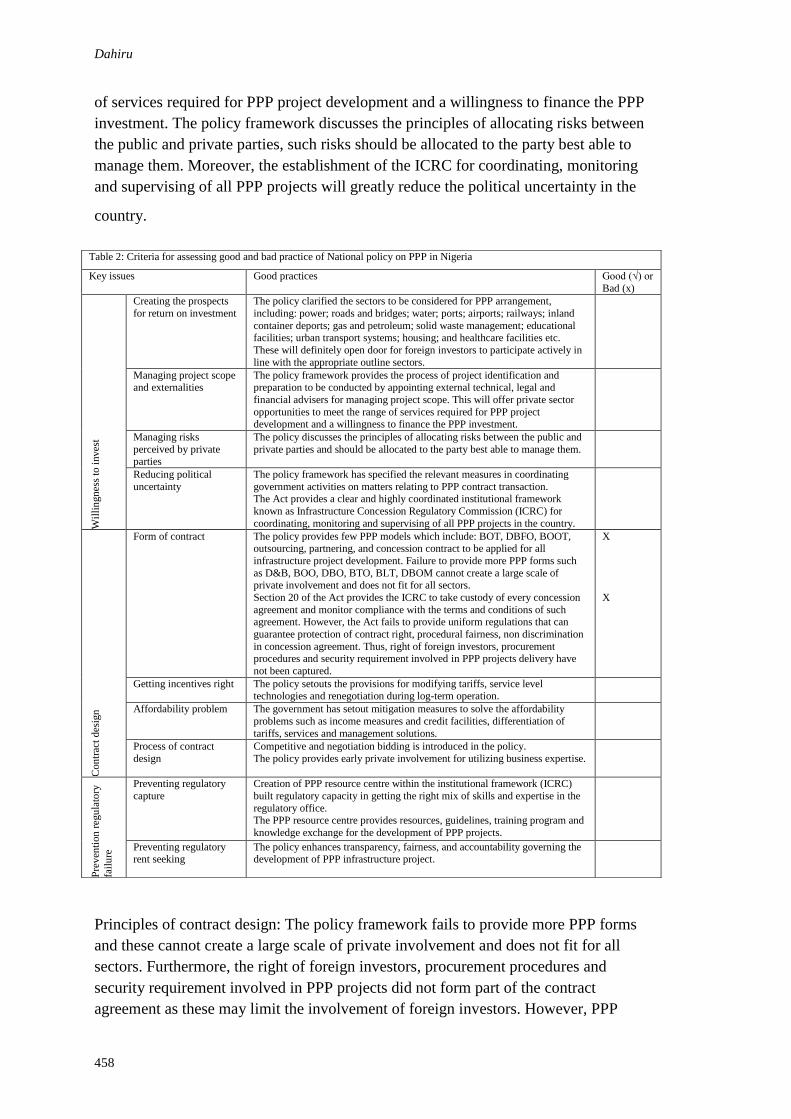
Dahiru
458
of services required for PPP project development and a willingness to finance the PPP
investment. The policy framework discusses the principles of allocating risks between
the public and private parties, such risks should be allocated to the party best able to
manage them. Moreover, the establishment of the ICRC for coordinating, monitoring
and supervising of all PPP projects will greatly reduce the political uncertainty in the
country.
Principles of contract design: The policy framework fails to provide more PPP forms
and these cannot create a large scale of private involvement and does not fit for all
sectors. Furthermore, the right of foreign investors, procurement procedures and
security requirement involved in PPP projects did not form part of the contract
agreement as these may limit the involvement of foreign investors. However, PPP
Table 2: Criteria for assessing good and bad practice of National policy on PPP in Nigeria
Key issues Good practices Good (√) or
Bad (x)
Wil
lin
gn
ess
to i
nves
t
Creating the prospects
for return on investment
The policy clarified the sectors to be considered for PPP arrangement,
including: power; roads and bridges; water; ports; airports; railways; inland
container deports; gas and petroleum; solid waste management; educational facilities; urban transport systems; housing; and healthcare facilities etc.
These will definitely open door for foreign investors to participate actively in
line with the appropriate outline sectors.
Managing project scope and externalities
The policy framework provides the process of project identification and preparation to be conducted by appointing external technical, legal and
financial advisers for managing project scope. This will offer private sector
opportunities to meet the range of services required for PPP project development and a willingness to finance the PPP investment.
Managing risks
perceived by private parties
The policy discusses the principles of allocating risks between the public and
private parties and should be allocated to the party best able to manage them.
Reducing political
uncertainty
The policy framework has specified the relevant measures in coordinating
government activities on matters relating to PPP contract transaction. The Act provides a clear and highly coordinated institutional framework
known as Infrastructure Concession Regulatory Commission (ICRC) for
coordinating, monitoring and supervising of all PPP projects in the country.
Con
trac
t des
ign
Form of contract
The policy provides few PPP models which include: BOT, DBFO, BOOT, outsourcing, partnering, and concession contract to be applied for all
infrastructure project development. Failure to provide more PPP forms such
as D&B, BOO, DBO, BTO, BLT, DBOM cannot create a large scale of private involvement and does not fit for all sectors.
Section 20 of the Act provides the ICRC to take custody of every concession
agreement and monitor compliance with the terms and conditions of such agreement. However, the Act fails to provide uniform regulations that can
guarantee protection of contract right, procedural fairness, non discrimination
in concession agreement. Thus, right of foreign investors, procurement procedures and security requirement involved in PPP projects delivery have
not been captured.
X
X
Getting incentives right
The policy setouts the provisions for modifying tariffs, service level technologies and renegotiation during log-term operation.
Affordability problem
The government has setout mitigation measures to solve the affordability
problems such as income measures and credit facilities, differentiation of
tariffs, services and management solutions.
Process of contract
design
Competitive and negotiation bidding is introduced in the policy.
The policy provides early private involvement for utilizing business expertise.
Pre
ven
tion
reg
ula
tory
fail
ure
Preventing regulatory
capture
Creation of PPP resource centre within the institutional framework (ICRC)
built regulatory capacity in getting the right mix of skills and expertise in the
regulatory office. The PPP resource centre provides resources, guidelines, training program and
knowledge exchange for the development of PPP projects.
Preventing regulatory rent seeking
The policy enhances transparency, fairness, and accountability governing the development of PPP infrastructure project.
Public private partnership
459
investors need to have uniform regulations that can guarantee protection of contract
right, procedural fairness, and non discrimination in PPP contract agreement
(Kumaraswamy and Zhang , 2001; Jefferies et al., 2002; Zhang, 2005).
Getting incentives rights and affordability problem were properly addressed in the
policy framework for the realization of successful PPP projects delivery in the
country. Moreover, the creation of PPP resource center within the institutional
framework of ICRC may serve as a major step of preventing regulatory failure. This
center provides resources, guidelines, training program and knowledge exchange for
the development of PPP projects. In addition, the policy framework enhances
transparency, fairness, and accountability governing the development of PPP
infrastructure project (Table 2).
The above findings discovered that the theoretical framework of PPP governance
system in Nigeria is in line with international best practice especially in terms of
creating favourable investment environment and preventing regulatory failure that can
reduce political uncertainty. However, in terms of contract design, more PPP forms
were missing and this will not give room for PPP investors to massively invest in a
large scale infrastructure projects in the country. In addition, contract agreement was
poorly designed in a way that will not help PPP investors and lenders to relatively
guarantee the protection of contract rights throughout the concession period.
CONCLUSION
The success or failure of a PPP project is dependent on the competency of the
government in establishing regulatory framework that can facilitate willingness to
invest, contract design and prevention of regulatory failure. Many researchers
advocate that credibility and competency of the government plays a critical role in
PPP infrastructure development. Therefore the study reviewed, assessed and
discovered that the Nigeria’s PPP regulatory framework is favourably executed and is
in line with international best practice which is characterised as good governance in
PPP transaction. The most important factors on PPP good practice in Nigeria, include;
creation for the return on investment, managing risks perceived by the private sector,
reducing political uncertainty, getting incentives right, and affordability problem. This
in turn creates a positive investment landscape which ultimately allows government to
be able to attract the private sector investment in aiding the provision of infrastructure
to the people.
However, failure to provide more PPP forms in the policy framework and lack of
uniform regulations in contract agreement that can guarantee protection of contract
right and procedural fairness has resulted in to poor contract design. Furthermore, due
to its complexity, implementation of PPP project often requires uniform regulations in
contract agreement. It is therefore recommends that the ICRC should provide more
PPP forms in its policy framework and design a PPP contract agreement for uniform
regulations that can guarantee the protection of contract right.
Dahiru
460
REFERENCES
Abdel Aziz, A.M. (2007) Successful Delivery of Public-Private Partnerships for Infrastructure
Development. Journal of Construction Engineering and Management, Vol. 133 No.
12, pp 918-931.
Cuttaree, V. (2008). Successes and Failures of PPP Projects.
Durchslag, S., Puri, T. and Rao, A. (1994) Promise of Infrastructure of Privatization. The
McKinsey Quarterly, No.1 pp 3-19.
Dahiru, A. (2011). Appraisal of Build-Operate-Transfer Procurement process in Infrastructure
projects development. Unpublished PhD thesis, Building Department, Ahmadu Bello
University Zaria, Nigeria.
Dong, V.P. (2009). Breaking the Iceberg of Public-Private-Partnership in Vietnam.
Unpublished
MSc Thesis, Delf University of Technology (TUDelf), Netherlands.
Infrastructure concession regulatory commission Act (2005). An Act provides for the
establishment of the infrastructure concession regulatory commission, and other
related matters in Nigeria.
Jefferies, E., Paul, M. and Walker, S. (2002). Critical Success Factors of the BOT
Procurement System Reflections from the Stadium Australia Case Study,
Engineering, Construction and Architectural Management , Vol. 9 No. 4 pp 352-361.
Kee, J. E. and Forrer, J. (2002). Private Finance Initiative—The Theory behind the Practice.
Paper presented at the 14th Annual Conference of the Association for Budgeting and
Financial Management, Kansas City, Missouri.
Koch, C. and Buser, M. (2006) Emerging Meta-governance as an Institutional Framework for
Public Private Partnership Networks in Denmark. International Journal of Project
Management, No.14 pp 548-556.
Koppenjan J. F. M. (2005). The formation of Public-Private-Partnerships: lessons from nine
transport infrastructure projects in the Netherlands, Public Administration, vol. 83,
No. 1, pp 135-157.
Kumaraswamy, M.M. and Zhang, X.Q. (2001) Governmental Role in BOT-Led Infrastructure
Development. International Journal of Project Management, Vol.19, No.4, pp 195-
205.
Kwak, Y.H., Chih, Y. and Ibb, C.W. (2009) Towards a Comprehensive Understanding of
Public-Private-Partnerships for Infrastructure Development. California management
review, vol. 51, No. 2, pp 51-77.
Li, Q.M., Qiao, j. and Xiong, L. (2005). Critical Success Factor for PPP/PFI Projects in the
UK Construction Industry, Construction Management and Economics, Vol. 23, pp
459-471
National policy on Public-Private-Partnership in Nigeria (2009).Policy document prepared by
the infrastructure concession regulatory commission providing clear and consistent
process and procedure guides for all aspects of PPP projects development in Nigeria.
UNCITRAL (2001).Legislative Guide on Privately Financed Infrastructure projects.
Document prepared by the United Nations Commission on International Trade Law.
UNIDO (1996) UNIDO BOT Guidelines: guidelines for infrastructure development through
BOT projects. UNIDO publication, Vienna, Austria, ID/SER.O/22
World Bank (2006) Infrastructure Regulatory Systems. A publication of the World Bank,
Washington, D.C., USA.

Public private partnership
461
Xiong, T. Zeng, D. and Cheng, F. (2006). Critical Success Factors of Infrastructure Projects
under PPP Model in China.
Zhang, X.Q. (2005) Criteria for Selecting the Private-Sector Partner in Public-Private
Partnerships. Journal of Construction Engineering and Management, Vol. 131 No.6,
pp 631-644.

Dahiru, D. and Shehu, N. (2012) An evaluation of the concrete production in typical construction sites
in Nigeria In: Laryea, S., Agyepong, S.A., Leiringer, R. and Hughes, W. (Eds) Procs 4th West Africa
Built Environment Research (WABER) Conference, 24-26 July 2012, Abuja, Nigeria, 463-472.
463
AN EVALUATION OF THE CONCRETE PRODUCTION
IN TYPICAL CONSTRUCTION SITES IN NIGERIA
Dauda Dahiru 1
and Nasiru Shehu 2
Department of Building, Ahmadu Bello University, Zaria – Nigeria
Department of Building, Federal Polytechnic, Kaura Namoda - Nigeria
One of the major problems encountered in the construction of buildings, is the use of
defective material which cause the perennial problems of structural failure in the
construction industry in Nigeria leading to loss of lives and properties. This is a report
on an assessment of concrete production in typical construction sites in Nigeria. It
was achieved by a careful study of contract documents with special reference to mix
design/specification. Concrete sample was then produced using information obtained
from the document (control sample). Renal samples of actual concrete used were
collected randomly cast, cured (sample specimen) and subjected to compressive
strength after 7, 14, 21, 28 curing days. Checklist was prepared on the right method of
concrete production and used to assess how concrete was produced. Result of the
study shows that non adherence to the correct steps of concrete production such as the
use of wrong water/cement ratio and use of crude method of batching were identified
as the common problem in concrete production. It was also found that the average
strength of concrete produced on two sites did not attain the minimum strength
required at 28 days by the BS 1881, (1983b) part 116, while the concrete produced on
another site has a strength of 20.01N/mm2 at 28 days which is close to the
specification of BS 1881 and the controlled sample average strength of concrete at 28
days was 23.79N/mm2 which is within the range specified by the BS 1881 part 116
(1983b).Based on the results obtained, the compressive strength of concrete collected
from sites was less than the control specimen by 14% hence it was recommended that
14% should be added to the estimated design strength, as a factor of safety to take
care of the problems of the handling of the concrete materials and other construction
inaccuracies. Government and professional bodies should make concerted effort in
enforcing National Building Code.
Keywords: evaluation, compressive, concrete, strength, quality
INTRODUCTION
One of the serious problems facing the construction industry in Nigeria is structural
failure. Adenuga (1999) in Olufemi (2008) reported that over 36 reported cases of
collapsed building occurred between 1974 and 1999. Result of investigation revealed
that the use of defective construction materials as one of the major cause of structural
failure. (Emeka, 2011)
Concrete is the most widely used construction material in, not only Nigeria, but all
over the world. According to WBCSD (2000) twice as much concrete is used in

Dahiru and Shehu
464
construction around the world than the total of all other construction materials-
including wood, steel, plastic and aluminium.
Thus, any discussion on structural failure would not be complete without reference to
concrete. (Dahiru 2010). However, unlike most other prominent construction material
like steel, which is produced under carefully controlled conditions, with even the
properties determined in a laboratory, and clearly described in a manufacturer's certificate,
the quality of concrete is subject to variation from the one designed or specified.
Concrete’s constituents are handled and subsequently mixed together to give certain
required quality/properties; these include compressive strength, workability, durability
and good cohesion. It is certain that when these requirements are not met, failure may
occur (Okekere 2007).
To guide against failure, there is the need for quality control; which according to
Gambhir (2006) is a corporate, dynamic programme to ensure that all aspects of
materials, equipments and workmanship are well looked after. Quality control is,
therefore, conformity to the specifications. The owner will have no right to expect
anything more than what is in the specification. The builder, on the other hand knows
that anything less than what is in the specification will not be acceptable to the client.
IAEA (2002) defined quality control as the controls applied to each production stage
to produce a quality product.
According to Gambhir (2006) the most practical method of quality control is to
conform to specification. One major and very important step in a quality control is
testing of concrete. For the fact that compressive strength is the most important
property of concrete, which is used to assess most other properties of concrete,
compressive strength is used as a quality index by not only design and control
engineers, but also professional builders. (McIntosh, 1997 Gupta and Gupta, 2006;
Shetty, 2009 and Neville and Brooks, 2010).
Most of the concrete used in the construction industry in Nigeria is in-situ cast concrete.
Besides that, there is clear evidence that handling of constituent materials and of the
finished product before placing may be responsible for the production of substandard
concrete.This brings the need to improve the handling standard of concrete and its
constituent materials. In addition it is not only desirable but necessary that design and
control engineers should know the quality of concrete actually produced on site so that
it can give them a good idea of the extent of deviation from the ones specified in the
contract document. This will assist in arriving at the reasonable estimate of allowance
(Factor of safety) that should be provided in design and specification of concrete, so
as to guide against failure. This explains the reason why efforts were made by many
researchers relating to problem of concrete production in Nigeria such as: Garba et al
(2004), Okereke (2007), Dahiru (2010), Emeka (2011) and Sadiku (2011). According
to okereke (2007) there are contradictions in the results of many of the researches
undertaken on concreting; largely because researchers were unable to simulate site
conditions in the laboratory. This has led some experts in hot weather concreting in
concluding that the result of study on concrete production, as far from being

Concrete production
465
conclusive. (Okereke, 2007) This brings the need to devise yet another approach to
the study of concrete production .This is particularly important in view of the dynamic
nature of the construction industry. Past results may no longer be valid now. Added to
the fact that the ingredients for good and bad concrete may be the same, the difference
in quality lies with the knowledge skill and experience of the person producing the
concrete. This is a report on the evaluation of the concrete production in typical
construction sites in Nigeria. In order to achieve the desired goal, the following steps
were followed:
Study the handling process and the workers producing concrete.
To determine the quality of concrete as specified by contract document with special
reference to structural design, specification and Bills of quantities.
To Study contract documents, the handling process and calibre of workers especially
level of supervision and the commitment exhibited by the workers towards the
achievement of good quality concrete during concrete production..
To use the information so obtained, from step 1, 2, and 3 to produce control samples
of concrete and determine the quality of concrete produced on site.
To compare the quality of concrete in a typical construction site and the one produced
in laboratory.
METHODOLOGY
The methods used can be summarized under the following headings:
Field survey and study of contract documents:
Studying the contract drawings to come up with the actual method of Concrete
production specified.
Site visit to observe the concrete practices. – especially handling process
Structured interview and interaction with the supervisors of concrete production.
EXPERIMENTAL PROGRAMME
Preamble
In view of the fact that researchers have undertaken studies on various aspects of
concrete production in Nigeria, this paper made an attempt to report on, not only the
quality of concrete produced but to examine effort made in solving the observed
problems. For instance problems due to high temperature and high relative humidity,
etc. To achieve the desired objective, three construction sites were selected for that
purpose. These construction sites are located at Kaura Namoda and Birnin Magaji.
Contract documents for such project were studied. So that it will give an idea of the
quality of concrete as specified by the contract document, for projects under study.
This was then used to produce a control sample. Also, the actual concrete produced in
these sites under study, were randomly collected and their compressive strengths were
determined and compared with the standard. The study was confined to medium sized
Dahiru and Shehu
466
projects; for the fact that recent study revealed that structural failure is more
pronounced in buildings from five storey down wards.(Ede 2010 and Dauda 2011)
Description of the type of projects
These consists of library complex, administrative block for federal polytechnic Kaura
Namoda and local government secretariat complex belonging to Bimin Magaji local
government all in Zamfara state, Nigeria .
Library complex
This library is of two storey framed building (comprising slab, beam, column, stair
case and foundation) located at Federal Polytechnic Kaura Namoda, Zamfara state.
Administrative block
This is also two storey building framed and intended for administrative activities of
the polytechnic located close to the main gate of the institution.
Local Government Secretariat Complex
This is an administrative office for all the staff of the Birnin Magaji local government
located at the centre. of the city of Birnin Magaji and is of two storey framed building.
MATERIALS
The materials used for the study are: cement, fine aggregate coarse aggregate and
ready mixed concrete from the selected construction sites in Kaura Namoda and
Birnin Magaji, Zamfara State – Nigeria.
a. Cement
The cement used for the experiment was Ordinary Portland Cement, OPC,
manufactured and recently supplied by Sokoto cement. It conforms to the relevant
Nigerian and British standards.
b. Fine Aggregates
Fine aggregates used in this research work were clean and air - dried river sand
obtained from Zamfara state. It was sieved with a 5mm B5 112 (1971) sieve, so as to
remove the impurities and larger aggregates. Before the fine aggregate was used; it
was subjected to sieve analysis. This was undertaken in accordance to the BS 933 Part
1 (1997).
c. Aggregates
The coarse aggregate used were crushed granite stones from single quarry obtained
from Zamfara State, Nigeria.
Concrete production
467
d. Harmful Impurities
The aggregate were inspected in order to determine whether they contain harmful
impurities in such a form or quantity that can adversely affect the properties of
concrete. The result of the inspection showed that no such impurities were present.
e. Test Samples
Ready mixed concrete was collected from the actual concrete sample produced and
used for the construction of buildings at the sites under study. The samples were
prepared in 150mm x 150mm x 150mm cubes, cured and subjected to compressive
strength test after each curing day. Then a control sample was produced using the
specification contained in the Contract documents. This is in order to compare the
samples produced at each site with one specified in the contract document.
A total of 12 concrete cubes (150mm x 150mm x150mm) were produced and used as
control sample for this experiment. While 36 concrete cubes were obtained from the
three sites considered this was because in all the three sites considered the
specifications were the same.
STUDY OF THE CONCRETE PRODUCTION
Documents
These consist of Bills of Quantities, Specifications article of agreements and
conditions of contract which were under the custody of the contractor and were
carefully studied and used for this study.
Caliber of People Producing the Concrete
An interactions with the people assigned to produce concrete was carried out. So as to
know the quality of manpower used for concrete production in these sites.. .
Level of Supervision of Concrete Production
The quality and extent of supervision was also investigated.
TEST PROCEDURES
The test of concrete was carried out in the Department of Civil Engineering
Technology Laboratory, Federal Polytechnic Kaura Namoda, Zamfara State in
accordance to the relevant standards, especially the British Standards. For the fact that
the most important property of concrete at fresh and hardened stage are workability
and compressive strength, respectively. The following tests were undertaken
Measurement of Workability: Slump test was used to determine the workability of
the fresh concrete sample used for the experiment.
Compressive Strength Test; The compressive strength of concrete sample from the
chosen construction sites was determined.
Cube Density Test: Density of concrete samples was determined.
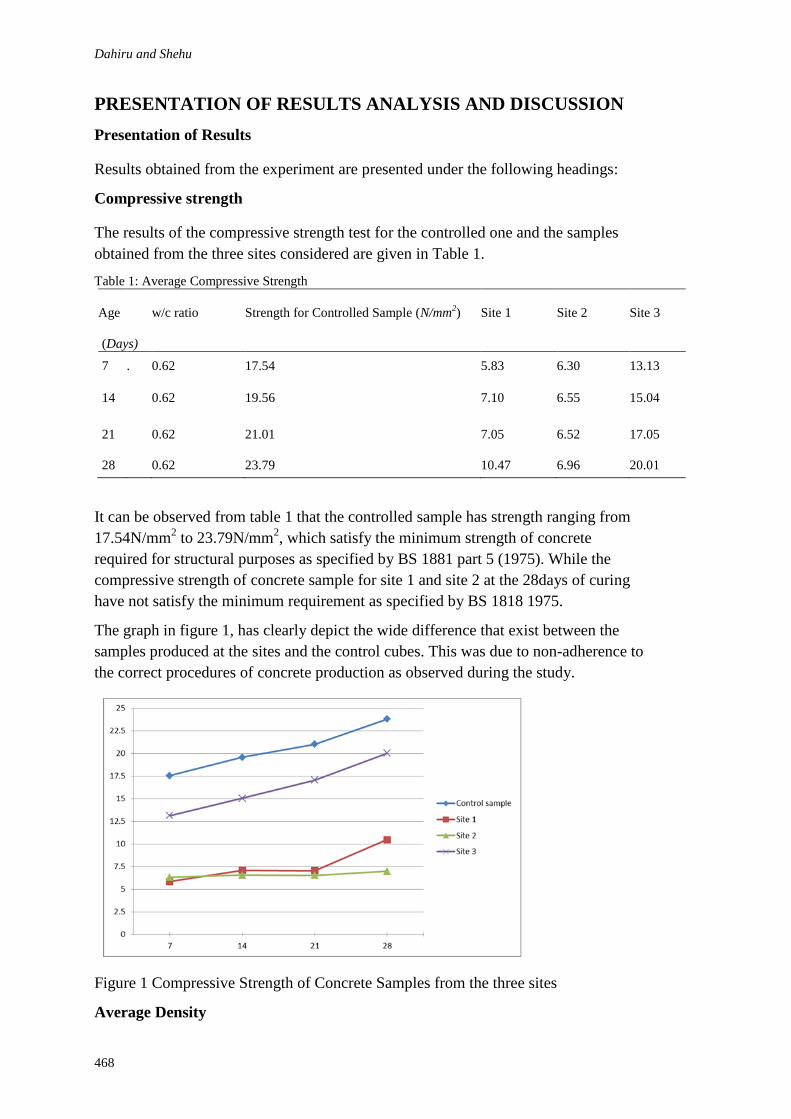
Dahiru and Shehu
468
PRESENTATION OF RESULTS ANALYSIS AND DISCUSSION
Presentation of Results
Results obtained from the experiment are presented under the following headings:
Compressive strength
The results of the compressive strength test for the controlled one and the samples
obtained from the three sites considered are given in Table 1.
Table 1: Average Compressive Strength
Age
w/c ratio Strength for Controlled Sample (N/mm2) Site 1 Site 2 Site 3
(Days)
7 . 0.62 17.54 5.83 6.30 13.13
14 0.62 19.56 7.10 6.55 15.04
21 0.62 21.01 7.05 6.52 17.05
28 0.62 23.79 10.47 6.96 20.01
It can be observed from table 1 that the controlled sample has strength ranging from
17.54N/mm2 to 23.79N/mm
2, which satisfy the minimum strength of concrete
required for structural purposes as specified by BS 1881 part 5 (1975). While the
compressive strength of concrete sample for site 1 and site 2 at the 28days of curing
have not satisfy the minimum requirement as specified by BS 1818 1975.
The graph in figure 1, has clearly depict the wide difference that exist between the
samples produced at the sites and the control cubes. This was due to non-adherence to
the correct procedures of concrete production as observed during the study.
Figure 1 Compressive Strength of Concrete Samples from the three sites
Average Density

Concrete production
469
Table 2 shows the results of the average Density of controlled concrete and those ones
produced by three sites considered.
Table 2: Average Density
S/N Age( days) Control Site 1 Site 2 Site 3
1 7 2360.37 2277.50 2392.10 2994.56
2 14 2362.47 2299.20 2197.53 237926
3 21 2368.40 2824.70 2281.48 2293.33
4 28 2380.25 2354.50 2373.33 2320.00
The densities were determined at saturated surface dry (S.S.D) condition. The density
ranges from 2360.37kg/m3 to 2380.25kg/m
3 for the controlled concrete produced. This
compares well with the normal weight concrete which is the range of 2355kg/m3 to
2560kg/m3. While the density for the three sites ranges from 2197.53kg/m
3 to
824.70kg/m3.
Workability
The workability (slump) test for the controlled concrete and those obtained from the
three sites considered are shown in table 3.
From table 3, the controlled concrete sample has a slum of 20mm, while site 1, site.2,
and site 3 have workability ranging from 100mm to 150mm slump which is relatively
has higher than that of control sample. This is to be expected because result of study
of concrete production in these sites shows that too much water was added to the mix
in order to achieve workability. This results in the reduction of the compressive
strength.
Table 3: Slump Test
Concrete mix w/c ratio Slump (mm) Degree of workability
Controlled 0.62 20 Low
Site 1 0.62 100 High
Site 2 0.62 0 Extremely High
Site 3 0.62 150 High
Table 4: Average Strength, Standard Deviation and Coefficient of Variation for the Experiment
Age Control Site 1 Site 2 Site 3
28days
Mean
Strength
(N/mm2)
23.79 10.47 6.96 20.01
28days
Standard
Deviation
(N/mm2)
1.32 0.46 0.57 0.61
28days Coefficient
of variation (%) 5.55 4.39 8.19 3.05
Dahiru and Shehu
470
ANALYSIS AND DISCUSSION
i Compressive Strength
Looking at the results of the compressive strength test, it can be observed from Table
4 that the compressive strength in site 2 is less than that of the controlled one. This
represent 14% of compressive strength which is far below the provision of BS
1881(1983) Part 116.. This may be due to the fact that the workability is extremely
high
ii Density
The results of test on density, in Table 3 show that the density of controlled concrete
sample is relatively higher than the concrete sample from the three sites. This may be
due to insufficient consolidation of concrete sample during production which can
affect the quality of concrete produced.
Iii Contract Document Studied
Result of the study of the contract documents shows that there was a comprehensive
specification on the expected quality of the concrete to be used by the contractors, for
each of the projects studied. However the specification was exactly the same for all
the three sites. Thus there was no consideration given to the peculiar nature of these
sites. Also the use of plasticizers was specified in the contract document.
Iv Check list
A checked list on important and correct steps to be followed in the production of
concrete was also prepared. This was used in assessing the whole process of concrete
production at these sites .In which each of these steps was allocated with a mark.
Concrete production in each of the sites was assessed .Result showed that all the three
sites could not get a pass mark (50%) as they were not strictly observing those steps.
Important steps such as ordering from same source, non adherence to the
specifications, provision of good storage facilities, testing of materials, competent
labour force, regular curing, consolidation, etc were not observed See appendix E. A
major problem observed is the use of too much water in concrete production. This
account for the low compressive strength noted in the sites studied.
CONCLUSION AND RECOMMANDATIONS
Conclusion
Based on the test result, analysis and discussion carried out the following conclusions
were drawn.
i. Adequate attention was not given to the important steps followed in the production
of concrete in construction sites. Problem of concrete production on sites under study
could be attributed to the non adherence to specification. Batching was “by eye”, in
these sites no any test carried out on the concrete produced in Typical Nigerian
construction sites, use of unqualified workers, etc.
Concrete production
471
iii. No consideration was given to the distinctive nature of each project or construction
sites.
iv. There was no any expert in concrete production who handles the production of
concrete on the sites studied. Concrete produced on the sites considered has density
ranging from 2124.8kg/m3 to 2423.70 kg/m
3. These values compare very low with
those of the normal weight concrete which ranges 2355kg/m3 to 2565kg/m3.
v. The compressive strengths of the concrete produced on the sites considered
compares unfavourably with that of control sample at the same age and for example,
site l and 2 have an average compressive strength of 10.47N/mm2 and 6.96N/mm
2
while site 3 has 20.01N/mm2 these values are 13.32N/mm2 and 16.83N/mm
2 for site 1
and 2 less than that of the control sample of 23.79N/mm2 while site 3 has 3.78N/mm
2
less than that of control samples.
vi. Based on the study carried out on a typical construction sites it can be concluded
that the sites are using crude/unorthodox way to produce concrete.
RECOMMENDATIONS
1.In view of the fact that the compressive strength of concrete produced in all the three
sites are below standard, by 14%, designers should always give a reasonable factor of
safety of at least 14%, in their design of concrete. They should consider the peculiar
nature of both the project and the construction sites.
2. The client and contractors should employ registered professionals who can handle
the production of concrete so that the safety of the occupants will be ensured.
3. Strict adherence to the specifications and carrying out of tests on concrete produced
should be emphasized. In this regard, the professional bodies and government
agencies should put eyes on what is happening in Nigeria construction project most
especially on production of concrete. In this regard, the National Building Code
should be enforced.
4. Further tests should be carried out on these sites to ascertain the quality of concrete
so produced and its significant consequences on the users of such project
REFERENCE
British Standard, BS 112 (1971): “Determination of Properties of Fine Aggregate”
BSI, Linfordwood, Milton Keynes MK14 6LE, U.K.
Emeka, C. (2011) A Study of Concrete production in the Nigerian Construction Industry. An
Unpublished B.Sc project. Department of Building, A.B.U Zaria Nigeria.
Dauda, P. .(2011)” A Study on the Causes of Structural Failure in Nigerian Construction
industry” An
Unpublished B,Sc project Department of Building Ahmadu Bello University, Zaria- Nigeria
Dahiru, D. (2010) A Study of the problems of ready mix concrete production in the
construction industry in Nigeria and its cost implications. In:
Laryea,S.Leiringer,R.and Hughes, W.(Eds) Procs Weat Africa Built Environment
Research (WABER) Conference, July 27th - 28
th 2010, Accra, Ghana
Dahiru and Shehu
472
Dahiru, D (2011)’An Evaluation of the Compressive Strength of concrete using selected NDT
methods”
A Ph D Seminar, department of Civil Engineering , Ahmadu Bello University, Zaria - Nigeria
Ede, A.N. (2010)”Structural Stability in Nigeria and Worsening Environmental Disorder: The
Way
Forward” In: Laryea,S.Leiringer,R.and Hughes, W.(Eds) Procs Weat Africa Built
Environment Research (WABER) Conference, July 27th - 28
th 2010, Accra, Ghana,
489 – 497.
Garba, M.M, Rotimi, J.O.B and John, K. (2004) A Study of mix design in the Nigerian
Construction Industry. ” ATBU Journal of Environmental Technology ATBUJET
School of Environmental Technology Abubakar Tafawa Balewa University P.M.B.
0248 Bauchi, Nigeria.
Gupta, B.I. and Gupta, A. (2008): “Concrete Technology.” Standard Publishers Distributors.
Gambhir, M.L. (2006): “Concrete Technology.” Second Edition Tata McGraw Hill,
New Delhi, India.
IAEA (2002): “Guide to Non-Destructive Testing of Concrete Structures.”
International Atomic Energy Agency, Vienna – Austria.
McIntosh, J. (1997): “Concrete and Statistics CR Books.” A McLaren Company
London U.K.
Neville, A.M. and Brooks (2010): “Concrete Technology.” Second Edition, Addison
Wesley Longman Ltd, Edinburgh Gate, Harlow Essex CM 20 2JE, England.
Okekere, P.A. (2007): “Concreting in Nigeria and Challenges in the Next
Millennium.” A Paper Presented at a Two - day Workshop at Ahmadu Bello
University, Zaria, 12 - 15th
March 2007.
Olufemi O.E. (2008): “The Principles and Practice of Building Surveying and Structural
Investigation: The Technicalities and Procedure.” Being a Text of the Paper Delivered
at organized by NOABS, University of Lagos, Nigeria 3rd
– 5th April 2008.
Shetty, M.S. (2009): “Concrete Technology: Theory and Practice.” S. Chand and Company
Ltd, Ram Nagar, New - Delhi 110 055, India
Sadiku, S. (2011) A Study of the Influence of Local Mix Design on The Compressive
Strength of Concrete. An Unpublished B.Sc Project, Department of Building, A.B.U.
Zaria, Nigeria.

Abdulsalam, D., Mati, A.A., Shika, A.S. and Saleh, Y.M. (2012) Quantity and quality assessment of
artificial lighting system of buildings in Nigeria In: Laryea, S., Agyepong, S.A., Leiringer, R. and
Hughes, W. (Eds) Procs 4th West Africa Built Environment Research (WABER) Conference, 24-26 July
2012, Abuja, Nigeria, 473-482.
473
QUANTITY AND QUALITY ASSESSMENT OF
ARTIFICIAL LIGHTING SYSTEM OF BUILDINGS IN
NIGERIA
Dalhatu Abdulsalam1, Abdullahi A. Mati
2, Aliyu Suleiman Shika
3 and Yunusa
M. Saleh
Department of Building, Ahmadu Bello University Zaria – Nigeria
Department of Building Technology, Nuhu Bamalli Polytechnic Zaria-Nigeria
Centre for Energy Research and Training, Ahmadu Bello University Zaria – Nigeria
Quantity and quality of lit environment has been defined as parameters that determine
a good and sufficient interior lighting system that can avoid glare completely. In an
attempt to avoid glaring effect of artificial lighting system, British Zonal (BZ) system
classify luminaries into 10 standard light distribution classes BZ numbers 1 – 10. In
this work, three (3) interior lighting catalogues were assessed for describing the
conformity with the BZ system classification. While, analytical method for measuring
and accessing glare index was used for measuring the compliance of some selected
lighting design to minimum requirement. The study shows that, all the products
conform to the percentage of light output distribution of five (5) standards of
luminaries. In addition, all products have relevant photometric data in their catalogues
with BZ classes or polar curves of each luminary. However, the specified limiting
glare values were found to be adequate. The values lies between 0.2-9.5 in the
respective spaces while 10.48 and 10.65 were for the summation of two interior
spaces studied and were also adequate.
Keywords: artificial lighting, glare index, illuminance, luminaire, polar curve
INTRODUCTION
Like other lighting systems, artificial lighting is also an issue of both quantity and
quality. A designer of an interior lighting system must be able to find either from
luminaires catalogue or from the photometric data, whether or not a particular
luminaries fulfils both quantity and quality requirement of the lighting installation.
Lighting quantity is basically refers to Illuminance (E) required for a particular task,
defined as density of luminous flux falling on a working plane (lumen per m2). Over
lighting a space ought to be avoided due to the misconception that the more light in
space, the higher the quality. Not only does over lighting waste energy, but it can also
reduce lighting quality.
With regard to quality of illumination IES recommend three issues that should be
considered: Glare, uniformity of illumination and colour rendering (Lighting and
Energy, 2009). In additions to that, Esmond (1984) opined that, the factors affecting
average Illuminance over space includes number and output of fittings, maintenance
Abdulsalam et al.
474
and utilisation factor and acknowledging losses in fittings, room surfaces and area.
Though, Galbreath (2006) on the other hand concluded that, selection of a situation
level of illumination depends on the specific task to be performed in the room.
ILE (2005) remarked that, the major cause of obtrusive light is from over lighting and
is a waste of energy, there are published standards for most lighting tasks, adherence
to which will help minimise upward reflected light. Recommended minimum values
of illumination for a variety of tasks are listed in the lighting Handbook, published by
the Illuminating Engineering Society. Therefore, care should be taken when selecting
luminaires to ensure that appropriate units are chosen and that their location will
reduce spill light and glare to a minimum. Luminaires are specifically designed
lighting equipment that minimises the upward spread of light near to and above the
horizontal (ILE, 2005).
Quality of lighting depends on several factors that include the basic type of lighting
used; Ambient, Accent, Task, Decorative or Kinetic. This study considered the accent,
task and decorative that combines accent and task. The former enhance the character
of a room, add interest or highlight features while the later improves visual clarity,
prevents tiredness and helps focus the mind on the job (Design Skills, 2010). Quality
of lighting on the other hand depends upon the nature of lamps and luminaries, and
can be specified by vector and scalar luminance. It is imperative, therefore that
luminaries manufacturers publish all photometric data concerning their product in an
easily understandable form. In view of this, the paper addresses the concept of lighting
system and BZ system of classification for clear guidance to the application of the
classes for sufficient and sustainable quantity and quality of light output of luminaries.
Luminaries and Avoiding Glare: Lamps commonly called ‘light bulbs’ are the
removable portion of a Luminaires which converts electrical energy to both visible
and non-visible electromagnetic energy. Specialists, who work with lighting, carefully
avoid energetic units for measuring of the light output of source of light (GNU 2007).
Lamps are of two general types; Incandescent source and gas discharge source. Both
the sources vary in colour appearance, how the emitted light looks, colour rendering
and how it makes surrounding colours look (Esmond 1984).
Luminaries is the light fitting that holds or contain a lamps and usually absorbs and
redirect some of the luminous flux emitted by the lamp and in the design of lighting
installations the choice of lamp must be combined with the choice of luminaries
(Mcmullan 1992). A wide range of fitting is now available to give various light
outputs and distributions. Effective brightness control can also be achieved by
incorporating the tubes in the fabric of the building (Hopkinson and Kay 1972).
Common types of luminaries in used includes surface mounted, recessed ceiling and
wall bracket/mounted for downward lighting and a sconce type for upward lighting
both for General lighting system. While a track type of luminary is for Accent and a
portable/table type is for Task lighting system respectively.
The aim of an efficient lighting design is not only to provide Illuminance levels
sufficient for good visual performance, but also to maintain a comfortable and
pleasant atmosphere. Avoiding glare is the most single crucial factor in good lighting
quality. Glare is the brightness within the field of vision that causes discomfort,
annoyance interference and eye fatigue. It reduces the visibility of an object and is the
common fault of lighting installation. Reflected, Disability and Discomfort glare are
the common types and could fall on either direct or indirect type of glare.
Artificial lighting system
475
Lighting design distinguish between reflected, disability and discomfort type of glare,
though are really just different manifestations of bad adaptation conditions. They
occur where artificial lights appear too bright compared with the average of brightness
of the interior. Therefore, according to IES code (1977) the careful matching of the
reflectivity of all surfaces in a room is required for a balanced light distribution.
Good visibility is possible when the ratio of the luminance in an area does not exceed
3:1 and does not fall below 1:3. The use of lighting control also results in improved
energy efficiency and reduced energy demand. Frances (1994) described that, lighting
controls allow the end-user greater control over the lighting system. An appropriate
tuned lighting system may improve worker productivity by reducing glare. The more
accurate methods for predicting and therefore avoiding the cumulative effect of
artificial lighting glare includes; mathematical methods and tabular methods.
However, according to Esmond (1984) the more common way is tables, used to
establish the visual comfort probability, and there is the UK table method, the IES
glare index and the BZ system. The IES index takes into account the following: the
number of fittings, their brightness, their position in the visual field and the
reflectance of surrounding room surfaces. BZ system consider the distribution of light
from a luminaires by a system of numbers 1 – 10 based on upward and downward
light output distribution.
Therefore it is important that, the science of light production and luminaries
photometric are balanced with the artistic application of light as a medium in our built
environment (GNU, 2007). According to Boer and Fischer (1981), much of the
information on which lighting calculation and design are based is supplied by the
equipment manufacturers in the form of technical data sheets. A typical data sheet for
a Luminaires will contain the sort of information: Zonal flux, light output ratio,
utilisation factor, room index and reflectance, direct ratio, glare limitation curves etc.
RESEARCH METHODOLOGY
The paper was written through reviewing the relevant materials and sources that
addresses the British Zonal (BZ) system or polar curves that classify luminaries to 10
classes of light output distribution. It collects information that concerned the concept
for clear description of the concept, whereby comparison was made between the
various percentage of light output distributions given by different researchers. Field
survey on the other hands sourced lighting catalogues of interior lighting system that
apply the BZ concept in their manufacturing process. The catalogue was considered
for showing the extent of application of the BZ system classification of luminaries
using tables and descriptions. Such that, lighting system attain a satisfactory lighting
quantity and quality. Comparison were also made between the lighting catalogue
sourced to bring among which has the more relevant application of the system.
However, as glare in lighting design is quantified and assess by a glare index, the total
discomfort glare for a given environment is specified by an index of glare sensation
(m)
Glare index (m) = ………………………… (1)
Abdulsalam et al.
476
Where, L = ; AP = projected area, I = candela power.
Q = 20.4w + 1.52w0.2
– 0.075; W = = , Where, D =
distance to the source, H, W and Y are obtain in a chart P vs H/W and Y/W.
a = n-0.09914
, n = number of sources in the field of view.
F = field luminance (cd/m2)
P = position index from a chart (m).
Therefore, glare index allowed in two separate lighting designs of various spaces were
computed and compared with the limiting values for accessing compliance based on
the limiting glare index Specified by IES code. The assessment as well, considered
evaluating the adequacy in summation for both the two lighting designs studied.
Finally, conclusion and recommendations were drawn for better interior lighting of
buildings.
RESULT AND DISCUSSIONS
British Zonal system “polar curves” are a variety which, relevantly enough from the
glare point of view, concern themselves with only the light distribution below the
fittings. The system makes it possible to assigns most Luminaires to one of ten
categories. BZ number 1 to 10 corresponding to one of ten hypothetical distributions
rising as the spread of downward light distribution becomes greater. However, this is
adequate for many purposes as the current European system uses lighting-fitting
luminance as the sole basis for evaluating glare, though the method may soon be
extended to take account of the room context (Esmond 1984). Therefore, a good
understanding of the BZ system is built-up through that of the light output distribution
of luminaries.
Light Output Distribution of Luminaries: According to Mcmullan (1992), the
properties of the total light output distribution from the Luminaires are emitted into
the upper and lower hemispheres formed by a plane through the middle of the lamp
filament. This is defined by the light output ratio of each luminary. It takes into
account for the loss of light energy both inside and by transmission through light
fittings;
Light output ratio (LOR) =
Downward Light output ratio (DLOR) = Downward Light output of luminaire
Light output of its lamp(s)
Upward Light output ratio (ULOR) = Upward Light output of luminaire
Light output of its lamp(s)
Total Light output of luminaire
Light output of its lamp(s)
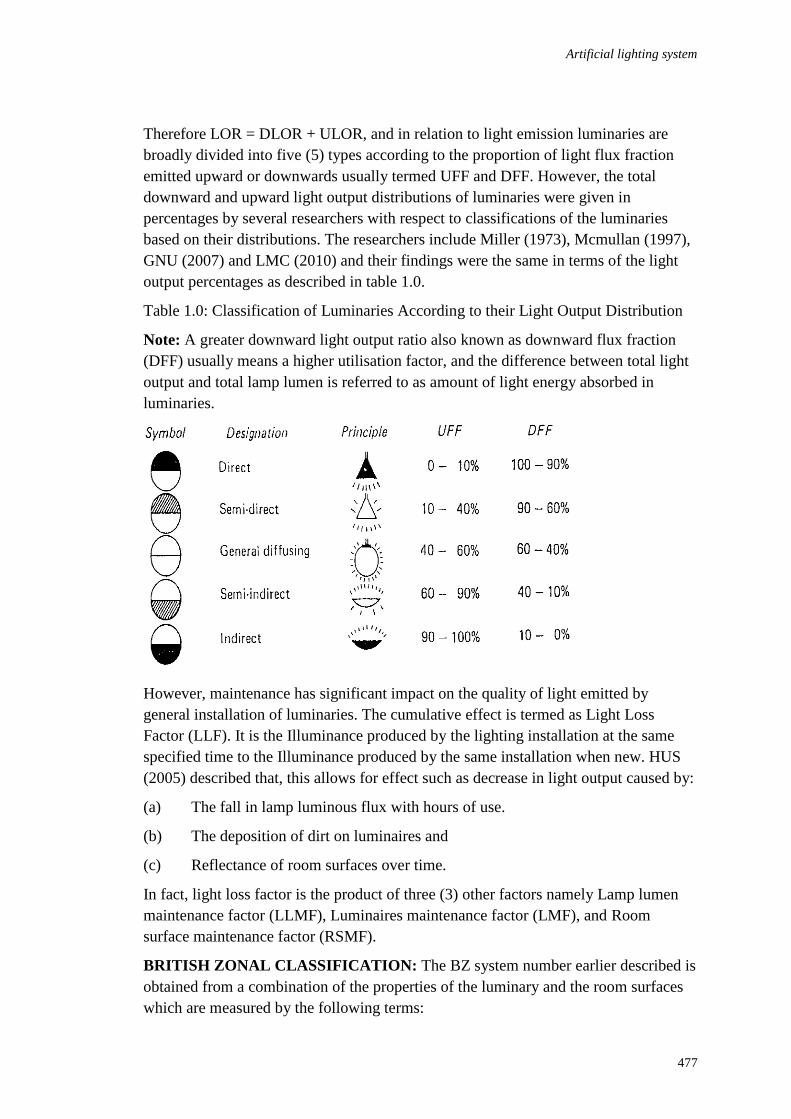
Artificial lighting system
477
Therefore LOR = DLOR + ULOR, and in relation to light emission luminaries are
broadly divided into five (5) types according to the proportion of light flux fraction
emitted upward or downwards usually termed UFF and DFF. However, the total
downward and upward light output distributions of luminaries were given in
percentages by several researchers with respect to classifications of the luminaries
based on their distributions. The researchers include Miller (1973), Mcmullan (1997),
GNU (2007) and LMC (2010) and their findings were the same in terms of the light
output percentages as described in table 1.0.
Table 1.0: Classification of Luminaries According to their Light Output Distribution
Note: A greater downward light output ratio also known as downward flux fraction
(DFF) usually means a higher utilisation factor, and the difference between total light
output and total lamp lumen is referred to as amount of light energy absorbed in
luminaries.
However, maintenance has significant impact on the quality of light emitted by
general installation of luminaries. The cumulative effect is termed as Light Loss
Factor (LLF). It is the Illuminance produced by the lighting installation at the same
specified time to the Illuminance produced by the same installation when new. HUS
(2005) described that, this allows for effect such as decrease in light output caused by:
(a) The fall in lamp luminous flux with hours of use.
(b) The deposition of dirt on luminaires and
(c) Reflectance of room surfaces over time.
In fact, light loss factor is the product of three (3) other factors namely Lamp lumen
maintenance factor (LLMF), Luminaires maintenance factor (LMF), and Room
surface maintenance factor (RSMF).
BRITISH ZONAL CLASSIFICATION: The BZ system number earlier described is
obtained from a combination of the properties of the luminary and the room surfaces
which are measured by the following terms:
Abdulsalam et al.
478
1. Direct Ratio: The proportion of the total downward luminous flux from the
installation of luminaries which falls directly on the working plane. It is used to assess
the flux distribution of luminaries. According to HUS (2005) direct ratio has a low
value with a narrow room (small room index) and a luminary which emits most of its
light sideways (BZ 10), and on the contrary a high value with a wide room (large
room index) and a luminary that emits most of its light downwards (BZ 1).
2. Room Index: The ratio of room plan area to half the wall area between the working
and luminary planes. The ratio takes account of the proportion of the room by the
following formula. R.I = L X W___ ……………….. (2)
Hm (L x W)
Where: L = Length of the room
W = Width of the room
Hm = mounted height of the luminaires above the working
plane
A plot of direct ratio against room index for a particular luminary gives a curve which
can be described by the BZ number of the standard curve to which it is the closest fit.
The actual curves of most luminaries cross from one BZ zone to another as the room
index varies (Mcmullan 1992). BZ1 indicate a distribution of light that is mainly
downward and emit very little light above an angle of 45o and hence, it gives fewer
glares. Whereas BZ10 is a distribution that is mainly upward with the same conditions
and expected to give more glare. However, in between the two BZ8 distribute light
equally in all directions. Therefore, increase in BZ is proportional to increase in glare.
BBI lighting disclosed that, BZ classes above 6 or below 2 are predominantly not for
interior lighting purposes.
BZ SYSTEM APPLICATION: Application of BZ system classification of
luminaries is a concern of lighting designer and manufacturers of lighting fittings
(luminaries). The lighting designer is concerned with the scaling/descriptions of
features of the luminaries. The features are usually found in the photometric data of
each particular luminary. Polar curve is one of such data, and described by Thorn
(1999) as the luminous intensity distribution plotted on polar coordinates with the
back of the luminary horizontal. It has two lines, one showing the luminous intensity
at angles in transverse plane of luminary and the other showing the luminous intensity
at angle in the axial plane. However, the polar curves are useful for calculating the BZ
class of each luminary using the equations of the ten hypothetical polar distributions
BZ1 to BZ10. The equations range from 1αcos4θ to 1αsinθ for BZ1 to BZ10
respectively. Therefore, a lighting designer supposes to equip his self with adequate
knowledge of the features that make-up photometric data. So that, selection of a
particular luminary can provides adequate lighting with respect to quality and
quantity. Designers should also ensure that all factors relevant to the design of the
lighting installation are readily addressed. The checklist of lighting design system
provided by IES (1977) has luminaries as the fifth item with following to be ensured:
Artificial lighting system
479
Adequate appearance, Authenticated photometric data and Availability of spare-parts-
present and future. Manufacturers of the luminaries on the other hand consider
photometric data as prerequisite to patronizing their products. However, with this,
qualitative lighting design that avoid glare and enhances reliability and sustainability
of built environment is achieved. Hopkinson and Kay (1992) outlined the following
luminaries of the particular manufacturers with their BZ classes as in table 2.0
Table 2.0: BZ Classes of Some Luminaries
S/No Luminaire Type BZ Class Manufactures
Plastic louvers BZ 5-6 British Lighting Industries Ltd.
Un obtrusive recessed BZ 1-2 Elco Plastics Ltd
Polished Specula Reflector BZ 1-2 GEC Ltd
Prismatic Plastic Diffuser BZ 3-4 Rotaflx Ltd
The photometric data of the three different lighting catalogues A to C studied, has
relevant information, enough for the applications of BZ system to the interior lighting
design. However, two has direct application and the BZ class stated for each particular
limitation and the other has enough information to predict the BZ class of each
luminary. The details are as shown in Table 3.0
Table 3.0: BZ System Application by Different Manufacturer
It is observed that catalogue A provided the BZ class of each luminary without the
polar curves, unlike catalogue B that has no BZ class, though, provided the polar
curves such that BZ class can be predicted or calculated through the relevant formulae
for each BZ class. Catalogue C provided both the BZ class and polar curves for more
easer application. A luminary crossing from one class to another as shown in Table
3.0 is as result of varying room index.
ASSESSMENT OF GLARE INDEX: The glare index evaluation involved the
lighting design of the following interiors: Offices, Receptions, restaurant, kitchen and
store with significant differences in dimension, position of lighting point, and number
of luminaires in each interior with their respective standard service Illuminance for
both the case studied. Table 4.0 is the representation of the parameter involved and the
comparison with IES code of practice.
Type of luminaries Watts Source Models LOR
(%)
DLOR
(%)
ULOR
(%)
BZ
Class
Polar curve
Surface Mounted 40 A FLP 0.48 42 06 BZ 4 Not provided
Recessed ceiling 250 A EDL 0.25 25 00 BZ 2 Not
provided Wall mounted 2/40 A REL 0.59 56 03 BZ 3-4 Not
provided
Recessed Surface 2/36 B JI26253 0.71 01 70 - Provided
Surface 2/58 B FAMZ258 CAT Z MB 0.60 60 - - Provided
Suspended 2/28 B LSZG 0.74 0.8 66 - Provided
Ceiling Mounted 40 C A3E/A/R1065 0.67 56 11 BZ 4-5 Provided
Mounted ceiling 40 C A3E/A/R2065 0.63 49 14 BZ 4 Provided
Wall Mounted 28 C SNT2D28A1 0.17 - 71 - Provided
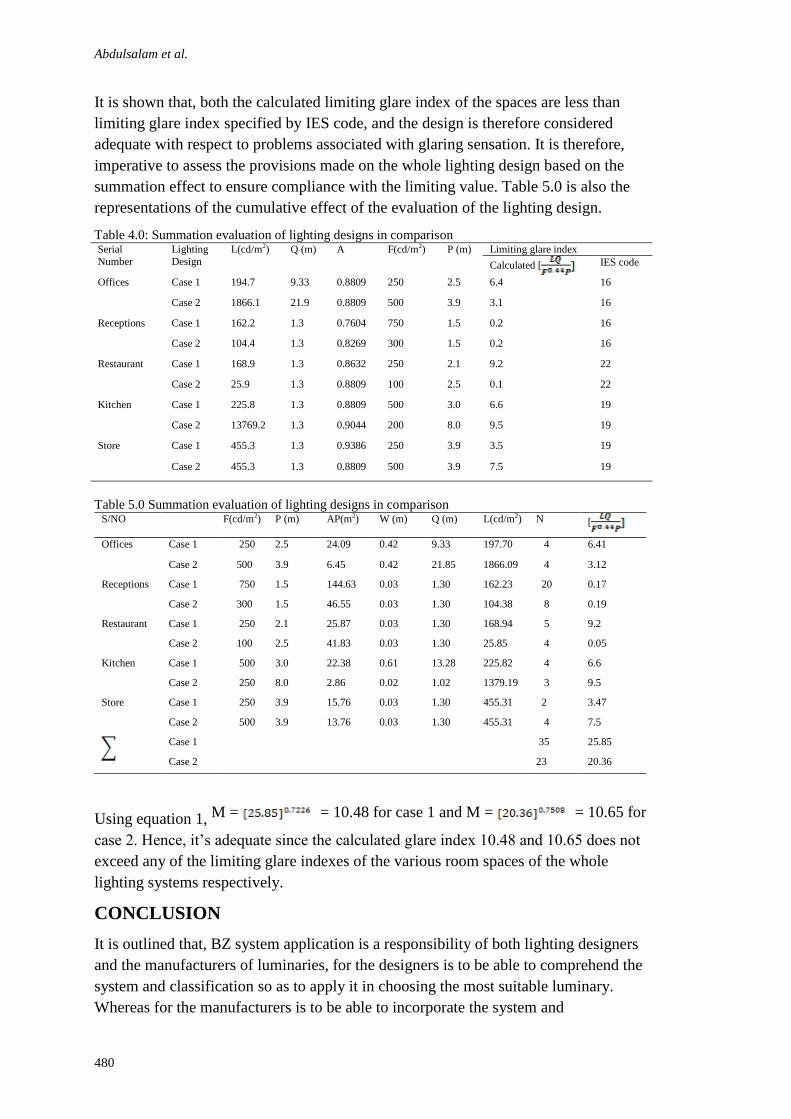
Abdulsalam et al.
480
It is shown that, both the calculated limiting glare index of the spaces are less than
limiting glare index specified by IES code, and the design is therefore considered
adequate with respect to problems associated with glaring sensation. It is therefore,
imperative to assess the provisions made on the whole lighting design based on the
summation effect to ensure compliance with the limiting value. Table 5.0 is also the
representations of the cumulative effect of the evaluation of the lighting design.
Table 4.0: Summation evaluation of lighting designs in comparison Serial
Number
Lighting
Design
L(cd/m2) Q (m) A F(cd/m2) P (m) Limiting glare index
Calculated [ IES code
Offices Case 1 194.7 9.33 0.8809 250 2.5 6.4 16
Case 2 1866.1 21.9 0.8809 500 3.9 3.1 16
Receptions Case 1 162.2 1.3 0.7604 750 1.5 0.2 16
Case 2 104.4 1.3 0.8269 300 1.5 0.2 16
Restaurant Case 1 168.9 1.3 0.8632 250 2.1 9.2 22
Case 2 25.9 1.3 0.8809 100 2.5 0.1 22
Kitchen Case 1 225.8 1.3 0.8809 500 3.0 6.6 19
Case 2 13769.2 1.3 0.9044 200 8.0 9.5 19
Store Case 1 455.3 1.3 0.9386 250 3.9 3.5 19
Case 2 455.3 1.3 0.8809 500 3.9 7.5 19
Table 5.0 Summation evaluation of lighting designs in comparison S/NO F(cd/m2) P (m) AP(m2) W (m) Q (m) L(cd/m2) N [
Offices Case 1 250 2.5 24.09 0.42 9.33 197.70 4 6.41
Case 2 500 3.9 6.45 0.42 21.85 1866.09 4 3.12
Receptions Case 1 750 1.5 144.63 0.03 1.30 162.23 20 0.17
Case 2 300 1.5 46.55 0.03 1.30 104.38 8 0.19
Restaurant Case 1 250 2.1 25.87 0.03 1.30 168.94 5 9.2
Case 2 100 2.5 41.83 0.03 1.30 25.85 4 0.05
Kitchen Case 1 500 3.0 22.38 0.61 13.28 225.82 4 6.6
Case 2 250 8.0 2.86 0.02 1.02 1379.19 3 9.5
Store Case 1 250 3.9 15.76 0.03 1.30 455.31 2 3.47
Case 2 500 3.9 13.76 0.03 1.30 455.31 4 7.5
Case 1 35 25.85
Case 2 23 20.36
Using equation 1, M = = 10.48 for case 1 and M = = 10.65 for
case 2. Hence, it’s adequate since the calculated glare index 10.48 and 10.65 does not
exceed any of the limiting glare indexes of the various room spaces of the whole
lighting systems respectively.
CONCLUSION
It is outlined that, BZ system application is a responsibility of both lighting designers
and the manufacturers of luminaries, for the designers is to be able to comprehend the
system and classification so as to apply it in choosing the most suitable luminary.
Whereas for the manufacturers is to be able to incorporate the system and
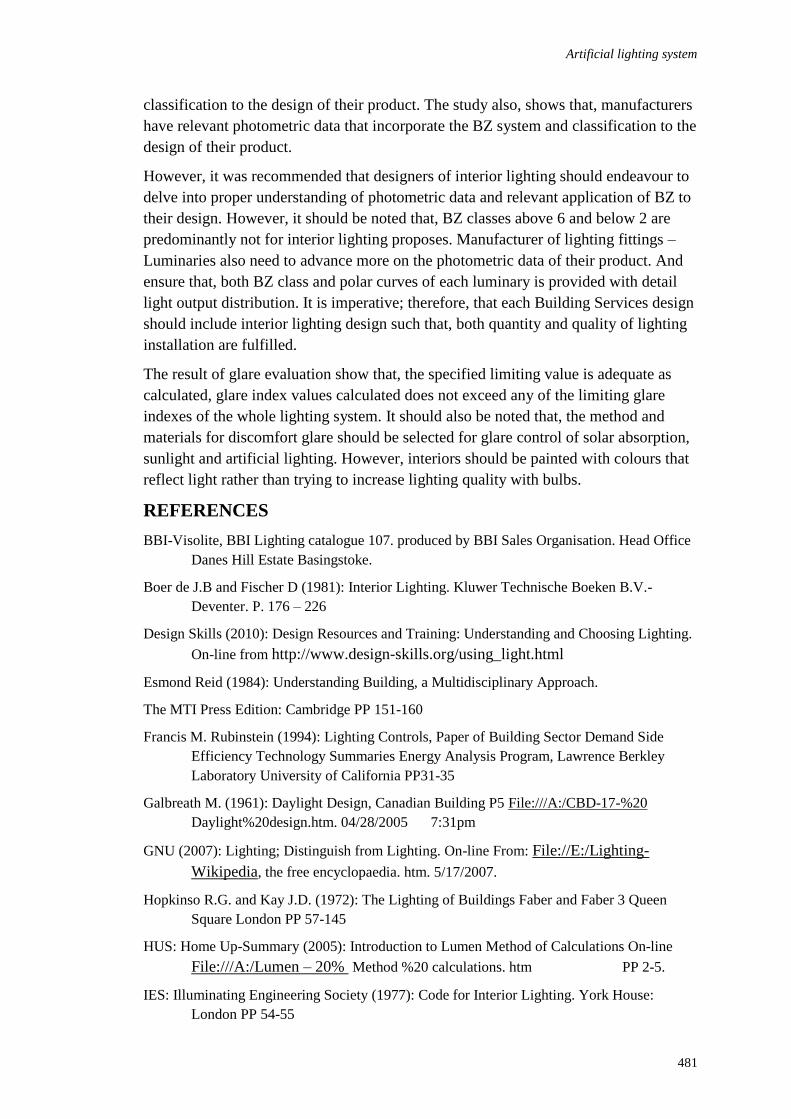
Artificial lighting system
481
classification to the design of their product. The study also, shows that, manufacturers
have relevant photometric data that incorporate the BZ system and classification to the
design of their product.
However, it was recommended that designers of interior lighting should endeavour to
delve into proper understanding of photometric data and relevant application of BZ to
their design. However, it should be noted that, BZ classes above 6 and below 2 are
predominantly not for interior lighting proposes. Manufacturer of lighting fittings –
Luminaries also need to advance more on the photometric data of their product. And
ensure that, both BZ class and polar curves of each luminary is provided with detail
light output distribution. It is imperative; therefore, that each Building Services design
should include interior lighting design such that, both quantity and quality of lighting
installation are fulfilled.
The result of glare evaluation show that, the specified limiting value is adequate as
calculated, glare index values calculated does not exceed any of the limiting glare
indexes of the whole lighting system. It should also be noted that, the method and
materials for discomfort glare should be selected for glare control of solar absorption,
sunlight and artificial lighting. However, interiors should be painted with colours that
reflect light rather than trying to increase lighting quality with bulbs.
REFERENCES
BBI-Visolite, BBI Lighting catalogue 107. produced by BBI Sales Organisation. Head Office
Danes Hill Estate Basingstoke.
Boer de J.B and Fischer D (1981): Interior Lighting. Kluwer Technische Boeken B.V.-
Deventer. P. 176 – 226
Design Skills (2010): Design Resources and Training: Understanding and Choosing Lighting.
On-line from http://www.design-skills.org/using_light.html
Esmond Reid (1984): Understanding Building, a Multidisciplinary Approach.
The MTI Press Edition: Cambridge PP 151-160
Francis M. Rubinstein (1994): Lighting Controls, Paper of Building Sector Demand Side
Efficiency Technology Summaries Energy Analysis Program, Lawrence Berkley
Laboratory University of California PP31-35
Galbreath M. (1961): Daylight Design, Canadian Building P5 File:///A:/CBD-17-%20
Daylight%20design.htm. 04/28/2005 7:31pm
GNU (2007): Lighting; Distinguish from Lighting. On-line From: File://E:/Lighting-
Wikipedia, the free encyclopaedia. htm. 5/17/2007.
Hopkinso R.G. and Kay J.D. (1972): The Lighting of Buildings Faber and Faber 3 Queen
Square London PP 57-145
HUS: Home Up-Summary (2005): Introduction to Lumen Method of Calculations On-line
File:///A:/Lumen – 20% Method %20 calculations. htm PP 2-5.
IES: Illuminating Engineering Society (1977): Code for Interior Lighting. York House:
London PP 54-55

Abdulsalam et al.
482
IES: Illuminating Engineering Society (1984): Lighting Handbook, 4th Edition.
IES: Illuminating Engineering Society (2001): Lighting Handbook, 5th Edition.
ILE: Institution of Lighting Engineers (2005): Guidance Notes for the Reduction of Obtrusive
LightGNO1 On-line from www.ile.org.uk
LMC: Lumen Method of Calculations (2010): Introduction to the Lumen Method of
Calculations. On-line from: http://personal.cityu.edu.hk/_bsapple/lumen.htm PP5.
Lighting and Energy (2009): A Factsheet from Austin Energy’s Green Building Program On-
line from www.Austinenergy.com
Mcmullan R. (1993): Environmental Science in Building. Macmillan Edition P.141.
Miller H.A. (1993): Electrical Installation Practice Edward Arnold (Publishers) Ltd London
PP 29 – 36
Thorn (1999): Thorn Lighting catalogues. Thorn Lighting Comprehensive Product Catalogue
PP 43-557.
Danso, F.O., Badu, E. and Ahadzie, D.E. (2012) The preference of Ghanaian contractors in providing
occupational health and safety items; an exploratory study In: Laryea, S., Agyepong, S.A., Leiringer,
R. and Hughes, W. (Eds) Procs 4th West Africa Built Environment Research (WABER) Conference, 24-
26 July 2012, Abuja, Nigeria, 483-493.
483
THE PREFERENCE OF GHANAIAN CONTRACTORS IN
PROVIDING OCCUPATIONAL HEALTH AND SAFETY
ITEMS; AN EXPLORATORY STUDY
Frederick Owusu Danso1, Edward Badu
2 and Divine Kwaku Ahadzie
3
1 Department of Building Technology, Takoradi Polytechnic, Takoradi, Ghana
2 Collage of Architecture and Planning, Kwame Nkrumah University of Science and Technology,
Kumasi Ghana
3 Centre for Settlements Studies, Kwame Nkrumah University of Science and Technology, Kumasi
Ghana
Most of the building construction site accidents in Ghana have been attributed to the
fact that building contractors do not provide the required health and safety items on
construction sites. This paper is aimed at establishing the preference of building
contractors to the provision of welfare facilities and safety equipments, so that their
understanding of the situation could be embodied in a framework for improving
health and safety management in Ghana. Structured questionnaires were used to elicit
the relevant data from building contractors on their preference for occupational health
and safety items on building construction sites in Kumasi, the second biggest city in
Ghana. The items were grouped under two major thematic areas, namely welfare
facilities and safety items. The building contractors were asked to indicate their
preference on 5- point rating scale. The findings reveal that, the building contractors’
preference for welfare facilities were in the order of first-aid equipment (1st), safe
drinking water (2nd), sanitary facilities (3rd), accommodation to change and store
clothing (4th) and means of heating food (5th). On the theme of safety items the
following emerged, helmet (1st), training in safety (2nd), appointment of safety
officers on site (3th), safety glasses, goggles, and face shields (4th) and safety boots
(5th). One sample statistics supported the findings, suggesting that the findings could
have wider relevance in Ghana. The findings have implications in as much as it can
be embodied in supporting contractors’ safety management strategies, and also policy
direction in future safety guidelines for improving health and safety practices on
Ghanaian construction sites.
Keywords: building contractors, construction industry, Ghana, occupational health,
safety
INTRODUCTION
Indications are that the provision of health and safety items in the Ghanaian
construction industry continues to fall behind many industries in spite of much effort
to improve the situation. Researchers such as Laryea et al (2010), Danso et al (2011)
have researched in that area and indeed in almost all cases, there were pieces of
evidence indicating that the provision of health and safety items on the Ghanaian
construction sites has been compromised. For example, after visiting about fourteen
Danso et al.
484
(14) active construction sites, Laryea et al (2010) found, only one construction site
appears to have sort of provided a standard health and safety procedures. Laryea’s
prime conclusion was, the Ghanaian construction industry do not place a high
premium on health and safety of their workers on site. The understanding is that,
employers within the sector provide substandard health and safety items or undertake
passive measures towards construction accidents on sites.
Danso et al, (2011) did indicate, about 60% of Ghanaian contractors provide
substandard welfare and safety items to their workers. Subsequently, Danso et al
(2010) concluded, most of the building construction site accidents in Ghana are due to
the fact that building contractors do not provide the required health and safety items
on construction sites.
In building collaborative framework for addressing the shortcomings arising from lack
of provision health and safety items on construction sites, Danso et al, (2011) sought
and presented the preference of construction sites workers on what should constitute
the important Occupational Health and Safety items on construction sites. Using one
sample statistics of preference as the methodology, Danso et al, (2011) presented
welfare facilities such as safe drinking water, suitable accommodation for resting,
sanitary facilities, first-aid equipment and water for washing as one of the way
forward in addressing the shortcomings of health and safety issues. In the case of
safety items, the site workers prefer to have safety boots, safety signs, hard hats or
helmet, training in safety and safety glasses on site (Danso et al, 2011).
These preferred health and safety items by site workers on construction sites are
indeed the very items lacking on construction sites in Ghana (Kheni , 2008, Laryea et
al 2010, Danso et al, 2011). However, the preference of building contractors on health
and safety items needed for addressing the real occupational health issues confronting
construction site workers were not clear. Hence this paper therefore seeks to find this
gap in its research. Hence the paper starts by first putting into perspective construction
accident trends in Ghana. This is then followed by the ILO’s 1992 health and safety
provisions on site, and the duties of building contractors in providing health and safety
items on site is next, whilst the framework that governs the provision of health and
safety items follows. Next is the discussions of the data collected and its analysis. The
subsequent section discusses the findings of the study. The conclusion and
recommendations follow after this section. Acknowledgement and the list of
references are detailed at the end of the paper.
CONSTRUCTION ACCIDENT TRENDS IN GHANA
The Ghanaian construction industry has been named as a huge potential of leading the
way for economic development (Danso et al, 2011). Thus quite apart from its 6.1% of
GDP contributions, Danso et al (2011) did show that the industry could be an
instrument for achieving the infrastructural guidelines of the Millennium
Development Goals (MDGs) and The Ghana Poverty Reduction Strategy II (GPRS II)
agenda. However, such important industry is burdened with occupational health and
safety (OHS) issues. For example, it was reported that the construction industry,
recorded 902 accident cases comprising 56 fatalities in 2000 and 846 non-fatal
accidents (Laryea et al 2010, Danso, 2005). According to Danso (2010), Kumasi (the
regional capital of Ashanti Region, Ghana) alone recorded 160 construction fatalities
from 1998 to 2008 (see Figure
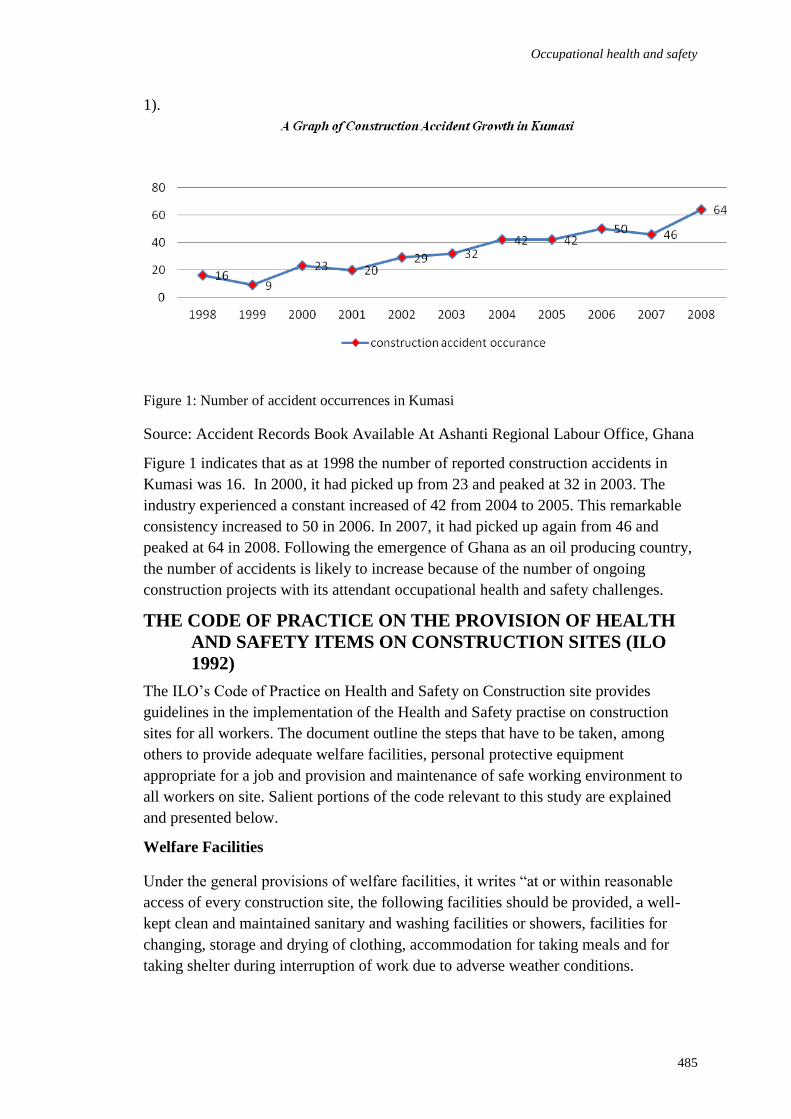
Occupational health and safety
485
1).
Figure 1: Number of accident occurrences in Kumasi
Source: Accident Records Book Available At Ashanti Regional Labour Office, Ghana
Figure 1 indicates that as at 1998 the number of reported construction accidents in
Kumasi was 16. In 2000, it had picked up from 23 and peaked at 32 in 2003. The
industry experienced a constant increased of 42 from 2004 to 2005. This remarkable
consistency increased to 50 in 2006. In 2007, it had picked up again from 46 and
peaked at 64 in 2008. Following the emergence of Ghana as an oil producing country,
the number of accidents is likely to increase because of the number of ongoing
construction projects with its attendant occupational health and safety challenges.
THE CODE OF PRACTICE ON THE PROVISION OF HEALTH
AND SAFETY ITEMS ON CONSTRUCTION SITES (ILO
1992)
The ILO’s Code of Practice on Health and Safety on Construction site provides
guidelines in the implementation of the Health and Safety practise on construction
sites for all workers. The document outline the steps that have to be taken, among
others to provide adequate welfare facilities, personal protective equipment
appropriate for a job and provision and maintenance of safe working environment to
all workers on site. Salient portions of the code relevant to this study are explained
and presented below.
Welfare Facilities
Under the general provisions of welfare facilities, it writes “at or within reasonable
access of every construction site, the following facilities should be provided, a well-
kept clean and maintained sanitary and washing facilities or showers, facilities for
changing, storage and drying of clothing, accommodation for taking meals and for
taking shelter during interruption of work due to adverse weather conditions.

Danso et al.
486
Drinking Water
The code requires that, contractors must provide enough portable or wholesome water
for all workers and this drinking water should be stored in closed containers only,
from which the water should be dispensed through taps or cocks.
Facilities for Food and Drink
Contractors are required in appropriate cases, depending on the number of workers,
the duration of the work and its location, make available adequate facilities for
obtaining or preparing food and drink at or near a construction site. The facilities
should be hygienic and located in hygienic environment.
Living Accommodation
The code of practice requires that suitable living accommodation should be made
available for all the workers at construction sites which are remote from their homes.
PERSONAL PROTECTIVE EQUIPMENT (PPE) AND
PROTECTIVE CLOTHING
Under this provision, employers were to note that suitable personal protective
equipment and protective clothing, having regard to the type of work and risks, should
be provided and maintained by them without cost to the workers. Also under this
provision, personal protective equipment and protective clothing should comply with
standards set by the authorities, taking into account as far as possible the ergonomic
principles. Further, employers should provide the workers with the appropriate
training to enable them to use the individual protective equipment, and should require
and ensure its proper and correct use.
Types of Protective Equipment and Protective Clothing
Employers are required by law to provide all workers with the following personal
protective equipment and protective clothing on site:
1. safety helmets or hard hats to protect the head from injury due to falling or
flying objects, or due to striking against objects or structures;
2. clear or coloured goggles, a screen, a face shield or other suitable device where
workers are likely to be exposed to eye or face injury from airborne dust or
flying particles, dangerous substances, harmful heat, light or other radiation,
and in particular during welding, flame cutting, rock drilling, concrete mixing
or other hazardous work;
3. protective gloves or gauntlets, appropriate barrier creams and suitable
protective clothing to protect hands or the whole body as required, against heat
radiation or while handling hot, hazardous or other substances which might
cause injury to the skin;
4. footwear of an appropriate type when employed at places where there is the
likelihood of exposure to adverse weather conditions, or of injury from falling
Occupational health and safety
487
or crushing objects, hot or hazardous substances, sharp-edged tools or nails
and slippery or ice- covered surfaces;
5. respiratory protective equipment, suitable for a particular environment, where
workers can be protected against airborne dust, fumes, vapours or gases by
ventilation or other means;
6. a suitable air line or self-contained breathing apparatus when employed in
places likely to have an oxygen deficiency;
7. respirators, overalls, head coverings, gloves, tight-fitting boiler suits,
impermeable footwear and aprons appropriate to the risks of radioactive
contamination in areas where unsealed radioactive sources are prepared or
used; and
8. waterproof clothing and head coverings when working in adverse weather
conditions
From the above section, it can be concluded that the legal framework (i.e. the ILO’s
Code of Practice on Health and Safety on Construction sites for construction workers
in general is adequate to protect them. This legal framework covers all construction
workers. It does not prohibit or exclude any section of workers from its protection.
Baah et al (2006) indicated that Ghana has so far ratified 46 ILO Conventions
including Convention No. 167 and its associated Recommendation No. 175. However,
it appears that Ghana has not been able to develop a comprehensive separate
legislation and policies in the context of Occupational Health and Safety (OHS) for
her construction workers, but rather it appears the industry depends on the National
labour Act 651 of 2003, Factories, Offices and Shop Act of 1970 and Workmen
compensation Act 1987, and the Building Regulation.
THEORETICAL FRAMEWORK
As demonstrated, pieces of evidence indicate that indeed there has been a significant
lack of provision of health and safety items on the Ghanaian construction sites and it
appears that the policy makers in Ghana have different view about the industry, such
that Anaman et al (2007) indicated that policy makers have not promoted this industry
towards engendering the much needed growth of the industry. In Ghana, the main
occupational health and safety policy frameworks are as listed below:
1. National labour Act 651 of 2003;
2. Factories, Offices and Shop Act of 1970;
3. Building Regulation; and
Workmen compensation Act 1987
These documents obviously do provide some legal framework on provision of welfare
and safety items in the Ghanaian construction industry. However indication from the
blueprints available suggests some lack of understanding or inconsistencies on the real
issues confronting construction site workers in the construction industry. Moreover
recent developments and challenges of construction site workers have not been
properly investigated to reflect modern occupational challenges. Here, the ILO
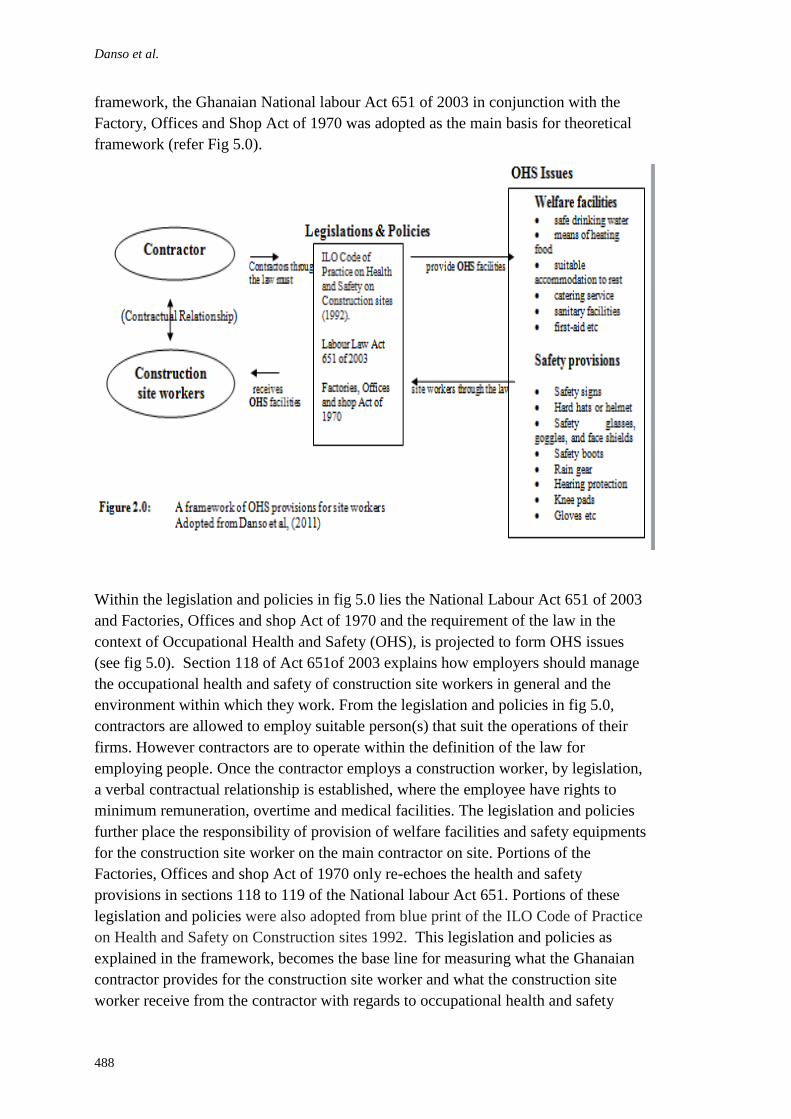
Danso et al.
488
framework, the Ghanaian National labour Act 651 of 2003 in conjunction with the
Factory, Offices and Shop Act of 1970 was adopted as the main basis for theoretical
framework (refer Fig 5.0).
Within the legislation and policies in fig 5.0 lies the National Labour Act 651 of 2003
and Factories, Offices and shop Act of 1970 and the requirement of the law in the
context of Occupational Health and Safety (OHS), is projected to form OHS issues
(see fig 5.0). Section 118 of Act 651of 2003 explains how employers should manage
the occupational health and safety of construction site workers in general and the
environment within which they work. From the legislation and policies in fig 5.0,
contractors are allowed to employ suitable person(s) that suit the operations of their
firms. However contractors are to operate within the definition of the law for
employing people. Once the contractor employs a construction worker, by legislation,
a verbal contractual relationship is established, where the employee have rights to
minimum remuneration, overtime and medical facilities. The legislation and policies
further place the responsibility of provision of welfare facilities and safety equipments
for the construction site worker on the main contractor on site. Portions of the
Factories, Offices and shop Act of 1970 only re-echoes the health and safety
provisions in sections 118 to 119 of the National labour Act 651. Portions of these
legislation and policies were also adopted from blue print of the ILO Code of Practice
on Health and Safety on Construction sites 1992. This legislation and policies as
explained in the framework, becomes the base line for measuring what the Ghanaian
contractor provides for the construction site worker and what the construction site
worker receive from the contractor with regards to occupational health and safety
Occupational health and safety
489
measures. Indeed the framework seeks to confirm the provision of and receipt of
standardised welfare and safety items.
DATA COLLECTION AND ANALYSIS
Observations followed by a questionnaire survey of preference of contractors for
occupational health and safety items were carried out in Kumasi. The choice of
Kumasi was based on the fact Kumasi is the second largest city in Ghana and has
some of the highest concentration of construction activities in Ghana.
The questionnaire used a five-point Likert-type scale to measure a range of preference
of welfare and safety items of opinions from “most preferred” to “least preferred” to
determine the preference of welfare and safety items. The significant agreement or
otherwise with the notion being tested was determined by adopting the mid-point
value of the index (i.e. 3point or neutral) as the hypothesized mean (Coakes and Steed,
2001). This means that any result significantly different from this uncommitted or
unsure value was assumed to be either most preferred or least preferred of welfare and
safety items to the notion being tested (Pullin and Haidar, 2003).
Indications from Erbil et al (2010) are that purposive sampling allows the researchers
to select the individual who have good knowledge on the subject in discussion. Here
contractors are the owners of the company and they take decisions on what to be
provided on site.
Using purposive sampling technique, 100 questionnaires were distributed to
contractors. Seventy-three were retrieved. Twenty three out of the seventy-three were
not properly completed and were therefore discarded. This brought the responses
effectively to fifty, representing a response rate of 50%. This response rate is
considered adequate as, according to Oladapo (2005), Newman and Idrus (2002) and
Ellhag and Boussabaine (1999), a response rate of 30% to 40.50% is good enough in
construction studies. Indications from Naoum, (2008) cited Creswell, (1994) is that
any inquiry into a social or human problem which is based on a theory composed of
variable, measured with number and analysed with statistical procedures is a
quantitative research. Here the quantitative approach was used for basis of
triangulating the results with previous findings, which were all based on quantitative
analysis
ONE SAMPLE STATISTIC MEANS OF PREFERENCE
One sample statistics of preference was carried out to determine the preference of
contractors in the provision of safety equipments and welfare facilities. While, the
mean ranking establishes the preference of some of these issues, it also provides a
clearer picture of the concerns raised by site workers in general. The ranking of these
variables (welfare facilities and safety issues), are determined by putting together the
sample size, the sample mean, the standard deviations and the standard error of each
of these variables of the welfare facilities and safety equipments.
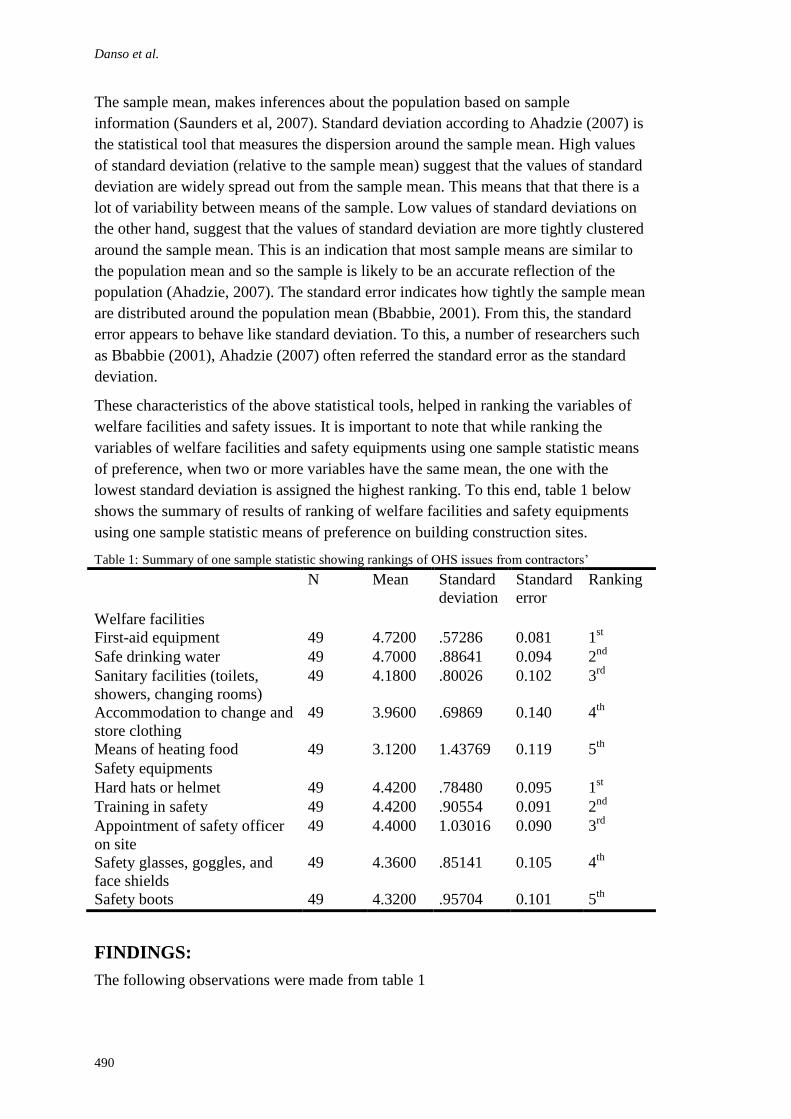
Danso et al.
490
The sample mean, makes inferences about the population based on sample
information (Saunders et al, 2007). Standard deviation according to Ahadzie (2007) is
the statistical tool that measures the dispersion around the sample mean. High values
of standard deviation (relative to the sample mean) suggest that the values of standard
deviation are widely spread out from the sample mean. This means that that there is a
lot of variability between means of the sample. Low values of standard deviations on
the other hand, suggest that the values of standard deviation are more tightly clustered
around the sample mean. This is an indication that most sample means are similar to
the population mean and so the sample is likely to be an accurate reflection of the
population (Ahadzie, 2007). The standard error indicates how tightly the sample mean
are distributed around the population mean (Bbabbie, 2001). From this, the standard
error appears to behave like standard deviation. To this, a number of researchers such
as Bbabbie (2001), Ahadzie (2007) often referred the standard error as the standard
deviation.
These characteristics of the above statistical tools, helped in ranking the variables of
welfare facilities and safety issues. It is important to note that while ranking the
variables of welfare facilities and safety equipments using one sample statistic means
of preference, when two or more variables have the same mean, the one with the
lowest standard deviation is assigned the highest ranking. To this end, table 1 below
shows the summary of results of ranking of welfare facilities and safety equipments
using one sample statistic means of preference on building construction sites.
Table 1: Summary of one sample statistic showing rankings of OHS issues from contractors’
N Mean Standard
deviation
Standard
error
Ranking
Welfare facilities
First-aid equipment 49 4.7200 .57286 0.081 1st
Safe drinking water 49 4.7000 .88641 0.094 2nd
Sanitary facilities (toilets,
showers, changing rooms)
49 4.1800 .80026 0.102 3rd
Accommodation to change and
store clothing
49 3.9600 .69869 0.140 4th
Means of heating food 49 3.1200 1.43769 0.119 5th
Safety equipments
Hard hats or helmet 49 4.4200 .78480 0.095 1st
Training in safety 49 4.4200 .90554 0.091 2nd
Appointment of safety officer
on site
49 4.4000 1.03016 0.090 3rd
Safety glasses, goggles, and
face shields
49 4.3600 .85141 0.105 4th
Safety boots 49 4.3200 .95704 0.101 5th
FINDINGS:
The following observations were made from table 1
Occupational health and safety
491
The standard deviations less than 1.0, normally indicate that there is little variability in
the data or there is consistency in agreement among the respondent in their responses
Ahadzie (2007). To this end, welfare facilities such as first-aid equipment, safe
drinking water, sanitary facilities, accommodation to change and store clothing, hard
hats or helmet and training of construction site workers in safety norms had their
standard deviations less than 1.0. This means that there was consistency in agreement
among contractors that, those items are needed for addressing the occupational health
issues confronting construction site workers on construction sites.
Welfare facilities
On the welfare related issues, employers ranked first-aid equipment first (1st) as the
most important facility for addressing the health and safety issues concerning
construction site workers. The second (2nd
) and third (3rd
) important facility were safe
drinking water and sanitary facilities. This finding is conclusive in that in a typical
Ghanaian construction site in Kumasi, sanitary facilities such as toilets and urinals are
in nonexistent and thereby construction site workers have to depend on nearby bushes.
With the first aid boxes, it was observed that some sites have the first boxes alright but
does not contain drugs.
Safety equipments
On the issue of safety items, contractors ranked hard hats or helmet first (1st) as the
most important facility for addressing the health and safety issues concerning
construction site workers. The second 2nd
and third (3rd
) important issues were training
of construction site workers in safety norms and appointment of safety officer on site.
The training of construction site workers in safety norms and appointment of safety
officer on sites is a kind of proactive measures for preventing accident on site. Acting
proactively requires one to anticipate problems before they occur and take steps to
make sure accidents don’t happen. Therefore contractors were demonstrating a
proactive kind of preventing accident on site. To react proactively towards accidents,
construction site workers think that wearing of safety boots and helmet couple with
safety signs is the best option and this is to the fact that they are directly involved in
the actual construction work.
CONCLUSION AND RECOMMENDATIONS
Findings from the study revealed that:
The number of reported construction accidents in Ghana keeps on increasing and as
the years go by, the situation becomes alarming.
The provision of health and safety items on the Ghanaian construction sites has been
compromised.
Employers of construction site workers think first-aid equipment, safe drinking water
sanitary facilities, hard hats or helmet, training of construction site workers in safety
norms and appointment of safety officer on site are what should constitute the
important Occupational Health and Safety items on site.

Danso et al.
492
The emergence of sanitary facilities such as toilet, first-aid equipment and hard hats or
helmet is an agreement with other studies that have alluded to the fact that sanitary
facilities and first-aid equipment are very important items lacking on Ghanaian
construction sites. The understanding of these findings is very important and its
implications can be embodied in supporting contractors’ safety management
strategies, and also on future policy direction on safety guidelines for improving
health and safety practices on Ghanaian construction sites.
ACKNOWLEDGEMENTS
The authors are grateful to Mr. Augustine Owusu Danso for his enormous
contribution.
REFERENCES
Ahadzie, D.K. (2007), Model for Predicting the Performance Of Project Managers At The
Construction Phase Of Mass House Building Projects,
http://wlv.openrepository.com/wlv/bitstream/2436/15393/2/Ahadzie_PhD%20t
hesis.pdf, Accessed on 12th November 2009
Anaman, K. A. and Osei-Amponsah C.,(2007), Analysis Of Causality Links Between The
Growth Of The Construction Industry And Growth Of The Macro-Economy In
Ghana, Construction Management and Economics, Vol 25, pp. 951-961.
Cotton A.P., Sohail, M. and Scott, R.E. (2005), Towards improved labour standards for
construction of minor works in low income countries, Engineering, Construction and
Architectural Management, Vol. 12 No. 6, pp. 617-632
Danso, F. O. (2005), Improving Safety on Building Construction Site on KNUST Campus in
Kumasi Ghana, Unpublished BSc Thesis, Faculty of Architecture and Building
Technology, KNUST, Kumasi, Ghana
Danso, F.O. (2010), Occupational Health and Safety Issues Involving Casual Workers on
Building Construction Sites In Ghana, A Kumasi Study, Unpublished BSc Thesis,
Faculty Of Architecture And Building Technology, KNUST, Kumasi, Ghana
Earl Babbie. (2001), The practice of social Research, Eve Howard, United States of America
Erbil, Y. and Akıncıtürk, N. (2010), An Exploratory Study Of Innovation Diffusion In
Architecture Firms, Scientific Research And Essays, Vol. 5(11), Pp. 1392-1401
ILO. (2005a), Prevention: A Global Strategy. Promoting Safety and Health at Work The ILO
Report For World Day For Safety And Health At Work International Labour
Organisation, Geneva, Switzerland. Accessed On 15th September 2009 from
Http://Www.Ilo.Org.Pk/Informationfiles/Prevention%20A%20Global%20Strategy.Pd
f
ILO. (2005b), Global Estimates Of Fatal Work Related Diseases And Occupational Accidents,
World Bank Regions. International Labour Organisation, Geneva. Programme On
Safety And Health At Work And Environment (Safework), Accessed On 15th
September 2009 From;
Http://Www.Ilo.Org/Public/English/Protection/Safework/Accidis/Globest_2005/Index
.Htm
ILO. (2007), The Decent Work Agenda In Africa: 2007-2015. In: Eleventh African Regional
Meeting, Held At Addis Ababa, Ethiopia. Report Of The Director General–
International
Occupational health and safety
493
Jayawardane, A.K.W. and Gunawardena, N.D. (1998), Construction Workers In Developing
Countries: A Case Study Of Sri Lanka, Construction Management And Economics,
London, E and FN Spon, Vol.16, Pp. 521-530.
Kheni, N.A. Dainty, A, R. and Gibb A. (2008), Health and Safety Management in Developing
Countries: A Study of Construction SMES in Ghana, Construction Management and
Economics, Vol. 26, pp. 1159-1169
KPMG (2008), Potential Opportunity for Investors Kumasi, Ghana, pp. 1-15.
Laryea, S. and Sarfo M. (2010), Health and safety on construction sites in Ghana, In: The
Construction, Building and Real Estate Research Conference of the Royal Institution
of Chartered Surveyors, Dauphine Université, Paris, France. Accessed on December
20th 2011on http://centaur.reading.ac.uk
Lopes, J. (1998), The Construction Industry And Macroeconomy In Sub-Saharan Africa Post
1970, Construction Management And Economics, Vol 16, pp 637-649.
Mitullah, W. V. And Wachira, I. N. (2003), Informal Labour In The Construction Industry In
Kenya: A Case Study Of Nairob, Sectoral Activities Programme Working Paper 204,
International Labour Organisation, Geneva.
Naoum, S. (2008), dissertation Research and writing for Construction Student, Oxford:
Butterworth-Heinemann.
National Labour ACT 651 (2003), Section 74 – 118.
Neuman W., (2007), Social Research: Quantitative and Qualitative Approaches, Pearson
Education, Inc., USA.
Oladapo, A. A. (2005), An Investigation Into The Use Of Ict In The Nigerian Construction
Industry, from
Http://Www.Itcon.Org/Data/Works/Att/2007_18.Content.02391.Pdf, Assessed
On 30 November 2009
Resell, E. and Applebaum, E. (1997), Nonstand Work Arrangement: A Challenge For Worker
And Labour Unions, Social Policy, Vol. 28 No 2 Pp31-6.
Vaid, K.N. (1999), The Construction Industry In Nepal - The Challenges Of Manpower
Development, National Institute Of Construction Management And Research
(NICMAR), Walchand Center, Mumbai
Wells, J. (2007), Informality In The Construction Sector In Developing Countries,
Construction Management And Economics, Vol. 25, Pp 87-93 0244218910.


Dassah, E.T., Ola-Adisa, E.O. and Odoala, M.C. (2012) The reach and limits of architectural theory in
practice: Interpretations from a Nigerian perspective In: Laryea, S., Agyepong, S.A., Leiringer, R. and
Hughes, W. (Eds) Procs 4th West Africa Built Environment Research (WABER) Conference, 24-26 July
2012, Abuja, Nigeria, 495-505.
495
THE REACH AND LIMITS OF ARCHITECTURAL
THEORY IN PRACTICE: INTERPRETATIONS FROM A
NIGERIAN PERSPECTIVE
Elizabeth T. Dassah1, Erepitan O. Ola-Adisa and Michael C. Odoala
1 Department of Architecture, University of Jos Nigeria
2 Department of Architecture, University of Jos Nigeria
Theory is an important part of our daily lives. From a framework of the scientific
method, the idea of theory as an organized body of concepts and principles which
offer logical explanations about relationships and phenomena is one that is generally
accepted. In this respect, the utility of theory in advancing both the understanding of
phenomena as well as of knowledge is significant. From a framework where
architecture is considered as a distinctive discipline, being both an art and a science, a
range of perspectives to the orientation of theory in architecture exist. The aim of this
paper is to examine the context and limits of theory in architecture generally, and go
further to explore relationships between the practical application of theory in design,
in academic research and in architectural practice specifically. Three theories that
have significantly influenced architecture from the mid – twentieth century and the
early part of the twenty-first century are highlighted in this paper. A discussion of
how they influenced design decisions, constraints and opportunities surrounding them
is also provided. Following these discussions is an example of the application of these
theories in an empirical study conducted in already occupied residential developments
in Nigeria.
Keywords: architecture, architectural theory, design
INTRODUCTION
The term ‘theory’ from the framework of the scientific method is understood to refer
to an organised system of interrelated concepts and principles, brought together in a
meaningful way to shed light on different aspects of phenomena of interest. The term
‘theory’ within architecture is rich and multi-dimensional in meaning. Architectural
theory has been defined by some as “the body of principles that explains and
interrelates all the facts of the subject” (Broadbent, 1995, p.20) and also as that which
“encompasses all the principles and concepts underlying the practice of architecture,
from the fundamental theories of classical proportions to theories about the social or
cultural role of architecture” (RIBA, 2011). Beyond being a body of generalized
principles, others consider theory in architecture to “refer to writings by architects
who describe a design method they have ‘proved’ by example over time” (Rendell,
2007). A defining characteristic of architecture as a social art, is that it assimilates
knowledge from within its’ own knowledge base as well as across different
disciplines; translates these into ideas, which then find expression in built form. This
paper focuses on a basic issue: what may be considered to be the limitations of
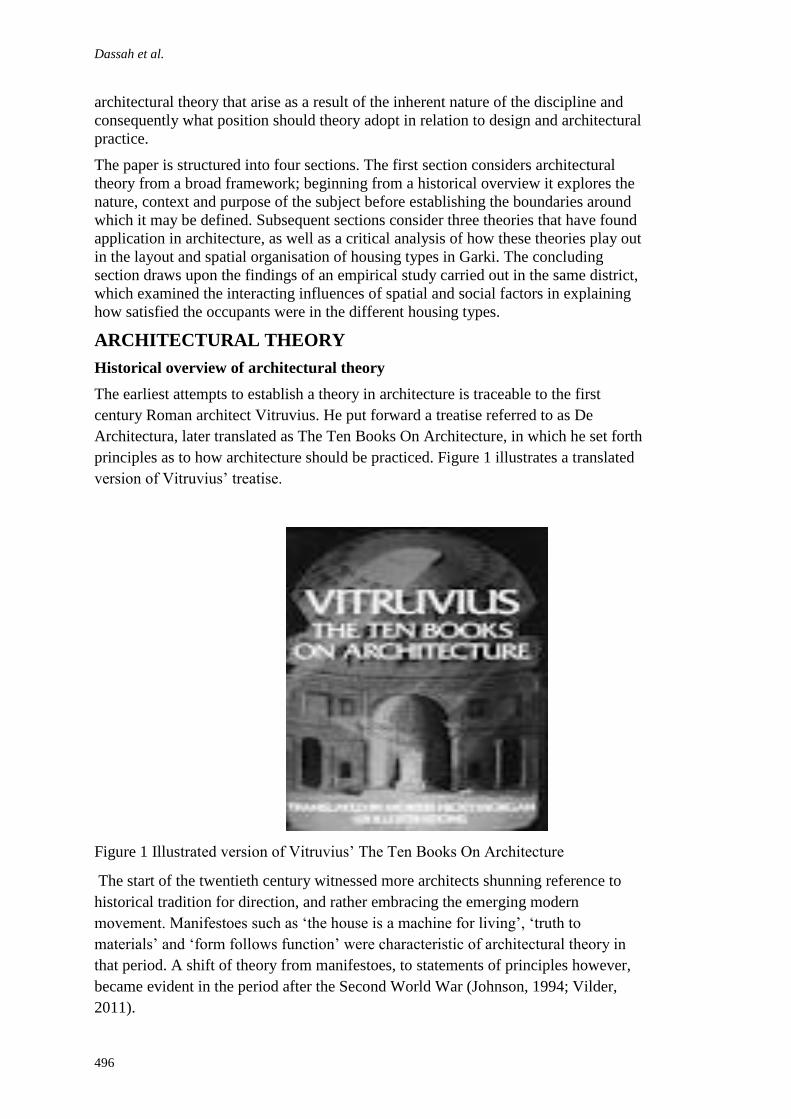
Dassah et al.
496
architectural theory that arise as a result of the inherent nature of the discipline and
consequently what position should theory adopt in relation to design and architectural
practice.
The paper is structured into four sections. The first section considers architectural
theory from a broad framework; beginning from a historical overview it explores the
nature, context and purpose of the subject before establishing the boundaries around
which it may be defined. Subsequent sections consider three theories that have found
application in architecture, as well as a critical analysis of how these theories play out
in the layout and spatial organisation of housing types in Garki. The concluding
section draws upon the findings of an empirical study carried out in the same district,
which examined the interacting influences of spatial and social factors in explaining
how satisfied the occupants were in the different housing types.
ARCHITECTURAL THEORY
Historical overview of architectural theory
The earliest attempts to establish a theory in architecture is traceable to the first
century Roman architect Vitruvius. He put forward a treatise referred to as De
Architectura, later translated as The Ten Books On Architecture, in which he set forth
principles as to how architecture should be practiced. Figure 1 illustrates a translated
version of Vitruvius’ treatise.
Figure 1 Illustrated version of Vitruvius’ The Ten Books On Architecture
The start of the twentieth century witnessed more architects shunning reference to
historical tradition for direction, and rather embracing the emerging modern
movement. Manifestoes such as ‘the house is a machine for living’, ‘truth to
materials’ and ‘form follows function’ were characteristic of architectural theory in
that period. A shift of theory from manifestoes, to statements of principles however,
became evident in the period after the Second World War (Johnson, 1994; Vilder,
2011).
Architectural theory
497
The 1960’s was a period when architectural theorists began expressing concerns in
respect of the discipline’s lack of a common theoretical base and began a search for a
unified theory that could be considered autonomous to architecture. The need for such
an agenda was necessitated by the interest individuals in other fields began showing
towards architecture. Written texts by Foucault, Barthe and Jacques Derrida which
sought to link architecture with philosophy and other social realms had a significant
influence on architectural theory. Robert Venturi’s book, Complexity and
Contradiction in Architecture, published in 1966, reflected an architectural theory
which was mediated by concepts from other fields. This text, among others played a
significant role in the emergence of the post-modern movement in architecture.
From this period to the end of the twentieth century, architectural theory witnessed a
gradual shift towards critical theory where rather than find a common theoretical base
or the dominance of a single viewpoint, the contrary was the case, with more camps
engaging in a range of discourses. In concluding and pointing to the state of theory as
architecture enters another century, Hays (2000) observes that, “architectural theory in
the twenty-first century has been characterised as a lineage running from structuralism
and phenomenology to post structuralism and de-construction”
Nature, context and purpose of theory in architecture
Architecture is a distinctive discipline, and as a result, the nature and purposes of
theory within this discipline differ slightly than those outlined by science. In science,
theory plays a role in assisting one to understand the world as it is – descriptive or
‘positivist’ in nature. In architecture, positive theories co-exist with normative
theories. According to Lang (1987), “an explicit positive theoretical base is necessary
for any discipline if it is to respond to the issues that face it, conduct the research
necessary for its progress, develop logical normative statements from its actions, and
understand the limits of its understanding”. Normative theory posits the world as it
should be. This, according to Johnson (1994, p.19), “involves prescriptions for actions
through standards (or norms), manifestoes, design principles, and philosophies
stemming from an ideological position on what should prevail in the world”. An
analytical theory is yet another type of architectural theory proposed by Hillier (2007,
p.53). Such a theory would “seek to understand architecture as a phenomenon, before
it seeks to guide the designer”. Hillier goes further to assert that “without the
protection of an analytic theory, architecture is inevitably subject to more and more
externally imposed restrictions that substitute social ideology for architectural
creativity”.
The reach and limits of architectural theory
Architectural theory may be likened to a wide stretch of territory which encompasses
several issues. To regard it as such assists us to define the reach and limits of its
boundaries. In this paper, for the purpose of expediency these boundaries will be
mapped out by how architectural theory relates with the past (history), with current
architectural practice and its’ position in relation to future architectural discourse.
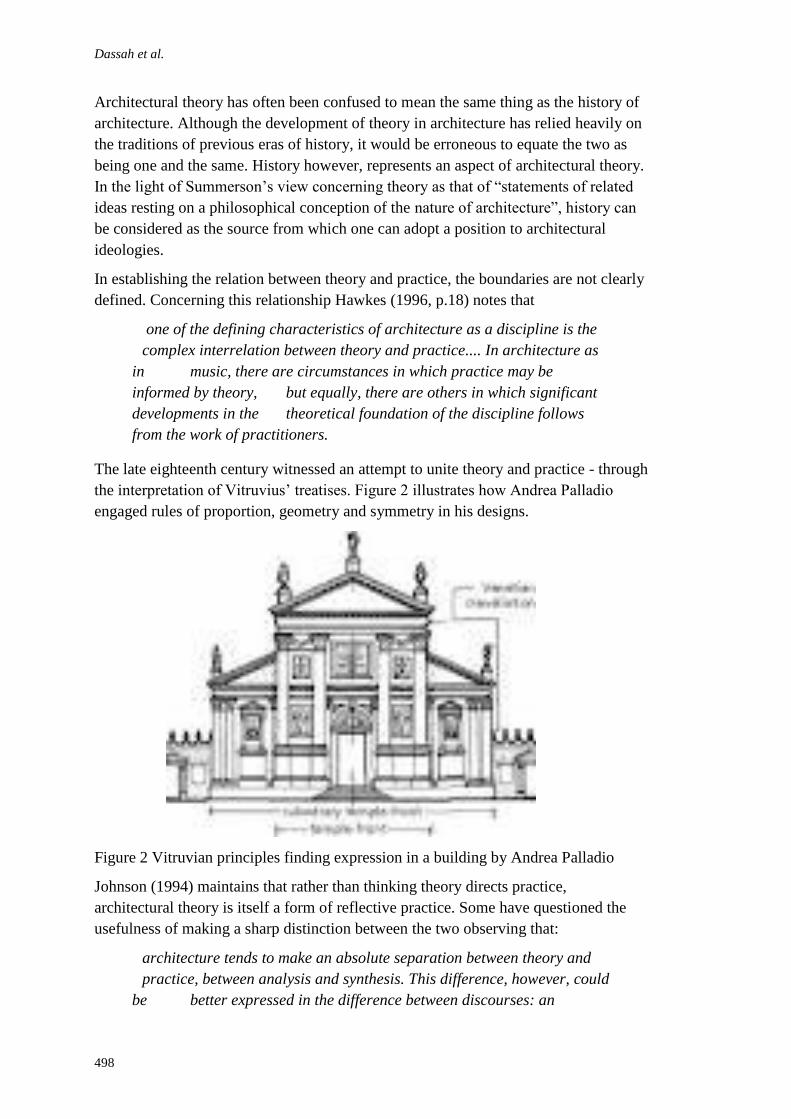
Dassah et al.
498
Architectural theory has often been confused to mean the same thing as the history of
architecture. Although the development of theory in architecture has relied heavily on
the traditions of previous eras of history, it would be erroneous to equate the two as
being one and the same. History however, represents an aspect of architectural theory.
In the light of Summerson’s view concerning theory as that of “statements of related
ideas resting on a philosophical conception of the nature of architecture”, history can
be considered as the source from which one can adopt a position to architectural
ideologies.
In establishing the relation between theory and practice, the boundaries are not clearly
defined. Concerning this relationship Hawkes (1996, p.18) notes that
one of the defining characteristics of architecture as a discipline is the
complex interrelation between theory and practice.... In architecture as
in music, there are circumstances in which practice may be
informed by theory, but equally, there are others in which significant
developments in the theoretical foundation of the discipline follows
from the work of practitioners.
The late eighteenth century witnessed an attempt to unite theory and practice - through
the interpretation of Vitruvius’ treatises. Figure 2 illustrates how Andrea Palladio
engaged rules of proportion, geometry and symmetry in his designs.
Figure 2 Vitruvian principles finding expression in a building by Andrea Palladio
Johnson (1994) maintains that rather than thinking theory directs practice,
architectural theory is itself a form of reflective practice. Some have questioned the
usefulness of making a sharp distinction between the two observing that:
architecture tends to make an absolute separation between theory and
practice, between analysis and synthesis. This difference, however, could
be better expressed in the difference between discourses: an
Architectural theory
499
analytical, exploratory, critical discourse and a normative discourse.
Most theories are developed within the first category, while practice
falls into the latter.
(Agrest 1991, p.1 cited in Johnson, 1994)
THREE THEORIES THAT HAVE FOUND APPLICATION IN
ARCHITECTURE
This section presents brief descriptions of three theories that have influenced
architecture for several years. The first to be described is the ‘behaviour-setting’
theory. It was developed by an environmental ecologist, Roger Barker (1968 cited by
Rapoport, 1982). The second is the theory of ‘defensible space’, developed by an
architect, Oscar Newman (1972). The third is a theory of the configuration of space,
commonly referred to as ‘space syntax’; also having originated from the field of
architecture.
Behaviour-setting theory
Barker’s behaviour-setting theory proposes that there are behaviours associated with
various physical settings. An assumption made by this theory is that as a result of
shared meaning, social groups within similar cultures are able to relate settings with
behaviours deemed appropriate. This theory has been widely used by architects,
however Johnson (1994) points out that difficulties arise when this theory is applied to
the design of buildings, or open spaces having multiple uses, where more than a single
behaviour-setting is bound to exist.
Theory of defensible space
The theory of ‘defensible space’ was developed in relation to high-rise public housing
estates. Newman observed that the tendency for crime to occur in spaces between
housing blocks was greater than in the streets bordering them. The fundamental
premise upon which the theory is based is that establishing clear zones of defensible
space enhances surveillance and so results in reduced crime in high-rise residential
settings. ‘Defensible space’ according to Newman (1972) is “a surrogate term for the
range of mechanisms – real and symbolic barriers, strongly defined areas of influence,
and improved opportunities for surveillance – that combine to bring an environment
under the control of its’ residents” (p.3). The principles underlying this theory have
had a far-reaching influence on the conceptualisation of spatial hierarchy among
architects.
Space syntax theory
Space syntax, is the most recent of the three theories. It was developed in the
architectural laboratory of the University College London. Space syntax theory,
suggests that space has a definite morphological structure, with relational patterns
existing within such a structure. An assumption carried by this theory is that, space in
built form is organised for social purposes, and as such, social and cultural patterns are
Dassah et al.
500
actually encoded within spatial structure. In addition, the theory further proposes that
spatial structure in its configuration, can either structure existing social relations or
generate potential social relations (by how it integrates individuals) through co-
presence (Hillier and Hanson, 1984; Hillier, 2007).
ENGAGING THEORY IN THE ANALYSIS OF HOUSING TYPES
AND SPATIAL ORGANISATION IN NIGERIA: CASE
STUDY OF HOUSES IN GARKI, ABUJA
Housing types
Garki district of Abuja was among the areas delineated for residential development in
the first phase of developing the new administrative capital of Nigeria. Delivering a
satisfactory residential environment for the public servants that were moving into the
new administrative capital was a major challenge for planners and architects alike.
The planning approach adopted revolved around the concept of neighbourhood units.
The development plan sub-divided Garki into seven neighbourhood units; each having
well planned layouts, dwelling units, infrastructure, basic services and some degree of
paved access.
Confronted with socio-cultural and economic considerations and the need to satisfy
functional requirements, three broad housing types were designed to meet the needs of
the different income groups. The single family detached and semi-detached housing
types are designed to accommodate one-bedroom, two-bedrooms and three-bedroom
units, with each unit having access to a little private space at the backyard. The flats
and multi-family housing types are arranged as three-storey blocks, with entrances to
each dwelling unit organised to have a common public space offset from a shared
staircase. As in the case of the former housing types, the flats and multi-housing are
designed to accommodate one-bedroom, two-bedrooms and three-bedroom units,
depending on the occupants' socio-income bracket.
A summary of the housing types identified in Garki are presented in Table 1.
Table 1: Summary of housing types and built space per household in Garki
Housing type Sub-type Plot area per
household
Built space per household
(sq. meters)
I. Single family detached/semi-
detached
*Large
*Medium
*Small
1,000
100-80
75-100
120-160
70-100
30-60
II. Flats *Large
*Medium
*Small
80
60-80
35-60
400
100
85-100
45-70
III. Multi-family *2-3 Family
*4 Family
*Transitional
120-150
180
240
40-75
60-80
60-80
Source: The master plan for Abuja (FCDA, 1979)
Organisation of space within and around dwellings as well as the adopted housing
typologies, reflect the ideals and orderliness of modernist design. Although basic
functional requirements are satisfied in the houses in Garki, very little can be said in
Architectural theory
501
terms of how any attempt to convey cultural meaning was integrated in the entire
housing program.
Significance of space in architecture and the social sciences
Architecture relies heavily on theories borrowed from the social science and for this
reason the significance and interactions of space in both fields is briefly discussed.
The concept of space is central and significant to architecture as a discipline with
some suggesting it to be the "art of the organisation of space" (Bruno, 1957). Space
has also been at the heart of several research efforts in the social sciences that have
had a direct bearing on architecture. The anthropologist, Edward Hall, for example,
was among early researchers that brought out the significance of space in regulating
social interaction in built form. The 'territoriality' theory which he proposed explains
the need of individuals to regulate social distances by claiming and defending a
personal territory (Hall, 1982). Amos Rapoport has likewise carried out extensive
studies about the symbolic meaning conveyed by the organisation of space across
cultures (Rapoport, 1982). Frank Duffy (1974) attempted to integrate architectural
concerns with theory and methods rooted in the social sciences in a Ph.D. thesis that
studied the relation between organizational structure and use of office space.
Implications and application of theory in the analysis of spaces in housing
This section highlights implications and application of the three previously discussed
theories in relation to the analysis of spaces in residential environments. Barker’s
behaviour-setting theory may be considered to be descriptive and explanatory in
nature. The concept 'behaviour setting' is understood to be places (settings) for
particular activities. By proposing that social rules for behaviour within settings are
dependent on the potentials the setting holds for different activities, it has resulted in
settings being configured to support the type of behaviour expected to occur there.
This theory has implications for designing outdoor spaces within neighbourhoods.
Furthermore, it has been used in the evaluation of housing programs to understand
why people refuse to use certain designed spaces for the intended activity or alter
them to suit 'culture-specific' needs.
Newman's proposition of having clearly identified zones of public, semi-public and
private space has had far reaching implications on how architects conceive space and
take decisions in the process of design. By categorizing space on a public-private
gradient it has allowed several studies to be undertaken in relation to the social
performance of public and private spaces in residential settings.
Space syntax is an analytical as well as a descriptive theory applied to the built
environment. It seeks to describe relational patterns in built space and to use these
patterns to interpret social and cultural meaning embedded in spatial form. The
patterns are represented and quantified with the aid of computer software.
Spatial patterns in built form are analysed at three levels. One level identifies and
analyses patterns of permeability within architectural space to differentiate the public
versus private nature of those spaces. Spaces considered more accessible (and more or
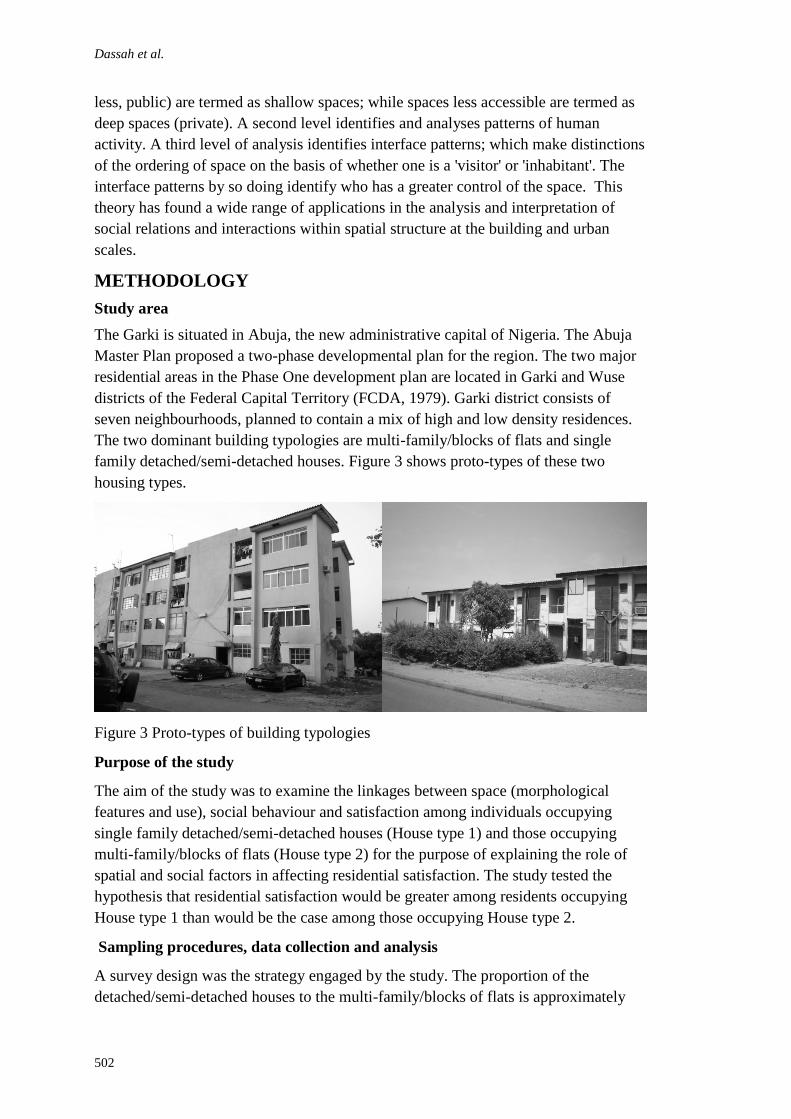
Dassah et al.
502
less, public) are termed as shallow spaces; while spaces less accessible are termed as
deep spaces (private). A second level identifies and analyses patterns of human
activity. A third level of analysis identifies interface patterns; which make distinctions
of the ordering of space on the basis of whether one is a 'visitor' or 'inhabitant'. The
interface patterns by so doing identify who has a greater control of the space. This
theory has found a wide range of applications in the analysis and interpretation of
social relations and interactions within spatial structure at the building and urban
scales.
METHODOLOGY
Study area
The Garki is situated in Abuja, the new administrative capital of Nigeria. The Abuja
Master Plan proposed a two-phase developmental plan for the region. The two major
residential areas in the Phase One development plan are located in Garki and Wuse
districts of the Federal Capital Territory (FCDA, 1979). Garki district consists of
seven neighbourhoods, planned to contain a mix of high and low density residences.
The two dominant building typologies are multi-family/blocks of flats and single
family detached/semi-detached houses. Figure 3 shows proto-types of these two
housing types.
Figure 3 Proto-types of building typologies
Purpose of the study
The aim of the study was to examine the linkages between space (morphological
features and use), social behaviour and satisfaction among individuals occupying
single family detached/semi-detached houses (House type 1) and those occupying
multi-family/blocks of flats (House type 2) for the purpose of explaining the role of
spatial and social factors in affecting residential satisfaction. The study tested the
hypothesis that residential satisfaction would be greater among residents occupying
House type 1 than would be the case among those occupying House type 2.
Sampling procedures, data collection and analysis
A survey design was the strategy engaged by the study. The proportion of the
detached/semi-detached houses to the multi-family/blocks of flats is approximately

Architectural theory
503
2:3. As a result a stratified random sample was drawn from each building sub-type
according to this proportion.
Data was collected using self-administered questionnaires, semi-structured interviews
and photographic documentation. The questionnaire contained a scale in which
residential satisfaction was made operative A total of two hundred questionnaires
were completed and returned, representing a 74% response rate. Data were analysed
using the SPSS-16.0 statistical package, as well as an extraction of recurrent themes in
the interview.
FINDINGS AND DISCUSSION
Findings from the study revealed that although residential satisfaction is the outcome
of several variables, space-related variables were in this case the most significant in
explaining the variance in residential satisfaction. The hypothesis tested was found to
be true as individuals occupying House type 1 indicated greater satisfaction in their
housing conditions than those occupying House type 2.
The patterns of space use and activity patterns as well as those who had more claims
to communal public space differed in the areas where single family detached/semi-
detached houses were when compared to those of multi-family/blocks of flats. The
tendency to use the space for culture-specific tasks (such as drying foodstuffs on the
walkways) was observed to be greater in the former housing type. It was observed in
both housing typologies that the occupants sought to further define their private
territories and establish their boundaries using hedges or iron grating (security rods).
The tendency to make spatial alterations to the dwelling was conspicuous among
residents of the detached/semi-detached housing types. Indicated also from the
findings was the presence of street traders in the open public space around the blocks
of flats; children were also found using spaces around the staircases as conversation
spots and playing along the street pavements.
Definitions of what constitute public and private space are mediated by the cultural
context; although this has been found to differ between individuals of different social
groups (Hillier, 2007; Rapoport, 1982). Not including supporting cues (like creating
places for outdoor sitting and relaxation) within the shared public space of the
residential setting may be a likely reason as to why use of shared public space among
residents is limited (Barker, 1969; Rapoport, 1982). The absence of clearly defined
zones as proposed by Newman (1972) may in part explain why the occupants go about
establishing and defining their own boundaries as well as why private activities were
found to spill-over to public space. The social ordering of space in these settings
allowed 'outsiders' rather than the 'inhabitants' to take control of the space for
commercial purposes as it evidently did not belong to anybody. The inclination also
by children to occupy and use spaces not prioritised by adults supports propositions
linked to space syntax theory (Hillier, 2007).
Dassah et al.
504
CONCLUSIONS
This paper started with the objective being to establish the context and limits of
architectural theory. In examining architectural theory at a general level and then
considering three specific theories that have influenced architecture we have brought
out some essential issues surrounding the problem of relating theory to architectural
practice. Unlike scientific theories that are explicit and their role clearly defined, the
nature and role of architectural theory differs. Theory in architecture guides practice
by providing one with ideas to think with. It provides design principles and historical
precedents which subsequently may form the basis for design decisions.
The study presented sought to find the face of theory from the context of a completed
housing programme. Findings from the study revealed that the social reality of how
space is used or modified by residents in a completed project may sometimes differ
from design intentions. They also revealed what we know - that theory permeates all
architectural endeavours. This theory includes that drawn from other disciplines as
well as that which could be considered mainly 'architectural' in nature.
REFERENCES
Broadbent, G. (1995) Architectural education, in Pearce, M. And Troy, M. Educating
Architects. London: Academy Editions.
Duffy, F. C. (1996) Office interiors and organisations: a comparative study of the
relation between organizational structure and the use of interior space in
sixteen office organizations. Ph.D. dissertation Princeton University
Hall, E. (1982) The Hidden dimension. New York: Doubleday Publishing.
Hanson, J. (2001) Morphology and design: reconciling intellect, intuition, and ethics in the
reflective practice of architecture, in Proceedings of the 3rd International Space
Syntax Symposium, Georgia Institute of Technology, Atlanta, GA,
http://undertow.arch.gatech.edu/homepages/3sss/
Hawkes, D. (1996) The environmental tradition studies in the architecture of the
environment. Cambridge: E and FN SPON.
Hays, M. K. (2000) Architectural theory since 1968. Cambridge: MIT Press.
Hillier B. and Hanson, J. (1984) The Social Logic of Space. London: Cambridge University
Press
Hillier B. (2007) Space is the machine: a configurational theory of architecture.
http://eprints.ucl.ac.uk//3881
Johnson, P. (1994) The theory of architecture: concepts, themes and practices. New York:
Van Nostrand Reinhold.
Newman, O. (1972) Defensible space. New York: Architectural Press.
Rapoport, A. (1982) The meaning of the built environment: a nonverbal communication
approach. Beverly Hills, CA: Sage.
Rendell, J. (2007) Art and architecture: a place between. London: I.B. Taurius.
Rapoport, A. (1982) The meaning of the built environment: a nonverbal communication
approach. Beverly Hills, CA: Sage.
Venturi, R. (1966) Complexity and contradiction in architecture. New York: The Museum of
Modern Art.

Architectural theory
505
Vilder, A. (2011) Troubles in theory: the state of the art 1945-2000. http://www.architectural-
review.com/issues/October-2011

Ekwevugbe, T., Brown, N. and Fan, D. (2012) Using indoor climatic measurements for occupancy
monitoring In: Laryea, S., Agyepong, S.A., Leiringer, R. and Hughes, W. (Eds) Procs 4th West Africa
Built Environment Research (WABER) Conference, 24-26 July 2012, Abuja, Nigeria, 507-520.
507
USING INDOOR CLIMATIC MEASUREMENTS FOR
OCCUPANCY MONITORING
Tobore Ekwevugbe1, Neil Brown and Denis Fan
Institute of Energy and Sustainable Development, De Montfort University, The Gateway, Leicester,
United Kingdom, LE 1 9BH
The operation of systems for indoor climatic control remains a challenging task for
facilities managers, energy managers, and the building industry in general. This is
compounded by increasing building control complexities, emergent sensing
technologies, and increasing pressure on commissioning. Industry can benefit from a
better description of the relationships between indoor climatic variables including
occupancy, which is vital for the development of building control algorithms for
improved energy efficiency and comfort. This paper presents an investigation of the
relationship between indoor climatic variables such as temperature, volatile organic
compound (VOCs), carbon dioxide (CO2) and occupancy in a naturally ventilated
non-domestic building (office kitchen area) using portable non-invasive sensors, with
occupancy level validation carried out using an infra-red people counter. Results
suggest that case temperature monitoring of electrical appliances is also a cost
effective way to establish usage patterns, from which occupancy can be inferred.
Experimental findings also show that VOC measurements can produce better
indications of occupancy than CO2 levels, while also measuring other air
contaminants which may affect indoor air quality, but this depends heavily on the
type of workspace under test.
Keywords: carbon dioxide, demand controlled, indoor air quality, occupancy,
ventilation
INTRODUCTION
People spend about 80% of their life time inside buildings (Dounis and Caraiscos
2009), and energy is consumed in most cases in order to condition the indoor
environment for occupants comfort. For building control operations, it is challenging
to find the balance between energy efficiency and a comfortable climate (Zhu et al.
2010). People interact with control devices to adjust comfort conditions based on their
preference (Mahdavi et al. 2006). The basic human need for indoor comfort has paved
the way for the emergence of building automation and control industry.
Advancements in sensor and telecommunication technologies have seen the cost of
implementation of building automation technology reduce drastically, increasing its
widespread use (Loveday and Virk 1992).
A building energy management system (BEMS) is a computerised system used to
control a heating, ventilation and air-conditioning (HVAC) system as well as lighting.
A key consideration for BEMS and the mechanical/electrical systems they control, is a
proper commissioning process. However, delays in general construction work, and
perceived cost savings, and early occupation of buildings, means commissioning time
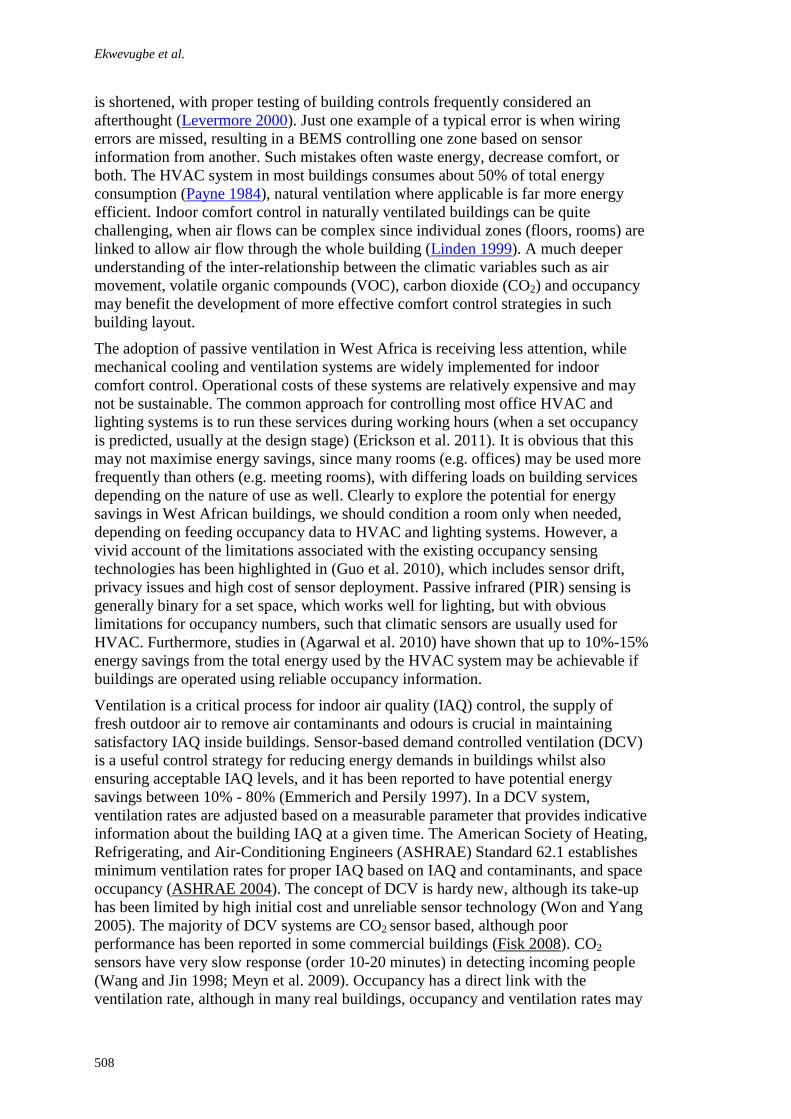
Ekwevugbe et al.
508
is shortened, with proper testing of building controls frequently considered an
afterthought (Levermore 2000). Just one example of a typical error is when wiring
errors are missed, resulting in a BEMS controlling one zone based on sensor
information from another. Such mistakes often waste energy, decrease comfort, or
both. The HVAC system in most buildings consumes about 50% of total energy
consumption (Payne 1984), natural ventilation where applicable is far more energy
efficient. Indoor comfort control in naturally ventilated buildings can be quite
challenging, when air flows can be complex since individual zones (floors, rooms) are
linked to allow air flow through the whole building (Linden 1999). A much deeper
understanding of the inter-relationship between the climatic variables such as air
movement, volatile organic compounds (VOC), carbon dioxide (CO2) and occupancy
may benefit the development of more effective comfort control strategies in such
building layout.
The adoption of passive ventilation in West Africa is receiving less attention, while
mechanical cooling and ventilation systems are widely implemented for indoor
comfort control. Operational costs of these systems are relatively expensive and may
not be sustainable. The common approach for controlling most office HVAC and
lighting systems is to run these services during working hours (when a set occupancy
is predicted, usually at the design stage) (Erickson et al. 2011). It is obvious that this
may not maximise energy savings, since many rooms (e.g. offices) may be used more
frequently than others (e.g. meeting rooms), with differing loads on building services
depending on the nature of use as well. Clearly to explore the potential for energy
savings in West African buildings, we should condition a room only when needed,
depending on feeding occupancy data to HVAC and lighting systems. However, a
vivid account of the limitations associated with the existing occupancy sensing
technologies has been highlighted in (Guo et al. 2010), which includes sensor drift,
privacy issues and high cost of sensor deployment. Passive infrared (PIR) sensing is
generally binary for a set space, which works well for lighting, but with obvious
limitations for occupancy numbers, such that climatic sensors are usually used for
HVAC. Furthermore, studies in (Agarwal et al. 2010) have shown that up to 10%-15%
energy savings from the total energy used by the HVAC system may be achievable if
buildings are operated using reliable occupancy information.
Ventilation is a critical process for indoor air quality (IAQ) control, the supply of
fresh outdoor air to remove air contaminants and odours is crucial in maintaining
satisfactory IAQ inside buildings. Sensor-based demand controlled ventilation (DCV)
is a useful control strategy for reducing energy demands in buildings whilst also
ensuring acceptable IAQ levels, and it has been reported to have potential energy
savings between 10% - 80% (Emmerich and Persily 1997). In a DCV system,
ventilation rates are adjusted based on a measurable parameter that provides indicative
information about the building IAQ at a given time. The American Society of Heating,
Refrigerating, and Air-Conditioning Engineers (ASHRAE) Standard 62.1 establishes
minimum ventilation rates for proper IAQ based on IAQ and contaminants, and space
occupancy (ASHRAE 2004). The concept of DCV is hardy new, although its take-up
has been limited by high initial cost and unreliable sensor technology (Won and Yang
2005). The majority of DCV systems are CO2 sensor based, although poor
performance has been reported in some commercial buildings (Fisk 2008). CO2
sensors have very slow response (order 10-20 minutes) in detecting incoming people
(Wang and Jin 1998; Meyn et al. 2009). Occupancy has a direct link with the
ventilation rate, although in many real buildings, occupancy and ventilation rates may
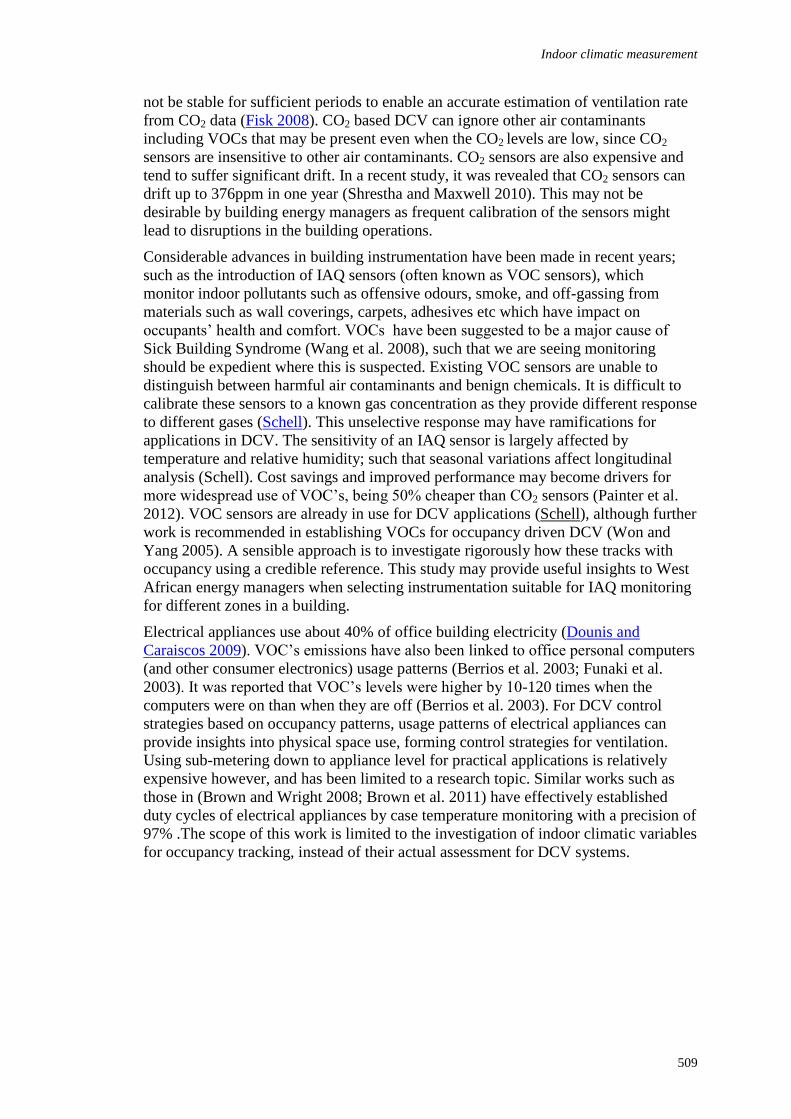
Indoor climatic measurement
509
not be stable for sufficient periods to enable an accurate estimation of ventilation rate
from CO2 data (Fisk 2008). CO2 based DCV can ignore other air contaminants
including VOCs that may be present even when the CO2 levels are low, since CO2
sensors are insensitive to other air contaminants. CO2 sensors are also expensive and
tend to suffer significant drift. In a recent study, it was revealed that CO2 sensors can
drift up to 376ppm in one year (Shrestha and Maxwell 2010). This may not be
desirable by building energy managers as frequent calibration of the sensors might
lead to disruptions in the building operations.
Considerable advances in building instrumentation have been made in recent years;
such as the introduction of IAQ sensors (often known as VOC sensors), which
monitor indoor pollutants such as offensive odours, smoke, and off-gassing from
materials such as wall coverings, carpets, adhesives etc which have impact on
occupants’ health and comfort. VOCs have been suggested to be a major cause of
Sick Building Syndrome (Wang et al. 2008), such that we are seeing monitoring
should be expedient where this is suspected. Existing VOC sensors are unable to
distinguish between harmful air contaminants and benign chemicals. It is difficult to
calibrate these sensors to a known gas concentration as they provide different response
to different gases (Schell). This unselective response may have ramifications for
applications in DCV. The sensitivity of an IAQ sensor is largely affected by
temperature and relative humidity; such that seasonal variations affect longitudinal
analysis (Schell). Cost savings and improved performance may become drivers for
more widespread use of VOC’s, being 50% cheaper than CO2 sensors (Painter et al.
2012). VOC sensors are already in use for DCV applications (Schell), although further
work is recommended in establishing VOCs for occupancy driven DCV (Won and
Yang 2005). A sensible approach is to investigate rigorously how these tracks with
occupancy using a credible reference. This study may provide useful insights to West
African energy managers when selecting instrumentation suitable for IAQ monitoring
for different zones in a building.
Electrical appliances use about 40% of office building electricity (Dounis and
Caraiscos 2009). VOC’s emissions have also been linked to office personal computers
(and other consumer electronics) usage patterns (Berrios et al. 2003; Funaki et al.
2003). It was reported that VOC’s levels were higher by 10-120 times when the
computers were on than when they are off (Berrios et al. 2003). For DCV control
strategies based on occupancy patterns, usage patterns of electrical appliances can
provide insights into physical space use, forming control strategies for ventilation.
Using sub-metering down to appliance level for practical applications is relatively
expensive however, and has been limited to a research topic. Similar works such as
those in (Brown and Wright 2008; Brown et al. 2011) have effectively established
duty cycles of electrical appliances by case temperature monitoring with a precision of
97% .The scope of this work is limited to the investigation of indoor climatic variables
for occupancy tracking, instead of their actual assessment for DCV systems.
Ekwevugbe et al.
510
Figure (1): Sensor placement in the test area
METHODOLOGY
The test area is a kitchen in a naturally ventilated university office building, used by
around 39 people. The kitchen is fitted with a refrigerator, a microwave, an electric
kettle and cupboards for storing beverages. Heating is supplied by four convective
radiators. The kitchen has two sets of windows, one facing the sun directly while the
other is shaded by an adjacent building. The occupancy schedule in the kitchen is
typical of an office setting, with light morning traffic, heavier in the afternoon, and
peaking at lunchtime. This is a fairly small space and comfort (IAQ) can quickly
deteriorate at peak occupancy. At best the indoor climate in the test area can be
considered as heavily dynamic. Figure (1) shows a clearer description of the test area.
All sensors were placed 1.5m from the ground as per standard practice (CIBSE 2009),
and located space as shown in figure (1). A temperature sensor is fitted to the
microwave case. A PIR sensor provided occupancy detection, located in a corner,
pointing towards the entrance. Sensors were also fitted to measure relative humidity
and air temperature. All sensors were still under the calibration warranty period, also
validated by preliminary checks. VOC and CO2 sensors were grouped together to
allow a more robust comparison between measurements. An infrared people counter
was installed at the entrance door to monitor occupant traffic, with a transmitter and
receiver pair mounted such that an infra-red beam is interrupted when occupants pass
through the door, (and a count is registered).
Indoor climatic variables such as temperature, CO2, VOCs, and events such as
occupant’s motion were monitored between 02 December, 2010 - 16 December, 2010.
Data were collected using HOBO data loggers (manuf. Onset Corporation).
Parameters such as air temperature and microwave case temperature events were
sampled every 10 minutes. VOCs and CO2 measurements were acquired every 2
minutes. Data was subsequently downloaded to a personal computer (PC) using a
Indoor climatic measurement
511
HOBO shuttle and uploaded to a MySQL database using MATLAB scripts. Figure (2)
illustrates the relevant data flows. Occupancy tracking data were subsequently
analysed in MATLAB. Self-contained sensors with built-in logging were deployed for
space air temperature and appliance case temperature, while CO2 and VOC
measurements using stand-alone sensors were connected to portable data loggers.
Assessment of sensor performance is based on sensor parameters such as accuracy,
precision, resolution, range, response time; others can be seen in (Bishop 2002).
Instruments deployed for monitoring variables considered in the study are described
below.
Figure (2): Data handling process
Air Temperature Measurements
Temperature logging utilised a 12-bit combined temperature and relative humidity
HOBO sensor (U12-013). This uses a thermistor based circuit for measuring
temperature; sensor resolution is 0.030C at 25
0C, and ± 0.35
0C between 0
0 and 50
0C. It
has a measurement range between -200and 70
0C. The air temperature of the kitchen
space is maintained at 210C by the existing BEMS during occupied periods.
Case Temperature Measurements
Most electrical equipment such as a microwave oven dissipates heat when switched on
and its case gets warm. Similarly, the case temperatures drop when switched off. The
case temperature of an electric appliance normally reaches few degrees (between 2-
60C) higher than the surrounding air temperature in a space when it is being used
(Brown et al. 2011). Monitoring this temperature can provide usage pattern
information; such that a HOBO logger was attached to the case of the microwave,
adjacent to the warm air extract louvers.
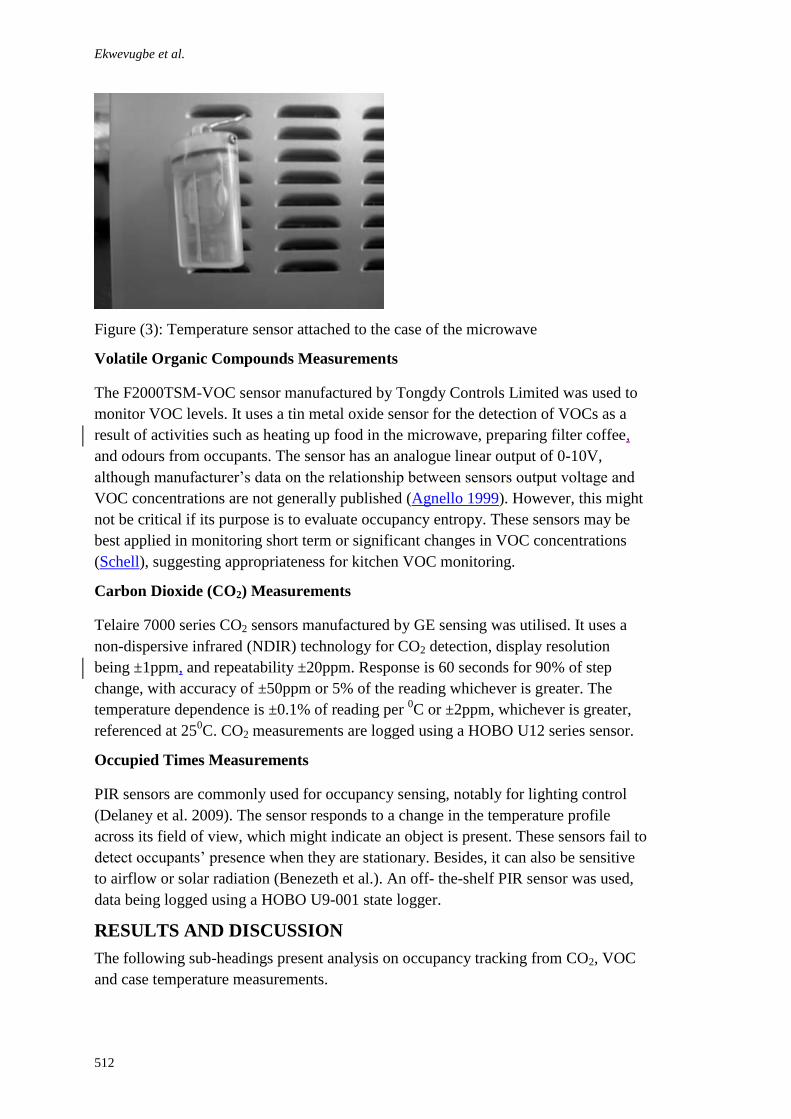
Ekwevugbe et al.
512
Figure (3): Temperature sensor attached to the case of the microwave
Volatile Organic Compounds Measurements
The F2000TSM-VOC sensor manufactured by Tongdy Controls Limited was used to
monitor VOC levels. It uses a tin metal oxide sensor for the detection of VOCs as a
result of activities such as heating up food in the microwave, preparing filter coffee,
and odours from occupants. The sensor has an analogue linear output of 0-10V,
although manufacturer’s data on the relationship between sensors output voltage and
VOC concentrations are not generally published (Agnello 1999). However, this might
not be critical if its purpose is to evaluate occupancy entropy. These sensors may be
best applied in monitoring short term or significant changes in VOC concentrations
(Schell), suggesting appropriateness for kitchen VOC monitoring.
Carbon Dioxide (CO2) Measurements
Telaire 7000 series CO2 sensors manufactured by GE sensing was utilised. It uses a
non-dispersive infrared (NDIR) technology for CO2 detection, display resolution
being ±1ppm, and repeatability ±20ppm. Response is 60 seconds for 90% of step
change, with accuracy of ±50ppm or 5% of the reading whichever is greater. The
temperature dependence is ±0.1% of reading per 0C or ±2ppm, whichever is greater,
referenced at 250C. CO2 measurements are logged using a HOBO U12 series sensor.
Occupied Times Measurements
PIR sensors are commonly used for occupancy sensing, notably for lighting control
(Delaney et al. 2009). The sensor responds to a change in the temperature profile
across its field of view, which might indicate an object is present. These sensors fail to
detect occupants’ presence when they are stationary. Besides, it can also be sensitive
to airflow or solar radiation (Benezeth et al.). An off- the-shelf PIR sensor was used,
data being logged using a HOBO U9-001 state logger.
RESULTS AND DISCUSSION
The following sub-headings present analysis on occupancy tracking from CO2, VOC
and case temperature measurements.
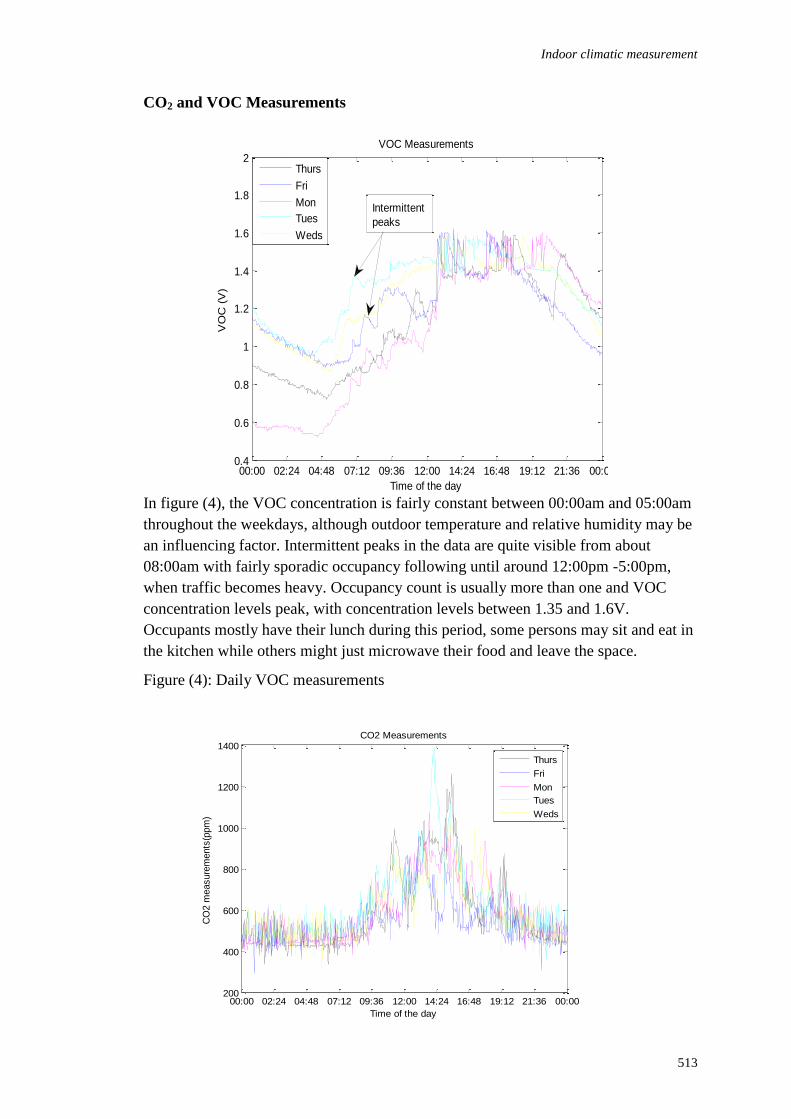
Indoor climatic measurement
513
CO2 and VOC Measurements
In figure (4), the VOC concentration is fairly constant between 00:00am and 05:00am
throughout the weekdays, although outdoor temperature and relative humidity may be
an influencing factor. Intermittent peaks in the data are quite visible from about
08:00am with fairly sporadic occupancy following until around 12:00pm -5:00pm,
when traffic becomes heavy. Occupancy count is usually more than one and VOC
concentration levels peak, with concentration levels between 1.35 and 1.6V.
Occupants mostly have their lunch during this period, some persons may sit and eat in
the kitchen while others might just microwave their food and leave the space.
Figure (4): Daily VOC measurements
00:00 02:24 04:48 07:12 09:36 12:00 14:24 16:48 19:12 21:36 00:00200
400
600
800
1000
1200
1400
Time of the day
CO
2 m
easure
ments
(ppm
)
CO2 Measurements
Thurs
Fri
Mon
Tues
Weds
00:00 02:24 04:48 07:12 09:36 12:00 14:24 16:48 19:12 21:36 00:000.4
0.6
0.8
1
1.2
1.4
1.6
1.8
2
Time of the day
VO
C (
V)
VOC Measurements
Thurs
Fri
Mon
Tues
Weds
Intermittent
peaks

Ekwevugbe et al.
514
Figure (5): Daily CO2 measurement
The trend in CO2 data is similar to VOC data for weekdays especially from 12:00pm
to 16:48pm, CO2 varied between 800 -1400ppm as shown in figure (5). Concentration
after work was fairly constant between 400ppm and 600ppm. Between 8:00am to
12:00pm (during this time space is expected to be occupied at least for short periods).
Occupancy events are not obvious for the CO2 measurements compared to VOC,
which is known to respond more quickly. However, between 12:00pm and 16:48pm,
peaks in the CO2 levels implying occupancy are clear, since occupancy periods tend to
be longer during this time of the day.
Analysing VOC and CO2 rates of change reveal how both track with occupancy
entropy. Using the results from a typical weekday (figure (6)), VOC measurements
clearly track occupancy more effectively than CO2 measurements in this environment.
Unoccupied VOC emissions settled to around 0.02V every 2minutes. Before 12:00pm,
VOC peaks track well with transient occupants activities. VOC measurements are able
to track closely against occupants’ activities especially during lunch time (between
12:00pm and 16:48pm). Unoccupied CO2 levels however were not stable enough to
determine a threshold.
00:00 02:24 04:48 07:12 09:36 12:00 14:24 16:48 19:12 21:36 00:000
0.05
0.1
0.15
0.2
0.25
0.3
0.35
Time of the day
Norm
alis
ed P
ara
mete
rs
CO2 and VOC measurements
VOC
CO2(*1000ppm)Occupancy
events
Figure (6): Occupancy entropy from CO2 and VOC measurements
A regression analysis was used to establish correlation between CO2 and VOC. Figure
(7) shows reasonable data clustering with an R-squared value of 0.4276. The intercept
of the graph is around 370ppm, suggesting the background CO2 level. Curiously, for a
particular value of VOC, CO2 values vary significantly. For instance, when the VOC
is 1.4V, it seems to correspond to a range of CO2 values between about 370ppm -
1400ppm. Due to the similar response from both parameters, it can be suggested that
they can both be used to perform similar functions such as occupancy tracking and
used as a control parameter for IAQ monitoring in DCV applications. One advantage
of VOC sensors could be sensitivity to a wide range of contaminants, CO2 sensors
solely monitors carbon dioxide, odours have no impact on CO2 levels. Meanwhile,
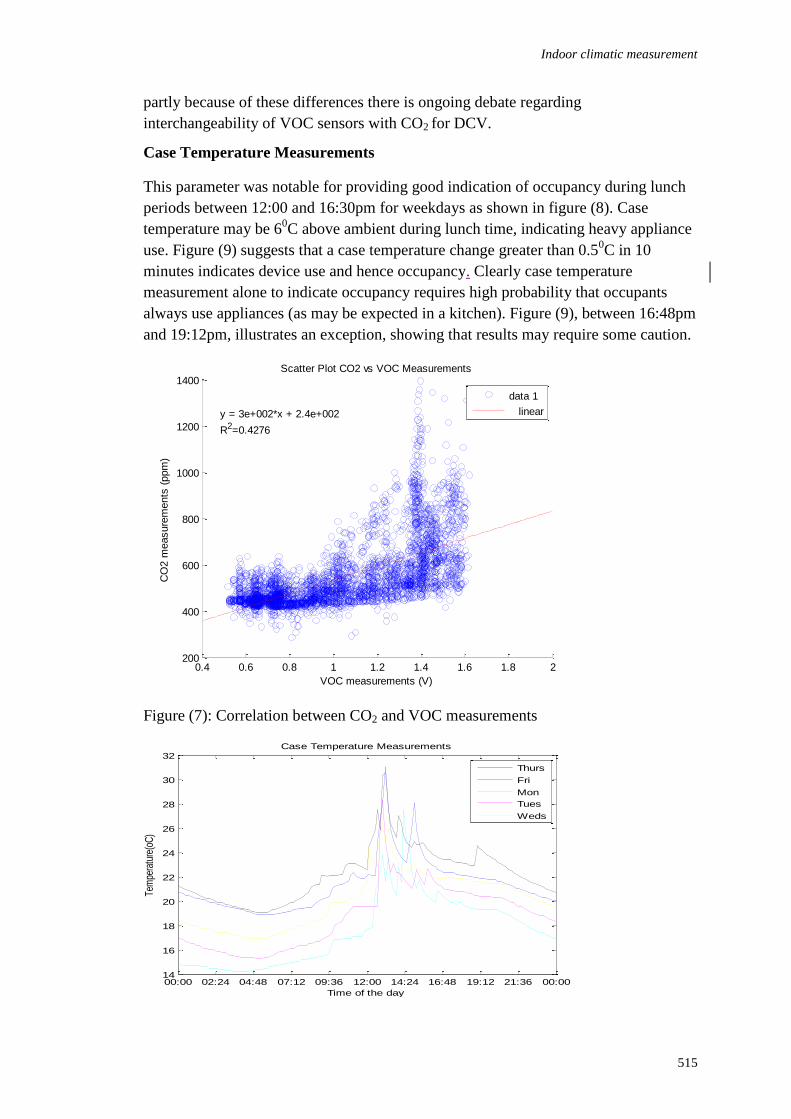
Indoor climatic measurement
515
partly because of these differences there is ongoing debate regarding
interchangeability of VOC sensors with CO2 for DCV.
Case Temperature Measurements
This parameter was notable for providing good indication of occupancy during lunch
periods between 12:00 and 16:30pm for weekdays as shown in figure (8). Case
temperature may be 60C above ambient during lunch time, indicating heavy appliance
use. Figure (9) suggests that a case temperature change greater than 0.50C in 10
minutes indicates device use and hence occupancy. Clearly case temperature
measurement alone to indicate occupancy requires high probability that occupants
always use appliances (as may be expected in a kitchen). Figure (9), between 16:48pm
and 19:12pm, illustrates an exception, showing that results may require some caution.
0.4 0.6 0.8 1 1.2 1.4 1.6 1.8 2200
400
600
800
1000
1200
1400
VOC measurements (V)
CO
2 m
easure
ments
(ppm
)
Scatter Plot CO2 vs VOC Measurements
y = 3e+002*x + 2.4e+002
R2=0.4276
data 1
linear
Figure (7): Correlation between CO2 and VOC measurements
00:00 02:24 04:48 07:12 09:36 12:00 14:24 16:48 19:12 21:36 00:0014
16
18
20
22
24
26
28
30
32
Time of the day
Tem
pera
ture
(oC
)
Case Temperature Measurements
Thurs
Fri
Mon
Tues
Weds
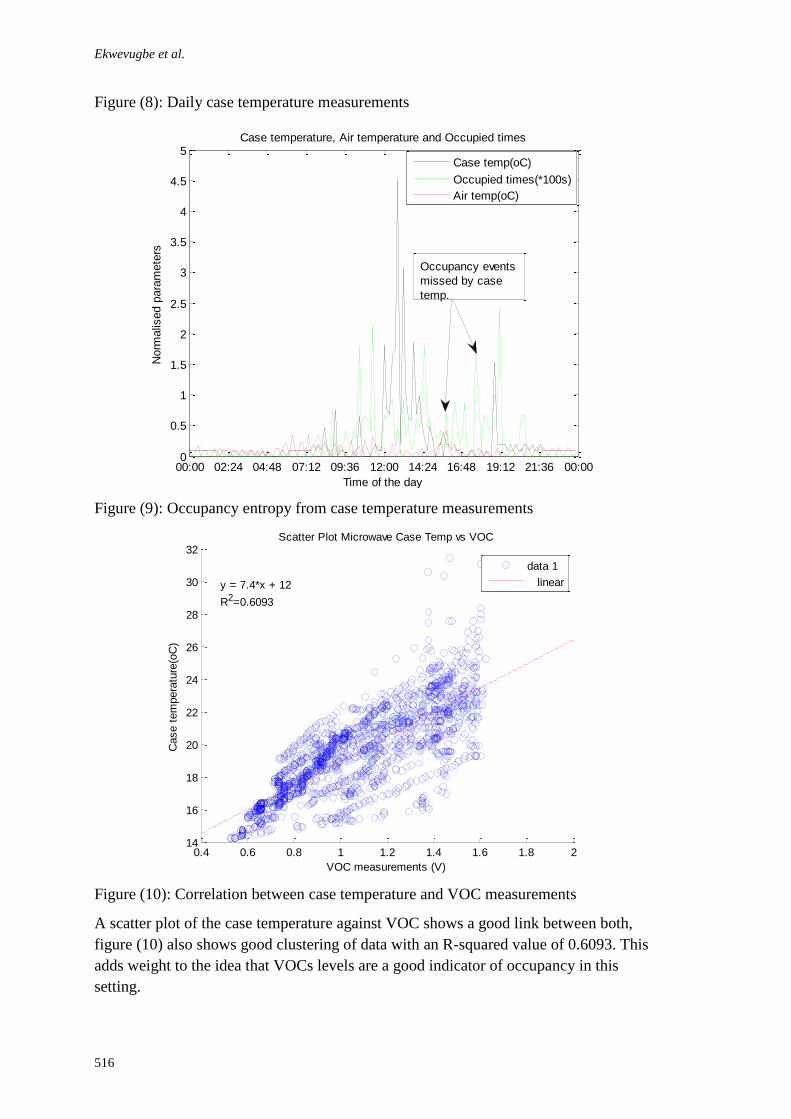
Ekwevugbe et al.
516
Figure (8): Daily case temperature measurements
00:00 02:24 04:48 07:12 09:36 12:00 14:24 16:48 19:12 21:36 00:000
0.5
1
1.5
2
2.5
3
3.5
4
4.5
5
Time of the day
Norm
alis
ed p
ara
mete
rs
Case temperature, Air temperature and Occupied times
Case temp(oC)
Occupied times(*100s)
Air temp(oC)
Occupancy events
missed by case
temp.
Figure (9): Occupancy entropy from case temperature measurements
0.4 0.6 0.8 1 1.2 1.4 1.6 1.8 214
16
18
20
22
24
26
28
30
32
VOC measurements (V)
Case t
em
pera
ture
(oC
)
Scatter Plot Microwave Case Temp vs VOC
y = 7.4*x + 12
R2=0.6093
data 1
linear
Figure (10): Correlation between case temperature and VOC measurements
A scatter plot of the case temperature against VOC shows a good link between both,
figure (10) also shows good clustering of data with an R-squared value of 0.6093. This
adds weight to the idea that VOCs levels are a good indicator of occupancy in this
setting.
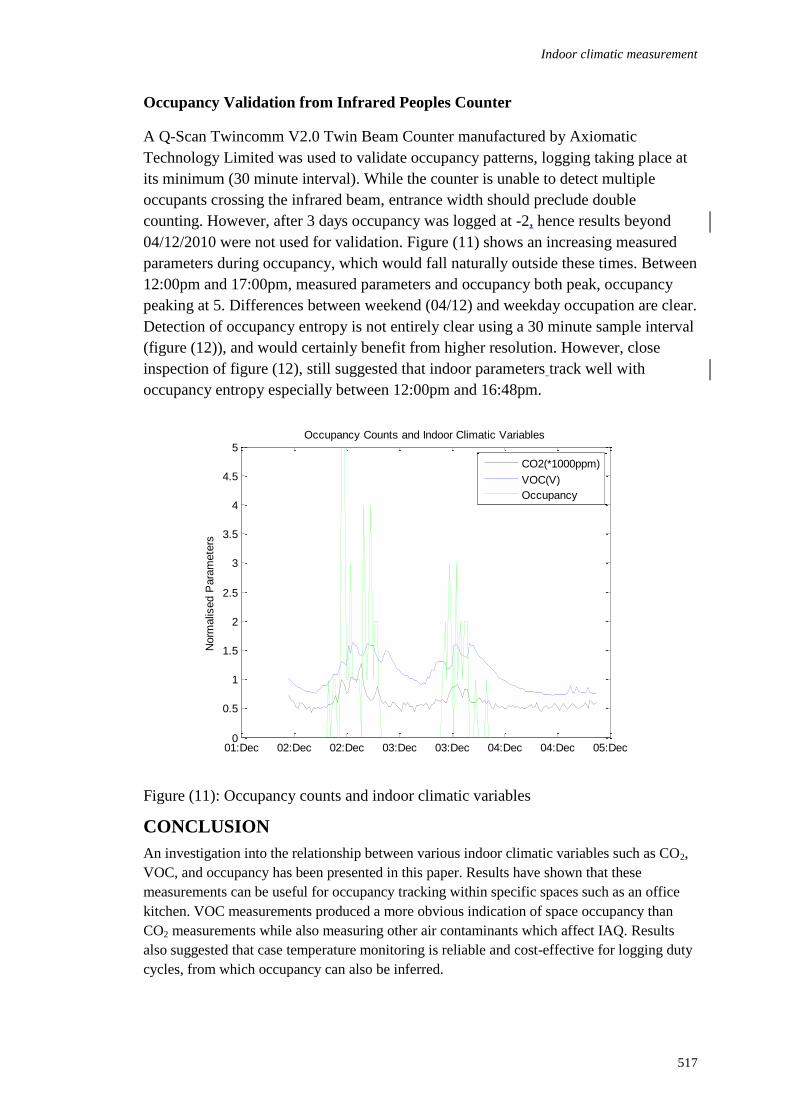
Indoor climatic measurement
517
Occupancy Validation from Infrared Peoples Counter
A Q-Scan Twincomm V2.0 Twin Beam Counter manufactured by Axiomatic
Technology Limited was used to validate occupancy patterns, logging taking place at
its minimum (30 minute interval). While the counter is unable to detect multiple
occupants crossing the infrared beam, entrance width should preclude double
counting. However, after 3 days occupancy was logged at -2, hence results beyond
04/12/2010 were not used for validation. Figure (11) shows an increasing measured
parameters during occupancy, which would fall naturally outside these times. Between
12:00pm and 17:00pm, measured parameters and occupancy both peak, occupancy
peaking at 5. Differences between weekend (04/12) and weekday occupation are clear.
Detection of occupancy entropy is not entirely clear using a 30 minute sample interval
(figure (12)), and would certainly benefit from higher resolution. However, close
inspection of figure (12), still suggested that indoor parameters track well with
occupancy entropy especially between 12:00pm and 16:48pm.
Figure (11): Occupancy counts and indoor climatic variables
CONCLUSION
An investigation into the relationship between various indoor climatic variables such as CO2,
VOC, and occupancy has been presented in this paper. Results have shown that these
measurements can be useful for occupancy tracking within specific spaces such as an office
kitchen. VOC measurements produced a more obvious indication of space occupancy than
CO2 measurements while also measuring other air contaminants which affect IAQ. Results
also suggested that case temperature monitoring is reliable and cost-effective for logging duty
cycles, from which occupancy can also be inferred.
01:Dec 02:Dec 02:Dec 03:Dec 03:Dec 04:Dec 04:Dec 05:Dec0
0.5
1
1.5
2
2.5
3
3.5
4
4.5
5
Norm
alis
ed P
ara
mete
rs
Occupancy Counts and Indoor Climatic Variables
CO2(*1000ppm)
VOC(V)
Occupancy
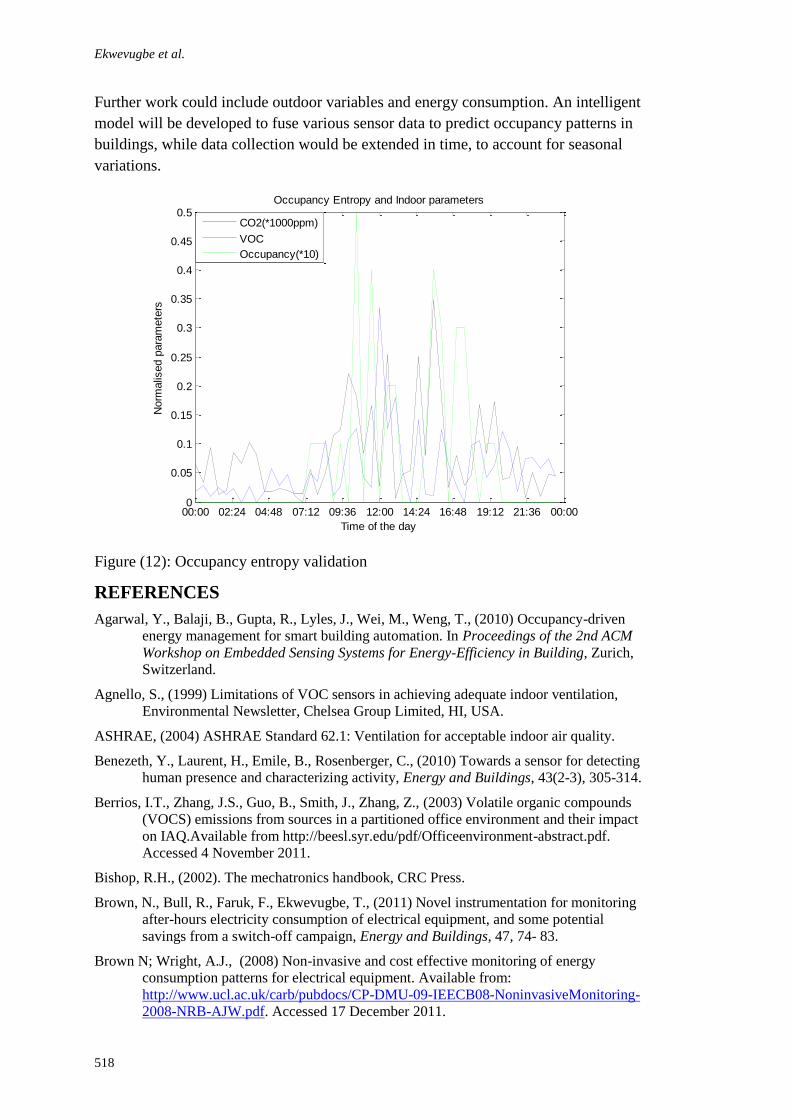
Ekwevugbe et al.
518
Further work could include outdoor variables and energy consumption. An intelligent
model will be developed to fuse various sensor data to predict occupancy patterns in
buildings, while data collection would be extended in time, to account for seasonal
variations.
00:00 02:24 04:48 07:12 09:36 12:00 14:24 16:48 19:12 21:36 00:000
0.05
0.1
0.15
0.2
0.25
0.3
0.35
0.4
0.45
0.5
Time of the day
Norm
alis
ed p
ara
mete
rs
Occupancy Entropy and Indoor parameters
CO2(*1000ppm)
VOC
Occupancy(*10)
Figure (12): Occupancy entropy validation
REFERENCES
Agarwal, Y., Balaji, B., Gupta, R., Lyles, J., Wei, M., Weng, T., (2010) Occupancy-driven
energy management for smart building automation. In Proceedings of the 2nd ACM
Workshop on Embedded Sensing Systems for Energy-Efficiency in Building, Zurich,
Switzerland.
Agnello, S., (1999) Limitations of VOC sensors in achieving adequate indoor ventilation,
Environmental Newsletter, Chelsea Group Limited, HI, USA.
ASHRAE, (2004) ASHRAE Standard 62.1: Ventilation for acceptable indoor air quality.
Benezeth, Y., Laurent, H., Emile, B., Rosenberger, C., (2010) Towards a sensor for detecting
human presence and characterizing activity, Energy and Buildings, 43(2-3), 305-314.
Berrios, I.T., Zhang, J.S., Guo, B., Smith, J., Zhang, Z., (2003) Volatile organic compounds
(VOCS) emissions from sources in a partitioned office environment and their impact
on IAQ.Available from http://beesl.syr.edu/pdf/Officeenvironment-abstract.pdf.
Accessed 4 November 2011.
Bishop, R.H., (2002). The mechatronics handbook, CRC Press.
Brown, N., Bull, R., Faruk, F., Ekwevugbe, T., (2011) Novel instrumentation for monitoring
after-hours electricity consumption of electrical equipment, and some potential
savings from a switch-off campaign, Energy and Buildings, 47, 74- 83.
Brown N; Wright, A.J., (2008) Non-invasive and cost effective monitoring of energy
consumption patterns for electrical equipment. Available from:
http://www.ucl.ac.uk/carb/pubdocs/CP-DMU-09-IEECB08-NoninvasiveMonitoring-
2008-NRB-AJW.pdf. Accessed 17 December 2011.
Indoor climatic measurement
519
CIBSE, (2009) Building control system, Chartered Instititue of Building Services Engineers,
London , United Kingdom.
Delaney, D.T., O'Hare, G.M., Ruzzelli, A.G., (2009) Evaluation of energy-efficiency in
lighting systems using sensor networks. In Proceedings of the First ACM Workshop
on Embedded Sensing Systems for Energy Efficiency in Buildings, 4-6 November
2009, Newyork, USA, 61-66.
Dounis, A.I. and Caraiscos, C., (2009) Advanced control systems engineering for energy and
comfort management in a building environment- A review, Renewable and
Sustainable Energy Reviews. 13 (6-7), 1246-1261.
Emmerich, S.J., Persily, A.K, (1997) Literature review on CO2- based demand-controlled
ventilation, ASHRAE Transcations- American Society of Heating Refrigerating Air -
Conditioning Engineers, 103(2), 229-243.
Erickson, V.L.,Carreira-Perpinan, M.A., Cerpa, A.E., (2011) OBSERVE: Occupancy-based
system for efficient reduction of HVAC energy. In Information Processing in Sensor
Networks (IPSN), 2011 10th International Conference, 12-14 April 2011, Chicago,
USA, 258-269.
Fisk, W.J., (2008) A pilot Study of the accuracy of CO2 sensors in commercial buildings,
Lawerence Berkeley National Laboratory. Available from
http://escholarship.org/uc/item/78t0t90v#page-1 Accessed 15 January, 2012.
Funaki, R., Tanabe, S., Tanaka, H., Nakagawa, T., (2003) Measurements of chemical
emission rates from portable PC and electronic appliances, Journal of Asian
Architecture and Building Engineering, 2(2), 55-59.
Guo, X., Tiller, D.K., Henze, G. P., Waters, C.E., (2010) The performance of occupancy-
based lighting control systems: A review, Lighting Research and Techology. 42(4),
415-431.
Levermore, G.J., (2000) Building energy management systems in applications to low energy
HVAC and natural ventilation. 2nd edition, E and FN Spon.
Linden, P.F., (1999) The fluid mechanics of natural ventilation, Annual Review of Fluid
Mechanics. 31, 201-238.
Loveday, D.L. and Virk, G.S., (1992) Artificial intelligence for buildings, Applied Energy,
41(3), 201-221.
Mahdavi, A., Kabir , E., Mohammadi, A., Lambeva, L., Proglhof, C., (2006) User interactions
with environmental control systems in buildings. Available from:
http://www.unige.ch/cuepe/html/plea2006/Vol1/PLEA2006_PAPER862.pdf.
Accessed on 10 November, 2011.
Meyn, S., Surana, A., Yiqing, L., Oggianu, S.M., Narayanan, S., Frewen, T.A., (2009) A
sensor-utility-network method for estimation of occupancy in buildings. Decision and
Control 2009 held jointly with the 2009 28th Chinese Control Conference. CDC/CCC
2009. In Proceedings of the 48th IEEE Conference, 15-18 December 2009 ,Shanghai,
China,1494-1500.
Painter, B., Brown, N., Cook, M.J., (2012) Practical application of a sensor overlay system for
building monitoring and commissioning, Energy and Buildings 48(0), 29-39.
Payne, F.W., (1984) Energy management control system handbook,Fairmont Press.
Shrestha, S., Maxwell, G., (2010) Product testing report supplement :Wall mounted carbon
dioxide (CO2) transmitters, National Buildings Controls Information Program.
Available from
http://www.energy.iastate.edu/Efficiency/Commercial/download_nbcip/PTR_CO2_3
_2010SUPPfin.pdf. Accessed 01 December 2011.

Ekwevugbe et al.
520
Wang, B.L., Takigawa, T., Yamasaki, Y., Sakano, N., Wang, D.H., Ogino, K., (2008)
Symptom definitions for SBS (sick building syndrome) in residential dwellings,
International Journal of Hygiene and Environmental Health,. 211(1–2), 114-120.
Wang, S., Jin, X., (1998) CO2 - Based occupancy detection for on-line outdoor airflow
control, Indoor and Built Environment, 7(3), 165-181.
Won, D., Yang., W., (2005) The state of -the-art in sensor technology for demand-controlled
ventilation. Institute for Research in Construction, Canada. Available from
http://www.nrc-cnrc.gc.ca/obj/irc/doc/pubs/rr/rr243/rr243.pdf. Accessed 01 December
2011.
Zhu, W., Rui, Y., Lingfeng, W., (2010) Multi-agent intelligent controller design for smart and
sustainable buildings. In proceedings of Systems Conference, 2010 4th Annual IEEE,5-
8 April, 2010, San Diego, CA , USA, 277-282.
Emenike, A.I. (2012) Urban open spaces; luxury or necessity In: Laryea, S., Agyepong, S.A.,
Leiringer, R. and Hughes, W. (Eds) Procs 4th West Africa Built Environment Research (WABER)
Conference, 24-26 July 2012, Abuja, Nigeria, 521-521.
521
URBAN OPEN SPACES; LUXURY OR NECESSITY
Augusta Ifeoma Emenike1
Department of Architecture, Enugu State University of Science and Technology, Enugu, Nigeria
In the urban context, the various land uses are mapped out following laid down rules
and regulations, which go a long way in enhancing of the environment. The issue of
open spaces need to be defined properly and everybody should be aware of the
inherent benefits of open spaces to everything living and non living alike. Their
effects are far reaching physically, socially, psychologically, politically,
economically, ecologically and other wise Ojo (1978) and with the current rate of
urbanization, modernization and increasing rate of literacy, there is enhanced demand
for outdoor spaces and facilities. In some developed countries, there are organized
call for the preservation and conservation of open spaces and creation of new ones
where possible. The likes of Fredrick Olmsted championed the movement in New
York central park design in 1879. Our Nigerian attitude towards the value of land
where we believe in maximum use made of any piece of land seems to heighten the
problems of urban open spaces. In many sub division plans, provisions for open
spaces; parks, playground, buffer etc are abused because the executing body neglect
implementation (development) of the spaces as provided, with tike these spaces
become disused, overgrown with bushes and uncared for areas. These become high
crime where lives and properties are longer safe. This research seeks to show how
important open spaces are to the populace. This is done by establishing a relationship
between open spaces and public health, open spaces and economic stability, open
spaces and environmental quality and so on. In doing this, it will help broaden our
understanding of the usefulness of open spaces in terms of satisfying people’s
outdoor, recreational needs and stimulating liveable environment amidst pressing
needs on limited resources. It also enhances and protects resources base and mitigates
urban heat island and climate changes generally. It will make the work of the planners
easier because, with enlightened society, the why’s of policy maker will e4asily be
answered by laying hand on available useful data on areas of need and thus enhance
policies on open spaces development generally.
Keywords: climate change, luxury, necessity, urban, open space.

Emuze, F.A., Shakantu, W.M. and Ntsihlele, K. (2012) A case for the construction of green buildings in
Lesotho: A pilot study In: Laryea, S., Agyepong, S.A., Leiringer, R. and Hughes, W. (Eds) Procs 4th
West Africa Built Environment Research (WABER) Conference, 24-26 July 2012, Abuja, Nigeria, 523-
533.
523
A CASE FOR THE CONSTRUCTION OF GREEN
BUILDINGS IN LESOTHO: A PILOT STUDY
F.A. Emuze1, W.M. Shakantu
2 and K. Ntsihlele
1Built Environment Research Centre (BERC), School of the Built Environment, Nelson Mandela
Metropolitan University, PO Box 77000, Port Elizabeth, South Africa, 6031
The concept of green building (GB) arose from the need to propagate sustainable
construction (development) practices in the built environment. The goal is to ensure
the creation of sustainable buildings that contribute to the restoration rather than the
destruction of the environment. As a result, new standards, rules and regulations have
been developed to take forward the GB approach. For developing countries such as
Lesotho, the concept brings to the fore new challenges in terms of finance, education
and training, health and safety (H&S), among others. In this context, the overall
objective of the paper is centred on the investigation of GB challenges in terms of
sustainable construction and energy efficiency in buildings in Lesotho. Self-
administered questionnaires were distributed among the owners and occupants of five
building types in the district of Maseru. Selected findings include: there is a lack of
knowledge and understanding of GB approach; much is not being done to create
enough awareness related to GB; and most importantly, very little education and
training is provided in this regard. In effect, the concept of GB is yet to take a solid
foothold in Lesotho, and it can be argued that continuous education and training that
is underpinned by appropriate funding of research and development (R&D) and the
actual construction process provides a platform for improvement.
Keywords: energy efficiency, green building, Lesotho, questionnaire, sustainable
construction.
BACKGROUND
Green buildings (GB) as described by the American Society for Testing and Materials
(ASTM) are designed, constructed, renovated, operated, and reused in an
environmentally and energy-efficient manner. According to Foster, Stelmack and
Hindman (2007), GB exhibit high levels of environmental, economic, and engineering
performance that include energy efficiency and conservation; materials and resource
efficiency; occupant health and productivity; transportation efficiency; and improved
environmental quality including water, air, land, limited resources and ecosystems.
The terms ‘Green Building’ and ‘Green Architecture’ are used interchangeably and
are often used when referring to the whole process and life-cycle of building from the
design, site selection, materials sourcing, construction, operation and ultimately
decommissioning of buildings. Another term commonly used is ‘sustainable
construction’ and this usually addresses the ecological, social and economic issues of
a building in terms of its community (Kibert, 2005). For the sake of simplicity in the
context of this discourse, ‘green building’ is used. 1 [email protected]

Emuze et al.
524
A research that provided detailed review of the GB guidelines in the USA, UK and
Japan and analysed their impact on Indian guidelines show that many developed
countries have made substantial progress in embracing the GB movement (Potbhare et
al., 2009). The study further noted that there is a great need to promote the
development and adoption of GB guidelines in developing countries.
The basic goal of GB outlined by the Department of Environmental Affairs and
Tourism (2009) is to create an attractive and comfortable shelter that does not harm
the earth in its manufacture or use. It is further stated that this goal is motivated by
other goals, which include:
Creating more desirable human experience;
Reducing impacts that arise during occupancy;
Reducing impacts on the environment of construction related activities, and
Reducing the impact of the structure at the end of its life (demolition).
For instance, vernecular architecture of buildings in Lesotho included the design and
construction of buildings with earth. Earth as a building material is a mixture of clay,
sand, silt and most of the time with larger aggregates such as stones or gravel (Houben
and Guilland, 1994). Due to technological developments and changing lifestyles, new
building materials have emerged and most buildings are not constructed with earth
anymore. It is mostly in the rural areas of Lesotho that such buildings are still being
constructed with mud and thatch. This is because most people in the rural areas
cannot afford to build houses with more modern materials. Therefore, increasing the
awareness of GB benefits in the region could lead to less harm to the already damaged
environment, and buildings would also have more positive impacts on occupants in
terms of improvements of indoor and outdoor climate from reduced productions of
building materials in the environment. Given that anecdotal evidence indicates that
GB related practices can be deemed to be inadequate among builders in Lesotho, the
study was conducted in order to:
Investigate the initiatives being taken to spread the awareness of GB and its
benefits in Lesotho;
Measure the extent to which building owners and / or occupants understand
and appreciate the GB concept, and
Make a case for the construction of GB in Lesotho.
SUSTAINABLE DEVELOPMENT
Ever since mankind has being constructing buildings, traditional societies have been
the true leaders of sustainable development in numerous ways with people using
materials available in their immediate surroundings for construction. This was, and
still is in some places, with the understanding that in order for people to survive, they
needed to maintain a balance with the cycles of life around them. Traditional buildings
were constructed with stone, wood, leaves, earth, and bamboo, among others (Houben
and Guilland, 1994). These buildings are built with the objective of providing shelter
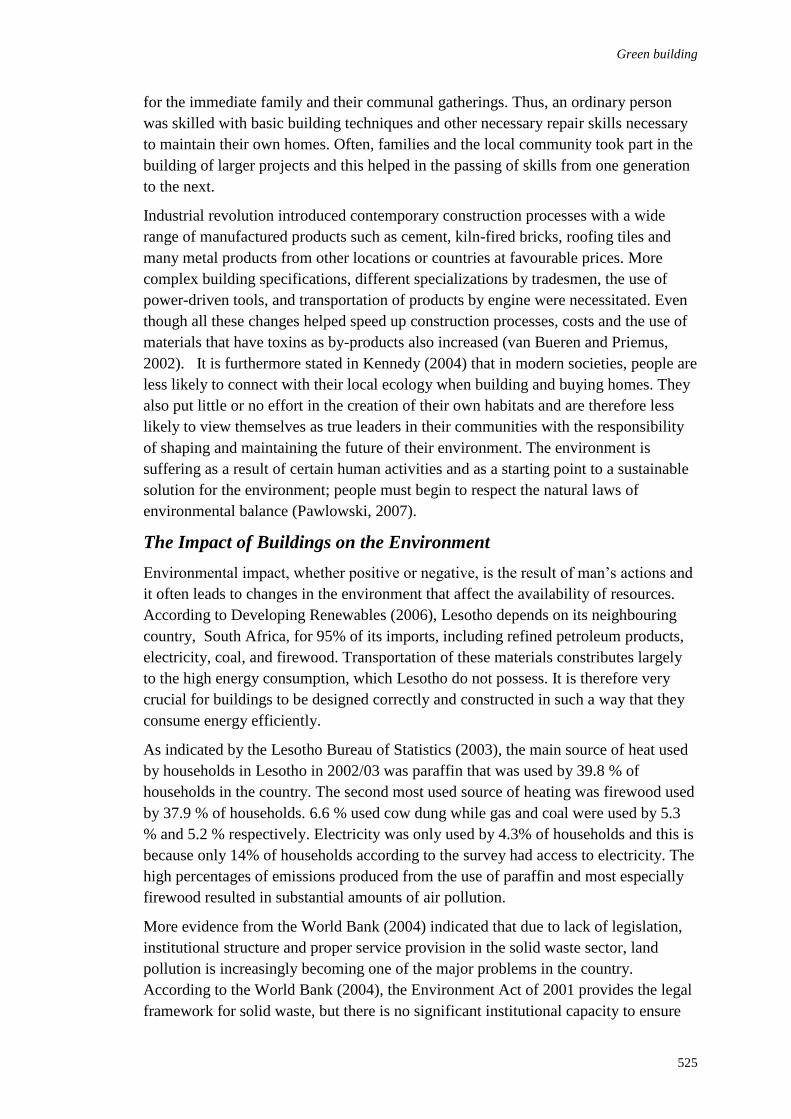
Green building
525
for the immediate family and their communal gatherings. Thus, an ordinary person
was skilled with basic building techniques and other necessary repair skills necessary
to maintain their own homes. Often, families and the local community took part in the
building of larger projects and this helped in the passing of skills from one generation
to the next.
Industrial revolution introduced contemporary construction processes with a wide
range of manufactured products such as cement, kiln-fired bricks, roofing tiles and
many metal products from other locations or countries at favourable prices. More
complex building specifications, different specializations by tradesmen, the use of
power-driven tools, and transportation of products by engine were necessitated. Even
though all these changes helped speed up construction processes, costs and the use of
materials that have toxins as by-products also increased (van Bueren and Priemus,
2002). It is furthermore stated in Kennedy (2004) that in modern societies, people are
less likely to connect with their local ecology when building and buying homes. They
also put little or no effort in the creation of their own habitats and are therefore less
likely to view themselves as true leaders in their communities with the responsibility
of shaping and maintaining the future of their environment. The environment is
suffering as a result of certain human activities and as a starting point to a sustainable
solution for the environment; people must begin to respect the natural laws of
environmental balance (Pawlowski, 2007).
The Impact of Buildings on the Environment
Environmental impact, whether positive or negative, is the result of man’s actions and
it often leads to changes in the environment that affect the availability of resources.
According to Developing Renewables (2006), Lesotho depends on its neighbouring
country, South Africa, for 95% of its imports, including refined petroleum products,
electricity, coal, and firewood. Transportation of these materials constributes largely
to the high energy consumption, which Lesotho do not possess. It is therefore very
crucial for buildings to be designed correctly and constructed in such a way that they
consume energy efficiently.
As indicated by the Lesotho Bureau of Statistics (2003), the main source of heat used
by households in Lesotho in 2002/03 was paraffin that was used by 39.8 % of
households in the country. The second most used source of heating was firewood used
by 37.9 % of households. 6.6 % used cow dung while gas and coal were used by 5.3
% and 5.2 % respectively. Electricity was only used by 4.3% of households and this is
because only 14% of households according to the survey had access to electricity. The
high percentages of emissions produced from the use of paraffin and most especially
firewood resulted in substantial amounts of air pollution.
More evidence from the World Bank (2004) indicated that due to lack of legislation,
institutional structure and proper service provision in the solid waste sector, land
pollution is increasingly becoming one of the major problems in the country.
According to the World Bank (2004), the Environment Act of 2001 provides the legal
framework for solid waste, but there is no significant institutional capacity to ensure
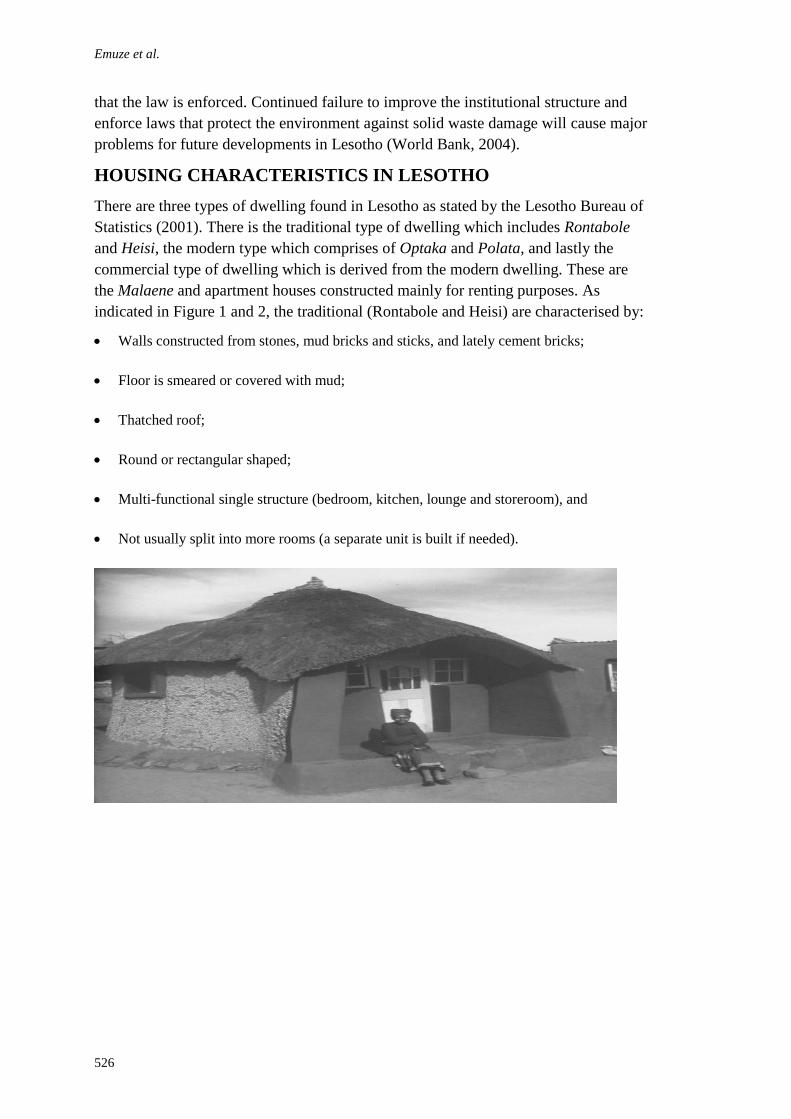
Emuze et al.
526
that the law is enforced. Continued failure to improve the institutional structure and
enforce laws that protect the environment against solid waste damage will cause major
problems for future developments in Lesotho (World Bank, 2004).
HOUSING CHARACTERISTICS IN LESOTHO
There are three types of dwelling found in Lesotho as stated by the Lesotho Bureau of
Statistics (2001). There is the traditional type of dwelling which includes Rontabole
and Heisi, the modern type which comprises of Optaka and Polata, and lastly the
commercial type of dwelling which is derived from the modern dwelling. These are
the Malaene and apartment houses constructed mainly for renting purposes. As
indicated in Figure 1 and 2, the traditional (Rontabole and Heisi) are characterised by:
Walls constructed from stones, mud bricks and sticks, and lately cement bricks;
Floor is smeared or covered with mud;
Thatched roof;
Round or rectangular shaped;
Multi-functional single structure (bedroom, kitchen, lounge and storeroom), and
Not usually split into more rooms (a separate unit is built if needed).
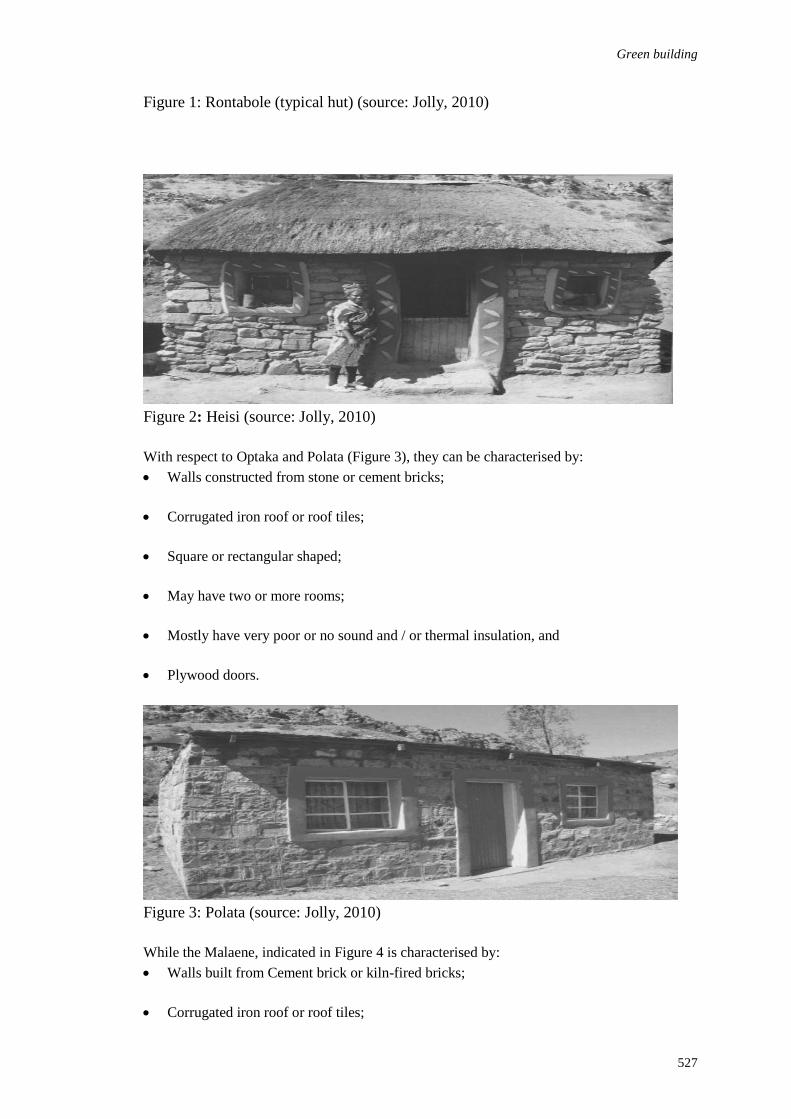
Green building
527
Figure 1: Rontabole (typical hut) (source: Jolly, 2010)
Figure 2: Heisi (source: Jolly, 2010)
With respect to Optaka and Polata (Figure 3), they can be characterised by:
Walls constructed from stone or cement bricks;
Corrugated iron roof or roof tiles;
Square or rectangular shaped;
May have two or more rooms;
Mostly have very poor or no sound and / or thermal insulation, and
Plywood doors.
Figure 3: Polata (source: Jolly, 2010)
While the Malaene, indicated in Figure 4 is characterised by:
Walls built from Cement brick or kiln-fired bricks;
Corrugated iron roof or roof tiles;
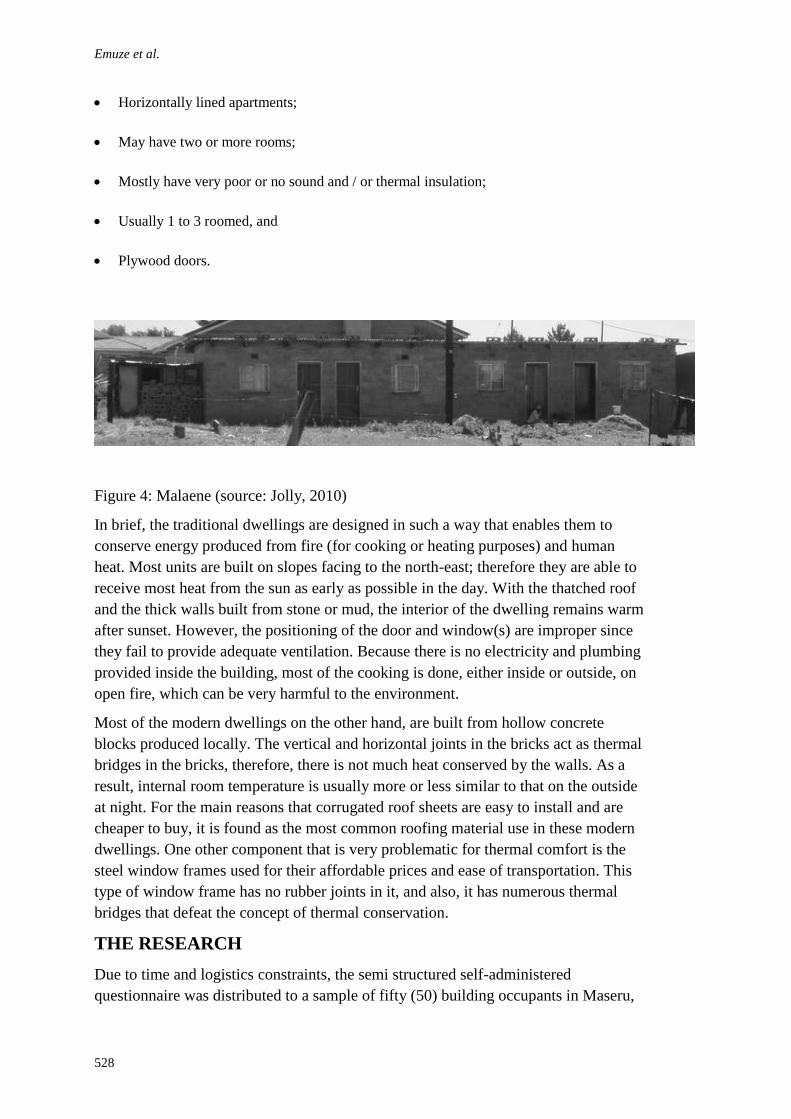
Emuze et al.
528
Horizontally lined apartments;
May have two or more rooms;
Mostly have very poor or no sound and / or thermal insulation;
Usually 1 to 3 roomed, and
Plywood doors.
Figure 4: Malaene (source: Jolly, 2010)
In brief, the traditional dwellings are designed in such a way that enables them to
conserve energy produced from fire (for cooking or heating purposes) and human
heat. Most units are built on slopes facing to the north-east; therefore they are able to
receive most heat from the sun as early as possible in the day. With the thatched roof
and the thick walls built from stone or mud, the interior of the dwelling remains warm
after sunset. However, the positioning of the door and window(s) are improper since
they fail to provide adequate ventilation. Because there is no electricity and plumbing
provided inside the building, most of the cooking is done, either inside or outside, on
open fire, which can be very harmful to the environment.
Most of the modern dwellings on the other hand, are built from hollow concrete
blocks produced locally. The vertical and horizontal joints in the bricks act as thermal
bridges in the bricks, therefore, there is not much heat conserved by the walls. As a
result, internal room temperature is usually more or less similar to that on the outside
at night. For the main reasons that corrugated roof sheets are easy to install and are
cheaper to buy, it is found as the most common roofing material use in these modern
dwellings. One other component that is very problematic for thermal comfort is the
steel window frames used for their affordable prices and ease of transportation. This
type of window frame has no rubber joints in it, and also, it has numerous thermal
bridges that defeat the concept of thermal conservation.
THE RESEARCH
Due to time and logistics constraints, the semi structured self-administered
questionnaire was distributed to a sample of fifty (50) building occupants in Maseru,

Green building
529
the capital city of Lesotho. At the end of the survey, only twenty-five (25)
questionnaires were validly completed, which equates to a 50% response rate. Given
that the questionnaires were hand delivered, the reasons for the 50% response rate
achieved were immediately apparent. Generally, most of the individuals that failed to
complete the survey displayed apathy towards the completion of surveys or research
itself
In terms of background information with respect to the respondents, the findings
indicate that the respondents occupy different types of buildings. These include Heisi
(rectangular hipped thatch roof), Malaene (horizontally attached lined flat-roofed),
Optaka (hipped iron-roofed), Polate (flat-roofed house) and Rontabole (mud hut). It
was observed that 32% of the respondents occupied Polata, while 40% occupied
Optaka and Malaine. In addition, 20% and 8% also occupied Rontabole and Heisi
respectively.
THE FINDINGS
When asked questions related to their understanding of what sustainable building
entails, 48% of the respondent were 'unsure', 20% of them 'do not know' what it is,
and only 32% perceive that they do have an understanding of sustainability issues in
the industry. The respondents that concurred that they are aware of sustainable
buildings concepts were then asked how they become exposed to it. It is notable that
none of them had undergone any form of trainings related to sustainability, while 52%
of them were exposed to the concept through the media.
In particular, Table 1 indicates that on a scale of 1 (none) to 5 (extensive), none of the
respondents have an extensive exposure to GB concepts. It can be observed on the
table that 16% of the respondents have no exposure, 28% have limited exposure, 24%
have fair exposure, and 32% have good exposure. As an indication of the reliability of
these responses, a follow up question that elicited for information related to energy
efficiency techniques was asked. The response to the question indicates that only five
respondents knew about the use of natural materials such as thatch and mud for
building construction, while another five of them opined that they are aware that solar
energy could be a useful means for energy conservation.
Table 1: Extent to which respondents are exposed to the green building concept
Response (%)
Mean score No exposure
Extensive exposure
1 2 3 4 5
16.0 28.0 24.0 32.0 0.0 2.72
Since awareness can increase through interpersonal contacts, the respondents were
asked if the builders of their houses suggest a sustainable building technique / or
concept to them when their houses were under construction. As indicated in Table 2,
none of the respondents were introduced to GB concepts at this stage of the
construction process.
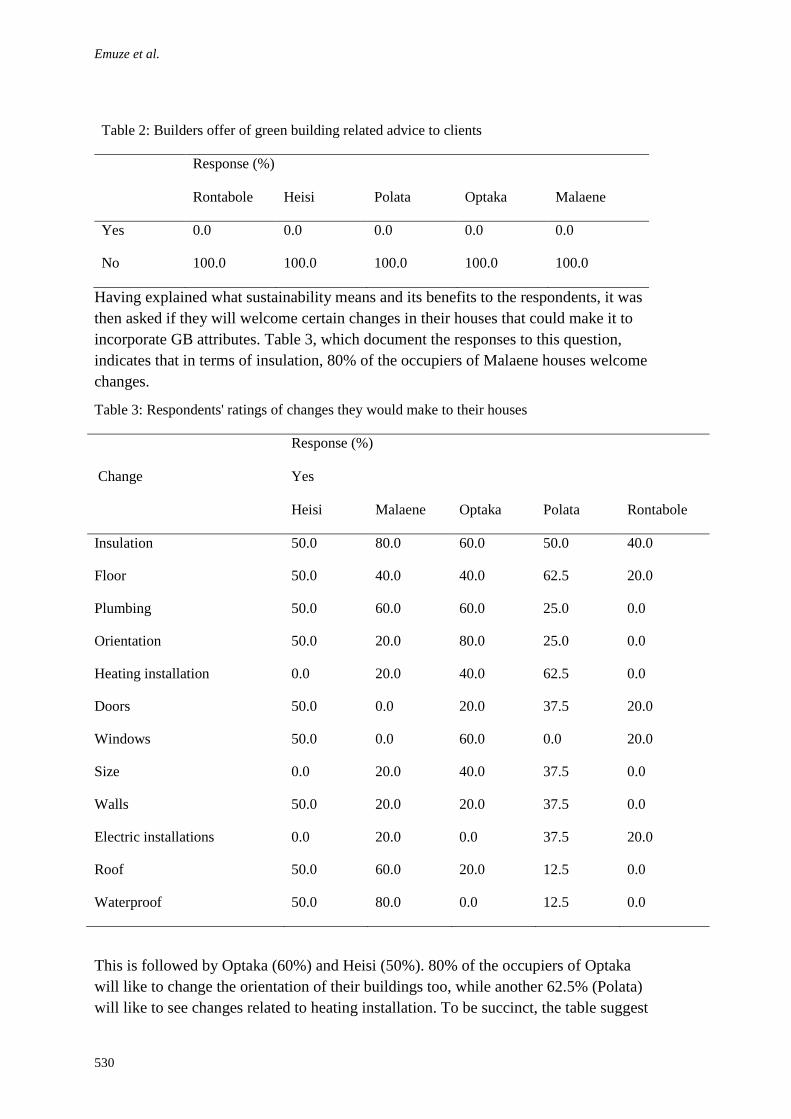
Emuze et al.
530
Table 2: Builders offer of green building related advice to clients
Response (%)
Rontabole Heisi Polata Optaka Malaene
Yes 0.0 0.0 0.0 0.0 0.0
No 100.0 100.0 100.0 100.0 100.0
Having explained what sustainability means and its benefits to the respondents, it was
then asked if they will welcome certain changes in their houses that could make it to
incorporate GB attributes. Table 3, which document the responses to this question,
indicates that in terms of insulation, 80% of the occupiers of Malaene houses welcome
changes.
Table 3: Respondents' ratings of changes they would make to their houses
Change
Response (%)
Yes
Heisi Malaene Optaka Polata Rontabole
Insulation 50.0 80.0 60.0 50.0 40.0
Floor 50.0 40.0 40.0 62.5 20.0
Plumbing 50.0 60.0 60.0 25.0 0.0
Orientation 50.0 20.0 80.0 25.0 0.0
Heating installation 0.0 20.0 40.0 62.5 0.0
Doors 50.0 0.0 20.0 37.5 20.0
Windows 50.0 0.0 60.0 0.0 20.0
Size 0.0 20.0 40.0 37.5 0.0
Walls 50.0 20.0 20.0 37.5 0.0
Electric installations 0.0 20.0 0.0 37.5 20.0
Roof 50.0 60.0 20.0 12.5 0.0
Waterproof 50.0 80.0 0.0 12.5 0.0
This is followed by Optaka (60%) and Heisi (50%). 80% of the occupiers of Optaka
will like to change the orientation of their buildings too, while another 62.5% (Polata)
will like to see changes related to heating installation. To be succinct, the table suggest
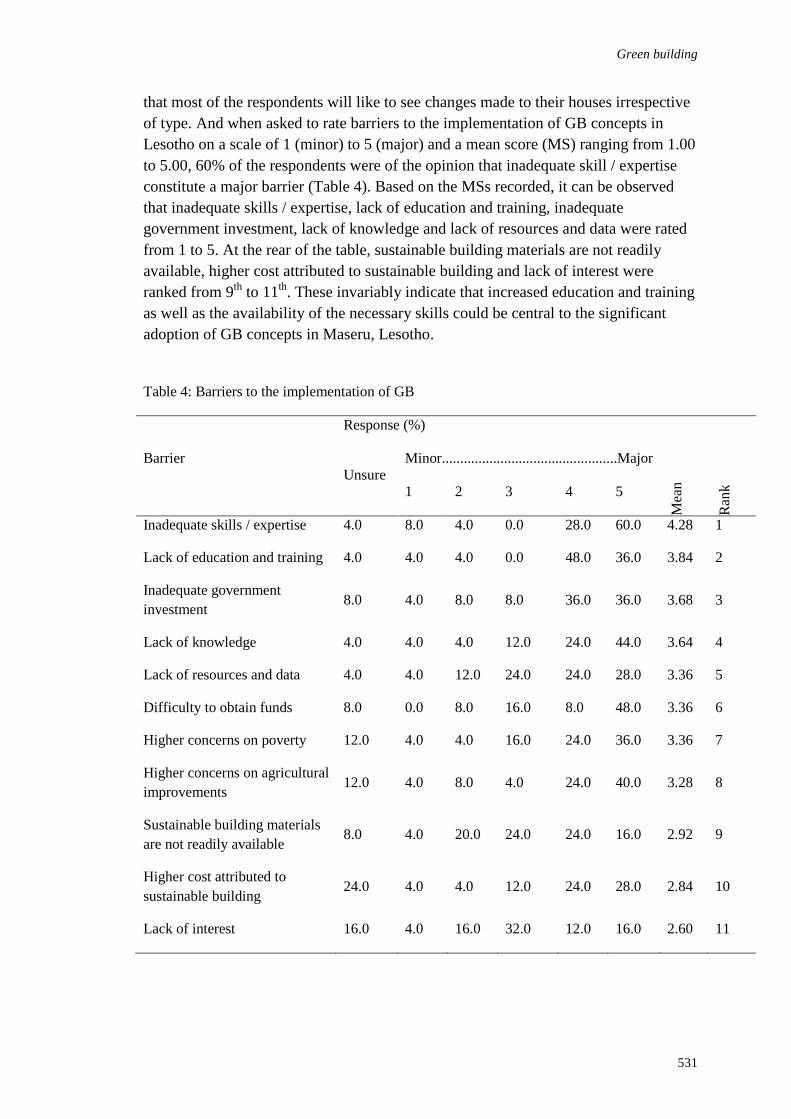
Green building
531
that most of the respondents will like to see changes made to their houses irrespective
of type. And when asked to rate barriers to the implementation of GB concepts in
Lesotho on a scale of 1 (minor) to 5 (major) and a mean score (MS) ranging from 1.00
to 5.00, 60% of the respondents were of the opinion that inadequate skill / expertise
constitute a major barrier (Table 4). Based on the MSs recorded, it can be observed
that inadequate skills / expertise, lack of education and training, inadequate
government investment, lack of knowledge and lack of resources and data were rated
from 1 to 5. At the rear of the table, sustainable building materials are not readily
available, higher cost attributed to sustainable building and lack of interest were
ranked from 9th
to 11th
. These invariably indicate that increased education and training
as well as the availability of the necessary skills could be central to the significant
adoption of GB concepts in Maseru, Lesotho.
Table 4: Barriers to the implementation of GB
Barrier
Response (%)
Mea
n
Ran
k Unsure
Minor................................................Major
1 2 3 4 5
Inadequate skills / expertise 4.0 8.0 4.0 0.0 28.0 60.0 4.28 1
Lack of education and training 4.0 4.0 4.0 0.0 48.0 36.0 3.84 2
Inadequate government
investment 8.0 4.0 8.0 8.0 36.0 36.0 3.68 3
Lack of knowledge 4.0 4.0 4.0 12.0 24.0 44.0 3.64 4
Lack of resources and data 4.0 4.0 12.0 24.0 24.0 28.0 3.36 5
Difficulty to obtain funds 8.0 0.0 8.0 16.0 8.0 48.0 3.36 6
Higher concerns on poverty 12.0 4.0 4.0 16.0 24.0 36.0 3.36 7
Higher concerns on agricultural
improvements 12.0 4.0 8.0 4.0 24.0 40.0 3.28 8
Sustainable building materials
are not readily available 8.0 4.0 20.0 24.0 24.0 16.0 2.92 9
Higher cost attributed to
sustainable building 24.0 4.0 4.0 12.0 24.0 28.0 2.84 10
Lack of interest 16.0 4.0 16.0 32.0 12.0 16.0 2.60 11
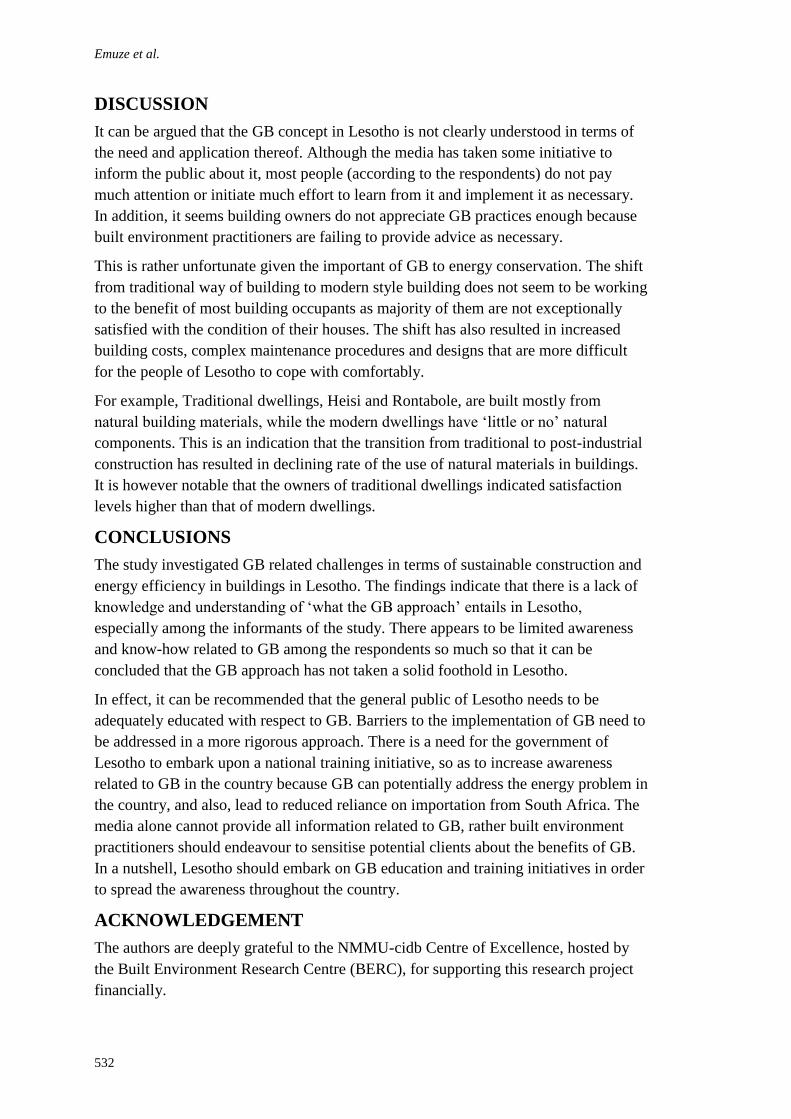
Emuze et al.
532
DISCUSSION
It can be argued that the GB concept in Lesotho is not clearly understood in terms of
the need and application thereof. Although the media has taken some initiative to
inform the public about it, most people (according to the respondents) do not pay
much attention or initiate much effort to learn from it and implement it as necessary.
In addition, it seems building owners do not appreciate GB practices enough because
built environment practitioners are failing to provide advice as necessary.
This is rather unfortunate given the important of GB to energy conservation. The shift
from traditional way of building to modern style building does not seem to be working
to the benefit of most building occupants as majority of them are not exceptionally
satisfied with the condition of their houses. The shift has also resulted in increased
building costs, complex maintenance procedures and designs that are more difficult
for the people of Lesotho to cope with comfortably.
For example, Traditional dwellings, Heisi and Rontabole, are built mostly from
natural building materials, while the modern dwellings have ‘little or no’ natural
components. This is an indication that the transition from traditional to post-industrial
construction has resulted in declining rate of the use of natural materials in buildings.
It is however notable that the owners of traditional dwellings indicated satisfaction
levels higher than that of modern dwellings.
CONCLUSIONS
The study investigated GB related challenges in terms of sustainable construction and
energy efficiency in buildings in Lesotho. The findings indicate that there is a lack of
knowledge and understanding of ‘what the GB approach’ entails in Lesotho,
especially among the informants of the study. There appears to be limited awareness
and know-how related to GB among the respondents so much so that it can be
concluded that the GB approach has not taken a solid foothold in Lesotho.
In effect, it can be recommended that the general public of Lesotho needs to be
adequately educated with respect to GB. Barriers to the implementation of GB need to
be addressed in a more rigorous approach. There is a need for the government of
Lesotho to embark upon a national training initiative, so as to increase awareness
related to GB in the country because GB can potentially address the energy problem in
the country, and also, lead to reduced reliance on importation from South Africa. The
media alone cannot provide all information related to GB, rather built environment
practitioners should endeavour to sensitise potential clients about the benefits of GB.
In a nutshell, Lesotho should embark on GB education and training initiatives in order
to spread the awareness throughout the country.
ACKNOWLEDGEMENT
The authors are deeply grateful to the NMMU-cidb Centre of Excellence, hosted by
the Built Environment Research Centre (BERC), for supporting this research project
financially.
Green building
533
REFERENCES
Department of Environmental Affairs ans Tourism. (2009). Green building in South Africa:
Emerging Trends. Pretoria: CSIR.
Developing Renewables (2006). Country energy information - Lesotho. London: DR.
Foster, K., Stelmack, A., and Hindman, D. (2007 : 69). Sustainable residential interiors. New
Jersey: Wiley and Sons Inc.
Houben, H. and Guilland, H. (1994) Earth construction: a comprehensive guide. London:
ITDG Publishing.
Jolly, P. (2010). Ditema- Some Decorated Sotho Buildings. Cape Town: Vernacularch.
Kennedy, J. F. (2004). Building without borders: sustainable for the global village. Gabriola
Island: New society publishers.
Kibert, J. C. (2005). Sustainable construcion. New Jersey: John Wiley and Sons, inc.
Lesotho Bureau of Statistics. (2002/03). Household Budget Survey report . Maseru: Lesotho
Bureau of Statistics.
Lesotho bureau of statistics. (2001). Lesotho Demographic Survey. Maseru: The Bureau of
Statistics.
Pawlowski, A. (2007) How many dimensions does sustainable development have? Journal of
Sustainable Development, 26, pp. 81-90.
Potbhare, V., Syal, M., Arif, M., Khalfan, M.M.A and Egbu, C. (2009). Emergence of green
building guidelines in developed countries and their impact on India. Journal of
Engineering, Design and Technology, Vol. 7 No. 1, pp. 99-121.
The World bank. (2004). A country framework report: Private solutions for infrastructure in
Lesotho. Washington: The World Bank.
Van Bueren, E.M and Priemus, H. (2002) Institutional barriers to sustainable construction.
Journal of Environment and Planning B: Planning and Design, 29, pp.75-86.

England, P.E. and Yakub, A. A. Efforts in Rural Development by African Governments; Focus on
Nigeria’s Niger Delta In: Laryea, S., Agyepong, S.A., Leiringer, R. and Hughes, W. (Eds) Procs 4th
West Africa Built Environment Research (WABER) Conference, 24-26 July 2012, Abuja, Nigeria, 535-
550.
535
EFFORTS IN RURAL DEVELOPMENT BY AFRICAN
GOVERNMENTS; FOCUS ON NIGERIA’S NIGER
DELTA
Prince E England1 and A. A. Yakub
2
Research fellow, University of Abuja, Nigeria
Department of Estate Management, Hussaini Adamu Federal Polytechnic, Nigeria
The Niger Delta is a predominately rural settlement with small and scattered hamlets
comprising of 80 percent of the population living in largely rural communities within
dispersed and linear village settlements remaining underdeveloped and unplanned,
despite the various attempts made by the federal government of Nigeria such as the
establishment of OMPADEC and later the NDDC which has actually moderated the
crisis, but remain inadequate and ineffective, epitomized by increasing environmental
degradation, excruciating poverty and inadequate infrastructural development
resulting in formation of various agitation groups demanding control of their
resources. This study examines the impact of NDDC projects on the lives of the rural
people by identifying the rural development projects carried out, their distribution;
impact; the level of community participation and their sustainability. It was found out
that such projects do not make significant impact in terms of development as they are
not evenly spread and lacks sustainability through the use of Mann-Whitney U Test.
Amongst the recommendation includes that the NDDC should avail itself with the
prevailing peace in the region sequel to the amnesty programme offered by the
Federal Government of Nigeria to justify the purpose why the commission was
established.
Keywords: Niger delta, project, sustainable development; rural development
INTRODUCTION
Nigeria is endowed with enormous human and material resource most especially
within the Niger delta area of the country, which is rich in mineral resources such as
crude oil and natural gas, (Moffat and Linden, 1995). For quite sometimes, the area
was on the news both locally and internationally as a result of youth restiveness,
clamoring for development of the area and participation in the control of the
resources. The area is underdeveloped and unplanned, despite the various attempts or
approaches made by the federal government of Nigeria to ameliorate the problems of
underdevelopment. According to Omotola (2007), the establishment of OMPADEC
and later the NDDC by the federal government of Nigeria are the most outstanding
institutional responses to a deepening crisis and contradictions of the Niger delta.
Though these responses actually moderate the crisis, they remain inadequate and
ineffective, epitomized by increasing environmental degradation, excruciating
poverty, inadequate infrastructural development and total neglect which has
England and Yakub
536
culminated to tension resulting in formation of various agitation groups in the region
demanding to control their resources.
The Niger Delta is a predominately rural dwellers with small and scattered hamlets,
the vast majority of settlements comprises of largely rural communities in dispersed
and linear village settlements, with 80 percent of the population of the region residing
in the rural areas. According to Koinyan (1980), the bulk of the country’s population
is in rural areas, so also the bulk of the country’s resources, particularly the country’s
natural and mineral resources. The Niger Delta is reckoned to be one of the largest
Deltas in the world, considered to be the largest in Africa, even larger than the
classical type, the famous life giving Delta of Egypt (Durotoye, 2000)
A casual visit to the area reveals a high level of poverty of the people,
underdevelopment and glaring lack of planning (Booker, 2001). According to Moffat
and Linden (1995) the problems experienced in the area over the years which include
agricultural and land degradation resulting from continuous and frequent cropping to
meet the needs of the population and inflow of migrants, fisheries depletion through
over fishing, juvenile harvest and destruction of fishing methods, deforestation and
forest degradation as a result of logging, biodiversity loss and habitat destruction
owing to population pressures, pollution and oil industry upstream activities, gas
flaring, refineries, solid waste and vehicular emission, erosion and flooding. These
are accompanied by economic losses, social, health, housing, infrastructural and utility
problems also abound, and of course, the problem of resource use and ownership
labeled resource control (Moffat and Linden 1995).
Previous attempts had been made by the Federal Government of Nigeria to develop
the Niger Delta region which includes the Niger Delta Development Board established
in 1960 to manage the developmental needs and challenges of the region. The Board
existed for seven years, achieved little and faded away sequel to the military coup in
1966 and subsequently to the outbreak of Civil War in 1967. Secondly, following
growing agitation for renewed focus on the development of the region, the Federal
Government of Nigeria in 1980 set up a presidential task force (popularly known as
the 1.5% committee). The aim of the committee was to allocate 1.5% from the Federal
Account to tackle the developmental problems of the region but that did not yield the
desired result needed by the people of the region. Furthermore, in 1992 the Oil
mineral producing Area Commission was set up, funded from three percent of federal
oil revenue to take care of the developmental needs of the people which initially raised
the spirit and hopes of the people, but inefficiency and corruption in the organization
resulted in yet more disappointment (NDRDMP, 2006). Fourthly, the Niger Delta
Environment Survey (NDES) was set up in 1995 by Shell Petroleum Development
Company (SPDC) on behalf of its joint partners (NNPC, ELF and AGIP). It was set
up to reconcile industry, environment and community interest in the Niger Delta
region and to undertake environmental study of the region and to provide the required
data base. The survey is now almost entirely funded by oil companies in Nigeria under
the Umbrella of the Oil Producers Trade Section (OPTS) of the Lagos Chamber of
Commerce.
In 1999, the federal government of Nigeria scraped OMPADEC and replaced it with
the Niger Delta Development Commission (NDDC) which was officially inaugurated
on December 21, 2000 with a “vision to offer a lasting solution to the socio –
economic difficulties of the Niger delta region, and a mission” to facilitate the rapid
even and sustainable development of the Niger Delta in to a region that is
economically regenerate and politically peaceful”. (NDADMP, 2006).
Rural development
537
The commission received N47 billion from its funding sources, awarded about 700
contracts. The project include 40 road projects, 90 water projects,129 electrification
projects, 47 shore protection/jetty projects, 50 health centers and 205 new blocks of
six class rooms (NDRDMP,2006).
In spite of the aforementioned about NDDC in the Niger Delta, people in the region
still complain of underdevelopment and neglect. This research work therefore seeks to
look into the developmental projects of NDDC and their impact on rural development
in Bayelsa, Delta and Rivers state. The research is therefore aimed at assessing the
impact of the NDDC on rural development in the Niger delta, with emphasis on
Bayelsa, Delta and Rivers states by identifying the rural development projects carried
out; assessing the distribution of the developmental projects of NDDC in the three
states; identifying the criteria used in sitting projects; examining the impact of such
projects, on the lives of the rural people; assessing the level of community
participation in the executed projects by NDDC and assessing the sustainability of the
projects.
The three states were chosen for the study because they are contiguous with similar
cultural characteristics. Also, they have similar difficult terrain which needs more
developmental attention than other areas of the region.
THEORETICAL BASIS
Rural development
Rural development entails changes in social economic structures, institutions,
relationship and processes it does not imply agricultural and economic growth alone.
It requires massive effort to increase production, great and agreed employment and
root out fundamental causes of poverty, disease and ignorance. United Nations
Educational, Scientific and Cultural Organization (UNESCO) conference in 1970
defined rural development as a process whereby a series of quantitative and qualitative
changes are introduced into an area resulting in the improvement of the living
conditions of the inhabitants through increased production (UNESCO, 1970)
Thus, rural development can conclusively be seen as a strategy aimed at the
progressive improvement of living standards of the rural population through the
development and utilization of the resources, human and material, of the rural areas
(Oloko and Oloko, 1987).
OVERVIEW OF RURAL DEVELOPMENT EFFORTS IN
NIGERIA
As far back as early 1970s rural development has been identified as a strategy for
improving the economic social life of the rural people in Nigeria. Since then,
successive governments at various levels have embarked on several programmes
aimed at rural development such as the National Accelerated Food Production
Programme (NAFPP), River Basin Development Authorities (RBDA), Fadama I and
II programme, the Agricultural Development Projects (ADPS), Green Revolution
Programme, Agricultural Credit Guarantee Scheme (ACGS), Directorate of Food,
Road and Rural Infrastructure (DFRRI), Niger Delta Development Board (NDDB),
Oil Mineral Producing Areas Development Commission (OMPADEC).
England and Yakub
538
In terms of agricultural development, the Nigerian government has executed certain
plans and programmes aimed at developing the sector with a view to promoting rural
development which includes the input subsidy policy, establishment of eleven (11)
Agricultural Research institutes and extension research liaison services. Prominent
among the mass campaign programmes launched were the OFN-Operation Feed the
Nation in 1975 which did not succeed in increasing food production or productivity in
the agricultural sector but was successful in creating awareness about the need to go
back to land, the execution was not co-coordinated as students who were not
committed to agriculture were used to implement the programme. The Nigerian
Agricultural and Cooperative Bank was also established to make agricultural credit
accessible to farmers. In 1979 the Green Revolution was launched which was
conceived in Nigeria as a call for an accelerated increase in agricultural production
through radical modernization of agriculture by removing all the known constraints to
improved production and the provision of needed inputs and Agric Mechanization. In
conceiving the green revolution, the rural small farmer was recognized as the center
piece and this is in keeping with the advice of the World Bank. The Green Revolution
in Nigeria failed due to lack of adequate infrastructural base and over politicization of
the program.
There was also the establishment of the River-Basin and Rural-Development
Authorities. The River-Basin was a concept in the regional and ecological
development of agriculture production. They use the fertile soils of the River Basins
for the improvement of agricultural production and integrated rural development.
Then came the A.D.P- Agricultural Development Project and the use of special task
units like the D.F.R.R.I- Directorate for Food, Road and Rural Infrastructure to
accelerate agricultural production and rural transformation. Even though these
programmes have recorded moderate achievements by raising the income of farmers
in their areas of operation, their overall impact is grossly unproportional to the huge
investments in them.
In terms of developments in the Niger delta, the genesis of the Niger Delta
Development Commission (NDDC) is largely a response to the demand of the people
of the Niger Delta, a populous area inhabited by a diversity of minority ethnic groups.
The commission were officially inaugurated on December 21, 2000 with the vision
“to offer a lasting solution to the socio-economic difficulties of the Niger Delta
Region” and a mission “to facilitate the rapid, and sustainable development of the
Niger Delta region into an area that is economically prosperous, socially stable,
economically regenerative and politically peaceful”. (NDRDMP, 2006)
The NDDC Act provided for generous funding sources, including:
Federal Government Contribution, which was to be equivalent to 15% of the monthly
statutory allocation due to member states of the commission from the Federation
Account.
Oil and gas processing company’s contribution of 3% of their total budget.
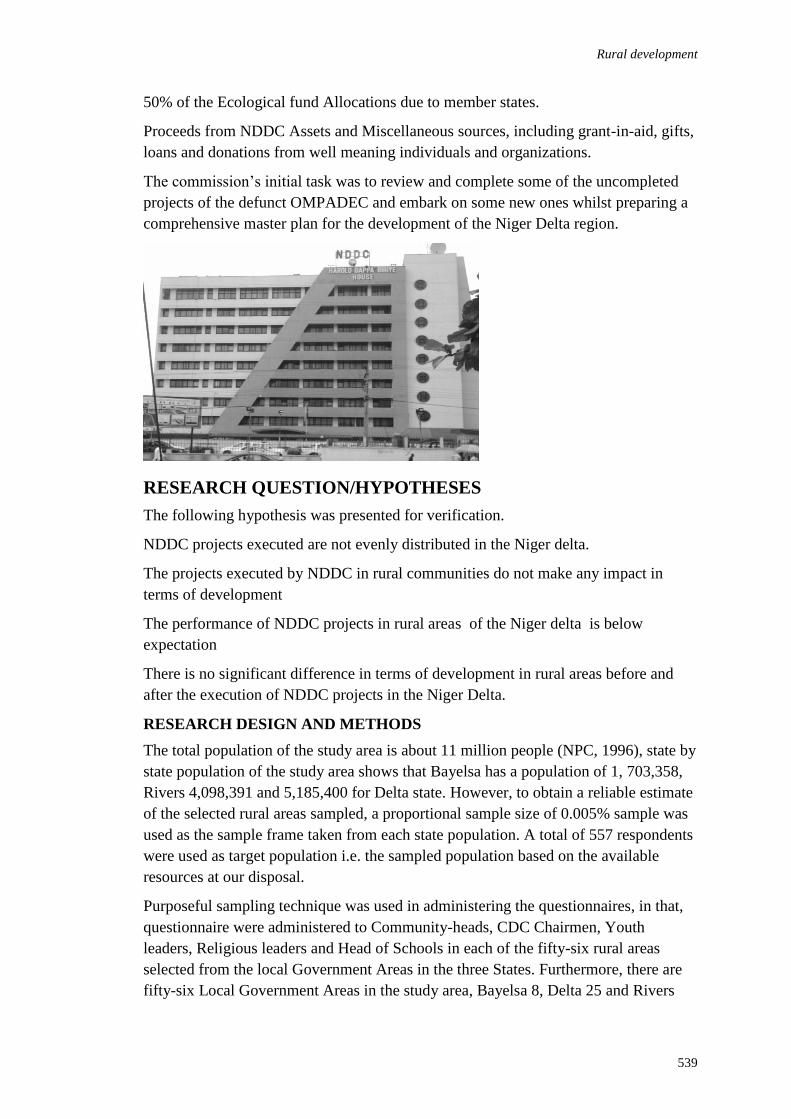
Rural development
539
50% of the Ecological fund Allocations due to member states.
Proceeds from NDDC Assets and Miscellaneous sources, including grant-in-aid, gifts,
loans and donations from well meaning individuals and organizations.
The commission’s initial task was to review and complete some of the uncompleted
projects of the defunct OMPADEC and embark on some new ones whilst preparing a
comprehensive master plan for the development of the Niger Delta region.
RESEARCH QUESTION/HYPOTHESES
The following hypothesis was presented for verification.
NDDC projects executed are not evenly distributed in the Niger delta.
The projects executed by NDDC in rural communities do not make any impact in
terms of development
The performance of NDDC projects in rural areas of the Niger delta is below
expectation
There is no significant difference in terms of development in rural areas before and
after the execution of NDDC projects in the Niger Delta.
RESEARCH DESIGN AND METHODS
The total population of the study area is about 11 million people (NPC, 1996), state by
state population of the study area shows that Bayelsa has a population of 1, 703,358,
Rivers 4,098,391 and 5,185,400 for Delta state. However, to obtain a reliable estimate
of the selected rural areas sampled, a proportional sample size of 0.005% sample was
used as the sample frame taken from each state population. A total of 557 respondents
were used as target population i.e. the sampled population based on the available
resources at our disposal.
Purposeful sampling technique was used in administering the questionnaires, in that,
questionnaire were administered to Community-heads, CDC Chairmen, Youth
leaders, Religious leaders and Head of Schools in each of the fifty-six rural areas
selected from the local Government Areas in the three States. Furthermore, there are
fifty-six Local Government Areas in the study area, Bayelsa 8, Delta 25 and Rivers
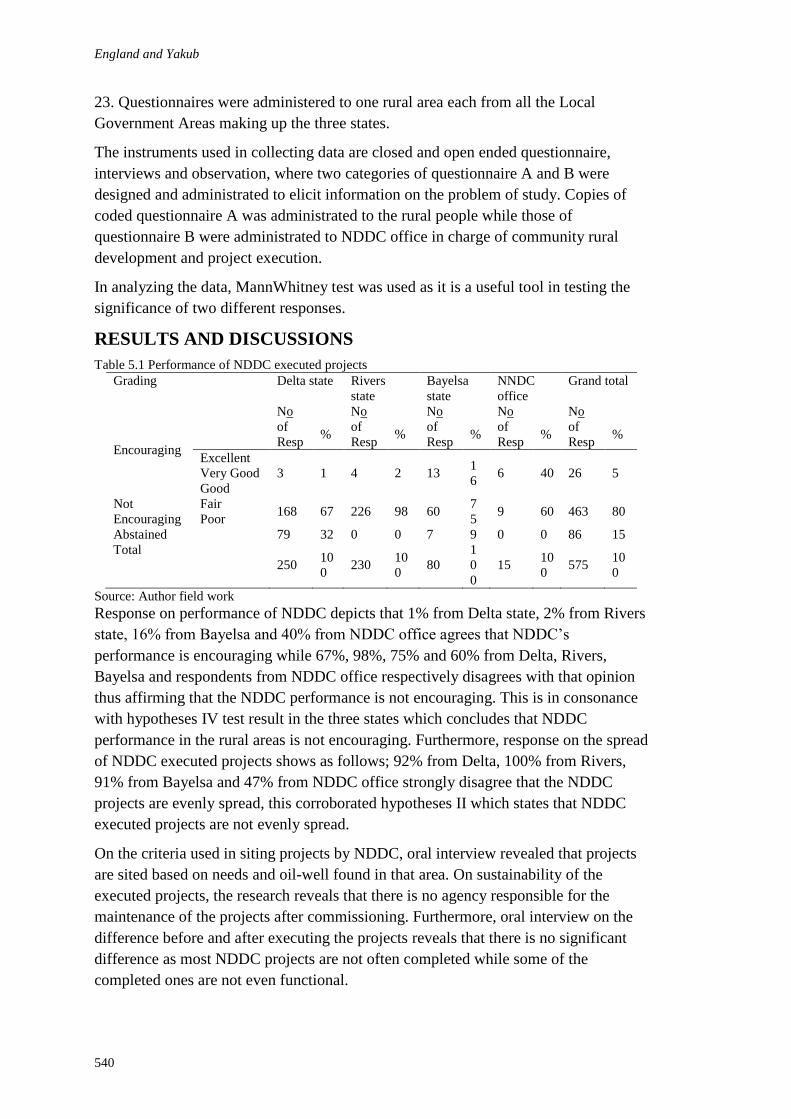
England and Yakub
540
23. Questionnaires were administered to one rural area each from all the Local
Government Areas making up the three states.
The instruments used in collecting data are closed and open ended questionnaire,
interviews and observation, where two categories of questionnaire A and B were
designed and administrated to elicit information on the problem of study. Copies of
coded questionnaire A was administrated to the rural people while those of
questionnaire B were administrated to NDDC office in charge of community rural
development and project execution.
In analyzing the data, MannWhitney test was used as it is a useful tool in testing the
significance of two different responses.
RESULTS AND DISCUSSIONS
Table 5.1 Performance of NDDC executed projects
Grading Delta state Rivers
state
Bayelsa
state
NNDC
office
Grand total
Encouraging
No
of
Resp
%
No
of
Resp
%
No
of
Resp
%
No
of
Resp
%
No
of
Resp
%
Excellent
Very Good
Good
3 1 4 2 13 1
6 6 40 26 5
Not
Encouraging
Fair 168 67 226 98 60
7
5 9 60 463 80
Poor
Abstained 79 32 0 0 7 9 0 0 86 15
Total
250 10
0 230
10
0 80
1
0
0
15 10
0 575
10
0
Source: Author field work
Response on performance of NDDC depicts that 1% from Delta state, 2% from Rivers
state, 16% from Bayelsa and 40% from NDDC office agrees that NDDC’s
performance is encouraging while 67%, 98%, 75% and 60% from Delta, Rivers,
Bayelsa and respondents from NDDC office respectively disagrees with that opinion
thus affirming that the NDDC performance is not encouraging. This is in consonance
with hypotheses IV test result in the three states which concludes that NDDC
performance in the rural areas is not encouraging. Furthermore, response on the spread
of NDDC executed projects shows as follows; 92% from Delta, 100% from Rivers,
91% from Bayelsa and 47% from NDDC office strongly disagree that the NDDC
projects are evenly spread, this corroborated hypotheses II which states that NDDC
executed projects are not evenly spread.
On the criteria used in siting projects by NDDC, oral interview revealed that projects
are sited based on needs and oil-well found in that area. On sustainability of the
executed projects, the research reveals that there is no agency responsible for the
maintenance of the projects after commissioning. Furthermore, oral interview on the
difference before and after executing the projects reveals that there is no significant
difference as most NDDC projects are not often completed while some of the
completed ones are not even functional.
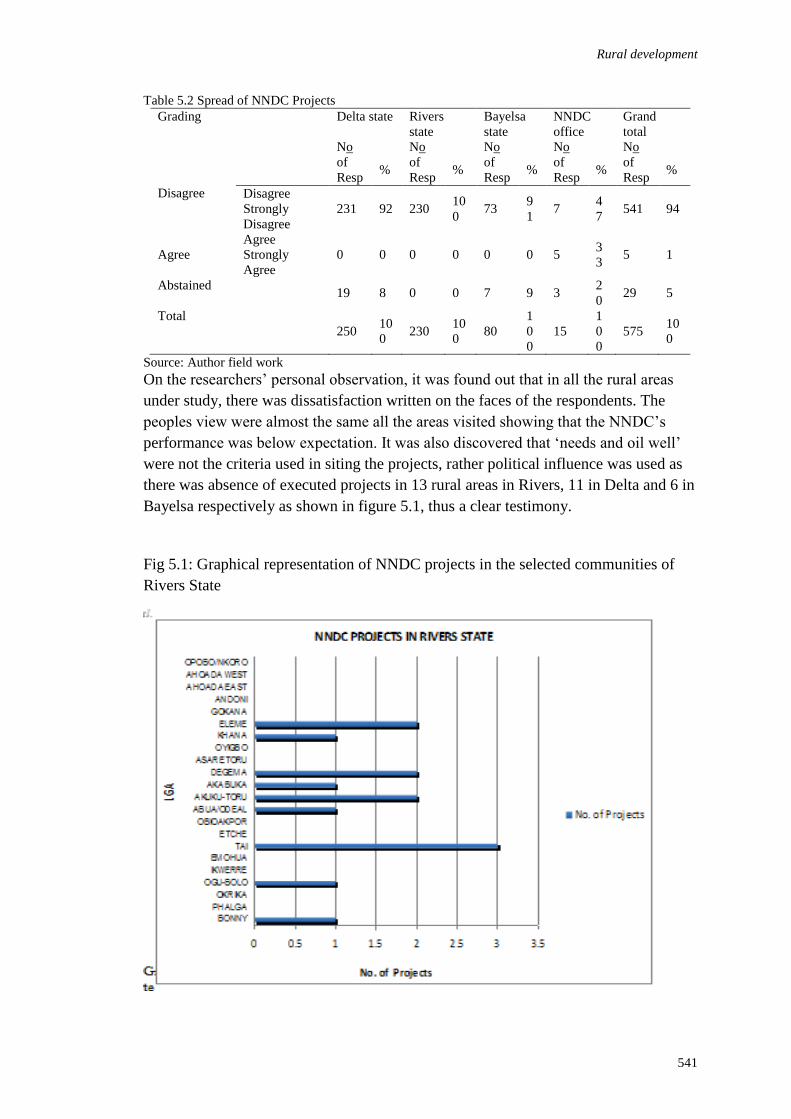
Rural development
541
Table 5.2 Spread of NNDC Projects
Grading Delta state Rivers
state
Bayelsa
state
NNDC
office
Grand
total
Disagree
No
of
Resp
%
No
of
Resp
%
No
of
Resp
%
No
of
Resp
%
No
of
Resp
%
Disagree
Strongly
Disagree
231 92 230 10
0 73
9
1 7
4
7 541 94
Agree
Agree
Strongly
Agree
0 0 0 0 0 0 5 3
3 5 1
Abstained 19 8 0 0 7 9 3
2
0 29 5
Total
250 10
0 230
10
0 80
1
0
0
15
1
0
0
575 10
0
Source: Author field work
On the researchers’ personal observation, it was found out that in all the rural areas
under study, there was dissatisfaction written on the faces of the respondents. The
peoples view were almost the same all the areas visited showing that the NNDC’s
performance was below expectation. It was also discovered that ‘needs and oil well’
were not the criteria used in siting the projects, rather political influence was used as
there was absence of executed projects in 13 rural areas in Rivers, 11 in Delta and 6 in
Bayelsa respectively as shown in figure 5.1, thus a clear testimony.
Fig 5.1: Graphical representation of NNDC projects in the selected communities of
Rivers State
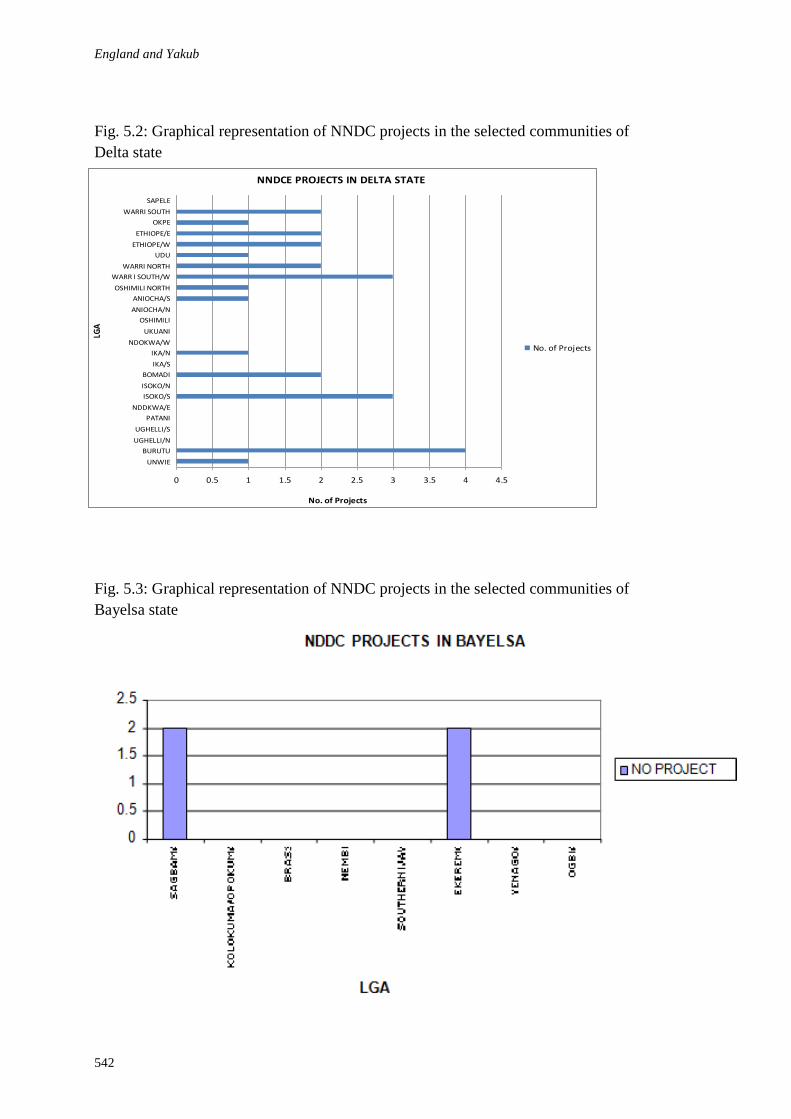
England and Yakub
542
Fig. 5.2: Graphical representation of NNDC projects in the selected communities of
Delta state
Fig. 5.3: Graphical representation of NNDC projects in the selected communities of
Bayelsa state
NNDCE PROJECTS IN DELTA STATE
0 0.5 1 1.5 2 2.5 3 3.5 4 4.5
UNWIE
BURUTU
UGHELLI/N
UGHELLI/S
PATANI
NDDKWA/E
ISOKO/S
ISOKO/N
BOMADI
IKA/S
IKA/N
NDOKWA/W
UKUANI
OSHIMILI
ANIOCHA/N
ANIOCHA/S
OSHIMILI NORTH
WARR I SOUTH/W
WARRI NORTH
UDU
ETHIOPE/W
ETHIOPE/E
OKPE
WARRI SOUTH
SAPELE
LGA
No. of Projects
No. of Projects
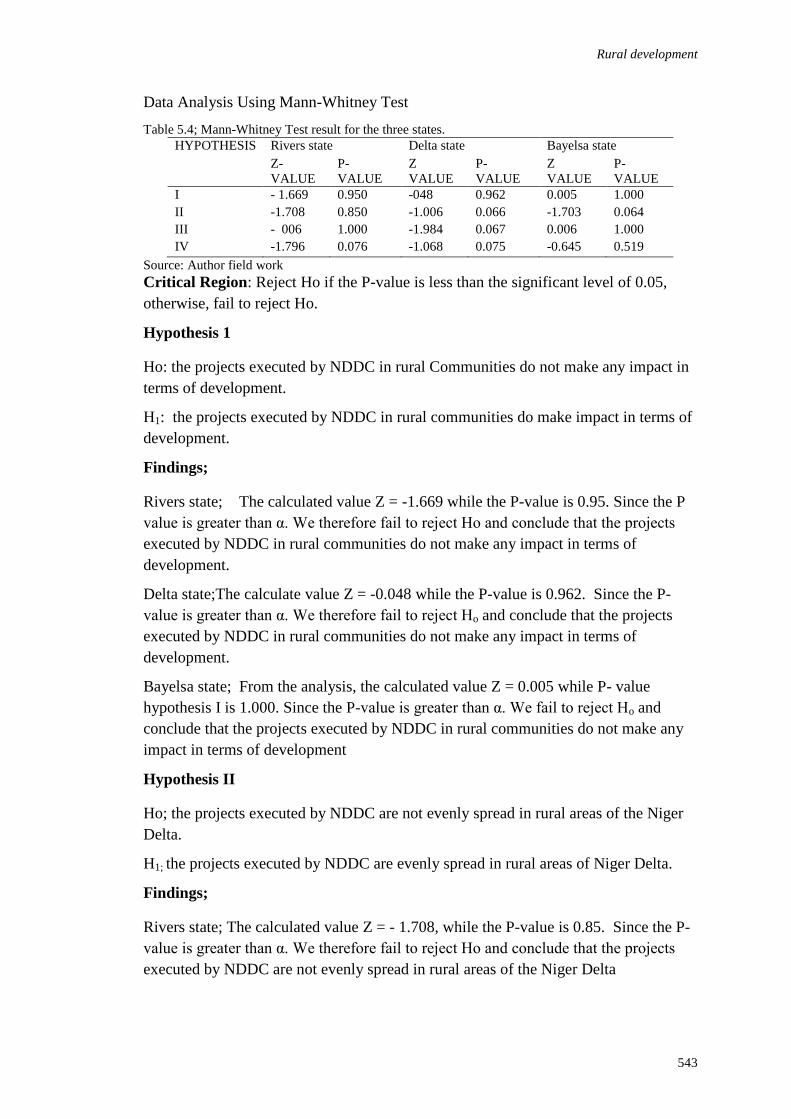
Rural development
543
Data Analysis Using Mann-Whitney Test
Table 5.4; Mann-Whitney Test result for the three states.
HYPOTHESIS Rivers state Delta state Bayelsa state
Z-
VALUE
P-
VALUE
Z
VALUE
P-
VALUE
Z
VALUE
P-
VALUE
I - 1.669 0.950 -048 0.962 0.005 1.000
II -1.708 0.850 -1.006 0.066 -1.703 0.064
III - 006 1.000 -1.984 0.067 0.006 1.000
IV -1.796 0.076 -1.068 0.075 -0.645 0.519
Source: Author field work
Critical Region: Reject Ho if the P-value is less than the significant level of 0.05,
otherwise, fail to reject Ho.
Hypothesis 1
Ho: the projects executed by NDDC in rural Communities do not make any impact in
terms of development.
H1: the projects executed by NDDC in rural communities do make impact in terms of
development.
Findings;
Rivers state; The calculated value Z = -1.669 while the P-value is 0.95. Since the P
value is greater than α. We therefore fail to reject Ho and conclude that the projects
executed by NDDC in rural communities do not make any impact in terms of
development.
Delta state;The calculate value Z = -0.048 while the P-value is 0.962. Since the P-
value is greater than α. We therefore fail to reject Ho and conclude that the projects
executed by NDDC in rural communities do not make any impact in terms of
development.
Bayelsa state; From the analysis, the calculated value Z = 0.005 while P- value
hypothesis I is 1.000. Since the P-value is greater than α. We fail to reject Ho and
conclude that the projects executed by NDDC in rural communities do not make any
impact in terms of development
Hypothesis II
Ho; the projects executed by NDDC are not evenly spread in rural areas of the Niger
Delta.
H1; the projects executed by NDDC are evenly spread in rural areas of Niger Delta.
Findings;
Rivers state; The calculated value Z = - 1.708, while the P-value is 0.85. Since the P-
value is greater than α. We therefore fail to reject Ho and conclude that the projects
executed by NDDC are not evenly spread in rural areas of the Niger Delta
England and Yakub
544
Delta state;The calculated value Z=- 1.006 while the P- value is 0.66. Since the P-
value is greater than α. We therefore fail to reject Ho and conclude that the projects
executed by NDDC are not evenly spread in rural areas of the Niger Delta.
Bayelsa state; The calculated value Z=-1.705 while the P-value from table III
hypothesis II is 0.064. Since the P-value is greater than α. We therefore reject Ho and
conclude that the projects executed by NDDC are not evenly spread in rural areas of
the Niger Delta.
Hypothesis III
Ho; there is no significance difference in terms of development in rural areas
before and after the execution of NDDC projects.
H1; there is significance difference in terms of development in rural areas before
and after the execution of NDDC projects.
FINDINGS;
Rivers state; The calculated value z= 0.006 while the P-value is 1.000. Since the P-
value is greater than α. We fail to reject Ho and conclude that there is no significance
difference in terms of development in rural areas before and after the execution of
NDDC projects.
Delta state; The calculated value Z=- 1.984 while the P-value is 0.067. Since the P-
value is greater than α. We therefore reject Ho and conclude that there is no
significance difference in terms of development in rural areas before and after the
execution of NDDC projects.
Bayelsa state; The calculated value Z= 0.006 while the P=value from table III
hypothesis III is 1.000. Since the P-value is greater than α. We fail to reject Ho and
conclude that there is no difference in terms of development in rural areas before and
after the execution of NDDC project in rural areas of the Niger Delta
Hypothesis IV
Ho; the performance of NDDC projects in rural areas of the Niger Delta is not
encouraging.
H1; the performance of NDDC projects in rural areas of the Niger Delta is
encouraging.
Findings;
Rivers state; The calculated value Z=-1.796 while the P-value is 0.076. Since the P-
value is greater than α. We therefore fail to reject Ho and conclude that the
performance of NDDC projects in rural areas of the Niger Delta is not encouraging
Delta state; The calculated value is Z=-1.068 while the P-value is 0.075. Since the P-
Value is greater than α. We therefore fail to reject Ho and conclude that the
performance of NDDC projects in rural areas of the Niger Delta is not encouraging.

Rural development
545
Bayelsa state; The calculated values Z==0.645 while the P-value from table III
hypothesis IV is 0.519. Since P-value is greater than α. We therefore fail to project
Ho and conclude that the performance of NDDC projects in rural areas of the Niger
Delta is not encouraging
RECOMMENDATIONS
The issue of sustainability should be taken more seriously; the projects should be
maintained after five to ten years of commissioning also an agency should be
responsible for the maintenance of the projects executed by NDDC or the projects
should be handed over to the state, local government or the rural people as the case
maybe. The issue of needs of the people should be taken more seriously or else it will
be a fruitless effort, moreover, Projects should be based on the human activities found
in the rural areas with emphasis on skill acquisition, agriculture and ecological and
infrastructural development in the rural areas so as to attain a sustainable development
that will stand the test of time. The increasing number of uncompleted projects
indicates that there is no effective monitoring of NDDC projects. .
CONCLUSION
This paper addresses the performance of NDDC in the Niger Delta where generally
their performance has been rated below expectations as the generality of the rural
dwellers are of the opinion that the spread of the projects within the rural areas in the
Niger Delta are not evenly spread as most of these projects were sited with political
undertone as shown in the study (Table 5.2). Also in line with the performance of
NDDC projects, the respondents confirmed that such performance is poorly rated.
This was further corroborated by the federated correspondencts chapel of Nigerian
Union of Journalists (NUJ) – Rivers state chapter which says for the past 11 years of
its existence the NNDC has achieved very little and made no meaningful impact in the
region. The body pointed out that the NNDC failed to execute basic programmes that
would have transformed the region. Thus, the need for the NDDC officials and the
government to address these problems to bring to an end the continues agitations of
the Niger Delta people.
REFERENCES
Aboyade, B.O. (1976); Issues in the Development of Tropical Africa. Ibadan: University of
Ibadan Press.
Aboyade, B.O. (1987); The Provision of information for Rural Development, Ibadan:
Fountain publications.
Abumere, S.I. (1978); “Traditional Agricultural System and Staple Food production”, In J.S.
Oguntoyinbo; O.O Areola; and M. Filani (eds). Geography of Nigerian Development.
Ibadan: Heinemann Educational Books.
Adesiyan, J. O. (1985), Regional development alternative: A Critical Assessment of Gombe
Agricultural Development project. Unpublished PhD Thesis, Ahmadu Bello
University Zaria
England and Yakub
546
Ajoku B.C. (2005): Rural land use practices and sustainable forest Resources
management in Ekwere L.G.A of Rivers State. Unpublished M.Sc thesis. University
of Port Harcourt
Azaiki .S. (2003); Inequities in Nigeria politics: Treasures Books Yenagoa
Berko, S.Y. (2001); Self Help Organizations, Co-operatives and Rural Development.
Computer Edge publisher Enugu
Boudeville, J.R. (1966); Problems of Regional Economic Planning. Edinburgh University
Press, Edinburgh.
Chambers .R. (1994) participatory Rural Appraisal (PRA): Analysis of experience world
Development
Dekor, J.B. (2007): The role of urban centre’s in rural Development: A case study of
Bori, Rivers state: unpublished M. Sc thesis. University of Port Harcourt
Eboh E.C (1995) Rural Development in Nigeria: concepts processes and prospects. Auto
century publishers Enugu.
Ebong M.O (2006): Mobilization of Resources for Rural Development in Nigeria :
Mabass printing company, Calabar.
Ekpo A.H. and Olaniyi .O. (1995); Rural Development in Nigeria: Analysis of the impact of
the Directorate for Food, roads and rural infrastructure (DFRRI) in Rural
Development in Nigeria: Concept, processes and prospects. Autocentury publishers,
Enugu.
England, P.E.T. (1998); Sources of conflicts between migrant tenant farmers and host
communities. A case study of Odoni, Sagbama L.G.A Unpublished B.Sc project
Unical
England, P.E.T. (2009s); Sources of conflicts between migrant tenant farmers and host
communities in Nigeria: internal journal of sociology and Anthology.
Hammer P C. (2001) Joining Rural Development theory and Rural Education practice
Hoyle, B.S. (1974); Spatial Aspects of Development, London: John Wiley
Igben, M.S. (1987); “Socio-Economics Activities of Women in Some selected Nigeria
Rural Communities: Implications for Integrated Rural Development in Nigeria”, In
Omu, F.I.A and Makinwa, P.k. (eds) Integrated Rural Development in Nigeria and
Women’s Role. Heinemann: Ibadan.
Ijere, M.O. (1988), “Mobilization, Unemployment and Nigeria’s Rural Development” in
Igbozurike, U.M. (ed), Critical Issues in Rural Development, Owerri: karto Press.
John A.U. (1985); Integrated Rural Development: An Appraisal of the Ayamgba
Agricultural Development project Benue state. Unpublished PhD Thesis. Ahmadu
Bello University Zaria
John B.I. (1989): Rural Development and Bureaucracy in Nigeria: Longman Nigeria
Limited
June 2001- September 2006
June 2001-September 2005
June 2001-September 2005
Kauzeni, A.S. (1989); “Rural Development Alternatives and the Role of Local Level
Development Strategy: Tanzania Case Study”. Regional Development Dialogue 9(2):
105-138.
Rural development
547
Koinyan, L.D. (1989): The way forward: integrated Rural Development. The people
programme, DFRRI, Lagos.
Koinyan, L.D. (1990): Why Rural Development is a must: Directorate for Food, Roads and
Rural infrastructures: the presidency National Assembly complex Lagos.
Mabogunje, A.L. (1980); The Development Process: A Spatial Perspective. London:
Hutchinson and Co. Publishers Ltd.
Mabojunje, A.L. (1977), On Developing and Development. Ibadan: University of
Ibadan Press.
Maddison, A. (1970); Economic Progress and Policy in Developing Countries, London:
Allen and Unwin.
Mbachu, O. (1989); “Government and Its Agencies in Rural Development”, in
Igbozurike, U.M.; Okpara, E. E. and Awuzie, U.A. (eds), in Roles and Paradigms in
the Rural Development of Nigeria, Owerri: kartopress.
Mere, A. (1987); “Nigerian Women in Development: Strengths and Constraints” in Omu,
F.I.A and Makinwa, P.K. (eds) Integrated Rural Development in Nigeria and
Women’s Role. Heinemann: Ibadan.
Moemeka, A.A. (1987); “Integrated Rural Development in Bendel State: The Role of, and
Strategy for Mass Media Communication” in Omu, F.I.A. and Makinwa, P.K. (eds)
Integrated Rural Development in Nig. And Women’s Role. Heinemann: Ibadan.
Ndukwe .C, (2005); Issues in Rural and community Development. John Jacob publishers
Ltd Enugu.
Neher, P.A. (1971); Economic Growth and Development. New York: John Wiley.
Nweze, M (1988): Prospective on community and Rural development in Nigeria, centre for
Development studies, Jos.
Nyerere, J.K. (1969); “Presidential Circular No.1 of 1969” in Cliffe, L. (eds)
Obasi I.N and Oguche .D. (1995): Innovative programmes in Rural Development in Nigeria:
An Evaluation of the Better life programmes using APBS framework. In Rural
Development in Nigeria concepts processes and prospects. Auto century publishers,
Enugu.
Ogbeka, S.N. (1988); “Indigenous Technology – A Dynamic Tool for Rural Development”
in Igbozurike, U.M. (ed) Critical Issues in Rural Development. Owerri, Karto Press.
Okediji, F.O. (1973); “Population, Resources and Development. The case of Tropical
Africa”, Staff/Graduate Seminars (1973/74) No. 4, University of Ibadan.
Olanrewaju, S.A. (1984), “The Rural Development Problem Revised: some Lessons
from the Chinese Experience”. Paper presented at the National Seminar on Innovative
Approaches to Development Theory, N.I.S.E.R. Ibadan.
Olatunbosun, D. (1971); “Western Nigerian Farm Settlement: An Appraisal”, Journal of
Developing Areas, Vol. 5, No. 1. Pp. 417-428.
Olatunbosun, D. (1975); Nigeria’s Neglected Rural Majority. London, Heinemann.
Olayiwola L.M., Adeleye O.A (2005); Rural infrastructural development in Nigeria:
Between 1960 and 1990. problems and challenges. Journal of social science, 11(2):
91-96.
Olayiwole, C.B. (1984), “Rural Women’s Participation in Agricultural Activities. Implications
for Training Extension Home Economist”. Ph. D. Dissertation, College of Home
Economics, Kansas State University, Kansas.
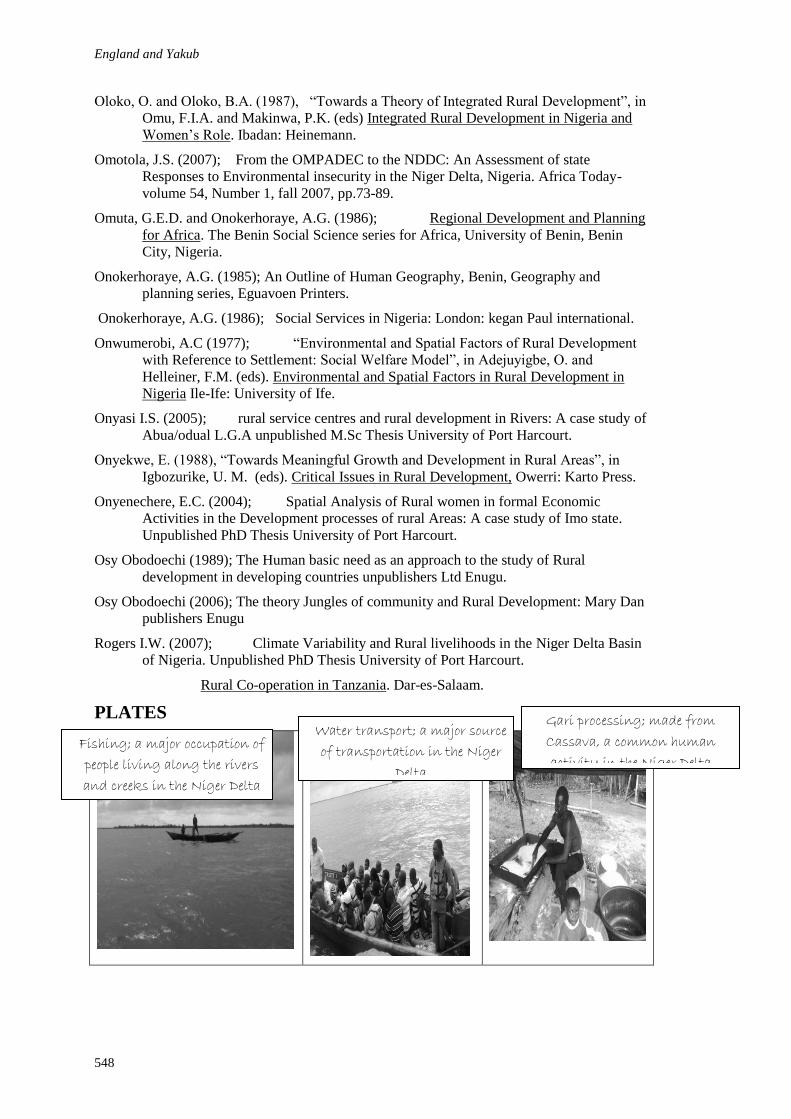
England and Yakub
548
Oloko, O. and Oloko, B.A. (1987), “Towards a Theory of Integrated Rural Development”, in
Omu, F.I.A. and Makinwa, P.K. (eds) Integrated Rural Development in Nigeria and
Women’s Role. Ibadan: Heinemann.
Omotola, J.S. (2007); From the OMPADEC to the NDDC: An Assessment of state
Responses to Environmental insecurity in the Niger Delta, Nigeria. Africa Today-
volume 54, Number 1, fall 2007, pp.73-89.
Omuta, G.E.D. and Onokerhoraye, A.G. (1986); Regional Development and Planning
for Africa. The Benin Social Science series for Africa, University of Benin, Benin
City, Nigeria.
Onokerhoraye, A.G. (1985); An Outline of Human Geography, Benin, Geography and
planning series, Eguavoen Printers.
Onokerhoraye, A.G. (1986); Social Services in Nigeria: London: kegan Paul international.
Onwumerobi, A.C (1977); “Environmental and Spatial Factors of Rural Development
with Reference to Settlement: Social Welfare Model”, in Adejuyigbe, O. and
Helleiner, F.M. (eds). Environmental and Spatial Factors in Rural Development in
Nigeria Ile-Ife: University of Ife.
Onyasi I.S. (2005); rural service centres and rural development in Rivers: A case study of
Abua/odual L.G.A unpublished M.Sc Thesis University of Port Harcourt.
Onyekwe, E. (1988), “Towards Meaningful Growth and Development in Rural Areas”, in
Igbozurike, U. M. (eds). Critical Issues in Rural Development, Owerri: Karto Press.
Onyenechere, E.C. (2004); Spatial Analysis of Rural women in formal Economic
Activities in the Development processes of rural Areas: A case study of Imo state.
Unpublished PhD Thesis University of Port Harcourt.
Osy Obodoechi (1989); The Human basic need as an approach to the study of Rural
development in developing countries unpublishers Ltd Enugu.
Osy Obodoechi (2006); The theory Jungles of community and Rural Development: Mary Dan
publishers Enugu
Rogers I.W. (2007); Climate Variability and Rural livelihoods in the Niger Delta Basin
of Nigeria. Unpublished PhD Thesis University of Port Harcourt.
Rural Co-operation in Tanzania. Dar-es-Salaam.
PLATES
Fishing; a major occupation of
people living along the rivers
and creeks in the Niger Delta
Gari processing; made from
Cassava, a common human
activity in the Niger Delta
Water transport; a major source
of transportation in the Niger
Delta
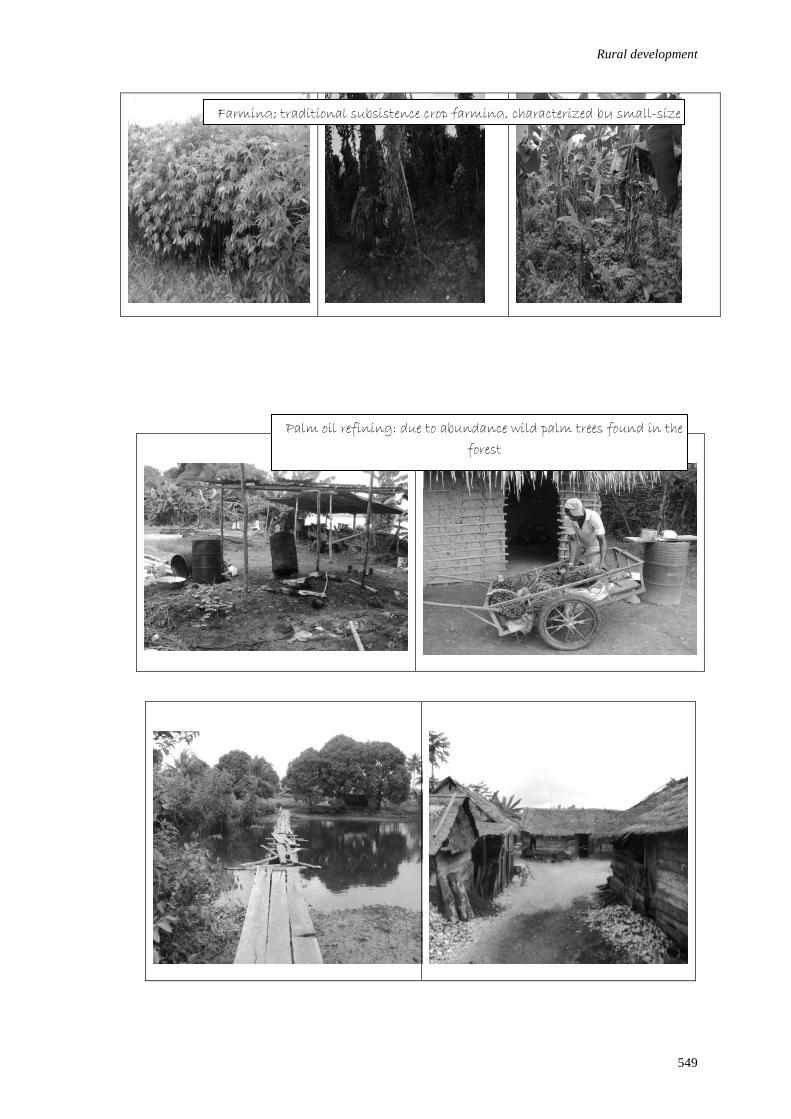
Rural development
549
Farming; traditional subsistence crop farming, characterized by small-size
farm holdings
Palm oil refining: due to abundance wild palm trees found in the
forest

England and Yakub
550
The above picture shows deplorable condition of Diema community in Brass Local
Government Areas of Bayelsa state with no simple social amenity and no accessible
road to the community. There are more rural communities like Diema in the Niger
Delta which does not have any simple project from NDDC and are in serious need of
development projects.

Ezeokoli, N.B., Bello, V.A. and Adebisi, O.S. (2012) Determinants of vacancy rate in shopping centres
in Akure, Nigeria In: Laryea, S., Agyepong, S.A., Leiringer, R. and Hughes, W. (Eds) Procs 4th West
Africa Built Environment Research (WABER) Conference, 24-26 July 2012, Abuja, Nigeria, 551-561.
551
DETERMINANTS OF VACANCY RATE IN SHOPPING
CENTRES IN AKURE, NIGERIA
N.B. Ezeokoli1, V.A. Bello
2 and O.S. Adebisi
3
Department of Estate Management, Federal University of Technology Akure, Nigeria
This paper examined the factors that cause vacancy in shopping centres in Akure. A
total number of thirty five (35) shopping centres in Akure were sampled and
questionnaire were administered on the tenants of the selected centres, while
seventeen (17) Estate Surveyors and Valuers in Akure were also selected in order to
determine the factors that influence the choice of a tenant to stay or leave a centre.
The data collected were analysed using Weighted Mean Score and Multiple
Regression Analysis. The result showed that factors such as location, volume of sales,
customers’ patronage, and visibility of the centre are responsible for the choice of
retail space in a particular centre. The result further showed demand and supply
factors to be the major determinants of vacancy rate in a shopping centre. Vacancy
rate is directly related to supply of shopping centre’s spaces and inversely related to
the demand for shopping spaces. It is therefore recommended that property
developers should seek the services of Estate Surveyors and Valuers to advise them
on the best location for shopping centres’ development which will in turn command
high demand.
Keywords: Akure, determinants, market imbalance, shopping centre, vacancy rate
INTRODUCTION
The evolution of shopping centre followed the changes in consumers’ and retailers’
behavioural pattern (Eppli and Benjamin, 1993). This is evidenced in the complexity
of consumer’s shopping pattern and the retailer’s behaviour in agglomerated retail
centres. The need for shopping necessitated the construction of multiple retail outlets
enclosed in a single building. Most neighbourhood shopping centres were built to
satisfy the neighbouring community’s shopping needs. However, some of these
shopping centres are not meeting the expectations of the tenants and the developers
alike as the returns expected from the lease of these retail spaces are not met. Some
consumers prefer to pay for transportation to the city centres to purchase goods rather
than the shopping centre in their neighbourhood. This often triggers the exodus of
retailers to shopping centres that are performing better, thereby causing vacancy in
some of the centres.
Akure, which is the capital city of Ondo state, is one of the urban centres that is
witnessing high proliferation of shopping centres in different locations. In recent past,
investors have diverted their funds into real property development due to the
profitability of the market. The availability of funds by financial institutions and the
increase in the level of demand for properties also serve as motivating factors to the
Ezeokoli
552
investors. The increase in demand for commercial properties such as shopping centres
led to an increase in the relative supply of such accommodation. This resulted in the
conversion of some of the purpose-built residential properties into commercial uses
especially shopping centres in and at the fringe of the Central Business District.
Shopping centres are on the increase, as more shopping spaces are needed for
effective commercial activities. However, the uncontrolled level of development of
this property type, especially in poor locations, results in high rate of vacancy
experienced in some of these centres. More so, the ongoing dualization of the Arakale
road has left so many retailers without spaces thereby increasing the total level of
demand for shopping spaces within the city. Despite this increase in demand for
shopping spaces, shopping centres in some areas still have vacant spaces. The
question therefore, is why are there vacancies in shopping centres even though there is
demand for them? What are the factors that motivate the tenants to take up spaces in
particular shopping centres and how do the factors affect vacancy rare?
The remainder of the paper is structured as follows. The next section (section 2)
consists of a review of existing literature on the determinant of vacancy rates in
shopping centres. The review is followed by a discussion of the research method
employed with the results presented and analyzed in section three (3) and four (4).
Section five (5) consists of the summary of findings, recommendation and conclusion.
LITERATURE REVIEW
Many research works focused on the factors that influence the rents of shopping
centres. However, those literatures that examined vacancy rate dwelt much on office
space and residential properties. For instance, Hendershott and Haurin (1988),
Sirmans and Benjamin (1991), Jud et al (1996) and Hendershott et al (2002) surveyed
the empirical literature on rents and vacancies. With few exceptions, the literature
provides empirical support for the existence of a natural vacancy rate in commercial
office space markets as well as in apartment markets. Shilling et al (1987) also looked
into the issue of natural and actual vacancy rates in office property and hypothesized
that increased vacancy rate slows the rate of exchange in rent whenever the actual
vacancy rate exceeds the desired (natural) rate. The study revealed that the demand for
office space in a given building is highly elastic due to the presence of close
substitutes. The level of rent was positive and significant determinant of building
vacancy rate while building age and size were negatively associated with the rate of
vacancy.
Vacancy rate in shopping centres can be attributable to several factors which defers
from centre to centre and across regions. A number of these factors could be
responsible for tenants’ choice of shopping centres space in any neighbourhood. The
findings of Ooi and Sim (2006) revealed that both physical size of a centre and the
presence of a Cineplex enhance the attractiveness of a suburban shopping centre. It
adduced that the presence of cinema in a centre will cause shoppers to spend more and
to stay longer in a centre thereby creating high traffic flow which in effect enhances
patronage, while large centres (size) create pleasant environment for shoppers to stay.
This however may not be true for all cases especially if the environment is not
conducive and the property not well located because shoppers will not be attracted to
the centre thereby reducing sales and eventually leading to the vacation of such
Determinants of vacancy rates
553
centres for a better one by tenants. More so in an economy like Nigeria where such
social activities are not fully embraced, this factor becomes irrelevant.
The loss of tenants in a shopping centre is majorly influenced by the increasing
mismatch between the locations of demand and that of supply (Belsky and Goodman,
1996). Many better sited centres, according to Ownbey et. al. (1994) demonstrates
good rental performance and limited vacancies even in a weakened economic or over-
built environment. It follows that some centres in economically vibrant environments
can still experience much vacancy if not well sited. But what determines a good
situation of shopping centre is in the performance of such a centre. This is determined
by the level of traffic it can generate per time. When traffic generated is high, level of
sales becomes attractive thereby pushing tenants to place more demand for spaces in
such centres. For instance, Chun et. al. (2001) adduced that traffic generated in a
centre is responsible for the level of sales, and hence determine the attraction of
tenants to such centres for spaces. When the evidence of sales is lacking, it could lead
to vacancy as tenants may be forced to close shops. This is evident in some of the
shopping centres in Akure. As some of the centres are teeming with traffics and
customers, some others are not.
According to Belsky and Goodman (1996), when supply is higher than demand in a
particular location, there will be natural vacancy rate. However, Simmons (1992);
Ownbey et.al. (1994); and Forgey et. al. (1995) opined that with respect to location of
any shopping centre, the two most commonly noted determinants of retail patronage
are accessibility and visibility. It implies that the choice of shopping space and
consequently the demand for shopping space is sequel to the level of patronages in
such a centre and this is reflected in the traffic generated in the centre. Hardin and
Wolverton’s (2000) study on ‘Micro-Market Determinants of Neighbourhood Centre
Rental Rates’, using a regression model of rent and vacancy, revealed that Primary
trade area and property specific characteristics are the primary determinants of
neighbourhood center vacancy and rental rates. The regression results from the
maximum center RENT model indicated that vacancy is a function of the condition of
the trade area’s retail property market.
In addition, the report of Colliers International (2010) revealed that the existing vacant
units in high streets and shopping centres do not meet the needs of the modern day
retailer in terms of size and pitch location. In essence, it is not so much a problem of a
lack of shopping centre floor space, but rather a lack of quality shopping centre floor
space. It argued, therefore, that there should be a greater emphasis on regenerating
obsolete shopping centre floor space, rather than adding to the total stock. But, as
noted in Akure, many tenants take up spaces at newly constructed centres with good
facilities and quality floor spaces only to move out of such after some periods of time,
thus hampering on the success of such centres. It can thus be argued that tenants are
not as interested in facilities as they are in the volume of sales they realise.
Many areas of the United Kingdom, as noted by Colliers International (2010), are near
to or at saturation point in terms of the ratio between available consumer expenditure
Ezeokoli
554
and retail floor space and often the creation of new schemes simply moves spending
from one location to another, rather than soaking up any perceived excess demand.
Thus, an increase in supply of shopping spaces could sometimes lead to vacancy. For
instance, Grubb and Ellis (2009) reported that the over-supply of space in Atlanta
contributed to the high level of vacancy experienced in the third quarter of 2009. The
third quarter ended with more than 500,000 square feet in occupancy loss, about
135,000 square feet less than in the second quarter. The Victoria retail market segment
in Australia had a slight increase in vacancy from 2008 to 2009 levels. The shopping
centre vacancy rate increased from 1.1% to 2.1% in 2009 and Victoria’s downtown
street front vacancy increased from 2.7% to 3.5%. This relatively muted change in
vacancy is due, in part, to Victoria’s stable government employment base and the
limited overall supply of retail options in the region. Therefore, if the rate of
proliferation of shopping centres is not checked, it could lead to high rate of vacancy
especially in Akure, Nigeria, which is an emerging market.
The variables that determine vacancy rate in shopping centres in these studies
included volume of sales or profits, traffic generated, location, shopping center size,
age, presence of anchor tenant, tenant mix, architectural design, market condition
(demand and supply), and ability to pay rent. However, the situation is slightly
different in Nigeria were only some of the variables are present. This may be because
of the different markets that exist. In this respect, the variables used in the
determination of the vacancy rate in this study are location of centres, age, design,
accessibility, visibility, distance, rent, demand and supply of shopping spaces.
RESEARCH METHODOLOGY
The study was carried out in six selected areas (Oba Adesida, Oyemekun/Ilesha Road,
Oke-Ijebu, Oluwatuyi/Ijoka, Oke Aro/Oshinle and Federal University of Technology
Akure (FUTA)) of Akure South Local Government Area of Ondo State. 35 shopping
centres (containing 1352 shopping spaces) were randomly selected from 57 centres in
the study areas. Also, 17 registered practicing Estate Surveyors and Valuers were
selected for the study. Using the formula by Kothari (2004) for determining sample
size from large sample frame, the sample size of the shopping spaces arrived at was
299. Questionnaire was administered on 299 tenants of the shopping spaces out which
280 were returned and good for analysis. This represents 94% of the sample size.
Questionnaire was also, administered on the 17 registered Estate Surveyors and
Valuers in Akure
The questionnaire for tenants of the shopping space were structured to get information
on the number of shopping spaces in the center, number of spaces vacant, level of
sales in the shops, reasons for wanting to relocate and the factors that prompted the
choice of location. While the Estate Surveyors and Valuers were asked among others
factors responsible for high vacancy rate in shopping centres in the study areas.
The data collected were analyzed using descriptive statistics (Mean Score) and
inferential statistics in form of Multiple Linear Regression Model.
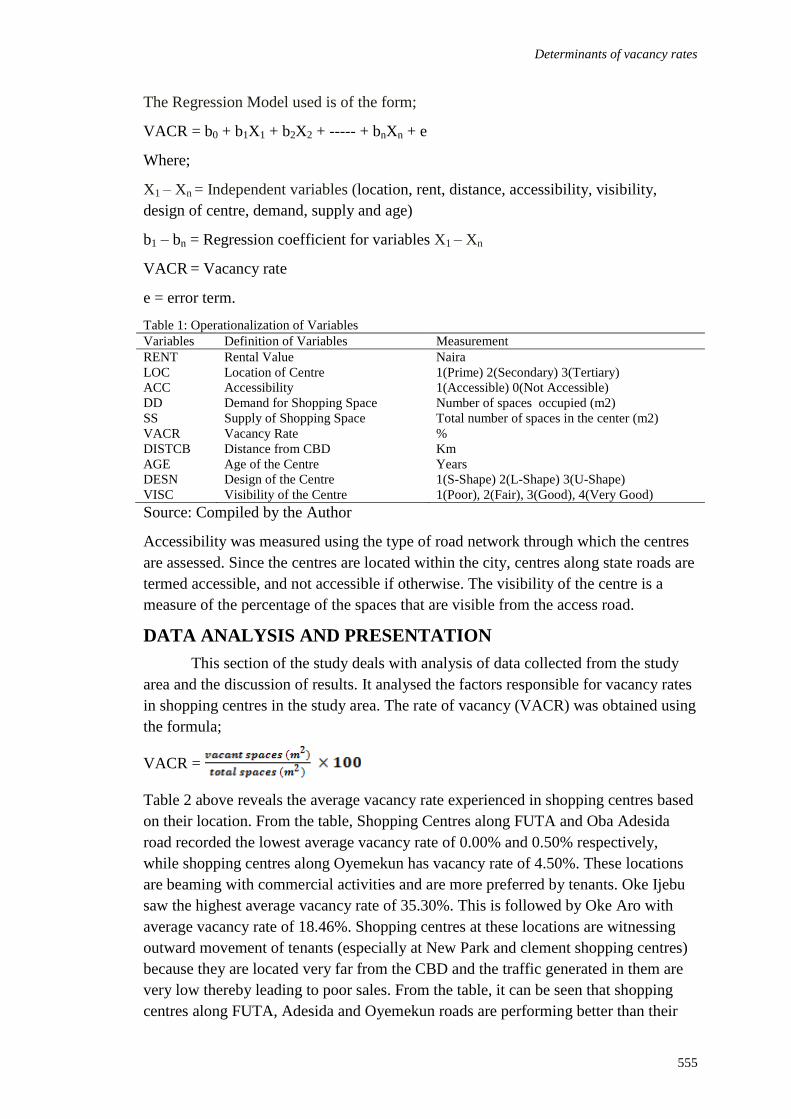
Determinants of vacancy rates
555
The Regression Model used is of the form;
VACR = b0 + b1X1 + b2X2 + ----- + bnXn + e
Where;
X1 – Xn = Independent variables (location, rent, distance, accessibility, visibility,
design of centre, demand, supply and age)
b1 – bn = Regression coefficient for variables X1 – Xn
VACR = Vacancy rate
e = error term.
Table 1: Operationalization of Variables
Variables Definition of Variables Measurement
RENT
LOC
ACC
DD
SS
VACR
DISTCB
AGE
DESN
VISC
Rental Value
Location of Centre
Accessibility
Demand for Shopping Space
Supply of Shopping Space
Vacancy Rate
Distance from CBD
Age of the Centre
Design of the Centre
Visibility of the Centre
Naira
1(Prime) 2(Secondary) 3(Tertiary)
1(Accessible) 0(Not Accessible)
Number of spaces occupied (m2)
Total number of spaces in the center (m2)
%
Km
Years
1(S-Shape) 2(L-Shape) 3(U-Shape)
1(Poor), 2(Fair), 3(Good), 4(Very Good)
Source: Compiled by the Author
Accessibility was measured using the type of road network through which the centres
are assessed. Since the centres are located within the city, centres along state roads are
termed accessible, and not accessible if otherwise. The visibility of the centre is a
measure of the percentage of the spaces that are visible from the access road.
DATA ANALYSIS AND PRESENTATION
This section of the study deals with analysis of data collected from the study
area and the discussion of results. It analysed the factors responsible for vacancy rates
in shopping centres in the study area. The rate of vacancy (VACR) was obtained using
the formula;
VACR =
Table 2 above reveals the average vacancy rate experienced in shopping centres based
on their location. From the table, Shopping Centres along FUTA and Oba Adesida
road recorded the lowest average vacancy rate of 0.00% and 0.50% respectively,
while shopping centres along Oyemekun has vacancy rate of 4.50%. These locations
are beaming with commercial activities and are more preferred by tenants. Oke Ijebu
saw the highest average vacancy rate of 35.30%. This is followed by Oke Aro with
average vacancy rate of 18.46%. Shopping centres at these locations are witnessing
outward movement of tenants (especially at New Park and clement shopping centres)
because they are located very far from the CBD and the traffic generated in them are
very low thereby leading to poor sales. From the table, it can be seen that shopping
centres along FUTA, Adesida and Oyemekun roads are performing better than their
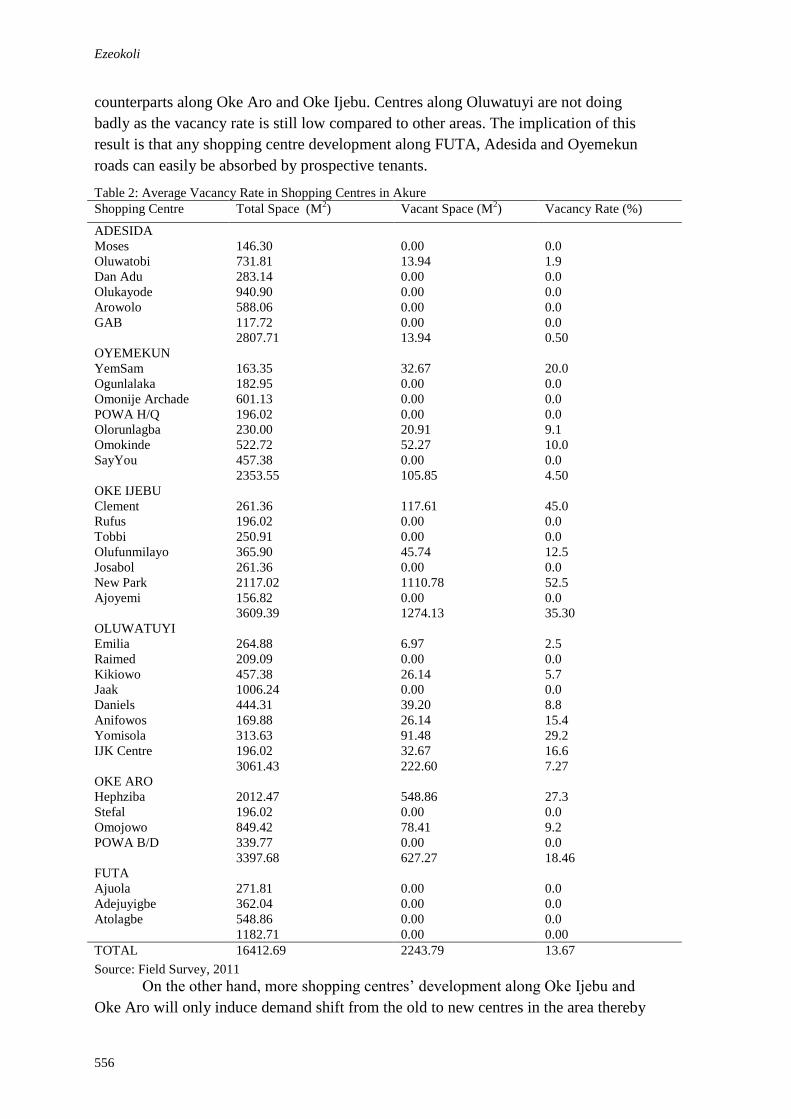
Ezeokoli
556
counterparts along Oke Aro and Oke Ijebu. Centres along Oluwatuyi are not doing
badly as the vacancy rate is still low compared to other areas. The implication of this
result is that any shopping centre development along FUTA, Adesida and Oyemekun
roads can easily be absorbed by prospective tenants.
Table 2: Average Vacancy Rate in Shopping Centres in Akure
Shopping Centre Total Space (M2) Vacant Space (M
2) Vacancy Rate (%)
ADESIDA
Moses
Oluwatobi
Dan Adu
Olukayode
Arowolo
GAB
OYEMEKUN
YemSam
Ogunlalaka
Omonije Archade
POWA H/Q
Olorunlagba
Omokinde
SayYou
OKE IJEBU
Clement
Rufus
Tobbi
Olufunmilayo
Josabol
New Park
Ajoyemi
OLUWATUYI
Emilia
Raimed
Kikiowo
Jaak
Daniels
Anifowos
Yomisola
IJK Centre
OKE ARO
Hephziba
Stefal
Omojowo
POWA B/D
FUTA
Ajuola
Adejuyigbe
Atolagbe
146.30
731.81
283.14
940.90
588.06
117.72
2807.71
163.35
182.95
601.13
196.02
230.00
522.72
457.38
2353.55
261.36
196.02
250.91
365.90
261.36
2117.02
156.82
3609.39
264.88
209.09
457.38
1006.24
444.31
169.88
313.63
196.02
3061.43
2012.47
196.02
849.42
339.77
3397.68
271.81
362.04
548.86
1182.71
0.00
13.94
0.00
0.00
0.00
0.00
13.94
32.67
0.00
0.00
0.00
20.91
52.27
0.00
105.85
117.61
0.00
0.00
45.74
0.00
1110.78
0.00
1274.13
6.97
0.00
26.14
0.00
39.20
26.14
91.48
32.67
222.60
548.86
0.00
78.41
0.00
627.27
0.00
0.00
0.00
0.00
0.0
1.9
0.0
0.0
0.0
0.0
0.50
20.0
0.0
0.0
0.0
9.1
10.0
0.0
4.50
45.0
0.0
0.0
12.5
0.0
52.5
0.0
35.30
2.5
0.0
5.7
0.0
8.8
15.4
29.2
16.6
7.27
27.3
0.0
9.2
0.0
18.46
0.0
0.0
0.0
0.00
TOTAL 16412.69 2243.79 13.67
Source: Field Survey, 2011
On the other hand, more shopping centres’ development along Oke Ijebu and
Oke Aro will only induce demand shift from the old to new centres in the area thereby
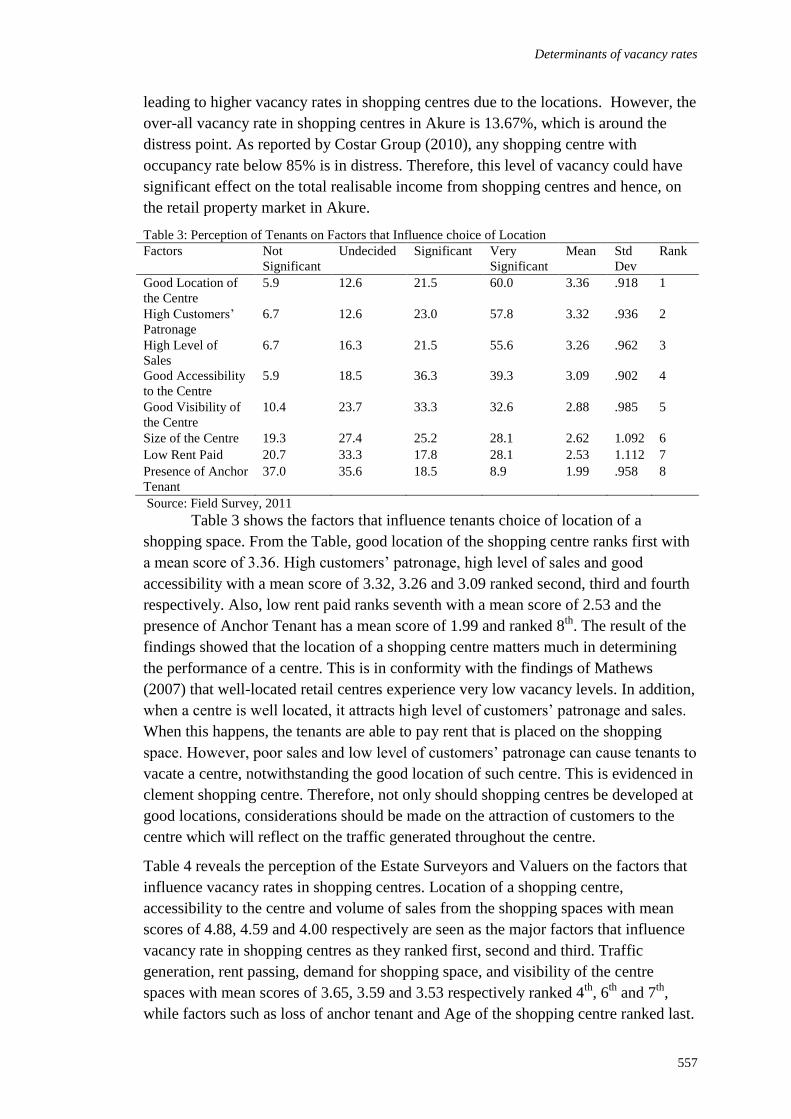
Determinants of vacancy rates
557
leading to higher vacancy rates in shopping centres due to the locations. However, the
over-all vacancy rate in shopping centres in Akure is 13.67%, which is around the
distress point. As reported by Costar Group (2010), any shopping centre with
occupancy rate below 85% is in distress. Therefore, this level of vacancy could have
significant effect on the total realisable income from shopping centres and hence, on
the retail property market in Akure.
Table 3: Perception of Tenants on Factors that Influence choice of Location
Factors Not
Significant
Undecided Significant Very
Significant
Mean Std
Dev
Rank
Good Location of
the Centre
5.9 12.6 21.5 60.0 3.36 .918 1
High Customers’
Patronage
6.7 12.6 23.0 57.8 3.32 .936 2
High Level of
Sales
6.7 16.3 21.5 55.6 3.26 .962 3
Good Accessibility
to the Centre
5.9 18.5 36.3 39.3 3.09 .902 4
Good Visibility of
the Centre
10.4 23.7 33.3 32.6 2.88 .985 5
Size of the Centre 19.3 27.4 25.2 28.1 2.62 1.092 6
Low Rent Paid 20.7 33.3 17.8 28.1 2.53 1.112 7
Presence of Anchor
Tenant
37.0 35.6 18.5 8.9 1.99 .958 8
Source: Field Survey, 2011
Table 3 shows the factors that influence tenants choice of location of a
shopping space. From the Table, good location of the shopping centre ranks first with
a mean score of 3.36. High customers’ patronage, high level of sales and good
accessibility with a mean score of 3.32, 3.26 and 3.09 ranked second, third and fourth
respectively. Also, low rent paid ranks seventh with a mean score of 2.53 and the
presence of Anchor Tenant has a mean score of 1.99 and ranked 8th
. The result of the
findings showed that the location of a shopping centre matters much in determining
the performance of a centre. This is in conformity with the findings of Mathews
(2007) that well-located retail centres experience very low vacancy levels. In addition,
when a centre is well located, it attracts high level of customers’ patronage and sales.
When this happens, the tenants are able to pay rent that is placed on the shopping
space. However, poor sales and low level of customers’ patronage can cause tenants to
vacate a centre, notwithstanding the good location of such centre. This is evidenced in
clement shopping centre. Therefore, not only should shopping centres be developed at
good locations, considerations should be made on the attraction of customers to the
centre which will reflect on the traffic generated throughout the centre.
Table 4 reveals the perception of the Estate Surveyors and Valuers on the factors that
influence vacancy rates in shopping centres. Location of a shopping centre,
accessibility to the centre and volume of sales from the shopping spaces with mean
scores of 4.88, 4.59 and 4.00 respectively are seen as the major factors that influence
vacancy rate in shopping centres as they ranked first, second and third. Traffic
generation, rent passing, demand for shopping space, and visibility of the centre
spaces with mean scores of 3.65, 3.59 and 3.53 respectively ranked 4th
, 6th
and 7th
,
while factors such as loss of anchor tenant and Age of the shopping centre ranked last.
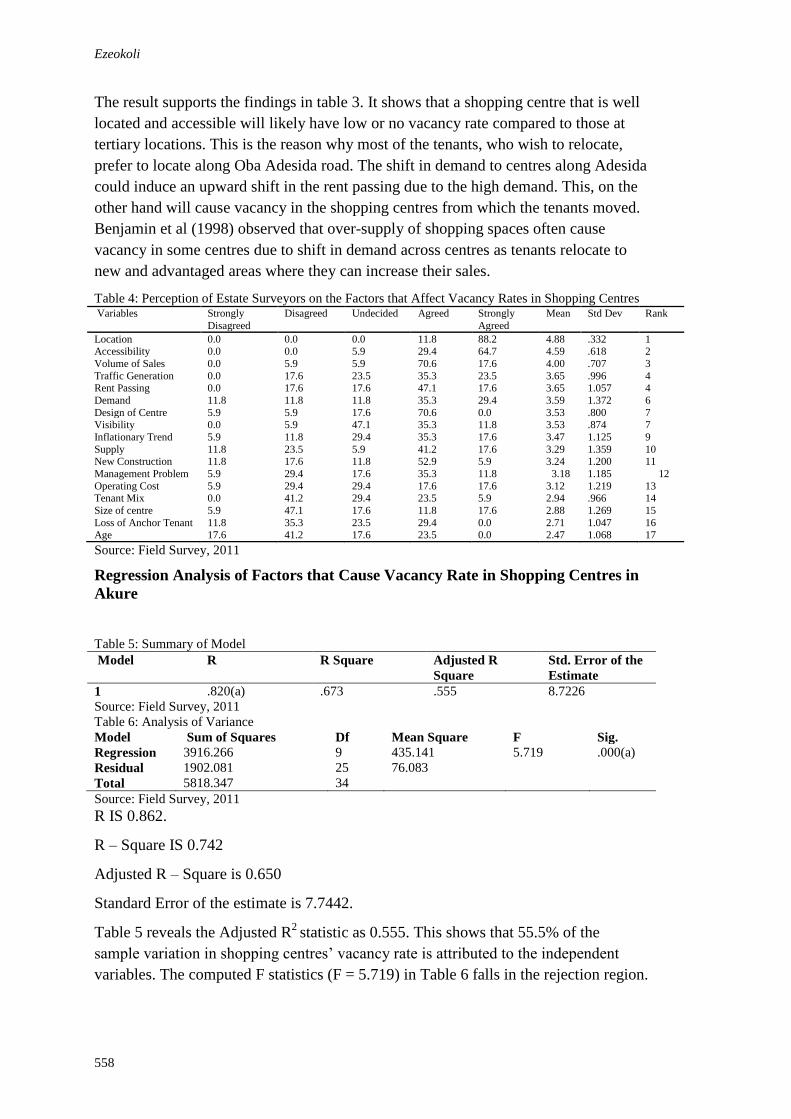
Ezeokoli
558
The result supports the findings in table 3. It shows that a shopping centre that is well
located and accessible will likely have low or no vacancy rate compared to those at
tertiary locations. This is the reason why most of the tenants, who wish to relocate,
prefer to locate along Oba Adesida road. The shift in demand to centres along Adesida
could induce an upward shift in the rent passing due to the high demand. This, on the
other hand will cause vacancy in the shopping centres from which the tenants moved.
Benjamin et al (1998) observed that over-supply of shopping spaces often cause
vacancy in some centres due to shift in demand across centres as tenants relocate to
new and advantaged areas where they can increase their sales.
Table 4: Perception of Estate Surveyors on the Factors that Affect Vacancy Rates in Shopping Centres Variables Strongly
Disagreed
Disagreed Undecided Agreed Strongly
Agreed
Mean Std Dev Rank
Location 0.0 0.0 0.0 11.8 88.2 4.88 .332 1 Accessibility 0.0 0.0 5.9 29.4 64.7 4.59 .618 2
Volume of Sales 0.0 5.9 5.9 70.6 17.6 4.00 .707 3
Traffic Generation 0.0 17.6 23.5 35.3 23.5 3.65 .996 4 Rent Passing 0.0 17.6 17.6 47.1 17.6 3.65 1.057 4
Demand 11.8 11.8 11.8 35.3 29.4 3.59 1.372 6
Design of Centre 5.9 5.9 17.6 70.6 0.0 3.53 .800 7 Visibility 0.0 5.9 47.1 35.3 11.8 3.53 .874 7
Inflationary Trend 5.9 11.8 29.4 35.3 17.6 3.47 1.125 9
Supply 11.8 23.5 5.9 41.2 17.6 3.29 1.359 10 New Construction 11.8 17.6 11.8 52.9 5.9 3.24 1.200 11
Management Problem 5.9 29.4 17.6 35.3 11.8 3.18 1.185 12
Operating Cost 5.9 29.4 29.4 17.6 17.6 3.12 1.219 13 Tenant Mix 0.0 41.2 29.4 23.5 5.9 2.94 .966 14
Size of centre 5.9 47.1 17.6 11.8 17.6 2.88 1.269 15
Loss of Anchor Tenant 11.8 35.3 23.5 29.4 0.0 2.71 1.047 16
Age 17.6 41.2 17.6 23.5 0.0 2.47 1.068 17
Source: Field Survey, 2011
Regression Analysis of Factors that Cause Vacancy Rate in Shopping Centres in
Akure
Table 5: Summary of Model
Model R R Square Adjusted R
Square
Std. Error of the
Estimate
1 .820(a) .673 .555 8.7226
Source: Field Survey, 2011
Table 6: Analysis of Variance
Model Sum of Squares Df Mean Square F Sig.
Regression 3916.266 9 435.141 5.719 .000(a)
Residual 1902.081 25 76.083
Total 5818.347 34
Source: Field Survey, 2011
R IS 0.862.
R – Square IS 0.742
Adjusted R – Square is 0.650
Standard Error of the estimate is 7.7442.
Table 5 reveals the Adjusted R2
statistic as 0.555. This shows that 55.5% of the
sample variation in shopping centres’ vacancy rate is attributed to the independent
variables. The computed F statistics (F = 5.719) in Table 6 falls in the rejection region.
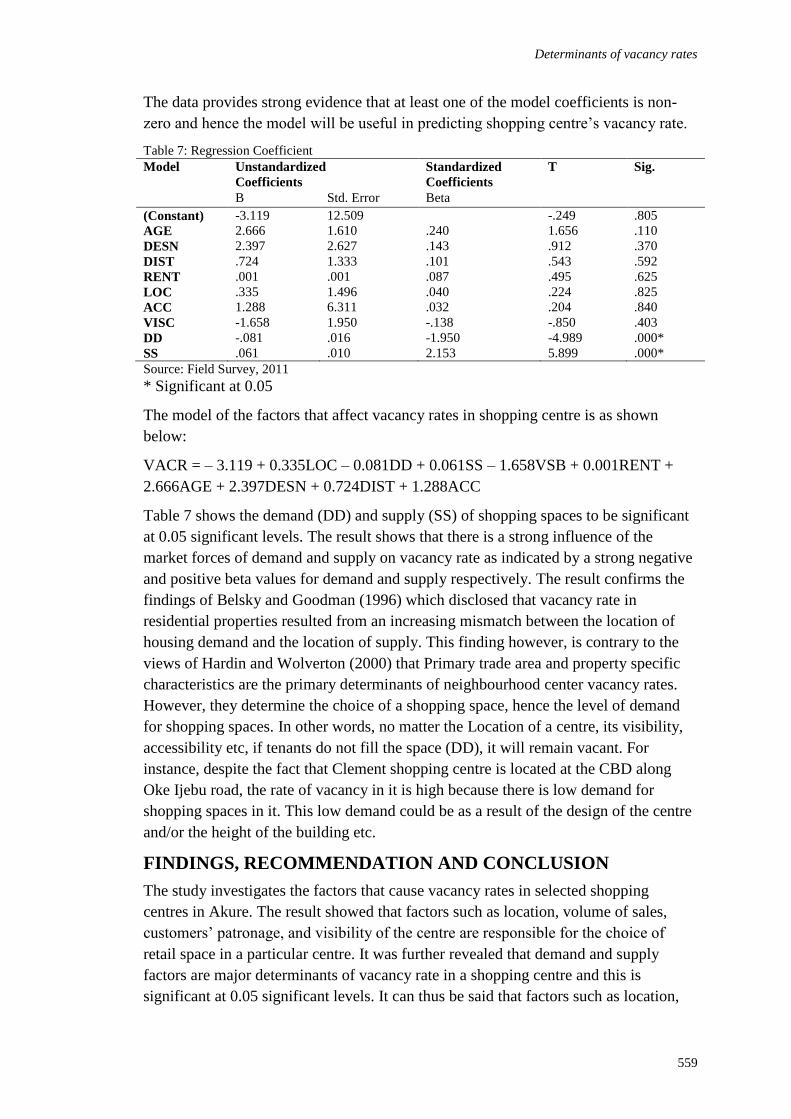
Determinants of vacancy rates
559
The data provides strong evidence that at least one of the model coefficients is non-
zero and hence the model will be useful in predicting shopping centre’s vacancy rate.
Table 7: Regression Coefficient
Model Unstandardized
Coefficients
Standardized
Coefficients
T Sig.
B Std. Error Beta
(Constant) -3.119 12.509 -.249 .805
AGE 2.666 1.610 .240 1.656 .110
DESN 2.397 2.627 .143 .912 .370
DIST .724 1.333 .101 .543 .592
RENT .001 .001 .087 .495 .625
LOC .335 1.496 .040 .224 .825
ACC 1.288 6.311 .032 .204 .840
VISC -1.658 1.950 -.138 -.850 .403
DD -.081 .016 -1.950 -4.989 .000*
SS .061 .010 2.153 5.899 .000*
Source: Field Survey, 2011
* Significant at 0.05
The model of the factors that affect vacancy rates in shopping centre is as shown
below:
VACR = – 3.119 + 0.335LOC – 0.081DD + 0.061SS – 1.658VSB + 0.001RENT +
2.666AGE + 2.397DESN + 0.724DIST + 1.288ACC
Table 7 shows the demand (DD) and supply (SS) of shopping spaces to be significant
at 0.05 significant levels. The result shows that there is a strong influence of the
market forces of demand and supply on vacancy rate as indicated by a strong negative
and positive beta values for demand and supply respectively. The result confirms the
findings of Belsky and Goodman (1996) which disclosed that vacancy rate in
residential properties resulted from an increasing mismatch between the location of
housing demand and the location of supply. This finding however, is contrary to the
views of Hardin and Wolverton (2000) that Primary trade area and property specific
characteristics are the primary determinants of neighbourhood center vacancy rates.
However, they determine the choice of a shopping space, hence the level of demand
for shopping spaces. In other words, no matter the Location of a centre, its visibility,
accessibility etc, if tenants do not fill the space (DD), it will remain vacant. For
instance, despite the fact that Clement shopping centre is located at the CBD along
Oke Ijebu road, the rate of vacancy in it is high because there is low demand for
shopping spaces in it. This low demand could be as a result of the design of the centre
and/or the height of the building etc.
FINDINGS, RECOMMENDATION AND CONCLUSION
The study investigates the factors that cause vacancy rates in selected shopping
centres in Akure. The result showed that factors such as location, volume of sales,
customers’ patronage, and visibility of the centre are responsible for the choice of
retail space in a particular centre. It was further revealed that demand and supply
factors are major determinants of vacancy rate in a shopping centre and this is
significant at 0.05 significant levels. It can thus be said that factors such as location,

Ezeokoli
560
accessibility, volume of sales, customers’ patronage etc indirectly affect vacancy rate
in shopping centres since they determine tenants’ choice of shopping space.
Developers need to study the location where demand for shopping spaces are high
before embarking on shopping centre’s development. Supply of shopping spaces in
poor areas like Oke Ijebu and Oke Aro will only increase the incidence of vacancies in
these areas thereby causing demand shift from such locations or centres to other
locations where sales can be maximized. Some retailers even prefer to stay in an open
space in front of a centre at the CBD and pay rent for such open space rather than take
up shopping spaces in centres were sales are poor. Therefore, demand and supply of
shopping spaces must be at equilibrium for a shopping centre not experience
vacancies. As demand for space in a particular centre increases, vacancy reduces and
vice versa. This also has effect on the performance of such centre in terms of rental
income received.
It is therefore, recommended that Estate Surveyors and Valuers as expert in the
property market should advice the property owners, especially shopping centres, on
best location where demand for shopping space is high returns at the optimal level.
REFERENCE
Belsky, E. and Goodman, J.L. (1996). Explaining the Vacancy Rate-Rent Paradox of the
1980s. Journal of Real Estate Research, 11(3), 309 – 323
Benjamin J.D., Jud, G.D, and Winkler, D.T. (1998), Retail Space Demand and Supply: An
Integrative Model
Chun, G.H., Eppli, M.J. and Shilling, J.D. (2001). A Simulation Analysis of the Relationship
between Retail Sales and Shopping Center Rents. Journal of Real Estate Research.
21(3), 164-185.
Colliers International (2010). Research and Forecasting UK Great Britain Retail.
www.colliers.com/uk
Costar Group (2010). Regional Real Estate Report, 9/13/10
Eppli, M.J. and Benjamin, J.D. (1994). The Evolution of Shopping Centre Research: A
Review and Analysis. Journal of Real Estate Research, 9(1). 5 – 32
Eppli, M.J. and Shilling, J.D. (1996). How Critical Is A Good Location To A Regional
Shopping Center? Journal of Real Estate Research, 12(3), 1 - 2.
Forgey, F.A., Goebel, P.R. and Nixon, B. (1995). Addressing tenant selection to maintain
shopping center success, Economic Development Review, 13(2), 56 - 59.
Gabriel, S.A. and Nothaft, F.E. (2001). Rental Housing Markets, the Incidence and Duration
of Vacancy, and the Natural Vacancy Rate. Journal of Urban Economics, 49, 121 –
149.
Grubb and Ellis, (2009). Oversupply of Space Causes Vacancy Hike. Grubb and Ellis
Company Atlanta, www.grubb-ellis.com, Honolulu.
Hagen, D.A. and Hansen, J.L. (2010). Rental Housing and the Natural Vacancy Rate. Journal
of Real Estate Research, 32(4), 413 – 433
Hardin III, W.G. and Wolverton, M.L. (2000). Micro-Market Determinants of Rental Rates.
Journal of Real estate Research, 20(3), 299 – 322
Determinants of vacancy rates
561
Hendershott, P.H. and Haurin, D.R. (1988). Adjustments in the Real Estate Market. Journal of
the American Real Estate and Urban Economics Association, 16(4), 343 – 354.
Hendershott, P.H., MacGregor, B.D. and Tse, R. (2002). Estimation of the Rental Adjustment
Process. Real Estate Economics, 30, 165 – 183.
Hudson, K. and Zimmerman, A. (2008). “Mall Glut to Clog Market for Years,” The Wall
Street Journal.
Jud, G.D., Benjamin, J.D. and Sirmans, G.S. (1996). What Do We Know about Apartments
and Their Markets? Journal of Real Estate Research, 11(3), 243 – 257.
Kothari, C. (2004). Research Methodology: Methods and Techniques. New Age International
Publishers Limited, New Delhi.
Mathews, G.K. (2007). Seattle Real Estate Market Review. www.gvakm.com
Ooi, J. T. L. and Sim, L. (2007). The magnetism of suburban shopping centres: do size and
Cineplex matter? Journal of Property Investment and Finance, 25(2), 111-135.
Ownbey, K.L., Davis, K. and Sundel, H.H. (1994). The Effect of Location Variables on the
Gross Rents of Neighbourhood Shopping Centres. Journal of Real Estate Research,
9(1), 111 - 123
Shilling, J.D., Sirmans, C.F. and Corgel, J.B. (1987). Price Adjustment Process for Rental
Office Space. Journal of Urban Economics, 17, 208 - 229.
Simmons, R.A. (1992). Site attributes in retail leasing: an analysis of a fast-food restaurant
market, The Appraisal Journal, 60 (4), 521 - 531.
Sirmans, G.S. and Benjamin, J.D. (1991). Determinants of Market Rent. Journal of Real
Estate Research, 6(3), 357 – 380.

Famakin, I.O., Aje, I.O. and Olajide, O.A. (2012) Assessment of bid evaluation strategies for
construction projects in Lagos State, Nigeria In: Laryea, S., Agyepong, S.A., Leiringer, R. and Hughes,
W. (Eds) Procs 4th West Africa Built Environment Research (WABER) Conference, 24-26 July 2012,
Abuja, Nigeria, 563-574.
563
ASSESSMENT OF BID EVALUATION STRATEGIES
FOR CONSTRUCTION PROJECTS IN LAGOS STATE,
NIGERIA
I. O. Famakin1, I. O. Aje and O. A. Olajide
Department of Quantity Surveying, Federal University of Technology, Akure, Nigeria
The selection of an appropriate contractor to execute a construction project is a tricky
and hard procedure thereby making bid evaluation one of the major challenges that
face clients and consultants in the construction sector. The study centres on the
assessment of bid evaluation strategies for construction projects in Lagos State.
Primary data were collected through the administration of questionnaire to practicing
construction professionals who have been involved in the evaluation of bids submitted
by contractors for construction works in Lagos state which were analyzed using the
Statistical Package for Social Sciences (SPSS). Mean Item Score was used for ranking
the identified bid evaluation strategies and the level of importance attached to bid
evaluation strategies for different construction projects. Chi-square test statistics was
used to determine the significance of the level of importance attached to bid
evaluation strategies. The study revealed that the lowest bidder system and past
performance and performance metrics are the most widely used bid evaluation
strategies in Lagos state while a high level of importance is attached to the lowest
bidder system and past performance and performance metrics respectively. It is
recommended that new and improved techniques of bid evaluation strategies should
be incorporated in the system for construction projects in Lagos State.
Keywords: bid, evaluation, strategy, Nigeria
INTRODUCTION
The construction industry is considered unique in that it stimulates the growth of the
other industrial sectors and contributes more to any country’s economy than the other
manufacturing or other services industry and its growth influences the country’s
development (Hillebrant, 1985). Fadamiro and Ogunsemi (1996) affirmed that the
construction industry is one of the largest single industries in the world which
contributes immensely to employment, gross fixed capital formation and gross
domestic products. In addition, Ibironke (2003) opined that the construction industry
is almost as old as nature itself and unlike many manufacturing industries; it is
concerned mostly with one-off projects. The construction industry is very important in
the economic development of any nation, especially in an expanding economy like
Nigeria.
Bid evaluation strategies are an important process which cannot be overlooked in the
construction process because it establishes the criteria for selecting a suitable
contractor once the decision to invite contractor to tender has been made
(Palaneesearan and Kumaraswamy, 2000). Bid evaluation in a multi-agent contracting

Famakin et al.
564
environment presents a challenging search problem. This problem is illustrated in the
client desire to achieve great value for money which often is not the case (Ahmed,
2007). In recent times, this process has been abused leading to delay in project
delivery which leads to cost overrun in terms in value, time and quality.
According to Hughes (1978), bid evaluation strategies is the overall planning,
controlling, coordinating and assessing the cost needed to execute a future project
from inception to completion aimed at meeting a client’s requirement and ensuring
completion on time within cost and the required quality standard. The need for study
on bid evaluation strategies in the construction industry has gained increased attention
in the last few years among researchers in the field of construction due to its
importance on the delivery of construction project and as a function of its influence on
the choice of contractor selection based on certain criteria. Factors necessitating
paradigm shift in the operations and service delivery of construction professionals in
contractor selection includes the increasing demand for value-added services and
prompt completion of construction projects at reduced cost by client (Akintoye, 2001),
complexity of modern construction infrastructure (Page, Pearson and Pryke, 2004) and
globalization (Smith, 2004; Peansupap, 2004).
This has made construction professionals to seek for strategies and tools to improve
the quality of their services in the frame of bid evaluation. Therefore, the study aims
to assess the various bid evaluation strategies being used in the study location, criteria
used for bid evaluation and factors affecting the use of the various bid evaluation
strategies using the questionnaire survey to get responses from respondents identified
for the study.
LITERATURE REVIEW
Bid evaluation in the construction industry
Bid evaluation is one of the major challenges that face clients and consultants in the
selection of contractors for construction works (Alsugair, 1999). This has enhanced
the use of several bid evaluation strategies to help clients (public and private) in
evaluating contractors’ bids and select the most appropriate one. In order to improve
effectiveness and efficiency of bid evaluation within the Nigerian construction
industry, it is critical to enhance the management of invitation and submission of bids
as well as the bid evaluation strategies in use because of its paramount role in the
project success.
Bid evaluation involves all the planned ways intended to achieve a purpose regarding
the bids submitted pertaining to a proposed project which thereby forms an opinion of
the amount, value or quality after proper examination. Strategy can be formulated only
after the objectives to be accomplished have been determined. There are various bid
evaluation strategies in use in the Nigerian construction industry today and they can
be classified into three and they are bid evaluation strategies based on cost
consideration framework, pre-qualification method and multi-criteria quantitative
method.
All tendering procedures and bid evaluation strategy are normally aimed at selecting
the most suitable contractor for a project and securing from him a suitable offer and
using this as a basis for an agreement for execution of the project (Aniekwu and
Bid evaluation strategies
565
Okpala, 1987). The different bid evaluation strategies used for construction projects in
Lagos State are classified into three groups which are discussed below:
BID EVALUATION STRATEGIES
Cost consideration framework
Among all factors that may affect the selection of a contractor, cost or price
consideration has for a long time been the basis of bid evaluation strategy in use in the
Nigerian construction industry. Although the lowest bidder system protects the public
from improper practices, it has certain disadvantages. These include unreasonable low
bids either accidentally or deliberately or unqualified contractor bidding which cause
extensive delay, cost overrun, quality problems and increased number of disputes
(Singh, 2005).
This shortcoming attached to its use in the Nigerian construction industry has called
for modification to be made to it as a bid evaluation strategy. Over the years some
modification to the lowest bidder system were made, such as reasonable bidder and
public interest which opens the door to other evaluation strategies to be adopted
instead of the single criterion system of the lowest bidder system.
Pre-Qualification method
To ensure the quality of contractors, bid evaluation strategy based on valuation can be
done beforehand with a prequalification method. Facing the client’s scrutiny regarding
the competency to handle the business aspects of the operation during prequalification
allows the contractor to focus on the specifics of the construction project once it has
passed through prequalification and been short-listed. This also allows the owner’s bid
evaluation strategy to focus only on the specific elements of the project, without being
distracted by the other business considerations.
In the simplest meaning prequalification is a before tendering procedure which allows
to choose the most appropriate candidates from amongst those declaring willingness
to participate in the tendering. Prequalification is defined by Moore (1985) as the
screening of construction contractors by project owners or their representatives
according to a predetermined set of criteria deemed necessary for successful project
performance, in order to determine the contractor’s competence or ability to
participate in the project bid. Clough (1986) asserts that prequalification means that
the firm which wants to participate in the tendering needs to be qualified before it can
be issued bidding documents or before it can submit a proposal.
The aim of prequalification is often not only contractor competence evaluation but
also limitation of potential bidders. In such a case it is necessary not only to judge
whether the contractor fulfills the basic criteria, but also to what degree are they
fulfilled. Bid evaluation strategy makes use of certain criteria during pre-qualification,
it should be noted that not all criteria are equally important for the client. The basic
issue is assigning the right weight to the criteria. However, bid evaluation strategy
Famakin et al.
566
based on pre-qualification method is not without its own shortcoming such as the time
lag between submission of bid and pre-qualification of the contractor.
Multi-criteria quantitative method
In most cases, it can be stated that contractor’s selection problem is a multi-criteria
problem. The complex nature of contractor selection has made the scope of bid
evaluation strategies to be widened to include the use of multi-criteria in the Nigerian
construction industry (Zavadskas, Liias and Turskis, 2008; Ginevicius and Podvezko,
2008; Turskis, 2008; Plebankiewicz, 2009). Bid evaluation strategies based on the
multi-criteria quantitative system does not consider cost as the only awarding reason,
but also considers other important attributes. The key of multi-criteria quantitative
system is that the selection process of the contractors is based on more attributes such
as bid price/cost, time, quality, managerial safety, accountability, competence and
sufficiency of contractors (Liu et al., 2000).
The main concept of the multi-criteria bidding system is that the selection process of
the contractors will be based on more attributes than just the price and the successful
bidder will be the one who has the highest combined bidding value of the multiple
attributes. The scores of those attributes are transformed into values and those values
of all the attributes are totaled to give the combined bidding value. One multi-criteria
model is the performance predicting system for contractor selection proposed by
Alarcon and Mourgues (2002). The proposed system utilizes a methodology that
predicts the potential performance of the contractors under analysis. The model takes
into account the most important characteristics of the contractor that influence project
performance such as contractor organization chart, contractor resources, project
location, project type and others.
Similar framework was introduced by Alsugair (1999). This framework proposed a
bid evaluation strategy by identifying 36 evaluation criteria which grouped into main
9 classes such as financial evaluation of the bid, bid understanding, completeness of
bid documents and others. Those factors were presented in question forms where the
evaluating score results from the score given against each question. The use of this bid
evaluation strategy in the Nigerian construction industry has improved the decision
taken in the selection of suitable contractor but likewise it has its own demerits in
regard to time wasting. Time is usually wasted during the compilation of the various
criteria and grading of the competing contractors based on the compiled multi-criteria.
Also, the calculation of the highest bidding value for the multi-criteria’s is very
complex and tiring and any mistake during such calculation will mislead the client in
the award of the contract which may have a harmful effect to the project delivery.
RESEARCH METHODOLOGY
The target population for the study were practicing construction professionals who
have participated in the process of evaluating bids submitted by contractors for
construction works in Lagos state. In order to have a defined sample size, the list of
practicing professionals who were financial members and who are based in the study
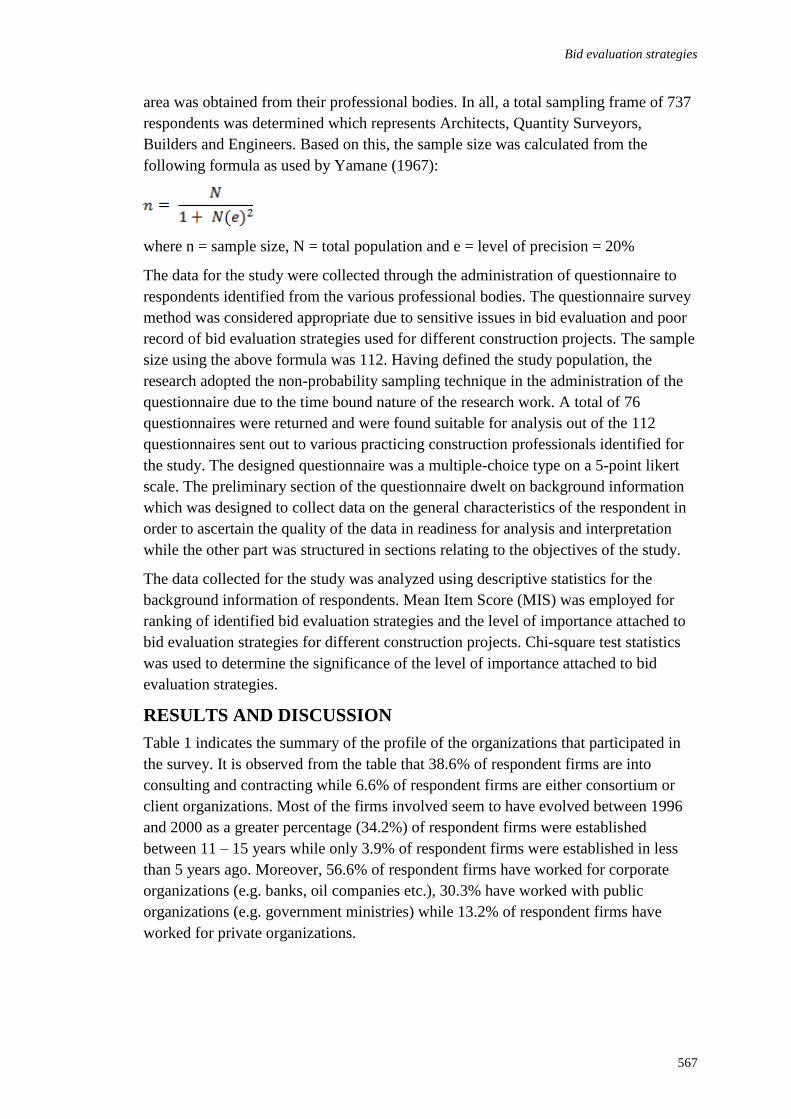
Bid evaluation strategies
567
area was obtained from their professional bodies. In all, a total sampling frame of 737
respondents was determined which represents Architects, Quantity Surveyors,
Builders and Engineers. Based on this, the sample size was calculated from the
following formula as used by Yamane (1967):
where n = sample size, N = total population and e = level of precision = 20%
The data for the study were collected through the administration of questionnaire to
respondents identified from the various professional bodies. The questionnaire survey
method was considered appropriate due to sensitive issues in bid evaluation and poor
record of bid evaluation strategies used for different construction projects. The sample
size using the above formula was 112. Having defined the study population, the
research adopted the non-probability sampling technique in the administration of the
questionnaire due to the time bound nature of the research work. A total of 76
questionnaires were returned and were found suitable for analysis out of the 112
questionnaires sent out to various practicing construction professionals identified for
the study. The designed questionnaire was a multiple-choice type on a 5-point likert
scale. The preliminary section of the questionnaire dwelt on background information
which was designed to collect data on the general characteristics of the respondent in
order to ascertain the quality of the data in readiness for analysis and interpretation
while the other part was structured in sections relating to the objectives of the study.
The data collected for the study was analyzed using descriptive statistics for the
background information of respondents. Mean Item Score (MIS) was employed for
ranking of identified bid evaluation strategies and the level of importance attached to
bid evaluation strategies for different construction projects. Chi-square test statistics
was used to determine the significance of the level of importance attached to bid
evaluation strategies.
RESULTS AND DISCUSSION
Table 1 indicates the summary of the profile of the organizations that participated in
the survey. It is observed from the table that 38.6% of respondent firms are into
consulting and contracting while 6.6% of respondent firms are either consortium or
client organizations. Most of the firms involved seem to have evolved between 1996
and 2000 as a greater percentage (34.2%) of respondent firms were established
between 11 – 15 years while only 3.9% of respondent firms were established in less
than 5 years ago. Moreover, 56.6% of respondent firms have worked for corporate
organizations (e.g. banks, oil companies etc.), 30.3% have worked with public
organizations (e.g. government ministries) while 13.2% of respondent firms have
worked for private organizations.
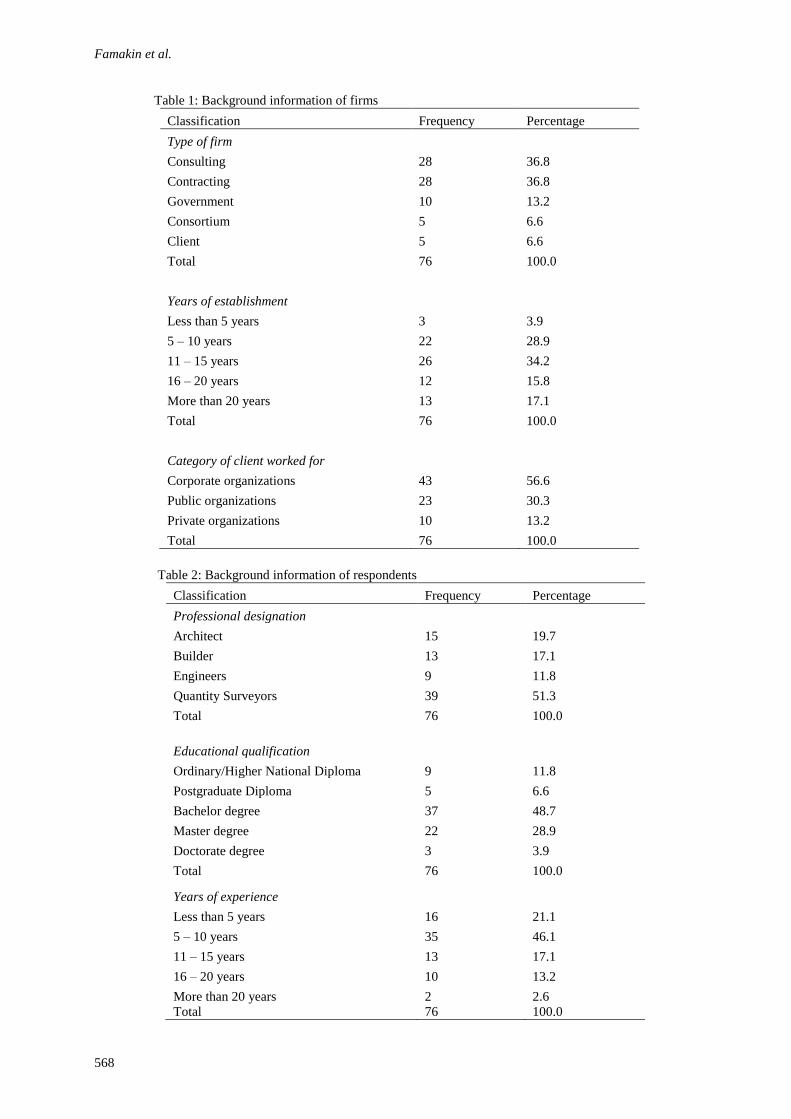
Famakin et al.
568
Table 1: Background information of firms
Classification Frequency Percentage
Type of firm
Consulting 28 36.8
Contracting 28 36.8
Government 10 13.2
Consortium 5 6.6
Client 5 6.6
Total 76 100.0
Years of establishment
Less than 5 years 3 3.9
5 – 10 years 22 28.9
11 – 15 years 26 34.2
16 – 20 years 12 15.8
More than 20 years 13 17.1
Total 76 100.0
Category of client worked for
Corporate organizations 43 56.6
Public organizations 23 30.3
Private organizations 10 13.2
Total 76 100.0
Table 2: Background information of respondents
Classification Frequency Percentage
Professional designation
Architect 15 19.7
Builder 13 17.1
Engineers 9 11.8
Quantity Surveyors 39 51.3
Total 76 100.0
Educational qualification
Ordinary/Higher National Diploma 9 11.8
Postgraduate Diploma 5 6.6
Bachelor degree 37 48.7
Master degree 22 28.9
Doctorate degree 3 3.9
Total 76 100.0
Years of experience
Less than 5 years 16 21.1
5 – 10 years 35 46.1
11 – 15 years 13 17.1
16 – 20 years 10 13.2
More than 20 years 2 2.6
Total 76 100.0
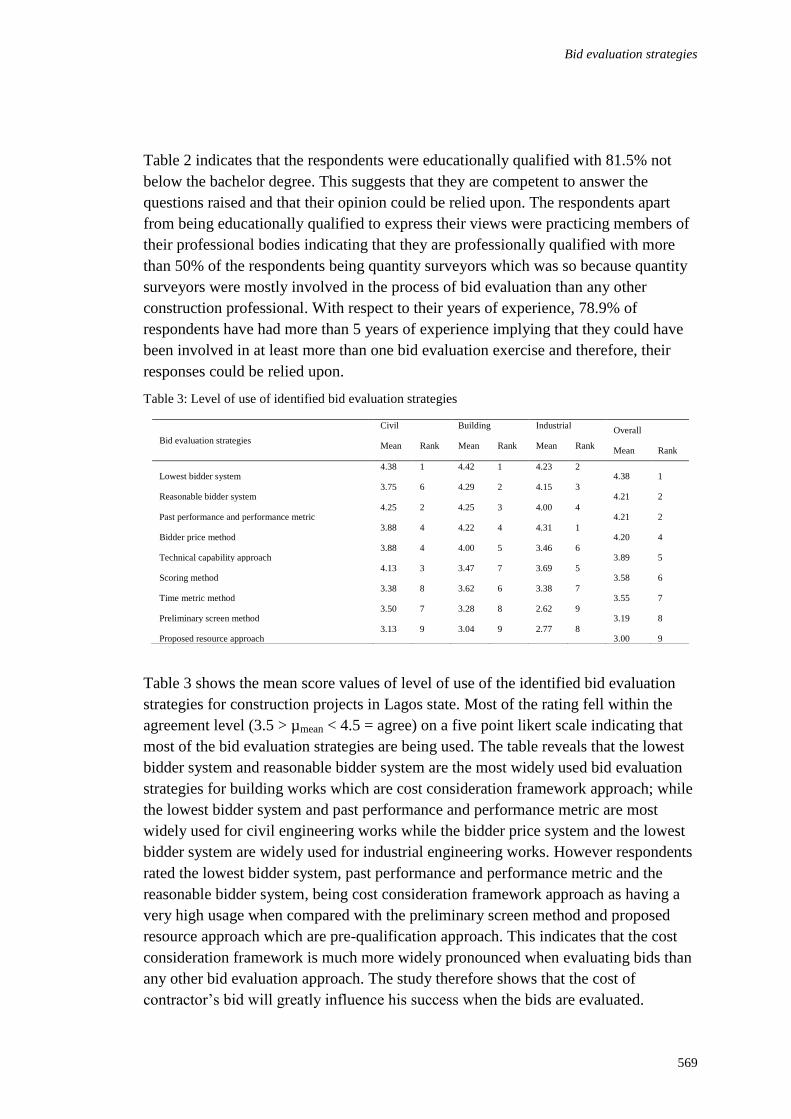
Bid evaluation strategies
569
Table 2 indicates that the respondents were educationally qualified with 81.5% not
below the bachelor degree. This suggests that they are competent to answer the
questions raised and that their opinion could be relied upon. The respondents apart
from being educationally qualified to express their views were practicing members of
their professional bodies indicating that they are professionally qualified with more
than 50% of the respondents being quantity surveyors which was so because quantity
surveyors were mostly involved in the process of bid evaluation than any other
construction professional. With respect to their years of experience, 78.9% of
respondents have had more than 5 years of experience implying that they could have
been involved in at least more than one bid evaluation exercise and therefore, their
responses could be relied upon.
Table 3: Level of use of identified bid evaluation strategies
Table 3 shows the mean score values of level of use of the identified bid evaluation
strategies for construction projects in Lagos state. Most of the rating fell within the
agreement level (3.5 > µmean < 4.5 = agree) on a five point likert scale indicating that
most of the bid evaluation strategies are being used. The table reveals that the lowest
bidder system and reasonable bidder system are the most widely used bid evaluation
strategies for building works which are cost consideration framework approach; while
the lowest bidder system and past performance and performance metric are most
widely used for civil engineering works while the bidder price system and the lowest
bidder system are widely used for industrial engineering works. However respondents
rated the lowest bidder system, past performance and performance metric and the
reasonable bidder system, being cost consideration framework approach as having a
very high usage when compared with the preliminary screen method and proposed
resource approach which are pre-qualification approach. This indicates that the cost
consideration framework is much more widely pronounced when evaluating bids than
any other bid evaluation approach. The study therefore shows that the cost of
contractor’s bid will greatly influence his success when the bids are evaluated.
Bid evaluation strategies
Civil Building Industrial Overall
Mean Rank Mean Rank Mean Rank Mean Rank
Lowest bidder system 4.38 1 4.42 1 4.23 2
4.38 1
Reasonable bidder system 3.75 6 4.29 2 4.15 3
4.21 2
Past performance and performance metric 4.25 2 4.25 3 4.00 4
4.21 2
Bidder price method 3.88 4 4.22 4 4.31 1
4.20 4
Technical capability approach 3.88 4 4.00 5 3.46 6
3.89 5
Scoring method 4.13 3 3.47 7 3.69 5
3.58 6
Time metric method 3.38 8 3.62 6 3.38 7
3.55 7
Preliminary screen method 3.50 7 3.28 8 2.62 9
3.19 8
Proposed resource approach 3.13 9 3.04 9 2.77 8
3.00 9
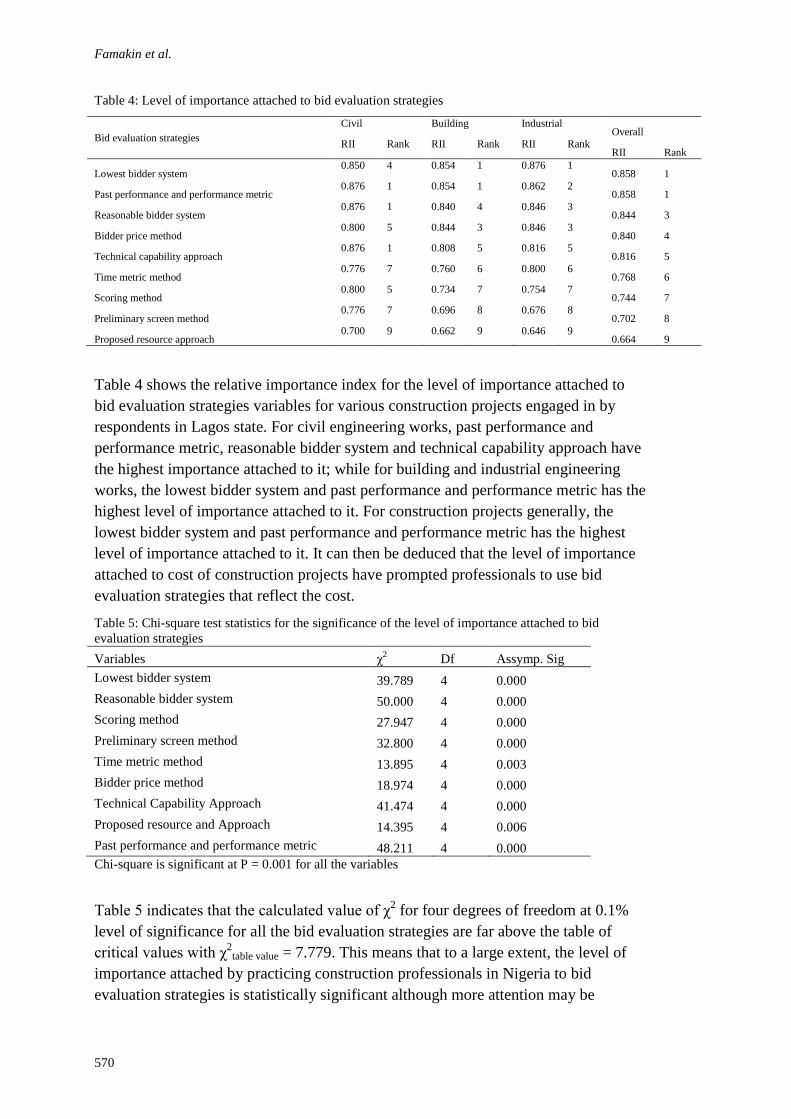
Famakin et al.
570
Table 4: Level of importance attached to bid evaluation strategies
Table 4 shows the relative importance index for the level of importance attached to
bid evaluation strategies variables for various construction projects engaged in by
respondents in Lagos state. For civil engineering works, past performance and
performance metric, reasonable bidder system and technical capability approach have
the highest importance attached to it; while for building and industrial engineering
works, the lowest bidder system and past performance and performance metric has the
highest level of importance attached to it. For construction projects generally, the
lowest bidder system and past performance and performance metric has the highest
level of importance attached to it. It can then be deduced that the level of importance
attached to cost of construction projects have prompted professionals to use bid
evaluation strategies that reflect the cost.
Table 5: Chi-square test statistics for the significance of the level of importance attached to bid
evaluation strategies
Variables χ2
Df Assymp. Sig
Lowest bidder system 39.789 4 0.000
Reasonable bidder system 50.000 4 0.000
Scoring method 27.947 4 0.000
Preliminary screen method 32.800 4 0.000
Time metric method 13.895 4 0.003
Bidder price method 18.974 4 0.000
Technical Capability Approach 41.474 4 0.000
Proposed resource and Approach 14.395 4 0.006
Past performance and performance metric 48.211 4 0.000
Chi-square is significant at P = 0.001 for all the variables
Table 5 indicates that the calculated value of χ2 for four degrees of freedom at 0.1%
level of significance for all the bid evaluation strategies are far above the table of
critical values with χ2
table value = 7.779. This means that to a large extent, the level of
importance attached by practicing construction professionals in Nigeria to bid
evaluation strategies is statistically significant although more attention may be
Bid evaluation strategies
Civil Building Industrial Overall
RII Rank RII Rank RII Rank RII Rank
Lowest bidder system 0.850 4 0.854 1 0.876 1
0.858 1
Past performance and performance metric 0.876 1 0.854 1 0.862 2
0.858 1
Reasonable bidder system 0.876 1 0.840 4 0.846 3
0.844 3
Bidder price method 0.800 5 0.844 3 0.846 3
0.840 4
Technical capability approach 0.876 1 0.808 5 0.816 5
0.816 5
Time metric method 0.776 7 0.760 6 0.800 6
0.768 6
Scoring method 0.800 5 0.734 7 0.754 7
0.744 7
Preliminary screen method 0.776 7 0.696 8 0.676 8
0.702 8
Proposed resource approach 0.700 9 0.662 9 0.646 9
0.664 9
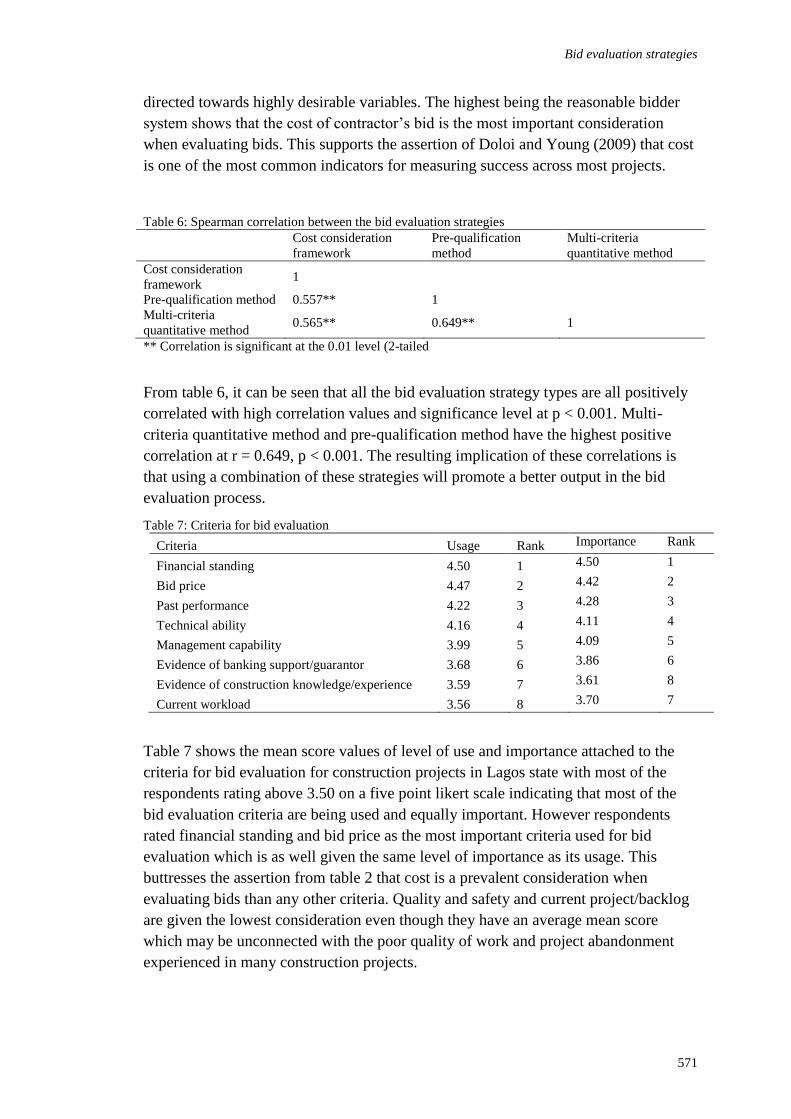
Bid evaluation strategies
571
directed towards highly desirable variables. The highest being the reasonable bidder
system shows that the cost of contractor’s bid is the most important consideration
when evaluating bids. This supports the assertion of Doloi and Young (2009) that cost
is one of the most common indicators for measuring success across most projects.
Table 6: Spearman correlation between the bid evaluation strategies
Cost consideration
framework
Pre-qualification
method
Multi-criteria
quantitative method
Cost consideration
framework 1
Pre-qualification method 0.557** 1
Multi-criteria
quantitative method 0.565** 0.649** 1
** Correlation is significant at the 0.01 level (2-tailed
From table 6, it can be seen that all the bid evaluation strategy types are all positively
correlated with high correlation values and significance level at p < 0.001. Multi-
criteria quantitative method and pre-qualification method have the highest positive
correlation at r = 0.649, p < 0.001. The resulting implication of these correlations is
that using a combination of these strategies will promote a better output in the bid
evaluation process.
Table 7: Criteria for bid evaluation
Criteria Usage Rank Importance Rank
Financial standing 4.50 1 4.50 1
Bid price 4.47 2 4.42 2
Past performance 4.22 3 4.28 3
Technical ability 4.16 4 4.11 4
Management capability 3.99 5 4.09 5
Evidence of banking support/guarantor 3.68 6 3.86 6
Evidence of construction knowledge/experience 3.59 7 3.61 8
Current workload 3.56 8 3.70 7
Table 7 shows the mean score values of level of use and importance attached to the
criteria for bid evaluation for construction projects in Lagos state with most of the
respondents rating above 3.50 on a five point likert scale indicating that most of the
bid evaluation criteria are being used and equally important. However respondents
rated financial standing and bid price as the most important criteria used for bid
evaluation which is as well given the same level of importance as its usage. This
buttresses the assertion from table 2 that cost is a prevalent consideration when
evaluating bids than any other criteria. Quality and safety and current project/backlog
are given the lowest consideration even though they have an average mean score
which may be unconnected with the poor quality of work and project abandonment
experienced in many construction projects.

Famakin et al.
572
Table 8: Factors affecting the use of bid evaluation strategies
Factors Mean Rank
Corruption and favoritism 4.00 1
Management and co-ordination 3.71 2
Government policies 3.51 3
Level of training 3.29 4
Research and development 3.25 5
Table 8 shows the factors affecting the use of bid evaluation strategies for
construction projects in Lagos state. From the table, corruption and favouritism was
ranked as the highest factor affecting the use of bid evaluation strategies with a mean
of 4.00 followed by management and co-ordination with a mean of 3.71.
CONCLUSION AND RECOMMENDATIONS
This study has shown that the lowest bidder system, past performance and
performance metric and reasonable bidder system approach appear to be used more
frequently in the bid evaluation process which gives more attention to cost
consideration. However, these variables have different level of importance attached to
them when evaluating bids from a wide range of construction projects. All the three
major bid evaluation strategies are highly positively correlated which shows that using
a combination of methods would help to improve the performance of construction
contractors.
The study further revealed that financial standing and price of contractor’s bid are the
most important criteria considered during the bid evaluation process which reveals
that the price of contractor’s bid will greatly determine the success of his bid; this will
be largely responsible for the indiscriminately low bids that contractors submit so that
they can win the contract and which resultantly affect most construction projects as
contractors may become insolvent or cut corners so that they can remain in business.
Similarly corruption and favouritism has been rated as having the highest factor that
affects the use of bid evaluation strategies which has made the process a routine
exercise as contractors to win the contract might even have been determined before
the process. Based on the findings of the study, the following recommendations are
being formulated:
Practicing construction professionals should embrace the combination of
methods in the process of bid evaluation so as to ensure that a better output is
gotten from the bidding process.
Cost should not be given utmost consideration in the choice of a suitable
contractor for a construction project.
Contractors with indiscriminately low bids should have their bids rejected so
that abandonment and delay in construction projects can be greatly reduced.
Bid evaluation strategies
573
Construction professionals who carry out bid evaluation should follow
professional ethics in carrying out their work so as to ensure that corruption
and favouritism is eliminated in the bid evaluation process.
REFERENCES
Ahmed, S. (2007). Factors affecting the selection of the appropriate construction management
at risk contractor. Fifth LACCEI International Latin American and Caribbean
Conference for Engineering and Technology on Developing Entrepreneurial
Engineers for the Sustainable Growth of Latin America and the Caribbean: Education,
Innovation, Technology and Practice” 29 May – 1 June 2007, Tampico, México.
Akintoye, A. (2001). Quantity surveying: an art or science? A researchers’ Perspective, in:
Moneke, G.O. (Ed.): Quantity Surveying and Total Cost Management, The Nigerian
Institute of Quantity Surveyors, Lagos, 19–41.
Alarcon, L. F. and Mourgues, C. (2002). Performance modeling for contractor selection.
Journal of Management in Engineering, 18(2), 52-60.
Alsugair, A. M. (1999). Framework for evaluating bids of construction contractors. Journal of
Management in Engineering, 15(2), 72-78.
Aniekwu, A. N. and Okpala, D. C. (1987). Contractual arrangements and the performance of
the Nigerian construction industry (the structural component). Construction
Management and Economics, 5(1), 3-11.
Clough, R. (1986). Construction contracting. New York: Wiley and Sons Ltd
Doloi, H. and Young, B. (2009). Achieving cost performance from the client’s, consultant’s
and contractor’s perspectives. Being a paper presented at the Construction and
Building Research Conference of the Royal Institution of Chartered Surveyors held at
the University of Cape Town on the 10th and 11
th September.
Fadamiro, J. A. and Ogunsemi, D. R. (1996). Fundamentals of building design, construction
and materials. Ile-Ife: Fancy Production Ltd.
Ginevicius, R. and Podvezko, V. (2008). Multi-criteria graphical analytical evaluation of the
financial state of construction enterprises. Technological and Economic Development
of Economy, 14(4), 452–46
Hillebrant, P. M. (1985). Economics theory and the construction industry. London: Macmillan
Publishers.
Hughes, G. A. (1978). The anatomy of quantity surveying (2nd ed.). London: The
construction press.
Ibironke, O. T. (2003) Construction finance. Birnin Kebbi: Timlab Quanticost.
Liu, S. L., Lai, K. K. and Wang, S. Y. (2000). Multiple criteria models for evaluation of
competitive bids. IMA Journal of Applied Mathematics in Business and Industry.
Moore, M. J. (1985). Selecting a contractor for fast-track projects: principles of contractor
evaluation. Plant Engineering, 39, 74–75.
Page, M., Pearson, S. and Pryke, S. (2004). Innovative and current practice in large UK
quantity surveying firms, RICS Foundation Research Paper Series 4, 25, Retrieved
May 16, 2009, from http://www.rics.foundation.org.
Palaneesearan, E. and Kumaraswamy, M. M. (2000). Contractor selection for design/build
projects. Journal of Construction Engineering and Management, 126(5), 331-339.
Famakin et al.
574
Peansupap, V. (2004). An exploratory approach to the diffusion of ICT in a project
environment. Thesis submitted to School of Property, Construction and Project
Management, RMIT University, Retrieved May 16, 2009, from
http://adt.ib.mit.edu.au/adt/public/adt - VIT 20050331.101946.1019461.
Plebankiewicz, E. (2009). Contractor prequalification model using fuzzy sets. Journal of Civil
Engineering and Management, 15(4), 377–385
Singh, D., Robert L. and Tiong, K. (2005). A fuzzy decision framework for contractor
selection. Journal of Construction Engineering and Management, 131, 62-70
Smith, P. (2004). Trends in Australian quantity surveying profession. Retrieved on May 16,
2009, from http://www.icoste.org/round.
Turskis, Z. (2008). Multi-attribute contractors ranking method by applying ordering of
feasible alternatives of solutions in terms of preferability technique. Technological
and Economic Development of Economy, 14(2), 224–239.
Yamane, T. (1967). Statistics: an introductory analysis (2nd ed.). New York: Harper and Row.
Zavadskas, E. K., Liias, R. and Turskis, Z. (2008). Multi-attribute decision-making methods
for assessment of quality in bridges and road construction: state-of-the-art surveys.
The Baltic Journal of Road and Bridge Engineering, 3(3), 152–160.
Fatoye, E.O. (2012) Contributing factors of delay in the Nigerian construction industry: A comparative
analysis with other selected countries In: Laryea, S., Agyepong, S.A., Leiringer, R. and Hughes, W.
(Eds) Procs 4th West Africa Built Environment Research (WABER) Conference, 24-26 July 2012,
Abuja, Nigeria, 575-587.
575
CONTRIBUTING FACTORS OF DELAY IN THE
NIGERIAN CONSTRUCTION INDUSTRY: A
COMPARATIVE ANALYSIS WITH OTHER SELECTED
COUNTRIES
Emmanuel O. Fatoye1
Department of Quantity Surveying, Lagos State Polytechnic, Lagos, Nigeria
Most construction projects are completed according to clients’ specification, but
rarely within planned completion period. This study attempted to identify the causes
delay in the Nigerian construction industry. The objectives of the study are to: (1)
identify and rank the most important causes of delay as perceived by various groups
of construction industry participants, (2) test the strength of agreement between the
rankings of any two groups of construction industry participants on importance of
individual causes, (3) compare the Nigeria situation with some selected countries. In
all 105 structured interviews were conducted and the result were used for the study.
From the study delayed payment, poor site management and supervision, and
inadequate resources respectively were ranked as the most important delay causes.
Comparing the result with literature in other countries showed that the most important
causes of construction delay in Nigeria are also true for other countries of the world.
The study recommended that clients should ensure adequate and available sources of
finance before commencement of projects so that honouring of interim certificates
could be done as at when due. Contracting organisations should pay more premiums
to providing relevant training programmes or short-time courses in reputable
organisations for their technical and managerial personnel.
Keywords: delays, time, project
INTRODUCTION
A successful construction project is said to be one that has accomplished its technical
performance, maintained its schedule and remained within budgetary provision
(Frimpong, Oluwoye and Crawford, 2003). According to Wright (1997), most projects
are eventually completed more or less to specification, but seldom on time and within
budget. In the survey of 8,000 projects by Frame in 1994, only 16% of them could
satisfy the three famous performance criteria: completing projects on time, within
budgeted cost and quality standard (Ameh, Soyingbe and Odusami, 2010). Hence time
and cost are the twin imperatives of clients. Out of many problems arising during
construction implementation, delays and cost overruns are two main concerns (Le-
Hoai, Lee and Lee, 2008).
In Nigeria particularly, according to Aibinu and Odeyinka (2006), the problem of
delays are severe, disruptive and expensive. They represent an area of leakages in the
construction industry. Kaliba, Muya and Mumba (2009) argued that clients’
Fatoye
576
satisfactions are compromised when project costs or schedules exceed their planned
targets. The funding profiles would no longer match the budget requirement and
further slippage in schedule could result. Processing time- and cost- related claims
associated with delays generate disputes and further delays. If the goals of any
construction project are to be achieved, the issues of time, cost, quality and users’
satisfaction become very relevant.
This paper aims at comparing time overrun in the Nigerian construction industry with
other selected countries. The objectives of the study are to:
identify and rank the most important causes of delay as perceived by various groups of
construction industry participants (the clients, consultants, and contractors).
test the strength of association between the rankings of any two groups of construction
industry participants on important delay factors.
compare the Nigeria situation with some selected countries
LITERATURE REVIEW
Completing projects on time is an indicator of efficiency and a measure of success or
viability (Ogunsemi and Jagboro, 2006; Sambasivan and Soon, 2007; Ahsan and
Gunawan, 2010). According to Chan and Kuramaswany (1997), Frimpong et al
(2003), a project is considered successful if it is completed on time, within budget and
to the specified quality standard. However, it becomes rare that a project is completed
within the scheduled time mostly because time is a commodity that is surrendered to
easily (Elinwa and Joshua, 2001). This results into turning profitable projects into
loosing ventures (Sweis, Sweis, Hammed and Shboul, 2008). The problem of
construction delays is a global phenomenon (Sambasivan and Soon, 2007) and the
Nigerian housing sector is no exception. Therefore, improving time performance of
construction projects still remains one of the challenges facing the construction
industry, especially in developing countries like Nigeria.
Construction delay refers to a situation where a construction project does not come to
completion within the planned time (Kaliba, Muya and Mumba (2009). According to
Kaming, Olomolaiye, Holt, and Harris (1997), Frimpong et al (2003), Assaf and Al-
Hejji (2006), construction delay is defined as the time overrun either beyond
completion date specified in a contract, or beyond the date that the parties agreed upon
for delivery of a project. Aibinu and Jagboro (2002) stated that delay is a situation
when the contractor and the client jointly and severally contribute to the non-
completion of the project within the original or the stipulated or agreed contract
period. The issue of construction delay is a global one (Sambasivan and Soon, 2007)
A preliminary investigation preceding the main study of Odeyinka and Yusif (1997) in
Nigeria indicated that seven out of ten (70%) housing projects surveyed suffered
delays during their execution. Odusami and Olusanya (2000) indicated that 38 out of
40 (95%) projects sampled in Lagos Metropolis experienced delay giving an average
percentage delay of 51% of planned duration. The study of Aibinu and Jagboro
(2002) revealed that the average time overrun of the building projects studied in
Nigeria were 92.64% and 59.23% of the estimated project duration for projects
Delay
577
ranging from 0 to 10million and 10million and above respectively. Okuwoga (1998)
in his own study claimed that the performance of public sector housing projects in
Nigeria in terms of cost and time parameters over the years is, to say the least,
unsatisfactory. The Nigerian construction industry is, therefore, said to be facing a
major criticism of growing rate of delays in project delivery and this has become
endemic (Aibinu and Jagboro, 2002).
In other countries like Hong Kong, the study of Kumaraswamy and Chan (1998)
indicated that project delays are fairly common with a mean of 37%. In Saudi Arabia,
70% of construction projects experienced time overrun beyond the scheduled
completion dates and the average of time overrun was between 10% and 30% of the
original duration (Assaf and Al-Hejji, 2006). According to Sambasivan and Soon
(2007), about 17.3% (of 417 government contracts) in Malaysia were considered sick
(more than 3 months of delay or abandonment). In a preliminary survey conducted by
Frimpong et al (2003), of 47 groundwater projects completed in Ghana between 1970
and 1999, the data revealed that 75% of them exceeded the original project schedule.
Financial difficulties faced by contractors, too many change orders from owners, poor
planning and scheduling of the project by the contractors were the major sources of
delays in Jordan (Sweis et al, 2008). It was stressed that contractors’ financial
difficulties were traceable to the natural result of the competitive nature of the
industry where the small size and the independent nature of most residential often lead
them to underbidding rivals to win contracts. In the Malaysian construction industry,
the causes of delay were identified by Sambasivan and Soon (2007), as contractors’
poor site management (contractor-related), inadequate contractors’ experience
(contractor-related), inadequate clients’ finance and payments for completed work
(client-related) and problems with sub-contractors (construction-related) were among
the ten most important causes.
Late delivery of construction materials is responsible for nearly 25 percent of the total
project delays in Kuwait (Koushki and Kartam, 2004). According to them, the larger
and costlier projects experienced longer time delays and higher cost increases due to
the late delivery of their construction materials. Frimpong et al. (2003) identified five
most important factors causing delay in underground construction projects in Ghana
(agreed by the owners, contractors and consultants) as monthly payment difficulties
from agencies, poor contractor management, material procurement, poor technical
performance and escalation of material prices.
STUDY METHODOLOGY
Data were collected using structured interviews which were designed to obtain in-
depth factors causing delays. This is in a bid to eliminate personal barrier and get
direct and reliable information. The interviews were conducted with the assistance of
educated, well trained and experienced interviewers within the building industry. They
were trained to be friendly, objective, tactful and well mannered. The structured
interviews were administered on key construction industry participants i.e. the clients,
consultants and contractors organisations which are represented by architects,
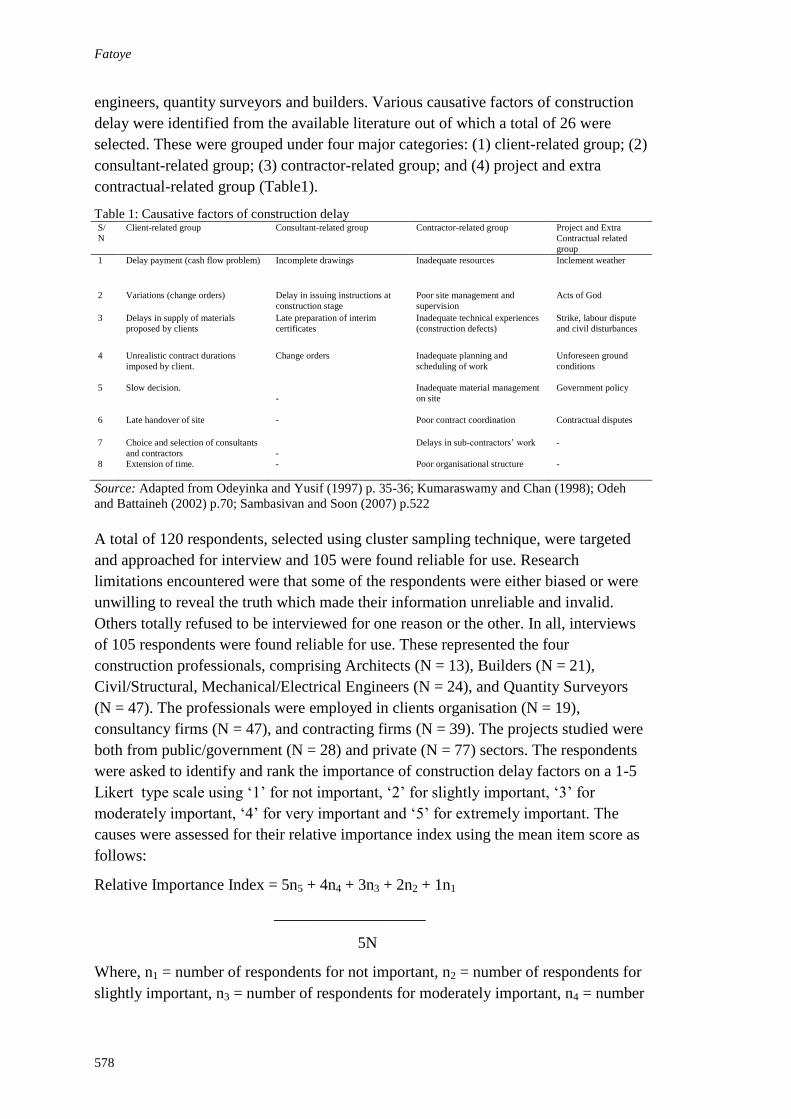
Fatoye
578
engineers, quantity surveyors and builders. Various causative factors of construction
delay were identified from the available literature out of which a total of 26 were
selected. These were grouped under four major categories: (1) client-related group; (2)
consultant-related group; (3) contractor-related group; and (4) project and extra
contractual-related group (Table1).
Table 1: Causative factors of construction delay S/
N
Client-related group Consultant-related group Contractor-related group Project and Extra
Contractual related
group
1 Delay payment (cash flow problem)
Incomplete drawings
Inadequate resources
Inclement weather
2 Variations (change orders) Delay in issuing instructions at
construction stage
Poor site management and
supervision
Acts of God
3 Delays in supply of materials
proposed by clients
Late preparation of interim
certificates
Inadequate technical experiences
(construction defects)
Strike, labour dispute
and civil disturbances
4 Unrealistic contract durations
imposed by client.
Change orders
Inadequate planning and
scheduling of work
Unforeseen ground
conditions
5 Slow decision.
-
Inadequate material management
on site
Government policy
6 Late handover of site - Poor contract coordination
Contractual disputes
7 Choice and selection of consultants
and contractors
-
Delays in sub-contractors’ work
-
8 Extension of time. - Poor organisational structure
-
Source: Adapted from Odeyinka and Yusif (1997) p. 35-36; Kumaraswamy and Chan (1998); Odeh
and Battaineh (2002) p.70; Sambasivan and Soon (2007) p.522
A total of 120 respondents, selected using cluster sampling technique, were targeted
and approached for interview and 105 were found reliable for use. Research
limitations encountered were that some of the respondents were either biased or were
unwilling to reveal the truth which made their information unreliable and invalid.
Others totally refused to be interviewed for one reason or the other. In all, interviews
of 105 respondents were found reliable for use. These represented the four
construction professionals, comprising Architects (N = 13), Builders (N = 21),
Civil/Structural, Mechanical/Electrical Engineers (N = 24), and Quantity Surveyors
(N = 47). The professionals were employed in clients organisation (N = 19),
consultancy firms (N = 47), and contracting firms (N = 39). The projects studied were
both from public/government (N = 28) and private (N = 77) sectors. The respondents
were asked to identify and rank the importance of construction delay factors on a 1-5
Likert type scale using ‘1’ for not important, ‘2’ for slightly important, ‘3’ for
moderately important, ‘4’ for very important and ‘5’ for extremely important. The
causes were assessed for their relative importance index using the mean item score as
follows:
Relative Importance Index = 5n5 + 4n4 + 3n3 + 2n2 + 1n1
___________________
5N
Where, n1 = number of respondents for not important, n2 = number of respondents for
slightly important, n3 = number of respondents for moderately important, n4 = number
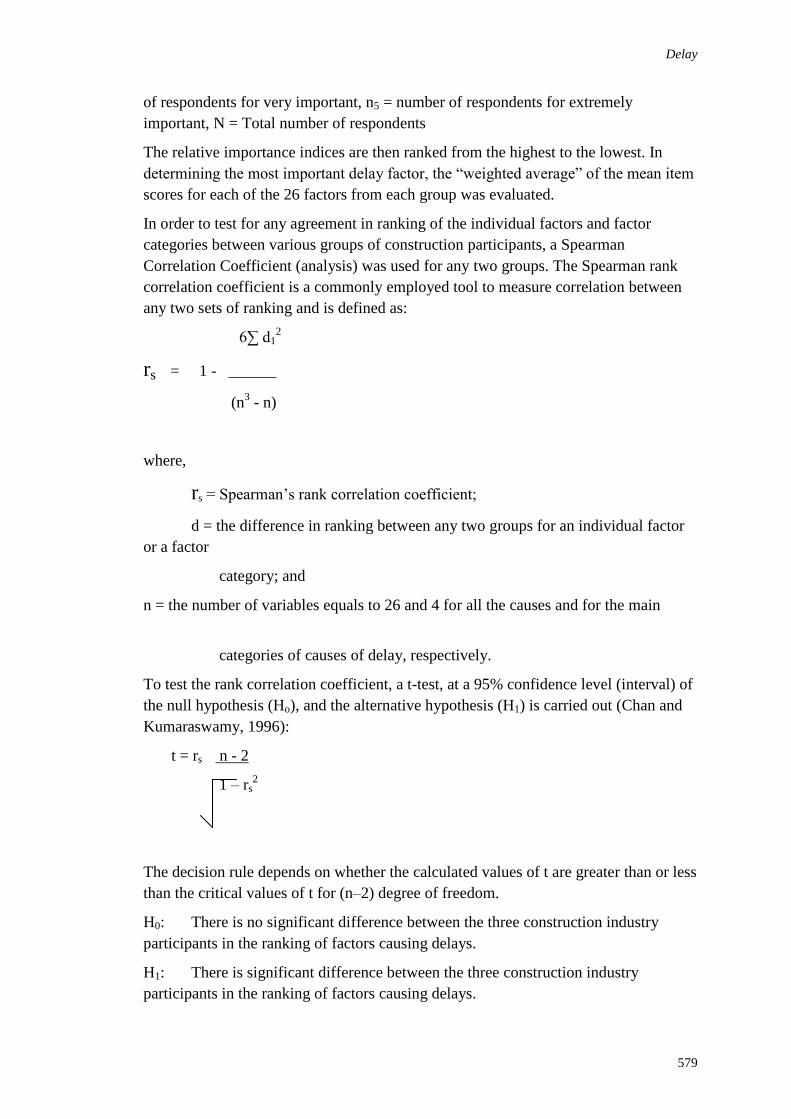
Delay
579
of respondents for very important, n5 = number of respondents for extremely
important, N = Total number of respondents
The relative importance indices are then ranked from the highest to the lowest. In
determining the most important delay factor, the “weighted average” of the mean item
scores for each of the 26 factors from each group was evaluated.
In order to test for any agreement in ranking of the individual factors and factor
categories between various groups of construction participants, a Spearman
Correlation Coefficient (analysis) was used for any two groups. The Spearman rank
correlation coefficient is a commonly employed tool to measure correlation between
any two sets of ranking and is defined as:
6∑ d12
rs = 1 - ______
(n3 - n)
where,
rs = Spearman’s rank correlation coefficient;
d = the difference in ranking between any two groups for an individual factor
or a factor
category; and
n = the number of variables equals to 26 and 4 for all the causes and for the main
categories of causes of delay, respectively.
To test the rank correlation coefficient, a t-test, at a 95% confidence level (interval) of
the null hypothesis (Ho), and the alternative hypothesis (H1) is carried out (Chan and
Kumaraswamy, 1996):
t = rs n - 2
1 – rs2
The decision rule depends on whether the calculated values of t are greater than or less
than the critical values of t for (n–2) degree of freedom.
H0: There is no significant difference between the three construction industry
participants in the ranking of factors causing delays.
H1: There is significant difference between the three construction industry
participants in the ranking of factors causing delays.
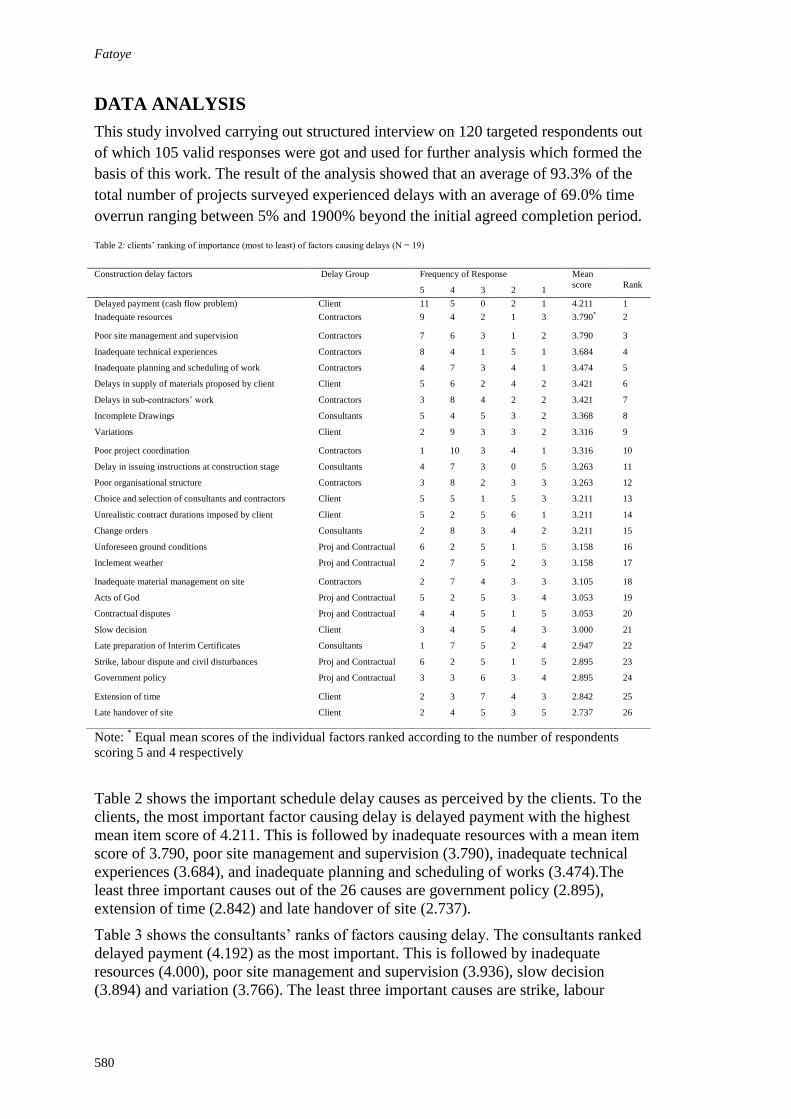
Fatoye
580
DATA ANALYSIS
This study involved carrying out structured interview on 120 targeted respondents out
of which 105 valid responses were got and used for further analysis which formed the
basis of this work. The result of the analysis showed that an average of 93.3% of the
total number of projects surveyed experienced delays with an average of 69.0% time
overrun ranging between 5% and 1900% beyond the initial agreed completion period.
Note: * Equal mean scores of the individual factors ranked according to the number of respondents
scoring 5 and 4 respectively
Table 2 shows the important schedule delay causes as perceived by the clients. To the
clients, the most important factor causing delay is delayed payment with the highest
mean item score of 4.211. This is followed by inadequate resources with a mean item
score of 3.790, poor site management and supervision (3.790), inadequate technical
experiences (3.684), and inadequate planning and scheduling of works (3.474).The
least three important causes out of the 26 causes are government policy (2.895),
extension of time (2.842) and late handover of site (2.737).
Table 3 shows the consultants’ ranks of factors causing delay. The consultants ranked
delayed payment (4.192) as the most important. This is followed by inadequate
resources (4.000), poor site management and supervision (3.936), slow decision
(3.894) and variation (3.766). The least three important causes are strike, labour
Table 2: clients’ ranking of importance (most to least) of factors causing delays (N = 19)
Construction delay factors
Delay Group Frequency of Response Mean
score
Rank 5 4 3 2 1
Delayed payment (cash flow problem) Client 11 5 0 2 1 4.211 1
Inadequate resources Contractors 9 4 2 1 3 3.790* 2
Poor site management and supervision Contractors 7 6 3 1 2 3.790 3
Inadequate technical experiences Contractors 8 4 1 5 1 3.684 4
Inadequate planning and scheduling of work Contractors 4 7 3 4 1 3.474 5
Delays in supply of materials proposed by client Client 5 6 2 4 2 3.421 6
Delays in sub-contractors’ work Contractors 3 8 4 2 2 3.421 7
Incomplete Drawings Consultants 5 4 5 3 2 3.368 8
Variations Client 2 9 3 3 2 3.316 9
Poor project coordination Contractors 1 10 3 4 1 3.316 10
Delay in issuing instructions at construction stage Consultants 4 7 3 0 5 3.263 11
Poor organisational structure Contractors 3 8 2 3 3 3.263 12
Choice and selection of consultants and contractors Client 5 5 1 5 3 3.211 13
Unrealistic contract durations imposed by client Client 5 2 5 6 1 3.211 14
Change orders Consultants 2 8 3 4 2 3.211 15
Unforeseen ground conditions Proj and Contractual 6 2 5 1 5 3.158 16
Inclement weather Proj and Contractual 2 7 5 2 3 3.158 17
Inadequate material management on site Contractors 2 7 4 3 3 3.105 18
Acts of God Proj and Contractual 5 2 5 3 4 3.053 19
Contractual disputes Proj and Contractual 4 4 5 1 5 3.053 20
Slow decision Client 3 4 5 4 3 3.000 21
Late preparation of Interim Certificates Consultants 1 7 5 2 4 2.947 22
Strike, labour dispute and civil disturbances Proj and Contractual 6 2 5 1 5 2.895 23
Government policy Proj and Contractual 3 3 6 3 4 2.895 24
Extension of time Client 2 3 7 4 3 2.842 25
Late handover of site Client 2 4 5 3 5 2.737 26
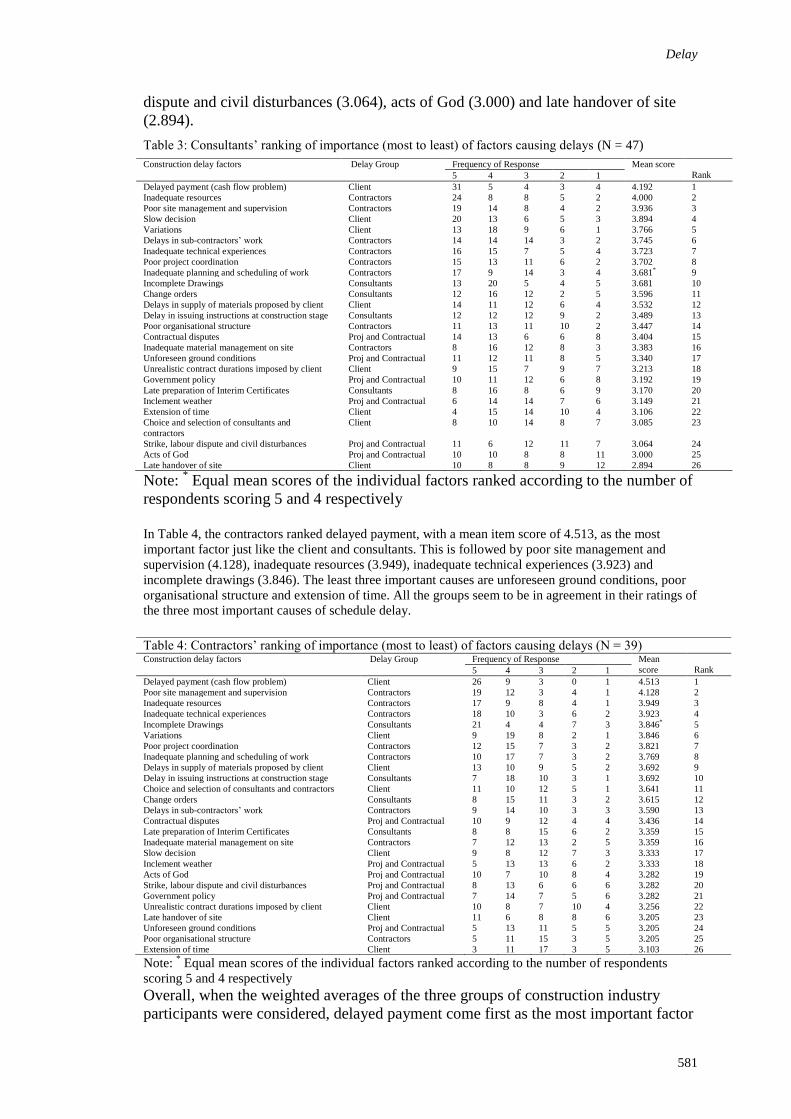
Delay
581
dispute and civil disturbances (3.064), acts of God (3.000) and late handover of site
(2.894).
Table 3: Consultants’ ranking of importance (most to least) of factors causing delays (N = 47)
Note: * Equal mean scores of the individual factors ranked according to the number of
respondents scoring 5 and 4 respectively
In Table 4, the contractors ranked delayed payment, with a mean item score of 4.513, as the most
important factor just like the client and consultants. This is followed by poor site management and
supervision (4.128), inadequate resources (3.949), inadequate technical experiences (3.923) and
incomplete drawings (3.846). The least three important causes are unforeseen ground conditions, poor
organisational structure and extension of time. All the groups seem to be in agreement in their ratings of
the three most important causes of schedule delay.
Note: * Equal mean scores of the individual factors ranked according to the number of respondents
scoring 5 and 4 respectively
Overall, when the weighted averages of the three groups of construction industry
participants were considered, delayed payment come first as the most important factor
Construction delay factors
Delay Group Frequency of Response Mean score
Rank 5 4 3 2 1
Delayed payment (cash flow problem) Client 31 5 4 3 4 4.192 1
Inadequate resources Contractors 24 8 8 5 2 4.000 2
Poor site management and supervision Contractors 19 14 8 4 2 3.936 3
Slow decision Client 20 13 6 5 3 3.894 4
Variations Client 13 18 9 6 1 3.766 5
Delays in sub-contractors’ work Contractors 14 14 14 3 2 3.745 6
Inadequate technical experiences Contractors 16 15 7 5 4 3.723 7
Poor project coordination Contractors 15 13 11 6 2 3.702 8
Inadequate planning and scheduling of work Contractors 17 9 14 3 4 3.681* 9
Incomplete Drawings Consultants 13 20 5 4 5 3.681 10
Change orders Consultants 12 16 12 2 5 3.596 11
Delays in supply of materials proposed by client Client 14 11 12 6 4 3.532 12
Delay in issuing instructions at construction stage Consultants 12 12 12 9 2 3.489 13
Poor organisational structure Contractors 11 13 11 10 2 3.447 14
Contractual disputes Proj and Contractual 14 13 6 6 8 3.404 15
Inadequate material management on site Contractors 8 16 12 8 3 3.383 16
Unforeseen ground conditions Proj and Contractual 11 12 11 8 5 3.340 17
Unrealistic contract durations imposed by client Client 9 15 7 9 7 3.213 18
Government policy Proj and Contractual 10 11 12 6 8 3.192 19
Late preparation of Interim Certificates Consultants 8 16 8 6 9 3.170 20
Inclement weather Proj and Contractual 6 14 14 7 6 3.149 21
Extension of time Client 4 15 14 10 4 3.106 22
Choice and selection of consultants and
contractors
Client 8 10 14 8 7 3.085 23
Strike, labour dispute and civil disturbances Proj and Contractual 11 6 12 11 7 3.064 24
Acts of God Proj and Contractual 10 10 8 8 11 3.000 25
Late handover of site Client 10 8 8 9 12 2.894 26
Table 4: Contractors’ ranking of importance (most to least) of factors causing delays (N = 39) Construction delay factors
Delay Group Frequency of Response Mean
score
Rank 5 4 3 2 1
Delayed payment (cash flow problem) Client 26 9 3 0 1 4.513 1
Poor site management and supervision Contractors 19 12 3 4 1 4.128 2
Inadequate resources Contractors 17 9 8 4 1 3.949 3
Inadequate technical experiences Contractors 18 10 3 6 2 3.923 4
Incomplete Drawings Consultants 21 4 4 7 3 3.846* 5
Variations Client 9 19 8 2 1 3.846 6
Poor project coordination Contractors 12 15 7 3 2 3.821 7
Inadequate planning and scheduling of work Contractors 10 17 7 3 2 3.769 8
Delays in supply of materials proposed by client Client 13 10 9 5 2 3.692 9
Delay in issuing instructions at construction stage Consultants 7 18 10 3 1 3.692 10
Choice and selection of consultants and contractors Client 11 10 12 5 1 3.641 11
Change orders Consultants 8 15 11 3 2 3.615 12
Delays in sub-contractors’ work Contractors 9 14 10 3 3 3.590 13
Contractual disputes Proj and Contractual 10 9 12 4 4 3.436 14
Late preparation of Interim Certificates Consultants 8 8 15 6 2 3.359 15
Inadequate material management on site Contractors 7 12 13 2 5 3.359 16
Slow decision Client 9 8 12 7 3 3.333 17
Inclement weather Proj and Contractual 5 13 13 6 2 3.333 18
Acts of God Proj and Contractual 10 7 10 8 4 3.282 19
Strike, labour dispute and civil disturbances Proj and Contractual 8 13 6 6 6 3.282 20
Government policy Proj and Contractual 7 14 7 5 6 3.282 21
Unrealistic contract durations imposed by client Client 10 8 7 10 4 3.256 22
Late handover of site Client 11 6 8 8 6 3.205 23
Unforeseen ground conditions Proj and Contractual 5 13 11 5 5 3.205 24
Poor organisational structure Contractors 5 11 15 3 5 3.205 25
Extension of time Client 3 11 17 3 5 3.103 26
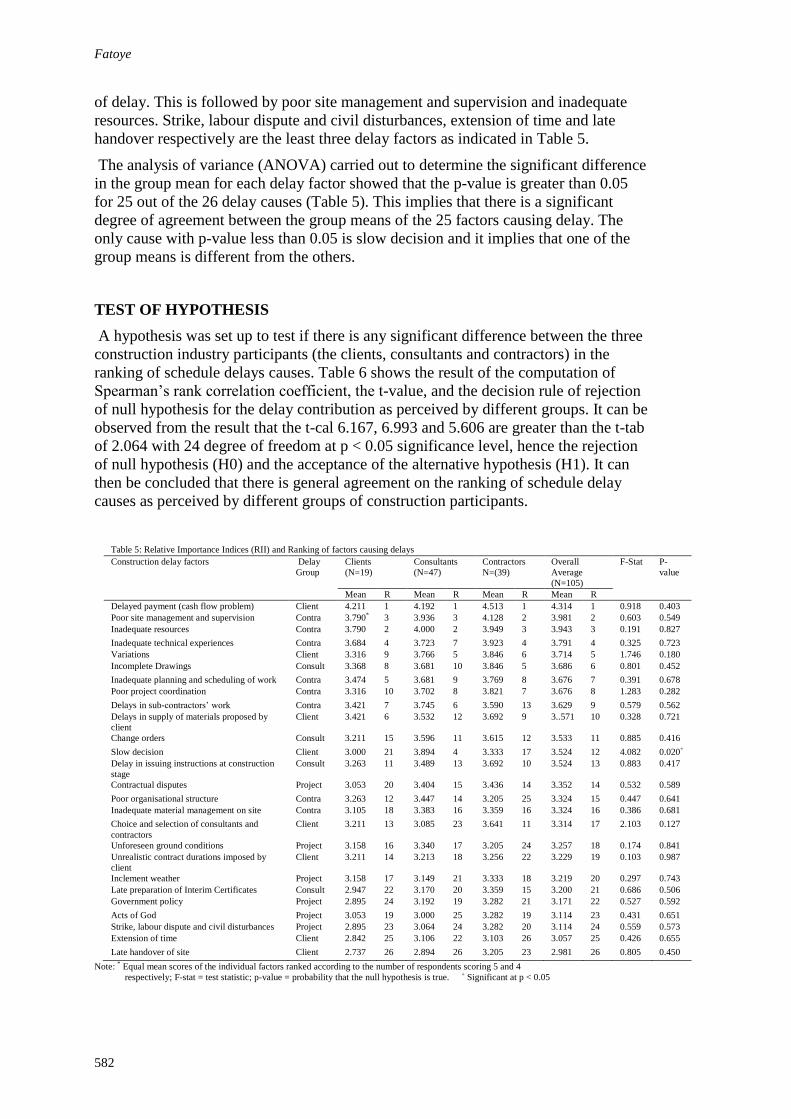
Fatoye
582
of delay. This is followed by poor site management and supervision and inadequate
resources. Strike, labour dispute and civil disturbances, extension of time and late
handover respectively are the least three delay factors as indicated in Table 5.
The analysis of variance (ANOVA) carried out to determine the significant difference
in the group mean for each delay factor showed that the p-value is greater than 0.05
for 25 out of the 26 delay causes (Table 5). This implies that there is a significant
degree of agreement between the group means of the 25 factors causing delay. The
only cause with p-value less than 0.05 is slow decision and it implies that one of the
group means is different from the others.
TEST OF HYPOTHESIS
A hypothesis was set up to test if there is any significant difference between the three
construction industry participants (the clients, consultants and contractors) in the
ranking of schedule delays causes. Table 6 shows the result of the computation of
Spearman’s rank correlation coefficient, the t-value, and the decision rule of rejection
of null hypothesis for the delay contribution as perceived by different groups. It can be
observed from the result that the t-cal 6.167, 6.993 and 5.606 are greater than the t-tab
of 2.064 with 24 degree of freedom at p < 0.05 significance level, hence the rejection
of null hypothesis (H0) and the acceptance of the alternative hypothesis (H1). It can
then be concluded that there is general agreement on the ranking of schedule delay
causes as perceived by different groups of construction participants.
Table 5: Relative Importance Indices (RII) and Ranking of factors causing delays
Construction delay factors
Delay
Group
Clients
(N=19)
Consultants
(N=47)
Contractors
N=(39)
Overall
Average
(N=105)
F-Stat P-
value
Mean R Mean R Mean R Mean R
Delayed payment (cash flow problem) Client 4.211 1 4.192 1 4.513 1 4.314 1 0.918 0.403
Poor site management and supervision Contra 3.790* 3 3.936 3 4.128 2 3.981 2 0.603 0.549
Inadequate resources Contra 3.790 2 4.000 2 3.949 3 3.943 3 0.191 0.827
Inadequate technical experiences Contra 3.684 4 3.723 7 3.923 4 3.791 4 0.325 0.723
Variations Client 3.316 9 3.766 5 3.846 6 3.714 5 1.746 0.180
Incomplete Drawings Consult 3.368 8 3.681 10 3.846 5 3.686 6 0.801 0.452
Inadequate planning and scheduling of work Contra 3.474 5 3.681 9 3.769 8 3.676 7 0.391 0.678
Poor project coordination Contra 3.316 10 3.702 8 3.821 7 3.676 8 1.283 0.282
Delays in sub-contractors’ work Contra 3.421 7 3.745 6 3.590 13 3.629 9 0.579 0.562
Delays in supply of materials proposed by
client
Client 3.421 6 3.532 12 3.692 9 3..571 10 0.328 0.721
Change orders Consult 3.211 15 3.596 11 3.615 12 3.533 11 0.885 0.416
Slow decision Client 3.000 21 3.894 4 3.333 17 3.524 12 4.082 0.020+
Delay in issuing instructions at construction
stage
Consult 3.263 11 3.489 13 3.692 10 3.524 13 0.883 0.417
Contractual disputes Project 3.053 20 3.404 15 3.436 14 3.352 14 0.532 0.589
Poor organisational structure Contra 3.263 12 3.447 14 3.205 25 3.324 15 0.447 0.641
Inadequate material management on site Contra 3.105 18 3.383 16 3.359 16 3.324 16 0.386 0.681
Choice and selection of consultants and
contractors
Client 3.211 13 3.085 23 3.641 11 3.314 17 2.103 0.127
Unforeseen ground conditions Project 3.158 16 3.340 17 3.205 24 3.257 18 0.174 0.841
Unrealistic contract durations imposed by
client
Client 3.211 14 3.213 18 3.256 22 3.229 19 0.103 0.987
Inclement weather Project 3.158 17 3.149 21 3.333 18 3.219 20 0.297 0.743
Late preparation of Interim Certificates Consult 2.947 22 3.170 20 3.359 15 3.200 21 0.686 0.506
Government policy Project 2.895 24 3.192 19 3.282 21 3.171 22 0.527 0.592
Acts of God Project 3.053 19 3.000 25 3.282 19 3.114 23 0.431 0.651
Strike, labour dispute and civil disturbances Project 2.895 23 3.064 24 3.282 20 3.114 24 0.559 0.573
Extension of time Client 2.842 25 3.106 22 3.103 26 3.057 25 0.426 0.655
Late handover of site Client 2.737 26 2.894 26 3.205 23 2.981 26 0.805 0.450
Note: * Equal mean scores of the individual factors ranked according to the number of respondents scoring 5 and 4
respectively; F-stat = test statistic; p-value = probability that the null hypothesis is true. + Significant at p < 0.05
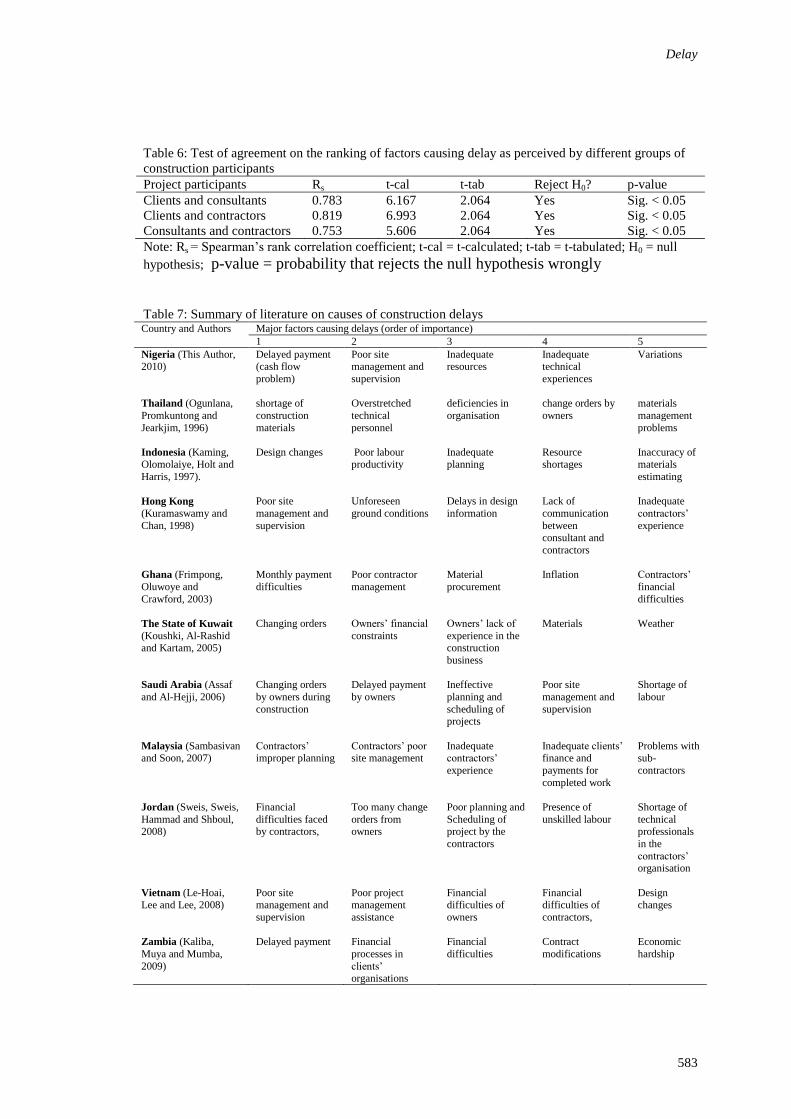
Delay
583
Table 6: Test of agreement on the ranking of factors causing delay as perceived by different groups of
construction participants
Project participants Rs t-cal t-tab Reject H0? p-value
Clients and consultants 0.783 6.167 2.064 Yes Sig. < 0.05
Clients and contractors 0.819 6.993 2.064 Yes Sig. < 0.05
Consultants and contractors 0.753 5.606 2.064 Yes Sig. < 0.05
Note: Rs = Spearman’s rank correlation coefficient; t-cal = t-calculated; t-tab = t-tabulated; H0 = null
hypothesis; p-value = probability that rejects the null hypothesis wrongly
Table 7: Summary of literature on causes of construction delays Country and Authors Major factors causing delays (order of importance)
1 2 3 4 5
Nigeria (This Author, 2010)
Delayed payment (cash flow
problem)
Poor site management and
supervision
Inadequate resources
Inadequate technical
experiences
Variations
Thailand (Ogunlana,
Promkuntong and
Jearkjim, 1996)
shortage of
construction
materials
Overstretched
technical
personnel
deficiencies in
organisation
change orders by
owners
materials
management
problems
Indonesia (Kaming, Olomolaiye, Holt and
Harris, 1997).
Design changes Poor labour productivity
Inadequate planning
Resource shortages
Inaccuracy of materials
estimating
Hong Kong (Kuramaswamy and
Chan, 1998)
Poor site
management and
supervision
Unforeseen
ground conditions
Delays in design
information
Lack of
communication
between
consultant and
contractors
Inadequate
contractors’
experience
Ghana (Frimpong,
Oluwoye and
Crawford, 2003)
Monthly payment
difficulties
Poor contractor
management
Material
procurement
Inflation Contractors’
financial
difficulties
The State of Kuwait
(Koushki, Al-Rashid and Kartam, 2005)
Changing orders Owners’ financial
constraints
Owners’ lack of
experience in the construction
business
Materials Weather
Saudi Arabia (Assaf
and Al-Hejji, 2006)
Changing orders
by owners during
construction
Delayed payment
by owners
Ineffective
planning and
scheduling of projects
Poor site
management and
supervision
Shortage of
labour
Malaysia (Sambasivan and Soon, 2007)
Contractors’ improper planning
Contractors’ poor site management
Inadequate contractors’
experience
Inadequate clients’ finance and
payments for
completed work
Problems with sub-
contractors
Jordan (Sweis, Sweis,
Hammad and Shboul, 2008)
Financial
difficulties faced by contractors,
Too many change
orders from owners
Poor planning and
Scheduling of project by the
contractors
Presence of
unskilled labour
Shortage of
technical professionals
in the
contractors’ organisation
Vietnam (Le-Hoai, Lee and Lee, 2008)
Poor site management and
supervision
Poor project management
assistance
Financial difficulties of
owners
Financial difficulties of
contractors,
Design changes
Zambia (Kaliba,
Muya and Mumba,
2009)
Delayed payment Financial
processes in
clients’ organisations
Financial
difficulties
Contract
modifications
Economic
hardship
Fatoye
584
Comparison with literature from some selected Countries
The focus of this section is to get a general view about factors causing construction
delay among 10 selected developing countries from previous studies through an
examination of / comparison with five most important factors from this survey, ranked
in order of importance (Table 7). Delayed payment (clients’ cash flow problem) was
ranked as the most important factor in Nigeria (this study). This was also ranked first
in Ghana, and Zambia, ranked second in Kuwait and Saudi Arabia and third in
Vietnam. Poor site management and supervision ranking second is not a problem only
in Nigeria but in many other countries. It ranked first in Hong Kong and Vietnam,
ranked second in Ghana and Malaysia and ranked fourth Saudi Arabia. Inadequate
resources, the third in order of importance in Nigeria, exist in Thailand as first in the
form of shortage of construction materials, and third in Ghana in the form of material
procurement. Inadequate technical experiences ranked fourth in Nigeria, it ranked
third in Malaysia and fifth in Hong Kong. Variations, the fifth in order of importance
in Nigeria exists as first in rank in Kuwait (as changing orders), Saudi Arabia (as
changing orders by owners during construction) and in Indonesia (as changing orders),
ranked second in Jordan, fourth in Thailand, and fifth in Vietnam in the form of
design changes. The five most important delay causes in the Nigerian construction is
also factual in different countries of the world. This analysis has, therefore,
contributed to the fact that developing nations of the world are facing analogous
challenges on the way of advancement in the construction sectors and re-validated the
fact that Nigeria is not an exception in the problem of construction delays as a global
phenomenon.
DISCUSSION OF FINDINGS
These research findings show that there is unanimous agreement among the
construction participants in the ranking of 26 delay factors which shows that delayed
payment is the most important factor. This is similar to Mezher and Tuwil (1998) in
Lebanon, Frimpong et al (2003) in Ghana and Kaliba et al (2009) in Zambia where
cash problems (financing and payment for completed work) were also ranked as the
most important factor for construction delays. Building construction projects involve
huge amount of money and most contractors will experience financial difficulties to
carry on construction processes when payments are not made by clients as at when
due. This will consequently result in time delays, project abandonment, clients not
being able to get return on investment, and negative socio-economic impacts on
construction workers in the face of possible retrenchment. The second in the rank of
causes of schedule delay is poor site management and supervision. This also ranked
second in the list of delay factors in the Ghanaian and Malaysian construction
industries respectively (Frimpong et al 2003; Sambasivan and Soon, 2007).
Completing project on schedule realistically reflects the contractor’s ability to
organise and control the site operations, to optimally allocate resources and to manage
the flow of information to and from the design team. Contrariwise, poor site
management and supervision could be attributed to a deficiency of site planning and
Delay
585
organisation, lack experience and training at the technical and managerial level,
inadequate technical and managerial man power, as well as low level of productivity
on the part of the contractor (Okpala and Aniekwu, 1988).
The analysis of variance (ANOVA) carried out to determine the significant difference
in the group mean for each delay factor implied that there is a significant degree of
agreement between the group means of the 25 factors causing delay. This was
corroborated by the result of the Spearman’s rank correlated coefficient that there is
general agreement on the ranking of schedule delay causes as perceived by different
groups of construction participants with the correlated coefficient ranging between
0.753 and 0.819. Coupling these results with the summary of literature on causes of
construction delay in other countries, it can be said that Nigeria is not an exception in
the problem of construction delays as a global phenomenon.
CONCLUSION
Construction delay in Nigerian is the focus of discussion in this field survey. A total of
26 factors causing delay are identified and combined into four groups. The survey
included 19 clients, 47 consultants and 39 contractors. The analysis of the information
collected from the survey was carried out using the “mean item score” method and
correlated using spearman’s rank correlation coefficient. The study shows that
Nigerian construction industry experiences an average of 69.0% time overrun with
93.3% of the total number of surveyed projects exceeding their initial planned
completion period. All the three groups of construction participants opined, by the
relative importance indices, that delayed payments, poor site management and
supervision as well as inadequate resources are the three most important causes of
delay in the Nigerian construction industry. The fourth and fifth in the rank were
inadequate technical experience and variations respectively. The values of the
spearman’s rank correlation coefficient show that this is a relative good agreement
between each two groups of construction participants in the ranking of the importance
of delayed causes. The highest degree of agreement is 0.819 between clients and
contractors while the lowest is 0.753 between consultants and contractors. Comparing
the result with literature from other countries showed that the most important causes
of construction delay in Nigeria is a global phenomenon which needs to be rigorously
tackled for the purpose of sustainable construction industry. Delay payment caused by
the clients will negatively affect contractors’ cash flow, cause liquidation and
retrenchment of construction workers. Poor site management and supervision on the
part of contractors will result into prolong delays and poor quality of work. All these
could give rise to project abandonment, inability of client to get value for his
investment and strained relationship between the two parties.
The study recommended that clients should ensure adequate and available sources of
finance before commencement of projects so that honouring of interim certificates
could be done as at when due. They should carry out a pre-construction planning of
project tasks and resource needs. This will assist the contractors’ cash flow towards
early project completion. Contracting organisations should pay more premiums to

Fatoye
586
providing relevant training programmes or short-time courses in reputable
organisations for their technical and managerial personnel.
SUGGESTED AREA FOR FURTHER RESEARCH
Similar studies can be performed in other states or geographical zones in Nigeria
using the same methodology which may, however, be subject to further improvement.
The study can equally be done for other specific projects like housing, administrative
blocks, financial institutions, hospitals, etc.
REFERENCES
Ahsan, K. and Gunawan, I. (2010). Analysis of cost and schedule performance of international
development projects. International Journal of Project Management, 28, 68-78.
Aibinu, A. A. and Jagboro, G. O. (2002). The effects of construction delays on project
delivery in Nigerian construction industry. International Journal of Project
Management 20, 593-599.
Aibinu, A. A. and Odeyinka, H. A. (2006). Construction delays and their causative factors in
Nigeria. Journal of Construction Engineering and Management, ASCE, 132 (7),
667-677.
Ameh, O. J., Soyingbe, A. A. and Odusami, K. T. (2010). Significant factors causing cost
overruns in telecommunication projects in Nigeria. Journal of Construction in
Developing Countries, 15, xxx-xxx.
Assaf, S. A. and Al-Hejji, S. (2006). Causes of delays in large construction projects.
International Journal of Project Management, 24, 349-357.
Chan, D. M. W. and Kumaraswamy, M. M. (1997). A comparative study of causes of time
overruns in Hong Kong construction projects. International Journal of Project
Management, 15 (1), 55-63.
Elinwa, A. U. and Joshua, M. (2001). Time-overrun factors in Nigerian Construction industry.
Journal of Construction Engineering and Management, 127 (5), 419-425.
Frimpong, Y., Oluwoye, J. and Crawford, L. (2003). Causes of delay and cost overruns in
construction of groundwater projects in developing countries: Ghana as a case study.
International Journal of Project Management, 21, 321-326.
Kaliba, C., Muya, M., and Mumba, K. (2009). Cost escalation and schedule delays in road
construction projects in Zambia. International Journal of Project Management, 27
(5), 522-531.
Kaming, P. F., Olomolaiye, P. O., Holt, G. O., and Harris, F. G. (1997). Factors influencing
construction time and cost overruns on high-rise projects in Indonesia. Construction
Management and Economics, 15, 83-94.
Koushki, P. A. and Kartam, N. (2004). Impact of construction materials on project time and
cost in Kuwait. Engineering, Construction and Architectural Management, 11 (2),
126-132.
Koushki, P. A., Al-Rashid, K., and Kartam, N. (2005). Delays and cost increases in the
construction of private residential projects in Kuwait. Construction Management and
Economics, 23, 285-294.
Kumaraswamy and Chan (1998). Contributors to construction delays. Construction
Management and Economics, 16, 17-29
Delay
587
Le-Hoai, L., Lee, Y. D. and Lee, J. Y. (2008). Delay and cost overruns in Vietnam large
construction projects: a comparison with other selected countries, KSCE, Journal of
Civil Engineering, 12 (6), 367-377.
Mezher, T. M. and Tawil, W. (1998). Causes of delays in the construction industry in
Lebanon. Engineering, Construction and Architectural Management, 5 (3), 252-260.
Odeh, A. M. and Battaineh, H. T. (2002). Causes of construction delay: Traditional Contracts.
International Journal of Project Management, 20, 67-73.
Odeyinka, H. A. and Yusif, A. (1997). The causes and effects of construction delays on
completion cost of housing projects in Nigeria. Journal of Financial Management of
Property and Construction, 2, 31-44.
Odusami, K. T. and Olusanya, O. O. (2000). Clients’ contribution to delays on building
projects. The Quantity Surveyor, 30, 30-33.
Ogunlana, S. O., Promkuntong, K., and Jearkirm, V. (1996). Construction delays in a fast
growing economy: comparing Thailand with other economies. International Journal
of Project Management, 14 (1), 37-45.
Ogunsemi, D. R. and Jagboro, G. O. (2006). Time-cost model for building projects in Nigeria.
Construction Management and Economics, 24, 253-258.
Okpala, D. C., Aniekwu, A. N. (1988). Causes of high costs of construction in Nigeria.
Journal of Construction Engineering and Management, 114 (2), 233-244.
Okuwoga, A. A. (1998). Cost-time performance of public sector housing projects in Nigeria.
Habitat International, 22 (4), 389-395.
Sambasivan, M. and Soon, Y. W. (2007). Causes and effects of delays in Malaysian
construction industry. International Journal of Project Management, 25, 517-526.
Sweis, G., Sweis, R., Hammad, A. A., and Shboul, A. (2008). Delays in construction projects:
the case of Jordan. International Journal of Project Management, 26 (6), 665-674.
Wright, J. N. (1997). Time and budget: the twin imperatives of a project sponsor.
International Journal of Project Management, 15 (3), 181-186.

Isaacs-Sodeye, F. (2012) The kitchen in domestic space: A comparative study of kitchens cooking and
culinary practice in Ile-Ife, Nigeria In: Laryea, S., Agyepong, S.A., Leiringer, R. and Hughes, W. (Eds)
Procs 4th West Africa Built Environment Research (WABER) Conference, 24-26 July 2012, Abuja,
Nigeria, 589-605.
589
THE KITCHEN IN DOMESTIC SPACE: A
COMPARATIVE STUDY OF KITCHENS COOKING
AND CULINARY PRACTICE IN ILE-IFE, NIGERIA
Folake Isaacs-Sodeye1
The Bartlett School of Graduate StudiesUniversity College London, Gower Street, London, United
Kingdom
This paper presents results of an empirical study carried out on domestic spaces in Ile-
Ife, Nigeria as part of a PhD study at the University College London (Ekundayo*,
2007). It is a common strategy in ethnographic research to replicate studies that have
been successfully carried out in one area, in another geographical context. Applying
this cumulative approach, the bi-polar framework that had originally been proposed
by architectural theorist, Roderick Lawrence (1988, 1983) in a cross-cultural
comparative study of sixty houses in Adelaide, Australia with another sixty houses in
Cherry Hinton, Cambridgeshire, England, was adopted to this study of domestic space
in Ile-Ife, Nigeria (Ekundayo, 2007). This consisted of an intra-cultural comparative
study of seventy-five households from three distinct areas of Ile-Ife that cut across the
socio-economic strata, and with particular emphasis on the kitchen facilities, cooking
and culinary practice. However, it soon emerged that the framework proposed in the
Lawrence study could not be adopted in the Ile-Ife sample. In order to obtain any
significant data for analysis, a new system of analysis had to developed from first
principles taking into account, context-specific and culturally relevant variables. The
aim is threefold:a/ to develop tools for cross-cultural comparative study. b/ to
represent the place of activity, objects and food in the home. c/ to define the
mechanism by which compatibility and incompatibility of activites in spatial
proximity is determined.The study found firstly that space labels did not determine
space use; secondly, that the boundaries of culinary practice was dispersed beyond the
boundaries of the space that was actually labeled as a kitchen; and thirdly that it was
the sensory awareness of other domestic activities in discernible proximity that
significantly determined the compatibility and incompatibility of domestic activities
in space.
Keywords: boundary, culinary practice, domestic space, food ,kitchen
INTRODUCTION
It is almost obligatory for sociological essays on the domestic environment to make a
link between society and the home (Kaplan 2005; Weissman, 1994;) In domestic
space studies, particularly in the ethnography and sociological disciplines, the kitchen
is almost always cited as a viable environment to study the dynamics of human
interaction and interrelationships (Rendell, 2000; Ardener, 2000; Deutsche, 2000;
Valentine, 1999; Revel, 1992; Heldke, 1992). Indeed, there are several reasons why a
study of kitchens would be of interest to architects and sociologists. For instance, a
study of kitchens will make it possible to assess roles and how aspects of work are
Isaacs-Sodeye
590
allocated amongst individuals particularly on the grounds of gender, age and social
status. In this sense, the kitchen may serve as a means of observing the manner in
which principles of social hierarchy can be employed within a culture. Kitchens can
also serve as a tool for comparison between different cultures and sub-cultures
(Lawrence 1987, 1982a), and “as a means of comparing the conceptual approaches to
design and space use between architects and laypersons” (Amole, 1985). If lifestyle
choices are arguably evident in the materials people acquire or aspire to acquire, the
study of kitchens can also serve as a means of assessing how the household chooses to
expend its labour, time and money (Clarke, 2001; Miller 2001).
PROBLEM DEFINITION
In order to replicate studies in different geographical and cultural contexts, it is very
useful that the parameters of the various studies are in comparable formats for the
findings to be beneficial. Both Nigeria and Australia are former colonies of Great
Britain, and current nation state members of the British Commonwealth. The
households studied in Australia and England have a common heritage and to some
extent, culture, particularly the European settlers and British subjects of Anglo-Saxon
ancestry. The households in the Ile-Ife study on the other hand are of an African
culture and ancestry.
Bearing that in mind, the framework proposed by Lawrence (1982a) on the
comparative analysis of sixty houses and kitchens in Australia and England did not
translate to the seventy-five Yoruba households studied because of fundamental
contextual differences in linguistic concepts and sociological inferences of the use of
particular words, as well as in the space layouts. The Lawrence model categorized
domestic space using words like public, private, clean/dirty, symbolic/secular and so
on. Concepts like public and private for instance are sociological constructs that are
vulnerable to subjective cultural interpretation or misinterpretation, and do not have a
consistent literal translation into Yoruba. The word ‘public’ in English connotes a
place that everyone has access to, and the converse is private. When translating it to
Yoruba, the word “public” had to be further clarified in terms of whom the space
would be accessible to. For example, in one Muslim household where a man had his
wives in seclusion, accessibility to the women’s quarters was forbidden to other male
adults in the family, whereas, it was allowed for grocers and traders who were
complete strangers, provided they were female. Furthermore, the Yoruba word for
dirt ( d t – connotes filth, whereas, the concept that was intended is that of a messy
space, not a filthy space. Whilst most people would readily agree that food preparation
was a messy activity, they would consider it an affront on their hygiene standards to
use the word for dirt to characterise their cooking space. Essentially, the application of
the Lawrence framework was found to be limiting in eliciting the responses needed
for the study, and in some respects, it was considered misleading. Moreover, the
Lawrence study was based on self-contained domestic units in which all the facilities
were available within the curtilage (or site boundary) of building; and even in cases
where outhouses were used, none were shared with other households. However, in the
Ile-Ife study, only the “Western designed houses” for single nuclear family
households fulfilled this criterion. Several households lived with and shared spaces
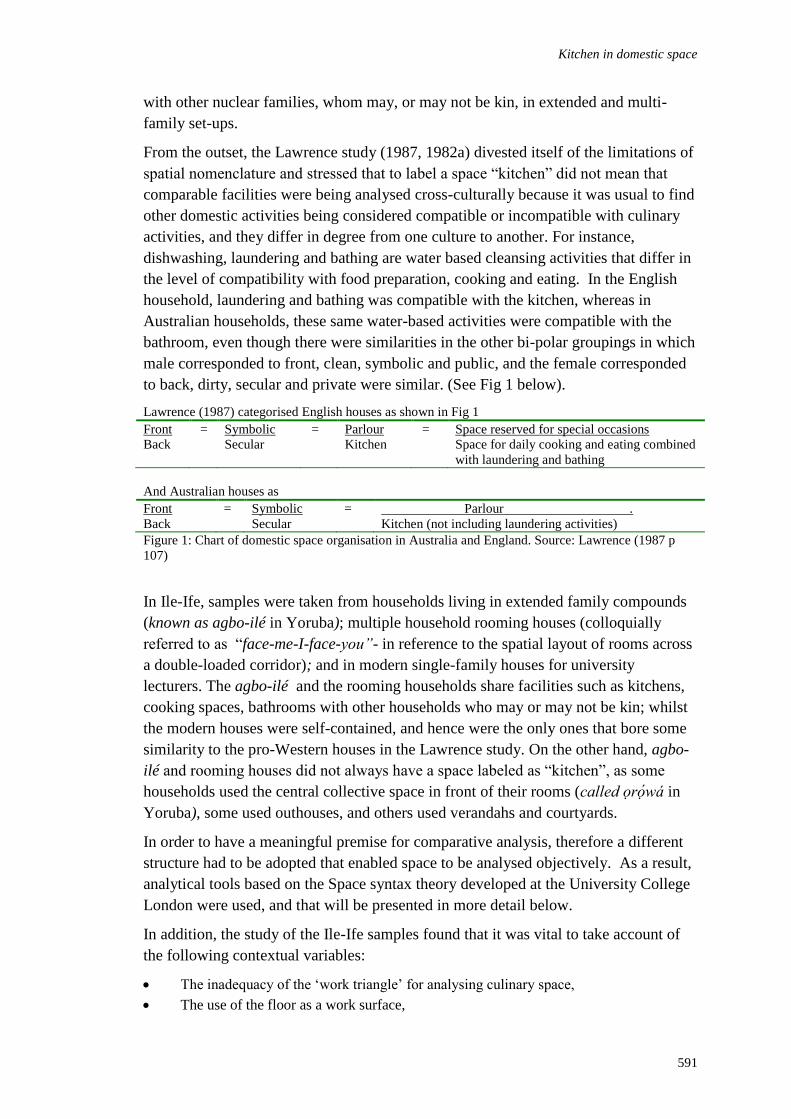
Kitchen in domestic space
591
with other nuclear families, whom may, or may not be kin, in extended and multi-
family set-ups.
From the outset, the Lawrence study (1987, 1982a) divested itself of the limitations of
spatial nomenclature and stressed that to label a space “kitchen” did not mean that
comparable facilities were being analysed cross-culturally because it was usual to find
other domestic activities being considered compatible or incompatible with culinary
activities, and they differ in degree from one culture to another. For instance,
dishwashing, laundering and bathing are water based cleansing activities that differ in
the level of compatibility with food preparation, cooking and eating. In the English
household, laundering and bathing was compatible with the kitchen, whereas in
Australian households, these same water-based activities were compatible with the
bathroom, even though there were similarities in the other bi-polar groupings in which
male corresponded to front, clean, symbolic and public, and the female corresponded
to back, dirty, secular and private were similar. (See Fig 1 below).
Lawrence (1987) categorised English houses as shown in Fig 1
Front
Back
= Symbolic
Secular
= Parlour
Kitchen
= Space reserved for special occasions
Space for daily cooking and eating combined
with laundering and bathing
And Australian houses as
Front
Back
= Symbolic
Secular
= Parlour .
Kitchen (not including laundering activities)
Figure 1: Chart of domestic space organisation in Australia and England. Source: Lawrence (1987 p
107)
In Ile-Ife, samples were taken from households living in extended family compounds
(known as agbo-ilé in Yoruba); multiple household rooming houses (colloquially
referred to as “face-me-I-face-you”- in reference to the spatial layout of rooms across
a double-loaded corridor); and in modern single-family houses for university
lecturers. The agbo-ilé and the rooming households share facilities such as kitchens,
cooking spaces, bathrooms with other households who may or may not be kin; whilst
the modern houses were self-contained, and hence were the only ones that bore some
similarity to the pro-Western houses in the Lawrence study. On the other hand, agbo-
ilé and rooming houses did not always have a space labeled as “kitchen”, as some
households used the central collective space in front of their rooms (called r w in
Yoruba), some used outhouses, and others used verandahs and courtyards.
In order to have a meaningful premise for comparative analysis, therefore a different
structure had to be adopted that enabled space to be analysed objectively. As a result,
analytical tools based on the Space syntax theory developed at the University College
London were used, and that will be presented in more detail below.
In addition, the study of the Ile-Ife samples found that it was vital to take account of
the following contextual variables:
The inadequacy of the ‘work triangle’ for analysing culinary space,
The use of the floor as a work surface,
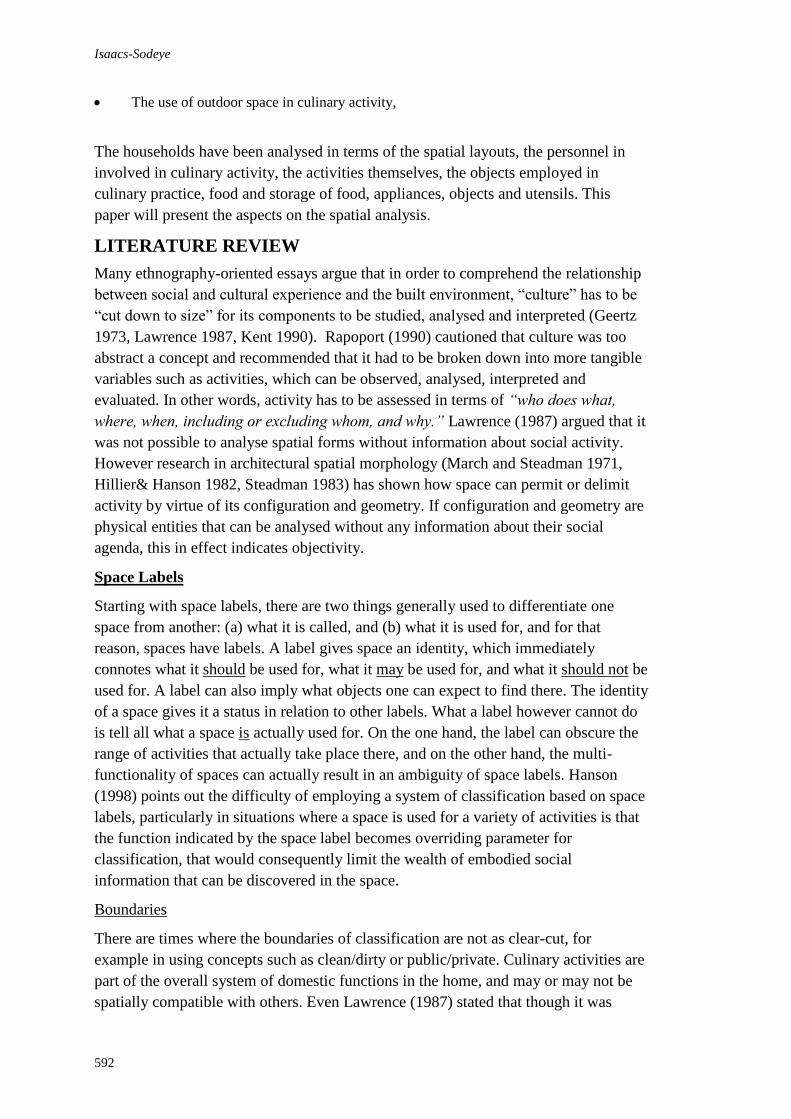
Isaacs-Sodeye
592
The use of outdoor space in culinary activity,
The households have been analysed in terms of the spatial layouts, the personnel in
involved in culinary activity, the activities themselves, the objects employed in
culinary practice, food and storage of food, appliances, objects and utensils. This
paper will present the aspects on the spatial analysis.
LITERATURE REVIEW
Many ethnography-oriented essays argue that in order to comprehend the relationship
between social and cultural experience and the built environment, “culture” has to be
“cut down to size” for its components to be studied, analysed and interpreted (Geertz
1973, Lawrence 1987, Kent 1990). Rapoport (1990) cautioned that culture was too
abstract a concept and recommended that it had to be broken down into more tangible
variables such as activities, which can be observed, analysed, interpreted and
evaluated. In other words, activity has to be assessed in terms of “who does what,
where, when, including or excluding whom, and why.” Lawrence (1987) argued that it
was not possible to analyse spatial forms without information about social activity.
However research in architectural spatial morphology (March and Steadman 1971,
Hillier& Hanson 1982, Steadman 1983) has shown how space can permit or delimit
activity by virtue of its configuration and geometry. If configuration and geometry are
physical entities that can be analysed without any information about their social
agenda, this in effect indicates objectivity.
Space Labels
Starting with space labels, there are two things generally used to differentiate one
space from another: (a) what it is called, and (b) what it is used for, and for that
reason, spaces have labels. A label gives space an identity, which immediately
connotes what it should be used for, what it may be used for, and what it should not be
used for. A label can also imply what objects one can expect to find there. The identity
of a space gives it a status in relation to other labels. What a label however cannot do
is tell all what a space is actually used for. On the one hand, the label can obscure the
range of activities that actually take place there, and on the other hand, the multi-
functionality of spaces can actually result in an ambiguity of space labels. Hanson
(1998) points out the difficulty of employing a system of classification based on space
labels, particularly in situations where a space is used for a variety of activities is that
the function indicated by the space label becomes overriding parameter for
classification, that would consequently limit the wealth of embodied social
information that can be discovered in the space.
Boundaries
There are times where the boundaries of classification are not as clear-cut, for
example in using concepts such as clean/dirty or public/private. Culinary activities are
part of the overall system of domestic functions in the home, and may or may not be
spatially compatible with others. Even Lawrence (1987) stated that though it was
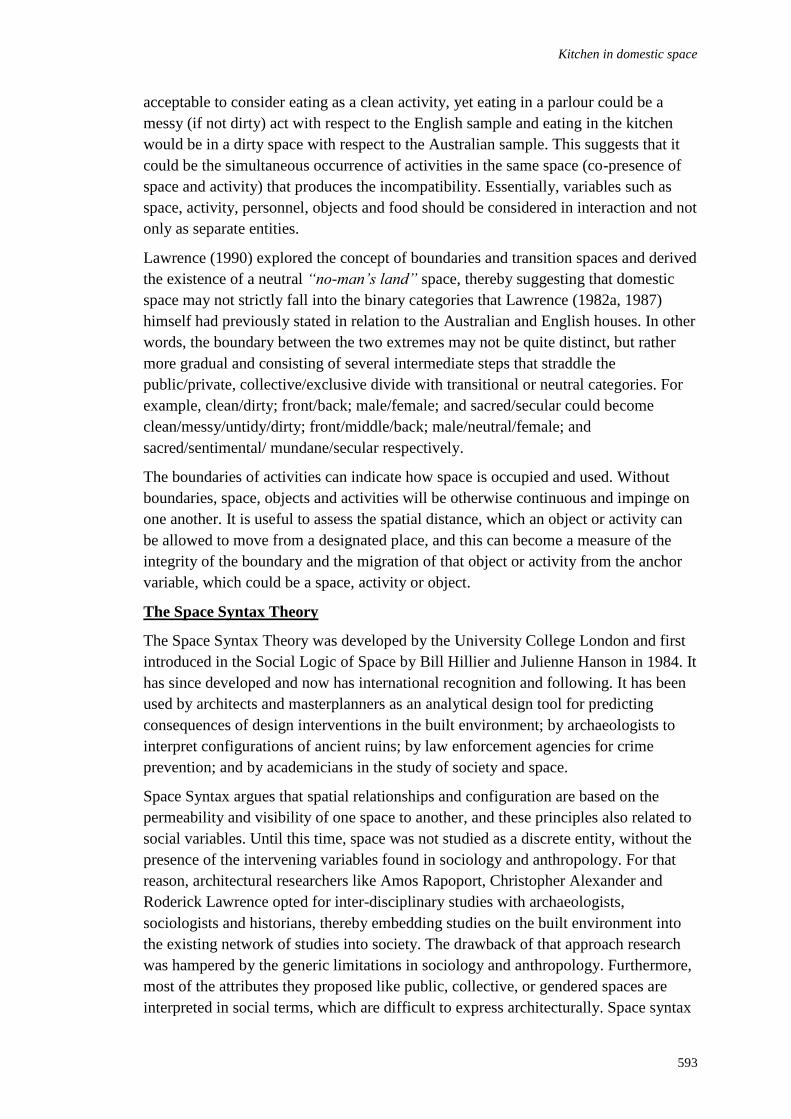
Kitchen in domestic space
593
acceptable to consider eating as a clean activity, yet eating in a parlour could be a
messy (if not dirty) act with respect to the English sample and eating in the kitchen
would be in a dirty space with respect to the Australian sample. This suggests that it
could be the simultaneous occurrence of activities in the same space (co-presence of
space and activity) that produces the incompatibility. Essentially, variables such as
space, activity, personnel, objects and food should be considered in interaction and not
only as separate entities.
Lawrence (1990) explored the concept of boundaries and transition spaces and derived
the existence of a neutral “no-man’s land” space, thereby suggesting that domestic
space may not strictly fall into the binary categories that Lawrence (1982a, 1987)
himself had previously stated in relation to the Australian and English houses. In other
words, the boundary between the two extremes may not be quite distinct, but rather
more gradual and consisting of several intermediate steps that straddle the
public/private, collective/exclusive divide with transitional or neutral categories. For
example, clean/dirty; front/back; male/female; and sacred/secular could become
clean/messy/untidy/dirty; front/middle/back; male/neutral/female; and
sacred/sentimental/ mundane/secular respectively.
The boundaries of activities can indicate how space is occupied and used. Without
boundaries, space, objects and activities will be otherwise continuous and impinge on
one another. It is useful to assess the spatial distance, which an object or activity can
be allowed to move from a designated place, and this can become a measure of the
integrity of the boundary and the migration of that object or activity from the anchor
variable, which could be a space, activity or object.
The Space Syntax Theory
The Space Syntax Theory was developed by the University College London and first
introduced in the Social Logic of Space by Bill Hillier and Julienne Hanson in 1984. It
has since developed and now has international recognition and following. It has been
used by architects and masterplanners as an analytical design tool for predicting
consequences of design interventions in the built environment; by archaeologists to
interpret configurations of ancient ruins; by law enforcement agencies for crime
prevention; and by academicians in the study of society and space.
Space Syntax argues that spatial relationships and configuration are based on the
permeability and visibility of one space to another, and these principles also related to
social variables. Until this time, space was not studied as a discrete entity, without the
presence of the intervening variables found in sociology and anthropology. For that
reason, architectural researchers like Amos Rapoport, Christopher Alexander and
Roderick Lawrence opted for inter-disciplinary studies with archaeologists,
sociologists and historians, thereby embedding studies on the built environment into
the existing network of studies into society. The drawback of that approach research
was hampered by the generic limitations in sociology and anthropology. Furthermore,
most of the attributes they proposed like public, collective, or gendered spaces are
interpreted in social terms, which are difficult to express architecturally. Space syntax
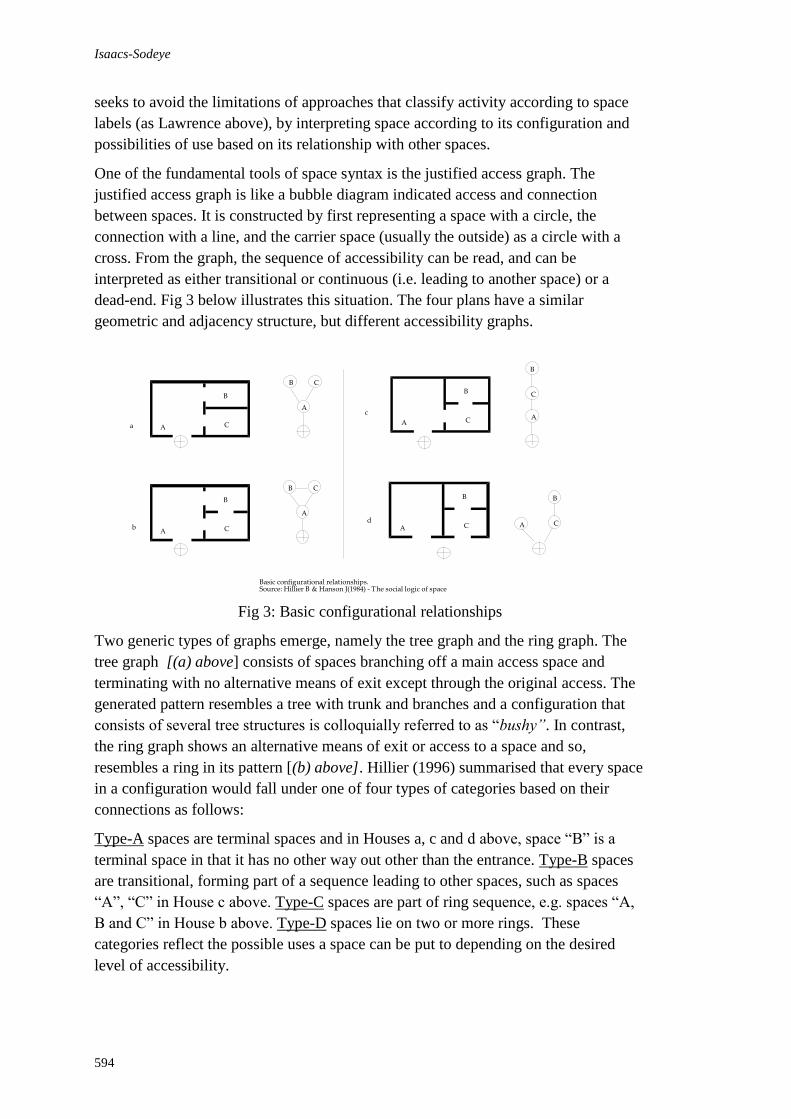
Isaacs-Sodeye
594
seeks to avoid the limitations of approaches that classify activity according to space
labels (as Lawrence above), by interpreting space according to its configuration and
possibilities of use based on its relationship with other spaces.
One of the fundamental tools of space syntax is the justified access graph. The
justified access graph is like a bubble diagram indicated access and connection
between spaces. It is constructed by first representing a space with a circle, the
connection with a line, and the carrier space (usually the outside) as a circle with a
cross. From the graph, the sequence of accessibility can be read, and can be
interpreted as either transitional or continuous (i.e. leading to another space) or a
dead-end. Fig 3 below illustrates this situation. The four plans have a similar
geometric and adjacency structure, but different accessibility graphs.
Fig 3: Basic configurational relationships
Two generic types of graphs emerge, namely the tree graph and the ring graph. The
tree graph [(a) above] consists of spaces branching off a main access space and
terminating with no alternative means of exit except through the original access. The
generated pattern resembles a tree with trunk and branches and a configuration that
consists of several tree structures is colloquially referred to as “bushy”. In contrast,
the ring graph shows an alternative means of exit or access to a space and so,
resembles a ring in its pattern [(b) above]. Hillier (1996) summarised that every space
in a configuration would fall under one of four types of categories based on their
connections as follows:
Type-A spaces are terminal spaces and in Houses a, c and d above, space “B” is a
terminal space in that it has no other way out other than the entrance. Type-B spaces
are transitional, forming part of a sequence leading to other spaces, such as spaces
“A”, “C” in House c above. Type-C spaces are part of ring sequence, e.g. spaces “A,
B and C” in House b above. Type-D spaces lie on two or more rings. These
categories reflect the possible uses a space can be put to depending on the desired
level of accessibility.
Basic configurational relationships.Source: Hillier B & Hanson J(1984) - The social logic of space
A
B
C
A
B
C
B C
A
B C
A
a
b
A
B
C
B
A
C
B
CAA
B
C
c
d
Kitchen in domestic space
595
The justified graph (j-graph for short) differs from the accessibility graph that has
been used by March and Steadman (1971) in the sense that it does not only indicate
adjacency between spaces, but maps (justifies) the permeability from a particular
space, thereby analysing depth. Adjacency is a pre-condition for accessibility but
permeability narrows down the multiplicity of possibilities that geometric adjacency
can produce, thereby reflecting the reality of space use. A graph can therefore read as
either shallow or deep depending on the total number of steps of all convex spaces
from a particular space. Theoretically, the shallowest graph possible will be where
every space in the system is connected to the one carrier space or one step-depth
away, and the deepest will be if all spaces were arranged in a single continuous
sequence as in House c in Fig 3 above, whereby every step increases the overall depth
from the carrier space (Hanson 1998).
The space syntax theory therefore demonstrates how the configurational properties of
space can be used to ascertain and interpret embodied social information, either in the
differential ways inhabitants and visitors occupy space or in the way inhabitants
appropriate and allocate space for different uses, by analysing the floor plans and then
relate any findings to space labels and use. Unlike Alexander et al (1977), where bold
statements called “a pattern language” are already given on what intuitively
constitutes good or poor spatial environments, space syntax provides the tools to
assess and interpret spatial environments and reveal the configurational properties that
make one environment good, and the other bad. The space syntax tools presented in
this paper map out the justified graph to ascertain step depth of the kitchen and the
distribution and spatial co-presence of culinary activities and culinary objects all
around the domestic space.
METHOD
Empirical research for this study was supported by sample taken from three distinct
areas of Ile-Ife, namely the traditonal core area, the central business district and the
university staff quarters. Seventy-five households were interviewed in the three study
areas guided by an open-ended questionnaire, with twenty-five from each area. The
aim was to conduct an intra-cultural comparative study within a sub-culture of a single
ethnic group i.e. culinary practice in Yoruba domestic space with households that cut
across the broad socio-economic strata. As such, the study dealt with comparable
activities and materials in the households and reduced the distraction of cross-cultural
variances in interpretation. Some interviews were conducted in the Yoruba language.
The fieldwork collected data on: (a) the personnel involved in culinary activity; (b)
activities – cooking, eating, dishwashing, foodprocessing (transformation of raw foods
to a processed state prior to cooking), and ceremonial cooking (bulk cooking for
parties and celebrations); (c) objects – culinary utensils, receptacles, traditional
appliances, electronic appliances; (d) food – raw, cooked, processed; and (e) space –
for activities of heat source for cooking, water source for cleaning and for storage of
food and utensils. As part of the survey, the site plan, the floor plan of the house and
the internal configuration of the kitchen were sketched out on graph paper guided by
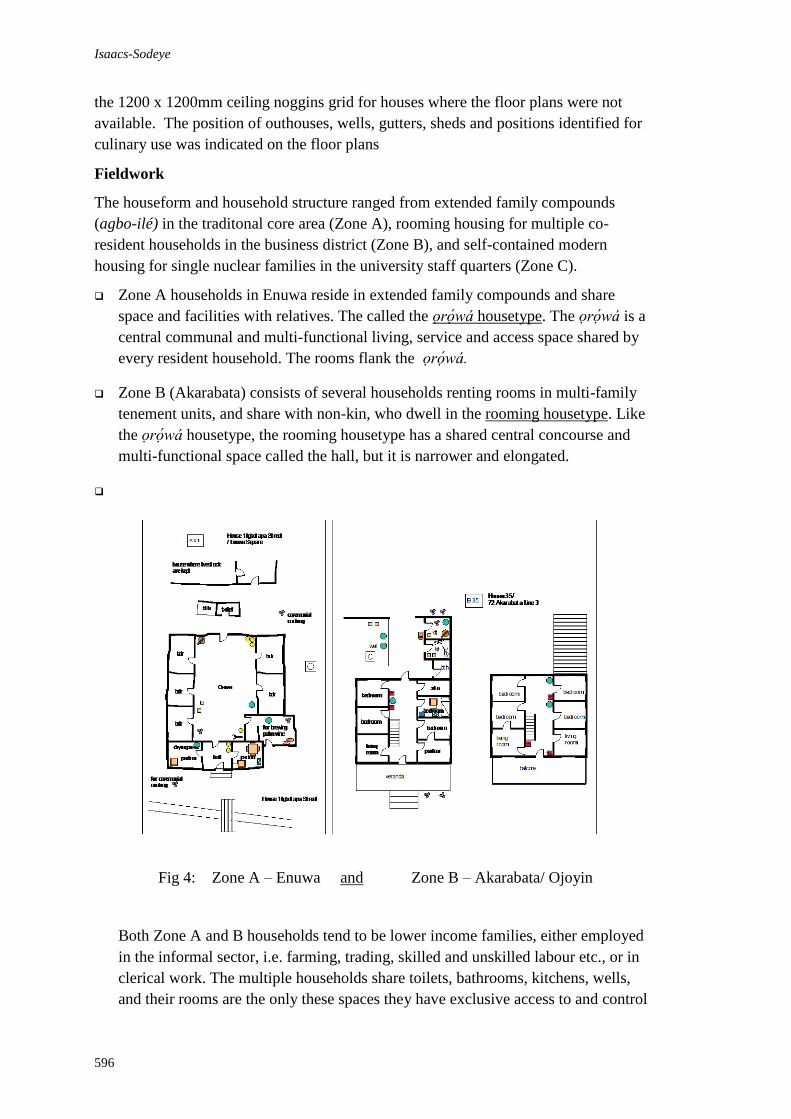
Isaacs-Sodeye
596
the 1200 x 1200mm ceiling noggins grid for houses where the floor plans were not
available. The position of outhouses, wells, gutters, sheds and positions identified for
culinary use was indicated on the floor plans
Fieldwork
The houseform and household structure ranged from extended family compounds
(agbo-ilé) in the traditonal core area (Zone A), rooming housing for multiple co-
resident households in the business district (Zone B), and self-contained modern
housing for single nuclear families in the university staff quarters (Zone C).
Zone A households in Enuwa reside in extended family compounds and share
space and facilities with relatives. The called the r w housetype. The r w is a
central communal and multi-functional living, service and access space shared by
every resident household. The rooms flank the r w .
Zone B (Akarabata) consists of several households renting rooms in multi-family
tenement units, and share with non-kin, who dwell in the rooming housetype. Like
the r w housetype, the rooming housetype has a shared central concourse and
multi-functional space called the hall, but it is narrower and elongated.
Fig 4: Zone A – Enuwa and Zone B – Akarabata/ Ojoyin
Both Zone A and B households tend to be lower income families, either employed
in the informal sector, i.e. farming, trading, skilled and unskilled labour etc., or in
clerical work. The multiple households share toilets, bathrooms, kitchens, wells,
and their rooms are the only these spaces they have exclusive access to and control
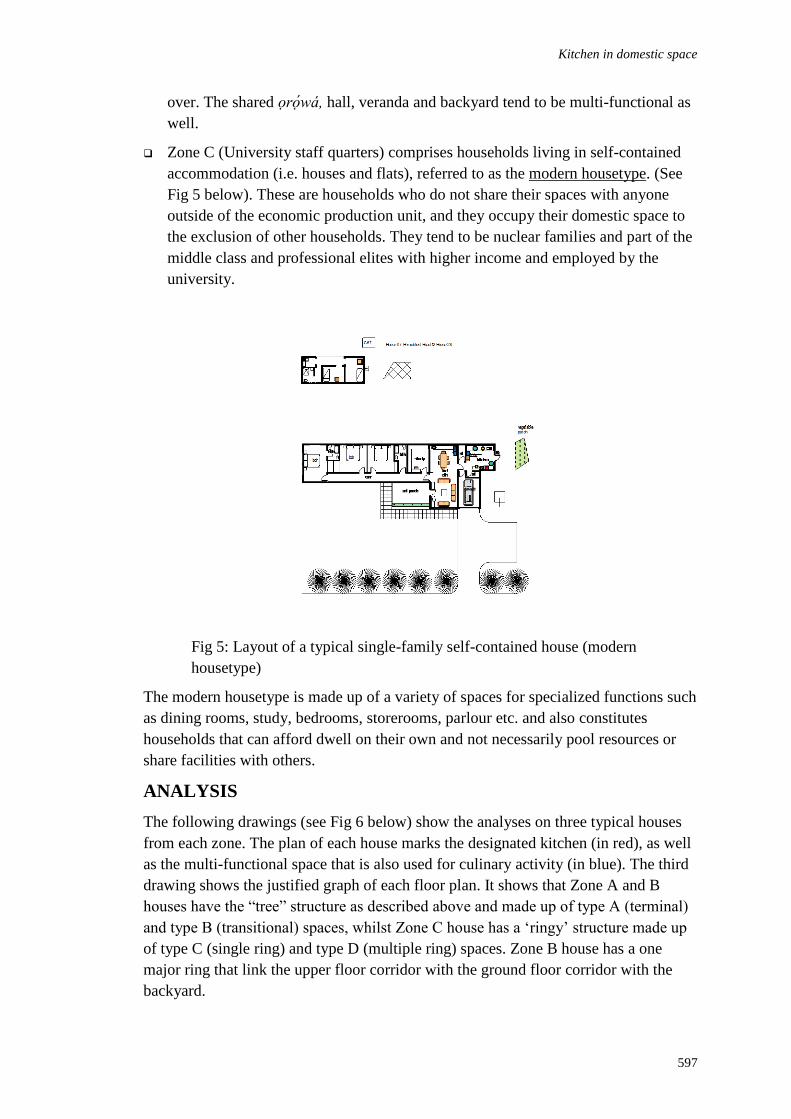
Kitchen in domestic space
597
over. The shared r w , hall, veranda and backyard tend to be multi-functional as
well.
Zone C (University staff quarters) comprises households living in self-contained
accommodation (i.e. houses and flats), referred to as the modern housetype. (See
Fig 5 below). These are households who do not share their spaces with anyone
outside of the economic production unit, and they occupy their domestic space to
the exclusion of other households. They tend to be nuclear families and part of the
middle class and professional elites with higher income and employed by the
university.
Fig 5: Layout of a typical single-family self-contained house (modern
housetype)
The modern housetype is made up of a variety of spaces for specialized functions such
as dining rooms, study, bedrooms, storerooms, parlour etc. and also constitutes
households that can afford dwell on their own and not necessarily pool resources or
share facilities with others.
ANALYSIS
The following drawings (see Fig 6 below) show the analyses on three typical houses
from each zone. The plan of each house marks the designated kitchen (in red), as well
as the multi-functional space that is also used for culinary activity (in blue). The third
drawing shows the justified graph of each floor plan. It shows that Zone A and B
houses have the “tree” structure as described above and made up of type A (terminal)
and type B (transitional) spaces, whilst Zone C house has a ‘ringy’ structure made up
of type C (single ring) and type D (multiple ring) spaces. Zone B house has a one
major ring that link the upper floor corridor with the ground floor corridor with the
backyard.
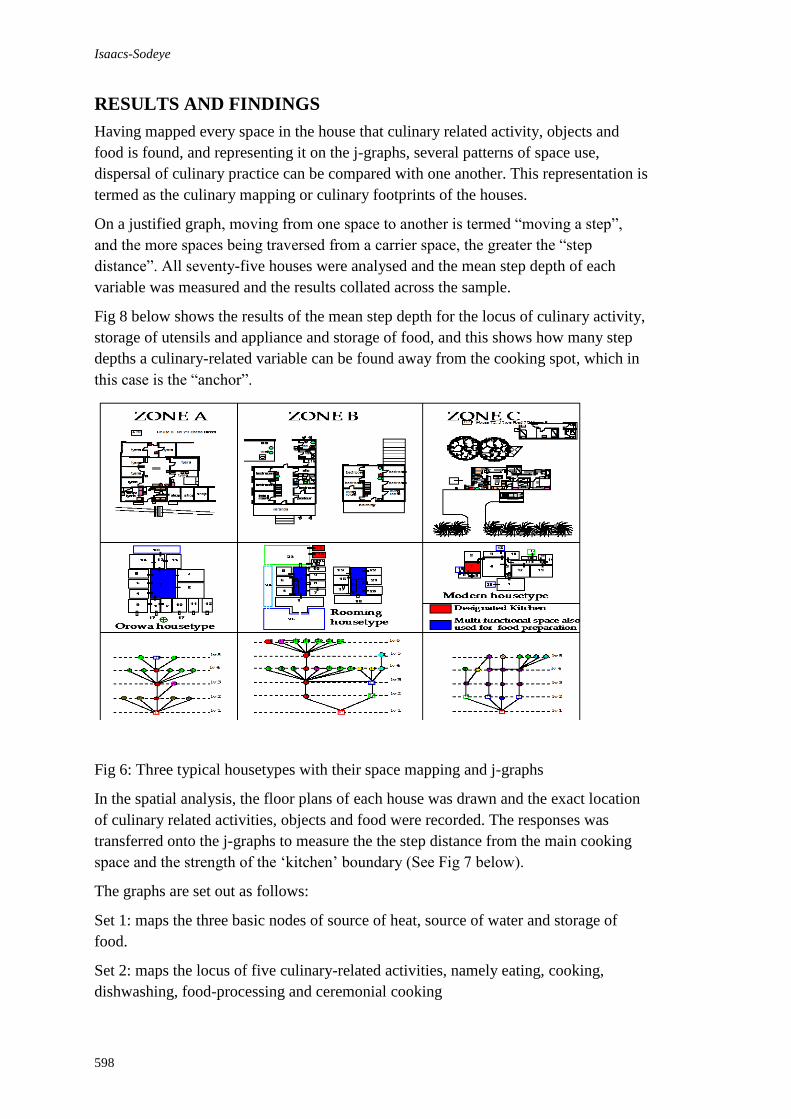
Isaacs-Sodeye
598
RESULTS AND FINDINGS
Having mapped every space in the house that culinary related activity, objects and
food is found, and representing it on the j-graphs, several patterns of space use,
dispersal of culinary practice can be compared with one another. This representation is
termed as the culinary mapping or culinary footprints of the houses.
On a justified graph, moving from one space to another is termed “moving a step”,
and the more spaces being traversed from a carrier space, the greater the “step
distance”. All seventy-five houses were analysed and the mean step depth of each
variable was measured and the results collated across the sample.
Fig 8 below shows the results of the mean step depth for the locus of culinary activity,
storage of utensils and appliance and storage of food, and this shows how many step
depths a culinary-related variable can be found away from the cooking spot, which in
this case is the “anchor”.
Fig 6: Three typical housetypes with their space mapping and j-graphs
In the spatial analysis, the floor plans of each house was drawn and the exact location
of culinary related activities, objects and food were recorded. The responses was
transferred onto the j-graphs to measure the the step distance from the main cooking
space and the strength of the ‘kitchen’ boundary (See Fig 7 below).
The graphs are set out as follows:
Set 1: maps the three basic nodes of source of heat, source of water and storage of
food.
Set 2: maps the locus of five culinary-related activities, namely eating, cooking,
dishwashing, food-processing and ceremonial cooking

Kitchen in domestic space
599
Set 3: maps the utensils and appliances used namely the mortar and pestle, the
grinding stone, cooking utensils, electrical appliances and the fridge/freezer.
Set 4: maps the storage of food, namely perishables, non-perishables, uncooked foods,
cooked foods, fruits, vegetables, grains and cereals.
The graphs shows that several spaces such as parlours and bedrooms had culinary
footprints beyond the cooking space. The mean step depth for each activity, object and
food was collated and then compared. The closer the mean is to zero, the stronger the
boundary of the kitchen and the more self-contained the kitchen was and vice-versa
Fig 7: J-graph analyses for 3 basic nodes, and locus of activity, utensils and food
Culinary Variable Zone A-Enuwa Zone B- Akarabata Zone C- University
Activity 1.389 1.68 0.90
Utensils 1.271 1.411 0.48
Food 1.612 2.21 0.93
Mean step Depth for Zone 1.486 1.95 0.844
Fig 8: Mean Step Depth for 75 houses for each variable
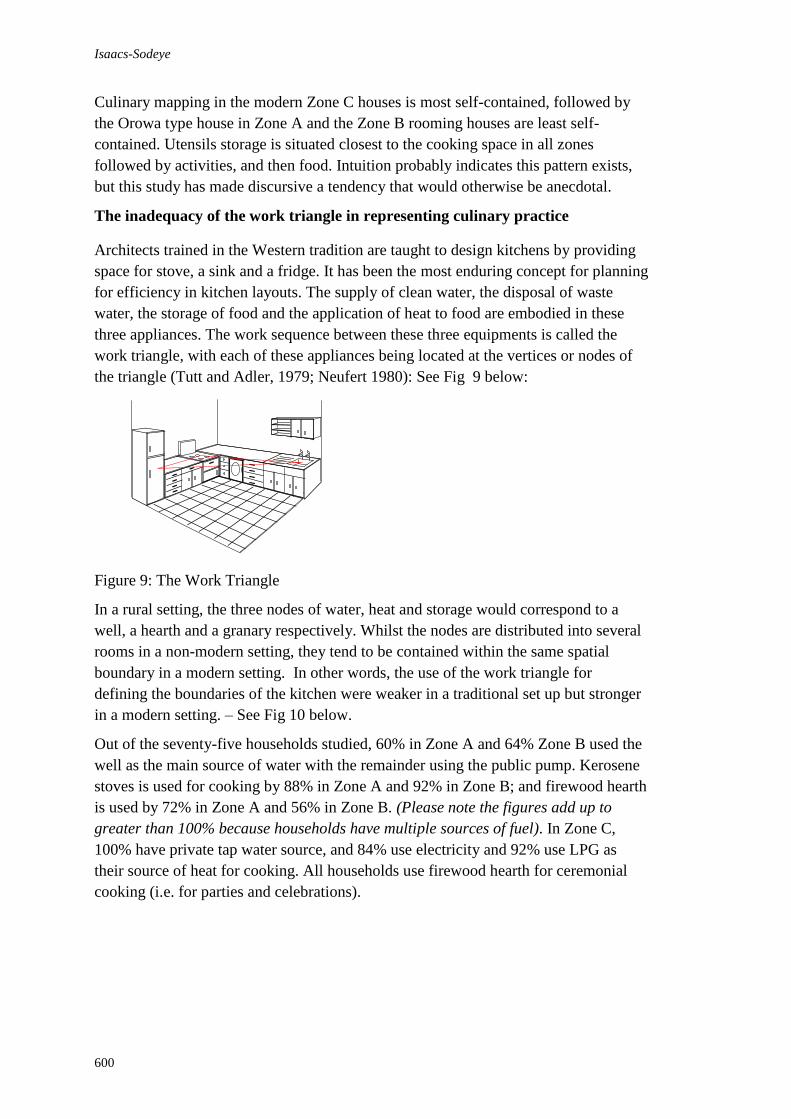
Isaacs-Sodeye
600
Culinary mapping in the modern Zone C houses is most self-contained, followed by
the Orowa type house in Zone A and the Zone B rooming houses are least self-
contained. Utensils storage is situated closest to the cooking space in all zones
followed by activities, and then food. Intuition probably indicates this pattern exists,
but this study has made discursive a tendency that would otherwise be anecdotal.
The inadequacy of the work triangle in representing culinary practice
Architects trained in the Western tradition are taught to design kitchens by providing
space for stove, a sink and a fridge. It has been the most enduring concept for planning
for efficiency in kitchen layouts. The supply of clean water, the disposal of waste
water, the storage of food and the application of heat to food are embodied in these
three appliances. The work sequence between these three equipments is called the
work triangle, with each of these appliances being located at the vertices or nodes of
the triangle (Tutt and Adler, 1979; Neufert 1980): See Fig 9 below:
Figure 9: The Work Triangle
In a rural setting, the three nodes of water, heat and storage would correspond to a
well, a hearth and a granary respectively. Whilst the nodes are distributed into several
rooms in a non-modern setting, they tend to be contained within the same spatial
boundary in a modern setting. In other words, the use of the work triangle for
defining the boundaries of the kitchen were weaker in a traditional set up but stronger
in a modern setting. – See Fig 10 below.
Out of the seventy-five households studied, 60% in Zone A and 64% Zone B used the
well as the main source of water with the remainder using the public pump. Kerosene
stoves is used for cooking by 88% in Zone A and 92% in Zone B; and firewood hearth
is used by 72% in Zone A and 56% in Zone B. (Please note the figures add up to
greater than 100% because households have multiple sources of fuel). In Zone C,
100% have private tap water source, and 84% use electricity and 92% use LPG as
their source of heat for cooking. All households use firewood hearth for ceremonial
cooking (i.e. for parties and celebrations).

Kitchen in domestic space
601
Fig 10 – The three basic nodes for culinary activity
The work triangle itself may be a misnomer because it does not even take “work”, i.e.
what takes place between the nodes into account. Major aspects of food preparation
involve hands-on contact with food: mixing, cutting, peeling, slicing take place on
work surfaces. Modern appliances such as ovens, microwave ovens, dishwashers and
washing machines, food-processors etc. now feature strongly in the modern kitchen
such that the work triangle is gradually becoming obsolete in its use in the study of
kitchen. The storage and retrieval of implements, utensils and appliances is also
missing from the classification yet it stands to reason that the ease of accessibility for
retrieval would help to make the kitchen more efficient. The kitchen is actually
characterized by work and retrieval of items for work. Therefore, the representation of
the kitchen has to be broadened to consist of the places for activities, the source of
water, the source of heat, the storage of utensils and the storage of food.
The use of the floor as a work surface
Tutt and Alder’s (1979) New Metric Handbook for architectural space standards
shows that standing is the most used posture in the modern kitchen and it corresponds
to the level of the worktop and accessibility to storage at different levels. Several
Yoruba culinary practices use the floor as a work surface in addition to an elevated
one such as a table or bench. In addition, postures such as kneeling, sitting and
standing are employed depending on the implements being used. Fig 11, Fig 12 and
Fig 13 show the floor being used as a work surface.
Fig 11– Grinding Stone; Fig 12- stirring dough; Fig 13– mortar/pestle
In the study, 72% of households in Zone A and B used the grinding stone as a main
implement, but only 4% in Zone C did. Also, 80% in Zone A, 92% in Zone B and
80% in Zone C used the mortar and pestle. This shows that a significant number of
household in the study still use the floor as a work surface.
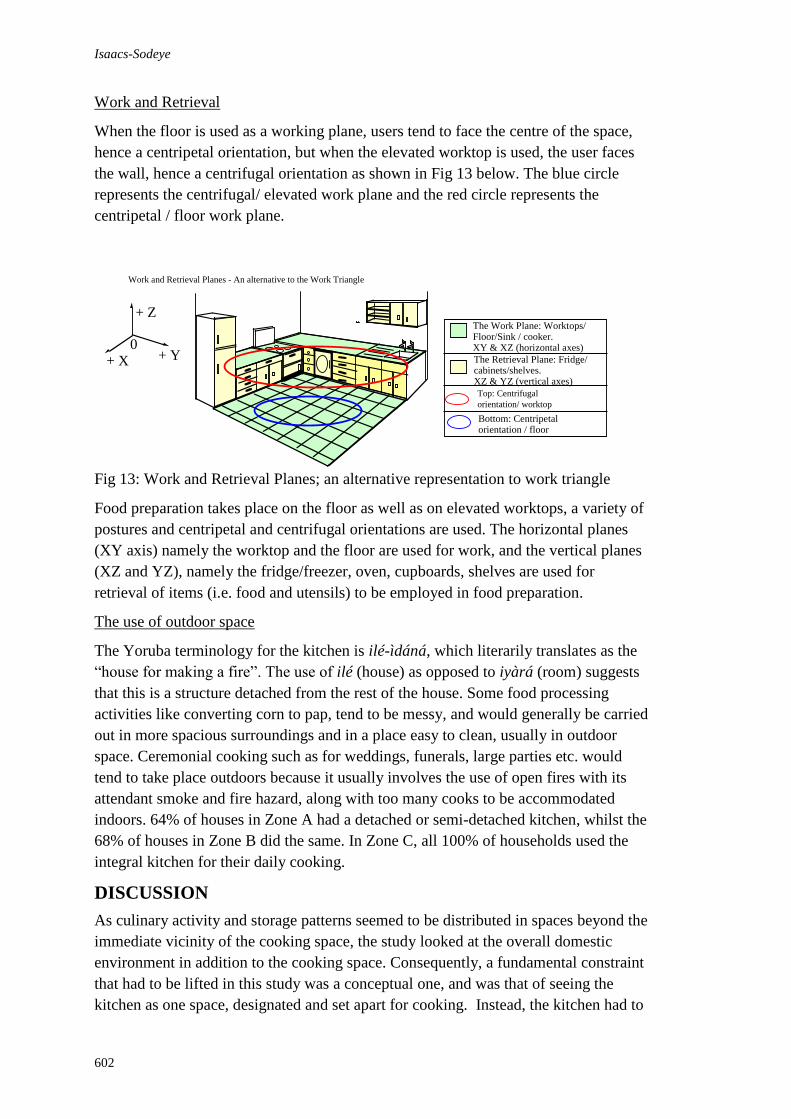
Isaacs-Sodeye
602
Work and Retrieval
When the floor is used as a working plane, users tend to face the centre of the space,
hence a centripetal orientation, but when the elevated worktop is used, the user faces
the wall, hence a centrifugal orientation as shown in Fig 13 below. The blue circle
represents the centrifugal/ elevated work plane and the red circle represents the
centripetal / floor work plane.
Work and Retrieval Planes - An alternative to the Work Triangle
0
+ Z
+ Y+ X
The Work Plane: Worktops/ Floor/Sink / cooker.XY & XZ (horizontal axes)
The Retrieval Plane: Fridge/ cabinets/shelves.XZ & YZ (vertical axes)
Top: Centrifugal
orientation/ worktop
Bottom: Centripetalorientation / floor
Fig. 7 - Representation of the kitchen including postures and work surfaces
Fig 13: Work and Retrieval Planes; an alternative representation to work triangle
Food preparation takes place on the floor as well as on elevated worktops, a variety of
postures and centripetal and centrifugal orientations are used. The horizontal planes
(XY axis) namely the worktop and the floor are used for work, and the vertical planes
(XZ and YZ), namely the fridge/freezer, oven, cupboards, shelves are used for
retrieval of items (i.e. food and utensils) to be employed in food preparation.
The use of outdoor space
The Yoruba terminology for the kitchen is ilé-ìdáná, which literarily translates as the
“house for making a fire”. The use of ilé (house) as opposed to iyàrá (room) suggests
that this is a structure detached from the rest of the house. Some food processing
activities like converting corn to pap, tend to be messy, and would generally be carried
out in more spacious surroundings and in a place easy to clean, usually in outdoor
space. Ceremonial cooking such as for weddings, funerals, large parties etc. would
tend to take place outdoors because it usually involves the use of open fires with its
attendant smoke and fire hazard, along with too many cooks to be accommodated
indoors. 64% of houses in Zone A had a detached or semi-detached kitchen, whilst the
68% of houses in Zone B did the same. In Zone C, all 100% of households used the
integral kitchen for their daily cooking.
DISCUSSION
As culinary activity and storage patterns seemed to be distributed in spaces beyond the
immediate vicinity of the cooking space, the study looked at the overall domestic
environment in addition to the cooking space. Consequently, a fundamental constraint
that had to be lifted in this study was a conceptual one, and was that of seeing the
kitchen as one space, designated and set apart for cooking. Instead, the kitchen had to
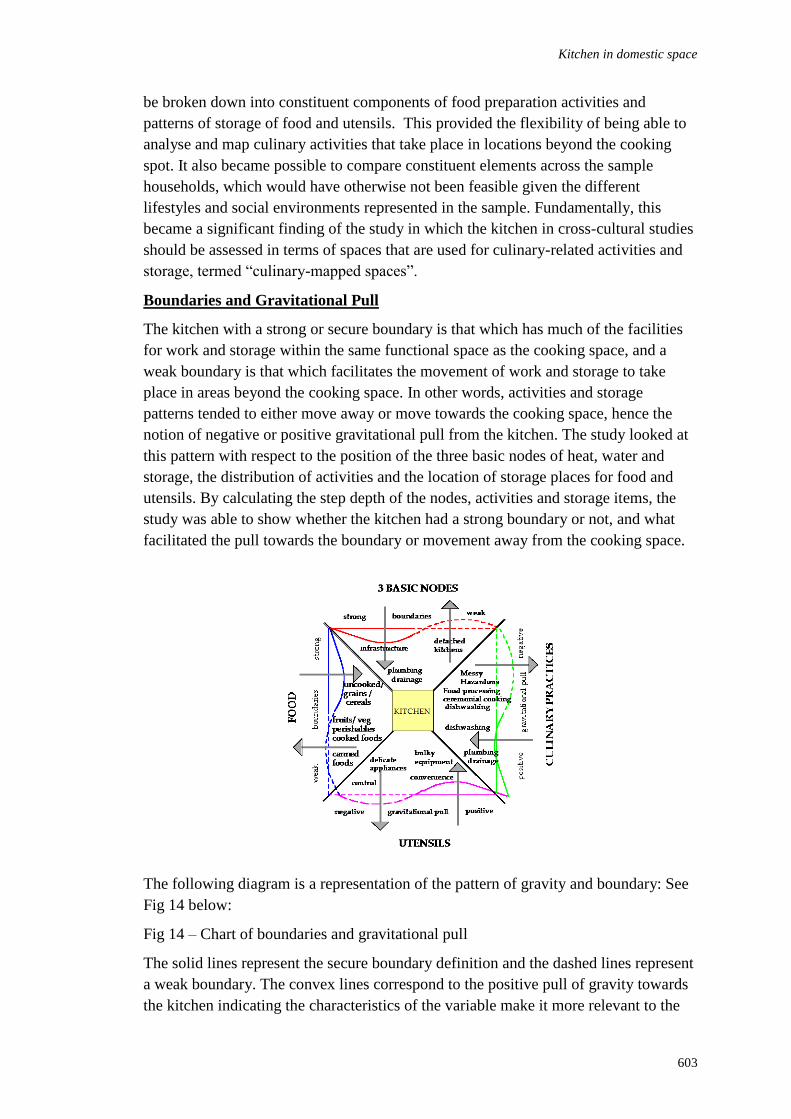
Kitchen in domestic space
603
be broken down into constituent components of food preparation activities and
patterns of storage of food and utensils. This provided the flexibility of being able to
analyse and map culinary activities that take place in locations beyond the cooking
spot. It also became possible to compare constituent elements across the sample
households, which would have otherwise not been feasible given the different
lifestyles and social environments represented in the sample. Fundamentally, this
became a significant finding of the study in which the kitchen in cross-cultural studies
should be assessed in terms of spaces that are used for culinary-related activities and
storage, termed “culinary-mapped spaces”.
Boundaries and Gravitational Pull
The kitchen with a strong or secure boundary is that which has much of the facilities
for work and storage within the same functional space as the cooking space, and a
weak boundary is that which facilitates the movement of work and storage to take
place in areas beyond the cooking space. In other words, activities and storage
patterns tended to either move away or move towards the cooking space, hence the
notion of negative or positive gravitational pull from the kitchen. The study looked at
this pattern with respect to the position of the three basic nodes of heat, water and
storage, the distribution of activities and the location of storage places for food and
utensils. By calculating the step depth of the nodes, activities and storage items, the
study was able to show whether the kitchen had a strong boundary or not, and what
facilitated the pull towards the boundary or movement away from the cooking space.
The following diagram is a representation of the pattern of gravity and boundary: See
Fig 14 below:
Fig 14 – Chart of boundaries and gravitational pull
The solid lines represent the secure boundary definition and the dashed lines represent
a weak boundary. The convex lines correspond to the positive pull of gravity towards
the kitchen indicating the characteristics of the variable make it more relevant to the
Isaacs-Sodeye
604
kitchen. The concave lines correspond to the negative pull of gravity indicating
incompatible characteristics of the variable that facilitate its movement away from the
kitchen. For culinary activity, basic infrastructure such as plumbing, drainage, water
and fuel strengthens the boundary whereas messy and hazardous activities such as
dishwashing, food-processing and ceremonial cooking would take place outdoors
thereby weakening the boundary. For storage of utensils, the convenience of
accessibility for retrieval such as for pots, pans, utensils and bulky items strengthens
the boundary, whereas the control over misuse of delicate and expensive appliances
tends to weaken the boundary as they are kept in places where access to it is
controlled. With regards to the storage of food, canned food and expensive delicacies
are stored where access is controlled, such as in the main bedroom, hence a weakened
boundary, but uncooked staple grains are stored with less control hence, a strong
boundary.
CONCLUSION
Going back to the original research questions, the study demonstrated how the
technique of mapping culinary related activity across domestic space can be a
representational and analytical tool for cross-cultural comparative study. Also, by
mapping activities, objects and food on a justified accessibility graph, the spatial co-
presence and step distance is represented and can be readily comprehended, analysed
and compared. The study also provides discursive reasoning for culinary practice
patterns that would otherwise be anecdotal.
On a wider scale, this paper argues for an increased practical understanding of the
domestic environment in order to effectively analyse, design and develop cultural
relevant built forms for Nigerian households.
ACKNOWLEDGMENTS:
I wish to acknowledge my PhD Supervisor, Prof Julienne Hanson (rtd) of the UCL
Bartlett School of Graduate Studies for guiding me through to getting my PhD; as well
as the respondent households in Ile-Ife for participating in this research. Thank you.
REFERENCES
Amole, S.A. (1985) The kitchen in domestic space: A comparison of the conceptual scheme
of some architects with laypersons.
Ardener, S. (2000) The Partition of Space. In: Rendell, J., Penner, B. and Borden, I., (Eds.)
Gender Space Architecture: An interdisciplinary introduction, pp. 112-117. London:
Routledge
Alexander, C., Ishikawa, S., Silverstein, M., Jacobson, M., Fiksdahl-King, I. and Angel, S.
(1977) A Pattern Language, edn. New York: Oxford University Press.
Clarke, A.J. (2001) The Aesthetics of Social Aspiration. In: Miller, D., (Ed.) Home
Possessions, pp. 23-45. Oxford: Berg]
Deutsche, R. (2000) Men in Space. In: Rendell, J., Penner, B. and Borden, I., (Eds.) Gender
Space Architecture: An interdisciplinary introduction, pp. 134-139. London:
Routledge
Kitchen in domestic space
605
Ekundayo, O.O (2007) Status, Solidarity and Social Mobility in Domestic Space. A
comparative study of kitchens, cooking and culinary practice in Ile-Ife, Nigeria.
Unpublished PhD Thesis held at Senate House, University of London
Goffman, E. (1959) The Presentation of Self in Everyday life, edn. London: Penguin Books.
Hanson, J. (1998) Decoding Homes and Houses: Cambridge University Press.
H Heldke, L.M. (1992) Foodmaking as a thoughtful practice. In: Curtin, D.&. and Heldke,
L.M., (Eds.) Cooking, Eating, Thinking. Transformative philosophies of food, pp.
203-229. Bloomington and Indianapolis: Indiana University Press Limited]
Hillier, B. and Hanson, J. (1984) The social logic of space, edn. Cambridge: Cambridge
University Press.
Kent, S. ( 1990) A cross-cultural study of segmentation, architecture, and the use of space. In:
Kent, S., (Ed.) Domestic Architecture and the use of space. An inter-disciplinary
cross-cultural study, pp. 127-152. Cambridge: Cambridge University Press]
Lawrence, R.J. (1982a) Domestic Space and Society: a cross-cultural study. Comparative
Studies in Society and History 21, 104-130.
Lawrence, R.J. (1987) Housing, Dwellings and Homes: Design theory, research and practice,
edn. New York: John Wiley and Sons.
Levi-Strauss, C. 1966) The culinary triangle. New Society 937-940.
Miller, D. (2001) Possessions. In: Miller, D., (Ed.) Home Possessions, pp. 107-121. Oxford:
Berg
Ojo, G.J.A. (1966a) Yoruba Culture. A Geographical Analysis, edn. Ife, London: University
of Ife Press and University of London Press.
Ozaki, R. and Lewis, J.R. (2006) Boundaries and the meaning of social space: a study of
Japanese house plans. Environment and Planning D: Society and Space 24, 91-104.
Rapoport, A. (1990) Systems of activities and systems of settings. In: Kent, S., (Ed.)
Domestic architecture and the use of space, pp. 9-20. Cambridge: Cambridge
University Press]
Revel J.F (1992) – from Culture and Cuisine – in: Curtin D.&. and Heldke, L.M., (Eds.)
Cooking, Eating, Thinking. Transformative philosophies of food, pp. 145 –152 and
244 – 250. Bloomington and Indianapolis: Indiana University Press Limited]
Tutt, P. and Adler, D. (1979) New Metric handbook, London: The Architectural Press.
Valentine, G. (1999) Eating in: home, consumption and identity. In: From the Sociological
Review 1999 pp 491-524. Published by Blackwell Publishers, 108 Cowley Road,
Oxford OX4 1JF, UK and 350 Main Street, Malden, MA 02148, US.


Olatunde, F.A. (2012) Mass housing in Nigeria, customize the brief: Provide a desired house In:
Laryea, S., Agyepong, S.A., Leiringer, R. and Hughes, W. (Eds) Procs 4th West Africa Built
Environment Research (WABER) Conference, 24-26 July 2012, Abuja, Nigeria, 607-617.
607
MASS HOUSING IN NIGERIA, CUSTOMIZE THE
BRIEF: PROVIDE A DESIRED HOUSE
Folaranmi Adedayo Olatunde Department of Architecture, Federal University of Technology, Minna, Niger State, Nigeria
The nature of the housing designs in mass housing schemes in Nigeria is a function of
how architects were trained to handle mass housing designs while in school. It is
common practice to find that the houses in majority of the mass housing schemes in
Nigeria are similar and that the houses are never house owner specific. It is often
assumed by architects working on mass housing schemes that the process of making
the houses specific is cumbersome, so many architects take the simple alternative of
providing a single or few options of design and repeat them all around the site. The
nature of the construction method of these mass housing schemes allows for the
design briefs of the individual house to be different. This paper seeks to show how
design brief in mass housing in Nigeria can be customized. This is done through the
development of a customization brief model with aid of a network of computers. It is
expected that if the model is applied into mass housing practice in Nigeria, desired
house/homes by prospective house owners in mass housing schemes would be met.
Keywords: architect, customization, house owner, mass housing, model
INTRODUCTION
A trip around the major cities in Nigeria with a view of examining the mass housing
schemes will reveal great similarities amongst them regardless of the region. A large
percentage of the mass housing schemes are generic within the estates and differences
only show in terms of aesthetics value when compared with other estates. Nigeria is
believed to be made up of people of different cultures and beliefs, these two factors
can be expressed in different forms ranging living pattern, marriage type, and privacy
demand. It is therefore logical to conclude that if some of these factors are to be
addressed by the architect then the houses in mass housing schemes in Nigeria should
not be the same. The problem of providing generic houses has contributed to the rate
of housing modification witnessed in these housing schemes, despite these
modifications architects working on mass housing schemes have continued the same
trend. This trend raises two questions for the architects:
Whether the house owners in mass housing schemes are different from those of
individually built houses?
Whether the house owners in mass housing schemes should get a desired house?
A cause of this problem could be traced to the design brief of these estates because the
form of mass housing construction in Nigeria is notnprefabrication; hence there is no
need for generic designs. An examination of these housing estates will show that the
owners are not different from those who built their houses personally, because they all
have specific needs and aspirations. In response to the second question, the houses are

Olatunde
608
paid for by the owners over a period of time and the cost of modifying the house is
also borne by them.
An examination of the curriculum of many schools of Architecture in Nigeria will
reveal that the method adopted and taught to students in area of mass housing design
is basically generic design principle, where emphasis is often placed on the initial cost
of construction and not client needs. This method is adapted in the design brief of
mass housing schemes provision. While in countries like the Netherlands, Portugal,
Japan and Malaysia attempts are being made to ensure that the houses in mass housing
schemes are client oriented. It is common in many mass housing schemes in Nigeria
to find the individual houses appearing or being the same within the estate and similar
when compared with other estates in the country. This trend creates the impression
that the characteristics of house owners are the same in Nigeria. However Nigeria as a
whole is characterised with different religions, household sizes, occupation, sense of
beauty and cultures. An examination of the housing policies developed by the
government over the years have often been considered a failure and a reason adduced
for this is explained by Kadiri (2005) that the repetition of the same house type
throughout the country and in cities at state level in spite of the socio-cultural
differences that prevailed was a major factor. An examination of the design process in
mass housing in Nigeria by Adedayo (2011a) showed that the point of deviation
between mass housing design and individual personally built house is at the briefing
stage. It is this point that this paper seeks to explore and show how the design brief in
the briefing stage in mass housing can become house owner oriented so that
prospective house owners can have a customized (desired) house.
The foundation of this research is hinged on the works of Cuperus (2003), Duarte
(2005), Niemeijer and Vries (2007), Hofman and Halman (2006) and Lim and Khalid
(2003). These researches have sought to provide methods of providing customized
housing units for the prospective house owners, the common factors in the options
provided by these researches are the use of computers, internet and the house owners.
An examination of the various methods suggested by these researchers show that they
are location or country specific and are aimed to fit the mass housing provision
method and process of their countries. In each of the researches the researchers
examined the process of mass housing and sought to introduce the house owner into
the process either before the construction of the house or during the design stage and
in some cases like that of Cuperus (2003) at the briefing stage and this was motivated
by the design constraints introduced by the government of Almere in the Netherlands.
An examination of the mass housing process in Nigeria showed that the individual
housing unit are built on-site individually hence in order to provide a desired house for
the house owner, the design brief for each house has to be generated. This suggestion
appears cumbersome but according to Niemeijer and Vries (2007), the use of
computer programming will reduce or eliminate the problem. This work aims to show
how the design briefs in mass housing provision in Nigeria can be customized using
computers and ensure that it fits into the Nigerian environment.
HOUSE OWNERS IN MASS HOUSING VERSUS INDIVIDUAL
HOUSING
In Nigeria mass housing provision is driven by two major factors namely profit and
politics as exemplified by the location of the houses and the overall cost the clients
pay. These two factors are ways by which politicians in power empower their
followers through the award of contracts for the construction of these houses at high
Mass housing
609
costs using state funds. The allocation of the housing units is also based on political
patronage. These two factors are fuelled by the level of corruption obtainable within
the Nigerian system. In the run-up to the provision of the mass housing in Nigeria, the
housing providers assume that the house owners are insignificant as they are not
considered in the brief because it is believed that the client is not responsible for the
initial capital for the house. These believe has been shown to be untrue by the
researches of Tipple and Ameen (1999) and Makachia (2005), where house owners
transform their houses to meet their needs. In the case of individually provided
housing, the house owner is the one who initiates the housing design by inviting the
architect to discuss with him. The house that usually results from this process ensures
that the desires of the house owner are met and the house is customized. In this type of
house it is uncommon to find housing transformation taking place. It is possible to
assume that the house owners in both cases are different however; this is not the case.
In individual housing the house owners’ needs are similar to those of the house
owners in mass housing schemes, these needs range from housing space in terms of
sizes of rooms and number of rooms because of their varying family sizes. The need
for aesthetics is a concern to both sets of house owners, the religion of the house
owners also vary in both cases. The need of security is not limited to only the
individual house owners in individual housing schemes, privacy is also of importance
to both parties. The expressions of these issues are different from each individual and
they vary in importance to the house owners.
In the case of the house owner in individual housing schemes the problems are tackled
at the design brief stage and hence the houses are different from each other, however
the situation is different in the case of mass housing schemes. The view of Cormier,
Olewnik, and Lewis (2008), is that no two consumers are identical and that typically
differences in personal preference occur even if they are subtle. The summary of these
problems is that the house owners are different regardless of the type of housing
schemes they find themselves; this gives reason for the need of customization of the
brief in mass housing schemes because the brief in individual housing schemes are
already customized before the construction of the house. The challenge therefore is
how to meet this need in mass housing schemes in Nigeria and this can be achieved
through the customization of the design brief for the individual housing units in the
mass housing schemes.
INDIVIDUAL HOUSE VERSUS MASS HOUSING
In every mass housing scheme the major component in the housing scheme are the
housing units, which is in line with what is obtainable in the case of privately
commissioned housing. In mass housing schemes the housing units are usually generic
in nature which is not the situation in personally designed houses. According to Pine
(1993) generic products are a result of mass production principle adopted in any
manufacturing or production industry of which housing is a part. The basic
assumption in the production of a generic housing unit is that the house owner’s needs
Olatunde
610
can be standardised or generalised and a single design brief will suffice. This is not the
situation in individual housing where the designed house is a solution to a particular
house owner’s needs and aspirations regardless of how subtle the need might be. This
is why a visit to any residential area in Nigeria where the house owners built the
houses themselves, will reveal that the houses are often not the same in planning and
certainly do not appear the same. The houses in mass housing schemes do not meet
the needs of the house owners while the reverse is what is observable when it is
houses built by house owners personally. A major difference in the two forms of
houses is that while the architect meets with the house owner in the individually built
houses, the architect usually meets with the financing party (government/private
developer) however in mass housing. It implies therefore that the brief in mass
housing is never prospective house owner oriented.
The examination of the two forms of houses would reveal that the creation of identity
is not achieved in mass housing schemes in Nigeria, while the reverse is the case with
none mass housing scheme. In the individual housing, usually everything required by
the house owner is provided for at the inception of the house while in the case of a
mass produced housing the house owners have to make do with what is available like
tenants. A comparison of similar housing units from both categories of the housing
under discussion will show that for a basic three bedroom bungalow one will get
different variations and combinations in the individual sponsored housing, with the
variations might be as little as the number of toilets. In the case of mass housing the
general idea is to just provide the basic function. In order to understand these houses
there is the need to examine the design brief of the two categories of housing.
DESIGN BRIEF IN PERSONAL HOUSES VERSUS MASS
HOUSING
The design brief in none mass housing scheme is considered as customized briefs
because it is client specific and it is derived from interaction with the client. The
process of generating design briefs is time related and hence in the case of mass
housing where the number of clients is large the process becomes cumbersome and
unachievable if the same method in single client design is adopted directly. This is
supported by Niemeijer and Vries (2007), which stated that most architects working
on mass housing projects in Holland still apply the traditional method of manually
creating the designs which makes customization a cumbersome process. In solving the
problem the use of computers was advocated by the researcher to customize the house
through design. In the generation of a design brief for the personally constructed
house the process in simple and straight forward and it involves a face to face contact
between the house owner and the architect and it is usually in a discussion format. In
other to create this discussion between the architect and the prospective house owner
in such a way that it would not be cumbersome, the use of a network of computer was
advocated by Niemeijer and Vries (2007) for the purpose of customizing the design.
The aspect by which design brief in mass housing would be customized is shown in
figure 1.0, which is from part of the general process proposed for the customization of
housing unit which will guarantee a desired house.
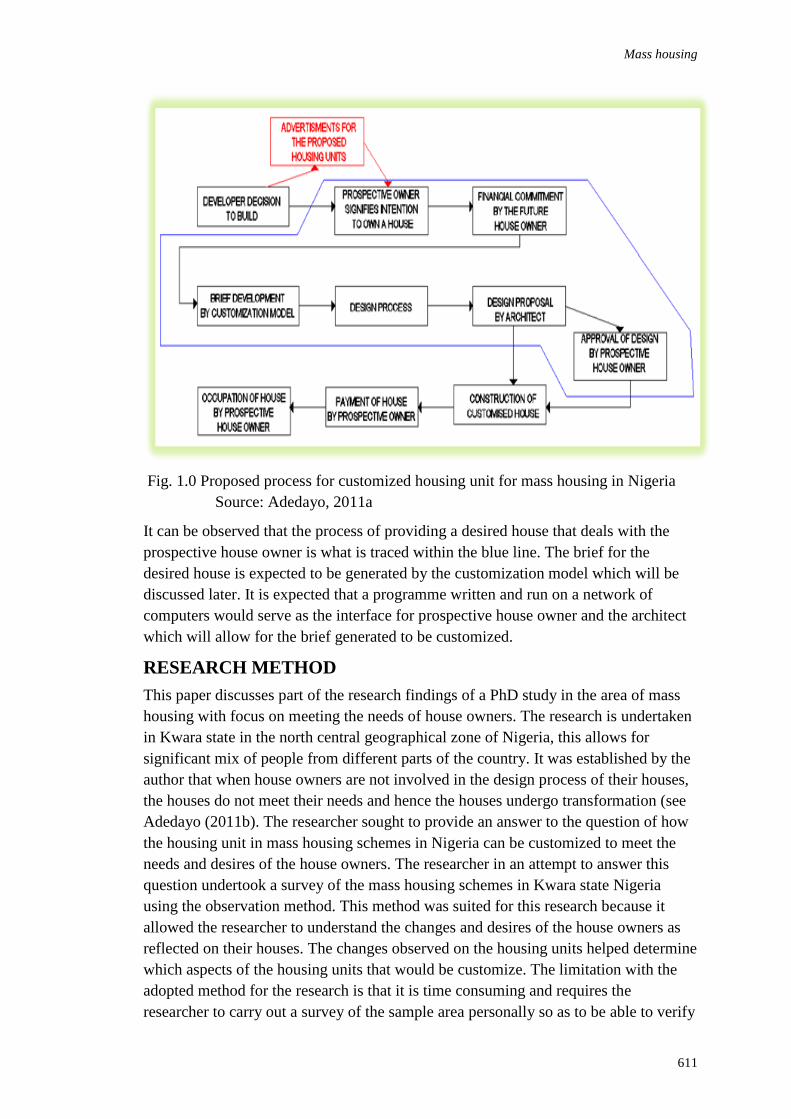
Mass housing
611
Fig. 1.0 Proposed process for customized housing unit for mass housing in Nigeria
Source: Adedayo, 2011a
It can be observed that the process of providing a desired house that deals with the
prospective house owner is what is traced within the blue line. The brief for the
desired house is expected to be generated by the customization model which will be
discussed later. It is expected that a programme written and run on a network of
computers would serve as the interface for prospective house owner and the architect
which will allow for the brief generated to be customized.
RESEARCH METHOD
This paper discusses part of the research findings of a PhD study in the area of mass
housing with focus on meeting the needs of house owners. The research is undertaken
in Kwara state in the north central geographical zone of Nigeria, this allows for
significant mix of people from different parts of the country. It was established by the
author that when house owners are not involved in the design process of their houses,
the houses do not meet their needs and hence the houses undergo transformation (see
Adedayo (2011b). The researcher sought to provide an answer to the question of how
the housing unit in mass housing schemes in Nigeria can be customized to meet the
needs and desires of the house owners. The researcher in an attempt to answer this
question undertook a survey of the mass housing schemes in Kwara state Nigeria
using the observation method. This method was suited for this research because it
allowed the researcher to understand the changes and desires of the house owners as
reflected on their houses. The changes observed on the housing units helped determine
which aspects of the housing units that would be customize. The limitation with the
adopted method for the research is that it is time consuming and requires the
researcher to carry out a survey of the sample area personally so as to be able to verify
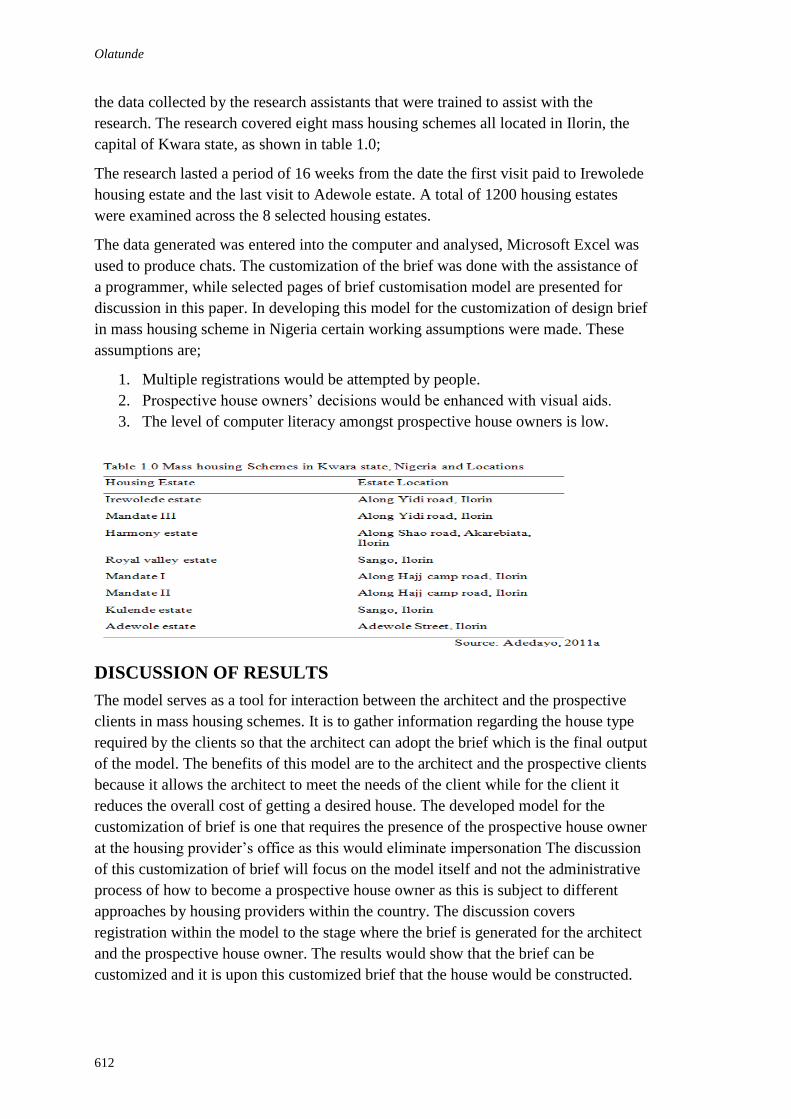
Olatunde
612
the data collected by the research assistants that were trained to assist with the
research. The research covered eight mass housing schemes all located in Ilorin, the
capital of Kwara state, as shown in table 1.0;
The research lasted a period of 16 weeks from the date the first visit paid to Irewolede
housing estate and the last visit to Adewole estate. A total of 1200 housing estates
were examined across the 8 selected housing estates.
The data generated was entered into the computer and analysed, Microsoft Excel was
used to produce chats. The customization of the brief was done with the assistance of
a programmer, while selected pages of brief customisation model are presented for
discussion in this paper. In developing this model for the customization of design brief
in mass housing scheme in Nigeria certain working assumptions were made. These
assumptions are;
1. Multiple registrations would be attempted by people.
2. Prospective house owners’ decisions would be enhanced with visual aids.
3. The level of computer literacy amongst prospective house owners is low.
DISCUSSION OF RESULTS
The model serves as a tool for interaction between the architect and the prospective
clients in mass housing schemes. It is to gather information regarding the house type
required by the clients so that the architect can adopt the brief which is the final output
of the model. The benefits of this model are to the architect and the prospective clients
because it allows the architect to meet the needs of the client while for the client it
reduces the overall cost of getting a desired house. The developed model for the
customization of brief is one that requires the presence of the prospective house owner
at the housing provider’s office as this would eliminate impersonation The discussion
of this customization of brief will focus on the model itself and not the administrative
process of how to become a prospective house owner as this is subject to different
approaches by housing providers within the country. The discussion covers
registration within the model to the stage where the brief is generated for the architect
and the prospective house owner. The results would show that the brief can be
customized and it is upon this customized brief that the house would be constructed.

Mass housing
613
Fig.2.0 Prospective house owners registration page Source: Author, 2012
The displayed page of the model in figure 2.0 shows the registration of the prospective
house owner. The intent of this page is ascertaining the identity of the person and also
a unique pin number would be generated for the individual. The information required
here are personal can only be accessed by the model administrator. The information
would also assist in the allocation of plots to the house owners so as to avoid
allocating plots close to facilities that might be considered offensive to the prospective
house owner based on religious ground. The “User ID” and “Password” will be
generated upon successful completion of registration and this can be modified by the
prospective house owner and used on subsequent occasions.
This page in figure 3.0 is where the customization of the brief begins with the
selection of the task that the prospective house owner wants to perform. The choice of
editing building plan at the left side of the page will give the opportunity for the
individual to select the house type of choice from the various ones in the data base of
the housing provider. The client can edit already submitted details and the opportunity
to change the password is also available.

Olatunde
614
Fig.3.0 Housing unit editing page Source: Author,
2012
The details for the generation of the brief are what would be inputted in this page as
can be observed from figure 3.0 that the boxes to the right is meant for such purpose.
While inputting the details the prospective house owner can view the pictorial
selection of the plan or elevations. The choice of finishes and specification of
materials for selected aspects of the building of which the interest of the prospective
house owner is required can also be made.
Fig.4.0 Prospective house owner preview of selected floor plan Source:
Author, 2012
This view in figure 4.0 is what would be displayed when the house owner chooses to
view the diagram for the floor plan that has been selected. It allows for the individual
to examine it with the help of an assigned trained person from the housing provider so
that he/she is sure that the plan is satisfactory to him/her. It is also possible for the
client to print this page for further consultation with his/her familly members. It is
possible for the client not to like the selected floor plan at this stage, he has the
opportunity to go back and make another selection that suits him. When this process is
completed the selection of corresponding elevations is the next step.
Fig.5.0 Prospective house owner preview of selected front elevation Source: Author, 2012
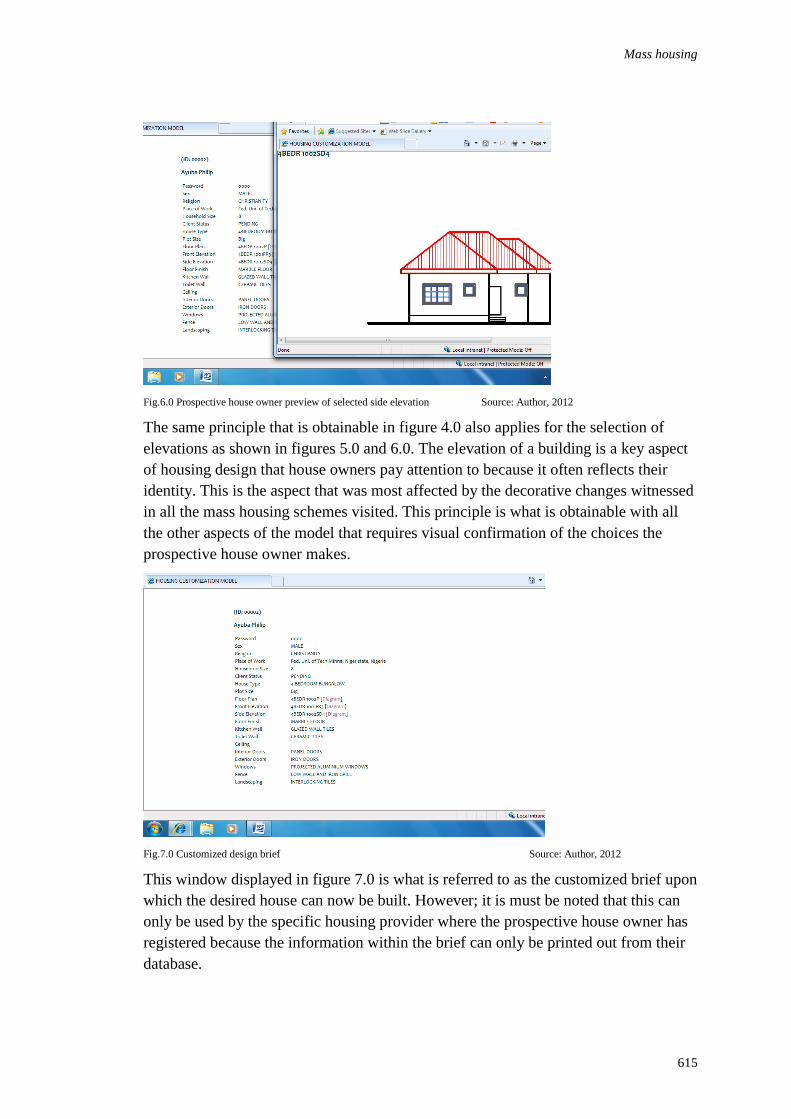
Mass housing
615
Fig.6.0 Prospective house owner preview of selected side elevation Source: Author, 2012
The same principle that is obtainable in figure 4.0 also applies for the selection of
elevations as shown in figures 5.0 and 6.0. The elevation of a building is a key aspect
of housing design that house owners pay attention to because it often reflects their
identity. This is the aspect that was most affected by the decorative changes witnessed
in all the mass housing schemes visited. This principle is what is obtainable with all
the other aspects of the model that requires visual confirmation of the choices the
prospective house owner makes.
Fig.7.0 Customized design brief Source: Author, 2012
This window displayed in figure 7.0 is what is referred to as the customized brief upon
which the desired house can now be built. However; it is must be noted that this can
only be used by the specific housing provider where the prospective house owner has
registered because the information within the brief can only be printed out from their
database.
Olatunde
616
CONCLUSIONS
The housing transformation witnessed in many mass housing estates in Nigeria has
shown that it was wrong to ignore the clients in mass housing schemes. The process of
producing design brief by architects working on mass housing schemes was identified
as a factor responsible for the nature of the housing units in mass housing schemes. In
Nigeria this process is what the customization model sought to correct by creating a
medium that allows for multiple clients to interact with the architect virtually and
assist in generating individual design brief. This was done taking into account the
peculiar nature of Nigeria. The benefit of the approach is that housing units developed
from the process will address the client’s needs and aspirations and hence reduce post-
construction changes resulting from design brief. It will also assist in reducing the
overall cost of the house from the owners view point.
The use of computers became the necessary medium for achieving this because of the
capacity that a network of computers with the right programme running offers, this is
line with view of Pollard (2008) that stated that mass customization goes around the
concept of “build to order”, which is to make products customer specific. It also aligns
with the view of Niemeijer and Vries (2007) that the use of a computer programme
should allow for changes to be made such that it would not take as much time as that
of the manual process. This customized brief should therefore be the foundation of
desired house for the house owners in mass housing schemes.
REFERENCES
Adedayo, O.F. (2011a). Customization of Housing Units on Mass Housing Estates on Nigeria:
A Case Study of Kwara State. An unpublished PhD research proposal submitted to the
Department of Architecture Federal University of Technology Minna, Niger State.
Adedayo, O.F. (2011b), House Owners Participation in Mass Housing Provision in Niger
State Nigeria: A Need for Change from Speculative to Specific Housing. Proceedings
of the WABER 2011 Conference, 2, 559-570
Cormier, P. Olewnik, A. Lewis, K. (2008). An Approach to Quantifying Design Flexibility for
Mass Customization in Early Design Stages. Proceedings of the ASME 2008
International Design Engineering Technical Conferences and Computers and
Information in Engineering Conference, Brooklyn, New York, USA
Cuperus, Y. (2003). Mass customization in housing an open building/lean construction study.
Retrieved from http:/www.y Cuperus-obom.org on 24th February 2009, 21:46pm.
Duarte, J.P. (2005). Towards the mass customization of housing: the grammar of Siza’s
houses at Malagueria: Environment and Planning B: Planning and Design,14, 347-
380.
Hofman, E. Halman, J.I.M. (2006). Variation in housing design: Identifying Customer
preferences.351-368. Retrieved from
http:/www.irddirekt.de/daten/iconda/CIB8977.pdf on 24th November 2009, 2:43 pm.
Kadiri, K.O. (2005), Mass Housing through Earth Construction Technology in Nigeria:
Pakistan Journal of Social Sciences, 3(5), 755-760.
Lim, T.Y. Khalid, H.M. (2003). A framework on virtual collaborative customization in home
modification. Proceedings of SEAMEC Kuching. 354-361.

Mass housing
617
Makachia, P. (2005). Influence of House Form on Dweller-Initiated Transformations in Urban
Housing. XXXIII IAHS World Congress on Housing Transforming Housing
Environment through Design. Held between 27th – 30
th September 2005 in Pretoria,
South Africa.
Niemeijer, R.A. and Vries, B. (2007). A feasibility study for a mass-customization system.
Retrieved from http:/www.proclient.org/wp_content/uploads/2008/os/feasibility.pdf
on 24th November 2009, 1:43 pm.
Pine, B. J. I.(1993). Mass Customization: The New Frontier in Business Competition. Boston,
MA: Harvard Business School Press.
Pollard, D. (2008). Strategies for Mass Customization. Journal of Business and Economics
Research, 6(7), 77- 86.
Tipple, A.G. and Ameen, M.S. (1999). User initiated extension activity in Bangladesh:
“building slums” or area improvement? Environment and Urbanization, 11(1), 165-
183.

Gasu, M. B., Ajayi, A. O. and Ogunjumo, E. A. (2011) The Use of Laterite-Cement-Enhanced Bricks in
the Provision of Public Infrastructure: A Case Study of Osun State University Bukateria Complex,
Osogbo, Osun State, Nigeria In: Laryea, S., Agyepong, S.A., Leiringer, R. and Hughes, W. (Eds)
Procs 4th West Africa Built Environment Research (WABER) Conference, 24-26 July 2012, Abuja,
Nigeria, 619-626.
619
THE USE OF LATERITE-CEMENT-ENHANCED
BRICKS IN THE PROVISION OF PUBLIC
INFRASTRUCTURE: A CASE STUDY OF OSUN STATE
UNIVERSITY BUKATERIA COMPLEX, OSOGBO,
OSUN STATE, NIGERIA
M.B. Gasu1, A.O. Ajayi and E. Ogunjumo
Department of Urban and Regional Planning, Osun State University, Osogbo
The study examined the use of laterite-cement-enhanced bricks in the provision of
low cost students’ infrastructural facilities in Osun State University, Osogbo with a
view to creating an environment that is aesthetically pleasing for working, living and
recreation. Primary data made use of semi-structured interviews and focused group
discussions on the key participants in the project while secondary data was gotten
from publications. Results show that the use of laterite-cement-enhanced bricks was
able to cut down the cost of construction by between 20% and 30%. Therefore the use
of laterite-cement-enhanced-bricks has the potentials that could propel the
construction of low cost housing which could go a long way to promote economic
growth, reduce poverty and inequality, and ensure an orderly environment which
could aid planning and decision making process and the attainment of the Millennium
Development Goals (MDGs).
Keywords: laterite-enhanced-brick, public infrastructure, low cost housing, poverty
INTRODUCTION
The provision of adequate and reliable physical infrastructure for the citizenry of any
nation by the Government cannot be overemphasised considering the role it plays in
supporting the growth of the economy, delivery of social services and enabling the
movement of goods and services. Public infrastructural facilities have long been
identified as a catalyst for triggering and sustaining the multiplier effect of such
spending on economic growth in the developing countries and therefore have a vital
role to play in the attainment of the Millennium Development Goals (MDGs) (World
Bank,1994; Sader, 2000; Spoehr, et al, 2002; Colin, et al., 2004; Van, 2005).
Akampurira, et al (2009) also observed that the traditional responsibility of the
provision, management and financing of the development of physical infrastructural
assets were within the ambit of the government who draws its financing from various
taxation mechanisms.
However, recent events have revealed that this onus is fast being eroded from the
society for most governments or public institutions have found their hands tied to a
corner as a result of challenges from emerging global issues such as liberalisation of

Gasu et al.
620
trade, privatisation of public institutions, deregulation, economic integration, rural
urban migration, rapid urbanisation; the economic crunch, poverty and population
explosion in the developing countries just to mention but a few. Adeyinka and
Olugbamila (2011) posited that some of these challenges were associated with
endemic budget deficits and inefficient management of large infrastructural projects
and services within the public sector. Izedonmi (2011) while agreeing with the above
assertions observed that Government is willing to provide everything for its citizens
but the means to do so was no longer there, for revenue was dwindling in addition to
problems of inflation and the general financial crisis.
In Nigeria the construction industry accounted for over 6% of the GNP, employing not
less that 40% of labour force (CBN, 2000). Okereke (2006) argued that to underscore
the importance of the construction industry, the Federal Executive Council once
approved a total of N468 billion for infrastructural development, out of which N439
billion was earmarked for construction of roads and related infrastructure constituting
94% of the amount. Nigeria, with a population of over 150 million people can only
boast of between 2 to 3 housing developing units per 1000 persons, as against 8 to 10
housing units recommended by the United Nations for countries with annual growth
rate of 3.3 percent on the basis of annual birth rate of 49.3 per 1000 persons (UN
Report, 1998). The Federal Government noted further that, it needs 12 million housing
to be able to address the housing challenge facing the country (Vanguard, 2008).
However, there is a general consensus that government has no business doing business
and that what it needs to do is to provide the general enabling environment which
includes; investment incentives and security. This notion is premised on the way most
public goods (infrastructure and services) are managed for, they have always been
surrounded by controversies such as; project failure, abandonment, corruption, and
nepotism (Sotola and Ayodele, 2011).
It was at this backdrop that this study was conceived to seek answers to questions such
as; can laterite-cement-enhanced-bricks bridge the gap of the short fall in low cost
housing in Nigeria? What are the alternative construction methods? The study had as
objective to assess the role of laterite-cement-enhanced bricks for the provision of low
cost students’ infrastructural facilities in Osun State University, Osogbo with a view
to creating an environment that is aesthetically pleasing for working, living and
recreation.
THEORETICAL FRAMEWORK
The Government has always been at the forefront of providing public infrastructure
and services for the wellbeing of its citizens. According to Olayiwola and Adeleye
(2004) Government involvement in the provision of infrastructural facilities in Nigeria
dates back to 1917 when the colonial government promulgated the Township
ordinance which classified settlements into three: first, second and third classs
townships. They observed further that the first class towns harbour the whites and
their employees and received the lion’s share of investments on infrastructural
development at the expense of the others and this trend continued until 1952 when the
local councils were established in Western Nigeria. Hirschman (1958) defines
infrastructural facilities as the basic services without which primary, secondary and
tertiary productive activities cannot function adequately. From broader perspectives,
infrastructural facilities embrace all public services from law and order through
education and public health to transportation, housing, communication and water
supply (Mabogunje, 1974; Khan, 1979 and Olayiwola and Adeleye, 2004). Therefore,
Bricks
621
infrastructural facilities are elements in the package of basic needs which a
community would like to procure for a better living (Olayiwola and Adeleye, 2004).
Khan (1979) categorised infrastructural facilities into three namely: physical
infrastructure such as; roads, water, electrification, storage and processing facilities;
social infrastructure such as; health and educational facilities, community centres,
housing, markets, fire services; institutional infrastructure which include; credit and
financial institutions, agricultural research facilities and social infrastructure.
There is a growing concern over the number of Nigerians who become homeless
every year as the number of tenants out numbers the landlords. Even in some cases
some tenants find themselves homeless too, for either another landlord has ejected
them or their building has collapsed given the wave of recent building collapse in
Nigeria (Igbokwe, 2006; Gasu et al, 2010). Experts committee on the constructions
industry set up by the Obasanjo’s administration observed that, Nigerians were 16
million houses short of their housing requirements and attributed it to; rising cost of
building materials, disparity in development, escalating cost of affordable shelter,
increasing incidence of poverty, unprecedented increase in population, rising
unemployment amongst others with construction cost taking between 60-70% of the
cost of the materials (Igbokwe, 2006; Gasu, et al 2010). Similarly, Akinpelu and
Udeme (2010) identified the lack of access to affordable housing by most citizens to
include; lack of access to land, finance especially the bizzare nature of the mortgage
sector, high cost of construction, high cost of building materials most of which are
imported and the dearth of competent artisans to execute projects. The implication is
that Nigeria needs to produce about 20 million housing units between now and the
year 2015. This translates to the construction of 3,600,000 housing units annually if
the country is to meet the Millennium Development Goals (MDGs) target for housing
for all. However, paradoxically the National Housing Policy recommends the
production of a rediclous number of forty thousand (40,000) housing units per annum
nation wide. The MDGs requires “renewed political commitment and effective actions
from member nations to help the poor and disadvantaged improve their shelter and
neighbourhoods” (Okereke, 2006).
Furthermore, the experts in the building industry have amongst other things blamed
the government for making housing construction unaffordable to the majority of
citizens resulting from the difficulties of land acquisition which is a direct consequent
of the 1978 Land Use Act (Akinpelu and Udeme, 2010). The experts also stated
further that Governments direct intervention instead of providing a succour, has
further widen the gap between the low income earners, majority of whom can not
afford a home on their own and the affluent who instantly buy up the few houses
constructed by the government agencies meant for low income earners.It has equally
been observed that the ever rising cost of building materials especially cement has not
made the matter any better. The prices of building materials are usually prohibitive for
public infrastructural provision especially housing as some are at times out of the
reach of the common man (Gasu et al, 2010). Another dimension of the problem
stems from over reliance on cement which happens to be the main ingredient for the
provision of public infrastructure especially housing where it constitute 40% of
building materials (Suleiman, 2011). Ajanlekoko (2001) observed that the nation
needs about 8.5 million metric tonnes of cement yearly, meanwhile the cement
companies produce between 2-3million metric tonnes and that the short fall has been
responsible for the galloping cost of cement over the years. However, there is a ray of
hope following the recent inauguration of the $1bn Dangote cement plant at Ibese
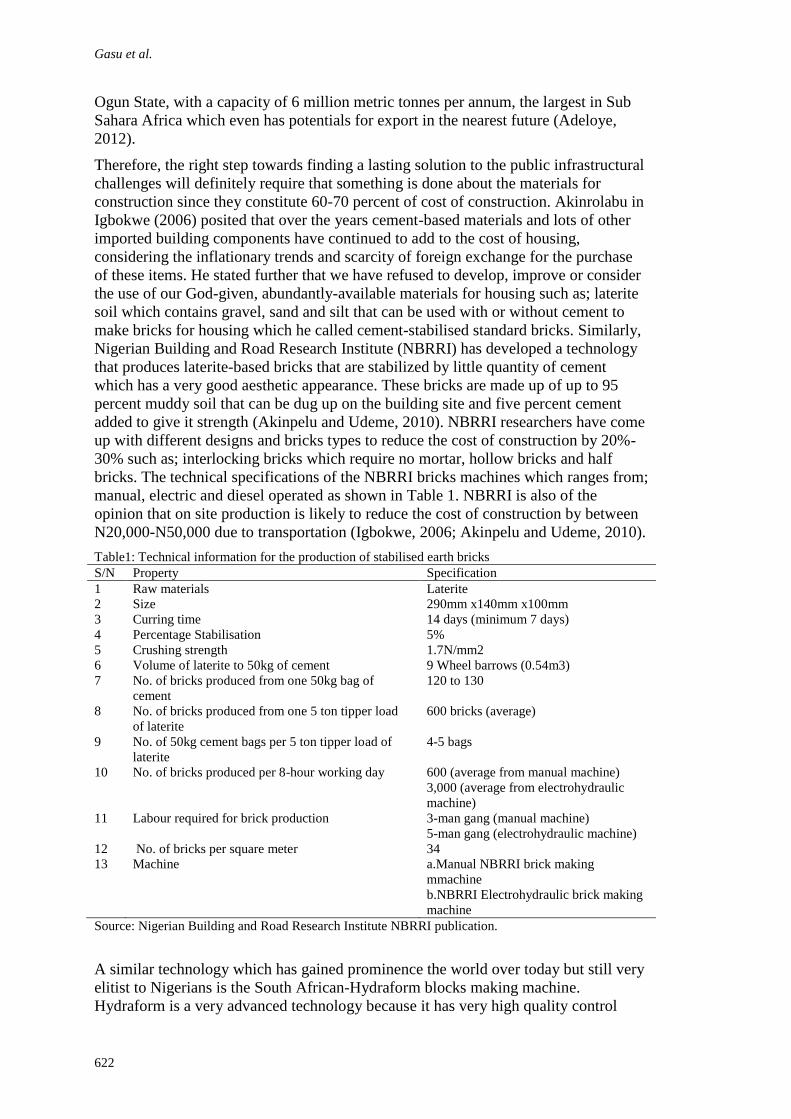
Gasu et al.
622
Ogun State, with a capacity of 6 million metric tonnes per annum, the largest in Sub
Sahara Africa which even has potentials for export in the nearest future (Adeloye,
2012).
Therefore, the right step towards finding a lasting solution to the public infrastructural
challenges will definitely require that something is done about the materials for
construction since they constitute 60-70 percent of cost of construction. Akinrolabu in
Igbokwe (2006) posited that over the years cement-based materials and lots of other
imported building components have continued to add to the cost of housing,
considering the inflationary trends and scarcity of foreign exchange for the purchase
of these items. He stated further that we have refused to develop, improve or consider
the use of our God-given, abundantly-available materials for housing such as; laterite
soil which contains gravel, sand and silt that can be used with or without cement to
make bricks for housing which he called cement-stabilised standard bricks. Similarly,
Nigerian Building and Road Research Institute (NBRRI) has developed a technology
that produces laterite-based bricks that are stabilized by little quantity of cement
which has a very good aesthetic appearance. These bricks are made up of up to 95
percent muddy soil that can be dug up on the building site and five percent cement
added to give it strength (Akinpelu and Udeme, 2010). NBRRI researchers have come
up with different designs and bricks types to reduce the cost of construction by 20%-
30% such as; interlocking bricks which require no mortar, hollow bricks and half
bricks. The technical specifications of the NBRRI bricks machines which ranges from;
manual, electric and diesel operated as shown in Table 1. NBRRI is also of the
opinion that on site production is likely to reduce the cost of construction by between
N20,000-N50,000 due to transportation (Igbokwe, 2006; Akinpelu and Udeme, 2010).
Table1: Technical information for the production of stabilised earth bricks
S/N Property Specification
1 Raw materials Laterite
2 Size 290mm x140mm x100mm
3 Curring time 14 days (minimum 7 days)
4 Percentage Stabilisation 5%
5 Crushing strength 1.7N/mm2
6 Volume of laterite to 50kg of cement 9 Wheel barrows (0.54m3)
7 No. of bricks produced from one 50kg bag of
cement
120 to 130
8 No. of bricks produced from one 5 ton tipper load
of laterite
600 bricks (average)
9 No. of 50kg cement bags per 5 ton tipper load of
laterite
4-5 bags
10 No. of bricks produced per 8-hour working day 600 (average from manual machine)
3,000 (average from electrohydraulic
machine)
11 Labour required for brick production 3-man gang (manual machine)
5-man gang (electrohydraulic machine)
12 No. of bricks per square meter 34
13 Machine a.Manual NBRRI brick making
mmachine
b.NBRRI Electrohydraulic brick making
machine
Source: Nigerian Building and Road Research Institute NBRRI publication.
A similar technology which has gained prominence the world over today but still very
elitist to Nigerians is the South African-Hydraform blocks making machine.
Hydraform is a very advanced technology because it has very high quality control
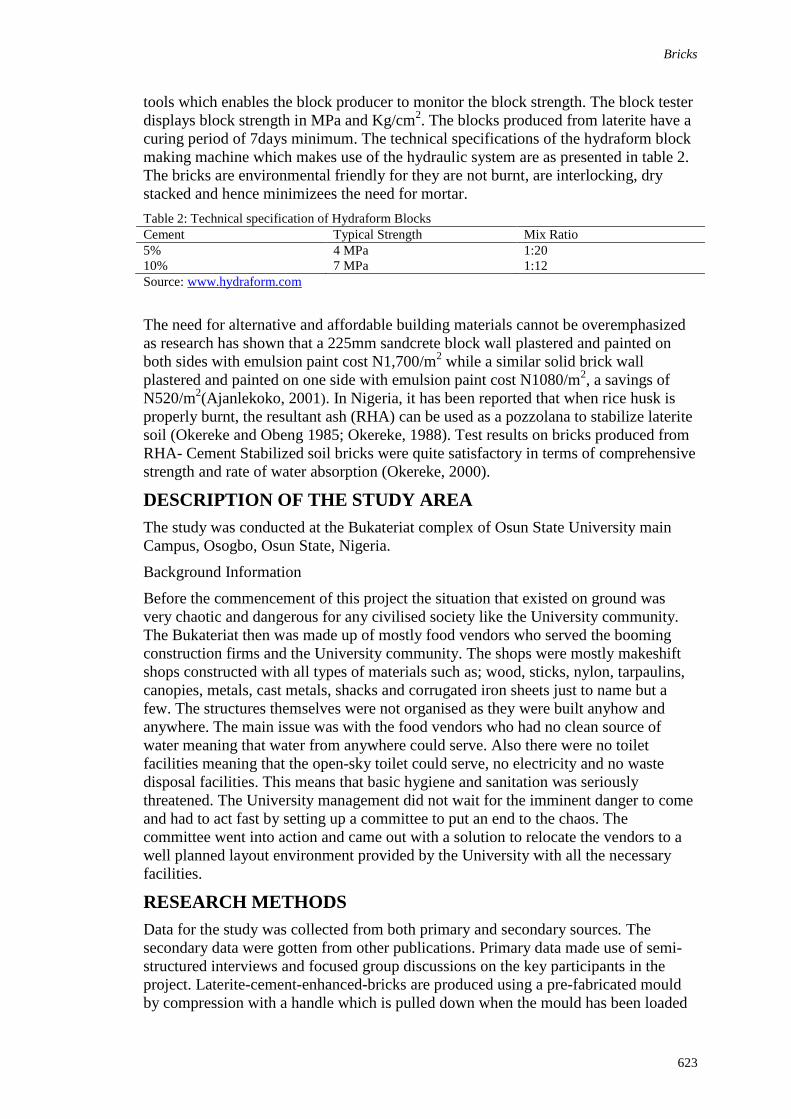
Bricks
623
tools which enables the block producer to monitor the block strength. The block tester
displays block strength in MPa and Kg/cm2. The blocks produced from laterite have a
curing period of 7days minimum. The technical specifications of the hydraform block
making machine which makes use of the hydraulic system are as presented in table 2.
The bricks are environmental friendly for they are not burnt, are interlocking, dry
stacked and hence minimizees the need for mortar.
Table 2: Technical specification of Hydraform Blocks
Cement Typical Strength Mix Ratio
5% 4 MPa 1:20
10% 7 MPa 1:12
Source: www.hydraform.com
The need for alternative and affordable building materials cannot be overemphasized
as research has shown that a 225mm sandcrete block wall plastered and painted on
both sides with emulsion paint cost N1,700/m2 while a similar solid brick wall
plastered and painted on one side with emulsion paint cost N1080/m2, a savings of
N520/m2(Ajanlekoko, 2001). In Nigeria, it has been reported that when rice husk is
properly burnt, the resultant ash (RHA) can be used as a pozzolana to stabilize laterite
soil (Okereke and Obeng 1985; Okereke, 1988). Test results on bricks produced from
RHA- Cement Stabilized soil bricks were quite satisfactory in terms of comprehensive
strength and rate of water absorption (Okereke, 2000).
DESCRIPTION OF THE STUDY AREA
The study was conducted at the Bukateriat complex of Osun State University main
Campus, Osogbo, Osun State, Nigeria.
Background Information
Before the commencement of this project the situation that existed on ground was
very chaotic and dangerous for any civilised society like the University community.
The Bukateriat then was made up of mostly food vendors who served the booming
construction firms and the University community. The shops were mostly makeshift
shops constructed with all types of materials such as; wood, sticks, nylon, tarpaulins,
canopies, metals, cast metals, shacks and corrugated iron sheets just to name but a
few. The structures themselves were not organised as they were built anyhow and
anywhere. The main issue was with the food vendors who had no clean source of
water meaning that water from anywhere could serve. Also there were no toilet
facilities meaning that the open-sky toilet could serve, no electricity and no waste
disposal facilities. This means that basic hygiene and sanitation was seriously
threatened. The University management did not wait for the imminent danger to come
and had to act fast by setting up a committee to put an end to the chaos. The
committee went into action and came out with a solution to relocate the vendors to a
well planned layout environment provided by the University with all the necessary
facilities.
RESEARCH METHODS
Data for the study was collected from both primary and secondary sources. The
secondary data were gotten from other publications. Primary data made use of semi-
structured interviews and focused group discussions on the key participants in the
project. Laterite-cement-enhanced-bricks are produced using a pre-fabricated mould
by compression with a handle which is pulled down when the mould has been loaded
Gasu et al.
624
with the mixture. The materials needed for the production of the bricks include;
buckets for water, a piece of wood for levelling, watering can, engine oil for
lubricating the mould, shovel for mixing, a scraper and a pre-fabricated brick making
machine. Laterite of 7-8 wheelbarrows were mixed with a bag of cement, water added
just enough to bind and loaded into a mould compressed to produce 100 bricks. It
takes between 8-10 days for the bricks to be cured and ready for use. The bricks have
been tested and found to be: sound and bullet proof, stronger because it is not hollow,
cheaper for plastering of external walls is not required for beautification and cost
reduction, easy to set and possess this natural cooling effect. The number of bricks
produced a day depend on the number of labourers and the efficiency of the machine.
RESULTS AND DISCUSSIONS
Private developers were invited with priority given to those who were already on
ground and after a series of consultative meetings, plots were allotted based on first
come first served and given the go ahead to Build Operate and Transfer (BOT) for a
period of twenty-five years. Enforcement of rules, ethics, adherence to laid down
standards found inside the tenancy agreement were to be ensured by the Works
Department of the University while the committee exercised an oversight function of
supervision of the whole project implementation. The committee looked inwards and
came out with the use of laterite-cement-enhanced bricks which brought down the cost
to about four hundred and fifty thousand naira (N450, 000.00) per developer using
direct labour (25% reduction NBRI, Igbokwe, 2006, Akinpelu and Udeme, 2010)
down from six hundred thousand naira (N600, 000.00) using the normal sandcrete
blocks which was out of the reach of the common man.
The allocation was done block by block and as soon as four persons per block were
ready, works on their block commenced since they share internal walls which further
reduced the cost of construction. Each developer was given a maximum of six months
to develop his/her plot and failure to build within the specified period, the rights of
occupancy were revoked and allotted to persons on the waiting list who were ready to
build. With laterite-cement-enhanced-bricks, only the internal walls are plastered
leaving the external chocolate-brown-like walls to give an excellent aesthetically
pleasing environment for relaxation and studies. Allottees after completing their
structures were expected to pay only for the services such as electricity bills and water
rating until after twenty-five years at the expiration of their tenancy, after which the
property would be transferred to the University and the developers can now be
charged rents, on an amount to be agreed upon. All facilities and services to make the
environment, functional and efficient such as: electricity, water, toilets, drainages,
waste disposal, recreation, security and roads were provided. The use of laterite-
enhanced-bricks reduced the cost of construction in line with studies by Igbokwe,
2006; Akinpelu and Udeme, 2010 which could serve as an impetus to promote the
construction of low cost housing; an indication that it could boost the economy, create
wealth and jobs, in short serve as an alternative for public infrastructural provision in
concordance with earlier studies by World Bank, 1994; Sader, 2000; Spoehr, et al,
2002; Colon, et al., 2004 and Van, 2005.
CONCLUSION AND RECOMMENDATIONS
The study revealed that, laterite-enhanced-bricks as opposed to sand-crete blocks
reduced the cost of construction from six hundred thousand Naira (N600, 000.00) to
four hundred and fifty thousand Naira (N450, 000.00); about (25%). This technology
Bricks
625
if it could be improved upon and promoted could go a long way to bridge the gap of
low cost housing and other public infrastructural provision given the shrinking public
purse. It can therefore, be concluded that through research and looking inward,
alternatives to the conventional building materials could be sourced which could serve
as a catalyst to propel the provision of low cost construction of shopping centres,
markets, housing and other infrastructural facilities that may change the phase of the
construction industry in Nigeria and other developing countries. Therefore,
technology innovations could play a key role in ensuring that the slogan “housing for
all” becomes a reality wich may go a long way in achieving the MDGs.
REFERENCES
Adeloye, L. (2012). Jonathan inaugurates $1bn Dangote cement plant: THE PUNCH, 12
Febraury 2012, pp 1.
Adeyinka, S.A. and Olugbamila, O.B. (2011). Public-private partnership as a strategy for
urban infrastructure provision in Nigerian cities: Being a paper presented at the 42nd
Annual Conference/General Meeting of the Nigerian Institute of Town Planners held
at Osogbo, Osun State between 26th and 29th October, 2011.
Ajanlekoko, J. S. (2001). Sustainable Housing Development in Nigeria – The Financial and
Infrastructural Implication: International Conference on Spatial Information for
Sustainable Development Nairobi, Kenya 2–5 October 2001.
Akampurira, E., Root, D. and Shakantu, W. (2009). Stakeholders perceptions in the factors
constraining the development and implementation of public-private partnerships in
Ugandan electricity sector: Journal of Energy in Southern Africa Vol. 2 No. 2 pp. 2-9.
Akinpelu, D. and Udeme, E. (2010). Experts list obstacles to affordable home. THE PUNCH.
Monday April 26, 2010, pp 15.
CBN, (2000). Central Bank of Nigeria: Statistical bulletin Vol. 4 No 2 December1992.
Colin, K., Park, D and Yin-Fang, Z. (2004). Foreign Direct Investment in Infrastructure
inDeveloping Countries: Does regulation make a difference? Asian Development.
Gasu, M.B., Fadare, S.O. and Olayiwola, K.(2010). Rural Housing Needs and Responses:
Challenges and Prospects in Nigeria. Journal of Urban and Regional Planning
Review, University of Lagos, Akoka Lagos.
Hydraform (2012). www.hydraform .com acessed April 2012.
Igbokwe, S (2006). “Akinrolabu uses laterite in his building projects. He recommends it to
whoever wants to save cost in building his own house”: THE PUNCH, Monday, July
31, 2006 pp4.
Izedonmi, F. (2011). Managing and Funding Public-Private Partnership: The Role of the
Chartered Accountants: Paper presented at 6th Eastern District Conference of the
Institute of Chartered Accountants of Nigeria, Owerri, 19th-22nd July, 2011, pp.1-28.
Khan, A. (1979). Social Policy and Social Services, 2nd Ed. New York: Random House.
Mabogunje, A. (1974). Infrastructure in Planning Process. Town and Planning
Country Planning Summer School, England: University of London.
Okereke, P. A. and Obeng, E.N. (1985). “Rice Husk Ash as a Soil Stabilizer” proceedings of
17th national conference on materials testing research and control paper No 6. pp 90-
96 Logos.
Okereke, P. A. and Onyegiri, D. (2005). Appropriate construction techniques for migrant
communities in migration and Livehood on southwest Nigeria (ed) Prof Wemer
Doppler and Siegfried Baner, Farming and Rural System Economics Vol 62 pp23-29
Geissen Germany.
Gasu et al.
626
Okereke, P.A. (2006). The use of sustainable materials and equipment for the construction
process, proceeding of the 36th annual conference of the Nigeria Institute of Building,
held at Crest Hotel and Gardens, Jos, Wednesday 9th –Sunday 12
th August 2006.
Olayiwola, L. M. and Adeleye, O.A. (2004). Rural Infrastrucural Development in Nigeria:
Between 1960 and 1999- Problems and Challenges. J. Soc. Sci. Pp1-7.
Sader, F. (2000). Attracting foreign direct investment into infrastructure, Foreign
InvestmentAdvisory Services. Occasional paper 12, The International Finance
Corporation and the World Bank.
Sotola. O. and Ayodele, T. (2011). Public-Private Partnership: Will it fix infrastructure in
Nigeria? Initiative for Public Policy Analysis, policy paper, November, 2011.
Spoehr, J., Whitfield, D., Sheil, C., Quiggin, J. and Davidson, K. (2002). Partnership
Privatisation and Public Interest, Public-Private Partnership and the Financing of
InternationalDevelopment in South Australia, Centre for Labour Research, University
of Adelaide Australia.
Suleiman, M. (2011). Challenges to affordable housing in Nigeria. Cooljoe News January, 26
2011.
UNDP (1998). United Nations development Report, pp 39.
Vaanguard (2008). Twelve million new houses needed in Nigeria says Minister.
http://www.vanguarddngr.com. Acessed may 2009.
Van, R. J. (2005). Financing infrastructure in development.
Webb, R. and Pulle, B. (2002). Public-Private Partnership: An introduction, Research Paper
No.1, 2002-2003 Economics, Commerce and Industrial Relations Groups availableat
http:/www.aph.gov.au/library/pubs/rp/2002-03/03PR0I.html.
World Bank (1994). World Development Report 1994: Infrastructure for development, World
Bank, Oxford University Press, New York.

Halm, K.E. (2011) Greening Accra: The use of landscape architecture to enhance the city’s
environment In: Laryea, S., Agyepong, S.A., Leiringer, R. and Hughes, W. (Eds) Procs 4th West
Africa Built Environment Research (WABER) Conference, 24-26 July 2012, Abuja, Nigeria, 627-641.
627
GREENING ACCRA: THE USE OF LANDSCAPE
ARCHITECTURE TO ENHANCE THE CITY’S
ENVIRONMENT
Karen Evans Halm1
Department of Architecture, School of Applied Sciences, Central University College, Miotso, Accra,
Ghana
The city of Accra, after 55years of Ghana’s independence has an urban landscape
characterized by an increasing number of freestanding signature buildings devoid of
consideration for the design of the spaces in between them. If this situation continues
unchecked, it could cause local businesses to flee the district and make foreign
investors to look elsewhere no matter how frantically the country is marketed. The
economic centre of the central business district is characterized by excessive heat,
inadequate parking, unavailability of seating, unacceptable competition for circulation
space between pedestrians, vehicles and hawkers, etc. Landscape architecture, a
discipline that seeks to mitigate the effect of man’s development on nature, is a tool
that can be used to enhance the image of the city, improve upon the comfort levels for
the residents, and cleanliness of the environment, whiles beautifying it. This paper
addresses the role of landscape architecture in a city’s development within the context
of the physical environment of Accra’s CBD, focusing on its parks, open spaces and
circulation routes. Sustainable and easy-to-implement proposals, which aim at
alleviating the urban landscape problems of Accra, have been made to serve as a
contribution of ideas to help decision- makers create a Sub-Saharan African garden
city which is clean and green.
Keywords: Accra, beautification, environmental improvement, greenery, urban
INTRODUCTION
An urban landscape, aside the natural landscape, is also influenced mainly by the
culture of the people. Moughtin (1996) therefore described it as an element of a
people’s spiritual and physical culture, and is indeed, one of the highest expressions of
that culture.
Its form easily conveys pertinent, unwritten and unspoken messages to outsiders and
this shapes the image of that culture in the minds of both the residents and visitors.
The first set of cities emerged circa 3000BC in Egypt, Mesopotamia, Indus Valley and
Mesoamerica. Ellis (2006) in his definition of good city form stated that, the culture of
elaborate religion, politics and governance, military exploits, commerce and
agriculture indeed played a pivotal role in the shaping of their urban form which was a
mixture of both the organic and deliberately planned types. Ancient Egypt, for
example, was located along the Nile Valley, bounded on each side by the desert. Their
natural landscape, geographically, protected them from foreign incursions and also
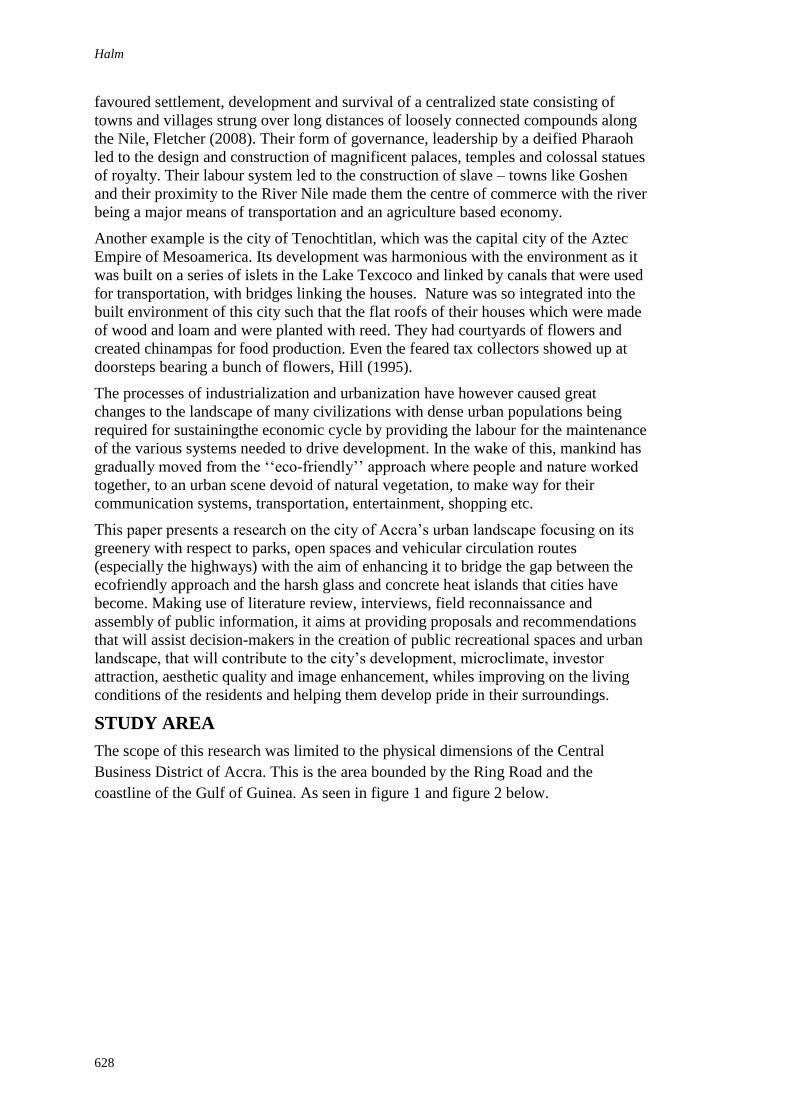
Halm
628
favoured settlement, development and survival of a centralized state consisting of
towns and villages strung over long distances of loosely connected compounds along
the Nile, Fletcher (2008). Their form of governance, leadership by a deified Pharaoh
led to the design and construction of magnificent palaces, temples and colossal statues
of royalty. Their labour system led to the construction of slave – towns like Goshen
and their proximity to the River Nile made them the centre of commerce with the river
being a major means of transportation and an agriculture based economy.
Another example is the city of Tenochtitlan, which was the capital city of the Aztec
Empire of Mesoamerica. Its development was harmonious with the environment as it
was built on a series of islets in the Lake Texcoco and linked by canals that were used
for transportation, with bridges linking the houses. Nature was so integrated into the
built environment of this city such that the flat roofs of their houses which were made
of wood and loam and were planted with reed. They had courtyards of flowers and
created chinampas for food production. Even the feared tax collectors showed up at
doorsteps bearing a bunch of flowers, Hill (1995).
The processes of industrialization and urbanization have however caused great
changes to the landscape of many civilizations with dense urban populations being
required for sustainingthe economic cycle by providing the labour for the maintenance
of the various systems needed to drive development. In the wake of this, mankind has
gradually moved from the ‘‘eco-friendly’’ approach where people and nature worked
together, to an urban scene devoid of natural vegetation, to make way for their
communication systems, transportation, entertainment, shopping etc.
This paper presents a research on the city of Accra’s urban landscape focusing on its
greenery with respect to parks, open spaces and vehicular circulation routes
(especially the highways) with the aim of enhancing it to bridge the gap between the
ecofriendly approach and the harsh glass and concrete heat islands that cities have
become. Making use of literature review, interviews, field reconnaissance and
assembly of public information, it aims at providing proposals and recommendations
that will assist decision-makers in the creation of public recreational spaces and urban
landscape, that will contribute to the city’s development, microclimate, investor
attraction, aesthetic quality and image enhancement, whiles improving on the living
conditions of the residents and helping them develop pride in their surroundings.
STUDY AREA
The scope of this research was limited to the physical dimensions of the Central
Business District of Accra. This is the area bounded by the Ring Road and the
coastline of the Gulf of Guinea. As seen in figure 1 and figure 2 below.
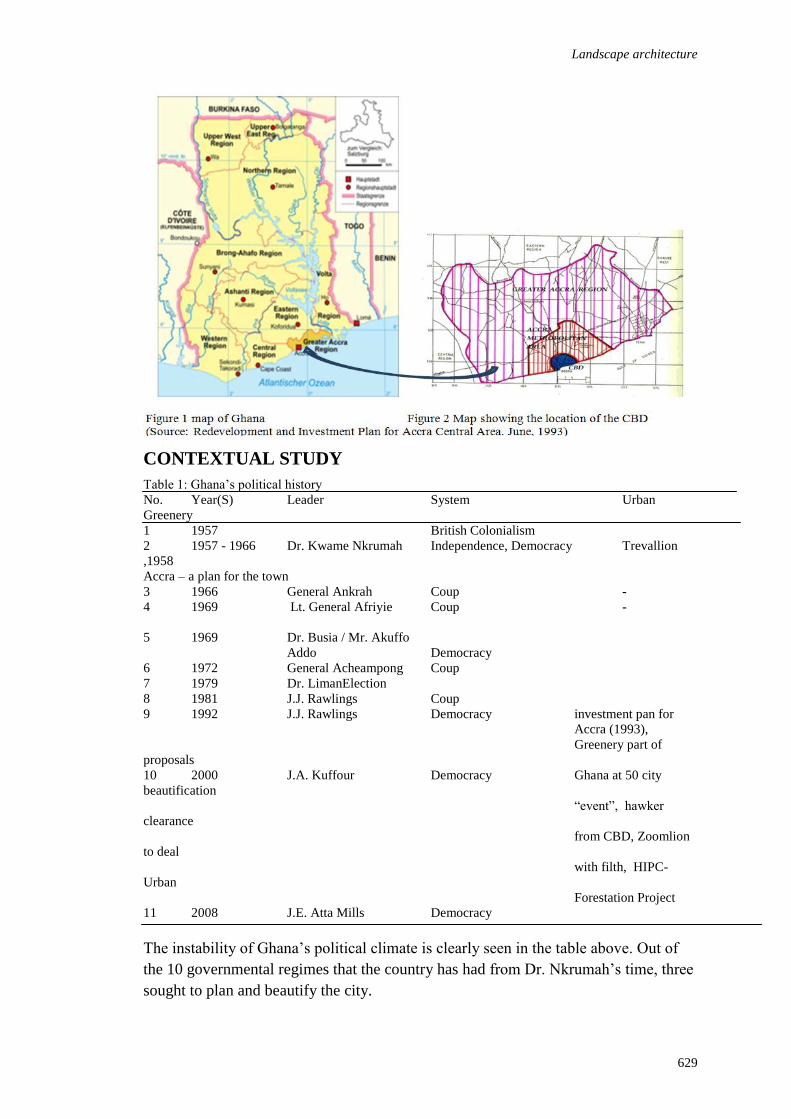
Landscape architecture
629
CONTEXTUAL STUDY
Table 1: Ghana’s political history
No. Year(S) Leader System Urban
Greenery
1 1957 British Colonialism
2 1957 - 1966 Dr. Kwame Nkrumah Independence, Democracy Trevallion
,1958
Accra – a plan for the town
3 1966 General Ankrah Coup -
4 1969 Lt. General Afriyie Coup -
5 1969 Dr. Busia / Mr. Akuffo
Addo Democracy
6 1972 General Acheampong Coup
7 1979 Dr. LimanElection
8 1981 J.J. Rawlings Coup
9 1992 J.J. Rawlings Democracy investment pan for
Accra (1993),
Greenery part of
proposals
10 2000 J.A. Kuffour Democracy Ghana at 50 city
beautification
“event”, hawker
clearance
from CBD, Zoomlion
to deal
with filth, HIPC-
Urban
Forestation Project
11 2008 J.E. Atta Mills Democracy
The instability of Ghana’s political climate is clearly seen in the table above. Out of
the 10 governmental regimes that the country has had from Dr. Nkrumah’s time, three
sought to plan and beautify the city.
Halm
630
The people and culture
Accra is a cosmopolitan city with a rapidly growing population. In 2000, according to
the state of the world’s cities 2008 / 2009, its population was 1,6 74m by 2010 it had
increased by 71.78% to 2.3332m it is estimated to grow to 3.041mil by 2020.
Originally founded by the Ga’s in the 1500s along the Atlantic Ocean, the city grained
the role of a fishing port by the 16th
C and eventually became the capital of both the
Region and nation. This role it plays well as almost all the nine government sponsored
languages, as stated in the Final draft report of the National tourism development plan
for Ghana 1996-2014, can be heard being spoken in various areas of the town
especially Twi and Ewe though Ga is the language of the indigenous people. Being
the heart of the country with every region represented there, the relationship / attitude
of the urban dwellers to landscape gives a little window of the nation’s attitude to the
subject. Presently open spaces are mostly used for funerals, child naming ceremonies,
wedding receptions, and other rites of passage and where they are not available roads
are blocked with or without permit for the celebrations. Open spaces are also used for
political rallies, entertainment, church meetings, corporate fun games, and organized
sporting activities. These same spaces after these events however, are abandoned (the
reasons are stated below) awaiting the next big event.
The natural environment
Table 2: characteristics of the natural environment
No. Element Characteristics
1 Geology Accraian series (sandstone, shale, sandstone and shale)
2 Soil Drif materials, alluvial and mooted clays from underlying shale, residual
clays and
gravels, sandy clay soils
3 Erosion General sheet erosion, Gully erosion along all major drainage channels
leading to
siltation and flooding
4 Climate Tropical , Rainfall –736mm annually, Temperature - 24.70C - 29
0C
5 Water quality Satisfactory
6 Air quality Good, except for industrial areas, High odour levels due to poor sanitation
7 Constraints Flooding, earthquake, coastal storms, high winds, occasional pollution from
automobiles, endangered marine and bird life especially at aquatic areas.
Historical changes to greenery
B.A.W. Trevallion thought, in his report on the “Accra a plan for the town” that,
Accra was fortunate in terms of existing and potential open spaces as of 1958. This
was because most of the undeveloped land was owned by the government and they
had reserved extensive expanse of building-free zones. Also the town and country
planning department had been very efficient in their operations in the 1940’s making
sure that the planning and development regulations had been adhered to. There was
however a shortage of local open space in the already established residential towns
like Usher Town and James Town and the purchase of the ear-marked ones in the
developing residential areas proved problematic. The major open spaces have been the

Landscape architecture
631
Coastal Strip from Mamprobi (west) to Labadi (east), the corridors (“green wedges”)
between the existing residential areas and the Independence Avenue Park (which
extends from the sea to the Castle Road). Also available then were the cricket oval,
stadium and the race course. The attractively laid out gardens in the CBD were owned
by the stool. There were no parks in Accra and the only forest reserve in the Greater
Accra Metropolitan Area (GAMA) was the Achimota Forest, which is outside the
CBD but served as a refreshing approach into the CBD. Town gardens in the centre of
Accra where shoppers and visitors could rest for a while and workers could spend
their lunch hour were also absent.
Trevallion’s design proposal included the creation of ‘green wedges’, which were the
patches of open space or greenery left between developments to separate residential
areas from each other thus breaking the monotony of vast unbroken areas were also to
offer the opportunity to accommodate recreational activities and safe pedestrian ways.
These green wedges were protected from development until they were gradually
encroached upon until now that the Accra C.B.D has no nature reserves. According to
the draft final report of the Strategic Plan for the Greater Accra Metropolitan Area
published in 1992, concerning the private and commercially operated recreational
facilities and open spaces, there are a number of hotels with swimming pools, serviced
beaches and tennis courts. Most of these are however outside the CBD.
Table 3 current state of open spaces
Types Name Uses / State
National Parks Efua Sutherland Park Originally a children’s park. Now used for
organized
Events, picnics, educational trips, wedding
pictures.
grossly inadequate facilities, limited access as all
gates are
usually locked, very poor lighting, deteriorating
gradually
Sporting Accra Sports Stadium all sporting activities especially football
church conventions(though limited),
entertainment
refurbished for CAN 2008, Relatively good
condition
National Hockey Pitch Hockey tournaments, youth games
Accra Race Course Used to be for horse racing events, Destroyed for construction
Town Gardens Kimbu Gardens Privately operated, eatery Attached, More
planting
required, maintenance
District parks Supreme Court Gardens Fore Court to buildings not open to public,
maintenance
required( see plate 5)
Car parks / Rawlings Park parking for private cars with some taxi ranks
Lorry stations Tema Station Commercial transport terminal poor sanitation, no
greenery, harsh environment ( see plate 2)
Others Street median Bare soil, needs greenery
Road edges and triangles Grassed and chain link fenced
Paths and edges Hawking ( see plate 1)
Coast line defecation, unplanted, erosion
Halm
632
SOME SUCCESSFUL SCENARIOS
Co2 makes up 77% of the global greenhouse gas emissions and over 40% of that is
caused by deforestation and change in land use from natural to formed or built up
areas. Some cities have however been able to establish interventions using several
measures or approaches and they are presented below not as comparisons but as guide
that Accra may adopt.
Bogota
This is the largest and the capital city of Colombia with a population of 6.8mil as of
2005 (www.wikipedia.com ). Its urban planning and environmental success illustrate
the possibility for large developing country cities to make significant improvement in
the residents’ quality of life via responsible planning, greenery and visionary
leadership. The creation of the ‘‘Alameda Porvenir’’, a 17-km wooded pedestrian and
bicycle network, which was started by one mayor and completed by another, with
street furniture provided at sections has facilitated an increase in the percentage of
trips in the city made by bicycles and a resultant reduction in levels of ambient air
pollution in the city.
Ouagadougou
This is the capital of one of the poorest countries in West Africa, Burkina Faso. It was
faced with felling of trees for firewood from the few “green zones’’ available in the
city, sand and gravel harvesting from the rivers and other water bodies for sale to
building contractors, by women who were usually the bread-winners for their
families(www.unhabitat.org). The Green Brigade was therefore created by the city
mayor in 1995, with the objectives of job creation for women, improvement upon the
city’s image and cleanliness of public spaces and streets, and to mitigate
environmental damage to the city’s green spaces. The organization, as of 2010, had
employed 1700 women and as a result, the city’s green spaces and trees are more
protected.
Singapore
This tropical city-state, which was once third world, with similar challenges as many
West African cities today, has been able to transform its economy and environment
into a 1st World success story. Today, according to the Nparks annual report 2010 / 11,
it boasts of over 314 parks seeking always to infuse biodiversity into the spaces where
people live, work and play, with a ‘‘city in a garden’’ concept. Once again visionary
leadership and planning played a pivotal role with the first leader P.M Lee Kuan Yew
using the birthing concept of greenery as a tool for nation building in the 1960s. Their
approach was below:
Executive Intervention
The “Greening Singapore” vision was a government agenda which they supported
fully with great political will.
Human Resource Intervention

Landscape architecture
633
Singapore is clean and green today because the people were also educated and
made to embrace the vision as their own and as a national heritage.
Legislative Intervention
Tree Planting Day was institutionalized, Anti Spitting Campaign, and major clean
ups.
Institutions set up were mobilized and empowered with legislature to implement
the vision.
Incentive programs were created to encourage developers and architects to
incorporate greenery in their projects.
The government institutions have control of the physical development of the city.
Physical Intervention
Detailed planning of the city and adherence to the plans and regulations for the city
development.
Over all land use plan including ample space for parks and open space.
Detailed layout of parks and water bodies conserving the existing ones and creating
new ones.
Street greenery was also detailed out using road codes to simplify the process.
Greenery was attained systematically and patiently with various schemes designed
to protect the greenery.
All sewages were closed and surface drains were converted into underground
drains.
The city was cleaned up of the filth, slums were cleared and all the water bodies
were distilled redirecting the waste from them.
ANALYTICAL STUDY OF ACCRA
Merits
The climate is favourable for greenery.
Vast stretch of coastline excellent for recreation.
Possible development of the old fishing town into a tourist attraction.
It has some open spaces already which could be refurbished and reclaimed.
Existing fence walls and others to be erected presents good opportunities for
vertical greenery.
A greenway could be created along the Korle Lagoon and Odaw River.
Rocky outcrops serve as protection and an erosion check.
Demerits
Difficulties in land acquisition
Acute lack of funds and logistics for institutions in charge of greenery.
Poor maintenance culture.
Inability of governmental agencies to enforce protection laws.
Over-emphasis on sports as a recreational activity.
Localized pollution at light industrial Area.
The streets offer absolutely no comfort at all to pedestrians.
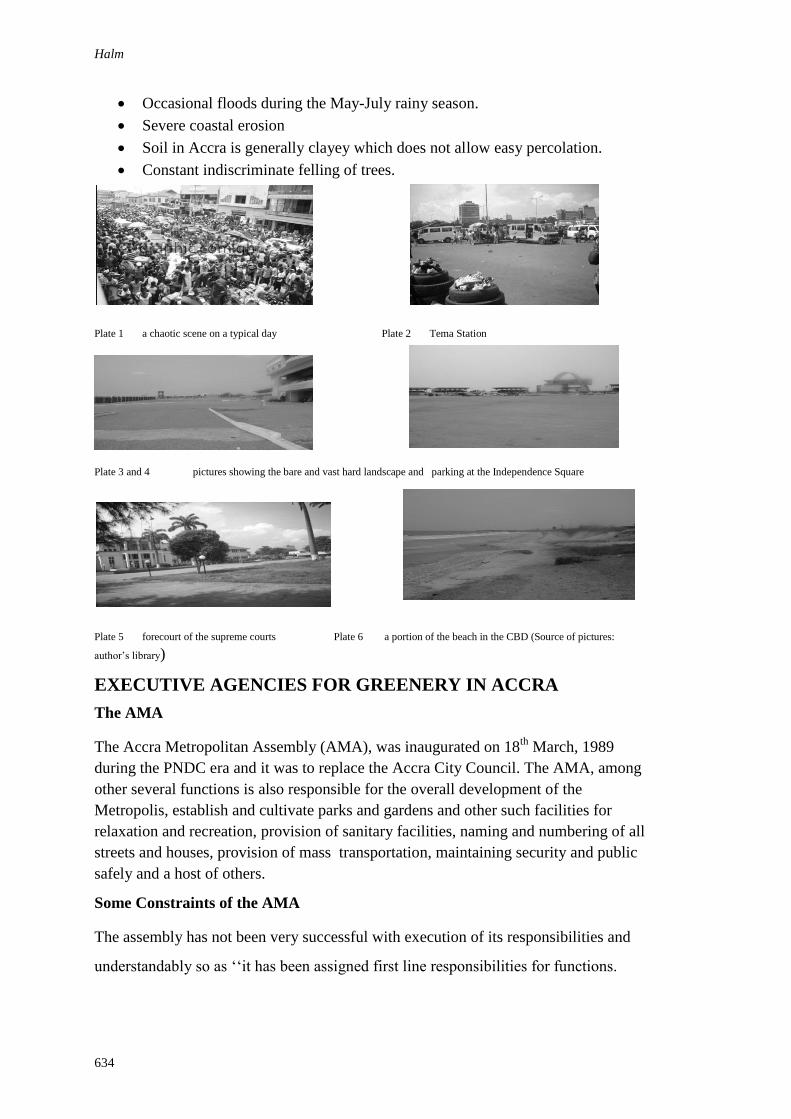
Halm
634
Occasional floods during the May-July rainy season.
Severe coastal erosion
Soil in Accra is generally clayey which does not allow easy percolation.
Constant indiscriminate felling of trees.
Plate 1 a chaotic scene on a typical day Plate 2 Tema Station
Plate 3 and 4 pictures showing the bare and vast hard landscape and parking at the Independence Square
Plate 5 forecourt of the supreme courts Plate 6 a portion of the beach in the CBD (Source of pictures:
author’s library)
EXECUTIVE AGENCIES FOR GREENERY IN ACCRA
The AMA
The Accra Metropolitan Assembly (AMA), was inaugurated on 18th
March, 1989
during the PNDC era and it was to replace the Accra City Council. The AMA, among
other several functions is also responsible for the overall development of the
Metropolis, establish and cultivate parks and gardens and other such facilities for
relaxation and recreation, provision of sanitary facilities, naming and numbering of all
streets and houses, provision of mass transportation, maintaining security and public
safely and a host of others.
Some Constraints of the AMA
The assembly has not been very successful with execution of its responsibilities and
understandably so as ‘‘it has been assigned first line responsibilities for functions.
Landscape architecture
635
It is clearly not structured or equipped to handle.’’ (Mensah E.T. et al). Some of the
inadequacies are stated below.
Scope of responsibilities is too wide.
Semi-illiterates and stark illiterates were engaged as revenue collectors.
No clear and practical guidelines have been established as a matter of policy
for the performance of the role of the sub-structures.
A persistent liquidity crisis, due to its inability to mobilize enough revenue to
service its budget and provide services. (with central government paying 100%
of salaries)
Low calibre of staff and their correspondingly low levels of remuneration.
The problem of indiscipline in the city.
Parks and Garden Department
The Department of Parks and Gardens, was established in 1988 for the development
of the nation’s landscape and the preservation and beautification of the environment.
Though there are branches in all ten regions, the department is gradually becoming
extinct due to similar problems as the AMA. The lack of logistics, qualified personnel,
low staff strength and inadequate funding has made the department ineffective.
Traffic and Sanitation Improvement Task Force
The traffic and sanitation improvement task force (TASIT), was originally conceived
to stem the deterioration in the environmental sanitation and traffic congestion in the
city by enforcing a programme designed to engender discipline, a sense of
responsibility and voluntarianism in the people concerning environmental issues.
Launched on 29th
January, 1988, the programme was heralded with fanfare and the
general public joined in city council’s special beautification campaign to give Accra a
much desired and an unprecedented face-lift with individuals painting their buildings,
most of which had not seen any maintenance in years( E.T. Mensah and T.K Dick).
The strong-arm tactics, though it worked, later became unpopular and coupled with
the AMA’s own internal problems of inadequacies and complete lack of resources for
the prompt performance of their work, apathy and lack of commitment among some
sections of the public developed and only a shadow of TASIT remains today in the
form of a phenomenon code-named “aaba ei”, meaning “they are coming”.
RECOMMENDATIONS
The recommendations relating to Accra's greenery and open space are described
below:
Executive intervention
As is evident in the various scenarios above, visionary leadership plays a
central role in the success of such a quest. The environmental enhancement
and beautification of Accra must be deemed important and be seen as
beneficial to all by governments, so they can give the much needed political
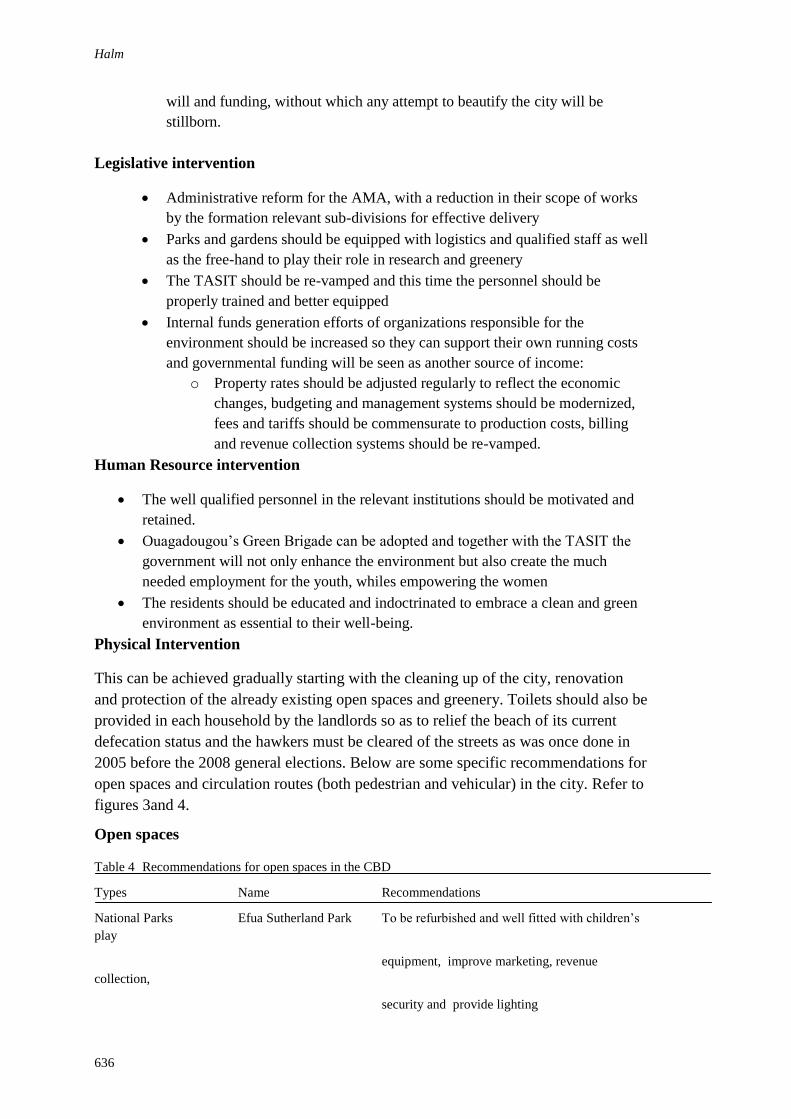
Halm
636
will and funding, without which any attempt to beautify the city will be
stillborn.
Legislative intervention
Administrative reform for the AMA, with a reduction in their scope of works
by the formation relevant sub-divisions for effective delivery
Parks and gardens should be equipped with logistics and qualified staff as well
as the free-hand to play their role in research and greenery
The TASIT should be re-vamped and this time the personnel should be
properly trained and better equipped
Internal funds generation efforts of organizations responsible for the
environment should be increased so they can support their own running costs
and governmental funding will be seen as another source of income:
o Property rates should be adjusted regularly to reflect the economic
changes, budgeting and management systems should be modernized,
fees and tariffs should be commensurate to production costs, billing
and revenue collection systems should be re-vamped.
Human Resource intervention
The well qualified personnel in the relevant institutions should be motivated and
retained.
Ouagadougou’s Green Brigade can be adopted and together with the TASIT the
government will not only enhance the environment but also create the much
needed employment for the youth, whiles empowering the women
The residents should be educated and indoctrinated to embrace a clean and green
environment as essential to their well-being.
Physical Intervention
This can be achieved gradually starting with the cleaning up of the city, renovation
and protection of the already existing open spaces and greenery. Toilets should also be
provided in each household by the landlords so as to relief the beach of its current
defecation status and the hawkers must be cleared of the streets as was once done in
2005 before the 2008 general elections. Below are some specific recommendations for
open spaces and circulation routes (both pedestrian and vehicular) in the city. Refer to
figures 3and 4.
Open spaces
Table 4 Recommendations for open spaces in the CBD
Types Name Recommendations
National Parks Efua Sutherland Park To be refurbished and well fitted with children’s
play
equipment, improve marketing, revenue
collection,
security and provide lighting
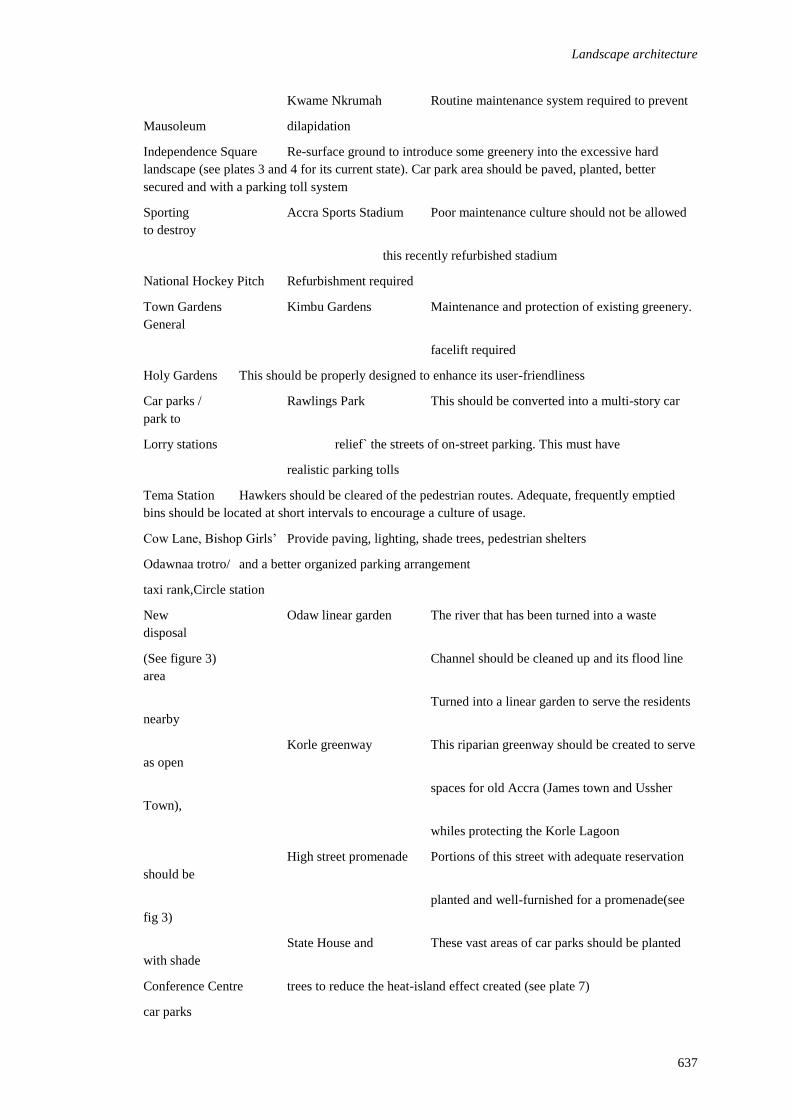
Landscape architecture
637
Kwame Nkrumah Routine maintenance system required to prevent
Mausoleum dilapidation
Independence Square Re-surface ground to introduce some greenery into the excessive hard
landscape (see plates 3 and 4 for its current state). Car park area should be paved, planted, better
secured and with a parking toll system
Sporting Accra Sports Stadium Poor maintenance culture should not be allowed
to destroy
this recently refurbished stadium
National Hockey Pitch Refurbishment required
Town Gardens Kimbu Gardens Maintenance and protection of existing greenery.
General
facelift required
Holy Gardens This should be properly designed to enhance its user-friendliness
Car parks / Rawlings Park This should be converted into a multi-story car
park to
Lorry stations relief` the streets of on-street parking. This must have
realistic parking tolls
Tema Station Hawkers should be cleared of the pedestrian routes. Adequate, frequently emptied
bins should be located at short intervals to encourage a culture of usage.
Cow Lane, Bishop Girls’ Provide paving, lighting, shade trees, pedestrian shelters
Odawnaa trotro/ and a better organized parking arrangement
taxi rank,Circle station
New Odaw linear garden The river that has been turned into a waste
disposal
(See figure 3) Channel should be cleaned up and its flood line
area
Turned into a linear garden to serve the residents
nearby
Korle greenway This riparian greenway should be created to serve
as open
spaces for old Accra (James town and Ussher
Town),
whiles protecting the Korle Lagoon
High street promenade Portions of this street with adequate reservation
should be
planted and well-furnished for a promenade(see
fig 3)
State House and These vast areas of car parks should be planted
with shade
Conference Centre trees to reduce the heat-island effect created (see plate 7)
car parks

Halm
638
Coastline This should be cleaned up and eroded portions reclaimed,
coconut trees should then be planted all along it and
private development should be ecologically friendly
Figure 3 map showing the various open spaces as captured in table 4 above (see
plate 7 an example of a planted car park)
Figure 4 Map showing the proposed network of greenery for the CBD (see figures 5 to
7 below for schematic sections through the planted streets)
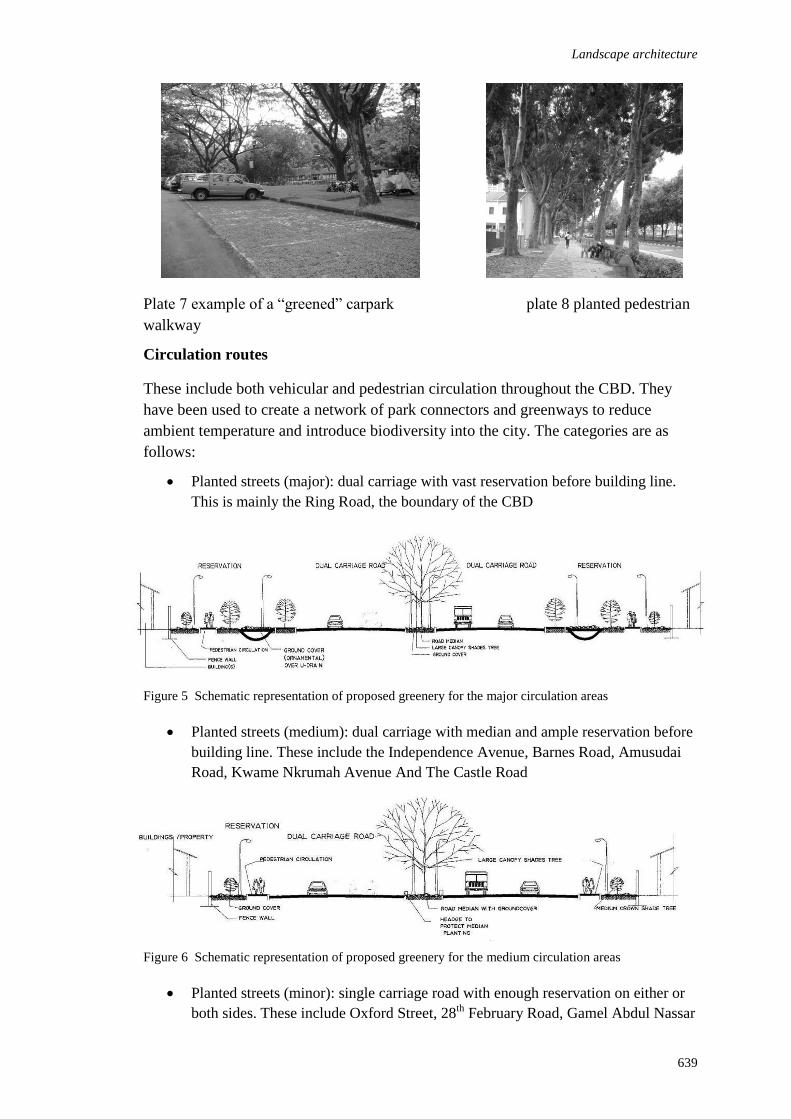
Landscape architecture
639
Plate 7 example of a “greened” carpark plate 8 planted pedestrian
walkway
Circulation routes
These include both vehicular and pedestrian circulation throughout the CBD. They
have been used to create a network of park connectors and greenways to reduce
ambient temperature and introduce biodiversity into the city. The categories are as
follows:
Planted streets (major): dual carriage with vast reservation before building line.
This is mainly the Ring Road, the boundary of the CBD
Figure 5 Schematic representation of proposed greenery for the major circulation areas
Planted streets (medium): dual carriage with median and ample reservation before
building line. These include the Independence Avenue, Barnes Road, Amusudai
Road, Kwame Nkrumah Avenue And The Castle Road
Figure 6 Schematic representation of proposed greenery for the medium circulation areas
Planted streets (minor): single carriage road with enough reservation on either or
both sides. These include Oxford Street, 28th February Road, Gamel Abdul Nassar
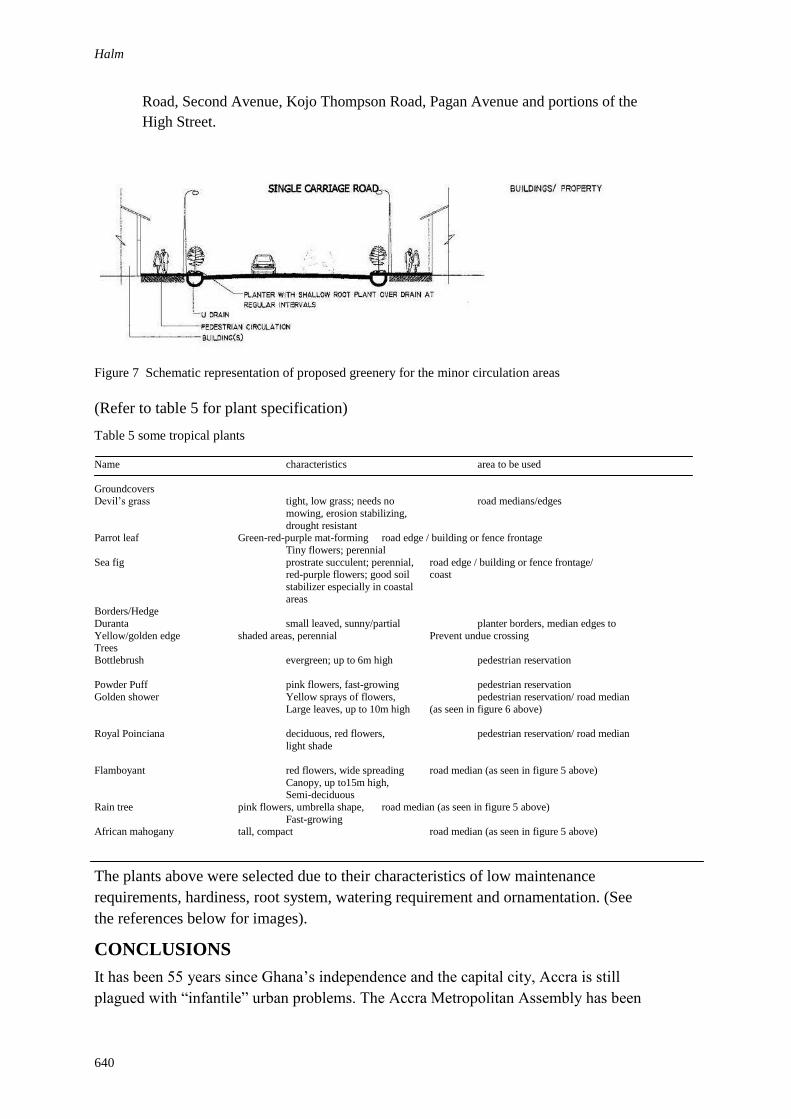
Halm
640
Road, Second Avenue, Kojo Thompson Road, Pagan Avenue and portions of the
High Street.
Figure 7 Schematic representation of proposed greenery for the minor circulation areas
(Refer to table 5 for plant specification)
Table 5 some tropical plants
Name characteristics area to be used
Groundcovers Devil’s grass tight, low grass; needs no road medians/edges
mowing, erosion stabilizing,
drought resistant
Parrot leaf Green-red-purple mat-forming road edge / building or fence frontage
Tiny flowers; perennial
Sea fig prostrate succulent; perennial, road edge / building or fence frontage/ red-purple flowers; good soil coast
stabilizer especially in coastal
areas Borders/Hedge
Duranta small leaved, sunny/partial planter borders, median edges to
Yellow/golden edge shaded areas, perennial Prevent undue crossing Trees
Bottlebrush evergreen; up to 6m high pedestrian reservation
Powder Puff pink flowers, fast-growing pedestrian reservation
Golden shower Yellow sprays of flowers, pedestrian reservation/ road median
Large leaves, up to 10m high (as seen in figure 6 above)
Royal Poinciana deciduous, red flowers, pedestrian reservation/ road median
light shade
Flamboyant red flowers, wide spreading road median (as seen in figure 5 above)
Canopy, up to15m high, Semi-deciduous
Rain tree pink flowers, umbrella shape, road median (as seen in figure 5 above)
Fast-growing African mahogany tall, compact road median (as seen in figure 5 above)
The plants above were selected due to their characteristics of low maintenance
requirements, hardiness, root system, watering requirement and ornamentation. (See
the references below for images).
CONCLUSIONS
It has been 55 years since Ghana’s independence and the capital city, Accra is still
plagued with “infantile” urban problems. The Accra Metropolitan Assembly has been

Landscape architecture
641
struggling with the clearance of hawkers from the streets for years now. The
leadership of both previous and current governments has not had the political will, to
harmonize the development of the city with the natural landscape. Though attempts
have been made to beautify the city, it has not been sustained. Visionary leadership is
essential for the achievement of such a target and if only governments will appreciate
the importance of this subject, strengthen the administrative arms of the environment
and educate the people inculcating discipline and an acceptance of the “green vision”
as their own, then together with an enhanced culture of maintenance Accra can be
molded into the garden – city of sub-Saharan Africa. Accra was once called “small
London” because of its beauty in the early 60s. That has been lost, indeed, but can be
regained and Ghanaians can have a clean, green and eco-friendly urban landscape.
REFERENCES
Ellis Cliff. History of Cities and City Planning.
Fletcher Bannister, (20th Edition). A History of Architecture. Architectural Press
Hill, W.F. Landscape Handbook for the Tropics. Packard publishing, 1995.
Lynch, Kevin. The Image of the City. Cambridge, MA: MIT Press, 1960
Mensah E.T. et al. Local government administration in ghana, the accra experience 1982-1992
Moughtin, Cliff J. Urban Design Green Dimensions. 1996
Moughtin, Cliff J. The City Street and Square. Third Edition, 2003.
Smith, S. Daniel and Hellmund, P. Cawood Ecology of Greenways. University of Minnesota
Pres, 1993.
Trevallion, B.A.W. "Accra a plan for the town"
Yew, Kuan, L., "From 3rd world; the Singapore Story"
National tourism development plan for Ghana 1996-20140. Final draft report, February, 1996.
Redevelopment and Investment Plan for Accra Central Area. June, 1993
State of the world’s cities 2008 / 2009, Harmonious cities
Strategic Plan for the Greater Accra Metropolitan Area, Five year development plan.Volumes
1-5
www.unhabitat.org
www.wikipedia.org
www.davesgarden.com
www.anpsa.org.au
www.botanikfoto.com
www.art.com
www.digitalflowers.com
www.saveranibagh.org
www.maryland.com.

Hammad, D.B., Rishi, A.G. and Yahaya, M.B. (2012) Mitigating construction project risk using
Building Information Modelling (BIM) In: Laryea, S., Agyepong, S.A., Leiringer, R. and Hughes, W.
(Eds) Procs 4th West Africa Built Environment Research (WABER) Conference, 24-26 July 2012,
Abuja, Nigeria, 643-652.
643
MITIGATING CONSTRUCTION PROJECT RISK USING
BUILDING INFORMATION MODELLING (BIM)
D.B. Hammad1, A. G. Rishi
2 and M. B. Yahaya
3
1,2Building Technology Programme, Department of Technical Education, College of Education Azare
Bauchi State, Nigeria 3Works and Service Department, College of Education Azare, Bauchi State, Nigeria
One of the major constrains facing the construction industry is multiple stakeholders
as well as numerous stages related to a construction process. Disintegration remains a
barrier to smooth flow of information among stakeholders which may consequently
lead to a poor communication and staggered information handling. The break in flow
of information may eventually leads to growth in mistrust and poor relationships
between actors involved in the construction projects and this may trigger an internal
risk. On the other hand, development in information and communication has resulted
to innovations aimed at reengineering construction process from conceptual phase to
operation and maintenance. One of such innovations is the building information
modelling popularly known as BIM. BIM is a new approach to integrated project
delivery in which, a single comprehensive repository of the facilities data from
conceptual to operation and maintenance is generated and coordinated concurrently. It
is considered as a novel revolutionary achievement in the construction industry that
will enhance effective communication and subsequently improves productivity in
construction project delivery. Therefore, the objectives of this paper are to review the
concept of Building information modelling (BIM) and demonstrate how BIM can
reduce internal risk in construction delivery process.
Keywords: building information, modelling, project risk
INTRODUCTION
One of the major challenges facing the construction industry is multiple stakeholders
as well as numerous stages related to a construction process. In addition, construction
projects are characterized with many unique features such as long period, complicated
process, abominable environment, financial intensity and dynamic organization
structures (1).This complication in technology and organization has triggered
problems of fragmentation in communication and information handling and it has led
to the growth of adversarial relationships between the actors involved in construction
project (2). The fragmentation is frequently viewed as one of the key contributors to
low productivity in the construction industry. Similarly, project delivery procedure
relies on paper-based modes of communication (3). Errors and omissions in paper
documents often cause unanticipated expenses, delays, as well as eventual lawsuits
between the various parties in a project team. These problems cause friction, financial
expense and delays (4). In addition, construction is practically site-specific and
Hammad, Rishi and Yahaya
644
seldom done by exactly the same project team. This structure complicates the
preparations for any project and may generate considerable difficulties for the project
team (5). A particular level of understanding ought to transpire amongst the project
team to develop working procedures which consider the particular project and the
individual qualities of the team members. In addition, repetitive characteristic of the
information in a drawing set is another source of errors which may lead to risk. The
organization of the drawings for large projects can be complex, and as a project
develops, it is likely that some of the changes are not being effected in all places
affected in the documents and this will lead to misinterpretation and .
Hence, various attempts to manage this kind of problems include various
organizational set ups like the design-build approach, the application of real-time
technology, for instance project Internet sites meant for sharing plans and documents;
and also use of 3 dimensional Computer-aided-design tools. Nevertheless, these
techniques have boosted the exchange of information, but they have done little to
lessen the seriousness as well as rate of recurrence of disputes attributable to
traditional paperwork or their digital equivalents.
Therefore, there has been a need for an effective communications infrastructure that
facilitates seamless inter-working between the disparate professionals involved in
construction projects Such an infrastructure needs be based on interoperable
information and communication technologies, and should facilitate information
interchange between members of the project team and across stages in the project
lifecycle from construction to inspection and maintenance (6). This communications
infrastructure should be inhabited by a shared construction project model in the form
of integrated product models and project database; these resulted to Building
Information Modeling (BIM). Therefore, the objective of this paper is to demonstrate
how BIM can be used to alleviate internal risk in construction project lifecycle.
RISK IN CONSTRUCTION PROJECT
A Project has been defined by (7) as “a unique and temporary endeavor that
introduces changes to create a product or service that meet defined objectives using
various resources within set constrains” the resources may include both human and
material. Human resources in construction project include and not limited to design
team, consulting engineers, estimators, contractors, sub-contractors etc. Presences of
this multiple interests lead to complication of the process. It is thus, agreed that,
projects are risky; therefore, there is no risk free project. Risk has been defined by (8)
as a combination of the probability of occurrence of a defined hazard and the
magnitude of the consequences of the occurrence. The definition implies that, there
are two basic components to risk: probability of an event occurring and the negative
impact due to the occurrence of the event. However, (9) opined that construction have
more inherent risk due to the involvement of many contracting parties such as owners,
designers, contractors, subcontractors, suppliers, etc.. While risk are cannot be
eliminated, successful projects are those where risks are effectively managed (10).
Risks are related to rewards. Some risk should be accepted as long as they are in line
with the rewards. It is generally noted that, risk is rooted in uncertainties and that
uncertainties results from inadequate information. Similarly, hoarding of information
can lead to the distortion and restriction of information (11). In other words, mistrust
and miscommunication create a self-feeding spiral way from the real needs of the
projects and towards litigation and failures. A project team facing the risk of continues
uncertainties, speed, complexity and change, therefore, cannot afford mistrust and
miscommunication. Avoiding them and reducing uncertainties require
Risk mitigation using BIM
645
multidisciplinary methods for defining design and construction activities and the
dependencies between them in the project t(11). Traditionally, risk in construction
project may emanate from socioeconomic factors such as environment, public safety
and the general economy, organizational relationships including contractual relations,
participant attitudes and communications and technological problems such as design
assumptions, site conditions, construction procedures and occupational safety.
According to (9), project risks are divided into two groups, according to their source;
into external and internal. External risk are those that are beyond the control of the
project management while Internal risks are those that are project related and usually
fall under the control of the project management team which is the main concern of
this paper. Internal risks are divided according to the party who might be the
originator of risk events such as owners, designers, contractors etc. Risk at the design
might emanate from;
Defective design, incomplete design or design may include lots of mistake or may
not be constructible. Designers are some time rushed to complete the design phase
by owners to start construction early and achieve the time to market objectives.
Deficiencies in drawings and specifications. This relates to quality of drawings
and specifications produced by the design professionals.
Changes made to the design during the construction phase are another source of
internal risk in construction project.
Since BIM is a data rich object-oriented, intelligent and parametric digital
representation of the facility, from which views and data appropriate to various users
needs can be extracted and analyzed to generate information as opined that can be
used to make decision and improved the process of delivering the facility with minor
risk.
CONCEPT OF BUILDING INFORMATION MODELING (BIM)
BIM has been described in various ways by various authors. Notably the definitions
were either process based or product based.(3) posited BIM as ether noun or verb. As
a noun to mean Building Information Model which is a compilation of building
information. The data are interrelated objects with all pertinent information on each
object attached to it. For instance, a door in a model is not just a few lines
representing a door, but contains all information that pertains to manufacturing,
locating, installing, finishing and maintaining it. Users needing access to information
view only information pertinent to their interest without changing the overall
relational data. Thus, the power of the model is that many parties can work with a
common database and have current information.
When used as a verb, Building Information Modeling refers to the act of simulating
real activity relating to a building or construction project. This opinion is supported by
(12), (13), (14).Whichever the case or tense may be, BIM refers to a relatively new
technology that supports visualization and communication of building design and
construction processes. Rather than a software, BIM is “a systems approach to the
design, construction, ownership, management, operation, maintenance, use, and
demolition or reuse of buildings” (12). (15), gives a comprehensive description of the
technology as a “digital representation of physical and functional characteristics of a
facility; a shared knowledge resource for information about a facility forming a
reliable basis for decisions during its life-cycle information using open industry

Hammad, Rishi and Yahaya
646
standards to form business decision for realizing better value”. Similarly, (16), (17)
described Building information modeling as a set of interacting policies, processes and
technologies generating a methodology to manage the essential building design and
projects data in digital format throughout the building’s lifecycle as described by (16)
in Figure 1 that shows the integrated model of BIM process, which include, people
technology, process and policies. Hence, BIM in this context cannot be defined as a
single entity such as product or process but rather as an entire paradigm shift which
cover the whole spectrum of construction project delivery process. Therefore, going
by these definitions, Building information modeling is characterized with the
followings;
It digital in technology
BIM is Three dimensional (3D)
It involved database
It involved software and hardware
It must have define protocol
Figure 1 Integrated BIM process by (16)
Therefore, not all three dimensional (3D) object modeling solutions are considered
BIM design technology. Few example of such non-BIM modeling solutions as cited
by (4) are:
modeling that contain 3D data only and no (or few) object attributes
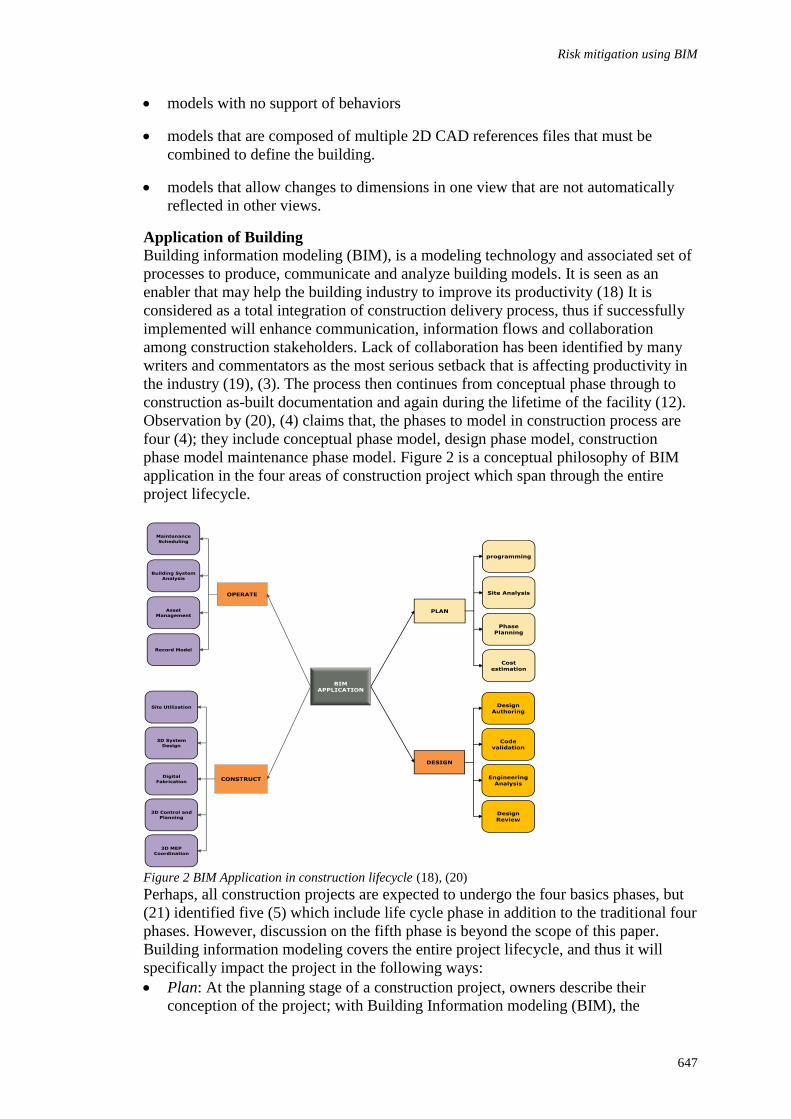
Risk mitigation using BIM
647
models with no support of behaviors
models that are composed of multiple 2D CAD references files that must be
combined to define the building.
models that allow changes to dimensions in one view that are not automatically
reflected in other views.
Application of Building
Building information modeling (BIM), is a modeling technology and associated set of
processes to produce, communicate and analyze building models. It is seen as an
enabler that may help the building industry to improve its productivity (18) It is
considered as a total integration of construction delivery process, thus if successfully
implemented will enhance communication, information flows and collaboration
among construction stakeholders. Lack of collaboration has been identified by many
writers and commentators as the most serious setback that is affecting productivity in
the industry (19), (3). The process then continues from conceptual phase through to
construction as-built documentation and again during the lifetime of the facility (12).
Observation by (20), (4) claims that, the phases to model in construction process are
four (4); they include conceptual phase model, design phase model, construction
phase model maintenance phase model. Figure 2 is a conceptual philosophy of BIM
application in the four areas of construction project which span through the entire
project lifecycle.
Figure 2 BIM Application in construction lifecycle (18), (20)
Perhaps, all construction projects are expected to undergo the four basics phases, but
(21) identified five (5) which include life cycle phase in addition to the traditional four
phases. However, discussion on the fifth phase is beyond the scope of this paper.
Building information modeling covers the entire project lifecycle, and thus it will
specifically impact the project in the following ways:
Plan: At the planning stage of a construction project, owners describe their
conception of the project; with Building Information modeling (BIM), the
Hammad, Rishi and Yahaya
648
designer can easily communicate with owners and rapidly and accurately get their
opinions on how to program the execution of the project based on site condition
analysis result, phase planning and estimated budget of the entire project (22).
Moreover, in a number of projects, the project team use 3D models to
communicate design ideas to owners or city authorities and to coordinates the
integration of the design from various trades (23). This approach could be used to
improve the communication between various interests in construction project
significantly.
Design: in this phase, instant 3D visualization of spaces and alternatives that could
quickly be evaluated by technical and non-technical staff alike can be realized. In
addition, sections, perspectives, plan views and quantity take offs could quickly
automatically be visualized updated to effectively ascertain potential costs (24).
Moreover, code validation and engineering analysis, such as energy analysis, can
be easily generated, thus, the parametric attributes allow programming information
to quickly be compiled for comparison to original authorization documents with a
high degree of confidence in its accuracy.
Construction: BIM allow the simulation of construction process using all possible
attributes related to cost, planning and scheduling (4). Objects in the building
model can be grouped according to phase of construction and linked to appropriate
activities in a project scheduled. Hence, BIM simulations functions as
communication tools to for revealing potential bottleneck as a method for
improving collaboration among the project team. Moreover, constructability
analysis which can allows contractors to review project and to ensure its feasibility
can be efficiently and accurately done using building information modeling
software as posited by (5).
Operation and maintenance: BIM is useful in digitizing facilities management services
in both new and old construction facilities (25). It is easier in new facilities wherein
further information could be added when due in a facility’s life. Ability to support
facility management is considered as an important value-added feature for the
BIM approach, making a strong business case (26)(26)(25) as found by 276
Gu,Ning 2010 while studying the Understanding and facilitating BIM adoption
in the AEC industry. He further explained that, the information stored and
maintained during the project is useful for later access and retrieval. This database
is beneficial in updating as well as diagnosing the information required for |the
maintenance of the building facilities. Although, in the majority of construction
projects, modifications are normally made within the construction phase. BIM
facilitates interactive digital reproduction of interiors and exteriors of facilities in 3D, by
enabling rich photo-realistic presentations Therefore, the actual end product might
have several variations from the initial design, which might need to be represented
and recognized in the BIM model. It helps in updating the designed model to
incorporate the changes made during construction. This is particularly important
because it is the actual as-built information, which is required for facilities
maintenance and management.
Benefits of Building Information Modeling BIM
Some benefits of building information Modeling (BIM) includes, coordination and
collaboration, early detection of conflicts which lead to risk mitigation, faster drafting
and many more. Figure 3 represents the advantages associated with Building
information modeling as an integration platform of the entire project life cycle as
opined by (15), while similarly, (14) observed the following advantages:

Risk mitigation using BIM
649
Visualization: A useful manifestation of the BIM process is, it helps to make the
management process more transparent; i.e., the three-dimensional (3D) model can
easily displays what has and has not been obtained in virtually any given area. The
weaknesses of the project therefore be readily noticeable in the BIM model since most
of the process revolves on visualization with the 3D model (5)
Fabrication drawing: From the 3D BIM model, shop drawings for fabrication of
any building component can be easily generated
Code checking: To maintain standardization of design, code checking is crucial so as
to ascertain compliance with local regulation and international codes of practice.
Therefore, design done in BIM can be easily checked for compliance
Cost estimation: all components in BIM are developed with inbuilt characteristics of
material, cost, volume, etc; therefore, design with BIM will help in generating
accurate cost estimate of the project.
Conflicts detection: 3D visualization of design will enhance easy detection of
interference, automatically. For instance, the system will verify that pipes does not
intersect with beams, ducts or wall
Forensic analysis: With 3D visualization, it is easy to graphically illustrate potential
failures, leaks, evacuation plans etc.
Facilities Management: BIM is considered the best tool for space planning,
renovations and maintenance operations.
Figure 3. Schematic diagram of integrated design process. (15)
HOW BIM CAN MITIGATE RISK IN CONSTRUCTION PROJECTS
The construction risk at the design stage may occur when the completed building does
not meet the needs of the owners and occupants (8). Changing needs of the owner
over time or poor communication between design staff and the owner creates this risk.
However, Building Information Modeling (BIM) refers to the creation and
coordinated use of a collection of digital information about a building project. The
information can include cost, schedule, fabrication, maintenance, energy, and 3D
models which are used for design decision-making, production of high quality
construction documents, predicting performance, cost estimating, and construction
planning, and eventually, for managing and operating the facility (27) based on these
functionalities of BIM, it can therefore be used in mitigating construction risk in the
following ways:
Elimination of manual extraction of drawing through data exchange platform or
other method of integrating process. BIM applications utilize parametric
Hammad, Rishi and Yahaya
650
modeling. Parametric modeling involved the use of relational database containing
information regarding the elements of a structure and their relationships. The
capture and management of objects relationships is useful in enabling a high level
of model analysis beyond object properties (3). Therefore, the model can be used
to generate space calculations, energy efficiency, structural analysis details and
traditional design document (4) Thus, the risk of wrong measurement or inaccurate
generation of cost will be minimized.
Reducing the design deficiency through data exchange platform: the main benefit
of BIM is its ability to decrease errors made by design and construction teams by
employing the mechanism of conflict detection through visualization techniques,
referring to relevant parts in relations to the whole building model (28). As BIM
becomes more capable of handling more building information, this can help to
save cost through reduction of risk in time and errors.
Integrating design process with construction and engineering: this can be
achieved when a builder simulates a building before and during the actual
construction process. 4D or 5D models which integrates time and cost in addition
to the 3D geometry models. In this way, changes cannot only be controlled in the
design and engineering stages, but also can be controlled to some extent in the
built environment lifecycle (29). It is ideally suited on projects with high cost and
high risk and which can lead to high rewards for mitigating those cost and risk.
BIM with schedule and cost which when it is made accessible to all stake holders
will foster communication and cooperation thereby ameliorating the risk of
defragmentation among project actors.
CONCLUSION
Mitigating risk in construction projects has been considered as an important attempt in
order to achieve project’s objective in terms of time, cost, quality, safety and
sustainability. Risk has been identified as a combination of the probability of
occurrence of a defined hazard and the magnitude of the consequences of the
occurrence. Risk in construction may be influenced by either internal factors or
external factors. While internal factors are project oriented and can be controlled by
the project team, external factors cannot be controlled by the project team. The paper
has identified some internal factors that may cause risk in construction project; these
may include defective designed, unclear specification and improper documentation of
changes in the drawing. In addition, the paper identified the concept of Building
Information Modeling as to build a building virtually, prior to building it physically,
in order to work out problems, and simulate and analyze potential impacts. Moreover,
the paper highlights some areas of application of BIM construction project lifecycle.
Finally, BIM has been identified as sophisticate platform that will help in reducing
risk in construction project, particularly in elimination of the common errors in the
design management. Although, few researches have been conducted on how BIM will
improve productivity in construction site, but more empirical findings are required to
extensively find out how BIM may be practically be used to improve quality in
construction projects.
REFERENCES
Zou PXW, Zhang G, Wang J. Understanding the key risks in construction projects in China.
Int J Project Manage 2007 8;25(6):601-614.

Risk mitigation using BIM
651
Nitithamyong P, Skibniewski MJ. Web-based construction project management systems: how
to make them successful? Autom Constr 2004 7;13(4):491-506.
Mutai KA. Factors Influencing the use of Building Information Modeling (BIM) within
Leading Construction Firms in the United State of America. 2009.
Estman C, Teicholz P, Sacks R, Liston K. BIM Handbook: A Guide to Building Information
Modeling for Owners, Managers, Designers, Engineers and Contractors. Second ed.
USA: John Wiley and Sons, Inc.; 2011.
Kymmel W. Building Information Modeling: Planning and Managing Construction Projects
with 4D CAD and Simulations. First Edition ed. USA: McGraw-Hill Construction
Series; 2008.
Alshawi M. Rethinking IT in Construction and Engineering: Organisational Readiness. 1
Edition ed. USA: Routledg; 2007.
Hillson D. Effective Opportunity Management for Projects: Exploiting Positive Risk. Mercel
Dekker Inc, New York; 2004.
Albertor DM. Project Management for Facility Construction: A Guide for Engineers and
Architects. First edition ed. Germany: Springer Science; 2011.
El-Sayegh SM. Risk assessment and allocation in the UAE construction industry. Int J Project
Manage 2008 5;26(4):431-438.
Zou PXW, Zhang G, Wang J. Understanding the key risks in construction projects in China.
Int J Project Manage 2007 8;25(6):601-614.
Elvin G. Integrated Practice in Architecture: Mastering Design-Build, Fast-Track, and
Building Information Modeling. First ed. Canada: John Wiley and Sons, Inc.; 2007.
Smith KS, Tardif M,. Building Information Modeling: A Strategic Implementation Guide for
Architects, Engineers, Constractors and Real Estate Asset Managers. First ed. USA:
John Wiley and Son, Inc; 2009.
Aouad G, Lee A, Wu S editors. Constructing the Future: nD Modeling. First ed. UK: Tylor
and Francis; 2007.
Azhar S. Building Information Modeling (BIM): Trends, Benefits, Risks, and Challenges for
the AEC Industry. Leadership and Management in Engineering 2011;Vol. 11,(No.
3):241-252.
BSA. National BIM standards. 2007.
Bilal S. Building information modelling framework: A research and delivery foundation for
industry stakeholders. Autom Constr 2009 5;18(3):357-375.
Arayici Y, Coates P, Koskela L, Kagioglou M, Usher C, O'Reilly K. Technology adoption in
the BIM implementation for lean architectural practice. Autom Constr 2011
3;20(2):189-195.
Eastman C, Teicholz P, Sacks R, Liston K. BIM Handbook: A Guide to Building Information
Modeling for Owners, Managers, Designers, Engineers and Contractors. Second
Edition ed. USA: Wiley; 2011.
Douglas E. Chelson. The effects of building information modeling on construction site
productivity. United States -- Maryland: University of Maryland, College Park; 2010.
Jernigan FE, - Onuma KG. Big BIM, Little Bim: The Practical Approach to Building
Information Modeling : Integrated Practice Done the Right Way! 2008.
Park J, Kim B, Kim C, Kim H. 3D/4D CAD Applicability for Life-Cycle Facility
Management. Journal of Computing in Civil Engineering 2011;Vol.25(No.2,):129-
138.
Hammad, Rishi and Yahaya
652
Gou HL, Li H, Skitmore M. Life-Cycle Management of Construction Projects Based on
Virtual Prototyping Technology. Journal of Management in Engineering
2010;26.(No.1):41-47.
Hartmann T, Gao J, Fischer M. Areas of Application for 3D and 4D Models on Construction
Projects. Journal of Construction Engineering and Management 2008;Vol. 134(No.
10):776-784.
Çetiner O. A Review of Building Information Modeling Tools from an Architectural Design
Perspective. In: Underwood J, Isikdag U, editors. Handbook of Research on Building
Information Modeling and Construction Informatics: Concepts and Technologies.
First ed. New York: InformatIon scIence reference; 2011. p. 19-28.
Olatunji OA, Sher WD. The Applications of Building Information Modelling in Facilities
Management. In: Underwood J, Isikdag U, editors. Handbook of Research on
Building Information Modeling and Construction Informatics: Concepts and
Technologies. First ed. USM: InformatIon scIence reference; 2011. p. 239-253.
Gu N, London K. Understanding and facilitating BIM adoption in the AEC industry. Autom
Constr 2010 12;19(8):988-999.
Van Nederveen S, Beheshti.R., Gielingh W. Modelling Concepts for BIM. In: Underwood J,
Isikdag U, editors. Handbook of Research on Building Information Modeling and
Construction Informatics: Concepts and Technologies. First ed. New York:
InformatIon scIence reference; 2010. p. 1-18.
Oxman R. Digital Design Collaboration; From BIM to BKM -enhancing human creativity. In:
Shen Q, G., Brandon P, Baldwin A, editors. Collaborative Construction Information
Management. First edition ed. London: Spoon Press; 2009. p. 92-108.
Rossetti MD, Hill RR, Johnson B, Dunkin A, Ingalis RG, editors. Use of Building
Information Models in simulation. Winter Simulation Conference; 2009; : IEEE;
2009.
Ibem, E. O. and Aduwo, E. B. (2012) Public-Private Partnerships (PPPs) in Housing Provision in Ogun
State, Nigeria: Opportunities and Challenges In: Laryea, S., Agyepong, S.A., Leiringer, R. and
Hughes, W. (Eds) Procs 4th West Africa Built Environment Research (WABER) Conference, 24-26 July
2012, Abuja, Nigeria, 653-662.
653
PUBLIC-PRIVATE PARTNERSHIPS (PPPS) IN
HOUSING PROVISION IN OGUN STATE, NIGERIA:
OPPORTUNITIES AND CHALLENGES
Eziyi O. Ibem1 and Egidario B. Aduwo
Department of Architecture, College of Science and Technology Covenant University, Canaan Land,
Ota, Ogun State, Nigeria
There is a consensus among housing experts and policy makers that there are not
enough resources for government alone to address growing urban housing challenges
in many developing countries. Consequently, a paradigm shift from government
provision to partnerships between the public and private sectors is advocated. The
study examined the prospects and challenges of Public-Private Partnerships (PPPs) in
housing provision in Ogun State Southwest Nigeria. Data were derived from the
review of official records and interview enquires. Findings show that Public-Private
Partnership in housing in the study area is based on the joint venture approach
between government agencies and corporate commercial private property developers.
So far, attention has been on the provision of housing for high-income earners, while
the challenges of insufficient numbers of housing units and housing affordability
among low-income earners have not been addressed. The key challenges militating
against Public-Private Partnership in housing are inadequate supply of land by
government and housing finance as well as the exclusion of low-income people from
the PPPs. Given the huge housing supply deficit in Ogun State, it is argued that the
future success of PPP is contingent upon addressing these challenges and the
involvement of organizations that represent low-income people in the institutional
framework of the PPPs.
Keywords: Ogun state, public-private-partnership, public housing, urban area
INTRODUCTION
One of the significant changes in the housing sector in recent times was an attempt to
place more responsibility for public housing provision on the private sector through
Public-Private-Partnerships (PPPs). This is in recognition of failure of the government
provider approach to address quantitative and qualitative inadequacies and housing
affordability challenges in public housing in many less-developed countries. Drawing
on the Global Strategy for Shelter to the Year 2000 (UNCHS, 1992) and Enabling
Markets to Work (World Bank, 1993), the New National Housing and Urban
Development Policy (NNHUDP) in 2002 seeks to ensure that all Nigerians have
access to decent, safe and sanitary housing at an affordable cost through private
sector-led initiatives (Aribigbola, 2008). This policy recognizes that PPP is a key
means of engaging the private sector in addressing qualitative and quantitative
inadequacies as well as housing affordability challenges in the public-sector housing
in Nigeria (Ibem, 2010). By definition, PPP generally represents a wide range of
Ibem and Aduwo
654
institutional arrangements between public and private sectors in sharing
responsibilities, benefits and risks in housing and infrastructure provision (UN-
HABITAT, 2006b; Abd Aziz et al. 2007; Ibem, 2011a; 2011b). In housing provision
in particular, PPP has been celebrated on the notion that it promotes multi-
stakeholders’ participation; enhances productivity of the public- sector housing and
reduces housing affordability challenges (UN-HABITAT, 2006b; Shelter Afrique,
2008). Hence, it has continued to attract research attention among scholars,
researchers, professionals and public policy experts.
Ogun State, Southwest Nigeria, is one of the States in the forefront of adopting PPP in
housing provision. As one of the most urbanized and industrialized State in Nigeria,
coupled with its proximity to Lagos, this State had an official population figure of
about 3,728,098 in 2006 (Federal Republic of Nigeria, 2007) and current estimate
shows that by 2025, the population of Ogun State will be about 9.3 million(Ogun State
Regional Development Strategy, 2008). Adamson (1996) noted that the living
environment in this State as measured by housing characteristics is generally very
poor and unsanitary. Official statistics also show that the housing supply deficit in this
State is over 240,000 housing units, and this is expected to increase annually by 7500
housing units (Ogun State Ministry of Housing, 2008). To sustain this emerging
demographic trend and address increasing housing supply deficit, Ogun State
Government adopted PPP in 2003 as part of the housing sector reforms.
Studies have shown the extent to which PPP in housing has been successful in
different countries across the world (Ong and Lenard 2002; Freut, 2005; UN-
HABITAT, 2006b). Others have focused on the role of government agencies in PPP in
housing (Ibem, 2010) and the contributions of PPP to addressing urban housing
challenges in Nigeria (Ibem, 2011a; 2011b; Adegun and Taiwo, 2011). However, to
date, there are few empirical studies on the prospects and challenges of PPPs in public
housing in Nigeria. Among these few studies, none has specifically investigated the
adoption of PPP in housing in Ogun State, Southwest Nigeria. Consequently, the
study sought to examine the prospects and challenges of PPP in housing provision in
Ogun State. It identified the key partners, their roles and the target population, as well
as cost of housing in PPP housing schemes. The challenges militating against the PPPs
in meeting housing needs of low-income urban residents in Ogun State were also
examined. The paper is expected to extend our understanding of the adoption of PPP
in housing in the study area.
PUBLIC HOUSING AND THE EMERGENCE OF PPPs IN OGUN STATE
Public housing in Ogun State is provided by Federal and State government agencies.
The federal agencies involved are the Federal Ministry of Lands and Housing and
Federal Housing Authority (FHA), while State government agencies are the Ogun
State Ministry of Housing (OSMOH), Ogun State Housing Corporation (OSHC),
Ogun State Property and Investment Corporation (OPIC), Gateway City Development
Company Limited (GCDCL) and the Bureau of Lands and Survey. Public housing
provision formally began in Ogun State with the establishment of the Western
Nigerian Housing Corporation (WNHC) in 1958. This agency was established by the
colonial government to construct and manage public housing estates and also grant
soft loans to individuals to build their own houses (Onibokun, 1985).Two of the
housing estates constructed by the WNHC, namely, the Ibara GRA and Igbeba
housing estates in Abeokuta and Ijebu-Ode, respectively, were inherited by Ogun
State when the State was created out of the old Western State in April, 1976. In a bid
to increase public housing stock at the end of the civil war in 1970, the Federal
Public private partnership
655
Military Government established the Federal Housing Authority (FHA) to construct
subsidized housing for low-income earners across the country on rental basis.
Consequently, the FHA provided 893 serviced plots in Ogun State in the site-and-
service scheme implemented in the then newly created States of Bauchi, Benue,
Gongola, Imo, Niger, Ogun and Ondo as well as Lagos in 1976 (UN-HABITAT
2006a).
In 1977, the Ogun State Government, created Ogun State Housing Corporation
(OSHC) as the first State owned housing agency in the State. The OSHC was an
offshoot of the defunct Western Nigerian Housing Corporation and was charged with
the responsibility of increasing the availability of residential housing, commercial and
industrial buildings for public acquisition in the State. Within the first year of its
creation, it constructed 200 housing units at Oke Ata in Abeokuta and another 350
housing units in Ijebu Ode on rental basis (Ogun State Regional Development
Strategy, 2008). This agency currently has several housing estates in major urban
areas of the State. In the National Low-Cost Housing Programme (1979-1983), the
FHA also constructed 512 housing units in Ogun State out of the 8,000 housing units
planned for the State. According to the Ogun State Regional Development Strategy
(2008), this represents a dismal 18 percent achievement level. However, in addition to
OSHC, the Ogun State government in September 1984, established a second State
government owned agency: the Ogun State Property and Investment Corporation
(OPIC) to undertake the business of housing provision on commercial basis in urban
areas within and outside the State (Ogun State Regional Development Strategy,
2008).This was in line with the move towards commercialization of public-sector
housing which was a fall out of the economic restructuring agenda of the Federal
Government of Nigeria. Since its inception, OPIC has been involved in site-and-
services and turnkey housing schemes in Abeokuta, Agbara and Mowe areas of Ogun
State.
The continued qualitative and quantitative shortage of housing in Ogun State in
particular and Nigeria as a whole suggests that government intervention through the
provider approach in the last few decades has not addressed the housing challenges in
this country. In fact, while public housing provision suffered due to under-investment,
the need for urban housing grew alarmingly, especially among the urban poor and
low-income earners. Consequently, the New National Housing and Urban
Development Policy (NNHUDP) was launched in 2002. This was significant in
providing the needed legal framework for the adoption of PPP in housing in Nigeria
(Ibem, 2011a) and the departure from provider to enablement approach (Aribigbola,
2008). Drawing on this policy framework, the Ogun State Government embarked on
housing sector reforms by formulating a new State Housing Policy in 2003 and
subsequently adopted PPP in housing provision. At the onset, the emergence of PPP in
Ogun State stemmed from the huge demand for housing, the State government’s
dwindling budget, massive demand coming from all categories of residents for quality
housing and wider recognition of housing as a catalyst to boost economic growth and
job creation (Ibem, 2011c). With average annual housing need estimated at 7,500
units, it is projected that approximately 1.55 million housing units will be required in
the State by the year 2025 (Ogun State Regional Development Strategy, 2008). This is
an indication of the magnitude of additional housing need in Ogun State, assuming
that the current housing supply deficit will not worsen. In recognition of the huge
investment needed to address housing provision challenges, government in Ogun State
adopted the idea of PPP in public housing to narrow the gap between the demand for
Ibem and Aduwo
656
and supply of urban housing for all categories of people by pooling resources from the
private sector . However, much is not known of the extent to which this approach is
impacting on public housing in this State. This study was an attempt to narrow this
gap in knowledge.
PUBLIC-PRIVATE PARTNERSHIPS IN HOUSING AND SERVICE
PROVISION
PPP is celebrated globally as a viable strategy for delivering public services to cities in
less-developed countries (Miraftab, 2004). This is based on the notion that PPP
promotes multiple stakeholders’ participation in the provision of critical infrastructure
(Pessoa. 2006; World Bank, 2006), leads to a reduction in governments’ expenditure
(Brown et al., 2006), and encourages efficient use of resources for improved service
delivery at an affordable cost (Klijn and Koppenjan , 2000). These apparent merits
have heightened research activities on different aspects of PPP, and thus, different
meanings, conceptions and variants of PPPs have emerged (Bovaird, 2004;
Tomlinson, 2005; Mazouz et al., 2008). There are two main divergent opinions on
PPP. Whilst some argue that PPP is collaborative arrangements between the public,
profit and not for profit private sectors in the provision of public services hitherto
provided solely by the State (Miraftab, 2004; Adams et al., 2006; Brown et al., 2006),
others hold the view that PPP is another form of privatization in which the provision
of social services and infrastructure is contracted out to private sector organizations
(Bovaird, 2004; World Bank, 2006). PPP as a collaborative arrangement based on
mutual trust between the public and private sectors (Ong and Lenard, 2002; UN-
HABITAT, 2006b) means that PPP entails sharing of responsibilities, benefits and
risks among government, markets and people in the delivery of vital public services.
Based on the Enabling Markets to Work (World Bank, 1993) and the Public
Management (NPM) theory (Yamamoto, 2007), it is argued that PPP seeks to address
the short comings of government provider approach by engaging the private sector in
a collaborative manner. The implication of this is that PPP is seen as an institutional
arrangement consisting of interdependent partners who play different roles according
to their strengths and weaknesses in achieving common goals in a win-win situation
(UN-HABITAT, 2006b). In this regard, it is advocated that government should rather
focus mainly on providing enabling regulatory and financial environment for the
optimum performance of the private sector in the provision of social services and
infrastructure.
On the other hand, PPP as a form of outsourcing and privatization is based on
contractual arrangement between government and private commercial organizations
(World Bank, 2006). This allows private sector organizations to be involved in the
construction of critical infrastructure. Some have argued that PPP as another form of
privatization is an avenue for governments to abdicate their social responsibilities to
the private sector in the provision of key social services (Scott (2004), and that this
may result in diluting government’s control over decision making, management
supervision and accountability; and may ultimately undermine competition between
service providers in the long run (Bovaird, 2004; Tomlinson, 2005). The foregoing
suggest that besides the benefits of PPP, there are also obvious longstanding concerns
on the possibility of PPP resulting in the loss of independence in decision making on
the part of government and commercialization of social service provision. This is
definitely without implication for affordability of services to low-income people in the
society.

Public private partnership
657
However, in spite of these concerns, there is a consensus among scholars and
practitioners that PPP entails the participation of government, markets and non-profit
private sectors in the provision of social services and infrastructure hitherto provided
by government. The World Bank (2006) described PPP as private sector participation
in service and infrastructure provision. Indeed, there is increasing evidence in the
literature suggesting that PPPs are becoming very common in social policy and urban
development across the globe. Studies have also shown that PPPs have been used in
the construction and management of transport facilities and utilities (Batley, 1996;
World Bank, 2006), provision and management of educational, health and prison
facilities (Patel, 2007), environmental protection (Nwangi, 2000), urban renewal
(Osborne and Johnson, 2003) and waste management (Ahmed and Ali, 2004). PPPs
have also been adopted in housing provision in countries such as Egypt, India,
Pakistan, South Africa (Payne, 1999), Malaysia (Ong and Lenard 2002; Aziz and
Hanif, 2006; Abd Aziz et al. 2007), Brazil (Freut, 2005), the Philippines, Turkey,
India, Canada ( UN-HABITAT, 2006b), Nigeria (Ibem, 2011a, 2011b; Adegun and
Taiwo, 2011) and Kenya (Otiso, 2003) among others . Aggregate findings of these
studies show that despite differences in socio-political and economic contexts in these
countries, the PPPs have performed differently in infrastructure and housing
provisions. For instance, UN-HABITAT (2006b) revealed that PPPs have made
minimal contributions to low-income housing in developed countries, and that state-
market partnerships have been most profitable in housing low-income households in
the Joint Venture housing programme in the Philippines. In Nigeria, the above cited
studies found out that state-market partnership was the key variant of PPP operating in
this country. Consequently, larger percentage of housing units provided in PPP
housing schemes were targeted mainly at high-income earners. In view of the fact that
no study has examined the prospects and challenges of PPPs in public housing
delivery in Nigeria, this study attempted at filling this research gap.
RESEARCH METHOD
This paper draws on a study conducted to evaluate overall performance of public
housing in Ogun State between 2003 and 2010. Data used in this paper were derived
from both primary and secondary sources. Primary data were collected through
qualitative interview enquiries using an interview guide. Secondary data were derived
from the review of official records. The research was conducted between June, 2008
and February, 2010 in the study area. The four participants selected from two public
housing agencies and two private sector organization involved in PPP in housing
provision in Ogun State were purposively selected for the qualitative interviews. At
the time of this survey, two public housing agencies: Ogun State Ministry of Housing
(OSMOH) and Gateway City Development Company Limited (GCDCL) and two
private sector organizations: the Sparklight Property Development Company Limited
and Grants Property Limited were the key partners in PPP housing schemes in the
State. These organizations were selected for the research. Informants were selected
based on job designation, scope of professional practice and years of experience.
Those interviewed were of the ranks of Head of Departments and above. The
interviews were based on an interview guide which contained questions relating to
such issues such as the role of, and relationships between partners, the target
population and cost of housing provided as well as the challenges of PPP in housing
provision in the State. The interviews were manually recorded and data were analyzed
using content analysis.
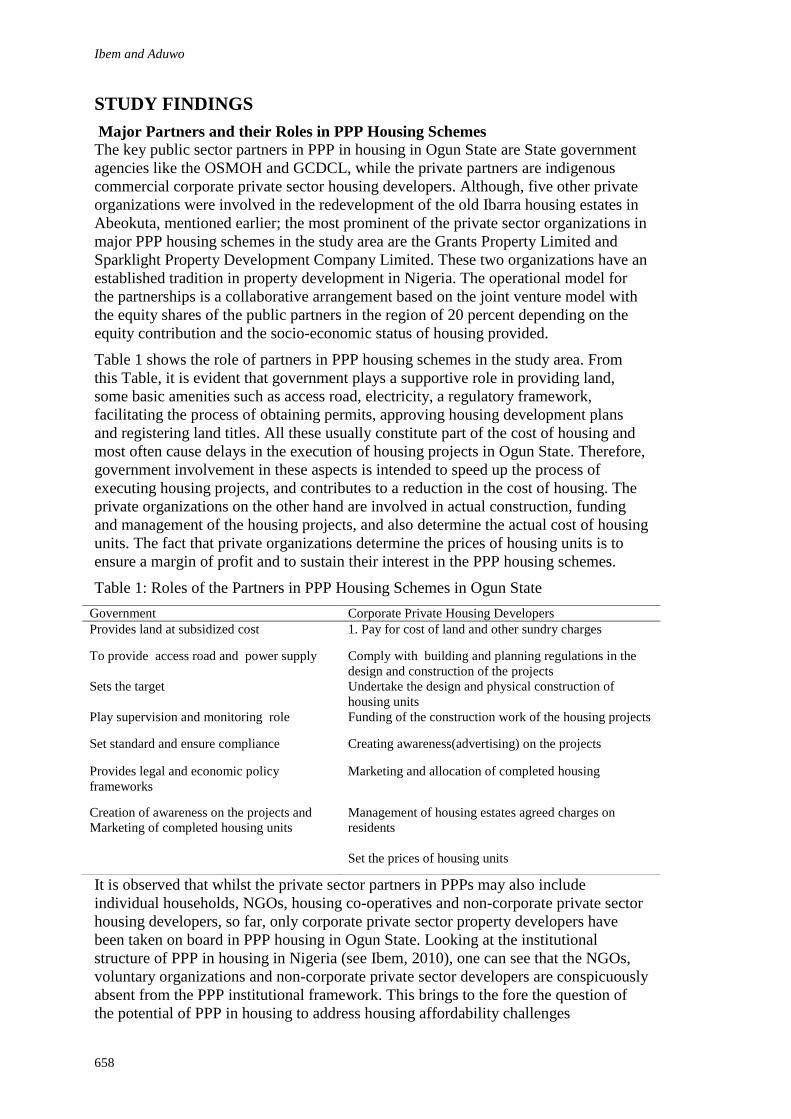
Ibem and Aduwo
658
STUDY FINDINGS
Major Partners and their Roles in PPP Housing Schemes
The key public sector partners in PPP in housing in Ogun State are State government
agencies like the OSMOH and GCDCL, while the private partners are indigenous
commercial corporate private sector housing developers. Although, five other private
organizations were involved in the redevelopment of the old Ibarra housing estates in
Abeokuta, mentioned earlier; the most prominent of the private sector organizations in
major PPP housing schemes in the study area are the Grants Property Limited and
Sparklight Property Development Company Limited. These two organizations have an
established tradition in property development in Nigeria. The operational model for
the partnerships is a collaborative arrangement based on the joint venture model with
the equity shares of the public partners in the region of 20 percent depending on the
equity contribution and the socio-economic status of housing provided.
Table 1 shows the role of partners in PPP housing schemes in the study area. From
this Table, it is evident that government plays a supportive role in providing land,
some basic amenities such as access road, electricity, a regulatory framework,
facilitating the process of obtaining permits, approving housing development plans
and registering land titles. All these usually constitute part of the cost of housing and
most often cause delays in the execution of housing projects in Ogun State. Therefore,
government involvement in these aspects is intended to speed up the process of
executing housing projects, and contributes to a reduction in the cost of housing. The
private organizations on the other hand are involved in actual construction, funding
and management of the housing projects, and also determine the actual cost of housing
units. The fact that private organizations determine the prices of housing units is to
ensure a margin of profit and to sustain their interest in the PPP housing schemes.
Table 1: Roles of the Partners in PPP Housing Schemes in Ogun State
It is observed that whilst the private sector partners in PPPs may also include
individual households, NGOs, housing co-operatives and non-corporate private sector
housing developers, so far, only corporate private sector property developers have
been taken on board in PPP housing in Ogun State. Looking at the institutional
structure of PPP in housing in Nigeria (see Ibem, 2010), one can see that the NGOs,
voluntary organizations and non-corporate private sector developers are conspicuously
absent from the PPP institutional framework. This brings to the fore the question of
the potential of PPP in housing to address housing affordability challenges
Government Corporate Private Housing Developers
Provides land at subsidized cost 1. Pay for cost of land and other sundry charges
To provide access road and power supply Comply with building and planning regulations in the
design and construction of the projects
Sets the target Undertake the design and physical construction of
housing units
Play supervision and monitoring role Funding of the construction work of the housing projects
Set standard and ensure compliance Creating awareness(advertising) on the projects
Provides legal and economic policy
frameworks
Marketing and allocation of completed housing
Creation of awareness on the projects and
Marketing of completed housing units
Management of housing estates agreed charges on
residents
Set the prices of housing units

Public private partnership
659
confronting most low-income residents in the study area. It is therefore, argued that
the expansion of the PPPs and inclusion of organizations representing low-income
people in the decision making process in PPP housing is important to ensure that the
PPP strategy addresses the housing needs of low-income earners in the society.
PPP Housing Schemes
The operational document of PPP in housing in Ogun State is the Memorandum of
Understanding (MOU) between the government and corporate commercial private
sector housing developers. Based on this, two types of PPP housing schemes are in
operation in Ogun State. First is the development of new housing estates such as the
OGD-Sparklight and Havilah Villas housing estates. Second is the redevelopment of
the Ibarra housing estate, Abeokuta, which is part of the urban renewal schemes in the
State. Table 2 shows the socio-economic status of the estates, number of housing units
and the unit prices of the different housing types provided in the PPP housing
schemes. It is evident from Table 2 that whilst the OGD-Sparklight estate carters for
the need of low, middle and high income people, the other two estates are luxury
apartments for the high income people. In supply terms, the PPPs have provided less
than 1, 000 housing units between 2003 and 2010 in Ogun State. This is indeed a very
small fraction of the average annual housing supply deficit put at 7,500 units. Table 2
also shows that in terms of cost of housing, purchasing a house under a PPP generally
requires between N3.45million and N37.5 million, depending on the size of housing
unit and the PPP. In fact, looking at the cheapest housing unit provided in the OGD-
Sparklight housing estate, one would begin to wonder how many low and middle-
income earners can afford this. With the minimum wage of N18, 000.00, a level four
officer in the public service will require a minimum 15 years of continuous savings of
his total annual income to be able to buy a 2-bedroom terraced bungalow. This goes to
suggest that housing units provided by the PPPs are not affordable to most low-
income people.
Table 2: PPP Housing Schemes in Ogun State (2007-2010)
Housing Scheme No. of Units Housing Typology Unit Price
N(million)
OGD-Sparklight,
Ibafo
340 housing units for
low, middle, High
income earners
2-Bedroom Terraced Bungalow 3.45
Detached 2-bedroom 4.38
Semi-Detached 3-bedroom 5.52
Detached 3-bedroom 6.5
Havilah Villas,
Isheri
100 housing units for
high- income class
3-Bedroom Luxury flat 15.5
4-Bedroom Bungalow 15.0
4-Bedroom Terraced House 17.5
4-Bedroom Twin Duplex 25.5
5-Bedroom Detached house 37.5
Ibarra Housing
Estate , Abeokuta
112 housing units for
high income Class
4-Bedroom Detached Bungalow 25.0
Total 552
1 US Dollar = N159.00 as at February, 2012
It is observed from the onset that one of the reasons for jettisoning government sole
provider to PPP approach is to improve the productivity of public-sector housing and
make housing more affordable to the low-income people. However, at present, it
appears that the provision of land, some basic amenities and other incentives by
government have not translated to significant increase in urban housing stock and
significant reduction in the cost of housing to affordable level for most low-income
earners. The implication of this is that the low volume of new construction in general
and for low-income category in particular as well as the cost of housing units are most

Ibem and Aduwo
660
likely to affect the availability and affordability of housing provided by the PPPs in
Ogun State.
Challenges of PPPs in Housing Provision
A number of factors were identified as constraints to the implementation of PPP in
housing in the study area. First is that of acquisition of and access to land. Although,
government is using land as a key incentive to encourage private sector into
partnerships; developable land has not been readily available from the government.
Consequently, this has limited the expansion of the housing stock in general and
implementation of PPP housing projects in Ogun State in particular. Since, access to a
continuous supply of land remains a key attraction for the private sector’s interest in
public housing delivery; government should consider the establishment of land banks
for PPP housing projects in this State.
Another challenge is access to adequate housing finance. As noted by those
interviewed, high interest rates by commercial banks are not encouraging short term
facilities for long term investment in housing projects; and thus, shrinking the
quantum of fund available to finance PPP housing projects. Therefore, concerted
efforts should be made at involving more financial institutions as key partners in PPP
housing, and such projects should be designed to suit existing and emerging funding
protocols of financial institutions.
Lastly, besides the foregoing factors, there are also indications that the adoption of
high building standards in PPP schemes had also contributed to low volume of low-
income housing. To this end, it is suggested that government should look into the
issue of high building standards with a view to reducing housing standards to enable
the PPPs provide sufficient low-income housing units at affordable cost.
CONCLUSIONS
This paper examined the prospects and challenges in the implementation of PPP in
response to burgeoning housing shortage and the failure of government provider
approach to address this challenge in the last few decades in Ogun State Southwest
Nigeria. The integral component of PPP in housing in the study area is the use of land
by government to attract corporate private sector property developers into partnership.
So far, the joint venture approach has been predominant and this is based on
memorandum of understanding between the partners.
PPP has been instrumental in reducing the financial burden on government in public
housing provision by allowing the government to undertake the role of facilitator in
providing land and regulatory framework. The private sector on the other hand is
involved in funding, construction and management of housing projects. Although,
housing production under the PPP has been embraced by government and corporate
commercial private housing developers; the challenges of insufficient number of
housing units and housing affordability to low-income earners are yet to be addressed.
At the operational level, inadequate supply of land and housing finance, and exclusion
of low-income people in the decision making process in the PPPs constitute
challenges to the success of PPP in housing in Ogun State. Therefore, the future
success of PPP in housing in the study area is consequent upon addressing these
challenges and increasing social content in the PPPs.
REFERENCES
Abd Aziz, W. N. A., and Hanif, N. R. (2006). Business Partnership in Meeting Housing needs
of the Urban Poor. Global Built Environment Review, 5(2), 39–48.
Public private partnership
661
Abd Aziz, W. N., Hani, N. R., and Musa, Z. N. (2007). Public–Private Partnerships approach:
Asuccess story in achieving democracy in the home ownership for urban inhabitants
in Kuala Lumpur Malaysia. Reviewed paper, Real CORP 007 Proceedings,
Tagungsband, Vienna, May 20–23, 2007. Available online (http://www.corp.at).
Retrieved February 15, 2008
Adams, J., Young, A., and Zhihong, W. (2006). Public–Private Partnerships in China:
Rational system and constraints. International Journal of Public Sector Management,
19(2), 384–396.
Adamson, K.Y. (1996). Towards an Environmental Action Plan for Ogun State. Draft Final
Report, World Bank Assisted Project. Abuja: Federal Environmental Protection
Agency
Adegun, O.B. and Taiwo, A.A.(2011).Contribution and Challenges of private Sector’s in
Housing in Nigeria: Case Study of Akure, Ondo State. Journal of Housing and the
Built Environment, 26 (4), 457-467
Ahmed, S.A. and Ali, M. (2004) Partnerships for Solid waste management in developing
Countries: linking the theories to realities, Habitat International, (28), 467–479.
Aribigbola, A. (2008). Housing policy formulation in developing countries: Evidences of
Programme Implementation from Akure, Ondo State Nigeria. Journal of Human
Ecology, 23(2), 125–134.
Batley, R. (1996). Public-Private Relationships and Performance in Service Provision. Urban
Studies, 33(4– 5), 723–75
Bovaird, T. (2004). Public-Private Partnerships: From contested Concepts to Prevalent
Practices. International Review of Administrative Sciences, 70(2), 199–215
Brown, A., Allison, O., and Luo, J. (2006). The suitability of Public-Private Partnership in the
Provision ofsustainable housing in China. World Review of Entrepreneurship,
Management and Sustainable Development, 1(1/2), 101–124.
Federal Republic of Nigeria (2007) Official Gazette on the breakdown of the National and
State Provisional Totals 2006 census, S.I N0 23 of 2007, N0.24, Vol.94 Lagos 15th
May
Fruet, G.M. (2005) The low-income housing cooperatives in Porto Alegre, Brazil: a
State/CommunityPartnership, Habitat International, (29), 300–324.
Ibem, E.O. (2010) An Assessment of the Role of Government Agencies in Public-Private
Partnerships (PPPs) in Housing Delivery in Nigeria. Journal of Construction in
Developing Countries, 15(2) 23-48.
Ibem, E.O. (2011a). The Contribution of Public Private Partnerships (PPPs) to Improving
Accessibility of Low-Income Earner to Housing in Southern Nigeria. Journal of
Housing and the Built Environment. 26(2)201-217.
Ibem, E.O. (2011b) Public Private Partnership (PPP) in Housing Provision in Lagos Megacity
Region, Nigeria. International Journal of Housing Policy, 11(2), 133-154.
Ibem, E.O. (2011c). Evaluation of Public Housing in Ogun State, Nigeria.
Unpublished Ph.D Architecture Thesis submitted to the School of
Postgraduate Studies, Covenant University, Canaan Land, Ota, Nigeria.
Klijn, E.H. and Koppenjan, J.M. (2000) Public management and policy networks: foundation
of a Networkapproach to governance. Public Management, 2(2), 135–158.
Mazouz, B., Facal, J., and Viola, J. (2008). Public-Private Partnership: Elements for a project-
Based Management Typology. Project Management Journal. 39(2), 98–110.
Ibem and Aduwo
662
Nwangi, S. W. (2000). Partnerships in urban environmental management: An approach to
Solving environmental problems in Nakuru, Kenya. Environment and Urbanization,
12(8), 77–92.
Ogun State Regional Development Strategy (2008). Our Collective Responsibility. Ikeja:
Comprehensive Project Management Services Limited
Ogun State Ministry of Housing, (2008). Housing Delivery in Ogun State. Abeokuta: Ministry
of Housing
Onibokun, A. G. (1985). Housing in Nigeria. Ibadan: Nigerian Institute for Social and
Economic.Research (NISER).
Ong, H. C. and Lenard, D. (2002). Partnerships between Stakeholders in the Provision of and
Access to Affordable Housing in Malaysia. Paper presented at FIG XXII.
International Congress held at Washington, D.C., USA, April 19–22, 2002.
Otiso, K.M. (2003) State, Voluntary and Private sector partnerships for Slum Upgrading and
Basic Service Delivery in Nairobi City Kenya. Cities, 20(4), 221–229.
Tomlnson, F. (2005). Idealistic and Pragmatic Versions of the Discourse of Partnership.
Organizational Studies, 26(8), 1169–1188.
Patel, K. (2007). Going Global:The World of Public Private Partnership. UK: CBI. Available
Online:http://www.cbi.org.uk/bookshop. Retrieved on May 12, 2008
Payne, G. (1999) (ed). Making common ground: Public–Private Partnerships in Land for
Housing. London: Intermediate Technology Publications.
Pessoa, A. (2006). Public-Private sector partnerships in developing countries: Prospects and
Drawbacks. FEP working paper no. 228. Available online http://www.fep.up.pt. Retrieved in March 3, 2008.
Scott, M. (2004). Building institutional capacity in rural Northern Ireland: The role of
Partnership governance in the leader II programme. Journal Rural Studies of (20),
49–59.
Shelter Afrique (2008). Mortgage financing for increased access to housing in Africa,
symposium organized jointly by Shelter Afrique and the Ministry of Housing,
Republic of Togo held in Lome on 10th June, 2008. Available Online.
www.shelterafrique.org.November 15, 2008.
UNCHS (1992). Global Shelter Strategy to the Year 2000. Nairobi: UNCHS
UN-HABITAT (2006a). National Experiences with Shelter Delivery for the Poorest Groups.
Nairobi: UNHABITAT
UN-HABITAT (2006b). Public–Private Partnerships in Enabling Shelter Strategies. Nairobi:
UNHABITAT
World Bank (1993). Housing: Enabling Market to Works with Technical Supplement.
Washington: World Bank
World Bank. (2006). Private Participation in Infrastructure Projects Database, Washington
DC: World Bank. Online http://ppi.worldbank.org/. Retrieved on April 12, 20
Yamamoto, R. (2007). Multi-Level Governance and Public–Private Partnerships: Theoretical
Basis and Public Management. Interdisciplinary Information Science 13(1), 65–88.
Ibn-Mohammed, T., Greenough, R., Taylor, S., Ozawa-Meida, L. and Acquaye, A. (2012) Foundation
for a decision support framework for optimal sequencing of emissions savings refurbishment options in
non-domestic buildings In: Laryea, S., Agyepong, S.A., Leiringer, R. and Hughes, W. (Eds) Procs 4th
West Africa Built Environment Research (WABER) Conference, 24-26 July 2012, Abuja, Nigeria, 663-
675.
663
FOUNDATION FOR A DECISION SUPPORT
FRAMEWORK FOR OPTIMAL SEQUENCING OF
EMISSIONS SAVINGS REFURBISHMENT OPTIONS IN
NON-DOMESTIC BUILDINGS
Taofeeq Ibn-Mohammed1, R.Greenough; S.Taylor, L. Ozawa-Meida and A.
Acquaye 1 Institute of Energy and Sustainable Development, De Montfort University, Leicester
2 School of Civil and Building Engineering, Loughborough University, Loughborough
3Centre for Energy, Environment and Sustainability, University of Sheffield, Sheffield
The need for a concerted effort towards reducing greenhouse gas emissions to
mitigate the pernicious effect of climate change continues to mount. Non-domestic
buildings account for 17% of the greenhouse gas emissions in the UK and currently,
they emit an estimated 100 million tonnes (Mt) of carbon dioxide per year. Therefore,
the reduction of GHG emissions from the products and processes involved in the
lifecycle of non-domestic buildings are of utmost importance in meeting national and
global emissions reduction targets. Today, measures for reducing GHG emissions that
are most appropriate for retrofitting non-domestic buildings, including renewable
energy generation technologies, energy efficiency measures and inducements to
change behaviour are widely available. With such a variety of available measures, the
challenge for the decision makers is to consider energy, environmental and financial
factors and apply the measures so as to reduce overall emissions in the most cost-
effective way, while taking into account any interactions. Attaining such a goal will
require a robust decision-making methodology with which optimal choices can be
made regarding the prioritisation of emissions-saving refurbishment options. This
paper, gives an overview of relevant literature in this field, a proposed decision-
making framework and some thoughts on how measures of financial costs and both
embodied and operational emissions can be combined into a robust way. This will
allow ranking and sequencing of retrofit options to reduce emissions in non-domestic
buildings in a cost-effective manner.
Keywords: emission, energy conservation, non-domestic buildings
BACKGROUND AND INTRODUCTION
The public’s memory has not yet forgotten the extreme weather events and natural
disasters that characterised the year 2011. 355 natural disasters occurred in the first
half of 2011 alone (Munich RE, 2011). Examples include: the 12th Jan. 2011 rain-
triggered landslides that killed nearly 800 and left 14,000 homeless in Brazil; 3rd Feb.
2011 biggest cyclone in a century that hit Australia; 2011 floods in Australia and
Bangkok; 21st Feb. 2011 New Zealand earthquake which leads to $20 billion in
economic losses with a death toll of 181 people; the largest earthquake in Japan’s
Ibn-Mohammed et al.
664
history, which occurred on 11th March, 2011, killing at least 15,500 people, leaving
behind $210 billion in property damage (Munich RE, 2011).Global warming—the
slow but steady increase of earth’s global temperature— is believed today to pose a
grave danger to the stability of the environment, if it continues (IPCC, 2007a). While
it is difficult to directly link global warming with the extreme weather events
highlighted above, compelling evidences suggests that more such events are to be
expected if nothing is done to mitigate the climate change (IPCC, 2007a).
Anthropogenic greenhouse gases (GHG) are believed to have contributed to most of
the observed recent global warming. This view is summarized in the IPCC report
(IPCC, 2007a): Most of the observed increase in globally averaged temperatures since
the mid-20th century is very likely due to the observed increase in anthropogenic
GHG concentrations. In the century that has passed since this warming was first
predicted, the average surface of the globe has warmed by about 0.8oC (IPCC,
2007a). The continuous increase in CO2 concentrations due to steady rise in globally
averaged temperature will have severe climate impacts, with higher local maximum
temperatures, fewer cold days, more heavy rain, summer drought, decreased snow
cover and sea ice as well as increase in storm intensity all deemed likely (IPCC, 2001;
Hulme et al., 2002). The challenge facing the world is therefore to minimise adverse
impacts on the environment, meet rising energy demand, and support economic
growth while moving towards a low carbon economy.
An assessment of global emissions sources shows that the building sector is a major
consumer of global primary energy supply and subsequently a major contributor to
global GHG emissions and environmental burden (Kolokotsa et al., 2009). The United
Nations Environment Programme (UNEP,2005) reports that the environmental
(including carbon) footprint of the building sector consists of: 40% of energy use,
30% raw materials use, 25% of solid waste, 25% water use, and 12% of land use. The
trend may seem to be rising since Pérez-Lombard et al (2008) also stated that global
GHG emissions from buildings continue to rise at an annual rate of 1.5%. The
building sector therefore represents a priority sector by the United Nation in terms of
climate change mitigation since it is collectively responsible for 40% of the world’s
energy consumption and one third of global GHG emissions as well as representing
the largest emissions source in most developed and developing countries (UNEP-
SBCI, 2008; IEA, 2009; USGBC, 2009). This statistics clearly indicates that buildings
are key component in dealing with energy and climate problems. As a result, in the
past decades, there have been significant efforts towards designing, operating, and
maintaining energy efficient and environmentally conscious buildings, with most
countries pledging to make all new building carbon-neutral at appointed times.
However, during the period in which emissions must be drastically reduced, the vast
majority of buildings will be the existing ones (Hinnells et al., 2008), the greatest
energy savings and carbon emissions reductions can therefore be made through
refurbishment (Carbon Trust, 2009).
Optimal energy management and energy efficiency in the building sector is a valuable
tool for reducing GHG emissions. Moreover, the financial benefits from using energy
efficient technologies form the key stimulus for building owners. The most significant
carbon impact of buildings currently comes from operational energy requirements. As
such, considerable effort has gone into reducing buildings’ operational emissions by
improving energy efficiency within the building envelope. But, as building fabric
designs improves through higher insulation levels, reduced air permeability etc, to
reduce operational energy usage, the relative proportion of carbon emissions
Emissions savings
665
embodied within the building increases and its contribution to total life cycle
emissions becomes more significant (Ding, 2004; Nassen et al., 2007; Lee and White,
2008; Smith and Fieldson, 2008; Dixit et al., 2010; Engin and Frances, 2010). Hence,
there is an increasing focus on the reduction of embodied emissions either through
optimisation of building fabric to reduce material use or through the specification of
materials with a lower embodied carbon. However, methods and tools to reduce
embodied and operational carbon are considered in isolation when making decisions
about energy management in buildings. To this end,in selecting the most appropriate
actions or strategies for building refurbishment and reduction of buildings’
environmental impact, it is imperative to gain insight into demand-side and supply-
side retrofitting technologies in the context of operational and embodied emissions,
financial cost and occupant needs, so that the trade-offs between various design
options can be communicated and decisions can be made that are informed both by
environmental and financial considerations.
This paper describes a methodological approach for the development of a novel and
robust decision-making methodology that will rank and sequence a range of emissions
savings refurbishment options. The aim of the paper is to provide a foundation for the
development of a best-value approach to emissions saving in a non-domestic building,
taking into account operational and embodied emissions as well as cost. The
objectives of the paper are to:
i.) Undertake a review of the relationship between embodied emissions
and operational emissions over the life cycle of buildings and highlighting the
increasing importance of embodied emissions in building energy assessment
ii.) Present the foundations and principles for the development of a robust
methodological framework across three variables (financial costs, embodied and
operational emissions) for the optimal ranking and sequencing retrofit options which
will support decision making in order to reduce GHG emissions in non-domestic
buildings
COMPARISON OF OPERATING AND EMBODIED EMISSIONS
OVER THE LIFE CYCLE OF BUILDINGS
Energy use during the lifespan of buildings consists of embodied energy, operating
energy, demolition energy and energy use for disposal and recycling after end of life
use (Cole and Kernan, 1996; Chen et al., 2000; Hubermanand et al., 2008). The
embodied energy of a building is the total energy associated with its production—that
is to extract the raw materials, process and manufacture them as necessary, transport
them to site and use them to construct the building (Reddy et al., 2003; Yang et al.,
2005; Ramesh et al., 2010). Embodied energy may be divided into two parts: initial
and recurring embodied energy. Initial embodied energy of a building is the energy
incurred for initial construction of the building (Chen et al., 2001; Ramesh et al.,
2010). It represents the non-renewable energy consumed in the acquisition of raw
materials, their processing, manufacturing, transportation to site, and construction. On
the other hand, recurring embodied energy represents the energy consumed to
maintain, repair, restore, refurbish or replace materials, components or systems during
the effective life of the building (Treloar,1998; Ding, 2004; Chen et al., 2000; Ramesh
et al., 2010).
Operational emission encompasses all activities related to the use of the buildings,
over its life span. It is the emissions expended in keeping the indoor environment
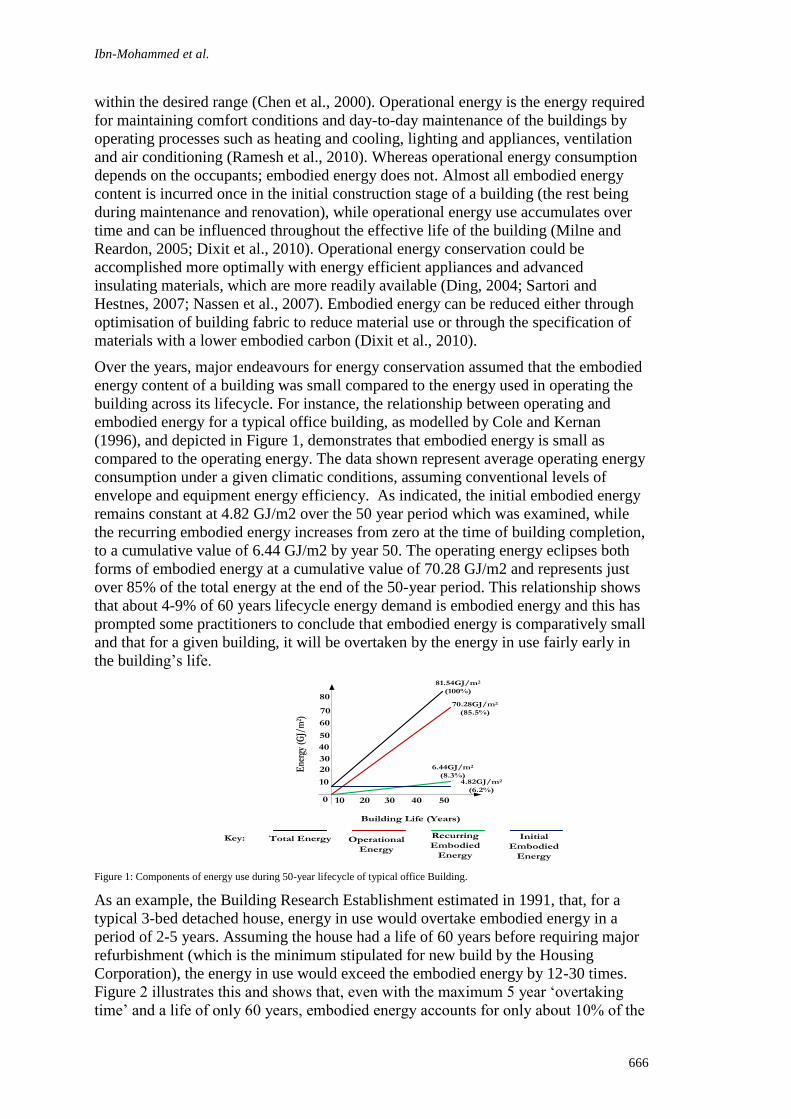
Ibn-Mohammed et al.
666
within the desired range (Chen et al., 2000). Operational energy is the energy required
for maintaining comfort conditions and day-to-day maintenance of the buildings by
operating processes such as heating and cooling, lighting and appliances, ventilation
and air conditioning (Ramesh et al., 2010). Whereas operational energy consumption
depends on the occupants; embodied energy does not. Almost all embodied energy
content is incurred once in the initial construction stage of a building (the rest being
during maintenance and renovation), while operational energy use accumulates over
time and can be influenced throughout the effective life of the building (Milne and
Reardon, 2005; Dixit et al., 2010). Operational energy conservation could be
accomplished more optimally with energy efficient appliances and advanced
insulating materials, which are more readily available (Ding, 2004; Sartori and
Hestnes, 2007; Nassen et al., 2007). Embodied energy can be reduced either through
optimisation of building fabric to reduce material use or through the specification of
materials with a lower embodied carbon (Dixit et al., 2010).
Over the years, major endeavours for energy conservation assumed that the embodied
energy content of a building was small compared to the energy used in operating the
building across its lifecycle. For instance, the relationship between operating and
embodied energy for a typical office building, as modelled by Cole and Kernan
(1996), and depicted in Figure 1, demonstrates that embodied energy is small as
compared to the operating energy. The data shown represent average operating energy
consumption under a given climatic conditions, assuming conventional levels of
envelope and equipment energy efficiency. As indicated, the initial embodied energy
remains constant at 4.82 GJ/m2 over the 50 year period which was examined, while
the recurring embodied energy increases from zero at the time of building completion,
to a cumulative value of 6.44 GJ/m2 by year 50. The operating energy eclipses both
forms of embodied energy at a cumulative value of 70.28 GJ/m2 and represents just
over 85% of the total energy at the end of the 50-year period. This relationship shows
that about 4-9% of 60 years lifecycle energy demand is embodied energy and this has
prompted some practitioners to conclude that embodied energy is comparatively small
and that for a given building, it will be overtaken by the energy in use fairly early in
the building’s life.
0 10 20 30 40 50
10
20
30
40
50
60
70
80
81.54GJ/m2
(100%)
70.28GJ/m2
(85.5%)
6.44GJ/m2
(8.3%)4.82GJ/m2
(6.2%)
Building Life (Years)
Ene
rgy
(GJ/
m2 )
Key: Total Energy Operational
Energy
Recurring
Embodied
Energy
Initial
Embodied
Energy Figure 1: Components of energy use during 50-year lifecycle of typical office Building.
As an example, the Building Research Establishment estimated in 1991, that, for a
typical 3-bed detached house, energy in use would overtake embodied energy in a
period of 2-5 years. Assuming the house had a life of 60 years before requiring major
refurbishment (which is the minimum stipulated for new build by the Housing
Corporation), the energy in use would exceed the embodied energy by 12-30 times.
Figure 2 illustrates this and shows that, even with the maximum 5 year ‘overtaking
time’ and a life of only 60 years, embodied energy accounts for only about 10% of the

Emissions savings
667
0 10 20 30 40 50
Building Life (Years)
Energ
y con
sumpti
on
60
Embodied energy
Energy in use
Total energy
lifetime energy use of the building. If the overtaking time were lower and the lifetime
of the building a more typical 100 years, then energy in use would be 40-50 times
more significant than embodied energy (i.e. embodied energy would account for only
2-2.5% of total energy consumption). The obvious conclusion from this example is
that, in minimising energy consumption over the lifetime of a building, reducing
energy in use is far more effective than minimising embodied energy.
Figure 2: Relationship between operational energy and embodied energy over a building’s lifecycle
Climate change is the most serious global sustainability issue and the energy required
to operate buildings constitutes a major component of global emissions (UNEP-SBCI,
2008; IEA, 2009; USGBC, 2009). As a consequence, considerable effort has gone into
reducing buildings’ operational emissions by improving energy efficiency within the
building envelope. Furthermore, due to the advent of energy efficient equipment and
appliances, along with more advanced and effective insulation materials;
improvements in building fabric design, reduced air permeability, benign sources of
renewable energy, e.t.c, the potential for curbing operating energy has increased. As
such, the relative proportion of CO2 emissions embodied within the building increases
and its contribution to total life cycle energy becomes more significant. Hence,
embodied energy has become of great interest in sustainable architecture and building
design and needs to be considered along with operating energy in order to reduce total
lifecycle emission by buildings (Ding, 2004; Nassen et al., 2007; Lee and White,
2008; Smith and Fieldson, 2008; Dixit et al., 2010; Engin and Frances, 2010).
The assumption that embodied energy typically comprised about 10% of a building’s
total lifecycle energy use no longer holds true, as present-day research, which details
the proportion of embodied versus operational emissions across different buildings
and infrastructure, has shown that this can be higher. For instance, the research carried
out by the Commonwealth Scientific and Industrial Research Organisation (CSIRO,
2006) shows that an average household in Australia contains about 1,000 GJ of energy
embodied in the materials used in its construction. This is equivalent to about 15 years
of normal operational energy use. For a house that lasts 100 years, this is over 10% of
the energy used in its life (Milne and Reardon, 2005). The research concludes that as
buildings become more energy efficient in their operations, the embodied energy will
approach half the lifetime energy consumption. Pullen (2000) also stated that the
embodied energy of a building is a very significant portion of the lifecycle energy
consumption when compared to operational energy use. Ding (2004) reports that the
production of building components off-site accounts for 75% of the total energy
embedded in buildings and this share of energy is gradually increasing as a result of
the increased use of highly energy intensive materials (Sartori and Hestnes, 2007;
Langston and Langston, 2008).
Webster (2004) estimates a global weighting potential (GWP) of 2-22% attributable to
embodied emissions, based on 3 different building types, over a 50 year life, in the US
and in Montreal. Athena (2007) estimated 9-12% of 60 year life-cycle energy demand
is embodied energy. BuildCarbonNeutral (2007) stated that equivalent CO2 is 13-18%

Ibn-Mohammed et al.
668
over a 66 year life span. Lee and White (2008) conducted life cycle energy analysis of
buildings based on the implementation of five different intervention options ranging
across baseline (i.e. do nothing scenario), energy efficiency, clean power,
refurbishment and rebuild. They concluded that embodied carbon is 3-35% of 100
year life-cycle energy demand. The lower and upper limit of the range represents
embodied carbon for baseline and rebuild respectively. Similarly, Engin and Francis
(2010) reported that embodied carbon is 11-50% of 60 year life-cycle emissions based
on different building options as covered by Lee and White (2008).
For a single-storey office building in the UK, Yohanis and Norton (2002) reported that
the energy initially embodied in a building could be as much as 67% of the
operational energy over a 25 year period. Similarly, Eaton and Amato (2005) found a
much larger percentage of the total carbon emissions attributable to what the materials
embodied. They reported that embodied carbon is 37-43% of 60 year life-cycle carbon
emissions. Smith and Fieldson (2008), estimate that up to 80% of the life-cycle carbon
emissions are embodied carbon.. For traditional buildings in developing countries, the
embodied energy can be large compared to the operating energy, as the latter is quite
low (IPCC, 2007a). Table 1 summarises the most frequently cited research comparing
embodied energy and operational energy over the total lifecycle of buildings.
Table 1: Variation of embodied emissions versus operational emissions in different buildings
As the wider international recognition and global concern over energy use, material
and resource utilization and the emissions of GHGs into the atmosphere continues to
grow, embodied emissions associated with buildings is now of enormous importance
as shown from the foregoing analysis. It therefore constitute a key issue that is
required to be tackled in the design stages of building refurbishment in order to strive
towards a truly energy-efficient building. Global efforts to reduce energy consumption
Emissions savings
669
in buildings cannot be totally achieved by ignoring the energy embodied in buildings.
It is therefore essential to calibrate the performance of buildings in terms of both
embodied and operating energy in order to reduce lifecycle energy consumption
(Treolar et al., 2001; Langston and Langston, 2008). This suggests an approach that
would account for all energy consumption from cradle-to-grave (i.e. from raw
material extraction through materials processing, manufacture, distribution, use, repair
and maintenance, and disposal or recycling). In specifying emissions savings
refurbishment options with a low embodied energy component, decisions about choice
of materials, construction process and design options, etc, must be taken at an early
stage where design changes can be made and preferential low embodied energy
materials selection adopted. Environmental assessments that takes embodied
emissions into consideration at the early design stage are more likely to assist in the
selection of sustainable materials and to minimise the use of energy (Acquaye, 2010)
Currently, there is an increasing focus on the reduction of embodied emissions either
through optimisation of building fabric to reduce material use or through the
specification of materials with a lower embodied carbon to reduce the amount of
energy embodied in buildings. The replacement of materials that require significant
amounts of energy to produce (e.g. concrete and steel) with materials requiring small
amounts of energy to produce (e.g. wood products) will reduce the amount of energy
embodied in buildings but this must be considered together with other variables such
as the functionality of the building. Whether this reduces lifecycle energy use,
however, depends on the effect of materials choice on the energy requirements for
heating and cooling over the building’s life span and end of life scenarios (Börjesson
and Gustavsson, 2000; Lenzen and Treloar, 2002). Nevertheless, taking embodied and
operating emissions into account in building energy analysis will contribute to data
and information required to create an energy economy that accounts for indirect and
direct contributions (Dixit et al., 2010). Better awareness of the embodied energy
content of building materials will encourage not only the production and development
of low embodied energy materials, but also their preference among building designers
to curb energy use and carbon dioxide discharge (Ding, 2004). In future, legislation
(which places a price on carbon, using, for example, cap and trade schemes) and
technologies will emphasize radical operational emissions reductions while the large
existing building stock will necessitate major refurbishment and/or rebuild effort. It is
therefore crucial to employ a whole-life carbon accounting methodology in analysing
the lifecycle energy use of buildings (Engin and Frances, 2010). By so doing, the
trade-offs between various design options can be communicated so that decisions can
be made that are informed both by environmental and financial considerations.
PROPOSED METHODOLOGICAL FRAMEWORK
Any low carbon intervention measure or actions undertaken during the operational
stage of a building can be either refurbishment or retrofit. The term refurbishment
implies the necessary modifications in order to return a building to its original state,
while retrofit includes the necessary actions that will improve the building’s energy
and/or environmental performance (Kolokotsa et al., 2009). The pathway to ensuring
the sustainability of a building is achieved must involve taking the necessary decisions
that can optimize the overall building system. Hence, the paper presents a framework
for decision support approach illustrated in Figure 3 which will identify the overall
goal for the decision making as well as the subsidiary objectives and the various
indices or criteria against which option performance may be measured.
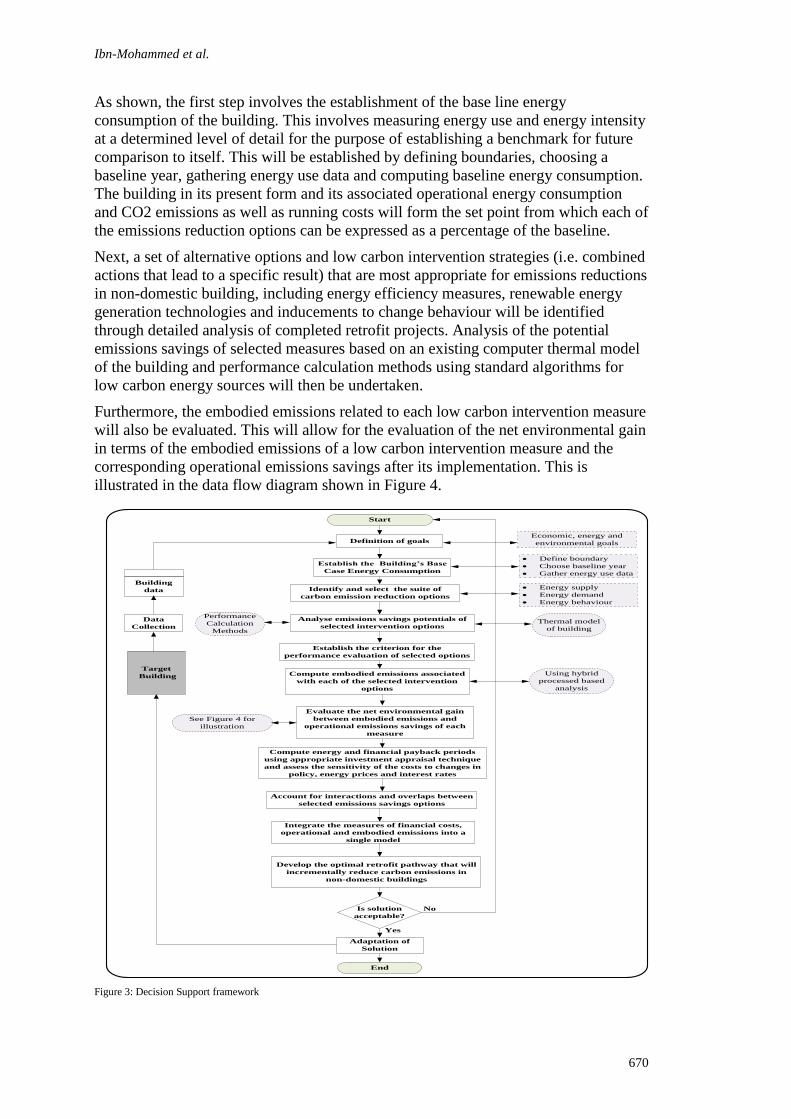
Ibn-Mohammed et al.
670
As shown, the first step involves the establishment of the base line energy
consumption of the building. This involves measuring energy use and energy intensity
at a determined level of detail for the purpose of establishing a benchmark for future
comparison to itself. This will be established by defining boundaries, choosing a
baseline year, gathering energy use data and computing baseline energy consumption.
The building in its present form and its associated operational energy consumption
and CO2 emissions as well as running costs will form the set point from which each of
the emissions reduction options can be expressed as a percentage of the baseline.
Next, a set of alternative options and low carbon intervention strategies (i.e. combined
actions that lead to a specific result) that are most appropriate for emissions reductions
in non-domestic building, including energy efficiency measures, renewable energy
generation technologies and inducements to change behaviour will be identified
through detailed analysis of completed retrofit projects. Analysis of the potential
emissions savings of selected measures based on an existing computer thermal model
of the building and performance calculation methods using standard algorithms for
low carbon energy sources will then be undertaken.
Furthermore, the embodied emissions related to each low carbon intervention measure
will also be evaluated. This will allow for the evaluation of the net environmental gain
in terms of the embodied emissions of a low carbon intervention measure and the
corresponding operational emissions savings after its implementation. This is
illustrated in the data flow diagram shown in Figure 4.
Establish the criterion for the
performance evaluation of selected options
Identify and select the suite of
carbon emission reduction options
Compute embodied emissions associated
with each of the selected intervention
options
Evaluate the net environmental gain
between embodied emissions and
operational emissions savings of each
measure
Compute energy and financial payback periods
using appropriate investment appraisal technique
and assess the sensitivity of the costs to changes in
policy, energy prices and interest rates
Establish the Building’s Base
Case Energy Consumption
Thermal model
of building
Performance
Calculation
Methods
Using hybrid
processed based
analysis
See Figure 4 for
illustration
Account for interactions and overlaps between
selected emissions savings options
Integrate the measures of financial costs,
operational and embodied emissions into a
single model
Develop the optimal retrofit pathway that will
incrementally reduce carbon emissions in
non-domestic buildings
Target
Building
Data
Collection
Building
data
Start
Definition of goals
Define boundary
Choose baseline year
Gather energy use data
Energy supply
Energy demand
Energy behaviour
Is solution
acceptable?
Adaptation of
Solution
End
Economic, energy and
environmental goals
Yes
No
Analyse emissions savings potentials of
selected intervention options
Figure 3: Decision Support framework
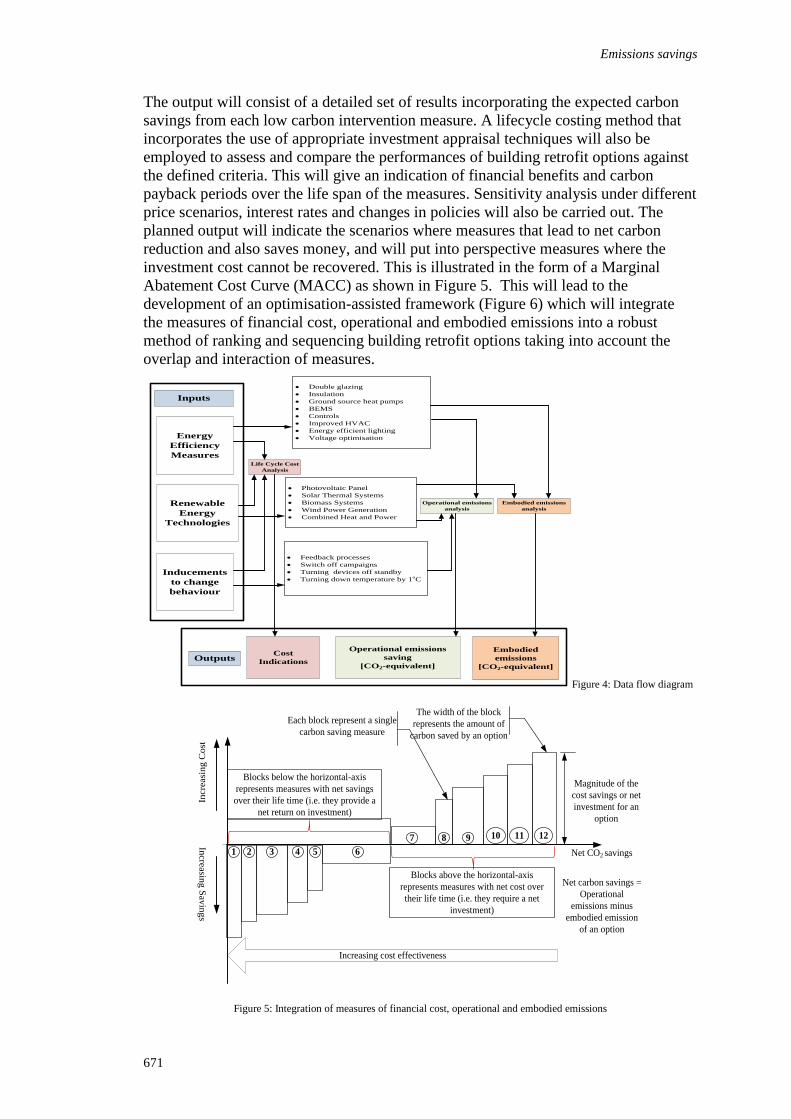
Emissions savings
671
The output will consist of a detailed set of results incorporating the expected carbon
savings from each low carbon intervention measure. A lifecycle costing method that
incorporates the use of appropriate investment appraisal techniques will also be
employed to assess and compare the performances of building retrofit options against
the defined criteria. This will give an indication of financial benefits and carbon
payback periods over the life span of the measures. Sensitivity analysis under different
price scenarios, interest rates and changes in policies will also be carried out. The
planned output will indicate the scenarios where measures that lead to net carbon
reduction and also saves money, and will put into perspective measures where the
investment cost cannot be recovered. This is illustrated in the form of a Marginal
Abatement Cost Curve (MACC) as shown in Figure 5. This will lead to the
development of an optimisation-assisted framework (Figure 6) which will integrate
the measures of financial cost, operational and embodied emissions into a robust
method of ranking and sequencing building retrofit options taking into account the
overlap and interaction of measures.
Double glazing
Insulation
Ground source heat pumps
BEMS
Controls
Improved HVAC
Energy efficient lighting
Voltage optimisation
Photovoltaic Panel
Solar Thermal Systems
Biomass Systems
Wind Power Generation
Combined Heat and Power
Feedback processes
Switch off campaigns
Turning devices off standby
Turning down temperature by 1oC
Energy
Efficiency
Measures
Renewable
Energy
Technologies
Inducements
to change
behaviour
Inputs
Cost
Indications
Embodied
emissions
[CO2-equivalent]
Operational emissions
saving
[CO2-equivalent]Outputs
Life Cycle Cost
Analysis
Embodied emissions
analysis
Operational emissions
analysis
Figure 4: Data flow diagram
Increasing cost effectiveness
The width of the block
represents the amount of
carbon saved by an option
Net CO2 savings
Magnitude of the
cost savings or net
investment for an
option
Incre
asin
g S
avin
gs
Incre
asi
ng C
ost
Net carbon savings =
Operational
emissions minus
embodied emission
of an option
1 2 3 4 5 6
7 8 9 10 11 12
Blocks below the horizontal-axis
represents measures with net savings
over their life time (i.e. they provide a
net return on investment)
Blocks above the horizontal-axis
represents measures with net cost over
their life time (i.e. they require a net
investment)
Each block represent a single
carbon saving measure
Figure 5: Integration of measures of financial cost, operational and embodied emissions
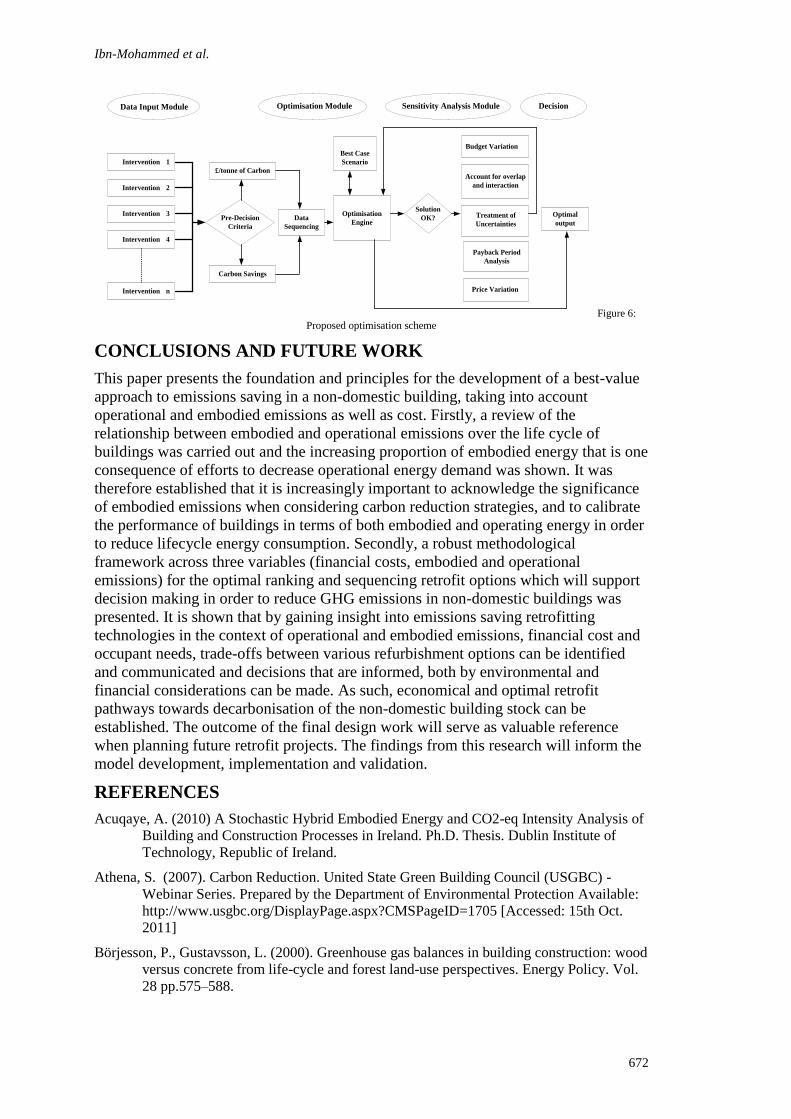
Ibn-Mohammed et al.
672
Intervention 1
Intervention 2
Intervention 3
Intervention 4
Intervention n
Pre-Decision
Criteria
£/tonne of Carbon
Carbon Savings
Optimisation
Engine
Solution
OK?
Budget VariationBest Case
Scenario
Account for overlap
and interaction
Treatment of
Uncertainties
Payback Period
Analysis
Data Input Module Optimisation Module Sensitivity Analysis Module Decision
Price Variation
Data
Sequencing
Optimal
output
Figure 6:
Proposed optimisation scheme
CONCLUSIONS AND FUTURE WORK
This paper presents the foundation and principles for the development of a best-value
approach to emissions saving in a non-domestic building, taking into account
operational and embodied emissions as well as cost. Firstly, a review of the
relationship between embodied and operational emissions over the life cycle of
buildings was carried out and the increasing proportion of embodied energy that is one
consequence of efforts to decrease operational energy demand was shown. It was
therefore established that it is increasingly important to acknowledge the significance
of embodied emissions when considering carbon reduction strategies, and to calibrate
the performance of buildings in terms of both embodied and operating energy in order
to reduce lifecycle energy consumption. Secondly, a robust methodological
framework across three variables (financial costs, embodied and operational
emissions) for the optimal ranking and sequencing retrofit options which will support
decision making in order to reduce GHG emissions in non-domestic buildings was
presented. It is shown that by gaining insight into emissions saving retrofitting
technologies in the context of operational and embodied emissions, financial cost and
occupant needs, trade-offs between various refurbishment options can be identified
and communicated and decisions that are informed, both by environmental and
financial considerations can be made. As such, economical and optimal retrofit
pathways towards decarbonisation of the non-domestic building stock can be
established. The outcome of the final design work will serve as valuable reference
when planning future retrofit projects. The findings from this research will inform the
model development, implementation and validation.
REFERENCES
Acuqaye, A. (2010) A Stochastic Hybrid Embodied Energy and CO2-eq Intensity Analysis of
Building and Construction Processes in Ireland. Ph.D. Thesis. Dublin Institute of
Technology, Republic of Ireland.
Athena, S. (2007). Carbon Reduction. United State Green Building Council (USGBC) -
Webinar Series. Prepared by the Department of Environmental Protection Available:
http://www.usgbc.org/DisplayPage.aspx?CMSPageID=1705 [Accessed: 15th Oct.
2011]
Börjesson, P., Gustavsson, L. (2000). Greenhouse gas balances in building construction: wood
versus concrete from life-cycle and forest land-use perspectives. Energy Policy. Vol.
28 pp.575–588.

Emissions savings
673
BuildCarbonNeutral, (2007). United State Green Building Council (USGBC) - Webinar
Series. Available: http://www.usgbc.org/DisplayPage.aspx?CMSPageID=1705
[Accessed: 15th Oct. 2011]
Carbon Trust (2008). Low Carbon Refurbishment of Buildings- A guide to achieving carbon
savings from refurbishment of non-domestic buildings.
Carbon Trust (2009). Building the future, today: transforming the economic and carbon
performance of the buildings we work in
Chen, T.Y., Burnett, J., Chau, C.K. (2001). Analysis of embodied energy use in the residential
building of Hong Kong. Journal of Energy. Vol. 26, pp. 323-340
Cole, R and Kernan, PC (1996) Life Cycle Energy Use in Office Buildings; Building and
Environment, 31 (4), pp 307-317
Commonwealth Scientific and Industrial Research Organisation, CSIRO (2006) Sustainable
Built Environment: Embodied Energy, Available at: http://www.dbce.csiro.au/ind-
serv/brochures/embodied/embodied.htm
Crowther, P. (1999). Design for disassembly to recover embodied energy, in: The 16th
Annual Conference on Passive and Low Energy Architecture, Melbourne/
Brisbane/Cairns, Australia, 1999.
Department of Energy and Climate Change [DECC], (2009) Climate Change Act 2008:
Impact Assessment Available: http://www.decc.gov.uk [Accessed: 28th Sept. 2011]
Department of Trade and Industry [DTI] (2007) Meeting the Energy Challenge-A White
Paper on Energy. Available: http://www.dti.gov.uk/files/file39387.pdf Accessed:
[Accessed: 20th Sept. 2011]
Ding, G. (2004) The development of a multi-criteria approach for the measurement of
sustainable performance for built projects and facilities, Ph.D. Thesis, University of
technology, Sydney, Australia, 2004.
Dixit, M. K., Fernandez-Solis, J.L., Lavy, S. and Culp, C.H (2010). Identification of
parameters for embodied energy measurement- A literature review. Journal of Energy
and Buildings Vol. 42, Pages 1238-1247.
Eaton, K.J. and Amato, A. (2005). A comparative environmental lifecycle assessment of
modern office buildings. The Steel Construction Institute. ISBN 1 85942 0583
Energy Saving Trust (2010). Sustainable refurbishment: Towards an 80% reduction in CO2
emissions, water efficiency, waste reduction and climate change adaptation.
Engin, A. and Frances, Y. (2010). Zero Carbon Isn’t Really Zero: Why Embodied Carbon in
Materials Can’t Be Ignored Available: http://www.di.net/articles/archive/zero_carbon/
[Accessed: 27th Feb.2011]
Healey, J. (2009) “Zero Carbon Standards (New Buildings)”, written statement by the
Minister for Housing and Planning, 24 November 2009. Available at:
http://www.communities.gov.uk/statements/corporate/zerocarbonstandards
Hellingsworth, B., Best, R. and de Valence, G. (2002). Design and Construction: Building in
Value; Published by Elsevier Science Limited; ISBN: 0 7506 51490
Hinnells, M. (2008). Technologies to achieve demand reduction and microgeneration in
buildings. Energy Policy. Vol 36. pp. 4427–4433
HM Government, (2010). Innovation and Growth Team. Low Carbon Construction-Final
Report. Available: http://www.bis.gov.uk/assets/biscore/business-sectors/docs/l/10-
1266-low-carbon-construction-igt-final-report.pdf [Accessed: 25th Oct. 2011]
Ibn-Mohammed et al.
674
Hubermanand, N and Pearlmutter, D (2008) A life-cycle energy analysis of building materials
in the Negev desert; Energy and Buildings; 40(5), pp 837-848
Hulme, M., Jenkins, G. J., Lu, X., Turnpenny, J. R., Mitchell, T. D., Jones, R. G., Lowe, J.,
Murphy, J. M., Hassell, D., Boorman, P., McDonald, R. and Hill, S. (2002). Climate
Change Scenarios for the United Kingdom: The UKCIP02 Scientific Report. Tyndall
Centre for Climate Change Research, School of Environmental Sciences, University
of East Anglia, Norwich, UK.
IEA (International Energy Agency), 2006a. Energy Technology Perspectives. OECD/IEA,
Paris.
Intergovernmental Panel on Climate Change (IPCC) (2007a) Climate Change 2007: The
Physical Science Basis. Contribution of Working Group I to the Fourth Assessment
Report of the Intergovernmental Panel on Climate Change, 2007, Cambridge:
Cambridge University Press. Available: http://www.ipcc.ch/pdf/assessment-
report/ar4/wg1/ar4-wg1-spm.pdf [Accessed 20th Sept. 2011]
Intergovernmental Panel on Climate Change (IPCC) (2007d) Climate Change 2007:
Mitigation of Climate Change. Contribution of Working Group III to the Fourth
Assessment Report of the Intergovernmental Panel on Climate Change, 2007,
Cambridge: Cambridge University Press. http://www.ipcc.ch/pdf/assessment-
report/ar4/wg1/ar4-wg1-spm.pdf [Accessed 20th Sept. 2011]
International Energy Agency [IEA] (2006) World Energy Outlook Available:
www.iea.org/textbase/nppdf/free/2006/weo2006.pdf [Accessed: 26th Sept. 2011]
International Energy Agency [IEA] (2009) World Energy Consumption by Sector Available:
http://www.iea.org/stats/index.asp [Accessed: 26th Sept. 2011]
Jowsey, E. and J. Grant (2009) Greening the Existing Housing Stock, Faculty of Development
and Society, Sheffield Hallam University. Available at:
http://www.prres.net/papers/Jowsey_Greening_The_Existing_Housing_Stock.pdf
Kolokotsa, D., Diakaki, C., Grigoroudis, E., Stavrakakis, G. and Kalaitzakis, K. (2009).
Decision support methodologies on the energy efficiency and energy management in
buildings. Advances in Building Energy Research Vol.3 pp.121-146 ISSN: 1751-2549
(Online) Available: www.earthscanjournals.com [Accessed: 15th Jan.2012]
Langston, Y.L. and Langston C.A. (2008). Reliability of building embodied energy
modelling: an analysis of 30 Melbourne case studies, Construction Management and
Economics 26 (2) 147–160.
Lazarus, N. (2005) “Potential for reducing the environmental impact of construction
materials”, commissioned by Bioregional Development Group, January 2005.
Available:
http://www.bioregional.com/files/publications/ZsquaredImpactMaterials_Jan05.pdf
Lee, M.B and White G. (2008). Embodied Energy LCA Assessment of replacement options
for windows and traditional buildings Crichton Carbon Centre. Available:
http://www.historicscotland.gov.uk/gary_white_carbon_footprint_of_traditional_buil
dings_and_materials.pdf [Accessed: 27th Feb.2011]
Liang, J., Li, B., Wu, Y., Yao, R. (2007). An investigation of the existing situation and trends
in building energy efficiency management in China. Energy and Buildings. Vol.39
pp.1098–1106
Miller, A.J. (2001).Embodied energy—a lifecycle of transportation energy embodied in
construction materials, in: COBRA 2001, Conference Papers, RICS Foundation,
2001.
Emissions savings
675
Milne, G. and Reardon, C. (2005) Embodied Energy and Material Use. Australia's guide to
environmentally sustainable homes, pp. 136-139, Available:
http://www.yourhome.gov.au/technical/pubs/fs52.pdf [Accessed: 18th June. 2011]
Munich RE (2011). World Environment- msnbc.com. Available:
http://www.msnbc.msn.com/id/43727793/ns/world_news-
world_environment/t/already-costliest-year-natural-disasters/#.Tq2xqXLvRVU
[Accessed: 3rd Nov. 2011]
Nassen, J., Holmberg, J., Wadeskog, A. Nyman, M. (2007). Direct and indirect energy use
and carbon emissions in the production phase of buildings: an input output analysis,
Energy 32 (9) (2007) 1593–1602.
Pérez-Lombard, L., Ortiz, J., Pout, C. (2008). A review on buildings energy consumption
information. Energy and Buildings. Vol. 40 pp. 394–398
Pullen, S. F. (2000). Energy used in the construction and operation of houses. Architectural
Science Review; 43(2), pp87-94
Ramesh, T., Prakash, R. and Shukla, K.K. (2010), Life cycle energy analysis of buildings: an
overview, Energy and Buildings, Vol. 42, No. 10, pp.1592–1600.
Reddy, B.V.V and Jagadish, K.S. (2003) Embodied energy of common and alternative
building materials and technologies; Energy and Buildings, 35(2), pp 129-137
Sartori, I. and Hestnes, A.G. (2007). Energy use in the life cycle of conventional and low
energy buildings: a review article, Energy and Building 39 (3) 249–257.
Smith, BP. (2008). Whole Life Carbon Footprinting. The Structural Engineer, 18th March
2008. Vol. 86, No. 6, pp.15–16. Available:
http://www.istructe.org/thestructuralengineer/archiveissue.asp?VID=86&IID=6 [Accessed:
1st Dec. 2011]
Sodagar, B., Fieldson, R. and Gilroy-Scott, B. (2008). Design for Sustainable Architecture
and Environments. The international journal of environmental, cultural, economic and
social sustainability. Vol. 4, No. 4, pp.73–84. ISSN 1832-2077. Available:
http://eprints.lincoln.ac.uk/3873/1/DesignforSustainableArchitectureandEnvironments
.pdf [Accessed: 9th Dec. 2011]
Treloar, G., Fay, R., Ilozor, B., and Love, P. (2001) Building materials selection: greenhouse
strategies for built facilities, Facilities 19 (3/4) 139–149.
UNEP (United Nations Environmental Programme), 2007. Buildings and Climate Change:
Status, Challenges, and Opportunities. UNEP.
United Nations Environmental Programme-Sustainable Buildings and Climate Initiative,
[UNEP-SBCI] (2008) Protocol for Measuring Energy Use and Reporting Greenhouse
Gas Emissions from Building Operations
United States Green Building Council, [USGBC] (2009). The LEED reference Guide for
Green Building Design and Construction for the Design, Construction and Major
Renovations of Commercial and Institutional Building
Webster, M.D. (2004) Relevance of Structural Engineers to Sustainable Design of Buildings.
Journal of Structural Engineering International. Vol. 14, No. 3, 1 August 2004. , pp.
181-185(5)
Yang, J.,Brandon, P.S; Sidwell, T and Sidwell, AC (2005) Smart and Sustainable Built
Environment; Blackwell Publishing; ISBN: 10: 1-4051-2422-9
Yohanis, Y. G., and Norton, B.(2002) Life-cycle operational and embodied energy for a
generic single-storey office building in the UK Journal of Energy Vol. 27 Pages 77-
92.

Idiake, J E and Bala, K (2012) Improving Labour Productivity in Masonry Work in Nigeria: The
Application of Lean Management Techniques In: Laryea, S., Agyepong, S.A., Leiringer, R. and
Hughes, W. (Eds) Procs 4th West Africa Built Environment Research (WABER) Conference, 24-26 July
2012, Abuja, Nigeria, 677-686.
677
IMPROVING LABOUR PRODUCTIVITY IN MASONRY
WORK IN NIGERIA: THE APPLICATION OF LEAN
MANAGEMENT TECHNIQUES
John Ebhohimen Idiake1 and Kabir Bala
2
Department of Building, Faculty of Environmental Design Ahmadu Bello University, Zaria Kaduna
State, Nigeria
The performance of local contracting firms is very important to any nation’s
economic growth. This performance is hitched on the firms’ construction efficiency
which can be improved by increasing productivity. Therefore this paper examines the
analysis of labour output for masonry work in the construction of six bungalow
buildings in Abuja metropolis. The objective was to determine the level of labour
productivity of contractors handling the construction of bungalow buildings and to
identify gaps in levels of productivity and reasons for the differentials. The
computation of the performance indexes that is Project Waste index (PWI),
Performance ratio and disruption Index (DI), it was learnt that about 50% of the
projects studied were poorly managed. The projects had low productivity rating. The
other 50% performed well. The PWI values computed for the project studied ranged
from 0.0106 to 0.1940. It was observed that three of the projects had PWI values
lower than 0.1 which is an indication of good performance and three had values
greater than 0.1. Three of the projects had Performance ratio (PR) value of 1.1389,
1.1689 and 1.9662 which showed poor performance. It was observed that low outputs
were accomplished with high labour inputs. Other factors found out by direct
observation for the non performing projects were distance of materials from work
stations, system of daily payment method without adequate supervision and shortages
of materials on site. It was recommended that the site managers of each of the non
performing projects should learn reasons for gaps and make necessary adjustments in
order to improve performance by raising labour productivity. It was also
recommended that the lean benchmarking task should not be once for all exercise
among the firms investigated but should be a continuous practice until the best
practice height is attained.
Keywords: indigenous firms, labour, management, performance, productivity, project
INTRODUCTION
In Nigeria, building construction firms are usually categorized by several criteria.
The classifications are mostly done on the scope of operation, ownership and
management control. Idoro 2007 cited in Idoro 2010, defines “indigenous contractors
as those contractors that are fully owned and managed by Nigerians, while the
expatriate contractors in order words referred to as foreign contractors are mainly
Idiake and Bala
678
private firms that are jointly owned by Nigerians and foreigners but solely managed
by expatriates”.
The indigenous ones need careful attention and development because of the
contribution of this sector to social and
economic development in the nation especially in the areas of job formation,
‘entrepreneurship’, wealth dispersal, financial effectiveness in deployment of
resources, elasticity to market demands, distribution of development, “economic and
political independence, and innovation” (Olugboyega 1998).
Olugboyega 1995, Enshassi et’al 2007 and Idoro, 2010, identified the preference of
foreign contractors to their indigenous counterparts in the awards and execution of
contracts. This is borne out of the fact that the later lack managerial exposure, are
deficient in planning and management skills and exhibit low productivity. Other
reasons for preference include problems of poor financial management, storage and
retrieval of empirical data for the purposes of planning capital, labour and material
resources.
Kerzner 1998; Bolles 2002; Dai and Wells, 2004, observed that inconsistent modern
project management practices can influence a company’s competitive position in the
market place. They added that organsations failing to adopt consistent production
management methods such as lean (benchmarking) principles regularly lose market
share to peer companies that have institutionalised modern management techniques.
They further pointed out that firms or organisations that delay in adopting formalized
practices suffer specific consequences, including failure to learn from shared
experiences, late and over budget projects, and low labour productivity.
Andersen and Petterson (1995) had earlier suggested the application of benchmarking
technique to accelerate change in attitude and behaviour in an organisation. In view of
the fact that it is a mechanism for “improvement and change”, it will further help an
organisation to search for industry best practices that will bring about superior
performance by examining the performance and practices of other firms. There is the
problem of lack of existing benchmarks for the local construction industry resulting in
low productivity. There is also the problem of unwillingness of the local firms to
embrace change mechanism perhaps because of the contractor’s operating
environment (Ofori, 1991). Therefore to complement previous government efforts to
promote and develop indigenous contractors (Ofori, 1991; Olugboyega 1995 and
Olugboyega 1998) there is the need to develop labour productivity benchmarks for
indigenous firms in Nigeria, if not nationally but within a benchmarking club of firms.
BENCHMARKING
Benchmarking originated in the manufacturing industry as systematically and
continuously measuring and comparing the firm’s business and management
processes against best practice in the same field (Harris and McCaffer, 2001).
Benchmarking has been identified as one of the principles of lean construction
(Osman and Abdel Razek 1996). Benchmarking therefore can be defined as a
systematic and continuous measurement process; a process of continuously measuring
and comparing the output of one organisation to the output of another organisation
anywhere in the world to acquire information which will assist the organisation to
improve its operation or productivity (Koskela 1992; Madigan 1997). In another
words, benchmarking is said to be the continuous process of measuring products,
services and practices against the toughest competitors or those recognized as industry
Labour Productivity
679
leaders (Camp 1989). From this definition, benchmarking measurement can be applied
to products, production, process, services (labour) and practices. “The term
benchmarking involves measurement which can be achieved by comparing internal
and external practices and recording the significant differences to highlight the best
practices that must be executed to realize superiority” (Straker 2006).
THE SIGNIFICANCE OF BENCHMARKING
Benchmarking accelerates the need for change in attitude and behaviour in an org
organisation where it is practiced. It is a mechanism for “improvement and change”.
Benchmarking helps an organisation to search for industry best practices that will
bring about superior performance by examining the performance and practices of
other firms (Andersen and Petterson 1995).
For benchmarking to be successful there must be the need for available data for
effective comparison and setting of a baseline. It also requires the provision of
realistic and achievable targets coupled with the appropriate handling of the
challenges of operational complacency. The exercise allows for the identification of
areas of weakness and indicates what needs to be done to improve. It identifies
potential areas of growth, raise attentiveness to performance and create a greater
openness about strengths and weakness. Furthermore, it allows the operatives to
visualize the improvement as a strong motivator for change. It can also help create an
atmosphere conducive for continuous improvement and changes, and creates a sense
of urgency from improvement (Amanda et al., 2011).
Determination of Project Benchmarking Attributes
(i) Project Characteristics
Thomas et al (2002) and Thomas and Zavrski (1999b), explain the project
characteristics as follows.
Total Work hours: Total Work hours are the summation of daily work hours in each
project.
Total Quantities: Total quantities are the summation of daily quantities in each
project.
Cumulative Productivity (wh/m2): Total work hours (wh) over Total quantities (m
2
).
Baseline Productivity: The baseline productivity is the best implementation a
contractor can achieve for a particular project in other words is the best and most
consistent productivity that the contractor achieved on a project.
Number of Abnormal Workdays: - According to Thomas and Zavrski, (1999b) the
indiscriminate changeability in daily productivity figures when there are no
disruptions is about twice the baseline productivity. Figures exceeding this boundary
are usually the effect of transferable causes that is disruptions. An important measure
of performance is the number of abnormal or disrupted days.
(ii) Project performance parameters (benchmarks)
Disruption Index: The first measure of labour performance (benchmarks) is the
disruption index (D1). It is the ratio of the number of disruption workdays divided by
the total number of observed workdays (Thomas and Zavrski 1996; Enshassi et al.,
2007).
Idiake and Bala
680
Performance Ratio (PR): The performance ratio (PR) is the actual cumulative
productivity divided by the expected baseline productivity (average values of baseline
of all projects) Abdel – Razek et al., 2007).
Project Management Index (PMI): The project management index sometime
referred to as project waste index (PWI) is a dimensionless parameter that reflects the
influence that project management has on the cumulative labour operations. It is
expressed as the ratio of the difference between the cumulative productivity and
baseline productivity over expected baseline productivity (Thomas and Zavrski 1999a,
b). According to Abdel – Razek et al 2007, the baseline productivity occurs when the
materials, equipment, and information flows are good and planning is adequate. As
PMI is a measure of the difference between the actual and baseline productivity, it
provides a measure of the impact of poor material, equipment and information flows,
and inadequate planning. This makes it a measure of waste, which is one of the issues
being addressed by lean construction. Reduced waste can lead to better flow and
productivity. The lower the PMI value the better is the project management’s
influence on overall operation (Thomas and Zavrski 1999b). Mathematically, the PMI
eliminates the productivity influence of complex design.
RESEARCH METHOD
Direct Activity Observation
The direct activity observation method was used in gathering data for the research
work.
Six project sites were investigated in this work. All the sites sampled were located in
Kado district area of Abuja which is one of the fastest developing areas in Abuja in
terms of housing and infrastructure. It is an area recently approved by Federal Capital
Development Authority (FCDA) for development. The data collected were gathered
by observing work activity on site with the support of research assistants. Work done
by every operative was noted on the daily recording sheets including times spent on
the activities. This daily data collection form allowed for recording the direct work of
the bricklayers, time for accomplishing such task, the number of crew involved
whether skilled worker or unskilled worker. The data gathering form allowed the
observers or research assistants to monitor and note critical factors of productivity
affecting work men on site.
At the end of the masonry operation that is block laying, which varied from one site to
the other, the daily data gathering forms were retrieved from the observers by the
researcher for onward extraction of the daily input and output quantities. These values
were entered into the data collation sheet, from which the daily labour productivities,
baseline days and abnormal days were computed.
Assumptions
(1) All other factors of labour productivity are captured in the critical factors,
which are stated in the instrument, identified in literature.
(2) The performance indicators used for assessing the projects were mainly project
waste index, performance ratio and disruptive index.
Table 4.1, shows the days of observations, the gang size, work hours, daily quantity,
daily labour productivity, baseline days and abnormal days. The total crew size was
81 workers and total work hours amounted to 559 hours. The figure for the total
quantities (474m2) was found to be lower than the total work hours. The project
attributes were computed using the equations and steps described above in section 2.3.
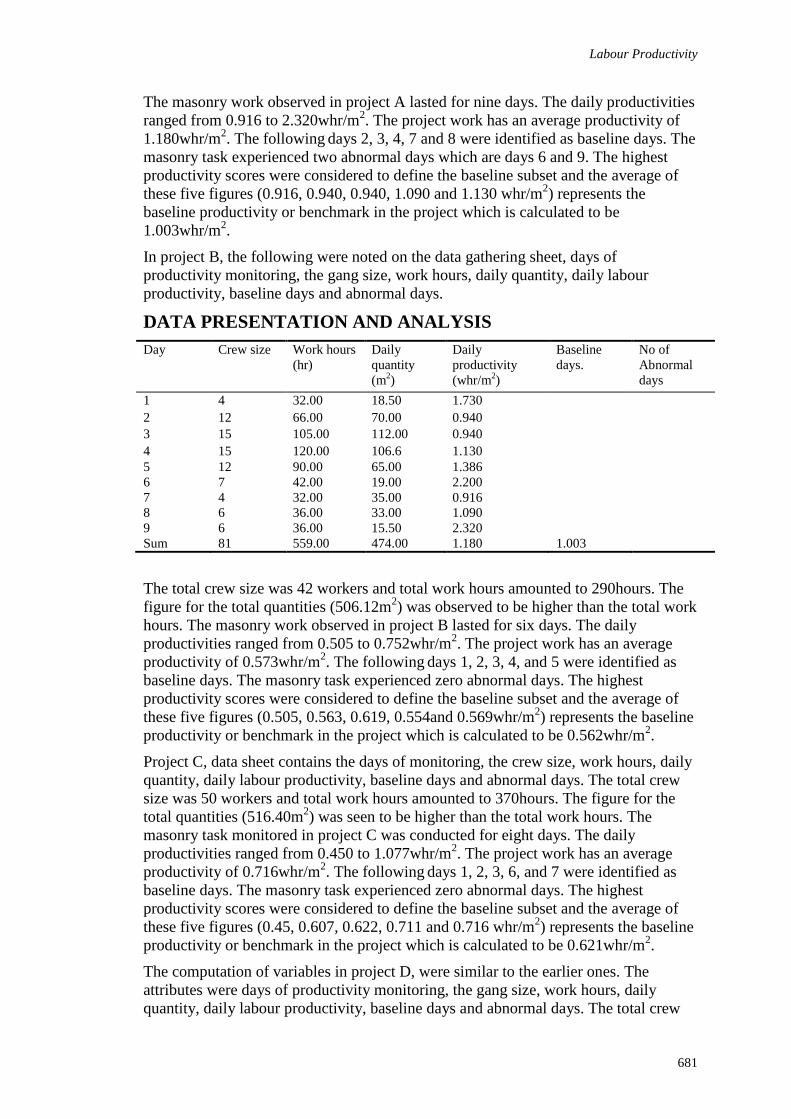
Labour Productivity
681
The masonry work observed in project A lasted for nine days. The daily productivities
ranged from 0.916 to 2.320whr/m2. The project work has an average productivity of
1.180whr/m2. The following
days 2, 3, 4, 7 and 8 were identified as baseline days. The
masonry task experienced two abnormal days which are days 6 and 9. The highest
productivity scores were considered to define the baseline subset and the average of
these five figures (0.916, 0.940, 0.940, 1.090 and 1.130 whr/m2) represents the
baseline productivity or benchmark in the project which is calculated to be
1.003whr/m2.
In project B, the following were noted on the data gathering sheet, days of
productivity monitoring, the gang size, work hours, daily quantity, daily labour
productivity, baseline days and abnormal days.
DATA PRESENTATION AND ANALYSIS
Day Crew size Work hours
(hr)
Daily
quantity
(m2)
Daily
productivity
(whr/m2)
Baseline
days.
No of
Abnormal
days
1 4 32.00 18.50 1.730
2 12 66.00 70.00 0.940
3 15 105.00 112.00 0.940
4 15 120.00 106.6 1.130
5 12 90.00 65.00 1.386
6 7 42.00 19.00 2.200
7 4 32.00 35.00 0.916
8 6 36.00 33.00 1.090
9 6 36.00 15.50 2.320
Sum 81 559.00 474.00 1.180 1.003
The total crew size was 42 workers and total work hours amounted to 290hours. The
figure for the total quantities (506.12m2) was observed to be higher than the total work
hours. The masonry work observed in project B lasted for six days. The daily
productivities ranged from 0.505 to 0.752whr/m2. The project work has an average
productivity of 0.573whr/m2. The following
days 1, 2, 3, 4, and 5 were identified as
baseline days. The masonry task experienced zero abnormal days. The highest
productivity scores were considered to define the baseline subset and the average of
these five figures (0.505, 0.563, 0.619, 0.554and 0.569whr/m2) represents the baseline
productivity or benchmark in the project which is calculated to be 0.562whr/m2.
Project C, data sheet contains the days of monitoring, the crew size, work hours, daily
quantity, daily labour productivity, baseline days and abnormal days. The total crew
size was 50 workers and total work hours amounted to 370hours. The figure for the
total quantities (516.40m2) was seen to be higher than the total work hours. The
masonry task monitored in project C was conducted for eight days. The daily
productivities ranged from 0.450 to 1.077whr/m2. The project work has an average
productivity of 0.716whr/m2. The following
days 1, 2, 3, 6, and 7 were identified as
baseline days. The masonry task experienced zero abnormal days. The highest
productivity scores were considered to define the baseline subset and the average of
these five figures (0.45, 0.607, 0.622, 0.711 and 0.716 whr/m2) represents the baseline
productivity or benchmark in the project which is calculated to be 0.621whr/m2.
The computation of variables in project D, were similar to the earlier ones. The
attributes were days of productivity monitoring, the gang size, work hours, daily
quantity, daily labour productivity, baseline days and abnormal days. The total crew
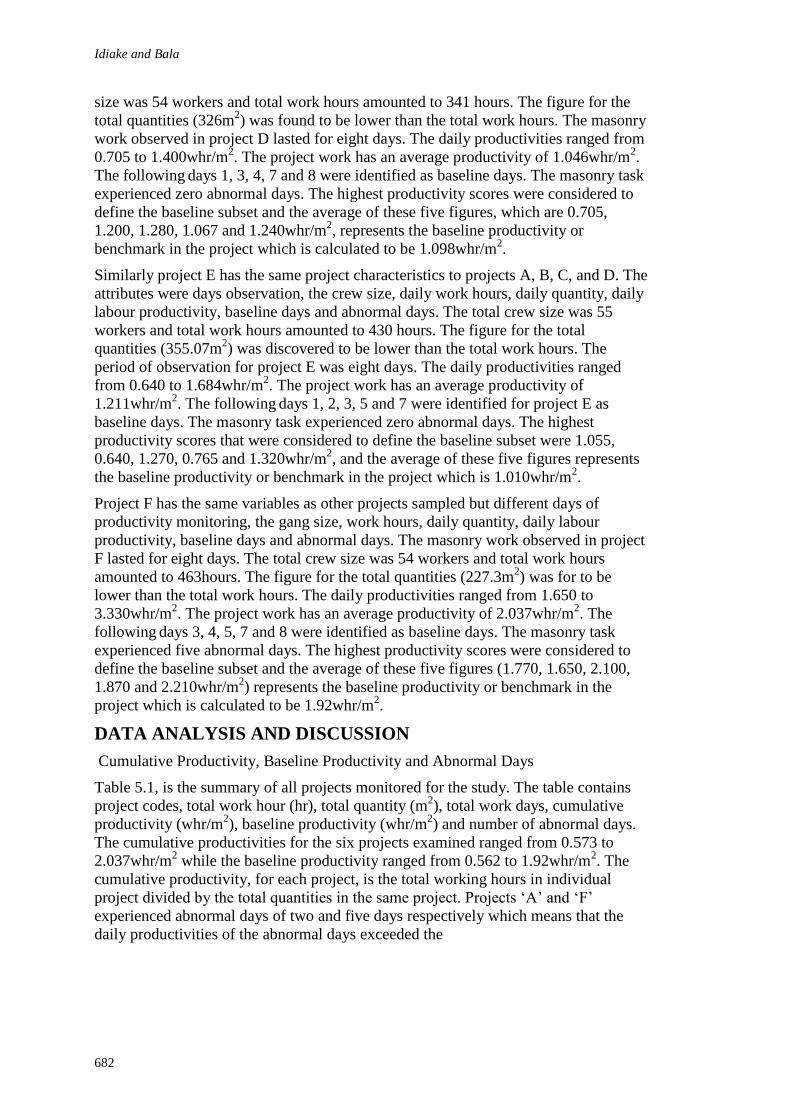
Idiake and Bala
682
size was 54 workers and total work hours amounted to 341 hours. The figure for the
total quantities (326m2) was found to be lower than the total work hours. The masonry
work observed in project D lasted for eight days. The daily productivities ranged from
0.705 to 1.400whr/m2. The project work has an average productivity of 1.046whr/m
2.
The following days 1, 3, 4, 7 and 8 were identified as baseline days. The masonry task
experienced zero abnormal days. The highest productivity scores were considered to
define the baseline subset and the average of these five figures, which are 0.705,
1.200, 1.280, 1.067 and 1.240whr/m2, represents the baseline productivity or
benchmark in the project which is calculated to be 1.098whr/m2.
Similarly project E has the same project characteristics to projects A, B, C, and D. The
attributes were days observation, the crew size, daily work hours, daily quantity, daily
labour productivity, baseline days and abnormal days. The total crew size was 55
workers and total work hours amounted to 430 hours. The figure for the total
quantities (355.07m2) was discovered to be lower than the total work hours. The
period of observation for project E was eight days. The daily productivities ranged
from 0.640 to 1.684whr/m2. The project work has an average productivity of
1.211whr/m2. The following
days 1, 2, 3, 5 and 7 were identified for project E as
baseline days. The masonry task experienced zero abnormal days. The highest
productivity scores that were considered to define the baseline subset were 1.055,
0.640, 1.270, 0.765 and 1.320whr/m2, and the average of these five figures represents
the baseline productivity or benchmark in the project which is 1.010whr/m2.
Project F has the same variables as other projects sampled but different days of
productivity monitoring, the gang size, work hours, daily quantity, daily labour
productivity, baseline days and abnormal days. The masonry work observed in project
F lasted for eight days. The total crew size was 54 workers and total work hours
amounted to 463hours. The figure for the total quantities (227.3m2) was for to be
lower than the total work hours. The daily productivities ranged from 1.650 to
3.330whr/m2. The project work has an average productivity of 2.037whr/m
2. The
following days 3, 4, 5, 7 and 8 were identified as baseline days. The masonry task
experienced five abnormal days. The highest productivity scores were considered to
define the baseline subset and the average of these five figures (1.770, 1.650, 2.100,
1.870 and 2.210whr/m2) represents the baseline productivity or benchmark in the
project which is calculated to be 1.92whr/m2.
DATA ANALYSIS AND DISCUSSION
Cumulative Productivity, Baseline Productivity and Abnormal Days
Table 5.1, is the summary of all projects monitored for the study. The table contains
project codes, total work hour (hr), total quantity (m2), total work days, cumulative
productivity (whr/m2), baseline productivity (whr/m
2) and number of abnormal days.
The cumulative productivities for the six projects examined ranged from 0.573 to
2.037whr/m2 while the baseline productivity ranged from 0.562 to 1.92whr/m
2. The
cumulative productivity, for each project, is the total working hours in individual
project divided by the total quantities in the same project. Projects ‘A’ and ‘F’
experienced abnormal days of two and five days respectively which means that the
daily productivities of the abnormal days exceeded the
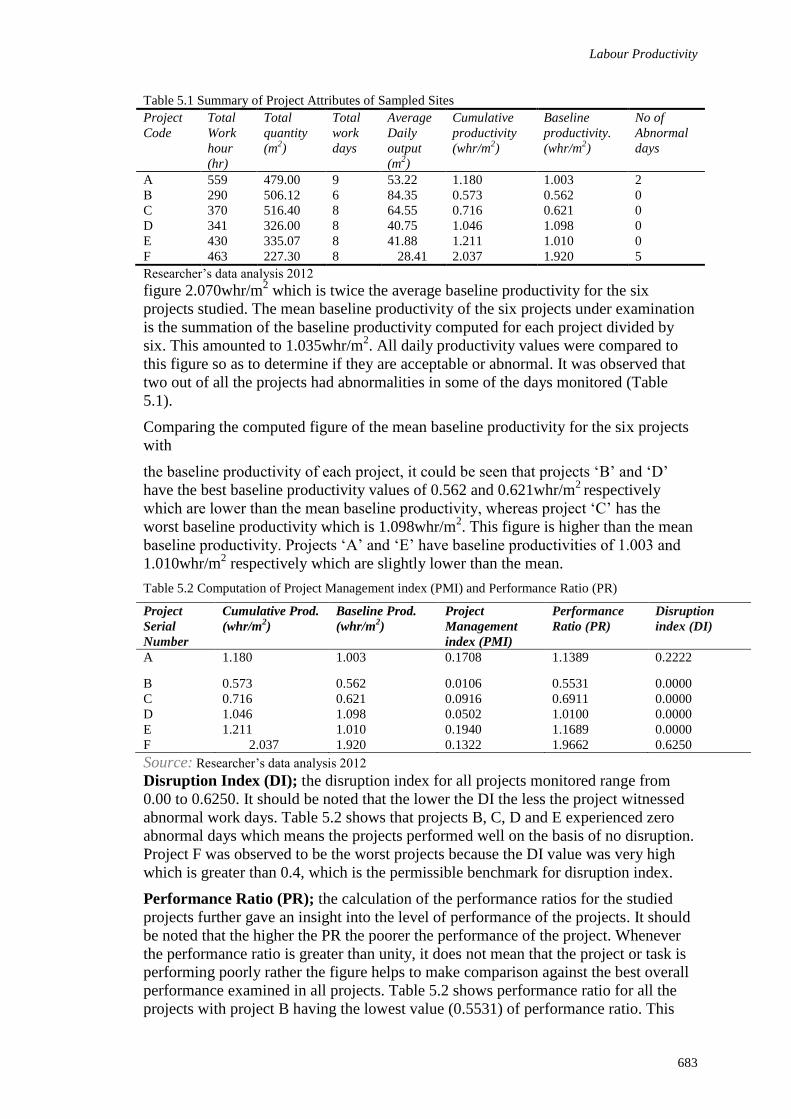
Labour Productivity
683
Table 5.1 Summary of Project Attributes of Sampled Sites
Project
Code
Total
Work
hour
(hr)
Total
quantity
(m2)
Total
work
days
Average
Daily
output
(m2)
Cumulative
productivity
(whr/m2)
Baseline
productivity.
(whr/m2)
No of
Abnormal
days
A 559 479.00 9 53.22 1.180 1.003 2
B 290 506.12 6 84.35 0.573 0.562 0
C 370 516.40 8 64.55 0.716 0.621 0
D 341 326.00 8 40.75 1.046 1.098 0
E
F
430
463
335.07
227.30
8
8
41.88
28.41
1.211
2.037
1.010
1.920
0
5
Researcher’s data analysis 2012
figure 2.070whr/m2 which is twice the average baseline productivity for the six
projects studied. The mean baseline productivity of the six projects under examination
is the summation of the baseline productivity computed for each project divided by
six. This amounted to 1.035whr/m2. All daily productivity values were compared to
this figure so as to determine if they are acceptable or abnormal. It was observed that
two out of all the projects had abnormalities in some of the days monitored (Table
5.1).
Comparing the computed figure of the mean baseline productivity for the six projects
with
the baseline productivity of each project, it could be seen that projects ‘B’ and ‘D’
have the best baseline productivity values of 0.562 and 0.621whr/m2
respectively
which are lower than the mean baseline productivity, whereas project ‘C’ has the
worst baseline productivity which is 1.098whr/m2. This figure is higher than the mean
baseline productivity. Projects ‘A’ and ‘E’ have baseline productivities of 1.003 and
1.010whr/m2 respectively which are slightly lower than the mean.
Table 5.2 Computation of Project Management index (PMI) and Performance Ratio (PR)
Source: Researcher’s data analysis 2012
Disruption Index (DI); the disruption index for all projects monitored range from
0.00 to 0.6250. It should be noted that the lower the DI the less the project witnessed
abnormal work days. Table 5.2 shows that projects B, C, D and E experienced zero
abnormal days which means the projects performed well on the basis of no disruption.
Project F was observed to be the worst projects because the DI value was very high
which is greater than 0.4, which is the permissible benchmark for disruption index.
Performance Ratio (PR); the calculation of the performance ratios for the studied
projects further gave an insight into the level of performance of the projects. It should
be noted that the higher the PR the poorer the performance of the project. Whenever
the performance ratio is greater than unity, it does not mean that the project or task is
performing poorly rather the figure helps to make comparison against the best overall
performance examined in all projects. Table 5.2 shows performance ratio for all the
projects with project B having the lowest value (0.5531) of performance ratio. This
Project
Serial
Number
Cumulative Prod.
(whr/m2)
Baseline Prod.
(whr/m2)
Project
Management
index (PMI)
Performance
Ratio (PR)
Disruption
index (DI)
A 1.180 1.003 0.1708 1.1389 0.2222
B 0.573 0.562 0.0106 0.5531 0.0000
C 0.716 0.621 0.0916 0.6911 0.0000
D 1.046 1.098 0.0502 1.0100 0.0000
E 1.211 1.010 0.1940 1.1689 0.0000
F 2.037 1.920 0.1322 1.9662 0.6250
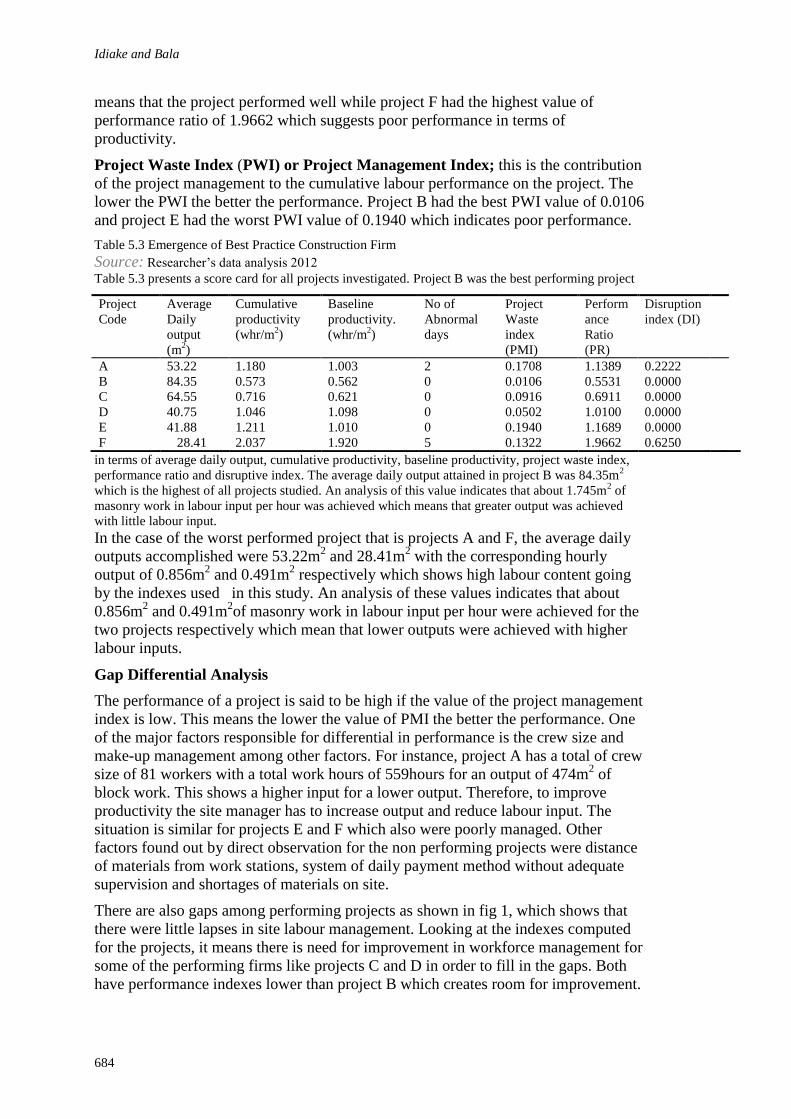
Idiake and Bala
684
means that the project performed well while project F had the highest value of
performance ratio of 1.9662 which suggests poor performance in terms of
productivity.
Project Waste Index (PWI) or Project Management Index; this is the contribution
of the project management to the cumulative labour performance on the project. The
lower the PWI the better the performance. Project B had the best PWI value of 0.0106
and project E had the worst PWI value of 0.1940 which indicates poor performance.
Table 5.3 Emergence of Best Practice Construction Firm Source: Researcher’s data analysis 2012
Table 5.3 presents a score card for all projects investigated. Project B was the best performing project
in terms of average daily output, cumulative productivity, baseline productivity, project waste index,
performance ratio and disruptive index. The average daily output attained in project B was 84.35m2
which is the highest of all projects studied. An analysis of this value indicates that about 1.745m2 of
masonry work in labour input per hour was achieved which means that greater output was achieved
with little labour input.
In the case of the worst performed project that is projects A and F, the average daily
outputs accomplished were 53.22m2 and 28.41m
2 with the corresponding hourly
output of 0.856m2 and 0.491m
2 respectively which shows high labour content going
by the indexes used in this study. An analysis of these values indicates that about
0.856m2 and 0.491m
2of masonry work in labour input per hour were achieved for the
two projects respectively which mean that lower outputs were achieved with higher
labour inputs.
Gap Differential Analysis
The performance of a project is said to be high if the value of the project management
index is low. This means the lower the value of PMI the better the performance. One
of the major factors responsible for differential in performance is the crew size and
make-up management among other factors. For instance, project A has a total of crew
size of 81 workers with a total work hours of 559hours for an output of 474m2 of
block work. This shows a higher input for a lower output. Therefore, to improve
productivity the site manager has to increase output and reduce labour input. The
situation is similar for projects E and F which also were poorly managed. Other
factors found out by direct observation for the non performing projects were distance
of materials from work stations, system of daily payment method without adequate
supervision and shortages of materials on site.
There are also gaps among performing projects as shown in fig 1, which shows that
there were little lapses in site labour management. Looking at the indexes computed
for the projects, it means there is need for improvement in workforce management for
some of the performing firms like projects C and D in order to fill in the gaps. Both
have performance indexes lower than project B which creates room for improvement.
Project
Code
Average
Daily
output
(m2)
Cumulative
productivity
(whr/m2)
Baseline
productivity.
(whr/m2)
No of
Abnormal
days
Project
Waste
index
(PMI)
Perform
ance
Ratio
(PR)
Disruption
index (DI)
A 53.22 1.180 1.003 2 0.1708 1.1389 0.2222
B 84.35 0.573 0.562 0 0.0106 0.5531 0.0000
C 64.55 0.716 0.621 0 0.0916 0.6911 0.0000
D 40.75 1.046 1.098 0 0.0502 1.0100 0.0000
E
F
41.88
28.41
1.211
2.037
1.010
1.920
0
5
0.1940
0.1322
1.1689
1.9662
0.0000
0.6250
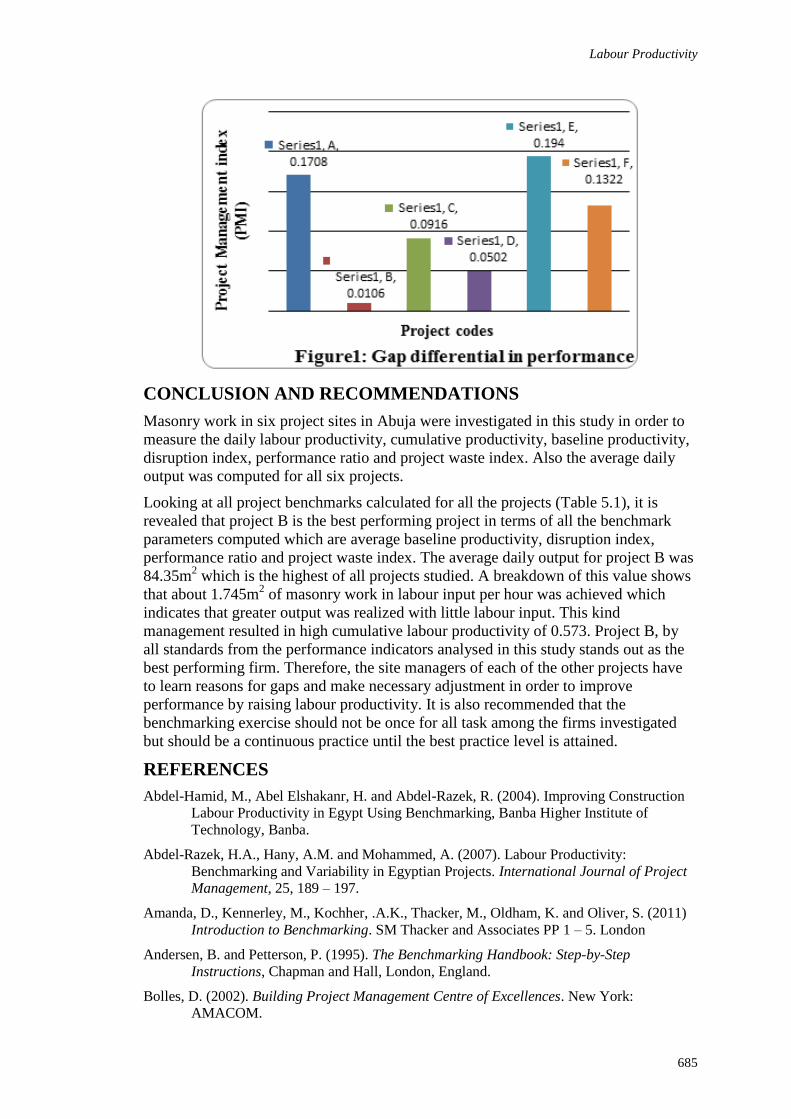
Labour Productivity
685
CONCLUSION AND RECOMMENDATIONS
Masonry work in six project sites in Abuja were investigated in this study in order to
measure the daily labour productivity, cumulative productivity, baseline productivity,
disruption index, performance ratio and project waste index. Also the average daily
output was computed for all six projects.
Looking at all project benchmarks calculated for all the projects (Table 5.1), it is
revealed that project B is the best performing project in terms of all the benchmark
parameters computed which are average baseline productivity, disruption index,
performance ratio and project waste index. The average daily output for project B was
84.35m2 which is the highest of all projects studied. A breakdown of this value shows
that about 1.745m2 of masonry work in labour input per hour was achieved which
indicates that greater output was realized with little labour input. This kind
management resulted in high cumulative labour productivity of 0.573. Project B, by
all standards from the performance indicators analysed in this study stands out as the
best performing firm. Therefore, the site managers of each of the other projects have
to learn reasons for gaps and make necessary adjustment in order to improve
performance by raising labour productivity. It is also recommended that the
benchmarking exercise should not be once for all task among the firms investigated
but should be a continuous practice until the best practice level is attained.
REFERENCES
Abdel-Hamid, M., Abel Elshakanr, H. and Abdel-Razek, R. (2004). Improving Construction
Labour Productivity in Egypt Using Benchmarking, Banba Higher Institute of
Technology, Banba.
Abdel-Razek, H.A., Hany, A.M. and Mohammed, A. (2007). Labour Productivity:
Benchmarking and Variability in Egyptian Projects. International Journal of Project
Management, 25, 189 – 197.
Amanda, D., Kennerley, M., Kochher, .A.K., Thacker, M., Oldham, K. and Oliver, S. (2011)
Introduction to Benchmarking. SM Thacker and Associates PP 1 – 5. London
Andersen, B. and Petterson, P. (1995). The Benchmarking Handbook: Step-by-Step
Instructions, Chapman and Hall, London, England.
Bolles, D. (2002). Building Project Management Centre of Excellences. New York:
AMACOM.
Idiake and Bala
686
Camp, R.C. (1989). Benchmarking; The Search for Industry Best Practices that Lead to
Superior Performance. ASQC Quality Press, Milwanke, Wisconsin
Dai, X.C and Wells, W.G., (2004). An Exploration of Project Management Office Features
and their Relationship to Project Performance. International Journal of Project
Management, 22(7), 523 – 532.
Enshassi, A., Mohammed, S., Mayer, P., and Abed, K. (2007). Bench marking Masonry
Labour Productivity, International Journal of Productivity and Performance
Management .Vol. 56(4) 358 – 368.
Harris, F. and McCaffer, R. (2001). Modern Construction Management. Oxford Blackwell.
Idoro, G. I. (2007). A Comparative Study of Direct Labour and Design-Tender-
Construct Procurement Systems in Nigeria. A PhD Thesis. Department of Building,
University of Lagos, Akoka, Lagos, Nigeria.
Idoro, G. I. (2010). Influence of quality performance on clients' patronage of indigenous and
expatriate construction contractors in Nigeria. Journal of Civil Engineering and
Management. Vol 16, No. 1, pp. 65-73
Kerzner, H. (1998). In Search of Excellence in Project Management: Successful Practices in
High Performances Organizations. New York: Van Nostrand Reinhold
Koskela, K. (1992). Application of the New Production Philosophy to Construction. CIFE
Tech. Rep. No 72, Center for integrated facility Engineering, Stanford Univ. Stanford,
LA., 4-50.
Madigan, D. (1997). Benchmark Method Version, 3, No. ACL/DLV/96/015, Agile
Construction Initiative, University of Bath.
Ofori, G. (1991). Programmes for Improving the Performance of Contracting Firms in
Developing Countries: A review of Approaches and Appropriate Options. Journal of
Management and Economics. Vol 9, pp. 19-38
Olugbeyega, A. A. (1995). Indigenous Contractors’ Perceptions of the Constraints on
Contractors’ Performance and Development Programmes Required in Nigeria.
Habitat Intl. Vol. 19, No. 4, pp. 599-613.
Olugbeyega, A. A. (1998). Indigenous Contractors’ Perceptions of the Importance of Topics
for Contractor Training in Nigeria. Habitat Intl. Vol. 22, No. 2, pp. 137-147.
Osman, I. and Abdel – Razek, R.H. (1996). Measuring for Competitiveness: The Role of
Benchmarking: Proceedings of the Cairo first international Conference on Concrete
Structures, Cairo Univ., Cairo, vol. 1 pp 5 – 12.
Straker, I.A. (2006). Airport Car Parking Strategy Lessons from the Non-Airport Sector A
Doctoral Thesis of Loughborough University
Thomas, H.R. and Zavrski, I. (1999a). Theoretical Model for International Benchmarking of
Labour Productivity. Tech. Rep. No. 9913, Pennsylvania Transportation Institute,
University Park, PA.
Thomas, H.R. and Zavrski, I. (1999 b). Construction Baseline Productivity: Theory and
Practice Journal of Construction Engineering and management. ASCE, Vol. 125, (5)
Thomas, H.R, Horman, M.J, Lemes de Souza, U.E, and Zavrski, I. (2002). Benchmarking of
Labour – Intensive Construction Activities: Lean construction and fundamental
principles of workforce management. Tech. Rep., Pennsylvania Transportation
Institute, University Park, PA.
Ijaola, I (2012) An analysis of contractors’ approaches to risk management practices in Lagos state,
Nigeria In: Laryea, S., Agyepong, S.A., Leiringer, R. and Hughes, W. (Eds) Procs 4th West Africa
Built Environment Research (WABER) Conference, 24-26 July 2012, Abuja, Nigeria, 687-695.
687
AN ANALYSIS OF CONTRACTORS’ APPROACHES TO
RISK MANAGEMENT PRACTICES IN LAGOS STATE,
NIGERIA
Irewolede Ijaola1
Department of Building Technology, Yaba College of Technology, Lagos, Nigeria
Emphases have not been placed on risks during construction in Nigeria and such risks
when not properly managed have contributed to unsuccessful project. This research
aimed at analyzing contractors approaches to risk management practices in Nigeria.
Questionnaire survey was used to elicit information from 60 contractors firms in
Lagos state. 39 questionnaires were returned representing response rate of 65%. Three
hypotheses were tested using Analysis of Variance (ANOVA). The result of the study
revealed that there are no differences in risk management approaches employed by
contractors firms in Nigeria. The paper also identified lack of knowledge on risk
management as the major problem in risk management practice. Providing training
and seminar on risk management will increase the awareness level of risk
management in Nigeria
Keywords: contractor, Nigeria, questionnaire, risk management, Lagos State
INTRODUCTION
Risks during construction of most projects are inevitable and different risk
management techniques are used to manage these risks. Most of the risks that occur
during construction project affect the cost, time and quality of work, which may result
in cost overruns, time overruns, low quality of work, disruptions and disputes. In some
cases, risks may lead to delay and abandonment of project.
The Nigerian construction industry experiences such, as project are frequently
characterized by cost overrun and time overrun which resulted in delay of project
(Aibinu and Jagboro, 2002). Yet few emphases are placed on risk management
practices in Nigeria.
This paper seeks to examine the approaches to risk management practices among
contractors in Nigeria. The contractors were grouped according to their years of
operation in Nigeria. This was meant to determine if their years of operation will
create differences in risk management practice and subsequently serve as a basis for
measuring their performance in terms of cost, time and quality.
The findings will assist project participant to know the approaches of risk
management among contractors in Nigeria, it will also expose them to the current
level of risk management practice and finally suggest ways of improving the current
practices in order to improve contractors’ performance.
Ijaola
688
LITERATURE REVIEW
Risk is a certain occurrence in human life and it occurs in day to day activities. It
occurs in construction because of the complex activities involved. According to
Odeyinka (2000), risk is inherent in all human endeavours; including construction
activities and the risk element involved are diverse and varied.
Dada (2010) identified financial, political and physical risks as the most important risk
factors. Ojo (2010) carried out an empirical study and found out the risk factor with
the highest occurrence is design changes during construction, followed by inadequate
specifications while Obiegbu (2010) found out that awarding the design to unqualified
designer is the most important ranked factors in risk categorization.
Risk management process starts with risk identification. Lyons and skirtmore (2004)
and Tang et al carried out research and found out brainstorming is the most common
risk identification technique used whereas Bajaj et al (1997) concluded that the top-
down approach is the most frequently used method of risk identification techniques,
where project are analysed from an overall point of view while the bottom-up risk
identification techniques are not common unless questionnaire and checklist approach.
Wang and Chou (2003) conducted multiple case studies using a systematic analytical
procedure to identify risks in highway project in Taiwan.
Cano and De la Cruz (2002) developed Delphi analysis to assess project risk while
Warszawsk and Sacks (2004) proposed a multifactor method to risk assessment in
which an economic risk is inherent in a construction project can be calculated with
input information of varying level of details. Choi and Mahadevan (2008) developed a
risk assessment methodology for construction project by combining existing large
quantities of data and project specific information through updating approaches, Tar
and Carr (2000) used a hierarchical risk breakdown structure representation to develop
a formal model for qualitative risk assessment.
Empirical study carried out by Tang et al (2007) revealed that the construction
industry has shifted from risk transfer to risk reduction while Dada (2010) concluded
that the Nigerian construction industry considered risk transfer as the highest
mitigating tool used, followed by risk reduction, risk avoidance and risk retention.
Baker et al (1997) carried out a study in which the choice and the use of the most
successful risk response techniques within the oil and gas industry were compared
with that of the construction industry. They concluded that risk reduction as a
response to assessed risks is most commonly used by both sectors and the construction
industry concentrates almost exclusively on reduction of financial risk.
RESEARCH METHOD
Questionnaire survey was use to elicit information on risk management approaches
adopted by contractors in Lagos state, Nigeria. The contactors were grouped
according to their years of operation in Nigeria that is “less than 10 years”, “10-29
years”, “30-39 years” and 40 years above”. The questionnaire was designed to
analysed the different risk identification, analysis and response techniques used by the
contractors. The respondents were asked to score on a scale of 1 to 3, “Yes”, “No”,
“Not Sure”.
A total of 60 questionnaires were administered to selected construction companies in
Lagos state. 39 questionnaires were returned and valid for analysis representing 65%
response rate.
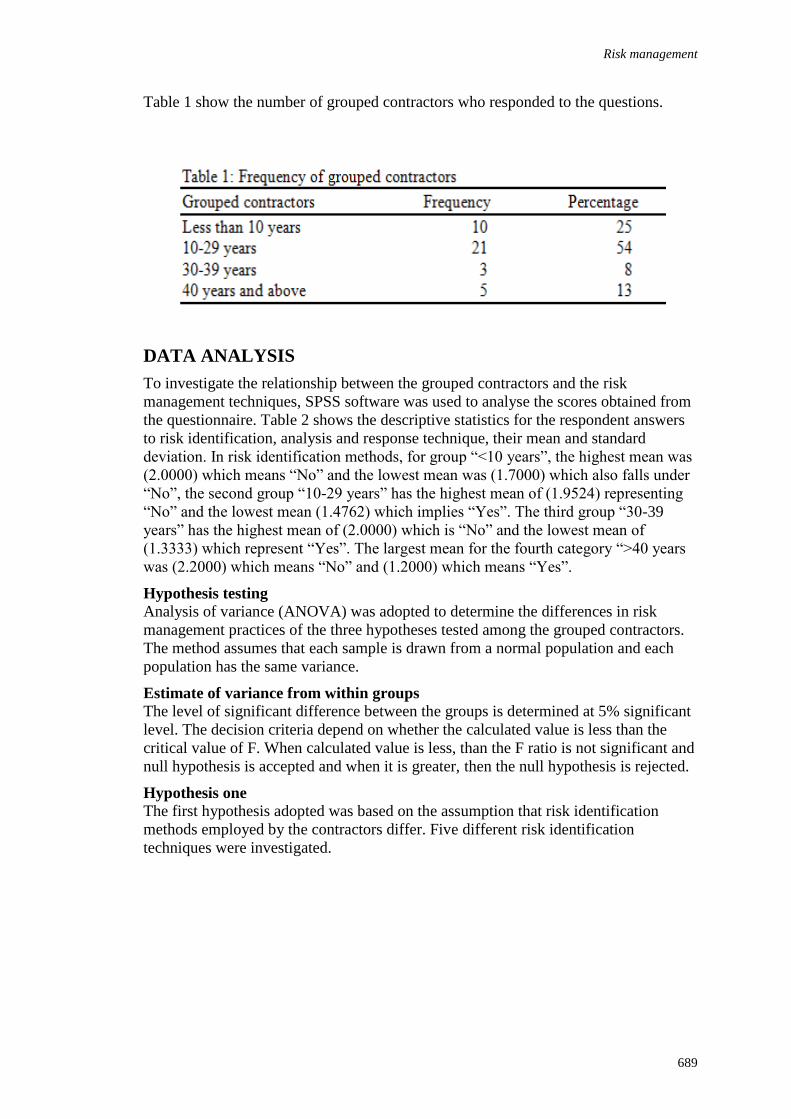
Risk management
689
Table 1 show the number of grouped contractors who responded to the questions.
DATA ANALYSIS
To investigate the relationship between the grouped contractors and the risk
management techniques, SPSS software was used to analyse the scores obtained from
the questionnaire. Table 2 shows the descriptive statistics for the respondent answers
to risk identification, analysis and response technique, their mean and standard
deviation. In risk identification methods, for group “<10 years”, the highest mean was
(2.0000) which means “No” and the lowest mean was (1.7000) which also falls under
“No”, the second group “10-29 years” has the highest mean of (1.9524) representing
“No” and the lowest mean (1.4762) which implies “Yes”. The third group “30-39
years” has the highest mean of (2.0000) which is “No” and the lowest mean of
(1.3333) which represent “Yes”. The largest mean for the fourth category “>40 years
was (2.2000) which means “No” and (1.2000) which means “Yes”.
Hypothesis testing
Analysis of variance (ANOVA) was adopted to determine the differences in risk
management practices of the three hypotheses tested among the grouped contractors.
The method assumes that each sample is drawn from a normal population and each
population has the same variance.
Estimate of variance from within groups
The level of significant difference between the groups is determined at 5% significant
level. The decision criteria depend on whether the calculated value is less than the
critical value of F. When calculated value is less, than the F ratio is not significant and
null hypothesis is accepted and when it is greater, then the null hypothesis is rejected.
Hypothesis one
The first hypothesis adopted was based on the assumption that risk identification
methods employed by the contractors differ. Five different risk identification
techniques were investigated.

Ijaola
690
F ratio = Estimate of variance from between groups
To test the difference in the mean value for the five different identification techniques,
the following hypothesis is tested H0: There is no difference in the mean value for risk
identification techniques employed by contractors.H1: There is difference in the mean
value for risk identification techniques employed by contractors.
Table 3 shows ANOVA results for the differences in the mean values of the five risk
identification techniques. The F value for all the five is less than the critical value of
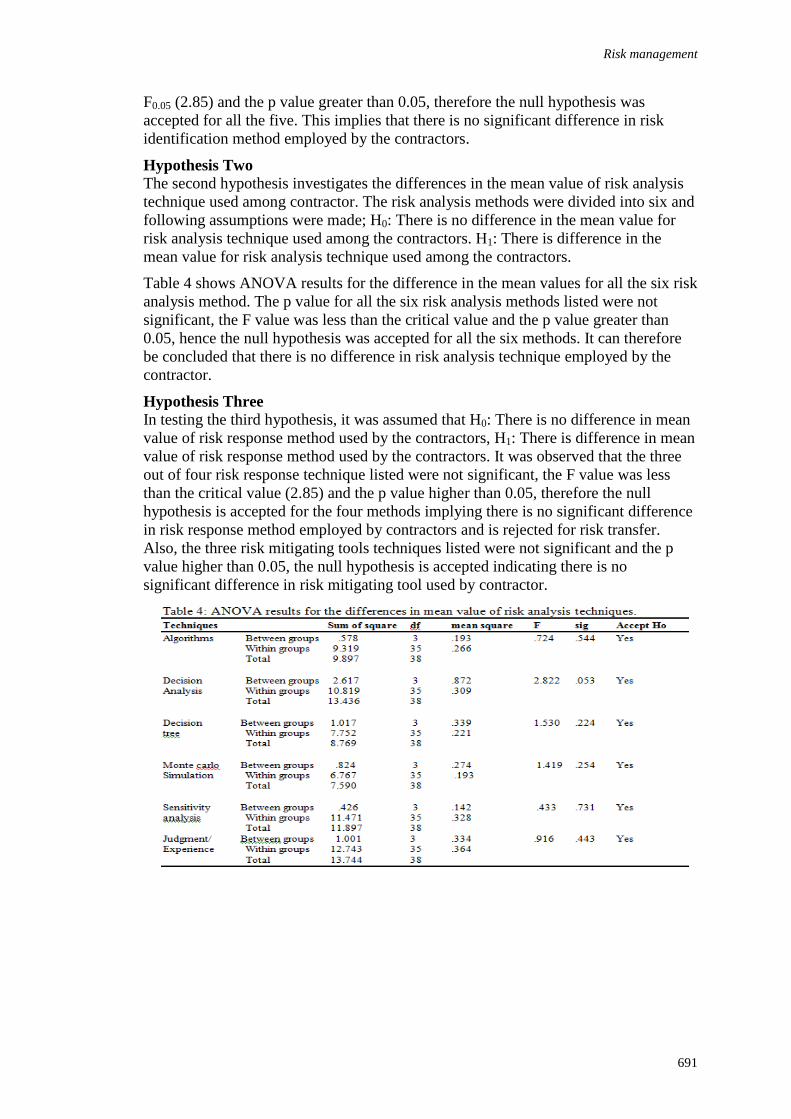
Risk management
691
F0.05 (2.85) and the p value greater than 0.05, therefore the null hypothesis was
accepted for all the five. This implies that there is no significant difference in risk
identification method employed by the contractors.
Hypothesis Two
The second hypothesis investigates the differences in the mean value of risk analysis
technique used among contractor. The risk analysis methods were divided into six and
following assumptions were made; H0: There is no difference in the mean value for
risk analysis technique used among the contractors. H1: There is difference in the
mean value for risk analysis technique used among the contractors.
Table 4 shows ANOVA results for the difference in the mean values for all the six risk
analysis method. The p value for all the six risk analysis methods listed were not
significant, the F value was less than the critical value and the p value greater than
0.05, hence the null hypothesis was accepted for all the six methods. It can therefore
be concluded that there is no difference in risk analysis technique employed by the
contractor.
Hypothesis Three
In testing the third hypothesis, it was assumed that H0: There is no difference in mean
value of risk response method used by the contractors, H1: There is difference in mean
value of risk response method used by the contractors. It was observed that the three
out of four risk response technique listed were not significant, the F value was less
than the critical value (2.85) and the p value higher than 0.05, therefore the null
hypothesis is accepted for the four methods implying there is no significant difference
in risk response method employed by contractors and is rejected for risk transfer.
Also, the three risk mitigating tools techniques listed were not significant and the p
value higher than 0.05, the null hypothesis is accepted indicating there is no
significant difference in risk mitigating tool used by contractor.
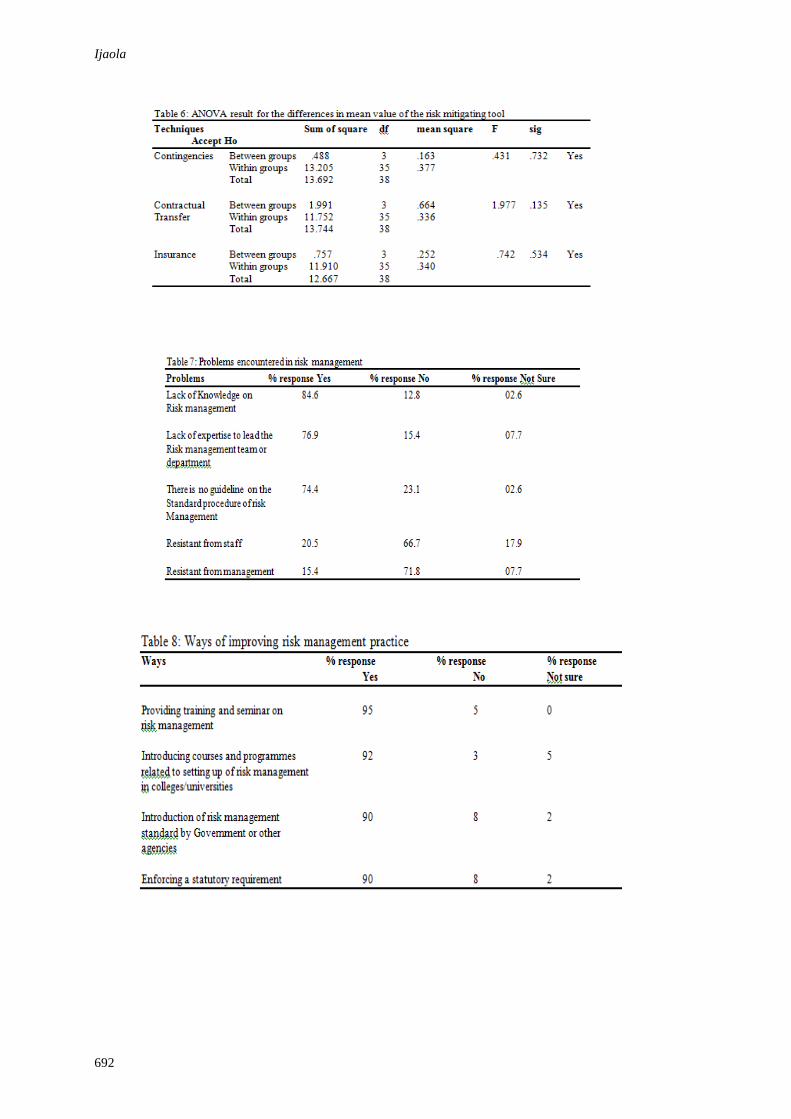
Ijaola
692

Risk management
693
DISCUSSION OF FINDINGS
The major problem identified in risk management practice is lack of knowledge on
risk management. This can be clearly seen in the mean value of risk management
techniques among the grouped contractors as most of the mean value falls within
“No”. It was observed that brainstorming and case based approach were the method
frequently used. These methods are qualitative in nature and little knowledge about
risk management technique is required. This is in line with Tang et al (2007) in which
brainstorming was identified as the most common risk identification technique used.
The mean value among the grouped contractors for risk analysis technique is within
(2.0000) “No”. This is a strong indication that most of the contractors do not use risk
analysis technique due lack of knowledge on risk management. This is a strong
indication that most of the contractors do not use risk analysis due to lack knowledge
on risk management. This support the view of Akintoye and Macleod (1997), Choi
and Mahadevan (2008) in which formal risk analysis techniques are rarely used due to
lack of Knowledge.
In responding to risk, it was discovered that risk reduction was the preferred method,
this is logical as most contractors would not want to retain risk, this is line with Tang
et al (2007) conclusion in which it was ascertained that the construction industry has
shifted from risk transfer to risk reduction but in contrasts to Dada (2010) findings,
that the Nigerian construction industry considered risk transfer as the highest risk
response technique used followed by risk reduction. The risk mitigating tool mostly
used is insurance. This support the view of Odeyinka (2000) that the major method of
managing construction risks in Nigeria construction industry is through insurance. The
statistical analysis revealed that there are no differences in the mean values for all the
risk identification, analysis, and response technique listed. This is in contrast with
Hassanein and Afify (2007) in which they concluded that risk identification effort
varies among contractors with those possessing past experience far better. This means
that company years of operation do not have influence on the risk management
practices and subsequently cannot serve as a basis for measuring their performance.
Ijaola
694
CONCLUSION
This study addresses risk management approaches among contractors in Nigeria, this
was meant to examine if their years of experience will create differences in their risk
management approaches and then serve as a basis for their performance. It was
observed that the risk identification methods frequently used are brainstorming and
case based approach, these two methods can easily be done without any formal
process. Risk analysis processes were not practiced and risk reduction is the most
prefer method of risk response. The mitigating tool commonly used is insurance.
Based on these findings, it can be concluded that formal risk management is not
practiced in Nigeria. There were no significant differences in risk identification,
analysis and response technique tested among the contractors, therefore it can be
concluded that their number of years have no significant effect on risk management
practice and non can be said to perform better. One major discovery is that providing
training and seminar on risk management will increase the awareness level of risk
management in Nigeria which will subsequently make contractors to consider risk
management practice during construction project and increases their performance in
terms of cost, time and quality.
REFERENCES
Aibinu A A and Jagboro G O (2002) The effects of construction delays on project delivery in
Nigeria construction industry. International Journal of Project management, 20,593-
599
Akintoye, A and Macleod J (1997) Risk analysis and management in construction.
International Journal of Project Management, 15(1), 31-38.
Alfredo del Cano, P E and Pilar de la Cruz, P E (2002) Integrated methodology for project
risk management. Journal of Construction Engineering and Management, 134 (3),
885-893.
Bajaj, D, Oluwoye, J and Lenard, D (1997) An analysis of contractors’ approaches to risk
identification in New South Wales, Australia. Construction Management and
Economics, 15, 363-369.
Baker, S, Ponniah, D and Smith, S (1999) Risk response technique employed currently for
major projects. Construction Management and Economics, 17, 205-213.
Choi, H and Mahadevan, S (2008) Construction project risk assessment using existing
database and project-specific information. Journal of Construction Engineering and
Management, 134(11), 894-902.
Dada, J O (2010) Strategies for militating risk in construction projects, In proceedings of the
40th Annual general meeting/conference of the Nigerian Institute of Building, 7th-
11th July 2010, Asaba, Delta, Nigeria, 28-35.
Hassanein, A A G and Afify, H M F (2007) Risk management practices of contractors: a case
study of power station projects in Egypt. Journal of Financial Management of
Property and construction, 12(3), 165-179.
Lyons, T and Skitmore, M (2004) Project risk management in the Queensland engineering
construction industry: A survey. International Journal of Project Management, 22,51-
61.
Obiegbu, M E (2010) A holistic overview of risk management in building project, In
proceedings of the 40th Annual general meeting/conference of the Nigerian Institute
of Building, 7th-11th July 2010, Asaba, Delta, Nigeria.

Risk management
695
Ojo, G K (2010) An assessment of the construction site risk related factors, In proceedings of
the 40th Annual general meeting/conference of the Nigerian Institute of Building, 7th-
11th July 2010, Asaba, Delta, Nigeria, 9-14.
Tah, J H M and Carr V (2001) Knowledge-Based approach to construction project risk
management. Journal of Computing in Civil Engineering, 15(3), 170-177.
Tang, W, Qiang, M, Duffield, C F Young, D M and Youmei, L (2007) Risk management in
the Chinese construction industry. Journal of Construction Engineering and
Management, 133, (12), 944-956.
Wang, M and Chou, H (2003) Risk allocation and risk handling of highway projects in
Taiwan. Journal of Management in Engineering. 19, (22), 60-68.

Ijatuyi, O and Taiwo, A A (2012) Bridging the cultural gap between traditional and modern building
designs In: Laryea, S., Agyepong, S.A., Leiringer, R. and Hughes, W. (Eds) Procs 4th West Africa
Built Environment Research (WABER) Conference, 24-26 July 2012, Abuja, Nigeria, 697-707.
697
BRIDGING THE CULTURAL GAP BETWEEN
TRADITIONAL AND MODERN BUILDING DESIGNS
Oluwatosin Olufunto Ijatuyi1
and Abraham Adeniyi Taiwo 2
Department of Architecture, Federal university of Technology, Akure Nigeria
This paper examines the relationship that exists between traditional and modern
building designs in some selected towns in the South-western part of Nigeria. The
author expounds that there is a gradual neglect of traditional architecture for
architectural styles that are not sympathetic to the local climate. Studying the
architecture of palaces and buildings, various current trends and challenges are
identified. Precisely, these include: an abysmal neglect of local building materials;
planning and zoning that are not traditionally-based and a gradual loss of symbolism
and concepts in the form of palace buildings. Although traditional designs are given
up for modern designs, and most palaces and buildings are now a shadow of their
former past, the author remains optimistic and points out that, in an attempt to curtail
the side effects of this cultural gap and create a sustainable human environment,
taking the values and heritage of such environment as starting points can be helpful in
achieving modern cultural patterns and forms that evolve from the society’s own
cultural past. This is simply making traditional architecture as the starting point of
creative designs in planning, and also evolving in materials such as steel, concrete,
glass, aluminium and so on, a functional modern architecture that is developed from
an indigenous architecture To achieve this, the study recommends that the best of
local building materials should be synthesized with that of modern materials with
adequate consideration of the local climate; planning and zoning of spaces should be
traditionally-based; and the use of symbolism and concepts in the forms of palace
buildings should be embraced.
Keywords: building design, culture, modern architecture, palace, traditional
architecture
INTRODUCTION
Kolawole (2003) said it is a common saying that what we see today is a product of
yesterday. The need to examine the past and be familiarized with some basic features
of rich traditional architecture developed from cultural practices, and its relationship
with modern architecture cannot be left unattended to (Dmochowski1990). Nigeria is
a multi-ethnic nation enriched with over 250 tribal groups (Olotuah, 2009). These
tribal groups have distinct cultural settings which are spread across the nation Nigeria.
Each of these tribes has distinct architecture which is agreeably sympathetic to her
environment and way of life (Barbour et al, 1982). The three major tribes in Nigeria –
the Hausa, Ibo, and the Yoruba are noted for specific design concepts and architecture
that meet their various needs e.g. protection from weather, wild animals, a sign of
cultural enrichment, e.t.c.(Barbour et al, 1982). However, technological advancement
has cut across the ancient Africa and Nigeria as a whole, and there have been
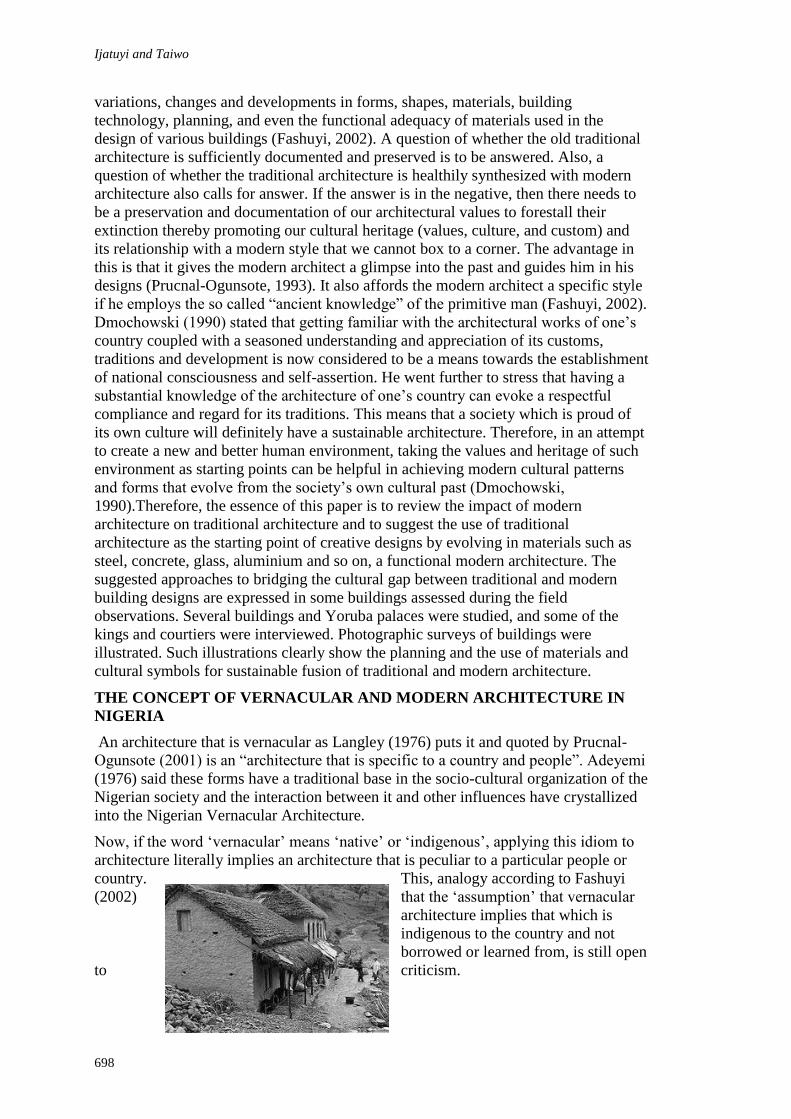
Ijatuyi and Taiwo
698
variations, changes and developments in forms, shapes, materials, building
technology, planning, and even the functional adequacy of materials used in the
design of various buildings (Fashuyi, 2002). A question of whether the old traditional
architecture is sufficiently documented and preserved is to be answered. Also, a
question of whether the traditional architecture is healthily synthesized with modern
architecture also calls for answer. If the answer is in the negative, then there needs to
be a preservation and documentation of our architectural values to forestall their
extinction thereby promoting our cultural heritage (values, culture, and custom) and
its relationship with a modern style that we cannot box to a corner. The advantage in
this is that it gives the modern architect a glimpse into the past and guides him in his
designs (Prucnal-Ogunsote, 1993). It also affords the modern architect a specific style
if he employs the so called “ancient knowledge” of the primitive man (Fashuyi, 2002).
Dmochowski (1990) stated that getting familiar with the architectural works of one’s
country coupled with a seasoned understanding and appreciation of its customs,
traditions and development is now considered to be a means towards the establishment
of national consciousness and self-assertion. He went further to stress that having a
substantial knowledge of the architecture of one’s country can evoke a respectful
compliance and regard for its traditions. This means that a society which is proud of
its own culture will definitely have a sustainable architecture. Therefore, in an attempt
to create a new and better human environment, taking the values and heritage of such
environment as starting points can be helpful in achieving modern cultural patterns
and forms that evolve from the society’s own cultural past (Dmochowski,
1990).Therefore, the essence of this paper is to review the impact of modern
architecture on traditional architecture and to suggest the use of traditional
architecture as the starting point of creative designs by evolving in materials such as
steel, concrete, glass, aluminium and so on, a functional modern architecture. The
suggested approaches to bridging the cultural gap between traditional and modern
building designs are expressed in some buildings assessed during the field
observations. Several buildings and Yoruba palaces were studied, and some of the
kings and courtiers were interviewed. Photographic surveys of buildings were
illustrated. Such illustrations clearly show the planning and the use of materials and
cultural symbols for sustainable fusion of traditional and modern architecture.
THE CONCEPT OF VERNACULAR AND MODERN ARCHITECTURE IN
NIGERIA
An architecture that is vernacular as Langley (1976) puts it and quoted by Prucnal-
Ogunsote (2001) is an “architecture that is specific to a country and people”. Adeyemi
(1976) said these forms have a traditional base in the socio-cultural organization of the
Nigerian society and the interaction between it and other influences have crystallized
into the Nigerian Vernacular Architecture.
Now, if the word ‘vernacular’ means ‘native’ or ‘indigenous’, applying this idiom to
architecture literally implies an architecture that is peculiar to a particular people or
country. This, analogy according to Fashuyi
(2002) that the ‘assumption’ that vernacular
architecture implies that which is
indigenous to the country and not
borrowed or learned from, is still open
to criticism.
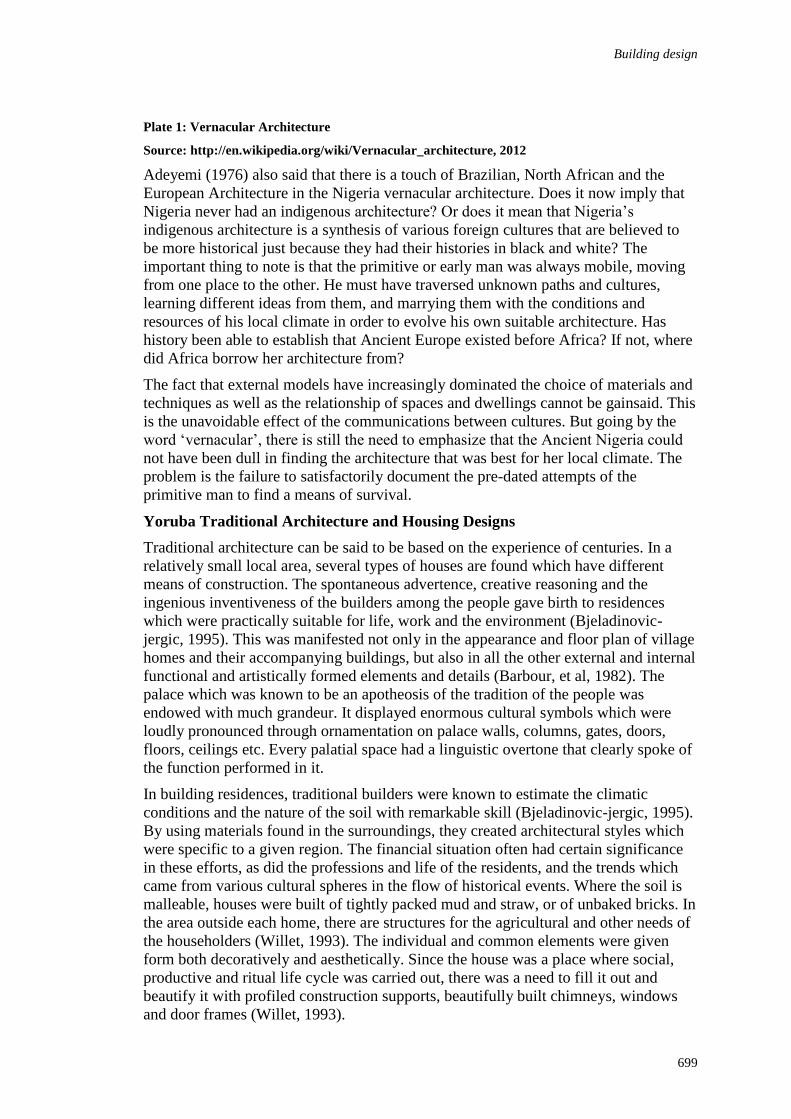
Building design
699
Plate 1: Vernacular Architecture
Source: http://en.wikipedia.org/wiki/Vernacular_architecture, 2012
Adeyemi (1976) also said that there is a touch of Brazilian, North African and the
European Architecture in the Nigeria vernacular architecture. Does it now imply that
Nigeria never had an indigenous architecture? Or does it mean that Nigeria’s
indigenous architecture is a synthesis of various foreign cultures that are believed to
be more historical just because they had their histories in black and white? The
important thing to note is that the primitive or early man was always mobile, moving
from one place to the other. He must have traversed unknown paths and cultures,
learning different ideas from them, and marrying them with the conditions and
resources of his local climate in order to evolve his own suitable architecture. Has
history been able to establish that Ancient Europe existed before Africa? If not, where
did Africa borrow her architecture from?
The fact that external models have increasingly dominated the choice of materials and
techniques as well as the relationship of spaces and dwellings cannot be gainsaid. This
is the unavoidable effect of the communications between cultures. But going by the
word ‘vernacular’, there is still the need to emphasize that the Ancient Nigeria could
not have been dull in finding the architecture that was best for her local climate. The
problem is the failure to satisfactorily document the pre-dated attempts of the
primitive man to find a means of survival.
Yoruba Traditional Architecture and Housing Designs
Traditional architecture can be said to be based on the experience of centuries. In a
relatively small local area, several types of houses are found which have different
means of construction. The spontaneous advertence, creative reasoning and the
ingenious inventiveness of the builders among the people gave birth to residences
which were practically suitable for life, work and the environment (Bjeladinovic-
jergic, 1995). This was manifested not only in the appearance and floor plan of village
homes and their accompanying buildings, but also in all the other external and internal
functional and artistically formed elements and details (Barbour, et al, 1982). The
palace which was known to be an apotheosis of the tradition of the people was
endowed with much grandeur. It displayed enormous cultural symbols which were
loudly pronounced through ornamentation on palace walls, columns, gates, doors,
floors, ceilings etc. Every palatial space had a linguistic overtone that clearly spoke of
the function performed in it.
In building residences, traditional builders were known to estimate the climatic
conditions and the nature of the soil with remarkable skill (Bjeladinovic-jergic, 1995).
By using materials found in the surroundings, they created architectural styles which
were specific to a given region. The financial situation often had certain significance
in these efforts, as did the professions and life of the residents, and the trends which
came from various cultural spheres in the flow of historical events. Where the soil is
malleable, houses were built of tightly packed mud and straw, or of unbaked bricks. In
the area outside each home, there are structures for the agricultural and other needs of
the householders (Willet, 1993). The individual and common elements were given
form both decoratively and aesthetically. Since the house was a place where social,
productive and ritual life cycle was carried out, there was a need to fill it out and
beautify it with profiled construction supports, beautifully built chimneys, windows
and door frames (Willet, 1993).
Ijatuyi and Taiwo
700
However, traditional architecture, which had specific forms in different places and
which was influenced by historical, economic and cultural factors, is rapidly inching
towards its end. Its undoubtedly great architectonic value is being dwarfed by foreign
influence. In a national context, traditional architecture is of the essence, but its
representation as the cultural heritage of a nation is diminishing. As the great
visionary and planner of twentieth century architecture, the famous Le Corbusier, said
"Tradition is an arrow which points to the future". As he travelled what was once the
Byzantine Empire, he tried to discover the secrets of its past, so that he could
understand the West (Bjeladinovic-jergic, 1995).
Modern Architecture and Its Evolution
Modern architecture came into existence about a century ago. According to Arayela
(2006) it came as a means of reconciling the forces of industrial revolution and to:
i. Rediscover the true path of architecture,
ii. Reveal the forms that suit the needs of the modern industrial society,
iii. Build the forms and images that are capable of depicting the ideals of a
distinct modern age.
Modern architecture had its forceful grip on architecture in the latter part of the 19th
century and the early part of the 20th
century. Its evolution cannot be unconnected to
the response to the supposed chaos of the earlier 19th
century revival of the historic
force.
Around the middle of the 19th
century, Caesar Daly and Eugene Violet-Le-Duc
(French Theorists) had little conception about the form of Modern architecture when
they were discussing the feasibility of a true modern style. It is a pioneer phase that
brought about Art Nouveau; and just before the turn of the 20th
century, considerable
progress was seen because of the intervention of structural inventions. At that time,
there were the notions that, for Modern architecture to be successful, it should: be
based on new construction procedure and means; subjected to the analysis of its
functions; inculcate modalities that imply human betterment; and be versatile and
flexible in application to human culture (Arayela, 2006).
Modern architecture became a tradition that suggested alternative ways of improving
the living conditions in Europe, Asia and America. According to Prucnal-Ogunsote,
(2002) the style was inherited, and in no time it became interesting in the
dissemination of its prototypes all over the world in the 1940s till the 1970s. Until
now, Nigeria has not been left out in witnessing the introduction of modern
architecture. Buildings like the National Arts Theatre by Techno Export – Bulgarian
Architects (1960), Western House by Nickson and Borys (1960), Godwin and
Hopwood Building by Godwin Hopwood (1959), Architecture House by Olumuyiwa
and Associates (1958) and so on, were all built at that time (Prucnal-Ogunsote, 2002).
The Problems of Modern Architecture and the Impact on Yoruba Palaces and
Building Designs
The two major problems that modern architecture encountered were
devaluation and transplantation Arayela, (2006). The former connotes that symbolic
forms were gradually being emptied of their original content and absorbed by
commercial interest and state bureaucracies. The latter problem depicts how modern
architecture was grafted into cultures that are different from which it began. Owing to
these, modern architecture has been loaded with torrential criticisms and questions
leaving one with confusion about our position in tradition. Scholars tend to view the
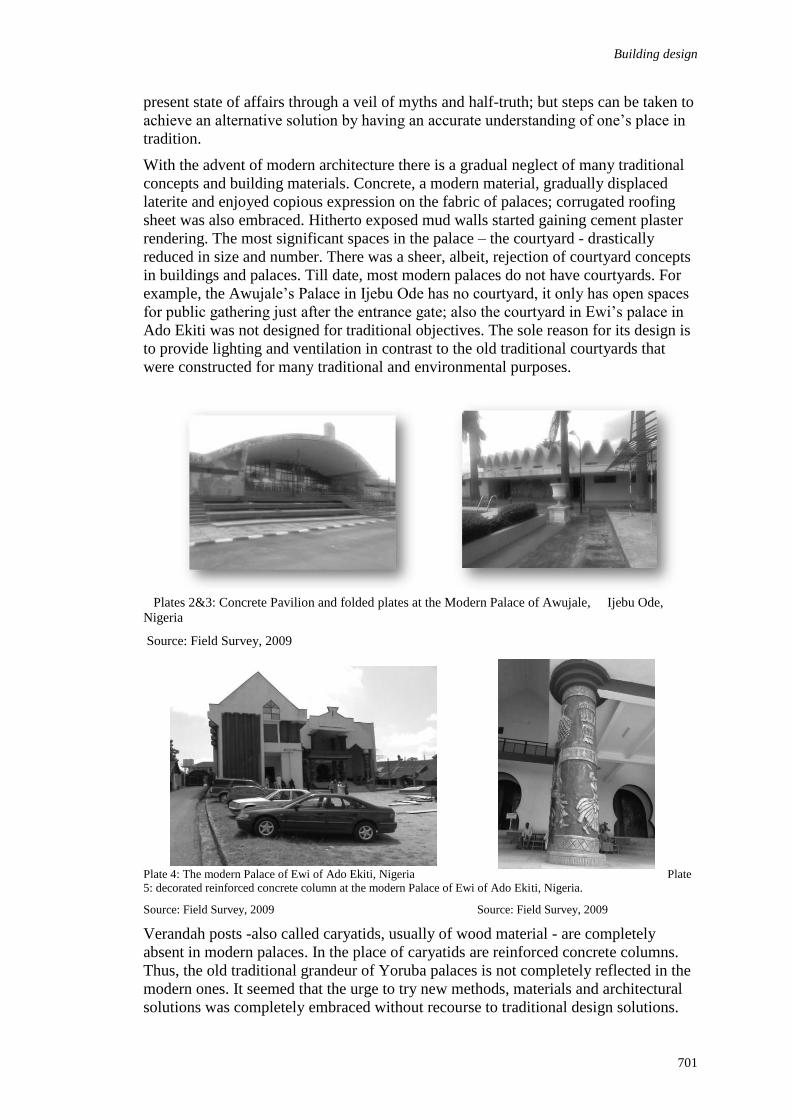
Building design
701
present state of affairs through a veil of myths and half-truth; but steps can be taken to
achieve an alternative solution by having an accurate understanding of one’s place in
tradition.
With the advent of modern architecture there is a gradual neglect of many traditional
concepts and building materials. Concrete, a modern material, gradually displaced
laterite and enjoyed copious expression on the fabric of palaces; corrugated roofing
sheet was also embraced. Hitherto exposed mud walls started gaining cement plaster
rendering. The most significant spaces in the palace – the courtyard - drastically
reduced in size and number. There was a sheer, albeit, rejection of courtyard concepts
in buildings and palaces. Till date, most modern palaces do not have courtyards. For
example, the Awujale’s Palace in Ijebu Ode has no courtyard, it only has open spaces
for public gathering just after the entrance gate; also the courtyard in Ewi’s palace in
Ado Ekiti was not designed for traditional objectives. The sole reason for its design is
to provide lighting and ventilation in contrast to the old traditional courtyards that
were constructed for many traditional and environmental purposes.
Plates 2&3: Concrete Pavilion and folded plates at the Modern Palace of Awujale, Ijebu Ode,
Nigeria
Source: Field Survey, 2009
Plate 4: The modern Palace of Ewi of Ado Ekiti, Nigeria Plate
5: decorated reinforced concrete column at the modern Palace of Ewi of Ado Ekiti, Nigeria.
Source: Field Survey, 2009 Source: Field Survey, 2009
Verandah posts -also called caryatids, usually of wood material - are completely
absent in modern palaces. In the place of caryatids are reinforced concrete columns.
Thus, the old traditional grandeur of Yoruba palaces is not completely reflected in the
modern ones. It seemed that the urge to try new methods, materials and architectural
solutions was completely embraced without recourse to traditional design solutions.
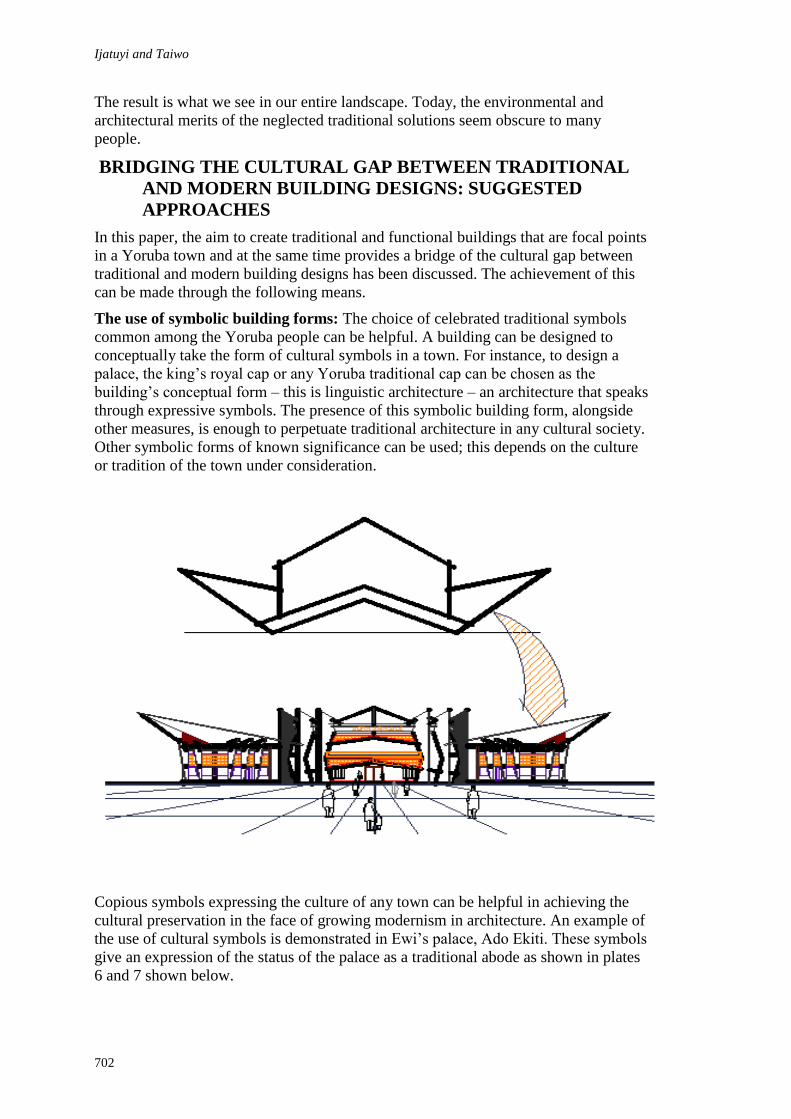
Ijatuyi and Taiwo
702
The result is what we see in our entire landscape. Today, the environmental and
architectural merits of the neglected traditional solutions seem obscure to many
people.
BRIDGING THE CULTURAL GAP BETWEEN TRADITIONAL
AND MODERN BUILDING DESIGNS: SUGGESTED
APPROACHES
In this paper, the aim to create traditional and functional buildings that are focal points
in a Yoruba town and at the same time provides a bridge of the cultural gap between
traditional and modern building designs has been discussed. The achievement of this
can be made through the following means.
The use of symbolic building forms: The choice of celebrated traditional symbols
common among the Yoruba people can be helpful. A building can be designed to
conceptually take the form of cultural symbols in a town. For instance, to design a
palace, the king’s royal cap or any Yoruba traditional cap can be chosen as the
building’s conceptual form – this is linguistic architecture – an architecture that speaks
through expressive symbols. The presence of this symbolic building form, alongside
other measures, is enough to perpetuate traditional architecture in any cultural society.
Other symbolic forms of known significance can be used; this depends on the culture
or tradition of the town under consideration.
Copious symbols expressing the culture of any town can be helpful in achieving the
cultural preservation in the face of growing modernism in architecture. An example of
the use of cultural symbols is demonstrated in Ewi’s palace, Ado Ekiti. These symbols
give an expression of the status of the palace as a traditional abode as shown in plates
6 and 7 shown below.
Plate 10: showing Long verandah at Olowo’s
palaceSource: researcher’s field survey, 2008.
Fig 1: The use of Symbolic forms
Source: Researcher’s Archive, 2009
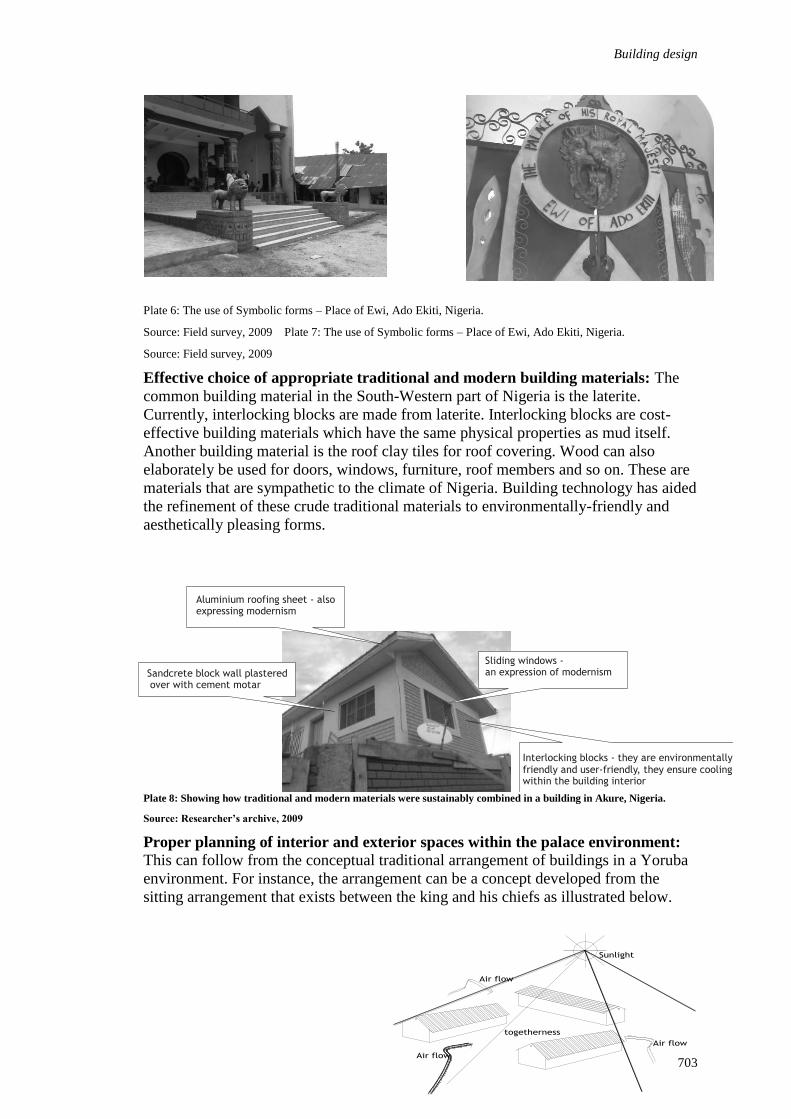
Building design
703
Plate 6: The use of Symbolic forms – Place of Ewi, Ado Ekiti, Nigeria.
Source: Field survey, 2009 Plate 7: The use of Symbolic forms – Place of Ewi, Ado Ekiti, Nigeria.
Source: Field survey, 2009
Effective choice of appropriate traditional and modern building materials: The
common building material in the South-Western part of Nigeria is the laterite.
Currently, interlocking blocks are made from laterite. Interlocking blocks are cost-
effective building materials which have the same physical properties as mud itself.
Another building material is the roof clay tiles for roof covering. Wood can also
elaborately be used for doors, windows, furniture, roof members and so on. These are
materials that are sympathetic to the climate of Nigeria. Building technology has aided
the refinement of these crude traditional materials to environmentally-friendly and
aesthetically pleasing forms.
Plate 8: Showing how traditional and modern materials were sustainably combined in a building in Akure, Nigeria.
Source: Researcher’s archive, 2009
Proper planning of interior and exterior spaces within the palace environment:
This can follow from the conceptual traditional arrangement of buildings in a Yoruba
environment. For instance, the arrangement can be a concept developed from the
sitting arrangement that exists between the king and his chiefs as illustrated below.
Air flow
Air flow
Air flow
Sunlight
togetherness
Sliding windows - an expression of modernismSandcrete block wall plastered
over with cement motar
Aluminium roofing sheet - also expressing modernism
Interlocking blocks - they are environmentally friendly and user-friendly, they ensure cooling within the building interior

Ijatuyi and Taiwo
704
Fig.2: Seating arrangement of the king and the chiefs in Yoruba
tradition.
Source: Researcher’s archive, 2009 Fig. 3: a three-dimensional
view of Fig. 2
Source: Field survey, 2009
The arrangement is in such a manner that would
ensure functional circulation, thermal comfort
and lighting. This concept is richly grounded in
the Yoruba traditional architecture. Taking a
critical look at it, it is obvious that this
arrangement is reminiscent of the traditional building arrangement in Yoruba areas. It
is part of Yoruba traditional architecture and it can also be a means to bridging the
cultural gap between traditional and modern building designs.
Consideration for local climate: Before the design a critical study of the site and its
adjoining environment should be carried out. Analysis of a local climate of the
problem area can help in the choice of building materials, and the zoning of spaces.
The zoning of the outdoor spaces can be well considered with respect to traditional
and modern architecture.
CONCLUSION
The basic concern of this paper was directed at reviewing the problem associated with
the embrace of a style of architecture that does not suit a specific local climate and
causing a displacement of vernacular and traditional architecture. The study focused
on proposing the choice of the best of the features and qualities of traditional and
modern architecture in order to tackle the above stated problem. The essence of
planning and design in architecture is to enhance the users’ comfort and make the
environment more responsive to living and working. This paper therefore has been
able to suggest and discuss the ways in which the cultural gap between traditional and
modern building designs can be bridged by means of the building materials used,
effective planning and zoning derived from the culture of the people, the use of
symbolic forms and the consideration for the local climate. If these approaches are
applied to building designs, the same favourable results will be expected. Findings
from field survey show that most designs stray from the objective of their designs in a
bid to create imposing and monumental edifice of great aesthetic appeal, hence, the
design problems of ventilation, lighting, circulation, devaluation of culture and
traditions among others. The owners of the buildings on their part should imbibe
maintenance culture so that future generations will not be deprived of their right to
enjoy the use of such buildings. Above all, an approach such as this can serve as a
reference point for future building projects.
KING
CHIEFS CHIEFSOPEN FLOOR FOR DISCUSSION
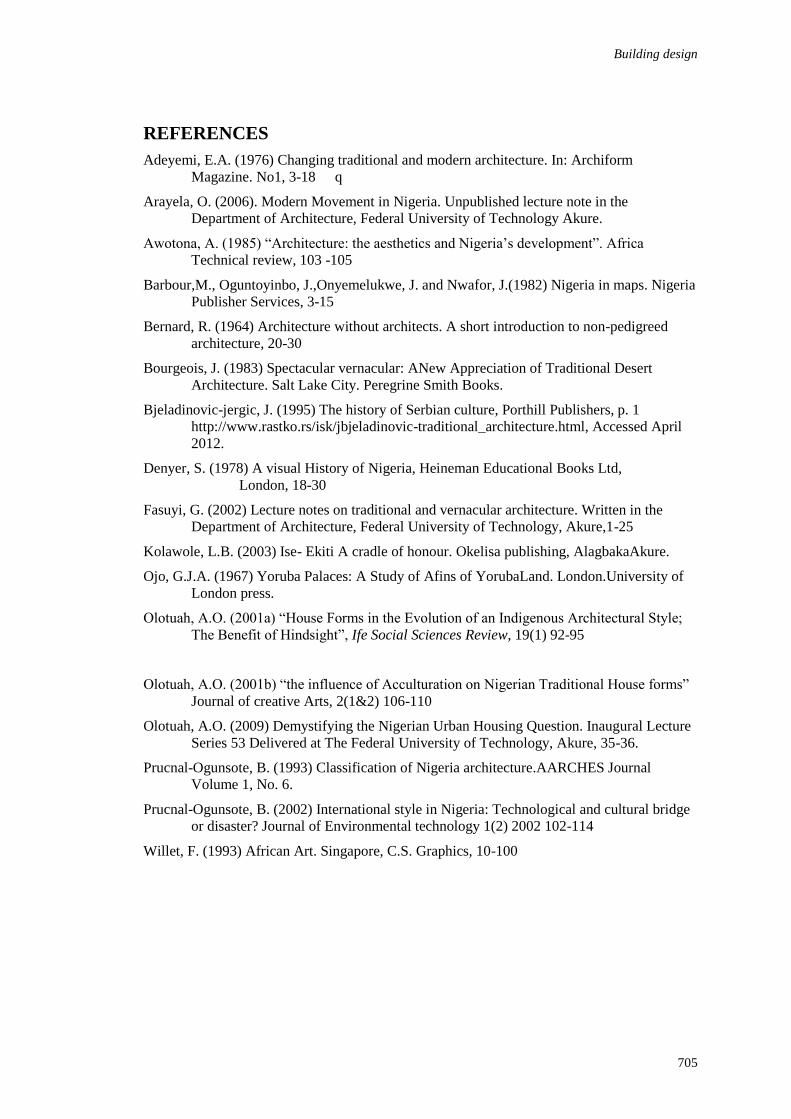
Building design
705
REFERENCES
Adeyemi, E.A. (1976) Changing traditional and modern architecture. In: Archiform
Magazine. No1, 3-18 q
Arayela, O. (2006). Modern Movement in Nigeria. Unpublished lecture note in the
Department of Architecture, Federal University of Technology Akure.
Awotona, A. (1985) “Architecture: the aesthetics and Nigeria’s development”. Africa
Technical review, 103 -105
Barbour,M., Oguntoyinbo, J.,Onyemelukwe, J. and Nwafor, J.(1982) Nigeria in maps. Nigeria
Publisher Services, 3-15
Bernard, R. (1964) Architecture without architects. A short introduction to non-pedigreed
architecture, 20-30
Bourgeois, J. (1983) Spectacular vernacular: ANew Appreciation of Traditional Desert
Architecture. Salt Lake City. Peregrine Smith Books.
Bjeladinovic-jergic, J. (1995) The history of Serbian culture, Porthill Publishers, p. 1
http://www.rastko.rs/isk/jbjeladinovic-traditional_architecture.html, Accessed April
2012.
Denyer, S. (1978) A visual History of Nigeria, Heineman Educational Books Ltd,
London, 18-30
Fasuyi, G. (2002) Lecture notes on traditional and vernacular architecture. Written in the
Department of Architecture, Federal University of Technology, Akure,1-25
Kolawole, L.B. (2003) Ise- Ekiti A cradle of honour. Okelisa publishing, AlagbakaAkure.
Ojo, G.J.A. (1967) Yoruba Palaces: A Study of Afins of YorubaLand. London.University of
London press.
Olotuah, A.O. (2001a) “House Forms in the Evolution of an Indigenous Architectural Style;
The Benefit of Hindsight”, Ife Social Sciences Review, 19(1) 92-95
Olotuah, A.O. (2001b) “the influence of Acculturation on Nigerian Traditional House forms”
Journal of creative Arts, 2(1&2) 106-110
Olotuah, A.O. (2009) Demystifying the Nigerian Urban Housing Question. Inaugural Lecture
Series 53 Delivered at The Federal University of Technology, Akure, 35-36.
Prucnal-Ogunsote, B. (1993) Classification of Nigeria architecture.AARCHES Journal
Volume 1, No. 6.
Prucnal-Ogunsote, B. (2002) International style in Nigeria: Technological and cultural bridge
or disaster? Journal of Environmental technology 1(2) 2002 102-114
Willet, F. (1993) African Art. Singapore, C.S. Graphics, 10-100
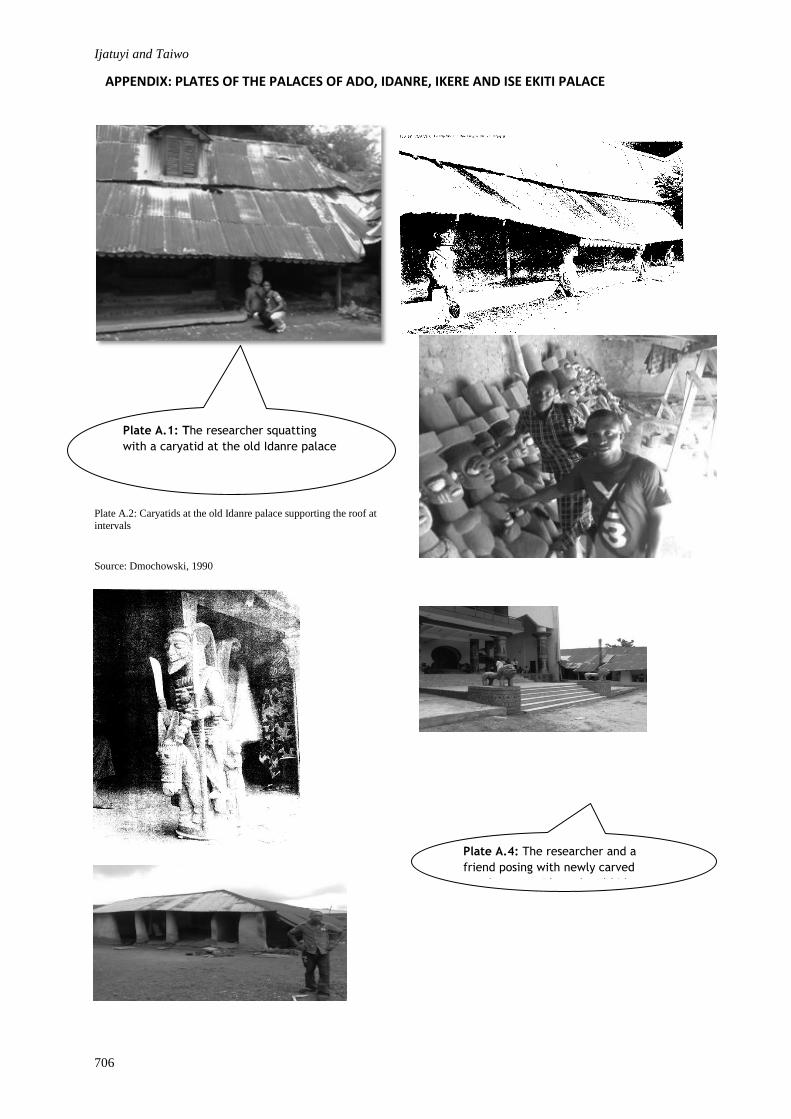
Ijatuyi and Taiwo
706
Plate A.2: Caryatids at the old Idanre palace supporting the roof at
intervals
Source: Dmochowski, 1990
Plate A.1: The researcher squatting
with a caryatid at the old Idanre palace
Source: field survey, 2009.
Plate A.4: The researcher and a
friend posing with newly carved
wooden caryatids at the old Idanre
palace
Source: field survey, 2009
APPENDIX: PLATES OF THE PALACES OF ADO, IDANRE, IKERE AND ISE EKITI PALACE
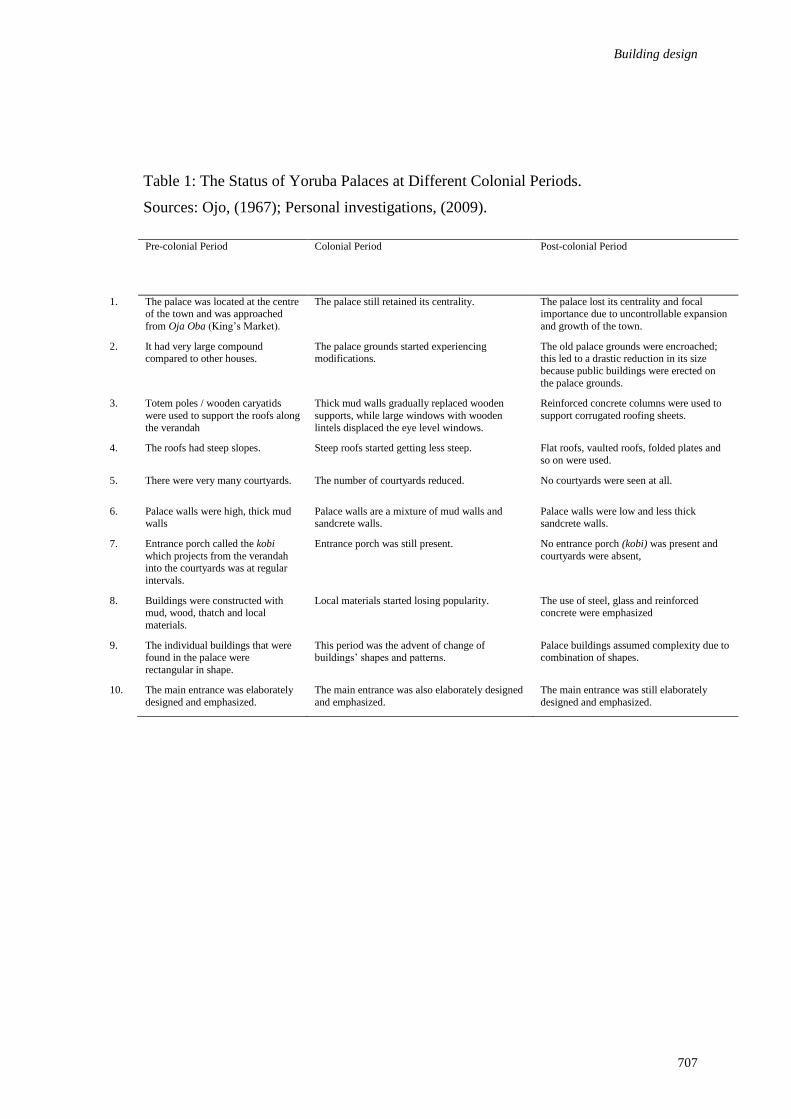
Building design
707
Table 1: The Status of Yoruba Palaces at Different Colonial Periods.
Sources: Ojo, (1967); Personal investigations, (2009).
Pre-colonial Period Colonial Period Post-colonial Period
1. The palace was located at the centre of the town and was approached
from Oja Oba (King’s Market).
The palace still retained its centrality. The palace lost its centrality and focal importance due to uncontrollable expansion
and growth of the town.
2. It had very large compound compared to other houses.
The palace grounds started experiencing modifications.
The old palace grounds were encroached; this led to a drastic reduction in its size
because public buildings were erected on
the palace grounds.
3. Totem poles / wooden caryatids
were used to support the roofs along
the verandah
Thick mud walls gradually replaced wooden
supports, while large windows with wooden
lintels displaced the eye level windows.
Reinforced concrete columns were used to
support corrugated roofing sheets.
4. The roofs had steep slopes. Steep roofs started getting less steep. Flat roofs, vaulted roofs, folded plates and
so on were used.
5. There were very many courtyards. The number of courtyards reduced. No courtyards were seen at all.
6. Palace walls were high, thick mud walls
Palace walls are a mixture of mud walls and sandcrete walls.
Palace walls were low and less thick sandcrete walls.
7. Entrance porch called the kobi
which projects from the verandah into the courtyards was at regular
intervals.
Entrance porch was still present. No entrance porch (kobi) was present and
courtyards were absent,
8. Buildings were constructed with mud, wood, thatch and local
materials.
Local materials started losing popularity. The use of steel, glass and reinforced concrete were emphasized
9. The individual buildings that were found in the palace were
rectangular in shape.
This period was the advent of change of buildings’ shapes and patterns.
Palace buildings assumed complexity due to combination of shapes.
10. The main entrance was elaborately
designed and emphasized.
The main entrance was also elaborately designed
and emphasized.
The main entrance was still elaborately
designed and emphasized.


Ijimdiya, T.S. and Igboro, T. (2012) Effect of used oil on the strength and compressibility behaviour of
lateritic soil In: Laryea, S., Agyepong, S.A., Leiringer, R. and Hughes, W. (Eds) Procs 4th West Africa
Built Environment Research (WABER) Conference, 24-26 July 2012, Abuja, Nigeria, 709-717.
709
EFFECT OF USED OIL ON THE STRENGTH AND
COMPRESSIBILITY BEHAVIOUR OF LATERITIC SOIL
T.S. Ijimdiya1 and T. Igboro
2
Department of Civil Engineering, Ahmadu Bello University, Nigeria
Appreciable quantities of used motor oil spills are common at and around mechanic
workshops. Laboratory testing program was carried out to determine the effect of
used motor oil contamination on the strength and compressibility properties of
lateritic soils. Contaminated specimens were prepared by mixing the soil with used
motor oil by weight of dry soil in order to evaluate the usefulness or otherwise of oil
contaminated soils in engineering construction. The results indicated a decrease in the
unconfined compressive strength (UCS), coefficient of consolidation, cv and
coefficient of volume compressibility, mv, up to 6% oil content. The UCS of the
specimens containing, 0, 2, 4, and 6 % oil content were 154, 185, 180, 151 and 103
kN/m2, while the coefficient of consolidation, cv and coefficient of volume
compressibility, mv, decreased to 373, 75, 27 and 12 m2/year and 157 x 10
-6, 334 x 10
-
5, 305 x 10
-5 and 540 x 10
-6 m
2/MN, respectively at 0, 2, 4 and 6 % oil content. The
results of laboratory tests show that properties of the soil were immensely impaired on
contamination with oil.
Keywords: coefficient of consolidation, compressibility, lateritic soil
INTRODUCTION
Used motor oil contaminations of soil are common wherever motor mechanic
workshops are located. It has been reported that the bearing capacity of such soils are
drastically reduced and made unsuitable for supporting engineering structures, or plant
growth by reducing the availability of nutrients or by increasing toxic contents in the
soil (Euchun and Braja, 2001).
Oil contaminated soil (OCS) has been defined by Colorado Department of Health and
Environment (2003), as any earthen material or artificial fill that has human or natural
alteration of its physical, chemical, biological or radiological integrity resulting from
the introduction of crude oil, any fraction or derivative thereof (such as gasoline,
diesel, or used motor oil) or any oil based product. Oil waste dumping, production,
pollution, and spills wreak havoc on the surrounding wildlife and habitat. It is in this
vein that geotechnical engineers are faced with increasing challenges as a result of oil
spills and hence the need for laboratory studies in order to develop methodologies for
testing, identification, classification, engineering behaviour, stabilization, utilization
and remediation technologies for such soils.
OCS could also be the waste product produced by cleaning up oil spills or due to oil
spillage. Left unattended, these soils pose a threat to human health and the
environment. Numerous remedial technologies are available to eliminate or
Ijimdiya and Igboro
710
significantly reduce the risk that OCS poses, such as: conversion of oily soil to road
base material or a topping layer for car parks and roads after mixing with aggregate or
a consolidation agent. Other methods include containment in large burial sites,
incineration, biological methods, absorption methods, soil washing methods, and
vacuum extraction. Most of these methods are expensive and uneconomical,
considering the large quantities of materials involved.
Lateritic soil as a soil group rather than well-defined materials is most commonly
found in the leached soils of the humid tropics where they were first studied. Lateritic
soils are formed under weathering systems productive of the process of laterization
(Wooltorton, 1975). The most important characterization is the decomposition of
ferro-aluminium silicate minerals and the permanent deposition of sesquioxide (i.e.,
oxides of iron and Aluminium - Fe2O3 and Al2O3) within the profile to form the
horizon of materials is known as laterite.
The term “laterization” describes the processes that produce laterite soils (Gidigasu,
and Kuma, 1987). Construction Industry Research and Information Association
(CIRIA, 1988) proposed the following definition for lateritic soils which states that
‘laterite in all its form is a highly weathered natural material formed by the
concentration of the hydrated oxides of iron and aluminium. This concentration may
be by residual accumulation or by solution, movement and chemical precipitation. For
the purpose of this study a modified definition is used which states that laterite is a
highly weathered material rich in secondary oxides of any of iron, aluminium,
manganese, or titanium (Ijimdiya, 2011).
The purpose of this study was to investigate the effect of used oil on the strength and
compressibility behavior of lateritic soils. Laboratory testing programme was carried
out on a reference soil- laterite taken from Shika – Zaria, Kaduna State, Nigeria. The
soil was contaminated with used motor oil at stepped concentrations of 0, 2, 4, 6 and 8
% by dry weight of soil (Al-Sanad et al., 1995). Similar researches were carried out
by Shin and Das (2001) on the bearing capacity of unsaturated oil-contaminated sand
in Kuwait. Shin and Das (2001) reported that the bearing capacity of oil-conatminated
sands drastically reduced.
During the last two decades, the results of a number of studies related to the physical
properties and behaviour of oil and petroleum contaminated soils have been published
(e.g., Al-Sanad et al., 1995; Aiban, 1997; Meegoda and Ratnaweera,1994;
Mohammed, 1995; Khamehchiyun, et al., 2006; Ijimdiya, 2007, 2010, 2011).
MATERIALS AND METHOD
Materials
Soil
The soil used in this study is a natural reddish brown laterite taken from a burrow pit
at Shika in Zaria (lat. 11o15N and long 7
o45
oE) or 0344054N and 1238202E UTM,
obtained using a global positioning system (GPS). It was collected as a disturbed
sample obtained at a depth of 0.5m below the ground. A study of the geological and
soil maps of Nigeria shows that the natural material obtained belongs to the group of
ferruginous tropical soils derived from acid igneous and metamorphic rocks (Osinubi,
1998a,b). The results of laboratory tests carried out on the natural and oil
contaminated soil samples are given in Tables 2 – 6.
The approach used in this study is that of artificial contamination of the soil with used
oil in the laboratory in agreement with other researchers (Al-Sanad, 1995 and Aiban
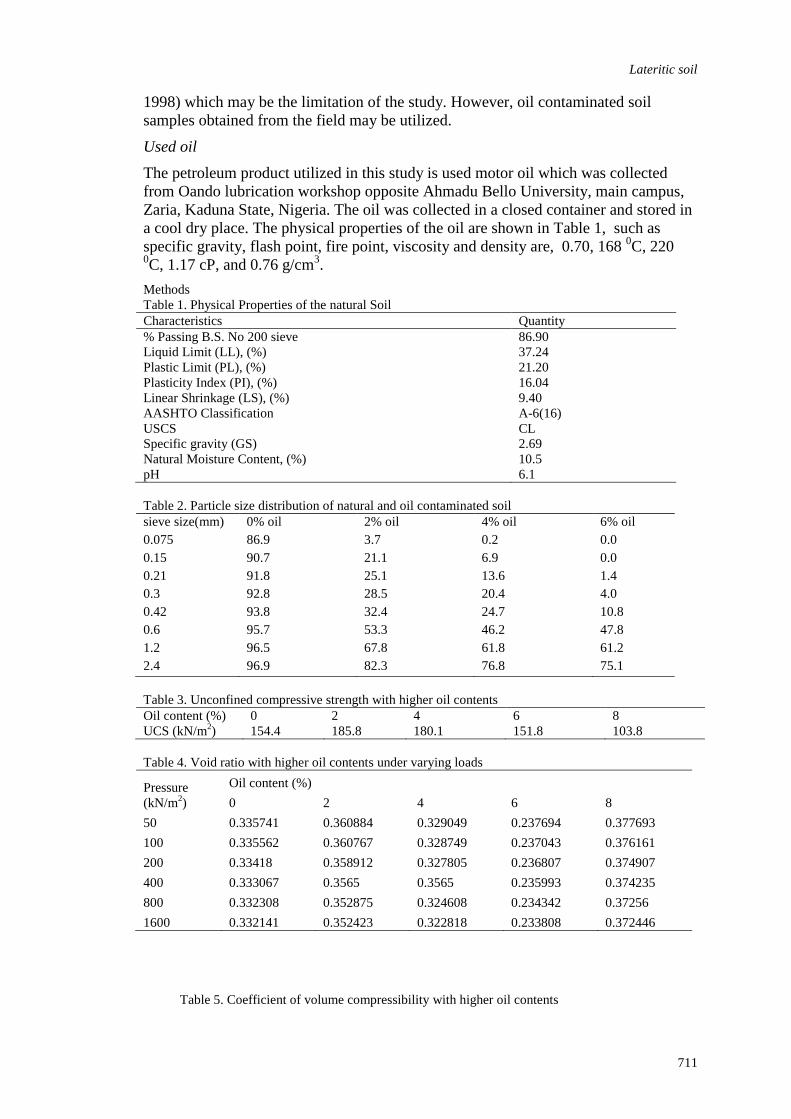
Lateritic soil
711
1998) which may be the limitation of the study. However, oil contaminated soil
samples obtained from the field may be utilized.
Used oil
The petroleum product utilized in this study is used motor oil which was collected
from Oando lubrication workshop opposite Ahmadu Bello University, main campus,
Zaria, Kaduna State, Nigeria. The oil was collected in a closed container and stored in
a cool dry place. The physical properties of the oil are shown in Table 1, such as
specific gravity, flash point, fire point, viscosity and density are, 0.70, 168 0C, 220
0C, 1.17 cP, and 0.76 g/cm
3.
Methods
Table 1. Physical Properties of the natural Soil
Characteristics Quantity
% Passing B.S. No 200 sieve
Liquid Limit (LL), (%)
Plastic Limit (PL), (%)
Plasticity Index (PI), (%)
Linear Shrinkage (LS), (%)
AASHTO Classification
USCS
Specific gravity (GS)
Natural Moisture Content, (%)
pH
86.90
37.24
21.20
16.04
9.40
A-6(16)
CL
2.69
10.5
6.1
Table 2. Particle size distribution of natural and oil contaminated soil
sieve size(mm) 0% oil 2% oil 4% oil 6% oil
0.075 86.9 3.7 0.2 0.0
0.15 90.7 21.1 6.9 0.0
0.21 91.8 25.1 13.6 1.4
0.3 92.8 28.5 20.4 4.0
0.42 93.8 32.4 24.7 10.8
0.6 95.7 53.3 46.2 47.8
1.2 96.5 67.8 61.8 61.2
2.4 96.9 82.3 76.8 75.1
Table 3. Unconfined compressive strength with higher oil contents
Oil content (%) 0 2 4 6 8
UCS (kN/m2) 154.4 185.8 180.1 151.8 103.8
Table 4. Void ratio with higher oil contents under varying loads
Pressure
(kN/m2)
Oil content (%)
0 2 4 6 8
50 0.335741 0.360884 0.329049 0.237694 0.377693
100 0.335562 0.360767 0.328749 0.237043 0.376161
200 0.33418 0.358912 0.327805 0.236807 0.374907
400 0.333067 0.3565 0.3565 0.235993 0.374235
800 0.332308 0.352875 0.324608 0.234342 0.37256
1600 0.332141 0.352423 0.322818 0.233808 0.372446
Table 5. Coefficient of volume compressibility with higher oil contents
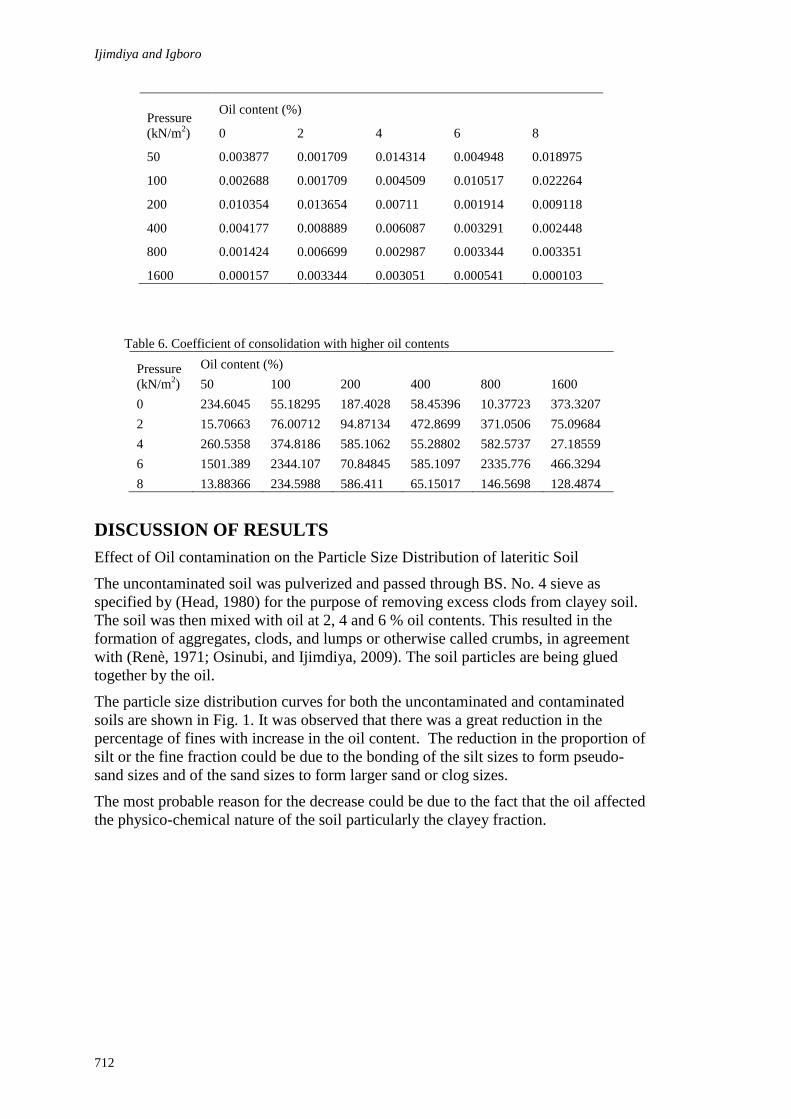
Ijimdiya and Igboro
712
Pressure
(kN/m2)
Oil content (%)
0 2 4 6 8
50 0.003877 0.001709 0.014314 0.004948 0.018975
100 0.002688 0.001709 0.004509 0.010517 0.022264
200 0.010354 0.013654 0.00711 0.001914 0.009118
400 0.004177 0.008889 0.006087 0.003291 0.002448
800 0.001424 0.006699 0.002987 0.003344 0.003351
1600 0.000157 0.003344 0.003051 0.000541 0.000103
Table 6. Coefficient of consolidation with higher oil contents
Pressure
(kN/m2)
Oil content (%)
50 100 200 400 800 1600
0 234.6045 55.18295 187.4028 58.45396 10.37723 373.3207
2 15.70663 76.00712 94.87134 472.8699 371.0506 75.09684
4 260.5358 374.8186 585.1062 55.28802 582.5737 27.18559
6 1501.389 2344.107 70.84845 585.1097 2335.776 466.3294
8 13.88366 234.5988 586.411 65.15017 146.5698 128.4874
DISCUSSION OF RESULTS
Effect of Oil contamination on the Particle Size Distribution of lateritic Soil
The uncontaminated soil was pulverized and passed through BS. No. 4 sieve as
specified by (Head, 1980) for the purpose of removing excess clods from clayey soil.
The soil was then mixed with oil at 2, 4 and 6 % oil contents. This resulted in the
formation of aggregates, clods, and lumps or otherwise called crumbs, in agreement
with (Renè, 1971; Osinubi, and Ijimdiya, 2009). The soil particles are being glued
together by the oil.
The particle size distribution curves for both the uncontaminated and contaminated
soils are shown in Fig. 1. It was observed that there was a great reduction in the
percentage of fines with increase in the oil content. The reduction in the proportion of
silt or the fine fraction could be due to the bonding of the silt sizes to form pseudo-
sand sizes and of the sand sizes to form larger sand or clog sizes.
The most probable reason for the decrease could be due to the fact that the oil affected
the physico-chemical nature of the soil particularly the clayey fraction.
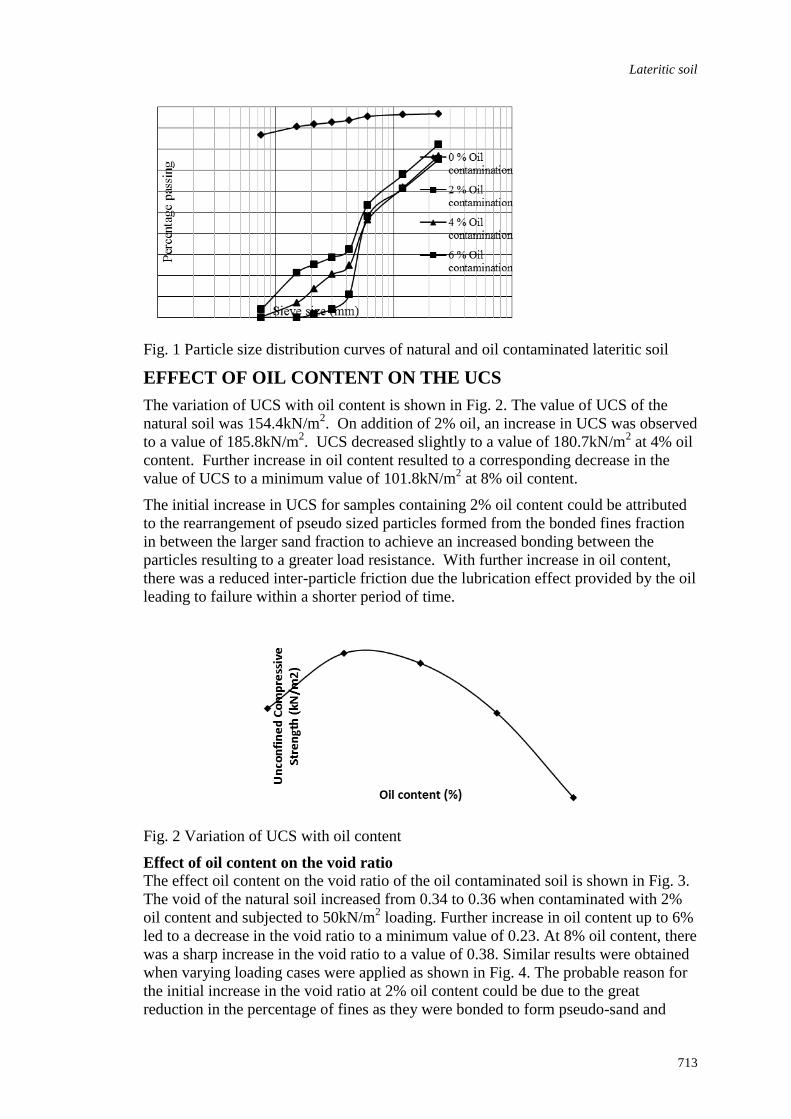
Lateritic soil
713
Fig. 1 Particle size distribution curves of natural and oil contaminated lateritic soil
EFFECT OF OIL CONTENT ON THE UCS
The variation of UCS with oil content is shown in Fig. 2. The value of UCS of the
natural soil was 154.4kN/m2. On addition of 2% oil, an increase in UCS was observed
to a value of 185.8kN/m2. UCS decreased slightly to a value of 180.7kN/m
2 at 4% oil
content. Further increase in oil content resulted to a corresponding decrease in the
value of UCS to a minimum value of 101.8kN/m2 at 8% oil content.
The initial increase in UCS for samples containing 2% oil content could be attributed
to the rearrangement of pseudo sized particles formed from the bonded fines fraction
in between the larger sand fraction to achieve an increased bonding between the
particles resulting to a greater load resistance. With further increase in oil content,
there was a reduced inter-particle friction due the lubrication effect provided by the oil
leading to failure within a shorter period of time.
Fig. 2 Variation of UCS with oil content
Effect of oil content on the void ratio
The effect oil content on the void ratio of the oil contaminated soil is shown in Fig. 3.
The void of the natural soil increased from 0.34 to 0.36 when contaminated with 2%
oil content and subjected to 50kN/m2 loading. Further increase in oil content up to 6%
led to a decrease in the void ratio to a minimum value of 0.23. At 8% oil content, there
was a sharp increase in the void ratio to a value of 0.38. Similar results were obtained
when varying loading cases were applied as shown in Fig. 4. The probable reason for
the initial increase in the void ratio at 2% oil content could be due to the great
reduction in the percentage of fines as they were bonded to form pseudo-sand and
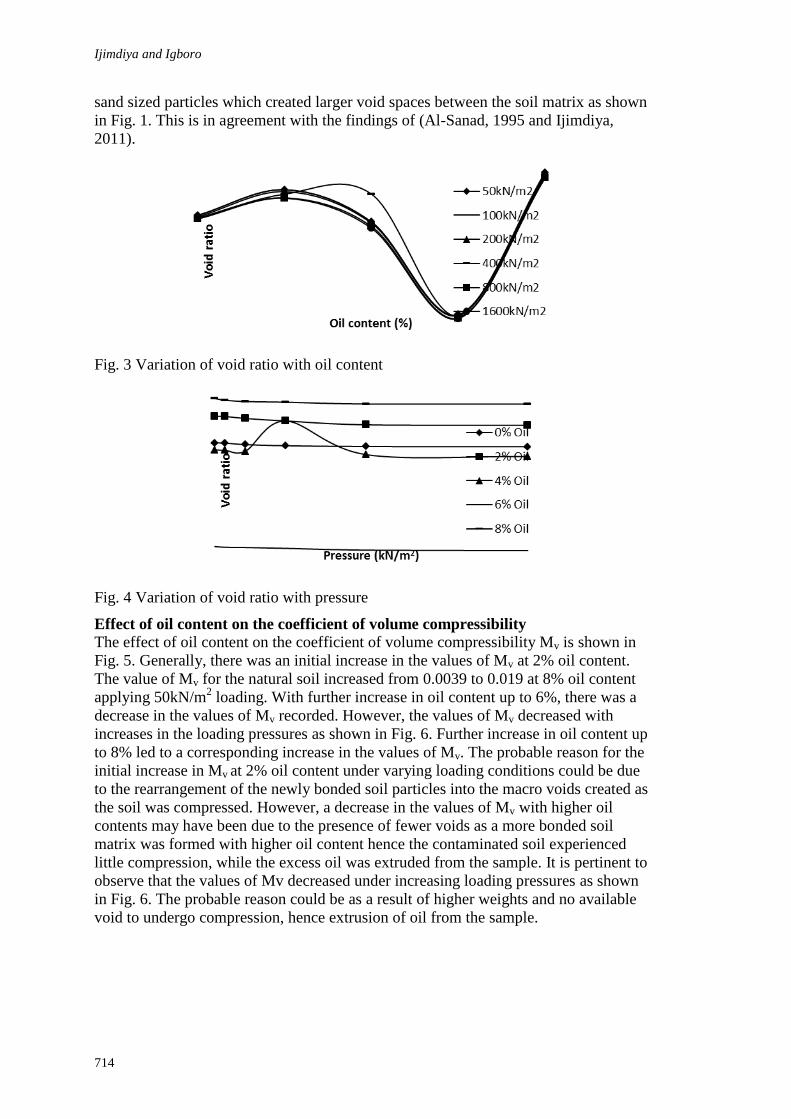
Ijimdiya and Igboro
714
sand sized particles which created larger void spaces between the soil matrix as shown
in Fig. 1. This is in agreement with the findings of (Al-Sanad, 1995 and Ijimdiya,
2011).
Fig. 3 Variation of void ratio with oil content
Fig. 4 Variation of void ratio with pressure
Effect of oil content on the coefficient of volume compressibility
The effect of oil content on the coefficient of volume compressibility Mv is shown in
Fig. 5. Generally, there was an initial increase in the values of Mv at 2% oil content.
The value of Mv for the natural soil increased from 0.0039 to 0.019 at 8% oil content
applying 50kN/m2 loading. With further increase in oil content up to 6%, there was a
decrease in the values of Mv recorded. However, the values of Mv decreased with
increases in the loading pressures as shown in Fig. 6. Further increase in oil content up
to 8% led to a corresponding increase in the values of Mv. The probable reason for the
initial increase in Mv at 2% oil content under varying loading conditions could be due
to the rearrangement of the newly bonded soil particles into the macro voids created as
the soil was compressed. However, a decrease in the values of Mv with higher oil
contents may have been due to the presence of fewer voids as a more bonded soil
matrix was formed with higher oil content hence the contaminated soil experienced
little compression, while the excess oil was extruded from the sample. It is pertinent to
observe that the values of Mv decreased under increasing loading pressures as shown
in Fig. 6. The probable reason could be as a result of higher weights and no available
void to undergo compression, hence extrusion of oil from the sample.
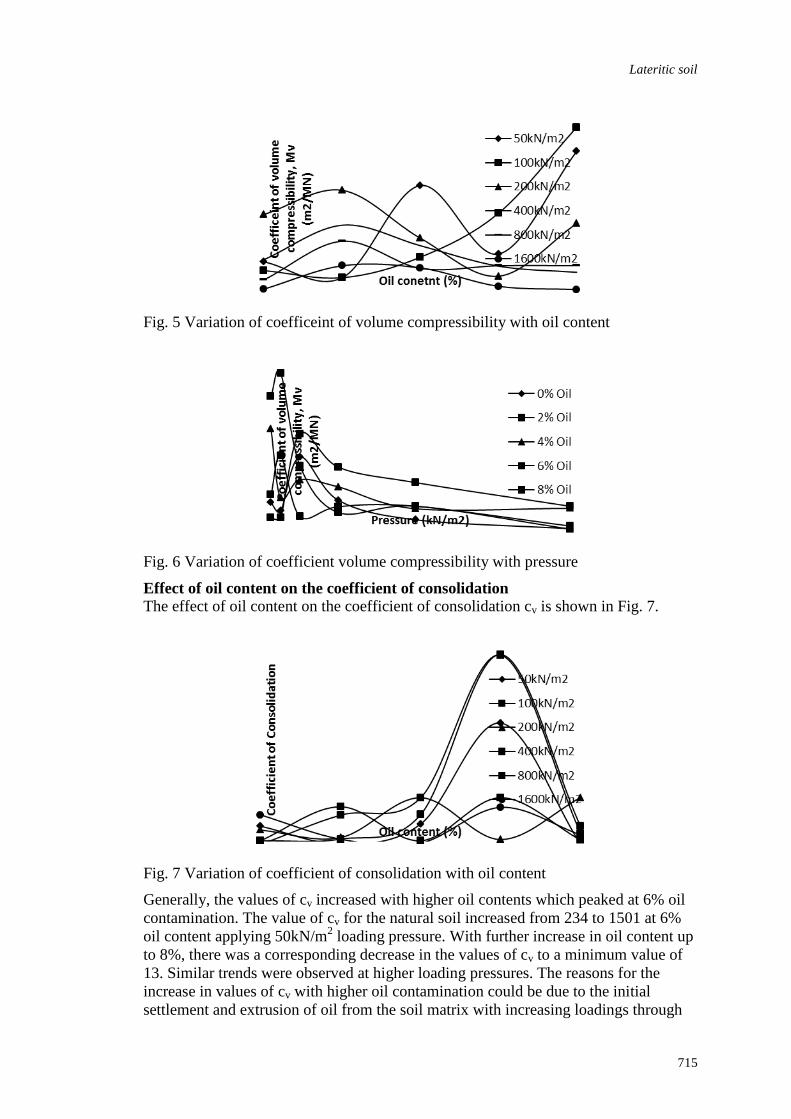
Lateritic soil
715
Fig. 5 Variation of coefficeint of volume compressibility with oil content
Fig. 6 Variation of coefficient volume compressibility with pressure
Effect of oil content on the coefficient of consolidation
The effect of oil content on the coefficient of consolidation cv is shown in Fig. 7.
Fig. 7 Variation of coefficient of consolidation with oil content
Generally, the values of cv increased with higher oil contents which peaked at 6% oil
contamination. The value of cv for the natural soil increased from 234 to 1501 at 6%
oil content applying 50kN/m2 loading pressure. With further increase in oil content up
to 8%, there was a corresponding decrease in the values of cv to a minimum value of
13. Similar trends were observed at higher loading pressures. The reasons for the
increase in values of cv with higher oil contamination could be due to the initial
settlement and extrusion of oil from the soil matrix with increasing loadings through
Ijimdiya and Igboro
716
the process of consolidation which is time dependent. However, at 8% oil content the
process of compressibility and consolidation occurred simultaneously as the excess oil
was extruded from the oil contaminated soil, hence lower values of cv were recorded.
CONCLUSION
Based on the results obtained from the investigation carried out the following
conclusions can be made:
The lateritic soil used is an A-6 or CL soil in AASHTO and USCS classification
systems, respectively.
The oil used has the following physical properties: specific gravity, flash point, fire
point, viscosity and density as, 0.70, 168 0C, 220 0C, 1.17 cP, and 0.76 g/cm3
respectively.
The natural soil had 86.9 % fines passing the BS sieve No. 200, with high plastic limit
and plasticity index.
There was great reduction in the amount of fines fraction with higher doses of oil by
dry weight of soil. The percentage of silt size fraction in the natural soil was 86.9 %
and this was reduced to 25.1, 13.6 and 1.4 % when contaminated with oil content at 2,
4 and 6 % oil contents by dry weight of soil, respectively.
Additionally, from the results of the study carried out, it was observed that the
presence of oil in the lateritic soil led to reduced values of UCS, void ratios and
increased values of volume compressibility, Mv, and coefficients of consolidation, cv.
The results clearly showed that oil contamination has serious negative influence on the
geotechnical properties of soils. Where these soils exists, they are not suitable for
engineering purposes and will require some remediation or stabilization processes in
order to improve the bearing capacity of the affected soil.
REFERENCES
Aiban, A. Saad (1997). “The effect of temperature on the engineering properties of oil-
contaminated sand. Environment International, Vol. 24, No.1/2, pp. 153-161, 1998.
Akintola F. A. (1982). “Geology and Geomorphology”. Nigeria in Maps, R.M. Barbours,
Editor, Hodder and Stoughton. London.
Alexander, L.T and Cady, J.G (1962). Genesis and hardening of Laterite soils US Department
of Agric. Technical Bulletin 1282 pp90.
Al-Sanad, H.A., Eid, W.K., and Ismael, N.F.(1995). “Geotechnical poperties of oil-
contaminated Kuwaiti sand.” Journal of Getech., Engrg., ASCE, Vol. 121, No. 5, pp.
407 – 412.
Areola, O. (1982). “Soils” In: Barbours K.M. (Editor) Nigeria in Maps, Hodder and
Stoughton, London.
Colorado Department of Public Health and Environment, (2003). Monitoring and
Removal or Treatment of Contaminated Soil.Colarado State.USA.
Construction Industry Research and Information Association (CIRIA) (1988). “Laterite in
road pavements.” Special publication 47, Transportation Road Research Laboratory,
London.
Euchun, C. S and Braja, M. D., (2001). Bearing capacity of unsaturated oil-contaminated
sand. International journal of Offshore and Polar Engineering, Vol. 11, No. 3, p. 1.
Lateritic soil
717
Evgin, E. and Das, B.M. (1992). “Mechanical behavior of an oil contaminated sand,” Envir.
Geotech., Proc., Mediterranean Conf., Usmen and Acar, eds., Balkema Publishers,
Rotterdam. The Netherlands, pp. 101 – 108.
Gidigasu, M.D. and Kuma, D.O.K. (1987). Geotechnical characterization of laterized
decomposed rocks for pavement construction in dry sub-humid environment. Proc. 6th
Southeast Asian Conf. on Soil Engineering, Taipei, Vol.1, pp. 493 – 506.
Head, K.H (1980). Manual of Soil Laboratory testing Vol. 1. Soil Classification and
Compaction. Pentech Press, London, Plymouth.
Ijimdiya, T.S. (2007). “Effect of Oil contamination on soil properties”. Book of Abstracts
5th Nigerian Material Congress, NIMACON 2007, November, Ile-Ife, Osun State.
Ijimdiya, T.S. (2010). “The effect of compactive effort on the compaction characteristics of
oil contaminated lateritic soils.” International Journal of Engineering (IJE). Vol. 4,
No. 4. Pp. 549 – 554.
Ijimdiya, T. S. (2011). “Effect of oil contamination on particle size distribution and plasticity
characteristics of lateritic soils.” Advanced Materials Research, Vol. 367, pp. 19.
http://www.scientific.net Trans Tech Publications. Switzerland.
Khamehchiyun, M., Charkhabi, A. H., and Tajik, M. (2006). “Effects of crude oil
contamination on geotechnical properties of clayey and sandy soils.” Journal of
Engineering Geology, Scienece Direct. Vol. 89, Issue 3 – 4, pp. 220 – 229.
Meegoda, N. J., and Ratnaweera, P. (1994). “ Compressibility of contaminated fine grained
soils.” Geotech. Testing Journal, Vol. 17, No. 1, pp. 101 – 112.
Mohammed, L.F. (1995). Performance and Persistence of oil binder in oil-stabilized Bahraini
soil. Proc. second regional conference of the ASCE-Saudi Arabia Section. Vol. I,
Beirut, Lebanon. Pp. 287-299. Svailable from: ASCE-SAS, Dharan 31311, Saudi
Arabia.
Osinubi, K. J. (1998a). “Influence of compactive efforts and compaction delays on lime-
treated soil.” Journal of Transportation Engineering. ASCE, Vol. 124, No. 2, pp. 149
– 155.
Osinubi, K. J. (1998b). “Permeability of lime – treated lateritic soil.” Journal of
Transportation Engineering. ASCE, Vol. 124, No. 5, pp. 465 – 469.
Osinubi, K.J. and Ijimdiya, T.S. (2009). Effect of Compactive Efforts on the Plasticity and
Strength Properties of Reconstituted laterite. Nigerian Society of Engineers, Technical
Transactions. Oct. – Dec. Vol. 44, No. 4. Pp. 1 – 14.
Renè F. Van Ganse (1971). “Immediate amelioration of wet cohesive soils by quicklime”.
Transportation and Research Record. Vol.5, pp.43 – 53.
Shin, E.C. and Das, M.D. (2001). “Bearing capacity of unsaturated oil-contaminated sand.
International Journal of Offshore and Polar Engineering, Vol. 11, No. 3.
Wooltorton, F.I.D (1975) Foreword of laterite soils Engineering by Gidigasu, M.D (1976),
Elsevier Scientific Publishing Company, New York: VII-XVII.


719
INDEX OF AUTHORS
A Abalaka, A E, 17
Abdul’Azeez, A D, 25
AbdulRazaq, M, 47
Abdulsalam, D, 473
Abeere-Inga, E, 413
Abubakar, A, 35
Achuenu, E, 55
Achuenu, S A, 55
Acquaye, A, 663
Adamu, N, 67
Adamu, N, 217
Adebisi, O S, 551
Adefemi, A, 67
Adegbehingbe, V O, 83
Adekunle, R A, 399
Ademeso, O, 99
Adeokun, C O, 109
Aduwo, E B, 653
Afeez, O S, 125
Agbede, O A, 177
Ahadzie,D K, 483
Ahiakwo, O, 133
Ahmed, U A, 25
Aigbavboa, C, 147
Ajadi, S B, 163
Ajagbe, W O, 177
Ajayi, A O, 619
Ajayi, M A, 191
Ajayi, O M, 203
Aje, I O, 563
Aka, A, 217
Akinluyi, M L, 377
Akinola, J A, 225
Akinradewo, O F, 329
Akinradewo, O F, 225
Aladeloba, E A, 237
Alao, T. O, 251
Alinaitwe, H, 263, 355
Ansah, S K, 275
Apeh, J A, 289
Arum, C, 299
Ashaolu, T A, 313
Awodele, O A, 329
Ayeni, D A, 345
Ayesiga, R, 355
Ayoade, A, 91
Ayoola, H A, 377
B Babatunde, A A, 91
Badu, E, 483
Bala, K, 677
Bamfo-Agyei, E, 275
Batagarawa, A, 389
Bello, V A, 551
Bello, W A, 399
Brown, N, 507
Buertey, J I T, 413
C Chukwu, K E, 367
D Dabara, I D, 427
Dadu, D W, 441
Dahiru, A, 451
Dahiru, D, 25, 463
Dahunsi, B I, 177
Danso, F O, 483
Dassah, E T, 495
E Ehoche, P E, 441
Ekwevugbe, T, 507
Emenike, A I, 521
Emmanuel O Fatoye, 575
Emuze, F A, 523
England, P E, 535
Ezeokoli, N B, 551
F Famakin, I O, 563
Fan, F, 507
Fasina, N, 99
G Gasu, M B, 619
Gora, K S, 441
Greenough, R, 663
H Halm, K E, 627
Hughes, W, 1
I Ibem, E O, 653
Ibn-Mohammed, T, 663
Ibrahim, A D, 47
Ibrahim, Y M, 47
Idiake, J E, 677
Igboro, T, 709
Ijaola, I, 687
Ijatuyi, O, 697
Ijimdiya, T S, 709
Isaacs-Sodeye, F, 589
K Kerali, A, 263
Khatib, J, 133
Kumi, T A, 413
L Lawal, A F, 377
M Mafimidiwo, B A, 203
Mati, A A, 473
N Nensok, M H, 67
Nensok, M H, 217
Ntsihlele, K, 523

720
O Odewande, A G, 427
Odoala, M C, 495
Ogunbode, E.O, 289
Ogunjumo, E A, 619
Ogunlana, S O, 329
Ogunsanmi, O E, 203
Okoli, O G, 17
Okorie, A, 427
Okunola, A S, 427
Ola-Adisa, E O, 495
Olajide, O A, 563
Olalusi, C A, 345
Olatunji, S O, 225
Oloke, D, 133
Olufemi, D, 125
Olurotimi, K, 91
Omole, F K, 191
Ozawa-Meida, L, 663
R Rugumayo, A, 355
S Salako, O A, 203
Saleh, Y M, 473
Semyalo, C, 263
Shakantu, W M, 523
Shehu, N, 463
Shika, A S, 473
Stanley, A M, 441
Suresh, S, 133
T Taiwo, A A, 697
Taylor, S, 663
Thwala, W, 147
U Uwadiegwu, B O, 367
W Windapo, A, 99
Y Yakub, A A, 535
Z Zubairu, I K, 25
Zubairu, S, 9
721
INDEX OF KEYWORDS
A Accra, 627
aesthetic standard, 83
aggregate, 217, 299
Akure, 191
appraisal technique, 367
architect, 607
architectural curriculum, 35
architectural theory, 495
architecture, 109, 495
artificial lighting, 473
B beautification, 345, 627
body of knowledge, 313
boundary, 589
building contractor, 483
building design, 697
building energy calculation, 389
building industry, 35
building information, 643
building project, 203
building structure, 25
built environment, 55
built environment professional, 83
C Cape Coast, 275
carbon dioxide, 507
cash flow, 47
cause, 91
certificate of occupancy, 237
characteristic, 217
client, 133
climate change, 521
coefficient of consolidation, 709
community development, 191
compressibility, 709
compressive, 463
compressive strength, 17, 177, 289, 299
computer simulation, 389
concrete, 177, 217, 463
construction industry, 67, 225, 483
construction Investment, 329
construction investment market, 329
construction process, 225
contaminated sand, 177
contingency, 413
contractor, 263, 687
crude oil, 177
culinary practice, 589
culture, 697
curing, 17
customization, 607
D date seed, 217
dead capital, 237
delay, 575
Delphi technique, 147
demand controlled,, 507
design, 203, 495
development, 91
discipline, 55
domestic, 109
domestic space, 589
drainage facility, 367
durability, 177, 217
E educator, 35
effect, 91
electricity consumption, 389
elevated temperature, 289
emission, 663
energy conservation, 389, 663
energy efficiency, 523
environmental improvement, 627
epistemic uncertainty, 413
estate surveyor and valuer, 427
evaluation, 463
F financial loss, 263
food, 589
forecast, 47
G Gain, 275
Ghana, 275, 483
glare index, 473
government policy, 237
grading, 251
green building, 523
greenery, 627
H heat minimization, 275
house owner, 607
housing, 377
housing development, 191
housing studies, 147
housing transformation, 83
hydration, 17
I Ibadan, 91
Ile-Ife, 109
illuminance, 473
impact, 203
indigenous firms, 677
indoor air quality, 507
industry, 133
infrastructure, 191
infrastructure regulatory system, 451
inspection, 367
inter-discipline, 313
K Kajuru, 441
722
L labour, 677
Lagos State, 687
land use Act, 237
landscaping, 345
laterite, 289
laterite-enhanced-brick, 619
lateritic soil, 709
lean construction, 133
Lesotho, 523
low cost housing, 619
low-income housing, 147
luminaire, 473
luxury, 521
M maintenance, 367
management, 677
mass housing, 607
mega city, 329
methodology, 147
mineral additive, 441
mix design, 251
model, 607
modelling, 643
modern architecture, 697
morph, 163
mud, 163
multi-discipline, 313
multi-skilling, 67
N necessity, 521
Niger delta, 535
Nigeria, 47, 345, 389, 451, 687
non-destructive test, 25
non-domestic building, 663
O occupancy, 507
occupational health, 483
Ogun state, 653
open space, 521
P packing density, 299
palace, 697
perception, 35
performance, 677
polar curve, 473
post-occupancy evaluation, 9
poverty, 619
practitioner, 35
private public partnerships, 355
procurement, 203, 451
productivity, 67, 677
professional, 55
professionalism, 313
project, 535, 575, 677
project risk, 643
public housing, 653
public infrastructure, 619
public private partnership, 329
public-private-partnership, 451, 653
pumice, 441
Q quality, 463
quality principle, 225
questionnaire, 523, 687
R rental value, 427
residential property, 427
residual strength, 289
risk, 203, 413
risk management, 687
rural development, 535
S safety, 483
sanitation service, 377
skin, 163
slum, 91
social space, 109
spatial, 109
specified strength, 251
spline, 163
stormwater, 367
strength, 463
structural integrity, 25
success factor, 355
sustainability, 9, 345
sustainable buildings, 9
sustainable construction, 523
sustainable development, 535
sustainable home, 191
systemic risk, 413
T technologists, 55
tenant, 427
texture, 163
time, 575
title, 237
total quality management, 225
traditional architecture, 697
U Uganda, 263, 355
uncertainty, 413
uncrushed aggregate, 251
urban, 521, 627
urban area, 653
urban slum, 427
V valuation, 313
ventilation, 507
W waste management, 377
waste minimization, 133
water supply, 377
work flow, 133
workability, 299