why people buy in organized retail store?
TRANSCRIPT
1 SIT Journal of Management Vol. 3. No. Special. November 2013. Pp. 1-10
Zia & Nuruzaman ISSN : 2278-9111
Why People Buy In Organized Retail Store?
Adil Zia* & Agha Nuruzzaman**
Abstract
Organized retail provides a new dimension to shopping activity. After liberalization in India in
1991, the retailers have shown a major shift in selling strategies. Accordingly, shoppers have
also shown more optimistic consumer behavior and are ready to welcome a wide array of new
mechanize. There are number of factors which motivate consumers to visit an organized store.
This paper is an attempt to unearth some important factors, for which shoppers visit an
organized store. This study uses Booms and Bitner’s 1981 extended marketing mix (7Ps) to
investigate factors for buying in an organized store. A judgmental sample of 97 college goers
from South Delhi was asked to participate in the survey. The two types of retail stores most
frequently named were food outlets and apparel retailers. The main reason to visit these stores
was largely based on product or service quality and price, but locality and the behavior of the
staff were also found to be significant.
Key Words: Organized Retail Store, Customer Preference, Product or Service Quality, Price,
Locality, Behavior
*Adil Zia, Assistant Professor, Dept. of Business Administration, Aligarh Muslim University,
Murshidabad Center, India E-mail: [email protected]; M:+91-9647674809
**Agha Nuruzzaman, Assistant Professor, Dept. of Business Administration, Aligarh Muslim University,
Murshidabad Center E-mail: [email protected]; M +91-9412545474
2 SIT Journal of Management Vol. 3. No. Special. November 2013. Pp. 1-10
Zia & Nuruzaman ISSN : 2278-9111
Introduction
The Indian retail industry is divided into organized and unorganized sectors. It is dominated by a
large number of small retailers consisting of the local kirana shops, owner-manned general
stores, chemists, footwear shops, apparel shops, paan and beedi shops, hand-cart hawkers,
pavement vendors, etc. which together make up the so-called “unorganized retail” or traditional
retail. These days’ consumers have witnessed the entry of a number of organized retailers
opening stores in various modern formats in metros and other important cities. Still, the overall
share of organized retailing in total retail business has remained low.
Organized retailing refers to trading activities undertaken by retailers in an organized way, they
follow certain principles. Further these organized retailers have well structured business
activities and well developed supply chain. Moreover there is departmentalization of business
activities like procurement, warehousing, distribution, sales, marketing, recruitment, etc. These
are mainly licensed retailers registered for sales tax, income tax, etc. These include the retail
chains, independent stores, corporate-backed hypermarkets and also the privately owned large
retail businesses etc.
The Indian retail sector accounts for over 20% of the country’s gross domestic product (GDP)
and contributes about 8% to total employment as reported by Price Waterhouse Cooupers, a
research agency in September 2012. The current estimated value of the Indian retail sector is
about 500 billion USD and is pegged to reach 1.3 trillion USD by 2020. The penetration level of
modern retail (currently 5-7 %) will increase six-fold from the current 27 billion USD to 220
billion USD in 2020.
Literature Review
There are researches to classify shopping into various basic types and most of the researches
have divided all shopping into four types. They are Recreational Shopping, List Shopping, Item
Shopping and Impulse Shopping. The categorization is based on planned vs. spontaneous nature
of shopping trip and the focused vs. open-ended nature of the purchases made as mentioned by
Narasimha, CEO, MASH Madsion Shopper Marketing.
3 SIT Journal of Management Vol. 3. No. Special. November 2013. Pp. 1-10
Zia & Nuruzaman ISSN : 2278-9111
Retailing studies have provided a great deal of knowledge about shop attributes, store
preferences and shopping satisfaction. Effective marketing-mix factors in retailing have been
identified and tested over the last few decades (e.g. Arnold et al., 1983; Bloemer & Odekerken-
Schröder, 2002; Hoffman & Turley, 2002). The multitude of variables can be grouped along a
continuum from the tangible/“hard” to the intangible/“soft” (e.g. Gilmore and Carson, 1993).
Yip, Chan & Poon (2012) in their study attempts to identify the common attributes of the
physical retail outlets favored by Hong Kong youths and to assess the relative importance of
“hard” and “soft” aspects of the retail marketing mix in appealing to this consumer segment.
They found that two types of shop most frequently named were food outlets and apparel retailers.
The attractiveness of these stores was mainly based on product or service quality and price, but
location and the behavior of the shop assistants were also cited as influential. Ranking as “my
favorite shop” was a combination of tangible qualities and intangible services.
According to Taylor & Cosenza (2002) Malaysia Generation Y adults love to visit the mall. They
visit the shopping mall very frequent at least 1 or 2 times a week. However, Generation Y adults
treat shopping mall activities as a social activity. They prefer hanging out with friends. Prior to
that, they follow and tag along with peers' opinion. As a result, their expenditure increases as
they shop with friends. They are also loyal customer that will constantly visit the same stores
each time they visit the shopping mall. Surprisingly, older Generation Y in Malaysia is not brand
conscious. Other than visiting some branded stores they do visit stores that provide them the
latest and updated trend.
Goswami & Mishra (2009) did a study on Would Indian consumers move from kirana stores to
organized retailers when shopping for groceries? In their study customer patronage to grocery
stores was found to be positively related to location, helpful, trustworthy salespeople, home
shopping, cleanliness, offers, quality and negatively related to travel convenience. Kiranas do
well on location but poorly on cleanliness, offers, quality, and helpful trustworthy salespeople.
The converse is true for organized retailers.
Zia, Akhtar, & Azam (2012) identified the key factors influencing the customers of organized
retail setup. It was found that two factors namely Execution related excellence and Problem
4 SIT Journal of Management Vol. 3. No. Special. November 2013. Pp. 1-10
Zia & Nuruzaman ISSN : 2278-9111
recovery have positive and significant impact where as one factor which is Expediting have
negative but insignificant impact on shopping experience under organized retail. Further, it was
concluded that pleasure found in shopping was first connected with tourism, the idea of the
leisurely spending of time, of going somewhere else, away from the spheres of home and work,
in order to be freed from duties and in order to enjoy oneself. Thus, despite consumers supposed
desire to nest or cocoon in their homes, shopping by catalog, phone or computer, brick-and-
mortar shopping still offers a unique appeal to many consumers and the opportunity to get out of
the house and experience a change of scene.
On the basis of above arguments and researches, following objectives were framed.
Objective
1. To find the type of retail store, shoppers like to visit in an organized retail setup.
2. To investigate the factors that attracts shoppers to an organized retail store.
Methodology
This study adopted a qualitative approach to identifying the attributes of college going
consumers’ reasons to visit an organized retail store. Retail stores were defined as physically
existing retail outlets in south Delhi. The data were collected in February 2013. Students from
Delhi University, South Campus in Delhi, India were selected. Sample of 97 respondents was
collected through a non-probability judgmental sampling technique where the researcher selects
units to be sampled based on their knowledge and professional judgment. Each respondent was
required to name retail store and the things they liked during that visit in past. The respondents
were then asked why they liked that particular shop or store, and to recall experiences related to
shopping there. No limit was set on the number of reasons provided. All participants were
required to share two experiences of their retail store, one for exterior layout and the other for a
specific element inside the shop that the respondent particularly liked.
Extension of the 4Ps - 7Ps Services Marketing Framework by Booms and Bitner
The 4Ps marketing mix which represents Product, Process, Pricing and Promotion, have been
most widely employed as a model for product marketing. It shows the company preparing an
5 SIT Journal of Management Vol. 3. No. Special. November 2013. Pp. 1-10
Zia & Nuruzaman ISSN : 2278-9111
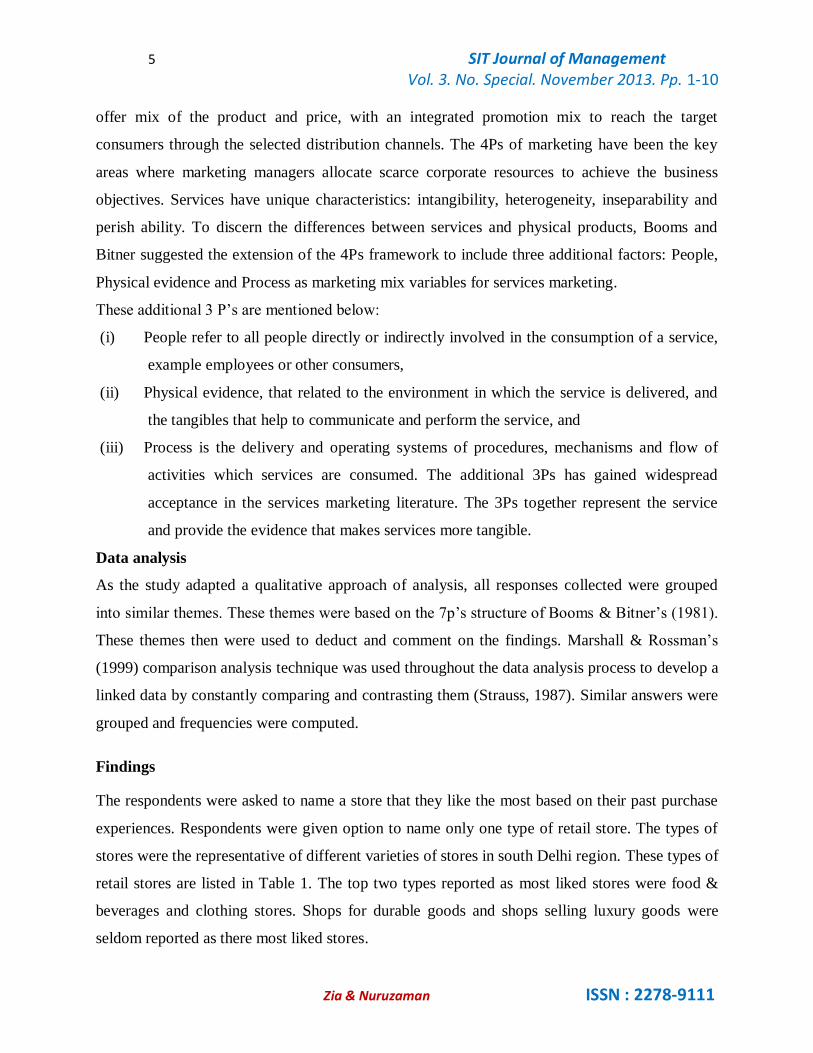
offer mix of the product and price, with an integrated promotion mix to reach the target
consumers through the selected distribution channels. The 4Ps of marketing have been the key
areas where marketing managers allocate scarce corporate resources to achieve the business
objectives. Services have unique characteristics: intangibility, heterogeneity, inseparability and
perish ability. To discern the differences between services and physical products, Booms and
Bitner suggested the extension of the 4Ps framework to include three additional factors: People,
Physical evidence and Process as marketing mix variables for services marketing.
These additional 3 P’s are mentioned below:
(i) People refer to all people directly or indirectly involved in the consumption of a service,
example employees or other consumers,
(ii) Physical evidence, that related to the environment in which the service is delivered, and
the tangibles that help to communicate and perform the service, and
(iii) Process is the delivery and operating systems of procedures, mechanisms and flow of
activities which services are consumed. The additional 3Ps has gained widespread
acceptance in the services marketing literature. The 3Ps together represent the service
and provide the evidence that makes services more tangible.
Data analysis
As the study adapted a qualitative approach of analysis, all responses collected were grouped
into similar themes. These themes were based on the 7p’s structure of Booms & Bitner’s (1981).
These themes then were used to deduct and comment on the findings. Marshall & Rossman’s
(1999) comparison analysis technique was used throughout the data analysis process to develop a
linked data by constantly comparing and contrasting them (Strauss, 1987). Similar answers were
grouped and frequencies were computed.
Findings
The respondents were asked to name a store that they like the most based on their past purchase
experiences. Respondents were given option to name only one type of retail store. The types of
stores were the representative of different varieties of stores in south Delhi region. These types of
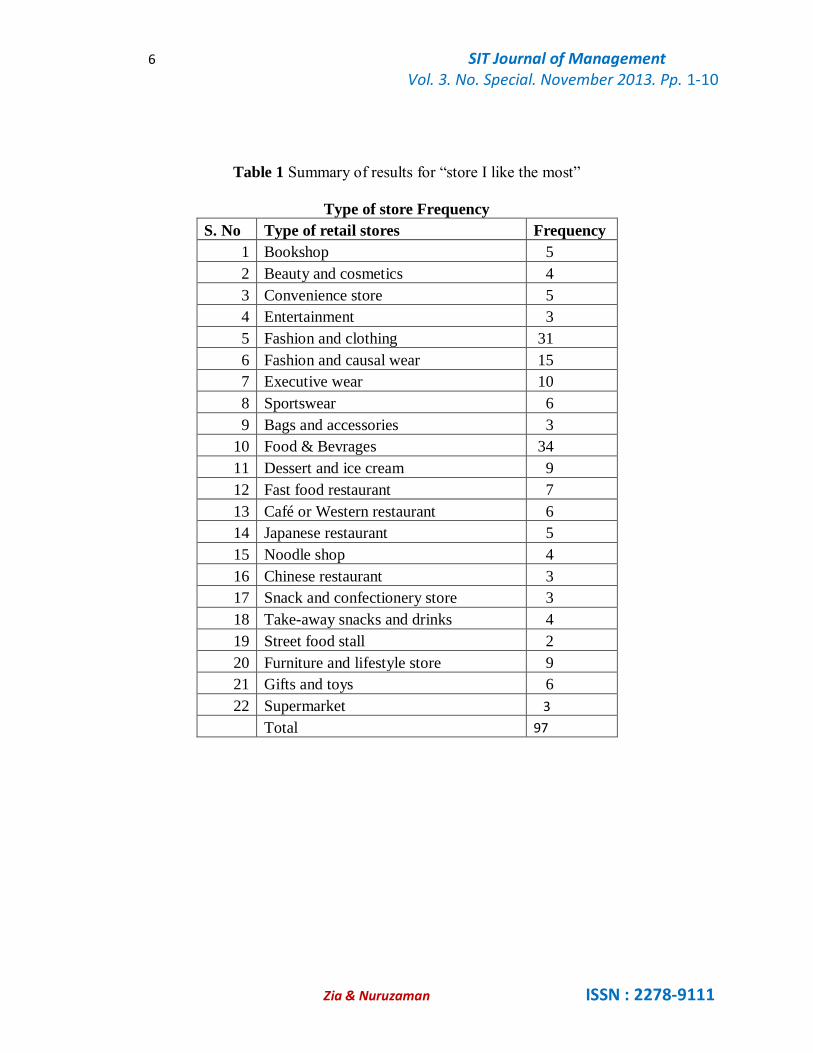
retail stores are listed in Table 1. The top two types reported as most liked stores were food &
beverages and clothing stores. Shops for durable goods and shops selling luxury goods were
seldom reported as there most liked stores.
6 SIT Journal of Management Vol. 3. No. Special. November 2013. Pp. 1-10
Zia & Nuruzaman ISSN : 2278-9111
Table 1 Summary of results for “store I like the most”
Type of store Frequency
S. No Type of retail stores Frequency
1 Bookshop 5
2 Beauty and cosmetics 4
3 Convenience store 5
4 Entertainment 3
5 Fashion and clothing 31
6 Fashion and causal wear 15
7 Executive wear 10
8 Sportswear 6
9 Bags and accessories 3
10 Food & Bevrages 34
11 Dessert and ice cream 9
12 Fast food restaurant 7
13 Café or Western restaurant 6
14 Japanese restaurant 5
15 Noodle shop 4
16 Chinese restaurant 3
17 Snack and confectionery store 3
18 Take-away snacks and drinks 4
19 Street food stall 2
20 Furniture and lifestyle store 9
21 Gifts and toys 6
22 Supermarket 3
Total 97
7 SIT Journal of Management Vol. 3. No. Special. November 2013. Pp. 1-10
Zia & Nuruzaman ISSN : 2278-9111
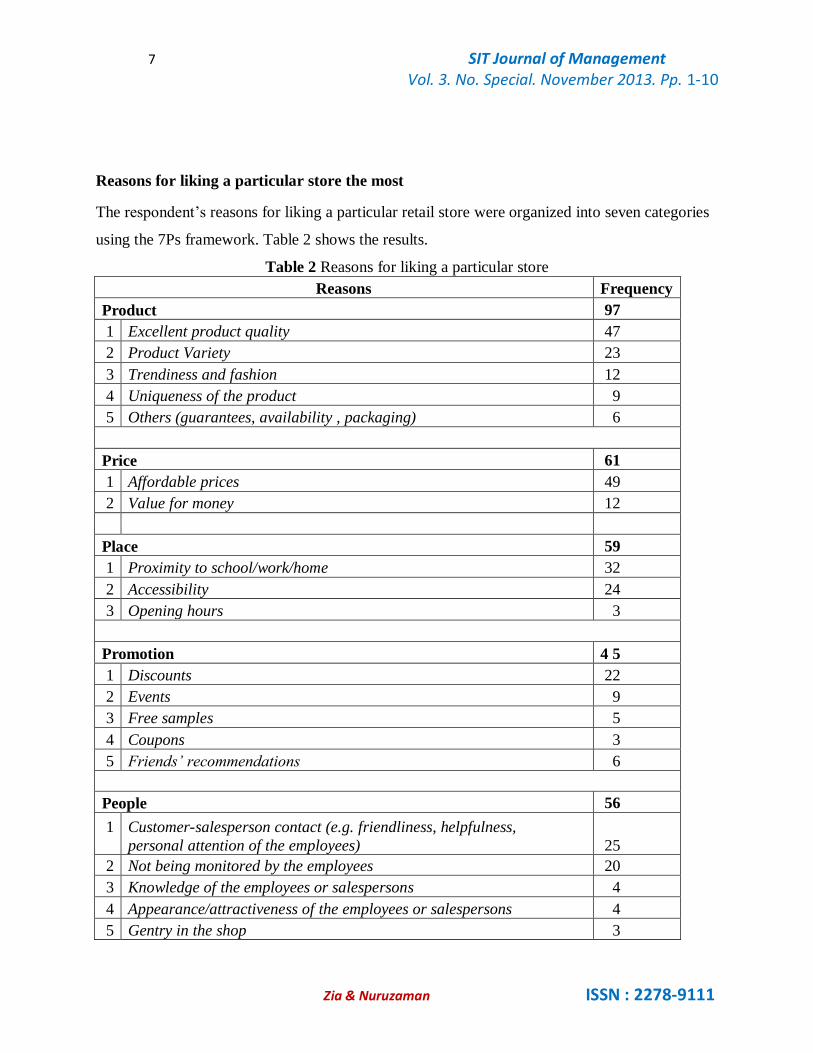
Reasons for liking a particular store the most
The respondent’s reasons for liking a particular retail store were organized into seven categories
using the 7Ps framework. Table 2 shows the results.
Table 2 Reasons for liking a particular store
Reasons Frequency
Product 97
1 Excellent product quality 47
2 Product Variety 23
3 Trendiness and fashion 12
4 Uniqueness of the product 9
5 Others (guarantees, availability , packaging) 6
Price 61
1 Affordable prices 49
2 Value for money 12
Place 59
1 Proximity to school/work/home 32
2 Accessibility 24
3 Opening hours 3
Promotion 4 5
1 Discounts 22
2 Events 9
3 Free samples 5
4 Coupons 3
5 Friends’ recommendations 6
People 56
1
Customer-salesperson contact (e.g. friendliness, helpfulness,
personal attention of the employees)
25
2 Not being monitored by the employees 20
3 Knowledge of the employees or salespersons 4
4 Appearance/attractiveness of the employees or salespersons 4
5 Gentry in the shop 3
8 SIT Journal of Management Vol. 3. No. Special. November 2013. Pp. 1-10
Zia & Nuruzaman ISSN : 2278-9111
Process 24
1 Free to stay as long as I wish 16
2 Efficiency 6
3 Self-help service format 2
Physical evidence 92
1 Attractive decor and color scheme 32
2 Cozy setting 24
3 Attractive window display and organized interior layout 11
4 Atmospherics (air-conditioning, background music, lighting) 10
5 Clean and tidy environment 8
6 Spacious environment 7
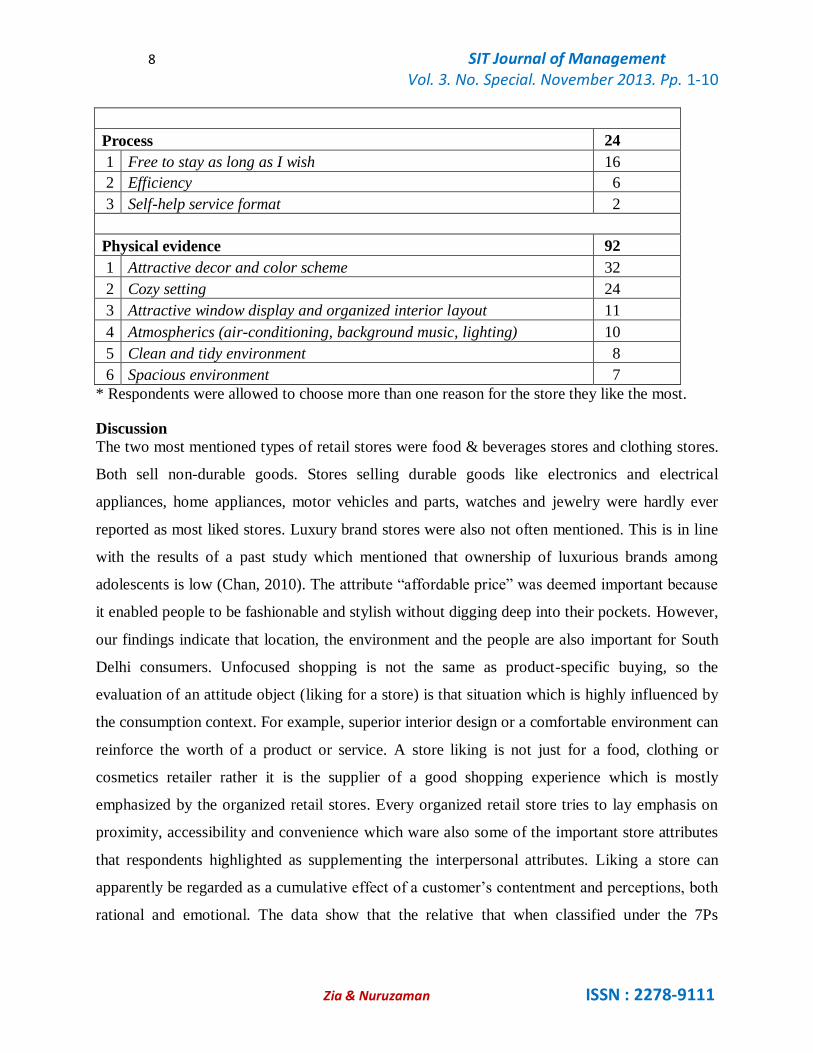
* Respondents were allowed to choose more than one reason for the store they like the most.
Discussion
The two most mentioned types of retail stores were food & beverages stores and clothing stores.
Both sell non-durable goods. Stores selling durable goods like electronics and electrical
appliances, home appliances, motor vehicles and parts, watches and jewelry were hardly ever
reported as most liked stores. Luxury brand stores were also not often mentioned. This is in line
with the results of a past study which mentioned that ownership of luxurious brands among
adolescents is low (Chan, 2010). The attribute “affordable price” was deemed important because
it enabled people to be fashionable and stylish without digging deep into their pockets. However,
our findings indicate that location, the environment and the people are also important for South
Delhi consumers. Unfocused shopping is not the same as product-specific buying, so the
evaluation of an attitude object (liking for a store) is that situation which is highly influenced by
the consumption context. For example, superior interior design or a comfortable environment can
reinforce the worth of a product or service. A store liking is not just for a food, clothing or
cosmetics retailer rather it is the supplier of a good shopping experience which is mostly
emphasized by the organized retail stores. Every organized retail store tries to lay emphasis on
proximity, accessibility and convenience which ware also some of the important store attributes
that respondents highlighted as supplementing the interpersonal attributes. Liking a store can
apparently be regarded as a cumulative effect of a customer’s contentment and perceptions, both
rational and emotional. The data show that the relative that when classified under the 7Ps
9 SIT Journal of Management Vol. 3. No. Special. November 2013. Pp. 1-10
Zia & Nuruzaman ISSN : 2278-9111
framework, the attributes seem separate in the analysis, but they are in fact interrelated and
interdependent.
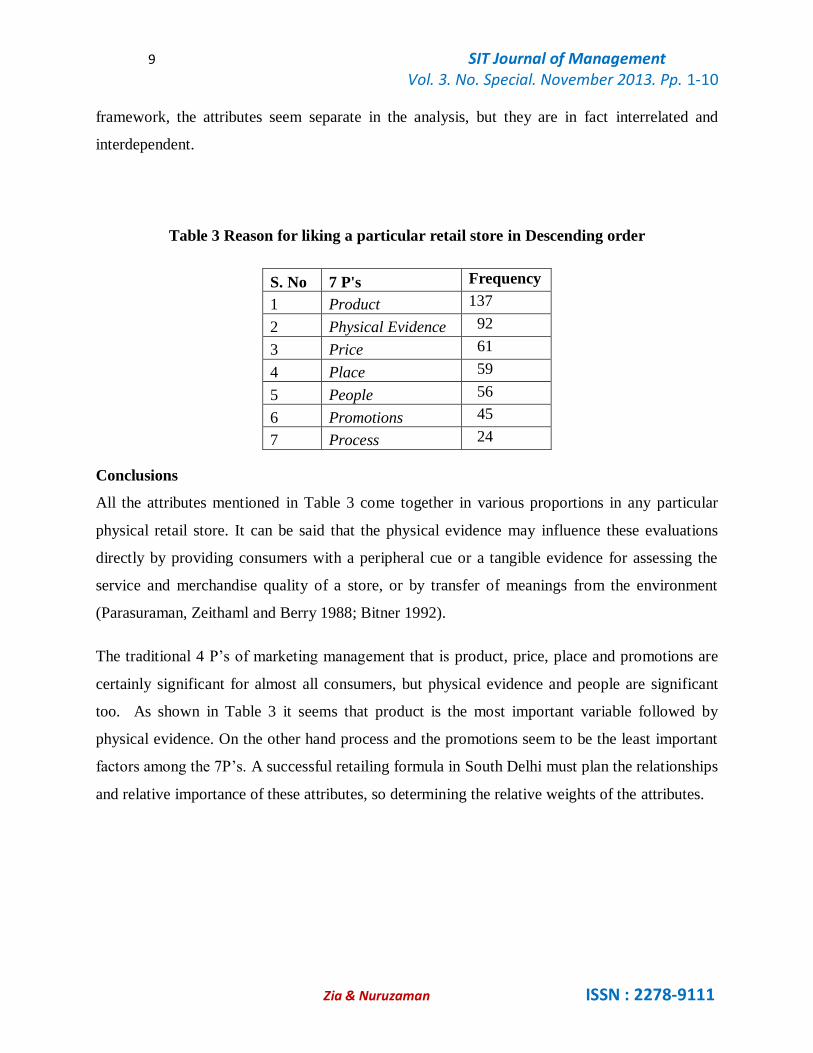
Table 3 Reason for liking a particular retail store in Descending order
S. No 7 P's Frequency
1 Product 137
2 Physical Evidence 92
3 Price 61
4 Place 59
5 People 56
6 Promotions 45
7 Process 24
Conclusions
All the attributes mentioned in Table 3 come together in various proportions in any particular
physical retail store. It can be said that the physical evidence may influence these evaluations
directly by providing consumers with a peripheral cue or a tangible evidence for assessing the
service and merchandise quality of a store, or by transfer of meanings from the environment
(Parasuraman, Zeithaml and Berry 1988; Bitner 1992).
The traditional 4 P’s of marketing management that is product, price, place and promotions are
certainly significant for almost all consumers, but physical evidence and people are significant
too. As shown in Table 3 it seems that product is the most important variable followed by
physical evidence. On the other hand process and the promotions seem to be the least important
factors among the 7P’s. A successful retailing formula in South Delhi must plan the relationships
and relative importance of these attributes, so determining the relative weights of the attributes.
10 SIT Journal of Management Vol. 3. No. Special. November 2013. Pp. 1-10
Zia & Nuruzaman ISSN : 2278-9111
Reference:
Arnold, S.J., Oum, T.H. & Tigert, D.J. (1983), “Determinant attributes in retail patronage:
Seasonal, temporal and international comparisons”, Journal of Marketing Research, Vol. 20(2),
pp. 149-57.
Bitner, Mary J. (1992), "Servicescapes: The Impact of Physical Surroundings on Customer and
Employees," Journal of Marketing, 56 (April), 57-71.
Bloemer, J. & Odekerken-Schröder, G. (2002), “Store satisfaction and store loyalty explained by
customer- and store-related factors”, Journal of Consumer Satisfaction, Dissatisfaction and
Complaining Behavior, Vol. 15, pp. 68-80.
Booms, B.H. & Bitner, M.J. (1981), “Marketing strategies and organization structures for service
firms, in Marketing of Services”, J. Donnelly and W.R. George (eds.), American Marketing
Association.
Chan, K. (2010), “Youth and Consumption”, City University of Hong Kong Press, Hong Kong.
Goswami, P. & Mishra, M. S. (2009), “Would Indian Consumers Move from Kirana Stores to
Organized Retailers When Shopping for Groceries?”, Asia Pacific Journal of Marketing and
Logistics, Vol. 21(1), 127-143.
Hoffman, D.K. & Turley, L.W. (2002), “Atmospherics, service encounters and consumer
decision making: An integrative perspective”, Journal of Marketing Theory and Practice, Vol.
10 No.3, pp. 33–48.
Marshall, C., & Rossman, G. (1999), “Designing qualitative research”, (3rd ed.). Thousand
Oaks, CA: Sage.
Parasuraman, A., Valerie A. Zeithaml, & Leonard L. Berry (1988), "SERVQUAL: A Multiple-
Item Scale for Measuring Consumer Perceptions of Service Quality," Journal of Retailing, 64
(1), 12-46.
Strauss, A. (1987), “Qualitative analysis for social scientists”, New York: Cambridge University
Press.
Taylor, S. L., & Cosenza, R. M. (2002), “Profiling later aged female teens: mall shopping
behavior and clothing choice”, Journal of Consumer Marketing, Vol. 19 (5), pp. 393-408.
Yip, T., Chan, K. & Poon, E. (2012), “Attributes of young consumers’ favorite retail shops: A
qualitative study”, Journal of Consumer Marketing, Vol.29 (7), pp. 545-552.
Zia, A., Akhtar, A. & Azam, M. K. (2012), “Factors Influencing Shopping Experience In
Organized Retailing: An Empirical Investigation”, South Asian Journal of Marketing &
Management Research, Vol. 2, pp. 138-152.