why do biologists use so many diagrams.3.1.a
TRANSCRIPT
To be presented at the biennial meeting of the Philosophy of Science Association, November 2012, and then published in revised form in Philosophy of Science
Why do biologists use so many diagrams?
Benjamin Sheredos, Daniel C. Burnston, Adele Abrahamsen
and William Bechtel University of California, San Diego
Abstract
Diagrams have distinctive characteristics that make them an effective medium for communicating research findings, but they are even more impressive as tools for scientific reasoning. Focusing on circadian rhythm research in biology to explore these roles, we examine diagrammatic formats that have been devised (a) to identify and illuminate circadian phenomena and (b) to develop and modify mechanistic explanations of these phenomena.
1. Prevalence and importance of diagrams in biology If you walk into a talk and do not know beforehand whether it is a philosophy or biology talk, a glance at the speaker’s slides will provide the answer. Philosophers favor text, whereas biologists shoehorn multiple images and diagrams into most of their slides. Likewise, if you attend a philosophy reading group or a biology journal club you can readily identify a major difference. Instead of verbally laying out the argument of the paper under study, the presenter in a journal club conveys hypotheses, methods, and results largely by working through diagrams from the paper. This reflects a more fundamental contrast between philosophers and biologists: their affinity for text versus diagrams is not just a matter of how they communicate once their work is done, but shapes every stage of inquiry. Whereas philosophers construct, evaluate, and revise arguments, and in doing so construct and revise sentences that convey the arguments, biologists seek to characterize phenomena in nature and to discover the mechanisms responsible for them. Diagrams are essential tools for biologists as they put forward, evaluate, and revise their accounts of phenomena and mechanisms. Diagrams play these roles in science more generally, but we have chosen to focus on biology – in particular, on the research topic of circadian rhythms – to begin to get traction on this understudied aspect of the scientific process. Circadian rhythms are oscillations in organisms with an approximately 24-‐hour cycle (circa = about + dies = day). They are endogenously generated but entrained to the day-‐night cycle in specific locales at different times of the year. They have been identified in numerous organisms—not only animals but also plants, fungi, and even cyanobacteria—and characterize a vast array of physiological processes (e.g., basic metabolism and body temperature) and behaviors (e.g., locomotion, sleep, and responding to stimuli). 2. Diagrams and mechanistic explanation Diagrams play a central role in biology because they are highly suited to two key tasks: (1) displaying phenomena at various levels of detail, and (2) constructing mechanistic explanations for those phenomena., Philosophers of biology have increased their attention
Sheredos, Burnston, Abrahamsen, and Bechtel p. 2
to those tasks over the last two decades, construing mechanisms as systems that produce a phenomenon of interest by means of the organized and coordinated operations performed by their parts (Bechtel and Richardson 1993/2010; Bechtel and Abrahamsen 2005; Machamer, Darden, and Craver 2000). To advance a mechanistic explanation, biologists must characterize the phenomenon of interest (e.g., circadian oscillations in activity), identify the mechanism they take to be responsible (e.g., a molecular “clock”), decompose it into its parts and operations, and recompose it (conceptually, physically, or mathematically) to show that the coordinated performance of these operations does indeed generate the phenomenon. Early in the discovery process scientists may identify only a few parts and operations, and hypothesize a relatively simple mechanism that can be recomposed by mentally imagining a short sequence or cycle of operations (e.g., a single gene expression feedback loop was initially posited for the molecular clock). At least in biology, further research generally uncovers additional parts and operations with complex organization and dynamics (e.g., multiple interacting feedback mechanisms constituting the overall molecular clock mechanism). While a simple mechanistic account might be presented linguistically in the form of a narrative about how each part in succession performs its operation, diagrams generally provide particularly useful representational formats for conceptualizing and reasoning about mechanisms.1 By displaying just a few common graphical elements in two dimensions, a diagram can visually depict a phenomenon or the organized parts and operations of an explanatory mechanism (Bechtel and Abrahamsen 2005; Perini 2005). Available elements include labels, line drawings, iconic symbols, noniconic symbols ( shapes, colors), and – the device most often used for operations – various styles of arrows. The spatial arrangement of these elements can convey spatial, temporal, or functional relations that help characterize a phenomenon or mechanism. Deploying our spatial cognition on diagrams has certain advantages over language-‐based reasoning in constructing mechanistic explanations. Notably, scientists can mentally animate (Hegarty 2004) a static diagram to simulate the succession of operations by which a simple sequential mechanism produces a phenomenon. Simultaneous operations are more challenging.2 The primary role of diagrams for scientists is not to provide a visual format for communicating the phenomena discovered or the mechanistic accounts that explain them. Rather, diagrams of mechanisms are comparable to the plans a designer develops before 1 Defining and classifying diagrams is beyond the scope of this paper; therefore, we focus on clear exemplars and set aside such formats as micrographs and animations. 2 As researchers recognize the complicated interaction of components in a mechanism and the complex dynamics emerging from multiple simultaneous operations, they often turn to computational modeling and the tools of dynamic systems analysis to understand how the mechanism will behave, giving rise to what Bechtel and Abrahamsen (2011) characterize as dynamic mechanistic explanations. Jones and Wolkenhauer (in press) provide a valuable account of how diagrams contribute to the construction of such computational models. It is also worth noting that linguistic reasoning has its own advantages. We would posit that the more complex the mechanism, the more beneficial is a coordinated deployment of linguistic, diagrammatic and computational resources.
Sheredos, Burnston, Abrahamsen, and Bechtel p. 3
building a new machine. These are used not just to tell those actually constructing the machine how to make it; they also figure in the design process. Before producing the final plans, the designer tries out different designs and evaluates whether they are likely to result in a working and efficient machine. Often the initial sketches of these plans reveal serious problems that must be overcome, resulting in revisions to the plans. The biologist is not creating the machine (except in fields such as synthetic biology), but is trying to reverse engineer it. Still, she needs to go through many of the same processes as a designer—sketching an initial diagram, identifying ways in which it is inadequate, and modifying the diagram repeatedly until it is judged a satisfactory mechanistic account of the targeted phenomenon. Moreover, the biologist wants to end up not merely with some possible mechanism capable of producing the phenomenon, but rather with the one actually present in the biological system. In what follows, we will examine how diagrams are put to work in biology, focusing on two key tasks: delineating phenomena, and constructing mechanistic accounts to explain them. 3. Diagrams to delineate the phenomenon An initial delineation of the phenomenon to be explained is a crucial step in mechanistic research. This remains true even if, in the course of discovering the mechanism, researchers revise their understanding of the phenomenon. Many philosophical accounts of mechanistic explanation have focused on linguistic descriptions of phenomena (e.g., “in fermentation, sugar is converted into alcohol and carbon dioxide by means of a series of intermediate reactions within yeast cells”). However, scientists focus much of their effort on obtaining much more specific, often quantitative, accounts of phenomena. Numerical data involved in characterizing a phenomenon may be presented in tables. As Bogen and Woodward (1988) made clear, however, explanations are directed not at the data but rather at the pattern extracted from the data—the phenomenon. Some data patterns can be captured in one or a few equations, such as the logarithmic function relating stimulus intensity (e.g., amplitude of a tone) to the sensation evoked (e.g., perceived loudness). By plotting these values on a graph, the phenomenon of a nonlinear relation between amplitude and loudness is immediately evident. The graph takes advantage of spatial cognition, whereas the logrithmic equation makes explicit a very precise claim that can and has been challenged (e.g., by those who argue for a power function). Scientists move deftly between linguistic descriptions, diagrams, and equations when all are available, using each to its best advantage. Diagrams are especially useful for thinking about dynamic phenomena – patterns of change over time. Circadian phenomena are dynamic, so diagrams conveying them generally incorporate time in some way (as the abscissa on a line graph, as the order of arrows in a sketch of a mechanism, as points along the trajectory in a state space, etc.). Moreover, research on circadian oscillations often targets the interaction between endogenous control (by an internal clock) and exogenous timing cues, commonly referred to as Zeitgebers. Hence, what was needed was a way of diagramming the activity of an organism, such as a mouse running on a wheel, that revealed at a glance its rhythmicity and the impact of Zeitgebers.
Sheredos, Burnston, Abrahamsen, and Bechtel p. 4
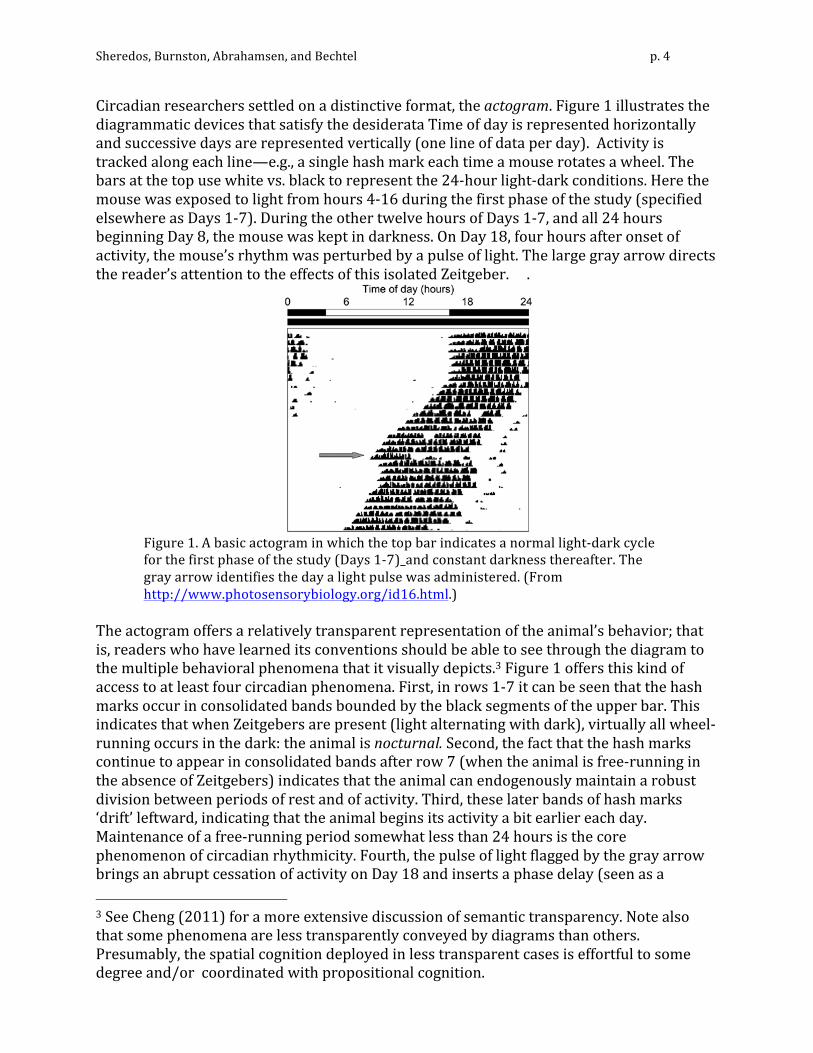
Circadian researchers settled on a distinctive format, the actogram. Figure 1 illustrates the diagrammatic devices that satisfy the desiderata Time of day is represented horizontally and successive days are represented vertically (one line of data per day). Activity is tracked along each line—e.g., a single hash mark each time a mouse rotates a wheel. The bars at the top use white vs. black to represent the 24-‐hour light-‐dark conditions. Here the mouse was exposed to light from hours 4-‐16 during the first phase of the study (specified elsewhere as Days 1-‐7). During the other twelve hours of Days 1-‐7, and all 24 hours beginning Day 8, the mouse was kept in darkness. On Day 18, four hours after onset of activity, the mouse’s rhythm was perturbed by a pulse of light. The large gray arrow directs the reader’s attention to the effects of this isolated Zeitgeber. .
Figure 1. A basic actogram in which the top bar indicates a normal light-‐dark cycle for the first phase of the study (Days 1-‐7)_and constant darkness thereafter. The gray arrow identifies the day a light pulse was administered. (From http://www.photosensorybiology.org/id16.html.)
The actogram offers a relatively transparent representation of the animal’s behavior; that is, readers who have learned its conventions should be able to see through the diagram to the multiple behavioral phenomena that it visually depicts.3 Figure 1 offers this kind of access to at least four circadian phenomena. First, in rows 1-‐7 it can be seen that the hash marks occur in consolidated bands bounded by the black segments of the upper bar. This indicates that when Zeitgebers are present (light alternating with dark), virtually all wheel-‐running occurs in the dark: the animal is nocturnal. Second, the fact that the hash marks continue to appear in consolidated bands after row 7 (when the animal is free-‐running in the absence of Zeitgebers) indicates that the animal can endogenously maintain a robust division between periods of rest and of activity. Third, these later bands of hash marks ‘drift’ leftward, indicating that the animal begins its activity a bit earlier each day. Maintenance of a free-‐running period somewhat less than 24 hours is the core phenomenon of circadian rhythmicity. Fourth, the pulse of light flagged by the gray arrow brings an abrupt cessation of activity on Day 18 and inserts a phase delay (seen as a 3 See Cheng (2011) for a more extensive discussion of semantic transparency. Note also that some phenomena are less transparently conveyed by diagrams than others. Presumably, the spatial cognition deployed in less transparent cases is effortful to some degree and/or coordinated with propositional cognition.
Sheredos, Burnston, Abrahamsen, and Bechtel p. 5
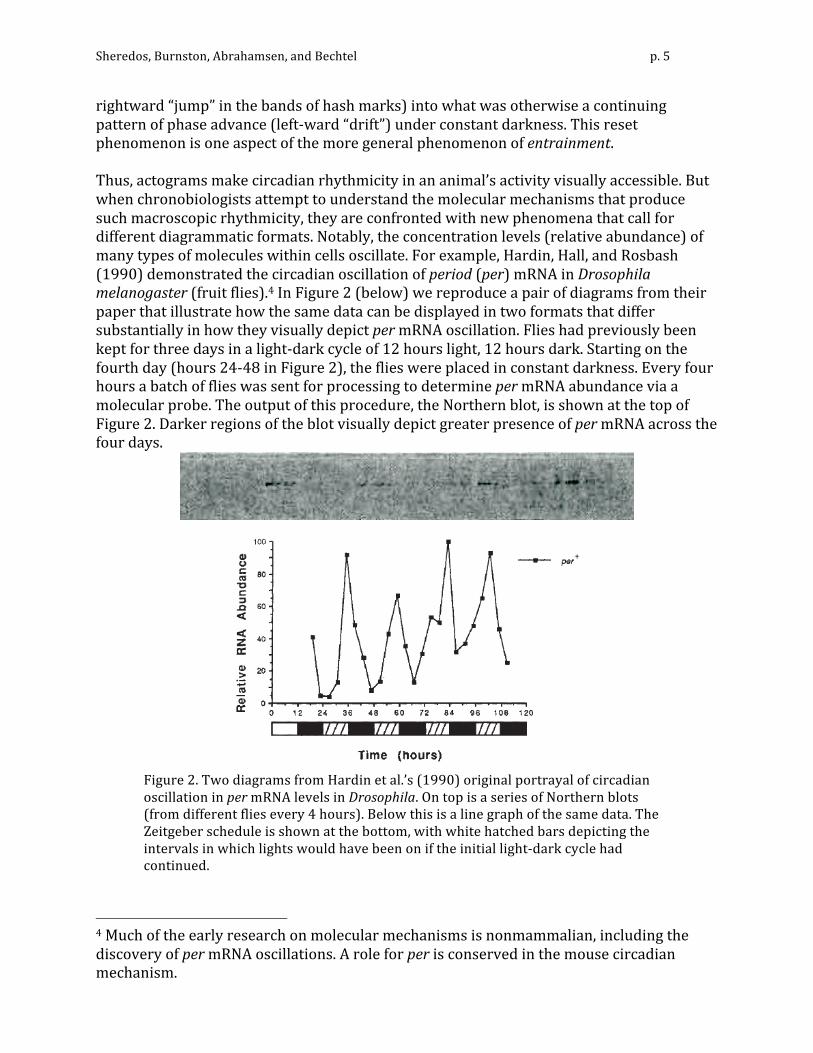
rightward “jump” in the bands of hash marks) into what was otherwise a continuing pattern of phase advance (left-‐ward “drift”) under constant darkness. This reset phenomenon is one aspect of the more general phenomenon of entrainment. Thus, actograms make circadian rhythmicity in an animal’s activity visually accessible. But when chronobiologists attempt to understand the molecular mechanisms that produce such macroscopic rhythmicity, they are confronted with new phenomena that call for different diagrammatic formats. Notably, the concentration levels (relative abundance) of many types of molecules within cells oscillate. For example, Hardin, Hall, and Rosbash (1990) demonstrated the circadian oscillation of period (per) mRNA in Drosophila melanogaster (fruit flies).4 In Figure 2 (below) we reproduce a pair of diagrams from their paper that illustrate how the same data can be displayed in two formats that differ substantially in how they visually depict per mRNA oscillation. Flies had previously been kept for three days in a light-‐dark cycle of 12 hours light, 12 hours dark. Starting on the fourth day (hours 24-‐48 in Figure 2), the flies were placed in constant darkness. Every four hours a batch of flies was sent for processing to determine per mRNA abundance via a molecular probe. The output of this procedure, the Northern blot, is shown at the top of Figure 2. Darker regions of the blot visually depict greater presence of per mRNA across the four days.
Figure 2. Two diagrams from Hardin et al.’s (1990) original portrayal of circadian oscillation in per mRNA levels in Drosophila. On top is a series of Northern blots (from different flies every 4 hours). Below this is a line graph of the same data. The Zeitgeber schedule is shown at the bottom, with white hatched bars depicting the intervals in which lights would have been on if the initial light-‐dark cycle had continued.
4 Much of the early research on molecular mechanisms is nonmammalian, including the discovery of per mRNA oscillations. A role for per is conserved in the mouse circadian mechanism.
Sheredos, Burnston, Abrahamsen, and Bechtel p. 6
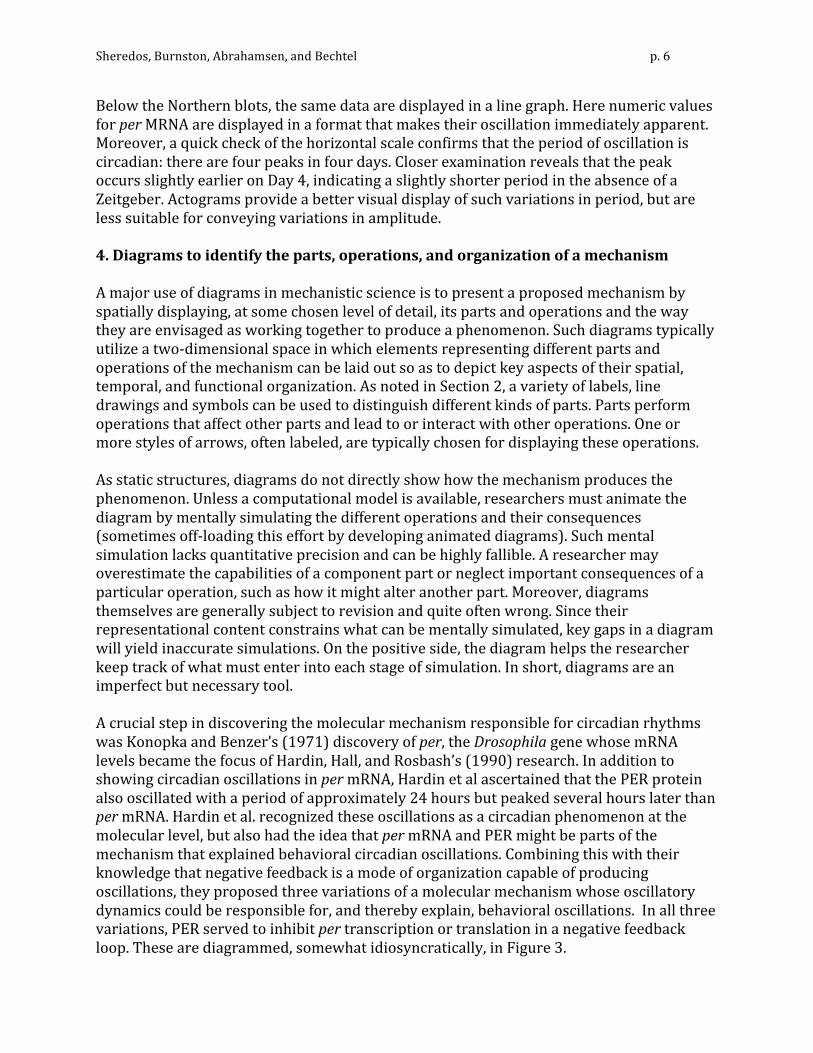
Below the Northern blots, the same data are displayed in a line graph. Here numeric values for per MRNA are displayed in a format that makes their oscillation immediately apparent. Moreover, a quick check of the horizontal scale confirms that the period of oscillation is circadian: there are four peaks in four days. Closer examination reveals that the peak occurs slightly earlier on Day 4, indicating a slightly shorter period in the absence of a Zeitgeber. Actograms provide a better visual display of such variations in period, but are less suitable for conveying variations in amplitude. 4. Diagrams to identify the parts, operations, and organization of a mechanism A major use of diagrams in mechanistic science is to present a proposed mechanism by spatially displaying, at some chosen level of detail, its parts and operations and the way they are envisaged as working together to produce a phenomenon. Such diagrams typically utilize a two-‐dimensional space in which elements representing different parts and operations of the mechanism can be laid out so as to depict key aspects of their spatial, temporal, and functional organization. As noted in Section 2, a variety of labels, line drawings and symbols can be used to distinguish different kinds of parts. Parts perform operations that affect other parts and lead to or interact with other operations. One or more styles of arrows, often labeled, are typically chosen for displaying these operations. As static structures, diagrams do not directly show how the mechanism produces the phenomenon. Unless a computational model is available, researchers must animate the diagram by mentally simulating the different operations and their consequences (sometimes off-‐loading this effort by developing animated diagrams). Such mental simulation lacks quantitative precision and can be highly fallible. A researcher may overestimate the capabilities of a component part or neglect important consequences of a particular operation, such as how it might alter another part. Moreover, diagrams themselves are generally subject to revision and quite often wrong. Since their representational content constrains what can be mentally simulated, key gaps in a diagram will yield inaccurate simulations. On the positive side, the diagram helps the researcher keep track of what must enter into each stage of simulation. In short, diagrams are an imperfect but necessary tool. A crucial step in discovering the molecular mechanism responsible for circadian rhythms was Konopka and Benzer’s (1971) discovery of per, the Drosophila gene whose mRNA levels became the focus of Hardin, Hall, and Rosbash’s (1990) research. In addition to showing circadian oscillations in per mRNA, Hardin et al ascertained that the PER protein also oscillated with a period of approximately 24 hours but peaked several hours later than per mRNA. Hardin et al. recognized these oscillations as a circadian phenomenon at the molecular level, but also had the idea that per mRNA and PER might be parts of the mechanism that explained behavioral circadian oscillations. Combining this with their knowledge that negative feedback is a mode of organization capable of producing oscillations, they proposed three variations of a molecular mechanism whose oscillatory dynamics could be responsible for, and thereby explain, behavioral oscillations. In all three variations, PER served to inhibit per transcription or translation in a negative feedback loop. These are diagrammed, somewhat idiosyncratically, in Figure 3.
Sheredos, Burnston, Abrahamsen, and Bechtel p. 7
Figure 3. Hardin et al.’s (1990) representation of three versions of their proposed molecular mechanism for circadian oscillations in terms of a negative feedback loop. Question marks indicate points of uncertainty as to the origin and termination of the feedback operation.
As we claimed above, diagrams are not solely vehicles for communicating a proposed mechanistic explanation; they also can serve as a representational tool employed in reasoning about the proposed mechanism. First, a diagram can be used to envisage how a particular mechanism functions to produce a phenomenon. In this case, the phenomenon involves regular oscillations. To understand how the mechanism produces such oscillations a viewer would begin at the upper left, where the known operations of transcription into mRNA and translation into a protein are portrayed. These result in the accumulation of PER molecules, represented in the diagram as a small line drawing of one molecule. Once PER accumulates, feedback must inhibit either transcription or translation, thereby stopping the accumulation of PER. The existing PER will gradually degrade (an operation not explicitly represented, but which molecular biologists would readily infer). As it degrades, the concentration of PER will decline. This will release the transcription and translation processes from inhibition, and synthesis of PER will begin again. When repeated, this cycle of active and repressed per expression will result in the observed pattern of rhythmic oscillations in both per mRNA and PER. A second major way in which such a diagram can serve reasoning about a mechanism is by making it clear where there are uncertainties about its operations. Note how little of Figure 3 is put forth as a depiction of previous discoveries concerning the mechanisms of per regulation. The bulk of the diagram serves as a simultaneous depiction of multiple possible mechanisms (sketched only in bare outline) that could explain oscillations of per mRNA and PER. The diagram is in large part an invitation to explanation, not a record of it. The possible mechanisms sketched here as (1) – (3) could each theoretically account for the observed oscillations. In (1), PER interacts with some biochemical substrate or process “X”,
Sheredos, Burnston, Abrahamsen, and Bechtel p. 8
which then somehow regulates either the per gene itself (transcriptional regulation), or the transcribed mRNA (post-‐transcriptional regulation). In (2), X interacts with some further substrate or process “Y,” which then does the same. In (3), the behavior of the organism provides the necessary feedback. What is known is only that the mechanism(s) at work in Drosophila must eventuate in regulation of per mRNA abundance. Third, the constraints presented by what is presented in the diagram serve to guide hypothesizing about and investigating of further elements of the proposed mechanism. Indeed, both the unknowns represented by the question marks in Figure 3 and the operations specified became the focus of subsequent research. For example, researchers sought not merely to determine where PER fed back to inhibit formation of more PER, but how it did so. This and other inquiries quickly led to the discovery of many additional components of the mechanism: by the end of the 1990s at least seven different genes, as well as their transcripts and proteins, were viewed as part of the clock mechanism, both in Drosophila and in mammals. Many of these were also shown to oscillate, but at different phases than PER. As the list of clock parts expanded and as researchers proposed multiple feedback loops, it became ever more crucial to be able to represent how the operations performed by individual parts affected other parts, and researchers regularly produced diagrams to illustrate and guide their reasoning. On the left in Figure 4 is a fairly typical contemporary diagram of the mammalian circadian oscillator. Key parts are indicated by upper-‐case labels: italicized for genes vs. enclosed in colored ovals for proteins. When proteins serve as transcription factors, they are shown attached to the promoter regions (E-‐box, D-‐box, and RRE) of the respective genes. In using this diagram to reason about the mechanism, researchers follow the action of individual proteins and the ways in which they activate or repress the expression of specific genes. At the top right is a further-‐specified version of the feedback loop first proposed by Hardin et al. in which PER inhibits its own transcription: it does so by dimerizing with CRY (Hardin et al.’s substrate “X”) and preventing the CLOCK/BMAL1 complex (Hardin et al.’s substrate “Y”) from upregulating per transcription at the E-‐box promoter site. There is also a second feedback loop responsible for the synthesis of CLOCK and BMAL1. A second promoter site on the per gene has been identified, and its activator (DBP) is part of a positive feedback loop. It should be obvious that as the understanding of the mechanism became more complicated, diagrams became ever more crucial both in representing the mechanism and in reasoning about it. We should note that research on this mechanism is far from complete. The inhibitory operations, in particular, are the focus of important ongoing research that is serving to identify yet additional parts and operations. Diagrams such as these serve not just to represent and facilitate reasoning about the mechanism but also serve as guides to where further investigation is required (even if these are not always explicitly signaled by question marks).
Sheredos, Burnston, Abrahamsen, and Bechtel p. 9
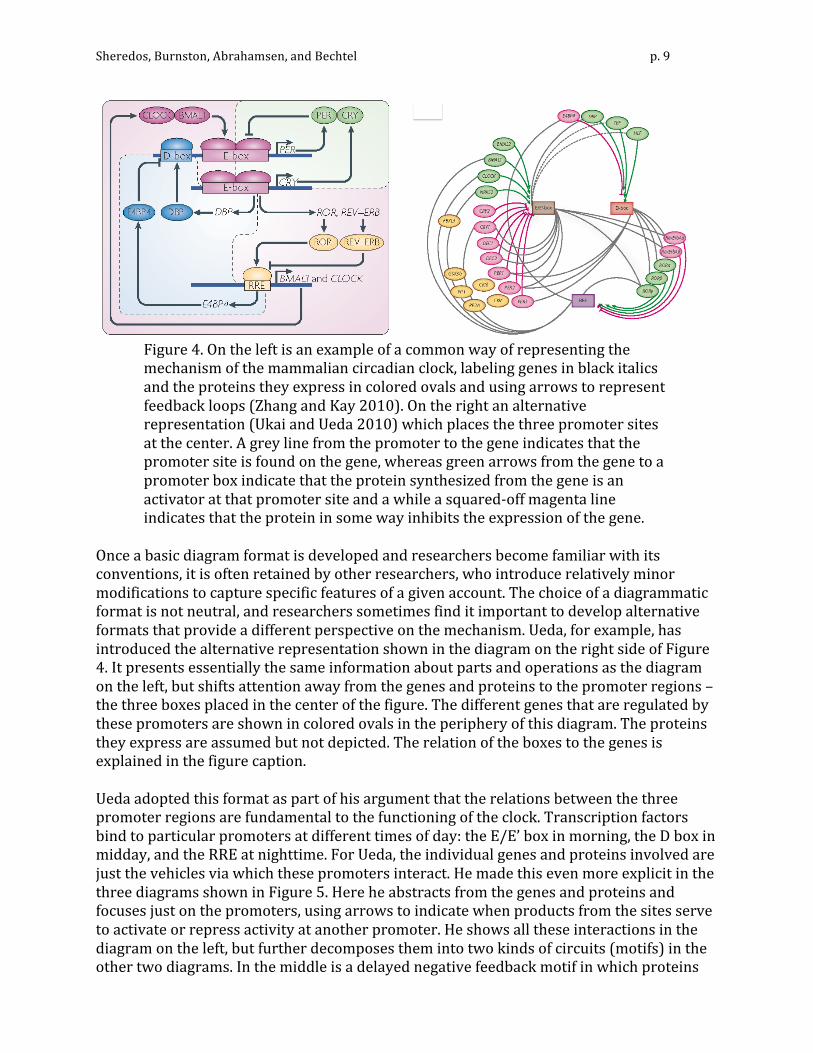
Figure 4. On the left is an example of a common way of representing the mechanism of the mammalian circadian clock, labeling genes in black italics and the proteins they express in colored ovals and using arrows to represent feedback loops (Zhang and Kay 2010). On the right an alternative representation (Ukai and Ueda 2010) which places the three promoter sites at the center. A grey line from the promoter to the gene indicates that the promoter site is found on the gene, whereas green arrows from the gene to a promoter box indicate that the protein synthesized from the gene is an activator at that promoter site and a while a squared-‐off magenta line indicates that the protein in some way inhibits the expression of the gene.
Once a basic diagram format is developed and researchers become familiar with its conventions, it is often retained by other researchers, who introduce relatively minor modifications to capture specific features of a given account. The choice of a diagrammatic format is not neutral, and researchers sometimes find it important to develop alternative formats that provide a different perspective on the mechanism. Ueda, for example, has introduced the alternative representation shown in the diagram on the right side of Figure 4. It presents essentially the same information about parts and operations as the diagram on the left, but shifts attention away from the genes and proteins to the promoter regions – the three boxes placed in the center of the figure. The different genes that are regulated by these promoters are shown in colored ovals in the periphery of this diagram. The proteins they express are assumed but not depicted. The relation of the boxes to the genes is explained in the figure caption. Ueda adopted this format as part of his argument that the relations between the three promoter regions are fundamental to the functioning of the clock. Transcription factors bind to particular promoters at different times of day: the E/E’ box in morning, the D box in midday, and the RRE at nighttime. For Ueda, the individual genes and proteins involved are just the vehicles via which these promoters interact. He made this even more explicit in the three diagrams shown in Figure 5. Here he abstracts from the genes and proteins and focuses just on the promoters, using arrows to indicate when products from the sites serve to activate or repress activity at another promoter. He shows all these interactions in the diagram on the left, but further decomposes them into two kinds of circuits (motifs) in the other two diagrams. In the middle is a delayed negative feedback motif in which proteins
Sheredos, Burnston, Abrahamsen, and Bechtel p. 10
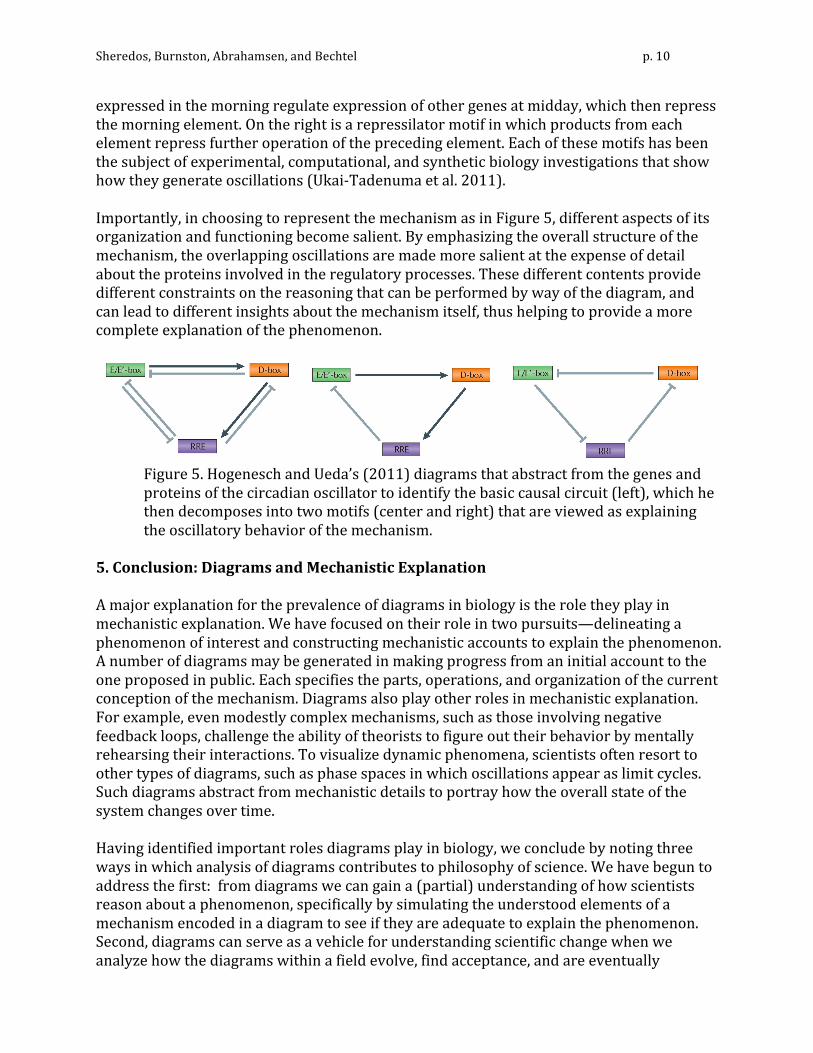
expressed in the morning regulate expression of other genes at midday, which then repress the morning element. On the right is a repressilator motif in which products from each element repress further operation of the preceding element. Each of these motifs has been the subject of experimental, computational, and synthetic biology investigations that show how they generate oscillations (Ukai-‐Tadenuma et al. 2011). Importantly, in choosing to represent the mechanism as in Figure 5, different aspects of its organization and functioning become salient. By emphasizing the overall structure of the mechanism, the overlapping oscillations are made more salient at the expense of detail about the proteins involved in the regulatory processes. These different contents provide different constraints on the reasoning that can be performed by way of the diagram, and can lead to different insights about the mechanism itself, thus helping to provide a more complete explanation of the phenomenon.
Figure 5. Hogenesch and Ueda’s (2011) diagrams that abstract from the genes and proteins of the circadian oscillator to identify the basic causal circuit (left), which he then decomposes into two motifs (center and right) that are viewed as explaining the oscillatory behavior of the mechanism.
5. Conclusion: Diagrams and Mechanistic Explanation A major explanation for the prevalence of diagrams in biology is the role they play in mechanistic explanation. We have focused on their role in two pursuits—delineating a phenomenon of interest and constructing mechanistic accounts to explain the phenomenon. A number of diagrams may be generated in making progress from an initial account to the one proposed in public. Each specifies the parts, operations, and organization of the current conception of the mechanism. Diagrams also play other roles in mechanistic explanation. For example, even modestly complex mechanisms, such as those involving negative feedback loops, challenge the ability of theorists to figure out their behavior by mentally rehearsing their interactions. To visualize dynamic phenomena, scientists often resort to other types of diagrams, such as phase spaces in which oscillations appear as limit cycles. Such diagrams abstract from mechanistic details to portray how the overall state of the system changes over time. Having identified important roles diagrams play in biology, we conclude by noting three ways in which analysis of diagrams contributes to philosophy of science. We have begun to address the first: from diagrams we can gain a (partial) understanding of how scientists reason about a phenomenon, specifically by simulating the understood elements of a mechanism encoded in a diagram to see if they are adequate to explain the phenomenon. Second, diagrams can serve as a vehicle for understanding scientific change when we analyze how the diagrams within a field evolve, find acceptance, and are eventually
Sheredos, Burnston, Abrahamsen, and Bechtel p. 11
discarded. Third, identifying the cognitive elements of diagram use, including their design and the learning processes required to interpret them, can provide insight into the cognitive processes involved in scientific reasoning more generally. By directing attention to the importance of diagrams in biology, we hope to have set the stage for more sustained philosophical inquiry. Acknowledgment Research for this paper was support by NSF Grant 1127640. References Bechtel, William, and Adele Abrahamsen. (2005). "Explanation: A Mechanist Alternative."
Studies in History and Philosophy of Biological and Biomedical Sciences 36:421-‐441. ———. (2011). "Complex Biological Mechanisms: Cyclic, Oscillatory, and Autonomous," In
Clifford A. Hooker, ed., Philosophy of Complex Systems. Handbook of the Philosophy of Science, 257-‐285. New York: Elsevier.
Bechtel, William, and Robert C. Richardson. (1993/2010). Discovering Complexity: Decomposition and Localization as Strategies in Scientific Research. Cambridge, MA: MIT Press. 1993 edition published by Princeton University Press.
Bogen, James, and James Woodward. (1988). "Saving the Phenomena." Philosophical Review 97:303-‐352.
Cheng, Peter C. H. (2011). "Probably Good Diagrams for Learning: Representational Epistemic Recodification of Probability Theory." Topics in Cognitive Science 3:475-‐498.
Hardin, Paul E., Jeffrey C. Hall, and Michael Rosbash. (1990). "Feedback of the Drosophila Period Gene Product on Circadian Cycling of Its Messenger Rna Levels." Nature 343:536-‐540.
Hegarty, Mary. (2004). "Mechanical Reasoning by Mental Simulation." Trends in Cognitive Science 8:280-‐285.
Hogenesch, John B., and Hiroki R. Ueda. (2011). "Understanding Systems-‐Level Properties: Timely Stories from the Study of Clocks." Nature Reviews Genetics 12:407-‐416.
Jones, Nicholaos, and Olaf Wolkenhauer. (in press). "Diagrams as Locality Aids for Explanation and Model Construction in Cell Biology." Biology and Philosophy.
Konopka, Ronald J., and Seymour Benzer. (1971). "Clock Mutants of Drosophila Melanogaster." Proceedings of the National Academy of Sciences (USA) 89:2112-‐2116.
Machamer, Peter, Lindley Darden, and Carl F. Craver. (2000). "Thinking About Mechanisms." Philosophy of Science 67:1-‐25.
Perini, Laura. (2005). "Explanation in Two Dimensions: Diagrams and Biological Explanation." Biology and Philosophy 20:257-‐269.
Ukai, Hideki, and Hiroki R. Ueda. (2010). "Systems Biology of Mammalian Circadian Clocks." Annual Review of Physiology 72:579-‐603.
Ukai-‐Tadenuma, Maki, Rikuhiro G. Yamada, Haiyan Xu, Jürgen A. Ripperger, Andrew C. Liu, and Hiroki R. Ueda. (2011). "Delay in Feedback Repression by Cryptochrome 1 Is Required for Circadian Clock Function." Cell 144:268-‐281.
Zhang, Eric E., and Steve A. Kay. (2010). "Clocks Not Winding Down: Unravelling Circadian Networks." Nat Rev Mol Cell Biol 11:764-‐776.