weight change after myocardial infarction—the enhancing recovery in coronary heart disease...
TRANSCRIPT

Weight Change after Myocardial Infarction - the ENRICHDExperience
Francisco Lopez-Jimenez, M.D.*, Colin O. Wu, PhD**, Xin Tian, PhD**, Chris O'Connor,M.D.***, Michael W. Rich, M.D.****, Matthew M. Burg, Ph.D.*#, David Sheps, M.D.*#*#, James.Raczynski, Ph.D.°, Virend K. Somers, M.D., PhD.*, and Allan S. Jaffe, M.D.*,@*Division of Cardiovascular Diseases, Mayo Clinic and Mayo Clinic, Rochester, MN.@ Department of Laboratory Medicine and Pathology, Mayo Clinic and Mayo Clinic, Rochester, MN.**Office of Biostatistics Research, NHLBI, Bethesda, MD.*** Duke University School of Medicine, Durham, NC****Washington University School of Medicine, St. Louis, MO*#Yale University School of Medicine, New Haven, CT, and Columbia University School of Medicine,NY, NY*#*# University of Florida School of Medicine, Gainesville, FL°University of Alabama School of Medicine, Birmingham, AL
AbstractBackground: The relationship of changes in weight to outcomes in patients post myocardialinfarction (MI) is controversial.
Methods: From the Enhancing Recovery in Coronary Heart Disease patients (ENRICHD) trial data,we assessed weight change, and the associations of baseline weight and change at follow-up outcomesand interactions between psychosocial factors.
Results: At baseline 73.6% of patients (N=1706) were overweight or obese; 134 patients had BMI≥ 40. Underweight patients were more likely to die or suffer nonfatal recurrent MI. After controllingfor covariates, overweight and obese patients had similar outcomes to normal weight patients.
Eighteen percent of patients gained > 5%, 27% lost > 5% and 55% had < 5% change in weight.Compared with weight loss <5%, the risk of death (adjusted hazard ratio [HR] =1.74, p=0.01), andcardiovascular death (HR=1.79, p=0.04) were increased with weight loss > 5%. After propensitymatching, weight loss >5% remained as a significant risk factor for death and CV death. There wasno interaction between weight change and depression and/or social support at baseline or follow up.Weight change was not associated with recurrent MI or cardiovascular hospitalizations.
© 2007 Mosby, Inc. All rights reserved.Corresponding author: Francisco Lopez-Jimenez, M.D., M.Sc. 200 First Street SW, Rochester, Minnesota 55905 Telephone: (507)284-8087 Facsimile: (507) 266-3623 [email protected]'s Disclaimer: This is a PDF file of an unedited manuscript that has been accepted for publication. As a service to our customerswe are providing this early version of the manuscript. The manuscript will undergo copyediting, typesetting, and review of the resultingproof before it is published in its final citable form. Please note that during the production process errors may be discovered which couldaffect the content, and all legal disclaimers that apply to the journal pertain.This report is an ENRICHD databank study.
NIH Public AccessAuthor ManuscriptAm Heart J. Author manuscript; available in PMC 2009 September 28.
Published in final edited form as:Am Heart J. 2008 March ; 155(3): 478–484. doi:10.1016/j.ahj.2007.10.026.
NIH
-PA Author Manuscript
NIH
-PA Author Manuscript
NIH
-PA Author Manuscript

Conclusions: A large proportion of patients lose or gain >5% of body weight after an MI. Theassociation between obesity and lower mortality is modulated by comorbidities. Weight loss afterMI is associated with worse outcomes and is not related to depression or social support.
BACKGROUNDExcess body weight, being overweight or obese, is a prevalent risk factor in patients with acutemyocardial infarction (AMI).1 The cardiologic societies recommend identification andmanagement of obesity as key components of primary prevention because of the greater riskfor cardiovascular events and all cause mortality in this group. Data assessing the impact ofobesity on outcomes in patients with established CAD however, are controversial. Studies ofpatients undergoing revascularization have shown better outcomes or no increased risk inoverweight and obese patients.2-6 Many studies have shown either no association or a favorableeffect of obesity in patients with MI; others only a modest association with recurrent events.1, 7-10 A pooled analysis of CAD patients has shown an inverse J curve with patients with BMIbetween 30-35 having the lowest long-term mortality.11
Weight change after MI could affect the disease trajectory. Prior studies have not assessed theeffects of weight change on outcomes post MI. Furthermore, no study has examined the roleof psychosocial factors on this issue. Depression and social isolation are associated withadverse clinical events after an MI and have been linked to weight changes in the generalpopulation.12 The present analysis was undertaken to evaluate the magnitude, direction, anddeterminants of weight change following MI, its effect on outcomes, and its relationship todepression and social isolation in the ENRICHD study population.
METHODSThe methods13 and results of ENRICHD have been reported previously.14 ENRICHD was anNIH-sponsored randomized clinical trial in patients with acute MI and either depression orsocial isolation. The primary study end point was all cause mortality and recurrent MI;secondary endpoints included all cause mortality, coronary revascularization and cardiachospitalizations. Criteria for recurrent myocardial infarction were as defined for enrollmentexcept for after revascularization procedures. There were 599 primary endpoint events duringa median of 29 months of follow-up.
Exclusion CriteriaWe excluded patients without a measure of body weight or height at baseline. Patients withBMI ≥ 60 or a weight change > 40%, were assumed to be errors in documentation. We alsoexcluded patients without a six-month evaluation and those in whom it occurred at > 270 days.
Body weight measurementsBaseline body weight came from the clinical record. Body weight was measured during follow-up visits using standard scales. Body Mass Index (BMI) was calculated by dividing the weightin kilos by the square of the height in meters. We created five groups according to BMI:Underweight (BMI < 20), normal weight (BMI ≥ 20 but < 25, overweight (BMI ≥ 25 but <30), obese (BMI ≥ 30 but < 40), and morbidly obese (BMI ≥ 40). Follow-up weight wasrecorded a median of 186, IQR = 98 to 270 days. Patients with clinical events in the first 6months of follow up were excluded. Change in weight was defined in as: a) delta weight,(change in weight from baseline to first follow-up); b) slope weight (change in weight frombaseline to follow-up divided by days of follow-up, times 180); and c) percent weight change(change in weight from baseline to follow-up, relative to baseline weight). Creatinine clearancewas calculated by Cockcroft-Gault equations.15
Lopez-Jimenez et al. Page 2
Am Heart J. Author manuscript; available in PMC 2009 September 28.
NIH
-PA Author Manuscript
NIH
-PA Author Manuscript
NIH
-PA Author Manuscript

Statistical analysisDifferences among weight groups were examined by Pearson's chi-squared test and theANOVA F-tests. Cox analysis was used to analyze the combined outcome of recurrent MI ordeath, all cause mortality, death from cardiovascular disease, fatal or nonfatal MI, nonfatal MI,and cardiovascular hospitalization.
Covariates in the regression models incorporated baseline clinical, demographic, andpsychosocial information. (Table 1).16 Baseline BMI was considered as a continuous variableand as a categorical variable. The incidence rates per 100 patient-years of follow-up werecalculated for each group.
To assess associations between weight changes and outcomes, we used separate Cox modelsfor: a) delta weight, b) slope weight, and c) 5% weight change, all adjusted for potentialpredictors used in previous ENRICHD analyses.16 Kaplan-Meier survival curves weregenerated for weight change groups. To account for imbalances in confounding variables ofweight change, we constructed logistic regression models in which the weight loss >5% wasa dependent variable and the variables in Table 2 were independent variables. We thenestimated the propensity score, defined as the conditional probability of having a weight loss>5% given all known measured covariates except outcome, for each patient.17 Patients withor without a weight loss > 5% were matched based on propensity scores.
Patients with missing covariates were excluded. Regression analyses using multiple imputationfor missing covariates had similar results. Analyses were performed using SAS 9.0 (SASInstitute Inc., Cary, NC).
RESULTSFrom the cohort of 2481 patients, 163 were excluded because of missing information or becausebaseline BMI was ≥ 60. Patients without follow-up weight information (n=549), 85 patientswith follow-up visit > 270 days window for the 6 month follow up, and 8 patients with a weightchange > 40% were excluded, leaving 1676 patients.
Baseline CharacteristicsAt baseline, 73.6% of patients (n =1706) were overweight or obese; 134 patients were morbidlyobese (BMI ≥ 40). Associations are shown in Table 1.
Weight change after MIThe average BMI was 28.95 ± 6.02 at baseline and 28.41 ± 5.72 at follow-up. Eighteen % (n= 301) had ≥ 5% weight gain, and 27% (n = 460) had ≥ 5% weight loss. Six-month weightchange (both loss and gain) was associated with baseline BMI, age, hypertension,revascularization after the index MI, heart failure and other comorbidities, antidepressant use,smoking history and smoking cessation during follow-up (Table 2).
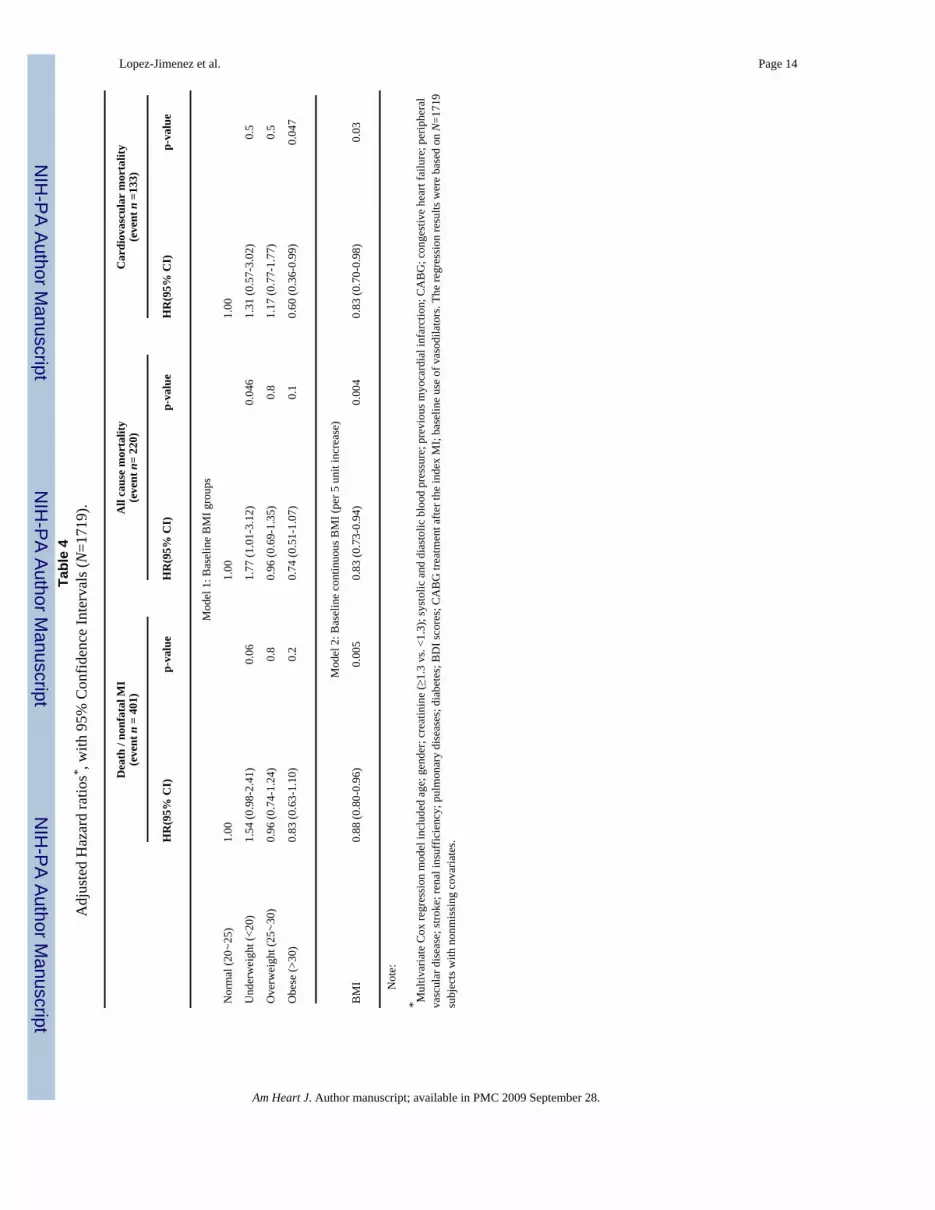
Baseline BMI and clinical outcomesEvent rates for baseline BMI groups appear in Table 3. Underweight patients had higher ratescompared with normal weight, overweight and obese patients (p<0.001, p<0.001 and p=0.004,respectively). Table 4 shows the adjusted hazard ratios and 95% confidence intervals forbaseline BMI groups. After adjusting for confounders, being underweight was only marginallyassociated with all cause mortality (HR=1.77, p=0.046). Obese patients had the lowest all-cause and cardiovascular mortality in unadjusted analysis (Table 3). After controlling forconfounders, overweight and obese patients were not significantly different from the normal
Lopez-Jimenez et al. Page 3
Am Heart J. Author manuscript; available in PMC 2009 September 28.
NIH
-PA Author Manuscript
NIH
-PA Author Manuscript
NIH
-PA Author Manuscript

weight group in regard to the primary endpoint of death or nonfatal MI, or all cause mortality,but were borderline significantly different for cardiovascular mortality (HR= 0.60, p=0.047).
Regression models adjusted for the creatinine clearance to provide a more accurate estimateof renal function (table 4) indicate that baseline BMI was not associated with all cause mortalityor cardiovascular mortality, while creatinine clearance was a highly significant predictor (datanot shown).
Weight change and clinical outcomesKaplan-Meier survival curves of all cause and cardiovascular mortality and the combinedoutcome of death and recurrent MI are shown in Figure 1 and hazard ratios for weight changesadjusted for baseline covariates, creatinine clearance, antidepressant use before 6 month,smoking cessation, and depression and social isolation score changes in table 5. Weight lossby all definitions was associated with an increased risk for all-cause mortality, after adjustmentfor confounders and psychosocial factors. Weight loss of > 5% was associated with 70%increased risk of all-cause mortality and a similar increase in cardiovascular mortality. Theinteraction terms for weight change and depression and social isolation scores at baseline andduring follow-up were not significant, i.e. outcomes were not associated with depression orsocial support. Weight change was not significantly associated with risk of myocardialinfarction (fatal or nonfatal) or cardiovascular hospitalizations (data not shown).
Propensity matching of patients with and without weight loss >5% resulted in propensity scoresof 0.71 (C statistic). Multivariate logistic modeling indicated that weight loss> 5% wasassociated with age, baseline BMI and height, CABG after index MI, and negatively associatedwith smoking cessation. Of 349 patients with weight loss >5% and nonmissing covariates, 327patients were matched to patients with the closest propensity score. The characteristics of thepropensity matched-pair samples were well matched (Table 2). After adjustment (Table 2),weight loss >5% were associated with increased risk of all cause and cardiovascular mortality.Propensity analysis of patients with or without a weight gain > 5% revealed no significantassociation (data not shown).
DISCUSSIONOur data indicate that after MI, a large proportion of patients lose or gain >5% of body weight.Furthermore, they indicate that the association between obesity and apparent lower mortalityis modulated by differences in comorbidities. In contrast, weight loss is associated with worseoutcomes not related to the presence and/or changes in depression or social isolation.
These findings have important implications for understanding the “obesity paradox” in CADpatients.3 In ENRICHD, prior to multivariable correction, a similar effect was observed.5-9
After correction for confounders, the association disappeared.
Approximately one third of patients lost >5% of their weight in the first 6 months after MI.Weight loss was associated with increased all-cause and cardiovascular mortality. Theseassociations were not related to depression, social isolation, or changes in smoking. Weightloss was not associated with recurrent myocardial infarction or cardiovascular hospitalizations.Weight gain, which occurred in lower weight individuals did not affect prognosis.
Differential weight change after MIMost studies and this ENRICHD cohort as well indicate that mean weight does not changeafter acute MI.18, 19 However, 27% experienced > 5% weight decrease, and 18% > 5% increase.Weight loss was associated with more co-morbidities at baseline, suggesting weight loss mightbe a marker of CVD severity or poorer overall health. For example, congestive heart failure
Lopez-Jimenez et al. Page 4
Am Heart J. Author manuscript; available in PMC 2009 September 28.
NIH
-PA Author Manuscript
NIH
-PA Author Manuscript
NIH
-PA Author Manuscript

can be associated with increased cachexins, decreased appetite, reduced musculoskeletalactivity and loss of muscle mass.20
Association Between Baseline BMI and Medical OutcomesThe association between obesity and better overall and cardiovascular survival is ablated afteradjusting for comorbidities and especially differences in creatinine clearance. Thus, previousreports might reflect incomplete adjustment for factors related to low BMI and. prior studiestesting did not adjust for creatinine clearance. BMI at baseline was not associated with recurrentMI or cardiovascular hospitalizations; supporting the concept that lower cardiovascularmortality likely reflects non-cardiac comorbidities not accounted in the analyses.
Association Between change in BMI and Long-term OutcomesThe association between body weight change after myocardial infarction and clinical outcomeshas not been tested previously. Weight loss is associated with higher all-cause mortality, evenafter adjustment. Weight loss however, was not associated with reinfarction or cardiovascularhospitalizations.
It is not clear why weight loss is associated with higher mortality, since it is not known whypatients lost weight. If weight loss was intentional, it might be that use of inappropriate orunhealthy diets with low intake of micronutrients like omega-3 fatty acids and antioxidants,or high intake of animal fat were responsible for adverse effects. However, we presume weightloss was unintentional and may be a consequence more of non-cardiac comorbidities.
Epidemiologic studies in patients without coronary disease have also shown thatunintentional weight loss is associated with higher mortality.21, 22 This has been attributed toco-morbidities such as depression or malnutrition in the elderly. These factors also areassociated with congestive heart failure.
Our findings that 1/3 of patients lost weight and have worse outcomes, may have significantpublic health implications. However, the ENRICHD cohort included more co-morbidities thanin most clinical trials of myocardial infarction.16
Weight gain did not alter prognosis. This is likely because weight gain occurred in lighterpatients or was due to residual negative confounding, i.e patients who gained weight werehealthier. These observations suggest that comparison groups in the complex area of weightloss and gain must be chosen carefully. Unfortunately, many studies, as ours lack sufficientnumbers to compare weight gain and/or loss within each BMI category.
Depression, Social Isolation and Weight Changes After MIDepression is a cause of weight gain and weight loss.12 Obesity is also a cause of depression,particularly if severe. We hypothesized that depression would be related to weight changebecause it is associated with adverse events after MI. However, depression did not interact withBMI at baseline or weight related rates of adverse events or survival. In animals, social isolationcontributes to weight loss and this may happen in humans.23, 24 Because social isolation isassociated with worse outcomes after myocardial infarction, we hypothesized that socialisolation would be a confounder as well. However, that was not the case.
Strengths and LimitationsThe strengths of our study include analysis of differential weight change providing betterascertainment of the exposure variable of interest. We were able to account for common co-morbidities and excluded patients with cancer evident at baseline. We used propensitymatching to control for unknown factors that could modulate risk. The use of creatinine
Lopez-Jimenez et al. Page 5
Am Heart J. Author manuscript; available in PMC 2009 September 28.
NIH
-PA Author Manuscript
NIH
-PA Author Manuscript
NIH
-PA Author Manuscript

clearance was particularly helpful. Multiple studies have shown that creatinine clearance isone of the strongest predictive factors in patients with coronary artery disease.25, 26 To the bestof our knowledge, no other study relating BMI to outcomes in patients with cardiovasculardisease has adjusted for creatinine clearance. Additionally, our study is the first one to includedepression, social isolation, and changes in smoking status.
Potential limitations include the retrospective design and that ENRICHD included only patientswith depression and/or social isolation. Therefore, we cannot generalize our results to otherpopulations. Another limitation is the use of BMI as the only measure of obesity. BMI isreproducible and a simple way to assess obesity because it correlates with body fat in middleage people without major comorbidities,27, 28 but not in patients with coronary artery disease.We have recently reported that in patients with CAD, BMI fails to detect excess body fat, thetrue definition of obesity.29 This may be particularly true for elderly patients in whomsarcopenia is prevalent.30 Alternatively, a high muscle mass hampers the specificity of BMIto detect body fat.
Additionally, body fat distribution was not ascertained in ENRICHD. Waist circumference isassociated with coronary artery disease and may be more important than BMI alone.18
Our findings underscore the need for clinical trials using all of these measures to test the effectsof intentional weight loss in patients with obesity and cardiovascular disease.
References1. Lopez-Jimenez F, Jacobsen SJ, Reeder GS, et al. Prevalence and secular trends of excess body weight
and impact on outcomes after myocardial infarction in the community. Chest 2004;125(4):1205–12.[PubMed: 15078726]
2. Powell BD, Lennon RJ, Lerman A, et al. Association of body mass index with outcome afterpercutaneous coronary intervention. Am J Cardiol 2003;91(4):472–6. [PubMed: 12586271]
3. Gurm HS, Brennan DM, Booth J, et al. Impact of body mass index on outcome after percutaneouscoronary intervention (the obesity paradox). Am J Cardiol 2002;90(1):42–5. [PubMed: 12088778]
4. Gruberg L, Weissman NJ, Waksman R, et al. The impact of obesity on the short-term and long-termoutcomes after percutaneous coronary intervention: the obesity paradox? J Am Coll Cardiol 2002;39(4):578–84. [PubMed: 11849854]
5. Kuduvalli M, Grayson AD, Oo AY, et al. The effect of obesity on mid-term survival following coronaryartery bypass surgery. Eur J Cardiothorac Surg 2003;23(3):368–73. [PubMed: 12614808]
6. Kim J, Hammar N, Jakobsson K, et al. Obesity and the risk of early and late mortality after coronaryartery bypass graft surgery. Am Heart J 2003;146(3):555–60. [PubMed: 12947378]
7. Rana JS, Mukamal KJ, Morgan JP, et al. Obesity and the risk of death after acute myocardial infarction.Am Heart J 2004;147(5):841–6. [PubMed: 15131540]
8. Krumholz HM, Chen J, Chen YT, et al. Predicting one-year mortality among elderly survivors ofhospitalization for an acute myocardial infarction: results from the Cooperative Cardiovascular Project.J Am Coll Cardiol 2001;38(2):453–9. [PubMed: 11499737]
9. Kennedy LM, Dickstein K, Anker SD, et al. The prognostic importance of body mass index aftercomplicated myocardial infarction. J Am Coll Cardiol 2005;45(1):156–8. [PubMed: 15629390]
10. Nigam A, Wright RS, Allison TG, et al. Excess weight at time of presentation of myocardial infarctionis associated with lower initial mortality risks but higher long-term risks including recurrent re-infarction and cardiac death. Int J Cardiol 2005;110(2):153–9. [PubMed: 16043245]
11. Romero-Corral A, Montori VM, Somers VK, et al. Association of bodyweight with total mortalityand with cardiovascular events in coronary artery disease: a systematic review of cohort studies.Lancet 2006;368(9536):666–78. [PubMed: 16920472]
12. Wing RR, Phelan S. Long-term weight loss maintenance. Am J Clin Nutr 2005;82(1 Suppl):222S–225S. [PubMed: 16002825]
Lopez-Jimenez et al. Page 6
Am Heart J. Author manuscript; available in PMC 2009 September 28.
NIH
-PA Author Manuscript
NIH
-PA Author Manuscript
NIH
-PA Author Manuscript

13. The ENRICHD investigators. Enhancing recovery in coronary heart disease patients (ENRICHD):study design and methods. Am Heart J 2000;139(1 Pt 1):1–9. [PubMed: 10618555]
14. Berkman LF, Blumenthal J, Burg M, et al. Effects of treating depression and low perceived socialsupport on clinical events after myocardial infarction: the Enhancing Recovery in Coronary HeartDisease Patients (ENRICHD) Randomized Trial. Jama 2003;289(23):3106–16. [PubMed:12813116]
15. Cockcroft DW, Gault MH. Prediction of creatinine clearance from serum creatinine. Nephron 1976;16(1):31–41. [PubMed: 1244564]
16. Jaffe AS, Krumholz HM, Catellier DJ, et al. Prediction of medical morbidity and mortality after acutemyocardial infarction in patients at increased psychosocial risk in the Enhancing Recovery inCoronary Heart Disease Patients (ENRICHD) study. Am Heart J 2006;152(1):126–35. [PubMed:16824842]
17. Rubin DB. Estimating causal effects from large data sets using propensity scores. Ann Intern Med1997;127(8 Pt 2):757–63. [PubMed: 9382394]
18. Dagenais GR, Yi Q, Mann JF, et al. Prognostic impact of body weight and abdominal obesity inwomen and men with cardiovascular disease. Am Heart J 2005;149(1):54–60. [PubMed: 15660034]
19. De Lorgeril M, Salen P, Martin JL, et al. Mediterranean diet, traditional risk factors, and the rate ofcardiovascular complications after myocardial infarction: final report of the Lyon Diet Heart Study.Circulation 1999;99(6):779–85. [PubMed: 9989963]
20. Cicoira M, Bolger AP, Doehner W, et al. High tumour necrosis factor-alpha levels are associatedwith exercise intolerance and neurohormonal activation in chronic heart failure patients. Cytokine2001;15(2):80–6. [PubMed: 11500083]
21. Kuller L, Wing R. Weight loss and mortality. Ann Intern Med 1993;119(7 Pt 1):630–2. [PubMed:8363176]
22. Lee IM, Paffenbarger RS Jr. Is weight loss hazardous? Nutr Rev 1996;54(4 Pt 2):S116–24. [PubMed:8700438]
23. Yamada K, Ohki-Hamazaki H, Wada K. Differential effects of social isolation upon body weight,food consumption, and responsiveness to novel and social environment in bombesin receptorsubtype-3 (BRS-3) deficient mice. Physiol Behav 2000;68(4):555–61. [PubMed: 10713297]
24. Van Leeuwen SD, Bonne OB, Avraham Y, et al. Separation as a new animal model for self-inducedweight loss. Physiol Behav 1997;62(1):77–81. [PubMed: 9226345]
25. Dixon SR, O'Neill WW, Sadeghi HM, et al. Usefulness of creatinine clearance in predicting earlyand late death after primary angioplasty for acute myocardial infarction. Am J Cardiol 2003;91(12):1454–7. [PubMed: 12804732]A6
26. Sorensen CR, Brendorp B, Rask-Madsen C, et al. The prognostic importance of creatinine clearanceafter acute myocardial infarction. Eur Heart J 2002;23(12):948–52. [PubMed: 12069449]
27. Marshall JD, Hazlett CB, Spady DW, et al. Validity of convenient indicators of obesity. Hum Biol1991;63(2):137–53. [PubMed: 2019407]
28. Warner JT, Cowan FJ, Dunstan FD, Gregory JW. The validity of body mass index for the assessmentof adiposity in children with disease states. Ann Hum Biol 1997;24(3):209–15. [PubMed: 9158840]
29. Romero-Corral A, Somers VK, Sierra-Johnson J, et al. Diagnostic performance of body mass indexto detect obesity in patients with coronary artery disease. Eur Heart J 2007;28(17):2087–93.[PubMed: 17626030]
30. Castillo EM, Goodman-Gruen D, Kritz-Silverstein D, et al. Sarcopenia in elderly men and women:the Rancho Bernardo study. Am J Prev Med 2003;25(3):226–31. [PubMed: 14507529]
Lopez-Jimenez et al. Page 7
Am Heart J. Author manuscript; available in PMC 2009 September 28.
NIH
-PA Author Manuscript
NIH
-PA Author Manuscript
NIH
-PA Author Manuscript
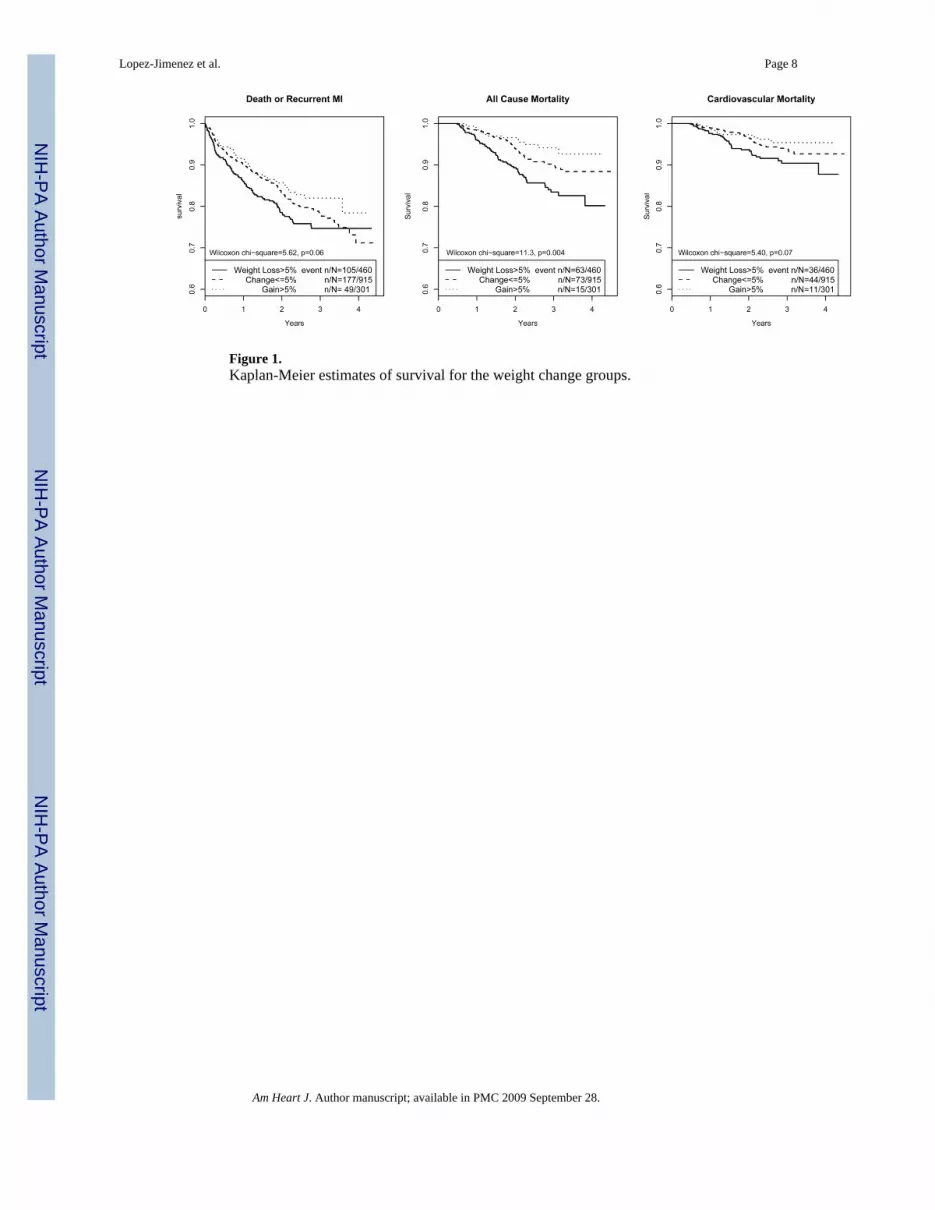
Figure 1.Kaplan-Meier estimates of survival for the weight change groups.
Lopez-Jimenez et al. Page 8
Am Heart J. Author manuscript; available in PMC 2009 September 28.
NIH
-PA Author Manuscript
NIH
-PA Author Manuscript
NIH
-PA Author Manuscript

NIH
-PA Author Manuscript
NIH
-PA Author Manuscript
NIH
-PA Author Manuscript
Lopez-Jimenez et al. Page 9Ta
ble
1B
asel
ine
Cha
ract
eris
tics A
ccor
ding
to th
e W
eigh
t Gro
ups b
y th
e B
ody
Mas
s Ind
ex (k
g/m
2 ).
Und
erw
eigh
t(B
MI<
20)
(n=8
4)
Nor
mal
(20∼
25)
(n=5
28)
Ove
rwei
ght
(25 ∼
30)
(n =
872
)
Obe
se(3
0 ∼
40)
(n =
700
)
Mor
bid
Obe
se(≥
40)
(n =
134
)
p-va
lue
Age
(yea
rs)
67.7
± 13
.163
.4 ±
13.
161
.9 ±
12.
057
.8 ±
11.
955
.7 ±
11.
8<0
.000
1
Ejec
tion
frac
tion
(%)
46.5
±12.
444
.1 ±
13.
544
.9 ±
13.
046
.7 ±
13.
246
.8 ±
12.
70.
037
Cre
atin
ine
(mg/
dL)
1.17
± 1
.16
1.27
± 1
.04
1.15
± 0
.66
1.11
± 0
.61
1.15
± 0
.58
0.01
3
Cre
atin
ine
clea
ranc
e53
.8±2
3.6
65.5
± 2
7.7
81.7
± 3
1.5
104.
4± 4
0.5
127.
1± 4
8.4
<0.0
001
Syst
olic
blo
od p
ress
ure
(mm
Hg)
118.
4±18
.312
1.5
±19.
812
3.2
± 18
.312
4.8
±19.
412
9.6
± 21
.6<0
.000
1
Dia
stol
ic b
lood
pre
ssur
e (m
m H
g)66
.1±1
0.4
69.0
± 1
0.3
70.4
± 1
0.8
71.3
± 1
1.3
73.5
± 1
2.5
<0.0
001
Com
orbi
dity
scor
e2.
15 ±
1.9
52.
13 ±
2.0
82.
01 ±
1.9
72.
43 ±
2.1
62.
81 ±
2.1
6<0
.000
1
BD
I sco
re17
.2±8
.315
.8 ±
8.4
15.0
± 8
.316
.3 ±
8.3
17.4
± 7
.70.
001
ESSI
scor
e22
.3±6
.222
.9 ±
6.3
23.3
± 6
.323
.0 ±
6.5
23.9
± 6
.30.
313
Gen
der (
% fe
mal
e)59
.542
.137
.348
.464
.2<0
.000
1
Kill
ip c
lass
III-
IV (%
)10
.78.
66.
98.
56.
50.
601
Smok
ing
hist
ory
(%)
59.0
68.8
66.6
64.0
60.6
0.15
7
Prev
ious
MI (
%)
38.1
26.9
26.1
28.3
27.3
0.20
8
CH
F hi
stor
y (%
)15
.216
.011
.415
.219
.40.
041
PVD
(%)
12.2
14.3
11.4
12.3
16.7
0.32
5
Stro
ke/T
IA (%
)14
.512
.18.
68.
76.
80.
064
Pulm
onar
y di
seas
e (%
)23
.819
.815
.220
.826
.90.
003
Dia
bete
s (%
)17
.126
.128
.242
.551
.5<0
.000
1
Hyp
erte
nsio
n (%
)47
.051
.460
.468
.379
.0<0
.000
1
Ren
al d
isea
se (%
)10
.811
.410
.09.
08.
50.
694
Prev
ious
CA
BG
(%)
18.1
15.4
12.7
12.0
6.9
0.04
8
CA
BG
afte
r ind
ex M
I (%
)14
.615
.419
.617
.312
.00.
120
Vas
odila
tors
(%)
42.5
42.8
41.8
41.0
44.4
0.94
8
Lipi
d lo
wer
ing
drug
s(%
)32
.142
.043
.945
.855
.70.
012
AC
E in
hibi
tor (
%)
45.6
45.1
49.0
49.5
47.6
0.59
2
β-B
lock
ers (
%)
74.4
71.7
76.6
75.4
77.6
0.32
5
Not
e: V
alue
s are
mea
ns ±
stan
dard
dev
iatio
n or
per
cent
ages
.
Am Heart J. Author manuscript; available in PMC 2009 September 28.

NIH
-PA Author Manuscript
NIH
-PA Author Manuscript
NIH
-PA Author Manuscript
Lopez-Jimenez et al. Page 10B
MI=
Bod
y M
ass I
ndex
, BD
I = B
eck
Dep
ress
ion
Inve
ntor
y; C
HF=
con
gest
ive
hear
t ailu
re; C
AB
G=C
oron
ary
Arte
ry B
ypas
s Gra
ft; E
SSI=
EN
RIC
HD
Soc
ial S
uppo
rt In
stru
men
t; M
I= m
yoca
rdia
lin
farc
tion;
PV
D =
per
iphe
ral v
ascu
lar d
isea
se.
Am Heart J. Author manuscript; available in PMC 2009 September 28.

NIH
-PA Author Manuscript
NIH
-PA Author Manuscript
NIH
-PA Author Manuscript
Lopez-Jimenez et al. Page 11Ta
ble
2Pa
tient
Cha
ract
eris
tics b
y th
e W
eigh
t Cha
nge
at F
ollo
w-u
p G
roup
s.
Bef
ore
Prop
ensi
ty S
core
Mat
chin
gA
fter
Prop
ensi
ty S
core
Mat
chin
g
Wei
ght L
oss
>5%
(n =
460
)
Wei
ght c
hang
e≤5
%(n
= 9
15)
Wei
ght G
ain
>5%
(n =
301
)
P-va
lue
Wei
ght L
oss
>5%
(n =
327
)
No
wei
ght l
oss
(n =
327
)P-
valu
e
Cha
ract
eris
tic a
t Bas
elin
e
Age
(yea
rs)
62.1
± 1
2.1
60.7
± 1
2.2
56.8
± 1
2.2
<0.0
001
61.6
± 1
2.3
61.8
± 1
2.3
0.87
6
Bas
elin
e B
MI (
kg/m
2 )30
.9 ±
6.6
28.6
± 5
.626
.9 ±
5.5
<0.0
001
30.6
± 6
.130
.7 ±
6.4
0.85
6
Ejec
tion
frac
tion
(%)
44.8
± 1
4.4
46.2
± 1
2.6
45.5
± 1
2.7
0.26
245
.4 ±
14.
446
.2 ±
12.
70.
525
Cre
atin
ine
(mg/
dL)
1.18
± 0
.75
1.15
± 0
.76
1.09
± 0
.56
0.22
41.
18 ±
0.6
91.
20 ±
0.7
70.
659
Cre
atin
ine
clea
ranc
e90
.7 ±
42.
785
.8 ±
37.
286
.1 ±
34.
60.
090
89.9
± 4
2.4
89.0
± 4
4.2
0.78
5
Syst
olic
blo
od p
ress
ure
(mm
Hg)
126.
1 ±
21.3
122.
9 ±
18.9
120.
8 ±
17.9
0.00
0712
4.8
± 19
.112
5.8
± 18
.90.
496
Dia
stol
ic b
lood
pre
ssur
e (m
m H
g)70
.8 ±
11.
270
.4 ±
11.
069
.6 ±
9.7
0.32
570
.2 ±
11.
070
.9 ±
10.
80.
407
Com
orbi
dity
scor
e2.
44 ±
2.1
62.
17 ±
2.0
61.
90 ±
1.9
10.
002
2.34
± 2
.15
2.42
± 2
.12
0.64
7
Hei
ght (
m)
1.68
6 ±0
.102
1.68
6 ±0
.108
1.69
2 ±0
.096
0.69
61.
69 ±
0.1
01.
69 ±
0.1
10.
605
BD
I sco
re15
.8 ±
8.5
15.4
± 8
.416
.1 ±
8.2
0.33
815
.1 ±
7.9
15.1
± 8
.10.
973
ESSI
scor
e23
.2 ±
6.4
23.2
± 6
.323
.2 ±
6.6
0.99
023
.5 ±
6.6
23.5
± 6
.20.
993
Gen
der (
% fe
mal
e)47
.645
.039
.20.
071
47.7
48.6
0.81
4
Kill
ip c
lass
III-
IV (%
)10
.66.
75.
70.
020
8.5
7.2
0.54
8
Prev
ious
MI (
%)
25.2
26.3
25.7
0.89
423
.623
.90.
927
CH
F hi
stor
y (%
)16
.712
.28.
70.
005
14.7
15.6
0.74
3
PVD
(%)
14.8
13.5
10.2
0.19
013
.814
.10.
910
Stro
ke/T
IA (%
)9.
210
.17.
80.
495
8.9
9.5
0.78
6
Pulm
onar
y di
seas
e (%
)20
.218
.916
.50.
449
21.7
24.5
0.40
4
Dia
bete
s (%
)36
.431
.831
.80.
199
34.3
34.6
0.93
4
Hyp
erte
nsio
n (%
)*64
.961
.950
.20.
0002
64.5
63.6
0.80
7
Ren
al d
isea
se (%
)11
.59.
18.
50.
269
10.7
11.9
30.
622
Prev
ious
CA
BG
%)
12.9
13.8
9.1
0.10
411
.912
.50.
811
CA
BG
afte
r ind
ex M
I(%
)25
.215
.413
.7<0
.000
125
.123
.60.
649
Lipi
d lo
wer
ing
drug
s(%
)45
.347
.149
.80.
490
45.8
45.7
0.97
7
Ant
idep
ress
ant u
se <
6 m
onth
(%)
15.2
13.0
19.2
0.02
814
.68
16.2
10.
589
Am Heart J. Author manuscript; available in PMC 2009 September 28.

NIH
-PA Author Manuscript
NIH
-PA Author Manuscript
NIH
-PA Author Manuscript
Lopez-Jimenez et al. Page 12
Bef
ore
Prop
ensi
ty S
core
Mat
chin
gA
fter
Prop
ensi
ty S
core
Mat
chin
g
Wei
ght L
oss
>5%
(n =
460
)
Wei
ght c
hang
e≤5
%(n
= 9
15)
Wei
ght G
ain
>5%
(n =
301
)
P-va
lue
Wei
ght L
oss
>5%
(n =
327
)
No
wei
ght l
oss
(n =
327
)P-
valu
e
Bas
elin
e sm
okin
g st
atus
<0.0
001
0.36
8
N
on-s
mok
er (%
)39
.336
.121
.439
.137
.3
F
orm
er sm
oker
(%)
38.2
32.8
30.5
35.5
32.4
C
urre
nt sm
oker
(%)
22.5
31.1
48.1
25.4
30.3
Cha
nge
from
bas
elin
e
B
DI c
hang
e−6
.0 ±
9.0
−6.6
± 8
.4−5
.9 ±
9.9
0.45
6−5
.8 ±
8.6
−5.2
± 8
.20.
391
E
SSI c
hang
e2.
6 ±
6.0
2.8
± 5.
92.
2 ±
6.0
0.26
92.
4 ±
5.7
2.1
± 5.
90.
557
S
mok
ing
cess
atio
n (%
)11
.312
.728
.2<0
.000
112
.512
.20.
906
Am Heart J. Author manuscript; available in PMC 2009 September 28.

NIH
-PA Author Manuscript
NIH
-PA Author Manuscript
NIH
-PA Author Manuscript
Lopez-Jimenez et al. Page 13Ta
ble
3Ev
ent I
ncid
ence
Rat
es* .
Bas
elin
e B
MI G
roup
s (N
= 2
318)
Out
com
eU
nder
wei
ght
(0∼
20)
(n=8
4)
Nor
mal
(20∼
25)
(n=5
28)
Ove
rwei
ght
(25 ∼
30)
(n =
872
)
Obe
se(3
0 ∼
40)
(n =
700
)
Obe
se 3
(≥40
)(n
= 1
34)
p-va
lue†
Dea
th o
r rec
urre
nt M
I (n
= 55
8)18
.4 (2
9)13
.7 (1
46)
11.2
(207
)10
.0 (1
49)
9.3
(27)
0.00
4
All
caus
e m
orta
lity
(n =
317
)12
.5 (2
1)7.
5 (9
0)6.
0 (1
21)
4.5
(74)
3.4
(11)
<0.0
01
Car
diov
ascu
lar m
orta
lity
(n=1
97)
6.5
(11)
4.5
(54)
4.3
(87)
2.4
(40)
1.5
(5)
<0.0
01
Fata
l or n
onfa
tal M
I (n
= 34
3)8.
3(13
)7.
5 (7
9)7.
1 (1
30)
6.8
(102
)6.
6 (1
9)0.
9
Rec
urre
nt n
onfa
tal M
I (n=
317
)7.
0(11
)6.
9 (7
3)6.
5 (1
19)
6.4
(95)
6.6
(19)
0.99
CV
Hos
pita
lizat
ion
(n =
847
)19
.9(2
7)22
.8 (1
96)
20.3
(308
)21
.7 (2
61)
24.6
(55)
0.6
Not
e:
* Per 1
00 p
atie
nt-y
ears
; num
bers
of e
vent
s are
show
n in
par
enth
eses
.
† The
p-va
lue
of th
e C
hi-s
quar
ed te
st fo
r equ
ality
of t
he in
cide
nce
rate
s for
the
five
BM
I gro
ups.
Am Heart J. Author manuscript; available in PMC 2009 September 28.
NIH
-PA Author Manuscript
NIH
-PA Author Manuscript
NIH
-PA Author Manuscript
Lopez-Jimenez et al. Page 14Ta
ble
4A
djus
ted
Haz
ard
ratio
s* , w
ith 9
5% C
onfid
ence
Inte
rval
s (N
=171
9).
Dea
th /
nonf
atal
MI
(eve
nt n
= 4
01)
All
caus
e m
orta
lity
(eve
nt n
= 22
0)C
ardi
ovas
cula
r m
orta
lity
(eve
nt n
=13
3)
HR
(95%
CI)
p-va
lue
HR
(95%
CI)
p-va
lue
HR
(95%
CI)
p-va
lue
Mod
el 1
: Bas
elin
e B
MI g
roup
s
Nor
mal
(20∼
25)
1.00
1.00
1.00
Und
erw
eigh
t (<2
0)1.
54 (0
.98-
2.41
)0.
061.
77 (1
.01-
3.12
)0.
046
1.31
(0.5
7-3.
02)
0.5
Ove
rwei
ght (
25∼
30)
0.96
(0.7
4-1.
24)
0.8
0.96
(0.6
9-1.
35)
0.8
1.17
(0.7
7-1.
77)
0.5
Obe
se (>
30)
0.83
(0.6
3-1.
10)
0.2
0.74
(0.5
1-1.
07)
0.1
0.60
(0.3
6-0.
99)
0.04
7
Mod
el 2
: Bas
elin
e co
ntin
uous
BM
I (pe
r 5 u
nit i
ncre
ase)
BM
I0.
88 (0
.80-
0.96
)0.
005
0.83
(0.7
3-0.
94)
0.00
40.
83 (0
.70-
0.98
)0.
03
Not
e:
* Mul
tivar
iate
Cox
regr
essi
on m
odel
incl
uded
age
; gen
der;
crea
tinin
e (≥
1.3
vs. <
1.3)
; sys
tolic
and
dia
stol
ic b
lood
pre
ssur
e; p
revi
ous m
yoca
rdia
l inf
arct
ion;
CA
BG
; con
gest
ive
hear
t fai
lure
; per
iphe
ral
vasc
ular
dis
ease
; stro
ke; r
enal
insu
ffic
ienc
y; p
ulm
onar
y di
seas
es; d
iabe
tes;
BD
I sco
res;
CA
BG
trea
tmen
t afte
r the
inde
x M
I; ba
selin
e us
e of
vas
odila
tors
. The
regr
essi
on re
sults
wer
e ba
sed
on N
=171
9su
bjec
ts w
ith n
onm
issi
ng c
ovar
iate
s.
Am Heart J. Author manuscript; available in PMC 2009 September 28.

NIH
-PA Author Manuscript
NIH
-PA Author Manuscript
NIH
-PA Author Manuscript
Lopez-Jimenez et al. Page 15Ta
ble
5A
djus
ted
Haz
ard
ratio
s* , w
ith 9
5% C
onfid
ence
Inte
rval
s (N
=12
42).
Dea
th /r
ecur
rent
MI
(eve
nt n
=239
)A
ll ca
use
mor
talit
y(e
vent
n =
107
)C
ardi
ovas
cula
r m
orta
lity
(eve
nt n
= 6
5)
HR
(95%
CI)
p-va
lue
HR
(95%
CI)
p-va
lue
HR
(95%
CI)
p-va
lue
Mod
el 1
: Wei
ght c
hang
e at
follo
w-u
p fr
om b
asel
ine
(per
5 k
g)
Del
ta w
eigh
t0.
91 (0
.83-
0.99
)0.
041
0.83
(0.7
2-0.
96)
0.01
10.
87 (0
.73-
1.04
)0.
1
Mod
el 2
: Wei
ght c
hang
e at
6 m
onth
s (pe
r 5 k
g)
Slop
e w
eigh
t0.
90 (0
.81-
0.99
)0.
030
0.83
(0.7
1-0.
96)
0.01
00.
87 (0
.73-
1.05
)0.
1
Mod
el 3
: Wei
ght c
hang
e gr
oups
Wei
ght c
hang
e≤5%
1.00
1.00
1.00
Wei
ght g
ain>
5%0.
76 (0
.52-
1.12
)0.
20.
72 (0
.38-
1.39
)0.
30.
82 (0
.37-
1.85
)0.
6
Wei
ght l
oss >
5%1.
38 (1
.03-
1.86
)0.
032
1.74
(1.1
3-2.
68)
0.01
21.
79 (1
.02-
3.14
)0.
043
Mod
el 4
: Wei
ght c
hang
e gr
oups
afte
r pro
pens
ity sc
ore
mat
chin
g†
Wei
ght l
oss >
5%1.
59 (1
.11-
2.28
)0.
012
2.06
(1.2
0-3.
52)
0.00
92.
20 (1
.06-
4.60
)0.
035
Not
e:
* Mul
tivar
iate
Cox
regr
essi
on m
odel
incl
uded
bas
elin
e B
MI,
antid
epre
ssan
t use
bef
ore
6 m
onth
, sm
okin
g ce
ssat
ion,
bas
elin
e sm
okin
g hi
stor
y, c
reat
inin
e cl
eara
nce
as w
ell o
ther
cov
aria
tes a
s in
Tabl
e 4.
Even
ts th
at o
ccur
red
befo
re th
e 6-
mon
th v
isit
wer
e no
t inc
lude
d. T
he re
gres
sion
resu
lts fo
r mod
el 1
-3 w
ere
base
d on
N=1
242
subj
ects
with
non
mis
sing
wei
ght c
hang
e an
d co
varia
tes.
Afte
r add
ition
alad
just
men
t for
eje
ctio
n fr
actio
n, K
illip
cla
ss, d
epre
ssio
n sc
ore
chan
ge a
nd so
cial
isol
atio
n sc
ore
chan
ge, t
he e
stim
ates
and
p-v
alue
s are
sim
ilar t
o ab
ove.
† The
prop
ensi
ty m
atch
ed sa
mpl
e of
N=6
54 p
atie
nts h
ave
129
deat
h/re
curr
ent M
I, 68
dea
th, a
nd 3
9 C
V d
eath
eve
nts,
and
the
wei
ght l
oss>
5% g
roup
hav
e 73
(57%
) dea
th/re
curr
ent M
I, 42
(62%
) dea
th,
and
25 (6
4%) C
V d
eath
eve
nts.
Am Heart J. Author manuscript; available in PMC 2009 September 28.