watersheds under new guidelines - indian council
TRANSCRIPT
WATERSHEDS UNDER NEW GUIDELINESWATERSHEDS UNDER NEW GUIDELINESWATERSHEDS UNDER NEW GUIDELINES
Sponsored by Sponsored by
Na
tion
al W
ate
rshe
d D
eve
lop
me
nt P
roje
ct for R
ain
fed
Are
as –
National Watershed Development Project for Rainfed Areas –
Ma
cro M
an
ag
em
en
t of A
gricu
lture
Sch
em
e
Macro Management of Agriculture Scheme
(2008-2014)(2008-2014)
De
pa
rtme
nt o
f Ag
ricultu
re &
Co
op
era
tion
,
Min
istry o
f Ag
ricultu
re, G
ove
rnm
en
t of In
dia
Department of Agriculture & Cooperation,
Ministry of Agriculture, Government of India
ICAR – INDIAN INSTITUTE OF SOIL AND WATER CONSERVATION
(Formerly Central Soil & Water Conservation Research & Training Institute)
ICAR – INDIAN INSTITUTE OF SOIL AND WATER CONSERVATION
(Formerly Central Soil & Water Conservation Research & Training Institute)
20162016
218, Kaulagarh Road, Dehradun – 248 195 (Uttarakhand)
ICARICARHkkd`avuqiHkkd`avuqi
DEVELOPMENT AND MANAGEMENT OF MODEL DEVELOPMENT AND MANAGEMENT OF MODEL
WATERSHEDS UNDER NEW GUIDELINESWATERSHEDS UNDER NEW GUIDELINES
tya ol, aj {k kn .e k l;h aLFr kj kk ukH
B.L. Dhyani Pradeep Dogra Nirmal Kumar G.C. Sharma Sangeeta N. SharmaB.L. Dhyani Pradeep Dogra Nirmal Kumar G.C. Sharma Sangeeta N. Sharma
Compiled and Edited by Compiled and Edited by
UnderUnder
Implemented byImplemented by
Production Guidance and Published by
Design, Layout and Production
Project Sponsored by
Suggested Citation
Dr. P.K. Misha,
ICAR – Indian Institute of Soil and Water Conservation
218, Kaulagarh Road
Dehradun – 248 195 (Uttarakhand)
Phone: 0135-2758564, Fax: 0135-2754213
Email: [email protected]
Nirmal Kumar
Department of Agriculture & Cooperation, Ministry of Agriculture, Government of India, New Delhi
under National Watershed Development Project for Rainfed Areas – Macro Management of Agriculture Scheme (2008-2014)
Dhyani, B.L.; Dogra, Pradeep; Kumar, Nirmal; Sharma, G.C. and Sharma, Sangeeta N. (2016). Development and Management of Model Watersheds under New Guidelines. ICAR – Indian Institute of Soil and Water Conservation, Dehradun : 112 p.
Printed at
Apna Janmat, Subhash Road, Dehradun (Uttarakhand)
© ICAR-Indian Institute of Soil and Water Conservation, 2016
ISBN

PREFACENearly 73% of the world’s cropland and about 60% of India’s cultivated area is rainfed. This land in India contributes to 40% of the country’s total food production. Global food demand is expected to increase to more than double by 2050 because of population growth and is likely two diversify due to increase in per capita income. While the challenge cannot be met through increased agricultural production alone, increased production is an essential part of the solution. However, in many cases including India, production capacities are deteriorating in the pace of rapid population growth, misdirected agricultural practices, and widespread land degradation. Land degradation is mainly attributed to water erosion, resulting into loss of soil fertility, and vegetation and
ground water depletion, thus resulting into decline of economic and environmental potentials. Land degradation can be rectified through holistic watershed approach. Improving agricultural production and restoring ecological balance are the twin objectives of watershed programmes. Watershed programmes are recognized as potential engines for agricultural growth and sustainable development. Success and sustainability of these programmes are directly related to collective action for conserving natural resources to enhance crop productivity, and livelihoods for sustainable income generation. In addition, watershed approach also focuses on integrated farming systems and management of common property resources to augment family income and improve nutritional levels of communities participating in watershed programmes. The treatment of any watershed is expected to improve agricultural as well as livestock productivity, and livelihood of the beneficiaries.
Keeping in view the problems of different agro-ecological regions, watershed projects were undertaken by ICAR - Indian Institute of Soil & Water Conservation (formerly Central Soil & Water Conservation Research & Training Institute) at its HQ at Dehradun and its Regional Research Centres located in Union Teritory of Chandigarh, Uttar Pradesh, Madhya Pradesh, Rajasthan, Gujarat, Karnataka, Odisha and Tamil Nadu States during 2008-2014 with the sponsorship of Ministry of Agriculture, Government of India under Micro-Management of Agriculture (MMA), National Watershed Development Project for Rainfed Areas (NWDPRA) scheme.
The project concentrated on capacity building of the beneficiaries in conservation and production aspects with improvement in basic livelihood through different livelihood activities that sustain them, especially during drought years by sustainable use of land and water resources. A blend of the recommended location specific technologies and local level innovations was attempted under the project. This document of watershed project presents a comprehensive assessment of the bio-physical and socio-economic impacts of various interventions in the watersheds for augmenting socio-economic/livelihood security of stakeholders. It is expected that this publication will be very useful for various watershed functionaries and others who are working in the areas. I congratulate all the contributors at the Headquarters and the Research Centres for bringing out this important publication.
(P.K. Mishra)Director
ICAR - Indian Institute of Soil and Water Conservation, Dehradun
March, 2016
Acknowledgement
The editors are highly thankful to Dr V.N. Sharda, Ex-Director, ICAR-IISWC (formerly CSWCRTI) and Nodal Officer during project period (2008-09 to July 11, 2011) for his painstaking efforts in identification of interventions, planning and providing valuable suggestions during implementation of various activities. Authors are also thankful to Dr. K.S. Dadhwal, Acting Director during 12 July 2011 to 17 January 2012 and Director of ICAR-IISWC, Dr. P.K. Mishra from January 18, 2012 onward for his valuable guidance and moral support extended to the project. All the support provided by the Indian Council of Agricultural Research (ICAR), New Delhi is duly acknowledged.
Financial support from the Department of Agriculture & Cooperation (DAC), Ministry of Agriculture, Government of India under National Watershed Development Project for Rainfed Areas – Macro Management of Agriculture (NWDPRA-MMA) scheme is also duly acknowledged. We also express our gratitude to the Secretary; Additional Secretary; Joint Secretary to Government of India and Additional Commissioner; Deputy Commissioner, Assistant Commissioner and all other Officers of Department of Agriculture & Cooperation (RFS Division), Ministry of Agriculture, Government of India, New Delhi during the project period for their technical and administrative guidance and support .
The team immensely benefitted from technical guidance and encouragement provided by different learned dignitaries, policy planners, bureaucrats, technocrats, and members of QRT and RAC teams of ICAR-IISWC who visited these projects from time to time. Project team is short of words to acknowledge their valuable technical guidance in accomplishing the project activities in most befitting manner.
Shri A.K. Khullar, Ex-Scientist (Selection Grade), ICAR-IISWC for his support till October 2009 in coordinating the project is heartily acknowledged. Cooperation and insights provided by the scientists and technical personnel of the Institute are also duly acknowledged. The technical support provided by various state department agencies in respective watershed for organizing camps on various themes from time to time is also thankfully acknowledged by the team.
The interventions of Heads of Village Councils and Watershed Associations of all the selected watersheds immensely helped in resolving differences and bringing out visible progress of the project. Farming community of the selected villages, which whole heartily participated in various project activities, deserve special thanks for their cooperation.
The help rendered by the present and past Chief Administrative Officers, Senior Finance & Accounts Officer, Administrative Officer, Finance & Account Officer, Officer-in-Charge (Store & Purchase), other staff of Administrative, Bill & Cash, Audit and Store Sections of ICAR-IISWC helped in smooth progress of the project is thankfully acknowledged. Staff of Prioritization, Monitoring and Evaluation (PME) Cell, Sh. S.K. Sinha, STO; Mrs. Meenakshi Pant, PA and Sh. Deepak Singh Thapa / Sh. Prem Singh Rawat for their Support Services are thanked for their sincere help and cooperation.
Editors
Guidance & Support
Technical Coordination
: Dr. V.N. Sharda Director & Nodal Officer upto July 11, 2011Dr. K.S. Dadhwal Acting Director during July 12, 2011 to January
17, 2012Dr. P.K. Mishra Director from January 18, 2012
: Er. C.P. Arora Principal Scientist (Engineering) upto July 31, 2011
Dr. B.L. Dhyani OIC (PME Cell) during August 2011 to December 2014
Dr. Pradeep Dogra Principal Scientist (Agricultural Economics)
Sh. Nirmal Kumar Chief Technical Officer
Ashti Watershed, Uttarakhand : Dr. G.P. Juyal Head (H&E) Division, Dehradun & Project Leader upto July 31, 2014
Dr. N.K. Sharma Principal Scientist (Agronomy)Dr. B.N. Ghosh Principal Scientist (Soils)Dr. Bankey Bihari Principal Scientist (Extension)Dr. J.M.S. Tomar Principal Scientist (Forestry)Dr. M. Muruganandam Senior Scientist (Fisheries)Dr. A.C. Rathore Senior Scientist (Horticulture)Er. S. Patra Scientist (Engineering)
Jalalpur Watershed, Uttar Pradesh : Dr. A.K. Singh Principal Scientist (SWCE) & Project LeaderDr. S.K. Dubey Principal Scientist (Soils) & Head, Research
Centre, AgraDr. P.K. Panda Senior Scientist (Agronomy) upto July 13, 2011Dr. R.K. Dubey Senior Scientist (Agronomy)Dr. S. Kala Scientist (Forestry)Dr. M. Praphawati Scientist (Soils)Dr. R.B. Meena Scientist (Soils)Dr. K.K. Sharma Senior Scientist (SWCE)
Ramasagara Watershed, Karnataka : Dr. S.L. Patil Principal Scientist (Agronomy) & Project LeaderEr. R.N. Adhikari Principal Scientist (Engineering) upto June 30,
2013Dr. A. Raizada Principal Scientist (Forestry) & Head, Research
Centre, Bellary from October 1, 2009Dr. D. Ramajayam Senior Scientist (Horticulture) upto March 19,
2012Dr. S.K.N. Math Principal Scientist (Soils) upto May 2010Mrs. M. Prabhavathi Scientist (Soils)Dr. Loganandan Senior Scientist (Extension)
Kajiyana Watershed, Haryana : Dr. R.P. Yadav Principal Scientist (Soils) & Project Leader upto November 3, 2014
Dr. Pratap Singh Principal Scientist upto July 2013Dr. S.L. Arya Principal Scientist (Agricultural Economics)
Contributor Scientist Teams
Contributors
Dr. V.K. Bhatt Principal Scientist ( )Dr. Pawan Sharma Principal Scientist (Soils)Dr. Ram Prasad Senior Scientist (Horticulture)Dr. Sharmistha Pal Scientist (Soils)Dr. A.K. Tiwari Principal Scientist & Head, Research Centre,
ChandigarhJigna Watershed, Madhya Pradesh : Dr. S.P. Tiwari Principal Scientist (Soils), Head, Research
Centre, Datia & Project LeaderDr. Dev Narayan Principal Scientist (Agronomy)Dr. Om Prakash Principal Scientist (Extension)Dr. H. Biswas Scientist (Soils) upto March 31, 2012Dr. P.P. Adhikari Scientist (Soils) upto May 23, 2012Sh. M.N. Ramesha Scientist (Forestry) upto July 20, 2013Dr. D.G. Durbude Senior Scientist (Engineering) from April 23,
2011 to April 17, 2013Sh. Prabhat Kumar Scientist (Soils) from May 24, 2012
Dhoti Watershed, Rajasthan : Dr. R.K. Singh Principal Scientist (Soils); Head, Research Centre, Kota & Project Leader
Dr. S.N. Prasad Principal Scientist and Head, Research Centre Kota upto January 2011
Dr. Ashok Kumar Principal Scientist (Agril. Economics)Er. B.K. Sethy Scientist (Engineering) upto Aug. 8, 2014Sh. H.R. Meena Scientist (Horticulture)Shakir Ali Senior Scientist (SWCE)
Lachhaputraghati Watershed, Odisha : Dr. K.P. Gore Head, Research Centre, Koraput & Project Leader upto Nov. 30, 2010
Dr. M. Madhu Principal Scientist; Head, Research Centre, Koraput & Project Leader from June 27, 2011
Er. B.S. Naik Scientist (Engineering)Sh. Praveen Jhakar Scientist (Agronomy)Sh. HC Hombe Gowda Scientist Dr. P.P. Adhikari Scientist (Soils) from May 26, 2012Sh. D. Barman Scientist (Soils)
Ayalur Watershed, Tamil Nadu : Dr. O.P.S. Khola Principal Scientist (Agronomy); Head, Research Centre, Udhagamandalam & Project Leader
Dr. K. Kannan Principal Scientist (Agronomy)Ms. V. Selvi Scientist (Engineering)Dr. D.V. Singh Principal Scientist (Agronomy) upto April 12,
2012Vejalpur-Rampura Watershed, Gujarat: Dr. R.S. Kurothe Principal Scientist (SWCE); Head, Research
Centre, Vasad upto December 9, 2014 & Project Leader upto November 2015
Dr. B.K. Rao Senior Scientist (SWCE)Dr. D.R. Sena Principal Scientist (SWCE) upto July 20, 2011 Dr. A.K. Vishwakarma Senior Scientist (Agronomy) upto July 31, 2013Dr. Gopal Kumar Scientist (Soils) upto September 28, 2015Dr. G.L. Bagdi Principal Scientist (Agricultural Extension) upto
May 30, 2015
Dr. V.C. Pande Senior Scientist (Agricultural Economics)
Engineering
Technical Support Teams
Ashti Watershed, Uttarakhand : Sh. R.K. Arya Senior Technical Officer ( )Sh. Ashok Kumar Chief Technical Officer (Agronomy)Sh. Rakesh Kumar Senior Technical Officer (Fisheries)
Jalalpur Watershed, Uttar Pradesh : Dr. S.C. Saxena Chief Technical Officer (Statistics) upto March 2015
Sh. A.P. Gawande Chief Technical Officer (Agriculture)Sh. B. Prasad Senior Technical Officer (Plant Science)Sh. Suresh Chandra Senior Technical Officer (Engineering) from July
11, 2011Sh. Radhey Shyam Senior Technical Officer (Agriculture)Sh. Prem Shankar Technical Officer (Engineering)Sh. Krishna Kumar Technical Officer (Agriculture) upto July 17,
2014Sh. Jamuna Prasad Technical OfficerSh. Than Chand Technical Officer (Agriculture)Sh. B.P. Joshi Technical Officer (Meteorology)Sh. Narayan Singh Technical Officer (Agriculture)
Ramasagara Watershed, Karnataka : Mr. K.K. Reddy Assistant Chief Tech. Officer (Agricultural Engineering)
Mr. K. Channabasappa Technical Officer (Social Science) upto February 2014
Mr. S.M. Mannikatti Technical Officer (Agronomy)Mr. B.N. Seshadri Technical Officer (Meteorology)Mr. P. Mohan Kumar Technical Assistant (Soils)
Kajiyana Watershed, Haryana : Sh. Ram Murti Assistant Chief Technical OfficerSh. Vikram Singh Senior Technical AssistantSh. Basudeo Technical Officer (Engineering)Sh. Harish Sharma Technical Officer Sh. A.K. Nitant Technical OfficerSh. A.N. Gupta Senior Technical Officer upto June 12, 2015Sh. Shailendra Yadav Senior Technical Officer (Horticulture)Sh. Surender Singh Chief Technical Officer (Economics)Sh. Akshay Kumar Technical Officer
Jigna Watershed, Madhya Pradesh : Sh. Pramod Kumar Technical Officer (Engineering)Sh. Santraj Assistant Chief Tech. Officer (Soils)Sh. Bangali Baboo Technical Officer (Statistics)Sh. B.D. Kushwaha Technical Officer (Meteorology)Sh. V.K. Dwivedi Assistant Chief Technical Officer (Forestry) upto
November 5, 2014Dhoti Watershed, Rajasthan : Sh. Hariom Arya Technical Assistant (Social Science)
Sh. B.K. Upadhyay Technical Officer (Horticulture)Sh. P.R. Raibole Technical Officer (Engineering)
Lachhaputraghati Watershed, Odisha : Sh. G.B. Naik Technical Officer (Plant Science)Sh. B.K. Dash Technical Officer (Engineering) upto December
31, 2014Ayalur Watewrshed, Tamil Nadu : Er. R. Mohanraj Senior Technical Officer (Engineering)
Er. E. Murugesan Senior Technical Assistant (Engineering)Vejalpur-Rampura Watershed, Gujarat: Sh. C.N. Damor Technical Officer
Sh. Anand Kumar Technical OfficerSh. D.G. Damor Technical Officer Sh. Prem Singh Technical Officer upto January 11, 2013Sh. J.K. Vankar Technical OfficerSh. M.J. Baraiya Ex Technical Officer upto June 30, 2013Sh. K.D. Mayawanshi Technical OfficerDr. Nyonand Senior Technical Officer
Engineering
Page
Preface AcknowledgementContributors
1. Introduction 1-2
2. Watershed Features 3-102.1 Salient features of basic resources of selected watersheds 3
3. Community Organization, Entry Point Activities and Capacity Building 11-203.1 Ashti watershed 113.2 Jalalpur watershed 113.3 Ramasagara watershed 123.4 Kajiyana watershed 143.5 Jigna watershed 153.6 Dhoti watershed 153.7 Lachhaputraghati watershed 173.8 Ayalur watershed 183.9 Vejalpur - Rampura watershed 19
4. Watershed Development Activates 21-244.1 Ashti watershed 214.2 Jalalpur watershed 254.3 Ramasagara watershed 284.4 Kajiyana watershed 364.5 Jigna watershed 394.6 Dhoti watershed 414.7 Lachhaputraghati watershed 444.8 Ayalur watershed 454.9 Vejalpur - Rampura watershed 51
5. Monitoring and Impact Evaluation 55-915.1 Ashti watershed 555.2 Jalalpur watershed 565.3 Ramasagara watershed 595.4 Kajiyana watershed 615.5 Jigna watershed 645.6 Dhoti watershed 665.7 Lachhaputraghati watershed 725.8 Ayalur watershed 785.9 Vejalpur - Rampura watershed 86
6. Physical and Financial Targets and Achievements 91-102
7. Lessons Learnt 103-104
8. Abbreviation & Acronyms 105-108
Annexure 1 : Project approval of RFS Division, Department of Agricu;ltural & Cooperation, 109Ministry of Agriculture, Government of India, New Delhi
st Annexure 2 : CSWCRTI, Dehradun Utilization Certificate as on March 31 2014. 111
Annexure 3 : Approval of RFS Division, DoAC, MoA, GoI, N. Delhi dated Aug. 8, 2015 for 112 stutilising unspent balance as on March 31 2014 for Publication
Contents
Introduction
Given the importance of the agriculture sector in the Indian economy in terms of its contribution to the GDP (16.11%), employment (52.3%) and the fact that it constitutes the backbone of the rural livelihood security system, the Union Government supplements and complements the efforts being made by the State Governments to promote agricultural production and productivity through technical and financial interventions. The Department of Agriculture & Cooperation formulates and implements National Policies and Programmes aimed at achieving rapid agricultural growth and development through optimum utilization of the country's land, water, soil, plant and Animal , Watershed Development Programme (WDP) is widely accepted as the panacea for accelerating agricultural production in the Country in general and from rain dependent agriculture in particular. It is one of the most popular development programme implemented across the country during 1998 to 2014 with different varieties. The Macro Management of Agriculture (MMA) Scheme is one of the major centrally sponsored schemes formulated by the Department in this endeveaour.
The Macro Management of Agriculture (MMA) Scheme was launched in 2000-01 by integrating 27 centrally sponsored schemes moving away from a programmatic to a macro management mode of assistance to the States in the form of Work Plans prepared by the States and implemented in a spirit of partnership with the States. The scheme was conceived to be a step to provide sufficient autonomy and initiative to State Governments to develop programmes and activities as per their felt needs and priorities. The scheme replaced the schematic rigid approach by a Work Plan based approach in an interactive mode to supplement / complement States' efforts in the agriculture sector. The MMA scheme was a major step towards decentralization, allowing flexibility to the States in selecting and prioritization of choose suitable interventions from the various components, in addition to their own efforts towards growth of the agriculture sector. Later, with the launch of the National Horticulture Mission in 2005-06, 10 components relating to horticulture were excluded from the MMA scheme. Thus, the MMA scheme comprised the 17 components, or sub-schemes, focusing on rice, wheat, coarse cereals, sugarcane, soil health, nutrient and pest management, farm mechanization and watershed development.
In the backdrop of launching of new initiatives, namely, the National Food Security Mission (NFSM) and the Rashtriya Krishi Vikas Yojana (RKVY), it became imperative to revise the existing MMA scheme to improve its efficacy in supplementing and complementing the efforts of the States towards enhancement of agricultural production and productivity, in the larger context of broad based inclusive growth highlighted in the XI Five Year Plan Document, as well as the National Policy on Farmers, 2007. In the Revised Macro Management of Agriculture (MMA) Scheme, the role of the scheme has been redefined to avoid overlapping and duplication of efforts, and to make it more relevant to the present agriculture scenario in the States to achieve the basic objective of food security and to improve the livelihood system for rural masses.
Watershed projects are recognized as potential drivers of agricultural growth and sustainable development in rainfed areas. Success and sustainability of watershed programs are directly related to collective action directed towards conserving natural resources for enhancing crop, tree and water productivity, livelihood security and gender equity. Realizing the need and relevance of rain water management centeric approach for sustainable development of rainfed agriculture in India, efforts were initiated in 1974 by implementing soil and water conservation technologies on watershed approach. Four watersheds were initially developed through people’s participation, which was later expanded to 47 models watersheds in 1982-83. Success stories emerging from these model watersheds paved way for developing watershed programmes as a major rural development activity for rainfed areas at national level. Over the years, watershed programmes have come a long way enriching the experience of successes and failures in synergistic integration of production systems, effective community participation, water and land resource development, and other related issues. Accordingly, project implementation guidelines were framed and successively reframed. Depletion in ground water resources at an alarming rate, concerns over climate change, shifting farming preferences for farming systems, changing socio-economic conditions, and advancements in remote sensing and geo-spatial analytical and planning technology are some of the major issues suggesting that guidelines and technologies package for watershed development project need to be revisited and updated based on experiences gained during the project implementation.
Introduction 1
01
Concise Report On Development And Management Of Model Watersheds Through Participatory Approach
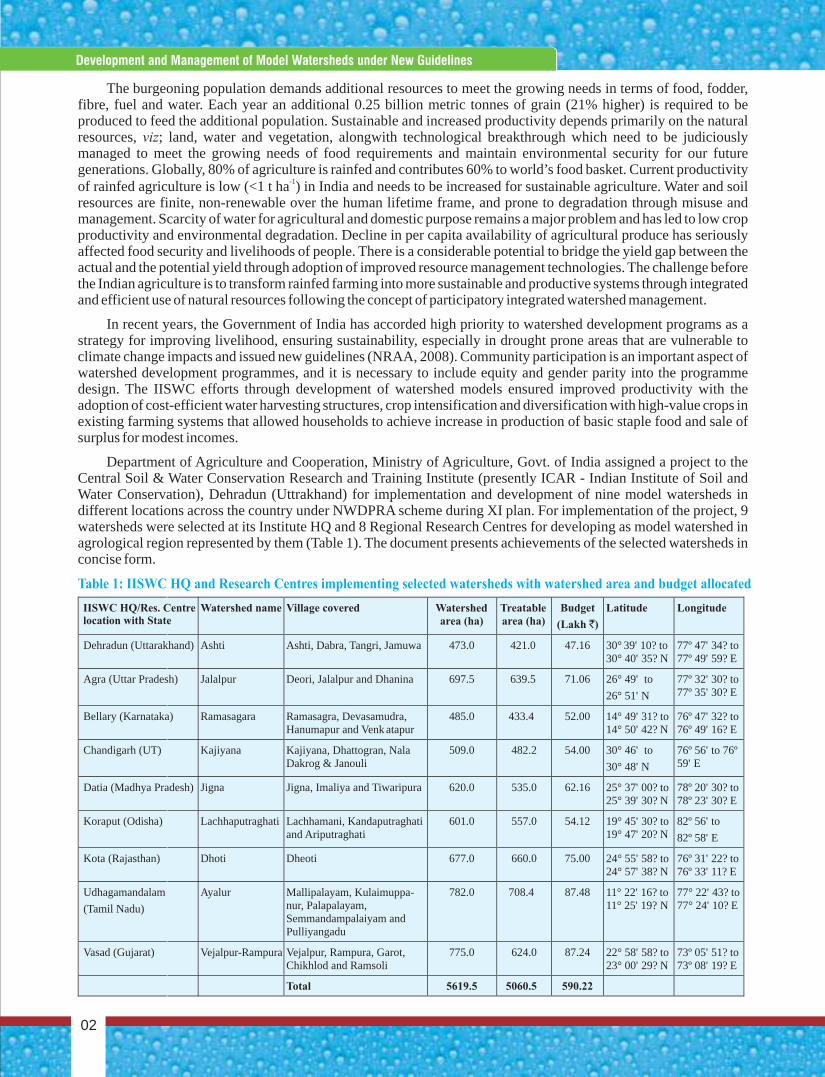
Table 1: IISWC HQ and Research Centres implementing selected watersheds with watershed area and budget allocated Village covered Watershed
area (ha) Treatable area (ha)
Budget
(Lakh `)
Latitude Longitude
Ashti, Dabra, Tangri, Jamuwa 473.0 421.0 47.16 30°
39' 10? to 30° 40' 35? N
77º 47' 34? to 77º 49' 59? E
Deori, Jalalpur and Dhanina 697.5 639.5 71.06 26° 49' to
26° 51' N
77º 32' 30? to 77º 35' 30? E
Ramasagra, Devasamudra, Hanumapur and Venk atapur
485.0
433.4
52.00
14° 49' 31? to 14° 50' 42? N
76º 47' 32? to 76º 49' 16? E
Kajiyana, Dhattogran, Nala Dakrog & Janouli
509.0
482.2
54.00
30° 46' to
30° 48' N 76º 56' to 76º
59' E
Jigna, Imaliya and Tiwaripura
620.0
535.0
62.16
25° 37' 00? to 25° 39' 30? N
78º 20' 30? to 78º 23' 30? E
Lachhamani, Kandaputraghati and Ariputraghati
601.0
557.0
54.12
19° 45' 30? to 19° 47' 20? N
82º 56' to
82º 58' E
Dheoti
677.0
660.0
75.00
24° 55' 58? to 24° 57' 38? N
76º 31' 22? to 76º 33' 11? E
Mallipalayam, Kulaimuppa-nur, Palapalayam, Semmandampalaiyam and Pulliyangadu
782.0
708.4
87.48
11° 22' 16? to 11° 25' 19? N
77° 22' 43? to 77° 24' 10? E
Vejalpur, Rampura, Garot, Chikhlod and Ramsoli
775.0
624.0
87.24
22° 58' 58? to 23° 00' 29? N
73º 05' 51? to 73º 08' 19? E
Total
5619.5
5060.5
590.22
The burgeoning population demands additional resources to meet the growing needs in terms of food, fodder, fibre, fuel and water. Each year an additional 0.25 billion metric tonnes of grain (21% higher) is required to be produced to feed the additional population. Sustainable and increased productivity depends primarily on the natural resources, viz; land, water and vegetation, alongwith technological breakthrough which need to be judiciously managed to meet the growing needs of food requirements and maintain environmental security for our future generations. Globally, 80% of agriculture is rainfed and contributes 60% to world’s food basket. Current productivity
-1of rainfed agriculture is low (<1 t ha ) in India and needs to be increased for sustainable agriculture. Water and soil resources are finite, non-renewable over the human lifetime frame, and prone to degradation through misuse and management. Scarcity of water for agricultural and domestic purpose remains a major problem and has led to low crop productivity and environmental degradation. Decline in per capita availability of agricultural produce has seriously affected food security and livelihoods of people. There is a considerable potential to bridge the yield gap between the actual and the potential yield through adoption of improved resource management technologies. The challenge before the Indian agriculture is to transform rainfed farming into more sustainable and productive systems through integrated and efficient use of natural resources following the concept of participatory integrated watershed management.
In recent years, the Government of India has accorded high priority to watershed development programs as a strategy for improving livelihood, ensuring sustainability, especially in drought prone areas that are vulnerable to climate change impacts and issued new guidelines (NRAA, 2008). Community participation is an important aspect of watershed development programmes, and it is necessary to include equity and gender parity into the programme design. The IISWC efforts through development of watershed models ensured improved productivity with the adoption of cost-efficient water harvesting structures, crop intensification and diversification with high-value crops in existing farming systems that allowed households to achieve increase in production of basic staple food and sale of surplus for modest incomes.
Department of Agriculture and Cooperation, Ministry of Agriculture, Govt. of India assigned a project to the Central Soil & Water Conservation Research and Training Institute (presently ICAR - Indian Institute of Soil and Water Conservation), Dehradun (Uttrakhand) for implementation and development of nine model watersheds in different locations across the country under NWDPRA scheme during XI plan. For implementation of the project, 9 watersheds were selected at its Institute HQ and 8 Regional Research Centres for developing as model watershed in agrological region represented by them (Table 1). The document presents achievements of the selected watersheds in concise form.
02
Watershed name
Ashti
Jalalpur
Ramasagara
Kajiyana
Jigna
Lachhaputraghati
Dhoti
Ayalur
Vejalpur-Rampura
IISWC HQ/Res. Centrelocation with State
Dehradun (Uttarakhand)
Agra (Uttar Pradesh)
Bellary (Karnataka)
Chandigarh (UT)
Datia (Madhya Pradesh)
Koraput (Odisha)
Kota (Rajasthan)
Udhagamandalam
(Tamil Nadu)
Vasad (Gujarat)
Development and Management of Model Watersheds under New Guidelines
Watershed Features
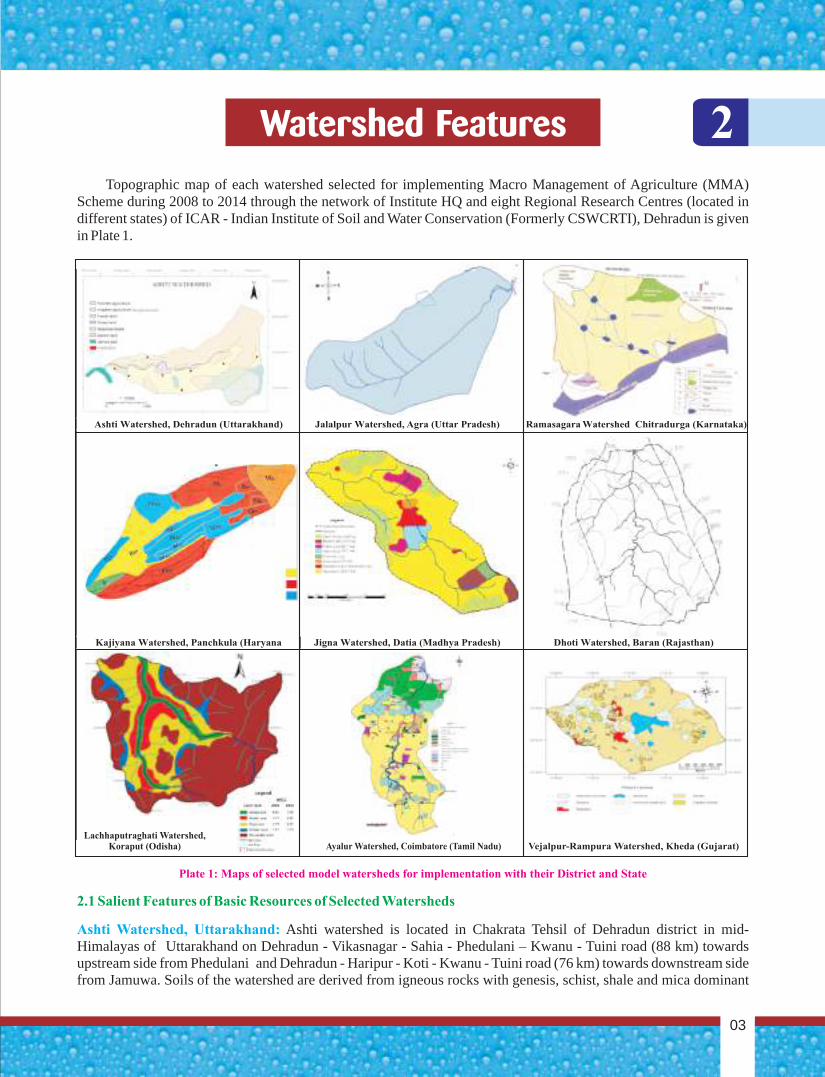
Topographic map of each watershed selected for implementing Macro Management of Agriculture (MMA) Scheme during 2008 to 2014 through the network of Institute HQ and eight Regional Research Centres (located in different states) of ICAR - Indian Institute of Soil and Water Conservation (Formerly CSWCRTI), Dehradun is given in Plate 1.
Ashti watershed is located in Chakrata Tehsil of Dehradun district in mid-Himalayas of Uttarakhand on Dehradun - Vikasnagar - Sahia - Phedulani – Kwanu - Tuini road (88 km) towards upstream side from Phedulani and Dehradun - Haripur - Koti - Kwanu - Tuini road (76 km) towards downstream side from Jamuwa. Soils of the watershed are derived from igneous rocks with genesis, schist, shale and mica dominant
Plate 1: Maps of selected model watersheds for implementation with their District and State
2.1 Salient Features of Basic Resources of Selected Watersheds
Ashti Watershed, Uttarakhand:
Ashti Watershed, Dehradun (Uttarakhand) Jalalpur Watershed, Agra (Uttar Pradesh)
Ramasagara Watershed Chitradurga (Karnataka)
Kajiyana Watershed, Panchkula (Haryana Jigna Watershed, Datia (Madhya Pradesh) Dhoti Watershed, Baran (Rajasthan)
Lachhaputraghati Watershed, Koraput (Odisha) Ayalur Watershed, Coimbatore (Tamil Nadu) Vejalpur-Rampura Watershed, Kheda (Gujarat)
2
Introduction
03
minerals. Texturally, the soils are light with predominantly gravelly sandy loam to silty clay loam texture with high bulk density, and infiltration and permeability rates. Water holding capacity is very low, both at field capacity and permanent wilting point. Generally, soils are slightly acidic in nature with low available nitrogen, and medium to high in phosphorus and potassium availability. Due to steep elevation difference, the watershed interestingly presents climatic variation from sub-temperature to sub-tropical with Banj oak and mango growing in the same watershed. Most of the rainfall (75-80%) is received during monsoon (June-September). High intensity storms and, sometimes, cloud bursts are common occurrence. Stray snow fall is received in the high reaches.
The watershed has an area under community forest (44.9 ha) and reserve forest (46.2 ha). Community grassland/Ghasni (12.0 ha) besides privately owned agricultural lands in the watershed. Forests are mainly dominated by broad-leaved species. Major tree species in the watershed are Quercus leucotrichophora (Banj oak), Aesculus indica (Pangar), Rhododendron arboreum (Burans), Machilus spp., Bombax ceiba (Semal) and Terminalia belerica (Bahera). Some of the commonly found shrubs/bushes in the watershed are: Indigofera pulchella (saknya), Woodfordia fruticosa (Dayla), Adhatoda vasica (Basinga), Rhus parviflora (Tungla), Berberis asiatica (Kingore), Rubus ellipicus (Kotrana) and Myrsine africana. There are also bamboo species in the watershed, mostly Dendroclamus strictus, D. hamiltonii, and Arundinaria spp. Total area under grasslands (locally known as Ghasni or Maung) is limited in the watershed, mostly confined in the civil soyam, Panchayati as well as land under private ownership, and managed to meet the fodder requirement for large livestock population during the lean period (off-season). The major grasses in these are Chrysopogon fulvus and Heteropogon contortus with Themeda anathera and Arundinella sp. A well-established agroforestry system is being largely practiced by the farmers of the watershed. Common agroforestry tree species in the watershed are Quercus leucotrichophora (Banj oak), Boehmeria rugulosa (Gainthi), Grewia optiva (Bhimal), Prunus cerasoides (Panja), Celtis australis (Kharik), Ficus roxburghii (Timla), F. cunea (Khaina), F. glomerata (Umar), Myrica esculanta (Kaphal), Terminalia belerica (Bahera), Bauhinia purpurea (Guriyal) etc. There are no planned orchards in the watershed. However, common fruit trees in the watershed are temperate fruits like pear, peach, plum, apricot (chulu), walnuts and subtropical fruits like pomegranate, banana, papaya, guava and citrus species. The land capability classification showed that the maximum area (152.0 ha) is under Class VIII followed by Class III (140.0 ha) lands in the watershed. Area under Class VI and Class VII is 77 ha and 83 ha, respectively. Area under Class IV is 21.0 ha only. As per LCC criteria, 161.0 ha out of total (473 ha) watershed area of is under arable land use, and the remaining area of 312 ha is allocated to non-arable land use.
Drinking water is available in almost all the watershed villages through pipe lines from the natural springs. Irrigation water is available in limited areas adjoining to the main stream through Guhls mainly near Jamuwa village. Village Dabra is totally rainfed. Major source of livelihood in the watershed is the combination of farming (crop cultivation alongwith animal husbandry), labour (mainly agriculture and road construction under the PWD), and business, as well as solely farming, labour and service.
Agriculture is the main occupation of the watershed farmers. Main crops raised are mustard, lentil, wheat, bajra, and gram. Most of the land is kept fallow during the kharif season. Only about 25% area under agriculture is cropped during kharif season. Land is utilized for wheat and gram during rabi season. Land kept as fallow is used for sowing mustard (35%), lentil (30%), wheat (20%), gram (10%) and 5% for others during rabi season. Single crop rotation is fallow-mustard / wheat / gram / lentil / bajra / jowar - fallow. The watershed has 524 families and a human population of 3049 (male: 853; female: 725 and children: 1471). The general caste dominates in the watershed (52.31%) followed by scheduled caste (19.15%), other backward class as 10.04%, and minority and others (18.50%). Total livestock population in watershed was 782 (cows: 135; buffalos: 424; goats: 180 and sheeps: 43). Watershed is dominated by marginal and small farmers (< 2 ha) which constitute 84.2% of total land holdings. The watershed had 19 tractors; 19 trailers; 4 threshers/cutters; 3 diesel tube wells; 14 submersible pumps and 7 jugars based on ITKs.
nd The watershed represents the 22 most resource poor district in the Country (NRAA, 2012). The total population of the Ramasagara watershed was 1019 during pre-project period and increased to 1177 during post-project period with an average family size varying from 6.0 to 6.4 persons. There are 184 farm families residing in the watershed population (male 36%, female 35% and children 29%). In the watershed 19% of farm families belong to the marginal category (land holding <1 ha), 45% of families belong to small category (1-2 ha), 28% families have land holdings between 2 ha to 4 ha, whereas farmers with land holding > 4 ha are only 8% of total
Jalapur Watershed, Uttar Pradesh:
Ramasagara Watershed, Karnataka:
Concise Report On Development And Management Of Model Watersheds Through Participatory Approach
04
Development and Management of Model Watersheds under New Guidelines
farm families. General economic condition of the farm families is poor. Total livestock population was 1065 during 2008-09 and increased to 1362 during post-project. Nearly 11% of the animal population is used for draught purpose, whereas, 17% meets the milk requirement, 14% are young stocks, and 58% meets the meat and chicken requirement indicating that a larger population of livestock is under sheep, goat and poultry rearing. Farmers’ literacy rate is low (15%). Among the beneficiaries in the watershed, only nine farmers have pucca houses. Nearly 124 farmers in the watershed have semi-pucca houses and 51 farmers are residing in kachha houses. Three tractors are owned by large farmers in the watershed. All farmers having irrigation facilities (bore wells) have sprayers and electricity powered pump sets for lifting water from bore wells. Nearly 50 farm families own chaff cutters. There are no State Government transport facilities in the watershed. Auto rickshaws/tempos are the only means of transport. All the families in the watershed are engaged in agricultural works, except five beneficiaries who are employed in Government service and 8 in private factories on regular employment. There is a seasonal migration of 120 people to the cities during summer when there are no agricultural activities at farms.
The watershed is in Shivalik hills having steep hills followed by eroded piedmont and fluvial valleys. Upper catchment consists of steep hill, middle portion has rolling topography and bottom is moderately sloping valleys. Three drains join Jabrot nala which ultimately flows into Ghaggar river. Out of a total area of 509 ha, 284 ha is under forest. Forest area is in two blocks. Upper one is natural vegetation comprising mainly of khair trees and second block in the middle of watershed has man-made plantation mainly of eucalyptus with lantana and other shrubs as under canopy. Out of the remaining 225 ha, major portion (144 ha) is under crops, besides area under habitation, wasteland and fallows. Rainfed areas is primarily used to produce maize, kulthi, wheat, gram etc. while irrigated area is put under a diverse range of cereals and cash crops like paddy, ginger, tomato, colocasia, turmeric, chillies, wheat and mustard production. Watershed consists of four villages, inhabited by 151 families. Total population is 867 (male 32%, female 31% and children below 18 years of age 37%). Average family size was 5.7. Sex ratio in the watershed villages is 967 females per 1000 males which is far above the State average (861). Total livestock population of the watershed is 666. Buffaloes contribute 38% followed by goats (25%). Buffaloes are preferred for milk selling. All the villagers have milk for selling to booths of Vita Milk Cooperative of Haryana State Government. Milk is sold on fat content basis. Of the 151 households in the watershed 5% are landless, 68% are in marginal category (<1 ha), and only 3% fall into large land holding category (>4 ha). Major source of livelihood of the people in watershed area is agriculture. About 51% of the working males are engaged in agriculture occupation followed by daily wages (19%) and Government service (17%).
Majority of the soils of Shivaliks in Haryana are developed from sandstone, shale and conglomerate. Dominant soils are shallow to moderately deep, well to excessively drained, dark reddish brown, loamy-skeletal occurring on moderately steep to steeply sloping hills. Land capability classifications (LCC) survey of the Kajiyana watershed brought out that the prevailing LCC Classes in the watershed are II, III, IV, V and VI with 104.29, 152.45, 193.99, 10.09, 48.18 ha area, respectively. In addition, sub-classes ‘e’ indicates erosion hazard and ‘s’ indicates shallow soil depth and limitation to root zone. About 95% of the household buildings are cemented and in most of the cases, cattle sheds are pucca. All the villages were electrified in 1976-77. All the villages have radio, television and telephone connectivity. There is one primary and one middle school in Janouli village and high school facility available in Dhattoghran village. Nearest police post is in Pinjore, which is 7 km away from watershed villages. The nearest veterinary hospital is in Ganeshpur Bhurian at the distance of 5 km from Janouli. The nearest small market is at Issarnagar town (7 km). The kuhl irrigation system in village Janouli is 400 years old and pucca kuhl was constructed in and around 1983. At present, the irrigation water is distributed as per barabandi system. This system is being followed as a part of the old settlement. In all the four villages, wherever the irrigation is available through kuhls, the farmers prefer sowing vegetables like ginger, colocasia, turmeric and tomato for being high value crops. Literacy rate is very high (above 85%) and so is the strong sense of community participation.
Watershed area represents semi-arid climate. Inspite of long term annual average rainfall of 835.5 mm distributed over 39 days, the uncertainty and erratic pattern of rainfall coupled with frequent long dry spells often cause crop failures in normal rainfall years. The region faced critical water deficit/drought situation in recent past which lead to severe scarcity of water for drinking as well as for agriculture and other purposes. Watershed is the part of the Sindh river basin. It drains in the river through a seasonal stream called Somla. Landscape is rugged, featuring undulating terrain with low rocky outcrops, narrow valleys, and plains. Surface rocks are predominantly granite of the lower pre-Cambrian/Archaen period. The watershed abounds in open scrub and thin forest. Major soil groups in the region are red (Rakar and Parwa), black (Kabar and Mar) and mixed red and
Kajiyana Watershed, Haryana:
Jigna Watershed, Madhya Pradesh:
Introduction
05
Watershed Features
black soils, belonging to the orders Entisol, Inceptisol and Vertisol. They occur in patches. A major portion (250.2 ha, 40%) of the watershed contains Class III land, characterized mainly by its susceptibility to erosion. About 24% of the Class III land has soil related problems (salinity, stoniness/gravelly). Capability Class II (171.5 ha) occupies 27.7% of the watershed, of which 68% is prone to erosion hazards. About 23% of capability Class II land remains submerged for about three months in a year. This class mostly surrounds the drainage lines. Class IV lands (41.9 ha) are characterized by moderate multi-directional slopes, moderate soil erosion, stoniness and shallow soil depth with rapid infiltration rates, occupying only 6.8% of the watershed and are mostly located along the ridges. Capability Class VI occupies about 4.76% (29.5 ha) of the watershed area and is characterized with moderate to steep multi-directional slope, shallow soil depths, stoniness and scanty vegetation. Capability Class VII (38.7 ha) and VIII (44.3 ha) together comprise about 13.4% of the watershed area and are characterized with steep to very steep slope, and rocky outcrops suffering from meager vegetation.
Human population within watershed recorded at the beginning of the project was 3031. Out of the three villages/hamlets, lying in the watershed, Jigna had largest population (2848) followed by Tiwaripura and Imaliya having 15 different castes. There were 403 families with an average of 5-7 members in each family. Agriculture and cattle rearing is the primary livelihood in the watershed in which about 75% of the villagers are engaged. About 20% population belongs to poor community dependant on labour based livelihood in nearby areas, and remaining 5% in other works. Out of the total population of livestock in the watershed, 28% is of cow and buffalo and remaining 62% are goat, sheep etc. comprising mostly non-descript and low productivity breeds. The livestock population follows the order: goat > sheep > cow > buffalo in the watershed. Diversified land use system exists in Jigna watershed (agriculture - 58.9%, open scrub - 20.1%, barren - 5.1%, fallow - 4.2%, water body - 2.7%, reserve forest - 1.5%, horticulture - 0.4% and others - 7.1%). Maximum number (200) of farming families in the watershed belongs to small category of farmers followed by marginal (150), medium (150) and large holding categories (50).
Out of the total area (620 ha), about 59% area (365.3 ha) is under agriculture, of which 75% is rainfed. Rainfed agriculture is practiced mainly on sloppy lands, particularly above village pond. The main crop sequence followed in the watershed are: Groundnut - fallow / Fallow - lentil; Sorghum - fallow / Fallow - gram; Maize - fallow / Fallow - mustard; Pearlmillet - fallow / Maize - fallow and Sesame - fallow / Groundnut - fallow. Out of 365.3 ha area agriculture land, only 25% area (93.8 ha) is under irrigation. Irrigation to agricultural crops in watershed area is mainly given through open wells, bore wells and through open channels from village pond. About 35 ha area (10%) is estimated under assured irrigation through tube wells. Single cropping rotations are Fallow - wheat / barley, Fallow-pea, Fallow - mustard, Fallow - gram and Fallow - lentil while double cropping rotations are Paddy - wheat, Paddy- mustard, Paddy - gram, Maize - gram and Paddy - Barley. Village pond is major source of irrigation and it recharges wells in the vicinity. Productivity level of crops is very low in this area. Cropping technology to deal with effects of aberrant weather conditions is inadequate. Broadcasting is the commonly practiced method of seed sowing in kharif crops in the watershed. Area under forest is 9.1 ha. Natural vegetation consists of open scrub forest with scattered trees. Grasses, climbers and thorny shrubs are found in the lower and middle storeys. Foot hillocks are mainly under rainfed agriculture. There is no well established agroforestry system. Naturally regenerated trees were left on farm bunds to thrive as a source of fodder and fuel wood. These scattered trees are conspicuous throughout the watershed. There are no properly established live edges in the watershed. Live fencing with few thorny species has been maintained around the farm lands. Multi-purpose trees available in the watershed are mahua, mango, aonla, dhak, ber, neem, kardhai, imli, babul, khejri etc.
Dhoti watershed is located in the Panchayat Samiti Atru of Baran district of Rajasthan. Topography of the watershed is slightly undulating with 1% to 6% slope. The direction of general slope is from south-west to north-east with a total fall of 8 m from the highest contour to lowest contour. Climate of the region is dry sub-humid with surplus water in the months of July, August and September. Average annual rainfall in the watershed area is
-1874 mm with maximum intensity of 150 mm hr , and its distribution is highly erratic as more than 90% rainfall is received during July to September in the form of intense storms. Watershed is located in ‘Pathar and Bundelkhand Upland’ sub-region of Central Highlands. Landform is classified as Sedimentary Scrap Lands. The area lies in a typical alluvial terrain. The watershed field slopes range from 1% - 6%. A nala originating from the upper ridge passes through the watershed and forms part of the watershed. The watershed soil is classified as Fine, Typic Chromusterts of vertisols soil order. Surface texture varies from clay to clay loam (>35%). These soils are deep to very deep dark grayish brown, calcareous, moderately to well drained. Fine soils with weakly expressed slicken sides on nearly level plains constitute the dominant soil scape. The soils in levelled fields are generally having higher clay content (>35%)
Dhoti Watershed, Rajasthan:
Concise Report On Development And Management Of Model Watersheds Through Participatory Approach
06
Development and Management of Model Watersheds under New Guidelines
and better fertility status, whereas fields with multidirectional slopes (1 to 3%) had eroded faces with lower clay content and fertility status. Soils are slightly alkaline and would require gypsum application for improving soil quality. One main gully with seven subsidiaries drains the watershed with total of 38 numbers of drains.
The watershed does not have any specified area as forest land, however, scanty and sparsely occurring natural trees, shrubs and grasses are observed along the field boundaries and community land. Among the forest trees spp., Acacia nilotica was most common followed by Acacia leucophloea, Azadirachta indica, Ailanthus excelsa, Butea monosperma, Dalbergia sissoo, Holoptelia integrifolia and Albizia lebbek. Common shrubs are Calotropis procera, Capparis deciduas, Capparis zeylancia, Balanites aegyptiaca species. Grass species observed are Cynodon dactylon, Cenchrus ciliaris, Dicanthium annulatum, Hetropogon contortus, Apluda mutica, Desmostachys bipinnata and Saccharum spontaneum. Maximum area is predominantly under rainfed farming in the watershed with soybean as major crop during kharif while mustard is the prominent crop during rabi followed by coriander / wheat / chickpea. There were no organized orchards present in the watershed, however, barring naturally occurring trees on field bunds, there were no well planned agro-forestry practices observed throughout the watershed.
Total population of Dhoti village is 1612 with average family size of 5 persons. Total livestock population of the watershed village is 2030. Maximum livestock population reared is goats (38%) followed by buffalo and cows due to scarcity of fodder and poor socio-economic conditions. Open grazing system is prevalent which lead to soil degradation. Average land holding is 2.8 ha, which is higher in comparison to region average. Literacy rate in the watershed is quite low despite of a very old primary school existing in the village, which was recently upgraded to high school. Village is electrified and has radio, television and telephone connectivity. Nearest market is 15 km at Baran town. About 20 castes are residing in the village but maximum households belong to Meena (ST) and Bairwa (SC) castes. Dhoti village is also very well connected with telephone and mobile networks.
Water resources status of Dhoti watershed was very poor. People depend upon open wells and bore wells for meeting their domestic needs and irrigation purposes. The watershed was very rich in respect of water resources from 1992 to 2002 as several bore wells were functional and plenty of groundwater was available at the depth of 30-35 m. The water table depth increased to 80 m to 100 m due to uncontrolled exploitation and non-adoption of conservation measures. The watershed has three land capability classes, Class II (510.18 ha), Class III (113.52) and Class VI lands cover nala of the watershed.
Climate of the watershed is warm and humid with normal annual rainfall of 1452.2 mm received in 77 rainy days. About 81% of the total rainfall is received during June to September (south-west monsoon). Bright sunshine hours vary from 1.84 to 3.98 and 6.29 to 9.04 during the monsoon and the post monsoon
-1 -1season, respectively. The average evaporation rate is 3.7 mm day with maximum in May (6.2 mm day ) and minimum -1during the month of August (2.1 mm day ). Water balance study showed that surplus water is available for agricultural
use between the month of May and October with a length of growing period of about 170 days.
The soils are red with sandy clay loam in texture, acidic in reaction, medium in organic carbon (0.69%), soil -1 -1 -1available nitrogen (288 kg ha ) and phosphorus content (11.1 kg ha ) and high in potassium content (313 kg ha ). The
LCC of the watershed revealed that maximum area is under Class III (43.1%) followed by Class VI (22.6%) and Class VII (20%). The Class II and IV account for 6.6% and 7.7% of the total watershed area, respectively. Class II is under paddy cultivation and the majority of the Class III & IV is under rainfed crops of paddy and ragi, whereas Class VI and Class VII land is under degraded forest and shifting cultivation. Out of the total geographical area of 601.24 ha, maximum area is under degraded forest (61%) followed by the net cultivated area (20.15%), current fallow (11.5%), area under non-agricultural use (6.0%) and area under pasture land (1.4%). Watershed has a total population of 992 living in 315 households. Tribal population accounts for about 66% of the total population of the watershed. Major occupation is agriculture providing family income of 2,500 per month.
Ayalur watershed drains into the river Bhavani. Slope of the watershed ranges from less than 1% to 7%. About 42% of the watershed area has slopes above 3%. Watershed lies in the tropical zone characterized with scanty rainfall and dry climate. Average annual rainfall is about 600 mm. Most of the annual rainfall (about 51%) is received during the north-east monsoon (October to December) accompanied with high intensity storms. Watershed also receives good rains (about 30%) during south-west monsoon. Soils of watershed are chiefly gravelly, stony and sandy of the red variety. Upper part of the watershed is mostly of red sandy. Red loam is prevalent
Lachhaputraghati Watershed, Odisha:
Ayalur Watershed, Tamil Nadu:
Introduction
07
Watershed Features
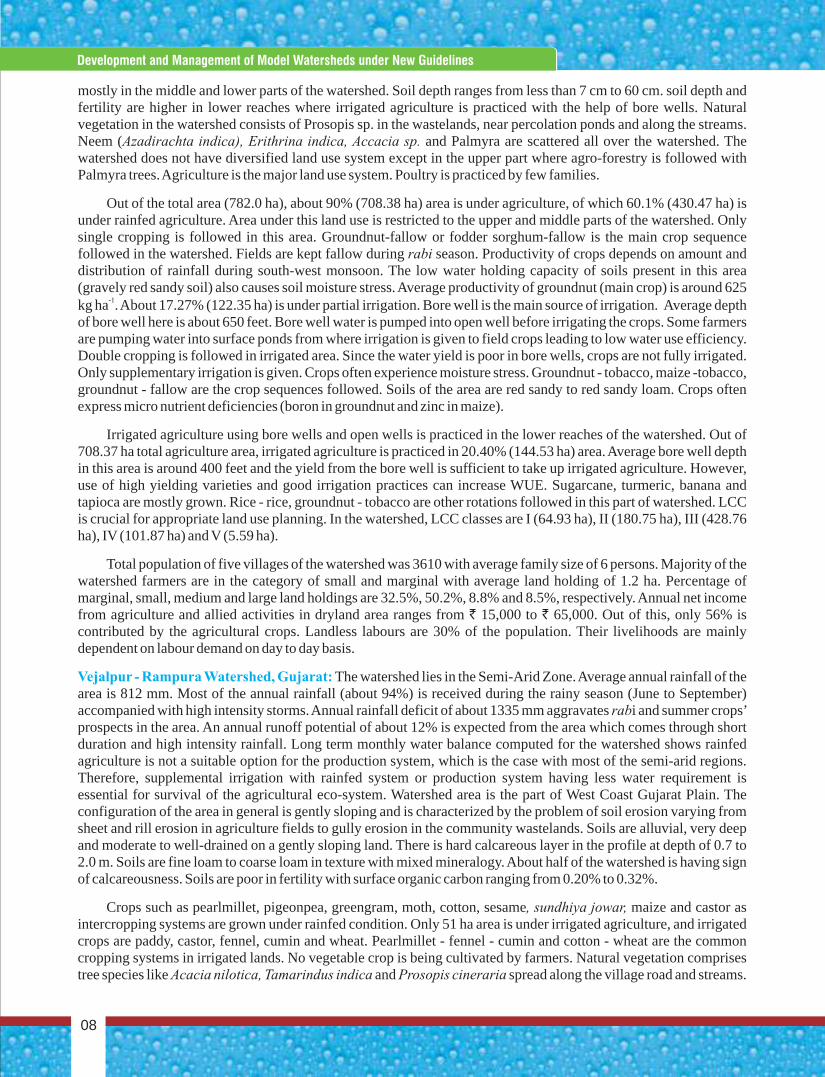
mostly in the middle and lower parts of the watershed. Soil depth ranges from less than 7 cm to 60 cm. soil depth and fertility are higher in lower reaches where irrigated agriculture is practiced with the help of bore wells. Natural vegetation in the watershed consists of Prosopis sp. in the wastelands, near percolation ponds and along the streams. Neem (Azadirachta indica), Erithrina indica, Accacia sp. and Palmyra are scattered all over the watershed. The watershed does not have diversified land use system except in the upper part where agro-forestry is followed with Palmyra trees. Agriculture is the major land use system. Poultry is practiced by few families.
Out of the total area (782.0 ha), about 90% (708.38 ha) area is under agriculture, of which 60.1% (430.47 ha) is under rainfed agriculture. Area under this land use is restricted to the upper and middle parts of the watershed. Only single cropping is followed in this area. Groundnut-fallow or fodder sorghum-fallow is the main crop sequence followed in the watershed. Fields are kept fallow during rabi season. Productivity of crops depends on amount and distribution of rainfall during south-west monsoon. The low water holding capacity of soils present in this area (gravely red sandy soil) also causes soil moisture stress. Average productivity of groundnut (main crop) is around 625
-1kg ha . About 17.27% (122.35 ha) is under partial irrigation. Bore well is the main source of irrigation. Average depth of bore well here is about 650 feet. Bore well water is pumped into open well before irrigating the crops. Some farmers are pumping water into surface ponds from where irrigation is given to field crops leading to low water use efficiency. Double cropping is followed in irrigated area. Since the water yield is poor in bore wells, crops are not fully irrigated. Only supplementary irrigation is given. Crops often experience moisture stress. Groundnut - tobacco, maize -tobacco, groundnut - fallow are the crop sequences followed. Soils of the area are red sandy to red sandy loam. Crops often express micro nutrient deficiencies (boron in groundnut and zinc in maize).
Irrigated agriculture using bore wells and open wells is practiced in the lower reaches of the watershed. Out of 708.37 ha total agriculture area, irrigated agriculture is practiced in 20.40% (144.53 ha) area. Average bore well depth in this area is around 400 feet and the yield from the bore well is sufficient to take up irrigated agriculture. However, use of high yielding varieties and good irrigation practices can increase WUE. Sugarcane, turmeric, banana and tapioca are mostly grown. Rice - rice, groundnut - tobacco are other rotations followed in this part of watershed. LCC is crucial for appropriate land use planning. In the watershed, LCC classes are I (64.93 ha), II (180.75 ha), III (428.76 ha), IV (101.87 ha) and V (5.59 ha).
Total population of five villages of the watershed was 3610 with average family size of 6 persons. Majority of the watershed farmers are in the category of small and marginal with average land holding of 1.2 ha. Percentage of marginal, small, medium and large land holdings are 32.5%, 50.2%, 8.8% and 8.5%, respectively. Annual net income from agriculture and allied activities in dryland area ranges from ` 15,000 to ` 65,000. Out of this, only 56% is contributed by the agricultural crops. Landless labours are 30% of the population. Their livelihoods are mainly dependent on labour demand on day to day basis.
The watershed lies in the Semi-Arid Zone. Average annual rainfall of the area is 812 mm. Most of the annual rainfall (about 94%) is received during the rainy season (June to September) accompanied with high intensity storms. Annual rainfall deficit of about 1335 mm aggravates rabi and summer crops’ prospects in the area. An annual runoff potential of about 12% is expected from the area which comes through short duration and high intensity rainfall. Long term monthly water balance computed for the watershed shows rainfed agriculture is not a suitable option for the production system, which is the case with most of the semi-arid regions. Therefore, supplemental irrigation with rainfed system or production system having less water requirement is essential for survival of the agricultural eco-system. Watershed area is the part of West Coast Gujarat Plain. The configuration of the area in general is gently sloping and is characterized by the problem of soil erosion varying from sheet and rill erosion in agriculture fields to gully erosion in the community wastelands. Soils are alluvial, very deep and moderate to well-drained on a gently sloping land. There is hard calcareous layer in the profile at depth of 0.7 to 2.0 m. Soils are fine loam to coarse loam in texture with mixed mineralogy. About half of the watershed is having sign of calcareousness. Soils are poor in fertility with surface organic carbon ranging from 0.20% to 0.32%.
Crops such as pearlmillet, pigeonpea, greengram, moth, cotton, sesame, sundhiya jowar, maize and castor as intercropping systems are grown under rainfed condition. Only 51 ha area is under irrigated agriculture, and irrigated crops are paddy, castor, fennel, cumin and wheat. Pearlmillet - fennel - cumin and cotton - wheat are the common cropping systems in irrigated lands. No vegetable crop is being cultivated by farmers. Natural vegetation comprises tree species like Acacia nilotica, Tamarindus indica and Prosopis cineraria spread along the village road and streams.
Vejalpur - Rampura Watershed, Gujarat:
Concise Report On Development And Management Of Model Watersheds Through Participatory Approach
08
Development and Management of Model Watersheds under New Guidelines
Species like Azadirachta indica, Prosopis cineraria, Holoptelia integrifolia etc. exist along field boundaries. There are very few fruit species like mango along the field boundary. Though no organized orchards are present in the watershed, homestead scattered planting of fruit trees of mango has been practiced by farmers. No agro-forestry practices exist in the watershed.
Out of the six villages/hamlets in the watershed, land of two villages, Nana Rampura and Vejalpur completely fall within the watershed boundary. Only few land holders of Mota Rampura, Garod, Ramsoli and Chikhlod are within the watershed boundary. The human population of Mota Rampura, Vejalpur, Nana Rampura and Ramsoli is 1089, 690, 970 and 735, respectively. Majority of the watershed farmers are in the marginal category (< 1 ha) and small (1-2 ha). Though, a considerable livestock is maintained for milk production, no improved breeds of different livestock are visible in Vejalpur-Rampura watershed. Milk is sold to Cooperative Dairy Society, Vejalpur-Rampura. In the watershed, 597 ha area is under regular cultivation out of which 545 ha is rainfed and only 50 ha is irrigated as per water availability. Main sources of irrigation are the old defunct natural ponds which have lost their functional utility for want of effective storability and water recycling systems. Area under grasslands and wastelands is about 130 ha.
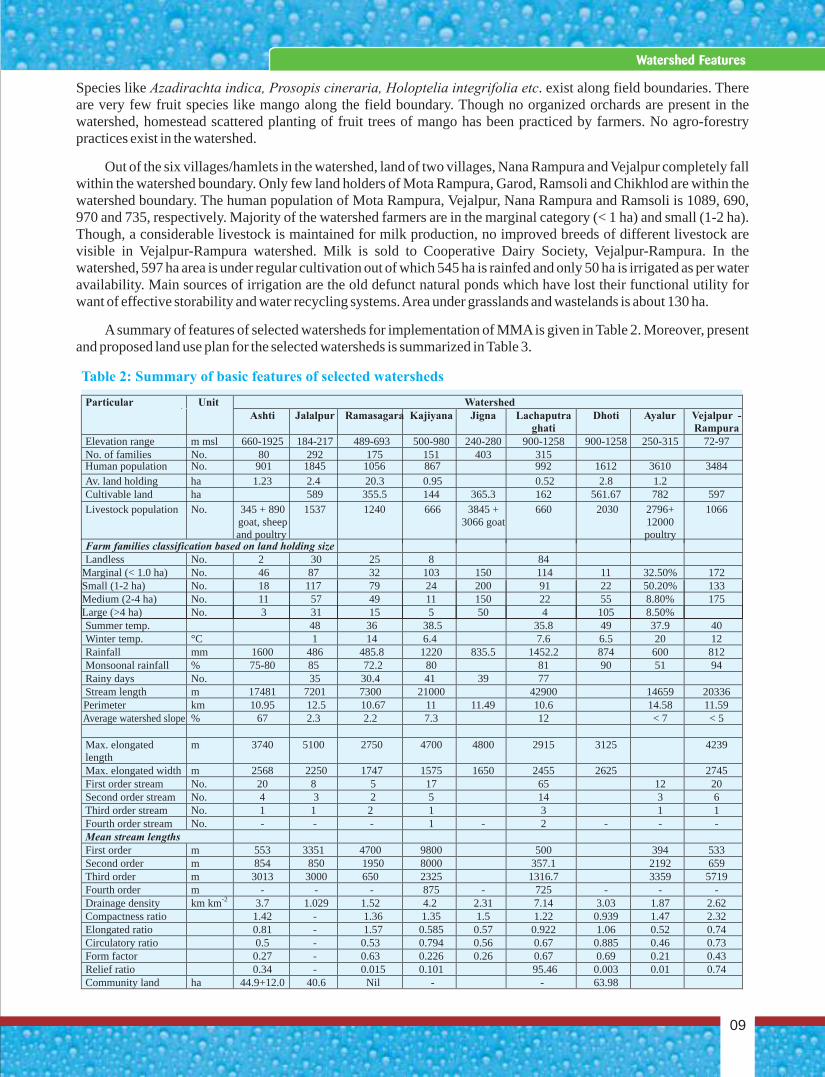
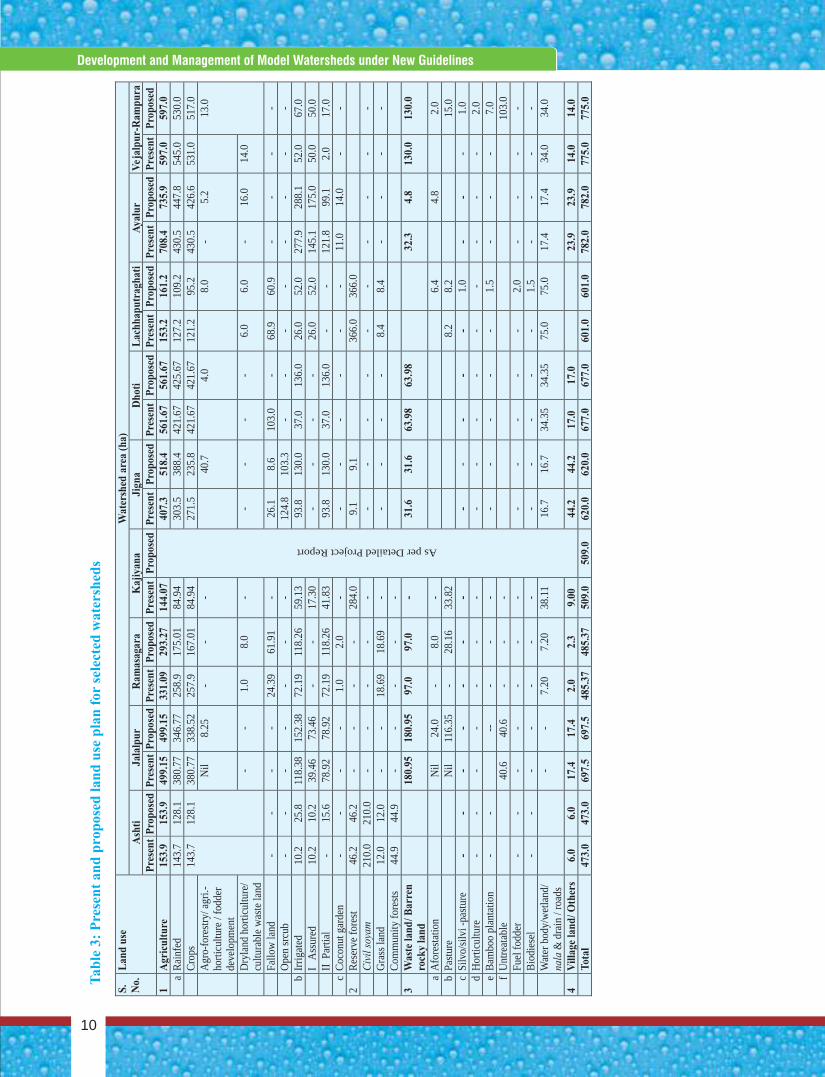
A summary of features of selected watersheds for implementation of MMA is given in Table 2. Moreover, present and proposed land use plan for the selected watersheds is summarized in Table 3.
Particular Unit Watershed Ashti Jalalpur Ramasagara Kajiyana Jigna Lachaputra
ghati Dhoti Ayalur Vejalpur -
Rampura Elevation range m msl 660-1925 184-217 489-693 500-980 240-280 900-1258 900-1258 250-315 72-97 No. of families No. 80 292 175 151 403 315
Summer
temp.
°C
48
36
38.5
35.8
49
37.9
40
Winter temp.
°C
1
14
6.4
7.6
6.5
20
12
Rainfall
mm
1600
486
485.8
1220
835.5
1452.2
874
600
812 Monsoonal rainfall
%
75-80
85
72.2
80
81
90
51
94
Rainy days
No.
35
30.4
41
39
77 Stream length
m
17481
7201
7300
21000
42900
14659
20336
Perimeter
km
10.95
12.5
10.67
11
11.49
10.6
14.58
11.59 Average watershed slope
%
67
2.3
2.2
7.3
12
< 7
< 5
Max. elongated length
m
3740
5100
2750
4700
4800
2915
3125
4239
Max. elongated width
m
2568
2250
1747
1575
1650
2455
2625
2745 First order stream
No.
20
8
5
17
65
12
20
Second order stream
No.
4
3
2
5
14
3
6 Third order stream
No.
1
1
2
1
3
1
1
Fourth order stream
No.
-
-
-
1
-
2
-
-
-
Mean stream lengths
First order
m
553
3351
4700
9800
500
394
533 Second
order
m
854
850
1950
8000
357.1
2192
659
Third
order
m
3013
3000
650
2325
1316.7
3359
5719
Fourth
order
m
-
-
-
875
-
725
-
-
-
Drainage density
km km-2
3.7
1.029
1.52
4.2
2.31
7.14
3.03
1.87
2.62
Compactness ratio
1.42
-
1.36
1.35
1.5
1.22
0.939
1.47
2.32
Elongated ratio
0.81
-
1.57
0.585
0.57
0.922
1.06
0.52
0.74
Circulatory ratio
0.5
-
0.53
0.794
0.56
0.67
0.885
0.46
0.73
Form factor
0.27
-
0.63
0.226
0.26
0.67
0.69
0.21
0.43
Relief ratio
0.34
-
0.015
0.101
95.46
0.003
0.01
0.74
Community land
ha
44.9+12.0
40.6
Nil
-
-
63.98
Table 2: Summary of basic features of selected watersheds
Av. land holding ha 1.23 2.4 20.3 0.95 0.52 2.8 1.2 Cultivable land
ha
589
355.5
144
365.3
162
561.67
782
597
Farm families classification based on land holding size
Landless No. 2 30 25 8 84 Marginal (< 1.0 ha) No. 46 87 32 103 150 114 11 32.50% 172 Small (1-2 ha) No. 18 117 79 24 200 91 22 50.20% 133 Medium (2-4 ha) No. 11 57 49 11 150 22 55 8.80% 175 Large (>4 ha) No. 3 31 15 5 50 4 105 8.50%
Human population No. 901 1845 1056 867 992 1612 3610 3484
Livestock population No. 345 + 890
goat, sheep and poultry
1537 1240 666 3845 + 3066 goat
660 2030 2796+ 12000 poultry
1066
Introduction
09
Watershed Features
Ta
ble
3:
Pre
sen
t a
nd
pro
pos
ed l
and
use
pla
n f
or s
elec
ted
wat
ersh
eds
Concise Report On Development And Management Of Model Watersheds Through Participatory Approach
10
Development and Management of Model Watersheds under New Guidelines
S.
No.
L
and
use
W
ater
shed
are
a (h
a)
Ash
ti
Jala
lpu
r
Ram
asag
ara
K
ajiy
ana
Ji
gna
D
hot
i
Lac
hh
apu
trag
hat
i
Aya
lur
V
ejal
pu
r-R
amp
ura
P
rese
nt
Pro
pos
ed P
rese
nt
Pro
pos
ed Pre
sen
t Pro
pos
ed Pre
sen
t Pro
pos
ed
Pre
sen
t
Pro
pos
ed
Pre
sen
t
Pro
pos
ed
Pre
sen
t
Pro
pos
ed
Pre
sen
t
Pro
pos
ed
Pre
sen
t
Pro
pos
ed
1 A
gric
ult
ure
15
3.9
15
3.9
49
9.15
49
9.15
33
1.09
29
3.27
144
.07
As per Detailed Project Report
407.
3
518.
4 5
61.6
7 56
1.67
153.
2 1
61.2
708.
4 73
5.9
597.
0 59
7.0
a R
ainf
ed
143.
7
128.
1
380.
77
346.
77
258.
9
175.
01
84.9
4
303.
5 3
88.4
421
.67
425.
67 12
7.2
109.
2 43
0.5
447.
8 54
5.0
530.
0
C
rops
14
3.7
12
8.1
38
0.77
33
8.52
25
7.9
16
7.01
84
.94
27
1.5
235.
8 42
1.67
421.
67 12
1.2
95.2
430.
5 42
6.6
531.
0 51
7.0
Agr
o-fo
rest
ry/ a
gri.-
horti
cultu
re /
fodd
er
deve
lopm
ent
Nil
8.
25
-
-
-
40
.7
4.
0
8.
0
-
5.2
13.0
D
ryla
nd h
ortic
ultu
re/
cultu
rabl
e w
aste
land
-
-
1.
0
8.0
-
-
-
-
-
6.
0
6.0
-
16
.0 14
.0
Fa
llow
land
-
-
-
-
24
.39
61
.91
-
26
.1
8.6
10
3.0
-
68
.9 60
.9
-
-
-
-
O
pen
srcu
b
-
-
-
-
-
-
-
124.
8 10
3.3
-
-
-
-
-
-
-
-
b Irrig
ated
10
.2
25.8
11
8.38
15
2.38
72
.19
11
8.26
59
.13
93
.8
130.
0
37.0
136.
0 26
.0 52
.0 27
7.9
288.
1 52
.0 67
.0
I
Ass
ured
10
.2
10.2
39
.46
73
.46
-
-
17
.30
-
-
-
-
26
.0 52
.0 14
5.1
175.
0 50
.0 50
.0
II
Par
tial
-
15
.6
78.9
2
78.9
2
72.1
9
118.
26
41.8
3
93.8
13
0.0
37
.0 13
6.0
-
-
12
1.8
99.1
2.0
17.0
c Coc
onut
gar
den
-
-
-
-
1.
0
2.0
-
-
-
-
-
-
-
11
.0 14
.0
-
-
2 R
eser
ve fo
rest
46
.2
46.2
-
-
-
-
28
4.0
9.
1
9.1
36
6.0
366.
0
Civ
il s
oyam
210.
0
210.
0
-
-
-
-
-
-
-
-
-
-
-
-
-
-
-
Gra
ss la
nd
12.0
12.0
-
-
18.6
9
18.6
9
-
-
-
-
-
8.4
8.4
-
-
-
-
Com
mun
ity fo
rest
s
44.9
44.9
-
-
-
-
-
3
Was
te la
nd
/ Bar
ren
ro
cky
lan
d
180.
95
180.
95
97.0
97.0
-
31.6
31.6
63.9
8
63.9
8
32.3
4.8
130.
0
130.
0
a A
fore
stat
ion
Nil
24.0
-
8.0
-
6.4
4.8
2.0
b Past
ure
Nil
116.
35
-
28.1
6
33.8
2
8.2
8.2
15.0
c Silv
o/si
lvi -
past
ure
-
-
-
-
-
-
-
-
-
-
-
-
1.0
-
-
-
1.0
d Hor
ticul
ture
-
-
-
-
-
-
-
-
-
-
-
-
-
-
-
-
2.0
e Bam
boo
plan
tatio
n
-
-
--
-
-
-
-
-
-
-
-
1.5
-
-
-
7.0
f Unt
reat
able
40.6
40.6
-
-
-
103.
0
Fuel
fodd
er
-
-
-
-
-
-
-
-
-
-
-
-
2.0
-
-
-
-
Bio
dies
el
-
-
-
-
-
-
-
-
-
-
-
-
1.5
-
-
-
-
Wat
er b
ody/
wet
land
/ na
la
& d
rain
/ ro
ads
-
-
7.20
7.20
38.1
1
16.7
16.7
34.3
5
34.3
5
75.0
75.0
17.4
17.4
34.0
34.0
4
Vil
lage
lan
d/ O
ther
s
6.0
6.0
17.4
17.4
2.0
2.3
9.00
44.2
44.2
17.0
17.0
23.9
23.9
14.0
14.0
Tot
al
473.
0
473.
0
697.
5
697.
5
485.
37
485.
37
509.
0
509.
0
620.
0
620.
0
677.
0
677.
0
601.
0
601.
0
782.
0
782.
0
775.
0
775.
0
Entry Point Activities, Community
Organization and Capacity Building
Past experience has indicated that watershed development without the participation of farmers has not created a positive impact on productivity and sustainablility in development and management of watersheds has been absent. Hence, as per guidelines of NWDPRA programme under Macro-Management of Agriculture (MMA) Scheme funded by the Department of Agriculture & Cooperation (MoA, GoI) in the XI Five Year Plan, the watershed projects were implemented in over 5600 ha from 2008 to 2014, in participatory mode. Nearly 5% of the total watershed budget was earmarked for Entry Point Activities (EPA) and spent to meet out immediate common needs in the first year of the preparatory phase. The EPA activities helped to develop good social rapport and confidence among the beneficiaries with the project implementing agency (PIA) in implementing watershed activities as planned. All the EPA activities were identified through PRA and Gram Sabha meetings.
Entry Point Activities: Construction of concrete roads (locally known as Kharanja) was conducted in the watershed on demand of the villagers to provide a better walking road and also help in easier transportation of household goods in the village compared to kachcha roads.
Farmers’ Training: Training on vermi-compost preparation techniques was organized at the Uttarakhand Livestock Development Board, Kalsi Centre during February 8-10, 2011. Training on soil and water conservation techniques was also organized at ICAR-IISWC, Dehradun under capacity building component during March 22-24, 2011.
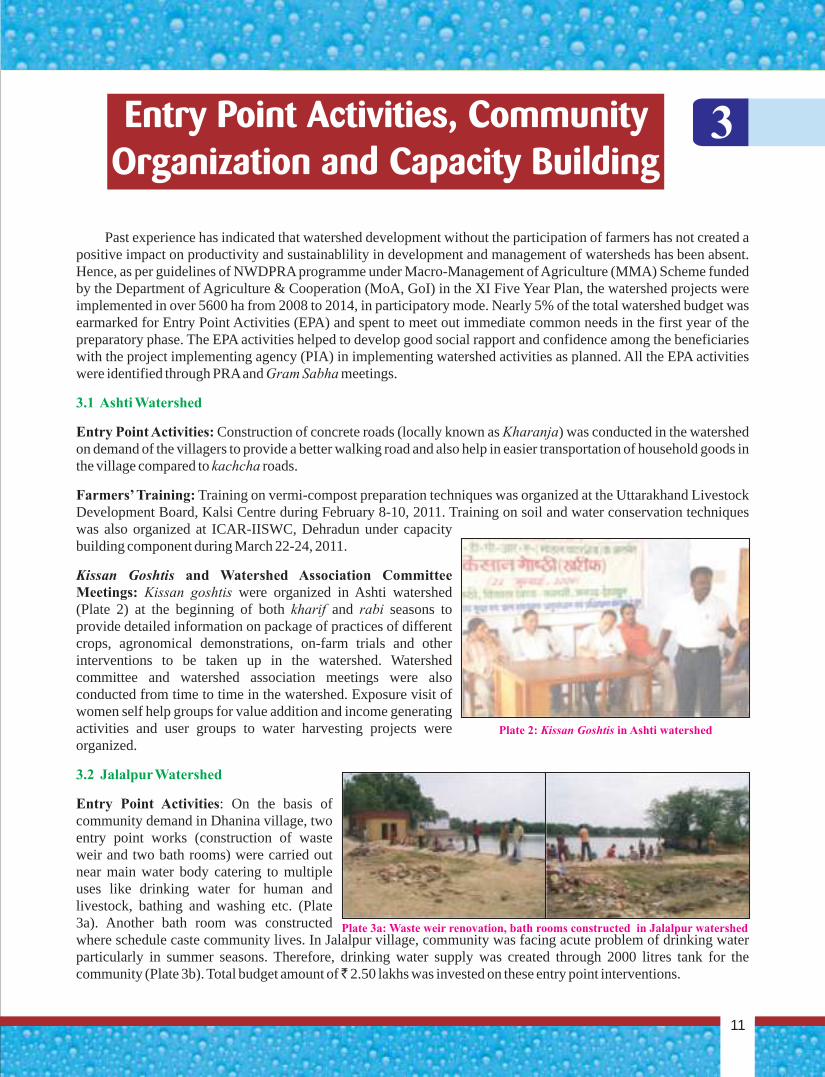
Kissan Goshtis and Watershed Association Committee Meetings: Kissan goshtis were organized in Ashti watershed (Plate 2) at the beginning of both kharif and rabi seasons to provide detailed information on package of practices of different crops, agronomical demonstrations, on-farm trials and other interventions to be taken up in the watershed. Watershed committee and watershed association meetings were also conducted from time to time in the watershed. Exposure visit of women self help groups for value addition and income generating activities and user groups to water harvesting projects were organized.
Entry Point Activities: On the basis of community demand in Dhanina village, two entry point works (construction of waste weir and two bath rooms) were carried out near main water body catering to multiple uses like drinking water for human and livestock, bathing and washing etc. (Plate 3a). Another bath room was constructed where schedule caste community lives. In Jalalpur village, community was facing acute problem of drinking water particularly in summer seasons. Therefore, drinking water supply was created through 2000 litres tank for the community (Plate 3b). Total budget amount of 2.50 lakhs was invested on these entry point interventions.
3.1 Ashti Watershed
3.2 Jalalpur Watershed
Plate 2: Kissan Goshtis in Ashti watershed
Plate 3a: Waste weir renovation, bath rooms constructed in Jalalpur watershed
3
Introduction
11
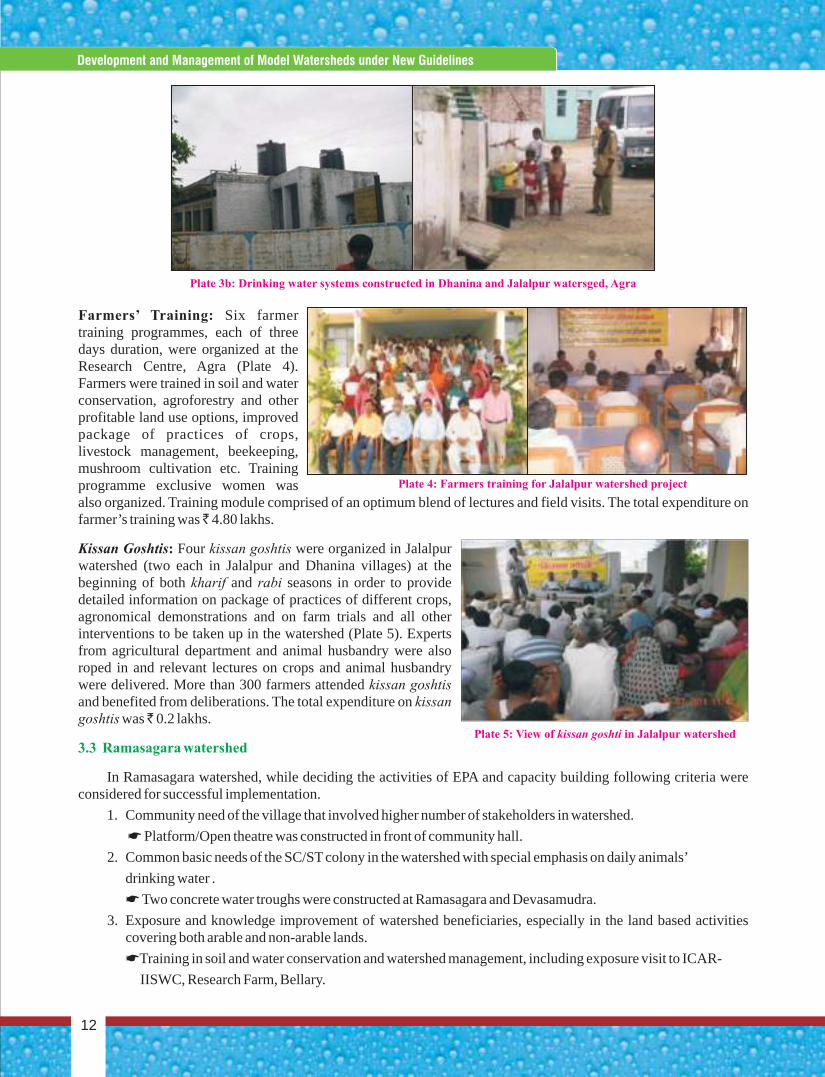
Plate 4: Farmers training for Jalalpur watershed project
Concise Report On Development And Management Of Model Watersheds Through Participatory Approach
12
Development and Management of Model Watersheds under New Guidelines
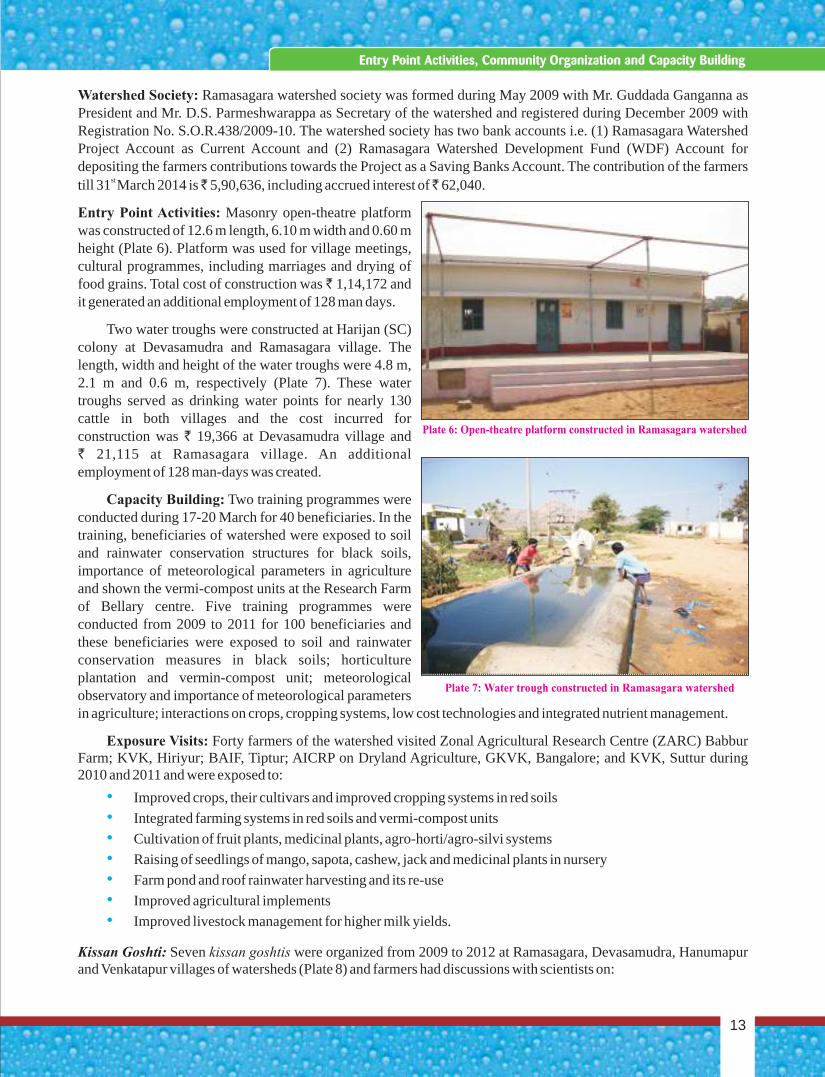
Farmers’ Training: Six farmer training programmes, each of three days duration, were organized at the Research Centre, Agra (Plate 4). Farmers were trained in soil and water conservation, agroforestry and other profitable land use options, improved package of practices of crops, livestock management, beekeeping, mushroom cultivation etc. Training programme exclusive women was also organized. Training module comprised of an optimum blend of lectures and field visits. The total expenditure on farmer’s training was 4.80 lakhs.
Kissan Goshtis: Four kissan goshtis were organized in Jalalpur watershed (two each in Jalalpur and Dhanina villages) at the beginning of both kharif and rabi seasons in order to provide detailed information on package of practices of different crops, agronomical demonstrations and on farm trials and all other interventions to be taken up in the watershed (Plate 5). Experts from agricultural department and animal husbandry were also roped in and relevant lectures on crops and animal husbandry were delivered. More than 300 farmers attended kissan goshtis and benefited from deliberations. The total expenditure on kissan goshtis was 0.2 lakhs.
In Ramasagara watershed, while deciding the activities of EPA and capacity building following criteria were considered for successful implementation.
1. Community need of the village that involved higher number of stakeholders in watershed.
* Platform/Open theatre was constructed in front of community hall.
2. Common basic needs of the SC/ST colony in the watershed with special emphasis on daily animals’
drinking water .
* Two concrete water troughs were constructed at Ramasagara and Devasamudra.
3. Exposure and knowledge improvement of watershed beneficiaries, especially in the land based activities covering both arable and non-arable lands.
*Training in soil and water conservation and watershed management, including exposure visit to ICAR-
IISWC, Research Farm, Bellary.
3.3 Ramasagara watershed
Plate 3b: Drinking water systems constructed in Dhanina and Jalalpur watersged, Agra
Plate 5: View of kissan goshti in Jalalpur watershed
Introduction
13
Entry Point Activities, Community Organization and Capacity Building
Plate 6: Open-theatre platform constructed in Ramasagara watershed
Plate 7: Water trough constructed in Ramasagara watershed
Watershed Society: Ramasagara watershed society was formed during May 2009 with Mr. Guddada Ganganna as President and Mr. D.S. Parmeshwarappa as Secretary of the watershed and registered during December 2009 with Registration No. S.O.R.438/2009-10. The watershed society has two bank accounts i.e. (1) Ramasagara Watershed Project Account as Current Account and (2) Ramasagara Watershed Development Fund (WDF) Account for depositing the farmers contributions towards the Project as a Saving Banks Account. The contribution of the farmers
st till 31 March 2014 is 5,90,636, including accrued interest of 62,040.
Entry Point Activities: Masonry open-theatre platform was constructed of 12.6 m length, 6.10 m width and 0.60 m height (Plate 6). Platform was used for village meetings, cultural programmes, including marriages and drying of food grains. Total cost of construction was 1,14,172 and it generated an additional employment of 128 man days.
Two water troughs were constructed at Harijan (SC) colony at Devasamudra and Ramasagara village. The length, width and height of the water troughs were 4.8 m, 2.1 m and 0.6 m, respectively (Plate 7). These water troughs served as drinking water points for nearly 130 cattle in both villages and the cost incurred for construction was ` 19,366 at Devasamudra village and ` 21,115 at Ramasagara village. An additional employment of 128 man-days was created.
Capacity Building: Two training programmes were conducted during 17-20 March for 40 beneficiaries. In the training, beneficiaries of watershed were exposed to soil and rainwater conservation structures for black soils, importance of meteorological parameters in agriculture and shown the vermi-compost units at the Research Farm of Bellary centre. Five training programmes were conducted from 2009 to 2011 for 100 beneficiaries and these beneficiaries were exposed to soil and rainwater conservation measures in black soils; horticulture plantation and vermin-compost unit; meteorological observatory and importance of meteorological parameters in agriculture; interactions on crops, cropping systems, low cost technologies and integrated nutrient management.
Exposure Visits: Forty farmers of the watershed visited Zonal Agricultural Research Centre (ZARC) Babbur Farm; KVK, Hiriyur; BAIF, Tiptur; AICRP on Dryland Agriculture, GKVK, Bangalore; and KVK, Suttur during 2010 and 2011 and were exposed to:
Improved crops, their cultivars and improved cropping systems in red soils
Integrated farming systems in red soils and vermi-compost units
Cultivation of fruit plants, medicinal plants, agro-horti/agro-silvi systems
Raising of seedlings of mango, sapota, cashew, jack and medicinal plants in nursery
Farm pond and roof rainwater harvesting and its re-use
Improved agricultural implements
Improved livestock management for higher milk yields.
Kissan Goshti: Seven kissan goshtis were organized from 2009 to 2012 at Ramasagara, Devasamudra, Hanumapur and Venkatapur villages of watersheds (Plate 8) and farmers had discussions with scientists on:
`
•••••••
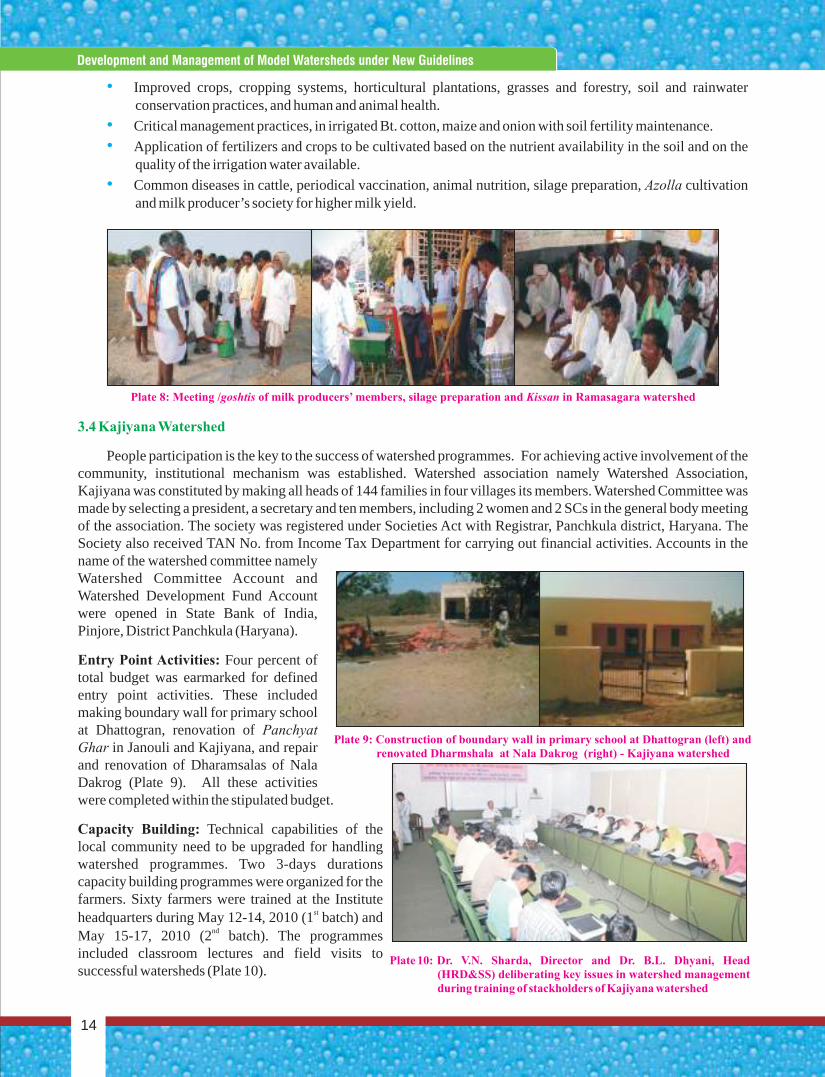
Plate 8: Meeting /goshtis of milk producers’ members, silage preparation and Kissan in Ramasagara watershed
Plate 9: Construction of boundary wall in primary school at Dhattogran (left) and renovated Dharmshala at Nala Dakrog (right) - Kajiyana watershed
Plate 10: Dr. V.N. Sharda, Director and Dr. B.L. Dhyani, Head (HRD&SS) deliberating key issues in watershed management during training of stackholders of Kajiyana watershed
•
••
•
Improved crops, cropping systems, horticultural plantations, grasses and forestry, soil and rainwater conservation practices, and human and animal health.
Critical management practices, in irrigated Bt. cotton, maize and onion with soil fertility maintenance.
Application of fertilizers and crops to be cultivated based on the nutrient availability in the soil and on the quality of the irrigation water available.
Common diseases in cattle, periodical vaccination, animal nutrition, silage preparation, Azolla cultivation and milk producer’s society for higher milk yield.
People participation is the key to the success of watershed programmes. For achieving active involvement of the community, institutional mechanism was established. Watershed association namely Watershed Association, Kajiyana was constituted by making all heads of 144 families in four villages its members. Watershed Committee was made by selecting a president, a secretary and ten members, including 2 women and 2 SCs in the general body meeting of the association. The society was registered under Societies Act with Registrar, Panchkula district, Haryana. The Society also received TAN No. from Income Tax Department for carrying out financial activities. Accounts in the name of the watershed committee namely Watershed Committee Account and Watershed Development Fund Account were opened in State Bank of India, Pinjore, District Panchkula (Haryana).
Entry Point Activities: Four percent of total budget was earmarked for defined entry point activities. These included making boundary wall for primary school at Dhattogran, renovation of Panchyat Ghar in Janouli and Kajiyana, and repair and renovation of Dharamsalas of Nala Dakrog (Plate 9). All these activities were completed within the stipulated budget.
Capacity Building: Technical capabilities of the local community need to be upgraded for handling watershed programmes. Two 3-days durations capacity building programmes were organized for the farmers. Sixty farmers were trained at the Institute
stheadquarters during May 12-14, 2010 (1 batch) and ndMay 15-17, 2010 (2 batch). The programmes
included classroom lectures and field visits to successful watersheds (Plate 10).
3.4 Kajiyana Watershed
Concise Report On Development And Management Of Model Watersheds Through Participatory Approach
14
Development and Management of Model Watersheds under New Guidelines
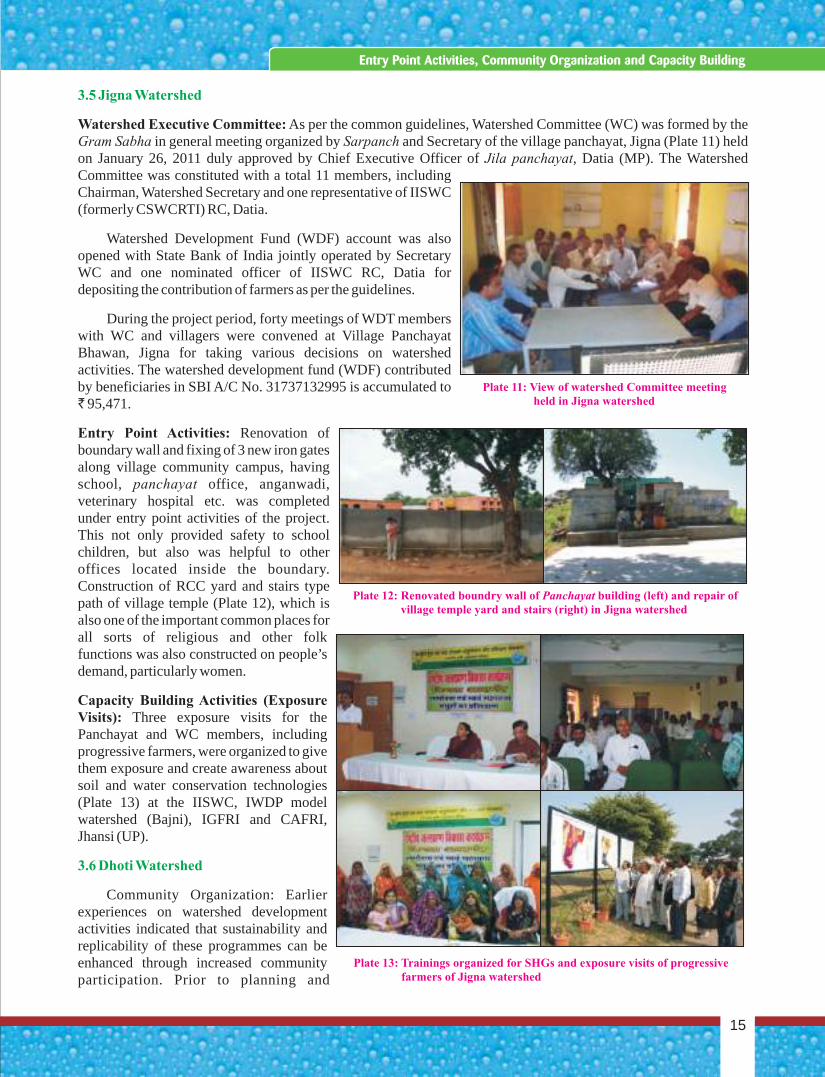
3.5 Jigna Watershed
3.6 Dhoti Watershed
Watershed Executive Committee: As per the common guidelines, Watershed Committee (WC) was formed by the Gram Sabha in general meeting organized by Sarpanch and Secretary of the village panchayat, Jigna (Plate 11) held on January 26, 2011 duly approved by Chief Executive Officer of Jila panchayat, Datia (MP). The Watershed Committee was constituted with a total 11 members, including Chairman, Watershed Secretary and one representative of IISWC (formerly CSWCRTI) RC, Datia.
Watershed Development Fund (WDF) account was also opened with State Bank of India jointly operated by Secretary WC and one nominated officer of IISWC RC, Datia for depositing the contribution of farmers as per the guidelines.
During the project period, forty meetings of WDT members with WC and villagers were convened at Village Panchayat Bhawan, Jigna for taking various decisions on watershed activities. The watershed development fund (WDF) contributed by beneficiaries in SBI A/C No. 31737132995 is accumulated to ` 95,471.
Entry Point Activities: Renovation of boundary wall and fixing of 3 new iron gates along village community campus, having school, panchayat office, anganwadi, veterinary hospital etc. was completed under entry point activities of the project. This not only provided safety to school children, but also was helpful to other offices located inside the boundary. Construction of RCC yard and stairs type path of village temple (Plate 12), which is also one of the important common places for all sorts of religious and other folk functions was also constructed on people’s demand, particularly women.
Capacity Building Activities (Exposure Visits): Three exposure visits for the Panchayat and WC members, including progressive farmers, were organized to give them exposure and create awareness about soil and water conservation technologies (Plate 13) at the IISWC, IWDP model watershed (Bajni), IGFRI and CAFRI, Jhansi (UP).
Community Organization: Earlier experiences on watershed development activities indicated that sustainability and replicability of these programmes can be enhanced through increased community participation. Prior to planning and
Plate 11: View of watershed Committee meeting held in Jigna watershed
Plate 12: Renovated boundry wall of Panchayat building (left) and repair of village temple yard and stairs (right) in Jigna watershed
Plate 13: Trainings organized for SHGs and exposure visits of progressive farmers of Jigna watershed
Introduction
15
Entry Point Activities, Community Organization and Capacity Building
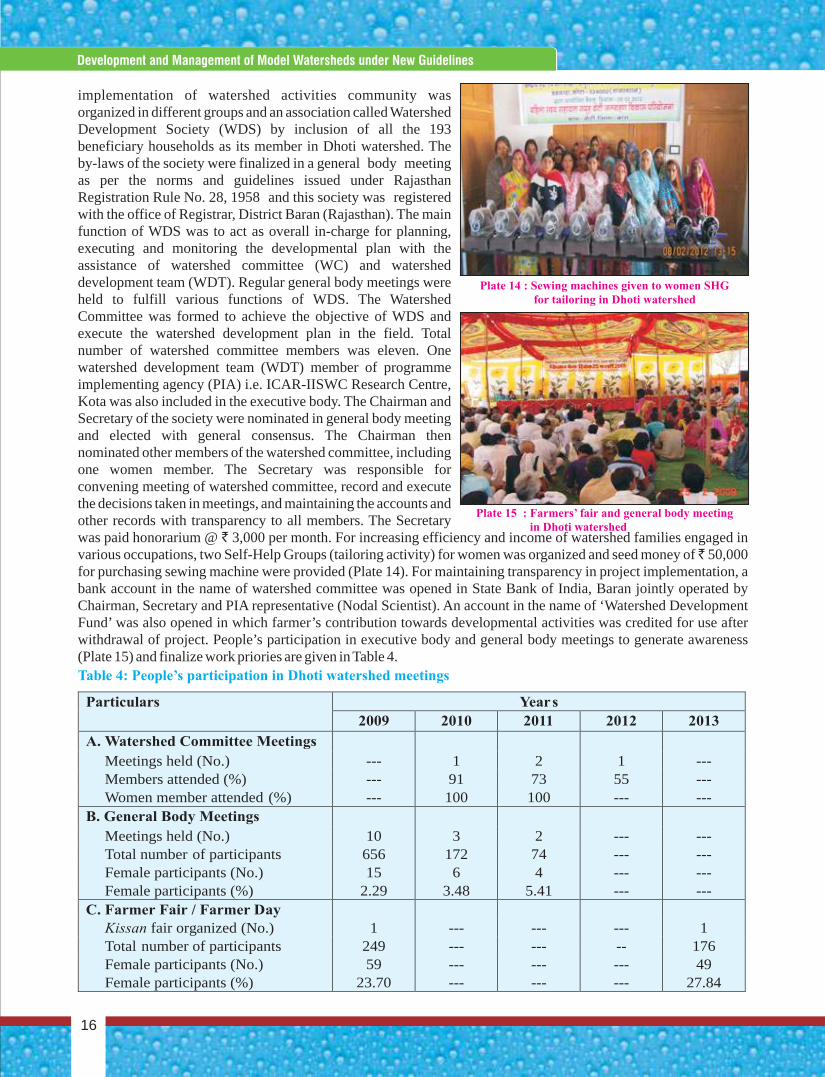
implementation of watershed activities community was organized in different groups and an association called Watershed Development Society (WDS) by inclusion of all the 193 beneficiary households as its member in Dhoti watershed. The by-laws of the society were finalized in a general body meeting as per the norms and guidelines issued under Rajasthan Registration Rule No. 28, 1958 and this society was registered with the office of Registrar, District Baran (Rajasthan). The main function of WDS was to act as overall in-charge for planning, executing and monitoring the developmental plan with the assistance of watershed committee (WC) and watershed development team (WDT). Regular general body meetings were held to fulfill various functions of WDS. The Watershed Committee was formed to achieve the objective of WDS and execute the watershed development plan in the field. Total number of watershed committee members was eleven. One watershed development team (WDT) member of programme implementing agency (PIA) i.e. ICAR-IISWC Research Centre, Kota was also included in the executive body. The Chairman and Secretary of the society were nominated in general body meeting and elected with general consensus. The Chairman then nominated other members of the watershed committee, including one women member. The Secretary was responsible for convening meeting of watershed committee, record and execute the decisions taken in meetings, and maintaining the accounts and other records with transparency to all members. The Secretary was paid honorarium @ ` 3,000 per month. For increasing efficiency and income of watershed families engaged in various occupations, two Self-Help Groups (tailoring activity) for women was organized and seed money of 50,000 for purchasing sewing machine were provided (Plate 14). For maintaining transparency in project implementation, a bank account in the name of watershed committee was opened in State Bank of India, Baran jointly operated by Chairman, Secretary and PIA representative (Nodal Scientist). An account in the name of ‘Watershed Development Fund’ was also opened in which farmer’s contribution towards developmental activities was credited for use after withdrawal of project. People’s participation in executive body and general body meetings to generate awareness (Plate 15) and finalize work priories are given in Table 4.
Particulars Years
2009 2010 2011 2012 2013
A. Watershed Committee Meetings Meetings held (No.) --- 1 2 1 --- Members attended (%) --- 91 73 55 --- Women member attended (%) --- 100 100 --- ---
B. General Body Meetings Meetings held (No.) 10 3 2 --- --- Total number of participants 656 172 74 --- --- Female participants (No.) 15 6 4 --- --- Female participants (%) 2.29 3.48 5.41 --- ---
C. Farmer Fair / Farmer Day Kissan fair organized (No.) 1 --- --- --- 1 Total number of participants 249 --- --- -- 176 Female participants (No.) 59 --- --- --- 49 Female participants (%) 23.70 --- --- --- 27.84
Table 4: People’s participation in Dhoti watershed meetings
Plate 15 : Farmers’ fair and general body meeting in Dhoti watershed
Plate 14 : Sewing machines given to women SHG for tailoring in Dhoti watershed
Concise Report On Development And Management Of Model Watersheds Through Participatory Approach
16
Development and Management of Model Watersheds under New Guidelines

Entry Point Activities: Entry point activity is the first formal project intervention which was undertaken after selection and finalization of the watershed. During the rapport building and planning stages of project implementation, entry point activities (EPA) as per stachholders’ preferences were taken up for developing their confidence and to establish credibility of WDT members (Plate 16). Two EPA (renovation of village Hanuman temple and renovation of Mata Ji ka Chabootra) was carried out in Dhoti watershed.
Capacity Building: The beneficiary members of watershed and formed self help group (SHGs) were given basic training for skill up gradation and orientation on technical and organizational aspects of watershed development. Details of training programme conducted under the Dhoti watershed is given in Table 5.
Exposure Visit: The members of WC and other progressive farmers of watershed were taken for one exposure visit during September 14-17, 2009 to a model watershed and research institutions which helped in improving their level of understanding about the methodological details and expected benefits of watershed development project.
Community Organization: Community organization is considered to be an important component of any rural development project. A multi-disciplinary team of scientists and technical officers constituted watershed development team (WDT) who conducted several rounds of meeting with the watershed community. Participatory rural appraisal (PRA) exercise was conducted to generate awareness about the project and its mode of operation and execution (Plate 17). Further, exposure visits to successfully executed watersheds were conducted to build confidence of the watershed communities and several entry point activities (EPA) were undertaken by the WDT in the watershed with the community contributions (Table 6). Watershed level local people’s institutions represented
3.7 Lachhaputraghati Watershed
Table 5: Capacity building of stakeholders of Dhoti watershed S.
No. Topic of the training No. of participants Training date
Male Female 1 Watershed Management 25 -- 2-4 June, 20092 Watershed Management 26 -- 7-9 June, 20093 Avenues of income generation activities in rural setup 22 -- 15-17 June, 20114 Income of generation through handicraft and tailoring -- 20 18-21 June, 2011
Total 73 20
Plate 17: Community organization and capacity building activities in Lachhaputraghati watershed
Table 6: Activities for awareness and community confidence building in Lachhaputraghati watershed
Plate 16 : Rapport building and initiation of participatory planning in Dhoti watershed
Activity Year Total
2007-08 2008-09 2009-10 2010-11 Village meetings 5 3 2 1 11
No to anti-liquor campaign
3
2
1 -
6
Campaign for health and hygiene
3
2
1 -
6
Motivation for enrollment of children in school
1
1
1 1
4
Wall paintings depicting benefits of the watershed programme
12
12 6
-
30
Participation in exhibitions
1
1
1
3
Campaign for Saving in bank account 1 1 1 - 3
Introduction
17
Entry Point Activities, Community Organization and Capacity Building
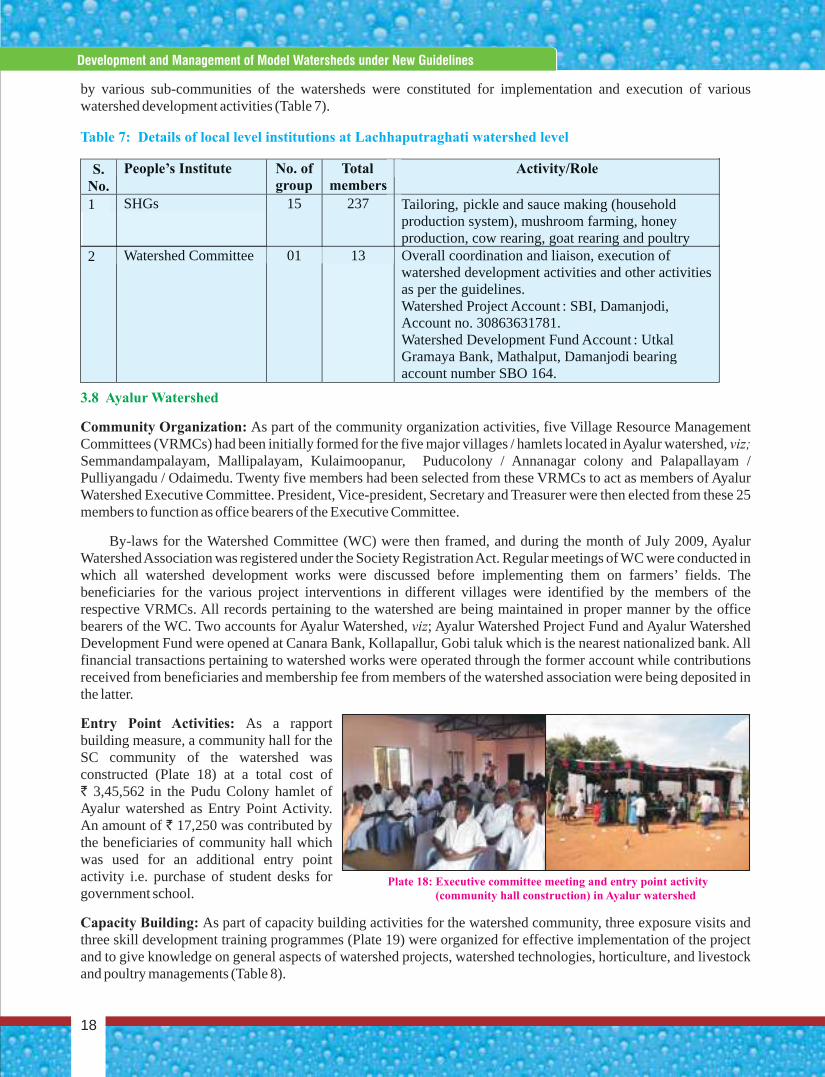
by various sub-communities of the watersheds were constituted for implementation and execution of various watershed development activities (Table 7).
Community Organization: As part of the community organization activities, five Village Resource Management Committees (VRMCs) had been initially formed for the five major villages / hamlets located in Ayalur watershed, viz; Semmandampalayam, Mallipalayam, Kulaimoopanur, Puducolony / Annanagar colony and Palapallayam / Pulliyangadu / Odaimedu. Twenty five members had been selected from these VRMCs to act as members of Ayalur Watershed Executive Committee. President, Vice-president, Secretary and Treasurer were then elected from these 25 members to function as office bearers of the Executive Committee.
By-laws for the Watershed Committee (WC) were then framed, and during the month of July 2009, Ayalur Watershed Association was registered under the Society Registration Act. Regular meetings of WC were conducted in which all watershed development works were discussed before implementing them on farmers’ fields. The beneficiaries for the various project interventions in different villages were identified by the members of the respective VRMCs. All records pertaining to the watershed are being maintained in proper manner by the office bearers of the WC. Two accounts for Ayalur Watershed, viz; Ayalur Watershed Project Fund and Ayalur Watershed Development Fund were opened at Canara Bank, Kollapallur, Gobi taluk which is the nearest nationalized bank. All financial transactions pertaining to watershed works were operated through the former account while contributions received from beneficiaries and membership fee from members of the watershed association were being deposited in the latter.
Entry Point Activities: As a rapport building measure, a community hall for the SC community of the watershed was constructed (Plate 18) at a total cost of ` 3,45,562 in the Pudu Colony hamlet of Ayalur watershed as Entry Point Activity. An amount of ` 17,250 was contributed by the beneficiaries of community hall which was used for an additional entry point activity i.e. purchase of student desks for government school.
Capacity Building: As part of capacity building activities for the watershed community, three exposure visits and three skill development training programmes (Plate 19) were organized for effective implementation of the project and to give knowledge on general aspects of watershed projects, watershed technologies, horticulture, and livestock and poultry managements (Table 8).
3.8 Ayalur Watershed
Plate 18: Executive committee meeting and entry point activity (community hall construction) in Ayalur watershed
Overall coordination and liaison, execution of
Table 7: Details of local level institutions at Lachhaputraghati watershed level
Tailoring, pickle and sauce making (household production system), mushroom farming, honey production, cow rearing, goat rearing and poultry
Activity/Role
watershed development activities and other activities as per the guidelines. Watershed Project Account : SBI, Damanjodi, Account no. 30863631781. Watershed Development Fund Account : Utkal Gramaya Bank, Mathalput, Damanjodi bearing account number SBO 164.
2 Watershed Committee 01 13
group
1 SHGs 15 237
S. No.
People’s Institute No. of
Total members
Concise Report On Development And Management Of Model Watersheds Through Participatory Approach
18
Development and Management of Model Watersheds under New Guidelines
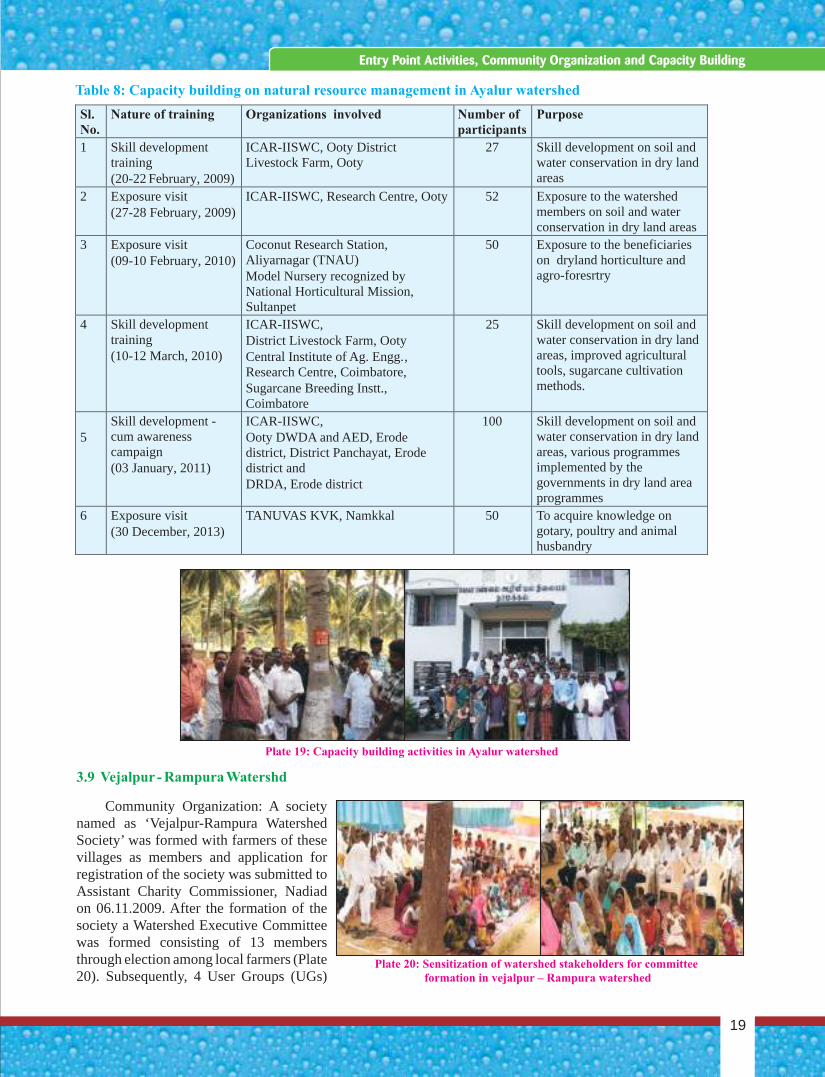
3.9 Vejalpur - Rampura Watershd
Community Organization: A society named as ‘Vejalpur-Rampura Watershed Society’ was formed with farmers of these villages as members and application for registration of the society was submitted to Assistant Charity Commissioner, Nadiad on 06.11.2009. After the formation of the society a Watershed Executive Committee was formed consisting of 13 members through election among local farmers (Plate 20). Subsequently, 4 User Groups (UGs)
husbandry
Sl. No.
Nature of training Organizations involved Number of participants
Purpose
1 Skill development training (20-22 February, 2009)
ICAR-IISWC, Ooty District Livestock Farm, Ooty
27 Skill development on soil and water conservation in dry land areas
2 Exposure visit (27-28 February, 2009)
ICAR-IISWC, Research Centre, Ooty 52 Exposure to the watershed members on soil and water conservation in dry land areas
3 Exposure visit (09-10 February, 2010)
Coconut Research Station, Aliyarnagar (TNAU) Model Nursery recognized by National Horticultural Mission, Sultanpet
50 Exposure to the beneficiaries on dryland horticulture and agro-foresrtry
4 Skill development training (10-12 March, 2010)
ICAR-IISWC, District Livestock Farm, Ooty Central Institute of Ag. Engg., Research Centre, Coimbatore, Sugarcane Breeding Instt., Coimbatore
25 Skill development on soil and water conservation in dry land areas, improved agricultural tools, sugarcane cultivation methods.
5 Skill development - cum awareness campaign (03 January, 2011)
ICAR-IISWC, Ooty DWDA and AED, Erode district, District Panchayat, Erode district and DRDA, Erode district
100 Skill development on soil and water conservation in dry land areas, various programmes implemented by the governments in dry land area programmes
6 Exposure visit (30 December, 2013)
TANUVAS KVK, Namkkal 50 To acquire knowledge on gotary, poultry and animal
Table 8: Capacity building on natural resource management in Ayalur watershed
Plate 19: Capacity building activities in Ayalur watershed
Plate 20: Sensitization of watershed stakeholders for committee formation in vejalpur – Rampura watershed
Introduction
19
Entry Point Activities, Community Organization and Capacity Building
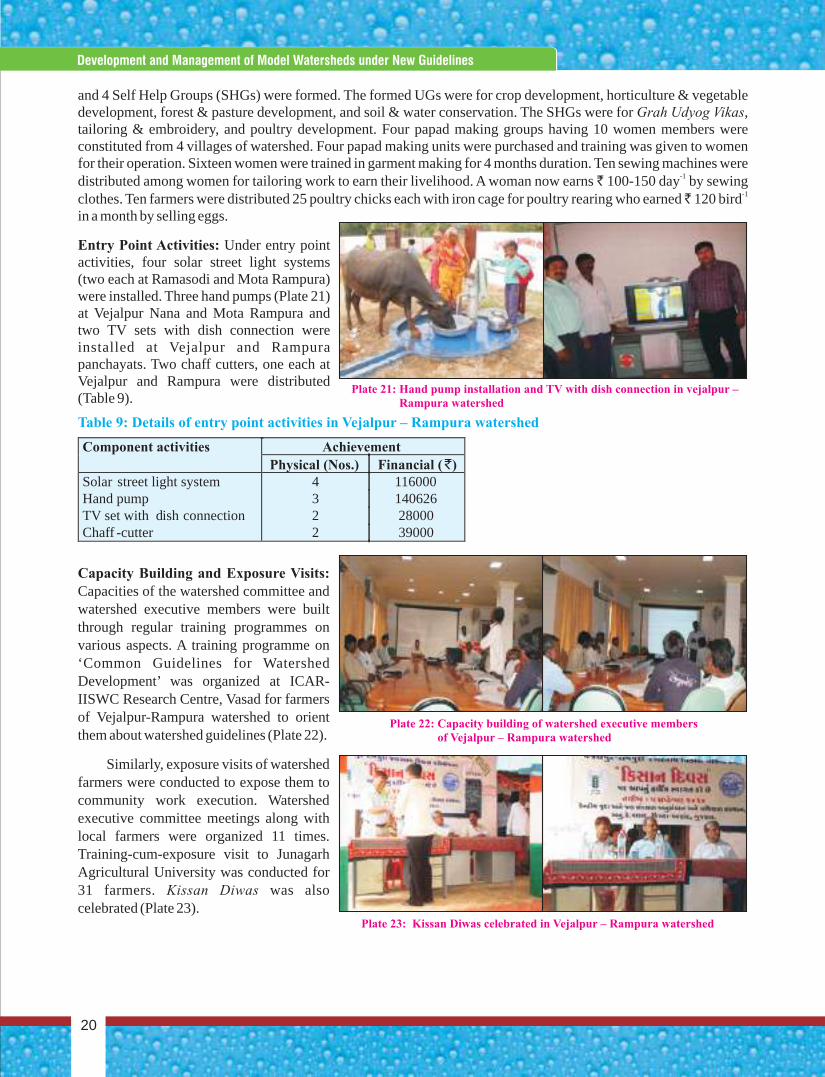
and 4 Self Help Groups (SHGs) were formed. The formed UGs were for crop development, horticulture & vegetable development, forest & pasture development, and soil & water conservation. The SHGs were for Grah Udyog Vikas, tailoring & embroidery, and poultry development. Four papad making groups having 10 women members were constituted from 4 villages of watershed. Four papad making units were purchased and training was given to women for their operation. Sixteen women were trained in garment making for 4 months duration. Ten sewing machines were distributed among women for tailoring work to earn their livelihood. A woman now earns 100-150 day by sewing
-1clothes. Ten farmers were distributed 25 poultry chicks each with iron cage for poultry rearing who earned 120 bird in a month by selling eggs.
Entry Point Activities: Under entry point activities, four solar street light systems (two each at Ramasodi and Mota Rampura) were installed. Three hand pumps (Plate 21) at Vejalpur Nana and Mota Rampura and two TV sets with dish connection were installed at Vejalpur and Rampura panchayats. Two chaff cutters, one each at Vejalpur and Rampura were distributed (Table 9).
Capacity Building and Exposure Visits: Capacities of the watershed committee and watershed executive members were built through regular training programmes on various aspects. A training programme on ‘Common Guidelines for Watershed Development’ was organized at ICAR-IISWC Research Centre, Vasad for farmers of Vejalpur-Rampura watershed to orient them about watershed guidelines (Plate 22).
Similarly, exposure visits of watershed farmers were conducted to expose them to community work execution. Watershed executive committee meetings along with local farmers were organized 11 times. Training-cum-exposure visit to Junagarh Agricultural University was conducted for 31 farmers. Kissan Diwas was also celebrated (Plate 23).
-1
Plate 21: Hand pump installation and TV with dish connection in vejalpur – Rampura watershed
Component activities Achievement Physical (Nos.) Financial ( `)
Solar street light system 4 116000 Hand pump 3 140626 TV set with dish connection 2 28000 Chaff -cutter 2 39000
Table 9: Details of entry point activities in Vejalpur – Rampura watershed
Plate 23: Kissan Diwas celebrated in Vejalpur – Rampura watershed
Plate 22: Capacity building of watershed executive members of Vejalpur – Rampura watershed
Concise Report On Development And Management Of Model Watersheds Through Participatory Approach
20
Development and Management of Model Watersheds under New Guidelines
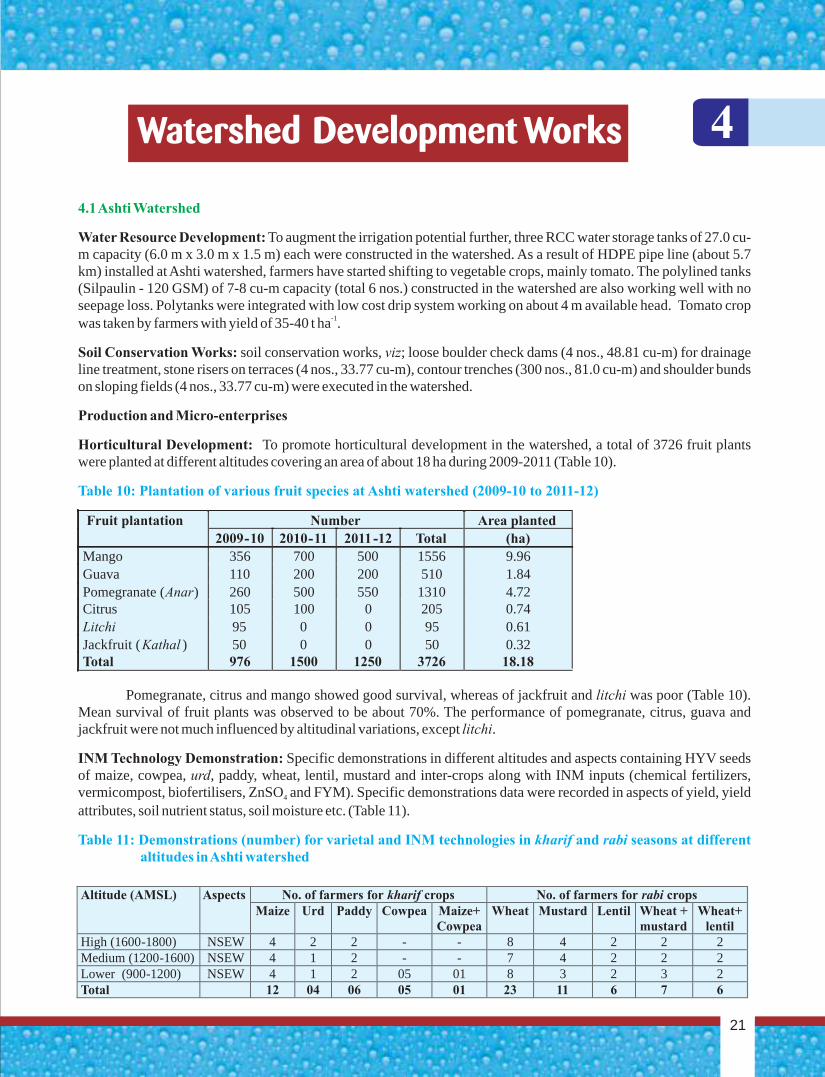
Watershed Development Works
4.1 Ashti Watershed
Water Resource Development: To augment the irrigation potential further, three RCC water storage tanks of 27.0 cu-m capacity (6.0 m x 3.0 m x 1.5 m) each were constructed in the watershed. As a result of HDPE pipe line (about 5.7 km) installed at Ashti watershed, farmers have started shifting to vegetable crops, mainly tomato. The polylined tanks (Silpaulin - 120 GSM) of 7-8 cu-m capacity (total 6 nos.) constructed in the watershed are also working well with no seepage loss. Polytanks were integrated with low cost drip system working on about 4 m available head. Tomato crop
-1was taken by farmers with yield of 35-40 t ha .
Soil Conservation Works: soil conservation works, viz; loose boulder check dams (4 nos., 48.81 cu-m) for drainage line treatment, stone risers on terraces (4 nos., 33.77 cu-m), contour trenches (300 nos., 81.0 cu-m) and shoulder bunds on sloping fields (4 nos., 33.77 cu-m) were executed in the watershed.
Production and Micro-enterprises
Horticultural Development: To promote horticultural development in the watershed, a total of 3726 fruit plants were planted at different altitudes covering an area of about 18 ha during 2009-2011 (Table 10).
Pomegranate, citrus and mango showed good survival, whereas of jackfruit and litchi was poor (Table 10). Mean survival of fruit plants was observed to be about 70%. The performance of pomegranate, citrus, guava and jackfruit were not much influenced by altitudinal variations, except litchi.
INM Technology Demonstration: Specific demonstrations in different altitudes and aspects containing HYV seeds of maize, cowpea, urd, paddy, wheat, lentil, mustard and inter-crops along with INM inputs (chemical fertilizers, vermicompost, biofertilisers, ZnSO and FYM). Specific demonstrations data were recorded in aspects of yield, yield 4
attributes, soil nutrient status, soil moisture etc. (Table 11).
Table 10: Plantation of various fruit species at Ashti watershed (2009-10 to 2011-12)
Table 11: Demonstrations (number) for varietal and INM technologies in kharif and rabi seasons at different altitudes in Ashti watershed
Fruit plantation Number Area planted
2009 10 2010 11 2011 12 Total (ha)
Mango 356 700 500 1556 9.96 Guava 110 200 200 510 1.84 Pomegranate (Anar) 260 500 550 1310 4.72 Citrus 105 100 0 205 0.74 Litchi 95 0 0 95 0.61 Jackfruit (Kathal ) 50 0 0 50 0.32 Total 976 1500 1250 3726 18.18
Altitude (AMSL)
Aspects No. of farmers for kharif crops No. of farmers for rabi crops Maize Urd Paddy Cowpea Maize+
Cowpea Wheat Mustard Lentil Wheat +
mustard Wheat+
lentil High (1600-1800) NSEW 4 2 2 - - 8 4 2 2 2 Medium (1200-1600) NSEW 4 1 2 - - 7 4 2 2 2 Lower (900-1200) NSEW 4 1 2 05 01 8 3 2 3 2 Total 12 04 06 05 01 23 11 6 7 6
4
21
- - -
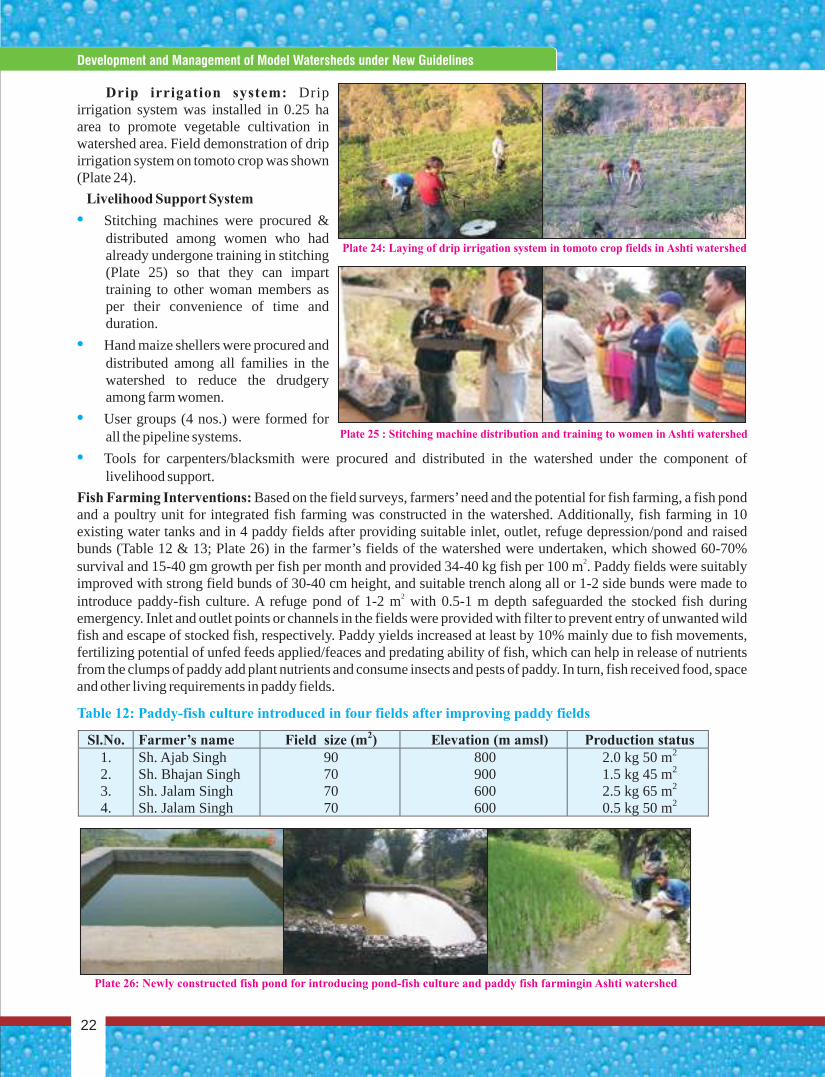
Concise Report On Development And Management Of Model Watersheds Through Participatory Approach
22
Development and Management of Model Watersheds under New Guidelines
Drip irrigation system: Drip irrigation system was installed in 0.25 ha area to promote vegetable cultivation in watershed area. Field demonstration of drip irrigation system on tomoto crop was shown (Plate 24).
Livelihood Support System
Stitching machines were procured & distributed among women who had already undergone training in stitching (Plate 25) so that they can impart training to other woman members as per their convenience of time and duration.
Hand maize shellers were procured and distributed among all families in the watershed to reduce the drudgery among farm women.
User groups (4 nos.) were formed for all the pipeline systems.
Tools for carpenters/blacksmith were procured and distributed in the watershed under the component of livelihood support.
Fish Farming Interventions: Based on the field surveys, farmers’ need and the potential for fish farming, a fish pond and a poultry unit for integrated fish farming was constructed in the watershed. Additionally, fish farming in 10 existing water tanks and in 4 paddy fields after providing suitable inlet, outlet, refuge depression/pond and raised bunds (Table 12 & 13; Plate 26) in the farmer’s fields of the watershed were undertaken, which showed 60-70%
2survival and 15-40 gm growth per fish per month and provided 34-40 kg fish per 100 m . Paddy fields were suitably improved with strong field bunds of 30-40 cm height, and suitable trench along all or 1-2 side bunds were made to
2introduce paddy-fish culture. A refuge pond of 1-2 m with 0.5-1 m depth safeguarded the stocked fish during emergency. Inlet and outlet points or channels in the fields were provided with filter to prevent entry of unwanted wild fish and escape of stocked fish, respectively. Paddy yields increased at least by 10% mainly due to fish movements, fertilizing potential of unfed feeds applied/feaces and predating ability of fish, which can help in release of nutrients from the clumps of paddy add plant nutrients and consume insects and pests of paddy. In turn, fish received food, space and other living requirements in paddy fields.
•
•
•
•
Plate 25 : Stitching machine distribution and training to women in Ashti watershed
Plate 24: Laying of drip irrigation system in tomoto crop fields in Ashti watershed
Sl.No. Farmer’s name Field size (m2) Elevation (m amsl) Production status 1. Sh. Ajab Singh 90 800 2.0 kg 50 m2 2. Sh. Bhajan Singh 70 900 1.5 kg 45 m2 3. Sh. Jalam Singh 70 600 2.5 kg 65 m2 4. Sh. Jalam Singh 70 600 0.5 kg 50 m2
Table 12: Paddy-fish culture introduced in four fields after improving paddy fields
Plate 26: Newly constructed fish pond for introducing pond-fish culture and paddy fish farmingin Ashti watershed
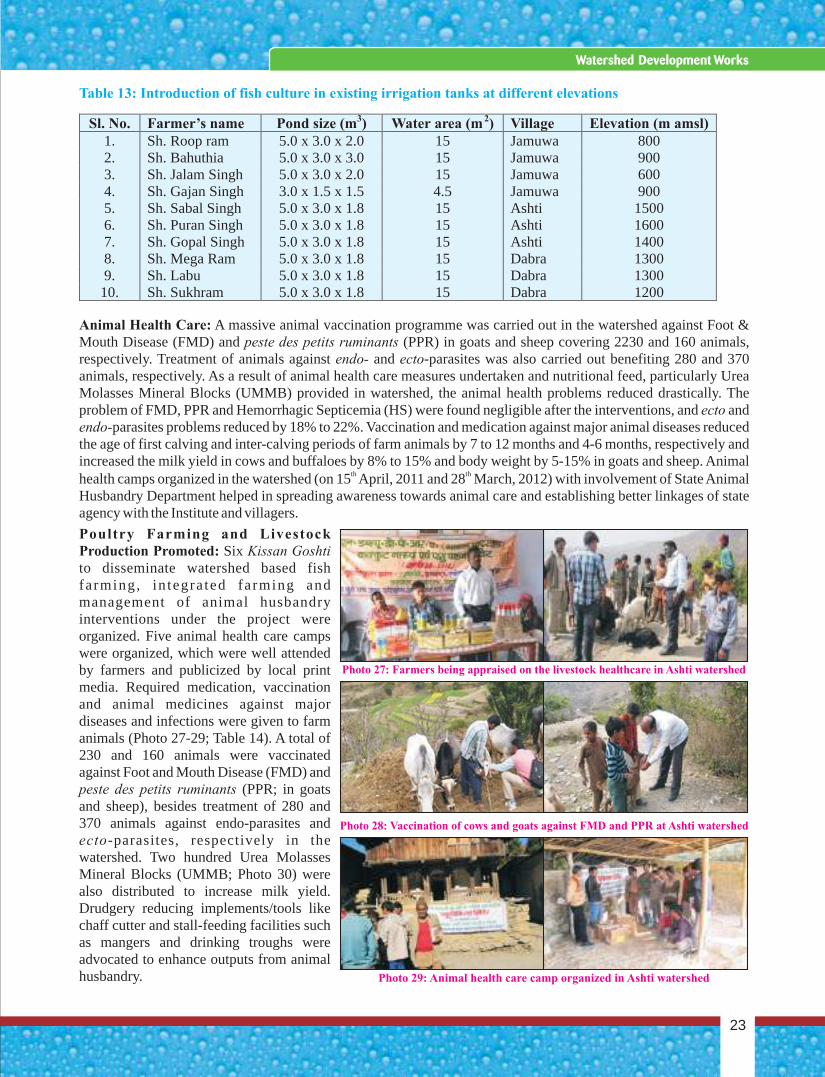
Sl. No. Farmer’s name Pond size (m3) Water area (m2) Village Elevation (m amsl) 1. Sh. Roop ram 5.0 x 3.0 x 2.0 15 Jamuwa 800 2. Sh. Bahuthia 5.0 x 3.0 x 3.0 15 Jamuwa 900 3. Sh. Jalam Singh 5.0 x 3.0 x 2.0 15 Jamuwa 600 4. Sh. Gajan Singh 3.0 x 1.5 x 1.5 4.5 Jamuwa 900 5. Sh. Sabal Singh 5.0 x 3.0 x 1.8 15 Ashti 1500 6. Sh. Puran Singh 5.0 x 3.0 x 1.8 15 Ashti 1600 7. Sh. Gopal Singh 5.0 x 3.0 x 1.8 15 Ashti 1400 8. Sh. Mega Ram 5.0 x 3.0 x 1.8 15 Dabra 1300 9. Sh. Labu 5.0 x 3.0 x 1.8 15 Dabra 1300
10. Sh. Sukhram 5.0 x 3.0 x 1.8 15 Dabra 1200
Table 13: Introduction of fish culture in existing irrigation tanks at different elevations
Animal Health Care: A massive animal vaccination programme was carried out in the watershed against Foot & Mouth Disease (FMD) and peste des petits ruminants (PPR) in goats and sheep covering 2230 and 160 animals, respectively. Treatment of animals against endo- and ecto-parasites was also carried out benefiting 280 and 370 animals, respectively. As a result of animal health care measures undertaken and nutritional feed, particularly Urea Molasses Mineral Blocks (UMMB) provided in watershed, the animal health problems reduced drastically. The problem of FMD, PPR and Hemorrhagic Septicemia (HS) were found negligible after the interventions, and ecto and endo-parasites problems reduced by 18% to 22%. Vaccination and medication against major animal diseases reduced the age of first calving and inter-calving periods of farm animals by 7 to 12 months and 4-6 months, respectively and increased the milk yield in cows and buffaloes by 8% to 15% and body weight by 5-15% in goats and sheep. Animal
th thhealth camps organized in the watershed (on 15 April, 2011 and 28 March, 2012) with involvement of State Animal Husbandry Department helped in spreading awareness towards animal care and establishing better linkages of state agency with the Institute and villagers.
Poultry Farming and Livestock Production Promoted: Six Kissan Goshti to disseminate watershed based fish farming, in tegra ted farming and management of animal husbandry interventions under the project were organized. Five animal health care camps were organized, which were well attended by farmers and publicized by local print media. Required medication, vaccination and animal medicines against major diseases and infections were given to farm animals (Photo 27-29; Table 14). A total of 230 and 160 animals were vaccinated against Foot and Mouth Disease (FMD) and peste des petits ruminants (PPR; in goats and sheep), besides treatment of 280 and 370 animals against endo-parasites and ecto-parasites, respectively in the watershed. Two hundred Urea Molasses Mineral Blocks (UMMB; Photo 30) were also distributed to increase milk yield. Drudgery reducing implements/tools like chaff cutter and stall-feeding facilities such as mangers and drinking troughs were advocated to enhance outputs from animal husbandry.
Photo 27: Farmers being appraised on the livestock healthcare in Ashti watershed
Photo 28: Vaccination of cows and goats against FMD and PPR at Ashti watershed
Photo 29: Animal health care camp organized in Ashti watershed
23
Watershed Development Works
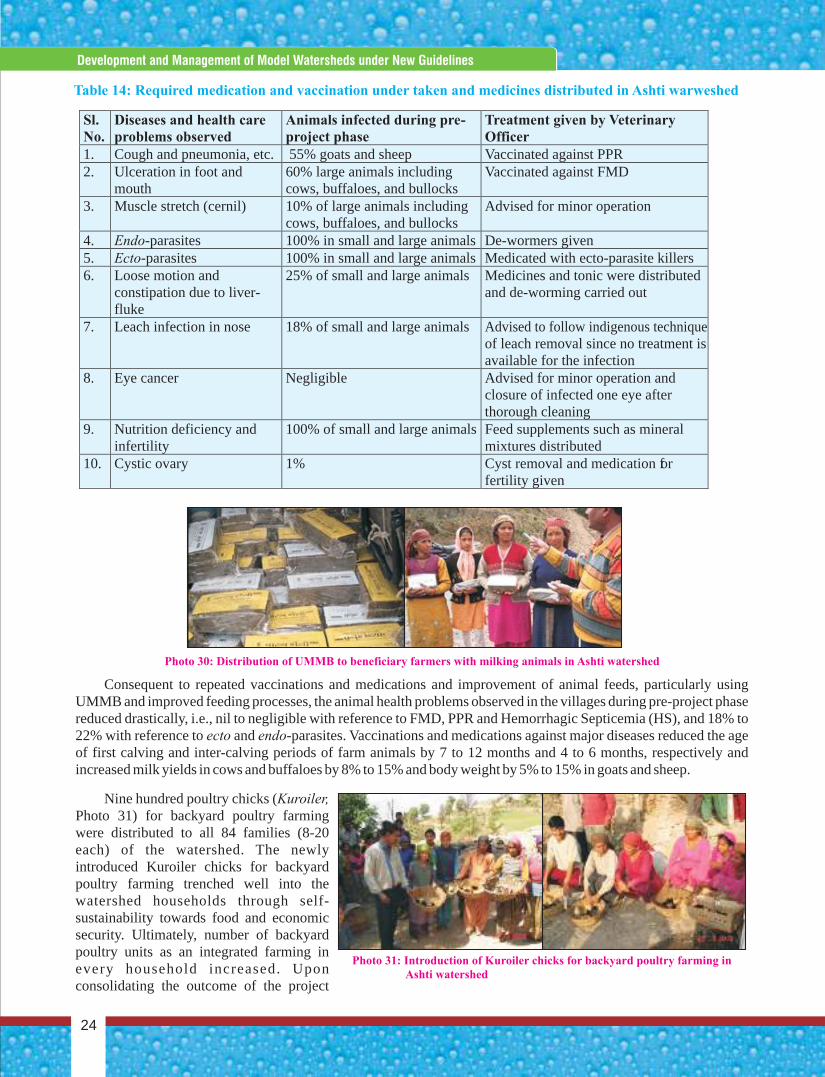
Photo 30: Distribution of UMMB to beneficiary farmers with milking animals in Ashti watershed
Sl. No.
Diseases and health care problems observed
Animals infected during pre-project phase
Treatment given by Veterinary Officer
1. Cough and pneumonia, etc. 55% goats and sheep Vaccinated against PPR 2. Ulceration in foot and
mouth 60% large animals including cows, buffaloes, and bullocks
Vaccinated against FMD
3. Muscle stretch (cernil) 10% of large animals including cows, buffaloes, and bullocks
Advised for minor operation
4. Endo-parasites 100% in small and large animals De-wormers given 5. Ecto-parasites 100% in small and large animals Medicated with ecto-parasite killers 6. Loose motion and
constipation due to liver-fluke
25% of small and large animals Medicines and tonic were distributed and de-worming carried out
7. Leach infection in nose 18% of small and large animals Advised to follow indigenous technique of leach removal since no treatment is available for the infection
8. Eye cancer Negligible Advised for minor operation and closure of infected one eye after thorough cleaning
9. Nutrition deficiency and infertility
100% of small and large animals Feed supplements such as mineral mixtures distributed
10. Cystic ovary 1% Cyst removal and medication for fertility given
Table 14: Required medication and vaccination under taken and medicines distributed in Ashti warweshed
Consequent to repeated vaccinations and medications and improvement of animal feeds, particularly using UMMB and improved feeding processes, the animal health problems observed in the villages during pre-project phase reduced drastically, i.e., nil to negligible with reference to FMD, PPR and Hemorrhagic Septicemia (HS), and 18% to 22% with reference to ecto and endo-parasites. Vaccinations and medications against major diseases reduced the age of first calving and inter-calving periods of farm animals by 7 to 12 months and 4 to 6 months, respectively and increased milk yields in cows and buffaloes by 8% to 15% and body weight by 5% to 15% in goats and sheep.
Nine hundred poultry chicks (Kuroiler, Photo 31) for backyard poultry farming were distributed to all 84 families (8-20 each) of the watershed. The newly introduced Kuroiler chicks for backyard poultry farming trenched well into the watershed households through self-sustainability towards food and economic security. Ultimately, number of backyard poultry units as an integrated farming in every household increased. Upon consolidating the outcome of the project
Photo 31: Introduction of Kuroiler chicks for backyard poultry farming in Ashti watershed
Concise Report On Development And Management Of Model Watersheds Through Participatory Approach
24
Development and Management of Model Watersheds under New Guidelines
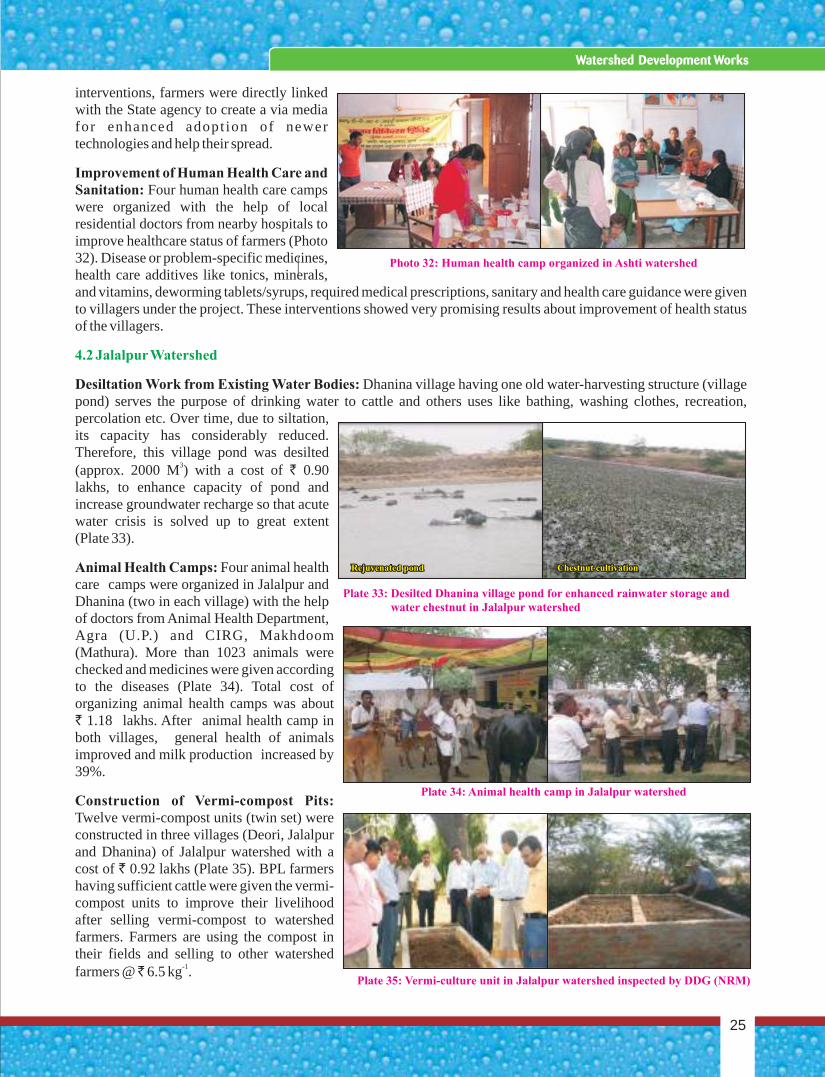
interventions, farmers were directly linked with the State agency to create a via media for enhanced adopt ion of newer technologies and help their spread.
Improvement of Human Health Care and Sanitation: Four human health care camps were organized with the help of local residential doctors from nearby hospitals to improve healthcare status of farmers (Photo 32). Disease or problem-specific medicines, health care additives like tonics, minerals, and vitamins, deworming tablets/syrups, required medical prescriptions, sanitary and health care guidance were given to villagers under the project. These interventions showed very promising results about improvement of health status of the villagers.
Desiltation Work from Existing Water Bodies: Dhanina village having one old water-harvesting structure (village pond) serves the purpose of drinking water to cattle and others uses like bathing, washing clothes, recreation, percolation etc. Over time, due to siltation, its capacity has considerably reduced. Therefore, this village pond was desilted
3(approx. 2000 M ) with a cost of 0.90 lakhs, to enhance capacity of pond and increase groundwater recharge so that acute water crisis is solved up to great extent (Plate 33).
Animal Health Camps: Four animal health care camps were organized in Jalalpur and Dhanina (two in each village) with the help of doctors from Animal Health Department, Agra (U.P.) and CIRG, Makhdoom (Mathura). More than 1023 animals were checked and medicines were given according to the diseases (Plate 34). Total cost of organizing animal health camps was about ` 1.18 lakhs. After animal health camp in both villages, general health of animals improved and milk production increased by 39%.
Construction of Vermi-compost Pits: Twelve vermi-compost units (twin set) were constructed in three villages (Deori, Jalalpur and Dhanina) of Jalalpur watershed with a cost of ` 0.92 lakhs (Plate 35). BPL farmers having sufficient cattle were given the vermi-compost units to improve their livelihood after selling vermi-compost to watershed farmers. Farmers are using the compost in their fields and selling to other watershed
-1farmers @ 6.5 kg .
4.2 Jalalpur Watershed
`
Plate 34: Animal health camp in Jalalpur watershed
Plate 35: Vermi-culture unit in Jalalpur watershed inspected by DDG (NRM)
Photo 32: Human health camp organized in Ashti watershed
Plate 33: Desilted Dhanina village pond for enhanced rainwater storage and water chestnut in Jalalpur watershed
Rejuvenated pondRejuvenated pond Chestnut cultivationChestnut cultivation
25
Watershed Development Works
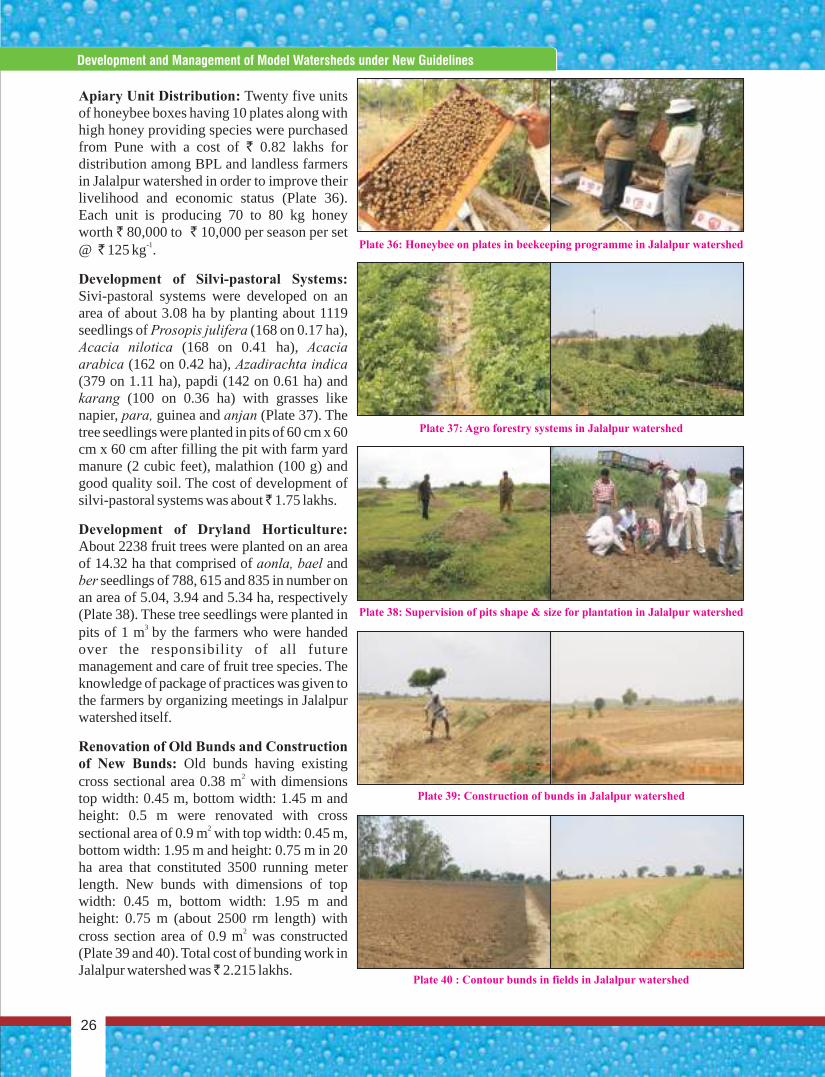
Plate 39: Construction of bunds in Jalalpur watershed
Plate 40 : Contour bunds in fields in Jalalpur watershed
Plate 36: Honeybee on plates in beekeeping programme in Jalalpur watershed
Plate 37: Agro forestry systems in Jalalpur watershed
Plate 38: Supervision of pits shape & size for plantation in Jalalpur watershed
Apiary Unit Distribution: Twenty five units of honeybee boxes having 10 plates along with high honey providing species were purchased from Pune with a cost of ` 0.82 lakhs for distribution among BPL and landless farmers in Jalalpur watershed in order to improve their livelihood and economic status (Plate 36). Each unit is producing 70 to 80 kg honey worth ` 80,000 to ` 10,000 per season per set
-1@ 125 kg .
Development of Silvi-pastoral Systems: Sivi-pastoral systems were developed on an area of about 3.08 ha by planting about 1119 seedlings of Prosopis julifera (168 on 0.17 ha), Acacia nilotica (168 on 0.41 ha), Acacia arabica (162 on 0.42 ha), Azadirachta indica (379 on 1.11 ha), papdi (142 on 0.61 ha) and karang (100 on 0.36 ha) with grasses like napier, para, guinea and anjan (Plate 37). The tree seedlings were planted in pits of 60 cm x 60 cm x 60 cm after filling the pit with farm yard manure (2 cubic feet), malathion (100 g) and good quality soil. The cost of development of silvi-pastoral systems was about 1.75 lakhs.
Development of Dryland Horticulture: About 2238 fruit trees were planted on an area of 14.32 ha that comprised of aonla, bael and ber seedlings of 788, 615 and 835 in number on an area of 5.04, 3.94 and 5.34 ha, respectively (Plate 38). These tree seedlings were planted in
3 pits of 1 m by the farmers who were handed over the responsibility of all future management and care of fruit tree species. The knowledge of package of practices was given to the farmers by organizing meetings in Jalalpur watershed itself.
Renovation of Old Bunds and Construction of New Bunds: Old bunds having existing
2cross sectional area 0.38 m with dimensions top width: 0.45 m, bottom width: 1.45 m and height: 0.5 m were renovated with cross
2sectional area of 0.9 m with top width: 0.45 m, bottom width: 1.95 m and height: 0.75 m in 20 ha area that constituted 3500 running meter length. New bunds with dimensions of top width: 0.45 m, bottom width: 1.95 m and height: 0.75 m (about 2500 rm length) with
2cross section area of 0.9 m was constructed (Plate 39 and 40). Total cost of bunding work in Jalalpur watershed was 2.215 lakhs.
Concise Report On Development And Management Of Model Watersheds Through Participatory Approach
26
Development and Management of Model Watersheds under New Guidelines
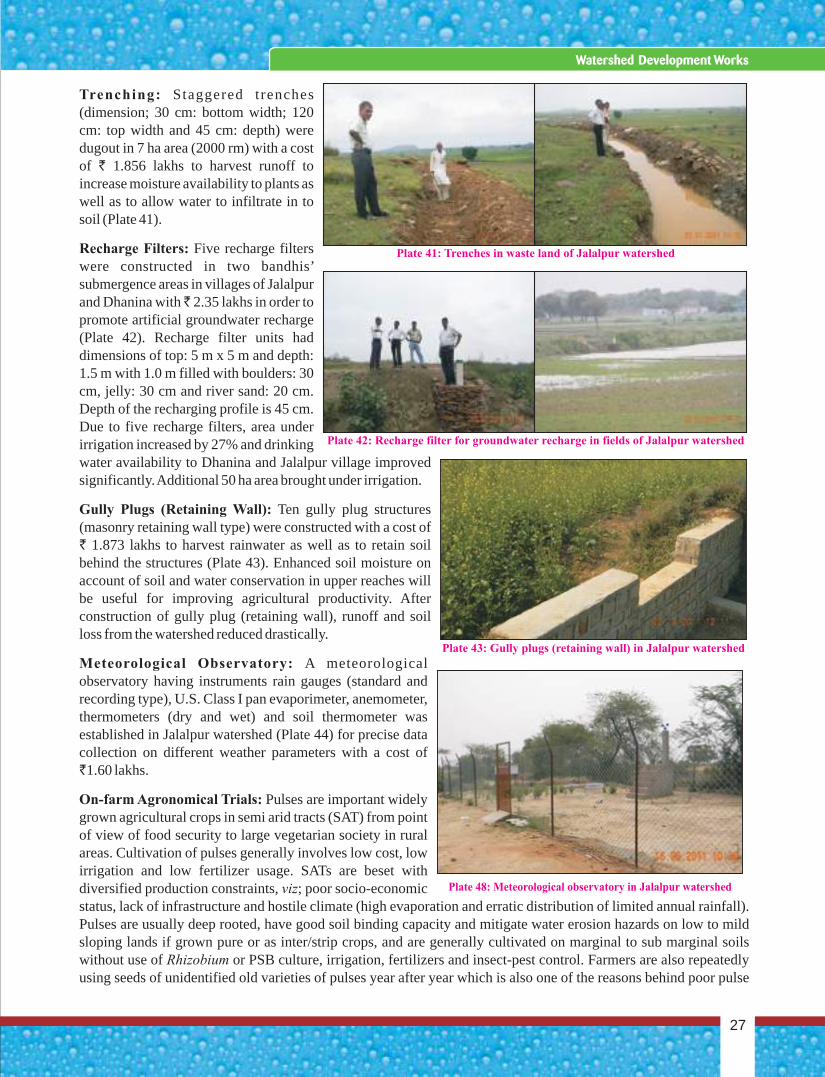
Trenching: Staggered trenches (dimension; 30 cm: bottom width; 120 cm: top width and 45 cm: depth) were dugout in 7 ha area (2000 rm) with a cost of ` 1.856 lakhs to harvest runoff to increase moisture availability to plants as well as to allow water to infiltrate in to soil (Plate 41).
Recharge Filters: Five recharge filters were constructed in two bandhis’ submergence areas in villages of Jalalpur and Dhanina with 2.35 lakhs in order to promote artificial groundwater recharge (Plate 42). Recharge filter units had dimensions of top: 5 m x 5 m and depth: 1.5 m with 1.0 m filled with boulders: 30 cm, jelly: 30 cm and river sand: 20 cm. Depth of the recharging profile is 45 cm. Due to five recharge filters, area under irrigation increased by 27% and drinking water availability to Dhanina and Jalalpur village improved significantly. Additional 50 ha area brought under irrigation.
Gully Plugs (Retaining Wall): Ten gully plug structures (masonry retaining wall type) were constructed with a cost of ` 1.873 lakhs to harvest rainwater as well as to retain soil behind the structures (Plate 43). Enhanced soil moisture on account of soil and water conservation in upper reaches will be useful for improving agricultural productivity. After construction of gully plug (retaining wall), runoff and soil loss from the watershed reduced drastically.
Meteorological Observatory: A meteorological observatory having instruments rain gauges (standard and recording type), U.S. Class I pan evaporimeter, anemometer, thermometers (dry and wet) and soil thermometer was established in Jalalpur watershed (Plate 44) for precise data collection on different weather parameters with a cost of `1.60 lakhs.
On-farm Agronomical Trials: Pulses are important widely grown agricultural crops in semi arid tracts (SAT) from point of view of food security to large vegetarian society in rural areas. Cultivation of pulses generally involves low cost, low irrigation and low fertilizer usage. SATs are beset with diversified production constraints, viz; poor socio-economic status, lack of infrastructure and hostile climate (high evaporation and erratic distribution of limited annual rainfall). Pulses are usually deep rooted, have good soil binding capacity and mitigate water erosion hazards on low to mild sloping lands if grown pure or as inter/strip crops, and are generally cultivated on marginal to sub marginal soils without use of Rhizobium or PSB culture, irrigation, fertilizers and insect-pest control. Farmers are also repeatedly using seeds of unidentified old varieties of pulses year after year which is also one of the reasons behind poor pulse
Plate 41: Trenches in waste land of Jalalpur watershed
Plate 42: Recharge filter for groundwater recharge in fields of Jalalpur watershed
Plate 43: Gully plugs (retaining wall) in Jalalpur watershed
Plate 48: Meteorological observatory in Jalalpur watershed
27
Watershed Development Works
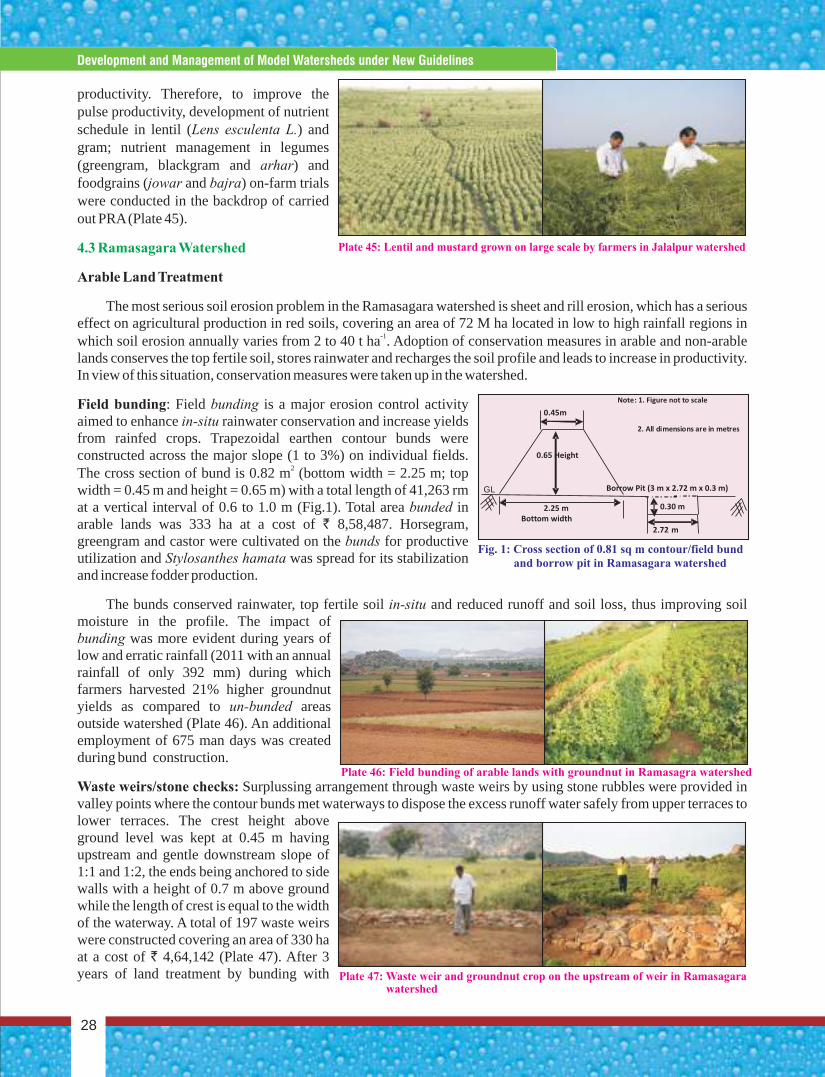
productivity. Therefore, to improve the pulse productivity, development of nutrient schedule in lentil (Lens esculenta L.) and gram; nutrient management in legumes (greengram, blackgram and arhar) and foodgrains (jowar and bajra) on-farm trials were conducted in the backdrop of carried out PRA (Plate 45).
Arable Land Treatment
The most serious soil erosion problem in the Ramasagara watershed is sheet and rill erosion, which has a serious effect on agricultural production in red soils, covering an area of 72 M ha located in low to high rainfall regions in
-1which soil erosion annually varies from 2 to 40 t ha . Adoption of conservation measures in arable and non-arable lands conserves the top fertile soil, stores rainwater and recharges the soil profile and leads to increase in productivity. In view of this situation, conservation measures were taken up in the watershed.
Field bunding: Field bunding is a major erosion control activity aimed to enhance in-situ rainwater conservation and increase yields from rainfed crops. Trapezoidal earthen contour bunds were constructed across the major slope (1 to 3%) on individual fields.
2The cross section of bund is 0.82 m (bottom width = 2.25 m; top width = 0.45 m and height = 0.65 m) with a total length of 41,263 rm at a vertical interval of 0.6 to 1.0 m (Fig.1). Total area bunded in arable lands was 333 ha at a cost of ` 8,58,487. Horsegram, greengram and castor were cultivated on the bunds for productive utilization and Stylosanthes hamata was spread for its stabilization and increase fodder production.
The bunds conserved rainwater, top fertile soil in-situ and reduced runoff and soil loss, thus improving soil moisture in the profile. The impact of bunding was more evident during years of low and erratic rainfall (2011 with an annual rainfall of only 392 mm) during which farmers harvested 21% higher groundnut yields as compared to un-bunded areas outside watershed (Plate 46). An additional employment of 675 man days was created during bund construction.
Waste weirs/stone checks: Surplussing arrangement through waste weirs by using stone rubbles were provided in valley points where the contour bunds met waterways to dispose the excess runoff water safely from upper terraces to lower terraces. The crest height above ground level was kept at 0.45 m having upstream and gentle downstream slope of 1:1 and 1:2, the ends being anchored to side walls with a height of 0.7 m above ground while the length of crest is equal to the width of the waterway. A total of 197 waste weirs were constructed covering an area of 330 ha at a cost of ` 4,64,142 (Plate 47). After 3 years of land treatment by bunding with
4.3 Ramasagara Watershed
Plate 46: Field bunding of arable lands with groundnut in Ramasagra watershed
Plate 47: Waste weir and groundnut crop on the upstream of weir in Ramasagara watershed
Fig. 1: Cross section of 0.81 sq m contour/field bund and borrow pit in Ramasagara watershed
0.30
m
0.45m
2.72
m
2.25 m
GL
Bottom width
0.65 Height
Borrow Pit (3 m x 2.72 m x 0.3 m)
Note: 1. Figure not to scale
Plate 45: Lentil and mustard grown on large scale by farmers in Jalalpur watershed
Concise Report On Development And Management Of Model Watersheds Through Participatory Approach
28
Development and Management of Model Watersheds under New Guidelines
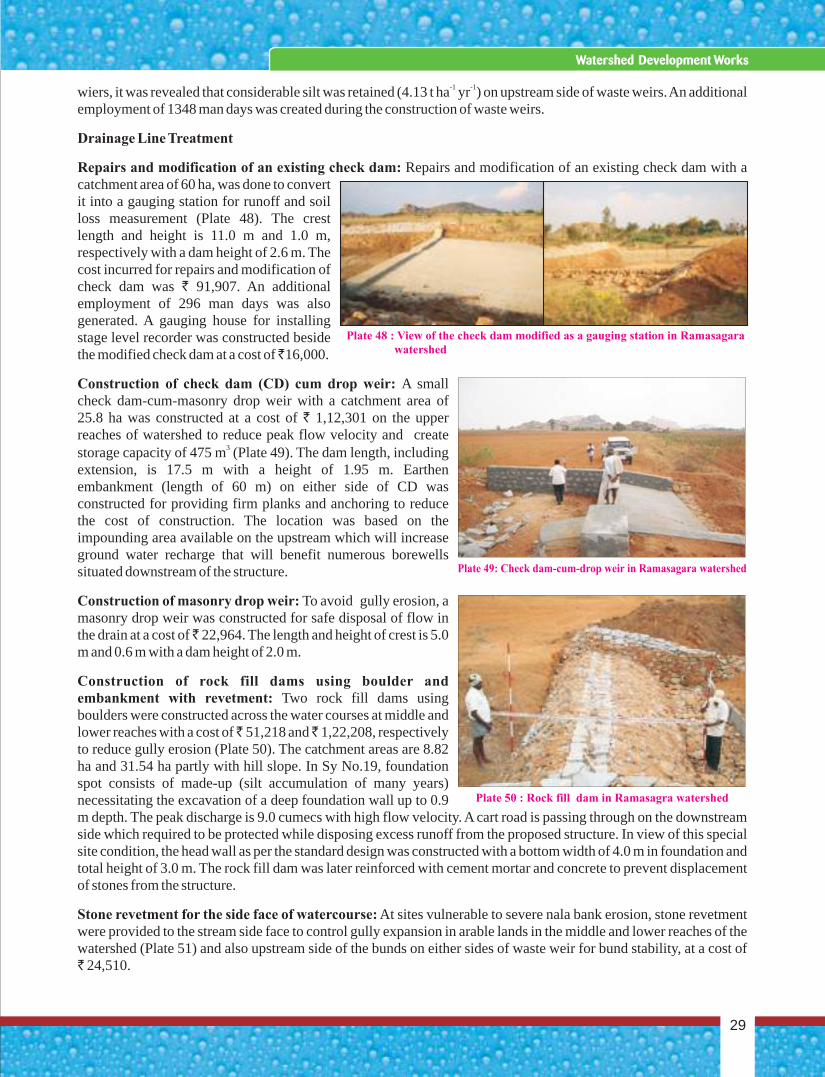
-1 -1wiers, it was revealed that considerable silt was retained (4.13 t ha yr ) on upstream side of waste weirs. An additional employment of 1348 man days was created during the construction of waste weirs.
Drainage Line Treatment
Repairs and modification of an existing check dam: Repairs and modification of an existing check dam with a catchment area of 60 ha, was done to convert it into a gauging station for runoff and soil loss measurement (Plate 48). The crest length and height is 11.0 m and 1.0 m, respectively with a dam height of 2.6 m. The cost incurred for repairs and modification of check dam was ` 91,907. An additional employment of 296 man days was also generated. A gauging house for installing stage level recorder was constructed beside the modified check dam at a cost of 16,000.
Construction of check dam (CD) cum drop weir: A small check dam-cum-masonry drop weir with a catchment area of 25.8 ha was constructed at a cost of ` 1,12,301 on the upper reaches of watershed to reduce peak flow velocity and create
3storage capacity of 475 m (Plate 49). The dam length, including extension, is 17.5 m with a height of 1.95 m. Earthen embankment (length of 60 m) on either side of CD was constructed for providing firm planks and anchoring to reduce the cost of construction. The location was based on the impounding area available on the upstream which will increase ground water recharge that will benefit numerous borewells situated downstream of the structure.
Construction of masonry drop weir: To avoid gully erosion, a masonry drop weir was constructed for safe disposal of flow in the drain at a cost of 22,964. The length and height of crest is 5.0 m and 0.6 m with a dam height of 2.0 m.
Construction of rock fill dams using boulder and embankment with revetment: Two rock fill dams using boulders were constructed across the water courses at middle and lower reaches with a cost of 51,218 and 1,22,208, respectively to reduce gully erosion (Plate 50). The catchment areas are 8.82 ha and 31.54 ha partly with hill slope. In Sy No.19, foundation spot consists of made-up (silt accumulation of many years) necessitating the excavation of a deep foundation wall up to 0.9 m depth. The peak discharge is 9.0 cumecs with high flow velocity. A cart road is passing through on the downstream side which required to be protected while disposing excess runoff from the proposed structure. In view of this special site condition, the head wall as per the standard design was constructed with a bottom width of 4.0 m in foundation and total height of 3.0 m. The rock fill dam was later reinforced with cement mortar and concrete to prevent displacement of stones from the structure.
Stone revetment for the side face of watercourse: At sites vulnerable to severe nala bank erosion, stone revetment were provided to the stream side face to control gully expansion in arable lands in the middle and lower reaches of the watershed (Plate 51) and also upstream side of the bunds on either sides of waste weir for bund stability, at a cost of ` 24,510.
Plate 50 : Rock fill dam in Ramasagra watershed
Plate 49: Check dam-cum-drop weir in Ramasagara watershed
Plate 48 : View of the check dam modified as a gauging station in Ramasagara watershed
29
Watershed Development Works
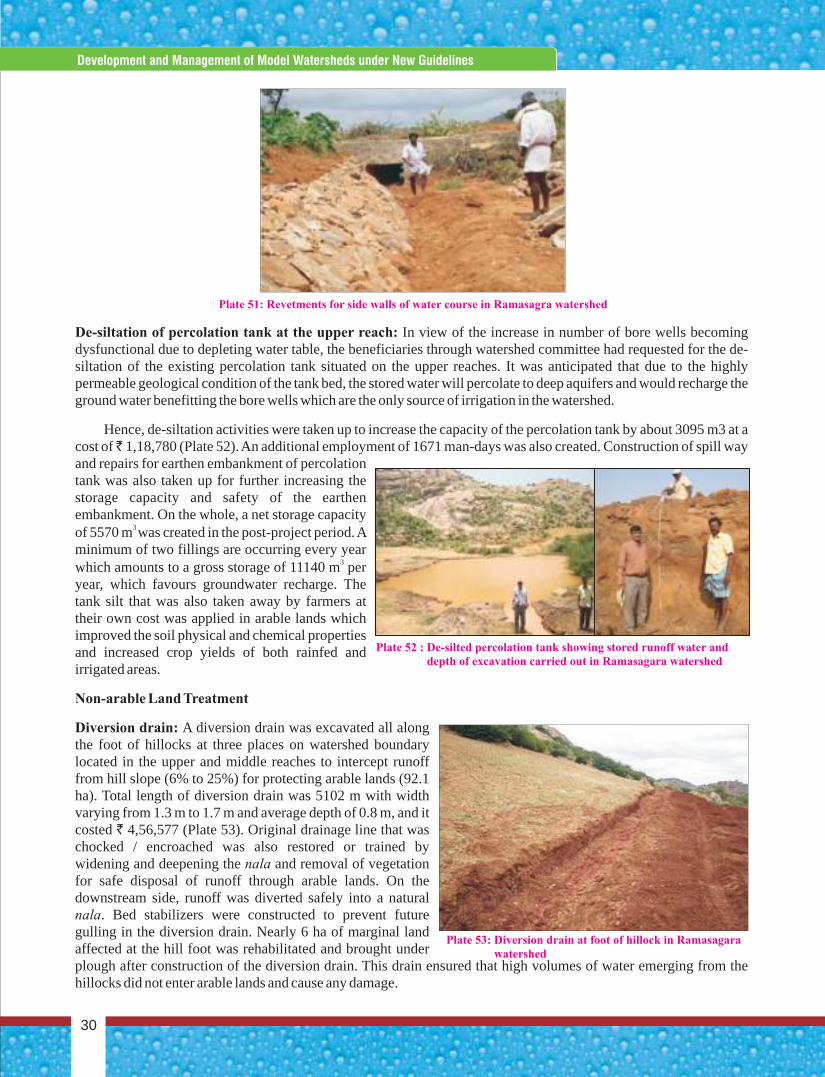
De-siltation of percolation tank at the upper reach: In view of the increase in number of bore wells becoming dysfunctional due to depleting water table, the beneficiaries through watershed committee had requested for the de-siltation of the existing percolation tank situated on the upper reaches. It was anticipated that due to the highly permeable geological condition of the tank bed, the stored water will percolate to deep aquifers and would recharge the ground water benefitting the bore wells which are the only source of irrigation in the watershed.
Hence, de-siltation activities were taken up to increase the capacity of the percolation tank by about 3095 m3 at a cost of 1,18,780 (Plate 52). An additional employment of 1671 man-days was also created. Construction of spill way and repairs for earthen embankment of percolation tank was also taken up for further increasing the storage capacity and safety of the earthen embankment. On the whole, a net storage capacity
3 of 5570 m was created in the post-project period. A minimum of two fillings are occurring every year
3which amounts to a gross storage of 11140 m per year, which favours groundwater recharge. The tank silt that was also taken away by farmers at their own cost was applied in arable lands which improved the soil physical and chemical properties and increased crop yields of both rainfed and irrigated areas.
Non-arable Land Treatment
Diversion drain: A diversion drain was excavated all along the foot of hillocks at three places on watershed boundary located in the upper and middle reaches to intercept runoff from hill slope (6% to 25%) for protecting arable lands (92.1 ha). Total length of diversion drain was 5102 m with width varying from 1.3 m to 1.7 m and average depth of 0.8 m, and it costed ` 4,56,577 (Plate 53). Original drainage line that was chocked / encroached was also restored or trained by widening and deepening the nala and removal of vegetation for safe disposal of runoff through arable lands. On the downstream side, runoff was diverted safely into a natural nala. Bed stabilizers were constructed to prevent future gulling in the diversion drain. Nearly 6 ha of marginal land affected at the hill foot was rehabilitated and brought under plough after construction of the diversion drain. This drain ensured that high volumes of water emerging from the hillocks did not enter arable lands and cause any damage.
Plate 53: Diversion drain at foot of hillock in Ramasagara watershed
Plate 51: Revetments for side walls of water course in Ramasagra watershed
Plate 52 : De-silted percolation tank showing stored runoff water and depth of excavation carried out in Ramasagara watershed
Concise Report On Development And Management Of Model Watersheds Through Participatory Approach
30
Development and Management of Model Watersheds under New Guidelines
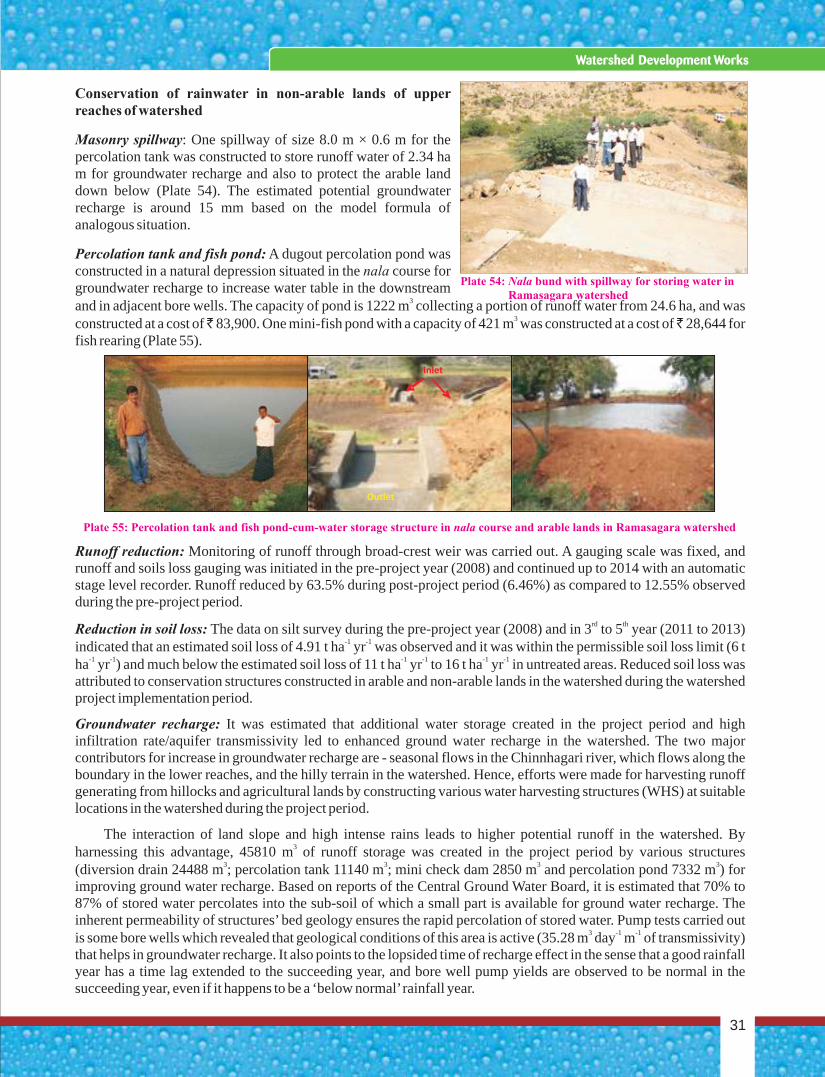
Conservation of rainwater in non-arable lands of upper reaches of watershed
Masonry spillway: One spillway of size 8.0 m × 0.6 m for the percolation tank was constructed to store runoff water of 2.34 ha m for groundwater recharge and also to protect the arable land down below (Plate 54). The estimated potential groundwater recharge is around 15 mm based on the model formula of analogous situation.
Percolation tank and fish pond: A dugout percolation pond was constructed in a natural depression situated in the nala course for groundwater recharge to increase water table in the downstream
3and in adjacent bore wells. The capacity of pond is 1222 m collecting a portion of runoff water from 24.6 ha, and was 3constructed at a cost of 83,900. One mini-fish pond with a capacity of 421 m was constructed at a cost of 28,644 for
fish rearing (Plate 55).
Runoff reduction: Monitoring of runoff through broad-crest weir was carried out. A gauging scale was fixed, and runoff and soils loss gauging was initiated in the pre-project year (2008) and continued up to 2014 with an automatic stage level recorder. Runoff reduced by 63.5% during post-project period (6.46%) as compared to 12.55% observed during the pre-project period.
rd thReduction in soil loss: The data on silt survey during the pre-project year (2008) and in 3 to 5 year (2011 to 2013) -1 -1indicated that an estimated soil loss of 4.91 t ha yr was observed and it was within the permissible soil loss limit (6 t
-1 -1 -1 -1 -1 -1ha yr ) and much below the estimated soil loss of 11 t ha yr to 16 t ha yr in untreated areas. Reduced soil loss was attributed to conservation structures constructed in arable and non-arable lands in the watershed during the watershed project implementation period.
Groundwater recharge: It was estimated that additional water storage created in the project period and high infiltration rate/aquifer transmissivity led to enhanced ground water recharge in the watershed. The two major contributors for increase in groundwater recharge are - seasonal flows in the Chinnhagari river, which flows along the boundary in the lower reaches, and the hilly terrain in the watershed. Hence, efforts were made for harvesting runoff generating from hillocks and agricultural lands by constructing various water harvesting structures (WHS) at suitable locations in the watershed during the project period.
The interaction of land slope and high intense rains leads to higher potential runoff in the watershed. By 3harnessing this advantage, 45810 m of runoff storage was created in the project period by various structures
3 3 3 3(diversion drain 24488 m ; percolation tank 11140 m ; mini check dam 2850 m and percolation pond 7332 m ) for improving ground water recharge. Based on reports of the Central Ground Water Board, it is estimated that 70% to 87% of stored water percolates into the sub-soil of which a small part is available for ground water recharge. The inherent permeability of structures’ bed geology ensures the rapid percolation of stored water. Pump tests carried out
3 -1 -1is some bore wells which revealed that geological conditions of this area is active (35.28 m day m of transmissivity) that helps in groundwater recharge. It also points to the lopsided time of recharge effect in the sense that a good rainfall year has a time lag extended to the succeeding year, and bore well pump yields are observed to be normal in the succeeding year, even if it happens to be a ‘below normal’ rainfall year.
Plate 54: Nala bund with spillway for storing water in Ramasagara watershed
Outlet
Inlet
Plate 55: Percolation tank and fish pond-cum-water storage structure in nala course and arable lands in Ramasagara watershed
31
Watershed Development Works
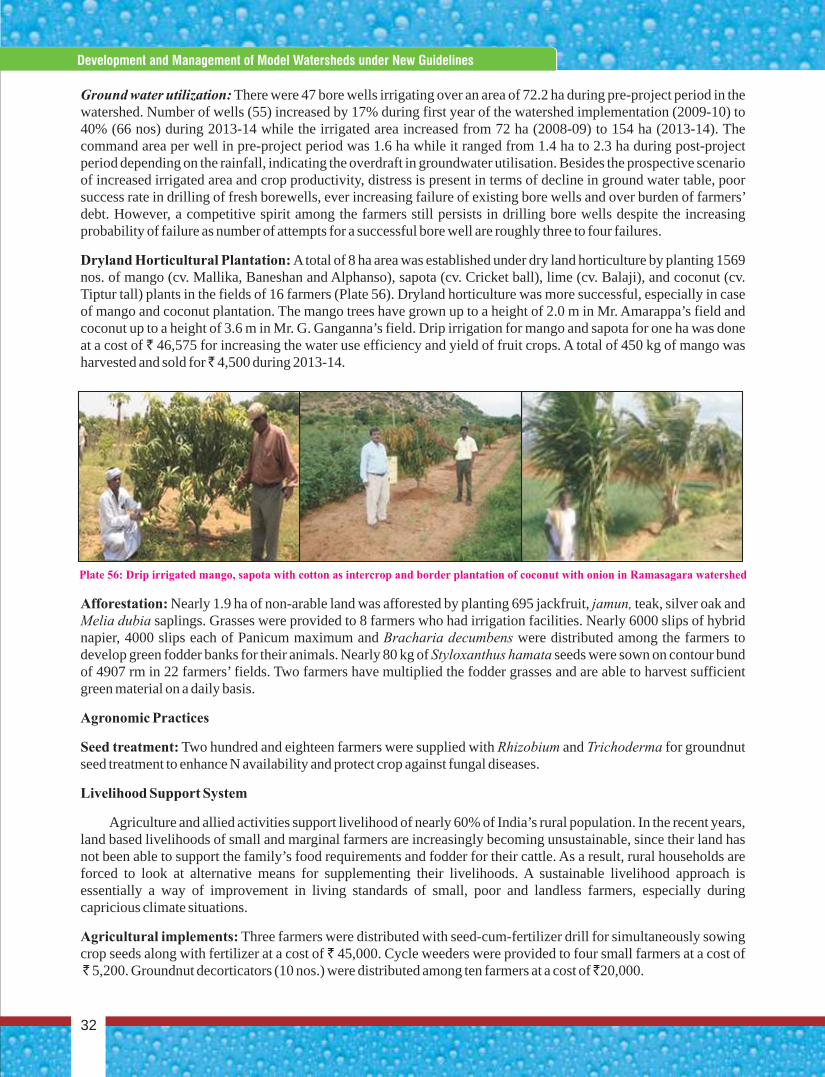
Ground water utilization: There were 47 bore wells irrigating over an area of 72.2 ha during pre-project period in the watershed. Number of wells (55) increased by 17% during first year of the watershed implementation (2009-10) to 40% (66 nos) during 2013-14 while the irrigated area increased from 72 ha (2008-09) to 154 ha (2013-14). The command area per well in pre-project period was 1.6 ha while it ranged from 1.4 ha to 2.3 ha during post-project period depending on the rainfall, indicating the overdraft in groundwater utilisation. Besides the prospective scenario of increased irrigated area and crop productivity, distress is present in terms of decline in ground water table, poor success rate in drilling of fresh borewells, ever increasing failure of existing bore wells and over burden of farmers’ debt. However, a competitive spirit among the farmers still persists in drilling bore wells despite the increasing probability of failure as number of attempts for a successful bore well are roughly three to four failures.
Dryland Horticultural Plantation: A total of 8 ha area was established under dry land horticulture by planting 1569 nos. of mango (cv. Mallika, Baneshan and Alphanso), sapota (cv. Cricket ball), lime (cv. Balaji), and coconut (cv. Tiptur tall) plants in the fields of 16 farmers (Plate 56). Dryland horticulture was more successful, especially in case of mango and coconut plantation. The mango trees have grown up to a height of 2.0 m in Mr. Amarappa’s field and coconut up to a height of 3.6 m in Mr. G. Ganganna’s field. Drip irrigation for mango and sapota for one ha was done at a cost of ` 46,575 for increasing the water use efficiency and yield of fruit crops. A total of 450 kg of mango was harvested and sold for 4,500 during 2013-14.
Afforestation: Nearly 1.9 ha of non-arable land was afforested by planting 695 jackfruit, jamun, teak, silver oak and Melia dubia saplings. Grasses were provided to 8 farmers who had irrigation facilities. Nearly 6000 slips of hybrid napier, 4000 slips each of Panicum maximum and Bracharia decumbens were distributed among the farmers to develop green fodder banks for their animals. Nearly 80 kg of Styloxanthus hamata seeds were sown on contour bund of 4907 rm in 22 farmers’ fields. Two farmers have multiplied the fodder grasses and are able to harvest sufficient green material on a daily basis.
Agronomic Practices
Seed treatment: Two hundred and eighteen farmers were supplied with Rhizobium and Trichoderma for groundnut seed treatment to enhance N availability and protect crop against fungal diseases.
Livelihood Support System
Agriculture and allied activities support livelihood of nearly 60% of India’s rural population. In the recent years, land based livelihoods of small and marginal farmers are increasingly becoming unsustainable, since their land has not been able to support the family’s food requirements and fodder for their cattle. As a result, rural households are forced to look at alternative means for supplementing their livelihoods. A sustainable livelihood approach is essentially a way of improvement in living standards of small, poor and landless farmers, especially during capricious climate situations.
Agricultural implements: Three farmers were distributed with seed-cum-fertilizer drill for simultaneously sowing crop seeds along with fertilizer at a cost of 45,000. Cycle weeders were provided to four small farmers at a cost of 5,200. Groundnut decorticators (10 nos.) were distributed among ten farmers at a cost of 20,000.
Plate 56: Drip irrigated mango, sapota with cotton as intercrop and border plantation of coconut with onion in Ramasagara watershed
Concise Report On Development And Management Of Model Watersheds Through Participatory Approach
32
Development and Management of Model Watersheds under New Guidelines
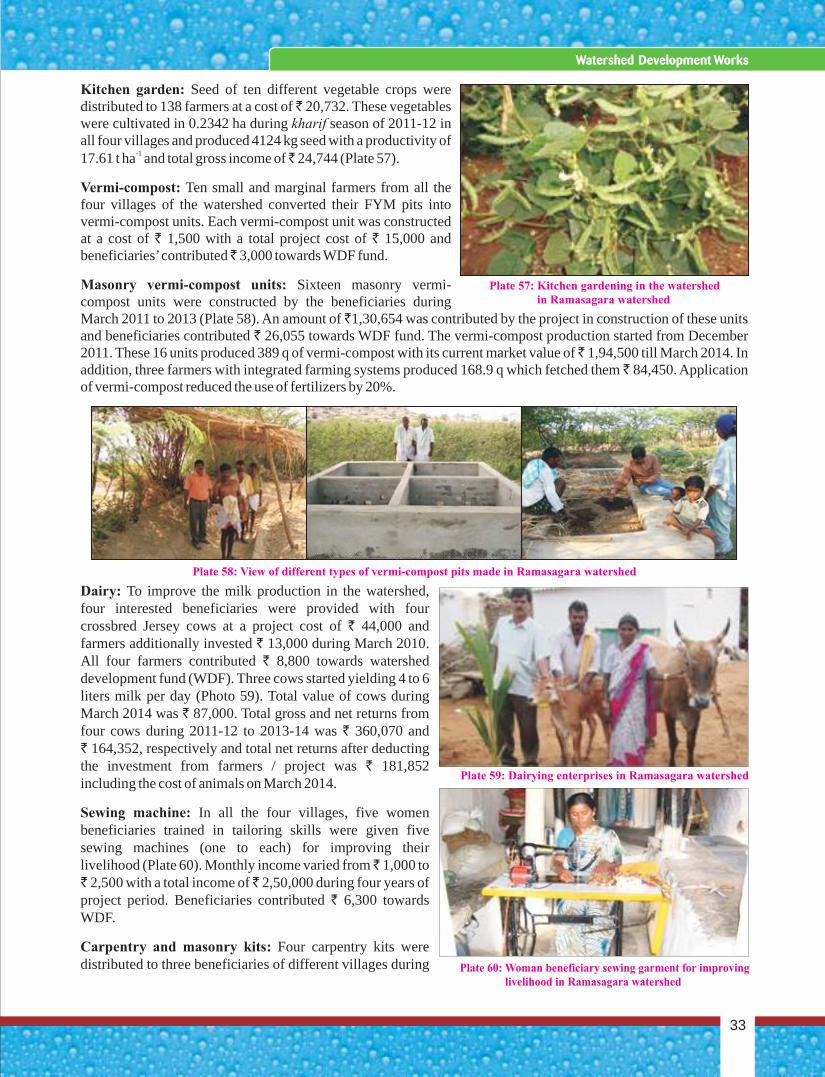
Kitchen garden: Seed of ten different vegetable crops were distributed to 138 farmers at a cost of 20,732. These vegetables were cultivated in 0.2342 ha during kharif season of 2011-12 in all four villages and produced 4124 kg seed with a productivity of
-117.61 t ha and total gross income of 24,744 (Plate 57).
Vermi-compost: Ten small and marginal farmers from all the four villages of the watershed converted their FYM pits into vermi-compost units. Each vermi-compost unit was constructed at a cost of ` 1,500 with a total project cost of ` 15,000 and beneficiaries’ contributed 3,000 towards WDF fund.
Masonry vermi-compost units: Sixteen masonry vermi-compost units were constructed by the beneficiaries during March 2011 to 2013 (Plate 58). An amount of 1,30,654 was contributed by the project in construction of these units and beneficiaries contributed ` 26,055 towards WDF fund. The vermi-compost production started from December 2011. These 16 units produced 389 q of vermi-compost with its current market value of 1,94,500 till March 2014. In addition, three farmers with integrated farming systems produced 168.9 q which fetched them 84,450. Application of vermi-compost reduced the use of fertilizers by 20%.
Dairy: To improve the milk production in the watershed, four interested beneficiaries were provided with four crossbred Jersey cows at a project cost of ` 44,000 and farmers additionally invested ` 13,000 during March 2010. All four farmers contributed ` 8,800 towards watershed development fund (WDF). Three cows started yielding 4 to 6 liters milk per day (Photo 59). Total value of cows during March 2014 was ` 87,000. Total gross and net returns from four cows during 2011-12 to 2013-14 was ` 360,070 and ` 164,352, respectively and total net returns after deducting the investment from farmers / project was ` 181,852 including the cost of animals on March 2014.
Sewing machine: In all the four villages, five women beneficiaries trained in tailoring skills were given five sewing machines (one to each) for improving their livelihood (Plate 60). Monthly income varied from 1,000 to ` 2,500 with a total income of 2,50,000 during four years of project period. Beneficiaries contributed ` 6,300 towards WDF.
Carpentry and masonry kits: Four carpentry kits were distributed to three beneficiaries of different villages during
Plate 59: Dairying enterprises in Ramasagara watershed
Plate 60: Woman beneficiary sewing garment for improving livelihood in Ramasagara watershed
Plate 57: Kitchen gardening in the watershed in Ramasagara watershed
Plate 58: View of different types of vermi-compost pits made in Ramasagara watershed
33
Watershed Development Works
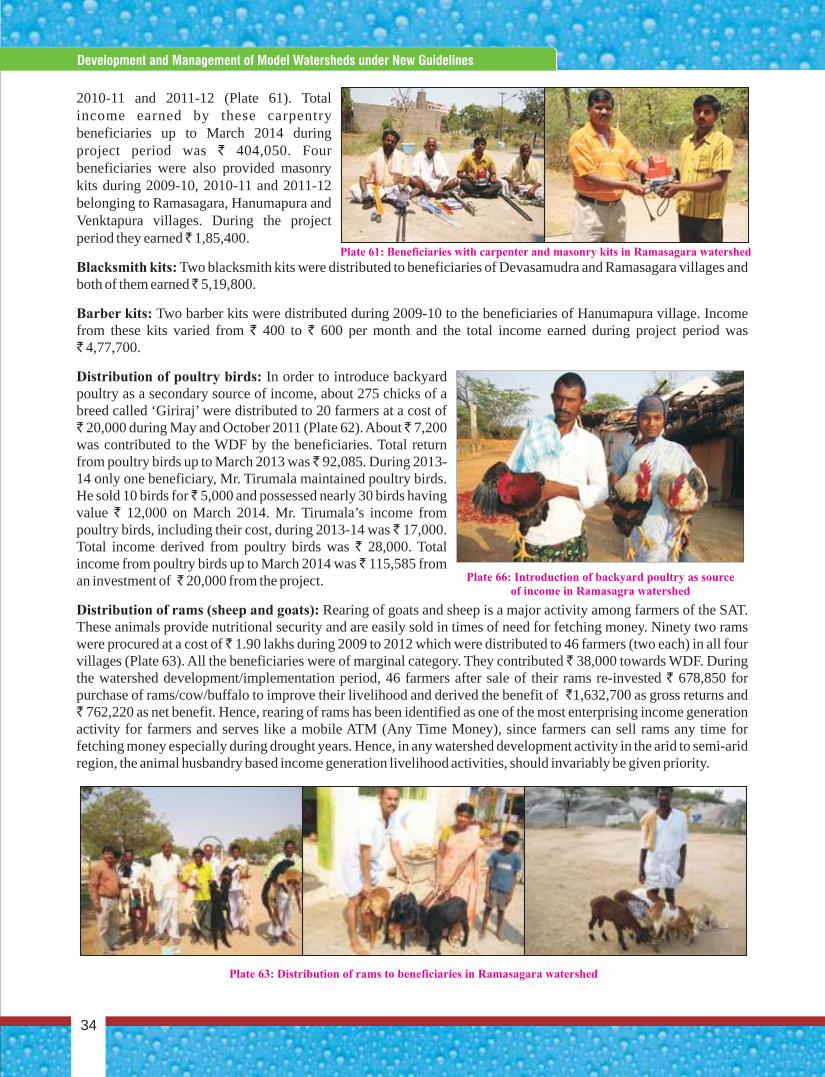
2010-11 and 2011-12 (Plate 61). Total income earned by these carpentry beneficiaries up to March 2014 during project period was ` 404,050. Four beneficiaries were also provided masonry kits during 2009-10, 2010-11 and 2011-12 belonging to Ramasagara, Hanumapura and Venktapura villages. During the project period they earned 1,85,400.
Blacksmith kits: Two blacksmith kits were distributed to beneficiaries of Devasamudra and Ramasagara villages and both of them earned 5,19,800.
Barber kits: Two barber kits were distributed during 2009-10 to the beneficiaries of Hanumapura village. Income from these kits varied from ` 400 to ` 600 per month and the total income earned during project period was ` 4,77,700.
Distribution of poultry birds: In order to introduce backyard poultry as a secondary source of income, about 275 chicks of a breed called ‘Giriraj’ were distributed to 20 farmers at a cost of ` 20,000 during May and October 2011 (Plate 62). About 7,200 was contributed to the WDF by the beneficiaries. Total return from poultry birds up to March 2013 was 92,085. During 2013-14 only one beneficiary, Mr. Tirumala maintained poultry birds. He sold 10 birds for 5,000 and possessed nearly 30 birds having value ` 12,000 on March 2014. Mr. Tirumala’s income from poultry birds, including their cost, during 2013-14 was 17,000. Total income derived from poultry birds was ` 28,000. Total income from poultry birds up to March 2014 was 115,585 from an investment of 20,000 from the project.
Distribution of rams (sheep and goats): Rearing of goats and sheep is a major activity among farmers of the SAT. These animals provide nutritional security and are easily sold in times of need for fetching money. Ninety two rams were procured at a cost of 1.90 lakhs during 2009 to 2012 which were distributed to 46 farmers (two each) in all four villages (Plate 63). All the beneficiaries were of marginal category. They contributed 38,000 towards WDF. During the watershed development/implementation period, 46 farmers after sale of their rams re-invested ` 678,850 for purchase of rams/cow/buffalo to improve their livelihood and derived the benefit of 1,632,700 as gross returns and ` 762,220 as net benefit. Hence, rearing of rams has been identified as one of the most enterprising income generation activity for farmers and serves like a mobile ATM (Any Time Money), since farmers can sell rams any time for fetching money especially during drought years. Hence, in any watershed development activity in the arid to semi-arid region, the animal husbandry based income generation livelihood activities, should invariably be given priority.
Plate 63: Distribution of rams to beneficiaries in Ramasagara watershed
Plate 61: Beneficiaries with carpenter and masonry kits in Ramasagara watershed
Plate 66: Introduction of backyard poultry as source of income in Ramasagra watershed
Concise Report On Development And Management Of Model Watersheds Through Participatory Approach
34
Development and Management of Model Watersheds under New Guidelines
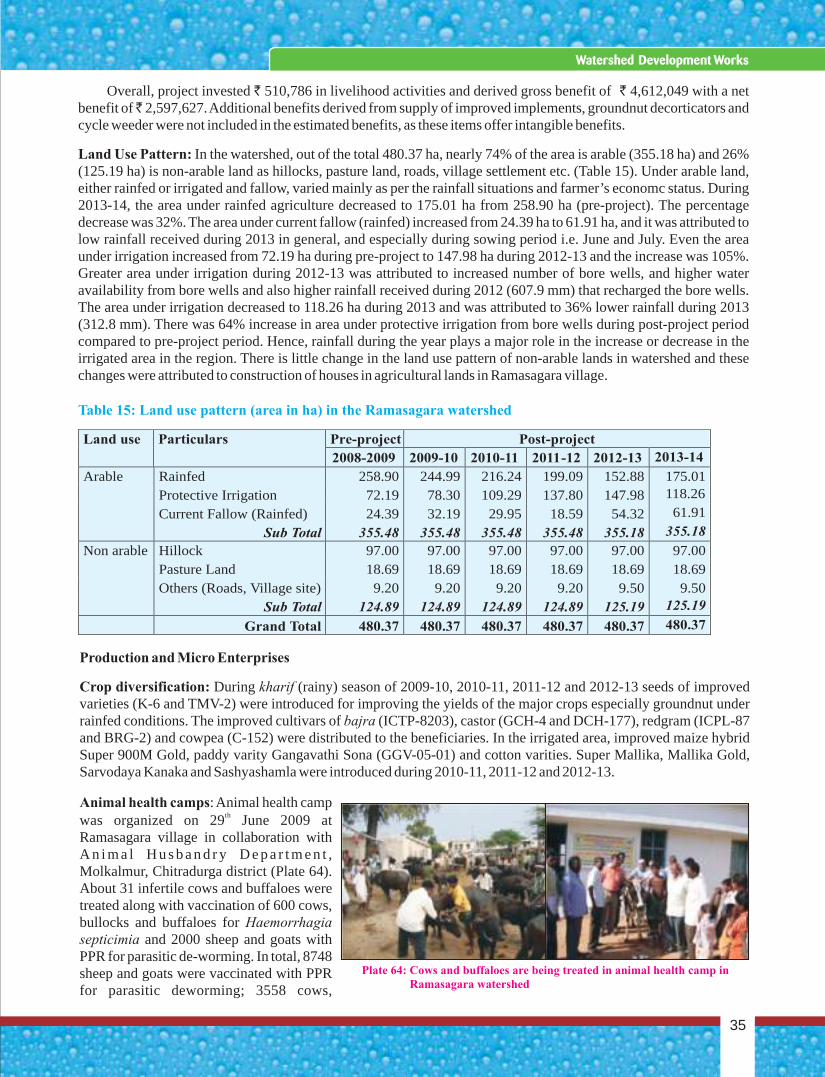
35
Watershed Development Works
Production and Micro Enterprises
Crop diversification: During kharif (rainy) season of 2009-10, 2010-11, 2011-12 and 2012-13 seeds of improved varieties (K-6 and TMV-2) were introduced for improving the yields of the major crops especially groundnut under rainfed conditions. The improved cultivars of bajra (ICTP-8203), castor (GCH-4 and DCH-177), redgram (ICPL-87 and BRG-2) and cowpea (C-152) were distributed to the beneficiaries. In the irrigated area, improved maize hybrid Super 900M Gold, paddy varity Gangavathi Sona (GGV-05-01) and cotton varities. Super Mallika, Mallika Gold, Sarvodaya Kanaka and Sashyashamla were introduced during 2010-11, 2011-12 and 2012-13.
Animal health camps: Animal health camp thwas organized on 29 June 2009 at
Ramasagara village in collaboration with A n i m a l H u s b a n d r y D e p a r t m e n t , Molkalmur, Chitradurga district (Plate 64). About 31 infertile cows and buffaloes were treated along with vaccination of 600 cows, bullocks and buffaloes for Haemorrhagia septicimia and 2000 sheep and goats with PPR for parasitic de-worming. In total, 8748 sheep and goats were vaccinated with PPR for parasitic deworming; 3558 cows,
Plate 64: Cows and buffaloes are being treated in animal health camp in Ramasagara watershed
Overall, project invested 510,786 in livelihood activities and derived gross benefit of 4,612,049 with a net benefit of 2,597,627. Additional benefits derived from supply of improved implements, groundnut decorticators and cycle weeder were not included in the estimated benefits, as these items offer intangible benefits.
Land Use Pattern: In the watershed, out of the total 480.37 ha, nearly 74% of the area is arable (355.18 ha) and 26% (125.19 ha) is non-arable land as hillocks, pasture land, roads, village settlement etc. (Table 15). Under arable land, either rainfed or irrigated and fallow, varied mainly as per the rainfall situations and farmer’s economc status. During 2013-14, the area under rainfed agriculture decreased to 175.01 ha from 258.90 ha (pre-project). The percentage decrease was 32%. The area under current fallow (rainfed) increased from 24.39 ha to 61.91 ha, and it was attributed to low rainfall received during 2013 in general, and especially during sowing period i.e. June and July. Even the area under irrigation increased from 72.19 ha during pre-project to 147.98 ha during 2012-13 and the increase was 105%. Greater area under irrigation during 2012-13 was attributed to increased number of bore wells, and higher water availability from bore wells and also higher rainfall received during 2012 (607.9 mm) that recharged the bore wells. The area under irrigation decreased to 118.26 ha during 2013 and was attributed to 36% lower rainfall during 2013 (312.8 mm). There was 64% increase in area under protective irrigation from bore wells during post-project period compared to pre-project period. Hence, rainfall during the year plays a major role in the increase or decrease in the irrigated area in the region. There is little change in the land use pattern of non-arable lands in watershed and these changes were attributed to construction of houses in agricultural lands in Ramasagara village.
` `
Land use Particulars Pre-project Post-project
2008-2009
2009-10
2010-11
2011-12
2012-13
2013-14
Arable
Rainfed
258.90
244.99
216.24
199.09
152.88
175.01
Protective Irrigation
72.19
78.30
109.29
137.80
147.98
118.26
Current Fallow (Rainfed)
24.39
32.19
29.95
18.59
54.32
61.91
Sub Total
355.48
355.48
355.48
355.48
355.18
355.18
Non arable
Hillock
97.00
97.00
97.00
97.00
97.00
97.00 Pasture Land
18.69
18.69
18.69
18.69
18.69
18.69
Others (Roads, Village site)
9.20
9.20
9.20
9.20
9.50
9.50 Sub
Total
124.89
124.89
124.89
124.89
125.19
125.19
Grand Total
480.37
480.37
480.37
480.37
480.37
480.37
Table 15: Land use pattern (area in ha) in the Ramasagara watershed
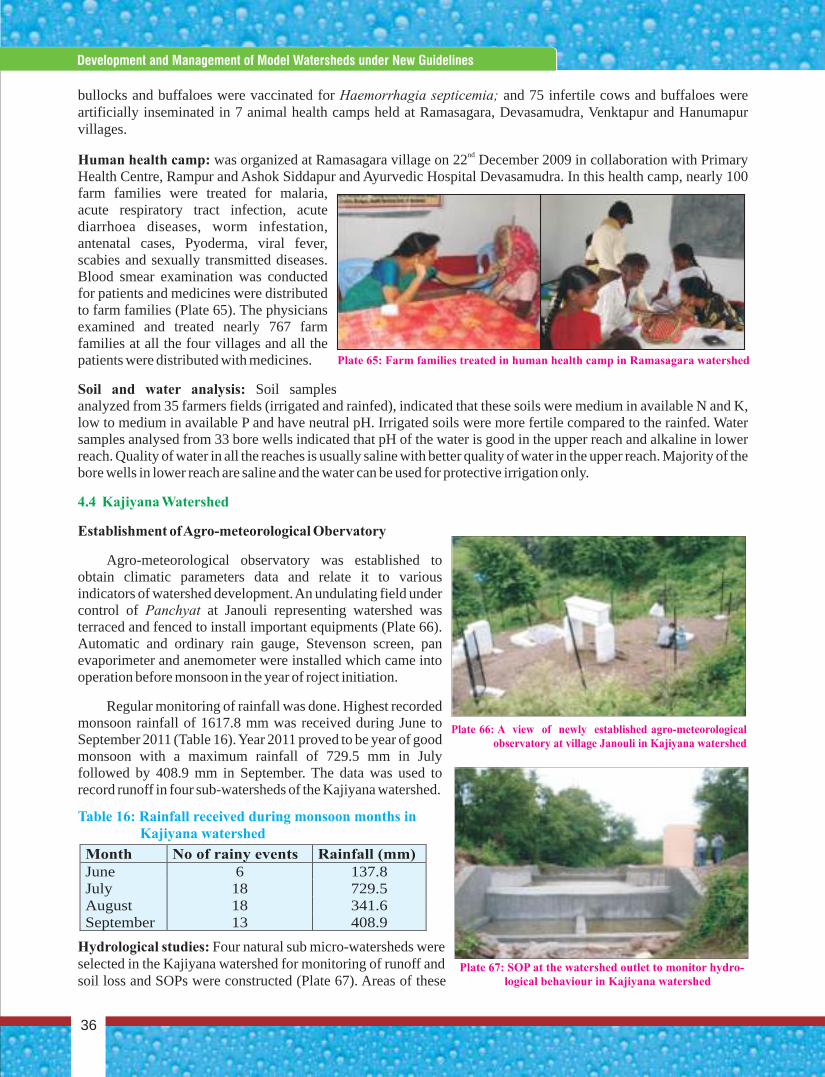
bullocks and buffaloes were vaccinated for Haemorrhagia septicemia; and 75 infertile cows and buffaloes were artificially inseminated in 7 animal health camps held at Ramasagara, Devasamudra, Venktapur and Hanumapur villages.
ndHuman health camp: was organized at Ramasagara village on 22 December 2009 in collaboration with Primary Health Centre, Rampur and Ashok Siddapur and Ayurvedic Hospital Devasamudra. In this health camp, nearly 100 farm families were treated for malaria, acute respiratory tract infection, acute diarrhoea diseases, worm infestation, antenatal cases, Pyoderma, viral fever, scabies and sexually transmitted diseases. Blood smear examination was conducted for patients and medicines were distributed to farm families (Plate 65). The physicians examined and treated nearly 767 farm families at all the four villages and all the patients were distributed with medicines.
Soil and water analysis: Soil samples analyzed from 35 farmers fields (irrigated and rainfed), indicated that these soils were medium in available N and K, low to medium in available P and have neutral pH. Irrigated soils were more fertile compared to the rainfed. Water samples analysed from 33 bore wells indicated that pH of the water is good in the upper reach and alkaline in lower reach. Quality of water in all the reaches is usually saline with better quality of water in the upper reach. Majority of the bore wells in lower reach are saline and the water can be used for protective irrigation only.
Establishment of Agro-meteorological Obervatory
Agro-meteorological observatory was established to obtain climatic parameters data and relate it to various indicators of watershed development. An undulating field under control of Panchyat at Janouli representing watershed was terraced and fenced to install important equipments (Plate 66). Automatic and ordinary rain gauge, Stevenson screen, pan evaporimeter and anemometer were installed which came into operation before monsoon in the year of roject initiation.
Regular monitoring of rainfall was done. Highest recorded monsoon rainfall of 1617.8 mm was received during June to September 2011 (Table 16). Year 2011 proved to be year of good monsoon with a maximum rainfall of 729.5 mm in July followed by 408.9 mm in September. The data was used to record runoff in four sub-watersheds of the Kajiyana watershed.
Hydrological studies: Four natural sub micro-watersheds were selected in the Kajiyana watershed for monitoring of runoff and soil loss and SOPs were constructed (Plate 67). Areas of these
4.4 Kajiyana Watershed
Plate 66: A view of newly established agro-meteorological observatory at village Janouli in Kajiyana watershed
Month No of rainy events Rainfall (mm)
June 6 137.8 July 18 729.5 August 18 341.6 September 13 408.9
Plate 65: Farm families treated in human health camp in Ramasagara watershed
Plate 67: SOP at the watershed outlet to monitor hydro- logical behaviour in Kajiyana watershed
Table 16: Rainfall received during monsoon months in Kajiyana watershed
Concise Report On Development And Management Of Model Watersheds Through Participatory Approach
36
Development and Management of Model Watersheds under New Guidelines
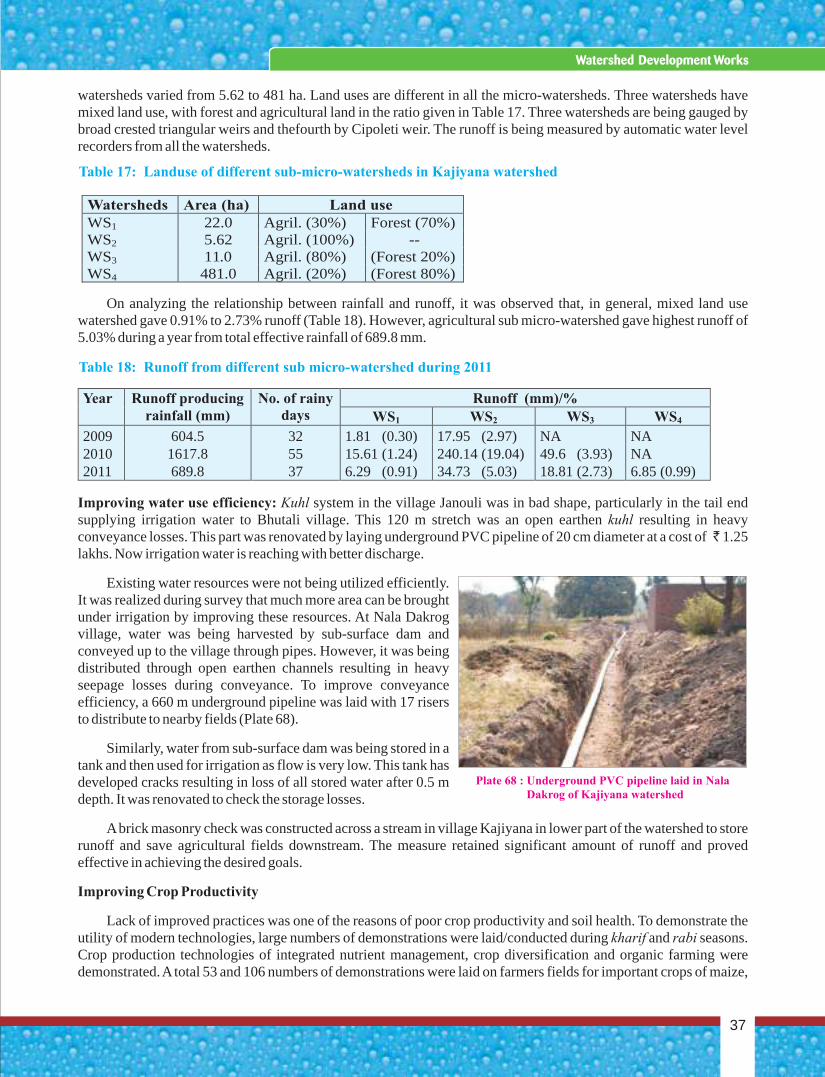
Plate 68 : Underground PVC pipeline laid in Nala Dakrog of Kajiyana watershed
Watersheds Area (ha) Land use WS1 22.0 Agril. (30%) Forest (70%) WS2 5.62 Agril. (100%) -- WS3 11.0 Agril. (80%) (Forest 20%) WS4 481.0 Agril. (20%) (Forest 80%)
Table 17: Landuse of different sub-micro-watersheds in Kajiyana watershed
Year Runoff producing rainfall (mm)
No. of rainy days
Runoff (mm)/% WS1 WS2 WS3 WS4 2009 604.5 32 1.81 (0.30) 17.95 (2.97) NA NA 2010 1617.8 55 15.61 (1.24) 240.14 (19.04) 49.6 (3.93) NA 2011 689.8 37 6.29 (0.91) 34.73 (5.03) 18.81 (2.73) 6.85 (0.99)
watersheds varied from 5.62 to 481 ha. Land uses are different in all the micro-watersheds. Three watersheds have mixed land use, with forest and agricultural land in the ratio given in Table 17. Three watersheds are being gauged by broad crested triangular weirs and thefourth by Cipoleti weir. The runoff is being measured by automatic water level recorders from all the watersheds.
On analyzing the relationship between rainfall and runoff, it was observed that, in general, mixed land use watershed gave 0.91% to 2.73% runoff (Table 18). However, agricultural sub micro-watershed gave highest runoff of 5.03% during a year from total effective rainfall of 689.8 mm.
Improving water use efficiency: Kuhl system in the village Janouli was in bad shape, particularly in the tail end supplying irrigation water to Bhutali village. This 120 m stretch was an open earthen kuhl resulting in heavy conveyance losses. This part was renovated by laying underground PVC pipeline of 20 cm diameter at a cost of 1.25 lakhs. Now irrigation water is reaching with better discharge.
Existing water resources were not being utilized efficiently. It was realized during survey that much more area can be brought under irrigation by improving these resources. At Nala Dakrog village, water was being harvested by sub-surface dam and conveyed up to the village through pipes. However, it was being distributed through open earthen channels resulting in heavy seepage losses during conveyance. To improve conveyance efficiency, a 660 m underground pipeline was laid with 17 risers to distribute to nearby fields (Plate 68).
Similarly, water from sub-surface dam was being stored in a tank and then used for irrigation as flow is very low. This tank has developed cracks resulting in loss of all stored water after 0.5 m depth. It was renovated to check the storage losses.
A brick masonry check was constructed across a stream in village Kajiyana in lower part of the watershed to store runoff and save agricultural fields downstream. The measure retained significant amount of runoff and proved effective in achieving the desired goals.
Improving Crop Productivity
Lack of improved practices was one of the reasons of poor crop productivity and soil health. To demonstrate the utility of modern technologies, large numbers of demonstrations were laid/conducted during kharif and rabi seasons. Crop production technologies of integrated nutrient management, crop diversification and organic farming were demonstrated. A total 53 and 106 numbers of demonstrations were laid on farmers fields for important crops of maize,
Table 18: Runoff from different sub micro-watershed during 2011
37
Watershed Development Works
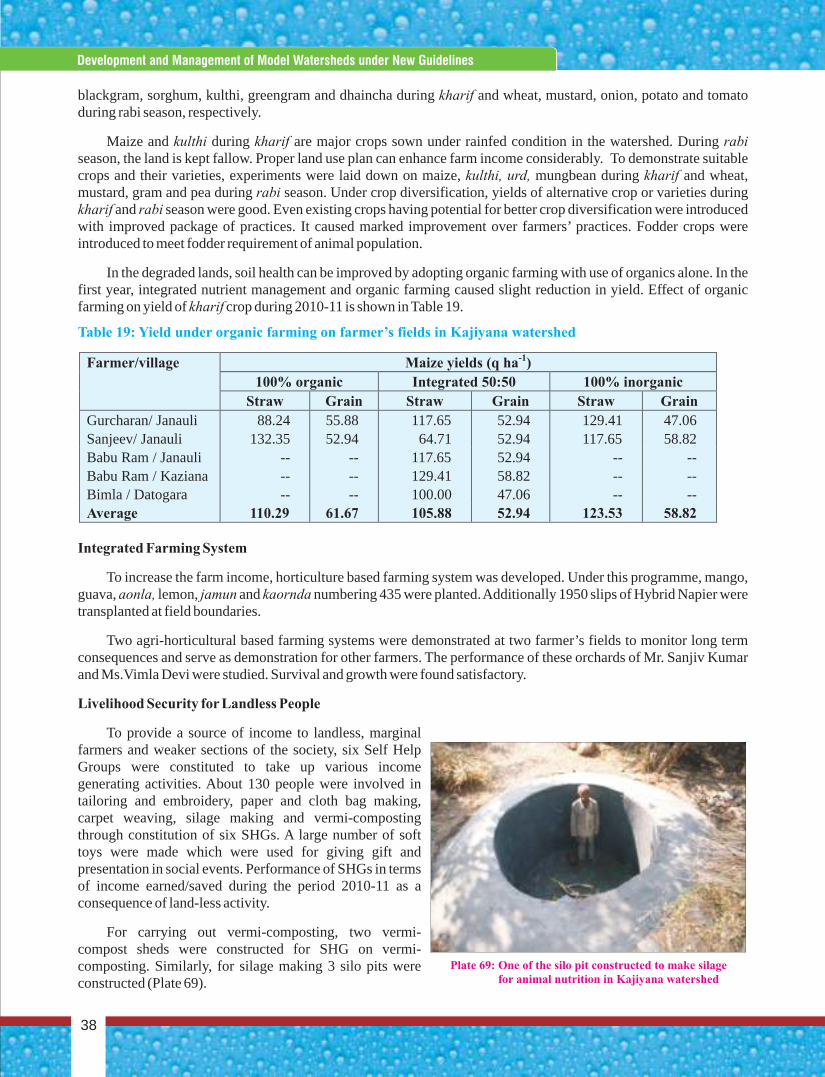
blackgram, sorghum, kulthi, greengram and dhaincha during kharif and wheat, mustard, onion, potato and tomato during rabi season, respectively.
Maize and kulthi during kharif are major crops sown under rainfed condition in the watershed. During rabi season, the land is kept fallow. Proper land use plan can enhance farm income considerably. To demonstrate suitable crops and their varieties, experiments were laid down on maize, kulthi, urd, mungbean during kharif and wheat, mustard, gram and pea during rabi season. Under crop diversification, yields of alternative crop or varieties during kharif and rabi season were good. Even existing crops having potential for better crop diversification were introduced with improved package of practices. It caused marked improvement over farmers’ practices. Fodder crops were introduced to meet fodder requirement of animal population.
In the degraded lands, soil health can be improved by adopting organic farming with use of organics alone. In the first year, integrated nutrient management and organic farming caused slight reduction in yield. Effect of organic farming on yield of kharif crop during 2010-11 is shown in Table 19.
Integrated Farming System
To increase the farm income, horticulture based farming system was developed. Under this programme, mango, guava, aonla, lemon, jamun and kaornda numbering 435 were planted. Additionally 1950 slips of Hybrid Napier were transplanted at field boundaries.
Two agri-horticultural based farming systems were demonstrated at two farmer’s fields to monitor long term consequences and serve as demonstration for other farmers. The performance of these orchards of Mr. Sanjiv Kumar and Ms.Vimla Devi were studied. Survival and growth were found satisfactory.
Livelihood Security for Landless People
To provide a source of income to landless, marginal farmers and weaker sections of the society, six Self Help Groups were constituted to take up various income generating activities. About 130 people were involved in tailoring and embroidery, paper and cloth bag making, carpet weaving, silage making and vermi-composting through constitution of six SHGs. A large number of soft toys were made which were used for giving gift and presentation in social events. Performance of SHGs in terms of income earned/saved during the period 2010-11 as a consequence of land-less activity.
For carrying out vermi-composting, two vermi-compost sheds were constructed for SHG on vermi-composting. Similarly, for silage making 3 silo pits were constructed (Plate 69).
Table 20 : Farmer/village Maize yields (q ha-1)
100% organic Integrated 50:50 100% inorganic Straw Grain Straw Grain Straw Grain
Gurcharan/ Janauli 88.24 55.88 117.65 52.94 129.41 47.06 Sanjeev/ Janauli 132.35 52.94 64.71 52.94 117.65 58.82 Babu Ram / Janauli -- -- 117.65 52.94 -- -- Babu Ram / Kaziana -- -- 129.41 58.82 -- -- Bimla / Datogara -- -- 100.00 47.06 -- -- Average 110.29 61.67 105.88 52.94 123.53 58.82
Plate 69: One of the silo pit constructed to make silage for animal nutrition in Kajiyana watershed
Table 19: Yield under organic farming on farmer’s fields in Kajiyana watershed
Concise Report On Development And Management Of Model Watersheds Through Participatory Approach
38
Development and Management of Model Watersheds under New Guidelines
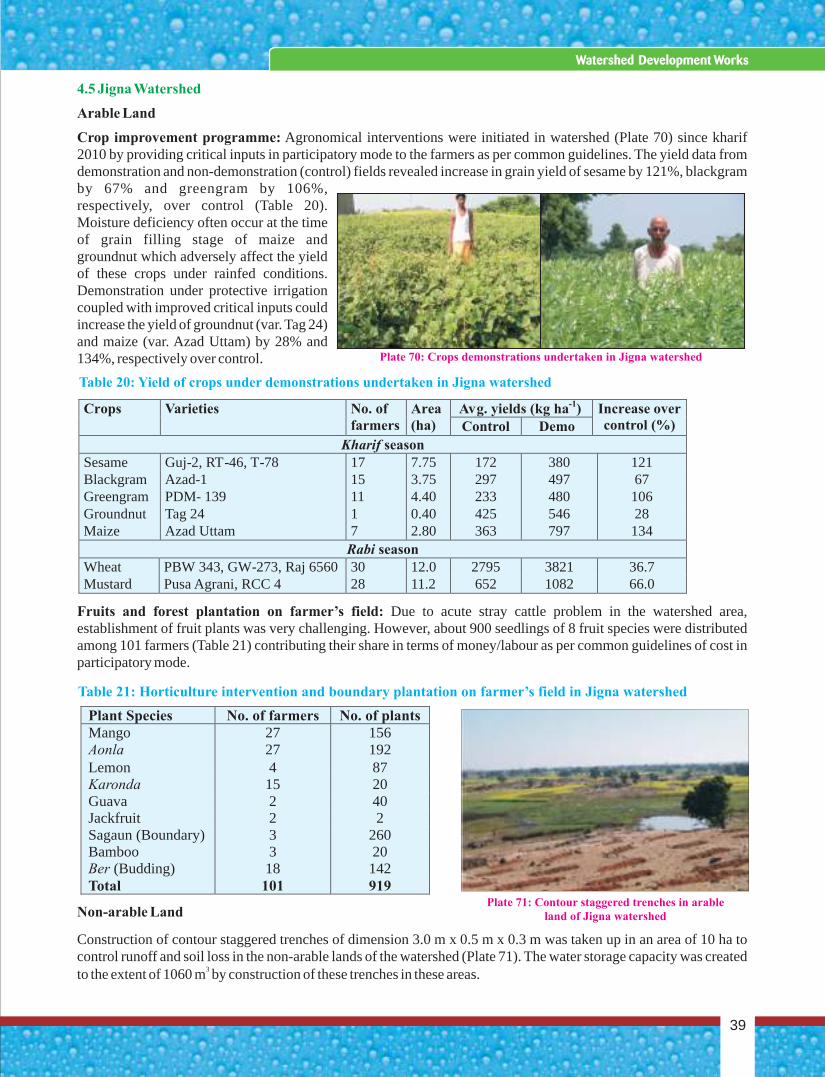
4.5 Jigna Watershed
Arable Land
Crop improvement programme: Agronomical interventions were initiated in watershed (Plate 70) since kharif 2010 by providing critical inputs in participatory mode to the farmers as per common guidelines. The yield data from demonstration and non-demonstration (control) fields revealed increase in grain yield of sesame by 121%, blackgram by 67% and greengram by 106%, respectively, over control (Table 20). Moisture deficiency often occur at the time of grain filling stage of maize and groundnut which adversely affect the yield of these crops under rainfed conditions. Demonstration under protective irrigation coupled with improved critical inputs could increase the yield of groundnut (var. Tag 24) and maize (var. Azad Uttam) by 28% and 134%, respectively over control.
Fruits and forest plantation on farmer’s field: Due to acute stray cattle problem in the watershed area, establishment of fruit plants was very challenging. However, about 900 seedlings of 8 fruit species were distributed among 101 farmers (Table 21) contributing their share in terms of money/labour as per common guidelines of cost in participatory mode.
Non-arable Land
Construction of contour staggered trenches of dimension 3.0 m x 0.5 m x 0.3 m was taken up in an area of 10 ha to control runoff and soil loss in the non-arable lands of the watershed (Plate 71). The water storage capacity was created
3to the extent of 1060 m by construction of these trenches in these areas.
Plate 70: Crops demonstrations undertaken in Jigna watershed
Plant Species No. of farmers No. of plants Mango 27 156 Aonla 27 192 Lemon 4 87 Karonda 15 20 Guava 2 40 Jackfruit 2 2 Sagaun (Boundary) 3 260 Bamboo 3 20 Ber (Budding) 18 142 Total 101 919
Table 21: Horticulture intervention and boundary plantation on farmer’s field in Jigna watershed
Crops
Varieties
No. of farmers
Area (ha)
Avg. yields (kg ha-1) Increase over control (%) Control Demo
Kharif season Sesame Guj-2, RT-46, T-78 17 7.75 172 380 121 Blackgram Azad-1 15 3.75 297 497 67 Greengram PDM- 139 11 4.40 233 480 106 Groundnut Tag 24 1 0.40 425 546 28 Maize Azad Uttam 7 2.80 363 797 134
Rabi season Wheat PBW 343, GW-273, Raj 6560 30 12.0 2795 3821 36.7 Mustard Pusa Agrani, RCC 4 28 11.2 652 1082 66.0
Plate 71: Contour staggered trenches in arable land of Jigna watershed
Table 20: Yield of crops under demonstrations undertaken in Jigna watershed
39
Watershed Development Works
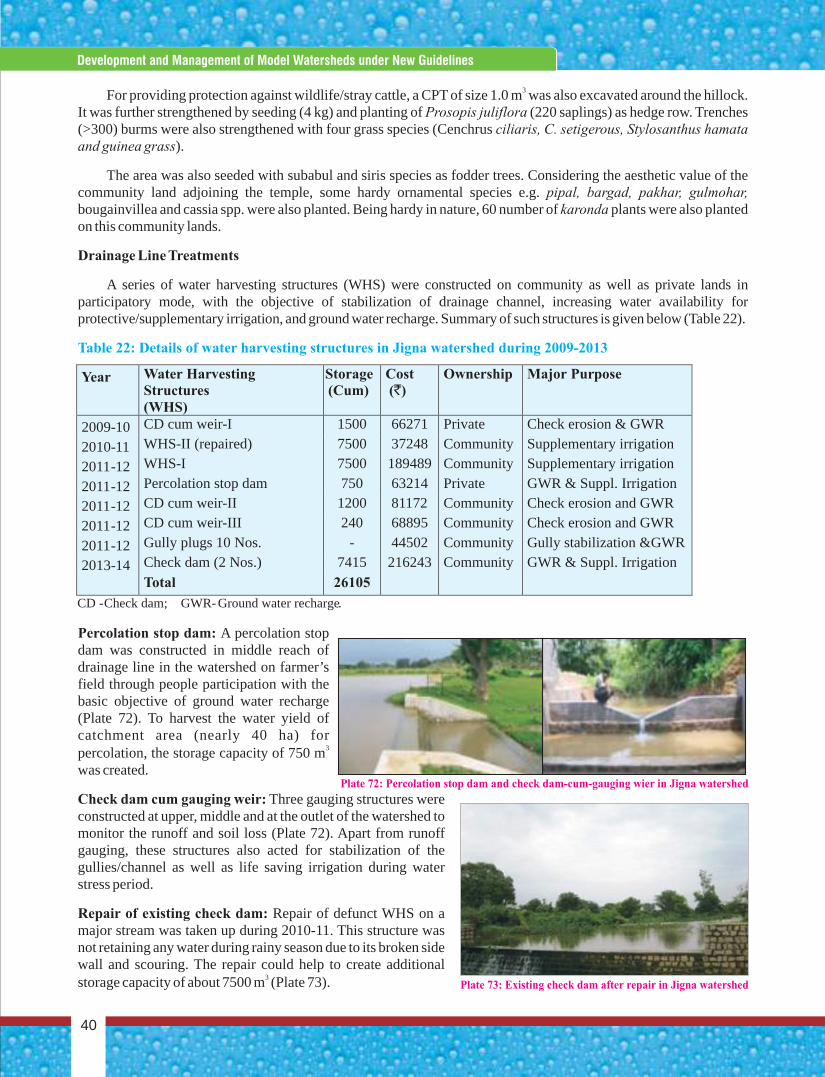
Concise Report On Development And Management Of Model Watersheds Through Participatory Approach
40
Development and Management of Model Watersheds under New Guidelines
3For providing protection against wildlife/stray cattle, a CPT of size 1.0 m was also excavated around the hillock. It was further strengthened by seeding (4 kg) and planting of Prosopis juliflora (220 saplings) as hedge row. Trenches (>300) burms were also strengthened with four grass species (Cenchrus ciliaris, C. setigerous, Stylosanthus hamata and guinea grass).
The area was also seeded with subabul and siris species as fodder trees. Considering the aesthetic value of the community land adjoining the temple, some hardy ornamental species e.g. pipal, bargad, pakhar, gulmohar, bougainvillea and cassia spp. were also planted. Being hardy in nature, 60 number of karonda plants were also planted on this community lands.
Drainage Line Treatments
A series of water harvesting structures (WHS) were constructed on community as well as private lands in participatory mode, with the objective of stabilization of drainage channel, increasing water availability for protective/supplementary irrigation, and ground water recharge. Summary of such structures is given below (Table 22).
Percolation stop dam: A percolation stop dam was constructed in middle reach of drainage line in the watershed on farmer’s field through people participation with the basic objective of ground water recharge (Plate 72). To harvest the water yield of catchment area (nearly 40 ha) for
3percolation, the storage capacity of 750 m was created.
Check dam cum gauging weir: Three gauging structures were constructed at upper, middle and at the outlet of the watershed to monitor the runoff and soil loss (Plate 72). Apart from runoff gauging, these structures also acted for stabilization of the gullies/channel as well as life saving irrigation during water stress period.
Repair of existing check dam: Repair of defunct WHS on a major stream was taken up during 2010-11. This structure was not retaining any water during rainy season due to its broken side wall and scouring. The repair could help to create additional
3storage capacity of about 7500 m (Plate 73).
Table 22: Details of water harvesting structures in Jigna watershed during 2009-2013
Year Water Harvesting Structures (WHS)
Storage (Cum)
Cost (`)
Ownership Major Purpose
2009-10 CD cum weir-I 1500 66271 Private Check erosion & GWR 2010-11 WHS-II (repaired) 7500 37248 Community Supplementary irrigation 2011-12 WHS-I 7500 189489 Community Supplementary irrigation 2011-12 Percolation stop dam 750 63214 Private GWR & Suppl. Irrigation 2011-12 CD cum weir-II 1200 81172 Community Check erosion and GWR 2011-12 CD cum weir-III 240 68895 Community Check erosion and GWR 2011-12 Gully plugs 10 Nos. - 44502 Community Gully stabilization &GWR 2013-14 Check dam (2 Nos.) 7415 216243 Community GWR & Suppl. Irrigation
Total 26105 CD -Check dam; GWR - Ground water recharge.
Plate 72: Percolation stop dam and check dam-cum-gauging wier in Jigna watershed
Plate 73: Existing check dam after repair in Jigna watershed
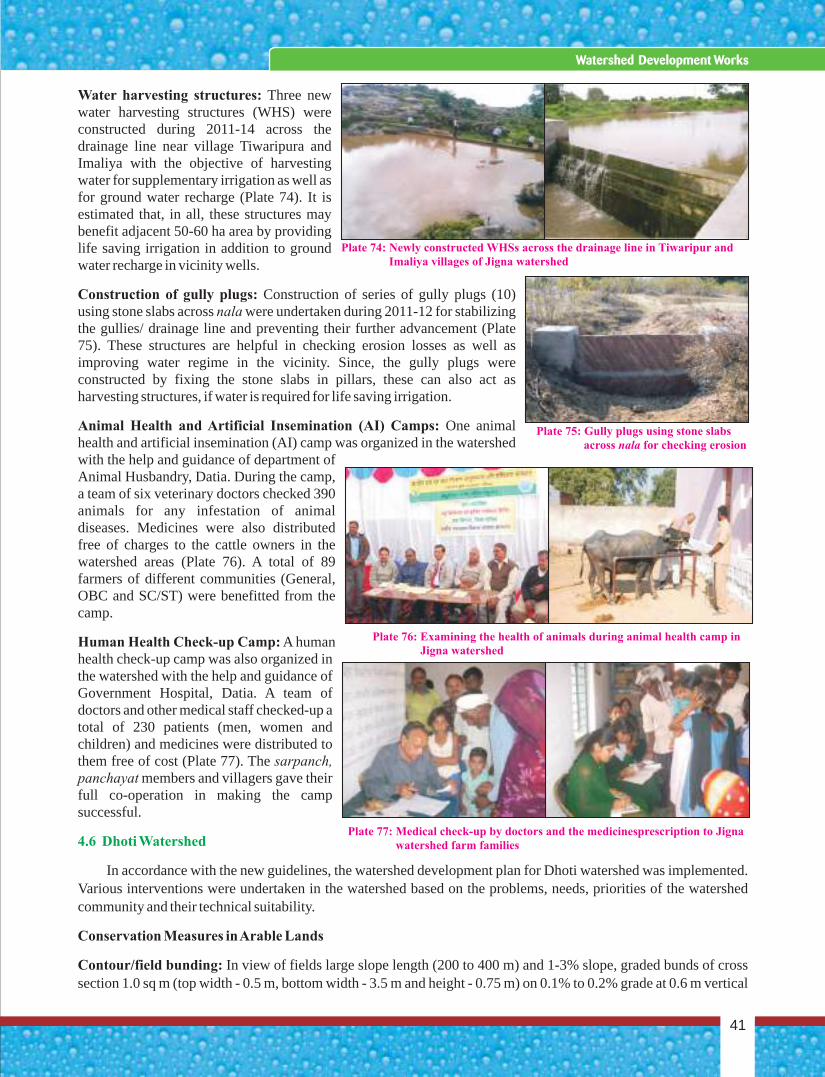
Water harvesting structures: Three new water harvesting structures (WHS) were constructed during 2011-14 across the drainage line near village Tiwaripura and Imaliya with the objective of harvesting water for supplementary irrigation as well as for ground water recharge (Plate 74). It is estimated that, in all, these structures may benefit adjacent 50-60 ha area by providing life saving irrigation in addition to ground water recharge in vicinity wells.
Construction of gully plugs: Construction of series of gully plugs (10) using stone slabs across nala were undertaken during 2011-12 for stabilizing the gullies/ drainage line and preventing their further advancement (Plate 75). These structures are helpful in checking erosion losses as well as improving water regime in the vicinity. Since, the gully plugs were constructed by fixing the stone slabs in pillars, these can also act as harvesting structures, if water is required for life saving irrigation.
Animal Health and Artificial Insemination (AI) Camps: One animal health and artificial insemination (AI) camp was organized in the watershed with the help and guidance of department of Animal Husbandry, Datia. During the camp, a team of six veterinary doctors checked 390 animals for any infestation of animal diseases. Medicines were also distributed free of charges to the cattle owners in the watershed areas (Plate 76). A total of 89 farmers of different communities (General, OBC and SC/ST) were benefitted from the camp.
Human Health Check-up Camp: A human health check-up camp was also organized in the watershed with the help and guidance of Government Hospital, Datia. A team of doctors and other medical staff checked-up a total of 230 patients (men, women and children) and medicines were distributed to them free of cost (Plate 77). The sarpanch, panchayat members and villagers gave their full co-operation in making the camp successful.
In accordance with the new guidelines, the watershed development plan for Dhoti watershed was implemented. Various interventions were undertaken in the watershed based on the problems, needs, priorities of the watershed community and their technical suitability.
Conservation Measures in Arable Lands
Contour/field bunding: In view of fields large slope length (200 to 400 m) and 1-3% slope, graded bunds of cross section 1.0 sq m (top width - 0.5 m, bottom width - 3.5 m and height - 0.75 m) on 0.1% to 0.2% grade at 0.6 m vertical
4.6 Dhoti Watershed
Plate 75: Gully plugs using stone slabs across nala for checking erosion
Plate 76: Examining the health of animals during animal health camp in Jigna watershed
Plate 77: Medical check-up by doctors and the medicinesprescription to Jigna watershed farm families
Plate 74: Newly constructed WHSs across the drainage line in Tiwaripur and Imaliya villages of Jigna watershed
41
Watershed Development Works
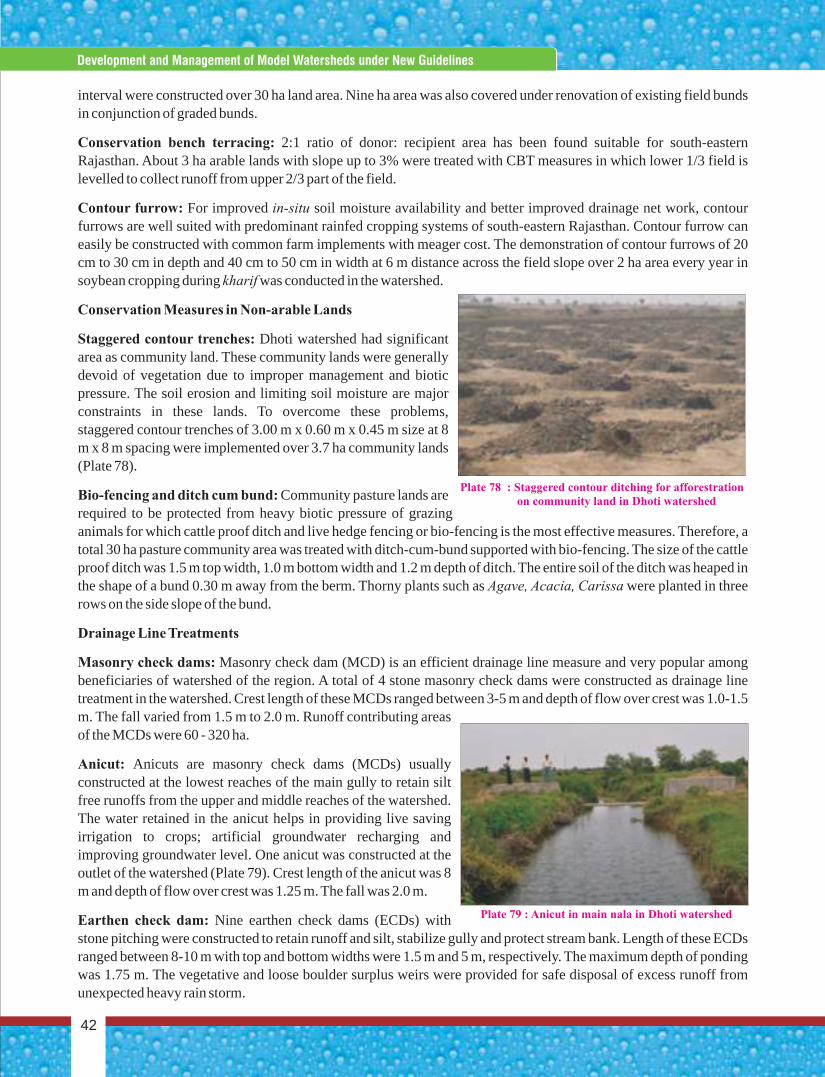
interval were constructed over 30 ha land area. Nine ha area was also covered under renovation of existing field bunds in conjunction of graded bunds.
Conservation bench terracing: 2:1 ratio of donor: recipient area has been found suitable for south-eastern Rajasthan. About 3 ha arable lands with slope up to 3% were treated with CBT measures in which lower 1/3 field is levelled to collect runoff from upper 2/3 part of the field.
Contour furrow: For improved in-situ soil moisture availability and better improved drainage net work, contour furrows are well suited with predominant rainfed cropping systems of south-eastern Rajasthan. Contour furrow can easily be constructed with common farm implements with meager cost. The demonstration of contour furrows of 20 cm to 30 cm in depth and 40 cm to 50 cm in width at 6 m distance across the field slope over 2 ha area every year in soybean cropping during kharif was conducted in the watershed.
Conservation Measures in Non-arable Lands
Staggered contour trenches: Dhoti watershed had significant area as community land. These community lands were generally devoid of vegetation due to improper management and biotic pressure. The soil erosion and limiting soil moisture are major constraints in these lands. To overcome these problems, staggered contour trenches of 3.00 m x 0.60 m x 0.45 m size at 8 m x 8 m spacing were implemented over 3.7 ha community lands (Plate 78).
Bio-fencing and ditch cum bund: Community pasture lands are required to be protected from heavy biotic pressure of grazing animals for which cattle proof ditch and live hedge fencing or bio-fencing is the most effective measures. Therefore, a total 30 ha pasture community area was treated with ditch-cum-bund supported with bio-fencing. The size of the cattle proof ditch was 1.5 m top width, 1.0 m bottom width and 1.2 m depth of ditch. The entire soil of the ditch was heaped in the shape of a bund 0.30 m away from the berm. Thorny plants such as Agave, Acacia, Carissa were planted in three rows on the side slope of the bund.
Drainage Line Treatments
Masonry check dams: Masonry check dam (MCD) is an efficient drainage line measure and very popular among beneficiaries of watershed of the region. A total of 4 stone masonry check dams were constructed as drainage line treatment in the watershed. Crest length of these MCDs ranged between 3-5 m and depth of flow over crest was 1.0-1.5 m. The fall varied from 1.5 m to 2.0 m. Runoff contributing areas of the MCDs were 60 - 320 ha.
Anicut: Anicuts are masonry check dams (MCDs) usually constructed at the lowest reaches of the main gully to retain silt free runoffs from the upper and middle reaches of the watershed. The water retained in the anicut helps in providing live saving irrigation to crops; artificial groundwater recharging and improving groundwater level. One anicut was constructed at the outlet of the watershed (Plate 79). Crest length of the anicut was 8 m and depth of flow over crest was 1.25 m. The fall was 2.0 m.
Earthen check dam: Nine earthen check dams (ECDs) with stone pitching were constructed to retain runoff and silt, stabilize gully and protect stream bank. Length of these ECDs ranged between 8-10 m with top and bottom widths were 1.5 m and 5 m, respectively. The maximum depth of ponding was 1.75 m. The vegetative and loose boulder surplus weirs were provided for safe disposal of excess runoff from unexpected heavy rain storm.
Plate 78 : Staggered contour ditching for afforestration on community land in Dhoti watershed
Plate 79 : Anicut in main nala in Dhoti watershed
Concise Report On Development And Management Of Model Watersheds Through Participatory Approach
42
Development and Management of Model Watersheds under New Guidelines
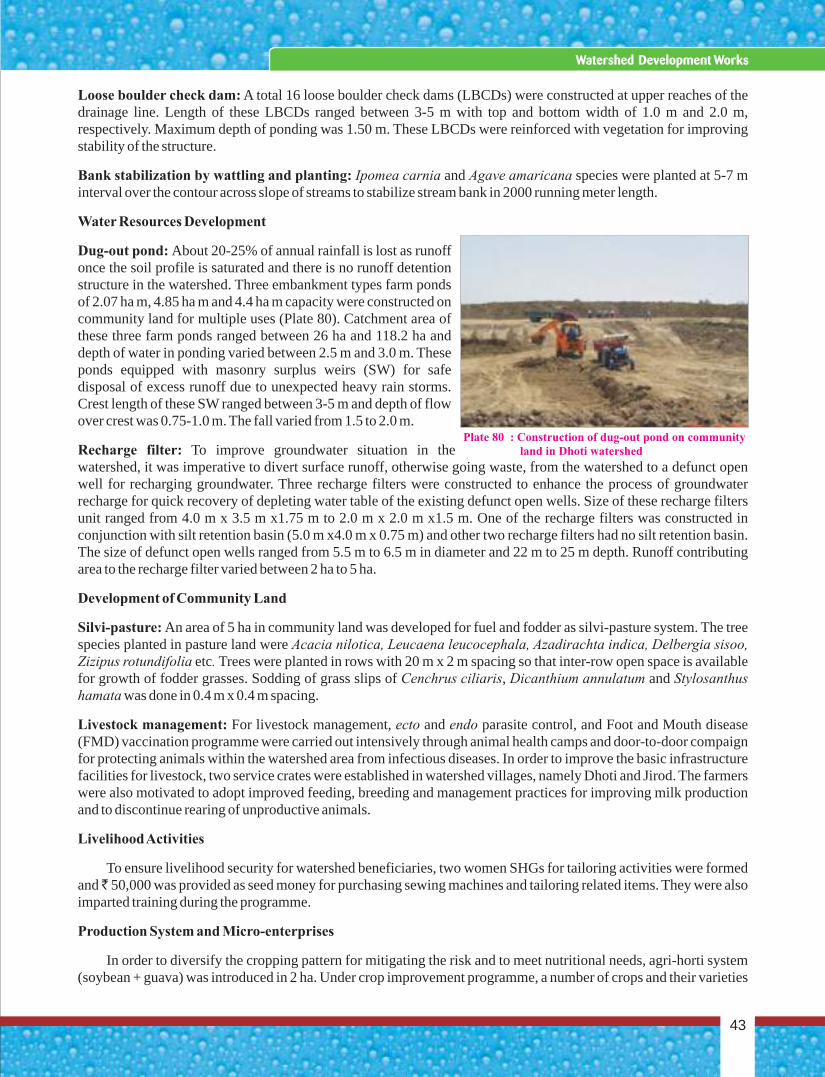
Loose boulder check dam: A total 16 loose boulder check dams (LBCDs) were constructed at upper reaches of the drainage line. Length of these LBCDs ranged between 3-5 m with top and bottom width of 1.0 m and 2.0 m, respectively. Maximum depth of ponding was 1.50 m. These LBCDs were reinforced with vegetation for improving stability of the structure.
Bank stabilization by wattling and planting: Ipomea carnia and Agave amaricana species were planted at 5-7 m interval over the contour across slope of streams to stabilize stream bank in 2000 running meter length.
Water Resources Development
Dug-out pond: About 20-25% of annual rainfall is lost as runoff once the soil profile is saturated and there is no runoff detention structure in the watershed. Three embankment types farm ponds of 2.07 ha m, 4.85 ha m and 4.4 ha m capacity were constructed on community land for multiple uses (Plate 80). Catchment area of these three farm ponds ranged between 26 ha and 118.2 ha and depth of water in ponding varied between 2.5 m and 3.0 m. These ponds equipped with masonry surplus weirs (SW) for safe disposal of excess runoff due to unexpected heavy rain storms. Crest length of these SW ranged between 3-5 m and depth of flow over crest was 0.75-1.0 m. The fall varied from 1.5 to 2.0 m.
Recharge filter: To improve groundwater situation in the watershed, it was imperative to divert surface runoff, otherwise going waste, from the watershed to a defunct open well for recharging groundwater. Three recharge filters were constructed to enhance the process of groundwater recharge for quick recovery of depleting water table of the existing defunct open wells. Size of these recharge filters unit ranged from 4.0 m x 3.5 m x1.75 m to 2.0 m x 2.0 m x1.5 m. One of the recharge filters was constructed in conjunction with silt retention basin (5.0 m x4.0 m x 0.75 m) and other two recharge filters had no silt retention basin. The size of defunct open wells ranged from 5.5 m to 6.5 m in diameter and 22 m to 25 m depth. Runoff contributing area to the recharge filter varied between 2 ha to 5 ha.
Development of Community Land
Silvi-pasture: An area of 5 ha in community land was developed for fuel and fodder as silvi-pasture system. The tree species planted in pasture land were Acacia nilotica, Leucaena leucocephala, Azadirachta indica, Delbergia sisoo, Zizipus rotundifolia etc. Trees were planted in rows with 20 m x 2 m spacing so that inter-row open space is available for growth of fodder grasses. Sodding of grass slips of Cenchrus ciliaris, Dicanthium annulatum and Stylosanthus hamata was done in 0.4 m x 0.4 m spacing.
Livestock management: For livestock management, ecto and endo parasite control, and Foot and Mouth disease (FMD) vaccination programme were carried out intensively through animal health camps and door-to-door compaign for protecting animals within the watershed area from infectious diseases. In order to improve the basic infrastructure facilities for livestock, two service crates were established in watershed villages, namely Dhoti and Jirod. The farmers were also motivated to adopt improved feeding, breeding and management practices for improving milk production and to discontinue rearing of unproductive animals.
Livelihood Activities
To ensure livelihood security for watershed beneficiaries, two women SHGs for tailoring activities were formed and 50,000 was provided as seed money for purchasing sewing machines and tailoring related items. They were also imparted training during the programme.
Production System and Micro-enterprises
In order to diversify the cropping pattern for mitigating the risk and to meet nutritional needs, agri-horti system (soybean + guava) was introduced in 2 ha. Under crop improvement programme, a number of crops and their varieties
Plate 80 : Construction of dug-out pond on community land in Dhoti watershed
43
Watershed Development Works
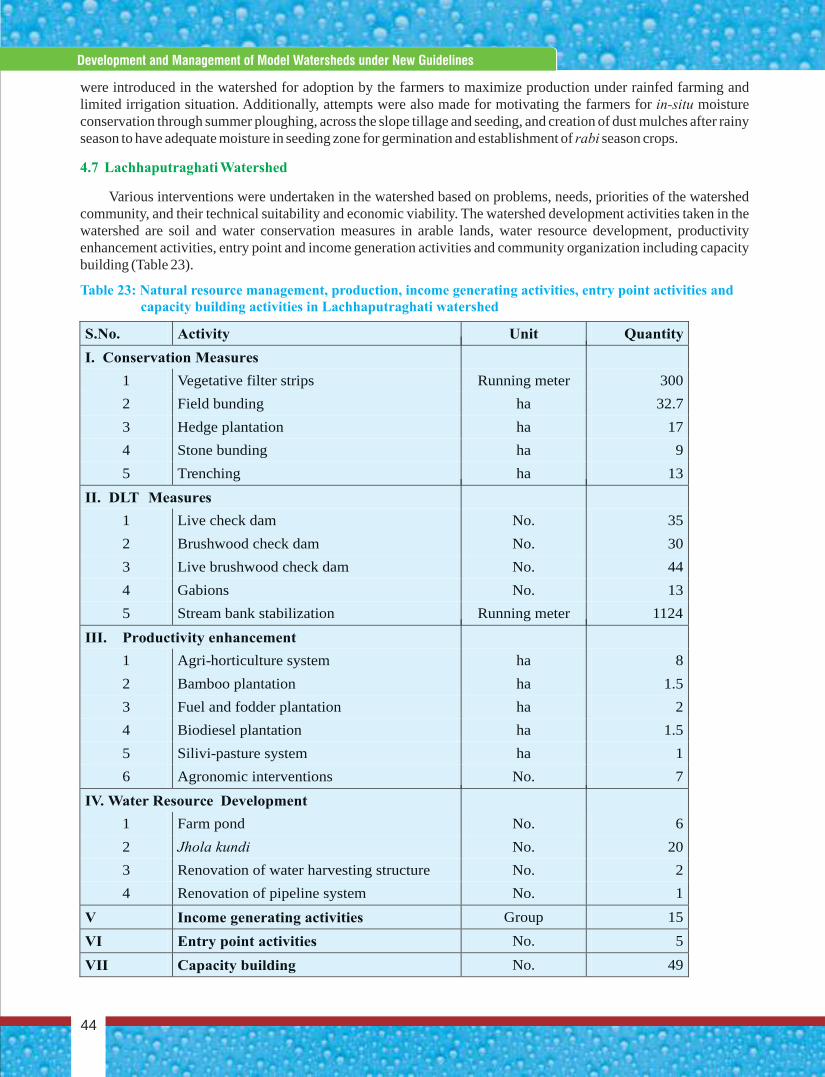
VII Capacity building No. 49
were introduced in the watershed for adoption by the farmers to maximize production under rainfed farming and limited irrigation situation. Additionally, attempts were also made for motivating the farmers for in-situ moisture conservation through summer ploughing, across the slope tillage and seeding, and creation of dust mulches after rainy season to have adequate moisture in seeding zone for germination and establishment of rabi season crops.
Various interventions were undertaken in the watershed based on problems, needs, priorities of the watershed community, and their technical suitability and economic viability. The watershed development activities taken in the watershed are soil and water conservation measures in arable lands, water resource development, productivity enhancement activities, entry point and income generation activities and community organization including capacity building (Table 23).
4.7 Lachhaputraghati Watershed
Table 23: Natural resource management, production, income generating activities, entry point activities and capacity building activities in Lachhaputraghati watershed
S.No. Activity Unit Quantity
I. Conservation Measures
1 Vegetative filter strips Running meter 300
2 Field bunding ha 32.7
3 Hedge plantation ha 17
4 Stone bunding ha 9
5 Trenching ha 13
II. DLT Measures
1 Live check dam No. 35
2 Brushwood check dam No. 30
3 Live brushwood check dam No. 44
4 Gabions No. 13
5 Stream bank stabilization Running meter 1124
III. Productivity enhancement
1 Agri-horticulture system ha 8
2 Bamboo plantation ha 1.5
3 Fuel and fodder plantation ha 2
4 Biodiesel plantation ha 1.5
5 Silivi-pasture system ha 1
6 Agronomic interventions No. 7
IV. Water Resource Development
1 Farm pond No. 6
2 Jhola kundi No. 20
3 Renovation of water harvesting structure No. 2
4 Renovation of pipeline system No. 1
V Income generating activities Group 15
VI Entry point activities No. 5
Concise Report On Development And Management Of Model Watersheds Through Participatory Approach
44
Development and Management of Model Watersheds under New Guidelines
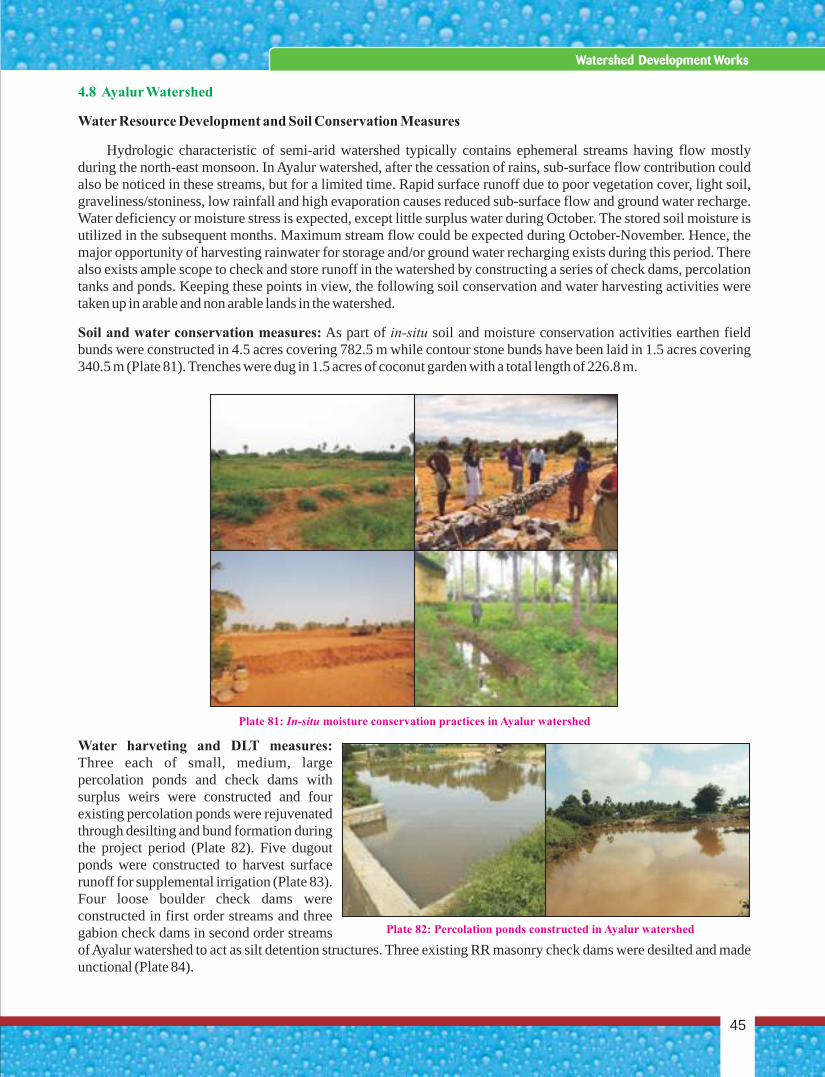
Plate 82: Percolation ponds constructed in Ayalur watershed
4.8 Ayalur Watershed
Water Resource Development and Soil Conservation Measures
Hydrologic characteristic of semi-arid watershed typically contains ephemeral streams having flow mostly during the north-east monsoon. In Ayalur watershed, after the cessation of rains, sub-surface flow contribution could also be noticed in these streams, but for a limited time. Rapid surface runoff due to poor vegetation cover, light soil, graveliness/stoniness, low rainfall and high evaporation causes reduced sub-surface flow and ground water recharge. Water deficiency or moisture stress is expected, except little surplus water during October. The stored soil moisture is utilized in the subsequent months. Maximum stream flow could be expected during October-November. Hence, the major opportunity of harvesting rainwater for storage and/or ground water recharging exists during this period. There also exists ample scope to check and store runoff in the watershed by constructing a series of check dams, percolation tanks and ponds. Keeping these points in view, the following soil conservation and water harvesting activities were taken up in arable and non arable lands in the watershed.
Soil and water conservation measures: As part of in-situ soil and moisture conservation activities earthen field bunds were constructed in 4.5 acres covering 782.5 m while contour stone bunds have been laid in 1.5 acres covering 340.5 m (Plate 81). Trenches were dug in 1.5 acres of coconut garden with a total length of 226.8 m.
Water harveting and DLT measures: Three each of small, medium, large percolation ponds and check dams with surplus weirs were constructed and four existing percolation ponds were rejuvenated through desilting and bund formation during the project period (Plate 82). Five dugout ponds were constructed to harvest surface runoff for supplemental irrigation (Plate 83). Four loose boulder check dams were constructed in first order streams and three gabion check dams in second order streams of Ayalur watershed to act as silt detention structures. Three existing RR masonry check dams were desilted and made unctional (Plate 84).
Plate 81: In-situ moisture conservation practices in Ayalur watershed
45
Watershed Development Works
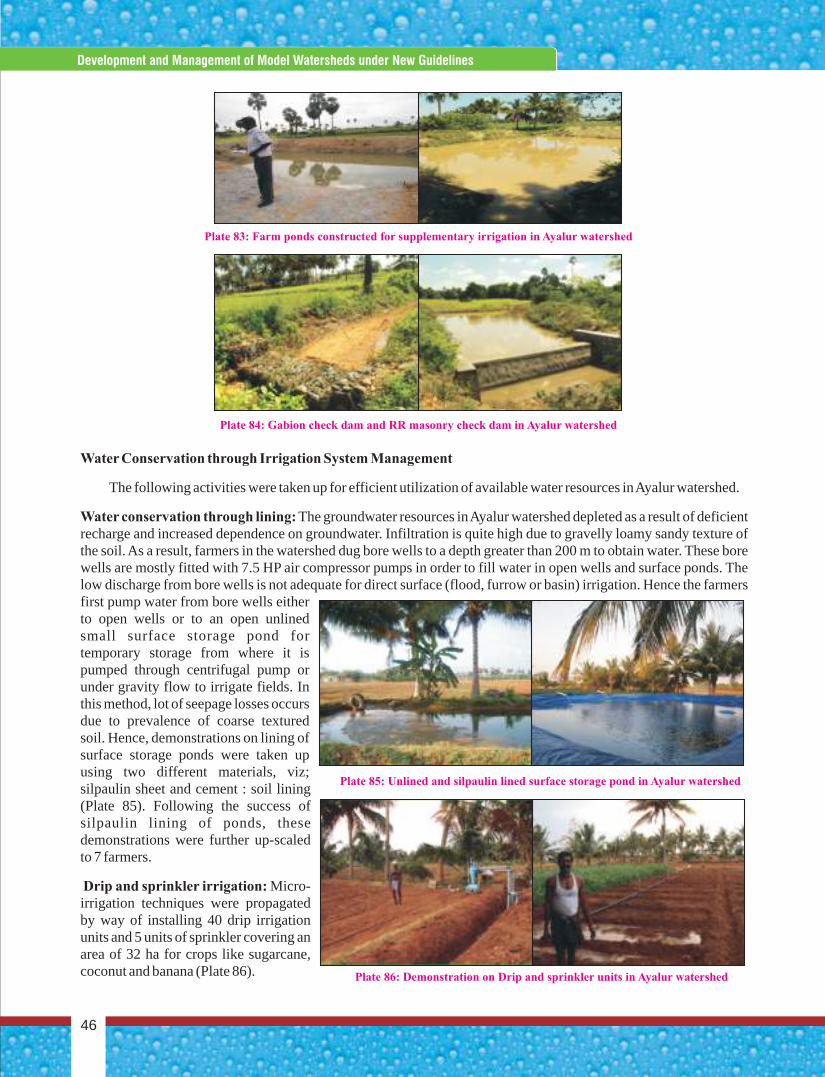
Water Conservation through Irrigation System Management
The following activities were taken up for efficient utilization of available water resources in Ayalur watershed.
Water conservation through lining: The groundwater resources in Ayalur watershed depleted as a result of deficient recharge and increased dependence on groundwater. Infiltration is quite high due to gravelly loamy sandy texture of the soil. As a result, farmers in the watershed dug bore wells to a depth greater than 200 m to obtain water. These bore wells are mostly fitted with 7.5 HP air compressor pumps in order to fill water in open wells and surface ponds. The low discharge from bore wells is not adequate for direct surface (flood, furrow or basin) irrigation. Hence the farmers first pump water from bore wells either to open wells or to an open unlined small surface storage pond for temporary storage from where it is pumped through centrifugal pump or under gravity flow to irrigate fields. In this method, lot of seepage losses occurs due to prevalence of coarse textured soil. Hence, demonstrations on lining of surface storage ponds were taken up using two different materials, viz; silpaulin sheet and cement : soil lining (Plate 85). Following the success of silpaulin lining of ponds, these demonstrations were further up-scaled to 7 farmers.
Drip and sprinkler irrigation: Micro-irrigation techniques were propagated by way of installing 40 drip irrigation units and 5 units of sprinkler covering an area of 32 ha for crops like sugarcane, coconut and banana (Plate 86).
`
Plate 83: Farm ponds constructed for supplementary irrigation in Ayalur watershed
Plate 84: Gabion check dam and RR masonry check dam in Ayalur watershed
Plate 86: Demonstration on Drip and sprinkler units in Ayalur watershed
Plate 85: Unlined and silpaulin lined surface storage pond in Ayalur watershed
Concise Report On Development And Management Of Model Watersheds Through Participatory Approach
46
Development and Management of Model Watersheds under New Guidelines
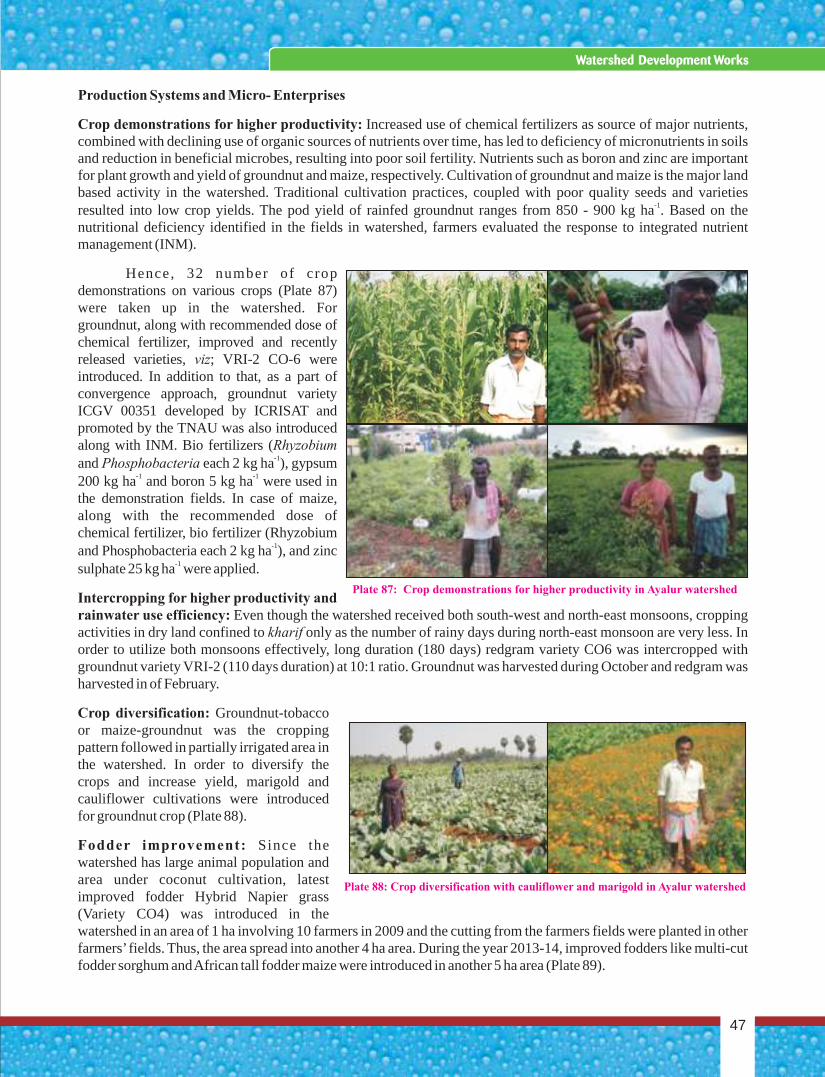
47
Watershed Development Works
Plate 87: Crop demonstrations for higher productivity in Ayalur watershed
Plate 88: Crop diversification with cauliflower and marigold in Ayalur watershed
Production Systems and Micro- Enterprises
Crop demonstrations for higher productivity: Increased use of chemical fertilizers as source of major nutrients, combined with declining use of organic sources of nutrients over time, has led to deficiency of micronutrients in soils and reduction in beneficial microbes, resulting into poor soil fertility. Nutrients such as boron and zinc are important for plant growth and yield of groundnut and maize, respectively. Cultivation of groundnut and maize is the major land based activity in the watershed. Traditional cultivation practices, coupled with poor quality seeds and varieties
-1resulted into low crop yields. The pod yield of rainfed groundnut ranges from 850 - 900 kg ha . Based on the nutritional deficiency identified in the fields in watershed, farmers evaluated the response to integrated nutrient management (INM).
Hence, 32 number of crop demonstrations on various crops (Plate 87) were taken up in the watershed. For groundnut, along with recommended dose of chemical fertilizer, improved and recently released varieties, viz; VRI-2 CO-6 were introduced. In addition to that, as a part of convergence approach, groundnut variety ICGV 00351 developed by ICRISAT and promoted by the TNAU was also introduced along with INM. Bio fertilizers (Rhyzobium
-1and Phosphobacteria each 2 kg ha ), gypsum -1 -1200 kg ha and boron 5 kg ha were used in
the demonstration fields. In case of maize, along with the recommended dose of chemical fertilizer, bio fertilizer (Rhyzobium
-1and Phosphobacteria each 2 kg ha ), and zinc -1sulphate 25 kg ha were applied.
Intercropping for higher productivity and rainwater use efficiency: Even though the watershed received both south-west and north-east monsoons, cropping activities in dry land confined to kharif only as the number of rainy days during north-east monsoon are very less. In order to utilize both monsoons effectively, long duration (180 days) redgram variety CO6 was intercropped with groundnut variety VRI-2 (110 days duration) at 10:1 ratio. Groundnut was harvested during October and redgram was harvested in of February.
Crop diversification: Groundnut-tobacco or maize-groundnut was the cropping pattern followed in partially irrigated area in the watershed. In order to diversify the crops and increase yield, marigold and cauliflower cultivations were introduced for groundnut crop (Plate 88).
Fodder improvement: Since the watershed has large animal population and area under coconut cultivation, latest improved fodder Hybrid Napier grass (Variety CO4) was introduced in the watershed in an area of 1 ha involving 10 farmers in 2009 and the cutting from the farmers fields were planted in other farmers’ fields. Thus, the area spread into another 4 ha area. During the year 2013-14, improved fodders like multi-cut fodder sorghum and African tall fodder maize were introduced in another 5 ha area (Plate 89).
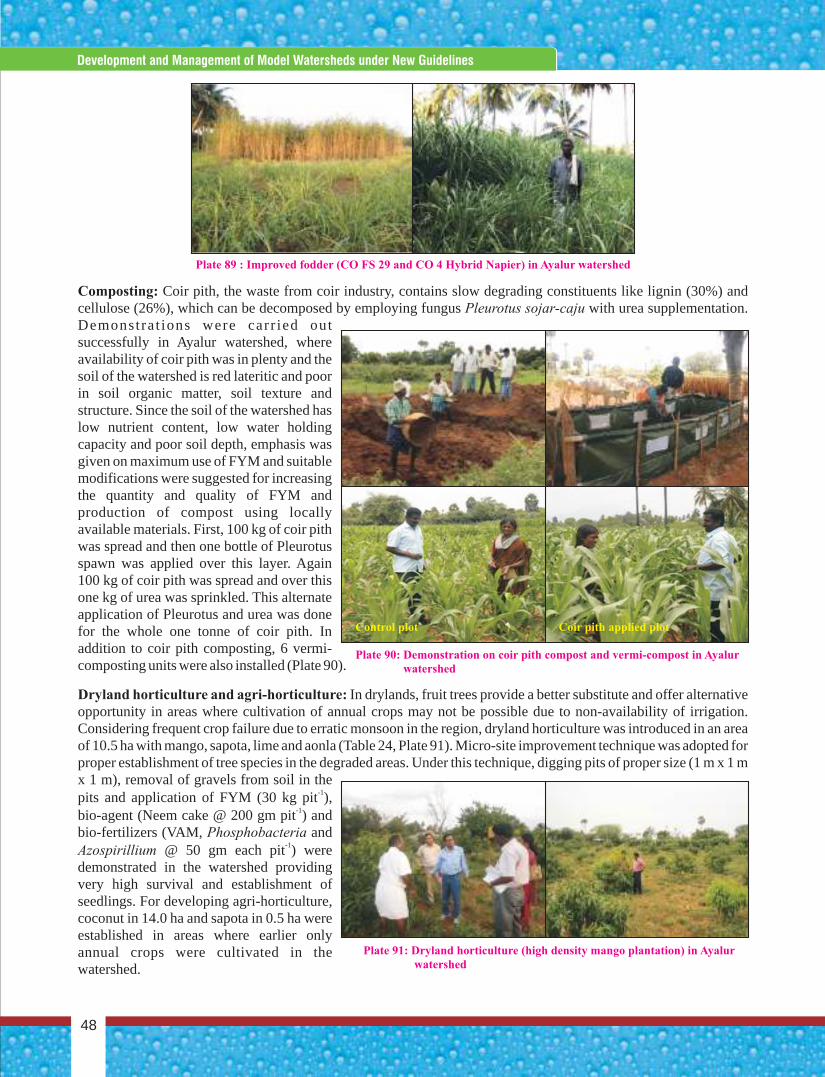
Plate 89 : Improved fodder (CO FS 29 and CO 4 Hybrid Napier) in Ayalur watershed
Plate 90: Demonstration on coir pith compost and vermi-compost in Ayalur watershed
Control plot Coir pith applied plot
Plate 91: Dryland horticulture (high density mango plantation) in Ayalur watershed
Composting: Coir pith, the waste from coir industry, contains slow degrading constituents like lignin (30%) and cellulose (26%), which can be decomposed by employing fungus Pleurotus sojar-caju with urea supplementation. Demonstra t ions were carr ied out successfully in Ayalur watershed, where availability of coir pith was in plenty and the soil of the watershed is red lateritic and poor in soil organic matter, soil texture and structure. Since the soil of the watershed has low nutrient content, low water holding capacity and poor soil depth, emphasis was given on maximum use of FYM and suitable modifications were suggested for increasing the quantity and quality of FYM and production of compost using locally available materials. First, 100 kg of coir pith was spread and then one bottle of Pleurotus spawn was applied over this layer. Again 100 kg of coir pith was spread and over this one kg of urea was sprinkled. This alternate application of Pleurotus and urea was done for the whole one tonne of coir pith. In addition to coir pith composting, 6 vermi-composting units were also installed (Plate 90).
Dryland horticulture and agri-horticulture: In drylands, fruit trees provide a better substitute and offer alternative opportunity in areas where cultivation of annual crops may not be possible due to non-availability of irrigation. Considering frequent crop failure due to erratic monsoon in the region, dryland horticulture was introduced in an area of 10.5 ha with mango, sapota, lime and aonla (Table 24, Plate 91). Micro-site improvement technique was adopted for proper establishment of tree species in the degraded areas. Under this technique, digging pits of proper size (1 m x 1 m x 1 m), removal of gravels from soil in the
-1pits and application of FYM (30 kg pit ), -1bio-agent (Neem cake @ 200 gm pit ) and
bio-fertilizers (VAM, Phosphobacteria and -1Azospirillium @ 50 gm each pit ) were
demonstrated in the watershed providing very high survival and establishment of seedlings. For developing agri-horticulture, coconut in 14.0 ha and sapota in 0.5 ha were established in areas where earlier only annual crops were cultivated in the watershed.
Concise Report On Development And Management Of Model Watersheds Through Participatory Approach
48
Development and Management of Model Watersheds under New Guidelines
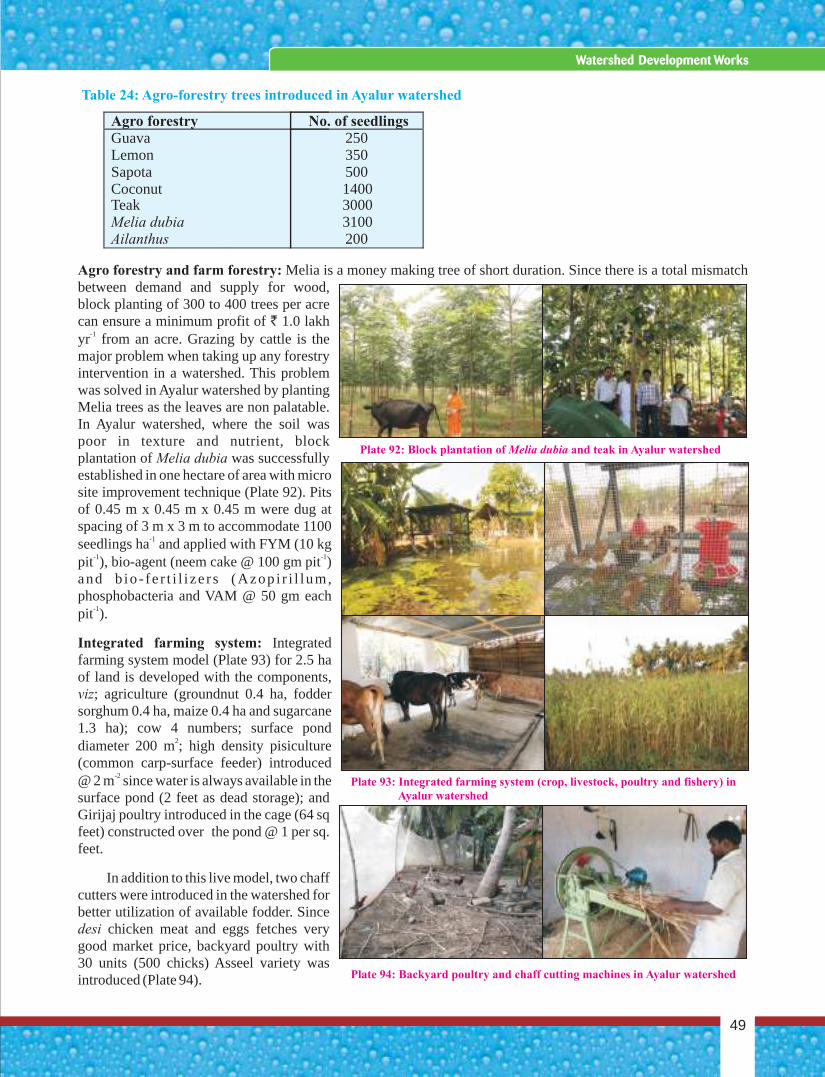
Agro forestry and farm forestry: Melia is a money making tree of short duration. Since there is a total mismatch between demand and supply for wood, block planting of 300 to 400 trees per acre can ensure a minimum profit of ` 1.0 lakh
-1yr from an acre. Grazing by cattle is the major problem when taking up any forestry intervention in a watershed. This problem was solved in Ayalur watershed by planting Melia trees as the leaves are non palatable. In Ayalur watershed, where the soil was poor in texture and nutrient, block plantation of Melia dubia was successfully established in one hectare of area with micro site improvement technique (Plate 92). Pits of 0.45 m x 0.45 m x 0.45 m were dug at spacing of 3 m x 3 m to accommodate 1100
-1seedlings ha and applied with FYM (10 kg -1 -1pit ), bio-agent (neem cake @ 100 gm pit )
and b io - fe r t i l i ze r s (Azop i r i l lum, phosphobacteria and VAM @ 50 gm each
-1pit ).
Integrated farming system: Integrated farming system model (Plate 93) for 2.5 ha of land is developed with the components, viz; agriculture (groundnut 0.4 ha, fodder sorghum 0.4 ha, maize 0.4 ha and sugarcane 1.3 ha); cow 4 numbers; surface pond
2diameter 200 m ; high density pisiculture (common carp-surface feeder) introduced
-2@ 2 m since water is always available in the surface pond (2 feet as dead storage); and Girijaj poultry introduced in the cage (64 sq feet) constructed over the pond @ 1 per sq. feet.
In addition to this live model, two chaff cutters were introduced in the watershed for better utilization of available fodder. Since desi chicken meat and eggs fetches very good market price, backyard poultry with 30 units (500 chicks) Asseel variety was introduced (Plate 94).
Table 24: Agro-forestry trees introduced in Ayalur watershed
Agro forestry No. of seedlings Guava Lemon Sapota Coconut Teak Melia dubia Ailanthus
250 350 500 1400 3000 3100 200
Plate 94: Backyard poultry and chaff cutting machines in Ayalur watershed
Plate 92: Block plantation of Melia dubia and teak in Ayalur watershed
Plate 93: Integrated farming system (crop, livestock, poultry and fishery) in Ayalur watershed
49
Watershed Development Works
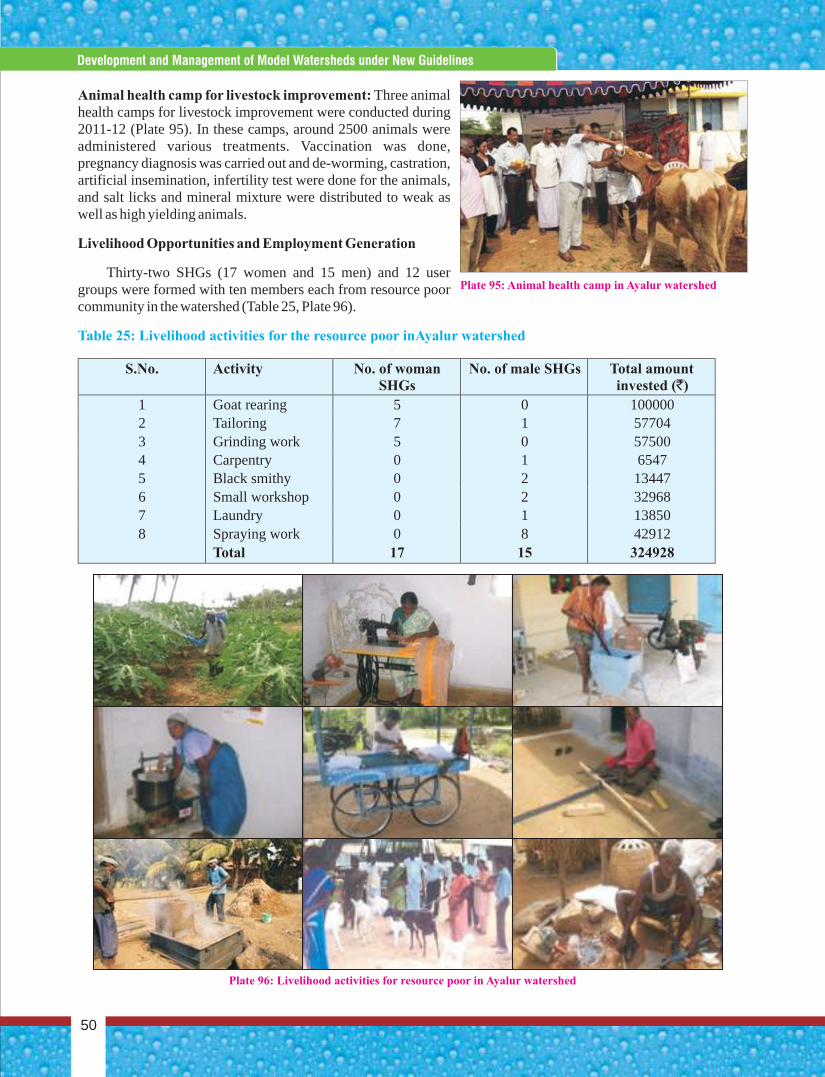
Animal health camp for livestock improvement: Three animal health camps for livestock improvement were conducted during 2011-12 (Plate 95). In these camps, around 2500 animals were administered various treatments. Vaccination was done, pregnancy diagnosis was carried out and de-worming, castration, artificial insemination, infertility test were done for the animals, and salt licks and mineral mixture were distributed to weak as well as high yielding animals.
Livelihood Opportunities and Employment Generation
Thirty-two SHGs (17 women and 15 men) and 12 user groups were formed with ten members each from resource poor community in the watershed (Table 25, Plate 96).
Table 25: Livelihood activities for the resource poor inAyalur watershed
Plate 95: Animal health camp in Ayalur watershed
S.No. Activity No. of woman SHGs
No. of male SHGs Total amount invested (`)
1 Goat rearing 5 0 100000 2 Tailoring 7 1 57704 3 Grinding work 5 0 57500 4 Carpentry 0 1 6547 5 Black smithy 0 2 13447 6 Small workshop 0 2 32968 7 Laundry 0 1 13850 8 Spraying work 0 8 42912 Total 17 15 324928
Plate 96: Livelihood activities for resource poor in Ayalur watershed
Concise Report On Development And Management Of Model Watersheds Through Participatory Approach
50
Development and Management of Model Watersheds under New Guidelines
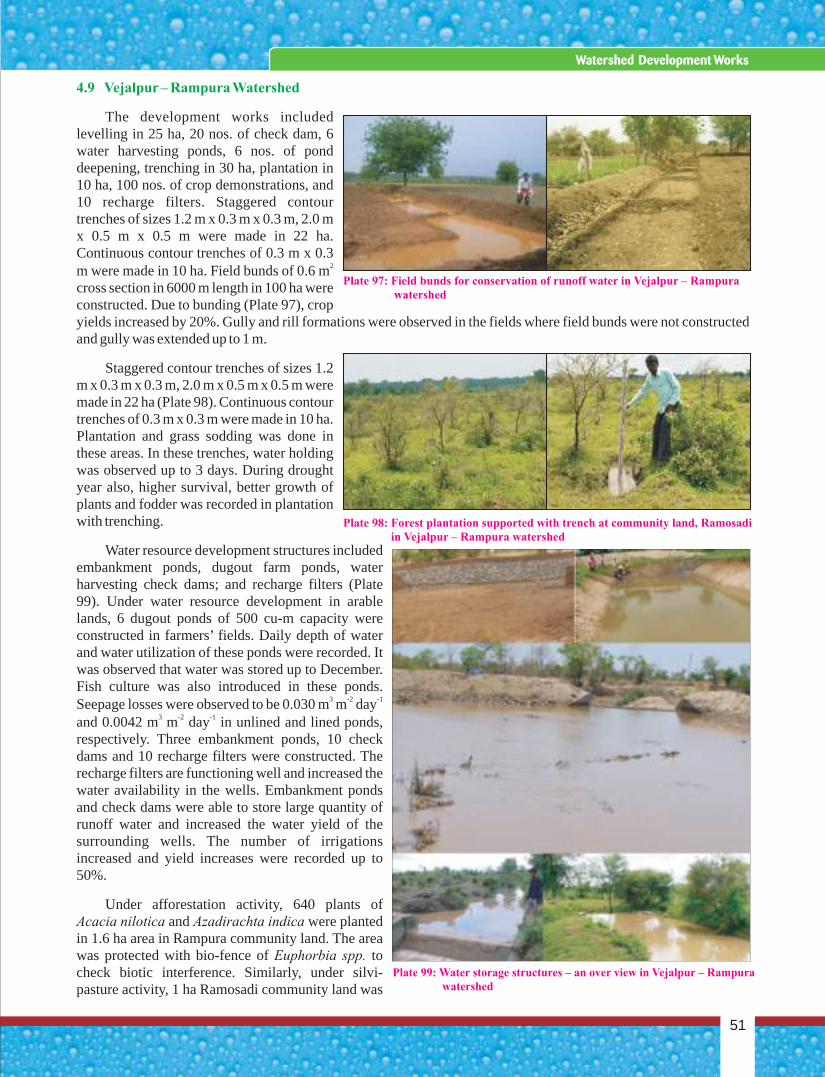
4.9 Vejalpur – Rampura Watershed
The development works included levelling in 25 ha, 20 nos. of check dam, 6 water harvesting ponds, 6 nos. of pond deepening, trenching in 30 ha, plantation in 10 ha, 100 nos. of crop demonstrations, and 10 recharge filters. Staggered contour trenches of sizes 1.2 m x 0.3 m x 0.3 m, 2.0 m x 0.5 m x 0.5 m were made in 22 ha. Continuous contour trenches of 0.3 m x 0.3
2m were made in 10 ha. Field bunds of 0.6 m cross section in 6000 m length in 100 ha were constructed. Due to bunding (Plate 97), crop yields increased by 20%. Gully and rill formations were observed in the fields where field bunds were not constructed and gully was extended up to 1 m.
Staggered contour trenches of sizes 1.2 m x 0.3 m x 0.3 m, 2.0 m x 0.5 m x 0.5 m were made in 22 ha (Plate 98). Continuous contour trenches of 0.3 m x 0.3 m were made in 10 ha. Plantation and grass sodding was done in these areas. In these trenches, water holding was observed up to 3 days. During drought year also, higher survival, better growth of plants and fodder was recorded in plantation with trenching.
Water resource development structures included embankment ponds, dugout farm ponds, water harvesting check dams; and recharge filters (Plate 99). Under water resource development in arable lands, 6 dugout ponds of 500 cu-m capacity were constructed in farmers’ fields. Daily depth of water and water utilization of these ponds were recorded. It was observed that water was stored up to December. Fish culture was also introduced in these ponds.
3 -2 -1Seepage losses were observed to be 0.030 m m day 3 -2 -1and 0.0042 m m day in unlined and lined ponds,
respectively. Three embankment ponds, 10 check dams and 10 recharge filters were constructed. The recharge filters are functioning well and increased the water availability in the wells. Embankment ponds and check dams were able to store large quantity of runoff water and increased the water yield of the surrounding wells. The number of irrigations increased and yield increases were recorded up to 50%.
Under afforestation activity, 640 plants of Acacia nilotica and Azadirachta indica were planted in 1.6 ha area in Rampura community land. The area was protected with bio-fence of Euphorbia spp. to check biotic interference. Similarly, under silvi-pasture activity, 1 ha Ramosadi community land was
Plate 98: Forest plantation supported with trench at community land, Ramosadi in Vejalpur – Rampura watershed
Plate 97: Field bunds for conservation of runoff water in Vejalpur – Rampura watershed
Plate 99: Water storage structures – an over view in Vejalpur – Rampura watershed
51
Watershed Development Works
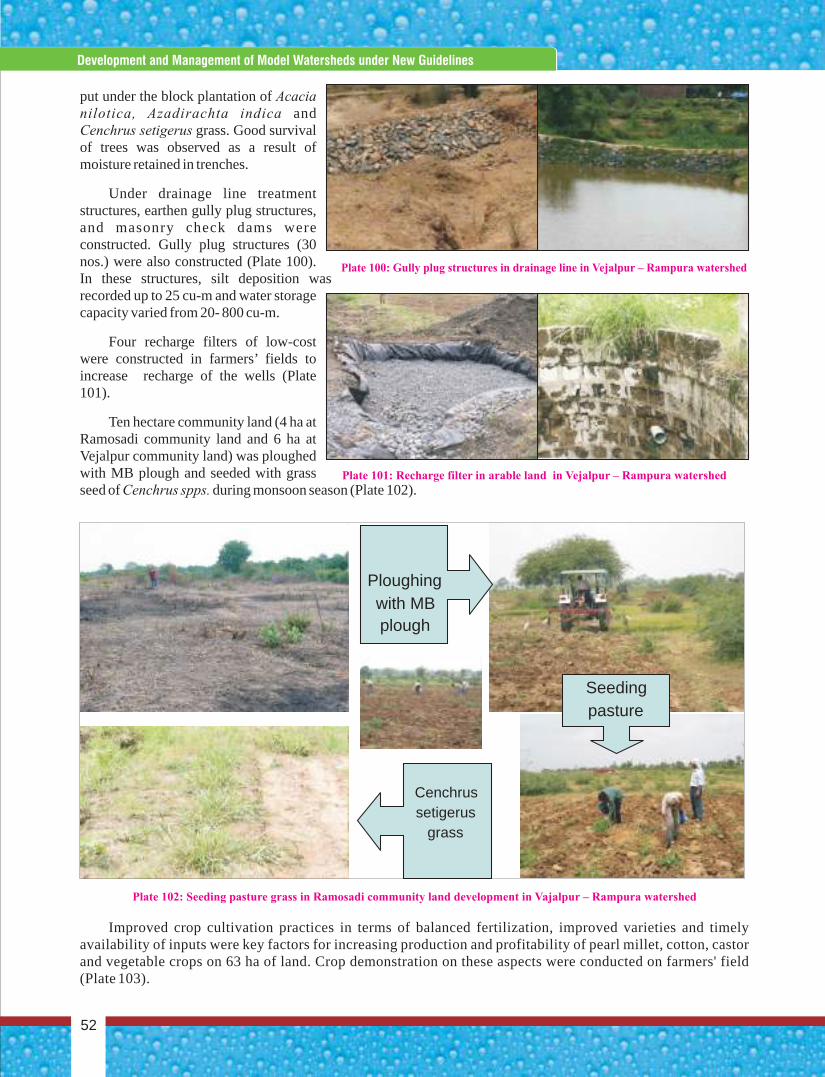
put under the block plantation of Acacia nilotica, Azadirachta indica and Cenchrus setigerus grass. Good survival of trees was observed as a result of moisture retained in trenches.
Under drainage line treatment structures, earthen gully plug structures, and masonry check dams were constructed. Gully plug structures (30 nos.) were also constructed (Plate 100). In these structures, silt deposition was recorded up to 25 cu-m and water storage capacity varied from 20- 800 cu-m.
Four recharge filters of low-cost were constructed in farmers’ fields to increase recharge of the wells (Plate 101).
Ten hectare community land (4 ha at Ramosadi community land and 6 ha at Vejalpur community land) was ploughed with MB plough and seeded with grass seed of Cenchrus spps. during monsoon season (Plate 102).
Improved crop cultivation practices in terms of balanced fertilization, improved varieties and timely availability of inputs were key factors for increasing production and profitability of pearl millet, cotton, castor and vegetable crops on 63 ha of land. Crop demonstration on these aspects were conducted on farmers' field (Plate 103).
Cenchrus setigerus
grass
Seeding pasture
Ploughing with MB plough
Plate 100: Gully plug structures in drainage line in Vejalpur – Rampura watershed
Plate 102: Seeding pasture grass in Ramosadi community land development in Vajalpur – Rampura watershed
Plate 101: Recharge filter in arable land in Vejalpur – Rampura watershed
Concise Report On Development And Management Of Model Watersheds Through Participatory Approach
52
Development and Management of Model Watersheds under New Guidelines
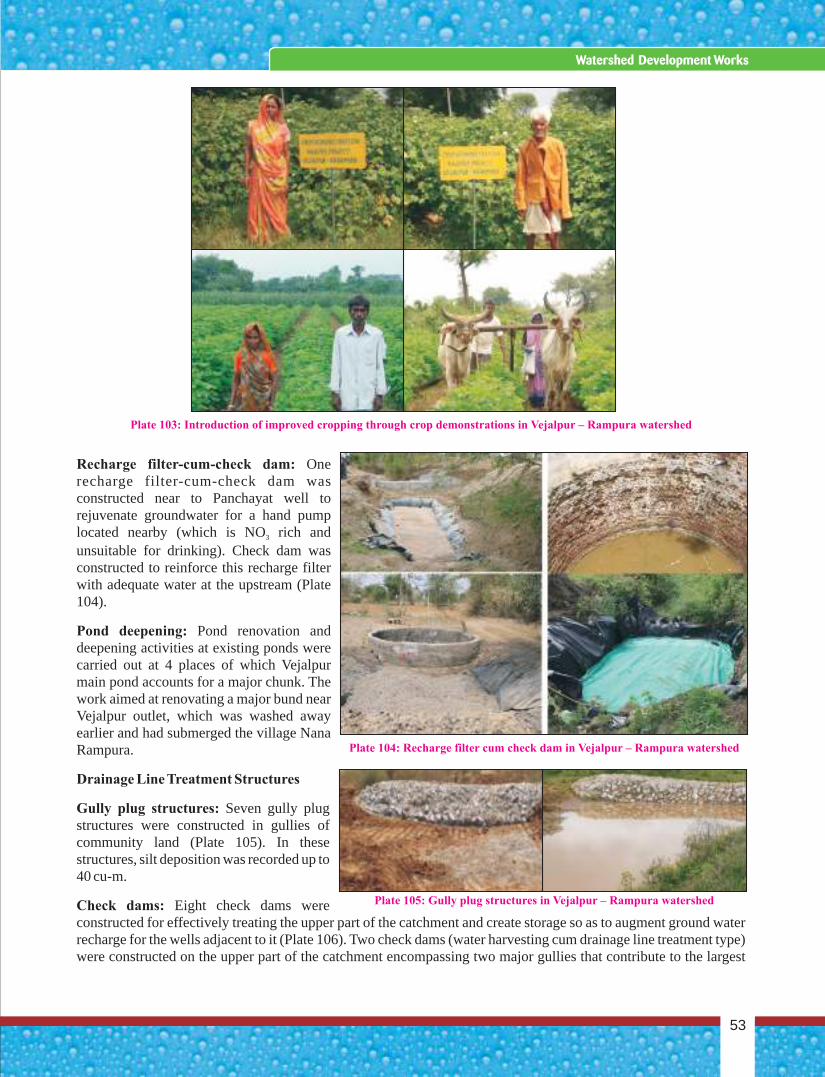
Recharge filter-cum-check dam: One recharge filter-cum-check dam was constructed near to Panchayat well to rejuvenate groundwater for a hand pump located nearby (which is NO rich and 3
unsuitable for drinking). Check dam was constructed to reinforce this recharge filter with adequate water at the upstream (Plate 104).
Pond deepening: Pond renovation and deepening activities at existing ponds were carried out at 4 places of which Vejalpur main pond accounts for a major chunk. The work aimed at renovating a major bund near Vejalpur outlet, which was washed away earlier and had submerged the village Nana Rampura.
Drainage Line Treatment Structures
Gully plug structures: Seven gully plug structures were constructed in gullies of community land (Plate 105). In these structures, silt deposition was recorded up to 40 cu-m.
Check dams: Eight check dams were constructed for effectively treating the upper part of the catchment and create storage so as to augment ground water recharge for the wells adjacent to it (Plate 106). Two check dams (water harvesting cum drainage line treatment type) were constructed on the upper part of the catchment encompassing two major gullies that contribute to the largest
Plate 103: Introduction of improved cropping through crop demonstrations in Vejalpur – Rampura watershed
Plate 105: Gully plug structures in Vejalpur – Rampura watershed
Plate 104: Recharge filter cum check dam in Vejalpur – Rampura watershed
53
Watershed Development Works
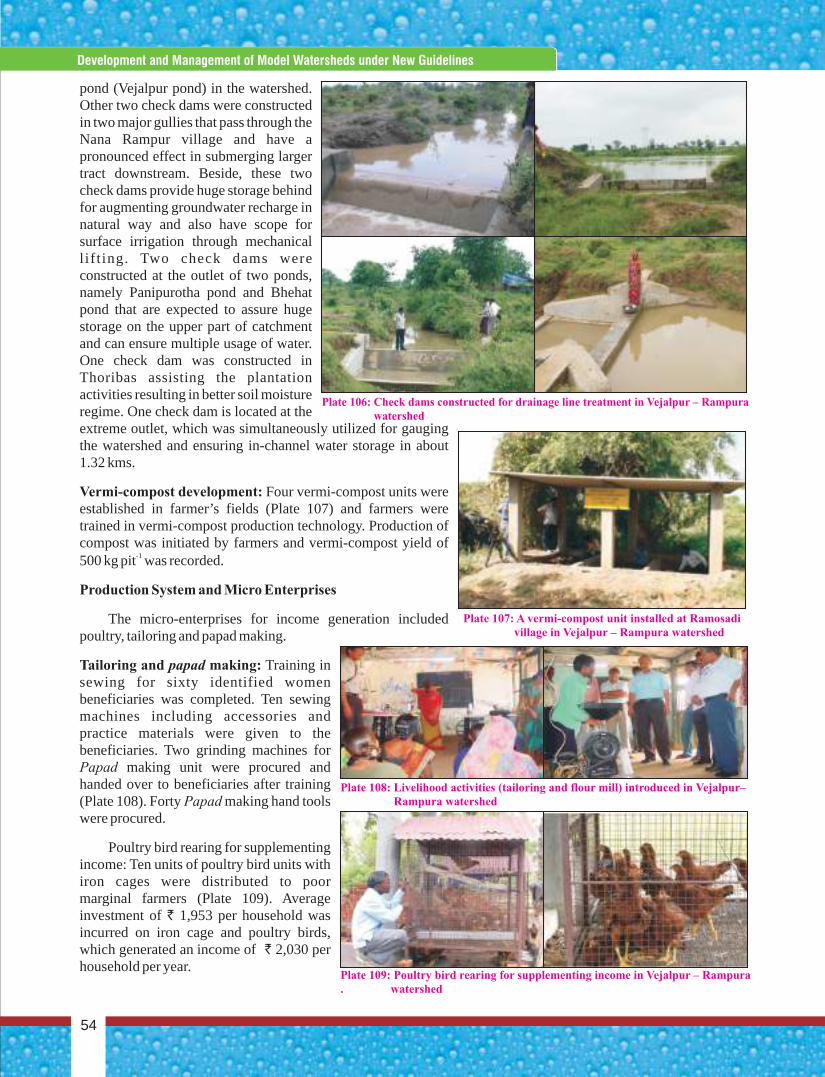
pond (Vejalpur pond) in the watershed. Other two check dams were constructed in two major gullies that pass through the Nana Rampur village and have a pronounced effect in submerging larger tract downstream. Beside, these two check dams provide huge storage behind for augmenting groundwater recharge in natural way and also have scope for surface irrigation through mechanical l if t ing. Two check dams were constructed at the outlet of two ponds, namely Panipurotha pond and Bhehat pond that are expected to assure huge storage on the upper part of catchment and can ensure multiple usage of water. One check dam was constructed in Thoribas assisting the plantation activities resulting in better soil moisture regime. One check dam is located at the extreme outlet, which was simultaneously utilized for gauging the watershed and ensuring in-channel water storage in about 1.32 kms.
Vermi-compost development: Four vermi-compost units were established in farmer’s fields (Plate 107) and farmers were trained in vermi-compost production technology. Production of compost was initiated by farmers and vermi-compost yield of
-1500 kg pit was recorded.
Production System and Micro Enterprises
The micro-enterprises for income generation included poultry, tailoring and papad making.
Tailoring and papad making: Training in sewing for sixty identified women beneficiaries was completed. Ten sewing machines including accessories and practice materials were given to the beneficiaries. Two grinding machines for Papad making unit were procured and handed over to beneficiaries after training (Plate 108). Forty Papad making hand tools were procured.
Poultry bird rearing for supplementing income: Ten units of poultry bird units with iron cages were distributed to poor marginal farmers (Plate 109). Average investment of ` 1,953 per household was incurred on iron cage and poultry birds, which generated an income of ` 2,030 per household per year.
Plate 106: Check dams constructed for drainage line treatment in Vejalpur – Rampura watershed
Plate 107: A vermi-compost unit installed at Ramosadi village in Vejalpur – Rampura watershed
Plate 109: Poultry bird rearing for supplementing income in Vejalpur – Rampura . watershed
Plate 108: Livelihood activities (tailoring and flour mill) introduced in Vejalpur– Rampura watershed
Concise Report On Development And Management Of Model Watersheds Through Participatory Approach
54
Development and Management of Model Watersheds under New Guidelines
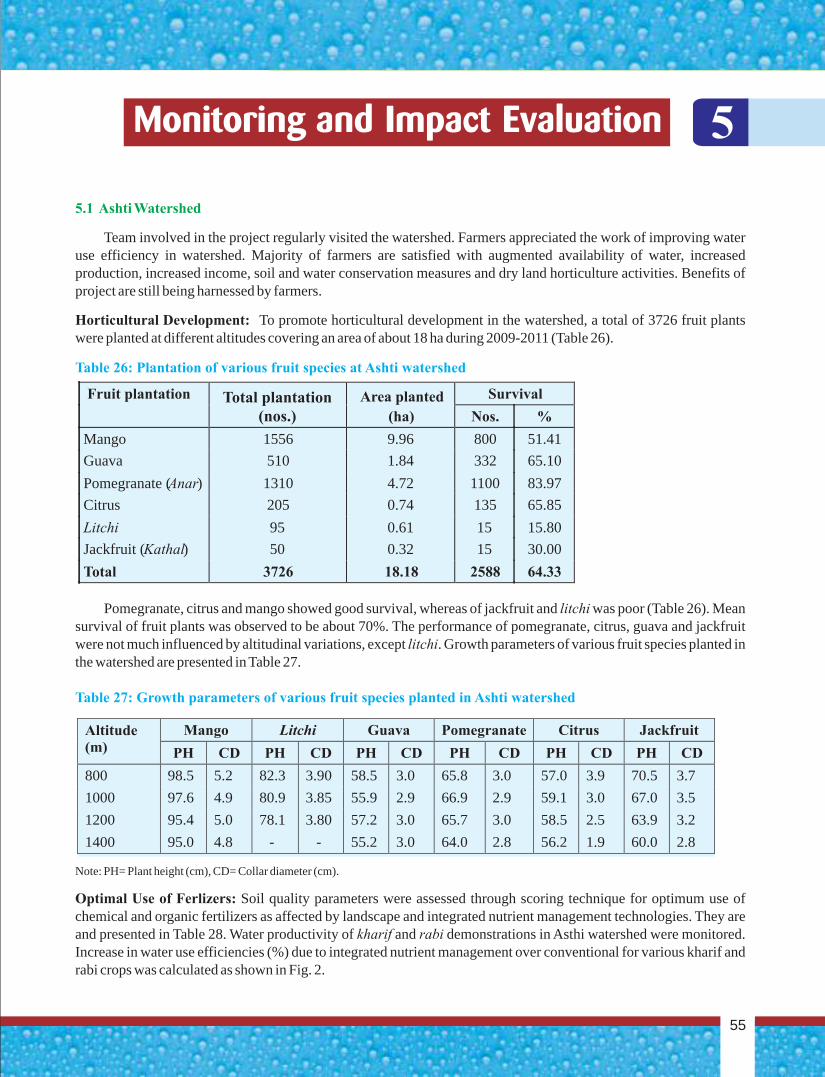
55
Monitoring and Impact Evaluation
5.1 Ashti Watershed
Team involved in the project regularly visited the watershed. Farmers appreciated the work of improving water use efficiency in watershed. Majority of farmers are satisfied with augmented availability of water, increased production, increased income, soil and water conservation measures and dry land horticulture activities. Benefits of project are still being harnessed by farmers.
Horticultural Development: To promote horticultural development in the watershed, a total of 3726 fruit plants were planted at different altitudes covering an area of about 18 ha during 2009-2011 (Table 26).
Pomegranate, citrus and mango showed good survival, whereas of jackfruit and litchi was poor (Table 26). Mean survival of fruit plants was observed to be about 70%. The performance of pomegranate, citrus, guava and jackfruit were not much influenced by altitudinal variations, except litchi. Growth parameters of various fruit species planted in the watershed are presented in Table 27.
Note: PH= Plant height (cm), CD= Collar diameter (cm).
Optimal Use of Ferlizers: Soil quality parameters were assessed through scoring technique for optimum use of chemical and organic fertilizers as affected by landscape and integrated nutrient management technologies. They are and presented in Table 28. Water productivity of kharif and rabi demonstrations in Asthi watershed were monitored. Increase in water use efficiencies (%) due to integrated nutrient management over conventional for various kharif and rabi crops was calculated as shown in Fig. 2.
Table 26: Plantation of various fruit species at Ashti watershed
Table 27: Growth parameters of various fruit species planted in Ashti watershed
Altitude (m)
Mango Litchi Guava Pomegranate Citrus Jackfruit
PH CD PH CD PH CD PH CD PH CD PH CD
800 98.5 5.2 82.3 3.90 58.5 3.0 65.8 3.0 57.0 3.9 70.5 3.7
1000 97.6 4.9 80.9 3.85 55.9 2.9 66.9 2.9 59.1 3.0 67.0 3.5
1200 95.4 5.0 78.1 3.80 57.2 3.0 65.7 3.0 58.5 2.5 63.9 3.2
1400 95.0 4.8 - - 55.2 3.0 64.0 2.8 56.2 1.9 60.0 2.8
Fruit plantation Total plantation (nos.)
Area planted (ha)
Survival
Nos. %
Mango 1556 9.96 800 51.41 Guava 510 1.84 332 65.10
Pomegranate (Anar) 1310 4.72 1100 83.97 Citrus 205 0.74 135 65.85
Litchi 95 0.61 15 15.80 Jackfruit (Kathal) 50 0.32 15 30.00
Total 3726 18.18 2588 64.33
5
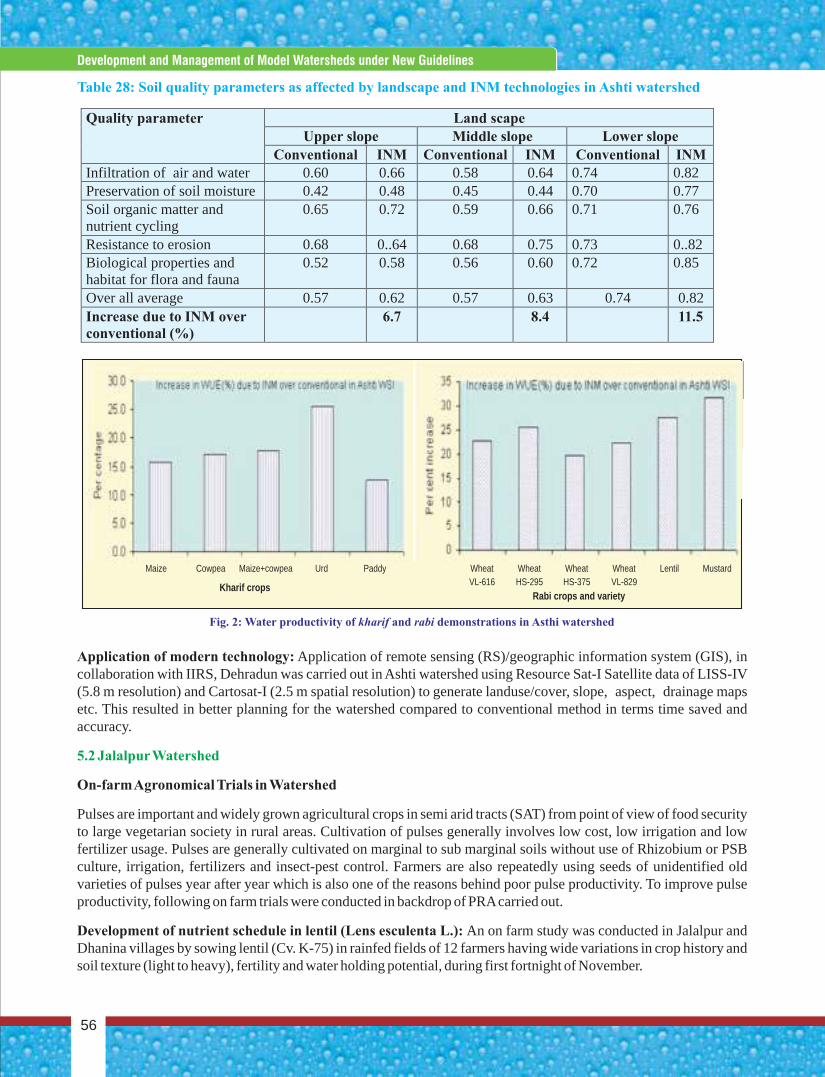
Application of modern technology: Application of remote sensing (RS)/geographic information system (GIS), in collaboration with IIRS, Dehradun was carried out in Ashti watershed using Resource Sat-I Satellite data of LISS-IV (5.8 m resolution) and Cartosat-I (2.5 m spatial resolution) to generate landuse/cover, slope, aspect, drainage maps etc. This resulted in better planning for the watershed compared to conventional method in terms time saved and accuracy.
On-farm Agronomical Trials in Watershed
Pulses are important and widely grown agricultural crops in semi arid tracts (SAT) from point of view of food security to large vegetarian society in rural areas. Cultivation of pulses generally involves low cost, low irrigation and low fertilizer usage. Pulses are generally cultivated on marginal to sub marginal soils without use of Rhizobium or PSB culture, irrigation, fertilizers and insect-pest control. Farmers are also repeatedly using seeds of unidentified old varieties of pulses year after year which is also one of the reasons behind poor pulse productivity. To improve pulse productivity, following on farm trials were conducted in backdrop of PRA carried out.
Development of nutrient schedule in lentil (Lens esculenta L.): An on farm study was conducted in Jalalpur and Dhanina villages by sowing lentil (Cv. K-75) in rainfed fields of 12 farmers having wide variations in crop history and soil texture (light to heavy), fertility and water holding potential, during first fortnight of November.
5.2 Jalalpur Watershed
Quality parameter Land scape Upper slope Middle slope Lower slope
Conventional INM Conventional INM Conventional INM Infiltration of air and water 0.60 0.66 0.58 0.64 0.74 0.82 Preservation of soil moisture 0.42 0.48 0.45 0.44 0.70 0.77 Soil organic matter and nutrient cycling
0.65 0.72 0.59 0.66 0.71 0.76
Resistance to erosion 0.68 0..64 0.68 0.75 0.73 0..82 Biological properties and habitat for flora and fauna
0.52 0.58 0.56 0.60 0.72 0.85
Over all average 0.57 0.62 0.57 0.63 0.74 0.82 Increase due to INM over conventional (%)
6.7 8.4 11.5
Table 28: Soil quality parameters as affected by landscape and INM technologies in Ashti watershed
Fig. 2: Water productivity of kharif and rabi demonstrations in Asthi watershed
Maize Cowpea Maize+cowpea Urd Paddy
Kharif crops
Wheat Wheat Wheat Wheat Lentil MustardVL-616 HS-295 HS-375 VL-829
Rabi crops and variety
Concise Report On Development And Management Of Model Watersheds Through Participatory Approach
56
Development and Management of Model Watersheds under New Guidelines
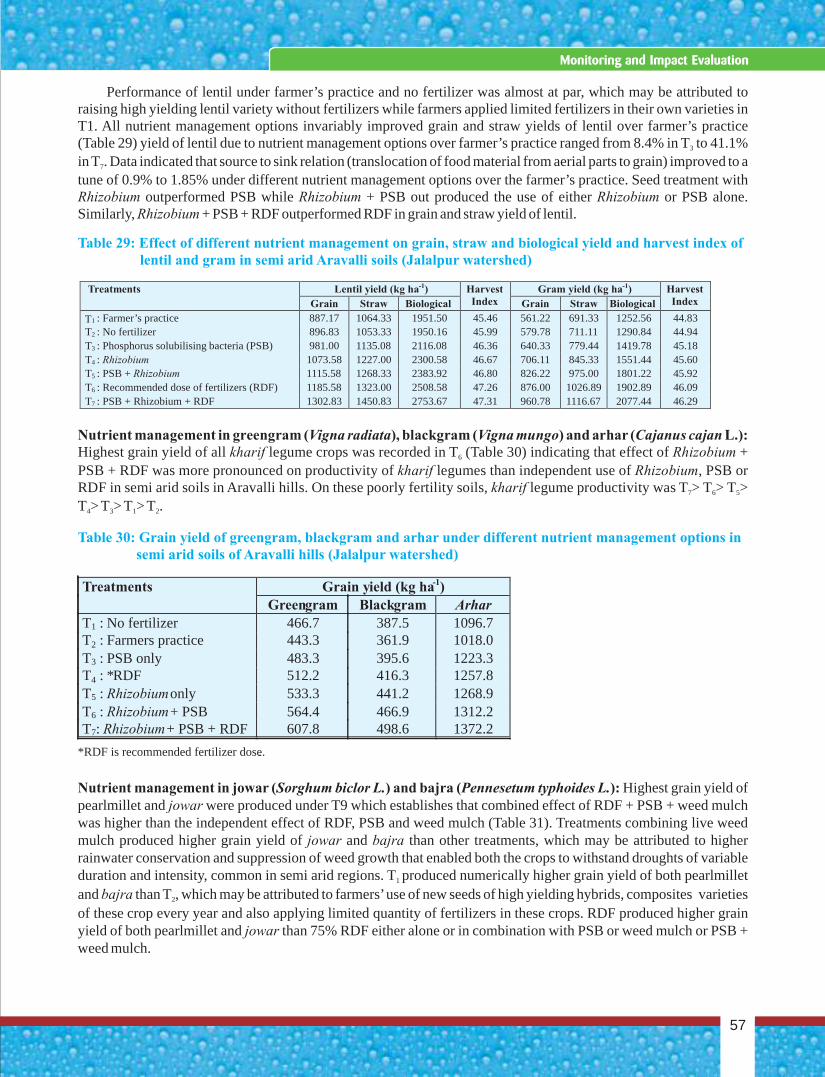
Performance of lentil under farmer’s practice and no fertilizer was almost at par, which may be attributed to raising high yielding lentil variety without fertilizers while farmers applied limited fertilizers in their own varieties in T1. All nutrient management options invariably improved grain and straw yields of lentil over farmer’s practice (Table 29) yield of lentil due to nutrient management options over farmer’s practice ranged from 8.4% in T to 41.1% 3
in T . Data indicated that source to sink relation (translocation of food material from aerial parts to grain) improved to a 7
tune of 0.9% to 1.85% under different nutrient management options over the farmer’s practice. Seed treatment with Rhizobium outperformed PSB while Rhizobium + PSB out produced the use of either Rhizobium or PSB alone. Similarly, Rhizobium + PSB + RDF outperformed RDF in grain and straw yield of lentil.
Nutrient management in greengram (Vigna radiata), blackgram (Vigna mungo) and arhar (Cajanus cajan L.): Highest grain yield of all kharif legume crops was recorded in T (Table 30) indicating that effect of Rhizobium + 6
PSB + RDF was more pronounced on productivity of kharif legumes than independent use of Rhizobium, PSB or RDF in semi arid soils in Aravalli hills. On these poorly fertility soils, kharif legume productivity was T > T > T > 7 6 5
T > T > T > T . 4 3 1 2
Nutrient management in jowar (Sorghum biclor L.) and bajra (Pennesetum typhoides L.): Highest grain yield of pearlmillet and jowar were produced under T9 which establishes that combined effect of RDF + PSB + weed mulch was higher than the independent effect of RDF, PSB and weed mulch (Table 31). Treatments combining live weed mulch produced higher grain yield of jowar and bajra than other treatments, which may be attributed to higher rainwater conservation and suppression of weed growth that enabled both the crops to withstand droughts of variable duration and intensity, common in semi arid regions. T produced numerically higher grain yield of both pearlmillet 1
and bajra than T , which may be attributed to farmers’ use of new seeds of high yielding hybrids, composites varieties 2
of these crop every year and also applying limited quantity of fertilizers in these crops. RDF produced higher grain yield of both pearlmillet and jowar than 75% RDF either alone or in combination with PSB or weed mulch or PSB + weed mulch.
Table 29: Effect of different nutrient management on grain, straw and biological yield and harvest index of lentil and gram in semi arid Aravalli soils (Jalalpur watershed)
Table 30: Grain yield of greengram, blackgram and arhar under different nutrient management options in semi arid soils of Aravalli hills (Jalalpur watershed)
*RDF is recommended fertilizer dose..
Treatments Grain yield (kg ha-1)
Greengram Blackgram Arhar T1 : No fertilizer 466.7 387.5 1096.7 T2 : Farmers practice 443.3 361.9 1018.0 T3 : PSB only 483.3 395.6 1223.3 T4 : *RDF 512.2 416.3 1257.8 T5 : Rhizobium only 533.3 441.2 1268.9 T6 : Rhizobium + PSB 564.4 466.9 1312.2 T7: Rhizobium + PSB + RDF 607.8 498.6 1372.2
Treatments Lentil yield (kg ha-1) Harvest Index
Gram yield (kg ha-1) Harvest Index Grain Straw Biological Grain Straw Biological
T1 : Farmer’s practice 887.17 1064.33 1951.50 45.46 561.22 691.33 1252.56 44.83 T2 : No fertilizer 896.83 1053.33 1950.16 45.99 579.78 711.11 1290.84 44.94 T3 : Phosphorus solubilising bacteria (PSB) 981.00 1135.08 2116.08 46.36 640.33 779.44 1419.78 45.18 T4 : Rhizobium 1073.58 1227.00 2300.58 46.67 706.11 845.33 1551.44 45.60 T5 : PSB + Rhizobium 1115.58 1268.33 2383.92 46.80 826.22 975.00 1801.22 45.92 T6 : Recommended dose of fertilizers (RDF) 1185.58 1323.00 2508.58 47.26 876.00 1026.89 1902.89 46.09 T7 : PSB + Rhizobium + RDF 1302.83 1450.83 2753.67 47.31 960.78 1116.67 2077.44 46.29
57
Monitoring and Impact Evaluation
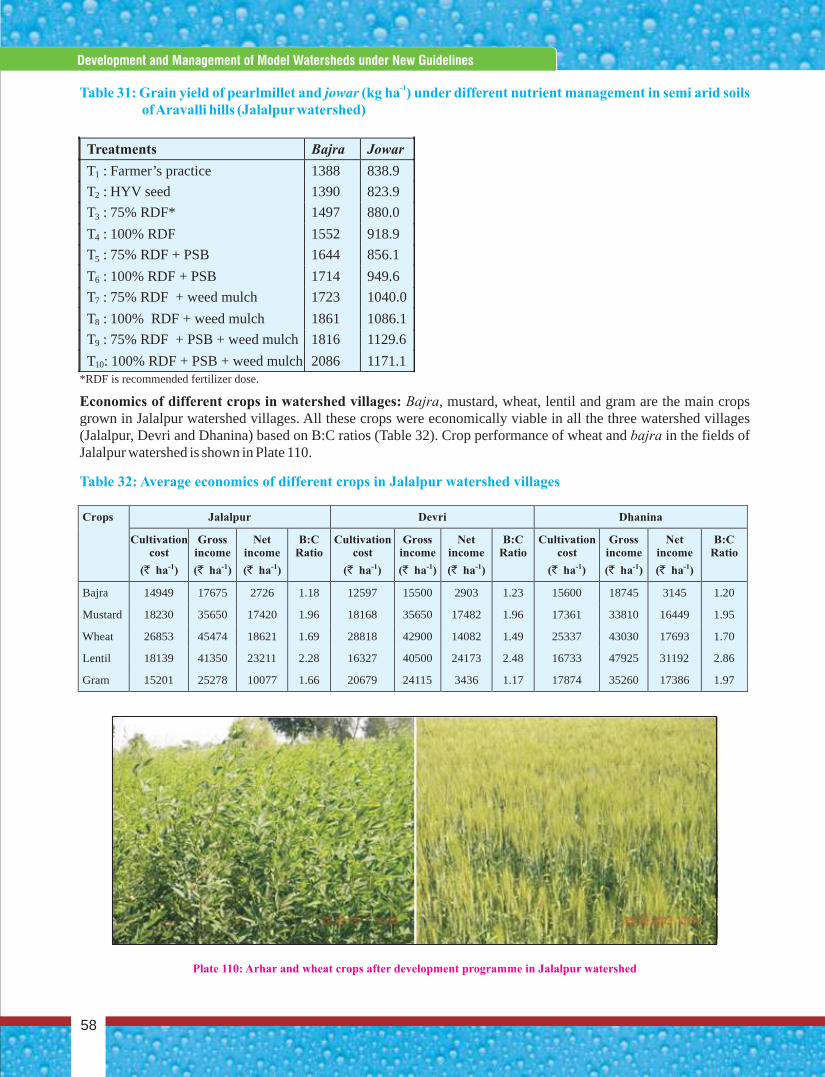
-1Table 31: Grain yield of pearlmillet and jowar (kg ha ) under different nutrient management in semi arid soils
of Aravalli hills (Jalalpur watershed)
Table 32: Average economics of different crops in Jalalpur watershed villages
Economics of different crops in watershed villages: Bajra, mustard, wheat, lentil and gram are the main crops grown in Jalalpur watershed villages. All these crops were economically viable in all the three watershed villages (Jalalpur, Devri and Dhanina) based on B:C ratios (Table 32). Crop performance of wheat and bajra in the fields of Jalalpur watershed is shown in Plate 110.
Plate 110: Arhar and wheat crops after development programme in Jalalpur watershed
Crops Jalalpur Devri Dhanina
Cultivation cost
(` ha-1)
Gross income
(` ha-1)
Net income
( ha-1)
B:C Ratio
Cultivation cost
( ha-1)
Gross income
(` ha-1)
Net income
(` ha-1)
B:C Ratio
Cultivation cost
(` ha-1)
Gross income
(` ha-1)
Net income
(` ha-1)
B:C Ratio
Bajra
14949
17675
2726
1.18
12597
15500
2903
1.23
15600
18745
3145
1.20
Mustard
18230
35650
17420
1.96
18168
35650
17482
1.96
17361
33810
16449
1.95
Wheat
26853
45474
18621
1.69
28818
42900
14082
1.49
25337
43030
17693
1.70
Lentil
18139
41350
23211
2.28
16327
40500
24173
2.48
16733
47925
31192
2.86
Gram
15201
25278
10077
1.66
20679
24115
3436
1.17
17874
35260
17386
1.97
Treatments Bajra Jowar
T1 : Farmer’s practice 1388 838.9 T2 : HYV seed 1390 823.9 T3 : 75% RDF* 1497 880.0 T4 : 100% RDF 1552 918.9 T5 : 75% RDF + PSB 1644 856.1 T6 : 100% RDF + PSB 1714 949.6 T7 : 75% RDF + weed mulch 1723 1040.0 T8
: 100% RDF + weed mulch
1861
1086.1
T9 : 75% RDF + PSB + weed mulch
1816
1129.6
T10: 100% RDF + PSB + weed mulch
2086
1171.1
*RDF is recommended fertilizer dose.
Concise Report On Development And Management Of Model Watersheds Through Participatory Approach
58
Development and Management of Model Watersheds under New Guidelines
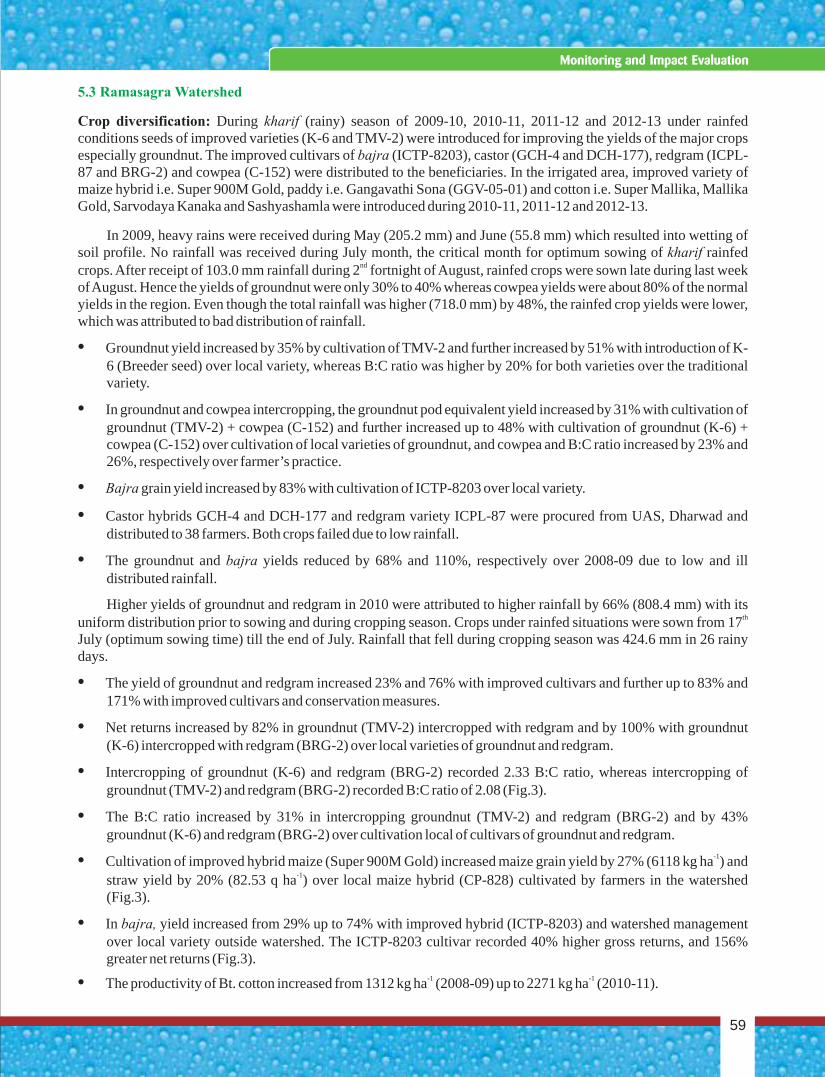
5.3 Ramasagra Watershed
Crop diversification: During kharif (rainy) season of 2009-10, 2010-11, 2011-12 and 2012-13 under rainfed conditions seeds of improved varieties (K-6 and TMV-2) were introduced for improving the yields of the major crops especially groundnut. The improved cultivars of bajra (ICTP-8203), castor (GCH-4 and DCH-177), redgram (ICPL-87 and BRG-2) and cowpea (C-152) were distributed to the beneficiaries. In the irrigated area, improved variety of maize hybrid i.e. Super 900M Gold, paddy i.e. Gangavathi Sona (GGV-05-01) and cotton i.e. Super Mallika, Mallika Gold, Sarvodaya Kanaka and Sashyashamla were introduced during 2010-11, 2011-12 and 2012-13.
In 2009, heavy rains were received during May (205.2 mm) and June (55.8 mm) which resulted into wetting of soil profile. No rainfall was received during July month, the critical month for optimum sowing of kharif rainfed
ndcrops. After receipt of 103.0 mm rainfall during 2 fortnight of August, rainfed crops were sown late during last week of August. Hence the yields of groundnut were only 30% to 40% whereas cowpea yields were about 80% of the normal yields in the region. Even though the total rainfall was higher (718.0 mm) by 48%, the rainfed crop yields were lower, which was attributed to bad distribution of rainfall.
• Groundnut yield increased by 35% by cultivation of TMV-2 and further increased by 51% with introduction of K-6 (Breeder seed) over local variety, whereas B:C ratio was higher by 20% for both varieties over the traditional variety.
• In groundnut and cowpea intercropping, the groundnut pod equivalent yield increased by 31% with cultivation of groundnut (TMV-2) + cowpea (C-152) and further increased up to 48% with cultivation of groundnut (K-6) + cowpea (C-152) over cultivation of local varieties of groundnut, and cowpea and B:C ratio increased by 23% and 26%, respectively over farmer’s practice.
• Bajra grain yield increased by 83% with cultivation of ICTP-8203 over local variety.
• Castor hybrids GCH-4 and DCH-177 and redgram variety ICPL-87 were procured from UAS, Dharwad and distributed to 38 farmers. Both crops failed due to low rainfall.
• The groundnut and bajra yields reduced by 68% and 110%, respectively over 2008-09 due to low and ill distributed rainfall.
Higher yields of groundnut and redgram in 2010 were attributed to higher rainfall by 66% (808.4 mm) with its thuniform distribution prior to sowing and during cropping season. Crops under rainfed situations were sown from 17
July (optimum sowing time) till the end of July. Rainfall that fell during cropping season was 424.6 mm in 26 rainy days.
• The yield of groundnut and redgram increased 23% and 76% with improved cultivars and further up to 83% and 171% with improved cultivars and conservation measures.
• Net returns increased by 82% in groundnut (TMV-2) intercropped with redgram and by 100% with groundnut (K-6) intercropped with redgram (BRG-2) over local varieties of groundnut and redgram.
• Intercropping of groundnut (K-6) and redgram (BRG-2) recorded 2.33 B:C ratio, whereas intercropping of groundnut (TMV-2) and redgram (BRG-2) recorded B:C ratio of 2.08 (Fig.3).
• The B:C ratio increased by 31% in intercropping groundnut (TMV-2) and redgram (BRG-2) and by 43% groundnut (K-6) and redgram (BRG-2) over cultivation local of cultivars of groundnut and redgram.
-1• Cultivation of improved hybrid maize (Super 900M Gold) increased maize grain yield by 27% (6118 kg ha ) and -1straw yield by 20% (82.53 q ha ) over local maize hybrid (CP-828) cultivated by farmers in the watershed
(Fig.3).
• In bajra, yield increased from 29% up to 74% with improved hybrid (ICTP-8203) and watershed management over local variety outside watershed. The ICTP-8203 cultivar recorded 40% higher gross returns, and 156% greater net returns (Fig.3).
-1 -1• The productivity of Bt. cotton increased from 1312 kg ha (2008-09) up to 2271 kg ha (2010-11).
59
Monitoring and Impact Evaluation
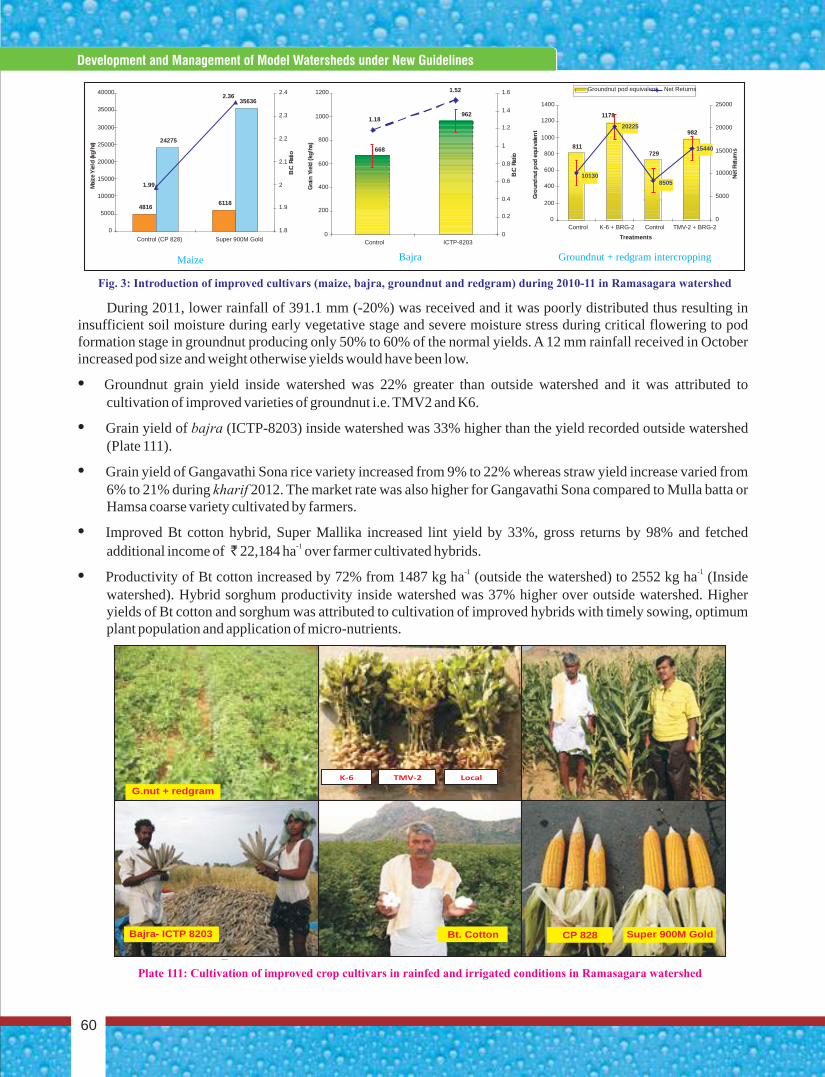
48166118
24275
35636
1.99
2.36
0
5000
10000
15000
20000
25000
30000
35000
40000
Control (CP 828) Super 900M Gold
Mai
zeY
ield
(kg/
ha)
1.8
1.9
2
2.1
2.2
2.3
2.4
B:C
Ratio
668
9621.18
1.52
0
200
400
600
800
1000
1200
Control ICTP-8203
Gra
inYi
eld
(kg/
ha)
0
0.2
0.4
0.6
0.8
1
1.2
1.4
1.6
B:C
Ratio
811729
982
1178
15440
10130
20225
8505
0
200
400
600
800
1000
1200
1400
Control K-6 + BRG-2 Control TMV-2 + BRG-2
Treatments
Gro
und
nutp
odeq
uiva
len
t
0
5000
10000
15000
20000
25000
Net
Ret
urn
s
Groundnut pod equivalent Net Returns
G.nut + redgram
ICTP 8203Bajra- Super 900M GoldCP 828Bt. Cotton
K-6 TMV-2 Local
Groundnut + redgram intercropping
Fig. 3: Introduction of improved cultivars (maize, bajra, groundnut and redgram) during 2010-11 in Ramasagara watershed
Maize Bajra
Plate 111: Cultivation of improved crop cultivars in rainfed and irrigated conditions in Ramasagara watershed
During 2011, lower rainfall of 391.1 mm (-20%) was received and it was poorly distributed thus resulting in insufficient soil moisture during early vegetative stage and severe moisture stress during critical flowering to pod formation stage in groundnut producing only 50% to 60% of the normal yields. A 12 mm rainfall received in October increased pod size and weight otherwise yields would have been low.
• Groundnut grain yield inside watershed was 22% greater than outside watershed and it was attributed to cultivation of improved varieties of groundnut i.e. TMV2 and K6.
• Grain yield of bajra (ICTP-8203) inside watershed was 33% higher than the yield recorded outside watershed (Plate 111).
• Grain yield of Gangavathi Sona rice variety increased from 9% to 22% whereas straw yield increase varied from 6% to 21% during kharif 2012. The market rate was also higher for Gangavathi Sona compared to Mulla batta or Hamsa coarse variety cultivated by farmers.
• Improved Bt cotton hybrid, Super Mallika increased lint yield by 33%, gross returns by 98% and fetched additional income of 22,184 ha over farmer cultivated hybrids.
-1 -1• Productivity of Bt cotton increased by 72% from 1487 kg ha (outside the watershed) to 2552 kg ha (Inside watershed). Hybrid sorghum productivity inside watershed was 37% higher over outside watershed. Higher yields of Bt cotton and sorghum was attributed to cultivation of improved hybrids with timely sowing, optimum plant population and application of micro-nutrients.
-1
Concise Report On Development And Management Of Model Watersheds Through Participatory Approach
60
Development and Management of Model Watersheds under New Guidelines
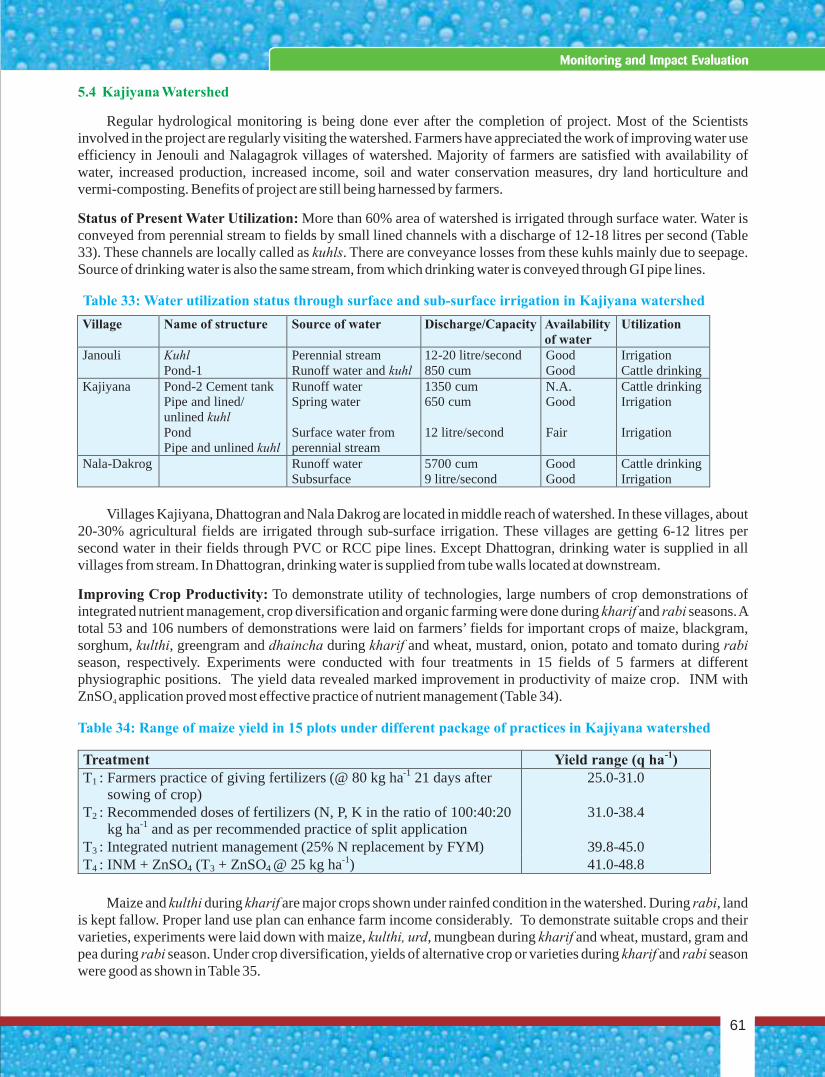
5.4 Kajiyana Watershed
Regular hydrological monitoring is being done ever after the completion of project. Most of the Scientists involved in the project are regularly visiting the watershed. Farmers have appreciated the work of improving water use efficiency in Jenouli and Nalagagrok villages of watershed. Majority of farmers are satisfied with availability of water, increased production, increased income, soil and water conservation measures, dry land horticulture and vermi-composting. Benefits of project are still being harnessed by farmers.
Status of Present Water Utilization: More than 60% area of watershed is irrigated through surface water. Water is conveyed from perennial stream to fields by small lined channels with a discharge of 12-18 litres per second (Table 33). These channels are locally called as kuhls. There are conveyance losses from these kuhls mainly due to seepage. Source of drinking water is also the same stream, from which drinking water is conveyed through GI pipe lines.
Villages Kajiyana, Dhattogran and Nala Dakrog are located in middle reach of watershed. In these villages, about 20-30% agricultural fields are irrigated through sub-surface irrigation. These villages are getting 6-12 litres per second water in their fields through PVC or RCC pipe lines. Except Dhattogran, drinking water is supplied in all villages from stream. In Dhattogran, drinking water is supplied from tube walls located at downstream.
Improving Crop Productivity: To demonstrate utility of technologies, large numbers of crop demonstrations of integrated nutrient management, crop diversification and organic farming were done during kharif and rabi seasons. A total 53 and 106 numbers of demonstrations were laid on farmers’ fields for important crops of maize, blackgram, sorghum, kulthi, greengram and dhaincha during kharif and wheat, mustard, onion, potato and tomato during rabi season, respectively. Experiments were conducted with four treatments in 15 fields of 5 farmers at different physiographic positions. The yield data revealed marked improvement in productivity of maize crop. INM with ZnSO application proved most effective practice of nutrient management (Table 34).4
Maize and kulthi during kharif are major crops shown under rainfed condition in the watershed. During rabi, land is kept fallow. Proper land use plan can enhance farm income considerably. To demonstrate suitable crops and their varieties, experiments were laid down with maize, kulthi, urd, mungbean during kharif and wheat, mustard, gram and pea during rabi season. Under crop diversification, yields of alternative crop or varieties during kharif and rabi season were good as shown in Table 35.
Table 34: Range of maize yield in 15 plots under different package of practices in Kajiyana watershed
Village Name of structure Source of water Discharge/Capacity Availability of water
Utilization
Janouli
Kuhl Pond-1
Perennial stream Runoff water and kuhl
12-20 litre/second 850 cum
Good Good
Irrigation Cattle drinking
Kajiyana
Pond-2 Cement tank Pipe and lined/ unlined kuhl Pond Pipe and unlined kuhl
Runoff water Spring water Surface water from perennial stream
1350 cum 650 cum 12 litre/second
N.A. Good Fair
Cattle drinking Irrigation Irrigation
Nala-Dakrog Runoff water Subsurface
5700 cum 9 litre/second
Good Good
Cattle drinking Irrigation
Treatment Yield range (q ha-1) T1 : Farmers practice of giving fertilizers (@ 80 kg ha-1 21 days after
sowing of crop) 25.0-31.0
T2 : Recommended doses of fertilizers (N, P, K in the ratio of 100:40:20 kg ha-1 and as per recommended practice of split application
31.0-38.4
T3 : Integrated nutrient management (25% N replacement by FYM) 39.8-45.0 T4 : INM + ZnSO4 (T3 + ZnSO4 @ 25 kg ha-1) 41.0-48.8
Table 33: Water utilization status through surface and sub-surface irrigation in Kajiyana watershed
61
Monitoring and Impact Evaluation
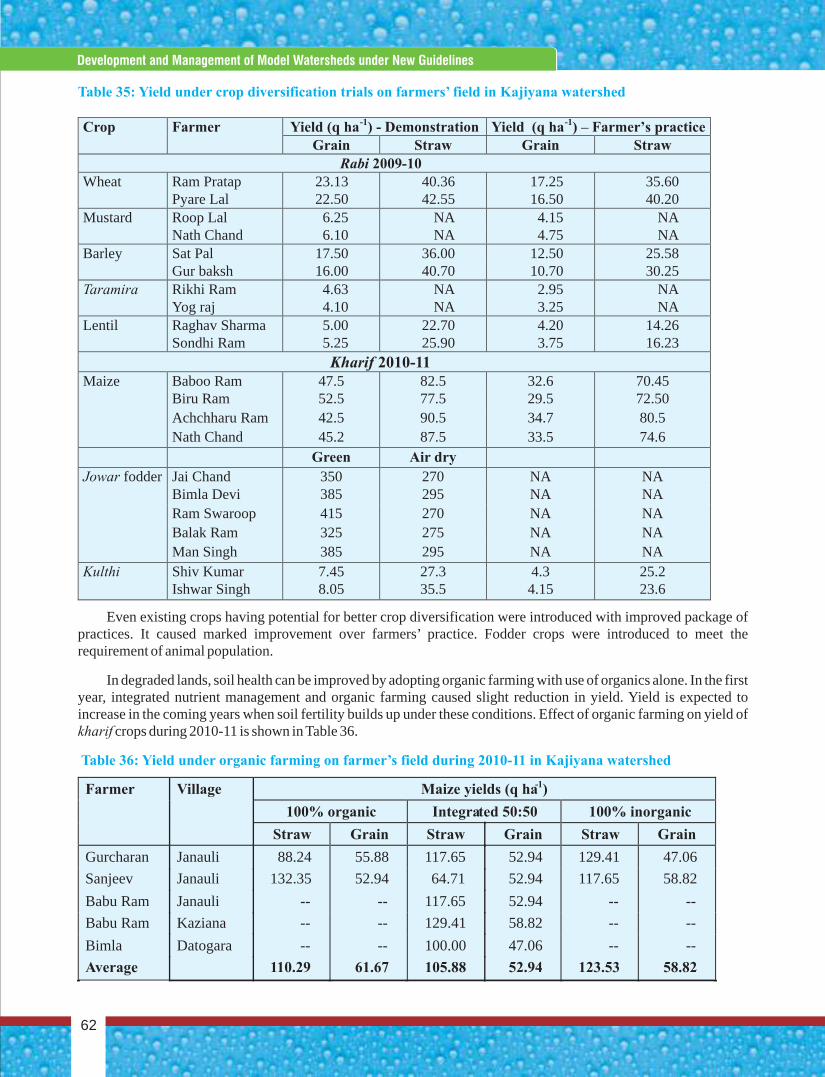
Table 35: Yield under crop diversification trials on farmers’ field in Kajiyana watershed
Table 36: Yield under organic farming on farmer’s field during 2010-11 in Kajiyana watershed
Even existing crops having potential for better crop diversification were introduced with improved package of practices. It caused marked improvement over farmers’ practice. Fodder crops were introduced to meet the requirement of animal population.
In degraded lands, soil health can be improved by adopting organic farming with use of organics alone. In the first year, integrated nutrient management and organic farming caused slight reduction in yield. Yield is expected to increase in the coming years when soil fertility builds up under these conditions. Effect of organic farming on yield of kharif crops during 2010-11 is shown in Table 36.
Crop Farmer Yield (q ha-1) - Demonstration Yield (q ha-1) – Farmer’s practice Grain Straw Grain Straw
Rabi 2009-10 Wheat Ram Pratap 23.13 40.36 17.25 35.60 Pyare Lal 22.50 42.55 16.50 40.20 Mustard Roop Lal 6.25 NA 4.15 NA Nath Chand 6.10 NA 4.75 NA Barley Sat Pal 17.50 36.00 12.50 25.58 Gur baksh 16.00 40.70 10.70 30.25 Taramira Rikhi Ram 4.63 NA 2.95 NA Yog raj 4.10 NA 3.25 NA Lentil Raghav Sharma 5.00 22.70 4.20 14.26 Sondhi Ram 5.25 25.90 3.75 16.23
Kharif 2010-11 Maize Baboo Ram 47.5 82.5 32.6 70.45 Biru Ram 52.5 77.5 29.5 72.50 Achchharu Ram 42.5 90.5 34.7 80.5 Nath Chand 45.2 87.5 33.5 74.6 Green Air dry Jowar fodder Jai Chand 350 270 NA NA Bimla Devi 385 295 NA NA Ram Swaroop 415 270 NA NA Balak Ram 325 275 NA NA Man Singh 385 295 NA NA Kulthi Shiv Kumar 7.45 27.3 4.3 25.2 Ishwar Singh 8.05 35.5 4.15 23.6
Farmer Village Maize yields (q ha-1)
100% organic Integrated 50:50 100% inorganic
Straw Grain Straw Grain Straw Grain
Gurcharan Janauli 88.24 55.88 117.65 52.94 129.41 47.06 Sanjeev Janauli 132.35 52.94 64.71 52.94 117.65 58.82
Babu Ram Janauli -- -- 117.65 52.94 -- -- Babu Ram Kaziana -- -- 129.41 58.82 -- --
Bimla Datogara -- -- 100.00 47.06 -- -- Average 110.29 61.67 105.88 52.94 123.53 58.82
Concise Report On Development And Management Of Model Watersheds Through Participatory Approach
62
Development and Management of Model Watersheds under New Guidelines
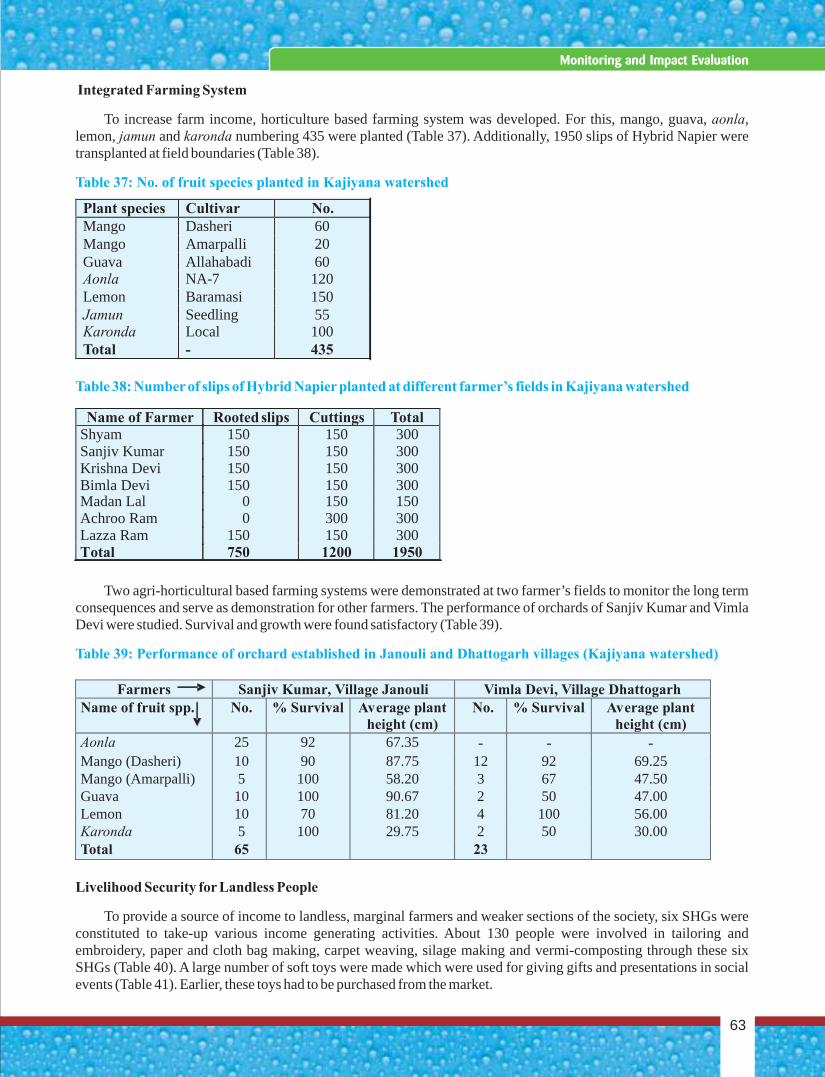
Integrated Farming System
To increase farm income, horticulture based farming system was developed. For this, mango, guava, aonla, lemon, jamun and karonda numbering 435 were planted (Table 37). Additionally, 1950 slips of Hybrid Napier were transplanted at field boundaries (Table 38).
Two agri-horticultural based farming systems were demonstrated at two farmer’s fields to monitor the long term consequences and serve as demonstration for other farmers. The performance of orchards of Sanjiv Kumar and Vimla Devi were studied. Survival and growth were found satisfactory (Table 39).
Livelihood Security for Landless People
To provide a source of income to landless, marginal farmers and weaker sections of the society, six SHGs were constituted to take-up various income generating activities. About 130 people were involved in tailoring and embroidery, paper and cloth bag making, carpet weaving, silage making and vermi-composting through these six SHGs (Table 40). A large number of soft toys were made which were used for giving gifts and presentations in social events (Table 41). Earlier, these toys had to be purchased from the market.
Table 37: No. of fruit species planted in Kajiyana watershed
Table 38: Number of slips of Hybrid Napier planted at different farmer’s fields in Kajiyana watershed
Table 39: Performance of orchard established in Janouli and Dhattogarh villages (Kajiyana watershed)
Plant species Cultivar No. Mango Dasheri 60 Mango Amarpalli 20 Guava Allahabadi 60 Aonla NA-7 120 Lemon Baramasi 150 Jamun Seedling 55 Karonda Local 100 Total - 435
Name of Farmer Rooted slips Cuttings Total Shyam 150 150 300 Sanjiv Kumar 150 150 300 Krishna Devi 150 150 300 Bimla Devi 150 150 300 Madan Lal 0 150 150 Achroo Ram 0 300 300 Lazza Ram 150 150 300 Total 750 1200 1950
Farmers Sanjiv Kumar, Village Janouli Vimla Devi, Village Dhattogarh Name of fruit spp. No. % Survival Average plant
height (cm) No. % Survival Average plant
height (cm) Aonla 25 92 67.35 - - - Mango (Dasheri) 10 90 87.75 12 92 69.25 Mango (Amarpalli) 5 100 58.20 3 67 47.50 Guava 10 100 90.67 2 50 47.00 Lemon 10 70 81.20 4 100 56.00 Karonda 5 100 29.75 2 50 30.00 Total 65 23
63
Monitoring and Impact Evaluation
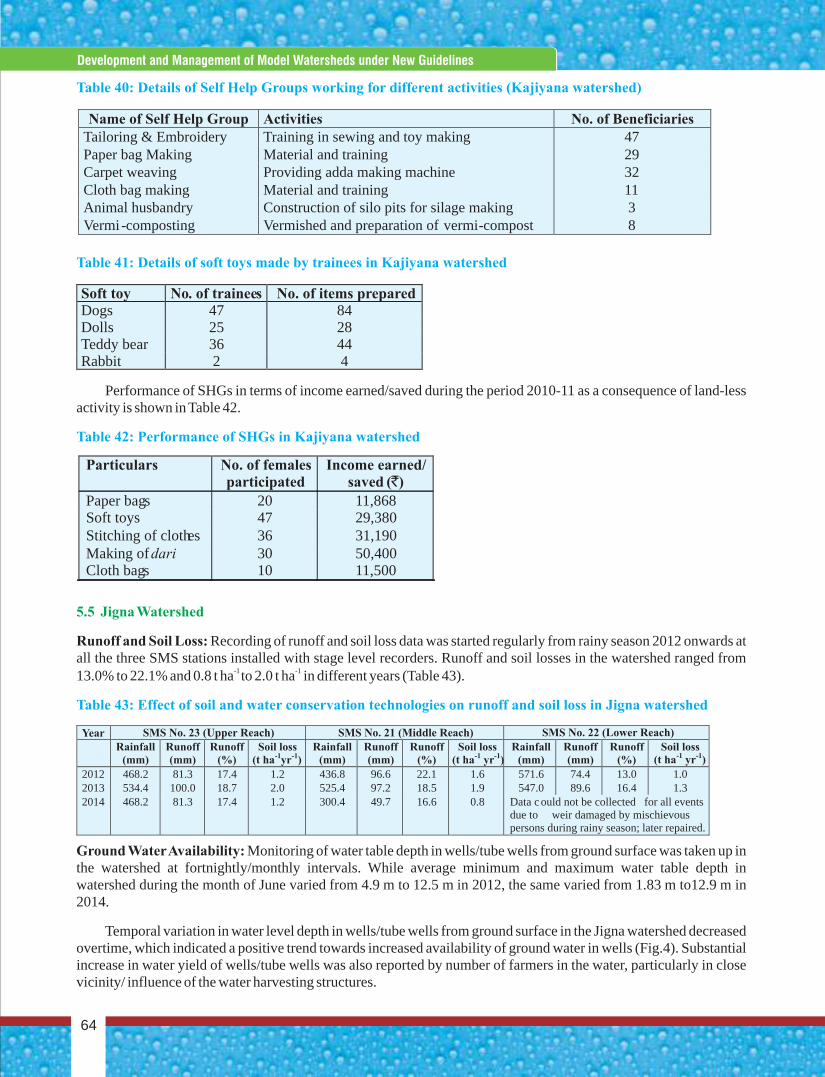
Table 40: Details of Self Help Groups working for different activities (Kajiyana watershed)
Table 41: Details of soft toys made by trainees in Kajiyana watershed
Table 42: Performance of SHGs in Kajiyana watershed
Table 43: Effect of soil and water conservation technologies on runoff and soil loss in Jigna watershed
Performance of SHGs in terms of income earned/saved during the period 2010-11 as a consequence of land-less activity is shown in Table 42.
Runoff and Soil Loss: Recording of runoff and soil loss data was started regularly from rainy season 2012 onwards at all the three SMS stations installed with stage level recorders. Runoff and soil losses in the watershed ranged from
-1 -113.0% to 22.1% and 0.8 t ha to 2.0 t ha in different years (Table 43).
Ground Water Availability: Monitoring of water table depth in wells/tube wells from ground surface was taken up in the watershed at fortnightly/monthly intervals. While average minimum and maximum water table depth in watershed during the month of June varied from 4.9 m to 12.5 m in 2012, the same varied from 1.83 m to12.9 m in 2014.
Temporal variation in water level depth in wells/tube wells from ground surface in the Jigna watershed decreased overtime, which indicated a positive trend towards increased availability of ground water in wells (Fig.4). Substantial increase in water yield of wells/tube wells was also reported by number of farmers in the water, particularly in close vicinity/ influence of the water harvesting structures.
5.5 Jigna Watershed
Name of Self Help Group Activities No. of Beneficiaries Tailoring & Embroidery Training in sewing and toy making 47 Paper bag Making Material and training 29 Carpet weaving Providing adda making machine 32 Cloth bag making Material and training 11 Animal husbandry Construction of silo pits for silage making 3 Vermi-composting Vermished and preparation of vermi-compost 8
Soft toy No. of trainees No. of items prepared Dogs 47 84 Dolls 25 28 Teddy bear 36 44 Rabbit 2 4
Particulars No. of females participated
Income earned/ saved (`)
Paper bags 20 11,868 Soft toys 47 29,380 Stitching of clothes 36 31,190 Making of dari 30 50,400 Cloth bags 10 11,500
Year SMS No. 23 (Upper Reach) SMS No. 21 (Middle Reach) SMS No. 22 (Lower Reach)
Rainfall (mm)
Runoff (mm)
Runoff (%)
Soil loss (t ha-1yr-1)
Rainfall (mm)
Runoff (mm)
Runoff (%)
Soil loss (t ha-1 yr-1)
Rainfall (mm)
Runoff (mm)
Runoff (%)
Soil loss (t ha-1 yr-1)
2012 468.2 81.3 17.4 1.2 436.8 96.6 22.1 1.6 571.6 74.4 13.0 1.0 2013 534.4 100.0 18.7 2.0 525.4 97.2 18.5 1.9 547.0 89.6 16.4 1.3 2014 468.2 81.3 17.4 1.2 300.4 49.7 16.6 0.8 Data c ould not be collected for all events
due to weir damaged by mischievous persons during rainy season; later repaired.
Concise Report On Development And Management Of Model Watersheds Through Participatory Approach
64
Development and Management of Model Watersheds under New Guidelines
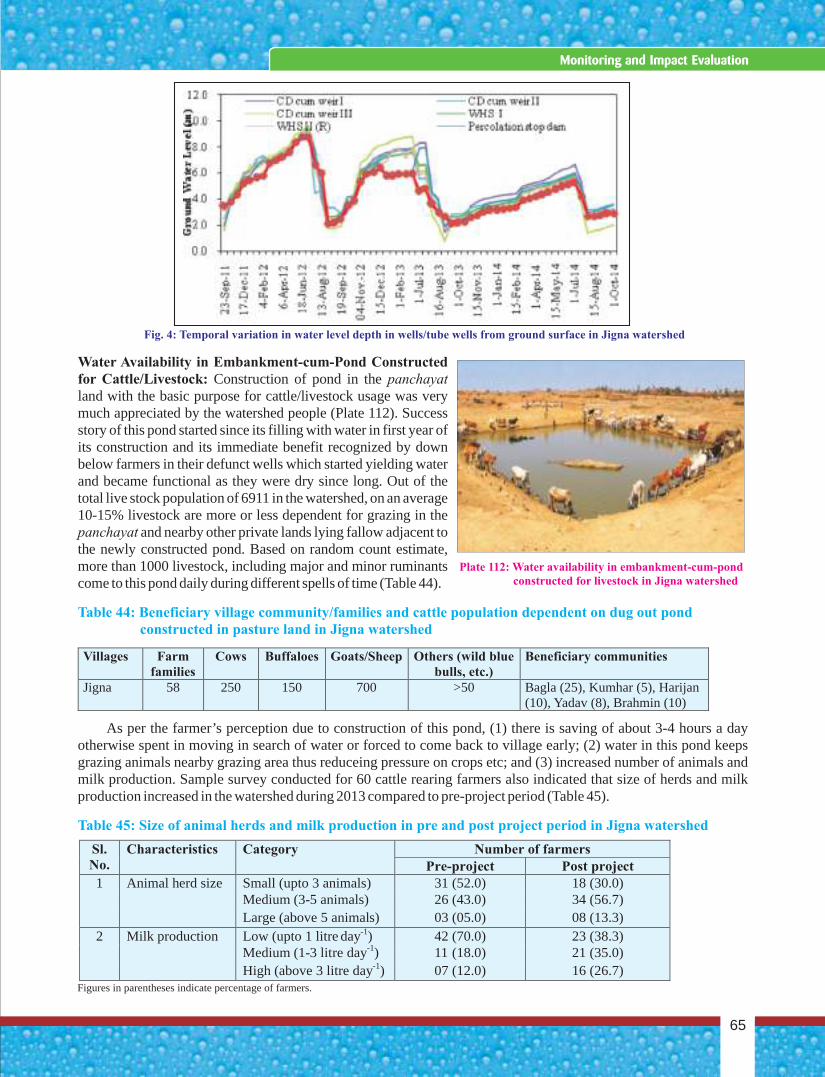
Fig. 4: Temporal variation in water level depth in wells/tube wells from ground surface in Jigna watershed
Water Availability in Embankment-cum-Pond Constructed for Cattle/Livestock: Construction of pond in the panchayat land with the basic purpose for cattle/livestock usage was very much appreciated by the watershed people (Plate 112). Success story of this pond started since its filling with water in first year of its construction and its immediate benefit recognized by down below farmers in their defunct wells which started yielding water and became functional as they were dry since long. Out of the total live stock population of 6911 in the watershed, on an average 10-15% livestock are more or less dependent for grazing in the panchayat and nearby other private lands lying fallow adjacent to the newly constructed pond. Based on random count estimate, more than 1000 livestock, including major and minor ruminants come to this pond daily during different spells of time (Table 44).
As per the farmer’s perception due to construction of this pond, (1) there is saving of about 3-4 hours a day otherwise spent in moving in search of water or forced to come back to village early; (2) water in this pond keeps grazing animals nearby grazing area thus reduceing pressure on crops etc; and (3) increased number of animals and milk production. Sample survey conducted for 60 cattle rearing farmers also indicated that size of herds and milk production increased in the watershed during 2013 compared to pre-project period (Table 45).
Table 44: Beneficiary village community/families and cattle population dependent on dug out pond constructed in pasture land in Jigna watershed
Table 45: Size of animal herds and milk production in pre and post project period in Jigna watershed
Plate 112: Water availability in embankment-cum-pond constructed for livestock in Jigna watershed
Villages Farm families
Cows Buffaloes Goats/Sheep Others (wild blue bulls, etc.)
Beneficiary communities
Jigna 58 250 150 700 >50 Bagla (25), Kumhar (5), Harijan (10), Yadav (8), Brahmin (10)
65
Monitoring and Impact Evaluation
Sl. No.
Characteristics Category Number of farmers Pre-project Post project
1 Animal herd size Small (upto 3 animals) 31 (52.0) 18 (30.0) Medium (3-5 animals) 26 (43.0) 34 (56.7) Large (above 5 animals) 03 (05.0) 08 (13.3)
2 Milk production Low (upto 1 litre day-1) 42 (70.0) 23 (38.3)
Medium (1-3 litre day-1) 11 (18.0) 21 (35.0)
High
(above 3
litre day-1)
07
(12.0)
16
(26.7)
Figures in parentheses indicate percentage of farmers.
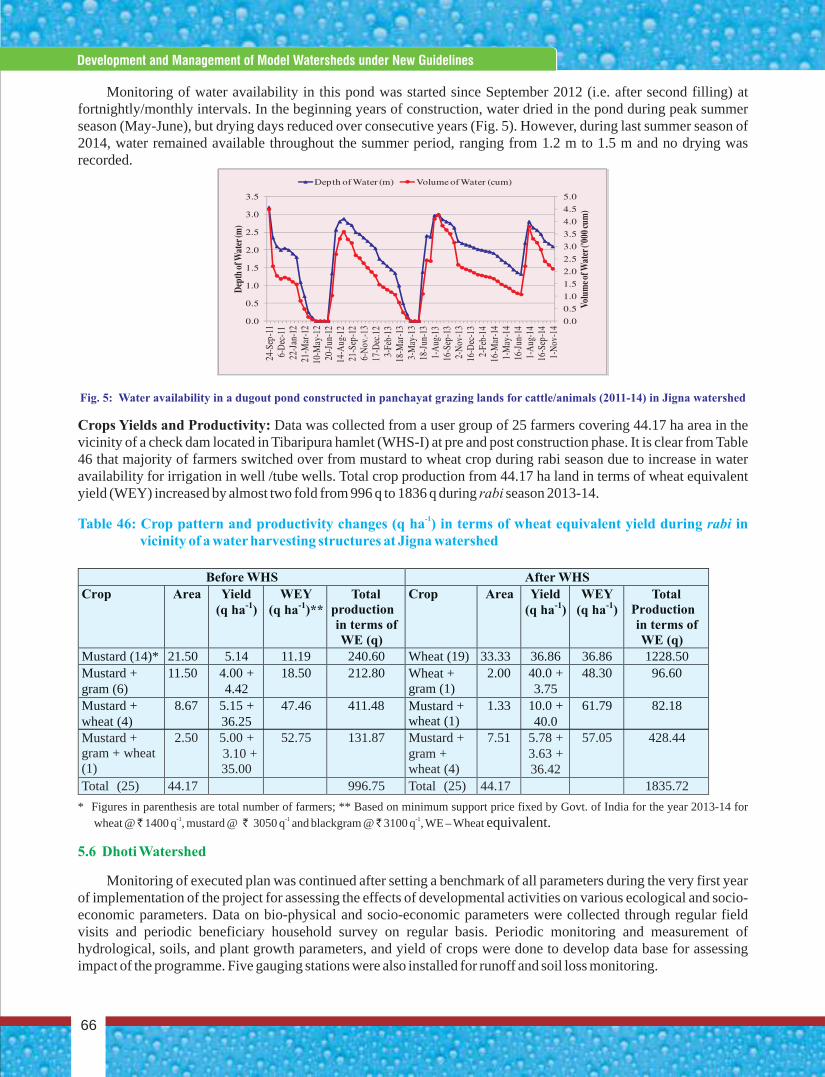
Monitoring of water availability in this pond was started since September 2012 (i.e. after second filling) at fortnightly/monthly intervals. In the beginning years of construction, water dried in the pond during peak summer season (May-June), but drying days reduced over consecutive years (Fig. 5). However, during last summer season of 2014, water remained available throughout the summer period, ranging from 1.2 m to 1.5 m and no drying was recorded.
Crops Yields and Productivity: Data was collected from a user group of 25 farmers covering 44.17 ha area in the vicinity of a check dam located in Tibaripura hamlet (WHS-I) at pre and post construction phase. It is clear from Table 46 that majority of farmers switched over from mustard to wheat crop during rabi season due to increase in water availability for irrigation in well /tube wells. Total crop production from 44.17 ha land in terms of wheat equivalent yield (WEY) increased by almost two fold from 996 q to 1836 q during rabi season 2013-14.
* Figures in parenthesis are total number of farmers; ** Based on minimum support price fixed by Govt. of India for the year 2013-14 for-1 -1 -1 wheat @ 1400 q , mustard @ 3050 q and blackgram @ 3100 q , WE – Wheat equivalent.
Monitoring of executed plan was continued after setting a benchmark of all parameters during the very first year of implementation of the project for assessing the effects of developmental activities on various ecological and socio-economic parameters. Data on bio-physical and socio-economic parameters were collected through regular field visits and periodic beneficiary household survey on regular basis. Periodic monitoring and measurement of hydrological, soils, and plant growth parameters, and yield of crops were done to develop data base for assessing impact of the programme. Five gauging stations were also installed for runoff and soil loss monitoring.
Fig. 5: Water availability in a dugout pond constructed in panchayat grazing lands for cattle/animals (2011-14) in Jigna watershed
-1Table 46: Crop pattern and productivity changes (q ha ) in terms of wheat equivalent yield during rabi in
vicinity of a water harvesting structures at Jigna watershed
5.6 Dhoti Watershed
Before WHS After WHS
Crop Area Yield (q ha-1)
WEY (q ha-1)**
Total productionin terms of WE (q)
Crop Area Yield (q ha-1)
WEY (q ha-1)
Total Productionin terms of WE (q)
Mustard (14)* 21.50 5.14 11.19 240.60 Wheat (19) 33.33 36.86 36.86 1228.50 Mustard + gram (6)
11.50 4.00 + 4.42
18.50 212.80 Wheat + gram (1)
2.00 40.0 + 3.75
48.30 96.60
Mustard + wheat (4)
8.67 5.15 + 36.25
47.46 411.48 Mustard + wheat (1)
1.33 10.0 + 40.0
61.79 82.18
Mustard + gram + wheat (1)
2.50 5.00 + 3.10 + 35.00
52.75 131.87 Mustard + gram + wheat (4)
7.51 5.78 + 3.63 + 36.42
57.05 428.44
Total (25) 44.17 996.75 Total (25) 44.17 1835.72
Concise Report On Development And Management Of Model Watersheds Through Participatory Approach
66
Development and Management of Model Watersheds under New Guidelines
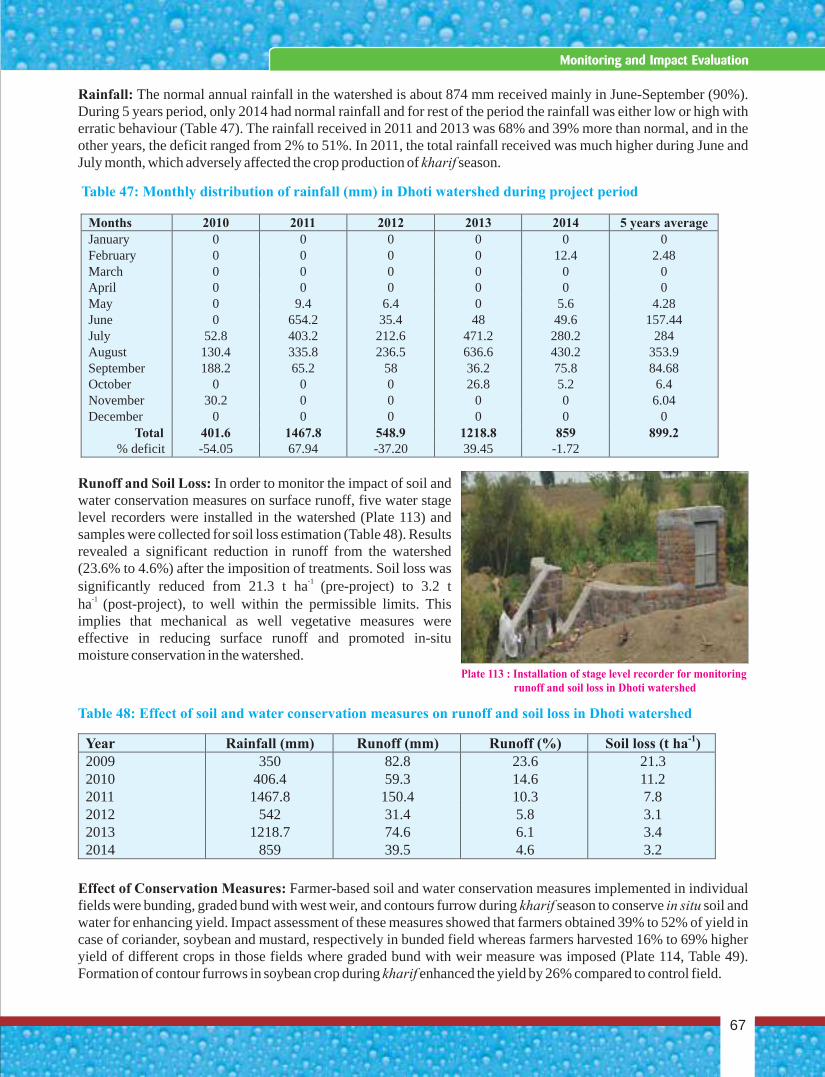
Rainfall: The normal annual rainfall in the watershed is about 874 mm received mainly in June-September (90%). During 5 years period, only 2014 had normal rainfall and for rest of the period the rainfall was either low or high with erratic behaviour (Table 47). The rainfall received in 2011 and 2013 was 68% and 39% more than normal, and in the other years, the deficit ranged from 2% to 51%. In 2011, the total rainfall received was much higher during June and July month, which adversely affected the crop production of kharif season.
Runoff and Soil Loss: In order to monitor the impact of soil and water conservation measures on surface runoff, five water stage level recorders were installed in the watershed (Plate 113) and samples were collected for soil loss estimation (Table 48). Results revealed a significant reduction in runoff from the watershed (23.6% to 4.6%) after the imposition of treatments. Soil loss was
-1 significantly reduced from 21.3 t ha (pre-project) to 3.2 t -1 ha (post-project), to well within the permissible limits. This
implies that mechanical as well vegetative measures were effective in reducing surface runoff and promoted in-situ moisture conservation in the watershed.
Effect of Conservation Measures: Farmer-based soil and water conservation measures implemented in individual fields were bunding, graded bund with west weir, and contours furrow during kharif season to conserve in situ soil and water for enhancing yield. Impact assessment of these measures showed that farmers obtained 39% to 52% of yield in case of coriander, soybean and mustard, respectively in bunded field whereas farmers harvested 16% to 69% higher yield of different crops in those fields where graded bund with weir measure was imposed (Plate 114, Table 49). Formation of contour furrows in soybean crop during kharif enhanced the yield by 26% compared to control field.
Table 47: Monthly distribution of rainfall (mm) in Dhoti watershed during project period
Table 48: Effect of soil and water conservation measures on runoff and soil loss in Dhoti watershed
Months 2010 2011 2012 2013 2014 5 years average January 0 0 0 0 0 0 February 0 0 0 0 12.4 2.48 March 0 0 0 0 0 0 April 0 0 0 0 0 0 May 0 9.4 6.4 0 5.6 4.28 June 0 654.2 35.4 48 49.6 157.44 July 52.8 403.2 212.6 471.2 280.2 284 August 130.4 335.8 236.5 636.6 430.2 353.9 September 188.2 65.2 58 36.2 75.8 84.68 October 0 0 0 26.8 5.2 6.4 November 30.2 0 0 0 0 6.04 December 0 0 0 0 0 0
Total 401.6 1467.8 548.9 1218.8 859 899.2 % deficit -54.05 67.94 -37.20 39.45 -1.72
Plate 113 : Installation of stage level recorder for monitoring runoff and soil loss in Dhoti watershed
Year Rainfall (mm) Runoff (mm) Runoff (%) Soil loss (t ha-1) 2009 350 82.8 23.6 21.3 2010 406.4 59.3 14.6 11.2 2011 1467.8 150.4 10.3 7.8 2012 542 31.4 5.8 3.1 2013 1218.7 74.6 6.1 3.4 2014 859 39.5 4.6 3.2
67
Monitoring and Impact Evaluation
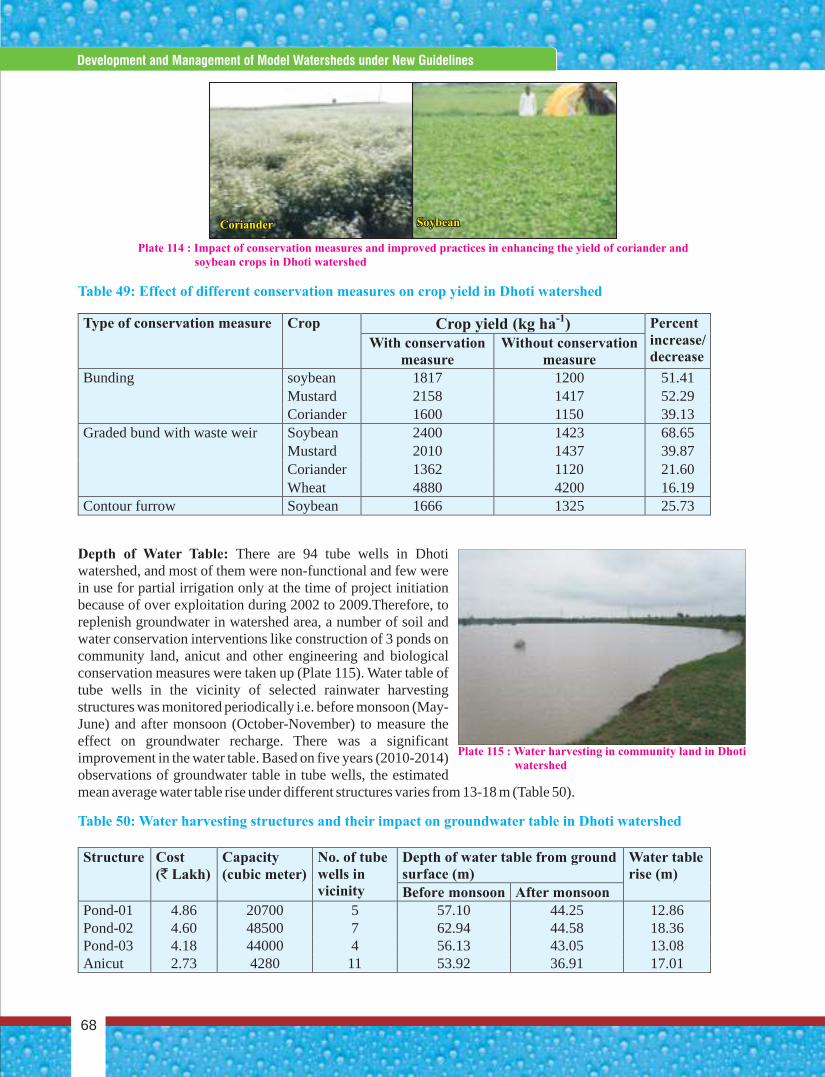
Table 49: Effect of different conservation measures on crop yield in Dhoti watershed
Table 50: Water harvesting structures and their impact on groundwater table in Dhoti watershed
Depth of Water Table: There are 94 tube wells in Dhoti watershed, and most of them were non-functional and few were in use for partial irrigation only at the time of project initiation because of over exploitation during 2002 to 2009.Therefore, to replenish groundwater in watershed area, a number of soil and water conservation interventions like construction of 3 ponds on community land, anicut and other engineering and biological conservation measures were taken up (Plate 115). Water table of tube wells in the vicinity of selected rainwater harvesting structures was monitored periodically i.e. before monsoon (May-June) and after monsoon (October-November) to measure the effect on groundwater recharge. There was a significant improvement in the water table. Based on five years (2010-2014) observations of groundwater table in tube wells, the estimated mean average water table rise under different structures varies from 13-18 m (Table 50).
Type of conservation measure Crop Crop yield (kg ha-1) Percentincrease/ decrease
With conservation measure
Without conservation measure
Bunding soybean 1817 1200 51.41 Mustard 2158 1417 52.29 Coriander 1600 1150 39.13
Graded bund with waste weir Soybean 2400 1423 68.65 Mustard 2010 1437 39.87 Coriander 1362 1120 21.60 Wheat 4880 4200 16.19
Contour furrow Soybean 1666 1325 25.73
Plate 114 : Impact of conservation measures and improved practices in enhancing the yield of coriander and soybean crops in Dhoti watershed
CorianderCoriander SoybeanSoybean
Plate 115 : Water harvesting in community land in Dhoti watershed
Structure
Cost (` Lakh)
Capacity (cubic meter)
No. of tube wells in vicinity
Depth of water table from ground surface (m)
Water table rise (m)
Before monsoon After monsoon Pond-01 4.86 20700 5 57.10 44.25 12.86 Pond-02 4.60 48500 7 62.94 44.58 18.36 Pond-03 4.18 44000 4 56.13 43.05 13.08 Anicut 2.73 4280 11 53.92 36.91 17.01
Concise Report On Development And Management Of Model Watersheds Through Participatory Approach
68
Development and Management of Model Watersheds under New Guidelines
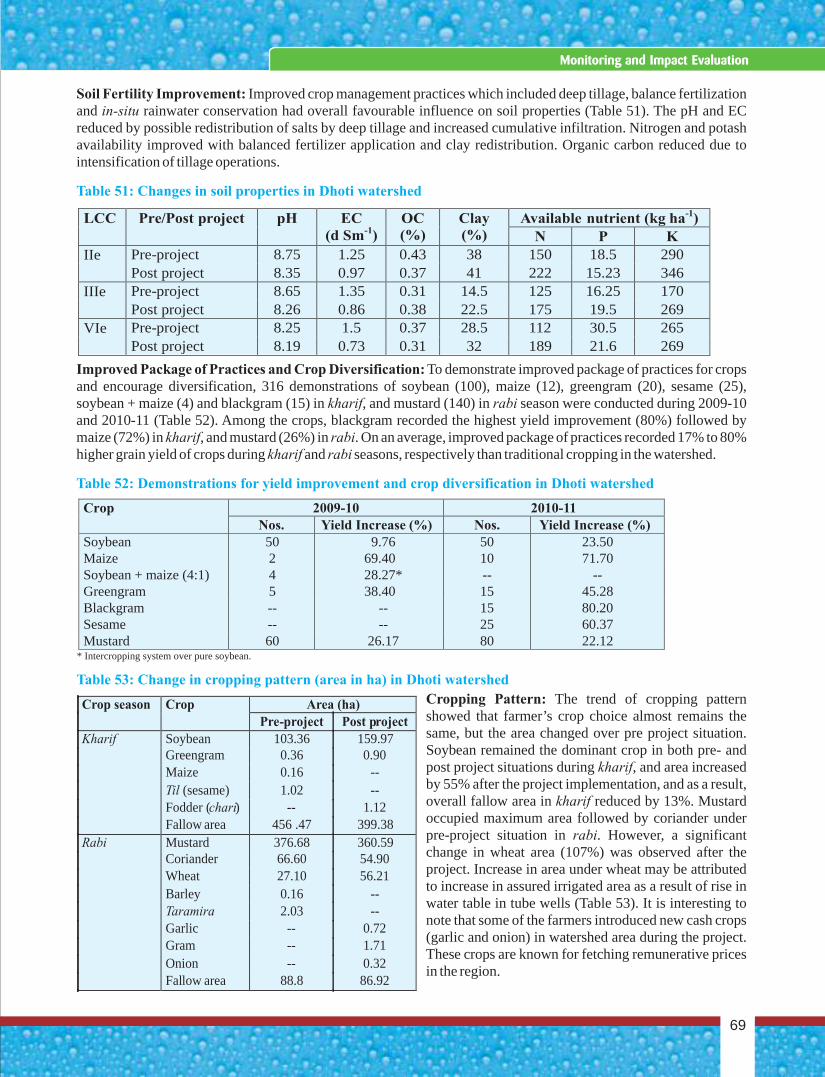
Soil Fertility Improvement: Improved crop management practices which included deep tillage, balance fertilization and in-situ rainwater conservation had overall favourable influence on soil properties (Table 51). The pH and EC reduced by possible redistribution of salts by deep tillage and increased cumulative infiltration. Nitrogen and potash availability improved with balanced fertilizer application and clay redistribution. Organic carbon reduced due to intensification of tillage operations.
Improved Package of Practices and Crop Diversification: To demonstrate improved package of practices for crops and encourage diversification, 316 demonstrations of soybean (100), maize (12), greengram (20), sesame (25), soybean + maize (4) and blackgram (15) in kharif, and mustard (140) in rabi season were conducted during 2009-10 and 2010-11 (Table 52). Among the crops, blackgram recorded the highest yield improvement (80%) followed by maize (72%) in kharif, and mustard (26%) in rabi. On an average, improved package of practices recorded 17% to 80% higher grain yield of crops during kharif and rabi seasons, respectively than traditional cropping in the watershed.
Cropping Pattern: The trend of cropping pattern showed that farmer’s crop choice almost remains the same, but the area changed over pre project situation. Soybean remained the dominant crop in both pre- and post project situations during kharif, and area increased by 55% after the project implementation, and as a result, overall fallow area in kharif reduced by 13%. Mustard occupied maximum area followed by coriander under pre-project situation in rabi. However, a significant change in wheat area (107%) was observed after the project. Increase in area under wheat may be attributed to increase in assured irrigated area as a result of rise in water table in tube wells (Table 53). It is interesting to note that some of the farmers introduced new cash crops (garlic and onion) in watershed area during the project. These crops are known for fetching remunerative prices in the region.
Table 51: Changes in soil properties in Dhoti watershed
Table 52: Demonstrations for yield improvement and crop diversification in Dhoti watershed
LCC Pre/Post project pH EC (d Sm-1)
OC (%)
Clay (%)
Available nutrient (kg ha-1) N P K
IIe Pre-project 8.75 1.25 0.43 38 150 18.5 290 Post project 8.35 0.97 0.37 41 222 15.23 346
IIIe Pre-project 8.65 1.35 0.31 14.5 125 16.25 170 Post project 8.26 0.86 0.38 22.5 175 19.5 269
VIe Pre-project 8.25 1.5 0.37 28.5 112 30.5 265 Post project 8.19 0.73 0.31 32 189 21.6 269
Crop 2009-10 2010-11 Nos. Yield Increase (%) Nos. Yield Increase (%) Soybean 50 9.76 50 23.50 Maize 2 69.40 10 71.70 Soybean + maize (4:1) 4 28.27* -- -- Greengram 5 38.40 15 45.28 Blackgram -- -- 15 80.20 Sesame
--
--
25
60.37
Mustard
60
26.17
80
22.12
* Intercropping system over pure soybean.
Crop season Crop Area (ha) Pre-project Post project
Kharif Soybean 103.36 159.97
Greengram 0.36 0.90
Maize
0.16
--
Til
(sesame)
1.02
--
Fodder (chari)
--
1.12
Fallow
area
456 .47
399.38 Rabi
Mustard
376.68
360.59
Coriander
66.60
54.90
Wheat
27.10
56.21
Barley
0.16
--
Taramira
2.03
--
Garlic
--
0.72
Gram
--
1.71
Onion
--
0.32
Fallow
area
88.8
86.92
Table 53: Change in cropping pattern (area in ha) in Dhoti watershed
69
Monitoring and Impact Evaluation
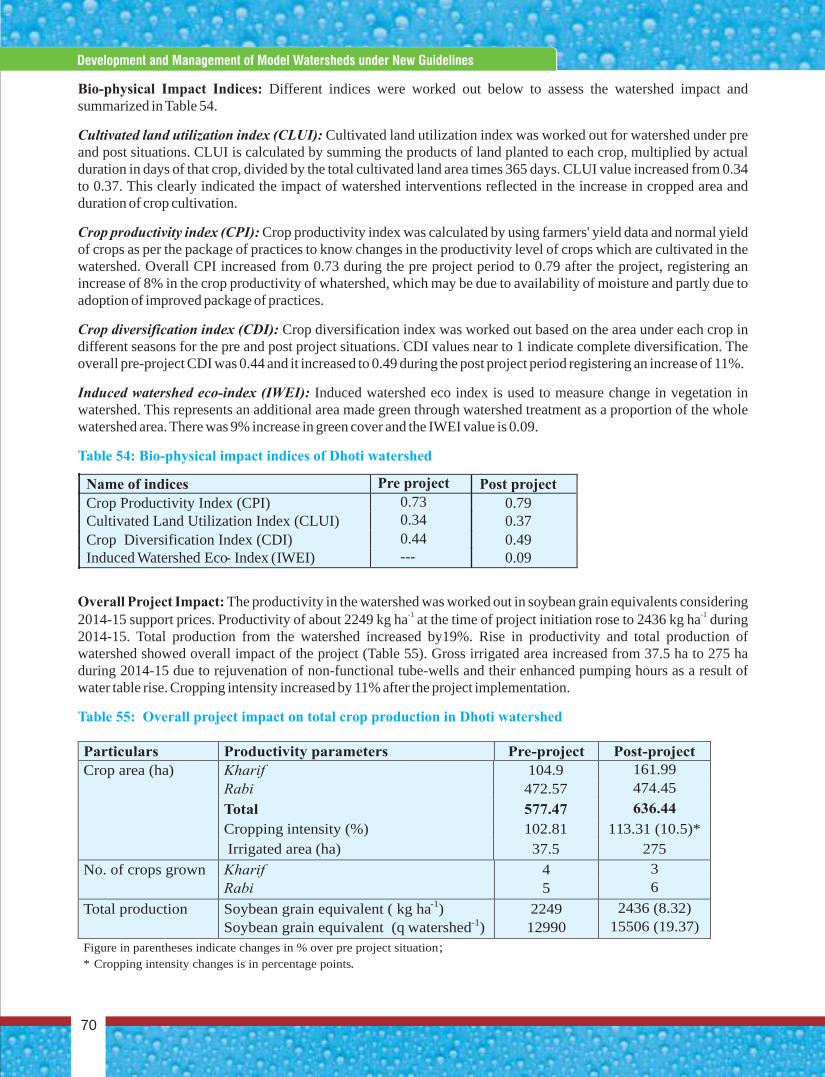
Bio-physical Impact Indices: Different indices were worked out below to assess the watershed impact and summarized in Table 54.
Cultivated land utilization index (CLUI): Cultivated land utilization index was worked out for watershed under pre and post situations. CLUI is calculated by summing the products of land planted to each crop, multiplied by actual duration in days of that crop, divided by the total cultivated land area times 365 days. CLUI value increased from 0.34 to 0.37. This clearly indicated the impact of watershed interventions reflected in the increase in cropped area and duration of crop cultivation.
Crop productivity index (CPI): Crop productivity index was calculated by using farmers' yield data and normal yield of crops as per the package of practices to know changes in the productivity level of crops which are cultivated in the watershed. Overall CPI increased from 0.73 during the pre project period to 0.79 after the project, registering an increase of 8% in the crop productivity of whatershed, which may be due to availability of moisture and partly due to adoption of improved package of practices.
Crop diversification index (CDI): Crop diversification index was worked out based on the area under each crop in different seasons for the pre and post project situations. CDI values near to 1 indicate complete diversification. The overall pre-project CDI was 0.44 and it increased to 0.49 during the post project period registering an increase of 11%.
Induced watershed eco-index (IWEI): Induced watershed eco index is used to measure change in vegetation in watershed. This represents an additional area made green through watershed treatment as a proportion of the whole watershed area. There was 9% increase in green cover and the IWEI value is 0.09.
Overall Project Impact: The productivity in the watershed was worked out in soybean grain equivalents considering -1 -12014-15 support prices. Productivity of about 2249 kg ha at the time of project initiation rose to 2436 kg ha during
2014-15. Total production from the watershed increased by19%. Rise in productivity and total production of watershed showed overall impact of the project (Table 55). Gross irrigated area increased from 37.5 ha to 275 ha during 2014-15 due to rejuvenation of non-functional tube-wells and their enhanced pumping hours as a result of water table rise. Cropping intensity increased by 11% after the project implementation.
Table 54: Bio-physical impact indices of Dhoti watershed
Table 55: Overall project impact on total crop production in Dhoti watershed
Name of indices Pre project Post project
Crop Productivity Index (CPI) Cultivated Land Utilization Index (CLUI) Crop Diversification Index (CDI) Induced Watershed Eco- Index (IWEI)
0.73 0.34 0.44 ---
0.79 0.37 0.49 0.09
Particulars Productivity parameters Pre-project Post-project Crop area (ha) Kharif 104.9 161.99 Rabi 472.57 474.45 Total 577.47 636.44
Cropping intensity (%) 102.81 113.31 (10.5)* Irrigated area (ha) 37.5 275
No. of crops grown Kharif 4 3 Rabi 5 6 Total production Soybean grain equivalent ( kg ha-1) 2249 2436 (8.32) Soybean grain equivalent (q watershed-1) 12990 15506 (19.37) Figure in parentheses indicate changes in % over pre project situation; * Cropping intensity changes is in percentage points.
Concise Report On Development And Management Of Model Watersheds Through Participatory Approach
70
Development and Management of Model Watersheds under New Guidelines
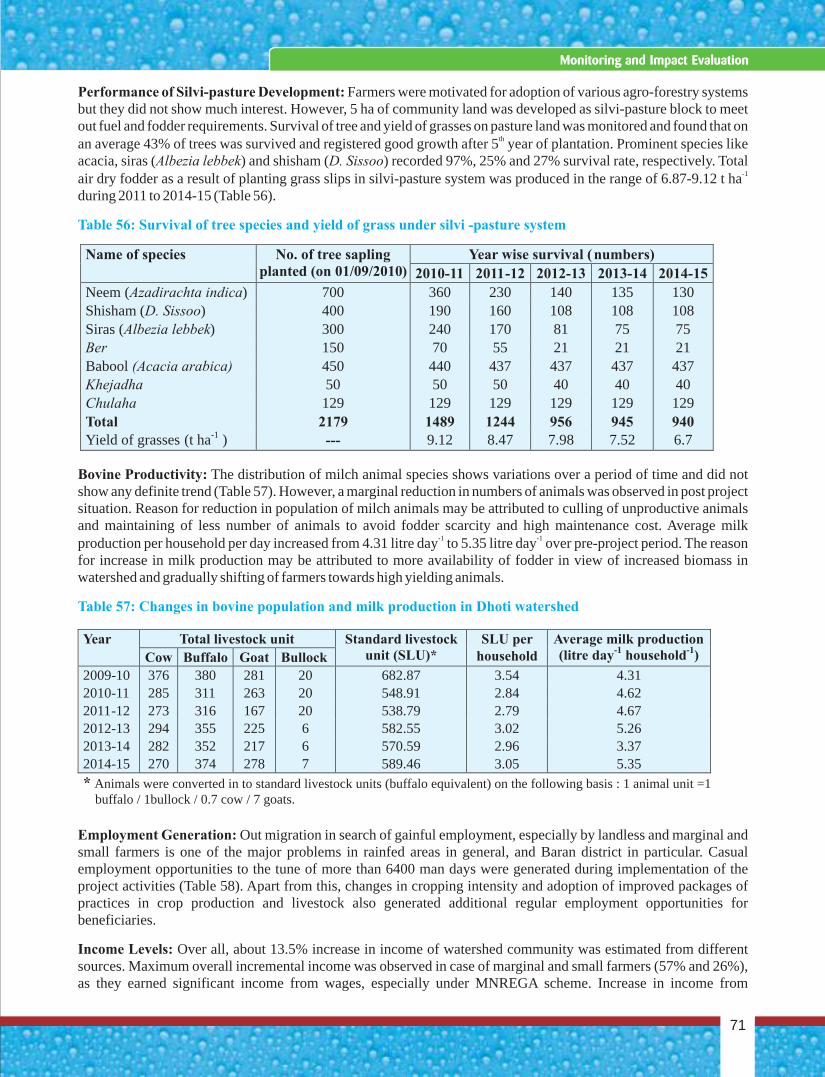
Performance of Silvi-pasture Development: Farmers were motivated for adoption of various agro-forestry systems but they did not show much interest. However, 5 ha of community land was developed as silvi-pasture block to meet out fuel and fodder requirements. Survival of tree and yield of grasses on pasture land was monitored and found that on
than average 43% of trees was survived and registered good growth after 5 year of plantation. Prominent species like acacia, siras (Albezia lebbek) and shisham (D. Sissoo) recorded 97%, 25% and 27% survival rate, respectively. Total
-1air dry fodder as a result of planting grass slips in silvi-pasture system was produced in the range of 6.87-9.12 t ha during 2011 to 2014-15 (Table 56).
Bovine Productivity: The distribution of milch animal species shows variations over a period of time and did not show any definite trend (Table 57). However, a marginal reduction in numbers of animals was observed in post project situation. Reason for reduction in population of milch animals may be attributed to culling of unproductive animals and maintaining of less number of animals to avoid fodder scarcity and high maintenance cost. Average milk
-1 -1production per household per day increased from 4.31 litre day to 5.35 litre day over pre-project period. The reason for increase in milk production may be attributed to more availability of fodder in view of increased biomass in watershed and gradually shifting of farmers towards high yielding animals.
Employment Generation: Out migration in search of gainful employment, especially by landless and marginal and small farmers is one of the major problems in rainfed areas in general, and Baran district in particular. Casual employment opportunities to the tune of more than 6400 man days were generated during implementation of the project activities (Table 58). Apart from this, changes in cropping intensity and adoption of improved packages of practices in crop production and livestock also generated additional regular employment opportunities for beneficiaries.
Income Levels: Over all, about 13.5% increase in income of watershed community was estimated from different sources. Maximum overall incremental income was observed in case of marginal and small farmers (57% and 26%), as they earned significant income from wages, especially under MNREGA scheme. Increase in income from
Table 56: Survival of tree species and yield of grass under silvi -pasture system
Table 57: Changes in bovine population and milk production in Dhoti watershed
Name of species No. of tree sapling planted (on 01/09/2010)
Year wise survival (numbers) 2010-11 2011-12 2012-13 2013-14 2014-15
Neem (Azadirachta indica) 700 360 230 140 135 130 Shisham (D. Sissoo) 400 190 160 108 108 108 Siras (Albezia lebbek) 300 240 170 81 75 75 Ber 150 70 55 21 21 21 Babool (Acacia arabica) 450 440 437 437 437 437 Khejadha 50 50 50 40 40 40 Chulaha 129 129 129 129 129 129 Total 2179 1489 1244 956 945 940 Yield of grasses (t ha-1 ) --- 9.12 8.47 7.98 7.52 6.7
Year Total livestock unit Standard livestock unit (SLU)*
SLU per household
Average milk production (litre day-1 household-1) Cow Buffalo Goat Bullock
2009-10 376 380 281 20 682.87 3.54 4.31 2010-11 285 311 263 20 548.91 2.84 4.62 2011-12 273 316 167 20 538.79 2.79 4.67 2012-13 294 355 225 6 582.55 3.02 5.26 2013-14 282 352 217 6 570.59 2.96 3.37 2014-15 270 374 278 7 589.46 3.05 5.35 * Animals were converted in to standard livestock units (buffalo equivalent) on the following basis : 1 animal unit =1
buffalo / 1bullock / 0.7 cow / 7 goats.
71
Monitoring and Impact Evaluation
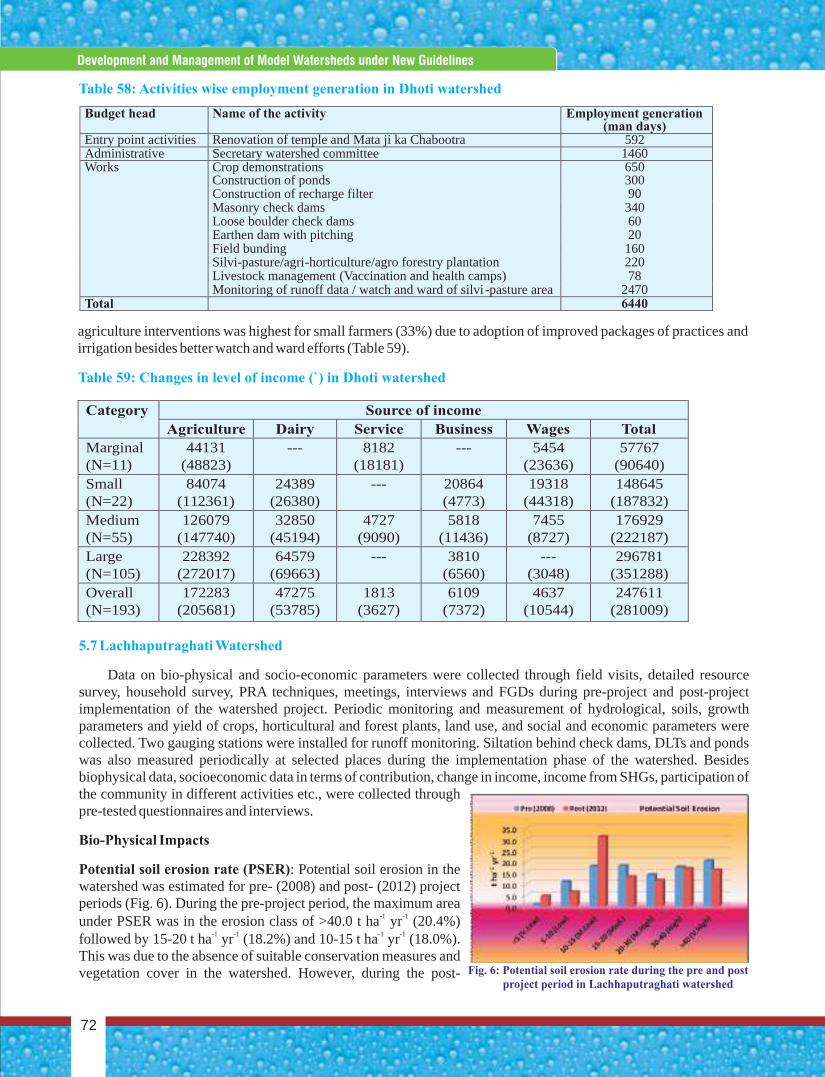
agriculture interventions was highest for small farmers (33%) due to adoption of improved packages of practices and irrigation besides better watch and ward efforts (Table 59).
Table 58: Activities wise employment generation in Dhoti watershed
Category Source of income Agriculture Dairy Service Business Wages Total
Marginal (N=11)
44131 (48823)
--- 8182 (18181)
--- 5454 (23636)
57767 (90640)
Small (N=22)
84074 (112361)
24389 (26380)
--- 20864 (4773)
19318 (44318)
148645 (187832)
Medium (N=55)
126079 (147740)
32850 (45194)
4727 (9090)
5818 (11436)
7455 (8727)
176929 (222187)
Large (N=105)
228392 (272017)
64579 (69663)
--- 3810 (6560)
--- (3048)
296781 (351288)
Overall (N=193)
172283 (205681)
47275 (53785)
1813 (3627)
6109 (7372)
4637 (10544)
247611 (281009)
Table 59: Changes in level of income (`) in Dhoti watershed
5.7 Lachhaputraghati Watershed
Data on bio-physical and socio-economic parameters were collected through field visits, detailed resource survey, household survey, PRA techniques, meetings, interviews and FGDs during pre-project and post-project implementation of the watershed project. Periodic monitoring and measurement of hydrological, soils, growth parameters and yield of crops, horticultural and forest plants, land use, and social and economic parameters were collected. Two gauging stations were installed for runoff monitoring. Siltation behind check dams, DLTs and ponds was also measured periodically at selected places during the implementation phase of the watershed. Besides biophysical data, socioeconomic data in terms of contribution, change in income, income from SHGs, participation of the community in different activities etc., were collected through pre-tested questionnaires and interviews.
Bio-Physical Impacts
Potential soil erosion rate (PSER): Potential soil erosion in the watershed was estimated for pre- (2008) and post- (2012) project periods (Fig. 6). During the pre-project period, the maximum area
-1 -1under PSER was in the erosion class of >40.0 t ha yr (20.4%) -1 -1 -1 -1followed by 15-20 t ha yr (18.2%) and 10-15 t ha yr (18.0%).
This was due to the absence of suitable conservation measures and vegetation cover in the watershed. However, during the post- Fig. 6: Potential soil erosion rate during the pre and post
project period in Lachhaputraghati watershed
Budget head Name of the activity Employment generation (man days)
Entry point activities Renovation of temple and Mata ji ka Chabootra 592 Administrative Secretary watershed committee 1460 Works Crop demonstrations 650 Construction of ponds 300
Construction of recharge filter 90 Masonry check dams 340 Loose boulder check dams 60 Earthen dam with pitching 20 Field bunding 160 Silvi-pasture/agri-horticulture/agro forestry plantation 220 Livestock management (Vaccination and health camps) 78 Monitoring of runoff data / watch and ward of silvi -pasture area 2470
Total 6440
Concise Report On Development And Management Of Model Watersheds Through Participatory Approach
72
Development and Management of Model Watersheds under New Guidelines
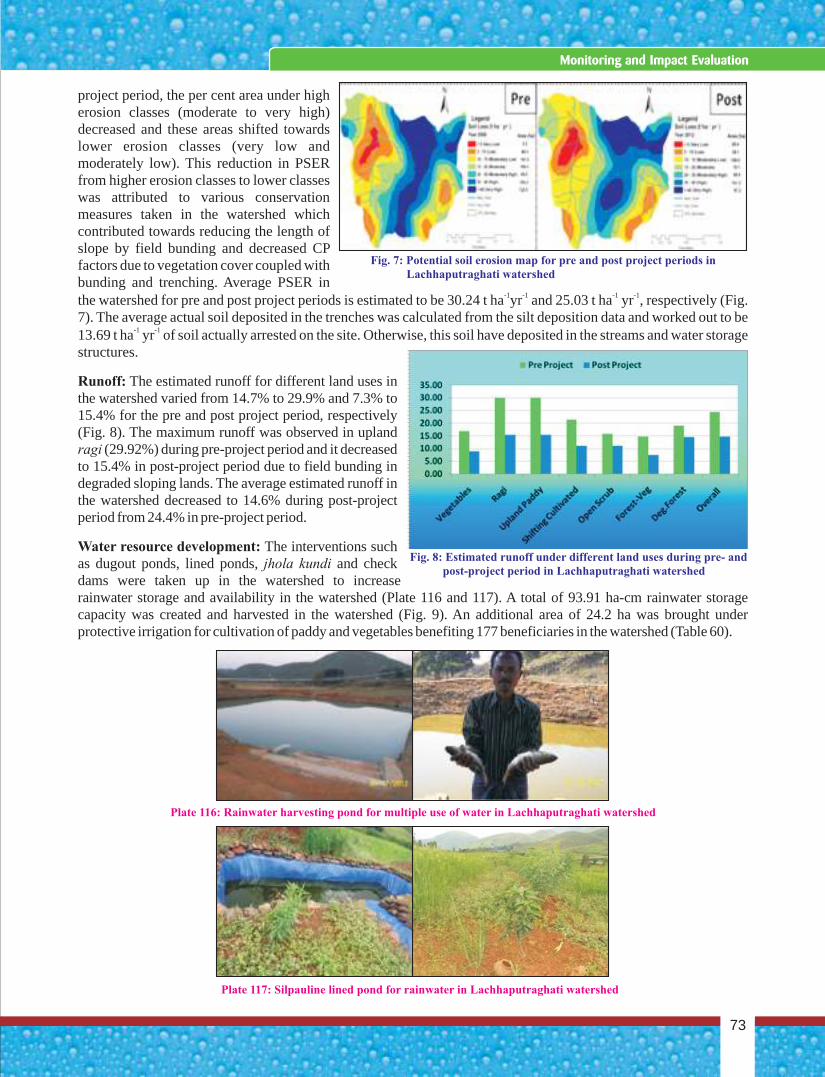
project period, the per cent area under high erosion classes (moderate to very high) decreased and these areas shifted towards lower erosion classes (very low and moderately low). This reduction in PSER from higher erosion classes to lower classes was attributed to various conservation measures taken in the watershed which contributed towards reducing the length of slope by field bunding and decreased CP factors due to vegetation cover coupled with bunding and trenching. Average PSER in
-1 -1 -1 -1the watershed for pre and post project periods is estimated to be 30.24 t ha yr and 25.03 t ha yr , respectively (Fig. 7). The average actual soil deposited in the trenches was calculated from the silt deposition data and worked out to be
-1 -113.69 t ha yr of soil actually arrested on the site. Otherwise, this soil have deposited in the streams and water storage structures.
Runoff: The estimated runoff for different land uses in the watershed varied from 14.7% to 29.9% and 7.3% to 15.4% for the pre and post project period, respectively (Fig. 8). The maximum runoff was observed in upland ragi (29.92%) during pre-project period and it decreased to 15.4% in post-project period due to field bunding in degraded sloping lands. The average estimated runoff in the watershed decreased to 14.6% during post-project period from 24.4% in pre-project period.
Water resource development: The interventions such as dugout ponds, lined ponds, jhola kundi and check dams were taken up in the watershed to increase rainwater storage and availability in the watershed (Plate 116 and 117). A total of 93.91 ha-cm rainwater storage capacity was created and harvested in the watershed (Fig. 9). An additional area of 24.2 ha was brought under protective irrigation for cultivation of paddy and vegetables benefiting 177 beneficiaries in the watershed (Table 60).
Fig. 7: Potential soil erosion map for pre and post project periods in Lachhaputraghati watershed
Fig. 8: Estimated runoff under different land uses during pre- and post-project period in Lachhaputraghati watershed
Plate 117: Silpauline lined pond for rainwater in Lachhaputraghati watershed
Plate 116: Rainwater harvesting pond for multiple use of water in Lachhaputraghati watershed
73
Monitoring and Impact Evaluation
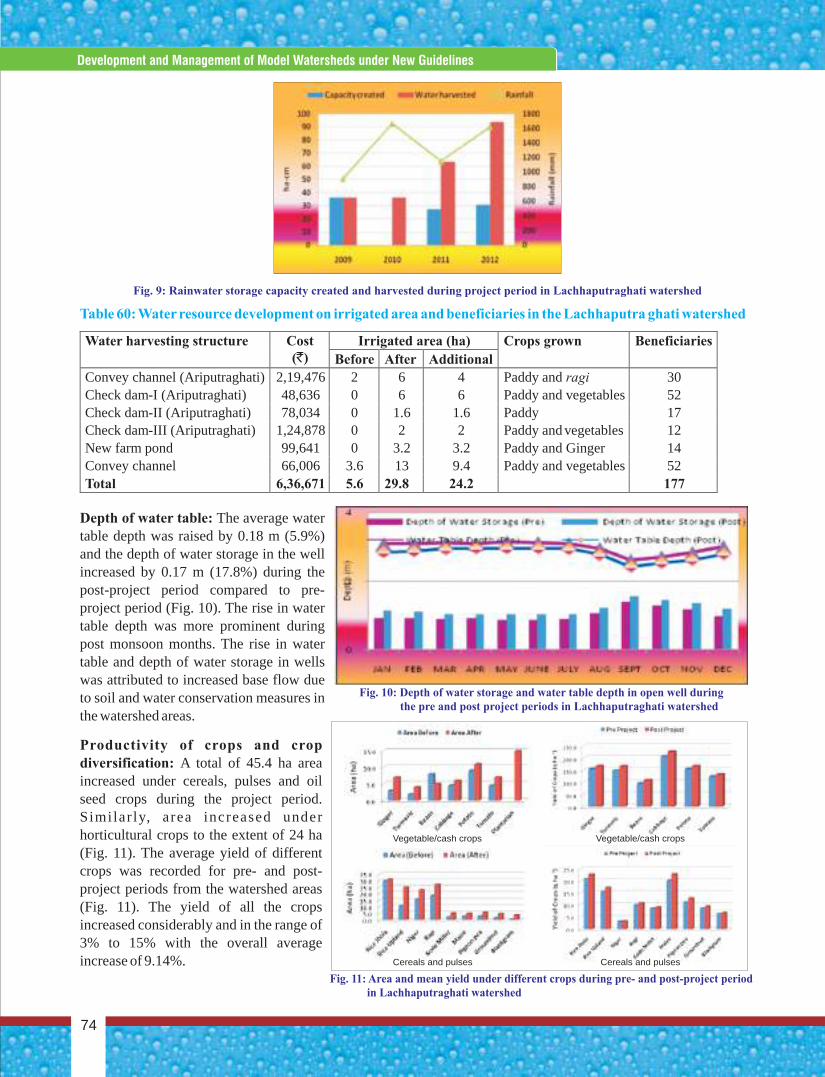
Table 60: Water resource development on irrigated area and beneficiaries in the Lachhaputra ghati watershed
Depth of water table: The average water table depth was raised by 0.18 m (5.9%) and the depth of water storage in the well increased by 0.17 m (17.8%) during the post-project period compared to pre-project period (Fig. 10). The rise in water table depth was more prominent during post monsoon months. The rise in water table and depth of water storage in wells was attributed to increased base flow due to soil and water conservation measures in the watershed areas.
Productivity of crops and crop diversification: A total of 45.4 ha area increased under cereals, pulses and oil seed crops during the project period. Similar ly, area increased under horticultural crops to the extent of 24 ha (Fig. 11). The average yield of different crops was recorded for pre- and post-project periods from the watershed areas (Fig. 11). The yield of all the crops increased considerably and in the range of 3% to 15% with the overall average increase of 9.14%.
Fig. 9: Rainwater storage capacity created and harvested during project period in Lachhaputraghati watershed
Water harvesting structure Cost (`)
Irrigated area (ha) Crops grown Beneficiaries
Before After Additional
Convey channel (Ariputraghati) 2,19,476 2 6 4 Paddy and ragi 30 Check dam-I (Ariputraghati) 48,636 0 6 6 Paddy and vegetables 52 Check dam-II (Ariputraghati) 78,034 0 1.6 1.6 Paddy 17 Check dam-III (Ariputraghati) 1,24,878 0 2 2 Paddy and vegetables 12 New farm pond 99,641 0 3.2 3.2 Paddy and Ginger 14 Convey channel 66,006 3.6 13 9.4 Paddy and vegetables 52 Total 6,36,671 5.6 29.8 24.2 177
Fig. 10: Depth of water storage and water table depth in open well during the pre and post project periods in Lachhaputraghati watershed
Fig. 11: Area and mean yield under different crops during pre- and post-project period in Lachhaputraghati watershed
Vegetable/cash crops Vegetable/cash crops
Cereals and pulses Cereals and pulses
Concise Report On Development And Management Of Model Watersheds Through Participatory Approach
74
Development and Management of Model Watersheds under New Guidelines
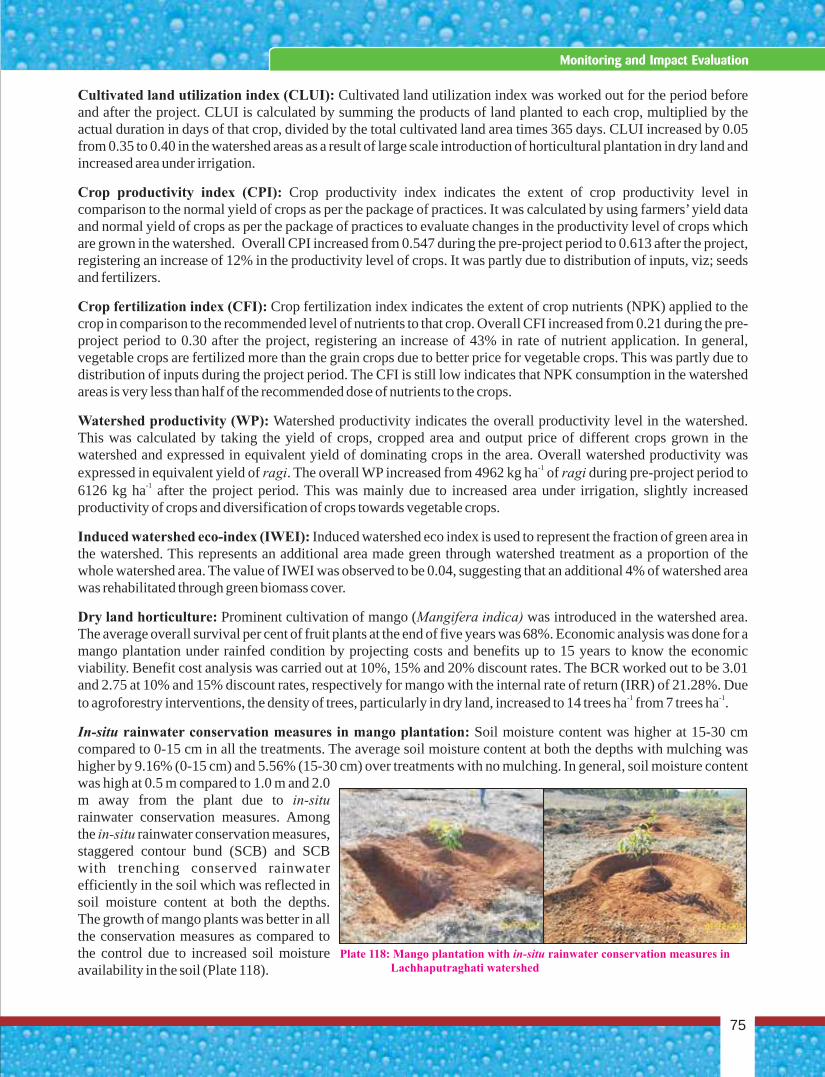
Cultivated land utilization index (CLUI): Cultivated land utilization index was worked out for the period before and after the project. CLUI is calculated by summing the products of land planted to each crop, multiplied by the actual duration in days of that crop, divided by the total cultivated land area times 365 days. CLUI increased by 0.05 from 0.35 to 0.40 in the watershed areas as a result of large scale introduction of horticultural plantation in dry land and increased area under irrigation.
Crop productivity index (CPI): Crop productivity index indicates the extent of crop productivity level in comparison to the normal yield of crops as per the package of practices. It was calculated by using farmers’ yield data and normal yield of crops as per the package of practices to evaluate changes in the productivity level of crops which are grown in the watershed. Overall CPI increased from 0.547 during the pre-project period to 0.613 after the project, registering an increase of 12% in the productivity level of crops. It was partly due to distribution of inputs, viz; seeds and fertilizers.
Crop fertilization index (CFI): Crop fertilization index indicates the extent of crop nutrients (NPK) applied to the crop in comparison to the recommended level of nutrients to that crop. Overall CFI increased from 0.21 during the pre-project period to 0.30 after the project, registering an increase of 43% in rate of nutrient application. In general, vegetable crops are fertilized more than the grain crops due to better price for vegetable crops. This was partly due to distribution of inputs during the project period. The CFI is still low indicates that NPK consumption in the watershed areas is very less than half of the recommended dose of nutrients to the crops.
Watershed productivity (WP): Watershed productivity indicates the overall productivity level in the watershed. This was calculated by taking the yield of crops, cropped area and output price of different crops grown in the watershed and expressed in equivalent yield of dominating crops in the area. Overall watershed productivity was
-1expressed in equivalent yield of ragi. The overall WP increased from 4962 kg ha of ragi during pre-project period to -16126 kg ha after the project period. This was mainly due to increased area under irrigation, slightly increased
productivity of crops and diversification of crops towards vegetable crops.
Induced watershed eco-index (IWEI): Induced watershed eco index is used to represent the fraction of green area in the watershed. This represents an additional area made green through watershed treatment as a proportion of the whole watershed area. The value of IWEI was observed to be 0.04, suggesting that an additional 4% of watershed area was rehabilitated through green biomass cover.
Dry land horticulture: Prominent cultivation of mango (Mangifera indica) was introduced in the watershed area. The average overall survival per cent of fruit plants at the end of five years was 68%. Economic analysis was done for a mango plantation under rainfed condition by projecting costs and benefits up to 15 years to know the economic viability. Benefit cost analysis was carried out at 10%, 15% and 20% discount rates. The BCR worked out to be 3.01 and 2.75 at 10% and 15% discount rates, respectively for mango with the internal rate of return (IRR) of 21.28%. Due
-1 -1to agroforestry interventions, the density of trees, particularly in dry land, increased to 14 trees ha from 7 trees ha .
In-situ rainwater conservation measures in mango plantation: Soil moisture content was higher at 15-30 cm compared to 0-15 cm in all the treatments. The average soil moisture content at both the depths with mulching was higher by 9.16% (0-15 cm) and 5.56% (15-30 cm) over treatments with no mulching. In general, soil moisture content was high at 0.5 m compared to 1.0 m and 2.0 m away from the plant due to in-situ rainwater conservation measures. Among the in-situ rainwater conservation measures, staggered contour bund (SCB) and SCB with trenching conserved rainwater efficiently in the soil which was reflected in soil moisture content at both the depths. The growth of mango plants was better in all the conservation measures as compared to the control due to increased soil moisture availability in the soil (Plate 118).
Plate 118: Mango plantation with in-situ rainwater conservation measures in Lachhaputraghati watershed
75
Monitoring and Impact Evaluation
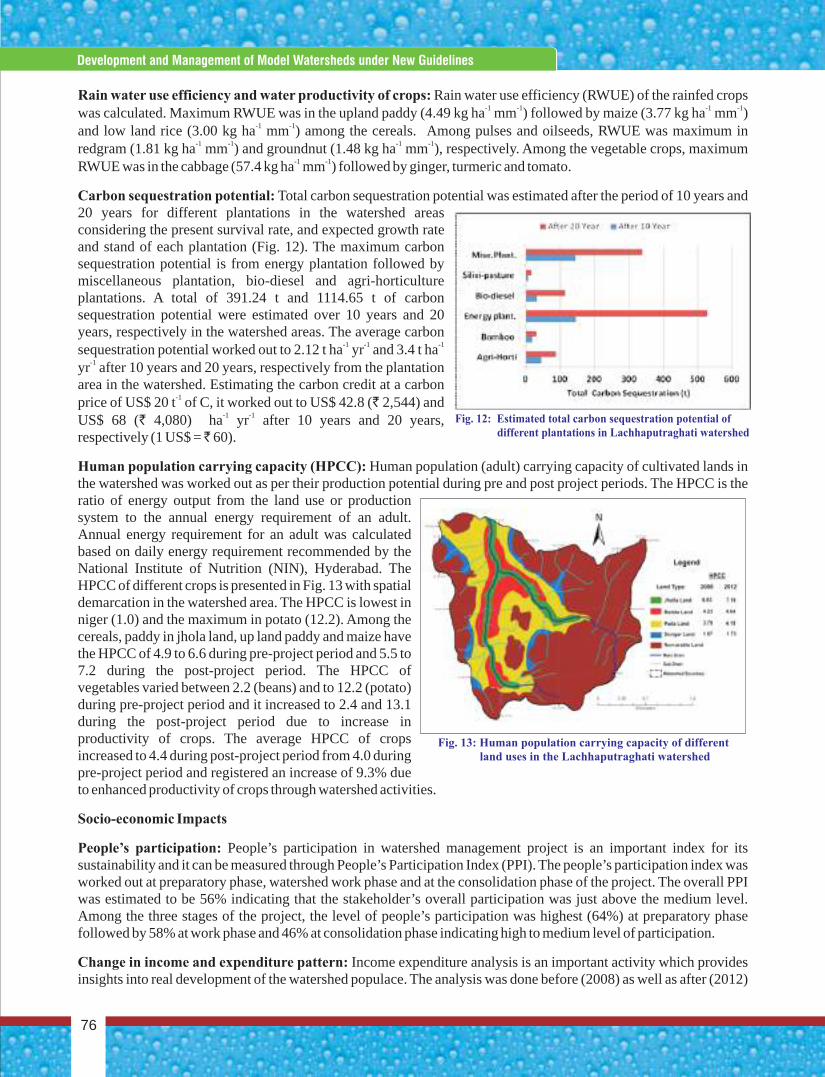
Fig. 12: Estimated total carbon sequestration potential of different plantations in Lachhaputraghati watershed
Fig. 13: Human population carrying capacity of different land uses in the Lachhaputraghati watershed
Rain water use efficiency and water productivity of crops: Rain water use efficiency (RWUE) of the rainfed crops -1 -1 -1 -1was calculated. Maximum RWUE was in the upland paddy (4.49 kg ha mm ) followed by maize (3.77 kg ha mm )
-1 -1and low land rice (3.00 kg ha mm ) among the cereals. Among pulses and oilseeds, RWUE was maximum in -1 -1 -1 -1redgram (1.81 kg ha mm ) and groundnut (1.48 kg ha mm ), respectively. Among the vegetable crops, maximum
-1 -1RWUE was in the cabbage (57.4 kg ha mm ) followed by ginger, turmeric and tomato.
Carbon sequestration potential: Total carbon sequestration potential was estimated after the period of 10 years and 20 years for different plantations in the watershed areas considering the present survival rate, and expected growth rate and stand of each plantation (Fig. 12). The maximum carbon sequestration potential is from energy plantation followed by miscellaneous plantation, bio-diesel and agri-horticulture plantations. A total of 391.24 t and 1114.65 t of carbon sequestration potential were estimated over 10 years and 20 years, respectively in the watershed areas. The average carbon
-1 -1 -1sequestration potential worked out to 2.12 t ha yr and 3.4 t ha -1yr after 10 years and 20 years, respectively from the plantation
area in the watershed. Estimating the carbon credit at a carbon -1price of US$ 20 t of C, it worked out to US$ 42.8 (` 2,544) and
-1 -1US$ 68 (` 4,080) ha yr after 10 years and 20 years, respectively (1 US$ = 60).
Human population carrying capacity (HPCC): Human population (adult) carrying capacity of cultivated lands in the watershed was worked out as per their production potential during pre and post project periods. The HPCC is the ratio of energy output from the land use or production system to the annual energy requirement of an adult. Annual energy requirement for an adult was calculated based on daily energy requirement recommended by the National Institute of Nutrition (NIN), Hyderabad. The HPCC of different crops is presented in Fig. 13 with spatial demarcation in the watershed area. The HPCC is lowest in niger (1.0) and the maximum in potato (12.2). Among the cereals, paddy in jhola land, up land paddy and maize have the HPCC of 4.9 to 6.6 during pre-project period and 5.5 to 7.2 during the post-project period. The HPCC of vegetables varied between 2.2 (beans) and to 12.2 (potato) during pre-project period and it increased to 2.4 and 13.1 during the post-project period due to increase in productivity of crops. The average HPCC of crops increased to 4.4 during post-project period from 4.0 during pre-project period and registered an increase of 9.3% due to enhanced productivity of crops through watershed activities.
Socio-economic Impacts
People’s participation: People’s participation in watershed management project is an important index for its sustainability and it can be measured through People’s Participation Index (PPI). The people’s participation index was worked out at preparatory phase, watershed work phase and at the consolidation phase of the project. The overall PPI was estimated to be 56% indicating that the stakeholder’s overall participation was just above the medium level. Among the three stages of the project, the level of people’s participation was highest (64%) at preparatory phase followed by 58% at work phase and 46% at consolidation phase indicating high to medium level of participation.
Change in income and expenditure pattern: Income expenditure analysis is an important activity which provides insights into real development of the watershed populace. The analysis was done before (2008) as well as after (2012)
Concise Report On Development And Management Of Model Watersheds Through Participatory Approach
76
Development and Management of Model Watersheds under New Guidelines
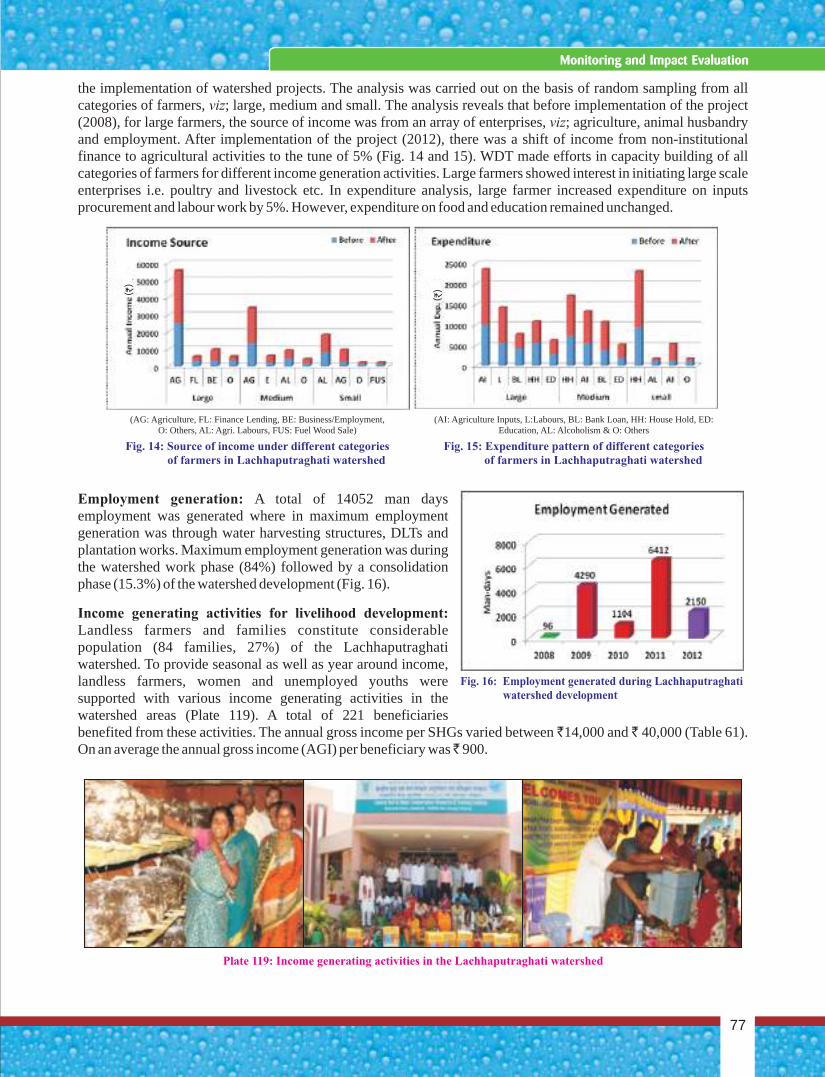
(AG: Agriculture, FL: Finance Lending, BE: Business/Employment, O: Others, AL: Agri. Labours, FUS: Fuel Wood Sale)
Fig. 14: Source of income under different categories of farmers in Lachhaputraghati watershed
(AI: Agriculture Inputs, L:Labours, BL: Bank Loan, HH: House Hold, ED: Education, AL: Alcoholism & O: Others
Fig. 16: Employment generated during Lachhaputraghati watershed development
Fig. 15: Expenditure pattern of different categories of farmers in Lachhaputraghati watershed
`( )
`( )
Plate 119: Income generating activities in the Lachhaputraghati watershed
the implementation of watershed projects. The analysis was carried out on the basis of random sampling from all categories of farmers, viz; large, medium and small. The analysis reveals that before implementation of the project (2008), for large farmers, the source of income was from an array of enterprises, viz; agriculture, animal husbandry and employment. After implementation of the project (2012), there was a shift of income from non-institutional finance to agricultural activities to the tune of 5% (Fig. 14 and 15). WDT made efforts in capacity building of all categories of farmers for different income generation activities. Large farmers showed interest in initiating large scale enterprises i.e. poultry and livestock etc. In expenditure analysis, large farmer increased expenditure on inputs procurement and labour work by 5%. However, expenditure on food and education remained unchanged.
Employment generation: A total of 14052 man days employment was generated where in maximum employment generation was through water harvesting structures, DLTs and plantation works. Maximum employment generation was during the watershed work phase (84%) followed by a consolidation phase (15.3%) of the watershed development (Fig. 16).
Income generating activities for livelihood development: Landless farmers and families constitute considerable population (84 families, 27%) of the Lachhaputraghati watershed. To provide seasonal as well as year around income, landless farmers, women and unemployed youths were supported with various income generating activities in the watershed areas (Plate 119). A total of 221 beneficiaries benefited from these activities. The annual gross income per SHGs varied between 14,000 and 40,000 (Table 61). On an average the annual gross income (AGI) per beneficiary was 900.
77
Monitoring and Impact Evaluation
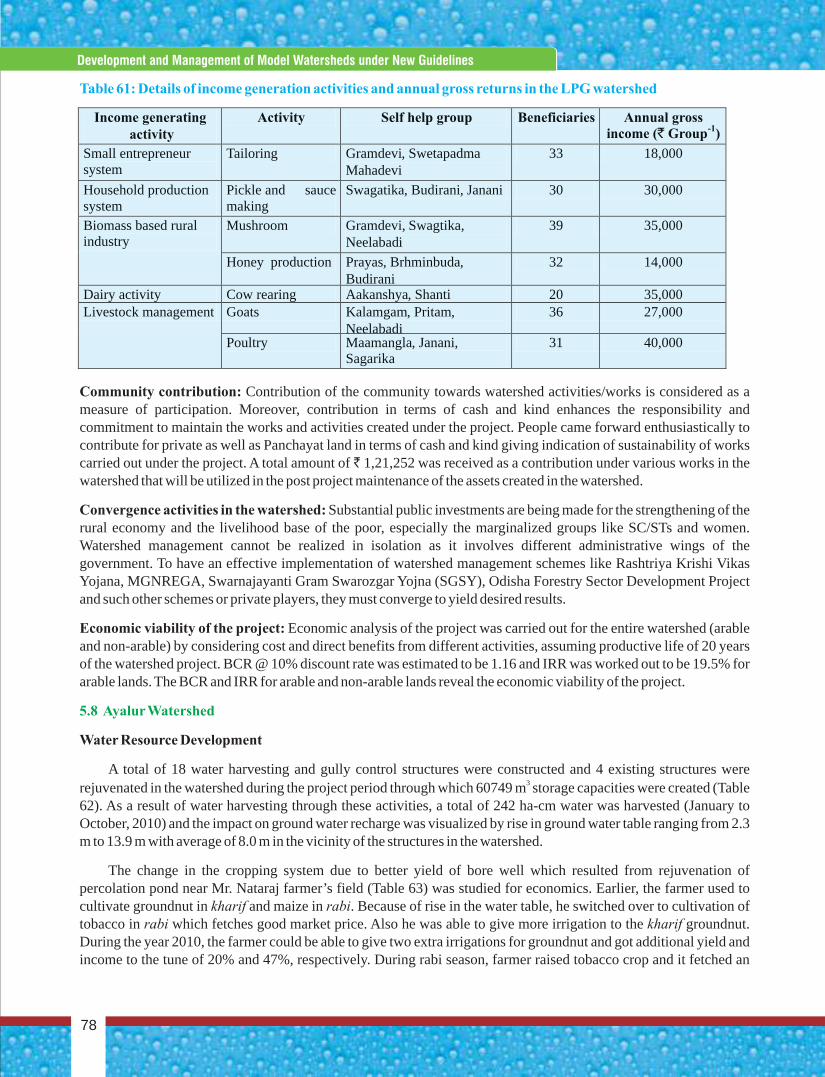
Concise Report On Development And Management Of Model Watersheds Through Participatory Approach
78
Development and Management of Model Watersheds under New Guidelines
Table 61: Details of income generation activities and annual gross returns in the LPG watershed
Community contribution: Contribution of the community towards watershed activities/works is considered as a measure of participation. Moreover, contribution in terms of cash and kind enhances the responsibility and commitment to maintain the works and activities created under the project. People came forward enthusiastically to contribute for private as well as Panchayat land in terms of cash and kind giving indication of sustainability of works carried out under the project. A total amount of 1,21,252 was received as a contribution under various works in the watershed that will be utilized in the post project maintenance of the assets created in the watershed.
Convergence activities in the watershed: Substantial public investments are being made for the strengthening of the rural economy and the livelihood base of the poor, especially the marginalized groups like SC/STs and women. Watershed management cannot be realized in isolation as it involves different administrative wings of the government. To have an effective implementation of watershed management schemes like Rashtriya Krishi Vikas Yojana, MGNREGA, Swarnajayanti Gram Swarozgar Yojna (SGSY), Odisha Forestry Sector Development Project and such other schemes or private players, they must converge to yield desired results.
Economic viability of the project: Economic analysis of the project was carried out for the entire watershed (arable and non-arable) by considering cost and direct benefits from different activities, assuming productive life of 20 years of the watershed project. BCR @ 10% discount rate was estimated to be 1.16 and IRR was worked out to be 19.5% for arable lands. The BCR and IRR for arable and non-arable lands reveal the economic viability of the project.
Water Resource Development
A total of 18 water harvesting and gully control structures were constructed and 4 existing structures were 3rejuvenated in the watershed during the project period through which 60749 m storage capacities were created (Table
62). As a result of water harvesting through these activities, a total of 242 ha-cm water was harvested (January to October, 2010) and the impact on ground water recharge was visualized by rise in ground water table ranging from 2.3 m to 13.9 m with average of 8.0 m in the vicinity of the structures in the watershed.
The change in the cropping system due to better yield of bore well which resulted from rejuvenation of percolation pond near Mr. Nataraj farmer’s field (Table 63) was studied for economics. Earlier, the farmer used to cultivate groundnut in kharif and maize in rabi. Because of rise in the water table, he switched over to cultivation of tobacco in rabi which fetches good market price. Also he was able to give more irrigation to the kharif groundnut. During the year 2010, the farmer could be able to give two extra irrigations for groundnut and got additional yield and income to the tune of 20% and 47%, respectively. During rabi season, farmer raised tobacco crop and it fetched an
5.8 Ayalur Watershed
Income generating activity
Activity Self help group Beneficiaries Annual gross income (` Group-1)
Small entrepreneur system
Tailoring Gramdevi, Swetapadma Mahadevi
33 18,000
Household production system
Pickle and sauce making
Swagatika, Budirani, Janani 30 30,000
Biomass based rural industry
Mushroom Gramdevi, Swagtika, Neelabadi
39 35,000
Honey production Prayas, Brhminbuda, Budirani
32 14,000
Dairy activity Cow rearing Aakanshya, Shanti 20 35,000 Livestock management Goats Kalamgam, Pritam,
Neelabadi 36 27,000
Poultry Maamangla, Janani, Sagarika
31 40,000
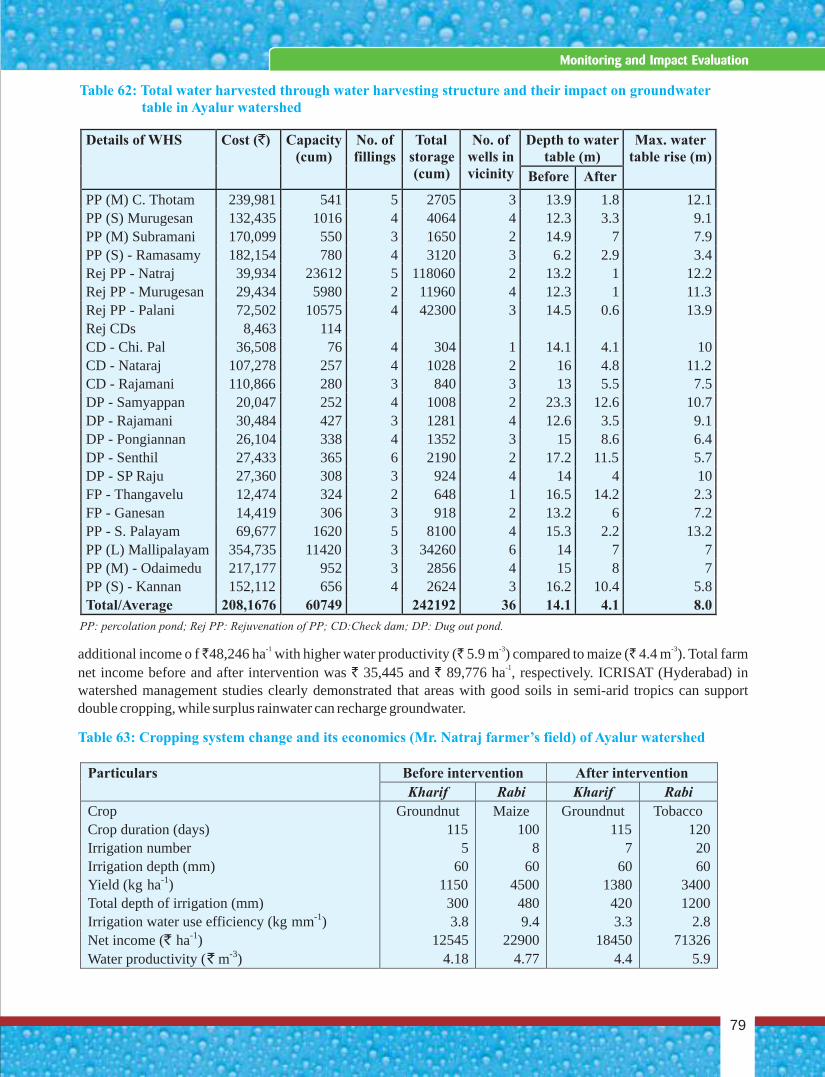
-1 -3 -3additional income o f 48,246 ha with higher water productivity ( 5.9 m ) compared to maize ( 4.4 m ). Total farm -1net income before and after intervention was ` 35,445 and ` 89,776 ha , respectively. ICRISAT (Hyderabad) in
watershed management studies clearly demonstrated that areas with good soils in semi-arid tropics can support double cropping, while surplus rainwater can recharge groundwater.
` ` `
Table 63: Cropping system change and its economics (Mr. Natraj farmer’s field) of Ayalur watershed
Particulars Before intervention After intervention Kharif Rabi Kharif Rabi
Crop Groundnut Maize Groundnut Tobacco Crop duration (days) 115 100 115 120 Irrigation number 5 8 7 20 Irrigation depth (mm) 60 60 60 60 Yield (kg ha-1) 1150 4500 1380 3400 Total depth of irrigation (mm) 300 480 420 1200 Irrigation water use efficiency (kg mm-1) 3.8 9.4 3.3 2.8 Net income (` ha-1) 12545 22900 18450 71326 Water productivity (` m-3) 4.18 4.77 4.4 5.9
Table 62: Total water harvested through water harvesting structure and their impact on groundwater table in Ayalur watershed
79
Monitoring and Impact Evaluation
Rej PP - Murugesan 29,434 5980 2 11960 4 12.3 1 11.3 Rej PP - Palani 72,502 10575 4 42300 3 14.5 0.6 13.9 Rej CDs 8,463 114 CD - Chi. Pal 36,508 76 4 304 1 14.1 4.1 10 CD - Nataraj 107,278 257 4 1028 2 16 4.8 11.2 CD - Rajamani 110,866 280 3 840 3 13 5.5 7.5 DP - Samyappan 20,047 252 4 1008 2 23.3 12.6 10.7 DP - Rajamani 30,484 427 3 1281 4 12.6 3.5 9.1 DP - Pongiannan 26,104 338 4 1352 3 15 8.6 6.4 DP - Senthil 27,433 365 6 2190 2 17.2 11.5 5.7 DP - SP Raju 27,360 308 3 924 4 14 4 10 FP - Thangavelu 12,474 324 2 648 1 16.5 14.2 2.3 FP - Ganesan 14,419 306 3 918 2 13.2 6 7.2 PP - S. Palayam 69,677 1620 5 8100 4 15.3 2.2 13.2 PP (L) Mallipalayam 354,735 11420 3 34260 6 14 7 7 PP (M) - Odaimedu 217,177 952 3 2856 4 15 8 7 PP (S) - Kannan 152,112 656 4 2624 3 16.2 10.4 5.8 Total/Average 208,1676 60749 242192 36 14.1 4.1 8.0
PP: percolation pond; Rej PP: Rejuvenation of PP; CD:Check dam; DP: Dug out pond.
Details of WHS Cost (`) Capacity (cum)
No. of fillings
Total storage (cum)
No. of wells in vicinity
Depth to water table (m)
Max. water table rise (m)
Before After
PP (M) C. Thotam 239,981 541 5 2705 3 13.9 1.8 12.1 PP (S) Murugesan 132,435 1016 4 4064 4 12.3 3.3 9.1 PP (M) Subramani 170,099 550 3 1650 2 14.9 7 7.9 PP (S) - Ramasamy 182,154 780 4 3120 3 6.2 2.9 3.4 Rej PP - Natraj 39,934 23612 5 118060 2 13.2 1 12.2
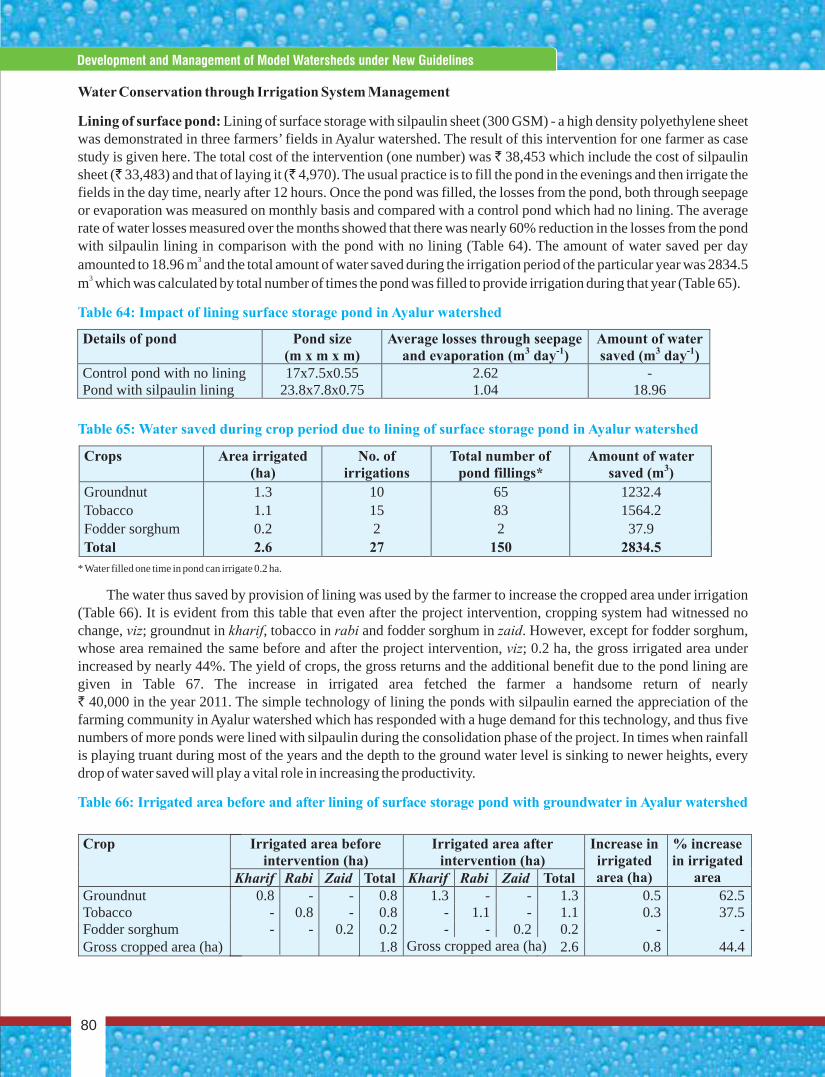
Water Conservation through Irrigation System Management
Lining of surface pond: Lining of surface storage with silpaulin sheet (300 GSM) - a high density polyethylene sheet was demonstrated in three farmers’ fields in Ayalur watershed. The result of this intervention for one farmer as case study is given here. The total cost of the intervention (one number) was ` 38,453 which include the cost of silpaulin sheet (` 33,483) and that of laying it (` 4,970). The usual practice is to fill the pond in the evenings and then irrigate the fields in the day time, nearly after 12 hours. Once the pond was filled, the losses from the pond, both through seepage or evaporation was measured on monthly basis and compared with a control pond which had no lining. The average rate of water losses measured over the months showed that there was nearly 60% reduction in the losses from the pond with silpaulin lining in comparison with the pond with no lining (Table 64). The amount of water saved per day
3 amounted to 18.96 m and the total amount of water saved during the irrigation period of the particular year was 2834.5 3m which was calculated by total number of times the pond was filled to provide irrigation during that year (Table 65).
* Water filled one time in pond can irrigate 0.2 ha.
The water thus saved by provision of lining was used by the farmer to increase the cropped area under irrigation (Table 66). It is evident from this table that even after the project intervention, cropping system had witnessed no change, viz; groundnut in kharif, tobacco in rabi and fodder sorghum in zaid. However, except for fodder sorghum, whose area remained the same before and after the project intervention, viz; 0.2 ha, the gross irrigated area under increased by nearly 44%. The yield of crops, the gross returns and the additional benefit due to the pond lining are given in Table 67. The increase in irrigated area fetched the farmer a handsome return of nearly ` 40,000 in the year 2011. The simple technology of lining the ponds with silpaulin earned the appreciation of the farming community in Ayalur watershed which has responded with a huge demand for this technology, and thus five numbers of more ponds were lined with silpaulin during the consolidation phase of the project. In times when rainfall is playing truant during most of the years and the depth to the ground water level is sinking to newer heights, every drop of water saved will play a vital role in increasing the productivity.
Table 64: Impact of lining surface storage pond in Ayalur watershed
Table 65: Water saved during crop period due to lining of surface storage pond in Ayalur watershed
Table 66: Irrigated area before and after lining of surface storage pond with groundwater in Ayalur watershed
Details of pond Pond size (m x m x m)
Average losses through seepage and evaporation (m3 day-1)
Amount of water saved (m3 day-1)
Control pond with no lining 17x7.5x0.55 2.62 - Pond with silpaulin lining 23.8x7.8x0.75 1.04 18.96
Crops Area irrigated (ha)
No. of irrigations
Total number of pond fillings*
Amount of water saved (m3)
Groundnut 1.3 10 65 1232.4 Tobacco 1.1 15 83 1564.2 Fodder sorghum 0.2 2 2 37.9 Total 2.6 27 150 2834.5
Crop Irrigated area before intervention (ha)
Irrigated area after intervention (ha)
Increase in irrigated area (ha)
% increase in irrigated
area Kharif Rabi Zaid Total Kharif Rabi Zaid Total Groundnut 0.8 - - 0.8 1.3 - - 1.3 0.5 62.5 Tobacco - 0.8 - 0.8 - 1.1 - 1.1 0.3 37.5 Fodder sorghum - - 0.2 0.2 - - 0.2 0.2 - - Gross cropped area (ha) 1.8 2.6 0.8 44.4
Gross cropped area (ha)
Concise Report On Development And Management Of Model Watersheds Through Participatory Approach
80
Development and Management of Model Watersheds under New Guidelines
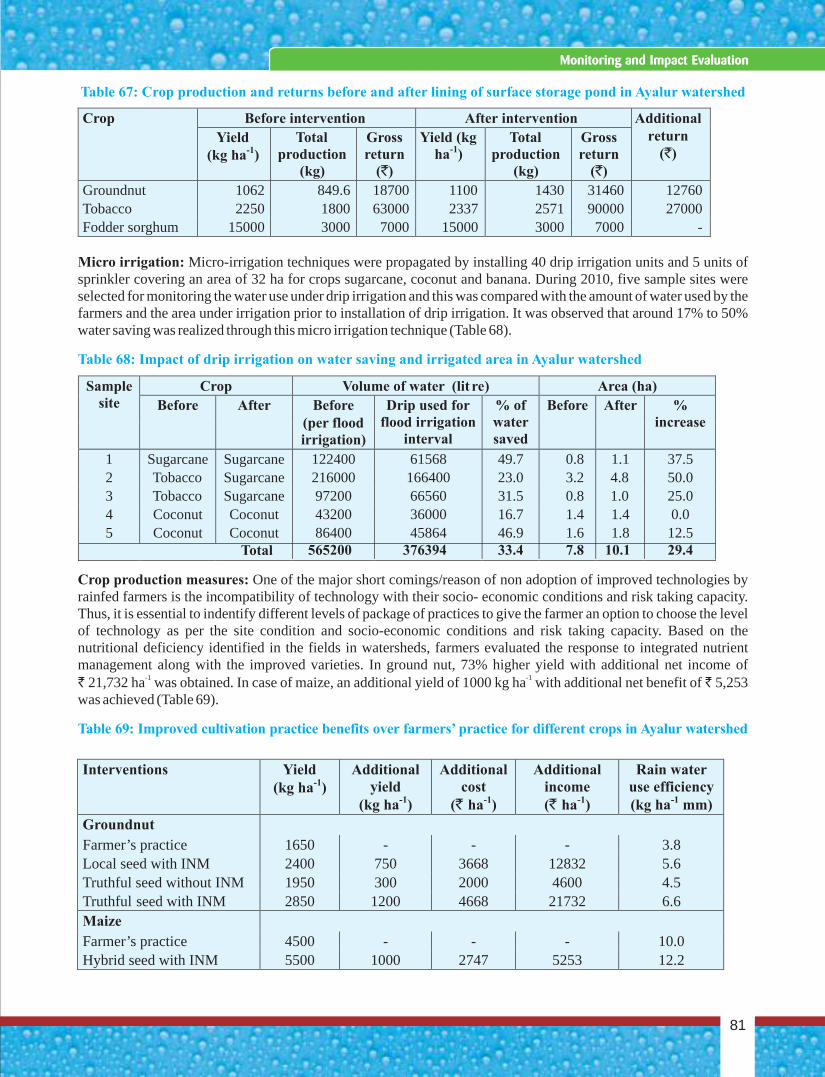
Table 67: Crop production and returns before and after lining of surface storage pond in Ayalur watershed
Table 68: Impact of drip irrigation on water saving and irrigated area in Ayalur watershed
Table 69: Improved cultivation practice benefits over farmers’ practice for different crops in Ayalur watershed
Micro irrigation: Micro-irrigation techniques were propagated by installing 40 drip irrigation units and 5 units of sprinkler covering an area of 32 ha for crops sugarcane, coconut and banana. During 2010, five sample sites were selected for monitoring the water use under drip irrigation and this was compared with the amount of water used by the farmers and the area under irrigation prior to installation of drip irrigation. It was observed that around 17% to 50% water saving was realized through this micro irrigation technique (Table 68).
Crop production measures: One of the major short comings/reason of non adoption of improved technologies by rainfed farmers is the incompatibility of technology with their socio- economic conditions and risk taking capacity. Thus, it is essential to indentify different levels of package of practices to give the farmer an option to choose the level of technology as per the site condition and socio-economic conditions and risk taking capacity. Based on the nutritional deficiency identified in the fields in watersheds, farmers evaluated the response to integrated nutrient management along with the improved varieties. In ground nut, 73% higher yield with additional net income of ` 21,732 ha was obtained. In case of maize, an additional yield of 1000 kg ha with additional net benefit of 5,253 was achieved (Table 69).
-1 -1
Crop Before intervention After intervention Additional return
(`) Yield
(kg ha-1) Total
production (kg)
Gross return
(`)
Yield (kg ha-1)
Total production
(kg)
Gross return
(`) Groundnut 1062 849.6 18700 1100 1430 31460 12760 Tobacco 2250 1800 63000 2337 2571 90000 27000 Fodder sorghum 15000 3000 7000 15000 3000 7000 -
Sample site
Crop Volume of water (lit re) Area (ha) Before After Before
(per flood irrigation)
Drip used for flood irrigation
interval
% of water saved
Before After % increase
1 Sugarcane Sugarcane 122400 61568 49.7 0.8 1.1 37.5 2 Tobacco Sugarcane 216000 166400 23.0 3.2 4.8 50.0 3 Tobacco Sugarcane 97200 66560 31.5 0.8 1.0 25.0 4 Coconut Coconut 43200 36000 16.7 1.4 1.4 0.0 5
Coconut
Coconut 86400 45864 46.9 1.6 1.8 12.5 Total 565200 376394 33.4 7.8 10.1 29.4
81
Monitoring and Impact Evaluation
Interventions Yield (kg ha-1)
Additional yield
(kg ha-1)
Additional cost
( ha-1)
Additional income ( ha-1)
Rain water use efficiency (kg ha-1 mm)
Groundnut Farmer’s practice 1650 - - - 3.8 Local seed with INM 2400 750 3668 12832 5.6 Truthful seed without INM 1950 300 2000 4600 4.5 Truthful seed with INM 2850 1200 4668 21732 6.6
Maize
Farmer’s practice 4500 - - - 10.0
Hybrid seed with INM 5500 1000 2747 5253 12.2
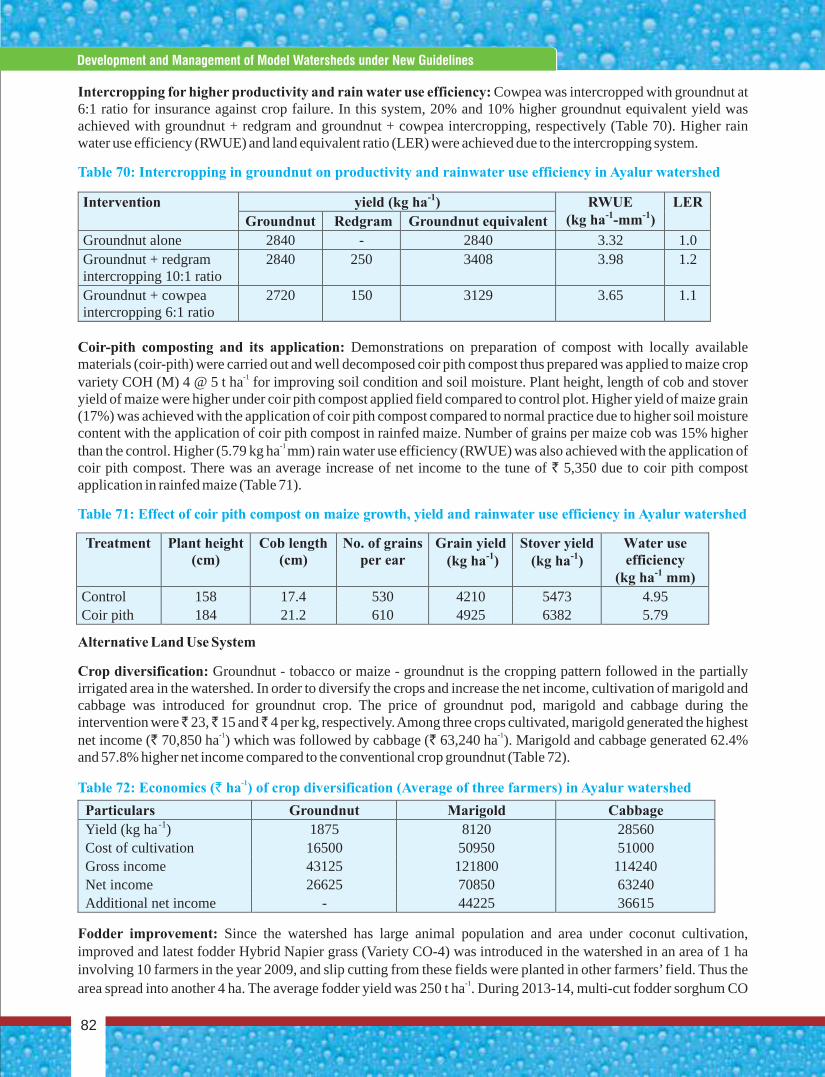
Intervention yield (kg ha-1) RWUE (kg ha-1-mm-1)
LER Groundnut Redgram Groundnut equivalent
Groundnut alone 2840 - 2840 3.32 1.0 Groundnut + redgram intercropping 10:1 ratio
2840 250 3408 3.98 1.2
Groundnut + cowpea intercropping 6:1 ratio
2720 150 3129 3.65 1.1
Treatment Plant height (cm)
Cob length (cm)
No. of grains per ear
Grain yield (kg ha-1)
Stover yield (kg ha-1)
Water use efficiency
(kg ha-1 mm) Control 158 17.4 530 4210 5473 4.95 Coir pith 184 21.2 610 4925 6382 5.79
Particulars Groundnut Marigold Cabbage Yield (kg ha -1) 1875 8120 28560 Cost of cultivation 16500 50950 51000 Gross income 43125 121800 114240 Net income 26625 70850 63240 Additional net income - 44225 36615
Concise Report On Development And Management Of Model Watersheds Through Participatory Approach
Intercropping for higher productivity and rain water use efficiency: Cowpea was intercropped with groundnut at 6:1 ratio for insurance against crop failure. In this system, 20% and 10% higher groundnut equivalent yield was achieved with groundnut + redgram and groundnut + cowpea intercropping, respectively (Table 70). Higher rain water use efficiency (RWUE) and land equivalent ratio (LER) were achieved due to the intercropping system.
Coir-pith composting and its application: Demonstrations on preparation of compost with locally available materials (coir-pith) were carried out and well decomposed coir pith compost thus prepared was applied to maize crop
-1variety COH (M) 4 @ 5 t ha for improving soil condition and soil moisture. Plant height, length of cob and stover yield of maize were higher under coir pith compost applied field compared to control plot. Higher yield of maize grain (17%) was achieved with the application of coir pith compost compared to normal practice due to higher soil moisture content with the application of coir pith compost in rainfed maize. Number of grains per maize cob was 15% higher
-1 than the control. Higher (5.79 kg ha mm) rain water use efficiency (RWUE) was also achieved with the application of coir pith compost. There was an average increase of net income to the tune of ` 5,350 due to coir pith compost application in rainfed maize (Table 71).
Alternative Land Use System
Crop diversification: Groundnut - tobacco or maize - groundnut is the cropping pattern followed in the partially irrigated area in the watershed. In order to diversify the crops and increase the net income, cultivation of marigold and cabbage was introduced for groundnut crop. The price of groundnut pod, marigold and cabbage during the intervention were 23, 15 and 4 per kg, respectively. Among three crops cultivated, marigold generated the highest
-1 -1net income (` 70,850 ha ) which was followed by cabbage (` 63,240 ha ). Marigold and cabbage generated 62.4% and 57.8% higher net income compared to the conventional crop groundnut (Table 72).
Fodder improvement: Since the watershed has large animal population and area under coconut cultivation, improved and latest fodder Hybrid Napier grass (Variety CO-4) was introduced in the watershed in an area of 1 ha involving 10 farmers in the year 2009, and slip cutting from these fields were planted in other farmers’ field. Thus the
-1area spread into another 4 ha. The average fodder yield was 250 t ha . During 2013-14, multi-cut fodder sorghum CO
Table 70: Intercropping in groundnut on productivity and rainwater use efficiency in Ayalur watershed
Table 71: Effect of coir pith compost on maize growth, yield and rainwater use efficiency in Ayalur watershed
Table 72: Economics (` ha ) of crop diversification (Average of three farmers) in Ayalur watershed-1
Concise Report On Development And Management Of Model Watersheds Through Participatory Approach
82
Development and Management of Model Watersheds under New Guidelines
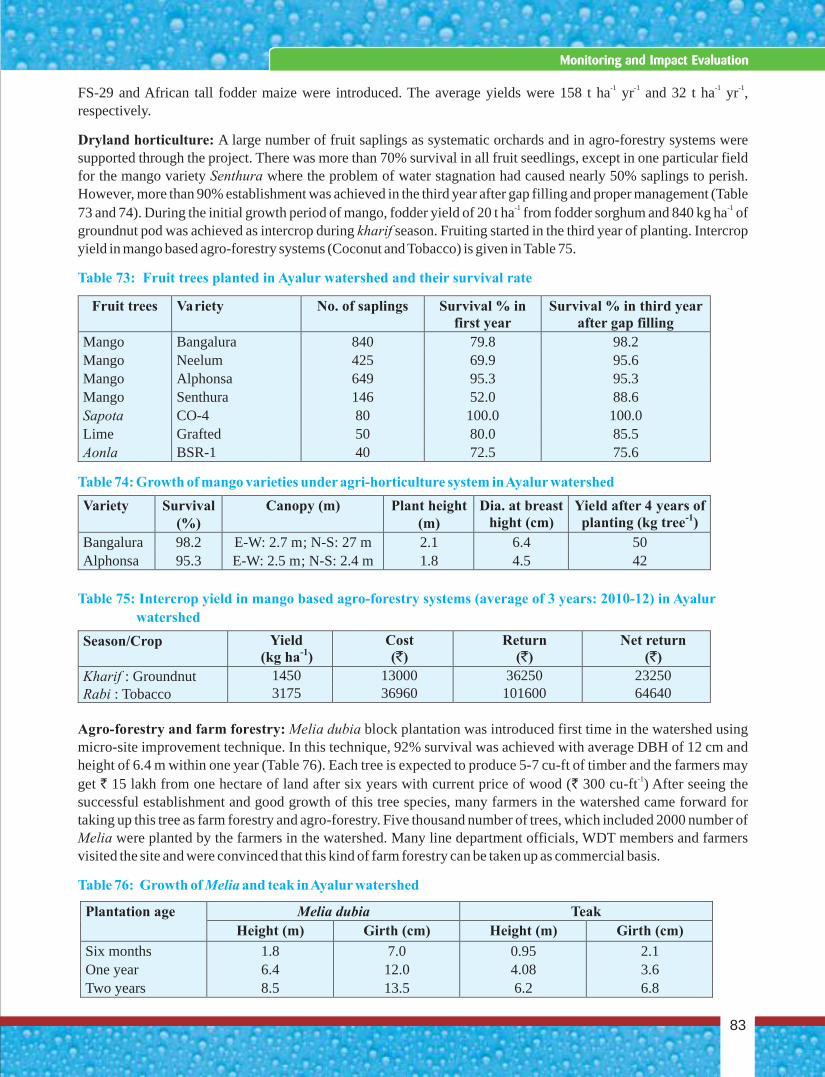
-1 -1 -1 -1FS-29 and African tall fodder maize were introduced. The average yields were 158 t ha yr and 32 t ha yr , respectively.
Dryland horticulture: A large number of fruit saplings as systematic orchards and in agro-forestry systems were supported through the project. There was more than 70% survival in all fruit seedlings, except in one particular field for the mango variety Senthura where the problem of water stagnation had caused nearly 50% saplings to perish. However, more than 90% establishment was achieved in the third year after gap filling and proper management (Table
-1 -173 and 74). During the initial growth period of mango, fodder yield of 20 t ha from fodder sorghum and 840 kg ha of groundnut pod was achieved as intercrop during kharif season. Fruiting started in the third year of planting. Intercrop yield in mango based agro-forestry systems (Coconut and Tobacco) is given in Table 75.
Agro-forestry and farm forestry: Melia dubia block plantation was introduced first time in the watershed using micro-site improvement technique. In this technique, 92% survival was achieved with average DBH of 12 cm and height of 6.4 m within one year (Table 76). Each tree is expected to produce 5-7 cu-ft of timber and the farmers may
-1get ` 15 lakh from one hectare of land after six years with current price of wood (` 300 cu-ft ) After seeing the successful establishment and good growth of this tree species, many farmers in the watershed came forward for taking up this tree as farm forestry and agro-forestry. Five thousand number of trees, which included 2000 number of Melia were planted by the farmers in the watershed. Many line department officials, WDT members and farmers visited the site and were convinced that this kind of farm forestry can be taken up as commercial basis.
Table 73: Fruit trees planted in Ayalur watershed and their survival rate
Table 74: Growth of mango varieties under agri-horticulture system in Ayalur watershed
Table 75: Intercrop yield in mango based agro-forestry systems (average of 3 years: 2010-12) in Ayalur
watershed
Table 76: Growth of Melia and teak in Ayalur watershed
Fruit trees Variety No. of saplings Survival % in first year
Survival % in third year after gap filling
Mango Bangalura 840 79.8 98.2 Mango Neelum 425 69.9 95.6 Mango Alphonsa 649 95.3 95.3 Mango Senthura 146 52.0 88.6 Sapota CO-4 80 100.0 100.0 Lime Grafted 50 80.0 85.5 Aonla BSR-1 40 72.5 75.6
Variety Survival (%)
Canopy (m) Plant height (m)
Dia. at breast hight (cm)
Yield after 4 years of planting (kg tree-1)
Bangalura 98.2 E-W: 2.7 m; N-S: 27 m 2.1 6.4 50 Alphonsa 95.3 E-W: 2.5 m; N-S: 2.4 m 1.8 4.5 42
Season/Crop Yield (kg ha-1)
Cost (`)
Return (`)
Net return (`)
Kharif : Groundnut 1450 13000 36250 23250 Rabi : Tobacco 3175 36960 101600 64640
83
Monitoring and Impact Evaluation
Plantation age Melia dubia Teak
Height (m) Girth (cm) Height (m) Girth (cm)
Six months 1.8 7.0 0.95 2.1 One year 6.4 12.0 4.08 3.6 Two years 8.5 13.5 6.2 6.8
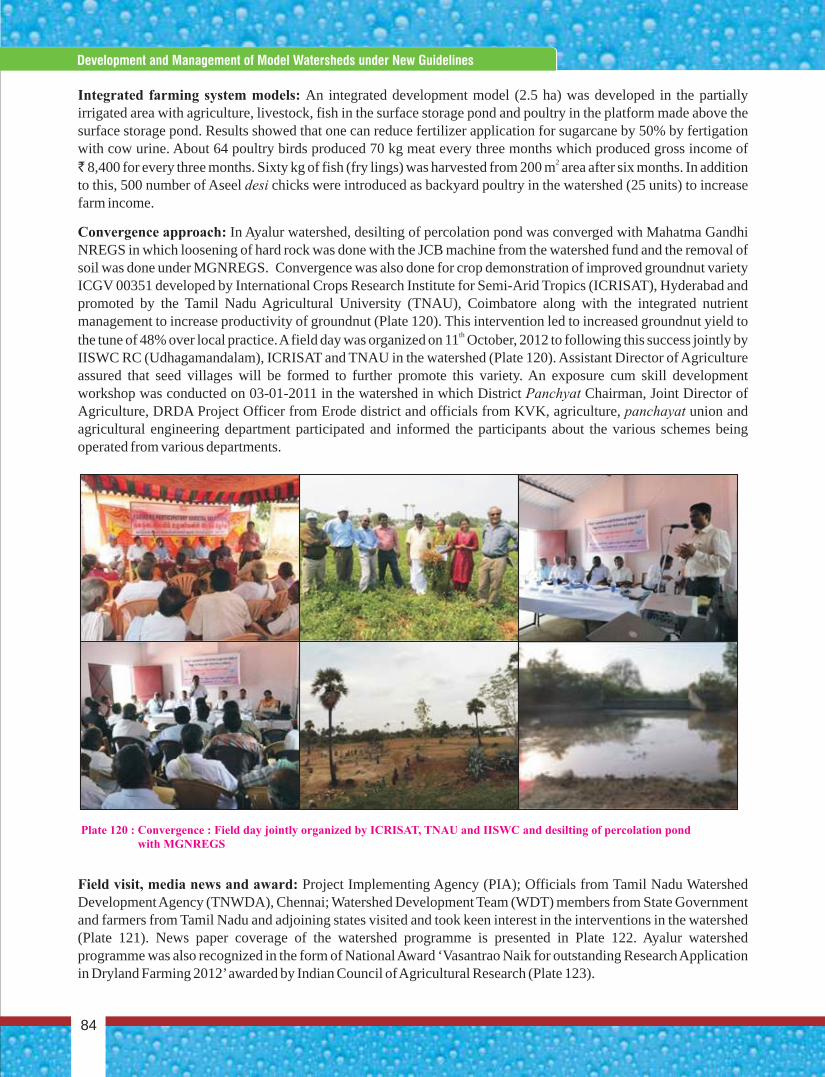
Plate 120 : Convergence : Field day jointly organized by ICRISAT, TNAU and IISWC and desilting of percolation pond with MGNREGS
Concise Report On Development And Management Of Model Watersheds Through Participatory Approach
84
Development and Management of Model Watersheds under New Guidelines
Integrated farming system models: An integrated development model (2.5 ha) was developed in the partially irrigated area with agriculture, livestock, fish in the surface storage pond and poultry in the platform made above the surface storage pond. Results showed that one can reduce fertilizer application for sugarcane by 50% by fertigation with cow urine. About 64 poultry birds produced 70 kg meat every three months which produced gross income of ` 8,400 for every three months. Sixty kg of fish (fry lings) was harvested from 200 m area after six months. In addition to this, 500 number of Aseel desi chicks were introduced as backyard poultry in the watershed (25 units) to increase farm income.
Convergence approach: In Ayalur watershed, desilting of percolation pond was converged with Mahatma Gandhi NREGS in which loosening of hard rock was done with the JCB machine from the watershed fund and the removal of soil was done under MGNREGS. Convergence was also done for crop demonstration of improved groundnut variety ICGV 00351 developed by International Crops Research Institute for Semi-Arid Tropics (ICRISAT), Hyderabad and promoted by the Tamil Nadu Agricultural University (TNAU), Coimbatore along with the integrated nutrient management to increase productivity of groundnut (Plate 120). This intervention led to increased groundnut yield to
ththe tune of 48% over local practice. A field day was organized on 11 October, 2012 to following this success jointly by IISWC RC (Udhagamandalam), ICRISAT and TNAU in the watershed (Plate 120). Assistant Director of Agriculture assured that seed villages will be formed to further promote this variety. An exposure cum skill development workshop was conducted on 03-01-2011 in the watershed in which District Panchyat Chairman, Joint Director of Agriculture, DRDA Project Officer from Erode district and officials from KVK, agriculture, panchayat union and agricultural engineering department participated and informed the participants about the various schemes being operated from various departments.
Field visit, media news and award: Project Implementing Agency (PIA); Officials from Tamil Nadu Watershed Development Agency (TNWDA), Chennai; Watershed Development Team (WDT) members from State Government and farmers from Tamil Nadu and adjoining states visited and took keen interest in the interventions in the watershed (Plate 121). News paper coverage of the watershed programme is presented in Plate 122. Ayalur watershed programme was also recognized in the form of National Award ‘Vasantrao Naik for outstanding Research Application in Dryland Farming 2012’ awarded by Indian Council of Agricultural Research (Plate 123).
2
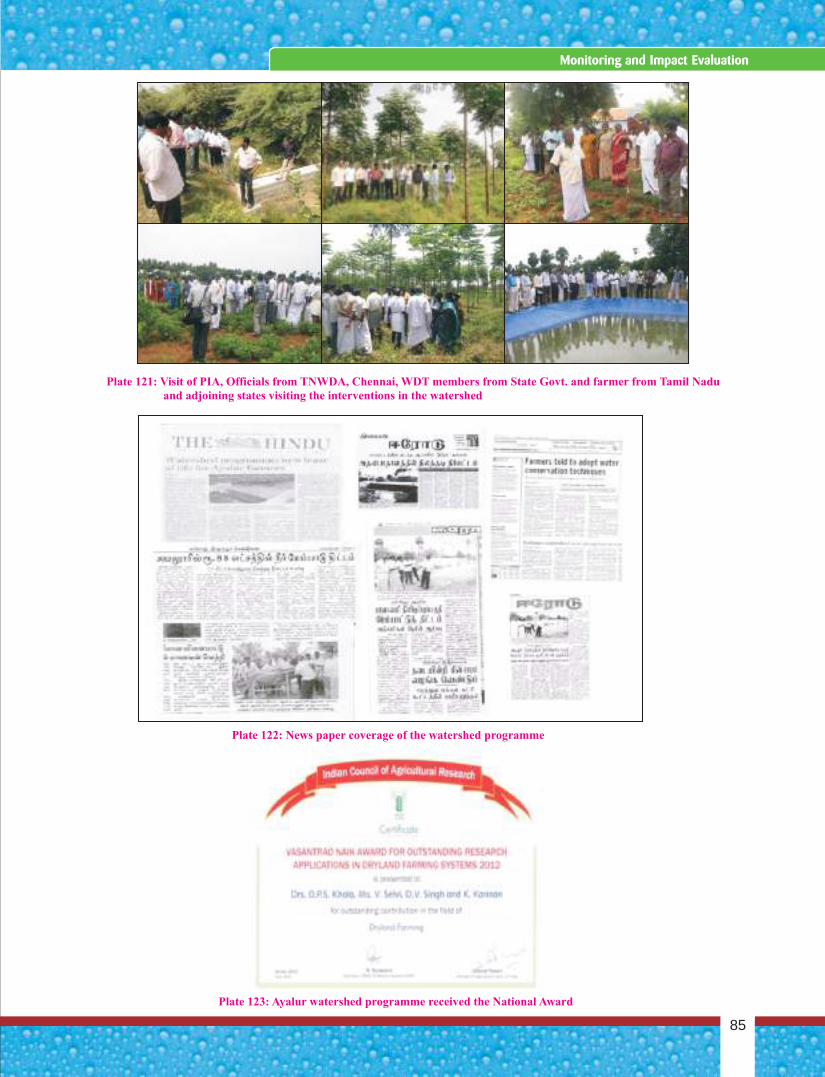
85
Monitoring and Impact Evaluation
Plate 121: Visit of PIA, Officials from TNWDA, Chennai, WDT members from State Govt. and farmer from Tamil Nadu and adjoining states visiting the interventions in the watershed
Plate 122: News paper coverage of the watershed programme
Plate 123: Ayalur watershed programme received the National Award
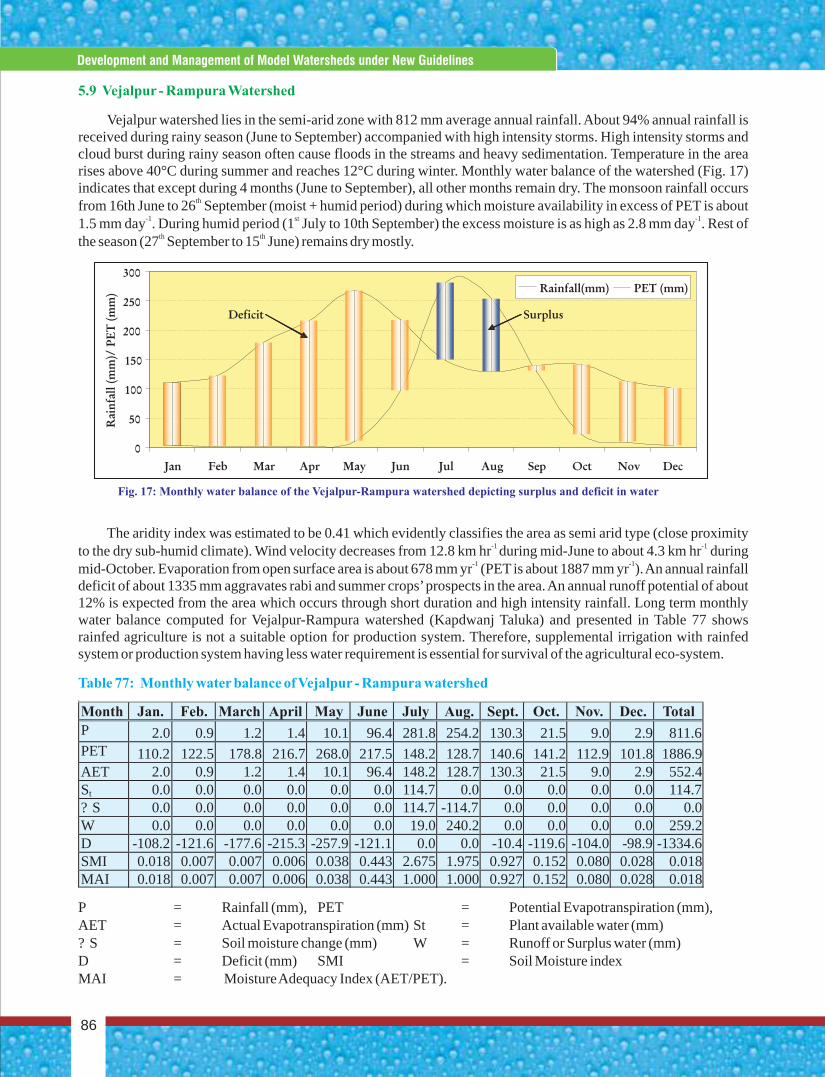
Fig. 17: Monthly water balance of the Vejalpur-Rampura watershed depicting surplus and deficit in water
0
50
100
150
200
250
300
Jan Feb Mar Apr May Jun Jul Aug Sep Oct Nov Dec
Rai
nfa
ll (
mm
)/ P
ET
(m
m) Rainfall(mm) PET (mm)
SurplusDeficit
5.9 Vejalpur - Rampura Watershed
Vejalpur watershed lies in the semi-arid zone with 812 mm average annual rainfall. About 94% annual rainfall is received during rainy season (June to September) accompanied with high intensity storms. High intensity storms and cloud burst during rainy season often cause floods in the streams and heavy sedimentation. Temperature in the area rises above 40°C during summer and reaches 12°C during winter. Monthly water balance of the watershed (Fig. 17) indicates that except during 4 months (June to September), all other months remain dry. The monsoon rainfall occurs
thfrom 16th June to 26 September (moist + humid period) during which moisture availability in excess of PET is about -1 st -11.5 mm day . During humid period (1 July to 10th September) the excess moisture is as high as 2.8 mm day . Rest of
th ththe season (27 September to 15 June) remains dry mostly.
The aridity index was estimated to be 0.41 which evidently classifies the area as semi arid type (close proximity -1 -1to the dry sub-humid climate). Wind velocity decreases from 12.8 km hr during mid-June to about 4.3 km hr during
-1 -1mid-October. Evaporation from open surface area is about 678 mm yr (PET is about 1887 mm yr ). An annual rainfall deficit of about 1335 mm aggravates rabi and summer crops’ prospects in the area. An annual runoff potential of about 12% is expected from the area which occurs through short duration and high intensity rainfall. Long term monthly water balance computed for Vejalpur-Rampura watershed (Kapdwanj Taluka) and presented in Table 77 shows rainfed agriculture is not a suitable option for production system. Therefore, supplemental irrigation with rainfed system or production system having less water requirement is essential for survival of the agricultural eco-system.
P = Rainfall (mm), PET = Potential Evapotranspiration (mm), AET = Actual Evapotranspiration (mm) St = Plant available water (mm)? S = Soil moisture change (mm) W = Runoff or Surplus water (mm)D = Deficit (mm) SMI = Soil Moisture index MAI = Moisture Adequacy Index (AET/PET).
Table 77: Monthly water balance of Vejalpur - Rampura watershed
Concise Report On Development And Management Of Model Watersheds Through Participatory Approach
86
Development and Management of Model Watersheds under New Guidelines
Month Jan. Feb. March April May June July Aug. Sept. Oct. Nov. Dec. Total P 2.0 0.9 1.2 1.4 10.1 96.4 281.8 254.2 130.3 21.5 9.0 2.9 811.6 PET 110.2 122.5 178.8 216.7 268.0 217.5 148.2 128.7 140.6 141.2 112.9 101.8 1886.9 AET 2.0 0.9 1.2 1.4 10.1 96.4 148.2 128.7 130.3 21.5 9.0 2.9 552.4 St 0.0 0.0 0.0 0.0 0.0 0.0 114.7 0.0 0.0 0.0 0.0 0.0 114.7 ? S 0.0 0.0 0.0 0.0 0.0 0.0 114.7 -114.7 0.0 0.0 0.0 0.0 0.0 W 0.0 0.0 0.0 0.0 0.0 0.0 19.0 240.2 0.0 0.0 0.0 0.0 259.2 D -108.2 -121.6 -177.6 -215.3 -257.9 -121.1 0.0 0.0 -10.4 -119.6 -104.0 -98.9 -1334.6 SMI 0.018 0.007 0.007 0.006 0.038 0.443 2.675 1.975 0.927 0.152 0.080 0.028 0.018 MAI 0.018 0.007 0.007 0.006 0.038 0.443 1.000 1.000 0.927 0.152 0.080 0.028 0.018
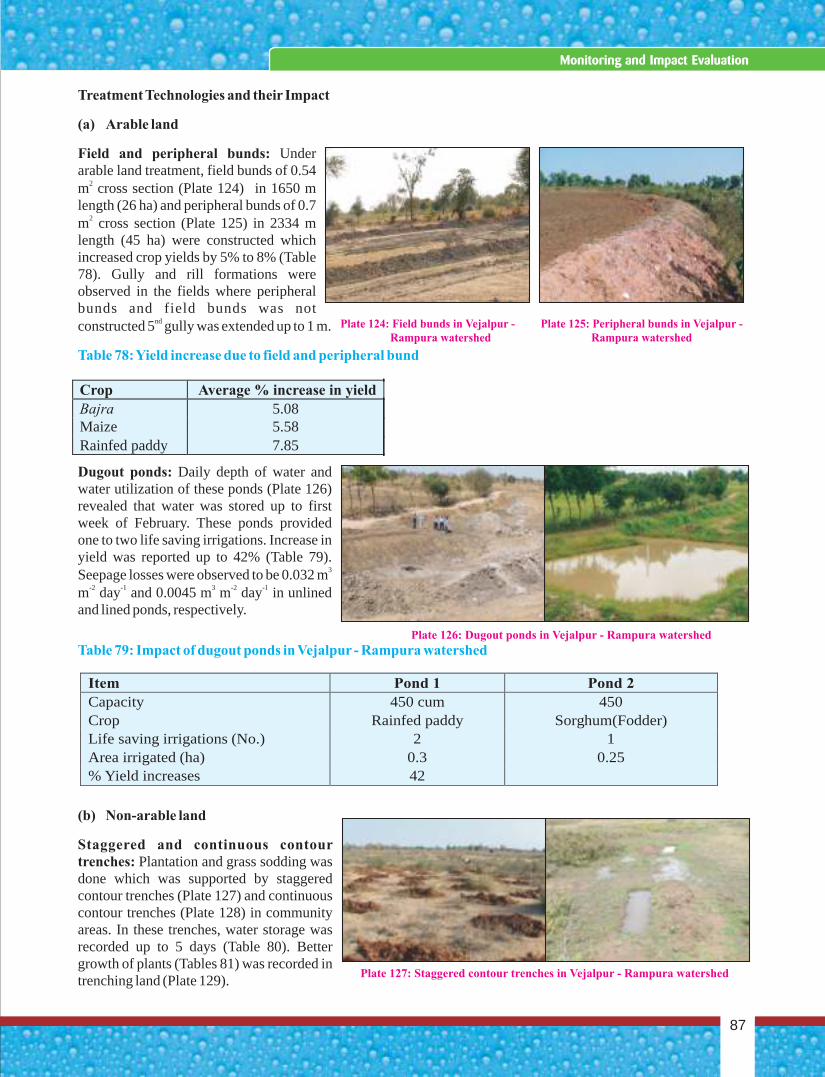
Plate 124: Field bunds in Vejalpur - Rampura watershed
Crop Average % increase in yield Bajra 5.08 Maize 5.58 Rainfed paddy 7.85
Plate 125: Peripheral bunds in Vejalpur - Rampura watershed
87
Monitoring and Impact Evaluation
Item Pond 1 Pond 2
Capacity 450 cum 450 Crop Rainfed paddy Sorghum(Fodder) Life saving irrigations (No.) 2 1 Area irrigated (ha) 0.3 0.25 % Yield increases 42
Plate 127: Staggered contour trenches in Vejalpur - Rampura watershed
Plate 126: Dugout ponds in Vejalpur - Rampura watershed
Treatment Technologies and their Impact
(a) Arable land
Field and peripheral bunds: Under arable land treatment, field bunds of 0.54
2m cross section (Plate 124) in 1650 m length (26 ha) and peripheral bunds of 0.7
2m cross section (Plate 125) in 2334 m length (45 ha) were constructed which increased crop yields by 5% to 8% (Table 78). Gully and rill formations were observed in the fields where peripheral bunds and field bunds was not
ndconstructed 5 gully was extended up to 1 m.
Dugout ponds: Daily depth of water and water utilization of these ponds (Plate 126) revealed that water was stored up to first week of February. These ponds provided one to two life saving irrigations. Increase in yield was reported up to 42% (Table 79).
3Seepage losses were observed to be 0.032 m -2 -1 3 -2 -1m day and 0.0045 m m day in unlined
and lined ponds, respectively.
(b) Non-arable land
Staggered and continuous contour trenches: Plantation and grass sodding was done which was supported by staggered contour trenches (Plate 127) and continuous contour trenches (Plate 128) in community areas. In these trenches, water storage was recorded up to 5 days (Table 80). Better growth of plants (Tables 81) was recorded in trenching land (Plate 129).
Table 78: Yield increase due to field and peripheral bund
Table 79: Impact of dugout ponds in Vejalpur - Rampura watershed

Table 80: Observations on water storage trenches in Vejalpur - Rampura watershed
Table 81: Plants survival under silvipasture and due to moisture conserved in trenches in community land of Vejalpur - Rampura watershed
Table 82: Silt deposition and water storage behind gully plugs in Vejalpur - Rampura watershed
Gully plug structures: Observations on gully plug structures revealed good silt retention and water storage behind the structures (Table 82).
Location
Size Days of
water holding
Ramasodi village
2.0 x 0.5 x 0.5 m 3
Ramasodi village
1.2 x 0.3 x 0.3 m 2
Vejalpura village
2.0 x 0.5 x 0.5 m 3Vejalpura village 1.2 x 0.3 x 0.3 m 2Nana- Rampura village 2.0 x 0.5 x 0.5 m 5Nana- Rampura village 1.2 x 0.3 x 0.3 m 3
Plate 129: Performance of tree plantation and grass in community land in Vejalpur-Rampura watershedPlate 128: Continuous contour trenches in Vejalpur - Rampura watershed
Concise Report On Development And Management Of Model Watersheds Through Participatory Approach
88
Development and Management of Model Watersheds under New Guidelines
Community land village
Plant species Plantation date
Under silvipasture Average plant survival due to moisture
conserved in trenches (%)
Numbers planted
Average plant survival (%)
Ramosadi Acacia nilotica July, 2009 200 74 74 Azadirachta indica July, 2009 200 11 11 Azadirachta indica July, 2010 - - 67 Nana-Rampura Acacia nilotica July, 2009 240 38 30 Azadirachta indica July, 2009 400 19 20
Gully plug No. Silt deposition (cu-m) Water Storage (cu-m)
Gully Plug 1 17.37 75 Gully Plug 2 15.48 165 Gully Plug 3 39.97 790 Gully Plug 4 28.29 189 Gully Plug 5 32.34 202 Gully Plug 6 14.64 61.2
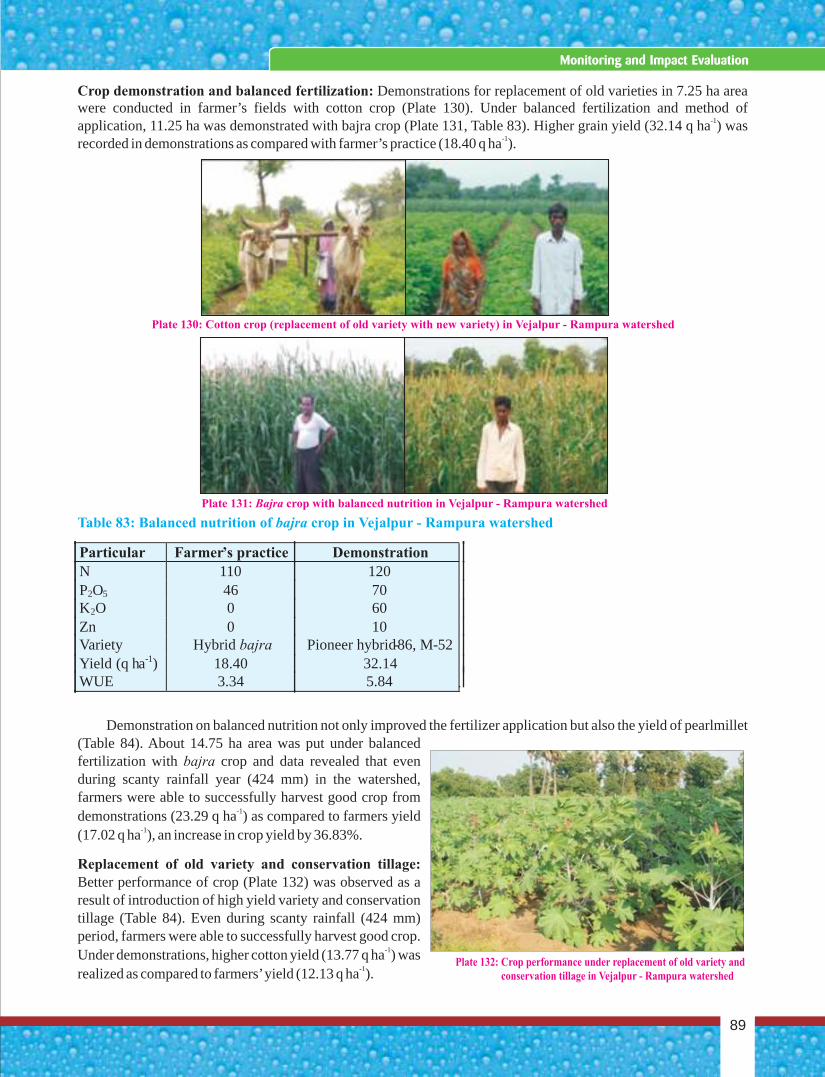
Crop demonstration and balanced fertilization: Demonstrations for replacement of old varieties in 7.25 ha area were conducted in farmer’s fields with cotton crop (Plate 130). Under balanced fertilization and method of
-1application, 11.25 ha was demonstrated with bajra crop (Plate 131, Table 83). Higher grain yield (32.14 q ha ) was -1recorded in demonstrations as compared with farmer’s practice (18.40 q ha ).
Demonstration on balanced nutrition not only improved the fertilizer application but also the yield of pearlmillet (Table 84). About 14.75 ha area was put under balanced fertilization with bajra crop and data revealed that even during scanty rainfall year (424 mm) in the watershed, farmers were able to successfully harvest good crop from
-1demonstrations (23.29 q ha ) as compared to farmers yield -1(17.02 q ha ), an increase in crop yield by 36.83%.
Replacement of old variety and conservation tillage: Better performance of crop (Plate 132) was observed as a result of introduction of high yield variety and conservation tillage (Table 84). Even during scanty rainfall (424 mm) period, farmers were able to successfully harvest good crop.
-1Under demonstrations, higher cotton yield (13.77 q ha ) was -1realized as compared to farmers’ yield (12.13 q ha ).
Table 83: Balanced nutrition of bajra crop in Vejalpur - Rampura watershed
89
Monitoring and Impact Evaluation
Plate 131: Bajra crop with balanced nutrition in Vejalpur - Rampura watershed
Plate 130: Cotton crop (replacement of old variety with new variety) in Vejalpur - Rampura watershed
Particular Farmer’s practice Demonstration N 110 120 P2O5 46 70 K2O 0 60 Zn 0 10 Variety Hybrid bajra Pioneer hybrid-86, M-52 Yield (q ha-1) 18.40 32.14
WUE 3.34 5.84
Plate 132: Crop performance under replacement of old variety and conservation tillage in Vejalpur - Rampura watershed
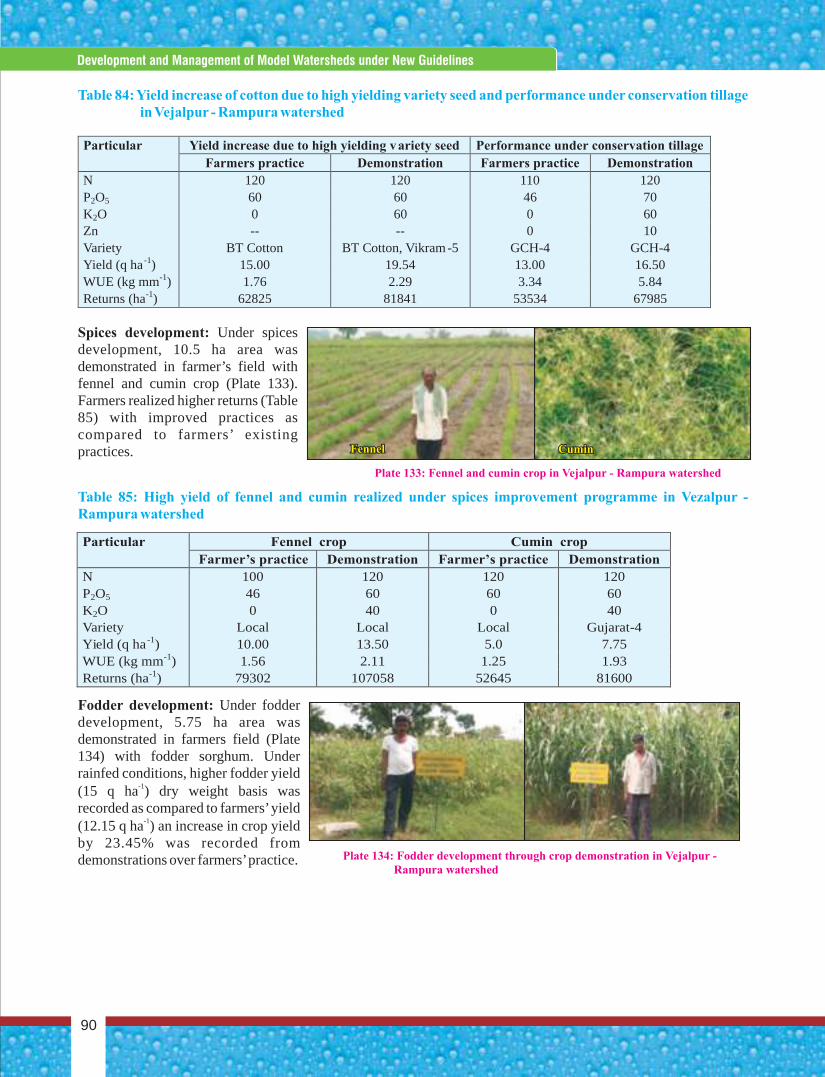
Table 84: Yield increase of cotton due to high yielding variety seed and performance under conservation tillage in Vejalpur - Rampura watershed
Table 85: High yield of fennel and cumin realized under spices improvement programme in Vezalpur - Rampura watershed
Spices development: Under spices development, 10.5 ha area was demonstrated in farmer’s field with fennel and cumin crop (Plate 133). Farmers realized higher returns (Table 85) with improved practices as compared to farmers’ existing practices.
Fodder development: Under fodder development, 5.75 ha area was demonstrated in farmers field (Plate 134) with fodder sorghum. Under rainfed conditions, higher fodder yield
-1(15 q ha ) dry weight basis was recorded as compared to farmers’ yield
-1(12.15 q ha ) an increase in crop yield by 23.45% was recorded from demonstrations over farmers’ practice.
Plate 133: Fennel and cumin crop in Vejalpur - Rampura watershed
Fennel Fennel CuminCumin
Particular Yield increase due to high yielding variety seed Performance under conservation tillage
Farmers practice Demonstration Farmers practice Demonstration
N 120 120 110 120 P2O5 60 60 46 70 K2O 0 60 0 60 Zn -- -- 0 10 Variety BT Cotton BT Cotton, Vikram-5 GCH-4 GCH-4 Yield (q ha -1) 15.00 19.54 13.00 16.50 WUE (kg mm-1) 1.76 2.29 3.34 5.84 Returns (ha-1) 62825 81841 53534 67985
Concise Report On Development And Management Of Model Watersheds Through Participatory Approach
90
Development and Management of Model Watersheds under New Guidelines
Particular Fennel crop Cumin crop
Demonstration Farmer’s practice Demonstration
N 100 120 120 120 P2O5 46 60 60 60 K2O 0 40 0 40 Variety Local Local Local Gujarat-4 Yield (q ha -1) 10.00 13.50 5.0 7.75 WUE (kg mm-1) 1.56 2.11 1.25 1.93 Returns (ha-1) 79302 107058 52645 81600
Farmer’s practice
Plate 134: Fodder development through crop demonstration in Vejalpur - Rampura watershed
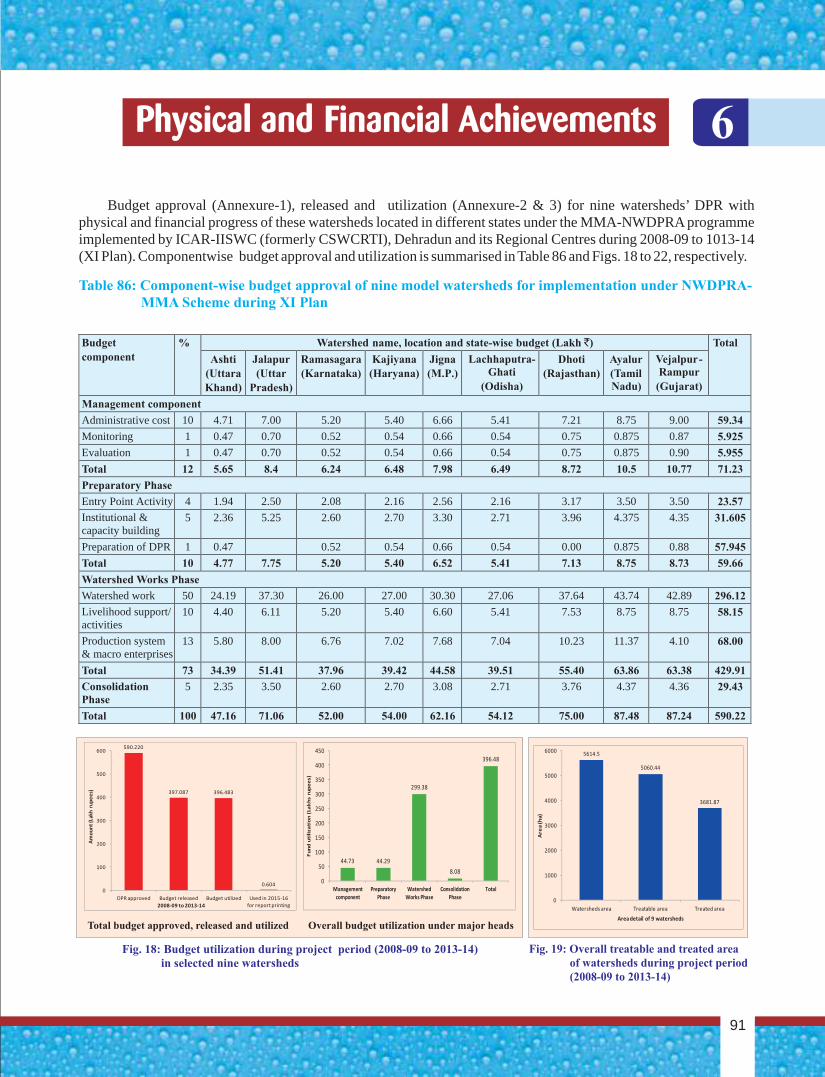
Budget approval (Annexure-1), released and utilization (Annexure-2 & 3) for nine watersheds’ DPR with physical and financial progress of these watersheds located in different states under the MMA-NWDPRA programme implemented by ICAR-IISWC (formerly CSWCRTI), Dehradun and its Regional Centres during 2008-09 to 1013-14 (XI Plan). Componentwise budget approval and utilization is summarised in Table 86 and Figs. 18 to 22, respectively.
Table 86: Component-wise budget approval of nine model watersheds for implementation under NWDPRA-MMA Scheme during XI Plan
Budget component
% Watershed name, location and state-wise budget (Lakh `) Total
Ashti (Uttara Khand)
Jalapur (Uttar
Pradesh)
Ramasagara (Karnataka)
Kajiyana (Haryana)
Jigna (M.P.)
Lachhaputra- Ghati
(Odisha)
Dhoti (Rajasthan)
Ayalur (Tamil Nadu)
Vejalpur-Rampur
(Gujarat)
Management component
Administrative cost 10 4.71 7.00 5.20 5.40 6.66 5.41 7.21 8.75 9.00 59.34
Monitoring 1 0.47 0.70 0.52 0.54 0.66 0.54 0.75 0.875 0.87 5.925
Evaluation 1 0.47 0.70 0.52 0.54 0.66 0.54 0.75 0.875 0.90 5.955
Total 12 5.65 8.4 6.24 6.48 7.98 6.49 8.72 10.5 10.77 71.23
Preparatory Phase
Entry Point Activity 4 1.94 2.50 2.08 2.16 2.56 2.16 3.17 3.50 3.50 23.57
Institutional & capacity building
5 2.36 5.25 2.60 2.70 3.30 2.71 3.96 4.375 4.35 31.605
Preparation of DPR 1 0.47 0.52 0.54 0.66 0.54 0.00 0.875 0.88 57.945
Total 10 4.77 7.75 5.20 5.40 6.52 5.41 7.13 8.75 8.73 59.66
Watershed Works Phase
Watershed work 50 24.19 37.30 26.00 27.00 30.30 27.06 37.64 43.74 42.89 296.12
Livelihood support/ activities
10 4.40 6.11 5.20 5.40 6.60 5.41 7.53 8.75 8.75 58.15
Production system & macro enterprises
13 5.80 8.00 6.76 7.02 7.68 7.04 10.23 11.37 4.10 68.00
Total 73 34.39 51.41 37.96 39.42 44.58 39.51 55.40 63.86 63.38 429.91
Consolidation Phase
5 2.35 3.50 2.60 2.70 3.08 2.71 3.76 4.37 4.36 29.43
Total 100 47.16 71.06 52.00 54.00 62.16 54.12 75.00 87.48 87.24 590.22
Total budget approved, released and utilized Overall budget utilization under major heads
Fig. 18: Budget utilization during project period (2008-09 to 2013-14) in selected nine watersheds
Fig. 19: Overall treatable and treated area of watersheds during project period (2008-09 to 2013-14)
Physical and Financial Achievements 6
91
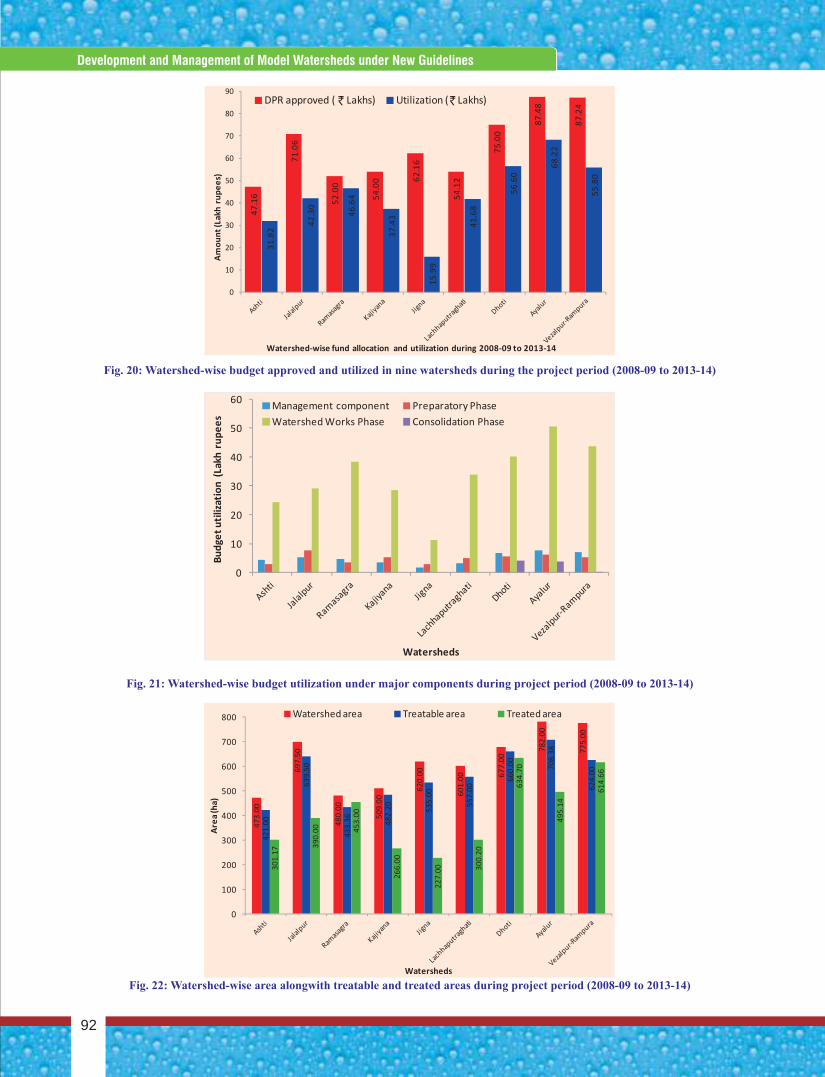
Fig. 20: Watershed-wise budget approved and utilized in nine watersheds during the project period (2008-09 to 2013-14)
Fig. 21: Watershed-wise budget utilization under major components during project period (2008-09 to 2013-14)
Fig. 22: Watershed-wise area alongwith treatable and treated areas during project period (2008-09 to 2013-14)
` `
92
Development and Management of Model Watersheds under New Guidelines
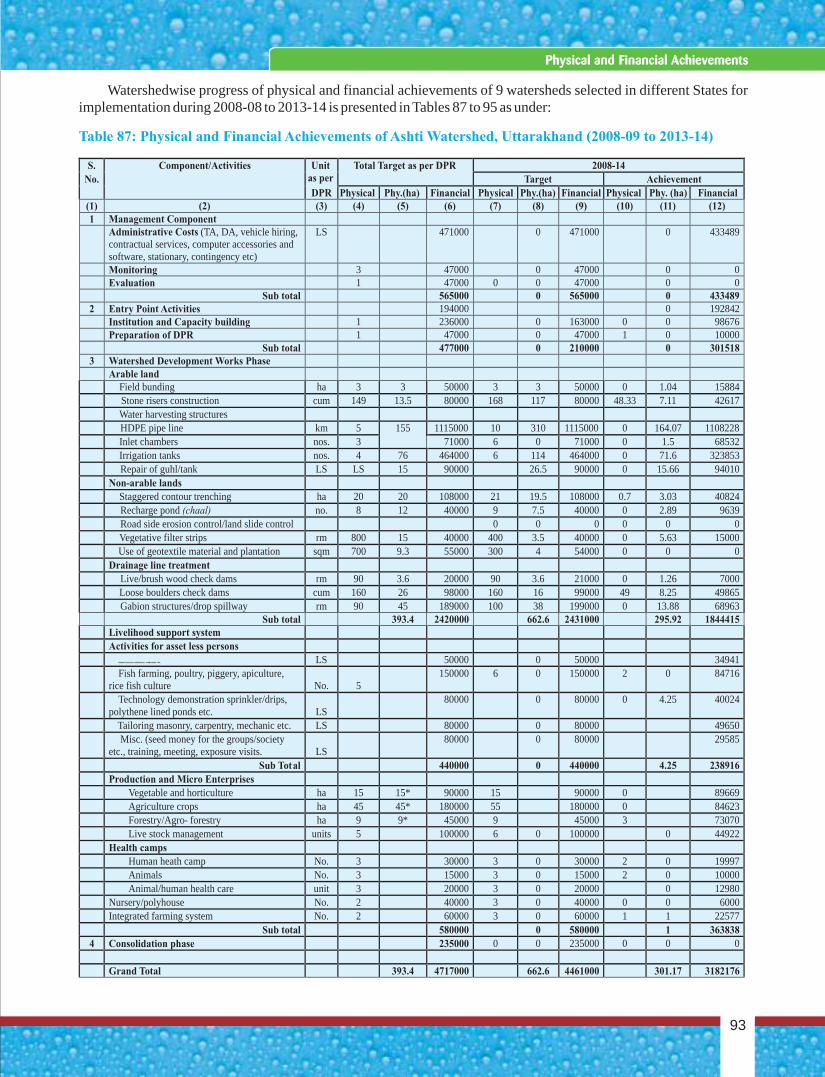
Watershedwise progress of physical and financial achievements of 9 watersheds selected in different States for implementation during 2008-08 to 2013-14 is presented in Tables 87 to 95 as under:
Table 87: Physical and Financial Achievements of Ashti Watershed, Uttarakhand (2008-09 to 2013-14)
S. Component/Activities
Unit as per
Total Target as per DPR
2008-14
No.
Target
Achievement
DPR
Physical
Phy.(ha)
Financial
Physical
Phy.(ha)
Financial
Physical
Phy. (ha)
Financial
(1)
(2)
(3)
(4)
(5)
(6)
(7)
(8)
(9)
(10)
(11)
(12)
1 Management Component
Administrative Costs (TA, DA, vehicle hiring, contractual services, computer accessories and software, stationary, contingency etc)
LS
471000
0
471000
0
433489
Monitoring
3
47000
0
47000
0
0Evaluation
1
47000
0
0
47000
0
0Sub total
565000
0
565000
0
433489
2 Entry Point Activities
194000
0
192842Institution and Capacity building
1
236000
0
163000
0
0
98676Preparation of DPR
1
47000
0
47000
1
0
10000Sub total
477000
0
210000
0
301518
3 Watershed Development Works Phase
Arable land
Field bunding ha 3 3 50000 3 3 50000 0 1.04 15884Stone risers construction cum 149 13.5 80000 168 117 80000 48.33 7.11 42617Water harvesting structures HDPE pipe line km 5 155 1115000 10 310 1115000 0 164.07 1108228Inlet chambers nos. 3 71000 6 0 71000 0 1.5 68532Irrigation tanks nos. 4 76 464000 6 114 464000 0 71.6 323853Repair of guhl/tank LS LS 15 90000 26.5 90000 0 15.66 94010
Non-arable lands Staggered contour trenching ha 20 20 108000 21 19.5 108000 0.7 3.03 40824Recharge pond (chaal) no. 8 12 40000 9 7.5 40000 0 2.89 9639Road side erosion control/land slide control 0 0 0 0 0 0Vegetative filter strips rm 800 15 40000 400 3.5 40000 0 5.63 15000Use of geotextile material and plantation sqm 700 9.3 55000 300 4 54000 0 0 0
Drainage line treatment Live/brush wood check dams rm 90 3.6 20000 90 3.6 21000 0 1.26 7000Loose boulders check dams cum 160 26 98000 160 16 99000 49 8.25 49865Gabion structures/drop spillway rm 90 45 189000 100 38 199000 0 13.88 68963
Sub total 393.4 2420000 662.6 2431000 295.92 1844415Livelihood support system Activities for asset less persons
Animal vaccines, médecines, médication etc,
LS 50000 0 50000 34941Fish farming, poultry, piggery, apiculture,
rice fish culture No. 5
150000 6 0 150000 2 0 84716
Technology demonstration sprinkler/drips, polythene lined ponds etc. LS
80000 0 80000 0 4.25 40024
Tailoring masonry, carpentry, mechanic etc. LS 80000 0 80000 49650Misc. (seed money for the groups/society
etc., training, meeting, exposure visits. LS 80000 0 80000 29585
Sub Total 440000 0 440000 4.25 238916
Production and Micro Enterprises Vegetable and horticulture ha 15 15* 90000 15 90000 0 89669Agriculture crops ha 45 45* 180000 55 180000 0 84623Forestry/Agro- forestry ha 9 9* 45000 9 45000 3 73070Live stock management units 5 100000 6 0 100000 0 44922
Health camps Human heath camp No. 3 30000 3 0 30000 2 0 19997Animals No. 3 15000 3 0 15000 2 0 10000Animal/human health care unit 3 20000 3 0 20000 0 12980
Nursery/polyhouse No. 2 40000 3 0 40000 0 0 6000Integrated farming system No. 2 60000 3 0 60000 1 1 22577
Sub total 580000 0 580000 1 363838
4 Consolidation phase 235000 0 0 235000 0 0 0
Grand Total 393.4 4717000 662.6 4461000 301.17 3182176
93
Physical and Financial Achievements
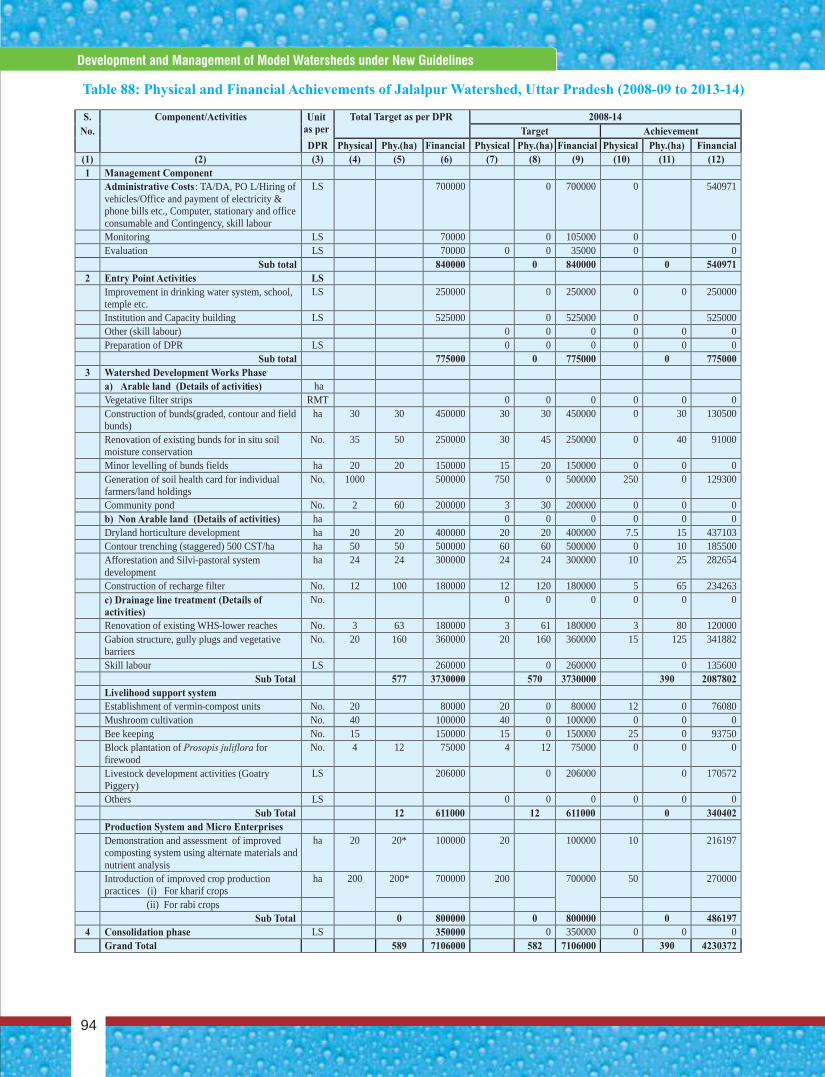
Table 88: Physical and Financial Achievements of Jalalpur Watershed, Uttar Pradesh (2008-09 to 2013-14)
S. Component/Activities Unit as per
Total Target as per DPR 2008-14
No. Target Achievement
DPR Physical Phy.(ha) Financial Physical Phy.(ha) Financial Physical Phy.(ha) Financial
(1) (2) (3) (4) (5) (6) (7) (8) (9) (10) (11) (12)
1 Management Component Administrative Costs: TA/DA, PO L/Hiring of
vehicles/Office and payment of electricity & phone bills etc., Computer, stationary and office consumable and Contingency, skill labour
LS 700000 0 700000 0 540971
Monitoring LS 70000 0 105000 0 0 Evaluation LS 70000 0 0 35000 0 0 Sub total 840000 0 840000 0 540971
2 Entry Point Activities LS Improvement in drinking water system, school,
temple etc. LS 250000 0 250000 0 0 250000
Institution and Capacity building LS 525000 0 525000 0 525000 Other (skill labour) 0 0 0 0 0 0 Preparation of DPR LS 0 0 0 0 0 0 Sub total 775000 0 775000 0 775000
3 Watershed Development Works Phase a) Arable land (Details of activities) ha Vegetative filter strips RMT 0 0 0 0 0 0 Construction of bunds(graded, contour and field
bunds) ha 30 30 450000 30 30 450000 0 30 130500
Renovation of existing bunds for in situ soil moisture conservation
No. 35 50 250000 30 45 250000 0 40 91000
Minor levelling of bunds fields ha 20 20 150000 15 20 150000 0 0 0 Generation of soil health card for individual
farmers/land holdings No. 1000 500000 750 0 500000 250 0 129300
Community pond No. 2 60 200000 3 30 200000 0 0 0 b) Non Arable land (Details of activities) ha 0 0 0 0 0 0 Dryland horticulture development ha 20 20 400000 20 20 400000 7.5 15 437103 Contour trenching (staggered) 500 CST/ha ha 50 50 500000 60 60 500000 0 10 185500 Afforestation and Silvi-pastoral system
development ha 24 24 300000 24 24 300000 10 25 282654
Construction of recharge filter No. 12 100 180000 12 120 180000 5 65 234263 c) Drainage line treatment (Details of
activities) No. 0 0 0 0 0 0
Renovation of existing WHS-lower reaches No. 3 63 180000 3 61 180000 3 80 120000 Gabion structure, gully plugs and vegetative
barriers No. 20 160 360000 20 160 360000 15 125 341882
Skill labour LS 260000 0 260000 0 135600 Sub Total 577 3730000 570 3730000 390 2087802
Livelihood support system Establishment of vermin-compost units No. 20 80000 20 0 80000 12 0 76080 Mushroom cultivation No. 40 100000 40 0 100000 0 0 0 Bee keeping No. 15 150000 15 0 150000 25 0 93750 Block plantation of Prosopis juliflora for
firewood No. 4 12 75000 4 12 75000 0 0 0
Livestock development activities (Goatry Piggery)
LS 206000 0 206000 0 170572
Others LS 0 0 0 0 0 0 Sub Total 12 611000 12 611000 0 340402
Production System and Micro Enterprises Demonstration and assessment of improved
composting system using alternate materials and nutrient analysis
ha 20 20* 100000 20 100000 10 216197
Introduction of improved crop production practices (i) For kharif crops
ha 200 200* 700000 200 700000 50 270000
(ii) For rabi crops Sub Total 0 800000 0 800000 0 486197
4 Consolidation phase LS 350000 0 350000 0 0 0 Grand Total 589 7106000 582 7106000 390 4230372
Concise Report On Development And Management Of Model Watersheds Through Participatory Approach
94
Development and Management of Model Watersheds under New Guidelines
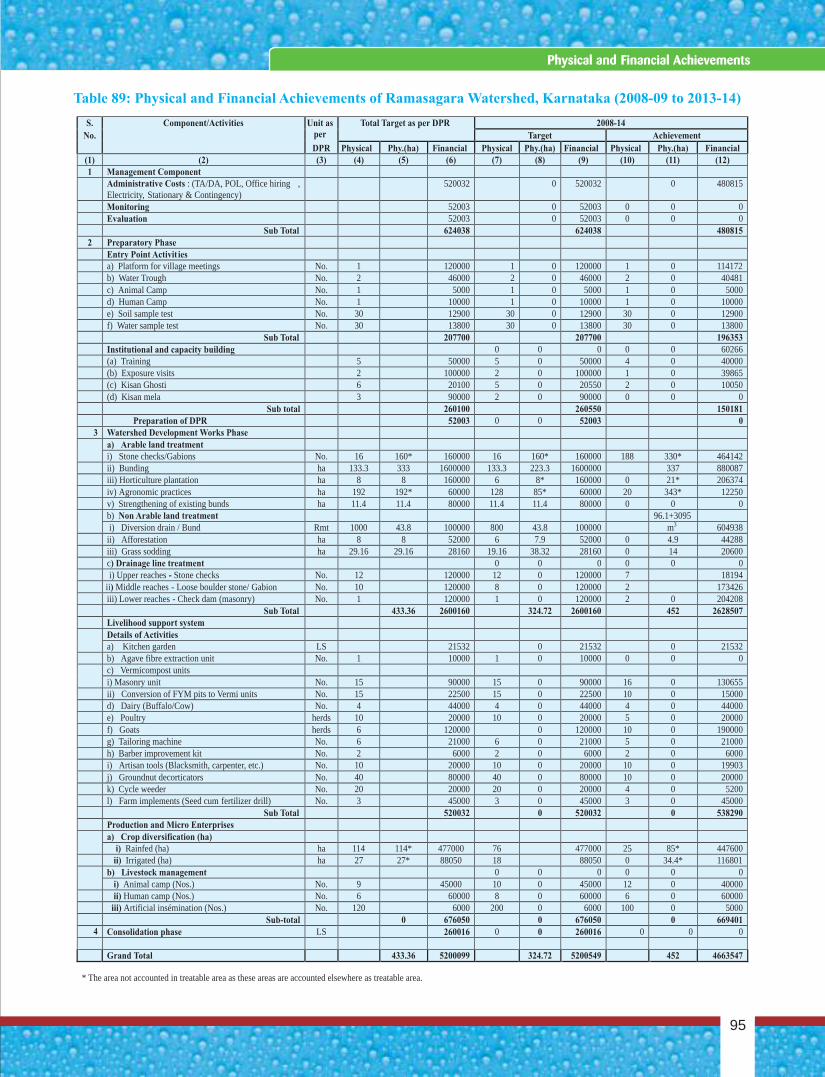
Table 89: Physical and Financial Achievements of Ramasagara Watershed, Karnataka (2008-09 to 2013-14)
S. Component/Activities Unit as per
Total Target as per DPR 2008-14
No. Target Achievement
DPR Physical Phy.(ha) Financial Physical Phy.(ha) Financial Physical Phy.(ha) Financial
(1) (2) (3) (4) (5) (6) (7) (8) (9) (10) (11) (12)
1 Management Component Administrative Costs : (TA/DA, POL, Office hiring ,
Electricity, Stationary & Contingency) 520032 0 520032 0 480815
Monitoring 52003 0 52003 0 0 0 Evaluation 52003 0 52003 0 0 0
Sub Total
624038
624038
480815
2
Preparatory Phase
Entry Point Activit ies
a)
Platform for village meetings
No.
1
120000
1
0
120000
1
0
114172
b)
Water Trough
No.
2
46000
2
0
46000
2
0
40481
c)
Animal Camp
No.
1
5000
1
0
5000
1
0
5000
d)
Human Camp
No.
1
10000
1
0
10000
1
0
10000
e)
Soil sample test
No.
30
12900
30
0
12900
30
0
12900
f)
Water sample test
No.
30
13800
30
0
13800
30
0
13800
Sub Total
207700
207700
196353
Institutional and capacity building
0
0
0
0
0
60266
(a)
Training
5
50000
5
0
50000
4
0
40000
(b)
Exposure visits
2
100000
2
0
100000
1
0
39865
(c)
Kisan Ghosti
6
20100
5
0
20550
2
0
10050
(d)
Kisan mela
3
90000
2
0
90000
0
0
0
Sub total
260100
260550
150181
Preparation of DPR
52003
0
0
52003
0
3
Watershed Development Works Phase
a)
Arable land treatment
i)
Stone checks/Gabions
No.
16
160*
160000
16
160*
160000
188
330*
464142
ii)
Bunding
ha
133.3
333
1600000
133.3
223.3
1600000
337
880087
iii)
Horticulture plantation
ha
8
8
160000
6
8*
160000
0
21*
206374
iv)
Agronomic practices
ha
192
192*
60000
128
85*
60000
20
343*
12250
v)
Strengthening of existing bunds
ha
11.4
11.4
80000
11.4
11.4
80000
0
0
0
b) Non Arable land treatment
96.1+3095
i)
Diversion drain / Bund
Rmt
1000
43.8
100000
800
43.8
100000
m3
604938
ii)
Afforestation
ha
8
8
52000
6
7.9
52000
0
4.9
44288
iii)
Grass sodding
ha
29.16
29.16
28160
19.16
38.32
28160
0
14
20600
c) Drainage line treatment
0
0
0
0
0
0
i) Upper reaches
-
Stone checks
No.
12
120000
12
0
120000
7
18194
ii)
Middle reaches
-
Loose boulder stone/
Gabion
No.
10
120000
8
0
120000
2
173426
iii) Lower reaches -
Check dam
(masonry)
No.
1
120000
1
0
120000
2
0
204208
Sub Total
433.36
2600160
324.72
2600160
452
2628507
Livelihood support system
Details of Activities
a)
Kitchen garden
LS
21532
0
21532
0
21532
b)
Agave fibre extraction unit
No.
1
10000
1
0
10000
0
0
0
c)
Vermicompost units
i) Masonry unit
No.
15
90000
15
0
90000
16
0
130655
ii)
Conversion of FYM pits to Vermi units
No.
15
22500
15
0
22500
10
0
15000
d)
Dairy (Buffalo/Cow)
No.
4
44000
4
0
44000
4
0
44000
e)
Poultry
herds
10
20000
10
0
20000
5
0
20000
f)
Goats
herds
6
120000
0
120000
10
0
190000
g)
Tailoring machine
No.
6
21000
6
0
21000
5
0
21000
h)
Barber improvement kit
No.
2
6000
2
0
6000
2
0
6000
i)
Artisan tools (Blacksmith, carpenter, etc.)
No.
10
20000
10
0
20000
10
0
19903
j)
Groundnut decorticators
No.
40
80000
40
0
80000
10
0
20000
k)
Cycle weeder
No.
20
20000
20
0
20000
4
0
5200
l)
Farm implements (Seed cum fertilizer drill)
No.
3
45000
3
0
45000
3
0
45000
Sub Total
520032
0
520032
0
538290
Production and Micro Enterprises
a)
Crop diversification (ha)
i)
Rainfed (ha)
ha
114
114*
477000
76
477000
25
85*
447600
ii)
Irrigated (ha)
ha
27
27*
88050
18
88050
0
34.4*
116801
b)
Livestock management
0
0
0
0
0
0
i)
Animal camp (Nos.)
No.
9
45000
10
0
45000
12
0
40000
ii)
Human camp (Nos.)
No.
6
60000
8
0
60000
6
0
60000
iii)
Artificial insémination (Nos.)
No.
120
6000
200
0
6000
100
0
5000
Sub-total
0
676050
0
676050
0
669401
Consolidation phase
LS
260016
0
0
260016
0
0
0
Grand Total
433.36
5200099
324.72
5200549
452
4663547
* The area not accounted in treatable area as these areas are accounted elsewhere as treatable area.
4
95
Physical and Financial Achievements
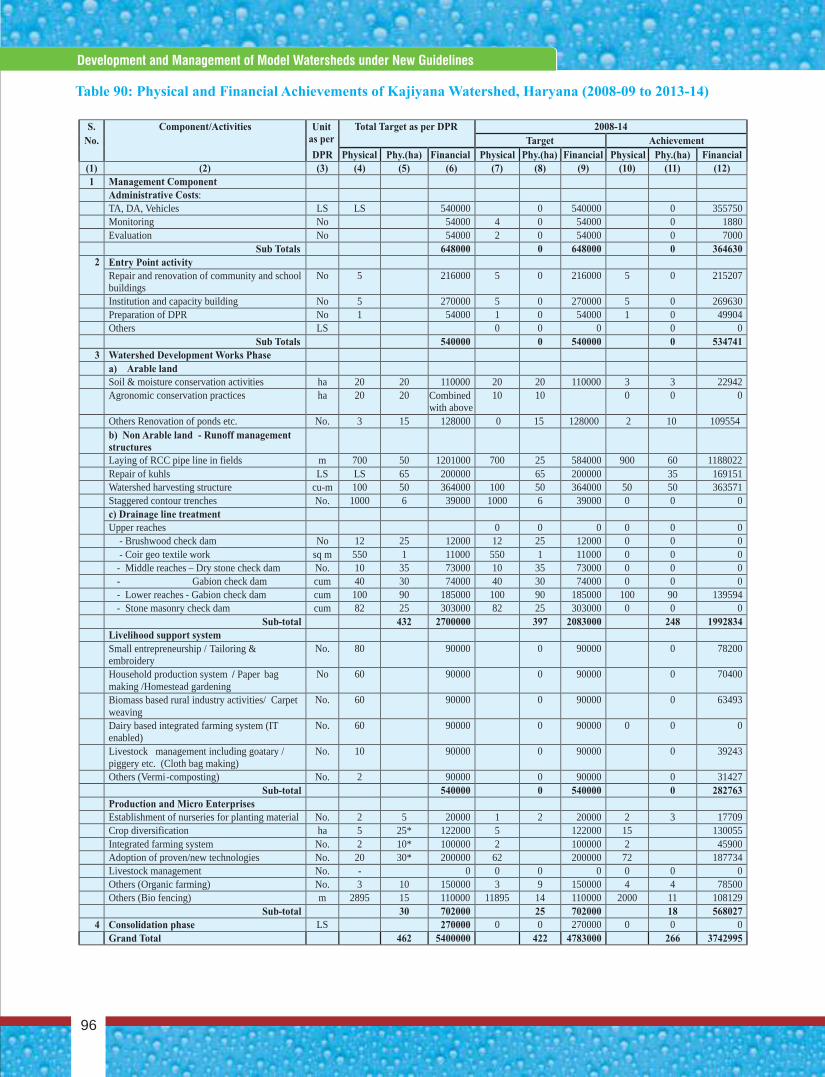
S. Component/Activities Unit as per
Total Target as per DPR 2008-14
No. Target Achievement
DPR Physical Phy.(ha) Financial Physical Phy.(ha) Financial Physical Phy.(ha) Financial
(1) (2) (3) (4) (5) (6) (7) (8) (9) (10) (11) (12)
1 Management Component Administrative Costs: TA, DA, Vehicles LS LS 540000 0 540000 0 355750 Monitoring No 54000 4 0 54000 0 1880 Evaluation No 54000 2 0 54000 0 7000 Sub Totals 648000 0 648000 0 364630
Entry Point activity Repair and renovation of community and school buildings
No 5 216000 5 0 216000 5 0 215207
Institution and capacity building No 5 270000 5 0 270000 5 0 269630 Preparation of DPR No 1 54000 1 0 54000 1 0 49904 Others LS 0 0 0 0 0 Sub Totals 540000 0 540000 0 534741
3 Watershed Development Works Phase
a) Arable land Soil & moisture conservation activities ha 20 20 110000 20 20 110000 3 3 22942 Agronomic conservation practices ha 20 20
Combined with above
10 10 0 0 0
Others Renovation of ponds etc. No. 3 15 128000 0 15 128000 2 10 109554 b) Non Arable land - Runoff management
structures
Laying of RCC pipe line in fields m 700 50 1201000 700 25 584000 900 60 1188022 Repair of kuhls LS LS 65 200000 65 200000 35 169151 Watershed harvesting structure cu-m 100 50 364000 100 50 364000 50 50 363571 Staggered contour trenches No. 1000 6 39000 1000 6 39000 0 0 0 c) Drainage line treatment
Upper reaches 0 0 0 0 0 0 - Brushwood check dam No 12 25 12000 12 25 12000 0 0 0 - Coir geo textile work sq m 550 1 11000 550 1 11000 0 0 0 - Middle reaches – Dry stone check dam No. 10 35 73000 10 35 73000 0 0 0 - Gabion check dam cum 40 30 74000 40 30 74000 0 0 0 - Lower reaches - Gabion check dam cum 100 90 185000 100 90 185000 100 90 139594 - Stone masonry check dam cum 82 25 303000 82 25 303000 0 0 0 Sub-total 432 2700000 397 2083000 248 1992834
Livelihood support system
Small entrepreneurship / Tailoring & embroidery
No. 80 90000 0 90000 0 78200
Household production system / Paper bag making /Homestead gardening
No 60 90000 0 90000 0 70400
Biomass based rural industry activities/ Carpet weaving
No. 60 90000 0 90000 0 63493
Dairy based integrated farming system (IT enabled)
No. 60 90000 0 90000 0 0 0
Livestock management including goatary / piggery etc. (Cloth bag making)
No. 10 90000 0 90000 0 39243
Others (Vermi-composting) No. 2 90000 0 90000 0 31427 Sub-total 540000 0 540000 0 282763
Production and Micro Enterprises Establishment of nurseries for planting material No. 2 5 20000 1 2 20000 2 3 17709 Crop diversification ha 5 25* 122000 5 122000 15 130055 Integrated farming system No. 2 10* 100000 2 100000 2 45900 Adoption of proven/new technologies No. 20 30* 200000 62 200000 72 187734 Livestock management No. - 0 0 0 0 0 0 0 Others (Organic farming) No. 3 10 150000 3 9 150000 4 4 78500 Others (Bio fencing) m 2895 15 110000 11895 14 110000 2000 11 108129 Sub-total 30 702000 25 702000 18 568027
4 Consolidation phase LS 270000 0 0 270000 0 0 0 Grand Total 462 5400000 422 4783000 266 3742995
Table 90: Physical and Financial Achievements of Kajiyana Watershed, Haryana (2008-09 to 2013-14)
2
Concise Report On Development And Management Of Model Watersheds Through Participatory Approach
96
Development and Management of Model Watersheds under New Guidelines
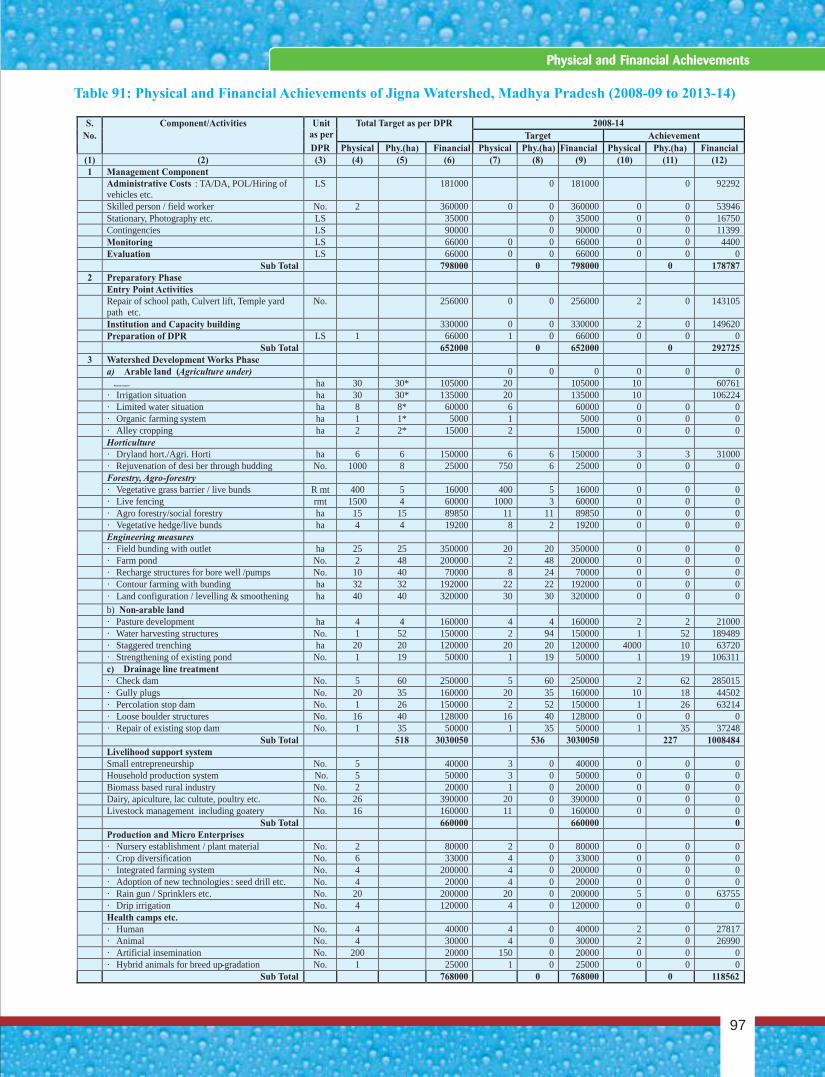
S.
Component/Activities
Unit as per
Total Target as per DPR
2008-14
No.
Target
Achievement
DPR
Physical
Phy.(ha)
Financial
Physical
Phy.(ha)
Financial
Physical
Phy.(ha)
Financial
(1)
(2)
(3)
(4)
(5)
(6)
(7)
(8)
(9)
(10)
(11)
(12)
1
Management Component
Administrative Costs : TA/DA, POL/Hiring of vehicles etc.
LS
181000
0
181000
0
92292
Skilled person / field worker
No.
2
360000
0
0
360000
0
0
53946
Stationary, Photography etc.
LS
35000
0
35000
0
0
16750
Contingencies
LS
90000
0
90000
0
0
11399
Monitoring
LS
66000
0
0
66000
0
0
4400
Evaluation
LS
66000
0
0
66000
0
0
0
Sub Total
798000
0
798000
0
178787
2
Preparatory Phase
Entry Point Activities
Repair of school path, Culvert lift, Temple yard path etc.
No.
256000
0
0
256000
2
0
143105
Institution and Capacity building
330000
0
0
330000
2
0
149620
Preparation of DPR
LS
1
66000
1
0
66000
0
0
0
Sub Total
652000
0
652000
0
292725
3
Watershed Development Works Phase
a)
Arable land (Agriculture under)
0
0
0
0
0
0
·
Rainfed situation
ha
30
30*
105000
20
105000
10
60761
·
Irrigation situation
ha
30
30*
135000
20
135000
10
106224
·
Limited water situation
ha
8
8*
60000
6
60000
0
0
0
·
Organic farming system
ha
1
1*
5000
1
5000
0
0
0
·
Alley cropping
ha
2
2*
15000
2
15000
0
0
0
Horticulture
·
Dryland hort./Agri. Horti
ha
6
6
150000
6
6
150000
3
3
31000
·
Rejuvenation of desi ber through budding
No.
1000
8
25000
750
6
25000
0
0
0
Forestry, Agro-forestry
·
Vegetative grass barrier / live bunds
R mt
400
5
16000
400
5
16000
0
0
0
·
Live fencing
rmt
1500
4
60000
1000
3
60000
0
0
0
·
Agro forestry/social forestry
ha
15
15
89850
11
11
89850
0
0
0
·
Vegetative hedge/live bunds
ha
4
4
19200
8
2
19200
0
0
0
Engineering measures
·
Field bunding with outlet
ha
25
25
350000
20
20 350000
0
0
0
·
Farm pond
No.
2
48
200000
2
48 200000
0
0
0
·
Recharge structures for bore well /pumps
No.
10
40
70000
8
24
70000
0
0
0
·
Contour farming with bunding
ha
32
32
192000
22
22 192000
0
0
0
·
Land configuration / levelling & smoothening
ha
40
40
320000
30
30 320000
0
0
0
b)
Non-arable land
·
Pasture development
ha
4
4
160000
4
4 160000
2
2
21000
·
Water harvesting structures
No.
1
52
150000
2
94 150000
1
52
189489
·
Staggered trenching
ha
20
20
120000
20
20 120000
4000
10
63720
·
Strengthening of existing pond
No.
1
19
50000
1
19
50000
1
19 106311
c)
Drainage line treatment
·
Check dam
No.
5
60
250000
5
60 250000
2
62
285015
·
Gully plugs
No.
20
35
160000
20
35 160000
10
18
44502
·
Percolation stop dam
No.
1
26
150000
2
52 150000
1
26
63214
·
Loose boulder structures
No.
16
40
128000
16
40 128000
0
0
0
·
Repair of existing stop dam
No.
1
35
50000
1
35
50000
1
35 37248
Sub Total
518
3030050
536
3030050
227
1008484
Livelihood support system
Small entrepreneurship
No.
5
40000
3
0
40000
0
0
0
Household production system No. 5 50000 3 0 50000 0 0 0 Biomass based rural industry No. 2 20000 1 0 20000 0 0 0 Dairy, apiculture, lac cultute, poultry etc. No. 26 390000 20 0 390000 0 0 0 Livestock management including goatery No. 16 160000 11 0 160000 0 0 0 Sub Total 660000 660000 0 Production and Micro Enterprises · Nursery establishment / plant material No. 2 80000 2 0 80000 0 0 0 · Crop diversification No. 6 33000 4 0 33000 0 0 0 · Integrated farming system No. 4 200000 4 0 200000 0 0 0 · Adoption of new technologies : seed drill etc. No. 4 20000 4 0 20000 0 0 0 · Rain gun / Sprinklers etc. No. 20 200000 20 0 200000 5 0 63755 · Drip irrigation No. 4 120000 4 0 120000 0 0 0 Health camps etc.
· Human No. 4 40000 4 0 40000 2 0 27817 · Animal No. 4 30000 4 0 30000 2 0 26990 · Artificial insemination No. 200 20000 150 0 20000 0 0 0 · Hybrid animals for breed up-gradation No. 1 25000 1 0 25000 0 0 0 Sub Total 768000 0 768000 0 118562
Table 91: Physical and Financial Achievements of Jigna Watershed, Madhya Pradesh (2008-09 to 2013-14)
97
Physical and Financial Achievements
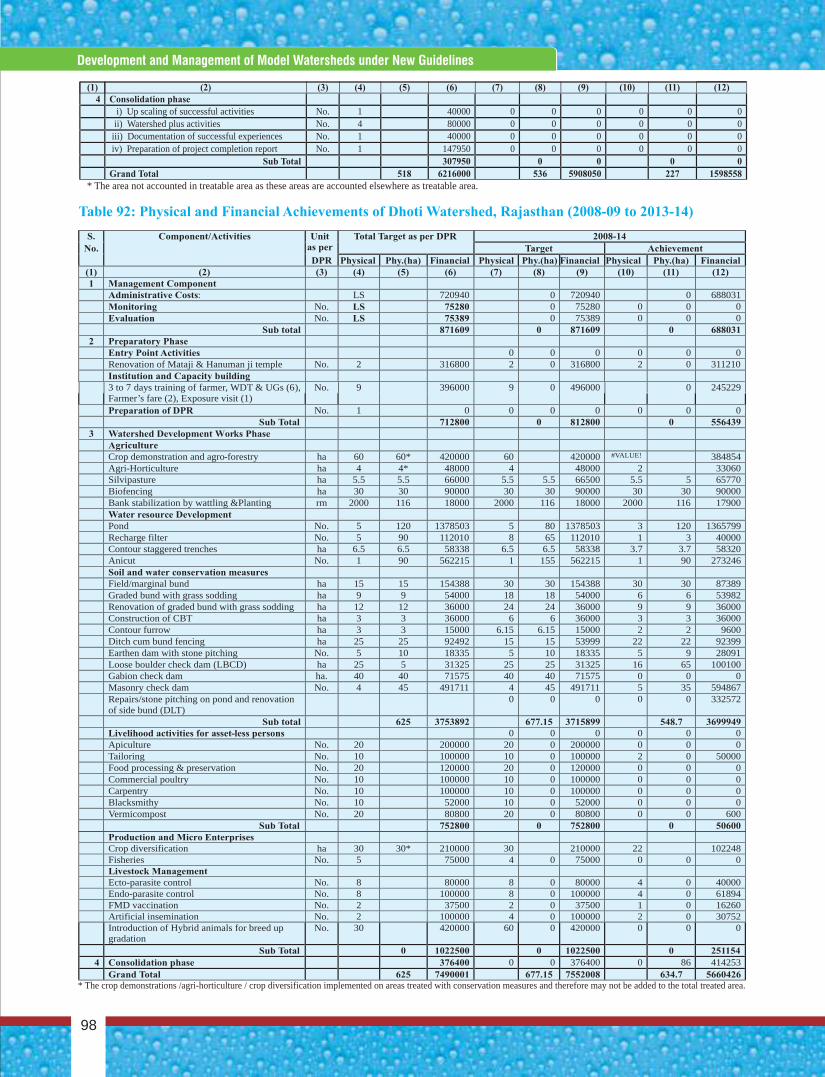
4 Consolidation phase
i)
Up scaling of successful activities
No.
1
40000
0
0
0
0
0
0
ii)
Watershed plus activities
No.
4
80000
0
0
0
0
0
0
iii)
Documentation of successful experiences
No.
1
40000
0
0
0
0
0
0
iv)
Preparation of project completion report
No.
1
147950
0
0
0
0
0
0Sub Total
307950
0
0
0
0
Grand Total
518
6216000
536
5908050
227
1598558
* The area not accounted in treatable area as these areas are accounted elsewhere as treatable area.
S. Component/Activities
Unit as per
Total Target as per DPR
2008-14
No. Target
Achievement
DPR
Physical
Phy.(ha)
Financial
Physical
Phy.(ha)
Financial
Physical
Phy.(ha)
Financial(1) (2)
(3)
(4)
(5)
(6)
(7)
(8)
(9)
(10)
(11)
(12)
1 Management Component
Administrative Costs:
LS
720940
0 720940
0
688031
Monitoring
No.
LS
75280
0
75280
0
0
0Evaluation
No.
LS
75389
0
75389
0
0
0
Sub total
871609
0
871609
0
6880312 Preparatory Phase
Entry Point Activities 0 0 0 0 0 0Renovation of Mataji & Hanuman ji temple No. 2 316800 2 0 316800 2 0 311210Institution and Capacity building 3 to 7 days training of farmer, WDT & UGs (6), Farmer’s fare (2), Exposure visit (1)
No. 9
396000 9
0
496000
0 245229
Preparation of DPR No. 1 0 0 0 0 0 0 0Sub Total 712800 0 812800 0 556439
3 Watershed Development Works Phase Agriculture
Crop demonstration and agro-forestry
ha
60
60*
420000
60
420000
#VALUE!
384854Agri-Horticulture
ha
4
4*
48000
4
48000
2
33060Silvipasture
ha
5.5
5.5
66000
5.5
5.5
66500
5.5
5 65770
Biofencing
ha
30
30
90000
30
30
90000
30
30 90000
Bank stabilization by wattling &Planting
rm
2000
116
18000
2000
116
18000
2000
116 17900
Water resource Development
Pond
No.
5
120
1378503
5
80
1378503
3
120
1365799Recharge filter
No.
5
90
112010
8
65
112010
1
3
40000Contour staggered trenches
ha
6.5
6.5
58338
6.5
6.5
58338
3.7
3.7
58320Anicut
No.
1
90
562215
1
155
562215
1
90
273246Soil and water conservation measures
Field/marginal bund
ha
15
15
154388
30
30
154388
30
30
87389Graded bund with grass sodding
ha
9
9
54000
18
18
54000
6
6
53982Renovation of graded bund with grass sodding
ha
12
12
36000
24
24
36000
9
9
36000Construction of CBT
ha
3
3
36000
6
6
36000
3
3
36000Contour furrow
ha
3
3
15000
6.15
6.15
15000
2
2
9600Ditch cum bund fencing
ha
25
25
92492
15
15
53999
22
22
92399Earthen dam with stone pitching
No.
5
10
18335
5
10
18335
5
9
28091Loose boulder check dam (LBCD)
ha
25
5
31325
25
25
31325
16
65
100100Gabion check dam
ha.
40
40
71575
40
40
71575
0
0
0Masonry check dam
No.
4
45
491711
4
45
491711
5
35
594867Repairs/stone pitching on pond and renovation of side bund (DLT)
0
0
0
0
0
332572
Sub total
625
3753892
677.15
3715899
548.7
3699949Livelihood activities for asset-less persons
0
0
0
0
0
0Apiculture
No.
20
200000
20
0
200000
0
0
0Tailoring
No.
10
100000
10
0
100000
2
0
50000Food processing & preservation
No.
20
120000
20
0
120000
0
0
0Commercial poultry
No.
10
100000
10
0
100000
0
0
0Carpentry
No.
10
100000
10
0
100000
0
0
0Blacksmithy
No.
10
52000
10
0
52000
0
0
0Vermicompost
No.
20
80800
20
0
80800
0
0
600Sub Total
752800
0
752800
0
50600
(1) (2) (3) (4) (5) (6) (7) (8) (9) (10) (11) (12)
Table 92: Physical and Financial Achievements of Dhoti Watershed, Rajasthan (2008-09 to 2013-14)
Production and Micro Enterprises
Crop diversification
ha
30
30*
210000
30
210000
22
102248
Fisheries
No.
5
75000
4
0
75000
0
0
0
Livestock Management
Ecto-parasite control
No.
8
80000
8
0
80000
4
0
40000
Endo-parasite control
No.
8
100000
8
0
100000
4
0
61894
FMD vaccination
No.
2
37500
2
0
37500
1
0
16260Artificial insemination No. 2 100000 4 0 100000 2 0
30752Introduction of Hybrid animals for breed up gradation
No. 30 420000 60 0 420000 0 0
0
Sub Total 0 1022500 0 1022500 0 251154
4 Consolidation phase 376400 0 0 376400 0 86 414253Grand Total 625 7490001 677.15 7552008 634.7 5660426
* The crop demonstrations /agri-horticulture / crop diversification implemented on areas treated with conservation measures and therefore may not be added to the total treated area.
Concise Report On Development And Management Of Model Watersheds Through Participatory Approach
98
Development and Management of Model Watersheds under New Guidelines
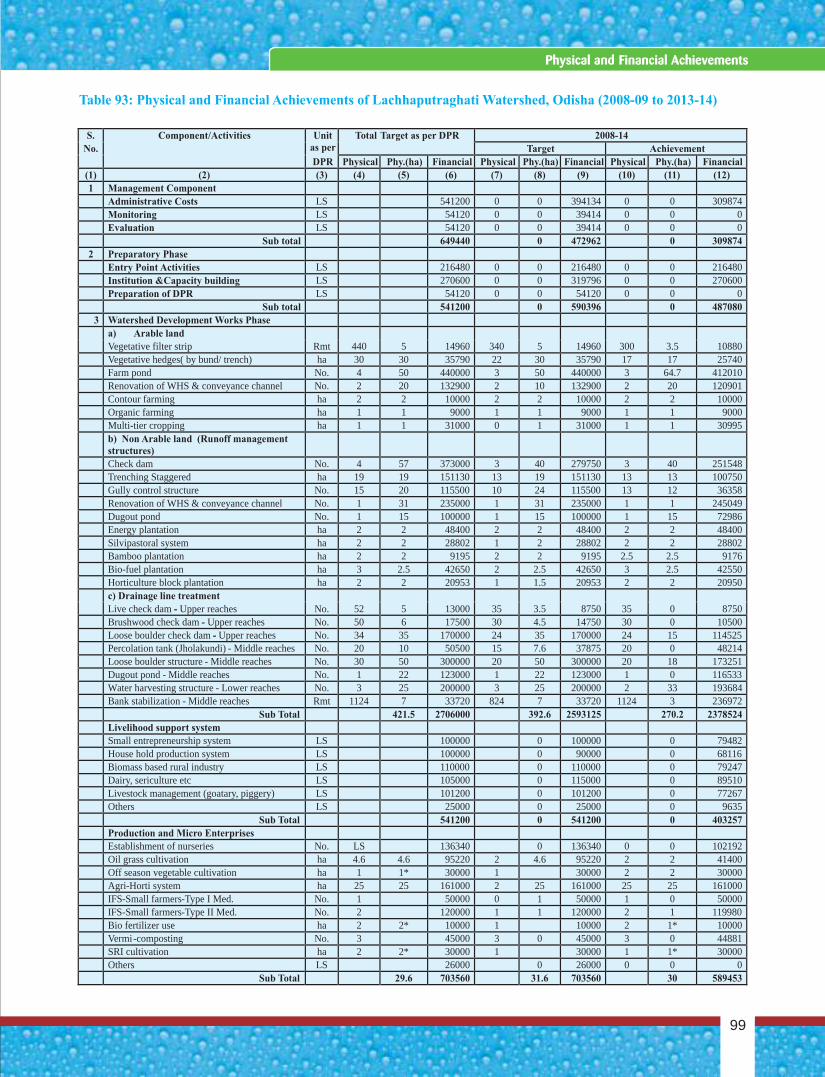
Table 93: Physical and Financial Achievements of Lachhaputraghati Watershed, Odisha (2008-09 to 2013-14)
S. Component/Activities Unit as per
Total Target as per DPR 2008-14 No. Target Achievement
DPR Physical Phy.(ha) Financial Physical Phy.(ha) Financial Physical Phy.(ha) Financial (1) (2) (3) (4) (5) (6) (7) (8) (9) (10) (11) (12) 1 Management Component
Administrative Costs LS 541200 0 0 394134 0 0 309874 Monitoring LS 54120 0 0 39414 0 0 0 Evaluation LS 54120 0 0 39414 0 0 0 Sub total 649440 0 472962 0 309874
2 Preparatory Phase
Entry Point Activities
LS 216480 0 0 216480 0 0 216480
Institution &Capacity building LS 270600 0 0 319796 0 0 270600
Preparation of DPR
LS
54120
0
0
54120
0
0
0
Sub total
541200
0
590396
0
487080
3
Watershed Development Works Phase
a)
Arable land
Vegetative filter strip
Rmt
440
5
14960
340
5
14960 300
3.5
10880
Vegetative hedges( by bund/ trench)
ha
30
30
35790
22
30
35790
17
17
25740
Farm pond
No.
4
50
440000
3
50
440000
3
64.7
412010
Renovation of WHS & conveyance channel
No.
2
20
132900
2
10
132900
2
20
120901
Contour farming
ha
2
2
10000
2
2
10000
2
2
10000
Organic farming
ha
1
1
9000
1
1
9000
1
1
9000
Multi-tier cropping
ha
1
1
31000
0
1
31000
1
1
30995
b)
Non Arable land (Runoff management
structures)
Check dam
No.
4
57
373000
3
40
279750
3
40
251548
Trenching Staggered
ha
19
19
151130
13
19
151130
13
13
100750
Gully control structure
No.
15
20
115500
10
24
115500
13
12
36358
Renovation of WHS
& conveyance channel
No.
1
31
235000
1
31
235000
1
1
245049
Dugout pond
No.
1
15
100000
1
15
100000
1
15
72986
Energy plantation
ha
2
2
48400
2
2
48400
2
2
48400
Silvipastoral system
ha
2
2
28802
1
2
28802
2
2
28802
Bamboo plantation
ha
2
2
9195
2
2
9195
2.5
2.5
9176
Bio-fuel plantation
ha
3
2.5
42650
2
2.5
42650
3
2.5
42550
Horticulture block plantation
ha
2
2
20953
1
1.5
20953
2
2
20950
c) Drainage line treatment
Live check dam
-
Upper reaches
No.
52
5
13000
35
3.5
8750
35
0
8750
Brushwood check dam -
Upper reaches
No.
50
6
17500
30
4.5
14750
30
0
10500
Loose boulder check dam -
Upper reaches
No.
34
35
170000
24
35
170000
24
15
114525
Percolation tank (Jholakundi) -
Middle reaches
No.
20
10
50500
15
7.6
37875
20
0
48214
Loose boulder structure -
Middle reaches
No.
30
50
300000
20
50
300000
20
18
173251
Dugout pond -
Middle reaches
No.
1
22
123000
1
22
123000
1
0
116533
Water harvesting structure -
Lower reaches
No.
3
25
200000
3
25
200000
2
33
193684
Bank stabilization -
Middle reaches
Rmt
1124
7
33720
824
7
33720
1124
3
236972
Sub Total
421.5
2706000
392.6
2593125
270.2
2378524
Livelihood support system
Small entrepreneurship system
LS
100000
0
100000
0
79482
House hold production system
LS
100000
0
90000
0
68116
Biomass based rural industry
LS
110000
0
110000
0
79247
Dairy, sericulture etc
LS
105000
0
115000
0
89510
Livestock management (goatary, piggery)
LS
101200
0
101200
0
77267
Others
LS
25000
0
25000
0
9635
Sub Total
541200
0
541200
0
403257
Production and Micro Enterprises
Establishment of nurseries
No.
LS
136340
0
136340
0
0
102192
Oil grass
cultivation
ha
4.6
4.6
95220
2
4.6
95220
2
2
41400
Off season vegetable cultivation
ha
1
1*
30000
1
30000
2
2
30000
Agri-Horti system
ha
25
25
161000
2
25
161000
25
25
161000
IFS-Small farmers-Type I Med.
No.
1
50000
0
1
50000
1
0
50000
IFS-Small farmers-Type II Med.
No.
2
120000
1
1
120000
2
1
119980
Bio fertilizer use
ha
2
2*
10000
1
10000
2
1*
10000
Vermi-composting
No.
3
45000
3
0
45000
3
0
44881
SRI cultivation
ha
2
2*
30000
1
30000
1
1*
30000
Others
LS
26000
0
26000
0
0
0
Sub Total
29.6
703560
31.6
703560
30
589453
99
Physical and Financial Achievements
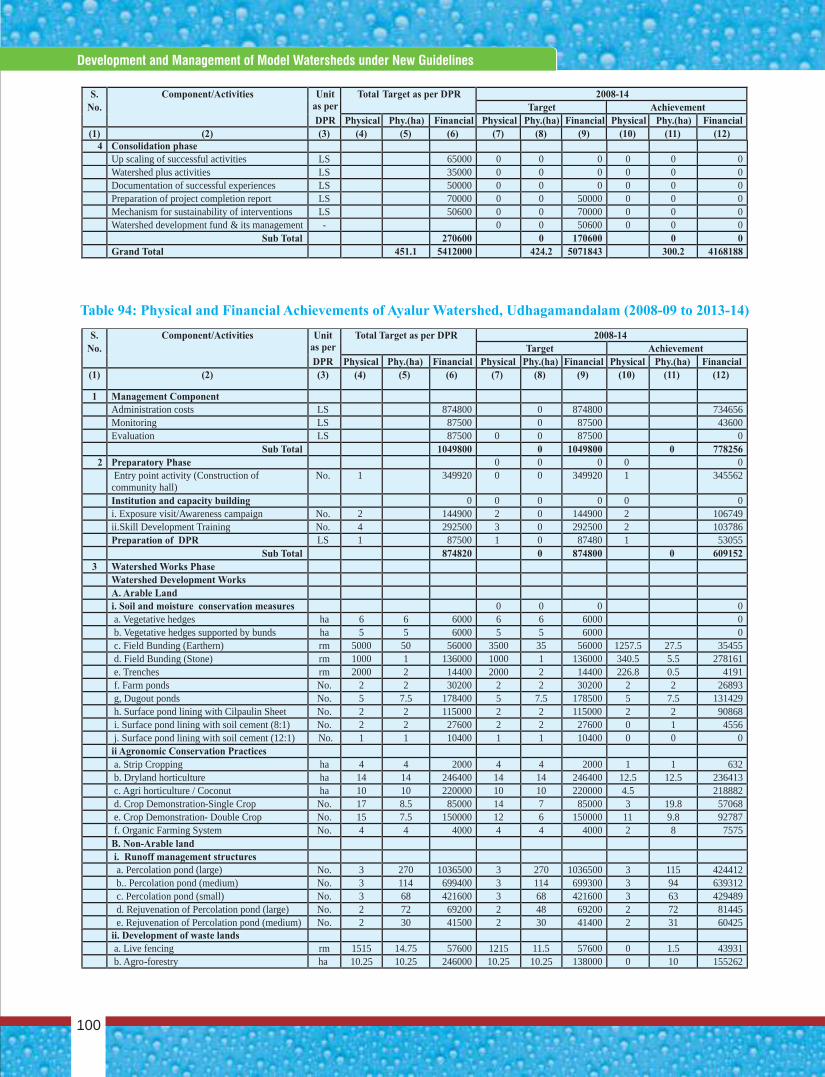
S. Component/Activities Unit
as per
Total Target as per DPR 2008-14 No. Target Achievement
DPR Physical Phy.(ha) Financial Physical Phy.(ha) Financial Physical Phy.(ha) Financial
(1) (2) (3) (4) (5) (6) (7) (8) (9) (10) (11) (12)
ii. Development of waste lands
a. Live fencing rm 1515 14.75 57600 1215 11.5 57600 0 1.5 43931b. Agro-forestry ha 10.25 10.25 246000 10.25 10.25 138000 0 10 155262
4
Consolidation phase
Up scaling of successful activities
LS
65000
0
0
0
0
0
0
Watershed plus activities
LS
35000
0
0
0
0
0
0
Documentation of successful experiences LS 50000 0 0 0 0 0 0Preparation of project completion report LS 70000 0 0 50000 0 0 0Mechanism for sustainability of interventions LS 50600 0 0 70000 0 0 0
Watershed development fund & its management
-
0
0
50600
0
0
0
Sub Total 270600 0 170600 0 0
Grand Total 451.1 5412000 424.2 5071843 300.2 4168188
1
Management Component
S.
Component/Activities
Unit as per
Total Target as per DPR
2008-14
No.
Target
Achievement
DPR Physical Phy.(ha) Financial Physical Phy.(ha) Financial Physical Phy.(ha) Financial
(1) (2) (3) (4) (5) (6) (7) (8) (9) (10) (11) (12)
Administration costs
LS
874800
0
874800
734656
Monitoring
LS
87500
0
87500
43600
Evaluation
LS
87500
0
0
87500
0
Sub Total
1049800
0
1049800
0
778256
2
Preparatory Phase
0
0
0
0
0
Entry point activity (Construction of community hall)
No.
1
349920
0
0
349920
1
345562
Institution and capacity building
0
0
0
0
0
0
i. Exposure visit/Awareness campaign
No.
2
144900
2
0
144900
2
106749
ii.Skill Development Training
No.
4
292500
3
0
292500
2
103786
Preparation of DPR
LS
1
87500
1
0
87480
1
53055
Sub Total
874820
0
874800
0
609152
3
Watershed Works Phase
Watershed Development Works
A. Arable Land
i. Soil and moisture conservation measures
0
0
0
0
a. Vegetative hedges
ha
6
6
6000
6
6
6000
0
b. Vegetative hedges supported by bunds
ha
5
5
6000
5
5
6000
0
c. Field Bunding (Earthern)
rm
5000
50
56000
3500
35
56000
1257.5
27.5
35455
d. Field Bunding (Stone)
rm
1000
1
136000
1000
1
136000
340.5
5.5
278161
e. Trenches
rm
2000
2
14400
2000
2
14400
226.8
0.5
4191
f. Farm ponds
No.
2
2
30200
2
2
30200
2
2
26893
g, Dugout ponds
No.
5
7.5
178400
5
7.5
178500
5
7.5
131429
h. Surface pond lining with Cilpaulin Sheet
No.
2
2
115000
2
2
115000
2
2
90868
i. Surface pond lining with soil cement (8:1)
No.
2
2
27600
2
2
27600
0
1
4556
j. Surface pond lining with soil cement (12:1)
No.
1
1
10400
1
1
10400
0
0
0
ii Agronomic Conservation Practices
a. Strip Cropping
ha
4
4
2000
4
4
2000
1
1
632
b. Dryland horticulture
ha
14
14
246400
14
14
246400
12.5
12.5
236413
c. Agri horticulture / Coconut
ha
10
10
220000
10
10
220000
4.5
218882
d. Crop Demonstration-Single Crop
No.
17
8.5
85000
14
7
85000
3
19.8
57068
e. Crop Demonstration-
Double Crop
No.
15
7.5
150000
12
6
150000
11
9.8
92787
f. Organic Farming System
No.
4
4
4000
4
4
4000
2
8
7575
B.
Non-Arable land
i. Runoff management structures
a. Percolation pond (large)
No.
3
270
1036500
3
270
1036500
3
115
424412
b.. Percolation pond (medium)
No.
3
114
699400
3
114
699300
3
94
639312
c. Percolation pond (small) No. 3 68 421600 3 68 421600 3 63 429489d. Rejuvenation of Percolation pond (large) No. 2 72 69200 2 48 69200 2 72 81445e. Rejuvenation of Percolation pond (medium) No. 2 30 41500 2 30 41400 2 31 60425
Table 94: Physical and Financial Achievements of Ayalur Watershed, Udhagamandalam (2008-09 to 2013-14)
Concise Report On Development And Management Of Model Watersheds Through Participatory Approach
100
Development and Management of Model Watersheds under New Guidelines
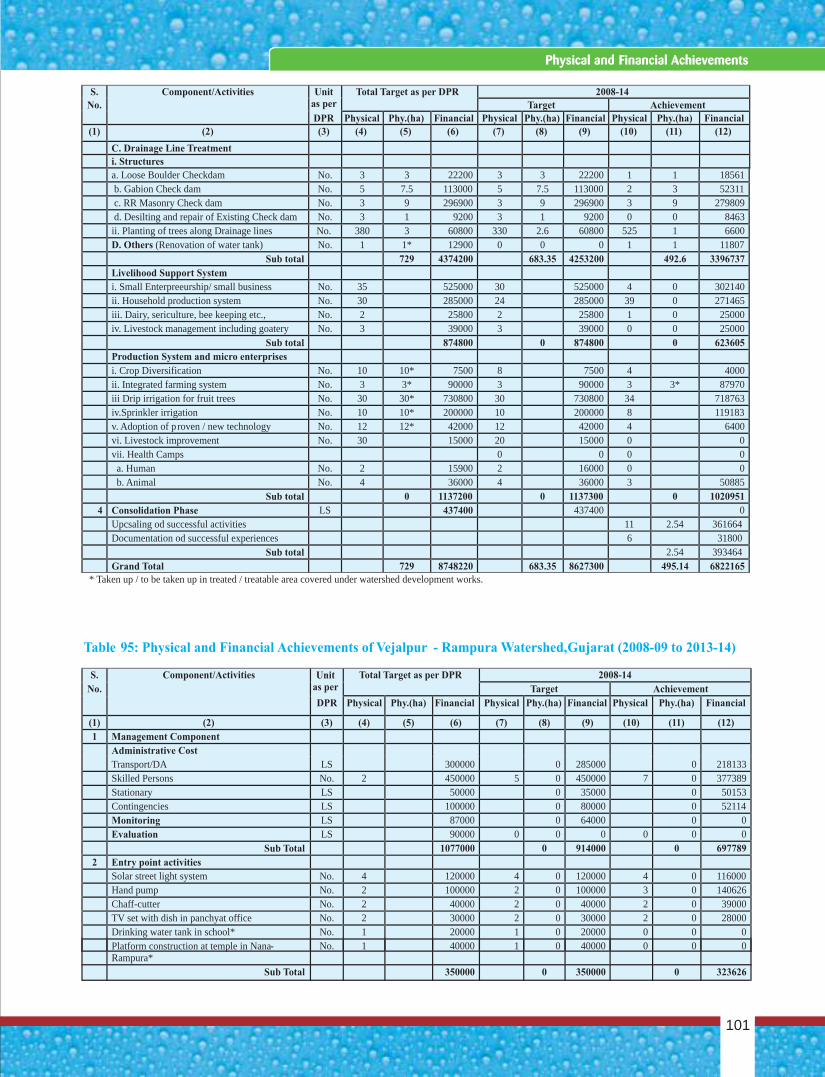
S. Component/Activities
Unit as per
Total Target as per DPR
2008-14
No.
Target
Achievement
DPR Physical Phy.(ha) Financial Physical Phy.(ha) Financial Physical Phy.(ha) Financial
(1) (2) (3) (4) (5) (6) (7) (8) (9) (10) (11) (12)
C. Drainage Line Treatment
i. Structures
a. Loose Boulder Checkdam
No.
3
3
22200
3
3
22200
1
1
18561
b. Gabion Check dam
No.
5
7.5
113000
5
7.5
113000
2
3
52311
c. RR Masonry Check dam
No.
3
9
296900
3
9
296900
3
9
279809
d. Desilting and repair of Existing Check dam
No.
3
1
9200
3
1
9200
0
0
8463
ii. Planting of trees along Drainage lines
No.
380
3
60800
330
2.6
60800
525
1
6600
D. Others (Renovation of water tank)
No.
1
1*
12900
0
0
0
1
1
11807
Sub total
729
4374200
683.35
4253200
492.6
3396737
Livelihood Support System
i. Small Enterpreeurship/ small business
No.
35
525000
30
525000
4
0
302140
ii. Household production system
No.
30
285000
24
285000
39
0
271465
iii. Dairy, sericulture, bee keeping etc.,
No.
2
25800
2
25800
1
0
25000
iv. Livestock management including goatery
No.
3
39000
3
39000
0
0
25000
Sub total
874800
0
874800
0
623605
Production System and micro enterprises
i. Crop Diversification
No.
10
10*
7500
8
7500
4
4000
ii. Integrated farming system
No.
3
3*
90000
3
90000
3
3*
87970
iii Drip irrigation for fruit trees
No.
30
30*
730800
30
730800
34
718763
iv.Sprinkler irrigation
No.
10
10*
200000
10
200000
8
119183
v. Adoption of proven / new technology
No.
12
12*
42000
12
42000
4
6400
vi. Livestock improvement
No.
30
15000
20
15000
0
0
vii. Health Camps
0
0
0
0
a. Human
No.
2
15900
2
16000
0
0
b. Animal
No.
4
36000
4
36000
3
50885
Sub total
0
1137200
0
1137300
0
1020951
4
Consolidation Phase
LS
437400
437400
0
Upcsaling od successful activities
11
2.54
361664
Documentation od successful experiences 6 31800Sub total 2.54 393464
Grand Total
729
8748220
683.35
8627300
495.14
6822165
* Taken up / to be taken up in treated / treatable area covered under watershed development works.
Table 95: Physical and Financial Achievements of Vejalpur - Rampura Watershed, Gujarat (2008-09 to 2013-14)
1
Management Component
S. Component/Activities Unit as per
Total Target as per DPR 2008-14
No. Target Achievement
DPR Physical Phy.(ha) Financial Physical Phy.(ha) Financial Physical Phy.(ha) Financial
(1) (2) (3) (4) (5) (6) (7) (8) (9) (10) (11) (12)
Administrative Cost
Transport/DA
LS
300000
0
285000
0
218133
Skilled Persons
No.
2
450000
5
0
450000
7
0
377389
Stationary
LS
50000
0
35000
0
50153
Contingencies
LS
100000
0
80000
0
52114
Monitoring
LS
87000
0
64000
0
0
Evaluation
LS
90000
0
0
0
0
0
0
Sub Total
1077000
0
914000
0
697789
2
Entry point activities
Solar street light system
No.
4
120000
4
0
120000
4
0
116000
Hand pump
No.
2
100000
2
0
100000
3
0
140626
Chaff-cutter
No.
2
40000
2
0
40000
2
0
39000
TV set with dish in panchyat office No. 2 30000 2 0 30000 2 0 28000Drinking water tank in school* No. 1 20000 1 0 20000 0 0 0Platform construction at temple in Nana-Rampura*
No. 1 40000 1 0 40000 0 0 0
Sub Total 350000 0 350000 0 323626
101
Physical and Financial Achievements
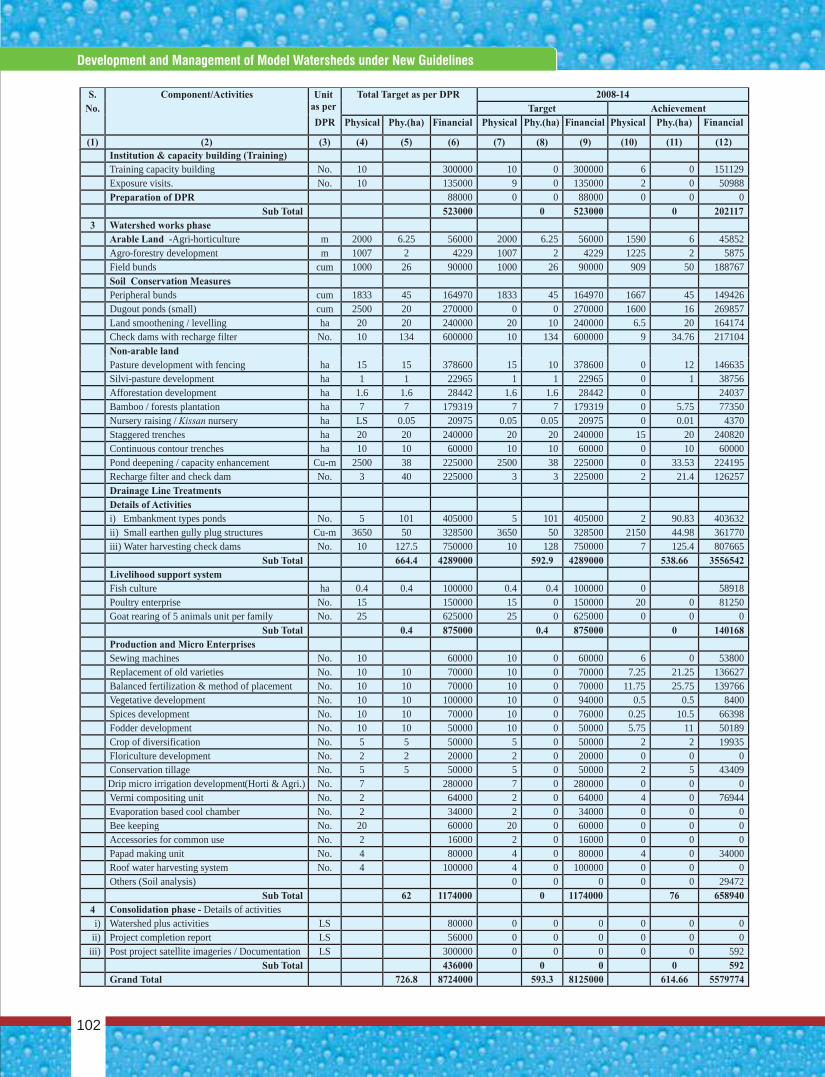
Institution & capacity building (Training)
Training capacity building
No.
10
300000
10
0
300000
6
0
151129
Exposure visits.
No.
10
135000
9
0
135000
2
0
50988
Preparation of DPR
88000
0
0
88000
0
0
0
Sub Total
523000
0
523000
0
202117
3
Watershed works phase
Arable Land -Agri-horticulture
m
2000
6.25
56000
2000
6.25
56000
1590
6
45852
Agro-forestry development
m
1007
2
4229
1007
2
4229
1225
2
5875
Field bunds
cum
1000
26
90000
1000
26
90000
909
50
188767
Soil Conservation Measures
Peripheral bunds
cum
1833
45
164970
1833
45
164970
1667
45
149426
Dugout ponds (small)
cum
2500
20
270000
0
0
270000
1600
16
269857
Land smoothening / levelling
ha
20
20
240000
20
10
240000
6.5
20
164174
Check dams with recharge filter
No.
10
134
600000
10
134
600000
9
34.76
217104
Non-arable land
Pasture development with fencing
ha
15
15
378600
15
10
378600
0
12
146635
Silvi-pasture development
ha
1
1
22965
1
1
22965
0
1
38756
Afforestation development
ha
1.6
1.6
28442
1.6
1.6
28442
0
24037
Bamboo / forests plantation
ha
7
7
179319
7
7
179319
0
5.75
77350
Nursery raising / Kissan
nursery
ha
LS
0.05
20975
0.05
0.05
20975
0
0.01
4370
Staggered trenches
ha
20
20
240000
20
20
240000
15
20
240820
Continuous contour trenches
ha
10
10
60000
10
10
60000
0
10
60000
Pond deepening / capacity enhancement
Cu-m
2500
38
225000
2500
38
225000
0
33.53
224195
Recharge filter and check dam
No.
3
40
225000
3
3
225000
2
21.4
126257
Drainage Line Treatments
Details of Activities
i)
Embankment types ponds
No.
5
101
405000
5
101
405000
2
90.83
403632
ii)
Small earthen gully plug structures
Cu-m
3650
50
328500
3650
50
328500
2150
44.98
361770
iii)
Water harvesting check dams
No.
10
127.5
750000
10
128
750000
7
125.4
807665
Sub Total
664.4
4289000
592.9
4289000
538.66
3556542
Livelihood support system
Fish culture
ha
0.4
0.4
100000
0.4
0.4
100000
0
58918
Poultry enterprise
No.
15
150000
15
0
150000
20
0
81250
Goat rearing of 5 animals unit per family
No.
25
625000
25
0
625000
0
0
0
Sub Total
0.4
875000
0.4
875000
0
140168
Production and Micro Enterprises
Sewing machines
No.
10
60000
10
0
60000
6
0
53800
Replacement of old varieties
No.
10
10
70000
10
0
70000
7.25
21.25
136627
Balanced fertilization & method of placement
No.
10
10
70000
10
0
70000
11.75
25.75
139766
Vegetative development
No.
10
10
100000
10
0
94000
0.5
0.5
8400
Spices development
No.
10
10
70000
10
0
76000
0.25
10.5
66398
Fodder development
No.
10
10
50000
10
0
50000
5.75
11
50189
Crop of diversification
No.
5
5
50000
5
0
50000
2
2
19935
Floriculture development
No.
2
2
20000
2
0
20000
0
0
0
Conservation tillage
No.
5
5
50000
5
0
50000
2
5
43409
Drip micro irrigation development(Horti & Agri.)
No.
7
280000
7
0
280000
0
0
0
Vermi compositing unit
No.
2
64000
2
0
64000
4
0
76944
Evaporation based cool chamber
No.
2
34000
2
0
34000
0
0
0
Bee keeping
No.
20
60000
20
0
60000
0
0
0
Accessories for common use
No.
2
16000
2
0
16000
0
0
0
Papad making unit
No.
4
80000
4
0
80000
4
0
34000
Roof water harvesting system
No.
4
100000
4
0
100000
0
0
0
Others (Soil analysis)
0
0
0
0
0
29472
Sub Total 62 1174000 0 1174000 76 658940
4 Consolidation phase - Details of activitiesi) Watershed plus activities LS 80000 0 0 0 0 0 0
ii) Project completion report LS 56000 0 0 0 0 0 0iii) Post project satellite imageries / Documentation LS 300000 0 0 0 0 0 592
Sub Total 436000 0 0 0 592
Grand Total 726.8 8724000 593.3 8125000 614.66 5579774
S. Component/Activities Unit as per
Total Target as per DPR 2008-14
No. Target Achievement
DPR Physical Phy.(ha) Financial Physical Phy.(ha) Financial Physical Phy.(ha) Financial
(1) (2) (3) (4) (5) (6) (7) (8) (9) (10) (11) (12)
Concise Report On Development And Management Of Model Watersheds Through Participatory Approach
102
Development and Management of Model Watersheds under New Guidelines
Based on experiences registered during the project implementation process and impact evaluation analysis following recommendations are made:
Need based entry point activities should be taken up as they establish credibility of the Watershed Development Team (WDT) and a rapport with the village community.
Detailed Project Report (DPR) should be prepared with primary stakeholder active participation, and cover all the proposed works including landless after ground verification.
Active participation of local community at each and every stage is a pre-requisite for any programme on development and management of watersheds.
Capacity building of primary stakeholders holds the key to achieve the desired results from watershed development projects.
Common interest of the community in getting benefits from a particular watershed activity undertaken on community land needs to be exploited for management of common property resources.
Degraded forest lands on high slopes needs to be protected and developed on priority through community participation and transparent mechanism of sharing of benefits with the community be developed for sustainability.
Need based conservation measures in arable lands (field bunding) should be adopted as they play a significant role in in-situ moisture conservation and thereby reducing runoff, soil loss and improving crop yields in rainfed crops, especially during drought years.
As far as possible ridge to valley sequenced approach should be adopted towards implementation of the watershed works.
Selection of appropriate site and type of conservation measures and gully control structures to be adopted in non-arable land are essential for reducing runoff peaks, silt deposition, water storage etc. which helped in gully stabilization and recharges groundwater and bore wells in watersheds.
Management of available water resources through renovation of village pond, construction of water harvesting tanks and improvement in water conveyance efficiency with improved diversified crop production system provides significant impact among farmers of a watershed.
Productivity enhancement and livelihoods should be the top priority of the watershed development.
For introducing any alternate land use system, simple distribution of seeds or tree seedlings leads to failure of the activity. Hence, associated technologies like micro-site improvement, micro irrigation, live fencing, drip irrigation should be given due importance for success of dry land horticulture and agro-forestry system, which plays a major role in improving water productivity.
Formation of local community based organization with crisp clear roles, responsibilities and benefit sharing mechanism helps to make them sustainable.
Annual and human development related activities are equally important in watershed development and be given due importance.
•
•
•
•
•
•
•
•
•
•
•
•
•
•
Lessons Learnt 7
103
•
•
•
•
•
•
•
•
•
•
Proper participatory can current monitoring and evaluation facilitate mid-term correction in confidence building about demonstrated technology.
Concept of social fencing needs to be strengthened to regulate grazing habits of animals and develop community land for improving fodder availability to boost milk production.
Success rate of activities pertaining to water resource creation and their efficient use is very high as farmers show high interest in these activities. These activities should be given high priority and more fund allocation.
Soil health cards should be prepared under every watershed project and provided to each and every farmer of watershed.
One of the mandatory conditions for selection of villages for watershed projects should be written agreement of primary stakeholders for contribution towards the Watershed Development Fund (WDF).
All members of Watershed Committee and staff such as Watershed Secretary should be given orientation and training to improve their knowledge and upgrade technical/ management and community organisational skills to a level that is appropriate for successful discharge of their responsibilities after withdrawal of the watershed development.
High priority be given to the project activities yielding quick returns to the primary stakeholders individually.
Livelihood activities introduced in a watershed do not get success if these are not linked with market intelligence and bank credit. The watershed plus activities must emphasize on such commercial issues after revisiting them.
Local communities play a pivotal role in natural resource management and therefore effective community sensitization and its mobilization is very critical for ensuring successful project implementation. Generally NGOs have proved to be far more successful than Government Organizations in social mobilization and therefore, credible NGOs having adequate experience of working with natural resource management projects may be involved in community organization.
Convergence of resources (technical and / or financial) with proper agreed mechanism with state government will facilitate to produce effective results in present and make them sustainable.
Concise Report On Development And Management Of Model Watersheds Through Participatory Approach
104
Development and Management of Model Watersheds under New Guidelines
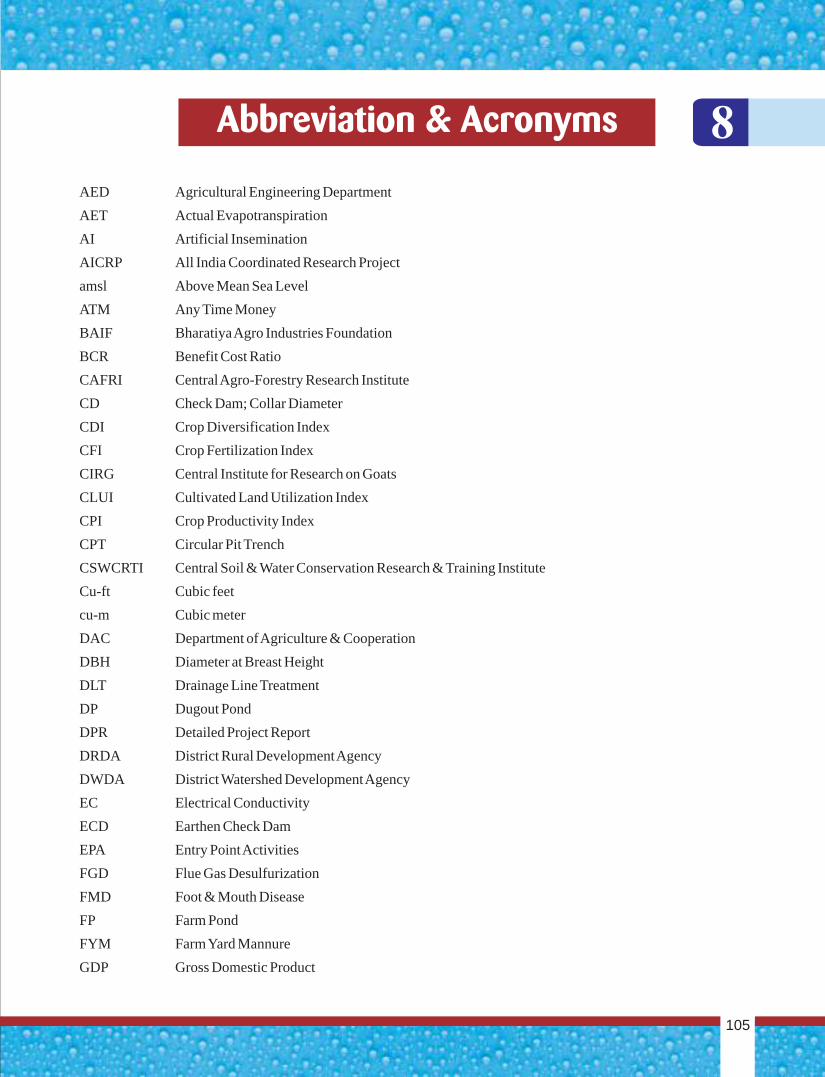
Abbreviation & Acronyms 8
105
AED Agricultural Engineering Department
AET Actual Evapotranspiration
AI Artificial Insemination
AICRP All India Coordinated Research Project
amsl Above Mean Sea Level
ATM Any Time Money
BAIF Bharatiya Agro Industries Foundation
BCR Benefit Cost Ratio
CAFRI Central Agro-Forestry Research Institute
CD Check Dam; Collar Diameter
CDI Crop Diversification Index
CFI Crop Fertilization Index
CIRG Central Institute for Research on Goats
CLUI Cultivated Land Utilization Index
CPI Crop Productivity Index
CPT Circular Pit Trench
CSWCRTI Central Soil & Water Conservation Research & Training Institute
Cu-ft Cubic feet
cu-m Cubic meter
DAC Department of Agriculture & Cooperation
DBH Diameter at Breast Height
DLT Drainage Line Treatment
DP Dugout Pond
DPR Detailed Project Report
DRDA District Rural Development Agency
DWDA District Watershed Development Agency
EC Electrical Conductivity
ECD Earthen Check Dam
EPA Entry Point Activities
FGD Flue Gas Desulfurization
FMD Foot & Mouth Disease
FP Farm Pond
FYM Farm Yard Mannure
GDP Gross Domestic Product
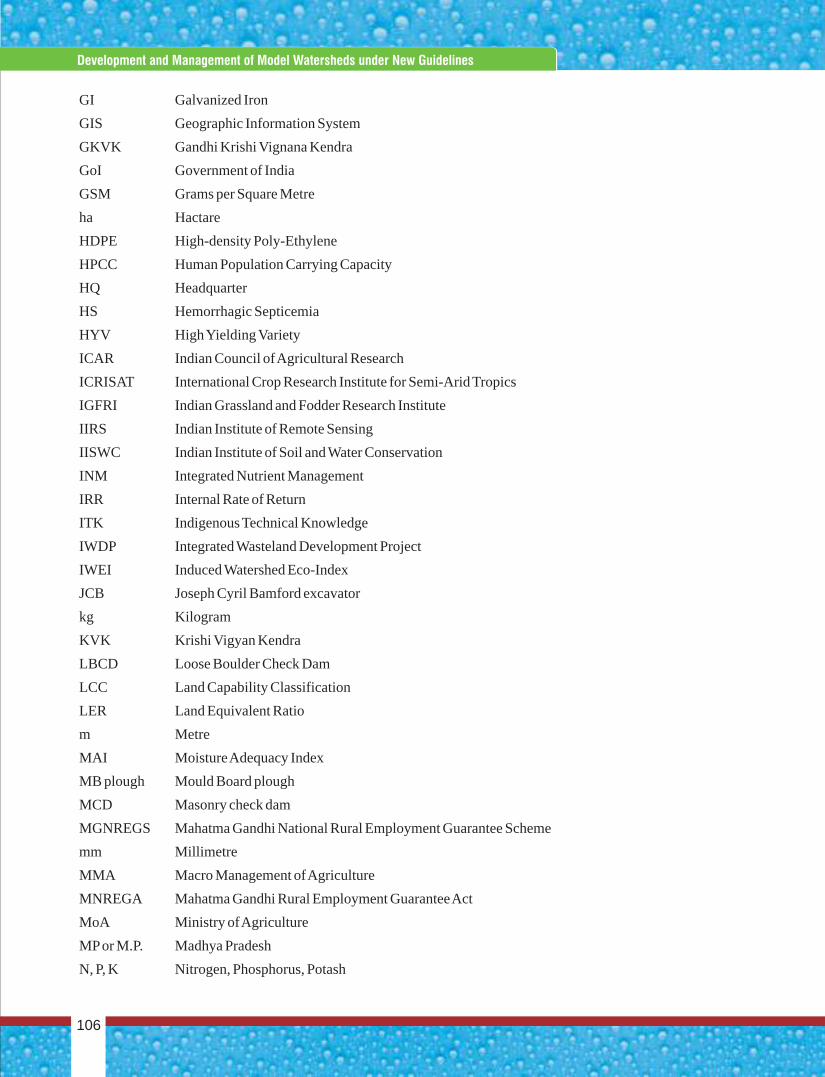
GI Galvanized Iron
GIS Geographic Information System
GKVK Gandhi Krishi Vignana Kendra
GoI Government of India
GSM Grams per Square Metre
ha Hactare
HDPE High-density Poly-Ethylene
HPCC Human Population Carrying Capacity
HQ Headquarter
HS Hemorrhagic Septicemia
HYV High Yielding Variety
ICAR Indian Council of Agricultural Research
ICRISAT International Crop Research Institute for Semi-Arid Tropics
IGFRI Indian Grassland and Fodder Research Institute
IIRS Indian Institute of Remote Sensing
IISWC Indian Institute of Soil and Water Conservation
INM Integrated Nutrient Management
IRR Internal Rate of Return
ITK Indigenous Technical Knowledge
IWDP Integrated Wasteland Development Project
IWEI Induced Watershed Eco-Index
JCB Joseph Cyril Bamford excavator
kg Kilogram
KVK Krishi Vigyan Kendra
LBCD Loose Boulder Check Dam
LCC Land Capability Classification
LER Land Equivalent Ratio
m Metre
MAI Moisture Adequacy Index
MB plough Mould Board plough
MCD Masonry check dam
MGNREGS Mahatma Gandhi National Rural Employment Guarantee Scheme
mm Millimetre
MMA Macro Management of Agriculture
MNREGA Mahatma Gandhi Rural Employment Guarantee Act
MoA Ministry of Agriculture
MP or M.P. Madhya Pradesh
N, P, K Nitrogen, Phosphorus, Potash
Concise Report On Development And Management Of Model Watersheds Through Participatory Approach
106
Development and Management of Model Watersheds under New Guidelines
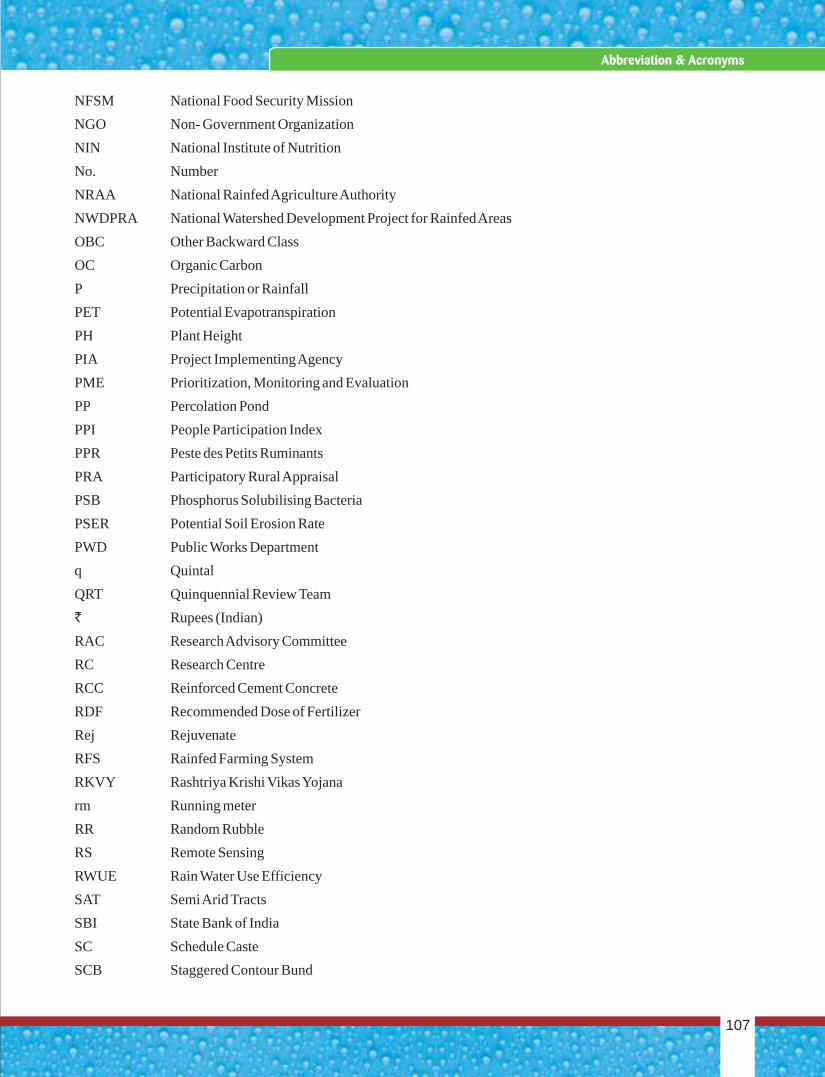
NFSM National Food Security Mission
NGO Non- Government Organization
NIN National Institute of Nutrition
No. Number
NRAA National Rainfed Agriculture Authority
NWDPRA National Watershed Development Project for Rainfed Areas
OBC Other Backward Class
OC Organic Carbon
P Precipitation or Rainfall
PET Potential Evapotranspiration
PH Plant Height
PIA Project Implementing Agency
PME Prioritization, Monitoring and Evaluation
PP Percolation Pond
PPI People Participation Index
PPR Peste des Petits Ruminants
PRA Participatory Rural Appraisal
PSB Phosphorus Solubilising Bacteria
PSER Potential Soil Erosion Rate
PWD Public Works Department
q Quintal
QRT Quinquennial Review Team
` Rupees (Indian)
RAC Research Advisory Committee
RC Research Centre
RCC Reinforced Cement Concrete
RDF Recommended Dose of Fertilizer
Rej Rejuvenate
RFS Rainfed Farming System
RKVY Rashtriya Krishi Vikas Yojana
rm Running meter
RR Random Rubble
RS Remote Sensing
RWUE Rain Water Use Efficiency
SAT Semi Arid Tracts
SBI State Bank of India
SC Schedule Caste
SCB Staggered Contour Bund
107
Abbreviation & Acronyms
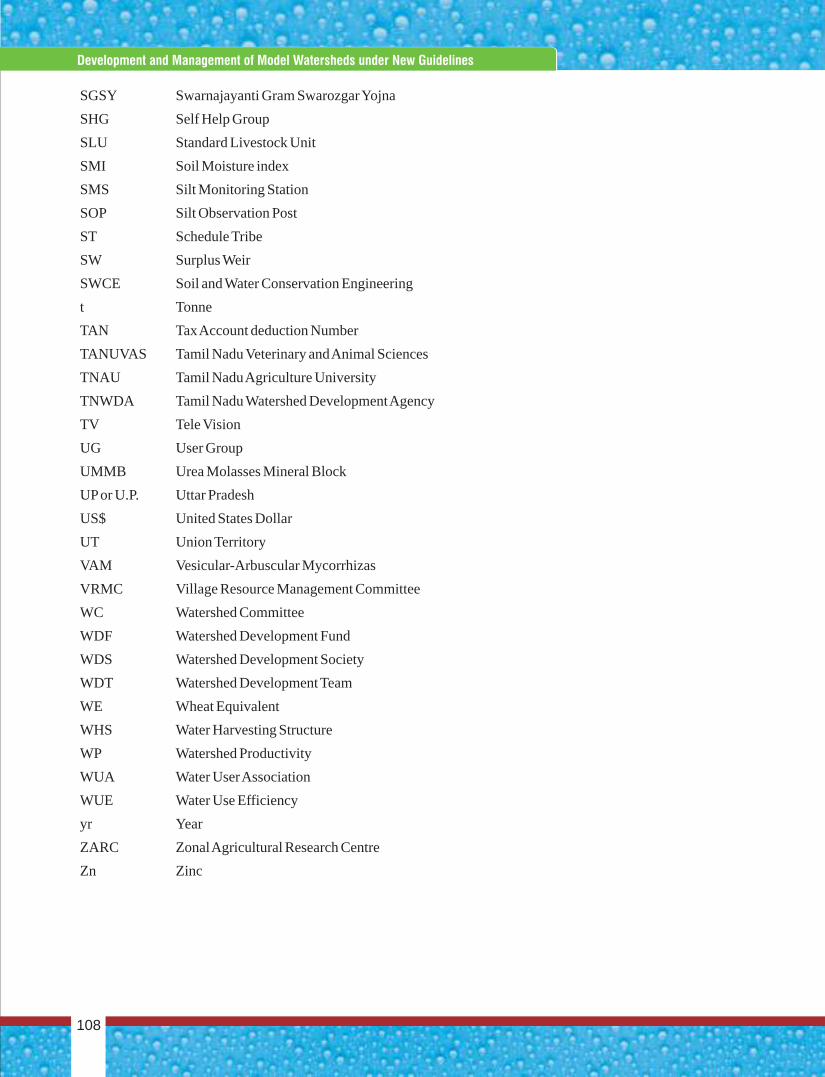
SGSY Swarnajayanti Gram Swarozgar Yojna
SHG Self Help Group
SLU Standard Livestock Unit
SMI Soil Moisture index
SMS Silt Monitoring Station
SOP Silt Observation Post
ST Schedule Tribe
SW Surplus Weir
SWCE Soil and Water Conservation Engineering
t Tonne
TAN Tax Account deduction Number
TANUVAS Tamil Nadu Veterinary and Animal Sciences
TNAU Tamil Nadu Agriculture University
TNWDA Tamil Nadu Watershed Development Agency
TV Tele Vision
UG User Group
UMMB Urea Molasses Mineral Block
UP or U.P. Uttar Pradesh
US$ United States Dollar
UT Union Territory
VAM Vesicular-Arbuscular Mycorrhizas
VRMC Village Resource Management Committee
WC Watershed Committee
WDF Watershed Development Fund
WDS Watershed Development Society
WDT Watershed Development Team
WE Wheat Equivalent
WHS Water Harvesting Structure
WP Watershed Productivity
WUA Water User Association
WUE Water Use Efficiency
yr Year
ZARC Zonal Agricultural Research Centre
Zn Zinc
Concise Report On Development And Management Of Model Watersheds Through Participatory Approach
108
Development and Management of Model Watersheds under New Guidelines
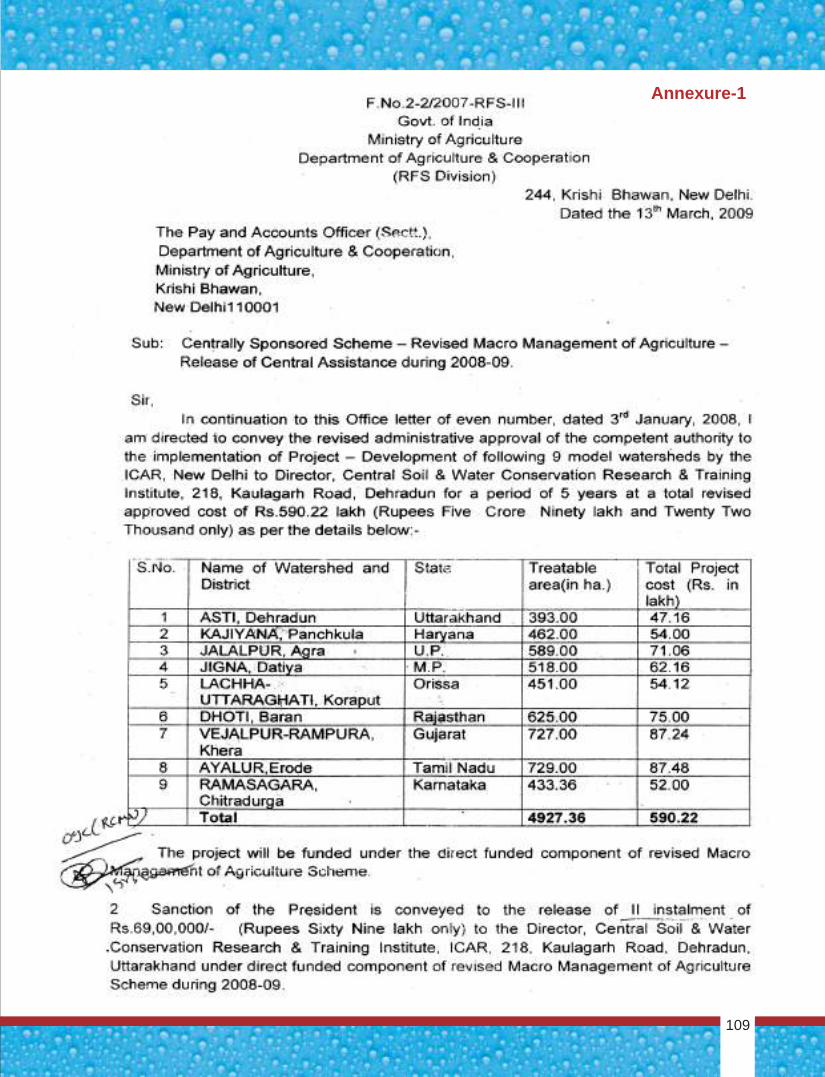
Annexure-1
109
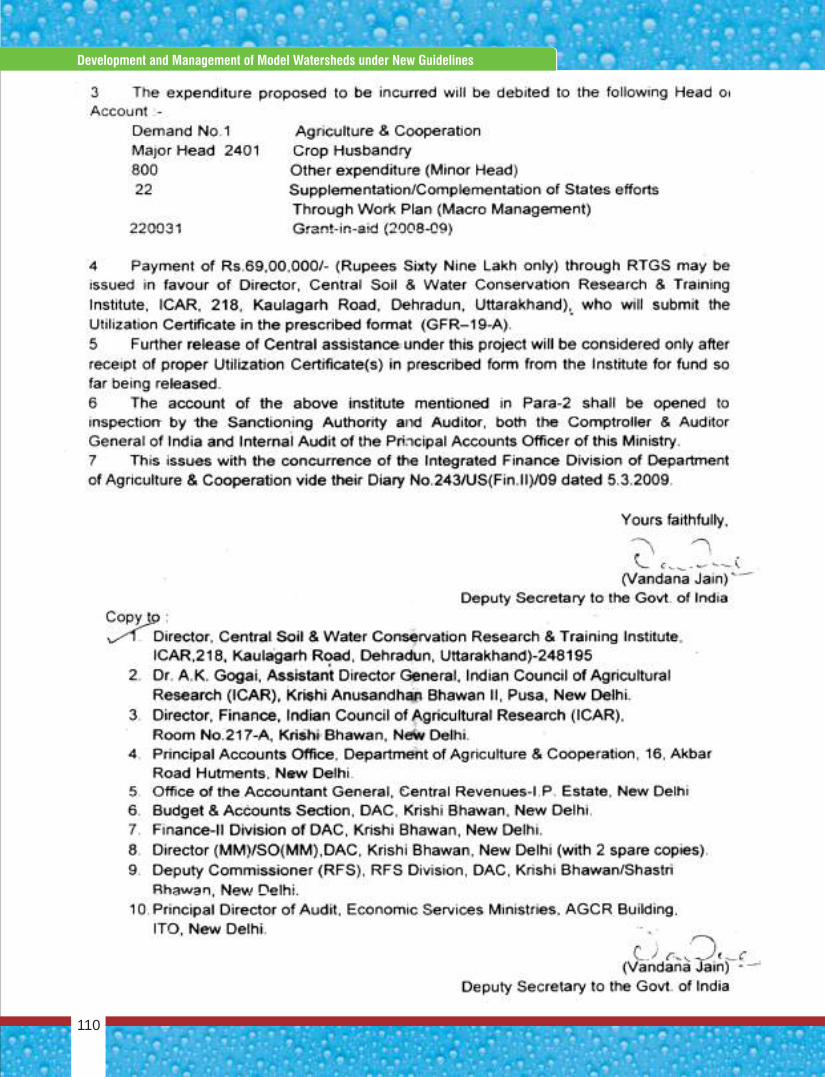
Concise Report On Development And Management Of Model Watersheds Through Participatory Approach
110
Development and Management of Model Watersheds under New Guidelines
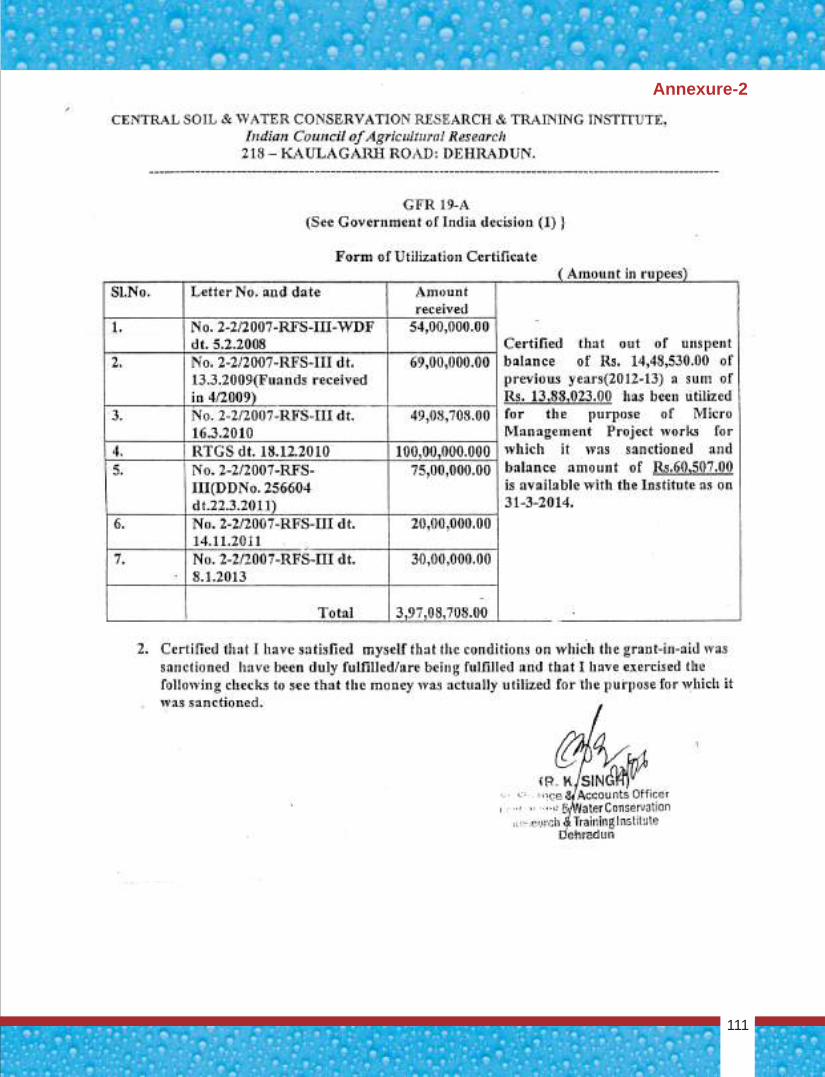
Annexure-2
111
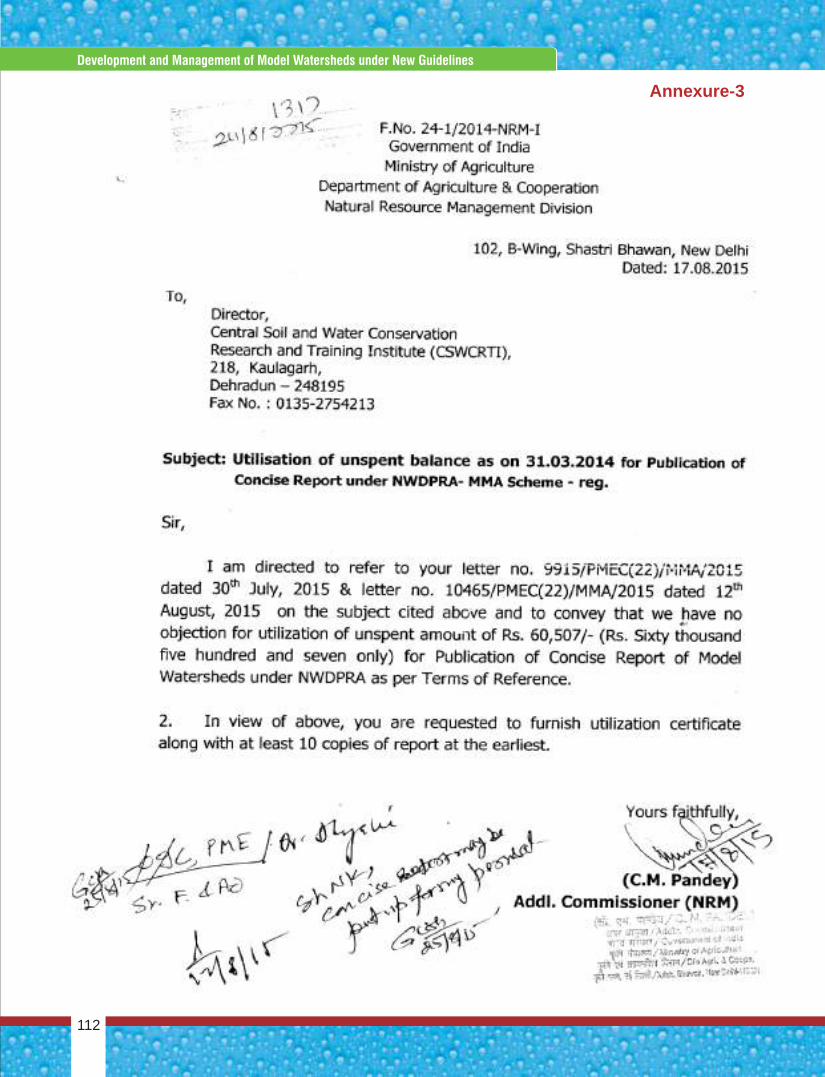
Annexure-3
Concise Report On Development And Management Of Model Watersheds Through Participatory Approach
112
Development and Management of Model Watersheds under New Guidelines