a saturated excess runoff pedotransfer function for vegetated watersheds
TRANSCRIPT
www.VadoseZoneJournal.org
A Saturated Excess Runoff Pedotransfer Function for Vegetated WatershedsSince Hewlett and Hibbert’s publication in 1967, there has been a slow recognition that saturated excess runoff is the main runoff mechanism in vegetated watersheds. Yet, most pedotransfer functions for predicting runoff are based on infiltration excess runoff. We, therefore, developed a simple pedotransfer function to predict saturation excess runoff, using data from eight watersheds on three continents. The runoff response was very similar for all watersheds, despite differences in climate, size, topography, and land use. Direct storm runoff occurred after a threshold amount of rainfall was exceeded. Runoff was linearly related to rainfall depth, indicating that a nearly constant proportion of the watershed was the source area. Size of source areas decreased with increasing depths of soils. The rainfall threshold was strongly dependent on the initial moisture conditions. The developed pedotransfer function for saturation excess runoff was used to predict water level fluctuation of two terminal lakes on the Caribbean Islands over a 25- to 30-yr period with the rainfall threshold computed following Thornthwaite–Mather and baseflow from the remaining part of the watershed employing a linear reservoir model. Taking the simplicity of the prediction technique with only four calibrated parameters into account, lake levels were predicted reasonably well to very good, including the rise in the lake level in the last 10 yr when the climate in the region became wetter. It is expected that the linear relationship of rainfall and runoff holds for storms lasting several days and can simplify flood predictions.
Abbreviation: SCS, Soil Conversion Service; SHE, Systeme Hydrologique Europeen; SWAT, Soil and Water Assessment Tool.
There is a long history of avoiding flood disasters by methods to predict and prevent floods. The Egyptians had already developed a flood warning system (i.e., run-ners) and directed excess flood water in Lake Moeris in the Faiyum hollow so Alexandria would not flood (Gabrecht, 1987). More than 43 centuries later, there are still 250 refereed articles in scientific journals that have been published in the last year on “flood prediction” according to the Science Citation Index. This is understandable since information for predicting floods and the capacity to calculate complex problems has increased at least a billion fold, making it possible to refine the historic techniques for predicting discharge at the outlet of a watershed and develop new ways to predict the locations of overland flow in the watershed. Opinions on the “right” complexity vary among hydrologists and soil scientists, with developers of Systeme Hydrologique Europeen (SHE) and Soil and Water Assessment Tool (SWAT) (Abbott et al., 1986; Arnold et al., 1998; Easton et al., 2008) adding more complexity to their already complex models. On the other hand, Jakeman and Hornberger (1993) argued that typical rainfall–runoff patterns only contained enough information to constrain simple hydrological models with as little as four free parameters. Zehe and Sivapalan (2009) have furthermore reasoned that due to the spatial heterogeneity and process complexity of the subsurface flow, predicting threshold behavior requires, as a first step, identification of first order controls.
It is fair to say that the current trend is to develop increasingly more intricate distributed watershed models to represent the complex and heterogenic landscape features (Weiler and McDonnell, 2007). These distributed models are generally based on some form of Darcy’s law (Beven, 1985, 2000) and can predict realistic distributed moisture contents and fluxes when the input data are accurate. Satellite imagery can provide the detail needed for surface features, but precise data for subsurface features are not (yet) available. In addi-tion, averaging of parameters at the watershed scale becomes problematic (McGuire et al., 2005). For example, the detail of a small valley might be lost by increasing grid sizes (Kuo
Despite the complexity of soils, topography, and land use of eight vegetated watersheds throughout the world, the runoff behavior after the threshold rainfall is exceeded is surprisingly simple and consists of a linear relationship between total rainfall and total direct runoff for each storm.
T.S. Steenhuis, D. Poteau, E.J. Romero Luna, C.D. Guzman, and C.R. Stoof, Dep. of Biological and Environmental Engineering, Cornell Univ., Ithaca, NY 14853. M. Hrnčíř, M. Šanda, and M. Císlerová, Czech Technical Univ. in Prague, Faculty of Civil Engineering, Thákurova 7, 166 29 Praha 6, Czech Republic. T.S. Steenhuis and S.A. Tilahun, School of Civil and Water Resources Engineering, Bahir Dar Univ., Bahir Dar, Ethiopia. L.A. Caballero, Dep. of Environment and Development Studies, Zamorano Univ., Honduras. B. Yitaferu, Amhara Agricultural Research Institute, Bahir Dar, Ethiopia. *Corresponding author ([email protected]).
Vadose Zone J. doi:10.2136/vzj2013.03.0060Received 18 Mar. 2013.
Special Section: Frontiers of Hydropedology in Vadose Zone Research
Tammo S. Steenhuis*Miroslav HrnčířDina PoteauEva J. Romero LunaSeifu A. TilahunLuis A. CaballeroChristian D. GuzmanCathelijne R. StoofMartin ŠandaBirru YitaferuMilena Císlerová
© Soil Science Society of America 5585 Guilford Rd., Madison, WI 53711 USA.All rights reserved. No part of this periodical may be reproduced or transmitted in any form or by any means, electronic or mechanical, including pho-tocopying, recording, or any information storage and retrieval system, without permission in writing from the publisher.
www.VadoseZoneJournal.org p. 2 of 10
et al., 1999; Weiler and Naef, 2003). Therefore, despite the math-ematical rigor that Darcy’s law brings, the predictive validity of the models is often in doubt (Seibert, 2003), and several hydrologists have therefore moved from fully distributed deterministic models towards more conceptually based models with fewer parameters, describing only dominant hydrological processes at the hillslope and catchment scales (Naef et al., 2002; Wagener et al., 2007). Therefore, we believe that there is still a need for models (i.e., pedo-transfer functions) that use few parameters and represent the right
“landscape processes.” These may look very different from the form based on “small scale physics” (i.e., Darcy’s law; Kirchner, 2006).
Many previous attempts to develop pedotransfer functions for direct runoff such as those developed by Green and Ampt (1911), Horton (1941), Kostiakov (1932), and the rational formula (Kuichling, 1889) have been based on the relative magnitude of rainfall intensity and infiltration capacity, which is a function of land use and soil type. Since systematically predicting rainfall intensity is almost impossible, and more importantly the rainfall intensity is greater than the saturated conductivity of the soils in well vegetated areas (as is specified in more detail in the “Results” section), these methods perform less than satisfactorily (Hewlett and Hibbert, 1967; Schneiderman et al., 2007). It might be of interest here that Horton’s (1941) perceptual model of infiltration processes was far more sophisticated and complete than normally presented in hydrological texts today (Beven, 2004a,2004b,2004c).
In this paper, we are concerned with developing direct runoff pedo-transfer functions for vegetated watersheds in which gravity (and not the water pressure potential) is the dominant force moving the water. These are watersheds with a slope of at least 1–2% and veg-etation present with saturation excess being the dominant runoff mechanism. The storm runoff is characterized by quick responses to rainfall pulses (Whipkey, 1966; Tesař et al., 2004).
Since pedotransfer functions are derived statistically, they might not apply outside the area for which they were developed. To make the transfer function widely applicable, we will test its validity for several locations throughout the world with different climates and landforms and for which we know the watershed characteristics well enough that we can check its validity. In this paper, we will employ the outflow measurement of a plot and a small watershed in the mountains of the Czech Republic (mild, temperate mixed ocean-continental climate), test it with previously published data for three watersheds in the Ethiopian Highlands (with a semi humid monsoon climate), and for a cloud forest catchment in Honduras. At the end, we will combine the transfer function with a water balance to calculate thresholds and predict lake level fluc-tuation for terminal lakes in Haiti and the Dominican Republic characterized by a semiarid monsoon climate.
6 Pedotransfer Function for Direct Runoff
In the saturation excess pedotransfer function, direct runoff con-sisting of fast interflow and surface runoff is generated by rainfall falling on areas that are saturated above a hardpan (restrictive layer) or the groundwater table such that are shown by Gish et al. (2005) in the USDA watershed and for the Kepler Farm of Pennsylvania State University by Zhu et al. (2010). The saturated regions expand as the rainstorm progresses (Hewlett and Hibbert, 1967) and the amount of runoff per unit increment of precipitation increases with time (Steenhuis et al., 1995; Liu et al., 2008), after which it becomes constant as we will show in this paper. As expected and shown by sprinkler experiments (Zehe et al. 2007), runoff is highly dependent on the initial soil moisture state as a result of the threshold dynamics of the system. Various explanations have been given for these phenomena, such as threshold behavior (McGrath et al., 2007; Spence, 2007; Lehmann et al., 2007; and Tromp-van Meerveld and McDonnell, 2006). Essentially, thresholding is a consequence of the highly nonlinear unsaturated hydraulic con-ductivity function where the conductivity remains small until it reaches field capacity and enough large pores are filled with water that the landscape starts responding to the precipitation. Based on this, the proposed transfer function for predicting runoff is based on the following main assumptions:
1. Infiltration rates of soils are greater than the rainfall intensity most of the times. We consider areas that are impermeable to be saturated almost immediately.
2. The threshold response to the rainfall is determined by the amount of soil water that can be stored to reach field capac-ity. This storage depends on the depth of the restrictive layer and/or the ground water table depth. Watersheds with little storage are fast responding, while those with large storage capacities are slow responding and release water over an extended time period.
3. Storm runoff response can be fast interflow and/or direct sur-face runoff. Since the importance of the shallow subsurface flow to the runoff-forming process in headwater catchments between runoff events has been well documented when the rainfall is equal or larger than the evaporation (i.e., Whipkey, 1966; Hewlett and Hibbert, 1967; Weyman, 1973; Bonell, 1998; Nieber, 2006), we propose that interflow between rainfall events sets up a characteristic moisture content pat-tern in the watershed (Schneiderman et al., 2007; Dahlke et al., 2012).
Thus, in essence, we assume that in its most basic form, the land-scape after sufficient rainfall (exceeding the threshold) always behaves the same (i.e., is self-organizing) in that direct runoff is generated from a portion of the watershed that is saturated and that is invariant from one storm runoff event to the next. Rainfall in the remaining part of the watershed infiltrates and will either evaporate or become baseflow.
www.VadoseZoneJournal.org p. 3 of 10
Based on the above description the pedotransfer function can be written as follows:
( ) for Q F P T P T= - > [1]
0 for Q P T= £ [2]
maxT S S= - [3]
where Q is the cumulative runoff usually in a day, but can be longer if the storm spans several days, F is the fraction of the area of the watershed contributing to runoff, P is the cumulative precipitation, and T is the threshold value; Smax is the maximum storage in the root zone and S is the actual storage.
6Materials and MethodsEight different watersheds in five countries are considered: the Czech Republic, highlands in Ethiopia, Honduras, the Dominican Republic, and Haiti with climates ranging from humid to semiarid and from monsoonal to temperate humid.
Uhlířská Catchment, Czech RepublicRunoff processes are analyzed in the 1.78 km2 Uhlířská catchment, situated in a mild, temperate mixed ocean-continental climate in the Jizera Mountains in the Czech Republic with peaks of just above 1100 m. The average annual rainfall total is 1400 mm. The Uhlířská catchment consists of approximately 10% valley areas with histosols that can potentially saturate, and 90% hillslope areas. Its discharge is measured at two scales: the catchment scale (1.78 km2) and experimental plot scale (0.2 ha). For the experimental plot that is located in a typical hillslope area, the interflow is collected in a trench. No surface flow is observed. The contributing area formed above the trench is about 200 m2. Its extent varies slightly, according to the degree of saturation of the soil profile (Šanda and Císlerová, 2009; Hrnčíř et al., 2010). The gauging station at the catchment outlet consists of both interflow from the hillsides and saturation excess runoff from the histosols in the watershed.
Forty-four rainfall–runoff episodes were selected from 11 vegeta-tion seasons (May– October) between 1998 and 2008 meeting the following criteria. The stream flow at the beginning and the end of each rainfall–runoff episode was at, or very close to, the long-term baseflow; consequently, the episodes are clearly bounded in the hydrograph. A minimum recorded rainfall total of 20 mm was chosen as a benchmark for a significant episode. Intense rainfall pulses often follow prolonged periods of shorter, less intense pulses sometimes separated by periods without rain. To prevent the con-tribution of the previous, less intense episode to the runoff, some of the selected rainfall–runoff episodes comprise several rainfall pulses, separated by hiatuses of variable lengths.
Ethiopian Highland CatchmentsExperimental catchments Anjeni, Andit Tid, and Maybar are located within Amhara Regional State, Ethiopia at elevations rang-ing from 2200 to 2500 m. Average annual rainfall for the three sites varies between 1350 and 1500 mm. Although the catchments all have similar land use (agricultural lands, with extensive soil erosion control structures built to assist the rainfed subsistence farming), they differ in size, topographic relief, and climate. Andit Tid, the largest study site (4 km2), is also the highest and least populated. Hillslopes are very steep and degraded, resulting in 54% of the long-term precipitation becoming runoff. Anjeni, located in one of the country’s most productive agricultural areas, is the lowest in eleva-tion and highest in population density. The site receives more rain than the other two and has only one rainy season, typically from May to October. The slopes are gentle in Anjeni, the soil profile is deep with higher infiltration capacity than in the other two catchments and, most importantly, the catchment is well treated by physical soil and water conservation measures. Finally, the Maybar catchment behaves in a similar manner to Anjeni except for the difference in rain season pattern that is bimodal. The majority of information about the Ethiopian catchments comes from two key publications (Liu et al., 2008, Steenhuis et al., 2009) and consequently further information may be found there or requested from the authors.
Honduras CatchmentDischarge was measured in 635 ha of a catchment dominated by cloud forests in 4 subwatersheds located within the La Tigra National Park of central Honduras. Watershed relief is dominated by moderate to steep slopes, with mean slopes ranging from 20 to 30%. Elevation ranges from 1374 to 2270 m. The climate is a semiarid monsoonal climate and is characterized by distinct wet and dry phases. Most of the rain occurs within two wet seasons. In addition, 90% of the annual precipitation falls in the wet phase beginning in the end of May and continuing through October. May and October are the peak months for rainfall (Caballero et al., 2013). Long-term climate data recorded at Zamorano University (35 km from the watersheds and at 800 m elevation) indicates a long term average precipitation of 1100 mm. More information can be found in the dissertation of Caballero (2012).
Haiti and the Dominican Republic CatchmentsThe two locations are Lake Saumatre in Haiti and Lake Enriquillo in the Dominican Republic. The lakes are only about 5 km apart at their closest point (Fig. S1a in the supplementary material) and have similar hydrogeological properties. Both lakes are terminal lakes with no surface outflow and, their areas, as determined by satellite-based bathymetric mapping using the Reflectance Ratio, have been increasing for the past 10 yr (Fig. S1b in the supplemen-tary material; Romero Luna and Poteau, 2011), causing flooding of roads, cities, and agricultural land. Deforestation and climate change have been mentioned as the cause for the increase. Lake Saumatre in Haiti is about 120 km2 with a watershed of 320 km2. The plain around the lake is composed of alluvium washed down

www.VadoseZoneJournal.org p. 4 of 10
from the neighboring mountains and easily drains water during rain events (Woodring et al., 1924). The mountains border the north and south of the watershed area are composed of limestone. Rainwater also infiltrates easily and flow through the porous media of these limestone areas (Woodring et al., 1924). Lake Enriquillo in the Dominican Republic is 265 km2 large, its watershed encom-passes about 2730 km2 and lies about 45 m below sea level, making it the lowest point in the Caribbean (Buck et al., 2005). Its salinity level also varies between two and three times that of ocean water. Remote sensing was used to study the land cover for the years of 1986 and 2010. It was found that, although there has been some land cover change, the change has not been significant enough to cause major changes in the hydrological balance.
These two watersheds are used to test the pedotransfer function. We will combine the transfer function developed for the water-sheds in the Czech Republic, Ethiopia, and Honduras with a water balance procedure to calculate the threshold and a linear reservoir to calculate the baseflow routine.
6ResultsWe will first demonstrate that saturation excess runoff is the domi-nant runoff mechanism by showing that the infiltration capacity is generally greater than the rainfall intensity. Subsequently, we will establish that after the threshold value is exceeded, there is a unique and linear relationship between total runoff and total effec-tive precipitation for each rainfall event. Finally, we will use (and validate) the transfer function to predict the lake level in Honduras and the Dominican Republic.
Infiltration Capacity in the SoilThe transfer function is based on the assumption that the infiltra-tion capacity of the soil at the surface is greater than the rainfall intensity. This is contrary to the soil survey data where most soils have hydraulic conductivities smaller than the rainfall intensities. For example, a silty loam or finer has conductivities of less than 4 cm h-1 (Clapp and Hornberger, 1978). These soil types, when measured in the field, have conductivities that are in the order of 10 times greater (Merwin et al., 1994) and Merwin’s case for a clay loam exceeded a 1-h, 100-yr rainfall event. Similar or greater values have been reported in Oregon (Johnson and Beschta, 1978) and in Honduras (Mendoza and Steenhuis, 2002) with the exception of severely degraded soils (Hanson et al., 2004). In the Maybar water-shed in Ethiopia (Bayabil et al., 2010), medium infiltration values are exceeded by rainfall intensities about 5% of the year. In the Czech Uhlířská Catchment, mean steady state infiltration rates are 15 m d-1 and the coefficient of variation is 126% (Tachecí, 2002).
Field infiltration measurements are more meaningful in predicting watershed behavior than the lab derived measurements because lab measurements are typically made on soils that have been dried, sieved, and repacked. In the field with sufficient organic matter,
infiltration rates are higher because aggregates and preferential f low patterns are common. Moreover, when rainfall intensity exceeds infiltration capacity during short periods, most of the runoff infiltrates on the way down to the stream when the inten-sity decreases (Stomph et al., 2002).
Threshold Behavior and Fractional Area ContributingTo examine the threshold behavior, we have plotted the total dis-charge vs. total storm precipitation for the watersheds. By linear regression of the precipitation vs. the runoff, the hydrological active fractional area of the watershed F is equal to the slope (Table 1). The average threshold value can be obtained by dividing the y-axis intercept by the tangent of the slope of the line (Table 1).
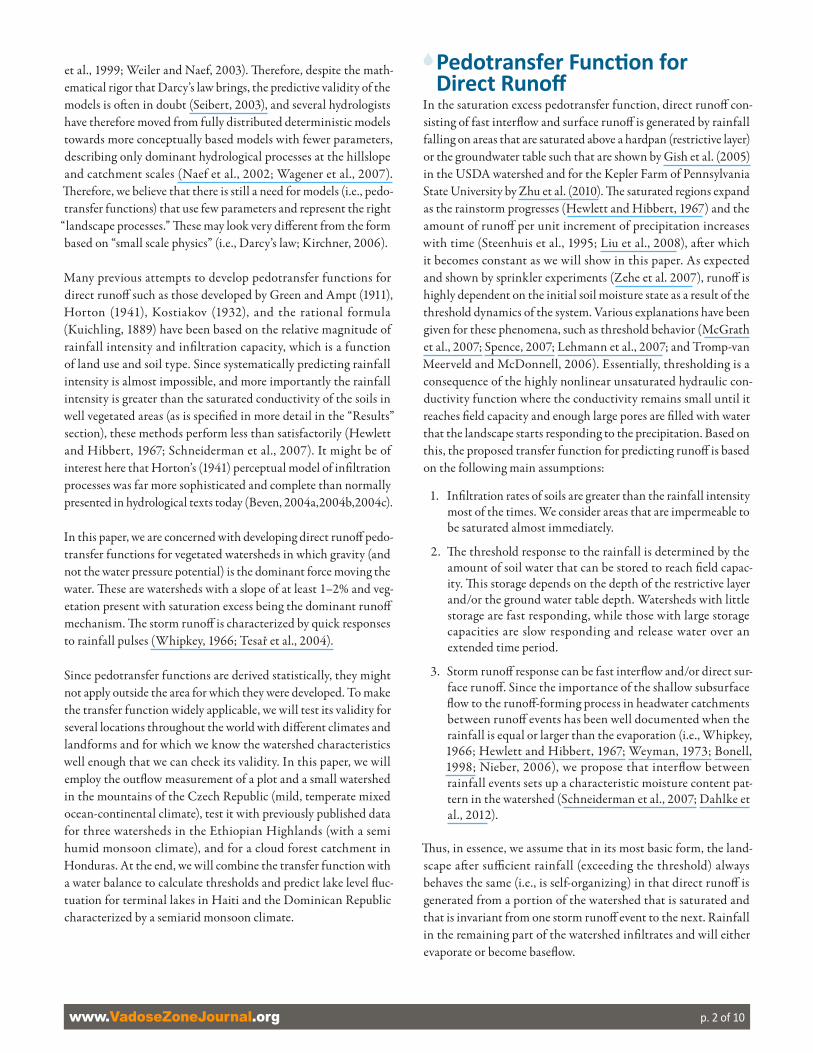
Uhlířská CatchmentAt the outlet of the 178 ha Uhlířská watershed, there is a unique relationship for the 44 runoff events between total precipitation and total runoff (thin black line in Fig. 1) that is statistically signifi-cant at the 95% confidence level (dashed lines). Closer examination of the data indicates that there is a difference in runoff response that is dependent on the initial moisture content of the watershed. When the watershed was nearly saturated (black squares, average initial saturation 0.92) the red line fitted through the outer points by eye shows that the intercept with the precipitation was in the order of 10 mm; when the watershed was dry (asterisks, blue line average initial saturation 0.65) the threshold was just below 60 mm
Table 1. Fraction of the watershed that is hydrological active, the threshold of rainfall in mm before the watershed becomes hydrological active, and the regression coefficient of the fit between storm runoff and precipitation for the Uhlířská catchment and plot in the Czech Repub-lic, three watershed in Ethiopia, Anjeni, Andit Tid and Maybar, and in the LaTigra watershed in Honduras. For the Lake Saumatre watershed in Haiti and Lake Enriquillo in the Dominican Republic, the statistics of the observed vs. the predicted lake levels are presented. The slope of the regression line was close to 1 for the Lake Enriquillo, and 0.5 for Lake Saumatre in Haiti because the observed lake level rise was earlier than observed.
Hydrological active area, fraction
Threshold value R2
mm
Uhlířská catchment, Czech Rep.† 0.67 16 0.93
Uhlířská plot, Czech Republic† 0.61 33 0.77
Anjeni, Ethiopia 0.50 0 0.83
Andit Tid, Ethiopia 0.70 0 0.53
Maybar, Ethiopia 0.50 0 0.75
LaTigra, Honduras 0.20 3 0.89
Lake Saumatre, Haiti‡ 0.45 25 0.54
Lake Enriquillo, Dominican Rep‡ 0.30 40 0.92
† Based on fitting all the data.‡ Predicted vs. observed lake levels.
www.VadoseZoneJournal.org p. 5 of 10
before any runoff was recorded. It is noteworthy that the slope of the two lines is the same and nearly all other runoff rainfall pairs fall between these two outer lines. Once the threshold is exceeded, approximately 80% of the rainfall becomes interflow and direct runoff. The fate of the remaining 20% is discussed later.
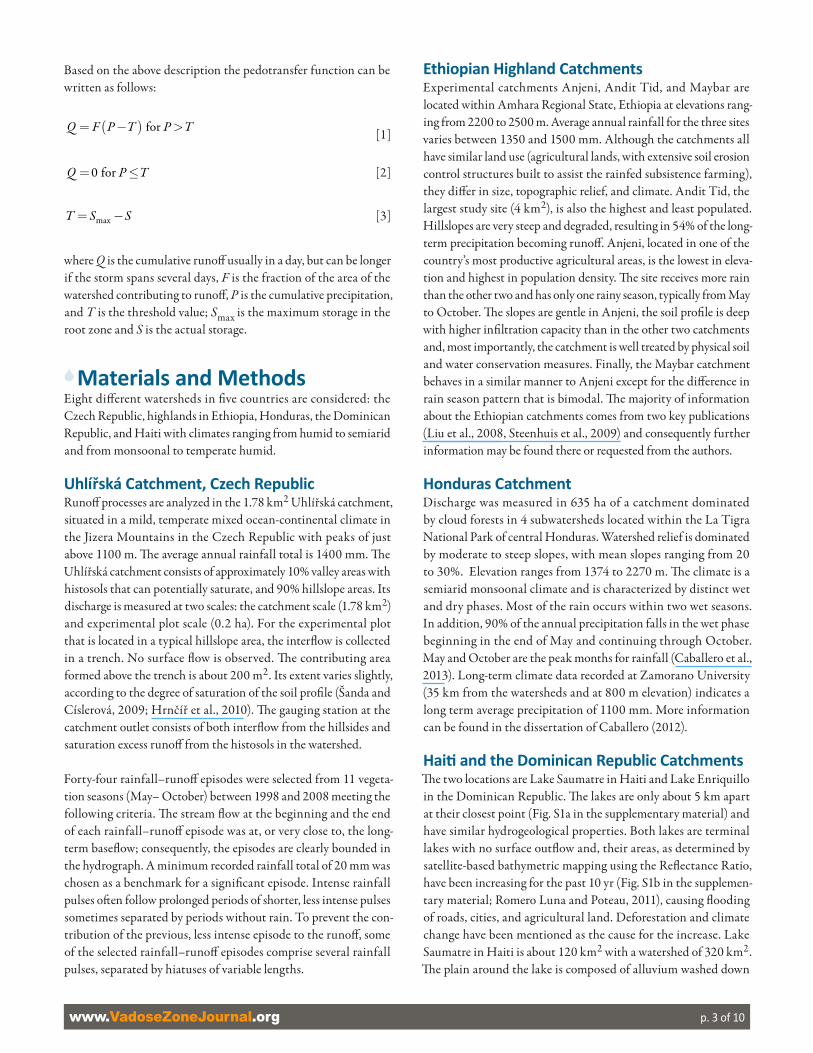
The 0.2 ha plot that was located on the hillside does not have any bottom land, and for that reason, overland flow does not occur and only interflow is measured in the trench (Fig. 2). Although there is distinctly greater variation in the rainfall–interflow relation-ship, interflow increases with total storm rainfall. Similar to the larger watershed, when the profile was wet, the threshold was lower
Fig. 1. Relationship of total precipitation and total runoff at various initial water saturation contents (symbols) at the the outlet of the 178 ha Uhlířská watershed in the Czech Republic. The black line is the fitted linear regression with 95% confidence intervals indicated with the dashed lines. The red and the blue lines bounds the rainfall runoff events.
Fig. 2. Relationship between total precipitation and total interflow at various initial water saturation contents (symbols) in the subsurface trench for the experimental 0.2 ha plot in the Uhlířská watershed in the Czech Republic. The black line is the fitted linear regression with 95% confidence intervals indicated with the dashed lines. The red line is fitted by eye through the wettest initial condition (black squares). The green line indicates the approxi-mate relationship for the next initial condition and the blue line has the same slope as the other two lines and is drawn through the observation point of the dryest initial watershed condition. The purple circle indicates the outlier that was not considered.
www.VadoseZoneJournal.org p. 6 of 10
than when the watershed was dry. The red line is approximately the outer boundary of the black squares and represents the inter-flow depth when the average watershed saturation was 0.92. The threshold rainfall before interflow occurs is approximately 35 mm. For the next wetness class (average saturation 0.85; grey diamonds), the threshold was in the order of 75 mm (green line). There is one outlier that is not considered because it seemed unrealistically high, with runoff nearly exceeding rainfall (Fig. 2). Rainfall amounts for 12 of the events were too small to exceed the threshold value and thus produced no interflow. Examination of Fig. 2 shows that the runoff was approximately the precipitation minus the threshold, which should not be a surprise since the watershed of the trench was chosen such that it only contained the contributing area of the collection ditch. The greater threshold value for small experimental plot on the hillside than for the full watershed could be partially caused by the fact that the soils have to become saturated before outflow in the trench could occur.
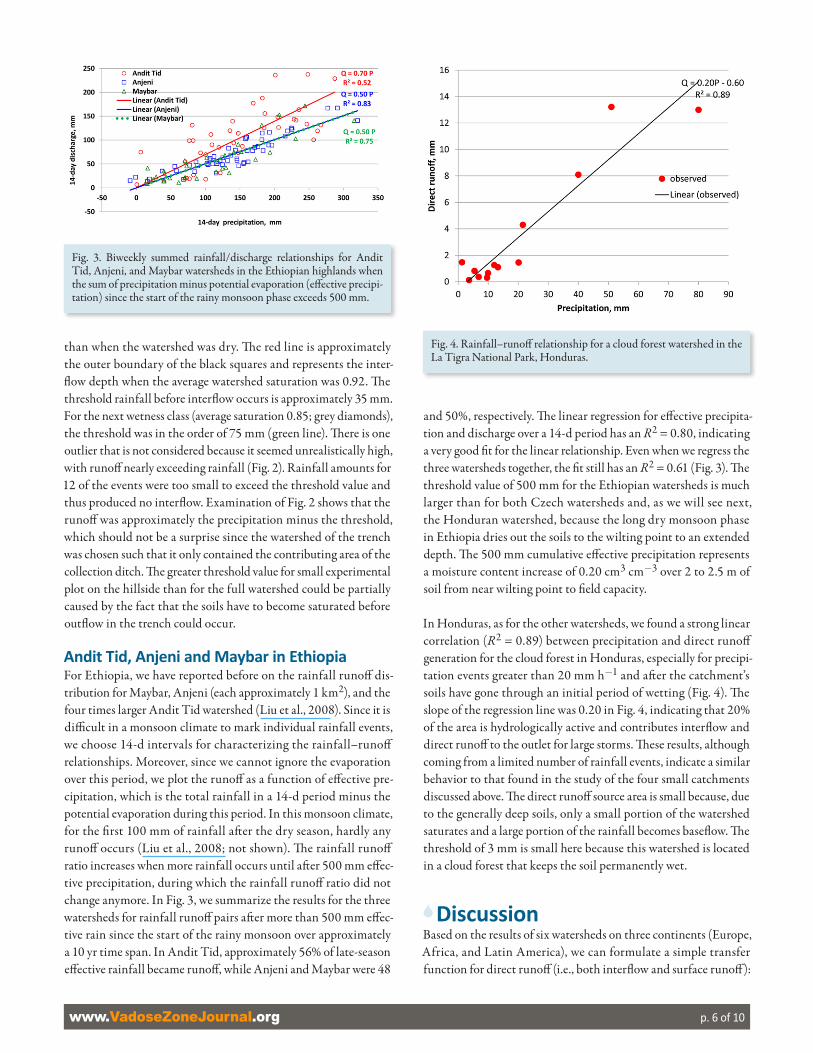
Andit Tid, Anjeni and Maybar in EthiopiaFor Ethiopia, we have reported before on the rainfall runoff dis-tribution for Maybar, Anjeni (each approximately 1 km2), and the four times larger Andit Tid watershed (Liu et al., 2008). Since it is difficult in a monsoon climate to mark individual rainfall events, we choose 14-d intervals for characterizing the rainfall–runoff relationships. Moreover, since we cannot ignore the evaporation over this period, we plot the runoff as a function of effective pre-cipitation, which is the total rainfall in a 14-d period minus the potential evaporation during this period. In this monsoon climate, for the first 100 mm of rainfall after the dry season, hardly any runoff occurs (Liu et al., 2008; not shown). The rainfall runoff ratio increases when more rainfall occurs until after 500 mm effec-tive precipitation, during which the rainfall runoff ratio did not change anymore. In Fig. 3, we summarize the results for the three watersheds for rainfall runoff pairs after more than 500 mm effec-tive rain since the start of the rainy monsoon over approximately a 10 yr time span. In Andit Tid, approximately 56% of late-season effective rainfall became runoff, while Anjeni and Maybar were 48
and 50%, respectively. The linear regression for effective precipita-tion and discharge over a 14-d period has an R2 = 0.80, indicating a very good fit for the linear relationship. Even when we regress the three watersheds together, the fit still has an R2 = 0.61 (Fig. 3). The threshold value of 500 mm for the Ethiopian watersheds is much larger than for both Czech watersheds and, as we will see next, the Honduran watershed, because the long dry monsoon phase in Ethiopia dries out the soils to the wilting point to an extended depth. The 500 mm cumulative effective precipitation represents a moisture content increase of 0.20 cm3 cm-3 over 2 to 2.5 m of soil from near wilting point to field capacity.
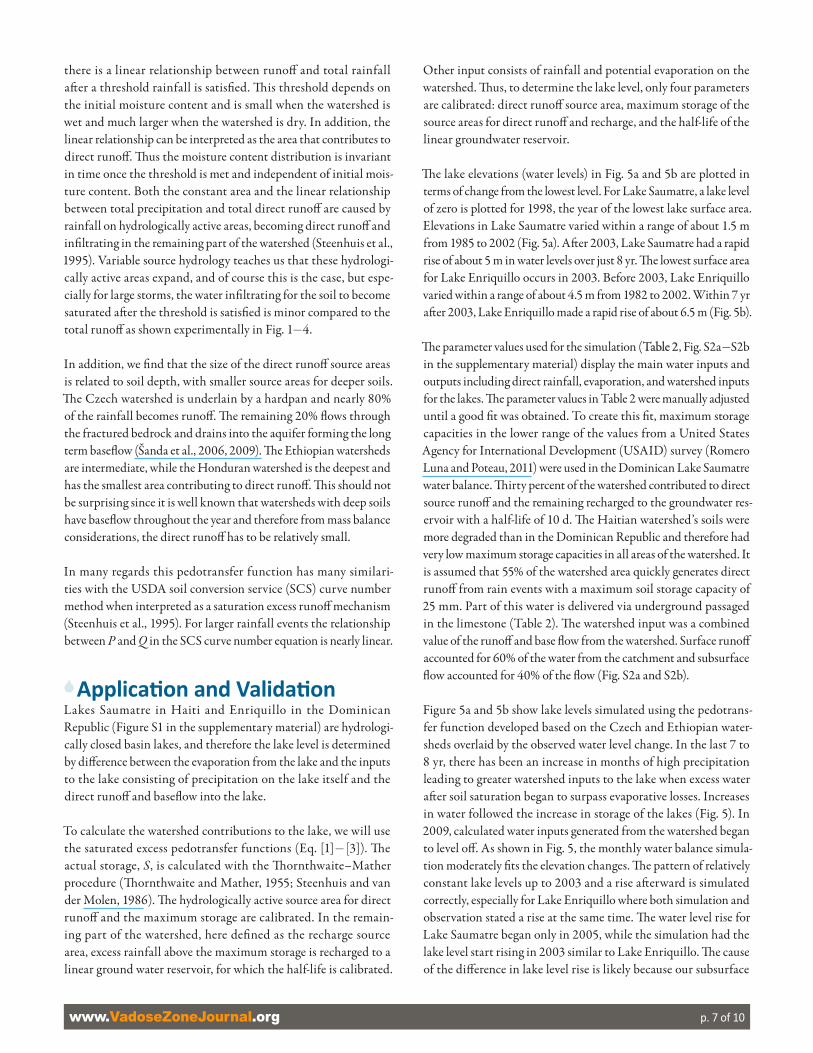
In Honduras, as for the other watersheds, we found a strong linear correlation (R2 = 0.89) between precipitation and direct runoff generation for the cloud forest in Honduras, especially for precipi-tation events greater than 20 mm h-1 and after the catchment’s soils have gone through an initial period of wetting (Fig. 4). The slope of the regression line was 0.20 in Fig. 4, indicating that 20% of the area is hydrologically active and contributes interflow and direct runoff to the outlet for large storms. These results, although coming from a limited number of rainfall events, indicate a similar behavior to that found in the study of the four small catchments discussed above. The direct runoff source area is small because, due to the generally deep soils, only a small portion of the watershed saturates and a large portion of the rainfall becomes baseflow. The threshold of 3 mm is small here because this watershed is located in a cloud forest that keeps the soil permanently wet.
6DiscussionBased on the results of six watersheds on three continents (Europe, Africa, and Latin America), we can formulate a simple transfer function for direct runoff (i.e., both interflow and surface runoff):
Fig. 3. Biweekly summed rainfall/discharge relationships for Andit Tid, Anjeni, and Maybar watersheds in the Ethiopian highlands when the sum of precipitation minus potential evaporation (effective precipi-tation) since the start of the rainy monsoon phase exceeds 500 mm.
Fig. 4. Rainfall–runoff relationship for a cloud forest watershed in the La Tigra National Park, Honduras.
www.VadoseZoneJournal.org p. 7 of 10
there is a linear relationship between runoff and total rainfall after a threshold rainfall is satisfied. This threshold depends on the initial moisture content and is small when the watershed is wet and much larger when the watershed is dry. In addition, the linear relationship can be interpreted as the area that contributes to direct runoff. Thus the moisture content distribution is invariant in time once the threshold is met and independent of initial mois-ture content. Both the constant area and the linear relationship between total precipitation and total direct runoff are caused by rainfall on hydrologically active areas, becoming direct runoff and infiltrating in the remaining part of the watershed (Steenhuis et al., 1995). Variable source hydrology teaches us that these hydrologi-cally active areas expand, and of course this is the case, but espe-cially for large storms, the water infiltrating for the soil to become saturated after the threshold is satisfied is minor compared to the total runoff as shown experimentally in Fig. 1-4.
In addition, we find that the size of the direct runoff source areas is related to soil depth, with smaller source areas for deeper soils. The Czech watershed is underlain by a hardpan and nearly 80% of the rainfall becomes runoff. The remaining 20% flows through the fractured bedrock and drains into the aquifer forming the long term baseflow (Šanda et al., 2006, 2009). The Ethiopian watersheds are intermediate, while the Honduran watershed is the deepest and has the smallest area contributing to direct runoff. This should not be surprising since it is well known that watersheds with deep soils have baseflow throughout the year and therefore from mass balance considerations, the direct runoff has to be relatively small.
In many regards this pedotransfer function has many similari-ties with the USDA soil conversion service (SCS) curve number method when interpreted as a saturation excess runoff mechanism (Steenhuis et al., 1995). For larger rainfall events the relationship between P and Q in the SCS curve number equation is nearly linear.
6Application and ValidationLakes Saumatre in Haiti and Enriquillo in the Dominican Republic (Figure S1 in the supplementary material) are hydrologi-cally closed basin lakes, and therefore the lake level is determined by difference between the evaporation from the lake and the inputs to the lake consisting of precipitation on the lake itself and the direct runoff and baseflow into the lake.
To calculate the watershed contributions to the lake, we will use the saturated excess pedotransfer functions (Eq. [1]-[3]). The actual storage, S, is calculated with the Thornthwaite–Mather procedure (Thornthwaite and Mather, 1955; Steenhuis and van der Molen, 1986). The hydrologically active source area for direct runoff and the maximum storage are calibrated. In the remain-ing part of the watershed, here defined as the recharge source area, excess rainfall above the maximum storage is recharged to a linear ground water reservoir, for which the half-life is calibrated.
Other input consists of rainfall and potential evaporation on the watershed. Thus, to determine the lake level, only four parameters are calibrated: direct runoff source area, maximum storage of the source areas for direct runoff and recharge, and the half-life of the linear groundwater reservoir.
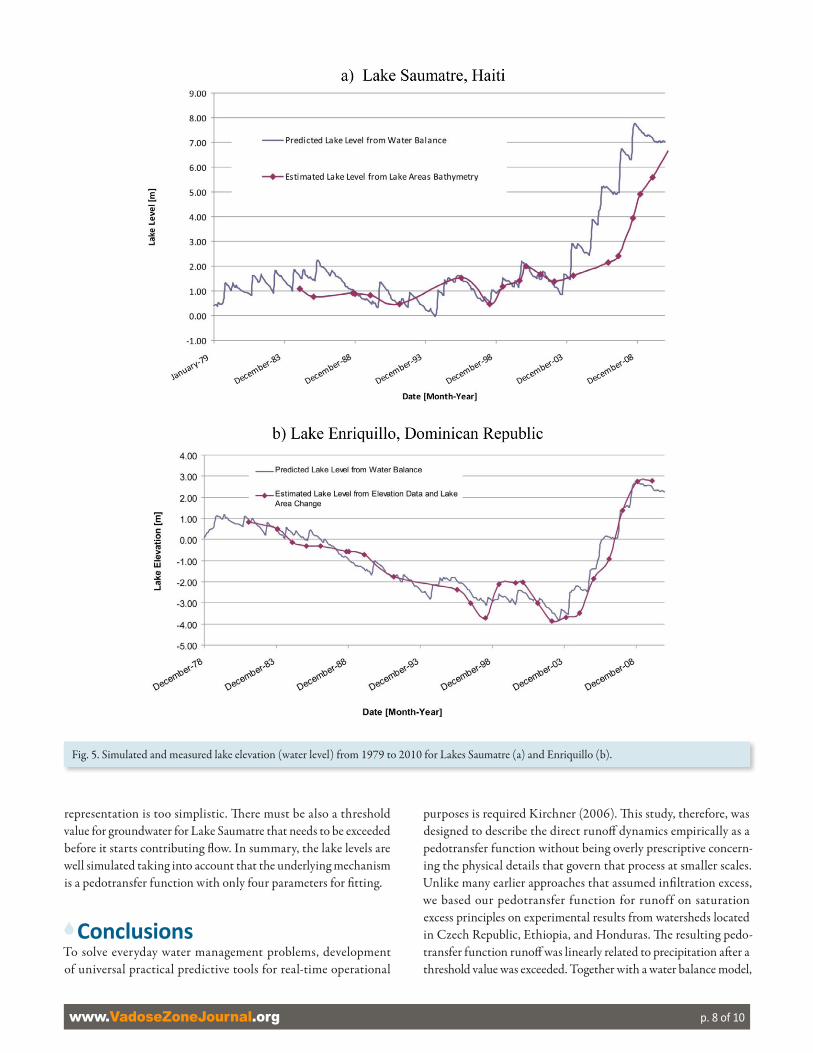
The lake elevations (water levels) in Fig. 5a and 5b are plotted in terms of change from the lowest level. For Lake Saumatre, a lake level of zero is plotted for 1998, the year of the lowest lake surface area. Elevations in Lake Saumatre varied within a range of about 1.5 m from 1985 to 2002 (Fig. 5a). After 2003, Lake Saumatre had a rapid rise of about 5 m in water levels over just 8 yr. The lowest surface area for Lake Enriquillo occurs in 2003. Before 2003, Lake Enriquillo varied within a range of about 4.5 m from 1982 to 2002. Within 7 yr after 2003, Lake Enriquillo made a rapid rise of about 6.5 m (Fig. 5b).
The parameter values used for the simulation (Table 2, Fig. S2a-S2b in the supplementary material) display the main water inputs and outputs including direct rainfall, evaporation, and watershed inputs for the lakes. The parameter values in Table 2 were manually adjusted until a good fit was obtained. To create this fit, maximum storage capacities in the lower range of the values from a United States Agency for International Development (USAID) survey (Romero Luna and Poteau, 2011) were used in the Dominican Lake Saumatre water balance. Thirty percent of the watershed contributed to direct source runoff and the remaining recharged to the groundwater res-ervoir with a half-life of 10 d. The Haitian watershed’s soils were more degraded than in the Dominican Republic and therefore had very low maximum storage capacities in all areas of the watershed. It is assumed that 55% of the watershed area quickly generates direct runoff from rain events with a maximum soil storage capacity of 25 mm. Part of this water is delivered via underground passaged in the limestone (Table 2). The watershed input was a combined value of the runoff and base flow from the watershed. Surface runoff accounted for 60% of the water from the catchment and subsurface flow accounted for 40% of the flow (Fig. S2a and S2b).
Figure 5a and 5b show lake levels simulated using the pedotrans-fer function developed based on the Czech and Ethiopian water-sheds overlaid by the observed water level change. In the last 7 to 8 yr, there has been an increase in months of high precipitation leading to greater watershed inputs to the lake when excess water after soil saturation began to surpass evaporative losses. Increases in water followed the increase in storage of the lakes (Fig. 5). In 2009, calculated water inputs generated from the watershed began to level off. As shown in Fig. 5, the monthly water balance simula-tion moderately fits the elevation changes. The pattern of relatively constant lake levels up to 2003 and a rise afterward is simulated correctly, especially for Lake Enriquillo where both simulation and observation stated a rise at the same time. The water level rise for Lake Saumatre began only in 2005, while the simulation had the lake level start rising in 2003 similar to Lake Enriquillo. The cause of the difference in lake level rise is likely because our subsurface
www.VadoseZoneJournal.org p. 8 of 10
representation is too simplistic. There must be also a threshold value for groundwater for Lake Saumatre that needs to be exceeded before it starts contributing flow. In summary, the lake levels are well simulated taking into account that the underlying mechanism is a pedotransfer function with only four parameters for fitting.
6ConclusionsTo solve everyday water management problems, development of universal practical predictive tools for real-time operational
purposes is required Kirchner (2006). This study, therefore, was designed to describe the direct runoff dynamics empirically as a pedotransfer function without being overly prescriptive concern-ing the physical details that govern that process at smaller scales. Unlike many earlier approaches that assumed infiltration excess, we based our pedotransfer function for runoff on saturation excess principles on experimental results from watersheds located in Czech Republic, Ethiopia, and Honduras. The resulting pedo-transfer function runoff was linearly related to precipitation after a threshold value was exceeded. Together with a water balance model,
Fig. 5. Simulated and measured lake elevation (water level) from 1979 to 2010 for Lakes Saumatre (a) and Enriquillo (b).
www.VadoseZoneJournal.org p. 9 of 10
the pedotransfer function could predict the rise in lake levels due to increased precipitation in Haiti and the Dominican Republic.
The conclusion, which is that each watershed, regardless of the loca-tion, climate, and topography eventually reaches a threshold point where after the runoff is a constant fraction of the total precipitation, has a potential for practical implications. This means that the source area for direct runoff and interflow is nearly constant after the rain-fall exceeds a threshold. We found that the contributing source area was smaller for watersheds with deep soils than watersheds underlain by a restricting layer. Furthermore, the threshold values increased with decreasing initial moisture contents. Uncertainty in the initial moisture conditions results relatively in a greater error in the predic-tion of runoff for small storms than for large events.
It is expected that the linear relationship of rainfall and runoff that was found for storms usually not lasting more than 1 d may hold for storms lasting several days. The present research may, there-fore, have the potential to simplify flood predictions in areas where saturation excess runoff dominates. In addition, the research may contribute to the solution of the problem of how to conceptual-ize and parameterize the effects of the antecedent conditions in a catchment on runoff formation (Weiler and McDonnell, 2007). However, it needs to be emphasized that the developed saturated excess pedotransfer function should be tested further to define the precise conditions where and over what time period the pedo-transfer function is valid.
AcknowledgmentsThis research has been supported by the Czech Technical University in Prague (SGS10/OHK1/2T/11), Czech Science Grant Agency 205/09/0831, the Czech Ministry of Education, Czech Republic (CEZ MSM 6840770002) and the Czech Ministry of Environment (SP/2e7/229/07), USAID through an HED grant, LASPAU (Academic and Professional Programs for the Americas), Cornell University that provided matching funds, and an anonymous donor.
ReferencesAbbott, M.B., J.C. Bathurst, J.A. Cunge, P.E. O’Connell, and J. Rasmussen. 1986.
An introduction to the European system: Systeme hydrologique europeen (SHE). J. Hydrol. 87:61–77. doi:10.1016/0022-1694(86)90115-0
Arnold, J.G., R. Srinivasan, R.S. Muttiah, and J.R. Williams. 1998. Large area hydrologic modeling and assessment. Part I: Model development. Water Resour. Bull. 34:73–89. doi:10.1111/j.1752-1688.1998.tb05961.x
Bayabil, H.K., S.A. Tilahun, A.S. Collick, B. Yitaferu, and T.S. Steenhuis. 2010. Are runoff processes ecologically or topographically driven in the (sub) humid
Ethiopian highlands? The case of the Maybar watershed. Ecohydrology 3:457–466. doi:10.1002/eco.170
Beven, K.J. 1985. Distributed modelling. In: M.G. Anderson and T.P. Burt, editors, Hydrological forecasting. Wiley. New York, p. 405–435.
Beven, K.J. 2004a. Infiltration excess overland flow at the Horton Hydrological Laboratory (or not)? J. Hydrol. 293:219–234. doi:10.1016/j.jhy-drol.2004.02.001
Beven, K.J. 2004b. Robert Horton’s perceptual model of infiltration processes. Hydrol. Processes 18:3447–3460. doi:10.1002/hyp.5740
Beven, K.J. 2004c. Robert E. Horton and abrupt rises of ground water. Hydrol. Processes 18:3687–3696. doi:10.1002/hyp.5741
Beven, K. 2000. Uniqueness of place and process representations in hydrological modelling. Hydrol. Earth Syst. Sci. 4:203–213. doi:10.5194/hess-4-203-2000
Bonell, M. 1998. Selected challenges in runoff generation research in forests from the hillslope headwater drainage basin scale. J. Am. Water Resour. Assoc. 34:765–785. doi:10.1111/j.1752-1688.1998.tb01514.x
Buck, D.G., M. Brenner, D.A. Hodell, J.H. Curits, J.B. Martin, and M. Pagani. 2005. Physical and chemical properties of hypersaline Lago Enriquillo, Dominican Republic. Verh. Int. Ver. Theor. Angew. Limnol. 29:725–731.
Caballero, L.A. 2012. Hydrology, hydrochemistry and implications for water sup-ply of a cloud forest in Central America. Ph.D. diss., Department of Biological and Environmental Engineering, Cornell Univ., Ithaca NY.
Caballero, L.A., Z.M. Easton, B.K. Richards, and T.S. Steenhuis. 2013. Evaluating the bio-hydrological impact of a cloud forest in Central America using a semi-distributed water balance model. J. Hydrol. Hydromech. 61:9–20. doi:10.2478/jhh-2013-0003
Clapp, R.B., and G.M. Hornberger. 1978. Empirical equations for some soil hydraulic properties. Water Resour. Res. 14:601–604. doi:10.1029/WR014i004p00601
Dahlke, H.E., Z.M. Easton, S.W. Lyon, and T.S. Steenhuis. 2012. Dissecting the variable source area concept- Subsurface flow pathways and water mixing processes in a hillslope. J. Hydrol. 420–421:125–141. doi:10.1016/j.jhy-drol.2011.11.052
Easton, Z.M., D.R. Fuka, M.T. Walter, D.M. Cowan, E.M. Schneiderman, and T.S. Steenhuis. 2008. Re-conceptualizing the soil and water assessment tool (SWAT) model to predict runoff from variable source areas. J. Hydrol. 348:279–291. doi:10.1016/j.jhydrol.2007.10.008
Gabrecht, G. 1987. Hydrologic and hydraulic concepts in antiquity. Hydraulics and hydraulic research. In: G. Garbrecht, editor, An historical review. IAHR and Balkema, Rotterdam, The Netherlands. p. 1–22.
Gish, T.J., C.L. Walthall, C.S.T. Daughtry, and K.-J.S. Kung. 2005. Response using soil moisture and spatial yield patterns to identify subsurface flow pathways. J. Environ. Qual. 34:274–286. doi:10.2134/jeq2005.0274
Green, W.H., and G. Ampt. 1911. Studies of soil physics, part I, the flow of air and water through soils. J. Agric. Sci. 4:1–24. doi:10.1017/S0021859600001441
Hanson, D.L., T.S. Steenhuis, M.F. Walter, and J. Boll. 2004. Effects of soil deg-radation and management practices on the surface water dynamics in the Talgua River watershed in Honduras. Land Degradation Dev. 15:367–381. doi:10.1002/ldr.603
Hewlett, J.D., and A.R. Hibbert. 1967. Factors affecting the response of small watersheds to precipitation in humid areas. In W.E. Sopper and H.W. Lull, editors, Forest hydrology. Proceedings of the international symposium on forest hydrology. Penn State Univ., University Park, PA. p. 275–290.
Horton, R.E. 1941. An approach towards a physical interpretation of in-filtration capacity. Soil Sci. Soc. Am. Proc. 5:399–417. doi:10.2136/sssaj1941.036159950005000C0075x
Hrnčíř, M., M. Šanda, A. Kulasová, and M. Císlerová. 2010. Runoff formation in a small catchment at hillslope and catchment scales. Hydrol. Processes 24:2248–2256. doi:10.1002/hyp.7614
Jakeman, A.J., and G.M. Hornberger. 1993. How much complexity is war-ranted in a rainfall-runoff model? Water Resour. Res. 29:2637–2649. doi:10.1029/93WR00877
Johnson, M.G., and R.L. Beschta. 1978. Seasonal variation of infiltration ca-pacities of soils in western Oregon. USDA Forest Service Pacific Northwest Forest and Range Experiment Station Research Note PNW-373. USDA Forest Service, Portland, OR.
Kirchner, J.W. 2006. Getting the right answers for the right reasons: Linking measurements, analyses, and models to advance the science of hydrology. Water Resour. Res. 42:W03S04. doi:10.1029/2005WR004362
Kostiakov, A.N. 1932. On the dynamics of the coefficient of water-percolation in soils and on the necessity of studying it from a dynamic point of view for purposes of amelioration. Transactions of the 6th Congress of International Soil Science Society. Moscow. p. 17–21.
Kuo, W.-L., T.S. Steenhuis, C.E. McCulloch, C.L. Mohler, D.A. Weinstein, S.D. DeGloria, and D.P. Swaney. 1999. Effect of grid size on runoff and soil moisture for a variable-source-area hydrology model. Water Resour. Res. 35:3419–3428. doi:10.1029/1999WR900183
Kuichling, E. 1889. The relation between the rainfall and the discharge of sewers in populous districts. Trans. ASCE 20:1–56.
Lehmann, P., C. Hinz, G. McGrath, H.J. Tromp-van Meerveld, and J.J. McDonnell. 2007. Rainfall threshold for hillslope outflow: An emergent property of flow
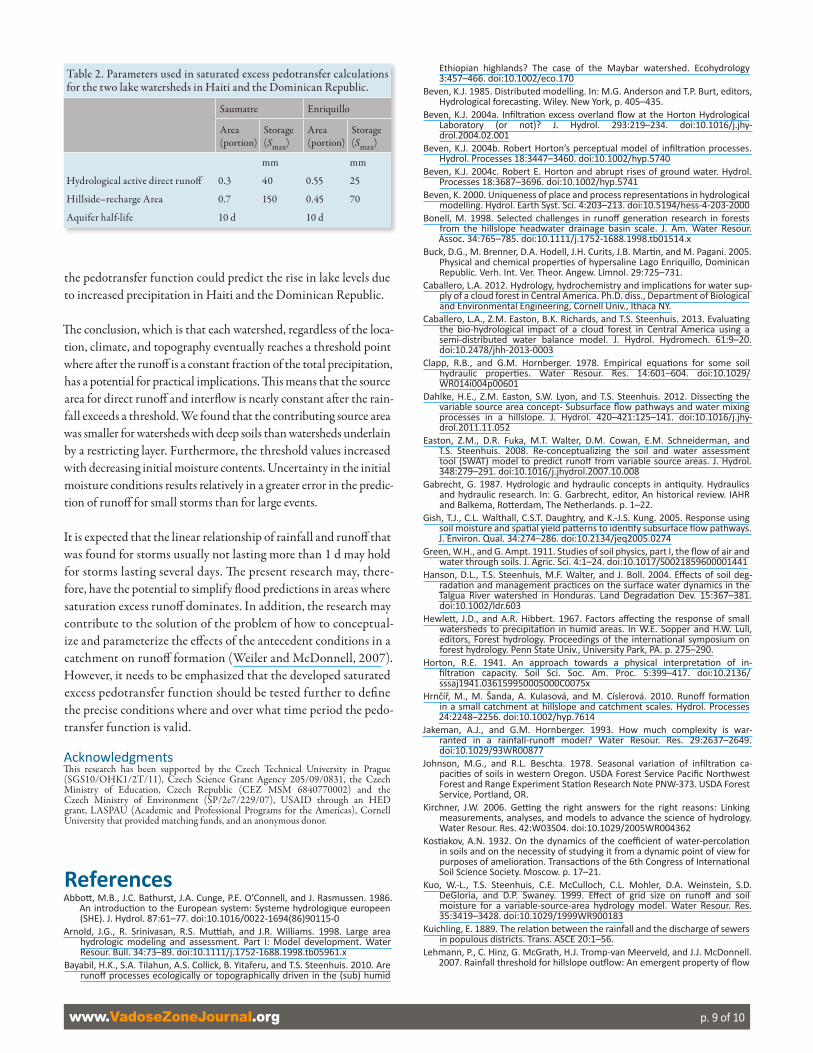
Table 2. Parameters used in saturated excess pedotransfer calculations for the two lake watersheds in Haiti and the Dominican Republic.
Saumatre Enriquillo
Area (portion)
Storage (Smax)
Area (portion)
Storage (Smax)
mm mm
Hydrological active direct runoff 0.3 40 0.55 25
Hillside–recharge Area 0.7 150 0.45 70
Aquifer half-life 10 d 10 d

www.VadoseZoneJournal.org p. 10 of 10
pathway connectivity. Hydrol. Earth Syst. Sci. 11:1047–1063. doi:10.5194/hess-11-1047-2007
Liu, B.M., A.S. Collick, G. Zeleke, E. Adgo, Z.M. Easton, and T.S. Steenhuis. 2008. Rainfall-discharge relationships for a monsoonal climate in the Ethiopian highlands. Hydrol. Processes 22:1059–1067. doi:10.1002/hyp.7022
McGrath, G.S., C. Hinz, and M. Sivapalan. 2007. Temporal dynamics of hydro-logical threshold events. Hydrol. Earth Syst. Sci. 11:923–938. doi:10.5194/hess-11-923-2007
McGuire, K.J., J.J. McDonnell, M. Weiler, C. Kendall, B.L. McGlynn, J.M. Welker, and J. Seibert. 2005. The role of topography on catchment-scale water resi-dence time. Water Resour. Res. 42:W05002. doi: 10.1029/2004WR003657
Mendoza, G., and T.S. Steenhuis. 2002. Determination of hydraulic behavior of hillsides with an hillslope infiltrometer. Soil Sci. Soc. Am. J. 66:1501–1504. doi:10.2136/sssaj2002.1501
Merwin, I.A., W.S. Stiles, and H.M. Van Es. 1994. Orchard groundcover manage-ment impact on soil physical properties. Soil Sci. Soc. Am. J. 119: 216–222
Naef, F., S. Scherrer, and M. Weiler. 2002. A process based assessment of the potential to reduce flood runoff by land use change. J. Hydrol. 267:74–79. doi:10.1016/S0022-1694(02)00141-5
Nieber, J.L. 2006. Lateral preferential flow through pathways formed by bio-logical and mechanical processes. Proceedings of the 1st International Conference Biohydrology 2006, Impact of biological factors on soil hydrol-ogy. http://www.ih.savba.sk/biohydrology2006/keynotelectures.htm (ac-cessed 21 Sept. 2013
Romero Luna, E.J., and D. Poteau. 2011. Water level fluctuations of Lake Enriquillo and Lake Saumatre in response to environmental changes. M.Eng., project, Cornell Univ., Ithaca, NY.
Šanda, M., and M. Císlerová. 2009. Transforming hydrographs in the hillslope sub-surface. J. Hydrol. Hydromech. 57:264–275. doi:10.2478/v10098-009-0023-z
Šanda, M., M. Hrnčíř, L. Novák, and M. Císlerová. 2006. Impact of the soil profile on rainfall-runoff process. J. Hydrol. Hydromech. 54:163–182.
Šanda, M., A. Kulasová, and M. Císlerová. 2009. Hydrological processes in the subsurface investigated by water isotopes and silica. Soil Water Res. 4:83–92.
Schneiderman, E.M., T.S. Steenhuis, D.J. Thongs, Z.M. Easton, M.S. Zion, G.F. Mendoza, M.T. Walter, and A.L. Neal. 2007. Incorporating variable source area hydrology into the curve number based generalized watershed loading function model. Hydrol. Processes 21:3420–3430. doi:10.1002/hyp.6556
Seibert, J. 2003. Reliability of model predictions outside calibration conditions. Nord. Hydrol. 34:477–492.
Spence, C. 2007. On the relation between dynamic storage and runoff: A discus-sion on thresholds, efficiency, and function. Water Resour. Res. 43:W12416. doi:10.1029/2006WR005645
Stomph, T.J., N. De Ridde, T.S. Steenhuis, and N.C. van de Giesen. 2002. Scale effects of Hortonian overland flow and rainfall runoff dynamics: Laboratory validation of a process based model. Earth Surf. Process. Landf. 27:847–855. doi:10.1002/esp.356
Steenhuis, T.S., and W.H. van der Molen. 1986. The Thornthwaite–Mather procedure as a simple engineering method to predict recharge. J. Hydrol. 84:221–229. doi:10.1016/0022-1694(86)90124-1
Steenhuis, T.S., A.S. Collick, Z.M. Easton, E.S. Leggesse, H.K. Bayabil, E.D. White, S.B. Awulachew, E. Adgo, and A.A. Ahmed. 2009. Predicting discharge and sediment for the Abay (Blue Nile) with a simple model. Hydrol. Processes 23:3728–3737. doi: 10.1002/hyp.7513
Steenhuis, T.S., M. Winchell, J. Rossing, J.A. Zollweg, and M.F. Walter. 1995. SCS runoff equation revisited for variable-source runoff areas. ASCE J. Irrig. Drain. 121:234–238. doi:10.1061/(ASCE)0733-9437(1995)121:3(234)
Tachecí, P. 2002. Hydrological regime of the small mountainous catchment and the assessment of the effects of the change of the vegetation cover. (in Czech). Ph.D. diss., Czech Technical Univ. in Prague, Prague, Czech Republic.
Tesař, M., M. Šír, J. Pražák, and L. Lichner. 2004. Instability driven flow and runoff formation in a small catchment. Geol. Acta 2:145–156.
Thornthwaite, C.W., and J.R. Mather. 1955. The water balance. Laboratory of Climatology, Publ. No. 8. Laboratory of Climatology, Centerton, NJ.
Tromp-van Meerveld, H.J., and J.J. McDonnell. 2006. Threshold relations in subsurface stormflow: 2. The fill and spill hypothesis. Water Resour. Res. 42:W02411. doi: 10.1029/2004WR003800
Wagener, T., M. Sivapalan, P.A. Troch, and R.A. Woods. 2007. Catchment clas-sification and hydrologic similarity. Georg. Compass 1: 901–931. doi: 10.1111/j.1749–8198.2007.00039.x
Weiler, M., and J.J. McDonnell. 2007. Conceptualizing lateral preferential flow networks and simulating the effects on gauged and ungauged hillslopes. Water Resour. Res. 43:W03403. doi:10.1029/2006WR004867
Weiler, M., and F. Naef. 2003. An experimental tracer study of the role of mac-ropores in infiltration in grassland soils. Hydrol. Processes 17:477–493. doi:10.1002/hyp.1136
Weyman, D.R. 1973. Measurements of the downslope flow of water in a soil. J. Hydrol. 20:267–288. doi:10.1016/0022-1694(73)90065-6
Whipkey, R.Z. 1966. Subsurface stormflow from forested slopes. Bull. Int. Assoc. Sci. Hydrol. 10:74–85.
Woodring, W.P., J.S. Brown, and W.S. Burbank. 1924. Geology of the Republic of Haiti. Dep. Publ. Works, Port-au-Prince, Haiti.
Zehe, E., and M. Sivapalan. 2009. Threshold behaviour in hydrological systems as (human) geo-ecosystems: Manifestations, controls, implications. Hydrol. Earth Syst. Sci. 13:1273–1292. doi:10.5194/hess-13-1273-2009
Zehe, E., H. Elsenbeer, F. Lindenmaier, K. Schulz, and G. Blöschl. 2007. Patterns of predictability in hydrological threshold systems. Water Resour. Res. 43:W07434. doi:10.1029/2006WR005589
Zhu, Q., H. Lin, and J. Doolittle. 2010. Repeated electromagnetic induction sur-veys for determining subsurface hydrologic dynamics in an agricultural land-scape. Soil Sci. Soc. Am. J. 74:1750–1762. doi:10.2136/sssaj2010.0055