beaufort watersheds restoration plan - north carolina
TRANSCRIPT
Beaufort Watersheds
Restoration Plan
2017
Davis Bay
Taylor Creek
Town Creek
1
Version June 2017
This watershed restoration plan was developed thanks to the Clean Water Act Section 205(j) Grant Program, administered by the North Carolina Division of Water Resources.
2
Contributing Partners
Town of Beaufort
Eastern Carolina Council
North Carolina Coastal Federation
Acknowledgements
Beaufort Stormwater Committee
N.C. DEQ Division of Energy, Mineral, and Land Resources
N.C. DEQ Division of Marine Fisheries
N.C. Department of Transportation
UNC Wilmington, Dept. of Environmental Studies
John Day Town of Beaufort
Kyle Garner Town of Beaufort
Mark Eakes Town of Beaufort
Wade Keeler Town of Beaufort
Patrick Flanagan Eastern Carolina Council
Whitney Jenkins N.C. Coastal Reserve & NERR
Lauren Kolodij N.C. Coastal Federation
Mariko Polk N.C. Coastal Federation
3
Table of Contents Acronyms and Definitions 94
Table of Contents 3
Guide to Nine Minimum Elements 5
Executive Summary 7
Introduction 8
1 Watershed Description 10
Physical and Natural Features 11
Land Use 15
2 Watershed Conditions 20
Water Quality 20
Source Assessment 32
3 Runoff Volume Reduction 44
Volume Reduction Methodology Error! Bookmark not defined.
Calculation Methodology 46
Runoff Calculations 47
4 Goals 55
Primary Goal 55
5 Management Strategies 62
Reduction Techniques 63
Present Strategies 67
Education and Outreach Activities 68
6 Implementation Schedule 77
Project Implementation Schedule 79
Milestones 82
Monitoring 83
Evaluation 87
Funding Cost and Technical Needs 89
Appendix A Additional Soil Information 100
Appendix B Water Quality Standards 108
Appendix C Shoreline Survey SOP 125

4
Appendix D Additional Potential Project Sites 129
Appendix E Potential Stormwater Incentive Strategies 144
Appendix F Green Street Stormwater Management Devices 165
183
5
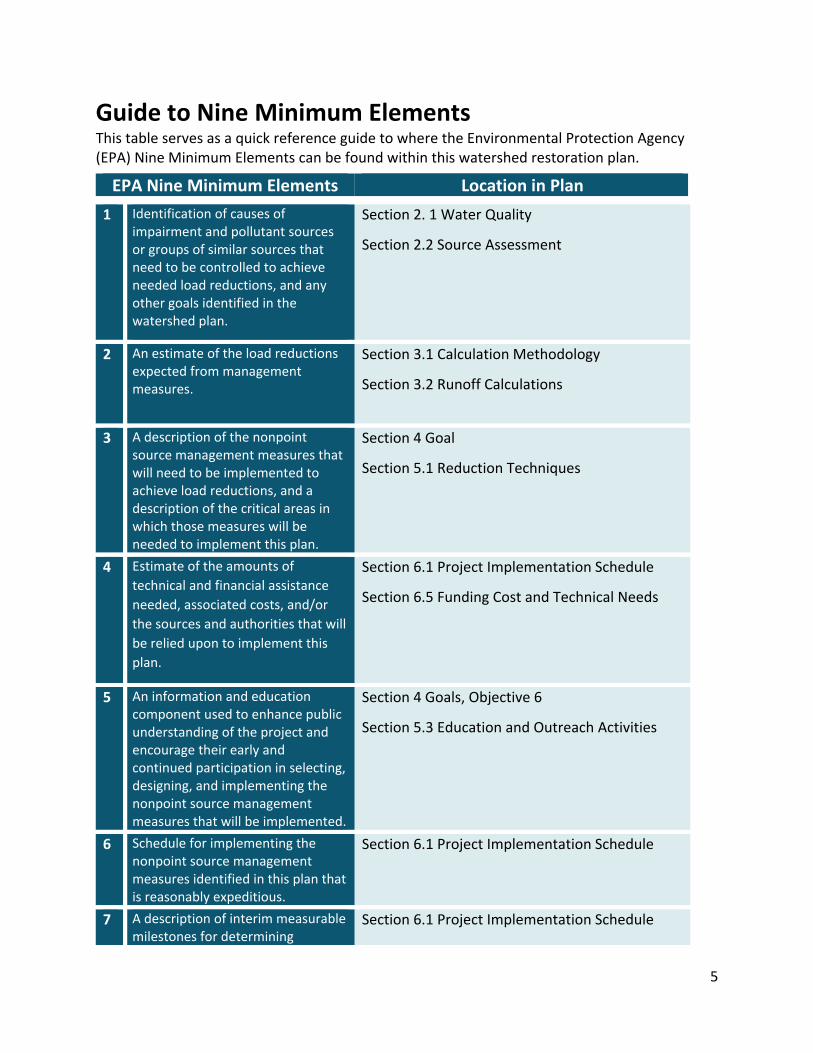
Guide to Nine Minimum Elements This table serves as a quick reference guide to where the Environmental Protection Agency (EPA) Nine Minimum Elements can be found within this watershed restoration plan.
EPA Nine Minimum Elements Location in Plan
1 Identification of causes of impairment and pollutant sources or groups of similar sources that need to be controlled to achieve needed load reductions, and any other goals identified in the watershed plan.
Section 2. 1 Water Quality
Section 2.2 Source Assessment
2 An estimate of the load reductions expected from management measures.
Section 3.1 Calculation Methodology
Section 3.2 Runoff Calculations
3 A description of the nonpoint source management measures that will need to be implemented to achieve load reductions, and a description of the critical areas in which those measures will be needed to implement this plan.
Section 4 Goal
Section 5.1 Reduction Techniques
4 Estimate of the amounts of
technical and financial assistance
needed, associated costs, and/or
the sources and authorities that will
be relied upon to implement this
plan.
Section 6.1 Project Implementation Schedule
Section 6.5 Funding Cost and Technical Needs
5 An information and education component used to enhance public understanding of the project and encourage their early and continued participation in selecting, designing, and implementing the nonpoint source management measures that will be implemented.
Section 4 Goals, Objective 6
Section 5.3 Education and Outreach Activities
6 Schedule for implementing the nonpoint source management measures identified in this plan that is reasonably expeditious.
Section 6.1 Project Implementation Schedule
7 A description of interim measurable milestones for determining
Section 6.1 Project Implementation Schedule
6
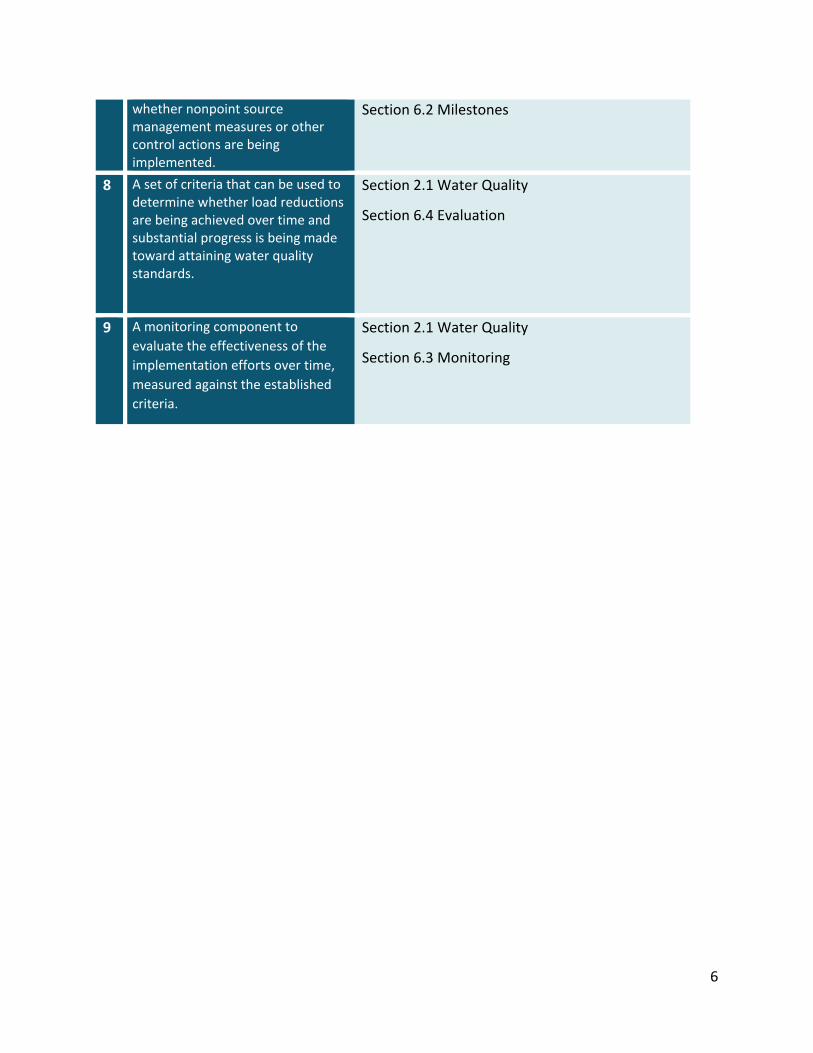
whether nonpoint source management measures or other control actions are being implemented.
Section 6.2 Milestones
8 A set of criteria that can be used to determine whether load reductions are being achieved over time and substantial progress is being made toward attaining water quality standards.
Section 2.1 Water Quality
Section 6.4 Evaluation
9 A monitoring component to
evaluate the effectiveness of the
implementation efforts over time,
measured against the established
criteria.
Section 2.1 Water Quality
Section 6.3 Monitoring
7
Executive Summary The Town of Beaufort has chosen to proactively develop a watershed restoration plan to
reduce stormwater runoff in the Beaufort Watersheds, which include Town Creek watershed,
Taylor Creek watershed, and Davis Bay watershed. This document provides an overview of the
past and present conditions of the Beaufort Watersheds and proposes methods and strategies
intended to reduce the volume of stormwater runoff to improve water quality in the
watersheds. Mimicking natural drainage processes protects life and properties from flooding,
improves the aesthetics of urban areas and maintains the water quantity and quality
requirements of receiving water bodies. This plan combines low-cost, high-yield strategies such
as community outreach initiatives and lot level retrofit projects aimed at reducing the impact of
impervious surface by mimicking natural hydrology to reduce flooding and protect water
quality. The Beaufort Watershed Restoration Plan emphasizes the application of the
Environmental Protection Agency (EPA) Nine Minimum Elements, the North Carolina
Department of Environmental Quality (DEQ) Section 319 office guidelines, and practiced coastal
watershed restoration methods developed by the plan’s partners. This plan is the result of
nearly two-year long process lead by citizens of Beaufort and the Town of Beaufort, Eastern
Carolina Council, and North Carolina Coastal Federation.
The Town is looking to reduce instances of flooding and the amount of stormwater runoff that
flows into the Beaufort Watersheds, since this is the conveyance medium in which bacteria and
other harmful constituents find their way into waterbodies. This restoration plan will be the
beginning of a multi-year process to implement and maintain, manage, and mitigate
stormwater runoff issues and provide best management practices within the Town. This
watershed restoration plan focuses on the importance of disconnecting impervious surfaces to
provide precipitation the opportunity to infiltrate into the ground and the use of best
management practices to treat, hold, and reduce stormwater runoff. There are multiple areas
of concern that offer opportunities to drastically reduce the amount of stormwater runoff and
instances of flooding in various areas throughout the watersheds. The Beaufort Watershed
Restoration Plan includes all nine elements of a watershed management plan as required by the
EPA to qualify to be eligible to apply for federal 319 grant funding. Additionally, the information
provided in this plan enables the Town and its partners to easily source the plan for information
necessary to apply for other state and national grant opportunities.
8
Introduction This watershed restoration plan provides a comprehensive management framework to address
water quality impairments in Town Creek, Taylor Creek, and Davis Bay (encompassing Turner
Creek and Gibbs Creek) watersheds on the southern end of the Beaufort peninsula,
encompassing much of the Town of Beaufort, North Carolina in Carteret County. Combined,
these watersheds receive much of the town’s stormwater runoff, contributing to bacteriological
impairments due to increased volumes of polluted stormwater runoff entering the surrounding
waters. By reducing stormwater runoff volume the instances, extent, and length of time
flooding occurs can also be reduced. The focus of this plan is to restore or mimic the natural,
pre-development hydrology of the watersheds prior to water quality impairment. Mimicking
natural drainage processes protects life and properties from flooding, improves the aesthetics
of urban areas and maintains the water quantity and quality requirements of receiving water
bodies.
Stormwater runoff is the primary contributing factor to the degradation of water quality of the
Beaufort Watersheds. Increased development of the Beaufort Watersheds has altered the
natural landscape, flow patterns, and infiltration rates. These alterations to surface hydrology
have reduced the amount of natural cover, while increasing the amount of impervious surfaces.
Instead of rainfall being infiltrated into the ground and vegetation, stormwater runoff flows
over impervious surfaces and into waterbodies with limited opportunity to naturally absorb
into the environment thus increasing the volume of water being transported and aggravating
instances of localized flooding. As water travels across hard, impervious surfaces, bacteria and
other pollutants are collected and transported through stormwater connected conveyance
systems, such as curbs, pipes, and ditches directly to our waterways. Reducing stormwater
runoff volumes impacting stormwater conveyance systems can reduce the instances, extent,
and length of time flooding occurs. Reducing stormwater runoff can also reduce bacteria and
other pollutants, such as total suspended solids, nutrient, and harmful constituents (oils, heavy
metals, chemicals, etc.). This plan seeks to address:
1. Restoring and maintaining the water quality of three Beaufort Watersheds;
2. Reduce instances of localized flooding to improve safety and protect property;
3. Prioritize cost effective Low Impact Development and stormwater retrofit techniques to
address stormwater management.
The Beaufort Watersheds have tremendous recreational and tourism value. Significant
recreational and habitat areas surround the watersheds, including the Rachel Carson Reserve
and nearby Radio Island. The Rachel Carson Reserve is managed jointly by NOAA and the NC
Department of Environmental Quality through the North Carolina Coastal Reserve and National
Estuarine Research Reserve, it is critical habitat for a multitude of species and is a heavily
visited recreational area. Town Creek borders the Town of Beaufort to the west and is
permanently closed and it abuts the SA waters of the Newport River. In recent years, the
increase in stormwater runoff following large rain events has resulted in an increase in the
9
frequency of water quality impairments, indicating that stormwater runoff is transporting
impairments downstream.
Improvements in water quality can be achieved by using stormwater reduction techniques that
reduce the volume of stormwater runoff thereby effectively treating stormwater runoff from
existing and new developments. This plan combines low-cost, high-yield strategies such as
community outreach initiatives and lot level retrofit projects aimed at reducing the impact of
impervious surface by mimicking natural hydrology to reduce flooding, protect water quality,
and provide the community with clean, usable waters. By focusing on techniques that reduce,
slow, and treat stormwater runoff, the plan can mimic the natural hydrology of the area before
urban expansion and development, reducing water quality impairments and localized flooding.
This document provides a framework for the restoration of Beaufort watershed water quality,
by reducing the volume of stormwater runoff.
10
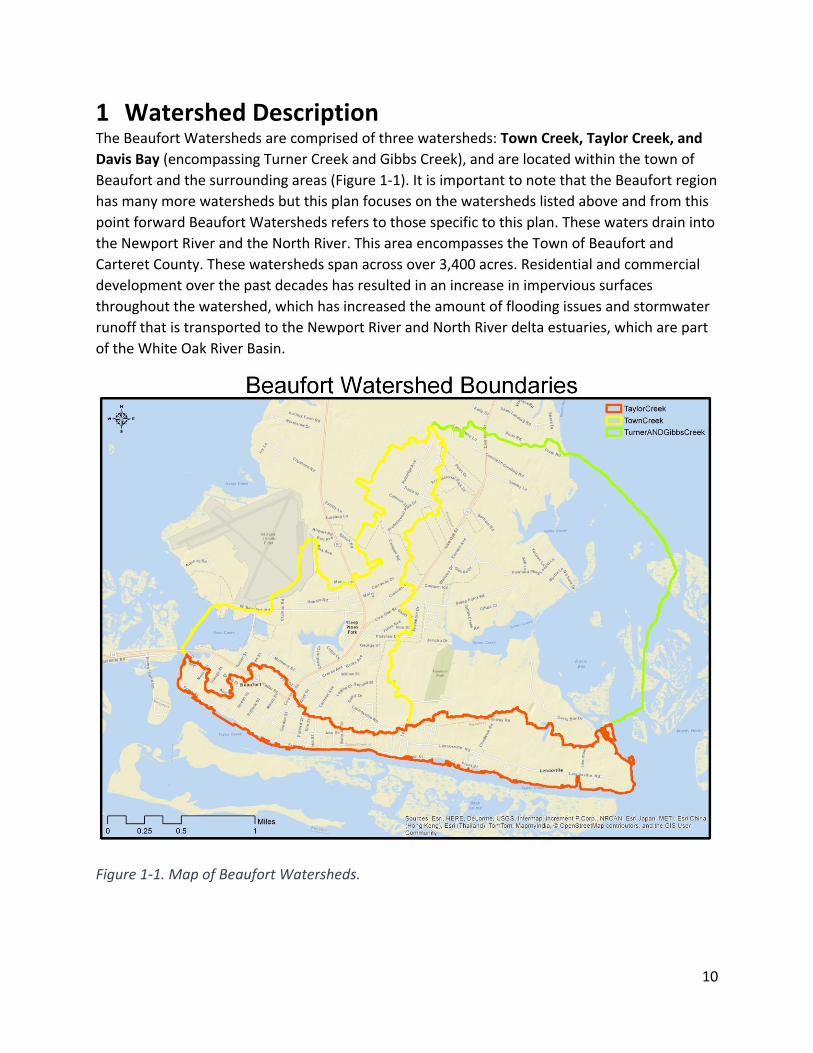
1 Watershed Description The Beaufort Watersheds are comprised of three watersheds: Town Creek, Taylor Creek, and
Davis Bay (encompassing Turner Creek and Gibbs Creek), and are located within the town of
Beaufort and the surrounding areas (Figure 1-1). It is important to note that the Beaufort region
has many more watersheds but this plan focuses on the watersheds listed above and from this
point forward Beaufort Watersheds refers to those specific to this plan. These waters drain into
the Newport River and the North River. This area encompasses the Town of Beaufort and
Carteret County. These watersheds span across over 3,400 acres. Residential and commercial
development over the past decades has resulted in an increase in impervious surfaces
throughout the watershed, which has increased the amount of flooding issues and stormwater
runoff that is transported to the Newport River and North River delta estuaries, which are part
of the White Oak River Basin.
Figure 1-1. Map of Beaufort Watersheds.
11
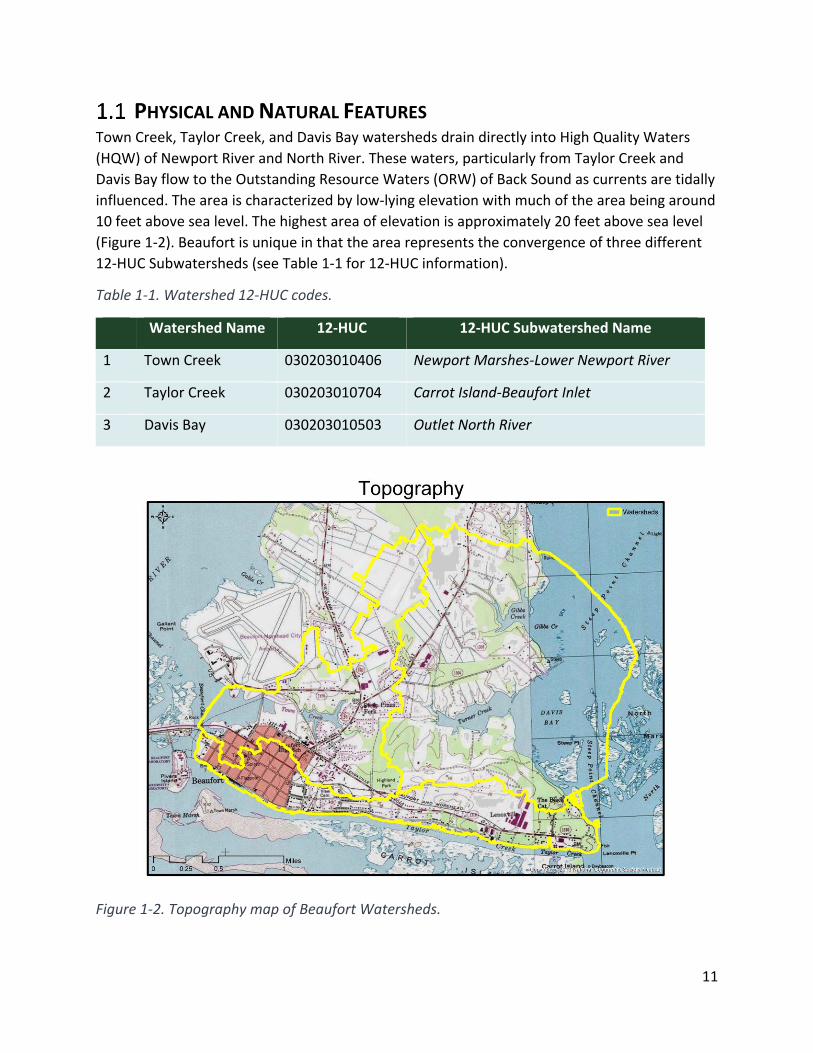
PHYSICAL AND NATURAL FEATURES Town Creek, Taylor Creek, and Davis Bay watersheds drain directly into High Quality Waters
(HQW) of Newport River and North River. These waters, particularly from Taylor Creek and
Davis Bay flow to the Outstanding Resource Waters (ORW) of Back Sound as currents are tidally
influenced. The area is characterized by low-lying elevation with much of the area being around
10 feet above sea level. The highest area of elevation is approximately 20 feet above sea level
(Figure 1-2). Beaufort is unique in that the area represents the convergence of three different
12-HUC Subwatersheds (see Table 1-1 for 12-HUC information).
Table 1-1. Watershed 12-HUC codes.
Watershed Name 12-HUC 12-HUC Subwatershed Name
1 Town Creek 030203010406 Newport Marshes-Lower Newport River
2 Taylor Creek 030203010704 Carrot Island-Beaufort Inlet
3 Davis Bay 030203010503 Outlet North River
Figure 1-2. Topography map of Beaufort Watersheds.
12
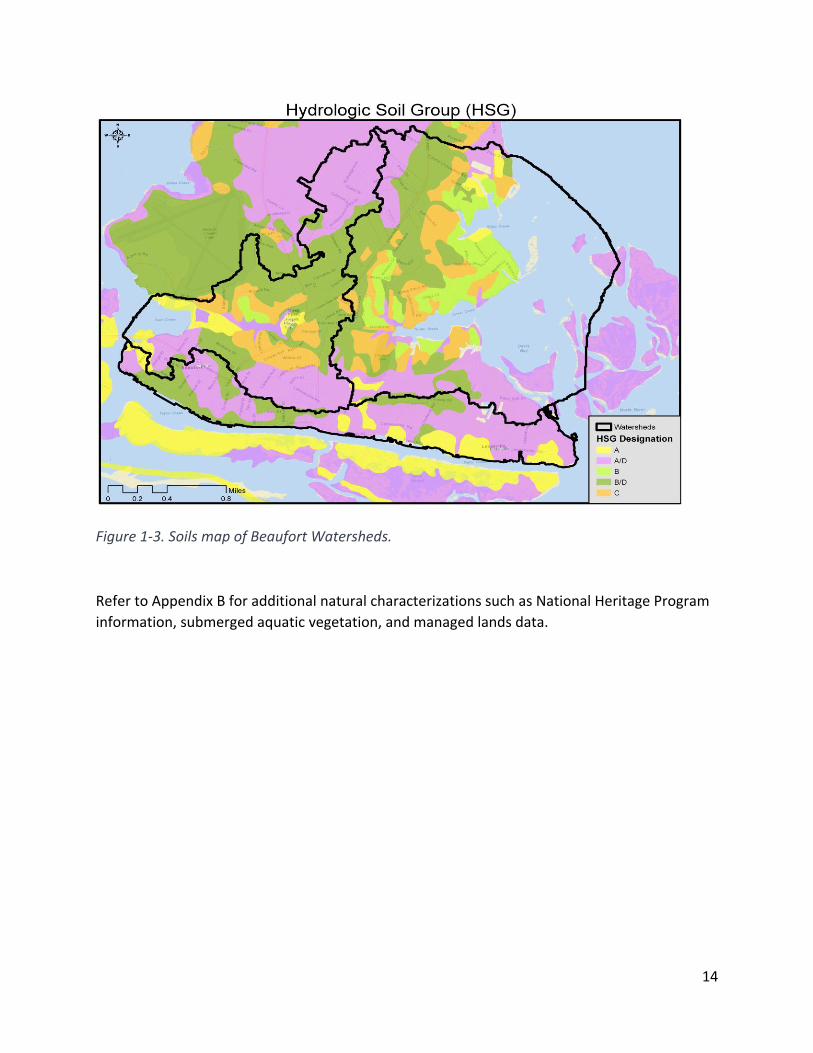
Soils Beaufort Watersheds are predominated by Group A/D and Group B/D hydrologic soil per the
United States Department of Agriculture Natural Resource Conservation Service (NRCS) data
collected from Web Soil Survey (Figure 1-3). Soil Group A tends to occur near the mouth of
Town Creek and along the eastward half of the Taylor Creek watershed. Soil Groups B and C are
prevalent closest to the creeks within Davis Bay watershed.
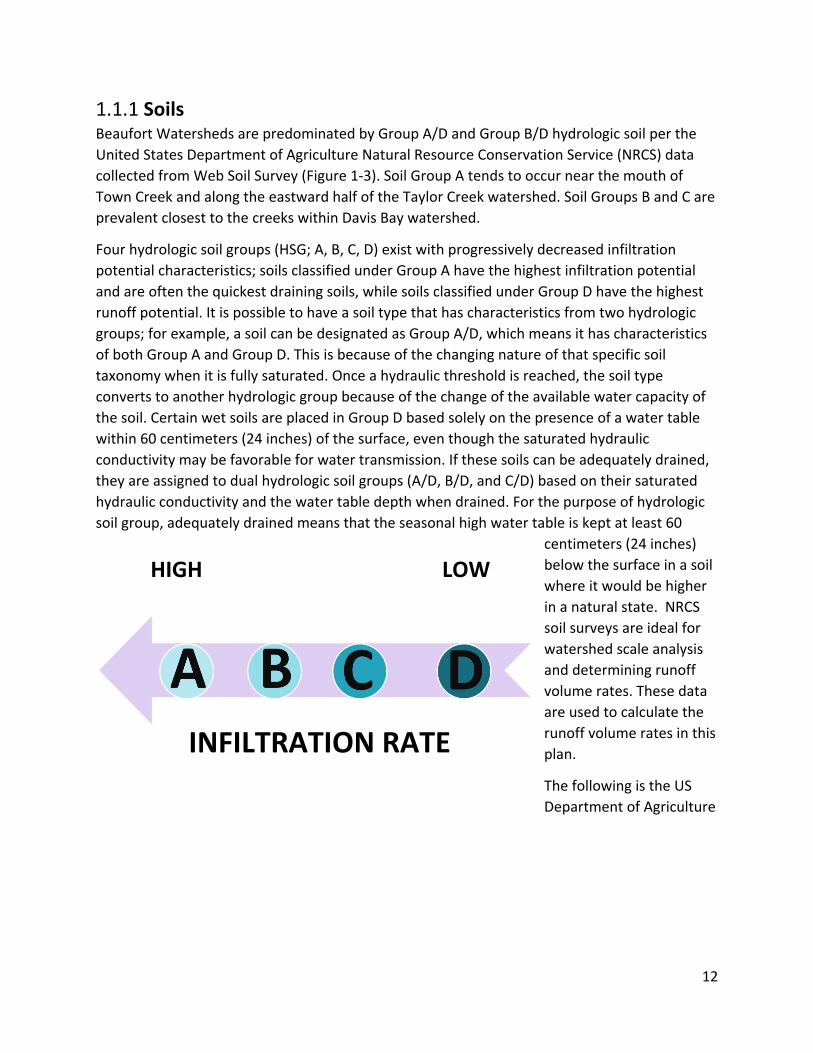
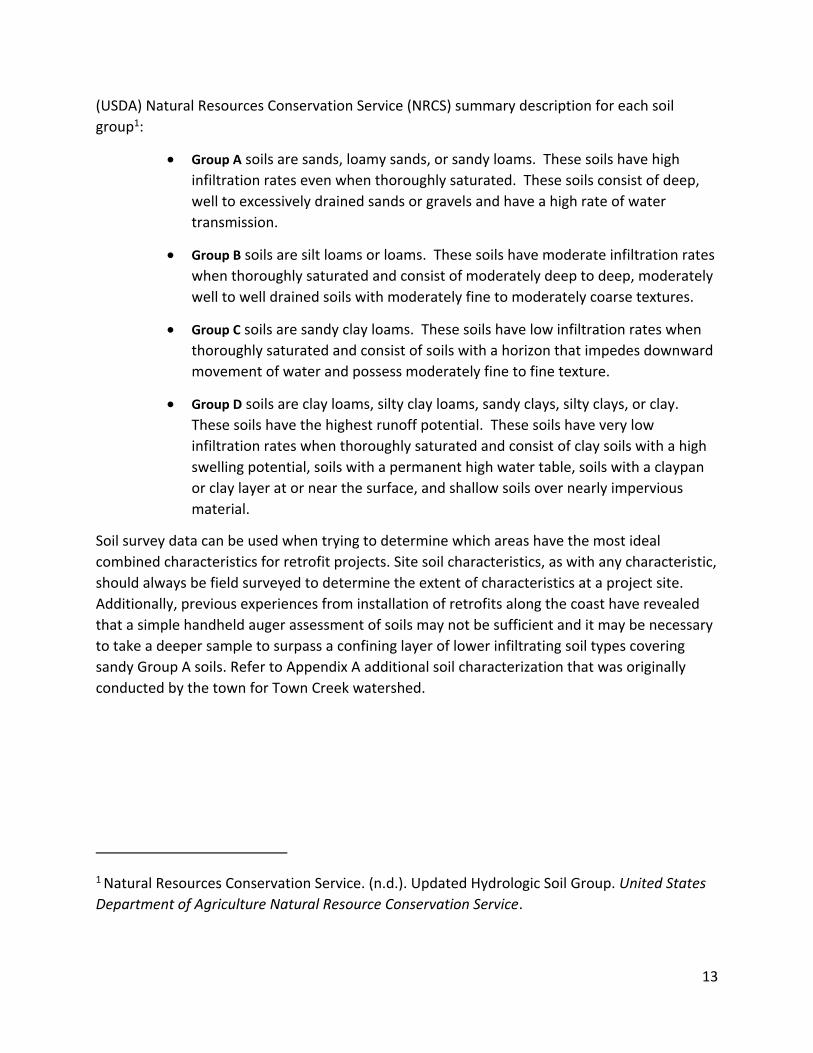
Four hydrologic soil groups (HSG; A, B, C, D) exist with progressively decreased infiltration
potential characteristics; soils classified under Group A have the highest infiltration potential
and are often the quickest draining soils, while soils classified under Group D have the highest
runoff potential. It is possible to have a soil type that has characteristics from two hydrologic
groups; for example, a soil can be designated as Group A/D, which means it has characteristics
of both Group A and Group D. This is because of the changing nature of that specific soil
taxonomy when it is fully saturated. Once a hydraulic threshold is reached, the soil type
converts to another hydrologic group because of the change of the available water capacity of
the soil. Certain wet soils are placed in Group D based solely on the presence of a water table
within 60 centimeters (24 inches) of the surface, even though the saturated hydraulic
conductivity may be favorable for water transmission. If these soils can be adequately drained,
they are assigned to dual hydrologic soil groups (A/D, B/D, and C/D) based on their saturated
hydraulic conductivity and the water table depth when drained. For the purpose of hydrologic
soil group, adequately drained means that the seasonal high water table is kept at least 60
centimeters (24 inches)
below the surface in a soil
where it would be higher
in a natural state. NRCS
soil surveys are ideal for
watershed scale analysis
and determining runoff
volume rates. These data
are used to calculate the
runoff volume rates in this
plan.
The following is the US
Department of Agriculture
HIGH LOW
INFILTRATION RATE
13
(USDA) Natural Resources Conservation Service (NRCS) summary description for each soil
group1:
• Group A soils are sands, loamy sands, or sandy loams. These soils have high
infiltration rates even when thoroughly saturated. These soils consist of deep,
well to excessively drained sands or gravels and have a high rate of water
transmission.
• Group B soils are silt loams or loams. These soils have moderate infiltration rates
when thoroughly saturated and consist of moderately deep to deep, moderately
well to well drained soils with moderately fine to moderately coarse textures.
• Group C soils are sandy clay loams. These soils have low infiltration rates when
thoroughly saturated and consist of soils with a horizon that impedes downward
movement of water and possess moderately fine to fine texture.
• Group D soils are clay loams, silty clay loams, sandy clays, silty clays, or clay.
These soils have the highest runoff potential. These soils have very low
infiltration rates when thoroughly saturated and consist of clay soils with a high
swelling potential, soils with a permanent high water table, soils with a claypan
or clay layer at or near the surface, and shallow soils over nearly impervious
material.
Soil survey data can be used when trying to determine which areas have the most ideal
combined characteristics for retrofit projects. Site soil characteristics, as with any characteristic,
should always be field surveyed to determine the extent of characteristics at a project site.
Additionally, previous experiences from installation of retrofits along the coast have revealed
that a simple handheld auger assessment of soils may not be sufficient and it may be necessary
to take a deeper sample to surpass a confining layer of lower infiltrating soil types covering
sandy Group A soils. Refer to Appendix A additional soil characterization that was originally
conducted by the town for Town Creek watershed.
1 Natural Resources Conservation Service. (n.d.). Updated Hydrologic Soil Group. United States
Department of Agriculture Natural Resource Conservation Service.
14
Figure 1-3. Soils map of Beaufort Watersheds.
Refer to Appendix B for additional natural characterizations such as National Heritage Program
information, submerged aquatic vegetation, and managed lands data.
15
LAND USE The Beaufort Watersheds encompass parts of the following municipalities:
• Town of Beaufort
• Carteret County
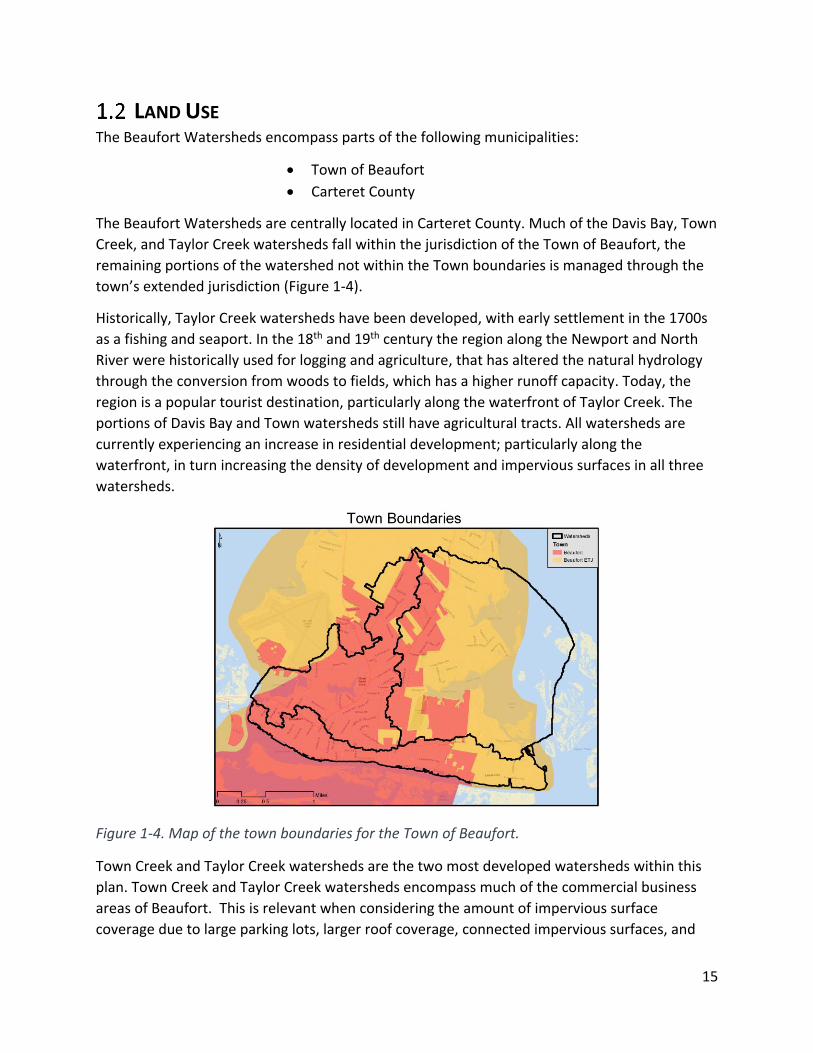
The Beaufort Watersheds are centrally located in Carteret County. Much of the Davis Bay, Town
Creek, and Taylor Creek watersheds fall within the jurisdiction of the Town of Beaufort, the
remaining portions of the watershed not within the Town boundaries is managed through the
town’s extended jurisdiction (Figure 1-4).
Historically, Taylor Creek watersheds have been developed, with early settlement in the 1700s
as a fishing and seaport. In the 18th and 19th century the region along the Newport and North
River were historically used for logging and agriculture, that has altered the natural hydrology
through the conversion from woods to fields, which has a higher runoff capacity. Today, the
region is a popular tourist destination, particularly along the waterfront of Taylor Creek. The
portions of Davis Bay and Town watersheds still have agricultural tracts. All watersheds are
currently experiencing an increase in residential development; particularly along the
waterfront, in turn increasing the density of development and impervious surfaces in all three
watersheds.
Figure 1-4. Map of the town boundaries for the Town of Beaufort.
Town Creek and Taylor Creek watersheds are the two most developed watersheds within this
plan. Town Creek and Taylor Creek watersheds encompass much of the commercial business
areas of Beaufort. This is relevant when considering the amount of impervious surface
coverage due to large parking lots, larger roof coverage, connected impervious surfaces, and
16
often reduced vegetated coverage. There are three marinas within the watersheds, this is
important to note as shellfishing is prohibited near marinas: Town Creek Marina in the Town
Creek watershed; Beaufort Docks and the Boat house at Front Street Village Marina in the
Taylor Creek watershed. There are multiple residential docks, multi-boat docks and boat ramps.
A unique feature of the Taylor Creek waterfront is that many residences have bulkheads,
making much of Taylor Creek’s shoreline hardened. Shorelines that are hardened often
experience a loss of natural vegetated coverage and benefits that would be provided by
nearshore, upland and riparian, and intertidal habitats. Town Creek and Davis Bay watersheds
have less shoreline hardening. Some tracks of land have been logged in the last two decades
within the Davis Bay watershed, which alters the vegetative coverage and, in turn, the runoff
curve numbers for this the watershed.
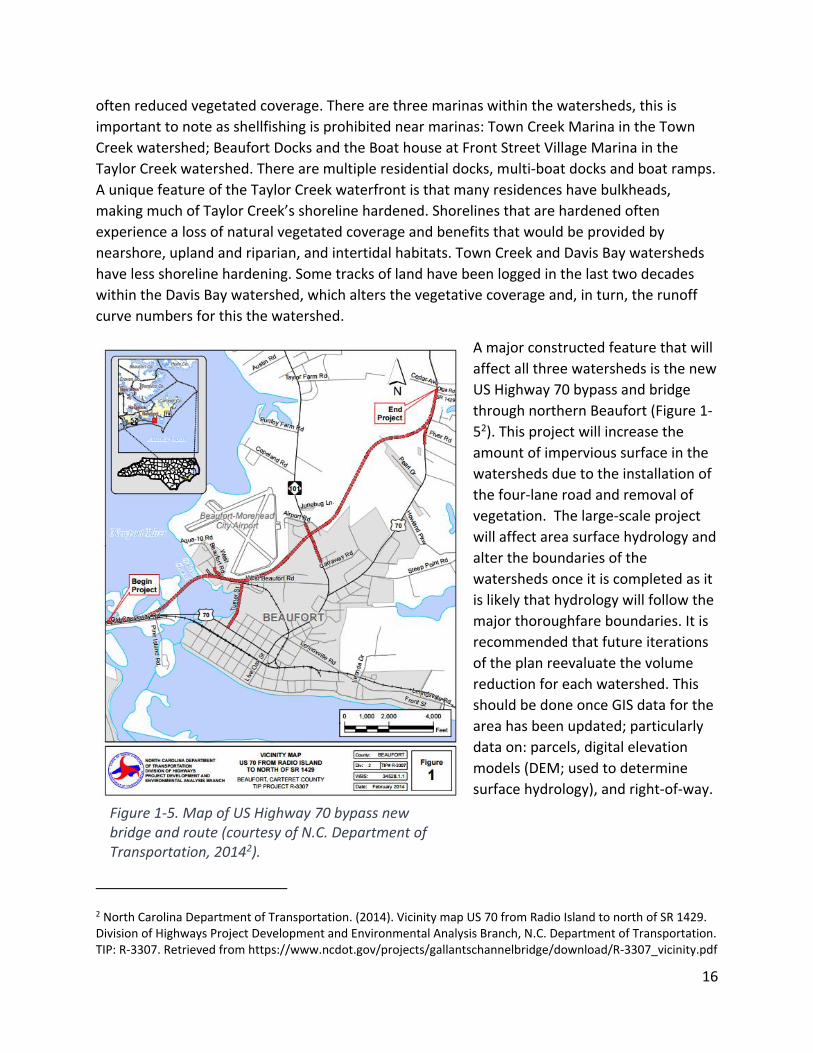
A major constructed feature that will
affect all three watersheds is the new
US Highway 70 bypass and bridge
through northern Beaufort (Figure 1-
52). This project will increase the
amount of impervious surface in the
watersheds due to the installation of
the four-lane road and removal of
vegetation. The large-scale project
will affect area surface hydrology and
alter the boundaries of the
watersheds once it is completed as it
is likely that hydrology will follow the
major thoroughfare boundaries. It is
recommended that future iterations
of the plan reevaluate the volume
reduction for each watershed. This
should be done once GIS data for the
area has been updated; particularly
data on: parcels, digital elevation
models (DEM; used to determine
surface hydrology), and right-of-way.
2 North Carolina Department of Transportation. (2014). Vicinity map US 70 from Radio Island to north of SR 1429. Division of Highways Project Development and Environmental Analysis Branch, N.C. Department of Transportation. TIP: R-3307. Retrieved from https://www.ncdot.gov/projects/gallantschannelbridge/download/R-3307_vicinity.pdf
Figure 1-5. Map of US Highway 70 bypass new bridge and route (courtesy of N.C. Department of Transportation, 20142).
17
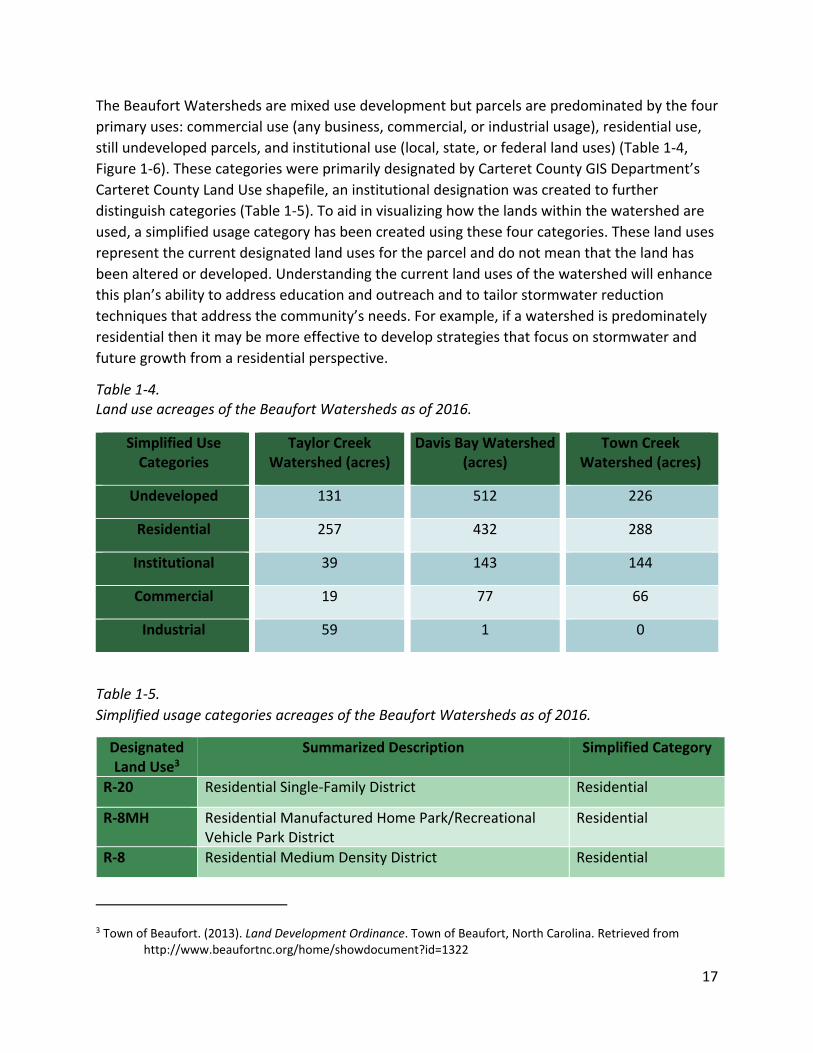
The Beaufort Watersheds are mixed use development but parcels are predominated by the four
primary uses: commercial use (any business, commercial, or industrial usage), residential use,
still undeveloped parcels, and institutional use (local, state, or federal land uses) (Table 1-4,
Figure 1-6). These categories were primarily designated by Carteret County GIS Department’s
Carteret County Land Use shapefile, an institutional designation was created to further
distinguish categories (Table 1-5). To aid in visualizing how the lands within the watershed are
used, a simplified usage category has been created using these four categories. These land uses
represent the current designated land uses for the parcel and do not mean that the land has
been altered or developed. Understanding the current land uses of the watershed will enhance
this plan’s ability to address education and outreach and to tailor stormwater reduction
techniques that address the community’s needs. For example, if a watershed is predominately
residential then it may be more effective to develop strategies that focus on stormwater and
future growth from a residential perspective.
Table 1-4. Land use acreages of the Beaufort Watersheds as of 2016.
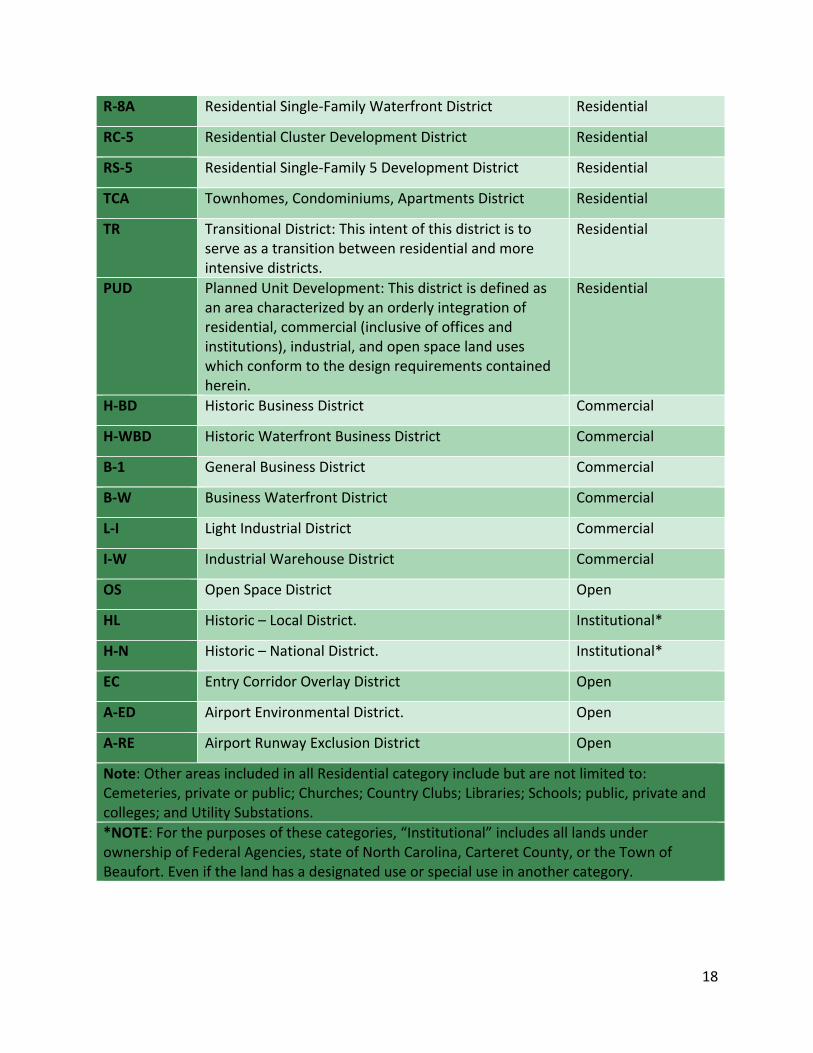
Table 1-5.
Simplified usage categories acreages of the Beaufort Watersheds as of 2016.
Designated Land Use3
Summarized Description Simplified Category
R-20 Residential Single-Family District Residential
R-8MH Residential Manufactured Home Park/Recreational Vehicle Park District
Residential
R-8 Residential Medium Density District Residential
3 Town of Beaufort. (2013). Land Development Ordinance. Town of Beaufort, North Carolina. Retrieved from http://www.beaufortnc.org/home/showdocument?id=1322
Simplified Use Categories
Taylor Creek Watershed (acres)
Davis Bay Watershed (acres)
Town Creek Watershed (acres)
Undeveloped 131 512 226
Residential 257 432 288
Institutional 39 143 144
Commercial 19 77 66
Industrial 59 1 0
18
R-8A Residential Single-Family Waterfront District Residential
RC-5 Residential Cluster Development District Residential
RS-5 Residential Single-Family 5 Development District Residential
TCA Townhomes, Condominiums, Apartments District Residential
TR Transitional District: This intent of this district is to serve as a transition between residential and more intensive districts.
Residential
PUD Planned Unit Development: This district is defined as an area characterized by an orderly integration of residential, commercial (inclusive of offices and institutions), industrial, and open space land uses which conform to the design requirements contained herein.
Residential
H-BD Historic Business District Commercial
H-WBD Historic Waterfront Business District Commercial
B-1 General Business District Commercial
B-W Business Waterfront District Commercial
L-I Light Industrial District Commercial
I-W Industrial Warehouse District Commercial
OS Open Space District Open
HL Historic – Local District. Institutional*
H-N Historic – National District. Institutional*
EC Entry Corridor Overlay District Open
A-ED Airport Environmental District. Open
A-RE Airport Runway Exclusion District Open
Note: Other areas included in all Residential category include but are not limited to: Cemeteries, private or public; Churches; Country Clubs; Libraries; Schools; public, private and colleges; and Utility Substations.
*NOTE: For the purposes of these categories, “Institutional” includes all lands under ownership of Federal Agencies, state of North Carolina, Carteret County, or the Town of Beaufort. Even if the land has a designated use or special use in another category.
19
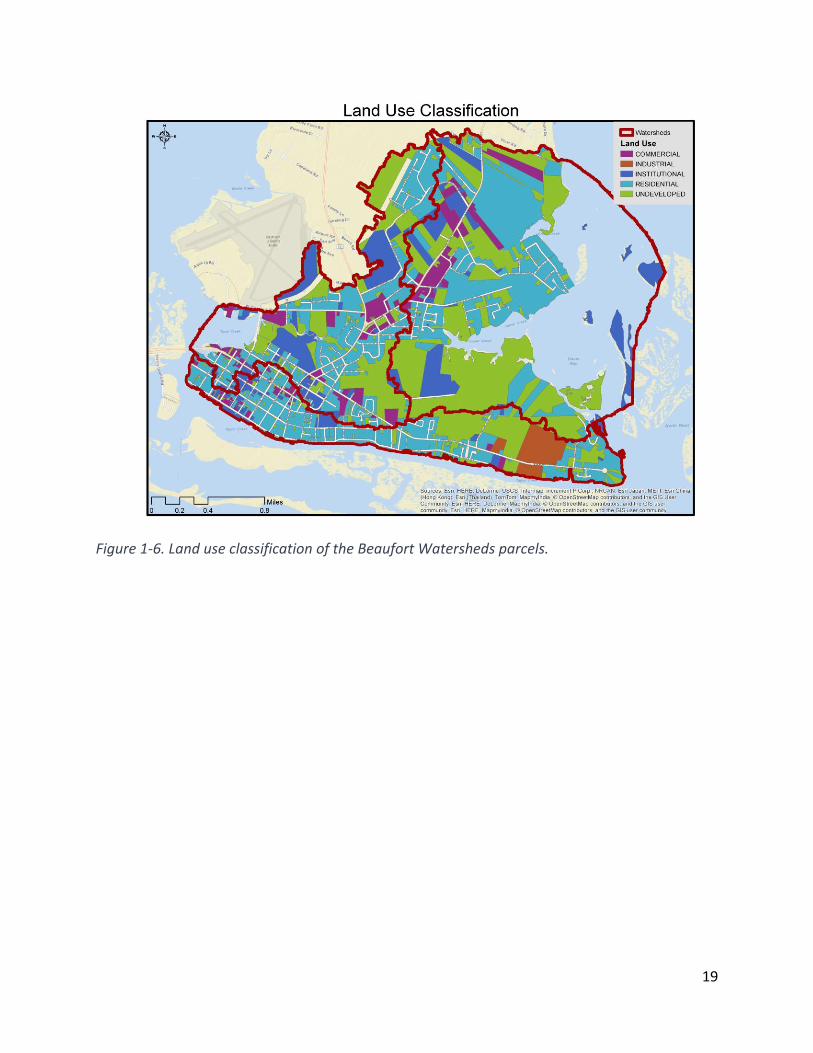
Figure 1-6. Land use classification of the Beaufort Watersheds parcels.
20
2 Watershed Conditions The Town of Beaufort and its partners have chosen to proactively develop a plan to restore the water quality in the Beaufort Watersheds by reducing the volume of stormwater runoff transporting pollutants to waterways. Previous projects, such as the Bradley and Hewletts Creek, White Oak River and Lockwoods Folly River Restoration Plans, utilized stormwater runoff reduction methodology. The stormwater runoff reduction methodology aims to mimic or restore natural hydrology, which gradually allows for the improvement of water quality by reducing the volume of stormwater runoff. This methodology can be applied by disconnecting connected stormwater conveyance systems and creating pathways that runoff can permeate into the ground. By reducing stormwater runoff we can reduce the volume of stormwater entering stormwater conveyance systems thus reducing the instances, extent, and length of time flooding occurs and reduce bacteria and other pollutants.
WATER QUALITY North Carolina has various methods to measures of water quality. This plan uses two: the
state’s water classification system, which is reported on the303(d) list, and swimming usage tier
scale system (Figure 2-1; refer to Appendix C for detailed guide of water quality classification).
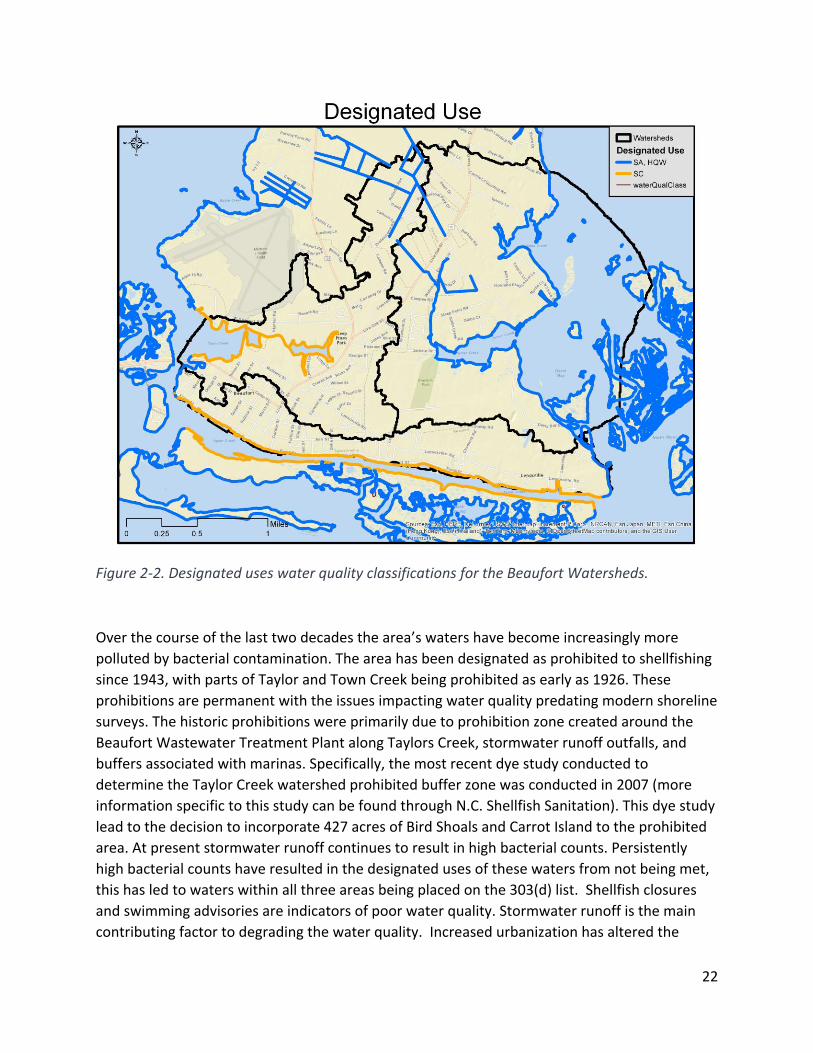
There are two distinct designated uses set by N.C. Department of Environmental Quality in the
Beaufort Watersheds: Class SA and Class SC (Figure 2-2). The waters of Davis Bay watershed are
designated as Class SA waters, and should be able to support direct contact recreation and
commercial shellfishing uses. Taylor and Town Creek watershed are designated as Class SC,
except for the most easterly and westerly portions of Taylor Creek watershed. Class SC waters
should be able to support secondary recreation activities such as fishing, boating, and other
activities that involve minimal skin contact; fish and non-commercial consumption; aquatic life
propagation and survival and wildlife. Portions of Town and Taylor Creek are within proximity
to marinas, which necessitate a buffer and will always be prohibited for shellfishing within the
marina buffers.
The tier scale effects the prioritization of sampling and the minimum water quality in swimming
waters with Tier I being the highest priority and are locations that are used daily, Tier II are not
used as heavily and see the most use on the weekend, and Tier III sites are used less frequently
(refer to Figure 2-1). These Tiers coincide with sampling requirements and maximum
observation of bacteria. There are four swimming water quality monitoring stations within the
boundaries of the watershed (three are Tier III, one is Tier I).
21
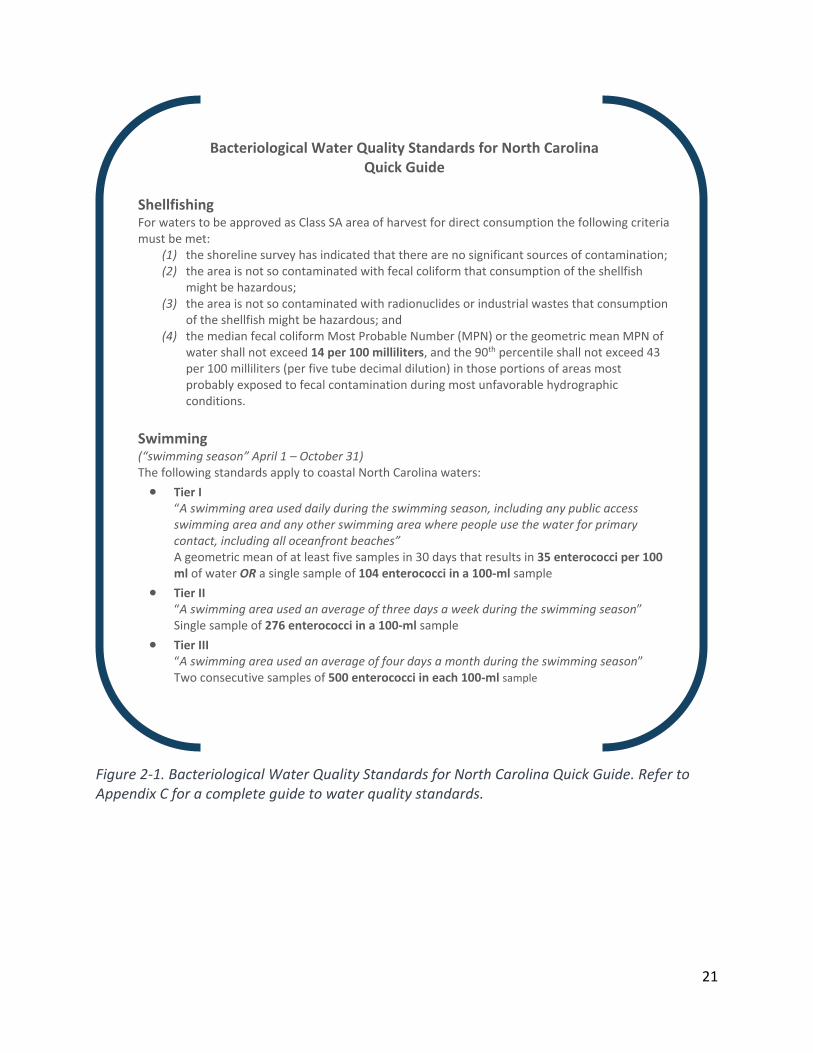
Figure 2-1. Bacteriological Water Quality Standards for North Carolina Quick Guide. Refer to Appendix C for a complete guide to water quality standards.
Bacteriological Water Quality Standards for North Carolina Quick Guide
Shellfishing For waters to be approved as Class SA area of harvest for direct consumption the following criteria must be met:
(1) the shoreline survey has indicated that there are no significant sources of contamination; (2) the area is not so contaminated with fecal coliform that consumption of the shellfish
might be hazardous; (3) the area is not so contaminated with radionuclides or industrial wastes that consumption
of the shellfish might be hazardous; and (4) the median fecal coliform Most Probable Number (MPN) or the geometric mean MPN of
water shall not exceed 14 per 100 milliliters, and the 90th percentile shall not exceed 43 per 100 milliliters (per five tube decimal dilution) in those portions of areas most probably exposed to fecal contamination during most unfavorable hydrographic conditions.
Swimming
(“swimming season” April 1 – October 31) The following standards apply to coastal North Carolina waters: • Tier I
“A swimming area used daily during the swimming season, including any public access swimming area and any other swimming area where people use the water for primary contact, including all oceanfront beaches” A geometric mean of at least five samples in 30 days that results in 35 enterococci per 100 ml of water OR a single sample of 104 enterococci in a 100-ml sample
• Tier II “A swimming area used an average of three days a week during the swimming season” Single sample of 276 enterococci in a 100-ml sample
• Tier III “A swimming area used an average of four days a month during the swimming season” Two consecutive samples of 500 enterococci in each 100-ml sample
22
Figure 2-2. Designated uses water quality classifications for the Beaufort Watersheds.
Over the course of the last two decades the area’s waters have become increasingly more
polluted by bacterial contamination. The area has been designated as prohibited to shellfishing
since 1943, with parts of Taylor and Town Creek being prohibited as early as 1926. These
prohibitions are permanent with the issues impacting water quality predating modern shoreline
surveys. The historic prohibitions were primarily due to prohibition zone created around the
Beaufort Wastewater Treatment Plant along Taylors Creek, stormwater runoff outfalls, and
buffers associated with marinas. Specifically, the most recent dye study conducted to
determine the Taylor Creek watershed prohibited buffer zone was conducted in 2007 (more
information specific to this study can be found through N.C. Shellfish Sanitation). This dye study
lead to the decision to incorporate 427 acres of Bird Shoals and Carrot Island to the prohibited
area. At present stormwater runoff continues to result in high bacterial counts. Persistently
high bacterial counts have resulted in the designated uses of these waters from not being met,
this has led to waters within all three areas being placed on the 303(d) list. Shellfish closures
and swimming advisories are indicators of poor water quality. Stormwater runoff is the main
contributing factor to degrading the water quality. Increased urbanization has altered the
23
original natural landscape. These alterations to the surface hydrology have reduced the
amount of natural cover and replaced it with impervious surface. As water travels across hard,
impervious surfaces, bacteria and other pollutants are collected and transported through
stormwater connected conveyance systems, such as curbs, pipes, and ditches directly to our
waterways. By reducing stormwater runoff we can reduce the volume of stormwater impacting
stormwater conveyance systems thus reducing the instances, extent, and length of time
flooding occurs. Reducing stormwater runoff can also reduce bacteria and other pollutants,
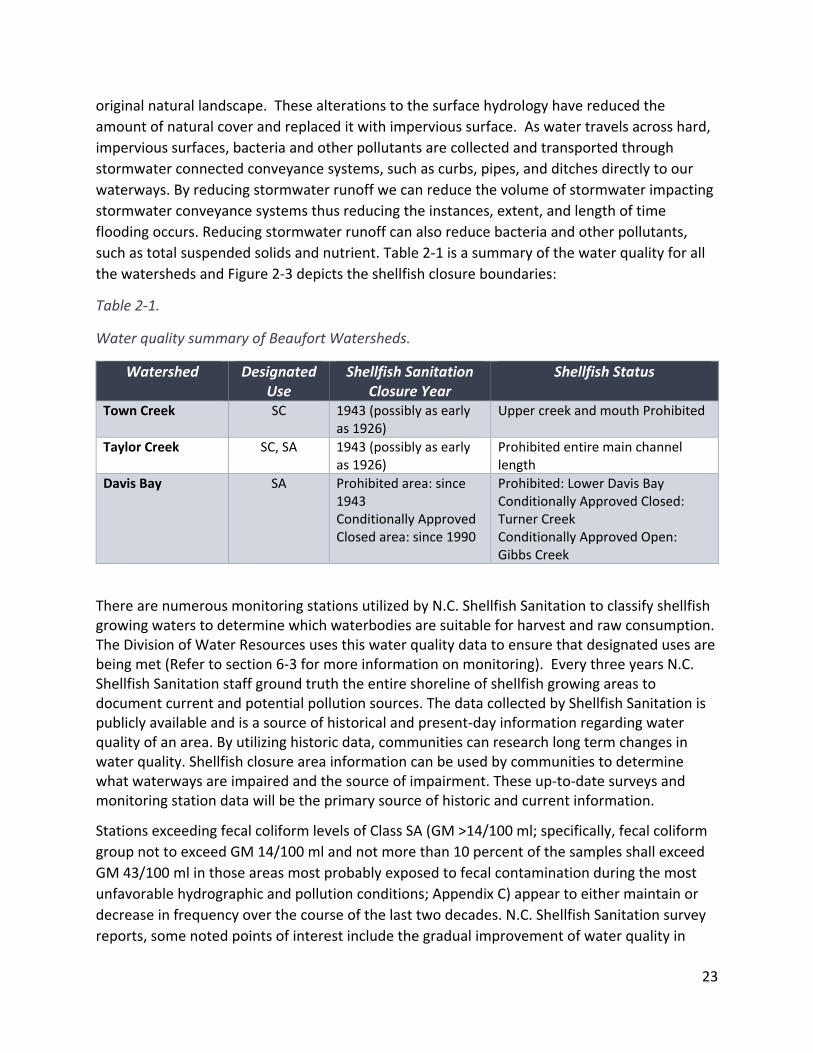
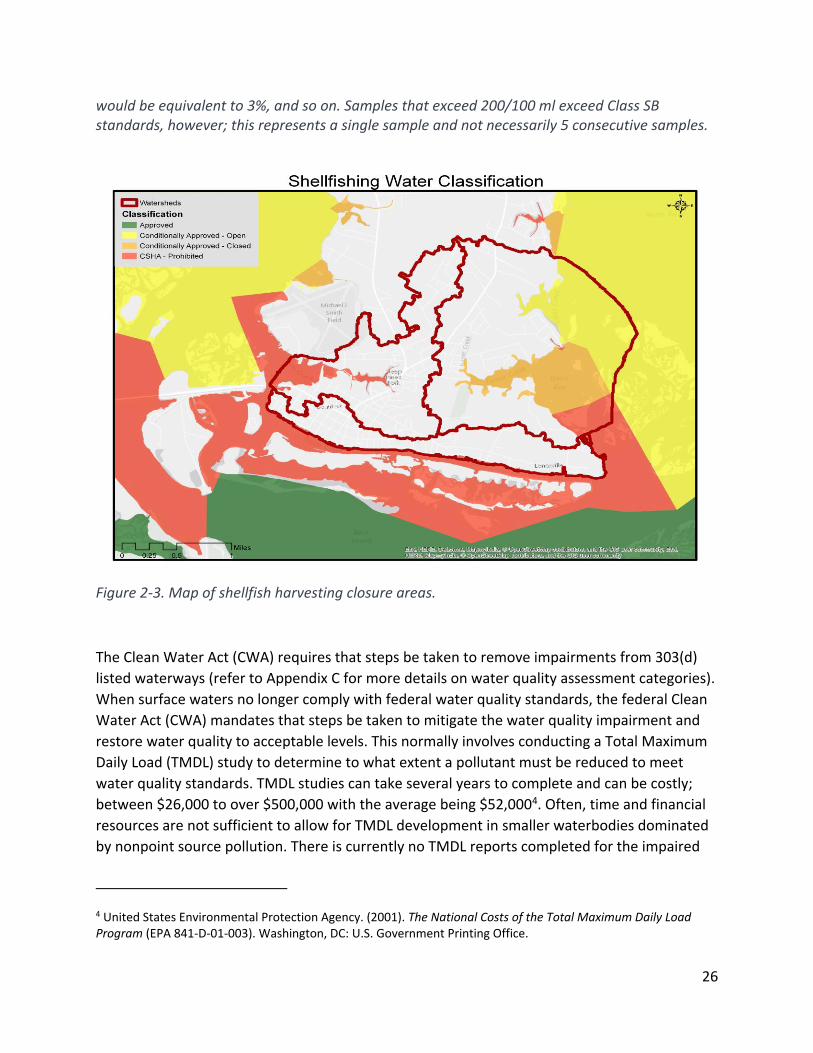
such as total suspended solids and nutrient. Table 2-1 is a summary of the water quality for all
the watersheds and Figure 2-3 depicts the shellfish closure boundaries:
Table 2-1.
Water quality summary of Beaufort Watersheds.
Watershed Designated Use
Shellfish Sanitation Closure Year
Shellfish Status
Town Creek SC 1943 (possibly as early as 1926)
Upper creek and mouth Prohibited
Taylor Creek SC, SA 1943 (possibly as early as 1926)
Prohibited entire main channel length
Davis Bay SA Prohibited area: since 1943 Conditionally Approved Closed area: since 1990
Prohibited: Lower Davis Bay Conditionally Approved Closed: Turner Creek Conditionally Approved Open: Gibbs Creek
There are numerous monitoring stations utilized by N.C. Shellfish Sanitation to classify shellfish growing waters to determine which waterbodies are suitable for harvest and raw consumption. The Division of Water Resources uses this water quality data to ensure that designated uses are being met (Refer to section 6-3 for more information on monitoring). Every three years N.C. Shellfish Sanitation staff ground truth the entire shoreline of shellfish growing areas to document current and potential pollution sources. The data collected by Shellfish Sanitation is publicly available and is a source of historical and present-day information regarding water quality of an area. By utilizing historic data, communities can research long term changes in water quality. Shellfish closure area information can be used by communities to determine what waterways are impaired and the source of impairment. These up-to-date surveys and monitoring station data will be the primary source of historic and current information.
Stations exceeding fecal coliform levels of Class SA (GM >14/100 ml; specifically, fecal coliform
group not to exceed GM 14/100 ml and not more than 10 percent of the samples shall exceed
GM 43/100 ml in those areas most probably exposed to fecal contamination during the most
unfavorable hydrographic and pollution conditions; Appendix C) appear to either maintain or
decrease in frequency over the course of the last two decades. N.C. Shellfish Sanitation survey
reports, some noted points of interest include the gradual improvement of water quality in
24
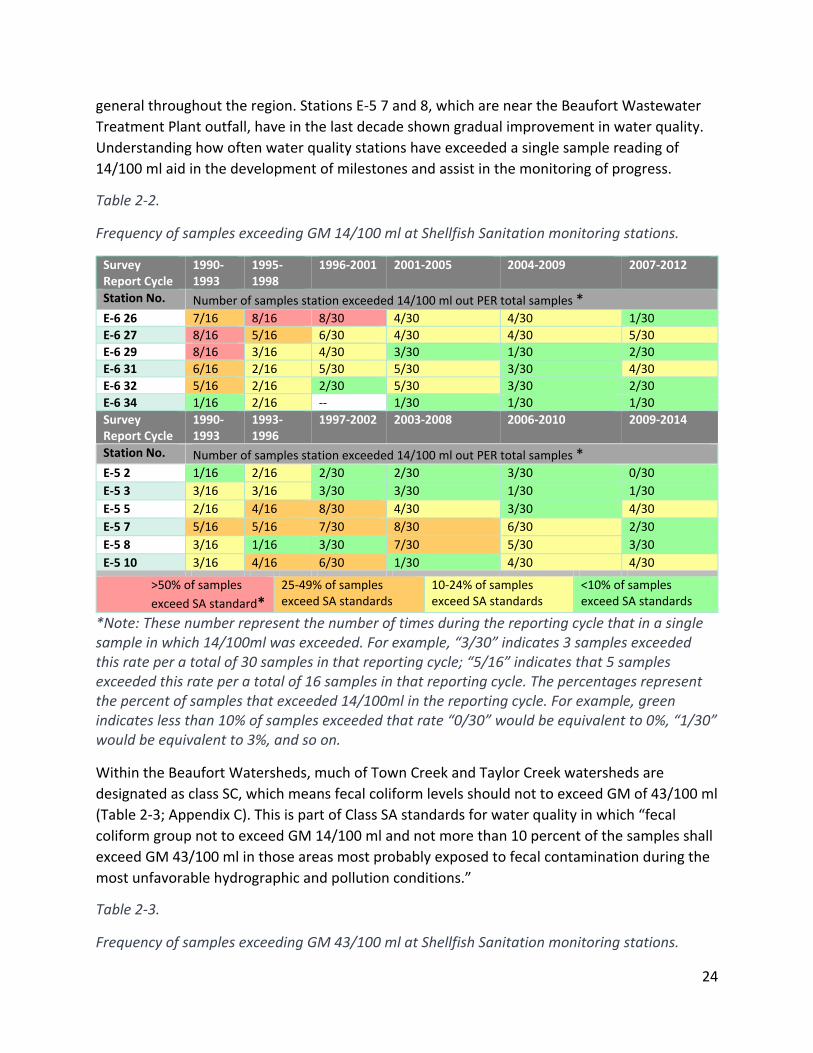
general throughout the region. Stations E-5 7 and 8, which are near the Beaufort Wastewater
Treatment Plant outfall, have in the last decade shown gradual improvement in water quality.
Understanding how often water quality stations have exceeded a single sample reading of
14/100 ml aid in the development of milestones and assist in the monitoring of progress.
Table 2-2.
Frequency of samples exceeding GM 14/100 ml at Shellfish Sanitation monitoring stations.
Survey Report Cycle
1990-1993
1995-1998
1996-2001 2001-2005 2004-2009 2007-2012
Station No. Number of samples station exceeded 14/100 ml out PER total samples *
E-6 26 7/16 8/16 8/30 4/30 4/30 1/30
E-6 27 8/16 5/16 6/30 4/30 4/30 5/30
E-6 29 8/16 3/16 4/30 3/30 1/30 2/30
E-6 31 6/16 2/16 5/30 5/30 3/30 4/30
E-6 32 5/16 2/16 2/30 5/30 3/30 2/30
E-6 34 1/16 2/16 -- 1/30 1/30 1/30
Survey Report Cycle
1990-1993
1993-1996
1997-2002 2003-2008 2006-2010 2009-2014
Station No. Number of samples station exceeded 14/100 ml out PER total samples *
E-5 2 1/16 2/16 2/30 2/30 3/30 0/30
E-5 3 3/16 3/16 3/30 3/30 1/30 1/30
E-5 5 2/16 4/16 8/30 4/30 3/30 4/30
E-5 7 5/16 5/16 7/30 8/30 6/30 2/30
E-5 8 3/16 1/16 3/30 7/30 5/30 3/30
E-5 10 3/16 4/16 6/30 1/30 4/30 4/30
>50% of samples
exceed SA standard*
25-49% of samples exceed SA standards
10-24% of samples exceed SA standards
<10% of samples exceed SA standards
*Note: These number represent the number of times during the reporting cycle that in a single sample in which 14/100ml was exceeded. For example, “3/30” indicates 3 samples exceeded this rate per a total of 30 samples in that reporting cycle; “5/16” indicates that 5 samples exceeded this rate per a total of 16 samples in that reporting cycle. The percentages represent the percent of samples that exceeded 14/100ml in the reporting cycle. For example, green indicates less than 10% of samples exceeded that rate “0/30” would be equivalent to 0%, “1/30” would be equivalent to 3%, and so on.
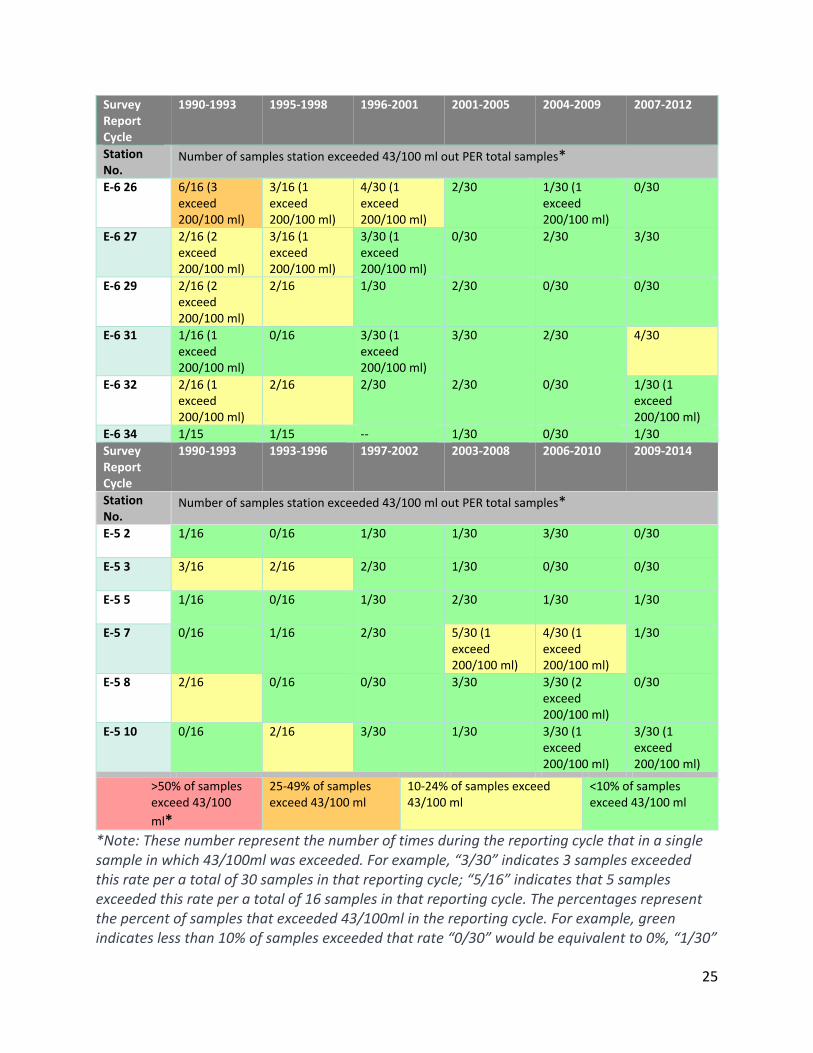
Within the Beaufort Watersheds, much of Town Creek and Taylor Creek watersheds are
designated as class SC, which means fecal coliform levels should not to exceed GM of 43/100 ml
(Table 2-3; Appendix C). This is part of Class SA standards for water quality in which “fecal
coliform group not to exceed GM 14/100 ml and not more than 10 percent of the samples shall
exceed GM 43/100 ml in those areas most probably exposed to fecal contamination during the
most unfavorable hydrographic and pollution conditions.”
Table 2-3.
Frequency of samples exceeding GM 43/100 ml at Shellfish Sanitation monitoring stations.
25
Survey Report Cycle
1990-1993 1995-1998 1996-2001 2001-2005 2004-2009 2007-2012
Station No.
Number of samples station exceeded 43/100 ml out PER total samples*
E-6 26 6/16 (3 exceed 200/100 ml)
3/16 (1 exceed 200/100 ml)
4/30 (1 exceed 200/100 ml)
2/30 1/30 (1 exceed 200/100 ml)
0/30
E-6 27 2/16 (2 exceed 200/100 ml)
3/16 (1 exceed 200/100 ml)
3/30 (1 exceed 200/100 ml)
0/30 2/30 3/30
E-6 29 2/16 (2 exceed 200/100 ml)
2/16 1/30 2/30 0/30 0/30
E-6 31 1/16 (1 exceed 200/100 ml)
0/16 3/30 (1 exceed 200/100 ml)
3/30 2/30 4/30
E-6 32 2/16 (1 exceed 200/100 ml)
2/16 2/30 2/30 0/30 1/30 (1 exceed 200/100 ml)
E-6 34 1/15 1/15 -- 1/30 0/30 1/30
Survey Report Cycle
1990-1993 1993-1996 1997-2002 2003-2008 2006-2010 2009-2014
Station No.
Number of samples station exceeded 43/100 ml out PER total samples*
E-5 2 1/16 0/16 1/30 1/30 3/30 0/30
E-5 3 3/16 2/16 2/30 1/30 0/30 0/30
E-5 5 1/16 0/16 1/30 2/30 1/30 1/30
E-5 7 0/16 1/16 2/30 5/30 (1 exceed 200/100 ml)
4/30 (1 exceed 200/100 ml)
1/30
E-5 8 2/16 0/16 0/30 3/30 3/30 (2 exceed 200/100 ml)
0/30
E-5 10 0/16 2/16 3/30 1/30 3/30 (1 exceed 200/100 ml)
3/30 (1 exceed 200/100 ml)
>50% of samples exceed 43/100
ml*
25-49% of samples exceed 43/100 ml
10-24% of samples exceed 43/100 ml
<10% of samples exceed 43/100 ml
*Note: These number represent the number of times during the reporting cycle that in a single sample in which 43/100ml was exceeded. For example, “3/30” indicates 3 samples exceeded this rate per a total of 30 samples in that reporting cycle; “5/16” indicates that 5 samples exceeded this rate per a total of 16 samples in that reporting cycle. The percentages represent the percent of samples that exceeded 43/100ml in the reporting cycle. For example, green indicates less than 10% of samples exceeded that rate “0/30” would be equivalent to 0%, “1/30”
26
would be equivalent to 3%, and so on. Samples that exceed 200/100 ml exceed Class SB standards, however; this represents a single sample and not necessarily 5 consecutive samples.
Figure 2-3. Map of shellfish harvesting closure areas.
The Clean Water Act (CWA) requires that steps be taken to remove impairments from 303(d)
listed waterways (refer to Appendix C for more details on water quality assessment categories).
When surface waters no longer comply with federal water quality standards, the federal Clean
Water Act (CWA) mandates that steps be taken to mitigate the water quality impairment and
restore water quality to acceptable levels. This normally involves conducting a Total Maximum
Daily Load (TMDL) study to determine to what extent a pollutant must be reduced to meet
water quality standards. TMDL studies can take several years to complete and can be costly;
between $26,000 to over $500,000 with the average being $52,0004. Often, time and financial
resources are not sufficient to allow for TMDL development in smaller waterbodies dominated
by nonpoint source pollution. There is currently no TMDL reports completed for the impaired
4 United States Environmental Protection Agency. (2001). The National Costs of the Total Maximum Daily Load Program (EPA 841-D-01-003). Washington, DC: U.S. Government Printing Office.
27
waters of the Beaufort Watersheds. Historic water quality records from the N.C. DWQ and
Shellfish Sanitation show that increased pathogen indicators in the creeks corresponds to
increased urbanization of the watershed. Partners agree that reduction of stormwater volume
is the most beneficial and cost-effective way to eliminate this bacteriologic pollutant. It is
relevant to note that the waters of North Carolina as a whole, do have a statewide TMDL study
due to mercury from point and nonpoint sources that result in mercury in fish tissue. The
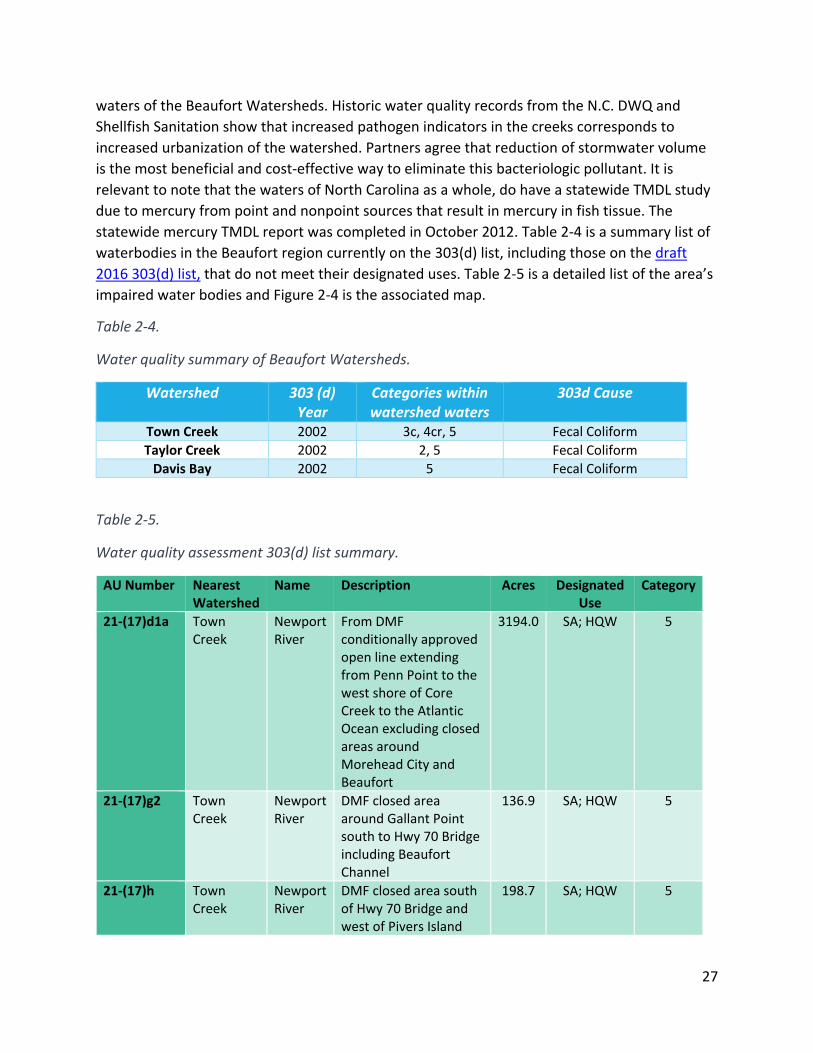
statewide mercury TMDL report was completed in October 2012. Table 2-4 is a summary list of
waterbodies in the Beaufort region currently on the 303(d) list, including those on the draft
2016 303(d) list, that do not meet their designated uses. Table 2-5 is a detailed list of the area’s
impaired water bodies and Figure 2-4 is the associated map.
Table 2-4.
Water quality summary of Beaufort Watersheds.
Watershed 303 (d) Year
Categories within watershed waters
303d Cause
Town Creek 2002 3c, 4cr, 5 Fecal Coliform
Taylor Creek 2002 2, 5 Fecal Coliform
Davis Bay 2002 5 Fecal Coliform
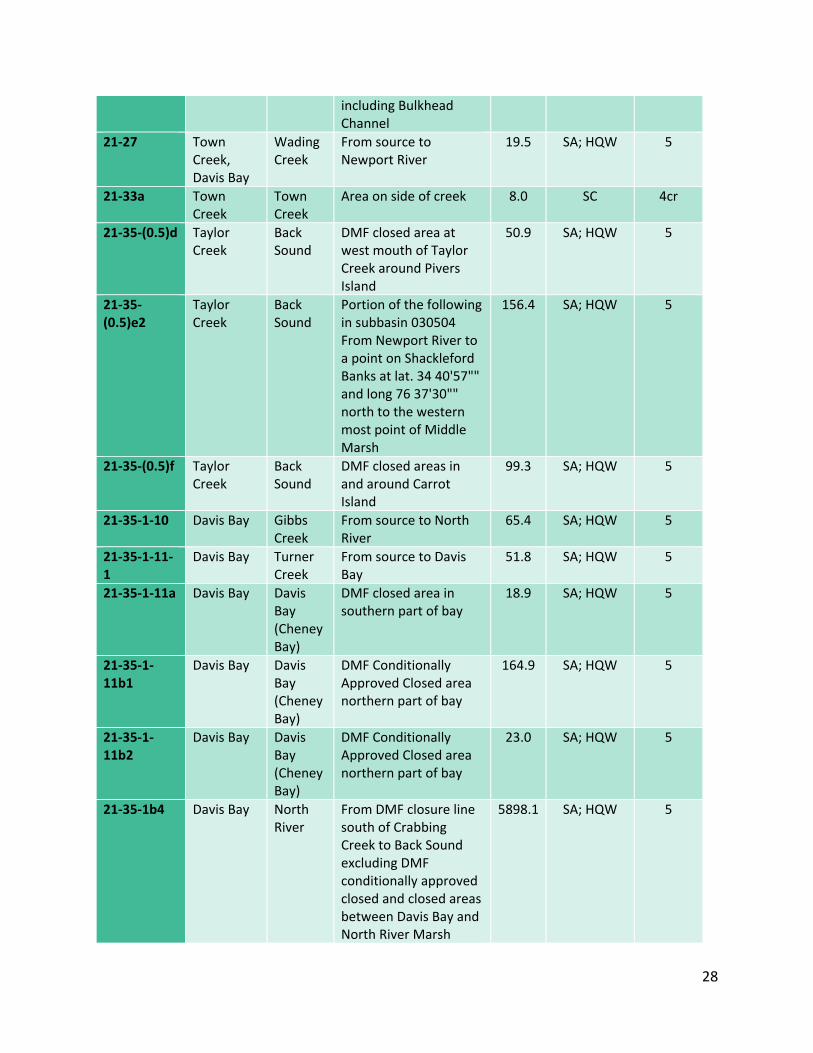
Table 2-5.
Water quality assessment 303(d) list summary.
AU Number Nearest Watershed
Name Description Acres Designated Use
Category
21-(17)d1a Town Creek
Newport River
From DMF conditionally approved open line extending from Penn Point to the west shore of Core Creek to the Atlantic Ocean excluding closed areas around Morehead City and Beaufort
3194.0 SA; HQW 5
21-(17)g2 Town Creek
Newport River
DMF closed area around Gallant Point south to Hwy 70 Bridge including Beaufort Channel
136.9 SA; HQW 5
21-(17)h Town Creek
Newport River
DMF closed area south of Hwy 70 Bridge and west of Pivers Island
198.7 SA; HQW 5
28
including Bulkhead Channel
21-27 Town Creek, Davis Bay
Wading Creek
From source to Newport River
19.5 SA; HQW 5
21-33a Town Creek
Town Creek
Area on side of creek 8.0 SC 4cr
21-35-(0.5)d Taylor Creek
Back Sound
DMF closed area at west mouth of Taylor Creek around Pivers Island
50.9 SA; HQW 5
21-35-(0.5)e2
Taylor Creek
Back Sound
Portion of the following in subbasin 030504 From Newport River to a point on Shackleford Banks at lat. 34 40'57"" and long 76 37'30"" north to the western most point of Middle Marsh
156.4 SA; HQW 5
21-35-(0.5)f Taylor Creek
Back Sound
DMF closed areas in and around Carrot Island
99.3 SA; HQW 5
21-35-1-10 Davis Bay Gibbs Creek
From source to North River
65.4 SA; HQW 5
21-35-1-11-1
Davis Bay Turner Creek
From source to Davis Bay
51.8 SA; HQW 5
21-35-1-11a Davis Bay Davis Bay (Cheney Bay)
DMF closed area in southern part of bay
18.9 SA; HQW 5
21-35-1-11b1
Davis Bay Davis Bay (Cheney Bay)
DMF Conditionally Approved Closed area northern part of bay
164.9 SA; HQW 5
21-35-1-11b2
Davis Bay Davis Bay (Cheney Bay)
DMF Conditionally Approved Closed area northern part of bay
23.0 SA; HQW 5
21-35-1b4 Davis Bay North River
From DMF closure line south of Crabbing Creek to Back Sound excluding DMF conditionally approved closed and closed areas between Davis Bay and North River Marsh
5898.1 SA; HQW 5

29
21-35-1c1 Davis Bay North River
DMF conditionally approved closed area between Davis Bay and North River Marsh
49.4 SA; HQW 5
21-35-1c2 Davis Bay North River
DMF conditionally approved closed area between Davis Bay and North River Marsh
17.8 SA; HQW 5
21-35-1d1 Taylor Creek
North River
DMF closed area between Davis Bay and North River Marsh
50.7 SA; HQW 5
21-35-1d2 Davis Bay North River
DMF closed area between Davis Bay and North River Marsh
138.5 SA; HQW 5
21-35-1e Davis Bay North River
DMF conditionally approved closed area at mouth of Newby Creek
27.4 SA; HQW 5
Figure 2-4. Water Quality Assessment Categories map.
30
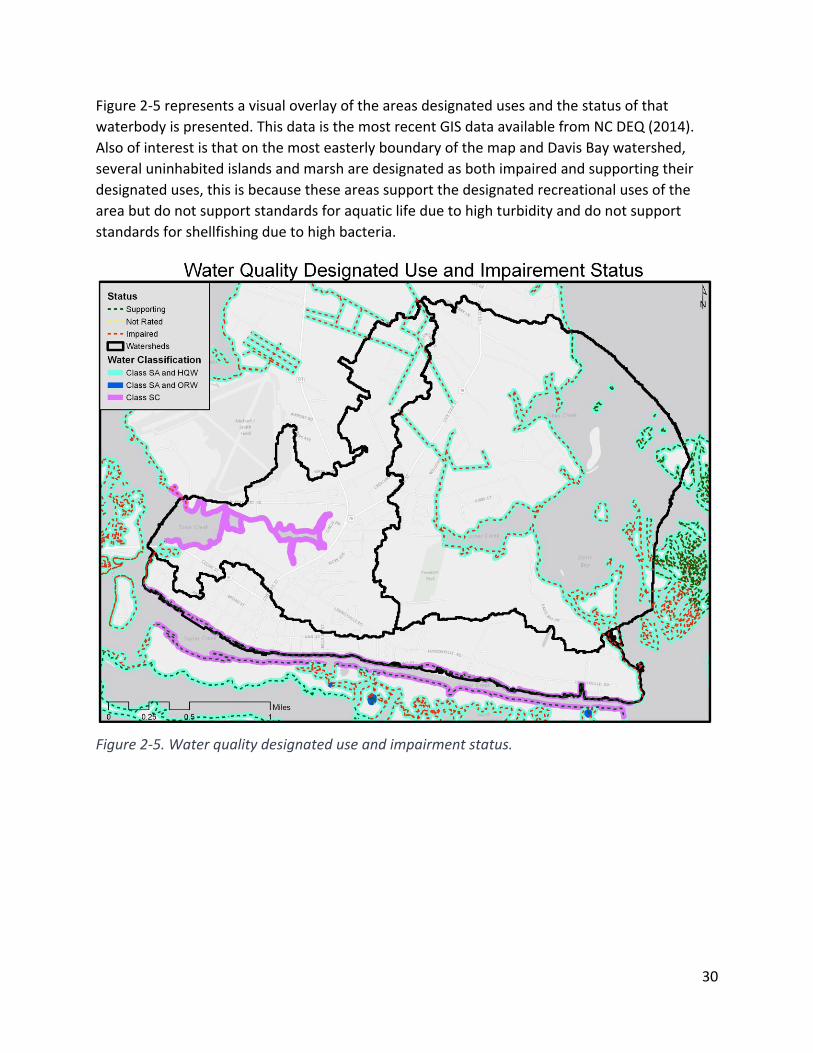
Figure 2-5 represents a visual overlay of the areas designated uses and the status of that
waterbody is presented. This data is the most recent GIS data available from NC DEQ (2014).
Also of interest is that on the most easterly boundary of the map and Davis Bay watershed,
several uninhabited islands and marsh are designated as both impaired and supporting their
designated uses, this is because these areas support the designated recreational uses of the
area but do not support standards for aquatic life due to high turbidity and do not support
standards for shellfishing due to high bacteria.
Figure 2-5. Water quality designated use and impairment status.
31
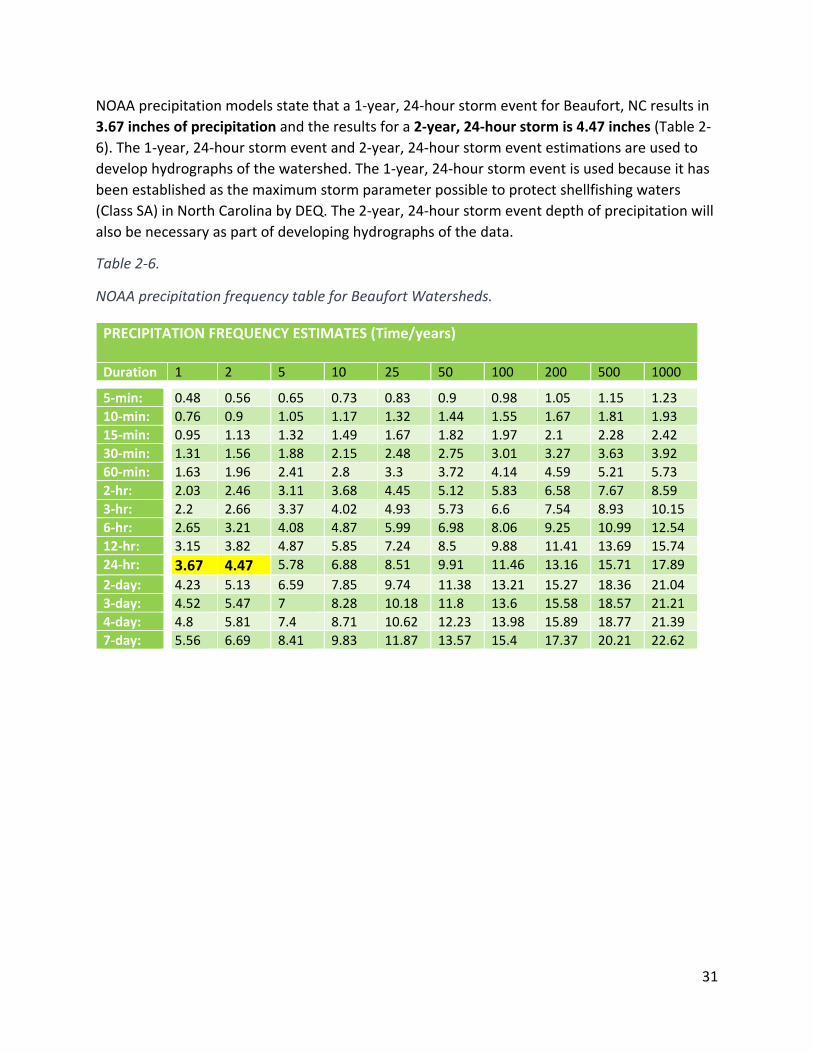
NOAA precipitation models state that a 1-year, 24-hour storm event for Beaufort, NC results in
3.67 inches of precipitation and the results for a 2-year, 24-hour storm is 4.47 inches (Table 2-
6). The 1-year, 24-hour storm event and 2-year, 24-hour storm event estimations are used to
develop hydrographs of the watershed. The 1-year, 24-hour storm event is used because it has
been established as the maximum storm parameter possible to protect shellfishing waters
(Class SA) in North Carolina by DEQ. The 2-year, 24-hour storm event depth of precipitation will
also be necessary as part of developing hydrographs of the data.
Table 2-6.
NOAA precipitation frequency table for Beaufort Watersheds.
PRECIPITATION FREQUENCY ESTIMATES (Time/years) Duration 1 2 5 10 25 50 100 200 500 1000
5-min: 0.48 0.56 0.65 0.73 0.83 0.9 0.98 1.05 1.15 1.23
10-min: 0.76 0.9 1.05 1.17 1.32 1.44 1.55 1.67 1.81 1.93
15-min: 0.95 1.13 1.32 1.49 1.67 1.82 1.97 2.1 2.28 2.42
30-min: 1.31 1.56 1.88 2.15 2.48 2.75 3.01 3.27 3.63 3.92
60-min: 1.63 1.96 2.41 2.8 3.3 3.72 4.14 4.59 5.21 5.73
2-hr: 2.03 2.46 3.11 3.68 4.45 5.12 5.83 6.58 7.67 8.59
3-hr: 2.2 2.66 3.37 4.02 4.93 5.73 6.6 7.54 8.93 10.15
6-hr: 2.65 3.21 4.08 4.87 5.99 6.98 8.06 9.25 10.99 12.54
12-hr: 3.15 3.82 4.87 5.85 7.24 8.5 9.88 11.41 13.69 15.74
24-hr: 3.67 4.47 5.78 6.88 8.51 9.91 11.46 13.16 15.71 17.89
2-day: 4.23 5.13 6.59 7.85 9.74 11.38 13.21 15.27 18.36 21.04
3-day: 4.52 5.47 7 8.28 10.18 11.8 13.6 15.58 18.57 21.21
4-day: 4.8 5.81 7.4 8.71 10.62 12.23 13.98 15.89 18.77 21.39
7-day: 5.56 6.69 8.41 9.83 11.87 13.57 15.4 17.37 20.21 22.62
32
SOURCE ASSESSMENT The primary source being addressed through this restoration plan will be stormwater runoff,
which carries pollutants such as bacteria, the most predominate water quality impairment as
identified by state reports and TMDL studies.
Nonpoint Source Pollution Due to rapid urban development and alteration of natural hydrology within the watershed,
bacterial pollutants have been found to be the primary issue as reported in water quality
assessments and Shellfish Sanitation reports. The difficulty in preventing violations of bacteria
standards for coastal waters caused by stormwater runoff is compounded by the unique
challenges related to coastal hydrology and bacteria pollution. These are:
1. The two bacteria used as indicators of water quality, fecal coliform and enterococcus,
naturally occur across the terrestrial landscape. These bacteria originate in the feces of
warm-blooded animals, such as birds, deer, raccoons and domestic pets. Although
prudent measures should be taken to reduce the sources of bacteria, these efforts alone
will not result in satisfactory improvements in coastal water quality due to unnatural
levels of stormwater being discharged.
2. Treating stormwater runoff to remove bacteria pollution before it flows into shellfishing
and swimming waters is impractical. Although some technology exists for decreasing
bacteria levels in runoff, it is not able to reduce levels to ensure pristine water quality
necessary to allow shellfish harvest and swimming.
3. Treated runoff can easily be re-contaminated. Due to the ubiquitous nature of bacteria
on the landscape, treated runoff, once discharged back on the landscape, will simply
pick up more bacteria. The result is ineffective and costly treatment.
A more effective approach is to reduce the amount of stormwater entering waterways.
Stormwater runoff can convey a variety of nonpoint source pollutants from a variety of sources.
Potential nonpoint sources range from animal sources to connected conveyance systems.
In the past, the Beaufort Watersheds has been the discharge point for treated wastewater and
untreated stormwater runoff. For example, Town Creek was once used as a discharge point for
sewage in 1923. Wastewater treatments plants along both Town Creek and Taylor Creek were
eventually closed due to expanding populations and increased urbanization, outdating the
systems.
Before the 1970s, Town Creek was the destination for poorly treated sewage. Once Beaufort’s
first wastewater treatment plant was built in the early 1970s, the amount of sewage going into
Town Creek was drastically reduced. This was the first improvement in water quality for Town
Creek, since the founding of Beaufort in 1709. Town Creek is one of the discharge areas for
stormwater runoff in Beaufort. The storm drainage system that is within the Town Creek
33
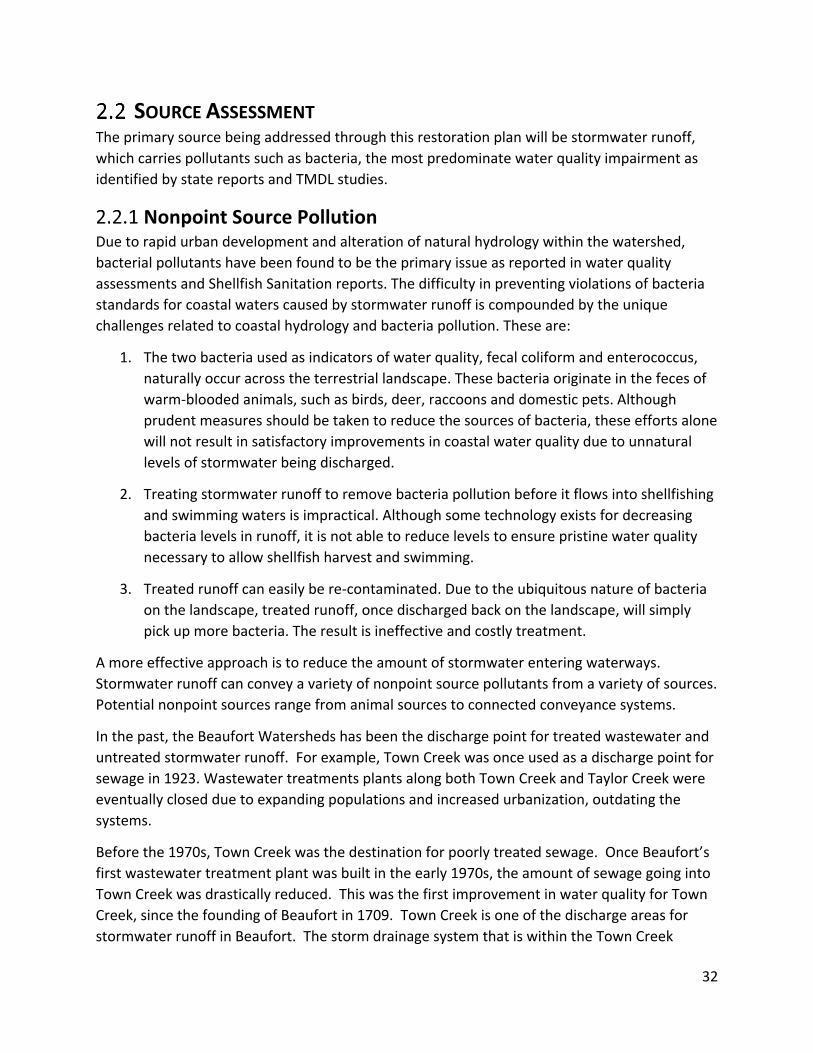
Watershed contains the following: two box culverts, 124 catch basins, 15 catch inlets, 62 drop
inlets, five flow pipes, 11 junction boxes, four retention basin outlets, 59 pipes, 33 storm
manholes, and 18.495 miles of ditch, curb and gutter, and stormwater pipe. From those inlets,
through the Town Creek stormwater drainage system, the stormwater is discharged through 17
different outlets that are distributed around Town Creek. Figure 2-6 details the stormwater
infrastructure that transports and ejects into Town Creek and the locations of the outlets points
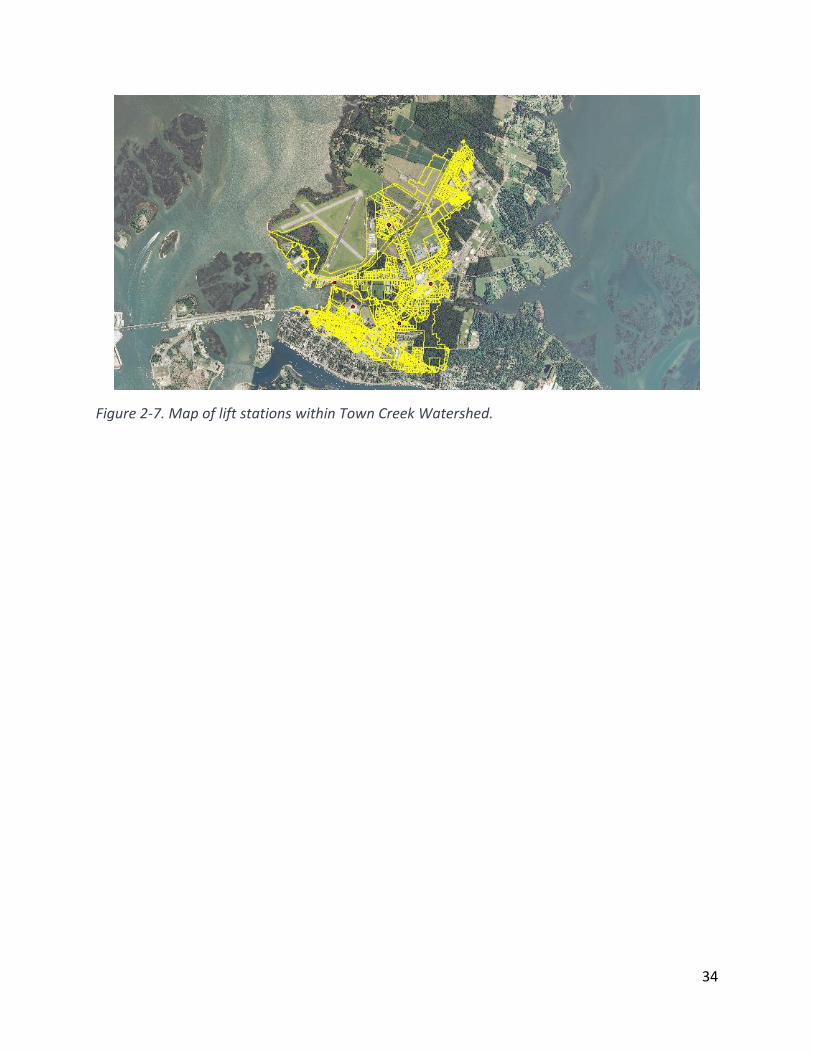
into Town Creek. There are multiple sewer lift stations in the Town Creek Watershed. Figure 2-
7 details the locations of 6 sewers lift stations in the Town Creek Watershed. These locations
along with others in the Town of Beaufort are checked daily to prevent overflows and leakages.
Fecal matter from warm blooded animals is the main source of various types of harmful
bacteria. These daily checks prevent such incidents from occurring and diminishing water
quality in the surrounding waterbodies.
Figure 2-6. Map of stormwater infrastructure within Town Creek Watershed.
34
Figure 2-7. Map of lift stations within Town Creek Watershed.
35
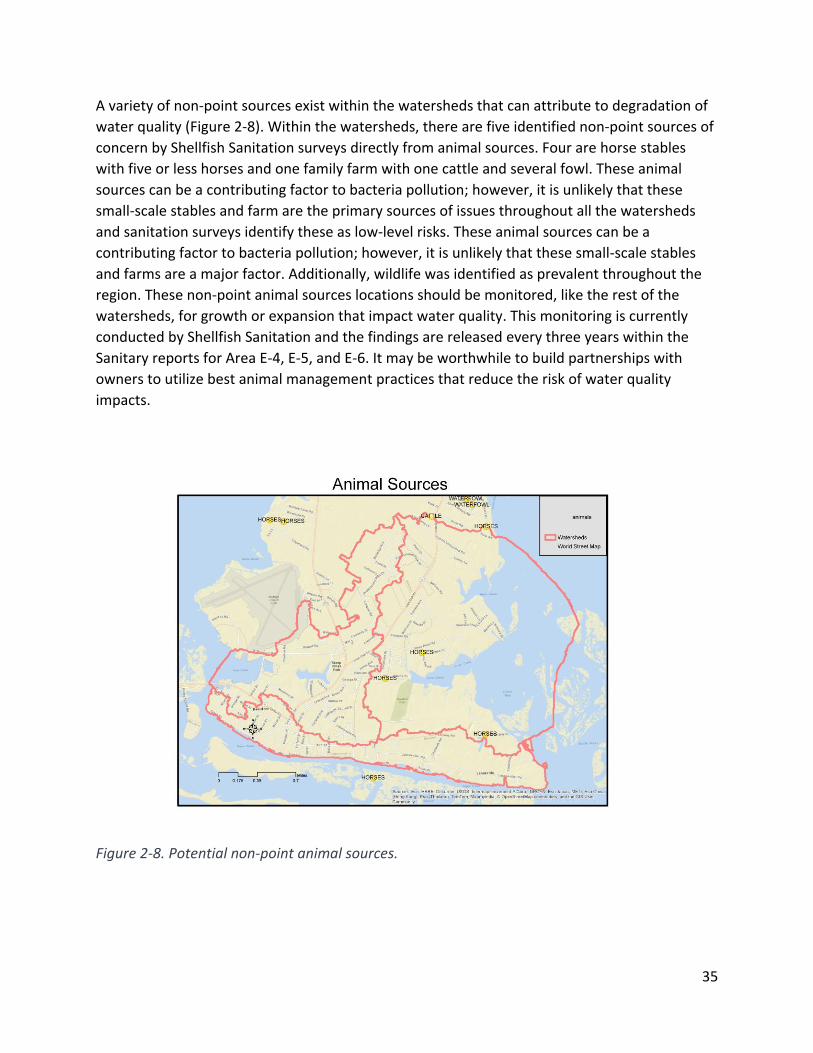
A variety of non-point sources exist within the watersheds that can attribute to degradation of
water quality (Figure 2-8). Within the watersheds, there are five identified non-point sources of
concern by Shellfish Sanitation surveys directly from animal sources. Four are horse stables
with five or less horses and one family farm with one cattle and several fowl. These animal
sources can be a contributing factor to bacteria pollution; however, it is unlikely that these
small-scale stables and farm are the primary sources of issues throughout all the watersheds
and sanitation surveys identify these as low-level risks. These animal sources can be a
contributing factor to bacteria pollution; however, it is unlikely that these small-scale stables
and farms are a major factor. Additionally, wildlife was identified as prevalent throughout the
region. These non-point animal sources locations should be monitored, like the rest of the
watersheds, for growth or expansion that impact water quality. This monitoring is currently
conducted by Shellfish Sanitation and the findings are released every three years within the
Sanitary reports for Area E-4, E-5, and E-6. It may be worthwhile to build partnerships with
owners to utilize best animal management practices that reduce the risk of water quality
impacts.
Figure 2-8. Potential non-point animal sources.
36
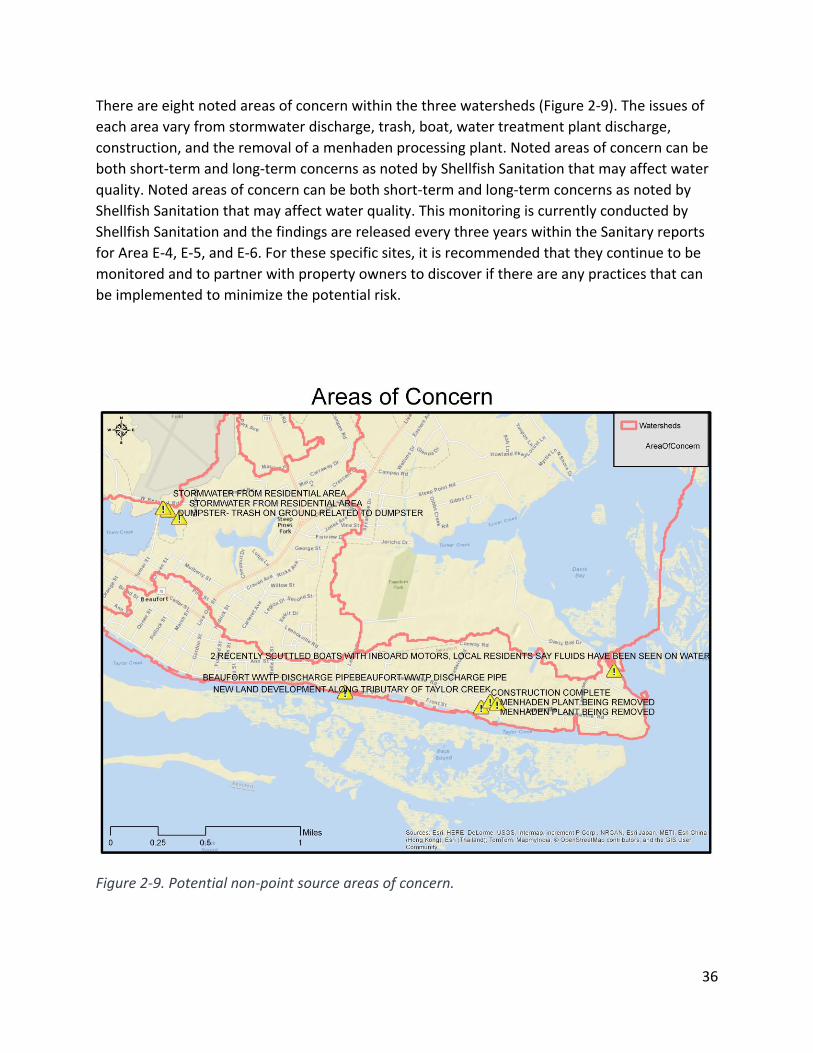
There are eight noted areas of concern within the three watersheds (Figure 2-9). The issues of
each area vary from stormwater discharge, trash, boat, water treatment plant discharge,
construction, and the removal of a menhaden processing plant. Noted areas of concern can be
both short-term and long-term concerns as noted by Shellfish Sanitation that may affect water
quality. Noted areas of concern can be both short-term and long-term concerns as noted by
Shellfish Sanitation that may affect water quality. This monitoring is currently conducted by
Shellfish Sanitation and the findings are released every three years within the Sanitary reports
for Area E-4, E-5, and E-6. For these specific sites, it is recommended that they continue to be
monitored and to partner with property owners to discover if there are any practices that can
be implemented to minimize the potential risk.
Figure 2-9. Potential non-point source areas of concern.
37
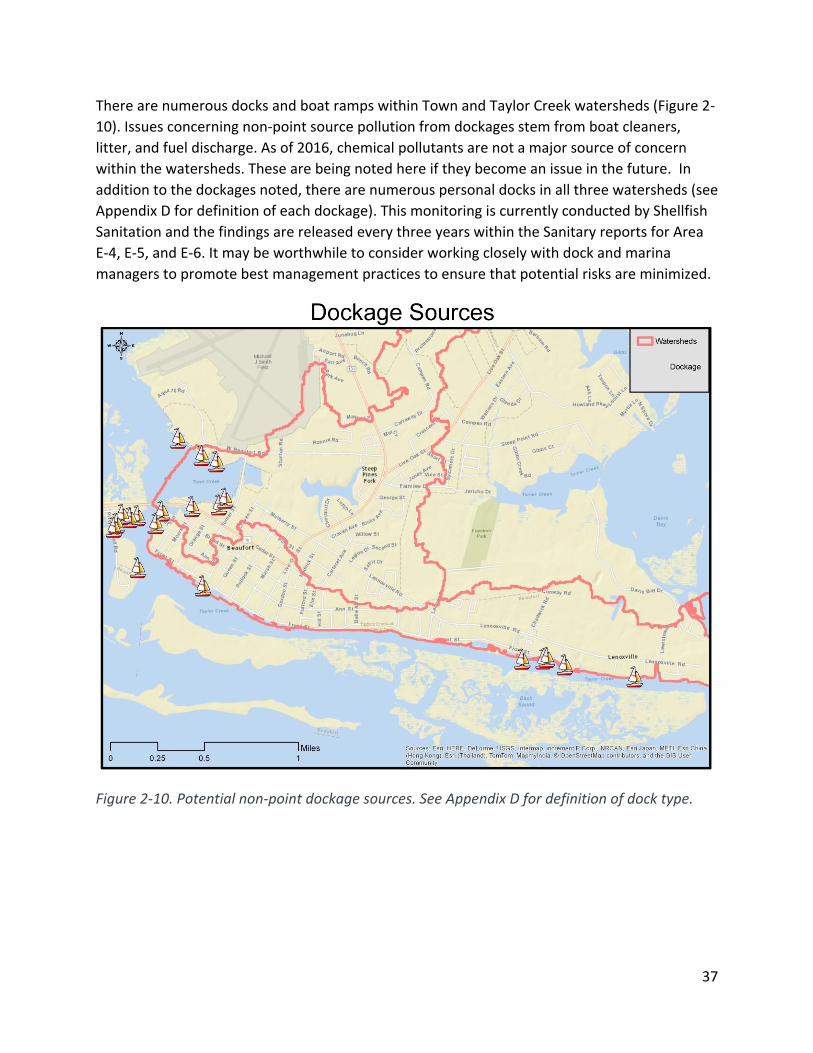
There are numerous docks and boat ramps within Town and Taylor Creek watersheds (Figure 2-
10). Issues concerning non-point source pollution from dockages stem from boat cleaners,
litter, and fuel discharge. As of 2016, chemical pollutants are not a major source of concern
within the watersheds. These are being noted here if they become an issue in the future. In
addition to the dockages noted, there are numerous personal docks in all three watersheds (see
Appendix D for definition of each dockage). This monitoring is currently conducted by Shellfish
Sanitation and the findings are released every three years within the Sanitary reports for Area
E-4, E-5, and E-6. It may be worthwhile to consider working closely with dock and marina
managers to promote best management practices to ensure that potential risks are minimized.
Figure 2-10. Potential non-point dockage sources. See Appendix D for definition of dock type.
38
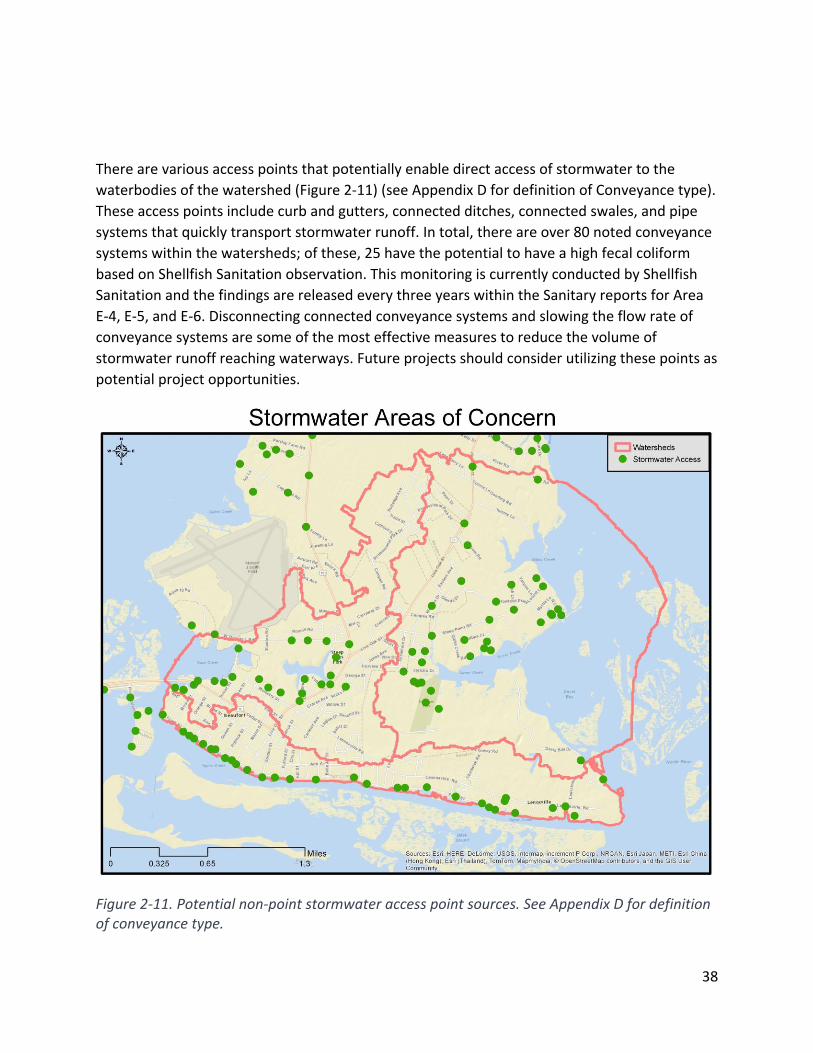
There are various access points that potentially enable direct access of stormwater to the
waterbodies of the watershed (Figure 2-11) (see Appendix D for definition of Conveyance type).
These access points include curb and gutters, connected ditches, connected swales, and pipe
systems that quickly transport stormwater runoff. In total, there are over 80 noted conveyance
systems within the watersheds; of these, 25 have the potential to have a high fecal coliform
based on Shellfish Sanitation observation. This monitoring is currently conducted by Shellfish
Sanitation and the findings are released every three years within the Sanitary reports for Area
E-4, E-5, and E-6. Disconnecting connected conveyance systems and slowing the flow rate of
conveyance systems are some of the most effective measures to reduce the volume of
stormwater runoff reaching waterways. Future projects should consider utilizing these points as
potential project opportunities.
Figure 2-11. Potential non-point stormwater access point sources. See Appendix D for definition of conveyance type.
39
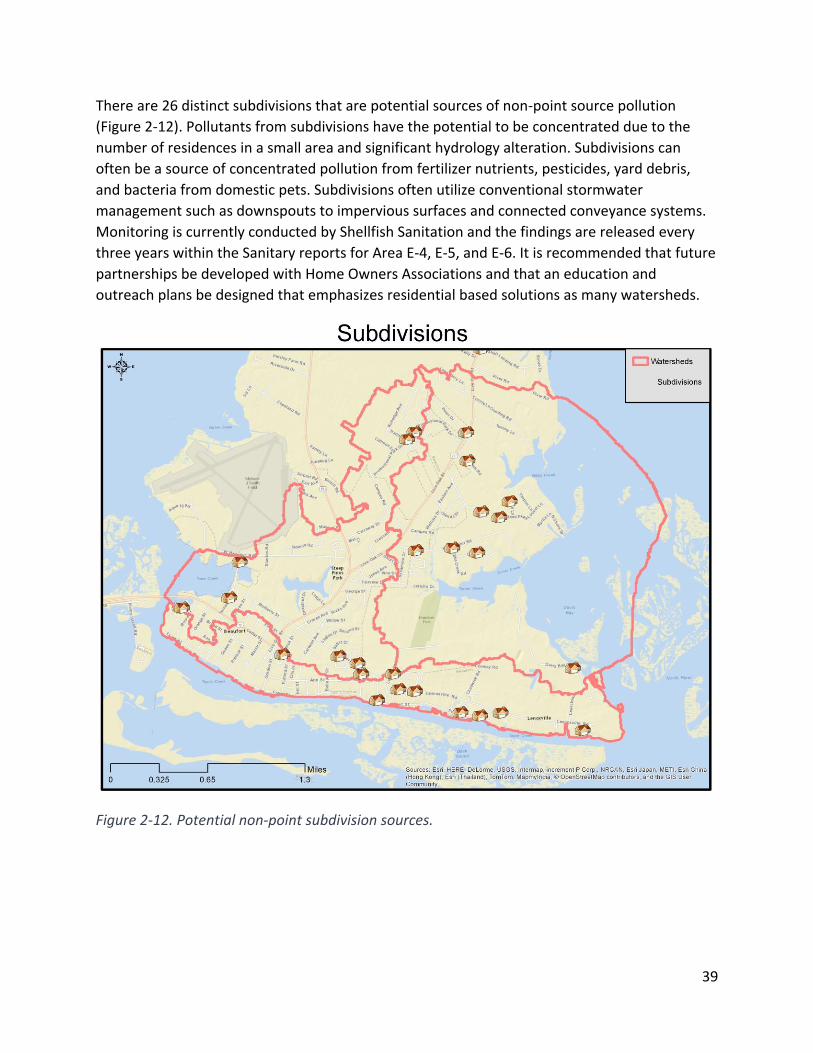
There are 26 distinct subdivisions that are potential sources of non-point source pollution
(Figure 2-12). Pollutants from subdivisions have the potential to be concentrated due to the
number of residences in a small area and significant hydrology alteration. Subdivisions can
often be a source of concentrated pollution from fertilizer nutrients, pesticides, yard debris,
and bacteria from domestic pets. Subdivisions often utilize conventional stormwater
management such as downspouts to impervious surfaces and connected conveyance systems.
Monitoring is currently conducted by Shellfish Sanitation and the findings are released every
three years within the Sanitary reports for Area E-4, E-5, and E-6. It is recommended that future
partnerships be developed with Home Owners Associations and that an education and
outreach plans be designed that emphasizes residential based solutions as many watersheds.
Figure 2-12. Potential non-point subdivision sources.
40
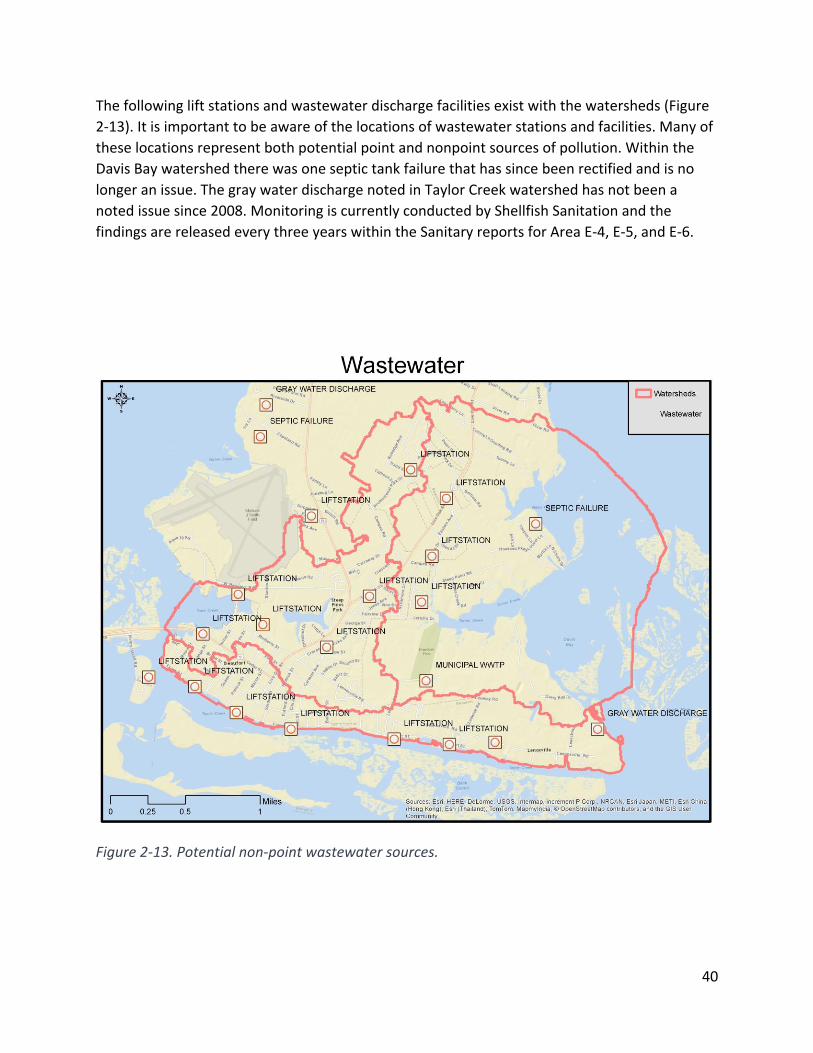
The following lift stations and wastewater discharge facilities exist with the watersheds (Figure
2-13). It is important to be aware of the locations of wastewater stations and facilities. Many of
these locations represent both potential point and nonpoint sources of pollution. Within the
Davis Bay watershed there was one septic tank failure that has since been rectified and is no
longer an issue. The gray water discharge noted in Taylor Creek watershed has not been a
noted issue since 2008. Monitoring is currently conducted by Shellfish Sanitation and the
findings are released every three years within the Sanitary reports for Area E-4, E-5, and E-6.
Figure 2-13. Potential non-point wastewater sources.
41
Point Sources Point source pollution can impair water quality and represent direct sources of pollution that
often have the potential to be mitigated. Point sources of pollution, unlike the diffuse non-point
sources, are any single identifiable source of pollution from which pollutants are discharged,
such as a pipe or ditch. They can pollute the water, but their effects can often be lessened or
eliminated through management strategies.
There are three National Pollutant Discharge Elimination System (NPDES) wastewater facilities
within the Beaufort Watersheds:
Facility Name Permit No. Receiving Stream
Glenda Drive WTP NC0072702 Turner Creek
Beaufort WWTP NC0021831 Taylor Creek (Davis Bay)
Pine Street WTP NC0072699 Town Creek
There are several State Stormwater Permits within the watershed (Figure 2-14). There are
numerous state stormwater permits within the Beaufort Watersheds. Three NPDES stormwater
permit are within the watershed:
Facility Name Permit No. Receiving Stream
Beaufort Public Works
Facility
NCG080687 Town Creek
Beaufort WWTP NCG110061 Turner Creek (Davis Bay)
Atlantic Veneer NCG210050 Taylor Creek
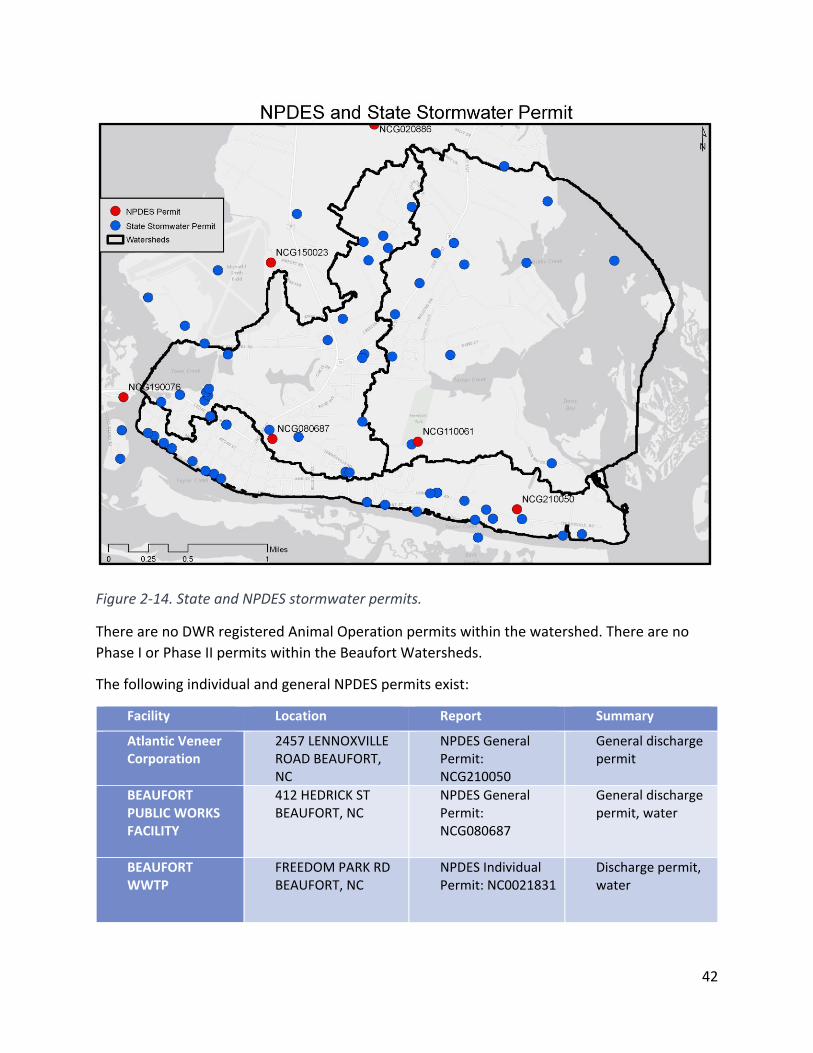
42
Figure 2-14. State and NPDES stormwater permits.
There are no DWR registered Animal Operation permits within the watershed. There are no
Phase I or Phase II permits within the Beaufort Watersheds.
The following individual and general NPDES permits exist:
Facility Location Report Summary
Atlantic Veneer Corporation
2457 LENNOXVILLE ROAD BEAUFORT, NC
NPDES General Permit: NCG210050
General discharge permit
BEAUFORT PUBLIC WORKS FACILITY
412 HEDRICK ST BEAUFORT, NC
NPDES General Permit: NCG080687
General discharge permit, water
BEAUFORT WWTP
FREEDOM PARK RD BEAUFORT, NC
NPDES Individual Permit: NC0021831
Discharge permit, water
43
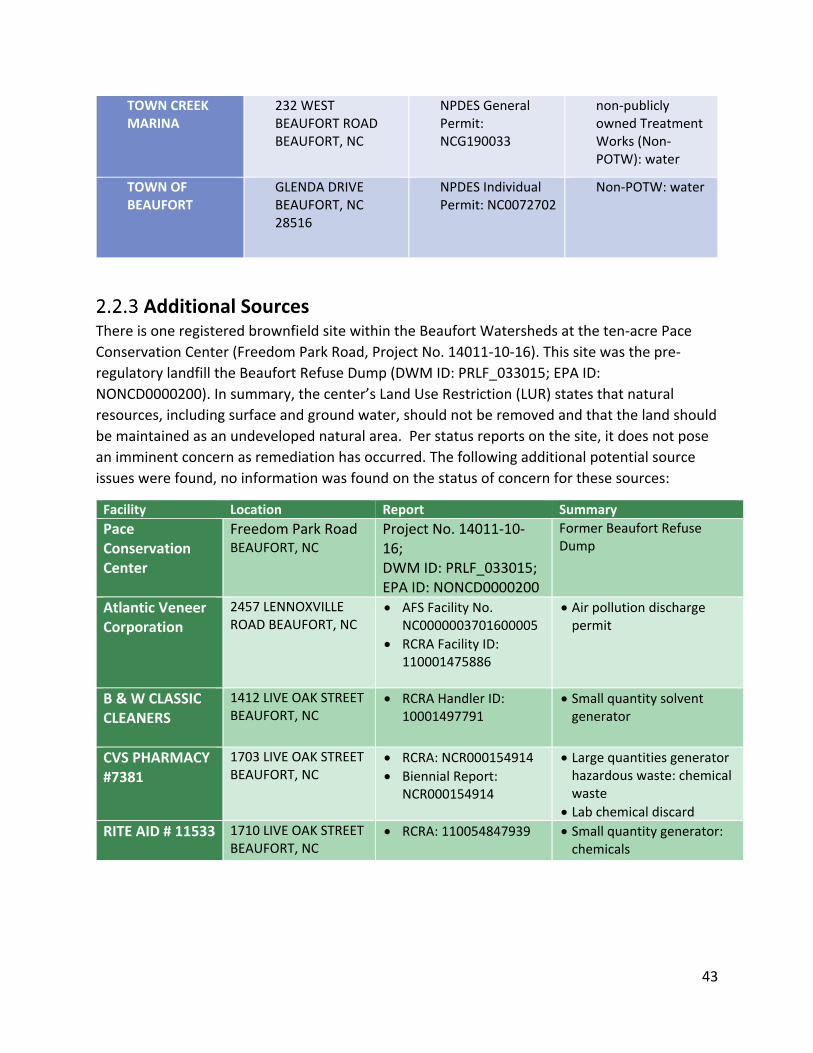
TOWN CREEK MARINA
232 WEST BEAUFORT ROAD BEAUFORT, NC
NPDES General Permit: NCG190033
non-publicly owned Treatment Works (Non-POTW): water
TOWN OF BEAUFORT
GLENDA DRIVE BEAUFORT, NC 28516
NPDES Individual Permit: NC0072702
Non-POTW: water
Additional Sources There is one registered brownfield site within the Beaufort Watersheds at the ten-acre Pace
Conservation Center (Freedom Park Road, Project No. 14011-10-16). This site was the pre-
regulatory landfill the Beaufort Refuse Dump (DWM ID: PRLF_033015; EPA ID:
NONCD0000200). In summary, the center’s Land Use Restriction (LUR) states that natural
resources, including surface and ground water, should not be removed and that the land should
be maintained as an undeveloped natural area. Per status reports on the site, it does not pose
an imminent concern as remediation has occurred. The following additional potential source
issues were found, no information was found on the status of concern for these sources:
Facility Location Report Summary
Pace Conservation Center
Freedom Park Road BEAUFORT, NC
Project No. 14011-10-16; DWM ID: PRLF_033015; EPA ID: NONCD0000200
Former Beaufort Refuse Dump
Atlantic Veneer Corporation
2457 LENNOXVILLE ROAD BEAUFORT, NC
• AFS Facility No. NC0000003701600005
• RCRA Facility ID: 110001475886
• Air pollution discharge permit
B & W CLASSIC CLEANERS
1412 LIVE OAK STREET BEAUFORT, NC
• RCRA Handler ID: 10001497791
• Small quantity solvent generator
CVS PHARMACY #7381
1703 LIVE OAK STREET BEAUFORT, NC
• RCRA: NCR000154914
• Biennial Report: NCR000154914
• Large quantities generator hazardous waste: chemical waste
• Lab chemical discard
RITE AID # 11533
1710 LIVE OAK STREET BEAUFORT, NC
• RCRA: 110054847939 • Small quantity generator: chemicals
44
3 Runoff Volume Reduction Coastal areas have undergone significant change as land use practices have intensified through
the increase in agriculture, forestry, and development. Prior to human alteration, more
rainwater was absorbed into the ground, evaporated, or used by vegetation through natural
hydrologic processes. Specifically, when rainwater is absorbed through the ground, bacteria
and other pollutants are filtered or eliminated through percolation. Intensive land uses
overwhelm the effectiveness of conventional stormwater systems. Conventional stormwater
management methods rely on peak flow storage but do not mitigate pollution and cannot keep
up with increased pressure from usage. As impervious surfaces and stormwater runoff increase,
hydrology is altered and can lead to an increase in sedimentation and erosion, ecosystem
degradation and loss, loss of aquatic biodiversity, degradation of water quality, and increased
flooding.
Instead of rainfall being infiltrated into the ground and vegetation, stormwater runoff flows
over impervious surfaces and into waterbodies with limited opportunity to naturally absorb
into the environment. Hard, impervious surfaces increase the volume of water being
transported to stormwater conveyance systems, which aggravates instances of localized
flooding. Stormwater is transported rapidly over impervious surfaces through connected
conveyance systems, including ditches, pipes, parking lots, and open grassy areas like yards that
are circumventing natural hydrologic processes. As water travels across hard, impervious
surfaces, bacteria and other pollutants are collected and transported through stormwater
connected conveyance systems, such as curbs, pipes, and ditches directly to our waterways. By
reducing stormwater runoff we can reduce the volume of stormwater impacting stormwater
conveyance systems thus reducing the instances, extent, and length of time flooding occurs.
Reducing stormwater runoff can also reduce bacteria and other pollutants, such as total
suspended solids, nutrient, and harmful constituents (oils, heavy metals, chemicals, etc.).
Restoration and management techniques that rely on stormwater reduction volume and that
mimic or restore natural hydrology can reduce stormwater and pollutant and the instances,
extent, and length of time flooding occurs.
Rather than focusing on reducing sources of contamination or attempting the difficult task of
treating pollutants from stormwater runoff, the management techniques identified in this plan
focus on reducing the overall volume of stormwater runoff to limit the conveyance from the
land into coastal waters. Low-impact development (LID) stormwater reduction practices and
stormwater retrofits can achieve this goal by replicating the natural hydrology and increasing
infiltration in impervious areas. LID practices are a form of land planning and engineering that
primarily focus on mimicking natural hydrology of the area to limit stormwater runoff. For
already developed locations stormwater retrofit reduction techniques can reduce the amount
of stormwater entering connected conveyance systems. The result of implementing stormwater
reduction practices is that less bacteria and pollutants are transported off the land and into
water systems.
45
Restoration of pre-development, natural hydrology can reduce pollutants being discharged into
coastal waterways and reduce the instances, extent, and length of time of localized flooding
occurs. Bacteria is affected by the following factors: the natural mortality of fecal coliform and
enterococcus bacteria, the prevention of bacteria and pollutants from entering waterbodies,
and the reduction in the velocity of waters traveling off the landscape resulting from lower
flows. Infiltration of rainfall into the ground can serves as an effective filtration system of
bacteria and pollutants. Additionally, once bacteria enter the landscape they are subject to
higher rates of mortality due to bombardment by ultraviolet radiation from sunlight.
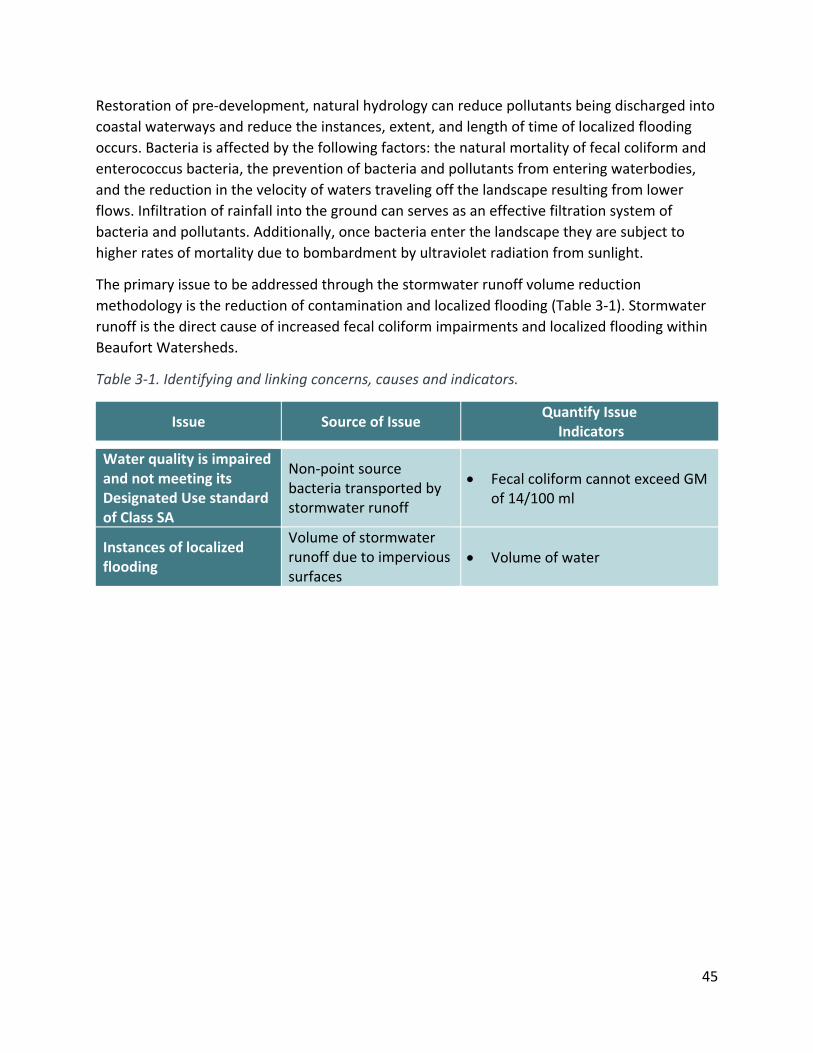
The primary issue to be addressed through the stormwater runoff volume reduction
methodology is the reduction of contamination and localized flooding (Table 3-1). Stormwater
runoff is the direct cause of increased fecal coliform impairments and localized flooding within
Beaufort Watersheds.
Table 3-1. Identifying and linking concerns, causes and indicators.
Issue Source of Issue Quantify Issue
Indicators
Water quality is impaired and not meeting its Designated Use standard of Class SA
Non-point source bacteria transported by stormwater runoff
• Fecal coliform cannot exceed GM of 14/100 ml
Instances of localized flooding
Volume of stormwater runoff due to impervious surfaces
• Volume of water
46
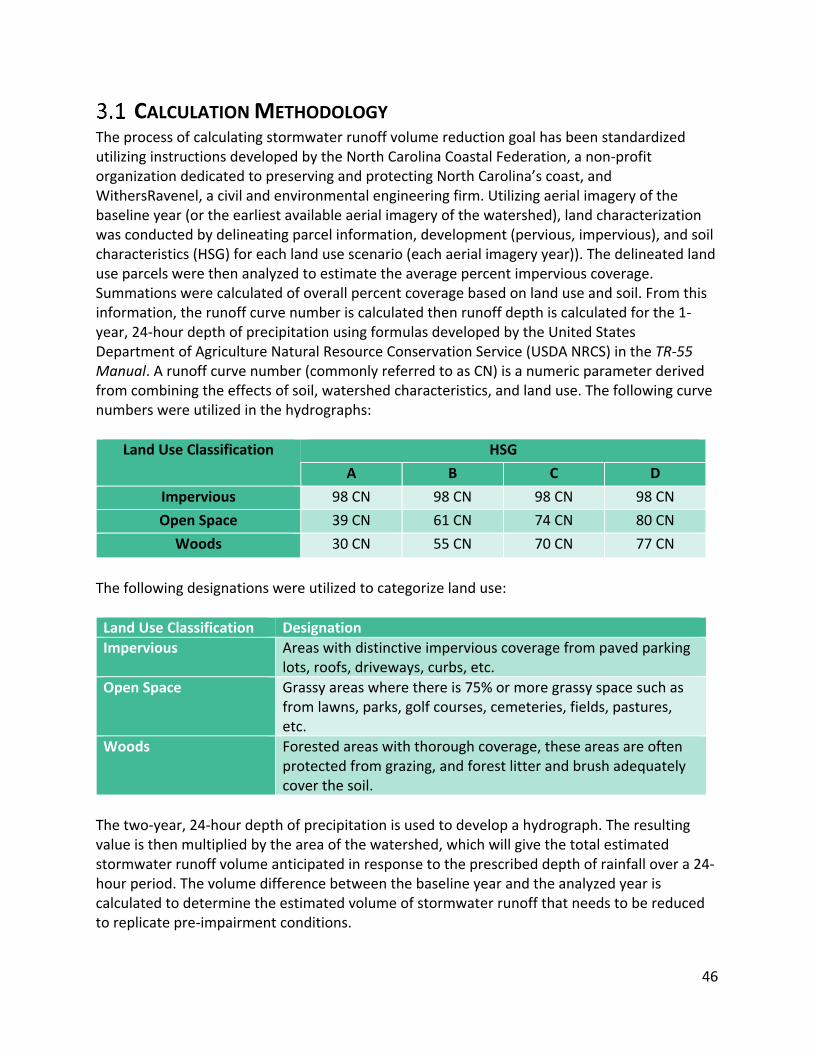
CALCULATION METHODOLOGY The process of calculating stormwater runoff volume reduction goal has been standardized utilizing instructions developed by the North Carolina Coastal Federation, a non-profit organization dedicated to preserving and protecting North Carolina’s coast, and WithersRavenel, a civil and environmental engineering firm. Utilizing aerial imagery of the baseline year (or the earliest available aerial imagery of the watershed), land characterization was conducted by delineating parcel information, development (pervious, impervious), and soil characteristics (HSG) for each land use scenario (each aerial imagery year)). The delineated land use parcels were then analyzed to estimate the average percent impervious coverage. Summations were calculated of overall percent coverage based on land use and soil. From this information, the runoff curve number is calculated then runoff depth is calculated for the 1-year, 24-hour depth of precipitation using formulas developed by the United States Department of Agriculture Natural Resource Conservation Service (USDA NRCS) in the TR-55 Manual. A runoff curve number (commonly referred to as CN) is a numeric parameter derived from combining the effects of soil, watershed characteristics, and land use. The following curve numbers were utilized in the hydrographs:
Land Use Classification HSG
A B C D
Impervious 98 CN 98 CN 98 CN 98 CN
Open Space 39 CN 61 CN 74 CN 80 CN
Woods 30 CN 55 CN 70 CN 77 CN
The following designations were utilized to categorize land use:
Land Use Classification Designation
Impervious Areas with distinctive impervious coverage from paved parking lots, roofs, driveways, curbs, etc.
Open Space Grassy areas where there is 75% or more grassy space such as from lawns, parks, golf courses, cemeteries, fields, pastures, etc.
Woods Forested areas with thorough coverage, these areas are often protected from grazing, and forest litter and brush adequately cover the soil.
The two-year, 24-hour depth of precipitation is used to develop a hydrograph. The resulting value is then multiplied by the area of the watershed, which will give the total estimated stormwater runoff volume anticipated in response to the prescribed depth of rainfall over a 24-hour period. The volume difference between the baseline year and the analyzed year is calculated to determine the estimated volume of stormwater runoff that needs to be reduced to replicate pre-impairment conditions.
47
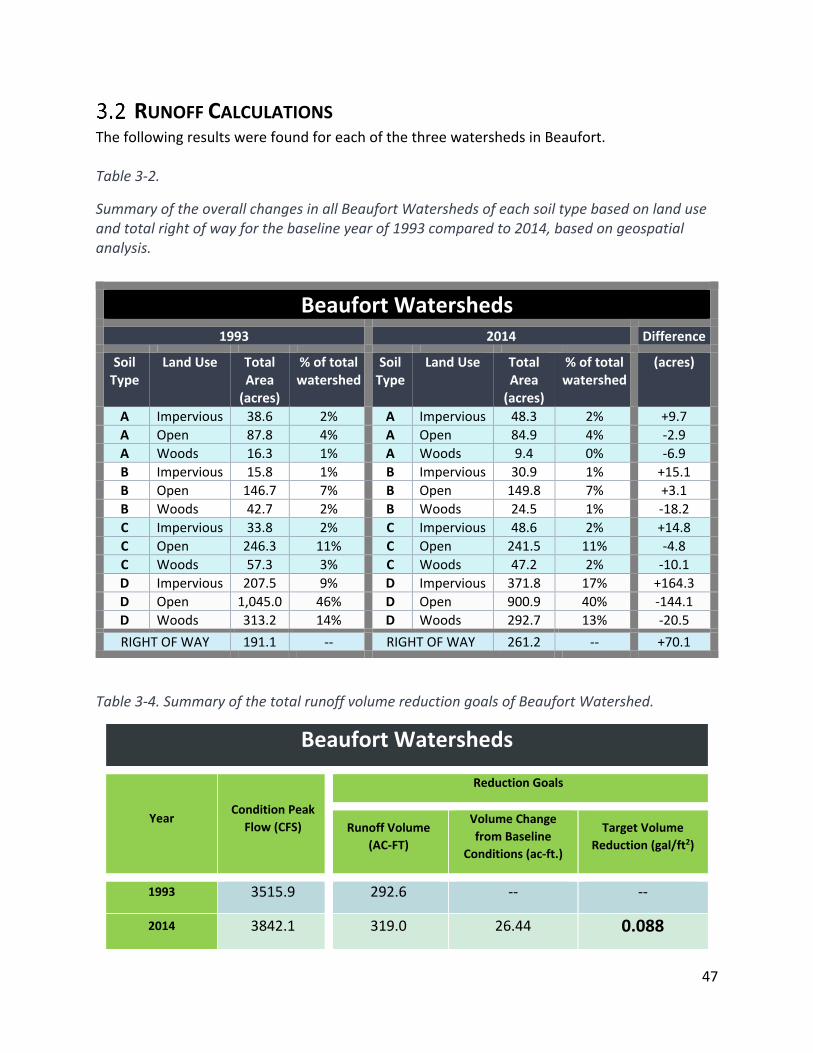
RUNOFF CALCULATIONS The following results were found for each of the three watersheds in Beaufort. Table 3-2.
Summary of the overall changes in all Beaufort Watersheds of each soil type based on land use and total right of way for the baseline year of 1993 compared to 2014, based on geospatial analysis.
Table 3-4. Summary of the total runoff volume reduction goals of Beaufort Watershed.
Beaufort Watersheds
Year Condition Peak
Flow (CFS)
Reduction Goals
Runoff Volume
(AC-FT)
Volume Change
from Baseline
Conditions (ac-ft.)
Target Volume
Reduction (gal/ft2)
1993 3515.9 292.6 -- --
2014 3842.1 319.0 26.44 0.088
Beaufort Watersheds
1993 2014 Difference
Soil Type
Land Use Total Area
(acres)
% of total watershed
Soil Type
Land Use Total Area
(acres)
% of total watershed
(acres)
A Impervious 38.6 2% A Impervious 48.3 2% +9.7
A Open 87.8 4% A Open 84.9 4% -2.9
A Woods 16.3 1% A Woods 9.4 0% -6.9
B Impervious 15.8 1% B Impervious 30.9 1% +15.1
B Open 146.7 7% B Open 149.8 7% +3.1
B Woods 42.7 2% B Woods 24.5 1% -18.2
C Impervious 33.8 2% C Impervious 48.6 2% +14.8
C Open 246.3 11% C Open 241.5 11% -4.8
C Woods 57.3 3% C Woods 47.2 2% -10.1
D Impervious 207.5 9% D Impervious 371.8 17% +164.3
D Open 1,045.0 46% D Open 900.9 40% -144.1
D Woods 313.2 14% D Woods 292.7 13% -20.5
RIGHT OF WAY 191.1 -- RIGHT OF WAY 261.2 -- +70.1
48
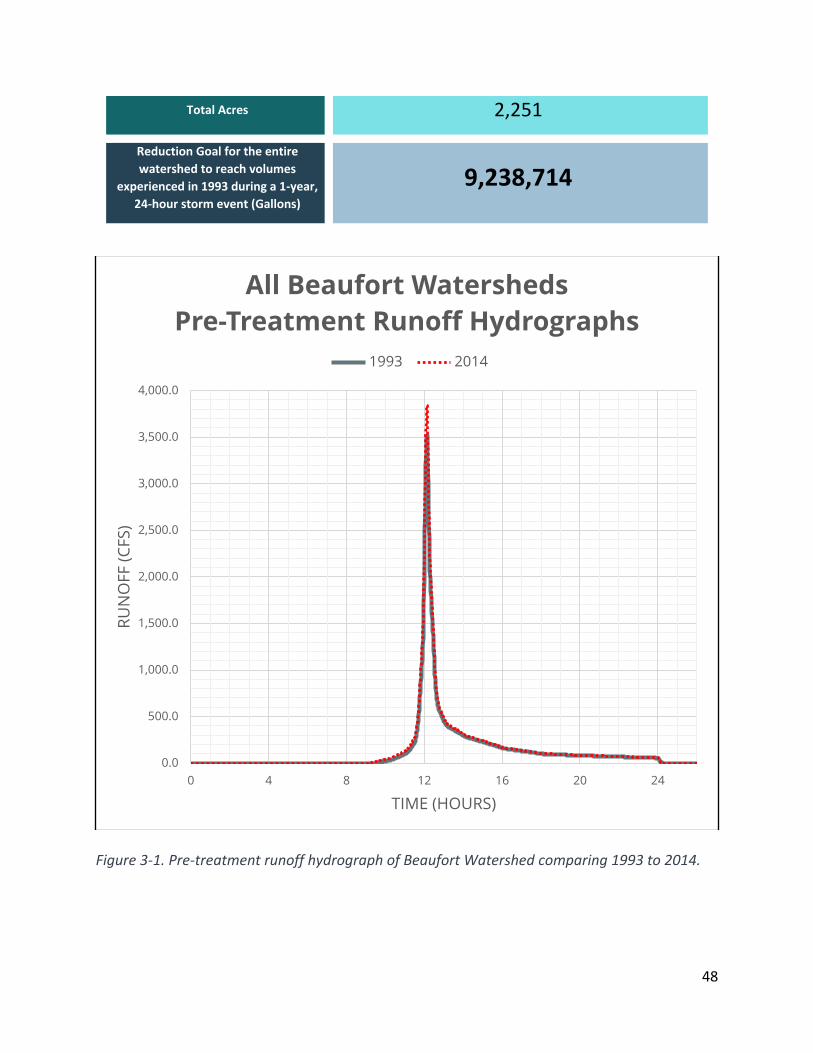
Total Acres 2,251
Reduction Goal for the entire
watershed to reach volumes
experienced in 1993 during a 1-year,
24-hour storm event (Gallons)
9,238,714
Figure 3-1. Pre-treatment runoff hydrograph of Beaufort Watershed comparing 1993 to 2014.
0.0
500.0
1,000.0
1,500.0
2,000.0
2,500.0
3,000.0
3,500.0
4,000.0
0 4 8 12 16 20 24
RU
NO
FF (
CFS
)
TIME (HOURS)
All Beaufort Watersheds
Pre-Treatment Runoff Hydrographs
1993 2014
49
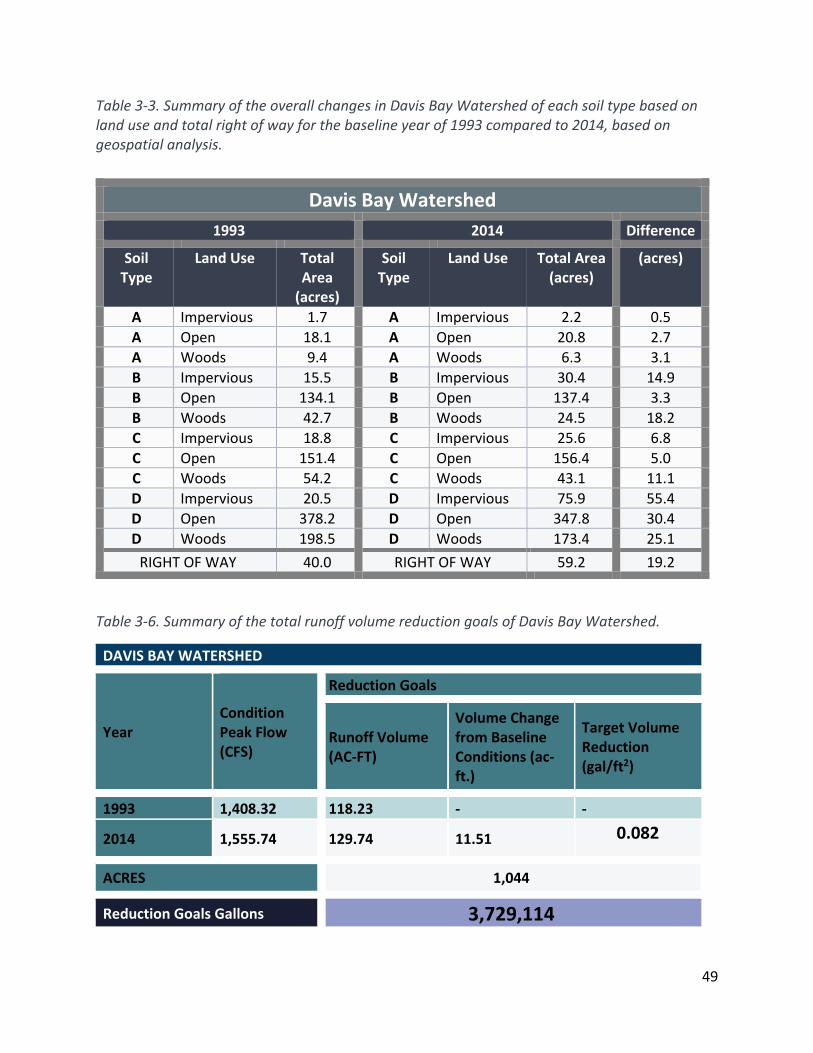
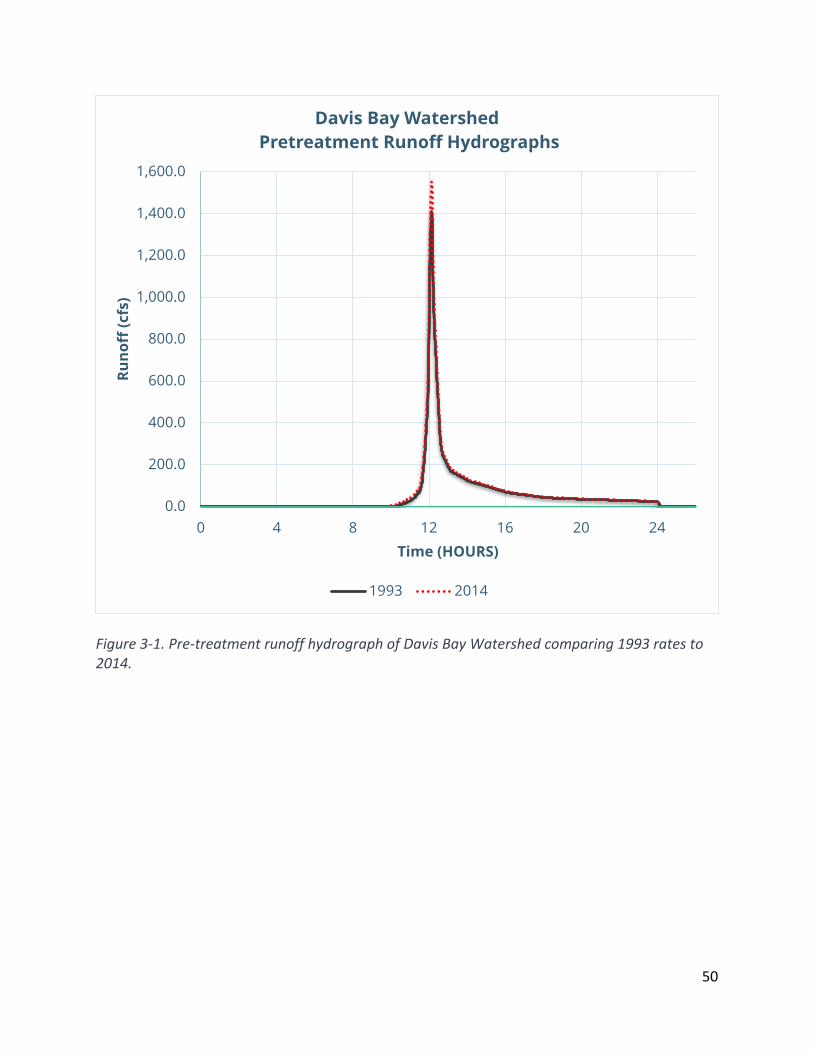
Table 3-3. Summary of the overall changes in Davis Bay Watershed of each soil type based on land use and total right of way for the baseline year of 1993 compared to 2014, based on geospatial analysis.
Table 3-6. Summary of the total runoff volume reduction goals of Davis Bay Watershed.
DAVIS BAY WATERSHED
Year Condition Peak Flow (CFS)
Reduction Goals
Runoff Volume (AC-FT)
Volume Change from Baseline Conditions (ac-ft.)
Target Volume Reduction (gal/ft2)
1993 1,408.32 118.23 - -
2014 1,555.74 129.74 11.51 0.082
ACRES 1,044
Reduction Goals Gallons 3,729,114
Davis Bay Watershed
1993 2014 Difference
Soil Type
Land Use Total Area
(acres)
Soil Type
Land Use Total Area (acres)
(acres)
A Impervious 1.7 A Impervious 2.2 0.5
A Open 18.1 A Open 20.8 2.7
A Woods 9.4 A Woods 6.3 3.1
B Impervious 15.5 B Impervious 30.4 14.9
B Open 134.1 B Open 137.4 3.3
B Woods 42.7 B Woods 24.5 18.2
C Impervious 18.8 C Impervious 25.6 6.8
C Open 151.4 C Open 156.4 5.0
C Woods 54.2 C Woods 43.1 11.1
D Impervious 20.5 D Impervious 75.9 55.4
D Open 378.2 D Open 347.8 30.4
D Woods 198.5 D Woods 173.4 25.1
RIGHT OF WAY 40.0 RIGHT OF WAY 59.2 19.2
50
Figure 3-1. Pre-treatment runoff hydrograph of Davis Bay Watershed comparing 1993 rates to 2014.
0.0
200.0
400.0
600.0
800.0
1,000.0
1,200.0
1,400.0
1,600.0
0 4 8 12 16 20 24
Ru
no
ff (
cfs
)
Time (HOURS)
Davis Bay Watershed
Pretreatment Runoff Hydrographs
1993 2014
51
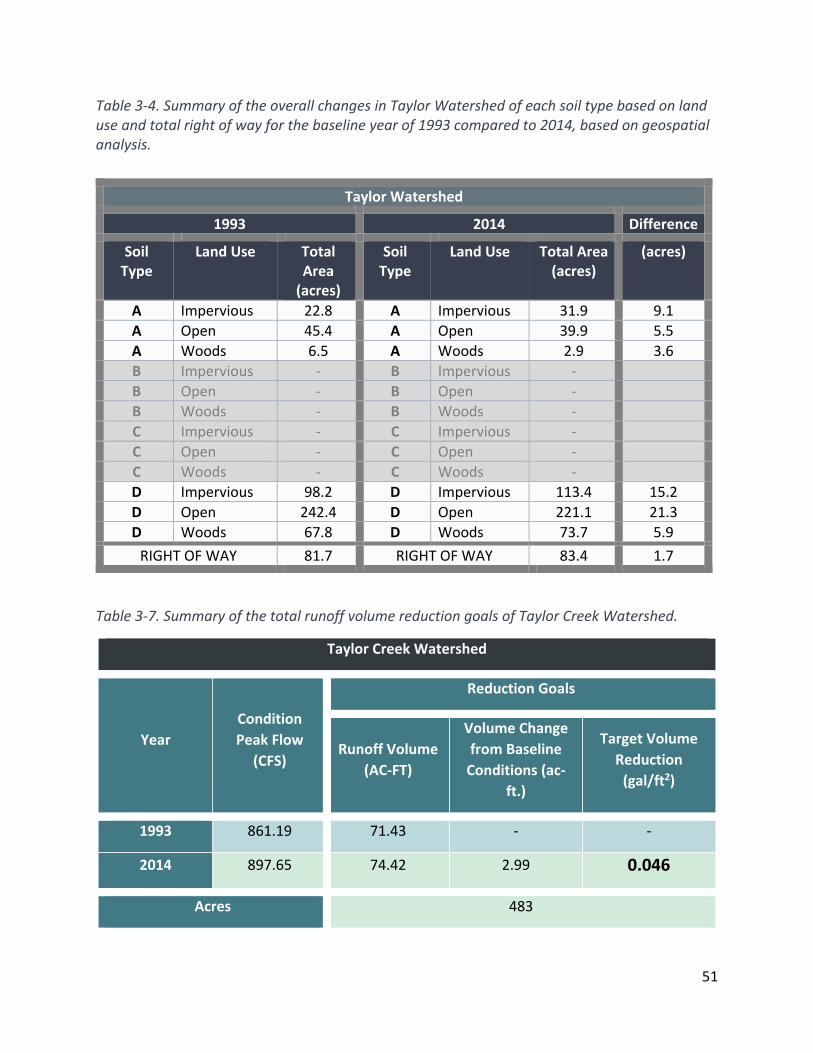
Table 3-4. Summary of the overall changes in Taylor Watershed of each soil type based on land use and total right of way for the baseline year of 1993 compared to 2014, based on geospatial analysis.
Table 3-7. Summary of the total runoff volume reduction goals of Taylor Creek Watershed.
Taylor Creek Watershed
Year
Condition
Peak Flow
(CFS)
Reduction Goals
Runoff Volume
(AC-FT)
Volume Change
from Baseline
Conditions (ac-
ft.)
Target Volume
Reduction
(gal/ft2)
1993 861.19 71.43 - -
2014 897.65 74.42 2.99 0.046
Acres 483
Taylor Watershed
1993 2014 Difference
Soil Type
Land Use Total Area
(acres)
Soil Type
Land Use Total Area (acres)
(acres)
A Impervious 22.8 A Impervious 31.9 9.1
A Open 45.4 A Open 39.9 5.5
A Woods 6.5 A Woods 2.9 3.6
B Impervious - B Impervious -
B Open - B Open -
B Woods - B Woods -
C Impervious - C Impervious -
C Open - C Open -
C Woods - C Woods -
D Impervious 98.2 D Impervious 113.4 15.2
D Open 242.4 D Open 221.1 21.3
D Woods 67.8 D Woods 73.7 5.9
RIGHT OF WAY 81.7 RIGHT OF WAY 83.4 1.7
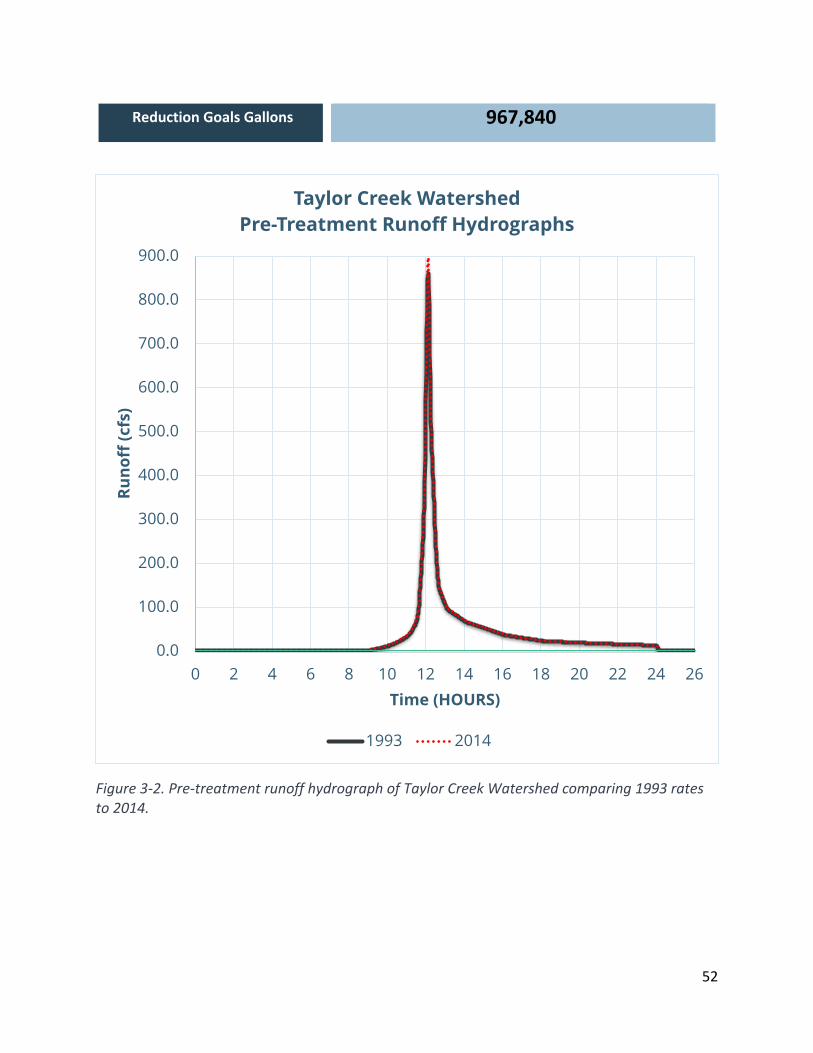
52
Reduction Goals Gallons 967,840
Figure 3-2. Pre-treatment runoff hydrograph of Taylor Creek Watershed comparing 1993 rates to 2014.
0.0
100.0
200.0
300.0
400.0
500.0
600.0
700.0
800.0
900.0
0 2 4 6 8 10 12 14 16 18 20 22 24 26
Ru
no
ff (
cfs
)
Time (HOURS)
Taylor Creek Watershed
Pre-Treatment Runoff Hydrographs
1993 2014
53
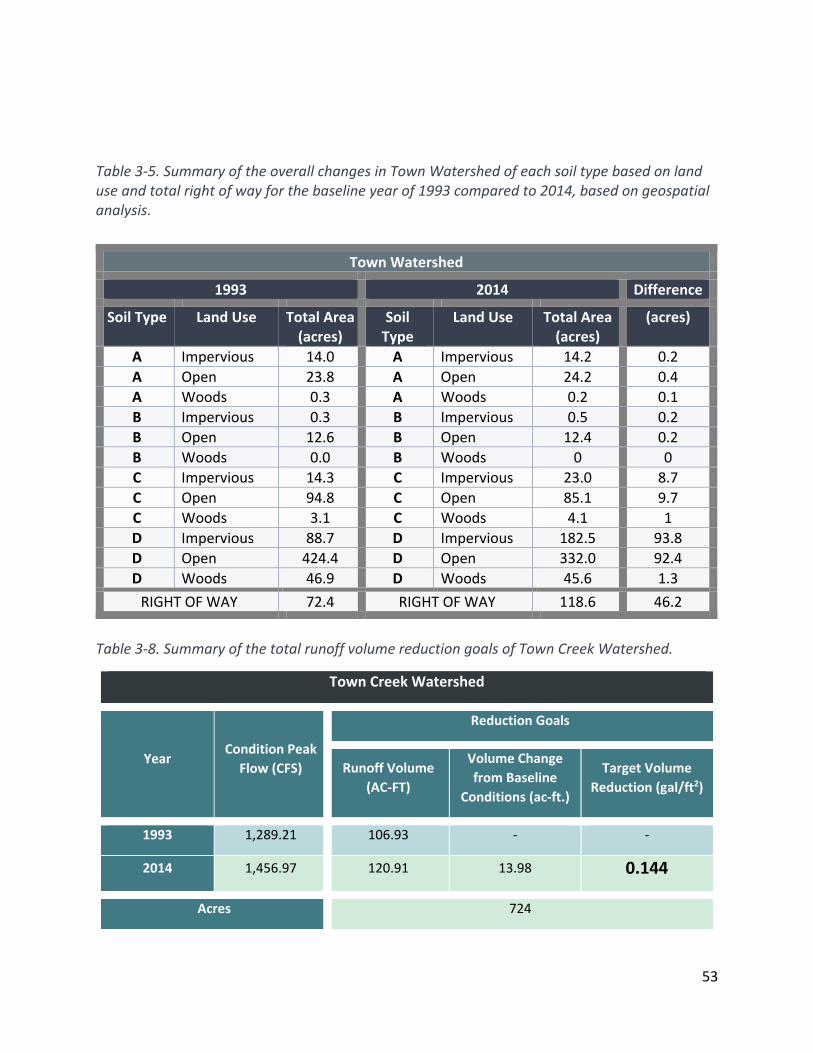
Table 3-5. Summary of the overall changes in Town Watershed of each soil type based on land use and total right of way for the baseline year of 1993 compared to 2014, based on geospatial analysis.
Table 3-8. Summary of the total runoff volume reduction goals of Town Creek Watershed.
Town Creek Watershed
Year Condition Peak
Flow (CFS)
Reduction Goals
Runoff Volume
(AC-FT)
Volume Change
from Baseline
Conditions (ac-ft.)
Target Volume
Reduction (gal/ft2)
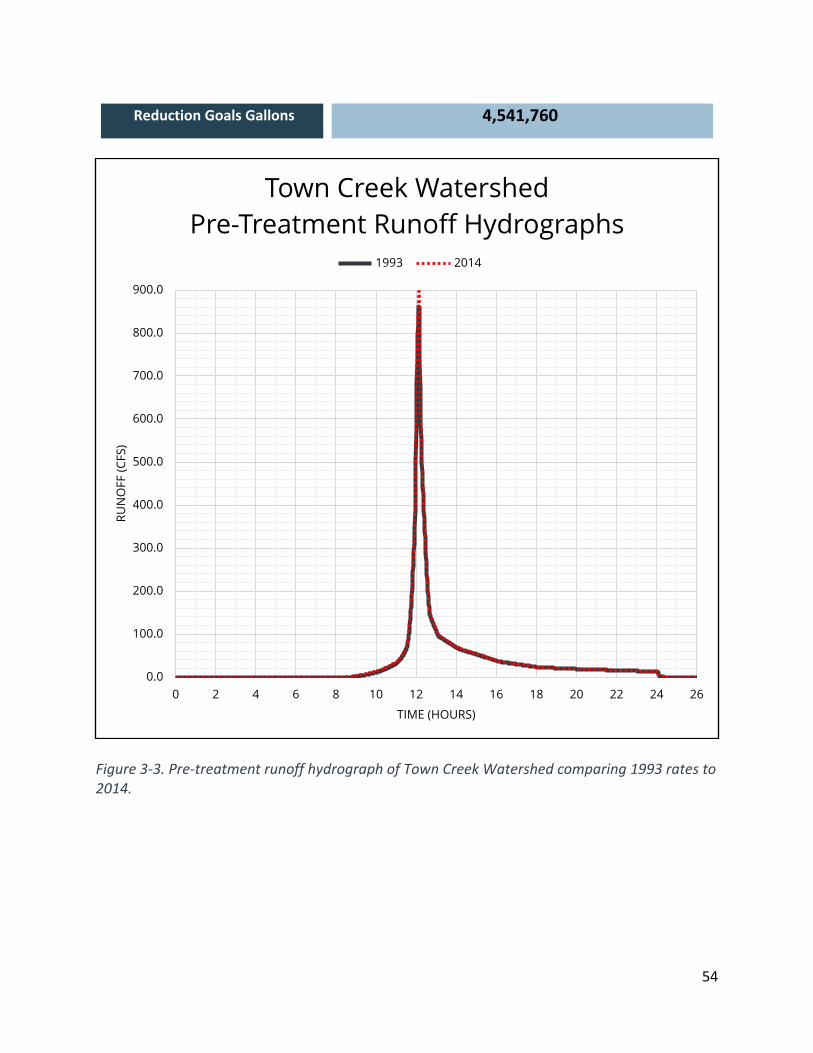
1993 1,289.21 106.93 - -
2014 1,456.97 120.91 13.98 0.144
Acres 724
Town Watershed
1993 2014 Difference
Soil Type Land Use Total Area (acres)
Soil Type
Land Use Total Area (acres)
(acres)
A Impervious 14.0 A Impervious 14.2 0.2
A Open 23.8 A Open 24.2 0.4
A Woods 0.3 A Woods 0.2 0.1
B Impervious 0.3 B Impervious 0.5 0.2
B Open 12.6 B Open 12.4 0.2
B Woods 0.0 B Woods 0 0
C Impervious 14.3 C Impervious 23.0 8.7
C Open 94.8 C Open 85.1 9.7
C Woods 3.1 C Woods 4.1 1
D Impervious 88.7 D Impervious 182.5 93.8
D Open 424.4 D Open 332.0 92.4
D Woods 46.9 D Woods 45.6 1.3
RIGHT OF WAY 72.4 RIGHT OF WAY 118.6 46.2
54
Reduction Goals Gallons 4,541,760
Figure 3-3. Pre-treatment runoff hydrograph of Town Creek Watershed comparing 1993 rates to 2014.
0.0
100.0
200.0
300.0
400.0
500.0
600.0
700.0
800.0
900.0
0 2 4 6 8 10 12 14 16 18 20 22 24 26
RU
NO
FF (
CFS
)
TIME (HOURS)
Town Creek Watershed
Pre-Treatment Runoff Hydrographs1993 2014
55
4 Goals The Beaufort Watersheds partners seek to utilize various stormwater reduction techniques to
reduce stormwater runoff by 0.088 gallons per square foot. This will be achieved through
targeted stormwater retrofits that infiltrate stormwater before it reaches the regions surface
waters. Mimicking natural drainage processes protects life and properties from flooding,
improves the aesthetics of urban areas and maintains the water quantity and quality
requirements of receiving water bodies. By addressing stormwater, this plan will directly
mitigate pathogenic pollution. The plan relies on community involvement from partners and
the community. The plan therefore includes community education opportunities to
demonstrate how surface runoff pollutes the waterways and how volume reduction will work
to restore water quality.
PRIMARY GOAL The goal of this plan is to improve water quality within the Beaufort region, and will be
accomplished by combining low-cost, high-yield strategies such as community outreach
initiatives and lot level retrofit projects that reduce the impact of impervious surface by
mimicking natural hydrology to reduce flooding, protect water quality, and provide the
community with clean, usable waters. This goal will be accomplished over the coming 30 years
by achieving objectives and management actions identified below. Over time, reductions in
the volume of stormwater runoff will be achieved through implementation of this plan and will
result in measurable water quality improvements, realized. This restoration plan uses the
innovative approach of reducing runoff volumes within the Beaufort region watersheds to
reduce existing water quality impairments and restore water quality. As with other plans that
incorporate this volume reduction philosophy, this plan emphasizes six restoration objectives to
accomplish its goals (Table 4-1).
Table 4-1. The primary goal of the watershed management plan and the objectives.
Primary Goal Restore impaired water quality in three Beaufort Watersheds.
OBJECTIVES
1 Data collection and analysis is conducted to accomplish the plan objectives.
2 New development and redevelopment does not create additional water quality
impairments.
3 Stormwater reduction techniques are applied on public properties.
4 The volume of stormwater runoff is reduced from existing private land uses.
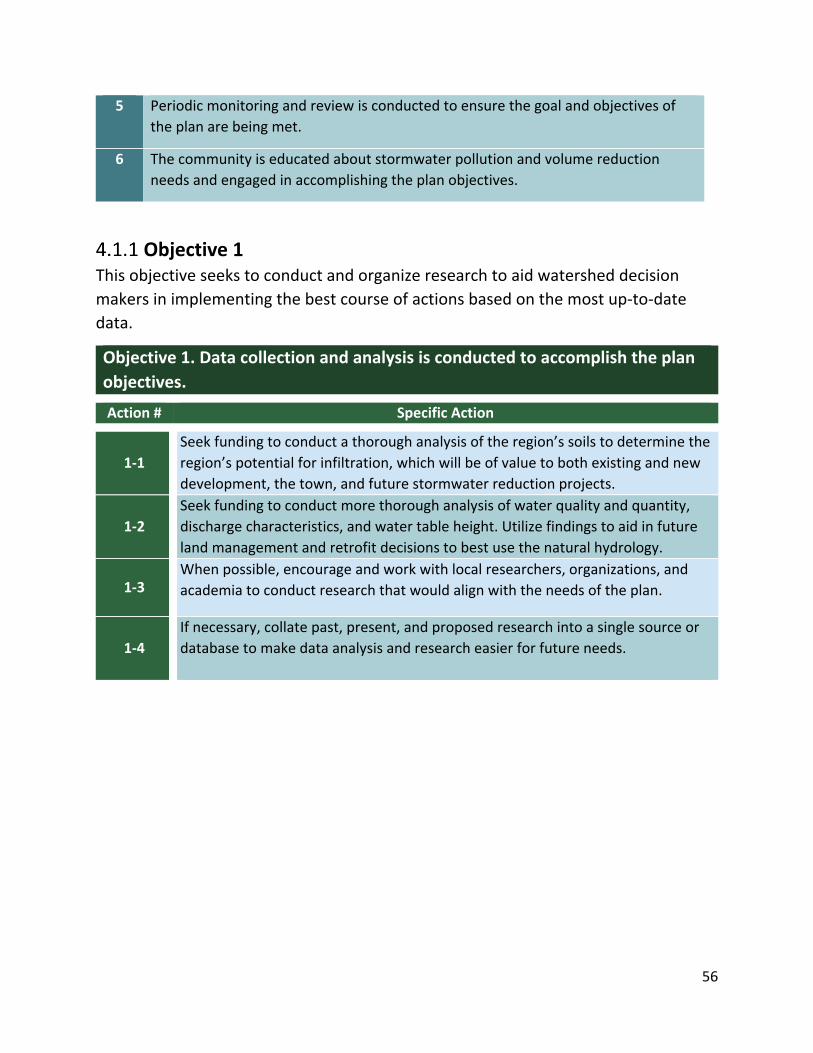
56
5 Periodic monitoring and review is conducted to ensure the goal and objectives of
the plan are being met.
6 The community is educated about stormwater pollution and volume reduction
needs and engaged in accomplishing the plan objectives.
Objective 1 This objective seeks to conduct and organize research to aid watershed decision
makers in implementing the best course of actions based on the most up-to-date
data.
Objective 1. Data collection and analysis is conducted to accomplish the plan
objectives.
Action # Specific Action
1-1
Seek funding to conduct a thorough analysis of the region’s soils to determine the
region’s potential for infiltration, which will be of value to both existing and new
development, the town, and future stormwater reduction projects.
1-2
Seek funding to conduct more thorough analysis of water quality and quantity,
discharge characteristics, and water table height. Utilize findings to aid in future
land management and retrofit decisions to best use the natural hydrology.
1-3 When possible, encourage and work with local researchers, organizations, and
academia to conduct research that would align with the needs of the plan.
1-4
If necessary, collate past, present, and proposed research into a single source or
database to make data analysis and research easier for future needs.
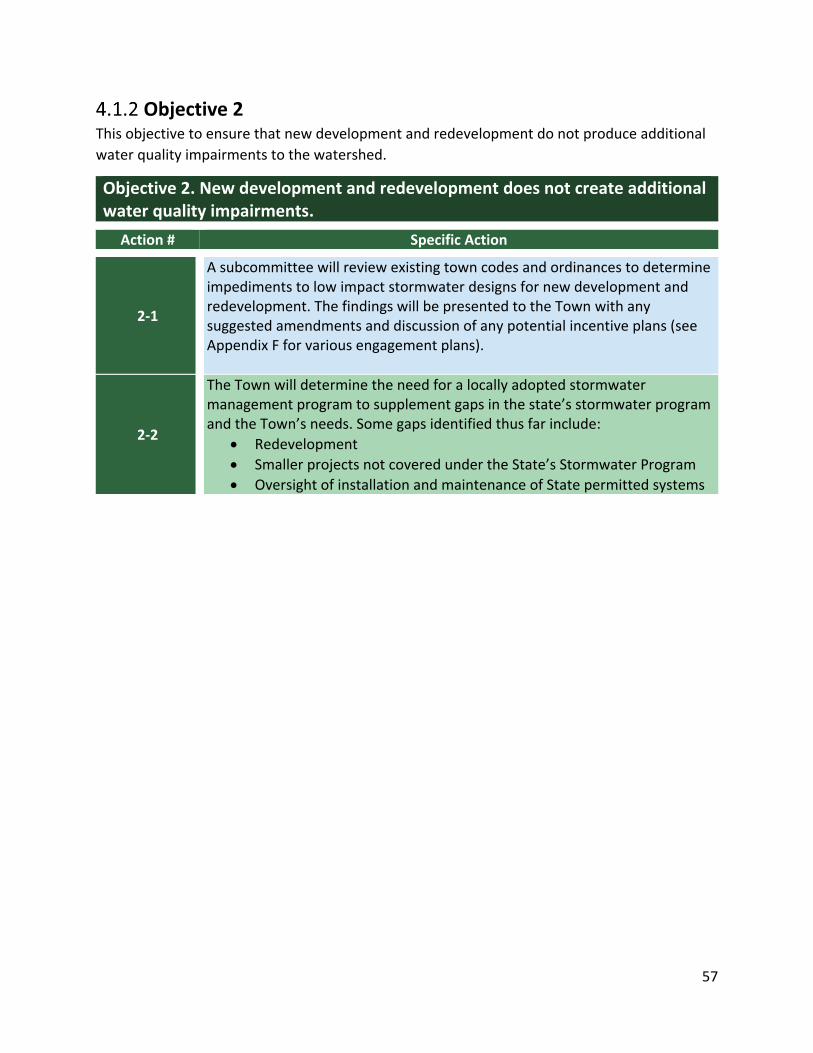
57
Objective 2 This objective to ensure that new development and redevelopment do not produce additional
water quality impairments to the watershed.
Objective 2. New development and redevelopment does not create additional water quality impairments.
Action # Specific Action
2-1
A subcommittee will review existing town codes and ordinances to determine impediments to low impact stormwater designs for new development and redevelopment. The findings will be presented to the Town with any suggested amendments and discussion of any potential incentive plans (see Appendix F for various engagement plans).
2-2
The Town will determine the need for a locally adopted stormwater management program to supplement gaps in the state’s stormwater program and the Town’s needs. Some gaps identified thus far include:
• Redevelopment
• Smaller projects not covered under the State’s Stormwater Program
• Oversight of installation and maintenance of State permitted systems
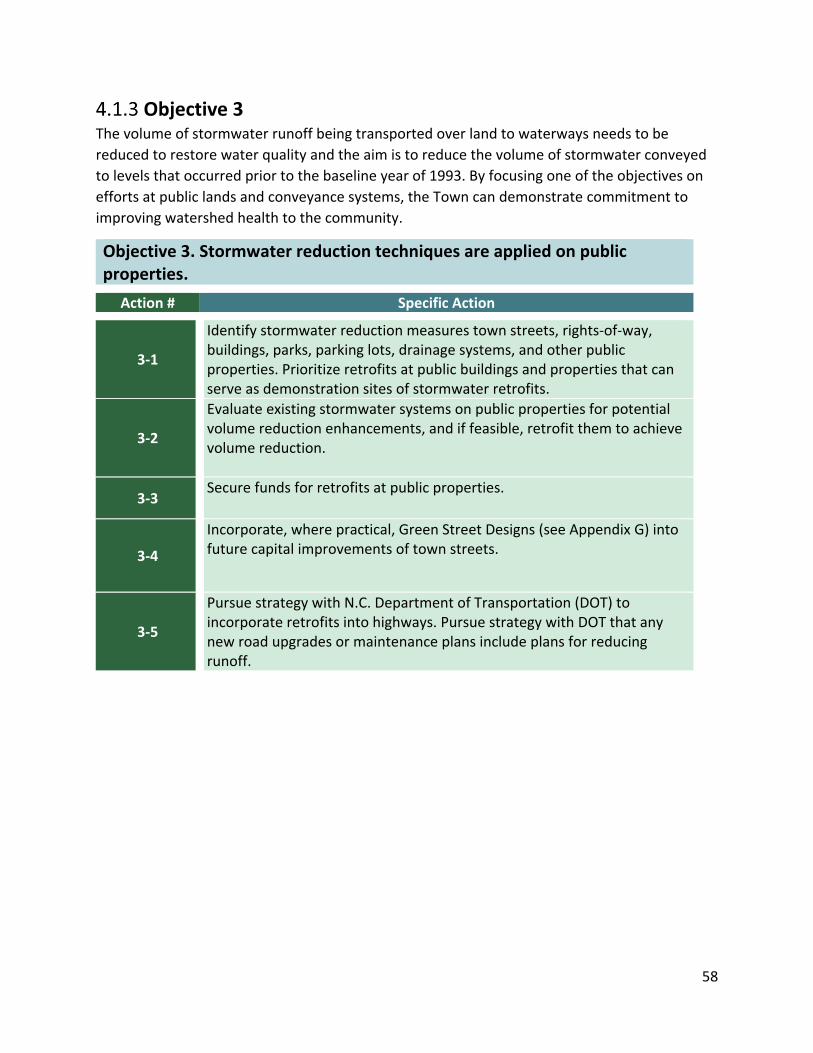
58
Objective 3 The volume of stormwater runoff being transported over land to waterways needs to be
reduced to restore water quality and the aim is to reduce the volume of stormwater conveyed
to levels that occurred prior to the baseline year of 1993. By focusing one of the objectives on
efforts at public lands and conveyance systems, the Town can demonstrate commitment to
improving watershed health to the community.
Objective 3. Stormwater reduction techniques are applied on public properties.
Action # Specific Action
3-1
Identify stormwater reduction measures town streets, rights-of-way, buildings, parks, parking lots, drainage systems, and other public properties. Prioritize retrofits at public buildings and properties that can serve as demonstration sites of stormwater retrofits.
3-2
Evaluate existing stormwater systems on public properties for potential volume reduction enhancements, and if feasible, retrofit them to achieve volume reduction.
3-3 Secure funds for retrofits at public properties.
3-4
Incorporate, where practical, Green Street Designs (see Appendix G) into future capital improvements of town streets.
3-5
Pursue strategy with N.C. Department of Transportation (DOT) to incorporate retrofits into highways. Pursue strategy with DOT that any new road upgrades or maintenance plans include plans for reducing runoff.
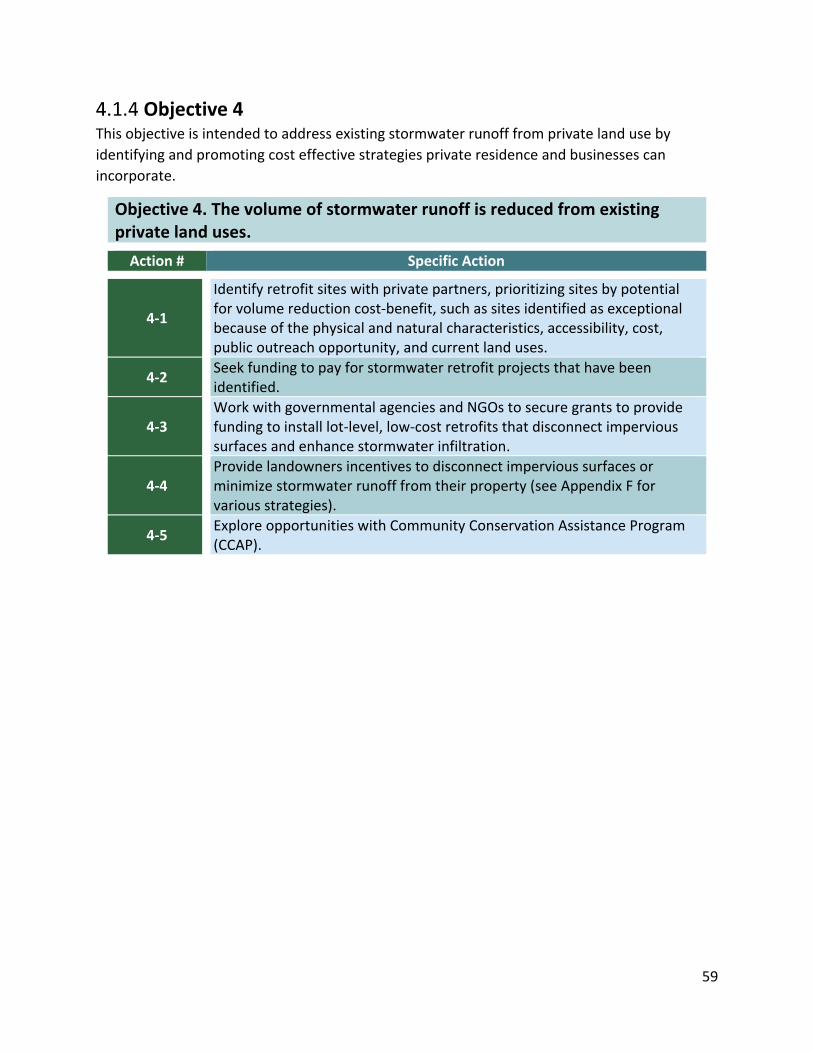
59
Objective 4 This objective is intended to address existing stormwater runoff from private land use by
identifying and promoting cost effective strategies private residence and businesses can
incorporate.
Objective 4. The volume of stormwater runoff is reduced from existing private land uses.
Action # Specific Action
4-1
Identify retrofit sites with private partners, prioritizing sites by potential for volume reduction cost-benefit, such as sites identified as exceptional because of the physical and natural characteristics, accessibility, cost, public outreach opportunity, and current land uses.
4-2 Seek funding to pay for stormwater retrofit projects that have been identified.
4-3 Work with governmental agencies and NGOs to secure grants to provide funding to install lot-level, low-cost retrofits that disconnect impervious surfaces and enhance stormwater infiltration.
4-4 Provide landowners incentives to disconnect impervious surfaces or minimize stormwater runoff from their property (see Appendix F for various strategies).
4-5 Explore opportunities with Community Conservation Assistance Program (CCAP).
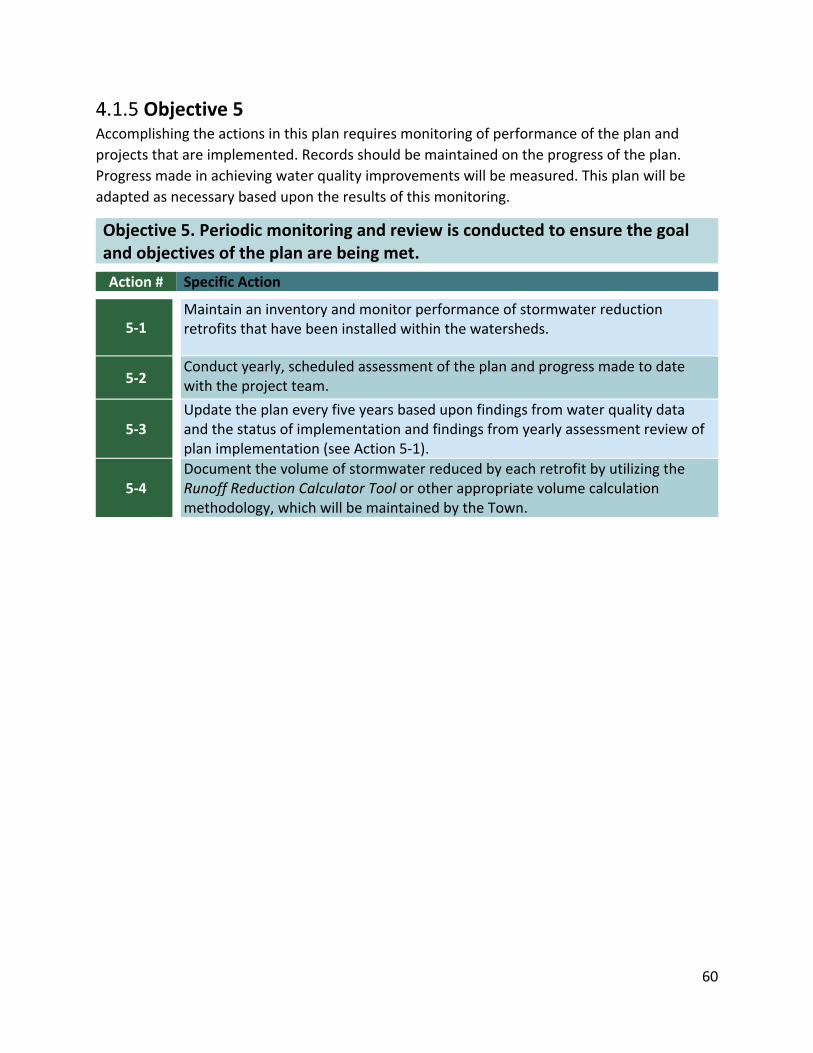
60
Objective 5 Accomplishing the actions in this plan requires monitoring of performance of the plan and
projects that are implemented. Records should be maintained on the progress of the plan.
Progress made in achieving water quality improvements will be measured. This plan will be
adapted as necessary based upon the results of this monitoring.
Objective 5. Periodic monitoring and review is conducted to ensure the goal and objectives of the plan are being met.
Action # Specific Action
5-1 Maintain an inventory and monitor performance of stormwater reduction retrofits that have been installed within the watersheds.
5-2 Conduct yearly, scheduled assessment of the plan and progress made to date with the project team.
5-3 Update the plan every five years based upon findings from water quality data and the status of implementation and findings from yearly assessment review of plan implementation (see Action 5-1).
5-4 Document the volume of stormwater reduced by each retrofit by utilizing the Runoff Reduction Calculator Tool or other appropriate volume calculation methodology, which will be maintained by the Town.
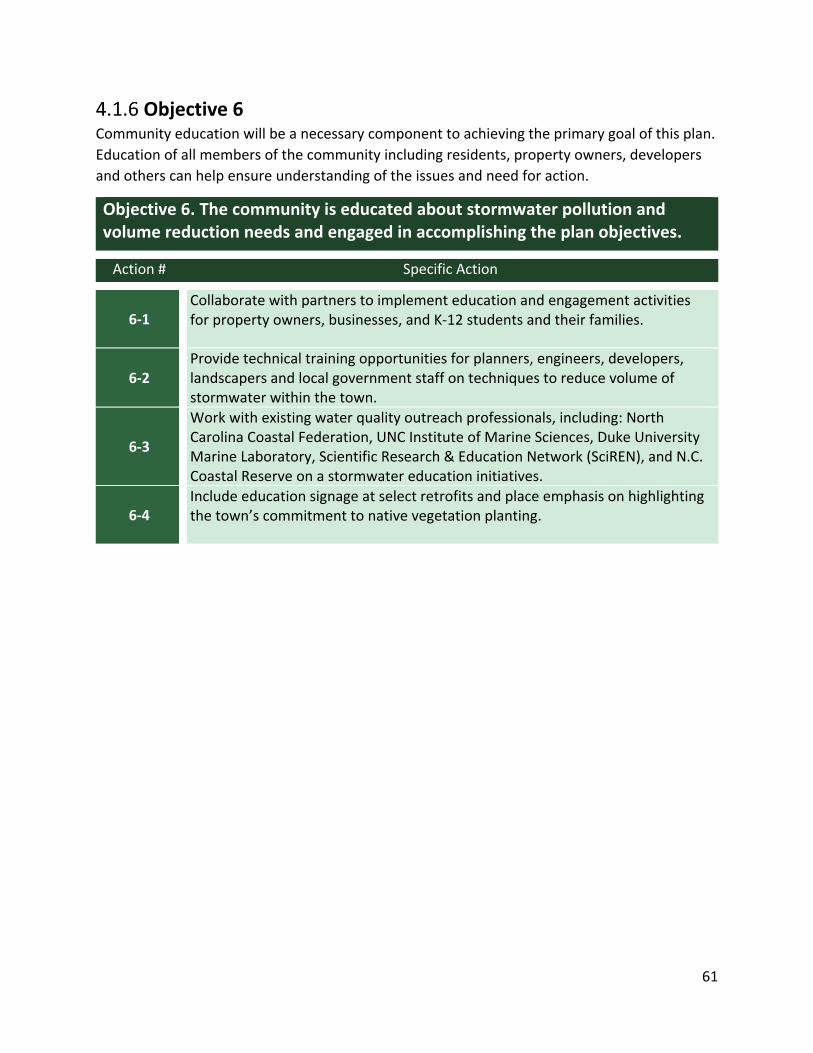
61
Objective 6 Community education will be a necessary component to achieving the primary goal of this plan.
Education of all members of the community including residents, property owners, developers
and others can help ensure understanding of the issues and need for action.
Objective 6. The community is educated about stormwater pollution and volume reduction needs and engaged in accomplishing the plan objectives.
Action # Specific Action
6-1 Collaborate with partners to implement education and engagement activities for property owners, businesses, and K-12 students and their families.
6-2 Provide technical training opportunities for planners, engineers, developers, landscapers and local government staff on techniques to reduce volume of stormwater within the town.
6-3
Work with existing water quality outreach professionals, including: North Carolina Coastal Federation, UNC Institute of Marine Sciences, Duke University Marine Laboratory, Scientific Research & Education Network (SciREN), and N.C. Coastal Reserve on a stormwater education initiatives.
6-4 Include education signage at select retrofits and place emphasis on highlighting the town’s commitment to native vegetation planting.
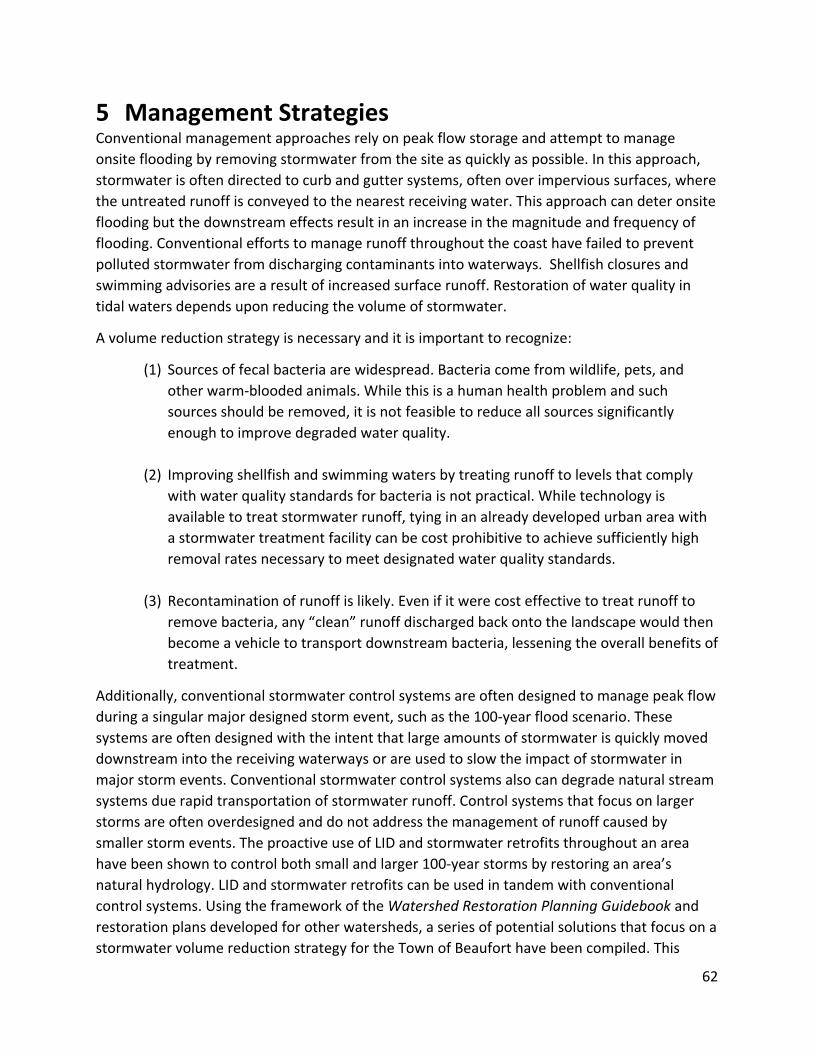
62
5 Management Strategies Conventional management approaches rely on peak flow storage and attempt to manage
onsite flooding by removing stormwater from the site as quickly as possible. In this approach,
stormwater is often directed to curb and gutter systems, often over impervious surfaces, where
the untreated runoff is conveyed to the nearest receiving water. This approach can deter onsite
flooding but the downstream effects result in an increase in the magnitude and frequency of
flooding. Conventional efforts to manage runoff throughout the coast have failed to prevent
polluted stormwater from discharging contaminants into waterways. Shellfish closures and
swimming advisories are a result of increased surface runoff. Restoration of water quality in
tidal waters depends upon reducing the volume of stormwater.
A volume reduction strategy is necessary and it is important to recognize:
(1) Sources of fecal bacteria are widespread. Bacteria come from wildlife, pets, and
other warm-blooded animals. While this is a human health problem and such
sources should be removed, it is not feasible to reduce all sources significantly
enough to improve degraded water quality.
(2) Improving shellfish and swimming waters by treating runoff to levels that comply
with water quality standards for bacteria is not practical. While technology is
available to treat stormwater runoff, tying in an already developed urban area with
a stormwater treatment facility can be cost prohibitive to achieve sufficiently high
removal rates necessary to meet designated water quality standards.
(3) Recontamination of runoff is likely. Even if it were cost effective to treat runoff to
remove bacteria, any “clean” runoff discharged back onto the landscape would then
become a vehicle to transport downstream bacteria, lessening the overall benefits of
treatment.
Additionally, conventional stormwater control systems are often designed to manage peak flow
during a singular major designed storm event, such as the 100-year flood scenario. These
systems are often designed with the intent that large amounts of stormwater is quickly moved
downstream into the receiving waterways or are used to slow the impact of stormwater in
major storm events. Conventional stormwater control systems also can degrade natural stream
systems due rapid transportation of stormwater runoff. Control systems that focus on larger
storms are often overdesigned and do not address the management of runoff caused by
smaller storm events. The proactive use of LID and stormwater retrofits throughout an area
have been shown to control both small and larger 100-year storms by restoring an area’s
natural hydrology. LID and stormwater retrofits can be used in tandem with conventional
control systems. Using the framework of the Watershed Restoration Planning Guidebook and
restoration plans developed for other watersheds, a series of potential solutions that focus on a
stormwater volume reduction strategy for the Town of Beaufort have been compiled. This

63
includes general strategies the town can consider incorporating to improve stormwater
management practices and plans. These strategies also include examples of potential actions
and retrofits to infrastructure within the town.
The management solutions, strategies, and techniques within this section and Section 6 are
strictly intended to be potential opportunities that the town can consider based on the
information compiled during the development of this restoration plan. The solutions listed are
general in scope and do not reflect actual projects that are being planned for implementation.
Before implementing any management solution, site assessments, additional considerations,
and research should be conducted.
REDUCTION TECHNIQUES Various stormwater management techniques can be implemented. Retrofits that reduce the
volume of stormwater runoff will be the priority. For residential areas, emphasis will be placed
on various single-family home retrofits, such as downspout retrofits, rain gardens, backyard
wetlands, rain barrels and other residential level retrofits. Emphasis will be placed on block-by-
block retrofit projects that aim and managing rainwater on site and minimizing the amount of
runoff from a property. Businesses can easily incorporate small-scale features like native
vegetation plantings, shade tree plantings or box planters to reduce the amount of runoff
leaving the property. Businesses can then consider incorporating stormwater retrofit
techniques into future developments or capital improvement projects (see Appendix F for
various incentive program solutions).
The town may consider amending or adding ordinances to better address stormwater runoff.
Possible changes and amendment could include preserving tree coverage and vegetated areas
and the consideration of ordinances to minimizing the amount of clearing and tree removal
that can occur. Similar regulations have been used in other nearby coastal communities. The
town can also consider landscaping policies that emphasize the use of native plants and reduce
the use of fertilizers and pesticides. Pet waste regulations and the installation of waste cleanup
stations can also be considered at public spaces. Future maintenance and capital improvement
projects at town-owned buildings, parks, parking lots, and drainage systems will consider the
incorporation of LID techniques and other Green Street Designs (Appendix G).
Table 5-1 and Figure 5-1 and 5-2 presents a variety of potential projects that can be considered
as funding becomes available. The list represents potential ideas for projects and can be used as
the basis for future projects (the detailed list is maintained by the Town). The list will likely
evolve to suit the condition and needs of the watersheds. In addition to this list, the town is
developing and maintaining a list of potential collaborative opportunities with local businesses
and commercial properties that will be added to the runoff reduction volume upon completion
of a project. The total number of indicators or specific details of each project can vary based on
funding and future needs that develop. The proposed management solutions, strategies, and
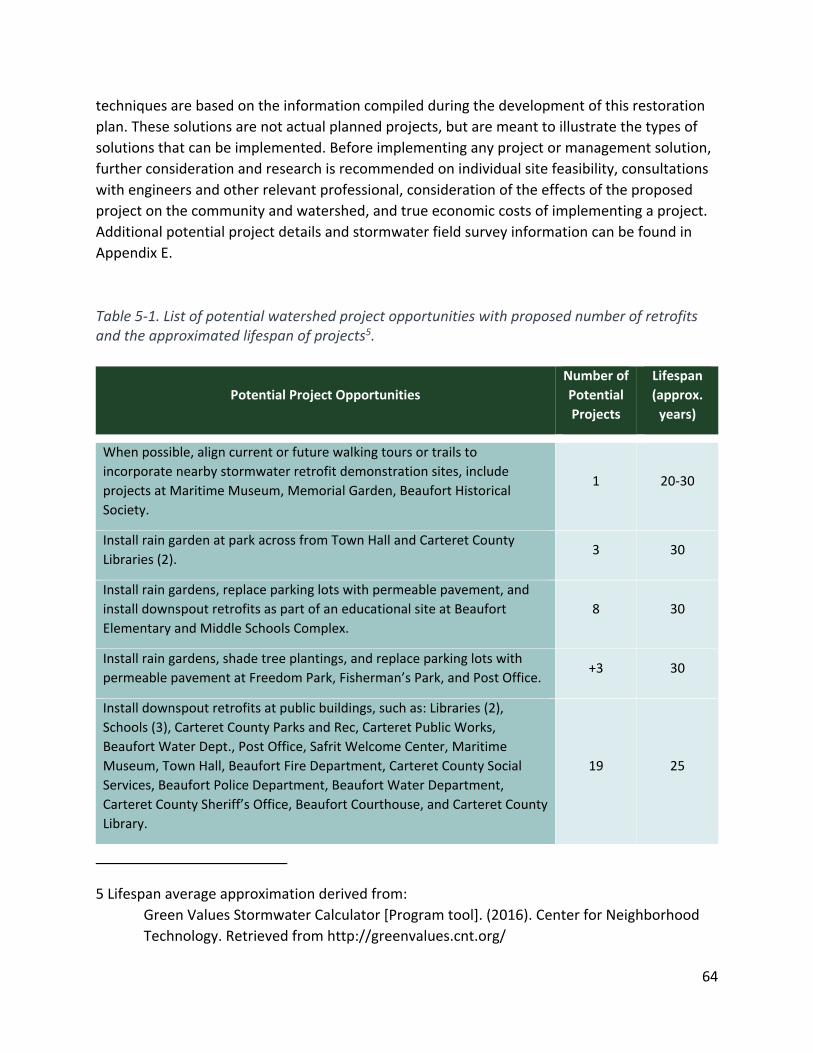
64
techniques are based on the information compiled during the development of this restoration
plan. These solutions are not actual planned projects, but are meant to illustrate the types of
solutions that can be implemented. Before implementing any project or management solution,
further consideration and research is recommended on individual site feasibility, consultations
with engineers and other relevant professional, consideration of the effects of the proposed
project on the community and watershed, and true economic costs of implementing a project.
Additional potential project details and stormwater field survey information can be found in
Appendix E.
Table 5-1. List of potential watershed project opportunities with proposed number of retrofits and the approximated lifespan of projects5.
Potential Project Opportunities
Number of
Potential
Projects
Lifespan
(approx.
years)
When possible, align current or future walking tours or trails to
incorporate nearby stormwater retrofit demonstration sites, include
projects at Maritime Museum, Memorial Garden, Beaufort Historical
Society.
1 20-30
Install rain garden at park across from Town Hall and Carteret County
Libraries (2). 3 30
Install rain gardens, replace parking lots with permeable pavement, and
install downspout retrofits as part of an educational site at Beaufort
Elementary and Middle Schools Complex.
8 30
Install rain gardens, shade tree plantings, and replace parking lots with
permeable pavement at Freedom Park, Fisherman’s Park, and Post Office. +3 30
Install downspout retrofits at public buildings, such as: Libraries (2),
Schools (3), Carteret County Parks and Rec, Carteret Public Works,
Beaufort Water Dept., Post Office, Safrit Welcome Center, Maritime
Museum, Town Hall, Beaufort Fire Department, Carteret County Social
Services, Beaufort Police Department, Beaufort Water Department,
Carteret County Sheriff’s Office, Beaufort Courthouse, and Carteret County
Library.
19 25
5 Lifespan average approximation derived from:
Green Values Stormwater Calculator [Program tool]. (2016). Center for Neighborhood
Technology. Retrieved from http://greenvalues.cnt.org/
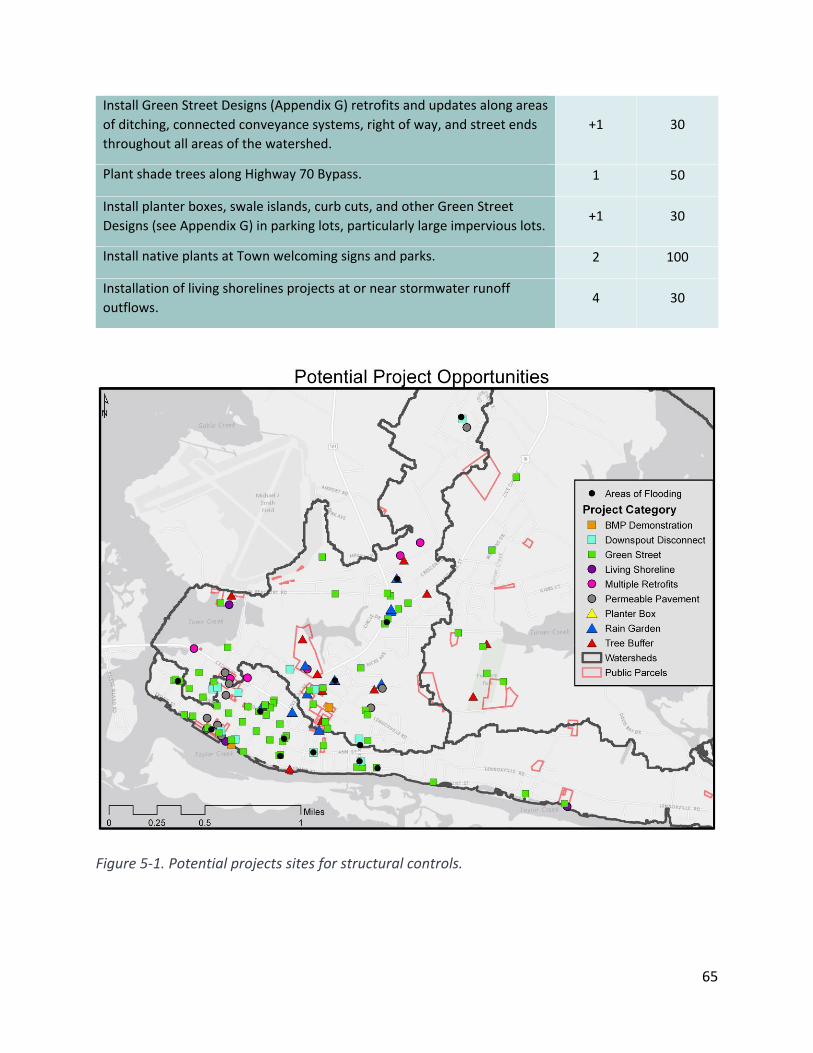
65
Install Green Street Designs (Appendix G) retrofits and updates along areas
of ditching, connected conveyance systems, right of way, and street ends
throughout all areas of the watershed.
+1 30
Plant shade trees along Highway 70 Bypass. 1 50
Install planter boxes, swale islands, curb cuts, and other Green Street
Designs (see Appendix G) in parking lots, particularly large impervious lots. +1 30
Install native plants at Town welcoming signs and parks. 2 100
Installation of living shorelines projects at or near stormwater runoff
outflows. 4 30
Figure 5-1. Potential projects sites for structural controls.
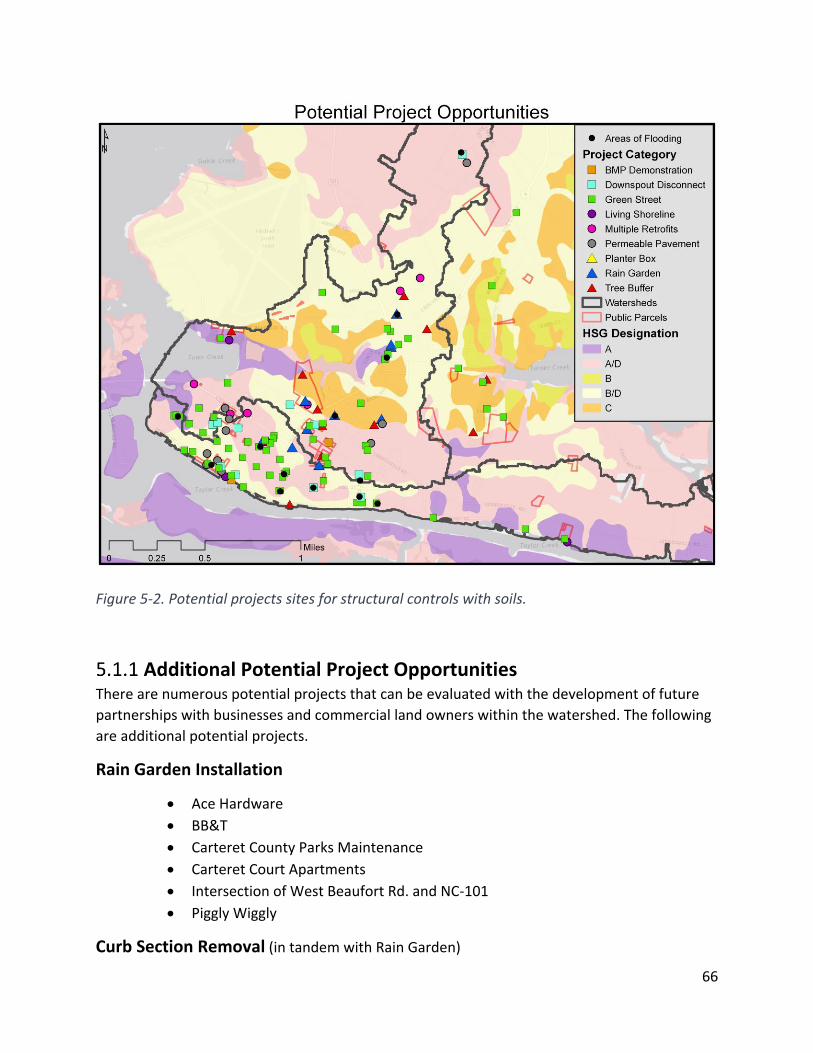
66
Figure 5-2. Potential projects sites for structural controls with soils.
Additional Potential Project Opportunities There are numerous potential projects that can be evaluated with the development of future
partnerships with businesses and commercial land owners within the watershed. The following
are additional potential projects.
Rain Garden Installation
• Ace Hardware
• BB&T
• Carteret County Parks Maintenance
• Carteret Court Apartments
• Intersection of West Beaufort Rd. and NC-101
• Piggly Wiggly
Curb Section Removal (in tandem with Rain Garden)
67
• Ace Hardware
• BB&T
• Carteret Court Apartments
• Piggly Wiggly
Shade Trees
• Along Front Street
• Along Highway 70 Bypass
Downspouts
• Ace Hardware
• BB&T
• Beaufort Reality
• General Store
• Piggly Wiggly
• Tidal Treasures
Permeable Pavement
• Ace Hardware
• BB&T
• Carteret County Parks Maintenance
• Carteret Court Apartments
• Piggly Wiggly
PRESENT STRATEGIES Being aware of the critical role of high water quality and appropriate stormwater management,
the Town of Beaufort approved the Stormwater Advisory Committee on January 11th, 2016. The
Committee is comprised of highly knowledgeable professionals that assist in strategy
development, program implementation, and the priority of capital improvement projects and
infrastructure needs for stormwater management.
The following Table 5-2 is a list of some of the existing stormwater retrofit and supporting
projects in the area. The volume reduction rates from these projects have not been included in
the volume reduction calculations. Plan partners intend to gather the information regarding the
specifications of projects in the watershed so that the volume reduced by each project can be
calculated and incorporated into the tabulations that will be kept on the total reduction that
has occurred in the watersheds. Doing this will be an important component to determining how
much runoff has already been reduced.

68
Table 5-2. List of present stormwater reduction projects
Project Location Year
Installed
Description
Tiller School Rain
Gardens
2011 Two rain gardens, designed by WithersRavenel, Inc.,
built by J. Barber Enterprises LLC, funded by a
Walmart grant, teachers and students helped to
plant and maintain the garden in partnership with
the North Carolina Coastal Federation
Lennoxville Boat Ramp
Rain Gardens
-- Rain gardens at Lennoxville public boat ramp
New Beaufort Fire
Department
2016 Permeable pavement and cisterns were incorporated
into the new Beaufort Fire Department building.
EDUCATION AND OUTREACH ACTIVITIES Beaufort property owners, businesses, and K-12 students and their families will be the target audiences of the education and outreach activities. Community outreach and engagement are critical to the long-term success of any watershed restoration plan. The plan will engage community groups within the watersheds including town residents, property owners, and businesses. The following subsections of section 5.3 represent potential activities that partners can implement. The solutions listed are not actual planned projects or activities being implemented. Before implementing any education or outreach activity presented here, further consideration and research is recommended be conducted on the feasibility, effectiveness, impact to the community and watershed. Beaufort is uniquely positioned in that there is a strong presence of educational and outreach resources nearby or currently implementing water quality based activities. Partnerships with organizations that specialize in education and outreach can be used to develop a robust and successful outreach plan.
The primary purpose of conducting education and outreach within the watershed is to expand and improve environmental literacy to ensure that the community maintains a vested interested in the protection and improvement of the watershed. Education and outreach will enhance public understanding of watershed, water quality, coastal stormwater and local flooding. Outreach messages should reinforce how reducing stormwater runoff volumes will benefit individuals and the community and improve local water quality.

69
Partnerships and Community Building The Beaufort Watershed Restoration Plan involves many partnerships, with Town officials and staff being key in carrying out this plan. To maintain a functioning local economy, water management is critical. Beaufort’s coastal waters are important for recreation, the local tourism industry, and fishing, elevating the importance of good water quality and stormwater management. To assist in the protection of local water quality, the Town of Beaufort created the Stormwater Advisory Committee in January 2016. The Committee is comprised of professionals from organizations including: North Carolina Coastal Reserve, North Carolina Coastal Federation, Eastern Carolina Council of Governments, UNC Institute of Marine Sciences, Duke University, state stormwater permitting, local businesses, and local property owners. This committee assists in strategy development, activity implementation, and the priority of capital improvement projects and infrastructure needs for stormwater management. This Committee has been assisting the Town develop this watershed restoration plan. Additionally, many committee members are involved with or connected to existing education and outreach efforts related to stormwater management, local flooding management, and water quality protection, which is outlined below.
Partnerships with public schools are an effective means of engaging the community and implementing education and outreach objectives. The North Carolina Coastal Reserve, North Carolina Coastal Federation, University of North Carolina Institute of Marine Sciences, and Duke University Marine Lab have all fostered partnerships with Beaufort public schools including Tiller School, Beaufort Elementary School, and Beaufort Middle School. Table 5-3 summarizes outreach activities currently being conducted by these partners with these schools related to stormwater and water quality.
Table 5-3.
Summary of current education and outreach activities in Beaufort.
Name of Activity Low Impact Development for Water Quality Protection Workshop
Objective(s) Participants will learn how land use decisions impact water quality; learn about Low Impact Development techniques that help protect water quality; learn about the costs and benefits of implementing LID; and learn about state permitting rules for stormwater control and LID techniques.
Audience Real Estate Professionals
Measure of Success
Post-workshop evaluation that includes “did you learn something new” and “do you intend to apply knowledge gained”
Timeline/Timing Held every 2-3 years in Carteret County
Point/Institution of Contact
Whitney Jenkins, NC Coastal Reserve & National Estuarine Research Reserve
Name of Activity Interactive Stormwater Lessons
Objective(s) Students will learn about water quality and ways they can help reduce stormwater runoff by participating in a hands-on lesson. This program uses an interactive stormwater model.
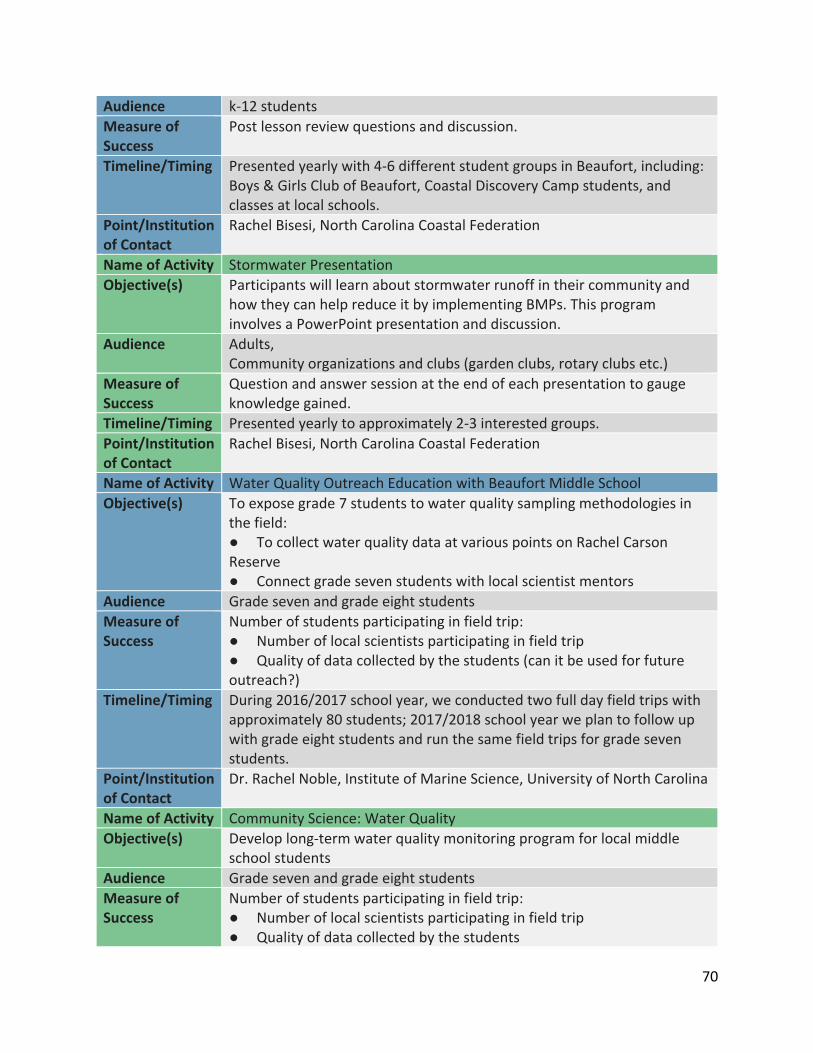
70
Audience k-12 students
Measure of Success
Post lesson review questions and discussion.
Timeline/Timing Presented yearly with 4-6 different student groups in Beaufort, including: Boys & Girls Club of Beaufort, Coastal Discovery Camp students, and classes at local schools.
Point/Institution of Contact
Rachel Bisesi, North Carolina Coastal Federation
Name of Activity Stormwater Presentation
Objective(s) Participants will learn about stormwater runoff in their community and how they can help reduce it by implementing BMPs. This program involves a PowerPoint presentation and discussion.
Audience Adults, Community organizations and clubs (garden clubs, rotary clubs etc.)
Measure of Success
Question and answer session at the end of each presentation to gauge knowledge gained.
Timeline/Timing Presented yearly to approximately 2-3 interested groups.
Point/Institution of Contact
Rachel Bisesi, North Carolina Coastal Federation
Name of Activity Water Quality Outreach Education with Beaufort Middle School
Objective(s) To expose grade 7 students to water quality sampling methodologies in the field: ● To collect water quality data at various points on Rachel Carson Reserve ● Connect grade seven students with local scientist mentors
Audience Grade seven and grade eight students
Measure of Success
Number of students participating in field trip: ● Number of local scientists participating in field trip ● Quality of data collected by the students (can it be used for future outreach?)
Timeline/Timing During 2016/2017 school year, we conducted two full day field trips with approximately 80 students; 2017/2018 school year we plan to follow up with grade eight students and run the same field trips for grade seven students.
Point/Institution of Contact
Dr. Rachel Noble, Institute of Marine Science, University of North Carolina
Name of Activity Community Science: Water Quality
Objective(s) Develop long-term water quality monitoring program for local middle school students
Audience Grade seven and grade eight students
Measure of Success
Number of students participating in field trip: ● Number of local scientists participating in field trip ● Quality of data collected by the students
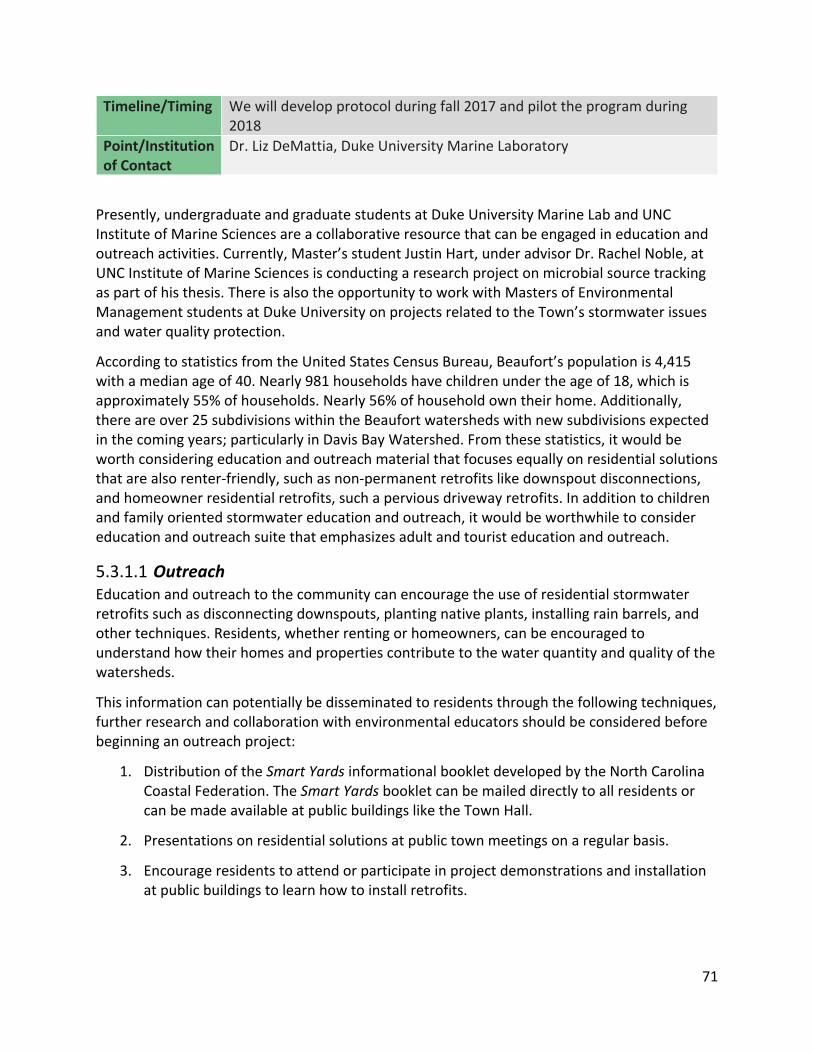
71
Timeline/Timing We will develop protocol during fall 2017 and pilot the program during 2018
Point/Institution of Contact
Dr. Liz DeMattia, Duke University Marine Laboratory
Presently, undergraduate and graduate students at Duke University Marine Lab and UNC Institute of Marine Sciences are a collaborative resource that can be engaged in education and outreach activities. Currently, Master’s student Justin Hart, under advisor Dr. Rachel Noble, at UNC Institute of Marine Sciences is conducting a research project on microbial source tracking as part of his thesis. There is also the opportunity to work with Masters of Environmental Management students at Duke University on projects related to the Town’s stormwater issues and water quality protection.
According to statistics from the United States Census Bureau, Beaufort’s population is 4,415 with a median age of 40. Nearly 981 households have children under the age of 18, which is approximately 55% of households. Nearly 56% of household own their home. Additionally, there are over 25 subdivisions within the Beaufort watersheds with new subdivisions expected in the coming years; particularly in Davis Bay Watershed. From these statistics, it would be worth considering education and outreach material that focuses equally on residential solutions that are also renter-friendly, such as non-permanent retrofits like downspout disconnections, and homeowner residential retrofits, such a pervious driveway retrofits. In addition to children and family oriented stormwater education and outreach, it would be worthwhile to consider education and outreach suite that emphasizes adult and tourist education and outreach.
5.3.1.1 Outreach Education and outreach to the community can encourage the use of residential stormwater retrofits such as disconnecting downspouts, planting native plants, installing rain barrels, and other techniques. Residents, whether renting or homeowners, can be encouraged to understand how their homes and properties contribute to the water quantity and quality of the watersheds.
This information can potentially be disseminated to residents through the following techniques, further research and collaboration with environmental educators should be considered before beginning an outreach project:
1. Distribution of the Smart Yards informational booklet developed by the North Carolina Coastal Federation. The Smart Yards booklet can be mailed directly to all residents or can be made available at public buildings like the Town Hall.
2. Presentations on residential solutions at public town meetings on a regular basis.
3. Encourage residents to attend or participate in project demonstrations and installation at public buildings to learn how to install retrofits.

72
4. Survey residents to determine the number of retrofits that have been installed at their residence, which can be helpful in determining volume reduction. Surveys can also help to determine if the community’s knowledge on stormwater has expanded.
5. Install educational signs about stormwater runoff at public areas such as: Town Hall, town parks, and other areas that are frequented by residents.
6. Present an article about residential stormwater issues in the town paper, social media, or newsletter. See Figure 5-3 as an example of what can be presented.
7. Outreach to subdivision homeowner’s associations to encourage stormwater and water quality education and disconnecting impervious surfaces.
Businesses, Developers, and Commercial Land Owners There are many businesses, developers, real estate agents, landscapers, and commercial landowners within the watersheds of Town Creek, Taylor Creek, and Davis Bay, particularly along Front Street, Highway 70, N.C. Highway 101, and along Lennoxville Road. Business is a mix of retail -- groceries, restaurants, gas stations – and service oriented like banks and doctors’ offices. Commercial areas account for some of the largest continuous, non-disconnected areas of impervious surfaces. Businesses could be encouraged to participate in retrofits at public and commercial properties.
5.3.2.1 Outreach Education and outreach to many businesses, developers, real estate agents, landscapers, and commercial landowners can focus on the disconnection of impervious surfaces and LID techniques for new development. The town could offer incentives to encourage businesses to install these techniques (see Appendix F). Various methods could be used to educate the business community. Collaboration with environmental educators should be considered before beginning an outreach activities:
1. Encourage businesses to host Smart Yards or other stormwater information for distribution to the community.
2. Meet with businesses to encourage participation and discuss potential retrofits that align with their capital improvement plans.
3. Conduct meeting for businesses and commercial land owners to educate them on stormwater issues and to promote LID techniques.
4. Encourage businesses, developers, and others to attend Low Impact Development for Water Quality Protection Workshop, hosted by NC Coastal Reserve, or similar workshops that educate attendees on stormwater management solutions.
5. Invite businesses to participate or sponsor events, such as stormwater retrofit installations, to encourage community involvement and cooperation.
6. Encourage those who are interested in retrofits that increase green space and permeable surfaces. Retrofits can vary from small-scale solutions like planting shade
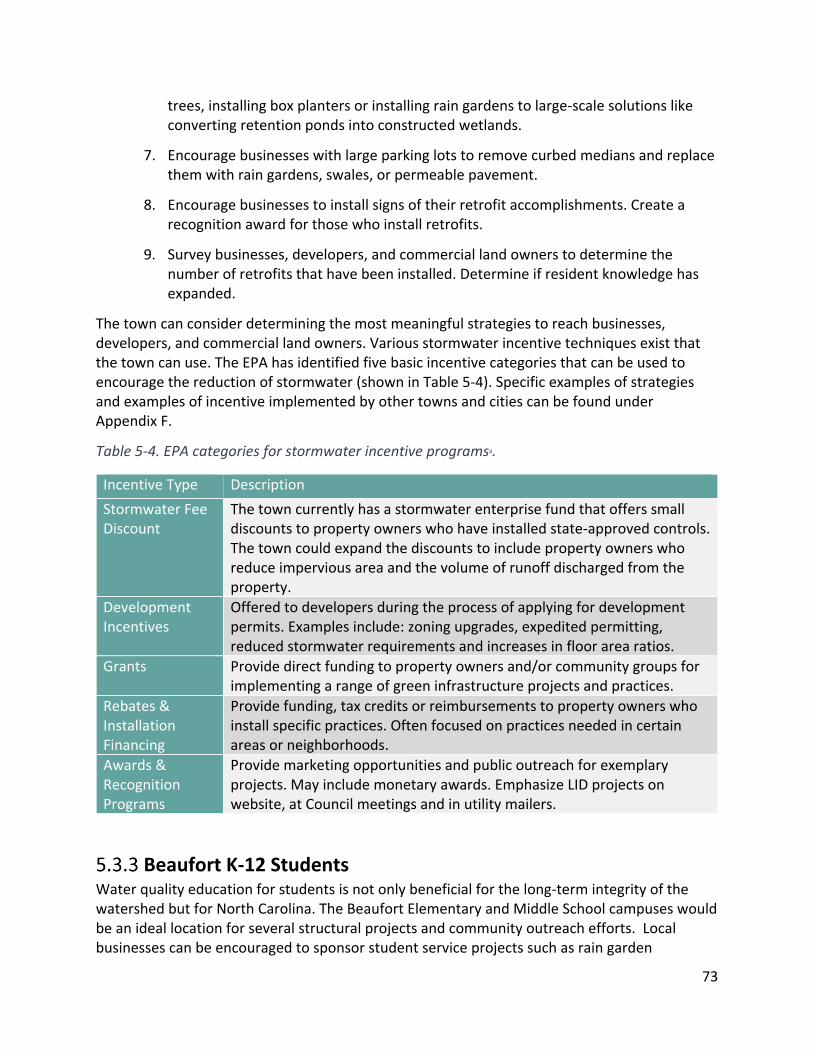
73
trees, installing box planters or installing rain gardens to large-scale solutions like converting retention ponds into constructed wetlands.
7. Encourage businesses with large parking lots to remove curbed medians and replace them with rain gardens, swales, or permeable pavement.
8. Encourage businesses to install signs of their retrofit accomplishments. Create a recognition award for those who install retrofits.
9. Survey businesses, developers, and commercial land owners to determine the number of retrofits that have been installed. Determine if resident knowledge has expanded.
The town can consider determining the most meaningful strategies to reach businesses, developers, and commercial land owners. Various stormwater incentive techniques exist that the town can use. The EPA has identified five basic incentive categories that can be used to encourage the reduction of stormwater (shown in Table 5-4). Specific examples of strategies and examples of incentive implemented by other towns and cities can be found under Appendix F.
Table 5-4. EPA categories for stormwater incentive programs4.
Incentive Type Description
Stormwater Fee Discount
The town currently has a stormwater enterprise fund that offers small discounts to property owners who have installed state-approved controls. The town could expand the discounts to include property owners who reduce impervious area and the volume of runoff discharged from the property.
Development Incentives
Offered to developers during the process of applying for development permits. Examples include: zoning upgrades, expedited permitting, reduced stormwater requirements and increases in floor area ratios.
Grants Provide direct funding to property owners and/or community groups for implementing a range of green infrastructure projects and practices.
Rebates & Installation Financing
Provide funding, tax credits or reimbursements to property owners who install specific practices. Often focused on practices needed in certain areas or neighborhoods.
Awards & Recognition Programs
Provide marketing opportunities and public outreach for exemplary projects. May include monetary awards. Emphasize LID projects on website, at Council meetings and in utility mailers.
Beaufort K-12 Students Water quality education for students is not only beneficial for the long-term integrity of the watershed but for North Carolina. The Beaufort Elementary and Middle School campuses would be an ideal location for several structural projects and community outreach efforts. Local businesses can be encouraged to sponsor student service projects such as rain garden
74
installation. Example projects such as permeable pavement and downspout retrofits with signs could also be installed. These activities can emulate and expand upon the rain garden project that is currently being implemented at the Tiller School or education activities being conducted with Beaufort Middle School students.
5.3.3.1 Message and Distribution Education and outreach to students can focus on stormwater, water quality, and non-structural retrofit lessons that students can relay to their families or strategies they can implement at their homes. Students can be encouraged to understand their role within the watersheds. Collaboration with environmental educators should be considered before beginning an outreach plan:
1. Development of age appropriate lessons associated with demonstration sites in the watershed, such as those currently being conducted by Dr. Rachel Noble with Beaufort Middle School children or Dr. Liz DeMattia with Duke University.
2. Encourage class participation in the installation of rain gardens, downspout disconnection, and other retrofit techniques as service projects or field trips.
3. Present an article in the school’s newsletter for parents to encourage family discussion, such as the example presented in Figure 5-3.
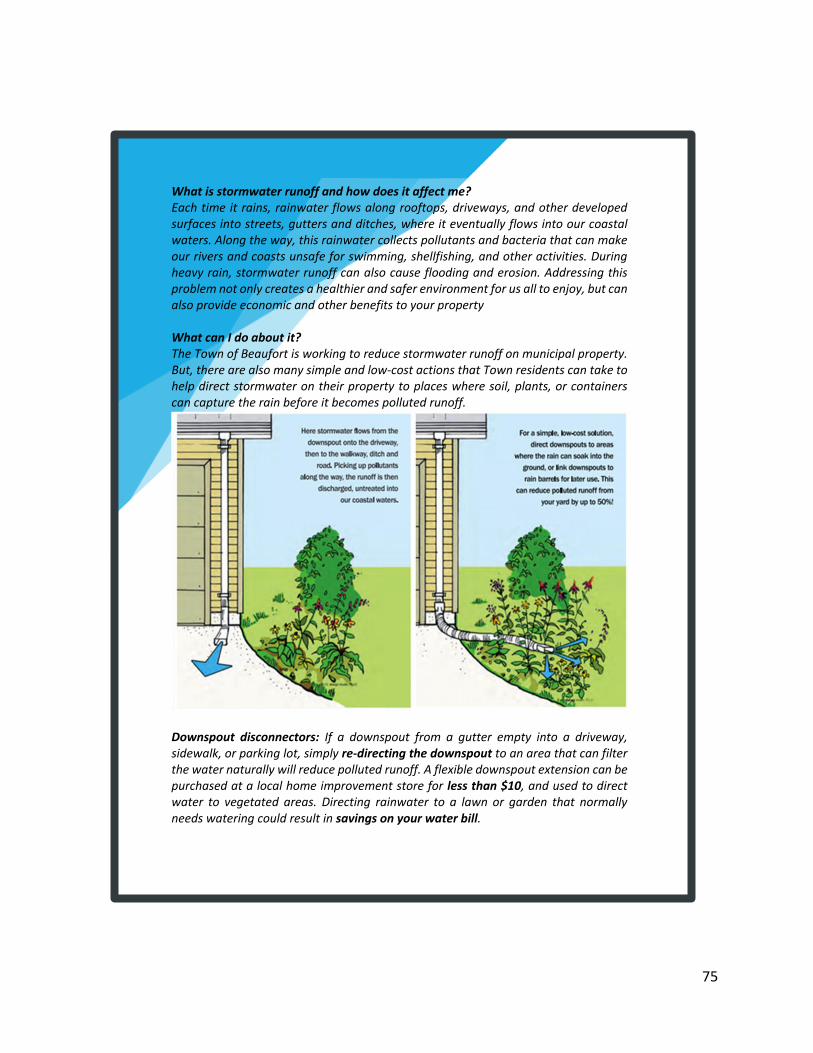
75
What is stormwater runoff and how does it affect me? Each time it rains, rainwater flows along rooftops, driveways, and other developed surfaces into streets, gutters and ditches, where it eventually flows into our coastal waters. Along the way, this rainwater collects pollutants and bacteria that can make our rivers and coasts unsafe for swimming, shellfishing, and other activities. During heavy rain, stormwater runoff can also cause flooding and erosion. Addressing this problem not only creates a healthier and safer environment for us all to enjoy, but can also provide economic and other benefits to your property What can I do about it? The Town of Beaufort is working to reduce stormwater runoff on municipal property. But, there are also many simple and low-cost actions that Town residents can take to help direct stormwater on their property to places where soil, plants, or containers can capture the rain before it becomes polluted runoff.
Downspout disconnectors: If a downspout from a gutter empty into a driveway, sidewalk, or parking lot, simply re-directing the downspout to an area that can filter the water naturally will reduce polluted runoff. A flexible downspout extension can be purchased at a local home improvement store for less than $10, and used to direct water to vegetated areas. Directing rainwater to a lawn or garden that normally needs watering could result in savings on your water bill.
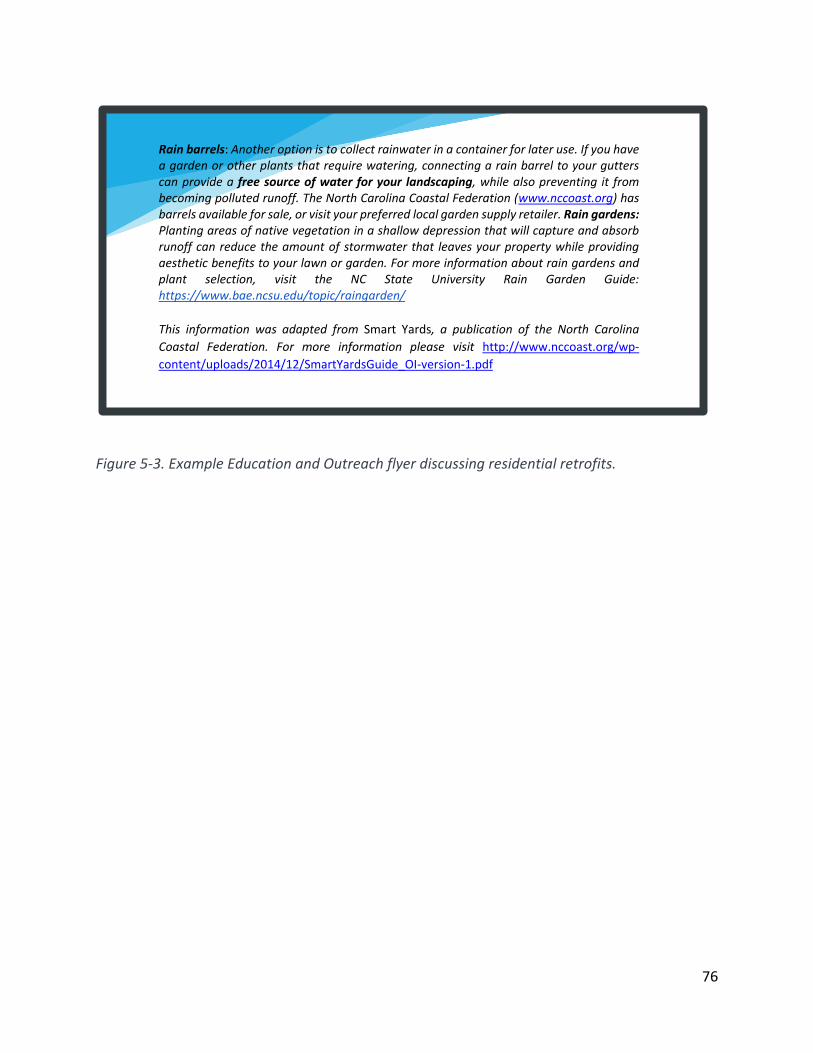
76
Figure 5-3. Example Education and Outreach flyer discussing residential retrofits.
Rain barrels: Another option is to collect rainwater in a container for later use. If you have a garden or other plants that require watering, connecting a rain barrel to your gutters can provide a free source of water for your landscaping, while also preventing it from becoming polluted runoff. The North Carolina Coastal Federation (www.nccoast.org) has barrels available for sale, or visit your preferred local garden supply retailer. Rain gardens: Planting areas of native vegetation in a shallow depression that will capture and absorb runoff can reduce the amount of stormwater that leaves your property while providing aesthetic benefits to your lawn or garden. For more information about rain gardens and plant selection, visit the NC State University Rain Garden Guide: https://www.bae.ncsu.edu/topic/raingarden/
This information was adapted from Smart Yards, a publication of the North Carolina
Coastal Federation. For more information please visit http://www.nccoast.org/wp-
content/uploads/2014/12/SmartYardsGuide_OI-version-1.pdf
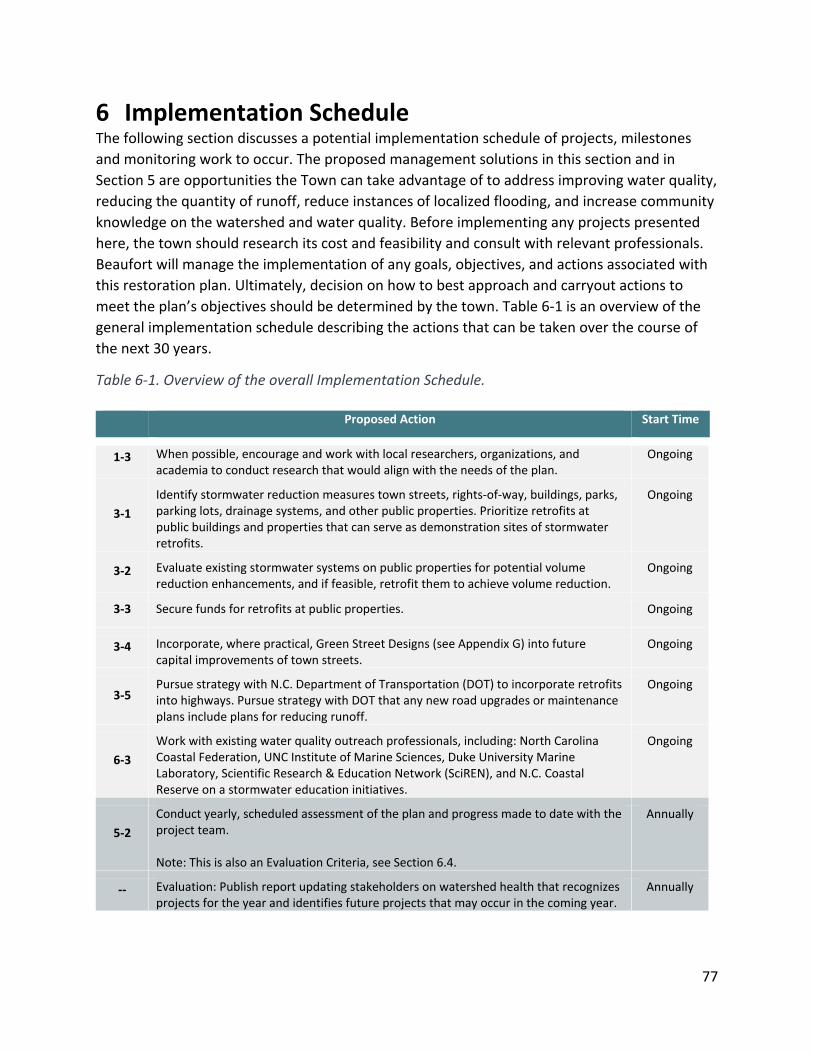
77
6 Implementation Schedule The following section discusses a potential implementation schedule of projects, milestones
and monitoring work to occur. The proposed management solutions in this section and in
Section 5 are opportunities the Town can take advantage of to address improving water quality,
reducing the quantity of runoff, reduce instances of localized flooding, and increase community
knowledge on the watershed and water quality. Before implementing any projects presented
here, the town should research its cost and feasibility and consult with relevant professionals.
Beaufort will manage the implementation of any goals, objectives, and actions associated with
this restoration plan. Ultimately, decision on how to best approach and carryout actions to
meet the plan’s objectives should be determined by the town. Table 6-1 is an overview of the
general implementation schedule describing the actions that can be taken over the course of
the next 30 years.
Table 6-1. Overview of the overall Implementation Schedule.
Proposed Action Start Time
1-3 When possible, encourage and work with local researchers, organizations, and academia to conduct research that would align with the needs of the plan.
Ongoing
3-1
Identify stormwater reduction measures town streets, rights-of-way, buildings, parks, parking lots, drainage systems, and other public properties. Prioritize retrofits at public buildings and properties that can serve as demonstration sites of stormwater retrofits.
Ongoing
3-2 Evaluate existing stormwater systems on public properties for potential volume reduction enhancements, and if feasible, retrofit them to achieve volume reduction.
Ongoing
3-3 Secure funds for retrofits at public properties. Ongoing
3-4 Incorporate, where practical, Green Street Designs (see Appendix G) into future capital improvements of town streets.
Ongoing
3-5 Pursue strategy with N.C. Department of Transportation (DOT) to incorporate retrofits into highways. Pursue strategy with DOT that any new road upgrades or maintenance plans include plans for reducing runoff.
Ongoing
6-3
Work with existing water quality outreach professionals, including: North Carolina Coastal Federation, UNC Institute of Marine Sciences, Duke University Marine Laboratory, Scientific Research & Education Network (SciREN), and N.C. Coastal Reserve on a stormwater education initiatives.
Ongoing
5-2
Conduct yearly, scheduled assessment of the plan and progress made to date with the project team. Note: This is also an Evaluation Criteria, see Section 6.4.
Annually
-- Evaluation: Publish report updating stakeholders on watershed health that recognizes projects for the year and identifies future projects that may occur in the coming year.
Annually
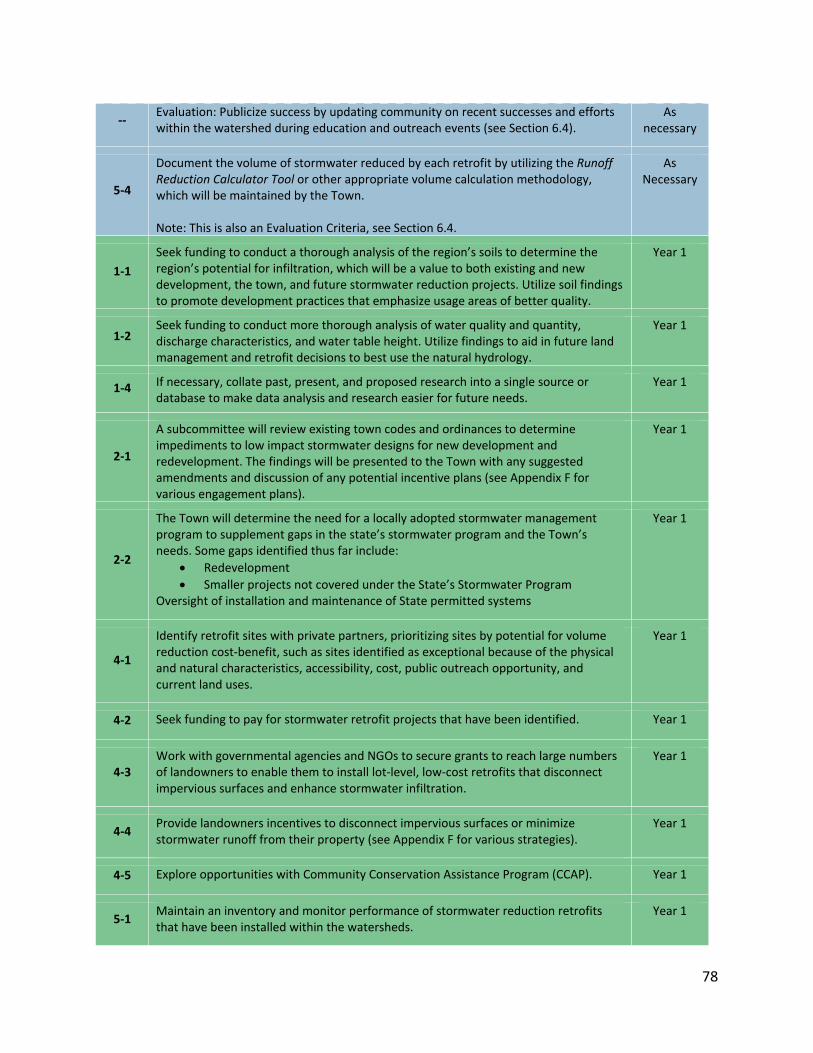
78
-- Evaluation: Publicize success by updating community on recent successes and efforts within the watershed during education and outreach events (see Section 6.4).
As necessary
5-4
Document the volume of stormwater reduced by each retrofit by utilizing the Runoff Reduction Calculator Tool or other appropriate volume calculation methodology, which will be maintained by the Town. Note: This is also an Evaluation Criteria, see Section 6.4.
As Necessary
1-1
Seek funding to conduct a thorough analysis of the region’s soils to determine the region’s potential for infiltration, which will be a value to both existing and new development, the town, and future stormwater reduction projects. Utilize soil findings to promote development practices that emphasize usage areas of better quality.
Year 1
1-2 Seek funding to conduct more thorough analysis of water quality and quantity, discharge characteristics, and water table height. Utilize findings to aid in future land management and retrofit decisions to best use the natural hydrology.
Year 1
1-4 If necessary, collate past, present, and proposed research into a single source or database to make data analysis and research easier for future needs.
Year 1
2-1
A subcommittee will review existing town codes and ordinances to determine impediments to low impact stormwater designs for new development and redevelopment. The findings will be presented to the Town with any suggested amendments and discussion of any potential incentive plans (see Appendix F for various engagement plans).
Year 1
2-2
The Town will determine the need for a locally adopted stormwater management program to supplement gaps in the state’s stormwater program and the Town’s needs. Some gaps identified thus far include:
• Redevelopment
• Smaller projects not covered under the State’s Stormwater Program Oversight of installation and maintenance of State permitted systems
Year 1
4-1
Identify retrofit sites with private partners, prioritizing sites by potential for volume reduction cost-benefit, such as sites identified as exceptional because of the physical and natural characteristics, accessibility, cost, public outreach opportunity, and current land uses.
Year 1
4-2 Seek funding to pay for stormwater retrofit projects that have been identified. Year 1
4-3 Work with governmental agencies and NGOs to secure grants to reach large numbers of landowners to enable them to install lot-level, low-cost retrofits that disconnect impervious surfaces and enhance stormwater infiltration.
Year 1
4-4 Provide landowners incentives to disconnect impervious surfaces or minimize stormwater runoff from their property (see Appendix F for various strategies).
Year 1
4-5 Explore opportunities with Community Conservation Assistance Program (CCAP). Year 1
5-1 Maintain an inventory and monitor performance of stormwater reduction retrofits that have been installed within the watersheds.
Year 1

79
Note: This is also an Evaluation Criteria, see Section 6.4.
6-1 Implement education and engagement activities for property owners, businesses, and K-12 students and their families.
Year 1
6-2 Provide technical training opportunities for planners, engineers, developers, landscapers and local government staff on techniques to reduce volume of stormwater within the town.
Year 1
6-4 Include education signage at select retrofits and place emphasis on highlighting the town’s commitment to native vegetation planting.
Year 1
5-3 Update the plan every 5 years based upon findings from water quality data and the status of implementation and findings from yearly assessment review of plan implementation (see Action 5-1; see Section 6.4).
Years 5, 10, 15, 20, 25
-- Final Evaluation. Determine whether to extend current plan (see Section 6.4). Year 30
PROJECT IMPLEMENTATION SCHEDULE The following is the suggested stormwater runoff reduction techniques previously introduced in
Section 5 with implementation schedule. The Maintenance Schedule column of Table 6-2
should be taken into consideration as part of the technical needs of the plan (see Section 6.5
regarding Funding Cost and Technical Needs). The list represents potential projects; the list will
likely evolve to suit the condition and needs the watersheds. The total number of indicators and
specific details of each project can vary based on funding and future needs that develop. The
proposed management solutions, strategies, and techniques are based on the information
compiled during the development of this restoration plan. These projects are not actual
planned projects, but illustrate potential opportunities.
Table 6-2. Potential Project Ideas Implementation schedule matrix table format. ‘Completed By’ represents the year that the project should be completed. ‘Indicators’ represent the measurable indication that the project has been completed.
Proposed Project Completed By Maintenance Schedule Indicator
Printing and mailing of Smart Yard (or similar
outreach material designed for the Town) to
residents with additional prints made
available at Public Libraries, Town Hall, and
Robert W. & Elva Faison Safrit Historical and
Welcome Center
Year 5 Annually provide
additional prints to
public buildings over the
course of 30 years
# of 960
residents
mailed; # of four
locations
supplied
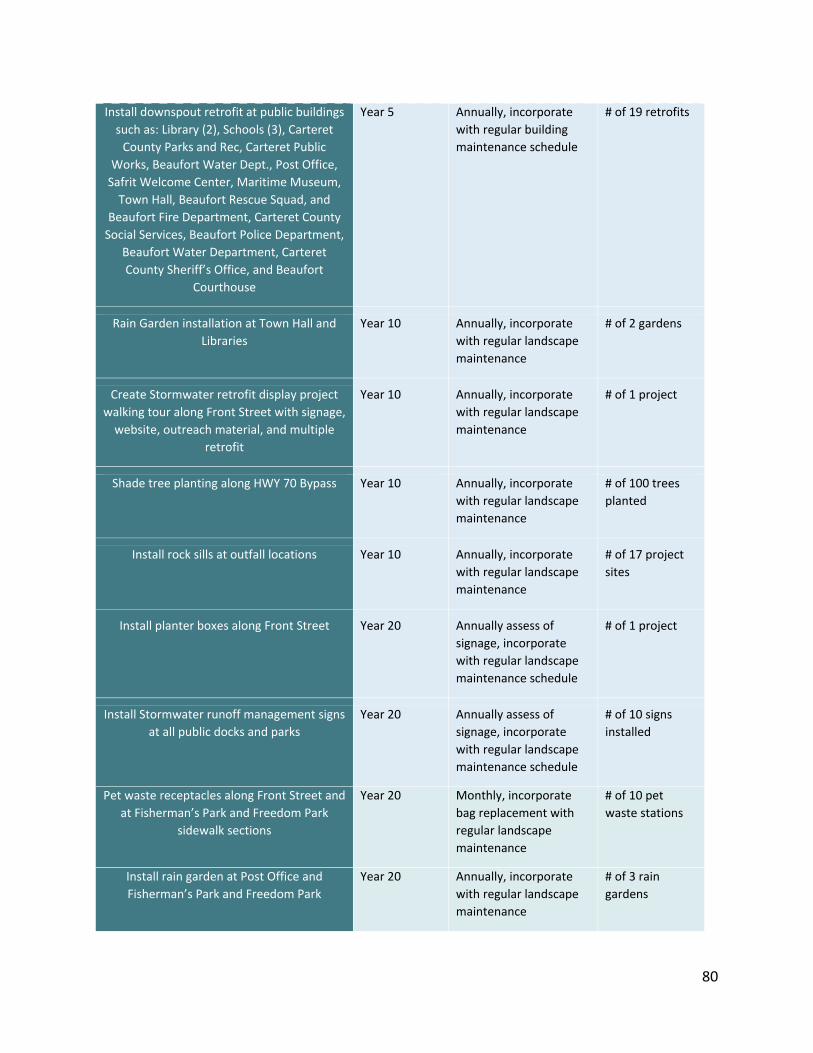
80
Install downspout retrofit at public buildings
such as: Library (2), Schools (3), Carteret
County Parks and Rec, Carteret Public
Works, Beaufort Water Dept., Post Office,
Safrit Welcome Center, Maritime Museum,
Town Hall, Beaufort Rescue Squad, and
Beaufort Fire Department, Carteret County
Social Services, Beaufort Police Department,
Beaufort Water Department, Carteret
County Sheriff’s Office, and Beaufort
Courthouse
Year 5 Annually, incorporate
with regular building
maintenance schedule
# of 19 retrofits
Rain Garden installation at Town Hall and
Libraries
Year 10 Annually, incorporate
with regular landscape
maintenance
# of 2 gardens
Create Stormwater retrofit display project
walking tour along Front Street with signage,
website, outreach material, and multiple
retrofit
Year 10 Annually, incorporate
with regular landscape
maintenance
# of 1 project
Shade tree planting along HWY 70 Bypass Year 10 Annually, incorporate
with regular landscape
maintenance
# of 100 trees
planted
Install rock sills at outfall locations Year 10 Annually, incorporate
with regular landscape
maintenance
# of 17 project
sites
Install planter boxes along Front Street Year 20 Annually assess of
signage, incorporate
with regular landscape
maintenance schedule
# of 1 project
Install Stormwater runoff management signs
at all public docks and parks
Year 20 Annually assess of
signage, incorporate
with regular landscape
maintenance schedule
# of 10 signs
installed
Pet waste receptacles along Front Street and
at Fisherman’s Park and Freedom Park
sidewalk sections
Year 20 Monthly, incorporate
bag replacement with
regular landscape
maintenance
# of 10 pet
waste stations
Install rain garden at Post Office and
Fisherman’s Park and Freedom Park
Year 20 Annually, incorporate
with regular landscape
maintenance
# of 3 rain
gardens
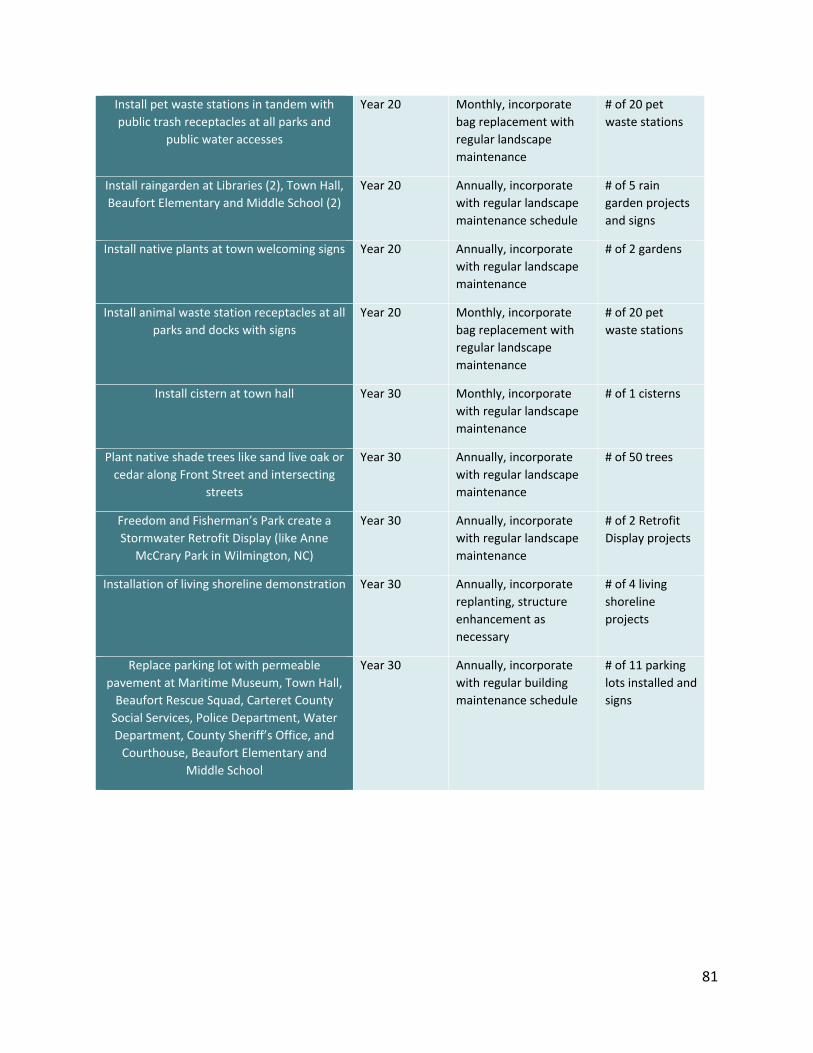
81
Install pet waste stations in tandem with
public trash receptacles at all parks and
public water accesses
Year 20 Monthly, incorporate
bag replacement with
regular landscape
maintenance
# of 20 pet
waste stations
Install raingarden at Libraries (2), Town Hall,
Beaufort Elementary and Middle School (2)
Year 20 Annually, incorporate
with regular landscape
maintenance schedule
# of 5 rain
garden projects
and signs
Install native plants at town welcoming signs Year 20 Annually, incorporate
with regular landscape
maintenance
# of 2 gardens
Install animal waste station receptacles at all
parks and docks with signs
Year 20 Monthly, incorporate
bag replacement with
regular landscape
maintenance
# of 20 pet
waste stations
Install cistern at town hall Year 30 Monthly, incorporate
with regular landscape
maintenance
# of 1 cisterns
Plant native shade trees like sand live oak or
cedar along Front Street and intersecting
streets
Year 30 Annually, incorporate
with regular landscape
maintenance
# of 50 trees
Freedom and Fisherman’s Park create a
Stormwater Retrofit Display (like Anne
McCrary Park in Wilmington, NC)
Year 30 Annually, incorporate
with regular landscape
maintenance
# of 2 Retrofit
Display projects
Installation of living shoreline demonstration Year 30 Annually, incorporate
replanting, structure
enhancement as
necessary
# of 4 living
shoreline
projects
Replace parking lot with permeable
pavement at Maritime Museum, Town Hall,
Beaufort Rescue Squad, Carteret County
Social Services, Police Department, Water
Department, County Sheriff’s Office, and
Courthouse, Beaufort Elementary and
Middle School
Year 30 Annually, incorporate
with regular building
maintenance schedule
# of 11 parking
lots installed and
signs

82
MILESTONES Milestones are measurable accomplishments utilized to track positive changes and success of
the plan. If a milestone is not met, an assessment will be conducted at the time of the annual
plan review to determine the cause and the appropriate steps that can be taken to address any
shortcomings or unforeseen circumstances. The milestones of the Beaufort Watersheds for
restoring water quality through volume reduction of surface runoff are:
Short-Term (< 10 years) • Reducing stormwater runoff by approximately 923,871 gallons of 9,238,714 gallons that
occurs during a one-year, 24-hour storm event through the implementation of
stormwater reduction techniques, determining volume that current stormwater
projects reduce, and the objectives of this plan.
• Develop an education and outreach concept for the target groups (residents, students,
and business owners) including educational materials.
• Hold quarterly education and outreach event.
• Source funding for at least five stormwater reduction projects.
• Accomplish one project per year through the Town’s Stormwater CIP.
Mid-Term (< 20 years) • Reducing stormwater runoff by approximately 2,309,678 gallons of 9,238,714 gallons
that occurs during a one-year, 24-hour storm event through the implementation of
stormwater reduction techniques, determining volume that current stormwater
projects reduce, and the objectives of this plan.
• Hold quarterly education and outreach event.
• Source funding for at least five additional stormwater reduction projects.
Long-Term (< 30 years) • Reducing stormwater runoff by approximately 4,619,357 gallons of 9,238,714 gallons
that occurs during a one-year, 24-hour storm event through the implementation of
stormwater reduction techniques, determining volume that current stormwater
projects reduce, and the objectives of this plan.
• Hold quarterly education and outreach event.
• Source funding for at least five additional stormwater reduction projects.
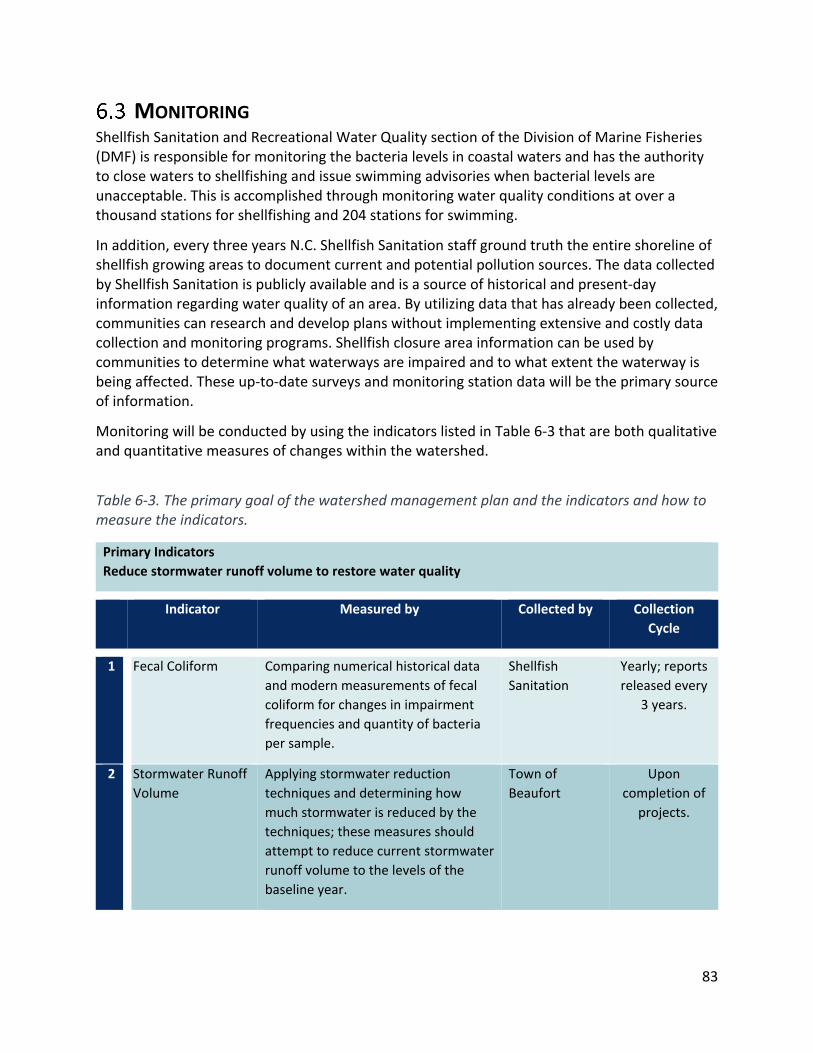
83
MONITORING Shellfish Sanitation and Recreational Water Quality section of the Division of Marine Fisheries (DMF) is responsible for monitoring the bacteria levels in coastal waters and has the authority to close waters to shellfishing and issue swimming advisories when bacterial levels are unacceptable. This is accomplished through monitoring water quality conditions at over a thousand stations for shellfishing and 204 stations for swimming.
In addition, every three years N.C. Shellfish Sanitation staff ground truth the entire shoreline of shellfish growing areas to document current and potential pollution sources. The data collected by Shellfish Sanitation is publicly available and is a source of historical and present-day information regarding water quality of an area. By utilizing data that has already been collected, communities can research and develop plans without implementing extensive and costly data collection and monitoring programs. Shellfish closure area information can be used by communities to determine what waterways are impaired and to what extent the waterway is being affected. These up-to-date surveys and monitoring station data will be the primary source of information.
Monitoring will be conducted by using the indicators listed in Table 6-3 that are both qualitative and quantitative measures of changes within the watershed.
Table 6-3. The primary goal of the watershed management plan and the indicators and how to measure the indicators.
Primary Indicators
Reduce stormwater runoff volume to restore water quality
Indicator Measured by Collected by Collection
Cycle
1 Fecal Coliform Comparing numerical historical data
and modern measurements of fecal
coliform for changes in impairment
frequencies and quantity of bacteria
per sample.
Shellfish
Sanitation
Yearly; reports
released every
3 years.
2 Stormwater Runoff
Volume
Applying stormwater reduction
techniques and determining how
much stormwater is reduced by the
techniques; these measures should
attempt to reduce current stormwater
runoff volume to the levels of the
baseline year.
Town of
Beaufort
Upon
completion of
projects.
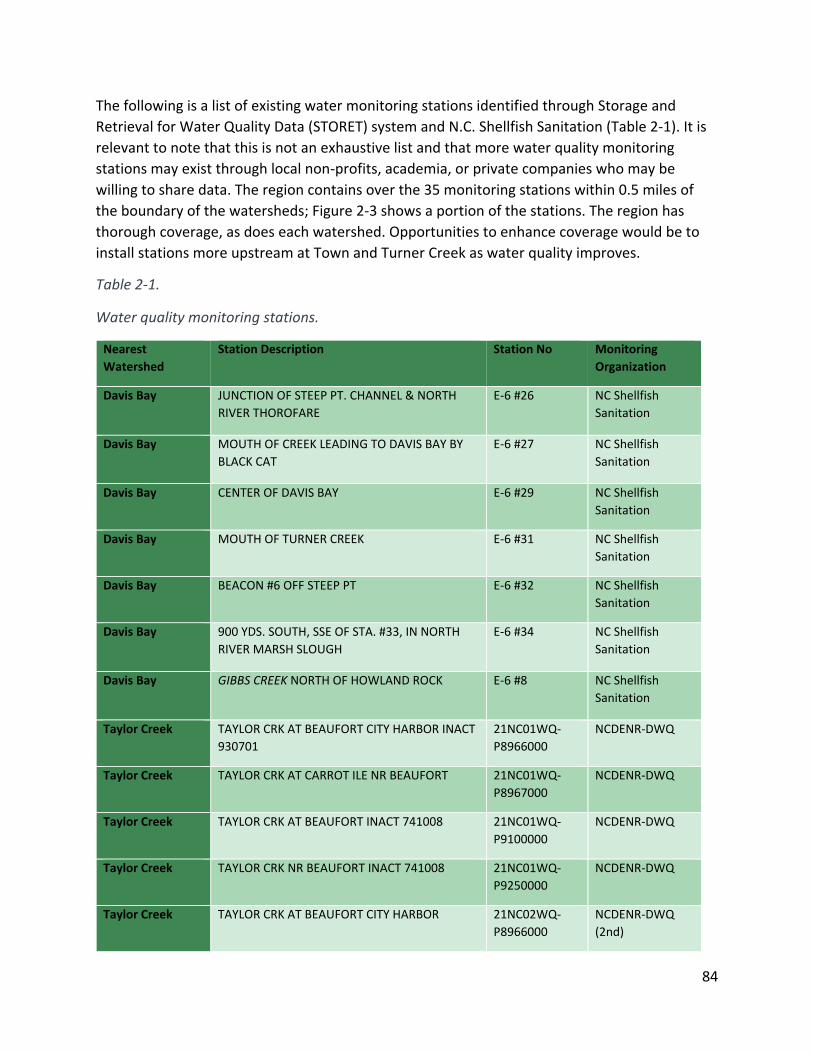
84
The following is a list of existing water monitoring stations identified through Storage and
Retrieval for Water Quality Data (STORET) system and N.C. Shellfish Sanitation (Table 2-1). It is
relevant to note that this is not an exhaustive list and that more water quality monitoring
stations may exist through local non-profits, academia, or private companies who may be
willing to share data. The region contains over the 35 monitoring stations within 0.5 miles of
the boundary of the watersheds; Figure 2-3 shows a portion of the stations. The region has
thorough coverage, as does each watershed. Opportunities to enhance coverage would be to
install stations more upstream at Town and Turner Creek as water quality improves.
Table 2-1.
Water quality monitoring stations.
Nearest
Watershed
Station Description Station No Monitoring
Organization
Davis Bay JUNCTION OF STEEP PT. CHANNEL & NORTH
RIVER THOROFARE
E-6 #26 NC Shellfish
Sanitation
Davis Bay MOUTH OF CREEK LEADING TO DAVIS BAY BY
BLACK CAT
E-6 #27 NC Shellfish
Sanitation
Davis Bay CENTER OF DAVIS BAY E-6 #29 NC Shellfish
Sanitation
Davis Bay MOUTH OF TURNER CREEK E-6 #31 NC Shellfish
Sanitation
Davis Bay BEACON #6 OFF STEEP PT E-6 #32 NC Shellfish
Sanitation
Davis Bay 900 YDS. SOUTH, SSE OF STA. #33, IN NORTH
RIVER MARSH SLOUGH
E-6 #34 NC Shellfish
Sanitation
Davis Bay GIBBS CREEK NORTH OF HOWLAND ROCK E-6 #8 NC Shellfish
Sanitation
Taylor Creek TAYLOR CRK AT BEAUFORT CITY HARBOR INACT
930701
21NC01WQ-
P8966000
NCDENR-DWQ
Taylor Creek TAYLOR CRK AT CARROT ILE NR BEAUFORT 21NC01WQ-
P8967000
NCDENR-DWQ
Taylor Creek TAYLOR CRK AT BEAUFORT INACT 741008 21NC01WQ-
P9100000
NCDENR-DWQ
Taylor Creek TAYLOR CRK NR BEAUFORT INACT 741008 21NC01WQ-
P9250000
NCDENR-DWQ
Taylor Creek TAYLOR CRK AT BEAUFORT CITY HARBOR 21NC02WQ-
P8966000
NCDENR-DWQ
(2nd)
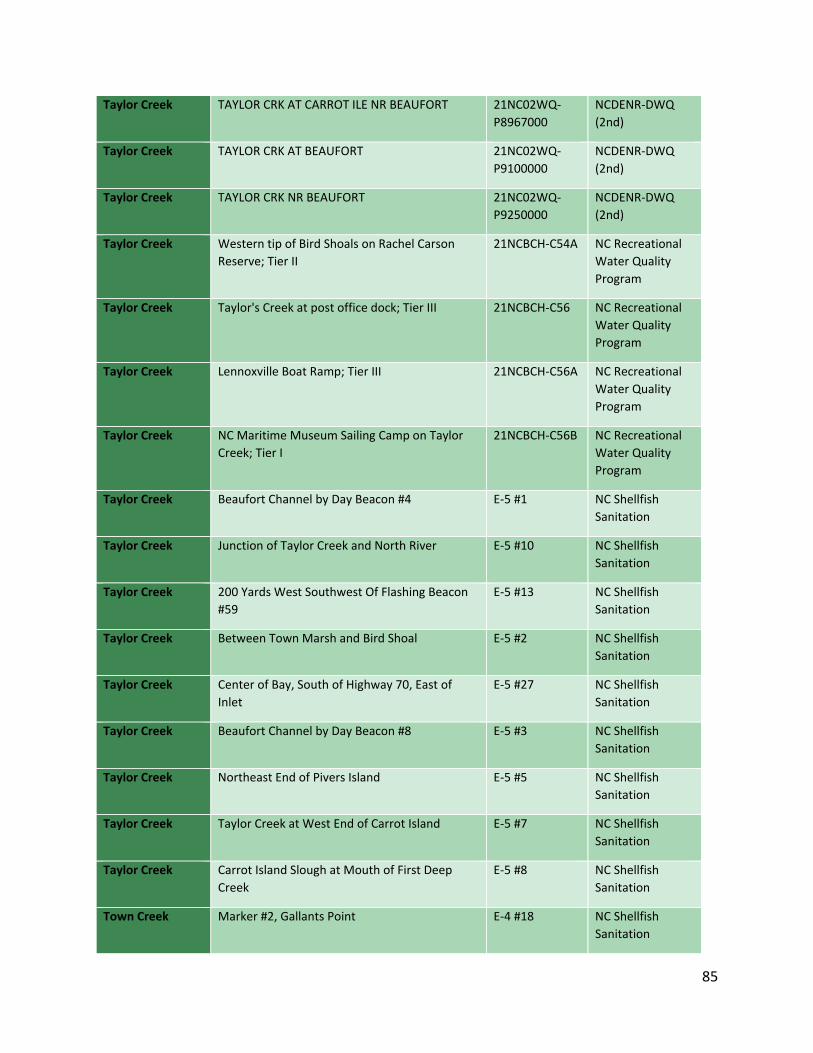
85
Taylor Creek TAYLOR CRK AT CARROT ILE NR BEAUFORT 21NC02WQ-
P8967000
NCDENR-DWQ
(2nd)
Taylor Creek TAYLOR CRK AT BEAUFORT 21NC02WQ-
P9100000
NCDENR-DWQ
(2nd)
Taylor Creek TAYLOR CRK NR BEAUFORT 21NC02WQ-
P9250000
NCDENR-DWQ
(2nd)
Taylor Creek Western tip of Bird Shoals on Rachel Carson
Reserve; Tier II
21NCBCH-C54A NC Recreational
Water Quality
Program
Taylor Creek Taylor's Creek at post office dock; Tier III 21NCBCH-C56 NC Recreational
Water Quality
Program
Taylor Creek Lennoxville Boat Ramp; Tier III 21NCBCH-C56A NC Recreational
Water Quality
Program
Taylor Creek NC Maritime Museum Sailing Camp on Taylor
Creek; Tier I
21NCBCH-C56B NC Recreational
Water Quality
Program
Taylor Creek Beaufort Channel by Day Beacon #4 E-5 #1 NC Shellfish
Sanitation
Taylor Creek Junction of Taylor Creek and North River E-5 #10 NC Shellfish
Sanitation
Taylor Creek 200 Yards West Southwest Of Flashing Beacon
#59
E-5 #13 NC Shellfish
Sanitation
Taylor Creek Between Town Marsh and Bird Shoal E-5 #2 NC Shellfish
Sanitation
Taylor Creek Center of Bay, South of Highway 70, East of
Inlet
E-5 #27 NC Shellfish
Sanitation
Taylor Creek Beaufort Channel by Day Beacon #8 E-5 #3 NC Shellfish
Sanitation
Taylor Creek Northeast End of Pivers Island E-5 #5 NC Shellfish
Sanitation
Taylor Creek Taylor Creek at West End of Carrot Island E-5 #7 NC Shellfish
Sanitation
Taylor Creek Carrot Island Slough at Mouth of First Deep
Creek
E-5 #8 NC Shellfish
Sanitation
Town Creek Marker #2, Gallants Point E-4 #18 NC Shellfish
Sanitation
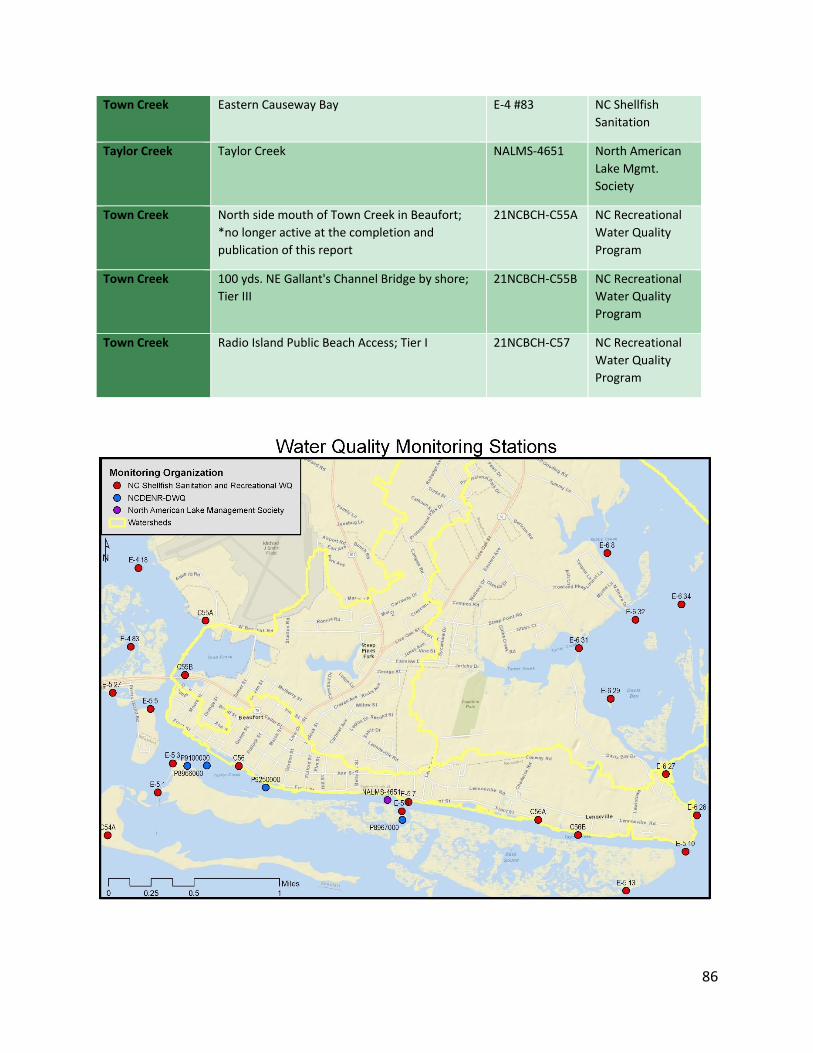
86
Town Creek Eastern Causeway Bay E-4 #83 NC Shellfish
Sanitation
Taylor Creek Taylor Creek NALMS-4651 North American
Lake Mgmt.
Society
Town Creek North side mouth of Town Creek in Beaufort;
*no longer active at the completion and
publication of this report
21NCBCH-C55A NC Recreational
Water Quality
Program
Town Creek 100 yds. NE Gallant's Channel Bridge by shore;
Tier III
21NCBCH-C55B NC Recreational
Water Quality
Program
Town Creek Radio Island Public Beach Access; Tier I 21NCBCH-C57 NC Recreational
Water Quality
Program
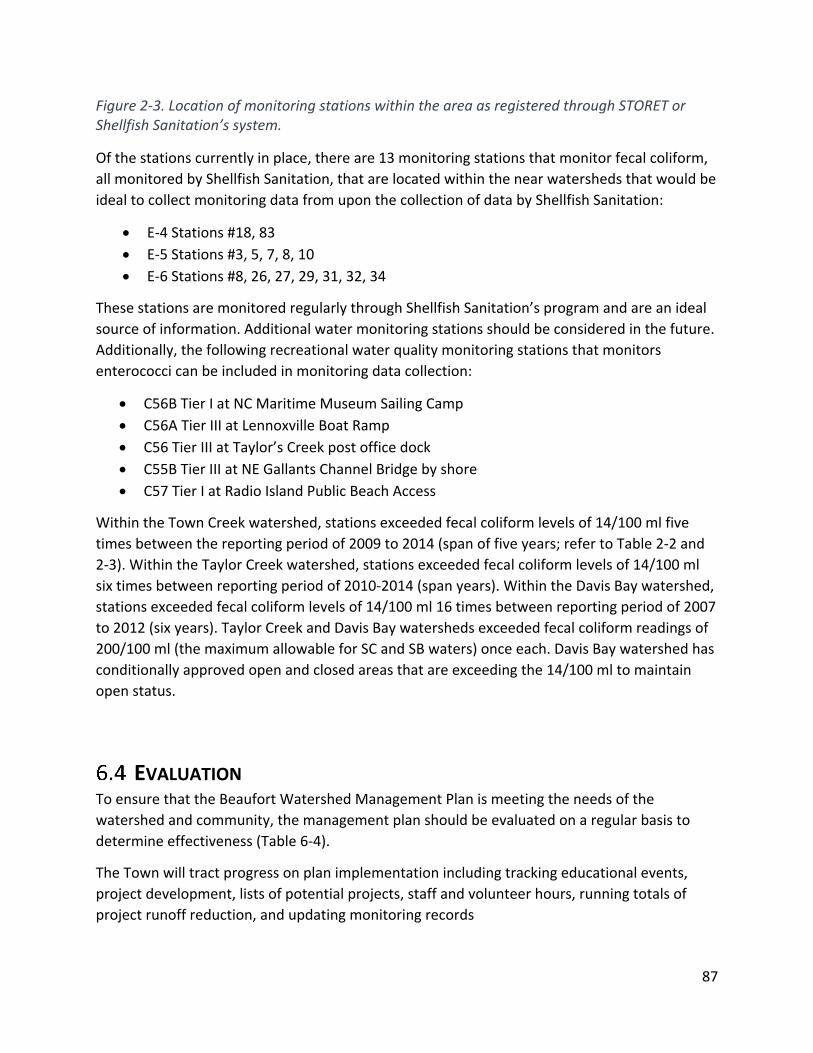
87
Figure 2-3. Location of monitoring stations within the area as registered through STORET or Shellfish Sanitation’s system.
Of the stations currently in place, there are 13 monitoring stations that monitor fecal coliform,
all monitored by Shellfish Sanitation, that are located within the near watersheds that would be
ideal to collect monitoring data from upon the collection of data by Shellfish Sanitation:
• E-4 Stations #18, 83
• E-5 Stations #3, 5, 7, 8, 10
• E-6 Stations #8, 26, 27, 29, 31, 32, 34
These stations are monitored regularly through Shellfish Sanitation’s program and are an ideal
source of information. Additional water monitoring stations should be considered in the future.
Additionally, the following recreational water quality monitoring stations that monitors
enterococci can be included in monitoring data collection:
• C56B Tier I at NC Maritime Museum Sailing Camp
• C56A Tier III at Lennoxville Boat Ramp
• C56 Tier III at Taylor’s Creek post office dock
• C55B Tier III at NE Gallants Channel Bridge by shore
• C57 Tier I at Radio Island Public Beach Access
Within the Town Creek watershed, stations exceeded fecal coliform levels of 14/100 ml five
times between the reporting period of 2009 to 2014 (span of five years; refer to Table 2-2 and
2-3). Within the Taylor Creek watershed, stations exceeded fecal coliform levels of 14/100 ml
six times between reporting period of 2010-2014 (span years). Within the Davis Bay watershed,
stations exceeded fecal coliform levels of 14/100 ml 16 times between reporting period of 2007
to 2012 (six years). Taylor Creek and Davis Bay watersheds exceeded fecal coliform readings of
200/100 ml (the maximum allowable for SC and SB waters) once each. Davis Bay watershed has
conditionally approved open and closed areas that are exceeding the 14/100 ml to maintain
open status.
EVALUATION To ensure that the Beaufort Watershed Management Plan is meeting the needs of the
watershed and community, the management plan should be evaluated on a regular basis to
determine effectiveness (Table 6-4).
The Town will tract progress on plan implementation including tracking educational events,
project development, lists of potential projects, staff and volunteer hours, running totals of
project runoff reduction, and updating monitoring records
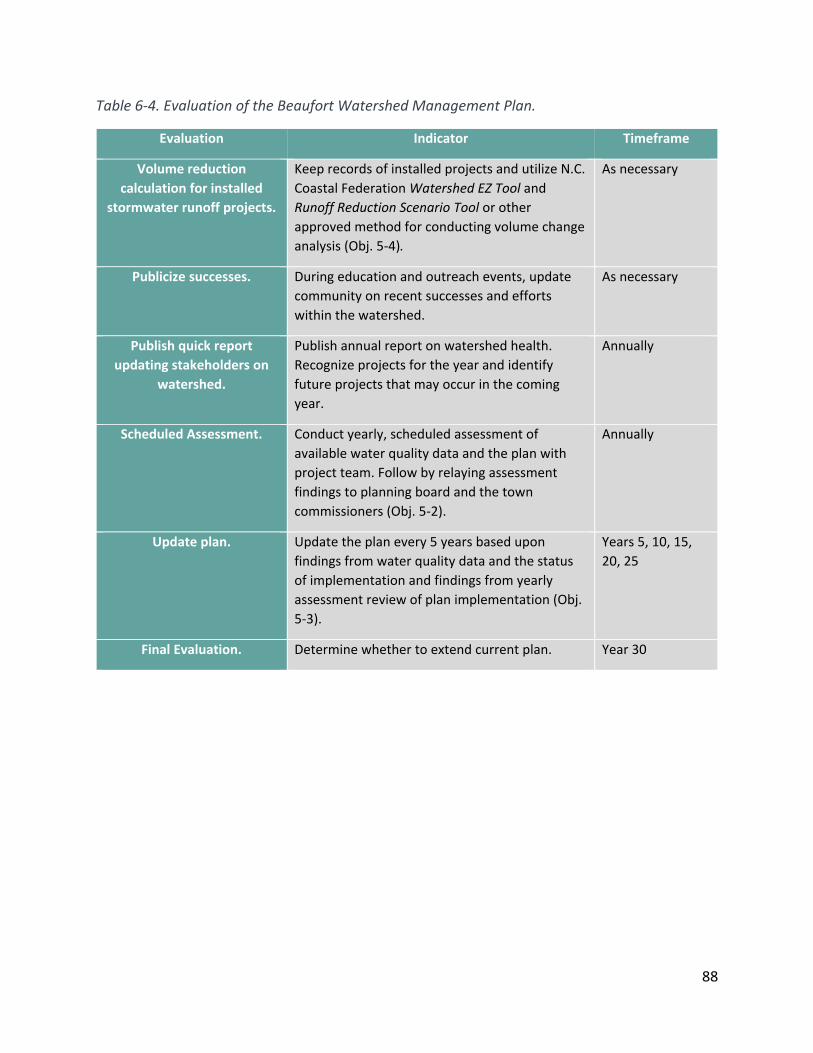
88
Table 6-4. Evaluation of the Beaufort Watershed Management Plan.
Evaluation Indicator Timeframe
Volume reduction
calculation for installed
stormwater runoff projects.
Keep records of installed projects and utilize N.C.
Coastal Federation Watershed EZ Tool and
Runoff Reduction Scenario Tool or other
approved method for conducting volume change
analysis (Obj. 5-4).
As necessary
Publicize successes. During education and outreach events, update
community on recent successes and efforts
within the watershed.
As necessary
Publish quick report
updating stakeholders on
watershed.
Publish annual report on watershed health.
Recognize projects for the year and identify
future projects that may occur in the coming
year.
Annually
Scheduled Assessment. Conduct yearly, scheduled assessment of
available water quality data and the plan with
project team. Follow by relaying assessment
findings to planning board and the town
commissioners (Obj. 5-2).
Annually
Update plan. Update the plan every 5 years based upon
findings from water quality data and the status
of implementation and findings from yearly
assessment review of plan implementation (Obj.
5-3).
Years 5, 10, 15,
20, 25
Final Evaluation. Determine whether to extend current plan. Year 30

89
FUNDING COST AND TECHNICAL NEEDS The total cost to implement a project varies greatly due to parameters such as location of the
project, size of project, design complexity, labor and materials, changes in the goods and
services market, and other parameters. As such, once a project is selected, the town will need
to determine project estimates. Annual maintenance should always be considered and
budgeted for accordingly. Project partners can explore various funding sources on a project by
project basis. The information compiled within this plan will serve as a source when developing
funding proposals.
Presently, technical needs for all projects include receiving true project estimates based on site
conditions and potentially, input of professional construction or engineering knowledge as
some projects will require this level of expertise. Additional technical needs include the
development of partnerships with state agencies, local organizations, or academia professionals
who can provide expertise and knowledge on the development of education and outreach
projects and scientific information regarding hydrology and water quality. The Maintenance
Schedule column of Table 6-2 should be taken into consideration as part of the technical
considerations of the plan as maintenances requires forethought to ensure funding and
technical skills are available for the duration of the life cycle of the projects. Table 6-5 should be
taken into consideration when determining maintenance costs of each project. Several projects
rely on using the in-kind services of volunteers to complete projects. Projects such as
downspout retrofit installation, rain garden installation, and living shoreline installation; can
utilize in-kind volunteer services to build and conduct maintenance, which can potentially
decrease project costs. Additionally, consideration should be given to the amount of staff time
that will be dedicated by the town and its partners on each project. Potential technical and
funding needs for each project have been discussed in Table 6-6.
Other various project based needs includes interest in seeking funding to conduct soil surveys
and water table survey of the region to accurately determine the region’s potential for water
infiltration, this will aid in more accurately determining how well certain retrofits will perform
at certain sites (this need has been addressed via Objective 1-1, 1-2). Having an accurate
assessment of the regions soils will also aid in accomplishing Objective 3-1 and Objective 4-1 to
develop a list of additional proposed retrofit sites; as the restoration plan matures and changes
occur in the region, the plan will be assessed regularly (Objective 5), which will necessitate new
projects be added to the plan. Seeking funding for retrofit projects is an important part of this
plan and is addressed through Objective 3-3 and 4-2.
Table 6-5. Approximate cost per unit of various LID BMP techniques.
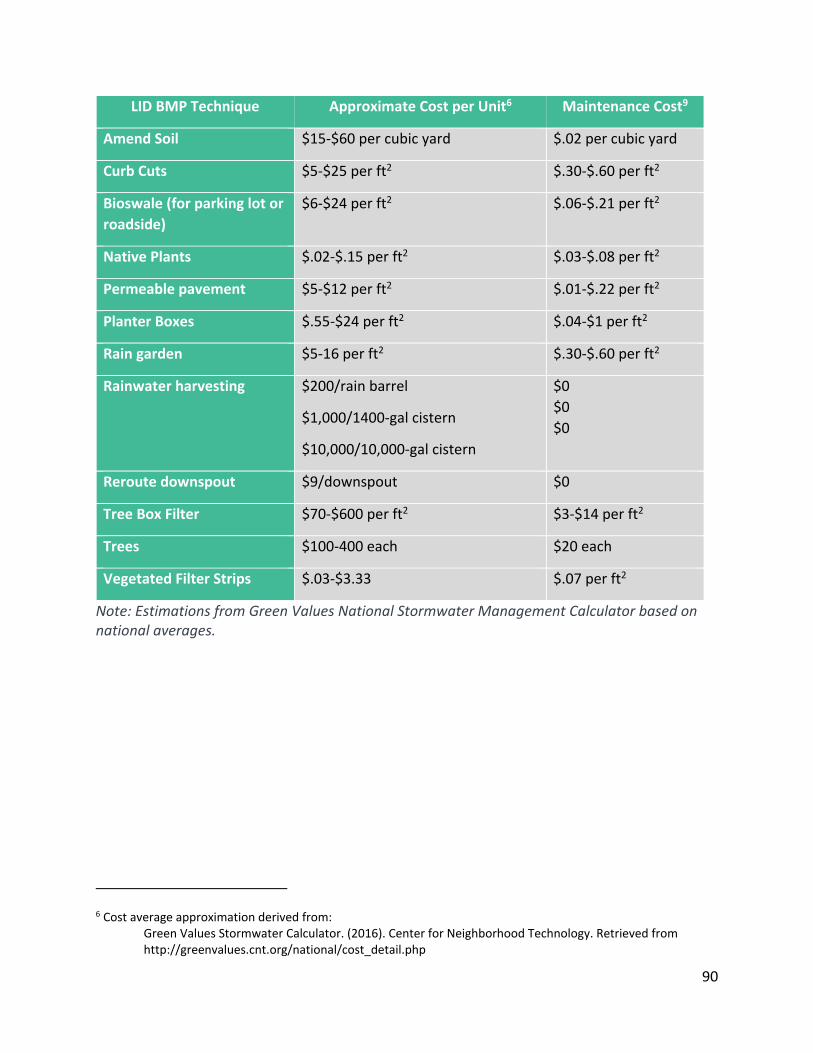
90
LID BMP Technique Approximate Cost per Unit6 Maintenance Cost9
Amend Soil $15-$60 per cubic yard $.02 per cubic yard
Curb Cuts $5-$25 per ft2 $.30-$.60 per ft2
Bioswale (for parking lot or
roadside)
$6-$24 per ft2 $.06-$.21 per ft2
Native Plants $.02-$.15 per ft2 $.03-$.08 per ft2
Permeable pavement $5-$12 per ft2 $.01-$.22 per ft2
Planter Boxes $.55-$24 per ft2 $.04-$1 per ft2
Rain garden $5-16 per ft2 $.30-$.60 per ft2
Rainwater harvesting $200/rain barrel
$1,000/1400-gal cistern
$10,000/10,000-gal cistern
$0
$0
$0
Reroute downspout $9/downspout $0
Tree Box Filter $70-$600 per ft2 $3-$14 per ft2
Trees $100-400 each $20 each
Vegetated Filter Strips $.03-$3.33 $.07 per ft2
Note: Estimations from Green Values National Stormwater Management Calculator based on national averages.
6 Cost average approximation derived from: Green Values Stormwater Calculator. (2016). Center for Neighborhood Technology. Retrieved from http://greenvalues.cnt.org/national/cost_detail.php
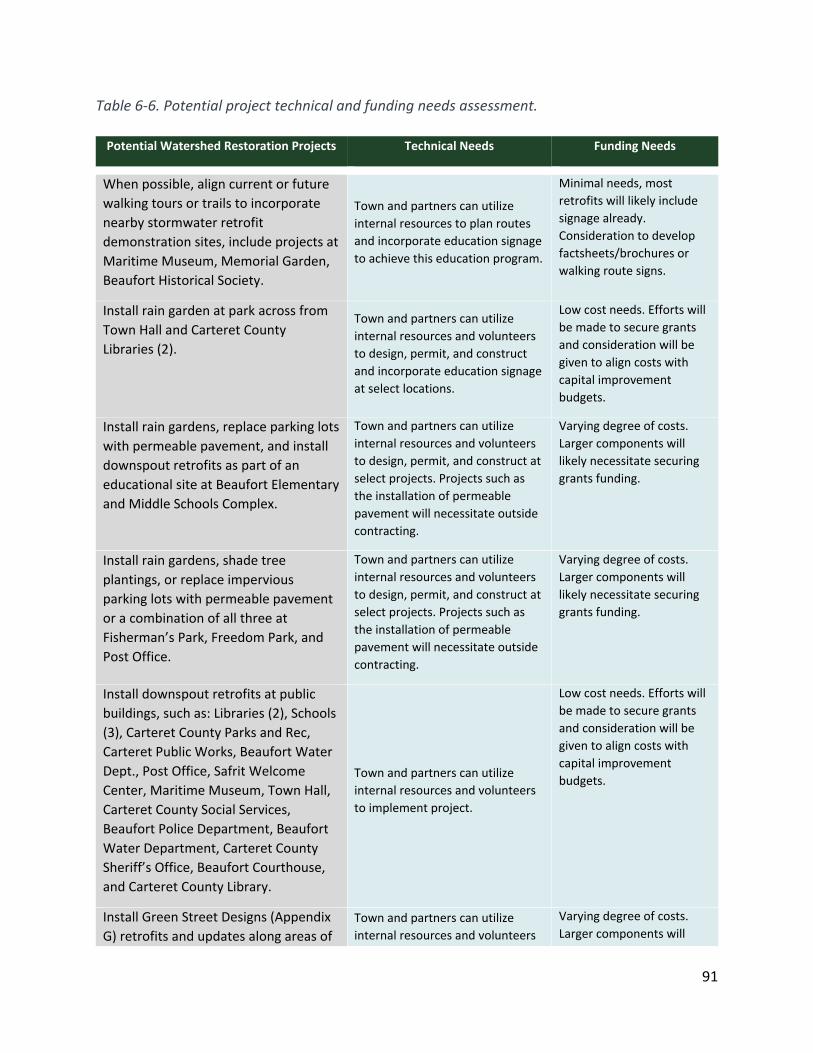
91
Table 6-6. Potential project technical and funding needs assessment.
Potential Watershed Restoration Projects Technical Needs Funding Needs
When possible, align current or future
walking tours or trails to incorporate
nearby stormwater retrofit
demonstration sites, include projects at
Maritime Museum, Memorial Garden,
Beaufort Historical Society.
Town and partners can utilize
internal resources to plan routes
and incorporate education signage
to achieve this education program.
Minimal needs, most
retrofits will likely include
signage already.
Consideration to develop
factsheets/brochures or
walking route signs.
Install rain garden at park across from
Town Hall and Carteret County
Libraries (2).
Town and partners can utilize
internal resources and volunteers
to design, permit, and construct
and incorporate education signage
at select locations.
Low cost needs. Efforts will
be made to secure grants
and consideration will be
given to align costs with
capital improvement
budgets.
Install rain gardens, replace parking lots
with permeable pavement, and install
downspout retrofits as part of an
educational site at Beaufort Elementary
and Middle Schools Complex.
Town and partners can utilize
internal resources and volunteers
to design, permit, and construct at
select projects. Projects such as
the installation of permeable
pavement will necessitate outside
contracting.
Varying degree of costs.
Larger components will
likely necessitate securing
grants funding.
Install rain gardens, shade tree
plantings, or replace impervious
parking lots with permeable pavement
or a combination of all three at
Fisherman’s Park, Freedom Park, and
Post Office.
Town and partners can utilize
internal resources and volunteers
to design, permit, and construct at
select projects. Projects such as
the installation of permeable
pavement will necessitate outside
contracting.
Varying degree of costs.
Larger components will
likely necessitate securing
grants funding.
Install downspout retrofits at public
buildings, such as: Libraries (2), Schools
(3), Carteret County Parks and Rec,
Carteret Public Works, Beaufort Water
Dept., Post Office, Safrit Welcome
Center, Maritime Museum, Town Hall,
Carteret County Social Services,
Beaufort Police Department, Beaufort
Water Department, Carteret County
Sheriff’s Office, Beaufort Courthouse,
and Carteret County Library.
Town and partners can utilize
internal resources and volunteers
to implement project.
Low cost needs. Efforts will
be made to secure grants
and consideration will be
given to align costs with
capital improvement
budgets.
Install Green Street Designs (Appendix
G) retrofits and updates along areas of
Town and partners can utilize
internal resources and volunteers
Varying degree of costs.
Larger components will
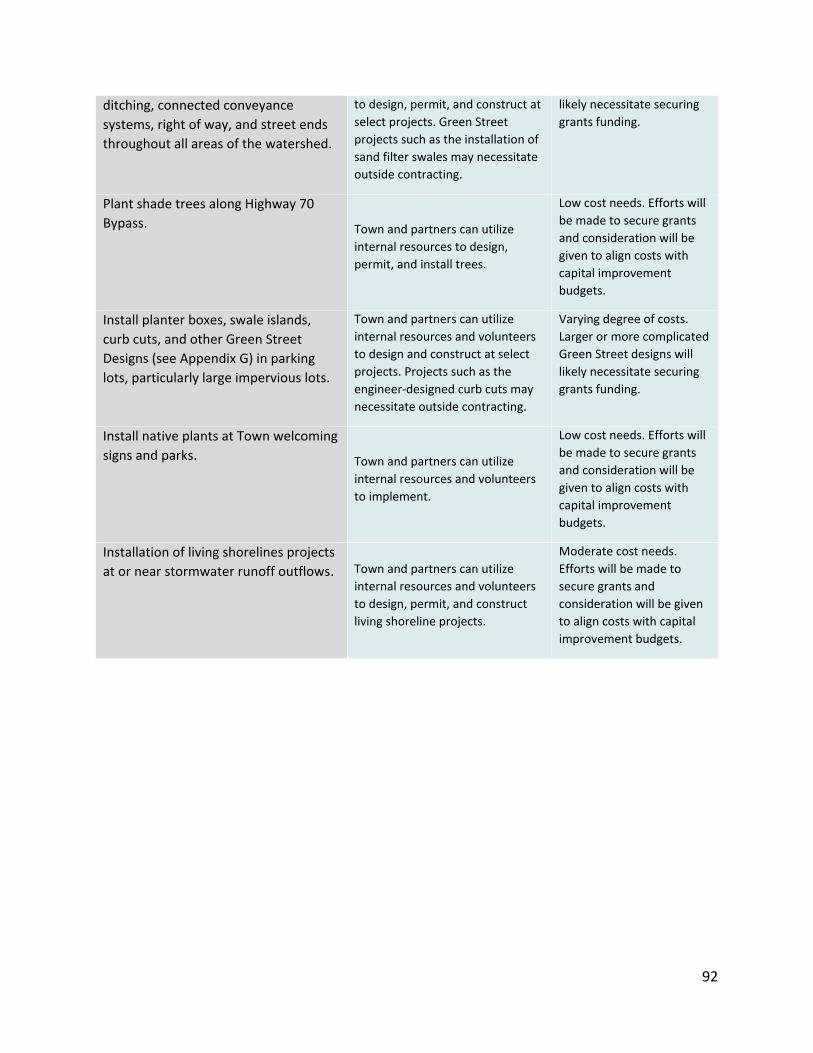
92
ditching, connected conveyance
systems, right of way, and street ends
throughout all areas of the watershed.
to design, permit, and construct at
select projects. Green Street
projects such as the installation of
sand filter swales may necessitate
outside contracting.
likely necessitate securing
grants funding.
Plant shade trees along Highway 70
Bypass. Town and partners can utilize
internal resources to design,
permit, and install trees.
Low cost needs. Efforts will
be made to secure grants
and consideration will be
given to align costs with
capital improvement
budgets.
Install planter boxes, swale islands,
curb cuts, and other Green Street
Designs (see Appendix G) in parking
lots, particularly large impervious lots.
Town and partners can utilize
internal resources and volunteers
to design and construct at select
projects. Projects such as the
engineer-designed curb cuts may
necessitate outside contracting.
Varying degree of costs.
Larger or more complicated
Green Street designs will
likely necessitate securing
grants funding.
Install native plants at Town welcoming
signs and parks. Town and partners can utilize
internal resources and volunteers
to implement.
Low cost needs. Efforts will
be made to secure grants
and consideration will be
given to align costs with
capital improvement
budgets.
Installation of living shorelines projects
at or near stormwater runoff outflows. Town and partners can utilize
internal resources and volunteers
to design, permit, and construct
living shoreline projects.
Moderate cost needs.
Efforts will be made to
secure grants and
consideration will be given
to align costs with capital
improvement budgets.

93
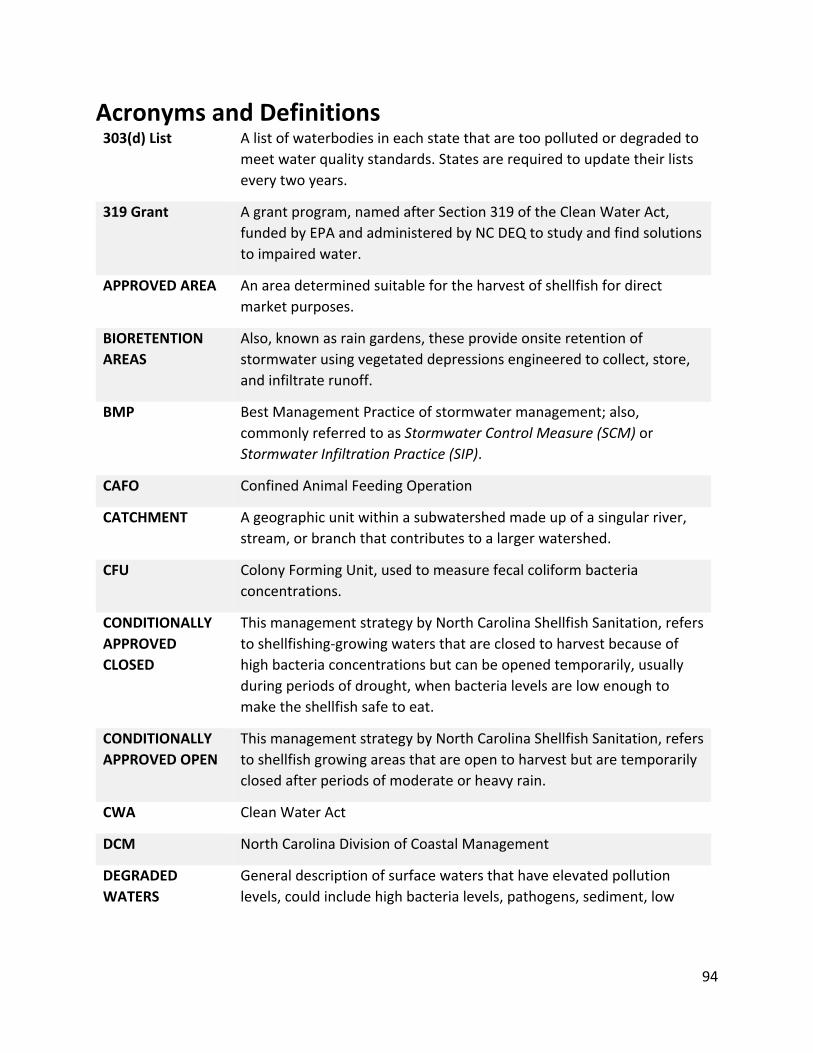
94
Acronyms and Definitions 303(d) List A list of waterbodies in each state that are too polluted or degraded to
meet water quality standards. States are required to update their lists
every two years.
319 Grant A grant program, named after Section 319 of the Clean Water Act,
funded by EPA and administered by NC DEQ to study and find solutions
to impaired water.
APPROVED AREA An area determined suitable for the harvest of shellfish for direct
market purposes.
BIORETENTION
AREAS
Also, known as rain gardens, these provide onsite retention of
stormwater using vegetated depressions engineered to collect, store,
and infiltrate runoff.
BMP Best Management Practice of stormwater management; also,
commonly referred to as Stormwater Control Measure (SCM) or
Stormwater Infiltration Practice (SIP).
CAFO Confined Animal Feeding Operation
CATCHMENT A geographic unit within a subwatershed made up of a singular river,
stream, or branch that contributes to a larger watershed.
CFU Colony Forming Unit, used to measure fecal coliform bacteria
concentrations.
CONDITIONALLY
APPROVED
CLOSED
This management strategy by North Carolina Shellfish Sanitation, refers
to shellfishing-growing waters that are closed to harvest because of
high bacteria concentrations but can be opened temporarily, usually
during periods of drought, when bacteria levels are low enough to
make the shellfish safe to eat.
CONDITIONALLY
APPROVED OPEN
This management strategy by North Carolina Shellfish Sanitation, refers
to shellfish growing areas that are open to harvest but are temporarily
closed after periods of moderate or heavy rain.
CWA Clean Water Act
DCM North Carolina Division of Coastal Management
DEGRADED
WATERS
General description of surface waters that have elevated pollution
levels, could include high bacteria levels, pathogens, sediment, low
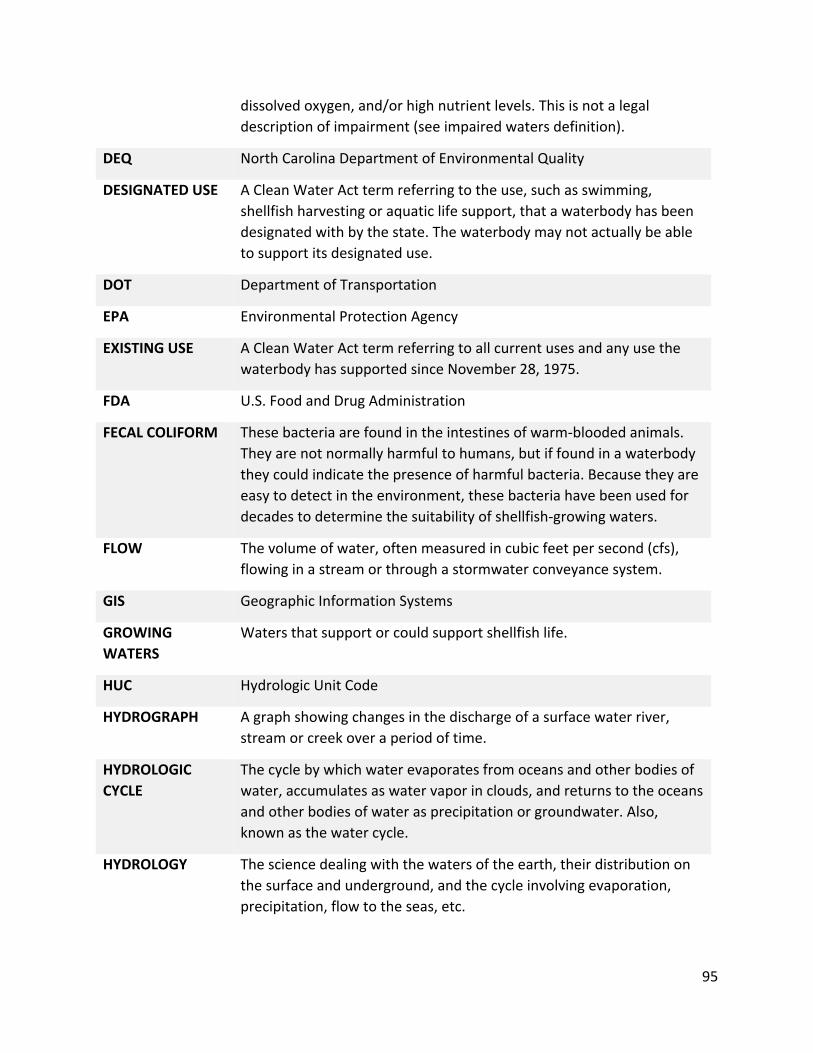
95
dissolved oxygen, and/or high nutrient levels. This is not a legal
description of impairment (see impaired waters definition).
DEQ North Carolina Department of Environmental Quality
DESIGNATED USE A Clean Water Act term referring to the use, such as swimming,
shellfish harvesting or aquatic life support, that a waterbody has been
designated with by the state. The waterbody may not actually be able
to support its designated use.
DOT Department of Transportation
EPA Environmental Protection Agency
EXISTING USE A Clean Water Act term referring to all current uses and any use the
waterbody has supported since November 28, 1975.
FDA U.S. Food and Drug Administration
FECAL COLIFORM These bacteria are found in the intestines of warm-blooded animals.
They are not normally harmful to humans, but if found in a waterbody
they could indicate the presence of harmful bacteria. Because they are
easy to detect in the environment, these bacteria have been used for
decades to determine the suitability of shellfish-growing waters.
FLOW The volume of water, often measured in cubic feet per second (cfs),
flowing in a stream or through a stormwater conveyance system.
GIS Geographic Information Systems
GROWING
WATERS
Waters that support or could support shellfish life.
HUC Hydrologic Unit Code
HYDROGRAPH A graph showing changes in the discharge of a surface water river,
stream or creek over a period of time.
HYDROLOGIC
CYCLE
The cycle by which water evaporates from oceans and other bodies of
water, accumulates as water vapor in clouds, and returns to the oceans
and other bodies of water as precipitation or groundwater. Also,
known as the water cycle.
HYDROLOGY The science dealing with the waters of the earth, their distribution on
the surface and underground, and the cycle involving evaporation,
precipitation, flow to the seas, etc.
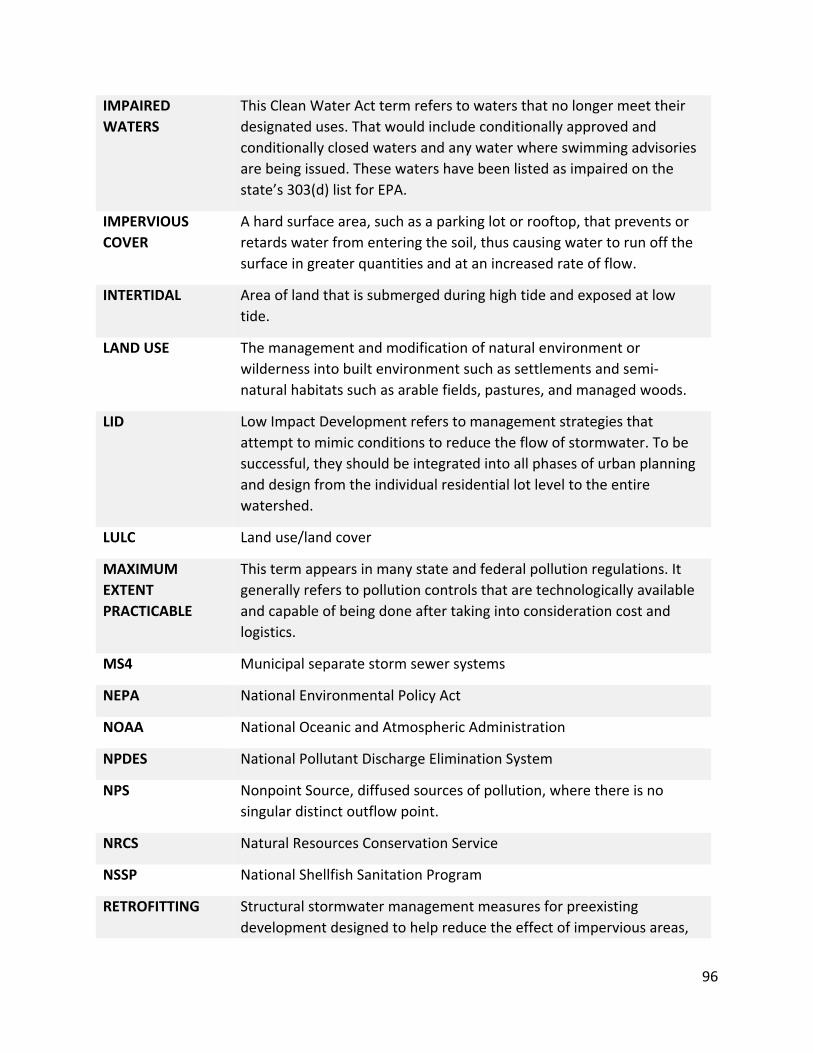
96
IMPAIRED
WATERS
This Clean Water Act term refers to waters that no longer meet their
designated uses. That would include conditionally approved and
conditionally closed waters and any water where swimming advisories
are being issued. These waters have been listed as impaired on the
state’s 303(d) list for EPA.
IMPERVIOUS
COVER
A hard surface area, such as a parking lot or rooftop, that prevents or
retards water from entering the soil, thus causing water to run off the
surface in greater quantities and at an increased rate of flow.
INTERTIDAL Area of land that is submerged during high tide and exposed at low
tide.
LAND USE The management and modification of natural environment or
wilderness into built environment such as settlements and semi-
natural habitats such as arable fields, pastures, and managed woods.
LID Low Impact Development refers to management strategies that
attempt to mimic conditions to reduce the flow of stormwater. To be
successful, they should be integrated into all phases of urban planning
and design from the individual residential lot level to the entire
watershed.
LULC Land use/land cover
MAXIMUM
EXTENT
PRACTICABLE
This term appears in many state and federal pollution regulations. It
generally refers to pollution controls that are technologically available
and capable of being done after taking into consideration cost and
logistics.
MS4 Municipal separate storm sewer systems
NEPA National Environmental Policy Act
NOAA National Oceanic and Atmospheric Administration
NPDES National Pollutant Discharge Elimination System
NPS Nonpoint Source, diffused sources of pollution, where there is no
singular distinct outflow point.
NRCS Natural Resources Conservation Service
NSSP National Shellfish Sanitation Program
RETROFITTING Structural stormwater management measures for preexisting
development designed to help reduce the effect of impervious areas,
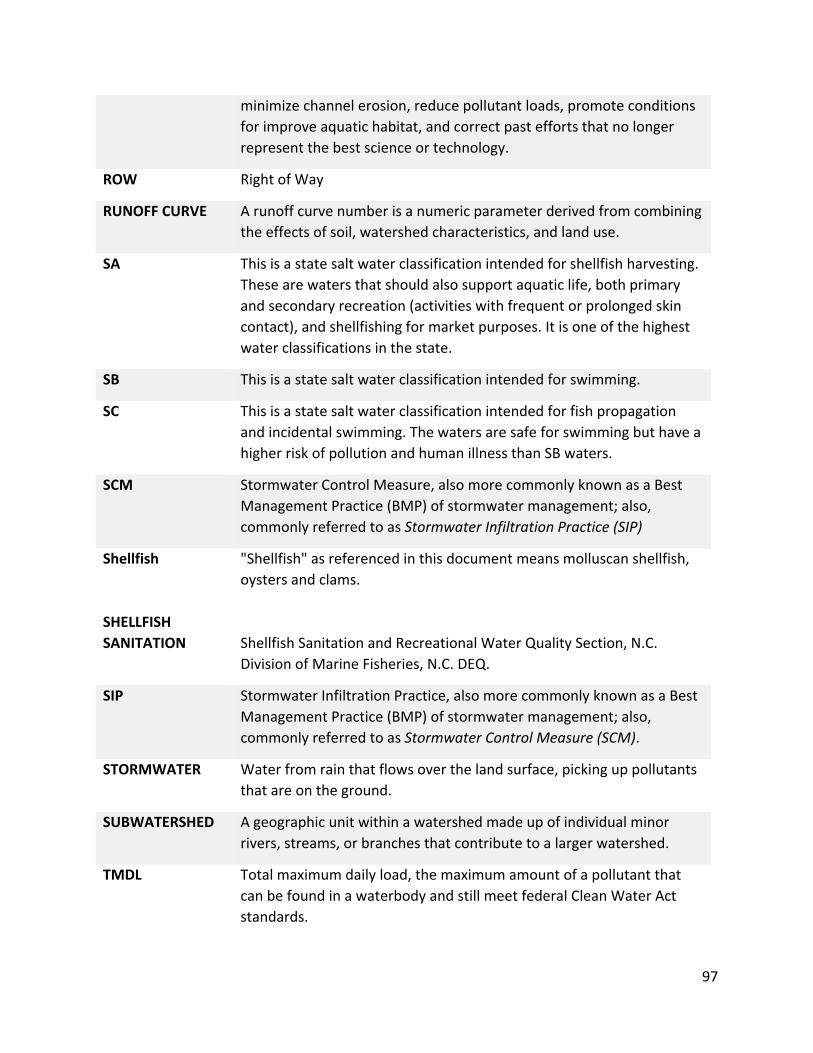
97
minimize channel erosion, reduce pollutant loads, promote conditions
for improve aquatic habitat, and correct past efforts that no longer
represent the best science or technology.
ROW Right of Way
RUNOFF CURVE A runoff curve number is a numeric parameter derived from combining
the effects of soil, watershed characteristics, and land use.
SA This is a state salt water classification intended for shellfish harvesting.
These are waters that should also support aquatic life, both primary
and secondary recreation (activities with frequent or prolonged skin
contact), and shellfishing for market purposes. It is one of the highest
water classifications in the state.
SB This is a state salt water classification intended for swimming.
SC This is a state salt water classification intended for fish propagation
and incidental swimming. The waters are safe for swimming but have a
higher risk of pollution and human illness than SB waters.
SCM Stormwater Control Measure, also more commonly known as a Best
Management Practice (BMP) of stormwater management; also,
commonly referred to as Stormwater Infiltration Practice (SIP)
Shellfish
SHELLFISH
SANITATION
"Shellfish" as referenced in this document means molluscan shellfish,
oysters and clams.
Shellfish Sanitation and Recreational Water Quality Section, N.C.
Division of Marine Fisheries, N.C. DEQ.
SIP Stormwater Infiltration Practice, also more commonly known as a Best
Management Practice (BMP) of stormwater management; also,
commonly referred to as Stormwater Control Measure (SCM).
STORMWATER Water from rain that flows over the land surface, picking up pollutants
that are on the ground.
SUBWATERSHED A geographic unit within a watershed made up of individual minor
rivers, streams, or branches that contribute to a larger watershed.
TMDL Total maximum daily load, the maximum amount of a pollutant that
can be found in a waterbody and still meet federal Clean Water Act
standards.
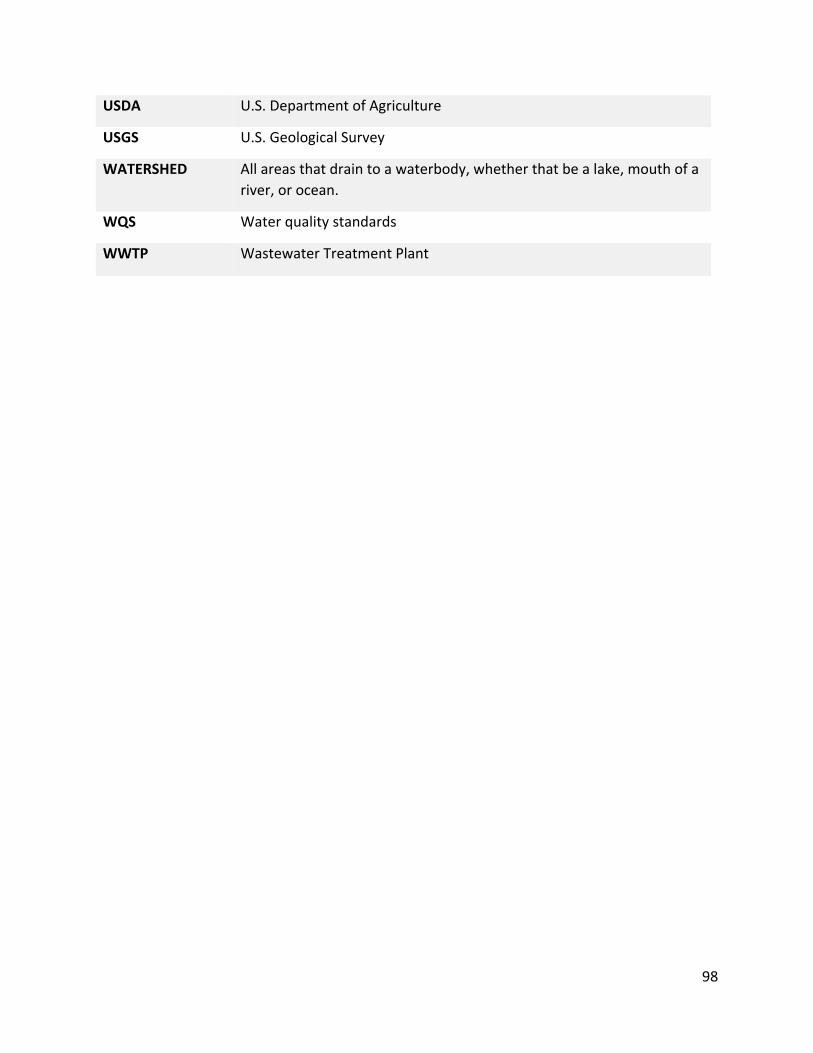
98
USDA U.S. Department of Agriculture
USGS U.S. Geological Survey
WATERSHED All areas that drain to a waterbody, whether that be a lake, mouth of a
river, or ocean.
WQS Water quality standards
WWTP Wastewater Treatment Plant

99
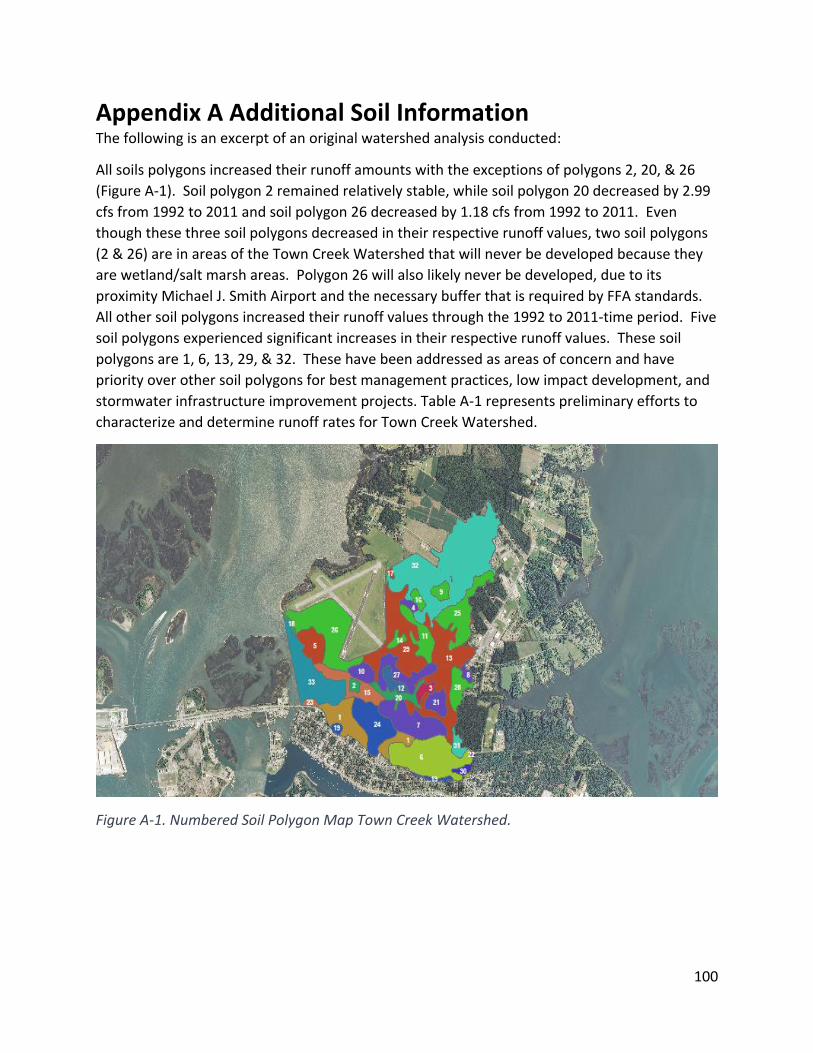
100
Appendix A Additional Soil Information The following is an excerpt of an original watershed analysis conducted:
All soils polygons increased their runoff amounts with the exceptions of polygons 2, 20, & 26
(Figure A-1). Soil polygon 2 remained relatively stable, while soil polygon 20 decreased by 2.99
cfs from 1992 to 2011 and soil polygon 26 decreased by 1.18 cfs from 1992 to 2011. Even
though these three soil polygons decreased in their respective runoff values, two soil polygons
(2 & 26) are in areas of the Town Creek Watershed that will never be developed because they
are wetland/salt marsh areas. Polygon 26 will also likely never be developed, due to its
proximity Michael J. Smith Airport and the necessary buffer that is required by FFA standards.
All other soil polygons increased their runoff values through the 1992 to 2011-time period. Five
soil polygons experienced significant increases in their respective runoff values. These soil
polygons are 1, 6, 13, 29, & 32. These have been addressed as areas of concern and have
priority over other soil polygons for best management practices, low impact development, and
stormwater infrastructure improvement projects. Table A-1 represents preliminary efforts to
characterize and determine runoff rates for Town Creek Watershed.
Figure A-1. Numbered Soil Polygon Map Town Creek Watershed.
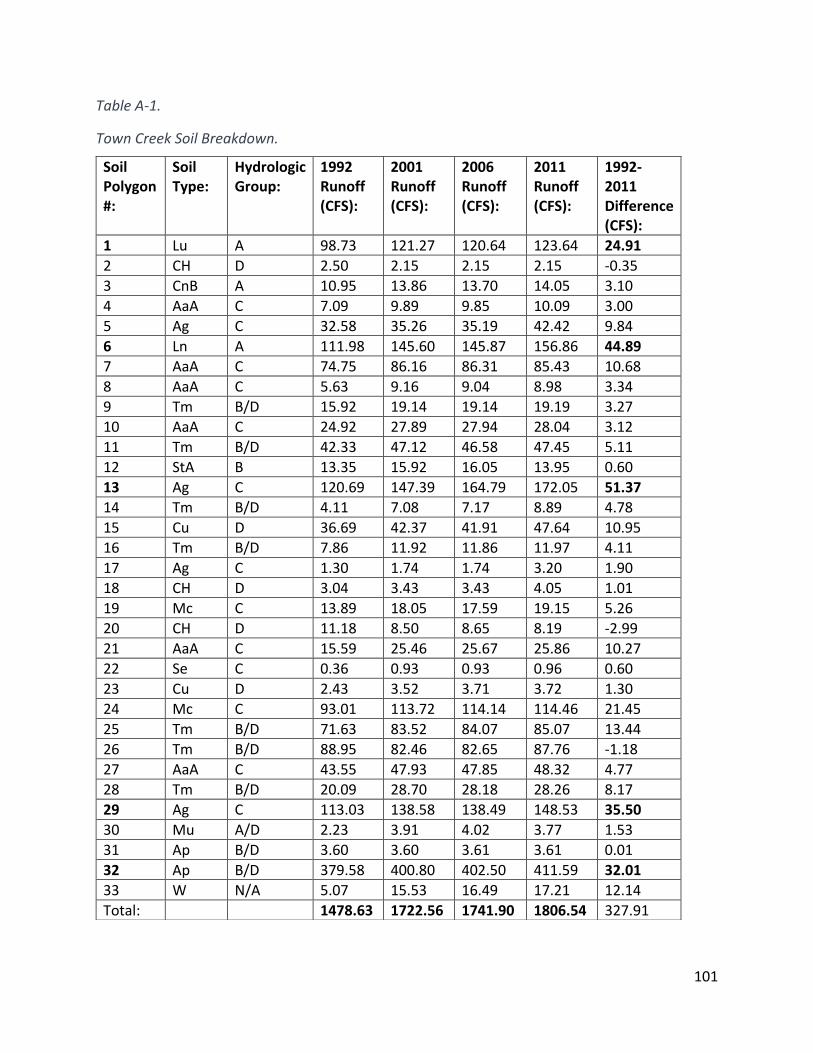
101
Table A-1.
Town Creek Soil Breakdown.
Soil Polygon #:
Soil Type:
Hydrologic Group:
1992 Runoff (CFS):
2001 Runoff (CFS):
2006 Runoff (CFS):
2011 Runoff (CFS):
1992-2011 Difference (CFS):
1 Lu A 98.73 121.27 120.64 123.64 24.91
2 CH D 2.50 2.15 2.15 2.15 -0.35
3 CnB A 10.95 13.86 13.70 14.05 3.10
4 AaA C 7.09 9.89 9.85 10.09 3.00
5 Ag C 32.58 35.26 35.19 42.42 9.84
6 Ln A 111.98 145.60 145.87 156.86 44.89
7 AaA C 74.75 86.16 86.31 85.43 10.68
8 AaA C 5.63 9.16 9.04 8.98 3.34
9 Tm B/D 15.92 19.14 19.14 19.19 3.27
10 AaA C 24.92 27.89 27.94 28.04 3.12
11 Tm B/D 42.33 47.12 46.58 47.45 5.11
12 StA B 13.35 15.92 16.05 13.95 0.60
13 Ag C 120.69 147.39 164.79 172.05 51.37
14 Tm B/D 4.11 7.08 7.17 8.89 4.78
15 Cu D 36.69 42.37 41.91 47.64 10.95
16 Tm B/D 7.86 11.92 11.86 11.97 4.11
17 Ag C 1.30 1.74 1.74 3.20 1.90
18 CH D 3.04 3.43 3.43 4.05 1.01
19 Mc C 13.89 18.05 17.59 19.15 5.26
20 CH D 11.18 8.50 8.65 8.19 -2.99
21 AaA C 15.59 25.46 25.67 25.86 10.27
22 Se C 0.36 0.93 0.93 0.96 0.60
23 Cu D 2.43 3.52 3.71 3.72 1.30
24 Mc C 93.01 113.72 114.14 114.46 21.45
25 Tm B/D 71.63 83.52 84.07 85.07 13.44
26 Tm B/D 88.95 82.46 82.65 87.76 -1.18
27 AaA C 43.55 47.93 47.85 48.32 4.77
28 Tm B/D 20.09 28.70 28.18 28.26 8.17
29 Ag C 113.03 138.58 138.49 148.53 35.50
30 Mu A/D 2.23 3.91 4.02 3.77 1.53
31 Ap B/D 3.60 3.60 3.61 3.61 0.01
32 Ap B/D 379.58 400.80 402.50 411.59 32.01
33 W N/A 5.07 15.53 16.49 17.21 12.14
Total: 1478.63 1722.56 1741.90 1806.54 327.91

102
Figure A-2. Runoff rates based on soil taxonomy (see Table A-1 for key).
In addition to calculating runoff values for all individual soil polygons that comprise the Town
Creek Watershed, the NCCF Runoff Calculation Tool was used to estimate the entire amount of
runoff that results from the entire area of the Town Creek Watershed for the years of 1992,
2001, 2006, & 2011. These calculations are in acre-feet, instead of cubic feet per second. The
following Figure A-2 and Table A-1 depict the estimated runoff amounts for the Town Creek
Watershed. These results were then plugged into the volume reduction goals aspect of the
NCCF Runoff Calculation Tool. This provided Town of Beaufort staff and its partners with
numerical goals for reduction of stormwater runoff within the Town Creek Watershed. These
sets of data provide areas of concern within the watershed that would relinquish the most
effective means of reducing the total amount of stormwater runoff in the Town Creek
Watershed. To return to 1992 runoff levels, at least 51.04 acre-feet of runoff must be captured,
diverted, and/or treated before being discharged into Town Creek.
Past runoff estimates were calculated from National Land Coverage Data at the yearly
increments of 1992, 2001, 2006, and 2011 and through the Federation’s Runoff Calculation Tool
found within the Watershed Restoration Planning Guidebook. These estimates provide
snapshots of past runoff values that can be used as benchmarks to measure the effectiveness of
existing and the progress of newly implemented best management practices employed by the
Town.
The objectives for the Town of Beaufort is to return Town Creek to at least 1992 stormwater
runoff values with emphasis on trying to improve it past the 1992 benchmark as well.
Precipitation, in the form of rainfall is the typically the main input into a water body, while
stream flow or tidal action is the output of the watershed. How waterbodies are affected by
precipitation is determined on a number of factors. These factors can be natural or man-made,
0.00
100.00
200.00
300.00
400.00
500.00
1 2 3 4 5 6 7 8 9 101112131415161718192021222324252627282930313233
CFS
Soil Polygon #
1992, 2001, 2006, 2011 Storm Water Runoff (CFS)
2011 Runoff: 2006 Runoff: 2001 Runoff: 1992 Runoff:
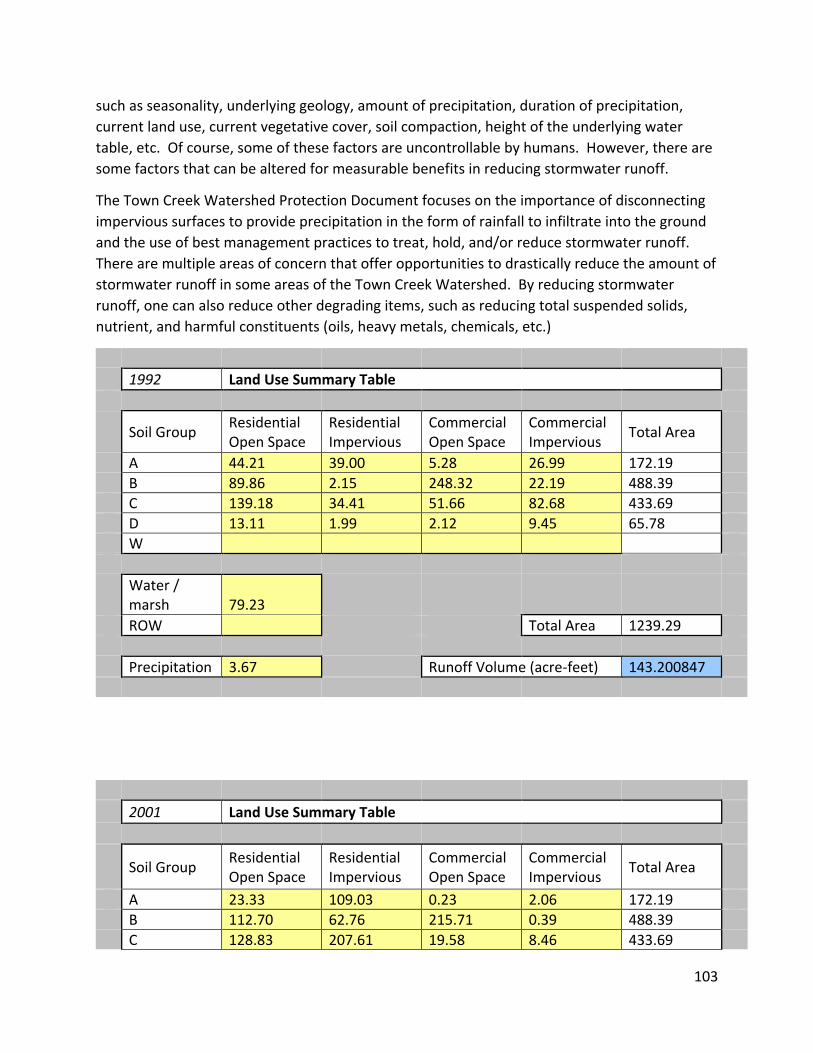
103
such as seasonality, underlying geology, amount of precipitation, duration of precipitation,
current land use, current vegetative cover, soil compaction, height of the underlying water
table, etc. Of course, some of these factors are uncontrollable by humans. However, there are
some factors that can be altered for measurable benefits in reducing stormwater runoff.
The Town Creek Watershed Protection Document focuses on the importance of disconnecting
impervious surfaces to provide precipitation in the form of rainfall to infiltrate into the ground
and the use of best management practices to treat, hold, and/or reduce stormwater runoff.
There are multiple areas of concern that offer opportunities to drastically reduce the amount of
stormwater runoff in some areas of the Town Creek Watershed. By reducing stormwater
runoff, one can also reduce other degrading items, such as reducing total suspended solids,
nutrient, and harmful constituents (oils, heavy metals, chemicals, etc.)
2001 Land Use Summary Table
Soil Group Residential Open Space
Residential Impervious
Commercial Open Space
Commercial Impervious
Total Area
A 23.33 109.03 0.23 2.06 172.19
B 112.70 62.76 215.71 0.39 488.39
C 128.83 207.61 19.58 8.46 433.69
1992 Land Use Summary Table
Soil Group Residential Open Space
Residential Impervious
Commercial Open Space
Commercial Impervious
Total Area
A 44.21 39.00 5.28 26.99 172.19
B 89.86 2.15 248.32 22.19 488.39
C 139.18 34.41 51.66 82.68 433.69
D 13.11 1.99 2.12 9.45 65.78
W
Water / marsh 79.23
ROW Total Area 1239.29
Precipitation 3.67 Runoff Volume (acre-feet) 143.200847
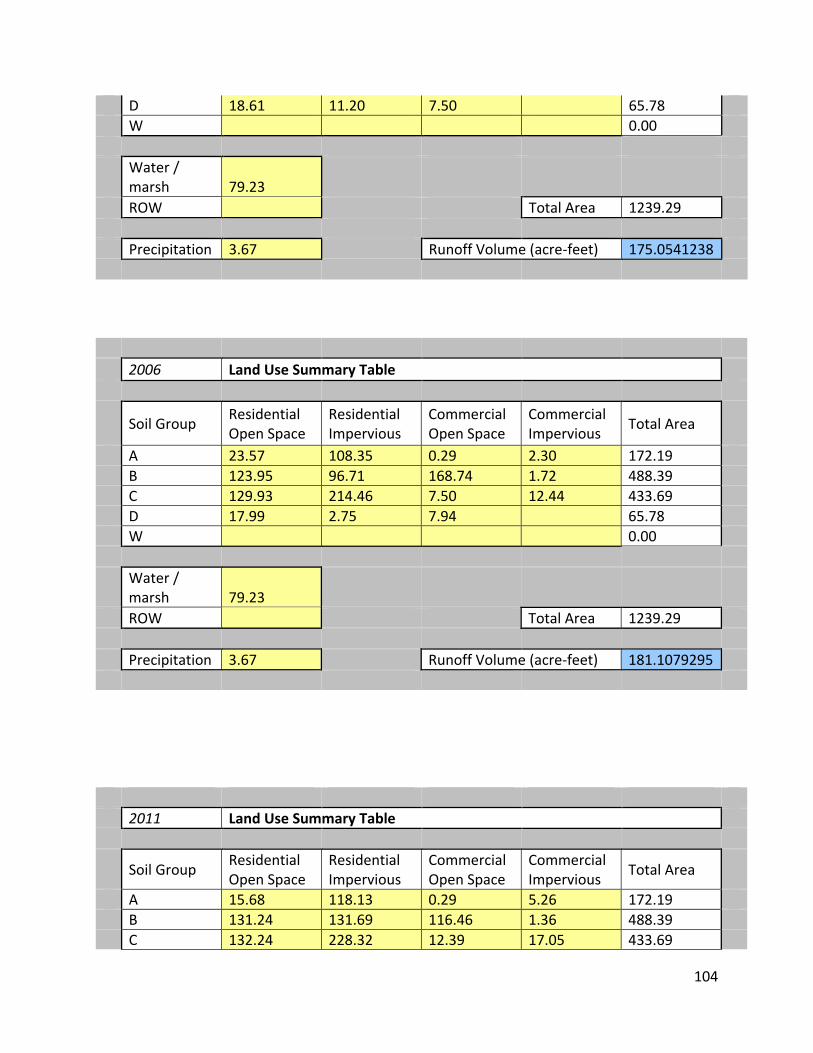
104
D 18.61 11.20 7.50 65.78
W 0.00
Water / marsh 79.23
ROW Total Area 1239.29
Precipitation 3.67 Runoff Volume (acre-feet) 175.0541238
2006 Land Use Summary Table
Soil Group Residential Open Space
Residential Impervious
Commercial Open Space
Commercial Impervious
Total Area
A 23.57 108.35 0.29 2.30 172.19
B 123.95 96.71 168.74 1.72 488.39
C 129.93 214.46 7.50 12.44 433.69
D 17.99 2.75 7.94 65.78
W 0.00
Water / marsh 79.23
ROW Total Area 1239.29
Precipitation 3.67 Runoff Volume (acre-feet) 181.1079295
2011 Land Use Summary Table
Soil Group Residential Open Space
Residential Impervious
Commercial Open Space
Commercial Impervious
Total Area
A 15.68 118.13 0.29 5.26 172.19
B 131.24 131.69 116.46 1.36 488.39
C 132.24 228.32 12.39 17.05 433.69
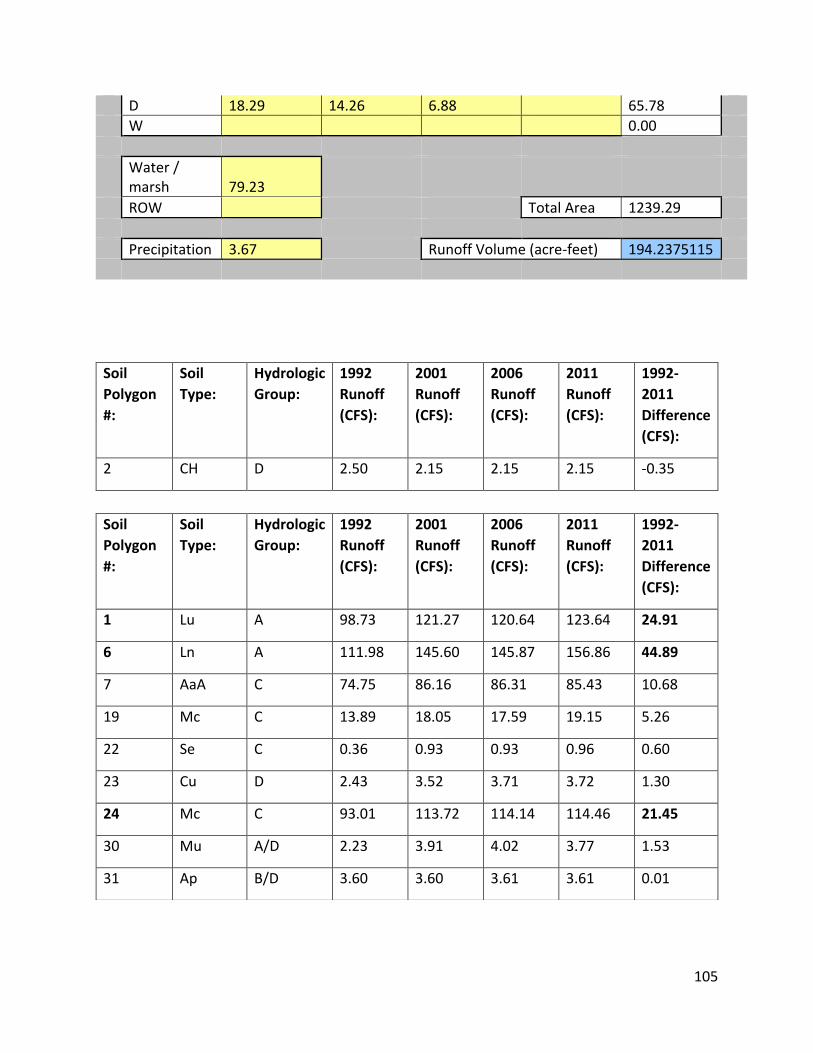
105
D 18.29 14.26 6.88 65.78
W 0.00
Water / marsh 79.23
ROW Total Area 1239.29
Precipitation 3.67 Runoff Volume (acre-feet) 194.2375115
Soil
Polygon
#:
Soil
Type:
Hydrologic
Group:
1992
Runoff
(CFS):
2001
Runoff
(CFS):
2006
Runoff
(CFS):
2011
Runoff
(CFS):
1992-
2011
Difference
(CFS):
2 CH D 2.50 2.15 2.15 2.15 -0.35
Soil
Polygon
#:
Soil
Type:
Hydrologic
Group:
1992
Runoff
(CFS):
2001
Runoff
(CFS):
2006
Runoff
(CFS):
2011
Runoff
(CFS):
1992-
2011
Difference
(CFS):
1 Lu A 98.73 121.27 120.64 123.64 24.91
6 Ln A 111.98 145.60 145.87 156.86 44.89
7 AaA C 74.75 86.16 86.31 85.43 10.68
19 Mc C 13.89 18.05 17.59 19.15 5.26
22 Se C 0.36 0.93 0.93 0.96 0.60
23 Cu D 2.43 3.52 3.71 3.72 1.30
24 Mc C 93.01 113.72 114.14 114.46 21.45
30 Mu A/D 2.23 3.91 4.02 3.77 1.53
31 Ap B/D 3.60 3.60 3.61 3.61 0.01
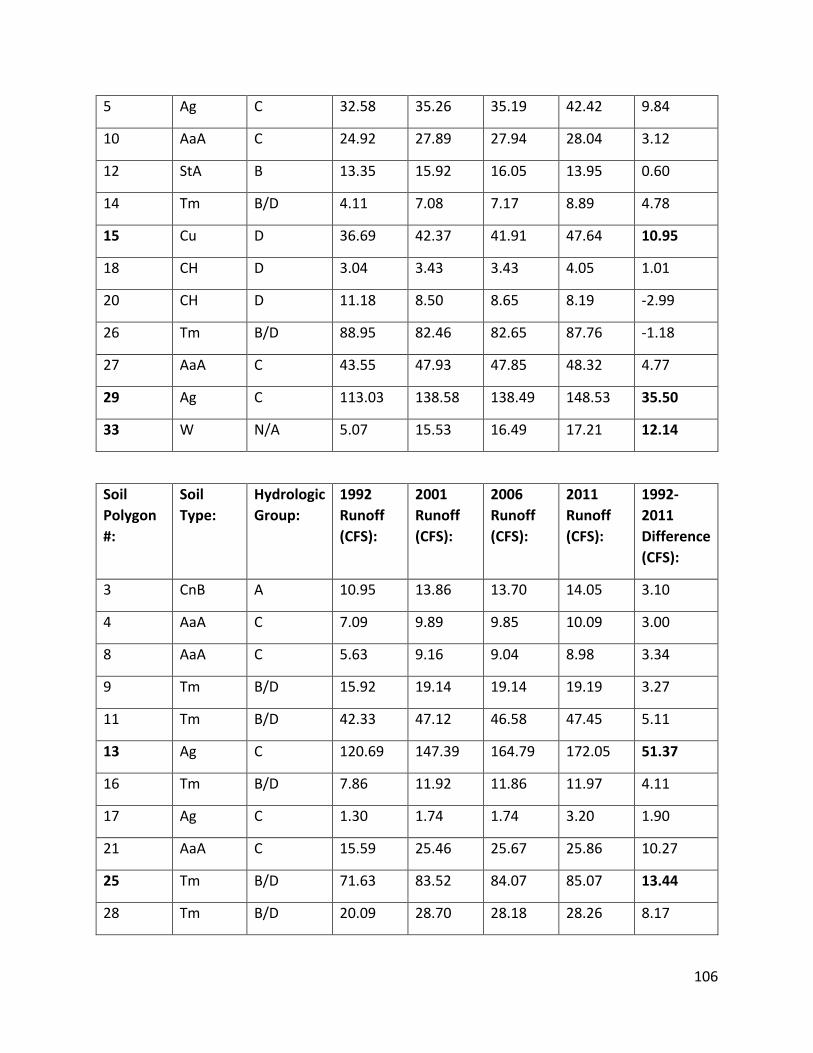
106
5 Ag C 32.58 35.26 35.19 42.42 9.84
10 AaA C 24.92 27.89 27.94 28.04 3.12
12 StA B 13.35 15.92 16.05 13.95 0.60
14 Tm B/D 4.11 7.08 7.17 8.89 4.78
15 Cu D 36.69 42.37 41.91 47.64 10.95
18 CH D 3.04 3.43 3.43 4.05 1.01
20 CH D 11.18 8.50 8.65 8.19 -2.99
26 Tm B/D 88.95 82.46 82.65 87.76 -1.18
27 AaA C 43.55 47.93 47.85 48.32 4.77
29 Ag C 113.03 138.58 138.49 148.53 35.50
33 W N/A 5.07 15.53 16.49 17.21 12.14
Soil
Polygon
#:
Soil
Type:
Hydrologic
Group:
1992
Runoff
(CFS):
2001
Runoff
(CFS):
2006
Runoff
(CFS):
2011
Runoff
(CFS):
1992-
2011
Difference
(CFS):
3 CnB A 10.95 13.86 13.70 14.05 3.10
4 AaA C 7.09 9.89 9.85 10.09 3.00
8 AaA C 5.63 9.16 9.04 8.98 3.34
9 Tm B/D 15.92 19.14 19.14 19.19 3.27
11 Tm B/D 42.33 47.12 46.58 47.45 5.11
13 Ag C 120.69 147.39 164.79 172.05 51.37
16 Tm B/D 7.86 11.92 11.86 11.97 4.11
17 Ag C 1.30 1.74 1.74 3.20 1.90
21 AaA C 15.59 25.46 25.67 25.86 10.27
25 Tm B/D 71.63 83.52 84.07 85.07 13.44
28 Tm B/D 20.09 28.70 28.18 28.26 8.17
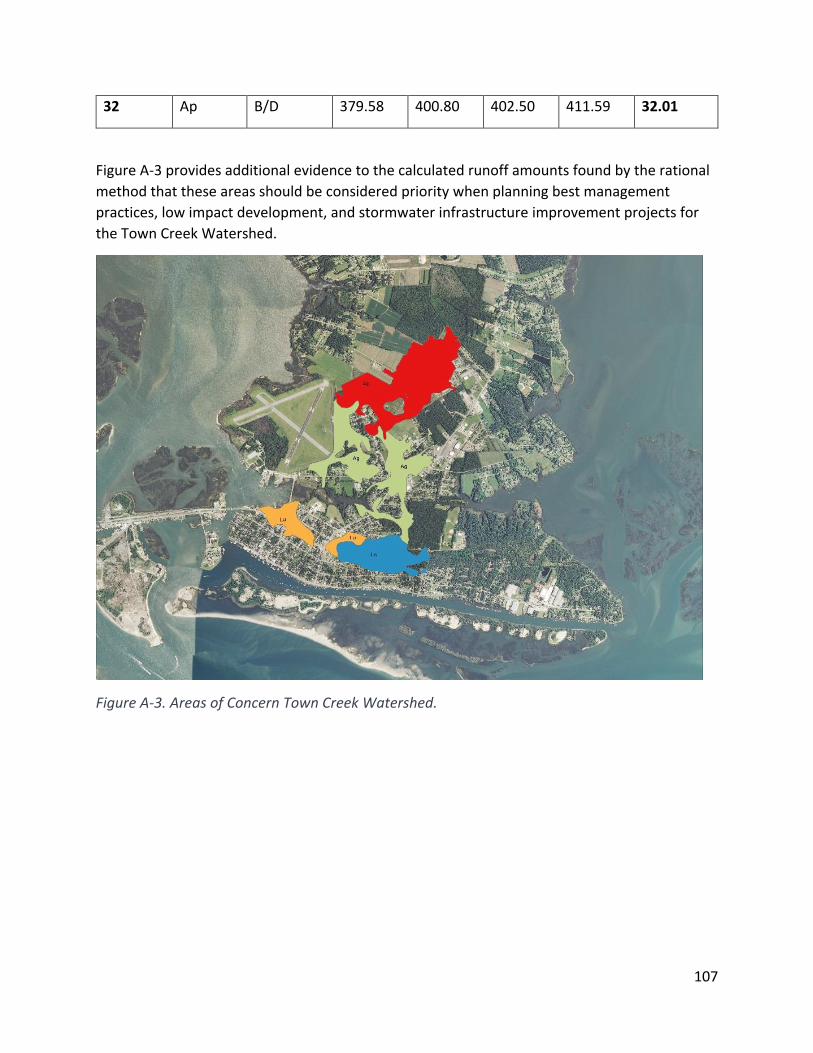
107
32 Ap B/D 379.58 400.80 402.50 411.59 32.01
Figure A-3 provides additional evidence to the calculated runoff amounts found by the rational
method that these areas should be considered priority when planning best management
practices, low impact development, and stormwater infrastructure improvement projects for
the Town Creek Watershed.
Figure A-3. Areas of Concern Town Creek Watershed.
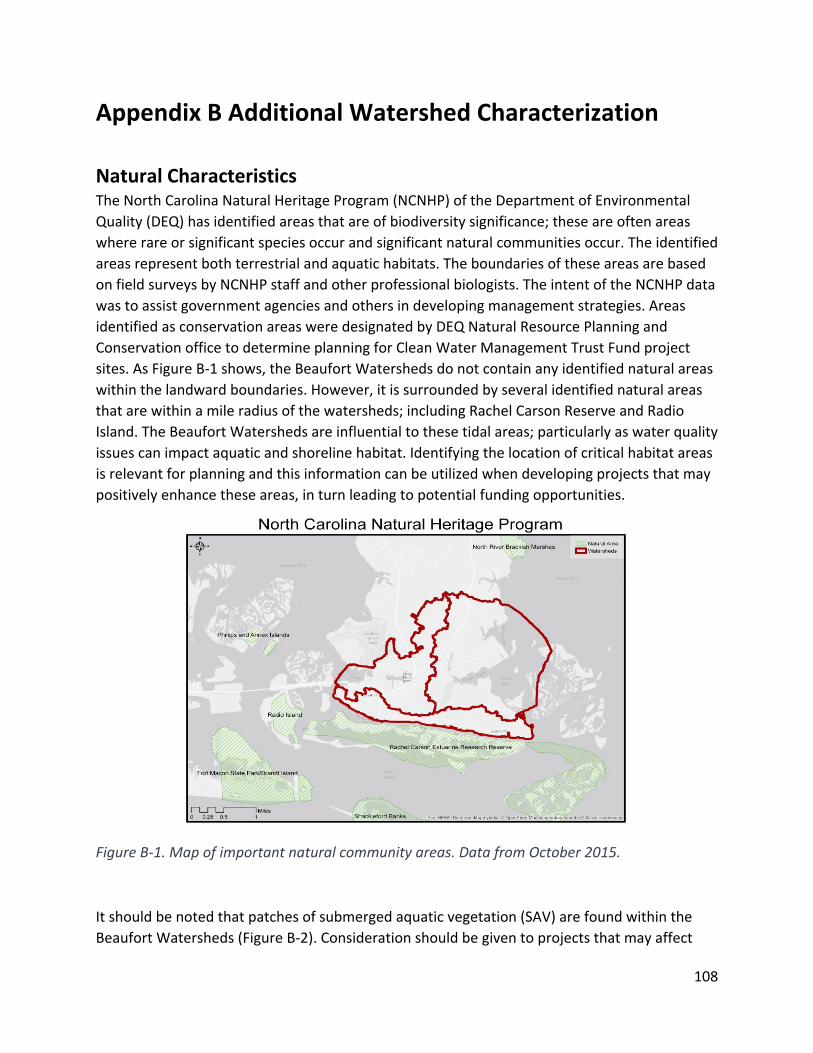
108
Appendix B Additional Watershed Characterization
Natural Characteristics The North Carolina Natural Heritage Program (NCNHP) of the Department of Environmental
Quality (DEQ) has identified areas that are of biodiversity significance; these are often areas
where rare or significant species occur and significant natural communities occur. The identified
areas represent both terrestrial and aquatic habitats. The boundaries of these areas are based
on field surveys by NCNHP staff and other professional biologists. The intent of the NCNHP data
was to assist government agencies and others in developing management strategies. Areas
identified as conservation areas were designated by DEQ Natural Resource Planning and
Conservation office to determine planning for Clean Water Management Trust Fund project
sites. As Figure B-1 shows, the Beaufort Watersheds do not contain any identified natural areas
within the landward boundaries. However, it is surrounded by several identified natural areas
that are within a mile radius of the watersheds; including Rachel Carson Reserve and Radio
Island. The Beaufort Watersheds are influential to these tidal areas; particularly as water quality
issues can impact aquatic and shoreline habitat. Identifying the location of critical habitat areas
is relevant for planning and this information can be utilized when developing projects that may
positively enhance these areas, in turn leading to potential funding opportunities.
Figure B-1. Map of important natural community areas. Data from October 2015.
It should be noted that patches of submerged aquatic vegetation (SAV) are found within the
Beaufort Watersheds (Figure B-2). Consideration should be given to projects that may affect
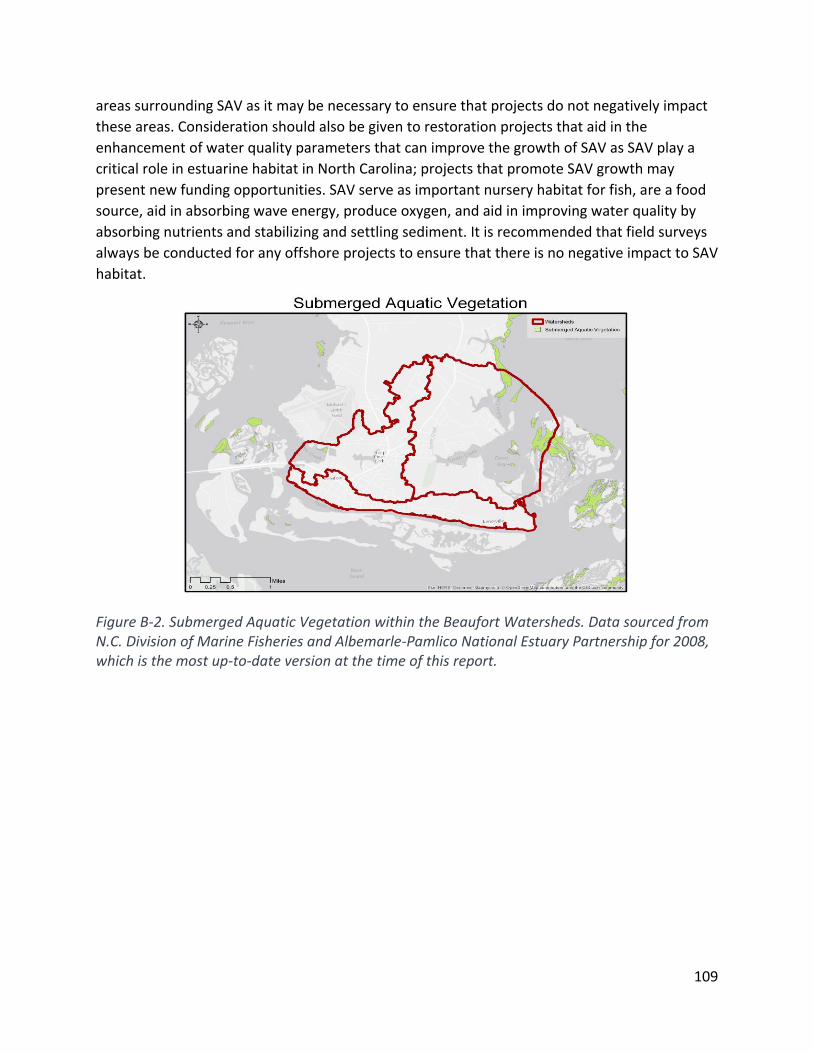
109
areas surrounding SAV as it may be necessary to ensure that projects do not negatively impact
these areas. Consideration should also be given to restoration projects that aid in the
enhancement of water quality parameters that can improve the growth of SAV as SAV play a
critical role in estuarine habitat in North Carolina; projects that promote SAV growth may
present new funding opportunities. SAV serve as important nursery habitat for fish, are a food
source, aid in absorbing wave energy, produce oxygen, and aid in improving water quality by
absorbing nutrients and stabilizing and settling sediment. It is recommended that field surveys
always be conducted for any offshore projects to ensure that there is no negative impact to SAV
habitat.
Figure B-2. Submerged Aquatic Vegetation within the Beaufort Watersheds. Data sourced from N.C. Division of Marine Fisheries and Albemarle-Pamlico National Estuary Partnership for 2008, which is the most up-to-date version at the time of this report.
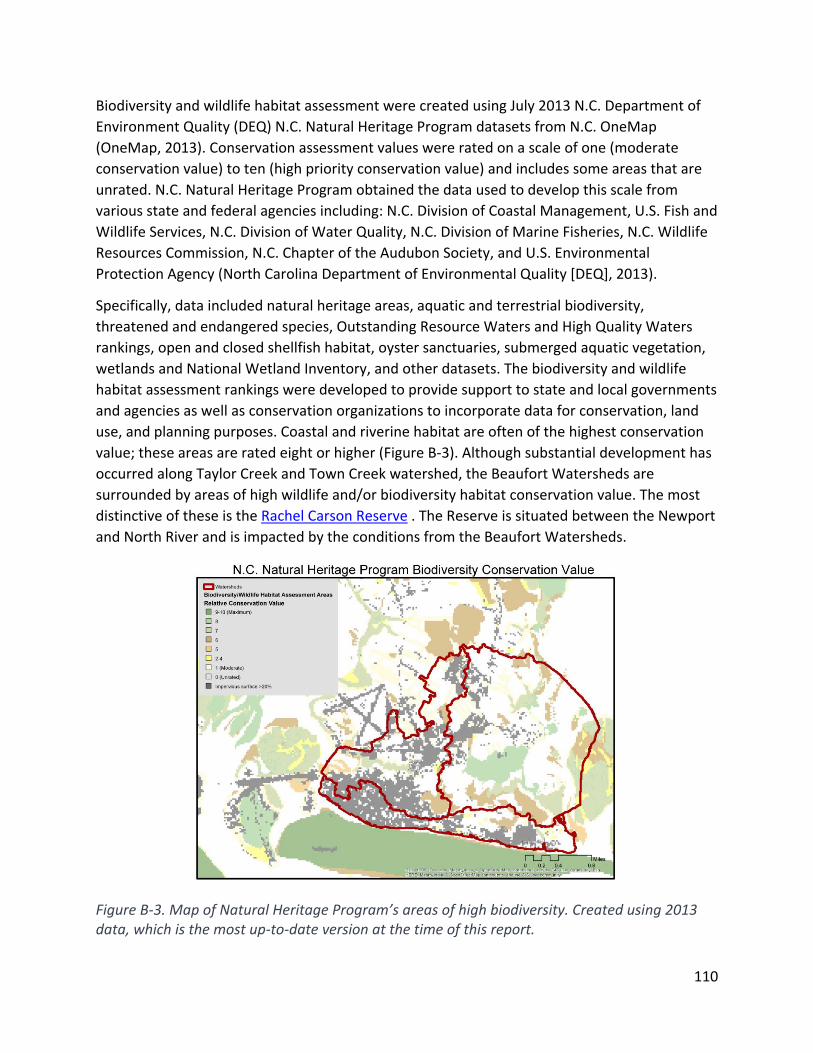
110
Biodiversity and wildlife habitat assessment were created using July 2013 N.C. Department of
Environment Quality (DEQ) N.C. Natural Heritage Program datasets from N.C. OneMap
(OneMap, 2013). Conservation assessment values were rated on a scale of one (moderate
conservation value) to ten (high priority conservation value) and includes some areas that are
unrated. N.C. Natural Heritage Program obtained the data used to develop this scale from
various state and federal agencies including: N.C. Division of Coastal Management, U.S. Fish and
Wildlife Services, N.C. Division of Water Quality, N.C. Division of Marine Fisheries, N.C. Wildlife
Resources Commission, N.C. Chapter of the Audubon Society, and U.S. Environmental
Protection Agency (North Carolina Department of Environmental Quality [DEQ], 2013).
Specifically, data included natural heritage areas, aquatic and terrestrial biodiversity,
threatened and endangered species, Outstanding Resource Waters and High Quality Waters
rankings, open and closed shellfish habitat, oyster sanctuaries, submerged aquatic vegetation,
wetlands and National Wetland Inventory, and other datasets. The biodiversity and wildlife
habitat assessment rankings were developed to provide support to state and local governments
and agencies as well as conservation organizations to incorporate data for conservation, land
use, and planning purposes. Coastal and riverine habitat are often of the highest conservation
value; these areas are rated eight or higher (Figure B-3). Although substantial development has
occurred along Taylor Creek and Town Creek watershed, the Beaufort Watersheds are
surrounded by areas of high wildlife and/or biodiversity habitat conservation value. The most
distinctive of these is the Rachel Carson Reserve . The Reserve is situated between the Newport
and North River and is impacted by the conditions from the Beaufort Watersheds.
Figure B-3. Map of Natural Heritage Program’s areas of high biodiversity. Created using 2013 data, which is the most up-to-date version at the time of this report.
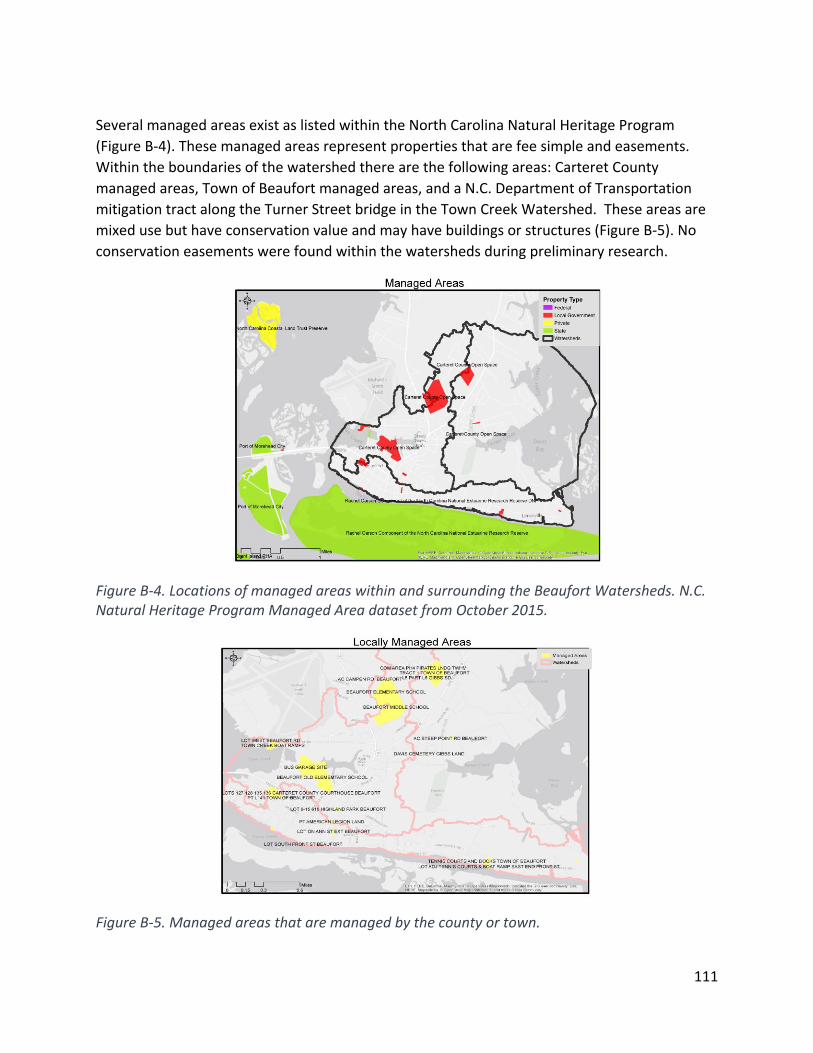
111
Several managed areas exist as listed within the North Carolina Natural Heritage Program
(Figure B-4). These managed areas represent properties that are fee simple and easements.
Within the boundaries of the watershed there are the following areas: Carteret County
managed areas, Town of Beaufort managed areas, and a N.C. Department of Transportation
mitigation tract along the Turner Street bridge in the Town Creek Watershed. These areas are
mixed use but have conservation value and may have buildings or structures (Figure B-5). No
conservation easements were found within the watersheds during preliminary research.
Figure B-4. Locations of managed areas within and surrounding the Beaufort Watersheds. N.C. Natural Heritage Program Managed Area dataset from October 2015.
Figure B-5. Managed areas that are managed by the county or town.
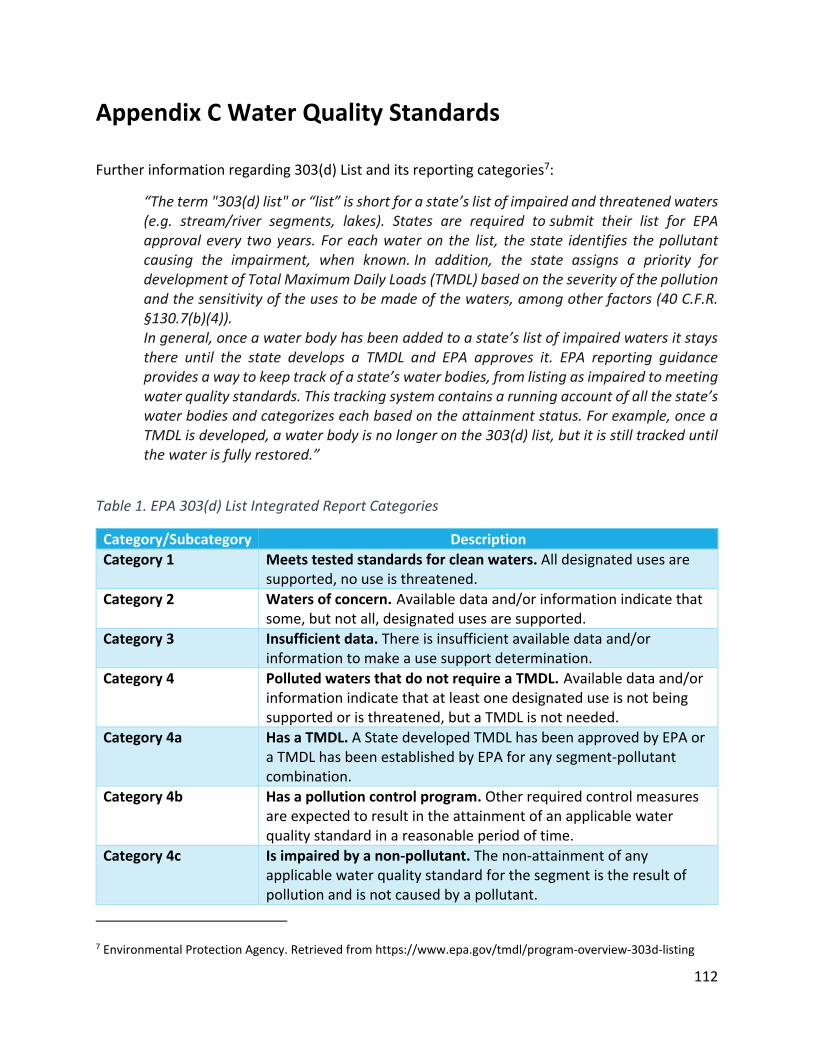
112
Appendix C Water Quality Standards
Further information regarding 303(d) List and its reporting categories7:
“The term "303(d) list" or “list” is short for a state’s list of impaired and threatened waters (e.g. stream/river segments, lakes). States are required to submit their list for EPA approval every two years. For each water on the list, the state identifies the pollutant causing the impairment, when known. In addition, the state assigns a priority for development of Total Maximum Daily Loads (TMDL) based on the severity of the pollution and the sensitivity of the uses to be made of the waters, among other factors (40 C.F.R. §130.7(b)(4)). In general, once a water body has been added to a state’s list of impaired waters it stays there until the state develops a TMDL and EPA approves it. EPA reporting guidance provides a way to keep track of a state’s water bodies, from listing as impaired to meeting water quality standards. This tracking system contains a running account of all the state’s water bodies and categorizes each based on the attainment status. For example, once a TMDL is developed, a water body is no longer on the 303(d) list, but it is still tracked until the water is fully restored.”
Table 1. EPA 303(d) List Integrated Report Categories
Category/Subcategory Description
Category 1 Meets tested standards for clean waters. All designated uses are supported, no use is threatened.
Category 2 Waters of concern. Available data and/or information indicate that some, but not all, designated uses are supported.
Category 3 Insufficient data. There is insufficient available data and/or information to make a use support determination.
Category 4 Polluted waters that do not require a TMDL. Available data and/or information indicate that at least one designated use is not being supported or is threatened, but a TMDL is not needed.
Category 4a Has a TMDL. A State developed TMDL has been approved by EPA or a TMDL has been established by EPA for any segment-pollutant combination.
Category 4b Has a pollution control program. Other required control measures are expected to result in the attainment of an applicable water quality standard in a reasonable period of time.
Category 4c Is impaired by a non-pollutant. The non-attainment of any applicable water quality standard for the segment is the result of pollution and is not caused by a pollutant.
7 Environmental Protection Agency. Retrieved from https://www.epa.gov/tmdl/program-overview-303d-listing
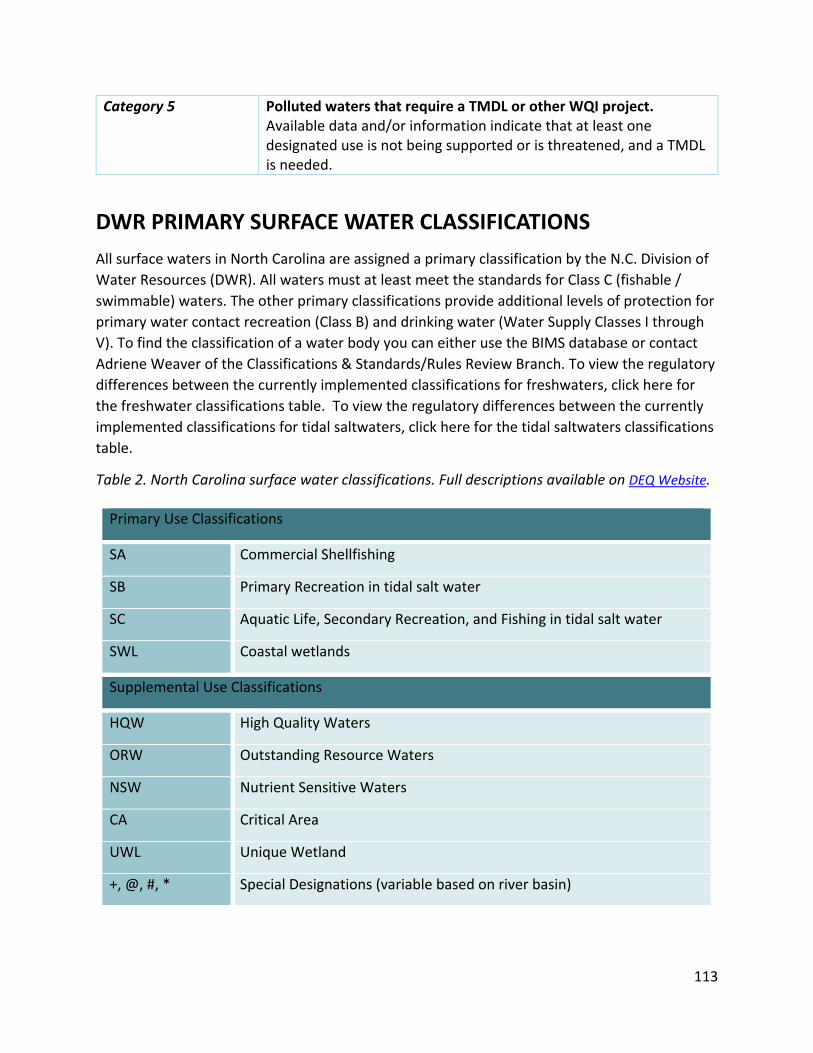
113
Category 5 Polluted waters that require a TMDL or other WQI project. Available data and/or information indicate that at least one designated use is not being supported or is threatened, and a TMDL is needed.
DWR PRIMARY SURFACE WATER CLASSIFICATIONS
All surface waters in North Carolina are assigned a primary classification by the N.C. Division of
Water Resources (DWR). All waters must at least meet the standards for Class C (fishable /
swimmable) waters. The other primary classifications provide additional levels of protection for
primary water contact recreation (Class B) and drinking water (Water Supply Classes I through
V). To find the classification of a water body you can either use the BIMS database or contact
Adriene Weaver of the Classifications & Standards/Rules Review Branch. To view the regulatory
differences between the currently implemented classifications for freshwaters, click here for
the freshwater classifications table. To view the regulatory differences between the currently
implemented classifications for tidal saltwaters, click here for the tidal saltwaters classifications
table.
Table 2. North Carolina surface water classifications. Full descriptions available on DEQ Website.
Primary Use Classifications
SA Commercial Shellfishing
SB Primary Recreation in tidal salt water
SC Aquatic Life, Secondary Recreation, and Fishing in tidal salt water
SWL Coastal wetlands
Supplemental Use Classifications
HQW High Quality Waters
ORW Outstanding Resource Waters
NSW Nutrient Sensitive Waters
CA Critical Area
UWL Unique Wetland
+, @, #, * Special Designations (variable based on river basin)
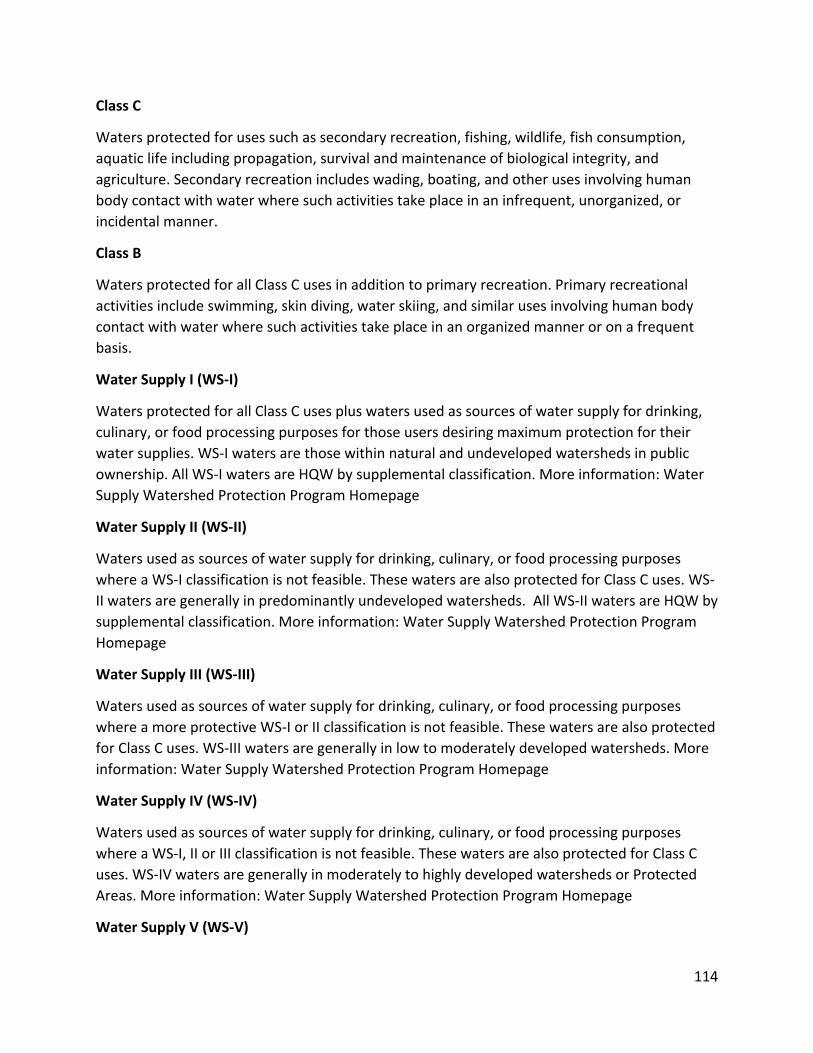
114
Class C
Waters protected for uses such as secondary recreation, fishing, wildlife, fish consumption,
aquatic life including propagation, survival and maintenance of biological integrity, and
agriculture. Secondary recreation includes wading, boating, and other uses involving human
body contact with water where such activities take place in an infrequent, unorganized, or
incidental manner.
Class B
Waters protected for all Class C uses in addition to primary recreation. Primary recreational
activities include swimming, skin diving, water skiing, and similar uses involving human body
contact with water where such activities take place in an organized manner or on a frequent
basis.
Water Supply I (WS-I)
Waters protected for all Class C uses plus waters used as sources of water supply for drinking,
culinary, or food processing purposes for those users desiring maximum protection for their
water supplies. WS-I waters are those within natural and undeveloped watersheds in public
ownership. All WS-I waters are HQW by supplemental classification. More information: Water
Supply Watershed Protection Program Homepage
Water Supply II (WS-II)
Waters used as sources of water supply for drinking, culinary, or food processing purposes
where a WS-I classification is not feasible. These waters are also protected for Class C uses. WS-
II waters are generally in predominantly undeveloped watersheds. All WS-II waters are HQW by
supplemental classification. More information: Water Supply Watershed Protection Program
Homepage
Water Supply III (WS-III)
Waters used as sources of water supply for drinking, culinary, or food processing purposes
where a more protective WS-I or II classification is not feasible. These waters are also protected
for Class C uses. WS-III waters are generally in low to moderately developed watersheds. More
information: Water Supply Watershed Protection Program Homepage
Water Supply IV (WS-IV)
Waters used as sources of water supply for drinking, culinary, or food processing purposes
where a WS-I, II or III classification is not feasible. These waters are also protected for Class C
uses. WS-IV waters are generally in moderately to highly developed watersheds or Protected
Areas. More information: Water Supply Watershed Protection Program Homepage
Water Supply V (WS-V)
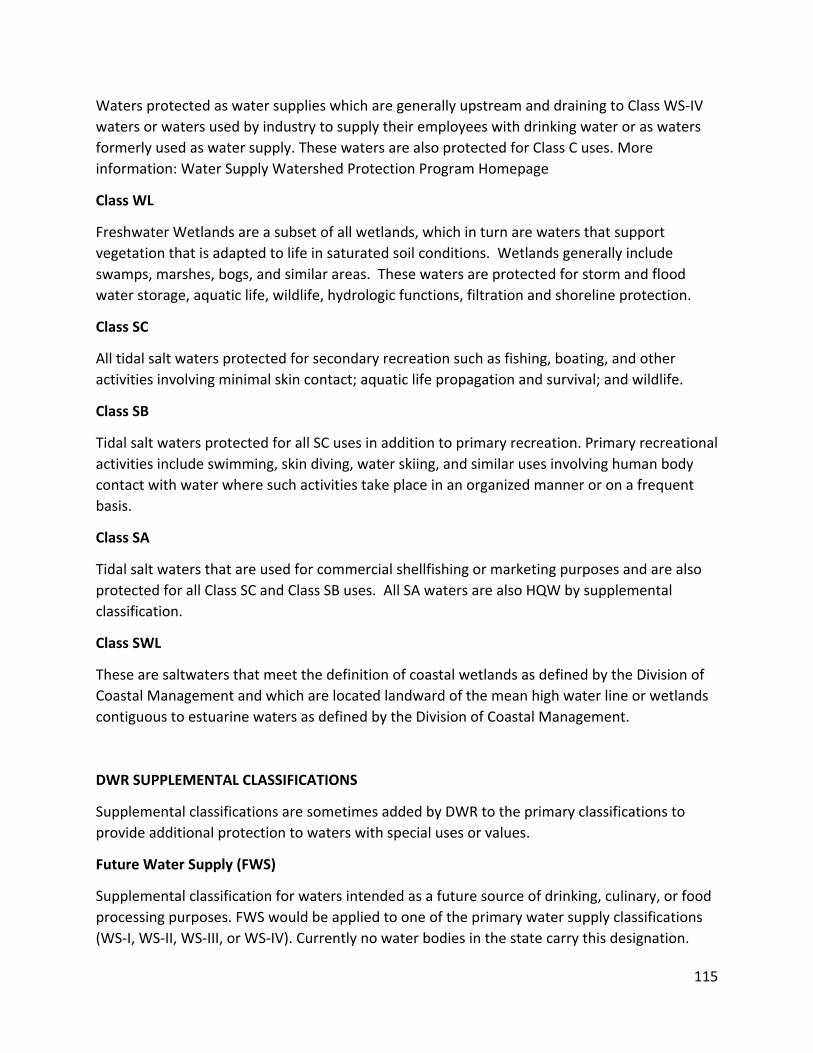
115
Waters protected as water supplies which are generally upstream and draining to Class WS-IV
waters or waters used by industry to supply their employees with drinking water or as waters
formerly used as water supply. These waters are also protected for Class C uses. More
information: Water Supply Watershed Protection Program Homepage
Class WL
Freshwater Wetlands are a subset of all wetlands, which in turn are waters that support
vegetation that is adapted to life in saturated soil conditions. Wetlands generally include
swamps, marshes, bogs, and similar areas. These waters are protected for storm and flood
water storage, aquatic life, wildlife, hydrologic functions, filtration and shoreline protection.
Class SC
All tidal salt waters protected for secondary recreation such as fishing, boating, and other
activities involving minimal skin contact; aquatic life propagation and survival; and wildlife.
Class SB
Tidal salt waters protected for all SC uses in addition to primary recreation. Primary recreational
activities include swimming, skin diving, water skiing, and similar uses involving human body
contact with water where such activities take place in an organized manner or on a frequent
basis.
Class SA
Tidal salt waters that are used for commercial shellfishing or marketing purposes and are also
protected for all Class SC and Class SB uses. All SA waters are also HQW by supplemental
classification.
Class SWL
These are saltwaters that meet the definition of coastal wetlands as defined by the Division of
Coastal Management and which are located landward of the mean high water line or wetlands
contiguous to estuarine waters as defined by the Division of Coastal Management.
DWR SUPPLEMENTAL CLASSIFICATIONS
Supplemental classifications are sometimes added by DWR to the primary classifications to
provide additional protection to waters with special uses or values.
Future Water Supply (FWS)
Supplemental classification for waters intended as a future source of drinking, culinary, or food
processing purposes. FWS would be applied to one of the primary water supply classifications
(WS-I, WS-II, WS-III, or WS-IV). Currently no water bodies in the state carry this designation.
116
High Quality Waters (HQW)
Supplemental classification intended to protect waters which are rated excellent based on
biological and physical/chemical characteristics through Division monitoring or special studies,
primary nursery areas designated by the Marine Fisheries Commission, and other functional
nursery areas designated by the Marine Fisheries Commission.
The following waters are HQW by definition:
• WS-I,
• WS-II,
• SA (commercial shellfishing),
• ORW,
Primary nursery areas (PNA) or other functional nursery areas designated by the Marine
Fisheries Commission, or
Waters for which DWR has received a petition for reclassification to either WS-I or WS-II.
Outstanding Resource Waters (ORW)
All outstanding resource waters are a subset of High Quality Waters. This supplemental
classification is intended to protect unique and special waters having excellent water quality
and being of exceptional state or national ecological or recreational significance. To qualify,
waters must be rated Excellent by DWR and have one of the following outstanding resource
values:
• Outstanding fish habitat and fisheries,
• Unusually high level of water based recreation or potential for such kind of
recreation,
• Some special designation such as North Carolina Natural and Scenic River or
National Wildlife Refuge,
• Important component of state or national park or forest, or
• Special ecological or scientific significance (rare or endangered species habitat,
research or educational areas).
For more details, refer to the Biological Assessment Branch homepage.
Nutrient Sensitive Waters (NSW)
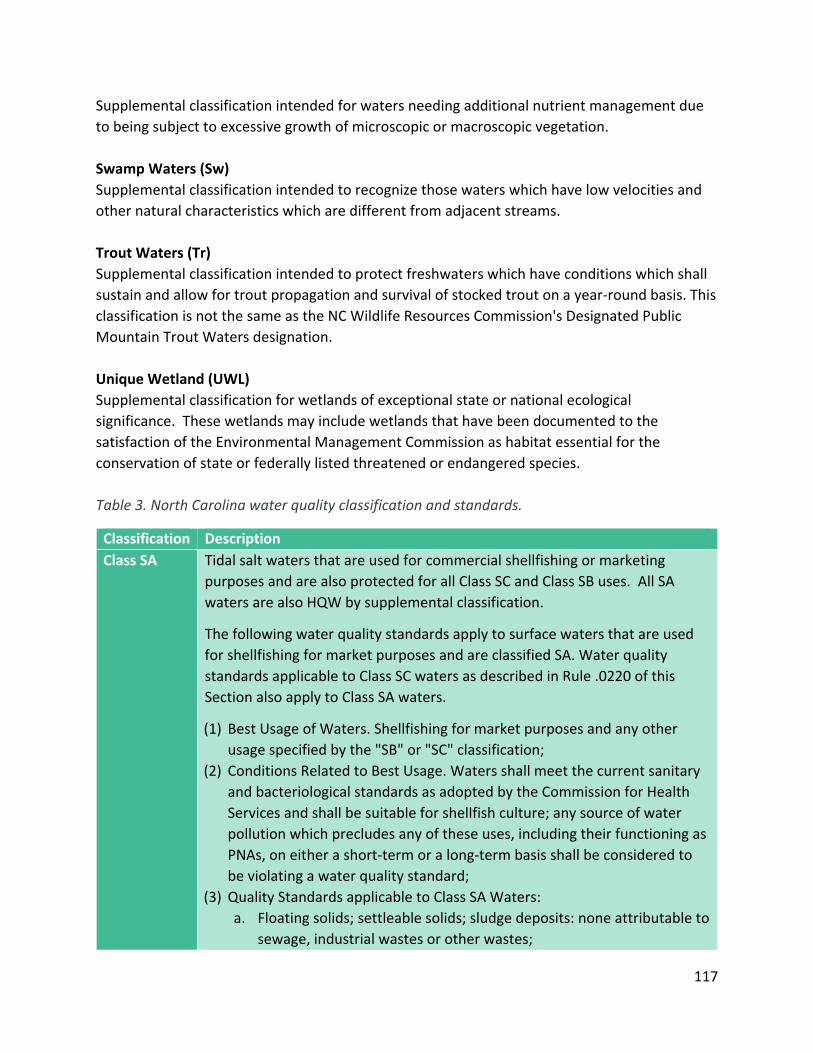
117
Supplemental classification intended for waters needing additional nutrient management due
to being subject to excessive growth of microscopic or macroscopic vegetation.
Swamp Waters (Sw)
Supplemental classification intended to recognize those waters which have low velocities and
other natural characteristics which are different from adjacent streams.
Trout Waters (Tr)
Supplemental classification intended to protect freshwaters which have conditions which shall
sustain and allow for trout propagation and survival of stocked trout on a year-round basis. This
classification is not the same as the NC Wildlife Resources Commission's Designated Public
Mountain Trout Waters designation.
Unique Wetland (UWL)
Supplemental classification for wetlands of exceptional state or national ecological
significance. These wetlands may include wetlands that have been documented to the
satisfaction of the Environmental Management Commission as habitat essential for the
conservation of state or federally listed threatened or endangered species.
Table 3. North Carolina water quality classification and standards.
Classification Description
Class SA Tidal salt waters that are used for commercial shellfishing or marketing
purposes and are also protected for all Class SC and Class SB uses. All SA
waters are also HQW by supplemental classification.
The following water quality standards apply to surface waters that are used
for shellfishing for market purposes and are classified SA. Water quality
standards applicable to Class SC waters as described in Rule .0220 of this
Section also apply to Class SA waters.
(1) Best Usage of Waters. Shellfishing for market purposes and any other
usage specified by the "SB" or "SC" classification;
(2) Conditions Related to Best Usage. Waters shall meet the current sanitary
and bacteriological standards as adopted by the Commission for Health
Services and shall be suitable for shellfish culture; any source of water
pollution which precludes any of these uses, including their functioning as
PNAs, on either a short-term or a long-term basis shall be considered to
be violating a water quality standard;
(3) Quality Standards applicable to Class SA Waters:
a. Floating solids; settleable solids; sludge deposits: none attributable to
sewage, industrial wastes or other wastes;
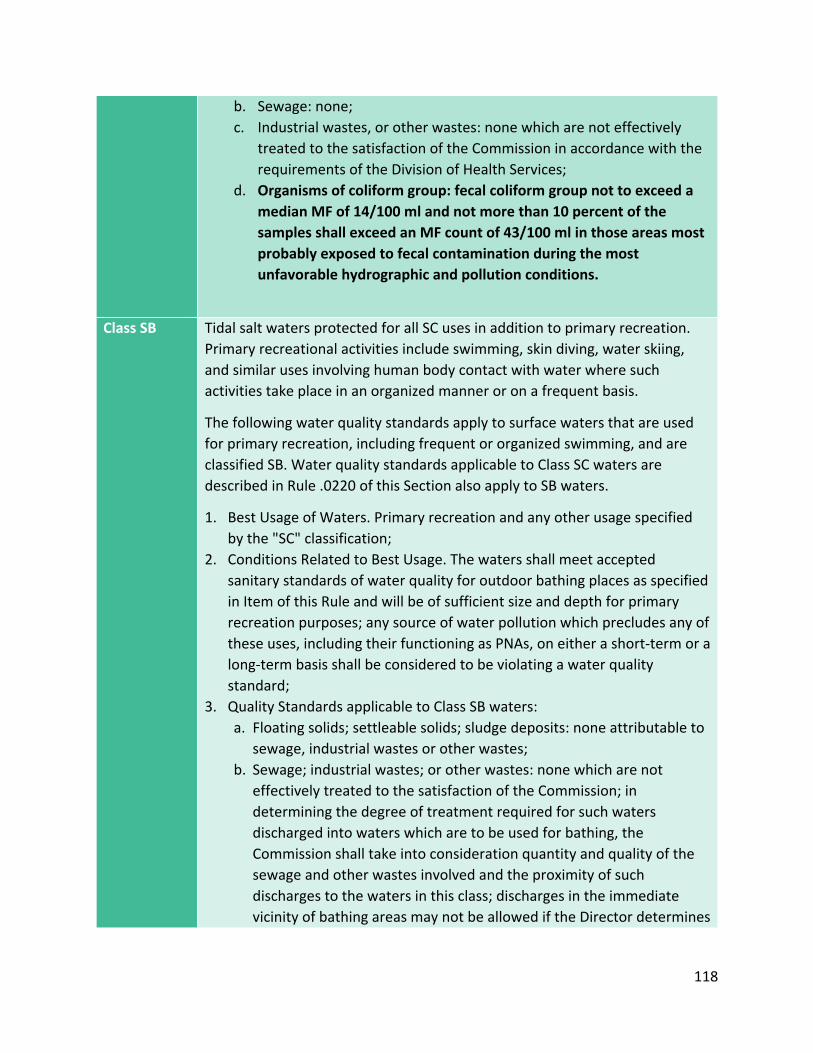
118
b. Sewage: none;
c. Industrial wastes, or other wastes: none which are not effectively
treated to the satisfaction of the Commission in accordance with the
requirements of the Division of Health Services;
d. Organisms of coliform group: fecal coliform group not to exceed a
median MF of 14/100 ml and not more than 10 percent of the
samples shall exceed an MF count of 43/100 ml in those areas most
probably exposed to fecal contamination during the most
unfavorable hydrographic and pollution conditions.
Class SB Tidal salt waters protected for all SC uses in addition to primary recreation.
Primary recreational activities include swimming, skin diving, water skiing,
and similar uses involving human body contact with water where such
activities take place in an organized manner or on a frequent basis.
The following water quality standards apply to surface waters that are used
for primary recreation, including frequent or organized swimming, and are
classified SB. Water quality standards applicable to Class SC waters are
described in Rule .0220 of this Section also apply to SB waters.
1. Best Usage of Waters. Primary recreation and any other usage specified
by the "SC" classification;
2. Conditions Related to Best Usage. The waters shall meet accepted
sanitary standards of water quality for outdoor bathing places as specified
in Item of this Rule and will be of sufficient size and depth for primary
recreation purposes; any source of water pollution which precludes any of
these uses, including their functioning as PNAs, on either a short-term or a
long-term basis shall be considered to be violating a water quality
standard;
3. Quality Standards applicable to Class SB waters:
a. Floating solids; settleable solids; sludge deposits: none attributable to
sewage, industrial wastes or other wastes;
b. Sewage; industrial wastes; or other wastes: none which are not
effectively treated to the satisfaction of the Commission; in
determining the degree of treatment required for such waters
discharged into waters which are to be used for bathing, the
Commission shall take into consideration quantity and quality of the
sewage and other wastes involved and the proximity of such
discharges to the waters in this class; discharges in the immediate
vicinity of bathing areas may not be allowed if the Director determines
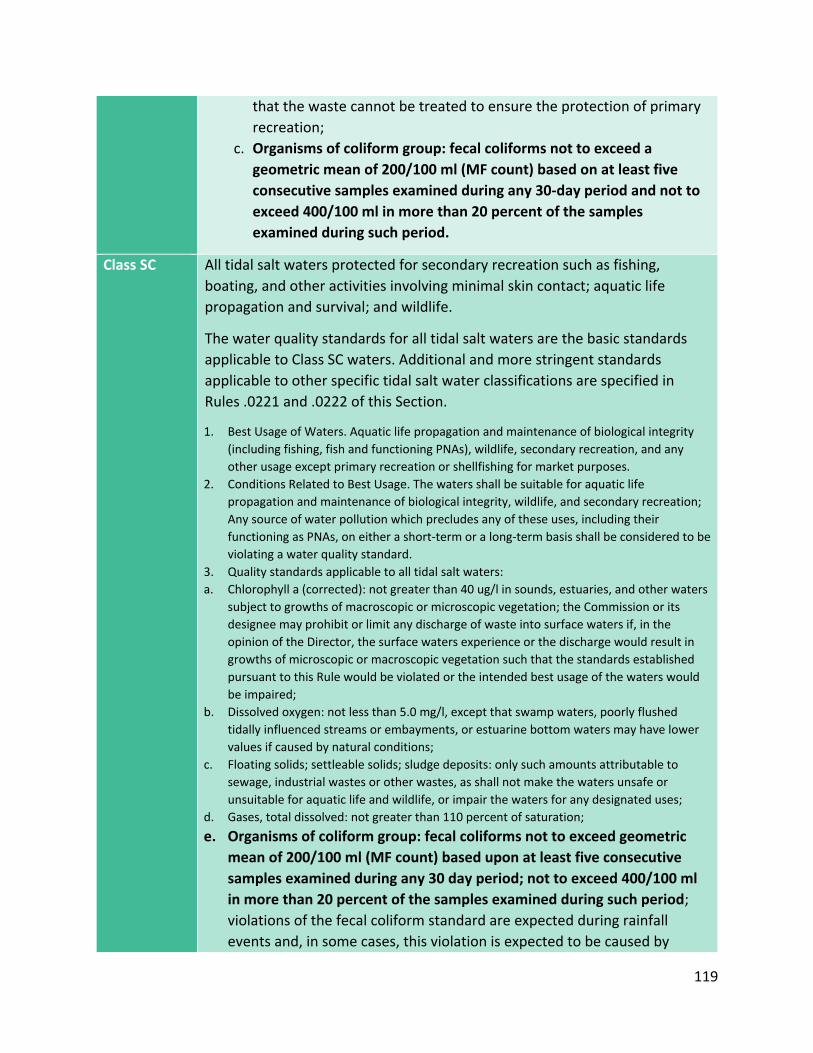
119
that the waste cannot be treated to ensure the protection of primary
recreation;
c. Organisms of coliform group: fecal coliforms not to exceed a
geometric mean of 200/100 ml (MF count) based on at least five
consecutive samples examined during any 30-day period and not to
exceed 400/100 ml in more than 20 percent of the samples
examined during such period.
Class SC All tidal salt waters protected for secondary recreation such as fishing,
boating, and other activities involving minimal skin contact; aquatic life
propagation and survival; and wildlife.
The water quality standards for all tidal salt waters are the basic standards
applicable to Class SC waters. Additional and more stringent standards
applicable to other specific tidal salt water classifications are specified in
Rules .0221 and .0222 of this Section.
1. Best Usage of Waters. Aquatic life propagation and maintenance of biological integrity
(including fishing, fish and functioning PNAs), wildlife, secondary recreation, and any
other usage except primary recreation or shellfishing for market purposes.
2. Conditions Related to Best Usage. The waters shall be suitable for aquatic life
propagation and maintenance of biological integrity, wildlife, and secondary recreation;
Any source of water pollution which precludes any of these uses, including their
functioning as PNAs, on either a short-term or a long-term basis shall be considered to be
violating a water quality standard.
3. Quality standards applicable to all tidal salt waters:
a. Chlorophyll a (corrected): not greater than 40 ug/l in sounds, estuaries, and other waters
subject to growths of macroscopic or microscopic vegetation; the Commission or its
designee may prohibit or limit any discharge of waste into surface waters if, in the
opinion of the Director, the surface waters experience or the discharge would result in
growths of microscopic or macroscopic vegetation such that the standards established
pursuant to this Rule would be violated or the intended best usage of the waters would
be impaired;
b. Dissolved oxygen: not less than 5.0 mg/l, except that swamp waters, poorly flushed
tidally influenced streams or embayments, or estuarine bottom waters may have lower
values if caused by natural conditions;
c. Floating solids; settleable solids; sludge deposits: only such amounts attributable to
sewage, industrial wastes or other wastes, as shall not make the waters unsafe or
unsuitable for aquatic life and wildlife, or impair the waters for any designated uses;
d. Gases, total dissolved: not greater than 110 percent of saturation;
e. Organisms of coliform group: fecal coliforms not to exceed geometric
mean of 200/100 ml (MF count) based upon at least five consecutive
samples examined during any 30 day period; not to exceed 400/100 ml
in more than 20 percent of the samples examined during such period;
violations of the fecal coliform standard are expected during rainfall
events and, in some cases, this violation is expected to be caused by
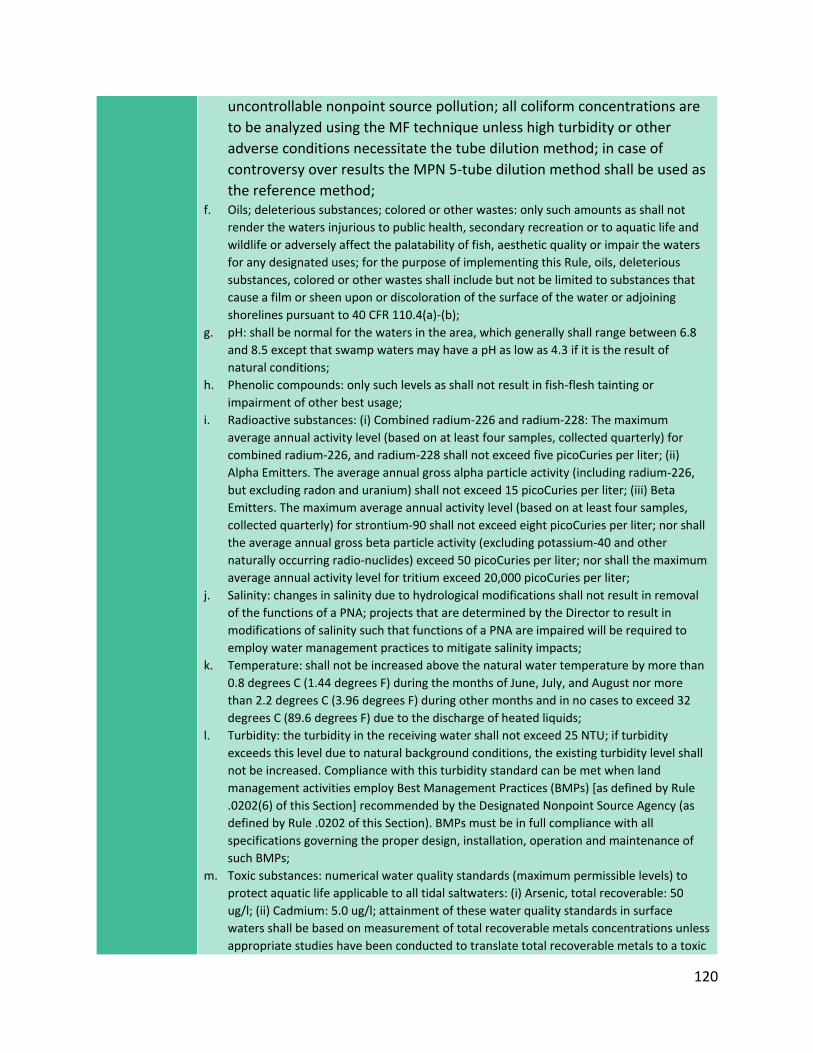
120
uncontrollable nonpoint source pollution; all coliform concentrations are
to be analyzed using the MF technique unless high turbidity or other
adverse conditions necessitate the tube dilution method; in case of
controversy over results the MPN 5-tube dilution method shall be used as
the reference method; f. Oils; deleterious substances; colored or other wastes: only such amounts as shall not
render the waters injurious to public health, secondary recreation or to aquatic life and
wildlife or adversely affect the palatability of fish, aesthetic quality or impair the waters
for any designated uses; for the purpose of implementing this Rule, oils, deleterious
substances, colored or other wastes shall include but not be limited to substances that
cause a film or sheen upon or discoloration of the surface of the water or adjoining
shorelines pursuant to 40 CFR 110.4(a)-(b);
g. pH: shall be normal for the waters in the area, which generally shall range between 6.8
and 8.5 except that swamp waters may have a pH as low as 4.3 if it is the result of
natural conditions;
h. Phenolic compounds: only such levels as shall not result in fish-flesh tainting or
impairment of other best usage;
i. Radioactive substances: (i) Combined radium-226 and radium-228: The maximum
average annual activity level (based on at least four samples, collected quarterly) for
combined radium-226, and radium-228 shall not exceed five picoCuries per liter; (ii)
Alpha Emitters. The average annual gross alpha particle activity (including radium-226,
but excluding radon and uranium) shall not exceed 15 picoCuries per liter; (iii) Beta
Emitters. The maximum average annual activity level (based on at least four samples,
collected quarterly) for strontium-90 shall not exceed eight picoCuries per liter; nor shall
the average annual gross beta particle activity (excluding potassium-40 and other
naturally occurring radio-nuclides) exceed 50 picoCuries per liter; nor shall the maximum
average annual activity level for tritium exceed 20,000 picoCuries per liter;
j. Salinity: changes in salinity due to hydrological modifications shall not result in removal
of the functions of a PNA; projects that are determined by the Director to result in
modifications of salinity such that functions of a PNA are impaired will be required to
employ water management practices to mitigate salinity impacts;
k. Temperature: shall not be increased above the natural water temperature by more than
0.8 degrees C (1.44 degrees F) during the months of June, July, and August nor more
than 2.2 degrees C (3.96 degrees F) during other months and in no cases to exceed 32
degrees C (89.6 degrees F) due to the discharge of heated liquids;
l. Turbidity: the turbidity in the receiving water shall not exceed 25 NTU; if turbidity
exceeds this level due to natural background conditions, the existing turbidity level shall
not be increased. Compliance with this turbidity standard can be met when land
management activities employ Best Management Practices (BMPs) [as defined by Rule
.0202(6) of this Section] recommended by the Designated Nonpoint Source Agency (as
defined by Rule .0202 of this Section). BMPs must be in full compliance with all
specifications governing the proper design, installation, operation and maintenance of
such BMPs;
m. Toxic substances: numerical water quality standards (maximum permissible levels) to
protect aquatic life applicable to all tidal saltwaters: (i) Arsenic, total recoverable: 50
ug/l; (ii) Cadmium: 5.0 ug/l; attainment of these water quality standards in surface
waters shall be based on measurement of total recoverable metals concentrations unless
appropriate studies have been conducted to translate total recoverable metals to a toxic
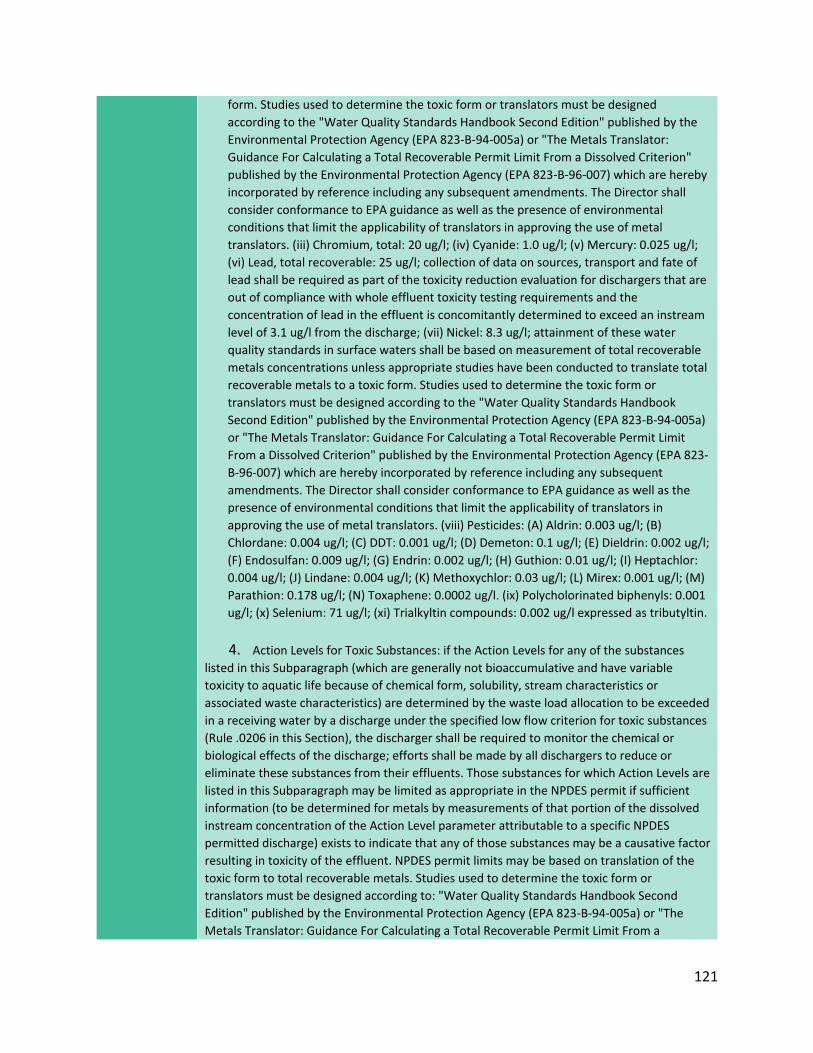
121
form. Studies used to determine the toxic form or translators must be designed
according to the "Water Quality Standards Handbook Second Edition" published by the
Environmental Protection Agency (EPA 823-B-94-005a) or "The Metals Translator:
Guidance For Calculating a Total Recoverable Permit Limit From a Dissolved Criterion"
published by the Environmental Protection Agency (EPA 823-B-96-007) which are hereby
incorporated by reference including any subsequent amendments. The Director shall
consider conformance to EPA guidance as well as the presence of environmental
conditions that limit the applicability of translators in approving the use of metal
translators. (iii) Chromium, total: 20 ug/l; (iv) Cyanide: 1.0 ug/l; (v) Mercury: 0.025 ug/l;
(vi) Lead, total recoverable: 25 ug/l; collection of data on sources, transport and fate of
lead shall be required as part of the toxicity reduction evaluation for dischargers that are
out of compliance with whole effluent toxicity testing requirements and the
concentration of lead in the effluent is concomitantly determined to exceed an instream
level of 3.1 ug/l from the discharge; (vii) Nickel: 8.3 ug/l; attainment of these water
quality standards in surface waters shall be based on measurement of total recoverable
metals concentrations unless appropriate studies have been conducted to translate total
recoverable metals to a toxic form. Studies used to determine the toxic form or
translators must be designed according to the "Water Quality Standards Handbook
Second Edition" published by the Environmental Protection Agency (EPA 823-B-94-005a)
or "The Metals Translator: Guidance For Calculating a Total Recoverable Permit Limit
From a Dissolved Criterion" published by the Environmental Protection Agency (EPA 823-
B-96-007) which are hereby incorporated by reference including any subsequent
amendments. The Director shall consider conformance to EPA guidance as well as the
presence of environmental conditions that limit the applicability of translators in
approving the use of metal translators. (viii) Pesticides: (A) Aldrin: 0.003 ug/l; (B)
Chlordane: 0.004 ug/l; (C) DDT: 0.001 ug/l; (D) Demeton: 0.1 ug/l; (E) Dieldrin: 0.002 ug/l;
(F) Endosulfan: 0.009 ug/l; (G) Endrin: 0.002 ug/l; (H) Guthion: 0.01 ug/l; (I) Heptachlor:
0.004 ug/l; (J) Lindane: 0.004 ug/l; (K) Methoxychlor: 0.03 ug/l; (L) Mirex: 0.001 ug/l; (M)
Parathion: 0.178 ug/l; (N) Toxaphene: 0.0002 ug/l. (ix) Polycholorinated biphenyls: 0.001
ug/l; (x) Selenium: 71 ug/l; (xi) Trialkyltin compounds: 0.002 ug/l expressed as tributyltin.
4. Action Levels for Toxic Substances: if the Action Levels for any of the substances
listed in this Subparagraph (which are generally not bioaccumulative and have variable
toxicity to aquatic life because of chemical form, solubility, stream characteristics or
associated waste characteristics) are determined by the waste load allocation to be exceeded
in a receiving water by a discharge under the specified low flow criterion for toxic substances
(Rule .0206 in this Section), the discharger shall be required to monitor the chemical or
biological effects of the discharge; efforts shall be made by all dischargers to reduce or
eliminate these substances from their effluents. Those substances for which Action Levels are
listed in this Subparagraph may be limited as appropriate in the NPDES permit if sufficient
information (to be determined for metals by measurements of that portion of the dissolved
instream concentration of the Action Level parameter attributable to a specific NPDES
permitted discharge) exists to indicate that any of those substances may be a causative factor
resulting in toxicity of the effluent. NPDES permit limits may be based on translation of the
toxic form to total recoverable metals. Studies used to determine the toxic form or
translators must be designed according to: "Water Quality Standards Handbook Second
Edition" published by the Environmental Protection Agency (EPA 823-B-94-005a) or "The
Metals Translator: Guidance For Calculating a Total Recoverable Permit Limit From a
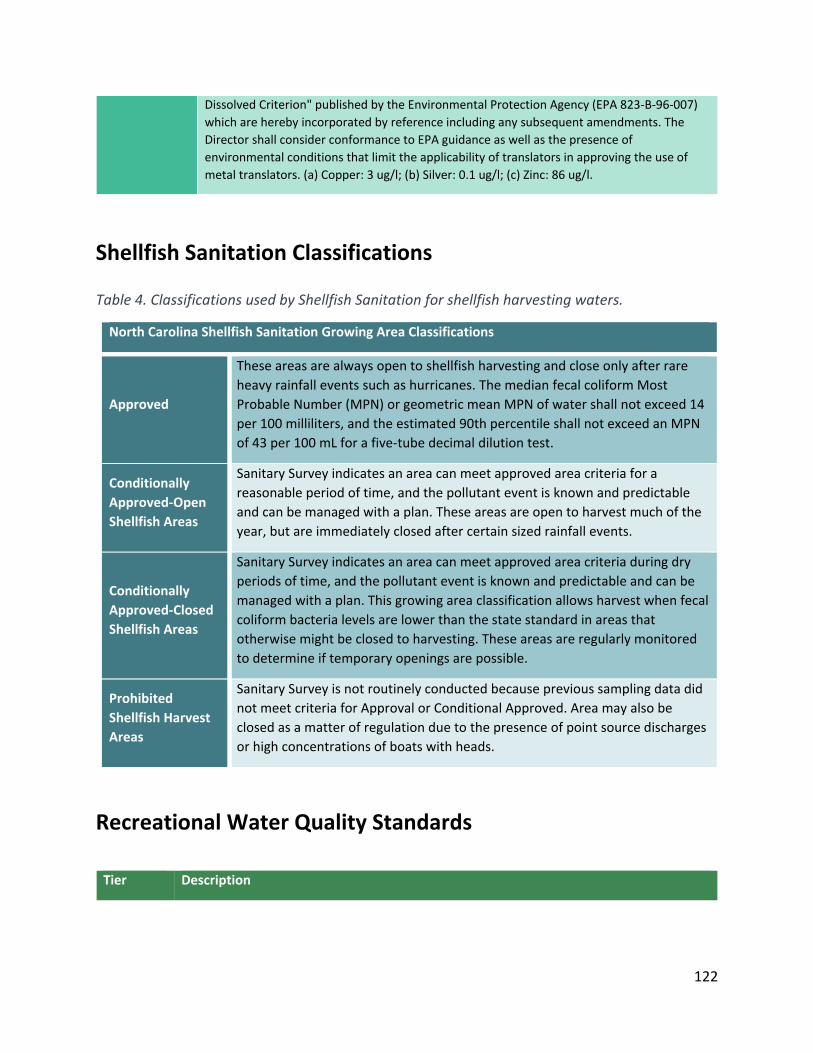
122
Dissolved Criterion" published by the Environmental Protection Agency (EPA 823-B-96-007)
which are hereby incorporated by reference including any subsequent amendments. The
Director shall consider conformance to EPA guidance as well as the presence of
environmental conditions that limit the applicability of translators in approving the use of
metal translators. (a) Copper: 3 ug/l; (b) Silver: 0.1 ug/l; (c) Zinc: 86 ug/l.
Shellfish Sanitation Classifications
Table 4. Classifications used by Shellfish Sanitation for shellfish harvesting waters.
North Carolina Shellfish Sanitation Growing Area Classifications
Approved
These areas are always open to shellfish harvesting and close only after rare
heavy rainfall events such as hurricanes. The median fecal coliform Most
Probable Number (MPN) or geometric mean MPN of water shall not exceed 14
per 100 milliliters, and the estimated 90th percentile shall not exceed an MPN
of 43 per 100 mL for a five-tube decimal dilution test.
Conditionally
Approved-Open
Shellfish Areas
Sanitary Survey indicates an area can meet approved area criteria for a
reasonable period of time, and the pollutant event is known and predictable
and can be managed with a plan. These areas are open to harvest much of the
year, but are immediately closed after certain sized rainfall events.
Conditionally
Approved-Closed
Shellfish Areas
Sanitary Survey indicates an area can meet approved area criteria during dry
periods of time, and the pollutant event is known and predictable and can be
managed with a plan. This growing area classification allows harvest when fecal
coliform bacteria levels are lower than the state standard in areas that
otherwise might be closed to harvesting. These areas are regularly monitored
to determine if temporary openings are possible.
Prohibited
Shellfish Harvest
Areas
Sanitary Survey is not routinely conducted because previous sampling data did
not meet criteria for Approval or Conditional Approved. Area may also be
closed as a matter of regulation due to the presence of point source discharges
or high concentrations of boats with heads.
Recreational Water Quality Standards
Tier Description
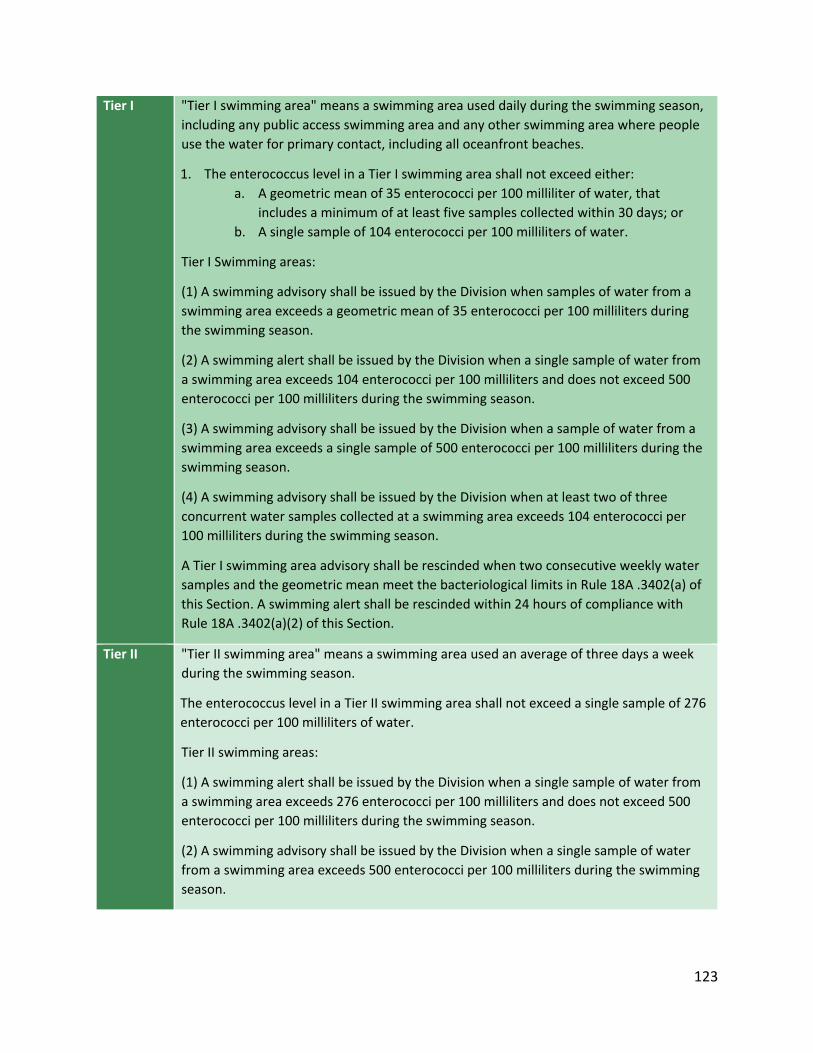
123
Tier I "Tier I swimming area" means a swimming area used daily during the swimming season,
including any public access swimming area and any other swimming area where people
use the water for primary contact, including all oceanfront beaches.
1. The enterococcus level in a Tier I swimming area shall not exceed either:
a. A geometric mean of 35 enterococci per 100 milliliter of water, that
includes a minimum of at least five samples collected within 30 days; or
b. A single sample of 104 enterococci per 100 milliliters of water.
Tier I Swimming areas:
(1) A swimming advisory shall be issued by the Division when samples of water from a
swimming area exceeds a geometric mean of 35 enterococci per 100 milliliters during
the swimming season.
(2) A swimming alert shall be issued by the Division when a single sample of water from
a swimming area exceeds 104 enterococci per 100 milliliters and does not exceed 500
enterococci per 100 milliliters during the swimming season.
(3) A swimming advisory shall be issued by the Division when a sample of water from a
swimming area exceeds a single sample of 500 enterococci per 100 milliliters during the
swimming season.
(4) A swimming advisory shall be issued by the Division when at least two of three
concurrent water samples collected at a swimming area exceeds 104 enterococci per
100 milliliters during the swimming season.
A Tier I swimming area advisory shall be rescinded when two consecutive weekly water
samples and the geometric mean meet the bacteriological limits in Rule 18A .3402(a) of
this Section. A swimming alert shall be rescinded within 24 hours of compliance with
Rule 18A .3402(a)(2) of this Section.
Tier II "Tier II swimming area" means a swimming area used an average of three days a week
during the swimming season.
The enterococcus level in a Tier II swimming area shall not exceed a single sample of 276
enterococci per 100 milliliters of water.
Tier II swimming areas:
(1) A swimming alert shall be issued by the Division when a single sample of water from
a swimming area exceeds 276 enterococci per 100 milliliters and does not exceed 500
enterococci per 100 milliliters during the swimming season.
(2) A swimming advisory shall be issued by the Division when a single sample of water
from a swimming area exceeds 500 enterococci per 100 milliliters during the swimming
season.
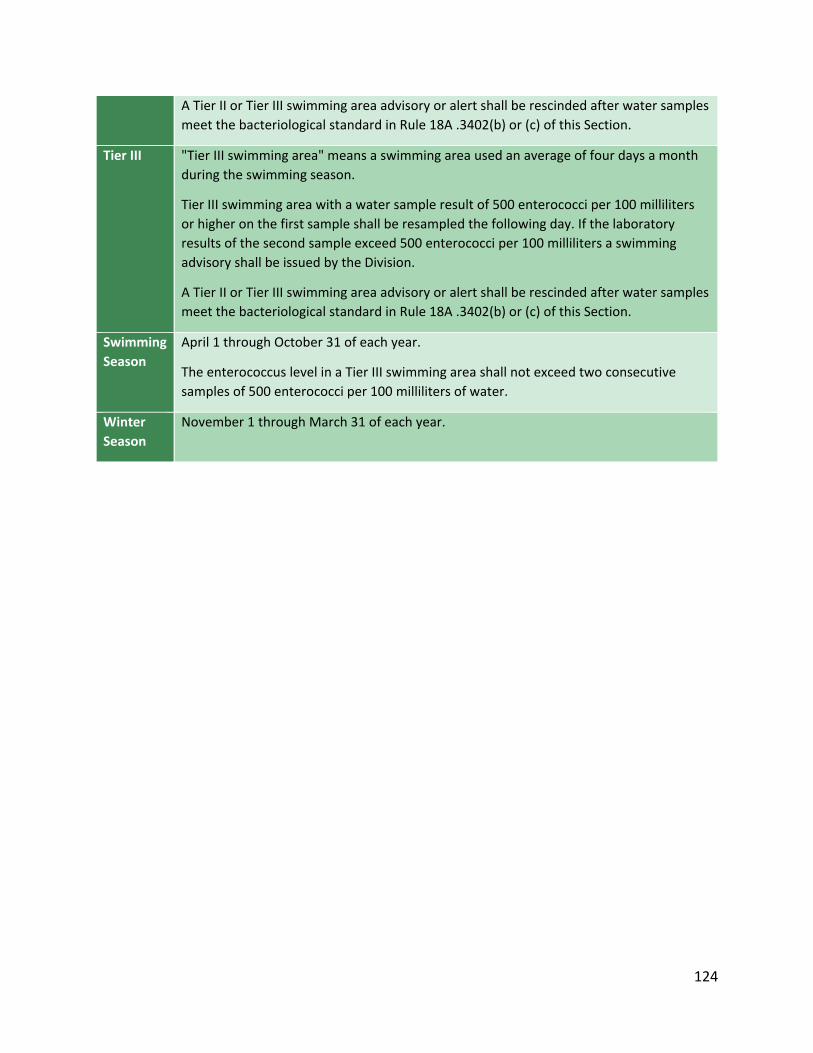
124
A Tier II or Tier III swimming area advisory or alert shall be rescinded after water samples
meet the bacteriological standard in Rule 18A .3402(b) or (c) of this Section.
Tier III "Tier III swimming area" means a swimming area used an average of four days a month
during the swimming season.
Tier III swimming area with a water sample result of 500 enterococci per 100 milliliters
or higher on the first sample shall be resampled the following day. If the laboratory
results of the second sample exceed 500 enterococci per 100 milliliters a swimming
advisory shall be issued by the Division.
A Tier II or Tier III swimming area advisory or alert shall be rescinded after water samples
meet the bacteriological standard in Rule 18A .3402(b) or (c) of this Section.
Swimming
Season
April 1 through October 31 of each year.
The enterococcus level in a Tier III swimming area shall not exceed two consecutive
samples of 500 enterococci per 100 milliliters of water.
Winter
Season
November 1 through March 31 of each year.
125
Appendix D Shoreline Survey SOP The following are direct excerpts from Shoreline Survey Program Standard Operating Procedure
created by Shellfish Sanitation and Recreational Water Quality Section on June 2011. These are
the standardized definitions used to designate nonpoint sources8.
Dockage In accordance with North Carolina Division of Environmental Health rules, and with guidance
from the United States Food and Drug Administration and the National Shellfish Sanitation
Program that marinas be considered as potential sources for contamination of shellfish, the
North Carolina Shellfish Sanitation and Recreational Water Quality Section adopts the following
policy to be used in the classification of shellfish harvesting waters with respect to marinas,
docking facilities, and other mooring areas.
Definitions
• Marina - A marina shall be defined as any water area with a structure (dock, basin,
floating dock, etc.) which is utilized for docking or otherwise mooring vessels and
constructed to provide temporary or permanent docking space for more than 10 boats.
• Open System – An open-system marina is a marina constructed in an area where tidal
currents have not been impeded by natural or man-made barriers.
• Closed System – A closed-system marina is a marina constructed in a canal, basin,
tributary, or other area with restricted tidal flow.
• Commercial Marina – A commercial marina is defined as a marina that offers one or
more of the following services: Fuel, transient dockage, haul-out facilities, or repair
services.
• Private Marina – A private marina includes any marina that is not defined as a
commercial marina.
• Entrance Canal – The entrance canal will be defined as the canal which is created or
significantly altered during marina construction to provide access for boats to that
facility.
• Cabin – An enclosed space on board a boat that can provide overnight shelter.
Defining Slips
8 Shellfish Sanitation. (2015). Shoreline Survey Program Standard Operating Procedures. North Carolina Department of Environmental Quality, Division of Marine Fisheries, Shellfish Sanitation and Recreational Water Quality Section.
126
When conducting a marina inspection, the following items will be counted as slips, in the
manner defined below:
1) Finger Pier Dockage -- A narrow pier; may project from the shore, larger pier or dock.
2) Linear Dockage – Typically, a slip will be counted for every 25 feet of linear dockage
available. However, in cases where all boats using the facility are greater than 25 feet in
length, a reasonable estimate of typical boat length can be substituted to determine the
slip count.
3) Dockage Areas For Fueling Or Sewage Pump out Use – A slip will be counted for every 50
feet of linear dockage at any fueling dock or sewage pumpout dock.
4) Moorings associated with the marina, or within 100 feet of the last slip
**Note: In open-system marinas subject to significant wave or wake action, cleats or tie-ups
not associated with defined boat slip structures such as pilings or finger piers will not be
included in the total slip count unless it can be shown that the area in question is being used for
the dockage of boats. If a boat is seen tied up in one of these areas, confer with DCM officials
to determine if this situation warrants further investigation.**
When conducting a marina inspection, the following items will not be counted as slips:
1) Temporary Tie-Ups Associated With A Boat Ramp - Temporary tie-ups associated with
boat ramps will be considered as any areas where the permanent dockage of boats
would prohibit or significantly impede the use of an active boat ramp.
2) Staging Areas Associated With Haul Outs or Dry Stack Drop Zones – Staging areas will be
considered as any areas where the permanent dockage of boats would prohibit or
significantly impede the use of an active haul-out or drop zone.
3) Moorings not associated with the marina that are more than 100 feet from the last slip
4) Jet Ski Slips
**Note: If there is evidence at a marina that any of these docking types are being used for
permanent dockage, then they will be considered slips and will be included in the total slip
count for the marina.**
Stormwater Conveyance Stormwater conveyances evaluated during the shoreline survey include any ditches, swales, or
pipes that drain residential areas, roads, farms, golf courses, or other human-altered
landscapes into shellfishing waters. Conveyances not evaluated include small ditches dug by
individual homeowners, pipes draining single-home gutter systems, or any drainage not
reaching shellfishing waters. Photographs of each conveyance should be taken indicating the
type of conveyance and the type of land use(s) drained.
127
Definitions
• “Conveyance” – Indicate the type(s) of stormwater conveyance that drain to the area
being evaluated. Select from: “Ditch/Swale to Pipe,” “Ditch/Swale,” “Curb/Gutter to
Pipe,” “Curb/Gutter to Ditch/Swale,” “Pipe to Pipe End,” “Pipe End to Ditch/Swale,” or
“Other.” If “Other” is selected, describe the conveyance system in the comments
section
• “Diameter” – If applicable, indicate the diameter of the last pipe the stormwater flows
through before discharging (including culvert pipes). If more than one pipe is used,
indicate the combined diameter of all pipes. The most common pipe diameters are
available from the drop down menu, or you can select “Other” and indicate the pipe
diameter in the comments section. If a pipe is present but you cannot determine its
diameter, select “Unknown.” If no pipe is present, select “Not Applicable”
• “Ditch Size” – If applicable, enter the depth and width, in feet, of the ditch or swale here
• “Sys Size” – This data field serves as an indicator of the size of the area drained by the
conveyance being evaluated. If a pipe diameter can be determined, then the following
criteria will be used to determine system size:
o Low = ≤ 18 inches
o Medium = 19-35 inches
o High = ≥ 36 inches
• If no pipe is present, use best professional judgement to determine the relative size of
the drainage area.
• “FC Conc” – This data field serves as an indicator of the potential peak bacteria
concentration discharged by the conveyance being evaluated. It is a subjective measure
based on your experience, although some relative guidelines are provided:
o Low = Drains a small area or an area with low-impact land uses; good buffers;
• little to no potential inputs; good filtering prior to discharge
o Medium = Drains a larger area or an area with mixed impact land-uses; some
▪ buffers; some potential inputs, none major; little filtering prior to
▪ discharge
o High = Drains a large area or an area with predominantly high impact land-uses;
little to no buffer; numerous potential sources or major sources; little to no
filtering prior to discharge
• “FC Load” – This data field is a composite of the “System Size” and “FC Concentration”
fields, and indicates the relative contribution of this particular stormwater conveyance
to the total bacterial load within the growing area. Average the values determined for
“System Size” and “FC Concentration” to determine this value.
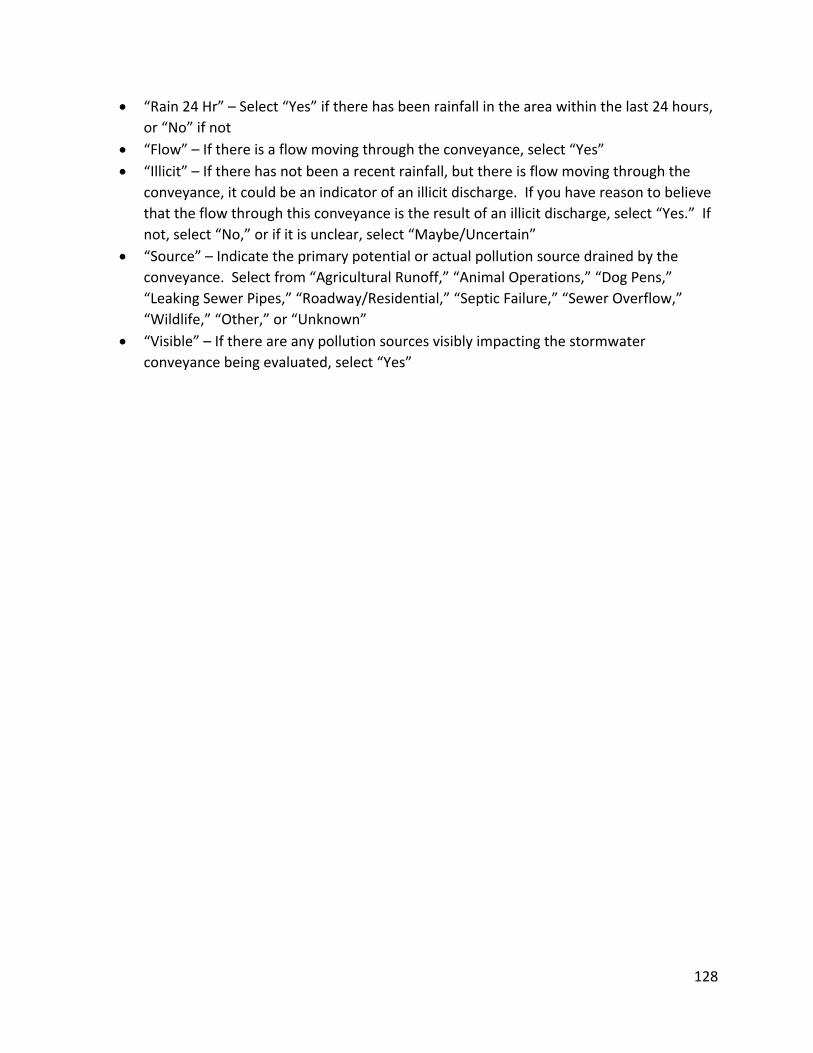
128
• “Rain 24 Hr” – Select “Yes” if there has been rainfall in the area within the last 24 hours,
or “No” if not
• “Flow” – If there is a flow moving through the conveyance, select “Yes”
• “Illicit” – If there has not been a recent rainfall, but there is flow moving through the
conveyance, it could be an indicator of an illicit discharge. If you have reason to believe
that the flow through this conveyance is the result of an illicit discharge, select “Yes.” If
not, select “No,” or if it is unclear, select “Maybe/Uncertain”
• “Source” – Indicate the primary potential or actual pollution source drained by the
conveyance. Select from “Agricultural Runoff,” “Animal Operations,” “Dog Pens,”
“Leaking Sewer Pipes,” “Roadway/Residential,” “Septic Failure,” “Sewer Overflow,”
“Wildlife,” “Other,” or “Unknown”
• “Visible” – If there are any pollution sources visibly impacting the stormwater
conveyance being evaluated, select “Yes”
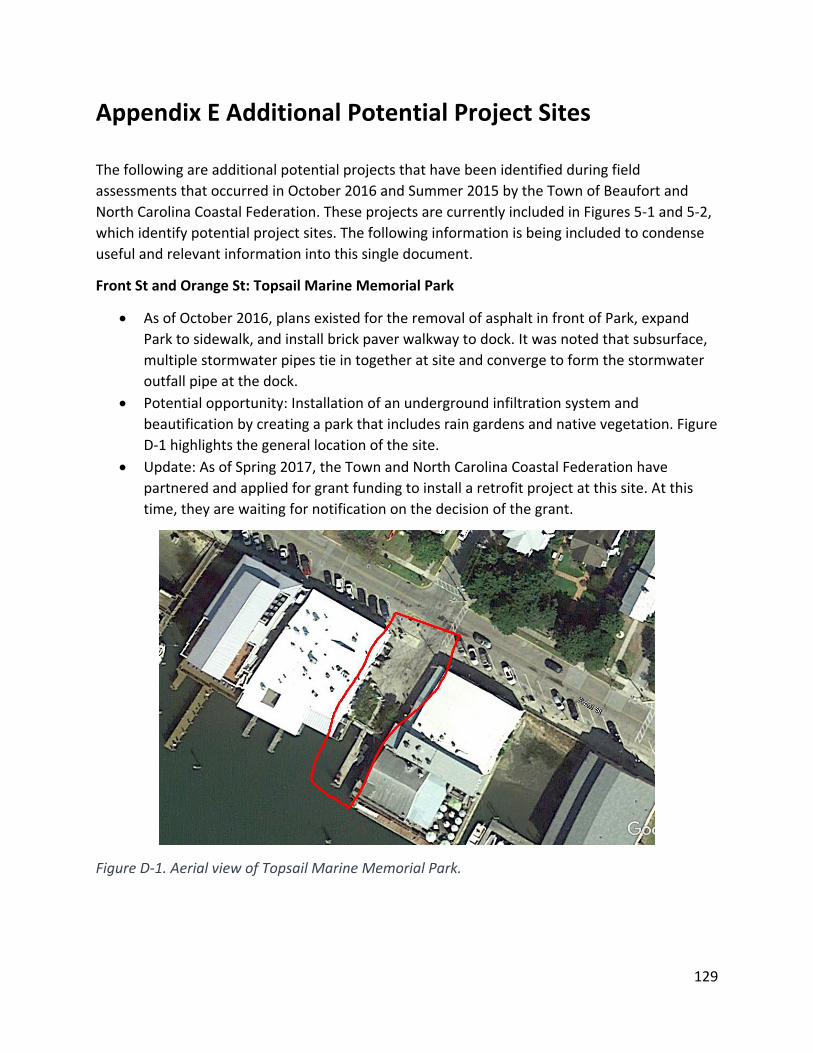
129
Appendix E Additional Potential Project Sites
The following are additional potential projects that have been identified during field
assessments that occurred in October 2016 and Summer 2015 by the Town of Beaufort and
North Carolina Coastal Federation. These projects are currently included in Figures 5-1 and 5-2,
which identify potential project sites. The following information is being included to condense
useful and relevant information into this single document.
Front St and Orange St: Topsail Marine Memorial Park
• As of October 2016, plans existed for the removal of asphalt in front of Park, expand
Park to sidewalk, and install brick paver walkway to dock. It was noted that subsurface,
multiple stormwater pipes tie in together at site and converge to form the stormwater
outfall pipe at the dock.
• Potential opportunity: Installation of an underground infiltration system and
beautification by creating a park that includes rain gardens and native vegetation. Figure
D-1 highlights the general location of the site.
• Update: As of Spring 2017, the Town and North Carolina Coastal Federation have
partnered and applied for grant funding to install a retrofit project at this site. At this
time, they are waiting for notification on the decision of the grant.
Figure D-1. Aerial view of Topsail Marine Memorial Park.
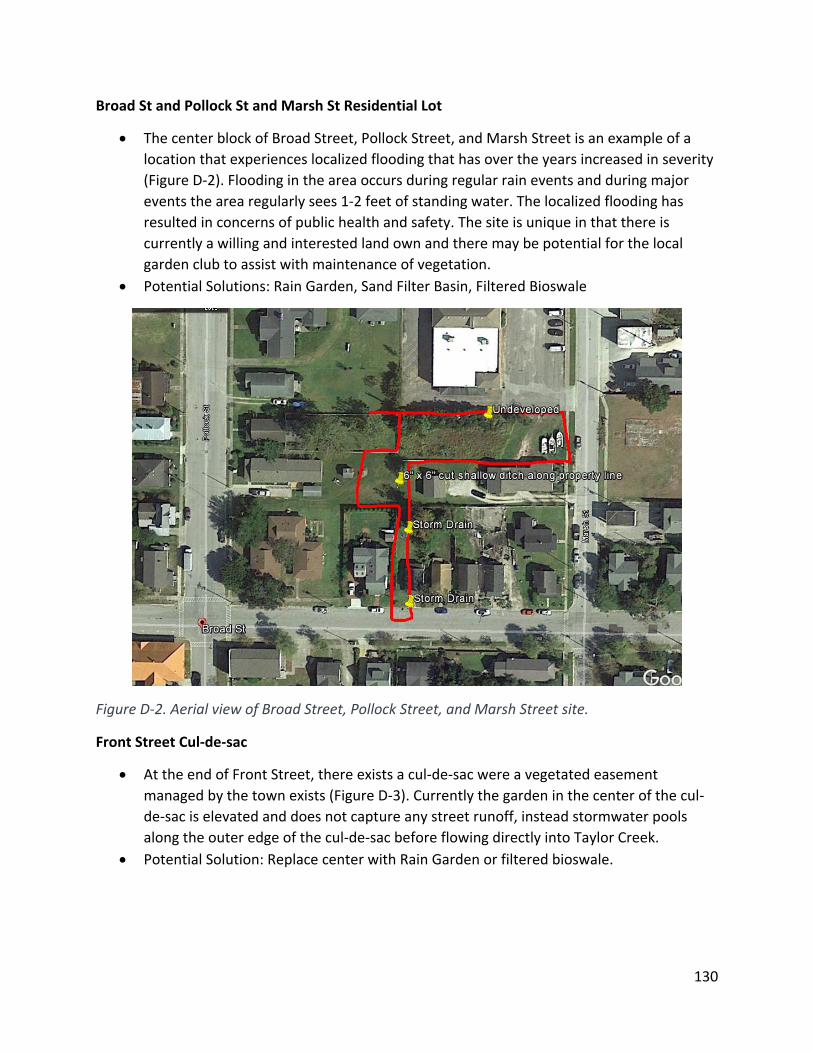
130
Broad St and Pollock St and Marsh St Residential Lot
• The center block of Broad Street, Pollock Street, and Marsh Street is an example of a
location that experiences localized flooding that has over the years increased in severity
(Figure D-2). Flooding in the area occurs during regular rain events and during major
events the area regularly sees 1-2 feet of standing water. The localized flooding has
resulted in concerns of public health and safety. The site is unique in that there is
currently a willing and interested land own and there may be potential for the local
garden club to assist with maintenance of vegetation.
• Potential Solutions: Rain Garden, Sand Filter Basin, Filtered Bioswale
Figure D-2. Aerial view of Broad Street, Pollock Street, and Marsh Street site.
Front Street Cul-de-sac
• At the end of Front Street, there exists a cul-de-sac were a vegetated easement
managed by the town exists (Figure D-3). Currently the garden in the center of the cul-
de-sac is elevated and does not capture any street runoff, instead stormwater pools
along the outer edge of the cul-de-sac before flowing directly into Taylor Creek.
• Potential Solution: Replace center with Rain Garden or filtered bioswale.
131
Figure D-3. Cul-de-sac at the end of Front Street.
Wellons Drive and Campen Road (Behind Beaufort Library and Roses)
• Along Wellons Drive, the asphalt shoulder is managed by the Town (Figure D-4). The
area has substantial impervious surface coverage.
• Potential solution: replace asphalt with bioswales (still need to allow access areas for
delivery trucks).
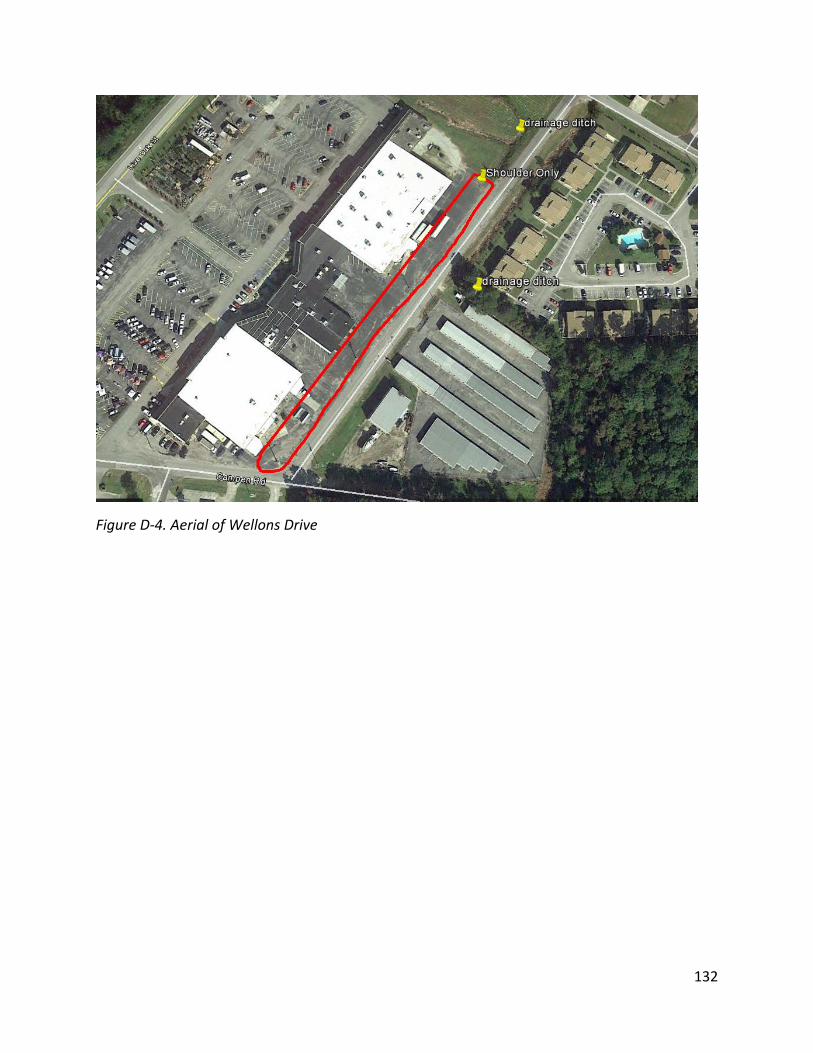
132
Figure D-4. Aerial of Wellons Drive
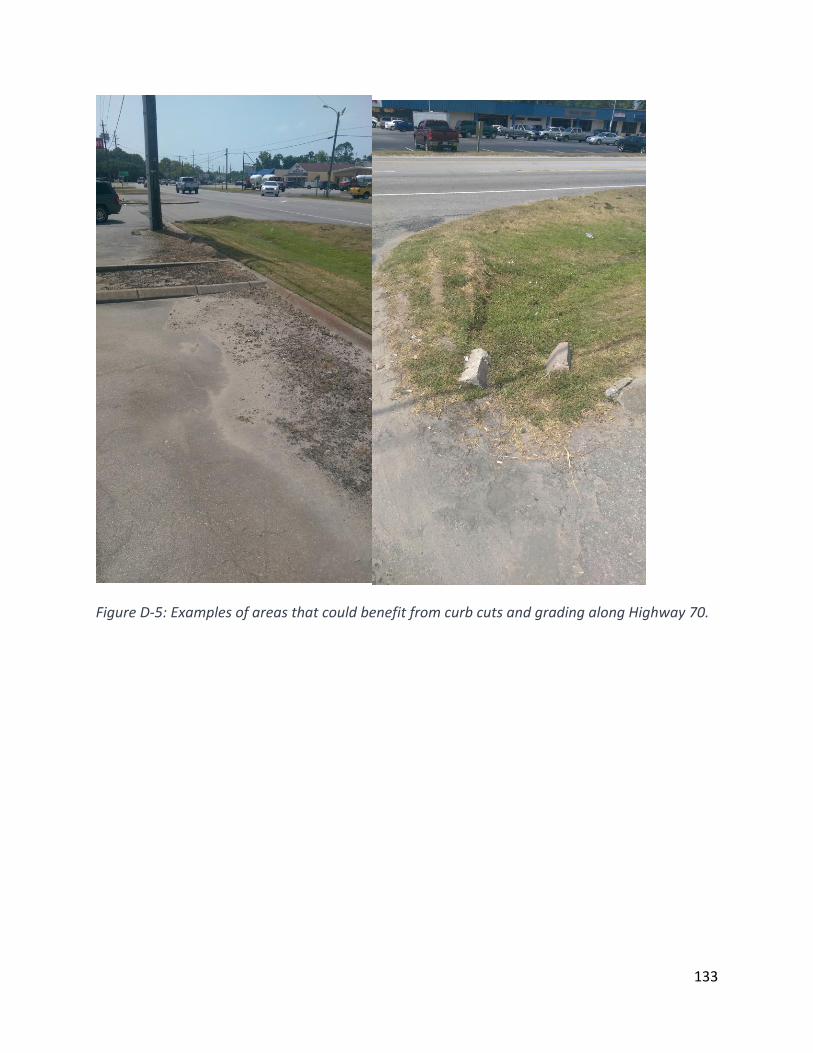
133
Figure D-5: Examples of areas that could benefit from curb cuts and grading along Highway 70.
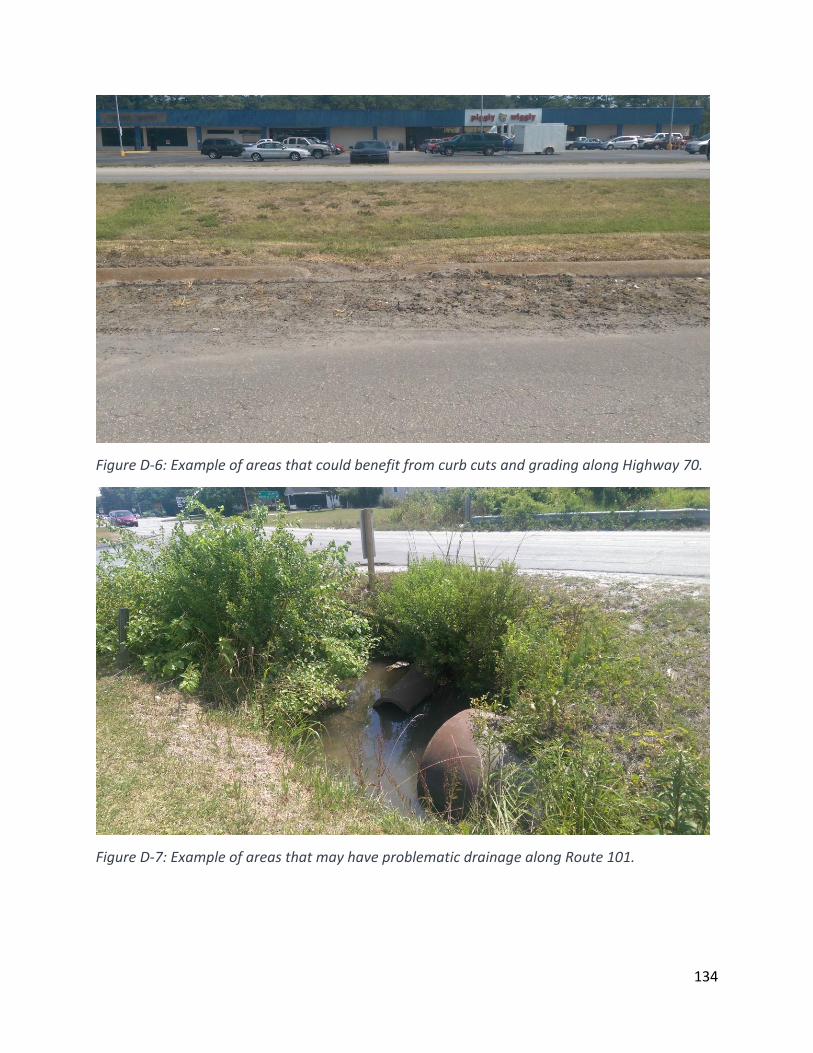
134
Figure D-6: Example of areas that could benefit from curb cuts and grading along Highway 70.
Figure D-7: Example of areas that may have problematic drainage along Route 101.
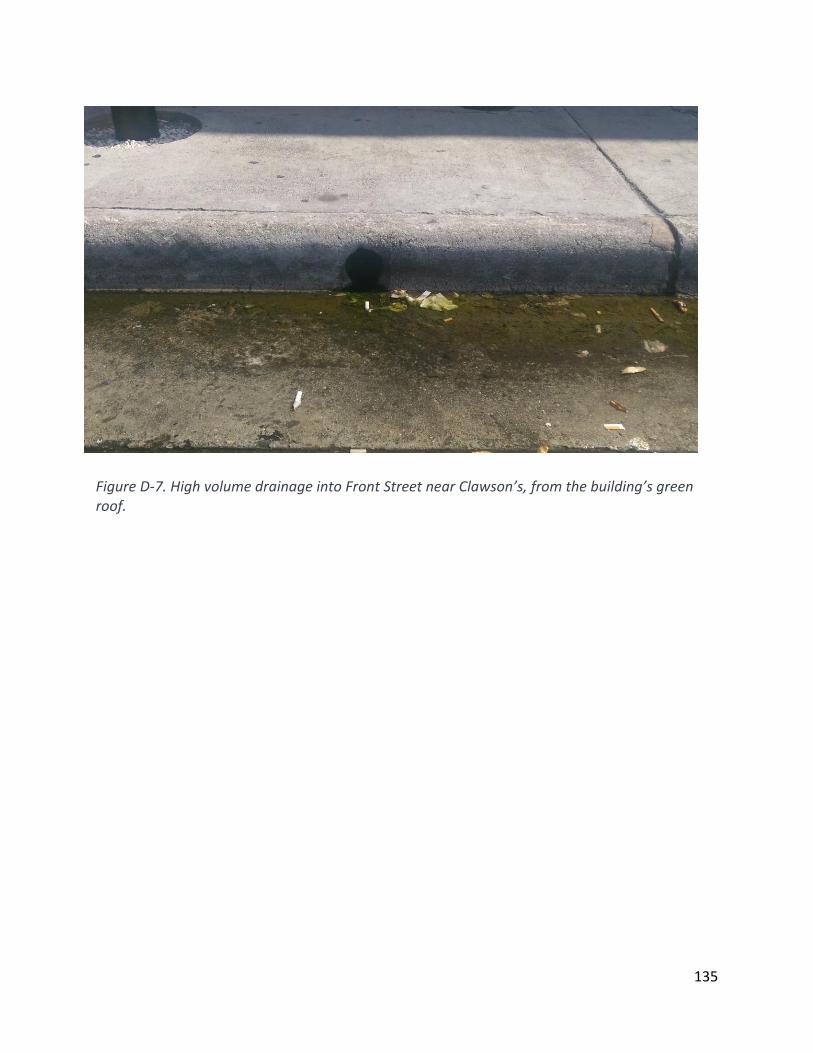
135
Figure D-7. High volume drainage into Front Street near Clawson’s, from the building’s green roof.
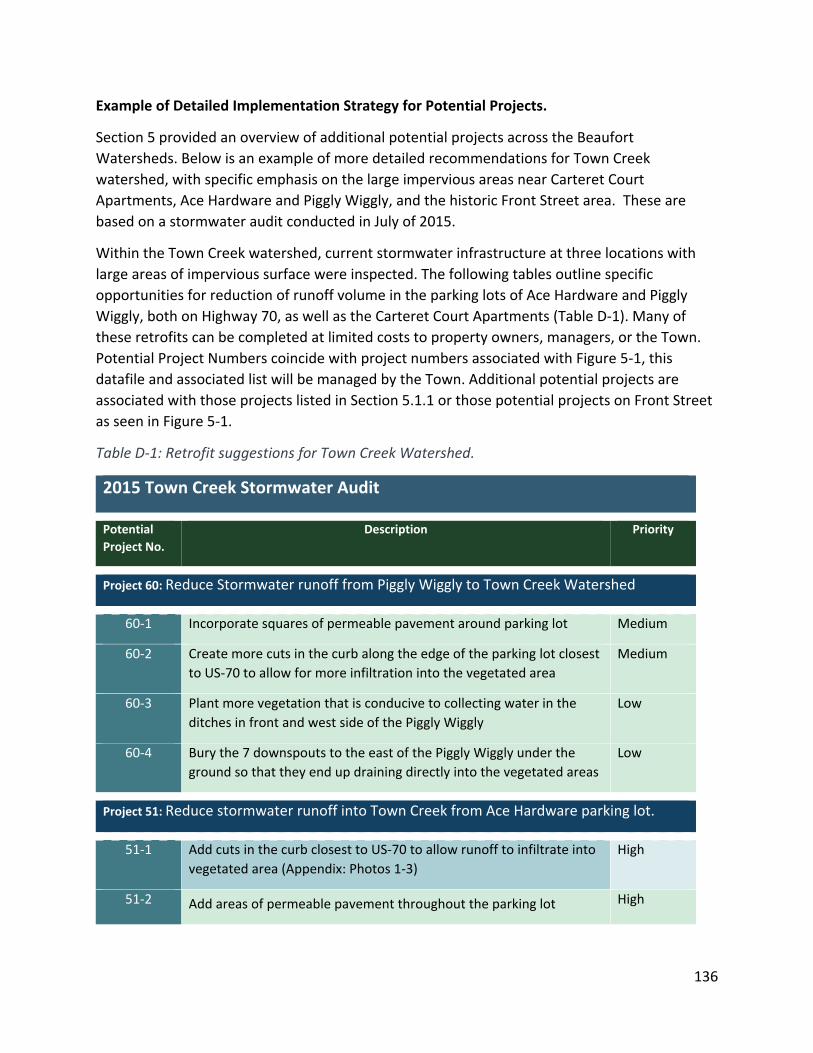
136
Example of Detailed Implementation Strategy for Potential Projects.
Section 5 provided an overview of additional potential projects across the Beaufort
Watersheds. Below is an example of more detailed recommendations for Town Creek
watershed, with specific emphasis on the large impervious areas near Carteret Court
Apartments, Ace Hardware and Piggly Wiggly, and the historic Front Street area. These are
based on a stormwater audit conducted in July of 2015.
Within the Town Creek watershed, current stormwater infrastructure at three locations with
large areas of impervious surface were inspected. The following tables outline specific
opportunities for reduction of runoff volume in the parking lots of Ace Hardware and Piggly
Wiggly, both on Highway 70, as well as the Carteret Court Apartments (Table D-1). Many of
these retrofits can be completed at limited costs to property owners, managers, or the Town.
Potential Project Numbers coincide with project numbers associated with Figure 5-1, this
datafile and associated list will be managed by the Town. Additional potential projects are
associated with those projects listed in Section 5.1.1 or those potential projects on Front Street
as seen in Figure 5-1.
Table D-1: Retrofit suggestions for Town Creek Watershed.
2015 Town Creek Stormwater Audit
Potential
Project No.
Description Priority
Project 60: Reduce Stormwater runoff from Piggly Wiggly to Town Creek Watershed
60-1 Incorporate squares of permeable pavement around parking lot Medium
60-2 Create more cuts in the curb along the edge of the parking lot closest
to US-70 to allow for more infiltration into the vegetated area
Medium
60-3 Plant more vegetation that is conducive to collecting water in the
ditches in front and west side of the Piggly Wiggly
Low
60-4 Bury the 7 downspouts to the east of the Piggly Wiggly under the
ground so that they end up draining directly into the vegetated areas
Low
Project 51: Reduce stormwater runoff into Town Creek from Ace Hardware parking lot.
51-1 Add cuts in the curb closest to US-70 to allow runoff to infiltrate into
vegetated area (Appendix: Photos 1-3)
High
51-2 Add areas of permeable pavement throughout the parking lot High
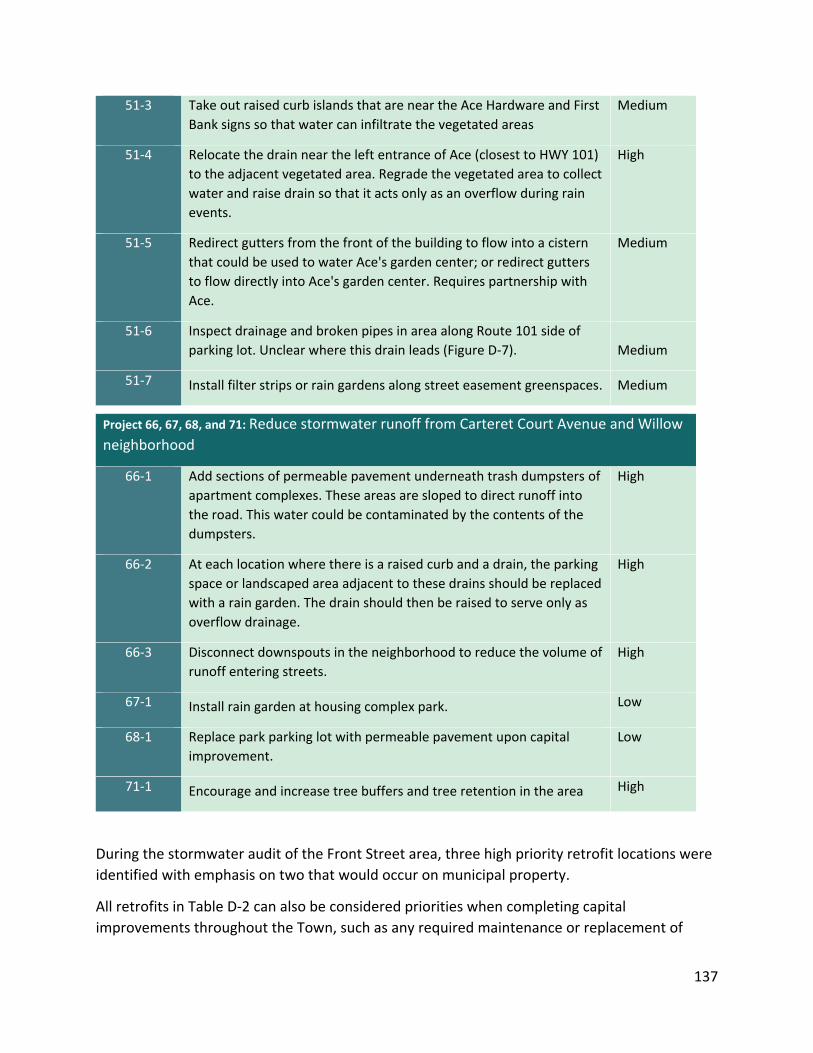
137
51-3 Take out raised curb islands that are near the Ace Hardware and First
Bank signs so that water can infiltrate the vegetated areas
Medium
51-4 Relocate the drain near the left entrance of Ace (closest to HWY 101)
to the adjacent vegetated area. Regrade the vegetated area to collect
water and raise drain so that it acts only as an overflow during rain
events.
High
51-5 Redirect gutters from the front of the building to flow into a cistern
that could be used to water Ace's garden center; or redirect gutters
to flow directly into Ace's garden center. Requires partnership with
Ace.
Medium
51-6 Inspect drainage and broken pipes in area along Route 101 side of
parking lot. Unclear where this drain leads (Figure D-7). Medium
51-7 Install filter strips or rain gardens along street easement greenspaces. Medium
Project 66, 67, 68, and 71: Reduce stormwater runoff from Carteret Court Avenue and Willow
neighborhood
66-1 Add sections of permeable pavement underneath trash dumpsters of
apartment complexes. These areas are sloped to direct runoff into
the road. This water could be contaminated by the contents of the
dumpsters.
High
66-2 At each location where there is a raised curb and a drain, the parking
space or landscaped area adjacent to these drains should be replaced
with a rain garden. The drain should then be raised to serve only as
overflow drainage.
High
66-3 Disconnect downspouts in the neighborhood to reduce the volume of
runoff entering streets.
High
67-1 Install rain garden at housing complex park. Low
68-1 Replace park parking lot with permeable pavement upon capital
improvement.
Low
71-1 Encourage and increase tree buffers and tree retention in the area High
During the stormwater audit of the Front Street area, three high priority retrofit locations were
identified with emphasis on two that would occur on municipal property.
All retrofits in Table D-2 can also be considered priorities when completing capital
improvements throughout the Town, such as any required maintenance or replacement of
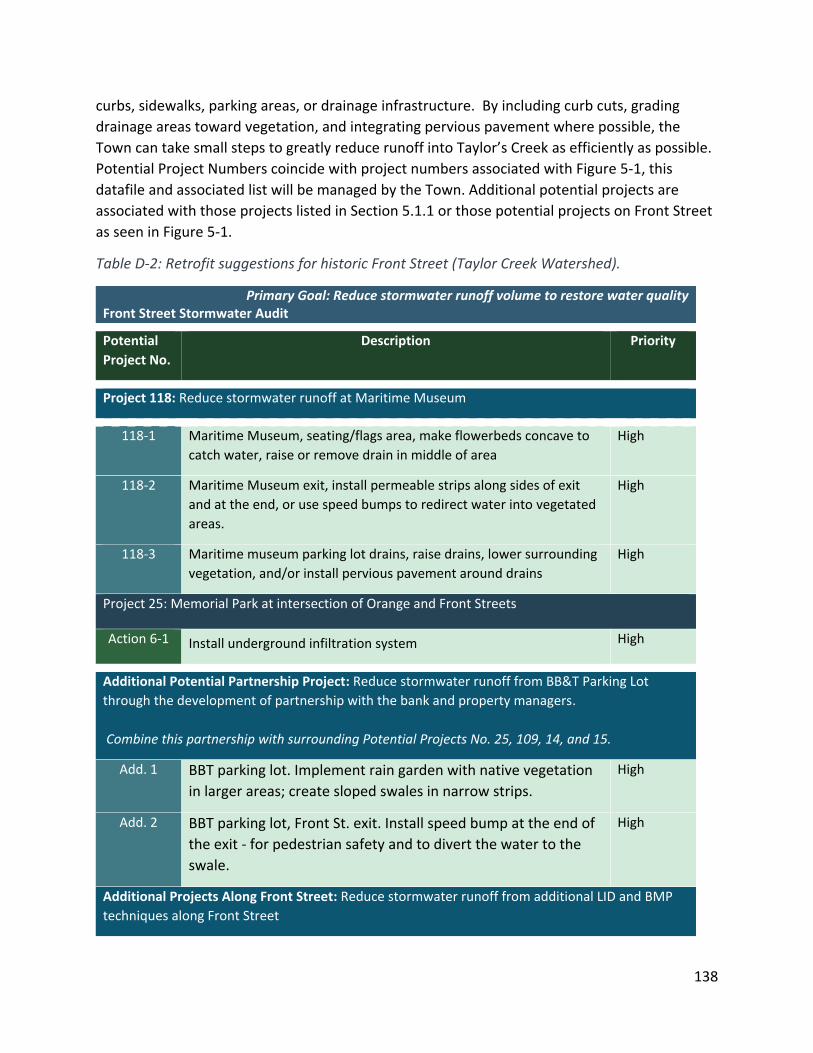
138
curbs, sidewalks, parking areas, or drainage infrastructure. By including curb cuts, grading
drainage areas toward vegetation, and integrating pervious pavement where possible, the
Town can take small steps to greatly reduce runoff into Taylor’s Creek as efficiently as possible.
Potential Project Numbers coincide with project numbers associated with Figure 5-1, this
datafile and associated list will be managed by the Town. Additional potential projects are
associated with those projects listed in Section 5.1.1 or those potential projects on Front Street
as seen in Figure 5-1.
Table D-2: Retrofit suggestions for historic Front Street (Taylor Creek Watershed).
Primary Goal: Reduce stormwater runoff volume to restore water quality Front Street Stormwater Audit
Potential
Project No.
Description Priority
Project 118: Reduce stormwater runoff at Maritime Museum
118-1 Maritime Museum, seating/flags area, make flowerbeds concave to
catch water, raise or remove drain in middle of area
High
118-2 Maritime Museum exit, install permeable strips along sides of exit
and at the end, or use speed bumps to redirect water into vegetated
areas.
High
118-3 Maritime museum parking lot drains, raise drains, lower surrounding
vegetation, and/or install pervious pavement around drains
High
Project 25: Memorial Park at intersection of Orange and Front Streets
Action 6-1 Install underground infiltration system High
Additional Potential Partnership Project: Reduce stormwater runoff from BB&T Parking Lot
through the development of partnership with the bank and property managers.
Combine this partnership with surrounding Potential Projects No. 25, 109, 14, and 15.
Add. 1 BBT parking lot. Implement rain garden with native vegetation
in larger areas; create sloped swales in narrow strips.
High
Add. 2 BBT parking lot, Front St. exit. Install speed bump at the end of
the exit - for pedestrian safety and to divert the water to the
swale.
High
Additional Projects Along Front Street: Reduce stormwater runoff from additional LID and BMP
techniques along Front Street
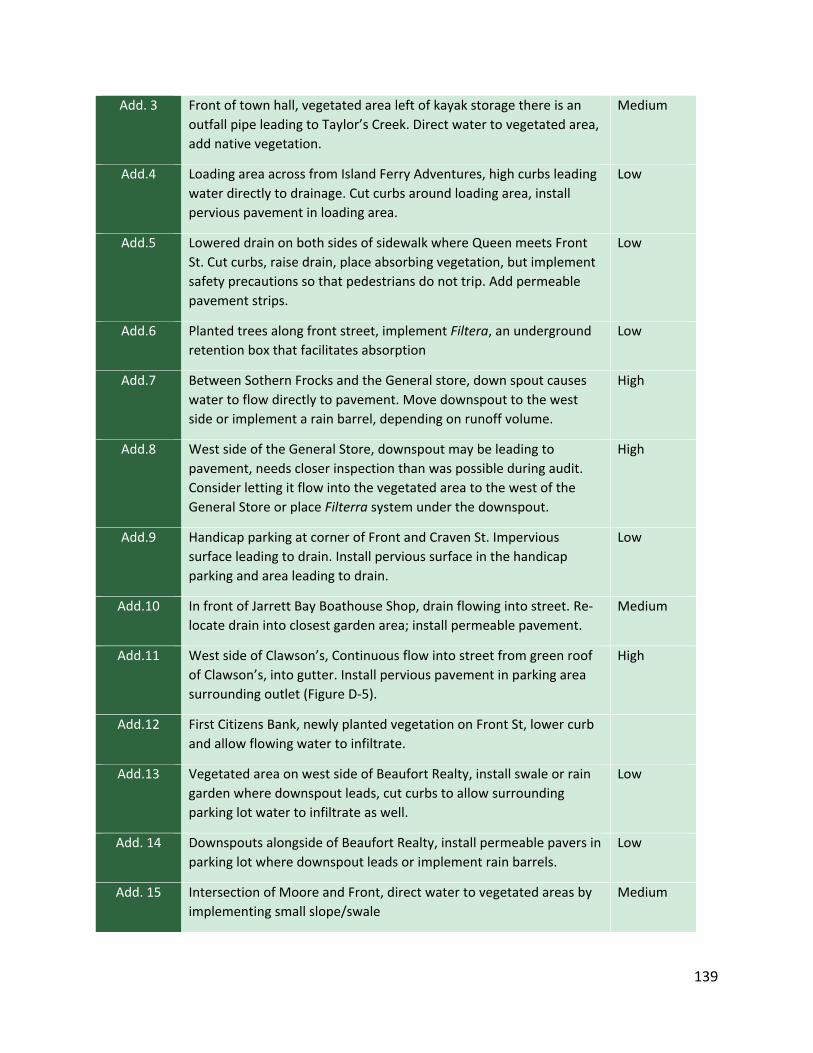
139
Add. 3 Front of town hall, vegetated area left of kayak storage there is an
outfall pipe leading to Taylor’s Creek. Direct water to vegetated area,
add native vegetation.
Medium
Add.4 Loading area across from Island Ferry Adventures, high curbs leading
water directly to drainage. Cut curbs around loading area, install
pervious pavement in loading area.
Low
Add.5 Lowered drain on both sides of sidewalk where Queen meets Front
St. Cut curbs, raise drain, place absorbing vegetation, but implement
safety precautions so that pedestrians do not trip. Add permeable
pavement strips.
Low
Add.6 Planted trees along front street, implement Filtera, an underground
retention box that facilitates absorption
Low
Add.7 Between Sothern Frocks and the General store, down spout causes
water to flow directly to pavement. Move downspout to the west
side or implement a rain barrel, depending on runoff volume.
High
Add.8 West side of the General Store, downspout may be leading to
pavement, needs closer inspection than was possible during audit.
Consider letting it flow into the vegetated area to the west of the
General Store or place Filterra system under the downspout.
High
Add.9 Handicap parking at corner of Front and Craven St. Impervious
surface leading to drain. Install pervious surface in the handicap
parking and area leading to drain.
Low
Add.10 In front of Jarrett Bay Boathouse Shop, drain flowing into street. Re-
locate drain into closest garden area; install permeable pavement.
Medium
Add.11 West side of Clawson’s, Continuous flow into street from green roof
of Clawson’s, into gutter. Install pervious pavement in parking area
surrounding outlet (Figure D-5).
High
Add.12 First Citizens Bank, newly planted vegetation on Front St, lower curb
and allow flowing water to infiltrate.
Add.13 Vegetated area on west side of Beaufort Realty, install swale or rain
garden where downspout leads, cut curbs to allow surrounding
parking lot water to infiltrate as well.
Low
Add. 14 Downspouts alongside of Beaufort Realty, install permeable pavers in
parking lot where downspout leads or implement rain barrels.
Low
Add. 15 Intersection of Moore and Front, direct water to vegetated areas by
implementing small slope/swale
Medium
140
Add. 16 Downspouts at Tidal Treasure (222 Front St.). Implement planter box
or direct to memorial garden.
Low
Add. 17 Lot on east side of Finz. Install rain garden or vegetated swale; direct
surrounding runoff sources to here (such as Finz downspout).
Medium
Add. 18 Public parking lot across from Clawson’s. Cut curbs around parking
lot, raise drain, implement vegetation or pervious pavement around
drains.
Medium
The following summary report was conducted by Dr. Jim Hunt as part of the Beaufort Stormwater Committee on June 7, 2016:
Tidal Contribution to Beaufort Storm Flooding Previously I looked at precipitation and tidal records for Beaufort over the last 15 years to demonstrate that the Fall 2015 flooding experienced by the Town was not unique. This note provides additional analysis of local tidal data over the past 40 years. While there is convincing data that mean sea level is rising along the North Carolina coast, the historical record demonstrates that infrequent high tides have water elevations rising at almost twice the rate of mean sea level. This has important implications for the Town as it anticipates the repair of its current stormwater infrastructure and plans for future conditions given the currently recognized flooding risk near tidal creeks and the waterfront. Data Source The data used in this analysis was obtained from NOAA for the Beaufort tidal gauge located at the Duke University Marine Laboratory on Pivers Island. All hourly data from 1974 through 2015 were downloaded using the Mean Low Low Water (MLLW) for the reference height. Only calendar years 1975 and 1976 were missing. Increasing Tidal Heights There is considerable interest in mean sea level rise for coastal communities as they assess current and future flooding risk. NOAA researchers have developed site specific models for “nuisance flooding” which would cause local disruption to transportation and commerce. In Beaufort, NOAA has defined a nuisance flood as having a tidal height of 4.5 feet (MLLW) and they have models that predict the frequency of nuisance flooding based on current mean sea level and because of various levels of sea level rise. The calculation of coastal flooding requires various models that represent storms and air pressure, associated winds, and freshwater inflow to the sounds. We probably do not have local expertise that could translate those modeling results into quantification of current and future flooding risks. As an alternative, the existing record can provide some estimate of future conditions.
141
The 40 years of tidal data at the Beaufort gauge provides a good record of what we have experienced and can form the basis for estimating future conditions. This analysis was guided by a desire to compare extreme tidal elevations over the historical record with the trend in mean sea level. Three different tidal elevations were calculated from the Beaufort tidal data.
1. Mean sea level was calculated from the hourly data for each year. While this is a straight forward calculation, the result is different from what NOAA reports since NOAA researchers calculate mean sea level trend based on monthly mean sea levels. There is thus a small difference in the rate between what NOAA reports and this analysis.
2. Mean high-high tide was calculated by identifying the highest tide for each day in each year and then determining the average of those daily values of the highest tide for each year. With the local tides usually having two high tides each day, the higher of the two was picked. Since hourly data were used, there is the possibility of missing a higher tidal height if 6-minute data were used. The record for 6-minute data is not as extensive as hourly data for this gauge and thus was not as helpful for long-term trend analysis.
3. The third characteristic of the tidal record was a measure of extreme events since they are the ones that potentially cause damage rather than average conditions. What was determined for each year of data was the fifth highest of the daily highest tides. It is possible to base the analysis on the highest of the high tides, but that record is highly variable because it includes the influence of tropical storms and hurricanes. The fifth highest high tide provides a measure of tidal heights that are equaled or exceeded five times in a year and is less subject to variability than one or two extreme events associated with tropical storms.
The following plot contains the yearly values of mean sea level (circles), average high-high tide (triangles) and fifth highest high tide (squares) with the excel-generated linear regression lines indicated. All three-annual series show an increase over the 40-year record, but what is of interest is the rate of increase is lowest for mean sea level, higher for average high-high tide and the highest for the fifth highest high tide. The rates of increase are the slopes of the regression lines and these are included in the table below expressed as feet per century.
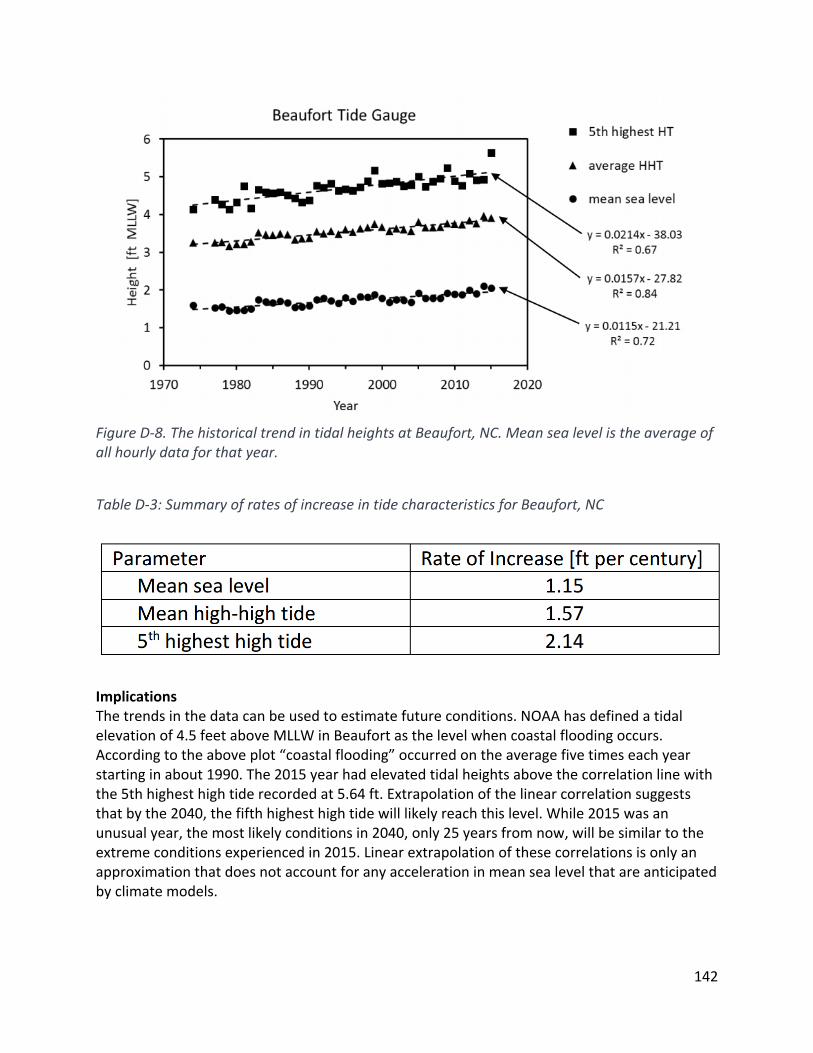
142
Figure D-8. The historical trend in tidal heights at Beaufort, NC. Mean sea level is the average of all hourly data for that year.
Table D-3: Summary of rates of increase in tide characteristics for Beaufort, NC
Implications The trends in the data can be used to estimate future conditions. NOAA has defined a tidal elevation of 4.5 feet above MLLW in Beaufort as the level when coastal flooding occurs. According to the above plot “coastal flooding” occurred on the average five times each year starting in about 1990. The 2015 year had elevated tidal heights above the correlation line with the 5th highest high tide recorded at 5.64 ft. Extrapolation of the linear correlation suggests that by the 2040, the fifth highest high tide will likely reach this level. While 2015 was an unusual year, the most likely conditions in 2040, only 25 years from now, will be similar to the extreme conditions experienced in 2015. Linear extrapolation of these correlations is only an approximation that does not account for any acceleration in mean sea level that are anticipated by climate models.
143
Beaufort and other coastal towns need to translate tidal elevation increases into remedial actions to fix existing problems and undertake infrastructure planning for new development. The Coastal Resources Commission offers limited guidance with their 30-year projection of mean sea level. A 30-year time horizon is insufficient for planning major infrastructure projects with projected life times of 50 to 100 years. Even new housing stock will likely have a useful life that exceeds 100 years based on the age distribution of Beaufort homes. The Coastal Resources Commission might be asked for guidance on how to anticipate and adapt to nuisance flooding conditions in the future. The soon to be issued FEMA (Federal Emergency Management Agency) flood maps for coastal North Carolina reflect current conditions and are only used to assess current risk for insurance purposes. The intent of the FEMA effort is to assess through data analysis and models the once in hundred-year flood event accounting for storm intensity, winds, waves, and local conditions under the existing sea level. The FEMA 2007 Guidelines and Specifications for Flood Hazard Mapping Partners acknowledges historical sea level trends, but states such effects as small. The once in hundred-year event will have catastrophic effects and since the NOAA designated “nuisance flooding” events will have far less damaging consequences. The Town of Beaufort should determine if the soon to be issued FEMA map provides guidance to the town as it evaluates the balance between community adaptation and individual flood risk management. In summary, the Fall 2015 coastal flooding conditions provide an example of future conditions along the North Carolina coast. An extrapolation of the occurrence of the fifth highest high tide each year suggests extreme conditions encountered in 2015 will be the norm in about 25 years. While neither the Coastal Resources Commission nor FEMA are providing guidance on future risk, coastal towns cannot ignore the future flooding risk as they implement infrastructure repairs and set development requirements to protect residents, commercial interests and critical public infrastructure. Beaufort will need to decide what level of collective action is appropriate for the town in providing public safety and what risks should be borne by individual residents and businesses when facing an uncertain but increasingly risky coastal zone.
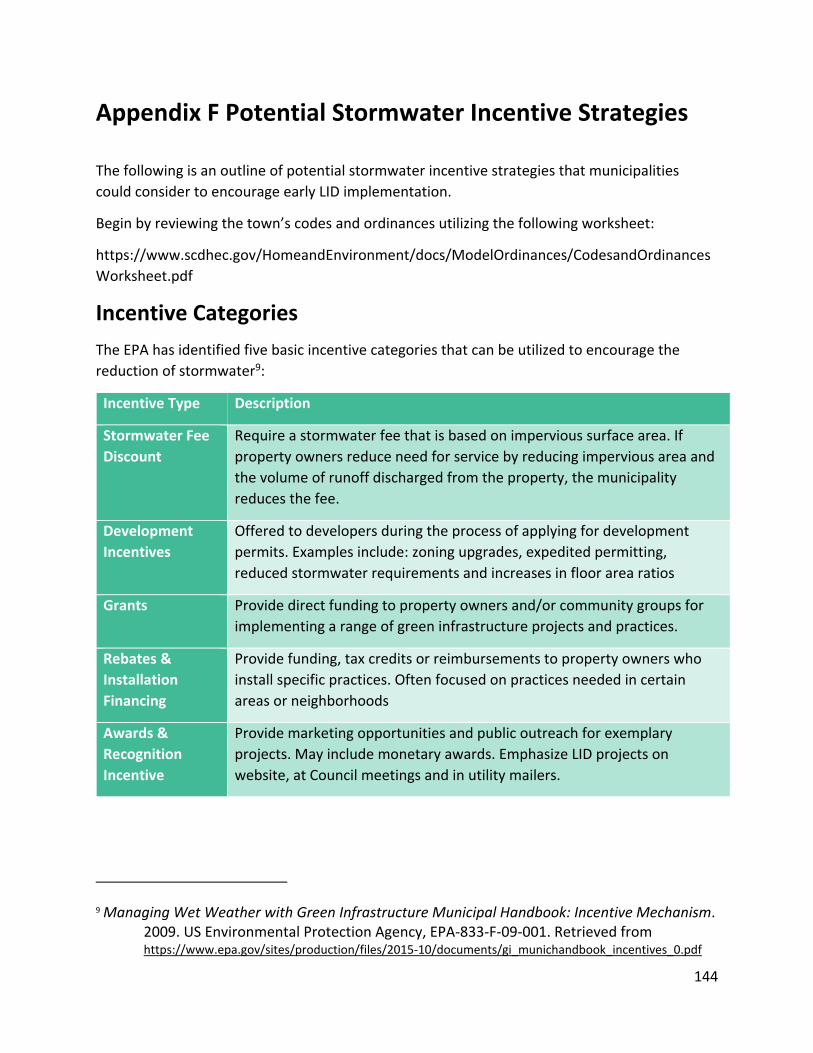
144
Appendix F Potential Stormwater Incentive Strategies The following is an outline of potential stormwater incentive strategies that municipalities
could consider to encourage early LID implementation.
Begin by reviewing the town’s codes and ordinances utilizing the following worksheet:
https://www.scdhec.gov/HomeandEnvironment/docs/ModelOrdinances/CodesandOrdinances
Worksheet.pdf
Incentive Categories
The EPA has identified five basic incentive categories that can be utilized to encourage the
reduction of stormwater9:
Incentive Type Description
Stormwater Fee
Discount
Require a stormwater fee that is based on impervious surface area. If
property owners reduce need for service by reducing impervious area and
the volume of runoff discharged from the property, the municipality
reduces the fee.
Development
Incentives
Offered to developers during the process of applying for development
permits. Examples include: zoning upgrades, expedited permitting,
reduced stormwater requirements and increases in floor area ratios
Grants Provide direct funding to property owners and/or community groups for
implementing a range of green infrastructure projects and practices.
Rebates &
Installation
Financing
Provide funding, tax credits or reimbursements to property owners who
install specific practices. Often focused on practices needed in certain
areas or neighborhoods
Awards &
Recognition
Incentive
Provide marketing opportunities and public outreach for exemplary
projects. May include monetary awards. Emphasize LID projects on
website, at Council meetings and in utility mailers.
9 Managing Wet Weather with Green Infrastructure Municipal Handbook: Incentive Mechanism. 2009. US Environmental Protection Agency, EPA-833-F-09-001. Retrieved from https://www.epa.gov/sites/production/files/2015-10/documents/gi_munichandbook_incentives_0.pdf
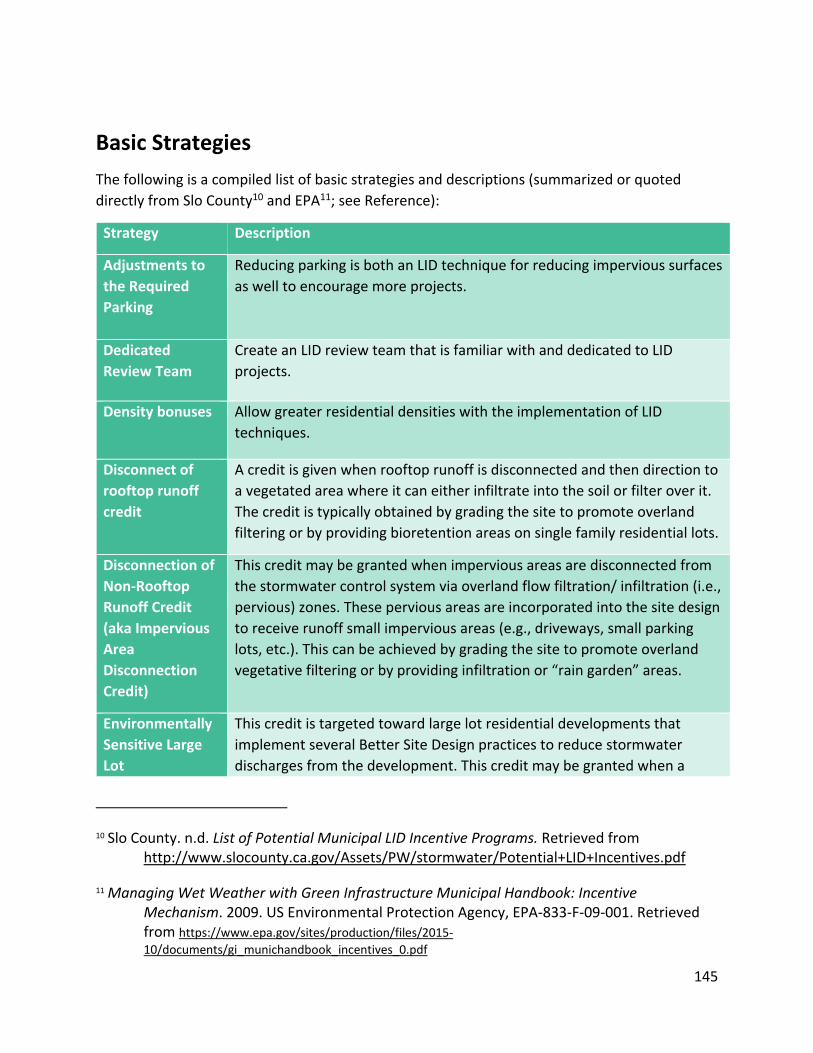
145
Basic Strategies
The following is a compiled list of basic strategies and descriptions (summarized or quoted
directly from Slo County10 and EPA11; see Reference):
Strategy Description
Adjustments to
the Required
Parking
Reducing parking is both an LID technique for reducing impervious surfaces
as well to encourage more projects.
Dedicated
Review Team
Create an LID review team that is familiar with and dedicated to LID
projects.
Density bonuses Allow greater residential densities with the implementation of LID
techniques.
Disconnect of
rooftop runoff
credit
A credit is given when rooftop runoff is disconnected and then direction to
a vegetated area where it can either infiltrate into the soil or filter over it.
The credit is typically obtained by grading the site to promote overland
filtering or by providing bioretention areas on single family residential lots.
Disconnection of
Non-Rooftop
Runoff Credit
(aka Impervious
Area
Disconnection
Credit)
This credit may be granted when impervious areas are disconnected from
the stormwater control system via overland flow filtration/ infiltration (i.e.,
pervious) zones. These pervious areas are incorporated into the site design
to receive runoff small impervious areas (e.g., driveways, small parking
lots, etc.). This can be achieved by grading the site to promote overland
vegetative filtering or by providing infiltration or “rain garden” areas.
Environmentally
Sensitive Large
Lot
This credit is targeted toward large lot residential developments that
implement several Better Site Design practices to reduce stormwater
discharges from the development. This credit may be granted when a
10 Slo County. n.d. List of Potential Municipal LID Incentive Programs. Retrieved from http://www.slocounty.ca.gov/Assets/PW/stormwater/Potential+LID+Incentives.pdf
11 Managing Wet Weather with Green Infrastructure Municipal Handbook: Incentive Mechanism. 2009. US Environmental Protection Agency, EPA-833-F-09-001. Retrieved from https://www.epa.gov/sites/production/files/2015-
10/documents/gi_munichandbook_incentives_0.pdf
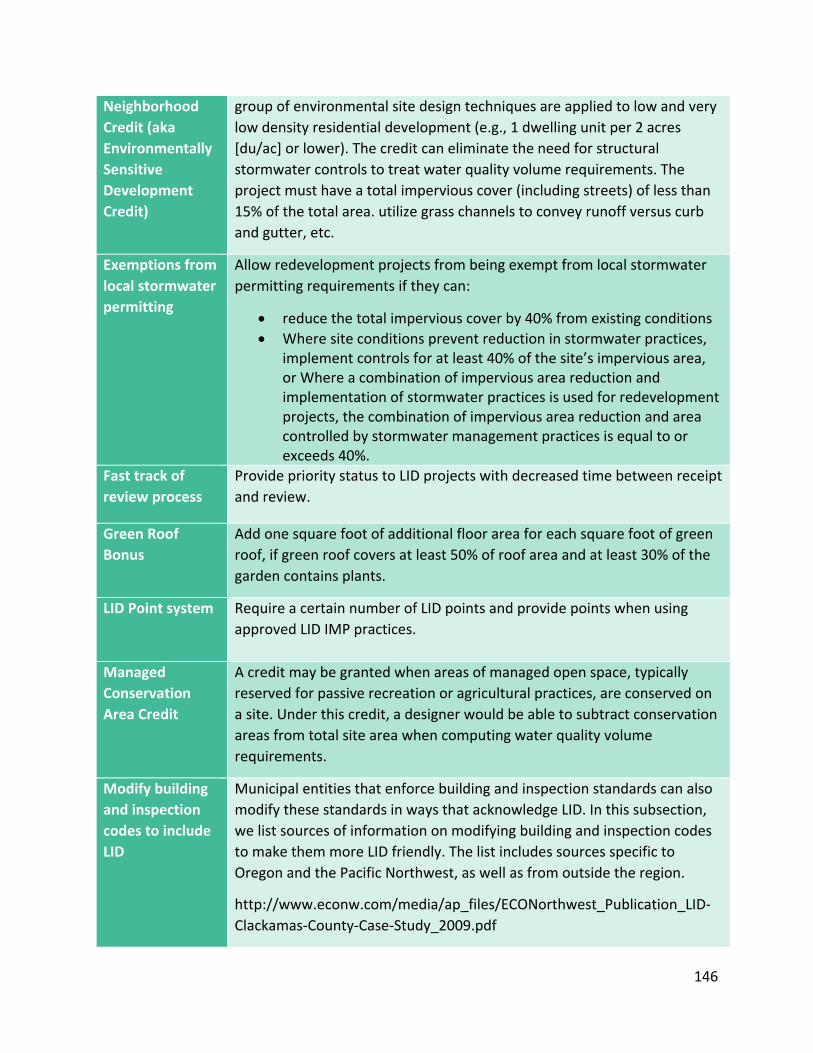
146
Neighborhood
Credit (aka
Environmentally
Sensitive
Development
Credit)
group of environmental site design techniques are applied to low and very
low density residential development (e.g., 1 dwelling unit per 2 acres
[du/ac] or lower). The credit can eliminate the need for structural
stormwater controls to treat water quality volume requirements. The
project must have a total impervious cover (including streets) of less than
15% of the total area. utilize grass channels to convey runoff versus curb
and gutter, etc.
Exemptions from
local stormwater
permitting
Allow redevelopment projects from being exempt from local stormwater
permitting requirements if they can:
• reduce the total impervious cover by 40% from existing conditions
• Where site conditions prevent reduction in stormwater practices, implement controls for at least 40% of the site’s impervious area, or Where a combination of impervious area reduction and implementation of stormwater practices is used for redevelopment projects, the combination of impervious area reduction and area controlled by stormwater management practices is equal to or exceeds 40%.
Fast track of
review process
Provide priority status to LID projects with decreased time between receipt
and review.
Green Roof
Bonus
Add one square foot of additional floor area for each square foot of green
roof, if green roof covers at least 50% of roof area and at least 30% of the
garden contains plants.
LID Point system
Require a certain number of LID points and provide points when using
approved LID IMP practices.
Managed
Conservation
Area Credit
A credit may be granted when areas of managed open space, typically
reserved for passive recreation or agricultural practices, are conserved on
a site. Under this credit, a designer would be able to subtract conservation
areas from total site area when computing water quality volume
requirements.
Modify building
and inspection
codes to include
LID
Municipal entities that enforce building and inspection standards can also
modify these standards in ways that acknowledge LID. In this subsection,
we list sources of information on modifying building and inspection codes
to make them more LID friendly. The list includes sources specific to
Oregon and the Pacific Northwest, as well as from outside the region.
http://www.econw.com/media/ap_files/ECONorthwest_Publication_LID-
Clackamas-County-Case-Study_2009.pdf
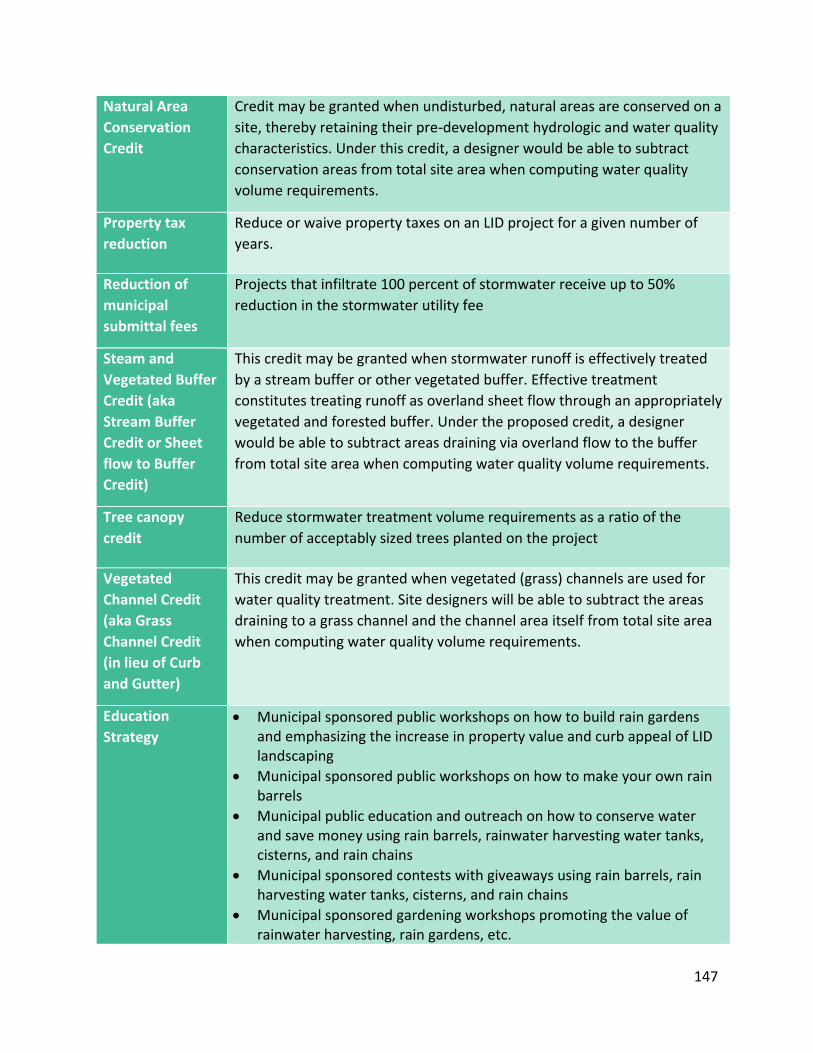
147
Natural Area
Conservation
Credit
Credit may be granted when undisturbed, natural areas are conserved on a
site, thereby retaining their pre-development hydrologic and water quality
characteristics. Under this credit, a designer would be able to subtract
conservation areas from total site area when computing water quality
volume requirements.
Property tax
reduction
Reduce or waive property taxes on an LID project for a given number of
years.
Reduction of
municipal
submittal fees
Projects that infiltrate 100 percent of stormwater receive up to 50%
reduction in the stormwater utility fee
Steam and
Vegetated Buffer
Credit (aka
Stream Buffer
Credit or Sheet
flow to Buffer
Credit)
This credit may be granted when stormwater runoff is effectively treated
by a stream buffer or other vegetated buffer. Effective treatment
constitutes treating runoff as overland sheet flow through an appropriately
vegetated and forested buffer. Under the proposed credit, a designer
would be able to subtract areas draining via overland flow to the buffer
from total site area when computing water quality volume requirements.
Tree canopy
credit
Reduce stormwater treatment volume requirements as a ratio of the
number of acceptably sized trees planted on the project
Vegetated
Channel Credit
(aka Grass
Channel Credit
(in lieu of Curb
and Gutter)
This credit may be granted when vegetated (grass) channels are used for
water quality treatment. Site designers will be able to subtract the areas
draining to a grass channel and the channel area itself from total site area
when computing water quality volume requirements.
Education
Strategy
• Municipal sponsored public workshops on how to build rain gardens and emphasizing the increase in property value and curb appeal of LID landscaping
• Municipal sponsored public workshops on how to make your own rain barrels
• Municipal public education and outreach on how to conserve water and save money using rain barrels, rainwater harvesting water tanks, cisterns, and rain chains
• Municipal sponsored contests with giveaways using rain barrels, rain harvesting water tanks, cisterns, and rain chains
• Municipal sponsored gardening workshops promoting the value of rainwater harvesting, rain gardens, etc.
148
Business
Outreach
Communication about grant opportunities, partnerships, awards,
competitions, and regulations via email, newsletter, website, etc. directed
directly at business owners and commercial land owners to encourage
participation and encourage a vested interest in the community
Examples of LID-friendly Regulatory Language
“Several cities and counties list LID-friendly stormwater ordinances on their web sites. A recent
Google search of “LID regulation” found the following LID ordinances:
• City of Sammamish, Washington: Ordinance 02008-236 Low Impact Development
Regulations. An ordinance of the City of Sammamish, Washington, amending the City of
Sammamish Municipal Code to create a Low Impact Development Chapter, and
amending certain other Chapters of the City of Sammamish Municipal code to ensure
consistency with the Low Impact Development Chapter.
http://www.ci.sammamish.wa.us/Ordinances.aspx?ID=107 (accessed January 5, 2009).
• Fauquier County, Virginia: A zoning ordinance text amendment to Sections 5-006.5, 12-
610 and 15-300 related to utilization of Low Impact Development techniques with site
development. http://www.fauquiercounty.gov/government/departments/BOS/past
agendas/02-14-08/lid_ord.htm (accessed January 5, 2009).
• Township of Lower Makefield, Pennsylvania: Ordinance No. 364. An ordinance of the
Township of Lower Makefield, Bucks County, Pennsylvania, amending the Lower
Makefield Township Codified Zoning Ordinance of 1996, as amended, to provide for Low
Impact Development Standards. http://www.lmt.org/LID%20-
%20ZONING%20v%206%20_4_.pdf (accessed January 5, 2009).”12
• Vermont utilizes a suite of stormwater regulations
http://acrpc.org/files/2012/04/LID_For_VT_Towns.pdf
Discussion of challenges faced by developers and how municipalities can maximize the
effectiveness of stormwater programs:
12 ECONorthwest. 2009. Low Impact Development at the local level: Developer’s experiences and city and county support. Retrieved from http://www.econw.com/media/ap_files/ECONorthwest_Publication_LID-Clackamas-County-Case-Study_2009.pdf
149
http://www.econw.com/media/ap_files/ECONorthwest_Publication_LID-Clackamas-County-
Case-Study_2009.pdf
List of Cost savings from installed LID stormwater controls:
http://www.econw.com/media/ap_files/ECONorthwest_Publication_LID-Clackamas-County-
Case-Study_2009.pdf
http://www.dep.wv.gov/WWE/Programs/stormwater/MS4/guidance/factsheets/Documents/In
corporating%20ESD%20into%20Municipal%20SW%20Programs.pdf
https://www3.epa.gov/region1/npdes/stormwater/assets/pdfs/IncorporatingLID.pdf
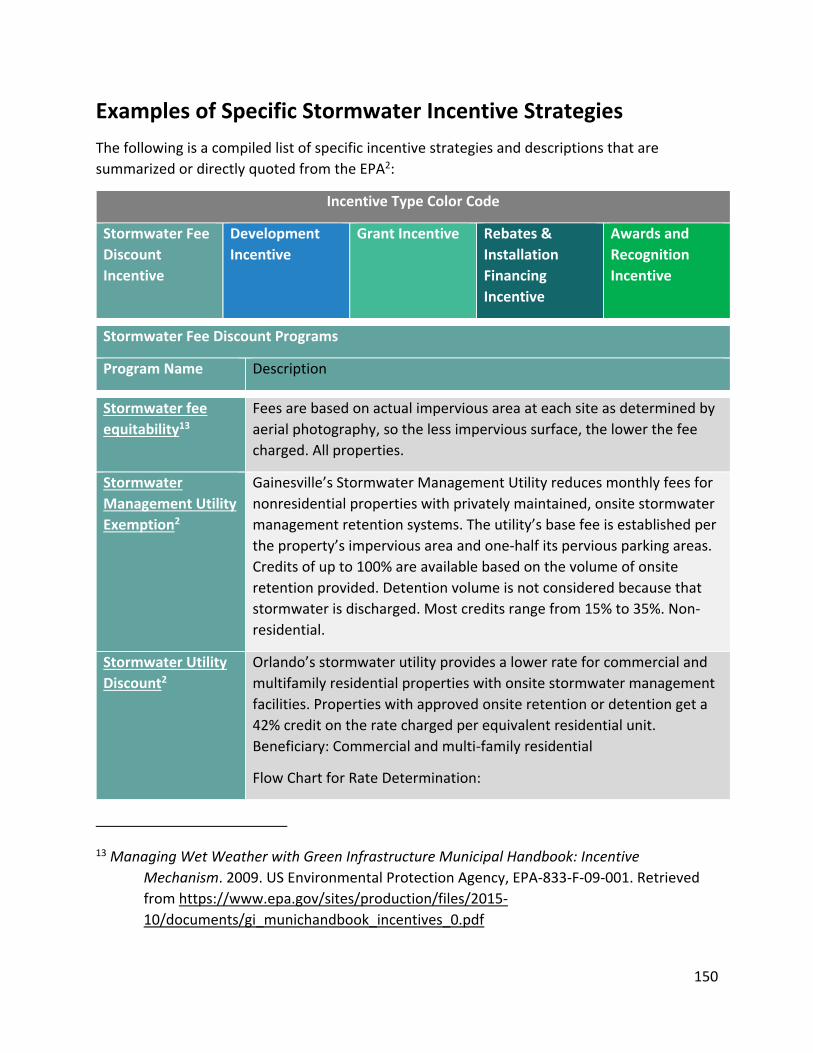
150
Examples of Specific Stormwater Incentive Strategies
The following is a compiled list of specific incentive strategies and descriptions that are
summarized or directly quoted from the EPA2:
Incentive Type Color Code
Stormwater Fee
Discount
Incentive
Development
Incentive
Grant Incentive Rebates &
Installation
Financing
Incentive
Awards and
Recognition
Incentive
Stormwater Fee Discount Programs
Program Name Description
Stormwater fee
equitability13
Fees are based on actual impervious area at each site as determined by
aerial photography, so the less impervious surface, the lower the fee
charged. All properties.
Stormwater
Management Utility
Exemption2
Gainesville’s Stormwater Management Utility reduces monthly fees for
nonresidential properties with privately maintained, onsite stormwater
management retention systems. The utility’s base fee is established per
the property’s impervious area and one-half its pervious parking areas.
Credits of up to 100% are available based on the volume of onsite
retention provided. Detention volume is not considered because that
stormwater is discharged. Most credits range from 15% to 35%. Non-
residential.
Stormwater Utility
Discount2
Orlando’s stormwater utility provides a lower rate for commercial and
multifamily residential properties with onsite stormwater management
facilities. Properties with approved onsite retention or detention get a
42% credit on the rate charged per equivalent residential unit.
Beneficiary: Commercial and multi-family residential
Flow Chart for Rate Determination:
13 Managing Wet Weather with Green Infrastructure Municipal Handbook: Incentive
Mechanism. 2009. US Environmental Protection Agency, EPA-833-F-09-001. Retrieved
from https://www.epa.gov/sites/production/files/2015-
10/documents/gi_munichandbook_incentives_0.pdf
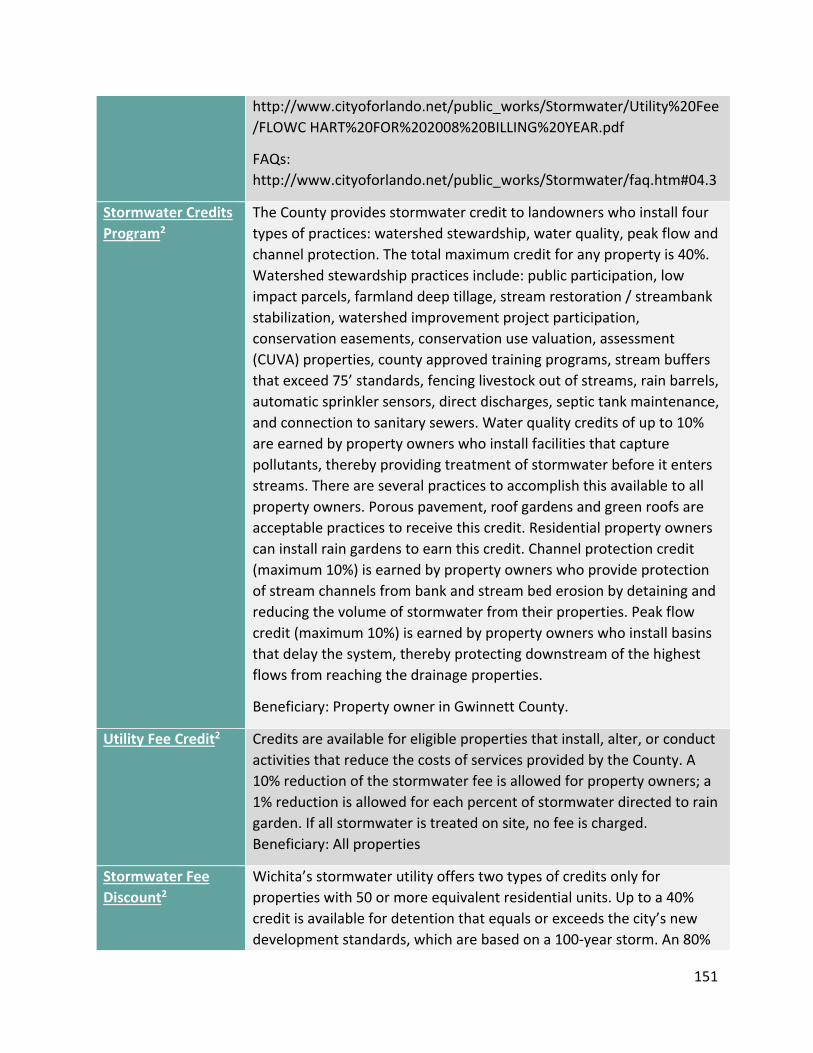
151
http://www.cityoforlando.net/public_works/Stormwater/Utility%20Fee
/FLOWC HART%20FOR%202008%20BILLING%20YEAR.pdf
FAQs:
http://www.cityoforlando.net/public_works/Stormwater/faq.htm#04.3
Stormwater Credits
Program2
The County provides stormwater credit to landowners who install four
types of practices: watershed stewardship, water quality, peak flow and
channel protection. The total maximum credit for any property is 40%.
Watershed stewardship practices include: public participation, low
impact parcels, farmland deep tillage, stream restoration / streambank
stabilization, watershed improvement project participation,
conservation easements, conservation use valuation, assessment
(CUVA) properties, county approved training programs, stream buffers
that exceed 75’ standards, fencing livestock out of streams, rain barrels,
automatic sprinkler sensors, direct discharges, septic tank maintenance,
and connection to sanitary sewers. Water quality credits of up to 10%
are earned by property owners who install facilities that capture
pollutants, thereby providing treatment of stormwater before it enters
streams. There are several practices to accomplish this available to all
property owners. Porous pavement, roof gardens and green roofs are
acceptable practices to receive this credit. Residential property owners
can install rain gardens to earn this credit. Channel protection credit
(maximum 10%) is earned by property owners who provide protection
of stream channels from bank and stream bed erosion by detaining and
reducing the volume of stormwater from their properties. Peak flow
credit (maximum 10%) is earned by property owners who install basins
that delay the system, thereby protecting downstream of the highest
flows from reaching the drainage properties.
Beneficiary: Property owner in Gwinnett County.
Utility Fee Credit2 Credits are available for eligible properties that install, alter, or conduct
activities that reduce the costs of services provided by the County. A
10% reduction of the stormwater fee is allowed for property owners; a
1% reduction is allowed for each percent of stormwater directed to rain
garden. If all stormwater is treated on site, no fee is charged.
Beneficiary: All properties
Stormwater Fee
Discount2
Wichita’s stormwater utility offers two types of credits only for
properties with 50 or more equivalent residential units. Up to a 40%
credit is available for detention that equals or exceeds the city’s new
development standards, which are based on a 100-year storm. An 80%
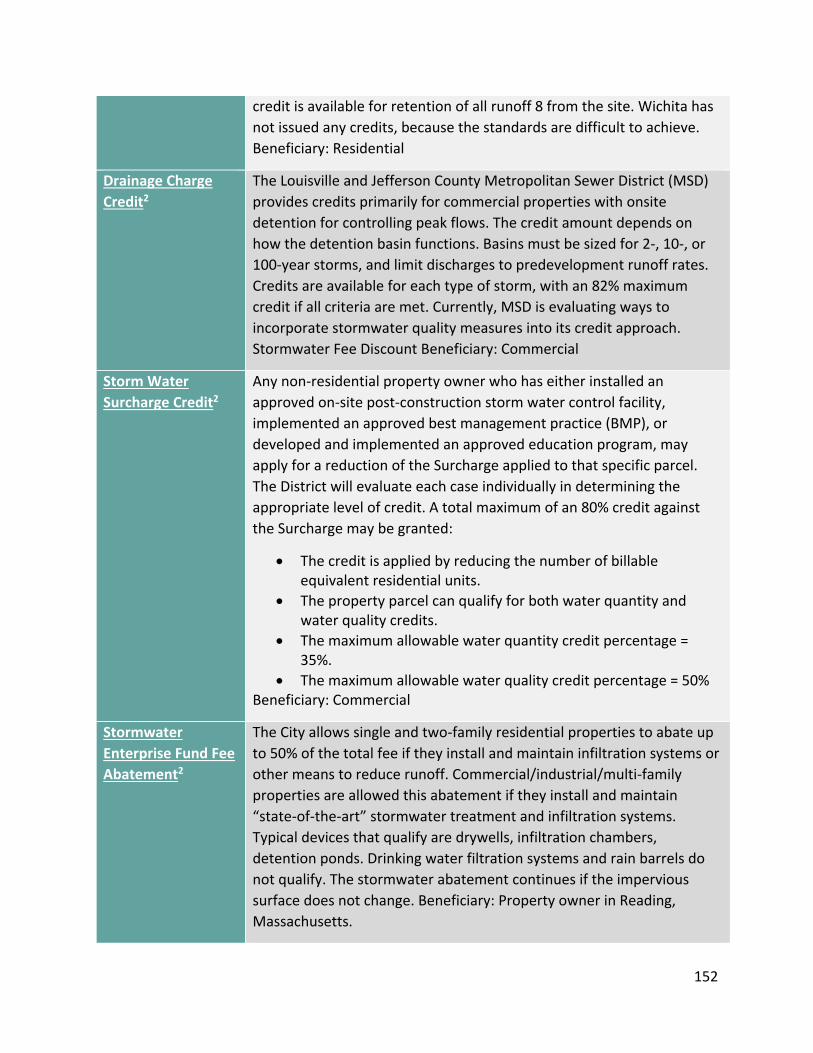
152
credit is available for retention of all runoff 8 from the site. Wichita has
not issued any credits, because the standards are difficult to achieve.
Beneficiary: Residential
Drainage Charge
Credit2
The Louisville and Jefferson County Metropolitan Sewer District (MSD)
provides credits primarily for commercial properties with onsite
detention for controlling peak flows. The credit amount depends on
how the detention basin functions. Basins must be sized for 2-, 10-, or
100-year storms, and limit discharges to predevelopment runoff rates.
Credits are available for each type of storm, with an 82% maximum
credit if all criteria are met. Currently, MSD is evaluating ways to
incorporate stormwater quality measures into its credit approach.
Stormwater Fee Discount Beneficiary: Commercial
Storm Water
Surcharge Credit2
Any non-residential property owner who has either installed an
approved on-site post-construction storm water control facility,
implemented an approved best management practice (BMP), or
developed and implemented an approved education program, may
apply for a reduction of the Surcharge applied to that specific parcel.
The District will evaluate each case individually in determining the
appropriate level of credit. A total maximum of an 80% credit against
the Surcharge may be granted:
• The credit is applied by reducing the number of billable equivalent residential units.
• The property parcel can qualify for both water quantity and water quality credits.
• The maximum allowable water quantity credit percentage = 35%.
• The maximum allowable water quality credit percentage = 50% Beneficiary: Commercial
Stormwater
Enterprise Fund Fee
Abatement2
The City allows single and two-family residential properties to abate up
to 50% of the total fee if they install and maintain infiltration systems or
other means to reduce runoff. Commercial/industrial/multi-family
properties are allowed this abatement if they install and maintain
“state-of-the-art” stormwater treatment and infiltration systems.
Typical devices that qualify are drywells, infiltration chambers,
detention ponds. Drinking water filtration systems and rain barrels do
not qualify. The stormwater abatement continues if the impervious
surface does not change. Beneficiary: Property owner in Reading,
Massachusetts.
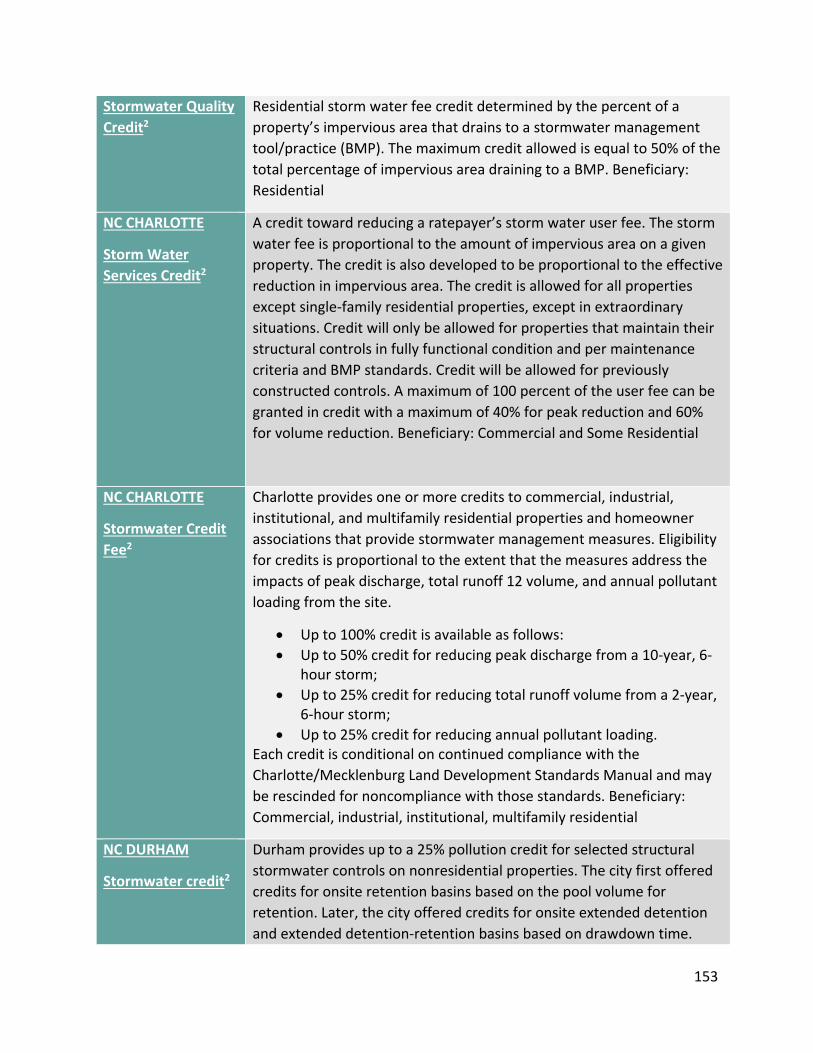
153
Stormwater Quality
Credit2
Residential storm water fee credit determined by the percent of a
property’s impervious area that drains to a stormwater management
tool/practice (BMP). The maximum credit allowed is equal to 50% of the
total percentage of impervious area draining to a BMP. Beneficiary:
Residential
NC CHARLOTTE
Storm Water
Services Credit2
A credit toward reducing a ratepayer’s storm water user fee. The storm
water fee is proportional to the amount of impervious area on a given
property. The credit is also developed to be proportional to the effective
reduction in impervious area. The credit is allowed for all properties
except single-family residential properties, except in extraordinary
situations. Credit will only be allowed for properties that maintain their
structural controls in fully functional condition and per maintenance
criteria and BMP standards. Credit will be allowed for previously
constructed controls. A maximum of 100 percent of the user fee can be
granted in credit with a maximum of 40% for peak reduction and 60%
for volume reduction. Beneficiary: Commercial and Some Residential
NC CHARLOTTE
Stormwater Credit
Fee2
Charlotte provides one or more credits to commercial, industrial,
institutional, and multifamily residential properties and homeowner
associations that provide stormwater management measures. Eligibility
for credits is proportional to the extent that the measures address the
impacts of peak discharge, total runoff 12 volume, and annual pollutant
loading from the site.
• Up to 100% credit is available as follows:
• Up to 50% credit for reducing peak discharge from a 10-year, 6-hour storm;
• Up to 25% credit for reducing total runoff volume from a 2-year, 6-hour storm;
• Up to 25% credit for reducing annual pollutant loading. Each credit is conditional on continued compliance with the
Charlotte/Mecklenburg Land Development Standards Manual and may
be rescinded for noncompliance with those standards. Beneficiary:
Commercial, industrial, institutional, multifamily residential
NC DURHAM
Stormwater credit2
Durham provides up to a 25% pollution credit for selected structural
stormwater controls on nonresidential properties. The city first offered
credits for onsite retention basins based on the pool volume for
retention. Later, the city offered credits for onsite extended detention
and extended detention-retention basins based on drawdown time.
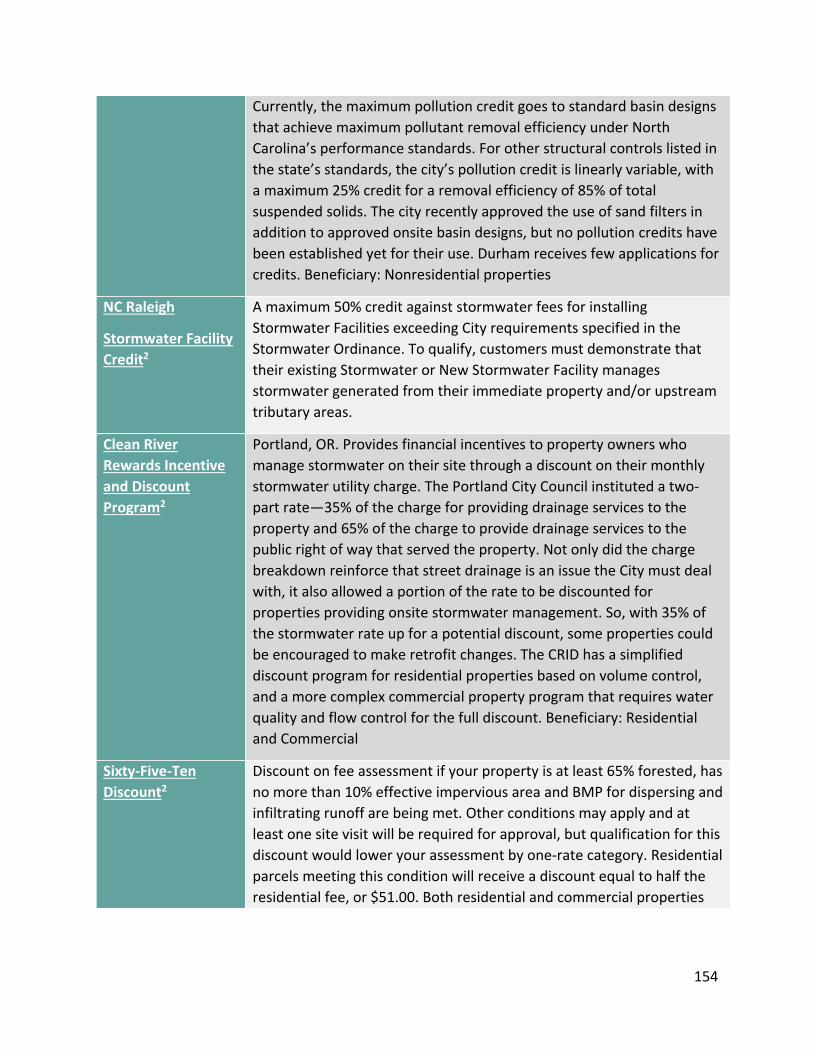
154
Currently, the maximum pollution credit goes to standard basin designs
that achieve maximum pollutant removal efficiency under North
Carolina’s performance standards. For other structural controls listed in
the state’s standards, the city’s pollution credit is linearly variable, with
a maximum 25% credit for a removal efficiency of 85% of total
suspended solids. The city recently approved the use of sand filters in
addition to approved onsite basin designs, but no pollution credits have
been established yet for their use. Durham receives few applications for
credits. Beneficiary: Nonresidential properties
NC Raleigh
Stormwater Facility
Credit2
A maximum 50% credit against stormwater fees for installing
Stormwater Facilities exceeding City requirements specified in the
Stormwater Ordinance. To qualify, customers must demonstrate that
their existing Stormwater or New Stormwater Facility manages
stormwater generated from their immediate property and/or upstream
tributary areas.
Clean River
Rewards Incentive
and Discount
Program2
Portland, OR. Provides financial incentives to property owners who
manage stormwater on their site through a discount on their monthly
stormwater utility charge. The Portland City Council instituted a two-
part rate—35% of the charge for providing drainage services to the
property and 65% of the charge to provide drainage services to the
public right of way that served the property. Not only did the charge
breakdown reinforce that street drainage is an issue the City must deal
with, it also allowed a portion of the rate to be discounted for
properties providing onsite stormwater management. So, with 35% of
the stormwater rate up for a potential discount, some properties could
be encouraged to make retrofit changes. The CRID has a simplified
discount program for residential properties based on volume control,
and a more complex commercial property program that requires water
quality and flow control for the full discount. Beneficiary: Residential
and Commercial
Sixty-Five-Ten
Discount2
Discount on fee assessment if your property is at least 65% forested, has
no more than 10% effective impervious area and BMP for dispersing and
infiltrating runoff are being met. Other conditions may apply and at
least one site visit will be required for approval, but qualification for this
discount would lower your assessment by one-rate category. Residential
parcels meeting this condition will receive a discount equal to half the
residential fee, or $51.00. Both residential and commercial properties
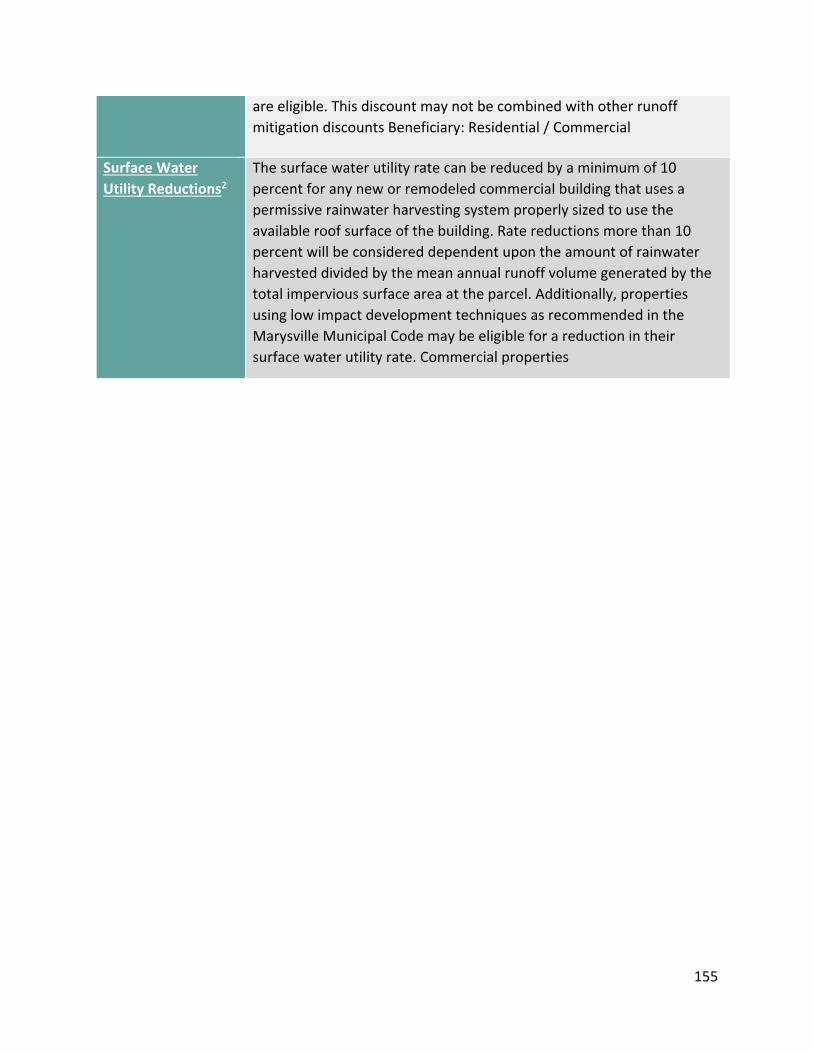
155
are eligible. This discount may not be combined with other runoff
mitigation discounts Beneficiary: Residential / Commercial
Surface Water
Utility Reductions2
The surface water utility rate can be reduced by a minimum of 10
percent for any new or remodeled commercial building that uses a
permissive rainwater harvesting system properly sized to use the
available roof surface of the building. Rate reductions more than 10
percent will be considered dependent upon the amount of rainwater
harvested divided by the mean annual runoff volume generated by the
total impervious surface area at the parcel. Additionally, properties
using low impact development techniques as recommended in the
Marysville Municipal Code may be eligible for a reduction in their
surface water utility rate. Commercial properties

156
Development Incentive
Incentive Name Description
Green Building and
Green Development
Program2
Green buildings or green developments shall qualify for expedited
permitting and priority inspections. Green buildings and developments
shall be defined and certified as appropriate by the U.S. Green Building
Council (i.e. Leadership in Energy and Environmental Design (LEED)
certification) or the Florida Green Building Coalition. The County
discontinued the permit fee rebate previously offered to these projects
as well on December 28, 2007. Beneficiary: Qualified developer in
Sarasota County.
Green Permit
Program2
Chicago's Department of Construction and Permits (DCAP) has created
an incentive that encourages inclusion of environmentally conscious
design elements by promising developer’s savings of both time and
money. Architects, developers and building owners can be part of an
expedited permit process by adding elements of green building
strategies and technologies from a menu of items created by DCAP.
Projects admitted into the Green Permit Program can receive permits in
less than 30 business days as opposed to the 60 to 90 that are normally
allotted for permit issuance. Participants that display a particularly high
level of green strategy can possibly have consultant code review fees
waived as well. A team of green building design experts compiled by the
city help applicants navigate the permit process to ensure timely
implementation of these technologies. Beneficiary: Architects,
developers, and building owners
Floor Area Ratio
Bonus2
Projects that install ecoroofs in the Central City Plan District are eligible
for a floor area ratio bonus, which increases the building’s allowable
area, and can use ecoroofs to conform to the Central City Design
Guidelines. Buildings can receive bonus FAR based on three ranges of
ecoroof coverage in relation to the building’s footprint: 10-30%, 30-60%
and 60% or greater earns one, two and three square feet of additional
floor area per square foot of ecoroof respectively. Beneficiary:
Commercial buildings in the Central City area of Portland.
http://www.portlandonline.com/shared/cfm/image.cfm?id=53363, see
510-28
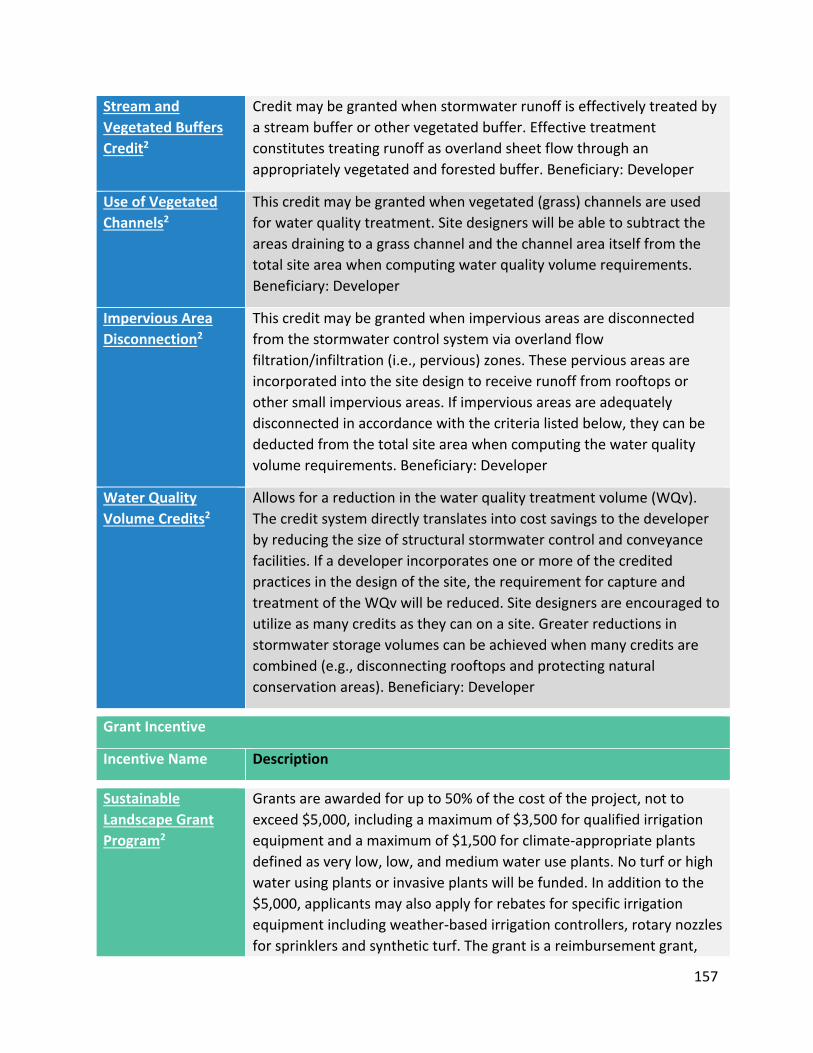
157
Stream and
Vegetated Buffers
Credit2
Credit may be granted when stormwater runoff is effectively treated by
a stream buffer or other vegetated buffer. Effective treatment
constitutes treating runoff as overland sheet flow through an
appropriately vegetated and forested buffer. Beneficiary: Developer
Use of Vegetated
Channels2
This credit may be granted when vegetated (grass) channels are used
for water quality treatment. Site designers will be able to subtract the
areas draining to a grass channel and the channel area itself from the
total site area when computing water quality volume requirements.
Beneficiary: Developer
Impervious Area
Disconnection2
This credit may be granted when impervious areas are disconnected
from the stormwater control system via overland flow
filtration/infiltration (i.e., pervious) zones. These pervious areas are
incorporated into the site design to receive runoff from rooftops or
other small impervious areas. If impervious areas are adequately
disconnected in accordance with the criteria listed below, they can be
deducted from the total site area when computing the water quality
volume requirements. Beneficiary: Developer
Water Quality
Volume Credits2
Allows for a reduction in the water quality treatment volume (WQv).
The credit system directly translates into cost savings to the developer
by reducing the size of structural stormwater control and conveyance
facilities. If a developer incorporates one or more of the credited
practices in the design of the site, the requirement for capture and
treatment of the WQv will be reduced. Site designers are encouraged to
utilize as many credits as they can on a site. Greater reductions in
stormwater storage volumes can be achieved when many credits are
combined (e.g., disconnecting rooftops and protecting natural
conservation areas). Beneficiary: Developer
Grant Incentive
Incentive Name Description
Sustainable
Landscape Grant
Program2
Grants are awarded for up to 50% of the cost of the project, not to
exceed $5,000, including a maximum of $3,500 for qualified irrigation
equipment and a maximum of $1,500 for climate-appropriate plants
defined as very low, low, and medium water use plants. No turf or high
water using plants or invasive plants will be funded. In addition to the
$5,000, applicants may also apply for rebates for specific irrigation
equipment including weather-based irrigation controllers, rotary nozzles
for sprinklers and synthetic turf. The grant is a reimbursement grant,
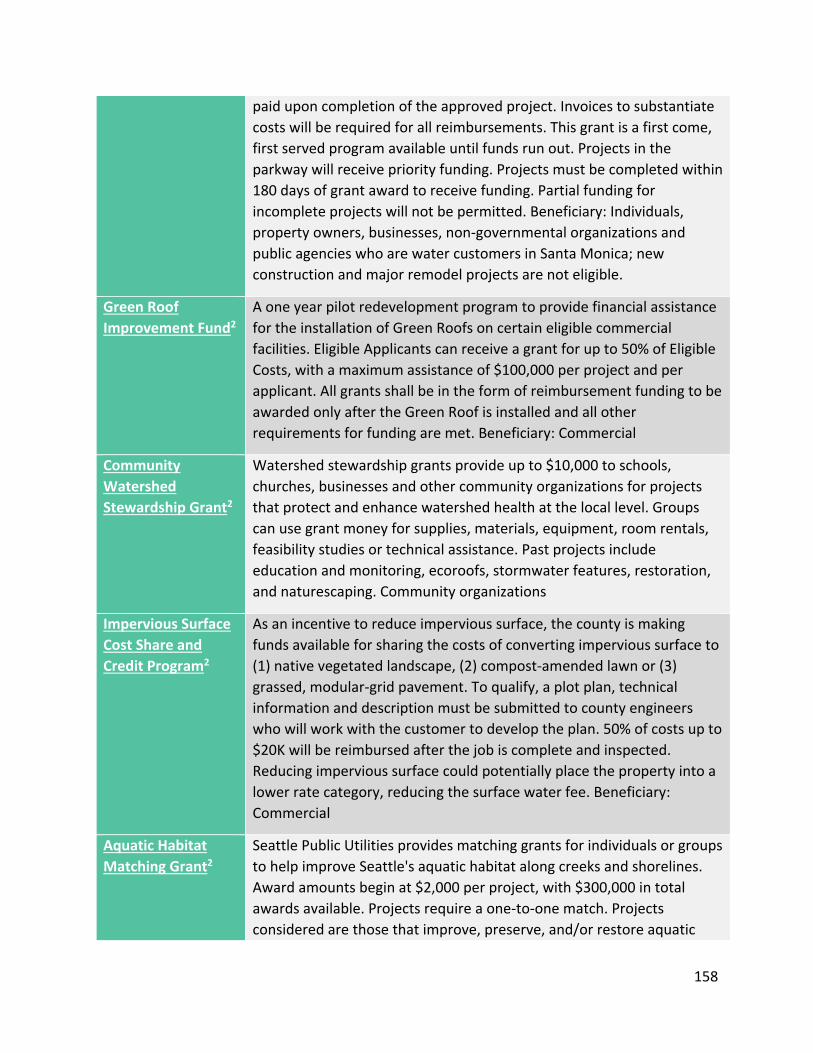
158
paid upon completion of the approved project. Invoices to substantiate
costs will be required for all reimbursements. This grant is a first come,
first served program available until funds run out. Projects in the
parkway will receive priority funding. Projects must be completed within
180 days of grant award to receive funding. Partial funding for
incomplete projects will not be permitted. Beneficiary: Individuals,
property owners, businesses, non-governmental organizations and
public agencies who are water customers in Santa Monica; new
construction and major remodel projects are not eligible.
Green Roof
Improvement Fund2
A one year pilot redevelopment program to provide financial assistance
for the installation of Green Roofs on certain eligible commercial
facilities. Eligible Applicants can receive a grant for up to 50% of Eligible
Costs, with a maximum assistance of $100,000 per project and per
applicant. All grants shall be in the form of reimbursement funding to be
awarded only after the Green Roof is installed and all other
requirements for funding are met. Beneficiary: Commercial
Community
Watershed
Stewardship Grant2
Watershed stewardship grants provide up to $10,000 to schools,
churches, businesses and other community organizations for projects
that protect and enhance watershed health at the local level. Groups
can use grant money for supplies, materials, equipment, room rentals,
feasibility studies or technical assistance. Past projects include
education and monitoring, ecoroofs, stormwater features, restoration,
and naturescaping. Community organizations
Impervious Surface
Cost Share and
Credit Program2
As an incentive to reduce impervious surface, the county is making
funds available for sharing the costs of converting impervious surface to
(1) native vegetated landscape, (2) compost-amended lawn or (3)
grassed, modular-grid pavement. To qualify, a plot plan, technical
information and description must be submitted to county engineers
who will work with the customer to develop the plan. 50% of costs up to
$20K will be reimbursed after the job is complete and inspected.
Reducing impervious surface could potentially place the property into a
lower rate category, reducing the surface water fee. Beneficiary:
Commercial
Aquatic Habitat
Matching Grant2
Seattle Public Utilities provides matching grants for individuals or groups
to help improve Seattle's aquatic habitat along creeks and shorelines.
Award amounts begin at $2,000 per project, with $300,000 in total
awards available. Projects require a one-to-one match. Projects
considered are those that improve, preserve, and/or restore aquatic
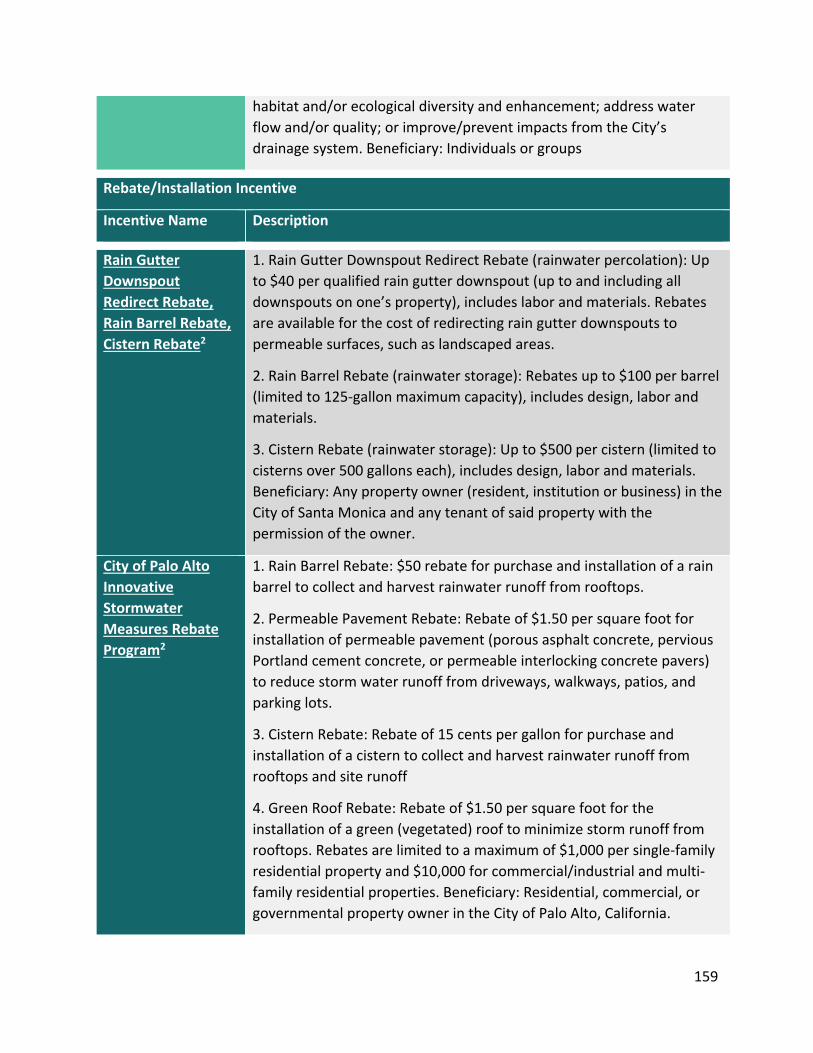
159
habitat and/or ecological diversity and enhancement; address water
flow and/or quality; or improve/prevent impacts from the City’s
drainage system. Beneficiary: Individuals or groups
Rebate/Installation Incentive
Incentive Name Description
Rain Gutter
Downspout
Redirect Rebate,
Rain Barrel Rebate,
Cistern Rebate2
1. Rain Gutter Downspout Redirect Rebate (rainwater percolation): Up
to $40 per qualified rain gutter downspout (up to and including all
downspouts on one’s property), includes labor and materials. Rebates
are available for the cost of redirecting rain gutter downspouts to
permeable surfaces, such as landscaped areas.
2. Rain Barrel Rebate (rainwater storage): Rebates up to $100 per barrel
(limited to 125-gallon maximum capacity), includes design, labor and
materials.
3. Cistern Rebate (rainwater storage): Up to $500 per cistern (limited to
cisterns over 500 gallons each), includes design, labor and materials.
Beneficiary: Any property owner (resident, institution or business) in the
City of Santa Monica and any tenant of said property with the
permission of the owner.
City of Palo Alto
Innovative
Stormwater
Measures Rebate
Program2
1. Rain Barrel Rebate: $50 rebate for purchase and installation of a rain
barrel to collect and harvest rainwater runoff from rooftops.
2. Permeable Pavement Rebate: Rebate of $1.50 per square foot for
installation of permeable pavement (porous asphalt concrete, pervious
Portland cement concrete, or permeable interlocking concrete pavers)
to reduce storm water runoff from driveways, walkways, patios, and
parking lots.
3. Cistern Rebate: Rebate of 15 cents per gallon for purchase and
installation of a cistern to collect and harvest rainwater runoff from
rooftops and site runoff
4. Green Roof Rebate: Rebate of $1.50 per square foot for the
installation of a green (vegetated) roof to minimize storm runoff from
rooftops. Rebates are limited to a maximum of $1,000 per single-family
residential property and $10,000 for commercial/industrial and multi-
family residential properties. Beneficiary: Residential, commercial, or
governmental property owner in the City of Palo Alto, California.
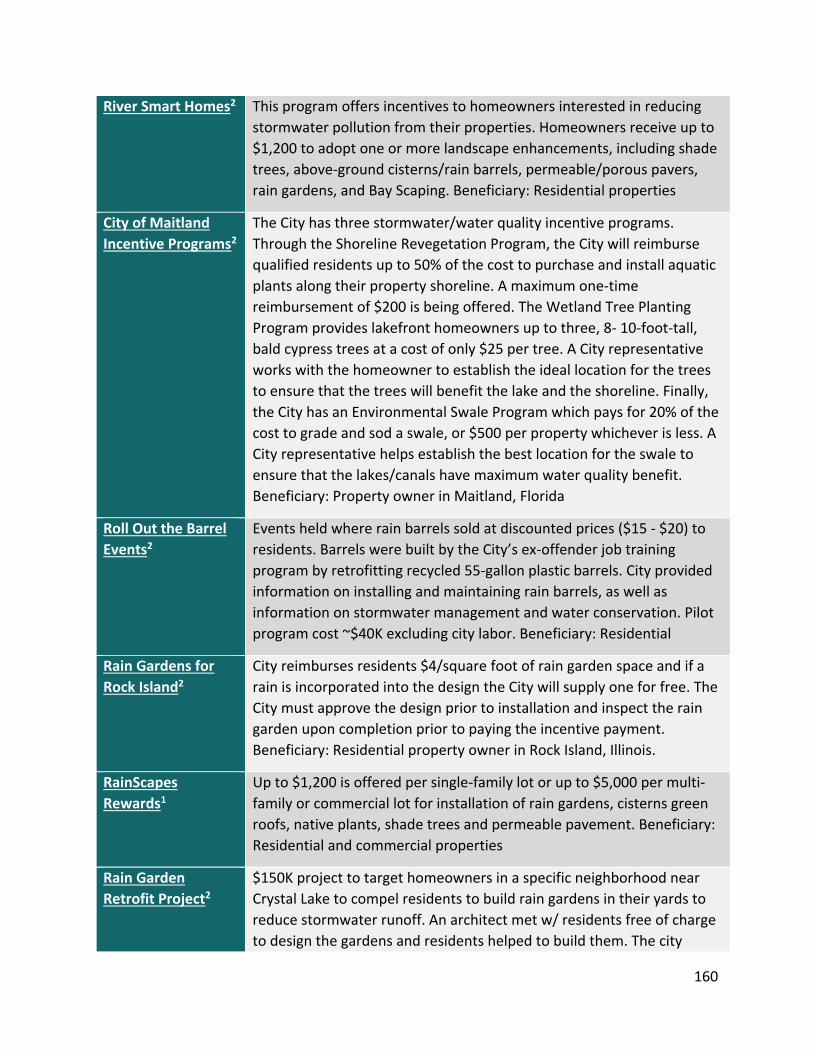
160
River Smart Homes2 This program offers incentives to homeowners interested in reducing
stormwater pollution from their properties. Homeowners receive up to
$1,200 to adopt one or more landscape enhancements, including shade
trees, above-ground cisterns/rain barrels, permeable/porous pavers,
rain gardens, and Bay Scaping. Beneficiary: Residential properties
City of Maitland
Incentive Programs2
The City has three stormwater/water quality incentive programs.
Through the Shoreline Revegetation Program, the City will reimburse
qualified residents up to 50% of the cost to purchase and install aquatic
plants along their property shoreline. A maximum one-time
reimbursement of $200 is being offered. The Wetland Tree Planting
Program provides lakefront homeowners up to three, 8- 10-foot-tall,
bald cypress trees at a cost of only $25 per tree. A City representative
works with the homeowner to establish the ideal location for the trees
to ensure that the trees will benefit the lake and the shoreline. Finally,
the City has an Environmental Swale Program which pays for 20% of the
cost to grade and sod a swale, or $500 per property whichever is less. A
City representative helps establish the best location for the swale to
ensure that the lakes/canals have maximum water quality benefit.
Beneficiary: Property owner in Maitland, Florida
Roll Out the Barrel
Events2
Events held where rain barrels sold at discounted prices ($15 - $20) to
residents. Barrels were built by the City’s ex-offender job training
program by retrofitting recycled 55-gallon plastic barrels. City provided
information on installing and maintaining rain barrels, as well as
information on stormwater management and water conservation. Pilot
program cost ~$40K excluding city labor. Beneficiary: Residential
Rain Gardens for
Rock Island2
City reimburses residents $4/square foot of rain garden space and if a
rain is incorporated into the design the City will supply one for free. The
City must approve the design prior to installation and inspect the rain
garden upon completion prior to paying the incentive payment.
Beneficiary: Residential property owner in Rock Island, Illinois.
RainScapes
Rewards1
Up to $1,200 is offered per single-family lot or up to $5,000 per multi-
family or commercial lot for installation of rain gardens, cisterns green
roofs, native plants, shade trees and permeable pavement. Beneficiary:
Residential and commercial properties
Rain Garden
Retrofit Project2
$150K project to target homeowners in a specific neighborhood near
Crystal Lake to compel residents to build rain gardens in their yards to
reduce stormwater runoff. An architect met w/ residents free of charge
to design the gardens and residents helped to build them. The city
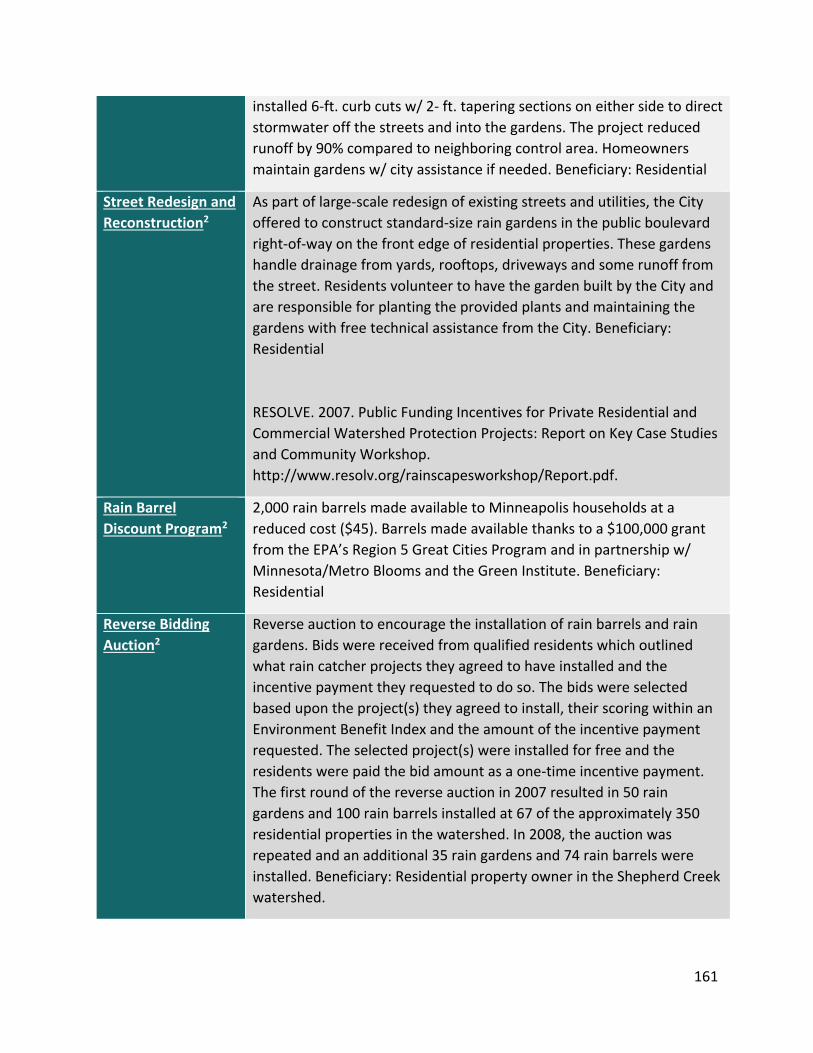
161
installed 6-ft. curb cuts w/ 2- ft. tapering sections on either side to direct
stormwater off the streets and into the gardens. The project reduced
runoff by 90% compared to neighboring control area. Homeowners
maintain gardens w/ city assistance if needed. Beneficiary: Residential
Street Redesign and
Reconstruction2
As part of large-scale redesign of existing streets and utilities, the City
offered to construct standard-size rain gardens in the public boulevard
right-of-way on the front edge of residential properties. These gardens
handle drainage from yards, rooftops, driveways and some runoff from
the street. Residents volunteer to have the garden built by the City and
are responsible for planting the provided plants and maintaining the
gardens with free technical assistance from the City. Beneficiary:
Residential
RESOLVE. 2007. Public Funding Incentives for Private Residential and
Commercial Watershed Protection Projects: Report on Key Case Studies
and Community Workshop.
http://www.resolv.org/rainscapesworkshop/Report.pdf.
Rain Barrel
Discount Program2
2,000 rain barrels made available to Minneapolis households at a
reduced cost ($45). Barrels made available thanks to a $100,000 grant
from the EPA’s Region 5 Great Cities Program and in partnership w/
Minnesota/Metro Blooms and the Green Institute. Beneficiary:
Residential
Reverse Bidding
Auction2
Reverse auction to encourage the installation of rain barrels and rain
gardens. Bids were received from qualified residents which outlined
what rain catcher projects they agreed to have installed and the
incentive payment they requested to do so. The bids were selected
based upon the project(s) they agreed to install, their scoring within an
Environment Benefit Index and the amount of the incentive payment
requested. The selected project(s) were installed for free and the
residents were paid the bid amount as a one-time incentive payment.
The first round of the reverse auction in 2007 resulted in 50 rain
gardens and 100 rain barrels installed at 67 of the approximately 350
residential properties in the watershed. In 2008, the auction was
repeated and an additional 35 rain gardens and 74 rain barrels were
installed. Beneficiary: Residential property owner in the Shepherd Creek
watershed.
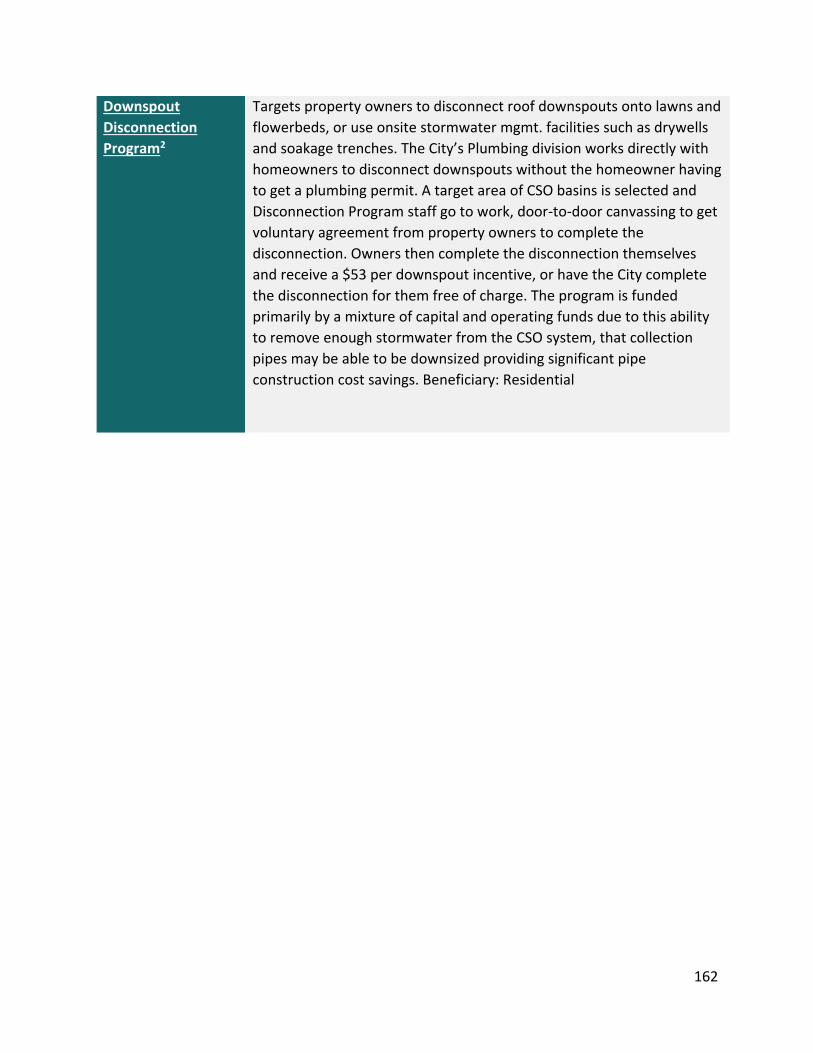
162
Downspout
Disconnection
Program2
Targets property owners to disconnect roof downspouts onto lawns and
flowerbeds, or use onsite stormwater mgmt. facilities such as drywells
and soakage trenches. The City’s Plumbing division works directly with
homeowners to disconnect downspouts without the homeowner having
to get a plumbing permit. A target area of CSO basins is selected and
Disconnection Program staff go to work, door-to-door canvassing to get
voluntary agreement from property owners to complete the
disconnection. Owners then complete the disconnection themselves
and receive a $53 per downspout incentive, or have the City complete
the disconnection for them free of charge. The program is funded
primarily by a mixture of capital and operating funds due to this ability
to remove enough stormwater from the CSO system, that collection
pipes may be able to be downsized providing significant pipe
construction cost savings. Beneficiary: Residential
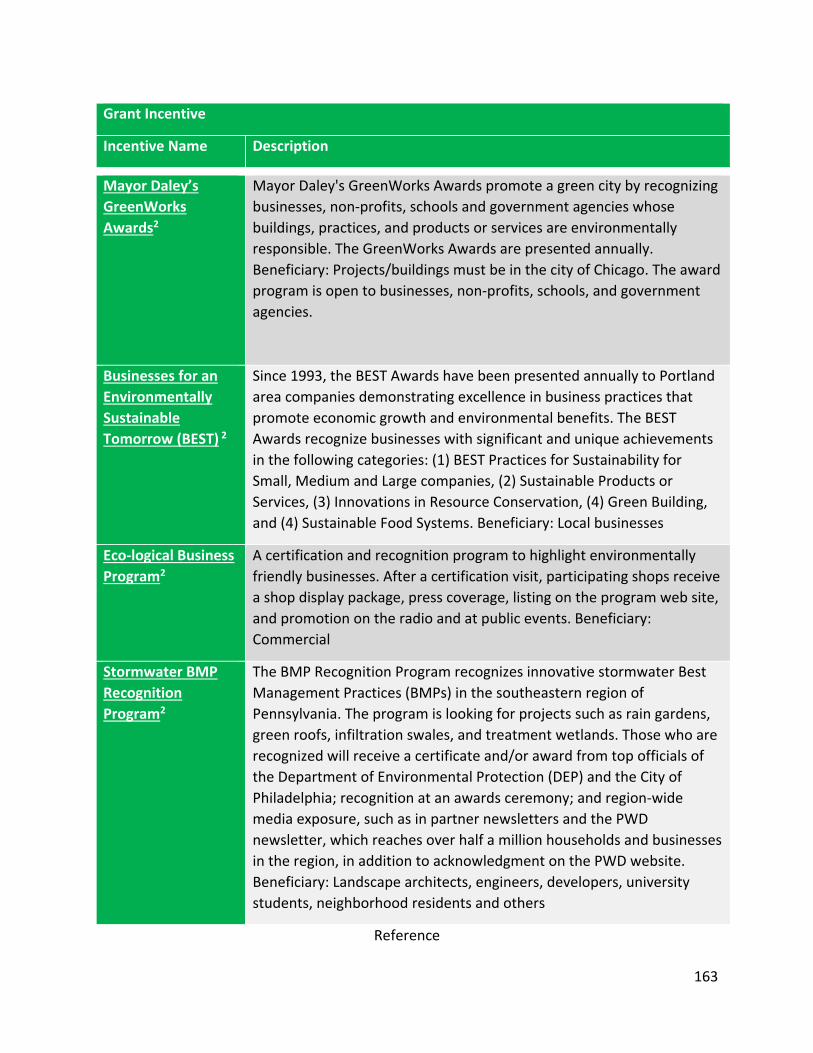
163
Grant Incentive
Incentive Name Description
Mayor Daley’s
GreenWorks
Awards2
Mayor Daley's GreenWorks Awards promote a green city by recognizing
businesses, non-profits, schools and government agencies whose
buildings, practices, and products or services are environmentally
responsible. The GreenWorks Awards are presented annually.
Beneficiary: Projects/buildings must be in the city of Chicago. The award
program is open to businesses, non-profits, schools, and government
agencies.
Businesses for an
Environmentally
Sustainable
Tomorrow (BEST) 2
Since 1993, the BEST Awards have been presented annually to Portland
area companies demonstrating excellence in business practices that
promote economic growth and environmental benefits. The BEST
Awards recognize businesses with significant and unique achievements
in the following categories: (1) BEST Practices for Sustainability for
Small, Medium and Large companies, (2) Sustainable Products or
Services, (3) Innovations in Resource Conservation, (4) Green Building,
and (4) Sustainable Food Systems. Beneficiary: Local businesses
Eco-logical Business
Program2
A certification and recognition program to highlight environmentally
friendly businesses. After a certification visit, participating shops receive
a shop display package, press coverage, listing on the program web site,
and promotion on the radio and at public events. Beneficiary:
Commercial
Stormwater BMP
Recognition
Program2
The BMP Recognition Program recognizes innovative stormwater Best
Management Practices (BMPs) in the southeastern region of
Pennsylvania. The program is looking for projects such as rain gardens,
green roofs, infiltration swales, and treatment wetlands. Those who are
recognized will receive a certificate and/or award from top officials of
the Department of Environmental Protection (DEP) and the City of
Philadelphia; recognition at an awards ceremony; and region-wide
media exposure, such as in partner newsletters and the PWD
newsletter, which reaches over half a million households and businesses
in the region, in addition to acknowledgment on the PWD website.
Beneficiary: Landscape architects, engineers, developers, university
students, neighborhood residents and others
Reference
164
Slo County. n.d. List of Potential Municipal LID Incentive Programs. Retrieved from http://www.slocounty.ca.gov/Assets/PW/stormwater/Potential+LID+Incentives.pdf
Managing Wet Weather with Green Infrastructure Municipal Handbook: Incentive Mechanism. 2009. US Environmental Protection Agency, EPA-833-F-09-001. Retrieved from https://www.epa.gov/sites/production/files/2015-10/documents/gi_munichandbook_incentives_0.pdf
Doll, A., and G. Lindsey. 1999. Credits Bring Economic Incentives for Onsite Stormwater
Management. Watershed and Wet Weather Technical Bulletin, January 1999, Water Environment Federation. http://stormwaterfinance.urbancenter.iupui.edu/PDFs/LindseyDoll.pdf
ECONorthwest. 2009. Low Impact Development at the local level: Developer’s experiences and city and county support. Retrieved from http://www.econw.com/media/ap_files/ECONorthwest_Publication_LID-Clackamas-County-Case-Study_2009.pdf
165
Appendix G Green Street Stormwater Management Devices
Green Street Stormwater Management Devices
The purpose of this appendix is to provide example designs of typical stormwater runoff
reduction practices that can be used within the public right of way. The measures shown are
examples of the techniques and processes encouraged with the watershed management plan.
These details are intended to serve as the starting point for stormwater retrofits alongside active roadways. These details outline the major design elements of curbside stormwater management facilities. Roadside safety, pedestrian safety, maintenance, gutter spread and other factors must still be evaluated prior to implementation. Additionally, existing utilities or environmental conditions may make it necessary to modify or revise the standard designs to fit each individual BMP location. Curbside stormwater management may not be feasible in all locations.
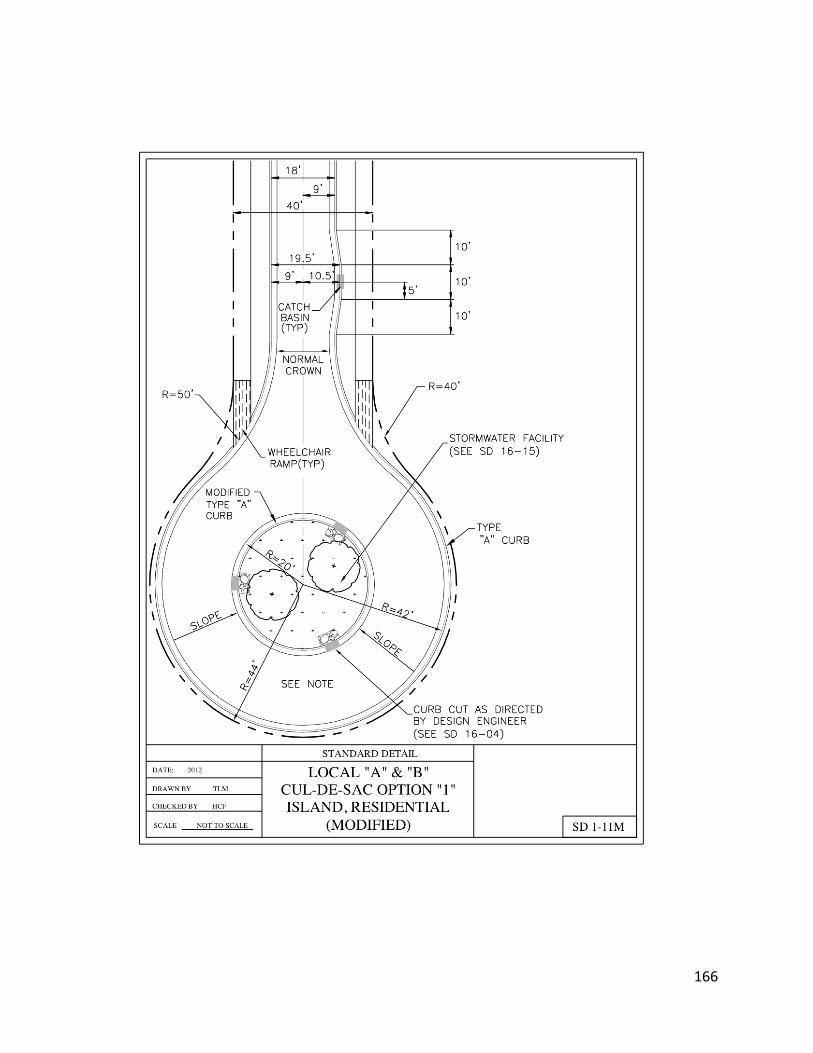
166
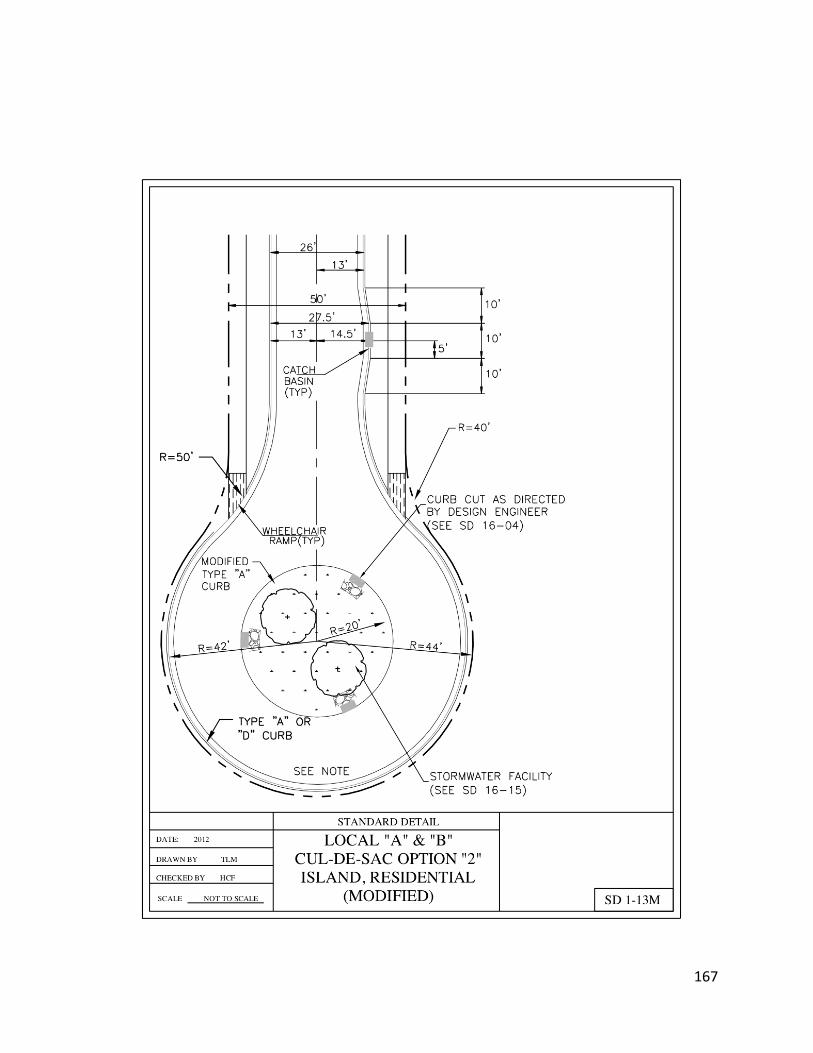
167

168
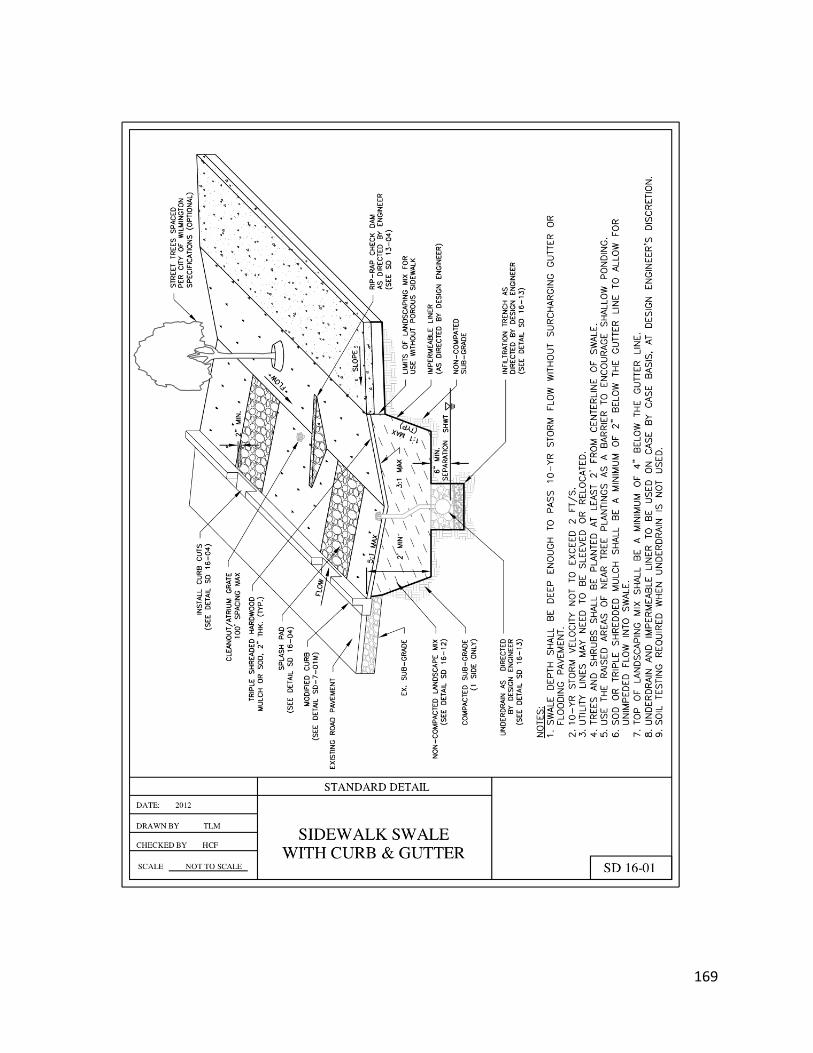
169
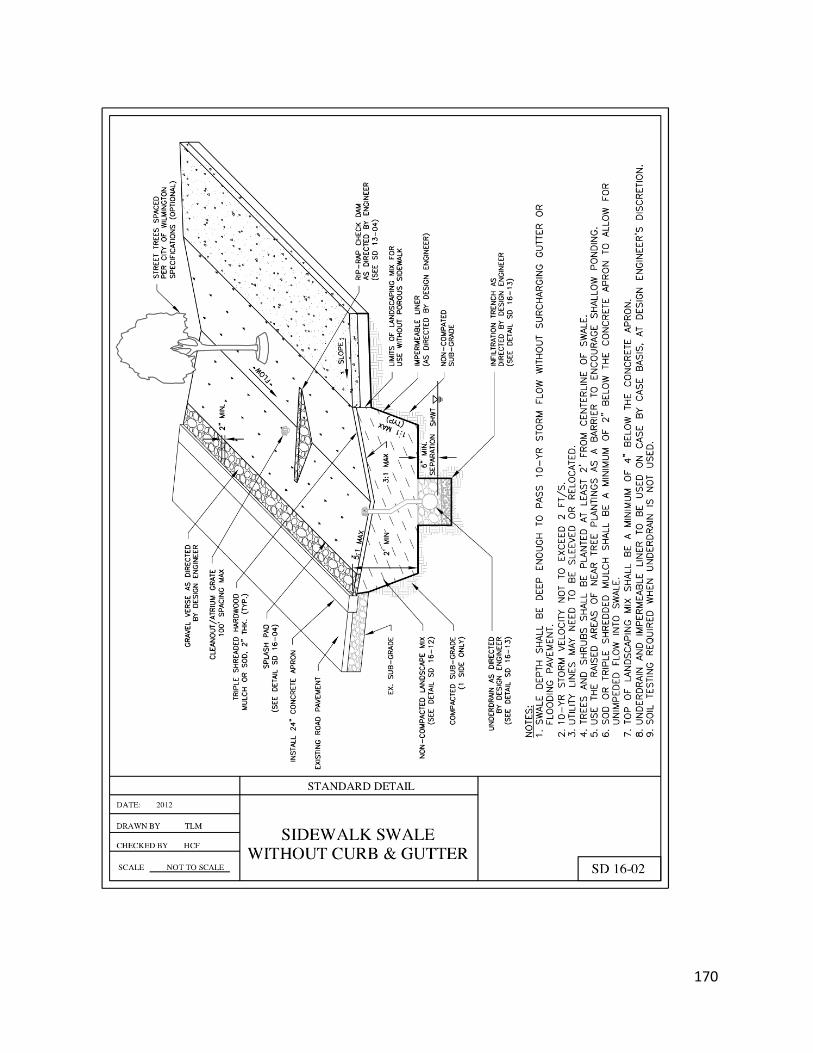
170
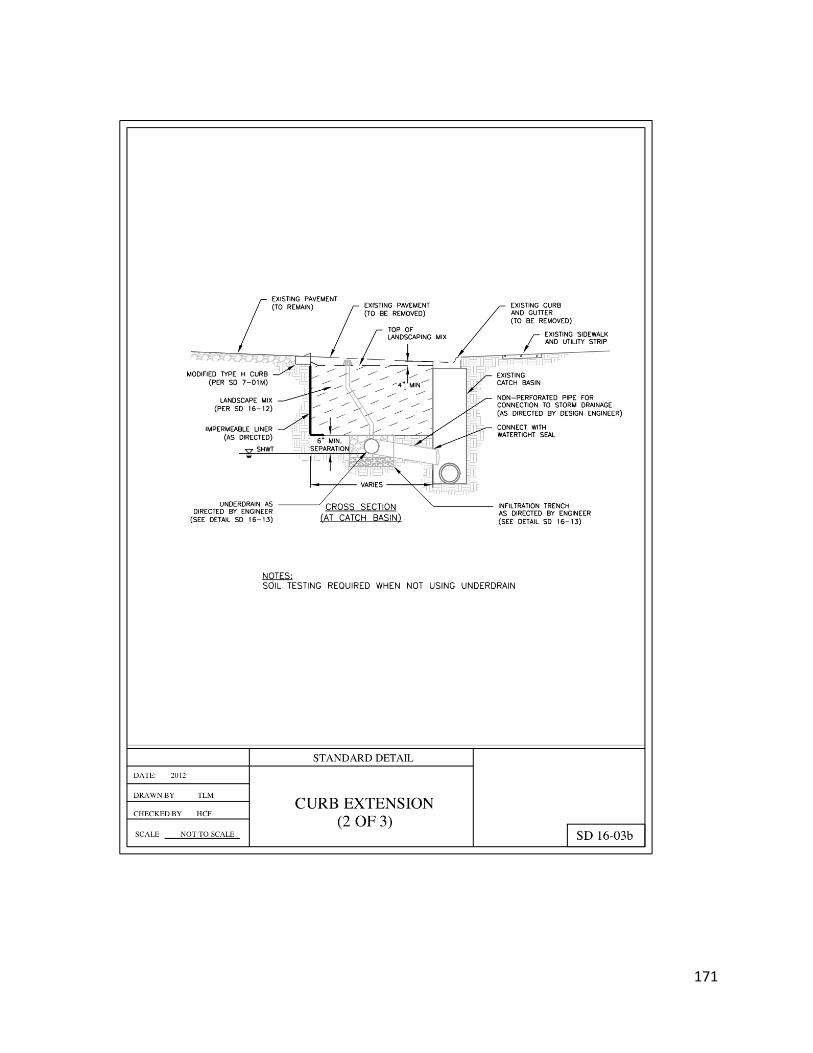
171
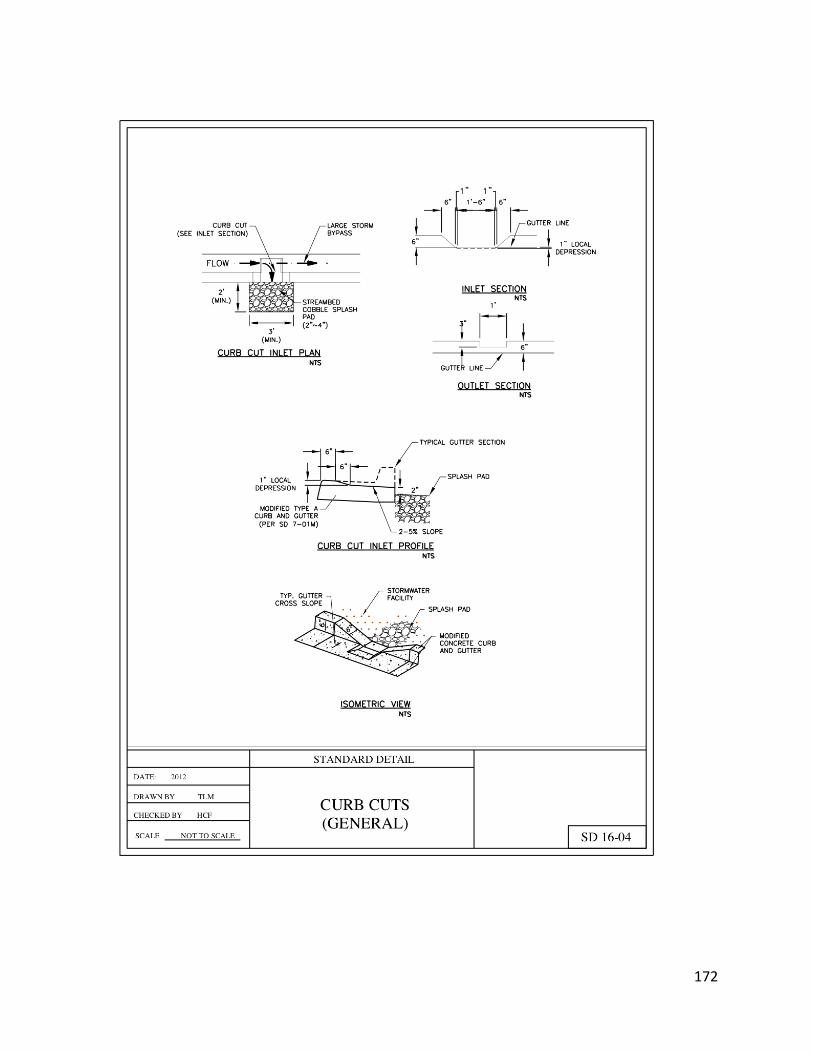
172
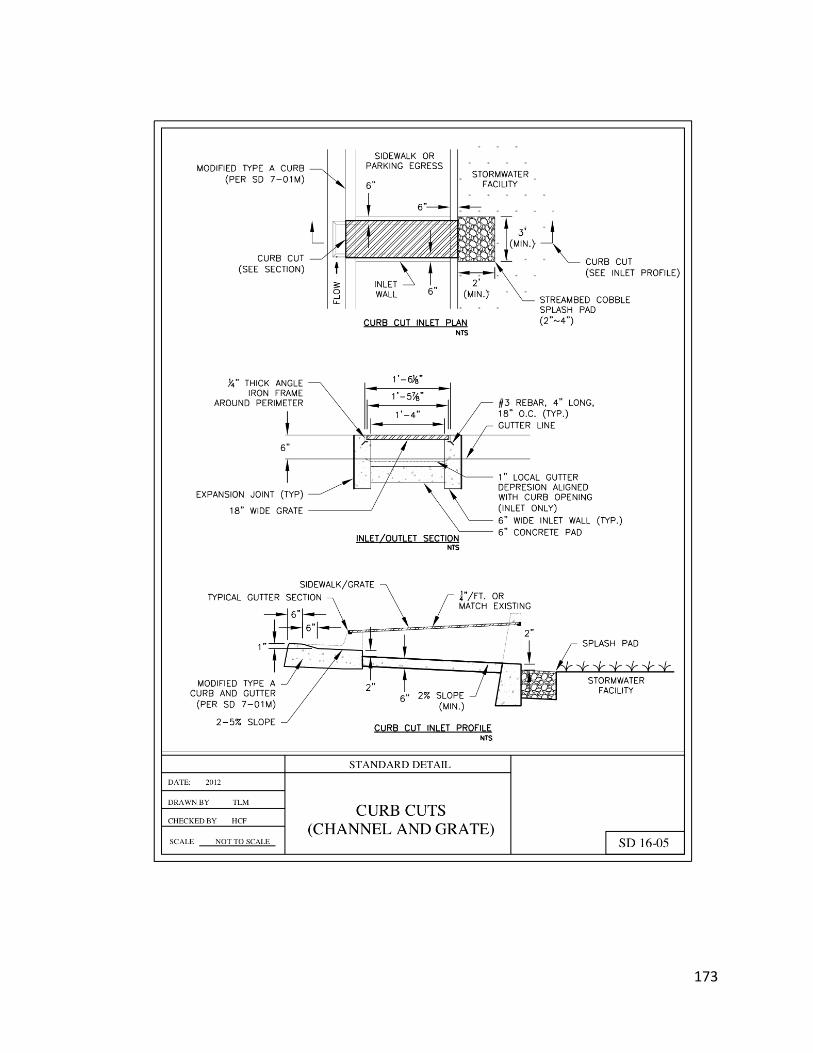
173
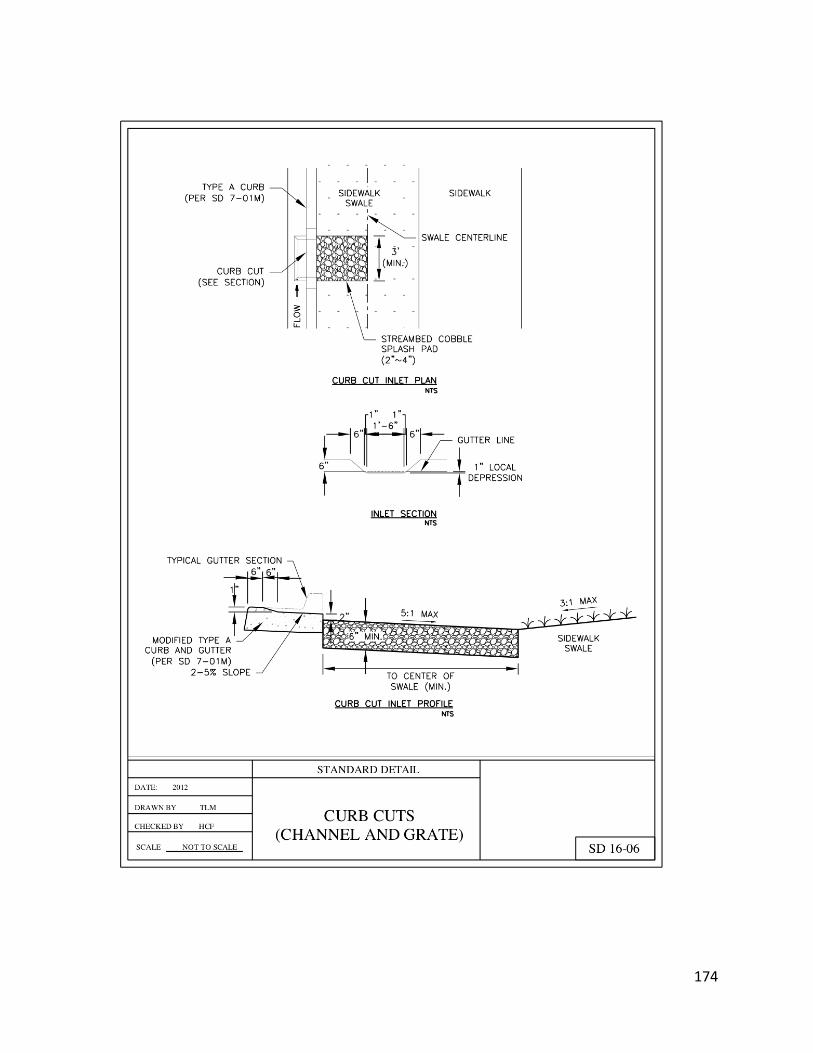
174
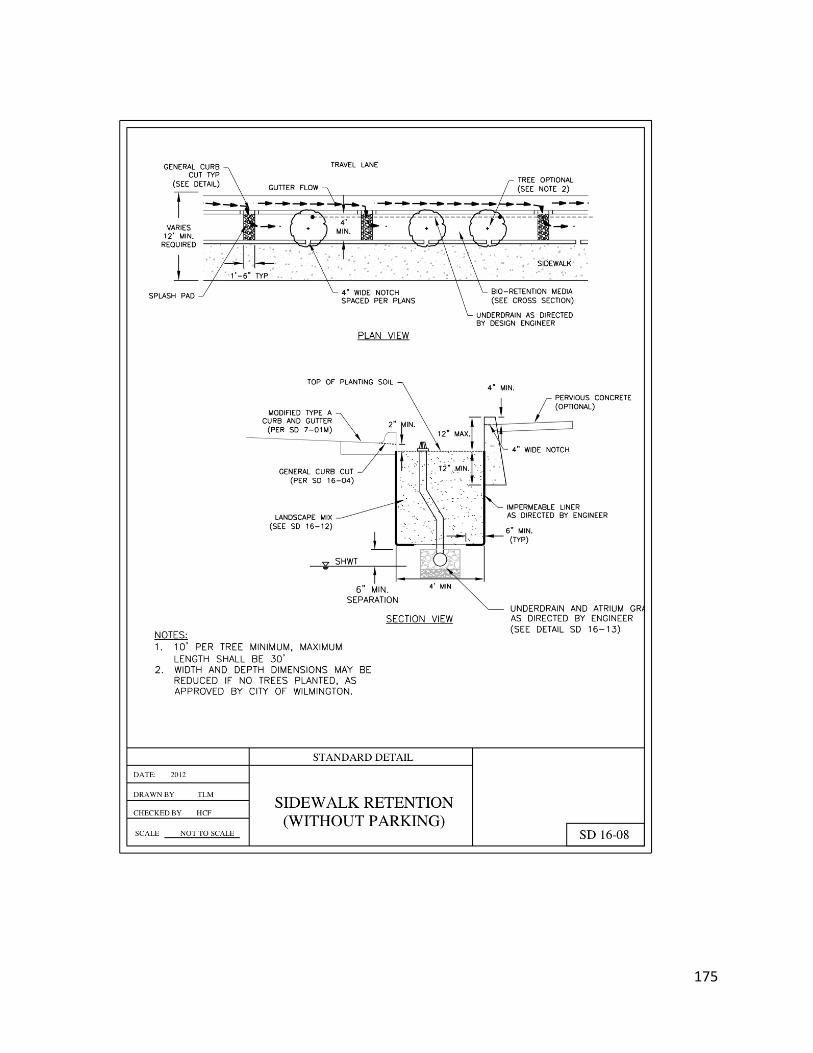
175
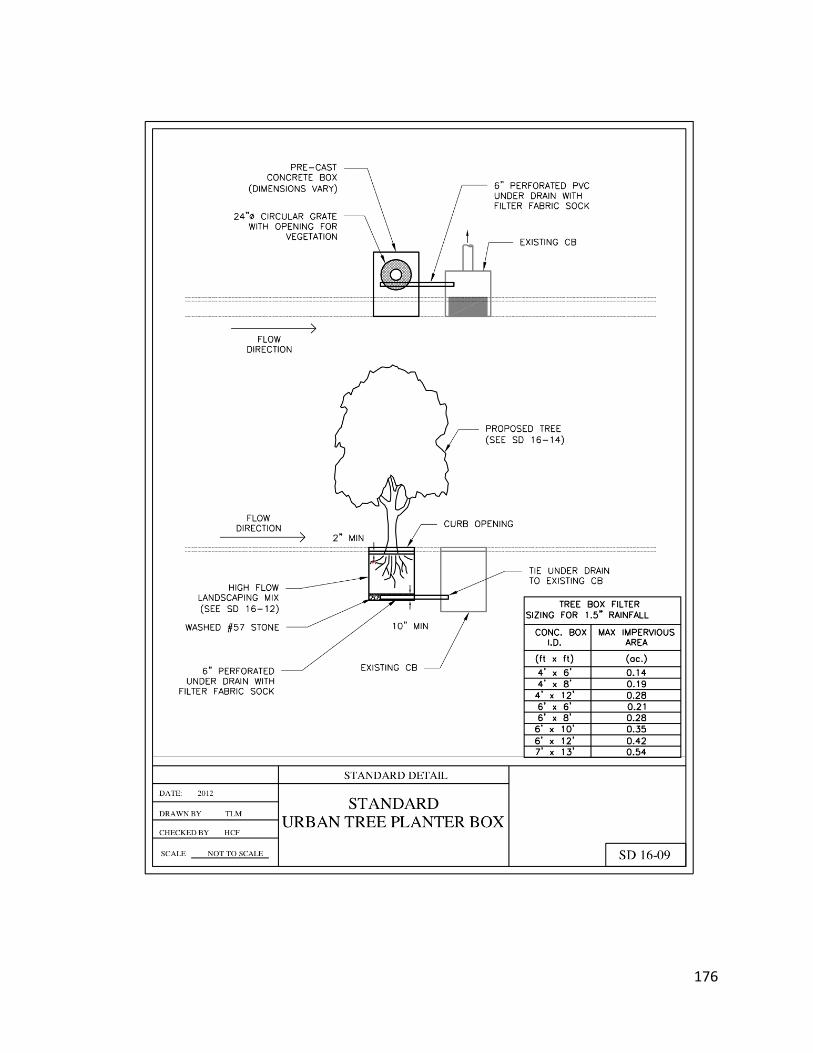
176
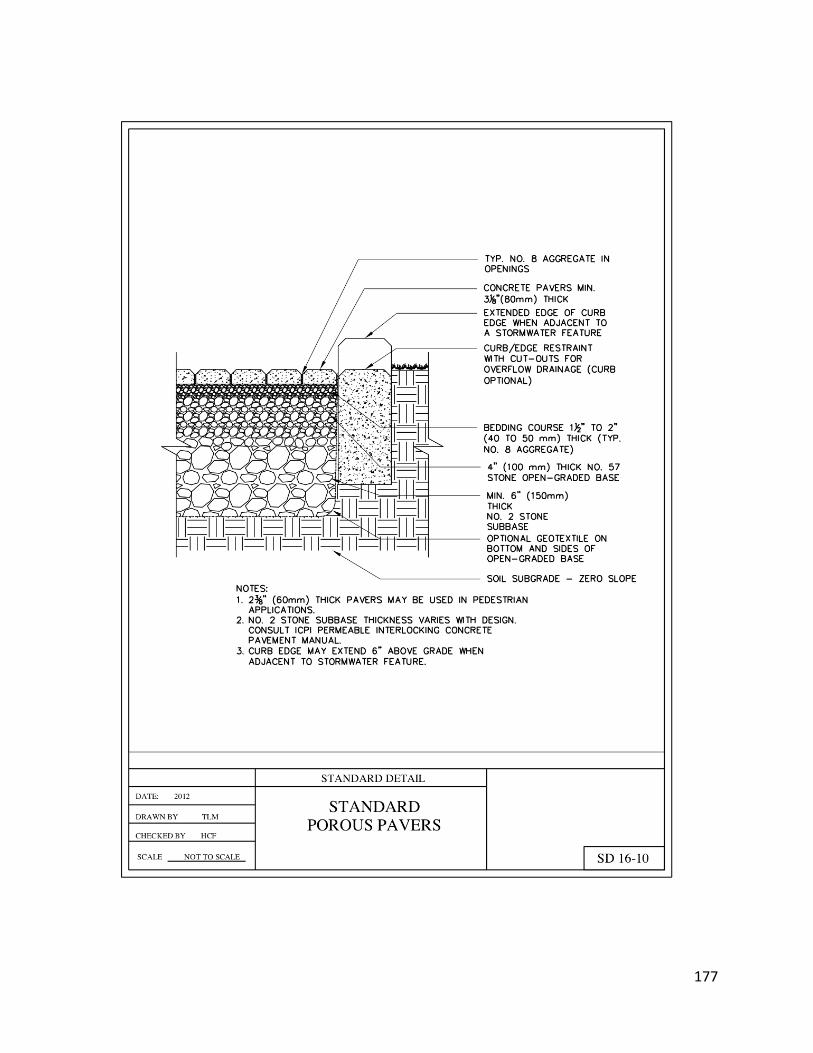
177
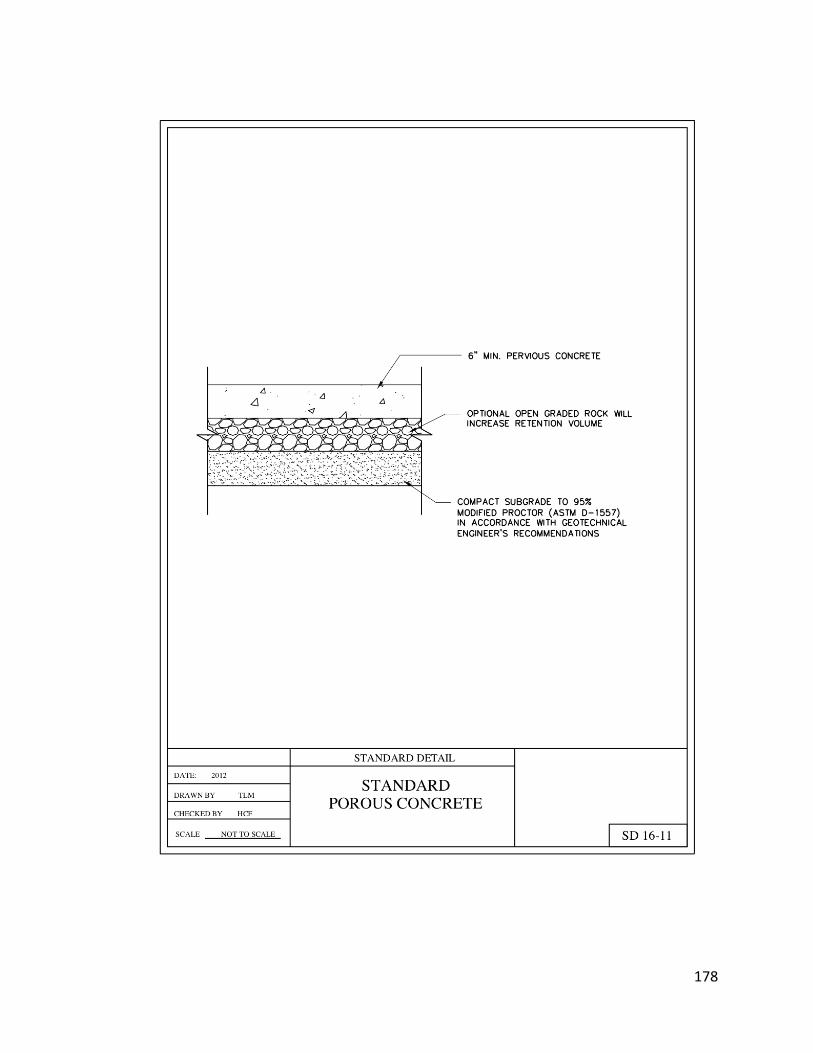
178
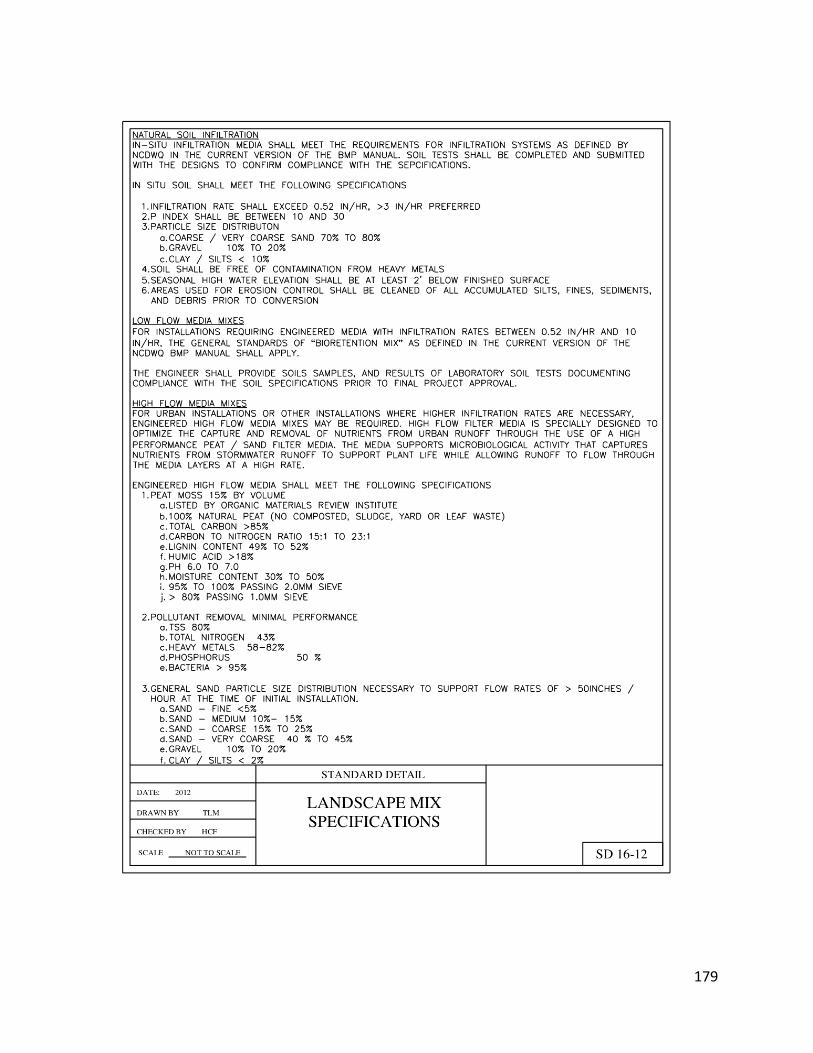
179
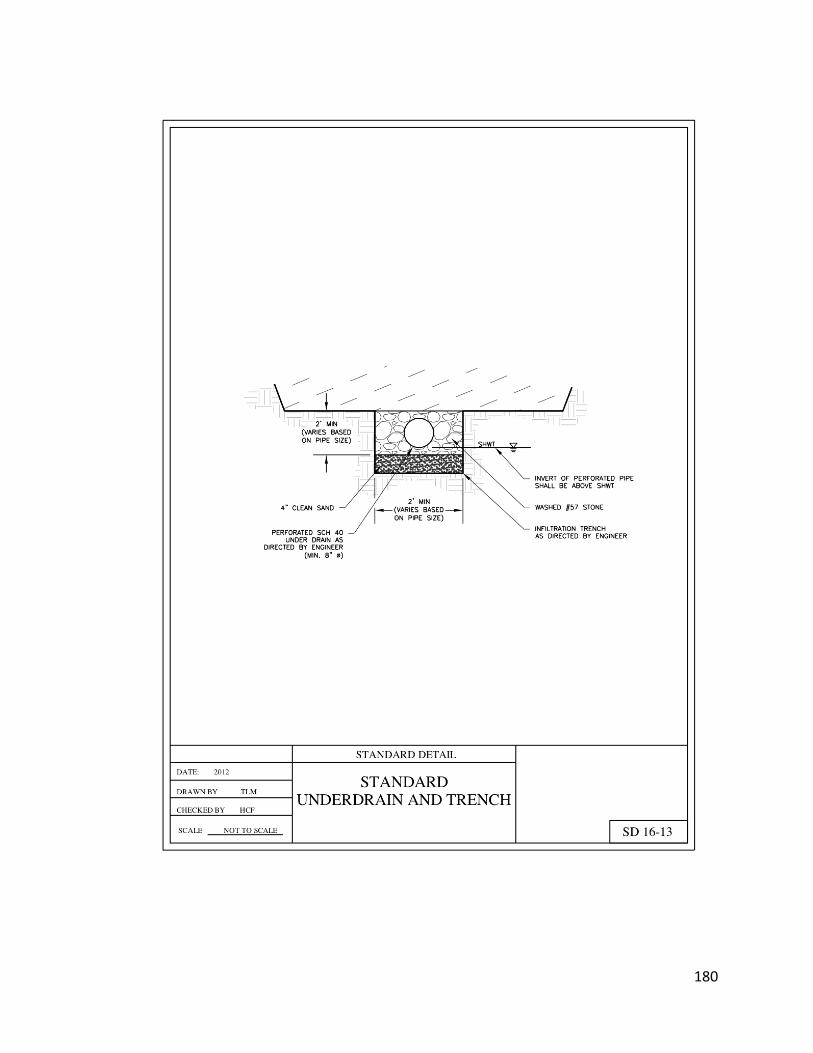
180
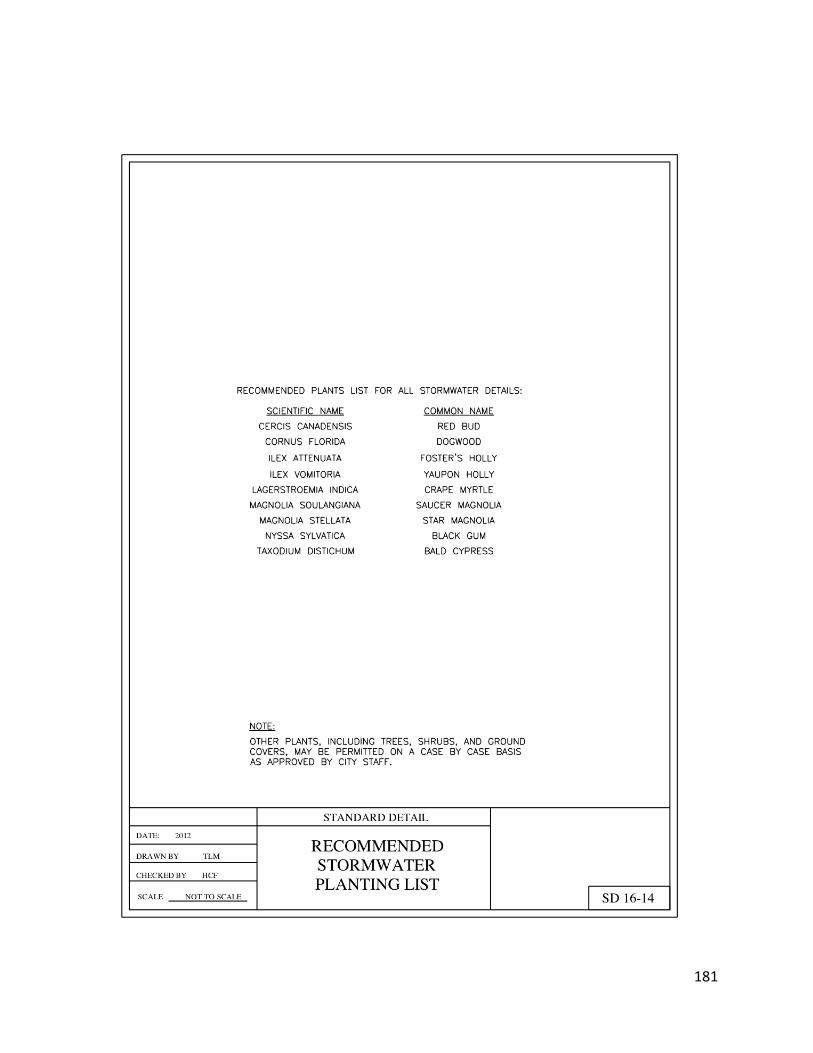
181
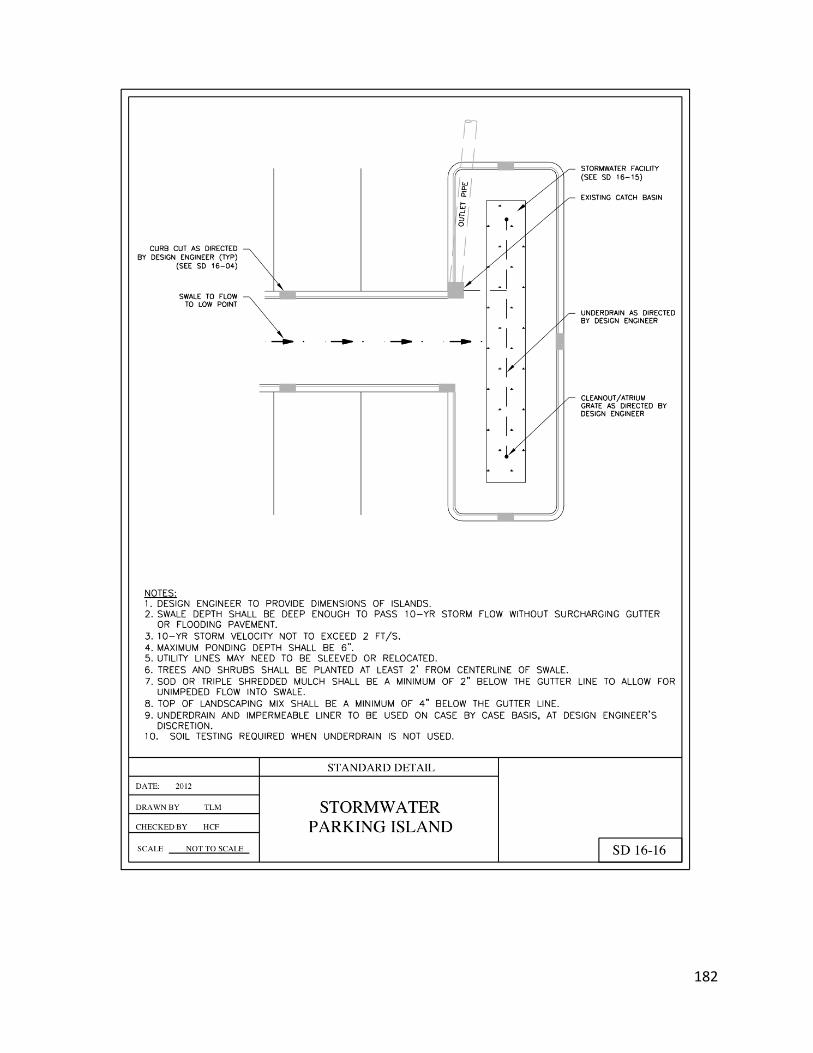
182
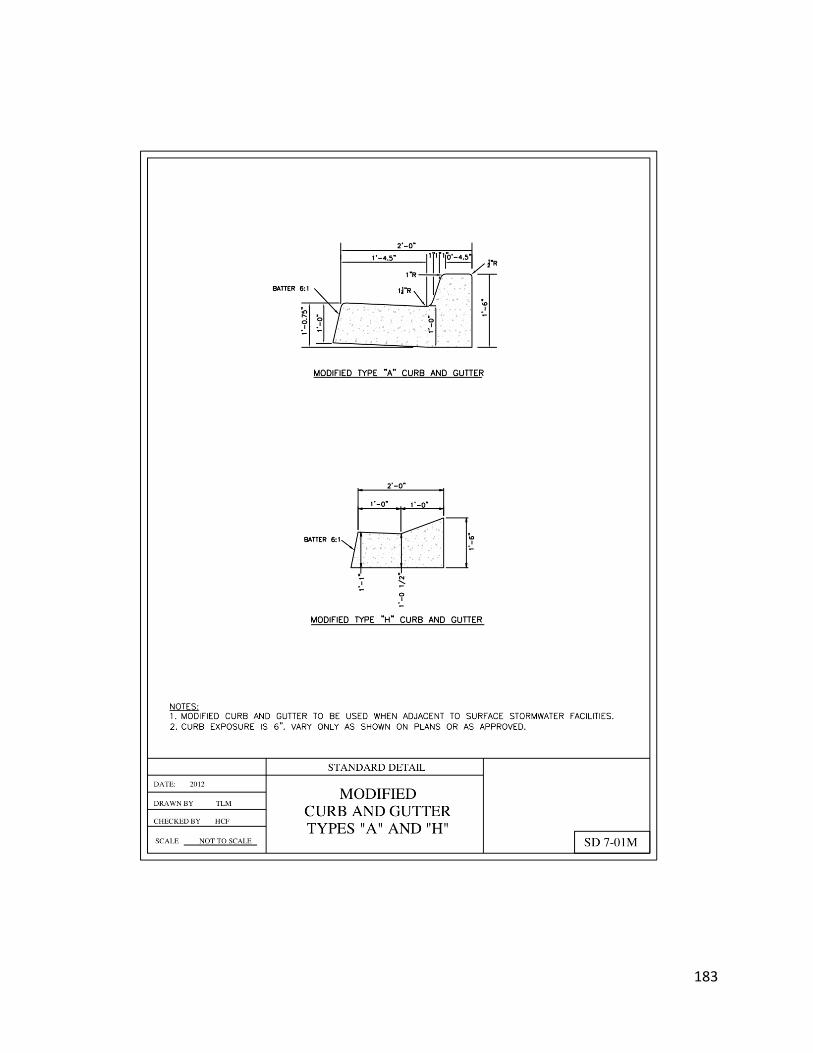
183