warming up for thermal coal - queen's university
TRANSCRIPT
November 2, 2020Warming Up For Thermal Coal
The information in this document is for EDUCATIONAL and NON-COMMERCIAL use only and is not intended to
constitute specific legal, accounting, financial or tax advice for any individual. In no event will QUIC, its members or
directors, or Queen’s University be liable to you or anyone else for any loss or damages whatsoever (including
direct, indirect, special, incidental, consequential, exemplary or punitive damages) resulting from the use of this
document, or reliance on the information or content found within this document. The information may not be
reproduced or republished in any part without the prior written consent of QUIC and Queen’s University.
QUIC is not in the business of advising or holding themselves out as being in the business of advising. Many
factors may affect the applicability of any statement or comment that appear in our documents to an individual's
particular circumstances.
© Queen’s University 2020
Insert Picture in Master View
RESEARCH REPORT
Energy & Utilities
November 2, 2020
Coal Industry Deep Dive
Warming Up For Thermal Coal
Garrett Johnston
Jamie Bennett
Matt Halpen
Cole McAleese
Alton Loveys
Over the course of recent years, the QUIC E&U team has focused itsattention upon numerous verticals within its coverage space; forexample, upstream E&P companies, midstream operators anddownstream refiners and marketers. However, all of such companieshave one commonality: they pertain to oil & gas, as well as derivativeproducts such as propane.
Presently, the E&U team is content with its portfolio allocationstrategy, and believes that such combines an ideal balance betweenupstream liquids torque and downstream/renewables hedging. Thus,the team thought that it would be interesting to take a deep diveinto a commodity that has gained notoriety in recent years, yet hasplayed an incredibly important role in getting society to where it istoday: coal. More specifically, the team will be analyzing thermalcoal, which is the variety that is utilized for energy generation.
To begin, a general overview of the industry will be provided. Next,the team will outline the history behind coal, and the incrediblyimportant role it has played in fueling the industrial revolution, aswell as the economy & culture of numerous communities across theworld. From there, some context will be provided in terms of coal’srecent decline, and the impact of various government policies uponthe commodity. Last, outlines of select publicly-traded coalcompanies will be provided, along with the team’s final conclusion asto whether or not there is still a case to be made in terms ofinvesting in the commodity given the current conditions.
November 2, 2020Warming Up For Thermal Coal
Table of Contents
2
Overview of the Coal Industry 3
Coal – A Brief History of the Commodity 6
Recent Coal Industry Developments 9
Coal in the Financial Markets 13
Deep Dive: Peabody Energy 16
Concluding Thoughts 18
November 2, 2020Warming Up For Thermal Coal
Overview of the Coal Industry
Main Use Cases
The coal industry is split into two distinct segments:
thermal coal and metallurgical (coking) coal. These
variations will be discussed in more detail later, but
this report will largely focus on thermal coal. For the
last 200 years, thermal coal has been critical in
generating the heat necessary to produce electricity.
Through the Industrial Revolution, coal was burned to
power steam turbines that allowed for factories and
train engines to function. To this day, coal is used to
generate 38% of the globe’s electricity, although
recent years have seen the fuel in decline due to
adverse environmental impacts. In the U.S., 91.8% of
coal is used for the generation of electricity in coal
power plants. The amount of coal used in power
generation in the U.S. peaked in 2007 at 1,045.14MM
short tons, dropping to 539.41MM short tons in 2019.
Coal can also be converted into liquid or gaseous
forms, referred to as synthetic fuels, although this
remains a limited use case.
Key Geographies
Unsurprisingly, the largest coal consumer globally is
China. It consumed 1,576MM short tons in 2018 for
electricity production and are expected to increase
their usage to 1,714MM short tons by 2024 (despite
significant investment in clean energy). Beyond China,
increases in coal usage can be attributed to
developing nations with a need for access to cheap
electricity. India, with its massive population, has a
significant need for additional electrical grid coverage
to rural areas. Coal is expected to see a 4.6% per year
increase in use in the country through 2024. Southeast
Asia is in a similar spot, with use expected to grow by
5% in the same time frame. In North America and
Europe, the picture is drastically different. The U.S. has
seen an increase in bountiful cheap energy due to the
shale boom (and associated low natural gas prices). As
such, the demand for coal and development of coal
power plants has slowed to a halt. In the EU, stricter
environmental regulations make coal an unaffordable
source of energy, resulting in a forecasted decrease in
use of 5% per year to 2024.
On the production side, China remains the largest coal
producer by far with 3,693MM short tons extracted in
2019. It continues to see production expanding at a
~4% growth rate. Indonesia’s production also
continues to climb, growing 12.4% in 2019 to 616MM
short tons. India’s production has levelled out recently,
although it remains the second largest producer
globally. In the developed world, the U.S. saw coal
production drop to 640MM short tons in 2019, which
is the lowest level seen in four decades (largely thanks
to the same headwinds that have decreased demand).
3
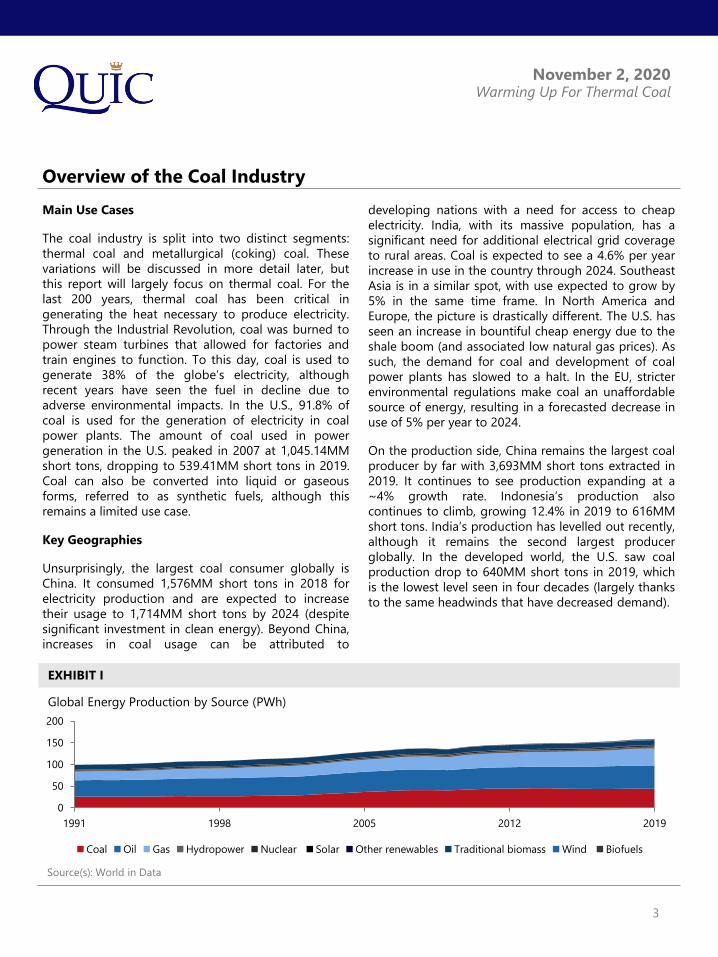
Source(s): World in Data
Global Energy Production by Source (PWh)
EXHIBIT I
0
50
100
150
200
1991 1998 2005 2012 2019
Coal Oil Gas Hydropower Nuclear Solar Other renewables Traditional biomass Wind Biofuels
November 2, 2020Warming Up For Thermal Coal
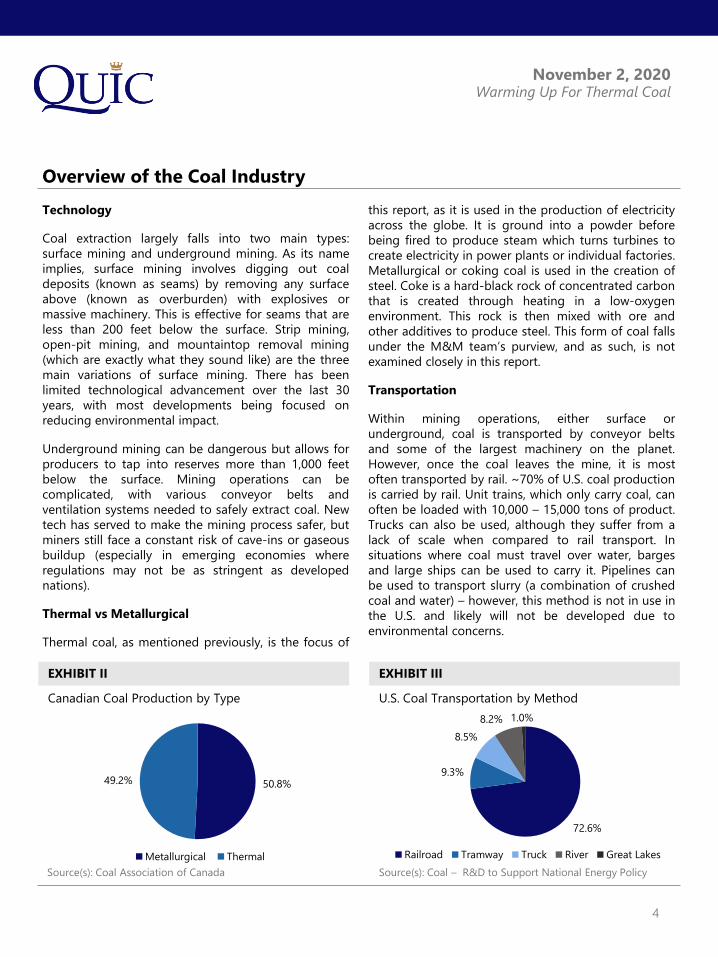
Source(s): Coal Association of Canada
Overview of the Coal Industry
Technology
Coal extraction largely falls into two main types:
surface mining and underground mining. As its name
implies, surface mining involves digging out coal
deposits (known as seams) by removing any surface
above (known as overburden) with explosives or
massive machinery. This is effective for seams that are
less than 200 feet below the surface. Strip mining,
open-pit mining, and mountaintop removal mining
(which are exactly what they sound like) are the three
main variations of surface mining. There has been
limited technological advancement over the last 30
years, with most developments being focused on
reducing environmental impact.
Underground mining can be dangerous but allows for
producers to tap into reserves more than 1,000 feet
below the surface. Mining operations can be
complicated, with various conveyor belts and
ventilation systems needed to safely extract coal. New
tech has served to make the mining process safer, but
miners still face a constant risk of cave-ins or gaseous
buildup (especially in emerging economies where
regulations may not be as stringent as developed
nations).
Thermal vs Metallurgical
Thermal coal, as mentioned previously, is the focus of
this report, as it is used in the production of electricity
across the globe. It is ground into a powder before
being fired to produce steam which turns turbines to
create electricity in power plants or individual factories.
Metallurgical or coking coal is used in the creation of
steel. Coke is a hard-black rock of concentrated carbon
that is created through heating in a low-oxygen
environment. This rock is then mixed with ore and
other additives to produce steel. This form of coal falls
under the M&M team’s purview, and as such, is not
examined closely in this report.
Transportation
Within mining operations, either surface or
underground, coal is transported by conveyor belts
and some of the largest machinery on the planet.
However, once the coal leaves the mine, it is most
often transported by rail. ~70% of U.S. coal production
is carried by rail. Unit trains, which only carry coal, can
often be loaded with 10,000 – 15,000 tons of product.
Trucks can also be used, although they suffer from a
lack of scale when compared to rail transport. In
situations where coal must travel over water, barges
and large ships can be used to carry it. Pipelines can
be used to transport slurry (a combination of crushed
coal and water) – however, this method is not in use in
the U.S. and likely will not be developed due to
environmental concerns.
4
50.8% 49.2%
Metallurgical Thermal
Canadian Coal Production by Type
EXHIBIT II
72.6%
9.3%
8.5%
8.2% 1.0%
Railroad Tramway Truck River Great Lakes
Source(s): Coal – R&D to Support National Energy Policy
U.S. Coal Transportation by Method
EXHIBIT III
November 2, 2020Warming Up For Thermal Coal
Overview of the Coal Industry
Pricing
Like oil and natural gas, coal prices vary based on
quality, geography and mining method. There are four
main types of coal, each with a different pricing profile.
Lignite, the lowest quality type, is high in moisture and
crumbles easily; however, due to lower supply in the
U.S., it fetched $19.86 per short ton in 2019.
Subbituminous coal is the third highest quality form
with 35-45% carbon. 44% of the total U.S. production
was this type and it cost an average of $14.01 per
short ton in 2019. The most common type in the U.S.,
bituminous coal, cost $58.93 per short ton in 2019 and
has two to three times the heating value of lignite. The
highest quality form is anthracite, which contains 86-
97% carbon. It sold for $102.22 in 2019 on average,
attributable to it only accounting for 1% of total U.S.
production. Given the variety of use cases for these
different forms, end users have vastly different costs.
Electric producers paid, on average, only $38.53 per
short ton in 2019, while coke producers paid $145.83
per short ton in the U.S.
Beyond the above variations, prices can also change
based on extraction technique. Surface mining
produces lower-priced coal than underground mining.
This is largely due to differences in costs. Another cost
driver is transportation, which means that some
regions will see higher pricing if transport distances
are further. Higher diesel prices can also play a role in
increasing the price of coal, as it is the fuel used in
most transportation methods.
Contract-Based Nature
One of the most common misconceptions of the
thermal coal industry is that all power plants are
locked into long-term contracts for their coal supply.
While many do have multiple-year contracts, 10+ year
supply deals are becoming increasingly rare. Over 90%
of coal purchased by volume in 2019 was using a
contract that was set to expire in five-years or less,
with 50% being purchased on the spot market. The
traditional thinking has been that long-term contracts
provide predictability and lower prices. However,
recent studies have shown that while pricing is
predictable, 10-20-year contracts can cost more than
<10-year contracts. With the cyclical annual nature of
coal prices (like natural gas prices), these contracts can
lock in prices that are much higher than spot rates.
Going forward, expected decreases in North American
demand may make long-term contracts impossible,
continuing the trend of spot-market purchases.
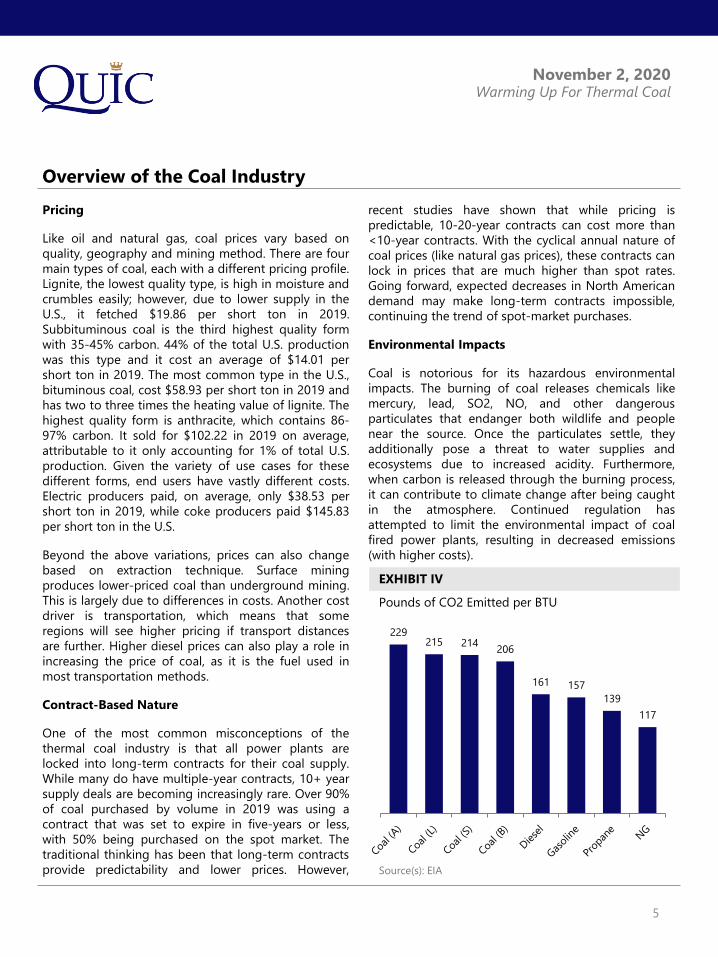
Environmental Impacts
Coal is notorious for its hazardous environmental
impacts. The burning of coal releases chemicals like
mercury, lead, SO2, NO, and other dangerous
particulates that endanger both wildlife and people
near the source. Once the particulates settle, they
additionally pose a threat to water supplies and
ecosystems due to increased acidity. Furthermore,
when carbon is released through the burning process,
it can contribute to climate change after being caught
in the atmosphere. Continued regulation has
attempted to limit the environmental impact of coal
fired power plants, resulting in decreased emissions
(with higher costs).
5
229215 214
206
161 157
139
117
Source(s): EIA
Pounds of CO2 Emitted per BTU
EXHIBIT IV
November 2, 2020Warming Up For Thermal Coal
Coal – A Brief History of the Commodity
Ancient Times
While one tends to think of coal as a commodity that
has been used exclusively in modern times,
archeological research indicates that coal was burned
during the Bronze Age (3000 – 4000 years ago) in
Wales for funerary rituals. Further, Aristotle gives
mention to coal in his work Meterologica, and Romans
in Great Britain utilized coal for heating purposes
before 400AD. Such is especially true in
Northumberland, which lies in close proximity to
numerous coal seams. Within North America, the Hopi
indigenous tribe utilized coal for heating, cooking and
ceremonial purposes starting in the 1100s.
Advances in Technology Across the Ages
Early coal mining consisted of surface mining;
however, in the late Middle Ages, underground mining
began to be adopted. However, such was hard, dirty
work and consisted of utilizing a pick to dislodge
pieces of coal by hand. However, such was changed
with the introduction of steam, compressed air and
electricity; in 1868, the first commercially successful
revolving-wheel cutter was introduced for operational
use. A further development occurred in 1891, when the
longwall cutter was introduced; such could begin at
one side of a continuous face of coal, and cut in a line
to the other side.
In the 1940s, a continuous system utilizing a “plow”
was introduced by Wilhelm Loebbe in Germany; such
consisted of an apparatus that was dragged across the
face of the coal seam, along with a conveyor snaked
just behind the plow. Such allowed the chipped-off
coal to be caught and transported out of the mine in
an automated fashion, thus reducing the need for
labour.
History of the U.S. Coal Industry
While the Hopi indigenous tribe had been utilized coal
for a number of years, the commodity was not
discovered by settlers until 1673. Commercial coal
mining began in the 1740s; however, it remained a
rather insignificant industry until the early 1800s, as
settlers preferred to use wood as an energy source.
The modern U.S. coal industry began in Virginia, as the
Richmond Basin began to be mined for its vast coal
deposits. While access to labour was plentiful, a weak
transportation system within the U.S. South limited the
potential for the commodity. On the other hand, in
Pennsylvania, individuals began mining a form of high-
carbon (and thus high-quality) form of coal called
anthracite on an industrial scale; by the 1840s,
anthracite became the standard form of energy along
the U.S. seaboard. The mid-19th century saw a rapid
expansion of coal across the U.S., and by 1861 20
states (mining a combined 20MM tons of anthracite)
were able to lay claim to being coal producers.
Over the course of the civil war coal prices augmented
by ~50%, as the demand from the military led to a
supply-demand imbalance. Such also saw the
expansion of railroads to reach the nation’s rapidly-
expanding coal mines. Further, railroad companies
began directly purchasing coalfields, and subsequently
leasing them to mining companies. This arrangement
allowed the vast coal mines of West Virginia to be
connected to industrial end-markets. By 1880, national
coal production reached 80MM tons aggregate.
Early standard within the U.S. coal industry was to pay
miners by the ton (as opposed to a fixed salary);
however, discontent amongst miners gave rise to
labour unions taking shape. By 1903, the United Mine
Workers possessed over 250,000 members.
Peak employment within the U.S. coal industry
occurred in 1924, with over 860,000 miners working
across the country. However, such then led to a period
of steady declines until the 1960s (with the exception
of during WWII), as oil and hydroelectric power began
to overtake coal within the country’s energy mix. While
mine employment rose in the 1970s due to the 1973
energy crisis, the coal industry (as of 2016) employs
just 75,000 miners. This is largely due to the
heightened presence of automation within the mines,
as well as competition from other energy sources.
6
November 2, 2020Warming Up For Thermal Coal
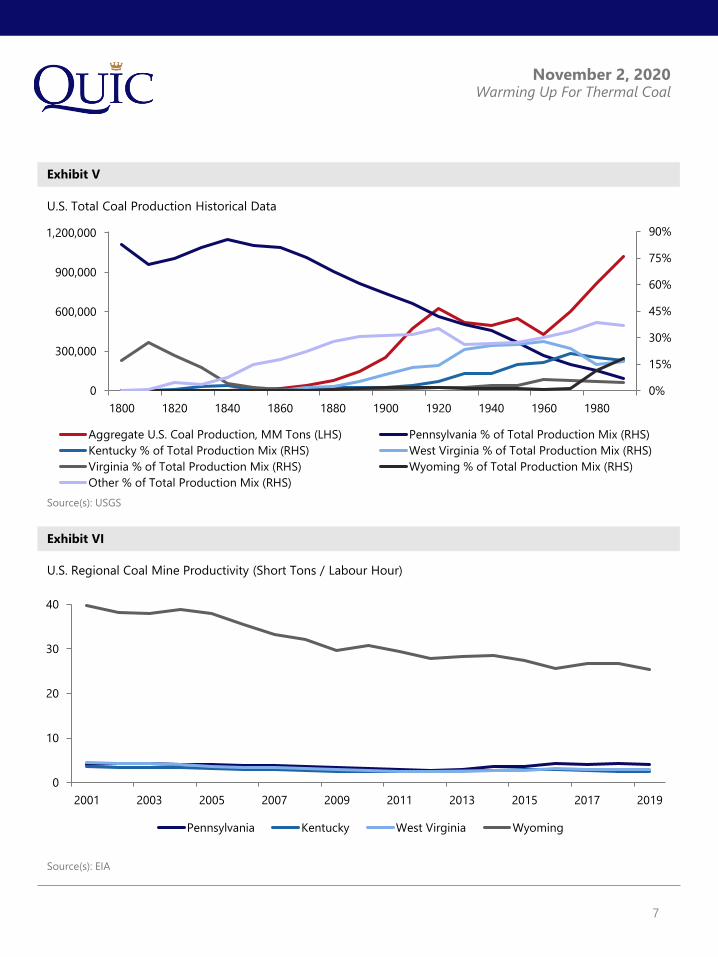
Exhibit V
Source(s): USGS
Exhibit VI
Source(s): EIA
U.S. Total Coal Production Historical Data
U.S. Regional Coal Mine Productivity (Short Tons / Labour Hour)
7
0%
15%
30%
45%
60%
75%
90%
0
300,000
600,000
900,000
1,200,000
1800 1820 1840 1860 1880 1900 1920 1940 1960 1980
Aggregate U.S. Coal Production, MM Tons (LHS) Pennsylvania % of Total Production Mix (RHS)
Kentucky % of Total Production Mix (RHS) West Virginia % of Total Production Mix (RHS)
Virginia % of Total Production Mix (RHS) Wyoming % of Total Production Mix (RHS)
Other % of Total Production Mix (RHS)
0
10
20
30
40
2001 2003 2005 2007 2009 2011 2013 2015 2017 2019
Pennsylvania Kentucky West Virginia Wyoming
November 2, 2020Warming Up For Thermal Coal
Recent Coal Industry Developments
Decline of US Coal Through the 21st Century
In 2010, the United States had 580 coal-fired power
plants. Such provided 45% of the country's electricity,
by 2018, the number of plants fell below 350 and the
market share of coal dropped to 30%. Coal-fired
power plants are the largest source in the United
States of climate-change causing carbon emissions.
The Navajo Generating Station alone emitted 15
million tons of carbon dioxide a year, equal to about
3.7 million cars driven for one year.
In Massachusetts v. EPA (2007), the Supreme Court
ruled that greenhouse gases are pollutants under the
provisions of the 1970 Clean Air Act, from which the
EPA determined that greenhouse gas emissions
endanger public health and the welfare of future
generations. In response to this ruling, the Obama
administration developed the “Clean Power Plan”, a
greenhouse gas regulatory program. This mandated
time-honored tools such as energy efficiency,
deployment of renewable energy technology,
improvements of thermal efficiency of existing coal-
fried power plants, and increased utilization of lower-
emitting generating units. Overall, the Clean Power
Plan worked to reduce greenhouse gas emissions from
the power sector by one-third by 2030. In 2015 the
Obama administration, revising standards that had not
been touched since the 1980s, required industry to set
deadlines for power plants to invest in state-of-the-art
wastewater treatment technology to keep toxic
pollution out of waterways. This regulation also
required them to monitor local water quality and make
more information about such results publicly available.
The Obama administration estimated the regulations
would stop about 1.4 billion pounds of toxic metals
and other pollutants from pouring into rivers and
streams and cost industry $480 million a year.
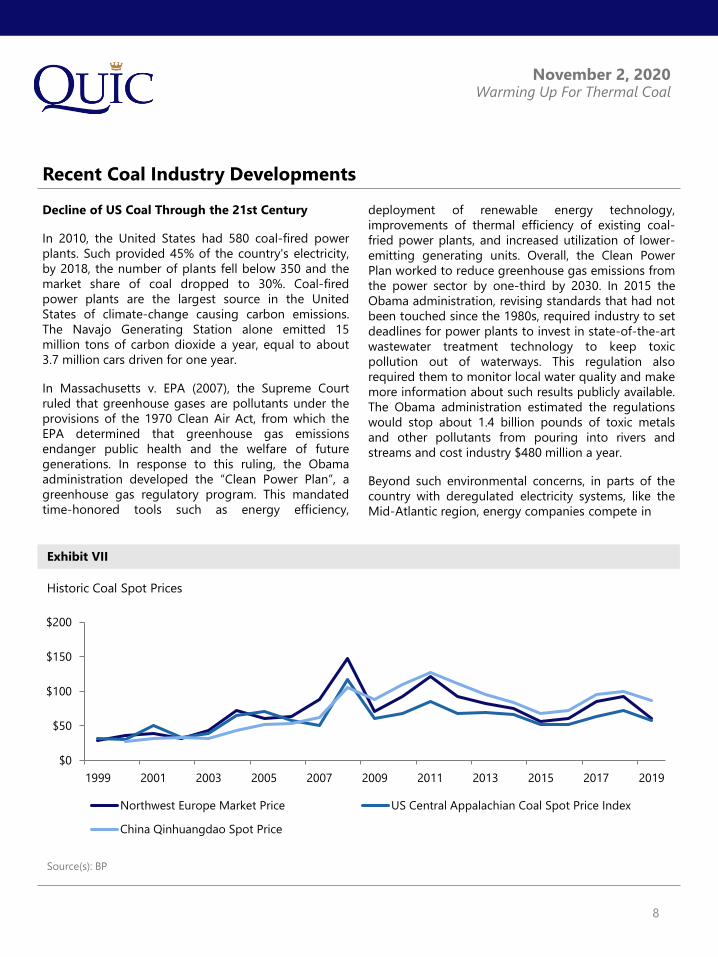
Beyond such environmental concerns, in parts of the
country with deregulated electricity systems, like the
Mid-Atlantic region, energy companies compete in
Exhibit VII
Source(s): BP
Historic Coal Spot Prices
8
$0
$50
$100
$150
$200
1999 2001 2003 2005 2007 2009 2011 2013 2015 2017 2019
Northwest Europe Market Price US Central Appalachian Coal Spot Price Index
China Qinhuangdao Spot Price
November 2, 2020Warming Up For Thermal Coal
Recent Coal Industry Developments
auctions to sell their electricity to the grid. A phase ofcheap natural gas has caused the prices to fall sharplyin recent years. This fall is a big reason that many coaland nuclear plants have become unprofitable. Themajority of any form of industry recovery has alsocentered around metallurgical coal production andAsian demand for such, rather than thermal coal.
Pre-COVID-19 many coal-producing states were alsoswitching to natural gas for power, in part because, instates like Pennsylvania, they produce increasingamounts of shale gas. The power-fuel mix supplyingthe PJM regional transmission electrical grid, whichserves 13 states including Pennsylvania, West Virginiaand Kentucky, went from 55 percent coal and 8percent natural gas in 2006 to 34 percent coal and 27percent gas in 2017.
Coal’s Failed “Revitalization” Under Trump
In October 2017, EPA Administrator Scott Pruittannounced the agency’s decision to repeal the CleanPower Plan stating, “the war on coal is over” and that“the past administration was using every bit of power
and authority to use EPA to pick winners and losers onhow we generate electricity in this country. That iswrong.”
However, unlike Hoover’s “War on Crime” or Reagan’s“War on Drugs”, coal is an economic sector. Like alleconomic sectors, the power industry can be affectedby a variety of factors, including market trends,changes in consumer preference and public value, andimplementation of regulatory actions intended toaddress voter concerns regarding public health, workersafety, economic competitiveness, or environmentalprotection. Over the past century changes in socialvalue, market trends, and public policy have allaffected the fortunes of the coal sector.
After the 2016 federal election, President DonaldTrump sided with coal-industry executives andlobbyists, intervened in direct shut-down cases, androlled back and relaxed environmental regulations.
President Trump has faced the headwinds of suchmarket trends however, such as low natural gas prices
Exhibit VIII
Source(s): BP
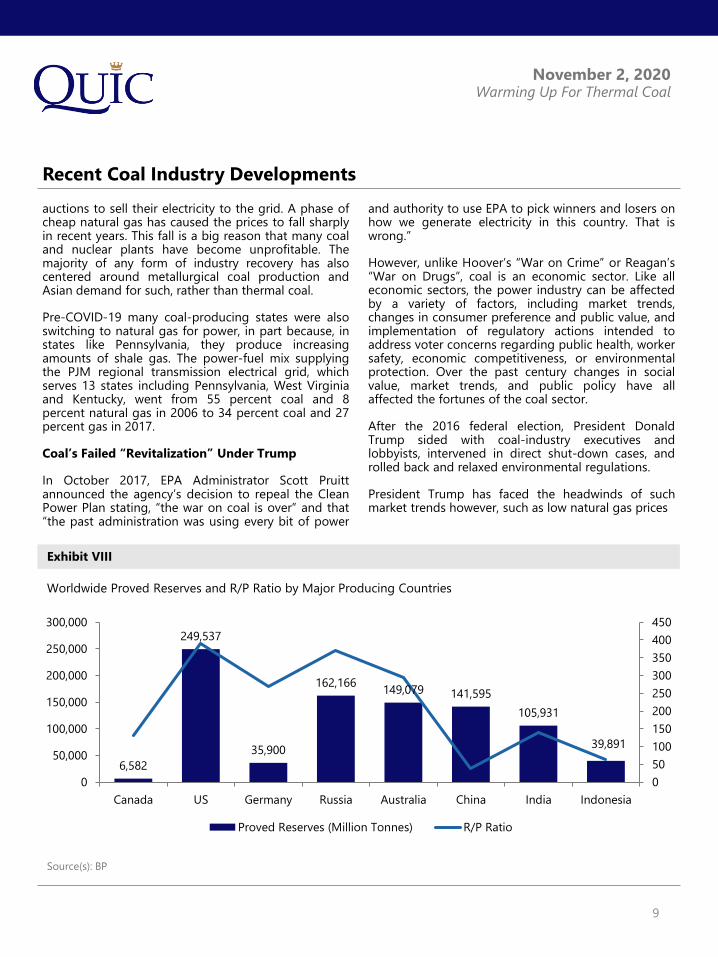
Worldwide Proved Reserves and R/P Ratio by Major Producing Countries
9
6,582
249,537
35,900
162,166149,079 141,595
105,931
39,891
0
50
100
150
200
250
300
350
400
450
0
50,000
100,000
150,000
200,000
250,000
300,000
Canada US Germany Russia Australia China India Indonesia
Proved Reserves (Million Tonnes) R/P Ratio
November 2, 2020Warming Up For Thermal Coal
Recent Coal Industry Developments
and the increased economic validity of solar, wind, and
other renewable energy sources.
Despite earlier efforts towards revitalizing coal,
President Trump’s administration has failed to
announce any large plans this year to help stabilize the
industry.
Since President Trump was inaugurated, 145 coal-
burning units at 75 power plants have been idled,
removing 15 percent of the nation’s coal-generated
capacity, enough to power about 30 million homes.
That is the fastest decline in coal-fuel capacity in any
single presidential term, greater than the rate during
either of President Barack Obama’s terms. An
additional 73 power plants have announced their
intention to close additional coal-burning units this
decade. An estimated 20 percent of the power
generated in the United States this year is expected to
come from coal, a fall from 31 percent in 2017. In part
because of the coronavirus-catalyzed recession, total
coal production is expected to drop this year to 511
million tons, down from 775 million tons in 2017. That
34 percent decline is the largest four-year drop in
production since 1932.
Overall, coal’s accelerating decline has produced one
of the Trump administrations most counterintuitive
outcomes. Air pollution in the United States related to
power production has declined rapidly despite the
administration’s intensive rollback of environmental
regulations. The amount of sulfur dioxide coming from
power plants, which causes health complications
including breathing difficulties and heart disease,
dropped by nearly 30 percent nationwide in the first
three years of President Trump’s tenure, a faster rate
of decline than the first three years of President
Obama’s tenure. Nitrogen oxide, another hazardous
pollutant, also dropped more significantly than in
President Obama’s first three years.
Economic Impact on the US
In 1920, a typical miner in the United States extracted
an average of four tons of bituminous coal per day.
Today in the western United States, which has the
largest surface mines in the nation, that figure is about
140 tons a day.
This surge in productivity meant huge declines in jobs
even when coal was the dominant source of fuel for
power plants, dropping from 862,000 miners in the
1920s to 135,000 by 1990, before leveling off around
50,000 nationwide during the Obama administration.
That number dropped to 42,000 in April, as
coronavirus shutdowns spread nationwide.
There have been many failed attempts to salvage such
unemployment. In Arizona, a campaign to save the
Navajo Generating Station was funded by Peabody
and other mining industry players, who formed an
alliance with the Navajo tribe and the United Mine
Workers union to create a movement they called “Yes
to N.G.S.” The plan aimed to pressure the Central
Arizona Project, the agency that runs the canal system
providing water to the region, to continue to buy
power from the plant. The group also pushed officials
in Washington D.C. to enact the cost-cutting
regulatory rollbacks. However, the Central Arizona
Project board refused to back down, after concluding
that its customers would save $14 million in 2020
alone by stopping all power purchases from the plant.
Coal Globally and Outlook:
From a global perspective, coal consumption fell by
0.6% in 2019, its fourth decline in six years, and its
share in the energy mix fell to 27.0%, its lowest level in
16 years. However, unlike the US, coal consumption
continued to increase in some emerging economies
such as China, Indonesia, and Vietnam, with growth in
India falling at its lowest since 2001. This can be
contributed to the relative lack of additional resource
options comparative to the US. IEEFA projected last
November that renewables would fully outpace coal-
fired generation on an annual basis in 2021. That
likelihood persists, and the transition, in fact, is gaining
speed.
10
November 2, 2020Warming Up For Thermal Coal
Coal Industry: Timeline of Major US Changing Factors
11
Timeframe Changing Factors
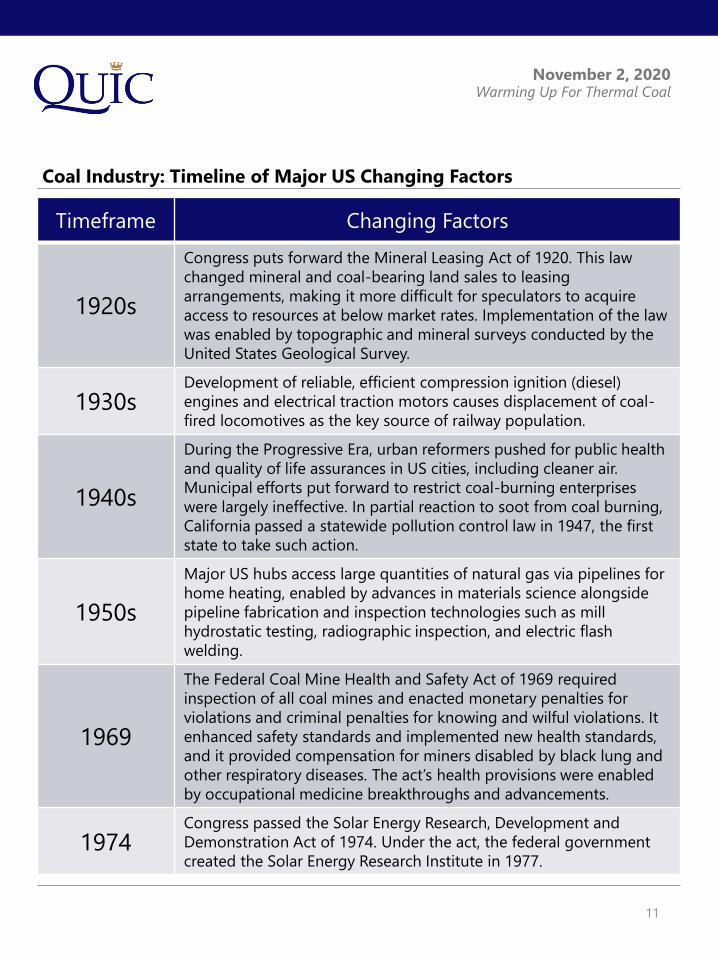
1920s
Congress puts forward the Mineral Leasing Act of 1920. This law
changed mineral and coal-bearing land sales to leasing
arrangements, making it more difficult for speculators to acquire
access to resources at below market rates. Implementation of the law
was enabled by topographic and mineral surveys conducted by the
United States Geological Survey.
1930sDevelopment of reliable, efficient compression ignition (diesel)
engines and electrical traction motors causes displacement of coal-
fired locomotives as the key source of railway population.
1940s
During the Progressive Era, urban reformers pushed for public health
and quality of life assurances in US cities, including cleaner air.
Municipal efforts put forward to restrict coal-burning enterprises
were largely ineffective. In partial reaction to soot from coal burning,
California passed a statewide pollution control law in 1947, the first
state to take such action.
1950s
Major US hubs access large quantities of natural gas via pipelines for
home heating, enabled by advances in materials science alongside
pipeline fabrication and inspection technologies such as mill
hydrostatic testing, radiographic inspection, and electric flash
welding.
1969
The Federal Coal Mine Health and Safety Act of 1969 required
inspection of all coal mines and enacted monetary penalties for
violations and criminal penalties for knowing and wilful violations. It
enhanced safety standards and implemented new health standards,
and it provided compensation for miners disabled by black lung and
other respiratory diseases. The act’s health provisions were enabled
by occupational medicine breakthroughs and advancements.
1974Congress passed the Solar Energy Research, Development and
Demonstration Act of 1974. Under the act, the federal government
created the Solar Energy Research Institute in 1977.
November 2, 2020Warming Up For Thermal Coal
Coal Industry: Timeline of Major US Changing Factors
12
Timeframe Changing Factors
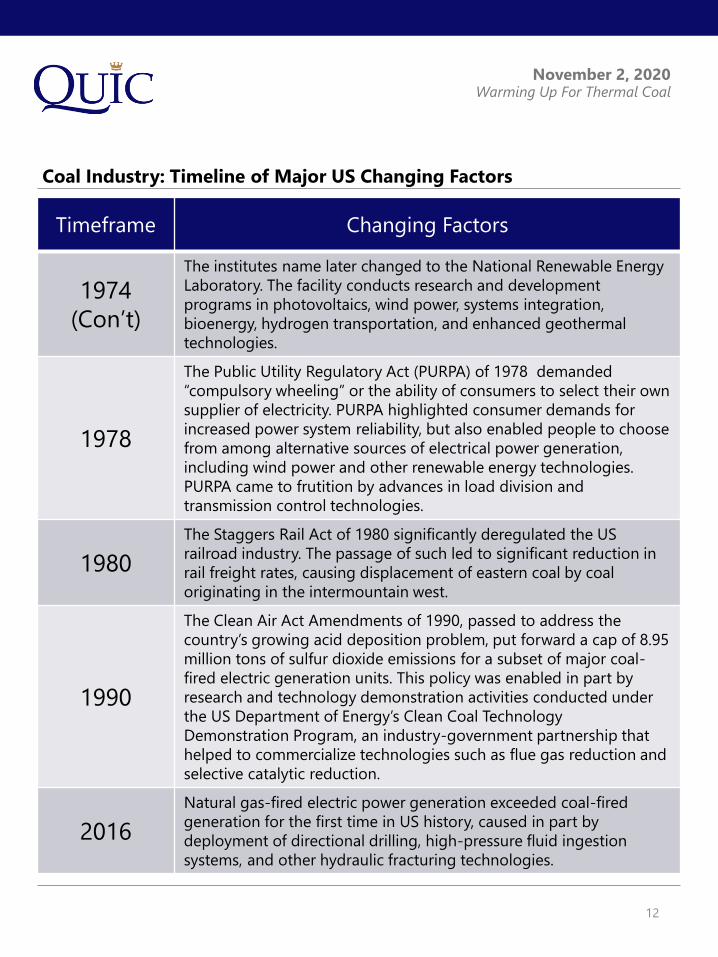
1974
(Con’t)
The institutes name later changed to the National Renewable Energy
Laboratory. The facility conducts research and development
programs in photovoltaics, wind power, systems integration,
bioenergy, hydrogen transportation, and enhanced geothermal
technologies.
1978
The Public Utility Regulatory Act (PURPA) of 1978 demanded
“compulsory wheeling” or the ability of consumers to select their own
supplier of electricity. PURPA highlighted consumer demands for
increased power system reliability, but also enabled people to choose
from among alternative sources of electrical power generation,
including wind power and other renewable energy technologies.
PURPA came to frutition by advances in load division and
transmission control technologies.
1980
The Staggers Rail Act of 1980 significantly deregulated the US
railroad industry. The passage of such led to significant reduction in
rail freight rates, causing displacement of eastern coal by coal
originating in the intermountain west.
1990
The Clean Air Act Amendments of 1990, passed to address the
country’s growing acid deposition problem, put forward a cap of 8.95
million tons of sulfur dioxide emissions for a subset of major coal-
fired electric generation units. This policy was enabled in part by
research and technology demonstration activities conducted under
the US Department of Energy’s Clean Coal Technology
Demonstration Program, an industry-government partnership that
helped to commercialize technologies such as flue gas reduction and
selective catalytic reduction.
2016
Natural gas-fired electric power generation exceeded coal-fired
generation for the first time in US history, caused in part by
deployment of directional drilling, high-pressure fluid ingestion
systems, and other hydraulic fracturing technologies.
November 2, 2020Warming Up For Thermal Coal
Public Market
Assessing companies within the coal sector is
challenging; there are not many feasible valuation
methods that consider the inherent risks of mining as
well as external factors such as the price of the
commodity or government regulations. The industry is
unique in that it shares hurdles with both the energy
and mining sectors; this makes accurate valuation
complex.
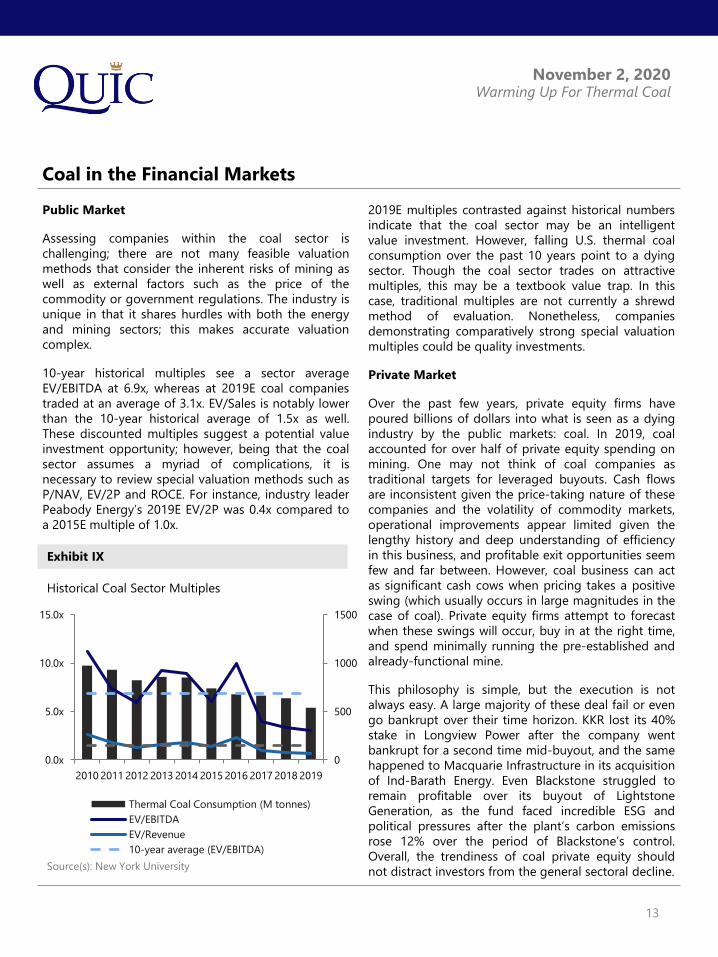
10-year historical multiples see a sector average
EV/EBITDA at 6.9x, whereas at 2019E coal companies
traded at an average of 3.1x. EV/Sales is notably lower
than the 10-year historical average of 1.5x as well.
These discounted multiples suggest a potential value
investment opportunity; however, being that the coal
sector assumes a myriad of complications, it is
necessary to review special valuation methods such as
P/NAV, EV/2P and ROCE. For instance, industry leader
Peabody Energy’s 2019E EV/2P was 0.4x compared to
a 2015E multiple of 1.0x.
2019E multiples contrasted against historical numbers
indicate that the coal sector may be an intelligent
value investment. However, falling U.S. thermal coal
consumption over the past 10 years point to a dying
sector. Though the coal sector trades on attractive
multiples, this may be a textbook value trap. In this
case, traditional multiples are not currently a shrewd
method of evaluation. Nonetheless, companies
demonstrating comparatively strong special valuation
multiples could be quality investments.
Private Market
Over the past few years, private equity firms have
poured billions of dollars into what is seen as a dying
industry by the public markets: coal. In 2019, coal
accounted for over half of private equity spending on
mining. One may not think of coal companies as
traditional targets for leveraged buyouts. Cash flows
are inconsistent given the price-taking nature of these
companies and the volatility of commodity markets,
operational improvements appear limited given the
lengthy history and deep understanding of efficiency
in this business, and profitable exit opportunities seem
few and far between. However, coal business can act
as significant cash cows when pricing takes a positive
swing (which usually occurs in large magnitudes in the
case of coal). Private equity firms attempt to forecast
when these swings will occur, buy in at the right time,
and spend minimally running the pre-established and
already-functional mine.
This philosophy is simple, but the execution is not
always easy. A large majority of these deal fail or even
go bankrupt over their time horizon. KKR lost its 40%
stake in Longview Power after the company went
bankrupt for a second time mid-buyout, and the same
happened to Macquarie Infrastructure in its acquisition
of Ind-Barath Energy. Even Blackstone struggled to
remain profitable over its buyout of Lightstone
Generation, as the fund faced incredible ESG and
political pressures after the plant’s carbon emissions
rose 12% over the period of Blackstone’s control.
Overall, the trendiness of coal private equity should
not distract investors from the general sectoral decline.
Coal in the Financial Markets
Exhibit IX
Source(s): New York University
Historical Coal Sector Multiples
13
0
500
1000
1500
0.0x
5.0x
10.0x
15.0x
2010 2011 2012 2013 2014 2015 2016 2017 2018 2019
Thermal Coal Consumption (M tonnes)
EV/EBITDA
EV/Revenue
10-year average (EV/EBITDA)
November 2, 2020Warming Up For Thermal Coal
Key Public Players
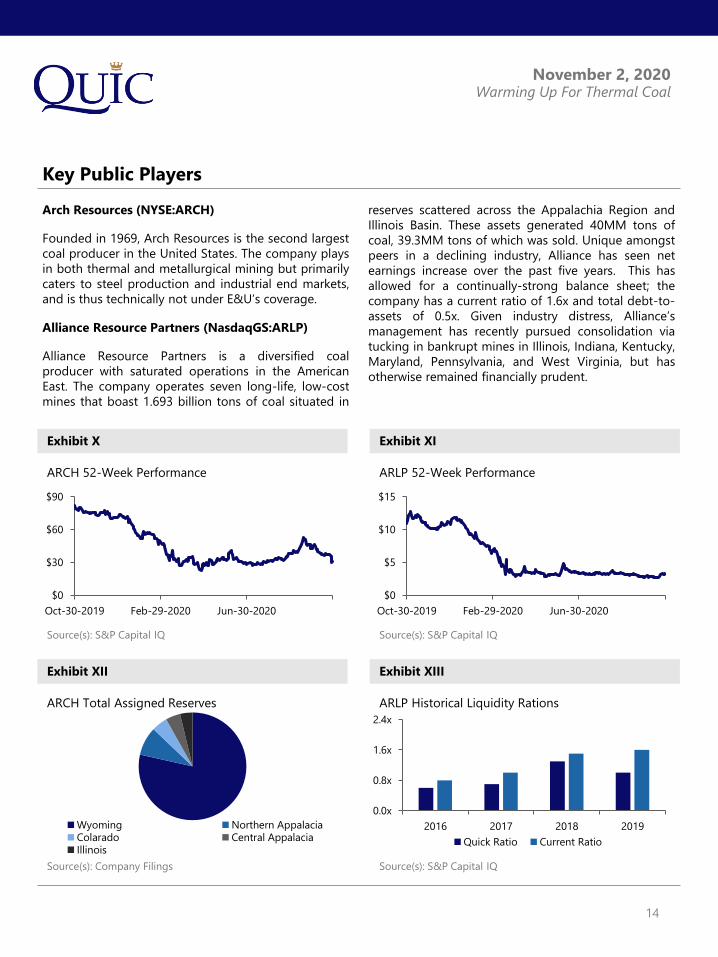
Arch Resources (NYSE:ARCH)
Founded in 1969, Arch Resources is the second largest
coal producer in the United States. The company plays
in both thermal and metallurgical mining but primarily
caters to steel production and industrial end markets,
and is thus technically not under E&U’s coverage.
Alliance Resource Partners (NasdaqGS:ARLP)
Alliance Resource Partners is a diversified coal
producer with saturated operations in the American
East. The company operates seven long-life, low-cost
mines that boast 1.693 billion tons of coal situated in
reserves scattered across the Appalachia Region and
Illinois Basin. These assets generated 40MM tons of
coal, 39.3MM tons of which was sold. Unique amongst
peers in a declining industry, Alliance has seen net
earnings increase over the past five years. This has
allowed for a continually-strong balance sheet; the
company has a current ratio of 1.6x and total debt-to-
assets of 0.5x. Given industry distress, Alliance’s
management has recently pursued consolidation via
tucking in bankrupt mines in Illinois, Indiana, Kentucky,
Maryland, Pennsylvania, and West Virginia, but has
otherwise remained financially prudent.
Exhibit XII
ARCH Total Assigned Reserves
Source(s): Company Filings
Source(s): S&P Capital IQ
Exhibit X
ARCH 52-Week Performance
ARLP Historical Liquidity Rations
Exhibit XIII
Source(s): S&P Capital IQ
Source(s): S&P Capital IQ
ARLP 52-Week Performance
Exhibit XI
14
$0
$30
$60
$90
Oct-30-2019 Feb-29-2020 Jun-30-2020
$0
$5
$10
$15
Oct-30-2019 Feb-29-2020 Jun-30-2020
Wyoming Northern AppalaciaColarado Central AppalaciaIllinois
0.0x
0.8x
1.6x
2.4x
2016 2017 2018 2019
Quick Ratio Current Ratio
November 2, 2020Warming Up For Thermal Coal
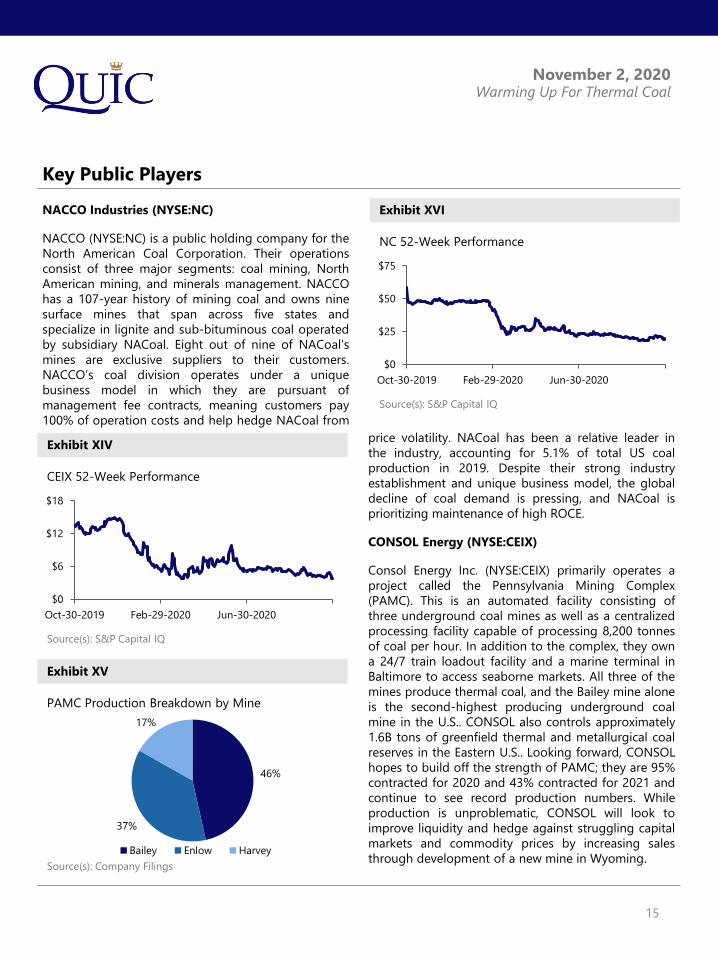
NACCO Industries (NYSE:NC)
NACCO (NYSE:NC) is a public holding company for the
North American Coal Corporation. Their operations
consist of three major segments: coal mining, North
American mining, and minerals management. NACCO
has a 107-year history of mining coal and owns nine
surface mines that span across five states and
specialize in lignite and sub-bituminous coal operated
by subsidiary NACoal. Eight out of nine of NACoal’s
mines are exclusive suppliers to their customers.
NACCO’s coal division operates under a unique
business model in which they are pursuant of
management fee contracts, meaning customers pay
100% of operation costs and help hedge NACoal from
sssss price volatility. NACoal has been a relative leader in
the industry, accounting for 5.1% of total US coal
production in 2019. Despite their strong industry
establishment and unique business model, the global
decline of coal demand is pressing, and NACoal is
prioritizing maintenance of high ROCE.
CONSOL Energy (NYSE:CEIX)
Consol Energy Inc. (NYSE:CEIX) primarily operates a
project called the Pennsylvania Mining Complex
(PAMC). This is an automated facility consisting of
three underground coal mines as well as a centralized
processing facility capable of processing 8,200 tonnes
of coal per hour. In addition to the complex, they own
a 24/7 train loadout facility and a marine terminal in
Baltimore to access seaborne markets. All three of the
mines produce thermal coal, and the Bailey mine alone
is the second-highest producing underground coal
mine in the U.S.. CONSOL also controls approximately
1.6B tons of greenfield thermal and metallurgical coal
reserves in the Eastern U.S.. Looking forward, CONSOL
hopes to build off the strength of PAMC; they are 95%
contracted for 2020 and 43% contracted for 2021 and
continue to see record production numbers. While
production is unproblematic, CONSOL will look to
improve liquidity and hedge against struggling capital
markets and commodity prices by increasing sales
through development of a new mine in Wyoming.
Source(s): S&P Capital IQ
NC 52-Week Performance
Exhibit XVI
Exhibit XV
PAMC Production Breakdown by Mine
Source(s): Company Filings
Source(s): S&P Capital IQ
Exhibit XIV
CEIX 52-Week Performance
Key Public Players
15
$0
$25
$50
$75
Oct-30-2019 Feb-29-2020 Jun-30-2020
$0
$6
$12
$18
Oct-30-2019 Feb-29-2020 Jun-30-2020
46%
37%
17%
Bailey Enlow Harvey
November 2, 2020Warming Up For Thermal Coal
General Overview
Founded in 1883 and headquartered in St. Louis,
Peabody Energy (NYSE:BTU) is the largest private
sector coal company in the world. Standard operations
include the mining, sale, and distribution of both
thermal and metallurgical coal for the respective
purposes of power and steel manufacturing to more
than 25 countries across six continents. Three Powder
Bay River Basin surface mines in Wyoming are the
company’s most productive assets and comprise >60%
of annual production. Uniquely, Peabody also owns 10
Seaborne Thermal and Metallurgical mines located off
the North and Southeastern coasts of Australia, assets
that account for 17% of production. 10% of coal is
sourced from three underground and four surface
mines in the American Midwest, and the company’s
least lucrative assets (accounting for only 7% of total
production) include three mines positioned in across
Arizona, New Mexico, and Colorado.
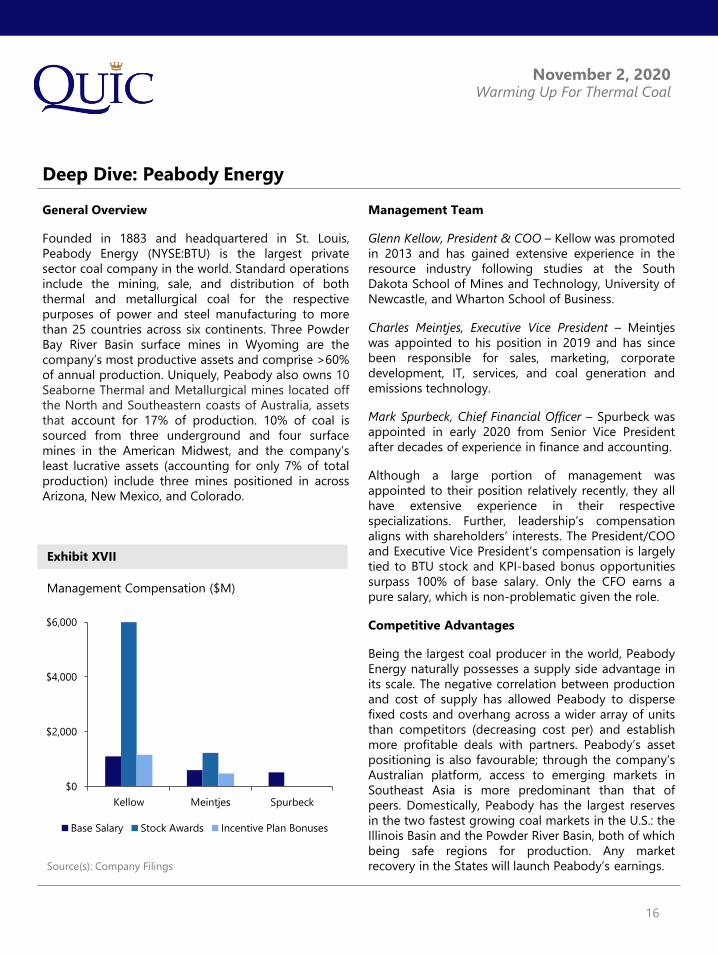
Management Team
Glenn Kellow, President & COO – Kellow was promoted
in 2013 and has gained extensive experience in the
resource industry following studies at the South
Dakota School of Mines and Technology, University of
Newcastle, and Wharton School of Business.
Charles Meintjes, Executive Vice President – Meintjes
was appointed to his position in 2019 and has since
been responsible for sales, marketing, corporate
development, IT, services, and coal generation and
emissions technology.
Mark Spurbeck, Chief Financial Officer – Spurbeck was
appointed in early 2020 from Senior Vice President
after decades of experience in finance and accounting.
Although a large portion of management was
appointed to their position relatively recently, they all
have extensive experience in their respective
specializations. Further, leadership’s compensation
aligns with shareholders’ interests. The President/COO
and Executive Vice President’s compensation is largely
tied to BTU stock and KPI-based bonus opportunities
surpass 100% of base salary. Only the CFO earns a
pure salary, which is non-problematic given the role.
Competitive Advantages
Being the largest coal producer in the world, Peabody
Energy naturally possesses a supply side advantage in
its scale. The negative correlation between production
and cost of supply has allowed Peabody to disperse
fixed costs and overhang across a wider array of units
than competitors (decreasing cost per) and establish
more profitable deals with partners. Peabody’s asset
positioning is also favourable; through the company’s
Australian platform, access to emerging markets in
Southeast Asia is more predominant than that of
peers. Domestically, Peabody has the largest reserves
in the two fastest growing coal markets in the U.S.: the
Illinois Basin and the Powder River Basin, both of which
being safe regions for production. Any market
recovery in the States will launch Peabody’s earnings.
Deep Dive: Peabody Energy
Exhibit XVII
Source(s): Company Filings
Management Compensation ($M)
16
$0
$2,000
$4,000
$6,000
Kellow Meintjes Spurbeck
Base Salary Stock Awards Incentive Plan Bonuses
November 2, 2020Warming Up For Thermal Coal
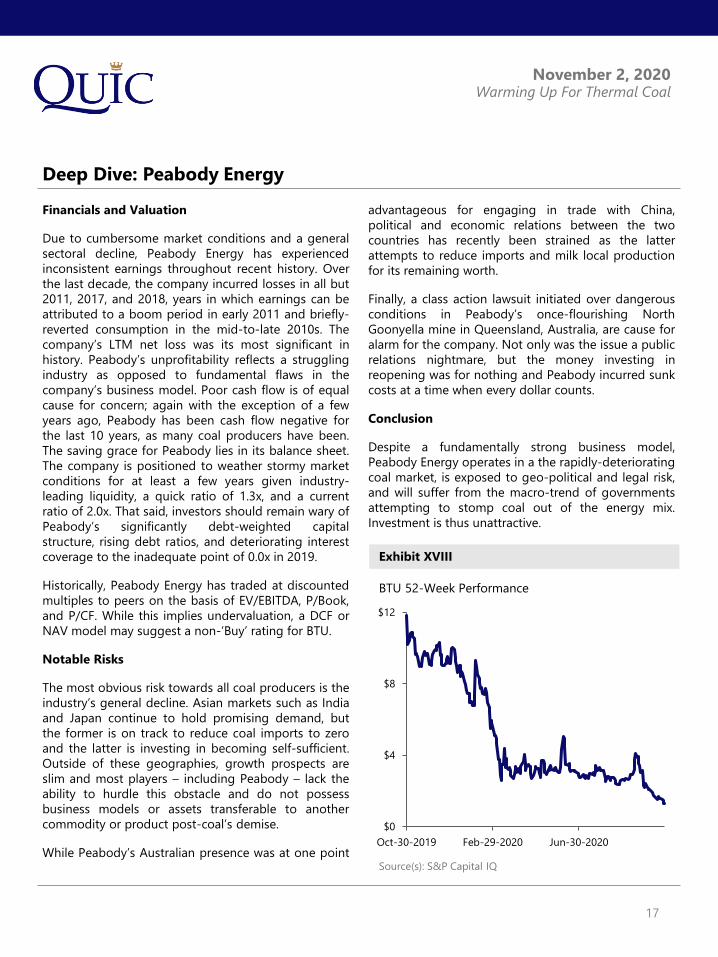
Financials and Valuation
Due to cumbersome market conditions and a general
sectoral decline, Peabody Energy has experienced
inconsistent earnings throughout recent history. Over
the last decade, the company incurred losses in all but
2011, 2017, and 2018, years in which earnings can be
attributed to a boom period in early 2011 and briefly-
reverted consumption in the mid-to-late 2010s. The
company’s LTM net loss was its most significant in
history. Peabody’s unprofitability reflects a struggling
industry as opposed to fundamental flaws in the
company’s business model. Poor cash flow is of equal
cause for concern; again with the exception of a few
years ago, Peabody has been cash flow negative for
the last 10 years, as many coal producers have been.
The saving grace for Peabody lies in its balance sheet.
The company is positioned to weather stormy market
conditions for at least a few years given industry-
leading liquidity, a quick ratio of 1.3x, and a current
ratio of 2.0x. That said, investors should remain wary of
Peabody’s significantly debt-weighted capital
structure, rising debt ratios, and deteriorating interest
coverage to the inadequate point of 0.0x in 2019.
Historically, Peabody Energy has traded at discounted
multiples to peers on the basis of EV/EBITDA, P/Book,
and P/CF. While this implies undervaluation, a DCF or
NAV model may suggest a non-’Buy’ rating for BTU.
Notable Risks
The most obvious risk towards all coal producers is the
industry’s general decline. Asian markets such as India
and Japan continue to hold promising demand, but
the former is on track to reduce coal imports to zero
and the latter is investing in becoming self-sufficient.
Outside of these geographies, growth prospects are
slim and most players – including Peabody – lack the
ability to hurdle this obstacle and do not possess
business models or assets transferable to another
commodity or product post-coal’s demise.
While Peabody’s Australian presence was at one point
advantageous for engaging in trade with China,
political and economic relations between the two
countries has recently been strained as the latter
attempts to reduce imports and milk local production
for its remaining worth.
Finally, a class action lawsuit initiated over dangerous
conditions in Peabody’s once-flourishing North
Goonyella mine in Queensland, Australia, are cause for
alarm for the company. Not only was the issue a public
relations nightmare, but the money investing in
reopening was for nothing and Peabody incurred sunk
costs at a time when every dollar counts.
Conclusion
Despite a fundamentally strong business model,
Peabody Energy operates in a the rapidly-deteriorating
coal market, is exposed to geo-political and legal risk,
and will suffer from the macro-trend of governments
attempting to stomp coal out of the energy mix.
Investment is thus unattractive.
Deep Dive: Peabody Energy
17
BTU 52-Week Performance
Source(s): S&P Capital IQ
Exhibit XVIII
$0
$4
$8
$12
Oct-30-2019 Feb-29-2020 Jun-30-2020
November 2, 2020Warming Up For Thermal Coal
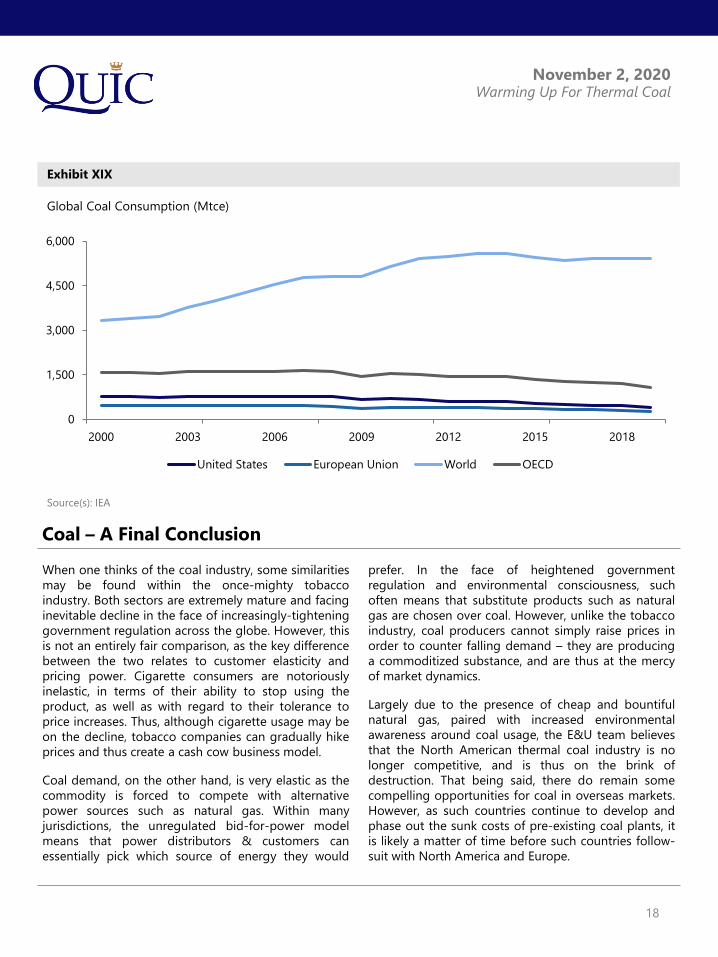
Exhibit XIX
Global Coal Consumption (Mtce)
Coal – A Final Conclusion
When one thinks of the coal industry, some similarities
may be found within the once-mighty tobacco
industry. Both sectors are extremely mature and facing
inevitable decline in the face of increasingly-tightening
government regulation across the globe. However, this
is not an entirely fair comparison, as the key difference
between the two relates to customer elasticity and
pricing power. Cigarette consumers are notoriously
inelastic, in terms of their ability to stop using the
product, as well as with regard to their tolerance to
price increases. Thus, although cigarette usage may be
on the decline, tobacco companies can gradually hike
prices and thus create a cash cow business model.
Coal demand, on the other hand, is very elastic as the
commodity is forced to compete with alternative
power sources such as natural gas. Within many
jurisdictions, the unregulated bid-for-power model
means that power distributors & customers can
essentially pick which source of energy they would
prefer. In the face of heightened government
regulation and environmental consciousness, such
often means that substitute products such as natural
gas are chosen over coal. However, unlike the tobacco
industry, coal producers cannot simply raise prices in
order to counter falling demand – they are producing
a commoditized substance, and are thus at the mercy
of market dynamics.
Largely due to the presence of cheap and bountiful
natural gas, paired with increased environmental
awareness around coal usage, the E&U team believes
that the North American thermal coal industry is no
longer competitive, and is thus on the brink of
destruction. That being said, there do remain some
compelling opportunities for coal in overseas markets.
However, as such countries continue to develop and
phase out the sunk costs of pre-existing coal plants, it
is likely a matter of time before such countries follow-
suit with North America and Europe.
Source(s): IEA
18
0
1,500
3,000
4,500
6,000
2000 2003 2006 2009 2012 2015 2018
United States European Union World OECD
November 2, 2020Warming Up For Thermal Coal
References
19
1. Arcadia Publishing
2. Bloomberg
3. Coal Association of Canada
4. Coal: R&D to Support National Energy Policy
5. Company Filings
6. EIA
7. Encyclopedia Britannica
8. Financial Post
9. Google Images
10. Market Watch
11. New York University
12. Private Equity Stakeholder Project
13. S&P Capital IQ
14. Seeking Alpha
15. USGS
16. World in Data