vowel variations among speakers of malaysian english
TRANSCRIPT

Vowel variations among speakers of Malaysian English
by
Sock Wun Phng
A thesis submitted to the graduate faculty
in partial fulfillment of the requirements for the degree of
MASTER OF ARTS
Major: Teaching English as a Second Language/Applied Linguistics
Program of Study Committee:
John M. Levis, Major Professor
Gulbahar H. Beckett
Charles L. Nagle
The student author and the program of study committee are solely responsible for the
content of this thesis. The Graduate College will ensure this thesis is globally accessible
and will not permit alterations after a degree is conferred.
Iowa State University
Ames, Iowa
2017
Copyright © Sock Wun Phng, 2017. All rights reserved.

ii
DEDICATION
This thesis, the culmination of two years of blood, sweat, and tears, is dedicated to
my family, both the first and the second; 谢谢 and danke.

iii
TABLE OF CONTENTS
Page
DEDICATION ........................................................................................................... ii
ACKNOWLEDGMENTS ......................................................................................... v
ABSTRACT………………………………. .............................................................. vi
CHAPTER 1 INTRODUCTION .......................................................................... 1
The Current State of Malaysian English .............................................................. 6
CHAPTER 2 LITERATURE REVIEW ............................................................... 9
Malaysian English and Singapore English .......................................................... 9
Existing Research on Malaysian English ............................................................. 13
CHAPTER 3 METHODOLOGY ......................................................................... 20
The Present Study ................................................................................................ 20
Participants ......................................................................................................... 21
Materials ......................................................................................................... 23
Equipment ......................................................................................................... 25
Recording Environment ....................................................................................... 25
Procedures ......................................................................................................... 25
Data Analysis ....................................................................................................... 26
CHAPTER 4 RESULTS AND DISCUSSION ..................................................... 31
Within-Group Comparison .................................................................................. 31
Across-Group Comparison .................................................................................. 52
CHAPTER 5 CONCLUSION ............................................................................... 78
Limitations of the Study and Future Research ..................................................... 80
NOMENCLATURE .................................................................................................. 82
REFERENCES .......................................................................................................... 83

iv
APPENDIX A: PARTICIPANT RECRUITMENT FACEBOOK POST ................. 87
APPENDIX B: SCREENING SURVEY................................................................... 88
APPENDIX C: INTERVIEW REFERENCE SHEET .............................................. 89
APPENDIX D: PASSAGE-READING TASK ......................................................... 90
APPENDIX E: SENTENCE-READING TASK ....................................................... 91
APPENDIX F: EXAMPLE PRAAT SCRIPT ........................................................... 92
APPENDIX G: IRB APPROVAL ............................................................................. 93

v
ACKNOWLEDGMENTS
This thesis would not have been possible if it were not for my major professor,
John Levis, and his unwavering patience and understanding throughout the entire
process. My frantic knocks on his door have never gone unanswered, and my rapid-fire
questions were always met with calm, thorough explanations. For all of your help, John, I
thank you very much.
My heart is full of gratitude also to my parents, who, from Day One, have never
opposed my interests in pursuing degrees in English and now, in linguistics. Had it not
been for their support, I would never have discovered this love and passion that I have for
my field. My gratitude extends to my younger sister, whose FaceTime hangouts have
accompanied me through many an all-nighter.
Last but certainly not least, I have no words to describe how thankful I am to have
the following people in my life: Lea Johannsen, the person who is basically my twin and
who has been there with me through thick, thin, and everything in between; Jeannette and
Andreas Johannsen, the kindest, most compassionate people I know and who gave me a
home away from home; Sinem Sonsaat, the amazing young woman who would drop
everything to help a friend in need; Altay Özkul, the officemate who allowed me to talk
his ear off; and Katlynne Davis, who showed me endless support and motivation even as
she battled her own thesis.

vi
ABSTRACT
The language policies in Malaysia, having been controlled by the ethnic Malays
ever since Independence Day in 1957, have hence dictated which language influences
each major ethnic group is exposed to. With the official language as well as the language
of instruction in public schools being Malay, ethnic Malays who speak it as a first
language (L1) are typically monolingual speakers of Malay. The ethnic Chinese and
Indians who usually speak Mandarin or Tamil as an L1 respectively are typically
bilingual or trilingual. These different language influences might play a role in how
speakers of each ethnic group produce Malaysian English (MalE) monophthongs and
diphthongs, and this study investigated what those influences might be in the form of
vowel variations. This study extracted formant values in the Bark scale from recordings
made of the participants reading 12 of Wells’ (1982) lexical sets: FLEECE, KIT, DRESS,
TRAP, GOOSE, FOOT, THOUGHT, LOT, STRUT, NURSE, FACE, and GOAT. The formant values
were used to plot vowel charts to facilitate comparisons among Malay-, Chinese-, and
Indian-influenced MalE.
It was found that Indian-influenced MalE (InMalE) varied the most from Malay-
influenced MalE (MaMalE) and Chinese-influenced MalE (ChMalE) in their productions
of the monophthongs KIT, DRESS, FOOT, LOT, and NURSE. MaMalE varied in FLEECE, and
ChMalE varied in GOOSE. TRAP, THOUGHT, and STRUT exhibited no significant across-
group variation. As for diphthongs, MaMalE did not diphthongize FACE. ChMalE’s FACE,
on the other hand, moved higher and more backed, and InMalE’s moved higher and more

vii
fronted. For the diphthong GOAT, only InMalE varied their production by realizing GOAT
as a monophthong.
These variations in vowel production may involve the role of language policy in
Malaysia as well as the power imbalance among ethnic groups. If more Indian
Malaysians are now Dominant Users of English, they speak English as an L1 and either
Malay or an Indian language as their second language, in contrast to Malay Malaysians’
L1 of Malay and Chinese Malaysians’ L1 of a Chinese language. This difference, in
combination with the power imbalance in Malaysia where the Malays hold the strongest
political influence, with the Chinese not far behind, and the Indians largely ignored,
might explain why InMalE varies the most from MaMalE and ChMalE. It might also
explain why MaMalE and ChMalE exhibit fewer variations between each other. The
study’s limitations are discussed and suggestions are provided for further research.

1
CHAPTER 1. INTRODUCTION
The English language has undergone copious changes since it was introduced to
Malaysia, then known as Malaya, by the British. The language alighted with them in
1771 when they arrived at Penang and established a trading post (Baker, 2008). Trading
posts in Singapore, then a part of Malaya, and Melaka soon followed. The map of Malaya
in Figure 1 shows Penang, Singapore, and Melaka and the years in which they fully
transitioned from being trading posts to being British settlements.
Figure 1. Penang, Singapore, and Melaka on a map of Malaya (Baker, 2008, p. 111)
Throughout the colonial period, English gained traction as the language for
administration, commerce, and government, especially as the British slowly overpowered

2
the Dutch colonists who had already settled in Malaya (Subramaniam, 2007).
Consequently, career development and social mobility for Malayans hinged on the
knowledge of English. As Subramaniam (2007) aptly put it, English became the language
of power.
However, in 1957, Malaya gained its independence from the British, Malaysia
was born, and the Malay language displaced English as the official language (Phoon &
Maclagan, 2009). This change is explained by Omar (as cited in Subramaniam, 2007):
The rise of nationalism which led to the independence of Malaya in 1957
brought with it the importance of Malay as an element of national identity.
Malay was the best choice to fulfil this function because of several factors: its
indigeneity, its role as a lingua franca, its position as a major language, its
possession of high literature, and the fact that it once had been an important
language of administration and diplomacy in the Malay archipelago. (pp. 11-12)
Ten years later, Malay was institutionalized and also became the language of
instruction in schools (Tan & Low, 2010). The only educational level that was exempted
from this policy was the primary level, the equivalent of first to sixth grade, where some
schools, dubbed the vernacular schools, used Mandarin or Tamil as the language of
instruction. This exemption mainly sprung up because many Chinese and Indian
communities in pre-independent Malaya already had their own primary schools. Because
these communities were comprised of speakers of different Chinese or Indian languages,
Mandarin and Tamil were adopted as the languages of instruction because they are the
languages used for interethnic communication in those communities.

3
The Chinese and Indian communities strongly opposed the British when they
tried to abolish these vernacular Mandarin- and Tamil-medium schools because the
English-medium schools run by the British promoted Western values and could
potentially eliminate the Chinese and Indian cultures from Malaya (Lee, 2015). The
mainland Chinese government, along with United Nations officials, was in opposition of
this British proposal as well because they viewed the move as an oppression of Chinese
culture (Lee, 2015). Thus, the British withdrew the proposal and chose to instead focus
on providing English education to the children of the Malay elites, whom they saw as
future leaders of the people (Saad as cited in Lee, 2015). Around the time of the second
World War, when Malayans prepared to pursue independence, ethnocentrism and
patriotism increased, and Malayans, the Malays included, embraced their vernacular
Malay, Chinese, and Indian schools, paving the way for the adoption of Malay as the
official language of independent Malaysia.
English, meanwhile, lingered in the background, spoken by the elites who
learned and used English during its heyday as well as by their descendants. Another
group of English learners and users were the students who attend a third type of school:
the private school. Private schools differed from the public and vernacular schools in that
English is the language of instruction. The syllabi taught and the materials used are
exactly the same as those taught and used in the other types of schools, but everything,
except Malay, was taught in English. Since private schools and vernacular schools made
up a small percentage of Malaysian schools, most students still grew up learning Malay
formally, resulting in Malay holding ground as the language for interethnic
communication among Malaysians as a whole (Tan & Low, 2010).

4
During this time, Malay, Mandarin, and Tamil still circulated as mother tongues,
but depending on one’s educational background, she could be a monolingual Malay
speaker, a bilingual Malay and Mandarin or Tamil speaker, or a trilingual Malay,
Mandarin or Tamil, and English speaker. With the first group being the biggest and the
third group the smallest, it did not come as a surprise when, in the past few decades, the
level of proficiency in English of Malaysians began plummeting (Tan & Low, 2010).
This posed an issue because 92 percent of Malaysian employers prioritized English
proficiency when making hiring decisions (Yong, Tan, & Yong, 2012).
In light of this issue, in 2003, the Minister for Education took action in the form
of updating the language policy (Tan & Low, 2010). Under the new policy, by 2008, all
mathematics and science classes were to be taught in English, and the national syllabi and
materials for said classes were reprinted in English (Tan & Low, 2010). The ministry
focused exclusively on mathematics and science because it believed that this way, not
only would it increase the general level of proficiency in English, but it would also make
Malaysia more competitive in science, technology, engineering, and mathematics fields
on the global stage because English is “tacitly acknowledged as the most effective
language today for scientific and technological development” (Nair-Venugopal, 2006, p.
52). However, in 2009, due to problems in its implementation, the policy was reversed,
reinstating Malay as the language of instruction for mathematics and science classes, to
be in full effect by 2012 (Tan & Low, 2010). Malay thus remained the language learned
formally by most Malaysians and, consequently, the language for interethnic
communication.

5
When discussing the ethnic groups in Malaysia, reference is being made to the
three main ethnic groups: the indigenous Malays and the immigrant Chinese and Indians
(Baskaran, 2008). Because the Malays “inhabited the area when modern written history
began and…were influenced culturally by the geography of the area” (Baker, 2008, p.
17), they were and still are referred to as the bumiputera, which translates to Princes of
the Land. Although the Chinese and Indians were already in Malaya before the arrival of
colonists and had intermarried with the Malays, the British, during their colonization of
Malaya, brought over more Chinese to work as miners in order to meet the increasing
demand worldwide for tin, one of Malaya’s largest exports in British trade deals
(Subramaniam, 2007). This resulted in the generalization that the Chinese and Indians
were immigrants imported by the colonists, a misconception that prevails to this day.
There are many other immigrant minority ethnic groups like the Thais,
Eurasians, and Arabs, but they only make up one percent of the Malaysian population,
whilst the Malays, as of 2016, make up 68.6%, the Chinese 23.4%, and the Indians make
up 7% of the total population of 31.7 million (Ho, 2016). This disproportionate
population distribution weighted in the Malays’ favors, coupled with the bumiputera
label, resulted in an added advantage that gave the Malays more control and power over
the country and its citizens. This racial divide is felt to this day, reinforced by the political
system (Baker, 2008), fueling conversations on the country’s language policies.
To better understand the complicated nature of deciding on an official language
or, at the very least, a shared language for interethnic communication, it must first be
understood that the first languages (L1s) spoken by just the major ethnic groups are
multiple. The Malays mostly speak Malay, Kadazan, or Iban; the Chinese mostly speak

6
Mandarin, Hokkien, or Cantonese; and the Indians mostly speak Tamil, Malayali, or
Telugu (Baskaran, 2008). Given that the Malays have the greatest political control, they
have the influence to decide on what that shared language should be. As a consequence,
Malays, as previously discussed, are mostly monolingual. The Chinese and Indians, on
the other hand, even those who attend vernacular schools or private schools, often come
in contact with languages other than their first because they need to know at least Malay
in order to function in Malaysian society. This potpourri of monolingualism,
bilingualism, and trilingualism, brought about by different ethnic and educational
backgrounds simmering in a small peninsular country, “inserts a local flavor” (Lee, 2015,
p. 1) into the English spoken in Malaysia, spawning a localized variety of the language:
Malaysian English.
The Current State of Malaysian English
Current descriptions of Malaysian English (MalE) divide the language into three
levels: the acrolect, the mesolect, and the basilect. The acrolect, summarized by Preshous
(2001) as the “‘high’ social dialect used for official and educational purposes” (p. 47), is
usually considered standard MalE because it is the dialect used on radio and television, in
much the same way as Received Pronunciation is viewed as standard British English. It is
the least marked of the three dialects. The mesolect is the “‘middle’ social dialect used in
semi-formal situations” (Preshous, 2001, p. 47) such as among colleagues at work. As for
the basilect, the “‘low’ social dialect” (Preshous, 2001, p. 47), it is the most marked of
the three dialects, typically used by speakers with lower levels of proficiency in English.
Today, the most common dialect of MalE that is used is the mesolect, dubbed
Colloquial Malaysian English (CMalE) or Manglish (Govindan & Pillai, 2017). CMalE is

7
used in everyday interactions with family and friends. However, it is viewed by some as a
non-standard version of English that is causing the decline in overall English proficiency
(Preshous, 2001). This mindset is typically held by members of the older generation,
those who were English-educated in British-controlled Malaya and who still see the
prestige associated with English (Preshous, 2001). This prescriptivist view is fueled by
how CMalE is such a mixture of the different L1s that it is sometimes understandable
only to Malaysians (Khojastehrad & Sattarova, 2015; Lee, 2015), which is disconcerting
for groups that regard CMalE as a step towards the “deterioration of the standard of
English” (Wong, Lee, Lee, & Yaacob, 2012, p. 147).
On the other end of the debate, Lee (2015) notes that CMalE is, in actuality,
dictated by its grammar. He laid out the conventions followed by speakers of CMalE,
examples of which are as follows:
1. Dropping subject pronouns for referential pronouns and dummy pronouns
E.g., (You) Never do anything right!
2. Replacing the present perfect tense with VERB + already
E.g., I shower already.
3. Omitting articles
E.g., Talk like (a) pretentious person. (p. 15)
He argues that CMalE is not necessarily wrong or improper. On the contrary, it is
usually the more proficient speakers who are able to switch between the acrolect and
mesolect to fit the speech context (Govindan & Pillai, 2017). Govindan and Pillai (2017)
observed that CMalE is used to “mark camaraderie and solidarity and also to construct
ethnic, cultural, and social identity” (p. 75). This observation is corroborated by

8
Gatbonton, Trofimovich, and Magid (2005), who found from two studies that accent
plays a role in ethnic group affiliation and that “the more learners sound like the speakers
of their target language, the less they are perceived by their peers to be loyal to their
home group” (p. 504). Even though their two studies focused on French and Chinese
speakers in Canada, a link can be drawn between that situation and the situation in
Malaysia. Gatbonton et al. (2005) discussed how this relationship between accent and
group affiliation remained stable across different learning contexts, suggesting that this
phenomenon is common in multilingual countries like Canada and Malaysia. Regardless
of a prescriptivist or descriptivist stance in the debate about CMalE, the situation
remains: MalE, like other varieties of English, is constantly changing and adapting to its
speakers.
9
CHAPTER 2. LITERATURE REVIEW
Malaysian English and Singapore English
Malaysia is, by Kachru’s (1985) definition, an Outer Circle country, where
English is institutionalized and used in multilingual and multicultural contexts. By this
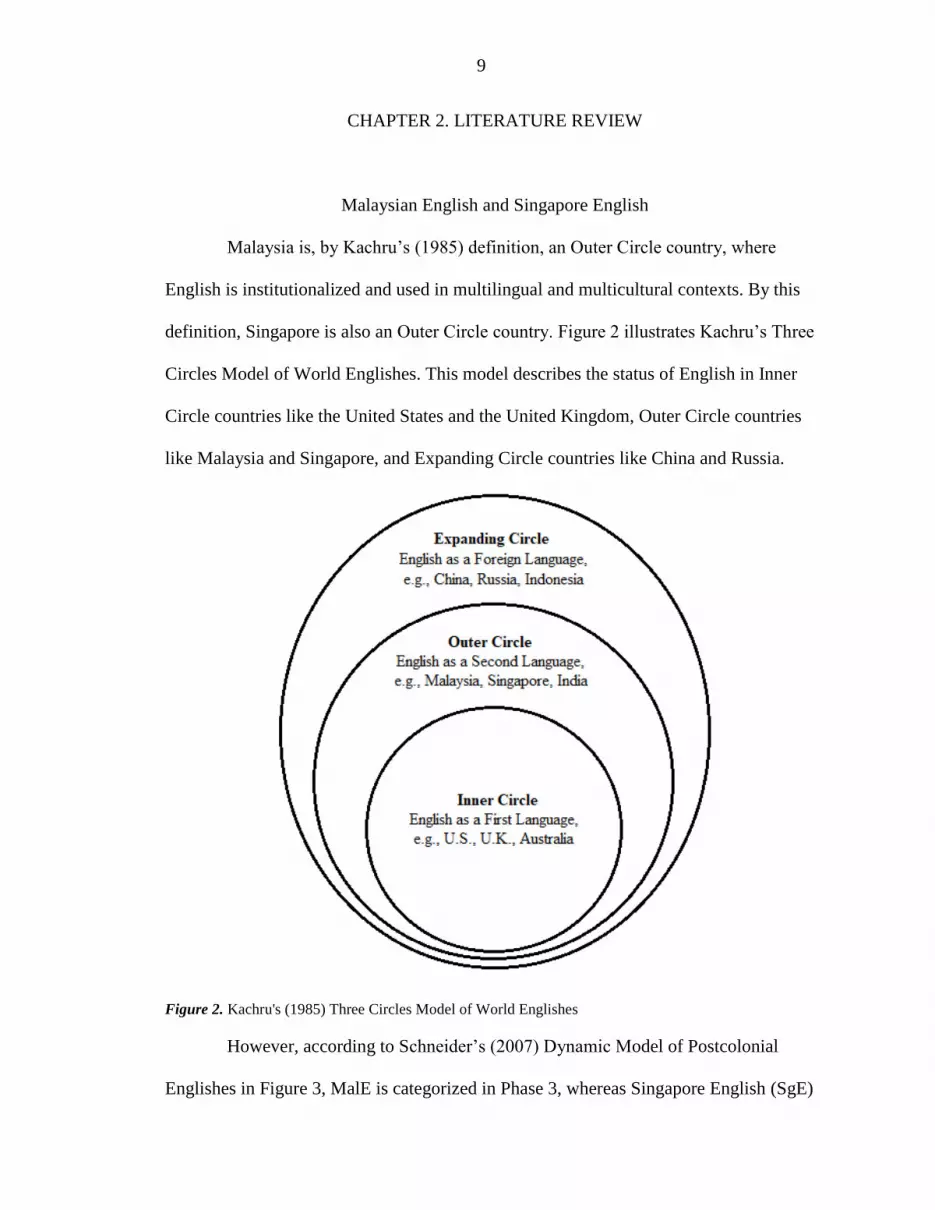
definition, Singapore is also an Outer Circle country. Figure 2 illustrates Kachru’s Three
Circles Model of World Englishes. This model describes the status of English in Inner
Circle countries like the United States and the United Kingdom, Outer Circle countries
like Malaysia and Singapore, and Expanding Circle countries like China and Russia.
Figure 2. Kachru's (1985) Three Circles Model of World Englishes
However, according to Schneider’s (2007) Dynamic Model of Postcolonial
Englishes in Figure 3, MalE is categorized in Phase 3, whereas Singapore English (SgE)

10
is categorized in Phase 4. Phase 3 is the Nativization phase, in which varieties typically
exhibit a marked local accent with variability among different sociolinguistic accents
(Schneider, 2007). On the other hand, varieties in Phase 4, the Endonormative
Stabilization phase, typically display more linguistic homogeneity (Schneider, 2007). The
Dynamic Model of Postcolonial Englishes thus suggests that the pronunciation of MalE
varies among speakers from different sociolinguistic backgrounds, ethnicity included, but
that speakers of SgE have, more or less, the same pronunciation regardless of
sociolinguistic background.
Figure 3. Schneider's (2007) Dynamic Model of Postcolonial Englishes
The Dynamic Model of Postcolonial Englishes touches on an important
distinction between MalE and SgE. It proffers the explanation that speakers from
different countries, despite sharing similar ethnic and cultural backgrounds, would still
differ in speech because they have had different experiences, likely connected to different
language policies.

11
When Malaysia gained its independence from Britain in 1957, the newly formed
government began the process of reclaiming the country’s identity, starting with the
establishment of Malay as the official language (Subramaniam, 2007). A decade later,
Malay successfully became the learned L1, and English took a backseat, having been
relegated to a second language (Subramaniam, 2007). It was around this time in 1965
when Singapore was, in Baker’s (2008) words, “expelled” (p. 347) from Malaysia due to
its diverging political beliefs. Singapore, then a Chinese-dominated state, did not agree
with having one ethnic group monopolizing the government, so Malaysia retaliated by
removing Singapore’s statehood. Singaporeans, scrambling to “fight for survival in a
hostile world…had to undertake a fundamental reevaluation of who they were, where
they were going, and what they were going to do to survive” (Baker, 2008, p. 347). They
adopted a new national identity, and they decided that the English language was going to
be a part of that identity.
Singapore adopted English as the language of instruction in schools in 1987 at all
levels and for all subjects, with Malay, Mandarin, and Tamil being offered as a second
language (Tan & Low, 2010). Since English is learned as an L1 for Singaporeans, it is the
language used for interethnic communication, uniting Singaporeans and strengthening
national identity (Tan & Low, 2010). Because the Malays, Chinese, and Indians in
Singapore speak their different ethnic languages as well, Singaporeans are mostly
bilingual at least.
Undeniably, even though MalE and SgE originated from the same roots, more
than five decades’ worth of differing political identities and language and educational
policies have created distinguishable differences between the two varieties, especially in

12
vowel production. The first difference is that SgE tends to reduce vowels more often and
more consistently than MalE (Tan & Low, 2014). Tan and Low (2014), in their study on
the rhythmic patterning of MalE and SgE, found that in both read speech and natural
speech, SgE speakers demonstrated a more stress-timed rhythm, with a significant
difference between the full-vowel sentence sets and reduced-vowel sentence sets that
were used. MalE, on the other hand, exhibited a more syllable-timed rhythm, with no
significant difference between the full-vowel and reduced-vowel sentence sets.
Second, SgE distinguishes between long-short vowel pairs but MalE does not
(Tan & Low, 2010). This difference causes MalE to have a more limited number of
vowel categories, when compared to SgE. Tan and Low (2010) found that SgE speakers
consistently distinguished between the vowel pairs /ɪ-i/ (as in BIT-BEAT), /ʌ-ɑ/ (as in CUT-
AFTERNOON), /ɒ-ɔ/ (as in COT-CAUGHT), and /ʊ-u/ (as in FOOT-SOON) in terms of vowel
duration. In MalE, the /ɒ-ɔ/ pair is never differentiated, showing that there is conflation of
/ɒ-ɔ/ in MalE and that speakers possess only one vowel to represent both sounds. This
pair also proved difficult for MalE speakers to differentiate in terms of vowel quality,
further explaining why MalE sounds more syllable-timed than SgE does. The conflation
of long-short vowel pairs in MalE, coupled with its lack of vowel reduction, gives MalE a
more staccato rhythm than SgE.
Despite these differences, many researchers have considered MalE and SgE as
interchangeable varieties (Brown, 1988a; Brown, 1988b; Platt & Weber, 1980; Platt,
Weber, & Ho, 1983; Tongue, 1979), most likely due to Malaysia and Singapore’s
overlapping histories.

13
Existing Research on Malaysian English
Researchers have now begun to contrast MalE and SgE in a crop of new articles
published in the last ten years. However, they seem to shy away from MalE phonology
and instead address other linguistic features such as syntax (Govindan & Pillai, 2017;
Khojasteh & Kafipour, 2012; Ting, Mahadhir, & Chang, 2010) and lexis (Ang, Rahim,
Tan, & Salehuddin, 2011; Tan, 2009a; Tan, 2009b). Nonetheless, there has been some
work done on MalE phonology with research on intelligibility (Rajadurai, 2006) and the
teaching and learning of pronunciation (Jayapalan & Pillai, 2011; Pillai, 2008; Pillai &
Jayapalan, 2010). In terms of recent studies on the sounds of MalE, these are mainly
sociolinguistic studies concerned with attitudes and perceptions toward MalE (Bolton,
2008; Lee, 2015; Wong et al., 2012).
When researchers move away from impressionistic work and into instrumental
analyses of MalE phonology, they still do not cover descriptions of MalE sounds; rather,
there is a strong focus on vowel contrasts and the role played by speakers’ L1s in
distinguishing between vowel pairs. Ahmad (2005) advocates that such studies are
important because understanding how Malaysian learners’ L1s affect their productions of
traditional vowel contrasts can aid in the understanding of how best to teach English
pronunciation in Malaysia. Pillai, Don, Knowles, and Tang (2010) beg to differ, however,
by stating:
We have to treat with some caution claims concerning the extent to which the L1
of Malaysian speakers influences their English pronunciation, since we are
dealing with a heterogeneous group with a wide range of L1s and ethnic,
geographical, educational, and socio-economic backgrounds. Valid

14
generalizations about vowels produced by Malaysians cannot be made using only
Malay as a reference point, particularly when referring to Malaysian English in
general. (p. 161)
Phoon, Abdullah, and Maclagan (2013) likewise agree that “MalE is not a uniform
variety of English” and that “one cannot therefore assume that all Malaysians sound alike
when they speak English” (p. 24).
In line with Pillai et al. (2010) and Phoon et al. (2013), Phoon and Maclagan
(2009) and Pillai (2014) agree that ethnicity affects a speaker’s pronunciation of MalE,
which echoes Schneider’s (2007) classification of MalE being a Phase 3 variety with
significant variability among sociolinguistic accents.
In spite of that, studies that include Chinese- and Indian-influenced MalE are few
and far between. Phoon and Maclagan (2009) found that although the number of MalE
consonants, 24, does not differ from other English varieties, they do differ in terms of
how they are realized. Figure 4 summarizes the findings for Chinese-influenced MalE
(ChMalE).
Place Bilabial Labio-
Dental
Inter-
Dental
Alveolar Post-
Alveolar
Palatal Velar Glottal
Manner
Plosive p b t d k g
Affricate ʈʃ dʒ
Fricative f v θ ð s z ʃ ʒ h
Nasal m n ŋ
Liquid l r
Glide w j
Figure 4. Consonant phoneme inventory of ChMalE (Phoon & Maclagan, 2009, p. 26)
For ChMalE consonants, Phoon and Maclagan (2009) found these features:
1. Glottalization of final stops
E.g., BED [beʔ], BOOK [bʊʔ], DOG [dɒʔ]

15
2. Devoicing of intervocalic and final voiced consonants
E.g., WEB [wɛp], EYES [aɪs], BRIDGE [brɪʈʃ]
3. Reduction of final consonant clusters
E.g., ELEPHANT [ælɪfən], PRESENT [prɛzən], LIFT [lɪf]
4. Flapping of intervocalic /t/
E.g., BUTTERFLY [bʌɽəflaɪ], CATERPILLAR [kæɽəpɪlə], COMPUTER [kɒmpjuɽə]
5. Substitution of labiodental fricative /v/ for bilabial glide /w/
E.g., VASE [was], VEST [wɛst], OVEN [ʌwən]
6. Avoidance of dental fricatives
E.g., BROTHER [brʌdə], TEETH [tif], NOTHING [nʌtɪŋ]
7. Omission of dark /l/
E.g., BALL [bɔʊ], MILK [mɪʊk], HOSPITAL [hɒspɪtə]
8. Rhoticity
E.g., FOUR [fɔr], MOTORCYCLE [motɚsaɪkʊ], BIRD [bɜrd]
9. Affrication of TR, DR, and STR
E.g., TREE [ʈʃri], DRUM [dʒʌm], STRAWBERRY [ʃtrɔbɛri]
10. Omission of morphological markers in final clusters
E.g., JUMPED [dʒʌmp], KICKED [kɪk], LAUGHED [laf] (pp. 26-33)
In terms of vowels, Pillai (2014) conducted an instrumental analysis of MalE
monophthongs and diphthongs with 11 participants of Chinese and Indian ethnicities by
using the University of Malaya’s Corpus of Spoken Malaysian English. Figure 5 shows
the monophthongs plotted on a formant chart. F2 on the x-axis stands for the second

16
formant, the value of which shows how fronted or backed a vowel is produced in the
mouth. F1 on the y-axis stands for the first formant, the value of which shows how high
or low a vowel is produced in the mouth. A formant chart thus provides a visualization of
the realizations of vowels in the mouth, allowing for easier comparisons.
This particular chart illustrates that:
1. /ɪ-i/, /e-æ/ (as in BET-BAT), and /ʌ-ɑ/ are produced close together, suggesting
conflation;
2. /ɒ-ɔ/ and /ʊ-u/ are produced far apart; and
3. /ɒ/ is produced more fronted and closer to /ʌ-ɑ/. (p. 67)
Figure 5. Monophthong vowels of MalE (Pillai et al., 2010, p. 165)
In Chinese- and Indian-influenced MalE, as Pillai (2014) found, /ɒ-ɔ/ are
produced far apart, whereas with Malay-influenced MalE (MaMalE), there is close
overlap in these vowels (Tan & Low, 2010).

17
As for MalE diphthongs, Figure 6 presents their average rate of change (ROC)
values, as found by Pillai (2014). ROC values describe the movements of diphthongs
from the first half of the vowel to the second half. When the ROC is a negative value, it
shows a rising trajectory from a lower vowel to a higher one, and when the ROC value is
small, it shows small movement. Therefore, with the values from Figure 6, it can be
deduced that the word BIDE moves slightly from the lower vowel /a/ to the higher vowel
/ɪ/.
Figure 6. Average rate of change (ROC) values for MalE diphthongs (Pillai, 2014, p. 75)
The MalE vowel inventory is similar to that of British English, with 13
monophthongs and seven diphthongs (Phoon & Maclagan, 2009). MalE’s realization of
those vowels, though, differ from British English, as shown in Figure 7. For ChMalE
vowels, Phoon and Maclagan (2009) found the following features:
1. Simplification of diphthongs
E.g., HAIR [hɛ], ALLIGATOR [ælɪgetə], PILLOW [pɪlo]
2. Distinction of vowel length
a. /i/ tends to be realized as a short, tense vowel with quality of /ɪ/
b. Words with /u/ in closed syllables realized with short, tense /ʊ/
c. Words with /ɜ/ (as in HEARD) may be produced as short, tense /ʌ/

18
d. Long, tense vowel /ɔ/ and short, lax vowel /ɒ/ not clearly distinct
e. Distinction between long, tense vowel /a/ and short, lax vowel /ʌ/ mostly
preserved
3. Realization of full vowels in unstressed syllables
E.g., OCTOPUS [ɒktəpʊs], AMBULANCE [æmbjuləns], POTATO [poteɪto] (pp. 34-37)
Key Word
(Wells, 1982)
RP Phonemic
Symbols
(Wells, 1982)
MalE
Phonemic
Symbols
Key Word
(Wells, 1982)
RP Phonemic
Symbols
(Wells, 1982)
MalE
Phonemic
Symbols
FLEECE i i or ɪ NURSE ɜ ɜ or ə
KIT ɪ ɪ STRUT ʌ ʌ or a
DRESS ɛ e or ɛ PRICE aɪ aɪ
TRAP æ æ MOUTH aʊ aʊ
GOOSE u u or ʊ CHOICE ɔɪ ɔɪ
FOOT ʊ ʊ or u FACE eɪ eɪ or e
THOUGHT ɔ ɔ or ɒ GOAT əʊ o or oʊ
LOT ɒ ɒ or ɔ NEAR ɪə ɪə
START ɑ a or ʌ SQUARE ɛə ɛə or ɛ
COMMA ə ə CURE ʊə Not tested
Figure 7. Vowel inventory of MalE (Phoon & Maclagan, 2009, p. 34)
While Pillai (2014) and Phoon and Maclagan (2009) covered ChMalE and
Indian-influenced MalE (InMalE) phonology comprehensively, more work still needs to
be done with comparisons of the three major accents: MaMalE, ChMalE, and InMalE.
Phoon et al. (2013) conducted a study that included participants from Malay,
Chinese, and Indian backgrounds, but it focused on MalE consonants. Phoon et al. (2013)
found that there are features in the realizations of MalE consonants that are distinctly
Malaysian, but there are also features that distinguish among the three accents. For
example, MaMalE, ChMalE, and InMalE all reduce final stop clusters such as the -NT in
PRESENT, producing it as /pɹɛzən/. However, only MaMalE and occasionally InMalE trill

19
R, as in /ræbɪt/ for RABBIT; only ChMalE rhotacizes final -R, as in /bəgəɹ/ for BURGER; and
only InMalE substitutes /v/ for /w/ as in /vɒtʃ/ for WATCH.
Often, when variation occurs in the pronunciation of Outer or Expanding Circle
Englishes, it is chalked up to the speakers’ different L1s, but in as complex a
sociolinguistic landscape as Malaysia, Phoon et al. (2013) speculate that “Malay may act
as a filter in the language transfer process and may influence [ChMalE and InMalE] as
well as [MaMalE]” (p. 20). What this shows is that there is value in studying MalE as a
standalone variety. More specifically, comparing the vowel inventories of MaMalE,
ChMalE, and InMalE allows for investigation into whether L1 transfer is in play or
whether Malay stands in the middle of that transfer process.
If there exist differences among these three accents, it can be speculated that L1
transfer is the cause of the differences. If there does not exist differences, that might then
mean that Malay is affecting the MalE phonology of speakers who do not speak Malay as
an L1. That could, in turn, reflect the effects of the language policy in Malaysia.

20
CHAPTER 3. METHODOLOGY
The Present Study
It is worthwhile to examine the possible relationship between the language
policy in Malaysia and the phonology of its variety of English as produced by its three
largest ethnic groups, all of which boast different linguistic repertoires, depending on
their educational and ethnic backgrounds. Hypothetically, if the language policy
influences how speakers of different L1s produce MalE monophthongs and diphthongs,
there should be little across-group variation. If this is the case, reforming the language
policy could be a step towards increasing the country’s overall English proficiency, if that
remains an issue for policymakers. On the other hand, if it is L1 transfer that influences
speakers’ productions of MalE monophthongs and diphthongs, policy reformation might
not be an effective measure.
In order to inspect this relationship, descriptions are needed of MaMalE,
ChMalE, and InMalE vowels. These descriptions would shed light on whether there are
within-group and across-group variations in vowel productions that would allow for the
comparison of these three accents of MalE. Prompted by such a possibility, this study
investigated the vowel quality of monophthongs and diphthongs among MaMalE,
ChMalE, and InMalE. The study was guided by two research questions:
1. What differences exist in the production of monophthongs among Malay-, Chinese-,
and Indian-influenced Malaysian English?
2. What differences exist in the production of diphthongs among Malay-, Chinese-, and
Indian-influenced Malaysian English?

21
Participants
Participants were recruited from the Malaysian student association at a large
American Midwestern university. An advertisement (Appendix A) was posted to the
association’s Facebook page. Joining this Facebook page is optional. In a welcome email
that Malaysian students receive prior to their arrival on campus, the link to join the
Facebook page is included for those interested. Because of that, the advertisement might
not have reached every Malaysian student on campus. An additional caveat is that the
Malay, Chinese, and Indian Malaysians who are interested might not speak Malay,
Mandarin, or Tamil at home. They might speak one of the other languages, and that
narrowed the potential participant pool.
Seven students responded to the advertisement over the course of a month. Four
reached out via private messages on Facebook Messenger, while the other three sent
emails. From these seven correspondences, only one stopped responding to emails. From
the remaining six responders, one referred a friend to the study, and that friend referred
another friend. Both referrals agreed to participate in the study, bringing the total
participants up to eight. The ninth and final participant was a friend brought along by
another one of the responders, and she was likewise interested in participating.
Table 1 summarizes the demographic information for the nine participants,
collected through a screening survey at the end of the informed consent form (Appendix
B). To ensure anonymity, participants were assigned into groups based on their first
language: MAL for the Malay speakers, MAN for the Mandarin speakers, and TAM for
the Tamil speakers. Their orders within their groups were than randomized to come up
with their code numbers.

22
Table 1.
Participants' demographic information
Group Participant code First language Age Gender
MAL MAL1 Malay 24 Female
MAL2 Malay 23 Male
MAL3
Malay 33 Female
MAN MAN1 Mandarin 21 Male
MAN2 Mandarin 19 Female
MAN3
Mandarin 19 Male
TAM TAM1 English 22 Male
TAM2 English 21 Male
TAM3 English 22 Male
The average age of participants in the MAL, MAN, and TAM groups is 27, 20,
and 22 respectively. Because of the limited responses to the advertisement, participant
demographics could not be controlled, resulting in differing ages and an unbalanced mix
of female and male participants. This was a concern because factors such as age and sex
can affect pronunciation (Wells, 1982). In MalE specifically, Tan and Low (2010) found
differences between female and male speakers. For example, female speakers tended to
overlap the /ɛ-æ/ and /ʌ-ɑ/ vowel pairs whereas male speakers did not.
Another detail to note is that the participants in the TAM group were actually L1
speakers of English, described by Govindan and Pillai (2017) as Dominant Users of
English. These Dominant Users of English generally come from multilingual
backgrounds, as is true for most Malaysians, but primarily speak English with family and
friends. They are still considered as having a Tamil background because, as explained by
the participants themselves, they still speak Tamil with their grandparents and extended
family members and grew up with Tamil influence. Joseph (2007) also found that Indian
Malaysians in such environments tend to acquire the phonological inventory of their
mothers, even if they do not necessarily have Tamil as an L1 or speak Tamil regularly.
23
With shifting educational and socio-economic backgrounds, Indian Malaysians are
increasingly identifying as Dominant Users of English (Govindan & Pillai, 2017).
Materials
There were four sets of materials used in this study: the informed consent
document, an interview reference sheet (Appendix C), the “Boy who Cried Wolf”
passage (Appendix D), and a PowerPoint presentation with 12 of Wells’ (1982) lexical
sets (Appendix E).
The “Boy who Cried Wolf” passage was chosen over the standard “North Wind
and the Sun” passage because of a few problems highlighted by Deterding (2006). First,
there are words in the “North Wind and the Sun” passage like CLOAK and OBLIGED that
are not as common in contemporary English, which might affect how participants
pronounce them and cause inconsistencies in the data. Second, some of the word orders,
e.g. the more closely did the traveler fold his cloak around him, are archaic and might
make participants’ readings of the passage more disjointed and less fluent. Third, the
“North Wind and the Sun” passage uses comparably longer sentences than the “Boy who
Cried Wolf” passage does, and longer sentences are more difficult to read aloud.
A PowerPoint presentation was utilized to elicit 12 of Wells’ (1982) lexical sets
in the carrier sentence Now I say WORD. It was set up to show the phrase Now I say
followed immediately by the target word. After each sentence, participants were
prompted to click the mouse to move on to the next sentence. An example slide is shown
in Figure 8.

24
Figure 8. Example slide in PowerPoint presentation
These 12 lexical sets, referred to henceforth as vowels, are representative of sets
of words with similar vowels. For example, the lexical set FLEECE is representative of
words containing the /i/ vowel such as BEAD or HEED. These 12 lexical sets were
specifically chosen because eight of them (FLEECE, KIT, DRESS, TRAP, GOOSE, FOOT,
THOUGHT, and LOT) contain vowel pairs that MalE has been previously thought to
conflate (Ahmad, 2005; Phoon & Maclagan, 2009; Tan & Low, 2010). One of them
(STRUT) has been shown to be realized as /strʌt/ and /strat/ interchangeably in MalE
(Phoon & Maclagan, 2009). One of them (NURSE) contains an r-colored vowel that MalE
realizes as /nɜs/ or /nəs/ (Phoon & Maclagan, 2009). The final two (FACE and GOAT) were
the only diphthongs investigated because they are the only diphthongs that show variation
in MalE, as was established in Figure 7. The other diphthong, SQUARE, has a final r-sound
that might affect the vowel production, as Phoon and Maclagan (2009) found. The order

25
in which these words were presented to participants was jumbled so that the progression
was not made obvious to them.
Equipment
The audio files were recorded on a Zoom H2 audio recorder as three separate
files corresponding to the three tasks for each participant. The .wav files were then
transferred to a Mac desktop computer and labelled (Participant Code) P(1/2/3). The
second task for the third participant in the Tamil-speaker group, for example, would thus
be TAM3 P2. Another Mac desktop was used for the PowerPoint slides for Task 3. This
computer was situated in the recording room.
Recording Environment
All recordings were made in a dedicated media lab, a small, enclosed room with
limited background noise. For the informed consent procedure and the first and second
tasks, the participant was seated at a table placed in the center of the room. For the third
task, the participant was seated behind the Mac desktop. The audio recorder was always
placed on the flat surface in front of them, about nine inches from the mouth. Only one
participant was interviewed in the room at any given time.
Procedures
When the participants arrived, they were seated at the table for the informed
consent procedure. After asking any questions, the participants signed the consent form
and completed the screening survey. Once it was confirmed that they were 18 years or
older and spoke Malay, Mandarin, or Tamil as a first language, the first task, the
interview, was started. For the second task, participants were handed a sheet with the
“Boy who Cried Wolf” passage, accompanied with instructions. They were given some

26
time to silently read through the passage to familiarize themselves with the story. The
audio recorder was started whenever they were ready to begin reading aloud. Participants
were then ushered to the desktop for the third task. They were given some time to read
the instructions, and questions were answered. When they were ready to begin, the audio
recorder was started. Participants had control of the mouse and could click to move on to
the next page whenever they were ready. After each data collection session, the audio
files were transferred onto a separate, private desktop computer and labelled accordingly.
Data Analysis
All of the data analyses were conducted on Praat Version 6.0.28 (Boersma &
Weenink, 2017). The analyses began with the audio from Task 3 because the citation
forms allowed for clearer realizations of the target words and consequently allowed for
more accurate formant extraction. Audio files from Tasks 1 and 2 were back-up files to
be consulted if there happened to be inconsistencies in the Task 3 data resulting from
unconventional pronunciations of the lexical sets or from noise.
To extract formants, each Task 3 audio file was opened in Praat. Each target
word was identified and selected. This process was streamlined by turning on formants,
which show up as red dotted lines in Figure 9.
There are five formants shown in the figure, but for the purposes of this study,
only the first and second formants were used. The first and second formants are the first
and second red dotted lines, counted from the bottom. If these two formants were parallel
to each other throughout the length of the vowel as in Figure 10, the vowel was
considered a monophthong. If the two formants were not parallel to each other

27
throughout the length of the vowel and instead diverged in their paths, the vowel was
considered a diphthong, as in Figure 11.
Figure 9. Praat interface for TAM1's LOT
Figure 10. Example of a monopthong

28
Figure 11. Example of a diphthong
Formant extraction for monophthongs involved clicking on the midpoint of the
vowel and pulling up the formant listing. Figure 12 shows a screenshot of the process,
with the values for the first and second formants highlighted on the formant listing.
Figure 12. Formant extraction for monophthongs

29
For diphthongs, in order to capture the glide or the movement that the vowel
makes from one part of the mouth to another, formants were recorded for the 25-percent
mark and the 75-percent mark of the entire vowel. As Figures 13 and 14 show, it was
akin to breaking the diphthong into two monophthongs and measuring their midpoints.
The formants extracted from Praat were provided in Hertz, but for this study,
they were converted into the Bark scale using the following formula that was proposed by
Zwicker and Terhardt (1980). Z in the formula is the frequency in Bark, and F is the
original frequency in Hertz:
Z = 13 arctan (0.00076F) + 3.5 arctan (F/7500)2
Bark is preferred to Hertz because it accounts for individual differences among
speakers such as the shape or the size of their mouths by transforming the frequencies
into a perceptual scale (Tan & Low, 2010).
With this formant frequency information, each of the participants’ vowel charts
were plotted onto a formant chart. F1 on the y-axis represents vowel height or how high
or low in the mouth the vowel was produced. F2 on the x-axis represents vowel frontness
or how front or back in the mouth the vowel was produced. Charts were also plotted for
each lexical set, with all participants’ productions included. The formant values of all
three participants were then averaged for each group to be used to plot a comprehensive
vowel chart for comparison across groups. These charts were plotted using Praat scripts,
an example of which can be found in Appendix F.

30
Figure 13. Formant extraction for diphthongs at 25-percent mark
Figure 14. Formant extraction for diphthongs at 75-percent mark

31
CHAPTER 4. RESULTS AND DISCUSSION
Within-Group Comparison
Malay-influenced Malaysian English
Table 2 shows the formant values in Bark of the 12 analyzed vowels for the
MAL group. Diphthongs are marked by two assigned values. For example, the F11/F12 of
GOOSE for MAL1 is 3.95/4.59, and the F21/F22 is 10.06/10.33. Based on these formant
values, it can be observed that MAL1 diphthongized vowels more frequently than did
MAL2 and MAL3, both of whom produced all 12 vowels as monophthongs, save for
FACE.
Table 2.
Formant values in Bark for MAL group
Vowels MAL1 MAL2 MAL3
F1 F2 F1 F2 F1 F2
FLEECE 3.89 15.66 3.30 13.67 3.64 15.37
KIT 4.44 15.56 3.58 14.21 4.22 15.06
DRESS 7.47 13.53 5.44 12.90 7.48 12.71
TRAP 8.10 13.38 6.13 12.21 7.69 12.55
GOOSE 3.95/4.59 10.06/10.33 3.75 8.47 3.69 8.25
FOOT 4.56 9.91 4.15 7.28 3.97 9.57
THOUGHT 7.28 9.13 6.31 8.97 7.14 9.62
LOT 8.02 10.51 5.94 8.55 7.15 9.05
STRUT 7.84 11.18 6.53 9.88 6.38 11.92
NURSE 6.66/5.60 12.20/11.31 4.85 12.41 5.35 12.22
FACE 4.71/4.04 15.01/15.31 4.34/4.15 12.84/13.86 3.79/4.58 15.21/15.00
GOAT 4.77/4.44 8.74/8.33 4.49 8.55 3.67 7.98
Figure 15 shows the vowel chart for MAL1. It can be observed that this
participant distinguished all 12 vowels and produced them as distinct from one another.
The only two vowels that exhibit some conflation are FOOT and the second half of the
diphthongized GOOSE. GOOSE moved lower in the mouth, toward the FOOT vowel. Besides
GOOSE, the other three diphthongs for MAL1 are NURSE, FACE, and GOAT. NURSE was still

32
produced as a mid central vowel, but it moved higher and more backed. FACE and GOAT
also moved higher, with FACE being fronted and GOAT being backed.
Figure 15. Vowel chart for MAL1
Apart from these observations, Figure 15 also shows that MAL1’s vowel chart
contains six discrete sections:
1. High front vowels (FLEECE, FACE, and KIT)
2. High back vowels (GOOSE, FOOT, and GOAT)

33
3. Mid central vowel (NURSE)
4. Low front vowels (DRESS and TRAP)
5. Low central vowels (STRUT and LOT)
6. Low back vowel (THOUGHT)
Figure 16 shows the vowel chart for MAL2. This participant distinguished
among all 12 vowels, and they all appear to be produced as monophthongs. The only
diphthong for MAL2 was FACE. It did not change much in terms of F1, but it moved
toward the front.
MAL2’s vowel chart can more or less be sectioned into five areas:
1. High front vowels (FLEECE, KIT, and FACE)
2. High back vowels (GOOSE, FOOT, and GOAT)
3. Mid front vowel (NURSE)
4. Low front vowels (DRESS and TRAP)
5. Low back vowels (LOT, THOUGHT, and STRUT)
MAL2, based on his vowel space, does not appear to have any central vowels.
Figure 17 shows the vowel chart for MAL3. There appears to be a number of conflated
vowels. GOAT and GOOSE and THOUGHT and LOT were produced very closely to each
other, suggesting that MAL3 realizes GOAT and GOOSE as the same vowel and THOUGHT
and LOT as the same vowel. That means that MAL3 only distinguished among ten of the
vowels. In terms of diphthongization, her only diphthong is FACE. It did not change much
in F2, but it moved lower in the mouth, past KIT. MAL3’s vowel chart can be divided into
five sections:

34
1. High front vowels (FLEECE, FACE, and KIT)
2. High back vowels (FOOT and GOAT/GOOSE)
3. Mid central vowels (NURSE and STRUT)
4. Low front vowels (DRESS and TRAP)
5. Low back vowel (THOUGHT/LOT)
Figure 16. Vowel chart for MAL2
35
In Figure 18, all three of the MAL participants’ vowel charts were combined into
one formant chart. MAL1’s chart was colored in maroon, MAL2’s chart was colored in
green, and MAL3’s chart was colored in blue. MAL1 and MAL3 appear to have a rather
similar vowel space in that the difference in F1 and F2 values among their vowel sections
is large, which suggests that MAL1 and MAL3 have larger vowel spaces. In contrast,
MAL2’s vowel space is smaller; the difference in his F1 and F2 values is smaller. Since
MAL2 was the only male speaker in the group, this difference could be attributable to a
gender difference.
It is also worth noting that despite the differences in vowel space size, the high
back vowels for all three participants still seem to have very similar F1 and F2 values.
The second half of MAL1’s GOAT diphthong and MAL2’s GOAT monophthong were
produced very closely to each other in terms of formant values. The same can be said of
MAL2’s GOOSE and MAL3’s GOAT/GOOSE. Besides the high back vowels, the high front
vowels were also produced very similarly between MAL1 and MAL3. Both of these
similarities suggest that the L1, Malay, could have an influence on the high vowels of
MaMalE.
These findings partially echo what Pillai et al. (2010) found, which was that
MaMalE exhibits the least contrast between the /i-ɪ/ vowel pair, as shown in Figure 19.
This pair corresponds to the FLEECE and KIT vowels in Figure 18. Another similarity
between these and Pillai et al.’s (2010) findings is that the vowels are produced at
approximately the same location in the mouth, with there being six vowel sections, the
same amount that MAL1 possesses.

36
Figure 17. Vowel chart for MAL3

37
Figure 18. Combined vowel chart for MAL participants

38
Figure 19. Monophthong vowels of MaMalE (Pillai et al., 2010, p. 168)
Chinese-influenced Malaysian English
For the MAN group, many of the 12 vowels were diphthongized, at least for
MAN1 and MAN2. MAN1 and MAN2 produced five diphthongs, but MAN3 produced
only two. All three of them were consistent with the diphthongization of FACE and GOAT.
Table 3 shows the formant values in Bark of the 12 vowels for the MAN participants.
Although Figure 20 shows some overlap in MAN1’s production of the 12
vowels, it can be argued that the gliding from diphthongization created more vowel
categories for MAN1. For example, GOAT and GOOSE appear at first glance to be
conflated, but MAN1’s diphthongization of them moved them away from each other.
GOAT moved slightly higher and more backed. GOOSE moved higher also but more
fronted. The same can be said of DRESS, which began as almost overlapping TRAP, but the
diphthongization moved it higher and more fronted and away from TRAP. The other two

39
diphthongs are FACE and THOUGHT. While FACE moved higher and slightly more backed,
THOUGHT moved lower and also more backed. Figure 20 also shows that MAN1’s vowel
chart has six sections:
1. High front vowels (FLEECE, FACE, and KIT)
2. High central vowel (second half of GOOSE)
3. High back vowels (GOAT, first half of GOOSE, and FOOT)
4. Mid central vowel (NURSE)
5. Low front vowels (DRESS, TRAP, and STRUT)
6. Low back vowels (THOUGHT and LOT)
Table 3.
Formant values in Bark for MAN group
Vowels MAN1 MAN2 MAN3
F1 F2 F1 F2 F1 F2
FLEECE 3.00 13.41 4.28/4.32 15.29/11.73 2.88 14.17
KIT 3.63 13.51 4.38/4.28 14.56/13.98 3.80 13.59
DRESS 6.59/6.23 11.10/11.88 7.00 12.52 6.01 11.82
TRAP 6.67 11.04 7.65 12.20 6.47 11.39
GOOSE 4.17/2.85 7.22/10.20 3.75 10.37 3.88 9.73
FOOT 4.10 8.22 4.25 9.96 4.24 8.22
THOUGHT 6.60/7.46 8.39/7.58 7.33 9.35 6.19 7.84
LOT 6.79 7.98 7.78 9.96 6.17 8.20
STRUT 6.98 10.20 7.09 10.81 6.25 10.62
NURSE 4.49 10.97 5.67/5.07 11.59/12.63 5.53 11.55
FACE 3.89/3.11 13.44/13.18 5.34/4.29 14.31/12.11 4.96/3.48 13.58/14.20
GOAT 4.06/3.64 7.16/6.90 4.48/4.22 9.78/9.51 5.16/4.67 8.01/6.19
MAN2, as illustrated by Figure 21, appears to have produced the 12 vowels as
distinct vowels, but three of her diphthongs move toward and conflate with the other
vowels. Her GOAT moved higher and slightly backed to meet her FOOT. As for her FLEECE
and FACE, they both moved and met in the same place. FLEECE did not change much in its
F1, but it moved back toward the central part of the mouth. FACE, on the other hand,

40
moved higher and back. Besides that, MAN2 also diphthongized KIT and NURSE. KIT, like
FLEECE, did not change much in F1 value, but it moved slightly back in the mouth. NURSE
moved higher and front, toward the high vowels.
Figure 20. Vowel chart for MAN1

41
Overall, MAN2’s vowel space can be divided into seven sections:
1. High front vowels (first half of FLEECE, KIT, and first half of FACE)
2. High central vowels (second half of FACE, second half of FLEECE, and second half of
NURSE)
3. High back vowels (GOOSE, GOAT, and FOOT)
4. Mid central vowel (NURSE)
5. Low front vowels (DRESS and TRAP)
6. Low central vowel (STRUT)
7. Low back vowels (THOUGHT and LOT)
There appears to be conflation between MAN3’s THOUGHT and LOT, as can be
seen in Figure 22. That suggests that MAN3 has only one vowel that represents both
THOUGHT and LOT. Apart from that, MAN3 produced the other ten vowels as distinct
vowels. The only two diphthongs for this participant are FACE and GOAT. FACE moved
higher and slightly front, while GOAT also moved higher albeit slightly and back.
Overall, Figure 22 shows that MAN3’s vowel space has six sections:
1. High front vowels (FLEECE, second half of FACE, and KIT)
2. High central vowel (GOOSE)
3. High back vowels (FOOT and GOAT)
4. Mid front vowel (first half of FACE)
5. Low front vowels (NURSE, DRESS, TRAP, and STRUT)
6. Low back vowel (THOUGHT/LOT)

42
Figure 21. Vowel chart for MAN2
From Figure 23, the MAN vowel charts do not appear to line up well. There does
not appear to be any intragroup conflation either. However, some of the vowels were
produced with approximate formant values:
1. MAN3’s KIT and first half of MAN1’s FACE
2. MAN3 and MAN2’s (first half of diphthong) NURSE
3. MAN3’s TRAP and MAN1’s DRESS
4. MAN1 and MAN3’s FOOT

43
Figure 22. Vowel chart for MAN3
44
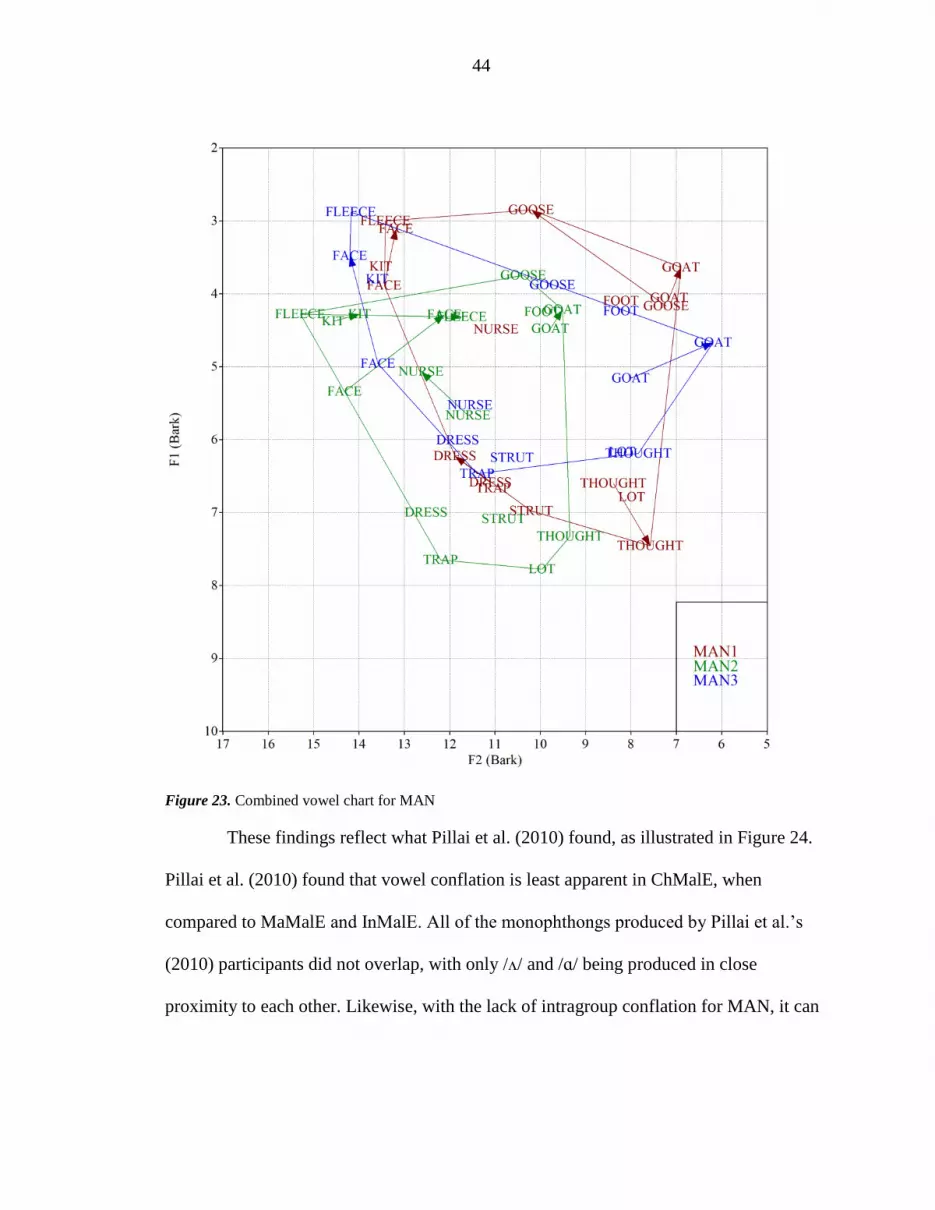
Figure 23. Combined vowel chart for MAN
These findings reflect what Pillai et al. (2010) found, as illustrated in Figure 24.
Pillai et al. (2010) found that vowel conflation is least apparent in ChMalE, when
compared to MaMalE and InMalE. All of the monophthongs produced by Pillai et al.’s
(2010) participants did not overlap, with only /ʌ/ and /ɑ/ being produced in close
proximity to each other. Likewise, with the lack of intragroup conflation for MAN, it can

45
be speculated that generally, in ChMalE, the 12 analyzed vowels are categories of their
own.
Figure 24. Monophthong vowels of ChMalE (Pillai et al., 2010, p. 169)
Indian-influenced Malaysian English
Table 4 shows the formant values of the 12 vowels as produced by the TAM
group. This group had the most demographically similar participants. They were all male
speakers aged 21 or 22, who speak English as an L1 with Tamil influence. Surprisingly,
none of them share many similarities in their diphthongizations of the vowels. The only
intragroup similarity is the diphthongization of FACE and GOAT.
Of the 12 vowels, only 11 of them were produced distinctly by TAM1, as Figure
25 illustrates. TAM1’s FACE was produced in almost the same place in the mouth as his
KIT, although the diphthongization of FACE brought it closer to FLEECE as it moved higher

46
and more front. The only other diphthong, GOAT, moved lower and more front, toward
LOT.
Table 4.
Formant values in Bark for TAM group
Vowels TAM1 TAM2 TAM3
F1 F2 F1 F2 F1 F2
FLEECE 3.35 13.84 2.71 13.95 4.04/3.01 14.20/13.04
KIT 4.30 13.06 4.56 13.08 4.61 13.00
DRESS 5.87 11.68 6.85 11.75 5.31 11.25
TRAP 6.87 11.07 7.66 11.13 6.12 11.01
GOOSE 3.14 8.23 3.29 9.67 4.00 8.87
FOOT 4.92 9.59 5.11/5.24 7.69/9.17 4.69 8.10
THOUGHT 7.05 8.29 8.01 8.24 5.77 8.74
LOT 5.90 8.97 8.08/7.73 8.34/8.34 5.83 12.26
STRUT 6.27 10.97 7.36 9.82 6.16 11.22
NURSE 5.44 12.27 5.69/5.48 10.82/11.82 4.95/4.99 11.64/13.00
FACE 4.37/3.73 13.23/13.58 4.77/3.94 13.44/14.02 4.39/3.97 13.39/13.57
GOAT 4.81/5.75 7.19/8.02 5.30/5.06 8.28/7.36 4.73/4.33 8.48/8.46
TAM1 has seven sections in his vowel space:
1. High front vowels (FLEECE, FACE, and KIT)
2. High back vowel (GOOSE)
3. Mid front vowels (NURSE, DRESS, and STRUT)
4. Mid central vowels (FOOT and LOT)
5. Mid back vowel (GOAT)
6. Low front vowel (TRAP)
7. Low back vowel (THOUGHT)
TAM2 appears to distinguish among ten of the 12 vowels, as shown in Figure 26.
The two vowels that conflated are THOUGHT and LOT. Even as LOT, a diphthong, moved
away from THOUGHT, the movement was slight and kept it in the same vicinity. Another
diphthong movement occurred between FOOT and GOAT when they switched places. FOOT
moved slightly lower and more front, and GOAT moved slightly higher and more back,

47
into the first half of FOOT. Besides LOT, FOOT, and GOAT, TAM2 also diphthongized FACE
and NURSE. FACE moved higher and more front, maintaining its position in the front-most
area of the vowel space. NURSE made the same movement higher and more front in the
mouth, but its movement was less marked than FACE’s, keeping it as a mid central vowel.
Figure 25. Vowel chart for TAM1

48
TAM2’s vowel space thus appears to have eight sections:
1. High front vowel (FLEECE)
2. High back vowel (GOOSE)
3. Mid front vowels (FACE and KIT)
4. Mid central vowel (NURSE)
5. Mid back vowels (FOOT and GOAT)
6. Low front vowels (DRESS and TRAP)
7. Low central vowel (STRUT)
8. Low back vowels (LOT and THOUGHT)
As can be seen in Figure 27, TAM3’s vowel space is already visibly smaller than
TAM1 and TAM2’s. He also seems to only distinguish among ten of the 12 vowels. His
STRUT and TRAP were produced almost directly on top of each other, suggesting that he
only has one vowel category to represent both of those vowels. In terms of
diphthongization, TAM3 has four: FLEECE, FACE, NURSE, and GOAT. FLEECE moved from
its position as a high front vowel into a higher but more backed position. FACE did not
change much in terms of frontness, but it moved slightly higher to join the first half of
FLEECE. NURSE maintained its height but moved from its position as a mid central vowel
to a mid front vowel. GOAT moved slightly higher, with not much change in its F2 value,
and stayed as a high back vowel.
Due to TAM3’s smaller vowel space, it came as no surprise that he only had six
sections:
1. High front vowels (FLEECE, FACE, and KIT)
2. High back vowels (GOOSE, GOAT, and FOOT)

49
3. Mid front vowel (second half of NURSE)
4. Mid central vowels (first half of NURSE and DRESS)
5. Low front vowels (LOT, STRUT, and TRAP)
6. Low back vowel (THOUGHT)
Figure 26. Vowel chart for TAM2

50
Figure 27. Vowel chart for TAM3
The TAM participants appear to have similarly shaped vowel charts, as Figure
28 shows. This might be where the homogeneity of the participant demographics makes
itself apparent. The TAM vowels also appear to be very peripheral in that they lean
toward the sides of the vowel spaces instead of staying in the middle. Even the mid
central vowels, except for TAM1’s FOOT, are closer to the front or back of the vowel
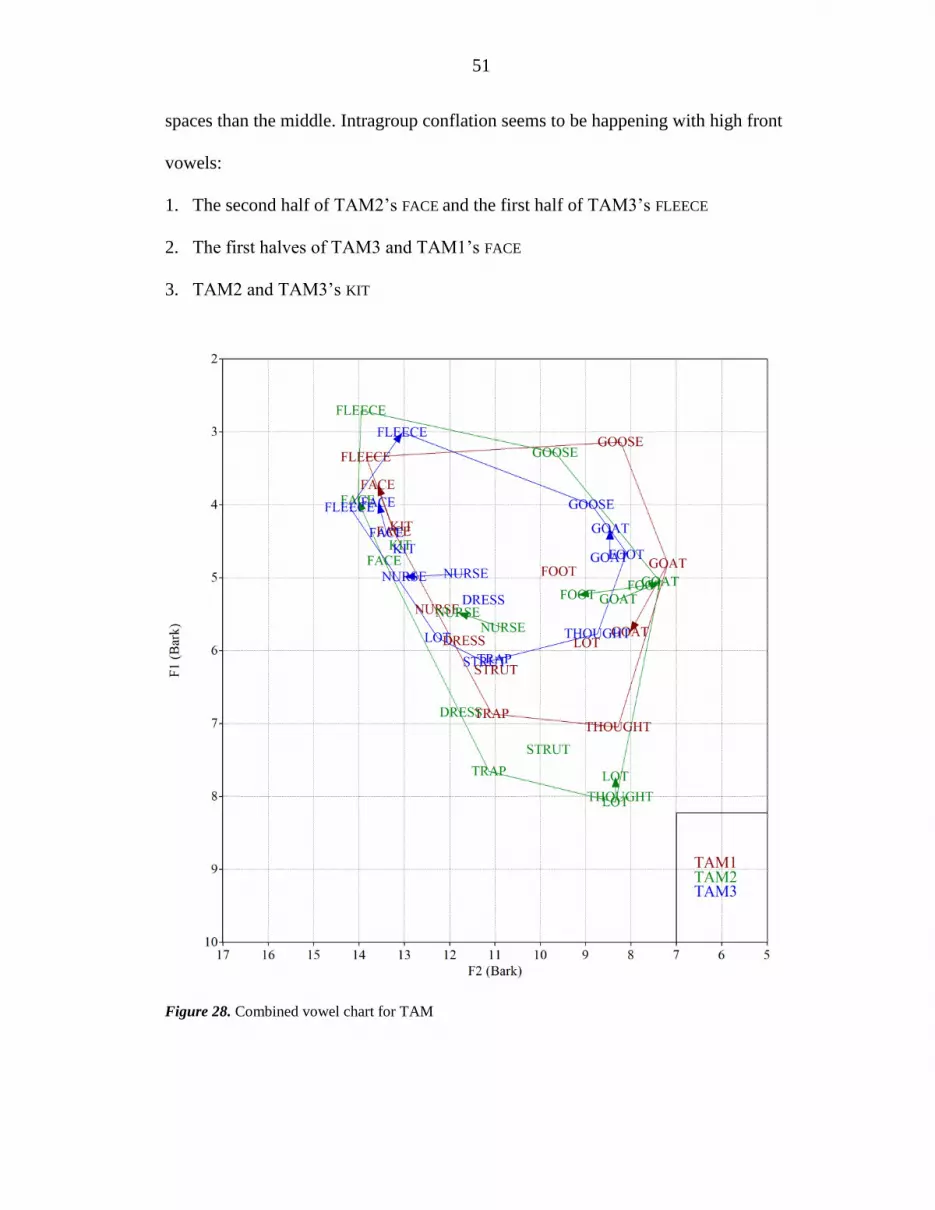
51
spaces than the middle. Intragroup conflation seems to be happening with high front
vowels:
1. The second half of TAM2’s FACE and the first half of TAM3’s FLEECE
2. The first halves of TAM3 and TAM1’s FACE
3. TAM2 and TAM3’s KIT
Figure 28. Combined vowel chart for TAM

52
Figure 29 shows Pillai et al.’s (2010) findings that InMalE’s /e/ and /æ/ vowels
are completely merged into one vowel. This vowel pair best corresponds to the DRESS and
TRAP vowels respectively, so judging from Figure 28, DRESS and TRAP also show
intragroup conflation. Figure 28 also shows intragroup conflation happening with the
high front vowels FLEECE and KIT, which correspond to the /i/ and /ɪ/ vowels in Figure 29.
Additionally, STRUT and LOT in Figure 28 overlap as well, and they correspond to the /ʌ/
and /ɒ/ vowels in Figure 29.
Figure 29. Monophthong vowels of InMalE (Pillai et al., 2010, p. 169)
Across-Group Comparison
Table 5 summarizes the characteristics of MaMalE, ChMalE, and InMalE, as
deduced from each group’s intragroup similarities. MAL appears to have the fewest
sections in their vowel spaces, with only High Front, High Back, Mid Central, Low
Front, Low Central, and Low Back. MAN has one more section, High Central. TAM has

53
the most number of sections. It has all of the six sections that MAL has plus Mid Front
and Mid Back. It does not, however, have MAN’s High Central.
With this information, it can be speculated that Malay has the least number of
vowel categories, followed by Mandarin, and Tamil has the most number of vowel
categories. Also, MAN appears to show the most intragroup variation, with no intragroup
conflation of vowels. This might be attributable to the more diverse L1s spoken by the
Chinese communities. Without access to the vowel inventories of Malaysian Malay,
Malaysian Mandarin, and Malaysian Tamil, however, direct comparisons cannot be
made. As for diphthongization, it is consistent between MAN and TAM, but MAL does
not diphthongize GOAT, possibly due to their smaller number of vowel categories.
Table 5.
Characteristics of Malay-, Chinese-, and Indian-influenced Malaysian English
Characteristic MAL MAN TAM
Sections of vowel
space
Five or six
High Front
High Back
Mid Central
Low Front
Low Central
Low Back
Six or seven
High Front
High Central
High Back
Mid Central
Low Front
Low Central
Low Back
Six to eight
High Front
High Back
Mid Front
Mid Central
Mid Back
Low Front
Low Central
Low Back
Conflation High vowels
GOAT
GOOSE
None High Front vowels
FACE
FLEECE
KIT
Diphthongization FACE FACE
GOAT
FACE
GOAT
For an across-group comparison of the vowels, vowel charts were plotted for
each individual vowel with all nine participants’ vowels on them. In each chart, the
maroon squares represent vowels for the MAL participants, the green circles represent

54
vowels for the MAN participants, and the blue diamonds represent vowels for the TAM
participants. Because FACE and GOAT are traditionally produced as diphthongs, their
charts were used for diphthong comparison. The other ten vowels were used for
monophthong comparison.
Monophthong production
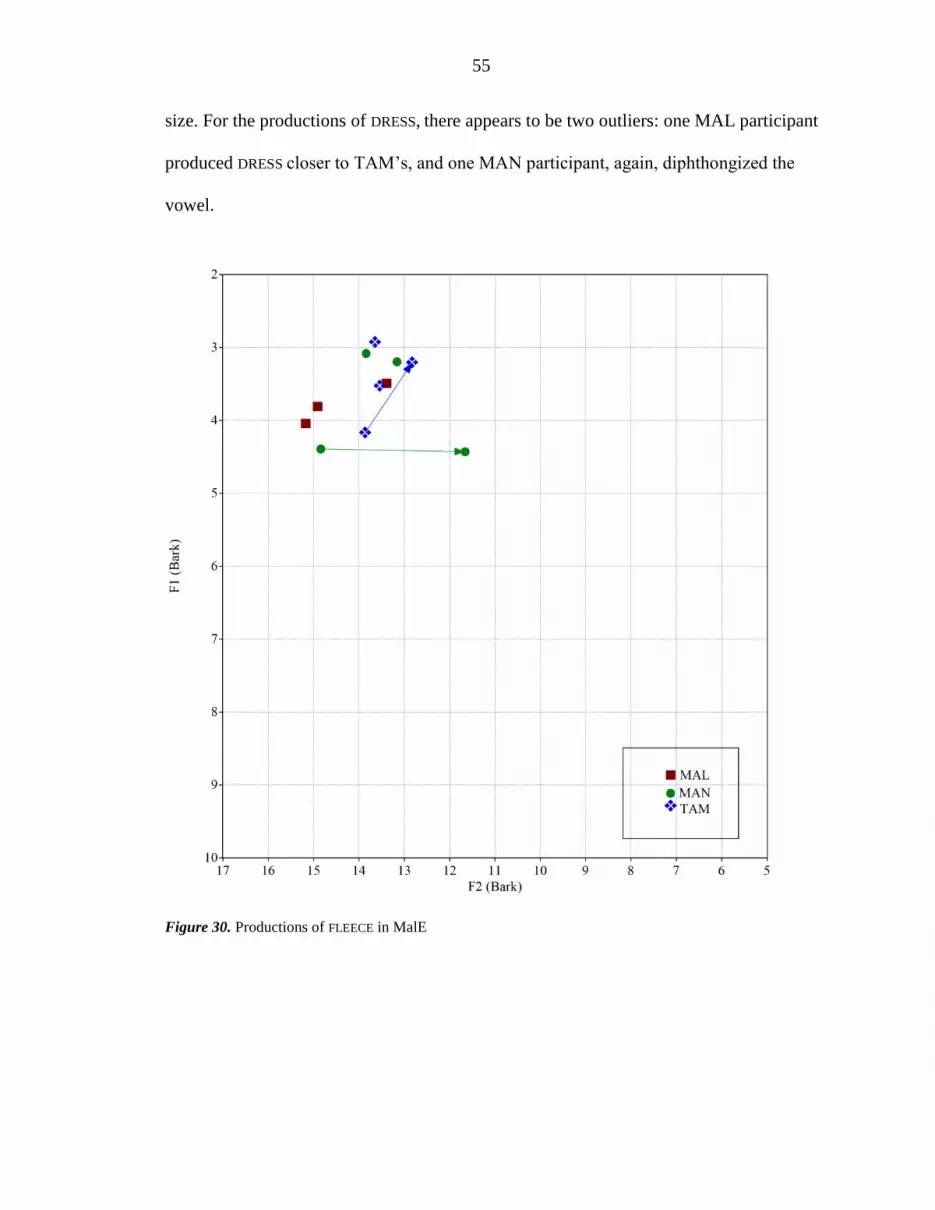
It can be seen from Figure 30 that all of the participants produced FLEECE as a
high front vowel. TAM appears to show the most consistency in F2 value, even after the
diphthongization by one TAM participant. MAL, on the other hand, shows the most
consistency in F1 value. Two of the participants even produced FLEECE close to each
other. MAN, although two of the participants also produced FLEECE close to each other,
the third participant not only produced it at a much lower position but also diphthongized
the vowel.
An observation about Figure 31 is that KIT is a stable vowel in MalE. All of the
groups produced KIT in intragroup clumps. They were all produced as high front vowels,
but MAL’s KIT is the most fronted, followed by MAN’s and TAM’s after. The TAM
participants were the most similar; two of their vowels are on the verge of conflation. KIT
was only diphthongized by one participant from the MAN group.
There appears to be a noticeable difference in F1 value among the nine
participants, as can be seen in Figure 32. That means that although all participants
produced DRESS as a central vowel, they differed in how high or low they produced it.
This might be attributable to the differences in the size of the participants’ vowel spaces.
Referring back to Figures 18, 23, and 28 for the combined vowel charts for each group,
even among the three participants in each group, there are differences in vowel space
55
size. For the productions of DRESS, there appears to be two outliers: one MAL participant
produced DRESS closer to TAM’s, and one MAN participant, again, diphthongized the
vowel.
Figure 30. Productions of FLEECE in MalE

56
Figure 31. Productions of KIT in MalE

57
Figure 32. Productions of DRESS in MalE
58
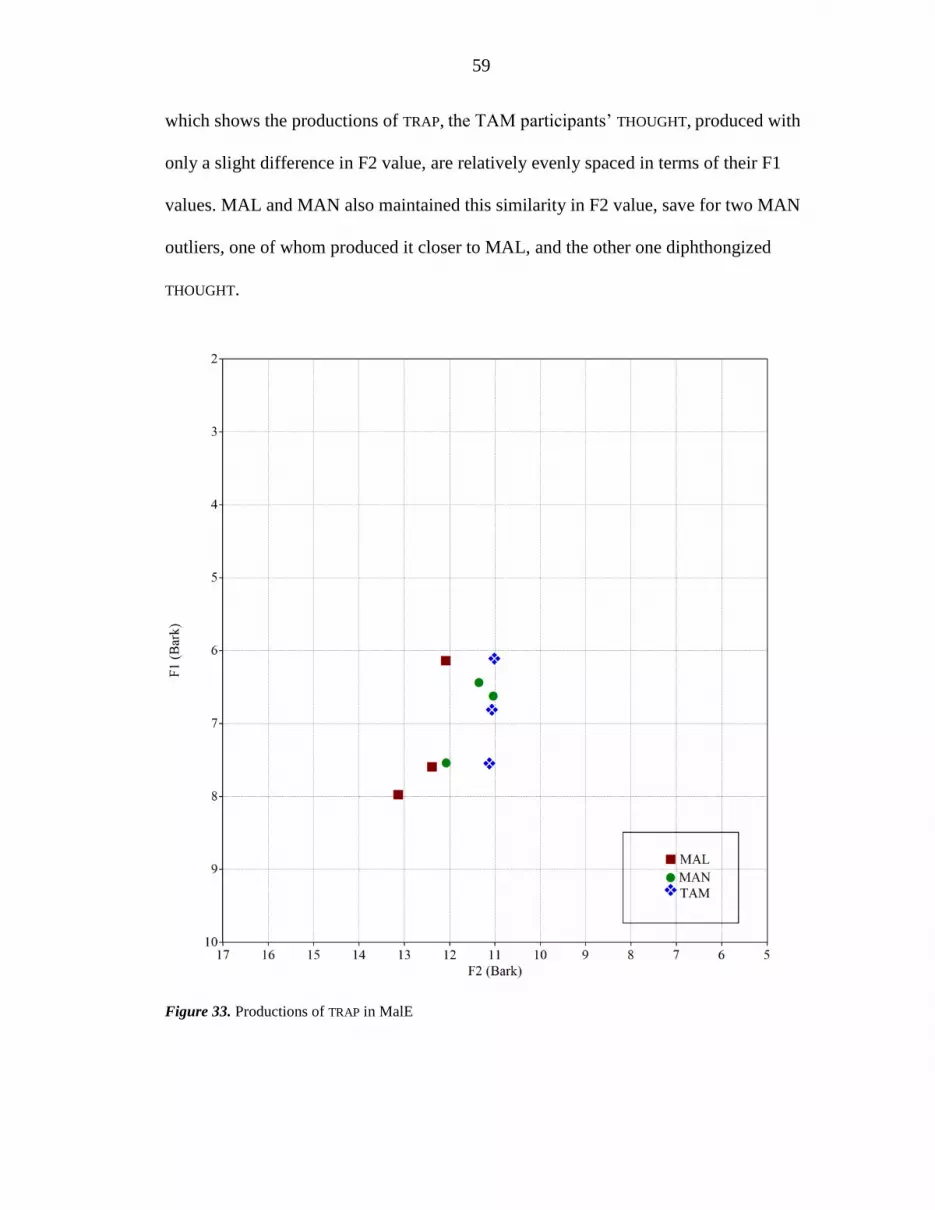
The same observation can be made about Figure 33 where the participants
produced TRAP with approximately the same F2 value, as a central vowel, but they
differed in height. Most prominently, among the TAM participants, TRAP was produced
with virtually the same F2 value, but the difference in F1 values among them is almost
exactly 0.7 Bark between the highest and the second highest and between the second
highest and the lowest. The other groups were not as consistent in their productions, with
an outlier MAL participant producing TRAP closer to where the MAN participants did,
and an outlier MAN participant producing it closer to where the MAL participants did.
From Figure 34, GOOSE appears to be produced by all participants as a high back
vowel. Up to this point, there has only been one MAN participant diphthongizing
traditionally monophthongal vowels. GOOSE is no different for MAN, but the participant
is now joined by a MAL outlier who also diphthongized GOOSE. Additionally, this MAL
outlier also produced GOOSE closer to MAN, while the other two MAL participants
produced it closely to each other.
FOOT, in Figure 35, appears to have been produced consistently among all of the
participants. They all produced FOOT as a high back vowel, and MAL and MAN seem to
realize FOOT at the same height, just with the majority of MAL producing it more fronted
than the majority of MAN. As for TAM, although their productions of FOOT were still in
the same general vicinity as the other two groups, their productions appear lower. One
TAM participant also diphthongized FOOT, moving it from a position closer to one other
TAM participant to a position closer to the remaining TAM participant.
All participants, for THOUGHT, produced it with approximately the same F2
values, in the back of the mouth, as Figure 36 delineates. Reminiscent of Figure 33,
59
which shows the productions of TRAP, the TAM participants’ THOUGHT, produced with
only a slight difference in F2 value, are relatively evenly spaced in terms of their F1
values. MAL and MAN also maintained this similarity in F2 value, save for two MAN
outliers, one of whom produced it closer to MAL, and the other one diphthongized
THOUGHT.
Figure 33. Productions of TRAP in MalE

60
Figure 34. Productions of GOOSE in MalE

61
Figure 35. Productions of FOOT in MalE

62
Figure 36. Productions of THOUGHT in MalE

63
Figure 37 shows that the productions of LOT are scattered throughout the low
back area of the mouth. While MAL and MAN’s productions are clumped, TAM’s LOT
exhibits some intragroup and intergroup variation. The intragroup variation is that two
TAM participants produced LOT higher than any other participant did. The other
participant produced it lower than the other participants did. There is also one TAM
participant who produced LOT in a much more fronted position than the other participants
did. As for intergroup variation, TAM is the only group with diphthongization of LOT.
From Figure 38, it can be observed that STRUT is produced as a low central vowel
in MalE. Unlike MAL, of which the participants exhibited even intragroup dispersion,
MAN and TAM both had two participants who produced the vowel closely to each other.
They both also have one outlier each. The MAN outlier produced STRUT closer together
with the TAM participants, while the TAM outlier produced it closer together with the
MAN participants, which seems to be a trend across several vowels. STRUT is also, up to
this point, the only stable monophthong apart from TRAP, and none of the participants
diphthongized it.
There appears to be intergroup conflation in the production of NURSE, as Figure
39 shows. NURSE appears to generally be clustered in one small section in the mid central
part of the mouth. One MAL participant, one MAN participant, and two TAM
participants diphthongized NURSE. All of the diphthongs also appear to move toward the
front of the mouth. The only exception is the MAL participant whose NURSE diphthong
moved towards the back.

64
Figure 37. Productions of LOT in MalE

65
Figure 38. Productions of STRUT in MalE

66
Figure 39. Productions of NURSE in MalE

67
RQ1: What differences exist in the production of monophthongs among Malay-,
Chinese-, and Indian-influenced Malaysian English?
Table 6.
Summary of monophthong productions
Vowels MAL MAN TAM
FLEECE High Front MT High Front MT High Front MT
KIT High Front MT High Front MT High Front MT
DRESS* Low Front MT Low Front MT Mid Front MT
TRAP Low Front MT Low Front MT Low Front MT
GOOSE High Back MT High Back MT High Back MT
FOOT* High Back MT High Back MT Mid Back MT
THOUGHT Low Back MT Low Back MT Low Back MT
LOT* Low Back MT Low Back MT Low Central MT
STRUT Low Front MT Low Front MT Low Front MT
NURSE Mid Central MT Mid Central MT Mid Central MT MT = monophthong, DT = diphthong
The ten monophthongs that were analyzed are FLEECE, KIT, DRESS, TRAP, GOOSE,
FOOT, THOUGHT, LOT, STRUT, and NURSE. For a more detailed look at the intergroup
differences in the production of the monophthongs and to support the derivations in Table
6, averages for the formant values were also calculated. The values were taken from
Table 2 for MAL, from Table 3 for MAN, and from Table 4 for TAM. For
monophthongs that were diphthongized by one participant in the group, both
monophthongs and diphthongs were included. The findings are presented in Table 7.
Asterisks next to the vowels show that there are intergroup variations in their
productions. The diverging production is bolded.
The values in Table 7 were then used to plot a combined vowel chart for MalE
monophthongs. MaMalE is denoted by the maroon chart, ChMalE is denoted by the
green chart, and InMalE is denoted by the blue chart in Figure 40. (M) and (D) were used
to mark vowels produced as monophthongs and diphthongs respectively. Vowels that

68
were not tagged with (M) or (D) are ones that were unanimously produced as
monophthongs.
Table 7.
Average formant values in Bark for monophthong productions
Vowels MAL MAN TAM
F1 F2 F1 F2 F1 F2
FLEECE (M) 3.61 14.90 2.94 13.79 3.03 13.90
FLEECE (D)
4.28/4.32 15.29/11.73 4.04/3.01 14.20/13.04
KIT (M) 4.08 14.94 3.72 13.55 4.49 13.05
KIT (D)
4.38/4.28 14.56/13.98
DRESS (M) 6.80 13.05 6.51 12.17 6.01 11.56
DRESS (D)
6.59/6.23 11.10/11.88
TRAP
7.31 12.71 6.93 11.54 6.88 11.07
GOOSE (M) 3.72 8.36 3.82 10.05 3.48 8.92
GOOSE (D)
3.95/4.59 10.06/10.33
FOOT (M) 4.23 8.92 4.20 8.80 4.81 8.85
FOOT (D)
5.11/7.73 8.34/8.34
THOUGHT
6.91 9.24 6.76 8.60 6.94 8.42
LOT (M) 7.04 9.37 6.91 8.71 5.87 10.62
LOT (D)
8.08/7.73 8.34/8.34
STRUT
6.92 10.99 6.77 10.54 6.60 10..67
NURSE (M) 5.10 12.32 5.01 11.26 5.44 12.27
NURSE (D) 6.66/5.60 12.20/11.31 5.67/5.07 11.59/12.63 5.32/5.24 11.23/12.41

69
Figure 40. Combined vowel chart for MalE monophthongs

70
By cross-referencing Tables 6 and 7 and Figure 40, it can be hypothesized that
TRAP, THOUGHT, and STRUT are stable vowels in MalE in that there is no variation in their
productions among speakers of MaMalE, ChMalE, and InMalE. TRAP was consistently
produced as a low front monophthong with an F1 Bark value ranging from 6.88 to 7.31
and an F2 Bark value ranging from 11.07 to 12.71. THOUGHT was consistently produced
as a low back monophthong with an F1 Bark value ranging from 6.76 to 6.94 and an F2
Bark value ranging from 8.42 to 9.24. STRUT was consistently produced as a low front
monophthong with an F1 Bark value ranging from 6.60 to 6.92 and an F2 Bark value
ranging from 10.54 to 10.99.
As for the seven other monophthongs, TAM varied the most from the other two
groups in its productions of the vowels. First, TAM produced KIT lower and more backed
than the other two groups. Second, TAM realized the low front vowel DRESS as a mid
front vowel, producing it higher and more backed than MAL and MAN did. Third, TAM
realized the high back vowel FOOT as a mid back vowel, producing it lower and more
fronted than MAL and MAN did. Fourth, TAM realized the low back vowel LOT as a low
central vowel, producing it higher and in a more fronted position than MAL and MAN
did. Last, TAM produced NURSE lower than the other two groups. These divergences can
also be seen in Figure 40, where the blue InMalE vowel chart appears to have more
vowels in the mid central area of the overall combined chart. Apart from that, MAL
produced FLEECE lower and more fronted than MAN and TAM did, and MAN produced
GOOSE lower and more fronted than the other two groups did.

71
Diphthong production
As Figure 41 illustrates, the FACE diphthong moved a relatively large distance,
but they all remained as high front vowels. For MAL, FACE moved higher and more front,
the only exception being the participant whose FACE moved lower and more back, almost
parallel to one of the other MAL participants. MAL also had the majority of its
participants produce FACE more fronted than any of the other participants did. For MAN,
FACE moved higher and more back, with the exception of one participant whose FACE
moved higher too but more front. TAM, however, appears to be the most consistent in its
production of the FACE diphthong. Not only do they move FACE higher and slightly to the
front, but they also produce the diphthongs very close to one another.
With the exception of two MAL participants, everyone produced GOAT as a
diphthong, as shown in Figure 42. Since the majority of MAL participants produced
GOAT as a monophthong instead of as a diphthong like MAN and TAM, it can be
hypothesized that there is an L1 factor in play. For the diphthongs, there appears to be a
trend across all of the participants in which the diphthong moves higher and more back in
the mouth, even for the one MAL participant who diphthongized GOAT. The only
participant whose diphthong did not move higher and more back is one of the TAM
participants, who moved GOAT on an opposite trajectory: lower and more front. A
similarity that carried across all participants is that GOAT was produced in the high back
region of the mouth.

72
RQ2: What differences exist in the production of diphthongs among Malay-,
Chinese-, and Indian-influenced Malaysian English?
Table 8.
Summary of diphthong productions
Vowels MAL MAN TAM
FACE* High Front DT Mid
High
Front
Front
DT High Front DT
GOAT* High Back MT High Back MT Mid Back DT
MT = monophthong, DT = diphthong
Figure 41. Productions of FACE in MalE

73
Figure 42. Productions of GOAT in MalE

74
The two diphthongs that were analyzed are FACE and GOAT. For a more detailed
look at the intergroup differences in the production of the diphthongs and to support the
derivations in Table 8, averages for the formant values were also calculated. As was
mentioned previously, the values were taken from Table 2 for MAL, from Table 3 for
MAN, and from Table 4 for TAM. For diphthongs that were not diphthongized by one
participant in the group, both monophthongs and diphthongs were included. The findings
are presented in Table 9. Asterisks next to the vowels show that there are intergroup
variations in their productions. The diverging production is bolded.
Table 9.
Average formant values in Bark for diphthong productions
Vowels MAL MAN TAM
F1 F2 F1 F2 F1 F2
FACE
4.28/4.26 14.35/14.72 4.73/3.63 13.78/13.16 4.51/3.88 13.35/13.72
GOAT (M) 4.08 8.27
GOAT (D) 4.77/4.44 8.74/8.33 4.57/4.18 8.32/7.53 4.96/5.05 7.98/7.95 M = monophthong, D = diphthong
The values in Table 9 were then used to plot a combined vowel chart for MalE
diphthongs. MaMalE is denoted by the maroon chart, ChMalE is denoted by the green
chart, and InMalE is denoted by the blue chart in Figure 43. (M) and (D) were used to
mark vowels produced as monophthongs and diphthongs respectively. Vowels that were
not tagged with (M) or (D) are ones that were unanimously produced as diphthongs.
It appears, by consulting Figure 43, that the productions of FACE and GOAT are
consistent across MaMalE, ChMalE, and InMalE only in which section of the vowel
chart they were produced in. For FACE, MAN and TAM both moved the diphthong
higher, but MAN moved it to the back while TAM moved it to the front. MAL’s FACE did
not change noticeably in height, but it moved slightly to the front, being realized more as

75
a monophthong than a diphthong. For GOAT, MAL and MAN’s GOAT both moved higher
and towards the back of the mouth. MAL, however, has participants who produced GOAT
as a monophthong, and TAM’s GOAT did not change much in F1 or F2 value and
remained static.
Regarding diphthongization in general, MAL diphthongized less often than
MAN did. Only MAL1 diphthongized more than one vowel, whereas MAN collectively
diphthongized FACE and GOAT. MAN1 and MAN2 even diphthongized an additional three
vowels and MAN3 an additional two.
While MAN diphthongized more of the vowels than MAL did, it still did not do
so more than TAM did. TAM, like MAN, collectively diphthongized FACE and GOAT, but
TAM2 diphthongized four more vowels, and TAM3 diphthongized five more. MAN’s
diphthongization was also more sporadic and seemingly random, with the only
agreements being THOUGHT, FACE, and GOAT. TAM, however, agreed on GOOSE, FOOT,
LOT, and NURSE, on top of FACE and GOAT. This intragroup variation among the MAN
participants might be due to the many language backgrounds that Chinese Malaysians are
influenced by. In a Chinese household in Malaysia, even if Mandarin is the primary
language spoken, speakers might still use a different language such as Hokkien or
Cantonese with their extended families or, especially, grandparents.

76
Figure 43. Combined vowel chart for MalE diphthongs

77
Figure 44. Combined vowel chart for MalE

78
CHAPTER 5. CONCLUSION
English may have once been the language of power in Malaysia, but after it
gained its independence from Britain, there was a push to regain its identity as a Malay-
dominated country. Even though the Malays were not the only major ethnicity in
Malaysia at the time, theirs is an ethnicity whose culture was influenced the most by the
geography of the area, earning them the bumiputera label. This history, coupled with the
still disproportionate population distribution among the different ethnicities, has had an
impact on the language policies in Malaysia. Because these language policies dictated
that Malay is the official language and should be taught in schools, with English taking
the backseat as a second language and Mandarin and Tamil largely ignored, many Malays
in the current language climate are monolingual Malay speakers, while many Chinese
and Indians are bilingual speakers at the very least of Mandarin or Tamil and Malay.
These different language influences housed in one small peninsular country have given
MalE a distinctive flavor.
From this study, it was found that InMalE exhibited the most variation in vowel
production among the three accents of MalE The monophthongs KIT, DRESS, FOOT, LOT,
and NURSE were produced differently by InMalE than by MaMalE and ChMalE. InMalE
produced KIT lower and more backed, DRESS higher and more backed, FOOT lower and
more fronted, LOT higher and more fronted, and NURSE lower. For FLEECE, MaMalE
produced it lower and more fronted, and for GOOSE, ChMalE produced it lower and more
fronted. The monophthongs TRAP, THOUGHT, AND STRUT did not appear to vary in
production among the three accents.
79
As for the diphthong FACE, MaMalE did not diphthongize the vowel, ChMalE
moved the diphthong higher and more backed, and InMalE moved it higher and more
fronted. The diphthong GOAT was produced as a monophthong by InMalE, setting it apart
from MaMalE and ChMalE.
These findings show that something about InMalE sets it apart from MaMalE
and ChMalE more often than MaMalE and ChMalE are set apart. First, it can be
speculated that the language policy to use Malay as the language of instruction in public
schools might affect the different accents’ productions of MalE vowels. Indian
Malaysians, being more and more likely Dominant Users of English, have English as
their L1s as opposed to an Indian language, making the Malay that they learn at school a
second language (L2). Whereas Malay Malaysians and Chinese Malaysians have Malay
as a language between their L1 and L2, Indian Malaysians do not. Because of that, there
is no Malay “filter” (p. 20) in the language transfer process, as Phoon et al. (2013) put it.
For the Malay and Chinese ethnic groups, because there is a higher possibility for Malay
to be the language learned before English, that filter exists, marking their production of
MalE vowels.
Another reason could be the power imbalance among the ethnic groups in
Malaysia. Since the Malays have the most political influence in the country, with the
Chinese following not far behind, sounding Malay might be an advantage for the Chinese
to bridge that gap. That could explain why there are fewer variations that exist between
MaMalE and ChMalE. Rindal (2010), for example, has argued that pronunciation is used
as an identity marker and that speakers who wish to associate with a certain group would
use that group’s pronunciation when socializing in order to fit in.

80
Limitations of the Study and Future Research
Due to the small-scale nature of this study, there were numerous limitations that
can be addressed in potential replications. First, three participants to each group is a
modest number even for a study on phonology. Because the recruitment advertisement
did not manage to reach all of the Malaysian students on campus, finding participants for
the study was challenging. In order to make the results more generalizable to the larger
Malaysian populace, it would have been ideal to have recruited four to five participants
for each group.
Second, another side effect of the small number of participants is that inferential
statistics could not be conducted. With a larger participant pool of perhaps ten
participants to each group, statistics such as t-tests can be used to describe the vowel
variations in more concrete detail. t-tests would have allowed for the determination of the
significance of the variations and whether the variations that were found are actually
differences that would distinguish among the three groups.
Third, it became apparent during data analysis that merely asking participants for
their L1 was not sufficient to fully answer the research questions. More comprehensive
language background information should be collected to explore whether participants
frequently came into contact with languages different from their L1s. For example, a
Tamil speaker who attends a Chinese vernacular school might be more strongly
influenced by Mandarin speakers than by Tamil speakers.
Last, it would have been beneficial to the study if the vowel inventories of
Malaysian Malay, Malaysian Mandarin, and Malaysian Tamil were available and
accessible. They would have allowed for direct comparisons with their MaMalE,

81
ChMalE, and InMalE counterparts to state with more certainty instead of just speculate
about whether there is L1 influence causing the variations in monophthong and diphthong
productions.

82
NOMENCLATURE
ChMalE Chinese-Influenced Malaysian English
CMalE Colloquial Malaysian English
F1 First Formant
F2 Second Formant
InMalE Indian-Influenced Malaysian English
L1 First Language
L2 Second Language
MAL Malay Speakers
MalE Malaysian English
MaMalE Malay-Influenced Malaysian English
MAN Mandarin Speakers
ROC Rate of Change
SgE Singapore English
TAM Tamil Speakers

83
REFERENCES
Ahmad, W. A. S. W. (2005). Vowel length discrimination among Malay speakers of
Malaysian English: An instrumental study. Retrieved from
http://research.ncl.ac.uk/ARECLS/vol4_documents/wan.pdf
Ang, L. H., Rahim, H. A., Tan, K. H., & Salehuddin, K. (2011). Collocations in
Malaysian English learners’ writing: A corpus-based error analysis. The Southeast
Asian Journal of English Language Studies, 17, 31-44. Retrieved from
http://www.ukm.my/ppbl/3L/3LHome.html
Baker, J. (2008). Crossroads: A popular history of Malaysia and Singapore. Singapore,
Singapore: Marshall Cavendish International.
Baskaran, L. (2008). Malaysian English: Phonology. In R. Mesthrie (Ed.), Africa, South
and Southeast Asia (pp. 278-291). Berlin, Germany: Mouton de Gruyter.
Boersma, P., & Weenink, D. (2017). Praat: Doing Phonetics by Computer (Version
6.0.28) [Software]. Available from http://www.praat.org
Bolton, K. (2008). English in Asia, Asian Englishes, and the issue of proficiency. English
Today, 24(2), 3-12. https://doi.org/10.1017/S026607840800014X
Brown, A. (1988a). The staccato effect in the pronunciation of English in Malaysia and
Singapore. In J. Foley (Ed.), New Englishes: The case of Singapore (pp. 115-128).
Singapore, Singapore: Singapore University Press.
Brown, A. (1988b). Vowel differences between Received Pronunciation and the English
of Malaysia and Singapore. In J. Foley (Ed.), New Englishes: The case of
Singapore (pp. 129-147). Singapore, Singapore: Singapore University Press.
Deterding, D. (2006). The North Wind versus a Wolf: Short texts for the description and
measurement of English pronunciation. Journal of the International Phonetic
Association, 36(2), 187-196. https://doi.org/10.1017/S0025100306002544
Gatbonton, E., Trofimovich, P., & Magid, M. (2005). Learners’ ethnic group affiliation
and L2 pronunciation accuracy: A sociolinguistic investigation. TESOL
Quarterly, 39(3), 489-511. https://doi.org/10.2307/3588491
Govindan, I. V. P., & Pillai, S. (2017). English question forms used by young Malaysian
Indians. The English Teacher, 38, 77-94. Retrieved from
http://journals.melta.org.my/index.php/tet/article/view/286
Ho, M. K. (2016). Current population estimates, Malaysia, 2014-2016. Retrieved from
https://www.dosm.gov.my
84
Jayapalan, K., & Pillai, S. (2011). The state of teaching and learning English
pronunciation in Malaysia: A preliminary study. Malaysian Journal of ELT
Research, 7(2), 63-81. Retrieved from
http://journals.melta.org.my/index.php/majer/article/view/155
Joseph, P. T. (2007). Phonological acquisition among Malaysian English child speakers
of Indian descent. Journal Sains Kesihatan Malaysia, 4(2), 13-26. Retrieved from
http://ejournal.ukm.my/jskm/article/view/4357
Kachru, B. B. (1985). Standards, codification and sociolinguistic realism: The English
language in the Outer Circle. In R. Quirk & H. G. Widdowson (Eds.), English in
the World: Teaching and learning the language and literatures (pp. 11-36).
Cambridge, U.K.: Cambridge University Press.
Khojasteh, L., & Kafipour, R. (2012). Non-empirically based teaching materials can be
potentially misleading: A case of modal auxiliary verbs in Malaysian English
language textbooks. English Language Teaching, 5(3), 62-72.
https://doi.org/10.5539/elt.v5n3p62
Khojastehrad, S., & Sattarova, M. (2015). International students’ linguistic awareness of
Malaysian English and its impact on intercultural communication effectiveness.
Advances in Language and Literary Studies, 6(5), 250-259.
https://doi.org/10.7575/aiac.alls.v.6n.5p.250
Lee, Z. E. (2015). Colloquial Malaysian English (CMalE): A problem or a cool
phenomenon? Retrieved from Repositori Universitat Jaume I.
Nair-Venugopal, S. (2006). An interactional model of English in Malaysia. Journal of
Asian Pacific Communication, 16(1), 51-75.
Phoon, H. S., Abdullah, A. C., & Maclagan, M. (2013). The consonant realizations of
Malay-, Chinese-, and Indian-influenced Malaysian English. Australian Journal
of Linguistics, 33(1), 3-30. https://doi.org/10.1080/07268602.2013.787902
Phoon, H. S., & Maclagan, M. A. (2009). Chinese Malaysian English phonology. Asian
Englishes, 12(1), 20-45. https://doi.org/10.1080/13488678.2009.10801247
Pillai, S. (2008). Speaking English the Malaysian way: Correct or not? English Today,
24(4), 42-45. https://doi.org/10.1017/S0266078408000382
Pillai, S. (2014). The monophthongs and diphthongs of Malaysian English: An
instrumental analysis. In H. J. Rahim & S. A. Manan (Eds.), English in Malaysia:
Postcolonial and Beyond (pp. 55-85). Bern, Switzerland: Peter Lang.

85
Pillai, S., Don, Z. M., Knowles, G., & Tang, J. (2010). Malaysian English: An
instrumental analysis of vowel contrasts. World Englishes, 29(2), 159-172.
https://doi.org/10.1111/j.1467-971X.2010.01636.x
Pillai, S., & Jayapalan, K. (2010). The teaching of pronunciation in Malaysia: State of the
art or no state at all? Proceedings from 19th MELTA International Conference
2010: Transformations in English Language Education. Kuala Lumpur, Malaysia:
MELTA.
Platt, J., & Weber, H. (1980). English in Singapore and Malaysia: Status, features and
functions. Kuala Lumpur, Malaysia: Oxford University Press.
Platt, J., Weber, H., & Ho, M. L. (1983). Singapore and Malaysia English. Philadelphia,
PA: John Benjamins.
Preshous, A. (2001). Where you going ah? English Today, 17(1), 46-53.
https://doi.org/10.1017/S0266078401001067
Rajadurai, J. (2006). Pronunciation issues in non-native contexts: A Malaysian case
study. Malaysian Journal of ELT Research, 2, 42-59. Retrieved from
http://journals.melta.org.my/index.php/majer/article/download/170/84
Rindal, U. (2010). Constructing identity with L2: Pronunciation and attitudes among
Norwegian learners of English. Journal of Sociolinguistics, 14(2), 240-261.
https://doi.org/10.1111/j.1467-9841.2010.00442.x
Schneider, E. W. (2007). Postcolonial English: Varieties around the world. Cambridge,
U.K.: Cambridge University Press.
Subramaniam, G. (2007). The changing tenor of English in multicultural postcolonial
Malaysia. Journal of Language Teaching, Linguistics and Literature, 13, 53-75.
Retrieved from http://www.journalarticle.ukm.my/1164
Tan, S. I. (2009a). Lexical borrowing in Malaysian English: Influences of Malay. Lexis,
3, 11-62. https://doi.org/10.1.1.475.8273
Tan, S. I. (2009b). Lexical borrowing from Chinese languages in Malaysian English.
World Englishes, 28(4), 451-484. https://doi.org/10.1111/j.1467-
971X.2009.01607.x
Tan, R. S. K., & Low, E-L. (2010). How different are the monophthongs of Malaysian
and Singapore English? English World-Wide, 31(2), 162-189.
https://doi.org/10.1075/eww.31.2.03tan

86
Tan, R. S. K., & Low, E-L. (2014). Rhythmic patterning in Malaysian and Singapore
English. Language and Speech, 57(2), 196-214.
https://doi.org/10.1177/0023830913496058
Ting, S-H., Mahadhir, M., & Chang, S-L. (2010). Grammatical errors in spoken English
of university students in oral communication courses. Journal of Language
Studies, 10(1), 53-70. Retrieved from
http://journalarticle.ukm.my/2322/1/page1_21.pdf
Tongue, R. K. (1979). The English of Singapore and Malaysia (2nd ed.). Singapore,
Singapore: Eastern Universities Press.
Wells, J. C. (1982). Accents of English I; An introduction. Cambridge, U.K.: Cambridge
University Press.
Wong, F. F., Lee, K. S., Lee, S. K., & Yaacob, A. (2012). English use as an identity
marker among Malaysian undergraduates. The Southeast Asian Journal of English
Language Studies, 18(1), 145-155. Retrieved from
http://www.ukm.my/ppbl/3L/3LHome.html
Yong, S. E., Tan, B. H., & Yong, M. F. (2012). Speech disfluencies and
mispronunciations in English oral communication among Malaysian
undergraduates. International Journal of Applied Linguistics & English
Literature, 1(7), 19-32. https://doi.org/10.7575/ijalel.v.1n.7p.19
Zwicker, E., & Terhardt, E. (1980). Analytical expression for critical-band rate and
critical bandwidth as a function of frequency. Journal of the Acoustical Society of
America, 68(1), 523-525. https://doi.org/10.1121/1.385079

87
APPENDIX A
PARTICIPANT RECRUITMENT FACEBOOK POST
Hi everyone! For my master’s thesis, I am conducting a study that investigates the vowel
sounds of Malaysian English to see if our most common first languages (Malay,
Mandarin, and Tamil) have an effect on how we pronounce English words. In order to do
that, I need to recruit Malaysians who speak Malay, Mandarin, or Tamil as a first
language, which means that you speak Malay, Mandarin, or Tamil with your family.
As a participant, all that you will need to do is meet with me for about 30 minutes.
During this time, you will read a short passage and a few short sentences for a recording.
As a thank-you for your participation, you will be entered into a lucky draw for one of
three $25 gift cards of your choice.
I will be forever grateful to anyone who is able to help me out with my study! By
participating, you are technically helping me to graduate! If you are interested, please
send me an email at [email protected] or just message me here on Facebook, and I will
get back to you.
You must be at least 18 years old in order to participate. Thank you so much!

88
APPENDIX B
SCREENING SURVEY
Participant’s Name (printed): ________________________________________________
__________________________________________ ________________________
Participant’s Signature Date
Screening Information
1. Are you at least 18 years old? Yes / No
2. What is your age? ____________
3. What is your first language? Malay / Mandarin / Tamil / Other: ____________

89
APPENDIX C
INTERVIEW REFERENCE SHEET
Hi (Name)! Thank you for agreeing to participate in my study! Before we start, let me
turn on my audio recorder.
1. How is your day going so far?
2. What are you studying at Iowa State?
3. How did you decide to do that?
4. Why did you choose to come to Iowa State?
Okay, let’s move on to the first task, the passage-reading task.

90
APPENDIX D
PASSAGE-READING TASK
Instructions: Please read through the passage silently once. When you are ready,
please read it aloud.
There was once a poor shepherd boy who used to watch his flocks in the fields next to a
dark forest near the foot of a mountain. One hot afternoon, he thought up a good plan to
get some company for himself and also to have a little fun. Raising his fist in the air, he
ran down to the village shouting, “Wolf! Wolf!” As soon as they heard him, the villagers
all rushed from their homes, full of concern for his safety, and two of his cousins even
stayed with him for a short while. This gave the boy so much pleasure that a few days
later, he tried exactly the same trick again, and once more, he was successful. However,
not long after, a wolf that had just escaped from the zoo was looking for a change from
its usual diet of chicken and duck, so overcoming its fear of being shot, it actually did
come out from the forest and began to threaten the sheep. Racing down to the village, the
boy of course cried out even louder than before. Unfortunately, as all of the villagers
were convinced that he was trying to fool them a third time, they told him, “Go away and
don’t bother us again.” The wolf had a feast.

91
APPENDIX E
SENTENCE-READING TASK
Instructions: You will see a series of 12 words in the sentence, “Now I say _______.”
Read each sentence as they appear on the screen.
Example slides:
All of the words included in this task are:
1. FLEECE
2. KIT
3. DRESS
4. TRAP
5. GOOSE
6. FOOT
7. THOUGHT
8. LOT
9. STRUT
10. NURSE
11. FACE
12. GOAT

92
APPENDIX F
EXAMPLE PRAAT SCRIPT
#MAL1 BARK
Erase all
12
Black
Select outer viewport: 0, 8, 0, 8
Axes: 17, 7, 10, 2
Draw inner box
Marks left every: 1, 1, "yes", "yes", "yes"
Marks bottom every: 1, 1, "yes", "yes", "yes"
Text left: "yes", "F1 (Bark)"
Text bottom: "yes", "F2 (Bark)"
Text: 15.66, "Centre", 3.89, "Half", "FLEECE"
Text: 15.56, "Centre", 4.44, "Half", "KIT"
Text: 13.53, "Centre", 7.47, "Half", "DRESS"
Text: 13.38, "Centre", 8.1, "Half", "TRAP"
Text: 10.06, "Centre", 3.95, "Half", "GOOSE"
Text: 10.33, "Centre", 4.59, "Half", "GOOSE"
Draw arrow: 10.06, 3.95, 10.33, 4.59
Text: 9.91, "Centre", 4.56, "Half", "FOOT"
Text: 9.13, "Centre", 7.28, "Half", "THOUGHT"
Text: 10.51, "Centre", 8.02, "Half", "LOT"
Text: 11.18, "Centre", 7.84, "Half", "STRUT"
Text: 12.2, "Centre", 6.66, "Half", "NURSE"
Text: 11.31, "Centre", 5.6, "Half", "NURSE"
Draw arrow: 12.2, 6.66, 11.31, 5.6
Text: 15.01, "Centre", 4.71, "Half", "FACE"
Text: 15.31, "Centre", 4.04, "Half", "FACE"
Draw arrow: 15.01, 4.71, 15.31, 4.04
Text: 8.74, "Centre", 4.77, "Half", "GOAT"
Text: 8.33, "Centre", 4.44, "Half", "GOAT"
Draw arrow: 8.74, 4.77, 8.33, 4.44
Draw line: 15.66, 3.89, 10.06, 3.95
Draw line: 10.06, 3.95, 8.33, 4.44
Draw line: 8.33, 4.44, 9.13, 7.28
Draw line: 9.13, 7.28, 10.51, 8.02
Draw line: 10.51, 8.02, 13.38, 8.1
Draw line: 13.38, 8.1, 15.56, 4.44
Draw line: 15.56, 4.44, 15.66, 3.89

93
APPENDIX G
IRB APPROVAL