visible spectroelectrochemical characterization of geobacter sulfurreducens biofilms on optically...
TRANSCRIPT
1
Visible spectroelectrochemical characterization of Geobacter sulfurreducens biofilms on optically transparent indium tin oxide (ITO) electrode Anand Jain1a,, Giulio Gazzola1a, Aurora Panzerab, Michele Zanonic, and Enrico Marsili1a∗
aSchool of Biotechnology, Dublin City University, Dublin -9, Ireland, bSchool of Physics, Dublin City University, Dublin -9, Ireland,
cNational Center for Sensor Research, Dublin City University, Dublin -9, Ireland,
To whom correspondence should be addressed: Dr Enrico Marsili, School of biotechnology, Dublin City University, Dublin 9, Ireland E mail: [email protected]; Phone: +353 1 700 8515 1 ISE member
2
ABSTRACT We report visible spectroelectrochemical (SEC) characterization of cytochrome c552 (cyt c552) in viable Geobacter sulfurreducens biofilms on tin-doped indium oxide (ITO) electrodes poised at 0.24 V vs. SHE. G. sulfurreducens biofilms were grown in minimal medium with acetate as electron donor (turnover conditions), followed by 24 hours incubation in electron donor-depleted medium (non-turnover conditions). The electronic absorption spectra of G. sulfurreducens biofilms showed the lowest energy absorption band in the reduced state at 552 nm, which indicated excess of cyt c552 in the biofilm. The spectra under non-turnover conditions displayed gradual reduction of the cyt c552, following the step-wise decrease of electrode potential from 0.0 V to -0.6 V vs. standard calomel electrode (SCE). The spectral changes were fully reversible in both positive and negative direction of the scan potential, with average midpoint potential value of -0.42 V vs. SCE. Confocal microscopy analysis revealed that the thickness of biofilms under turnover conditions and non-turnover conditions was approximately 35 and 3.5 µm, respectively. This is the first study to observe the reversible redox conversion of cyt c552 in viable G. sulfurreducens biofilms. Keywords: Electroactive biofilms; Geobacter sulfurreducens; Visible spectroscopy; Cytochrome c; Cyclic voltammetry.
3
1. Introduction Electroactive biofilms (EABs) are composed of microorganisms that conserve
energy through extracellular electron transfer (EET) to solid surfaces and electrodes [1]. Well-known EAB microorganisms include mostly gram-negative bacteria, such as Geobacter, Shewanella, Desulfovibrio, and Rhodopseudomonas genus. However, numerous microorganisms show some degree of electroactivity, when grown in absence of soluble electron acceptors. EABs are relevant to biogeochemistry, microbial fuel cells and biosensors [2]. They also show promises for wastewater treatment, bioremediation, and biosynthesis of bulk chemicals [3-5]. A thorough understanding of redox proteins involved in EET and their biophysical properties is required to optimize viable EABs-based applications [2]. In this study, we focus on EABs capable of direct electron transfer via outer membrane c type cytochromes (Omc). The most important model organism in this group is Geobacter sulfurreducens. Increasing evidence, based on molecular biology and direct electrochemistry experiments, shows that Omc are key components of the direct electron transfer chain in G. sulfurreducens biofilms grown on electrodes [6, 7] . A number of Omc have been isolated, purified, and identified in G. sulfurreducens. The lack of certain Omc, such as Omc Z and Omc B results in impaired EET capabilities and electrode respiration, as confirmed by direct electrochemical characterization [8]. Molecular biology analysis of EABs cannot measure in situ the biophysical properties of the biomolecules involved in the EET process. Also, the complexity of the EABs/electrode interface, with numerous electroactive species in a narrow potential range, limits the information provided by direct electrochemistry alone. The combination of spectroscopy and direct electrochemistry, termed spectroelectrochemistry (SEC), can overcome some of these limitations, and provide us with valuable information about the EET chain in viable biofilms. SEC is often utilized in organic chemistry [7, 8] to characterize biointerfaces, such as purified redox enzymes adsorbed onto optically transparent electrodes [8-11]. Purified c type cytochromes (c Cyts) and flavoproteins are some of the most studied redox proteins, owing their importance in electron transfer and energy generating processes in living organisms. However, purified proteins behave differently than in-vivo redox protein complexes, as previously reported [12]. Their biophysical properties, such as the conformational state, surface coverage, and interaction with electrode in viable EABs are not well understood. SEC analysis of viable EABs may unveil additional details in their biophysics. Recently, Busalmen et al [13] demonstrated the feasibility of Attenuated Total Reflection – Surface Enhanced Infrared Absorption Spectroscopy (ATR-SEIRAS) to characterize electron transfer at the adsorbed G. sulfurreducens cells and gold electrode interface. Similarly, Nakamura et al [12] used UV-VIS evanescent wave spectroscopy to study the redox properties of c Cyts of viable Shewanella loihica cells attached to ITO electrode. However, both SEC studies focused on redox processes in cells adsorbed to electrodes, rather than on fully grown, viable EABs. In order to design efficient bioelectrochemical devices, it is important to investigate redox proteins, such as c Cyts, in viable EABs. The heme entities in c Cyts show high molar absorption in the visible range, thus making visible absorption SEC a simple and effective tool for studying their in vivo redox
4
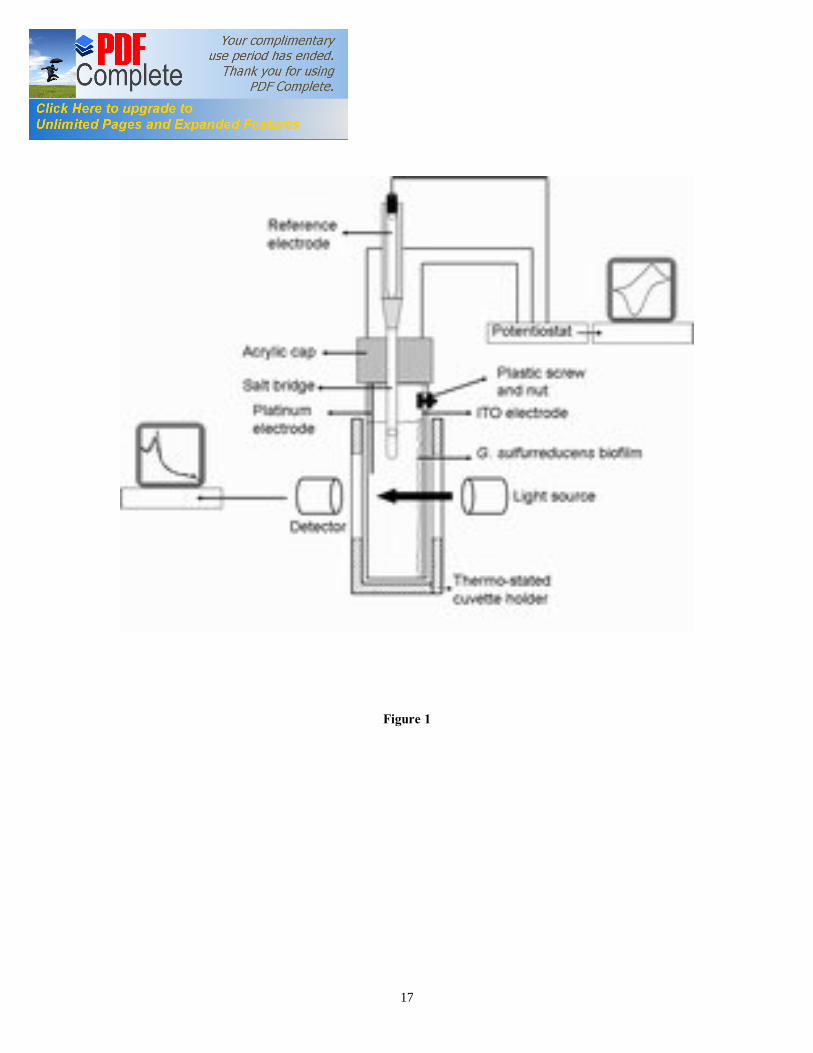
behavior. However, the scattering of light from microbial cell surface has limited the application of visible absorption spectroscopy for EAB characterization. Herein we demonstrate the feasibility of visible SEC technique for the study of the c Cyts redox behavior in a thin and viable G. sulfurreducens biofilm grown at ITO electrode. The SEC results were corroborated by confocal laser scanning microscopy (CLSM) analysis of the G. sulfurreducens biofilms. 2. Material and Methods 2.1. Bacterial Strain G. sulfurreducens strain PCA (ATCC #51573) was sub-cultured at 30 ˚C using a standard anaerobic medium containing per 1 L: 0.38 g KCl, 0.2 g NH4Cl, 0.069 g NaH2PO4 H2O, 0.04 g CaCl2·2H2O, 0.2 g MgSO4·7H2O, and 10 mL of a mineral mix (containing per 1 L: 1.5 g NTA, 0.1 g MnCl2·4H2O, 0.3 g FeSO4·7H2O, 0.17 g CoCl2·6H2O, 0.1 g ZnCl2, 0.04 g CuSO4·5H2O, 0.005 g AlK(SO4)2·12H2O, 0.005 g H3BO3, 0.09 g Na2MoO4, 0.12 g NiCl2, 0.02 g NaWO4·2H2O, and 0.10 g Na2SeO4). Acetate was provided as an electron donor at 20 mM. Non-growth medium containing per 1 L: 0.38 g KCl, 0.069 g NaH2PO4·H20, 0.04 g CaCl2·2H20, 0.2 g MgSO4·7H2O was used for the starvation of G. sulfurreducens biofilm. All media were adjusted to pH 6.8 prior to addition of 2 g/L NaHCO3, and flushed with oxygen-free N2/CO2 (80/20, v/v). Each culture was grown until early stationary phase (OD600 approx. 0.4), then inoculated in the electrochemical cell. 2.2. Electrochemical cell A three-electrode electrochemical cell (EC) was constructed using standard 4 ml polypropylene plastic cuvette (Fisher, Ireland) (Figure 1). The polyacrylic top cap accommodated also the gas inlet and the inoculation port. A standard calomel electrode (SCE) was used as the reference electrode, connected to the EC via a saturated KCl salt bridge ending in a 3 mm Vycor glass membrane (Bioanalytical Systems, UK). A 0.1 mm Pt wire was used as the counter electrode. A 3×1 cm piece of ITO-coated polypropylene sheet (60 Ώ) (Sigma, Ireland) was attached to the potentiostat via Pt wire, nylon screw and nut (Small Part, USA) and served as the working electrode. The assembled EC was mounted in the thermo-stated cuvette holder of a Cary 50 UV-VIS spectrometer (Varian, UK). The incident light was applied perpendicular to the working electrode, entering biofilm/electrode interface prior to the bulk medium phase, as shown in Figure 1. The head space of the EC was continuously flushed with humidified, sterile N2/CO2 (80/20, v/v), which had been passed over a heated copper column to remove trace oxygen. The EC was connected to a 5-channel potentiostat (VSP, Bio-Logic, USA), equipped with the electrochemical software EC-Lab (V.9.45). 2.3. G. sulfurreducens biofilm growth, starvation and recovery The EC fitted with the ITO working electrode was inoculated with 50% (v/v) of G. sulfurreducens early stationary culture. After inoculation and addition of 20 mM acetate as electron donor, the working electrode was poised at 0.0 V vs. SCE (0.24 V vs. standard hydrogen electrode (SHE), and the oxidation (anodic) current was recorded. The
5
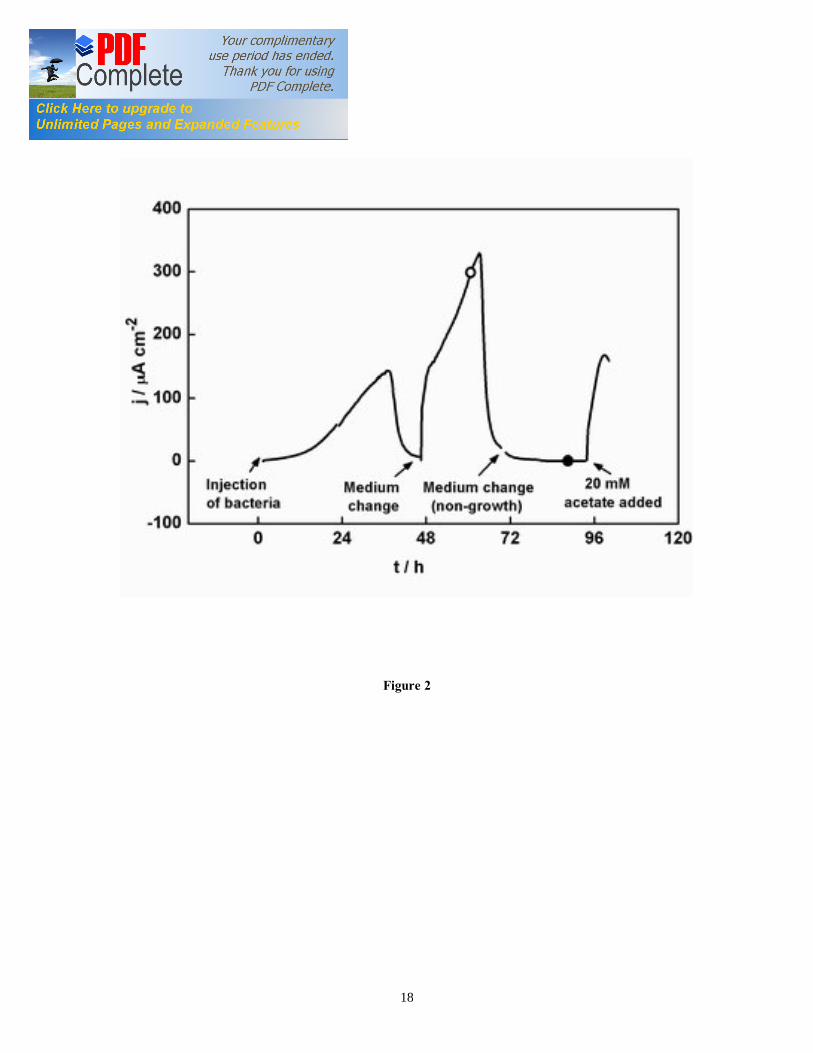
EC was always maintained at 30 ˚C. In a typical experiment, the G. sulfurreducens biofilm was grown for 72 hours until steady state current was achieved. Subsequently, the medium was replaced with non-growth medium without acetate, and the EC was washed 3 times with the same medium in order to remove the loosely attached biofilm and the residual acetate. At the end of the electron donor starvation experiment, 20 mM acetate was added to the EC, and the current recovery was monitored to determine the residual electroactivity. Coulombic efficiency was calculated as previously described [14]. 2.4. Electrochemical techniques Chronoamperometry (CA) and cyclic voltammetry (CV) were used to analyze the G. sulfurreducens biofilm formed at ITO electrode, as previously described [15]. The parameters for the techniques were chosen as it follows: CA: E = 0.0 V vs. SCE; CV: equilibrium time 5 s, scan rate 1 mV/s, Ei = -0.8 V vs. SCE, Ef = 0.0 V vs. SCE. Scan rate analysis was performed on the biofilm depleted of acetate, with scan rate ranging from 1 mV/s to 1000 mV/s. The electroactive surface coverage of the attached biofilm was determined by integrating the peak of the baseline-subtracted CV at 1 mV/s. 2.5. UV-VIS Spectroscopy of G. sulfurreducens biofilm The electronic absorption spectra of G. sulfurreducens biofilms grown on ITO electrodes were recorded within 600 to 350 nm wavelength, at different applied electrode potential, ranging from 0.0 V to -0.6 V vs. SCE. The background spectra of the ITO electrode in anaerobic medium acquired at different potential was subtracted, in order to account for the background scattering and absorption. The spectroscopic surface coverage (As) of the biofilm cyt c552 was calculated from the area under the Soret peak (Ap) (409 nm) according to the equation: As=Ap/ (2·1000·є), where є = 105/(M·cm) is the molar absorptivity at 410 nm of cyt c552 in solution. In cyclic voltabsorptometry (CVA), the change in peak height of α band, A552nm, was plotted as a function of sweep potential. The CVA derivative with respect to the working electrode potential, DCVA, was calculated according to standard procedure [10]. 2.6. Confocal laser microscopy The G. sulfurreducens biofilm samples were collected under turnover conditions (fully grown biofilm) and non-turnover conditions (biofilms maintained for 24 hours without acetate). The samples were removed from the EC in an anaerobic chamber (Coy Laboratory, USA), then stained for 20 minutes in 1 mg/ml acridine orange. After rinsing to eliminate excess dye, the samples were fixed to a glass slide. The confocal images were captured with a laser scanning microscope (Zeiss LSM 510, USA), using argon laser 488 nm as excitation source. The objective was a PLAN apochromatic 63 x oil immersion, with numerical aperture 1.40. Fluorescence was recorded with a low pass filter at 505 nm. A series of images were taken along the biofilm thickness (Z axis) at regular intervals (0.5 µm), followed by a 3D volume reconstruction. 3. Results and discussion 3.1. G. sulfurreducens biofilm growth on ITO electrode. The biofilm formation on ITO electrode poised at 0.0 V vs. SCE was characterized through CA. A typical experiment is shown in Figure 2. Following inoculation of suspended G. sulfurreducens cells, we observed a rapidly increasing current, which is the
6
result of catalytic oxidation of acetate in the G. sulfurreducens biofilm growing at the ITO electrode. The maximum current density was 150 µA/cm2 after 36 hours. After approximately 48 hours, the electron donor (acetate) was completely consumed, and the current dropped to near-zero. Following replacement of spent medium with fresh growth medium containing 20 mM acetate, the current density resumed in 2.5 hours to about 90% of the maximum observed at 36 hours. We have previously reported that such rapid increase in current density exceeds reported growth rates for G. sulfurreducens, therefore is not caused by biofilm growth [16]. After this short recovery period, the current density increased with a rate of 13 µA/(cm2·h), which corresponds to a doubling time of approximately 10-11 hours, compatible with the reported growth rates for G. sulfurreducens. The current density increased to a second maximum of 340 µA/cm2 after 64 hours. Further medium change and addition of acetate did not increase the oxidation current (data not shown). Finally, the oxidation current dropped to near-zero when most of the acetate was oxidized. When the growth medium with acetate was replaced with starvation medium without acetate, the current density stabilized to less than 1 µA/cm2 after few hours. This indicated the complete depletion of electron donor within the biofilm. Following the addition of 20 mM acetate at 94 hours, nearly 50% of the original current was recovered within six hours. These data agree with previous results for G. sulfurreducens biofilm grown on graphite electrode, where 50% of the initial current was recovered following a 36 hours starvation period [16]. The coulombic efficiency of a typical G. sulfurreducens biofilms between each medium change was approximately 90%. This result agrees with previous findings [17, 18] and confirms that rapid drops in the oxidation current after 36 and 64 hours, respectively, are due to the exhaustion of acetate in the solution. The observed pattern for the oxidation current shown in Figure 2 is similar to those recently reported by our group and other authors. For example, Marsili et al. [15] grew G. sulfurreducens biofilms on graphite electrodes. They showed that the oxidation current increases fast in the initial stages of microbial attachment and biofilm growth, and then a current plateau is reached, which is independent from the concentration of electron donor in the EC. Fricke et al. [17] grew G. sulfurreducens biofilms on graphite electrodes. In their study, the bioelectrocatalytic current increases to a maximum until the electron donor (acetate) was completely consumed. Following substrate addition, the current increases again to a second, higher maximum. In another study, Dumas et al. [18] grew G. sulfurreducens biofilms on dimensionally stable anodes (DSA). They observed that the oxidation current increases rapidly following injection of bacteria, until it reaches a stable current plateau. When acetate was nearly consumed, the current dropped, but it resumed immediately upon addition of acetate. Also, the sudden drop in current was very rapid and not consistent with substrate limitations. However, a similar current pattern was observed in numerous electroactive biofilm studies, and it is likely due to metabolic limitations that arise when substrate concentration decrease below the minimum value that can sustain bacterial membrane processes [19]. Marsili et al. [16] showed that the pattern of oxidation current in G. sulfurreducens biofilms on graphite electrode depends on numerous factors, such as the initial concentration of the inoculum, the electrode
7
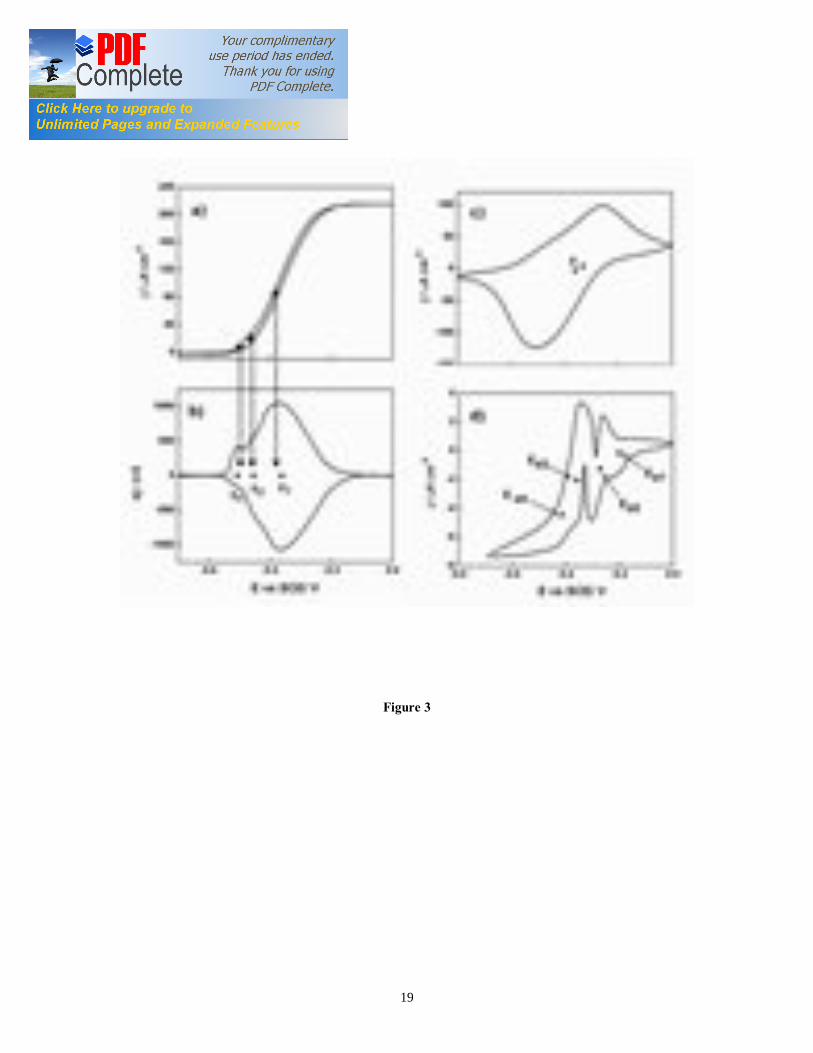
potential, etc. In this study, we are not focusing on the factors that determine the oxidation current in G. sulfurreducens biofilms. Our primary goal is to use alternate growth and starvation periods to obtain a thin, highly active G. sulfurreducens biofilm, which is suitable for SEC analysis. The CA results were repeatable, and the current maxima differed less than 5 % among independent biological replicates (n = 10). Overall, our results demonstrated that commercial ITO is a suitable support material for the growth of electroactive G. sulfurreducens biofilms. ITO was recently used for the spectroelectrochemical characterization of immobilized Shewanella loihica PV4 cells [12]. Also, Parra et al [20] have recently studied adsorbed G. sulfurreducens cells at ITO anode for microbial fuel cell application. However, this is the first time that G. sulfurreducens biofilms are grown in a reproducible manner on ITO electrodes in potentiostat-controlled electrochemical cells. 3.2. Turnover cyclic voltammetry The CV of G. sulfurreducens biofilm under turnover conditions was recorded at 64 hours, (Figure 3a). The CV of biofilm under turnover conditions showed a single, well-developed sigmoidal wave at lower scan rate that onset at -0.5 V vs. SCE (Figure 3a). The wave evolved into anodic and cathodic peaks at higher scan rate (data not shown), as previously observed for catalytic electron transfer [18]. As the potential increased, the anodic (oxidation) current increased until a plateau was reached at -0.2 V vs. SCE. The first order derivative of the turnover CV showed one major redox center E1 at -0.361 V vs. SCE (Figure 3b). Other two smaller maxima were observed at -0.450 V (E2) and -0.500 V (E3) vs. SCE, respectively. The occurrence of more than one redox center in first order derivative of the turnover CV could be due to the presence of non-equivalent heme groups in the cytochromes of G. sulfurreducens, as reported earlier [17]. G. sulfurreducens oxidizes acetate completely [18] according to the equation (1): - CH3COO- + 4H2O Bacterial biofilm HCO3
- + 9H+ + 8 e- (1) In this study, we adopt the electrochemical scheme proposed by Richter et al [21] to describe the catalytic electron transfer processes in G. sulfurreducens biofilms. Equation (2) describes the catalytic oxidation of acetate in the G. sulfurreducens biofilm cells. The electrons generated are transferred to the electrode by the cells in contact with the electrode, as in equation (3).: Cells (oxidized) + nCH3COOH + 4nH2O → Cells (reduced) + 2nHCO3
− + 10nH+ (2) Cells (reduced) → Cells (oxidized) + m e− (3) 3.3. Non–turnover cyclic voltammetry The electrochemical profile of G. sulfurreducens biofilm was also determined under non-turnover conditions (Figure 3c, 3d). The non-turnover CV at slower scan rate (1 mV/s) showed four putative redox couples (Figure 3d). The peaks in the voltammogram were significantly overlapping, so a quantitative determination of their electrochemical features was not possible. These CVs are similar to those obtained under non-turnover conditions at graphite electrodes [16, 17]. However, the details of the biomolecule(s)
8
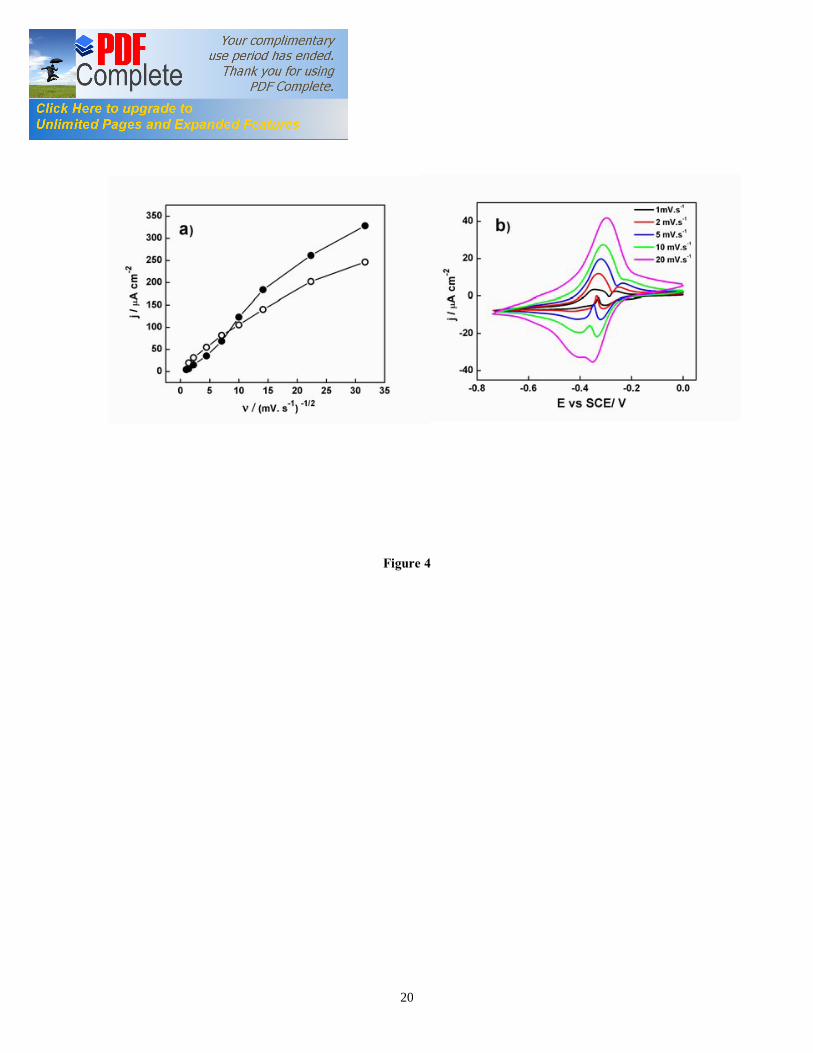
corresponding to each redox peak have not been explained. In fact, viable cells are much more complex than purified redox proteins usually described in SEC studies. It is likely that each peak observed in the non-turnover CV is originated by several biomolecules/ redox proteins within a narrow range of redox potentials. The shape of the voltammogram is similar to previous results for electroactive bacteria where Omc contribute to EET [16, 17, 22, 23]. The electron transfer process appears sluggish, as shown by the disappearance of three out of four redox couples as the scan rate increased over 20 mV/s (Figure 3c). The major redox couple (Ea3) had a midpoint potential of -0.383 V vs. SCE. A comparison of derivative of turnover CV with non-turnover CV shows that redox couples associated with the midpoint potential of -0.358 V (Ea3) and -0.413 V (Ea4) contribute to the catalytic electron transfer at the electrode interface (Figure 3d), whereas redox centers Ea1 and Ea2 appear electrocatalytically inactive. The redox couples at 0.358 V and -0.413 V vs. SCE may indicate the presence of non-equivalent heme groups in cytochrome of G. sulfurreducens biofilm involved in the EET, as previously reported [24]. The multiple redox potentials of the hemes in Omc help in promoting electron transfer from the biofilm to the electrode, which may function at different potentials, depending on the resistance to electron flow and the rates of metabolism in the biofilm. The electron transfer from G. sulfurreducens to solid electron acceptors is accomplished by a wide variety of Omc, such as Omc B (-0.43 V vs. SCE), Omc S (-0.456 V vs. SCE), and Omc Z (-0.465 V vs. SCE) [13, 25-27]. The potential of purified Omc B most likely corresponds to redox centre at -0.413 V in our experiments. The electroactive surface coverage was calculated as 750 pmol of proteins/cm2 of the projected geometric electrode area. This coverage is in agreement with the value reported by Yuan et al [28] for microbial fuel cell anodes. Armstrong et al [29] reported that a monolayer of protein can pack on surface with a density of about 1 pmol/cm2. These observations suggest that the redox proteins far from the electrode interface are to some extent electrically connected to the redox proteins at the biofilm/electrode interface. The high surface coverage value also suggests the possibility of electron relay to periplasmic proteins or even to proteins in quinone pool [30]. However, there is a lack of direct evidence for such electron relay mechanism. The direct electron transfer between redox centre at -0.358 V (Ea3) and ITO electrode was studied using CV at increasing scan rate (Figure 4b). Under non-turnover conditions, one would expect biofilms to behave as thin-film, with the peak current linearly dependent on scan rate, as commonly reported for adsorbed redox proteins [29]. However, the electrochemistry of the living bacterial cells/biofilms differs significantly with that of isolated redox proteins [17]. We observed that the peak current follows two different regimes, at low scan rate and fast scan rate. This complex behavior likely result from the three-dimensional structure of electroactive biofilms and from the long time needed for the complete oxidation of acetate in viable cells, approximately 2 seconds [15]. 3.4. Electronic absorption spectra of G. sulfurreducens biofilm 3.4.1. Absorption spectra of G. sulfurreducens biofilm under turnover conditions The G. sulfurreducens biofilms formed at ITO electrode exhibit an intense reddish-
9
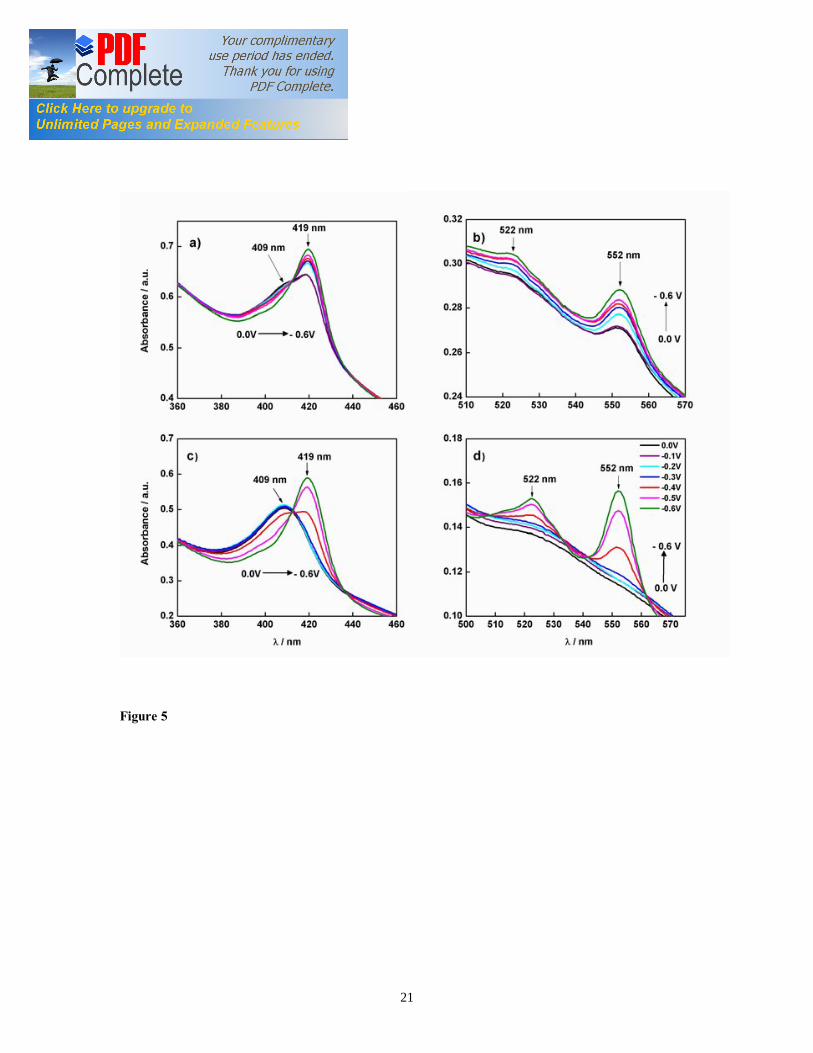
orange color, which indicates the high concentration of Omc, as previously reported for G. sulfurreducens cell suspension [31]. The electronic absorption spectra of G. sulfurreducens biofilms grown with 20 mM acetate as electron donor shows two absorption peaks for Soret band at 409 nm and 419 nm (Figure 5a) that indicate the oxidized and reduced form of cyt c552, respectively. The weak absorption bands at 522 nm (β band) and 552 nm (α band) are characteristic of the reduced form of heme groups in cyt c552 (Figure 5b). Upon step-wise decrease of the electrode potential from 0.0 to -0.6 V vs. SCE, the absorbance of the peaks at 419, 522, and 552 nm increased (Figure 5), suggesting reduction of the oxidized cyt c552. Thus, it appears that G. sulfurreducens biofilms under turnover conditions contain reduced as well as oxidized cyt c552. 3.4.2. Absorption spectra of G. sulfurreducens biofilm under non-turnover condition The absorption spectra of G. sulfurreducens biofilm maintained for 24 hours in absence of acetate at 0.0 V vs. SCE shows two absorption peaks at 409 nm and 528 nm (Figure 5c, 5d). These absorption peaks indicate the presence of the sole oxidized form of cyt c552 in the biofilm. The biofilm cyt c552 spectra obtained under non-turnover condition are very similar to the spectra reported earlier for the oxidized state of isolated and purified Omc from G. sulfurreducens [25]. Upon stepping the electrode potential from 0.0 to -0.6 V, there was a red-shift (419 nm) of the Soret band, indicating reduction of heme groups in cyt c552 (Figure 5c). A similar shift in the Soret absorption band was reported earlier only for purified c type cytochromes (c Cyts) adsorbed on to optically transparent electrodes (OTEs) [12]. At -0.4 V vs. SCE, the Soret band showed two equivalent absorption maxima at 409 nm and 419 nm, indicating equilibrium concentration of oxidized and reduced cyt c552 in the biofilm (Figure 5 c). At potential lower than the midpoint potential (-0.4 V vs. SCE), the cyt c552 cannot transfer the electrons to the electrode, and they were completely reduced.
Collinson and Bowden [32] suggested that the wavelength and intensity of the Soret absorption band are sensitive to the conformational state of the heme group in c Cyts and the weakening of the heme crevice further blue-shifts the Soret band as far as 407 nm. On the other hand, the formation of a mixed high-spin/low-spin complex further blue-shifts the Soret band to 398-400 nm while the formation of a fully high-spin complex results in the appearance of the Soret band at 395 nm. However, such abnormal shift was not observed in the Soret band of G. sulfurreducens biofilm cyt c552 spectra, implying the stable and low spin conformational change in heme-protein complex of the biofilm cyt c552 during potential step experiment. At -0.6 V, two more absorption peaks at 522 nm (β band) and 552 nm (α band) were also observed (Figure 4d). These peaks are also consistent with the reduced form of purified c Cyts previously reported [25]. The occurrence of clear, well defined α and β bands in the G. sulfurreducens biofilm absorption spectra indicates the feasibility of visible spectroscopy for studying in-vivo redox processes involving heme-containing proteins in viable EABs attached at OTEs. However, circular dichroism and other interface characterization techniques may provide a better insight into the conformational changes occurring in heme-protein complex during potential step. The biofilm cyt c552 showed fully reversible spectra in either direction of scan potential at
10
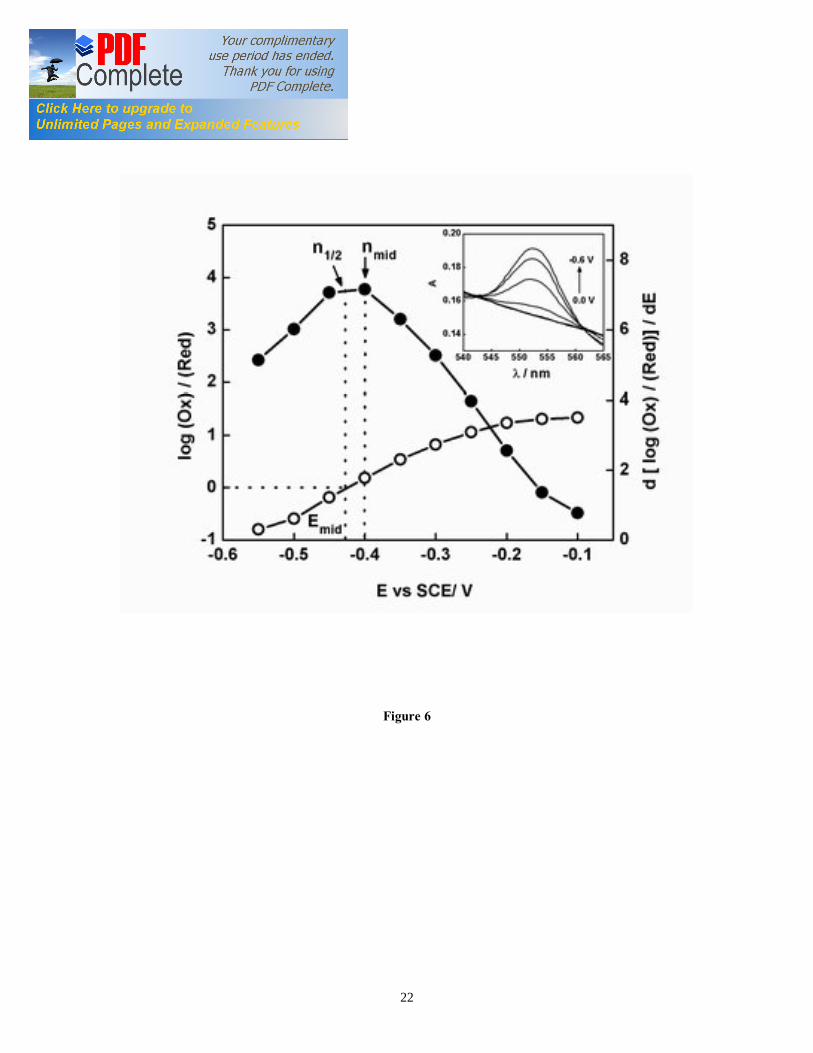
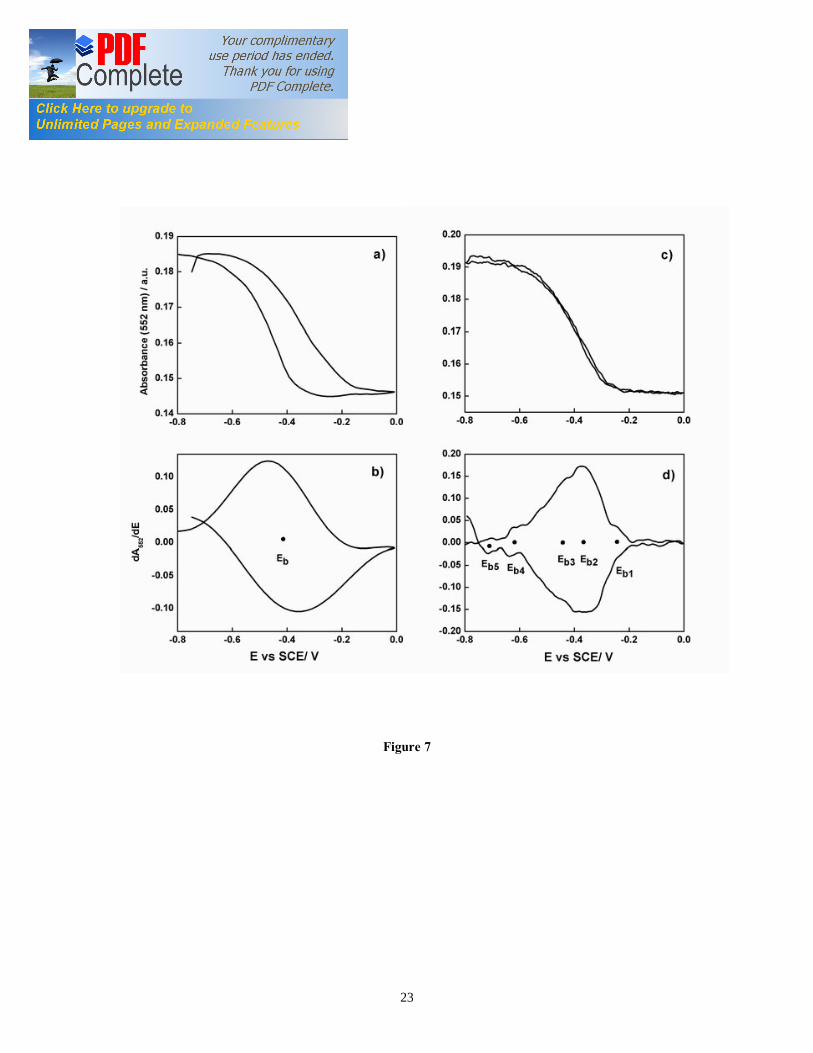
least six times without detectable change in behavior (data not shown). For what concerns the characterization of interface redox properties, viable EABs have great advantage over adsorbed purified redox proteins systems. In fact, the adsorption process may cause conformational change in the purified proteins, thus affecting their redox properties and behavior at the EAB/electrode interface [33]. The spectroscopic surface coverage area of the cyt c552 in G. sulfurreducens biofilm at ITO electrode was 1250 pmol of proteins/cm2, which is almost double than the calculated electroactive surface coverage area (750 pmol cm2). This could be due to that CV probes only the biofilm in close proximity to the electrode. In fact, the usefulness of this technique in probing the bulk biofilm has been questioned due to significant potential gradient in the biofilms [34]. It is also possible that other cellular materials contribute to the absorption spectra of the biofilm, and thus increasing the Soret absorption peak. At present, the discrepancy between spectroscopic and electroactive surface coverage is not well understood. It should be noted that EABs achieve high concentration of redox proteins per unit of surface at a fraction of the cost needed for immobilization of purified proteins [29]. 3.5. Spectroelectrochemistry of G. sulfurreducens biofilm under non-turnover conditions The background-subtracted absorbance of the biofilm at 552 nm under non-turnover conditions was plotted as a function of applied potential (Figure 6) according to Nernst equation: Log (Ox) / (Red) = Eapp – Emid (nF/RT) (4) Where (Ox) and (Red) represent the concentrations of the oxidized and reduced species, at a given applied potential (Eapp) and Emid is the midpoint potential of the redox couple determined by the CV. The first derivative of the curve showed a maximum at -0.42 V vs. SCE (E mid) that correspond to an n1/2 = 7.5. Since the biofilm cyt c552 has non-Nernstian response, the “n” value cannot be interpreted as the number of electrons involved in the redox process. However, n1/2 describes the level of cooperativity between different heme entities within the cyt c552. Our results indicate a high level of cooperativity within the heme groups of the biofilm cyt c552. Such non-Nernstian behavior is reported for proteins with more than one heme-binding site that display interactions between heme centers that influence their redox activity. For example, subunit-subunit interactions in tetrameric hemoglobin molecule cause differential binding of oxygen molecule to the heme centers [35]. These results suggest electron hopping between non-equivalent hemes in multiheme cyt c552 of G. sulfurreducens biofilm. The Emid value estimated through the Nernst plot corresponded well to the midpoint potentials of purified multiheme Omc B (-0.43 V vs. SCE) from G. sulfurreducens planktonic cells [25]. Experiments with Omc B deletion mutants by Richter et al [21] recently demonstrated that Omc B plays a crucial role in EET in G. sulfurreducens biofilm at graphite electrode. 3.6. Cyclic voltabsorptometry (CVA) and derivative cyclic voltabsorptometry (DCVA) of G. sulfurreducens biofilm under non-turnover condition The absorbance of G. sulfurreducens biofilm under non-turnover condition at a fixed wavelength (552 nm) was recorded as a function of scan potential at the same scan rate of the CV, also determined at the same time. The resulting absorbance versus potential plot
11
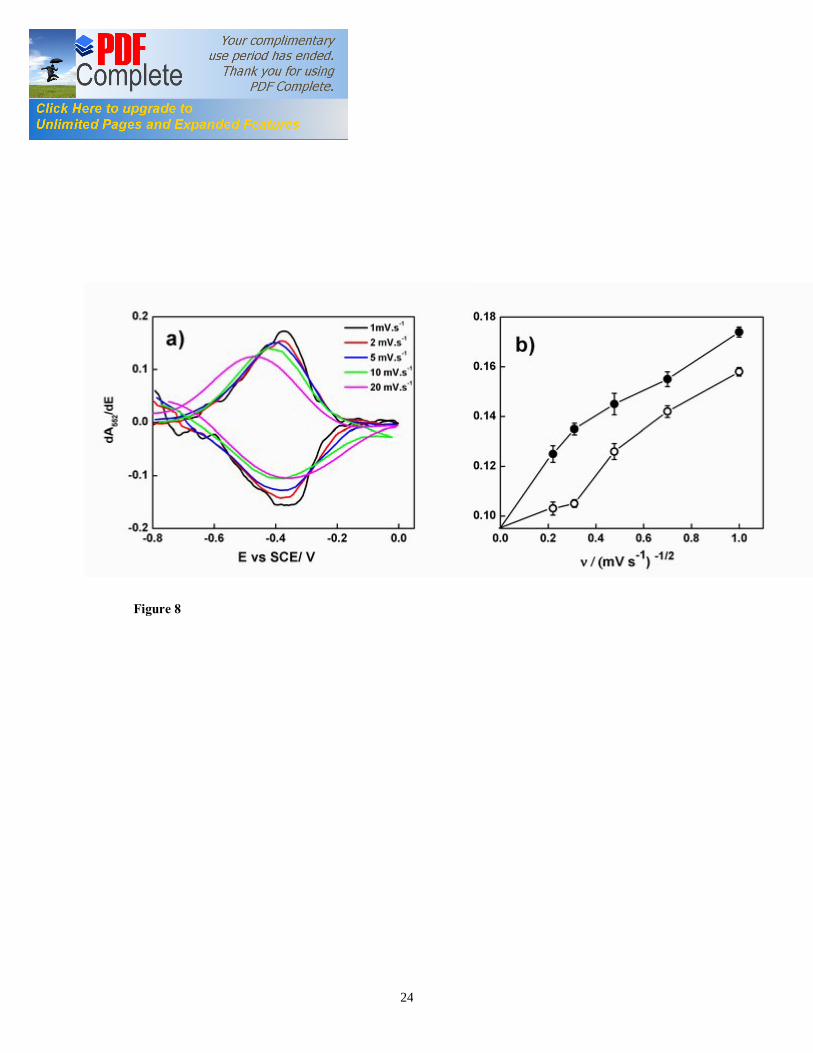
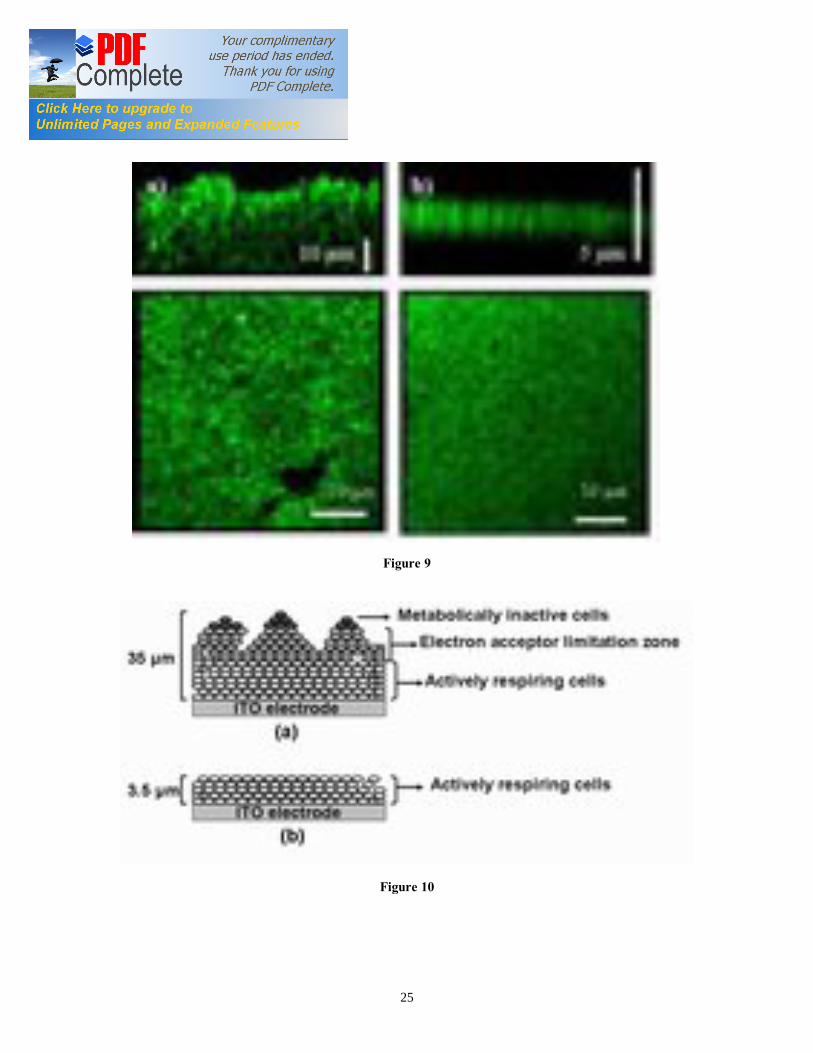
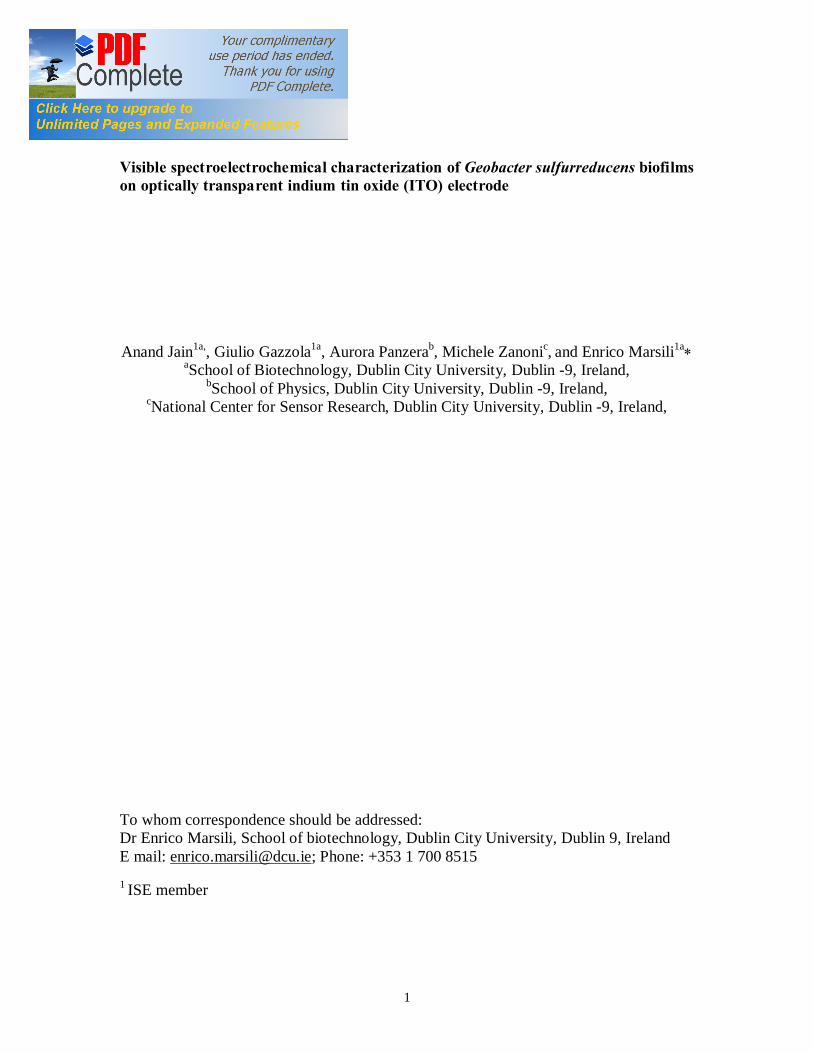
or cyclic voltabsorptommogram (CVA) (Figure 7a) corresponded to the heme reduction and oxidation with cyclic sweep of the applied potential between 0.0 V and -0.6 V vs. SCE. The CVA signal results mainly from the integrated population change while the CV signal results from differential change in redox state [10, 11]. Therefore, the comparison of the CVA with CV data was facilitated by differentiation of the CVA, followed by smoothing with a fast Fourier transform algorithm, to obtain derivative cyclic voltabsorptometry data (DCVA). At 20 mV/s, the DCVA waveform shows one major redox center, at a formal potential of -0.42 V vs. SCE, close to the midpoint potential calculated from Nernst plot (Figure 7b). The shape of the DCVA waveform at high scan rate shows similarity with the corresponding CV waveform at higher scan rate. However, at slower scan rates (1 mV/s) (Figure 7d), the DCVA waveform was markedly different from the corresponding CV at slower scan rate. Although five putative redox centers can be seen in DCVA (at 1 mV/s), it seemed that major redox centers at -0.38 V and -0.43 V vs. SCE are actually contributing to the EET transfer process (Figure 7d). We showed for the first time the applicability of CVA and DCVA in elucidating the major electrocatalytically active redox centers in a viable EAB in an analogous manner to non-turnover cyclic voltammetry. Furthermore, the DCVA waveforms are reported to be essentially background free, in contrast to the CV data [10]. DCVA of biofilm under non-turnover condition (Figure 8a, 8b) at low scan rate did not show a clear correlation with inverse square root of the scan rate dependence, as reported for adsorbed redox proteins such as flavin mononucleotide (FMN) [11]. 3.7. Confocal microscopy of G. sulfurreducens biofilm The G. sulfurreducens biofilm structure and thickness was elucidated using confocal microscopy (Figure 9a). Biofilm grown with 20 mM acetate covered the whole ITO electrode surface and had a maximum thickness of 35 µm. The biofilms showed typical pillar-like structures, with top fluffy layer and dense inner core, as previously reported for electroactive biofilms [36, 37]. The biofilm thickness determined the applicability of in-vivo UV-visible spectroelectrochemistry. In fact, the absorption spectra of 35 µm thick biofilms under turnover conditions showed a mixture of reduced and oxidized cyt c552 . On the other hand, the biofilms imaged after 24 h of incubation without electron donor at oxidative potential showed few densely packed layers of cells with an average thickness of 3.5 µm, as reported earlier [24] (Figure 9b). These results suggest that the redox state of cyt c552 located in biofilm layers far from the electrode may be partially determined by the electrode potential. On the other hand, the redox state of cyt c552 in thin EABs is determined mostly by the applied electrode potential. We propose a conceptual model of the G. sulfurreducens biofilm structure (Figure 10) that explains the absorption spectra and the confocal analysis. In this model, the biofilm may be subdivided in three regions: a) dense inner core, b) electron acceptor limitation zone, and c) metabolically inactive zone. In the inner biofilm core, in proximity of the electrode, the cells are actively respiring, thus transferring electrons to the electrode. The cyt c552 in this thin zone can undergo complete oxidation or reduction under non-turnover conditions, as a function of applied electrode potential. Following starvation, EABs consist mainly of this zone. In the intermediate zone, the electron acceptor is limiting, i.e. the potential to which the cells
12
are exposed decreases as the distance from the electrode increases. Therefore, the cyt c552 in this zone can be oxidized or reduced partially by changing the electrode potential. Finally, the top layers of the biofilms are metabolically inactive, thus they contribute very little to the overall electron transfer process. The cyt c552 in this zone are always reduced under the experimental conditions adopted in this study and their redox state cannot be altered by changing the electrode potential. Thick biofilms under turnover conditions show all the three zones, thus the absorption peaks correspond to those of oxidized and poorly reduced cyt c552. The starvation phase favored the detachment of the less coherent top biofilm layers, thus leaving only the inner metabolically active layers. Starvation-induced biofilm detachment has been reported earlier in variety of biofilms such as Pseudomonas aeruginosa [38], and Pseudomonas sp CE-2 [39]. However, the effect of electron donor/acceptor concentration on the electroactive biofilm microstructure remains largely unknown. Nevin et al [36] reported that on the graphite stick anodes, the exterior of the G. sulfurreducens biofilms had a substantial percentage of dead cells whereas cells closest to the anode were primarily viable. Frank et al. [37] showed that the top layers of the pillar like structure in G. sulfurreducens biofilm are metabolically inactive and may not contribute to EET. Marsili et al. [16] found that the electron transfer rate measured in thick biofilms is lower than the theoretical rate, likely because of poor metabolic activity of the top biofilm layers. Consequently, denser and thinner biofilm, where most of the cells can transfer electrons to the electrode, are more suitable for SEC investigation. 4. Conclusion In-vivo visible SEC of EAB provides unique characterization of redox processes at electrode/biofilm interface. Mature biofilms thinned through prolonged starvation at oxidative potentials are the optimal system for visible SEC, provided that planktonic and loosely attached cells are removed from the SEC cell. Under these conditions, SEC enables to characterize in-vivo redox conversion of cyt c552 in viable biofilm, thus providing insight on the redox process. We have proved the feasibility of in-vivo SEC on the EAB-forming microorganism G. sulfurreducens. We have successfully measured stable potential-dependent charging and discharging of cyt c552 in G. sulfurreducens biofilm under non-turnover conditions. The quality of biophysical information that can be obtained through SEC depends on the biofilm formation, the EET rate, and the growth stage of the biofilm itself. Acknowledgement Anand Jain is supported by the Irish Research Council for science, engineering and technology (IRCSET) - EMPOWER fellowship. Enrico Marsili is supported by the EU-FP7 Marie Curie International Reintegration Program. We thank Dr. D. Heering (University of Delft, The Netherlands) for providing the software Utilities for Data Analysis (UTILS) version 1.0 for the baseline calculations.
13
References [1] S. Dulon, S. Parot, M.L. Délia, A. Bergel, J. Appl. Electrochem. 37 (2007) 173. [2] B. Erable, N.M. Duţeanu, M.M. Ghangrekar, C. Dumas, K. Scott, Biofouling 26 (2010) 57. [3] K.B. Gregory, D.R. Lovley, Environ. Sci. Technol. 39 (2005) 8943. [4] A. Kumlanghan, J. Liu, P. Thavarungkul, P. Kanatharana, B. Mattiasson, Biosens. Bioelectron. 22 (2007) 2939. [5] H. Liu, R. Ramnarayanan, B.E. Logan, Environ. Sci. Technol. 38 (2004) 2281. [6] T. Mehta, M.V. Coppi, S.E. Childers, D.R. Lovley, Appl. Environ. Microbiol. 71 (2005) 8634. [7] D. Lovley, Geobiology 6 (2008) 225. [8] J. Borloo, B. Vergauwen, L. De Smet, A. Brigé, B. Motte, B. Devreese, J.V. Beeumen, FEBS J. 274 (2007) 3728. [9] E.E. Bancroft, J.S. Sidwell, H.N. Blount, Anal. Chem. 53 (1981) 1390. [10] Y. Astuti, E. Topoglidis, G. Gilardi, J.R. Durrant, Bioelectrochemistry 63 (2004) 55. [11] Y. Astuti, E. Topoglidis, P.B. Briscoe, A. Fantuzzi, G. Gilardi, J.R. Durrant, J. Am. Chem. Soc. 126 (2004) 8001. [12] R. Nakamura, K. Ishii, K. Hashimoto, Angew. Chem. Int. Edit. 48 (2009) 1606. [13] J.P. Busalmen, A. Esteve-Nuñez, A. Berná, J.M. Feliu, Bioelectrochemistry 78 (2010) 25. [14] B.E. Logan (eds), Microbial fuel cells, a John Wiley & Sons, Inc, 2007,Ch. 4. [15] E. Marsili, J.B. Rollefson, D.B. Baron, R.M. Hozalski, D.R. Bond, Appl. Environ. Microb. 74 (2008) 7329. [16] E. Marsili, J. Sun, D.R. Bond, Electroanal. 22 (2010) 865. [17] K. Fricke, F. Harnisch, U. Schroder, Energy. Environ. Sci. 1 (2008), 144. [18] C. Dumas, R. Basseguy, A. Bergel, Electrochim. Acta 53 (2008) 5235. [19] D. Finkelstein, L. Tender, J. Gregoryzeikus, Environ. Sci. Technol. 40 (2006) 6990. [20] E.A. Parra, A. Higa, C.R. Buie, J.D. Coates, L. Lin, Proc. 23rd IEEE Micro Electro Mechanical Systems (MEMS) Int. Conf. (2010) 1183. [21] K. Richter, C. Bücking, M. Schicklberger, J. Gescher, J. Microbiol. Meth. 82 (2010) 184. [22] H.S. Park, B.H. Kim, H.S. Kim, H.J. Kim, G.T. Kim, I.S. Chang, Y.K. Park, H.I. Chang, Anaerobe 7 (2001) 297. [23] H.J. Kim, H.S. Park, M.S. Hyun, I.S. Chang, M. Kim, B.H. Kim, Enzyme Microb. Tech. 30 (2002) 145. [24] K.P. Katuri, P. Kavanagh, S. Saravanan, D. Leech, Chem. Commun. 46 (2010) 4758. [25] K. Inoue, X. Qian, L. Morgado, B.C. Kim, T. Mester, M. Izallalen, C.A. Salgueiro, D.R. Lovley, Appl. Environ. Microb. 76 (2010) 3999. [26] X. Qian, G. Reguera, T. Mester, D.R. Lovley, FEMS Microbiol. Lett. 277 (2007) 21. [27] L. Shi, T.C. Squier, J.M. Zachara, J.K. Frederickson, Mol. Microbiol. 65 (2007) 12.
14
[28] Y. Yuan, S. Zhou, N. Xu, L. Zhuang, Colloid.Surface. B 82 (2011) 641. [29] F.A. Armstrong, H.A. Heering, J. Hirst, Chem. Soc. Rev. 26 (1997) 169. [30] D. Baron, E. Labelle, D. Coursolle, J.A. Gralnick, D.R. Bond, J. Biol. Chem, 42 (2009) 28865. [31] S. Seeliger, R.C. Ruwisch, B. Schink, J. Bacteriol.180 (1998) 3686. [32] M. Collinson, E.F. Bowden, Anal. Chem. 64 (1992) 1470. [33] C.W. Herbold, J.H. Miller, S.C. Goheen, J. Chromatogr. A 863 (1999)137. [34] C. Dumas, A. Mollica, D. Feron, R. Basseguy, A. Bergel, Bioresour. Technol 99 (2008) 8887. [35] S. Dhungana, A.L. Crumbliss, in: W. Kaim, A. Klein (Eds.) Spectroelectrochemistry, the Royal Society of Chemistry, Cambridge, 2008, Ch. 2. [36] K.P. Nevin, H. Richter, S.F. Covalla, J.P. Johnson, T.L. Woodard, A.L. Orloff, H. Jia, M. Zhang, D.R. Lovley, Environ. Microbiol. 10 (2008) 2505. [37] A.E. Franks, K.P. Nevin, R.H. Glaven, D.R. Lovley, ISME J. 4 (2010) 509. [38] D.G. Allison, B. Ruiz, C. SanJose, A. Jaspe, P. Gilbert, FEMS Microbiol. Lett. 167 (1998) 179. [39] A. Jain, N.B. Bhosle, Biofouling 24 (2008) 283.
15
Figure captions Figure 1. SEC Experimental setup; the EC was composed of calomel reference electrode, platinum wire counter electrode, and ITO working electrode (WE). The incident light entered the cell from the biofilm/electrode interface. The transmitted light was collected to determine the absorbance of the sample. The electrodes were connected to a potentiostat. Figure 2. Typical chronoamperometry of G. sulfurreducens biofilm formed at ITO electrode. The open and close circle represents the CV and SEC analysis performed under turnover (after 64 hours) and non-turnover conditions (after 86 hours), respectively. Following addition of 20 mM acetate after 96 hours, current resumed to 50% of its maximum value. Figure 3. CV (a) and first derivative of CV (b) of the G. sulfurreducens biofilm grown in medium containing acetate (turnover conditions), CV under non-turnover conditions, at high scan rate 50 mV/s (c) and slow scan rate 1 mV/s (d). Note that the redox couple at -0.361 V vs. SCE (E1) actually contributes to the catalytic electron transfer at anode, whereas E2 and E3 appears electrocatalytically inactive. Figure 4. Cyclic voltammetry of the G. sulfurreducens biofilm under non-turnover condition, obtained at increasing scan rate (a), and the absolute values of the peak current as a function of scan rate for the Ea3 redox center (b). Full and empty circles indicate the reduction and oxidation peak, respectively. Only selected CVs are shown in (a). Figure 5. Electronic absorption spectra of G. sulfurreducens biofilm under turnover (a, b) and non-turnover condition (c, d). Under turnover and non-turnover conditions, the Soret absorption band show two peaks at 409 nm and 419 nm, and weak absorption bands appear at 522 (β band) and 552 nm (α band). Following step-wise decrease of electrode potential from 0.0 to -0.6 V vs. SCE, the red shift (419 nm) of Soret absorption band and the gradual increase of the peak intensity at 522 nm and 552 nm were more pronounced under non-turnover than under turnover conditions. Figure 6. Nernst plot of log [Ox]/ [Red] of the biofilm c Cyts (empty circles), and the first derivative of Nernst plot (full circles), as a function of electrode potential. Inset shows the increase in the peak intensity of α band with the increase in electrode potential, which was used for the Nernst plot. Figure 7. CVA (a, c) and DCVA (b, d) of G. sulfurreducens biofilm under non-turnover conditions, at two different scan rate, 20 mV/s (a, b) and 1 mV/s (c, d). DCVA at 20 mV/s shows one redox center at -0.42 V, which splits into five redox couples at 1 mV/s. The two major redox centers at -0.38 V and -0.43 V in DCVA at slower scan rate are related to the electron transfer process. CVA and DCVA data were reproducible among independent biological replicates (n=10). The average difference in current and absorbance was less that < 5%. Figure 8. DCVA of G. sulfurreducens biofilm (a) and scan rate dependence of the absolute peak current (b) obtained from (a). Figure 9. Confocal microscope picture of the G. sulfurreducens biofilm grown in
16
medium containing 20 mM acetate (a), and incubated in non-growth medium without acetate (b). The biofilms were stained with the acridine orange (1 mg/ml). The biofilm (a) show a typical pillar like structure, with top fluffy layer and dense inner core, whereas biofilm (b) consist of few layers of densely packed cells. Figure 10. Conceptual model of the G. sulfurreducens biofilm under turnover (a), and non-turnover conditions (b). The turnover biofilm (a) comprises of metabolically inactive cells in the topmost zone, electron acceptor limited cells in the middle zone, and actively respiring cells in inner core close to the electrode surface. In-contrast, non-turnover biofilm (b) consist of few layers of actively respiring cells in close contact with the electrode.