village of glendale h eights, illinois
TRANSCRIPT

Vill
age
of G
lend
ale
Hei
ghts
, Illi
nois COMPREHENSIVE
ANNUAL FINANCIAL REPORTFor the Fiscal Year Ended
April 30, 2017
A Proud & Progressive Village for All People

VILLAGE OF GLENDALE HEIGHTS, ILLINOIS
COMPREHENSIVE ANNUAL FINANCIAL REPORT
Year Ended April 30, 2017
Prepared by Finance Department Bill Poling, Finance Director
Andrea Fogt, Assistant Finance Director

VILLAGE OF GLENDALE HEIGHTS, ILLINOIS COMPREHENSIVE ANNUAL FINANCIAL REPORT
April 30, 2017
CONTENTS
INTRODUCTORY SECTION – (Unaudited) Letter of Transmittal .......................................................................................................................................... i Certificate of Achievement for Excellence in Financial Reporting ......................................................................................................................................... xi Municipal Organization Structure .................................................................................................................. xii Principal Officials .............................................................................................................................................. xiii FINANCIAL SECTION Independent Auditor’s Report ......................................................................................................................... 1 Required Supplementary Information: Management’s Discussion and Analysis ........................................................................................................ 3 Basic Financial Statements: Village-wide Financial Statements: Statement of Net Position ................................................................................................................................. 12 Statement of Activities ...................................................................................................................................... 13 Fund Financial Statements: Balance Sheet – Governmental Funds ............................................................................................................. 14 Reconciliation of Governmental Funds Balance Sheet to Statement of Net Position ........................................................................................................................... 15 Statement of Revenues, Expenditures and Changes in Fund Balances – Governmental Funds ..................................................................................................... 16 Reconciliation of the Statement of Revenues, Expenditures and Changes in Fund Balances of Governmental Funds to the Statement of Activities ............................................................................................................. 17
Statement of Net Position – Proprietary Funds ............................................................................................. 18 Statement of Revenues, Expenses and Changes in Net Position – Proprietary Funds ............................................................................................. 19 Statement of Cash Flows – Proprietary Funds .............................................................................................. 20 Statement of Fiduciary Net Position – Fiduciary Funds .............................................................................. 21
VILLAGE OF GLENDALE HEIGHTS, ILLINOIS COMPREHENSIVE ANNUAL FINANCIAL REPORT
April 30, 2017
CONTENTS
FINANCIAL SECTION (Continued) Statement of Changes in Fiduciary Net Position – Fiduciary Fund ........................................................... 22 Notes to the Financial Statements ................................................................................................................... 23 Required Supplementary Information: Budgetary Comparison Schedule: Schedule of Revenues, Expenditures and Changes in Fund Balance – Budget (GAAP Basis) and Actual – General Fund ........................................................................................................................................... 56 Historical Pension and Retiree’s Health Plan Information Schedules of Funding Progress ................................................................................................................. 57 Schedule of Changes in Illinois Municipal Retirement Fund Net Pension Liability and Related Ratios ............................................................................................................ 58 Schedule of Illinois Municipal Retirement Fund Contributions .......................................................... 59 Schedule of Changes in Police Pension Fund Net Pension Liability ................................................... 60 Schedule of Police Pension Fund Contributions .................................................................................... 61 Schedule of Police Pension Fund Investment Rate of Return .............................................................. 62 Notes to the Required Supplementary Information .............................................................................. 63 Combining and Individual Fund Financial Statements and Schedules: Major Governmental Funds General Fund Financial Schedules: Balance Sheet by Account ........................................................................................................................ 64 Schedule of Revenues, Expenditures and Changes in Fund Balance by Account – All General Fund Accounts .................................................................... 65 Supplemental Schedules: Schedule of Revenues, Expenditures and Changes in Fund Balance – Budget (GAAP Basis) and Actual – General Account ...................................................... 66 Schedule of Detailed Revenues – Budget (GAAP Basis) and Actual - General Account ....................................................................................................................................... 67 Schedule of Expenditures - Budget (GAAP Basis) and Actual - General Account ....................................................................................................................................... 71 Schedule of Detailed Expenditures - Budget (GAAP Basis) and Actual – General Account ................................................................................................................ 72 Schedule of Revenues, Expenditures and Changes in Fund Balance – Budget (GAAP Basis) and Actual Liability Insurance Account .................................................................................................................... 83
VILLAGE OF GLENDALE HEIGHTS, ILLINOIS COMPREHENSIVE ANNUAL FINANCIAL REPORT
April 30, 2017
CONTENTS
FINANCIAL SECTION (Continued) Debt Service Fund Financial Schedule: Schedule of Revenues, Expenditures and Changes in Fund Balance – Budget (GAAP Basis) and Actual .......................................................................... 84 Nonmajor Governmental Funds Combining Balance Sheet ................................................................................................................................. 85 Combining Statement of Revenues, Expenditures and Changes in Fund Balances ...................................................................................................................... 90 Special Revenue Funds: Recreation Fund Financial Schedules: Schedule of Revenues, Expenditures and Changes in Fund Balance – Budget (GAAP Basis) and Actual ............................................................................. 95 Supplemental Schedules: Schedule of Detailed Revenues – Budget (GAAP Basis) and Actual ................................................ 96 Schedule of Detailed Expenditures – Budget (GAAP Basis) and Actual ............................................................................................................................................... 97 Emergency Service Fund Financial Schedule: Schedule of Revenues, Expenditures and Changes in Fund Balance – Budget (GAAP Basis) and Actual ........................................................................ 100 Handicapped Recreation Fund Financial Schedule: Schedule of Revenues, Expenditures and Changes in Fund Balance – Budget (GAAP Basis) and Actual ........................................................................ 101 Motor Fuel Tax Fund Financial Schedule: Schedule of Revenues, Expenditures and Changes in Fund Balance – Budget (GAAP Basis) and Actual .......................................................................... 102 Founders’ Day Fund Financial Schedule: Schedule of Revenues, Expenditures and Changes in Fund Balance – Budget (GAAP Basis) and Actual ........................................................................ 103

VILLAGE OF GLENDALE HEIGHTS, ILLINOIS COMPREHENSIVE ANNUAL FINANCIAL REPORT
April 30, 2017
CONTENTS
FINANCIAL SECTION (Continued) Parks & Recreation Development Fund Financial Schedule: Schedule of Revenues and Changes in Fund Balance – Budget (GAAP Basis) and Actual ........................................................................ 104 Infrastructure Fund Financial Schedule: Schedule of Revenues, Expenditures and Changes in Fund Balance – Budget (GAAP Basis) and Actual ........................................................................ 105 Special Service Area #1 Fund Financial Schedule: Schedule of Revenues and Changes in Fund Balance - Budget (GAAP Basis) and Actual ......................................................................... 106 Special Service Area #2 Fund Financial Schedule: Schedule of Revenues and Changes in Fund Balance – Budget (GAAP Basis) and Actual ........................................................................ 107 Special Service Area #3 Fund Financial Schedule: Schedule of Revenues and Changes in Fund Balance - Budget (GAAP Basis) and Actual ......................................................................... 108 Special Service Area #4 Fund Financial Schedule: Schedule of Revenues and Changes in Fund Balance - Budget (GAAP Basis) and Actual ......................................................................... 109 Special Service Area #5 Fund Financial Schedule: Schedule of Revenues and Changes in Fund Balance - Budget (GAAP Basis) and Actual ......................................................................... 110 Special Service Area #6 Fund Financial Schedule: Schedule of Revenues and Changes in Fund Balance – Budget (GAAP Basis) and Actual ........................................................................ 111

VILLAGE OF GLENDALE HEIGHTS, ILLINOIS COMPREHENSIVE ANNUAL FINANCIAL REPORT
April 30, 2017
CONTENTS
FINANCIAL SECTION (Continued) Special Service Area #7 Fund Financial Schedule: Schedule of Revenues and Changes in Fund Balance - Budget (GAAP Basis) and Actual ......................................................................... 112
Special Service Area #8 Fund Financial Schedule: Schedule of Revenues and Changes in Fund Balance (GAAP Basis) and Actual ......................................................................................... 113 Article 36 Fund Financial Schedule: Schedule of Revenues, Expenditures and Changes in Fund Balance - Budget (GAAP Basis) and Actual ......................................................................... 114 TIF No. 1 Fund Financial Schedule: Schedule of Revenues, Expenditures and Changes in Fund Balance - Budget (GAAP Basis) and Actual ......................................................................... 115 TIF No. 2 Fund Financial Schedule: Schedule of Revenues, Expenditures and Changes in Fund Balance - Budget (GAAP Basis) and Actual ......................................................................... 116 TIF No. 3 Fund Financial Schedule: Schedule of Revenues, Expenditures and Changes in Fund Balance - Budget (GAAP Basis) and Actual ......................................................................... 117 TIF No. 4 Fund Financial Schedule: Schedule of Revenues, Expenditures and Changes in Fund Balance - Budget (GAAP Basis) and Actual ......................................................................... 118 TIF No. 5 Fund Financial Schedule: Schedule of Expenditures and Changes in Fund Balance – Budge (GAAP Basis) and Actual ....................................................................... 119

VILLAGE OF GLENDALE HEIGHTS, ILLINOIS COMPREHENSIVE ANNUAL FINANCIAL REPORT
April 30, 2017
CONTENTS
FINANCIAL SECTION (Continued) IMRF Fund Financial Schedule: Schedule of Revenues, Expenditures and Changes in Fund Balance – Budge (GAAP Basis) and Actual ....................................................................... 120
Historical Building Fund Financial Schedule: Schedule of Revenues, Expenditures and Changes in Fund Balance – Budget (GAAP Basis) and Actual ..................................................................... 121 Capital Projects Funds: Vehicle Replacement Fund Financial Schedule: Schedule of Revenues, Expenditures and Changes in Fund Balance - Budget (GAAP Basis) and Actual ......................................................................... 122 Computer Replacement Fund Financial Schedule: Schedule of Revenues, Expenditures and Changes in Fund Balance – Budget (GAAP Basis) and Actual ........................................................................ 123 Capital Projects Fund Financial Schedule: Schedule of Revenues, Expenditures and Changes in Fund Balance - Budget (GAAP Basis) and Actual ......................................................................... 124 Recreation Equipment Replacement Fund Financial Schedule: Schedule of Expenditures and Changes in Fund Balance – Budget (GAAP Basis) and Actual .......................................................................... 125 GOB Series 2010 Fund Financial Schedule: Schedule of Revenues, Expenditures and Changes in Fund Balance – Budget (GAAP Basis) and Actual .......................................................................... 126

VILLAGE OF GLENDALE HEIGHTS, ILLINOIS COMPREHENSIVE ANNUAL FINANCIAL REPORT
April 30, 2017
CONTENTS
FINANCIAL SECTION (Continued) Major Proprietary Funds: Golf Course Fund Supplemental Schedules: Schedule of Revenues and Expenses – Budget (Budget Basis) and Actual ........................................................................................................ 127 Schedule of Operating Expenses - Budget (Budget Basis) and Actual .............................................. 128 Environmental Services Fund Supplemental Schedules: Schedule of Revenues and Expenses - Budget (Budget Basis) and Actual ........................................................................................................ 132 Schedule of Operating Expenses – Budget (Budget Basis) and Actual ............................................. 133 Fiduciary Fund Types: Pension Trust Fund Financial Schedules: Schedule of Changes in Plan Net Position – Budget (GAAP Basis) and Actual ......................................................................................................... 138 Escrow Agency Fund Financial Schedules: Statement of Changes in Assets and Liabilities .................................................................................... 139 SUPPLEMENTAL DATA – (Unaudited) Schedule of Insurance in Force ........................................................................................................................ 140 Long-Term Debt Requirements General Obligation Bond Series of 2006 .................................................................................................. 141 General Obligation Bond Series of 2007 .................................................................................................. 142 General Obligation Bond Series of 2008 .................................................................................................. 143 General Obligation Bond Series of 2009 .................................................................................................. 144 General Obligation Bond Series of 2010 .................................................................................................. 145 STATISTICAL SECTION – (Unaudited) Net Position by Component ............................................................................................................................. 146 Changes in Net Position ................................................................................................................................... 147 Program Revenues by Function/Program ...................................................................................................... 148

VILLAGE OF GLENDALE HEIGHTS, ILLINOIS COMPREHENSIVE ANNUAL FINANCIAL REPORT
April 30, 2017
CONTENTS
STATISTICAL SECTION – (Unaudited) (Continued) Fund Balances, Governmental Funds ............................................................................................................. 150 Changes in Fund Balances, Governmental Funds ........................................................................................ 151 Equalized Assessed Value (EAV) and Estimated Actual Value of Taxable Property ............................................................................................................ 152 Property Tax Rates – Direct and Overlapping Governments ...................................................................... 153 Principal Property Tax Payers ......................................................................................................................... 155 Property Tax Levies and Collections .............................................................................................................. 156 Ratios of Outstanding Debt by Type ............................................................................................................... 157 Ratios of General Bonded Debt Outstanding ................................................................................................ 158 Direct and Overlapping Governmental Activities Debt ............................................................................... 159 Debt Margin Information ................................................................................................................................. 160 Demographic and Economic Statistics ............................................................................................................ 161 Principal Employers .......................................................................................................................................... 162 Full-time Employees by Function/Program ................................................................................................... 163 Operating Indicators by Function/Program ................................................................................................... 164 Capital Asset Statistics by Function/Program................................................................................................ 165
INTRODUCTORY SECTION


ii
information for the preparation of the Village's financial statements in conformity with Generally Accepted Accounting Principles (GAAP). The cost of internal controls should not outweigh their benefits; therefore, internal controls have been designed to provide reasonable rather than absolute assurance that the financial statements are free from material misstatement. GAAP requires that management provide a narrative introduction, overview and analysis to accompany the basic financial statements in the form of Management's Discussion and Analysis (MD&A). Readers are encouraged to consider the information presented in this letter, in conjunction with additional information that is furnished in the MD&A. The Village's MD&A is found immediately following the independent auditor's report. VILLAGE PROFILE The Village is a home rule municipality under the Constitution of the State of Illinois (the “State”). The Village is governed by a Village President and Board of Trustees. The Village President and Village Clerk are elected at large for four-year terms. Six trustees are elected by district for staggered four-year terms.
Serving under the Village President is the appointed Village Administrator who directs the management of the Village and eight appointed department directors, including the Finance Director and Chief of Police. The Village President also appoints consulting firms that serve as Village Attorney and Village Engineer. The Village provides a full range of services including police protection, public works, building permit, inspection and community development, recreation and social events, health, human and senior services, water and sewer and other general government services.
iii
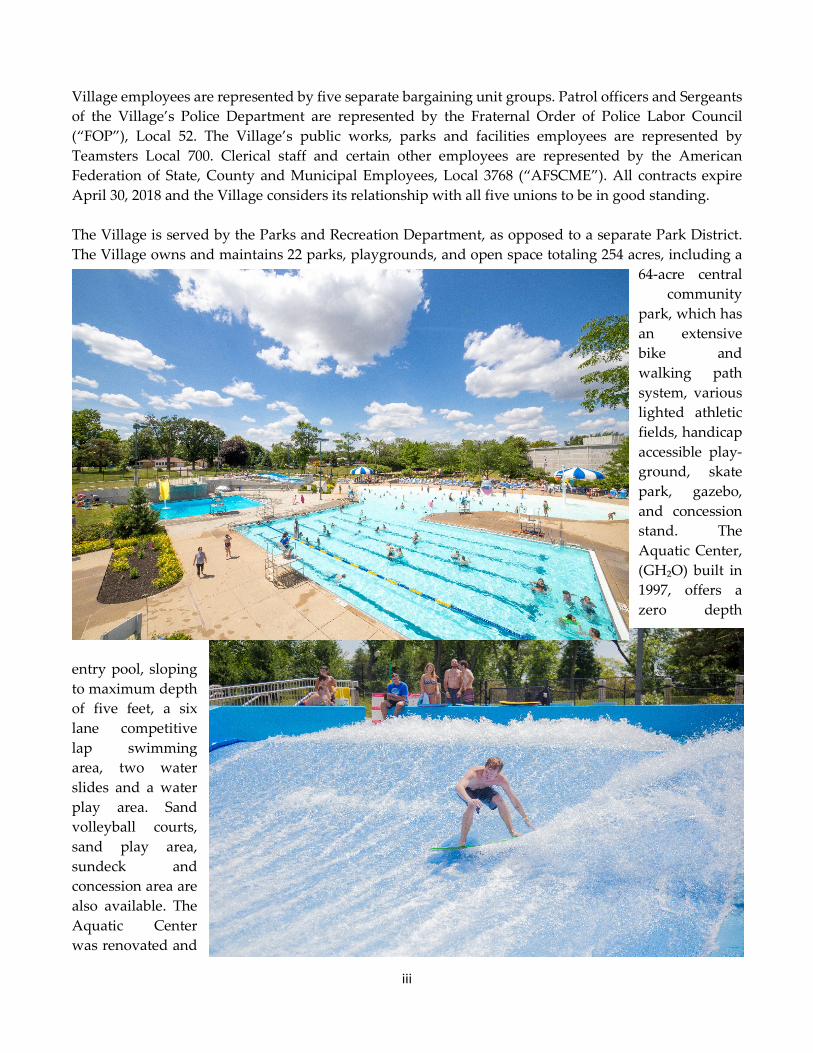
Village employees are represented by five separate bargaining unit groups. Patrol officers and Sergeants of the Village’s Police Department are represented by the Fraternal Order of Police Labor Council (“FOP”), Local 52. The Village’s public works, parks and facilities employees are represented by Teamsters Local 700. Clerical staff and certain other employees are represented by the American Federation of State, County and Municipal Employees, Local 3768 (“AFSCME”). All contracts expire April 30, 2018 and the Village considers its relationship with all five unions to be in good standing. The Village is served by the Parks and Recreation Department, as opposed to a separate Park District. The Village owns and maintains 22 parks, playgrounds, and open space totaling 254 acres, including a
64-acre central community
park, which has an extensive bike and walking path system, various lighted athletic fields, handicap accessible play- ground, skate park, gazebo, and concession stand. The Aquatic Center, (GH₂O) built in 1997, offers a zero depth
entry pool, sloping to maximum depth of five feet, a six lane competitive lap swimming area, two water slides and a water play area. Sand volleyball courts, sand play area, sundeck and concession area are also available. The Aquatic Center was renovated and

iv
celebrated a grand re-opening on July 4, 2012, creating a new aquatic experience with multiple attractions which would add thrills that hold the attention of young and the young at heart. The new features include a high dive, low dive, drop slide and the FlowRider (a surf simulator.)
The Glendale Lakes Golf Club, golf course, clubhouse, and banquet facility is owned and operated by the Village of Glendale Heights. The golf course features an 18-hole championship design with water features that add challenge and beauty. Glendale Lakes also offers a full service Pro-shop stocked for any golfers needs. Banquet rooms accommodate up to 250 people for weddings, showers and parties. The Golf Club restaurant is open on Fridays only during the Lent season for the Fish Fry. During the golf season, grill items from
the bar area are available for lunch or dinner after golfing.
Elementary education is primarily provided by Marquardt School District number 15 and Queen Bee School District number 16. There is also one parochial school, St. Matthew’s School, that serves the
v
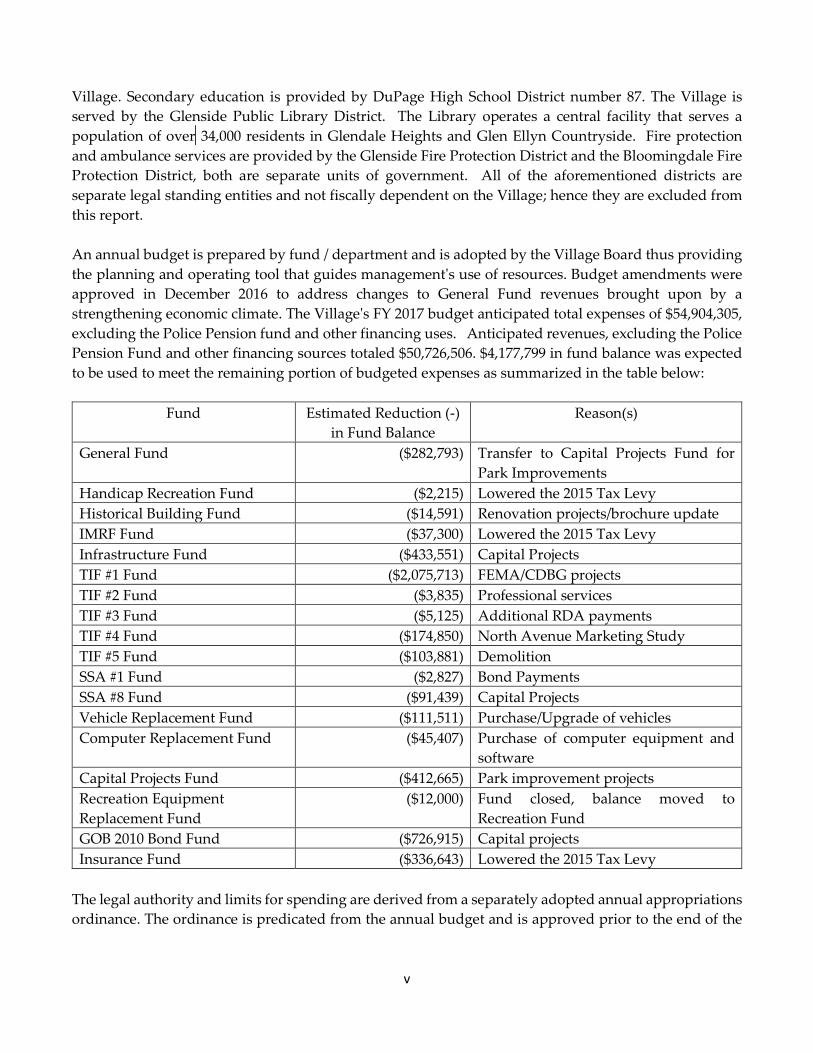
Village. Secondary education is provided by DuPage High School District number 87. The Village is served by the Glenside Public Library District. The Library operates a central facility that serves a population of over ver 34,000 residents in Glendale Heights and Glen Ellyn Countryside. Fire protection and ambulance services are provided by the Glenside Fire Protection District and the Bloomingdale Fire Protection District, both are separate units of government. All of the aforementioned districts are separate legal standing entities and not fiscally dependent on the Village; hence they are excluded from this report. An annual budget is prepared by fund / department and is adopted by the Village Board thus providing the planning and operating tool that guides management's use of resources. Budget amendments were approved in December 2016 to address changes to General Fund revenues brought upon by a strengthening economic climate. The Village's FY 2017 budget anticipated total expenses of $54,904,305, excluding the Police Pension fund and other financing uses. Anticipated revenues, excluding the Police Pension Fund and other financing sources totaled $50,726,506. $4,177,799 in fund balance was expected to be used to meet the remaining portion of budgeted expenses as summarized in the table below:
Fund Estimated Reduction (-) in Fund Balance
Reason(s)
General Fund ($282,793) Transfer to Capital Projects Fund for Park Improvements
Handicap Recreation Fund ($2,215) Lowered the 2015 Tax Levy Historical Building Fund ($14,591) Renovation projects/brochure update IMRF Fund ($37,300) Lowered the 2015 Tax Levy Infrastructure Fund ($433,551) Capital Projects TIF #1 Fund ($2,075,713) FEMA/CDBG projects TIF #2 Fund ($3,835) Professional services TIF #3 Fund ($5,125) Additional RDA payments TIF #4 Fund ($174,850) North Avenue Marketing Study TIF #5 Fund ($103,881) Demolition SSA #1 Fund ($2,827) Bond Payments SSA #8 Fund ($91,439) Capital Projects Vehicle Replacement Fund ($111,511) Purchase/Upgrade of vehicles Computer Replacement Fund ($45,407) Purchase of computer equipment and
software Capital Projects Fund ($412,665) Park improvement projects Recreation Equipment Replacement Fund
($12,000) Fund closed, balance moved to Recreation Fund
GOB 2010 Bond Fund ($726,915) Capital projects Insurance Fund ($336,643) Lowered the 2015 Tax Levy
The legal authority and limits for spending are derived from a separately adopted annual appropriations ordinance. The ordinance is predicated from the annual budget and is approved prior to the end of the

vi
first quarter of the fiscal year as provided in State Statute. Further information regarding significant accounting policies can be found within the CAFR at Note 1. INFORMATION USEFUL IN ASSESSING THE VILLAGE'S ECONOMIC CONDITION The information presented in the financial statements is perhaps best understood when it is considered from the broader perspective of the specific environment within which the Village operates. Local economy The Village is in the Chicago metropolitan area and benefits from the regions' diverse economy which is the foundation of a community's fiscal health. Understanding the broader economy in which the Village operates is critical in assessing the financial condition and interpreting the financial position. To that end, pertinent economic data and other relevant factors about the Village, often presented with ten-year trend data, can be found in the statistical section of this CAFR. One of Glendale Heights’ key assets is its location on the regional highway network. The Village is easily accessible via Interstate 290 (Eisenhower Expressway), located less than two miles to the north and east of the Village, and Interstate 355 (North-South Toll Way), located less than one mile to the east of the Village. State Route 64 (North Avenue) crosses the southern section of the Village and State Route 20 (Lake Street) is located just to the north of the Village. O’Hare International Airport is approximately 15 miles northeast of the Village. The Village has nine business parks totaling 465 acres predominately located along the Chicago Central and Pacific Railroad corridor. The Village’s industrial and commercial districts are the foundation of its fiscal health because State shared sales tax revenue is one of the Village’s largest sources of revenue. Businesses located throughout the community include a wide variety of food stores, restaurants, merchandise, and professional services for residents, as well as neighbors in nearby towns. There is over one million square feet of retail space located primarily in twenty-one shopping centers in the Village, plus some large standalone retailers such as Target, Home Depot, Menards, and three large automobile dealerships. There was major economic development within the Village in 2016/2017 as the Village welcomed many new businesses. Increased economic development improves property values, increases the tax base through property tax and sales tax, and lessens the tax burden on all property owners. In addition to the new businesses that opened last year, several other developments were approved and are under construction. A new Shell gas station at Army Trail Road and Bloomingdale Road opened this past spring. Burrito Parilla conducted extensive remodeling of the former Wendy’s restaurant on Army Trail

vii
Road and also opened in early 2017. Dunkin Donuts will be remodeling the former restaurant at the southwest corner of Army Trail Road and Bloomingdale Road, and will include another tenant located
in the building. The owner of the former Dominick’s site sold the property, and staff is working with the new owner on a redevelopment plan, which will be reviewed in the spring of 2017. Having the property redeveloped has been a major priority since it became vacant, and the Village is excited about the future plans for this space.
The Community Development Department continues to work with AMITA Health Adventist Medical Center, GlenOaks as they remodel and upgrade the hospital campus. Several new projects are under review, which will result in exciting improvements to the hospital. Staff continues to meet with shopping center property owners to provide assistance in locating new tenants to their centers and encouraging them to improve their facilities. In addition to Community Development’s focus on economic development, the department also monitors existing property within the Village to help protect and improve property values, as well as the safety of its residents. Staff identifies property maintenance violations; licenses and inspections of rental property; conducts real estate transfer inspections; and responds to resident complaints. The Village of Glendale Heights continues to attract investors who purchase and rent homes. We welcome these investors provided they comply with Village codes and ordinances. The number of single-family rental
Shell Station now open at Army Trail Road and Bloomingdale Road
Amita Health Adventist Medical Center, GlenOaks
viii
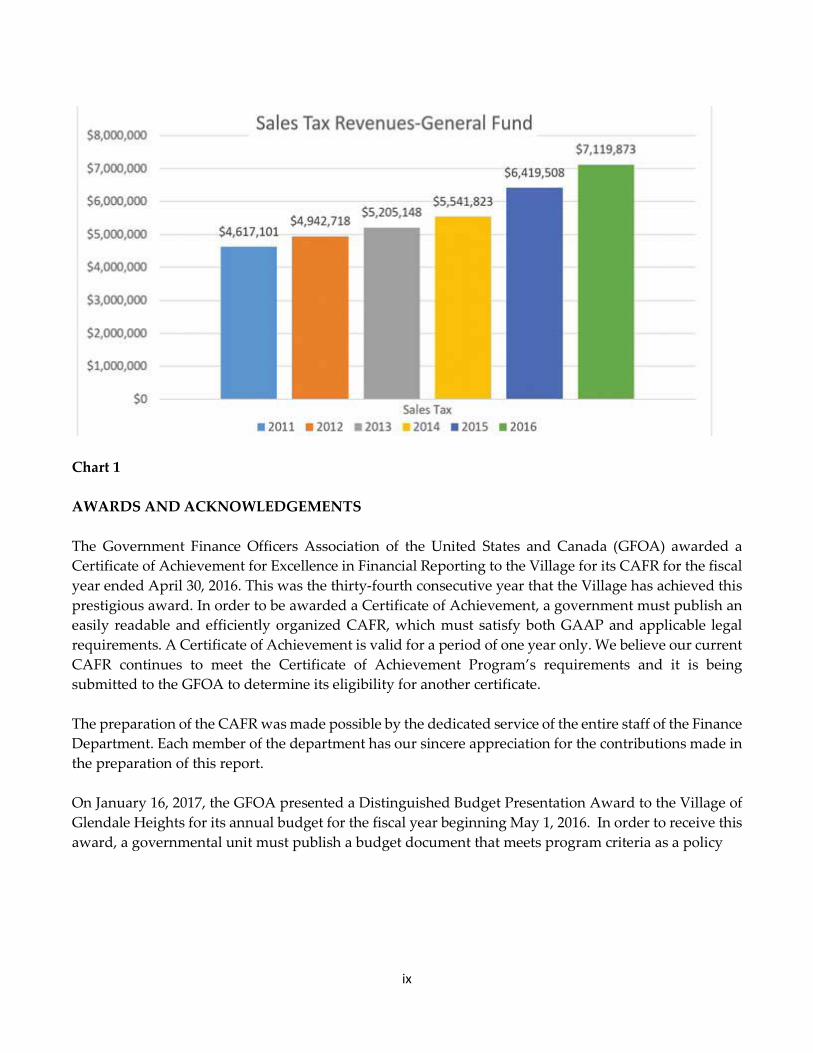
homes has increased to 2,302 in 2016, which must all be licensed and inspected. Staff also inspects all common areas along with a percentage of units of the 2,898 multi-family apartments in the Village. Launched in 2008, the Crime Prevention Partnership Program works with landlords and tenants to ensure that the rental units are properly maintained through the licensing and inspection process as well as the Crime Prevention Partnership Program. Through this program, the Village provides landlords and tenants information about their rights and obligations to comply with the law. If a landlord or tenant fails to comply with the laws and ordinances, the property could be declared a nuisance, and citations issued. This program is important to deter crime and help protect property values in our community. Staff also responds to service requests from residents as well as identifies property that is not properly maintained, and contacts owners to request that violations be addressed. Although the majority of property owners address violations, a citation will be issued if a violation is not resolved. Staff also works with management companies and homeowners associations to ensure that common areas and buildings are maintained. Long-term financial planning, relevant financial policies and major initiatives In December 2013, the Village Board of Trustees, in a confirming act of fiscal responsibility, adopted a fund balance reserve policy, recognizing that a strong fund reserve is essential to the financial health of a community, to ensure favorable credit ratings, and to be prepared for emergencies, unanticipated expenses and revenue shortfalls. This policy acknowledges and embraces the need to ensure the financial security and solvency of the Village. The policy provides for a level of general fund balance at no less than four months’ worth of operating expenditures. The Village staff, following specific directives of the Village Board, has been involved in setting a variety of objectives and projects throughout the year, which reflect the Village’s commitment to ensuring that its stakeholders, both residents and businesses, are able to live and work in a thriving community environment. The Village has formulated a Capital Improvement Program (CIP), which covers a period of 1-5 years, and is reviewed and modified semi-annually in conjunction with the overall budget. State shared sales tax revenue is the Village’s greatest revenue source. Knowing this, the Village is very sensitive with respect to protecting and promoting its sales tax base whenever possible. The Village hosts an annual business appreciation event to show goodwill toward the business community. The Village has offered incentives in the form of sales tax rebates and tax increment financing districts to assist in attracting new businesses. With a strong reliance on sales tax revenue, the forecasts continue to be monitored continuously, although revenue growth now appears to be stable and sustained (see Chart 1 below). Recent statistics showing a bottoming out in the housing market have also been encouraging.
ix
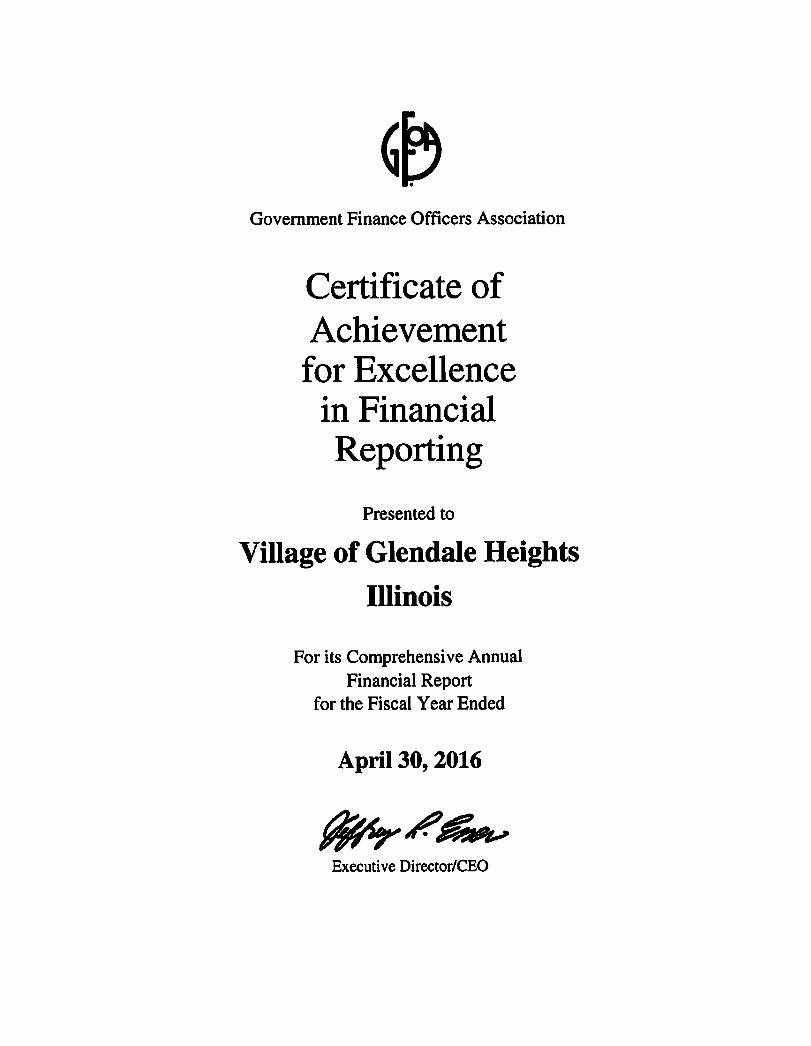
Chart 1 AWARDS AND ACKNOWLEDGEMENTS The Government Finance Officers Association of the United States and Canada (GFOA) awarded a Certificate of Achievement for Excellence in Financial Reporting to the Village for its CAFR for the fiscal year ended April 30, 2016. This was the thirty-fourth consecutive year that the Village has achieved this prestigious award. In order to be awarded a Certificate of Achievement, a government must publish an easily readable and efficiently organized CAFR, which must satisfy both GAAP and applicable legal requirements. A Certificate of Achievement is valid for a period of one year only. We believe our current CAFR continues to meet the Certificate of Achievement Program’s requirements and it is being submitted to the GFOA to determine its eligibility for another certificate. The preparation of the CAFR was made possible by the dedicated service of the entire staff of the Finance Department. Each member of the department has our sincere appreciation for the contributions made in the preparation of this report. On January 16, 2017, the GFOA presented a Distinguished Budget Presentation Award to the Village of Glendale Heights for its annual budget for the fiscal year beginning May 1, 2016. In order to receive this award, a governmental unit must publish a budget document that meets program criteria as a policy


EXEC
UTI
VE
SE
CR
ETA
RY
ELEC
TED
OFF
ICIA
LS: V
ILLA
GE
PR
ESID
ENT,
V
ILLA
GE
CLE
RK
& 6
DIS
TRIC
T TR
UST
EES
VIL
LA
GE
OF
GLE
ND
ALE
HE
IGH
TS
MU
NIC
IPA
L O
RG
AN
IZA
TIO
N S
TR
UC
TU
RE
VIL
LAG
E O
F G
LEN
DA
LE H
EIG
HTS
MIS
SIO
N S
TATE
MEN
T
The
Vill
age
of G
len
dal
e H
eigh
ts s
triv
es t
o im
pro
ve t
he
qu
alit
y o
f lif
e fo
r al
l its
res
iden
ts a
nd
co
mm
its
to s
erve
, pro
tect
an
d p
rovi
de
a h
igh
sta
nd
ard
of s
ervi
ces
and
pro
gram
s th
rou
gh t
he
coo
per
ativ
e ef
fort
s o
f it
s re
sid
ents
, bu
sin
esse
s, e
mp
loye
es
and
ele
cted
off
icia
ls.
GLE
ND
ALE
HEI
GH
TS
RES
IDEN
TS
AD
VIS
OR
Y C
OM
MIS
SIO
NS
& C
OM
MIT
TEES
LEG
AL
CO
UN
CIL
V
ILLA
GE
AD
MIN
ISTR
ATO
R
CO
NSU
LTIN
G E
NG
INEE
R
EXEC
UTI
VE
SE
CR
ETA
RY
ASS
ISTA
NT
VIL
LAG
E A
DM
INIS
TRA
TOR
AD
MIN
ISTR
ATI
ON
D
EPA
RTM
ENT
AD
MIN
ISTR
ATI
VE
SER
VIC
ES D
EPA
RTM
ENT
CO
MM
UN
ITY
DEV
ELO
PM
ENT
& L
OC
AL
ENFO
RC
EMEN
T
FIN
AN
CE
D
EPA
RTM
ENT
PO
LIC
E
DEP
AR
TMEN
T P
AR
KS,
REC
REA
TIO
N
& F
AC
ILIT
IES
PU
BLI
C W
OR
KS
DEP
AR
TMEN
T
HU
MA
N
RES
OU
RC
ES
PU
BLI
C
REL
ATI
ON
S
SEN
IOR
C
ENTE
R
UTI
LITY
BIL
LIN
G
INFO
RM
ATI
ON
SY
STEM
S
PU
RC
HA
SIN
G
VIL
LAG
E LI
CEN
SIN
G
AD
MIN
ISTR
ATI
ON
BU
ILD
ING
CO
DE
ENFO
RC
EMEN
T
BU
DG
ET
GEN
ERA
L A
CC
OU
NTI
NG
AD
MIN
ISTR
ATI
ON
PA
TRO
L
SUP
PO
RT
OP
ERA
TIO
NS
PA
RK
S &
G
RO
UN
DS
REC
REA
TIO
N
FAC
ILIT
Y
MA
INTE
NA
NC
E
STR
EET
DIV
ISIO
N
WA
TER
& S
EWER
D
IVIS
ION
FLEE
T D
IVIS
ION
W.P
.C.F
ASS
T TO
VIL
LAG
E A
DM
INIS
TRA
TOR
AD
MIN
ISTR
ATI
VE
SEC
RET
AR
Y
OFF
ICE
TEC
HN
ICIA
N
ENG
INEE
RIN
G
GLE
ND
ALE
LA
KES
GO
LF
CO
UR
SE

VILLAGE OF GLENDALE HEIGHTS, ILLINOIS COMPREHENSIVE ANNUAL FINANCIAL REPORT
April 30, 2017
xiii.
PRINCIPAL OFFICIALS
VILLAGE PRESIDENT Linda Jackson
VILLAGE CLERK
Marie Schmidt
VILLAGE BOARD OF TRUSTEES William Schmidt, District 1 Pat Maritato, District 4 Sharon Fonte/Sullivan, Deputy Mayor, District 2 Chester Pojack, District 5 Michael Light, District 3 Mary Schroeder, District 6
ADMINISTRATIVE
Raquel Becerra, Village Administrator Roger Mabbitt, Assistant Village Administrator
FINANCE DEPARTMENT
Bill Poling, Director of Finance
Andrea Fogt, Assistant Finance Director
VILLAGE DEPARTMENT DIRECTORS Douglas Flint Chief of Police Rachael Kaplan Public Works Director Joanne Kalchbrenner Community Development Director Holly Beth Wood Administrative Service Manager Keith Knautz Parks, Recreation & Facilities Director

FINANCIAL SECTION

INDEPENDENT AUDITOR’S REPORT
1.
INDEPENDENT AUDITOR’S REPORT Honorable President and Members of the Board of Trustees Village of Glendale Heights, Illinois Report on the Financial Statements We have audited the accompanying financial statements of the governmental activities, the business-type activities, each major fund, and the aggregate remaining fund information of the Village of Glendale Heights, Illinois (“Village”), as of and for the year ended April 30, 2017, and the related notes to the financial statements, which collectively comprise the Village’s basic financial statements as listed in the table of contents. Management’s Responsibility for the Financial Statements
Management is responsible for the preparation and fair presentation of these financial statements in accordance with accounting principles generally accepted in the United States of America; this includes the design, implementation, and maintenance of internal control relevant to the preparation and fair presentation of financial statements that are free from material misstatement, whether due to fraud or error. Auditor’s Responsibility
Our responsibility is to express opinions on these financial statements based on our audit. We conducted our audit in accordance with auditing standards generally accepted in the United States of America and the standards applicable to financial audits contained in Government Auditing Standards, issued by the Comptroller General of the United States. Those standards require that we plan and perform the audit to obtain reasonable assurance about whether the financial statements are free from material misstatement.
An audit involves performing procedures to obtain audit evidence about the amounts and disclosures in the financial statements. The procedures selected depend on the auditor’s judgment, including the assessment of the risks of material misstatement of the financial statements, whether due to fraud or error. In making those risk assessments, the auditor considers internal control relevant to the entity’s preparation and fair presentation of the financial statements in order to design audit procedures that are appropriate in the circumstances, but not for the purpose of expressing an opinion on the effectiveness of the entity’s internal control. Accordingly, we express no such opinion. An audit also includes evaluating the appropriateness of accounting policies used and the reasonableness of significant accounting estimates made by management, as well as evaluating the overall presentation of the financial statements. We believe that the audit evidence we have obtained is sufficient and appropriate to provide a basis for our audit opinions. Opinions In our opinion, the financial statements referred to above present fairly, in all material respects, the respective financial position of the governmental activities, the business-type activities, each major fund, and the aggregate remaining fund information of the Village, as of April 30, 2017 and the respective changes in financial position and, where applicable, cash flows thereof for the year then ended in accordance with accounting principles generally accepted in the United States of America.

2.
Other Matters
Required Supplementary Information Accounting principles generally accepted in the United States of America require that the management’s discussion and analysis, budgetary comparison schedule for the General Fund, and historical pension and retiree’s health plan information, as listed in the table of contents be presented to supplement the basic financial statements. Such information, although not a part of the basic financial statements, is required by Governmental Accounting Standards Board who considers it to be an essential part of financial reporting for placing the basic financial statements in an appropriate operational, economic, or historical context. We have applied certain limited procedures to the required supplementary information in accordance with auditing standards generally accepted in the United States of America, which consisted of inquiries of management about the methods of preparing the information and comparing the information for consistency with management’s responses to our inquiries, the basic financial statements, and other knowledge we obtained during our audit of the basic financial statements. We do not express an opinion or provide any assurance on the information because the limited procedures do not provide us with sufficient evidence to express an opinion or provide any assurance. Supplementary Information Our audit was conducted for the purpose of forming opinions on the financial statements that collectively comprise the Village’s basic financial statements. The introductory section, combining and individual fund financial statements and schedules, supplemental data and statistical section are presented for purposes of additional analysis and are not a required part of the basic financial statements. The combining and individual fund financial statements and schedules are the responsibility of management and were derived from and relates directly to the underlying accounting and other records used to prepare the basic financial statements. Such information has been subjected to the auditing procedures applied in the audit of the basic financial statements and certain additional procedures, including comparing and reconciling such information directly to the underlying accounting and other records used to prepare the basic financial statements or to the basic financial statements themselves, and other additional procedures in accordance with auditing standards generally accepted in the United States of America. In our opinion, the combining and individual fund financial statements and schedules are fairly stated, in all material respects, in relation to the basic financial statements as a whole.
The introductory section, supplemental data and statistical section have not been subjected to the auditing procedures applied in the audit of the basic financial statements, and accordingly, we do not express an opinion or provide any assurance on them. Report on Other Legal and Regulatory Requirements
In accordance with Government Auditing Standards, we have also issued our report dated October 27, 2017, on our consideration of the Village’s internal control over financial reporting and on our tests of its compliance with certain provisions of laws, regulations, contracts, and grant agreements and other matters. The purpose of that report is to describe the scope of our testing of internal control over financial reporting and compliance and the results of that testing, and not to provide an opinion on internal control over financial reporting or on compliance. That report is an integral part of an audit performed in accordance with Government Auditing Standards in considering the Village’s internal control over financial reporting and compliance. Crowe Horwath LLP Oak Brook, Illinois October 27, 2017

REQUIRED SUPPLEMENTARY INFORMATION:
MANAGEMENT’S DISCUSSION AND ANALYSIS

VILLAGE OF GLENDALE HEIGHTS, ILLINOIS MANAGEMENT’S DISCUSSION AND ANALYSIS
April 30, 2017
(Continued)
3.
This discussion and analysis of the financial activities of the Village of Glendale Heights, Illinois (the “Village”) for the fiscal year ended April 30, 2017 (FY17) is hereby submitted. Readers are encouraged to consider the information presented here, in conjunction with additional information that is furnished in the letter of transmittal. Further, this correspondence is intended to serve as an introduction to the Village’s basic financial statements, which comprise three components: 1) government-wide financial statements, 2) fund financial statements, and 3) notes to the financial statements. The Comprehensive Annual Financial Report (CAFR) also contains other supplementary information in addition to the basic financial statements. Financial Highlights
• In fiscal year 2016, the Village implemented GASB No. 68, Accounting and Financial Reporting for Pensions. The most notable impact of this new standard is the addition of net pension liabilities in the Statement of Net Position. Previously, these amounts were only disclosed in the notes and in the required supplemental information (RSI). As of April 30, 2017, the Village had a net pension liability for the Police Pension Fund of $28.32 million and a net pension liability for the Illinois Municipal Retirement Fund (IMRF) of $9.92 million.
• Total net position increased by $2.72 million during the period from $72.77 million to $75.49 million. Removing the effects of GASB 68, total net position during the period would have been $114.61 million.
• Governmental activities net position increased $2.33 million to $37.38 million. Within governmental activities net position, unrestricted net position decreased $352 thousand to $(12.47) million. This decrease in overall net position and unrestricted net position is primarily attributable to a decrease in the deferred outflow of resources, which contributed $1.81 million to the decreases. $981 thousand of governmental activities net position/fund balance is restricted at year-end, with this balance intended to be used to meet the Village’s ongoing obligations to citizens and creditors.
• Business-type activities net position increased $387 thousand to $38.11 million. The primary cause of the increase in overall net position is attributable to change in net pension liability, which contributed $392 thousand million to the increase. Net investment in capital assets at year-end increased by $749 thousand from the prior year to a level of $40.83 million.
• Total governmental funds fund balance increased $876,111 or 4.6% from the prior year to $19.77 million. The General Fund’s total fund balance increased $839,948 or 7.1% over the prior year to $12.59 million. The fund’s amended budget anticipated a $619,436 decrease in fund balance. Detailed information on these changes can be found further in this discussion and analysis and throughout this CAFR.
• Proprietary fund type – enterprise funds total operating revenues increased by $403,459 or 3.38%; operating expenses increased by $692,075 or 5.7% and operating loss decreased to ($466,875) compared to an operating loss of ($178,259) the prior year. Additional information on these changes can be found further in the discussion and analysis and throughout this CAFR.
• As a whole, the Village’s overall financial position improved versus the prior year.

VILLAGE OF GLENDALE HEIGHTS, ILLINOIS MANAGEMENT’S DISCUSSION AND ANALYSIS
April 30, 2017
(Continued)
4.
OVERVIEW OF FINANCIAL STATEMENTS Government-Wide Financial Statements The government-wide financial statements are designed to provide readers with a broad overview of the Village’s finances, in a manner similar to a private-sector business. The Statement of Net Position presents information on all of the Village’s assets/deferred outflows and liabilities/deferred inflows, with the difference between the two reported as Net Position. Over time increases or decreases in Net Position may serve as a useful indicator of whether the financial position of the Village is improving or deteriorating. The Statement of Activities presents information showing how the Village’s Net Position changed during the most recent fiscal year. All changes in Net Position are reported as soon as the underlying event giving rise to the change occurs, regardless of the timing of related cash flows. Thus, revenues and expenses are reported in this statement for some items that will only result in cash flows in future fiscal periods. Both statements distinguish functions of the Village that are principally supported by taxes and intergovernmental revenues (governmental activities) from other functions that are intended to recover all or a significant portion of their costs through user fees and charges (business-type activities). The governmental activities of the Village include general government, health and public safety, highways and streets, public services, culture and recreation, economic development and interest on long term debt. The business-type activities include a water and sewerage utility and a golf course. Fund Financial Statements A fund is a grouping of related accounts that is used to maintain control over resources that have been segregated for specific activities or objectives. The Village uses fund accounting to ensure and demonstrate compliance with finance-related legal requirements. All of the funds of the Village can be divided into three categories: governmental funds, proprietary funds and fiduciary funds. Governmental funds are used to account for essentially the same functions reported as governmental activities in the government-wide financial statements. However, unlike the government-wide financial statements, governmental fund financial statements focus on near-term inflows and outflows of spendable resources, as well as on balances of spendable resources available at the end of the fiscal year. Because the focus of governmental funds is narrower than that of the government-wide financial statements, it is useful to compare the information presented for governmental funds with similar information presented for governmental activities in the government-wide financial statements. By doing so, readers may better understand the long-term impact of the Village’s near-term financing decisions. Both the governmental fund balance sheet and the governmental fund statement of revenues, expenditures and changes in fund balances provide a reconciliation to facilitate this comparison between governmental funds and governmental activities. The Village maintains thirty-two individual governmental funds. Information is presented separately in the governmental fund balance sheet and in the governmental fund statement of revenues, expenditures and changes in fund balances for the general fund and debt service fund, both of which are considered to be major funds.
VILLAGE OF GLENDALE HEIGHTS, ILLINOIS MANAGEMENT’S DISCUSSION AND ANALYSIS
April 30, 2017
(Continued)
5.
Information from the Village’s thirty governmental funds are combined into a single column presentation. Individual fund information for these non-major governmental funds is provided elsewhere in the report. The Village maintains one type of proprietary fund (enterprise funds). Enterprise funds are used to report the same functions presented as business-type activities in the government-wide financial statements. The Village uses enterprise funds to account for its environmental services (i.e. water and sanitary sewer operations) and its golf course. Proprietary funds provide the same type of information as the government-wide financial statements. The proprietary fund financial statements provide separate information for the environmental services fund and the golf course fund, both of which are considered to be major funds of the Village. Fiduciary funds are used to account for resources held for the benefit of parties outside the Village. Fiduciary funds are not reflected in the government-wide financial statements because the resources of those funds are not available to support the Village’s own programs. The accounting used for fiduciary funds is similar to that used by proprietary funds. The Village maintains two fiduciary funds which are the Escrow Agency Fund and Police Pension Fund. Notes to the Financial Statements The Notes provide additional information that is essential to a full understanding of the information provided in the government-wide and fund financial statements. In addition to the basic financial statements and accompanying Notes, this CAFR presents certain required supplementary information (RSI) concerning the Village’s progress in funding its obligation to provide pension benefits to its employees. Combining and individual fund financial statement and schedules are presented after the RSI. Supplemental data provides a schedule of insurance in force and schedules of long term debt requirements. The statistical section presents comparative and trend data on financial trends, revenue and debt capacity, and demographic, economic and operating information. GOVERNMENT-WIDE FINANCIAL ANALYSIS
Statement of Net Position Over time, total net position and changes thereto, may serve as a useful indicator of a government’s financial position. The following chart reflects the condensed Statement of Net Position:

VILLAGE OF GLENDALE HEIGHTS, ILLINOIS MANAGEMENT’S DISCUSSION AND ANALYSIS
April 30, 2017
(Continued)
6.
2017 2016 2017 2016 2017 2016Assets:Current & other assets 35,482,256$ 32,780,384$ 2,583,104$ 1,914,035$ 38,065,360$ 34,694,419$ Capital assets 83,236,233 82,852,130 40,831,490 40,082,725 124,067,723 122,934,855
Total assets 118,718,489 115,632,514 43,414,594 41,996,760 162,133,083 157,629,274
Deferred Outflows Pensions 9,720,377 11,533,089 788,516 970,289 10,508,893 12,503,378
Liabilities:Current liabilities 9,421,151 8,017,216 2,671,409 1,913,161 12,092,560 9,930,377 Long-term liabilities 69,902,892 75,028,547 2,955,625 3,328,563 72,858,517 78,357,110
Total liabilities 79,324,043 83,045,763 5,627,034 5,241,724 84,951,077 88,287,487
Deferred Inflows Pensions 2,958,755 - 464,138 - 3,422,893 - Unavailable Revenue 8,776,461 9,072,436 - - 8,776,461 9,072,436
Total deferred inflows 11,735,216 9,072,436 464,138 - 12,199,354 9,072,436
Net Position:Invested in capital assets, net 48,864,413 45,245,643 40,831,490 40,082,725 89,695,903 85,328,368 Restricted 981,369 1,916,355 - - 981,369 1,916,355 Unrestricted (12,466,175) (12,114,594) (2,719,552) (2,357,400) (15,185,727) (14,471,994)
Total Net Position 37,379,607$ 35,047,404$ 38,111,938$ 37,725,325$ 75,491,545$ 72,772,729$
Activities Activities Government
TotalGovernmental Business-Type Primary
Investment in capital assets net of related debt accounts for approximately 118.8% of the total Net Position of the Village. Current and other assets increased over the prior year due to an increase in cash on hand at year-end.

VILLAGE OF GLENDALE HEIGHTS, ILLINOIS MANAGEMENT’S DISCUSSION AND ANALYSIS
April 30, 2017
(Continued)
7.
$9,143,471
$12,316,025
$4,067,352 $3,770,899 $912,916
$5,174,395
$10,777,041
$1,568,858 $2,019,682
$1,281,384
2017 Government-Wide Revenues
Property Taxes
Sales/Home Rule Tax
Income and Use Tax
Public Services Taxes
Miscellaneous Revenues
Governmental: Charges for Services
Environmental: Charges for Servcies
Golf Course: Charges for Services
Operating Grants and Contributions
Capital Grants and Contributions
$11,014,448
$12,195,198
$3,468,991$2,690,962
$3,834,962
$2,294,229
$10,762,008
$2,052,409
2017 Government-Wide Expenses
General Government
Public Safety
Public Works
Capital Projects
Culture and Recreation
Interest on Long-Term Debt
Environmental
Golf Course

VILLAGE OF GLENDALE HEIGHTS, ILLINOIS MANAGEMENT’S DISCUSSION AND ANALYSIS
April 30, 2017
(Continued)
8.
Statement of Activities The following chart reflects the condensed Statement of Activities:
2017 2016 2017 2016 2017 2016
REVENUESProgram Revenues: Charges for Services 5,174,395$ 5,157,039$ 12,345,899$ 11,905,357$ 17,520,294$ 17,062,396$ Oper. Grants/Contrib. 2,012,432 552,077 7,250 116,589 2,019,682 668,666 Cap. Grants/Contrib. 517,489 534,242 763,895 106,702 1,281,384 640,944 General Revenues: Property Taxes 9,143,471 9,147,188 - - 9,143,471 9,147,188 Other Taxes 19,484,860 19,704,993 669,416 - 20,154,276 19,704,993 Other 912,643 270,975 273 38,244 912,916 309,219
Total Revenues 37,245,290 35,366,514 13,786,733 12,166,892 51,032,023 47,533,406
EXPENSES General Government 11,014,448 10,809,443 - - 11,014,448 10,809,443 Public Safety 12,195,198 11,803,189 - - 12,195,198 11,803,189 Public Works/Cap Proj. 6,159,953 4,395,775 - - 6,159,953 4,395,775 Culture and Recreation 3,834,962 3,577,716 2,052,409 2,105,676 5,887,371 5,683,392 Interest on Debt 2,294,229 2,495,242 - - 2,294,229 2,495,242 Water - - 10,762,008 10,034,641 10,762,008 10,034,641
Total Expenses 35,498,790 33,081,365 12,814,417 12,140,317 48,313,207 45,221,682
Change in Net Position Before Transfers 1,746,500 2,285,149 972,316 26,575 2,718,816 2,311,724
Transfers 585,703 748,500 (585,703) (748,500) - -
Change in Net Position 2,332,203$ 3,033,649$ 386,613 (721,925) 2,718,816$ 2,311,724$
GovernmentalActivities
Business-TypeActivities
TotalGovernment
During fiscal year 2016/17, revenues experienced an increase when compared to fiscal year 2015/16. The increase shown in Operating Grants was due to an increase in grants awarded to the Village from FEMA, CDBG and DCEO. The increase in charges for services was due primarily to an increase in the water rates that was effective during the year. The increase in Other Revenues was due to an increase to the Home Rule Sales Tax that occurred in July 2016 and the imposition of a Water/Sewer Capital Infrastructure Fee. Operating expenses increased in comparison from fiscal year 2016/17 to fiscal year 2015/16 for the governmental activities, mainly due to salary and benefit increases, most of which are determined by contractual agreement. The Village also added 2 Police Officers and a Building Official during the 2017 fiscal year. A number of road and other capital maintenance projects that were performed in 2016/17 accounts for the variance in General Government and
VILLAGE OF GLENDALE HEIGHTS, ILLINOIS MANAGEMENT’S DISCUSSION AND ANALYSIS
April 30, 2017
(Continued) 9.
Public Works/Capital Projects between years. Business-type increased from the prior year due to more purchased water costs from the DuPage Water Commission and rehabilitation costs associated with 2 water towers within the Village.
FUND FINANCIAL ANALYSIS
Governmental Funds
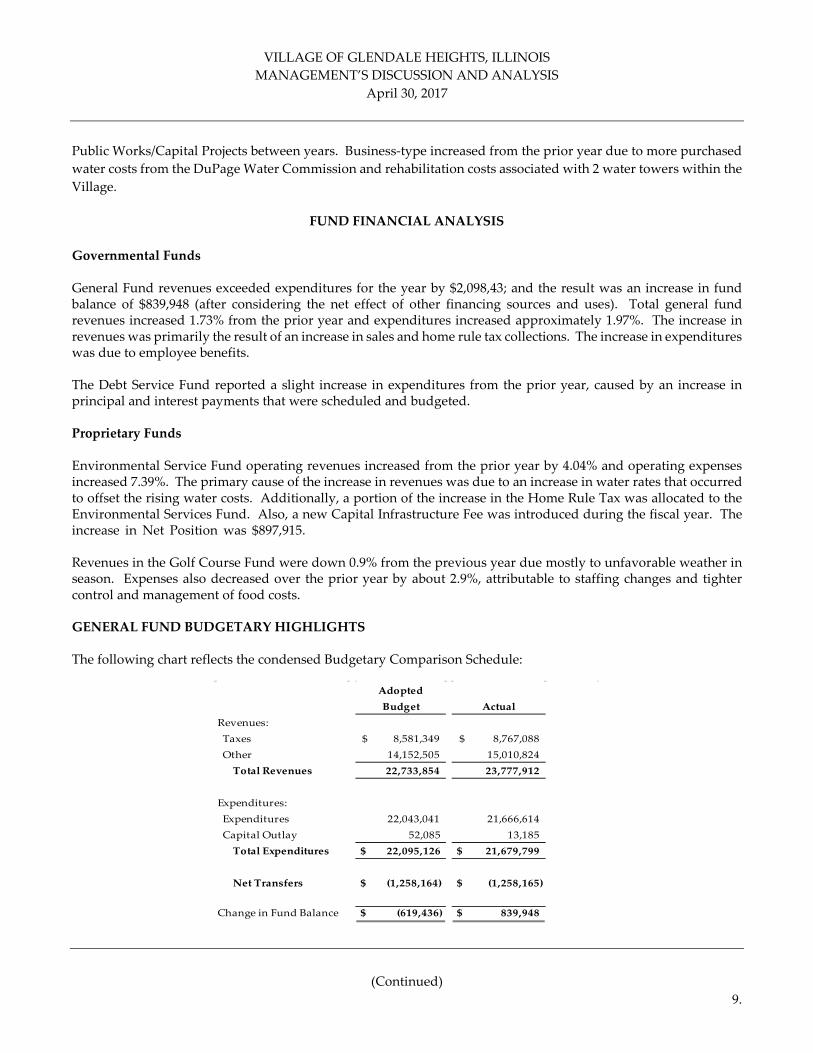
General Fund revenues exceeded expenditures for the year by $2,098,43; and the result was an increase in fund balance of $839,948 (after considering the net effect of other financing sources and uses). Total general fund revenues increased 1.73% from the prior year and expenditures increased approximately 1.97%. The increase in revenues was primarily the result of an increase in sales and home rule tax collections. The increase in expenditures was due to employee benefits.
The Debt Service Fund reported a slight increase in expenditures from the prior year, caused by an increase in principal and interest payments that were scheduled and budgeted.
Proprietary Funds
Environmental Service Fund operating revenues increased from the prior year by 4.04% and operating expenses increased 7.39%. The primary cause of the increase in revenues was due to an increase in water rates that occurred to offset the rising water costs. Additionally, a portion of the increase in the Home Rule Tax was allocated to the Environmental Services Fund. Also, a new Capital Infrastructure Fee was introduced during the fiscal year. The increase in Net Position was $897,915. due to assets that were paid for by the capital projects fund and then subsequently transferred to the Environmental Service fund. Revenues in the Golf Course Fund were down 0.9% from the previous year due mostly to unfavorable weather in season. Expenses also decreased over the prior year by about 2.9%, attributable to staffing changes and tighter control and management of food costs.
GENERAL FUND BUDGETARY HIGHLIGHTS
The following chart reflects the condensed Budgetary Comparison Schedule:
AdoptedBudget Actual
Revenues: Taxes 8,581,349$ 8,767,088$ Other 14,152,505 15,010,824
Total Revenues 22,733,854 23,777,912
Expenditures: Expenditures 22,043,041 21,666,614 Capital Outlay 52,085 13,185
Total Expenditures $ 22,095,126 $ 21,679,799
Net Transfers $ (1,258,164) $ (1,258,165)
Change in Fund Balance $ (619,436) $ 839,948

10.
The most prominent variation (favorable) from the budget at year-end was attributable to significant collections in Sales, Home Rule and Real Estate Transfer taxes. A sixth month budget review is conducted during the year and the budget was amended to best-known estimates at that time.
CAPITAL ASSET AND DEBT ADMINISTRATION
Capital Assets
NetBalance Additions/ Balance5/1/2016 Deletions 04/30/17
Land/CIP 32,632,664 611,492 33,244,156
Infrastructure 37,304,057 1,233,771 38,537,828 Buildings 40,125,184 61,696 40,186,880 Improvements 9,181,718 30,689 9,212,407 Vehicles/Equipment 7,454,494 (18,096) 7,436,398 Accum. Depreciation on Capital Assets (43,845,987) (1,535,449) (45,381,436)
82,852,130 384,103 83,236,233
Non-Depreciable Assets:
Other Capital Assets:
Totals
Change in Capital Assets
The major changes in capital assets were due to various infrastructure projects that occurred in the Village's Tax Increment Financing (TIF) #1 Infrastructure Funds. See Note 5 to the financial statements for additional information on capital assets.
NetBalance Additions/ Balance05/01/16 Deletions 4/30/2017
Land/CIP 5,413,805 8,001 5,421,806
Infrastructure 62,769,319 - 62,769,319 Buildings 10,650,537 2,187,247 12,837,784 Improvements 1,065,233 14,057 1,079,290 Vehicles/Equipment/Furniture/Fixtures 2,509,719 (588) 2,509,131 Accum. Depreciation on Capital Assets (42,325,888) (1,459,952) (43,785,840)
40,082,725 748,765 40,831,490
Business-Type ActivitiesChange in Capital Assets
Non-Depreciable Assets:
Other Capital Assets:
Totals
The major changes in capital assets were due to the improvements in the water and sewer distribution system. See Note 5 to the financial statements for additional information on capital assets.
(Continued)

11.
Debt Administration
At April 30, 2017, the Village had outstanding debt as follows:
General Obligation Bonds Series 2006 $ 1,155,000 General Obligation Bonds Series 2007 $ 3,160,000 General Obligation Bonds Series 2008 $ 1,180,000 General Obligation Bonds Series 2009 $ 4,395,000 General Obligation Bonds Series 2010 $ 24,530,000
The regular principal and interest payments were made and no new debt was issued during the year. See Note 6 to the financial statements for additional information on debt.
ECONOMIC FACTORS
Some significant events will take place in the upcoming year that will put pressures on the financial resources of the Village, the most notable of those being continued economic volatility, particularly with the potential impacts on State Shared income tax revenues, and legislation which could impose a freeze on the Village's local property tax levy, as well as salary and benefit costs increases.
CONTACTING THE VILLAGE’S FINANCIAL MANAGEMENT
This financial report is designed to provide our citizens, customers, investors and creditors with a general overview of the Village’s finances. Questions concerning this report or requests for additional financial information should be directed to the Finance Director, Village of Glendale Heights, 300 Civic Center Plaza, Glendale Heights Illinois, 60139.

BASIC
FINANCIAL STATEMENTS

STATEMENT 1
See accompanying notes to financial statements. 12.
Governmental Business-typeActivities Activities Total
ASSETSCurrent Assets:
Cash and Investments 15,873,789$ 4,472,630$ 20,346,419$ Property Tax Receivable 8,776,458 - 8,776,458 Due From Other Governments 4,252,175 182,805 4,434,980 Accounts Receivable (Net of Allowances) 2,221,840 1,761,419 3,983,259 Internal Balances 3,878,032 (3,878,032) - Deposits 106,584 3,000 109,584 Other Assets 373,378 41,282 414,660
Total Current Assets 35,482,256 2,583,104 38,065,360
Non-Current Assets:Capital Assets:
Land 30,520,527 5,404,185 35,924,712 Construction in Progress 2,723,629 17,621 2,741,250 Capital Assets, Net of Accumulated Depreciation 49,992,077 35,409,684 85,401,761
Total Non-Current Assets 83,236,233 40,831,490 124,067,723 TOTAL ASSETS 118,718,489 43,414,594 162,133,083
DEFERRED OUTFLOWS OF RESOURCESPensions 9,720,377 788,516 10,508,893
LIABILITIESCurrent:
Accounts Payable 2,589,195 1,589,188 4,178,383 Accrued Payroll 673,337 186,942 860,279 Deposits Payable 313,886 622,469 936,355 Other Payables 307,586 101,361 408,947 Unearned Revenue 580,367 16,819 597,186 Interest Payable 674,884 - 674,884 Long-Term Obligations, Due Within One Year:
Compensated Absences 936,896 154,630 1,091,526 Bonds Payable 3,345,000 - 3,345,000
Total Current Liabilities 9,421,151 2,671,409 12,092,560
Non-Current:Long-Term Obligations, Due in More Than One Year:
Compensated Absences 2,404,261 304,659 2,708,920 Bonds Payable (Net of Discount) 31,026,820 - 31,026,820 Net Pension Liability 35,585,498 2,650,966 38,236,464 Net OPEB Obligation 886,313 - 886,313
Total Non-Current Liabilities 69,902,892 2,955,625 72,858,517 TOTAL LIABILITIES 79,324,043 5,627,034 84,951,077
DEFERRED INFLOWS OF RESOURCESPensions 2,958,755 464,138 3,422,893 Property Taxes 8,776,461 - 8,776,461
TOTAL DEFERRED INFLOWS OF RESOURCES 11,735,216 464,138 12,199,354
NET POSITIONNet Investment in Capital Assets 48,864,413 40,831,490 89,695,903 Restricted Net Position:
TIF Projects 981,369 - 981,369 Unrestricted (12,466,175) (2,719,552) (15,185,727)
TOTAL NET POSITION 37,379,607$ 38,111,938$ 75,491,545$
VILLAGE OF GLENDALE HEIGHTS, ILLINOIS
STATEMENT OF NET POSITIONAPRIL 30, 2017
STATEMENT 2
See accompanying notes to financial statements. 13.
Operating CapitalCharges for Grants and Grants and Governmental Business-Type
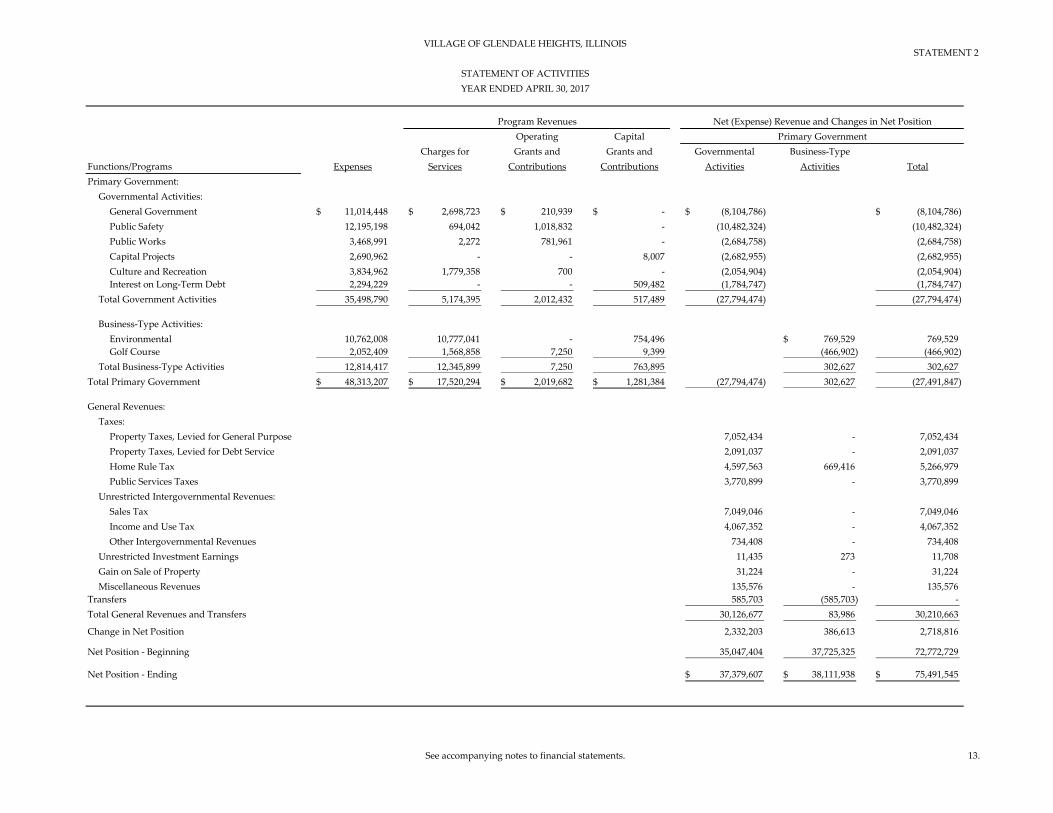
Functions/Programs Expenses Services Contributions Contributions Activities Activities TotalPrimary Government:
Governmental Activities:General Government 11,014,448$ 2,698,723$ 210,939$ -$ (8,104,786)$ (8,104,786)$ Public Safety 12,195,198 694,042 1,018,832 - (10,482,324) (10,482,324) Public Works 3,468,991 2,272 781,961 - (2,684,758) (2,684,758) Capital Projects 2,690,962 - - 8,007 (2,682,955) (2,682,955) Culture and Recreation 3,834,962 1,779,358 700 - (2,054,904) (2,054,904) Interest on Long-Term Debt 2,294,229 - - 509,482 (1,784,747) (1,784,747)
Total Government Activities 35,498,790 5,174,395 2,012,432 517,489 (27,794,474) (27,794,474)
Business-Type Activities:Environmental 10,762,008 10,777,041 - 754,496 769,529$ 769,529 Golf Course 2,052,409 1,568,858 7,250 9,399 (466,902) (466,902)
Total Business-Type Activities 12,814,417 12,345,899 7,250 763,895 302,627 302,627 Total Primary Government 48,313,207$ 17,520,294$ 2,019,682$ 1,281,384$ (27,794,474) 302,627 (27,491,847)
General Revenues:Taxes:
Property Taxes, Levied for General Purpose 7,052,434 - 7,052,434 Property Taxes, Levied for Debt Service 2,091,037 - 2,091,037 Home Rule Tax 4,597,563 669,416 5,266,979 Public Services Taxes 3,770,899 - 3,770,899
Unrestricted Intergovernmental Revenues:Sales Tax 7,049,046 - 7,049,046 Income and Use Tax 4,067,352 - 4,067,352 Other Intergovernmental Revenues 734,408 - 734,408
Unrestricted Investment Earnings 11,435 273 11,708 Gain on Sale of Property 31,224 - 31,224 Miscellaneous Revenues 135,576 - 135,576
Transfers 585,703 (585,703) - Total General Revenues and Transfers 30,126,677 83,986 30,210,663
Change in Net Position 2,332,203 386,613 2,718,816
Net Position - Beginning 35,047,404 37,725,325 72,772,729
Net Position - Ending 37,379,607$ 38,111,938$ 75,491,545$
Primary Government
VILLAGE OF GLENDALE HEIGHTS, ILLINOIS
STATEMENT OF ACTIVITIESYEAR ENDED APRIL 30, 2017
Program Revenues Net (Expense) Revenue and Changes in Net Position

14.
STATEMENT 3
NonmajorGeneral Debt Governmental
Fund Service Fund Funds TotalASSETS
Cash and Investments 7,227,073$ 177,694$ 8,469,022$ 15,873,789$ Property Tax Receivable 3,160,375 1,720,161 3,895,922 8,776,458 Sales Tax Receivable 1,938,155 - - 1,938,155 State Income Tax Receivable 979,937 - - 979,937 Accounts Receivable (Net of Allowances) 1,598,536 - 623,304 2,221,840 Interest Receivable 7,822 - 2,836 10,658 Advances to Other Funds 4,246,676 - 768,041 5,014,717 Intergovernmental Receivable 242,542 185,086 906,455 1,334,083 Deposits 106,584 - - 106,584 Prepaid Items 301,612 - 2,271 303,883 Inventories 58,837 - - 58,837
TOTAL ASSETS 19,868,149$ 2,082,941$ 14,667,851$ 36,618,941$
LIABILITIES, DEFERRED INFLOWS OF RESOURCES AND FUND BALANCELIABILITIES
Accounts Payable 1,085,339$ -$ 1,503,856$ 2,589,195$ Accrued Payroll 618,080 - 55,257 673,337 Deposits Payable 301,032 - 12,854 313,886 Interest Payable - - 40,143 40,143 Advances from Other Funds - - 1,136,685 1,136,685 Unearned Revenue 589,704 - 813,645 1,403,349 Other Payables 295,759 - 12,470 308,229 Compensated Absences - Current 318,997 - - 318,997
TOTAL LIABILITIES 3,208,911 - 3,574,910 6,783,821
DEFERRED INFLOWS OF RESOURCESProperty Taxes 3,160,376 1,720,161 3,895,924 8,776,461 Unavailable Revenue - State Taxes 908,447 - 195,335 1,103,782 Unavailable Revenue - Grants - 185,087 - 185,087
TOTAL DEFERRED INFLOWS OF RESOURCES 4,068,823 1,905,248 4,091,259 10,065,330
FUND BALANCENonspendable:
Inventory 58,837 - - 58,837 Deposits 106,584 - - 106,584 Prepaids 301,612 - 2,271 303,883 Long-term Note Receivable 24,213 - - 24,213 Long-term Interfund Advances 4,246,676 - 768,041 5,014,717
Restricted:Police Activities 183,005 - - 183,005 TIF Projects - - 981,369 981,369 Special Service Area Projects - - 980,699 980,699 Recreation Activities - - 985,147 985,147 Emergency Service Activities - - 50,001 50,001 Motor Fuel Tax Activities - - 1,063,965 1,063,965 Grants - - 27,149 27,149 Capital Projects - - 734,997 734,997 Special Events - - 26,651 26,651 Debt Service 177,693 - 177,693
Assigned:Capital Projects - - 2,708,885 2,708,885
Unassigned 7,669,488 - (1,327,493) 6,341,995 TOTAL FUND BALANCE 12,590,415 177,693 7,001,682 19,769,790
TOTAL LIABILITIES, DEFERRED INFLOWS OF RESOURCES AND FUND BALANCE 19,868,149$ 2,082,941$ 14,667,851$ 36,618,941$
VILLAGE OF GLENDALE HEIGHTS, ILLINOIS
GOVERNMENTAL FUNDS
Major Funds
See accompanying notes to financial statements.
BALANCE SHEETAPRIL 30, 2017

STATEMENT 4
________________________________________________________________________________________________________See accopmpanying notes to financial statements
15.
Total Fund Balances - Governmental Funds 19,769,790$
Amounts reported for governmental activities in the statement of net position aredifferent because:
Capital assets used in governmental activities are not financial resources and therefore are not reported in the funds:
Capital Assets 128,617,669$ Accumulated Depreciation (45,381,436)
Net Capital Assets 83,236,233
Some liabilities/assets reported in the statement of net position do not require the use of current financial resources and therefore are not reported as liabilities/assets in governmental funds. These liabilities/assets consist of :
General Obligation Bonds Payable (34,371,820) Net Pension Liabilities (35,585,498) Net OPEB Obligation (886,313) Compensated Absences (3,021,517) Interest Payable (634,741)
Total Long-term liabilities (74,499,889)
Deferred outflows and inflows of resources related to pensions do not involve available financial resources and accordingly are not reported on the fund financial statements 6,761,622
Some of the state's revenues will be collected after year-end but are not available soonenough to pay for the current period's expenditures and therefore are a deferred inflow in the funds.
State Revenues as a deferred inflow in Funds 1,103,782
Some grant revenues will be collected after year-end but are not available soon enough to pay for the current period's expenditures and therefore are deferred in the funds.
Grant Revenues Deferred in Funds 814,975
The Build America Bonds provide for a rebate to offset a portion of the interest payable.Interest payable and expense are only recorded at the government wide statements, thus the offsetting revenue is recorded at the government wide statements and included as unavailable revenue in the funds. 185,087
Net position of governmental activities 37,379,607$
VILLAGE OF GLENDALE HEIGHTS, ILLINOIS
RECONCILIATION OF GOVERNMENTAL FUNDS BALANCE SHEETTO STATEMENT OF NET POSITION
APRIL 30, 2017

See accompanying notes to financial statements. 16.
STATEMENT 5
NonmajorGeneral Debt Governmental
Fund Service Fund Funds Total
REVENUESTaxes 8,767,088$ 2,091,037$ 6,496,144$ 17,354,269$ Licenses and Permits 1,709,109 - - 1,709,109 Charges for Service 980,709 - 1,593,280 2,573,989 Fines and Forfeitures 596,111 - - 596,111 Donations - - 700 700 Intergovernmental 11,416,881 - 1,865,335 13,282,216 Investment Earnings (Loss) (8,800) 1,192 19,043 11,435 Miscellaneous 316,814 519,200 108,450 944,464
TOTAL REVENUES 23,777,912 2,611,429 10,082,952 36,472,293
EXPENDITURESCurrent:
General Government 10,382,230 - 990,299 11,372,529 Public Safety 7,677,492 - 57,890 7,735,382 Highways and Streets 3,606,892 - 1,166,316 4,773,208 Culture and Recreation - - 2,672,052 2,672,052
Capital Outlay 13,185 - 4,038,734 4,051,919 Debt Service:
Principal Payments - 3,235,000 - 3,235,000 Interest Payments - 1,853,185 484,972 2,338,157 Fees - 3,638 - 3,638
TOTAL EXPENDITURES 21,679,799 5,091,823 9,410,263 36,181,885
Excess (deficiency) of revenues over (under)expenditures 2,098,113 (2,480,394) 672,689 290,408
OTHER FINANCING SOURCES (USES)Transfers In 579,607 2,567,959 1,289,541 4,437,107 Transfers Out (1,837,772) - (2,013,632) (3,851,404)
TOTAL OTHER FINANCING SOURCES (USES) (1,258,165) 2,567,959 (724,091) 585,703
Change in Fund Balance 839,948 87,565 (51,402) 876,111
Fund Balance at beginning of year 11,750,467 90,128 7,053,084 18,893,679
Fund Balance at end of year 12,590,415$ 177,693$ 7,001,682$ 19,769,790$
YEAR ENDED APRIL 30, 2017
Major Funds
VILLAGE OF GLENDALE HEIGHTS, ILLINOIS
GOVERNMENTAL FUNDSSTATEMENT OF REVENUES, EXPENDITURES AND CHANGES IN FUND BALANCES

STATEMENT 6
See accompanying notes to financial statements. 17.
Net change in fund balances - total governmental funds 876,111$
Amounts reported for governmental activities in the Statement of Activities are different because:
Governmental funds report capital outlays as expenditures while governmental activitiesreport depreciation expense to allocate those expenditures over the life of the assets.
Capital Outlay 3,009,538$ Depreciation (2,448,300)
Capital Outlay in Excess of Depreciation 561,238
The net effect of various mscellaneous transactions involving capital assets (177,135)
Repayment of principal on long-term debt is an expenditure in the governmental funds, but the repayment reduces long-term liabilities in the statement of net position.
Principal Retirement 3,235,000
Revenues in the statement of activities that do not provide current financial resources are notreported as revenues in the funds. 783,873
Some expenses reported in the statement of activities do not require the use of currentfinancial resources and therefore are not reported in the governmental funds.
Change in Compensated Absences (148,284) Change in Pension Liability and Deferred Items (2,600,643) Change in Net OPEB Obligation (241,552) Change in Accrued Interest on Debt 43,928 Amortization of Bond Discount (5,042) Amortization of Bond Premium 4,709
Total Expenses of Non-Current Resources (2,946,884)
Change in net position of governmental activities 2,332,203$
VILLAGE OF GLENDALE HEIGHTS, ILLINOIS
YEAR ENDED APRIL 30, 2017
RECONCILIATION OF THE STATEMENT OF REVENUES, EXPENDITURES ANDCHANGES IN FUND BALANCES OF GOVERNMENTAL FUNDS TO THE
STATEMENT OF ACTIVITIES

STATEMENT 7
________________________________________________________________________________________________________________________
See accompanying notes to financial statements. 18.
Golf EnvironmentalCourse Fund Services Fund Total
ASSETSCurrent:
Cash and Investments -$ 4,472,630$ $ 4,472,630 Accounts Receivable 36,219 1,725,200 1,761,419 Intergovernmental Receivable - 182,805 182,805 Deposits 3,000 - 3,000 Inventories 38,861 - 38,861 Prepaid Assets 2,066 355 2,421
Total Current Assets 80,146 6,380,990 6,461,136
Noncurrent:Capital Assets:
Land 5,265,000 139,185 5,404,185 Construction in Progress - 17,621 17,621 Capital Assets, Net of Accumulated Depreciation 2,565,984 32,843,700 35,409,684
Total Noncurrent Assets 7,830,984 33,000,506 40,831,490
Total Assets 7,911,130 39,381,496 47,292,626
DEFERRED OUTFLOWS OF RESOURCESPensions 138,712 649,804 788,516
LIABILITIESCurrent:
Accounts Payable 69,271 1,519,917 1,589,188 Accrued Payroll 54,800 132,142 186,942 Deposits Payable 92,003 530,466 622,469 Unearned Revenue - 16,819 16,819 Other Payables 6,346 95,015 101,361 Advances from Other Funds 3,878,032 - 3,878,032
Total Current Liabilities 4,129,270 2,420,171 6,549,441
Noncurrent:Compensated Absences 113,998 190,661 304,659 Net Pension Liability 466,344 2,184,622 2,650,966
Total Noncurrent Liabilities 580,342 2,375,283 2,955,625
Total Liabilities 4,709,612 4,795,454 9,505,066
DEFERRED INFLOWS OF RESOURCESPensions 127,345 336,793 464,138
NET POSITIONNet Investment in Capital Assets 7,830,984 33,000,506 40,831,490 Unrestricted (4,618,099) 1,898,547 (2,719,552)
Total Net Position 3,212,885$ 34,899,053$ 38,111,938$
VILLAGE OF GLENDALE HEIGHTS, ILLINOIS
STATEMENT OF NET POSITIONPROPRIETARY FUNDS
APRIL 30, 2017

STATEMENT 8
________________________________________________________________________________________________________________________
See accompanying notes to financial statements. 19.
Golf EnvironmentalCourse Fund Services Fund Total
OPERATING REVENUESCharges for Service 1,568,858$ 10,777,041$ 12,345,899$
Total operating revenues 1,568,858 10,777,041 12,345,899
OPERATING EXPENSESAdministration 847,444 - 847,444 Operations - 9,432,115 9,432,115 Golf Course 1,050,734 - 1,050,734 Depreciation and Amortization 152,588 1,329,893 1,482,481
Total operating expenses 2,050,766 10,762,008 12,812,774
Operating Income (Loss) (481,908) 15,033 (466,875)
NONOPERATING REVENUES (EXPENSES)State Grants 7,250 - 7,250 Home Rule Tax - 669,416 669,416 Loss on disposal of property (1,643) - (1,643) Interest - 273 273
Total nonoperating revenues (expenses) 5,607 669,689 675,296
Income (loss) before capital contributions and transfers (476,301) 684,722 208,421
CAPITAL CONTRIBUTIONS
Capital Contributions 9,399 754,496 763,895
Income (loss) before transfers (466,902) 1,439,218 972,316
TRANSFERSTransfers In - 158,000 158,000 Transfers Out (44,400) (699,303) (743,703)
Total transfers (44,400) (541,303) (585,703)
Net Income (Loss) (511,302) 897,915 386,613
Net Position at beginning of year 3,724,187 34,001,138 37,725,325
Net Position at end of year 3,212,885$ 34,899,053$ 38,111,938$
VILLAGE OF GLENDALE HEIGHTS, ILLINOIS
STATEMENT OF REVENUES, EXPENSES AND CHANGES IN NET POSITIONPROPRIETARY FUNDS
YEAR ENDED APRIL 30, 2017

STATEMENT 9
See accompanying notes to financial statements. 20.
Golf EnvironmentalCourse Fund Services Fund Total
CASH FLOWS FROM OPERATING ACTIVITIESReceipts from Customers 1,579,835$ 10,730,439$ 12,310,274$ Payments to Suppliers (1,066,661) (6,317,501) (7,384,162) Payments to Employees (748,432) (2,182,923) (2,931,355)
Net cash provided (used) by operating activities (235,258) 2,230,015 1,994,757
CASH FLOWS FROM NONCAPITAL FINANCING ACTIVITIESInterfund Borrowing 287,441 - 287,441 Operating Grants 7,250 - 7,250 Home Rule Tax - 486,611 486,611 Transfers (to) from Other Funds (44,400) (541,303) (585,703) Net cash provided (used) by noncapital financing activities 250,291 (54,692) 195,599
CASH FLOWS FROM CAPITAL AND RELATEDFINANCING ACTIVITIES
Purchases of Capital Assets (15,033) (1,453,961) (1,468,994) Net cash provided (used) by capital and related financing activities (15,033) (1,453,961) (1,468,994)
CASH FLOWS FROM INVESTING ACTIVITIESInterest - 273 273
Net cash provided (used) by investing activities - 273 273
Net increase (decrease) in cash and cash equivalents - 721,635 721,635
Balances - beginning of the year - 3,750,995 3,750,995
Balances - end of year -$ 4,472,630$ 4,472,630$
Reconciliation of operating income (loss) to net cash provided byoperating activities:
Operating income (loss) (481,908)$ 15,033$ (466,875)$ Adjustments to reconcile operating income to net cash provided by
operating activities:Depreciation and Amortization 152,588 1,329,893 1,482,481
Change in assets and liabilities:Decrease (Increase) Receivables 10,977 (50,338) (39,361) Decrease (Increase) Inventory (10,288) - (10,288) Decrease (Increase) Prepaid Assets (2,066) (355) (2,421) Decrease (Increase) Deferred Outflows - Pensions 46,547 135,226 181,773 (Decrease) Increase Payables and Accruals 33,132 734,427 767,559 (Decrease) Increase Deposits Payable 3,060 6,635 9,695 (Decrease) Increase Net Pension Liability (114,645) (277,299) (391,944) Decrease (Increase) Deferred Inflows - Pensions 127,345 336,793 464,138
Net cash provided (used) by operating activities (235,258)$ 2,230,015$ 1,994,757$
Supplemental Disclosures:Cash and Cash Equivalents -$ 4,472,630$ 4,472,630$ Investments - - -
Total -$ 4,472,630$ 4,472,630$
The Golf Course and Environmental Fund received $9,399 and $754,796, respectively, in contributed assets.
VILLAGE OF GLENDALE HEIGHTS, ILLINOIS
The change in fair value of investments that are not cash and cash equivalents is not significant.
STATEMENT OF CASH FLOWSPROPRIETARY FUNDS
YEAR ENDED APRIL 30, 2017

STATEMENT 10
See accompanying notes to financial statements. 21.
PensionAgency Fund Trust Fund
Escrow PoliceAgency Fund Pension Fund
ASSETSCash and Investments
Cash and Equivalents 919,248$ 1,641,229$ U. S. Government Securities - 6,405,062 Municipal Bonds - 153,083 Mutual Funds - 16,069,267 Corporate Bonds - 10,513,966 Stocks - 2,197,179
Accrued Interest Receivable - 150,557 Total Assets 919,248$ 37,130,343
LIABILITIESDeposits Payable 919,248$ -$
Total Liabilities 919,248$ -
NET POSITIONRestricted for Pensions 37,130,343
Total Net Position 37,130,343$
Total Liabilities and Net Position 37,130,343$
FIDUCIARY FUNDSAPRIL 30, 2017
VILLAGE OF GLENDALE HEIGHTS, ILLINOIS
STATEMENT OF FIDUCIARY NET POSITION
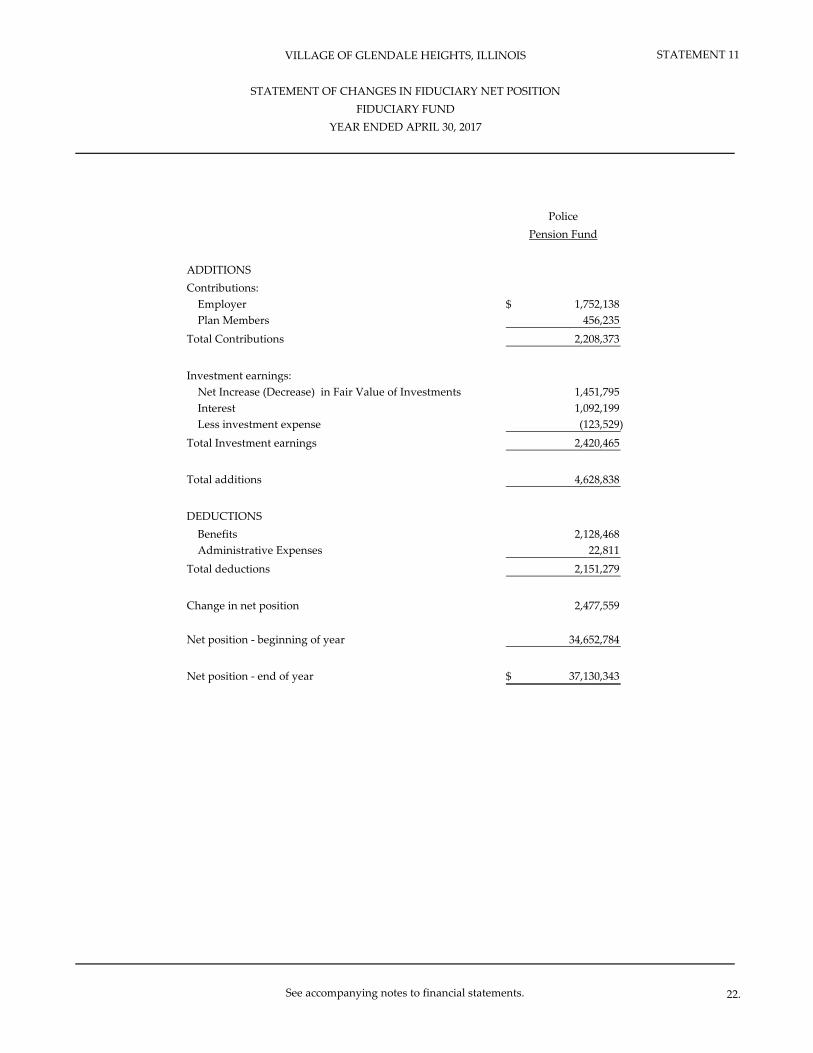
STATEMENT 11
See accompanying notes to financial statements. 22.
PolicePension Fund
ADDITIONSContributions:
Employer 1,752,138$ Plan Members 456,235
Total Contributions 2,208,373
Investment earnings:Net Increase (Decrease) in Fair Value of Investments 1,451,795 Interest 1,092,199 Less investment expense (123,529)
Total Investment earnings 2,420,465
Total additions 4,628,838
DEDUCTIONSBenefits 2,128,468 Administrative Expenses 22,811
Total deductions 2,151,279
Change in net position 2,477,559
Net position - beginning of year 34,652,784
Net position - end of year 37,130,343$
VILLAGE OF GLENDALE HEIGHTS, ILLINOIS
STATEMENT OF CHANGES IN FIDUCIARY NET POSITIONFIDUCIARY FUND
YEAR ENDED APRIL 30, 2017
VILLAGE OF GLENDALE HEIGHTS, ILLINOIS NOTES TO THE FINANCIAL STATEMENTS
April 30, 2017
(Continued)
23.
NOTE 1 - SUMMARY OF SIGNIFICANT ACCOUNTING POLICIES The financial statements of the Village of Glendale Heights, Illinois (the “Village have been prepared in conformity with accounting principles generally accepted in the United States of America, as applied to governmental units (hereinafter to be referred to as generally accepted accounting principles (GAAP)). The Governmental Accounting Standards Board (“GASB”) is the accepted standard-setting body for establishing governmental accounting and financial reporting principles. The significant of the Village’s accounting policies are described below. Reporting Entity: The Village operates under a board-administrator form of government as a home rule community (as defined by the State of Illinois Constitution) and provides the following services: public safety (police), street and bridge maintenance, water and sewer utility, public improvements, planning and zoning, engineering and inspection, and general governmental administrative services. As required by GAAP, these financial statements present the Village (the primary government) and its component units, entities for which the Village is considered to be financially accountable. Blended component units, although legally separate entities, are, in substance, part of the Village’s operations and are included within the primary government. Blended Component Unit: Police Pension Employees Retirement System - The Village’s police employees participate in the Police Pension Employees Retirement System (PPERS). PPERS functions for the benefit of these employees and is governed by a five-member pension board. Two members appointed by the Village’s President, one elected pension beneficiary and two elected police employees constitute the pension board. The Village and PPERS participants are obligated to fund all PPERS costs based upon actuarial valuations. The PPERS’s share of revenues comes from property taxes levied by the Village. Although the Police Pension Employees Retirement System is a legally separate entity, the Police Pension Fund financial data has been blended within the general purpose financial statements as a Pension Trust Fund. Basis of Presentation: The Village’s basic financial statements consist of village-wide statements, including a statement of net position, statement of activities and fund financial statements, which provide a more detailed level of financial information. The village-wide focus is more on the sustainability of the Village as an entity and the change in aggregate financial position resulting from activities of the fiscal period. Village-Wide Financial Statements - The statement of net position and the statement of activities display information about the village as a whole. In the village-wide statement of net position, both the governmental and business-type activities columns are presented on a consolidated basis by column. These statements include the financial activities of the primary government, except for fiduciary activities. For the most part, the effect of interfund activity has been removed from these statements. Governmental activities, which normally are supported by taxes and intergovernmental revenues, are reported separately from business-type activities, which rely to a significant extent on fees and charges for support. Interfund services provided and used are not eliminated in the process of consolidation. The village-wide statement of activities reflects both the direct expenses and net cost of each function of the Village’s governmental activities and business-like activity.

VILLAGE OF GLENDALE HEIGHTS, ILLINOIS NOTES TO THE FINANCIAL STATEMENTS
April 30, 2017
(Continued)
24.
NOTE 1 - SUMMARY OF SIGNIFICANT ACCOUNTING POLICIES (Continued) Direct expenses are those that are clearly identifiable with a specific function. Program revenues include charges paid by the recipient for the goods or services offered by the program, grants and contributions that are restricted to meeting the operational or capital requirements of a particular program and interest earned on grants that is required to be used to support a particular program. Revenues, which are not classified as program revenues, are presented as general revenues of the Village, with certain limited exceptions. The comparison of direct expenses with program revenues identifies the extent to which each government function or business segment is self-financing or draws from the general revenues of the Village. Fund Financial Statements - The financial transactions of the Village are recorded in individual funds. A fund is defined as a fiscal and accounting entity with a self-balancing set of accounts that comprise its assets, deferred outflows, liabilities, deferred inflows, fund equity, revenues, and expenditures or expenses, as appropriate. Separate statements for each fund category – governmental, proprietary, and fiduciary – are presented. The emphasis of fund financial statements is on major governmental and enterprise funds, each displayed in a separate column. All remaining governmental and enterprise funds are aggregated and presented as nonmajor funds. Proprietary fund operating revenues, such as charges for services, result from exchange transactions associated with the principal activity of the fund. Exchange transactions are those in which each party receives and gives up essentially equal values. Nonoperating revenues, such as subsidies and investment earnings, result from nonexchange transactions or ancillary activities. Measurement Focus and Basis of Accounting: Village-Wide Financial Statements - The village-wide financial statements, component unit financial statements, and fund financial statements for proprietary and fiduciary funds are reported using the economic resources measurement focus, except agency funds have no measurement focus and the accrual basis of accounting. The economic resources measurement focus means all assets, deferred outflows, liabilities and deferred inflows (whether current or non-current) are included on the statement of net position and the operating statements present increases (revenues) and decreases (expenses) in total net position. Under the accrual basis of accounting, revenues are recognized when earned, if measurable, and expenses are recognized as incurred, regardless of the timing of related cash flows. The Village has reported three categories of program revenues in the statement of activities (1) charges for services, (2) program-specific operating grants and contributions, and (3) program-specific capital grants and contributions. Program revenues are derived directly from the program itself or from external sources, such as the State of Illinois; they reduce the net cost of each function to be financed from the Village’s general revenues. For identifying the function to which program revenue pertains, the determining factor for charges for services is which function generates the revenue. For grants and contributions, the determining factor is the function to which the revenues are restricted. Eliminations have been made in the statement of net position to remove the “grossing-up” effect on assets and liabilities within the governmental activities column for amounts reported in the individual funds as interfund receivables and payables and advances. Similarly, transfers between funds have been eliminated in the statement of activities. Amounts reported in the governmental funds as receivable from or payable s

VILLAGE OF GLENDALE HEIGHTS, ILLINOIS NOTES TO THE FINANCIAL STATEMENTS
April 30, 2017
(Continued)
25.
NOTE 1 - SUMMARY OF SIGNIFICANT ACCOUNTING POLICIES (Continued) to fiduciary funds have been reclassified in the statement of net position as accounts receivable or payable to external parties. In addition to assets, the statement of financial position will sometimes report a separate section for deferred outflows of resources. This separate financial statement element, deferred outflows of resources, represents a consumption of net position that applies to a future period(s) and so will not be recognized as an outflow of resources (expense/expenditure) until then. The Village reports differences between expected and actual experience, changes in pension assumptions, and loss on pension investments. Differences between expected and actual experience and changes in pension plan assumptions are deferred and amortized over the average of the expected remaining service lives of employees that are provided with benefits through the pension plan. Loss on pension investments are deferred and amortized over five years. In addition to liabilities, the statement of financial position will sometimes report a separate section for deferred inflows of resources. This separate financial statement element, deferred inflows of resources, represents an acquisition of net position that applies to a future period(s) and so will not be recognized as an inflow of resources (revenue) until that time. The City reports resources associated with imposed nonexchange revenue transactions that are received or reported as a receivable before the period for which property taxes are levied as deferred inflows of resources. Additionally, certain amounts related to pensions must be deferred. Differences between expected and actual experience and change in pension assumptions are deferred and amortized over the average of the expected remaining service lives of all employees that are provided with benefits through the pension plan. The City also has another type of item, which arises only under a modified accrual basis of accounting, that qualifies for reporting in this category. Accordingly, the item, unavailable revenue, is reported only in the governmental funds balance sheet. These amounts are deferred and recognized as an inflow of resources in the period that the amounts become available. Fund Financial Statements - Governmental fund financial statements are reported using the current financial resources measurement focus and the modified accrual basis of accounting. Revenues are recognized as soon as they are both measurable and available. Revenues are considered to be available when they are collectible within the current period or soon enough thereafter to pay liabilities of the current period. For this purpose the Village considers revenues to be available if they are collected within sixty (60) days of the end of the current fiscal period. Revenues accrued at the end of the year include replacement tax, state sales tax, state income tax, court fines and motor fuel tax. All other revenue items are considered to be measurable and available only when cash is received by the government. Expenditures generally are recorded when a liability is incurred, as under accrual accounting. However, debt service expenditures, as well as expenditures related to compensated absences and claims and judgments, are recorded only when payment is due. Proprietary funds separate all activity into two categories: operating and non-operating revenues and expenses. Operating revenues and expenses result from providing services and producing and delivering goods. Non-operating revenues and expenses entail all other activity not included in operating revenues and expenses. Non-operating revenues and expenses include capital and noncapital financing activities and investing activities.

VILLAGE OF GLENDALE HEIGHTS, ILLINOIS NOTES TO THE FINANCIAL STATEMENTS
April 30, 2017
(Continued)
26.
NOTE 1 - SUMMARY OF SIGNIFICANT ACCOUNTING POLICIES (Continued) When an expenditure/expense is incurred for purposes for which both restricted and unrestricted resources are available, it is the Village’s policy to apply restricted resources first, then unrestricted resources as needed. Differences occur from the manner in which the governmental activities and the village-wide financial statements are prepared due to the inclusion of capital asset and long-term debt activity. Governmental fund financial statements, therefore, include reconciliation with brief explanations to better identify the relationship between the village-wide statements and the statements for governmental funds. The Village reports the following major governmental funds:
General Fund - The General Fund is the general operating fund of the Village. It is used to account for all financial resources except those required to be accounted for in another fund, also included is the Liability account. For financial reporting purposes, in accordance with GASB Statement No. 10, the Village’s insurance activity is reported as part of the general fund.
Debt Service Fund – This fund accounts for the payment of general obligation bond issues. Proprietary Funds: Proprietary funds account for operations (a) that are financed and operated in a manner similar to private business enterprises, where the intent of the governing body is that the costs (expenses, including depreciation) of providing goods or services to the general public on a continuing basis are financed or recovered primarily through user charges or (b) where the governing body has decided that periodic determination of revenues earned, expenses incurred and/or net income is appropriate for capital maintenance, public policy, management control, accountability or other purposes. The Village reports the following major proprietary funds:
Environmental Service Fund – The fund accounts for the provision of water, sewer and wastewater treatment services to the residents and businesses of the Village. All activities necessary to provide such services are accounted for in this fund, including, but not limited to, administration, operations, maintenance, financing and related debt service, and billing and collection. Golf Course Fund – The fund accounts for the operational activities of a municipal golf course. Activities include, but are not limited to, course construction, including clubhouses and maintenance facilities, operations, maintenance and financing.
Fiduciary Funds: Fiduciary funds are used to report assets held in a trustee or agency capacity for others and therefore cannot be used to support the Village’s own programs. Trust Funds - account for assets held by the Village as a trustee. This includes a pension trust fund. The pension trust fund has resources that are required to be held in trust for the members and beneficiaries of the police pension plan.

VILLAGE OF GLENDALE HEIGHTS, ILLINOIS NOTES TO THE FINANCIAL STATEMENTS
April 30, 2017
(Continued)
27.
NOTE 1 - SUMMARY OF SIGNIFICANT ACCOUNTING POLICIES (Continued) Agency Funds - account for assets the Village holds on behalf of others as their agent. The Village holds bonds from developers in this fund. Governmental Funds: In addition to the fund types mentioned above, the Village uses the following governmental fund types: Special Revenue Funds - account for the proceeds of specific revenue sources (other than debt service or major capital expenditures) that are legally restricted to expenditures for specified purposes. Capital Projects Funds - account for financial resources to be used for the acquisition or construction of major capital facilities other than those financed by proprietary funds and trust funds. Encumbrances: Encumbrance accounting, under which purchase orders, contracts and other commitments for the expenditures of resources are recorded in order to reserve that portion of the applicable appropriation, is utilized in the governmental and proprietary funds. For the year ended April 30, 2017, the Village had encumbrances of $302,057 for the General Fund, $1,764,837 for Nonmajor Governmental Fund, $465,552 for Environmental Fund and $2,369 for the Golf Course Fund totaling $2,534,815. Cash and Investments: Cash and Cash Equivalents - For purposes of the statement of cash flows, the Village’s proprietary fund types consider all highly liquid investments with an original maturity of three months or less when purchased to be cash equivalents. A portion of cash is restricted for liability purposes use only. Investments - Investments are stated at fair value in accordance with GASB 31. Fair value for the investment in Illinois Funds is the same as the value of the pool shares. State statute requires the Illinois Funds to comply with the Illinois Public Funds Investment Act. The Fund was created by the Illinois State Legislature and controlled by the Illinois State Treasurer. Short-Term Interfund Receivable/Payables: During the course of operation, numerous transactions occur between individual funds for goods provided or services rendered. These receivables and payables are classified as “Interfund Receivable” or “Interfund Payable” on the balance sheet. Any residual balances between the governmental activities and business-type activities are reported in the village-wide financial statements as “internal balances.” Prepaid Items: Payments made to vendors for services that will benefit periods beyond the date of this report are recorded as prepaid items. The Village uses the purchase method to account prepaid items in governmental funds. Inventories: Inventories are valued at market, using the first-in/first-out (“FIFO”) method. The costs of governmental fund-type inventories are recorded as expenditures when consumed rather than when purchased. Capital Assets: Capital assets, which include property, equipment, and infrastructure assets (e.g., roads,

VILLAGE OF GLENDALE HEIGHTS, ILLINOIS NOTES TO THE FINANCIAL STATEMENTS
April 30, 2017
(Continued)
28.
NOTE 1 - SUMMARY OF SIGNIFICANT ACCOUNTING POLICIES (Continued) bridges and similar items), are reported in the applicable governmental or business-type activities columns in the village-wide financial statements. Capital assets are defined by the Village as assets with a useful life of more than one year and an initial individual cost of more than: $ 100,000 Infrastructure $ 10,000 Buildings 25,000 Software 10,000 Site Improvements 10,000 Land Improvements 2,500 Vehicles 10,000 Equipment 1 Land All purchased capital assets are valued at cost where historical records are available and at an estimated historical cost where no historical records exist. Donated capital assets are valued at their estimated fair market value on the date received. The costs of normal maintenance and repairs that do not add to the value of the asset or materially extend asset lives are not capitalized. All reported capital assets except land, site improvements and construction in progress are depreciated. Improvements are depreciated over the remaining useful lives of the related capital assets. Depreciation on all assets is provided on the straight-line basis over the following estimated useful lives: Building 40 Years Equipment 5-10 Years Wastewater Systems 40 Years Water Systems 40 Years Residential Streets 40 Years Industrial Streets 40 Years Software 3-10 Years Vehicles 5-10 Years Intangible Assets - Water Purchase Rights: The Village is a member of the DuPage Water Commission and has executed a Water Supply Contract with the commission for a term ending in 2024. The contract provides that the Village pays its proportionate share of “fixed costs” (debt service and capital costs) to the commission, such obligation being unconditional and irrevocable. These costs were capitalized until the commission began to deliver water in January 1992 and were amortized, using the straight-line method, over a 20-year period ending in 2012. Compensated Absences: Vested vacation is earned on a calendar year basis. Most vacation for the year is used between April 30 and December 31. The vacation cost is expended as budgeted and is paid from operating funds at the time the vacation is utilized. The Village established a policy disallowing an accumulation of unused vacation. Prior balances in a liability account under previous policy have been eliminated by payment to the individuals and thus, the long-term liability eliminated. For union members the accumulation of sick time is defined by union contract with maximum accruals based on years of services. Non-union members may accrue up to 1,000 hours depending on their years of service. Fund Equity/Net Position: The components of fund balance include the following line items:

VILLAGE OF GLENDALE HEIGHTS, ILLINOIS NOTES TO THE FINANCIAL STATEMENTS
April 30, 2017
(Continued)
29.
NOTE 1 - SUMMARY OF SIGNIFICANT ACCOUNTING POLICIES (Continued)
a) Nonspendable fund balance includes amounts that cannot be spent because they are either not in spendable form or legally or contractually required to be maintained intact.
b) Restricted fund balance has externally enforceable limitations on use, such as limitations imposed by creditors, grantors, contributors, or laws and regulations of other governments as well as limitations imposed by law through constitutional provision or enabling legislation.
c) Committed fund balance is a self-imposed limitation set in place prior to the end of the period. The
limitations are imposed at the highest level of decision making that requires formal action at the same level. For the Village, the Board is the highest level of decision making and a resolution by the Board would be required to establish, modify or rescind a fund balance commitment. The Village has committed fund balance at April 30, 2017.
d) Assigned fund balance has limitations resulting from intended use, where the intended use is
established by the Board. The intended use is established by an official designated for that purpose. The Village has not designated anyone for this purpose.
d) Unassigned fund balance is the total fund balance in the general fund in excess of nonspendable,
restricted, committed, and assigned fund balance. Negative fund balances in governmental funds other than the general fund are also unassigned.
If there is an expenditure incurred for purposes for which committed, assigned, or unassigned fund balance classifications could be used, then the Village will consider committed fund balance to be spent first, then assigned fund balance and finally unassigned fund balance. If there is an expenditure incurred for purposes for which restricted or unrestricted fund balance could be used, then the Village will consider restricted fund balance to be spent first, then unrestricted fund balance. Net position represents the difference between assets, deferred outflows or resources, liabilities and deferred inflows of resources. Net investment in capital assets consists of capital assets, net of accumulated depreciation, reduced by the outstanding balances of any borrowing used for the acquisition, construction or improvement of those assets. Net position is reported as restricted when there are limitations imposed on their use either through the enabling legislation adopted by the Village or through external restrictions imposed by creditors, grantors, laws, or regulations of other governments. Bond Discounts/Premiums/Issuance Costs: Bond discounts and bond premiums are amortized over the term of the bonds using the bonds-outstanding method, which approximates the effective interest method. Bond discounts/premiums are presented as a reduction of the face amount of bonds payable. Issuance costs are expensed in the year of the bond issue. All other interfund transactions, except interfund services provided and used, are reported as operating transfers. Use of Estimates: Management has made a number of estimates and assumptions relating to the reporting of assets and liabilities to prepare these financial statements in conformity with generally accepted accounting principles. Actual results could differ.

VILLAGE OF GLENDALE HEIGHTS, ILLINOIS NOTES TO THE FINANCIAL STATEMENTS
April 30, 2017
(Continued)
30.
NOTE 2 - DEPOSITS AND INVESTMENTS The Village maintains a cash investment pool that is available for use by all funds, except the pension trust fund. Each fund type’s portion of this pool is displayed on the combined balance sheet as “cash and investments.” In addition, investments are separately held by several of the Village’s funds. The deposits and investments of the pension trust fund are held separately from those of other funds. Cash The carrying amount of cash, excluding the Pension Trust Fund, was $14,186,411 at April 30, 2017, while the bank balances were $14,569,427. In addition, the Village has $6,207 in petty cash funds. All account balances were either insured by the Federal Deposit Insurance Corporation’s (FDIC) for $250,000, or collateralized with securities of the U.S. Government or with letters of credit issued by the Federal Home Loan Bank held in the Village’s name by financial institutions acting as the Village’s agent. At April 30, 2017, the Pension Trust Fund’s carrying amount of cash was $1,641,228 while the bank balances were $1,641,228. All account balances at banks were either insured by the Federal Deposit Insurance Corporation (FDIC) for $250,000, or collateralized with securities of the U.S. Government or with letters of credit issued by the Federal Home Loan Bank held in the Pension Trust Fund’s name by a financial institution acting as the Fund’s agent. Certificates of Deposit Certificates of Deposit, excluding the Pension Trust Fund, amounted to $5,135,066 at April 30, 2017. Village policy states, certificates of deposit must be collateralized with securities of the U.S. Government in an amount equal to 110% of the funds on deposit. As of April 30, 2017, all CDs were collateralized. All investment collateral is held in safekeeping in the Village’s name by financial institutions acting as the Village’s agent. Collateral is priced to market semi-monthly and monitored regularly with additional collateral requested as necessary. Investments (excluding Pension Trust Fund) The Village deposits and invests all its monies in investments allowed by state statutes. Statutes authorize the Village to make deposits/invest in insured commercial banks, savings and loan institutions, obligations of the U.S. Treasury and U.S. Agencies, insured credit union shares, money market mutual funds with portfolios of securities issued or guaranteed by the United States or agreements to repurchase these same obligations, repurchase agreements, short-term commercial paper rated within the three highest classifications by at least two standard rating services, and the Illinois Public Treasurer’s Investment Pool. The following schedule reports the fair values and maturities (using the segmented time distribution method) for the Village’s investments at April 30, 2017.
Investment Type Fair ValueLess than One Year
One to Five Years
Six to Ten Years
Greater than Ten Years
State Treasurer Illinois Funds 1,937,164$ 1,937,164$ -$ -$ -$ Money Market 819 819 - - -
Total 1,937,983$ 1,937,983$ -$ -$ -$

VILLAGE OF GLENDALE HEIGHTS, ILLINOIS NOTES TO THE FINANCIAL STATEMENTS
April 30, 2017
(Continued)
31.
NOTE 2 - DEPOSITS AND INVESTMENTS (Continued) Interest Rate Risk. The Village does not have a formal investment policy that limits investment maturities as a means of managing its exposure to fair value losses arising from increasing interest rates. Credit Risk. The Village’s general investment policy is to apply the prudent-person rule: Investments are made as a prudent person would be expected to act, with discretion and intelligence, to seek reasonable income, preserve capital, and, in general, avoid speculative investments. The Village’s investment policy limits commercial paper investments to primarily A-1 Rated Paper. A-2 may be utilized but not to exceed 15% of total investments. A-3 not to exceed 5% of total investment and the total of A-2 and A-3 shall not exceed 15%. At April 30, 2017, the Village did not invest in any commercial paper. Credit ratings for the Village’s investments in debt securities as described by Standard & Poor’s at April 30, 2017 is AAAm for both State Treasurer of Illinois Funds and Money Market.
Custodial Credit Risk. For an investment, custodial credit risk is the risk that, in the event of the failure of the counterparty, the Village will not be able to recover the value of its investments or collateral securities that are in the possession of an outside party. The Village’s investment policy requires that all amounts in excess of any insurance limits be collateralized by one of the following: (1) United States Government Securities, (2) Obligations of Federal Agencies, (3) Obligations of Federal Instrumentalities, or (4) Obligations of the State of Illinois. The fair value of the pledge securities shall equal or exceed the portion of the deposit requiring collateralization. As of April 30, 2016, the Village’s investments were not subject to collateralization rules. Concentration of Credit Risk. The Village places the following limits on the amounts the Village may invest in any one issuer: no financial institution shall hold more than 50% of the Village investment portfolio, exclusive of U.S. Treasury securities; commercial paper shall not exceed 30% of the Village’s investment portfolio, State Treasurer Illinois Funds shall not exceed 50% of the Village’s investment portfolio and brokered certificates of deposit shall not exceed 30% of the Village’s investment portfolio. Pension Trust Fund’s Investments The Pension Trust Fund is authorized to invest in bonds, notes and other obligations of the U.S. Government; corporate debentures and obligations; insured mortgage notes and loans; common and preferred stocks; stock options; and other investment vehicles as set forth in the Illinois Compiled Statutes. The Pension Trust Fund’s policy is to maintain long-term focus on its investment decision-making process. Specifically, the Fund’s benefit liabilities extend many years into the future. As such, the investment focus should be on long-term results. The Fund’s fixed income performance objective is to meet or exceed the benchmark return of: 65% Lehman Government Index and 35% S&P 500 Index. The following schedule reports the fair values and maturities (using the segmented time distribution method) for the Pension Trust Fund’s investments at April 30, 2017.

VILLAGE OF GLENDALE HEIGHTS, ILLINOIS NOTES TO THE FINANCIAL STATEMENTS
April 30, 2017
(Continued)
32.
NOTE 2 - DEPOSITS AND INVESTMENTS (Continued)
Interest Rate Risk. The Pension Trust Fund does not have a formal investment policy that limits investment maturities as a means of managing its exposure to fair value losses arising from increasing interest rates. Credit Risk. The Pension Trust Fund’s policy does not limit credit risk. According to the provisions of the Illinois Compiled Statutes, fixed income purchases shall be limited to obligations issued or guaranteed as to principal and interest by the U.S. Government or any agency or instrumentality thereof, or to corporate and municipal issues. All securities shall be of “investment grade” quality; that is, at the time of purchases, rated no lower than “Baa” by Moody’s and no lower than “BBB” by Standard and Poor’s. The Board, at their discretion, may impose a higher standard on an individual investment manager basis as circumstances or investment objectives dictate. Credit ratings for the Pension Trust Fund’s investments in debt securities at April 30, 2017 (excluding obligations of the U.S. government or obligations explicitly guaranteed by the U.S. government, as they are not considered to have credit risk and do not require disclosure of credit quality) are as follows:
Custodial Credit Risk. For an investment, custodial credit risk is the risk that, in the event of the failure of the counterparty, the Pension Trust Fund will not be able to recover the value of its investments or collateral securities that are in the possession of an outside party. The Pension Trust Fund’s investment policy does not address collateralization. The Pension Trust Fund was fully collateralized as of April 30, 2017.
Less Than One to Six to Greater ThanInvestment Type Fair Value One Year Five Years Ten Years Ten YearsU.S Treasury Securities 3,954,174$ 90,132$ 1,814,432$ 1,052,139$ 997,471$ Federal Home Loan Mortg. Corp. 1,027,062 - 657,605 34,742 334,715 Federal Nat'l Mortgate Assoc. 1,423,826 70,011 323,282 278,268 752,265 Municipal Bonds 153,083 - 44,666 108,417 - Corporate Bonds 10,513,966 151,481 7,291,916 3,070,569 - Mutual Funds 16,069,267 16,069,267 - - - Total 33,141,378$ 16,380,891$ 10,131,901$ 4,544,135$ 2,084,451$
Investments Not Sensitive to Risk:Common and Preferred Stock 2,197,179 Total Investments 35,338,557$
Maturities
Investment Type A AA AAA BBB
Corporate Bonds 53% 11% 1% 35%
Municipal Bonds 0% 29% 71% 0%
Federal National Mortg Assoc 0% 0% 100% 0%
Federal Home Loan Mortg Corp 0% 0% 100% 0%
Disclosure Ratings for Debt Securities (S&P)
(As a percentage of total fair vaule for debt securities)

VILLAGE OF GLENDALE HEIGHTS, ILLINOIS NOTES TO THE FINANCIAL STATEMENTS
April 30, 2017
(Continued)
33.
NOTE 2 - DEPOSITS AND INVESTMENTS (Continued) Concentration of Credit Risk. The Pension Trust Fund places no limit on the amount the Trust Fund may invest in any one issuer. More than 3 percent of the Trust Fund’s investments were in Federal National Mortgage Association, US Treasury Securities, Mutual Funds, Corporate Bonds, and Federal Home Loan Mortgage Association. These investments are 4%, 12%, 48%, 32% and 3%, respectively, of the total Pension Trust Fund investments. Within the Mutual Funds category, 13% of the Trust Fund’s investments were in Vanguard Total Stock Market Index Fund Admiral Shares.
Fair Value Hierarchy. The Village and Pension Funds categorizes their fair value measurements within the fair value hierarchy established by GAAP. The hierarchy is based on the valuation inputs used to measure the fair value of the asset. Level 1 inputs are quoted prices in active markets for identical assets; Level 2 inputs are significant other observable inputs; Level 3 inputs are significant unobservable inputs. The Village and Pension Funds have the following recurring fair value measurements as of April 30, 2017 using a matrix pricing model:
Reconciliation of footnote to statements:Village Cash $ 14,186,411 Village CD’s 5,135,066 Village Petty Cash 6,207 Village Investments 1,937,983 Pension Cash 1,641,228 Pension Investments 35,338,558
Total per footnote $ 58,245,453
Cash and Investments per Statement 1 - Governmental $ 15,873,789 Cash and Investments per Statement 1 - Business Type 4,472,630 Escrow Agency Cash per Statement 10 919,248 Pension Cash and Investments per Statement 10 36,979,786
Total per financial statements $ 58,245,453
Fair
Quoted Prices in Active
Markets for Identical Assets
Significant Other
Observable Inputs
Significant Unobservable
InputsInvestment Type Value (Level 1) (Level 2) (Level 3)Police Pension
U.S Treasury Securities 3,954,174$ -$ 3,954,174$ -$ Mortgage-backed securities 2,450,888 - 2,450,888 -
Municipal Bonds 153,083 - 153,083 -
Corporate Bonds 10,513,966 - 10,513,966 -
Money Market Mutual Fund 16,069,267 16,069,267 - -
Common and Preferred Stock 2,197,179 2,197,179 - -
Police pension investment Total 35,338,557$ 18,266,446$ 17,072,111$ -$
Fair Value Measurements Using

VILLAGE OF GLENDALE HEIGHTS, ILLINOIS NOTES TO THE FINANCIAL STATEMENTS
April 30, 2017
(Continued)
34.
NOTE 3 - PROPERTY TAXES The Village’s property tax is levied each calendar year on all taxable real property located therein. For governmental funds only, property taxes, which are due within the current fiscal year, are recorded as revenue. The Village includes a provision for uncollectible property taxes of 1% of the gross levy. Property taxes are levied by December, on assessed valuation as of the previous January 1, on which date the tax levy becomes an enforceable lien against the property. Tax bills are prepared by the County and are due in two installments, on or about June 1 and September 1. The County collects such taxes and remits them shortly thereafter. Property taxes levied for calendar 2016 are recorded as receivable, net of estimated uncollectibles, in fiscal 2017. Revenues relating to these accruals for governmental fund types are recorded as a deferred inflow to the extent that they are not available. NOTE 4 - RECEIVABLES During the 2001 fiscal year, the Village entered into an agreement to loan the DuPage Mayors and Managers Conference $125,000. The Village will be receiving payments over 20 years. The note will be paid off in 2021. At April 30, 2017, $24,213 remains receivable on this note. The Village is a member/partner in the Northeast Dupage Special Recreation Area (NEDSRA). On May 8, 2013, the Articles of Agreement for NEDSRA were amended and restated establishing among other things, a Partner's ADA reserve fund, based on NEDSRA's past pension contributions. Partners would receive pension payment reimbursement from NEDSRA over a three-year period in three equal payments, which NEDSRA will make by crediting successive payments to each Partner's ADA reserve fund as stated in Article VIII. The Partner shall be entitled to access these monies at any time for Member Partner annual contributions to NEDSRA, reimbursement for Partner ADA projects benefitting NEDSRA, and reimbursement for sponsorship of NEDSRA events. For the year ended April 30, 2017, the Village contributed $164,985 to NEDSRA. NOTE 5 - CAPITAL ASSETS A summary of changes in the Village’s capital assets for the period May 1, 2016 through April 30, 2017 follows:

VILLAGE OF GLENDALE HEIGHTS, ILLINOIS NOTES TO THE FINANCIAL STATEMENTS
April 30, 2017
(Continued)
35.
NOTE 5 – CAPITAL ASSETS (Continued)
Depreciation expense for the Village’s Governmental Activities was charged to governmental functions as follows:
Balance at Balance atMay 1, 2016 Additions Deletions April 30, 2017
Governmental activities:Capital assets not being depreciated:
Land 30,521,016$ 3,000$ (3,489)$ 30,520,527$
Construction in progress 2,111,648 3,127,119 (2,515,138) 2,723,629 Subtotal 32,632,664 3,130,119 (2,518,627) 33,244,156
Capital assets being deprecicated:Infrastructure 37,304,057 1,818,733 (584,962) 38,537,828 Land improvements 9,181,718 107,409 (76,720) 9,212,407 Buildings 40,125,184 61,696 - 40,186,880 Equipment and vehicles 7,454,494 406,719 (424,815) 7,436,398
Subtotal 94,065,453 2,394,557 (1,086,497) 95,373,513
Accumulated depreciation:Infrastructure (25,926,468) (658,368) 412,354 (26,172,482) Land improvements (4,606,398) (453,554) 76,720 (4,983,232) Buildings (7,812,354) (893,713) - (8,706,067) Equipment and vehicles (5,500,767) (442,665) 423,777 (5,519,655)
Subtotal (43,845,987) (2,448,300) 912,851 (45,381,436) Total capital assets being depreciated, net 50,219,466 (53,743) (173,646) 49,992,077 Governmental activities
capital assets, net 82,852,130$ 3,076,376$ (2,692,273)$ 83,236,233$
General Government 1,121,696$ Public Safety 374,478 Culture and Recreation 634,925 Public Works 317,201
Total Depreciation Expense 2,448,300$

VILLAGE OF GLENDALE HEIGHTS, ILLINOIS NOTES TO THE FINANCIAL STATEMENTS
April 30, 2017
(Continued)
36.
NOTE 5 – CAPITAL ASSETS (Continued)
Depreciation expense of $1,329,893 for the Village’s Business-Type Activities was charged to the Environmental Services Fund and $152,588 was charged to the Golf Fund. NOTE 6 - LONG TERM DEBT The following is a summary of changes to the Village’s long-term debt for the fiscal year:
Balance at Balance atMay 1, 2016 Additions Deletions April 30, 2017
Business-type activities:Capital assets not being depreciated:
Land 5,404,185$ -$ -$ 5,404,185$ Construction in progress 9,620 22,057 (14,056) 17,621
Subtotal 5,413,805 22,057 (14,056) 5,421,806
Intangible capital assets:Water purchase rights 2,180,415 - - 2,180,415
Amortization:Water purchase rights (2,180,415) - - (2,180,415)
Total capital assets being amortized, net - - - -
Capital assets being depreciated:Infrastructure 62,769,319 - - 62,769,319 Land improvements 1,065,233 14,057 - 1,079,290 Buildings 10,650,537 2,190,834 (3,587) 12,837,784 Equipment and vehicles 2,509,719 19,997 (20,585) 2,509,131
Subtotal 76,994,808 2,224,888 (24,172) 79,195,524
Accumulated depreciation:Infrastructure (37,466,603) (1,046,245) - (38,512,848) Land improvements (446,762) (43,546) - (490,308) Buildings (2,850,199) (233,925) 3,588 (3,080,536) Equipment and vehicles (1,562,324) (158,765) 18,941 (1,702,148)
Subtotal (42,325,888) (1,482,481) 22,529 (43,785,840) Total capital assets being depreciated, net 34,668,920 742,407 (1,643) 35,409,684 Business-type activities
capital assets, net 40,082,725$ 764,464$ (15,699)$ 40,831,490$

VILLAGE OF GLENDALE HEIGHTS, ILLINOIS NOTES TO THE FINANCIAL STATEMENTS
April 30, 2017
(Continued)
37.
NOTE 6 - LONG TERM DEBT (Continued)
General Obligation Bonds
On May 1, 2006, the Village issued $3,000,000 of General Obligation Bonds Series 2006. The bonds are to be retired in annual installments ranging from $105,000 to $315,000 beginning April 1, 2007 through April 1, 2021 with interest payable semiannually at 3.50% to 4.00%. The bonds are payable from the Debt Service Fund. On December 15, 2007, the Village issued $5,475,000 of General Obligation Bonds Series 2007. The bonds are to be retired in annual installments ranging from $185,000 to $580,000 beginning December 15, 2011 through December 15, 2022 with interest payable semiannually at 3.50% to 4.00%. The bonds are payable from the Debt Service Fund. On December 15, 2008, the Village issued $5,000,000 of General Obligation Bonds Series 2008. The bonds are to be retired in annual installments ranging from $415,000 to $605,000 beginning December 15, 2010 through December 15, 2018 with interest payable semiannually at 3.250% to 3.875%. The bonds are payable from the Debt Service Fund.
Obligations Obligations
Outstanding Debt Debt Outstanding Due Within
April 30, 2016 Additions Retirement April 30, 2017 One Year
Government Activities
2006 General Obligation Bonds 1,395,000$ -$ 240,000$ 1,155,000$ 260,000$
2007 General Obligation Bonds 3,620,000 - 460,000 3,160,000 480,000
2008 General Obligation Bonds 1,730,000 - 550,000 1,180,000 575,000
2009 General Obligation Bonds 5,115,000 - 720,000 4,395,000 740,000
2010 General Obligation Bonds 25,795,000 - 1,265,000 24,530,000 1,290,000
Discount on Series 2006 (11,267) - 2,083 (13,350) -
Premium on Series 2007 20,494 - (2,759) 23,253 - Premium on Series 2008 5,356 - (1,951) 7,307 - Discount on Series 2009 (40,865) - 2,260 (43,125) - Discount on Series 2010 (22,231) - 700 (22,931) - Compensated Absences 3,096,807 1,085,180 840,830 3,341,157 936,896 Net OPEB Obligation 644,761 241,552 - 886,313 - Net Pension Liability - IMRF 8,101,552 - 835,523 7,266,029 - Net Pension Liability - Police 29,654,770 - 1,335,301 28,319,469 -
Total Governmental Activities 79,104,377$ 1,326,732$ 6,246,987$ 74,184,122$ 4,281,896$
Business-type Activities: Net Pension Liability - IMRF 3,042,910$ -$ 391,944$ 2,650,966$ -$ Compensated Absences 425,355 316,452 139,702 602,105 154,630
Total Business-type Activities 3,468,265$ 316,452$ 531,646$ 3,253,071$ 154,630$

VILLAGE OF GLENDALE HEIGHTS, ILLINOIS NOTES TO THE FINANCIAL STATEMENTS
April 30, 2017
(Continued)
38.
NOTE 6 - LONG TERM DEBT (Continued) On August 6, 2009, the Village issued $8,825,000 of General Obligation Bonds Series 2009. The bonds are to be retired in annual installments ranging from $130,000 to $805,000 beginning December 15, 2011 through December 15, 2029 with interest payable semiannually at 1.375% to 5.375%. The bonds are payable from the Debt Service Fund. These bonds are entitled to a direct payment subsidy from the United States Treasury in an amount equal to 28.1% of the interest due on each payment date. The Village must request this subsidy prior to each interest payment date. On April 1, 2010, the Village issued $29,940,000 of General Obligation Bonds Series 2010. The bonds are to be retired in annual installments ranging from $155,000 to $1,780,000 beginning December 15, 2011 through December 15, 2035 with interest payable semiannually at 1.300% to 6.250%. The bonds are payable from the Debt Service Fund. These bonds are entitled to a direct payment subsidy from the United States Treasury in an amount equal to 28.1% of the interest due on each payment date. The Village must request this subsidy prior to each interest payment date. Compensated Absences Compensated absences will be paid as they come due. They represent the amount outstanding for sick and vacation time at April 30, 2017 and will be paid from the fund where the employee’s salary is paid. This is normally the General Account or the Environmental Fund. Net Pension Liabilities and Net OPEB Obligation The Net Pension Liabilities and Net OPEB Obligation will be paid as it comes due. It will be paid from the General Fund, Recreation Fund, Water Fund, or Golf Fund, dependent on where the employee’s salary is paid. Debt Service Requirements to Maturity Annual debt service requirements to maturity are as follows:
Fiscal YearEnding
April 30 Principal Interest Treasury
Rebate Total2018 3,345,000 1,728,578 (530,145) 4,543,433 2019 3,495,000 1,595,804 (501,159) 4,589,645 2020 3,015,000 1,452,711 (469,700) 3,998,011 2021 2,525,000 1,319,608 (434,072) 3,410,536 2022 2,315,000 1,204,564 (405,708) 3,113,856
2023-2027 9,615,000 4,412,550 (1,536,269) 12,491,281 2028-2032 6,805,000 2,147,804 (751,731) 8,201,073 2033-2036 3,305,000 529,375 (185,281) 3,649,094
Total 34,420,000$ 14,390,994$ (4,814,065)$ 43,996,929$
Governmental ActivitiesGeneral Obligation Bonds

VILLAGE OF GLENDALE HEIGHTS, ILLINOIS NOTES TO THE FINANCIAL STATEMENTS
April 30, 2017
(Continued)
39.
NOTE 7 - OTHER INDIVIDUAL FUND DISCLOSURES Interfund amounts due from and due to other funds at April 30, 2017 are summarized as follows:
The interfunds occurred in order to assist the receivable funds that had a low cash balance at year end. Interfund transfers at April 30, 2017, are summarized as follows:
The transfers represent routine items. Generally, routine transfers occur to meet the operating purposes of another fund, such as the transfer from governmental funds to the capital projects funds to fund the activities of this fund type. The following funds had a negative fund balance: Special Service Area #2 Fund 115,387 Special Service Area #3 Fund 54,654 TIF North Ave Fund 154,875 President St/North Ave TIF 967,594 IMRF Fund 134,983
AdvancesTo/From
Amount NotDue within
Receivable Fund Payable Fund Amount One YearMajor Governmental Funds:General Fund Nonmajor Governmental Funds 368,644$ 368,644$ General Fund Golf Course Fund 3,878,032 3,878,032 Nonmajor Governmental Funds Nonmajor Governmental Funds 768,041 768,041
5,014,717$ 5,014,717$
Transfer TransferIn Out
Major Governmental Funds:General Fund 579,607$ 1,837,772$ Debt Service Fund 2,567,959 -
Total Major Governmental Funds 3,147,566 1,837,772
Major Enterprise FundsEnvironmental Service Fund 158,000 699,303 Golf Course Fund - 44,400
Total Major Enterprise Funds 158,000 743,703
Nonmajor Governmental Funds 1,289,541 2,013,632
Total Transfers 4,595,107$ 4,595,107$

VILLAGE OF GLENDALE HEIGHTS, ILLINOIS NOTES TO THE FINANCIAL STATEMENTS
April 30, 2017
(Continued)
40.
NOTE 8 – PLEDGES ON FUTURE REVENUES On January 1, 2008, the Village entered into a note agreement to pledge up to $9,400,000 to CG Center LLC (the “Developer”). This note is for the purpose of paying or reimbursing certain eligible redevelopment project costs incurred by the Developer in connection with the redevelopment of the project in the North Avenue and Bloomingdale Road PPA Tax project area in the Village. The note is to be retired in annual installments as the Incremental Real Estate Taxes and Incremental Sales Taxes revenues become sufficient for the payment through February 18, 2027 with interest payable annually at 7.64%. Unpaid interest payment as of April 30, 2017 is $2,364,965 with payments of $484,972 made during the year. On June 16, 2011, the Village entered into a redevelopment agreement with Dupage Dodge Chrysler Jeep Inc. and Kelly Moon Properties (“Parties”) for the purpose of paying or reimbursing certain eligible redevelopment project costs incurred by the Parties in connection with the redevelopment of certain property located south of North Avenue, west of Glen Ellyn Road and east of Western Avenue. The Village shall provide the parties up to $1,532,000 of tax increment financing assistance for redevelopment project costs in the form of three separate notes. The first is a $300,000 note that has been paid in full. The second is a $684,000 note bearing 8.5% interest per year compounding on December 31st and June 30th of each year until paid. Unpaid principal as of April 30, 2017 is $122,971. The third is a $584,000 note bearing 8.5% interest per year compounding on December 31st and June 30th each year until paid. Unpaid principal and interest as of April 30, 2017 is $344,445, with payments of $222,607 made during the year. These notes and related interest are to be retired when Incremental Real Estate Taxes become sufficient for the payments. On December 20, 2012, the Village entered into a redevelopment agreement with GHSA, LP for the purpose of paying or reimbursing certain eligible redevelopment project costs incurred by GHSA, LP in connection with the redevelopment of certain property located in the North Avenue/Bloomingdale Road Redevelopment Project Area. The Village has established a special tax allocation fund in which incremental taxes will be deposited annually. Reimbursement of redevelopment project costs shall be made annually on each special tax allocation fund allocation date. The agreement expires on December 31, 2027 or upon payment of a total of $1,464,750. The payments will only be made from available Incremental Real Estate Taxes. During the year ended April 30, 2017 payments of $104,625 were made. NOTE 9 - INTERGOVERNMENTAL RISK POOLS AND RISK MANAGEMENT The Village is exposed to various risks of loss related to torts; theft of, damage to, and destruction of assets; errors and omissions; injuries to employees; and natural disasters. The Village has bought general liability insurance and is self-insured for Workman’s Compensation claims up to $500,000 per claim. Currently, a third-party is administering the claims. As of April 30, 2017, there was $240,899 in unpaid claims. The claims liability is based on the requirements of GASB Statement No. 10, Accounting and Financial Reporting for Risk Financing and Related Insurance Issues, which requires that a liability for claims be reported if information prior to the issuance of the financial statements indicates that it is probable that a liability has been incurred at the date of the financial statements and the amount of the loss can be reasonably estimated. There has been no reduction in insurance coverage from the prior year and settlements did not exceed coverage for the past three years.
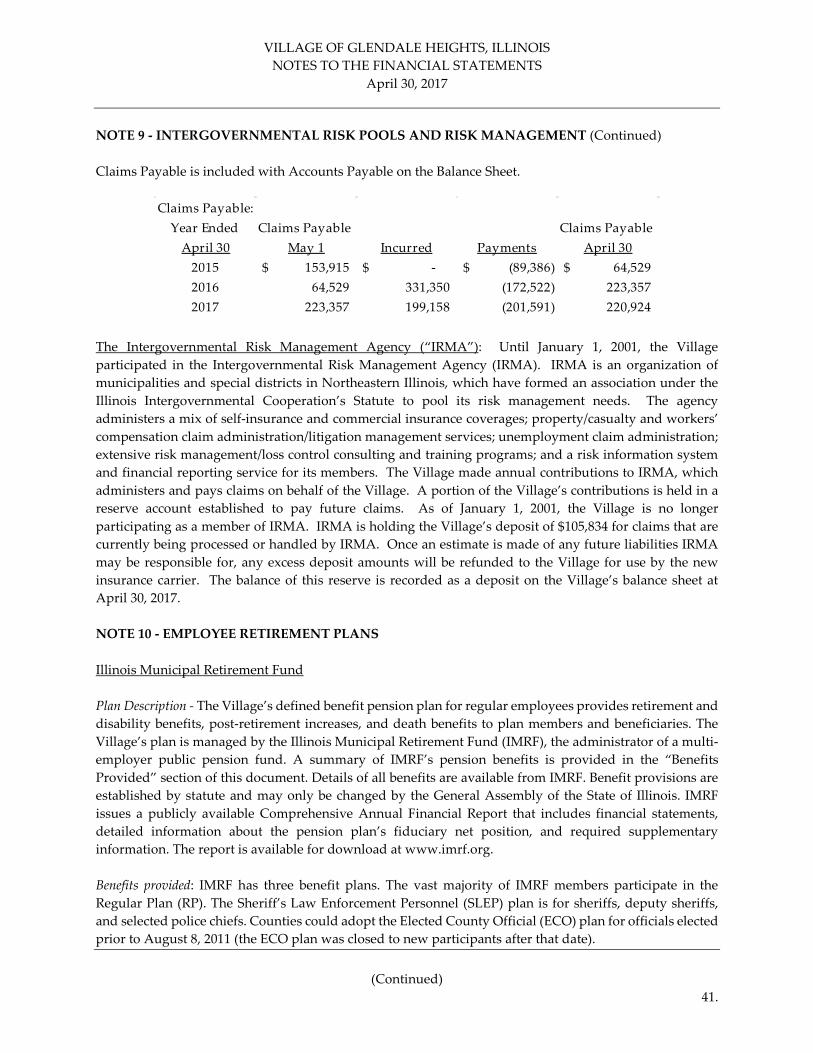
VILLAGE OF GLENDALE HEIGHTS, ILLINOIS NOTES TO THE FINANCIAL STATEMENTS
April 30, 2017
(Continued)
41.
NOTE 9 - INTERGOVERNMENTAL RISK POOLS AND RISK MANAGEMENT (Continued) Claims Payable is included with Accounts Payable on the Balance Sheet.
The Intergovernmental Risk Management Agency (“IRMA”): Until January 1, 2001, the Village participated in the Intergovernmental Risk Management Agency (IRMA). IRMA is an organization of municipalities and special districts in Northeastern Illinois, which have formed an association under the Illinois Intergovernmental Cooperation’s Statute to pool its risk management needs. The agency administers a mix of self-insurance and commercial insurance coverages; property/casualty and workers’ compensation claim administration/litigation management services; unemployment claim administration; extensive risk management/loss control consulting and training programs; and a risk information system and financial reporting service for its members. The Village made annual contributions to IRMA, which administers and pays claims on behalf of the Village. A portion of the Village’s contributions is held in a reserve account established to pay future claims. As of January 1, 2001, the Village is no longer participating as a member of IRMA. IRMA is holding the Village’s deposit of $105,834 for claims that are currently being processed or handled by IRMA. Once an estimate is made of any future liabilities IRMA may be responsible for, any excess deposit amounts will be refunded to the Village for use by the new insurance carrier. The balance of this reserve is recorded as a deposit on the Village’s balance sheet at April 30, 2017. NOTE 10 - EMPLOYEE RETIREMENT PLANS Illinois Municipal Retirement Fund Plan Description - The Village’s defined benefit pension plan for regular employees provides retirement and disability benefits, post-retirement increases, and death benefits to plan members and beneficiaries. The Village’s plan is managed by the Illinois Municipal Retirement Fund (IMRF), the administrator of a multi-employer public pension fund. A summary of IMRF’s pension benefits is provided in the “Benefits Provided” section of this document. Details of all benefits are available from IMRF. Benefit provisions are established by statute and may only be changed by the General Assembly of the State of Illinois. IMRF issues a publicly available Comprehensive Annual Financial Report that includes financial statements, detailed information about the pension plan’s fiduciary net position, and required supplementary information. The report is available for download at www.imrf.org. Benefits provided: IMRF has three benefit plans. The vast majority of IMRF members participate in the Regular Plan (RP). The Sheriff’s Law Enforcement Personnel (SLEP) plan is for sheriffs, deputy sheriffs, and selected police chiefs. Counties could adopt the Elected County Official (ECO) plan for officials elected prior to August 8, 2011 (the ECO plan was closed to new participants after that date).
Claims Payable:Year Ended Claims Payable Claims Payable
April 30 May 1 Incurred Payments April 302015 153,915$ -$ (89,386)$ 64,529$ 2016 64,529 331,350 (172,522) 223,357 2017 223,357 199,158 (201,591) 220,924

VILLAGE OF GLENDALE HEIGHTS, ILLINOIS NOTES TO THE FINANCIAL STATEMENTS
April 30, 2017
(Continued)
42.
NOTE 10 - EMPLOYEE RETIREMENT PLANS (Continued) All three IMRF benefit plans have two tiers. Employees hired before January 1, 2011, are eligible for Tier 1 benefits. Tier 1 employees are vested for pension benefits when they have at least eight years of qualifying service credit. Tier 1 employees who retire at age 55 (at reduced benefits) or after age 60 (at full benefits) with eight years of service are entitled to an annual retirement benefit, payable monthly for life, in an amount equal to 1-2/3% of the final rate of earnings for the first 15 years of service credit, plus 2% for each year of service credit after 15 years to a maximum of 75% of their final rate of earnings. Final rate of earnings is the highest total earnings during any consecutive 48 months within the last 10 years of service, divided by 48. Under Tier 1, the pension is increased by 3% of the original amount on January 1 every year after retirement. Employees hired on or after January 1, 2011, are eligible for Tier 2 benefits. For Tier 2 employees, pension benefits vest after ten years of service. Participating employees who retire at age 62 (at reduced benefits) or after age 67 (at full benefits) with ten years of service are entitled to an annual retirement benefit, payable monthly for life, in an amount equal to 1-2/3% of the final rate of earnings for the first 15 years of service credit, plus 2% for each year of service credit after 15 years to a maximum of 75% of their final rate of earnings. Final rate of earnings is the highest total earnings during any 96 consecutive months within the last 10 years of service, divided by 96. Under Tier 2, the pension is increased on January 1 every year after retirement, upon reaching age 67, by the lesser of:
- 3% of the original pension amount, or - ½ of the increase in the Consumer Price Index of the original pension amount.
Employees Covered by Benefit Terms: As of December 31, 2016 the following employees were covered by the benefit terms: Inactive Plan Members or Beneficiaries Currently Receiving Benefits 251 Active Plan Members 173 Total 424 Contributions: As set by statute, the Village’s Regular Plan Members are required to contribute 4.50% of their annual covered salary. The statutes require employers to contribute the amount necessary, in addition to member contributions, to finance the retirement coverage of its own employees. The Village’s annual required contribution rate for calendar year 2016 was 13.24%. The Village also contributes for disability benefits, death benefits, and supplemental retirement benefits, all of which are pooled at the IMRF level. Contribution rates for disability and death benefits are set by IMRF’s Board of Trustees, while the supplemental retirement benefits rate is set by statute. Net Pension Liability: The Village’s net pension liability for IMRF was measured as of December 31, 2016. The total pension liability used to calculate the net pension liability was determined by an actuarial valuation as of that date. Actuarial assumptions: The total pension liability in the December 31, 2016 actuarial valuation was determined using the following actuarial assumptions, applied to all periods included in the measurement:
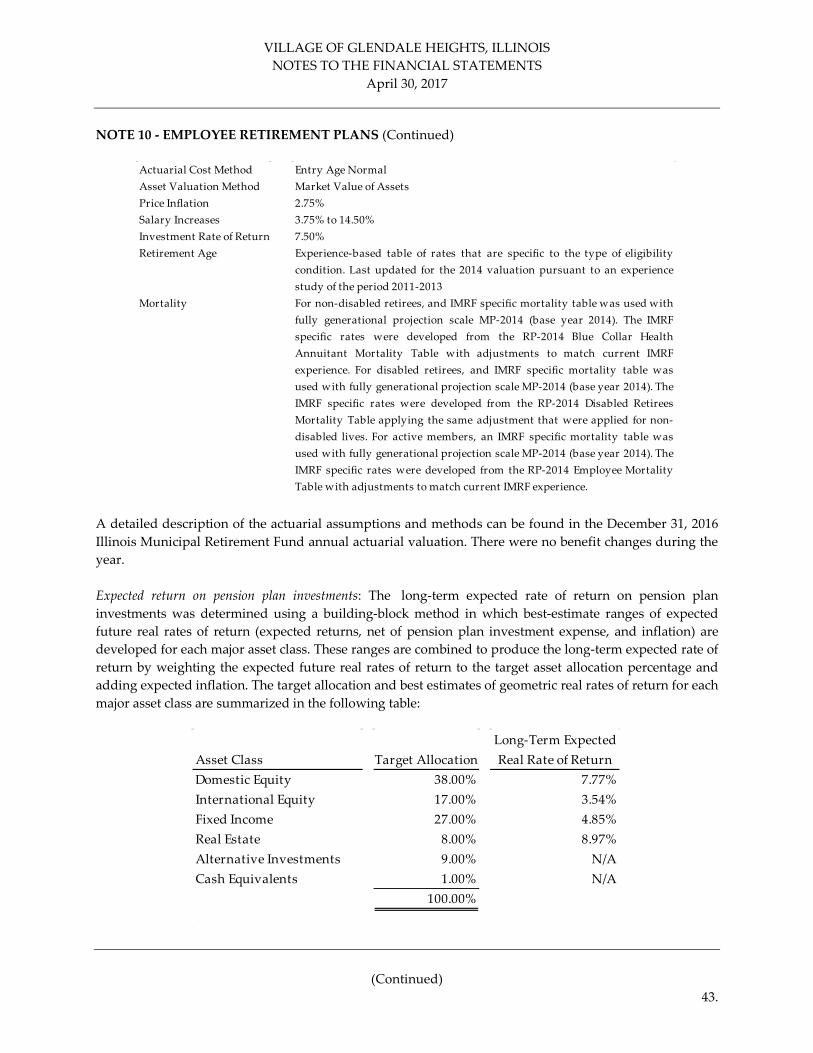
VILLAGE OF GLENDALE HEIGHTS, ILLINOIS NOTES TO THE FINANCIAL STATEMENTS
April 30, 2017
(Continued)
43.
NOTE 10 - EMPLOYEE RETIREMENT PLANS (Continued)
A detailed description of the actuarial assumptions and methods can be found in the December 31, 2016 Illinois Municipal Retirement Fund annual actuarial valuation. There were no benefit changes during the year. Expected return on pension plan investments: The long-term expected rate of return on pension plan investments was determined using a building-block method in which best-estimate ranges of expected future real rates of return (expected returns, net of pension plan investment expense, and inflation) are developed for each major asset class. These ranges are combined to produce the long-term expected rate of return by weighting the expected future real rates of return to the target asset allocation percentage and adding expected inflation. The target allocation and best estimates of geometric real rates of return for each major asset class are summarized in the following table:
Actuarial Cost Method Entry Age NormalAsset Valuation Method Market Value of AssetsPrice Inflation 2.75%Salary Increases 3.75% to 14.50%Investment Rate of Return 7.50%Retirement Age Experience-based table of rates that are specific to the type of eligibility
condition. Last updated for the 2014 valuation pursuant to an experiencestudy of the period 2011-2013
Mortality For non-disabled retirees, and IMRF specific mortality table was used withfully generational projection scale MP-2014 (base year 2014). The IMRFspecific rates were developed from the RP-2014 Blue Collar HealthAnnuitant Mortality Table with adjustments to match current IMRFexperience. For disabled retirees, and IMRF specific mortality table wasused with fully generational projection scale MP-2014 (base year 2014). TheIMRF specific rates were developed from the RP-2014 Disabled RetireesMortality Table applying the same adjustment that were applied for non-disabled lives. For active members, an IMRF specific mortality table wasused with fully generational projection scale MP-2014 (base year 2014). TheIMRF specific rates were developed from the RP-2014 Employee MortalityTable with adjustments to match current IMRF experience.
Long-Term ExpectedAsset Class Target Allocation Real Rate of ReturnDomestic Equity 38.00% 7.77%International Equity 17.00% 3.54%Fixed Income 27.00% 4.85%Real Estate 8.00% 8.97%Alternative Investments 9.00% N/ACash Equivalents 1.00% N/A
100.00%

VILLAGE OF GLENDALE HEIGHTS, ILLINOIS NOTES TO THE FINANCIAL STATEMENTS
April 30, 2017
(Continued)
44.
NOTE 10 - EMPLOYEE RETIREMENT PLANS (Continued) Discount rate: A single discount rate of 7.50% was used to measure the total pension liability. The projection of cash flow used to determine this single discount rate assumed that the plan members’ contributions will be made at the current contribution rate, and that employer contributions will be made at rates equal to the difference between actuarially determined contribution rates and the member rate. The single discount rates reflects:
(1) the long-term expected rate of return on pension plan investments (during the period in which the fiduciary net position is projected to be sufficient to pay benefits and
2) the tax-exempt municipal bond rate based on an index of 20-year general obligation bonds with an average AA credit rating (which is published by the Federal Reserve) as of the measurement date (to the extent that the contributions for use with the long-term expected rate of return are not met).
Based on those assumptions, the fiduciary net position was projected to not be available to make all projected future benefit payments of current plan members. Therefore, the long-term expected rate of return on pension plan investments was blended with the AA rated general obligation bond index at December 31, 2016 to arrive at the discount rates used to determine the total pension liability. For the purpose of the most recent valuation, the expected rate of return on plan investments is 7.50%, the municipal bond rate is 3.78%, and the resulting single discount rate is 7.50%, which is an increase of 0.01% from the previous measurement date. The last year the plan is expected to be fully funded is December 31, 2116.
Changes in the Net Pension Liability for the IMRF plan
Total Pension Plan Fiduciary Net PensionLiability Net Position (Asset)/Liability
(a) (b) (a) - (b)
Balances at 12/31/15 58,161,986$ 47,017,524$ 11,144,462$
Changes for the year:Service Cost 1,230,401 - 1,230,401 Interest 4,301,188 - 4,301,188 Actuarial Experience (1,642,024) - (1,642,024) Assumption Changes (234,048) - (234,048) Contributions - Employer - 1,443,734 (1,443,734) Contributions - Employee - 514,491 (514,491) Net Investment Income - 3,242,672 (3,242,672) Benefit payments, including refunds (2,395,403) (2,395,403) - Other (net Transfer) - (317,913) 317,913
Net Changes 1,260,114 2,487,581 (1,227,467)
Balances at 12/31/16 59,422,100$ 49,505,105$ 9,916,995$
Increase (Decrease)

VILLAGE OF GLENDALE HEIGHTS, ILLINOIS NOTES TO THE FINANCIAL STATEMENTS
April 30, 2017
(Continued)
45.
NOTE 10 - EMPLOYEE RETIREMENT PLANS (Continued) Sensitivity of the net pension liability to changes in the discount rate: The following presents the net pension liability of the Village, calculated using the discount rate of 7.50%, as well as what the Village’s net pension liability for IMRF plan would be if it were calculated using a discount rate that is 1-percentage-point lower (6.50%) or 1-percentage-point higher (8.50%) than the current rate:
Pension Expense and Deferred Outflows of Resources and Deferred Inflows of Resources Related to Pensions: For the year ended April 30, 2017 the Village recognized pension expense of $2,289,235 for the IMRF plan. At April 30, 2017, the Village reported deferred inflows or resources and deferred outflows or resources related to pensions from the following sources:
$412,774 reported as deferred outflows of resources related to pensions resulting from Village contributions subsequent to the measurement date will be recognized as a reduction of net pension liability in the reporting year ended April 30, 2018. Other amounts reported as deferred outflows of resources and deferred inflows of resources related to pensions will be recognized in pension expense as follows:
Current 1% Decrease Discount Rate 1% Increase
IMRF Plan 6.50% 7.50% 8.50%Village's Net Pension Liability 18,378,049$ 9,916,995$ 3,033,552$
Deferred DeferredOutflows of Inflows of
Deferred Amounts Related to Pensions Resources Resources
Deferred Amounts to be Recognized in PensionExpense in Future Periods
Differences between expected and actual experience 311,966$ 1,310,710$ Changes of assumptions 46,632 186,824 Net difference between projected and actual
earnings on pension plan investments 2,178,389 -
Total Deferred Amounts to be recognized in
pension expense in future periods 2,536,987 1,497,534
Pension Contributions made subsequentto the Measurement Date 412,774 -
Total Deferred Amounts Related to Pensions 2,949,761$ 1,497,534$

VILLAGE OF GLENDALE HEIGHTS, ILLINOIS NOTES TO THE FINANCIAL STATEMENTS
April 30, 2017
(Continued)
46.
NOTE 10 - EMPLOYEE RETIREMENT PLANS (Continued)
Police Pension Plan Plan Description. The Police Pension Plan is a single-employer defined benefit pension that covers all sworn police personnel. Although this is a single-employer pension plan, the defined benefits and employee and employer contribution levels are governed by Illinois State Statutes (40 ILCS 5/3) and may be amended only by the Illinois legislature. The Village accounts for the plan as a pension trust fund. A stand-alone financial report is not issued. The concept of vesting is not clearly defined in Illinois State statutes. As such, no information regarding employee eligibility for vesting is provided. At April 30, 2017, the Police Pension Plan membership was as follows:
Retirees and beneficiaries currently receiving benefits 32 Terminated employees entitled to benefits but not yet receiving them 4 Active Members 55
Total 91 The Police Pension Plan provides retirement benefits as well as death and disability benefits. Tier 1 employees (those hired prior to January 1, 2011) attaining the age of 50 or older with 20 or more years of creditable service are entitled to receive an annual retirement benefit equal to one-half of the salary attached to the rank held on the last day of service, or for one year prior to the last day, whichever is greater. The annual benefit shall be increased by 2.5% of such salary for each additional year of service over 20 years up to 30 years to a maximum of 75% of such salary. Employees with at least eight years but less than 20 years of credited service may retire at or after age 60 and receive a reduced benefit of 2.5% of final salary for each year of service. The monthly benefit of a police officer who retired with 20 or more years of service after January 1, 1977 shall be increased annually, following the first anniversary date of retirement and be paid upon reaching the age of at least 55 years, by 3.0% of the original pension and 3.0% compounded annually thereafter. Tier 2 employees (those hired on or after January 1, 2011) attaining the age of 55 or older with ten or more years of creditable service are entitled to receive an annual retirement benefit equal to the average monthly salary obtained by dividing the total salary of the police officer during the 96 consecutive months of service within the last 120 months of service in which the total salary was the highest by the number of months of service in that period. Police officers’ salary for pension purposes shall not exceed $106,800 however, that amount shall increase annually by the lesser of ½ of the annual change in the Consumer Price Index or 3.0%
Year Ending Net Deferred OutflowsApril 30 of Resources
2017 452,222$ 2018 452,222 2019 445,863 2020 (310,854)
Total 1,039,453$

VILLAGE OF GLENDALE HEIGHTS, ILLINOIS NOTES TO THE FINANCIAL STATEMENTS
April 30, 2017
(Continued)
47.
NOTE 10 - EMPLOYEE RETIREMENT PLANS (Continued) compounded. The annual benefit shall be increased by 2.5% of such salary for each additional year of service over 20 years up to 30 years to a maximum of 75.0% of such salary. Employees with at least ten years may retire at or after age 50 and receive a reduced benefit (i.e. ½% for each month under 55). The monthly benefit of a Tier 2 police officer shall be increased annually at age 60 on the January 1st after the police officer retires, or the first anniversary of the pension starting date, whichever is later. Noncompounding increases occur annually, each January thereafter. The increase is the lesser of 3.0% or ½ of the change in the Consumer Price Index for the proceeding calendar year. Contributions: Covered employees are required to contribute 9.91% of their base salary to the Police Pension Plan. If an employee leaves covered employment with less than 20 years of service, accumulated employee contributions may be refunded without accumulated interest. The Village is required to contribute the remaining amounts necessary to finance the plan as actuarially determined by an enrolled actuary, this includes the costs of administering the plan. Effective January 1, 2011, the Village has until the year 2040 to fund 90% of the past service costs for the Police Pension Plan. For the year ended April 30, 2016, the Village’s contribution was 31.01% of covered payroll. The projection of cash flows used to determine the discount rate assumed that employee contributions will be made at the current contribution rate and that Village contributions will be made at rates equal to the difference between actuarially determined contribution rates and the employee rate. Basis of Accounting - The accrual basis of accounting is utilized by pension trust funds. Under this method, additions to net plan assets are recorded when earned and deductions from net plan assets are recorded when the time related liabilities are incurred. Plan member contributions are recognized in the period in which the contributions are due. Employer contributions are recognized when due and the employer has made a formal commitment to provide the contributions. Benefits and refunds are recognized when due and payable in accordance with the terms of the plan. Method Used to Value Investments - Fixed-income securities are reported at fair market value. Short-term investments are reported a cost which approximates market value. Securities traded on national exchanges are valued at the last reported sales price. Investments that do not have any established market, if any, are reported at estimated fair value. Gains and losses of investments represent the increase (decrease) of cost over market value. Net Pension Liability: The Village’s net pension liability for the Police Pension plan was measured as of April 30, 2017, and the total pension liability used to calculate the net pension liability was determined by an actuarial valuation as of that date. Actuarial assumptions: The total pension liability in the April 30, 2017 actuarial valuation was determined using the following actuarial assumptions, applied to all periods included in the measurement:

VILLAGE OF GLENDALE HEIGHTS, ILLINOIS NOTES TO THE FINANCIAL STATEMENTS
April 30, 2017
(Continued)
48.
NOTE 10 - EMPLOYEE RETIREMENT PLANS (Continued)
All rates shown in the economic assumptions are assumed to be annual rates, compounded on an annual basis. Mortality rates are based on the assumption study prepared by Lauterbach & Amen, LLP in 2016. The table combines observed experience of Illinois Police Officers with the RP-2014 mortality table for blue collar workers. Mortality improvements have been made to 5 years past the valuation date. Other demographic assumption rates are based on a review of assumptions in the L&A 2016 study for Illinois Police Officers. Assumption changes: The assumed rate on High Quality 20 Year Tax-Exempt G.O. Bonds was changed from 3.32% to 3.82% for the current year. The underlying index used is The Bond Buyer 20-Bond GO Index as discussed in more detail later in this section. The choice of index is unchanged from the prior year. The rate has been updated to the current fiscal year end based on changes in market conditions as reflected in the Index. The change was made to reflect the actuaries understanding of the requirements of GASB under Statement 67 and Statement 68. The discount rate used in the determination of the Total Pension Liability was changed from 6.22% to 6.50%. The discount rate is impacted by a couple of metrics. Any change in the underlying High Quality 20 Year Tax Exempt G.O. Bond Rate will impact the blended discount rate. The demographic assumptions were changed to the tables shown above. The changes were made based on a study of Police Officers and police pension funds in Illinois. The changes are described in the assumption document for the pension fund. The changes were made to better reflect the future anticipated experience of the fund. Postemployment benefit changes: Eligibility for postemployment benefit increases is determined based on the Illinois Pension code. Tier 1 Police retirees are provided with an annual 3.0% increase in retirement benefits by statute when eligible. Tier 2 Police retirees are provided postemployment benefit increases based on one-half of the Consumer Price Index (Urban) for the prior September. The CPI-U for September, 1985 was 108.3. The CPI-U for September 2015 was 237.9. The average increase in the CPI-U for September, 1985 through September 2015 was 2.66% (on a compounded basis).
Actuarial Assumptions (Demographic)Mortality Table L&A 2016 Illinois Police Mortality RatesRetirement Rates L&A 2016 Illinois Police Retirement Rates Capped at age 65Disability Rates L&A 2016 Illinois Police Disability RatesTermination Rates L&A 2016 Illinois Police Termination RatesPercent Married 85.00%
Actuarial Assumptions (Economic) Discount Rate used for the Total Pension Liability 6.50% Long-Term Expected Rate of Return on Plan Assets 6.50% High Quality 20 Year Tax-Exempt G.O. Bond Rate 3.82% Projected Individual Salary Increases 3.50%-10.18% Projected Increase in Total Payroll 3.25% Consumer Price Index (Utilities) 2.50% Inflation Rate Included 2.50%

VILLAGE OF GLENDALE HEIGHTS, ILLINOIS NOTES TO THE FINANCIAL STATEMENTS
April 30, 2017
(Continued)
49.
NOTE 10 - EMPLOYEE RETIREMENT PLANS (Continued) Expected return on pension plan investments: The long-term expected rate of return on assets is intended to represent the best estimate of future real rates of return and is shown for each of the major asset classes in the investment policy. The expected rates of return shown below have been provided by the investment professionals that work with the Pension Fund. The Plan’s Board of Trustees has adopted and may only be amended by the Plan’s board, the asset allocation policy shown below for Plan assets. The Board shall seek an overall 50%/50% balance between value and growth investing with strategic allocation ranging within 15% of the target. Other allocations have a total target of 3.15%. The Trustees shall review the portfolio target allocations quarterly and consider rebalancing through new contributions or account asset transfers. The target allocation and best estimates of arithmetic real rate of return for each major asset class are summarized in the following table:
Rate of return: For the year ended April 30, 2017, the annual money-weighted rate of return on Plan’s assets, net of pension plan investment expense, was 7.11%. The money-weighted rate of return expresses investment performance, net of investment expense, adjusted for the changing amounts actually invested. Municipal bond rate: The municipal bond rate assumption is based on The Bond Buyer 20-Bond GO Index. The rate shown earlier in the Actuarial Assumption section is the December 30, 2015 rate. The 20-Bond GO Index is based on an average of certain general obligation municipal bonds maturing in 20 years and having an average rating equivalent of Moody's Aa2 and Standard & Poor's AA. The 20-Bond Index consists of 20 general obligation bonds that mature in 20 years. The average rating of the 20 bonds is roughly equivalent to Moody's Investors Service's Aa2 rating and Standard & Poor's Corp.'s AA. The indexes represent theoretical yields rather than actual price or yield quotations. Municipal bond traders are asked to estimate what a current-coupon bond for each issuer in the indexes would yield if the bond was sold at par value. The indexes are simple averages of the average estimated yields of the bonds.
Long-Term ExpectedAsset Class Target Allocation Real Rate of ReturnCash and cash Equivalents 0.00% 3.40%US Fixed Income 55.00% 5.00%US Large Cap Growth Equity 11.30% 10.30%US Large Cap Value Equity 11.30% 10.00%US Mid Cap Growth Equity 2.30% 11.30%US Mid Cap Value Equity 2.30% 10.60%US Small Cap Growth Equity 2.30% 12.20%US Small Cap Value Equity 2.30% 11.40%International Equity - Europe 5.20% 8.90%International Equity - Japan 5.20% 9.40%Real Estate Investment Trusts 1.60% 9.00%Infrastruture 1.60% 8.40%

VILLAGE OF GLENDALE HEIGHTS, ILLINOIS NOTES TO THE FINANCIAL STATEMENTS
April 30, 2017
(Continued)
50.
NOTE 10 - EMPLOYEE RETIREMENT PLANS (Continued) Discount rate: The discount rate used to measure the total pension liability was 6.50%. The discount rate used is based on a combination of the expected long-term rate of return on plan investments and the municipal bond rate. Cash flow projections were used to determine the extent which the plan’s future net position will be able to cover future benefit payments. To the extent future benefit payments are covered by the plan’s projected net position, the expected rate of return on plan investments is used to determine the portion of the net pension liability associated with those payments. To the extent future benefit payments are not covered by the plan’s projected net position, the municipal bond rate is used to determine the portion of the net pension liability associated with those payments. The discount rate has increased from the prior measurement date from 6.22%.
Sensitivity of the net pension liability to changes in the discount rate: The following presents the net pension liability of the Plans, calculated using the discount rate of 6.50 percent, as well as what the Plans’ net pension liability would be if it were calculated using a discount rate that is 1-percentage-point lower (5.50 percent) or 1-percentage-point higher (7.50 percent) than the current rate:
Changes in the Net Pension Liability for the Police Pension plan
Total Pension Plan Fiduciary Net PensionLiability Net Position Liability
(a) (b) (a) - (b)
Balances at 4/30/16 64,307,554$ 34,652,784$ 29,654,770$
Changes for the year:Service Cost 1,128,587 - 1,128,587 Interest 4,110,816 - 4,110,816 Actuarial Experience (232,768) - (232,768) Assumption Changes (1,735,909) - (1,735,909) Contributions - Employer - 1,752,138 (1,752,138) Contributions - Employee - 456,235 (456,235) Net Investment Income - 2,420,465 (2,420,465) Benefit payments, including refunds (2,128,468) (2,128,468) - Administrative Expense - (22,811) 22,811
Net Changes 1,142,258 2,477,559 (1,335,301)
Balances at 4/30/17 65,449,812$ 37,130,343$ 28,319,469$
Increase (Decrease)
1% Decrease Current 1% Increase5.50% Discount Rate 7.50%
Police Net Pension Liability 39,081,142$ 28,319,469$ 19,710,902$

VILLAGE OF GLENDALE HEIGHTS, ILLINOIS NOTES TO THE FINANCIAL STATEMENTS
April 30, 2017
(Continued)
51.
NOTE 10 - EMPLOYEE RETIREMENT PLANS (Continued) The sensitivity of the Net Pension Liability to the discount rate is based primarily on two factors (a) The duration of the plan’s expected benefit payments. Younger plans with benefit payments further in the future will be more sensitive to changes in the discount rate. (b) The funded percentage of the plan (ratio of net position to the total pension liability). The higher funded percentage, the higher the sensitivity to the discount rate. Pension Expense and Deferred Outflows of Resources and Deferred Inflows of Resources Related to Pensions: For the year ended April 30, 2017 the Village recognized pension expense of $3,732,818 for the Police Pension plan. At April 30, 2017, the Village reported deferred inflows or resources and deferred outflows or resources related to pensions from the following sources:
Amounts reported as deferred outflows of resources and deferred inflows of resources related to pensions will be recognized in pension expense as follows:
NOTE 11 – POST EMPLOYMENT BENEFITS Plan Description: The Village provides certain healthcare insurance benefits for retired employees. In accordance with the personnel policy, retired employees may continue to participate at their own expense in the Village’s health and life insurance programs. This is a single employer plan. The Plan does not issue its own stand-alone financial statements. This option is limited as follows:
a. It may be exercised only once, with the employee forfeiting any renewed participation upon cancellation.
b. Participation may be in either the life and health insurance programs, or both.
Deferred Outflows Deferred Inflowsof Resources of Resources
Differences Between Expected and ActualExperience 705,869$ 204,381$
Changes of Assumptions 5,476,741 1,524,212 Net Difference Between Projected and Actual
Earnings on Pension Plan Investments 1,312,700 132,942 Total 7,495,310$ 1,861,535$
Year ended April 30:2018 1,181,126$ 2019 1,181,126 2020 1,181,126 2021 743,560 2022 776,794 Thereafter 570,043 Total 5,633,775$

VILLAGE OF GLENDALE HEIGHTS, ILLINOIS NOTES TO THE FINANCIAL STATEMENTS
April 30, 2017
(Continued)
52.
NOTE 11 – POST EMPLOYMENT BENEFITS (Continued) Funding Policy: Funding is provided by The Village on a pay-as-you-go basis with no contribution from the retiree. The Village’s contribution on behalf of the employees to the insurance provider was $171,070 for the year ended April 30, 2017. Annual OPEB Cost and Net OPEB Obligation: The Village’s annual other post employment benefit (OPEB) cost is calculated on the annual required contribution (ARC). Actuarial calculations reflect a long-term perspective. The ARC represents a level of funding that, if paid on an ongoing basis, is projected to cover normal cost each year and amortize any unfunded actuarial liabilities over a period not to exceed thirty years. For fiscal year ended April 30, 2017, the Village’s annual OPEB cost of $412,622.
Funded Status and Funding Progress: As of April 30, 2016, the most recent actuarial valuation date, the actuarial accrued liability for benefits was $6,757,062.
Annual OPEB Cost and Net OPEB Obligation April 30, 2017
Annual required contribution 408,324$ Interest on net OPEB obligation 25,790 Adjustment to annual required contribution (21,492)
Annual OPEB cost 412,622 Contributions made 171,070
Increase (decrease) in net OPEB obligation 241,552 Net OPEB obligation beginning of year 644,761
Net OPEB obligation end of year 886,313$
Three Year Trend Information
Percentage of NetAnnual OPEB Annual OPEB Cost OPEB
Year Ended Cost Contributed Obligation
4/30/2017 412,622$ 41.0% 886,313$
4/30/2016 395,232 36.0% 644,761
4/30/2015 274,726 54.0% 391,844
ActuarialAccrued UAAL as a
Actuarial Liability Unfunded PercentageActuarial Value of (AAL) - AAL Funded Covered of CoveredValuation Assets Entry Age (UAAL) Ratio Payroll Payroll
Date (a) (b) (b-a) (a/b) ( c ) ((b-a)/c)
4/30/2016 -$ 6,757,062$ 6,757,062$ 0.0% 16,878,604$ 40.0%4/30/2013 - 5,105,609 5,105,609 0.0% 15,594,254 32.7%4/30/2012 - 4,500,305 4,500,305 0.0% 15,594,254 28.9%

VILLAGE OF GLENDALE HEIGHTS, ILLINOIS NOTES TO THE FINANCIAL STATEMENTS
April 30, 2017
(Continued)
53.
NOTE 11 – POST EMPLOYMENT BENEFITS (Continued) The schedule of funding progress, presented in the RSI following the notes to the financial statements, presents multiyear trend information about whether the actuarial value of plan assets is increasing or decreasing over time relative to the actuarial accrued liability for benefits. Actuarial Assumptions: As of April 30, 2016, the most recent actuarial valuation date, the entry age normal cost method was used. The actuarial assumptions included an annual healthcare cost trend rate of 3.90% initially, increasing the 7.00% in the second year before being reduced by decrements to an ultimate rate of 5.50%. The Unfunded Accrued Actuarial Liability is being amortized as level percentage of pay over 30 years on an open basis. An expected return of employee’s assets of 4.00% and rate of compensation increases of 4.00% were used. 50% of active employees are assumed to continue the participation from the active medical plan into the retiree medical plan upon retirement. Of the 50%, 40% are assumed to elect the PPO Plan and 60% are assumed to elect the HMO BA Plan. If an employee has waived active medical coverage they are assumed not to participate in the retiree medical plan. 100% of active employees are assumed to participate in the Life Insurance benefit upon retirement. 95% of IMRF retirees and 70% of Police retires receiving medical coverage are expected to lapse all coverages at age 65.
NOTE 12 – COMMITMENTS AND CONTINGENCIES
Commitments: The Village has commitments for various projects as of April 30, 2017 totaling $5,540,476.
Actuarial Assumptions (Demographic)
Retirement Rates 100% of the L&A Assumption Stufy for Police 2016 Capped at age 65
Withdrawal Rates 100% of the L&A Assumption Stufy for Police 2016
Disability Rates 100% of the L&A Assumption Stufy for Police 2016
Mortality Table 100% of the L&A Assumption Stufy for Police 2016
Termination Rates L&A 2016 Illinois Police Termination Rates
Election at Retirement IMRF 50%, Police 50%
Spousal Coverage 50%
Project Commitment FundSidewalk Replacement 135,000$ General FundAddison Dispatch 524,373 General FundTree Removal and Replacement 120,000 General FundNorth Avenue Flood Alleviation Project 2,226,975 Nonmajor Governmental Funds2017 MFT Project 1,389,224 Nonmajor Governmental FundsKlein Creek Retaining Wall 305,090 Nonmajor Governmental FundsFullerton Avenue Rehabilitation 147,911 Nonmajor Governmental FundsIMS Construction 50,905 Nonmajor Governmental FundsPayson Circle Lift Station 435,998 Environmental Services FundSanitary Sewer Lining 205,000 Environmental Services Fund
5,540,476$
VILLAGE OF GLENDALE HEIGHTS, ILLINOIS NOTES TO THE FINANCIAL STATEMENTS
April 30, 2017
(Continued)
54.
NOTE 12 – COMMITMENTS AND CONTINGENCIES (Continued) Litigation: From time to time, the Village is a defendant in various lawsuits. Although the outcome of these lawsuits is not presently determinable, in the opinion of the Village’s attorney, the resolution of these matters will not have a material adverse effect on the financial statements of the government.
NOTE 13 – NEW ACCOUNTING PRONOUNCEMENTS In June 2015, the GASB issued Statement No. 74 Financial Reporting for Postemployment Benefit Plans Other Than Pension Plans. The objective of this Statement is to improve the usefulness of information about postemployment benefits other than pensions (other postemployment benefits or OPEB) included in the general purpose external financial reports of state and local governmental OPEB plans for making decisions and assessing accountability. The requirements of this Statement are effective for the Village’s financial year ending April 30, 2018. This statement will have an effect on the financial statements of the Village. In June 2015, the GASB issued Statement No. 75 Accounting and Financial Reporting for Postemployment Benefits Other Than Pensions. The primary objective of this Statement is to improve accounting and financial reporting by state and local governments for postemployment benefits other than pensions (other postemployment benefits or OPEB). It also improves information provided by state and local governmental employers about financial support for OPEB that is provided by other entities. The requirements of this Statement are effective for the Village’s financial year ending April 30, 2019. This statement will have an effect on the financial statements of the Village. In December 2015, the GASB issued Statement 80, Blending Requirements for Certain Component Units – An Amendment of GASB Statement 14. This Statement amends the blending requirements for the financial statement presentation of component units of all state and local governments. The additional criterion requires blending of a component unit incorporated as a not-for-profit corporation in which the primary government is the sole corporate member. This Statement is effective for the Village’s fiscal year ended April 30, 2018. Management has not determined what impact, if any, this statement will have on its financial statements.
In March 2016, the GASB issued Statement 81, Irrevocable Split-Interest Agreements. The objective of this Statement is to improve accounting and financial reporting for irrevocable split-interest agreements by providing recognition and measurement guidance for situations in which a government is a beneficiary of the agreement. This Statement requires that a government that receives resources pursuant to an irrevocable split-interest agreement recognize assets, liabilities, and deferred inflows of resources at the inception of the agreement. Furthermore, this Statement requires that a government recognize assets representing its beneficial interests in irrevocable split-interest agreements that are administered by a third party, if the government controls the present service capacity of the beneficial interests. This Statement requires that a government recognize revenue when the resources become applicable to the reporting period. This Statement is effective for the Village’s fiscal year ended April 30, 2018. Management has not determined what impact, if any, this statement will have on its financial statements.

VILLAGE OF GLENDALE HEIGHTS, ILLINOIS NOTES TO THE FINANCIAL STATEMENTS
April 30, 2017
55.
NOTE 13 – NEW ACCOUNTING PRONOUNCEMENTS (Continued)
In March 2016, the GASB issued Statement 82, Pension Issues – An Amendment of GASB Statements No. 67, No. 68, and No. 73. The objective of this Statement is to address certain issues that have been raised with respect to Statements No. 67, Financial Reporting for Pension Plans, No. 68, Accounting and Financial Reporting for Pensions, and No. 73, Accounting and Financial Reporting for Pensions and Related Assets That Are Not within the Scope of GASB Statement 68, and Amendments to Certain Provisions of GASB Statements 67 and 68. Specifically, this Statement addresses issues regarding (1) the presentation of payroll-related measures in required supplementary information, (2) the selection of assumptions and the treatment of deviations from the guidance in an Actuarial Standard of Practice for financial reporting purposes, and (3) the classification of payments made by employers to satisfy employee (plan member) contribution requirements. This Statement is effective for the Village’s fiscal year ended April 30, 2018. Management has not determined what impact, if any, this statement will have on its financial statements.
In November 2016, the GASB issued Statement 83, Certain Asset Retirement Obligations. This Statement establishes criteria for determining the timing and pattern of recognition of a liability and a corresponding deferred outflow of resources for asset retirement obligations (AROs). This Statement is effective for the Village’s fiscal year ended April 30, 2020. This statement will have no effect on the Village.
In January 2017, the GASB issued Statement 84, Fiduciary Activities. The objective of this Statement is to improve guidance regarding the identification of fiduciary activities for accounting and financial reporting purposes and how those activities should be reported. This Statement establishes criteria for identifying fiduciary activities of all state and local governments. The focus of the criteria generally is on (1) whether a government is controlling the assets of the fiduciary activity and (2) the beneficiaries with whom a fiduciary relationship exists. Separate criteria are included to identify fiduciary component units and postemployment benefit arrangements that are fiduciary activities. This Statement is effective for the Village’s fiscal year ended April 30, 2020. Management has not determined what impact, if any, this statement will have on its financial statements
In March 2017, the GASB issued Statement 85, Omnibus 2017. The objective of this Statement is to address practice issues that have been identified during implementation and application of certain GASB Statements. This Statement addresses a variety of topics including issues related to blending component units, goodwill, fair value measurement and application, and postemployment benefits. This Statement is effective for the Village’s fiscal year ended April 30, 2019. Management has not determined what impact, if any, this statement will have on its financial statements.
In March 2017, the GASB issued Statement 86, Certain Debt Extinguishment Issues. The primary objective of this Statement is to improve consistency in accounting and financial reporting for in-substance defeasance of debt by providing guidance for transactions in which cash and other monetary assets acquired with only existing resources (resources other than the proceeds of refunding debt) are placed in an irrevocable trust for the sole purpose of extinguishing debt. This Statement also improves accounting and financial reporting for prepaid insurance on debt that is extinguished and notes to financial statements for debt that is defeased in substance. This Statement is effective for the Village’s fiscal year ended April 30, 2019. This Statement will have no effect on the Village.

RSI - 1
________________________________________________________________________________________________________________________
56.
VarianceOriginal Final Positive (Negative)Budget Budget Actual from Final Budget
REVENUESTaxes 8,477,849$ 8,581,349$ 8,767,088$ 185,739$ Licenses and Permits 1,611,900 1,614,300 1,709,109 94,809 Charges for Service 946,158 946,158 980,709 34,551 Fines and Forfeitures 612,000 588,000 596,111 8,111 Intergovernmental 10,262,966 10,618,756 11,416,881 798,125 Interest 34,000 34,000 33,054 (946) IPBC Investment Income (Loss) - - (41,854) (41,854) Miscellaneous 351,291 351,291 316,814 (34,477)
TOTAL REVENUES 22,296,164 22,733,854 23,777,912 1,044,058
EXPENDITURESCurrent:
General Government 10,588,168 10,540,608 10,382,230 158,378 Public Safety 7,677,159 7,785,042 7,677,492 107,550 Highways and Streets 3,516,149 3,717,391 3,606,892 110,499
Capital Outlay 52,600 52,085 13,185 38,900 TOTAL EXPENDITURES 21,834,076 22,095,126 21,679,799 415,327
Excess (deficiency) of revenues overexpenditures 462,088 638,728 2,098,113 1,459,385
OTHER FINANCING SOURCES (USES)Transfers In 579,608 579,608 579,607 (1) Transfers Out (1,437,772) (1,837,772) (1,837,772) -
TOTAL OTHER FINANCING SOURCES (USES) (858,164) (1,258,164) (1,258,165) (1)
Net change in fund balance (396,076)$ (619,436)$ 839,948 1,459,384$
Fund Balance at beginning of year 11,750,467
Fund Balance at end of year 12,590,415$
VILLAGE OF GLENDALE HEIGHTS, ILLINOIS
REQUIRED SUPPLEMENTARY INFORMATION
General Fund
YEAR ENDED APRIL 30, 2017
BUDGET (GAAP BASIS) AND ACTUALGENERAL FUND
BUDGETARY COMPARISON SCHEDULESCHEDULE OF REVENUES, EXPENDITURES AND CHANGES IN FUND BALANCE
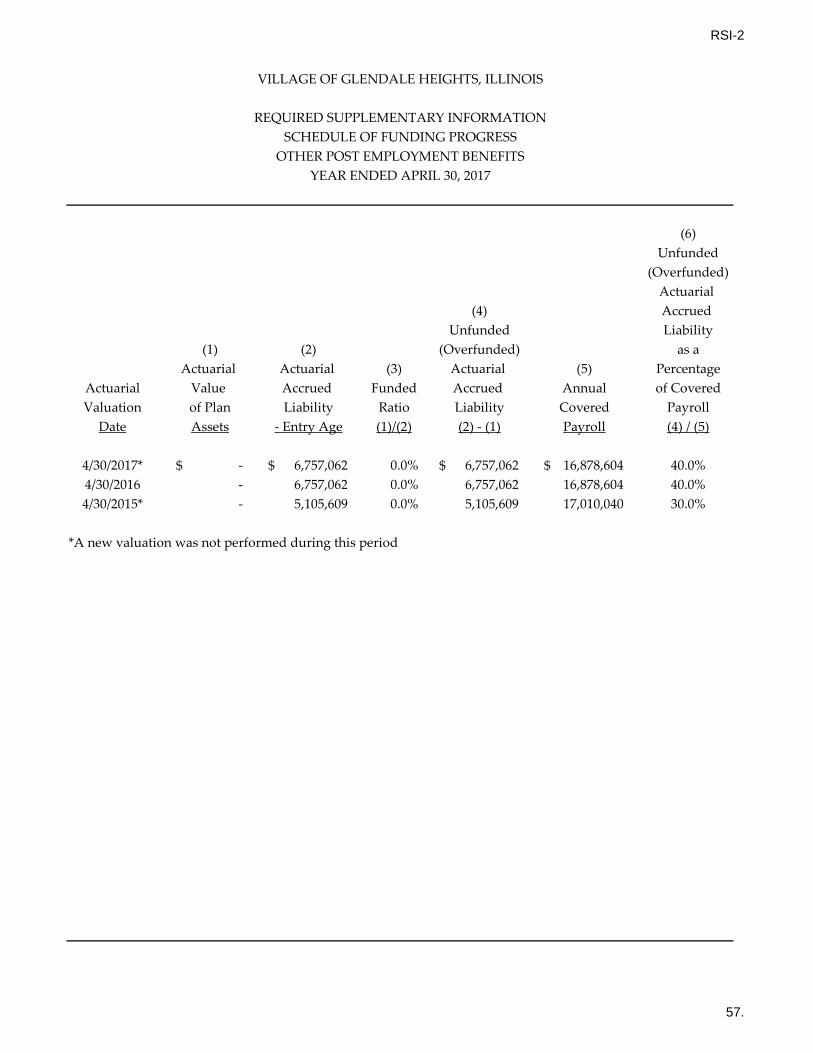
RSI-2
57.
VILLAGE OF GLENDALE HEIGHTS, ILLINOIS
REQUIRED SUPPLEMENTARY INFORMATIONSCHEDULE OF FUNDING PROGRESS
OTHER POST EMPLOYMENT BENEFITSYEAR ENDED APRIL 30, 2017
(6)Unfunded
(Overfunded)Actuarial
(4) Accrued Unfunded Liability
(1) (2) (Overfunded) as aActuarial Actuarial (3) Actuarial (5) Percentage
Actuarial Value Accrued Funded Accrued Annual of CoveredValuation of Plan Liability Ratio Liability Covered Payroll
Date Assets - Entry Age (1)/(2) (2) - (1) Payroll (4) / (5)
4/30/2017* -$ 6,757,062$ 0.0% 6,757,062$ 16,878,604$ 40.0%4/30/2016 - 6,757,062 0.0% 6,757,062 16,878,604 40.0%4/30/2015* - 5,105,609 0.0% 5,105,609 17,010,040 30.0%
*A new valuation was not performed during this period
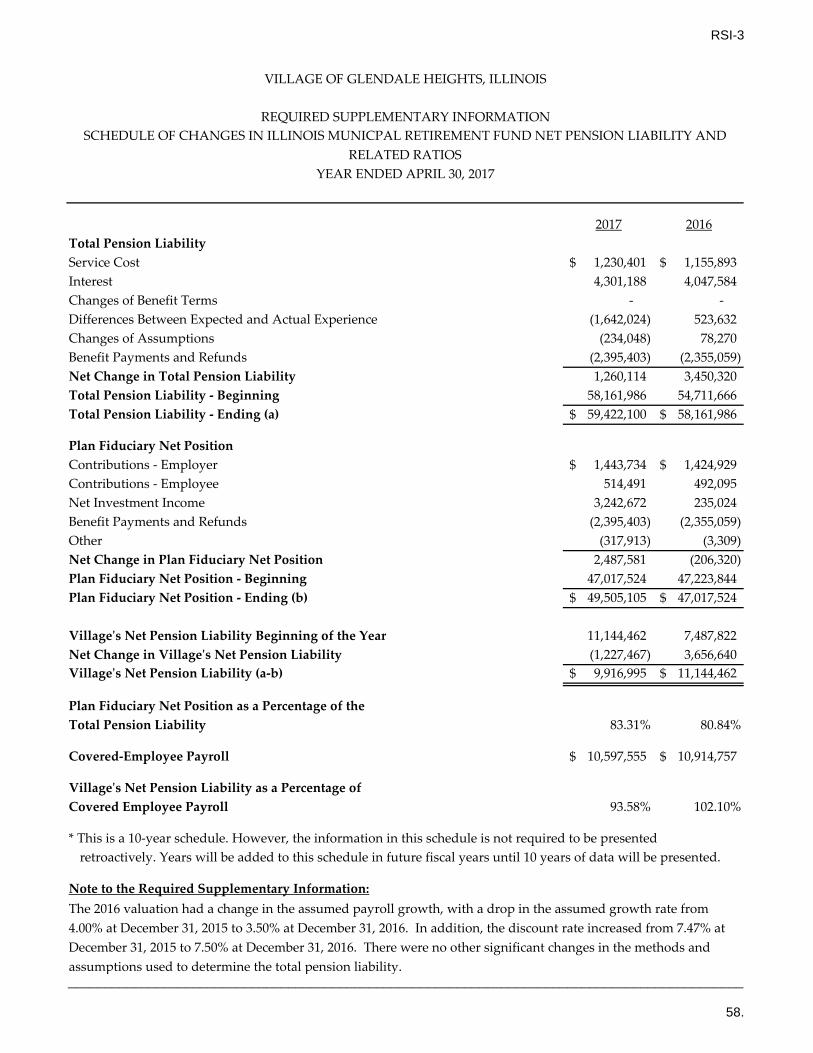
RSI-3
____________________________________________________________________________________________
58.
2017 2016Total Pension LiabilityService Cost 1,230,401$ 1,155,893$ Interest 4,301,188 4,047,584 Changes of Benefit Terms - - Differences Between Expected and Actual Experience (1,642,024) 523,632 Changes of Assumptions (234,048) 78,270 Benefit Payments and Refunds (2,395,403) (2,355,059) Net Change in Total Pension Liability 1,260,114 3,450,320 Total Pension Liability - Beginning 58,161,986 54,711,666 Total Pension Liability - Ending (a) 59,422,100$ 58,161,986$
Plan Fiduciary Net PositionContributions - Employer 1,443,734$ 1,424,929$ Contributions - Employee 514,491 492,095 Net Investment Income 3,242,672 235,024 Benefit Payments and Refunds (2,395,403) (2,355,059) Other (317,913) (3,309) Net Change in Plan Fiduciary Net Position 2,487,581 (206,320) Plan Fiduciary Net Position - Beginning 47,017,524 47,223,844 Plan Fiduciary Net Position - Ending (b) 49,505,105$ 47,017,524$
Village's Net Pension Liability Beginning of the Year 11,144,462 7,487,822 Net Change in Village's Net Pension Liability (1,227,467) 3,656,640 Village's Net Pension Liability (a-b) 9,916,995$ 11,144,462$
Plan Fiduciary Net Position as a Percentage of theTotal Pension Liability 83.31% 80.84%
Covered-Employee Payroll 10,597,555$ 10,914,757$
Village's Net Pension Liability as a Percentage ofCovered Employee Payroll 93.58% 102.10%
* This is a 10-year schedule. However, the information in this schedule is not required to be presentedretroactively. Years will be added to this schedule in future fiscal years until 10 years of data will be presented.
Note to the Required Supplementary Information:
VILLAGE OF GLENDALE HEIGHTS, ILLINOIS
REQUIRED SUPPLEMENTARY INFORMATION
YEAR ENDED APRIL 30, 2017
SCHEDULE OF CHANGES IN ILLINOIS MUNICPAL RETIREMENT FUND NET PENSION LIABILITY AND RELATED RATIOS
The 2016 valuation had a change in the assumed payroll growth, with a drop in the assumed growth rate from 4.00% at December 31, 2015 to 3.50% at December 31, 2016. In addition, the discount rate increased from 7.47% at December 31, 2015 to 7.50% at December 31, 2016. There were no other significant changes in the methods and assumptions used to determine the total pension liability.

RSI-4
59.
2017 2016 2015 2014 2013 2012 2011 2010 2009 2008
Actuarially determined contribution 1,403,116$ 1,422,193$ 1,454,069$ 1,375,306$ 1,300,211$ 1,258,194$ 1,200,032$ 1,112,860$ 1,073,897$ 1,061,533$ Contributions in relation to the
actuarially determined contribution 1,443,734 1,424,929 1,454,069 1,375,306 1,300,211 1,258,194 1,140,030 1,112,860 1,073,897 1,061,533 Contribution deficency (excess) (40,618)$ (2,736)$ -$ -$ -$ -$ 60,002$ -$ -$ -$
Covered payroll 10,597,555$ 10,914,757$ 10,644,719$ 10,172,384$ 9,978,598$ 10,017,467$ 9,901,255$ 10,598,664$ 10,395,909$ 10,171,122$
Contributions as a percentage ofcovered payroll 13.62% 13.06% 13.66% 13.52% 13.03% 12.56% 11.51% 10.50% 10.33% 10.44%
Notes to ScheduleValuation Date
Methods and assumptions used to determine 2016 contribution rate:
Actuarial cost method Aggregate entry age normalAmortization method Level percentage of payroll, closedRemaining amortization period Taxing bodies: 27-year closed period until remaining period reaches 15 years (then 15-year rolling period).Asset valuation method 5-year smoothed market, 20% corridorWage growth 3.50%Price inflation 2.75% - approximate; No explicit price inflation assumption is used in this valuationSalary increases 3.75% to 14.50% including inflationInvestment rate of return 7.50%Retirement age
Mortality
Other information:Changes There were no benefit changes during the year
The calculation of the 2016 contribution rate is based on valuation assumptions used in the December 31, 2014 actuarial valuation.
Actuarially determined contribution rates are calculated as of December 31 each year, which is 12 months prior to the beginning of the fiscal year in which contributionsare reported.
Experience-based table of rates that are specific to the type of eligibility condition. Last updated for the 2014 valuation pursuant to an experience study of the period 2011-2013.
For non-disabled retirees, an IMRF specific mortality table was used with fully generational projection scale MP-2014 (base year 2012). The IMRF specific rates were developed from the RP-2014 Blue Collar Health Annuitant Mortality Table with adjustments to match current IMRF experience. For disabled retirees, an IMRF specific mortality table was used with fully generational projection scale MP-2014 (base year 2012). The IMRF specific rates were developed from the RP-2014 Disabled Retirees Mortality Table applying the same adjustment that were applied for non-disabled lives. For active members, an IMRF specific mortality table was used with fully generational projection scale MP-2014 (base year 2012). The IMRF specific rates were developed from the RP-2014 Employee Mortality Table with adjustments to match current IMRF experience.
VILLAGE OF GLENDALE HEIGHTS, ILLINOIS
REQUIRED SUPPLEMENTARY INFORMATIONSCHEDULE OF ILLINOIS MUNICIPAL RETIREMENT FUND CONTRIBUTIONS
YEAR ENDED APRIL 30, 2017
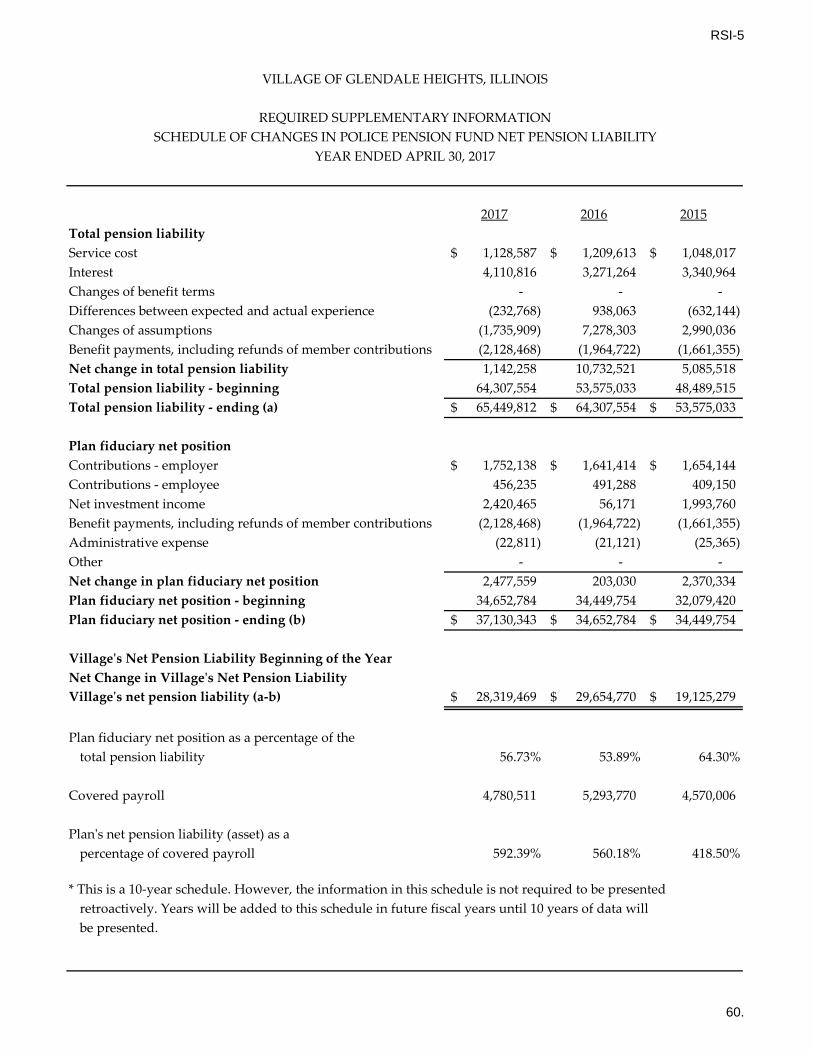
RSI-5
60.
2017 2016 2015Total pension liabilityService cost 1,128,587$ 1,209,613$ 1,048,017$ Interest 4,110,816 3,271,264 3,340,964 Changes of benefit terms - - - Differences between expected and actual experience (232,768) 938,063 (632,144) Changes of assumptions (1,735,909) 7,278,303 2,990,036 Benefit payments, including refunds of member contributions (2,128,468) (1,964,722) (1,661,355) Net change in total pension liability 1,142,258 10,732,521 5,085,518 Total pension liability - beginning 64,307,554 53,575,033 48,489,515 Total pension liability - ending (a) 65,449,812$ 64,307,554$ 53,575,033$
Plan fiduciary net positionContributions - employer 1,752,138$ 1,641,414$ 1,654,144$ Contributions - employee 456,235 491,288 409,150 Net investment income 2,420,465 56,171 1,993,760 Benefit payments, including refunds of member contributions (2,128,468) (1,964,722) (1,661,355) Administrative expense (22,811) (21,121) (25,365) Other - - - Net change in plan fiduciary net position 2,477,559 203,030 2,370,334 Plan fiduciary net position - beginning 34,652,784 34,449,754 32,079,420 Plan fiduciary net position - ending (b) 37,130,343$ 34,652,784$ 34,449,754$
Village's Net Pension Liability Beginning of the YearNet Change in Village's Net Pension LiabilityVillage's net pension liability (a-b) 28,319,469$ 29,654,770$ 19,125,279$
Plan fiduciary net position as a percentage of the total pension liability 56.73% 53.89% 64.30%
Covered payroll 4,780,511 5,293,770 4,570,006
Plan's net pension liability (asset) as a percentage of covered payroll 592.39% 560.18% 418.50%
* This is a 10-year schedule. However, the information in this schedule is not required to be presentedretroactively. Years will be added to this schedule in future fiscal years until 10 years of data willbe presented.
VILLAGE OF GLENDALE HEIGHTS, ILLINOIS
REQUIRED SUPPLEMENTARY INFORMATIONSCHEDULE OF CHANGES IN POLICE PENSION FUND NET PENSION LIABILITY
YEAR ENDED APRIL 30, 2017

RSI-6
61.
2017 2016 2015 2014 2013 2012 2011 2010 2009 2008
Actuarially determined contribution 2,277,609$ 1,735,774$ 1,729,126$ 1,952,021$ 1,864,094$ 1,352,131$ 1,352,131$ 1,183,058$ 1,183,058$ 943,756$ Contributions in relation to the
actuarially determined contribution 1,752,138 1,641,414 1,654,144 1,653,898 1,612,086 1,599,173 1,565,951 1,425,384 1,157,155 1,036,537 Contribution deficency (excess) 525,471$ 94,360$ 74,982$ 298,123$ 252,008$ (247,042)$ (213,820)$ (242,326)$ 25,903$ (92,781)$
Covered payroll 4,780,511$ 5,293,770$ 4,570,006$ 4,501,426$ 4,537,124$ 4,373,595$ 4,490,398$ 4,256,302$ 4,256,302$ 3,631,451$
Contributions as a percentage ofcovered payroll 36.65% 31.01% 36.20% 36.74% 35.53% 36.56% 34.87% 33.49% 27.19% 28.54%
Notes to ScheduleActuarial Cost Method Entry Age Normal (Level %)Asset Valuation Method Market ValueInflation 2.50%Salary Increases 3.50% - 10.18%Investment rate of return 6.50%Mortality Lauterbach & Amen, LLP Assumption Study for Police 2016.
The actuarially determed contribution shown for the current year is from the May 1, 2015 actuary report for the tax levy recommendation for the December, 2015 tax levy.
VILLAGE OF GLENDALE HEIGHTS, ILLINOIS
REQUIRED SUPPLEMENTARY INFORMATIONSCHEDULE OF POLICE PENSION FUND CONTRIBUTIONS
YEAR ENDED APRIL 30, 2017
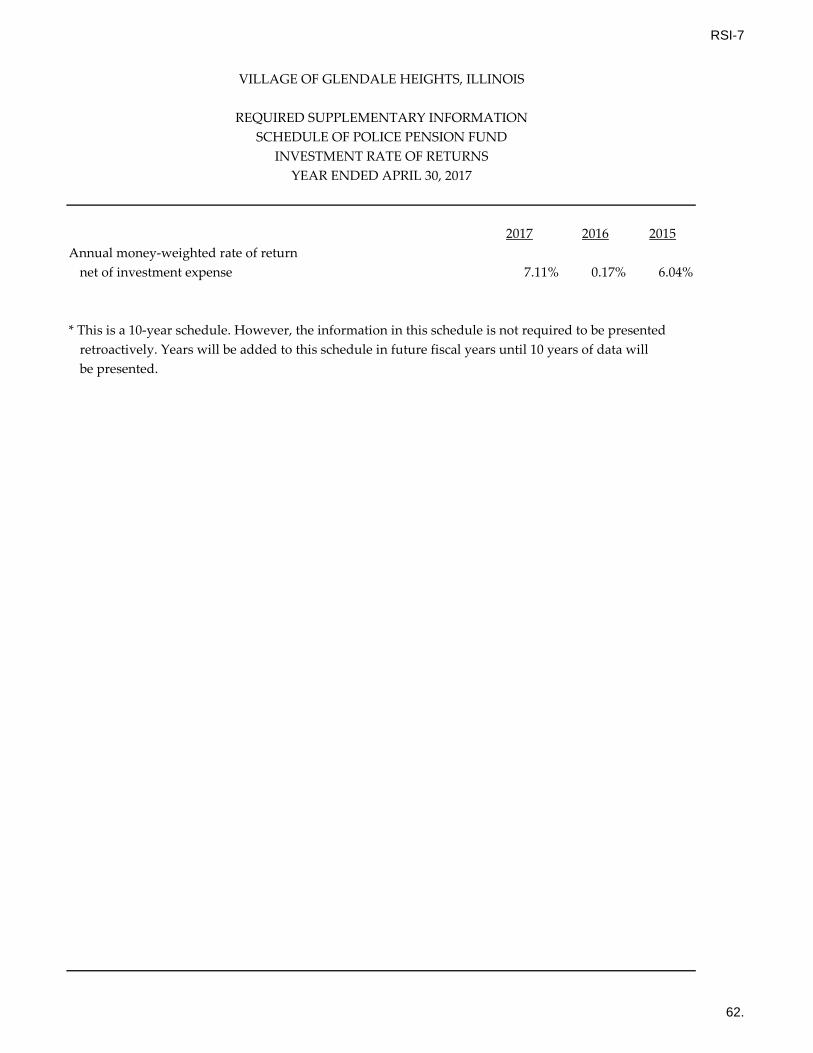
RSI-7
62.
2017 2016 2015Annual money-weighted rate of return
net of investment expense 7.11% 0.17% 6.04%
* This is a 10-year schedule. However, the information in this schedule is not required to be presentedretroactively. Years will be added to this schedule in future fiscal years until 10 years of data willbe presented.
VILLAGE OF GLENDALE HEIGHTS, ILLINOIS
REQUIRED SUPPLEMENTARY INFORMATIONSCHEDULE OF POLICE PENSION FUND
INVESTMENT RATE OF RETURNSYEAR ENDED APRIL 30, 2017
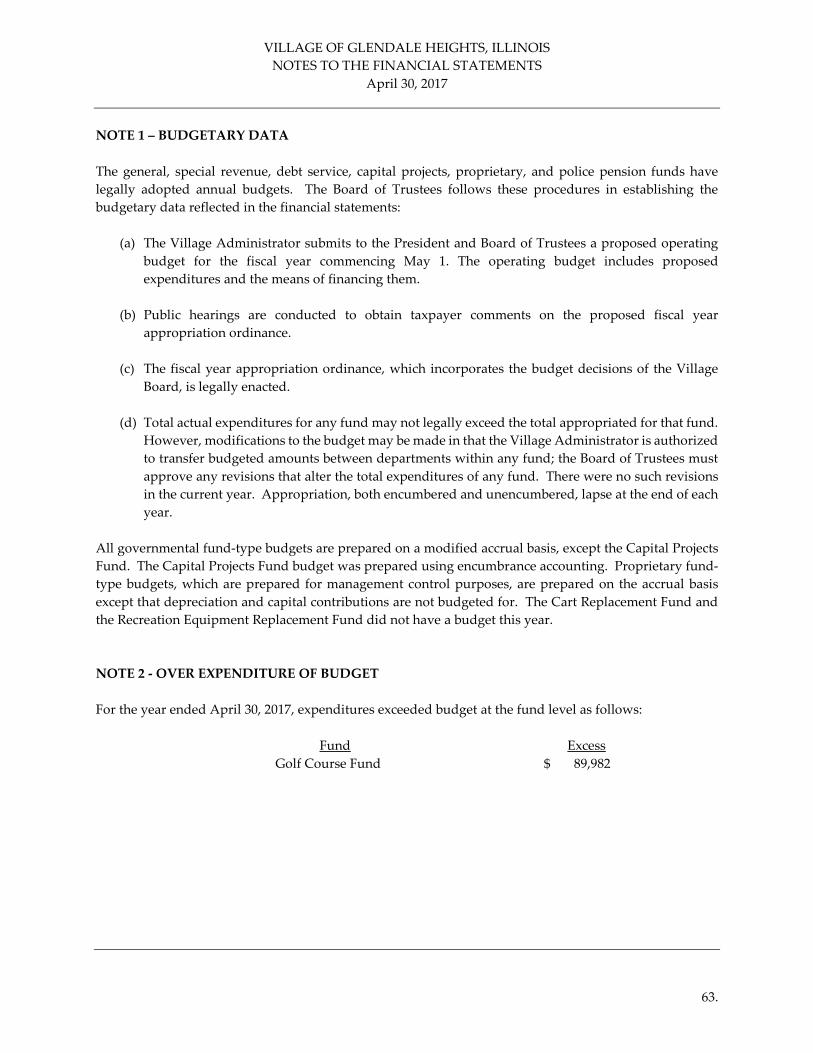
VILLAGE OF GLENDALE HEIGHTS, ILLINOIS NOTES TO THE FINANCIAL STATEMENTS
April 30, 2017
63.
NOTE 1 – BUDGETARY DATA The general, special revenue, debt service, capital projects, proprietary, and police pension funds have legally adopted annual budgets. The Board of Trustees follows these procedures in establishing the budgetary data reflected in the financial statements:
(a) The Village Administrator submits to the President and Board of Trustees a proposed operating budget for the fiscal year commencing May 1. The operating budget includes proposed expenditures and the means of financing them.
(b) Public hearings are conducted to obtain taxpayer comments on the proposed fiscal year
appropriation ordinance.
(c) The fiscal year appropriation ordinance, which incorporates the budget decisions of the Village Board, is legally enacted.
(d) Total actual expenditures for any fund may not legally exceed the total appropriated for that fund.
However, modifications to the budget may be made in that the Village Administrator is authorized to transfer budgeted amounts between departments within any fund; the Board of Trustees must approve any revisions that alter the total expenditures of any fund. There were no such revisions in the current year. Appropriation, both encumbered and unencumbered, lapse at the end of each year.
All governmental fund-type budgets are prepared on a modified accrual basis, except the Capital Projects Fund. The Capital Projects Fund budget was prepared using encumbrance accounting. Proprietary fund-type budgets, which are prepared for management control purposes, are prepared on the accrual basis except that depreciation and capital contributions are not budgeted for. The Cart Replacement Fund and the Recreation Equipment Replacement Fund did not have a budget this year. NOTE 2 - OVER EXPENDITURE OF BUDGET For the year ended April 30, 2017, expenditures exceeded budget at the fund level as follows: Fund Excess Golf Course Fund $ 89,982

GOVERNMENTAL FUND TYPES

MAJOR FUNDS

GENERAL FUND
General Account – To account for resources traditionally associated with governments that are not required to be accounted for in another fund. Liability Account – To account for revenues derived from a separate property tax levy that are subsequently used to cover premium and claim costs associated with general liability and workers compensation.

EXHIBIT 1
________________________________________________________________________________________________________________________64.
General LiabilityAccount Account Total
ASSETSCash and Investments 7,178,732$ 48,341$ 7,227,073$ Property Taxes Receivable 2,809,865 350,510 3,160,375 Sales Tax Receivable 1,938,155 - 1,938,155 State Income Tax Receivable 979,937 - 979,937 Intergovernmental Receivable 242,542 - 242,542 Accounts Receivable (Net of Allowance) 1,598,536 - 1,598,536 Interest Receivable 7,822 - 7,822 Advances to Other Funds 4,246,676 - 4,246,676 Deposits for Insurance 750 105,834 106,584 Prepaid Items 10,639 290,973 301,612 Inventories 58,837 - 58,837
TOTAL ASSETS 19,072,491$ 795,658$ 19,868,149$
LIABILITIES, DEFERRED INFLOWS OF RESOURCES AND FUND BALANCELIABILITIES
Accounts Payable 844,190 241,149 1,085,339 Accrued Payroll 615,995 2,085 618,080 Deposits Payable 301,032 - 301,032 Other Payables 295,759 - 295,759 Unearned Revenue 589,704 - 589,704 Compensated Absences - Current 318,997 - 318,997
TOTAL LIABILITIES 2,965,677 243,234 3,208,911
DEFERRED INFLOWS OF RESOURCESProperty Taxes 2,809,866 350,510 3,160,376 Unavailable Revenue - State Taxes 908,447 - 908,447
TOTAL DEFERRED INFLOWS OF RESOURCES 3,718,313 350,510 4,068,823
FUND BALANCENonspendable:
Inventory 58,837 - 58,837 Deposits 750 105,834 106,584 Prepaids 10,639 290,973 301,612 Long-term Note Receivable 24,213 - 24,213 Long-term Interfund Advances 4,246,676 - 4,246,676
Restricted:Police Activites 183,005 - 183,005
Unassigned 7,864,381 (194,893) 7,669,488 TOTAL FUND BALANCE 12,388,501 201,914 12,590,415
TOTAL LIABILITIES, DEFERRED INFLOWSOF RESOURCES AND FUND BALANCE 19,072,491$ 795,658$ 19,868,149$
VILLAGE OF GLENDALE HEIGHTS, ILLINOIS
GENERAL FUNDBALANCE SHEET BY ACCOUNT
APRIL 30, 2017

EXHIBIT 2
________________________________________________________________________________________________________________________
65.
General LiabilityAccount Account Total
REVENUESTaxes 8,413,858$ 353,230$ 8,767,088$ Licenses and Permits 1,709,109 - 1,709,109 Charges for Services 980,709 - 980,709 Fines and Forfeitures 596,111 - 596,111 Intergovernmental 11,416,881 - 11,416,881 Investment Earnings (Loss) (9,232) 432 (8,800) Miscellaneous 316,814 - 316,814
TOTAL REVENUES 23,424,250 353,662 23,777,912
EXPENDITURESCurrent:
General Government 9,567,630 814,600 10,382,230 Public Safety 7,677,492 - 7,677,492 Highways and Streets 3,606,892 - 3,606,892
Capital Outlay 13,185 - 13,185 TOTAL EXPENDITURES 20,865,199 814,600 21,679,799
Excess (deficiency) of revenues over expenditures 2,559,051 (460,938) 2,098,113
OTHER FINANCING SOURCES (USES)Transfers In 424,607 155,000 579,607 Transfers Out (1,837,772) - (1,837,772)
TOTAL OTHER FINANCING SOURCES (USES) (1,413,165) 155,000 (1,258,165)
Net Change in Fund Balance 1,145,886 (305,938) 839,948
Fund Balances at beginning of year 11,242,615 507,852 11,750,467
Fund Balances at end of year 12,388,501$ 201,914$ 12,590,415$
VILLAGE OF GLENDALE HEIGHTS, ILLINOIS
SCHEDULE OF REVENUES, EXPENDITURES AND CHANGES IN FUND BALANCE BY ACCOUNTALL GENERAL FUND ACCOUNTS
YEAR ENDED APRIL 30, 2017

EXHIBIT 3
________________________________________________________________________________________________________________________
66.
PositiveFinal (Negative) from
Budget Actual Final BudgetREVENUES
Taxes 8,231,349$ 8,413,858$ 182,509$ Licenses and Permits 1,614,300 1,709,109 94,809 Charges for Services 946,158 980,709 34,551 Fines and Forfeitures 588,000 596,111 8,111 Intergovernmental 10,618,756 11,416,881 798,125 Investment Earnings (Loss) 34,000 (9,232) (43,232) Miscellaneous 351,291 316,814 (34,477)
TOTAL REVENUES 22,383,854 23,424,250 1,040,396
EXPENDITURESCurrent:
General Government 9,698,965 9,567,630 131,335 Public Safety 7,785,042 7,677,492 107,550 Highways and Streets 3,717,391 3,606,892 110,499
Capital Outlay 52,085 13,185 38,900 TOTAL EXPENDITURES 21,253,483 20,865,199 388,284
Excess (deficiency) of revenues over expenditures 1,130,371 2,559,051 1,428,680
OTHER FINANCING SOURCES (USES)Transfers In 424,608 424,607 (1) Transfers Out (1,837,772) (1,837,772) -
TOTAL OTHER FINANCING SOURCES (USES) (1,413,164) (1,413,165) (1)
Net Change in Fund Balance (282,793)$ 1,145,886 1,428,679$
Fund Balance at beginning of year 11,242,615
Fund Balance at end of year 12,388,501$
YEAR ENDED APRIL 30, 2017
VILLAGE OF GLENDALE HEIGHTS, ILLINOIS
GENERAL ACCOUNTSCHEDULE OF REVENUES, EXPENDITURES AND CHANGES IN FUND BALANCE
BUDGET (GAAP BASIS) AND ACTUAL
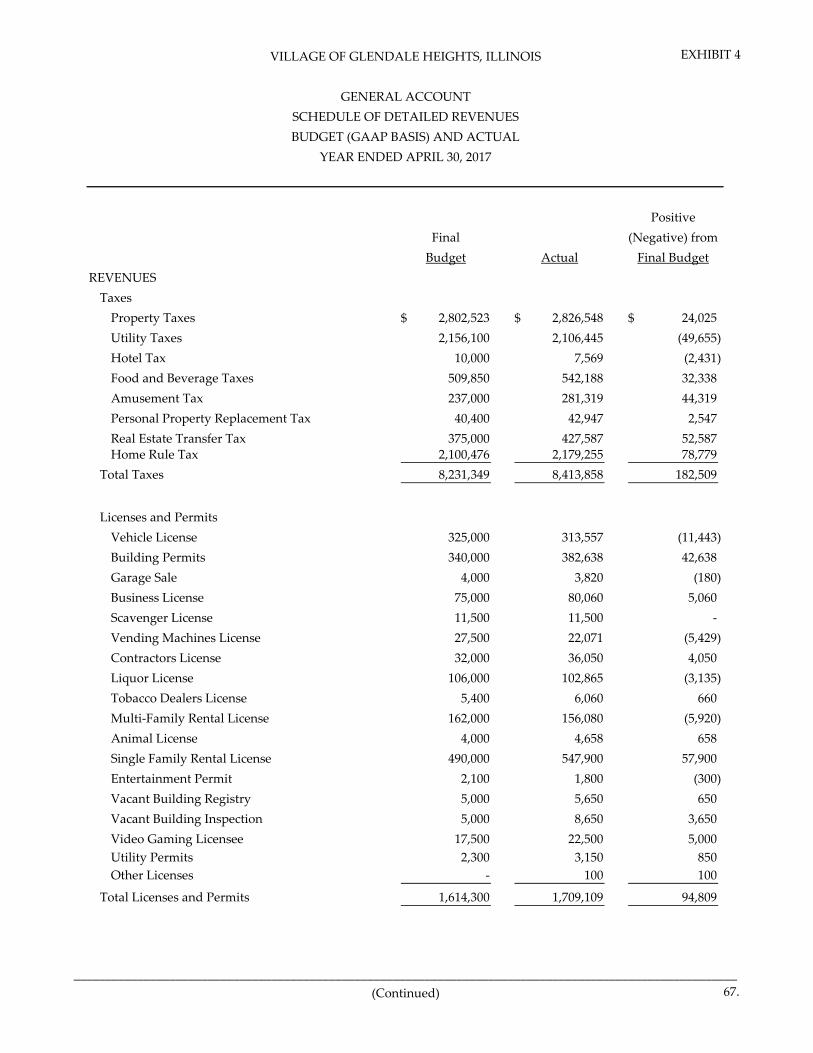
EXHIBIT 4
________________________________________________________________________________________________________(Continued) 67.
PositiveFinal (Negative) from
Budget Actual Final BudgetREVENUES
TaxesProperty Taxes 2,802,523$ 2,826,548$ 24,025$ Utility Taxes 2,156,100 2,106,445 (49,655) Hotel Tax 10,000 7,569 (2,431) Food and Beverage Taxes 509,850 542,188 32,338 Amusement Tax 237,000 281,319 44,319 Personal Property Replacement Tax 40,400 42,947 2,547 Real Estate Transfer Tax 375,000 427,587 52,587 Home Rule Tax 2,100,476 2,179,255 78,779
Total Taxes 8,231,349 8,413,858 182,509
Licenses and PermitsVehicle License 325,000 313,557 (11,443) Building Permits 340,000 382,638 42,638 Garage Sale 4,000 3,820 (180) Business License 75,000 80,060 5,060 Scavenger License 11,500 11,500 - Vending Machines License 27,500 22,071 (5,429) Contractors License 32,000 36,050 4,050 Liquor License 106,000 102,865 (3,135) Tobacco Dealers License 5,400 6,060 660 Multi-Family Rental License 162,000 156,080 (5,920) Animal License 4,000 4,658 658 Single Family Rental License 490,000 547,900 57,900 Entertainment Permit 2,100 1,800 (300) Vacant Building Registry 5,000 5,650 650 Vacant Building Inspection 5,000 8,650 3,650 Video Gaming Licensee 17,500 22,500 5,000 Utility Permits 2,300 3,150 850 Other Licenses - 100 100
Total Licenses and Permits 1,614,300 1,709,109 94,809
YEAR ENDED APRIL 30, 2017
VILLAGE OF GLENDALE HEIGHTS, ILLINOIS
GENERAL ACCOUNTSCHEDULE OF DETAILED REVENUESBUDGET (GAAP BASIS) AND ACTUAL

EXHIBIT 4
________________________________________________________________________________________________________(Continued) 68.
PositiveFinal (Negative) from
Budget Actual Final Budget
YEAR ENDED APRIL 30, 2017
VILLAGE OF GLENDALE HEIGHTS, ILLINOIS
GENERAL ACCOUNTSCHEDULE OF DETAILED REVENUESBUDGET (GAAP BASIS) AND ACTUAL
Charges for ServicesCourtroom Rental 62,200$ 46,238$ (15,962)$ Range Rental 6,000 6,000 - Water Tower Rental 71,263 71,263 - Cable TV Franchise Fee 448,000 439,451 (8,549) Re-Inspection Fee 6,000 13,825 7,825 Public Hearing Fee 6,000 9,000 3,000 False Alarm Fee 7,500 5,200 (2,300) Police Accident Report 4,000 4,295 295 Police Officer-Off Duty 7,000 20,506 13,506
Finger Printing Fee 1,500 1,495 (5) Animal Impound Fee 1,200 480 (720) Police Application 6,250 2,820 (3,430) Bassett Liquor Training 1,000 150 (850) Working W/O Permit 15,000 23,941 8,941 Real Estate Inspection Program 57,000 96,125 39,125 Application Fee - Liquor 4,287 14,539 10,252 Plat Filing Fee 500 - (500) County Right Of Way Fee 16,058 13,764 (2,294) Parks Usage Fees 8,000 8,341 341 Zoning Verification Fees 500 1,000 500 Senior Program 8,000 5,790 (2,210) Senior Bus 4,500 4,105 (395) Senior Center - Facility Rental 50,000 51,592 1,592 Senior Center - Salon Services 52,000 39,145 (12,855) Senior Center - Sponsorship 1,000 906 (94) Senior Center - Computer Management 250 149 (101) Senior Center - Fitness Memberships 7,200 6,370 (830) Senior Center - General Memberships 3,000 2,865 (135) Senior Center - Beverages Sold Revenue 6,000 6,650 650 Senior Center - Specialty Linens Revenue 6,000 4,680 (1,320) Senior Center - Other Rental Fees 1,900 1,025 (875)

EXHIBIT 4
________________________________________________________________________________________________________(Continued) 69.
PositiveFinal (Negative) from
Budget Actual Final Budget
YEAR ENDED APRIL 30, 2017
VILLAGE OF GLENDALE HEIGHTS, ILLINOIS
GENERAL ACCOUNTSCHEDULE OF DETAILED REVENUESBUDGET (GAAP BASIS) AND ACTUAL
Senior Center - Waitstaff Services 2,500$ 2,120$ (380)$ Senior Holiday Luncheon 3,300 3,307 7 Senior Trip Revenues 55,000 45,788 (9,212) Senior Center - Snacks 500 641 141 Senior Center - Facility Set Up Fees 4,000 3,500 (500) Senior Center - Salon Retail Revenue 2,250 801 (1,449) Senior Center - Dining Donations 5,000 - (5,000) Senior Center - Miscellaneous Income - 16,227 16,227 Salon Gratuities 1,500 691 (809) Gift Shop Revenue 3,000 5,924 2,924
Total Charges for Services 946,158 980,709 34,551
Fines and ForfeituresLocal DUI Prosecution 40,000 44,529 4,529 Parking Tickets 225,000 266,625 41,625 Compliance Tickets 114,000 116,889 2,889 Court Fines 207,000 165,968 (41,032) Liquor Fines 1,500 2,100 600 Tobacco Fines 500 - (500)
Total Fines and Forfeitures 588,000 596,111 8,111
IntergovernmentalState Municipal Taxes 6,793,578 7,629,258 835,680 State Income Tax 3,489,216 3,225,398 (263,818) Grants Police - Federal 17,000 7,895 (9,105) DuPage ETSB 200,000 200,000 -
Dumeg Fair Share Rebate 24,908 24,908 - State of Illinois 9,240 211,292 202,052 Chapter 56.5 Drug Fines 3,000 130 (2,870)
Pull Tab Tax Grant 2,500 1,852 (648) D.U.I. Grant 30,524 27,063 (3,461) Sex Offender Registration Grant 3,000 1,440 (1,560) Miscellaneous Local Grant - 5,000 5,000

EXHIBIT 4
________________________________________________________________________________________________________ 70.
PositiveFinal (Negative) from
Budget Actual Final Budget
YEAR ENDED APRIL 30, 2017
VILLAGE OF GLENDALE HEIGHTS, ILLINOIS
GENERAL ACCOUNTSCHEDULE OF DETAILED REVENUESBUDGET (GAAP BASIS) AND ACTUAL
State - Tobacco Grants 5,000$ 5,500$ 500$ Supervision Fines 25,000 15,854 (9,146) Electronic Citation 2,000 2,297 297 Forfeited Police Money - 34,576 34,576 DARE Account - 2,500 2,500 Parking Tickets-Collection Agency 4,665 4,665 - Other Revenue 9,125 17,253 8,128
Total Intergovernmental 10,618,756 11,416,881 798,125
Investment Income (Loss)Investment Income (Loss) 34,000 (9,232) (43,232)
MiscellaneousTowing Charges 125,000 103,505 (21,495) Boot Fee 1,665 4,960 3,295 Administration Parking Fees 25,000 37,835 12,835 50/50 Curb-Cut Program 2,500 2,272 (228) Tree Replacement 1,000 - (1,000) High School Resource Officer 120,076 99,154 (20,922) North Avenue Property 5,000 3,000 (2,000) Brick Sales 1,900 1,900 - Cash (Over) & Short - (27) (27) Miscellaneous Income 54,990 52,776 (2,214) Special Event Revenues 9,300 8,534 (766) Donation - Safety Town 4,000 2,045 (1,955) Donations - Other 860 860 -
Total Miscellaneous 351,291 316,814 (34,477)
TOTAL REVENUES 22,383,854$ 23,424,250$ 1,040,396$

EXHIBIT 5
________________________________________________________________________________________________________________________71.
PositiveFinal (Negative) from
Budget Actual Final BudgetEXPENDITURES
General GovernmentVillage Board 207,344$ 188,956$ 18,388$ Village Clerk 17,400 14,669 2,731 Police Commission 33,240 17,795 15,445 Planning Commission 3,401 675 2,726 Special Events Commission 7,815 7,257 558 Youth Commission 1,800 1,709 91 Community Diversity - 11 (11) Administrators 421,769 415,997 5,772 Human Resources 152,480 155,836 (3,356) Public Relations 110,484 109,262 1,222 Building Maintenance 938,593 923,945 14,648 Senior Center 422,720 386,582 36,138 Inspection Services 430,958 389,745 41,213 Administrative Services, Finance
and Community Development 1,835,372 1,745,683 89,689 Central Services 5,115,589 5,048,025 67,564 Miscellaneous Expense - 161,483 (161,483)
Total General Government 9,698,965 9,567,630 131,335
Public SafetyPolice Patrol 4,367,384 4,310,507 56,877 Police Investigations 1,286,425 1,284,731 1,694 Police Support Services 1,486,238 1,456,797 29,441 Community Policing 7,500 7,531 (31) Police Administration 637,495 617,926 19,569
Total Public Safety 7,785,042 7,677,492 107,550
Highways and StreetsStreets 1,579,142 1,683,077 (103,935) Fleet Maintenance 355,589 329,366 26,223 Parks and Grounds 1,541,115 1,359,807 181,308 Public Works 241,545 234,642 6,903
Total Highways and Streets 3,717,391 3,606,892 110,499
Capital OutlayPolice Patrol - Equipment 5,500 - 5,500 Police Support Services - Vehicles 1,000 - 1,000 Streets - Equipment 13,000 - 13,000 Parks and Grounds - Equipment 32,585 13,185 19,400
Total Capital Outlay 52,085 13,185 38,900
TOTAL EXPENDITURES 21,253,483$ 20,865,199$ 388,284$
YEAR ENDED APRIL 30, 2017
VILLAGE OF GLENDALE HEIGHTS, ILLINOIS
GENERAL ACCOUNTSCHEDULE OF EXPENDITURES
BUDGET (GAAP BASIS) AND ACTUAL

EXHIBIT 6
________________________________________________________________________________________________________________________(Continued) 72.
PositiveFinal (Negative) from
Budget Actual Final BudgetEXPENDITURES
General GovernmentVillage Board
Salaries - Regular 132,000$ 121,825$ 10,175$ Fica - Employer 8,184 7,235 949 Travel, Meeting & Conferences 3,000 2,889 111 Training & Seminars 100 - 100 Medicare - Employer 1,914 1,692 222 Legal 500 - 500 Professional - Other 300 - 300 Printing & Binding 500 165 335 Miscellaneous Office Supplies 200 157 43 Uniforms 500 - 500 Miscellaneous Supplies 4,000 3,671 329 Membership Dues 43,561 38,798 4,763 Subscriptions 300 259 41 Other Community Contributions 8,785 8,435 350 Civic Activities 3,500 3,630 (130) Miscellaneous - 200 (200)
Total Village Board 207,344 188,956 18,388
Village ClerkSalaries - Regular 10,000 10,000 - Fica - Employer 620 620 - Travel, Meeting & Conferences 250 - 250 Medicare - Employer 145 145 - Professional Others 4,500 3,417 1,083 Training and Seminars 150 - 150 Miscellaneous Office Supplies - 37 (37) Various Commissions 1,400 400 1,000 Membership Dues 335 50 285
Total Village Clerk 17,400 14,669 2,731
Police CommissionTravel, Meeting & Conferences 2,160 735 1,425 Printing & Binding 750 749 1 Recruiting 3,000 2,916 84 Miscellaneous Office Supplies 100 101 (1) Uniforms 100 64 36 Police Commission 2,000 2,000 - Testing 24,575 10,690 13,885 Membership Dues 555 540 15
Total Police Commission 33,240 17,795 15,445
Planning Commission
YEAR ENDED APRIL 30, 2017
VILLAGE OF GLENDALE HEIGHTS, ILLINOIS
GENERAL ACCOUNTSCHEDULE OF DETAILED EXPENDITURES
BUDGET (GAAP BASIS) AND ACTUAL

EXHIBIT 6
________________________________________________________________________________________________________________________(Continued) 73.
PositiveFinal (Negative) from
Budget Actual Final Budget
YEAR ENDED APRIL 30, 2017
VILLAGE OF GLENDALE HEIGHTS, ILLINOIS
GENERAL ACCOUNTSCHEDULE OF DETAILED EXPENDITURES
BUDGET (GAAP BASIS) AND ACTUAL
Fica - Employer 86$ 36$ 50$ Medicare - Employer 20 9 11 Planning Commission 3,295 630 2,665
Total Planning Commission 3,401 675 2,726
Special Events CommissionEntertainment - Special Events 4,690 3,880 810 Miscellaneous Supplies 3,125 3,377 (252)
Total Special Events Commission 7,815 7,257 558
Youth CommissionPrinting & Binding 400 400 - Miscellaneous Supplies 1,400 1,309 91
Total Youth Commission 1,800 1,709 91
Community DiversityEmployee Benefit - 11 (11)
Total Community Diversity - 11 (11)
AdministratorsSalaries - Regular 378,838 380,755 (1,917) Fica - Employer 23,488 19,696 3,792 Travel, Meeting & Conferences 2,000 1,471 529 Training & Seminars 350 89 261 Medicare - Employer 5,493 5,294 199 In-House Training/Employee Recognition 10,000 7,485 2,515 Printing & Binding 100 - 100 Miscellaneous Office Supplies 250 138 112 Gas & Fuel 1,100 848 252 Miscellaneous Supplies 150 63 87 Appearance Commission - 158 (158)
Total Administrators 421,769 415,997 5,772
Human ResourcesSalaries - Regular 111,153 115,676 (4,523) Fica - Employer 6,892 6,775 117 Travel, Meeting & Conferences 300 261 39 Medicare - Employer 1,612 1,585 27 Printing & Binding 2,850 2,281 569 Employee Physical Exam 15,000 14,949 51 Recruiting And Testing 3,000 2,959 41 Other Purchased Services 4,500 4,432 68 Miscellaneous Office Supplies 550 514 36 Miscellaneous Supplies 3,750 3,891 (141) Membership Dues 2,873 2,513 360
Total Human Resources 152,480 155,836 (3,356)

EXHIBIT 6
________________________________________________________________________________________________________________________(Continued) 74.
PositiveFinal (Negative) from
Budget Actual Final Budget
YEAR ENDED APRIL 30, 2017
VILLAGE OF GLENDALE HEIGHTS, ILLINOIS
GENERAL ACCOUNTSCHEDULE OF DETAILED EXPENDITURES
BUDGET (GAAP BASIS) AND ACTUAL
Public RelationsSalaries - Regular 58,276$ 58,295$ (19)$ Fica - Employer 3,614 3,573 41 Training & Seminars 1,175 590 585 Medicare - Employer 845 836 9 Printing & Binding 22,756 23,598 (842) Other Purchased Services 1,700 1,100 600 Postage 15,500 14,683 817 Miscellaneous Office Supplies 600 530 70 Miscellaneous Supplies 200 195 5 Computer Software 500 559 (59) Software Support and Maintenance 2,398 2,654 (256) Other Office Equipment 2,360 2,097 263 Subscriptions 560 552 8
Total Public Relations 110,484 109,262 1,222
Building MaintenanceSalaries - Regular 708,308 698,825 9,483 Salaries - Overtime 7,700 5,092 2,608 Fica - Employer 43,958 41,770 2,188 Travel, Meeting & Conferences 200 - 200 Training & Seminars 1,000 567 433 Medicare - Employer 10,280 9,769 511 Printing and Binding 425 250 175 Other Purchases - Services 57,466 46,950 10,516 Miscellaneous Office Supplies 5,700 5,551 149 Janitorial Supplies 18,000 20,402 (2,402) Electrical Supplies 10,800 8,375 2,425 Hardware Supplies 4,000 3,346 654 Plumbing Supplies 4,000 4,479 (479) Lumber Supplies 1,000 824 176 Other Building Maintenance Supplies 1,900 1,631 269 Uniforms 3,500 3,105 395 Gas & Fuel 6,000 6,246 (246) Building Maintenance Tools 3,100 2,986 114 Pager 106 106 - Building Maintenance Equipment 1,500 - 1,500 Maintenance Building Equipment 49,650 63,671 (14,021)
Total Building Maintenance 938,593 923,945 14,648
Senior Center
Salaries - Regular 254,917 240,633 14,284 Overtime Pay 100 - 100 Fica - Employer 15,805 14,728 1,077 Travel, Meeting & Conferences 1,250 1,269 (19)

EXHIBIT 6
________________________________________________________________________________________________________________________(Continued) 75.
PositiveFinal (Negative) from
Budget Actual Final Budget
YEAR ENDED APRIL 30, 2017
VILLAGE OF GLENDALE HEIGHTS, ILLINOIS
GENERAL ACCOUNTSCHEDULE OF DETAILED EXPENDITURES
BUDGET (GAAP BASIS) AND ACTUAL
Training & Seminars 1,200$ 151$ 1,049$ Medicare - Employer 3,696 3,445 251 Printing & Binding 5,100 4,890 210 Software Support & Maintenance 6,585 1,420 5,165 Other Purchase Services 7,200 6,721 479 Postage 1,125 976 149 Miscellaneous Office Supplies 4,502 4,619 (117) Uniforms 500 470 30 Gas & Fuel 3,600 3,435 165 Salon Supplies 7,200 5,473 1,727 Miscellaneous Supplies 3,500 3,530 (30) Other Operating Equipment 1,100 919 181 Lease Equipment 4,000 5,041 (1,041) Firness Room R&M 1,500 1,460 40 Membership Dues 670 393 277 Subscriptions 622 663 (41) Other Comm. Contribution 15,000 15,000 - Licenses 1,198 1,623 (425) Salon Gratuities 1,500 670 830 Gift Shop Expense 3,000 3,532 (532) Miscellaneous - 1,347 (1,347) Adult General Program 6,000 6,152 (152) Beverage Purchases 2,500 2,135 365 Speciality Linens Purchases 3,600 4,616 (1,016) Waitstaff Services Purchases 2,200 1,604 596 Senior Holiday Luncheon 4,000 4,185 (185) Senior Trips Expenditures 55,000 44,582 10,418 Snacks 300 270 30 Salon Retail Expenses 2,250 606 1,644 Facility Set Up Expenses 2,000 24 1,976
Total Senior Center 422,720 386,582 36,138
Inspection ServicesSalaries - Regular 362,480 326,160 36,320 Fica - Employer 22,453 19,798 2,655 Travel, Meeting & Conferences 300 - 300 Training & Seminars 3,365 3,310 55 Medicare - Employer 5,251 4,630 621 Contractual Services 26,950 24,965 1,985 Uniforms 1,125 1,126 (1) Gas & Fuel 3,210 3,640 (430) Miscellaneous Supplies 600 511 89 Other Operating Equipment 3,800 3,811 (11) Other Office Equipment 994 1,399 (405)

EXHIBIT 6
________________________________________________________________________________________________________________________(Continued) 76.
PositiveFinal (Negative) from
Budget Actual Final Budget
YEAR ENDED APRIL 30, 2017
VILLAGE OF GLENDALE HEIGHTS, ILLINOIS
GENERAL ACCOUNTSCHEDULE OF DETAILED EXPENDITURES
BUDGET (GAAP BASIS) AND ACTUAL
Membership Dues 430$ 395$ 35$ Total Inspection Services 430,958 389,745 41,213
Administrative Services, Finance and Community Development
Salaries - Regular 1,216,824 1,187,019 29,805 Temporary Help 7,902 5,938 1,964 Salaries - Overtime 2,100 1,350 750 Fica - Employer 75,684 70,092 5,592 Travel, Meeting & Conferences 700 375 325 Training & Seminars 10,920 1,010 9,910 Medicare - Employer 17,709 16,689 1,020 Auditing 37,285 35,885 1,400 Other Professional Services 16,304 14,706 1,598 Printing & Binding 23,750 20,327 3,423 Publications 2,000 80 1,920 Other Purchased Services 34,131 30,892 3,239 Filing Supplies 250 - 250 Network Consulting 143,000 134,803 8,197 Computer Equipment 12,250 12,334 (84) H.T.E. Annual Service Contract 40,121 40,116 5 Computer Specialized Supplies 2,082 1,376 706 Computer Software 29,446 17,155 12,291 Other Computer Equipment 6,481 5,529 952 Advertising 3,250 4,577 (1,327) Recording Fees 1,400 973 427 Licenses 1,500 1,461 39 Miscellaneous Office Supplies 4,050 1,966 2,084 Miscellaneous Supplies 9,025 9,127 (102) Software Support and Maintenance 39,055 34,688 4,367 Telephone 30,672 29,303 1,369 Leases - Equipment 5,000 6,188 (1,188) Uniforms 450 281 169 Other Office Equipment 4,475 4,315 160 Computer Hardware 55,546 55,291 255 Membership Dues 2,010 1,837 173
Total Administrative Services, Finance and Community Development 1,835,372 1,745,683 89,689
Central ServicesUnemployment Insurance 15,000 25,675 (10,675) Medical - Employer 2,432,860 2,103,225 329,635 Employer Contribution Police Pension 1,737,778 1,752,138 (14,360) Vacation & Sick Days Buy Back - 304,123 (304,123) Opt Out Medical Insurance 26,867 30,117 (3,250)

EXHIBIT 6
________________________________________________________________________________________________________________________(Continued) 77.
PositiveFinal (Negative) from
Budget Actual Final Budget
YEAR ENDED APRIL 30, 2017
VILLAGE OF GLENDALE HEIGHTS, ILLINOIS
GENERAL ACCOUNTSCHEDULE OF DETAILED EXPENDITURES
BUDGET (GAAP BASIS) AND ACTUAL
Health & Wellness 750$ 738$ 12$ Legal 350,000 361,138 (11,138) Prosecutors 130,000 126,859 3,141 Adjudicator 6,000 5,400 600 Engineering Services 1,250 1,770 (520) Lobbying Services 42,000 42,000 - Other Professional Services 4,860 3,527 1,333 Printing & Binding 3,125 2,825 300 Postage 53,350 21,929 31,421 Miscellaneous Office Supplies 56,357 41,692 14,665 Miscellaneous Supplies 13,800 12,009 1,791 Green Initiative 1,300 1,341 (41) Telephone 42,850 38,596 4,254 Cellular Phone 25,000 25,058 (58) Electricity 20,000 16,518 3,482 Natural Gas 7,500 1,768 5,732 Rentals - Equipment 22,450 20,618 1,832 Other Office Equipment 7,100 13,072 (5,972) North Avenue Property 3,000 1,602 1,398 Memorial Park Bricks 1,392 1,618 (226) Collection Agency Fee 66,000 33,988 32,012 Bad Debt Write Off 25,000 25,000 - Bank Fiscal Charges 20,000 33,681 (13,681)
Total Central Services 5,115,589 5,048,025 67,564
Miscellaneous Expense - 161,483 (161,483)
Total General Government 9,698,965 9,567,630 131,335
Public SafetyPolice Patrol
Salaries - Regular 3,650,217 3,698,058 (47,841) Salaries - Holiday 245,000 186,370 58,630 Salaries - Auxiliary Officers 12,000 11,728 272 Salaries - Off Duty Officers 7,000 6,000 1,000 Salaries - Overtime 326,089 281,814 44,275 Fica - Employer 20,514 20,354 160 Medicare - Employer 60,954 57,782 3,172 Employee - Severance Pay 14,106 14,106 - Ammunitions 12,000 16,803 (4,803) Targets For Gun Range 400 258 142 K-9 Unit 700 2,528 (1,828) Dog Food 700 - 700 Veterinary Cost 1,500 - 1,500 Other Police General Supplies 4,350 4,329 21

EXHIBIT 6
________________________________________________________________________________________________________________________(Continued) 78.
PositiveFinal (Negative) from
Budget Actual Final Budget
YEAR ENDED APRIL 30, 2017
VILLAGE OF GLENDALE HEIGHTS, ILLINOIS
GENERAL ACCOUNTSCHEDULE OF DETAILED EXPENDITURES
BUDGET (GAAP BASIS) AND ACTUAL
Car Wash 2,000$ 917$ 1,083$ Miscellaneous Supplies 7,754 7,360 394 Other Police Equipment 2,100 2,100 -
Total Police Patrol 4,367,384 4,310,507 56,877
Police InvestigationsSalaries - Regular 1,125,241 1,087,427 37,814 Salaries - Holiday 18,079 60,673 (42,594) Salaries - Overtime 108,556 104,016 4,540 Fica - Employer 3,927 3,309 618 Medicare - Employer 18,152 17,209 943 Other Purchased Services 7,406 7,846 (440) Investigation Contingency 750 750 - Other Police General Supplies 2,000 2,008 (8) Leases - Equipment 625 408 217 Membership Dues 375 365 10 Subscriptions 814 720 94 Towing Expenditures 500 - 500
Total Police Investigations 1,286,425 1,284,731 1,694
Police Support ServicesSalaries - Regular 628,542 619,543 8,999 Salaries - Holiday 10,475 11,700 (1,225) Salaries - Crossing Guards 51,000 46,587 4,413 Salaries - Overtime 13,036 5,341 7,695 Fica - Employer 35,153 37,221 (2,068) Medicare - Employer 9,569 10,027 (458) Printing & Binding 9,500 9,500 - Computer Data Access 24,920 20,385 4,535 Miscellaneous Office Supplies 1,200 1,200 - Veterinary Cost 500 300 200 Other Police General Supplies 4,300 5,248 (948) Gas & Fuel 85,000 77,695 7,305 Telephone 360 359 1 Leases - Equipment 14,925 14,969 (44) Police Department Equipment 68,535 68,706 (171) Animal Impoundment 3,150 2,758 392 Rodent Trapping 1,700 1,300 400 Dispatch Expense 524,373 523,958 415
Total Police Support Services 1,486,238 1,456,797 29,441
Community PolicingOther Police General Supplies 7,500 7,531 (31)
Police AdministrationSalaries - Regular 441,902 426,280 15,622

EXHIBIT 6
________________________________________________________________________________________________________________________(Continued) 79.
PositiveFinal (Negative) from
Budget Actual Final Budget
YEAR ENDED APRIL 30, 2017
VILLAGE OF GLENDALE HEIGHTS, ILLINOIS
GENERAL ACCOUNTSCHEDULE OF DETAILED EXPENDITURES
BUDGET (GAAP BASIS) AND ACTUAL
Salaries - Holiday -$ 1,934$ (1,934)$ Salaries - Overtime 500 310 190 Fica - Employer 16,398 15,376 1,022 Tuition Reimbursement - 4,793 (4,793) Travel, Meeting & Conferences 2,100 1,611 489 Training & Seminars 40,500 40,635 (135) Medicare - Employer 6,247 5,912 335 Printing & Binding 380 466 (86) Software Support & Maintenance 1,949 1,123 826 Polygraph Test 320 - 320 Other Police General Supplies 200 - 200 Uniforms 41,900 44,406 (2,506) Other Operating Supplies - 88 (88) Membership Dues 2,060 2,027 33 Accreditation (CALEA) 7,420 4,810 2,610 Miscellaneous Licenses 300 375 (75) Subscriptions 295 - 295 D.U.I. Fund - Expenditures 30,524 26,092 4,432 Pull-Tab Fund - Expenditures 2,500 682 1,818 Chapter 56.5 Drug Fines 3,000 3,487 (487) Sex Offendor Registration Fund 3,000 5,375 (2,375) Local Law Enforcement Block Grant - 3,480 (3,480) Supervision Fines 25,000 9,518 15,482 Electronic Citation Fees 2,000 - 2,000 Forfeited Funds - 10,226 (10,226) Local Miscellaneous Donations - 4,200 (4,200) State Tobacco Grants 5,000 1,234 3,766 Miscellaneous Safety Town Expenditures 4,000 3,486 514
Total Police Administration 637,495 617,926 19,569
Total Public Safety 7,785,042 7,677,492 107,550
Highways and StreetsStreets
Salaries - Regular 986,994 951,925 35,069 Salaries - Temporary 4,200 4,181 19 Salaries - Overtime 45,000 37,697 7,303 Fica - Employer 64,244 59,401 4,843 Travel, Meeting & Conferences 300 254 46 Training & Seminars 3,500 3,331 169 Medicare - Employer 15,025 13,892 1,133 Employee Severance Pay 11,343 - 11,343 Engineering 3,000 1,417 1,583 Debris Removal 40,000 38,818 1,182 50/50 Curb-Cut Program 5,000 4,662 338
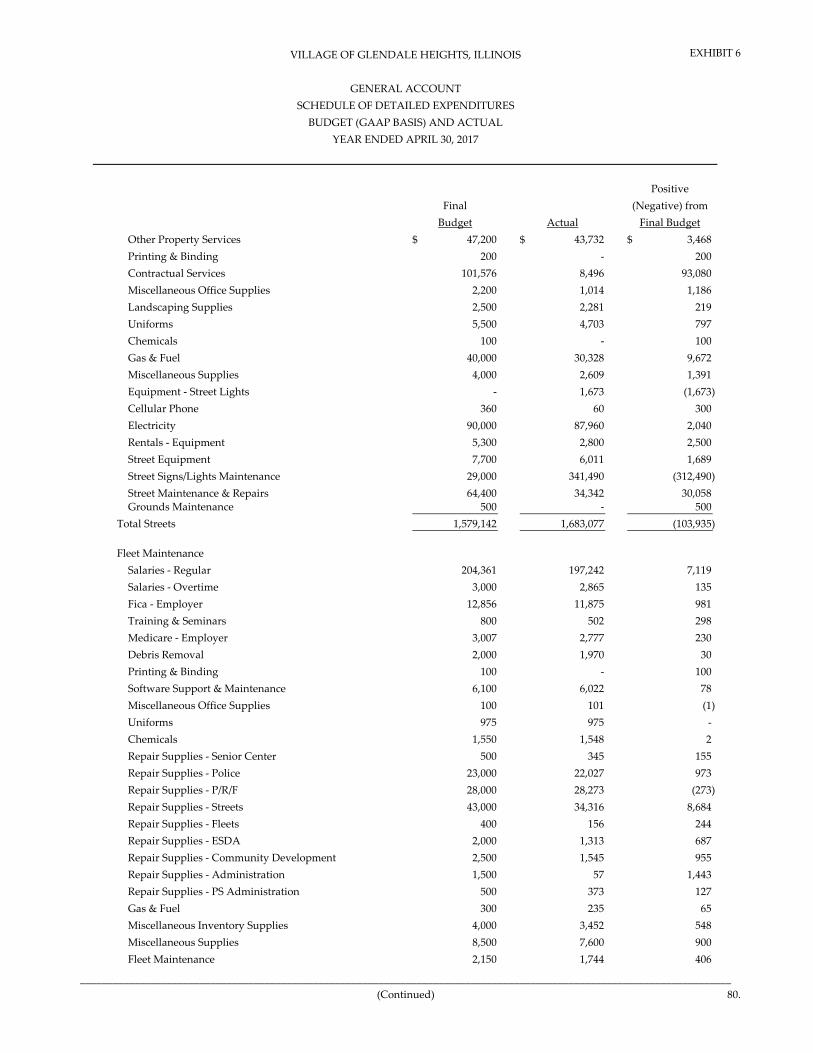
EXHIBIT 6
________________________________________________________________________________________________________________________(Continued) 80.
PositiveFinal (Negative) from
Budget Actual Final Budget
YEAR ENDED APRIL 30, 2017
VILLAGE OF GLENDALE HEIGHTS, ILLINOIS
GENERAL ACCOUNTSCHEDULE OF DETAILED EXPENDITURES
BUDGET (GAAP BASIS) AND ACTUAL
Other Property Services 47,200$ 43,732$ 3,468$ Printing & Binding 200 - 200 Contractual Services 101,576 8,496 93,080 Miscellaneous Office Supplies 2,200 1,014 1,186 Landscaping Supplies 2,500 2,281 219 Uniforms 5,500 4,703 797 Chemicals 100 - 100 Gas & Fuel 40,000 30,328 9,672 Miscellaneous Supplies 4,000 2,609 1,391 Equipment - Street Lights - 1,673 (1,673) Cellular Phone 360 60 300 Electricity 90,000 87,960 2,040 Rentals - Equipment 5,300 2,800 2,500 Street Equipment 7,700 6,011 1,689 Street Signs/Lights Maintenance 29,000 341,490 (312,490) Street Maintenance & Repairs 64,400 34,342 30,058 Grounds Maintenance 500 - 500
Total Streets 1,579,142 1,683,077 (103,935)
Fleet MaintenanceSalaries - Regular 204,361 197,242 7,119 Salaries - Overtime 3,000 2,865 135 Fica - Employer 12,856 11,875 981 Training & Seminars 800 502 298 Medicare - Employer 3,007 2,777 230 Debris Removal 2,000 1,970 30 Printing & Binding 100 - 100 Software Support & Maintenance 6,100 6,022 78 Miscellaneous Office Supplies 100 101 (1) Uniforms 975 975 - Chemicals 1,550 1,548 2 Repair Supplies - Senior Center 500 345 155 Repair Supplies - Police 23,000 22,027 973 Repair Supplies - P/R/F 28,000 28,273 (273) Repair Supplies - Streets 43,000 34,316 8,684 Repair Supplies - Fleets 400 156 244 Repair Supplies - ESDA 2,000 1,313 687 Repair Supplies - Community Development 2,500 1,545 955 Repair Supplies - Administration 1,500 57 1,443 Repair Supplies - PS Administration 500 373 127 Gas & Fuel 300 235 65 Miscellaneous Inventory Supplies 4,000 3,452 548 Miscellaneous Supplies 8,500 7,600 900 Fleet Maintenance 2,150 1,744 406

EXHIBIT 6
________________________________________________________________________________________________________________________(Continued) 81.
PositiveFinal (Negative) from
Budget Actual Final Budget
YEAR ENDED APRIL 30, 2017
VILLAGE OF GLENDALE HEIGHTS, ILLINOIS
GENERAL ACCOUNTSCHEDULE OF DETAILED EXPENDITURES
BUDGET (GAAP BASIS) AND ACTUAL
Leases - Equipment 1,500$ 1,078$ 422$ Fleet Maintenance Equipment 2,500 945 1,555 Membership Dues 390 30 360
Total Fleet Maintenance 355,589 329,366 26,223
Parks and GroundsSalaries - Regular 981,783 985,018 (3,235) Salaries - Temporary 19,000 18,843 157 Salaries - Overtime 30,000 18,103 11,897 Fica - Employer 64,064 61,345 2,719 Travel, Meeting & Conferences 700 25 675 Training & Seminars 2,340 1,719 621 Medicare - Employer 14,983 14,347 636 Debris Removal 5,000 3,606 1,394 Adopt a Street Program 50 - 50 Tree Removal 200,200 47,229 152,971 Software Support and Maintenance 3,234 3,233 1 Other Purchased Services 54,150 40,707 13,443 Office Supplies 268 78 190 Topdressing Soil 5,000 4,286 714 Gravel and Sand 1,511 1,510 1 Landscaping Supplies 12,000 13,186 (1,186) Fertilizer 12,500 12,015 485 Uniforms 6,250 5,685 565 Gas & Fuel 32,000 28,851 3,149 Miscellaneous Supplies 32,050 32,293 (243) Parks & Grounds Equipment - 9,300 (9,300) Parks & Grounds Tools 3,019 2,621 398 Pager 27 26 1 Electricity 30,000 26,229 3,771 Leases - Equipment 600 458 142 Rentals - Equipment 7,500 6,473 1,027 Equipment 4,996 4,996 - Playgroung Repairs and Maintenance 16,600 16,909 (309) Membership Dues 1,290 716 574
Total Parks and Grounds 1,541,115 1,359,807 181,308
Public Works Salaries - Regular 206,442 204,312 2,130 Fica - Employer 12,800 11,540 1,260 Travel, Meeting & Conferences 500 273 227 Training & Seminars 1,050 770 280 Medicare - Employer 2,993 2,843 150 Engineering 7,000 7,000 - Other Equipment 2,000 1,953 47

EXHIBIT 6
________________________________________________________________________________________________________________________ 82.
PositiveFinal (Negative) from
Budget Actual Final Budget
YEAR ENDED APRIL 30, 2017
VILLAGE OF GLENDALE HEIGHTS, ILLINOIS
GENERAL ACCOUNTSCHEDULE OF DETAILED EXPENDITURES
BUDGET (GAAP BASIS) AND ACTUAL
Printing & Binding 725$ 308$ 417$ Software Support & Maintenance 500 397 103 Miscellaneous Office Supplies 750 383 367 Uniforms 600 130 470 Miscellaneous Supplies 300 53 247 Gas & Fuel 1,500 1,315 185 Leases - Equipment 2,785 2,495 290 Public Works Facilities 200 70 130 Membership Dues 1,400 800 600
Total Public Works 241,545 234,642 6,903
Total Highways and Streets 3,717,391 3,606,892 110,499
Capital OutlayPolice Patrol - Equipment 5,500 - 5,500 Police Support Services - Vehicles 1,000 - 1,000 Streets - Equipment 13,000 - 13,000 Parks and Grounds - Other Equipment 32,585 13,185 19,400
Total Capital Outlay 52,085 13,185 38,900
TOTAL EXPENDITURES 21,253,483$ 20,865,199$ 388,284$

EXHIBIT 7
________________________________________________________________________________________________________________________
83.
PositiveFinal (Negative) from
Budget Actual Final BudgetREVENUES
Taxes 350,000$ 353,230$ 3,230$ Interest - 432 432
TOTAL REVENUES 350,000 353,662 3,662
EXPENDITURESGeneral Government
Liability Insurance Premiums 480,760 453,385 27,375 Liability Insurance - Consulting 54,800 55,050 (250) Liability Insurance - Self Insured 255,000 253,091 1,909 F-Time & Reg. Part-Time 36,092 37,551 (1,459) FICA - Employer 2,238 2,237 1 IMRF - Employer 4,900 4,921 (21) Medical - Employer 7,330 7,843 (513) Medicare - Employer 523 522 1
TOTAL EXPENDITURES 841,643 814,600 27,043
Excess (deficiency) of revenues over expenditures (491,643) (460,938) 30,705
OTHER FINANCING SOURCES (USES)Transfers In 155,000 155,000 -
TOTAL OTHER FINANCING SOURCES (USES) 155,000 155,000 -
Net Change in Fund Balance (336,643)$ (305,938) 30,705$
Fund Balance at beginning of year 507,852
Fund Balance at end of year 201,914$
YEAR ENDED APRIL 30, 2017
VILLAGE OF GLENDALE HEIGHTS, ILLINOIS
LIABILITY INSURANCE ACCOUNTSCHEDULE OF REVENUES, EXPENDITURES AND CHANGES IN FUND BALANCE
BUDGET (GAAP BASIS) AND ACTUAL
DEBT SERVICE FUND To accumulate monies for the payment of general obligation bond issues. Financing is provided by a specific annual tax levy and operating transfers from other funds.

EXHIBIT 8
________________________________________________________________________________________________________________________
84.
PositiveFinal (Negative) from
Budget Actual Final BudgetREVENUES
Taxes 2,074,837$ 2,091,037$ 16,200$ Interest 500 1,192 692 Miscellaneous 449,090 519,200 70,110
TOTAL REVENUES 2,524,427 2,611,429 87,002
EXPENDITURESDebt Service
Principal Payments 3,235,000 3,235,000 - Interest Payments 1,853,185 1,853,185 - Fiscal Charges 3,800 3,638 162
TOTAL EXPENDITURES 5,091,985 5,091,823 162
Excess (deficiency) of revenues over expenditures (2,567,558) (2,480,394) 87,164
OTHER FINANCING SOURCES (USES)Transfers In 2,567,959 2,567,959 -
TOTAL OTHER FINANCING SOURCES (USES) 2,567,959 2,567,959 -
Net Change in Fund Balance 401$ 87,565 87,164$
Fund Balance at beginning of year 90,128
Fund Balance at end of year 177,693$
YEAR ENDED APRIL 30, 2017
VILLAGE OF GLENDALE HEIGHTS, ILLINOIS
DEBT SERVICE FUNDSCHEDULE OF REVENUES, EXPENDITURES AND CHANGES IN FUND BALANCE
BUDGET (GAAP BASIS) AND ACTUAL

NONMAJOR GOVERNMENTAL FUNDS

_________________________________________________________________________________________________________________________________________________________________________________(Continued) 85.
EXHIBIT 9
Recreation Emergency Handicapped Motor Fuel Founders' Parks & Recreation InfrastructureFund Service Fund Recreation Fund Tax Fund Day Fund Development Fund Fund
ASSETSCash and Investments 898,721$ 52,403$ 53,034$ 989,068$ 18,042$ 161,599$ 631,984$ Property Taxes Receivable 1,170,104 51,478 168,314 - - - 146,855 Accounts Receivable (Net of Allowance) - - - 74,897 - - 548,407 Interest Receivable - - - - - - - Advances to Other Funds - - - - - - 170,041 Prepaid Items - - - - - - - Intergovernmental Receivable - - - - - - -
TOTAL ASSETS 2,068,825$ 103,881$ 221,348$ 1,063,965$ 18,042$ 161,599$ 1,497,287$
LIABILITIES, DEFERRED INFLOWS OF RESOURCES AND FUND BALANCELIABILITIES
Accounts Payable 59,786$ 2,402$ -$ -$ -$ -$ 250,059$ Accrued Payroll 55,257 - - - - - - Deposits Payable 695 - - - 4,500 - - Interest Payable - - - - - - - Advances from Other Funds - - - - - - - Unearned Revenue - - - - - - - Other Payables 12,470 - - - - - -
TOTAL LIABILITIES 128,208 2,402 - - 4,500 - 250,059
DEFERRED INFLOWS OF RESOURCESProperty Taxes 1,170,103 51,478 168,314 - - - 146,855 Unavailable Revenue - State Taxes - - - - - - 195,335
TOTAL DEFERRED INFLOWS OF RESOURCES 1,170,103 51,478 168,314 - - - 342,190
FUND BALANCENonspendable:
Prepaids - - - - - - - Long-term Interfund Advances - - - - - - 170,041
Restricted:TIF Projects - - - - - - - Special Service Area Projects - - - - - - - Recreation Activities 770,514 - 53,034 - - 161,599 - Emergency Service Activities - 50,001 - - - - - Motor Fuel Tax Activities - - - 1,063,965 - - - Grants - - - - - - - Capital Projects - - - - - - 734,997 Special Events - - - - 13,542 - -
Assigned:Capital Projects - - - - - - -
Unassigned - - - - - - - TOTAL FUND BALANCE 770,514 50,001 53,034 1,063,965 13,542 161,599 905,038
TOTAL LIABILITIES, DEFERRED INFLOWSOF RESOURCES AND FUND BALANCE 2,068,825$ 103,881$ 221,348$ 1,063,965$ 18,042$ 161,599$ 1,497,287$
Special Revenue Funds
VILLAGE OF GLENDALE HEIGHTS, ILLINOIS
NONMAJOR GOVERNMENTAL FUNDSCOMBINING BALANCE SHEET
APRIL 30, 2017

_________________________________________________________________________________________________________________________________________________________________________________(Continued) 86.
EXHIBIT 9
Special Service Special Service Special Service Special Service Special Service Special Service Special ServiceArea #1 Fund Area #2 Fund Area #3 Fund Area #4 Fund Area #5 Fund Area #6 Fund Area #7 Fund
ASSETSCash and Investments 29,142$ -$ -$ 151,507$ 235,777$ 112,857$ 316,482$ Property Taxes Receivable 11,841 36,678 38,402 21,579 28,151 29,887 15,782 Accounts Receivable (Net of Allowance) - - - - - - - Interest Receivable - - - - - - - Advances to Other Funds - - - - - - - Prepaid Items - - - - - - - Intergovernmental Receivable - - - - - - -
TOTAL ASSETS 40,983$ 36,678$ 38,402$ 173,086$ 263,928$ 142,744$ 332,264$
LIABILITIES, DEFERRED INFLOWS OF RESOURCES AND FUND BALANCELIABILITIES
Accounts Payable -$ -$ -$ -$ -$ -$ -$ Accrued Payroll - - - - - - - Deposits Payable - - - - - - - Interest Payable - - - - - - - Advances from Other Funds - 115,387 54,654 - - - - Unearned Revenue - - - - - - - Other Payables - - - - - - -
TOTAL LIABILITIES - 115,387 54,654 - - - -
DEFERRED INFLOWS OF RESOURCESProperty Taxes 11,842 36,678 38,402 21,580 28,151 29,888 15,782 Unavailable Revenue - State Taxes - - - - - - -
TOTAL DEFERRED INFLOWS OF RESOURCES 11,842 36,678 38,402 21,580 28,151 29,888 15,782
FUND BALANCENonspendable:
Prepaids - - - - - - - Long-term Interfund Advances - - - - - - -
Restricted:TIF Projects - - - - - - - Special Service Area Projects 29,141 - - 151,506 235,777 112,856 316,482 Recreation Activities - - - - - - - Emergency Service Activities - - - - - - - Motor Fuel Tax Activities - - - - - - - Grants - - - - - - - Capital Projects - - - - - - - Special Events - - - - - - -
Assigned:Capital Projects - - - - - - -
Unassigned - (115,387) (54,654) - - - - TOTAL FUND BALANCE 29,141 (115,387) (54,654) 151,506 235,777 112,856 316,482
TOTAL LIABILITIES, DEFERRED INFLOWSOF RESOURCES AND FUND BALANCE 40,983$ 36,678$ 38,402$ 173,086$ 263,928$ 142,744$ 332,264$
VILLAGE OF GLENDALE HEIGHTS, ILLINOIS
NONMAJOR GOVERNMENTAL FUNDSCOMBINING BALANCE SHEET
APRIL 30, 2017
Special Revenue Funds

_________________________________________________________________________________________________________________________________________________________________________________(Continued) 87.
EXHIBIT 9
Special Service TIF TIF TIF TIF TIFArea #8 Fund Article 36 Fund No. 1 Fund No. 2 Fund No. 3 Fund No. 4 Fund No. 5 Fund
ASSETSCash and Investments 134,937$ 27,384$ 578,280$ 19,107$ 326,687$ 683,782$ -$ Property Taxes Receivable 30,606 - 699,669 - 460,188 26,660 9,417 Accounts Receivable (Net of Allowance) - - - - - - - Interest Receivable - - - - - - - Advances to Other Funds - - - - - - - Prepaid Items - 2,271 - - - - - Intergovernmental Receivable - - 906,455 - - - -
TOTAL ASSETS 165,543$ 29,655$ 2,184,404$ 19,107$ 786,875$ 710,442$ 9,417$
LIABILITIES, DEFERRED INFLOWS OF RESOURCES AND FUND BALANCELIABILITIES
Accounts Payable -$ 235$ 725,965$ 135$ 135$ 135$ 950$ Accrued Payroll - - - - - - - Deposits Payable - - - - 7,659 - - Interest Payable - - - - 40,143 - - Advances from Other Funds - - - - - - 966,644 Unearned Revenue - - 813,645 - - - - Other Payables - - - - - - -
TOTAL LIABILITIES - 235 1,539,610 135 47,937 135 967,594
DEFERRED INFLOWS OF RESOURCESProperty Taxes 30,606 - 699,669 - 460,188 26,660 9,417 Unavailable Revenue - State Taxes - - - - - - -
TOTAL DEFERRED INFLOWS OF RESOURCES 30,606 - 699,669 - 460,188 26,660 9,417
FUND BALANCENonspendable:
Prepaids - 2,271 - - - - - Long-term Interfund Advances - - - - - - -
Restricted:TIF Projects - - - 18,972 278,750 683,647 - Special Service Area Projects 134,937 - - - - - - Recreation Activities - - - - - - - Emergency Service Activities - - - - - - - Motor Fuel Tax Activities - - - - - - - Grants - 27,149 - - - - - Capital Projects - - - - - - - Special Events - - - - - - -
Assigned:Capital Projects - - - - - - -
Unassigned - - (54,875) - - - (967,594) TOTAL FUND BALANCE 134,937 29,420 (54,875) 18,972 278,750 683,647 (967,594)
TOTAL LIABILITIES, DEFERRED INFLOWSOF RESOURCES AND FUND BALANCE 165,543$ 29,655$ 2,184,404$ 19,107$ 786,875$ 710,442$ 9,417$
VILLAGE OF GLENDALE HEIGHTS, ILLINOIS
NONMAJOR GOVERNMENTAL FUNDSCOMBINING BALANCE SHEET
APRIL 30, 2017
Special Revenue Funds

_________________________________________________________________________________________________________________________________________________________________________________(Continued) 88.
EXHIBIT 9
TotalHistorical Special Vehicle Computer Capital
IMRF Fund Building Fund Revenue Funds Replacement Fund Replacement Fund Projects FundASSETS
Cash and Investments 15,562$ 13,157$ 5,449,512$ 1,788,130$ 212,355$ 777,728$ Property Taxes Receivable 950,311 - 3,895,922 - - - Accounts Receivable (Net of Allowance) - - 623,304 - - - Interest Receivable - - - 2,836 - - Advances to Other Funds - - 170,041 598,000 - - Prepaid Items - - 2,271 - - - Intergovernmental Receivable - - 906,455 - - -
TOTAL ASSETS 965,873$ 13,157$ 11,047,505$ 2,388,966$ 212,355$ 777,728$
LIABILITIES, DEFERRED INFLOWS OF RESOURCES AND FUND BALANCELIABILITIES
Accounts Payable 150,545$ 48$ 1,190,395$ 129,286$ 3,781$ 16,270$ Accrued Payroll - - 55,257 - - - Deposits Payable - - 12,854 - - - Interest Payable - - 40,143 - - - Advances from Other Funds - - 1,136,685 - - - Unearned Revenue - - 813,645 - - - Other Payables - - 12,470 - - -
TOTAL LIABILITIES 150,545 48 3,261,449 129,286 3,781 16,270
DEFERRED INFLOWS OF RESOURCESProperty Taxes 950,311 - 3,895,924 - - - Unavailable Revenue - State Taxes - - 195,335 - - -
TOTAL DEFERRED INFLOWS OF RESOURCES 950,311 - 4,091,259 - - -
FUND BALANCENonspendable:
Prepaids - - 2,271 - - - Long-term Interfund Advances - - 170,041 598,000 - -
Restricted:TIF Projects - - 981,369 - - - Special Service Area Projects - - 980,699 - - - Recreation Activities - - 985,147 - - - Emergency Service Activities - - 50,001 - - - Motor Fuel Tax Activities - - 1,063,965 - - - Grants - - 27,149 - - - Capital Projects - - 734,997 - - - Special Events - 13,109 26,651 - - -
Assigned:Capital Projects - - - 1,661,680 208,574 761,458
Unassigned (134,983) - (1,327,493) - - - TOTAL FUND BALANCE (134,983) 13,109 3,694,797 2,259,680 208,574 761,458
TOTAL LIABILITIES, DEFERRED INFLOWSOF RESOURCES AND FUND BALANCE 965,873$ 13,157$ 11,047,505$ 2,388,966$ 212,355$ 777,728$
VILLAGE OF GLENDALE HEIGHTS, ILLINOIS
NONMAJOR GOVERNMENTAL FUNDSCOMBINING BALANCE SHEET
APRIL 30, 2017
Special Revenue Funds Capital Project Funds

_________________________________________________________________________________________________________________________________________________________________________________89.
EXHIBIT 9
Total Total NonmajorRecreation GOB Series Capital Governmental
Equipment Repl Fund 2010 Fund Projects Funds FundsASSETS
Cash and Investments -$ 241,297$ 3,019,510$ 8,469,022$ Property Taxes Receivable - - - 3,895,922 Accounts Receivable (Net of Allowance) - - - 623,304 Interest Receivable - - 2,836 2,836 Advances to Other Funds - - 598,000 768,041 Prepaid Items - - - 2,271 Intergovernmental Receivable - - - 906,455
TOTAL ASSETS -$ 241,297$ 3,620,346$ 14,667,851$
LIABILITIES, DEFERRED INFLOWS OF RESOURCES AND FUND BALANCELIABILITIES
Accounts Payable -$ 164,124$ 313,461$ 1,503,856$ Accrued Payroll - - - 55,257 Deposits Payable - - - 12,854 Interest Payable - - - 40,143 Advances from Other Funds - - - 1,136,685 Unearned Revenue - - - 813,645 Other Payables - - - 12,470
TOTAL LIABILITIES - 164,124 313,461 3,574,910
DEFERRED INFLOWS OF RESOURCESProperty Taxes - - - 3,895,924 Unavailable Revenue - State Taxes - - - 195,335
TOTAL DEFERRED INFLOWS OF RESOURCES - - - 4,091,259
FUND BALANCENonspendable:
Prepaids - - - 2,271 Long-term Interfund Advances - - 598,000 768,041
Restricted:TIF Projects - - - 981,369 Special Service Area Projects - - - 980,699 Recreation Activities - - - 985,147 Emergency Service Activities - - - 50,001 Motor Fuel Tax Activities - - - 1,063,965 Grants - - - 27,149 Capital Projects - - - 734,997 Special Events - - - 26,651
Assigned:Capital Projects - 77,173 2,708,885 2,708,885
Unassigned - - - (1,327,493) TOTAL FUND BALANCE - 77,173 3,306,885 7,001,682
TOTAL LIABILITIES, DEFERRED INFLOWSOF RESOURCES AND FUND BALANCE -$ 241,297$ 3,620,346$ 14,667,851$
COMBINING BALANCE SHEETAPRIL 30, 2017
VILLAGE OF GLENDALE HEIGHTS, ILLINOIS
NONMAJOR GOVERNMENTAL FUNDS
Capital Projects Funds

__________________________________________________________________________________________________________________________________________________________________________________(Continued)
90.
EXHIBIT 10
Recreation Emergency Handicapped Motor Fuel Founders' Parks & Recreation InfrastructureFund Service Fund Recreation Fund Tax Fund Day Fund Development Fund Fund
REVENUESTaxes 1,179,615$ 51,785$ 169,529$ -$ -$ -$ 2,538,322$ Charges for Services 1,192,885 - - - 400,395 - - Donations 700 - - - - - - Intergovernmental - - - 894,591 - - 551,957 Interest 670 30 96 7,073 - - - Miscellaneous 4,219 - - - 24,612 44,363 1,679
TOTAL REVENUES 2,378,089 51,815 169,625 901,664 425,007 44,363 3,091,958
EXPENDITURESCurrent:
General Government - - - - - - 36,408 Public Safety - 43,637 - - - - - Highways and Streets - - - 97,916 - - 120,661 Culture and Recreation 2,124,205 - 168,185 - 367,117 - -
Debt Service - - - - - - - Capital Outlay - - - 28,641 - - 1,536,469
TOTAL EXPENDITURES 2,124,205 43,637 168,185 126,557 367,117 - 1,693,538
Excess (deficiency) of revenues over expenditures 253,884 8,178 1,440 775,107 57,890 44,363 1,398,420
OTHER FINANCING SOURCES (USES)Transfers In 24,653 - - - - - - Transfers Out (25,000) - - - (43,807) - (1,349,995)
TOTAL OTHER FINANCING SOURCES (USES) (347) - - - (43,807) - (1,349,995)
Net Change in Fund Balance 253,537 8,178 1,440 775,107 14,083 44,363 48,425
Fund Balances at beginning of year 516,977 41,823 51,594 288,858 (541) 117,236 856,613
Fund Balances at end of year 770,514$ 50,001$ 53,034$ 1,063,965$ 13,542$ 161,599$ 905,038$
Special Revenue Funds
YEAR ENDED APRIL 30, 2017COMBINING STATEMENT OF REVENUES, EXPENDITURES AND CHANGES IN FUND BALANCES
NONMAJOR GOVERNMENTAL FUNDS
VILLAGE OF GLENDALE HEIGHTS, ILLINOIS

__________________________________________________________________________________________________________________________________________________________________________________(Continued)
91.
EXHIBIT 10
Special Service Special Service Special Service Special Service Special Service Special Service Special ServiceArea #1 Fund Area #2 Fund Area #3 Fund Area #4 Fund Area #5 Fund Area #6 Fund Area #7 Fund
REVENUESTaxes 12,261$ 34,026$ 34,749$ 20,793$ 27,062$ 29,750$ 14,716$ Charges for Services - - - - - - - Donations - - - - - - - Intergovernmental - - - - - - - Interest - - - - - - - Miscellaneous - - - - - - -
TOTAL REVENUES 12,261 34,026 34,749 20,793 27,062 29,750 14,716
EXPENDITURESCurrent:
General Government - - - - - - - Public Safety - - - - - - - Highways and Streets - - - - - - - Culture and Recreation - - - - - - -
Debt Service - - - - - - - Capital Outlay - - - - - - -
TOTAL EXPENDITURES - - - - - - -
Excess (deficiency) of revenues over expenditures 12,261 34,026 34,749 20,793 27,062 29,750 14,716
OTHER FINANCING SOURCES (USES)Transfers In - 97,056 62,908 - - - - Transfers Out (15,470) (131,276) (98,945) (12,128) (20,351) (17,630) -
TOTAL OTHER FINANCING SOURCES (USES) (15,470) (34,220) (36,037) (12,128) (20,351) (17,630) -
Net Change in Fund Balance (3,209) (194) (1,288) 8,665 6,711 12,120 14,716
Fund Balances at beginning of year 32,350 (115,193) (53,366) 142,841 229,066 100,736 301,766
Fund Balances at end of year 29,141$ (115,387)$ (54,654)$ 151,506$ 235,777$ 112,856$ 316,482$
VILLAGE OF GLENDALE HEIGHTS, ILLINOIS
NONMAJOR GOVERNMENTAL FUNDSCOMBINING STATEMENT OF REVENUES, EXPENDITURES AND CHANGES IN FUND BALANCES
YEAR ENDED APRIL 30, 2017
Special Revenue Funds

__________________________________________________________________________________________________________________________________________________________________________________(Continued)
92.
EXHIBIT 10
Special Service TIF TIF TIF TIF TIFArea #8 Fund Article 36 Fund No. 1 Fund No. 2 Fund No. 3 Fund No. 4 Fund No. 5 Fund
REVENUESTaxes 28,561$ -$ 701,714$ -$ 689,551$ -$ 5,954$ Charges for Services - - - - - - - Donations - - - - - - - Intergovernmental - - 418,787 - - - - Interest - - - - - - - Miscellaneous - 26,721 - - - - 49
TOTAL REVENUES 28,561 26,721 1,120,501 - 689,551 - 6,003
EXPENDITURESCurrent:
General Government - - - - - - - Public Safety - 14,253 - - - - - Highways and Streets 5,700 - 798,852 3,382 110,893 3,429 25,483 Culture and Recreation - - - - - - -
Debt Service - - - - 484,972 - - Capital Outlay 65,805 - 1,289,734 - - - -
TOTAL EXPENDITURES 71,505 14,253 2,088,586 3,382 595,865 3,429 25,483
Excess (deficiency) of revenues over expenditures (42,944) 12,468 (968,085) (3,382) 93,686 (3,429) (19,480)
OTHER FINANCING SOURCES (USES)Transfers In - - - - - - - Transfers Out - - (60,000) - - - -
TOTAL OTHER FINANCING SOURCES (USES) - - (60,000) - - - -
Net Change in Fund Balance (42,944) 12,468 (1,028,085) (3,382) 93,686 (3,429) (19,480)
Fund Balances at beginning of year 177,881 16,952 973,210 22,354 185,064 687,076 (948,114)
Fund Balances at end of year 134,937$ 29,420$ (54,875)$ 18,972$ 278,750$ 683,647$ (967,594)$
Special Revenue Funds
VILLAGE OF GLENDALE HEIGHTS, ILLINOIS
NONMAJOR GOVERNMENTAL FUNDSCOMBINING STATEMENT OF REVENUES, EXPENDITURES AND CHANGES IN FUND BALANCES
YEAR ENDED APRIL 30, 2017

__________________________________________________________________________________________________________________________________________________________________________________(Continued)
93.
EXHIBIT 10
TotalHistorical Special Vehicle Computer Capital
IMRF Fund Building Fund Revenue Funds Replacement Fund Replacement Fund Projects FundREVENUES
Taxes 957,756$ -$ 6,496,144$ -$ -$ -$ Charges for Services - - 1,593,280 - - - Donations - - 700 - - - Intergovernmental - - 1,865,335 - - - Interest 548 - 8,417 10,626 - - Miscellaneous - - 101,643 6,806 - -
TOTAL REVENUES 958,304 - 10,065,519 17,432 - -
EXPENDITURESCurrent:
General Government 926,552 - 962,960 - 27,339 - Public Safety - - 57,890 - - - Highways and Streets - - 1,166,316 - - - Culture and Recreation - 1,996 2,661,503 - - -
Debt Service - - 484,972 - - - Capital Outlay - - 2,920,649 226,737 16,132 412,311
TOTAL EXPENDITURES 926,552 1,996 8,254,290 226,737 43,471 412,311
Excess (deficiency) of revenues over expenditures 31,752 (1,996) 1,811,229 (209,305) (43,471) (412,311)
OTHER FINANCING SOURCES (USES)Transfers In - - 184,617 344,404 41,845 672,298 Transfers Out - - (1,774,602) - - (46,377)
TOTAL OTHER FINANCING SOURCES (USES) - - (1,589,985) 344,404 41,845 625,921
Net Change in Fund Balance 31,752 (1,996) 221,244 135,099 (1,626) 213,610
Fund Balances at beginning of year (166,735) 15,105 3,473,553 2,124,581 210,200 547,848
Fund Balances at end of year (134,983)$ 13,109$ 3,694,797$ 2,259,680$ 208,574$ 761,458$
VILLAGE OF GLENDALE HEIGHTS, ILLINOIS
NONMAJOR GOVERNMENTAL FUNDSCOMBINING STATEMENT OF REVENUES, EXPENDITURES AND CHANGES IN FUND BALANCES
YEAR ENDED APRIL 30, 2017
Special Revenue Funds Capital Project Funds
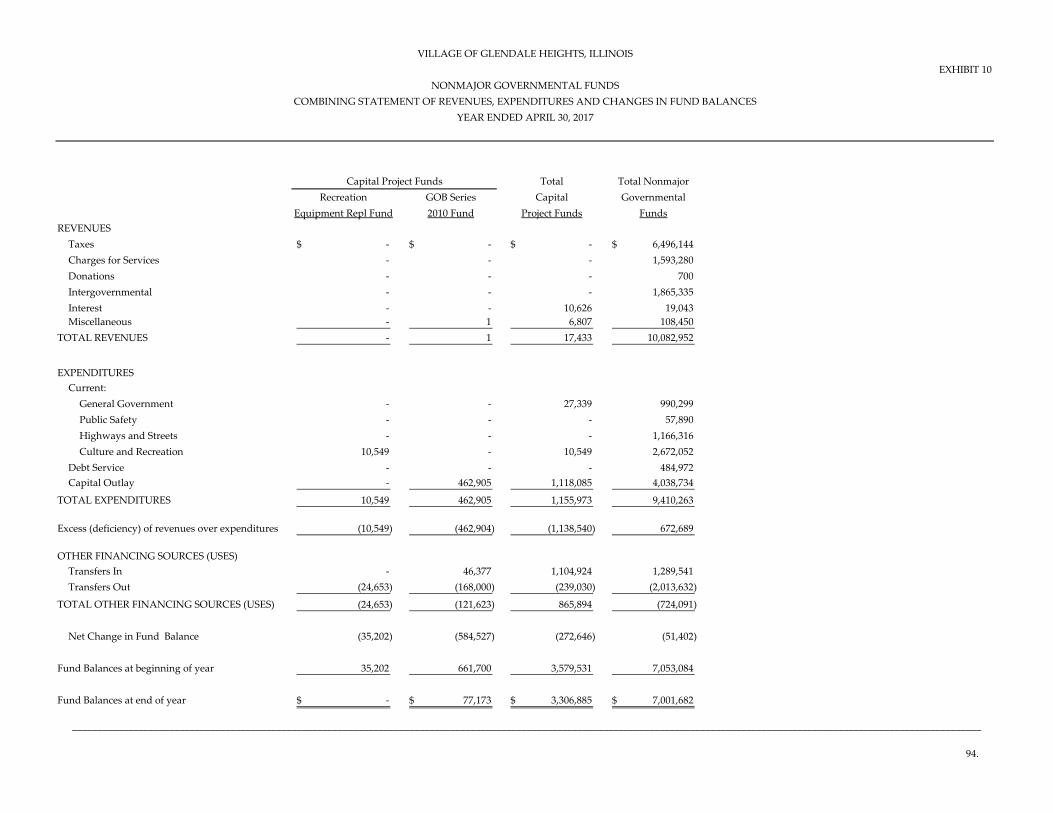
__________________________________________________________________________________________________________________________________________________________________________________
94.
EXHIBIT 10
Total Total NonmajorRecreation GOB Series Capital Governmental
Equipment Repl Fund 2010 Fund Project Funds FundsREVENUES
Taxes -$ -$ -$ 6,496,144$ Charges for Services - - - 1,593,280 Donations - - - 700 Intergovernmental - - - 1,865,335 Interest - - 10,626 19,043 Miscellaneous - 1 6,807 108,450
TOTAL REVENUES - 1 17,433 10,082,952
EXPENDITURESCurrent:
General Government - - 27,339 990,299 Public Safety - - - 57,890 Highways and Streets - - - 1,166,316 Culture and Recreation 10,549 - 10,549 2,672,052
Debt Service - - - 484,972 Capital Outlay - 462,905 1,118,085 4,038,734
TOTAL EXPENDITURES 10,549 462,905 1,155,973 9,410,263
Excess (deficiency) of revenues over expenditures (10,549) (462,904) (1,138,540) 672,689
OTHER FINANCING SOURCES (USES)Transfers In - 46,377 1,104,924 1,289,541 Transfers Out (24,653) (168,000) (239,030) (2,013,632)
TOTAL OTHER FINANCING SOURCES (USES) (24,653) (121,623) 865,894 (724,091)
Net Change in Fund Balance (35,202) (584,527) (272,646) (51,402)
Fund Balances at beginning of year 35,202 661,700 3,579,531 7,053,084
Fund Balances at end of year -$ 77,173$ 3,306,885$ 7,001,682$
VILLAGE OF GLENDALE HEIGHTS, ILLINOIS
NONMAJOR GOVERNMENTAL FUNDSCOMBINING STATEMENT OF REVENUES, EXPENDITURES AND CHANGES IN FUND BALANCES
YEAR ENDED APRIL 30, 2017
Capital Project Funds
SPECIAL REVENUE FUNDS Recreation Fund – To account for the operation and administration of recreation programs. Financing is provided by charges to the participants of the programs and a specific annual tax levy. Emergency Service Fund – To account for the operations and maintenance of an emergency preparedness system. Financing is provided by a specific annual tax levy. Handicapped Recreation Fund – To account for the operations and administration of recreation programs to handicapped individuals. Financing is provided by a specific annual tax levy. Motor Fuel Tax Fund – To account for the allotments to maintain the streets. Financing is provided by the Village’s share of Motor Fuel Tax allotments. Founders’ Day Fund – To account for the operations of the annual Village festival. Financing is provided by the charges at the festival. Parks & Recreation Development Fund – To account for the donations received and expenditures for park and recreation improvements. Infrastructure Fund – To account for the revenue received and expenditures for Village infrastructure improvements. Special Service Area #1 Fund – To account for and to make payments for the reconstruction, maintenance and repair of sidewalks, curbs and roads within the defined boundaries, including the cost of administration, legal and management. The funding for these services shall be paid from a specific annual tax levy imposed on property within that area. Special Service Area #2 Fund – To account for and to make payments for the reconstruction, maintenance and repair of sidewalks, curbs and roads within the defined boundaries, including the cost of administration, legal and management. The funding for these services shall be paid from a specific annual tax levy imposed on property within that area. Special Service Area #3 Fund – To account for and to make payments for the reconstruction, maintenance and repair of sidewalks, curbs and roads within the defined boundaries, including the cost of administration, legal and management. The funding for these services shall be paid from a specific annual tax levy imposed on property within that area. Special Service Area #4 Fund – To account for and to make payments for the reconstruction, maintenance and repair of sidewalks, curbs and roads within the defined boundaries, including the cost of administration, legal and management. The funding for these services shall be paid from a specific annual tax levy imposed on property within that area. Special Service Area #5 Fund – To account for and to make payments for the reconstruction, maintenance and repair of sidewalks, curbs and roads within the defined boundaries, including the cost of administration, legal and management. The funding for these services shall be paid from a specific annual tax levy imposed on property within that area.

SPECIAL REVENUE FUNDS (CONTINUED)
Special Service Area #6 Fund – To account for and to make payments for the reconstruction, maintenance and repair of sidewalks, curbs and roads within the defined boundaries, including the cost of administration, legal and management. The funding for these services shall be paid from a specific annual tax levy imposed on property within that area. Special Service Area #7 Fund – To account for and to make payments for the reconstruction, maintenance and repair of sidewalks, curbs and roads within the defined boundaries, including the cost of administration, legal and management. The funding for these services shall be paid from a specific annual tax levy imposed on property within that area. Special Service Area #8 Fund – To account for and to make payments for the reconstruction, maintenance and repair of sidewalks, curbs and roads within the defined boundaries, including the cost of administration, legal and management. The funding for these services shall be paid from a specific annual tax levy imposed on property within that area. Article 36 Fund – To account for revenues obtained from drug seizures and the expenditures related to police activity. TIF No. 1 Fund – To account for the financing and expenditures related to a specific tax increment financing district. The expenditures are restricted to items within the redevelopment plan. Financing is provided by a specific annual tax levy. TIF No. 2 Fund – To account for the financing and expenditures related to a specific tax Increment financing district. The expenditures are restricted to items within the redevelopment plan. Financing is provided by a specific annual tax levy. TIF No. 3 Fund – To account for the financing and expenditures related to a specific tax increment financing district. The expenditures are restricted to items within the redevelopment plan. Financing is provided by a specific annual tax levy. TIF No. 4 Fund – To account for the financing and expenditures related to a specific tax increment financing district. The expenditures are restricted to items within the redevelopment plan. Financing is provided by a specific annual tax levy. TIF No. 5 Fund – To account for the financing and expenditures related to a specific tax increment financing district. The expenditures are restricted to items within the redevelopment plan. Financing is provided by a specific annual tax levy. IMRF Fund – To account for the revenues and expenditures related to IMRF. Financing is provided by a specific annual tax levy. Historical Building Fund – To account for the donations received and expenditures for the historical building.

EXHIBIT 11
________________________________________________________________________________________________________________________
95.
PositiveFinal (Negative) from
Budget Actual Final BudgetREVENUES
Taxes 1,170,000$ 1,179,615$ 9,615$ Charges for Services 1,172,863 1,192,885 20,022 Donations 2,000 700 (1,300) Interest 500 670 170 Miscellaneous 500 4,219 3,719
TOTAL REVENUES 2,345,863 2,378,089 32,226
EXPENDITURESCurrent:
Culture and Recreation 2,250,118 2,124,205 125,913 Capital Outlay 17,800 - 17,800
TOTAL EXPENDITURES 2,267,918 2,124,205 143,713
Excess (deficiency) of revenues over expenditures 77,945 253,884 175,939
OTHER FINANCING SOURCES (USES)Transfers In - 24,653 24,653 Transfers Out (25,000) (25,000) -
TOTAL OTHER FINANCING SOURCES (USES) (25,000) (347) 24,653
Net Change in Fund Balance 52,945$ 253,537 200,592$
Fund Balance at beginning of year 516,977
Fund Balance at end of year 770,514$
YEAR ENDED APRIL 30, 2017
VILLAGE OF GLENDALE HEIGHTS, ILLINOIS
RECREATION FUNDSCHEDULE OF REVENUES, EXPENDITURES AND CHANGES IN FUND BALANCE
BUDGET (GAAP BASIS) AND ACTUAL

EXHIBIT 12
________________________________________________________________________________________________________________________
96.
PositiveFinal (Negative) from
Budget Actual Final BudgetREVENUES
TaxesProperty Taxes 1,170,000$ 1,179,615$ 9,615$
Charges for ServicesProgram Revenue 449,225 428,533 (20,692) Preschool Revenue 144,000 162,189 18,189 Pool Revenue 233,387 230,075 (3,312) Day Camp Revenue 342,751 368,546 25,795 Facility Fees 3,500 3,542 42
Total Charges for Services 1,172,863 1,192,885 20,022
Donations 2,000 700 (1,300) Interest 500 670 170 Miscellaneous 500 4,219 3,719
TOTAL REVENUES 2,345,863$ 2,378,089$ 32,226$
YEAR ENDED APRIL 30, 2017
VILLAGE OF GLENDALE HEIGHTS, ILLINOIS
RECREATION FUNDSCHEDULE OF DETAILED REVENUESBUDGET (GAAP BASIS) AND ACTUAL

EXHIBIT 13
________________________________________________________________________________________________________________________(Continued) 97.
PositiveFinal (Negative) from
Budget Actual Final BudgetEXPENDITURES
Culture and RecreationAdministration
Salaries - Regular 391,671$ 391,237$ 434$ Salaries - Holiday 1,000 1,001 (1) Salaries - Overtime 400 107 293 Fica - Employer 24,284 23,368 916 Unemployment Insurance 500 500 - Software Support & Maintenance 7,081 7,080 1 Other Purchased Services 800 1,104 (304) Travel, Meeting & Conferences 1,950 1,687 263 Training & Seminars 3,775 3,255 520 Medicare - Employer 5,679 5,532 147 Advertising 27,890 24,322 3,568 Postage 9,000 9,006 (6) Miscellaneous Office Supplies 700 543 157 Computer Software 1,423 1,776 (353) Uniforms 7,250 6,298 952 Gas & Fuel 800 564 236 Miscellaneous Supplies 6,000 7,056 (1,056) Office Equipment - 681 (681) Computer Equipment - 96 (96) Recreation 1,925 7,255 (5,330) Telephone 3,400 3,190 210 Cellular Phone 1,900 1,592 308 Electricity 99,500 97,821 1,679 Natural Gas 15,000 10,859 4,141 Leases - Equipment 8,500 8,609 (109) Recreation Equipment 4,874 4,854 20 Membership Dues 2,320 2,104 216 Subscriptions 50 - 50 Bank Fiscal Charges 20,000 20,036 (36)
Total Administration 647,672 641,533 6,139
Central ServicesSalaries - Regular 13,076 13,106 (30) Fica - Employer 811 794 17 Medicare - Employer 188 186 2 Imrf - Employer 115,589 112,466 3,123 Medical - Employer 162,384 141,127 21,257 Health & Wellness 375 431 (56) Opt Out Med Insurance 200 120 80
YEAR ENDED APRIL 30, 2017
VILLAGE OF GLENDALE HEIGHTS, ILLINOIS
RECREATION FUNDSCHEDULE OF DETAILED EXPENDITURES
BUDGET (GAAP BASIS) AND ACTUAL

EXHIBIT 13
________________________________________________________________________________________________________________________(Continued) 98.
PositiveFinal (Negative) from
Budget Actual Final Budget
YEAR ENDED APRIL 30, 2017
VILLAGE OF GLENDALE HEIGHTS, ILLINOIS
RECREATION FUNDSCHEDULE OF DETAILED EXPENDITURES
BUDGET (GAAP BASIS) AND ACTUAL
Network Consulting 13,600$ 13,338$ 262$ Total Central Services 306,223 281,568 24,655
Building and MaintenanceSalaries - Regular 127,251 128,738 (1,487) Salaries - Overtime 1,500 1,854 (354) Fica - Employer 7,890 7,721 169 Medicare - Employer 1,845 1,806 39 Training & Seminars 200 - 200 Other Purchased Services 51,500 47,468 4,032 Janitorial Supplies 7,500 6,532 968 Electrical Supplies 1,500 1,228 272 Hardware Supplies 800 568 232 Plumbing Supplies 800 366 434 Lumber Supplies 250 47 203 Other Building Maintenance Supplies 15,310 9,438 5,872 Building Maintenance Tools 700 286 414 Building Maintenance 3,738 896 2,842 Sports Hub 36,600 32,072 4,528
Total Building and Maintenance 257,384 239,020 18,364
Recreation ProgramsSalaries - Regular 330,827 269,981 60,846 Salaries - Overtime 400 307 93 Fica - Employer 20,481 17,402 3,079 Medicare - Employer 4,790 4,069 721 Facility Rental Supplies 1,000 512 488 Adult General Programs 2,000 - 2,000 General Fitness Classes 6,050 4,436 1,614 Karate 10,150 10,390 (240) Dance Programs 21,000 17,319 3,681 Gymnastics 6,400 6,896 (496) Youth Athletics 8,200 7,020 1,180 Youth General Programs 4,500 2,950 1,550 Tot General Programs 2,300 1,764 536 Youth Basketball Leagues 11,675 10,008 1,667 Youth Baseball/Softball 12,942 9,544 3,398 Football/Cheerleading 29,715 19,679 10,036 Indoor Soccer 49,350 44,911 4,439 Mens Basketball Leagues 8,000 6,069 1,931 Softball Leagues 6,100 3,099 3,001 Teen Programs 1,000 458 542
Total Recreation Programs 536,880 436,814 100,066

EXHIBIT 13
________________________________________________________________________________________________________________________ 99.
PositiveFinal (Negative) from
Budget Actual Final Budget
YEAR ENDED APRIL 30, 2017
VILLAGE OF GLENDALE HEIGHTS, ILLINOIS
RECREATION FUNDSCHEDULE OF DETAILED EXPENDITURES
BUDGET (GAAP BASIS) AND ACTUAL
PreschoolSalaries - Regular 112,000$ 115,423$ (3,423)$ Fica - Employer 6,945 7,053 (108) Medicare - Employer 1,625 1,650 (25) Preschool 7,950 7,462 488
Total Preschool 128,520 131,588 (3,068)
SwimmingFica - Employer 8,393 8,393 - Medicare - Employer 1,963 1,963 - Swim Lessons 11,676 11,675 1 Swim Team 27,949 26,325 1,624 Swim Passes 118,806 118,807 (1) Pool Concession 23,459 23,636 (177)
Total Swimming 192,246 190,799 1,447
Playgrounds and Special EventsFica-Employer 7,502 8,873 (1,371) Medicare-Employer 1,755 2,075 (320) Day Camp 52,868 58,898 (6,030) After School Program 84,500 100,887 (16,387) Special Activities 5,300 2,891 2,409 Day Camp 29,268 29,259 9
Total Playgrounds and Special Events 181,193 202,883 (21,690)
Total Culture and Recreation 2,250,118 2,124,205 125,913
Capital OutlayAdministration
Recreation Equipment 17,800 - 17,800
Total Capital Outlay 17,800 - 17,800
TOTAL EXPENDITURES 2,267,918$ 2,124,205$ 143,713$

EXHIBIT 14
________________________________________________________________________________________________________________________
100.
PositiveFinal (Negative) from
Budget Actual Final BudgetREVENUES
Taxes 51,000$ 51,785$ 785$ Interest 20 30 10
TOTAL REVENUES 51,020 51,815 795
EXPENDITURESPublic Safety
Emergency ServicesSalaries - Regular 22,791 19,306 3,485 Fica - Employer 1,424 1,197 227 Imrf - Employer 2,906 2,517 389 Medicare - Employer 334 280 54 Training & Seminars 1,350 744 606 Uniforms 800 758 42 Gas & Fuel 600 322 278 Printing & Binding 100 100 - Software Support & Maintenance 8,500 8,500 - Miscellaneous Supplies 1,500 1,416 84 Cellular Phone 300 150 150 Other Office Equipment 4,000 3,808 192 ESDA 6,000 4,539 1,461 Cert Program Expenses 400 - 400
TOTAL EXPENDITURES 51,005 43,637 7,368
Net Change in Fund Balance 15$ 8,178 8,163$
Fund Balance at beginning of year 41,823
Fund Balance at end of year 50,001$
YEAR ENDED APRIL 30, 2017
VILLAGE OF GLENDALE HEIGHTS, ILLINOIS
EMERGENCY SERVICE FUNDSCHEDULE OF REVENUES, EXPENDITURES AND CHANGES IN FUND BALANCE
BUDGET (GAAP BASIS) AND ACTUAL

EXHIBIT 15
________________________________________________________________________________________________________________________
101.
PositiveFinal (Negative) from
Budget Actual Final BudgetREVENUES
Taxes 168,185$ 169,529$ 1,344$ Interest - 96 96
TOTAL REVENUES 168,185 169,625 1,440
EXPENDITURESCulture and Recreation
Community Contributions 170,400 168,185 2,215 TOTAL EXPENDITURES 170,400 168,185 2,215
Net Change in Fund Balance (2,215)$ 1,440 3,655$
Fund Balance at beginning of year 51,594
Fund Balance at end of year 53,034$
YEAR ENDED APRIL 30, 2017
VILLAGE OF GLENDALE HEIGHTS, ILLINOIS
HANDICAPPED RECREATION FUNDSCHEDULE OF REVENUES, EXPENDITURES AND CHANGES IN FUND BALANCE
BUDGET (GAAP BASIS) AND ACTUAL
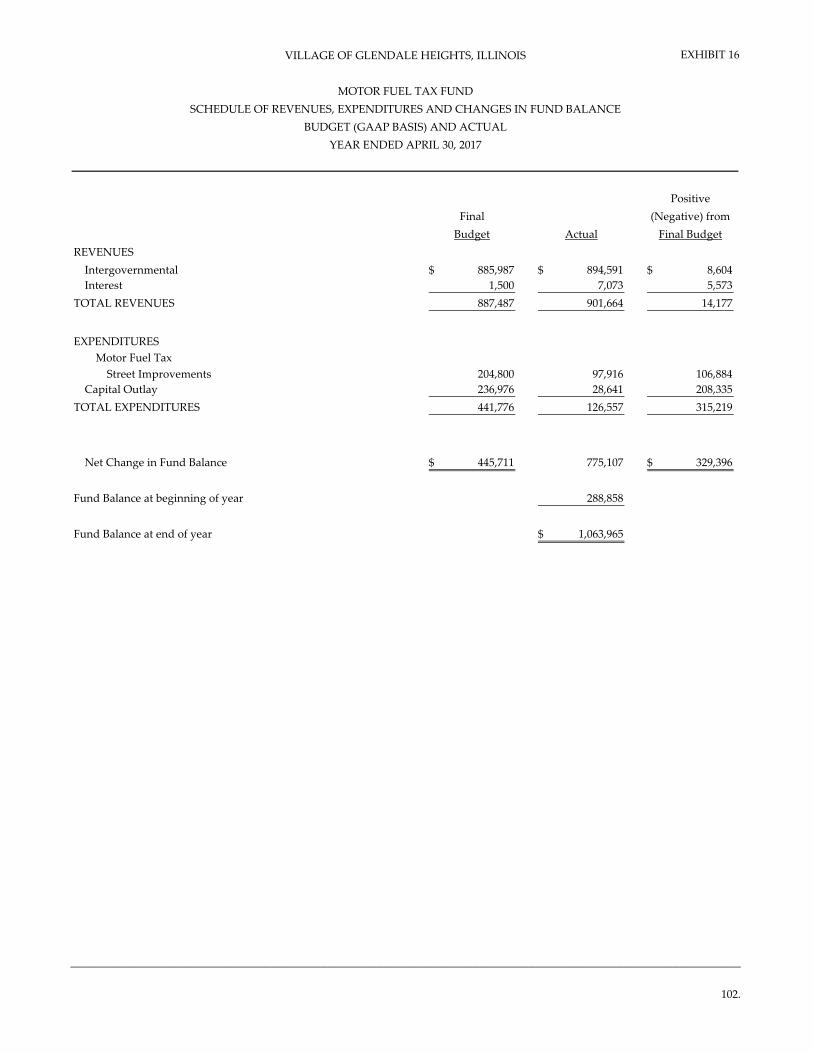
EXHIBIT 16
________________________________________________________________________________________________________________________
102.
PositiveFinal (Negative) from
Budget Actual Final BudgetREVENUES
Intergovernmental 885,987$ 894,591$ 8,604$ Interest 1,500 7,073 5,573
TOTAL REVENUES 887,487 901,664 14,177
EXPENDITURESMotor Fuel Tax
Street Improvements 204,800 97,916 106,884 Capital Outlay 236,976 28,641 208,335
TOTAL EXPENDITURES 441,776 126,557 315,219
Net Change in Fund Balance 445,711$ 775,107 329,396$
Fund Balance at beginning of year 288,858
Fund Balance at end of year 1,063,965$
YEAR ENDED APRIL 30, 2017
VILLAGE OF GLENDALE HEIGHTS, ILLINOIS
MOTOR FUEL TAX FUNDSCHEDULE OF REVENUES, EXPENDITURES AND CHANGES IN FUND BALANCE
BUDGET (GAAP BASIS) AND ACTUAL
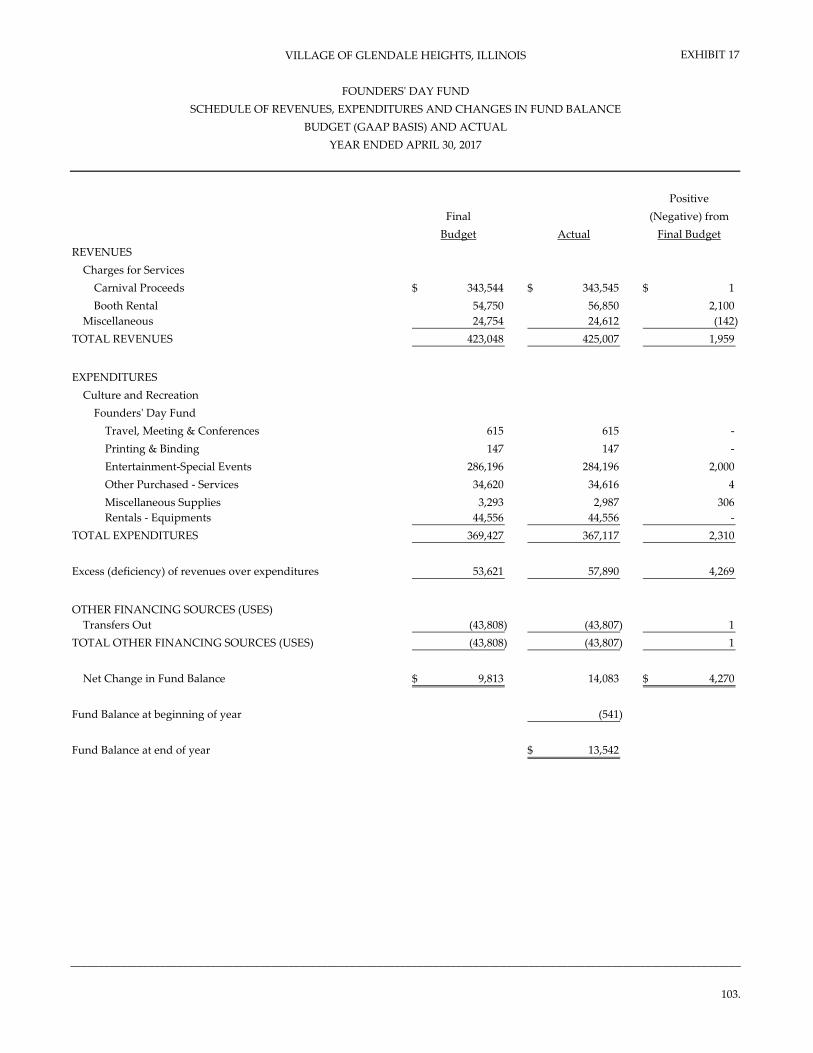
EXHIBIT 17
________________________________________________________________________________________________________________________
103.
PositiveFinal (Negative) from
Budget Actual Final BudgetREVENUES
Charges for ServicesCarnival Proceeds 343,544$ 343,545$ 1$ Booth Rental 54,750 56,850 2,100
Miscellaneous 24,754 24,612 (142) TOTAL REVENUES 423,048 425,007 1,959
EXPENDITURESCulture and Recreation
Founders' Day FundTravel, Meeting & Conferences 615 615 - Printing & Binding 147 147 - Entertainment-Special Events 286,196 284,196 2,000 Other Purchased - Services 34,620 34,616 4 Miscellaneous Supplies 3,293 2,987 306 Rentals - Equipments 44,556 44,556 -
TOTAL EXPENDITURES 369,427 367,117 2,310
Excess (deficiency) of revenues over expenditures 53,621 57,890 4,269
OTHER FINANCING SOURCES (USES)Transfers Out (43,808) (43,807) 1
TOTAL OTHER FINANCING SOURCES (USES) (43,808) (43,807) 1
Net Change in Fund Balance 9,813$ 14,083 4,270$
Fund Balance at beginning of year (541)
Fund Balance at end of year 13,542$
YEAR ENDED APRIL 30, 2017
VILLAGE OF GLENDALE HEIGHTS, ILLINOIS
FOUNDERS' DAY FUNDSCHEDULE OF REVENUES, EXPENDITURES AND CHANGES IN FUND BALANCE
BUDGET (GAAP BASIS) AND ACTUAL

EXHIBIT 18
________________________________________________________________________________________________________________________
104.
PositiveFinal (Negative) from
Budget Actual Final BudgetREVENUES
Tower Rental 44,208$ 44,363$ 155$
Net Change in Fund Balance 44,208$ 44,363 155$
Fund Balance at beginning of year 117,236
Fund Balance at end of year 161,599$
YEAR ENDED APRIL 30, 2017
VILLAGE OF GLENDALE HEIGHTS, ILLINOIS
PARKS & RECREATION DEVELOPMENT FUNDSCHEDULE OF REVENUES AND CHANGES IN FUND BALANCE
BUDGET (GAAP BASIS) AND ACTUAL

EXHIBIT 19
________________________________________________________________________________________________________________________
105.
PositiveFinal (Negative) from
Budget Actual Final BudgetREVENUES
Taxes 2,535,000$ 2,538,322$ 3,322$ Intergovernmental 565,000 551,957 (13,043) Interest 100 - (100) Miscellaneous 200 1,679 1,479
TOTAL REVENUES 3,100,300 3,091,958 (8,342)
EXPENDITURESGeneral Government
Professional - Legal 50,000 36,408 13,592 Highways and Streets
Engineering 326,764 120,661 206,103 Capital Outlay 1,807,092 1,536,469 270,623
TOTAL EXPENDITURES 2,183,856 1,693,538 490,318
Excess (deficiency) of revenues over expenditures 916,444 1,398,420 481,976
OTHER FINANCING SOURCES (USES)Transfers Out (1,349,995) (1,349,995) -
TOTAL OTHER FINANCING SOURCES (USES) (1,349,995) (1,349,995) -
Net Change in Fund Balance (433,551)$ 48,425 481,976$
Fund Balance at beginning of year 856,613
Fund Balance at end of year 905,038$
VILLAGE OF GLENDALE HEIGHTS, ILLINOIS
INFRASTRUCTURE FUNDSCHEDULE OF REVENUES, EXPENDITURES AND CHANGES IN FUND BALANCE
BUDGET (GAAP BASIS) AND ACTUALYEAR ENDED APRIL 30, 2017

EXHIBIT 20
________________________________________________________________________________________________________________________
106.
PositiveFinal (Negative) from
Budget Actual Final BudgetREVENUES
Taxes 12,643$ 12,261$ (382)$ Excess of Revenues 12,643 12,261 (382)
OTHER FINANCING SOURCES (USES)Transfers Out (15,470) (15,470) -
TOTAL OTHER FINANCING SOURCES (USES) (15,470) (15,470) -
Net Change in Fund Balance (2,827)$ (3,209) (382)$
Fund Balance at beginning of year 32,350
Fund Balance at end of year 29,141$
YEAR ENDED APRIL 30, 2017
VILLAGE OF GLENDALE HEIGHTS, ILLINOIS
SPECIAL SERVICE AREA #1 FUNDSCHEDULE OF REVENUES AND CHANGES IN FUND BALANCE
BUDGET (GAAP BASIS) AND ACTUAL
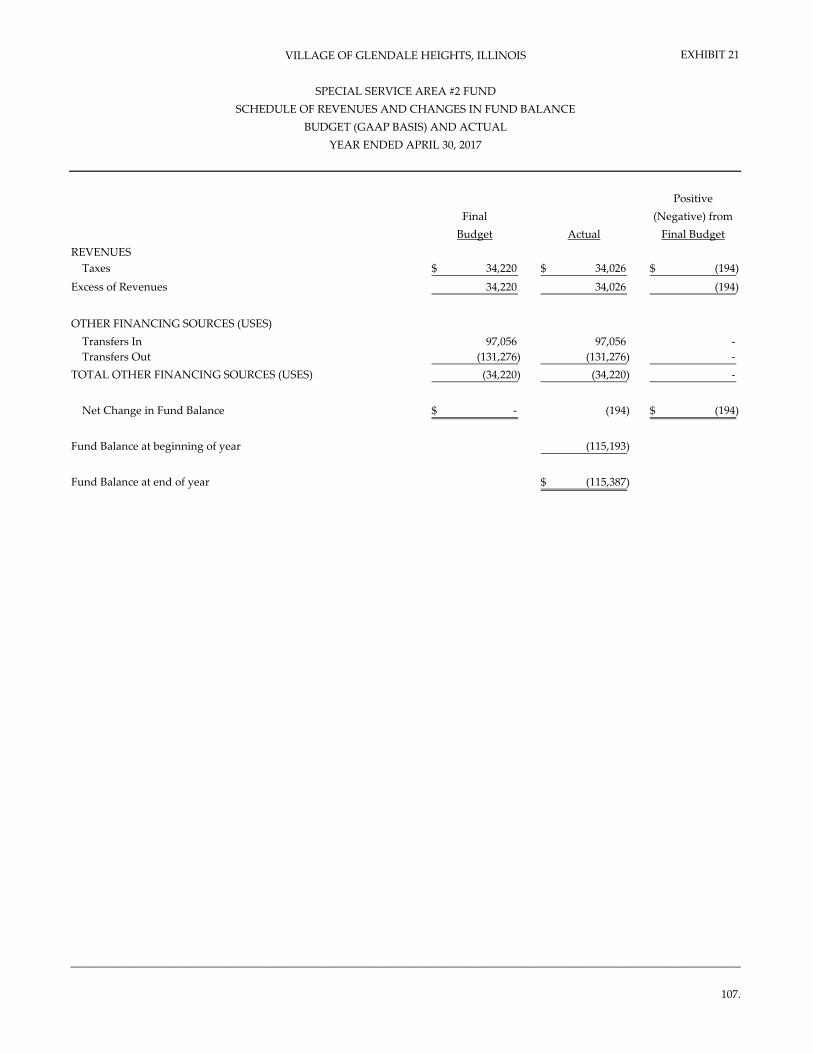
EXHIBIT 21
________________________________________________________________________________________________________________________
107.
PositiveFinal (Negative) from
Budget Actual Final BudgetREVENUES
Taxes 34,220$ 34,026$ (194)$ Excess of Revenues 34,220 34,026 (194)
OTHER FINANCING SOURCES (USES)Transfers In 97,056 97,056 - Transfers Out (131,276) (131,276) -
TOTAL OTHER FINANCING SOURCES (USES) (34,220) (34,220) -
Net Change in Fund Balance -$ (194) (194)$
Fund Balance at beginning of year (115,193)
Fund Balance at end of year (115,387)$
YEAR ENDED APRIL 30, 2017
VILLAGE OF GLENDALE HEIGHTS, ILLINOIS
SPECIAL SERVICE AREA #2 FUNDSCHEDULE OF REVENUES AND CHANGES IN FUND BALANCE
BUDGET (GAAP BASIS) AND ACTUAL

EXHIBIT 22
________________________________________________________________________________________________________________________
108.
PositiveFinal (Negative) from
Budget Actual Final BudgetREVENUES
Taxes 36,037$ 34,749$ (1,288)$ Excess of Revenues 36,037 34,749 (1,288)
OTHER FINANCING SOURCES (USES)Transfers In 62,908 62,908 - Transfers Out (98,945) (98,945) -
TOTAL OTHER FINANCING SOURCES (USES) (36,037) (36,037) -
Net Change in Fund Balance -$ (1,288) (1,288)$
Fund Balance at beginning of year (53,366)
Fund Balance at end of year (54,654)$
YEAR ENDED APRIL 30, 2017
VILLAGE OF GLENDALE HEIGHTS, ILLINOIS
SPECIAL SERVICE AREA #3 FUNDSCHEDULE OF REVENUES AND CHANGES IN FUND BALANCE
BUDGET (GAAP BASIS) AND ACTUAL

EXHIBIT 23
________________________________________________________________________________________________________________________
109.
PositiveFinal (Negative) from
Budget Actual Final BudgetREVENUES
Taxes 20,793$ 20,793$ -$ Excess of Revenues 20,793 20,793 -
OTHER FINANCING SOURCES (USES)Transfers Out (12,128) (12,128) -
TOTAL OTHER FINANCING SOURCES (USES) (12,128) (12,128) -
Net Change in Fund Balance 8,665$ 8,665 -$
Fund Balance at beginning of year 142,841
Fund Balance at end of year 151,506$
YEAR ENDED APRIL 30, 2017
VILLAGE OF GLENDALE HEIGHTS, ILLINOIS
SPECIAL SERVICE AREA #4 FUNDSCHEDULE OF REVENUES AND CHANGES IN FUND BALANCE
BUDGET (GAAP BASIS) AND ACTUAL
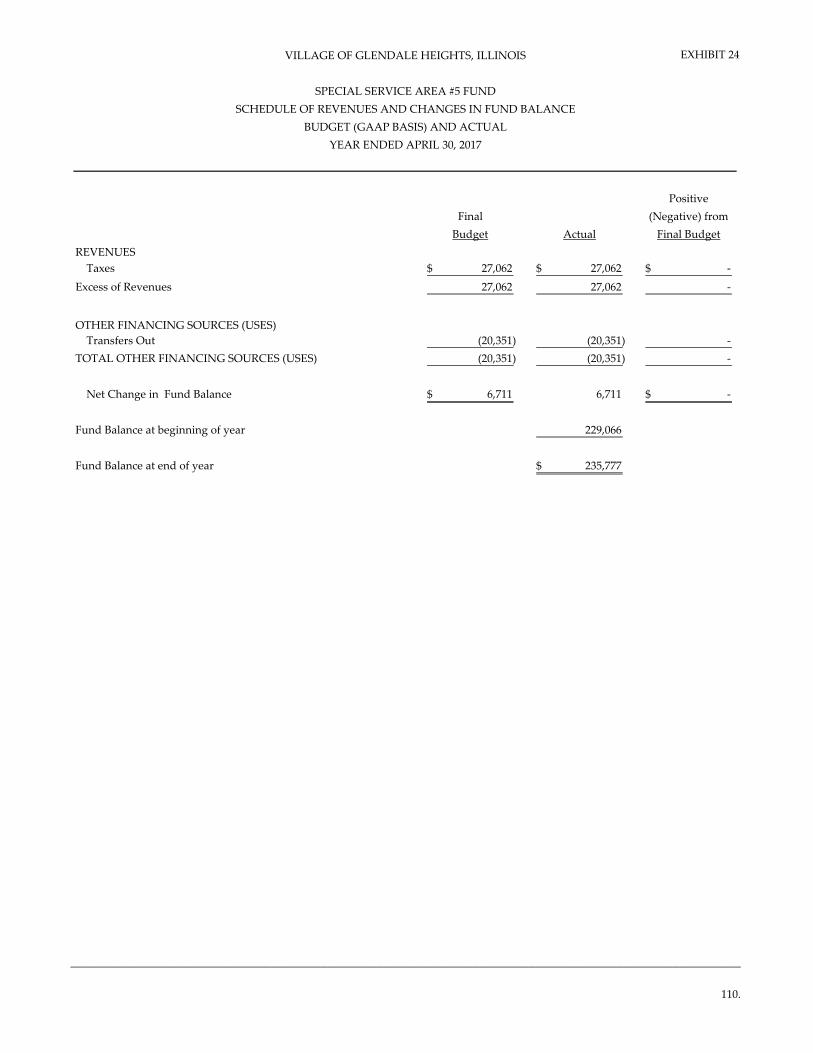
EXHIBIT 24
________________________________________________________________________________________________________________________
110.
PositiveFinal (Negative) from
Budget Actual Final BudgetREVENUES
Taxes 27,062$ 27,062$ -$ Excess of Revenues 27,062 27,062 -
OTHER FINANCING SOURCES (USES)Transfers Out (20,351) (20,351) -
TOTAL OTHER FINANCING SOURCES (USES) (20,351) (20,351) -
Net Change in Fund Balance 6,711$ 6,711 -$
Fund Balance at beginning of year 229,066
Fund Balance at end of year 235,777$
YEAR ENDED APRIL 30, 2017
VILLAGE OF GLENDALE HEIGHTS, ILLINOIS
SPECIAL SERVICE AREA #5 FUNDSCHEDULE OF REVENUES AND CHANGES IN FUND BALANCE
BUDGET (GAAP BASIS) AND ACTUAL

EXHIBIT 25
________________________________________________________________________________________________________________________
111.
PositiveFinal (Negative) from
Budget Actual Final BudgetREVENUES
Taxes 27,949$ 29,750$ 1,801$ Excess of Revenues 27,949 29,750 1,801
OTHER FINANCING SOURCES (USES)Transfers Out (17,630) (17,630) -
TOTAL OTHER FINANCING SOURCES (USES) (17,630) (17,630) -
Net Change in Fund Balance 10,319$ 12,120 1,801$
Fund Balance at beginning of year 100,736
Fund Balance at end of year 112,856$
YEAR ENDED APRIL 30, 2017
VILLAGE OF GLENDALE HEIGHTS, ILLINOIS
SPECIAL SERVICE AREA #6 FUNDSCHEDULE OF REVENUES AND CHANGES IN FUND BALANCE
BUDGET (GAAP BASIS) AND ACTUAL

EXHIBIT 26
________________________________________________________________________________________________________________________
112.
PositiveFinal (Negative) from
Budget Actual Final BudgetREVENUES
Taxes 14,716$ 14,716$ -$
Net Change in Fund Balance 14,716$ 14,716 -$
Fund Balance at beginning of year 301,766
Fund Balance at end of year 316,482$
YEAR ENDED APRIL 30, 2017
VILLAGE OF GLENDALE HEIGHTS, ILLINOIS
SPECIAL SERVICE AREA #7 FUNDSCHEDULE OF REVENUES AND CHANGES IN FUND BALANCE
BUDGET (GAAP BASIS) AND ACTUAL

EXHIBIT 27
________________________________________________________________________________________________________________________
113.
PositiveFinal (Negative) from
Budget Actual Final BudgetREVENUES
Taxes 28,561$ 28,561$ -$
EXPENDITURESCurrent:
Highways and Streets 20,000 5,700 14,300 Capital Outlay 100,000 65,805 34,195
TOTAL EXPENDITURES 120,000 71,505 48,495
Net Change in Fund Balance (91,439)$ (42,944) 48,495$
Fund Balance at beginning of year 177,881
Fund Balance at end of year 134,937$
YEAR ENDED APRIL 30, 2017
VILLAGE OF GLENDALE HEIGHTS, ILLINOIS
SPECIAL SERVICE AREA #8 FUNDSCHEDULE OF REVENUES AND CHANGES IN FUND BALANCE
BUDGET (GAAP BASIS) AND ACTUAL

EXHIBIT 28
________________________________________________________________________________________________________________________
114.
PositiveFinal (Negative) from
Budget Actual Final BudgetREVENUES
Interest 100$ -$ (100)$ Miscellaneous 23,405 26,721 3,316
TOTAL REVENUES 23,505 26,721 3,216
EXPENDITURESPublic Safety
AdministrationVehicle Title & Registration 2,500 665 1,835 Towing Fee 2,500 - 2,500 Gas & Oil 100 - 100 Miscellaneous Expenditures 16,105 13,588 2,517
TOTAL EXPENDITURES 21,205 14,253 6,952
Net Change in Fund Balance 2,300$ 12,468 10,168$
Fund Balance at beginning of year 16,952
Fund Balance at end of year 29,420$
YEAR ENDED APRIL 30, 2017
VILLAGE OF GLENDALE HEIGHTS, ILLINOIS
ARTICLE 36 FUNDSCHEDULE OF REVENUES, EXPENDITURES AND CHANGES IN FUND BALANCE
BUDGET (GAAP BASIS) AND ACTUAL
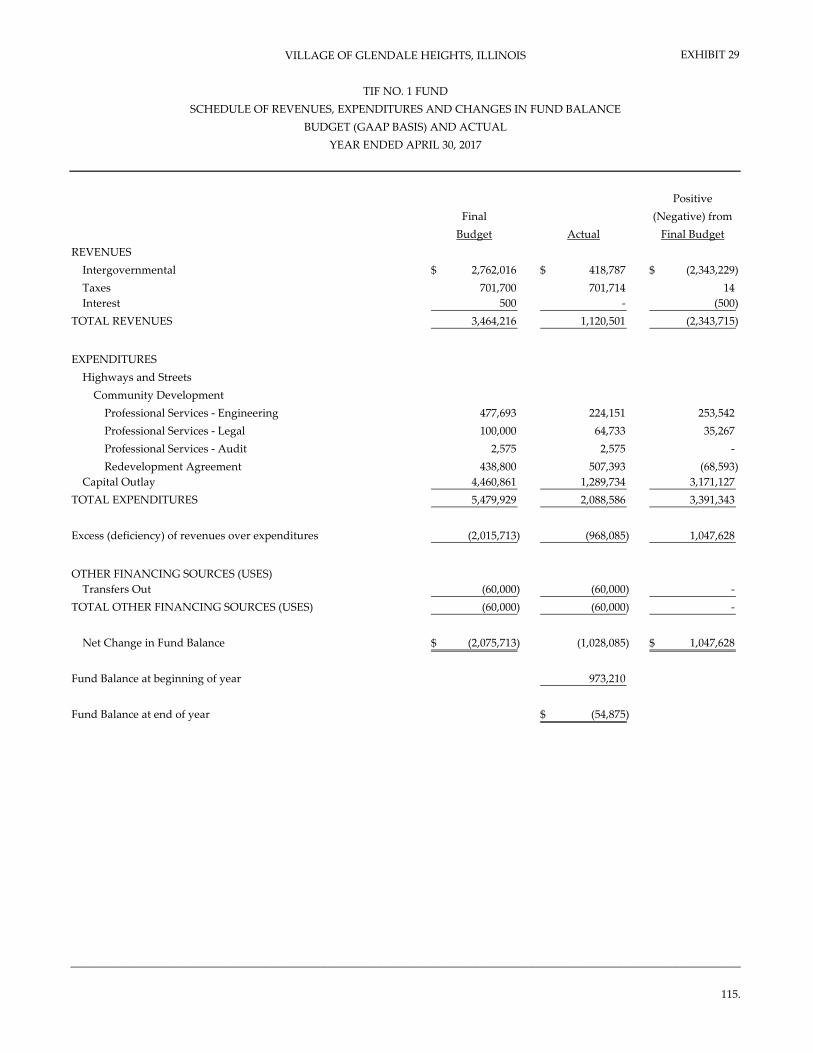
EXHIBIT 29
________________________________________________________________________________________________________________________
115.
PositiveFinal (Negative) from
Budget Actual Final BudgetREVENUES
Intergovernmental 2,762,016$ 418,787$ (2,343,229)$ Taxes 701,700 701,714 14 Interest 500 - (500)
TOTAL REVENUES 3,464,216 1,120,501 (2,343,715)
EXPENDITURESHighways and Streets
Community DevelopmentProfessional Services - Engineering 477,693 224,151 253,542 Professional Services - Legal 100,000 64,733 35,267 Professional Services - Audit 2,575 2,575 - Redevelopment Agreement 438,800 507,393 (68,593)
Capital Outlay 4,460,861 1,289,734 3,171,127 TOTAL EXPENDITURES 5,479,929 2,088,586 3,391,343
Excess (deficiency) of revenues over expenditures (2,015,713) (968,085) 1,047,628
OTHER FINANCING SOURCES (USES)Transfers Out (60,000) (60,000) -
TOTAL OTHER FINANCING SOURCES (USES) (60,000) (60,000) -
Net Change in Fund Balance (2,075,713)$ (1,028,085) 1,047,628$
Fund Balance at beginning of year 973,210
Fund Balance at end of year (54,875)$
YEAR ENDED APRIL 30, 2017
VILLAGE OF GLENDALE HEIGHTS, ILLINOIS
TIF NO. 1 FUNDSCHEDULE OF REVENUES, EXPENDITURES AND CHANGES IN FUND BALANCE
BUDGET (GAAP BASIS) AND ACTUAL

EXHIBIT 30
________________________________________________________________________________________________________________________
116.
PositiveFinal (Negative) from
Budget Actual Final BudgetREVENUES
Taxes 650$ -$ (650)$ Interest 15 - (15)
TOTAL REVENUES 665 - (665)
EXPENDITURESHighways and Streets
AdministrationConsulting Services - Legal 4,500 3,382 1,118
Net Change in Fund Balance (3,835)$ (3,382) 453$
Fund Balance at beginning of year 22,354
Fund Balance at end of year 18,972$
YEAR ENDED APRIL 30, 2017
VILLAGE OF GLENDALE HEIGHTS, ILLINOIS
TIF NO. 2 FUNDSCHEDULE OF REVENUES, EXPENDITURES AND CHANGES IN FUND BALANCE
BUDGET (GAAP BASIS) AND ACTUAL

EXHIBIT 31
________________________________________________________________________________________________________________________
117.
PositiveFinal (Negative) from
Budget Actual Final BudgetREVENUES
Taxes 707,250$ 689,551$ (17,699)$ Interest 200 - (200)
TOTAL REVENUES 707,450 689,551 (17,899)
EXPENDITURESHighways and Streets
AdministrationProfessional Services - Auditing 2,575 2,575 - Professional Services - Legal 15,000 3,693 11,307 Economic Development Contributions 141,500 104,625 36,875
Debt ServiceInterest Expense 553,500 484,972 68,528
TOTAL EXPENDITURES 712,575 595,865 116,710
Net Change in Fund Balance (5,125)$ 93,686 98,811$
Fund Balance at beginning of year 185,064
Fund Balance at end of year 278,750$
YEAR ENDED APRIL 30, 2017
VILLAGE OF GLENDALE HEIGHTS, ILLINOIS
TIF NO. 3 FUNDSCHEDULE OF REVENUES, EXPENDITURES AND CHANGES IN FUND BALANCE
BUDGET (GAAP BASIS) AND ACTUAL
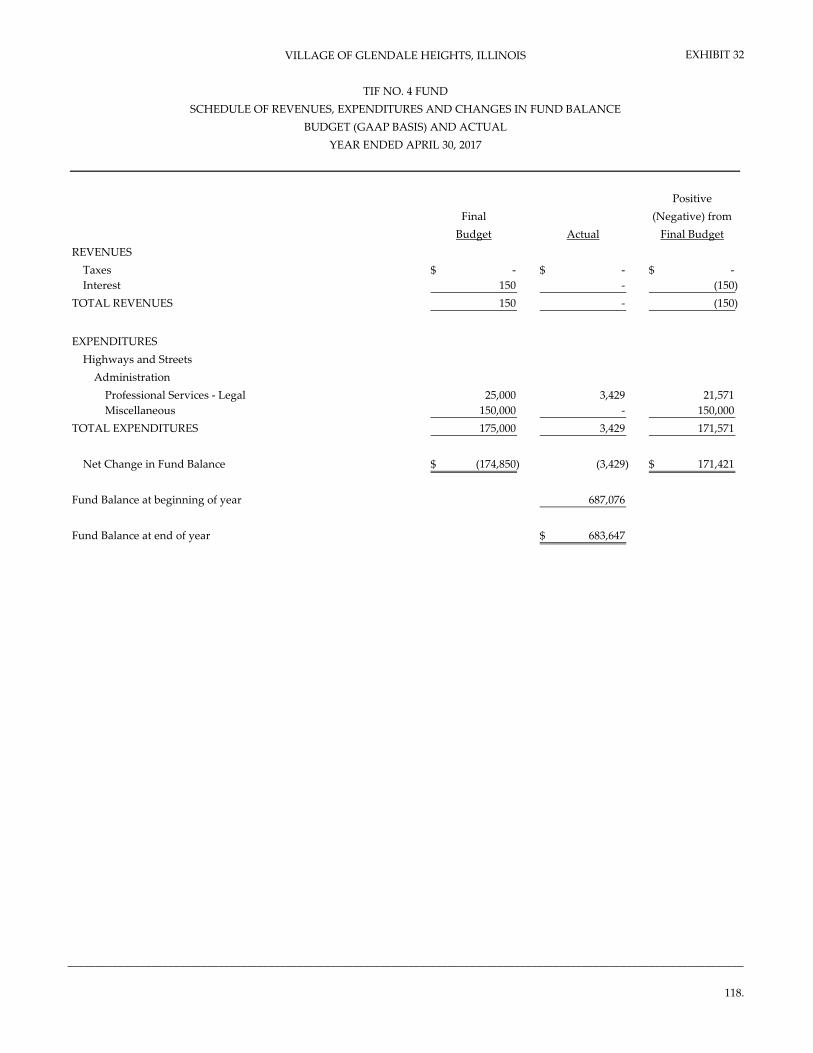
EXHIBIT 32
_________________________________________________________________________________________________________________________
118.
PositiveFinal (Negative) from
Budget Actual Final BudgetREVENUES
Taxes -$ -$ -$ Interest 150 - (150)
TOTAL REVENUES 150 - (150)
EXPENDITURESHighways and Streets
AdministrationProfessional Services - Legal 25,000 3,429 21,571 Miscellaneous 150,000 - 150,000
TOTAL EXPENDITURES 175,000 3,429 171,571
Net Change in Fund Balance (174,850)$ (3,429) 171,421$
Fund Balance at beginning of year 687,076
Fund Balance at end of year 683,647$
VILLAGE OF GLENDALE HEIGHTS, ILLINOIS
TIF NO. 4 FUNDSCHEDULE OF REVENUES, EXPENDITURES AND CHANGES IN FUND BALANCE
BUDGET (GAAP BASIS) AND ACTUALYEAR ENDED APRIL 30, 2017

EXHIBIT 33
_________________________________________________________________________________________________________________________
119.
PositiveFinal (Negative) from
Budget Actual Final BudgetREVENUES
Taxes 5,954$ 5,954$ -$ Miscellaneous - 49 49
TOTAL REVENUES 5,954 6,003 49
EXPENDITURESHighways and Streets
AdministrationProfessional Services - Legal 109,835 25,483 84,352
TOTAL EXPENDITURES 109,835 25,483 84,352
Net Change in Fund Balance (103,881)$ (19,480) 84,401$
Fund Balance at beginning of year (948,114)
Fund Balance at end of year (967,594)$
VILLAGE OF GLENDALE HEIGHTS, ILLINOIS
TIF NO. 5 FUNDSCHEDULE OF REVENUES, EXPENDITURES AND CHANGES IN FUND BALANCE
BUDGET (GAAP BASIS) AND ACTUALYEAR ENDED APRIL 30, 2017

EXHIBIT 34
________________________________________________________________________________________________________________________
120.
PositiveFinal (Negative) from
Budget Actual Final BudgetREVENUES
Taxes 950,000$ 957,756$ 7,756$ Interest 100 548 448
TOTAL REVENUES 950,100 958,304 8,204
EXPENDITURESGeneral Government
IMRF - Employer 987,400 926,552 60,848 TOTAL EXPENDITURES 987,400 926,552 60,848
Net Change in Fund Balance (37,300)$ 31,752 69,052$
Fund Balance at beginning of year (166,735)
Fund Balance at end of year (134,983)$
YEAR ENDED APRIL 30, 2017
VILLAGE OF GLENDALE HEIGHTS, ILLINOIS
IMRF FUNDSCHEDULE OF REVENUES, EXPENDITURES AND CHANGES IN FUND BALANCE
BUDGET (GAAP BASIS) AND ACTUAL
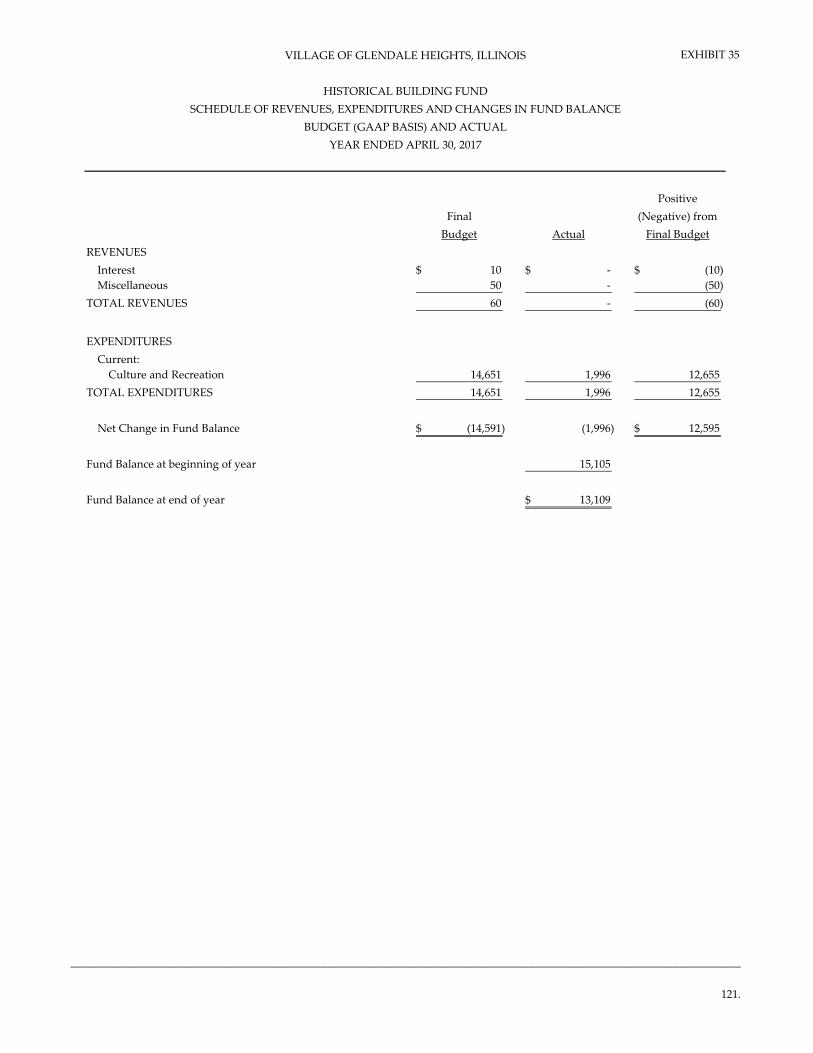
EXHIBIT 35
________________________________________________________________________________________________________________________
121.
PositiveFinal (Negative) from
Budget Actual Final BudgetREVENUES
Interest 10$ -$ (10)$ Miscellaneous 50 - (50)
TOTAL REVENUES 60 - (60)
EXPENDITURESCurrent:
Culture and Recreation 14,651 1,996 12,655 TOTAL EXPENDITURES 14,651 1,996 12,655
Net Change in Fund Balance (14,591)$ (1,996) 12,595$
Fund Balance at beginning of year 15,105
Fund Balance at end of year 13,109$
YEAR ENDED APRIL 30, 2017
VILLAGE OF GLENDALE HEIGHTS, ILLINOIS
HISTORICAL BUILDING FUNDSCHEDULE OF REVENUES, EXPENDITURES AND CHANGES IN FUND BALANCE
BUDGET (GAAP BASIS) AND ACTUAL

CAPITAL PROJECTS FUNDS Vehicle Replacement Fund – To account for the financing and replacement of vehicles used by the Village. Financing is provided by operating transfers from other funds. Computer Replacement Fund – To account for the financing and replacement of computers used by the Village. Financing is provided by operating transfers from other funds. Capital Projects Fund – To account for the financing of capital improvement projects. Financing is provided by bond proceeds and operating transfers from other funds. Cart Replacement Fund – To account for the financing and replacement of carts used by the Golf Course. Financing is provided by operating transfers from the Golf Course. Recreation Equipment Replacement Fund – To account for the financing of recreation equipment used by the Village. Financing is provided by operating transfers from the Recreation Fund. GOB Series 2010 Fund - To account for financial resources to be used for the acquisition or construction of major capital facilities that is funded by the bond proceeds.
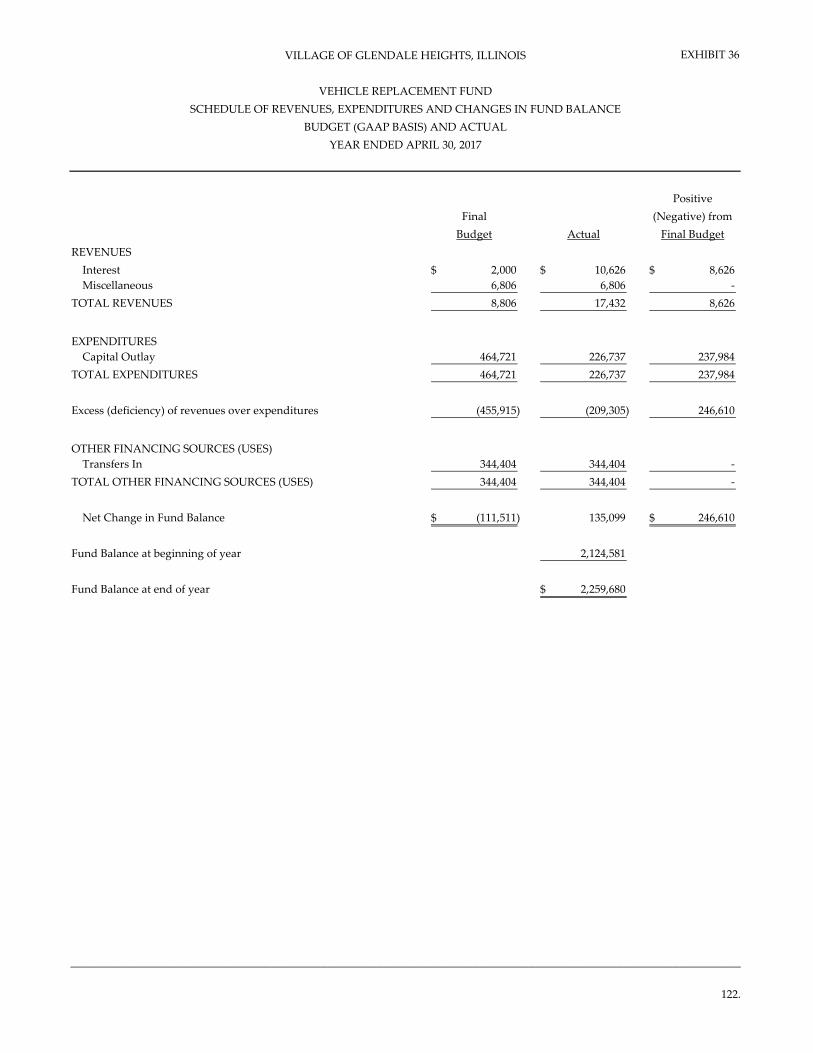
EXHIBIT 36
________________________________________________________________________________________________________________________
122.
PositiveFinal (Negative) from
Budget Actual Final BudgetREVENUES
Interest 2,000$ 10,626$ 8,626$ Miscellaneous 6,806 6,806 -
TOTAL REVENUES 8,806 17,432 8,626
EXPENDITURESCapital Outlay 464,721 226,737 237,984
TOTAL EXPENDITURES 464,721 226,737 237,984
Excess (deficiency) of revenues over expenditures (455,915) (209,305) 246,610
OTHER FINANCING SOURCES (USES)Transfers In 344,404 344,404 -
TOTAL OTHER FINANCING SOURCES (USES) 344,404 344,404 -
Net Change in Fund Balance (111,511)$ 135,099 246,610$
Fund Balance at beginning of year 2,124,581
Fund Balance at end of year 2,259,680$
YEAR ENDED APRIL 30, 2017
VEHICLE REPLACEMENT FUND
VILLAGE OF GLENDALE HEIGHTS, ILLINOIS
SCHEDULE OF REVENUES, EXPENDITURES AND CHANGES IN FUND BALANCEBUDGET (GAAP BASIS) AND ACTUAL

EXHIBIT 37
________________________________________________________________________________________________________________________
123.
PositiveFinal (Negative) from
Budget Actual Final BudgetREVENUES
Interest 150$ -$ (150)$ TOTAL REVENUES 150 - (150)
EXPENDITURESCurrent:
General Government - 27,339 (27,339) Capital Outlay 87,402 16,132 71,270
TOTAL EXPENDITURES 87,402 43,471 43,931
Excess (deficiency) of revenues over expenditures (87,252) (43,471) 43,781
OTHER FINANCING SOURCES (USES)Transfers In 41,845 41,845 -
TOTAL OTHER FINANCING SOURCES (USES) 41,845 41,845 -
Net Change in Fund Balance (45,407)$ (1,626) 43,781$
Fund Balance at beginning of year 210,200
Fund Balance at end of year 208,574$
YEAR ENDED APRIL 30, 2017
VILLAGE OF GLENDALE HEIGHTS, ILLINOIS
COMPUTER REPLACEMENT FUNDSCHEDULE OF REVENUES, EXPENDITURES AND CHANGES IN FUND BALANCE
BUDGET (GAAP BASIS) AND ACTUAL

EXHIBIT 38
________________________________________________________________________________________________________________________
124.
PositiveFinal (Negative) from
Budget Actual Final BudgetREVENUES
IntergovernmentalState Grant 25,000$ -$ (25,000)$
Total Intergovernmental 25,000 - (25,000)
Interest -$ -$ -$ TOTAL REVENUES 25,000 - (25,000)
EXPENDITURESCapital Outlay 1,109,963$ 412,311$ 697,652$
TOTAL EXPENDITURES 1,109,963 412,311 697,652
Excess (deficiency) of revenues over expenditures (1,084,963) (412,311) 672,652
OTHER FINANCING SOURCES (USES)Transfers In 672,298 672,298 - Transfers Out - (46,377) 46,377
TOTAL OTHER FINANCING SOURCES (USES) 672,298 625,921 46,377
Net Change in Fund Balance (412,665)$ 213,610 626,275$
Fund Balance at beginning of year 547,848
Fund Balance at end of year 761,458$
YEAR ENDED APRIL 30, 2017
VILLAGE OF GLENDALE HEIGHTS, ILLINOIS
CAPITAL PROJECTS FUNDSCHEDULE OF EXPENDITURES AND CHANGES IN FUND BALANCE
BUDGET (GAAP BASIS) AND ACTUAL

EXHIBIT 39
________________________________________________________________________________________________________________________
125.
PositiveFinal (Negative) from
Budget Actual Final Budget
EXPENDITURESCapital Outlay 12,000$ -$ 12,000$ Building and Maintenance - 10,549 (10,549)
TOTAL EXPENDITURES 12,000 10,549 1,451
Excess (deficiency) of revenues over expenditures (12,000) (10,549) 1,451
OTHER FINANCING SOURCES (USES)Transfers Out - (24,653) 24,653
TOTAL OTHER FINANCING SOURCES (USES) - (24,653) 24,653
Net Change in Fund Balance (12,000)$ (35,202) (23,202)$
Fund Balance at beginning of year 35,202
Fund Balance at end of year -$
VILLAGE OF GLENDALE HEIGHTS, ILLINOIS
RECREATION EQUIPMENT REPLACEMENT FUNDSCHEDULE OF EXPENDITURES AND CHANGES IN FUND BALANCE
BUDGET (GAAP BASIS) AND ACTUALYEAR ENDED APRIL 30, 2017

EXHIBIT 40
________________________________________________________________________________________________________________________
126.
PositiveFinal (Negative) from
Budget Actual Final BudgetREVENUES
Miscellaneous -$ 1$ 1$ TOTAL REVENUES - 1 1
EXPENDITURESCapital Outlay 558,915 462,905 96,010
TOTAL EXPENDITURES 558,915 462,905 96,010
Excess (deficiency) of revenues over expenditures (558,915) (462,904) 96,011
OTHER FINANCING SOURCES (USES)Transfers In - 46,377 46,377 Transfers Out (168,000) (168,000) -
TOTAL OTHER FINANCING SOURCES (USES) (168,000) (121,623) 46,377
Net Change in Fund Balance (726,915)$ (584,527) 142,388$
Fund Balance at beginning of year 661,700
Fund Balance at end of year 77,173$
VILLAGE OF GLENDALE HEIGHTS, ILLINOIS
GOB SERIES 2010 FUNDSCHEDULE OF REVENUES, EXPENDITURES AND CHANGES IN FUND BALANCE
BUDGET (GAAP BASIS) AND ACTUALYEAR ENDED APRIL 30, 2017

PROPRIETARY FUND TYPE

ENTERPRISE FUNDS Golf Course Fund – To account for the operational activities of a municipal golf course. Activities include, but are not limited to, course construction, including clubhouses and maintenance facilities, operations, maintenance and financing. Environmental Service Fund – To account for the provision of water, sewer and wastewater services to the residents of the Village. All activities necessary to provide such services are accounted for in this fund, including, but not limited to, administration, operations, maintenance, financing and related debt service, and billing and collection.

EXHIBIT 41
______________________________________________________________________________________________________________________127.
PositiveFinal (Negative) from
Budget Actual Final BudgetOPERATING REVENUES
Charges for ServicesRentals 225,750$ 134,209$ (91,541)$ Proshop Sales 54,600 42,417 (12,183) Green Fees 536,250 403,066 (133,184) Permanent Tee Times 400 100 (300) Memberships 19,600 10,661 (8,939) Concessions 222,881 206,448 (16,433) Banquet Revenue 740,000 733,583 (6,417) Entry Fees 6,450 6,450 - Sponsors 25,900 25,513 (387) Tickets 6,411 6,411 - Donations 250 - (250)
Total Charges for Services 1,838,492 1,568,858 (269,634)
Miscellaneous 7,000 - (7,000)
TOTAL OPERATING REVENUES 1,845,492 1,568,858 (276,634)
OPERATING EXPENSESAdministration 807,499 847,444 (39,945) Golf Course 1,000,697 1,050,734 (50,037)
TOTAL OPERATING EXPENSES 1,808,196 1,898,178 (89,982)
Operating income (loss) 37,296 (329,320) (366,616)
NONOPERATING REVENUES (EXPENSES)State Grants 7,250 7,250 - Interest 250 - (250)
TOTAL NONOPERATING REVENUES (EXPENSES) 7,500 7,250 (250)
Income (loss) before transfers 44,796 (322,070) (366,866)
TRANSFERSTransfers Out (44,400) (44,400) -
TOTAL TRANSFERS (44,400) (44,400) -
Net Income (Loss) - budgetary basis 396$ (366,470) (366,866)$
Adjustments to GAAP basis 144,832
Net Income (Loss) - GAAP basis (511,302)$
YEAR ENDED APRIL 30, 2017BUDGET (BUDGET BASIS) AND ACTUAL
VILLAGE OF GLENDALE HEIGHTS, ILLINOIS
GOLF COURSE FUNDSCHEDULE OF REVENUES AND EXPENSES

EXHIBIT 42
________________________________________________________________________________________________________________________(Continued) 128.
PositiveFinal (Negative) from
Budget Actual Final Budget
OPERATING EXPENSESAdministration
Building MaintenanceOther Purchased Services 6,575$ 6,353$ 222$ Janitorial Supplies 3,200 3,291 (91) Other Building Maintenance Supplies 1,000 1,070 (70) Building Maintenance 288 - 288 Golf Course - Clubhouse 5,124 4,493 631
Total Building Maintenance 16,187 15,207 980
Administration - Golf CourseSalaries - Regular 98,336 112,798 (14,462) Fica - Employer 6,435 5,968 467 Unemployment Insurance 2,000 2,000 - Imrf - Employer 69,250 126,410 (57,160) Medical - Employer 115,158 112,662 2,496 Travel, Meeting & Conferences 200 125 75 Medicare - Employer 1,506 1,396 110 Office Equipment 3,500 3,195 305 Other Equipment 600 359 241 Printing & Binding 350 21 329 Advertising 32,700 32,324 376 Mosquito & Animal Control 1,100 1,199 (99) Postage 150 - 150 Miscellaneous Supplies 200 215 (15) Telephone 7,300 8,231 (931) Cellular Phone 300 300 - Electricity 39,000 41,156 (2,156) Natural Gas 15,000 14,806 194 Leases - Equipment 5,152 4,488 664 Rentals - Equipment 976 1,010 (34) Other Improvements 13,250 8,442 4,808 Membership Dues 1,741 1,654 87 Licenses 1,125 1,108 17 Bank Fiscal Charges 21,500 19,296 2,204
Total Golf Course - Administration 436,829 499,163 (62,334)
Building & GroundsSalaries - Regular 123,668 126,137 (2,469) Salaries - Temporary 86,500 95,526 (9,026) Salaries - Overtime 1,000 805 195 Fica - Employer 13,372 13,448 (76) Travel, Meeting & Conferences 200 175 25
YEAR ENDED APRIL 30, 2017
VILLAGE OF GLENDALE HEIGHTS, ILLINOIS
GOLF COURSE FUNDSCHEDULE OF OPERATING EXPENSES
BUDGET (BUDGET BASIS) AND ACTUAL

EXHIBIT 42
________________________________________________________________________________________________________________________(Continued) 129.
PositiveFinal (Negative) from
Budget Actual Final Budget
YEAR ENDED APRIL 30, 2017
VILLAGE OF GLENDALE HEIGHTS, ILLINOIS
GOLF COURSE FUNDSCHEDULE OF OPERATING EXPENSES
BUDGET (BUDGET BASIS) AND ACTUAL
Training & Seminars 200$ 130$ 70$ Medicare - Employer 3,128 3,145 (17) Topdressing Soil 4,000 4,098 (98) Gravel and Sand - 2,661 (2,661) Grass Seeds 1,500 730 770 Landscaping Supplies 5,500 6,237 (737) Fertilizers 15,500 15,938 (438) Service Dog 7,600 7,600 - Uniforms 1,100 494 606 Chemicals 19,250 18,083 1,167 Gas & Fuel 13,000 10,941 2,059 Miscellaneous Supplies 200 107 93 Parks & Grounds Tools 1,000 418 582 Fleet Maintenance 250 - 250 Markers & Marking Paints 500 480 20 Green Supplies 1,000 334 666 Tee Supplies 1,200 874 326 Sand Trap Supplies 1,050 213 837 Other Building & Ground Supplies 500 - 500 Cellular Phone 300 300 - Leases - Equipment 2,740 (2,249) 4,989 Rentals - Equipment 2,200 1,576 624 Golf Course Equipment 22,250 12,166 10,084 Golf Carts 10,000 8,264 1,736 Golf Course - Maintenance Building 3,000 - 3,000 Golf Course 3,000 3,493 (493) Membership Dues 750 725 25 Subscriptions 25 - 25 Miscellaneous Expenses 222 225 (3) Golf Course Improvements 8,778 - 8,778
Total Building & Grounds 354,483 333,074 21,409
Total Administration 807,499 847,444 (39,945)
Golf CourseProshop
Salaries - Regular 35,791 35,926 (135) Salaries - Temporary 71,000 68,048 2,952 Salaries - Overtime 200 127 73 Fica - Employer 6,572 6,569 3 Medicare - Employer 1,537 1,536 1 Uniforms 1,100 1,088 12

EXHIBIT 42
________________________________________________________________________________________________________________________(Continued) 130.
PositiveFinal (Negative) from
Budget Actual Final Budget
YEAR ENDED APRIL 30, 2017
VILLAGE OF GLENDALE HEIGHTS, ILLINOIS
GOLF COURSE FUNDSCHEDULE OF OPERATING EXPENSES
BUDGET (BUDGET BASIS) AND ACTUAL
Handicap 1,000$ 610$ 390$ Pencils 225 201 24 Golf Accessories 100 - 100 Other Proshop Supplies 1,250 956 294 Golf Balls 7,000 6,552 448 Golf Gloves 1,965 1,861 104 Golf Apparels 4,235 3,051 1,184 Golf Accessories 1,500 1,039 461 Golf Clubs 6,000 4,876 1,124 Golf Shoes - 589 (589) Golf Gift Accessories 500 29 471 Event Gifts - For Sales 7,000 8,009 (1,009) Golf Headwear 2,500 2,153 347 Special Orders 4,000 5,339 (1,339) Equipment Rentals 31,000 24,232 6,768 Membership Dues 625 624 1 Subscriptions 25 - 25
Total Proshop 185,125 173,415 11,710
Food and BeverageSalaries - Regular 241,000 240,109 891 Salaries - Temporary 125,000 150,581 (25,581) Salaries - Overtime 1,000 963 37 Fica - Employer 22,847 25,081 (2,234) Travel, Meeting & Conferences 250 110 140 Training & Seminars 319 98 221 Medicare - Employer 5,344 5,866 (522) Printing & Binding 500 335 165 Cleaning Supplies 4,000 3,954 46 Uniforms 1,431 1,445 (14) Miscellaneous Supplies 3,500 3,797 (297) Other Operating Equipment 3,765 3,765 - Paper Goods 3,000 3,044 (44) Utensils 1,150 1,877 (727) Glass & Chinas 5,250 6,376 (1,126) Flowers 26,000 28,361 (2,361) Linens 400 - 400 Other General Supplies 300 314 (14) Beverages 18,000 17,100 900 Beer 23,000 24,921 (1,921) Liquor & Wines 25,000 31,410 (6,410) Foods 200,000 223,211 (23,211)

EXHIBIT 42
________________________________________________________________________________________________________________________131.
PositiveFinal (Negative) from
Budget Actual Final Budget
YEAR ENDED APRIL 30, 2017
VILLAGE OF GLENDALE HEIGHTS, ILLINOIS
GOLF COURSE FUNDSCHEDULE OF OPERATING EXPENSES
BUDGET (BUDGET BASIS) AND ACTUAL
Cigarettes & Tobacco 1,500$ 1,366$ 134$ Other Food and Beverage Supplies 15,000 14,864 136 Summer fest 16,500 11,888 4,612 Cellular Phone 300 300 - Golf Course Equipment Maintenance 7,500 8,350 (850) Membership Dues 50 50 - Dry Cleaning 100 - 100 Summer Fest Booth rental 25,000 25,000 - Bad debt expense - 4,218 (4,218)
Total Food and Beverage 777,006 838,754 (61,748)
Charity ClassicTravel, Meeting & Conferences 1,131 1,130 1 Other Community Contributions 24,000 24,000 - Charity Classic Expenses 13,435 13,435 -
Total Charity Classic 38,566 38,565 1
Total Golf Course 1,000,697 1,050,734 (50,037)
TOTAL OPERATING EXPENSES 1,808,196$ 1,898,178$ (89,982)$

EXHIBIT 43
________________________________________________________________________________________________________________________
132.
PositiveFinal (Negative) from
Budget Actual Final BudgetOPERATING REVENUES
Charges for ServicesWater and Sewer Receipts 10,372,231$ 10,498,676$ 126,445$ Penalties 250,000 278,488 28,488 Cash Over (Short) - (123) (123)
Total Charges for Services 10,622,231 10,777,041 154,810
TOTAL OPERATING REVENUES 10,622,231 10,777,041 154,810
OPERATING EXPENSESOperations 10,566,520 9,432,115 1,134,405
TOTAL OPERATING EXPENSES 10,566,520 9,432,115 1,134,405
Operating income (loss) 55,711 1,344,926 1,289,215
NONOPERATING REVENUES (EXPENSES)Capital Infrastructure Fee - - - Home Rule Tax 500,000 669,416 169,416 Interest 100 273 173
TOTAL NONOPERATING REVENUES (EXPENSES) 500,100 669,689 169,589
Income (loss) before transfers 555,811 2,014,615 1,458,804
TRANSFERSTransfers In 158,000 158,000 - Transfers Out (699,303) (699,303) -
TOTAL TRANSFERS (541,303) (541,303) -
Net Income (Loss) - budgetary basis 14,508$ 1,473,312 1,458,804$
Adjustments to GAAP basis - depreciation expense, contribution revenue, loss on disposal of assets 575,397
Net Income (Loss) - GAAP basis 897,915$
YEAR ENDED APRIL 30, 2017
VILLAGE OF GLENDALE HEIGHTS, ILLINOIS
ENVIRONMENTAL SERVICES FUNDSCHEDULE OF REVENUES AND EXPENSES
BUDGET (BUDGET BASIS) AND ACTUAL

EXHIBIT 44
________________________________________________________________________________________________________________________(Continued) 133.
PositiveFinal (Negative) from
Budget Actual Final Budget
OPERATING EXPENSESOperations
AdministrationSalaries - Regular 306,385$ 312,208$ (5,823)$ Salaries - Overtime Pay 3,700 971 2,729 Fica - Employer 18,542 18,270 272 Imrf - Employer 297,503 509,350 (211,847) Medical - Employer 482,461 445,722 36,739 Medicare - Employer 4,332 4,394 (62) Purchased Services 2,150 802 1,348 Health & Wellness 375 329 46 Opt Out Med Insurance 5,180 5,555 (375) Travel, Meeting & Conferences 250 220 30 Printing & Binding 1,100 806 294 Janitorial Supplies 3,500 3,203 297 Electrical Supplies 750 44 706 Hardware Supplies 100 63 37 Plumbing Supplies 175 66 109 Lumber Supplies 100 - 100 Building Maintenance 9,628 9,381 247 Miscellaneous Office Supplies 200 3 197 Postage 46,500 45,366 1,134 Pager 72 53 19 Miscellaneous Communication 25 19 6 Network Consulting 20,400 20,003 397 H.T.E. Annual Service Contract 19,873 19,873 - Other Purchase Services 29,900 32,948 (3,048)
Total Administration 1,253,201 1,449,781 (196,580)
Human ResourcesSalaries - Regular 44,749 46,562 (1,813) Fica - Employer 2,774 2,727 47 Medicare - Employer 649 638 11
Total Human Resources 48,172 49,927 (1,755)
Public RelationsSalaries - Regular 6,476 6,477 (1) Fica - Employer 402 397 5 Medicare - Employer 94 93 1
Total Public Relations 6,972 6,967 5
YEAR ENDED APRIL 30, 2017
VILLAGE OF GLENDALE HEIGHTS, ILLINOIS
ENVIRONMENTAL SERVICES FUNDSCHEDULE OF OPERATING EXPENSES
BUDGET (BUDGET BASIS) AND ACTUAL

EXHIBIT 44
________________________________________________________________________________________________________________________(Continued) 134.
PositiveFinal (Negative) from
Budget Actual Final Budget
YEAR ENDED APRIL 30, 2017
VILLAGE OF GLENDALE HEIGHTS, ILLINOIS
ENVIRONMENTAL SERVICES FUNDSCHEDULE OF OPERATING EXPENSES
BUDGET (BUDGET BASIS) AND ACTUAL
FinanceSalaries - Regular 107,531$ 107,531$ -$ Fica - Employer 6,529 6,320 209 Medicare - Employer 1,531 1,520 11
Total Finance 115,591 115,371 220
EngineeringSalaries - Regular 149,021 146,993 2,028 Fica - Employer 9,240 8,192 1,048 Travel 200 - 200 Training & Seminars 800 - 800 Medicare - Employer 2,160 2,059 101 Auditing 13,000 13,000 - Legal - 1,240 (1,240) Engineering 5,000 2,833 2,167 Printing & Binding 1,075 308 767 Postage 100 - 100 Miscellaneous Supplies 300 15 285 Uniforms 200 124 76 Gas & Fuel 500 68 432 Telephone 7,200 5,524 1,676 Cellular Phone 1,250 458 792 Natural Gas 7,000 - 7,000 Leases - Equipment 3,500 2,495 1,005 Membership Dues 500 - 500 Software Maintenance 500 397 103 Furniture & Fixtures 350 273 77 Bank Fiscal Charges 38,000 43,380 (5,380)
Total Engineering 239,896 227,359 12,537
WaterSalaries - Regular 487,554 492,021 (4,467) Salaries - Overtime 30,000 22,452 7,548 Fica - Employer 32,088 31,127 961 Travel, Meeting & Conferences 1,200 445 755 Training & Seminars 9,000 2,985 6,015 Medicare - Employer 7,505 7,280 225 Legal 10,000 7,425 2,575 Engineering 15,000 8,521 6,479 Public Works - Water Supplies 9,000 10,578 (1,578) Debris Removal 15,000 9,566 5,434

EXHIBIT 44
________________________________________________________________________________________________________________________(Continued) 135.
PositiveFinal (Negative) from
Budget Actual Final Budget
YEAR ENDED APRIL 30, 2017
VILLAGE OF GLENDALE HEIGHTS, ILLINOIS
ENVIRONMENTAL SERVICES FUNDSCHEDULE OF OPERATING EXPENSES
BUDGET (BUDGET BASIS) AND ACTUAL
Printing & Binding 2,300$ 266$ 2,034$ Contractual Services 137,406 56,946 80,460 Software Support & Maintenance 7,700 - 7,700 Miscellaneous Office Supplies 500 381 119 Gravel & Sand - 7,015 (7,015) Landscaping Supplies 5,000 4,104 896 Materials 26,000 47,075 (21,075) Uniforms 3,500 2,702 798 Chemicals 300 40 260 Gas & Fuel 15,000 12,999 2,001 Operational Supplies 74,500 76,663 (2,163) Miscellaneous Supplies 6,000 55,605 (49,605) Operational Equipment 5,000 3,225 1,775 Cellular Phone 580 483 97 Electricity 47,000 52,469 (5,469) Lake Michigan Water 3,936,000 4,096,488 (160,488) Rentals - Equipment 2,000 - 2,000 Infrastructure - Maintenance 6,000 4,728 1,272 Tank Maintenance 250 200 50 Membership Dues 750 672 78 Public Works - Water 87,200 - 87,200 Infrastructure - Water 707,878 29,369 678,509
Total Water 5,687,211 5,043,830 643,381
SewerSalaries - Regular 538,337 534,625 3,712 Salaries - Overtime 30,000 22,821 7,179 Fica - Employer 35,237 33,458 1,779 Training & Seminars 5,500 4,340 1,160 Medicare - Employer 8,241 7,824 417 Legal 13,000 14,802 (1,802) Engineering 221,025 56,829 164,196 Debris Removal 10,000 8,155 1,845 Contractual Services 51,513 30,742 20,771 Miscellaneous Office Supplies 500 382 118 Landscaping Supplies 4,000 2,965 1,035 Materials 10,000 8,028 1,972 Uniforms 4,000 2,783 1,217 Chemicals 10,000 6,624 3,376 Gas & Fuel 20,000 15,352 4,648 Operational Supplies 27,500 18,300 9,200

EXHIBIT 44
________________________________________________________________________________________________________________________(Continued) 136.
PositiveFinal (Negative) from
Budget Actual Final Budget
YEAR ENDED APRIL 30, 2017
VILLAGE OF GLENDALE HEIGHTS, ILLINOIS
ENVIRONMENTAL SERVICES FUNDSCHEDULE OF OPERATING EXPENSES
BUDGET (BUDGET BASIS) AND ACTUAL
Private Excavation Supplies 15,000$ 14,469$ 531$ Miscellaneous Supplies 4,000 3,705 295 Operational Equipment 6,000 6,181 (181) Cellular Phone 580 538 42 Electricity 25,000 20,990 4,010 Natural Gas 1,200 597 603 Rentals - Equipment 1,000 95 905 Capital Equipment 20,000 - 20,000 Infrastructure - Sewer 550,000 261,894 288,106
Total Sewer 1,611,633 1,076,499 535,134
Water TreatmentSalaries - Regular 567,022 557,803 9,219 Salaries - Overtime 20,000 17,250 2,750 Fica - Employer 36,395 35,053 1,342 Travel, Meeting & Conferences - 12 (12) Training & Seminars 8,400 6,902 1,498 Medicare - Employer 8,512 8,198 314 Legal Services 10,000 9,259 741 Engineering 137,900 69,068 68,832 Public Works - Water Treatment Supplies 19,250 17,414 1,836 Sludge Removal 105,000 97,713 7,287 Printing & Binding 1,500 517 983 Software Support & Maintenance 25,000 1,310 23,690 Miscellaneous Office Supplies 200 130 70 Other Purchased Services - 8,833 (8,833) Uniforms 2,650 2,178 472 Chemicals 36,650 27,509 9,141 Lab Supplies 6,000 4,116 1,884 Gas & Fuel 1,500 1,207 293 Oil & Grease 1,000 984 16 Miscellaneous Supplies 3,500 4,544 (1,044) Other Operating Equipment 2,000 1,432 568 Telephone 2,600 2,195 405 Cellular Phone 1,200 513 687 Electricity 220,000 226,193 (6,193) Natural Gas 9,000 5,189 3,811 Leases - Equipment 2,300 1,701 599 Public Works - Water Treatment Maintenance 55,300 65,542 (10,242) Public Works - Electrical Storm Damage 60,000 58,554 1,446
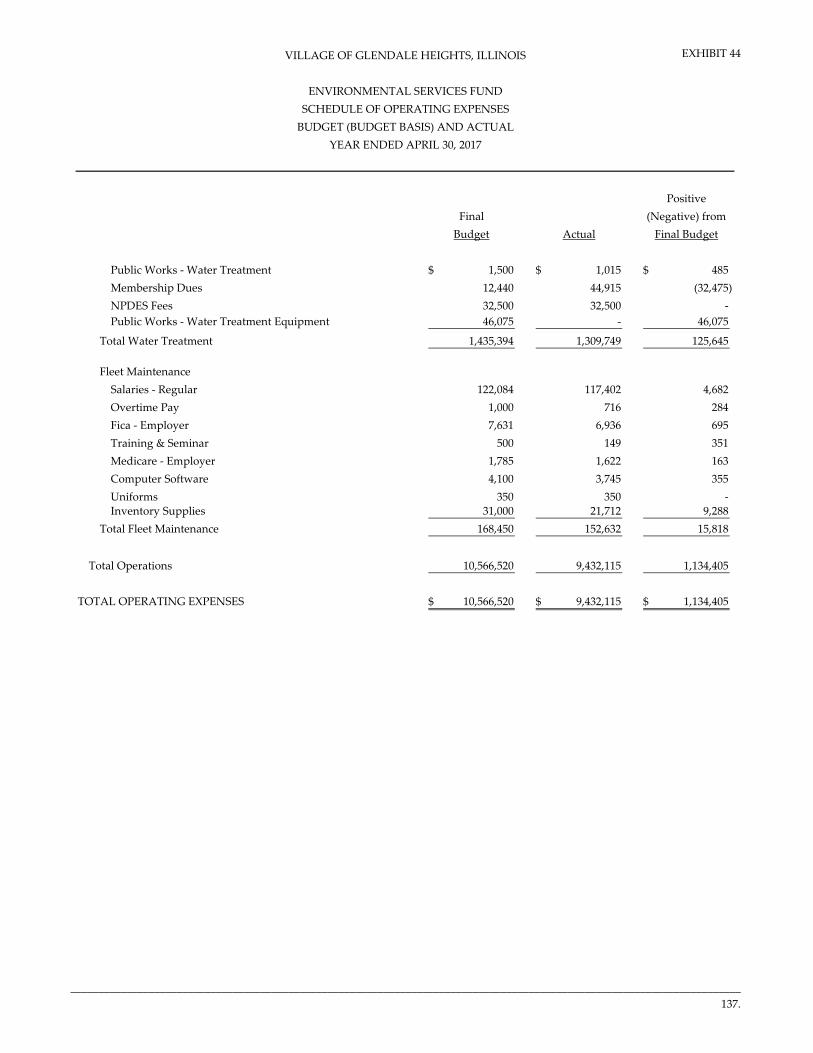
EXHIBIT 44
________________________________________________________________________________________________________________________137.
PositiveFinal (Negative) from
Budget Actual Final Budget
YEAR ENDED APRIL 30, 2017
VILLAGE OF GLENDALE HEIGHTS, ILLINOIS
ENVIRONMENTAL SERVICES FUNDSCHEDULE OF OPERATING EXPENSES
BUDGET (BUDGET BASIS) AND ACTUAL
Public Works - Water Treatment 1,500$ 1,015$ 485$ Membership Dues 12,440 44,915 (32,475) NPDES Fees 32,500 32,500 - Public Works - Water Treatment Equipment 46,075 - 46,075
Total Water Treatment 1,435,394 1,309,749 125,645
Fleet MaintenanceSalaries - Regular 122,084 117,402 4,682 Overtime Pay 1,000 716 284 Fica - Employer 7,631 6,936 695 Training & Seminar 500 149 351 Medicare - Employer 1,785 1,622 163 Computer Software 4,100 3,745 355 Uniforms 350 350 - Inventory Supplies 31,000 21,712 9,288
Total Fleet Maintenance 168,450 152,632 15,818
Total Operations 10,566,520 9,432,115 1,134,405
TOTAL OPERATING EXPENSES 10,566,520$ 9,432,115$ 1,134,405$

FIDUCIARY FUND TYPES

TRUST AND AGENCY FUNDS Pension Trust Fund – To account for the accumulation of resources to be used for retirement annuity payments in appropriate amounts and times in the future. Resources are contributed by employees at rates fixed by law and by the Village at amounts determined by an actuarial study. Escrow Agency Fund – To account for the 3% deposits from a developer that is required when construction within the Village occurs. The balance of the deposit is returned after any expenses, when the construction is completed.

EXHIBIT 45
________________________________________________________________________________________________________________________
138.
PositiveFinal (Negative) from
Budget Actual Final BudgetADDITIONS
ContributionsEmployee Contributions 442,000$ 456,235$ 14,235$ Employer Contributions 1,737,778 1,752,138 14,360
Total Contributions 2,179,778 2,208,373 28,595
Investment earnings:Net Increase in Fair Value of Investments - 1,451,795 1,451,795 Interest 500,000 1,092,199 592,199 Less investment expense (90,000) (123,529) (33,529)
Total Investment earnings 410,000 2,420,465 2,010,465
TOTAL ADDITIONS 2,589,778 4,628,838 2,039,060
DEDUCTIONSGeneral Government
Benefits 2,285,259 2,128,468 156,791 Administrative Expenses 27,645 22,811 4,834
TOTAL DEDUCTIONS 2,312,904 2,151,279 161,625
Change in Net Position 276,874$ 2,477,559 2,200,685$
Net Position Held Restricted for Pensionbeginning of year 34,652,784
Net Position Restricted for Pensionend of year 37,130,343$
YEAR ENDED APRIL 30, 2017
VILLAGE OF GLENDALE HEIGHTS, ILLINOIS
PENSION TRUST FUNDSCHEDULE OF CHANGES IN PLAN NET POSITION
BUDGET (GAAP BASIS) AND ACTUAL

EXHIBIT 46
________________________________________________________________________________________________________________________
139.
Beginning EndingBalance Increases Decreases Balance
ASSETSCash 931,225$ 1,458,706$ 1,470,683$ 919,248$
Total Assets 931,225$ 1,458,706$ 1,470,683$ 919,248$
LIABILITIES Accounts Payable 750$ 267,675$ 268,425$ -$
Deposits Payable 930,475 1,191,031 1,202,258 919,248
Total Liabilities 931,225$ 1,458,706$ 1,470,683$ 919,248$
VILLAGE OF GLENDALE HEIGHTS, ILLINOIS
ESCROW AGENCY FUND STATEMENT OF CHANGES IN ASSETS AND LIABILITIES
YEAR ENDED APRIL 30, 2017

SUPPLEMENTAL DATA
(Unaudited)

SCHEDULE 1
________________________________________________________________________________________________________________
140.
The current insurance coverage and risk retention related to these policies is as follows:
Public Entity Employee Benefits AdministrationEach Occurrence 1,000,000$ Aggregate 3,000,000 Deductible 1,000
Law Enforcement Liability ProgramAggregate Limit 2,000,000$ Each Wrongful Event 1,000,000 Each Wrongful Event Deductible 15,000
Liquor LiabilityAggregate Limit 1,000,000$ Each Person Bodily Inury Limit 1,000,000 Each Person Property Damage Limit 1,000,000 Loss of Means of Support Limit or Loss of Society Limit 1,000,000 Deductible None
Public Officials LiabilityEach Wrongful Act 1,000,000$ Total Limit 1,000,000 Deductible 25,000
Public Entity Employment Practices LiabilityEach Wrongful Offense 1,000,000$ Aggregate 1,000,000 Deductible 25,000
General Liability ProgramGeneral Aggregate 2,000,000$ Each Occurrence 1,000,000 Deductible None
Business Auto Liability ProgramAuto Liability 1,000,000$ Auto Medical Payments 5,000 (each person)
CyberFirst CoverageAggregate Limit 25,000$ Each Wrongful Act Deductible 25,000
Umbrella Liability ProgramGeneral Total Limit 10,000,000$ Law Enforcement Liability Ea. Wrongful act 10,000,000
VILLAGE OF GLENDALE HEIGHTS, ILLINOIS
SCHEDULE OF INSURANCE IN FORCEAPRIL 30, 2017

SCHEDULE 2
________________________________________________________________________________________________________________
141.
VILLAGE OF GLENDALE HEIGHTS, ILLINOIS
LONG-TERM DEBT REQUIREMENTSGENERAL OBLIGATION BOND SERIES OF 2006
APRIL 30, 2017
Date of issue:Original date of maturity:Original issue: $3,000,000Denomination of bonds: $5,000Interest rates: 3.50% - 4.00%Interest dates: April 1 and October 1Principal maturity date: April 1
PRINCIPAL AND INTEREST REQUIREMENTS
Fiscal YearEnding Requirements Interest DueApril 30 Principal Interest Total Apr 1 Amount Oct 1 Amount
2018 260,000$ 46,200$ 306,200$ 2018 23,100$ 2017 23,100$ 2019 280,000 35,800 315,800 2019 17,900 2018 17,900 2020 300,000 24,600 324,600 2020 12,300 2019 12,300 2021 315,000 12,600 327,600 2021 6,300 2020 6,300
1,155,000$ 119,200$ 1,274,200$ 59,600$ 59,600$
May 1, 2006April 1, 2021

SCHEDULE 3
________________________________________________________________________________________________________________________
142.
VILLAGE OF GLENDALE HEIGHTS, ILLINOIS
LONG-TERM DEBT REQUIREMENTSGENERAL OBLIGATION BOND SERIES OF 2007
APRIL 30, 2017
Date of issue:Original date of maturity:Original issue: $5,475,000Denomination of bonds: $5,000Interest rates: 3.50% - 4.00%Interest dates: June 15 and December 15Principal maturity date: December 15
PRINCIPAL AND INTEREST REQUIREMENTS
Fiscal YearEnding Requirements Interest DueApril 30 Principal Interest Total June 15 Amount Dec 15 Amount
2018 480,000$ 122,675$ 602,675$ 2017 61,337$ 2017 61,338$ 2019 495,000 104,675 599,675 2018 52,337 2018 52,338 2020 515,000 86,112 601,112 2019 43,056 2019 43,056 2021 535,000 66,800 601,800 2020 33,400 2020 33,400 2022 555,000 45,400 600,400 2021 22,700 2021 22,700 2023 580,000 23,200 603,200 2022 11,600 2022 11,600
3,160,000$ 448,862$ 3,608,862$ 224,430$ 224,432$
December 15, 2007December 15, 2022

SCHEDULE 4
________________________________________________________________________________________________________________________
143.
VILLAGE OF GLENDALE HEIGHTS, ILLINOIS
LONG-TERM DEBT REQUIREMENTSGENERAL OBLIGATION BOND SERIES OF 2008
APRIL 30, 2017
Date of issue:Original date of maturity:Original issue: $5,000,000Denomination of bonds: $5,000Interest rates: 3.25% - 3.875%Interest dates: June 15 and December 15Principal maturity date: December 15
PRINCIPAL AND INTEREST REQUIREMENTS
Fiscal YearEnding Requirements Interest DueApril 30 Principal Interest Total June 15 Amount Dec 15 Amount
2018 575,000$ 45,006$ 620,006$ 2017 22,503$ 2017 22,503$ 2019 605,000 23,444 628,444 2018 11,722 2018 11,722
1,180,000$ 68,450$ 1,248,450$ 34,225$ 34,225$
December 15, 2008December 15, 2018

SCHEDULE 5
________________________________________________________________________________________________________________________
144.
VILLAGE OF GLENDALE HEIGHTS, ILLINOIS
LONG-TERM DEBT REQUIREMENTSGENERAL OBLIGATION BOND SERIES OF 2009
APRIL 30, 2017
Date of issue: August 6, 2009Original date of maturity: December 15, 2029Original issue: $8,825,000Denomination of bonds: $5,000Interest rates: 1.375% - 5.375%Interest dates: June 15 and December 15Principal maturity date: December 15
PRINCIPAL AND INTEREST REQUIREMENTS
Fiscal YearEnding Requirements Interest Due
April 30 Principal Interest
Treasury Rebate Total June 15 Amount Dec 15 Amount
2018 740,000$ 203,950$ (71,383)$ 872,568$ 2017 101,975$ 2017 101,975$ 2019 775,000 174,350 (61,023) 888,328 2018 87,175 2018 87,175 2020 805,000 141,413 (49,494) 896,918 2019 70,706 2019 70,706 2021 245,000 105,188 (36,816) 313,372 2020 52,594 2020 52,594 2022 255,000 93,856 (32,850) 316,007 2021 46,928 2021 46,928 2023 265,000 81,744 (28,610) 318,133 2022 40,872 2022 40,872 2024 280,000 68,825 (24,089) 324,736 2023 34,413 2023 34,413 2025 300,000 54,825 (19,189) 335,636 2024 27,413 2024 27,413 2026 130,000 39,075 (13,676) 155,399 2025 19,538 2025 19,538 2027 140,000 32,250 (11,288) 160,963 2026 16,125 2026 16,125 2028 145,000 24,725 (8,654) 161,071 2027 12,363 2027 12,363 2029 155,000 16,931 (5,925) 166,006 2028 8,466 2028 8,466 2030 160,000 8,600 (3,010) 165,590 2029 4,300 2029 4,300
4,395,000$ 1,045,731$ (366,005)$ 5,074,726$ 522,866$ 522,866$

SCHEDULE 6
________________________________________________________________________________________________________________________
145.
VILLAGE OF GLENDALE HEIGHTS, ILLINOIS
LONG-TERM DEBT REQUIREMENTSGENERAL OBLIGATION BOND SERIES OF 2010
APRIL 30, 2017
Date of issue: April 1, 2010Original date of maturity: December 15, 2035Original issue: $29,940,000Denomination of bonds: $5,000Interest rates: 1.3% - 6.25%Interest dates: June 15 and December 15Principal maturity date: December 15
PRINCIPAL AND INTEREST REQUIREMENTS
Fiscal YearEnding Requirements Interest Due
April 30 Principal Interest
Treasury Rebate Total June 15 Amount Dec 15 Amount
2018 1,290,000$ 1,310,748$ (458,762)$ 2,141,986$ 2017 655,374$ 2017 655,374$ 2019 1,340,000 1,257,535 (440,137) 2,157,398 2018 628,768 2018 628,768 2020 1,395,000 1,200,585 (420,205) 2,175,380 2019 600,293 2019 600,293 2021 1,430,000 1,135,020 (397,257) 2,167,763 2020 567,510 2020 567,510 2022 1,505,000 1,065,308 (372,858) 2,197,450 2021 532,654 2021 532,654 2023 1,565,000 990,810 (346,784) 2,209,027 2022 495,405 2022 495,405 2024 1,635,000 911,778 (319,122) 2,227,655 2023 455,889 2023 455,889 2025 1,690,000 827,575 (289,651) 2,227,924 2024 413,788 2024 413,788 2026 1,780,000 738,850 (258,598) 2,260,253 2025 369,425 2025 369,425 2027 1,250,000 643,620 (225,267) 1,668,353 2026 321,810 2026 321,810 2028 1,310,000 575,495 (201,423) 1,684,072 2027 287,748 2027 287,748 2029 1,365,000 502,790 (175,977) 1,691,814 2028 251,395 2028 251,395 2030 1,435,000 425,668 (148,984) 1,711,684 2029 212,834 2029 212,834 2031 1,510,000 341,720 (119,602) 1,732,118 2030 170,860 2030 170,860 2032 725,000 251,875 (88,156) 888,719 2031 125,938 2031 125,938 2033 765,000 206,563 (72,297) 899,266 2032 103,281 2032 103,281 2034 805,000 158,750 (55,563) 908,188 2033 79,375 2033 79,375 2035 845,000 108,438 (37,953) 915,484 2034 54,219 2034 54,219 2036 890,000 55,625 (19,469) 926,156 2035 27,813 2035 27,813
24,530,000$ 12,708,750$ (4,448,062)$ 32,790,688$ 6,354,375$ 6,354,375$

STATISTICAL SECTION
(Unaudited)

STATISTICAL SECTION (Unaudited)
This statistical section of the comprehensive annual financial report presents detailed information as a context for understanding what the information in the financial statements, note disclosures, and required supplementary, and required supplementary information says about the Village’s overall financial health. Below is a description of the types of statistical schedules.
Financial Trends – These schedules contain trend information to help the reader understand how the Village’s financial performance has changed over time.
Revenue Capacity – These schedules contain information to help the reader assess the Village’s most significant local revenue source, the property tax.
Debt Capacity – These schedules represent information to help the reader assess the affordability of the Village’s current levels of outstanding debt and the Village’s ability to issue additional debt in the future.
Demographic and Economic Information – These schedules offer demographic and economic indicators to help the reader understand the environment within which the Village’s financial activities take place.
Operating Information – These schedules contain service and infrastructure data to help the reader understand how the information in the Villages report relates to the services the Village provides and the activities it performs.
.

Table 1
146.
Fiscal Year 2008 2009 2010 2011 2012 2013 2014 2015 2016 2017
GOVERNMENTAL ACTIVITIESNet investment in capital assets 37,884,970$ 44,607,890$ 42,289,303$ 35,209,812$ 33,829,777$ 33,856,581$ 37,471,678$ 40,587,050$ 45,245,643$ 48,864,413$ Restricted Net Position 13,339,556 12,840,529 42,644,662 6,992,315 6,408,725 4,766,831 4,392,692 2,974,593 1,916,355 981,369 Unrestricted 20,906,187 16,243,870 (16,626,618) 19,032,803 17,531,404 12,309,696 9,289,365 9,515,910 (12,114,594) (12,466,175)
TOTAL GOVERNMENTAL ACTIVITIES 72,130,713$ 73,692,289$ 68,307,347$ 61,234,930$ 57,769,906$ 50,933,108$ 51,153,735$ 53,077,553$ 35,047,404$ 37,379,607$
BUSINESS-TYPE ACTIVITIESNet investment in capital assets 40,282,279$ 39,668,795$ 40,153,598$ 42,545,769$ 42,542,276$ 41,749,113$ 41,149,363$ 40,181,186$ 40,082,725$ 40,831,490$ Unrestricted 1,136,192 (377,135) (1,262,991) (857,873) 581,098 1,114,947 660,511 161,063 (2,357,400) (2,719,552)
TOTAL BUSINESS-TYPE ACTIVITIES 41,418,471$ 39,291,660$ 38,890,607$ 41,687,896$ 43,123,374$ 42,864,060$ 41,809,874$ 40,342,249$ 37,725,325$ 38,111,938$
PRIMARY GOVERNMENTNet investment in capital assets 78,167,249$ 84,276,685$ 82,442,901$ 77,755,581$ 76,372,053$ 75,605,694$ 78,621,041$ 80,768,236$ 85,328,368$ 89,695,903$ Restricted Net Position 13,339,556 12,840,529 42,644,662 6,992,315 6,408,725 4,766,831 4,392,692 2,974,593 1,916,355 981,369 Unrestricted 22,042,379 15,866,735 (17,889,609) 18,174,930 18,112,502 13,424,643 9,949,876 9,676,973 (14,471,994) (15,185,727)
TOTAL PRIMARY GOVERNMENT 113,549,184$ 112,983,949$ 107,197,954$ 102,922,826$ 100,893,280$ 93,797,168$ 92,963,609$ 93,419,802$ 72,772,729$ 75,491,545$
Source: Financial Section, Statement of Net Position.
VILLAGE OF GLENDALE HEIGHTS, ILLINOIS
NET POSITION BY COMPONENT
Last Ten Fiscal Years
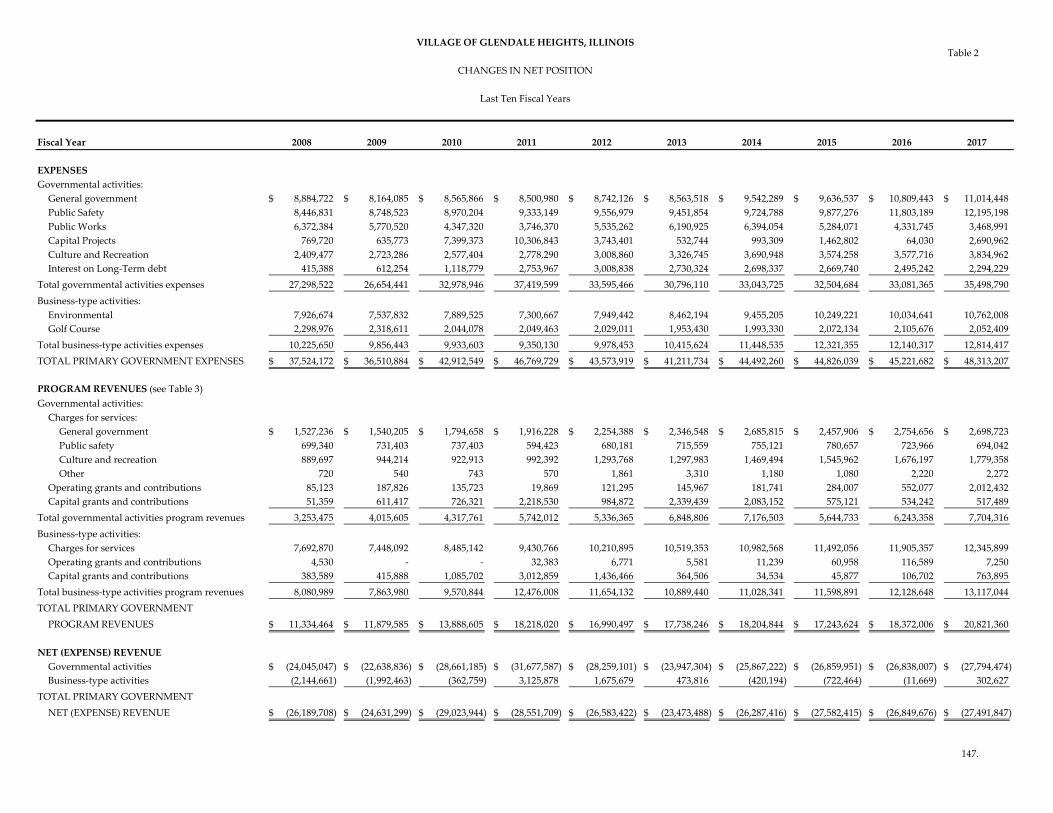
Table 2
147.
Fiscal Year 2008 2009 2010 2011 2012 2013 2014 2015 2016 2017
EXPENSESGovernmental activities:
General government 8,884,722$ 8,164,085$ 8,565,866$ 8,500,980$ 8,742,126$ 8,563,518$ 9,542,289$ 9,636,537$ 10,809,443$ 11,014,448$ Public Safety 8,446,831 8,748,523 8,970,204 9,333,149 9,556,979 9,451,854 9,724,788 9,877,276 11,803,189 12,195,198 Public Works 6,372,384 5,770,520 4,347,320 3,746,370 5,535,262 6,190,925 6,394,054 5,284,071 4,331,745 3,468,991 Capital Projects 769,720 635,773 7,399,373 10,306,843 3,743,401 532,744 993,309 1,462,802 64,030 2,690,962 Culture and Recreation 2,409,477 2,723,286 2,577,404 2,778,290 3,008,860 3,326,745 3,690,948 3,574,258 3,577,716 3,834,962 Interest on Long-Term debt 415,388 612,254 1,118,779 2,753,967 3,008,838 2,730,324 2,698,337 2,669,740 2,495,242 2,294,229
Total governmental activities expenses 27,298,522 26,654,441 32,978,946 37,419,599 33,595,466 30,796,110 33,043,725 32,504,684 33,081,365 35,498,790 Business-type activities:
Environmental 7,926,674 7,537,832 7,889,525 7,300,667 7,949,442 8,462,194 9,455,205 10,249,221 10,034,641 10,762,008 Golf Course 2,298,976 2,318,611 2,044,078 2,049,463 2,029,011 1,953,430 1,993,330 2,072,134 2,105,676 2,052,409
Total business-type activities expenses 10,225,650 9,856,443 9,933,603 9,350,130 9,978,453 10,415,624 11,448,535 12,321,355 12,140,317 12,814,417 TOTAL PRIMARY GOVERNMENT EXPENSES 37,524,172$ 36,510,884$ 42,912,549$ 46,769,729$ 43,573,919$ 41,211,734$ 44,492,260$ 44,826,039$ 45,221,682$ 48,313,207$
PROGRAM REVENUES (see Table 3)Governmental activities:
Charges for services:General government 1,527,236$ 1,540,205$ 1,794,658$ 1,916,228$ 2,254,388$ 2,346,548$ 2,685,815$ 2,457,906$ 2,754,656$ 2,698,723$ Public safety 699,340 731,403 737,403 594,423 680,181 715,559 755,121 780,657 723,966 694,042 Culture and recreation 889,697 944,214 922,913 992,392 1,293,768 1,297,983 1,469,494 1,545,962 1,676,197 1,779,358 Other 720 540 743 570 1,861 3,310 1,180 1,080 2,220 2,272
Operating grants and contributions 85,123 187,826 135,723 19,869 121,295 145,967 181,741 284,007 552,077 2,012,432 Capital grants and contributions 51,359 611,417 726,321 2,218,530 984,872 2,339,439 2,083,152 575,121 534,242 517,489
Total governmental activities program revenues 3,253,475 4,015,605 4,317,761 5,742,012 5,336,365 6,848,806 7,176,503 5,644,733 6,243,358 7,704,316 Business-type activities:
Charges for services 7,692,870 7,448,092 8,485,142 9,430,766 10,210,895 10,519,353 10,982,568 11,492,056 11,905,357 12,345,899 Operating grants and contributions 4,530 - - 32,383 6,771 5,581 11,239 60,958 116,589 7,250 Capital grants and contributions 383,589 415,888 1,085,702 3,012,859 1,436,466 364,506 34,534 45,877 106,702 763,895
Total business-type activities program revenues 8,080,989 7,863,980 9,570,844 12,476,008 11,654,132 10,889,440 11,028,341 11,598,891 12,128,648 13,117,044 TOTAL PRIMARY GOVERNMENT
PROGRAM REVENUES 11,334,464$ 11,879,585$ 13,888,605$ 18,218,020$ 16,990,497$ 17,738,246$ 18,204,844$ 17,243,624$ 18,372,006$ 20,821,360$
NET (EXPENSE) REVENUEGovernmental activities (24,045,047)$ (22,638,836)$ (28,661,185)$ (31,677,587)$ (28,259,101)$ (23,947,304)$ (25,867,222)$ (26,859,951)$ (26,838,007)$ (27,794,474)$ Business-type activities (2,144,661) (1,992,463) (362,759) 3,125,878 1,675,679 473,816 (420,194) (722,464) (11,669) 302,627
TOTAL PRIMARY GOVERNMENT NET (EXPENSE) REVENUE (26,189,708)$ (24,631,299)$ (29,023,944)$ (28,551,709)$ (26,583,422)$ (23,473,488)$ (26,287,416)$ (27,582,415)$ (26,849,676)$ (27,491,847)$
VILLAGE OF GLENDALE HEIGHTS, ILLINOIS
CHANGES IN NET POSITION
Last Ten Fiscal Years

Table 2
148.
Fiscal Year 2008 2009 2010 2011 2012 2013 2014 2015 2016 2017
VILLAGE OF GLENDALE HEIGHTS, ILLINOIS
CHANGES IN NET POSITION
Last Ten Fiscal Years
GENERAL REVENUES AND OTHER CHANGES IN NET POSITIONGovernmental activities:
Taxes 23,443,002$ 22,988,805$ 22,829,997$ 23,242,178$ 24,184,947$ 16,081,831$ 12,785,852$ 16,296,311$ 16,899,660$ 17,511,933$ Unrestricted Intergovernmental Revenues - - - - - - 12,426,403 11,271,262 11,952,521 11,850,806 Investment earnings 1,068,389 525,407 305,247 270,197 159,050 63,750 40,708 40,026 49,252 11,435 Gain on Property Sale 51,391 68,965 (142,433) 121,758 48,781 39,945 118,092 113,093 32,852 31,224 Miscellaneous 265,541 321,640 138,069 608,020 127,512 249,505 215,288 233,983 188,871 135,576 Transfers 322,071 295,596 145,363 363,017 273,787 833,670 660,291 829,094 748,500 585,703 Total governmental activities 25,150,394 24,200,413 23,276,243 24,605,170 24,794,077 17,268,701 26,246,634 28,783,769 29,871,656 30,126,677
Business-type activities:Investment earnings 163,324 43,372 6,523 378 510 1,327 1,510 715 - 669,416 Gain on Property Sale - - - - - - - - 1,161 273 Miscellaneous 1,685,987 117,876 100,546 34,050 33,076 99,213 24,789 83,218 37,083 - Transfers (322,071) (295,596) (145,363) (363,017) (273,787) (833,670) (660,291) (829,094) (748,500) (585,703) Total business-type activities 1,527,240 (134,348) (38,294) (328,589) (240,201) (733,130) (633,992) (745,161) (710,256) 83,986 TOTAL PRIMARY GOVERNMENT 26,677,634$ 24,066,065$ 23,237,949$ 24,276,581$ 24,553,876$ 16,535,571$ 25,612,642$ 28,038,608$ 29,161,400$ 30,210,663$
CHANGE IN NET POSITIONGovernmental activities 1,105,347$ 1,561,577$ (5,384,942)$ (7,072,417)$ (3,465,024)$ (6,678,603)$ 379,412$ 1,923,818$ 3,033,649$ 2,332,203$ Business-type activities (617,421) (2,126,811) (401,053) 2,797,289 1,435,478 (259,314) (1,054,186) (1,467,625) (721,925) 386,613
TOTAL PRIMARY GOVERNMENT CHANGE IN NET POSITION 487,926$ (565,234)$ (5,785,995)$ (4,275,128)$ (2,029,546)$ (6,937,917)$ (674,774)$ 456,193$ 2,311,724$ 2,718,816$
Source: Financial Section, Statement of Activities

Table 3
149.
Fiscal Year 2008 2009 2010 2011 2012 2013 2014 2015 2016 2017
FUNCTION/PROGRAMGOVERNMENTAL ACTIVITIES:
General government 1,528,061$ 1,587,905$ 1,795,158$ 1,916,708$ 2,306,858$ 2,353,954$ 2,706,880$ 2,548,475$ 2,779,872$ 2,909,662$ Public Safety 752,582 843,397 857,313 603,843 742,351 851,186 859,171 970,192 892,376 1,712,874 Public Works 720 540 743 570 1,861 3,310 1,180 1,080 341,354 784,233 Capital Projects - - - 100,000 68,750 1,282,600 1,539,889 - 18,750 8,007 Culture and Recreation 972,112 1,583,763 1,570,838 2,977,854 1,587,100 1,737,804 1,555,235 1,549,865 1,676,764 1,780,058 Interest on Long-Term Debt - - 93,709 143,037 629,445 619,952 514,148 575,121 534,242 509,482
TOTAL GOVERNMENTAL ACTIVITIES 3,253,475 4,015,605 4,317,761 5,742,012 5,336,365 6,848,806 7,176,503 5,644,733 6,243,358 7,704,316
BUSINESS-TYPE ACTIVITIESEnvironmental 6,101,367 5,531,080 7,640,813 10,079,696 9,437,097 9,087,508 9,404,476 9,982,906 10,462,449 10,777,164 Golf Course 1,979,622 2,332,900 1,930,031 2,396,312 2,197,035 1,801,932 1,623,865 1,615,985 1,666,199 1,585,507
TOTAL BUSINESS-TYPE ACTIVITIES 8,080,989 7,863,980 9,570,844 12,476,008 11,634,132 10,889,440 11,028,341 11,598,891 12,128,648 12,362,671 TOTAL PRIMARY GOVERNMENT 11,334,464$ 11,879,585$ 13,888,605$ 18,218,020$ 16,970,497$ 17,738,246$ 18,204,844$ 17,243,624$ 18,372,006$ 20,066,987$
Source: Financial Section, Statement of Activities
VILLAGE OF GLENDALE HEIGHTS, ILLINOIS
PROGRAM REVENUES BY FUNCTION/PROGRAM
Last Ten Fiscal Years

Table 4
150.
Fiscal Year 2008 2009 2010 2011 2012 2013 2014 2015 2016 2017
GENERAL FUNDReserved 3,124,410$ 3,377,379$ 3,777,190$ 3,559,272$ Unreserved 14,249,972 13,641,985 13,029,345 12,332,771
TOTAL GENERAL FUND 17,374,382 17,019,364 16,806,535 15,892,043
ALL OTHER GOVERNMENTAL FUNDSReserved 2,198,673 7,649,265 8,950,330 15,770,564 Unreserved, reported in:
Special revenue funds 3,689,252 3,782,658 3,109,516 5,035,033 Capital projects funds 8,868,351 6,250,933 35,168,276 15,898,617
TOTAL ALL OTHER GOVERNMENTAL FUNDS 14,756,276 17,682,856 47,228,122 36,704,214
TOTAL GOVERNMENTAL FUNDS 32,130,658$ 34,702,220$ 64,034,657$ 52,596,257$
GENERAL FUNDNonspendable 741,458$ 538,341$ 545,773$ 4,362,238$ 4,575,594$ 4,737,922$ Restricted 2,350,251 1,789,318 1,274,587 747,452 197,620 183,005 Assigned - - 6,091 - - - Unassigned 9,819,744 8,614,268 8,443,590 5,448,100 6,977,253 7,669,488
TOTAL GENERAL FUND 12,911,453 10,941,927 10,270,041 10,557,790 11,750,467 12,590,415
ALL OTHER GOVERNMENTAL FUNDSNonspendable - - 44,659 52,094 766,559 770,312 Restricted 8,647,048 5,821,201 5,542,023 4,718,495 4,627,477 5,027,671 Assigned 15,151,042 4,946,897 4,473,190 3,772,469 2,981,531 2,708,885 Unassigned (607,509) (861,818) (1,143,288) (1,055,221) (1,232,355) (1,327,493)
TOTAL ALL OTHER GOVERNMENTAL FUNDS 23,190,581 9,906,280 8,916,584 7,487,837 7,143,212 7,179,375
TOTAL GOVERNMENTAL FUNDS 36,102,034$ 20,848,207$ 19,186,625$ 18,045,627$ 18,893,679$ 19,769,790$
Note 1: The Village implemented GASB 54 in 2012 which adjusted the fund balance presentation.Source: Financial Section, Governmental Funds Balance Sheet
VILLAGE OF GLENDALE HEIGHTS, ILLINOIS
FUND BALANCES, GOVERNMENTAL FUNDS
Last Ten Fiscal Years

Table 5
151.
Fiscal Year 2008 2009 2010 2011 2012 2013 2014 2015 2016 2017
REVENUESTaxes 21,701,847$ 21,827,204$ 22,821,782$ 22,555,140$ 15,024,066$ 10,703,105$ 15,364,121$ 15,369,496$ 16,841,341$ 17,354,269$ Licenses and Permits 903,588 889,264 1,010,500 937,655 1,244,013 1,330,401 1,634,054 1,457,693 1,719,456 1,709,109 Intergovernmental 922,120 1,054,235 2,084,742 3,064,470 9,780,823 9,945,596 12,678,075 12,586,431 12,474,119 13,282,216 Charges for services 1,632,123 1,678,041 1,759,186 2,045,172 2,379,711 2,498,050 2,609,096 2,651,779 2,501,665 2,573,989 Fines and forfeitures 599,807 633,656 672,119 518,986 598,939 597,646 661,654 570,226 600,682 596,111 Investment earnings 1,068,389 525,407 305,247 270,197 159,050 63,750 40,708 40,026 49,252 11,435 Other revenues 387,085 490,533 310,949 830,217 846,228 959,177 966,636 887,321 1,204,936 945,164
Total revenues 27,214,959 27,098,340 28,964,525 30,221,837 30,032,830 26,097,725 33,954,344 33,562,972 35,391,451 36,472,293
EXPENDITURESGeneral government 9,106,903 8,588,667 9,601,251 9,399,084 9,833,464 9,757,600 10,601,153 10,719,013 11,174,772 11,372,529 Public Safety 6,716,115 7,026,331 7,108,416 7,194,416 7,191,906 7,274,817 7,382,444 7,642,988 7,738,926 7,735,382 Highways and Streets 5,841,038 5,510,645 3,878,242 3,380,841 4,847,892 5,497,141 4,546,537 4,809,635 4,839,171 4,773,208 Culture and Recreation 2,072,572 2,232,470 2,113,794 2,145,429 2,212,228 2,428,321 2,536,763 2,409,708 2,514,952 2,672,052 Capital Outlay 1,961,546 4,033,305 12,599,297 14,688,994 17,364,197 11,625,323 5,552,159 4,227,767 3,370,426 4,051,919 Debt service
Principal 2,095,000 1,765,000 2,240,000 2,875,000 2,315,000 2,840,000 2,925,000 3,015,000 3,115,000 3,235,000 Interest and Fees 377,021 683,730 921,878 2,339,490 3,036,153 2,762,020 2,732,161 2,708,953 2,538,652 2,341,795
Total expenditures 28,170,725 29,840,148 38,462,878 42,023,254 46,800,840 42,185,222 36,276,217 35,533,064 35,291,899 36,181,885
EXCESS (DEFICIENCY) OF REVENUES OVER (UNDER) EXPENDITURES (955,766) (2,741,808) (9,498,353) (11,801,417) (16,768,010) (16,087,497) (2,321,873) (1,970,092) 99,552 290,408
OTHER FINANCINGSOURCES (USES)Bonds issued 5,514,897 5,017,774 38,685,427 - - - - - - - Payment to escrow (463,313) - - - - - - - - - Sale of Assets - - - - - - - - - - Transfers in 3,317,404 2,521,475 3,468,927 3,079,551 8,203,774 4,301,420 4,227,186 4,670,168 4,024,139 4,437,107 Transfers out (2,995,333) (2,225,879) (3,323,564) (2,716,534) (7,929,987) (3,467,750) (3,566,895) (3,841,074) (3,275,639) (3,851,404)
Total other financing sources (uses) 5,373,655 5,313,370 38,830,790 363,017 273,787 833,670 660,291 829,094 748,500 585,703
NET CHANGE INFUND BALANCES 4,417,889$ 2,571,562$ 29,332,437$ (11,438,400)$ (16,494,223)$ (15,253,827)$ (1,661,582)$ (1,140,998)$ 848,052$ 876,111$
DEBT SERVICE AS A PERCENTAGE OF NONCAPITAL EXPENDITURES 8.9% 9.2% 9.5% 13.8% 16.0% 17.9% 22.2% 17.4% 18.2% 16.8%
Source: Financial Section, Governmental Funds Statement of Revenues, Expenditures and Changes in Fund Balance
VILLAGE OF GLENDALE HEIGHTS, ILLINOIS
CHANGES IN FUND BALANCES, GOVERNMENTAL FUNDS
Last Ten Fiscal Years

Table 6
152.
EstimatedLevy Real Total Tax ActualYear Residental Farming Commercial Industrial EAV Rate Value
2006 538,664,237$ 3,635$ 97,320,316$ 142,848,760$ 778,836,948$ 0.877$ 2,595,863,548$ 2007 596,225,368 3,292 99,553,404 138,946,010 834,728,074 0.875 2,782,148,671 2008 626,175,389 3,368 108,960,149 144,736,580 879,875,486 0.864 2,932,624,995 2009 619,560,961 3,710 107,387,307 138,101,350 865,053,328 0.864 2,883,222,742 2010 570,652,726 4,080 105,114,335 128,696,150 804,467,291 0.895 2,681,289,481 2011 478,349,222 4,478 102,902,266 127,183,090 708,439,056 0.992 2,361,227,374 2012 411,998,537 4,348 96,257,243 115,771,632 624,031,760 1.137 2,079,897,856 2013 374,466,922 4,790 86,757,382 108,870,260 570,099,354 1.268 1,900,141,147 2014 360,650,030 5,264 85,859,932 103,878,030 550,393,256 1.390 1,834,460,722 2015 355,330,575 5,790 89,643,500 101,320,200 546,300,065 1.399 1,820,818,117 2016 383,129,889 5,945 94,677,406 106,428,901 584,242,141 1.248 1,947,279,056
Source: Office of the County Clerk of DuPage County Certificate of Rates and Extensions.Note: It is assumed that Total EAV is 1/3rd of Estimated Actual Value
VILLAGE OF GLENDALE HEIGHTS, ILLINOIS
Last Ten Levy Years
ESTIMATED ACTUAL VALUE OF TAXABLE PROPERTYEQUALIZED ASSESSED VALUE (EAV) AND

Table 7
153.
Levy Year 2007 2008 2009 2010 2011 2012 2013 2014 2015 2016
Tax Rate*Direct Rate
Corporate 0.0000 0.0000 0.0000 0.0030 0.0059 0.0068 0.0074 0.0096 0.0078 0.0073Bond & Interest 0.2442 0.2320 0.2268 0.2030 0.2559 0.3192 0.3560 0.3806 0.3836 0.2974IMRF 0.0878 0.0837 0.0871 0.0991 0.1039 0.1261 0.1556 0.1801 0.1757 0.1643Police Protection 0.0599 0.0574 0.0589 0.0644 0.1210 0.1041 0.1209 0.1265 0.0634 0.0593Police Pension 0.1395 0.1608 0.1812 0.1994 0.2309 0.2747 0.2921 0.3001 0.3213 0.3690Liability 0.0926 0.0911 0.0720 0.0658 0.0000 0.0000 0.0000 0.0557 0.0648 0.0606Playground & Recreation 0.1430 0.1324 0.1347 0.1461 0.1491 0.1710 0.1938 0.2028 0.2164 0.2023Emergency/Disaster 0.0109 0.0111 0.0082 0.0076 0.0082 0.0095 0.0128 0.0104 0.0095 0.0089Social Security 0.0705 0.0703 0.0676 0.0766 0.0832 0.0970 0.1075 0.0887 0.1164 0.0413School Crossing Guard 0.0068 0.0065 0.0060 0.0070 0.0073 0.0084 0.0093 0.0094 0.0095 0.0089Recreation for Handicapped 0.0197 0.0186 0.0212 0.0230 0.0264 0.0200 0.0121 0.0260 0.0311 0.0291
Village of Glendale Heights 0.8749 0.8639 0.8637 0.8950 0.9918 1.1368 1.2675 1.3899 1.3995 1.2484
Total Direct Rate 0.8749 0.8639 0.8637 0.8950 0.9918 1.1368 1.2675 1.3899 1.3995 1.2484
Indirect RatesDupage County 0.1651 0.1557 0.1554 0.1659 0.1773 0.1929 0.2040 0.2057 0.1971 0.1848DuPage County Forest Preserve 0.1187 0.1206 0.1217 0.1321 0.1414 0.1542 0.1657 0.1691 0.1622 0.1514DuPage Water Commission 0.0000 0.0000 0.0000 0.0000 0.0000 0.0000 0.0000 0.0000 0.0000 0.0000DuPage Airport Authority 0.0000 0.0000 0.0000 0.0000 0.0169 0.0168 0.0178 0.0196 0.0188 0.0176Townships:
Bloomingdale 0.1556 0.1553 0.1580 0.1759 0.0846 0.0952 0.1060 0.1069 0.0911 0.0833Bloomingdale Twp. Road District 0.0000 0.0000 0.0000 0.0000 0.0886 0.1031 0.1147 0.1205 0.1180 0.1112Milton Township 0.1188 0.1287 0.1303 0.1449 0.0406 0.0439 0.0468 0.0484 0.0475 0.0457Milton Township Road District 0.0000 0.0000 0.0000 0.0000 0.0651 0.0720 0.0767 0.0793 0.0778 0.0748
Park Districts: Glen Ellyn Countryside 0.0876 0.0871 0.0876 0.0974 0.1173 0.1330 0.1434 0.1481 0.1520 0.1418Carol Stream 0.3709 0.3736 0.3860 0.4271 0.4691 0.4950 0.6087 0.6570 0.6562 0.6395Glen Ellyn 0.3161 0.3122 0.3182 0.3382 0.3711 0.4114 0.4377 0.4534 0.4435 0.3981
Fire Protection Districts: Bloomingdale 0.4273 0.4248 0.4539 0.5060 0.5546 0.6462 0.7237 0.7604 0.7475 0.7063Carol Stream 0.5731 0.5729 0.5795 0.6415 0.6797 0.7747 0.8578 0.8998 0.8750 0.8366
VILLAGE OF GLENDALE HEIGHTS, ILLINOIS
PROPERTY TAX RATES - DIRECT AND OVERLAPPING GOVERNMENTS
Last Ten Levy Years

Table 7
154.
Levy Year 2007 2008 2009 2010 2011 2012 2013 2014 2015 2016
VILLAGE OF GLENDALE HEIGHTS, ILLINOIS
PROPERTY TAX RATES - DIRECT AND OVERLAPPING GOVERNMENTS
Last Ten Levy Years
Glenside 0.6828 0.6841 0.6615 0.7297 0.8442 0.9722 1.0817 1.1904 1.2087 1.1434Sanitary District:
Glen Ellyn Heights 0.2000 0.2000 0.0000 0.2000 0.0000 0.0000 0.0000 0.0000 0.0000 0.0000Library District:
Glenside 0.3219 0.3218 0.3281 0.3626 0.4183 0.4908 0.6070 0.6398 0.6504 0.6125Mosquito Abatement Centers:
Glen Ellyn 0.0078 0.0077 0.0078 0.0084 0.0093 0.0103 0.0111 0.0115 0.0111 0.0107Wheaton 0.0154 0.0153 0.0155 0.0166 0.0178 0.0190 0.0194 0.0188 0.0156 0.0136
School Districts: Grade schools #15 3.6632 3.6573 3.7785 4.1841 4.6478 5.3654 6.3883 6.4924 6.5132 6.1419#16 3.7764 3.7688 3.8252 4.2369 4.8577 5.6866 6.2877 6.5709 6.5377 6.1507#41 2.6994 2.7026 2.7176 2.9086 2.9994 3.5720 3.8034 3.9236 3.7579 3.6171#U200 3.6473 3.6442 3.7112 3.9130 4.1112 4.6112 5.0165 5.1272 5.3108 5.1076High schools #87 1.6612 1.6507 1.6749 1.8378 2.0199 2.2868 2.3877 2.5824 2.5173 2.4030Junior college#502 (College of DuPage) 0.1888 0.1858 0.2127 0.2349 0.2495 0.2681 0.2956 0.2975 0.2786 0.2626
Total Indirect Rate 19.1974 19.1692 19.3236 21.2616 22.9814 26.4208 29.4014 30.5227 30.3880 28.8542
Total Tax Rate - All Purposes 20.0723 20.0331 20.1873 22.1566 23.9732 27.5576 30.6689 31.9126 31.7875 30.1026
Share of Total Tax Rate Levies bythe Village of Glendale Heights 4.4% 4.3% 4.3% 4.0% 4.1% 4.1% 4.1% 4.4% 4.4% 4.1%
*Property tax rates are per $100 of assessed valuation
Source: County Clerk

Table 8
155.
Percentage Percentageof Total Village of Total Village
Taxable Taxable Taxable TaxableAssessed Assessed Assessed Assessed
Taxpayer Value Value Value Value
Thompson Pts -$ 0.00% 10,339,490$ 1.77%Fordham Glen Apartments - 0.00% 9,583,620 1.64%Stonegate GH LLC - 0.00% 7,813,750 1.34%Crane and Norcross 10,600,000 1.36% 6,391,160 1.09%CG Center Two LLC - 0.00% 6,462,700 1.11%Briar Grace Mgmt Co - 0.00% 5,456,930 0.93%Prologis 4,525,320 0.58% 5,149,960 0.88%AMB Property Corp - 0.00% 4,052,020 0.69%Kronos Foods Inc. - 0.00% 3,700,810 0.63%Menard Inc. 5,324,840 0.68% 3,375,820 0.58%Equities Assoc Corp II 10,165,060 1.31% - 0.00%EQR-Re Tax Dept 6,014,680 0.77% - 0.00%UBS Investors LLC 5,522,190 0.71% - 0.00%First American Prop 5,292,160 0.68% - 0.00%UTI Holdings Inc. 5,108,950 0.66% - 0.00%Bloomingdale & North LLC 4,539,490 0.58% - 0.00%Teachers Ins & Ann Assoc 4,396,960 0.56% - 0.00%
Total 61,489,650$ 7.90% 62,326,260$ 10.67%
Total Equalized Assessed Valuation 778,836,948$ 584,242,141$
(1) The Levy year 2006 Taxpayers and their Taxable Equalized Assessed Values were obtained from the Village of Glendale Heights Glendale Heights Series 2007 Official Statement which listed as its source the DuPage County.(2) The Levy Year 2015 Taxpayers and their Taxable Equalized Assessed Values were obtained from a listing of numerous parcel valuations of equalized assessed valuations of $300,000 and over as recorded in the County Assessors' office. They were compiled from a meticulous page by page search of a listing of such records. It is possible, however, that certain smaller parcels may have been overlooked.
Source: Offices of the DuPage County Clerk, Assessor and Bloomingdale Township Assessor.
2016 Levy Year (2)2007 Levy Year(1)
VILLAGE OF GLENDALE HEIGHTS, ILLINOIS
PRINCIPAL PROPERTY TAX PAYERS
Current Year and Nine Years Ago

Table 9
156.
Levy Taxes Amount PercentageYear Levied Collected of Levy
2007 7,303,035$ 7,303,035$ 100.00%2008 7,601,254 7,601,254 100.00%2009 7,471,466 7,471,466 100.00%2010 7,199,982 7,199,982 100.00%2011 7,026,299 7,026,299 100.00%2012 7,093,993 6,844,513 96.48%2013 7,226,009 7,178,401 99.34%2014 7,649,916 7,598,241 99.32%2015 7,645,469 7,618,620 99.65%2016 7,293,679 *
Source: Office of the County Clerk of DuPage County
Note: *No collections made against the levy as of the date of the financial statements.
Note 2: There were no collections in subsequent years, thus the total collections is the same as the amount collected in that levy year. Also, the total collections to date is the same as the total collections in that levy year.
VILLAGE OF GLENDALE HEIGHTS, ILLINOIS
Last Ten Levy Years
PROPERTY TAX LEVIES AND COLLECTIONS

Table 10
157.
General General Total PercentageFiscal Obligation Capital Obligation Note Capital Primary of Personal PerYear Bonds Lease Bonds Payable Leases Government Income Capita
2008 14,980,000$ 45,736$ 1,890,000$ -$ -$ 16,915,736$ 4.07% 500 2009 18,215,000 16,761 1,630,000 - - 19,861,761 4.64% 587 2010 54,740,000 - 830,000 - - 55,570,000 13.48% 1,642 2011 51,865,000 - - - - 51,865,000 11.22% 1,532 2012 49,550,000 - - - - 49,550,000 7.79% 1,464 2013 46,710,000 - - - - 46,710,000 6.59% 1,353 2014 43,785,000 - - - - 43,785,000 6.03% 1,268 2015 40,770,000 - - - - 40,770,000 5.60% 1,181 2016 37,655,000 - - - - 37,655,000 5.27% 1,094 2017 34,420,000 - - - - 34,420,000 5.00% 1,001
Notes: Details regarding the Village's outstanding debt can be found in the notes to the financial statements.
VILLAGE OF GLENDALE HEIGHTS, ILLINOIS
RATIOS OF OUTSTANDING DEBT BY TYPE
Last Ten Fiscal Years
Business-type ActivitiesGovernmental Activities

Table 11
158.
Last Ten Fiscal Years
Ratio ofGeneral
Less Net Obligation GeneralGeneral Amount Set General Bonded Debt Obligation
Fiscal Obligation Aside for Obligation to Assessed Bonded DebtYear Bonded Debt Repayment Bonded Debt Value Per Capita
2007 14,735,000$ (1,350,548)$ 13,384,452$ 0.481% 377 2008 16,870,000 (1,293,461) 15,576,539 0.531% 425 2009 19,845,000 (1,454,106) 18,390,894 0.638% 488 2010 55,570,000 (1,454,106) 54,115,894 2.018% 1,491 2011 51,865,000 (441,535) 51,423,465 2.178% 1,279 2012 49,550,000 (537,109) 49,012,891 2.357% 871 2013 46,710,000 - 46,710,000 2.458% 759 2014 43,785,000 - 43,785,000 2.387% 698 2015 40,770,000 - 40,770,000 2.239% 647 2016 37,655,000 - 37,655,000 1.934% 609 2017 34,420,000 - 34,420,000 N/A 576
Source: Financial Statements
VILLAGE OF GLENDALE HEIGHTS, ILLINOIS
RATIOS OF GENERAL BONDED DEBT OUTSTANDING

Table 12
159.
(2)Percentage
of Debt(1) Applicable (3)
Gross to Government(**)Government Unit Bonded Debt Government(*) ValueVillage of Glendale Heights 34,420,000$ 100.00% 34,420,000$ Total Direct Debt 34,420,000 34,420,000
DuPage County 33,905,000 1.62% 548,244 DuPage County Forest Preserve 126,497,595 1.62% 2,045,466 School District 15 39,406,300 40.50% 15,959,157 School District 16 15,978,823 90.72% 14,496,308 School District 41 1,027,880 5.05% 51,857 School District 93 12,905,000 1.70% 219,772 High School District #87 54,515,000 11.37% 6,197,265 Unit School District 200 148,740,000 0.03% 40,160 College of DuPage #502 193,170,000 1.45% 2,791,307 Bloomingdale Fire Protection District 495,000 13.86% 68,617 Glenside Fire Protection District 250,000 90.15% 225,378 Glenside Public Library District - 93.25% - Carol Stream Park District 49,908,240 0.35% 174,180 Glen Ellyn Park District 5,320,000 3.46% 183,966 Total Overlapping Debt 682,118,838 43,001,675
Total Direct and OverlappingBonded Debt 716,538,838$ 77,421,675$
* Determined by ratio of total assessed value of property subject to taxation in overlapping unit to totalassessed value of property subject to taxation in Village of Glendale Heights
** Amount in column (2) multiplied by amount in column (1) but not to exceed column (1)(1) Excludes principal amounts of outstanding General Obligation Alternate Revenue Source Bonds which are expected to be paid from sources other than general taxation.(2) Includes original principal amounts of outstanding General Obligation Capital Appreciation Bonds.(3) Excludes Certificates of Indebtedness, installment contracts and/or notes.______Source: DuPage County Clerk's Office
VILLAGE OF GLENDALE HEIGHTS, ILLINOIS
DIRECT AND OVERLAPPING GOVERNMENTAL ACTIVITIES DEBT
As of April 30, 2017

Table 13
160.
Legal Debt Margin Calculation for Fiscal Year 2017
2016 Equalized Assessed Value 1,947,279,056$ Debt limit (8.625% of equalized assessed value) 167,952,819 Debt applicable to limit:
Outstanding Debt as of April 30 34,420,000 Less: Amount set aside for repayment -
Total net applicable debt 34,420,000 Legal Debt Margin 133,532,819$
Fiscal Year 2007 2008 2009 2010 2011 2012 2013 2014 2015 2016
Debt Limit 223,893,231$ 239,960,323$ 252,938,906$ 248,677,962$ 231,261,218$ 203,655,861$ 179,391,190$ 163,887,174$ 158,222,237$ 157,045,563$
General Obligation Bonded Debt 14,735,000 16,870,000 19,845,000 55,570,000 51,865,000 49,550,000 46,710,000 43,785,000 40,770,000 37,655,000 Less: Amount set aside for repayment (1,350,548) (1,293,461) (1,454,106) (1,454,106) (441,535) (537,109) - - - -
Total net debt applicable to limit 13,384,452 15,576,539 18,390,894 54,115,894 51,423,465 49,012,891 46,710,000 43,785,000 40,770,000 37,655,000
Legal Debt Margin 210,508,779$ 224,383,784$ 234,548,012$ 194,562,068$ 179,837,753$ 154,642,970$ 132,681,190$ 120,102,174$ 117,452,237$ 119,390,563$
Total net debt applicable to limitas a percentage of debt limit 5.98% 6.49% 7.27% 21.76% 22.24% 24.07% 26.04% 26.72% 25.77% 23.98%
Note: Under state law, as a homerule municipality, the Village has no legal limit on the amount of outstanding general obligation debt it may issue.
VILLAGE OF GLENDALE HEIGHTS, ILLINOIS
DEBT MARGIN INFORMATION
Last Ten Fiscal Years

Table 14
161.
(2) (4)(2) Median (3) Education (4) (5)
Fiscal (1) Personal Household Median Level in Years School UnemploymentYear Population Income Income Age of Schooling Enrollment Rate
2008 33,846 415,587,125 36,612 31.0 14.7 14,075 5.4%2009 33,846 428,054,739 37,711 31.0 14.7 14,098 10.1%2010 33,846 412,120,757 36,307 30.6 14.7 14,146 10.2%2011 33,846 462,185,184 40,204 30.0 14.7 13,977 10.5%2012 33,846 636,245,640 56,285 30.5 14.7 13,648 7.7%2013 34,535 709,244,783 61,529 32.0 14.7 13,568 8.8%2014 34,535 725,631,120 62,760 32.0 14.7 13,602 6.4%2015 34,530 728,625,678 63,019 34.1 14.7 13,569 6.4%2016 34,435 715,145,126 61,853 33.3 14.7 13,122 5.9%2017 34,381 688,224,114 59,778 33.2 14.1 12,536 4.2%
Source:(1) Estimated by U.S. Census Bureau
(2) U.S. Census Bureau, adjusted by the consumer price index
(3) U.S. Census Bureau
(4) U.S. Census School Enrollment, 2015 Estimate
(5) Illinois Department of Labor Monthly Labor Force Report, April 2017, preliminary data, not seasonally adjusted
VILLAGE OF GLENDALE HEIGHTS, ILLINOIS
DEMOGRAPHIC AND ECONOMIC STATISTICS
Last Ten Fiscal Years

Table 15
162.
Estimated EstimatedPercentage of Percentage of
Number of Total Employment (4) Number of Total Employment (4) Employer Employees Source Rank in Village* Employees Source Rank in Village*
Spraying Systems 1,000 (4) 1 5.5%General Hospital 526 (5) 2 2.9%Refrigeration Equipment, Beverage Dispensers 500 (a) 1 2.6% 450 (1) 3 2.5%Food Products-Manufacturer 400 (1) 4 2.2%Department Store 207 (5) 5 1.1%Industrial Fans & Blowers 200 (a) 4 1.1% 200 (1) 6 1.1%Personal Security Products 200 (1) 6 1.1%Grocers/Pharmacy 200 (5) 6 1.1%Home Center 200 (a) 4 1.1% 200 (5) 6 1.1%Precision Turning Components 125 (a) 6 0.7% 200 (1) 6 1.1%Village Government (Full-Time) 224 (a) 3 1.2% 197 (3) 7 1.1%Home Center 180 (a) 5 1.0% 180 (5) 8 1.0%Electronic Equipment & Supplies-Mfg 160 (1) 9 0.9%Ice Cream & Frozen Desserts Distributor 150 (a) 6 0.8% 150 (2) 10 0.8%Electronic Equipment & Supplies-Wholesalers 122 (a) 7 0.6% 122 (2) 12 0.7%Medical Device Components Manufacturing 120 (1) 13 0.7%Medical Supplies Distributor 120 (2) 13 0.7%Bolts & Fasteners 120 (a) 8 0.6% 80 (5) 14 0.4%Screws-Manufacturing 110 (a) 9 0.6% 50 (5) 15 0.3%Radio Enclosures 250 (a) 2 1.3%Industrial Paper Products 150 (a) 6 0.8%
* Includes Full and Part-time and/or Seasonal**The Illinois Department of Employment Security reported that 18,320 persons were employed in the Village in 2015***The Illinois Department of Employment Security reported that 18,098 Persons were emplyed in the Village in 2007Data Source: (a) Village of Glendale Heights Series 2007 Official Statement or 2007 Illinois Manufacturers' and Services Directories and selective telephone survey.(1) 2016 Illinois Manufacturers Directory(2) 2016 Illinois Services Directory(3) Village Financial Reports(4) Phone canvass of employers(5) ReferenceUSA.com
VILLAGE OF GLENDALE HEIGHTS, ILLINOIS
PRINCIPAL EMPLOYERS
Current Year and Nine Years Ago
Calendar Year 2016Calendar Year 2007

Table 16
163.
Fiscal Year 2008 2009 2010 2011 2012 2013 2014 2015 2016 2017
Function/ProgramGeneral government
Administration 11 10 10 10 9 8 9 9 9 9 Finance 8 6 6 5 5 6 6 6 6 5 Bldg Maintenance 16 - - - - - - - - - Others 14 10 10 11 11 9 9 9 9 10
Public SafetyPolice 55 61 56 54 53 52 53 52 52 52 Civilians 24 26 25 25 24 23 23 23 23 16
Public WorksStreets 18 18 17 16 19 20 17 17 17 16 Vehicle Maintenance 4 4 4 4 3 3 3 3 3 3 Water & Sewer 25 23 22 22 19 21 23 23 23 23
Community Development 12 13 12 11 8 9 10 10 10 9 Parks & Recreation 23 44 41 38 39 38 38 38 38 37 Golf Course 11 11 9 9 7 6 7 7 7 7
Total 221 226 212 205 197 195 198 197 197 187
Source: Finance Department
VILLAGE OF GLENDALE HEIGHTS, ILLINOIS
FULL-TIME EMPLOYEES BY FUNCTION/PROGRAM
Last Ten Fiscal Years

Table 17
164.
Fiscal year 2008 2009 2010 2011 2012 2013 2014 2015 2016 2017
Function/ProgramGeneral government
Building Permits Issued 1,645 1,357 1,823 1,552 1,376 1,885 1,835 2,403 2,244 2,401 Value of Construction Authorized 19,266,107 13,876,824 23,274,144 23,174,214 30,726,823 19,270,853 21,630,000 13,116,488 19,507,498 15,857,055 Number of Commercial Units Constructed 1 3 - - - - 3 - 3 5 Value of Commerical Construction (new
and improvement) 4,817,674$ 5,426,292$ 14,906,300$ 1,432,310$ 2,843,323$ 1,127,495$ 10,462,000$ 11,671,780$ 17,171,140$ 8,815,275$ Number of Residential Units Constructed 5 - - - - - - - - - Value of Residential Construction 2,230,000$ -$ -$ 1,034,884$ 945,943$ 1,780,508$ 1,036,000$ 1,444,708$ 2,336,358$ 7,041,780$
Public SafetyPolice
Police Responses (including 911 calls) 21,540 18,502 18,683 18,428 16,875 15,661 22,227 17,850 17,096 20,820 Physical arrests 1,057 1,024 988 950 731 722 339 803 690 694 Traffic Citations Written 6,978 7,367 6,998 7,768 5,919 5,565 4,876 5,231 4,336 6,075 Parking violations 8,003 8,051 7,991 11,550 8,710 9,565 9,536 9,735 9,869 10,073
Fire - Glenside Fire DepartmentEmergency responses 2,312 2,100 2,181 2,256 2,243 2,096 2,123 2,366 2,349 2,579 Fire Extinguised (all types) 117 55 113 95 102 112 41 49 90 75 Inpections 526 525 758 405 601 510 562 575 988 427
Fire - Bloomingdale Fire DepartmentEmergency responses 4,346 4,184 4,216 4,226 4,344 4,177 4,177 4,195 4,250 4,597 Fire Extinguised (all types) 164 142 127 67 78 145 145 135 65 126 Inspections 1,255 1,322 1,697 568 614 1,268 1,268 1,246 1,577 1,846
UtilityTotal water consumption 960,575,000 978,621,000 919,530,000 901,714,000 926,353,000 948,745,000 947,513,000 898,300,000 853,408,000 761,439,400 Average daily consumption 2,631,000 2,681,000 2,519,000 2,470,000 2,538,000 2,599,000 2,596,000 2,461,100 2,338,100 2,086,135
Sources: Various Village departments.
VILLAGE OF GLENDALE HEIGHTS, ILLINOIS
OPERATING INDICATORS BY FUNCTION/PROGRAM
Last Ten Fiscal Years

Table 18
165.
Fiscal Year 2008 2009 2010 2011 2012 2013 2014 2015 2016 2017
Function/ProgramMunicipal Buildings
Police Station 1 1 1 1 1 1 1 1 1 1 Fire Stations Glenside Fire 1 1 1 1 1 1 1 1 1 1 Bloomingdale Fire Dept 3 3 3 3 3 3 3 3 3 3 Public Works Facilities 1 1 1 1 1 1 1 1 1 1 Village Hall 1 1 1 1 1 1 1 1 1 1
Streets & HighwaysMiles of Streets 63 76 76 76 76 76 76 76 76 76 Number of Street Lights Village 810 809 840 840 840 840 840 840 840 840
UtilityMiles of watermains 73 73 76 76 76 76 76 76 76 76 Miles of Sanitary Sewers 40 40 40 83 83 83 83 83 83 83Number of fire hydrants 1,250 1,253 1,253 1,303 1,303 1,303 1,303 1,303 1,303 1,315
Parks & RecreationNumber of Parks & Playgrounds 22 22 22 22 22 22 22 22 22 22 Park Area in Acres 302 302 302 302 302 302 254 254 254 254
Facilities not inlcuded in the reporting entityNumber of elementary schools 9 9 9 9 9 9 9 9 9 9 Number of high schools 1 1 1 1 1 1 1 1 1 1 Number of libraries 1 1 1 1 1 1 1 1 1 1
Sources: Various Village departments.
VILLAGE OF GLENDALE HEIGHTS, ILLINOIS
CAPITAL ASSET STATISTICS BY FUNCTION/PROGRAM
Last Ten Fiscal Years