village of riverside, illinois
TRANSCRIPT
VILLAGE OF RIVERSIDE, ILLINOIS COMPREHENSIVE ANNUAL FINANCIAL
REPORT
FOR THE FISCAL YEAR ENDED
DECEMBER 31, 2017
VILLAGE OF RIVERSIDE,
ILLINOIS
COMPREHENSIVE
ANNUAL FINANCIAL REPORT
FOR THE FISCAL YEAR ENDED
DECEMBER 31, 2017
Prepared by:
Finance Department
VILLAGE OF RIVERSIDE, ILLINOIS
TABLE OF CONTENTS
PAGE
INTRODUCTORY SECTION
List of Principal Officials............................................................................................................................. i
Organizational Chart ................................................................................................................................... ii
Transmittal Letter...............................................................................................................................iii - viii
Certificate of Achievement for Excellence in Financial Reporting ........................................................... ix
FINANCIAL SECTION
INDEPENDENT AUDITORS' REPORT ......................................................................................... 1 - 2
MANAGEMENT’S DISCUSSION AND ANALYSIS ...................................................... MD&A 1 - 16
BASIC FINANCIAL STATEMENTS
Government-Wide Financial Statements
Statement of Net Position .......................................................................................................... 3 - 4
Statement of Activities ............................................................................................................... 5 - 6
Fund Financial Statements
Balance Sheet – Governmental Funds ....................................................................................... 7 - 8
Reconciliation of Total Governmental Fund Balance to
Net Position of Governmental Activities ...................................................................................9
Statement of Revenues, Expenditures and Changes in
Fund Balances – Governmental Funds ............................................................................ 10 - 11
Reconciliation of the Statement of Revenues, Expenditures and Changes in
Fund Balances of Governmental Funds to the Statement of Activities ...................................12
Statement of Net Position – Proprietary Funds...................................................................... 13 - 14
Statement of Revenues, Expenses and Changes in Net Position – Proprietary Funds ..................15
Statement of Cash Flows – Proprietary Funds ...............................................................................16
Statement of Fiduciary Net Position ..............................................................................................17
Statement of Changes in Fiduciary Net Position ...........................................................................18
Notes to the Financial Statements ................................................................................................ 19 - 58
REQUIRED SUPPLEMENTARY INFORMATION
Schedule of Employer Contributions
Illinois Municipal Retirement Fund ..................................................................................................59
Police Pension Fund ..........................................................................................................................60
VILLAGE OF RIVERSIDE, ILLINOIS
TABLE OF CONTENTS
PAGE
FINANCIAL SECTION – Continued
REQUIRED SUPPLEMENTARY INFORMATION – Continued
Schedule of Changes in the Employer’s Net Pension Liability
Illinois Municipal Retirement Fund ....................................................................................... 61 - 62
Police Pension Fund .......................................................................................................................63
Schedule of Investment Returns
Police Pension Fund .......................................................................................................................64
Schedule of Revenues, Expenditures and Changes in Fund Balances – Budget and Actual
General Fund ..................................................................................................................................65
COMBINING AND INDIVIDUAL FUND STATEMENTS AND SCHEDULES
Schedules of Revenues – Budget and Actual – General Fund..................................................... 66 - 67
Schedule of Expenditures – Budget and Actual – General Fund................................................. 68 - 74
Schedules of Revenues, Expenditures and Changes in Fund Balances – Budget and Actual
Debt Service Fund..........................................................................................................................75
Capital Projects Fund .....................................................................................................................76
Schedule of Expenditures – Budget and Actual – Capital Projects Fund .................................... 77 - 78
Combining Balance Sheet – Nonmajor Governmental – Special Revenue Funds ..............................79
Combining Statement of Revenues, Expenditures and
Changes in Fund Balances – Nonmajor Governmental – Special Revenue Funds .......................80
Schedules of Revenues, Expenditures and Changes in Fund Balances – Budget and Actual
Motor Fuel Tax – Special Revenue Fund ......................................................................................81
E-911 – Special Revenue Fund ......................................................................................................82
Schedules of Revenues, Expenses and Changes in Net Position – Budget and Actual
Water and Sewer – Enterprise Fund ..............................................................................................83
Parking Lot – Enterprise Fund .......................................................................................................84
Schedule of Changes in Fiduciary Net Position – Budget and Actual
Police Pension – Pension Trust Fund.............................................................................................85
SUPPLEMENTAL SCHEDULES
Long–Term Debt Requirements
General Obligation Refunding Bonds of 2010A .................................................................................86
General Obligation Refunding Bonds of 2011 ....................................................................................87
General Obligation Refunding Bonds of 2013 ....................................................................................88
General Obligation Bonds of 2015 ......................................................................................................89
General Obligation Limited Tax Refunding Bonds of 2017 ...............................................................90
IEPA Loan #L17-4322 Payable of 2011 ..............................................................................................91
IEPA Loan #L17-4323 Payable of 2011 ..............................................................................................92
VILLAGE OF RIVERSIDE, ILLINOIS
TABLE OF CONTENTS
PAGE
STATISTICAL SECTION (Unaudited)
Net Position by Component – Last Ten Fiscal Years ........................................................................ 93 - 94
Changes in Net Position – Last Ten Fiscal Years .............................................................................. 95 - 96
Fund Balances of Governmental Funds – Last Ten Fiscal Years ...................................................... 97 - 98
Changes in Fund Balances for Governmental Funds – Last Ten Fiscal Years ................................ 99 - 100
Assessed Value and Actual Value of Taxable Property – Last Ten Tax Levy Years ................... 101 - 102
Property Tax Burden on Taxpayers in the Village – Last Ten Tax Levy Years .....................................103
Direct and Overlapping Property Tax Rates – Last Ten Tax Levy Years ..................................... 104 - 105
Principal Property Taxpayers – Current Fiscal Year and Nine Fiscal Years Ago ...................................106
Property Tax Levies and Collections – Last Ten Tax Levy Years ..........................................................107
Sales Tax Revenue by Category – Last Ten Fiscal Years ............................................................. 108 - 109
Direct and Overlapping Sales Tax Rates – Last Ten Fiscal Years ..........................................................110
Ratios of Outstanding Debt by Type – Last Ten Fiscal Years ...................................................... 111 - 112
Ratios of General Bonded Debt Outstanding – Last Ten Fiscal Years ....................................................113
Schedule of Direct and Overlapping Governmental Activities Debt .......................................................114
Schedule of Legal Debt Margin – Last Ten Fiscal Years .............................................................. 115 - 116
Pledged-Revenue Coverage – Last Ten Fiscal Years ..............................................................................117
Demographic and Economic Statistics – Last Ten Fiscal Years ............................................................118
Principal Employers – Current Fiscal Year and Nine Fiscal Years Ago .................................................119
Full-Time Equivalent Village Government Employees by Function – Last Ten Fiscal Years ..... 120 - 121
Construction – Last Ten Fiscal Years ......................................................................................................122
Operating Indicators by Function/Program – Last Ten Fiscal Years ............................................ 123 - 124
Riverside Public Library – Operating Statistics – Last Nine Fiscal Years .................................... 125 - 126
Capital Asset Statistics by Function/Program – Last Ten Fiscal Years ......................................... 127 - 128
INTRODUCTORY SECTION
This section includes miscellaneous data regarding the Village including: List of Principal Officials,
Organizational Chart, Transmittal Letter and the Certificate of Achievement for Excellence in Financial
Reporting.

VILLAGE OF RIVERSIDE, ILLINOIS
Principal Officials
December 31, 2017
i
LEGISLATIVE
Village Board of Trustees
Benjamin Sells, President
Joseph Ballerine Elizabeth Peters
Patricia Julian Collins Douglas Pollock
Scott Lumsden Michael Sedivy
ADMINISTRATIVE
Jessica Frances, Village Manager
Cathy Haley, Village Clerk
DEPARTMENT MANAGERS
Sonya Abt, Director of Community Development
Karin Johns, Director of Finance
Matthew Buckley, Fire Chief/Emergency Management Director
Thomas Weitzel, Police Chief
Edward Bailey, Director of Public Works
Ron Malchiodi, Director of Parks and Recreation
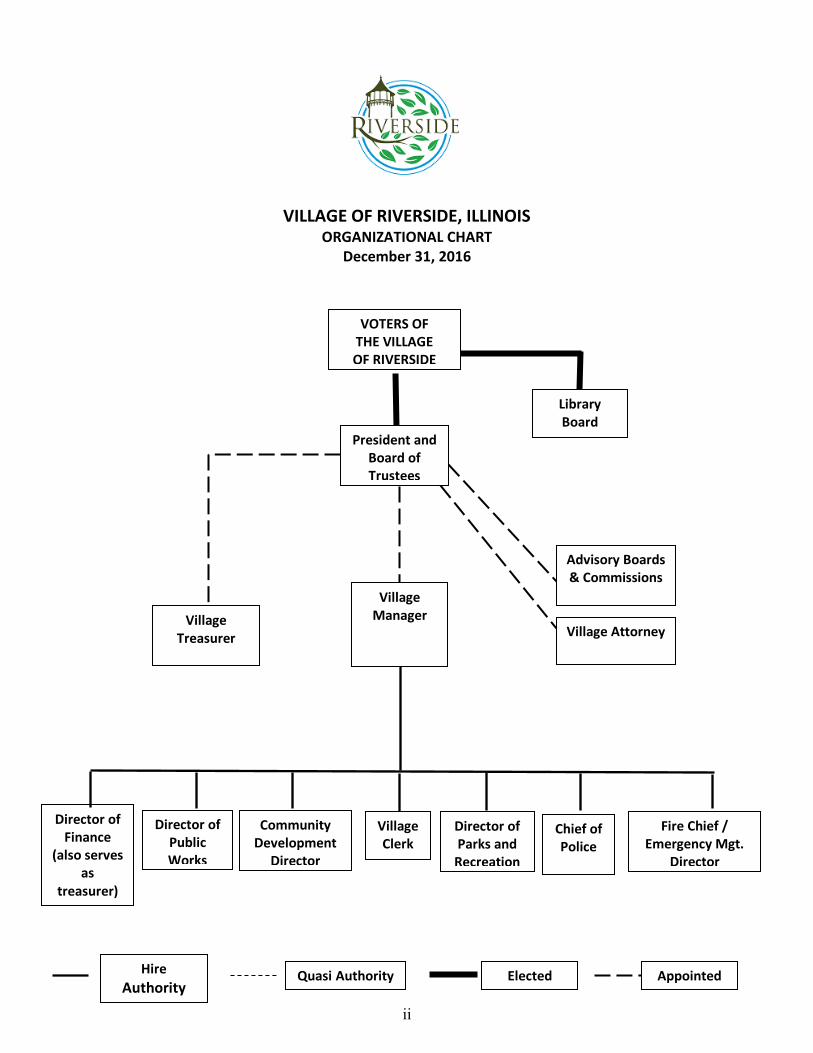
VILLAGE OF RIVERSIDE, ILLINOIS ORGANIZATIONAL CHART
December 31, 2016
Village Clerk
Chief of Police
Fire Chief / Emergency Mgt.
Director
Director of Parks and
Recreation
Director of Finance
(also serves as
treasurer)
Director of Public Works
Community Development
Director
Hire Authority
VOTERS OF THE VILLAGE OF RIVERSIDE
Quasi Authority
Library Board
President and Board of Trustees
Village Treasurer
Elected
Village Manager
Advisory Boards & Commissions
Appointed
Village Attorney
ii
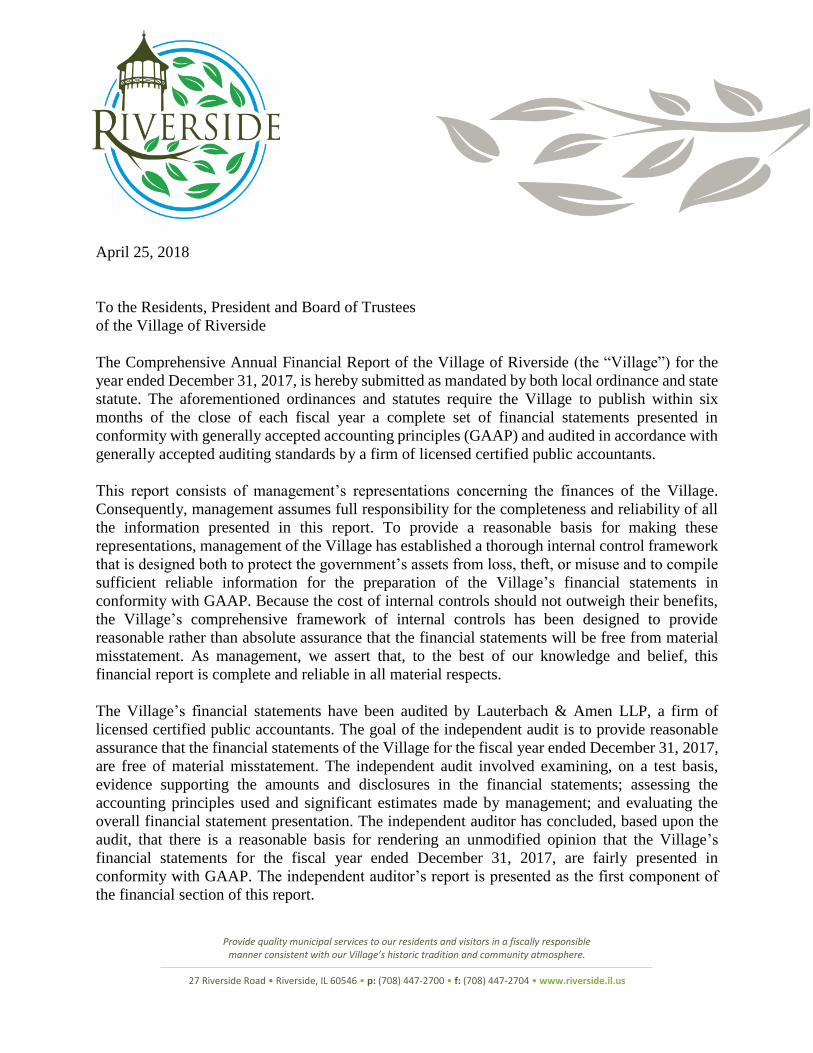
Provide quality municipal services to our residents and visitors in a fiscally responsible manner consistent with our Village’s historic tradition and community atmosphere.
27 Riverside Road • Riverside, IL 60546 • p: (708) 447-2700 • f: (708) 447-2704 • www.riverside.il.us
April 25, 2018
To the Residents, President and Board of Trustees
of the Village of Riverside
The Comprehensive Annual Financial Report of the Village of Riverside (the “Village”) for the
year ended December 31, 2017, is hereby submitted as mandated by both local ordinance and state
statute. The aforementioned ordinances and statutes require the Village to publish within six
months of the close of each fiscal year a complete set of financial statements presented in
conformity with generally accepted accounting principles (GAAP) and audited in accordance with
generally accepted auditing standards by a firm of licensed certified public accountants.
This report consists of management’s representations concerning the finances of the Village.
Consequently, management assumes full responsibility for the completeness and reliability of all
the information presented in this report. To provide a reasonable basis for making these
representations, management of the Village has established a thorough internal control framework
that is designed both to protect the government’s assets from loss, theft, or misuse and to compile
sufficient reliable information for the preparation of the Village’s financial statements in
conformity with GAAP. Because the cost of internal controls should not outweigh their benefits,
the Village’s comprehensive framework of internal controls has been designed to provide
reasonable rather than absolute assurance that the financial statements will be free from material
misstatement. As management, we assert that, to the best of our knowledge and belief, this
financial report is complete and reliable in all material respects.
The Village’s financial statements have been audited by Lauterbach & Amen LLP, a firm of
licensed certified public accountants. The goal of the independent audit is to provide reasonable
assurance that the financial statements of the Village for the fiscal year ended December 31, 2017,
are free of material misstatement. The independent audit involved examining, on a test basis,
evidence supporting the amounts and disclosures in the financial statements; assessing the
accounting principles used and significant estimates made by management; and evaluating the
overall financial statement presentation. The independent auditor has concluded, based upon the
audit, that there is a reasonable basis for rendering an unmodified opinion that the Village’s
financial statements for the fiscal year ended December 31, 2017, are fairly presented in
conformity with GAAP. The independent auditor’s report is presented as the first component of
the financial section of this report.
iv
GAAP requires that management provide a narrative introduction, overview, and analysis to
accompany the basic financial statements in the form of Management’s Discussion and Analysis
(MD&A). This letter of transmittal is designed to complement MD&A and should be read in
conjunction with it. The Village’s MD&A can be found immediately following the report of the
independent auditors.
Profile of the Government
The Village of Riverside, Cook County, Illinois, encompasses 1.9 square miles and is located in
western Cook County; approximately eleven miles west of Chicago’s “Loop.” The Village was
incorporated in 1875 and serves a population of 8,875. The Village is primarily a residential
community originally conceived and planned in 1869 as a model suburb by Frederick Law
Olmsted. In 1970, the Village was designated a National Historic Landmark by the U.S.
Department of Interior, who considered it a model of suburban planning with streets and areas
conforming to natural contours. Riverside homes are a collection of over 139 years of architecture,
ranging from small ranches to grand Queen Annes and farmhouses. The Village is home to five
Frank Lloyd Wright designed houses, two of which have been designated as National Historic
Landmarks by the National Park Service. In 2015, the Village was designated a Level II accredited
arboretum by Arbnet, an international consortium of arboreta.
The Village operates under the council-manager form of government. Policy-making and
legislative authority are vested in a governing board consisting of a President and six Trustees.
Elections are held every two years, at which time half of the Village board is elected at large to
four-year staggered terms. The President is elected every four years. The Village board appoints
the Village Manager, who is responsible for administration of the Village.
The Board of Trustees exercises, or has the ability to exercise, oversight of the various boards,
commissions and departments as depicted in the organizational chart, as well as the Police Pension
and Library funds; therefore, these activities are included in the reporting entity. However, the
Intergovernmental Risk Management Agency (IRMA) and North Suburban Employee Benefits
Cooperative (NSEBC) do not meet the established criteria for inclusion in the reporting entity, and
accordingly, are excluded from this report.
The Village provides a wide range of services including police protection and investigations, fire
protection, emergency medical, street maintenance, water and sewer, infrastructure improvements,
planning and zoning, building inspection, code enforcement, and recreational services in addition
to general administrative services. The Village also operates and maintains several residential and
commuter parking lots for the convenience of its residents and commuters that travel on the
Burlington Northern Santa Fe Line. The Village also acts as a landlord for one commercial venue
associated with the train station facilities.
The annual budget serves as the foundation for the Village’s financial planning and control. All
departments of the Village are required to submit budget requests to the Village Manager by mid-
July of each year. The Village Manager uses these requests as the starting point for developing a
proposed budget. The Village Manager and the Finance Director present a proposed budget to the
Village Board for review in September of each year. The Village Board is required to hold a public
hearing on the proposed budget and to adopt a final budget prior to the last Tuesday in December.
v
Activities of the general, special revenue, debt service, capital projects, proprietary and trust funds
are included in the annual budget. The level of budgetary control (that is, the level at which
expenditures cannot legally exceed the budgeted amount) is established at the department level in
the General Fund and the fund level for all other funds. The Village Manager serves as the Budget
Officer. Increases in departmental budgets require the special approval in the form of a budget
amendment by the Village Board. Budget-to-actual comparisons are provided in this report for
each individual governmental fund. The 2017 budget for the General Fund was amended one time.
In August and September 2017, staff presented to the Village Board the 10-year Capital
Improvement Plan and the comprehensive 5-year Financial Forecast Plan. This framework for
future financial planning established a proactive approach to managing capital and future
inflationary costs. Capital that is deferred from a given fiscal year is now tracked, providing the
Village Board with substantial information regarding the fiscal health of the community and future
capital needs. The 5-year Financial Forecast establishes trends based on historical data and
forecasts these revenue and expenditure trends over the duration of the forecast.
Factors Affecting Financial Condition
The information presented in the financial statements is perhaps best understood when it is
considered from the broader perspective of the specific environment within which the Village
operates.
Local economy. Per capita income in Riverside is $43,445 compared to $29,335 for Cook County
and $28,782 for the State of Illinois, as reported by the Bureau of the Census in 20101. More than
81.5% of the homes are owner occupied, and more than 57.1% of the residents age 25 years old or
older hold at least a bachelor’s degree. Home sales are no longer continuing to dwindle from a
peak of 246 in 2004. Previously, sales had dropped to a new low of 74 in 2009, but continue to
rebound with 95 in 2010, 89 in 2011, 141 in 2012, 187 in 2013, 157 in 2014, 170 in 2015,157 in
2016 and 201 in 2017. The 2010 Census reports the median home value of an owner occupied
property was $430,400 for Riverside compared to $265,800 for Cook County.
Riverside remains intensely dependent on its property tax revenue base to fund municipal services.
The Village’s high property tax collection rate is expected to continue; however, the Village must
maintain its current economic stability, particularly in holding home values, by maintaining its
level of services and community desirability. Between 1991 and 2010, EAV has increased on
average 3.06% in non-reassessment years and 21.50% in reassessment years. Beginning with the
2011 tax year, however, the Village’s EAV (equalized assessed value) has steadily decreased from
$330,268,593 in 2011 to $266,827,317 in 2016.
The past five years have not been the norm when compared to historical trends and we anticipate
that the continuing housing market recovery will result in a reversal of this most recent trend.
Additional detail of the Village’s Residential, Commercial and Industrial EAV can be found in the
Statistical Section of this document.
1 Census 2010 population, housing, and racial characteristics data was released in late 2011. The data provided from
income per capita is now modified to per capital money income in the past 12 months.
vi
Long-term financial planning. The Village is facing long-term financial challenges in funding
basic operations. There continues to be financial challenges to improving the Village’s
infrastructure and services. In 2007, the Village undertook multiple financial and service planning
efforts to help address financial issues.
In 2009, the Village continued a significant focus on improving the condition of Village streets. In
March of 2004, Village residents overwhelmingly supported (greater than 80% support) the
passage of a bond referendum that provided $2.06 million in bond proceeds to fund the Village’s
street program. In March 2006, voters of Riverside approved an additional 1.0% Non-Home Rule
Sales Tax, which is legally restricted to certain infrastructure. The Village has earmarked these
additional funds, estimated at over $200,000 annually, to supplement the Village’s road program.
This revenue, along with the annual MFT allotment by the State, will significantly support the
Village’s streets providing a regular resurfacing program.
In 2014, the Village was awarded several grants including a grant in the amount of $818,160 for
various repairs to the Riverside Train Station, a grant in the amount of $754,660 for the East
Burlington Streetscape Project and $421,500 for the resurfacing of East Burlington Street. These
two areas are essential to the Village and these improvements will have a great impact on the
overall appearance of the Village’s downtown area. Grant funding for the East Burlington
Streetscape and resurfacing projects has been obtained via the Village’s participation in the Surface
Transportation Program (STP), a federally funded program, and in October 2015 the Village was
notified that grant funding for the East Burlington Street resurfacing had increased to
approximately $1.206 million. Although preliminary work on the Streetscape Project was carried-
out in 2014 and 2015, actual construction was deferred to 2016 due to the increased scope of work.
Both the streetscape and resurfacing projects were substantially completed by the end of 2016,
however the Village is still awaiting close out of theses grants from the state. The train station
repair project was completed in 2017 through 2018.
Several Village facilities require ongoing maintenance and will require significant renovation to
make them usable in the future. The Village’s Youth Center (former Public Works facility), and
Fire Department stations need major renovation while the Police Department requires less
investment to carry-out similar modifications. Preliminary cost estimates for these projects total
$6.8M (estimates secured several years ago) and there is currently no funding source available. In
2018, the Village plans on completing a comprehensive Facility Study which will include Existing
Condition Study and Space Needs Analysis.
In 2014, the Village commissioned a Comprehensive Sewer Study which evaluated the Village’s
storm and sanitary systems. This study consisted of $7.97 million of improvements Village wide.
In 2017, the completed a large sewer separation project in the First Division costing approximately
$3.2 million. Street Improvements related to this project are budgeted to be completed in 2018.
The First Division Sewer Separation project was completed through use of cash reserves, no debt
service being utilized.
vii
Financial Policies affecting Financial Status
The Village continues to monitor the economic climate and its impact on the Village’s finances
and financial position. The Village continues to review financials monthly to ensure that revenues
and expenditures are in line with budgeted expectations. Staff continues to provide conservative
revenue projections. The last time mid-year budget modifications were necessary was in 2009.
There are financial concerns now and in the future that the Village continues to be cognizant of
and continues to take a proactive approach to address. The Village retains a fund balance policy
of 25% of the following year's budgeted expenditures in a cash flow reserve. Further, we retain a
debt service reserve to assure adequate cash is on hand for annual governmental debt service
payments, which are funded by property taxes. While the revenue from property tax is reliable, the
billing schedule, particularly the second installment, has had a history of being erratic. More
recently, however, tax bills have been delivered on time resulting in more prompt payments to the
village and increased the reliability of the Village's cash flows.
In August 2012, the Village board undertook a substantial review of existing policies for funding
capital projects. While many capital programs have a funding source, there is no reliable and
sustainable revenue for many general governmental capital investments, including sidewalk repair
and replacement, and maintenance of village facilities. During Fiscal Year 2013, the Village Board
decided that future funding for general governmental projects and vehicles will have to be funded
by annual transfers from unassigned fund balance in the General Fund. In 2014, 2015 and 2016,
$1.422 million, $360,000 and $1.068 million, respectively, were transferred from unassigned fund
balance in the General Fund to the Capital Projects Fund to fund the approved 2015, 2016 and
2017 capital improvements. Additionally, in anticipation of the 2004 road bonds being completely
liquidated during 2014, the Village took steps to evaluate the feasibility of issuing additional bonds
whose purpose would be to fund additional road improvements. Such bond issuance was placed
on a referendum which was approved by the majority of voters in November 2014. These bonds
closed in January 2015 and raised approximately $2.3 million. As of December 31, 2017 these
funds were fully expended.
New and Future GASB Pronouncements
GASB Statement No. 82 amends Statements No. 67, No. 68, and No. 73 for, among other things,
the presentation of payroll-related financial measures. Statement No. 82 revises the definition of
covered employee payroll and the Village expects that it will be required to implement this
Statement beginning with our CAFR for the fiscal year ending December 31, 2017.
GASB Statements No. 74 Financial Reporting for Post-Employment Benefit Plans Other Than
Pension Plans, and GASB Statement No. 75 Accounting and Financial Reporting for Post-
Employment Benefits Other Than Pension will be effective December 31, 2018. At present the
Village does not have other post-employment benefit (OPEB) liability. Village staff will review
what impact, if any, these two new statements will have on the Village.
Certificate of
Presented to
Village of Riverside
For its Comprehensive Annual
December 31, 2016
Executive Director/CEO
Financial Reportfor the Fiscal Year Ended
Reportingin Financial
for ExcellenceAchievement
Text38: Illinois
Government Finance Officers Association
ix
FINANCIAL SECTION
This section includes:
• Independent Auditors’ Report
• Management’s Discussion and Analysis
• Basic Financial Statements
• Required Supplementary Information
• Combining and Individual Fund Statements and Schedules
• Supplemental Schedules
INDEPENDENT AUDITORS’ REPORT
This section includes the opinion of the Village’s independent auditing firm.
2
Village of Riverside, Illinois
April 25, 2018
Page 2
Other Matters
Required Supplementary Information
Accounting principles generally accepted in the United States of America require that the management’s
discussion and analysis as listed in the table of contents and budgetary information reported in the required
supplementary information as listed in the table of contents, be presented to supplement the basic financial
statements. Such information, although not part of the basic financial statements, is required by the
Governmental Accounting Standards Board, who considers it to be an essential part of financial reporting
for placing the basic financial statements in an appropriate operational, economic, or historical context. We
have applied certain limited procedures to the required supplementary information in accordance with
auditing standards generally accepted in the United States of America, which consisted of inquiries of
management about the methods of preparing the information and comparing the information for consistency
with management’s responses to our inquiries, the basic financial statements, and other knowledge we
obtained during our audit of the basic financial statements. We do not express an opinion or provide any
assurance on the information because the limited procedures do not provide us with sufficient evidence to
express an opinion or provide any assurance.
Other Information
Our audit was conducted for the purpose of forming opinions on the financial statements that collectively
comprise the Village of Riverside, Illinois’ basic financial statements. The introductory section, combining
and individual fund financial statements and budgetary comparison schedules, supplemental schedules, and
statistical section are presented for purposes of additional analysis and are not a required part of the financial
statements.
The combining and individual fund financial statements and budgetary comparison schedules and
supplemental schedules are the responsibility of management and were derived from and relate directly to
the underlying accounting and other records used to prepare the financial statements. Such information has
been subjected to the auditing procedures applied in the audit of the financial statements and certain
additional procedures, including comparing and reconciling such information directly to the underlying
accounting and other records used to prepare the basic financial statements or to the basic financial
statements themselves, and other additional procedures in accordance with auditing standards generally
accepted in the United States of America. In our opinion, the combining and individual fund financial
statements and budgetary comparison schedules and supplemental schedules are fairly stated, in all material
respects, in relation to the basic financial statements as a whole.
The introductory and statistical sections have not been subjected to the auditing procedures applied in the
audit of the basic financial statements and, accordingly, we do not express an opinion or provide any
assurance on them.
LAUTERBACH & AMEN, LLP
MANAGEMENT’S DISCUSSION AND ANALYSIS
(See independent auditor’s report)
MD&A1
VILLAGE OF RIVERSIDE, ILLINOIS
MANAGEMENT’S DISCUSSION AND ANALYSIS
December 31, 2017
As the management of the Village of Riverside (the “Village”), we offer readers of the Village’s
financial statements this narrative overview and analysis of the financial activities of the Village
for the fiscal year ended December 31, 2017. The Management’s Discussion and Analysis
(MD&A) is designed to (1) assist the reader in focusing on significant financial issues, (2) provide
an overview of the Village’s financial authority, (3) identify changes in the Village’s financial
position (its ability to address the subsequent years’ challenges), (4) identify any material
deviations from the financial plan (the approved budget), and (5) identify individual fund issues
or concerns.
We encourage readers to consider the information presented here in conjunction with additional
information that we have furnished in our letter of transmittal, which may be found starting on
page iii of this report.
Financial Highlights
• As of December 31, 2017, the Village’s total net position was $18,367,033. This balance
represents a decrease of $302,314, or 1.6%, from prior year. This decrease consists of a
$755,885 decrease in governmental activities and a $453,571 increase in business-type
activities.
• The total fund balance of the governmental funds decreased $1,938,757 from $8,459,311
as of December 31, 2016 to $6,520,554 as of December 31, 2017.
• The final General Fund budget, as amended, called for an increase in fund balance of
$28,824 prior to any transfers out. Including transfers out of $687,841 total fund balance
for the General Fund decreased $918,766. The General Fund experienced a decrease in
fund balance of $230,925, prior to any transfers out, due to actual revenues of $9,326,922
coming in less than actual expenditures of $9,557,847. In December 2017, the Village
Board approved the transfer of $687,841 in assigned and unassigned fund balance from the
General Fund to the Capital Projects Fund to pay for anticipated 2018 capital expenditures.
• The General Fund fund balance under the sole discretion of the Village Board totaled
$3,079,911; net of non-spendable items equaling $597,809. This fund balance represents
30.1% of 2017 General Fund expenditures and other financing uses, and is in excess of the
Village’s fund balance policy of maintaining, at a minimum, an unassigned fund balance
of 25% of General Fund expenditures (3 months of operations) plus the next year’s
governmental debt service requirements.
• The Police Pension Trust Fund increased its fiduciary net position by $847,417 to a total
ending balance of $9,240,167. This represents a 10.1% increase over prior year. This
increase was primarily driven by the increased contributions by the Village and an increase
in realized gains during the year. The funding level of the Trust Fund has increased from
30.0% in 2016 to 33.9% in 2017.

VILLAGE OF RIVERSIDE, ILLINOIS
MANAGEMENT’S DISCUSSION AND ANALYSIS (continued)
(See independent auditor’s report)
MD&A 2
USING THE FINANCIAL SECTION OF THIS COMPREHENSIVE ANNUAL REPORT
The Village’s financial statements present two kinds of statements, each with a different snapshot
of the Village’s finances. The focus is on both the Village as a whole (government-wide) and on
the major individual funds. Both perspectives (government-wide and major fund) allow the user
to address relevant questions, broaden a basis for comparison (year to year or government to
government) and enhance the Village’s accountability.
Government-Wide Financial Statements
The government-wide financial statements are designed to provide readers with a broad overview
of the Village’s finances, in a manner similar to a private-sector business. Governmental and
business-type activities are consolidated into columns that add to a total for the Primary
Government.
The Statement of Net Position presents information on all of the Village’s assets/deferred outflows
of resources and liabilities/deferred inflows of resources, with the difference between the two
reported as net position. This statement combines and consolidates governmental funds’ current
financial resources (short-term spendable resources) with capital assets and long-term obligations
using the accrual basis of accounting and economic resources measurement focus. Over time,
increases or decreases in net position may serve as a useful indicator of whether the financial
position of the Village is improving or deteriorating.
The Statement of Activities presents information showing how the government’s net position
changed during the most recent fiscal year. All changes in net position are reported as soon as the
underlying event giving rise to the change occurs, regardless of the timing of the cash flows. Thus,
revenues and expenses are reported in this statement for some items that will only result in cash
flows in future fiscal periods (e.g., earned but unused sick leave).
The Governmental Activities reflect the Village's basic services, including police, fire, emergency
medical services, streets, infrastructure improvements, planning and zoning, building inspection,
code enforcement and recreational services in addition to general administrative services. Property
taxes, shared state sales taxes, local utility taxes, and shared state income taxes, finance the
majority of these activities. The business-type activities reflect private sector-type operations
(Water and Sewer Fund and the Parking Lot Fund), where the fee for service covers all or most of
the costs of operation, including depreciation.
The government-wide financial statements include not only the Village itself (known as the
primary government), but also the Riverside Public Library (the “Library”). The Village is
financially accountable for the Library but the Library has a separate governing board. Because
the Library is a component unit, its financial information is reported separately from the financial
information of the Village.
VILLAGE OF RIVERSIDE, ILLINOIS
MANAGEMENT’S DISCUSSION AND ANALYSIS (continued)
(See independent auditor’s report)
MD&A 3
Fund Financial Statements
A fund is a grouping of related accounts that is used to maintain control over resources that have
been segregated for specific activities or objectives. The Village, like other state and local
governments, uses fund accounting to ensure and demonstrate compliance with finance-related
legal requirements. The focus of the fund financial statements is now on major funds rather than
fund types. All of the funds of the Village can be divided into three categories: governmental
funds, proprietary funds, and fiduciary funds.
Governmental Funds. Governmental funds are used to account for essentially the same functions
reported as governmental activities in the government-wide financial statements. Unlike the
government-wide financial statements, governmental fund financial statements focus on near-term
inflows and outflows of spendable resources and balances of spendable resources available at the
end of the fiscal year. Such information is useful in evaluating a government’s near-term financing
requirements.
It is useful to compare the information presented for governmental funds (narrower focus) with
similar information presented for governmental activities in the government-wide financial
statements (broader focus). By doing so, readers may better understand the long-term impact of
the government’s near-term financing decisions. Both the governmental fund balance sheet and
the governmental fund statement of revenues, expenditures, and changes in fund balances provide
a reconciliation to facilitate this comparison between governmental funds and governmental
activities.
The Village maintains five individual governmental funds. Information is presented separately in
the governmental fund balance sheet and in the governmental fund statement of revenues,
expenditures, and changes in fund balances for the General Fund, the Debt Service Fund, and the
Capital Projects Fund, all of which are considered “major” funds. Data from the other two
governmental funds (the E-911 and Motor Fuel Tax Funds) are combined into a single, aggregate
presentation. Individual fund data for each of these nonmajor governmental funds is provided in
the form of combining statements elsewhere in this report.
On an annual basis, the Village adopts an annual budget for all of its funds. A budgetary
comparison schedule has been provided for the General Fund to demonstrate compliance with the
budget.
The basic governmental fund financial statements can be found on pages 7 through 12 of this
report.
Proprietary Funds. The Village maintains one type of proprietary fund: enterprise funds.
Enterprise funds are used to report the same functions presented as business-type activities in the
government-wide financial statements. The Village uses enterprise funds to account for its water
and sewer and parking lot operations.
VILLAGE OF RIVERSIDE, ILLINOIS
MANAGEMENT’S DISCUSSION AND ANALYSIS (continued)
(See independent auditor’s report)
MD&A 4
Proprietary funds provide the same type of information as the government-wide financial
statements, only in more detail. The proprietary fund financial statements provide separate
information for the Water and Sewer Fund, which is considered a major fund of the Village.
The basic proprietary fund financial statements can be found on pages 13 through 16 of this report.
Fiduciary Funds. Fiduciary funds are used to account for resources held for the benefit of parties
outside of the government. Fiduciary funds are not reflected in the government-wide financial
statements because the resources of those funds are not available to support the Village’s own
programs. The accounting used for fiduciary funds is much like that used for proprietary funds.
The Village maintains one fiduciary fund: Police Pension Fund.
The basic fiduciary fund financial statements can be found on pages 17 through 18 of this report.
Notes to the Financial Statements
The notes provide additional information that is essential to a full understanding of the data
provided in the government-wide and fund financial statements. The notes to the financial
statements can be found on pages 19 through 58 of this report.
Other Information
In addition to the basic financial statements and accompanying notes, this report also presents
certain required supplementary information concerning the Village’s progress in funding its
obligation to provide benefits to its employees as well as the budgetary comparison schedule for
the General Fund. Required supplementary information can be found on pages 59 through 65 of
this report.
The combining statements referred to earlier in connection with nonmajor governmental funds and
nonmajor enterprise funds are presented so the reader can understand the details of the smaller
funds for various purposes. Combining and individual fund statements and schedules can be found
on pages 66 through 85 of this report.
GOVERNMENT-WIDE STATEMENTS
Net Position
As noted earlier, net position may serve over time as a useful indicator of a government’s financial
position. In the case of the Village, assets/deferred outflows exceeded liabilities/deferred inflows
by $18,367,033 at the close of the most recent fiscal year.
By far the largest portion of the Village’s net position, 163.1%, reflects its investment in capital
assets (land, buildings, machinery and equipment), less any outstanding related debt used to
acquire those assets. The Village uses these capital assets to provide services to citizens;
consequently, these assets are not available for future spending. Although the Village’s investment
in its capital assets is reported net of related debt, it should be noted that the resources needed to
repay this debt must be provided from other sources, since the capital assets themselves cannot be
used to liquidate these liabilities. The following table reflects the condensed Statement of Net
Position.
VILLAGE OF RIVERSIDE, ILLINOIS
MANAGEMENT’S DISCUSSION AND ANALYSIS (continued)
(See independent auditor’s report)
MD&A 5
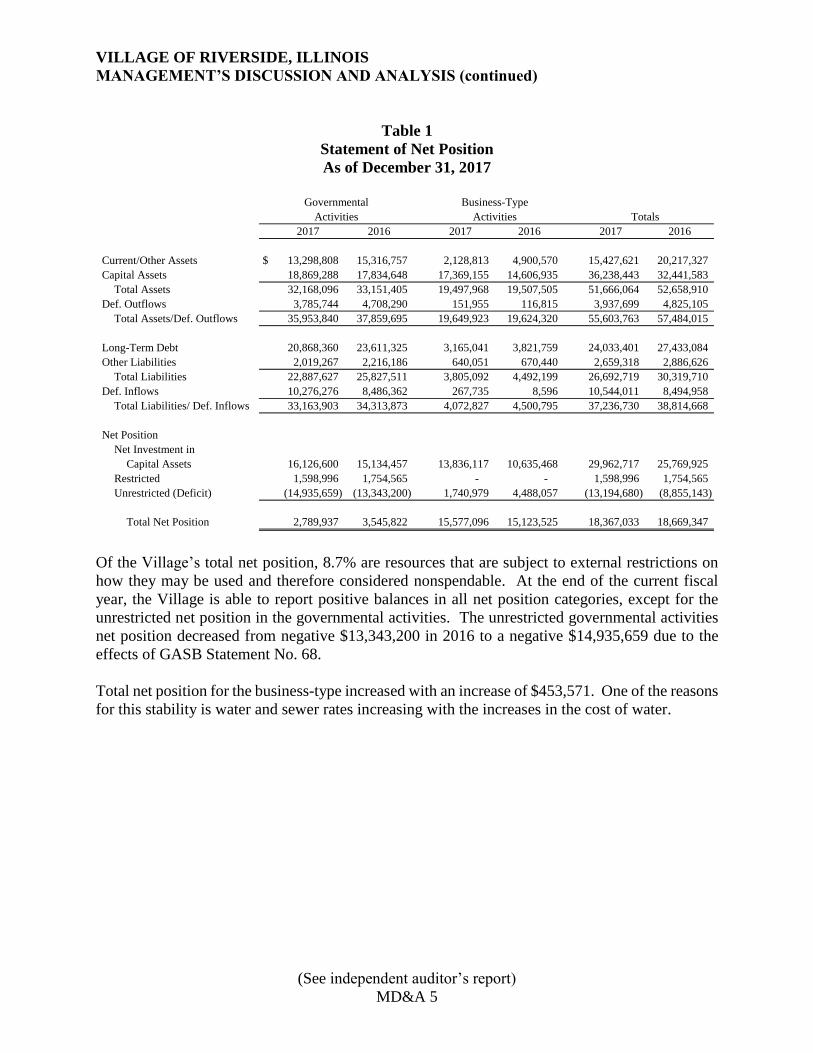
Table 1
Statement of Net Position
As of December 31, 2017
2017 2016 2017 2016 2017 2016
Current/Other Assets $ 13,298,808 15,316,757 2,128,813 4,900,570 15,427,621 20,217,327
Capital Assets 18,869,288 17,834,648 17,369,155 14,606,935 36,238,443 32,441,583
Total Assets 32,168,096 33,151,405 19,497,968 19,507,505 51,666,064 52,658,910
Def. Outflows 3,785,744 4,708,290 151,955 116,815 3,937,699 4,825,105
Total Assets/Def. Outflows 35,953,840 37,859,695 19,649,923 19,624,320 55,603,763 57,484,015
Long-Term Debt 20,868,360 23,611,325 3,165,041 3,821,759 24,033,401 27,433,084
Other Liabilities 2,019,267 2,216,186 640,051 670,440 2,659,318 2,886,626
Total Liabilities 22,887,627 25,827,511 3,805,092 4,492,199 26,692,719 30,319,710
Def. Inflows 10,276,276 8,486,362 267,735 8,596 10,544,011 8,494,958
Total Liabilities/ Def. Inflows 33,163,903 34,313,873 4,072,827 4,500,795 37,236,730 38,814,668
Net Position
Net Investment in
Capital Assets 16,126,600 15,134,457 13,836,117 10,635,468 29,962,717 25,769,925
Restricted 1,598,996 1,754,565 - - 1,598,996 1,754,565
Unrestricted (Deficit) (14,935,659) (13,343,200) 1,740,979 4,488,057 (13,194,680) (8,855,143)
Total Net Position 2,789,937 3,545,822 15,577,096 15,123,525 18,367,033 18,669,347
Governmental Business-Type
Activities Activities Totals
Of the Village’s total net position, 8.7% are resources that are subject to external restrictions on
how they may be used and therefore considered nonspendable. At the end of the current fiscal
year, the Village is able to report positive balances in all net position categories, except for the
unrestricted net position in the governmental activities. The unrestricted governmental activities
net position decreased from negative $13,343,200 in 2016 to a negative $14,935,659 due to the
effects of GASB Statement No. 68.
Total net position for the business-type increased with an increase of $453,571. One of the reasons
for this stability is water and sewer rates increasing with the increases in the cost of water.
VILLAGE OF RIVERSIDE, ILLINOIS
MANAGEMENT’S DISCUSSION AND ANALYSIS (continued)
(See independent auditor’s report)
MD&A 6
Activities
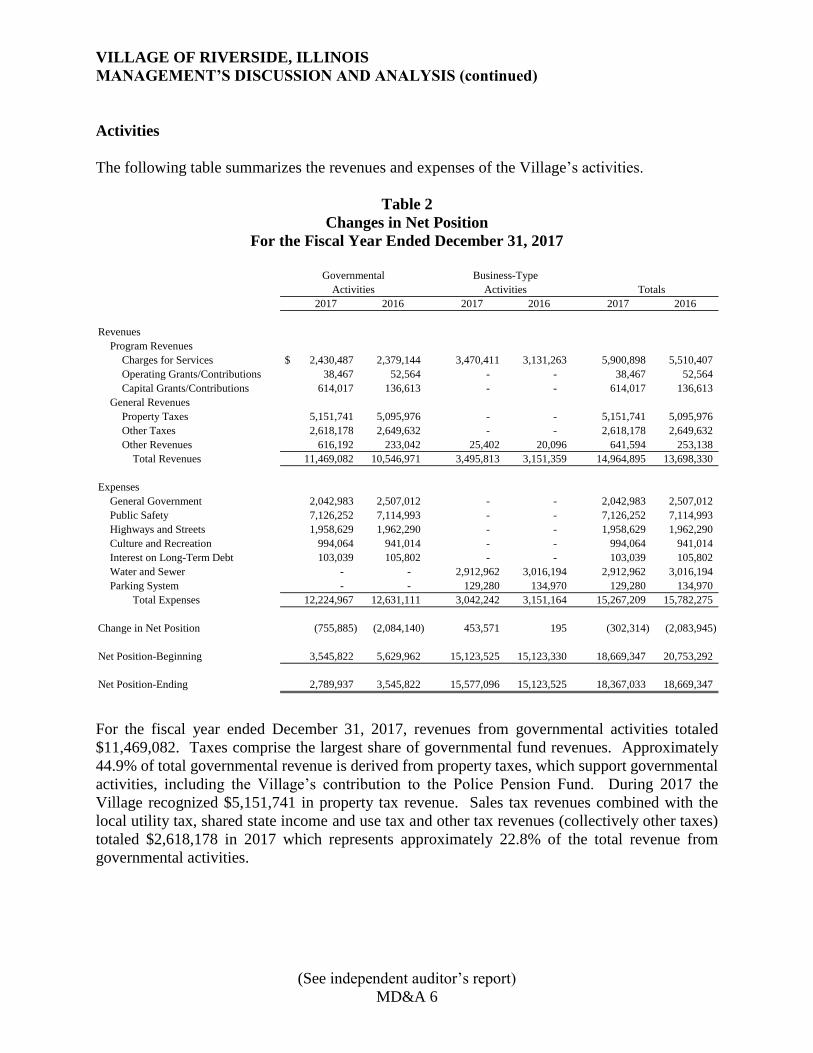
The following table summarizes the revenues and expenses of the Village’s activities.
Table 2
Changes in Net Position
For the Fiscal Year Ended December 31, 2017
2017 2016 2017 2016 2017 2016
Revenues
Program Revenues
Charges for Services $ 2,430,487 2,379,144 3,470,411 3,131,263 5,900,898 5,510,407
Operating Grants/Contributions 38,467 52,564 - - 38,467 52,564
Capital Grants/Contributions 614,017 136,613 - - 614,017 136,613
General Revenues
Property Taxes 5,151,741 5,095,976 - - 5,151,741 5,095,976
Other Taxes 2,618,178 2,649,632 - - 2,618,178 2,649,632
Other Revenues 616,192 233,042 25,402 20,096 641,594 253,138
Total Revenues 11,469,082 10,546,971 3,495,813 3,151,359 14,964,895 13,698,330
Expenses
General Government 2,042,983 2,507,012 - - 2,042,983 2,507,012
Public Safety 7,126,252 7,114,993 - - 7,126,252 7,114,993
Highways and Streets 1,958,629 1,962,290 - - 1,958,629 1,962,290
Culture and Recreation 994,064 941,014 - - 994,064 941,014
Interest on Long-Term Debt 103,039 105,802 - - 103,039 105,802
Water and Sewer - - 2,912,962 3,016,194 2,912,962 3,016,194
Parking System - - 129,280 134,970 129,280 134,970
Total Expenses 12,224,967 12,631,111 3,042,242 3,151,164 15,267,209 15,782,275
Change in Net Position (755,885) (2,084,140) 453,571 195 (302,314) (2,083,945)
Net Position-Beginning 3,545,822 5,629,962 15,123,525 15,123,330 18,669,347 20,753,292
Net Position-Ending 2,789,937 3,545,822 15,577,096 15,123,525 18,367,033 18,669,347
Governmental Business-Type
Activities Activities Totals
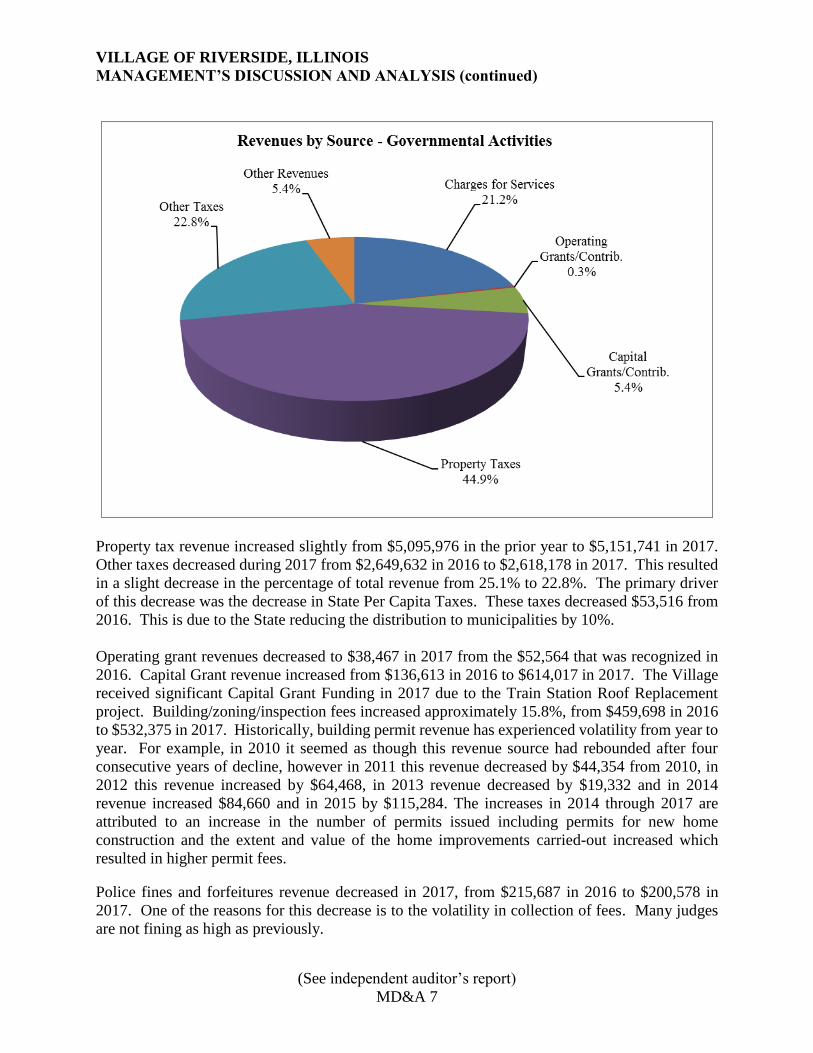
For the fiscal year ended December 31, 2017, revenues from governmental activities totaled
$11,469,082. Taxes comprise the largest share of governmental fund revenues. Approximately
44.9% of total governmental revenue is derived from property taxes, which support governmental
activities, including the Village’s contribution to the Police Pension Fund. During 2017 the
Village recognized $5,151,741 in property tax revenue. Sales tax revenues combined with the
local utility tax, shared state income and use tax and other tax revenues (collectively other taxes)
totaled $2,618,178 in 2017 which represents approximately 22.8% of the total revenue from
governmental activities.
VILLAGE OF RIVERSIDE, ILLINOIS
MANAGEMENT’S DISCUSSION AND ANALYSIS (continued)
(See independent auditor’s report)
MD&A 7
Property tax revenue increased slightly from $5,095,976 in the prior year to $5,151,741 in 2017.
Other taxes decreased during 2017 from $2,649,632 in 2016 to $2,618,178 in 2017. This resulted
in a slight decrease in the percentage of total revenue from 25.1% to 22.8%. The primary driver
of this decrease was the decrease in State Per Capita Taxes. These taxes decreased $53,516 from
2016. This is due to the State reducing the distribution to municipalities by 10%.
Operating grant revenues decreased to $38,467 in 2017 from the $52,564 that was recognized in
2016. Capital Grant revenue increased from $136,613 in 2016 to $614,017 in 2017. The Village
received significant Capital Grant Funding in 2017 due to the Train Station Roof Replacement
project. Building/zoning/inspection fees increased approximately 15.8%, from $459,698 in 2016
to $532,375 in 2017. Historically, building permit revenue has experienced volatility from year to
year. For example, in 2010 it seemed as though this revenue source had rebounded after four
consecutive years of decline, however in 2011 this revenue decreased by $44,354 from 2010, in
2012 this revenue increased by $64,468, in 2013 revenue decreased by $19,332 and in 2014
revenue increased $84,660 and in 2015 by $115,284. The increases in 2014 through 2017 are
attributed to an increase in the number of permits issued including permits for new home
construction and the extent and value of the home improvements carried-out increased which
resulted in higher permit fees.
Police fines and forfeitures revenue decreased in 2017, from $215,687 in 2016 to $200,578 in
2017. One of the reasons for this decrease is to the volatility in collection of fees. Many judges
are not fining as high as previously.
VILLAGE OF RIVERSIDE, ILLINOIS
MANAGEMENT’S DISCUSSION AND ANALYSIS (continued)
(See independent auditor’s report)
MD&A 8
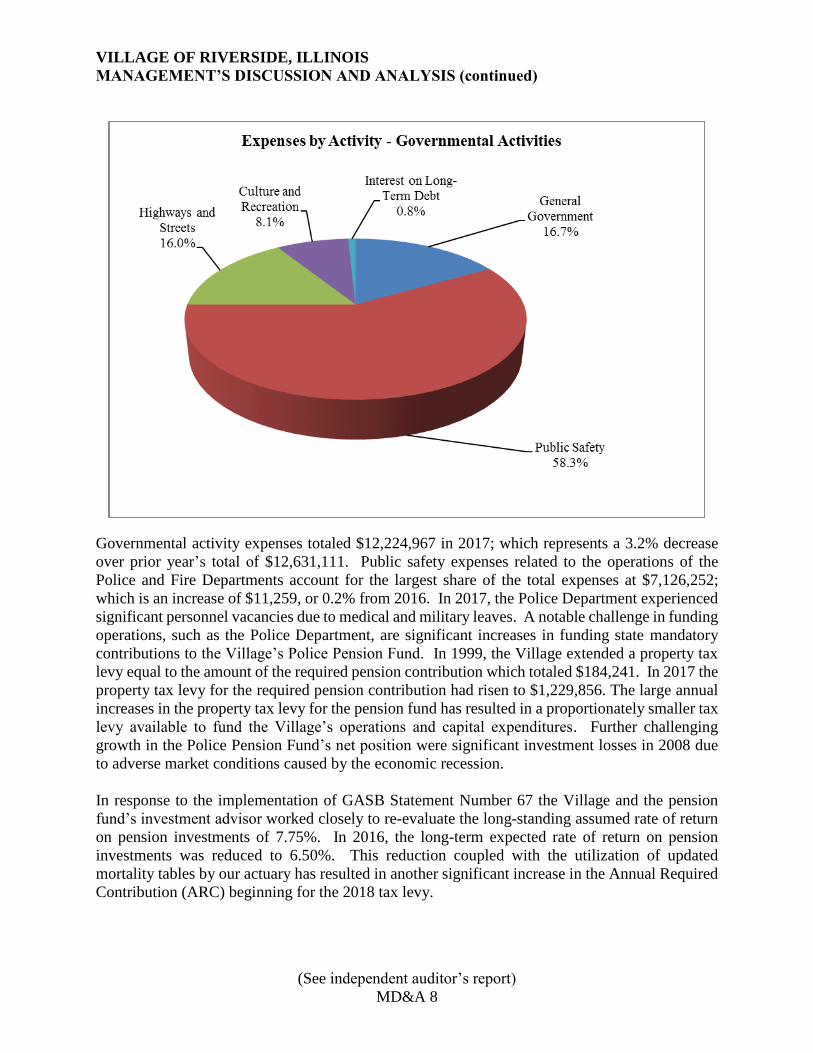
Governmental activity expenses totaled $12,224,967 in 2017; which represents a 3.2% decrease
over prior year’s total of $12,631,111. Public safety expenses related to the operations of the
Police and Fire Departments account for the largest share of the total expenses at $7,126,252;
which is an increase of $11,259, or 0.2% from 2016. In 2017, the Police Department experienced
significant personnel vacancies due to medical and military leaves. A notable challenge in funding
operations, such as the Police Department, are significant increases in funding state mandatory
contributions to the Village’s Police Pension Fund. In 1999, the Village extended a property tax
levy equal to the amount of the required pension contribution which totaled $184,241. In 2017 the
property tax levy for the required pension contribution had risen to $1,229,856. The large annual
increases in the property tax levy for the pension fund has resulted in a proportionately smaller tax
levy available to fund the Village’s operations and capital expenditures. Further challenging
growth in the Police Pension Fund’s net position were significant investment losses in 2008 due
to adverse market conditions caused by the economic recession.
In response to the implementation of GASB Statement Number 67 the Village and the pension
fund’s investment advisor worked closely to re-evaluate the long-standing assumed rate of return
on pension investments of 7.75%. In 2016, the long-term expected rate of return on pension
investments was reduced to 6.50%. This reduction coupled with the utilization of updated
mortality tables by our actuary has resulted in another significant increase in the Annual Required
Contribution (ARC) beginning for the 2018 tax levy.
VILLAGE OF RIVERSIDE, ILLINOIS
MANAGEMENT’S DISCUSSION AND ANALYSIS (continued)
(See independent auditor’s report)
MD&A 9
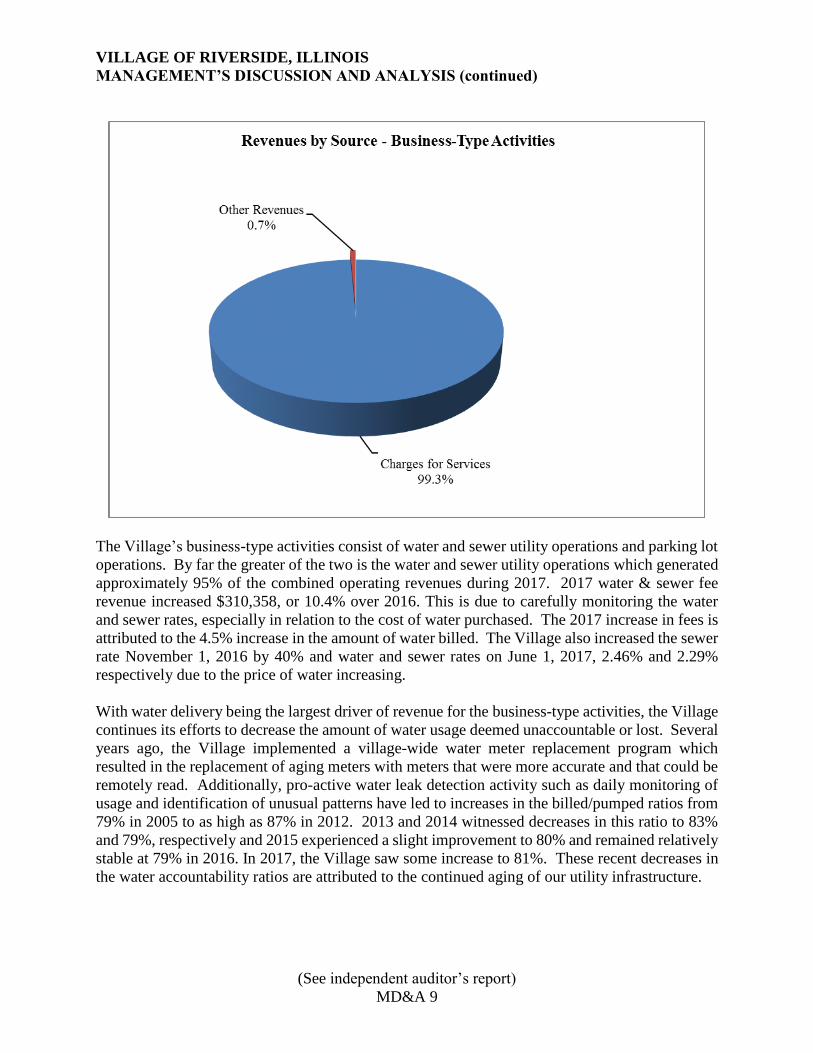
The Village’s business-type activities consist of water and sewer utility operations and parking lot
operations. By far the greater of the two is the water and sewer utility operations which generated
approximately 95% of the combined operating revenues during 2017. 2017 water & sewer fee
revenue increased $310,358, or 10.4% over 2016. This is due to carefully monitoring the water
and sewer rates, especially in relation to the cost of water purchased. The 2017 increase in fees is
attributed to the 4.5% increase in the amount of water billed. The Village also increased the sewer
rate November 1, 2016 by 40% and water and sewer rates on June 1, 2017, 2.46% and 2.29%
respectively due to the price of water increasing.
With water delivery being the largest driver of revenue for the business-type activities, the Village
continues its efforts to decrease the amount of water usage deemed unaccountable or lost. Several
years ago, the Village implemented a village-wide water meter replacement program which
resulted in the replacement of aging meters with meters that were more accurate and that could be
remotely read. Additionally, pro-active water leak detection activity such as daily monitoring of
usage and identification of unusual patterns have led to increases in the billed/pumped ratios from
79% in 2005 to as high as 87% in 2012. 2013 and 2014 witnessed decreases in this ratio to 83%
and 79%, respectively and 2015 experienced a slight improvement to 80% and remained relatively
stable at 79% in 2016. In 2017, the Village saw some increase to 81%. These recent decreases in
the water accountability ratios are attributed to the continued aging of our utility infrastructure.
VILLAGE OF RIVERSIDE, ILLINOIS
MANAGEMENT’S DISCUSSION AND ANALYSIS (continued)
(See independent auditor’s report)
MD&A 10
Parking lot service revenues experienced an increase in 2017. Such revenues increased from
$137,548 in 2016 to $166,338 in 2017. The last time that parking rates were adjusted was back in
2008 and in late 2015 the Village initiated an analysis of existing parking usage and fees to
determine whether or not a fee increase was warranted. Demand for parking continues to be strong
and based on a comparison of parking fees charged by many neighboring villages, the Village has
determined that an increase in fees is warranted in order to maintain existing services and fund the
necessary capital improvements of the various parking lots. These rates increased January 1, 2017
resulting in a 20.9% increase.
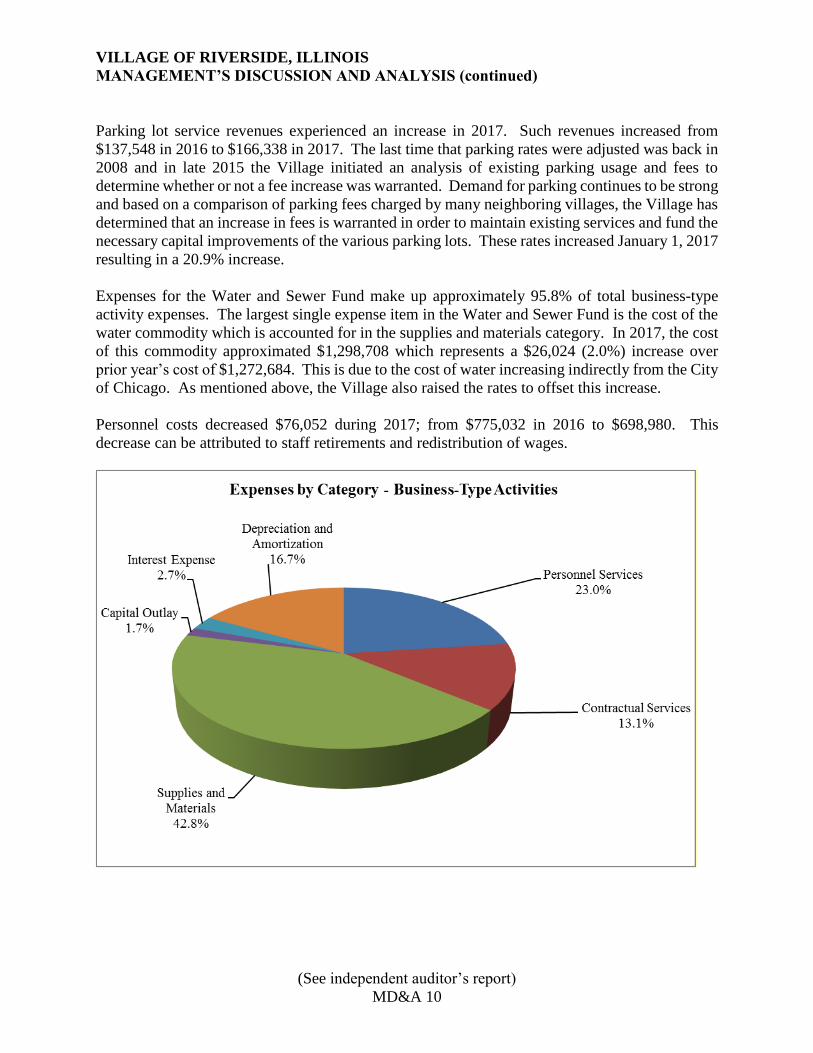
Expenses for the Water and Sewer Fund make up approximately 95.8% of total business-type
activity expenses. The largest single expense item in the Water and Sewer Fund is the cost of the
water commodity which is accounted for in the supplies and materials category. In 2017, the cost
of this commodity approximated $1,298,708 which represents a $26,024 (2.0%) increase over
prior year’s cost of $1,272,684. This is due to the cost of water increasing indirectly from the City
of Chicago. As mentioned above, the Village also raised the rates to offset this increase.
Personnel costs decreased $76,052 during 2017; from $775,032 in 2016 to $698,980. This
decrease can be attributed to staff retirements and redistribution of wages.
VILLAGE OF RIVERSIDE, ILLINOIS
MANAGEMENT’S DISCUSSION AND ANALYSIS (continued)
(See independent auditor’s report)
MD&A 11
FINANCIAL ANALYSIS OF THE VILLAGE’S FUNDS
Governmental Funds
At December 31, 2017, the Governmental Funds reported a combined fund balance of $6,520,554,
which is a $1,938,757 or 22.9% decrease from the prior year-end balance of $8,459,311. Fund
balance in the General Fund decreased $918,766; or 20.0% from $4,596,486 in 2016 to $3,677,720
in 2017. In late 2017, the Village Board approved a $687,841 operating transfer out of the General
Fund into the Capital Projects Fund to pay for capital improvements and purchases that are
scheduled in 2018. The Debt Service Fund experienced a net $22,282 increase in restricted fund
balance due, in part, to higher than expected property tax revenues and higher than anticipated
issuance of debt. The Capital Projects Fund had a $1,042,114 decrease in fund balance due to
expenditures of previously issued bond proceeds on projects. The non-major fund balance of
$775,216 is comprised of $238,213 in restricted fund balance for the E-911 Fund and $536,285 in
restricted fund balance for the Motor Fuel Tax Fund. The E-911 fund balance decreased $229,023
during the year primarily due to the set up costs associated with establishing a new consolidated
dispatch center with surrounding communities. The Village plans on closing the E-911 fund in
2018 due to this new center taking over these functions. The Motor Fuel Tax fund balance
increased $228,864 primarily due to no MFT capital projects during the year. Additional
discussion of specific revenues and expenditures was provided earlier in this MD&A.
At the end of 2017 the combined fund balance for the governmental funds equaled $6,520,554.
Of this total, $19,819 is unassigned, indicating that this balance is available for continuing Village
services and infrastructure investment. That portion of total fund balance that is restricted to
specific purposes totaled $1,605,134 and is comprised of $233,807 in remaining bond proceeds
that are restricted for street improvements, $383,399 for public safety, $536,285 for highways and
streets, $355,754 for debt service, and $15,899 for other various purposes.
Proprietary Funds
For the year ending December 31, 2017, the proprietary funds total net position increased by
$453,571 from $15,123,525 in 2016 to $15,577,096.
Net position for the Parking Lot Fund increased $37,822; or 4.0% over prior year due to lower
than expected operating expenses and capital improvement expenses being delayed to 2018. The
Village manages an additional 12 parking lots including a lot adjacent to the Burlington Northern
Santa Fe Railroad (BNSF railroad) that provides 150 parking spaces for use by commuters. A
portion of this lot is leased from BNSF and both parties renewed the lease agreement that expires
in early 2036.
VILLAGE OF RIVERSIDE, ILLINOIS
MANAGEMENT’S DISCUSSION AND ANALYSIS (continued)
(See independent auditor’s report)
MD&A 12
Budgetary Highlights
The General Fund is the Village’s primary operating fund and the largest source of day-to-day
service delivery. The total fund balance of the General Fund decreased $918,766; from $4,596,486
in 2016 to $3,677,720 in 2017. This decrease is comprised of $230,925 deficit from revenues less
than expenditures and less $687,841 in other financing uses. In December 2017, the Village board
approved the transfer of $687,841 in fund balance to the Capital Projects Fund for anticipated 2018
capital expenditures. The original General Fund budget consisted of $9,469,106 in revenues and
$9,422,457 in expenditures for a net budgeted surplus of $46,949. The Village subsequently
amended the original budget once by increasing both budgeted revenues and expenditures. The
budgeted revenue increases occurred in building, zoning, inspection fees, and grants while the
budgeted expenditure increases occurred in numerous departments including the Legislative,
Preservation Commission, Village Manager, Finance, Legal, Community Development,
Information Technology, Public Liability, Fire and Recreation departments. The final General
Fund amended budget resulted in a net budgeted surplus of $6,824 including transfers.
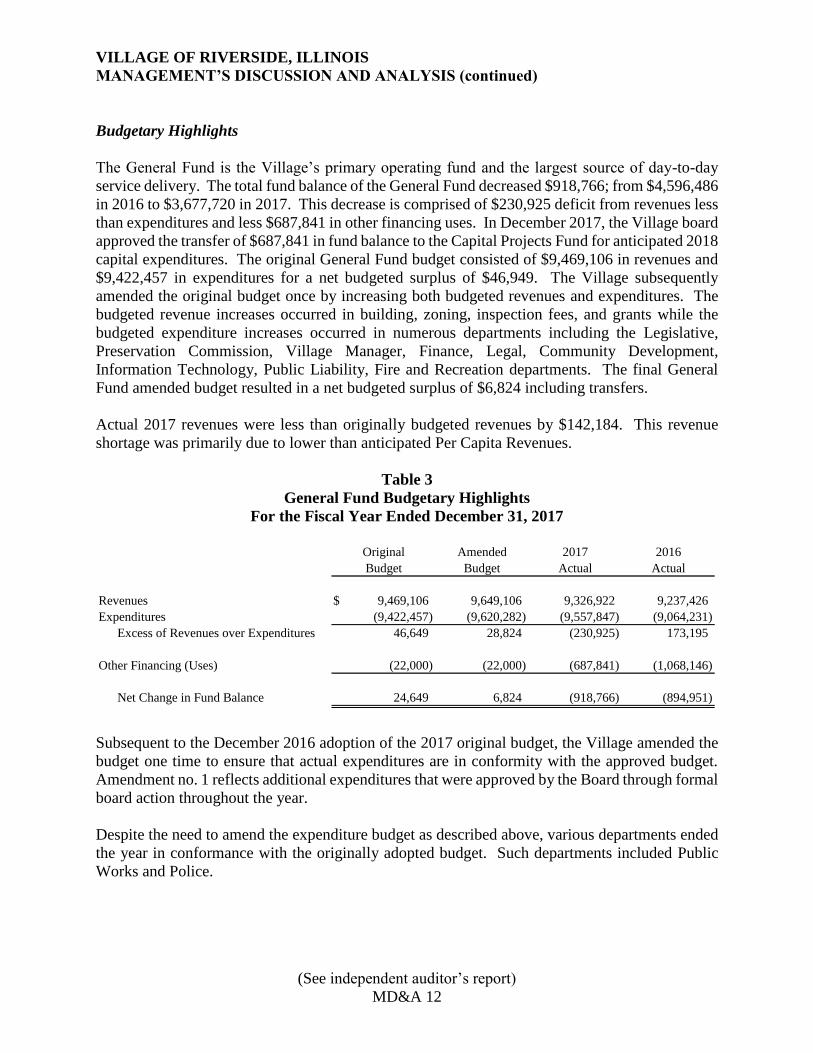
Actual 2017 revenues were less than originally budgeted revenues by $142,184. This revenue
shortage was primarily due to lower than anticipated Per Capita Revenues.
Table 3
General Fund Budgetary Highlights
For the Fiscal Year Ended December 31, 2017
Amended 2017 2016
Budget Actual Actual
Revenues $ 9,469,106 9,649,106 9,326,922 9,237,426
Expenditures (9,422,457) (9,620,282) (9,557,847) (9,064,231)
Excess of Revenues over Expenditures 46,649 28,824 (230,925) 173,195
Other Financing (Uses) (22,000) (22,000) (687,841) (1,068,146)
Net Change in Fund Balance 24,649 6,824 (918,766) (894,951)
Original
Budget
Subsequent to the December 2016 adoption of the 2017 original budget, the Village amended the
budget one time to ensure that actual expenditures are in conformity with the approved budget.
Amendment no. 1 reflects additional expenditures that were approved by the Board through formal
board action throughout the year.
Despite the need to amend the expenditure budget as described above, various departments ended
the year in conformance with the originally adopted budget. Such departments included Public
Works and Police.
VILLAGE OF RIVERSIDE, ILLINOIS
MANAGEMENT’S DISCUSSION AND ANALYSIS (continued)
(See independent auditor’s report)
MD&A 13
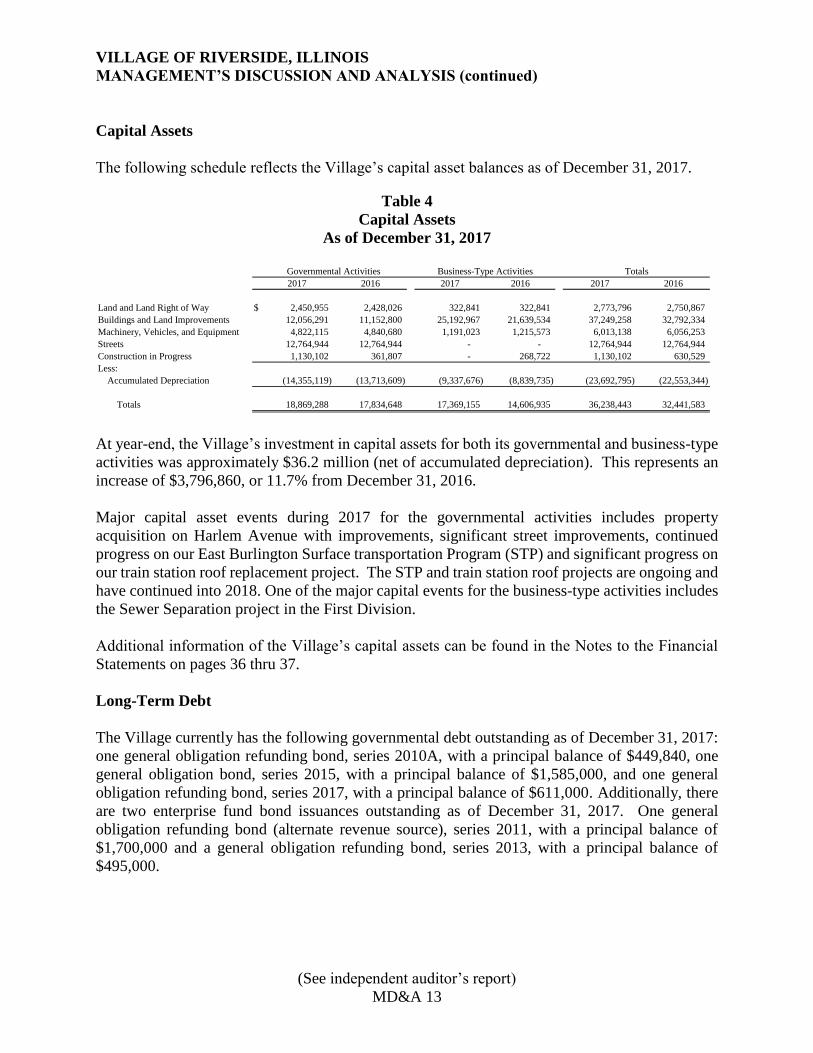
Capital Assets
The following schedule reflects the Village’s capital asset balances as of December 31, 2017.
Table 4
Capital Assets
As of December 31, 2017
2017 2016 2017 2016 2017 2016
Land and Land Right of Way $ 2,450,955 2,428,026 322,841 322,841 2,773,796 2,750,867
Buildings and Land Improvements 12,056,291 11,152,800 25,192,967 21,639,534 37,249,258 32,792,334
Machinery, Vehicles, and Equipment 4,822,115 4,840,680 1,191,023 1,215,573 6,013,138 6,056,253
Streets 12,764,944 12,764,944 - - 12,764,944 12,764,944
Construction in Progress 1,130,102 361,807 - 268,722 1,130,102 630,529
Less:
Accumulated Depreciation (14,355,119) (13,713,609) (9,337,676) (8,839,735) (23,692,795) (22,553,344)
Totals 18,869,288 17,834,648 17,369,155 14,606,935 36,238,443 32,441,583
Governmental Activities Business-Type Activities Totals
At year-end, the Village’s investment in capital assets for both its governmental and business-type
activities was approximately $36.2 million (net of accumulated depreciation). This represents an
increase of $3,796,860, or 11.7% from December 31, 2016.
Major capital asset events during 2017 for the governmental activities includes property
acquisition on Harlem Avenue with improvements, significant street improvements, continued
progress on our East Burlington Surface transportation Program (STP) and significant progress on
our train station roof replacement project. The STP and train station roof projects are ongoing and
have continued into 2018. One of the major capital events for the business-type activities includes
the Sewer Separation project in the First Division.
Additional information of the Village’s capital assets can be found in the Notes to the Financial
Statements on pages 36 thru 37.
Long-Term Debt
The Village currently has the following governmental debt outstanding as of December 31, 2017:
one general obligation refunding bond, series 2010A, with a principal balance of $449,840, one
general obligation bond, series 2015, with a principal balance of $1,585,000, and one general
obligation refunding bond, series 2017, with a principal balance of $611,000. Additionally, there
are two enterprise fund bond issuances outstanding as of December 31, 2017. One general
obligation refunding bond (alternate revenue source), series 2011, with a principal balance of
$1,700,000 and a general obligation refunding bond, series 2013, with a principal balance of
$495,000.
VILLAGE OF RIVERSIDE, ILLINOIS
MANAGEMENT’S DISCUSSION AND ANALYSIS (continued)
(See independent auditor’s report)
MD&A 14
During 2010 and 2011 the Village secured two loans with the Illinois Environmental Protection
Agency totaling $1,908,458 million. The current balance on these two loans as of December 31,
2017 is $1,300,070. Funding from these loans was provided to the Village on a reimbursement
basis as improvements to the Village’s water and sewer infrastructure were carried-out. These
loans do not require any interest payments and are scheduled to be repaid annually through
November 2030.
The Village, under its non-home rule authority, has a legal debt limit at December 31, 2017 of
$23,013,856. Under Illinois Statues, Alternate Bonds are not subject to the debt limitation.
Therefore, the Village is well under the legal debt limit with only $2,196,000 subject to the legal
debt limit, leaving a debt margin of $20,817,856. In 2013, the Village switched rating agencies
from Moody's Investors Service to Standard and Poor. The Village was previously rated by
Moody’s as Aa2 (reaffirmed in 2010); however, Standard and Poor increased the Village rating to
AA+ in 2013 and AAA in 2014.
Additional information of the Village’s long-term debt can be found in the Notes to the Financial
Statements on pages 38 thru 43.
Economic Factors and Next Year’s Budget’s and Rates
In general, the Village’s revenue stream remains constrained by property tax limits, a static
commercial property tax base and legislation that limits tax revenue. The Village's composition is
primarily residential with a very small and constant commercial component, which has resulted in
the placement of the majority of the property tax burden on homeowners. The property tax revenue
derived from the residential, commercial, and industrial properties is stable and makes up nearly
50% of governmental revenues. Because of the non-home rule tax cap, annual growth in property
tax revenue is small and in recent years has been limited to the growth in the annual Consumer
Price Index (CPI) which has averaged 1.48% over the most recent five years (2013-2017). The
CPI annual increase continues to remain low and will result in property tax revenue increasing by
approximately 2.10% in 2018 and 1.5% in 2019. Low percentage increases are expected to be the
norm as low inflation rates remain the policy of the Federal Reserve. State revenues have remained
relatively flat for several years with no anticipated movement in the short-term due to significant
budget problems with the State of Illinois and the consistent threat of reducing state shared
revenues. In 2011, the state individual income tax rate was temporarily increased by 67%; from a
flat rate of 3% to 5%. However, effective January 1, 2015 such increase automatically lapsed and
the tax rate has now been reduced to 3.75%. 2017 income tax receipts decreased approximately
8.64% over 2016, the Village anticipates that such receipts will continue to decline or remain
stagnant for the foreseeable future due to this decrease in the state tax rate.
Investment income experienced modest gains over prior year primarily due to slightly higher
interest rates. In 2017 the Village earned $63,083 in investment income compared to the $68,581
earned in 2016. This revenue stream is expected to decrease in 2018 as interest rates remain low
and fund balances have decreased. Utility tax revenue decreased to $597,575 compared to the
prior year’s revenues of $625,471. This revenue stream is composed of the Illinois Simplified
VILLAGE OF RIVERSIDE, ILLINOIS
MANAGEMENT’S DISCUSSION AND ANALYSIS (continued)
(See independent auditor’s report)
MD&A 15
Municipal Telecommunications Tax (SMTT) and taxes placed on the distribution of electricity
and natural gas.
Building permit, zoning and inspection revenues rose for a third consecutive year in 2017;
increasing from $219,996 in 2013 to $532,375 in 2017. This increase was driven by an increase
in the number of permit applications submitted to our Community Development department and
an increase in the value of the property improvements carried-out during the year. This activity
was also likely impacted by a decrease in foreclosed property inventory and improving home sale
activity.
During 2017 water and sewer revenue (including penalties) increased $310,358, or 10.37% over
2016. The water rate increased from $9.34 in 2016 to $9.57 on June 1, 2017 and the sewer rate
increased $0.50 to $1.75 starting November 1, 2016 and again to $1.79 on June 1, 2017. This was
the first time the sewer rate has been increased since 2002. Beginning in 2012 the Village has
been increasing water billing rates in response to increases passed onto the Village by the supplier.
The increases in these billing rates have equaled the increases in the costs of the water commodity;
and thus, the profit margin has remained unchanged since 2010. It is this profit margin that that
pays for the costs of operating the water system including maintenance of the underlying capital
equipment.
For several years now, the Village’s numerous parking facilities have experienced high demand
which is evidenced by the number of individuals currently on waiting lists to obtain parking
permits. Permit fees were last increased in 2008/2009 for all classes of customers to ensure that
the parking lot fund is adequately funded and to accumulate funds to carry-out the necessary
repairs and upgrades to the underlying capital assets. The Village’s practice is to review the
adequacy of our existing rate structure every four years (e.g. 2012, 2016, etc.) In late 2015 the
Village performed a detailed analysis of our existing fee structure and has determined that an
increase in the hourly, daytime permit and overnight permits is warranted due to the increasing
costs in the maintenance and management of our parking lots and the fact that many of the other
surrounding communities that also serve the BNSF rail line have had higher fees in place for a
number of years. The Village increased these rates effective January 1, 2017.
Budgeted expenditures for 2018 include increased personnel costs (wages, benefits and pension
costs) due to salary adjustments, many of which are required by existing employee labor
agreements. In an effort to contain ever increasing health insurance costs, in 2011 the Village
elected to join a health insurance pool that offered PPO coverage in addition to the existing HMO
coverage. Under the HMO plan employees had the option of selecting single (employee only) or
family coverage. With the addition of the PPO plan, employees now had the option of selecting
single, employee plus spouse, employee plus child or family coverage. Although the switch to
this health insurance pool resulted in an initial decrease in overall insurance costs, such costs
continued to experience significant annual increases going forward.
Another major cost to the Village is the annual contribution and deductible payments for liability
and worker’s compensation insurance. Such costs are approximating $260,000 annually and the
Village has been able to maintain this level through the use of accumulated premium credits. The
VILLAGE OF RIVERSIDE, ILLINOIS
MANAGEMENT’S DISCUSSION AND ANALYSIS (continued)
(See independent auditor’s report)
MD&A 16
Village also has the ability to dampen future cost increases by electing a higher deductible. As
part of the annual budgeting process, the Village evaluates its existing deductible levels and as
recently as 2014 the Village did elect to increase its deductible from $25,000 to $50,000 per claim.
This deductible level has remained unchanged through the 2017 fiscal year. In recent years, there
have also been changes in state law that has resulted in the creation of a second tier of pension
benefits applicable to newly hired participants of the Village-sponsored police pension and IMRF
plans. Although these changes will have a positive effect on the funding level of the pension fund
in the long-term, in the short-term the Village will continue to be under increasing pressure to
identify funds available to carry-out the minimum required annual contributions into these pension
funds.
CONTACTING THE VILLAGE'S FINANCIAL MANAGEMENT
This financial report is designed to provide our residents, customers, investors, and creditors with
a general overview of the Village's finances and to demonstrate the Village's accountability for the
funds it receives. This report and others may be found on the Village’s website:
www.riverside.il.us. Questions concerning this report or requests for additional financial
information should be directed to Karin Johns, Director of Finance, Village of Riverside, 27
Riverside Road, Riverside, Illinois 60546 or [email protected].
• Government-Wide Financial Statements
• Fund Financial Statements
Governmental Funds
Proprietary Funds
Fiduciary Fund
BASIC FINANCIAL STATEMENTS
The basic financial Statements include integrated sets of financial statements as required by the GASB. The sets
of statements include:
In addition, the notes to the financial statements are included to provide information that is essential to a user’s
understanding of the basic financial statements.
VILLAGE OF RIVERSIDE, ILLINOIS
Statement of Net Position
December 31, 2017
See Following Page
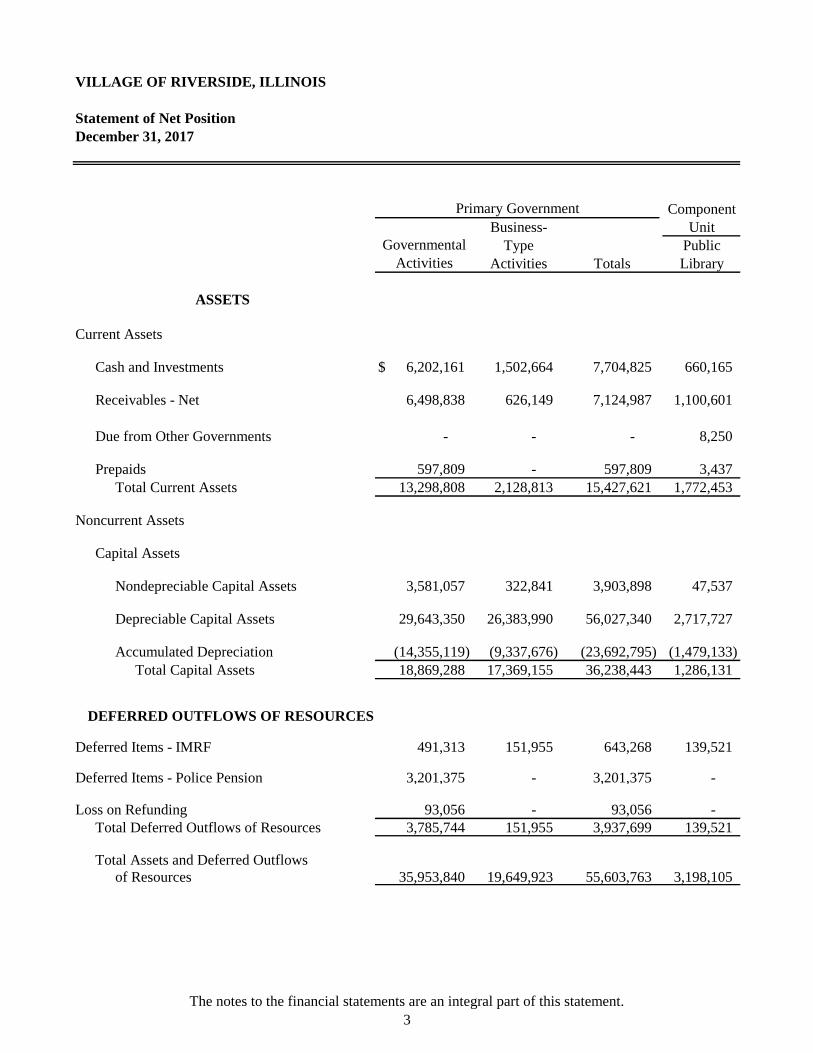
VILLAGE OF RIVERSIDE, ILLINOIS
Statement of Net Position
December 31, 2017
Component
Business- Unit
Type Public
Activities Totals Library
Current Assets
Cash and Investments $ 6,202,161 1,502,664 7,704,825 660,165
Receivables - Net 6,498,838 626,149 7,124,987 1,100,601
Due from Other Governments - - - 8,250
Prepaids 597,809 - 597,809 3,437
Total Current Assets 13,298,808 2,128,813 15,427,621 1,772,453
Noncurrent Assets
Capital Assets
Nondepreciable Capital Assets 3,581,057 322,841 3,903,898 47,537
Depreciable Capital Assets 29,643,350 26,383,990 56,027,340 2,717,727
Accumulated Depreciation (14,355,119) (9,337,676) (23,692,795) (1,479,133)
Total Capital Assets 18,869,288 17,369,155 36,238,443 1,286,131
Deferred Items - IMRF 491,313 151,955 643,268 139,521
Deferred Items - Police Pension 3,201,375 - 3,201,375 -
Loss on Refunding 93,056 - 93,056 -
Total Deferred Outflows of Resources 3,785,744 151,955 3,937,699 139,521
Total Assets and Deferred Outflows
of Resources 35,953,840 19,649,923 55,603,763 3,198,105
Governmental
Activities
ASSETS
DEFERRED OUTFLOWS OF RESOURCES
Primary Government
The notes to the financial statements are an integral part of this statement.
3
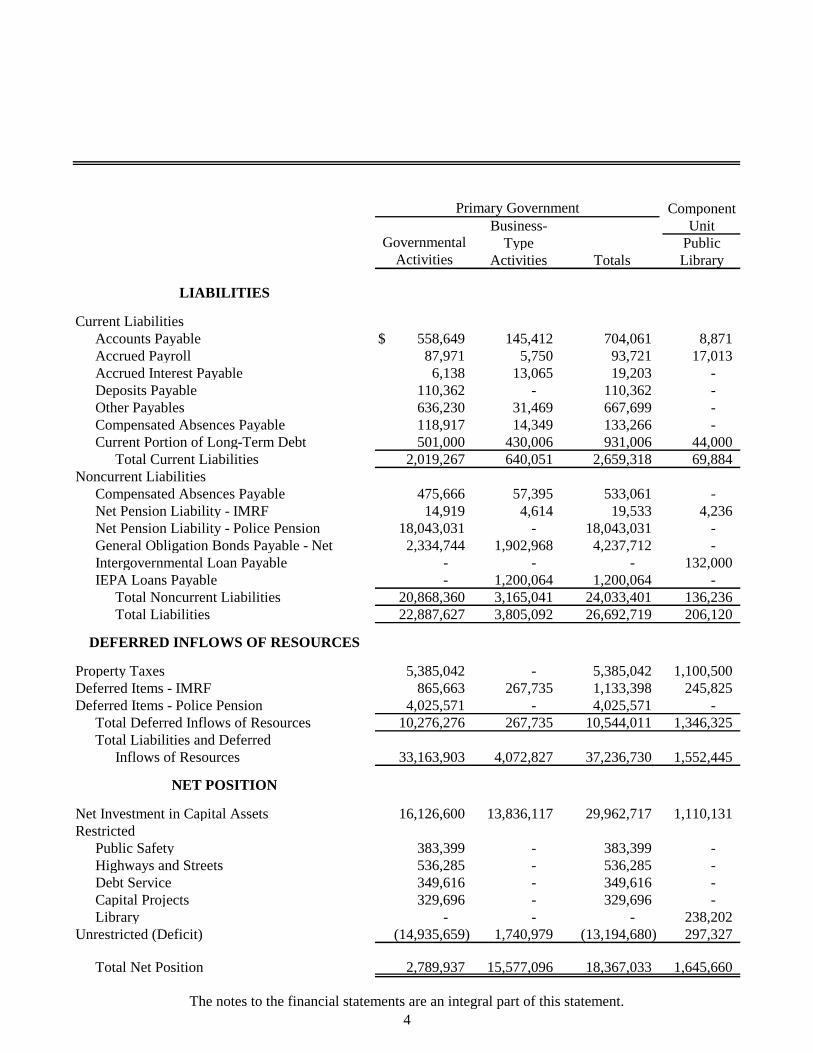
Component
Business- Unit
Type Public
Activities Totals Library
Current Liabilities
Accounts Payable $ 558,649 145,412 704,061 8,871
Accrued Payroll 87,971 5,750 93,721 17,013
Accrued Interest Payable 6,138 13,065 19,203 -
Deposits Payable 110,362 - 110,362 -
Other Payables 636,230 31,469 667,699 -
Compensated Absences Payable 118,917 14,349 133,266 -
Current Portion of Long-Term Debt 501,000 430,006 931,006 44,000
Total Current Liabilities 2,019,267 640,051 2,659,318 69,884
Noncurrent Liabilities
Compensated Absences Payable 475,666 57,395 533,061 -
Net Pension Liability - IMRF 14,919 4,614 19,533 4,236
Net Pension Liability - Police Pension 18,043,031 - 18,043,031 -
General Obligation Bonds Payable - Net 2,334,744 1,902,968 4,237,712 -
Intergovernmental Loan Payable - - - 132,000
IEPA Loans Payable - 1,200,064 1,200,064 -
Total Noncurrent Liabilities 20,868,360 3,165,041 24,033,401 136,236
Total Liabilities 22,887,627 3,805,092 26,692,719 206,120
Property Taxes 5,385,042 - 5,385,042 1,100,500
Deferred Items - IMRF 865,663 267,735 1,133,398 245,825
Deferred Items - Police Pension 4,025,571 - 4,025,571 -
Total Deferred Inflows of Resources 10,276,276 267,735 10,544,011 1,346,325
Total Liabilities and Deferred
Inflows of Resources 33,163,903 4,072,827 37,236,730 1,552,445
Net Investment in Capital Assets 16,126,600 13,836,117 29,962,717 1,110,131
Restricted
Public Safety 383,399 - 383,399 -
Highways and Streets 536,285 - 536,285 -
Debt Service 349,616 - 349,616 -
Capital Projects 329,696 - 329,696 -
Library - - - 238,202
Unrestricted (Deficit) (14,935,659) 1,740,979 (13,194,680) 297,327
Total Net Position 2,789,937 15,577,096 18,367,033 1,645,660
NET POSITION
Governmental
Activities
Primary Government
DEFERRED INFLOWS OF RESOURCES
LIABILITIES
The notes to the financial statements are an integral part of this statement.
4
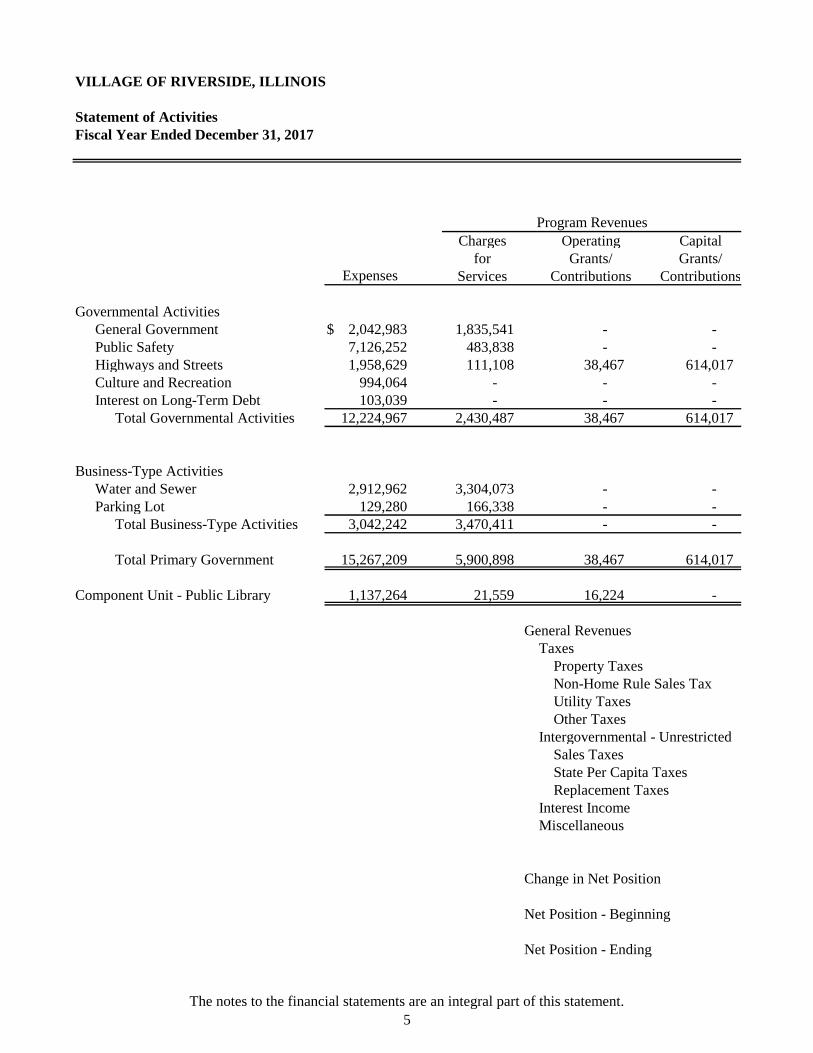
VILLAGE OF RIVERSIDE, ILLINOIS
Statement of Activities
Fiscal Year Ended December 31, 2017
Charges Operating Capital
for Grants/ Grants/
Services Contributions Contributions
Governmental Activities
General Government $ 2,042,983 1,835,541 - -
Public Safety 7,126,252 483,838 - -
Highways and Streets 1,958,629 111,108 38,467 614,017
Culture and Recreation 994,064 - - -
Interest on Long-Term Debt 103,039 - - -
Total Governmental Activities 12,224,967 2,430,487 38,467 614,017
Business-Type Activities
Water and Sewer 2,912,962 3,304,073 - -
Parking Lot 129,280 166,338 - -
Total Business-Type Activities 3,042,242 3,470,411 - -
Total Primary Government 15,267,209 5,900,898 38,467 614,017
Component Unit - Public Library 1,137,264 21,559 16,224 -
General Revenues
Taxes
Property Taxes
Non-Home Rule Sales Tax
Utility Taxes
Other Taxes
Intergovernmental - Unrestricted
Sales Taxes
State Per Capita Taxes
Replacement Taxes
Interest Income
Miscellaneous
Change in Net Position
Net Position - Beginning
Net Position - Ending
Expenses
Program Revenues
The notes to the financial statements are an integral part of this statement.
5
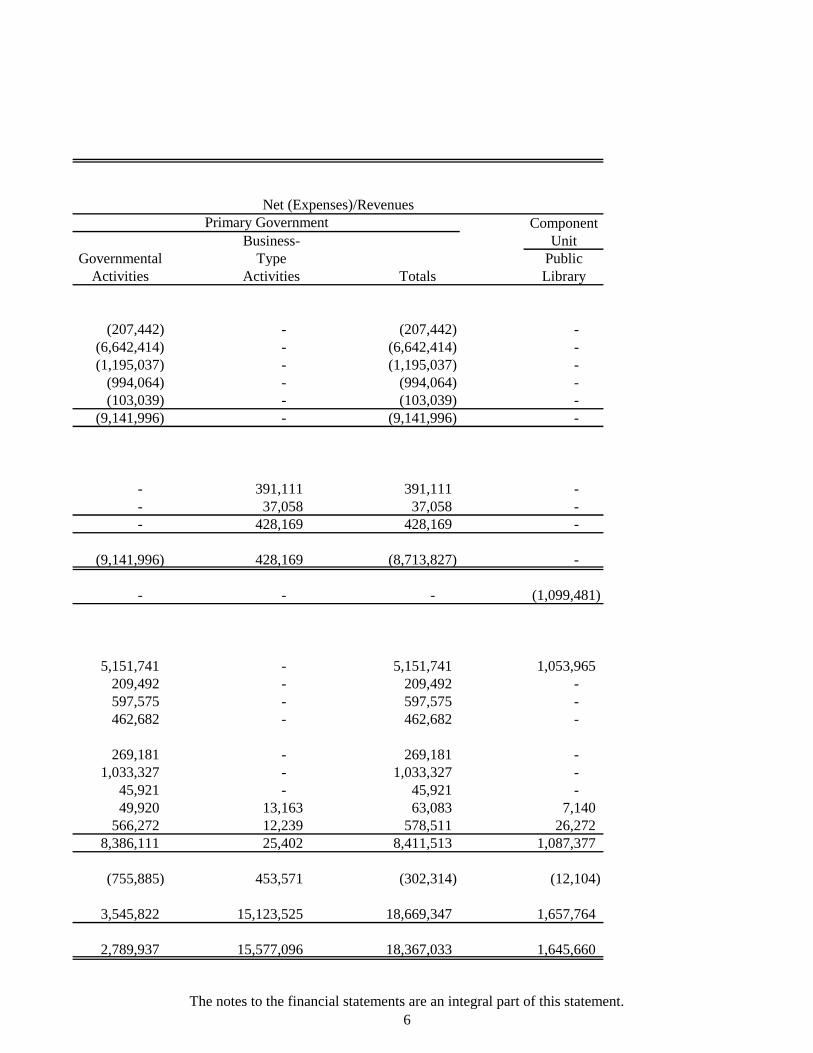
Component
Business- Unit
Governmental Type Public
Activities Activities Totals Library
(207,442) - (207,442) -
(6,642,414) - (6,642,414) -
(1,195,037) - (1,195,037) -
(994,064) - (994,064) -
(103,039) - (103,039) -
(9,141,996) - (9,141,996) -
- 391,111 391,111 -
- 37,058 37,058 -
- 428,169 428,169 -
(9,141,996) 428,169 (8,713,827) -
- - - (1,099,481)
5,151,741 - 5,151,741 1,053,965
209,492 - 209,492 -
597,575 - 597,575 -
462,682 - 462,682 -
269,181 - 269,181 -
1,033,327 - 1,033,327 -
45,921 - 45,921 -
49,920 13,163 63,083 7,140
566,272 12,239 578,511 26,272
8,386,111 25,402 8,411,513 1,087,377
(755,885) 453,571 (302,314) (12,104)
3,545,822 15,123,525 18,669,347 1,657,764
2,789,937 15,577,096 18,367,033 1,645,660
Primary Government
Net (Expenses)/Revenues
The notes to the financial statements are an integral part of this statement.
6
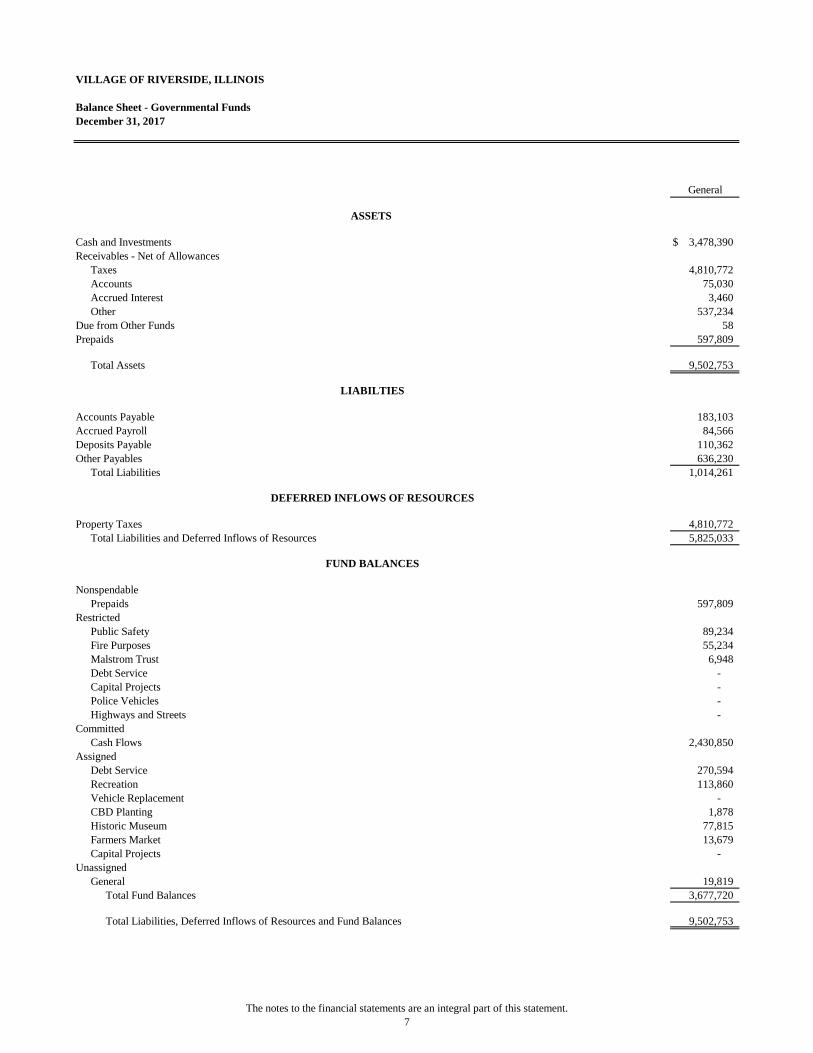
VILLAGE OF RIVERSIDE, ILLINOIS
Balance Sheet - Governmental Funds
December 31, 2017
Cash and Investments $ 3,478,390
Receivables - Net of Allowances
Taxes 4,810,772
Accounts 75,030
Accrued Interest 3,460
Other 537,234
Due from Other Funds 58
Prepaids 597,809
Total Assets 9,502,753
Accounts Payable 183,103
Accrued Payroll 84,566
Deposits Payable 110,362
Other Payables 636,230
Total Liabilities 1,014,261
Property Taxes 4,810,772
Total Liabilities and Deferred Inflows of Resources 5,825,033
Nonspendable
Prepaids 597,809
Restricted
Public Safety 89,234
Fire Purposes 55,234
Malstrom Trust 6,948
Debt Service -
Capital Projects -
Police Vehicles -
Highways and Streets -
Committed
Cash Flows 2,430,850
Assigned
Debt Service 270,594
Recreation 113,860
Vehicle Replacement -
CBD Planting 1,878
Historic Museum 77,815
Farmers Market 13,679
Capital Projects -
Unassigned
General 19,819
Total Fund Balances 3,677,720
Total Liabilities, Deferred Inflows of Resources and Fund Balances 9,502,753
LIABILTIES
General
ASSETS
DEFERRED INFLOWS OF RESOURCES
FUND BALANCES
The notes to the financial statements are an integral part of this statement.
7
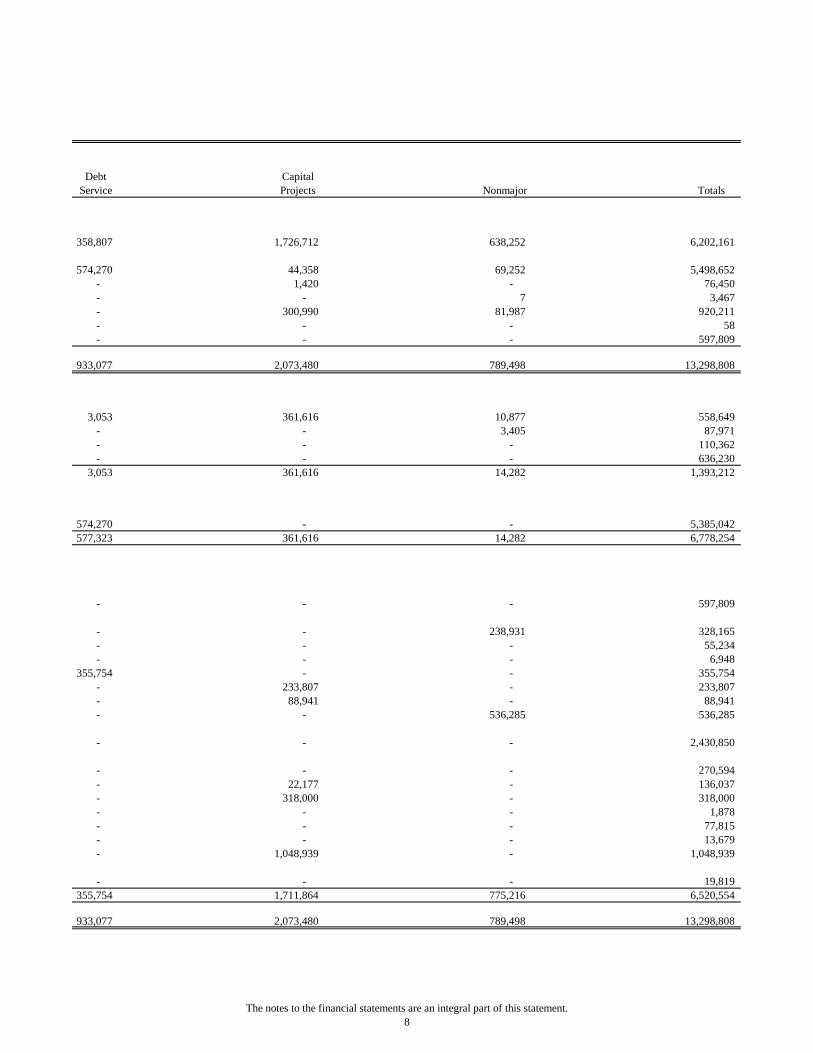
Debt Capital
Service Projects Nonmajor Totals
358,807 1,726,712 638,252 6,202,161
574,270 44,358 69,252 5,498,652
- 1,420 - 76,450
- - 7 3,467
- 300,990 81,987 920,211
- - - 58
- - - 597,809
933,077 2,073,480 789,498 13,298,808
3,053 361,616 10,877 558,649
- - 3,405 87,971
- - - 110,362
- - - 636,230
3,053 361,616 14,282 1,393,212
574,270 - - 5,385,042
577,323 361,616 14,282 6,778,254
- - - 597,809
- - 238,931 328,165
- - - 55,234
- - - 6,948
355,754 - - 355,754
- 233,807 - 233,807
- 88,941 - 88,941
- - 536,285 536,285
- - - 2,430,850
- - - 270,594
- 22,177 - 136,037
- 318,000 - 318,000
- - - 1,878
- - - 77,815
- - - 13,679
- 1,048,939 - 1,048,939
- - - 19,819
355,754 1,711,864 775,216 6,520,554
933,077 2,073,480 789,498 13,298,808
The notes to the financial statements are an integral part of this statement.
8
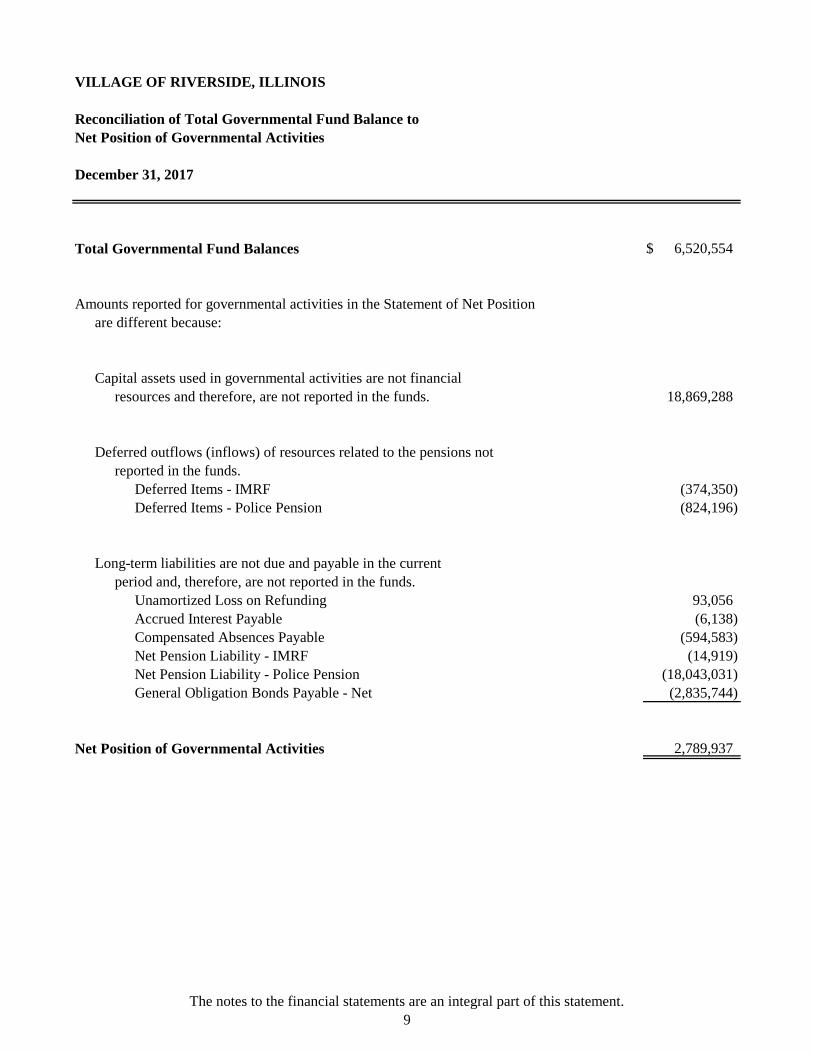
VILLAGE OF RIVERSIDE, ILLINOIS
Reconciliation of Total Governmental Fund Balance to
Net Position of Governmental Activities
December 31, 2017
Total Governmental Fund Balances $ 6,520,554
Amounts reported for governmental activities in the Statement of Net Position
are different because:
Capital assets used in governmental activities are not financial
resources and therefore, are not reported in the funds. 18,869,288
Deferred outflows (inflows) of resources related to the pensions not
reported in the funds.
Deferred Items - IMRF (374,350)
Deferred Items - Police Pension (824,196)
Long-term liabilities are not due and payable in the current
period and, therefore, are not reported in the funds.
Unamortized Loss on Refunding 93,056
Accrued Interest Payable (6,138)
Compensated Absences Payable (594,583)
Net Pension Liability - IMRF (14,919)
Net Pension Liability - Police Pension (18,043,031)
General Obligation Bonds Payable - Net (2,835,744)
Net Position of Governmental Activities 2,789,937
The notes to the financial statements are an integral part of this statement.
9
VILLAGE OF RIVERSIDE, ILLINOIS
Statement of Revenues, Expenditures and Changes in Fund Balances - Governmental Funds
Fiscal Year Ended December 31, 2017
See Following Page
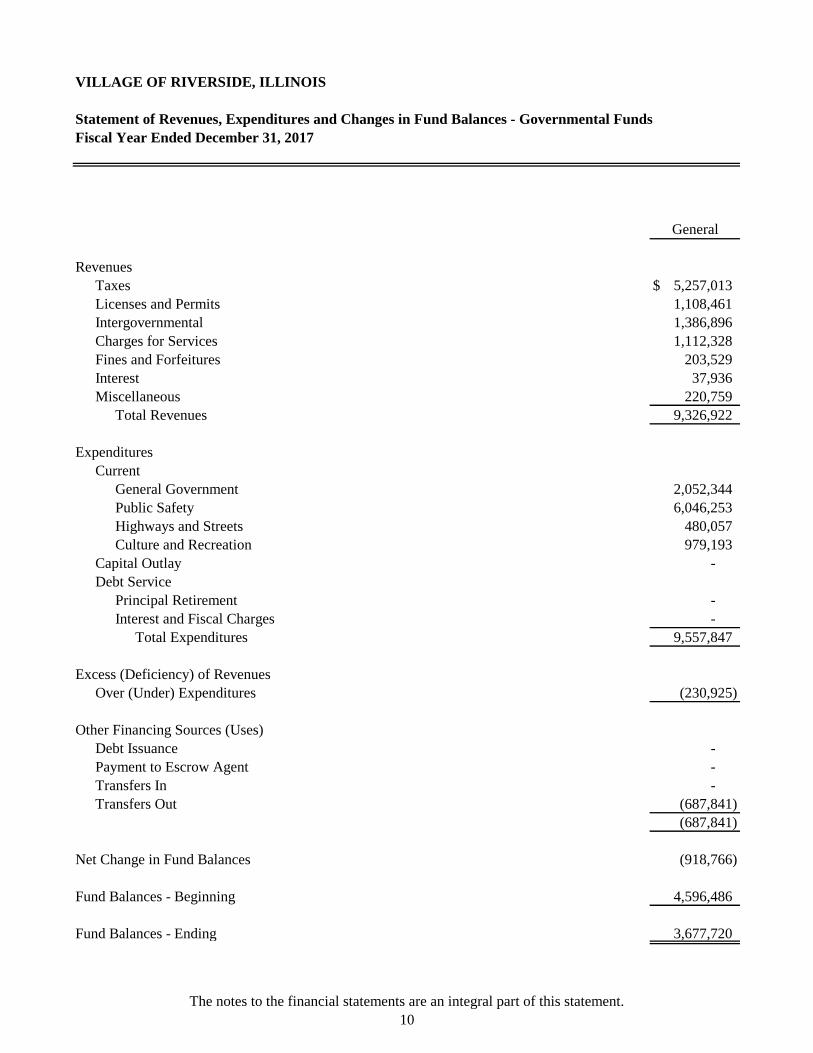
VILLAGE OF RIVERSIDE, ILLINOIS
Statement of Revenues, Expenditures and Changes in Fund Balances - Governmental Funds
Fiscal Year Ended December 31, 2017
Revenues
Taxes $ 5,257,013
Licenses and Permits 1,108,461
Intergovernmental 1,386,896
Charges for Services 1,112,328
Fines and Forfeitures 203,529
Interest 37,936
Miscellaneous 220,759
Total Revenues 9,326,922
Expenditures
Current
General Government 2,052,344
Public Safety 6,046,253
Highways and Streets 480,057
Culture and Recreation 979,193
Capital Outlay -
Debt Service
Principal Retirement -
Interest and Fiscal Charges -
Total Expenditures 9,557,847
Excess (Deficiency) of Revenues
Over (Under) Expenditures (230,925)
Other Financing Sources (Uses)
Debt Issuance -
Payment to Escrow Agent -
Transfers In -
Transfers Out (687,841)
(687,841)
Net Change in Fund Balances (918,766)
Fund Balances - Beginning 4,596,486
Fund Balances - Ending 3,677,720
General
The notes to the financial statements are an integral part of this statement.
10
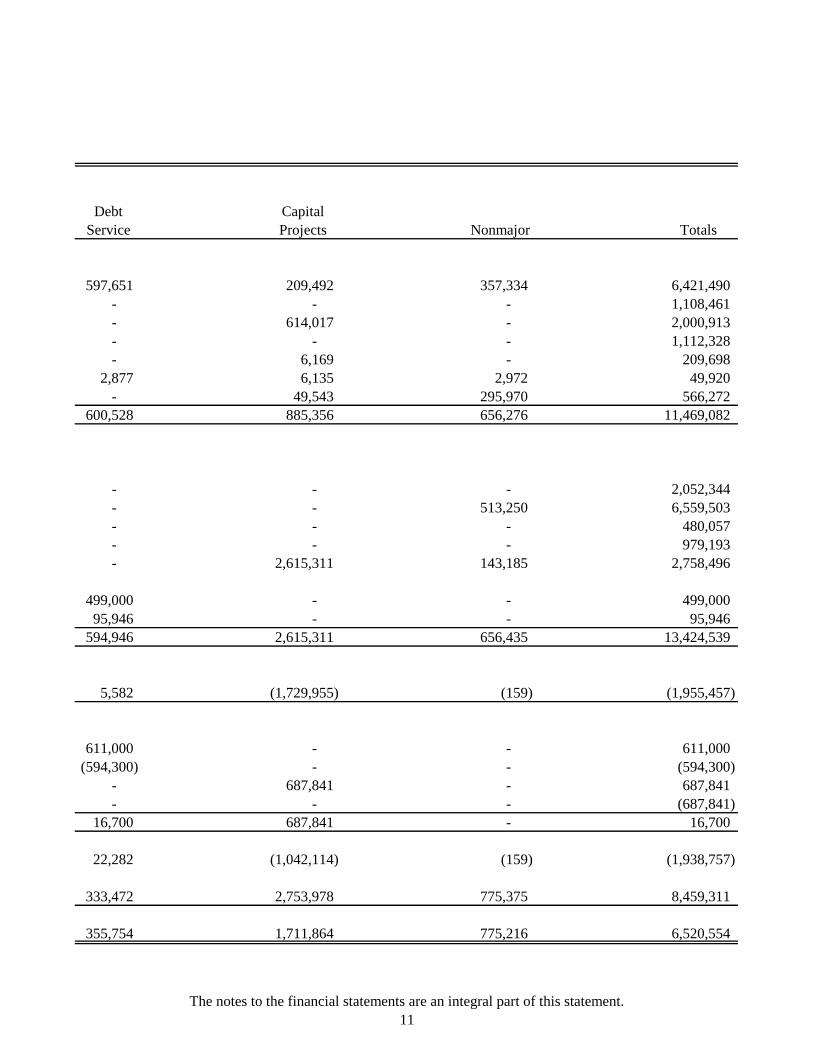
Debt Capital
Service Projects Nonmajor Totals
597,651 209,492 357,334 6,421,490
- - - 1,108,461
- 614,017 - 2,000,913
- - - 1,112,328
- 6,169 - 209,698
2,877 6,135 2,972 49,920
- 49,543 295,970 566,272
600,528 885,356 656,276 11,469,082
- - - 2,052,344
- - 513,250 6,559,503
- - - 480,057
- - - 979,193
- 2,615,311 143,185 2,758,496
499,000 - - 499,000
95,946 - - 95,946
594,946 2,615,311 656,435 13,424,539
5,582 (1,729,955) (159) (1,955,457)
611,000 - - 611,000
(594,300) - - (594,300)
- 687,841 - 687,841
- - - (687,841)
16,700 687,841 - 16,700
22,282 (1,042,114) (159) (1,938,757)
333,472 2,753,978 775,375 8,459,311
355,754 1,711,864 775,216 6,520,554
The notes to the financial statements are an integral part of this statement.
11
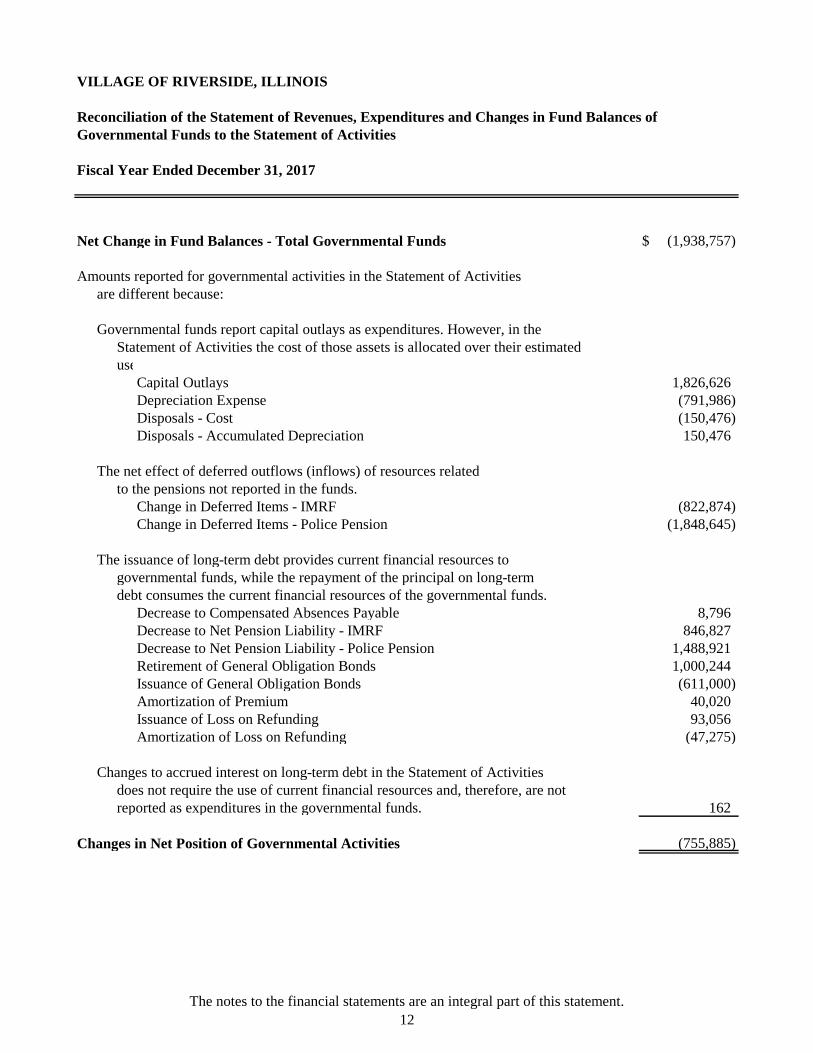
VILLAGE OF RIVERSIDE, ILLINOIS
Reconciliation of the Statement of Revenues, Expenditures and Changes in Fund Balances of
Governmental Funds to the Statement of Activities
Fiscal Year Ended December 31, 2017
Net Change in Fund Balances - Total Governmental Funds $ (1,938,757)
Amounts reported for governmental activities in the Statement of Activities
are different because:
Governmental funds report capital outlays as expenditures. However, in the
Statement of Activities the cost of those assets is allocated over their estimated
useful lives and reported as depreciation expense.
Capital Outlays 1,826,626
Depreciation Expense (791,986)
Disposals - Cost (150,476)
Disposals - Accumulated Depreciation 150,476
The net effect of deferred outflows (inflows) of resources related
to the pensions not reported in the funds.
Change in Deferred Items - IMRF (822,874)
Change in Deferred Items - Police Pension (1,848,645)
The issuance of long-term debt provides current financial resources to
governmental funds, while the repayment of the principal on long-term
debt consumes the current financial resources of the governmental funds.
Decrease to Compensated Absences Payable 8,796
Decrease to Net Pension Liability - IMRF 846,827
Decrease to Net Pension Liability - Police Pension 1,488,921
Retirement of General Obligation Bonds 1,000,244
Issuance of General Obligation Bonds (611,000)
Amortization of Premium 40,020
Issuance of Loss on Refunding 93,056
Amortization of Loss on Refunding (47,275)
Changes to accrued interest on long-term debt in the Statement of Activities
does not require the use of current financial resources and, therefore, are not
reported as expenditures in the governmental funds. 162
Changes in Net Position of Governmental Activities (755,885)
The notes to the financial statements are an integral part of this statement.
12

VILLAGE OF RIVERSIDE, ILLINOIS
Statement of Net Position - Proprietary Funds
December 31, 2017
See Following Page
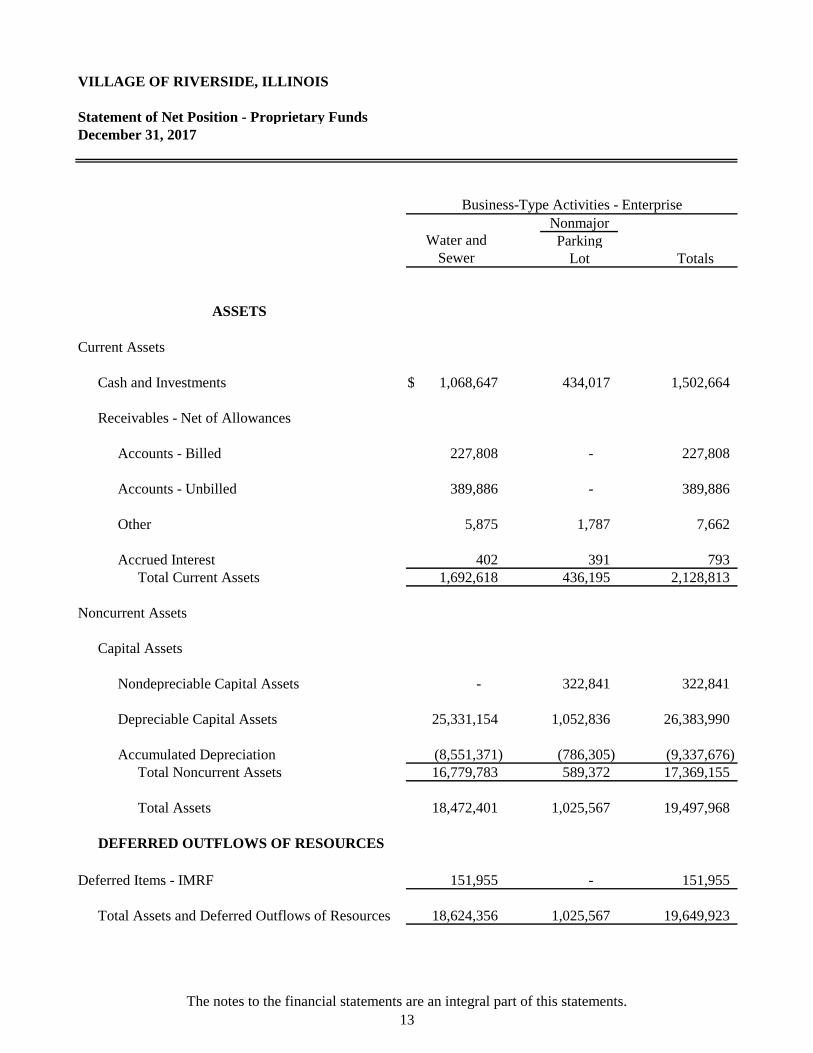
VILLAGE OF RIVERSIDE, ILLINOIS
Statement of Net Position - Proprietary Funds
December 31, 2017
Nonmajor
Parking
Lot Totals
Current Assets
Cash and Investments $ 1,068,647 434,017 1,502,664
Receivables - Net of Allowances
Accounts - Billed 227,808 - 227,808
Accounts - Unbilled 389,886 - 389,886
Other 5,875 1,787 7,662
Accrued Interest 402 391 793
Total Current Assets 1,692,618 436,195 2,128,813
Noncurrent Assets
Capital Assets
Nondepreciable Capital Assets - 322,841 322,841
Depreciable Capital Assets 25,331,154 1,052,836 26,383,990
Accumulated Depreciation (8,551,371) (786,305) (9,337,676)
Total Noncurrent Assets 16,779,783 589,372 17,369,155
Total Assets 18,472,401 1,025,567 19,497,968
Deferred Items - IMRF 151,955 - 151,955
Total Assets and Deferred Outflows of Resources 18,624,356 1,025,567 19,649,923
DEFERRED OUTFLOWS OF RESOURCES
Business-Type Activities - Enterprise
Sewer
Water and
ASSETS
The notes to the financial statements are an integral part of this statements.
13
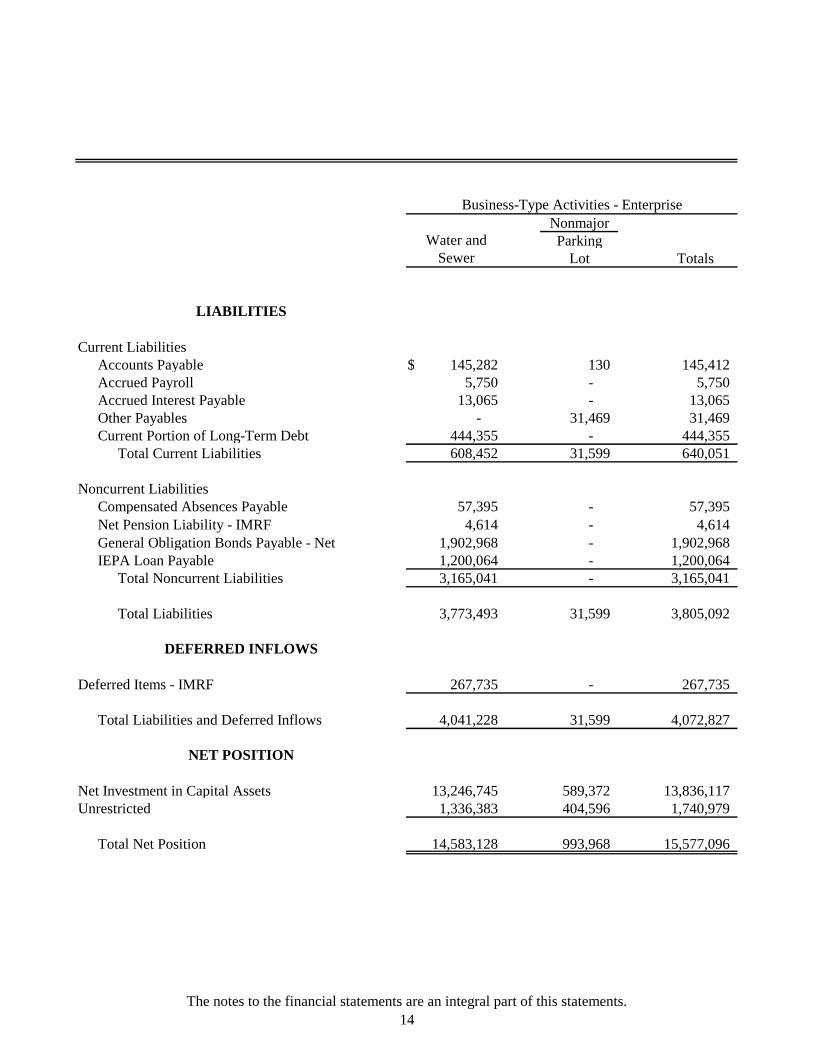
Nonmajor
Parking
Lot Totals
Current Liabilities
Accounts Payable $ 145,282 130 145,412
Accrued Payroll 5,750 - 5,750
Accrued Interest Payable 13,065 - 13,065
Other Payables - 31,469 31,469
Current Portion of Long-Term Debt 444,355 - 444,355
Total Current Liabilities 608,452 31,599 640,051
Noncurrent Liabilities
Compensated Absences Payable 57,395 - 57,395
Net Pension Liability - IMRF 4,614 - 4,614
General Obligation Bonds Payable - Net 1,902,968 - 1,902,968
IEPA Loan Payable 1,200,064 - 1,200,064
Total Noncurrent Liabilities 3,165,041 - 3,165,041
Total Liabilities 3,773,493 31,599 3,805,092
Deferred Items - IMRF 267,735 - 267,735
Total Liabilities and Deferred Inflows 4,041,228 31,599 4,072,827
Net Investment in Capital Assets 13,246,745 589,372 13,836,117
Unrestricted 1,336,383 404,596 1,740,979
Total Net Position 14,583,128 993,968 15,577,096
Business-Type Activities - Enterprise
Water and
NET POSITION
LIABILITIES
Sewer
DEFERRED INFLOWS
The notes to the financial statements are an integral part of this statements.
14
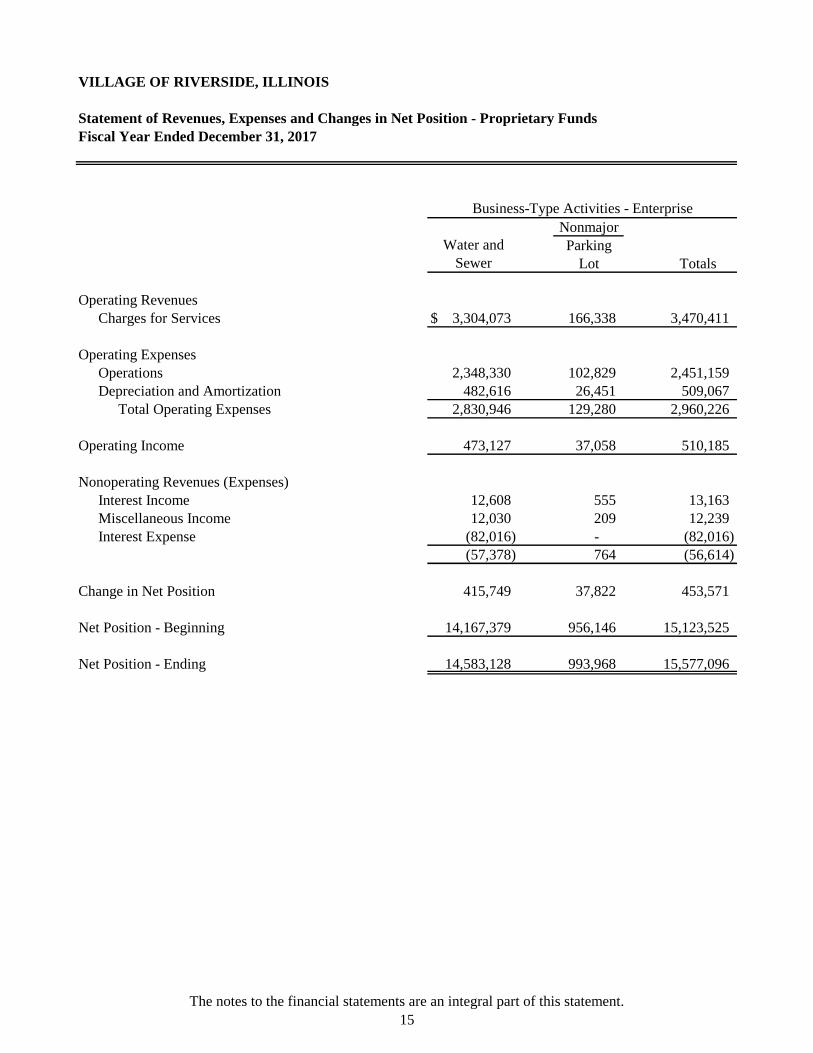
VILLAGE OF RIVERSIDE, ILLINOIS
Statement of Revenues, Expenses and Changes in Net Position - Proprietary Funds
Fiscal Year Ended December 31, 2017
Nonmajor
Parking
Lot Totals
Operating Revenues
Charges for Services $ 3,304,073 166,338 3,470,411
Operating Expenses
Operations 2,348,330 102,829 2,451,159
Depreciation and Amortization 482,616 26,451 509,067
Total Operating Expenses 2,830,946 129,280 2,960,226
Operating Income 473,127 37,058 510,185
Nonoperating Revenues (Expenses)
Interest Income 12,608 555 13,163
Miscellaneous Income 12,030 209 12,239
Interest Expense (82,016) - (82,016)
(57,378) 764 (56,614)
Change in Net Position 415,749 37,822 453,571
Net Position - Beginning 14,167,379 956,146 15,123,525
Net Position - Ending 14,583,128 993,968 15,577,096
Business-Type Activities - Enterprise
Sewer
Water and
The notes to the financial statements are an integral part of this statement.
15
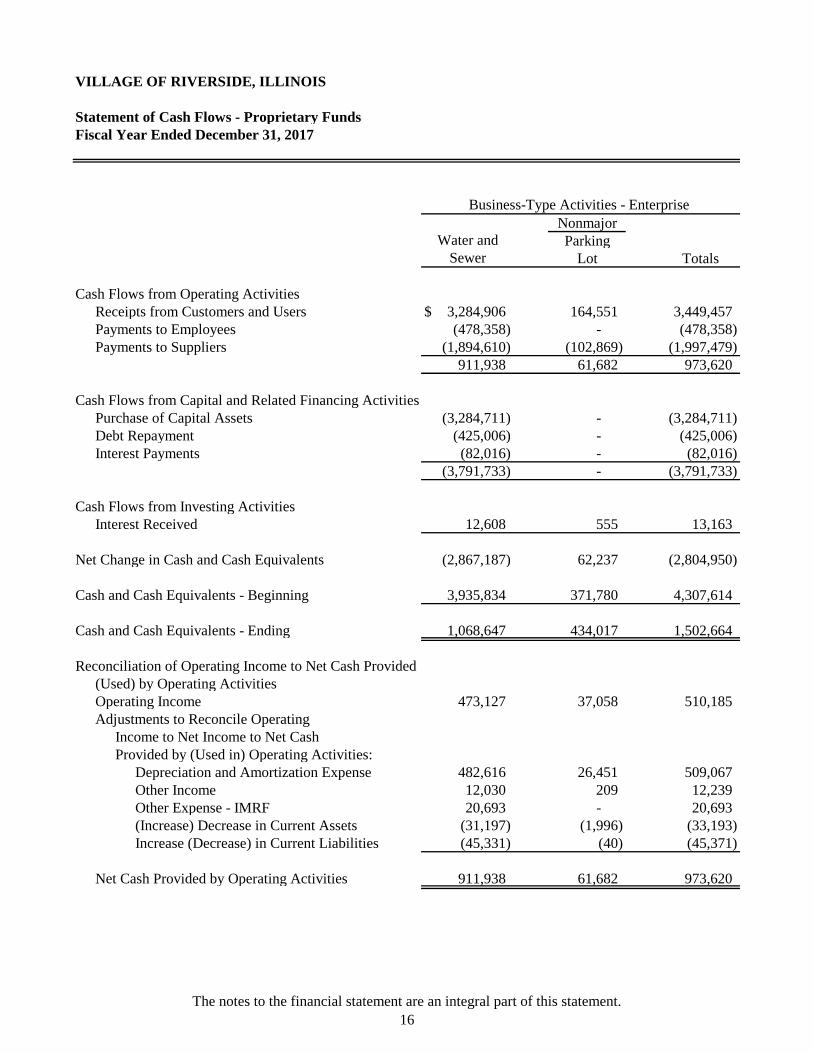
VILLAGE OF RIVERSIDE, ILLINOIS
Statement of Cash Flows - Proprietary Funds
Fiscal Year Ended December 31, 2017
Nonmajor
Parking
Lot Totals
Cash Flows from Operating Activities
Receipts from Customers and Users $ 3,284,906 164,551 3,449,457
Payments to Employees (478,358) - (478,358)
Payments to Suppliers (1,894,610) (102,869) (1,997,479)
911,938 61,682 973,620
Cash Flows from Capital and Related Financing Activities
Purchase of Capital Assets (3,284,711) - (3,284,711)
Debt Repayment (425,006) - (425,006)
Interest Payments (82,016) - (82,016)
(3,791,733) - (3,791,733)
Cash Flows from Investing Activities
Interest Received 12,608 555 13,163
Net Change in Cash and Cash Equivalents (2,867,187) 62,237 (2,804,950)
Cash and Cash Equivalents - Beginning 3,935,834 371,780 4,307,614
Cash and Cash Equivalents - Ending 1,068,647 434,017 1,502,664
Reconciliation of Operating Income to Net Cash Provided
(Used) by Operating Activities
Operating Income 473,127 37,058 510,185
Adjustments to Reconcile Operating
Income to Net Income to Net Cash
Provided by (Used in) Operating Activities:
Depreciation and Amortization Expense 482,616 26,451 509,067
Other Income 12,030 209 12,239
Other Expense - IMRF 20,693 - 20,693
(Increase) Decrease in Current Assets (31,197) (1,996) (33,193)
Increase (Decrease) in Current Liabilities (45,331) (40) (45,371)
Net Cash Provided by Operating Activities 911,938 61,682 973,620
Water and
Business-Type Activities - Enterprise
Sewer
The notes to the financial statement are an integral part of this statement.
16
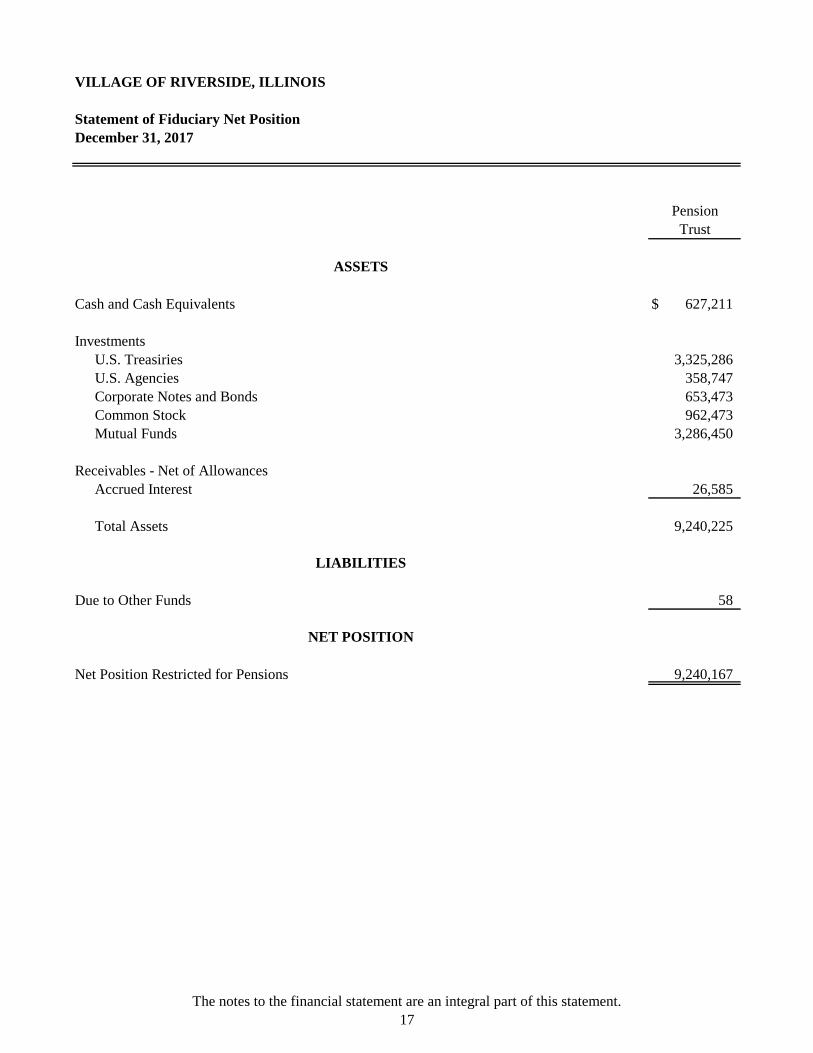
VILLAGE OF RIVERSIDE, ILLINOIS
Statement of Fiduciary Net Position
December 31, 2017
Cash and Cash Equivalents $ 627,211
Investments
U.S. Treasiries 3,325,286
U.S. Agencies 358,747
Corporate Notes and Bonds 653,473
Common Stock 962,473
Mutual Funds 3,286,450
Receivables - Net of Allowances
Accrued Interest 26,585
Total Assets 9,240,225
Due to Other Funds 58
Net Position Restricted for Pensions 9,240,167
Trust
Pension
ASSETS
LIABILITIES
NET POSITION
The notes to the financial statement are an integral part of this statement.
17
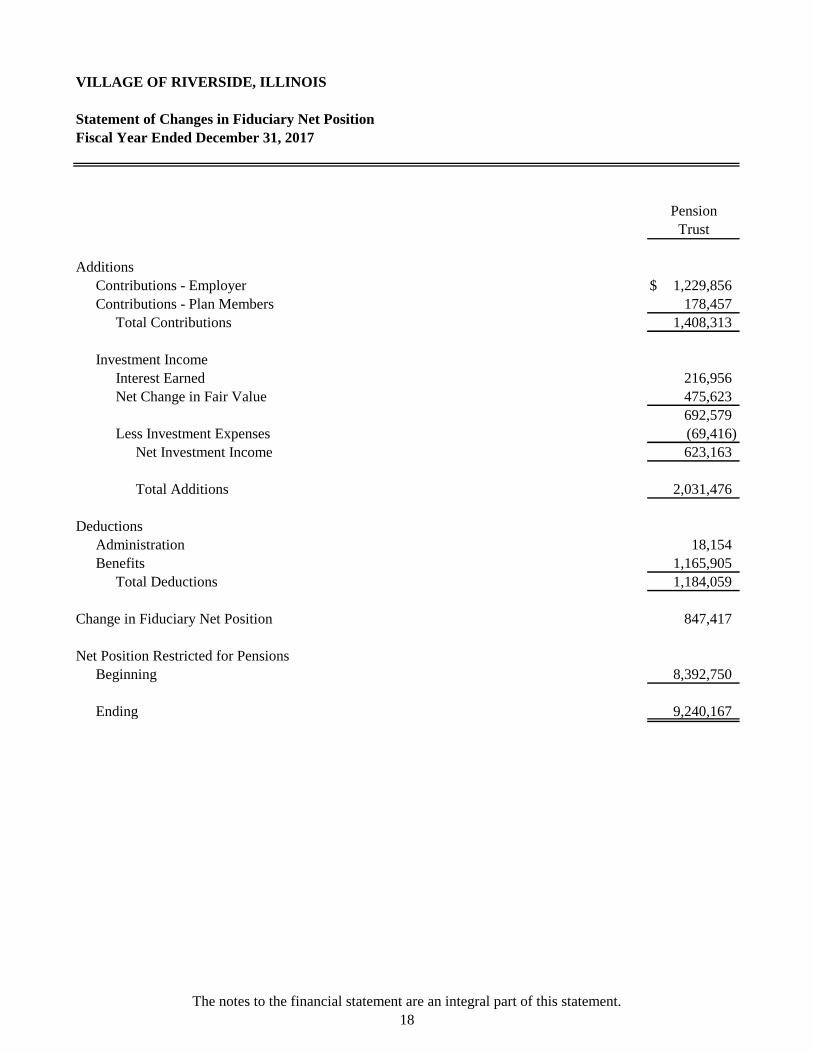
VILLAGE OF RIVERSIDE, ILLINOIS
Statement of Changes in Fiduciary Net Position
Fiscal Year Ended December 31, 2017
Additions
Contributions - Employer $ 1,229,856
Contributions - Plan Members 178,457
Total Contributions 1,408,313
Investment Income
Interest Earned 216,956
Net Change in Fair Value 475,623
692,579
Less Investment Expenses (69,416)
Net Investment Income 623,163
Total Additions 2,031,476
Deductions
Administration 18,154
Benefits 1,165,905
Total Deductions 1,184,059
Change in Fiduciary Net Position 847,417
Net Position Restricted for Pensions
Beginning 8,392,750
Ending 9,240,167
Pension
Trust
The notes to the financial statement are an integral part of this statement.
18
VILLAGE OF RIVERSIDE, ILLINOIS
Notes to the Financial Statements
December 31, 2017
19
NOTE 1 – SUMMARY OF SIGNIFICANT ACCOUNTING POLICIES
The Village of Riverside, Illinois (the Village) was incorporated in 1875. The Village is a municipal
corporation governed by a Village President and six-trustees, elected at large, using the Board-Manager
form of government. The Village’s major operations include police protection, highway and street
maintenance and reconstruction, building code enforcement, public improvements, economic
development, planning and zoning, water and sewerage services, parks and recreation, and general
administrative services.
The government-wide financial statements are prepared in accordance with generally accepted
accounting principles (GAAP). The Governmental Accounting Standards Board (GASB) is responsible
for establishing GAAP for state and local governments through its pronouncements (Statements and
Interpretations). The more significant of the Village’s accounting policies established in GAAP and
used by the Village are described below.
REPORTING ENTITY
The Village’s financial reporting entity comprises the following:
Primary Government: Village of Riverside
Discretely Presented Component Unit: Riverside Public Library
In determining the financial reporting entity, the Village complies with the provisions of GASB
Statement No. 61, “The Financial Reporting Omnibus – an Amendment of GASB Statements No. 14
and No. 34,” and includes all component units that have a significant operational or financial
relationship with the Village.
The Village’s police employees participate in the Police Pension Employees Retirement System
(PPERS), also referred to as the Police Pension Fund. PPERS functions for the benefit of these
employees and is governed by a five-member pension board. Two members appointed by the Village’s
Mayor, one elected pension beneficiary and two elected police employees constitute the pension board.
The participants are required to contribute a percentage of salary as established by state statute and the
Village is obligated to fund all remaining PPERS costs based upon actuarial valuations. The State of
Illinois is authorized to establish benefit levels and the Village is authorized to approve the actuarial
assumptions used in the determination of contribution levels. Although it is legally separate from the
Village, the PPERS is reported as if it were part of the primary Village because its sole purpose is to
provide retirement benefits for the Village’s police employees. The PPERS is reported as a pension
trust fund.
VILLAGE OF RIVERSIDE, ILLINOIS
Notes to the Financial Statements
December 31, 2017
20
NOTE 1 – SUMMARY OF SIGNIFICANT ACCOUNTING POLICIES – Continued
REPORTING ENTITY – Continued
Discretely Presented Component Unit
Discretely presented component units are separate legal entities that meet the component unit criteria
described above but do not meet the criteria for blending.
Riverside Public Library
The Riverside Public Library (the Library) has a separate elected board and provides service to
residents, generally within the geographic boundaries of the Village. The Library Board of Trustees
selects management staff, establishes budgets and otherwise directs the affairs of the Library. The
Library is a public library operating in accordance with the Illinois Local Library Act, 75 ILCS 5/1-0.1
et seq. The Library may not issue bonded debt without the Village’s approval and its annual budget and
property tax levy request are subject to the Village Board’s approval, as well as the potential financial
burden relationship existing. A copy of the Library’s report may be obtained by writing to the Riverside
Public Library, 1 Burling Road, Riverside, IL 60546-2259.
BASIS OF PRESENTATION
Government-Wide Statements
The Village’s basic financial statements include both government-wide (reporting the Village as a
whole) and fund financial statements (reporting the Village’s major funds). Both the government-wide
and fund financial statements categorize primary activities as either governmental or business type. The
Village’s police safety, highway and street maintenance and reconstruction, building code enforcement,
public improvements, economic development, planning and zoning, parks and recreation and general
administrative services are classified as governmental activities. The Village’s water and sewer services
are classified as business-type activities.
In the government-wide Statement of Net Position, both the governmental and business-type activities
columns are: (a) presented on a consolidated basis by column, and (b) reported on a full accrual,
economic resource basis, which recognizes all long-term assets/deferred outflows and receivables as
well as long-term debt/deferred inflows and obligations.
The Village’s net position is reported in three parts: net investment in capital assets; restricted; and
unrestricted. The Village first utilizes restricted resources to finance qualifying activities.
VILLAGE OF RIVERSIDE, ILLINOIS
Notes to the Financial Statements
December 31, 2017
21
NOTE 1 – SUMMARY OF SIGNIFICANT ACCOUNTING POLICIES – Continued
BASIS OF PRESENTATION – Continued
Government-Wide Statements – Continued
The government-wide Statement of Activities reports both the gross and net cost of each of the
Village’s functions and business-type activities (general government, public safety, highways and
streets, etc.). The functions are supported by general government revenues (property, sales and use
taxes, certain intergovernmental revenues, fines, permits and charges for services, etc.). The Statement
of Activities reduces gross expenses (including depreciation) by related program revenues, which
include 1) changes to customers or applicants who purchase, use or directly benefit from goods,
services or privileges provided by a given function or segment and 2) grants and contributions that are
restricted to meeting the operational or capital requirements of a particular function or segment.
The net costs (by function or business-type activity) are normally covered by general revenue (property,
sales and use taxes, certain intergovernmental revenues, permits and charges for services, etc.).
The Village does not allocate indirect costs. An administrative service fee is charged by the General
Fund to the other operating funds that is eliminated like a reimbursement (reducing the revenue and
expense in the General Fund) to recover the direct costs of General Fund services provided (finance,
personnel, purchasing, legal, technology management, etc.).
This government-wide focus is more on the sustainability of the Village as an entity and the change in
the Village’s net position resulting from the current year’s activities.
Fund Financial Statements
The financial transactions of the Village are reported in individual funds in the fund financial
statements. Each fund is accounted for by providing a separate set of self-balancing accounts that
comprise its assets/deferred outflows, liabilities/deferred inflows, fund equity, revenues and
expenditures/expenses. Funds are organized into three major categories: governmental, proprietary, and
fiduciary. The emphasis in fund financial statements is on the major funds in either the governmental or
business-type activities categories.
GASB Statement No. 34 sets forth minimum criteria (percentage of the assets/deferred outflows,
liabilities/deferred inflows, revenues or expenditures/expenses of either fund category or the
governmental and enterprise combined) for the determination of major funds. The Village electively
added funds, as major funds, which either have debt outstanding or a specific community focus. The
nonmajor funds are combined in a single column in the fund financial statements. A fund is considered
major if it is the primary operating fund of the Village or meets the following criteria:
VILLAGE OF RIVERSIDE, ILLINOIS
Notes to the Financial Statements
December 31, 2017
22
NOTE 1 – SUMMARY OF SIGNIFICANT ACCOUNTING POLICIES – Continued
BASIS OF PRESENTATION – Continued
Fund Financial Statements – Continued
Total assets/deferred outflows, liabilities/deferred inflows, revenues, or
expenditures/expenses of that individual governmental or enterprise fund
are at least 10 percent of the corresponding total for all funds of that
category or type; and
Total assets/deferred outflows, liabilities/deferred inflows, revenues, or
expenditures/expenses of the individual governmental fund or enterprise
fund are at least 5 percent of the corresponding total for all governmental
and enterprise funds combined.
The various funds are reported by generic classification within the financial statements. The following
fund types are used by the Village:
Governmental Funds
The focus of the governmental funds’ measurement (in the fund statements) is upon determination of
financial position and changes in financial position (sources, uses, and balances of financial resources)
rather than upon net income. The following is a description of the governmental funds of the Village:
General fund is the general operating fund of the Village. It is used to account for all financial resources
except those required to be accounted for in another fund. The General Fund is a major fund.
Special revenue funds are used to account for the proceeds of specific revenue sources that are legally
restricted to expenditures for specified purposes. The Village maintains two nonmajor special revenue
funds.
Debt service funds are used to account for the accumulation of funds for the periodic payment of
principal and interest on general long-term debt. The Debt Service Fund is treated as a major fund and
accumulates monies for the payment of the Village’s outstanding general obligation bonds.
Capital projects funds are used to account for financial resources to be used for the acquisition or
construction of major capital facilities (other than those financed by business-type/proprietary funds).
The Capital Projects Fund is also treated as a major fund.
VILLAGE OF RIVERSIDE, ILLINOIS
Notes to the Financial Statements
December 31, 2017
23
NOTE 1 – SUMMARY OF SIGNIFICANT ACCOUNTING POLICIES – Continued
BASIS OF PRESENTATION – Continued
Fund Financial Statements – Continued
Proprietary Funds
The focus of proprietary fund measurement is upon determination of operating income, changes in net
position, financial position, and cash flows. The generally accepted accounting principles applicable are
those similar to businesses in the private sector. The following is a description of the proprietary funds
of the Village:
Enterprise funds are required to account for operations for which a fee is charged to external users for
goods or services and the activity is (a) financed with debt that is solely secured by a pledge of the net
revenues, (b) has third party requirements that the cost of providing services, including capital costs, be
recovered with fees and charges, or (c) establishes fees and charges based on a pricing policy designed
to recover similar costs. The Village maintains two enterprise funds. The Waterworks and Sewerage
Fund, a major fund, is used to account for the provision of water and wastewater services to the
residents of the Village. All activities necessary to provide such services are accounted for in this fund.
The Parking Lot Fund, a nonmajor fund, is used to account for the operations of the Village’s
residential and commuter parking lots and parking areas. Revenues are provided from user permit fees
and daily space fees.
Fiduciary Funds
Fiduciary funds are used to report assets held in a trustee or agency capacity by the Village for others
and therefore are not available to support Village programs. The reporting focus is on net position and
changes in net position and is reported using accounting principles similar to proprietary funds.
Pension trust funds are used to account for assets held in a trustee capacity by the Village for pension
benefit payments. The Police Pension Fund accounts for the accumulation of resources to pay pension
costs. Resources are contributed by police force members at rates fixed by state statutes and by the
government through an annual property tax levy.
The Village’s fiduciary fund is presented in the fiduciary fund financial statements by type (pension
trust). Since by definition these assets are being held for the benefit of a third party (other local
governments, private parties, pension participants, etc.) and cannot be used to address activities or
obligations of the Village, this fund is not incorporated into the government-wide statements.
VILLAGE OF RIVERSIDE, ILLINOIS
Notes to the Financial Statements
December 31, 2017
24
NOTE 1 – SUMMARY OF SIGNIFICANT ACCOUNTING POLICIES – Continued
MEASUREMENT FOCUS AND BASIS OF ACCOUNTING
Measurement focus is a term used to describe “which” transactions are recorded within the various
financial statements. Basis of accounting refers to “when” transactions are recorded regardless of the
measurement focus applied.
Measurement Focus
On the government-wide Statement of Net Position and the Statement of Activities, both governmental
and business-type activities are presented using the economic resources measurement focus as defined
below.
In the fund financial statements, the “current financial resources” measurement focus or the “economic
resources” measurement focus is used as appropriate.
All governmental funds utilize a “current financial resources” measurement focus. Only current
financial assets/deferred outflows and liabilities/deferred inflows are generally included on their
balance sheets. Their operating statements present sources and uses of available spendable financial
resources during a given period. These funds use fund balance as their measure of available spendable
financial resources at the end of the period.
All proprietary and pension trust funds utilize an “economic resources” measurement focus. The
accounting objectives of this measurement focus are the determination of operating income, changes in
net position (or cost recovery), financial position, and cash flows. All assets/deferred outflows and
liabilities/deferred inflows (whether current or noncurrent) associated with their activities are reported.
Proprietary and pension trust fund equity is classified as net position.
Basis of Accounting
In the government-wide Statement of Net Position and Statement of Activities, both governmental and
business-type activities are presented using the accrual basis of accounting. Under the accrual basis of
accounting, revenues are recognized when earned and expenses are recorded when the liability/deferred
inflow is incurred or economic asset used. Revenues, expenses, gains, losses, assets/deferred outflows,
and liabilities/deferred inflows resulting from exchange and exchange-like transactions are recognized
when the exchange takes place.
In the fund financial statements, governmental funds are presented on the modified accrual basis of
accounting. Under this modified accrual basis of accounting, revenues are recognized when
“measurable and available.” Measurable means knowing or being able to reasonably estimate the
amount. Available means collectible within the current period or within sixty days after year-end. The
Village recognizes property taxes when they become both measurable and available in accordance with
GASB Codification Section P70.
VILLAGE OF RIVERSIDE, ILLINOIS
Notes to the Financial Statements
December 31, 2017
25
NOTE 1 – SUMMARY OF SIGNIFICANT ACCOUNTING POLICIES – Continued
MEASUREMENT FOCUS AND BASIS OF ACCOUNTING – Continued
Basis of Accounting – Continued
A sixty-day availability period is used for revenue recognition for all other governmental fund
revenues. Income tax will exceed the sixty-day recognition period due to the State of Illinois and the
long delay with releasing these funds. Expenditures (including capital outlay) are recorded when the
related fund liability is incurred, except for general obligation bond principal and interest which are
recognized when due.
In applying the susceptible to accrual concept under the modified accrual basis, those revenues
susceptible to accrual are property taxes, sales and use taxes, franchise taxes, licenses, interest revenue,
and charges for services. All other revenues are not susceptible to accrual because generally they are
not measurable until received in cash.
All proprietary and pension trust funds utilize the accrual basis of accounting. Under the accrual basis
of accounting, revenues are recognized when earned and expenses are recorded when the liability is
incurred or economic asset used. Proprietary funds distinguish operating revenues and expenses from
nonoperating items. Operating revenues and expenses generally result from providing services and
producing and delivering goods in connection with a proprietary fund’s principal ongoing operations.
The principal operating revenues of the Village’s enterprise funds are charges to customers for sales
and services. The Village also recognizes as operating revenue the portion of tap fees intended to
recover the cost of connecting new customers to the system.
Operating expenses for enterprise funds include the cost of sales and services, administrative expenses,
and depreciation on capital assets. All revenues and expenses not meeting this definition are reported as
nonoperating revenues and expenses.
ASSETS/DEFERRED OUTFLOWS, LIABILITIES/DEFERRED INFLOWS, AND NET
POSITION OR EQUITY
Cash and Investments
Cash and cash equivalents on the Statement of Net Position are considered to be cash on hand, demand
deposits, and cash with fiscal agent. For the purpose of the proprietary funds’ Statement of Cash Flows,
cash and cash equivalents are considered to be cash on hand, demand deposits, cash with fiscal agent,
and all highly liquid investments with an original maturity of three months or less.
Investments are generally reported at fair value. Short-term investments are reported at cost, which
approximates fair value. For investments, the Village categorizes its fair value measurements within the
fair value hierarchy established by generally accepted accounting principles. The hierarchy is based on
the valuation inputs used to measure the fair value of the asset. Level 1 inputs are quoted prices in
active markets for identical assets; Level 2 inputs are significant other observable inputs; Level 3 inputs
are significant unobservable inputs.
VILLAGE OF RIVERSIDE, ILLINOIS
Notes to the Financial Statements
December 31, 2017
26
NOTE 1 – SUMMARY OF SIGNIFICANT ACCOUNTING POLICIES – Continued
ASSETS/DEFERRED OUTFLOWS, LIABILITIES/DEFERRED INFLOWS, AND NET
POSITION OR EQUITY – Continued
Interfund Receivables, Payables and Activity
Interfund activity is reported as loans, services provided, reimbursements or transfers. Loans are
reported as interfund receivables and payables as appropriate and are subject to elimination upon
consolidation. Services provided, deemed to be at market or near market rates, are treated as revenues
and expenditures/expenses. Reimbursements are when one fund incurs a cost, charges the appropriate
benefiting fund and reduces its related cost as a reimbursement. All other interfund transactions are
treated as transfers. Any residual balances outstanding between the governmental activities and
business-type activities are reported in the government-wide financial statements as “internal balances.”
Receivables
In the government-wide financial statements, receivables consist of all revenues earned at year-end and
not yet received. Allowances for uncollectible accounts receivable are based upon historical trends and
the periodic aging of accounts receivable. Major receivables balances for governmental activities
include property taxes, sales and use taxes, franchise taxes, and grants. Business-type activities report
utility charges as their major receivables.
Prepaids
Certain payments to vendors reflect costs applicable to future accounting periods and are recorded as
prepaids in both the government-wide and fund financial statements. Prepaids are valued at cost, which
approximates market. The cost of governmental fund-type prepaids are recorded as expenditures when
consumed rather than when purchased.
Capital Assets
Capital assets purchased or acquired with an original cost of $10,000 or more, depending on asset class,
are reported at historical cost or estimated historical cost. Contributed assets are reported at aquisition
value as of the date received. Additions, improvements and other capital outlays that significantly
extend the useful life of an asset are capitalized. Other costs incurred for repairs and maintenance are
expensed as incurred.
The accounting and financial reporting treatment applied to a fund is determined by its measurement
focus. General capital assets are long-lived assets of the Village as a whole. Infrastructure such as
streets, traffic signals and signs are capitalized. In the case of the initial capitalization of general
infrastructure assets (i.e., those reported by the governmental activities) the government chose to
include all such items regardless of their acquisition date. The valuation basis for general capital assets
are historical cost, or where historical cost is not available, estimated historical cost based on
replacement costs.
VILLAGE OF RIVERSIDE, ILLINOIS
Notes to the Financial Statements
December 31, 2017
27
NOTE 1 – SUMMARY OF SIGNIFICANT ACCOUNTING POLICIES – Continued
ASSETS/DEFERRED OUTFLOWS, LIABILITIES/DEFERRED INFLOWS, AND NET
POSITION OR EQUITY – Continued
Capital Assets – Continued
Capital assets in the proprietary funds are capitalized in the fund in which they are utilized. The
valuation basis for proprietary fund capital assets are the same as those used for the general capital
assets. Donated capital assets are capitalized at estimated fair market value on the date donated.
Depreciation on all assets is computed and recorded using the straight-line method of depreciation over
the following estimated useful lives:
Building and Improvements 50 Years
Machinery and Equipment 5 - 10 Years
Vehicles 6 Years
Infrastructure 20 - 80 Years
Deferred Outflows/Inflows of Resources
Deferred outflow/inflow of resources represents an acquisition of net position that applies to a future
period and therefore will not be recognized as an outflow of resources (expense)/inflow of resources
(revenue) until that future time.
Compensated Absences
The Village accrues accumulated unpaid vacation and associated employee-related costs when earned
(or estimated to be earned) by the employee. In accordance with GASB Statement No. 16, no liability is
recorded for nonvesting accumulation rights to receive sick pay benefits. However, a liability is
recognized for that portion of accumulated sick leave that is estimated to be taken as “terminal leave”
prior to retirement. All vacation pay is accrued when incurred in the government-wide and proprietary
fund financial statements. A liability for these amounts is reported in the governmental funds only if
they have matured, for example, as a result of employee resignations and retirements.
VILLAGE OF RIVERSIDE, ILLINOIS
Notes to the Financial Statements
December 31, 2017
28
NOTE 1 – SUMMARY OF SIGNIFICANT ACCOUNTING POLICIES – Continued
ASSETS/DEFERRED OUTFLOWS, LIABILITIES/DEFERRED INFLOWS, AND NET
POSITION OR EQUITY – Continued
Long-Term Obligations
In the government-wide financial statements, and proprietary fund types in the fund financial
statements, long-term debt and other long-term obligations are reported as liabilities in the applicable
governmental activities, business-type activities, or proprietary fund type Statement of Net Position.
Bond premiums and discounts are deferred and amortized over the life of the bonds using the effective
interest method. Bonds payable are reported net of the applicable bond premium or discount. Bond
issuance costs are reported as expenses at the time of issuance.
In the fund financial statements, governmental fund types recognize bond premiums and discounts, as
well as bond issuance costs, during the current period. The face amount of debt issued is reported as
other financing sources. Premiums received on debt issuances are reported as other financing sources
while discounts on debt issuances are reported as other financing uses. Issuance costs, whether or not
withheld from the actual debt proceeds received, are reported as debt service expenditures.
Net Position
In the government-wide financial statements, equity is classified as net position and displayed in three
components:
Net Investment in Capital Assets – Consists of capital assets including
restricted capital assets, net of accumulated depreciation and reduced by
the outstanding balances of any bonds, mortgages, notes or other
borrowings that are attributable to the acquisition, construction, or
improvement of those assets.
Restricted – Consists of net position with constraints placed on the use
either by (1) external groups such as creditors, grantors, contributors, or
laws or regulations of other governments; or (2) law through constitutional
provisions or enabling legislations.
Unrestricted – All other net position balances that do not meet the
definition of “restricted” or “net investment in capital assets.”
VILLAGE OF RIVERSIDE, ILLINOIS
Notes to the Financial Statements
December 31, 2017
29
NOTE 2 – STEWARDSHIP, COMPLIANCE, AND ACCOUNTABILITY
BUDGETARY INFORMATION
Budgets are adopted on a basis consistent with generally accepted accounting principles. Annual
appropriated budgets are adopted for the General, Special Revenue, Debt Service, Capital Projects,
Enterprise and Pension Trust Funds. All annual appropriations lapse at fiscal year-end. Budget
amendments were made for the current fiscal year and are reflected in these financial statements.
The Village follows these procedures in establishing the budgetary data reflected in the financial
statements:
• The Village Manager submits to the Village Board of Trustees a proposed operating budget for
the fiscal year commencing the following January 1. The operating budget includes proposed
expenditures and the means of financing them.
• Public hearings are conducted by the Village to obtain taxpayer comments.
• Subsequently, the budget is legally enacted through passage of an ordinance.
• Formal budgetary integration is employed as a management control device during the year for
all funds.
• Budgets, as described above, are adopted on a basis consistent with generally accepted
accounting principles.
• Legal level of budgetary control is at the department level in the General Fund or fund level for
all other funds.
• Budgetary authority lapses at year end.
• State law requires that “expenditures be made in conformity with the budget.” Transfers
between line items in cost centers may be made by administrative action. Any amount to be
transferred between cost centers and/or funds would require Board approval.
• Budgeted amounts are as originally adopted, with the exception of Board approved budget
amendments which are reflected in the financial statements.
VILLAGE OF RIVERSIDE, ILLINOIS
Notes to the Financial Statements
December 31, 2017
30
NOTE 3 – DETAIL NOTES ON ALL FUNDS
DEPOSITS AND INVESTMENTS
The Village maintains a cash and investment pool that is available for use by all funds except the
pension trust funds. Each fund type's portion of this pool is displayed on the financial statements as
"cash and investments.” In addition, investments are separately held by several of the Village's funds.
The deposits and investments of the pension trust fund is held separately from those of other funds.
Permitted Deposits and Investments – Statutes authorize the Village to make deposits/invest in
commercial banks, savings and loan institutions, obligations of the U.S. Treasury and U.S. Agencies,
obligations of States and their political subdivisions, credit union shares, repurchase agreements,
commercial paper rated within the three highest classifications by at least two standard rating services,
Illinois Funds and the Illinois Metropolitan Investment Fund (IMET).
The deposits and investments of the Pension Fund are held separately from those of other Village funds.
Statutes authorize the Pension Fund to make deposits/invest in interest bearing direct obligations of the
United States of America; obligations that are fully guaranteed or insured as to the payment of principal
and interest by the United States of America; bonds, notes, debentures, or similar obligations of agencies
of the United States of America; savings accounts or certificates of deposit issued by banks or savings and
loan associations chartered by the United States of America or by the State of Illinois, to the extent that
the deposits are insured by the agencies or instrumentalities of the federal government; credit unions, to
the extent that the deposits are insured by the agencies or instrumentalities of the federal government;
State of Illinois bonds; pooled accounts managed by the Illinois Funds Market Fund (Formerly known as
IPTIP, Illinois Public Treasurer’s Investment Pool), or by banks, their subsidiaries or holding companies,
in accordance with the laws of the State of Illinois; bonds or tax anticipation warrants of any county,
township, or municipal corporation of the State of Illinois; direct obligations of the State of Israel; money
market mutual funds managed by investment companies that are registered under the Federal Investment
Company Act of 1940 and the Illinois Securities Law of 1953 and are diversified, open-ended
management investment companies, provided the portfolio is limited to specified restrictions; general
accounts of life insurance companies; and separate accounts of life insurance companies and mutual
funds, the mutual funds must meet specific restrictions, provided the investment in separate accounts
and mutual funds does not exceed ten percent of the Pension Fund’s plan net position; and corporate
bonds managed through an investment advisor, rated as investment grade by one of the two largest
rating services at the time of purchase. Pension Funds with plan net position of $2.5 million or more
may invest up to forty-five percent of plan net position in separate accounts of life insurance companies
and mutual funds. Pension Funds with plan net position of at least $5 million that have appointed an
investment advisor, may through that investment advisor invest up to forty-five percent of the plan net
position in common and preferred stocks that meet specific restrictions. In addition, Pension Funds with
plan net position of at least $10 million that have appointed an investment advisor, may invest up to
fifty percent of its net position in common and preferred stocks and mutual funds that meet specific
restrictions effective July 1, 2011 and up to fifty-five percent effective July 1, 2012.
VILLAGE OF RIVERSIDE, ILLINOIS
Notes to the Financial Statements
December 31, 2017
31
NOTE 3 – DETAIL NOTES ON ALL FUNDS – Continued
DEPOSITS AND INVESTMENTS – Continued
The Illinois Funds is an investment pool managed by the Illinois Public Treasurer’s Office which
allows governments within the State to pool their funds for investment purposes. Although not
registered with the SEC, Illinois Funds operates in a manner consistent with Rule 2a7 of the Investment
Company Act of 1940. Investments in Illinois Funds are valued at the share price, the price for which
the investment could be sold.
The Illinois Metropolitan Investment Fund (IMET) is a non-for-profit investment trust formed pursuant
to the Illinois Municipal Code. IMET is managed by a Board of Trustees elected from the participating
members. IMET is not registered with the SEC as an Investment Company. Investments in IMET are
valued at the share price, the price for which the investment could be sold.
Village Interest Rate Risk, Credit Risk, Custodial Credit Risk and Concentration Risk
Deposits. At year-end, the carrying amount of the Village’s deposits for governmental and business-
type activities totaled $5,566,673 and the bank balances totaled $6,138,869. Additionally, the Village
has $540,638 invested in the Illinois Fund and $1,597,514 invested in IMET at year-end. Both Illinois
Funds and IMET are 2a7-like investment pools that are measured at the net asset value per share
determined by the pool.
Interest Rate Risk. Interest rate risk is the risk that changes in interest rates will adversely affect the fair
value of an investment. In accordance with the Village’s investment policy, the Village limits its
exposure by structuring the portfolio to meet daily cash flow requirements for ongoing operations in
order to maximize yield on longer term investments by avoiding having to sell securities on the open
market before maturity and by investing operating funds in shorter term securities, money market
mutual funds or external investment pools. The Village’s investments in the Illinois Funds and IMET
have an average maturity of less than one year to three years.
Credit Risk. Credit risk is the risk that an issuer or other counterparty to an investment will not fulfill its
obligations. The Village limits its exposure by prequalifying financial institutions and other
intermediaries. At year-end, the Village’s investment in the Illinois Funds is rated AAAm by Standard
& Poor’s and the Village’s investment in the IMET 1-3 Year Fund is rated AAAf by Standard &
Poor’s.
Concentration Risk. This is the risk of loss attributed to the magnitude of the Village’s investment in a
single issuer. The Village’s investment policy requires diversification of investment to avoid
unreasonable risk. Additionally, the Village’s investment policy states that no financial institution shall
hold more than 40% of the total investments, commercial paper shall not exceed 10% of the Village’s
portfolio and deposits in Illinois Funds shall not exceed 50% of investments. At year-end, the Village
does not have any investments over 5 percent of cash and investments (other than investments issued or
explicitly guaranteed by the U.S. government and investments in mutual funds, external investment
pools, and other pooled investments).
VILLAGE OF RIVERSIDE, ILLINOIS
Notes to the Financial Statements
December 31, 2017
32
NOTE 3 – DETAIL NOTES ON ALL FUNDS – Continued
DEPOSITS AND INVESTMENTS – Continued
Village Interest Rate Risk, Credit Risk, Custodial Credit Risk and Concentration Risk –
Continued
Custodial Credit Risk. In the case of deposits, this is the risk that in the event of a bank failure, the
Village’s deposits may not be returned to it. The Village’s investment policy requires all deposits with
financial institution in excess of federal depository insurance be collateralized at 105% of the uninsured
bank balance, with collateral held under to guidelines of the Village’s written collateral agreement.
Collateral is required to be invested in government securities, obligations of federal agencies,
obligations of federal instrumentalities or obligations of the State of Illinois. At year-end, the entire
amount of the bank balance of deposits was covered by federal depository or equivalent insurance.
For an investment, this is the risk that in the event of the failure of the counterparty, the Village will not
be able to recover the value of its investments or collateral securities that are in the possession of an
outside party. To limits its exposure, the Village’s investment policy requires all security transactions
that are exposed to custodial credit risk to be processed on a delivery versus payment (DVP) basis with
the underlying investments held by a third-party custodian approved by the Village Treasurer and
evidenced by safekeeping receipts. At year-end, the Village’s investments in the Illinois Fund and
IMET are not subject to custodial credit risk.
Police Pension Fund Interest Rate Risk, Credit Risk, Custodial Credit Risk and Concentration
Risk
Deposits. At year-end, the carrying amount of the Fund’s deposits totaled $627,211 and the bank
balances totaled $634,460.
Investments. The Fund has the following investment fair values and maturities:
Less Than More Than
Investment Type 1 1 to 5 6 to 10 10
U.S. Treasuries $ 3,325,286 732,826 1,894,407 698,053 -
U.S. Agencies 358,747 572 281,473 9,441 67,261
Corporate Notes and Bonds 653,473 200,043 453,430 - -
4,337,506 933,441 2,629,310 707,494 67,261
Investment Maturities (in Years)
Fair
Value
VILLAGE OF RIVERSIDE, ILLINOIS
Notes to the Financial Statements
December 31, 2017
33
NOTE 3 – DETAIL NOTES ON ALL FUNDS – Continued
DEPOSITS AND INVESTMENTS – Continued
Police Pension Fund Interest Rate Risk, Credit Risk, Custodial Credit Risk and Concentration
Risk – Continued
Investments – Continued. The Fund has the following recurring fair value measurements as of
December 31, 2017:
Quoted
Prices
in Active Significant
Markets for Other Significant
Identical Observable Unobservable
Assets Inputs Inputs
Investments by Fair Value Level (Level 1) (Level 2) (Level 3)
Debt Securities
U.S. Treasuries $ 3,325,286 3,325,286 - -
U.S. Agencies 358,747 - 358,747 -
Corporate Notes and Bonds 653,473 - 653,473 -
Equity Securities
Common Stock 962,473 962,473 - -
Mutual Funds 3,286,450 3,286,450 - -
Total Investments by
Fair Value Level 8,586,429 7,574,209 1,012,220 -
Fair Value Measurements Using
Total
Debt Securities classified in Level 2 of the fair value hierarchy are valued using a matrix pricing
technique. Matrix pricing is used to value securities based on the securities’ relationship to benchmark
quoted prices.
Interest Rate Risk. The Fund’s investment policy limits exposure to interest rate risk by structuring the
portfolio to maximize the security of investments and the rate of return. This is accomplished by
diversifying the types of maturity ranges of securities.
Credit Risk. The Fund’s investment policy helps limit its exposure to credit risk by primarily investing
in U.S. Treasury and agency securities and by prequalifying financial institutions and investment
managers. At year-end, the Fund’s investments in securities of the U.S. agencies ratings were not
available. The corporate notes and bonds were rated A1, A1, A2, A2, A3, Aa2, Aa3, Baa1 and Baa1 by
Moody’s.
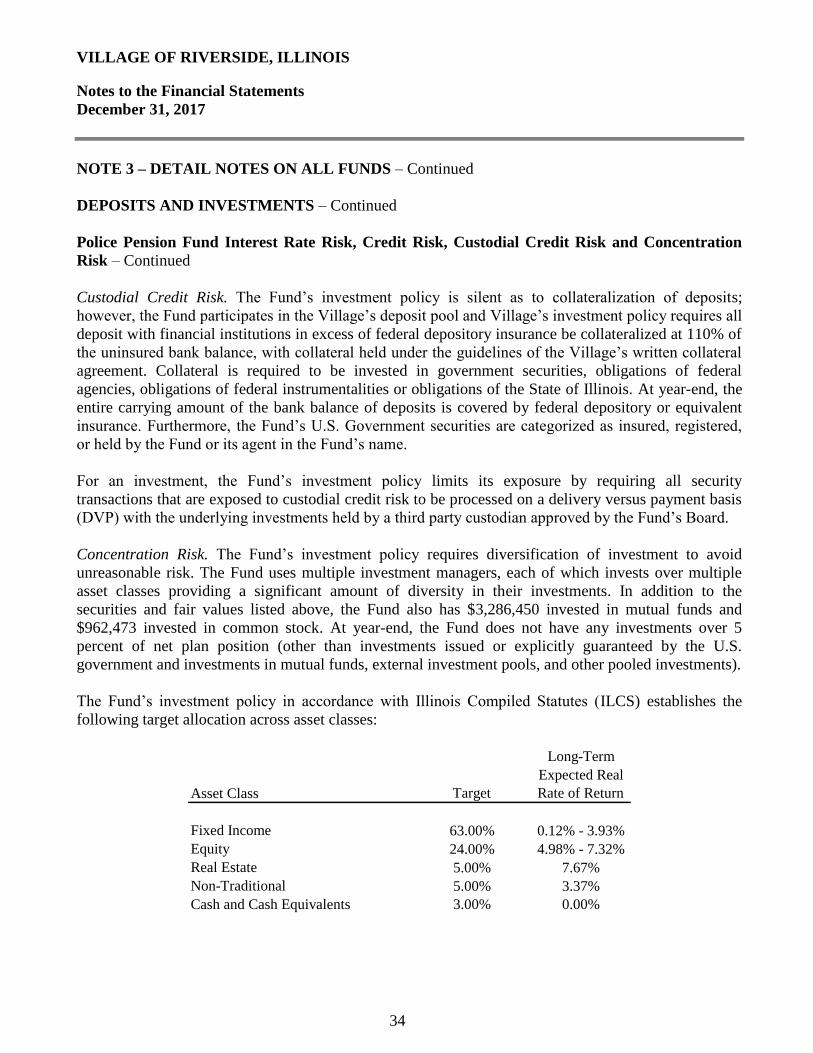
VILLAGE OF RIVERSIDE, ILLINOIS
Notes to the Financial Statements
December 31, 2017
34
NOTE 3 – DETAIL NOTES ON ALL FUNDS – Continued
DEPOSITS AND INVESTMENTS – Continued
Police Pension Fund Interest Rate Risk, Credit Risk, Custodial Credit Risk and Concentration
Risk – Continued
Custodial Credit Risk. The Fund’s investment policy is silent as to collateralization of deposits;
however, the Fund participates in the Village’s deposit pool and Village’s investment policy requires all
deposit with financial institutions in excess of federal depository insurance be collateralized at 110% of
the uninsured bank balance, with collateral held under the guidelines of the Village’s written collateral
agreement. Collateral is required to be invested in government securities, obligations of federal
agencies, obligations of federal instrumentalities or obligations of the State of Illinois. At year-end, the
entire carrying amount of the bank balance of deposits is covered by federal depository or equivalent
insurance. Furthermore, the Fund’s U.S. Government securities are categorized as insured, registered,
or held by the Fund or its agent in the Fund’s name.
For an investment, the Fund’s investment policy limits its exposure by requiring all security
transactions that are exposed to custodial credit risk to be processed on a delivery versus payment basis
(DVP) with the underlying investments held by a third party custodian approved by the Fund’s Board.
Concentration Risk. The Fund’s investment policy requires diversification of investment to avoid
unreasonable risk. The Fund uses multiple investment managers, each of which invests over multiple
asset classes providing a significant amount of diversity in their investments. In addition to the
securities and fair values listed above, the Fund also has $3,286,450 invested in mutual funds and
$962,473 invested in common stock. At year-end, the Fund does not have any investments over 5
percent of net plan position (other than investments issued or explicitly guaranteed by the U.S.
government and investments in mutual funds, external investment pools, and other pooled investments).
The Fund’s investment policy in accordance with Illinois Compiled Statutes (ILCS) establishes the
following target allocation across asset classes:
Long-Term
Expected Real
Asset Class Target Rate of Return
Fixed Income 63.00% 0.12% - 3.93%
Equity 24.00% 4.98% - 7.32%
Real Estate 5.00% 7.67%
Non-Traditional 5.00% 3.37%
Cash and Cash Equivalents 3.00% 0.00%
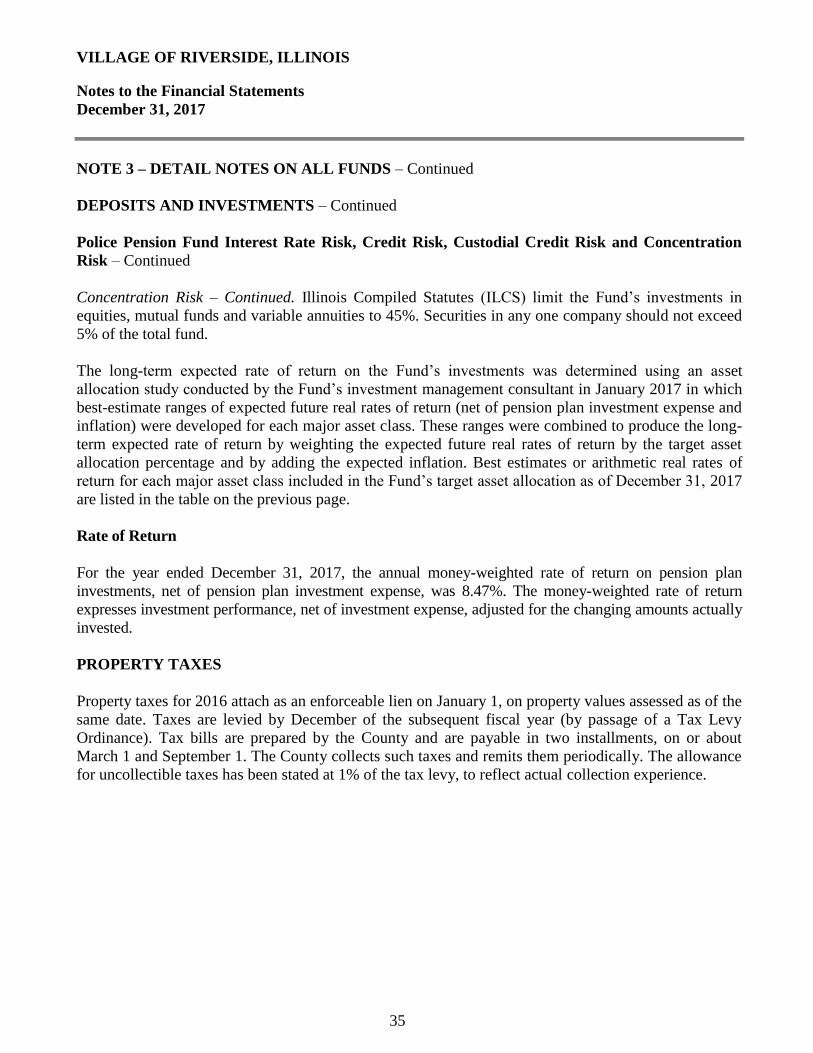
VILLAGE OF RIVERSIDE, ILLINOIS
Notes to the Financial Statements
December 31, 2017
35
NOTE 3 – DETAIL NOTES ON ALL FUNDS – Continued
DEPOSITS AND INVESTMENTS – Continued
Police Pension Fund Interest Rate Risk, Credit Risk, Custodial Credit Risk and Concentration
Risk – Continued
Concentration Risk – Continued. Illinois Compiled Statutes (ILCS) limit the Fund’s investments in
equities, mutual funds and variable annuities to 45%. Securities in any one company should not exceed
5% of the total fund.
The long-term expected rate of return on the Fund’s investments was determined using an asset
allocation study conducted by the Fund’s investment management consultant in January 2017 in which
best-estimate ranges of expected future real rates of return (net of pension plan investment expense and
inflation) were developed for each major asset class. These ranges were combined to produce the long-
term expected rate of return by weighting the expected future real rates of return by the target asset
allocation percentage and by adding the expected inflation. Best estimates or arithmetic real rates of
return for each major asset class included in the Fund’s target asset allocation as of December 31, 2017
are listed in the table on the previous page.
Rate of Return
For the year ended December 31, 2017, the annual money-weighted rate of return on pension plan
investments, net of pension plan investment expense, was 8.47%. The money-weighted rate of return
expresses investment performance, net of investment expense, adjusted for the changing amounts actually
invested.
PROPERTY TAXES
Property taxes for 2016 attach as an enforceable lien on January 1, on property values assessed as of the
same date. Taxes are levied by December of the subsequent fiscal year (by passage of a Tax Levy
Ordinance). Tax bills are prepared by the County and are payable in two installments, on or about
March 1 and September 1. The County collects such taxes and remits them periodically. The allowance
for uncollectible taxes has been stated at 1% of the tax levy, to reflect actual collection experience.
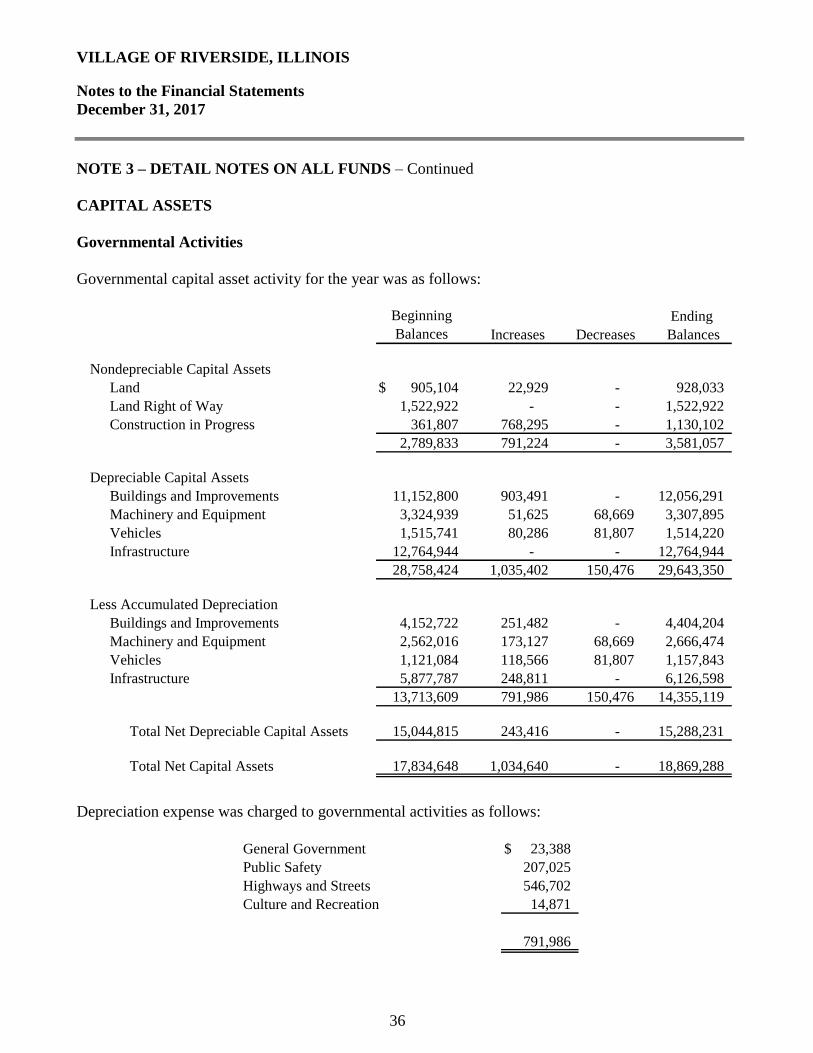
VILLAGE OF RIVERSIDE, ILLINOIS
Notes to the Financial Statements
December 31, 2017
36
NOTE 3 – DETAIL NOTES ON ALL FUNDS – Continued
CAPITAL ASSETS
Governmental Activities
Governmental capital asset activity for the year was as follows:
Ending
Increases Decreases Balances
Nondepreciable Capital Assets
Land $ 905,104 22,929 - 928,033
Land Right of Way 1,522,922 - - 1,522,922
Construction in Progress 361,807 768,295 - 1,130,102
2,789,833 791,224 - 3,581,057
Depreciable Capital Assets
Buildings and Improvements 11,152,800 903,491 - 12,056,291
Machinery and Equipment 3,324,939 51,625 68,669 3,307,895
Vehicles 1,515,741 80,286 81,807 1,514,220
Infrastructure 12,764,944 - - 12,764,944
28,758,424 1,035,402 150,476 29,643,350
Less Accumulated Depreciation
Buildings and Improvements 4,152,722 251,482 - 4,404,204
Machinery and Equipment 2,562,016 173,127 68,669 2,666,474
Vehicles 1,121,084 118,566 81,807 1,157,843
Infrastructure 5,877,787 248,811 - 6,126,598
13,713,609 791,986 150,476 14,355,119
Total Net Depreciable Capital Assets 15,044,815 243,416 - 15,288,231
Total Net Capital Assets 17,834,648 1,034,640 - 18,869,288
Beginning
Balances
Depreciation expense was charged to governmental activities as follows:
General Government $ 23,388
Public Safety 207,025
Highways and Streets 546,702
Culture and Recreation 14,871
791,986
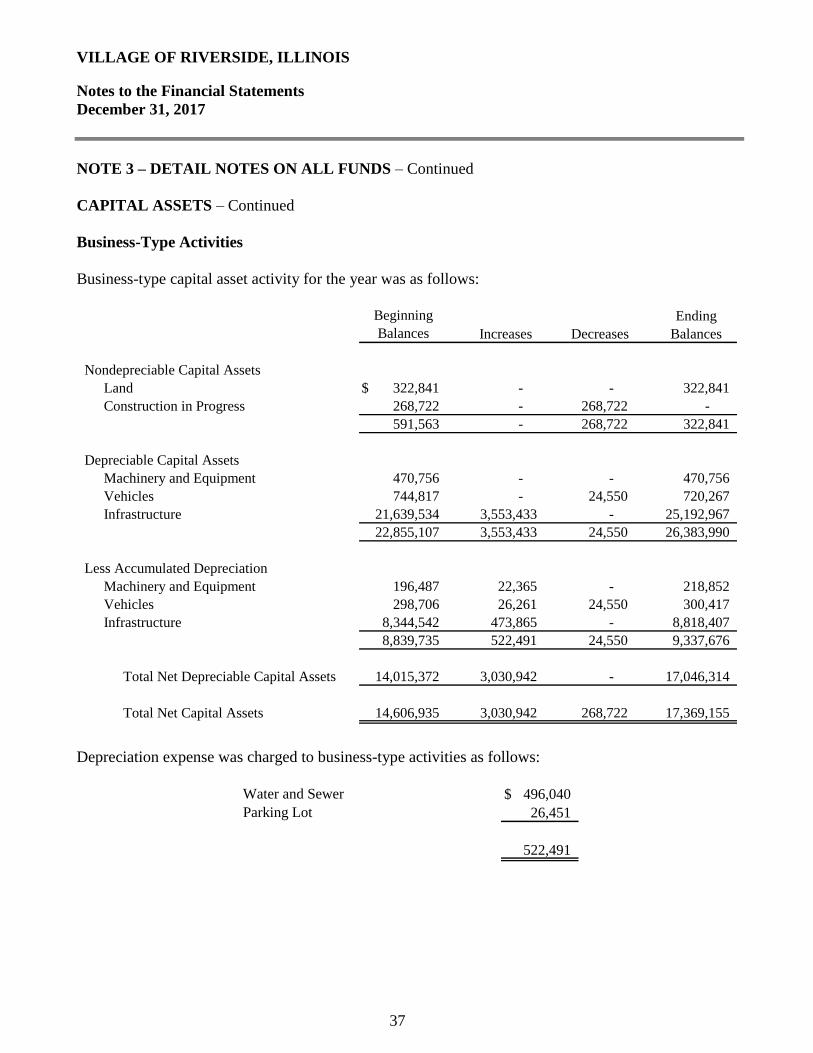
VILLAGE OF RIVERSIDE, ILLINOIS
Notes to the Financial Statements
December 31, 2017
37
NOTE 3 – DETAIL NOTES ON ALL FUNDS – Continued
CAPITAL ASSETS – Continued
Business-Type Activities
Business-type capital asset activity for the year was as follows:
Ending
Increases Decreases Balances
Nondepreciable Capital Assets
Land $ 322,841 - - 322,841
Construction in Progress 268,722 - 268,722 -
591,563 - 268,722 322,841
Depreciable Capital Assets
Machinery and Equipment 470,756 - - 470,756
Vehicles 744,817 - 24,550 720,267
Infrastructure 21,639,534 3,553,433 - 25,192,967
22,855,107 3,553,433 24,550 26,383,990
Less Accumulated Depreciation
Machinery and Equipment 196,487 22,365 - 218,852
Vehicles 298,706 26,261 24,550 300,417
Infrastructure 8,344,542 473,865 - 8,818,407
8,839,735 522,491 24,550 9,337,676
Total Net Depreciable Capital Assets 14,015,372 3,030,942 - 17,046,314
Total Net Capital Assets 14,606,935 3,030,942 268,722 17,369,155
Beginning
Balances
Depreciation expense was charged to business-type activities as follows:
Water and Sewer $ 496,040
Parking Lot 26,451
522,491
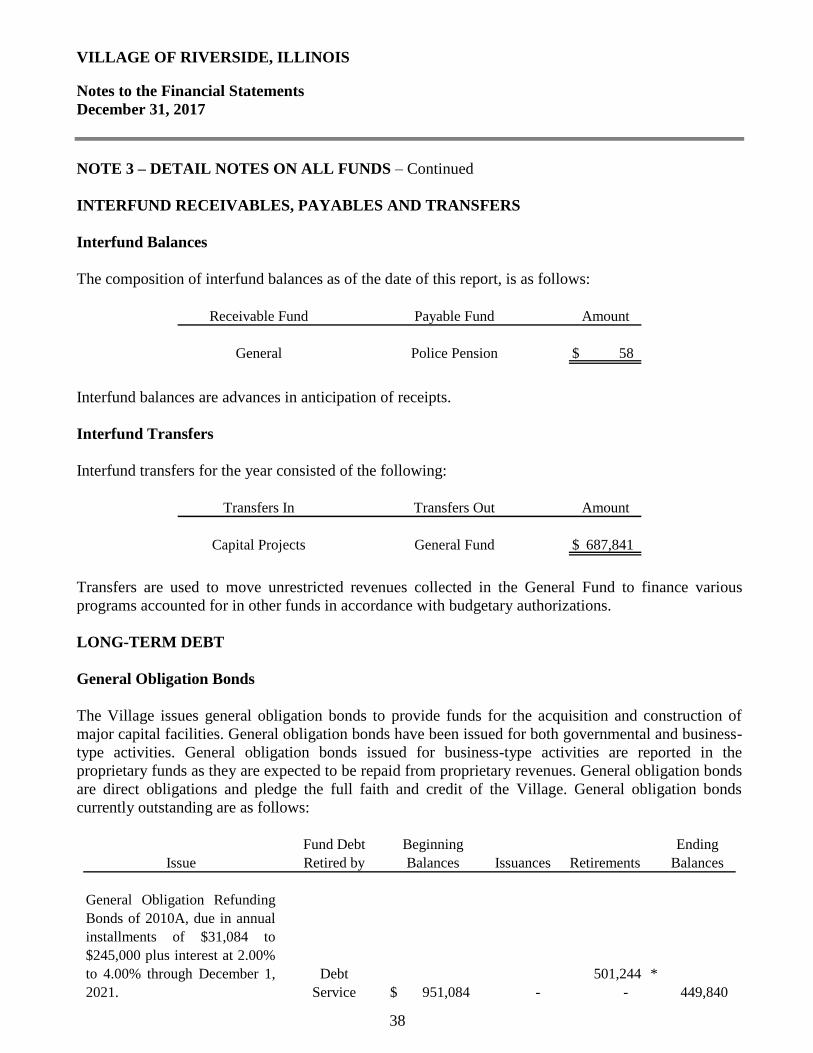
VILLAGE OF RIVERSIDE, ILLINOIS
Notes to the Financial Statements
December 31, 2017
38
NOTE 3 – DETAIL NOTES ON ALL FUNDS – Continued
INTERFUND RECEIVABLES, PAYABLES AND TRANSFERS
Interfund Balances
The composition of interfund balances as of the date of this report, is as follows:
Receivable Fund Payable Fund Amount
General Police Pension $ 58
Interfund balances are advances in anticipation of receipts.
Interfund Transfers
Interfund transfers for the year consisted of the following:
Transfers In Transfers Out Amount
Capital Projects General Fund $ 687,841
Transfers are used to move unrestricted revenues collected in the General Fund to finance various
programs accounted for in other funds in accordance with budgetary authorizations.
LONG-TERM DEBT
General Obligation Bonds
The Village issues general obligation bonds to provide funds for the acquisition and construction of
major capital facilities. General obligation bonds have been issued for both governmental and business-
type activities. General obligation bonds issued for business-type activities are reported in the
proprietary funds as they are expected to be repaid from proprietary revenues. General obligation bonds
are direct obligations and pledge the full faith and credit of the Village. General obligation bonds
currently outstanding are as follows:
Fund Debt Ending
Issue Retired by Issuances Retirements Balances
Debt 501,244 *
Service $ 951,084 - - 449,840
Beginning
Balances
General Obligation Refunding
Bonds of 2010A, due in annual
installments of $31,084 to
$245,000 plus interest at 2.00%
to 4.00% through December 1,
2021.
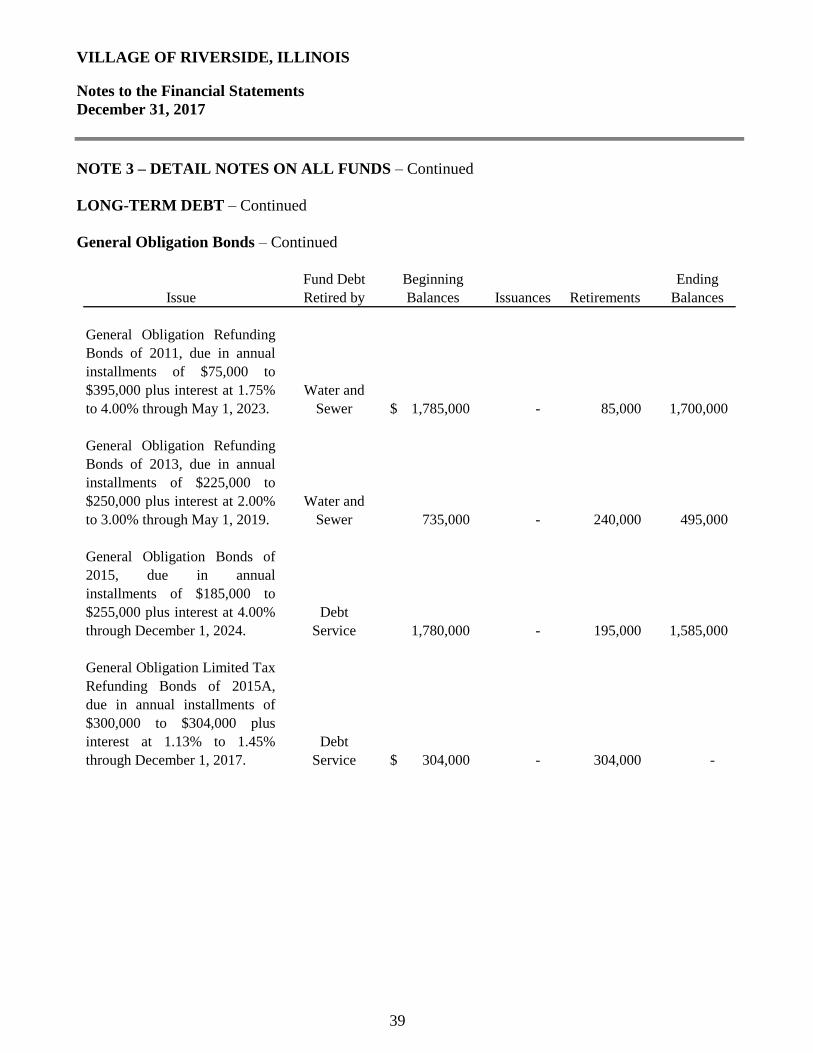
VILLAGE OF RIVERSIDE, ILLINOIS
Notes to the Financial Statements
December 31, 2017
39
NOTE 3 – DETAIL NOTES ON ALL FUNDS – Continued
LONG-TERM DEBT – Continued
General Obligation Bonds – Continued
Fund Debt Ending
Issue Retired by Issuances Retirements Balances
Water and
Sewer $ 1,785,000 - 85,000 1,700,000
Water and
Sewer 735,000 - 240,000 495,000
Debt
Service 1,780,000 - 195,000 1,585,000
Debt
Service $ 304,000 - 304,000 -
General Obligation Refunding
Bonds of 2011, due in annual
installments of $75,000 to
$395,000 plus interest at 1.75%
to 4.00% through May 1, 2023.
General Obligation Refunding
Bonds of 2013, due in annual
installments of $225,000 to
$250,000 plus interest at 2.00%
to 3.00% through May 1, 2019.
General Obligation Bonds of
2015, due in annual
installments of $185,000 to
$255,000 plus interest at 4.00%
through December 1, 2024.
General Obligation Limited Tax
Refunding Bonds of 2015A,
due in annual installments of
$300,000 to $304,000 plus
interest at 1.13% to 1.45%
through December 1, 2017.
Beginning
Balances
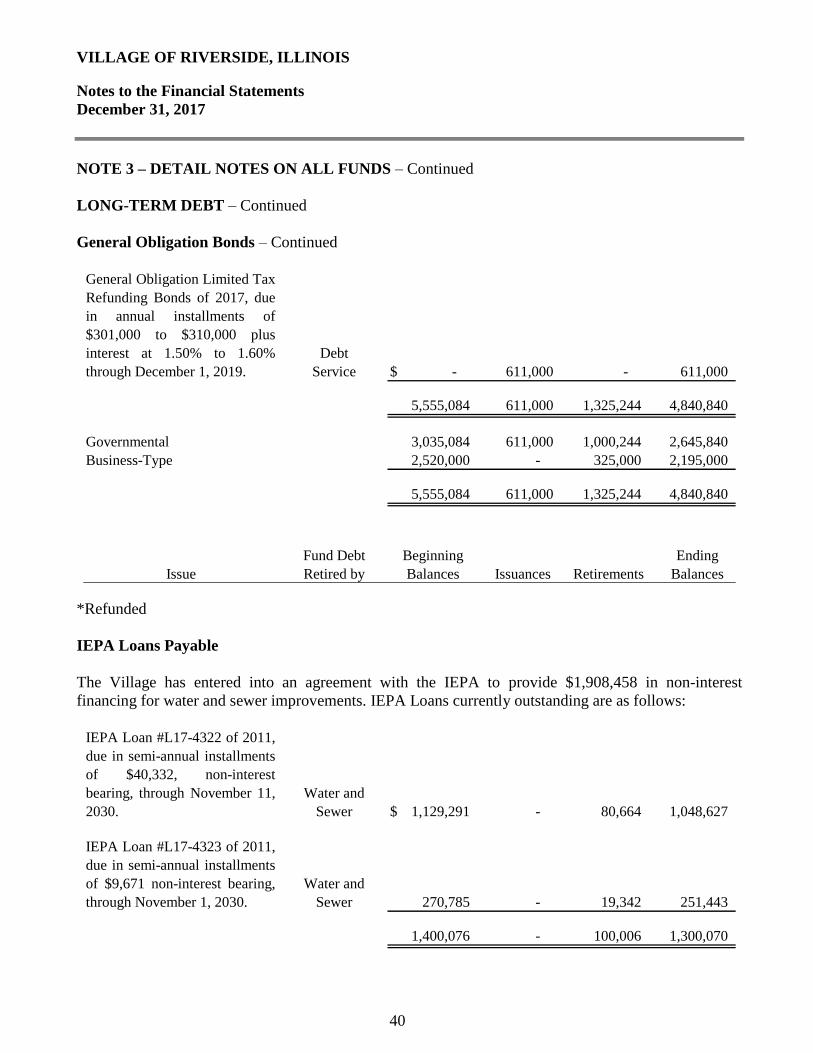
VILLAGE OF RIVERSIDE, ILLINOIS
Notes to the Financial Statements
December 31, 2017
40
NOTE 3 – DETAIL NOTES ON ALL FUNDS – Continued
LONG-TERM DEBT – Continued
General Obligation Bonds – Continued
Debt
Service $ - 611,000 - 611,000
5,555,084 611,000 1,325,244 4,840,840
Governmental 3,035,084 611,000 1,000,244 2,645,840
Business-Type 2,520,000 - 325,000 2,195,000
5,555,084 611,000 1,325,244 4,840,840
Fund Debt Ending
Issue Retired by Issuances Retirements Balances
General Obligation Limited Tax
Refunding Bonds of 2017, due
in annual installments of
$301,000 to $310,000 plus
interest at 1.50% to 1.60%
through December 1, 2019.
Beginning
Balances
*Refunded
IEPA Loans Payable
The Village has entered into an agreement with the IEPA to provide $1,908,458 in non-interest
financing for water and sewer improvements. IEPA Loans currently outstanding are as follows:
Water and
Sewer $ 1,129,291 - 80,664 1,048,627
Water and
Sewer 270,785 - 19,342 251,443
1,400,076 - 100,006 1,300,070
IEPA Loan #L17-4322 of 2011,
due in semi-annual installments
of $40,332, non-interest
bearing, through November 11,
2030.
IEPA Loan #L17-4323 of 2011,
due in semi-annual installments
of $9,671 non-interest bearing,
through November 1, 2030.
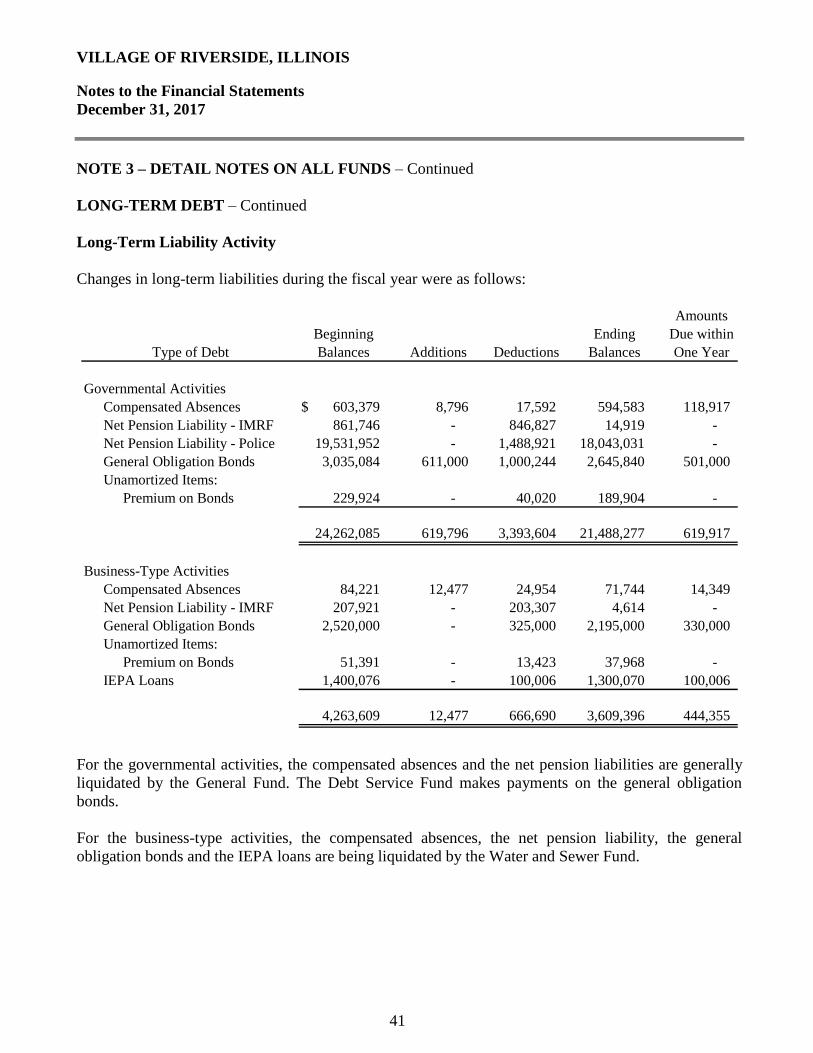
VILLAGE OF RIVERSIDE, ILLINOIS
Notes to the Financial Statements
December 31, 2017
41
NOTE 3 – DETAIL NOTES ON ALL FUNDS – Continued
LONG-TERM DEBT – Continued
Long-Term Liability Activity
Changes in long-term liabilities during the fiscal year were as follows:
Amounts
Ending Due within
Additions Deductions Balances One Year
Governmental Activities
Compensated Absences $ 603,379 8,796 17,592 594,583 118,917
Net Pension Liability - IMRF 861,746 - 846,827 14,919 -
Net Pension Liability - Police 19,531,952 - 1,488,921 18,043,031 -
General Obligation Bonds 3,035,084 611,000 1,000,244 2,645,840 501,000
Unamortized Items:
Premium on Bonds 229,924 - 40,020 189,904 -
24,262,085 619,796 3,393,604 21,488,277 619,917
Business-Type Activities
Compensated Absences 84,221 12,477 24,954 71,744 14,349
Net Pension Liability - IMRF 207,921 - 203,307 4,614 -
General Obligation Bonds 2,520,000 - 325,000 2,195,000 330,000
Unamortized Items:
Premium on Bonds 51,391 - 13,423 37,968 -
IEPA Loans 1,400,076 - 100,006 1,300,070 100,006
4,263,609 12,477 666,690 3,609,396 444,355
Beginning
Type of Debt Balances
For the governmental activities, the compensated absences and the net pension liabilities are generally
liquidated by the General Fund. The Debt Service Fund makes payments on the general obligation
bonds.
For the business-type activities, the compensated absences, the net pension liability, the general
obligation bonds and the IEPA loans are being liquidated by the Water and Sewer Fund.
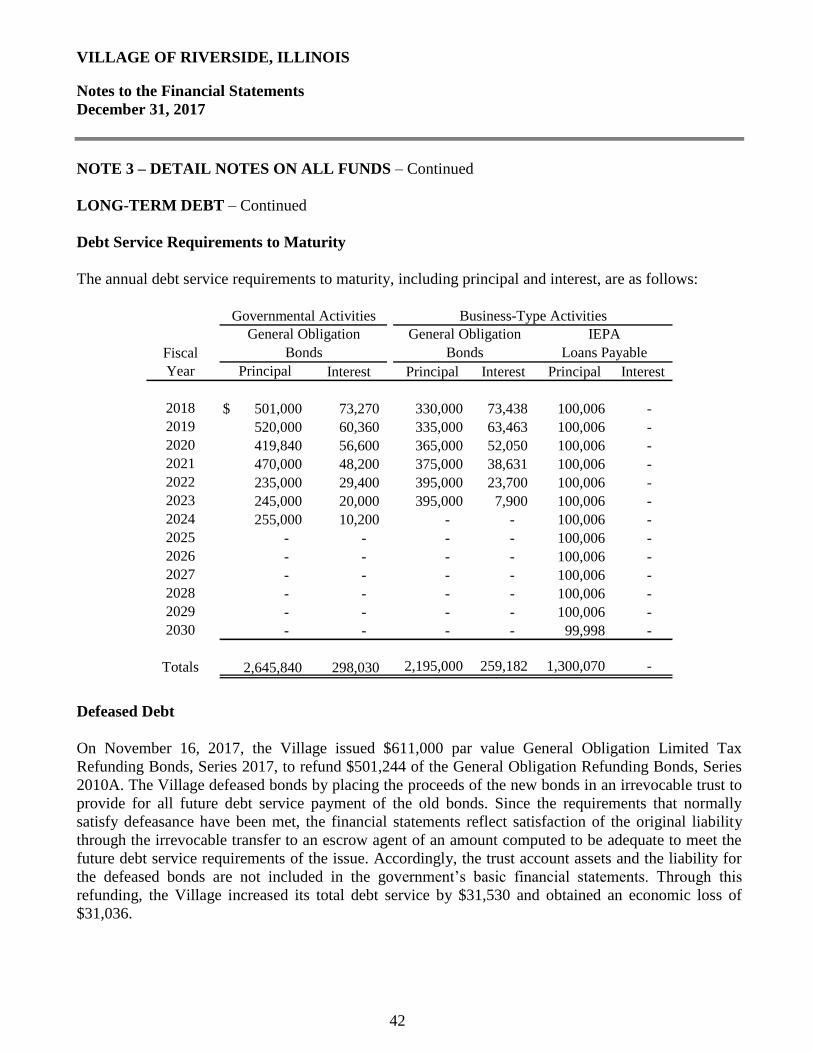
VILLAGE OF RIVERSIDE, ILLINOIS
Notes to the Financial Statements
December 31, 2017
42
NOTE 3 – DETAIL NOTES ON ALL FUNDS – Continued
LONG-TERM DEBT – Continued
Debt Service Requirements to Maturity
The annual debt service requirements to maturity, including principal and interest, are as follows:
Interest Principal Interest Principal Interest
$ 501,000 73,270 330,000 73,438 100,006 -
520,000 60,360 335,000 63,463 100,006 -
419,840 56,600 365,000 52,050 100,006 -
470,000 48,200 375,000 38,631 100,006 -
235,000 29,400 395,000 23,700 100,006 -
245,000 20,000 395,000 7,900 100,006 -
255,000 10,200 - - 100,006 -
- - - - 100,006 -
- - - - 100,006 -
- - - - 100,006 -
- - - - 100,006 -
- - - - 100,006 -
- - - - 99,998 -
2,645,840 298,030 2,195,000 259,182 1,300,070 -
Governmental Activities Business-Type Activities
General Obligation General Obligation IEPA
Fiscal Bonds Bonds Loans Payable
Year Principal
2018
2019
2020
2021
2028
2029
2030
Totals
2022
2023
2024
2025
2026
2027
Defeased Debt
On November 16, 2017, the Village issued $611,000 par value General Obligation Limited Tax
Refunding Bonds, Series 2017, to refund $501,244 of the General Obligation Refunding Bonds, Series
2010A. The Village defeased bonds by placing the proceeds of the new bonds in an irrevocable trust to
provide for all future debt service payment of the old bonds. Since the requirements that normally
satisfy defeasance have been met, the financial statements reflect satisfaction of the original liability
through the irrevocable transfer to an escrow agent of an amount computed to be adequate to meet the
future debt service requirements of the issue. Accordingly, the trust account assets and the liability for
the defeased bonds are not included in the government’s basic financial statements. Through this
refunding, the Village increased its total debt service by $31,530 and obtained an economic loss of
$31,036.
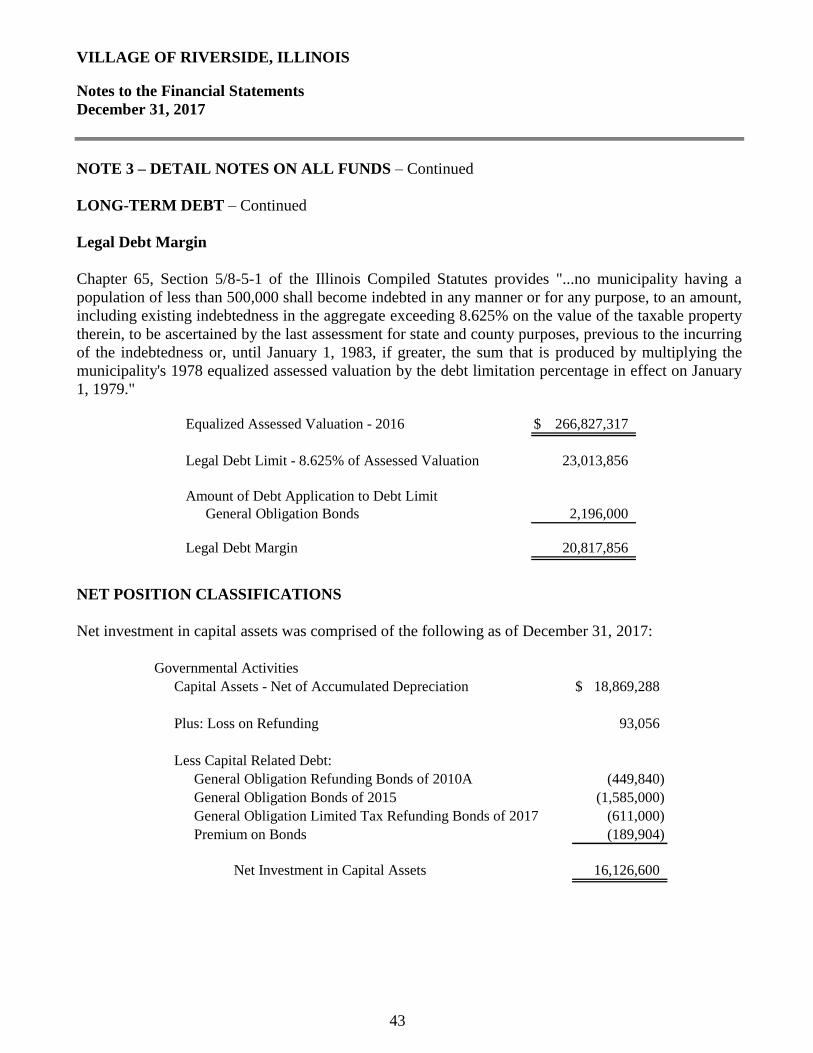
VILLAGE OF RIVERSIDE, ILLINOIS
Notes to the Financial Statements
December 31, 2017
43
NOTE 3 – DETAIL NOTES ON ALL FUNDS – Continued
LONG-TERM DEBT – Continued
Legal Debt Margin
Chapter 65, Section 5/8-5-1 of the Illinois Compiled Statutes provides "...no municipality having a
population of less than 500,000 shall become indebted in any manner or for any purpose, to an amount,
including existing indebtedness in the aggregate exceeding 8.625% on the value of the taxable property
therein, to be ascertained by the last assessment for state and county purposes, previous to the incurring
of the indebtedness or, until January 1, 1983, if greater, the sum that is produced by multiplying the
municipality's 1978 equalized assessed valuation by the debt limitation percentage in effect on January
1, 1979."
Equalized Assessed Valuation - 2016 $ 266,827,317
Legal Debt Limit - 8.625% of Assessed Valuation 23,013,856
Amount of Debt Application to Debt Limit
General Obligation Bonds 2,196,000
Legal Debt Margin 20,817,856
NET POSITION CLASSIFICATIONS
Net investment in capital assets was comprised of the following as of December 31, 2017:
Governmental Activities
Capital Assets - Net of Accumulated Depreciation $ 18,869,288
Plus: Loss on Refunding 93,056
Less Capital Related Debt:
General Obligation Refunding Bonds of 2010A (449,840)
General Obligation Bonds of 2015 (1,585,000)
General Obligation Limited Tax Refunding Bonds of 2017 (611,000)
Premium on Bonds (189,904)
Net Investment in Capital Assets 16,126,600
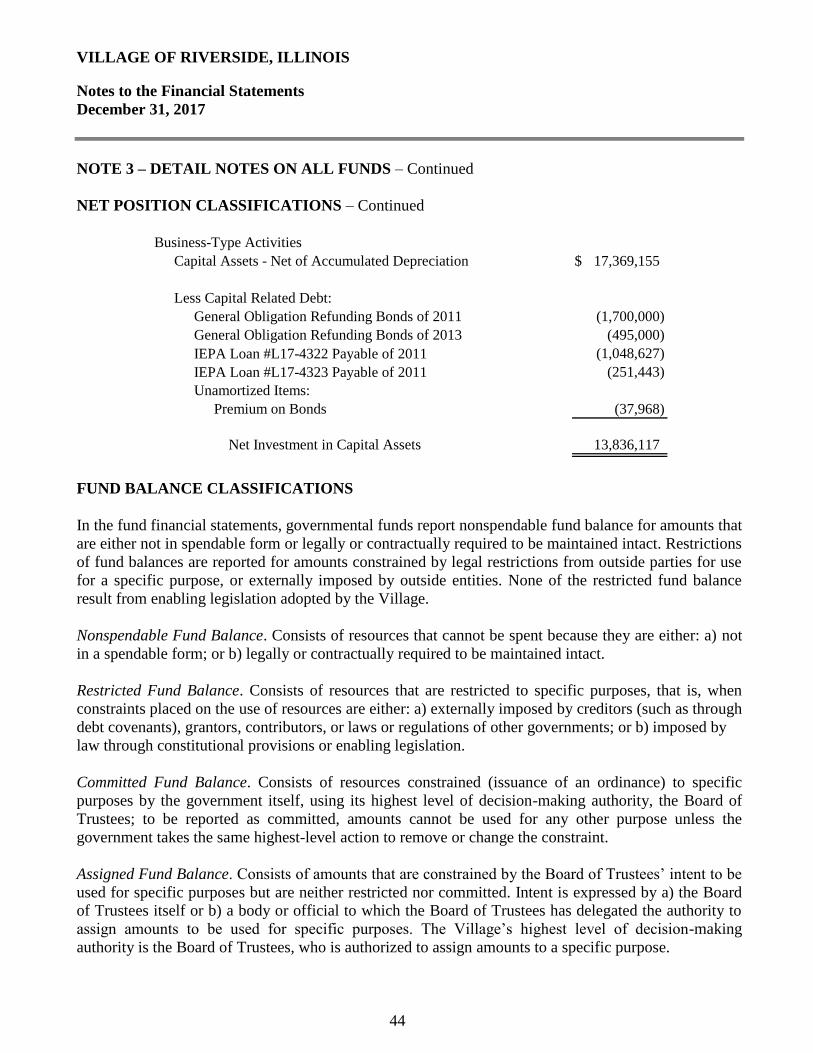
VILLAGE OF RIVERSIDE, ILLINOIS
Notes to the Financial Statements
December 31, 2017
44
NOTE 3 – DETAIL NOTES ON ALL FUNDS – Continued
NET POSITION CLASSIFICATIONS – Continued
Business-Type Activities
Capital Assets - Net of Accumulated Depreciation $ 17,369,155
Less Capital Related Debt:
General Obligation Refunding Bonds of 2011 (1,700,000)
General Obligation Refunding Bonds of 2013 (495,000)
IEPA Loan #L17-4322 Payable of 2011 (1,048,627)
IEPA Loan #L17-4323 Payable of 2011 (251,443)
Unamortized Items:
Premium on Bonds (37,968)
Net Investment in Capital Assets 13,836,117
FUND BALANCE CLASSIFICATIONS
In the fund financial statements, governmental funds report nonspendable fund balance for amounts that
are either not in spendable form or legally or contractually required to be maintained intact. Restrictions
of fund balances are reported for amounts constrained by legal restrictions from outside parties for use
for a specific purpose, or externally imposed by outside entities. None of the restricted fund balance
result from enabling legislation adopted by the Village.
Nonspendable Fund Balance. Consists of resources that cannot be spent because they are either: a) not
in a spendable form; or b) legally or contractually required to be maintained intact.
Restricted Fund Balance. Consists of resources that are restricted to specific purposes, that is, when
constraints placed on the use of resources are either: a) externally imposed by creditors (such as through
debt covenants), grantors, contributors, or laws or regulations of other governments; or b) imposed by
law through constitutional provisions or enabling legislation.
Committed Fund Balance. Consists of resources constrained (issuance of an ordinance) to specific
purposes by the government itself, using its highest level of decision-making authority, the Board of
Trustees; to be reported as committed, amounts cannot be used for any other purpose unless the
government takes the same highest-level action to remove or change the constraint.
Assigned Fund Balance. Consists of amounts that are constrained by the Board of Trustees’ intent to be
used for specific purposes but are neither restricted nor committed. Intent is expressed by a) the Board
of Trustees itself or b) a body or official to which the Board of Trustees has delegated the authority to
assign amounts to be used for specific purposes. The Village’s highest level of decision-making
authority is the Board of Trustees, who is authorized to assign amounts to a specific purpose.
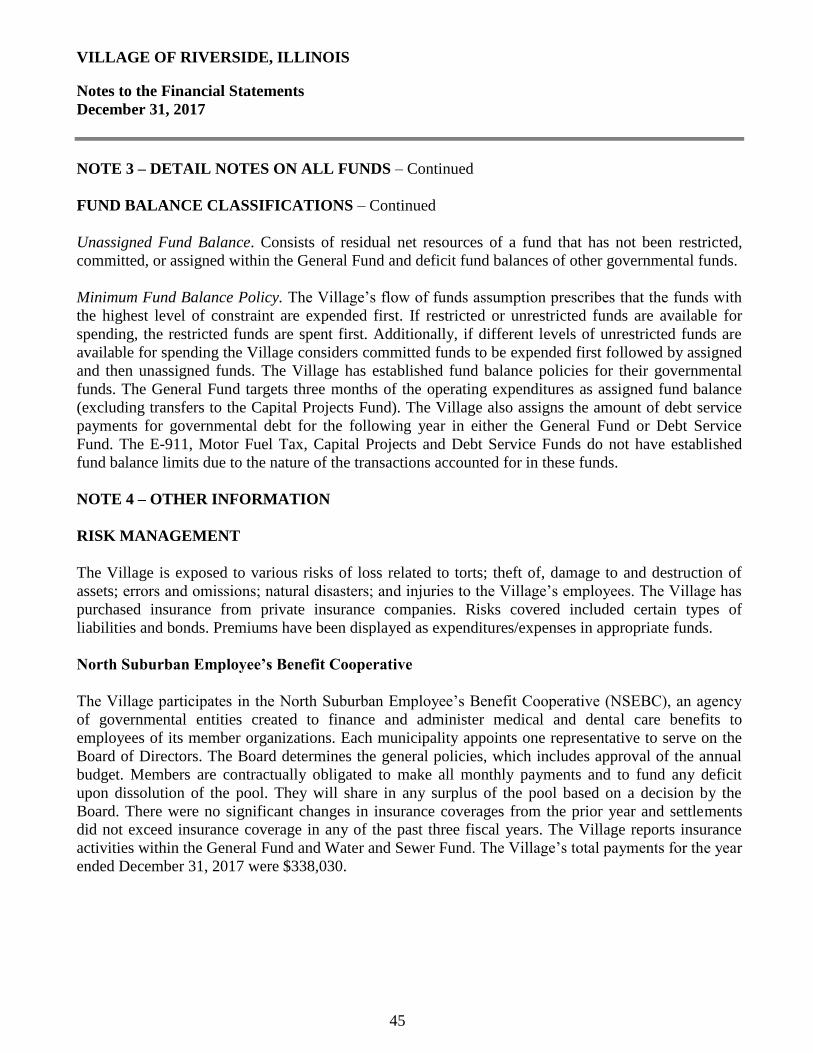
VILLAGE OF RIVERSIDE, ILLINOIS
Notes to the Financial Statements
December 31, 2017
45
NOTE 3 – DETAIL NOTES ON ALL FUNDS – Continued
FUND BALANCE CLASSIFICATIONS – Continued
Unassigned Fund Balance. Consists of residual net resources of a fund that has not been restricted,
committed, or assigned within the General Fund and deficit fund balances of other governmental funds.
Minimum Fund Balance Policy. The Village’s flow of funds assumption prescribes that the funds with
the highest level of constraint are expended first. If restricted or unrestricted funds are available for
spending, the restricted funds are spent first. Additionally, if different levels of unrestricted funds are
available for spending the Village considers committed funds to be expended first followed by assigned
and then unassigned funds. The Village has established fund balance policies for their governmental
funds. The General Fund targets three months of the operating expenditures as assigned fund balance
(excluding transfers to the Capital Projects Fund). The Village also assigns the amount of debt service
payments for governmental debt for the following year in either the General Fund or Debt Service
Fund. The E-911, Motor Fuel Tax, Capital Projects and Debt Service Funds do not have established
fund balance limits due to the nature of the transactions accounted for in these funds.
NOTE 4 – OTHER INFORMATION
RISK MANAGEMENT
The Village is exposed to various risks of loss related to torts; theft of, damage to and destruction of
assets; errors and omissions; natural disasters; and injuries to the Village’s employees. The Village has
purchased insurance from private insurance companies. Risks covered included certain types of
liabilities and bonds. Premiums have been displayed as expenditures/expenses in appropriate funds.
North Suburban Employee’s Benefit Cooperative
The Village participates in the North Suburban Employee’s Benefit Cooperative (NSEBC), an agency
of governmental entities created to finance and administer medical and dental care benefits to
employees of its member organizations. Each municipality appoints one representative to serve on the
Board of Directors. The Board determines the general policies, which includes approval of the annual
budget. Members are contractually obligated to make all monthly payments and to fund any deficit
upon dissolution of the pool. They will share in any surplus of the pool based on a decision by the
Board. There were no significant changes in insurance coverages from the prior year and settlements
did not exceed insurance coverage in any of the past three fiscal years. The Village reports insurance
activities within the General Fund and Water and Sewer Fund. The Village’s total payments for the year
ended December 31, 2017 were $338,030.
VILLAGE OF RIVERSIDE, ILLINOIS
Notes to the Financial Statements
December 31, 2017
46
NOTE 4 – OTHER INFORMATION
RISK MANAGEMENT – Continued
Intergovernmental Risk Management Agency (IRMA)
The Village also participates in the Intergovernmental Risk Management Agency (IRMA). IRMA is an
organization of municipalities and special districts in Northeastern Illinois which have formed an
association under the Illinois Intergovernmental Cooperation Statute to pool its risk management needs.
The agency administers a mix of self-insurance and commercial insurance coverages; property/casualty
and workers’ compensation claim administration/litigation management services; unemployment claim
administration; extensive risk management/loss control consulting and training programs; and a risk
information system and financial reporting service for its members.
The Village’s payments to IRMA are displayed on the financial statements as expenditures/expenses in
appropriate funds. Each member assumes the first $2,500 of each occurrence, and IRMA has a mix of
self-insurance and commercial insurance at various amounts about that level. Each member appoints
one delegate, along with an alternate delegate, to represent the member on the Board of Directors. The
Village does not exercise any control over the activities of the Agency beyond its representation on the
Board of Directors. Initial contributions are determined each year based on the individual member’s
eligible revenue as defined in the by-laws of IRMA and experience modification factors based on past
member loss experience. Members have a contractual obligation to fund any deficit of IRMA
attributable to a membership year during which they were a member. Supplemental contributions may
be required to fund these deficits.
CONTINGENT LIABILITIES
Litigation
The Village is a defendant in various lawsuits. Although the outcome of these lawsuits is not presently
determinable, in the opinion of the Village's attorney, the resolution of these matters will not have a
material adverse effect on the financial condition of the Village.
Grants
Amounts received or receivable from grantor agencies are subject to audit and adjustment by grantor
agencies, principally the federal government. Any disallowed claims, including amounts already
collected, may constitute a liability of the applicable funds. The amount, if any, of expenditures which
may be disallowed by the grantor cannot be determined at this time although the Village expects such
amounts, if any, to be immaterial.
VILLAGE OF RIVERSIDE, ILLINOIS
Notes to the Financial Statements
December 31, 2017
47
NOTE 4 – OTHER INFORMATION – Continued
EMPLOYEE RETIREMENT SYSTEM – DEFINED BENEFIT PENSION PLANS
The Village contributes to two defined benefit pension plans, the Illinois Municipal Retirement Fund
(IMRF), a defined benefit agent multiple-employer public employee retirement system and the Police
Pension Plan which is a single-employer pension plan. A separate report is issued for the Police Pension
Plan and may be obtained by writing to the Village at 27 Riverside Road, Riverside, Illinois 60546.
IMRF does issue a publicly available financial report that includes financial statements and required
supplementary information for the plan as a whole, but not by individual employer. That report may be
obtained on-line at www.imrf.org. The benefits, benefit levels, employee contributions, and employer
contributions are governed by Illinois Compiled Statutes (ILCS) and can only be amended by the
Illinois General Assembly.
Illinois Municipal Retirement (IMRF)
Plan Descriptions
Plan Administration. All employees (other than those covered by the Police Pension Plan) hired in
positions that meet or exceed the prescribed annual hourly standard must be enrolled in IMRF as
participating members. The plan is accounted for on the economic resources measurement focus and the
accrual basis of accounting. Employer and employee contributions are recognized when earned in the
year that the contributions are required, benefits and refunds are recognized as an expense and liability
when due and payable.
Benefits Provided. IMRF has three benefit plans. The vast majority of IMRF members participate in the
Regular Plan (RP). The Sheriff’s Law Enforcement Personnel (SLEP) plan is for sheriffs, deputy sheriffs,
and selected police chiefs. Counties could adopt the Elected County Official (ECO) plan for officials
elected prior to August 8, 2011 (the ECO plan was closed to new participants after that date).
IMRF provides two tiers of pension benefits. Employees hired before January 1, 2011, are eligible for
Tier 1 benefits. Tier 1 employees are vested for pension benefits when they have at least eight years of
qualifying service credit. Tier 1 employees who retire at age 55 (at reduced benefits) or after age 60
(at full benefits) with eight years of service are entitled to an annual retirement benefit, payable
monthly for life, in an amount equal to 1-2/3% of the final rate of earnings for the first 15 years of
service credit, plus 2% for each year of service credit after 15 years to a maximum of 75% of their
final rate of earnings. Final rate of earnings is the highest total earnings during any consecutive 48
months within the last 10 years of service, divided by 48. Under Tier 1, the pension is increased by 3%
of the original amount on January 1 every year after retirement.
VILLAGE OF RIVERSIDE, ILLINOIS
Notes to the Financial Statements
December 31, 2017
48
NOTE 4 – OTHER INFORMATION – Continued
EMPLOYEE RETIREMENT SYSTEM – DEFINED BENEFIT PENSION PLANS – Continued
Illinois Municipal Retirement (IMRF) – Continued
Plan Descriptions – Continued
Benefits Provided – Continued. Employees hired on or after January 1, 2011, are eligible for Tier 2
benefits. For Tier 2 employees, pension benefits vest after ten years of service. Participating
employees who retire at age 62 (at reduced benefits) or after age 67 (at full benefits) with ten years
of service are entitled to an annual retirement benefit, payable monthly for life, in an amount
equal to 1-2/3% of the final rate of earnings for the first 15 years of service credit, plus 2% for each
year of service credit after 15 years to a maximum of 75% of their final rate of earnings. Final rate of
earnings is the highest total earnings during any 96 consecutive months within the last 10 years of
service, divided by 96. Under Tier 2, the pension is increased on January 1 every year after retirement,
upon reaching age 67, by the lesser of:
• 3% of the original pension amount, or
• 1/2 of the increase in the Consumer Price Index of the original pension amount.
Plan Membership. As of December 31, 2017, the measurement date, the following employees were
covered by the benefit terms:
Inactive Plan Members Currently Receiving Benefits 65
Inactive Plan Members Entitled to but not yet Receiving Benefits 59
Active Plan Members 57
Total 181
A detailed breakdown of IMRF membership for inactive members for the Village and Library is
unavailable. The above numbers include all inactive members.
Contributions. As set by statute, the Village’s Regular Plan Members are required to contribute 4.5%
of their annual covered salary. The statute requires employers to contribute the amount necessary, in
addition to member contributions, to finance the retirement coverage of its own employees. For the
year-ended December 31, 2017, the Village’s contribution was 10.67% of covered payroll.
Net Pension Liability. The Village’s net pension liability was measured as of December 31, 2017. The
total pension liability used to calculate the net pension liability was determined by an actuarial
valuation as of that date.
VILLAGE OF RIVERSIDE, ILLINOIS
Notes to the Financial Statements
December 31, 2017
49
NOTE 4 – OTHER INFORMATION – Continued
EMPLOYEE RETIREMENT SYSTEM – DEFINED BENEFIT PENSION PLANS – Continued
Illinois Municipal Retirement (IMRF) – Continued
Plan Descriptions – Continued
Actuarial Assumptions. The total pension liability was determined by an actuarial valuation performed,
as of December 31, 2017, using the following actuarial methods and assumptions:
Actuarial Cost Method Entry Age
Normal
Asset Valuation Method Market
Actuarial Assumptions
Interest Rate 7.50%
Salary Increases 3.39% - 14.25%
Cost of Living Adjustments 2.50%
Inflation 2.50%
For nondisabled retirees, an IMRF specific mortality table was used with fully generational projection
scale MP-2017 (base year 2015). IMRF specific rates were developed from the RP-2014 Blue Collar
Health Annuitant Mortality Table with adjustments to match current IMRF experience. For disabled
retirees, an IMRF specific mortality tables was used with fully generational projection scale MP-2017
(base year 2015). IMRF specific rates were developed from the RP-2014 Disabled Retirees Mortality
Table applying the same adjustment that were applied for nondisabled lives. For active members, an
IMRF specific mortality table was used with fully generational projection scale MP-2017 (base year
2015). IMRF specific rates were developed from the RP-2014 Employee Mortality Table with
adjustments to match current IMRF experience.
The long-term expected rate of return on pension plan investments was determined using a building-
block method in which best-estimate ranges of expected future real rates of return (expected returns, net
of pension plan investment expense, and inflation) are developed for each major asset class. These
ranges are combined to produce the long-term expected rate of return by weighting the expected future
real rates of return to the target asset allocation percentage and adding expected inflation. The target
allocation and best estimates of geometric real rates of return for each major asset class are summarized
in the following table:
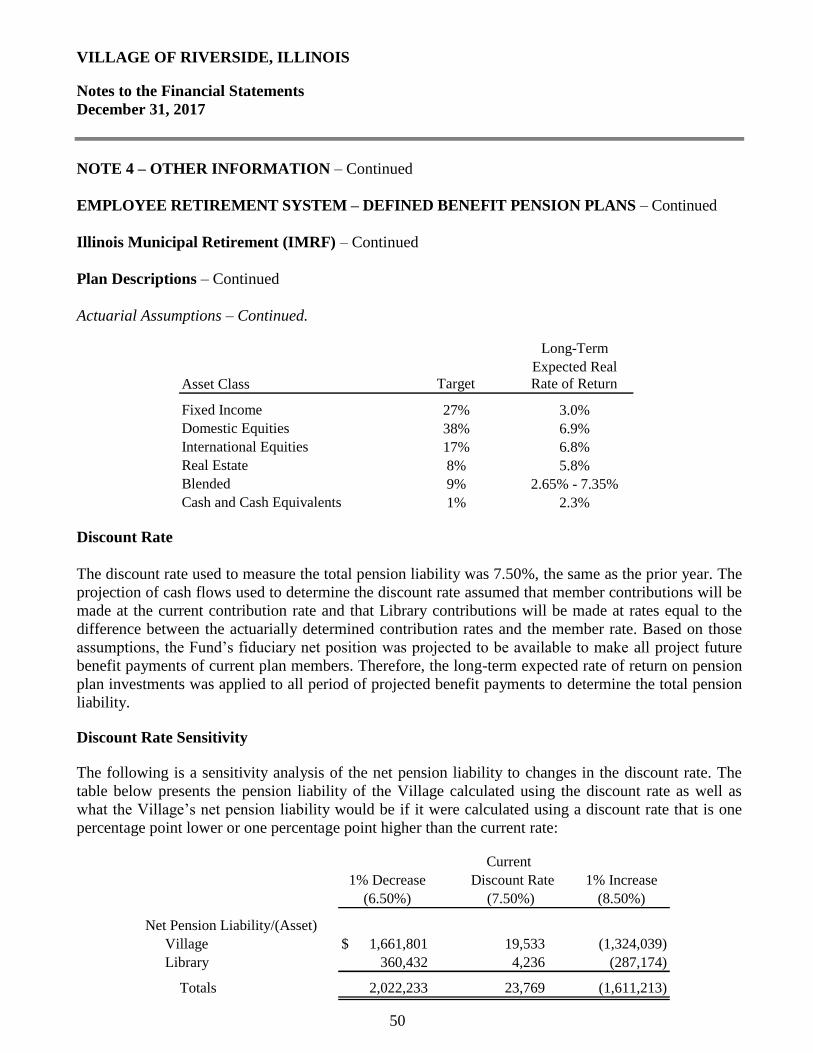
VILLAGE OF RIVERSIDE, ILLINOIS
Notes to the Financial Statements
December 31, 2017
50
NOTE 4 – OTHER INFORMATION – Continued
EMPLOYEE RETIREMENT SYSTEM – DEFINED BENEFIT PENSION PLANS – Continued
Illinois Municipal Retirement (IMRF) – Continued
Plan Descriptions – Continued
Actuarial Assumptions – Continued.
Long-Term
Expected Real
Asset Class Target Rate of Return
Fixed Income 27% 3.0%
Domestic Equities 38% 6.9%
International Equities 17% 6.8%
Real Estate 8% 5.8%
Blended 9% 2.65% - 7.35%
Cash and Cash Equivalents 1% 2.3%
Discount Rate
The discount rate used to measure the total pension liability was 7.50%, the same as the prior year. The
projection of cash flows used to determine the discount rate assumed that member contributions will be
made at the current contribution rate and that Library contributions will be made at rates equal to the
difference between the actuarially determined contribution rates and the member rate. Based on those
assumptions, the Fund’s fiduciary net position was projected to be available to make all project future
benefit payments of current plan members. Therefore, the long-term expected rate of return on pension
plan investments was applied to all period of projected benefit payments to determine the total pension
liability.
Discount Rate Sensitivity
The following is a sensitivity analysis of the net pension liability to changes in the discount rate. The
table below presents the pension liability of the Village calculated using the discount rate as well as
what the Village’s net pension liability would be if it were calculated using a discount rate that is one
percentage point lower or one percentage point higher than the current rate:
Current
Discount Rate
(7.50%)
Net Pension Liability/(Asset)
Village $ 1,661,801 19,533 (1,324,039)
Library 360,432 4,236 (287,174)
Totals 2,022,233 23,769 (1,611,213)
1% Decrease 1% Increase
(6.50%) (8.50%)

VILLAGE OF RIVERSIDE, ILLINOIS
Notes to the Financial Statements
December 31, 2017
51
NOTE 4 – OTHER INFORMATION – Continued
EMPLOYEE RETIREMENT SYSTEM – DEFINED BENEFIT PENSION PLANS – Continued
Illinois Municipal Retirement (IMRF) – Continued
Changes in the Net Pension Liability
Village Library Total
Total Pension Liability
Service Cost $ 277,825 60,258 338,083
Interest 865,484 187,717 1,053,201
Differences Between Expected
and Actual Experience 385,971 83,714 469,685
Change of Assumptions (408,318) (94,360) (502,678)
Benefit Payments, Including
Refunds of Member Contributions (570,599) (123,758) (694,357)
Net Change in Total Pension Liability 550,363 113,571 663,934
Total Pension Liability - Beginning 11,608,814 2,612,006 14,220,820
Total Pension Liability - Ending 12,159,177 2,725,577 14,884,754
Plan Fiduciary Net Position
Contributions - Employer 272,815 59,171 331,986
Contributions - Members 117,057 25,389 142,446
Net Investment Income 1,793,443 388,984 2,182,427
Benefit Payments, Including Refunds
of Member Contributions (570,599) (123,758) (694,357)
Other (Net Transfer) (12,219) (2,650) (14,869)
Net Change in Plan Fiduciary Net Position 1,600,497 347,136 1,947,633
Plan Net Position - Beginning 10,539,147 2,374,205 12,913,352
Plan Net Position - Ending 12,139,644 2,721,341 14,860,985
Employer's Net Pension Liability 19,533 4,236 23,769
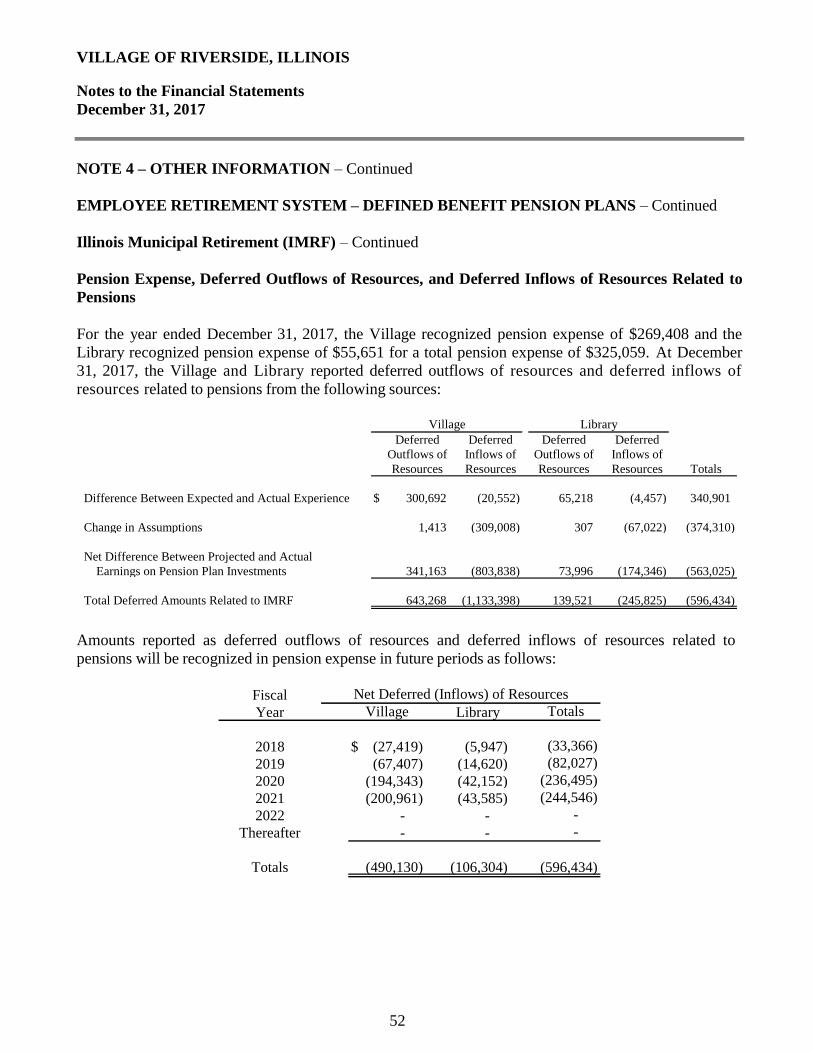
VILLAGE OF RIVERSIDE, ILLINOIS
Notes to the Financial Statements
December 31, 2017
52
NOTE 4 – OTHER INFORMATION – Continued
EMPLOYEE RETIREMENT SYSTEM – DEFINED BENEFIT PENSION PLANS – Continued
Illinois Municipal Retirement (IMRF) – Continued
Pension Expense, Deferred Outflows of Resources, and Deferred Inflows of Resources Related to
Pensions
For the year ended December 31, 2017, the Village recognized pension expense of $269,408 and the
Library recognized pension expense of $55,651 for a total pension expense of $325,059. At December
31, 2017, the Village and Library reported deferred outflows of resources and deferred inflows of
resources related to pensions from the following sources:
Deferred Deferred Deferred Deferred
Outflows of Inflows of Outflows of Inflows of
Resources Resources Resources Resources Totals
Difference Between Expected and Actual Experience $ 300,692 (20,552) 65,218 (4,457) 340,901
Change in Assumptions 1,413 (309,008) 307 (67,022) (374,310)
Net Difference Between Projected and Actual
Earnings on Pension Plan Investments 341,163 (803,838) 73,996 (174,346) (563,025)
Total Deferred Amounts Related to IMRF 643,268 (1,133,398) 139,521 (245,825) (596,434)
Village Library
Amounts reported as deferred outflows of resources and deferred inflows of resources related to
pensions will be recognized in pension expense in future periods as follows:
Fiscal
Year Library Totals
2018 $ (27,419) (5,947) (33,366)
2019 (67,407) (14,620) (82,027)
2020 (194,343) (42,152) (236,495)
2021 (200,961) (43,585) (244,546)
2022 - - -
Thereafter - - -
Totals (490,130) (106,304) (596,434)
Village
Net Deferred (Inflows) of Resources
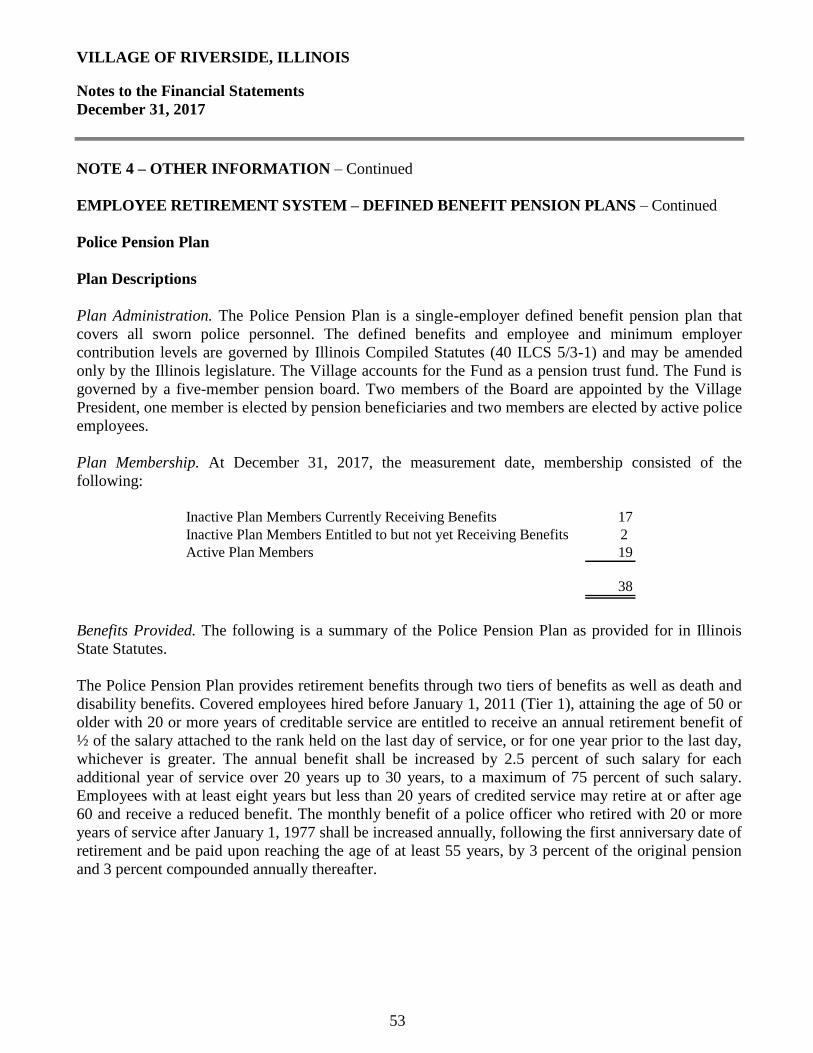
VILLAGE OF RIVERSIDE, ILLINOIS
Notes to the Financial Statements
December 31, 2017
53
NOTE 4 – OTHER INFORMATION – Continued
EMPLOYEE RETIREMENT SYSTEM – DEFINED BENEFIT PENSION PLANS – Continued
Police Pension Plan
Plan Descriptions
Plan Administration. The Police Pension Plan is a single-employer defined benefit pension plan that
covers all sworn police personnel. The defined benefits and employee and minimum employer
contribution levels are governed by Illinois Compiled Statutes (40 ILCS 5/3-1) and may be amended
only by the Illinois legislature. The Village accounts for the Fund as a pension trust fund. The Fund is
governed by a five-member pension board. Two members of the Board are appointed by the Village
President, one member is elected by pension beneficiaries and two members are elected by active police
employees.
Plan Membership. At December 31, 2017, the measurement date, membership consisted of the
following:
Inactive Plan Members Currently Receiving Benefits 17
Inactive Plan Members Entitled to but not yet Receiving Benefits 2
Active Plan Members 19
38
Benefits Provided. The following is a summary of the Police Pension Plan as provided for in Illinois
State Statutes.
The Police Pension Plan provides retirement benefits through two tiers of benefits as well as death and
disability benefits. Covered employees hired before January 1, 2011 (Tier 1), attaining the age of 50 or
older with 20 or more years of creditable service are entitled to receive an annual retirement benefit of
½ of the salary attached to the rank held on the last day of service, or for one year prior to the last day,
whichever is greater. The annual benefit shall be increased by 2.5 percent of such salary for each
additional year of service over 20 years up to 30 years, to a maximum of 75 percent of such salary.
Employees with at least eight years but less than 20 years of credited service may retire at or after age
60 and receive a reduced benefit. The monthly benefit of a police officer who retired with 20 or more
years of service after January 1, 1977 shall be increased annually, following the first anniversary date of
retirement and be paid upon reaching the age of at least 55 years, by 3 percent of the original pension
and 3 percent compounded annually thereafter.
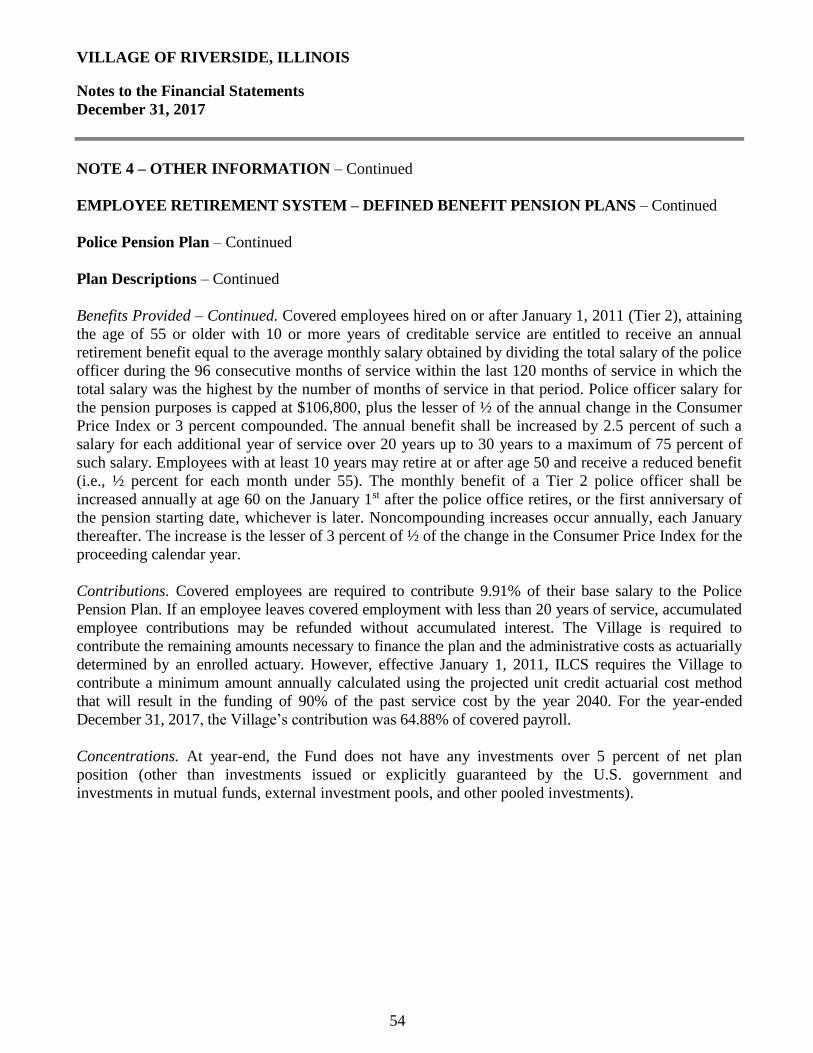
VILLAGE OF RIVERSIDE, ILLINOIS
Notes to the Financial Statements
December 31, 2017
54
NOTE 4 – OTHER INFORMATION – Continued
EMPLOYEE RETIREMENT SYSTEM – DEFINED BENEFIT PENSION PLANS – Continued
Police Pension Plan – Continued
Plan Descriptions – Continued
Benefits Provided – Continued. Covered employees hired on or after January 1, 2011 (Tier 2), attaining
the age of 55 or older with 10 or more years of creditable service are entitled to receive an annual
retirement benefit equal to the average monthly salary obtained by dividing the total salary of the police
officer during the 96 consecutive months of service within the last 120 months of service in which the
total salary was the highest by the number of months of service in that period. Police officer salary for
the pension purposes is capped at $106,800, plus the lesser of ½ of the annual change in the Consumer
Price Index or 3 percent compounded. The annual benefit shall be increased by 2.5 percent of such a
salary for each additional year of service over 20 years up to 30 years to a maximum of 75 percent of
such salary. Employees with at least 10 years may retire at or after age 50 and receive a reduced benefit
(i.e., ½ percent for each month under 55). The monthly benefit of a Tier 2 police officer shall be
increased annually at age 60 on the January 1st after the police office retires, or the first anniversary of
the pension starting date, whichever is later. Noncompounding increases occur annually, each January
thereafter. The increase is the lesser of 3 percent of ½ of the change in the Consumer Price Index for the
proceeding calendar year.
Contributions. Covered employees are required to contribute 9.91% of their base salary to the Police
Pension Plan. If an employee leaves covered employment with less than 20 years of service, accumulated
employee contributions may be refunded without accumulated interest. The Village is required to
contribute the remaining amounts necessary to finance the plan and the administrative costs as actuarially
determined by an enrolled actuary. However, effective January 1, 2011, ILCS requires the Village to
contribute a minimum amount annually calculated using the projected unit credit actuarial cost method
that will result in the funding of 90% of the past service cost by the year 2040. For the year-ended
December 31, 2017, the Village’s contribution was 64.88% of covered payroll.
Concentrations. At year-end, the Fund does not have any investments over 5 percent of net plan
position (other than investments issued or explicitly guaranteed by the U.S. government and
investments in mutual funds, external investment pools, and other pooled investments).
VILLAGE OF RIVERSIDE, ILLINOIS
Notes to the Financial Statements
December 31, 2017
55
NOTE 4 – OTHER INFORMATION – Continued
EMPLOYEE RETIREMENT SYSTEM – DEFINED BENEFIT PENSION PLANS – Continued
Police Pension Plan – Continued
Actuarial Assumptions
The total pension liability was determined by an actuarial valuation performed, as of December 31,
2017, using the following actuarial methods and assumptions:
Actuarial Cost Method Entry Age
Normal
Asset Valuation Method Market
Actuarial Assumptions
Interest Rate 6.50%
Salary Increases 2.50% - 13.13%
Cost of Living Adjustments 2.50%
Inflation 2.50%
Mortality rates were based on an independent actuary 2016 Illinois Police Mortality Rates.
Discount Rate
The discount rate used to measure the total pension liability was 6.50%, and the prior year used a
discount rate of 6.06%. The projection of cash flows used to determine the discount rate assumed that
member contributions will be made at the current contribution rate and that Library contributions will
be made at rates equal to the difference between the actuarially determined contribution rates and the
member rate. Based on those assumptions, the Fund’s fiduciary net position was projected to be
available to make all project future benefit payments of current plan members. Therefore, the long-term
expected rate of return on pension plan investments was applied to all period of projected benefit
payments to determine the total pension liability.
VILLAGE OF RIVERSIDE, ILLINOIS
Notes to the Financial Statements
December 31, 2017
56
NOTE 4 – OTHER INFORMATION – Continued
EMPLOYEE RETIREMENT SYSTEM – DEFINED BENEFIT PENSION PLANS – Continued
Police Pension Plan – Continued
Discount Rate Sensitivity
The following is a sensitive analysis of the net pension liability to changes in the discount rate. The
table below presents the pension liability of the Village calculated using the discount rate as well as
what the Village’s net pension liability would be if it were calculated using a discount rate that is one
percentage point lower or one percentage point higher than the current rate:
Current
Discount Rate
(6.50%)
Net Pension Liability $ 22,052,038 18,043,031 14,798,565
1% Decrease 1% Increase
(5.50%) (7.50%)
Changes in the Net Pension Liability
Total
Pension Plan Fiduciary Net Pension
Liability Net Position Liability
(A) (B) (A) - (B)
Balances at December 31, 2016 $ 27,924,702 8,392,750 19,531,952
Changes for the Year:
Service Cost 516,946 - 516,946
Interest on the Total Pension Liability 1,656,911 - 1,656,911
Difference Between Expected and Actual
Experience of the Total Pension Liability 7,734 - 7,734
Changes of Assumptions (1,657,190) - (1,657,190)
Contributions - Employer - 1,229,856 (1,229,856)
Contributions - Employees - 178,457 (178,457)
Net Investment Income - 623,163 (623,163)
Benefit Payments, including Refunds
of Employee Contributions (1,165,905) (1,165,905) -
Administrative Expense - (18,154) 18,154
Net Changes (641,504) 847,417 (1,488,921)
Balances at December 31, 2017 27,283,198 9,240,167 18,043,031
VILLAGE OF RIVERSIDE, ILLINOIS
Notes to the Financial Statements
December 31, 2017
57
NOTE 4 – OTHER INFORMATION – Continued
EMPLOYEE RETIREMENT SYSTEM – DEFINED BENEFIT PENSION PLANS – Continued
Police Pension Plan – Continued
Pension Expense, Deferred Outflows of Resources, and Deferred Inflows of Resources Related to
Pensions
For the year ended December 31, 2017, the Village recognized pension expense of $1,589,580. At
December 31, 2017, the Village reported deferred outflows of resources and deferred inflows of
resources related to pensions from the following sources:
Deferred Deferred
Outflows of Inflows of
Resources Resources Totals
Difference Between Expected and Actual Experience $ 6,531 (287,041) (280,510)
Change in Assumptions 2,813,343 (3,682,254) (868,911)
Net Difference Between Projected and Actual
Earnings on Pension Plan Investments 381,501 (56,276) 325,225
Total Deferred Amounts Related to Police Pension 3,201,375 (4,025,571) (824,196)
Amounts reported as deferred outflows of resources and deferred inflows of resources related to
pensions will be recognized in pension expense in future periods as follows:
Net Deferred
Outflows/
Fiscal (Inflows)
Year of Resources
2018 $ 128,844
2019 128,843
2020 (3,425)
2021 (466,046)
2022 (502,106)
Thereafter (110,306)
Total (824,196)
VILLAGE OF RIVERSIDE, ILLINOIS
Notes to the Financial Statements
December 31, 2017
58
NOTE 4 – OTHER INFORMATION – Continued
OTHER POST-EMPLOYMENT BENEFITS
In addition to providing pension benefits, the Village provides certain health care insurance benefits for
retired employees. The retirees pay 100 percent of the annual premium for health insurance. The
Village’s health insurance provider, North Suburban Employee Benefit Cooperative utilizes community
based rates, which adjust for the demographics of the Village’s pool of participants, including age, etc.
Therefore, there is no implicit subsidy to calculate in accordance with GASB Statement No. 45,
Accounting and Financial Reporting by Employers for Post-Employment Benefits Other Than Pensions.
Additionally, the Village had no former employees for which the Village was providing an explicit
subsidy as of December 31, 2017.
• Schedule of Employer Contributions
Illinois Municipal Retirement Fund
Police Pension Fund
• Schedule of Changes in the Employer’s Net Pension Liability
Illinois Municipal Retirement Fund
Police Pension Fund
• Schedule of Investment Returns
Police Pension Fund
• Budgetary Comparison Schedule
General Fund
Notes to the Required Supplementary Information
REQUIRED SUPPLEMENTARY INFORMATION
Required supplementary information includes financial information and disclosures that are required by the
GASB but are not considered a part of the basic financial statements. Such information includes:
Budgetary Information – Budgets are adopted on a basis consistent with generally accepted accounting
principles.
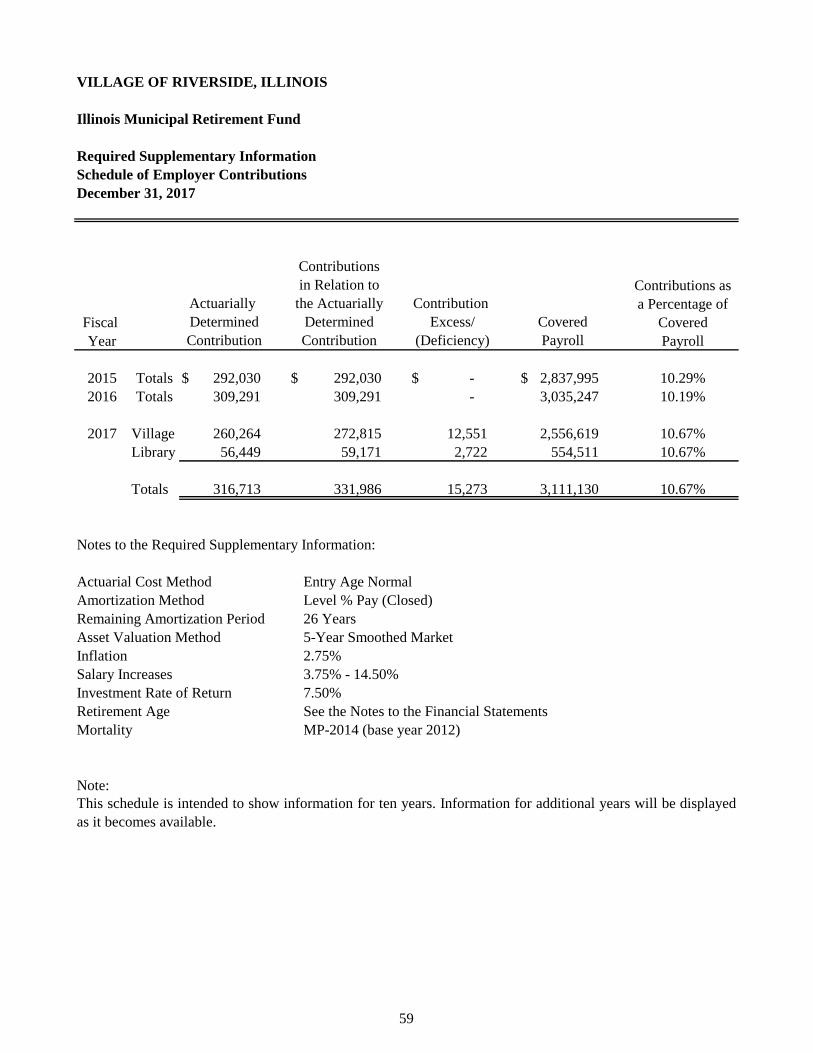
VILLAGE OF RIVERSIDE, ILLINOIS
Illinois Municipal Retirement Fund
Required Supplementary Information
Schedule of Employer Contributions
December 31, 2017
Contributions as
a Percentage of
Fiscal Covered
Year Payroll
2015 Totals $ 292,030 $ 292,030 $ - $ 2,837,995 10.29%
2016 Totals 309,291 309,291 - 3,035,247 10.19%
2017 Village 260,264 272,815 12,551 2,556,619 10.67%
Library 56,449 59,171 2,722 554,511 10.67%
Totals 316,713 331,986 15,273 3,111,130 10.67%
Notes to the Required Supplementary Information:
Actuarial Cost Method Entry Age Normal
Amortization Method Level % Pay (Closed)
Remaining Amortization Period 26 Years
Asset Valuation Method 5-Year Smoothed Market
Inflation 2.75%
Salary Increases 3.75% - 14.50%
Investment Rate of Return 7.50%
Retirement Age See the Notes to the Financial Statements
Mortality MP-2014 (base year 2012)
Note:
This schedule is intended to show information for ten years. Information for additional years will be displayed
as it becomes available.
Covered
Payroll
Actuarially
Determined
Contribution
Contribution
Excess/
(Deficiency)
Contributions
in Relation to
the Actuarially
Determined
Contribution
59
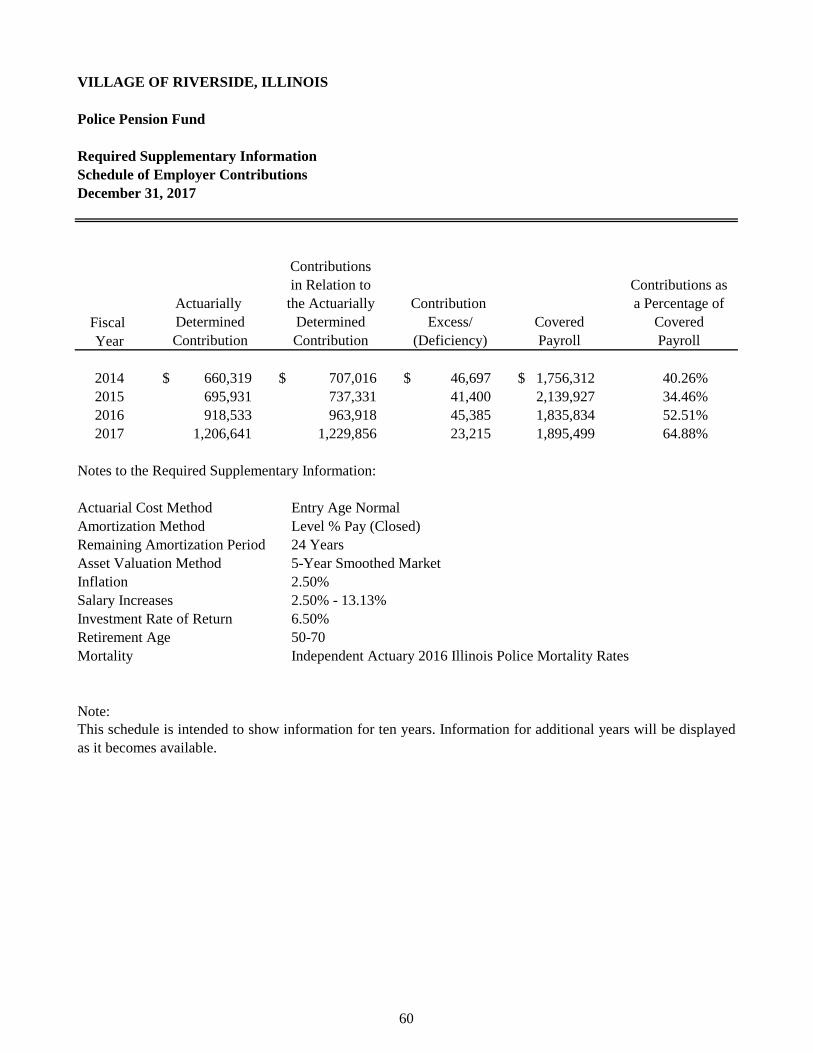
VILLAGE OF RIVERSIDE, ILLINOIS
Police Pension Fund
Required Supplementary Information
Schedule of Employer Contributions
December 31, 2017
Fiscal
Year
2014 $ 660,319 $ 707,016 $ 46,697 $ 1,756,312 40.26%
2015 695,931 737,331 41,400 2,139,927 34.46%
2016 918,533 963,918 45,385 1,835,834 52.51%
2017 1,206,641 1,229,856 23,215 1,895,499 64.88%
Notes to the Required Supplementary Information:
Actuarial Cost Method Entry Age Normal
Amortization Method Level % Pay (Closed)
Remaining Amortization Period 24 Years
Asset Valuation Method 5-Year Smoothed Market
Inflation 2.50%
Salary Increases 2.50% - 13.13%
Investment Rate of Return 6.50%
Retirement Age 50-70
Mortality Independent Actuary 2016 Illinois Police Mortality Rates
Note:
This schedule is intended to show information for ten years. Information for additional years will be displayed
as it becomes available.
Payroll Payroll
Contributions as
a Percentage of
Covered Covered
Contribution
Excess/
(Deficiency)
Actuarially
Determined
Contribution
Contributions
in Relation to
the Actuarially
Determined
Contribution
60

VILLAGE OF RIVERSIDE, ILLINOIS
Illinois Municipal Retirement Fund
Required Supplementary Information
Schedule of Changes in the Employer's Net Pension Liability
December 31, 2017
See Following Page
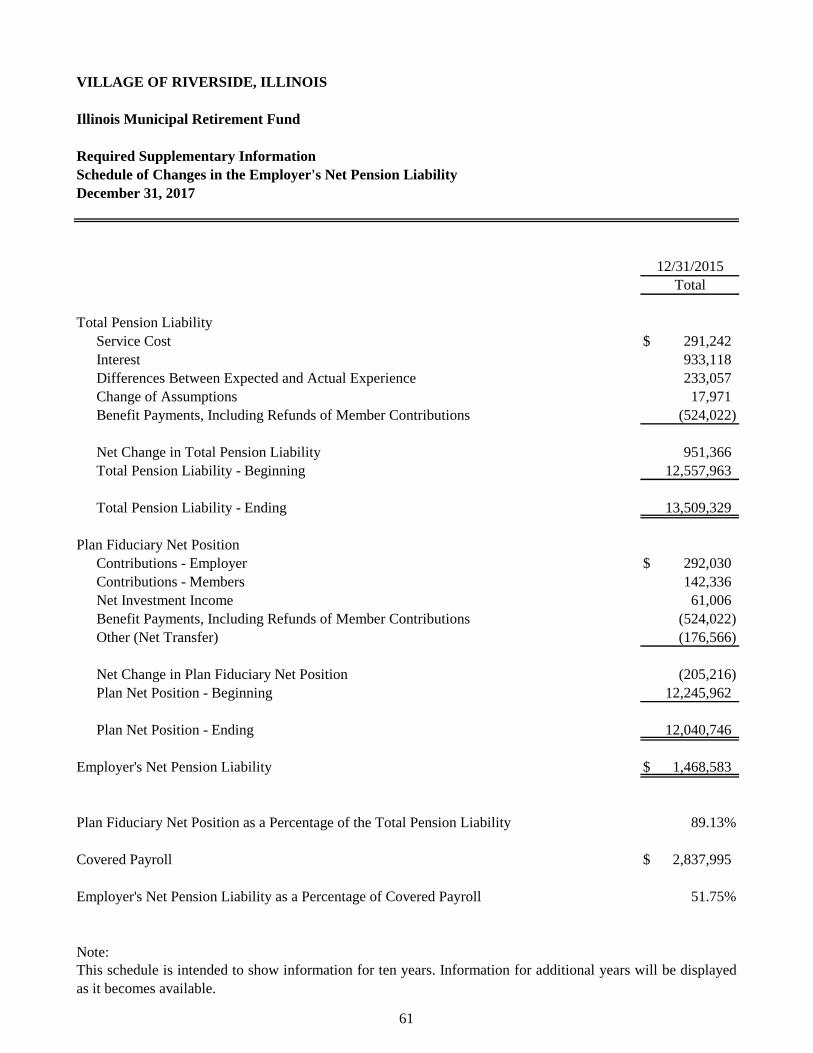
VILLAGE OF RIVERSIDE, ILLINOIS
Illinois Municipal Retirement Fund
Required Supplementary Information
Schedule of Changes in the Employer's Net Pension Liability
December 31, 2017
Total Pension Liability
Service Cost $ 291,242
Interest 933,118
Differences Between Expected and Actual Experience 233,057
Change of Assumptions 17,971
Benefit Payments, Including Refunds of Member Contributions (524,022)
Net Change in Total Pension Liability 951,366
Total Pension Liability - Beginning 12,557,963
Total Pension Liability - Ending 13,509,329
Plan Fiduciary Net Position
Contributions - Employer $ 292,030
Contributions - Members 142,336
Net Investment Income 61,006
Benefit Payments, Including Refunds of Member Contributions (524,022)
Other (Net Transfer) (176,566)
Net Change in Plan Fiduciary Net Position (205,216)
Plan Net Position - Beginning 12,245,962
Plan Net Position - Ending 12,040,746
Employer's Net Pension Liability $ 1,468,583
Plan Fiduciary Net Position as a Percentage of the Total Pension Liability 89.13%
Covered Payroll $ 2,837,995
Employer's Net Pension Liability as a Percentage of Covered Payroll 51.75%
Note:
12/31/2015
Total
This schedule is intended to show information for ten years. Information for additional years will be displayed
as it becomes available.
61
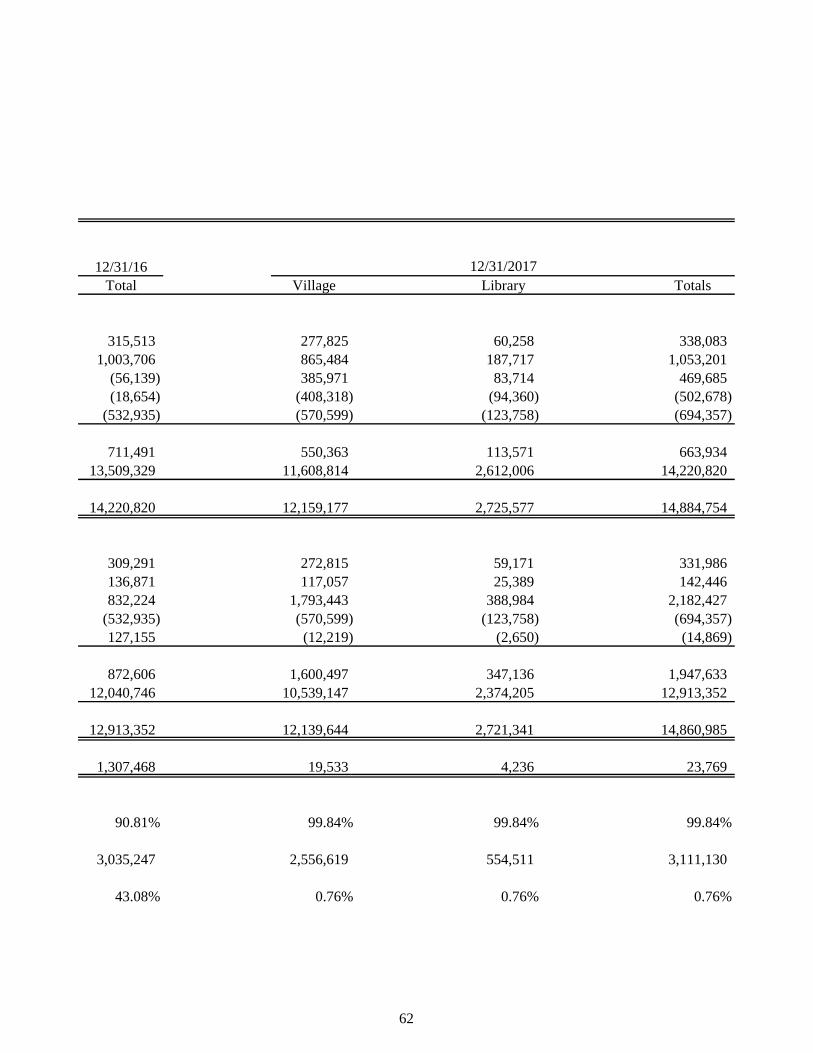
12/31/16
Total Village Library Totals
315,513 277,825 60,258 338,083
1,003,706 865,484 187,717 1,053,201
(56,139) 385,971 83,714 469,685
(18,654) (408,318) (94,360) (502,678)
(532,935) (570,599) (123,758) (694,357)
711,491 550,363 113,571 663,934
13,509,329 11,608,814 2,612,006 14,220,820
14,220,820 12,159,177 2,725,577 14,884,754
309,291 272,815 59,171 331,986
136,871 117,057 25,389 142,446
832,224 1,793,443 388,984 2,182,427
(532,935) (570,599) (123,758) (694,357)
127,155 (12,219) (2,650) (14,869)
872,606 1,600,497 347,136 1,947,633
12,040,746 10,539,147 2,374,205 12,913,352
12,913,352 12,139,644 2,721,341 14,860,985
1,307,468 19,533 4,236 23,769
90.81% 99.84% 99.84% 99.84%
3,035,247 2,556,619 554,511 3,111,130
43.08% 0.76% 0.76% 0.76%
12/31/2017
62
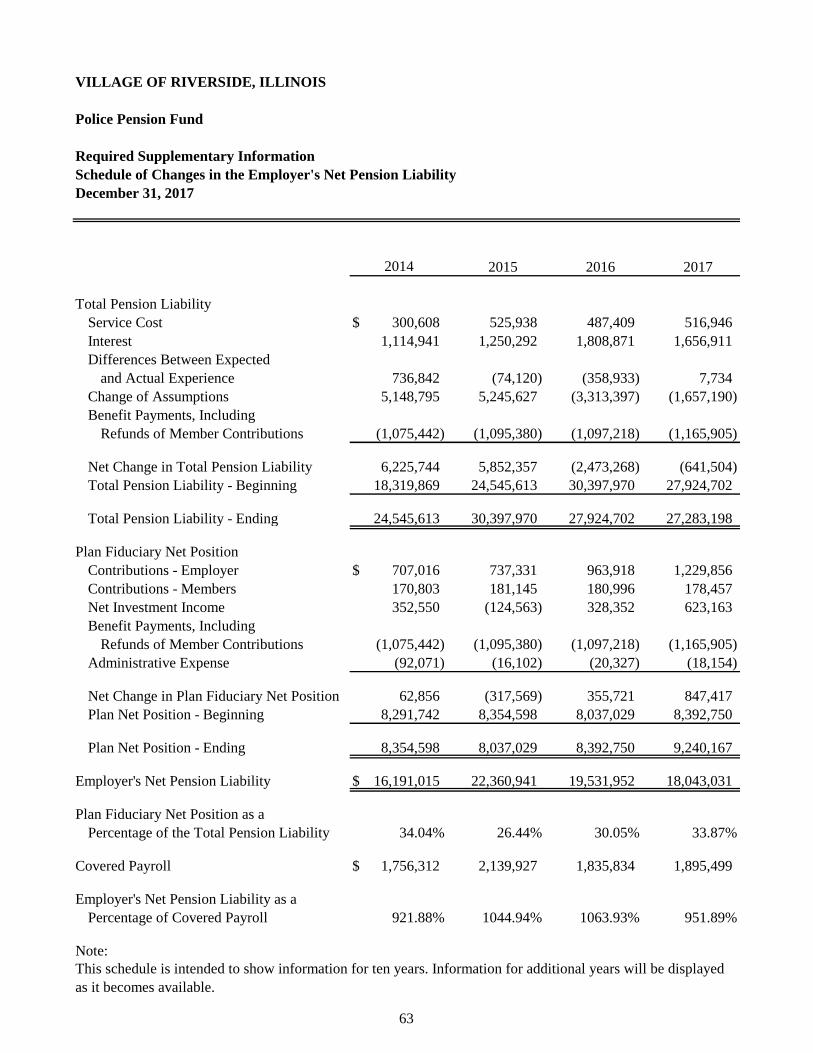
VILLAGE OF RIVERSIDE, ILLINOIS
Police Pension Fund
Required Supplementary Information
Schedule of Changes in the Employer's Net Pension Liability
December 31, 2017
2015 2016 2017
Total Pension Liability
Service Cost $ 300,608 525,938 487,409 516,946
Interest 1,114,941 1,250,292 1,808,871 1,656,911
Differences Between Expected
and Actual Experience 736,842 (74,120) (358,933) 7,734
Change of Assumptions 5,148,795 5,245,627 (3,313,397) (1,657,190)
Benefit Payments, Including
Refunds of Member Contributions (1,075,442) (1,095,380) (1,097,218) (1,165,905)
Net Change in Total Pension Liability 6,225,744 5,852,357 (2,473,268) (641,504)
Total Pension Liability - Beginning 18,319,869 24,545,613 30,397,970 27,924,702
Total Pension Liability - Ending 24,545,613 30,397,970 27,924,702 27,283,198
Plan Fiduciary Net Position
Contributions - Employer $ 707,016 737,331 963,918 1,229,856
Contributions - Members 170,803 181,145 180,996 178,457
Net Investment Income 352,550 (124,563) 328,352 623,163
Benefit Payments, Including
Refunds of Member Contributions (1,075,442) (1,095,380) (1,097,218) (1,165,905)
Administrative Expense (92,071) (16,102) (20,327) (18,154)
Net Change in Plan Fiduciary Net Position 62,856 (317,569) 355,721 847,417
Plan Net Position - Beginning 8,291,742 8,354,598 8,037,029 8,392,750
Plan Net Position - Ending 8,354,598 8,037,029 8,392,750 9,240,167
Employer's Net Pension Liability $ 16,191,015 22,360,941 19,531,952 18,043,031
Plan Fiduciary Net Position as a
Percentage of the Total Pension Liability 34.04% 26.44% 30.05% 33.87%
Covered Payroll $ 1,756,312 2,139,927 1,835,834 1,895,499
Employer's Net Pension Liability as a
Percentage of Covered Payroll 921.88% 1044.94% 1063.93% 951.89%
Note:
2014
This schedule is intended to show information for ten years. Information for additional years will be displayed
as it becomes available.
63
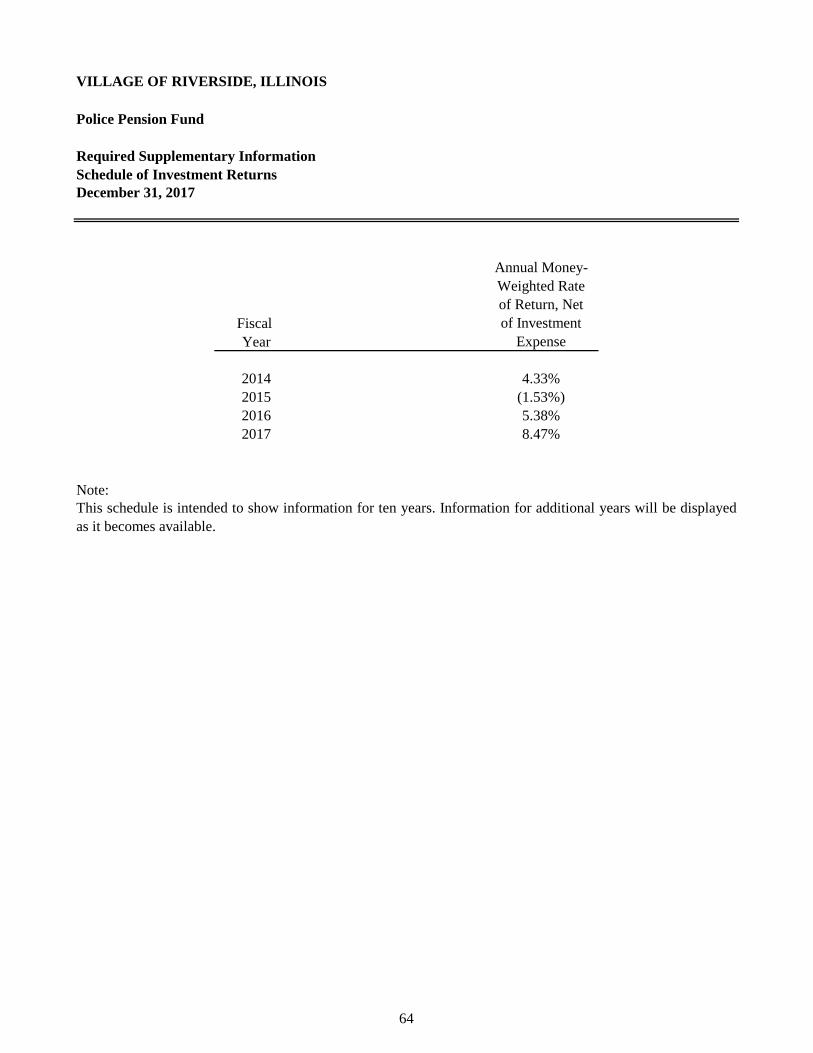
VILLAGE OF RIVERSIDE, ILLINOIS
Police Pension Fund
Required Supplementary Information
Schedule of Investment Returns
December 31, 2017
Annual Money-
Weighted Rate
of Return, Net
Fiscal of Investment
Year Expense
2014 4.33%
2015 (1.53%)
2016 5.38%
2017 8.47%
Note:
This schedule is intended to show information for ten years. Information for additional years will be displayed
as it becomes available.
64
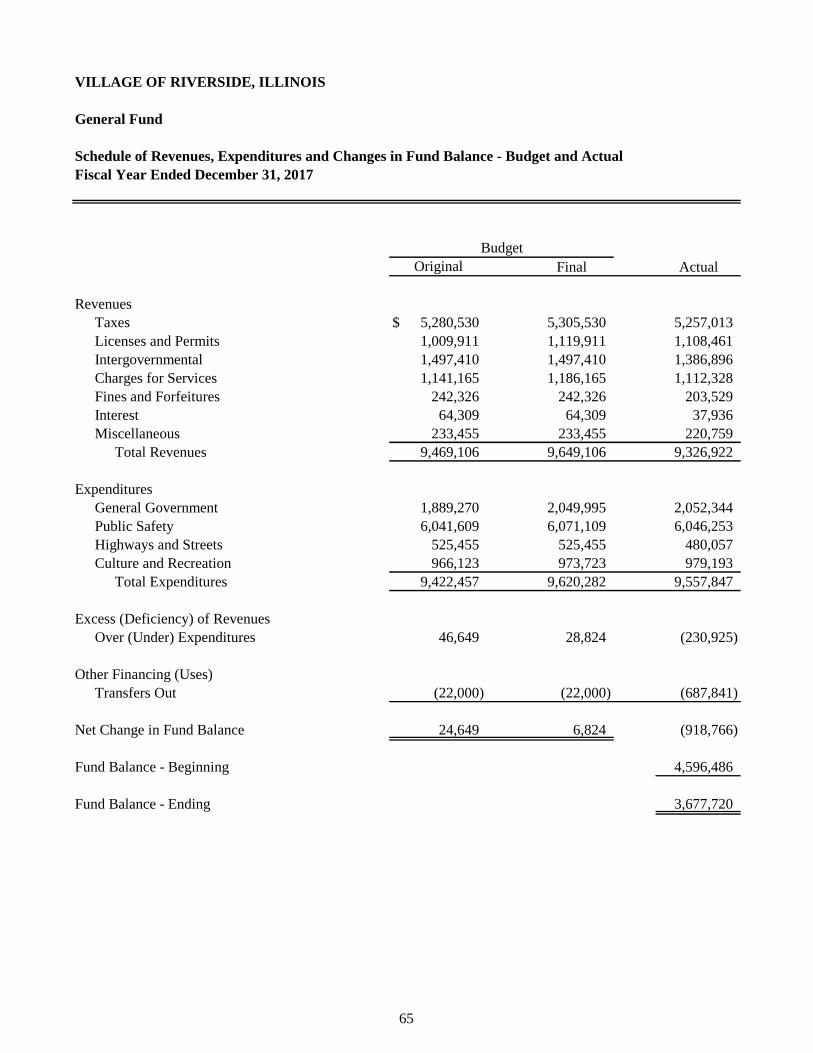
VILLAGE OF RIVERSIDE, ILLINOIS
General Fund
Schedule of Revenues, Expenditures and Changes in Fund Balance - Budget and Actual
Fiscal Year Ended December 31, 2017
Final Actual
Revenues
Taxes $ 5,280,530 5,305,530 5,257,013
Licenses and Permits 1,009,911 1,119,911 1,108,461
Intergovernmental 1,497,410 1,497,410 1,386,896
Charges for Services 1,141,165 1,186,165 1,112,328
Fines and Forfeitures 242,326 242,326 203,529
Interest 64,309 64,309 37,936
Miscellaneous 233,455 233,455 220,759
Total Revenues 9,469,106 9,649,106 9,326,922
Expenditures
General Government 1,889,270 2,049,995 2,052,344
Public Safety 6,041,609 6,071,109 6,046,253
Highways and Streets 525,455 525,455 480,057
Culture and Recreation 966,123 973,723 979,193
Total Expenditures 9,422,457 9,620,282 9,557,847
Excess (Deficiency) of Revenues
Over (Under) Expenditures 46,649 28,824 (230,925)
Other Financing (Uses)
Transfers Out (22,000) (22,000) (687,841)
Net Change in Fund Balance 24,649 6,824 (918,766)
Fund Balance - Beginning 4,596,486
Fund Balance - Ending 3,677,720
Budget
Original
65
Such statements and schedules include:
• Budgetary Comparison Schedules – Major Governmental Funds
• Combining Statements – Nonmajor Governmental Funds
• Budgetary Comparison Schedules – Nonmajor Governmental Funds
• Budgetary Comparison Schedules – Enterprise Funds
• Budgetary Comparison Schedule – Pension Trust Fund
OTHER SUPPLEMENTARY INFORMATION
Other supplementary information includes financial statements and schedules not required by the GASB, nor a
part of the basic financial statements, but are presented for purposes of additional analysis.
CAPITAL PROJECTS FUND
Capital Projects Funds are created to account for all resources used for the acquisition of capital facilities by a
governmental unit except those financed by Proprietary Funds.
Special Revenue Funds are created to account for the proceeds of specific revenue sources (other than fiduciary
funds or capital project funds) that are legally restricted to expenditure for specified purposes.
The Motor Fuel Tax Fund is used to account for funds restricted for the operation of street maintenance
programs and capital projects as authorized by the Illinois Department of Transportation. Financing is provided
by the Village’s share of gasoline taxes allocated by the State of Illinois.
COMBINING AND INDIVIDUAL FUND
FINANCIAL STATEMENTS AND SCHEDULES
GENERAL FUND
The General Fund, a major fund, accounts for all financial resources except those required to be accounted for
in another fund.
SPECIAL REVENUE FUNDS
Motor Fuel Tax Fund
E-911 Fund
The E-911 Fund is used to account for funds restricted for all emergency telephone services. Financing is
provided by a surcharge on telephone subscribers in the Village.
DEBT SERVICE FUND
Debt Service Funds are created to account for the accumulation of resources for, and the payment of, general
long-term debt principal and interest.
The Police Pension Fund is used to account for the accumulation of resources to be used for retirement annuity
payments to employees on the police force at appropriate amounts and times in the future. The fund does not
account for the administrative costs of the system, which are borne by the General Fund. Resources are
contributed by employees at rates fixed by law and by the Village at amounts determined by an annual actuarial
study.
COMBINING AND INDIVIDUAL FUND
FINANCIAL STATEMENTS AND SCHEDULES
ENTERPRISE FUNDS
The Parking Lot Course Fund is used to account for the operations of the Village’s residential and commuter
parking lots and parking areas. Revenues are provided from user permit fees and daily space fees.
Parking Lot Fund
PENSION TRUST FUND
Police Pension Fund
Water and Sewer Fund
The Water and Sewer Fund is used to account for the provision of water and wastewater services to the
residents of the Village. All activities necessary to provide such services are accounted for in this fund.
Enterprise Funds are used to account for operations that are financed and operated in a manner similar to private
business enterprises where the intent is that costs of providing goods or services to the general public on a
continuing basis be financed or recovered primarily through user charges; or where it has been decided that
periodic determination of revenues earned, expenses incurred, and/or net income is appropriate for capital
maintenance, public policy, management control, accountability, or other purpose.
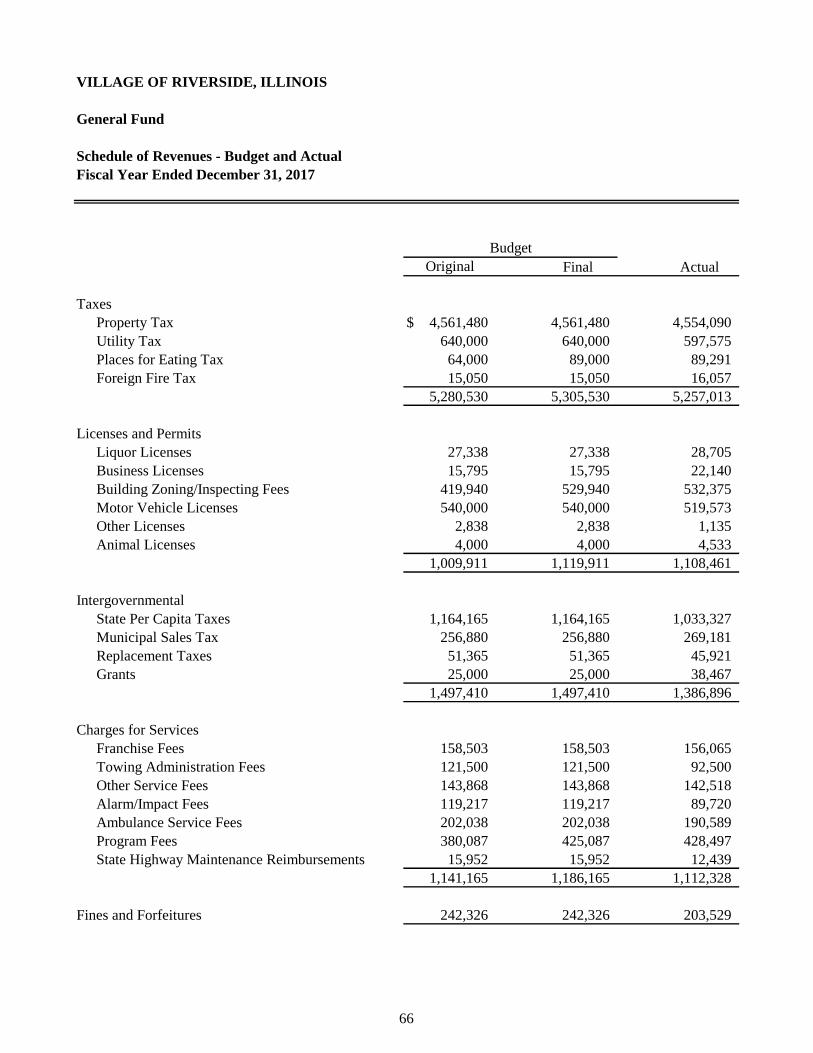
VILLAGE OF RIVERSIDE, ILLINOIS
General Fund
Schedule of Revenues - Budget and Actual
Fiscal Year Ended December 31, 2017
Final Actual
Taxes
Property Tax $ 4,561,480 4,561,480 4,554,090
Utility Tax 640,000 640,000 597,575
Places for Eating Tax 64,000 89,000 89,291
Foreign Fire Tax 15,050 15,050 16,057
5,280,530 5,305,530 5,257,013
Licenses and Permits
Liquor Licenses 27,338 27,338 28,705
Business Licenses 15,795 15,795 22,140
Building Zoning/Inspecting Fees 419,940 529,940 532,375
Motor Vehicle Licenses 540,000 540,000 519,573
Other Licenses 2,838 2,838 1,135
Animal Licenses 4,000 4,000 4,533
1,009,911 1,119,911 1,108,461
Intergovernmental
State Per Capita Taxes 1,164,165 1,164,165 1,033,327
Municipal Sales Tax 256,880 256,880 269,181
Replacement Taxes 51,365 51,365 45,921
Grants 25,000 25,000 38,467
1,497,410 1,497,410 1,386,896
Charges for Services
Franchise Fees 158,503 158,503 156,065
Towing Administration Fees 121,500 121,500 92,500
Other Service Fees 143,868 143,868 142,518
Alarm/Impact Fees 119,217 119,217 89,720
Ambulance Service Fees 202,038 202,038 190,589
Program Fees 380,087 425,087 428,497
State Highway Maintenance Reimbursements 15,952 15,952 12,439
1,141,165 1,186,165 1,112,328
Fines and Forfeitures 242,326 242,326 203,529
Budget
Original
66
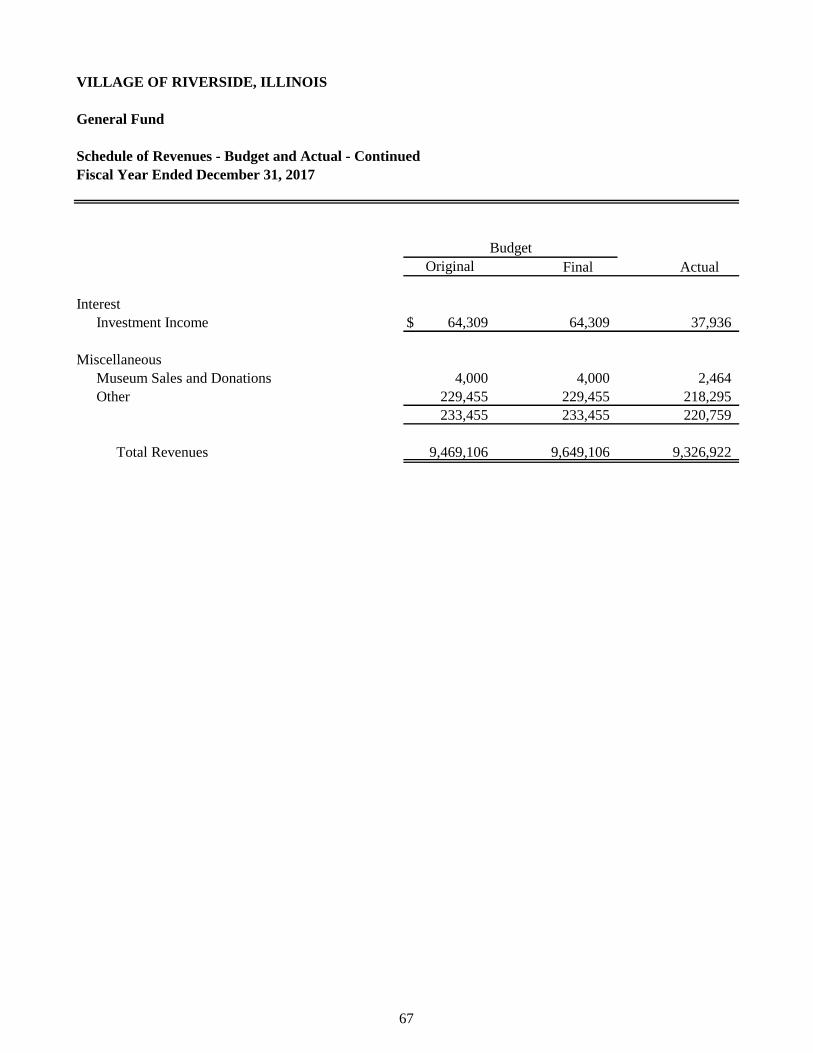
VILLAGE OF RIVERSIDE, ILLINOIS
General Fund
Schedule of Revenues - Budget and Actual - Continued
Fiscal Year Ended December 31, 2017
Final Actual
Interest
Investment Income $ 64,309 64,309 37,936
Miscellaneous
Museum Sales and Donations 4,000 4,000 2,464
Other 229,455 229,455 218,295
233,455 233,455 220,759
Total Revenues 9,469,106 9,649,106 9,326,922
Budget
Original
67
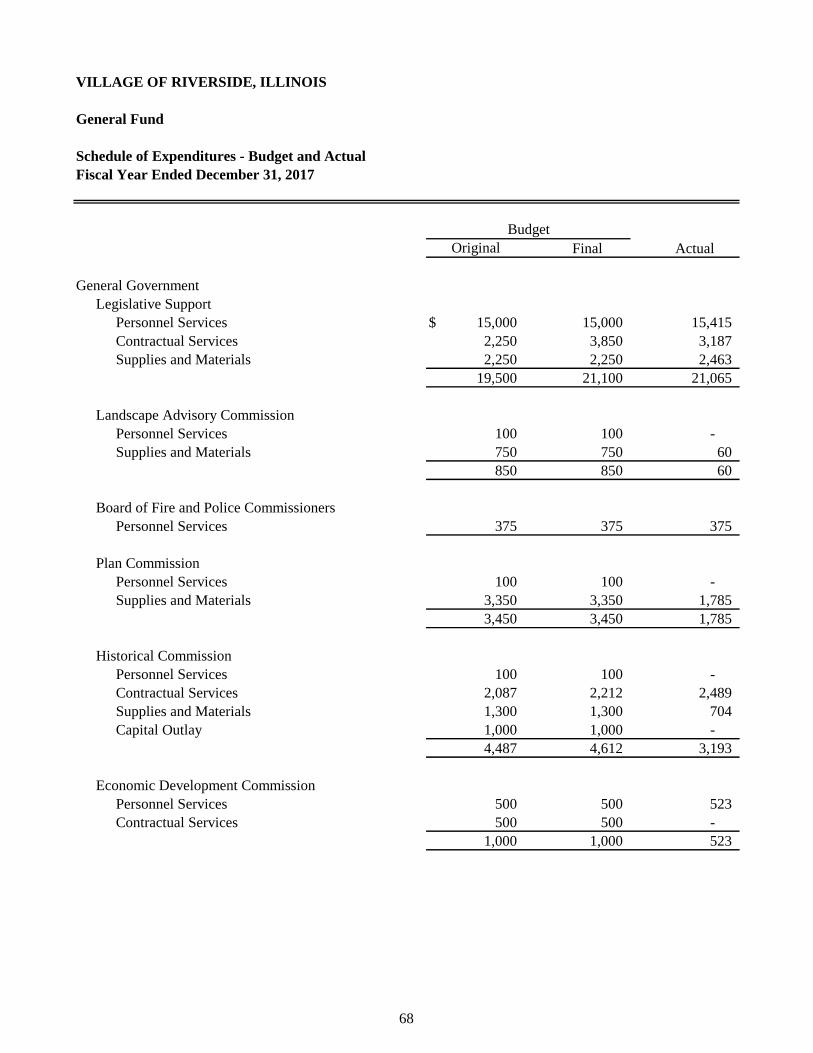
VILLAGE OF RIVERSIDE, ILLINOIS
General Fund
Schedule of Expenditures - Budget and Actual
Fiscal Year Ended December 31, 2017
Final Actual
General Government
Legislative Support
Personnel Services $ 15,000 15,000 15,415
Contractual Services 2,250 3,850 3,187
Supplies and Materials 2,250 2,250 2,463
19,500 21,100 21,065
Landscape Advisory Commission
Personnel Services 100 100 -
Supplies and Materials 750 750 60
850 850 60
Board of Fire and Police Commissioners
Personnel Services 375 375 375
Plan Commission
Personnel Services 100 100 -
Supplies and Materials 3,350 3,350 1,785
3,450 3,450 1,785
Historical Commission
Personnel Services 100 100 -
Contractual Services 2,087 2,212 2,489
Supplies and Materials 1,300 1,300 704
Capital Outlay 1,000 1,000 -
4,487 4,612 3,193
Economic Development Commission
Personnel Services 500 500 523
Contractual Services 500 500 -
1,000 1,000 523
Budget
Original
68
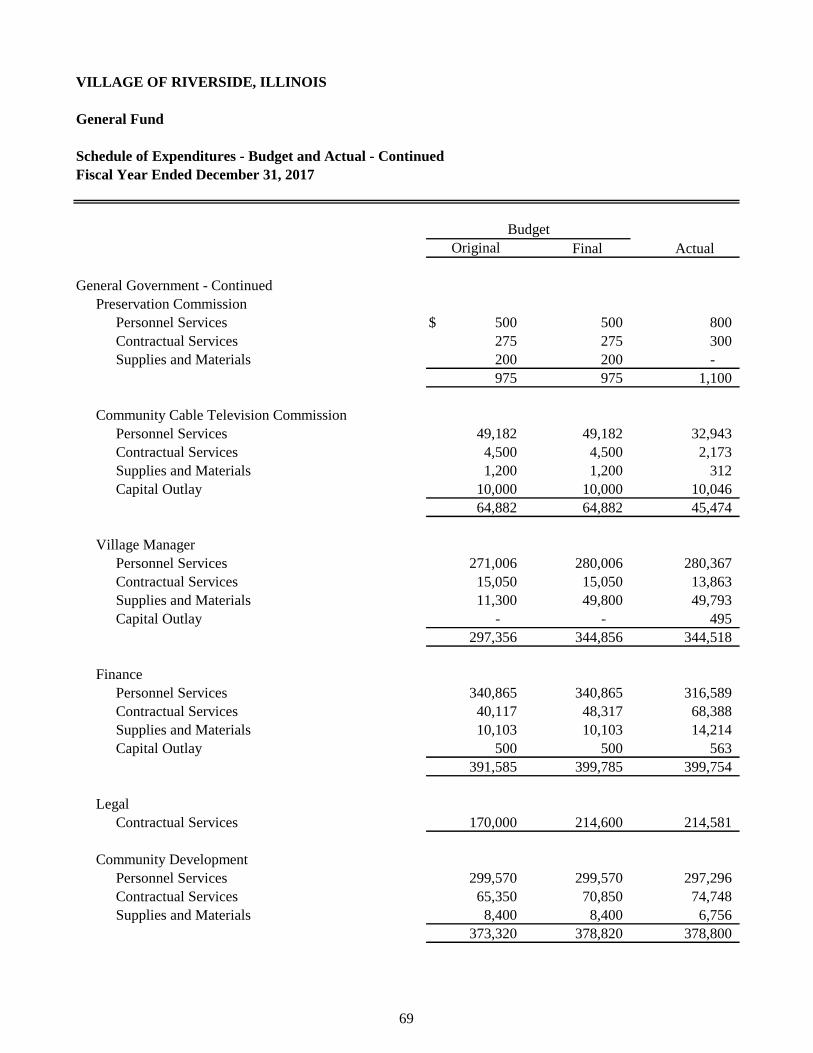
VILLAGE OF RIVERSIDE, ILLINOIS
General Fund
Schedule of Expenditures - Budget and Actual - Continued
Fiscal Year Ended December 31, 2017
Final Actual
General Government - Continued
Preservation Commission
Personnel Services $ 500 500 800
Contractual Services 275 275 300
Supplies and Materials 200 200 -
975 975 1,100
Community Cable Television Commission
Personnel Services 49,182 49,182 32,943
Contractual Services 4,500 4,500 2,173
Supplies and Materials 1,200 1,200 312
Capital Outlay 10,000 10,000 10,046
64,882 64,882 45,474
Village Manager
Personnel Services 271,006 280,006 280,367
Contractual Services 15,050 15,050 13,863
Supplies and Materials 11,300 49,800 49,793
Capital Outlay - - 495
297,356 344,856 344,518
Finance
Personnel Services 340,865 340,865 316,589
Contractual Services 40,117 48,317 68,388
Supplies and Materials 10,103 10,103 14,214
Capital Outlay 500 500 563
391,585 399,785 399,754
Legal
Contractual Services 170,000 214,600 214,581
Community Development
Personnel Services 299,570 299,570 297,296
Contractual Services 65,350 70,850 74,748
Supplies and Materials 8,400 8,400 6,756
373,320 378,820 378,800
Budget
Original
69
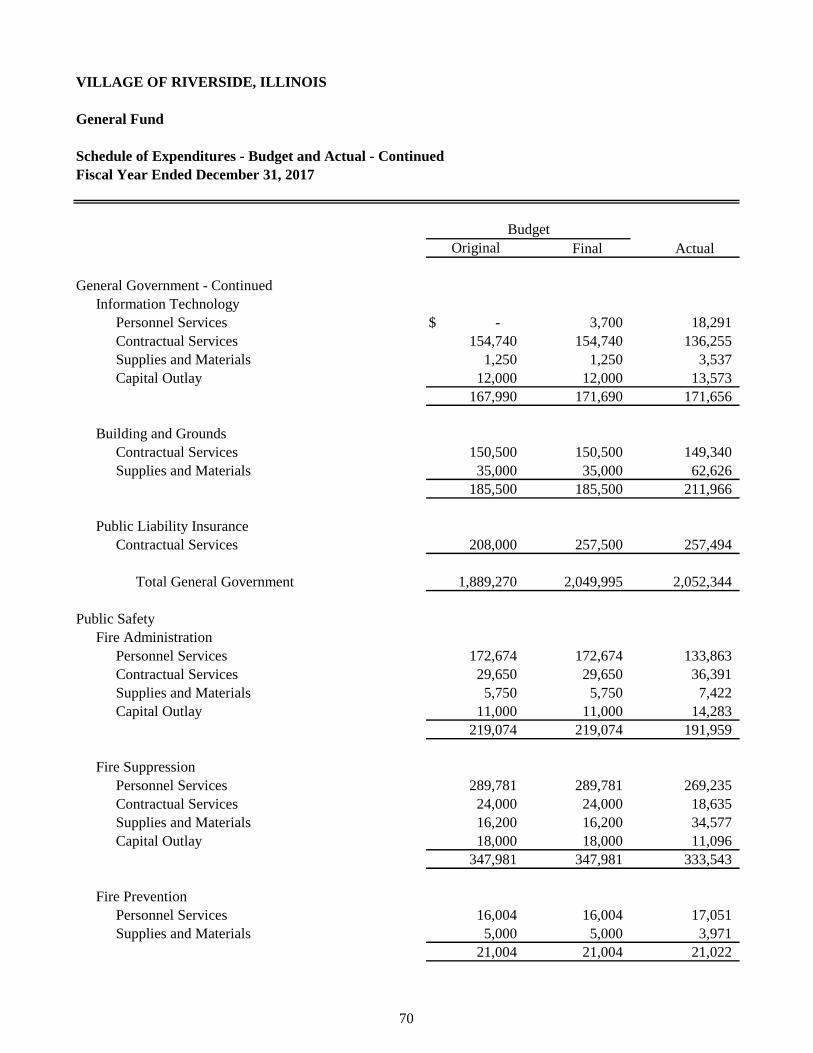
VILLAGE OF RIVERSIDE, ILLINOIS
General Fund
Schedule of Expenditures - Budget and Actual - Continued
Fiscal Year Ended December 31, 2017
Final Actual
General Government - Continued
Information Technology
Personnel Services $ - 3,700 18,291
Contractual Services 154,740 154,740 136,255
Supplies and Materials 1,250 1,250 3,537
Capital Outlay 12,000 12,000 13,573
167,990 171,690 171,656
Building and Grounds
Contractual Services 150,500 150,500 149,340
Supplies and Materials 35,000 35,000 62,626
185,500 185,500 211,966
Public Liability Insurance
Contractual Services 208,000 257,500 257,494
Total General Government 1,889,270 2,049,995 2,052,344
Public Safety
Fire Administration
Personnel Services 172,674 172,674 133,863
Contractual Services 29,650 29,650 36,391
Supplies and Materials 5,750 5,750 7,422
Capital Outlay 11,000 11,000 14,283
219,074 219,074 191,959
Fire Suppression
Personnel Services 289,781 289,781 269,235
Contractual Services 24,000 24,000 18,635
Supplies and Materials 16,200 16,200 34,577
Capital Outlay 18,000 18,000 11,096
347,981 347,981 333,543
Fire Prevention
Personnel Services 16,004 16,004 17,051
Supplies and Materials 5,000 5,000 3,971
21,004 21,004 21,022
Original
Budget
70
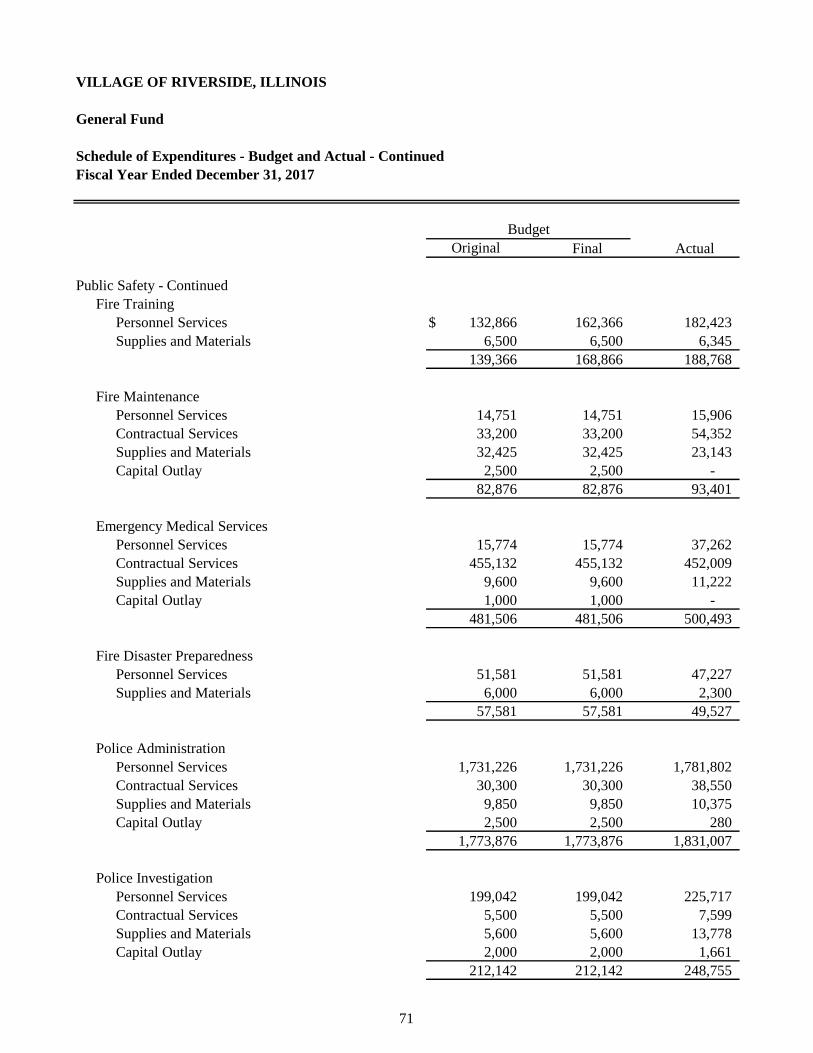
VILLAGE OF RIVERSIDE, ILLINOIS
General Fund
Schedule of Expenditures - Budget and Actual - Continued
Fiscal Year Ended December 31, 2017
Final Actual
Public Safety - Continued
Fire Training
Personnel Services $ 132,866 162,366 182,423
Supplies and Materials 6,500 6,500 6,345
139,366 168,866 188,768
Fire Maintenance
Personnel Services 14,751 14,751 15,906
Contractual Services 33,200 33,200 54,352
Supplies and Materials 32,425 32,425 23,143
Capital Outlay 2,500 2,500 -
82,876 82,876 93,401
Emergency Medical Services
Personnel Services 15,774 15,774 37,262
Contractual Services 455,132 455,132 452,009
Supplies and Materials 9,600 9,600 11,222
Capital Outlay 1,000 1,000 -
481,506 481,506 500,493
Fire Disaster Preparedness
Personnel Services 51,581 51,581 47,227
Supplies and Materials 6,000 6,000 2,300
57,581 57,581 49,527
Police Administration
Personnel Services 1,731,226 1,731,226 1,781,802
Contractual Services 30,300 30,300 38,550
Supplies and Materials 9,850 9,850 10,375
Capital Outlay 2,500 2,500 280
1,773,876 1,773,876 1,831,007
Police Investigation
Personnel Services 199,042 199,042 225,717
Contractual Services 5,500 5,500 7,599
Supplies and Materials 5,600 5,600 13,778
Capital Outlay 2,000 2,000 1,661
212,142 212,142 248,755
Budget
Original
71
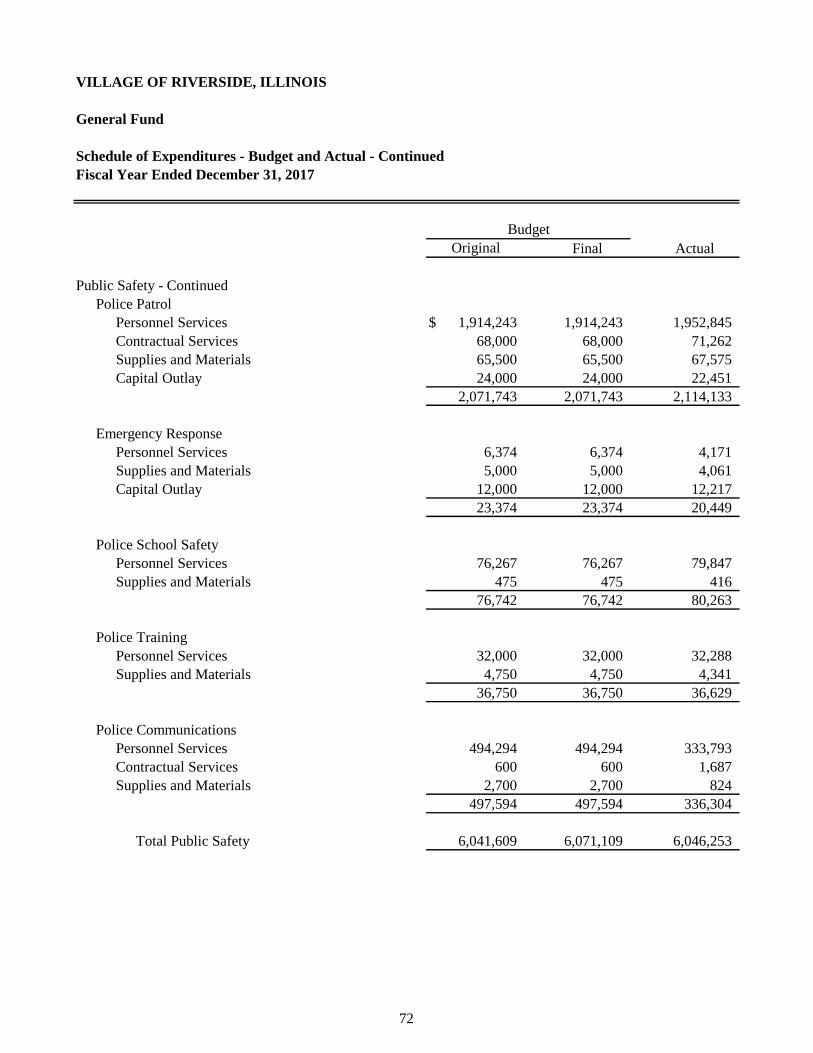
VILLAGE OF RIVERSIDE, ILLINOIS
General Fund
Schedule of Expenditures - Budget and Actual - Continued
Fiscal Year Ended December 31, 2017
Final Actual
Public Safety - Continued
Police Patrol
Personnel Services $ 1,914,243 1,914,243 1,952,845
Contractual Services 68,000 68,000 71,262
Supplies and Materials 65,500 65,500 67,575
Capital Outlay 24,000 24,000 22,451
2,071,743 2,071,743 2,114,133
Emergency Response
Personnel Services 6,374 6,374 4,171
Supplies and Materials 5,000 5,000 4,061
Capital Outlay 12,000 12,000 12,217
23,374 23,374 20,449
Police School Safety
Personnel Services 76,267 76,267 79,847
Supplies and Materials 475 475 416
76,742 76,742 80,263
Police Training
Personnel Services 32,000 32,000 32,288
Supplies and Materials 4,750 4,750 4,341
36,750 36,750 36,629
Police Communications
Personnel Services 494,294 494,294 333,793
Contractual Services 600 600 1,687
Supplies and Materials 2,700 2,700 824
497,594 497,594 336,304
Total Public Safety 6,041,609 6,071,109 6,046,253
Budget
Original
72
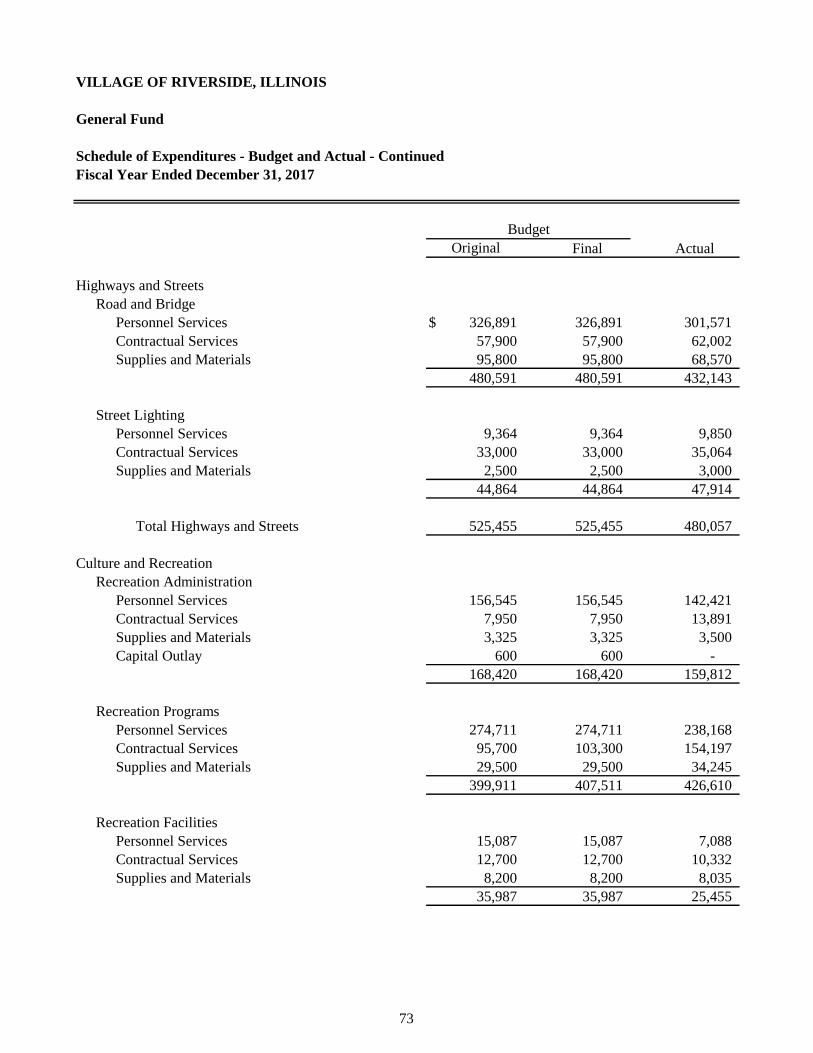
VILLAGE OF RIVERSIDE, ILLINOIS
General Fund
Schedule of Expenditures - Budget and Actual - Continued
Fiscal Year Ended December 31, 2017
Final Actual
Highways and Streets
Road and Bridge
Personnel Services $ 326,891 326,891 301,571
Contractual Services 57,900 57,900 62,002
Supplies and Materials 95,800 95,800 68,570
480,591 480,591 432,143
Street Lighting
Personnel Services 9,364 9,364 9,850
Contractual Services 33,000 33,000 35,064
Supplies and Materials 2,500 2,500 3,000
44,864 44,864 47,914
Total Highways and Streets 525,455 525,455 480,057
Culture and Recreation
Recreation Administration
Personnel Services 156,545 156,545 142,421
Contractual Services 7,950 7,950 13,891
Supplies and Materials 3,325 3,325 3,500
Capital Outlay 600 600 -
168,420 168,420 159,812
Recreation Programs
Personnel Services 274,711 274,711 238,168
Contractual Services 95,700 103,300 154,197
Supplies and Materials 29,500 29,500 34,245
399,911 407,511 426,610
Recreation Facilities
Personnel Services 15,087 15,087 7,088
Contractual Services 12,700 12,700 10,332
Supplies and Materials 8,200 8,200 8,035
35,987 35,987 25,455
Budget
Original
73
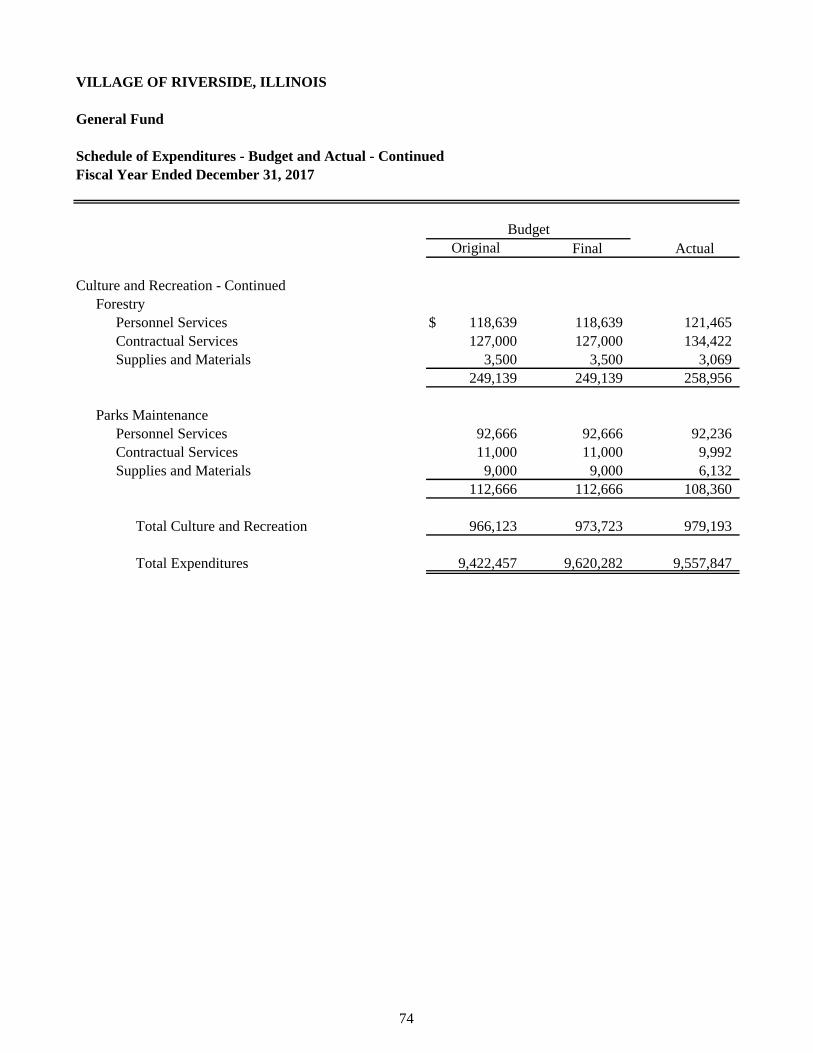
VILLAGE OF RIVERSIDE, ILLINOIS
General Fund
Schedule of Expenditures - Budget and Actual - Continued
Fiscal Year Ended December 31, 2017
Final Actual
Culture and Recreation - Continued
Forestry
Personnel Services $ 118,639 118,639 121,465
Contractual Services 127,000 127,000 134,422
Supplies and Materials 3,500 3,500 3,069
249,139 249,139 258,956
Parks Maintenance
Personnel Services 92,666 92,666 92,236
Contractual Services 11,000 11,000 9,992
Supplies and Materials 9,000 9,000 6,132
112,666 112,666 108,360
Total Culture and Recreation 966,123 973,723 979,193
Total Expenditures 9,422,457 9,620,282 9,557,847
Budget
Original
74
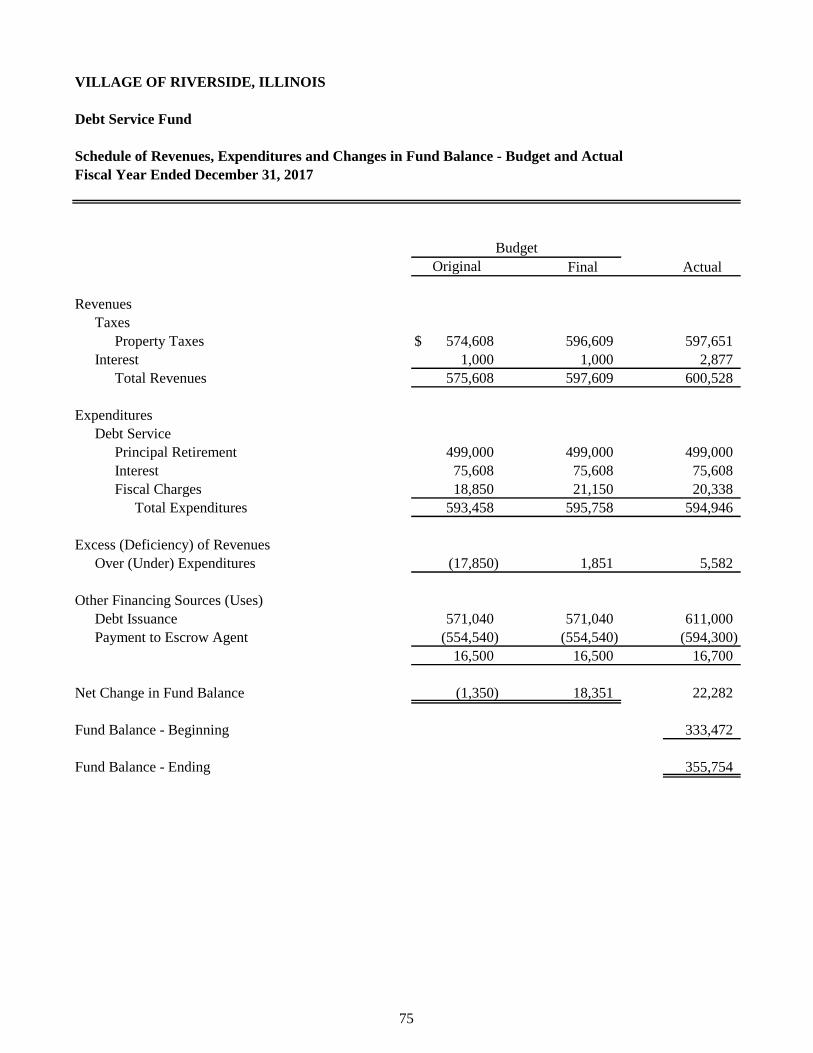
VILLAGE OF RIVERSIDE, ILLINOIS
Debt Service Fund
Schedule of Revenues, Expenditures and Changes in Fund Balance - Budget and Actual
Fiscal Year Ended December 31, 2017
Final Actual
Revenues
Taxes
Property Taxes $ 574,608 596,609 597,651
Interest 1,000 1,000 2,877
Total Revenues 575,608 597,609 600,528
Expenditures
Debt Service
Principal Retirement 499,000 499,000 499,000
Interest 75,608 75,608 75,608
Fiscal Charges 18,850 21,150 20,338
Total Expenditures 593,458 595,758 594,946
Excess (Deficiency) of Revenues
Over (Under) Expenditures (17,850) 1,851 5,582
Other Financing Sources (Uses)
Debt Issuance 571,040 571,040 611,000
Payment to Escrow Agent (554,540) (554,540) (594,300)
16,500 16,500 16,700
Net Change in Fund Balance (1,350) 18,351 22,282
Fund Balance - Beginning 333,472
Fund Balance - Ending 355,754
Budget
Original
75
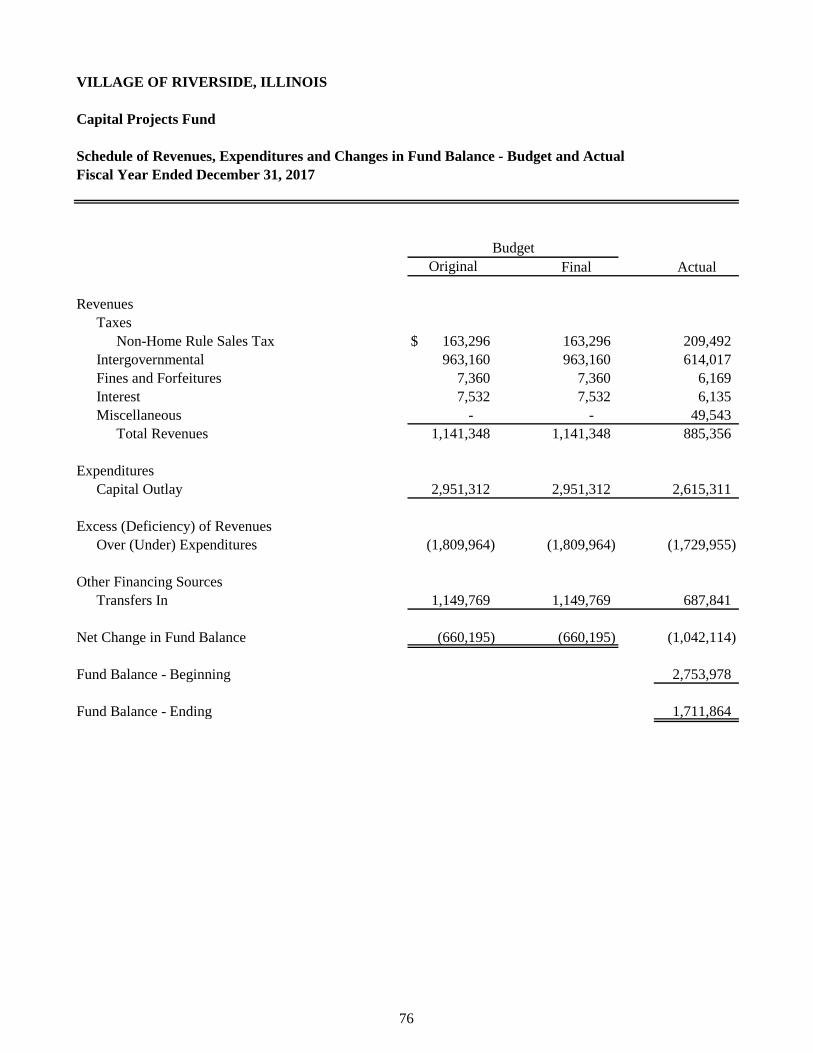
VILLAGE OF RIVERSIDE, ILLINOIS
Capital Projects Fund
Schedule of Revenues, Expenditures and Changes in Fund Balance - Budget and Actual
Fiscal Year Ended December 31, 2017
Final Actual
Revenues
Taxes
Non-Home Rule Sales Tax $ 163,296 163,296 209,492
Intergovernmental 963,160 963,160 614,017
Fines and Forfeitures 7,360 7,360 6,169
Interest 7,532 7,532 6,135
Miscellaneous - - 49,543
Total Revenues 1,141,348 1,141,348 885,356
Expenditures
Capital Outlay 2,951,312 2,951,312 2,615,311
Excess (Deficiency) of Revenues
Over (Under) Expenditures (1,809,964) (1,809,964) (1,729,955)
Other Financing Sources
Transfers In 1,149,769 1,149,769 687,841
Net Change in Fund Balance (660,195) (660,195) (1,042,114)
Fund Balance - Beginning 2,753,978
Fund Balance - Ending 1,711,864
Budget
Original
76
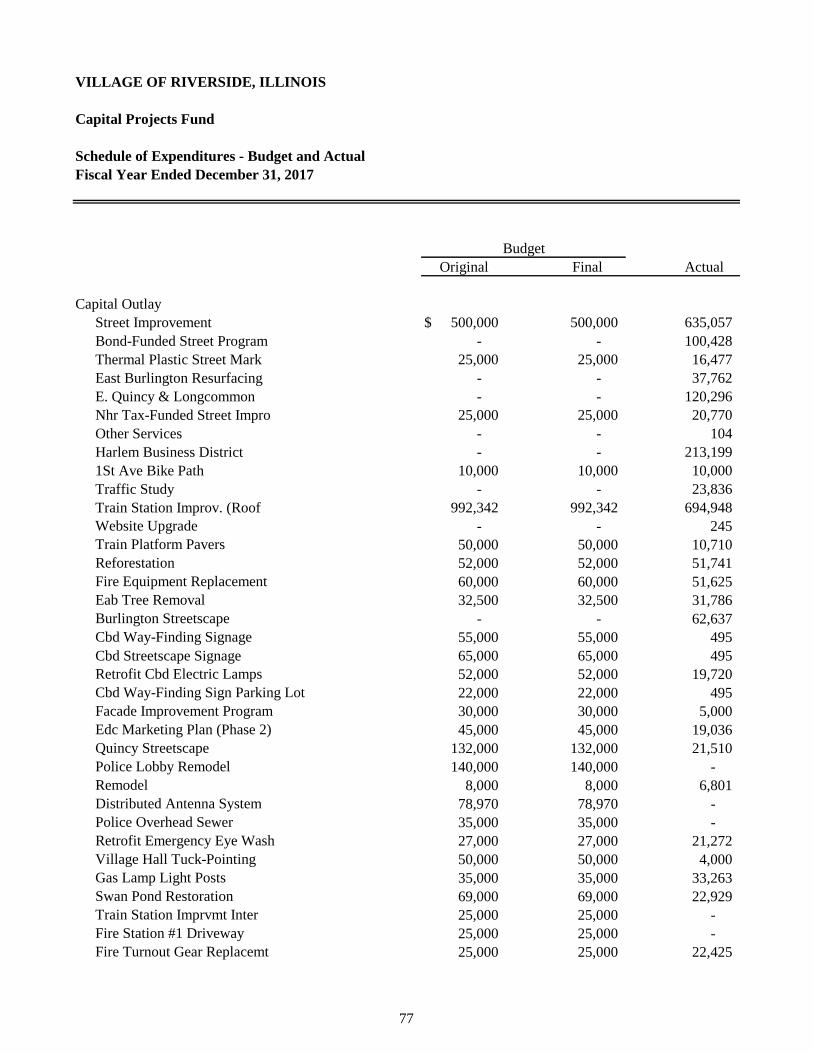
VILLAGE OF RIVERSIDE, ILLINOIS
Capital Projects Fund
Schedule of Expenditures - Budget and Actual
Fiscal Year Ended December 31, 2017
Final Actual
Capital Outlay
Street Improvement $ 500,000 500,000 635,057
Bond-Funded Street Program - - 100,428
Thermal Plastic Street Mark 25,000 25,000 16,477
East Burlington Resurfacing - - 37,762
E. Quincy & Longcommon - - 120,296
Nhr Tax-Funded Street Impro 25,000 25,000 20,770
Other Services - - 104
Harlem Business District - - 213,199
1St Ave Bike Path 10,000 10,000 10,000
Traffic Study - - 23,836
Train Station Improv. (Roof 992,342 992,342 694,948
Website Upgrade - - 245
Train Platform Pavers 50,000 50,000 10,710
Reforestation 52,000 52,000 51,741
Fire Equipment Replacement 60,000 60,000 51,625
Eab Tree Removal 32,500 32,500 31,786
Burlington Streetscape - - 62,637
Cbd Way-Finding Signage 55,000 55,000 495
Cbd Streetscape Signage 65,000 65,000 495
Retrofit Cbd Electric Lamps 52,000 52,000 19,720
Cbd Way-Finding Sign Parking Lot 22,000 22,000 495
Facade Improvement Program 30,000 30,000 5,000
Edc Marketing Plan (Phase 2) 45,000 45,000 19,036
Quincy Streetscape 132,000 132,000 21,510
Police Lobby Remodel 140,000 140,000 -
Remodel 8,000 8,000 6,801
Distributed Antenna System 78,970 78,970 -
Police Overhead Sewer 35,000 35,000 -
Retrofit Emergency Eye Wash 27,000 27,000 21,272
Village Hall Tuck-Pointing 50,000 50,000 4,000
Gas Lamp Light Posts 35,000 35,000 33,263
Swan Pond Restoration 69,000 69,000 22,929
Train Station Imprvmt Inter 25,000 25,000 -
Fire Station #1 Driveway 25,000 25,000 -
Fire Turnout Gear Replacemt 25,000 25,000 22,425
Budget
Original
77
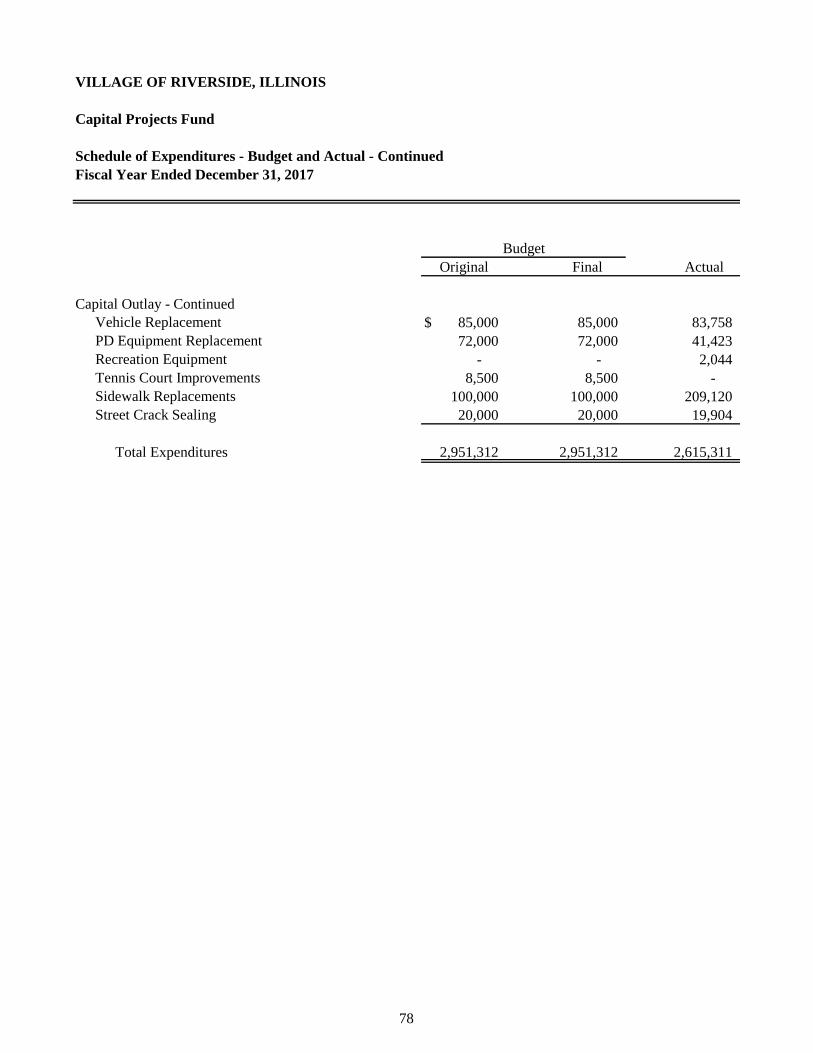
VILLAGE OF RIVERSIDE, ILLINOIS
Capital Projects Fund
Schedule of Expenditures - Budget and Actual - Continued
Fiscal Year Ended December 31, 2017
Final Actual
Capital Outlay - Continued
Vehicle Replacement $ 85,000 85,000 83,758
PD Equipment Replacement 72,000 72,000 41,423
Recreation Equipment - - 2,044
Tennis Court Improvements 8,500 8,500 -
Sidewalk Replacements 100,000 100,000 209,120
Street Crack Sealing 20,000 20,000 19,904
Total Expenditures 2,951,312 2,951,312 2,615,311
Budget
Original
78
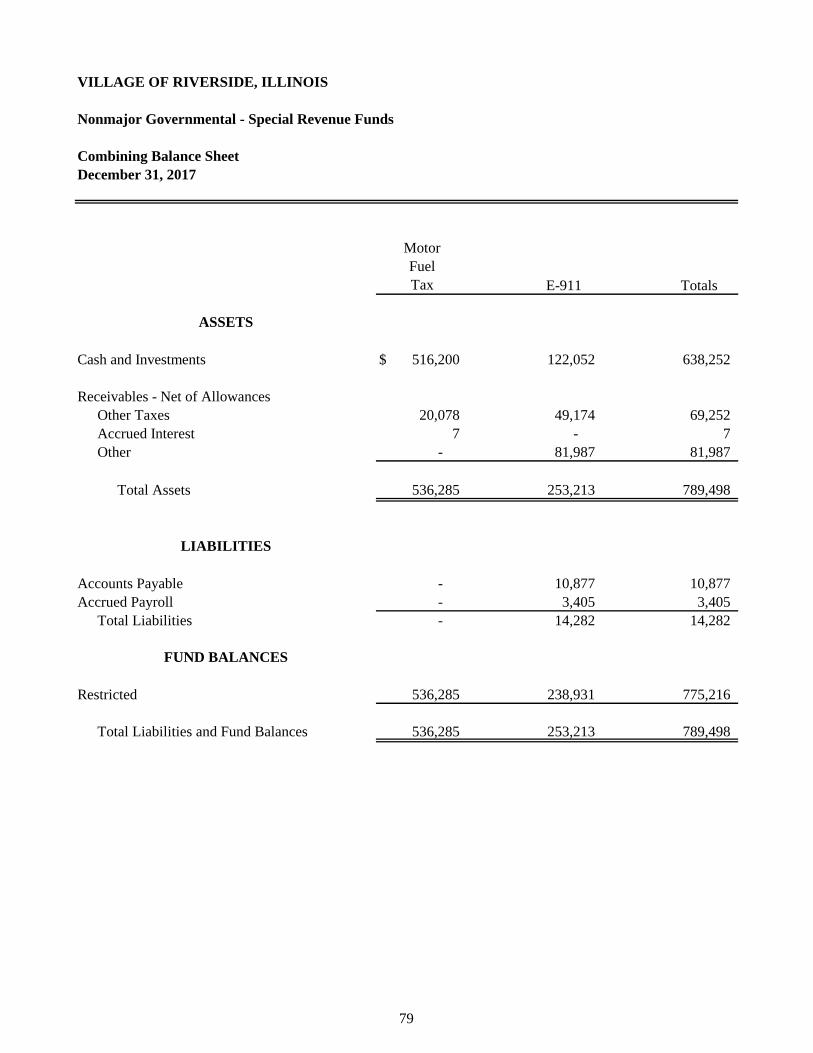
VILLAGE OF RIVERSIDE, ILLINOIS
Nonmajor Governmental - Special Revenue Funds
Combining Balance Sheet
December 31, 2017
E-911 Totals
Cash and Investments $ 516,200 122,052 638,252
Receivables - Net of Allowances
Other Taxes 20,078 49,174 69,252
Accrued Interest 7 - 7
Other - 81,987 81,987
Total Assets 536,285 253,213 789,498
Accounts Payable - 10,877 10,877
Accrued Payroll - 3,405 3,405
Total Liabilities - 14,282 14,282
Restricted 536,285 238,931 775,216
Total Liabilities and Fund Balances 536,285 253,213 789,498
Motor
Fuel
Tax
FUND BALANCES
ASSETS
LIABILITIES
79
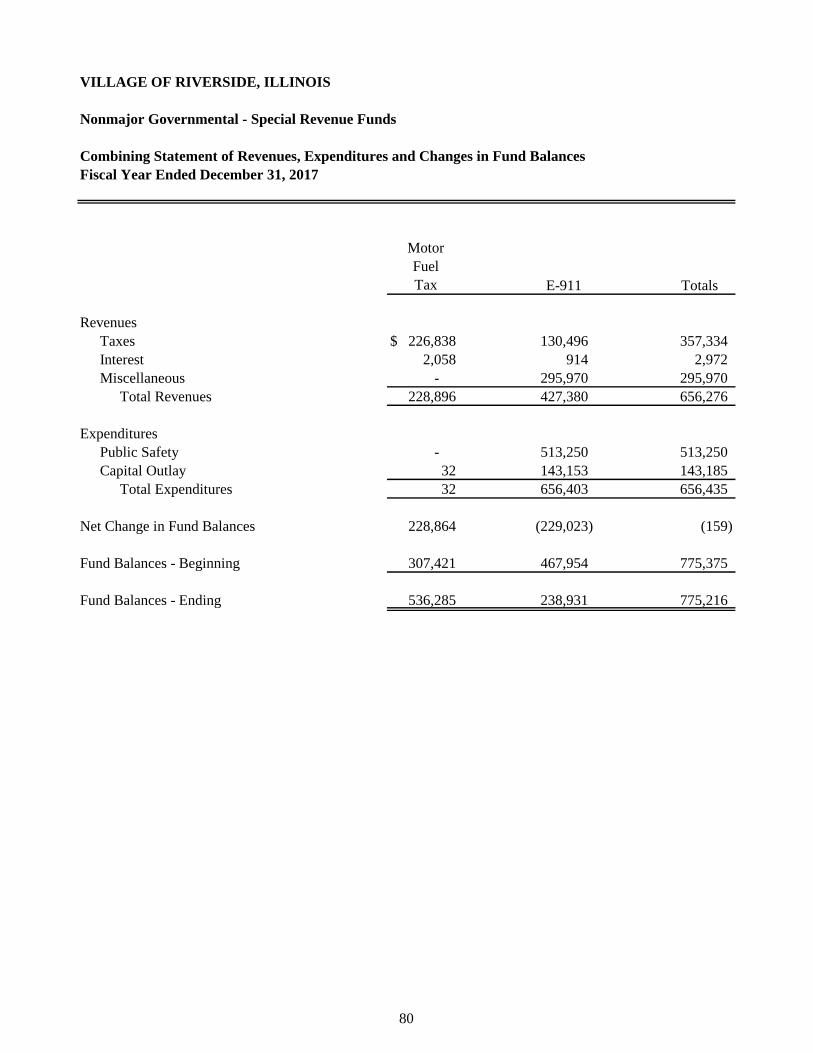
VILLAGE OF RIVERSIDE, ILLINOIS
Nonmajor Governmental - Special Revenue Funds
Combining Statement of Revenues, Expenditures and Changes in Fund Balances
Fiscal Year Ended December 31, 2017
E-911 Totals
Revenues
Taxes $ 226,838 130,496 357,334
Interest 2,058 914 2,972
Miscellaneous - 295,970 295,970
Total Revenues 228,896 427,380 656,276
Expenditures
Public Safety - 513,250 513,250
Capital Outlay 32 143,153 143,185
Total Expenditures 32 656,403 656,435
Net Change in Fund Balances 228,864 (229,023) (159)
Fund Balances - Beginning 307,421 467,954 775,375
Fund Balances - Ending 536,285 238,931 775,216
Motor
Fuel
Tax
80
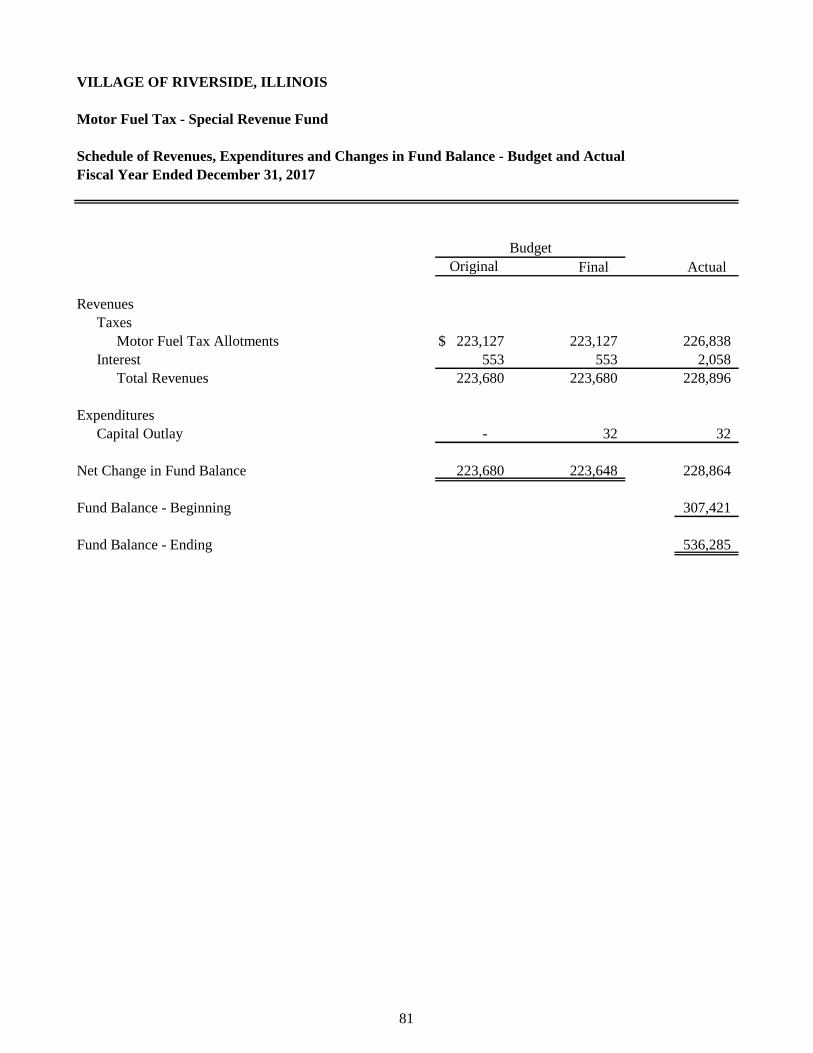
VILLAGE OF RIVERSIDE, ILLINOIS
Motor Fuel Tax - Special Revenue Fund
Schedule of Revenues, Expenditures and Changes in Fund Balance - Budget and Actual
Fiscal Year Ended December 31, 2017
Final Actual
Revenues
Taxes
Motor Fuel Tax Allotments $ 223,127 223,127 226,838
Interest 553 553 2,058
Total Revenues 223,680 223,680 228,896
Expenditures
Capital Outlay - 32 32
Net Change in Fund Balance 223,680 223,648 228,864
Fund Balance - Beginning 307,421
Fund Balance - Ending 536,285
Budget
Original
81
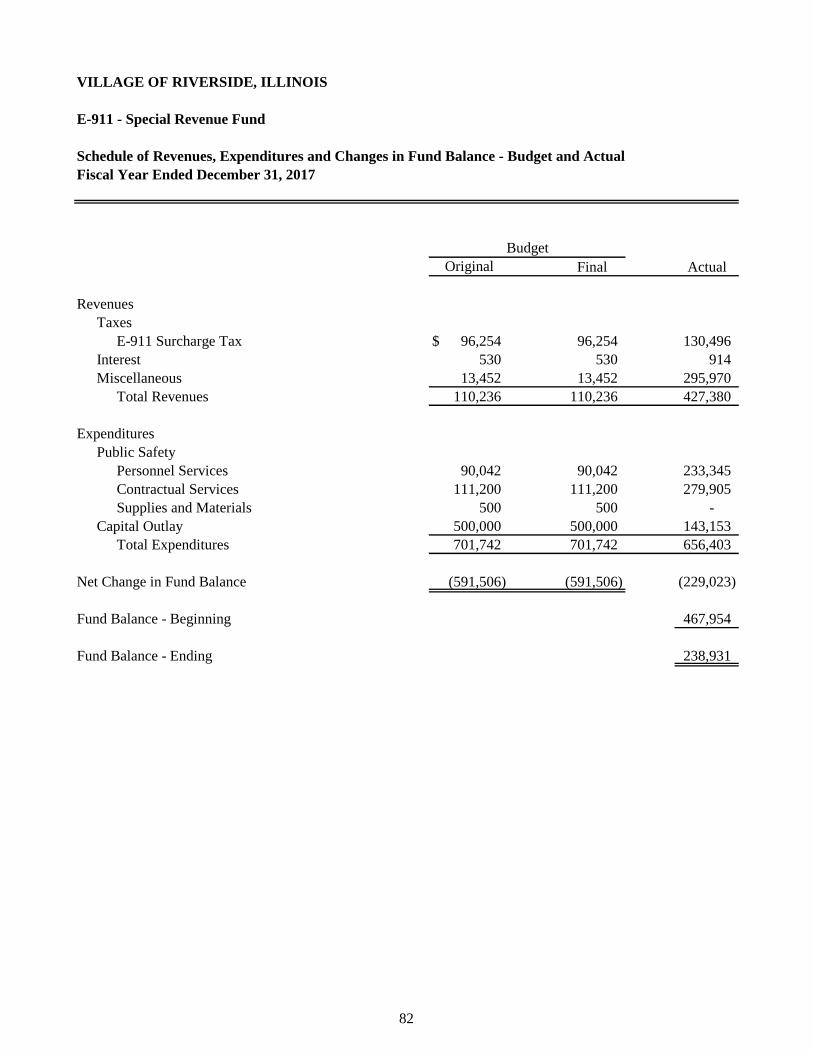
VILLAGE OF RIVERSIDE, ILLINOIS
E-911 - Special Revenue Fund
Schedule of Revenues, Expenditures and Changes in Fund Balance - Budget and Actual
Fiscal Year Ended December 31, 2017
Final Actual
Revenues
Taxes
E-911 Surcharge Tax $ 96,254 96,254 130,496
Interest 530 530 914
Miscellaneous 13,452 13,452 295,970
Total Revenues 110,236 110,236 427,380
Expenditures
Public Safety
Personnel Services 90,042 90,042 233,345
Contractual Services 111,200 111,200 279,905
Supplies and Materials 500 500 -
Capital Outlay 500,000 500,000 143,153
Total Expenditures 701,742 701,742 656,403
Net Change in Fund Balance (591,506) (591,506) (229,023)
Fund Balance - Beginning 467,954
Fund Balance - Ending 238,931
Budget
Original
82
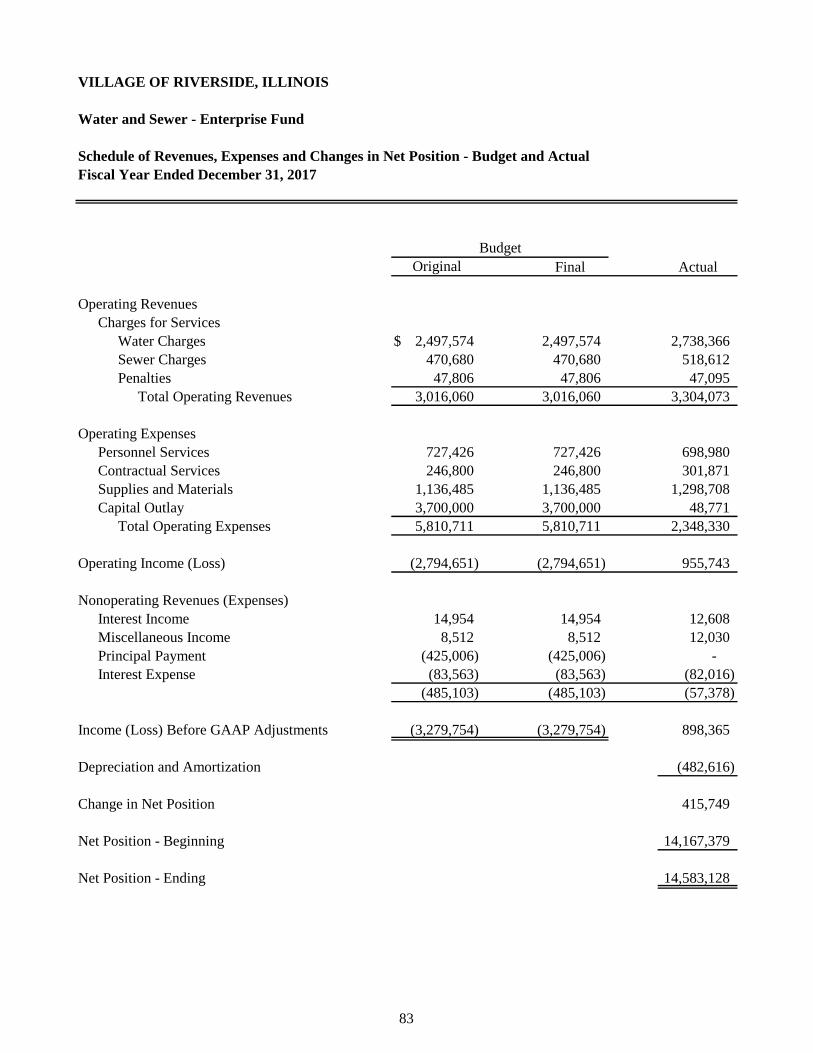
VILLAGE OF RIVERSIDE, ILLINOIS
Water and Sewer - Enterprise Fund
Schedule of Revenues, Expenses and Changes in Net Position - Budget and Actual
Fiscal Year Ended December 31, 2017
Final Actual
Operating Revenues
Charges for Services
Water Charges $ 2,497,574 2,497,574 2,738,366
Sewer Charges 470,680 470,680 518,612
Penalties 47,806 47,806 47,095
Total Operating Revenues 3,016,060 3,016,060 3,304,073
Operating Expenses
Personnel Services 727,426 727,426 698,980
Contractual Services 246,800 246,800 301,871
Supplies and Materials 1,136,485 1,136,485 1,298,708
Capital Outlay 3,700,000 3,700,000 48,771
Total Operating Expenses 5,810,711 5,810,711 2,348,330
Operating Income (Loss) (2,794,651) (2,794,651) 955,743
Nonoperating Revenues (Expenses)
Interest Income 14,954 14,954 12,608
Miscellaneous Income 8,512 8,512 12,030
Principal Payment (425,006) (425,006) -
Interest Expense (83,563) (83,563) (82,016)
(485,103) (485,103) (57,378)
Income (Loss) Before GAAP Adjustments (3,279,754) (3,279,754) 898,365
Depreciation and Amortization (482,616)
Change in Net Position 415,749
Net Position - Beginning 14,167,379
Net Position - Ending 14,583,128
Budget
Original
83
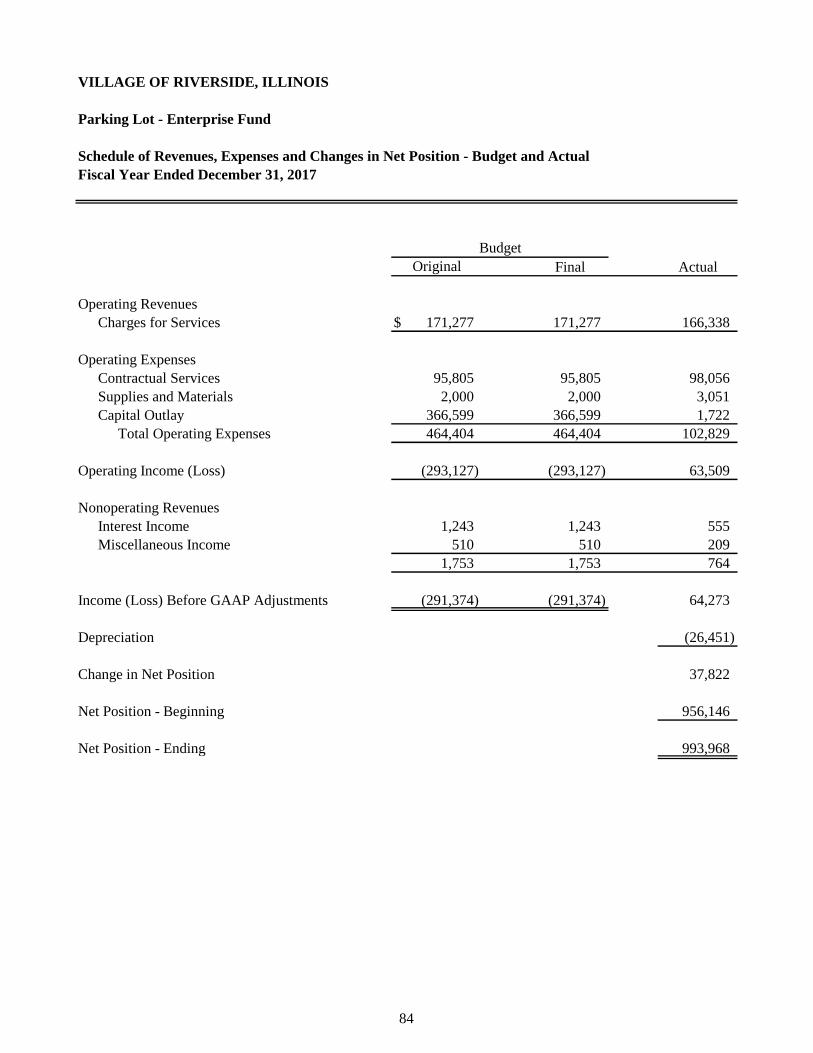
VILLAGE OF RIVERSIDE, ILLINOIS
Parking Lot - Enterprise Fund
Schedule of Revenues, Expenses and Changes in Net Position - Budget and Actual
Fiscal Year Ended December 31, 2017
Final Actual
Operating Revenues
Charges for Services $ 171,277 171,277 166,338
Operating Expenses
Contractual Services 95,805 95,805 98,056
Supplies and Materials 2,000 2,000 3,051
Capital Outlay 366,599 366,599 1,722
Total Operating Expenses 464,404 464,404 102,829
Operating Income (Loss) (293,127) (293,127) 63,509
Nonoperating Revenues
Interest Income 1,243 1,243 555
Miscellaneous Income 510 510 209
1,753 1,753 764
Income (Loss) Before GAAP Adjustments (291,374) (291,374) 64,273
Depreciation (26,451)
Change in Net Position 37,822
Net Position - Beginning 956,146
Net Position - Ending 993,968
Budget
Original
84
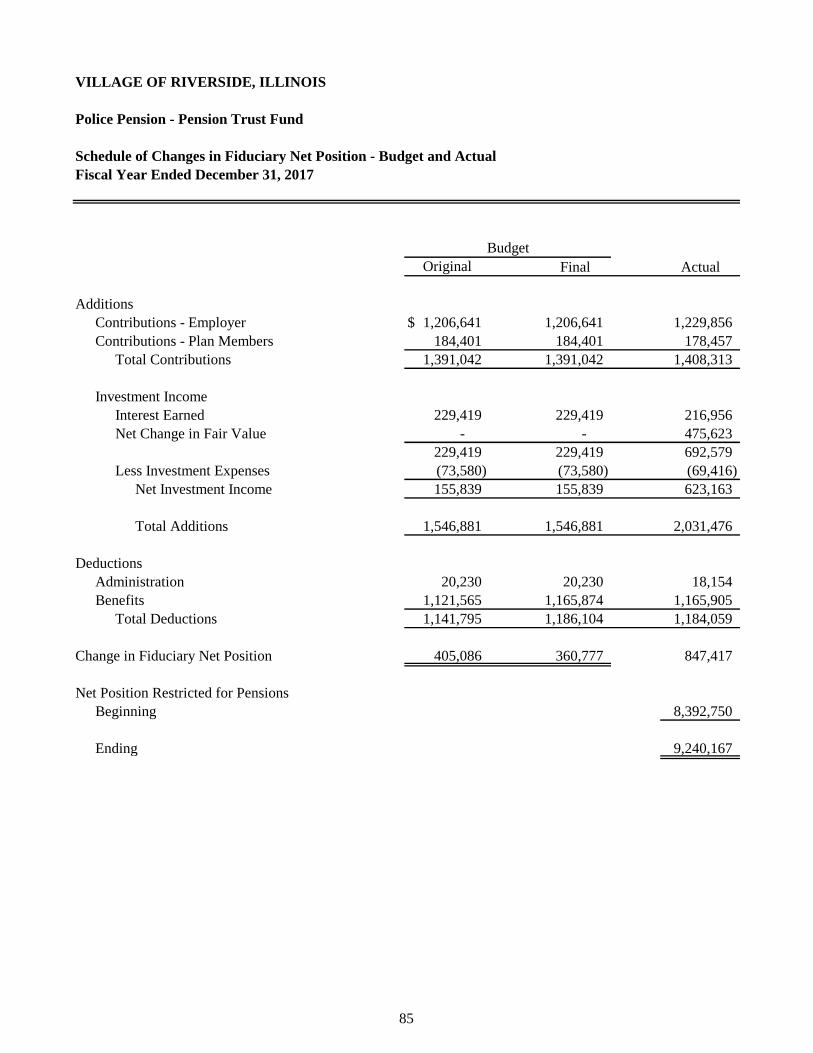
VILLAGE OF RIVERSIDE, ILLINOIS
Police Pension - Pension Trust Fund
Schedule of Changes in Fiduciary Net Position - Budget and Actual
Fiscal Year Ended December 31, 2017
Final Actual
Additions
Contributions - Employer $ 1,206,641 1,206,641 1,229,856
Contributions - Plan Members 184,401 184,401 178,457
Total Contributions 1,391,042 1,391,042 1,408,313
Investment Income
Interest Earned 229,419 229,419 216,956
Net Change in Fair Value - - 475,623
229,419 229,419 692,579
Less Investment Expenses (73,580) (73,580) (69,416)
Net Investment Income 155,839 155,839 623,163
Total Additions 1,546,881 1,546,881 2,031,476
Deductions
Administration 20,230 20,230 18,154
Benefits 1,121,565 1,165,874 1,165,905
Total Deductions 1,141,795 1,186,104 1,184,059
Change in Fiduciary Net Position 405,086 360,777 847,417
Net Position Restricted for Pensions
Beginning 8,392,750
Ending 9,240,167
Budget
Original
85
SUPPLEMENTAL SCHEDULES
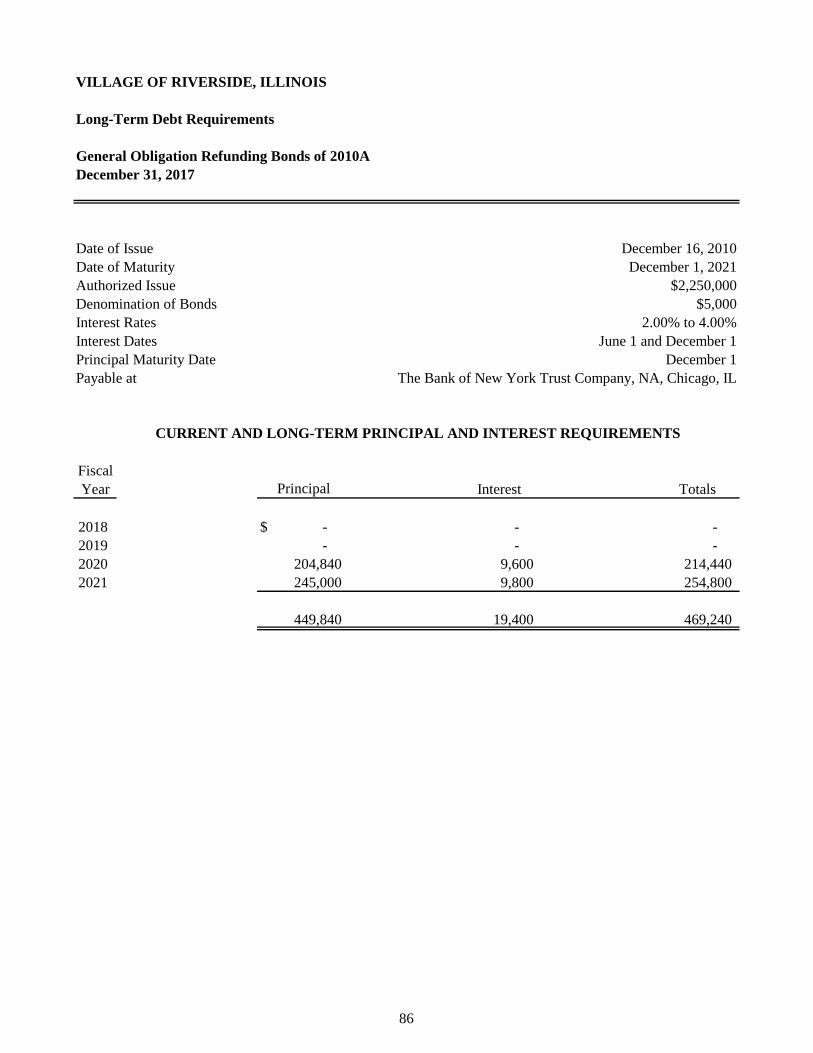
VILLAGE OF RIVERSIDE, ILLINOIS
Long-Term Debt Requirements
General Obligation Refunding Bonds of 2010A
December 31, 2017
Date of Issue December 16, 2010
Date of Maturity December 1, 2021
Authorized Issue $2,250,000
Denomination of Bonds $5,000
Interest Rates 2.00% to 4.00%
Interest Dates June 1 and December 1
Principal Maturity Date December 1
Payable at The Bank of New York Trust Company, NA, Chicago, IL
Fiscal
Year Interest Totals
2018 $ - - -
2019 - - -
2020 204,840 9,600 214,440
2021 245,000 9,800 254,800
449,840 19,400 469,240
CURRENT AND LONG-TERM PRINCIPAL AND INTEREST REQUIREMENTS
Principal
86

VILLAGE OF RIVERSIDE, ILLINOIS
Long-Term Debt Requirements
General Obligation Refunding Bonds of 2011
December 31, 2017
Date of Issue July 12, 2011
Date of Maturity May 1, 2023
Authorized Issue $2,175,000
Denomination of Bonds $5,000
Interest Rates 1.75% to 4.00%
Interest Dates May 1 and November 1
Principal Maturity Date May 1
Payable at The Bank of New York Trust Company, NA, Chicago, IL
Fiscal
Year Interest Totals
2018 $ 85,000 62,263 147,263
2019 85,000 59,713 144,713
2020 365,000 52,050 417,050
2021 375,000 38,631 413,631
2022 395,000 23,700 418,700
2023 395,000 7,900 402,900
1,700,000 244,257 1,944,257
CURRENT AND LONG-TERM PRINCIPAL AND INTEREST REQUIREMENTS
Principal
87
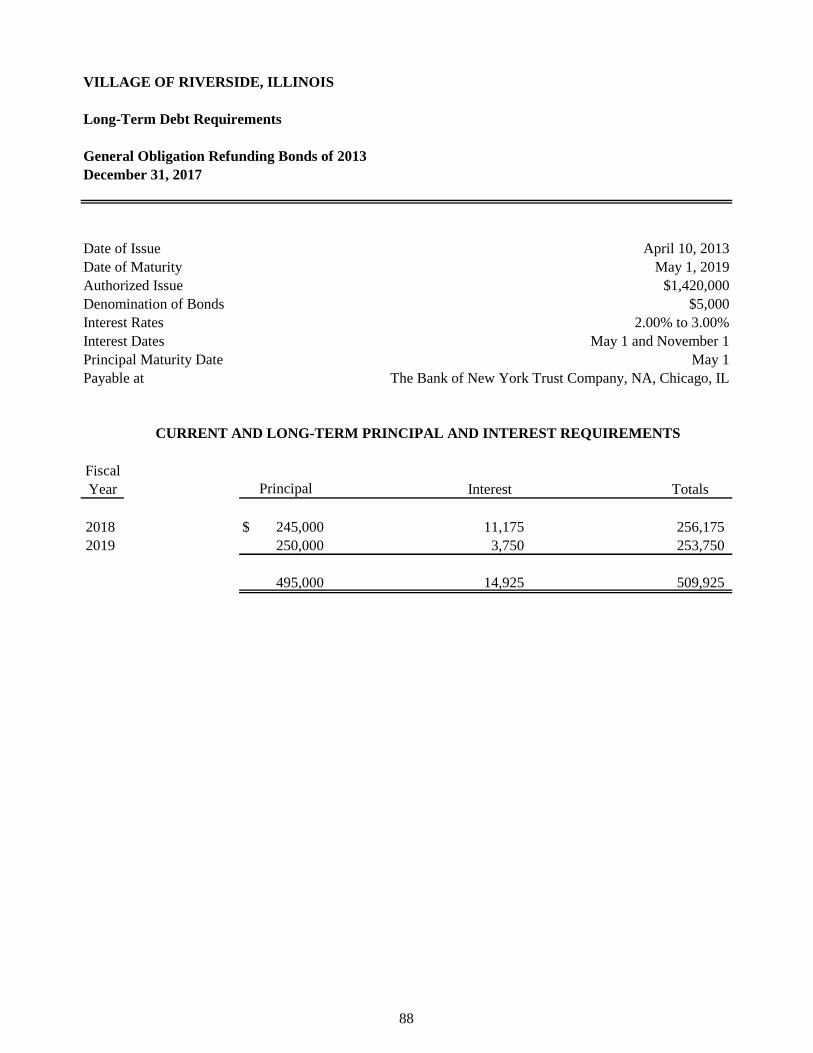
VILLAGE OF RIVERSIDE, ILLINOIS
Long-Term Debt Requirements
General Obligation Refunding Bonds of 2013
December 31, 2017
Date of Issue April 10, 2013
Date of Maturity May 1, 2019
Authorized Issue $1,420,000
Denomination of Bonds $5,000
Interest Rates 2.00% to 3.00%
Interest Dates May 1 and November 1
Principal Maturity Date May 1
Payable at The Bank of New York Trust Company, NA, Chicago, IL
Fiscal
Year Interest Totals
2018 $ 245,000 11,175 256,175
2019 250,000 3,750 253,750
495,000 14,925 509,925
CURRENT AND LONG-TERM PRINCIPAL AND INTEREST REQUIREMENTS
Principal
88
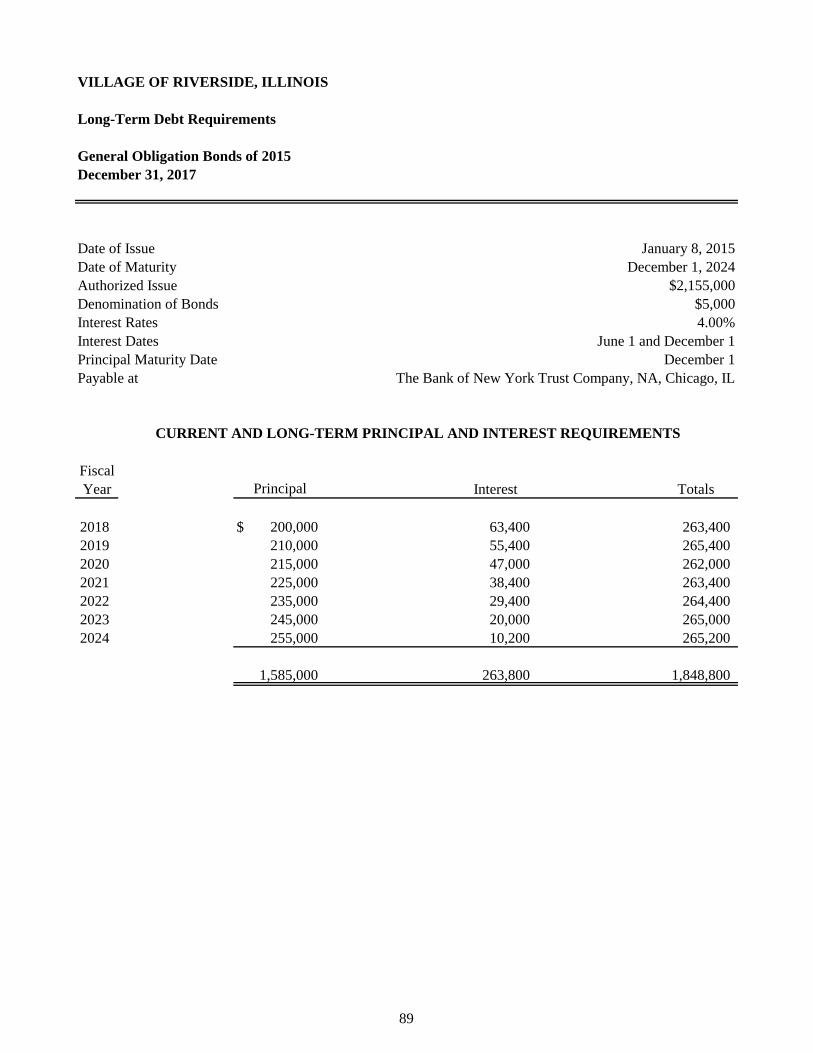
VILLAGE OF RIVERSIDE, ILLINOIS
Long-Term Debt Requirements
General Obligation Bonds of 2015
December 31, 2017
Date of Issue January 8, 2015
Date of Maturity December 1, 2024
Authorized Issue $2,155,000
Denomination of Bonds $5,000
Interest Rates 4.00%
Interest Dates June 1 and December 1
Principal Maturity Date December 1
Payable at The Bank of New York Trust Company, NA, Chicago, IL
Fiscal
Year Interest Totals
2018 $ 200,000 63,400 263,400
2019 210,000 55,400 265,400
2020 215,000 47,000 262,000
2021 225,000 38,400 263,400
2022 235,000 29,400 264,400
2023 245,000 20,000 265,000
2024 255,000 10,200 265,200
1,585,000 263,800 1,848,800
CURRENT AND LONG-TERM PRINCIPAL AND INTEREST REQUIREMENTS
Principal
89
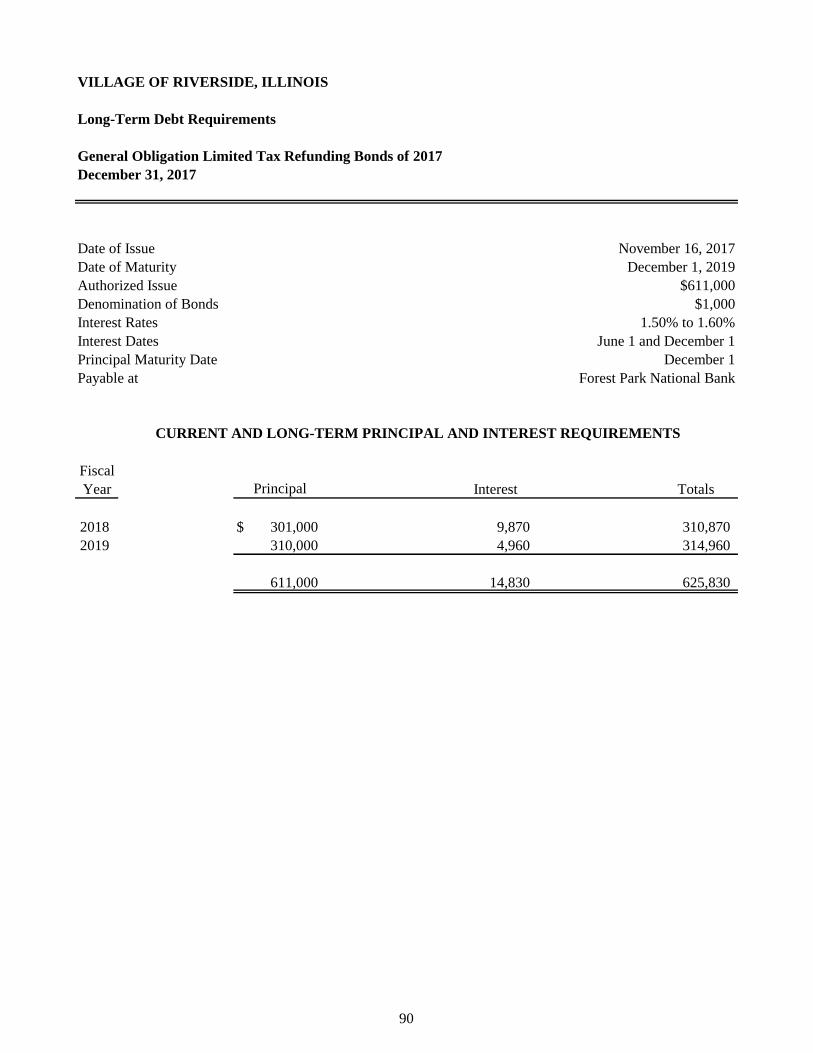
VILLAGE OF RIVERSIDE, ILLINOIS
Long-Term Debt Requirements
General Obligation Limited Tax Refunding Bonds of 2017
December 31, 2017
Date of Issue November 16, 2017
Date of Maturity December 1, 2019
Authorized Issue $611,000
Denomination of Bonds $1,000
Interest Rates 1.50% to 1.60%
Interest Dates June 1 and December 1
Principal Maturity Date December 1
Payable at Forest Park National Bank
Fiscal
Year Interest Totals
2018 $ 301,000 9,870 310,870
2019 310,000 4,960 314,960
611,000 14,830 625,830
CURRENT AND LONG-TERM PRINCIPAL AND INTEREST REQUIREMENTS
Principal
90

VILLAGE OF RIVERSIDE, ILLINOIS
Long-Term Debt Requirements
IEPA Loan #L17-4322 Payable of 2011
December 31, 2017
Date of Issue July 26, 2011
Date of Maturity November 11, 2030
Authorized Issue $1,531,293
Interest Rate Non-Interest
Interest Date Non-Interest
Principal Maturity Dates May 11 and November 11
Payable at Illinois Environmental Protection Agency
Fiscal
Year Interest Totals
2018 $ 80,664 - 80,664
2019 80,664 - 80,664
2020 80,664 - 80,664
2021 80,664 - 80,664
2022 80,664 - 80,664
2023 80,664 - 80,664
2024 80,664 - 80,664
2025 80,664 - 80,664
2026 80,664 - 80,664
2027 80,664 - 80,664
2028 80,664 - 80,664
2029 80,664 - 80,664
2030 80,659 - 80,659
1,048,627 - 1,048,627
CURRENT AND LONG-TERM PRINCIPAL AND INTEREST REQUIREMENTS
Principal
91
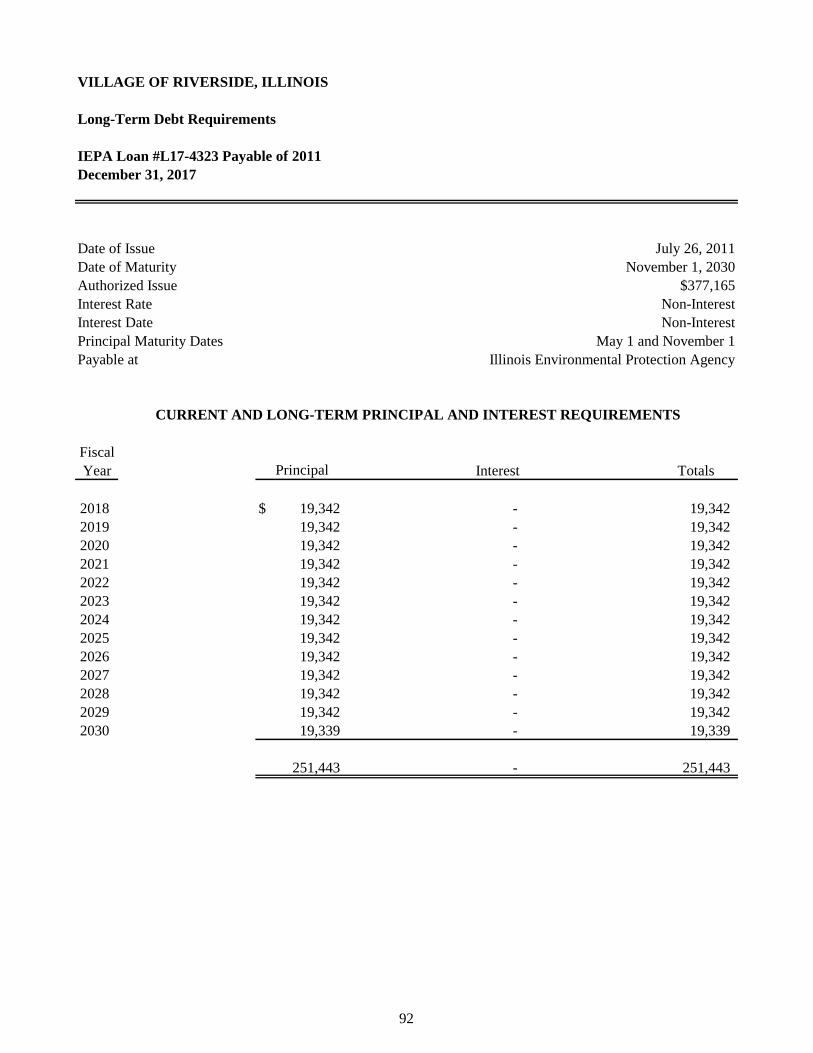
VILLAGE OF RIVERSIDE, ILLINOIS
Long-Term Debt Requirements
IEPA Loan #L17-4323 Payable of 2011
December 31, 2017
Date of Issue July 26, 2011
Date of Maturity November 1, 2030
Authorized Issue $377,165
Interest Rate Non-Interest
Interest Date Non-Interest
Principal Maturity Dates May 1 and November 1
Payable at Illinois Environmental Protection Agency
Fiscal
Year Interest Totals
2018 $ 19,342 - 19,342
2019 19,342 - 19,342
2020 19,342 - 19,342
2021 19,342 - 19,342
2022 19,342 - 19,342
2023 19,342 - 19,342
2024 19,342 - 19,342
2025 19,342 - 19,342
2026 19,342 - 19,342
2027 19,342 - 19,342
2028 19,342 - 19,342
2029 19,342 - 19,342
2030 19,339 - 19,339
251,443 - 251,443
CURRENT AND LONG-TERM PRINCIPAL AND INTEREST REQUIREMENTS
Principal
92
These schedules contain service and infrastructure data to help the reader understand how the information in the
Village’s financial report relates to the services the Village provides and the activities it performs.
These schedules contain trend information to help the reader understand how the Village’s financial
performance and well-being have changed over time.
STATISTICAL SECTION
(Unaudited)
This part of the comprehensive annual financial report presents detailed information as a context for
understanding what the information in the financial statements, note disclosures, and required supplementary
information says about the Village’s overall financial health.
Financial Trends
Operating Information
Revenue Capacity
These schedules contain information to help the reader assess the Village’s most significant local revenue
sources.
Debt Capacity
These schedules present information to help the reader assess the affordability of the Village’s current levels of
outstanding debt and the Village’s ability to issue additional debt in the future.
Demographic and Economic Information
These schedules offer demographic and economic indicators to help the reader understand the environment
within which the Village’s financial activities take place.

VILLAGE OF RIVERSIDE, ILLINOIS
Net Position by Component - Last Ten Fiscal Years
December 31, 2017 (Unaudited)
See Following Page
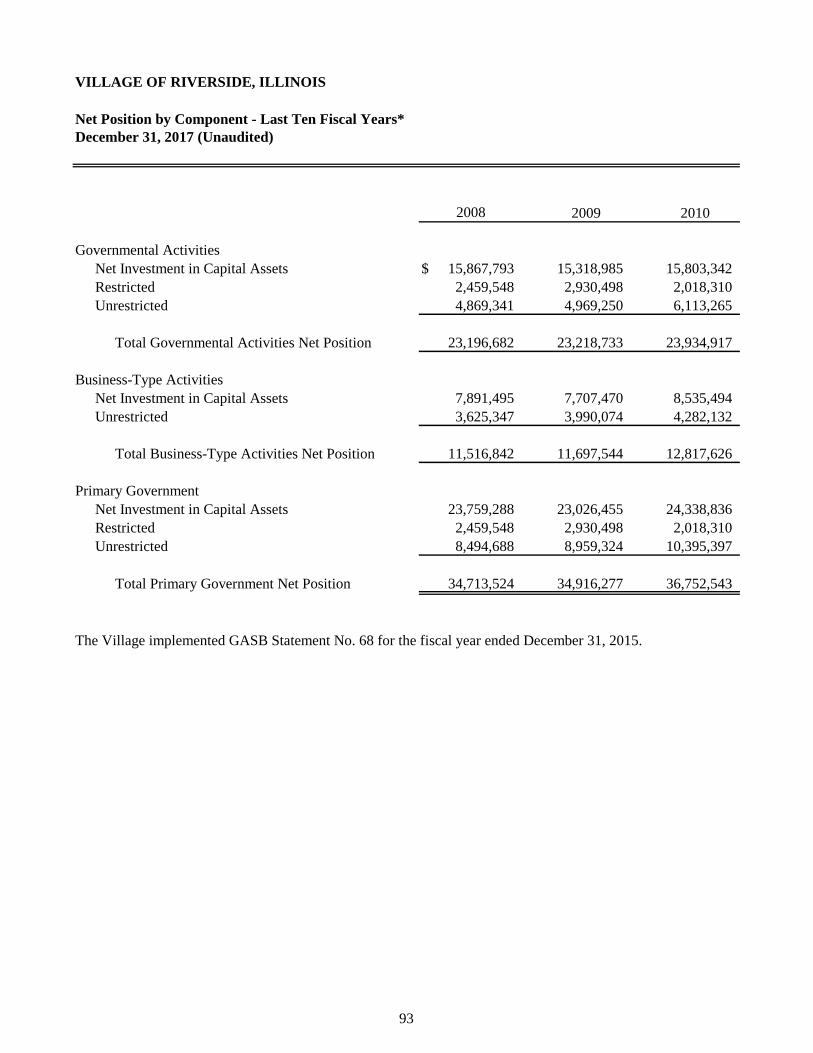
VILLAGE OF RIVERSIDE, ILLINOIS
Net Position by Component - Last Ten Fiscal Years*
2009 2010
Governmental Activities
Net Investment in Capital Assets $ 15,867,793 15,318,985 15,803,342
Restricted 2,459,548 2,930,498 2,018,310
Unrestricted 4,869,341 4,969,250 6,113,265
Total Governmental Activities Net Position 23,196,682 23,218,733 23,934,917
Business-Type Activities
Net Investment in Capital Assets 7,891,495 7,707,470 8,535,494
Unrestricted 3,625,347 3,990,074 4,282,132
Total Business-Type Activities Net Position 11,516,842 11,697,544 12,817,626
Primary Government
Net Investment in Capital Assets 23,759,288 23,026,455 24,338,836
Restricted 2,459,548 2,930,498 2,018,310
Unrestricted 8,494,688 8,959,324 10,395,397
Total Primary Government Net Position 34,713,524 34,916,277 36,752,543
The Village implemented GASB Statement No. 68 for the fiscal year ended December 31, 2015.
December 31, 2017 (Unaudited)
2008
93

2011 2012 2013 2014 2015 2016 2017
15,570,754 15,780,805 15,908,844 16,393,955 15,095,231 15,134,457 16,126,600
1,716,778 1,732,883 1,657,377 1,876,169 2,864,963 1,754,565 1,598,996
6,788,197 7,464,069 7,706,505 7,235,125 (12,330,232) (13,343,200) (14,935,659)
24,075,729 24,977,757 25,272,726 25,505,249 5,629,962 3,545,822 2,789,937
8,164,662 8,387,767 8,848,485 9,768,837 10,037,833 10,635,468 13,836,117
5,369,396 5,948,234 5,917,583 5,234,776 5,085,497 4,488,057 1,740,979
13,534,058 14,336,001 14,766,068 15,003,613 15,123,330 15,123,525 15,577,096
23,735,416 24,168,572 24,757,329 26,162,792 25,133,064 25,769,925 29,962,717
1,716,778 1,732,883 1,657,377 1,876,169 2,864,963 1,754,565 1,598,996
12,157,593 13,412,303 13,624,088 12,469,901 (7,244,735) (8,855,143) (13,194,680)
37,609,787 39,313,758 40,038,794 40,508,862 20,753,292 18,669,347 18,367,033
94
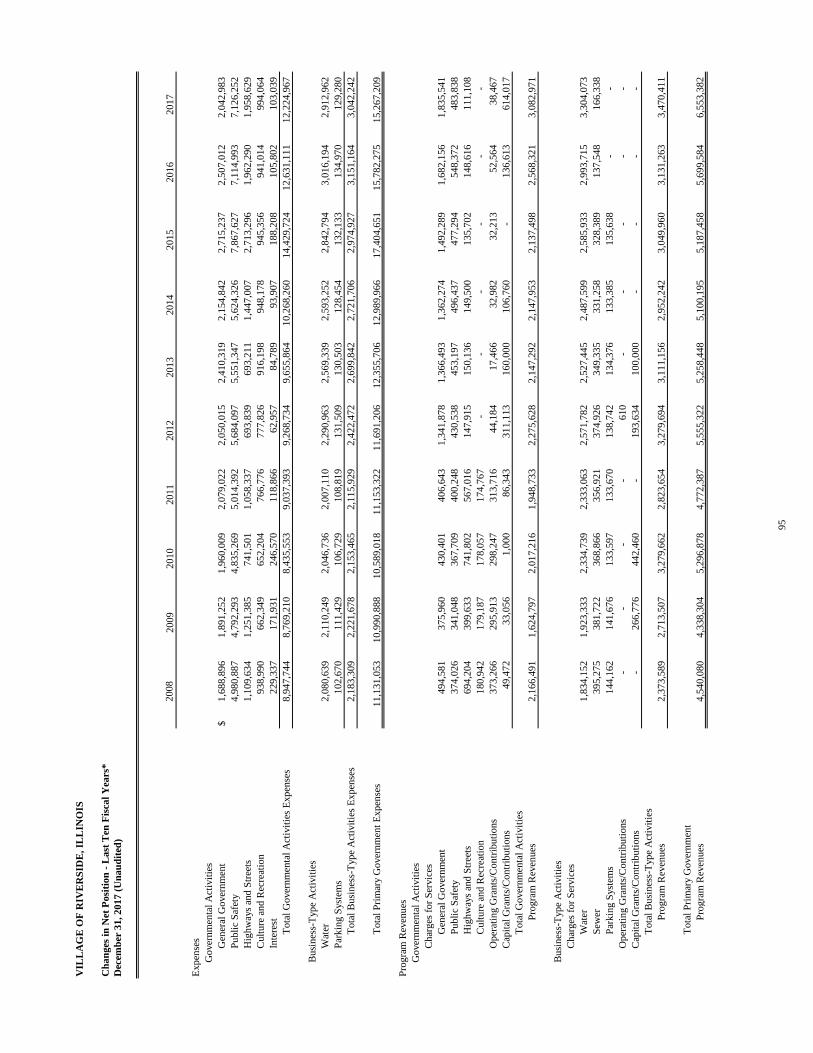
VIL
LA
GE
OF
RIV
ER
SID
E, IL
LIN
OIS
Ch
an
ges
in
Net
Posi
tion
- L
ast
Ten
Fis
cal
Yea
rs*
2009
2010
2011
2012
20
13
20
14
20
15
20
16
20
17
Expen
ses
Gover
nm
enta
l A
ctiv
itie
s
Gen
eral
Gover
nm
ent
$1,6
88,8
96
1,8
91,2
52
1,9
60,0
09
2,0
79,0
22
2,0
50,0
15
2,4
10
,31
9
2,1
54
,84
2
2
,71
5,2
37
2
,50
7,0
12
2
,04
2,9
83
Publi
c S
afet
y4,9
80,8
87
4,7
92,2
93
4,8
35,2
69
5,0
14,3
92
5,6
84,0
97
5,5
51
,34
7
5,6
24
,32
6
7
,86
7,6
27
7
,11
4,9
93
7
,12
6,2
52
Hig
hw
ays
and S
tree
ts1,1
09,6
34
1,2
51,3
85
741,5
01
1,0
58,3
37
693,8
39
69
3,2
11
1,4
47
,00
7
2
,71
3,2
96
1
,96
2,2
90
1
,95
8,6
29
Cult
ure
and R
ecre
atio
n938,9
90
662,3
49
652,2
04
766,7
76
777,8
26
91
6,1
98
94
8,1
78
94
5,3
56
94
1,0
14
99
4,0
64
Inte
rest
229,3
37
171,9
31
246,5
70
118,8
66
62,9
57
8
4,7
89
9
3,9
07
18
8,2
08
10
5,8
02
10
3,0
39
Tota
l G
over
nm
enta
l A
ctiv
itie
s E
xpen
ses
8,9
47,7
44
8,7
69,2
10
8,4
35,5
53
9,0
37,3
93
9,2
68,7
34
9,6
55
,86
4
10
,26
8,2
60
14
,42
9,7
24
1
2,6
31
,11
1
1
2,2
24
,96
7
Busi
nes
s-T
ype
Act
ivit
ies
Wat
er
2,0
80,6
39
2,1
10,2
49
2,0
46,7
36
2,0
07,1
10
2,2
90,9
63
2,5
69
,33
9
2,5
93
,25
2
2
,84
2,7
94
3
,01
6,1
94
2
,91
2,9
62
Par
kin
g S
yst
ems
102,6
70
111,4
29
106,7
29
108,8
19
131,5
09
13
0,5
03
12
8,4
54
13
2,1
33
13
4,9
70
12
9,2
80
Tota
l B
usi
nes
s-T
ype
Act
ivit
ies
Expen
ses
2,1
83,3
09
2,2
21,6
78
2,1
53,4
65
2,1
15,9
29
2,4
22,4
72
2,6
99
,84
2
2,7
21
,70
6
2
,97
4,9
27
3
,15
1,1
64
3
,04
2,2
42
Tota
l P
rim
ary G
over
nm
ent
Expen
ses
11,1
31,0
53
10,9
90,8
88
10,5
89,0
18
11,1
53,3
22
11,6
91,2
06
12,3
55
,70
6
12
,98
9,9
66
17
,40
4,6
51
1
5,7
82
,27
5
1
5,2
67
,20
9
Pro
gra
m R
even
ues
Gover
nm
enta
l A
ctiv
itie
s
Char
ges
for
Ser
vic
es
Gen
eral
Gover
nm
ent
494,5
81
375,9
60
430,4
01
406,6
43
1,3
41,8
78
1,3
66
,49
3
1,3
62
,27
4
1
,49
2,2
89
1
,68
2,1
56
1
,83
5,5
41
Publi
c S
afet
y374,0
26
341,0
48
367,7
09
400,2
48
430,5
38
45
3,1
97
49
6,4
37
47
7,2
94
54
8,3
72
48
3,8
38
Hig
hw
ays
and
Str
eets
694,2
04
399,6
33
741,8
02
567,0
16
147,9
15
15
0,1
36
14
9,5
00
13
5,7
02
14
8,6
16
11
1,1
08
Cult
ure
and R
ecre
atio
n180,9
42
179,1
87
178,0
57
174,7
67
-
-
-
-
-
-
Oper
atin
g G
rants
/Contr
ibuti
ons
373,2
66
295,9
13
298,2
47
313,7
16
44,1
84
1
7,4
66
3
2,9
82
32
,21
3
52
,56
4
38
,46
7
Cap
ital
Gra
nts
/Contr
ibuti
ons
49,4
72
33,0
56
1,0
00
86,3
43
311,1
13
16
0,0
00
10
6,7
60
-
1
36
,61
3
61
4,0
17
Tota
l G
over
nm
enta
l A
ctiv
itie
s
Pro
gra
m R
even
ues
2,1
66,4
91
1,6
24,7
97
2,0
17,2
16
1,9
48,7
33
2,2
75,6
28
2,1
47
,29
2
2,1
47
,95
3
2
,13
7,4
98
2
,56
8,3
21
3
,08
2,9
71
Busi
nes
s-T
ype
Act
ivit
ies
Char
ges
for
Ser
vic
es
Wat
er1,8
34,1
52
1,9
23,3
33
2,3
34,7
39
2,3
33,0
63
2,5
71,7
82
2,5
27
,44
5
2,4
87
,59
9
2
,58
5,9
33
2
,99
3,7
15
3
,30
4,0
73
Sew
er395,2
75
381,7
22
368,8
66
356,9
21
374,9
26
34
9,3
35
33
1,2
58
32
8,3
89
13
7,5
48
16
6,3
38
Par
kin
g S
yst
ems
144,1
62
141,6
76
133,5
97
133,6
70
138,7
42
13
4,3
76
13
3,3
85
13
5,6
38
-
-
Oper
atin
g G
rants
/Contr
ibuti
ons
-
-
-
-
610
-
-
-
-
-
Cap
ital
Gra
nts
/Contr
ibuti
ons
-
266,7
76
442,4
60
-
193,6
34
10
0,0
00
-
-
-
-
Tota
l B
usi
nes
s-T
ype
Act
ivit
ies
Pro
gra
m R
even
ues
2,3
73,5
89
2,7
13,5
07
3,2
79,6
62
2,8
23,6
54
3,2
79,6
94
3,1
11
,15
6
2,9
52
,24
2
3
,04
9,9
60
3
,13
1,2
63
3
,47
0,4
11
Tota
l P
rim
ary G
over
nm
ent
Pro
gra
m R
even
ues
4,5
40,0
80
4,3
38,3
04
5,2
96,8
78
4,7
72,3
87
5,5
55,3
22
5,2
58
,44
8
5,1
00
,19
5
5
,18
7,4
58
5
,69
9,5
84
6
,55
3,3
82
Dec
emb
er 3
1, 2017 (
Un
au
dit
ed)
2008
95
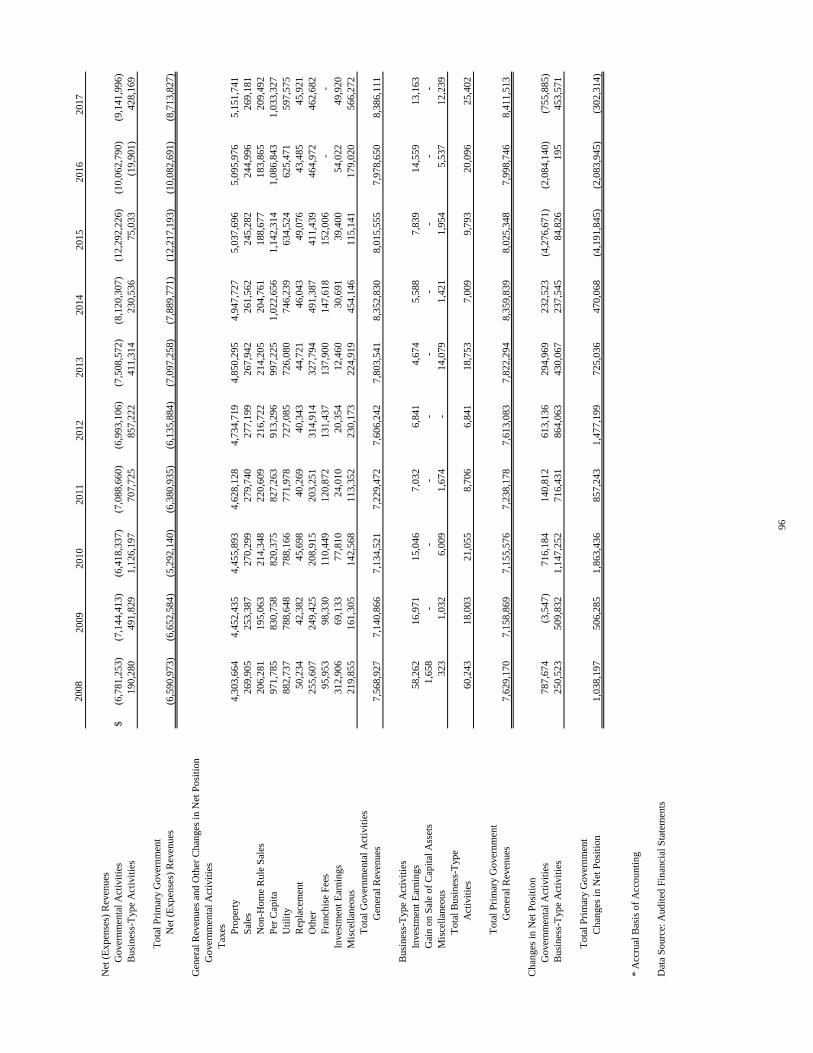
2009
2010
2011
2012
20
13
20
14
20
15
20
16
20
17
Net
(E
xpen
ses)
Rev
enues
Gover
nm
enta
l A
ctiv
itie
s$
(6,7
81,2
53)
(7,1
44,4
13)
(6,4
18,3
37)
(7,0
88,6
60)
(6,9
93,1
06)
(7,5
08
,57
2)
(8,1
20
,30
7)
(12
,29
2,2
26
)
(1
0,0
62
,79
0)
(9,1
41
,99
6)
Busi
nes
s-T
ype
Act
ivit
ies
190,2
80
491,8
29
1,1
26,1
97
707,7
25
857,2
22
41
1,3
14
23
0,5
36
75
,03
3
(19
,90
1)
42
8,1
69
Tota
l P
rim
ary G
over
nm
ent
Net
(E
xpen
ses)
Rev
enues
(6,5
90,9
73)
(6,6
52,5
84)
(5,2
92,1
40)
(6,3
80,9
35)
(6,1
35,8
84)
(7,0
97
,25
8)
(7,8
89
,77
1)
(12
,21
7,1
93
)
(1
0,0
82
,69
1)
(8,7
13
,82
7)
Gen
eral
Rev
enues
and O
ther
Chan
ges
in N
et P
osi
tion
Gover
nm
enta
l A
ctiv
itie
s
Tax
es Pro
per
ty4,3
03,6
64
4,4
52,4
35
4,4
55,8
93
4,6
28,1
28
4,7
34,7
19
4,8
50
,29
5
4,9
47
,72
7
5
,03
7,6
96
5
,09
5,9
76
5
,15
1,7
41
Sal
es269,9
05
253,3
87
270,2
99
279,7
40
277,1
99
26
7,9
42
26
1,5
62
24
5,2
82
24
4,9
96
26
9,1
81
Non-H
om
e R
ule
Sal
es206,2
81
195,0
63
214,3
48
220,6
09
216,7
22
21
4,2
05
20
4,7
61
18
8,6
77
18
3,8
65
20
9,4
92
Per
Cap
ita
971,7
85
830,7
58
820,3
75
827,2
63
913,2
96
99
7,2
25
1,0
22
,65
6
1
,14
2,3
14
1
,08
6,8
43
1
,03
3,3
27
Uti
lity
882,7
37
788,6
48
788,1
66
771,9
78
727,0
85
72
6,0
80
74
6,2
39
63
4,5
24
62
5,4
71
59
7,5
75
Rep
lace
men
t 50,2
34
42,3
82
45,6
98
40,2
69
40,3
43
4
4,7
21
4
6,0
43
49
,07
6
43
,48
5
45
,92
1
Oth
er255,6
07
249,4
25
208,9
15
203,2
51
314,9
14
32
7,7
94
49
1,3
87
41
1,4
39
46
4,9
72
46
2,6
82
Fra
nch
ise
Fee
s95,9
53
98,3
30
110,4
49
120,8
72
131,4
37
13
7,9
00
14
7,6
18
15
2,0
06
-
-
Inves
tmen
t E
arnin
gs
312,9
06
69,1
33
77,8
10
24,0
10
20,3
54
1
2,4
60
3
0,6
91
39
,40
0
54
,02
2
49
,92
0
Mis
cell
aneo
us
219,8
55
161,3
05
142,5
68
113,3
52
230,1
73
22
4,9
19
45
4,1
46
11
5,1
41
17
9,0
20
56
6,2
72
Tota
l G
over
nm
enta
l A
ctiv
itie
s
Gen
eral
Rev
enues
7,5
68,9
27
7,1
40,8
66
7,1
34,5
21
7,2
29,4
72
7,6
06,2
42
7,8
03
,54
1
8,3
52
,83
0
8
,01
5,5
55
7
,97
8,6
50
8
,38
6,1
11
Busi
nes
s-T
ype
Act
ivit
ies
Inves
tmen
t E
arnin
gs
58,2
62
16,9
71
15,0
46
7,0
32
6,8
41
4,6
74
5,5
88
7,8
39
14
,55
9
13
,16
3
Gai
n o
n S
ale
of
Cap
ital
Ass
ets
1,6
58
-
-
-
-
-
-
-
-
-
Mis
cell
aneo
us
323
1,0
32
6,0
09
1,6
74
-
1
4,0
79
1
,42
1
1,9
54
5,5
37
12
,23
9
Tota
l B
usi
nes
s-T
ype
Act
ivit
ies
60,2
43
18,0
03
21,0
55
8,7
06
6,8
41
18
,75
3
7,0
09
9,7
93
20
,09
6
25
,40
2
Tota
l P
rim
ary G
over
nm
ent
Gen
eral
Rev
enues
7,6
29,1
70
7,1
58,8
69
7,1
55,5
76
7,2
38,1
78
7,6
13,0
83
7,8
22
,29
4
8,3
59
,83
9
8
,02
5,3
48
7
,99
8,7
46
8
,41
1,5
13
Ch
anges
in N
et P
osi
tion
Gover
nm
enta
l A
ctiv
itie
s787,6
74
(3,5
47)
716,1
84
140,8
12
613,1
36
29
4,9
69
23
2,5
23
(4,2
76
,67
1)
(2
,08
4,1
40
)
(7
55
,88
5)
Busi
nes
s-T
ype
Act
ivit
ies
250,5
23
509,8
32
1,1
47,2
52
716,4
31
864,0
63
43
0,0
67
23
7,5
45
84
,82
6
19
5
4
53
,57
1
Tota
l P
rim
ary G
over
nm
ent
Chan
ges
in N
et P
osi
tion
1,0
38,1
97
506,2
85
1,8
63,4
36
857,2
43
1,4
77,1
99
72
5,0
36
47
0,0
68
(4,1
91
,84
5)
(2
,08
3,9
45
)
(3
02
,31
4)
* A
ccru
al B
asis
of
Acc
ounti
ng
Dat
a S
ourc
e: A
udit
ed F
inan
cial
Sta
tem
ents
2008
96

VILLAGE OF RIVERSIDE, ILLINOIS
Fund Balances of Governmental Funds - Last Ten Fiscal Years*
2009 2010
General Fund
Reserved $ 659,462 - -
Unreserved 3,524,407 - -
Nonspendable - 43,000 -
Restricted - 287,378 251,736
Committed - - -
Assigned - 2,048,385 2,269,943
Unassigned - 3,085,489 3,327,184
Total General Fund 4,183,869 5,464,252 5,848,863
All Other Governmental Funds
Reserved 1,095,736 1,281,977 1,407,060
Unreserved, Reported in,
Special Revenue Funds (36,829) - (60,410)
Capital Projects Funds 1,802,253 - -
Nonspendable 827,784 - 150,320
Restricted - - -
Assigned - 1,386,740 1,093,838
Unassigned - - -
Total All Other Governmental Funds 3,688,944 2,668,717 2,590,808
Total Governmental Funds 7,872,813 8,132,969 8,439,671
* Modified Accrual Basis of Accounting
Data Source: Audited Financial Statements
The Village implemented GASB No. 54 for the fiscal year ended December 31, 2009.
December 31, 2017 (Unaudited)
2008
97
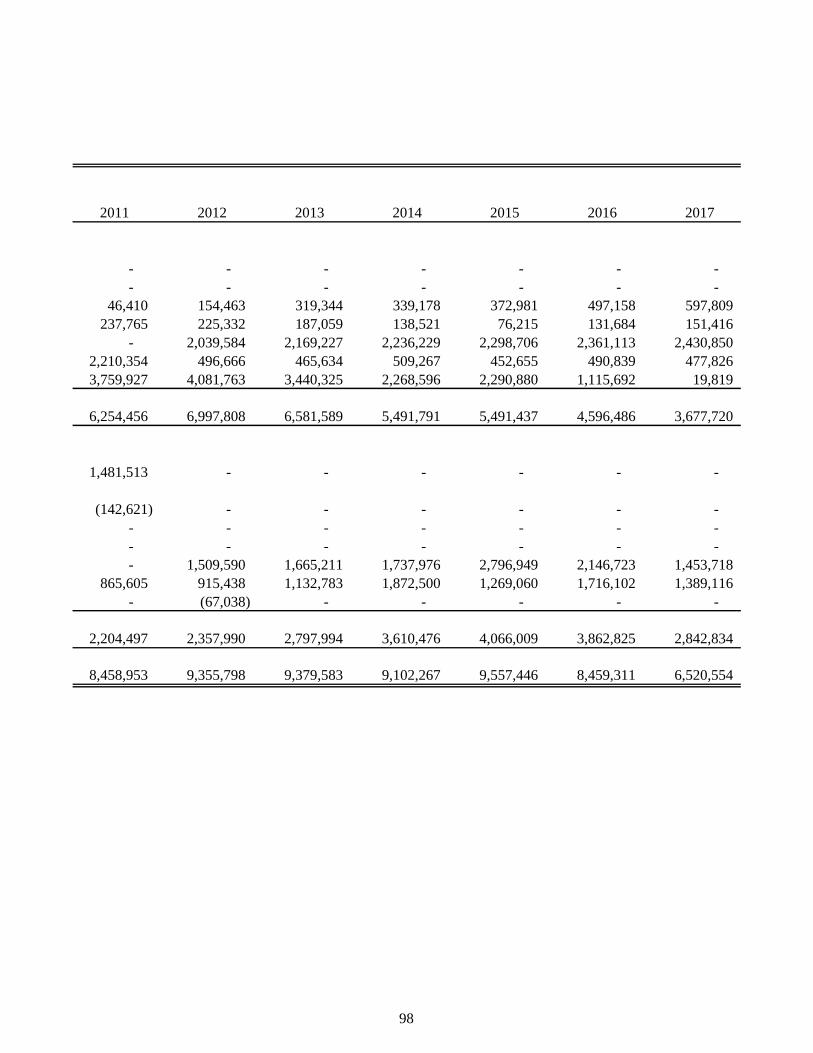
2011 2012 2013 2014 2015 2016 2017
- - - - - - -
- - - - - - -
46,410 154,463 319,344 339,178 372,981 497,158 597,809
237,765 225,332 187,059 138,521 76,215 131,684 151,416
- 2,039,584 2,169,227 2,236,229 2,298,706 2,361,113 2,430,850
2,210,354 496,666 465,634 509,267 452,655 490,839 477,826
3,759,927 4,081,763 3,440,325 2,268,596 2,290,880 1,115,692 19,819
6,254,456 6,997,808 6,581,589 5,491,791 5,491,437 4,596,486 3,677,720
1,481,513 - - - - - -
(142,621) - - - - - -
- - - - - - -
- - - - - - -
- 1,509,590 1,665,211 1,737,976 2,796,949 2,146,723 1,453,718
865,605 915,438 1,132,783 1,872,500 1,269,060 1,716,102 1,389,116
- (67,038) - - - - -
2,204,497 2,357,990 2,797,994 3,610,476 4,066,009 3,862,825 2,842,834
8,458,953 9,355,798 9,379,583 9,102,267 9,557,446 8,459,311 6,520,554
98
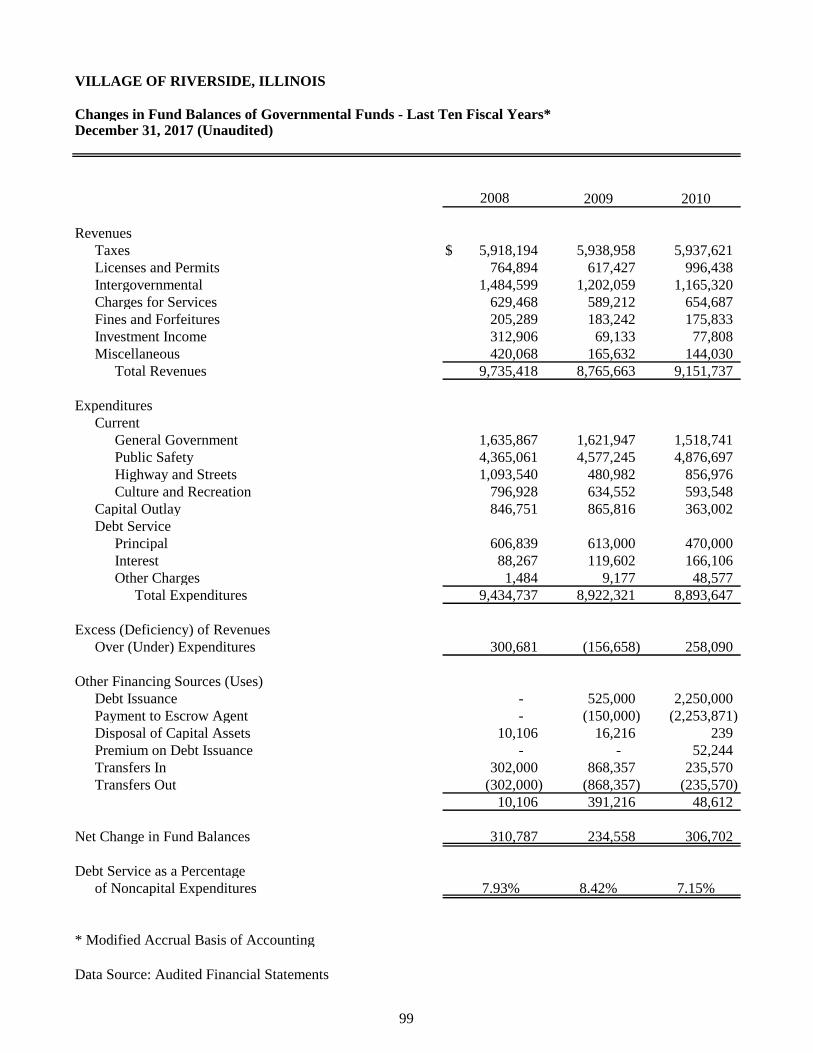
VILLAGE OF RIVERSIDE, ILLINOIS
Changes in Fund Balances of Governmental Funds - Last Ten Fiscal Years*
2009 2010
Revenues
Taxes $ 5,918,194 5,938,958 5,937,621
Licenses and Permits 764,894 617,427 996,438
Intergovernmental 1,484,599 1,202,059 1,165,320
Charges for Services 629,468 589,212 654,687
Fines and Forfeitures 205,289 183,242 175,833
Investment Income 312,906 69,133 77,808
Miscellaneous 420,068 165,632 144,030
Total Revenues 9,735,418 8,765,663 9,151,737
Expenditures
Current
General Government 1,635,867 1,621,947 1,518,741
Public Safety 4,365,061 4,577,245 4,876,697
Highway and Streets 1,093,540 480,982 856,976
Culture and Recreation 796,928 634,552 593,548
Capital Outlay 846,751 865,816 363,002
Debt Service
Principal 606,839 613,000 470,000
Interest 88,267 119,602 166,106
Other Charges 1,484 9,177 48,577
Total Expenditures 9,434,737 8,922,321 8,893,647
Excess (Deficiency) of Revenues
Over (Under) Expenditures 300,681 (156,658) 258,090
Other Financing Sources (Uses)
Debt Issuance - 525,000 2,250,000
Payment to Escrow Agent - (150,000) (2,253,871)
Disposal of Capital Assets 10,106 16,216 239
Premium on Debt Issuance - - 52,244
Transfers In 302,000 868,357 235,570
Transfers Out (302,000) (868,357) (235,570)
10,106 391,216 48,612
Net Change in Fund Balances 310,787 234,558 306,702
Debt Service as a Percentage
of Noncapital Expenditures 7.93% 8.42% 7.15%
* Modified Accrual Basis of Accounting
Data Source: Audited Financial Statements
December 31, 2017 (Unaudited)
2008
99
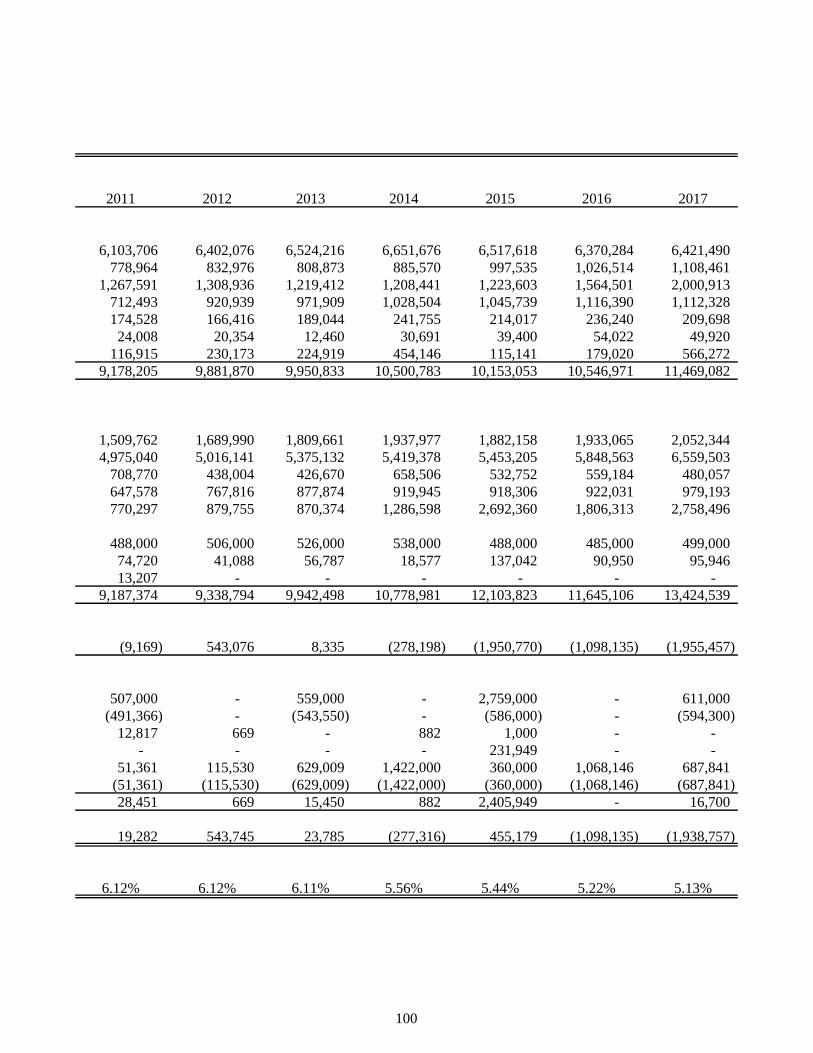
2011 2012 2013 2014 2015 2016 2017
6,103,706 6,402,076 6,524,216 6,651,676 6,517,618 6,370,284 6,421,490
778,964 832,976 808,873 885,570 997,535 1,026,514 1,108,461
1,267,591 1,308,936 1,219,412 1,208,441 1,223,603 1,564,501 2,000,913
712,493 920,939 971,909 1,028,504 1,045,739 1,116,390 1,112,328
174,528 166,416 189,044 241,755 214,017 236,240 209,698
24,008 20,354 12,460 30,691 39,400 54,022 49,920
116,915 230,173 224,919 454,146 115,141 179,020 566,272
9,178,205 9,881,870 9,950,833 10,500,783 10,153,053 10,546,971 11,469,082
1,509,762 1,689,990 1,809,661 1,937,977 1,882,158 1,933,065 2,052,344
4,975,040 5,016,141 5,375,132 5,419,378 5,453,205 5,848,563 6,559,503
708,770 438,004 426,670 658,506 532,752 559,184 480,057
647,578 767,816 877,874 919,945 918,306 922,031 979,193
770,297 879,755 870,374 1,286,598 2,692,360 1,806,313 2,758,496
488,000 506,000 526,000 538,000 488,000 485,000 499,000
74,720 41,088 56,787 18,577 137,042 90,950 95,946
13,207 - - - - - -
9,187,374 9,338,794 9,942,498 10,778,981 12,103,823 11,645,106 13,424,539
(9,169) 543,076 8,335 (278,198) (1,950,770) (1,098,135) (1,955,457)
507,000 - 559,000 - 2,759,000 - 611,000
(491,366) - (543,550) - (586,000) - (594,300)
12,817 669 - 882 1,000 - -
- - - - 231,949 - -
51,361 115,530 629,009 1,422,000 360,000 1,068,146 687,841
(51,361) (115,530) (629,009) (1,422,000) (360,000) (1,068,146) (687,841)
28,451 669 15,450 882 2,405,949 - 16,700
19,282 543,745 23,785 (277,316) 455,179 (1,098,135) (1,938,757)
6.12% 6.12% 6.11% 5.56% 5.44% 5.22% 5.13%
100
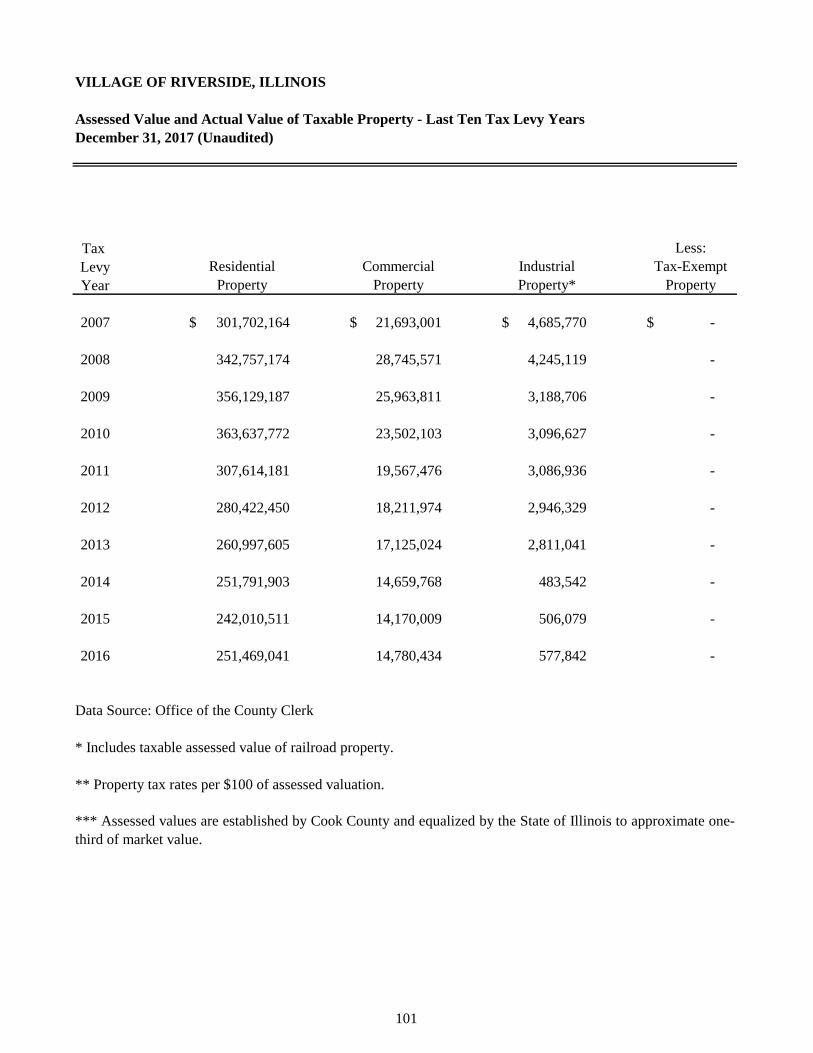
VILLAGE OF RIVERSIDE, ILLINOIS
Assessed Value and Actual Value of Taxable Property - Last Ten Tax Levy Years
December 31, 2017 (Unaudited)
Tax
Levy
Year
2007 $ 301,702,164 $ 21,693,001 $ 4,685,770 $ -
2008 342,757,174 28,745,571 4,245,119 -
2009 356,129,187 25,963,811 3,188,706 -
2010 363,637,772 23,502,103 3,096,627 -
2011 307,614,181 19,567,476 3,086,936 -
2012 280,422,450 18,211,974 2,946,329 -
2013 260,997,605 17,125,024 2,811,041 -
2014 251,791,903 14,659,768 483,542 -
2015 242,010,511 14,170,009 506,079 -
2016 251,469,041 14,780,434 577,842 -
Data Source: Office of the County Clerk
* Includes taxable assessed value of railroad property.
** Property tax rates per $100 of assessed valuation.
Less:
*** Assessed values are established by Cook County and equalized by the State of Illinois to approximate one-
third of market value.
Property Property Property* Property
Residential Commercial Industrial Tax-Exempt
101
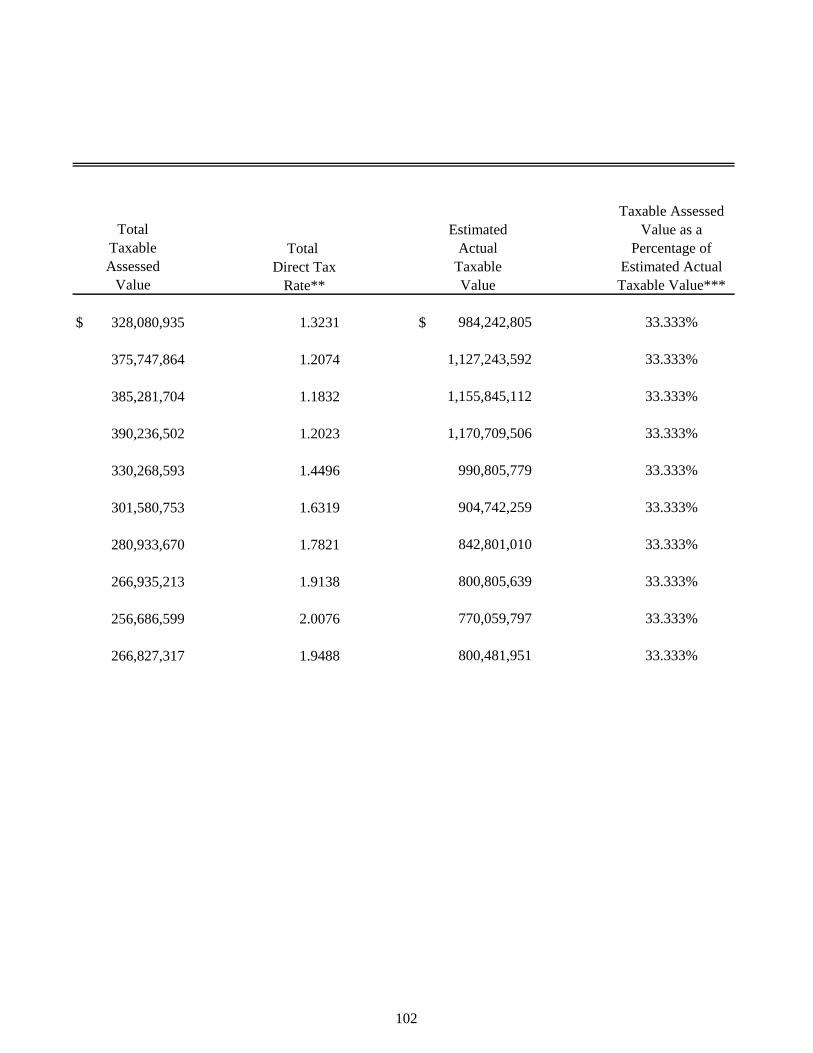
Taxable Assessed
Value as a
Total Percentage of
Direct Tax Estimated Actual
Rate** Taxable Value***
$ 328,080,935 1.3231 $ 984,242,805 33.333%
375,747,864 1.2074 1,127,243,592 33.333%
385,281,704 1.1832 1,155,845,112 33.333%
390,236,502 1.2023 1,170,709,506 33.333%
330,268,593 1.4496 990,805,779 33.333%
301,580,753 1.6319 904,742,259 33.333%
280,933,670 1.7821 842,801,010 33.333%
266,935,213 1.9138 800,805,639 33.333%
256,686,599 2.0076 770,059,797 33.333%
266,827,317 1.9488 800,481,951 33.333%
Total Estimated
Taxable Actual
Taxable
Value Value
Assessed
102
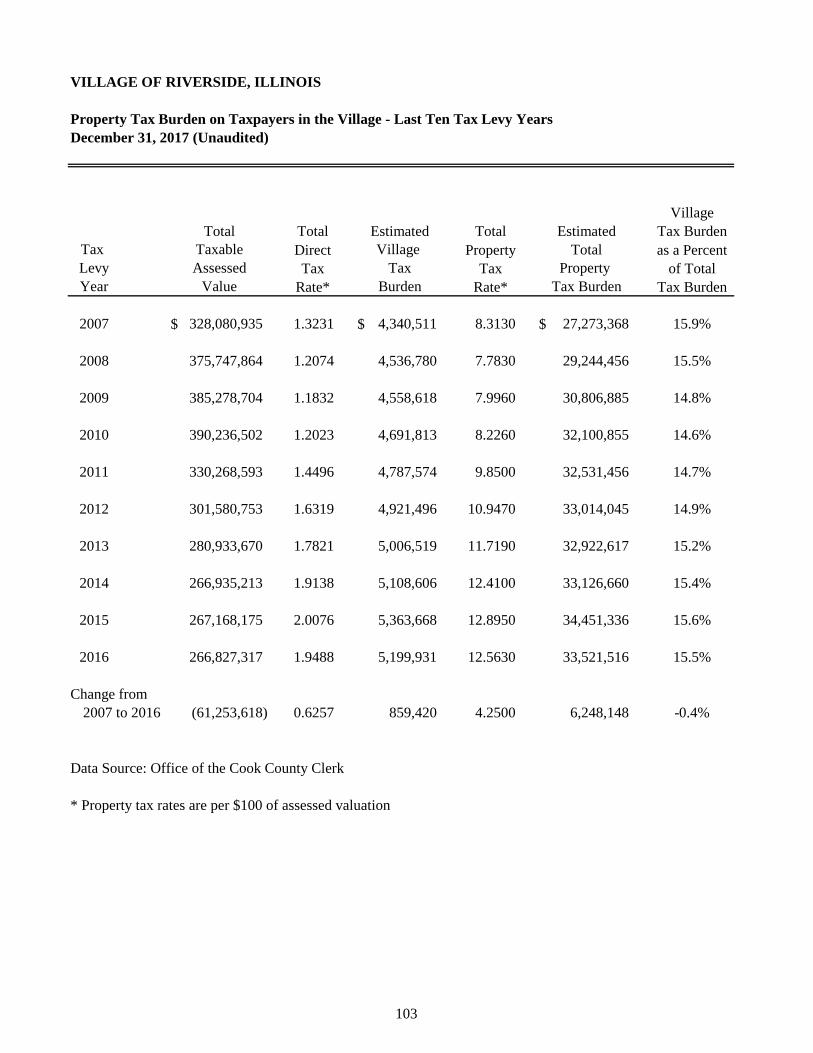
VILLAGE OF RIVERSIDE, ILLINOIS
Property Tax Burden on Taxpayers in the Village - Last Ten Tax Levy Years
December 31, 2017 (Unaudited)
Village
Total Total Tax Burden
Direct Property as a Percent
Tax Tax of Total
Rate* Rate* Tax Burden
$ 328,080,935 1.3231 $ 4,340,511 8.3130 $ 27,273,368 15.9%
375,747,864 1.2074 4,536,780 7.7830 29,244,456 15.5%
385,278,704 1.1832 4,558,618 7.9960 30,806,885 14.8%
390,236,502 1.2023 4,691,813 8.2260 32,100,855 14.6%
330,268,593 1.4496 4,787,574 9.8500 32,531,456 14.7%
301,580,753 1.6319 4,921,496 10.9470 33,014,045 14.9%
280,933,670 1.7821 5,006,519 11.7190 32,922,617 15.2%
266,935,213 1.9138 5,108,606 12.4100 33,126,660 15.4%
267,168,175 2.0076 5,363,668 12.8950 34,451,336 15.6%
266,827,317 1.9488 5,199,931 12.5630 33,521,516 15.5%
Change from
2007 to 2016 (61,253,618) 0.6257 859,420 4.2500 6,248,148 -0.4%
Data Source: Office of the Cook County Clerk
* Property tax rates are per $100 of assessed valuation
2015
2016
Total Estimated Estimated
Tax Taxable Village Total
Tax Property
Year Value Burden Tax Burden
2007
Levy Assessed
2014
2008
2009
2010
2011
2012
2013
103
VILLAGE OF RIVERSIDE, ILLINOIS
Direct and Overlapping Property Tax Rates - Last Ten Tax Levy Years
December 31, 2017 (Unaudited)
See Following Page
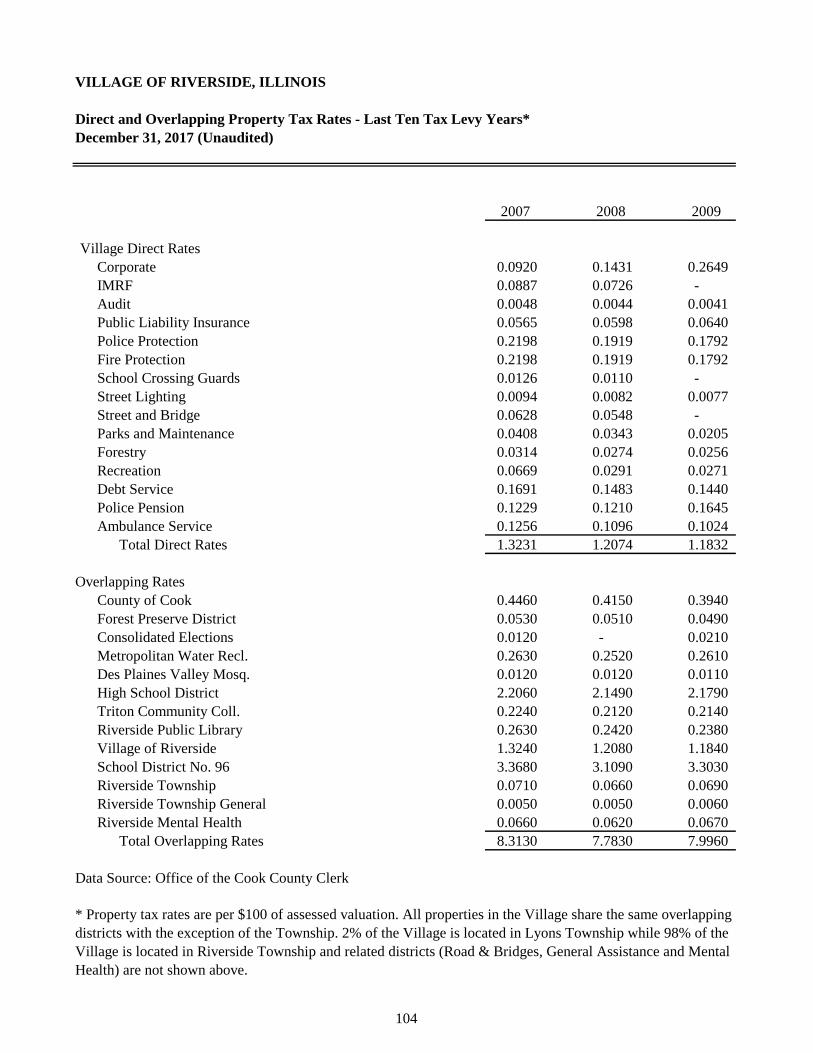
VILLAGE OF RIVERSIDE, ILLINOIS
Direct and Overlapping Property Tax Rates - Last Ten Tax Levy Years*
December 31, 2017 (Unaudited)
2007 2008 2009
Village Direct Rates
Corporate 0.0920 0.1431 0.2649
IMRF 0.0887 0.0726 -
Audit 0.0048 0.0044 0.0041
Public Liability Insurance 0.0565 0.0598 0.0640
Police Protection 0.2198 0.1919 0.1792
Fire Protection 0.2198 0.1919 0.1792
School Crossing Guards 0.0126 0.0110 -
Street Lighting 0.0094 0.0082 0.0077
Street and Bridge 0.0628 0.0548 -
Parks and Maintenance 0.0408 0.0343 0.0205
Forestry 0.0314 0.0274 0.0256
Recreation 0.0669 0.0291 0.0271
Debt Service 0.1691 0.1483 0.1440
Police Pension 0.1229 0.1210 0.1645
Ambulance Service 0.1256 0.1096 0.1024
Total Direct Rates 1.3231 1.2074 1.1832
Overlapping Rates
County of Cook 0.4460 0.4150 0.3940
Forest Preserve District 0.0530 0.0510 0.0490
Consolidated Elections 0.0120 - 0.0210
Metropolitan Water Recl. 0.2630 0.2520 0.2610
Des Plaines Valley Mosq. 0.0120 0.0120 0.0110
High School District 2.2060 2.1490 2.1790
Triton Community Coll. 0.2240 0.2120 0.2140
Riverside Public Library 0.2630 0.2420 0.2380
Village of Riverside 1.3240 1.2080 1.1840
School District No. 96 3.3680 3.1090 3.3030
Riverside Township 0.0710 0.0660 0.0690
Riverside Township General 0.0050 0.0050 0.0060
Riverside Mental Health 0.0660 0.0620 0.0670
Total Overlapping Rates 8.3130 7.7830 7.9960
Data Source: Office of the Cook County Clerk
* Property tax rates are per $100 of assessed valuation. All properties in the Village share the same overlapping
districts with the exception of the Township. 2% of the Village is located in Lyons Township while 98% of the
Village is located in Riverside Township and related districts (Road & Bridges, General Assistance and Mental
Health) are not shown above.
104
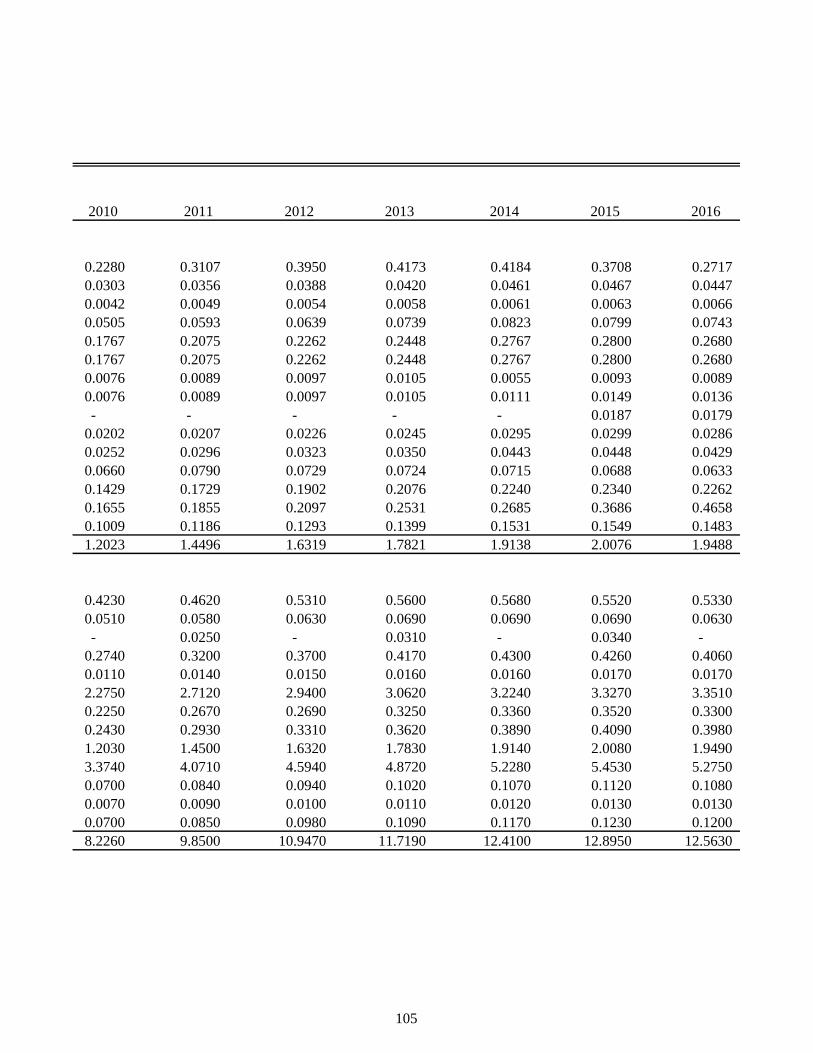
2010 2011 2012 2013 2014 2015 2016
0.2280 0.3107 0.3950 0.4173 0.4184 0.3708 0.2717
0.0303 0.0356 0.0388 0.0420 0.0461 0.0467 0.0447
0.0042 0.0049 0.0054 0.0058 0.0061 0.0063 0.0066
0.0505 0.0593 0.0639 0.0739 0.0823 0.0799 0.0743
0.1767 0.2075 0.2262 0.2448 0.2767 0.2800 0.2680
0.1767 0.2075 0.2262 0.2448 0.2767 0.2800 0.2680
0.0076 0.0089 0.0097 0.0105 0.0055 0.0093 0.0089
0.0076 0.0089 0.0097 0.0105 0.0111 0.0149 0.0136
- - - - - 0.0187 0.0179
0.0202 0.0207 0.0226 0.0245 0.0295 0.0299 0.0286
0.0252 0.0296 0.0323 0.0350 0.0443 0.0448 0.0429
0.0660 0.0790 0.0729 0.0724 0.0715 0.0688 0.0633
0.1429 0.1729 0.1902 0.2076 0.2240 0.2340 0.2262
0.1655 0.1855 0.2097 0.2531 0.2685 0.3686 0.4658
0.1009 0.1186 0.1293 0.1399 0.1531 0.1549 0.1483
1.2023 1.4496 1.6319 1.7821 1.9138 2.0076 1.9488
0.4230 0.4620 0.5310 0.5600 0.5680 0.5520 0.5330
0.0510 0.0580 0.0630 0.0690 0.0690 0.0690 0.0630
- 0.0250 - 0.0310 - 0.0340 -
0.2740 0.3200 0.3700 0.4170 0.4300 0.4260 0.4060
0.0110 0.0140 0.0150 0.0160 0.0160 0.0170 0.0170
2.2750 2.7120 2.9400 3.0620 3.2240 3.3270 3.3510
0.2250 0.2670 0.2690 0.3250 0.3360 0.3520 0.3300
0.2430 0.2930 0.3310 0.3620 0.3890 0.4090 0.3980
1.2030 1.4500 1.6320 1.7830 1.9140 2.0080 1.9490
3.3740 4.0710 4.5940 4.8720 5.2280 5.4530 5.2750
0.0700 0.0840 0.0940 0.1020 0.1070 0.1120 0.1080
0.0070 0.0090 0.0100 0.0110 0.0120 0.0130 0.0130
0.0700 0.0850 0.0980 0.1090 0.1170 0.1230 0.1200
8.2260 9.8500 10.9470 11.7190 12.4100 12.8950 12.5630
105
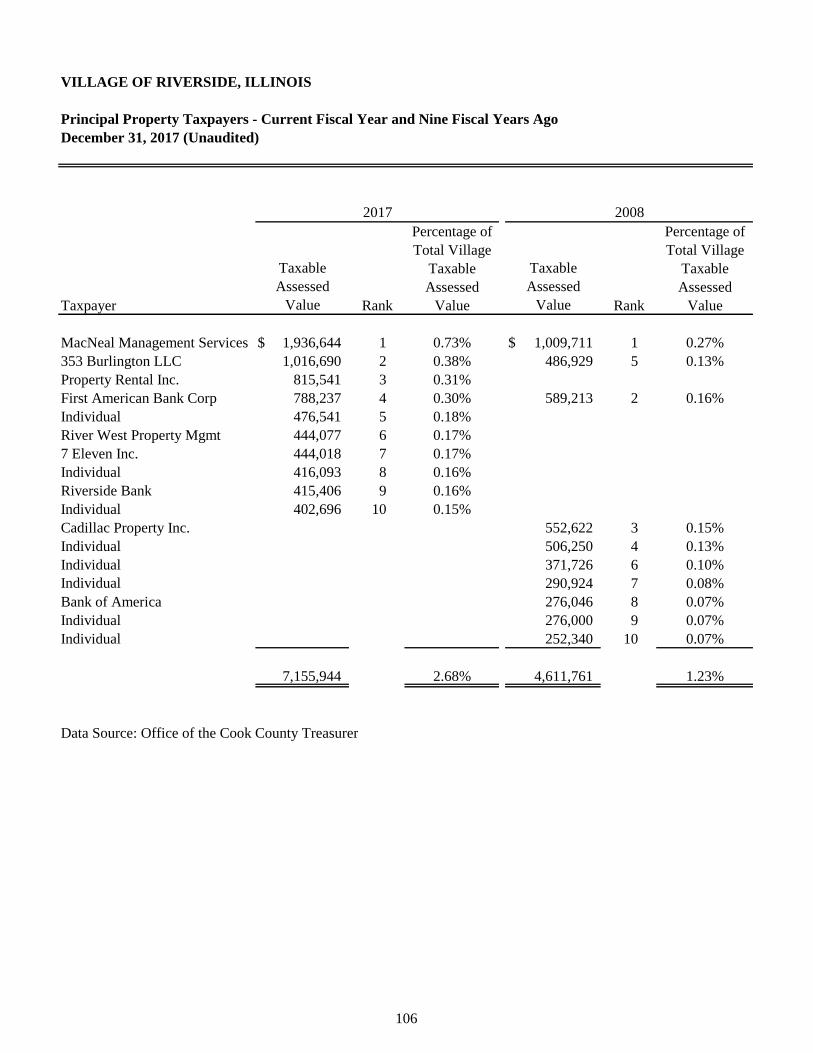
VILLAGE OF RIVERSIDE, ILLINOIS
Principal Property Taxpayers - Current Fiscal Year and Nine Fiscal Years Ago
December 31, 2017 (Unaudited)
Percentage of Percentage of
Total Village Total Village
Taxable Taxable
Assessed Assessed
Taxpayer Rank Value Rank Value
MacNeal Management Services $ 1,936,644 1 0.73% $ 1,009,711 1 0.27%
353 Burlington LLC 1,016,690 2 0.38% 486,929 5 0.13%
Property Rental Inc. 815,541 3 0.31%
First American Bank Corp 788,237 4 0.30% 589,213 2 0.16%
Individual 476,541 5 0.18%
River West Property Mgmt 444,077 6 0.17%
7 Eleven Inc. 444,018 7 0.17%
Individual 416,093 8 0.16%
Riverside Bank 415,406 9 0.16%
Individual 402,696 10 0.15%
Cadillac Property Inc. 552,622 3 0.15%
Individual 506,250 4 0.13%
Individual 371,726 6 0.10%
Individual 290,924 7 0.08%
Bank of America 276,046 8 0.07%
Individual 276,000 9 0.07%
Individual 252,340 10 0.07%
7,155,944 2.68% 4,611,761 1.23%
Data Source: Office of the Cook County Treasurer
Value Value
2017 2008
Taxable Taxable
Assessed Assessed
106
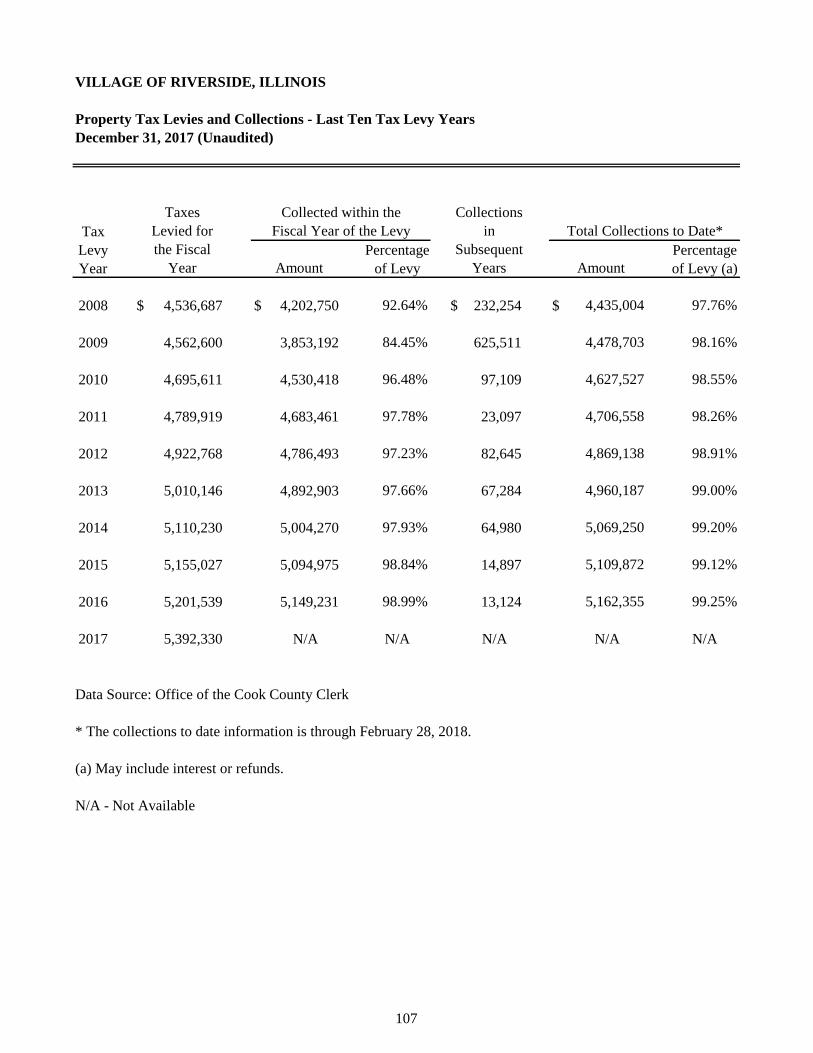
VILLAGE OF RIVERSIDE, ILLINOIS
Property Tax Levies and Collections - Last Ten Tax Levy Years
December 31, 2017 (Unaudited)
Tax
Levy Percentage Percentage
Year of Levy of Levy (a)
2008 $ 4,536,687 $ 4,202,750 92.64% $ 232,254 $ 4,435,004 97.76%
2009 4,562,600 3,853,192 84.45% 625,511 4,478,703 98.16%
2010 4,695,611 4,530,418 96.48% 97,109 4,627,527 98.55%
2011 4,789,919 4,683,461 97.78% 23,097 4,706,558 98.26%
2012 4,922,768 4,786,493 97.23% 82,645 4,869,138 98.91%
2013 5,010,146 4,892,903 97.66% 67,284 4,960,187 99.00%
2014 5,110,230 5,004,270 97.93% 64,980 5,069,250 99.20%
2015 5,155,027 5,094,975 98.84% 14,897 5,109,872 99.12%
2016 5,201,539 5,149,231 98.99% 13,124 5,162,355 99.25%
2017 5,392,330 N/A N/A N/A N/A N/A
Data Source: Office of the Cook County Clerk
* The collections to date information is through February 28, 2018.
(a) May include interest or refunds.
N/A - Not Available
Taxes Collected within the Collections
Levied for Fiscal Year of the Levy in Total Collections to Date*
the Fiscal Subsequent
Year Amount Years Amount
107
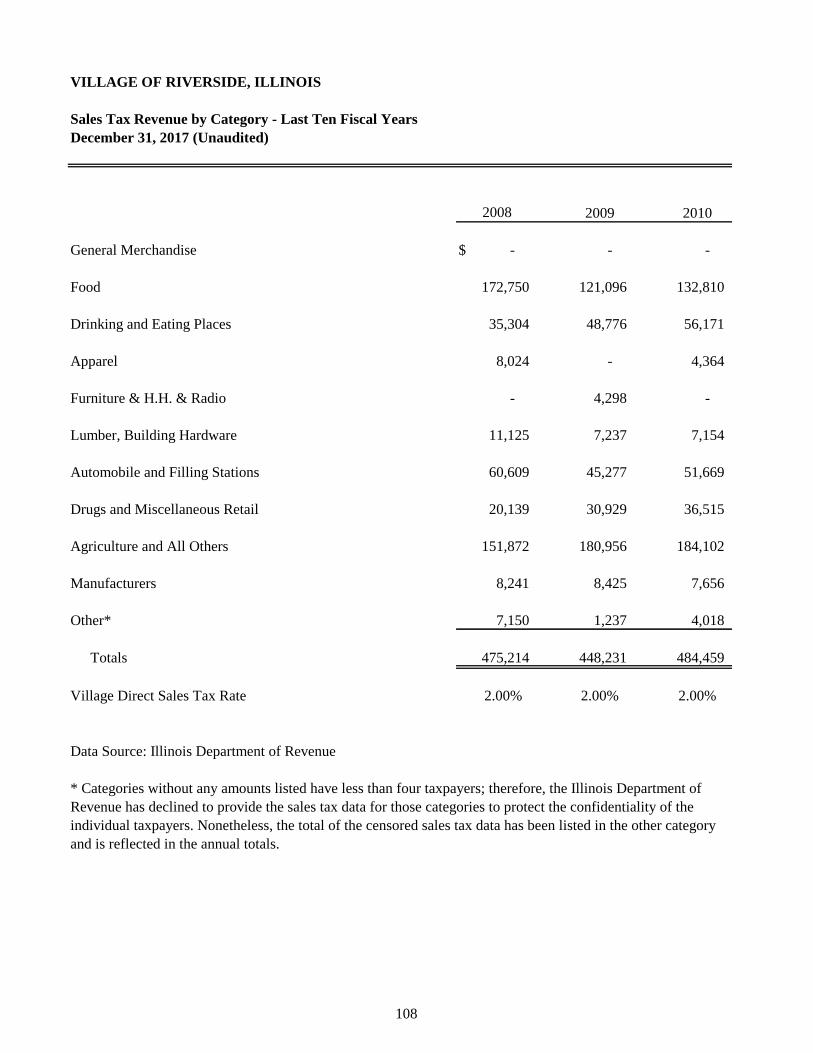
VILLAGE OF RIVERSIDE, ILLINOIS
Sales Tax Revenue by Category - Last Ten Fiscal Years
December 31, 2017 (Unaudited)
2009 2010
General Merchandise $ - - -
Food 172,750 121,096 132,810
Drinking and Eating Places 35,304 48,776 56,171
Apparel 8,024 - 4,364
Furniture & H.H. & Radio - 4,298 -
Lumber, Building Hardware 11,125 7,237 7,154
Automobile and Filling Stations 60,609 45,277 51,669
Drugs and Miscellaneous Retail 20,139 30,929 36,515
Agriculture and All Others 151,872 180,956 184,102
Manufacturers 8,241 8,425 7,656
Other* 7,150 1,237 4,018
Totals 475,214 448,231 484,459
Village Direct Sales Tax Rate 2.00% 2.00% 2.00%
Data Source: Illinois Department of Revenue
2008
* Categories without any amounts listed have less than four taxpayers; therefore, the Illinois Department of
Revenue has declined to provide the sales tax data for those categories to protect the confidentiality of the
individual taxpayers. Nonetheless, the total of the censored sales tax data has been listed in the other category
and is reflected in the annual totals.
108
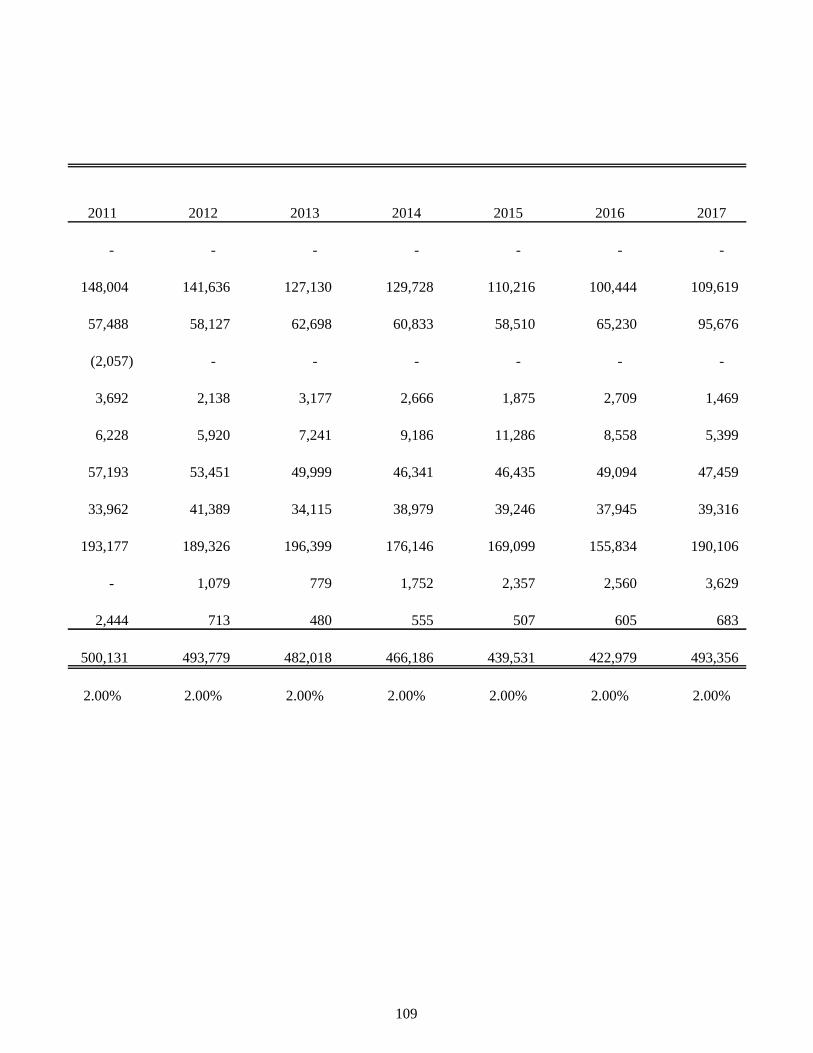
2011 2012 2013 2014 2015 2016 2017
- - - - - - -
148,004 141,636 127,130 129,728 110,216 100,444 109,619
57,488 58,127 62,698 60,833 58,510 65,230 95,676
(2,057) - - - - - -
3,692 2,138 3,177 2,666 1,875 2,709 1,469
6,228 5,920 7,241 9,186 11,286 8,558 5,399
57,193 53,451 49,999 46,341 46,435 49,094 47,459
33,962 41,389 34,115 38,979 39,246 37,945 39,316
193,177 189,326 196,399 176,146 169,099 155,834 190,106
- 1,079 779 1,752 2,357 2,560 3,629
2,444 713 480 555 507 605 683
500,131 493,779 482,018 466,186 439,531 422,979 493,356
2.00% 2.00% 2.00% 2.00% 2.00% 2.00% 2.00%
109
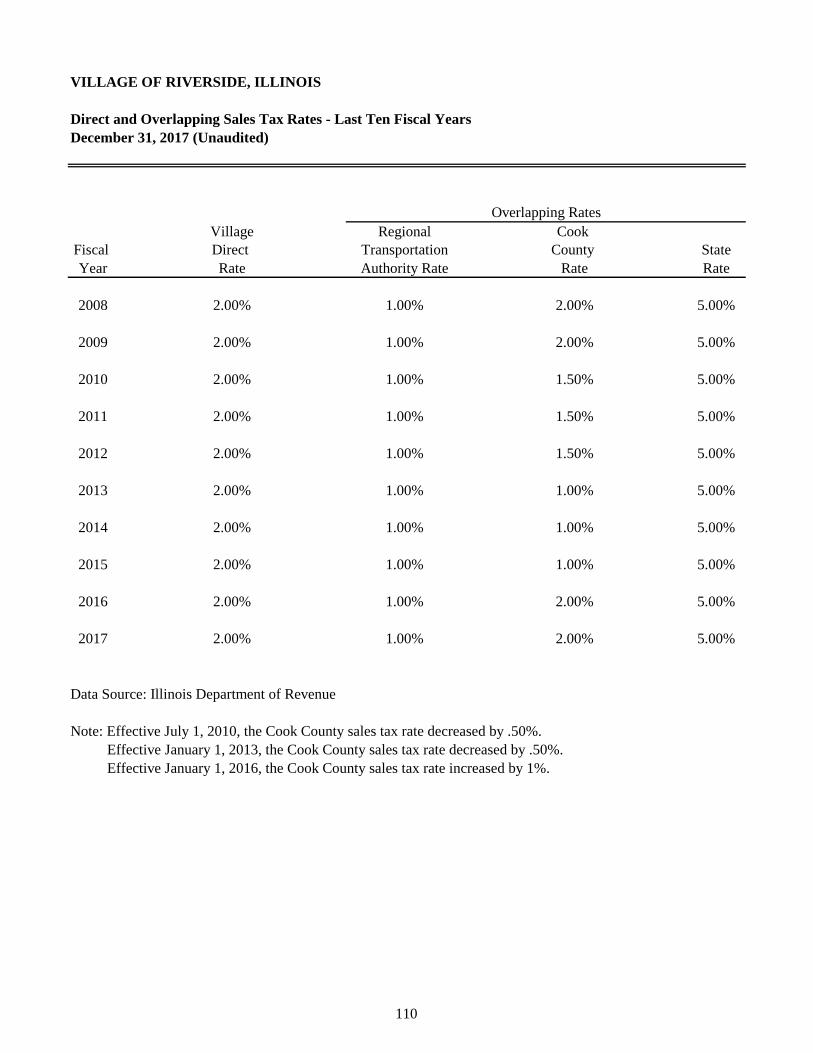
VILLAGE OF RIVERSIDE, ILLINOIS
Direct and Overlapping Sales Tax Rates - Last Ten Fiscal Years
December 31, 2017 (Unaudited)
Village Regional Cook
Fiscal Direct Transportation County State
Year Rate Authority Rate Rate Rate
2008 2.00% 1.00% 2.00% 5.00%
2009 2.00% 1.00% 2.00% 5.00%
2010 2.00% 1.00% 1.50% 5.00%
2011 2.00% 1.00% 1.50% 5.00%
2012 2.00% 1.00% 1.50% 5.00%
2013 2.00% 1.00% 1.00% 5.00%
2014 2.00% 1.00% 1.00% 5.00%
2015 2.00% 1.00% 1.00% 5.00%
2016 2.00% 1.00% 2.00% 5.00%
2017 2.00% 1.00% 2.00% 5.00%
Data Source: Illinois Department of Revenue
Note: Effective July 1, 2010, the Cook County sales tax rate decreased by .50%.
Effective January 1, 2013, the Cook County sales tax rate decreased by .50%.
Effective January 1, 2016, the Cook County sales tax rate increased by 1%.
Overlapping Rates
110
VILLAGE OF RIVERSIDE, ILLINOIS
Ratios of Outstanding Debt by Type - Last Ten Fiscal Years
December 31, 2017 (Unaudited)
See Following Page
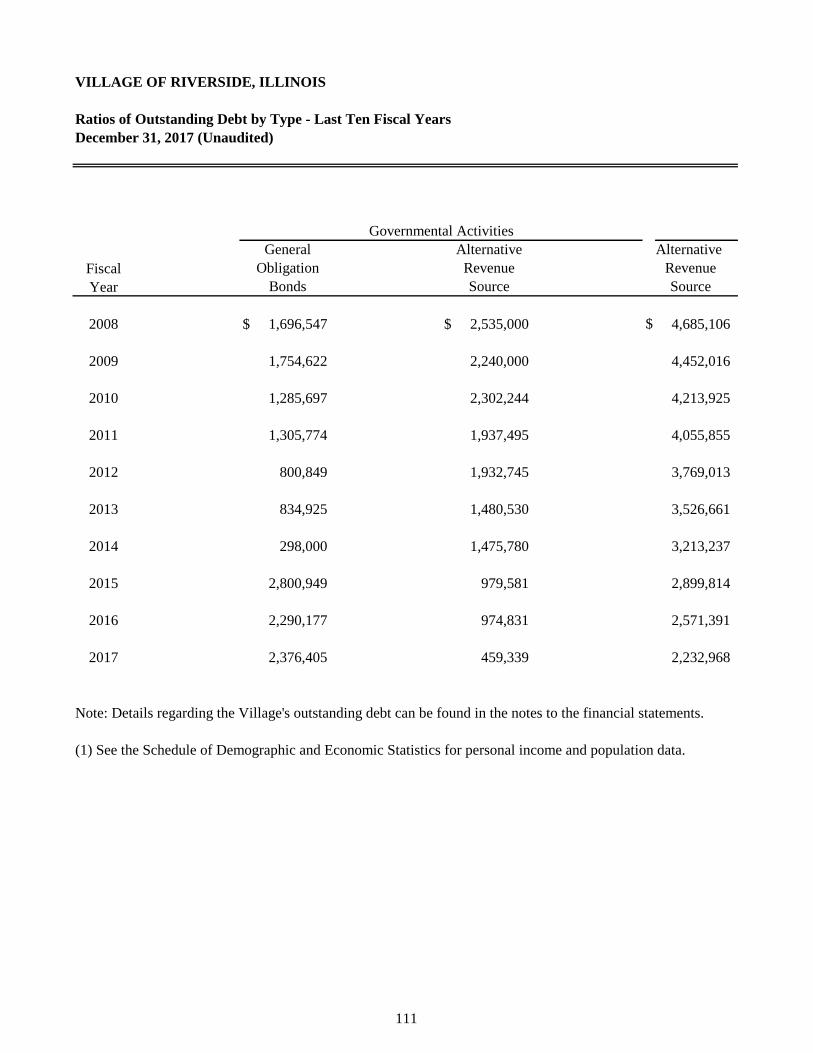
VILLAGE OF RIVERSIDE, ILLINOIS
Ratios of Outstanding Debt by Type - Last Ten Fiscal Years
December 31, 2017 (Unaudited)
Fiscal
Year
2008 $ 1,696,547 $ 2,535,000 $ 4,685,106
2009 1,754,622 2,240,000 4,452,016
2010 1,285,697 2,302,244 4,213,925
2011 1,305,774 1,937,495 4,055,855
2012 800,849 1,932,745 3,769,013
2013 834,925 1,480,530 3,526,661
2014 298,000 1,475,780 3,213,237
2015 2,800,949 979,581 2,899,814
2016 2,290,177 974,831 2,571,391
2017 2,376,405 459,339 2,232,968
Note: Details regarding the Village's outstanding debt can be found in the notes to the financial statements.
(1) See the Schedule of Demographic and Economic Statistics for personal income and population data.
Governmental Activities
General Alternative Alternative
Obligation Revenue Revenue
Bonds Source Source
111
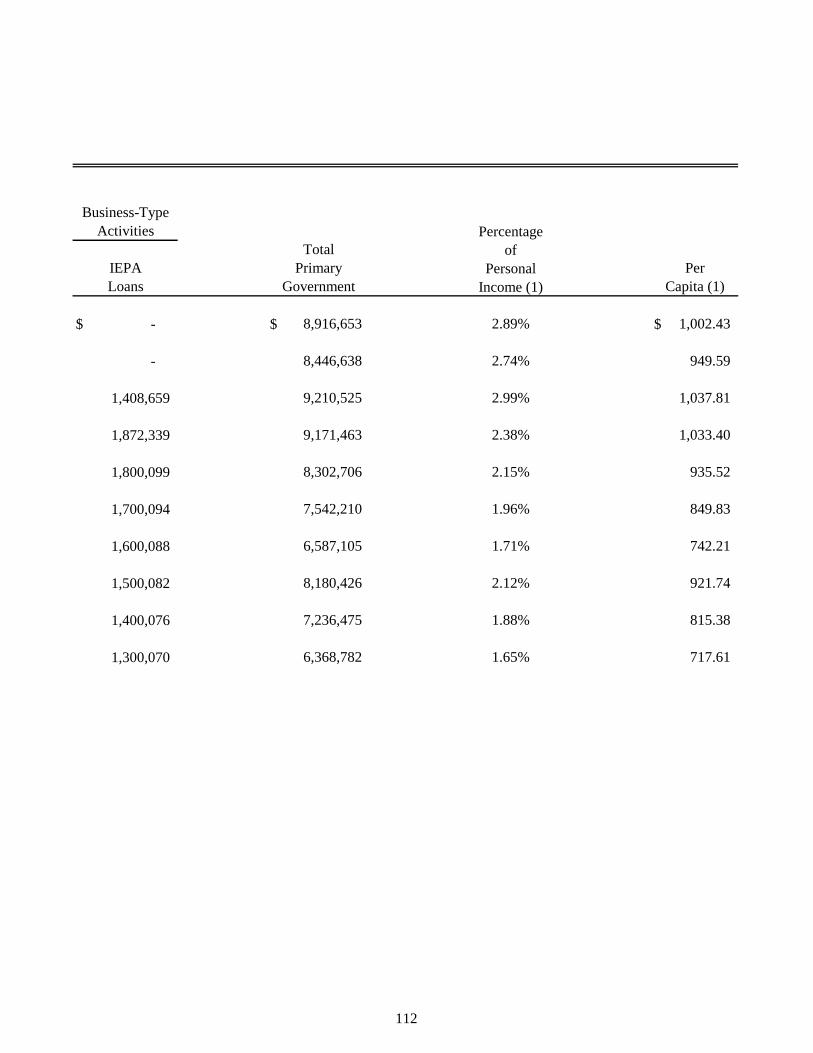
Percentage
of
Personal
Income (1)
$ - $ 8,916,653 2.89% $ 1,002.43
- 8,446,638 2.74% 949.59
1,408,659 9,210,525 2.99% 1,037.81
1,872,339 9,171,463 2.38% 1,033.40
1,800,099 8,302,706 2.15% 935.52
1,700,094 7,542,210 1.96% 849.83
1,600,088 6,587,105 1.71% 742.21
1,500,082 8,180,426 2.12% 921.74
1,400,076 7,236,475 1.88% 815.38
1,300,070 6,368,782 1.65% 717.61
Business-Type
Activities
Total
IEPA Primary Per
Loans Government Capita (1)
112
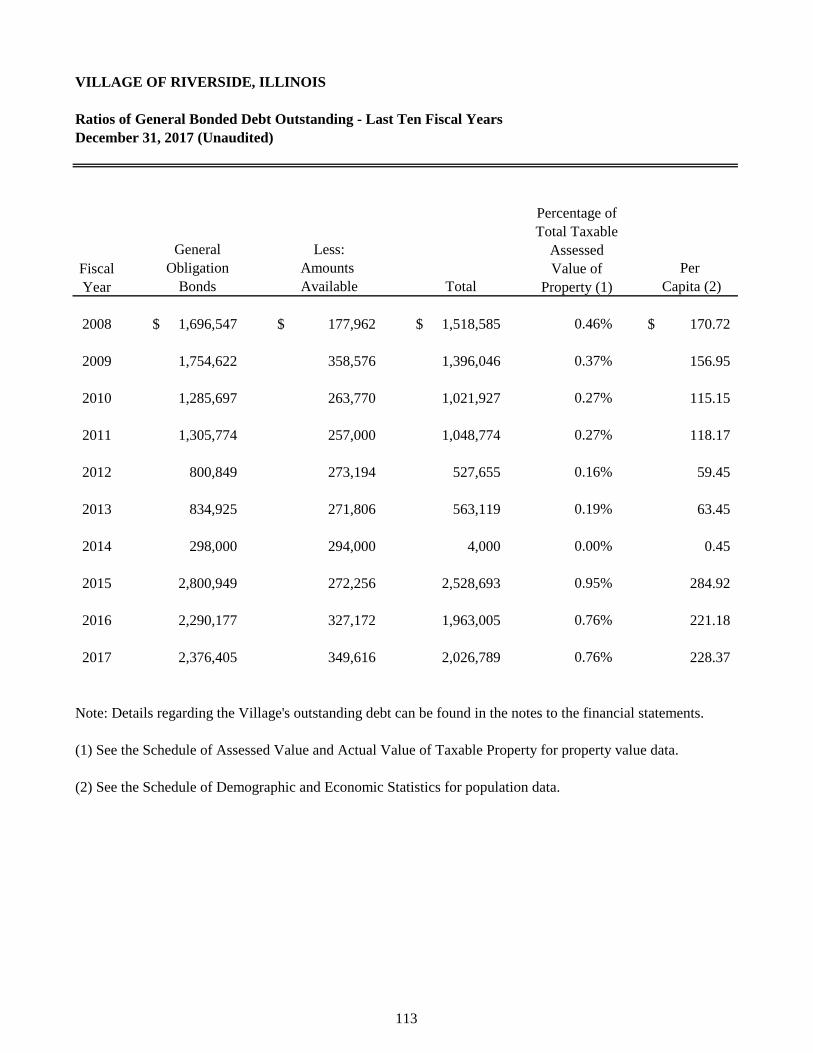
VILLAGE OF RIVERSIDE, ILLINOIS
Ratios of General Bonded Debt Outstanding - Last Ten Fiscal Years
December 31, 2017 (Unaudited)
Percentage of
Total Taxable
Assessed
Fiscal Value of
Year Property (1)
2008 $ 1,696,547 $ 177,962 $ 1,518,585 0.46% $ 170.72
2009 1,754,622 358,576 1,396,046 0.37% 156.95
2010 1,285,697 263,770 1,021,927 0.27% 115.15
2011 1,305,774 257,000 1,048,774 0.27% 118.17
2012 800,849 273,194 527,655 0.16% 59.45
2013 834,925 271,806 563,119 0.19% 63.45
2014 298,000 294,000 4,000 0.00% 0.45
2015 2,800,949 272,256 2,528,693 0.95% 284.92
2016 2,290,177 327,172 1,963,005 0.76% 221.18
2017 2,376,405 349,616 2,026,789 0.76% 228.37
Note: Details regarding the Village's outstanding debt can be found in the notes to the financial statements.
(1) See the Schedule of Assessed Value and Actual Value of Taxable Property for property value data.
(2) See the Schedule of Demographic and Economic Statistics for population data.
Bonds Available Total Capita (2)
General Less:
Obligation Amounts Per
113
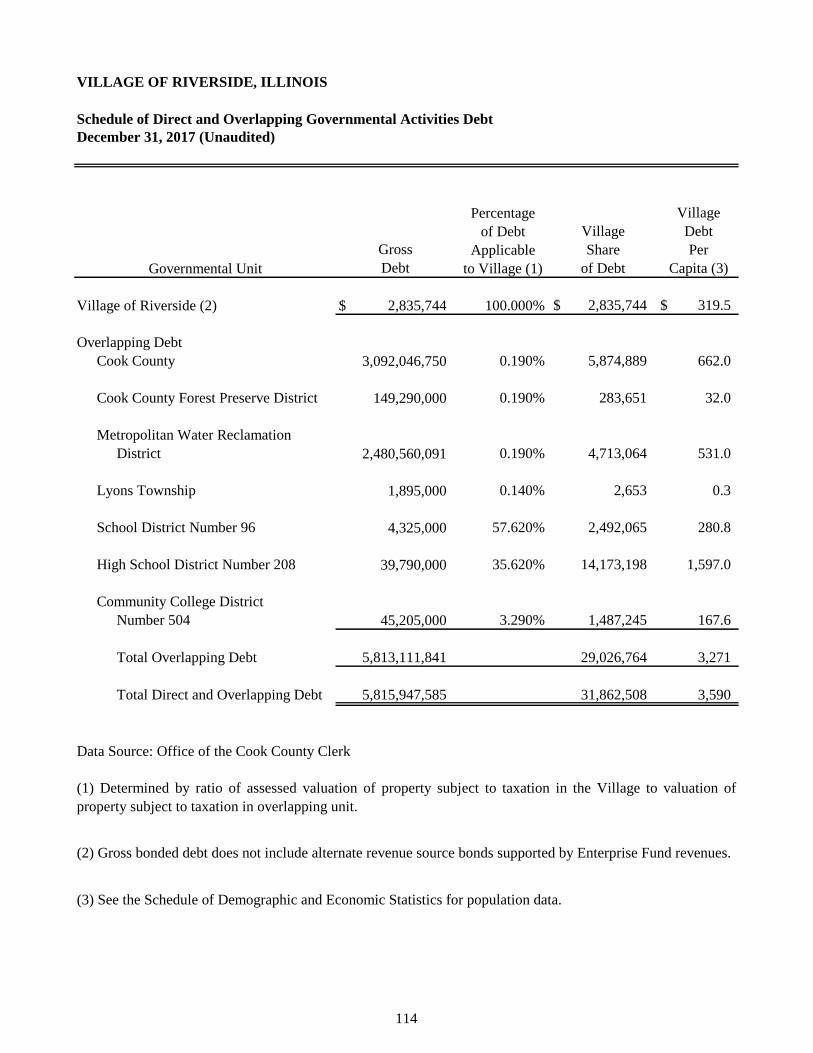
VILLAGE OF RIVERSIDE, ILLINOIS
Schedule of Direct and Overlapping Governmental Activities Debt
Percentage
of Debt
Applicable
Governmental Unit to Village (1)
Village of Riverside (2) $ 2,835,744 100.000% $ 2,835,744 $ 319.5
Overlapping Debt
Cook County 3,092,046,750 0.190% 5,874,889 662.0
Cook County Forest Preserve District 149,290,000 0.190% 283,651 32.0
Metropolitan Water Reclamation
District 2,480,560,091 0.190% 4,713,064 531.0
Lyons Township 1,895,000 0.140% 2,653 0.3
School District Number 96 4,325,000 57.620% 2,492,065 280.8
High School District Number 208 39,790,000 35.620% 14,173,198 1,597.0
Community College District
Number 504 45,205,000 3.290% 1,487,245 167.6
Total Overlapping Debt 5,813,111,841 29,026,764 3,271
Total Direct and Overlapping Debt 5,815,947,585 31,862,508 3,590
Data Source: Office of the Cook County Clerk
(3) See the Schedule of Demographic and Economic Statistics for population data.
December 31, 2017 (Unaudited)
Village
Village Debt
Gross Share Per
(1) Determined by ratio of assessed valuation of property subject to taxation in the Village to valuation of
property subject to taxation in overlapping unit.
(2) Gross bonded debt does not include alternate revenue source bonds supported by Enterprise Fund revenues.
Debt of Debt Capita (3)
114
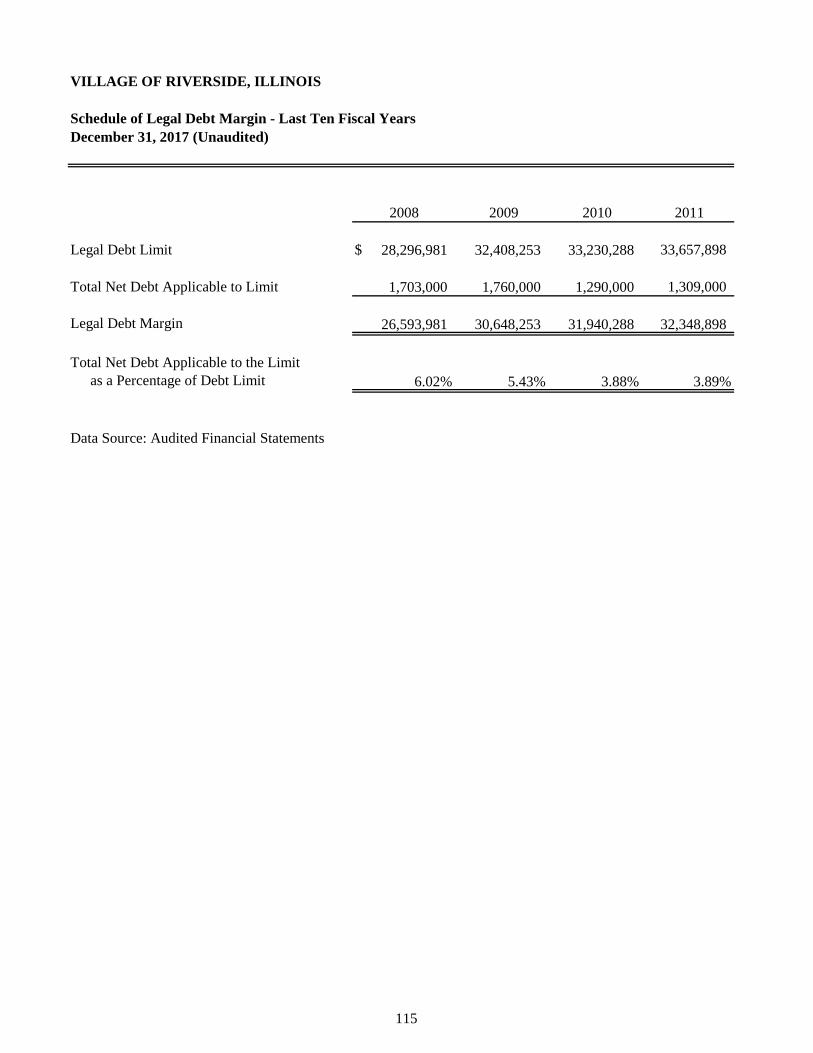
VILLAGE OF RIVERSIDE, ILLINOIS
Schedule of Legal Debt Margin - Last Ten Fiscal Years
2009 2010 2011
Legal Debt Limit $ 28,296,981 32,408,253 33,230,288 33,657,898
Total Net Debt Applicable to Limit 1,703,000 1,760,000 1,290,000 1,309,000
Legal Debt Margin 26,593,981 30,648,253 31,940,288 32,348,898
Total Net Debt Applicable to the Limit
as a Percentage of Debt Limit 6.02% 5.43% 3.88% 3.89%
Data Source: Audited Financial Statements
December 31, 2017 (Unaudited)
2008
115
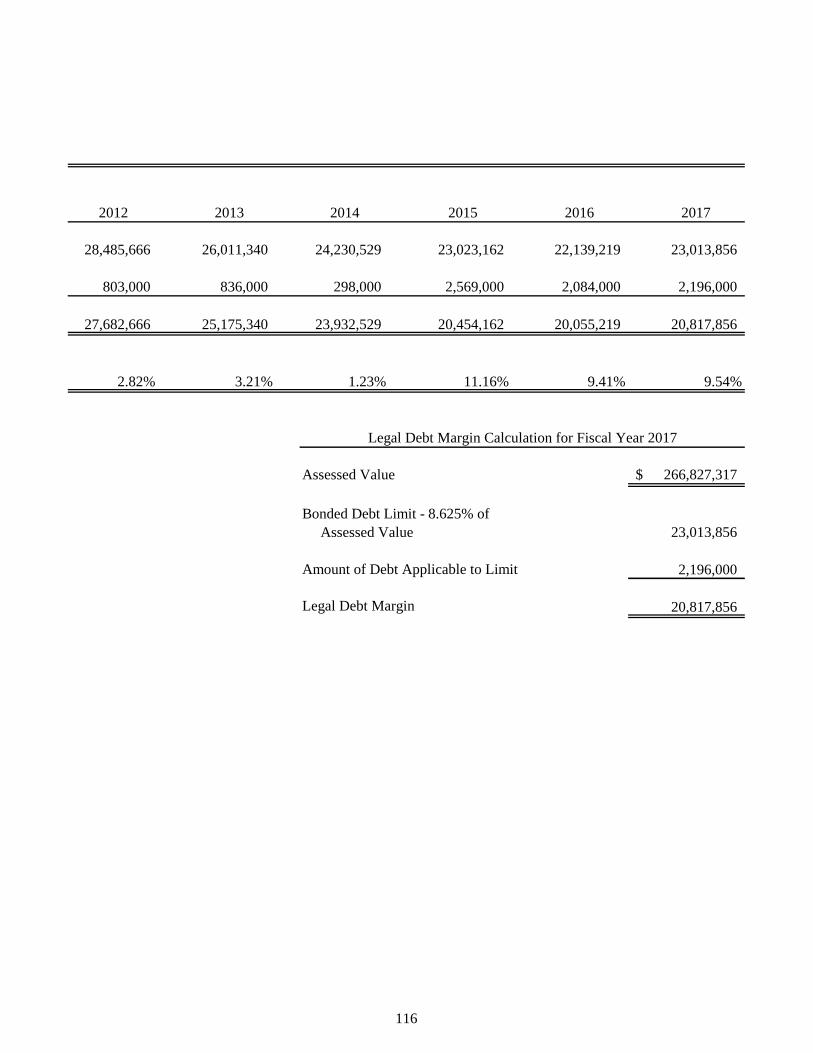
2012 2013 2014 2015 2016 2017
28,485,666 26,011,340 24,230,529 23,023,162 22,139,219 23,013,856
803,000 836,000 298,000 2,569,000 2,084,000 2,196,000
27,682,666 25,175,340 23,932,529 20,454,162 20,055,219 20,817,856
2.82% 3.21% 1.23% 11.16% 9.41% 9.54%
Assessed Value $ 266,827,317
Bonded Debt Limit - 8.625% of
Assessed Value 23,013,856
Amount of Debt Applicable to Limit 2,196,000
Legal Debt Margin 20,817,856
Legal Debt Margin Calculation for Fiscal Year 2017
116
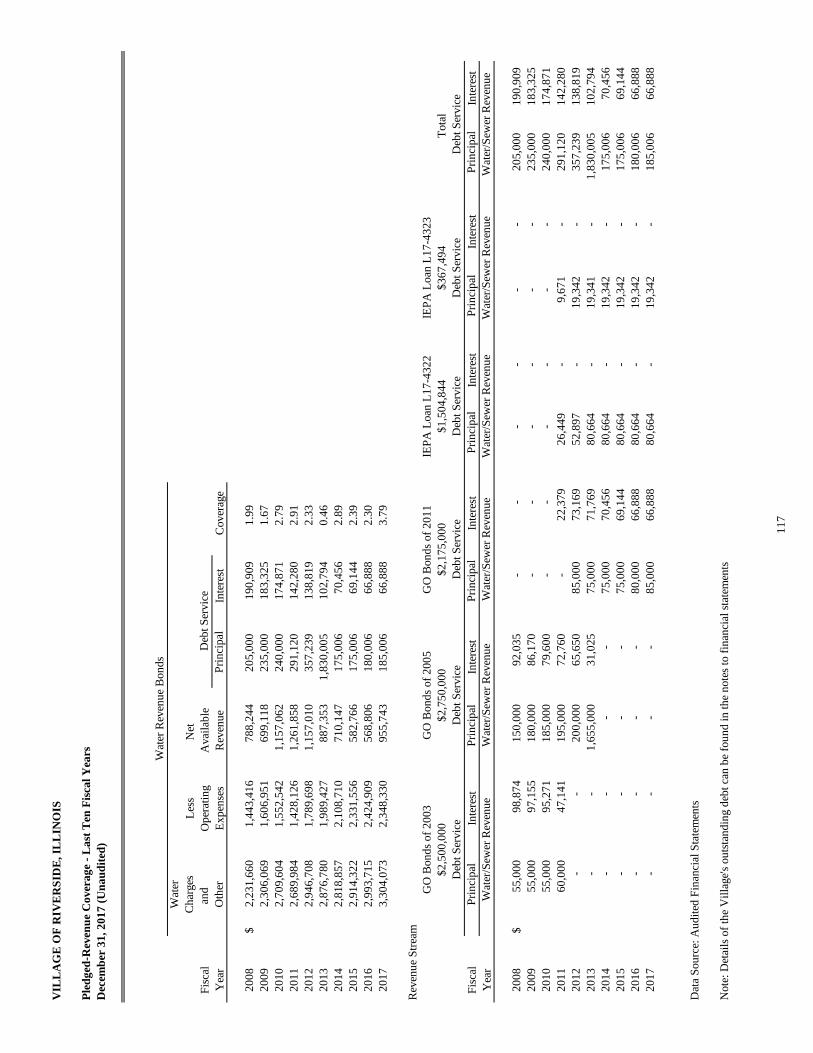
VIL
LA
GE
OF
RIV
ER
SID
E, IL
LIN
OIS
Ple
dg
ed-R
even
ue
Co
ver
ag
e -
La
st T
en F
isca
l Y
ears
Dec
emb
er 3
1, 2
01
7 (
Un
au
dit
ed)
Les
sN
et
Fis
cal
Op
erat
ing
Avai
lab
le
Yea
rE
xp
ense
sR
even
ue
Inte
rest
Cover
age
20
08
$2
,23
1,6
60
1,4
43
,41
6
78
8,2
44
20
5,0
00
19
0,9
09
1.9
9
20
09
2,3
06
,06
9
1,6
06
,95
1
69
9,1
18
23
5,0
00
18
3,3
25
1.6
7
20
10
2,7
09
,60
4
1,5
52
,54
2
1,1
57
,06
2
24
0,0
00
17
4,8
71
2.7
9
20
11
2,6
89
,98
4
1,4
28
,12
6
1,2
61
,85
8
29
1,1
20
14
2,2
80
2.9
1
20
12
2,9
46
,70
8
1,7
89
,69
8
1,1
57
,01
0
35
7,2
39
13
8,8
19
2.3
3
20
13
2,8
76
,78
0
1,9
89
,42
7
88
7,3
53
1,8
30
,00
5
10
2,7
94
0.4
6
20
14
2,8
18
,85
7
2,1
08
,71
0
71
0,1
47
17
5,0
06
70
,45
6
2.8
9
20
15
2,9
14
,32
2
2,3
31
,55
6
58
2,7
66
17
5,0
06
69
,14
4
2.3
9
20
16
2,9
93
,71
5
2,4
24
,90
9
56
8,8
06
18
0,0
06
66
,88
8
2.3
0
20
17
3,3
04
,07
3
2,3
48
,33
0
95
5,7
43
18
5,0
06
66
,88
8
3.7
9
Rev
enu
e S
trea
m
Fis
cal
Inte
rest
Inte
rest
Inte
rest
Inte
rest
Inte
rest
Inte
rest
Yea
r
20
08
$5
5,0
00
98
,87
4
15
0,0
00
92
,03
5
-
-
-
-
-
-
20
5,0
00
19
0,9
09
20
09
55
,00
0
97
,15
5
18
0,0
00
86
,17
0
-
-
-
-
-
-
23
5,0
00
18
3,3
25
20
10
55
,00
0
95
,27
1
18
5,0
00
79
,60
0
-
-
-
-
-
-
24
0,0
00
17
4,8
71
20
11
60
,00
0
47
,14
1
19
5,0
00
72
,76
0
-
22
,37
9
26
,44
9
-
9,6
71
-
29
1,1
20
14
2,2
80
20
12
-
-
20
0,0
00
65
,65
0
85
,00
0
73
,16
9
52
,89
7
-
19
,34
2
-
35
7,2
39
13
8,8
19
20
13
-
-
1,6
55
,00
0
31
,02
5
75
,00
0
71
,76
9
80
,66
4
-
19
,34
1
-
1,8
30
,00
5
10
2,7
94
20
14
-
-
-
-
75
,00
0
70
,45
6
80
,66
4
-
19
,34
2
-
17
5,0
06
70
,45
6
20
15
-
-
-
-
75
,00
0
69
,14
4
80
,66
4
-
19
,34
2
-
17
5,0
06
69
,14
4
20
16
-
-
-
-
80
,00
0
66
,88
8
80
,66
4
-
19
,34
2
-
18
0,0
06
66
,88
8
20
17
-
-
-
-
85
,00
0
66
,88
8
80
,66
4
-
19
,34
2
-
18
5,0
06
66
,88
8
Dat
a S
ou
rce:
Au
dit
ed F
inan
cial
Sta
tem
ents
Note
: D
etai
ls o
f th
e V
illa
ge'
s ou
tsta
nd
ing d
ebt
can
be
fou
nd
in
th
e n
ote
s to
fin
anci
al s
tate
men
ts
Pri
nci
pal
Pri
nci
pal
Oth
er
Wat
er R
even
ue
Bon
ds
Wat
er
Ch
arges
and
D
ebt
Ser
vic
e
Pri
nci
pal
$3
67
,49
4T
ota
l
GO
Bon
ds
of
20
03
GO
Bon
ds
of
20
05
GO
Bon
ds
of
20
11
IEP
A L
oan
L1
7-4
32
2IE
PA
Loan
L1
7-4
32
3
$2
,50
0,0
00
$2
,75
0,0
00
$2
,17
5,0
00
$1
,50
4,8
44
Deb
t S
ervic
e
Wat
er/S
ewer
Rev
enu
eW
ater
/Sew
er R
even
ue
Wat
er/S
ewer
Rev
enu
eW
ater
/Sew
er R
even
ue
Wat
er/S
ewer
Rev
enu
eW
ater
/Sew
er R
even
ue
Deb
t S
ervic
eD
ebt
Ser
vic
eD
ebt
Ser
vic
eD
ebt
Ser
vic
eD
ebt
Ser
vic
e
Pri
nci
pal
Pri
nci
pal
Pri
nci
pal
Pri
nci
pal
11
7

December 31, 2017 (Unaudited)
Fiscal Unemployment
Year Population Rate
2008 8,895 $ 308,763,240 $ 34,712 3.20%
2009 8,895 308,763,240 34,712 5.20%
2010 8,875 308,069,000 34,712 5.40%
2011 8,875 385,574,375 43,445 4.70%
2012 8,875 385,574,375 43,445 4.10%
2013 8,875 385,574,375 43,445 6.90%
2014 8,875 385,574,375 43,445 5.20%
2015 8,875 385,574,375 43,445 4.50%
2016 8,875 385,574,375 43,445 4.60%
2017 8,875 385,574,375 43,445 3.70%
Data Sources: Illinois Department of Employment Security (IDES) and U.S. Department of Commerce, Bureau of
the Census
Note: Beginning in 2011, per capita personal income figure represents per capita money income as defined and
published in the 2010 U.S. census.
Income Income
VILLAGE OF RIVERSIDE, ILLINOIS
Demographic and Economic Statistics - Last Ten Fiscal Years
Per
Capita
Personal Personal
118
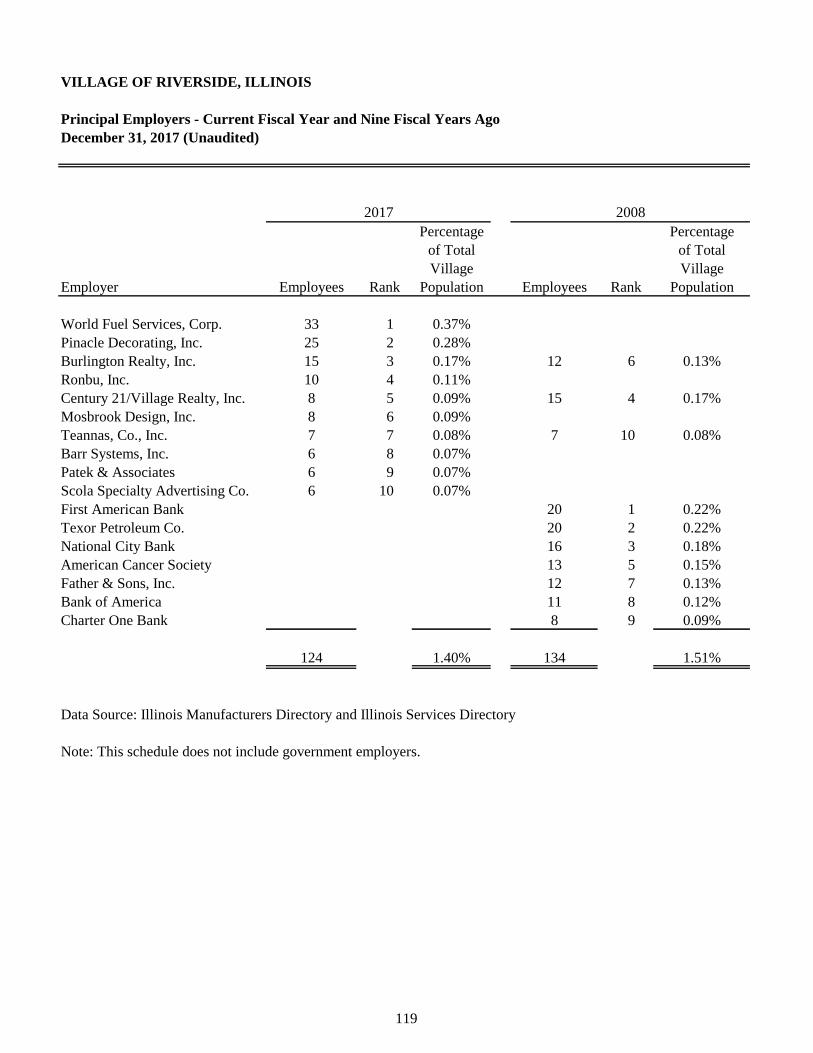
VILLAGE OF RIVERSIDE, ILLINOIS
Principal Employers - Current Fiscal Year and Nine Fiscal Years Ago
December 31, 2017 (Unaudited)
Percentage Percentage
of Total of Total
Village Village
Employer Employees Rank Population Employees Rank Population
World Fuel Services, Corp. 33 1 0.37%
Pinacle Decorating, Inc. 25 2 0.28%
Burlington Realty, Inc. 15 3 0.17% 12 6 0.13%
Ronbu, Inc. 10 4 0.11%
Century 21/Village Realty, Inc. 8 5 0.09% 15 4 0.17%
Mosbrook Design, Inc. 8 6 0.09%
Teannas, Co., Inc. 7 7 0.08% 7 10 0.08%
Barr Systems, Inc. 6 8 0.07%
Patek & Associates 6 9 0.07%
Scola Specialty Advertising Co. 6 10 0.07%
First American Bank 20 1 0.22%
Texor Petroleum Co. 20 2 0.22%
National City Bank 16 3 0.18%
American Cancer Society 13 5 0.15%
Father & Sons, Inc. 12 7 0.13%
Bank of America 11 8 0.12%
Charter One Bank 8 9 0.09%
124 1.40% 134 1.51%
Data Source: Illinois Manufacturers Directory and Illinois Services Directory
Note: This schedule does not include government employers.
20082017
119
VILLAGE OF RIVERSIDE, ILLINOIS
Full-Time Equivalent Village Government Employees by Function - Last Ten Fiscal Years
December 31, 2017 (Unaudited)
See Following Page
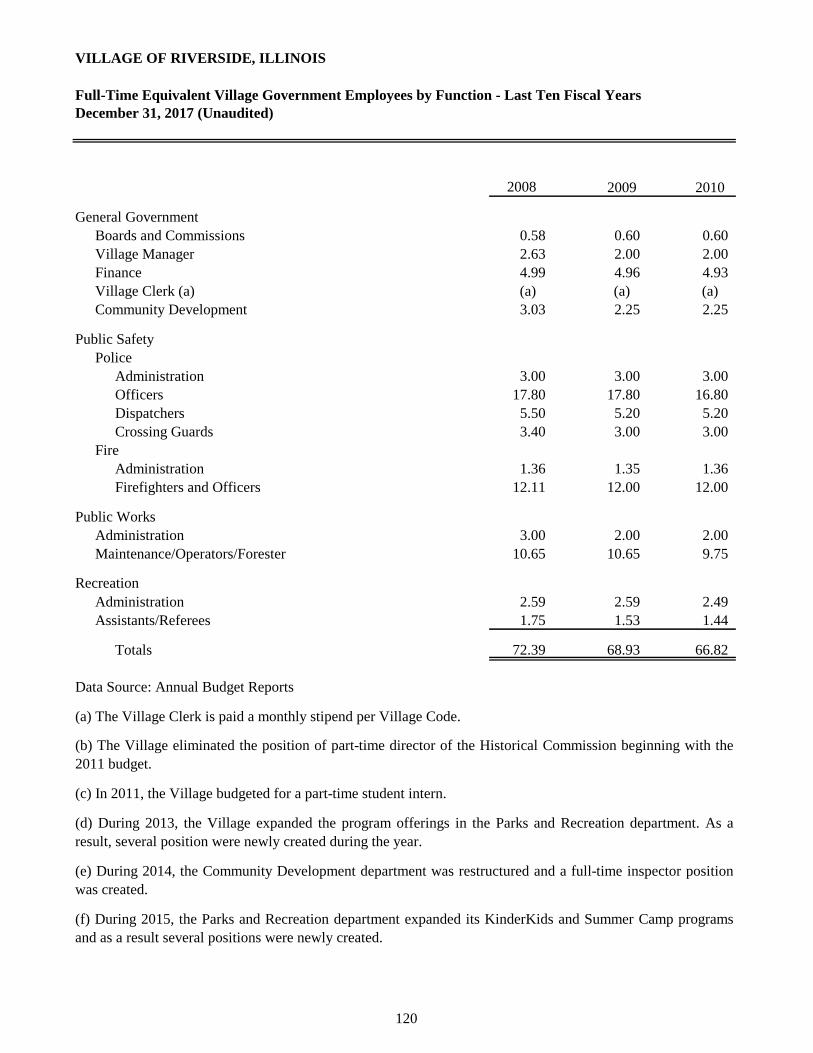
VILLAGE OF RIVERSIDE, ILLINOIS
Full-Time Equivalent Village Government Employees by Function - Last Ten Fiscal Years
2009 2010
General Government
Boards and Commissions 0.58 0.60 0.60
Village Manager 2.63 2.00 2.00
Finance 4.99 4.96 4.93
Village Clerk (a) (a) (a) (a)
Community Development 3.03 2.25 2.25
Public Safety
Police
Administration 3.00 3.00 3.00
Officers 17.80 17.80 16.80
Dispatchers 5.50 5.20 5.20
Crossing Guards 3.40 3.00 3.00
Fire
Administration 1.36 1.35 1.36
Firefighters and Officers 12.11 12.00 12.00
Public Works
Administration 3.00 2.00 2.00
Maintenance/Operators/Forester 10.65 10.65 9.75
Recreation
Administration 2.59 2.59 2.49
Assistants/Referees 1.75 1.53 1.44
Totals 72.39 68.93 66.82
Data Source: Annual Budget Reports
(a) The Village Clerk is paid a monthly stipend per Village Code.
(e) During 2014, the Community Development department was restructured and a full-time inspector position
was created.
(f) During 2015, the Parks and Recreation department expanded its KinderKids and Summer Camp programs
and as a result several positions were newly created.
December 31, 2017 (Unaudited)
(b) The Village eliminated the position of part-time director of the Historical Commission beginning with the
2011 budget.
(c) In 2011, the Village budgeted for a part-time student intern.
(d) During 2013, the Village expanded the program offerings in the Parks and Recreation department. As a
result, several position were newly created during the year.
2008
120
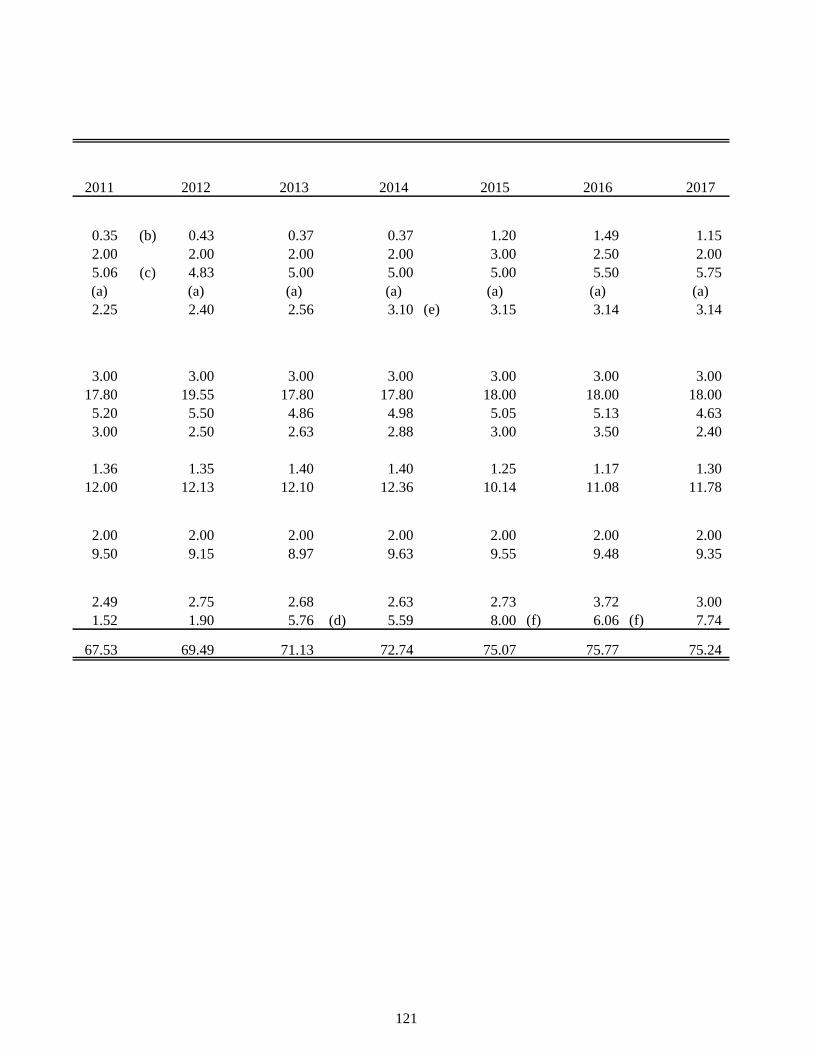
2011 2012 2013 2014 2015 2016 2017
0.35 (b) 0.43 0.37 0.37 1.20 1.49 1.15
2.00 2.00 2.00 2.00 3.00 2.50 2.00
5.06 (c) 4.83 5.00 5.00 5.00 5.50 5.75
(a) (a) (a) (a) (a) (a) (a)
2.25 2.40 2.56 3.10 (e) 3.15 3.14 3.14
3.00 3.00 3.00 3.00 3.00 3.00 3.00
17.80 19.55 17.80 17.80 18.00 18.00 18.00
5.20 5.50 4.86 4.98 5.05 5.13 4.63
3.00 2.50 2.63 2.88 3.00 3.50 2.40
1.36 1.35 1.40 1.40 1.25 1.17 1.30
12.00 12.13 12.10 12.36 10.14 11.08 11.78
2.00 2.00 2.00 2.00 2.00 2.00 2.00
9.50 9.15 8.97 9.63 9.55 9.48 9.35
2.49 2.75 2.68 2.63 2.73 3.72 3.00
1.52 1.90 5.76 (d) 5.59 8.00 (f) 6.06 (f) 7.74
67.53 69.49 71.13 72.74 75.07 75.77 75.24
121
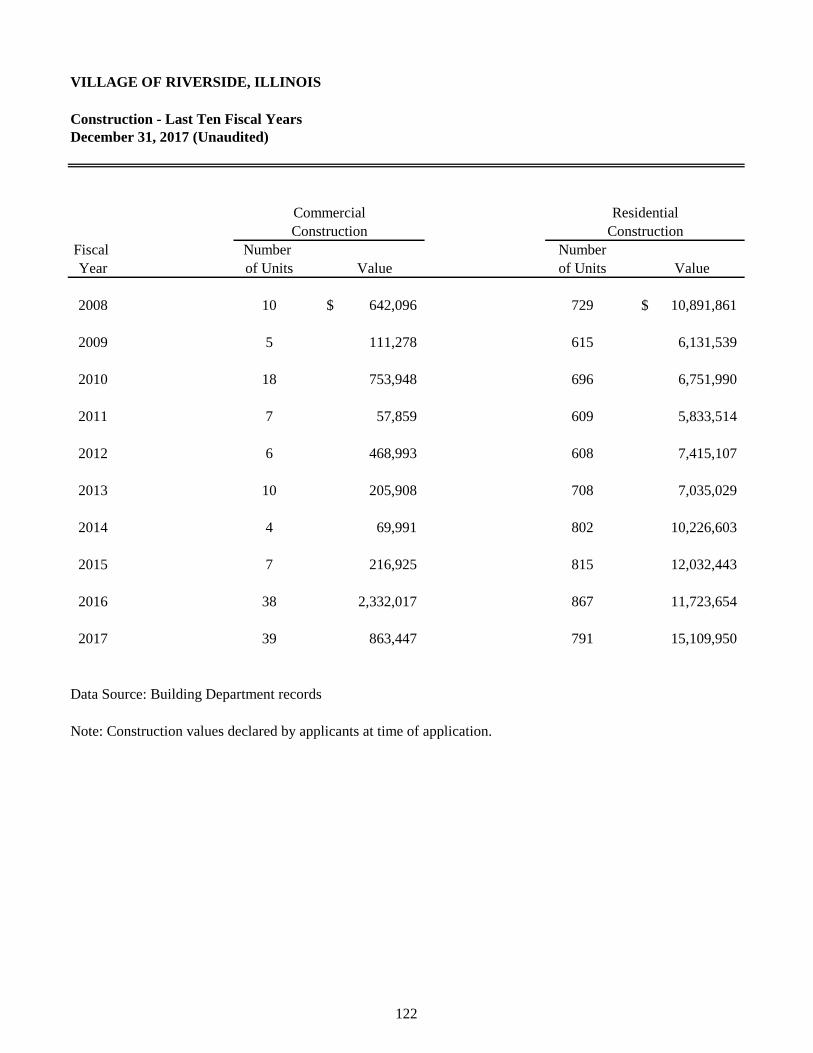
VILLAGE OF RIVERSIDE, ILLINOIS
Construction - Last Ten Fiscal Years
Fiscal Number Number
Year of Units of Units
2008 10 $ 642,096 729 $ 10,891,861
2009 5 111,278 615 6,131,539
2010 18 753,948 696 6,751,990
2011 7 57,859 609 5,833,514
2012 6 468,993 608 7,415,107
2013 10 205,908 708 7,035,029
2014 4 69,991 802 10,226,603
2015 7 216,925 815 12,032,443
2016 38 2,332,017 867 11,723,654
2017 39 863,447 791 15,109,950
Data Source: Building Department records
Note: Construction values declared by applicants at time of application.
Value Value
December 31, 2017 (Unaudited)
Commercial Residential
Construction Construction
122
VILLAGE OF RIVERSIDE, ILLINOIS
Operating Indicators by Function/Program - Last Ten Fiscal Years
December 31, 2017 (Unaudited)
See Following Page
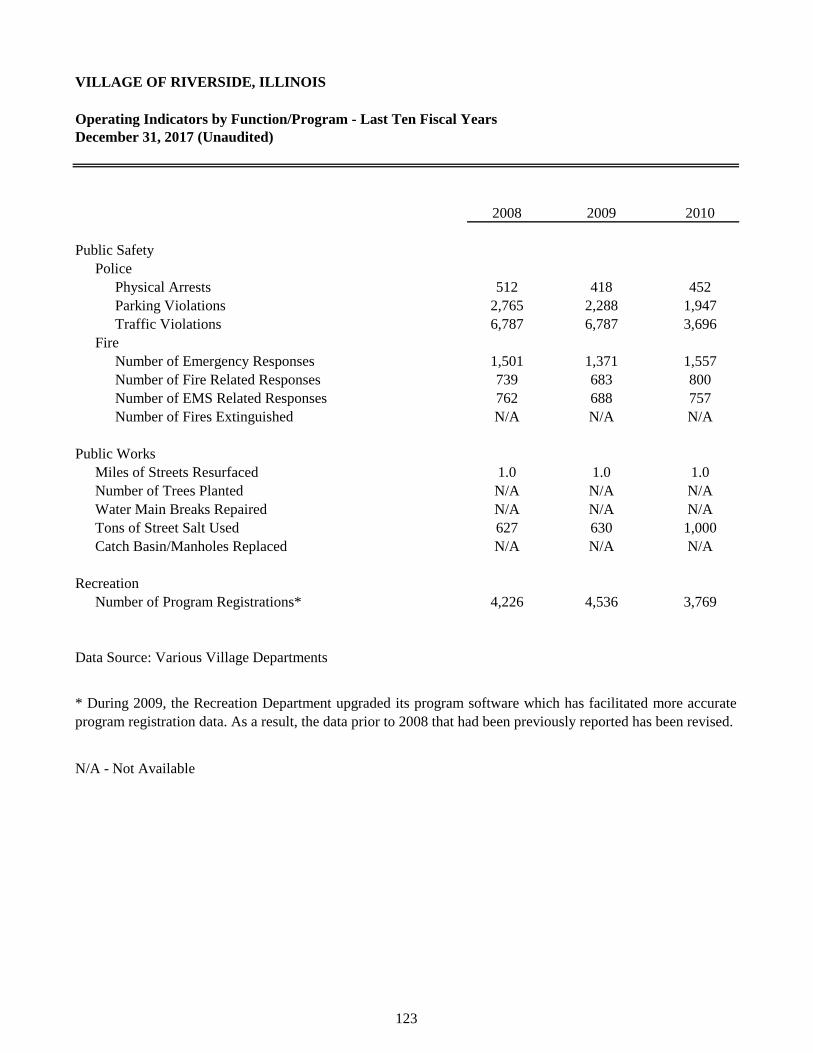
VILLAGE OF RIVERSIDE, ILLINOIS
Operating Indicators by Function/Program - Last Ten Fiscal Years
2008 2009 2010
Public Safety
Police
Physical Arrests 512 418 452
Parking Violations 2,765 2,288 1,947
Traffic Violations 6,787 6,787 3,696
Fire
Number of Emergency Responses 1,501 1,371 1,557
Number of Fire Related Responses 739 683 800
Number of EMS Related Responses 762 688 757
Number of Fires Extinguished N/A N/A N/A
Public Works
Miles of Streets Resurfaced 1.0 1.0 1.0
Number of Trees Planted N/A N/A N/A
Water Main Breaks Repaired N/A N/A N/A
Tons of Street Salt Used 627 630 1,000
Catch Basin/Manholes Replaced N/A N/A N/A
Recreation
Number of Program Registrations* 4,226 4,536 3,769
Data Source: Various Village Departments
N/A - Not Available
December 31, 2017 (Unaudited)
* During 2009, the Recreation Department upgraded its program software which has facilitated more accurate
program registration data. As a result, the data prior to 2008 that had been previously reported has been revised.
123
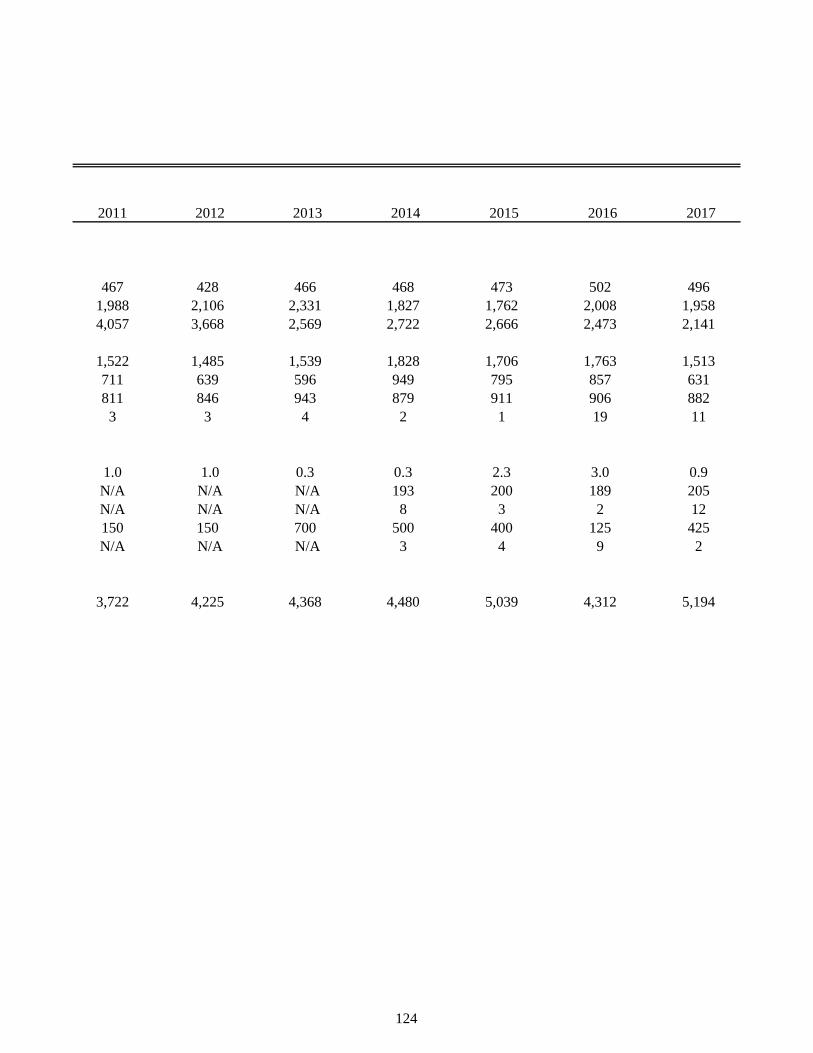
2011 2012 2013 2014 2015 2016 2017
467 428 466 468 473 502 496
1,988 2,106 2,331 1,827 1,762 2,008 1,958
4,057 3,668 2,569 2,722 2,666 2,473 2,141
1,522 1,485 1,539 1,828 1,706 1,763 1,513
711 639 596 949 795 857 631
811 846 943 879 911 906 882
3 3 4 2 1 19 11
1.0 1.0 0.3 0.3 2.3 3.0 0.9
N/A N/A N/A 193 200 189 205
N/A N/A N/A 8 3 2 12
150 150 700 500 400 125 425
N/A N/A N/A 3 4 9 2
3,722 4,225 4,368 4,480 5,039 4,312 5,194
124
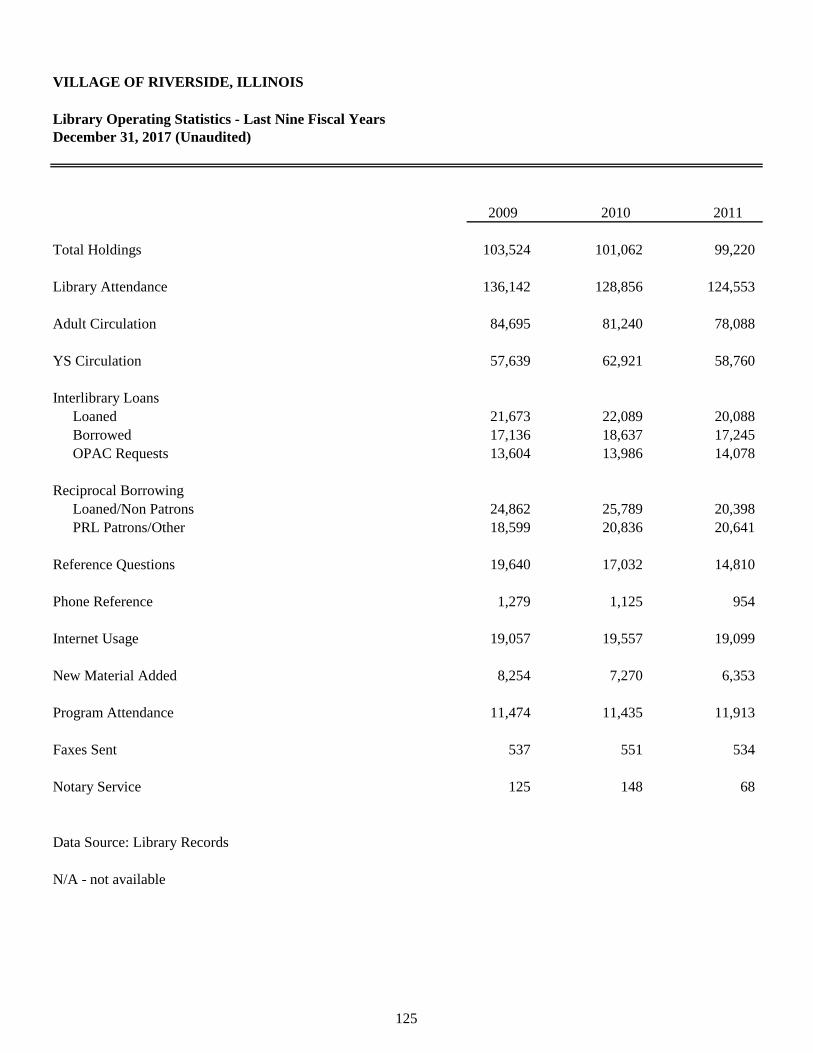
VILLAGE OF RIVERSIDE, ILLINOIS
Library Operating Statistics - Last Nine Fiscal Years
2009 2010 2011
Total Holdings 103,524 101,062 99,220
Library Attendance 136,142 128,856 124,553
Adult Circulation 84,695 81,240 78,088
YS Circulation 57,639 62,921 58,760
Interlibrary Loans
Loaned 21,673 22,089 20,088
Borrowed 17,136 18,637 17,245
OPAC Requests 13,604 13,986 14,078
Reciprocal Borrowing
Loaned/Non Patrons 24,862 25,789 20,398
PRL Patrons/Other 18,599 20,836 20,641
Reference Questions 19,640 17,032 14,810
Phone Reference 1,279 1,125 954
Internet Usage 19,057 19,557 19,099
New Material Added 8,254 7,270 6,353
Program Attendance 11,474 11,435 11,913
Faxes Sent 537 551 534
Notary Service 125 148 68
Data Source: Library Records
N/A - not available
December 31, 2017 (Unaudited)
125

2012 2013 2014 2015 2016 2017
96,220 89,557 80,244 77,917 66,124 64,547
131,444 125,717 127,092 133,349 130,297 119,768
76,179 72,364 69,748 74,169 75,572 66,696
58,261 53,172 56,437 55,700 54,725 68,082
21,509 19,749 17,202 16,910 16,639 14,059
18,555 18,558 18,764 17,592 16,212 15,031
15,149 14,345 13,606 13,928 14,724 14,510
18,213 17,257 16,119 15,439 11,523 10,658
19,498 18,115 17,113 15,997 14,934 15,627
13,947 13,346 15,796 13,200 13,159 14,035
804 699 704 N/A N/A N/A
19,743 15,748 16,174 15,301 13,883 13,123
5,051 4,320 3,669 4,580 3,869 3,437
13,512 12,788 17,253 16,986 18,106 18,715
581 472 540 401 380 342
165 144 110 106 121 178
126
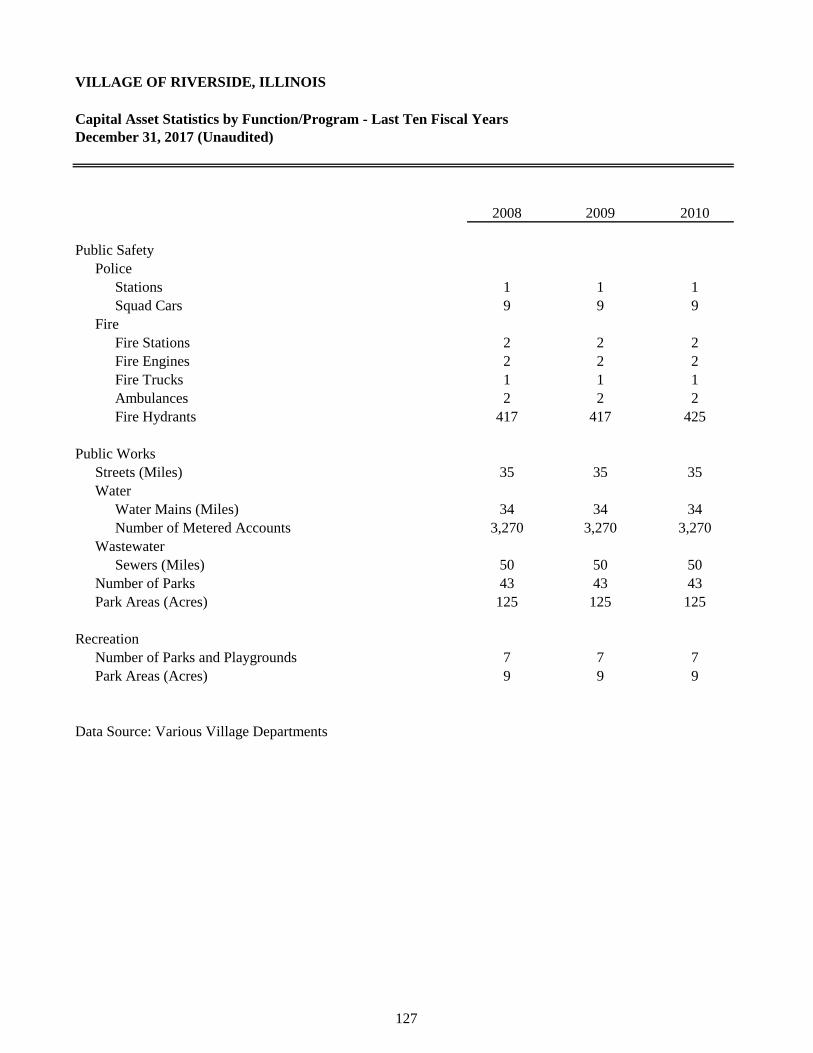
VILLAGE OF RIVERSIDE, ILLINOIS
Capital Asset Statistics by Function/Program - Last Ten Fiscal Years
2008 2009 2010
Public Safety
Police
Stations 1 1 1
Squad Cars 9 9 9
Fire
Fire Stations 2 2 2
Fire Engines 2 2 2
Fire Trucks 1 1 1
Ambulances 2 2 2
Fire Hydrants 417 417 425
Public Works
Streets (Miles) 35 35 35
Water
Water Mains (Miles) 34 34 34
Number of Metered Accounts 3,270 3,270 3,270
Wastewater
Sewers (Miles) 50 50 50
Number of Parks 43 43 43
Park Areas (Acres) 125 125 125
Recreation
Number of Parks and Playgrounds 7 7 7
Park Areas (Acres) 9 9 9
Data Source: Various Village Departments
December 31, 2017 (Unaudited)
127

2011 2012 2013 2014 2015 2016 2017
1 1 1 1 1 1 1
9 9 11 11 11 11 11
2 2 2 2 2 2 2
2 2 2 2 2 2 2
1 1 1 1 1 1 1
2 2 2 2 2 2 2
389 389 389 389 389 427 427
35 35 35 35 35 35 35
34 34 34 34 34 34 34
3,270 3,270 3,270 3,120 3,074 3,140 3,142
50 50 50 50 50 50 50
43 43 43 43 43 43 43
125 125 125 125 125 125 125
7 7 7 7 7 7 7
9 9 9 9 9 9 9
128