village-7: namon
TRANSCRIPT
Village-7: Namon
-i-
STUDY REPORT ON
SOCIO-ECONOMIC SURVEY OF EIGHT (8) CANDIDATE VILLAGES
Village 7: Namon Village
Table of Contents
FEATURE OF THE VILLAGE ..................................................................................... V7-1
PART 1 Village Profile Survey........................................................................ V7-2
1. General Information .......................................................................................... V7-2 2. Livelihood and Natural Resource Management ................................................ V7-5 3. Infrastructure ..................................................................................................... V7-15 4. Organization related to the Project Activities.................................................... V7-16 5. Others ................................................................................................................ V7-17
PART 2 Participatory Village Survey .............................................................. V7-19
1. Resource Map and Transect .............................................................................. V7-19 2. Resources Utilization and Major Products ........................................................ V7-19 3. Venn Diagram.................................................................................................... V7-20 4. Social Map......................................................................................................... V7-23 5. Present Rules on the Management/Use of Lands and Resources ...................... V7-27
PART 3 Household Interview Survey.............................................................. V7-30
A. Household Interview Survey ............................................................................. V7-30 1. General Information .......................................................................................... V7-30 2. Living Condition ............................................................................................... V7-32 3. Agriculture and Forestry Production ................................................................. V7-36 4. Estimated Marketed Volumes of Major Products by Village ............................ V7-45 5. Income and Expenditure.................................................................................... V7-46 6. Utilization of Credit/Loan ................................................................................. V7-50 7. Extension........................................................................................................... V7-51 B. Household Member Survey............................................................................... V7-51 8. Participation/Engagement of Household Members........................................... V7-51 9. Activities Wanted to Make Easy ....................................................................... V7-54
List of Tables
Table V7-1 Meteorological Data........................................................................... V7-T-1
-i-
List of Figures
Figure V7-1 Village Organization .......................................................................... V7-F-1 Figure V7-2 Seasonal Calendar .............................................................................. V7-F-2 Figure V7-3 Resource Map .................................................................................... V7-F-3 Figure V7-4 Transect .............................................................................................. V7-F-4 Figure V7-5 Venn Diagram of Major Products by Male Group ............................. V7-F-5 Figure V7-6 Venn Diagram of Major Products by Female Group ......................... V7-F-6 Figure V7-7 Social Map ......................................................................................... V7-F-7
V7-1
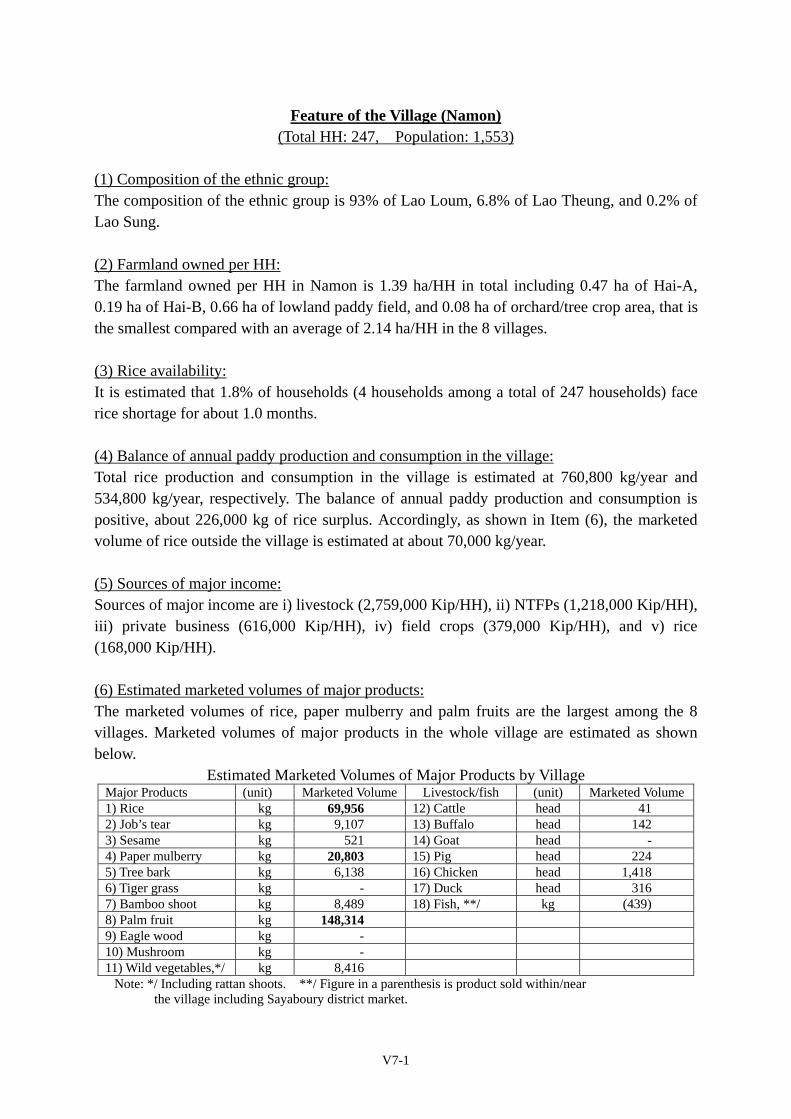
Feature of the Village (Namon) (Total HH: 247, Population: 1,553)
(1) Composition of the ethnic group: The composition of the ethnic group is 93% of Lao Loum, 6.8% of Lao Theung, and 0.2% of Lao Sung. (2) Farmland owned per HH: The farmland owned per HH in Namon is 1.39 ha/HH in total including 0.47 ha of Hai-A, 0.19 ha of Hai-B, 0.66 ha of lowland paddy field, and 0.08 ha of orchard/tree crop area, that is the smallest compared with an average of 2.14 ha/HH in the 8 villages. (3) Rice availability: It is estimated that 1.8% of households (4 households among a total of 247 households) face rice shortage for about 1.0 months. (4) Balance of annual paddy production and consumption in the village: Total rice production and consumption in the village is estimated at 760,800 kg/year and 534,800 kg/year, respectively. The balance of annual paddy production and consumption is positive, about 226,000 kg of rice surplus. Accordingly, as shown in Item (6), the marketed volume of rice outside the village is estimated at about 70,000 kg/year. (5) Sources of major income: Sources of major income are i) livestock (2,759,000 Kip/HH), ii) NTFPs (1,218,000 Kip/HH), iii) private business (616,000 Kip/HH), iv) field crops (379,000 Kip/HH), and v) rice (168,000 Kip/HH). (6) Estimated marketed volumes of major products: The marketed volumes of rice, paper mulberry and palm fruits are the largest among the 8 villages. Marketed volumes of major products in the whole village are estimated as shown below.
Estimated Marketed Volumes of Major Products by Village Major Products (unit) Marketed Volume Livestock/fish (unit) Marketed Volume1) Rice kg 69,956 12) Cattle head 41 2) Job’s tear kg 9,107 13) Buffalo head 142 3) Sesame kg 521 14) Goat head - 4) Paper mulberry kg 20,803 15) Pig head 224 5) Tree bark kg 6,138 16) Chicken head 1,418 6) Tiger grass kg - 17) Duck head 316 7) Bamboo shoot kg 8,489 18) Fish, **/ kg (439) 8) Palm fruit kg 148,314 9) Eagle wood kg - 10) Mushroom kg - 11) Wild vegetables,*/ kg 8,416
Note: */ Including rattan shoots. **/ Figure in a parenthesis is product sold within/near the village including Sayaboury district market.
V7-2
PART 1 VILLAGE PROFILE SURVEY Survey Period: 13 to 15 May 2004 Main Information Source: Village head, 2 deputy heads and some village authority members.
1. General Information
1.1 Location
Namon village is located in Sayaboury district 36 km from Sayaboury town (about 1 hr by car), 135 km from Luang Prabang (about 4 hrs. by car, excluding waiting time for crossing Mekong river. It usually takes 5~30 minutes)
1.2 History of the village
As far as the village head heard from his father, the village was built 474 years ago (in 1530 A.D.). The first 3 households came from different villages (two of them are Ban Na Peun and Ban Nam Hao).
Big fire burned down the whole village except the temple more than 100 years ago. Villagers dug Long Muang (or Houay Muang) Canal to fetch water from Ping River for future fires. (After completion of the canal, two big fires occurred in the village. But only several houses were burned down at that time due to water of the canal. Now they have a village fire fighting organization. 53 men are its members.) Now water of the canal is used for irrigation of the rice fields as well.
During 2nd Indochina war, Namon had an American military airport, from where many American bombers flew to drop missiles in Lao Issala controlled area of northern Laos.
Eagle wood boom began in 1984, when Vientiane buyers came to buy for the first time. The boom lasted for a decade.
Villagers used to walk to Sayaboury town for 8 hours until the road was built in 1995. Now they can easily go to Sayaboury by passenger trucks for an hour. This road brought traders, livestock diseases and foreign assistances.
Since 1997, Lao Theung people in Pak Seng district migrated to Na Khet area of the village.
1.3 Demography
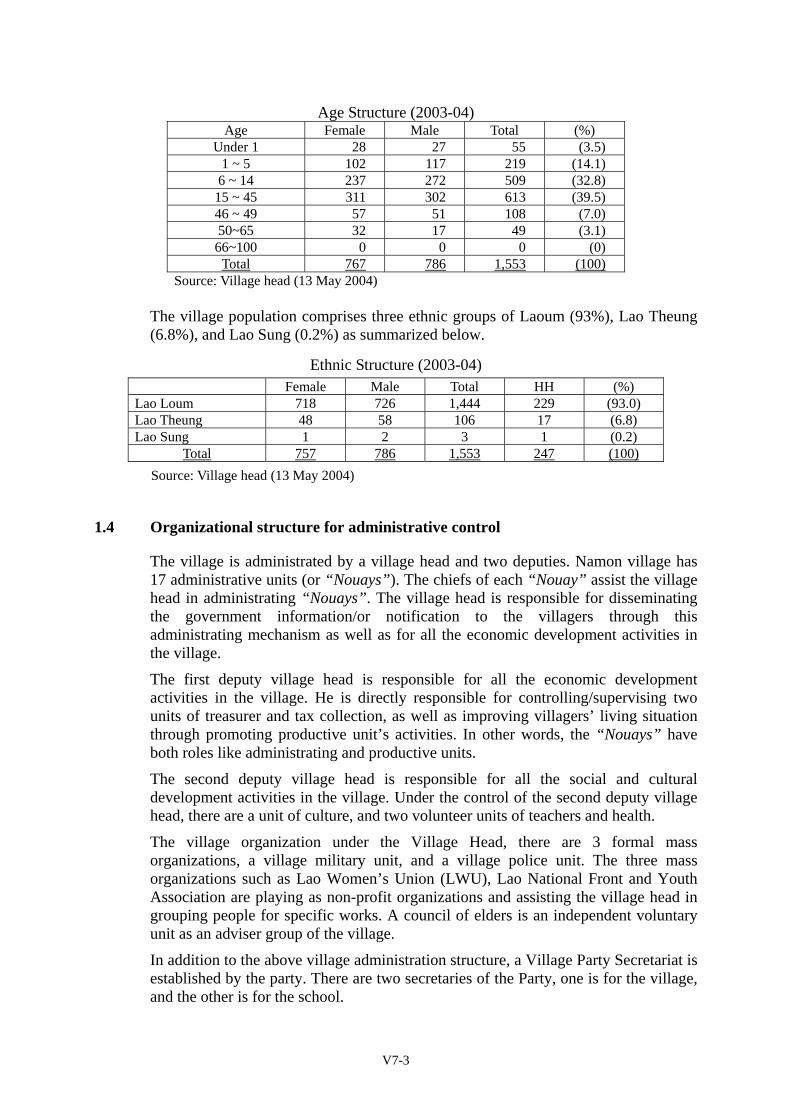
The village has 247 households and a population of 1,553 habitants. The average population is young with 50.4 % of the population under the age of 14. Available labor population (15~49) occupies 46.5 % of the total population. Female represents 49.4 % of the population as shown below.
V7-3
Age Structure (2003-04) Age Female Male Total (%)
Under 1 28 27 55 (3.5) 1 ~ 5 102 117 219 (14.1)
6 ~ 14 237 272 509 (32.8) 15 ~ 45 311 302 613 (39.5) 46 ~ 49 57 51 108 (7.0) 50~65 32 17 49 (3.1)
66~100 0 0 0 (0) Total 767 786 1,553 (100)
Source: Village head (13 May 2004)
The village population comprises three ethnic groups of Laoum (93%), Lao Theung (6.8%), and Lao Sung (0.2%) as summarized below.
Ethnic Structure (2003-04) Female Male Total HH (%) Lao Loum 718 726 1,444 229 (93.0) Lao Theung 48 58 106 17 (6.8) Lao Sung 1 2 3 1 (0.2)
Total 757 786 1,553 247 (100) Source: Village head (13 May 2004)
1.4 Organizational structure for administrative control
The village is administrated by a village head and two deputies. Namon village has 17 administrative units (or “Nouays”). The chiefs of each “Nouay” assist the village head in administrating “Nouays”. The village head is responsible for disseminating the government information/or notification to the villagers through this administrating mechanism as well as for all the economic development activities in the village.
The first deputy village head is responsible for all the economic development activities in the village. He is directly responsible for controlling/supervising two units of treasurer and tax collection, as well as improving villagers’ living situation through promoting productive unit’s activities. In other words, the “Nouays” have both roles like administrating and productive units.
The second deputy village head is responsible for all the social and cultural development activities in the village. Under the control of the second deputy village head, there are a unit of culture, and two volunteer units of teachers and health.
The village organization under the Village Head, there are 3 formal mass organizations, a village military unit, and a village police unit. The three mass organizations such as Lao Women’s Union (LWU), Lao National Front and Youth Association are playing as non-profit organizations and assisting the village head in grouping people for specific works. A council of elders is an independent voluntary unit as an adviser group of the village.
In addition to the above village administration structure, a Village Party Secretariat is established by the party. There are two secretaries of the Party, one is for the village, and the other is for the school.
V7-4
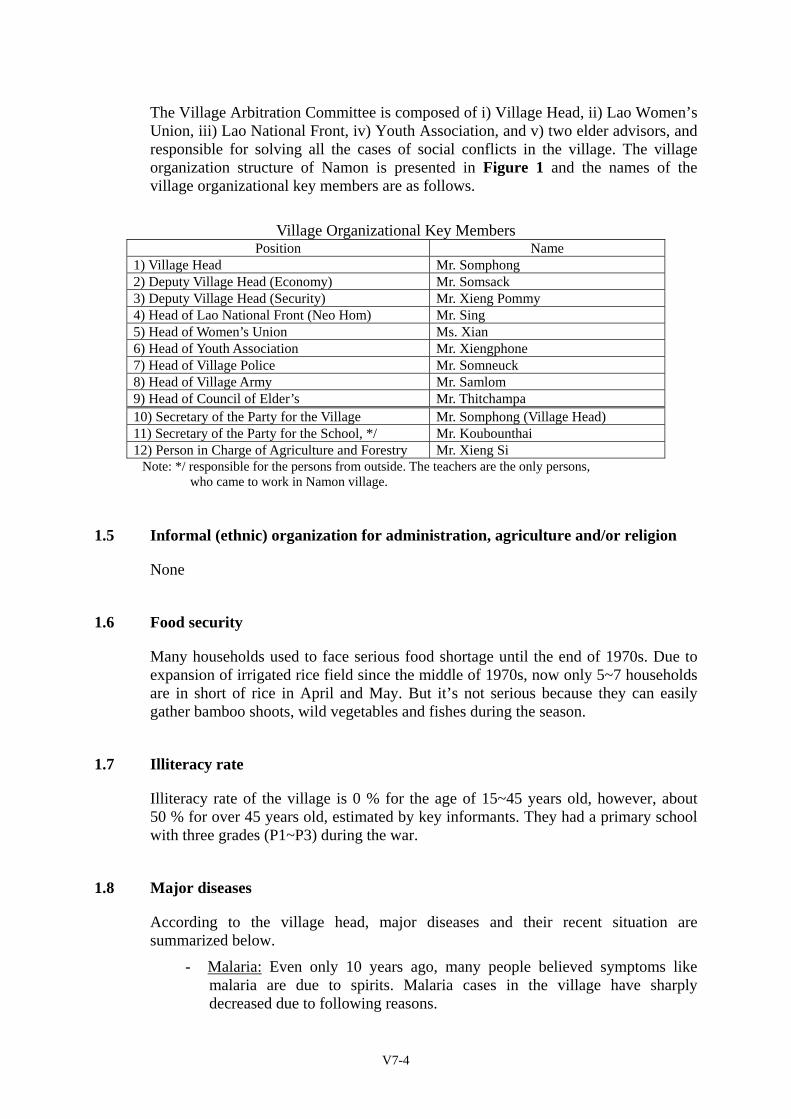
The Village Arbitration Committee is composed of i) Village Head, ii) Lao Women’s Union, iii) Lao National Front, iv) Youth Association, and v) two elder advisors, and responsible for solving all the cases of social conflicts in the village. The village organization structure of Namon is presented in Figure 1 and the names of the village organizational key members are as follows.
Village Organizational Key Members
Position Name 1) Village Head Mr. Somphong 2) Deputy Village Head (Economy) Mr. Somsack 3) Deputy Village Head (Security) Mr. Xieng Pommy 4) Head of Lao National Front (Neo Hom) Mr. Sing 5) Head of Women’s Union Ms. Xian 6) Head of Youth Association Mr. Xiengphone 7) Head of Village Police Mr. Somneuck 8) Head of Village Army Mr. Samlom 9) Head of Council of Elder’s Mr. Thitchampa 10) Secretary of the Party for the Village Mr. Somphong (Village Head) 11) Secretary of the Party for the School, */ Mr. Koubounthai 12) Person in Charge of Agriculture and Forestry Mr. Xieng Si
Note: */ responsible for the persons from outside. The teachers are the only persons, who came to work in Namon village.
1.5 Informal (ethnic) organization for administration, agriculture and/or religion
None
1.6 Food security
Many households used to face serious food shortage until the end of 1970s. Due to expansion of irrigated rice field since the middle of 1970s, now only 5~7 households are in short of rice in April and May. But it’s not serious because they can easily gather bamboo shoots, wild vegetables and fishes during the season.
1.7 Illiteracy rate
Illiteracy rate of the village is 0 % for the age of 15~45 years old, however, about 50 % for over 45 years old, estimated by key informants. They had a primary school with three grades (P1~P3) during the war.
1.8 Major diseases
According to the village head, major diseases and their recent situation are summarized below.
- Malaria: Even only 10 years ago, many people believed symptoms like malaria are due to spirits. Malaria cases in the village have sharply decreased due to following reasons.
V7-5
a) They can go to the hospital with the completion of the road in 1995; b) Completion of dispensary (clinic) in the village in 1996; c) Health advisers come to the village periodically to educate villagers to
clean dirty water with mosquito larva since 1997~98; d) EU supported mosquito nets and chemicals to prevent mosquito for
8,000 Kip (1 set) since 2000. - Diarrhea: from February to September. - Red eyes: Caused by unclean water during the rainy season. In March and
April, burning forest by shifting cultivation also cause red eyes. - “Kai ook um”: Under 10 years old. Fever. Not died. March and April.
1.9 Traditional custom, culture, event, cooperative works in the village
(1) Cooperative works Agricultural works There is no farmer management organization in the village. Household is the unit for agricultural work. Labor exchange gets decreasing year by year. Instead of labor exchange method, they hire people by cash or rice. Now paid labor is getting more common (60%) than labor exchange (40%). Others Marriage, diseases, funeral, building houses, building a school, cutting trees when the clinic was built, building canals and Buddhism festivals.
(2) Festival: - Yearly festival (Bun pacham pi): March - Lao New Year: April
2. Livelihood and Natural Resource Management
2.1 Topography
Namon village is surrounded by mountain ranges (about 800~1,200 m) in all directions. The elevation of the village habitat is about 520 m. Nam Ping river, Houay Khet and Houay Thu streams flow from the surrounding mountains and pass through the habitat area. Irrigated rice fields spread around the habitat area and along streams. Nam Met river flows from Nam Ngun village and pass near the western village border. Nam Met and Nam Ping rivers have water throughout the year with a minimum flow in March and April and a maximum flow in August and September. About 35 % of rice fields near Nam Ping river, Houay Ket and Houay Thu streams are under water by a big flood and about 10 % by a normal flood.
2.2 Meteorological data
Annual rainfall records at Sayaboury station in last 10 years (1993-2002) vary from 973 mm in 1998 to 1,610 mm in 2001 with an average of 1,297 mm. Detailed meteorological data including the maximum, minimum, and mean monthly average temperatures at Sayaboury station for recent 5 years are presented in Table 1.
V7-6
2.3 Land allocation
Forest land in Namon village was categorized with assistance of DAFO in 1997, and documents with map for plots in “Pa Somsai”, a housing lot and irrigated rice field (not for all households) were made respectively for each household in 2001. Each household keeps documents on housing lot and irrigated rice field but documents on lands in “Pa Somsai” are kept at DAFO office in Sayaboury. However, the Study Team could not confirm if DAFO kept such documents or not.
The Study Team supposes that the plots in “Pa Somsai” mentioned by the village head are the plots categorized as agricultural productive land “Din Phalith” by the land allocation program. According to DAFO staff, the documents for allocated land consist of i) Temporary Certificate for the use of each plot, signed by Land Allocation Committee at village level, the village head, and villagers concerned, and ii) Temporary Agreement for the use of each plot, signed by DAFO, the village head, and the villagers. In the documents, there is a section for drawing a sketch of the plot with its measurements.
Since the temporary agreement for the use of each plot is valid for three (3) years, there must be some further processes. According to DAFO staff, it is planned that after three years, the district land office will assess the actual use of the land as well as the tax payment situation for issuing the permanent certificate. However, no process is undertaken after issuing temporary certificates.
2.4 Land classification and distribution of each land use category
2.4.1 Data of DAFO
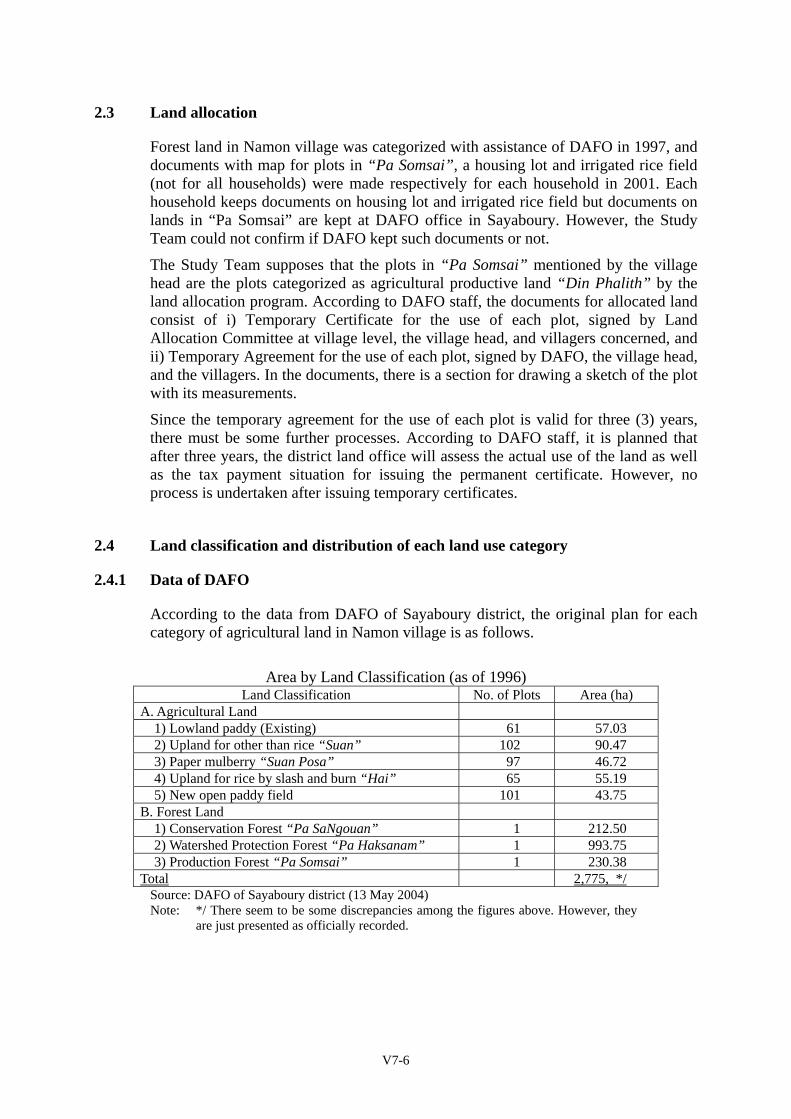
According to the data from DAFO of Sayaboury district, the original plan for each category of agricultural land in Namon village is as follows.
Area by Land Classification (as of 1996)
Land Classification No. of Plots Area (ha) A. Agricultural Land 1) Lowland paddy (Existing) 61 57.03 2) Upland for other than rice “Suan” 102 90.47 3) Paper mulberry “Suan Posa” 97 46.72 4) Upland for rice by slash and burn “Hai” 65 55.19 5) New open paddy field 101 43.75 B. Forest Land 1) Conservation Forest “Pa SaNgouan” 1 212.50 2) Watershed Protection Forest “Pa Haksanam” 1 993.75 3) Production Forest “Pa Somsai” 1 230.38 Total 2,775, */
Source: DAFO of Sayaboury district (13 May 2004) Note: */ There seem to be some discrepancies among the figures above. However, they
are just presented as officially recorded.
V7-7
2.4.2 Information from the village
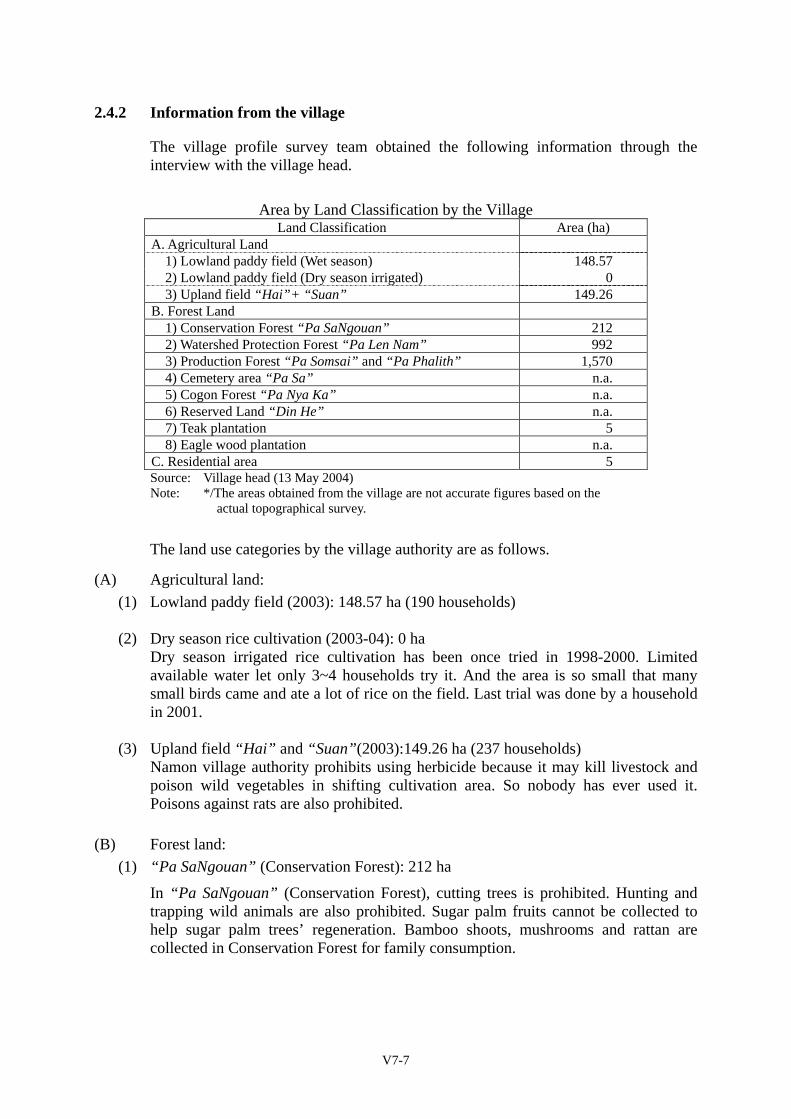
The village profile survey team obtained the following information through the interview with the village head.
Area by Land Classification by the Village
Land Classification Area (ha) A. Agricultural Land 1) Lowland paddy field (Wet season) 148.57 2) Lowland paddy field (Dry season irrigated) 0 3) Upland field “Hai”+ “Suan” 149.26 B. Forest Land
1) Conservation Forest “Pa SaNgouan” 212 2) Watershed Protection Forest “Pa Len Nam” 992 3) Production Forest “Pa Somsai” and “Pa Phalith” 1,570 4) Cemetery area “Pa Sa” n.a. 5) Cogon Forest “Pa Nya Ka” n.a. 6) Reserved Land “Din He” n.a. 7) Teak plantation 5 8) Eagle wood plantation n.a.
C. Residential area 5 Source: Village head (13 May 2004) Note: */The areas obtained from the village are not accurate figures based on the actual topographical survey.
The land use categories by the village authority are as follows.
(A) Agricultural land: (1) Lowland paddy field (2003): 148.57 ha (190 households)
(2) Dry season rice cultivation (2003-04): 0 ha
Dry season irrigated rice cultivation has been once tried in 1998-2000. Limited available water let only 3~4 households try it. And the area is so small that many small birds came and ate a lot of rice on the field. Last trial was done by a household in 2001.
(3) Upland field “Hai” and “Suan”(2003):149.26 ha (237 households) Namon village authority prohibits using herbicide because it may kill livestock and poison wild vegetables in shifting cultivation area. So nobody has ever used it. Poisons against rats are also prohibited.
(B) Forest land: (1) “Pa SaNgouan” (Conservation Forest): 212 ha
In “Pa SaNgouan” (Conservation Forest), cutting trees is prohibited. Hunting and trapping wild animals are also prohibited. Sugar palm fruits cannot be collected to help sugar palm trees’ regeneration. Bamboo shoots, mushrooms and rattan are collected in Conservation Forest for family consumption.
V7-8
Conservation Forest spreads at high altitude area of Phu Sop mountain range in southwest of the village and Phu Makhom mountain near Met river in the west and east side of the road to Phu Sani mountain.
(2) “Pa Len Nam” (Watershed Protection Forest): 993 ha
In “Pa Len Nam” (Watershed Protection Forest), cutting trees is prohibited. Hunting and trapping wild animals are prohibited but in fact they catch them with traps. Sugar palm fruits can be collected. A lot of sugar palm grow in this forest. Bamboo shoots, mushrooms and rattan are also collected in Watershed Protection Forest. Watershed forests of Houay Ket stream, Houay Thu stream, Houay Khang stream and Ping river are protected as “Pa Len Nam”.
(3) “Pa Somsai”(Production Forest and Community Production Forest)1: 1,570 ha
In Namon, “Pa Somsai” is allocated and used for slash and burn cultivation, which can be called “Pa Phalith” (Production Forest) like other villages. “Pa Somsai” = “Pa Phalith” spreads near the habitat area, irrigated rice field and roadside. Trees like “Mai Nyaan”, “Mai Pao”(Cephalostachyum sp. Gramineae, Bamboo) and “Mai Chak” (Milletia sp.)are cut for building house. Villagers catch wild animals like deer, “Nyuan” and wild pig with trap.
(4) “Pa Sa” (Cemetery Forest): (the area of “Pa Sa” is not available)
Nobody try to cut trees, gather NTFPs or even walk into “Pa Sa” because villagers are afraid of spirits. “Pa Sa” is located near the primary school.
(5) “Pa Nya Kha” (Cogon Forest): (the area of “Pa Nya Kha” is not available)
During 2nd Indochina War, Hmong people fighting with American army lived and engaged in shifting cultivation in the high altitude area of Phu Kum Kao mountain range in northeast of the village. Some area is prevented from regeneration of forest because of fires during dry season for slash and burn cultivation and still covered with cogon.
(6) Reserved Land “Din He”: (the area of “Din He” is not available)
According to the village head, there are reserved lands “Din He” in the village, which is kept for future land allocation to new households and new comers. The village head has a responsibility to allocate the land. However, the location and area of those lands could not be confirmed during this survey.
(7) Teak Plantation: 5 ha
1 Italics are Lao names of trees and animals obtained from the village key informants. Only identified
common/or genus/or family names are described in the following parentheses.
V7-9
About 7~8 households have 5 ha of teak trees plantation. They began to plant teak trees in 1995.
(8) Eagle Wood Plantation: (n.a.)
Cutting all eagle woods in the forest encourages villagers to plant eagle wood in 2003. Now about 30~50 % of households in Namon plant small number of eagle woods. The villagers voluntary plant the trees without advise of DAFO.
(C) Residential area: about 5 ha
2.5 Farming activity and production of major crops and livestock in the area
2.5.1 Farming activity
There are 148 ha of lowland paddy fields in Namon, owned by 190 households. It is simply calculated that among total 247 households, 77 % of households own 0.78 ha of lowland paddy fields in average. The farmers who own lowland paddy field, grow rice in lowland and cash crops in upland areas. However, the farmers who do not own lowland paddy field, grow mainly upland rice in “Hai” area.
Each household is allocated basically 3 plots (0.6~0.8 ha per plot) for 3-year rotation shifting cultivation system depending on family labor availability. The farmers who own lowland paddy filed, are not always allocated 3 plots but one or two plots depending on available family labor as well.
In “Hai” area they grow various kinds of crops like rice, sesame, Job’s tear, corn, cassava, taro, pumpkin, chili, egg plant and cucumber. Among these, sesame and Job’s tear are major cash crops and corn, taro and cassava are also important for household consumption as well as for feeding animals.
All those crops are planted just before the rainy season in end April and May. Firstly, rice is planted in the main area (sometimes together with cucumber and other vegetable crops) followed by sesame, corn, Job’s tear, and others. Sometimes, corn is firstly planted before rice. Sesame, Job’s tear and corn are normally planted around the rice plantation area as a boundary and also in small plots, so called “Suan”(garden). For growing those crops, the farmers do not use any fertilizers and only practice 3 times of weeding for rice and 2 times weeding for sesame, Job’s tear and corn.
2.5.2 Major crops
(1) Lowland rice Namon village had about 50 ha of lowland rice field in the middle of 1970s and heavily depended on shifting cultivation. They has cleared flat lands and made lowland rice field little by little for more than 25 years. According to key informants, there still is about 10 ha of flat land suitable for lowland rice field. But it cannot be
V7-10
used as rice field because of water deficiency. Harvest of lowland rice in Namon reaches to 4~4.5 ton/ha under the best condition (soil in rich nutrition, good weather and enough water). But it’s sometimes only 1 ton/ha because of diseases, insects/rats or water deficient. Rats are increasing for last 3~4 years. Paid labor is getting more common than labor exchange. Prices of agricultural labors are as follows.
- land preparation, a person with buffalo: 20,000 Kip/day, a person without buffalo: 10,000 Kip/day
- land preparation, a person with tractor: 400,000~500,000 Kip/ha - weeding, harvesting rice, transplanting rice or carrying rice: 8,000 Kip/day
or 1 “kron” (10kg) of un-hulled rice/day 190 households engage in lowland rice cultivation. 10 households of them cultivate lowland rice only, the others cultivate both lowland and upland rice. After harvest, vegetables are not planted in the rice field. They raise buffalo and cattle for 7 months (from November to May) in the area.
(2) Upland rice Households without enough lowland rice field plant upland rice. The best harvest of upland rice is more than 3 ton/ha. Villagers weed 4 times in Namon village. Paid labor is getting more common than labor exchange for upland rice cultivation as well. Price of agricultural labor is 8,000 Kip/day or 1 “kron” (10kg) of un-hulled rice/day for works like slashing, burning, sowing, weeding, harvesting rice and carrying rice. Planting of upland rice gets decreasing. Villagers tend to plant paper mulberry and sesame instead of upland rice as cash crops and buy rice.
(3) Job’s tear They began to plant Job’s tear in 2001. But extremely low price in 2002 (500 Kip/kg) discouraged most villagers to plant in 2003. About 10 households planted total 5 ha of Job’s tear in 2003. Price in 2003 (1,000 Kip/kg) was still not so attractive for the villagers that only a couple of households plant Job’s tear in 2004. Villagers plant sesame instead of Job’s tear.
(4) Sesame Villagers are not willing to plant sesame because of its low productivity for labor or land. But high price of last year made villagers to plant more sesame this year. (Compared with Job’s tear, sesame has an advantage in preservation. This is another reason they plant sesame instead of Job’s tear. A Thai company came to buy sesame in the village last year. About 30 % of households in the village plant sesame in 2004. They plant 2 kinds of sesame, whose harvest seasons are different. “Mak ga do” specie can be harvested in August and September. But harvesting in these months is inconvenient because of the heavy rain.
(5) Corn All households plant corn for family consumption. Corn is used for feeding pigs and poultry. Production of corn increases year by year for sales. They plant 2 kinds of corn. One is “Sali Do” for human and the other is “Sali Pi” (“Sali Hmong”), big but hard, and used for feed of pigs and poultry. DAFO promoted commercial corn production with hybrid seeds this year. But DAFO could not prepare the seeds before
V7-11
sowing season. So villagers planted local species this year. Hybrid seeds are 25,000 Kip/kg. They have never planted hybrid corns until now.
(6) Cassava All households plant cassava for family consumption. Villagers plant cassava for very long time as food for human. Production of cassava increases year by year for it is getting to be used as feed for livestock as well.
(7) Sweet potato All households plant sweet potato for family consumption. Sweet potato is also used as feed for pig.
(8) Paper mulberry About half of households in the village plant paper mulberry. Villagers planted paper mulberry following DAFO’s advice that the factory in Sayaboury would buy at good price. They bought at 3,000~3,500 Kip/kg before. But now they don’t buy even at 500 Kip/kg.
2.5.3 Livestock
The numbers of each livestock in the village are summarized below.
Number of Livestock Livestock Number
(Heads) 1) Buffalo 427 2) Cattle 45 3) Pig 623 4) Poultry 6,044 5) Goat 5 6) Elephant 2
(1) Buffalo: 427 heads (About 200 households) Number of buffalo is much more than that of cattle in Namon because buffalo is important labor force in lowland rice cultivation. But the number has decreased from more than 600 to 427 in just two years (2002 ~ March 2004). Many households sold buffalo (2.5~3 million Kip/head) and bought a tractor (more than 8 million Kip/unit) and/or built house for these several years. Diseases easily spread after the road reached to the village. This also discourages villagers to raise buffalo. Buffalos tend to suffer from “Tao Hua Luat” disease during rainy season (from July to September).
(2) Cattle: 45 heads(7~8 households) More than 500 heads of cattle had been raised in Namon from 1997 to 2000. Fallow land for raising cattle in the village is getting smaller and cattle often eat upland crops in “Hai” and “Suan”. Shifting cultivation area is getting decreased with advice of DAFO since 2000. This is the reason villager sold their cattle for last several years. About 10% of cattle have got vaccination since 2003.
(3) Pig: 623 heads (All households) After completion of the road between Sayaboury and Hong Sa, diseases often spread
V7-12
among pigs to die. Still no pigs in the village have got vaccination yet. Setting up toilets with assistance of England made number of pigs decreased because pigs lost an important feed source (human excretion). Hard work for preparing their feeds also discourages villagers raising pigs. Recently villagers sell their pigs early for fear of suffering diseases. They sell pigs and keep the money for building houses or in case of necessary.
(4) Poultry (Chicken, Duck and Turkey): 6,044 heads (All households) Number of poultry tends to increase as buyers in Sayaboury come to buy poultry almost every day for last several years. Some households have just begun raising turkeys in 2003. As buffalo and pigs, poultry suffer from diseases much easily after 1995. “Hua Luat” Diarrhea and “Ko Tiip” are major diseases for poultry. But they still raise poultry because it can be change to cash quickly when they need money urgently. No chickens in the village have ever got vaccination.
(5) Goat: 5 heads (1household) One household began to raise goats in 2003.
(6) Elephant: 2 heads (7~8 households) Some villagers jointly bought elephants with money they sold eagle woods. They use elephants for carrying 3 kinds of trees (“Mai Doo”(Rose wood) “Mai Kaa” and “Mai Ken”) in the village. The government is also a good client for hiring elephants for carrying trees.
2.6 Collecting NTFPs2
Major NTFPs collected in the village are as follows.
NTFPs collected in the Village
Major NTFPs Description 1) Hunting and trapping Hunting and trapping wild animals are prohibited in the
village. But villagers hunt wild animals like deer, wild pig, “Nyuan”, “Kwan”, monkeys, “Kan” in Watershed Protection Forest. One villager hunted a tiger a couple of years ago and sold at 72,000 Baht. He was arrested and sent to prison for a year. He was fined more than 100,000 Baht.
2) Paper mulberry Commercial gathering of paper mulberry also began in 1995, when the road from Sayaboury reached to the village. Villagers began to plant paper mulberry because natural ones got decreased. The sale price was 2,500 Kip/kg in 2003. But it went up to 3,000 Kip/kg and then fell sharply down to 1,500 Kip/kg this year. So villagers stop gathering. Now traders don’t buy even at 500 Kip/kg. Paper mulberry have an advantage that villagers can stop gathering if price drop.
2 Italics are Lao names of trees, NTFPs and animals obtained from the village key informants. Only identified
common/or genus/or family names are described in the following parentheses.
V7-13
3) Sugar palm
“Mak Tao”
Sugar palm bears fruits only 1~3 times of its life. Soon after bearing fruits, the tree will die. In 1995, when the road from Sayaboury reached to the village, traders came to buy sugar palm in Namon. Price was 1,500 Kip/kg for the first couple of years, but it was raised to 2,000 Kip/kg in 1998 because traders need more sugar palm fruits.
When villagers collect sugar palm fruits in forest, they go as a team of about five persons. Each person has his/her own role like collecting, boiling, crushing, looking for food and so on. And each of them gains 100,000 Kip for a time. Each villager in Namon usually go collecting sugar palm for 10~20 times (Average 1~2 million Kip per year per person).
Namon village has a regulation on collecting and selling sugar palm for sustainable resource management. Villagers can gather sugar palm fruits from November to March (Lao calendar) and they stopped collecting if traders stopped buying around March. Collecting sugar palm fruits in Conservation Forest is prohibited for promoting their regeneration.
Traders pay license fee (2 % of sold price) to the village and 90 % of them go to district treasury and keep the other 10 % in the village. Namon village began to collect money called “maintenance fee” from traders. Each truck coming to collect sugar palm fruits has to pay 100,000 Kip to the village. All of the maintenance fee collected can be kept in the village and used for expense such as food and drink when officials visit the village.
Namon villagers go collecting sugar palm fruits as far as Lon Sen village. The area used to belong to Namon village before. Now, Namon villagers pay 20,000 Kip per year per person to Lon Sen village as “maintenance fee” for collecting sugar palm fruits. Namon and Lon Sen villagers often make a team to cllect sugar palm fruits. Villagers feel sugar palm got decreased since 2003. But they think it temporally. Sugar palm plantation has not been seen yet.
4) Tree bark Villagers have experience of collecting “tree bark” for only one month in the history. In January 2004, a Chinese company came to buy “tree bark”. Villagers think the company will not come back..
5) Worm in bamboo
“Me Nomai”
“Me Nomai” is collected from bamboo trees of “Mai Hok”(Dendrocalamus sp. Gramineae), “Mai Bon” and “Mai San” for family consumption in September and October.
6) Cardamon Cardamon has more history as cash crops than sugar palm or paper mulberry. Villagers began to carry cardamon on their backs to Sayaboury in 1988~89. There is a lot of cardamon in Conservation Forest and Watershed Protection Forest of “Phu Sani” Mountain. They go to Lon Sen village to gather cardamon.. “Maintenance fee” is not requested for cardamon by Lon Sen village. (“Maintenance fee” is paid only for sugar palm in Lon Seng village.)
7) Bamboo shoots “No Hia”(Cephalostachyum sp. Gramineae), “No Lai” and
V7-14
“Nomai Bon” are typical bamboo shoots in Namon. These bamboo shoots are collected around road, river, streams and slash and burn cultivation area from May to October.
8) Mushrooms “Het Puak”(Termitomycetes sp., Agaricus integer Loureiro) (May), Jew’s ear “Het Sanun”(Auricularia polytricha (Montagne) Saccardo) (March and April) and white mushroom “Het Khao”(Lentinus sp.) (from March to May) are typical mushrooms collected in Namon. These mushrooms are collected nearby Community Production Forest, Conservation Forest and Watershed Protection Forest.
9) Rattan The villagers begun to collect and sell rattan in 1995. All households in Namon now collect rattan beside the roads in Phu Sani (north) and Phu Makkom (west) mountain ranges.
10) Resin Resin is collected from “Mai Pao” trees in Namon. Resin has been collected since 1995. Villagers collect resin in Kok Men Got and Phu Kum Yao mountains, where a lot of “Mai Pao” trees grow. About 1 ton of resin is produced every year in the village. Sale price of resin in the village is 2,000 Kip/kg.
11) Natural fruits Wild fruits like wild mango and wild rambutan in May, and wild “longan” in August are collected in any forest areas of Community Production Forest and Conservation Forest in the village.
12) Frog Many villagers go out to catch frogs after rain from May to September. Now so many people catch frogs in relatively small rice field that number of frogs gets decreased.
13) Bat Bats are caught with nets in March and April. Bats live in caves of Phu Makkom Mountain.
2.7 Use of water products
(1) Fishing Villagers usually go fishing to Nam Met river all the year because fishes in other rivers and streams in Namon are rather small. Fishing is difficult during rainy season. According to key informants, fishes in Nam Met river have decreased by 70% for a decade. The reasons are as follows.
- Some use explosives to catch fishes. - Others kill and collect fishes with electric shock. - People from other town and villagers come to catch fishes by car.
Using explosives and electric shock are prohibited and 5 and 3 persons were arrested respectively for illegal using this year. Villagers of Namon also go fishing to other nearby villages including Namtiao river. Fishes go up river and streams from March to May and down in September and October.
(2) Aquaculture 10 households have fish ponds for family production. Fish ponds were constructed near streams like Houay Ket and Houay Thu streams for these several years. Typical fishes for aquaculture are “Pa Ning” and “Pa Nang”(Kryptopterus apogon). Fish
V7-15
thief is a problem for raising fishes. (3) Others
Shrimps are captured in fish ponds, Nam Ping and Nam Met rivers for family consumption. Production volume is relatively small. Crabs live all rivers and streams in the village and are captured mainly in Nam Met and Nam Pin rivers and Houay Thu stream all the year. A lot of crabs can be seen during rainy season. Riverweed is gathered in Nam Met and Nam Pin rivers from December to March and collected for family consumption.
2.8 Other activities
(1) Weaving Until the middle of 1990s, women in all households used to weave and make cloths for family members. But most of them stopped weaving because they can go to Sayaboury to buy cheap and fashionable (as they think) clothes after the road was completed. Now only 3~4 households still engage in traditional weaving.
(2) Blacksmith 4 households engage in blacksmith. Labor exchange used to be the basic method for the cost of agricultural tools like that of Pong Dong village in Nan district, Luang Prabang province, but now villagers tend to pay for blacksmiths’ services.
2.9 Collective activities by the village for forest conservation
(1) Forest Fire Fighting There is a fire fighting organization in the village. 53 men are the members. This organization works for a fire in forests as well as in the habitat area. Mr. Somnuk is the leader of the organization.
(2) Efforts for Sustainable Sugar palm Usage See section 2.6 “Sugar palm” of NTFPs.
2.10 Seasonal calendar
Seasonal calendar, which shows various activities/issues/ events related to livelihood and natural resource management is presented in Figure 2.
3. Infrastructure
3.1 Location, current condition of social infrastructure
(1) Water supply A gravity-fed water supply system with 16 faucets was set up with the assistance of British government. There are two villagers who have a responsibility to watch and repair the water supply system. Their salary is 10,000 Kip per month. Their salary and repairing fee come from the money villagers pay. Each households pay 500 Kip per month as water fee.
V7-16
(2) School The new primary school building with 6 rooms (Grade1~5, P1~5) was built in 2000. High school students of Namon attend schools in Natak village or Sayaboury city.
(3) Clinic/Hospital Namon Dispensary with three beds was built by the assistance of British government in 1996. Two doctors work at the dispensary.
(4) Road The road connecting Sayaboury and Hong Sa district was built in 1995. Bridges on the roads were repaired in 1999~2000. The road will be upgraded with ADB 10th road improvement project. According to a Laotian consultant of ADB, the project will begin in the late 2004.
(5) Market There is no market in the village. Villagers buy daily necessaries at small shops in Namon and special commodities in Sayaboury.
(6) Electricity There is no public electricity. 24~25 households are supplied with electricity from private generators set at Nam Ping river. 4 households have gasoline generators. Most generators were purchased after 2000.
3.2 Agricultural infrastructure
(1) Irrigation Long Muang (or Houay Muang) Canal was build to fetch water from Nam Ping river for fires. Now water of the canal is used for irrigating rice fields as well. But no irrigated rice cultivation during the dry season is conducted in Namon due to limited water. Recently, improvement of the existing irrigation facilities is being considered using IFAD financing in the village.
(2) Rice mill There are 12 units of rice mills in Namon.
(3) Vehicle/Agricultural machine/Tractor Thirteen (13) tractors were purchased after 1997~98. There is one Soviet-made 6 wheels truck in the village (There is no 4wheels vehicle owned by villagers).
3.3 Infrastructure development plan
ADB 10th road improvement project (The project will be start in 2004.)
4. Organization related to the Project Activities
4.1 Organizations available in the village
(1) Water management unit See section 3.1 (1) Water supply.
V7-17
(2) Forest management unit
There is no forest management organization in the village. Mr. Xieng Si is in charge of forest issues.
(3) Farmer’s management unit
None (4) Village Bank “Kon tun baan”
Village bank was set up two months ago with assistance of the district financial department. The person in charge of finance in the village went to learn about the system in Luang Prabang for a week. The members are 63 households.
4.2 Any on-going/ implemented rural development project in the area
Sayaboury district is one of the 72 poorest districts in Lao PDR and target of NPEP (National Poverty Eradication Programme).
4.3 International organizations and/or local NGOs working in the area
(1) British government assisted a dispensary, a water supply system and toilets.
(2) EU rural development assisted mosquito nets and anti-mosquito chemicals.
4.4 Any agricultural promotion activities
None.
4.5 Availability of agricultural technicians
Mr. Vet studied at Agriculture and Forestry College in Xieng Ngun and worked at DAFO before. He married a woman in Namon and lives in the village now. He has already quitted DAFO. No veterinarian is available in the village. Normally, the village head and other villagers usually get livestock vaccination.
5. Others
5.1 DAFO extension staff activities to the village
DAFO staffs visit Namon village about 3~4 times a year. DAFO provides weather forecast information and introduce new cash crops.
5.2 Any migration project in the future
Not exist
V7-18
5.3 Situation of tax collection (land tax etc.)
Total Tax Revenue: 9,682,600 Kip as of January 2004, of which 8,432,584 Kip are transferred to Sayaboury district, and 1,250,006 Kip were kept in Namon village. Among 1,250,006 Kip in Namon village, 750,004 Kip (60%) are used for the village officers (salaries), and 500,002 Kip (40%) are reserved for the village.
V7-19
PART 2 PARTICIPATORY VILLAGE SURVEY
- Survey period : 13 to 15 May 2004 - Resource map and social map : 13 May 2004 - Venn diagram for marketing products : 13 May 2004 - Dependence on resources by well-being level : 14 May 2004 - Present rules on the use of resources : 15 May 2004
1. Resource Map and Transect
In order to clarify the present use of lands and other resources, a resource map was drawn by the villagers through a participatory process. A total of 16 villagers, who are representatives of each “Nouay”, participated in this session on 13 May 2004. Based on the resource map, a transect walk was conducted together with some village key informants on 14 May 2004. During the transect walk, the present use of lands and other resources were clarified by observing actual conditions of the sites. The resource map shows the different land types, in addition to roads, rivers, streams and habitation and the transect shows cross-sectional view of the different zones and provides comparative information such as main activities and problems for each land category as presented in Figure 3 and 4.
2. Resources Utilization and Major Products
Major products in each resource are summarized in the following table, the information of which was obtained through Transect Walk, Venn Diagram preparation and some informal discussions.
Major Products by each Land Category
No. Resources Products 1. Lowland paddy Rice (glutinous) Buffalo (in the dry season) Cattle (in the dry season) Dry season vegetable
2. Community Production Palm fruit “Mak Tao” Forests: Bamboo shoot “ Pa Somsai” Tiger grass Mushroom Rattan shoot Herbal medical root Wild banana flower Resin Tree bark Construction materials (bamboo, pole, timber)
2. Agricultural Land for Upland rice upland cultivation: Sesame “Hai” and “Suan” Maize (3 places per household, Job’s tear 1.0 ha for place/piece) Peanut or Fallow land for Cassava
V7-20
Slash and burn “Lao Orn” Wet season vegetable or “Pa Phalith” Buffalo (in fallow land) Cattle (in fallow land) Pig (in fallow land) Poultry (in fallow land)
3. Watersheds Rattan shoot Palm fruit
4. Rivers (Nam Ping) Fish 5. Streams Fish (Houay Thou, Meuang,
Khet and Khang) Shell Small shrimp
6. River sides Tiger grass (non-watersheds) Dry season vegetable
3. Venn Diagram
3.1 Importance of major products/resources
In order to clarify major products/resources in the village, the survey team organized group discussions through Venn Diagram preparation process in the afternoon on 13 May 2004. Thirty-two (32) participants (2 each from 16 “Nouays”) were divided into two groups, namely a male group (16 persons) and a female group (16 persons) and were asked about major products/resources for each group, their importance and its reason, and their market situation as well.
Regarding importance of the major products/resources, both groups described “rice” as the 1st priority like other villages. Rice is the most important crop for the villagers mainly for HH consumption as well as for sale. Totally, this village produces surplus rice owing to 148 ha of lowland paddy field, and sells the surplus rice to the local markets, mainly to Sayaboury district market. Importance ranking after rice is followed by “pig” as the 2nd, “tree bark” as the 3rd, “sesame” as the 4th, and “palm fruit” as the 5th, for male group. On the other hand, the female group listed up “poultry” as the 2nd priority, “fish and crab” as the 3rd, “wet and dry season vegetables” is the 4th, and “pig” is the 5th.
“Pig and poultry” were ranked as high priorities by both male and female groups because they thought such small animals were easily sold with rather short raising periods than large animals like cattle and buffalo. Male group listed up cash crops/NTFPs as important products such as tree bark, sesame, palm fruit. While female group listed up “fish” and “crab” as 3rd ranked products and “wet and dry season vegetables, which are almost for household consumption and considered to be important as food.
Palm fruit was ranked at 5th by male group but not listed in high priority by female group. This may be because female group do not appreciate hard processing works of palm fruit collection. Differences of major products/resources between male and female, and their priority, reasons and problems are summarized in the following table.
V7-21
Difference of Major Products/Resources between Male and Female, and their Priority, Reasons and Problems
Major Products Male Female Claimed Priority Claimed Priority
Reasons, */ Problems
1. Cultivated Crops
- Rice O 1 O 1 HH consumption and sale, about 30% of HH sell rice. Selling price of un-milled rice is 1,000 Kip/kg.
For lowland rice cultivation, damages by ants, rats and insects are serious, and for upland rice cultivation, hard weeding works is serious.
- Job’s tear O 10 -- -- Sale (and some saving for seeds), about 20% of HHs produce Job’s tear, a selling price of which is 800 Kip/kg.
Selling price is low comparing with productivity.
- Sesame O 4 -- -- Sale, for medicine and HH consumption, 100% of HHs produce sesame, a selling price of which is 3,000 Kip/kg.
- Wet season vegetable
-- -- O 4 Sale and HH consumption, 20% of HHs produce wet season vegetables.
- Dry season vegetable
-- -- O 4 HH consumption, 50% of HHs produce dry season vegetable with small quantity.
2. NTFPs - Paper mulberry O 6 -- -- Sale, 80% of HHs
collect paper mulberry, a selling price of which is 3,000 Kip/kg.
- Tiger grass O 9 -- -- Sale, 100% of HHs collect tiger grass, a selling price of which is 2,000 Kip/kg.
- Palm fruit O 5 -- -- Sale, 100% of HHs collect palm fruit, a selling price of which is 2,600 Kip/kg.
- Tree bark O 3 -- -- Sale - Herbal medical root
O 13 O 7 Sale, 30% of HHs collect herbal roots, a selling price of which is 1,000 Kip/kg.
- “Skhan” (edible winding species)
O 15 -- -- Sale and HH consumption, 80% of HHs collect, a selling price of which is 2,000 Kip/20 cm piece.
- Resin O 14 -- -- Sale, 50% of HHs collect resin, a selling price of which is 2,000
V7-22
Kip/kg. - Rattan shoot O 11 O 6 Sale, 20% of HHs
collect rattan shoot, a selling price of which is 1,000 Kip/3 pieces.
- Wild banana flower
O 16 -- -- Sale, 10% of HHs collect banana flower, a selling price of which is 1,000 Kip/4 pieces.
3. Livestock - Buffalo O 8 O 8 Sale and draught
animals, 5% of HHs own buffalos, a selling price of which is10,000 Baht per head.
Disease epidemics have not been serious after vaccination was given to animals. About 30 heads of buffalos and cattle died during 2003-04.
- Cattle O 7 O 8 Sale, 5 HHs owned cattle, a selling price of which is 8,000 Baht per head.
- Pig O 2 O 5 Sale and ceremony, almost all HHs raise pigs, a selling price of which is 300,000 to 600,000 Kip/head.
Hog cholera and stomach problem during April to June.
- Poultry -- -- O 2 Sale and HH consumption, all HHs raise chickens, a selling price of which is 20,000 Kip/head.
Chicken cholera occurred during march to May.
4. Others - Fish O 12 O 3 HH consumption and
sale, all HHs do fishing in the river, a 5% of HHs sell fish, selling price of which is 1,000 Kip/kg.
Outsiders exploited fish in Met river by using a dry cell battery.
- Crab -- -- O 3 Note: -/ Claimed as major corps but lower in rank. --/ Not claimed as major crops.
*/Activities in parenthesis mean secondary/minor purposes.
3.2 Marketing situation of major products
(1) Licensed middlemen There are three (3) groups of licensed middlemen in Sayaboury district, to whom the producers/villagers are officially to sell their products. The group-1 consists of 15 middlemen, who handle cash crops and NTFPs such as sesame, Job’s tear, paper mulberry, tiger grass, and tree bark. The group-2 consists of 17 middlemen, who handle buffalo and cattle. The group-3 consists of 11 middlemen, who handle pig and goat.
(2) Two village traders There are two (2) village traders who collect the village products and sell to the licensed middlemen above. Further, some products are directly collected by those
V7-23
licensed middlemen or the villagers carry their products by themselves directly to the middlemen, or to Sayaboury market.
(3) Venn Diagram of major products Destinations of major products were clarified through a Venn Diagram preparation as summarized in the following table. Venn Diagram in Namon village is presented in Figure 5 and 6.
Destination of Major Products Products Sell/Consume
in the village Sell to near
other markets, 1/Sell to
Middlemen, 2/ 1. Cultivated Crops - Rice O (O) - Job’s tear O - Sesame O - Wet season vegetables O (O) - Dry season vegetables O (O) 2. NTFPs - Paper mulberry O - Tiger grass O - Palm fruit O - Tree bark O - Herbal medical root O
- “Sakhan” (edible winding species)
O
- Resin O - Rattan shoot O - Wild banana flower O 3. Livestock - Buffalo O
- Cattle O - Pig O - Poultry (O) O Others - Fish O - Crab O
Note: O = major destination, (O) = minor destination 1/ Non-licensed middlemen come to the village to buy the products, or
the villagers carry their products by themselves directly to Sayaboury market. 2/ Village traders carry products to Sayaboury and sell to licensed middlemen, or
licensed middlemen directly come to the village to buy the products.
4. Social Map
4.1 Well-being ranking
A social map was drawn by the villagers through a participatory process. This session was organized on 13 May 2004 with a total of 16 villagers’ participants (representatives from 16 “Nouays”). The participants were asked to clarify themselves based on the well-being perceived by themselves, then they classified the well-being rank into three levels like i) over sufficient, ii) sufficient and iii) under sufficient. According to the participants, among the total of 247 households of the
V7-24
village, 46 households (18.6 %) were classified into “over sufficient” level, 181 (73.3 %) were “sufficient” level, and the other 20 (8.1 %) were “under sufficient” level, respectively. Among these, “under sufficient” level of 20 households normally face deficit in rice for not more than 5 months. The section 1.6 of Part 1 also describes about the situation of food security in the village, saying that “Only 5~7 households are in short of rice in April and May. But it’s not serious because they can easily collect bamboo shoots, wild vegetables and fishes during the season.”
These three (3) categories clarified by the participants are distinguished in the social map, as presented in Figure 7. It can be simply said that major indicators affecting on the living situation are if they have some lowland paddy fields. Living situation of each level clarified by the participants is summarized in the following table.
Living Situation by Each Level
Level Living Situation “Over sufficient” 46 HHs (18.6 %)
This group consists of 46 households. - They own lowland paddy fields (0.5 to 1.0 ha); - They produce surplus of rice and most of them sell some surplus; - They practice both wet and dry season paddy cultivation; - They live in permanent houses with brick/plank walls, cement floors,
and either tin or fiber cement roofing; - They all own motorcycles and a few own hand-tractors; - Some of them own rice mills; - Some own and run small shops; - Some own TV and VDC - They keep buffalos and cattle, and sell them when needed; - They keep pigs and poultry for both sale and HH
consumption/ceremony; - They collect and sell NTFPs in the village managed forest and
Namtiao managed forests; - They grow sesame and Job’s tear in their gardens “Suan”; - Two of them are village traders.
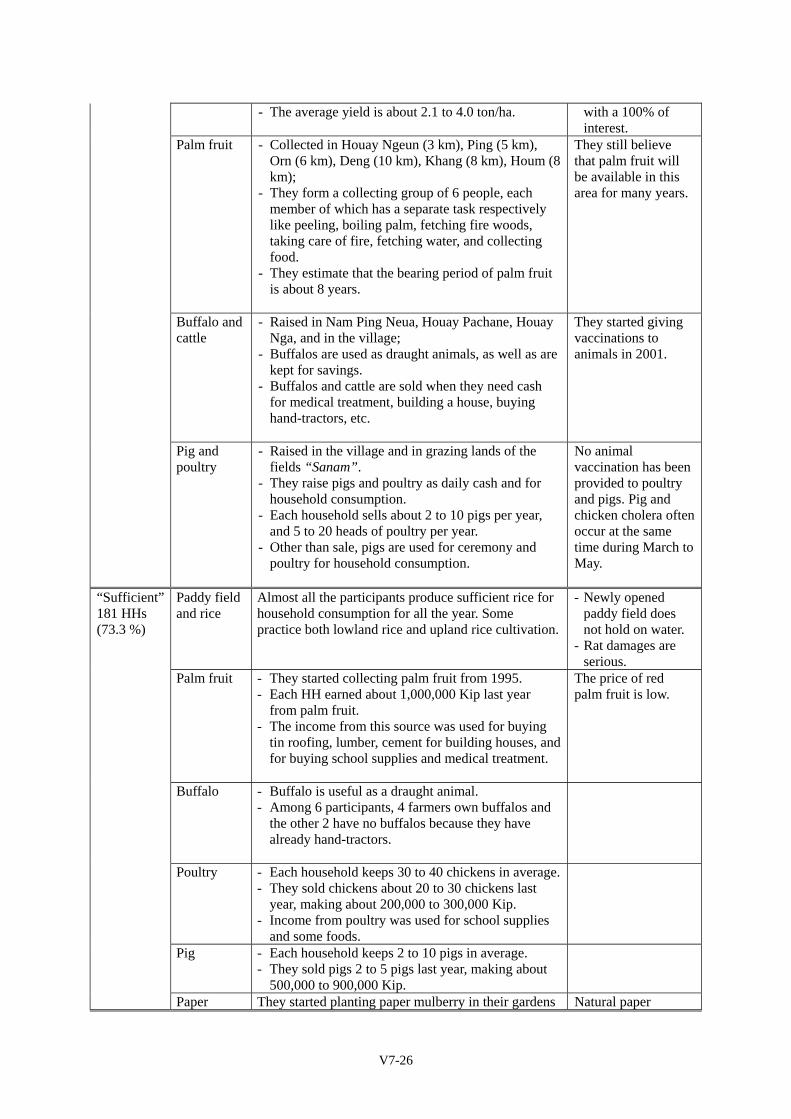
“Sufficient” 181 HHs (73.3 %)
This group consists of 181 households. - They produce sufficient rice for 12 months; - They own rather small lowland paddy fields but also practice in large
upland “Hai” areas; - They live in simple houses made of sawn wood materials with tin
roofing; - They collect NTFPs and sell them to village traders and/or outsiders; - They all have enough savings for medical purposes and school
utensils for children and other household necessity; - Some of them own a draught buffalo and a few cattle; - They keep pigs and poultry for sale and HH consumption; - They grow sesame and Job’s tear in their gardens “Suan”; - Some of them have enough money to hire tractors to plow and harrow
their farms.
“Under sufficient” 22 HHs (8.1 %)
This group consists of 22 households. - They mainly practice upland rice cultivation in “Hai” areas; - They have rice deficit about not more than 5 months; - They sell labors for rice; - They collect NTFPs for rice, and for medical needs and other
V7-25
household utensils; - They grow maize and cassava to substitute rice; - They have no spare cash; - They have many children; - They have debts from their relatives and friends, and - Some are not very healthy.
4.2 Dependence on various resources by well-being level
The group discussions were organized by each well-being level on 14 May 2004 to clarify the present use of and dependence on resources by the group and to grasp seasonal trends/changes of resources in terms of production and marketability. Six (6) participants for each group were selected by the villagers during the social map preparation. Participatory discussions gave us the following interesting suggestions.
1) “Over sufficient” level group ranked their resources like i) NTFPs and cash crop trading, ii) rice, iii) palm fruit, iv) buffalo and cattle, and v) pig and poultry, in order of importance.
2) “Sufficient” level” group ranked their resources like i) lowland paddy field and rice, ii) palm fruit, iii) buffalo, poultry and pig, iv) sesame, and v) paper mulberry and maize.
3) “Under sufficient” level group ranked their resources like i) rice, ii) palm fruit, iii) selling labor, iv) poultry, v) pig, vi) maize, vii) Job’s tear, viii) sesame, ix) Herbal medical root, and x) paper mulberry.
The above suggests that the poor people depend on selling labor and more NTFPs for food security, while the high level people depend on large animals and trading NTFPs and cash crops. The dependence on resources by each level is summarized below.
Dependence on Resource by Each Level Level Resources Dependence/Management on Resources Problems/
Difficulties “Over sufficient” 46 HHs (18.6 %)
NTFPs and cash crop trading
- Prior to starting business, they started with selling pigs, palm fruit, sesame, Job’s tear, cattle, buffalo;
- They started with small scale trading, using their own money for 7 to8 years;
- They traded palm fruit, paper mulberry, resin, Job’s tear, sesame, tiger grass, tree bark, and herbal medical roots;
Rice (Lowland paddy)
- Grown in lowland paddy fields located in Houay Ping, Thoo, Khang, Ket, and Nga;
- Traditional irrigation systems cover some parts of the paddy fields, which have to be repaired annually during the rainy season.
- They grow local varieties of rice. - No chemical fertilizers have ever been applied.
They just use animal manure but they don’t think it is enough. The yield of rice is not as high as they had long time before.
- The main problem is lack of irrigation water, which would ensure the production.
- The “under sufficient” group always have debts with the “over sufficient” group,
V7-26
- The average yield is about 2.1 to 4.0 ton/ha.
with a 100% of interest.
Palm fruit - Collected in Houay Ngeun (3 km), Ping (5 km), Orn (6 km), Deng (10 km), Khang (8 km), Houm (8 km);
- They form a collecting group of 6 people, each member of which has a separate task respectively like peeling, boiling palm, fetching fire woods, taking care of fire, fetching water, and collecting food.
- They estimate that the bearing period of palm fruit is about 8 years.
They still believe that palm fruit will be available in this area for many years.
Buffalo and cattle
- Raised in Nam Ping Neua, Houay Pachane, Houay Nga, and in the village;
- Buffalos are used as draught animals, as well as are kept for savings.
- Buffalos and cattle are sold when they need cash for medical treatment, building a house, buying hand-tractors, etc.
They started giving vaccinations to animals in 2001.
Pig and poultry
- Raised in the village and in grazing lands of the fields “Sanam”.
- They raise pigs and poultry as daily cash and for household consumption.
- Each household sells about 2 to 10 pigs per year, and 5 to 20 heads of poultry per year.
- Other than sale, pigs are used for ceremony and poultry for household consumption.
No animal vaccination has been provided to poultry and pigs. Pig and chicken cholera often occur at the same time during March to May.
“Sufficient” 181 HHs (73.3 %)
Paddy field and rice
Almost all the participants produce sufficient rice for household consumption for all the year. Some practice both lowland rice and upland rice cultivation.
- Newly opened paddy field does not hold on water.
- Rat damages are serious.
Palm fruit - They started collecting palm fruit from 1995. - Each HH earned about 1,000,000 Kip last year
from palm fruit. - The income from this source was used for buying
tin roofing, lumber, cement for building houses, and for buying school supplies and medical treatment.
The price of red palm fruit is low.
Buffalo - Buffalo is useful as a draught animal. - Among 6 participants, 4 farmers own buffalos and
the other 2 have no buffalos because they have already hand-tractors.
Poultry - Each household keeps 30 to 40 chickens in average. - They sold chickens about 20 to 30 chickens last
year, making about 200,000 to 300,000 Kip. - Income from poultry was used for school supplies
and some foods.
Pig - Each household keeps 2 to 10 pigs in average. - They sold pigs 2 to 5 pigs last year, making about
500,000 to 900,000 Kip.
Paper They started planting paper mulberry in their gardens Natural paper
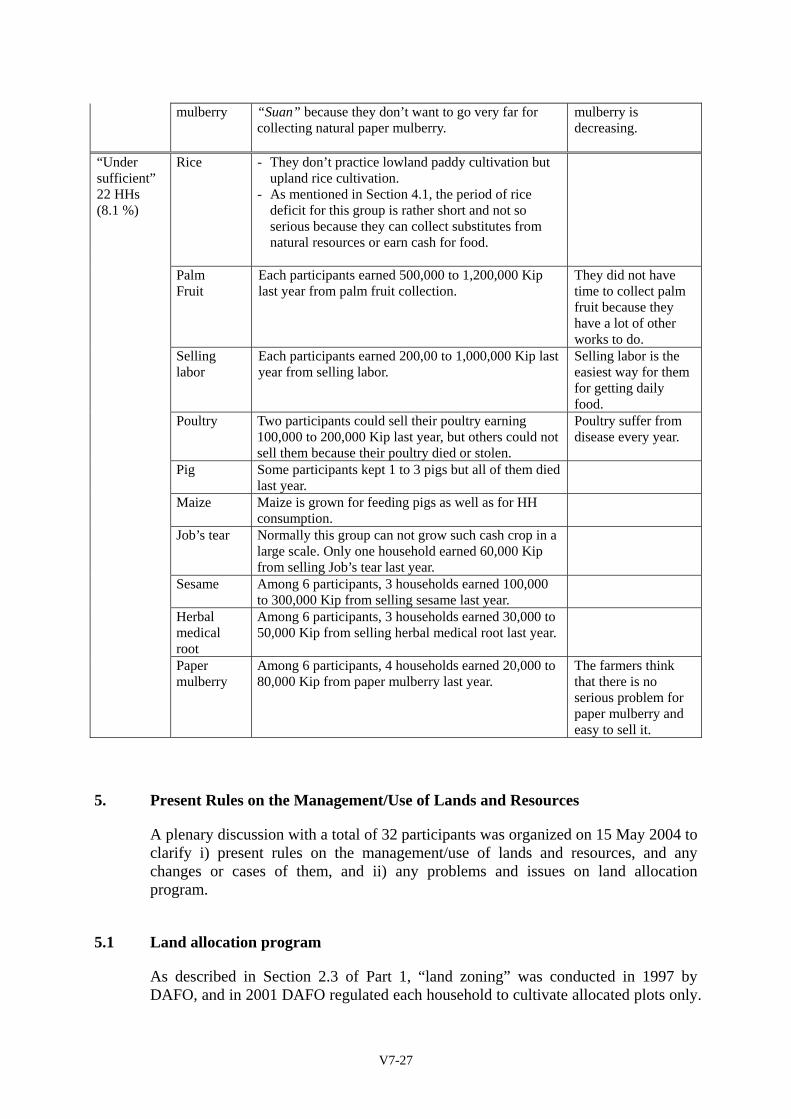
V7-27
mulberry “Suan” because they don’t want to go very far for collecting natural paper mulberry.
mulberry is decreasing.
“Under sufficient” 22 HHs (8.1 %)
Rice - They don’t practice lowland paddy cultivation but upland rice cultivation.
- As mentioned in Section 4.1, the period of rice deficit for this group is rather short and not so serious because they can collect substitutes from natural resources or earn cash for food.
Palm
Fruit Each participants earned 500,000 to 1,200,000 Kip last year from palm fruit collection.
They did not have time to collect palm fruit because they have a lot of other works to do.
Selling labor
Each participants earned 200,00 to 1,000,000 Kip last year from selling labor.
Selling labor is the easiest way for them for getting daily food.
Poultry Two participants could sell their poultry earning 100,000 to 200,000 Kip last year, but others could not sell them because their poultry died or stolen.
Poultry suffer from disease every year.
Pig Some participants kept 1 to 3 pigs but all of them died last year.
Maize Maize is grown for feeding pigs as well as for HH consumption.
Job’s tear Normally this group can not grow such cash crop in a large scale. Only one household earned 60,000 Kip from selling Job’s tear last year.
Sesame Among 6 participants, 3 households earned 100,000 to 300,000 Kip from selling sesame last year.
Herbal medical root
Among 6 participants, 3 households earned 30,000 to 50,000 Kip from selling herbal medical root last year.
Paper mulberry
Among 6 participants, 4 households earned 20,000 to 80,000 Kip from paper mulberry last year.
The farmers think that there is no serious problem for paper mulberry and easy to sell it.
5. Present Rules on the Management/Use of Lands and Resources
A plenary discussion with a total of 32 participants was organized on 15 May 2004 to clarify i) present rules on the management/use of lands and resources, and any changes or cases of them, and ii) any problems and issues on land allocation program.
5.1 Land allocation program
As described in Section 2.3 of Part 1, “land zoning” was conducted in 1997 by DAFO, and in 2001 DAFO regulated each household to cultivate allocated plots only.
V7-28
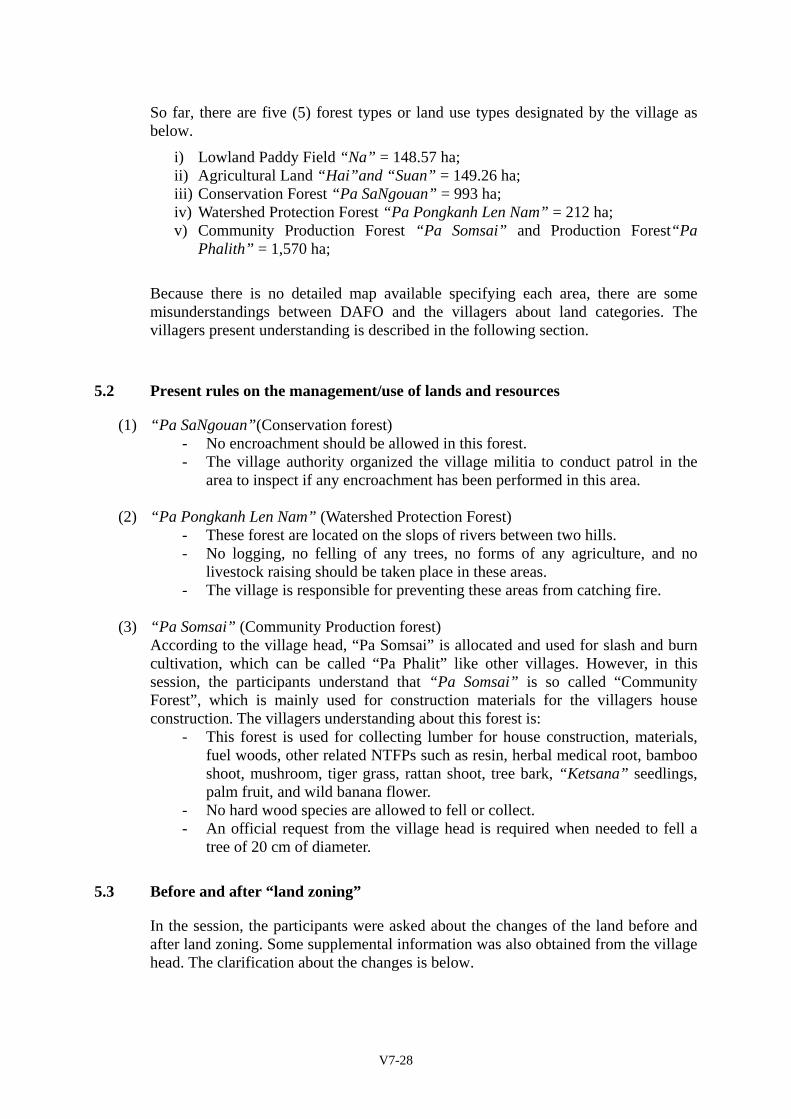
So far, there are five (5) forest types or land use types designated by the village as below.
i) Lowland Paddy Field “Na” = 148.57 ha; ii) Agricultural Land “Hai”and “Suan” = 149.26 ha; iii) Conservation Forest “Pa SaNgouan” = 993 ha; iv) Watershed Protection Forest “Pa Pongkanh Len Nam” = 212 ha; v) Community Production Forest “Pa Somsai” and Production Forest“Pa
Phalith” = 1,570 ha;
Because there is no detailed map available specifying each area, there are some misunderstandings between DAFO and the villagers about land categories. The villagers present understanding is described in the following section.
5.2 Present rules on the management/use of lands and resources
(1) “Pa SaNgouan”(Conservation forest) - No encroachment should be allowed in this forest. - The village authority organized the village militia to conduct patrol in the
area to inspect if any encroachment has been performed in this area.
(2) “Pa Pongkanh Len Nam” (Watershed Protection Forest) - These forest are located on the slops of rivers between two hills. - No logging, no felling of any trees, no forms of any agriculture, and no
livestock raising should be taken place in these areas. - The village is responsible for preventing these areas from catching fire.
(3) “Pa Somsai” (Community Production forest)
According to the village head, “Pa Somsai” is allocated and used for slash and burn cultivation, which can be called “Pa Phalit” like other villages. However, in this session, the participants understand that “Pa Somsai” is so called “Community Forest”, which is mainly used for construction materials for the villagers house construction. The villagers understanding about this forest is:
- This forest is used for collecting lumber for house construction, materials, fuel woods, other related NTFPs such as resin, herbal medical root, bamboo shoot, mushroom, tiger grass, rattan shoot, tree bark, “Ketsana” seedlings, palm fruit, and wild banana flower.
- No hard wood species are allowed to fell or collect. - An official request from the village head is required when needed to fell a
tree of 20 cm of diameter.
5.3 Before and after “land zoning”
In the session, the participants were asked about the changes of the land before and after land zoning. Some supplemental information was also obtained from the village head. The clarification about the changes is below.
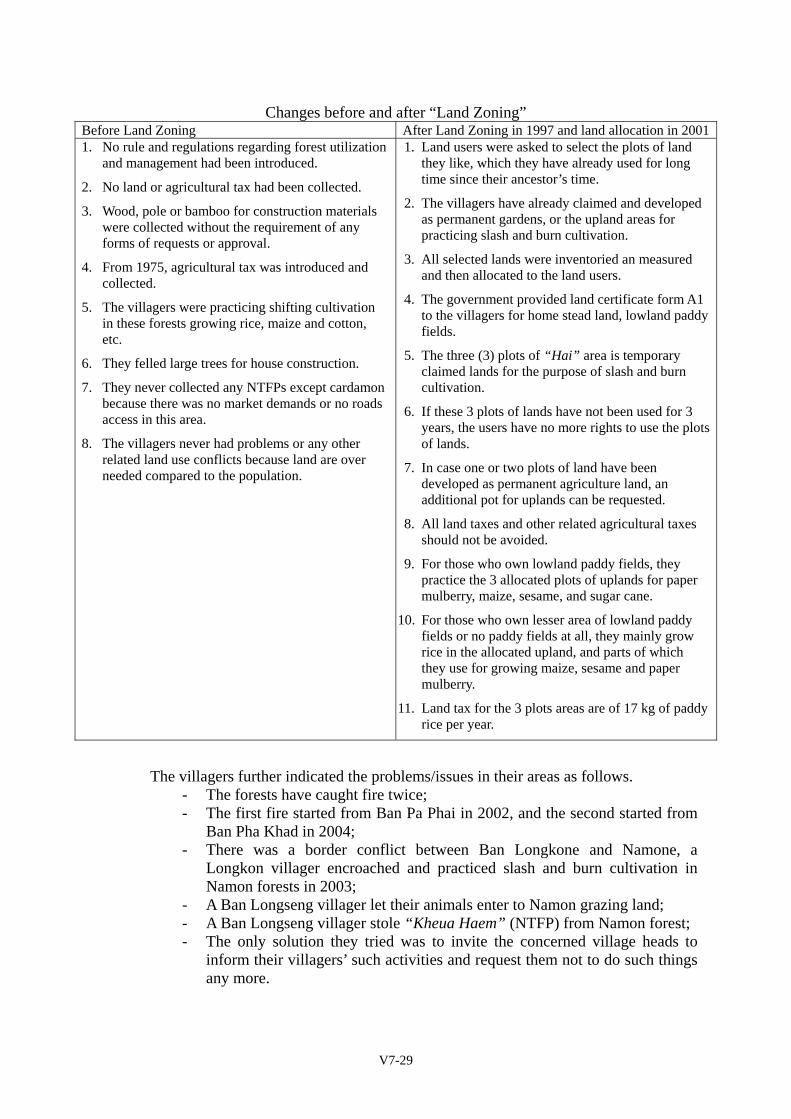
V7-29
Changes before and after “Land Zoning” Before Land Zoning After Land Zoning in 1997 and land allocation in 20011. No rule and regulations regarding forest utilization
and management had been introduced.
2. No land or agricultural tax had been collected.
3. Wood, pole or bamboo for construction materials were collected without the requirement of any forms of requests or approval.
4. From 1975, agricultural tax was introduced and collected.
5. The villagers were practicing shifting cultivation in these forests growing rice, maize and cotton, etc.
6. They felled large trees for house construction.
7. They never collected any NTFPs except cardamon because there was no market demands or no roads access in this area.
8. The villagers never had problems or any other related land use conflicts because land are over needed compared to the population.
1. Land users were asked to select the plots of land they like, which they have already used for long time since their ancestor’s time.
2. The villagers have already claimed and developed as permanent gardens, or the upland areas for practicing slash and burn cultivation.
3. All selected lands were inventoried an measured and then allocated to the land users.
4. The government provided land certificate form A1 to the villagers for home stead land, lowland paddy fields.
5. The three (3) plots of “Hai” area is temporary claimed lands for the purpose of slash and burn cultivation.
6. If these 3 plots of lands have not been used for 3 years, the users have no more rights to use the plots of lands.
7. In case one or two plots of land have been developed as permanent agriculture land, an additional pot for uplands can be requested.
8. All land taxes and other related agricultural taxes should not be avoided.
9. For those who own lowland paddy fields, they practice the 3 allocated plots of uplands for paper mulberry, maize, sesame, and sugar cane.
10. For those who own lesser area of lowland paddy fields or no paddy fields at all, they mainly grow rice in the allocated upland, and parts of which they use for growing maize, sesame and paper mulberry.
11. Land tax for the 3 plots areas are of 17 kg of paddy rice per year.
The villagers further indicated the problems/issues in their areas as follows. - The forests have caught fire twice; - The first fire started from Ban Pa Phai in 2002, and the second started from
Ban Pha Khad in 2004; - There was a border conflict between Ban Longkone and Namone, a
Longkon villager encroached and practiced slash and burn cultivation in Namon forests in 2003;
- A Ban Longseng villager let their animals enter to Namon grazing land; - A Ban Longseng villager stole “Kheua Haem” (NTFP) from Namon forest; - The only solution they tried was to invite the concerned village heads to
inform their villagers’ such activities and request them not to do such things any more.
V7-30
PART 3 HOUSEHOLD INTERVIEW SURVEY
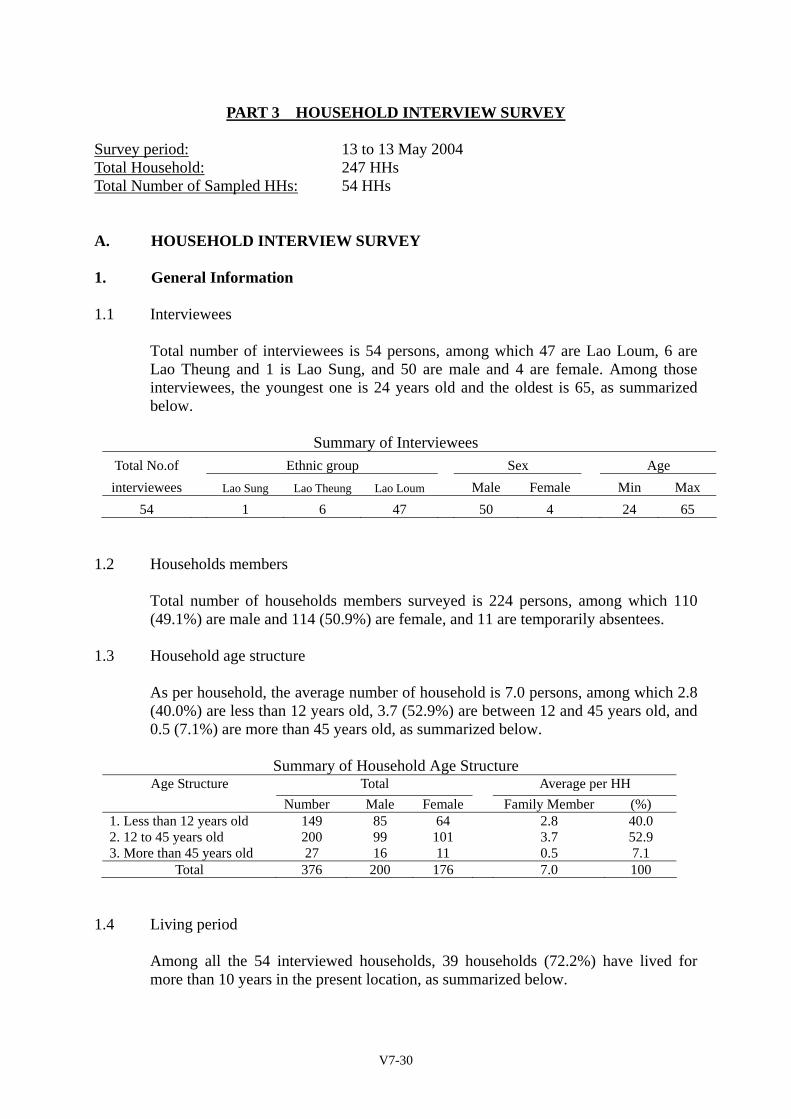
Survey period: 13 to 13 May 2004 Total Household: 247 HHs Total Number of Sampled HHs: 54 HHs A. HOUSEHOLD INTERVIEW SURVEY 1. General Information 1.1 Interviewees
Total number of interviewees is 54 persons, among which 47 are Lao Loum, 6 are Lao Theung and 1 is Lao Sung, and 50 are male and 4 are female. Among those interviewees, the youngest one is 24 years old and the oldest is 65, as summarized below.
Summary of Interviewees Total No.of Ethnic group Sex Age interviewees Lao Sung Lao Theung Lao Loum Male Female Min Max
54 1 6 47 50 4 24 65 1.2 Households members
Total number of households members surveyed is 224 persons, among which 110 (49.1%) are male and 114 (50.9%) are female, and 11 are temporarily absentees.
1.3 Household age structure As per household, the average number of household is 7.0 persons, among which 2.8 (40.0%) are less than 12 years old, 3.7 (52.9%) are between 12 and 45 years old, and 0.5 (7.1%) are more than 45 years old, as summarized below.
Summary of Household Age Structure Age Structure Total Average per HH
Number Male Female Family Member (%) 1. Less than 12 years old 149 85 64 2.8 40.0 2. 12 to 45 years old 200 99 101 3.7 52.9 3. More than 45 years old 27 16 11 0.5 7.1
Total 376 200 176 7.0 100
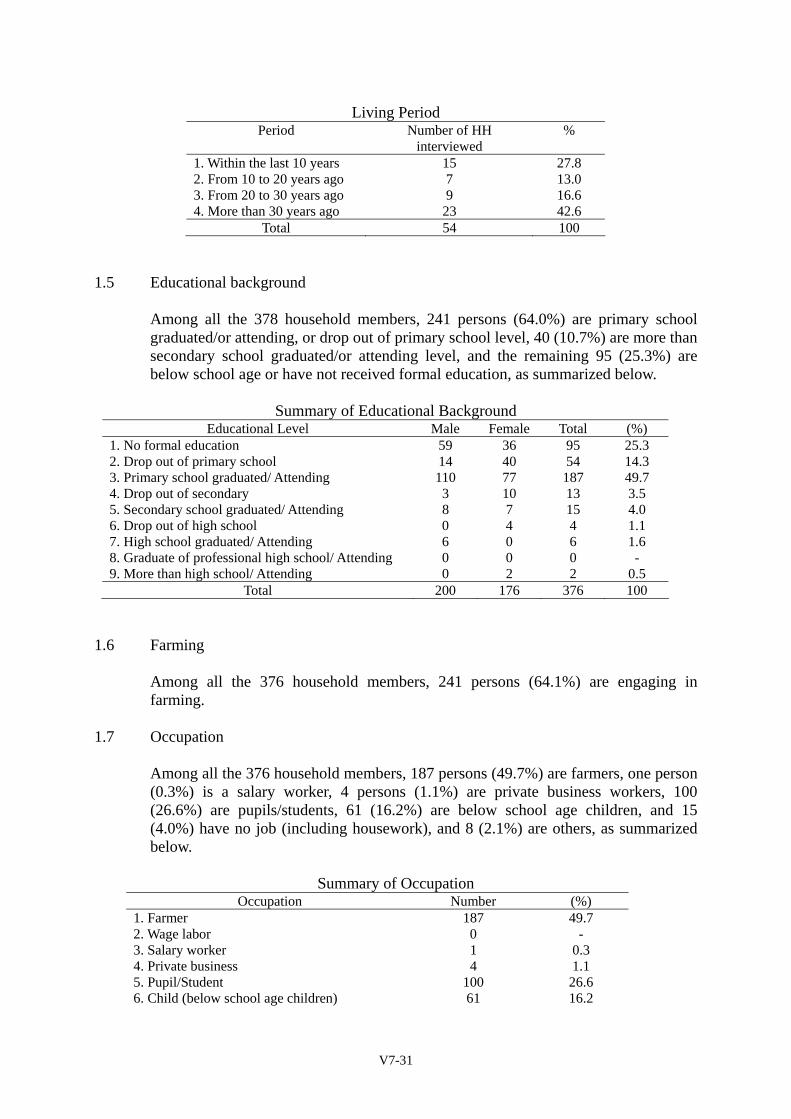
1.4 Living period Among all the 54 interviewed households, 39 households (72.2%) have lived for more than 10 years in the present location, as summarized below.
V7-31
Living Period Period Number of HH
interviewed %
1. Within the last 10 years 2. From 10 to 20 years ago 3. From 20 to 30 years ago 4. More than 30 years ago
15 7 9
23
27.8 13.0 16.6 42.6
Total 54 100
1.5 Educational background Among all the 378 household members, 241 persons (64.0%) are primary school graduated/or attending, or drop out of primary school level, 40 (10.7%) are more than secondary school graduated/or attending level, and the remaining 95 (25.3%) are below school age or have not received formal education, as summarized below.
Summary of Educational Background Educational Level Male Female Total (%)
1. No formal education 59 36 95 25.3 2. Drop out of primary school 14 40 54 14.3 3. Primary school graduated/ Attending 110 77 187 49.7 4. Drop out of secondary 3 10 13 3.5 5. Secondary school graduated/ Attending 8 7 15 4.0 6. Drop out of high school 0 4 4 1.1 7. High school graduated/ Attending 6 0 6 1.6 8. Graduate of professional high school/ Attending 0 0 0 - 9. More than high school/ Attending 0 2 2 0.5
Total 200 176 376 100
1.6 Farming Among all the 376 household members, 241 persons (64.1%) are engaging in farming.
1.7 Occupation Among all the 376 household members, 187 persons (49.7%) are farmers, one person (0.3%) is a salary worker, 4 persons (1.1%) are private business workers, 100 (26.6%) are pupils/students, 61 (16.2%) are below school age children, and 15 (4.0%) have no job (including housework), and 8 (2.1%) are others, as summarized below.
Summary of Occupation Occupation Number (%)
1. Farmer 187 49.7 2. Wage labor 0 - 3. Salary worker 1 0.3 4. Private business 4 1.1 5. Pupil/Student 100 26.6 6. Child (below school age children) 61 16.2
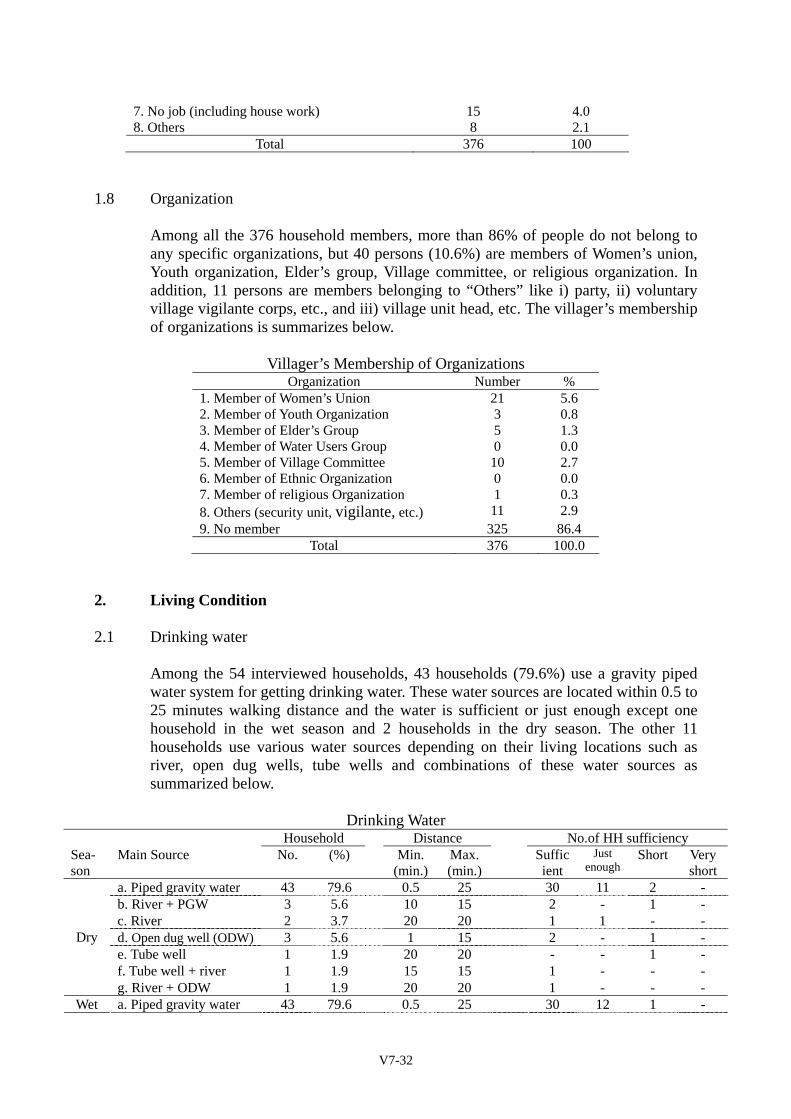
V7-32
7. No job (including house work) 15 4.0 8. Others 8 2.1
Total 376 100
1.8 Organization Among all the 376 household members, more than 86% of people do not belong to any specific organizations, but 40 persons (10.6%) are members of Women’s union, Youth organization, Elder’s group, Village committee, or religious organization. In addition, 11 persons are members belonging to “Others” like i) party, ii) voluntary village vigilante corps, etc., and iii) village unit head, etc. The villager’s membership of organizations is summarizes below.
Villager’s Membership of Organizations Organization Number %
1. Member of Women’s Union 21 5.6 2. Member of Youth Organization 3 0.8 3. Member of Elder’s Group 5 1.3 4. Member of Water Users Group 0 0.0 5. Member of Village Committee 10 2.7 6. Member of Ethnic Organization 0 0.0 7. Member of religious Organization 1 0.3 8. Others (security unit, vigilante, etc.) 11 2.9 9. No member 325 86.4
Total 376 100.0
2. Living Condition 2.1 Drinking water
Among the 54 interviewed households, 43 households (79.6%) use a gravity piped water system for getting drinking water. These water sources are located within 0.5 to 25 minutes walking distance and the water is sufficient or just enough except one household in the wet season and 2 households in the dry season. The other 11 households use various water sources depending on their living locations such as river, open dug wells, tube wells and combinations of these water sources as summarized below.
Drinking Water Household Distance No.of HH sufficiency Sea- son
Main Source No. (%) Min. (min.)
Max. (min.)
Sufficient
Just enough
Short Very short
a. Piped gravity water 43 79.6 0.5 25 30 11 2 - b. River + PGW 3 5.6 10 15 2 - 1 - c. River 2 3.7 20 20 1 1 - - d. Open dug well (ODW) 3 5.6 1 15 2 - 1 - e. Tube well 1 1.9 20 20 - - 1 - f. Tube well + river 1 1.9 15 15 1 - - -
Dry
g. River + ODW 1 1.9 20 20 1 - - - Wet a. Piped gravity water 43 79.6 0.5 25 30 12 1 -
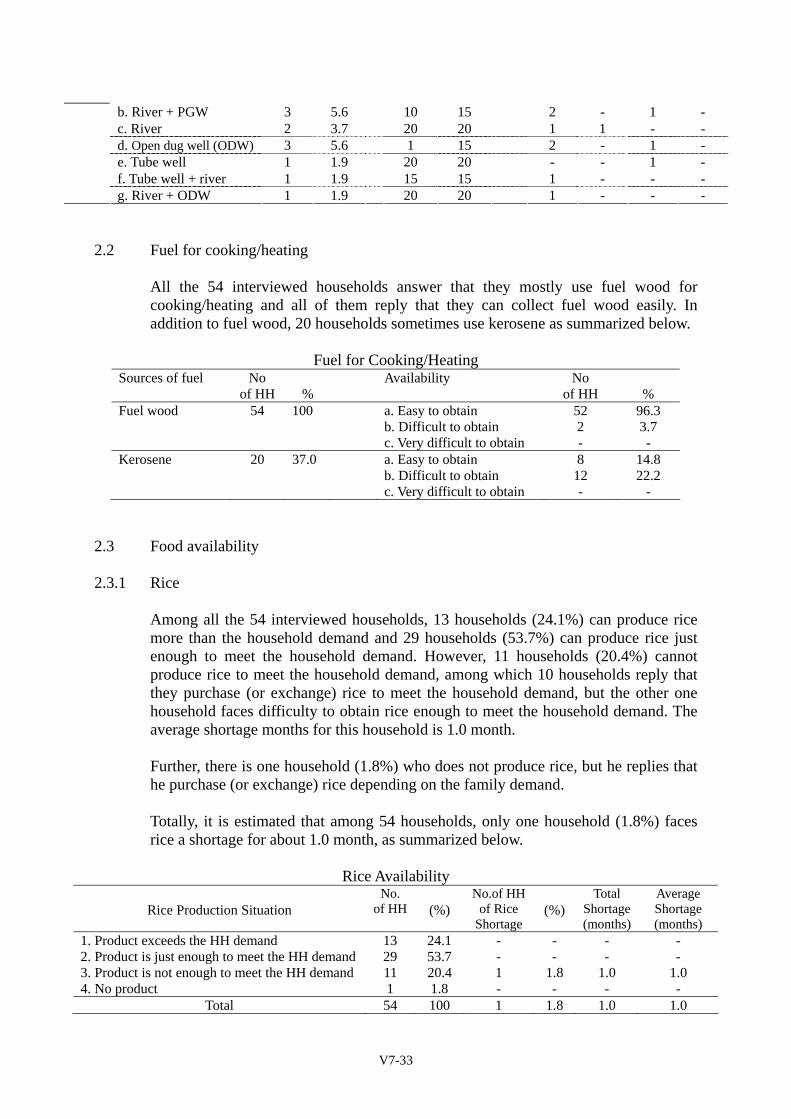
V7-33
b. River + PGW 3 5.6 10 15 2 - 1 - c. River 2 3.7 20 20 1 1 - - d. Open dug well (ODW) 3 5.6 1 15 2 - 1 - e. Tube well 1 1.9 20 20 - - 1 - f. Tube well + river 1 1.9 15 15 1 - - -
g. River + ODW 1 1.9 20 20 1 - - -
2.2 Fuel for cooking/heating
All the 54 interviewed households answer that they mostly use fuel wood for cooking/heating and all of them reply that they can collect fuel wood easily. In addition to fuel wood, 20 households sometimes use kerosene as summarized below.
Fuel for Cooking/Heating Sources of fuel No
of HH
% Availability No
of HH
% Fuel wood 54 100 a. Easy to obtain 52 96.3 b. Difficult to obtain 2 3.7 c. Very difficult to obtain - - Kerosene 20 37.0 a. Easy to obtain 8 14.8 b. Difficult to obtain 12 22.2 c. Very difficult to obtain - -
2.3 Food availability 2.3.1 Rice
Among all the 54 interviewed households, 13 households (24.1%) can produce rice more than the household demand and 29 households (53.7%) can produce rice just enough to meet the household demand. However, 11 households (20.4%) cannot produce rice to meet the household demand, among which 10 households reply that they purchase (or exchange) rice to meet the household demand, but the other one household faces difficulty to obtain rice enough to meet the household demand. The average shortage months for this household is 1.0 month. Further, there is one household (1.8%) who does not produce rice, but he replies that he purchase (or exchange) rice depending on the family demand. Totally, it is estimated that among 54 households, only one household (1.8%) faces rice a shortage for about 1.0 month, as summarized below.
Rice Availability
Rice Production Situation No.
of HH
(%) No.of HH
of Rice Shortage
(%)
Total Shortage (months)
Average Shortage (months)
1. Product exceeds the HH demand 13 24.1 - - - - 2. Product is just enough to meet the HH demand 29 53.7 - - - - 3. Product is not enough to meet the HH demand 11 20.4 1 1.8 1.0 1.0 4. No product 1 1.8 - - - -
Total 54 100 1 1.8 1.0 1.0
V7-34
2.3.2 Other than rice
Other cereals, root and tube crops, and vegetables: Products other than paddy such as other cereals, root and tube crops and vegetables are generally not serious like rice for the farmers because they can try to manage with their products, and a large part of interviewed households (85-94%) feel that such products are enough to meet the household demand or exceed the household demand. Further, there are some households who do not produce such other products than rice, 8 households (14.8%) for other cereals, 6 households (11.1%) for root and tube crops, 3 households (5.5%) for vegetables. However, they reply that they purchase or exchange such products depending on their needs and no households face a shortage of such products. Meat: Twenty-six (26) households (48.1%) reply that the product of meat is enough to meet the household demand. On the other hand, 13 households (24.1%) reply that the product of meat is not enough to meet the household demand, and 15 households (27.8%) do not produce any meat. However, all of those households (13 + 15 = 28 households) reply that they purchase or exchange meat depending on their needs and no households face a shortage of meat. Fish: Thirty-three (33) households (61.1%) reply that the product of fish is enough to meet the household demand or exceed the household demand. On the other hand, 6 households (11.1%) reply that the product of fish is not enough to meet the household demand, and 15 households do not produce/ catch any fish. However, all of those households (6 + 15 = 21 households) reply that they purchase or exchange fish depending on their needs and on households face a shortage of fish. Food availability other than rice is summarized below.
Food Availability other than Rice No.of HH for production of
Rice Production Situation Other Cereals
Root, Tube Crops
Vege- tables
Meat
Fish
1. Product exceeds the HH demand 0 2 1 0 4 2. Product is just enough to meet the HH demand 46 46 50 26 29 3. Product is not enough to meet the HH demand 0 0 0 13 6 4. No product 8 6 3 15 15
Total 54 54 54 54 54 5. No.of HHs having a shortage of each product 0 0 0 0 0 6. Average shortage period per HH above (month) 0 0 0 0 0
2.4 Availability of facilities
Availability of major facilities in each household is summarized below.
V7-35
Major Available Facilities in Each Household
Available Facilities Nos.of Unit (%) 1. Radio/radio cassette 29 53.7 2. VCD 2 3.7 3. TV. 0 - 4. Bicycle 21 38.9 5. Motorcycle 7 13.0 6. Car 1 1.85 7. Refrigerator 0 - 8. Electric fan 2 3.7 9. Sewing machine 9 16.7 10. Gas stove 0 - 11. Toilet 39 72.2 12. Hand tractor 7 13.0 13. Rice mill 4 7.4 14. Small hydro generator 2 3.7
2.5 Health situation 2.5.1 Major diseases
The interviewees were asked to enumerate 2 major diseases for children and adults, respectively. Major diseases for children under 15 years old are i) cold, ii) malaria, iii) dysentery, and those for adults are i) cold, ii) aches (body), iii) dysentery as summarized below.
Major Diseases Children under 15 years old Adults
Major diseases No.of HH % Major diseases No.of HH % 1. Cold 27 50.0 1. Cold 20 37.0 2. Malaria 11 20.3 2. Body aches 17 31.4 3. Dysentery 11 20.3 3. Dysentery 6 11.1 4. ……….. … … 4. ………. … …
2.5.2 Treatment for diseases
Major treatments for slight diseases are i) go to the village’s health worker and ii) buy medicine, and those for severe diseases are i) go to the provincial hospital and ii) go to the village’s health worker, as summarized below.
Treatment of Diseases Slight diseases Severe diseases
Major treatment No.of HH
% Major treatment No.of HH
%
1. Go to the village’s health worker 32 59.2 1. Go to the provincial hospital 37 68.512. Buy medicine 20 37.0 2. Go to the village’s health worker 3 5.553. ………. … … 3. ………. … …
V7-36
3 Agriculture and Forestry Production
3.1 Land tenure 3.1.1 Farm land operated
In this survey, the farm lands are categorized into four (4), i) “Hai-A” (upland slash and burn field, mainly for paddy), ii) “Hai-B” (upland slash and burn field, mainly for other crops than paddy), iii) “Na” (lowland paddy field), and iv) “Fruits/Vegetable”. “Hai-A”: Among all the 54 households, 37 households have ownership for “Hai-A”. Total area of “Hai-A” is 25.17 ha with a total of 56 plots and an average area of 0.45 ha/plot and 0.47 ha/HH. Further, there are 0.60 ha of lands rented from others, thus the average operated land is 0.48 ha/HH. “Hai-B”: Among all the 54 households, 28 households have ownership for “Hai-B”. Total area of “Hai-B” is 10.22 ha with a total of 38 plots and an average area of 0.27 ha/plot and 0.19 ha/HH. Further, there are 0.40 ha of land rented from others, thus the average operated land is 0.20 ha/HH. “Na” (Lowland paddy field): Among all the 54 households, 42 households have ownership for the lowland paddy field. Total area of the lowland paddy field is 35.71 ha with a total of 58 plots and an average area of 0.62 ha/plot and 0.66 ha/HH. Since there are no lands rented from others, thus the average operated land is the same as that of owned land, 0.66 ha/HH. “Fruits/ vegetables” field: Among all the 54 households, 11 households have ownership for “Fruits/ vegetables” field. Total area of “Fruits/ vegetables” field is 4.20 ha with a total of 12 plots and an average area of 0.35 ha/plot and 0.08 ha/HH. Since there are no rented lands of “Fruits/ vegetables” field, the average operated land of “Fruits/ vegetables” fields is the same as that of owned land, 0.08 ha/HH. The feature of farm land holding is summarized below.
Farm Land Operated
Land Owned by the HH Average Area per HH
Land Category No. of
HH
No. of
Plots
TotalArea (a)
(ha)
Averagearea
per Plot(ha/plot)
LandRent-
ed (b) (ha)
LandLea-sed (c)
(ha)
Land Ope- rated
(d) (ha)= (a)+(b)
-(c)
Land Owned (ha) (a)/54
Land Operated (ha(d)/54
1. Hai-A, 1/ 37 56 25.17 0.45 0.60 0 25.77 0.47 0.48
2. Hai-B, 2/ 28 38 10.22 0.27 0.40 0 10.62 0.19 0.20
3. Na (Lowland paddy) 42 58 35.71 0.62 - 0 35.71 0.66 0.66
4. Fruit/Vegetable, 3/ 11 12 4.20 0.35 - 0 4.20 0.08 0.08
V7-37
Total/Average - 164 75.30 1.69 1.00 0 76.30 1.39 1.41 Note: 1/ Upland slash and burn cultivation field, mainly for rice. 2/ Upland slash and bun cultivation field, mainly for other crops than rice. 3/ Except home garden
3.1.2 Land ownership
The answers about the land title of the “owned land” vary by interviewees. It was found that the owned lands were not always privately owned but some are i) government land but they have a right to cultivate traditionally, ii) government land but allocated by the village committee, and iii) they don’t know whose land that is, but they cultivate.
Among the “Hai-A” of 37 households, the lands of 17 households (45.9%) are “privately owned”, and the lands of 20 households (54.1%) are “government land but allocated by the village committee. In addition, there is one household who rents the lands with a total of 0.60 ha for farming practice in “Hai-A” Among the “Hai-B” of 28 households, the lands of 14 households (50%) are “privately owned” and the lands of 14 households (50%) are “government land but allocated by the village committee. In addition, there is one household who rents the land with a total of 0.4 ha for farming practice in “Hai-B” Among the lowland paddy fields of 42 households, the lands of 38 households (90.5%) are “privately owned”, the land of one household (2.4%) is “government land but they have a right to cultivate traditionally”, the lands of 3 households (7.1%) are “government land but allocated by the village committee”. There are no households who rent “lowland paddy fields” from others. Among the “Fruits/ vegetables” fields of 11 households, the lands of 6 households (54.5%) are “privately owned”, the land of 5 households (45.5%) is “government land but they have a right to cultivate traditionally”. There are no households who rent “Fruits/ vegetables” fields from others. The feature of the land title of the “owned land” is summarized below.
Future of the Land Ownership
Land Owned by the HH Others, Land Category No.of
HHs Private,
4/ Gov.(1),
5/ Gov.(2),
6/ Unclear,
7/ 8/
1. Hai-A, 1/ 37 17 0 20 0 1
2. Hai-B, 2/ 28 14 0 14 0 1
3. Na (Lowland paddy) 42 38 1 3 0 0
4. Fruit/Vegetable, 3/ 11 6 0 5 0 0 Note: 1/ Upland slash and burn cultivation field, mainly for rice. 2/ Upland slash and bun cultivation field, mainly for other crops than rice. 3/ Except home garden. 4/ Privately owned (they can sell it when ever you want).
V7-38
5/ Government land but they have a right to cultivate traditionally. 6/ Government land but allocated by the village committee. 7/They don’t know whose land that is, but they cultivate. 8/ Others
3.2 “Hai” area (upland slash and burn field)
3.2.1 Time required Among all the 54 households, 31 households have replied to the times required to go to their “Hai”area, which vary from 1 min. to 150 min. with an average of 75 minutes.
3.2.2 Repeated use of “Hai” area
“Hai-A”: Among 35 households who cultivated Hai-A in 2003, all of them answered that they would use the same lands within 1 to 3 years for cropping upland rice, and no households answered that they would not use the same land in near future. Among 35 households above, 21 households used the same lands in 2001 and also 21 households used the same land in 2002.
“Hai-B”: Among 22 households who cultivated Hai-B in 2003, all of them answered that they would use the same lands within 1 to 3 years for cropping upland field crops, and no households answered that they would not use the same lands in near future. Among 22 households above, 10 households used the same land in 2001 and 12 households used the same land in 2002.
The future of the repeated use of “Hai” area is summarized below.
Repeated Use of “Hai” Area Repeated Use Don’t Use Used in
“Hai” Category
No. of
HH
How many years later
For what crops
No. of
HH
Purpose/reason
Year 2002 (HH)
Year 2001 (HH)
“Hai-A” 35 1 to 3 Paddy 0 - 21 21 “Hai-B” 22 1 to 3 Upland crops 0 - 12 10
3.2.3 Total “Hai” (A+B) areas used per HH in last 4 years Total “Hai” (A+B) areas used per HH in last 4 years vary from 0.37 ha/HH in 2002 and 2002 to 0.55 ha/HH in 2003, with an average of 0.43 ha/HH, as summarized below.
Total “Hai” (A+B) Used Area Year Total Used Area (ha) Used Area per HH (ha) 2000 21.71 0.40 2001 22.71 0.42 2002 20.41 0.37 2003 29.96 0.55
Average 23.69 0.43
V7-39
3.2.4 Staying “Hai” area Among the 54 households, 5 households reply that they stay in the field continuously from “slash and burn” to “harvest”, whose living and working bases are basically in the field, including raising animals. On the other hand, 26 households do not stay in the field but go there based on requirements. In addition to those who stay in the field continuously, 8 households answered that they stayed in the field during the season for slash and burn, and 5 households for harvesting. The future of staying “Hai” area is summarized below.
Staying “Hai” Area Situation Number of HH
1. Stay during the season for slash and burn 8 2. Stay during the season for seeding 0 3. Stay during the season for harvesting 9 4. Stay continuously from slash &burn to harvest 5 5. Not stay, go there based on requirement 26
3.2.5 Decision maker for the “Hai” area selection
Among all the 54 households, 37 households (68.5%) answered that the head of household was a decision maker for the “Hai” area selection, as summarized below.
Decision Maker for the “Hai” Area Selection
Decision Maker Number of HH 1. Head of household 37 2. Other household member(s) 3 3. Village committee 0 4. Relatives 0 5. No comments 14
3.3 Crop production in “Hai”(slash and burn) area
(excluding crops grown in home garden)
3.3.1 Major crops
Major crops grown in “Hai” area in the wet season are i) rice (36 households), ii) Job’s tear (11 households), iii) maize (6 households), iv) sesame (3 households) and v) vegetables (7 households).
3.3.1 Production of 3 major crops in “Hai” area
Rice: Total production area of rice is 16.57 ha with a total production of 68,020 kg, among which, 8,744 kg (12.8% of the total production) were sold for cash. As for per household, it is estimated that the production of rice is 1,260 kg/HH with an average planted area of 0.31 ha, among which 162 kg were sold for cash, with a value of 183,384 Kip.
V7-40
Job’s tear: Total production area of Job’s tear is 2.30 ha with a total production of 2,021 kg, among which 1,991 kg (98.5% of the total production) were sold for cash. As for per household, it is estimated that the production of Job’s tear is 37.4 kg/HH with an average planted area of 0.04 ha, among which 36.9 kg were sold for cash with a value of 117,784 Kip. Sesame: Total production area of sesame is 0.40 ha with a total production of 122 kg, among which 114 kg (93.4% of the total production) were sold for cash. As for per household, it is estimated that the production of sesame is 2.2 kg/HH with an average planted area of 0.007 ha, 2.1 kg of which were sold for cash, with a vale of 4,788 Kip. No households used any chemical fertilizer or pesticide for the above crops. Major crop damages are pests, insects, rats, wild pigs and birds. Since there were no questions about agricultural chemicals, pesticide or insecticide in the questionnaires, such information was not obtained in this survey. The future of 3 major crop production is summarized below. Production of 3 Major Crops in “Hai” area by the 54 Interviewee Households
Items Major Crops 1. Name of crops Rice Job’s tear Sesame 2. Planted area : (ha) 16.57 2.30 0.4 : (kg seed) 829 23 103. Total production ( kg ) 68,020 2,021 1224. Form of Products Paddy Grain (unhusked) Seed 5. Production sold ( kg ) 8,744 1,991 1146. Price at sold ( Kip / kg ) 1,132 3,192 2,2807. Total sales ( Kip ) 9,894,000 6,355,000 260,0008. Production given to others (exchanged or lent to others) ( kg )
1,350 - -
9. Chemical fertilizer used ( kg ) No chemical fertilizer / Pesticide used 10. Major crop damage, if any Pests, diseases, insects, rats, wild pigs and birds
Production of 3 Major Crops in “Hai” area per HH Production Volume per HH
Items Crop 1 (a)/54 Crop 2(b)/54 Crop 3( c )/54 1. Name of crops Rice Job’s tear Sesame 2. Planted area : (ha) 0.31 0.04 0.007 : (kg seed) 15.34 0.4 0.193. Total production ( kg ) 1,260 37.4 2.24. Form of Products Paddy Grain (unhusked) Seed 5. Production sold ( kg ) 162 36.9 2.16. Price at sold ( Kip / kg ) 1,132 3,192 2,2807. Total sales ( Kip ) 183,384 117,784 4,788
V7-41
3.4 Crop production in “Na” (lowland paddy field) 3.4.1 Major crops
Only rice is grown in the lowland paddy field in the wet season by 42 households. 3.4.2 Production of rice in “Na” area
Rice: Among 54 households, 42 households grow rice in “Na” area. Total production area of rice is 34.29 ha with a total production of 97,484 kg, among which, 6,550 kg (6.7% of the total production) were sold for cash. As for per household, it is estimated that the production of rice is 1,805 kg/HH with an average planted area of 0.64 ha, among which 121 kg were sold for cash, with a value of 116,886 Kip.
Production of Rice in “Na” area by the 42 Interviewee Households Items Major Crops
1. Name of crops Rice 2. Planted area : (ha) 34.29 : (kg seed) 1,372 3. Total production ( kg ) 97,484 4. Form of Products Paddy 5. Production sold ( kg ) 6,550 6. Price at sold ( Kip / kg ) 966 7. Total sales ( Kip ) 6,325,000 8. Production given to others (exchanged or lent to others) ( kg )
1,340
9. Chemical fertilizer used ( kg ) 12 10. Major crop damage, if any Pests, diseases, insects, rats, wild
pigs and birds
Production of 3 Major Crops in “Na” area per HH Items Crop 1 (a)/54
1. Name of crops Rice 2. Planted area : (ha) 0.64 : (kg seed) 26 3. Total production ( kg ) 1,805 4. Form of Products Paddy 5. Production sold ( kg ) 121 6. Price at sold ( Kip / kg ) 966 7. Total sales ( Kip ) 116,886
3.5 Annual paddy production and consumption per HH The interviewees were asked their annual paddy production and consumption in their
households. Some slight difference between the results of questions of the paddy production in Section 3.3 and 3.4 (68,020 kg + 97,484 kg = 165,504 kg) and Section 3.5 (73,220 kg + 93,084 kg = 166,304 kg) is found but it is judged to be within an allowance for this survey. Annual paddy production and consumption, and their
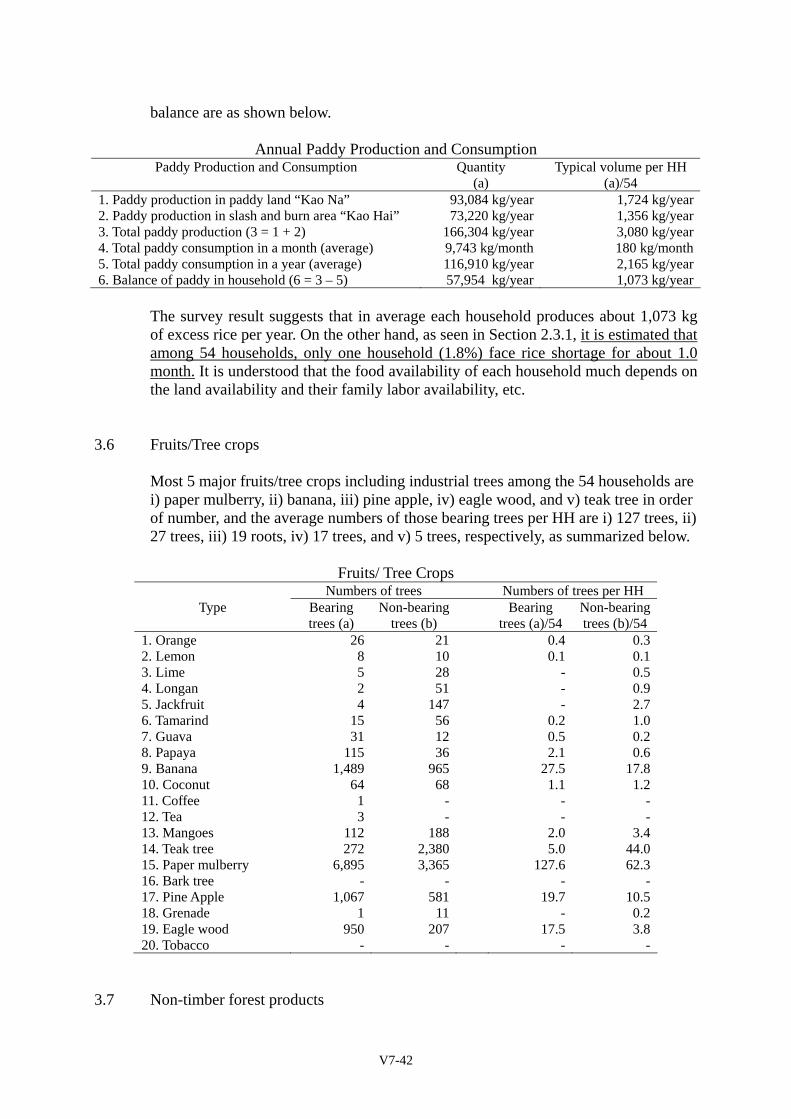
V7-42
balance are as shown below.
Annual Paddy Production and Consumption Paddy Production and Consumption Quantity
(a) Typical volume per HH
(a)/54 1. Paddy production in paddy land “Kao Na” 93,084 kg/year 1,724 kg/year2. Paddy production in slash and burn area “Kao Hai” 73,220 kg/year 1,356 kg/year3. Total paddy production (3 = 1 + 2) 166,304 kg/year 3,080 kg/year4. Total paddy consumption in a month (average) 9,743 kg/month 180 kg/month5. Total paddy consumption in a year (average) 116,910 kg/year 2,165 kg/year6. Balance of paddy in household (6 = 3 – 5) 57,954 kg/year 1,073 kg/year
The survey result suggests that in average each household produces about 1,073 kg of excess rice per year. On the other hand, as seen in Section 2.3.1, it is estimated that among 54 households, only one household (1.8%) face rice shortage for about 1.0 month. It is understood that the food availability of each household much depends on the land availability and their family labor availability, etc.
3.6 Fruits/Tree crops Most 5 major fruits/tree crops including industrial trees among the 54 households are
i) paper mulberry, ii) banana, iii) pine apple, iv) eagle wood, and v) teak tree in order of number, and the average numbers of those bearing trees per HH are i) 127 trees, ii) 27 trees, iii) 19 roots, iv) 17 trees, and v) 5 trees, respectively, as summarized below.
Fruits/ Tree Crops
Numbers of trees Numbers of trees per HH Type Bearing
trees (a) Non-bearing
trees (b) Bearing
trees (a)/54 Non-bearing trees (b)/54
1. Orange 26 21 0.4 0.3 2. Lemon 8 10 0.1 0.1 3. Lime 5 28 - 0.5 4. Longan 2 51 - 0.9 5. Jackfruit 4 147 - 2.7 6. Tamarind 15 56 0.2 1.0 7. Guava 31 12 0.5 0.2 8. Papaya 115 36 2.1 0.6 9. Banana 1,489 965 27.5 17.8 10. Coconut 64 68 1.1 1.2 11. Coffee 1 - - - 12. Tea 3 - - - 13. Mangoes 112 188 2.0 3.4 14. Teak tree 272 2,380 5.0 44.0 15. Paper mulberry 6,895 3,365 127.6 62.3 16. Bark tree - - - - 17. Pine Apple 1,067 581 19.7 10.5 18. Grenade 1 11 - 0.2 19. Eagle wood 950 207 17.5 3.8 20. Tobacco - - - -
3.7 Non-timber forest products
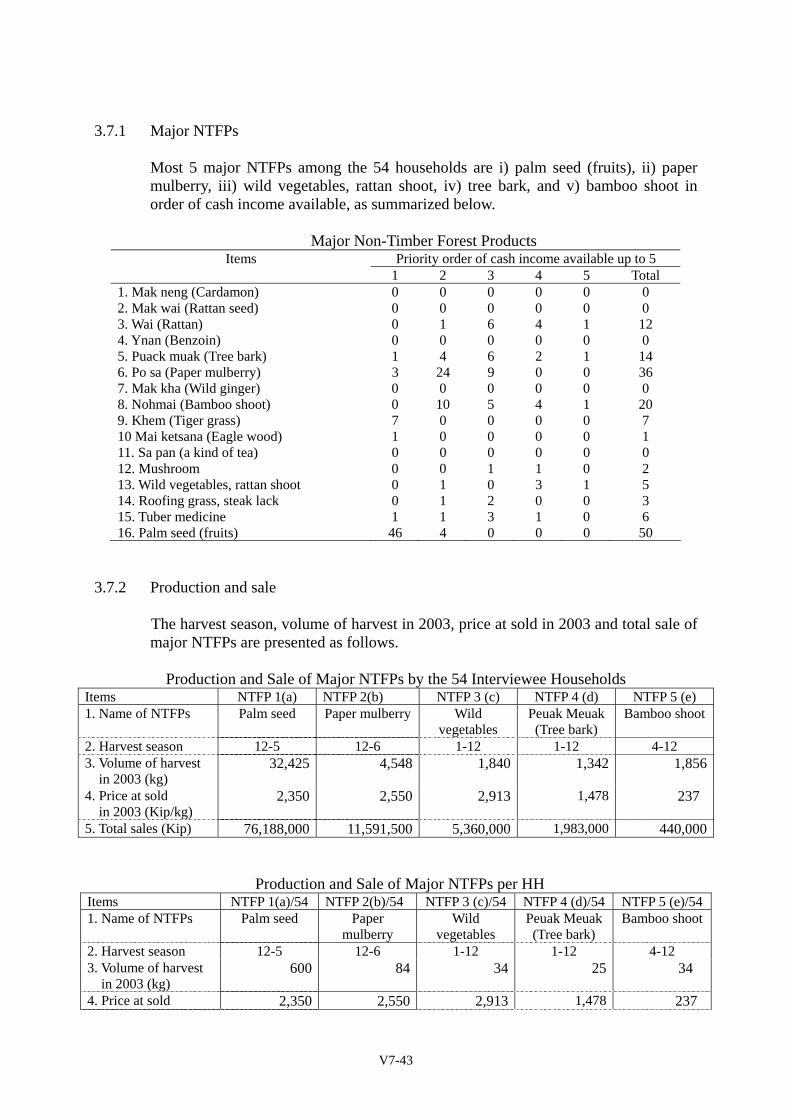
V7-43
3.7.1 Major NTFPs
Most 5 major NTFPs among the 54 households are i) palm seed (fruits), ii) paper mulberry, iii) wild vegetables, rattan shoot, iv) tree bark, and v) bamboo shoot in order of cash income available, as summarized below.
Major Non-Timber Forest Products Items Priority order of cash income available up to 5
1 2 3 4 5 Total 1. Mak neng (Cardamon) 0 0 0 0 0 0 2. Mak wai (Rattan seed) 0 0 0 0 0 0 3. Wai (Rattan) 0 1 6 4 1 12 4. Ynan (Benzoin) 0 0 0 0 0 0 5. Puack muak (Tree bark) 1 4 6 2 1 14 6. Po sa (Paper mulberry) 3 24 9 0 0 36 7. Mak kha (Wild ginger) 0 0 0 0 0 0 8. Nohmai (Bamboo shoot) 0 10 5 4 1 20 9. Khem (Tiger grass) 7 0 0 0 0 7 10 Mai ketsana (Eagle wood) 1 0 0 0 0 1 11. Sa pan (a kind of tea) 0 0 0 0 0 0 12. Mushroom 0 0 1 1 0 2 13. Wild vegetables, rattan shoot 0 1 0 3 1 5 14. Roofing grass, steak lack 0 1 2 0 0 3 15. Tuber medicine 1 1 3 1 0 6 16. Palm seed (fruits) 46 4 0 0 0 50
3.7.2 Production and sale
The harvest season, volume of harvest in 2003, price at sold in 2003 and total sale of major NTFPs are presented as follows.
Production and Sale of Major NTFPs by the 54 Interviewee Households Items NTFP 1(a) NTFP 2(b) NTFP 3 (c) NTFP 4 (d) NTFP 5 (e) 1. Name of NTFPs Palm seed Paper mulberry Wild
vegetables Peuak Meuak (Tree bark)
Bamboo shoot
2. Harvest season 12-5 12-6 1-12 1-12 4-12 3. Volume of harvest
in 2003 (kg) 32,425 4,548 1,840 1,342 1,856
4. Price at sold in 2003 (Kip/kg)
2,350 2,550 2,913 1,478 237
5. Total sales (Kip) 76,188,000 11,591,500 5,360,000 1,983,000 440,000
Production and Sale of Major NTFPs per HH Items NTFP 1(a)/54 NTFP 2(b)/54 NTFP 3 (c)/54 NTFP 4 (d)/54 NTFP 5 (e)/541. Name of NTFPs Palm seed Paper
mulberry Wild
vegetables Peuak Meuak (Tree bark)
Bamboo shoot
2. Harvest season 12-5 12-6 1-12 1-12 4-12 3. Volume of harvest
in 2003 (kg) 600 84 34 25 34
4. Price at sold 2,350 2,550 2,913 1,478 237
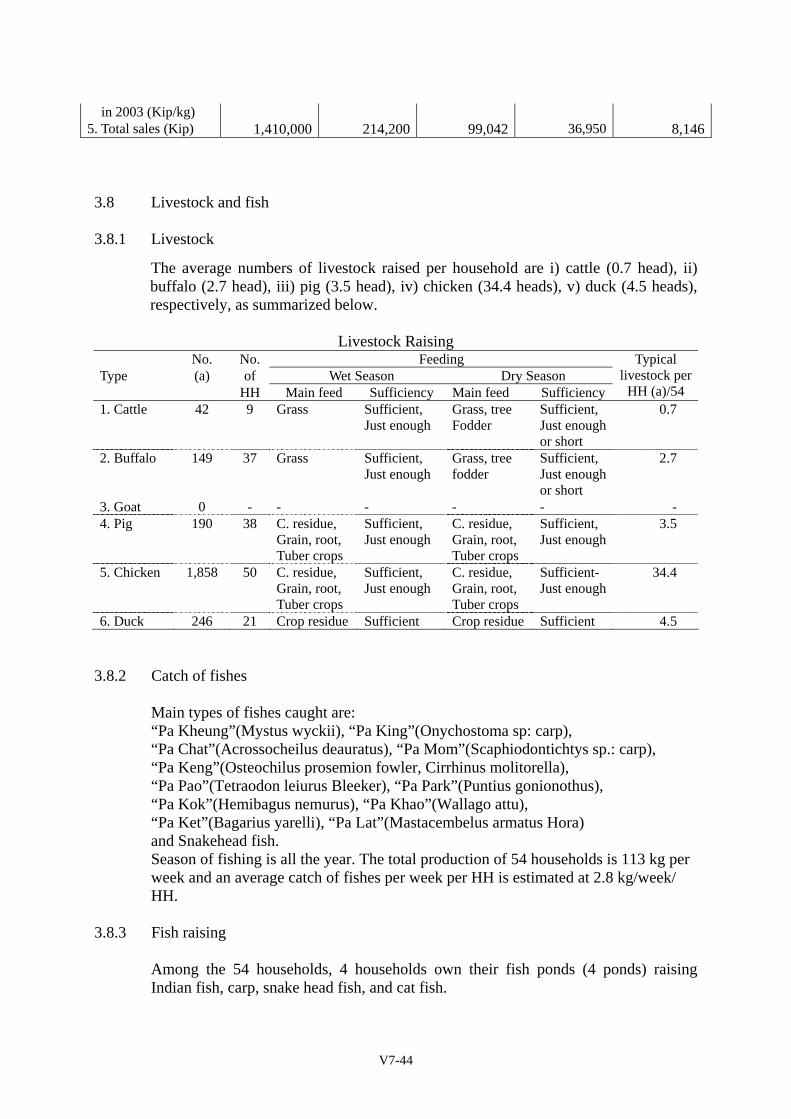
V7-44
in 2003 (Kip/kg) 5. Total sales (Kip) 1,410,000 214,200 99,042 36,950 8,146
3.8 Livestock and fish 3.8.1 Livestock
The average numbers of livestock raised per household are i) cattle (0.7 head), ii) buffalo (2.7 head), iii) pig (3.5 head), iv) chicken (34.4 heads), v) duck (4.5 heads), respectively, as summarized below.
Livestock Raising No. No. Feeding Type (a) of Wet Season Dry Season HH Main feed Sufficiency Main feed Sufficiency
Typical livestock per
HH (a)/54 1. Cattle 42 9 Grass Sufficient,
Just enough Grass, tree Fodder
Sufficient, Just enough or short
0.7
2. Buffalo 149 37 Grass Sufficient, Just enough
Grass, tree fodder
Sufficient, Just enough or short
2.7
3. Goat 0 - - - - - - 4. Pig 190 38 C. residue,
Grain, root, Tuber crops
Sufficient, Just enough
C. residue, Grain, root, Tuber crops
Sufficient, Just enough
3.5
5. Chicken 1,858 50 C. residue, Grain, root, Tuber crops
Sufficient, Just enough
C. residue, Grain, root, Tuber crops
Sufficient- Just enough
34.4
6. Duck 246 21 Crop residue Sufficient Crop residue Sufficient 4.5
3.8.2 Catch of fishes
Main types of fishes caught are: “Pa Kheung”(Mystus wyckii), “Pa King”(Onychostoma sp: carp), “Pa Chat”(Acrossocheilus deauratus), “Pa Mom”(Scaphiodontichtys sp.: carp), “Pa Keng”(Osteochilus prosemion fowler, Cirrhinus molitorella), “Pa Pao”(Tetraodon leiurus Bleeker), “Pa Park”(Puntius gonionothus), “Pa Kok”(Hemibagus nemurus), “Pa Khao”(Wallago attu), “Pa Ket”(Bagarius yarelli), “Pa Lat”(Mastacembelus armatus Hora) and Snakehead fish. Season of fishing is all the year. The total production of 54 households is 113 kg per week and an average catch of fishes per week per HH is estimated at 2.8 kg/week/ HH.
3.8.3 Fish raising
Among the 54 households, 4 households own their fish ponds (4 ponds) raising Indian fish, carp, snake head fish, and cat fish.
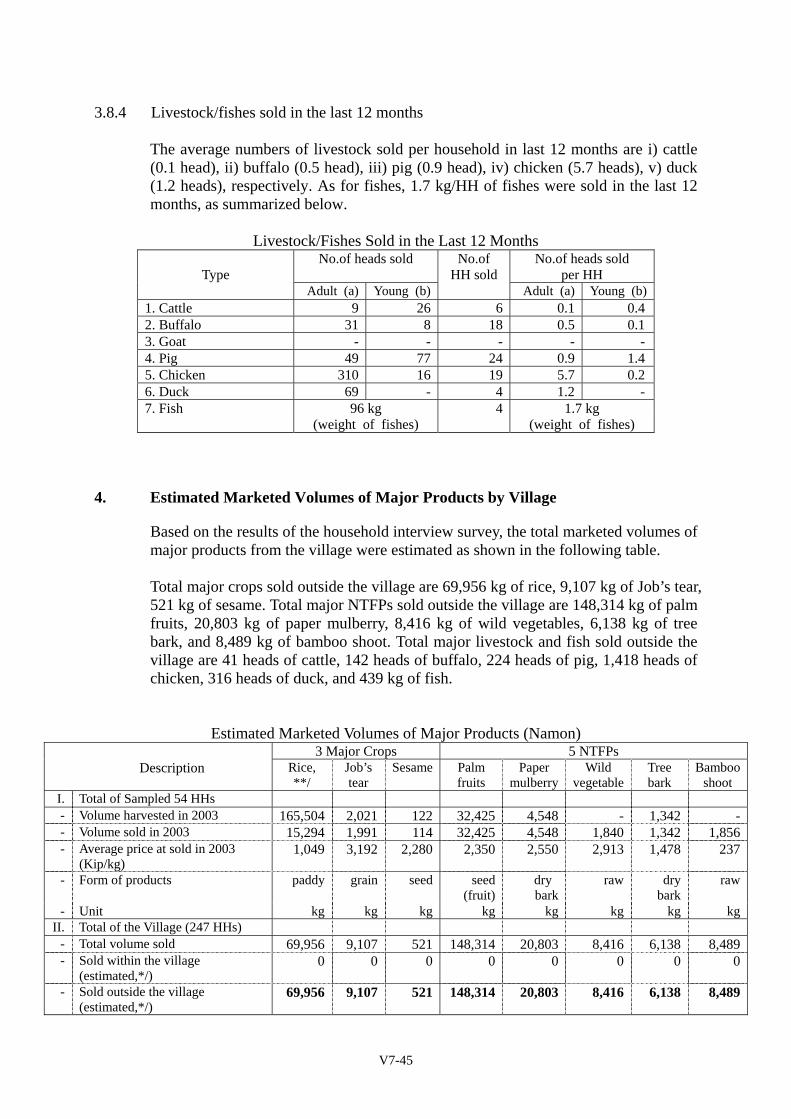
V7-45
3.8.4 Livestock/fishes sold in the last 12 months The average numbers of livestock sold per household in last 12 months are i) cattle (0.1 head), ii) buffalo (0.5 head), iii) pig (0.9 head), iv) chicken (5.7 heads), v) duck (1.2 heads), respectively. As for fishes, 1.7 kg/HH of fishes were sold in the last 12 months, as summarized below.
Livestock/Fishes Sold in the Last 12 Months
Type No.of heads sold No.of
HH sold No.of heads sold
per HH Adult (a) Young (b) Adult (a) Young (b) 1. Cattle 9 26 6 0.1 0.4 2. Buffalo 31 8 18 0.5 0.1 3. Goat - - - - - 4. Pig 49 77 24 0.9 1.4 5. Chicken 310 16 19 5.7 0.2 6. Duck 69 - 4 1.2 - 7. Fish 96 kg 4 1.7 kg (weight of fishes) (weight of fishes)
4. Estimated Marketed Volumes of Major Products by Village
Based on the results of the household interview survey, the total marketed volumes of major products from the village were estimated as shown in the following table. Total major crops sold outside the village are 69,956 kg of rice, 9,107 kg of Job’s tear, 521 kg of sesame. Total major NTFPs sold outside the village are 148,314 kg of palm fruits, 20,803 kg of paper mulberry, 8,416 kg of wild vegetables, 6,138 kg of tree bark, and 8,489 kg of bamboo shoot. Total major livestock and fish sold outside the village are 41 heads of cattle, 142 heads of buffalo, 224 heads of pig, 1,418 heads of chicken, 316 heads of duck, and 439 kg of fish.
Estimated Marketed Volumes of Major Products (Namon) 3 Major Crops 5 NTFPs Description Rice,
**/ Job’s tear
Sesame Palm fruits
Paper mulberry
Wild vegetable
Tree bark
Bambooshoot
I. Total of Sampled 54 HHs - Volume harvested in 2003 165,504 2,021 122 32,425 4,548 - 1,342 -- Volume sold in 2003 15,294 1,991 114 32,425 4,548 1,840 1,342 1,856- Average price at sold in 2003
(Kip/kg) 1,049 3,192 2,280 2,350 2,550 2,913 1,478 237
- Form of products paddy grain seed seed(fruit)
dry bark
raw drybark
raw
- Unit kg kg kg kg kg kg kg kgII. Total of the Village (247 HHs)
- Total volume sold 69,956 9,107 521 148,314 20,803 8,416 6,138 8,489- Sold within the village
(estimated,*/) 0 0 0 0 0 0 0 0
- Sold outside the village (estimated,*/)
69,956 9,107 521 148,314 20,803 8,416 6,138 8,489
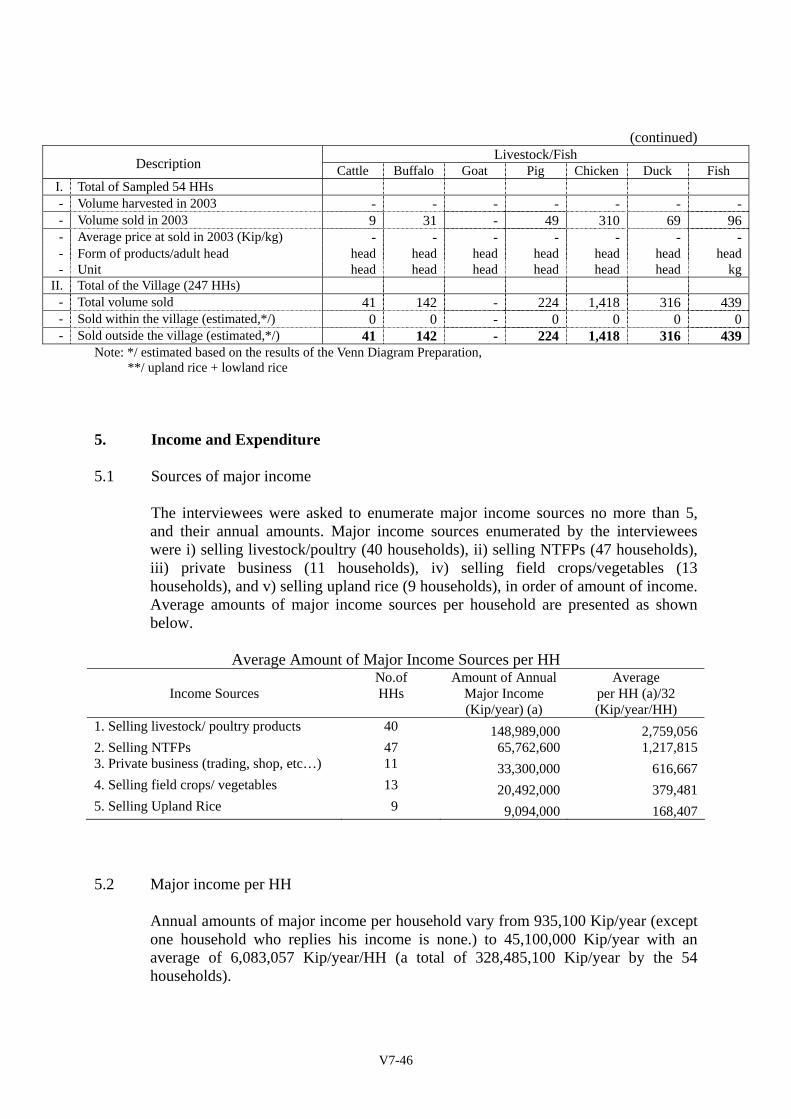
V7-46
(continued)
Livestock/Fish Description Cattle Buffalo Goat Pig Chicken Duck Fish I. Total of Sampled 54 HHs - Volume harvested in 2003 - - - - - - -- Volume sold in 2003 9 31 - 49 310 69 96- Average price at sold in 2003 (Kip/kg) - - - - - - -- Form of products/adult head head head head head head head head- Unit head head head head head head kg
II. Total of the Village (247 HHs) - Total volume sold 41 142 - 224 1,418 316 439- Sold within the village (estimated,*/) 0 0 - 0 0 0 0- Sold outside the village (estimated,*/) 41 142 - 224 1,418 316 439
Note: */ estimated based on the results of the Venn Diagram Preparation, **/ upland rice + lowland rice
5. Income and Expenditure 5.1 Sources of major income
The interviewees were asked to enumerate major income sources no more than 5, and their annual amounts. Major income sources enumerated by the interviewees were i) selling livestock/poultry (40 households), ii) selling NTFPs (47 households), iii) private business (11 households), iv) selling field crops/vegetables (13 households), and v) selling upland rice (9 households), in order of amount of income. Average amounts of major income sources per household are presented as shown below.
Average Amount of Major Income Sources per HH No.of Amount of Annual Average
Income Sources HHs Major Income per HH (a)/32 (Kip/year) (a) (Kip/year/HH)
1. Selling livestock/ poultry products 40 148,989,000 2,759,0562. Selling NTFPs 47 65,762,600 1,217,8153. Private business (trading, shop, etc…) 11 33,300,000 616,6674. Selling field crops/ vegetables 13 20,492,000 379,4815. Selling Upland Rice 9 9,094,000 168,407
5.2 Major income per HH Annual amounts of major income per household vary from 935,100 Kip/year (except one household who replies his income is none.) to 45,100,000 Kip/year with an average of 6,083,057 Kip/year/HH (a total of 328,485,100 Kip/year by the 54 households).
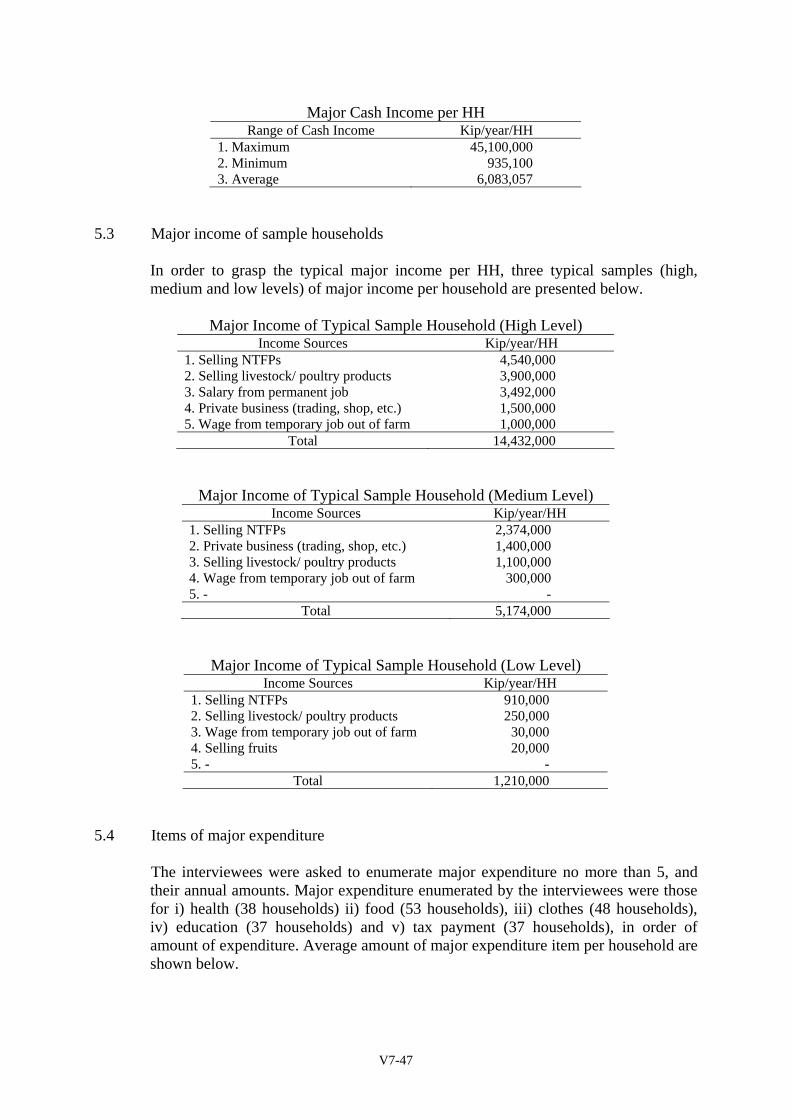
V7-47
Major Cash Income per HH Range of Cash Income Kip/year/HH
1. Maximum 45,100,000 2. Minimum 935,100 3. Average 6,083,057
5.3 Major income of sample households
In order to grasp the typical major income per HH, three typical samples (high, medium and low levels) of major income per household are presented below.
Major Income of Typical Sample Household (High Level) Income Sources Kip/year/HH
1. Selling NTFPs 4,540,000 2. Selling livestock/ poultry products 3,900,000 3. Salary from permanent job 3,492,000 4. Private business (trading, shop, etc.) 1,500,000 5. Wage from temporary job out of farm 1,000,000
Total 14,432,000
Major Income of Typical Sample Household (Medium Level) Income Sources Kip/year/HH
1. Selling NTFPs 2,374,000 2. Private business (trading, shop, etc.) 1,400,000 3. Selling livestock/ poultry products 1,100,000 4. Wage from temporary job out of farm 300,000 5. - -
Total 5,174,000
Major Income of Typical Sample Household (Low Level) Income Sources Kip/year/HH
1. Selling NTFPs 910,000 2. Selling livestock/ poultry products 250,000 3. Wage from temporary job out of farm 30,000 4. Selling fruits 20,000 5. - -
Total 1,210,000
5.4 Items of major expenditure
The interviewees were asked to enumerate major expenditure no more than 5, and their annual amounts. Major expenditure enumerated by the interviewees were those for i) health (38 households) ii) food (53 households), iii) clothes (48 households), iv) education (37 households) and v) tax payment (37 households), in order of amount of expenditure. Average amount of major expenditure item per household are shown below.
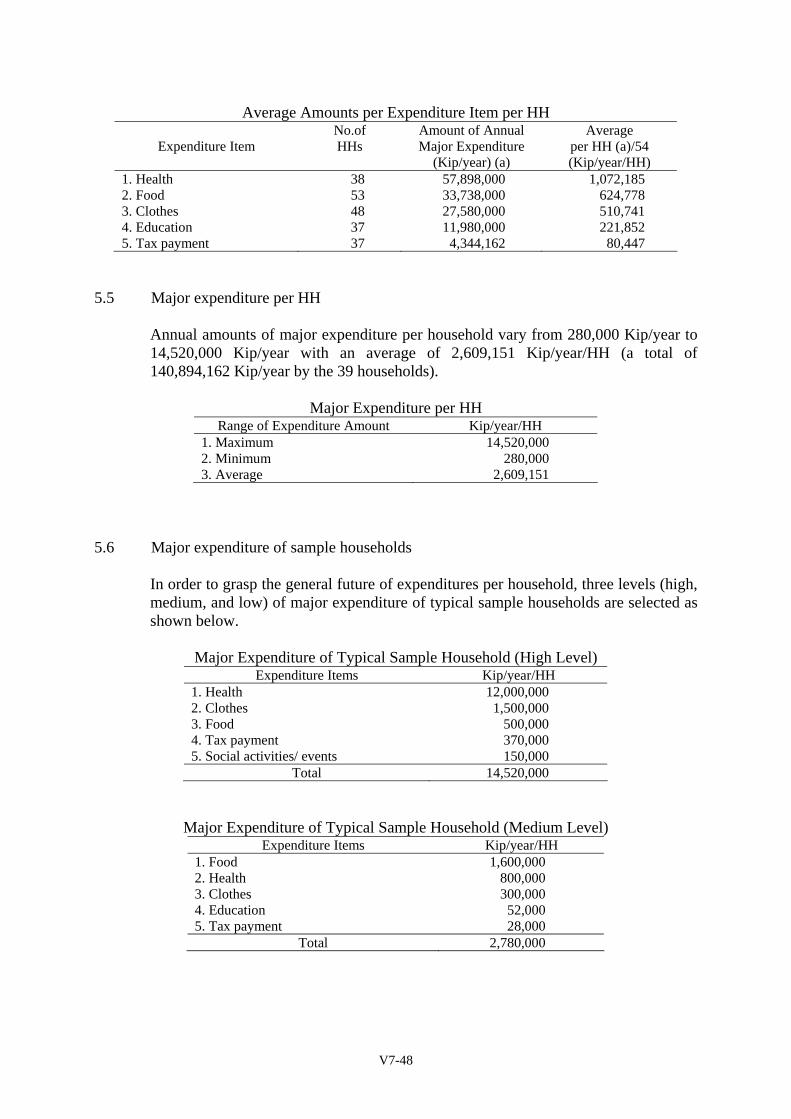
V7-48
Average Amounts per Expenditure Item per HH No.of Amount of Annual Average
Expenditure Item HHs Major Expenditure per HH (a)/54 (Kip/year) (a) (Kip/year/HH)
1. Health 38 57,898,000 1,072,185 2. Food 53 33,738,000 624,778 3. Clothes 48 27,580,000 510,741 4. Education 37 11,980,000 221,852 5. Tax payment 37 4,344,162 80,447
5.5 Major expenditure per HH Annual amounts of major expenditure per household vary from 280,000 Kip/year to 14,520,000 Kip/year with an average of 2,609,151 Kip/year/HH (a total of 140,894,162 Kip/year by the 39 households).
Major Expenditure per HH Range of Expenditure Amount Kip/year/HH
1. Maximum 14,520,000 2. Minimum 280,000 3. Average 2,609,151
5.6 Major expenditure of sample households
In order to grasp the general future of expenditures per household, three levels (high, medium, and low) of major expenditure of typical sample households are selected as shown below.
Major Expenditure of Typical Sample Household (High Level) Expenditure Items Kip/year/HH
1. Health 12,000,000 2. Clothes 1,500,000 3. Food 500,000 4. Tax payment 370,000 5. Social activities/ events 150,000
Total 14,520,000
Major Expenditure of Typical Sample Household (Medium Level) Expenditure Items Kip/year/HH
1. Food 1,600,000 2. Health 800,000 3. Clothes 300,000 4. Education 52,000 5. Tax payment 28,000
Total 2,780,000
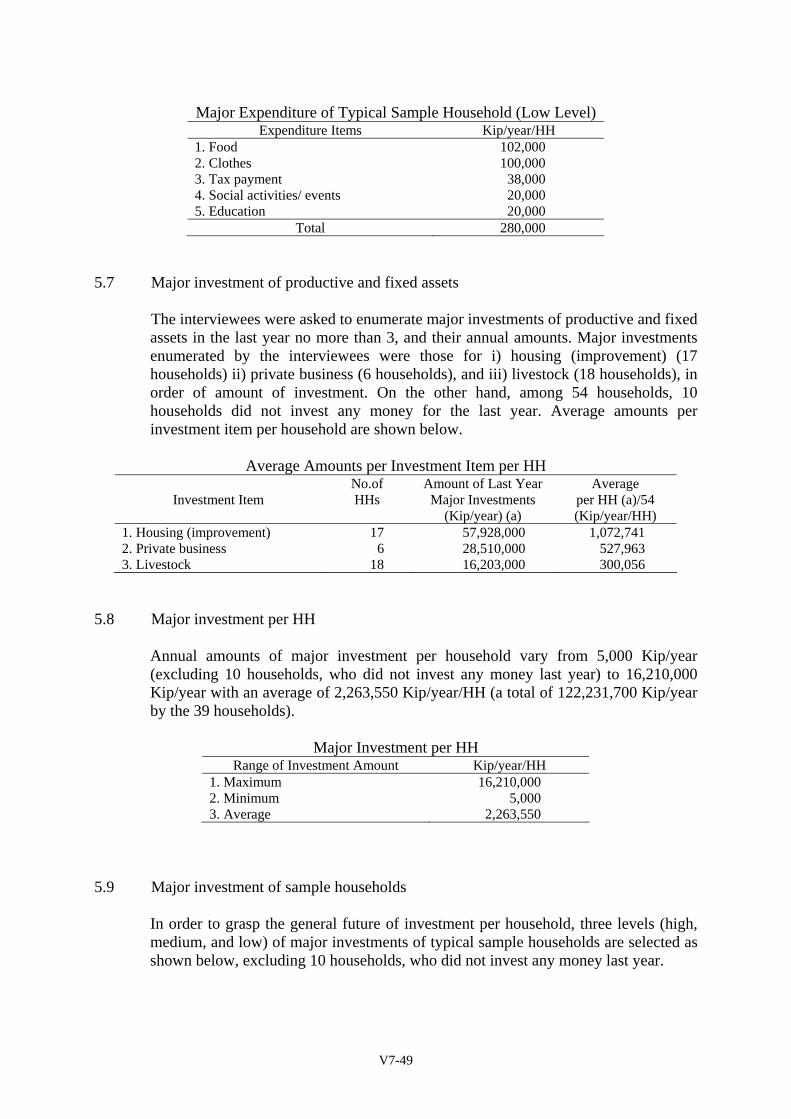
V7-49
Major Expenditure of Typical Sample Household (Low Level) Expenditure Items Kip/year/HH
1. Food 102,000 2. Clothes 100,000 3. Tax payment 38,000 4. Social activities/ events 20,000 5. Education 20,000
Total 280,000
5.7 Major investment of productive and fixed assets
The interviewees were asked to enumerate major investments of productive and fixed assets in the last year no more than 3, and their annual amounts. Major investments enumerated by the interviewees were those for i) housing (improvement) (17 households) ii) private business (6 households), and iii) livestock (18 households), in order of amount of investment. On the other hand, among 54 households, 10 households did not invest any money for the last year. Average amounts per investment item per household are shown below.
Average Amounts per Investment Item per HH No.of Amount of Last Year Average
Investment Item HHs Major Investments per HH (a)/54 (Kip/year) (a) (Kip/year/HH) 1. Housing (improvement) 17 57,928,000 1,072,741 2. Private business 6 28,510,000 527,963 3. Livestock 18 16,203,000 300,056
5.8 Major investment per HH Annual amounts of major investment per household vary from 5,000 Kip/year (excluding 10 households, who did not invest any money last year) to 16,210,000 Kip/year with an average of 2,263,550 Kip/year/HH (a total of 122,231,700 Kip/year by the 39 households).
Major Investment per HH Range of Investment Amount Kip/year/HH
1. Maximum 16,210,000 2. Minimum 5,000 3. Average 2,263,550
5.9 Major investment of sample households
In order to grasp the general future of investment per household, three levels (high, medium, and low) of major investments of typical sample households are selected as shown below, excluding 10 households, who did not invest any money last year.
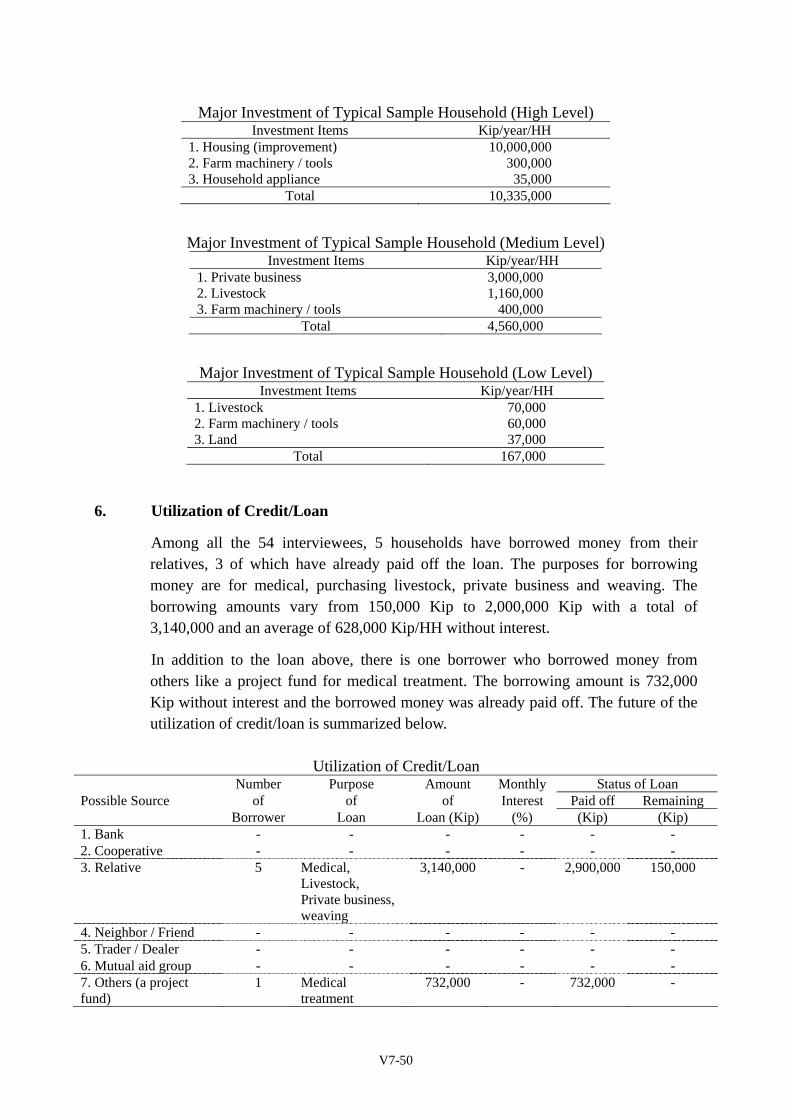
V7-50
Major Investment of Typical Sample Household (High Level) Investment Items Kip/year/HH
1. Housing (improvement) 10,000,000 2. Farm machinery / tools 300,000 3. Household appliance 35,000
Total 10,335,000
Major Investment of Typical Sample Household (Medium Level) Investment Items Kip/year/HH
1. Private business 3,000,000 2. Livestock 1,160,000 3. Farm machinery / tools 400,000
Total 4,560,000
Major Investment of Typical Sample Household (Low Level) Investment Items Kip/year/HH
1. Livestock 70,000 2. Farm machinery / tools 60,000 3. Land 37,000
Total 167,000 6. Utilization of Credit/Loan
Among all the 54 interviewees, 5 households have borrowed money from their relatives, 3 of which have already paid off the loan. The purposes for borrowing money are for medical, purchasing livestock, private business and weaving. The borrowing amounts vary from 150,000 Kip to 2,000,000 Kip with a total of 3,140,000 and an average of 628,000 Kip/HH without interest. In addition to the loan above, there is one borrower who borrowed money from others like a project fund for medical treatment. The borrowing amount is 732,000 Kip without interest and the borrowed money was already paid off. The future of the utilization of credit/loan is summarized below.
Utilization of Credit/Loan Number Purpose Amount Monthly Status of Loan Possible Source of of of Interest Paid off Remaining Borrower Loan Loan (Kip) (%) (Kip) (Kip) 1. Bank - - - - - - 2. Cooperative - - - - - - 3. Relative 5 Medical,
Livestock, Private business, weaving
3,140,000 - 2,900,000 150,000
4. Neighbor / Friend - - - - - - 5. Trader / Dealer - - - - - - 6. Mutual aid group - - - - - - 7. Others (a project fund)
1 Medical treatment
732,000 - 732,000 -
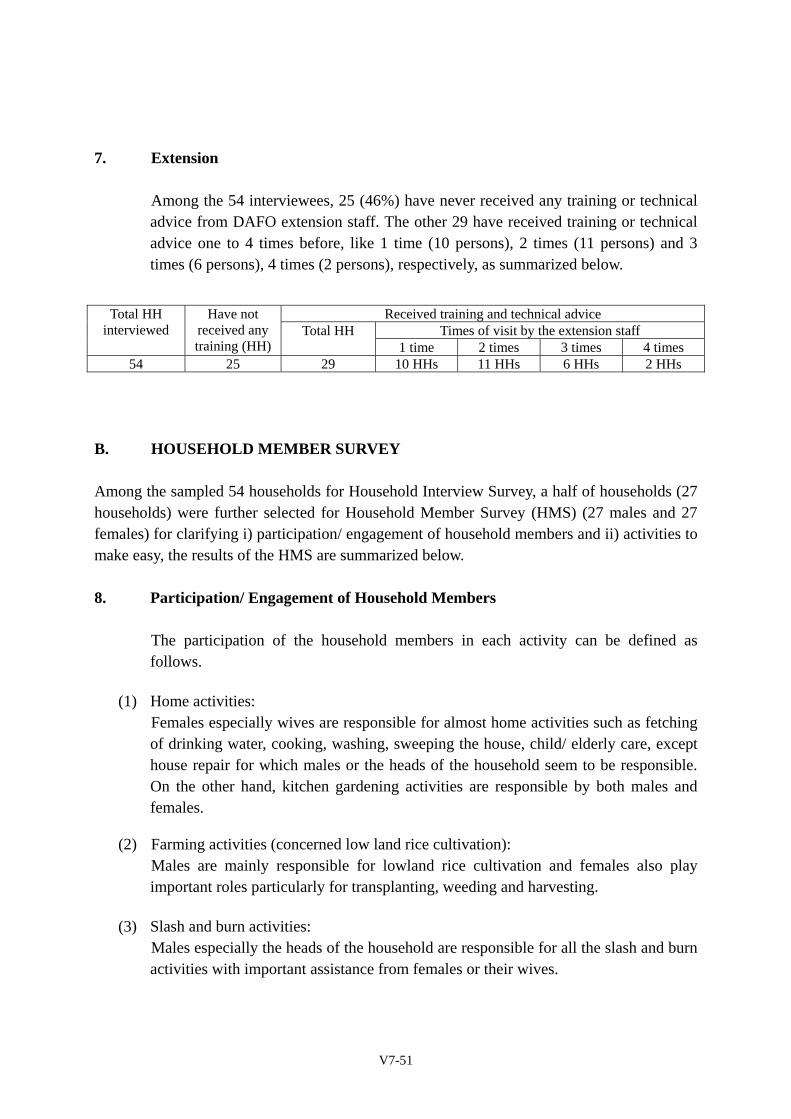
V7-51
7. Extension
Among the 54 interviewees, 25 (46%) have never received any training or technical advice from DAFO extension staff. The other 29 have received training or technical advice one to 4 times before, like 1 time (10 persons), 2 times (11 persons) and 3 times (6 persons), 4 times (2 persons), respectively, as summarized below.
B. HOUSEHOLD MEMBER SURVEY Among the sampled 54 households for Household Interview Survey, a half of households (27 households) were further selected for Household Member Survey (HMS) (27 males and 27 females) for clarifying i) participation/ engagement of household members and ii) activities to make easy, the results of the HMS are summarized below. 8. Participation/ Engagement of Household Members
The participation of the household members in each activity can be defined as follows.
(1) Home activities: Females especially wives are responsible for almost home activities such as fetching of drinking water, cooking, washing, sweeping the house, child/ elderly care, except house repair for which males or the heads of the household seem to be responsible. On the other hand, kitchen gardening activities are responsible by both males and females.
(2) Farming activities (concerned low land rice cultivation): Males are mainly responsible for lowland rice cultivation and females also play important roles particularly for transplanting, weeding and harvesting.
(3) Slash and burn activities: Males especially the heads of the household are responsible for all the slash and burn activities with important assistance from females or their wives.
Received training and technical advice Times of visit by the extension staff
Total HH interviewed
Have not received any training (HH)
Total HH 1 time 2 times 3 times 4 times
54 25 29 10 HHs 11 HHs 6 HHs 2 HHs
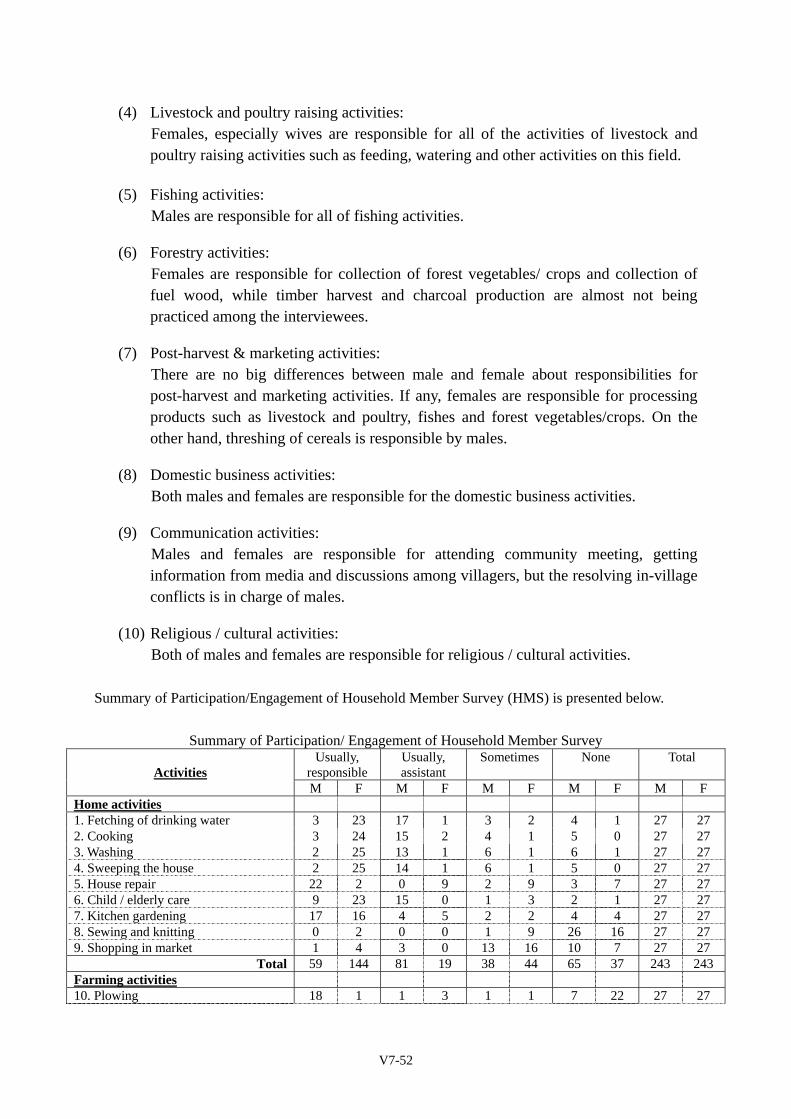
V7-52
(4) Livestock and poultry raising activities: Females, especially wives are responsible for all of the activities of livestock and poultry raising activities such as feeding, watering and other activities on this field.
(5) Fishing activities: Males are responsible for all of fishing activities.
(6) Forestry activities: Females are responsible for collection of forest vegetables/ crops and collection of fuel wood, while timber harvest and charcoal production are almost not being practiced among the interviewees.
(7) Post-harvest & marketing activities: There are no big differences between male and female about responsibilities for post-harvest and marketing activities. If any, females are responsible for processing products such as livestock and poultry, fishes and forest vegetables/crops. On the other hand, threshing of cereals is responsible by males.
(8) Domestic business activities: Both males and females are responsible for the domestic business activities.
(9) Communication activities: Males and females are responsible for attending community meeting, getting information from media and discussions among villagers, but the resolving in-village conflicts is in charge of males.
(10) Religious / cultural activities: Both of males and females are responsible for religious / cultural activities.
Summary of Participation/Engagement of Household Member Survey (HMS) is presented below.
Summary of Participation/ Engagement of Household Member Survey
Activities
Usually, responsible
Usually, assistant
Sometimes None Total
M F M F M F M F M F Home activities 1. Fetching of drinking water 3 23 17 1 3 2 4 1 27 27 2. Cooking 3 24 15 2 4 1 5 0 27 27 3. Washing 2 25 13 1 6 1 6 1 27 27 4. Sweeping the house 2 25 14 1 6 1 5 0 27 27 5. House repair 22 2 0 9 2 9 3 7 27 27 6. Child / elderly care 9 23 15 0 1 3 2 1 27 27 7. Kitchen gardening 17 16 4 5 2 2 4 4 27 27 8. Sewing and knitting 0 2 0 0 1 9 26 16 27 27 9. Shopping in market 1 4 3 0 13 16 10 7 27 27
Total 59 144 81 19 38 44 65 37 243 243Farming activities 10. Plowing 18 1 1 3 1 1 7 22 27 27
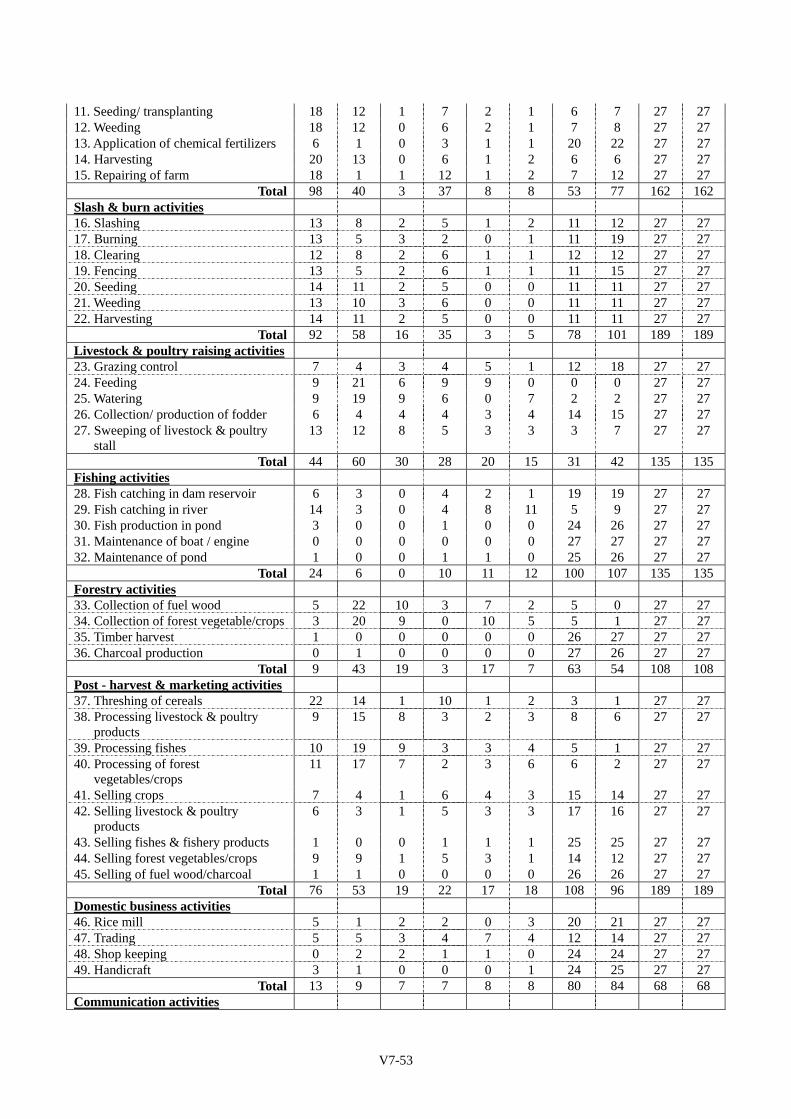
V7-53
11. Seeding/ transplanting 18 12 1 7 2 1 6 7 27 27 12. Weeding 18 12 0 6 2 1 7 8 27 27 13. Application of chemical fertilizers 6 1 0 3 1 1 20 22 27 27 14. Harvesting 20 13 0 6 1 2 6 6 27 27 15. Repairing of farm 18 1 1 12 1 2 7 12 27 27
Total 98 40 3 37 8 8 53 77 162 162Slash & burn activities 16. Slashing 13 8 2 5 1 2 11 12 27 27 17. Burning 13 5 3 2 0 1 11 19 27 27 18. Clearing 12 8 2 6 1 1 12 12 27 27 19. Fencing 13 5 2 6 1 1 11 15 27 27 20. Seeding 14 11 2 5 0 0 11 11 27 27 21. Weeding 13 10 3 6 0 0 11 11 27 27 22. Harvesting 14 11 2 5 0 0 11 11 27 27
Total 92 58 16 35 3 5 78 101 189 189Livestock & poultry raising activities 23. Grazing control 7 4 3 4 5 1 12 18 27 27 24. Feeding 9 21 6 9 9 0 0 0 27 27 25. Watering 9 19 9 6 0 7 2 2 27 27 26. Collection/ production of fodder 6 4 4 4 3 4 14 15 27 27 27. Sweeping of livestock & poultry
stall 13 12 8 5 3 3 3 7 27 27
Total 44 60 30 28 20 15 31 42 135 135Fishing activities 28. Fish catching in dam reservoir 6 3 0 4 2 1 19 19 27 27 29. Fish catching in river 14 3 0 4 8 11 5 9 27 27 30. Fish production in pond 3 0 0 1 0 0 24 26 27 27 31. Maintenance of boat / engine 0 0 0 0 0 0 27 27 27 27 32. Maintenance of pond 1 0 0 1 1 0 25 26 27 27
Total 24 6 0 10 11 12 100 107 135 135Forestry activities 33. Collection of fuel wood 5 22 10 3 7 2 5 0 27 27 34. Collection of forest vegetable/crops 3 20 9 0 10 5 5 1 27 27 35. Timber harvest 1 0 0 0 0 0 26 27 27 27 36. Charcoal production 0 1 0 0 0 0 27 26 27 27
Total 9 43 19 3 17 7 63 54 108 108Post - harvest & marketing activities 37. Threshing of cereals 22 14 1 10 1 2 3 1 27 27 38. Processing livestock & poultry
products 9 15 8 3 2 3 8 6 27 27
39. Processing fishes 10 19 9 3 3 4 5 1 27 27 40. Processing of forest
vegetables/crops 11 17 7 2 3 6 6 2 27 27
41. Selling crops 7 4 1 6 4 3 15 14 27 27 42. Selling livestock & poultry
products 6 3 1 5 3 3 17 16 27 27
43. Selling fishes & fishery products 1 0 0 1 1 1 25 25 27 27 44. Selling forest vegetables/crops 9 9 1 5 3 1 14 12 27 27 45. Selling of fuel wood/charcoal 1 1 0 0 0 0 26 26 27 27
Total 76 53 19 22 17 18 108 96 189 189Domestic business activities 46. Rice mill 5 1 2 2 0 3 20 21 27 27 47. Trading 5 5 3 4 7 4 12 14 27 27 48. Shop keeping 0 2 2 1 1 0 24 24 27 27 49. Handicraft 3 1 0 0 0 1 24 25 27 27
Total 13 9 7 7 8 8 80 84 68 68 Communication activities
V7-54
50. Attending community meetings 26 10 0 3 0 13 1 1 27 27 51. Resolving in-village conflicts 8 1 0 0 4 2 15 24 27 27 52. Getting information from TV 3 1 0 0 11 12 13 14 27 27 53. Getting information from Radio 11 9 3 2 8 8 5 8 27 27 54. Political discussion with others 11 9 5 2 7 7 4 9 27 27 55. Official letter writing 2 0 0 0 1 1 24 26 27 27
Total 61 30 8 7 31 43 62 82 162 162Religious / cultural activities 56. Dance party 6 4 0 1 10 6 11 16 27 27 57. Picnic 4 2 1 1 13 8 9 16 27 27 58. Worship ceremony 5 2 1 1 14 15 7 9 27 27 59. Sport events 2 1 0 0 3 1 22 25 27 27 60. Playing music 1 2 0 0 2 3 24 22 27 27 61. Drawing 2 3 1 0 2 1 22 23 27 27
Total 20 14 3 3 44 34 95 111 162 162 9. Activities Wanted to Make Easy
The interviewees were asked to choose up to 5 activities with priority which they want to make easy. The results of this question are summarized below.
Five Prioritized Activities to Make Easy Male Female
1. Weeding 1. Fetching of drinking water 2. Plowing 2. Collection of fuel wood 3. Threshing of cereals 3. Harvesting 4. Fencing 4. Child / elderly care 5. Repairing of farms 5. Collection of forest vegetables / crops
Summary of Priorities to Make Easy Activities wanted to make easy
1st 2nd 3rd 4th 5th Total
Activities M F M F M F M F M F M F
Home activities 1. Fetching of drinking water 1 1 1 1 1 1 42. Cooking 1 1 4 1 1 1 73. Washing 1 1 1 1 24. Sweeping the house 0 05. House repair 1 1 1 1 4 06. Child / elderly care 3 1 2 4 6 6 107. Kitchen gardening 2 1 1 2 1 3 1 6 58. Sewing and knitting 0 09. Shopping in market 0 0Farming activities 10. Plowing 6 1 7 1 2 1 3 1 19 311. Seeding/ transplanting 2 4 1 1 1 1 812. Weeding 3 1 3 1 6 3 1 2 10 1113. Application of chemical
fertilizers 0 0
14. Harvesting 1 3 2 2 2 3 2 3 7 11
V7-55
15. Repairing of farm 2 1 3 3 8 1Slash & burn activities 16. Slashing 2 1 3 1 2 1 6 717. Burning 1 1 1 1 3 118. Clearing 1 1 1 2 4 119. Fencing 2 3 1 3 2 1 9 320. Seeding 1 1 1 2 1 3 321. Weeding 6 6 3 3 3 1 1 5 3 1 16 1622. Harvesting 1 1 4 2 1 2 5 6Livestock & poultry raising 23. Grazing control 2 1 2 124. Feeding 1 1 2 2 1 3 425. Watering 0 026. Collection/ production of fodder 0 027. Sweeping of livestock &
poultry stall 1 1 0
Fishing activities 28. Fish catching in dam reservoir 0 029. Fish catching in river 2 1 1 1 2 1 1 7 230. Fish production in pond 0 031. Maintenance of boat / engine 0 032. Maintenance of pond 0 0Forestry activities 33. Collection of fuel wood 1 4 2 2 5 1 1334. Collection of forest
vegetable/crops 1 1 1 2 2 1 2 2 8
35. Timber harvest 0 036. Charcoal production 0 0Post-harvest & marketing activities
37. Threshing of cereals 3 1 1 2 3 1 8 338. Processing livestock & poultry
products 0 0
39. Processing fishes 0 040. Processing of forest
egetables/crops 0 0
41. Selling crops 0 042. Selling livestock & poultry
products 0 0
43. Selling fishes & fishery products
0 0
44. Selling forest vegetables/crops 0 045. Selling of fuel wood/charcoal 0 0Domestic business 46. Rice mill 1 1 047. Trading 1 0 148. Shop keeping 0 049. Handicraft 0 0
Total 27 27 27 27 27 27 27 27 27 27
Table & Figures

Rainfall at Sayaboury Station (unit: mm)Year Jan. Feb. Mar. Apr. May Jun. Jul. Aug. Sep. Oct. Nov. Dec. Total
1993 0.0 0.2 96.3 54.3 160.6 121.9 287.4 106.0 262.9 103.9 0.0 0.3 1,193.81994 0.0 20.8 169.5 50.3 226.2 160.7 174.3 256.2 320.5 11.8 19.3 45.4 1,455.01995 0.4 0.0 32.2 81.3 109.0 65.0 371.6 361.6 165.2 122.8 73.3 0.3 1,382.71996 0.0 13.2 53.5 124.1 48.4 208.4 211.6 263.6 252.0 67.7 58.4 0.0 1,300.91997 0.0 0.0 92.5 97.5 100.1 44.1 231.1 153.6 222.3 77.8 22.7 0.0 1,041.71998 3.3 3.9 10.9 158.6 151.9 164.7 165.1 136.6 117.2 56.7 4.7 0.0 973.61999 2.4 0.0 26.0 123.9 313.4 241.3 127.1 232.4 231.9 121.0 29.2 11.4 1,460.02000 0.0 26.1 7.2 129.5 223.1 177.1 172.6 60.1 310.0 89.7 5.5 0.0 1,200.92001 1.5 0.0 156.4 74.1 181.2 132.2 236.1 351.0 330.5 134.3 13.5 0.0 1,610.82002 10.9 2.4 6.7 32.3 237.3 54.7 172.9 224.0 293.9 171.8 117.4 35.6 1,359.9
Maximum Temperature at Sayaboury (Monthly Average) (unit: oC)Year Jan. Feb. Mar. Apr. May Jun. Jul. Aug. Sep. Oct. Nov. Dec.
1999 28.5 31.5 35.3 32.7 30.8 30.7 31.6 29.7 30.1 29.3 28.7 23.72000 29.2 29.0 33.0 33.3 30.7 31.2 30.7 30.8 29.6 30.1 28.4 28.32001 29.7 31.6 30.3 35.3 30.4 31.5 29.8 30.9 31.0 30.3 27.1 27.32002 27.2 31.5 33.3 35.3 32.0 31.8 29.9 29.9 30.0 30.1 27.1 27.32003 26.4 30.2 30.9 34.5 34.3 31.3 31.6 31.1 31.0 31.1 30.4 27.4
Minimum Temperature at Sayaboury (Monthly Average) (unit: oC)Year Jan. Feb. Mar. Apr. May Jun. Jul. Aug. Sep. Oct. Nov. Dec.
1999 14.6 15.2 16.9 22.9 23.4 24.0 24.4 23.6 23.4 21.7 18.8 11.82000 13.5 14.8 16.4 21.6 23.1 24.1 23.7 23.7 22.6 21.7 16.9 15.72001 15.2 15.1 20.0 22.5 23.4 23.9 24.0 24.0 23.2 22.6 15.8 16.32002 14.1 16.6 18.7 20.8 23.5 24.5 24.2 24.0 23.3 21.0 19.0 18.12003 15.7 16.4 18.2 21.9 23.5 24.0 23.8 24.1 23.4 22.2 17.4 13.8
Mean Temperature at Sayaboury (Monthly Average) (unit: oC)Year Jan. Feb. Mar. Apr. May Jun. Jul. Aug. Sep. Oct. Nov. Dec.
1999 20.7 22.9 25.3 26.7 26.2 26.6 27.3 26.0 25.9 24.8 22.7 16.82000 19.9 20.7 23.7 26.4 25.9 27.1 26.6 26.6 25.3 25.2 21.5 20.62001 21.3 22.5 24.3 28.0 26.1 26.9 26.3 26.6 26.2 25.7 20.8 20.62002 19.4 22.6 24.8 27.0 26.9 27.8 26.7 26.8 26.8 24.7 22.5 21.62003 19.9 21.6 23.5 27.0 27.9 27.2 27.0 27.0 26.2 25.9 22.7 19.0
Source: Department of Meteorology, Ministry of Agriculture and Forestry
Table V7-1 Meteorological Data (Namon)
V7-T-1
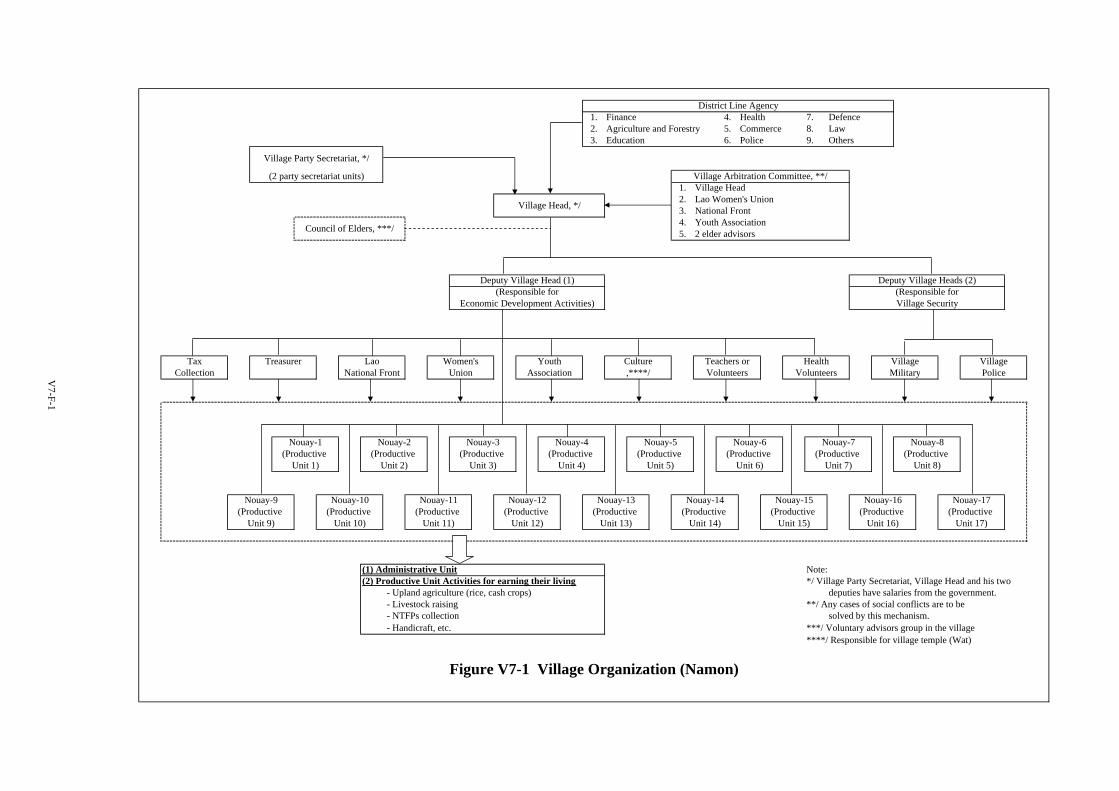
1. Finance 4. Health 7. Defence2. Agriculture and Forestry 5. Commerce 8. Law3. Education 6. Police 9. Others
1. Village Head2. Lao Women's Union3. National Front 4. Youth Association5. 2 elder advisors
Note: (2) Productive Unit Activities for earning their living */ Village Party Secretariat, Village Head and his two
- Upland agriculture (rice, cash crops) deputies have salaries from the government.- Livestock raising **/ Any cases of social conflicts are to be- NTFPs collection solved by this mechanism.- Handicraft, etc. ***/ Voluntary advisors group in the village
****/ Responsible for village temple (Wat)
V7-F-1
Village Head, */
Nouay-14Nouay-13Nouay-10 Nouay-11
Nouay-1(Productive
Unit 1)
Nouay-2(Productive
(Productive Unit 9)
,****/
Nouay-9
(Productive Unit 4)
Nouay-5(Productive
Unit 5)
Volunteers
Nouay-12(Productive
National Front Union
Unit 2)
Nouay-3(Productive
Unit 3)
Nouay-4
Figure V7-1 Village Organization (Namon)
Unit 12)(Productive
Unit 14)(Productive
Unit 13)(Productive
Unit 10)(Productive
Unit 11)
Village
Deputy Village Head (1)(Responsible for
YouthWomen's Culture HealthVolunteers Police
(1) Administrative Unit
Deputy Village Heads (2)(Responsible for
Lao
Economic Development Activities) Village Security
Teachers orAssociation
TaxCollection
District Line Agency
Treasurer Village
Village Party Secretariat, */
Military
Village Arbitration Committee, **/
Council of Elders, ***/
Nouay-17(Productive
Unit 17)
Nouay-15(Productive
Unit 15)
Nouay-16(Productive
Unit 16)
Nouay-8(Productive
Unit 8)
(2 party secretariat units)
Nouay-6(Productive
Unit 6)
Nouay-7(Productive
Unit 7)
Jan Feb Mar Apr May Jun Jul Aug Sep Oct Nov Dec Jan Feb Mar Apr May JunAGRICULTURE
Upland RiceSlashing
Buring
Fencing
Sowing
Weeding (1) (2)
Harvest Do specie Pi specie
Transport of rice
Irrigated Rice(Rainy Season)Paddy nursery
Transplant
Harvest
CornSali DoSali Pi
SesameMak Ga DoMak Ga Pi
Job's Tear
Mango
Jackfruit
Disease of rice (buan ) both irrigated and upland
LIVESTOCK
Diseases of Pig
Diseases of Poultry
Diseases of Baffalo(Tao Hua Luat )
NTFPs
Rattan
Paper Mulberry
MushroomsHet KhaoHet PuakHet DinHet Dan
Frog
Bamboo Shoots (several species)
Wild Mango
Wild Longan
Cardamon
Me Nomai
Sugar Palm
Resin
Bat
WATER PRODUCTS
Fish
Shell
Shrimp
Crab
Riverweed
RAIN AND WATER LEVEL
Rain Fall
Water Level
FOOD SECURITYFood Insecurity Months
Price of Rice 3000 3000 3000 3500 3500 3500
DISEASES
Diarrhea
Kai Ook Tum
Red Eyes
OTHER ACTIVITIES
Thatch Grass Collection
Blacksmith
House Maintenance
CEREMONIES
Yearly Festival *
New Year (Lao Loum) *
(3)
Figure V7-2 Seasonal Calender (Namon)
MIN MINMAX
nobody buy
V7-F-2
V7-F-3
Road to Namtiao
Nam Ping River
①
②③
⑤
⑤
④
⑦
⑧
⑥
③
Typical Transect Line
Figure V7-3 Resource Map (Namon)
To Natak
Village Boundary
Category Watershed Forest Road and Habitat Irrigated Rice Field Community Forest
(in Lao) Pa Len Nam Na Pi Pa Somsai
Transect Line on ① ③ ④ ⑤ ⑥Resource MapActivity Trees Shifting Cultivation Fishing Blacksmith Rice Cultivation Cutting trees for Trees Livesto
(Cutting trees is prohibited) upland rice pa chat Making Rice Wine sticky rice building house or sale (Cutting trees is prohibited) cattle mai hia (bamboo) sesame catfish mai nyang mai hia(bamboo) buffal mai sot (bamboo) job's tear pa phao Fruit Trees Collecting mai phao mai sot(bamboo) mai nyaan corn cocomut fishes mai chak mai nyaan (house material) mai kaen cassava Collecting jackfruit frog mai kaen (house material) Vegeta mai kaa shrimp tamarind rice field crab Bamboos mai khaa nyaa k
Livestock (Fallow Land) crab mango shell (Cutting trees is allowed) imperCollecting buffalo shell mai san (bamboo) Collecting nya c bamboo shoots cattle riverweed Vegetable Livestock (dry season) mai bon (bamboo) bamboo shoots mai to mushrooms pak gaad buffalo mai kaolaam (bamboo) mushrooms mai ko rattan Vegetation paper mulberry (riverside) onion cattle mai hok (bamboo) rattan sugar palm fruit nyaa khaa (a kind of cogon, chinese coriander pig mai lai (bamboo)
imperata cylindrica) Livestock pak hoom poultryWild Animals nya chilo (cogon) cattle cabbage Wild Animals Wild Animals Wild A(Capture is prohibited) mai meuat (house material) buffalo lettuce (Capture is prohibited) (Capture is prohibited) (Captu tiger mai koon wild pig tiger tiger bear mai phao Livestock bark deer (fan ) bear bear wild pig cattle wild pig wild p bark deer (fan ) Amimals pig Collecting bark deer (fan ) deer jackal (manai ) deer poultry bamboo shoots jackal (manai ) mole hoon wild pig buffalo mushrooms hoon birds mole rats rattan mole birds men sugar palm birds
resin wild fruits (mango, longan)
Problems Water level get decreased Water defficiency Hunting and trapping Forestduring the dry season. wild animals are prohibited the dry
But villagers catch deersFishes also get decreased birds and wild pigs with
trap.
Others sugar palm fruits After harvest, no crops Collecting sugar palm fruits Tigerscan be collected. are planted. is prohibited for regeneration. live in
Used fduring
Provinand arfor cat
V7-F-4
② ⑦
Figure V7-4 Transect (Namon)
Shifting Cultivation(Pa Somsai)
Pa Somsai
River/Streams& its circumference
Houay Thu/KhetNam Ping
Conservation Forest
Pa SaNgoan
V1-F-5
8 Buffalo
5 Palm fruit
9 Tiger grass
1
Rice
2
Pig
4 Sesame
7 Cattle
15
13
10 Job's tears
12 Fish
11 Rattan shoot
14
3 Tree bark
6 Paper mulberry
4 Sesame
Ya Houa Sakhan
Khi si
Selling to licensed middlemen
Producers take to other market
Marketing Household consumption and selling in the village Selling outside the village
Figure V7-5 Venn Diagram of Major Products by Male Group (Namon)
V1-F-5
1 Lowland rice
3 Fish Crab
2 Poultry
4 Vegetable
Paper mulberr
y
5Pig
6 Rattan shoot
7 Ya
Houa
8 -Buffalo -Cattle
Sesame
Job’s tear
Palm fruit
Tiger grass
Tree bark
Cardamom
Selling to licensed middlemen
Producers take to other market
Marketing Household consumption and selling in the village Selling outside the village
(Blerbal Medical roof)
Figure V7-6 Venn Diagram of Major Products by Female Group (Namon)
V7-F-7
Figure V7-7 Social Map
Legend Over Sufficient Sufficient Under Sufficient Gravityfed Water Supply Household Interviewee1 2 n
Village-8: Natak

-i-
STUDY REPORT ON
SOCIO-ECONOMIC SURVEY OF EIGHT (8) CANDIDATE VILLAGES
Village 8: Natak Village
Table of Contents
FEATURE OF THE VILLAGE ..................................................................................... V8-1
PART 1 Village Profile Survey........................................................................ V8-2
1. General Information .......................................................................................... V8-2 2. Livelihood and Natural Resource Management ................................................ V8-5 3. Infrastructure ..................................................................................................... V8-14 4. Organization related to the Project Activities.................................................... V8-15 5. Others ................................................................................................................ V8-16
PART 2 Participatory Village Survey .............................................................. V8-18
1. Resource Map and Transect .............................................................................. V8-18 2. Resources Utilization and Major Products ........................................................ V8-18 3. Venn Diagram.................................................................................................... V8-19 4. Social Map......................................................................................................... V8-22 5. Present Rules on the Management/Use of Lands and Resources ...................... V8-26
PART 3 Household Interview Survey.............................................................. V8-28
A. Household Interview Survey ............................................................................. V8-28 1. General Information .......................................................................................... V8-28 2. Living Condition ............................................................................................... V8-30 3. Agriculture and Forestry Production ................................................................. V8-33 4. Estimated Marketed Volumes of Major Products by Village ............................ V8-44 5. Income and Expenditure.................................................................................... V8-45 6. Utilization of Credit/Loan ................................................................................. V8-48 7. Extension........................................................................................................... V8-49 B. Household Member Survey............................................................................... V8-50 8. Participation/Engagement of Household Members........................................... V8-50 9. Activities Wanted to Make Easy ....................................................................... V8-53
List of Tables
Table V8-1 Meteorological Data........................................................................... V8-T-1
-i-
List of Figures
Figure V8-1 Village Organization .......................................................................... V8-F-1 Figure V8-2 Seasonal Calendar .............................................................................. V8-F-2 Figure V8-3 Resource Map .................................................................................... V8-F-3 Figure V8-4 Transect .............................................................................................. V8-F-4 Figure V8-5 Venn Diagram of Major Products by Male Group ............................. V8-F-5 Figure V8-6 Venn Diagram of Major Products by Female Group ......................... V8-F-6 Figure V8-7 Social Map ......................................................................................... V8-F-7
V8-1
Feature of the Village (Natak) (Total HH: 227, Population: 1,275)
(1) Composition of the ethnic group: The composition of the ethnic group is 94.4% of Lao Loum, 5.3% of Lao Theung, and 0.3% of Lao Sung. (2) Farmland owned per HH: The farmland owned per HH in Natak is 1.73 ha/HH in total including 0.65 ha of Hai-A, 0.42 ha of Hai-B, 0.51 ha of lowland paddy field, and 0.15 ha of orchard/tree crop area, that is 0.14 ha smaller compared with an average of 2.14 ha/HH in the 8 villages. (3) Rice availability: It is estimated that no households among a total of 227 households of Natak face rice shortage. (4) Balance of annual paddy production and consumption in the village: Total rice production and consumption in the village is estimated at 564,100 kg/year and 422,400 kg/year, respectively. The balance of annual paddy production and consumption is positive, about 141,700 kg of rice surplus. Accordingly, as shown in Item (6), the marketed volume of rice outside the village is estimated at about 38,400 kg/year. (5) Sources of major income: Sources of major income are i) livestock (3,230,000 Kip/HH), ii) private business (1,164,000 Kip/HH), iii) salary (926,000 Kip/HH), iv) NTFPs (441,000 Kip/HH), and v) temporary job (394,000 Kip/HH). (6) Estimated marketed volumes of major products: The marketed volumes of rice, paper mulberry, sesame, bamboo shoot and chicken are remarkable among the 8 villages. Marketed volumes of major products in the whole village are estimated as shown below.
Estimated Marketed Volumes of Major Products by Village Major Products (unit) Marketed Volume Livestock/fish (unit) Marketed Volume1) Rice kg 38,459 12) Cattle head 9 2) Job’s tear kg - 13) Buffalo head 105 3) Sesame kg 6,989 14) Goat head 13 4) Paper mulberry kg 13,611 15) Pig head 314 5) Tree bark kg - 16) Chicken head 6,116 6) Tiger grass kg 1,602 17) Duck head 1,951 7) Bamboo shoot kg 26,607 18) Fish, **/ kg (2,576) 8) Palm fruit kg - 9) Eagle wood kg - 10) Mushroom kg 2,218 11) Wild vegetables,*/ kg 2,899
Note: */ Including rattan shoots. **/ Figures in a parenthesis are products sold within/near the village including Sayaboury district market.
V8-2
PART 1 VILLAGE PROFILE SURVEY
Survey Period: 17 to 19 May 2004 Main Information Source: Village head, 2 deputy heads and some village authority members.
1. General Information
1.1 Location
Natak village is located in Sayaboury district 14 km from Sayaboury town (about 30 min. by car), 113 km from Luang Prabang (about 3 hrs. 20 min. by car, excluding waiting time for crossing Mekong river. It usually takes 5~30 minutes)
1.2 History of the village
Villagers in Ban Tana and Ban Pong had rice fields in the area, where they built Natak village later in 1887. There has been a road between Natak and Sayaboury via Ban Tana for a long time and it’s only 6 km from Natak to the market in Sayaboury. So Natak villagers usually walk along the road to Sayaboury town.
In 1994~95, the road from Sayaboury to Hong Sa district via Ban Soy and Ban Natak was built with assistance of ADB. Since this road is a roundabout way, 14 km between Natak and Sayaboury, the villagers never use this road to Sayaboury. The reason why the road was built via Ban Soy was to build the bridge over Hung River on the route No.4-A between Xieng Ngun and Sayabury.
Number of households is still increasing due to migration to the village. There were only 20~30 households in the 1960s. In 1998, 28 households migrated from Nalek to Natak. (Nalek village is 1 km north of Natak village. Household migrated from Nalek are those who used to live in Natak before. They moved Natak because they wanted to live near the road.) In 2004, household number has increased by 13 totaling up to 227.
1.3 Demography
The village has 227 households and a population of 1,275 habitants. Available labor population (15~49) occupies 41.2 % of the total population. The population of female and male is almost even as shown below.
Age Structure (as of March 2004) Age Female Male Total (%)
Under 1 46 42 88 (6.9) 1 ~ 5 55 53 108 (8.5)
6 ~ 14 165 180 345 (27.1) 15 ~ 45 204 201 405 (31.8) 46 ~ 49 63 57 120 (9.4) 50~65 62 60 122 (9.5)
66~above 43 44 87 (6.8) Total 638 637 1,275 (100)
Source: Village head (17 May 2004)
V8-3
The composition of the ethnic group is 94.4% of Lao Loum, 5.3% of Lao Theung, and 0.3% of Lao Sung, as summarized below.
Ethnic Structure (2003-04) Female Male Total HH (%) Lao Loum 616 587 1,203 205 (94.4) Lao Theung 21 47 68 21 (5.3) Lao Sung 1 3 4 1 (0.3)
Total 637 638 1,275 227 (100) Source: Village head (17 May 2004)
1.4 Organizational structure for administrative control
The village is administrated by a village head and two deputies. Natak village has 15 administrative units (or “Nouays”). The chiefs of each “Nouay” assist the village head in administrating “Nouays”. The village head is overall responsible for party and village affairs, and he is directly supervising the village defense and police affairs.
The first deputy village head is responsible for all the economic affairs, notably, he is handling taxes and other related village accounts. activities in the village. He is also responsible for improving villagers’ living situation through promoting productive unit’s activities. In other words, the “Nouays” have both roles like administrating and productive units.
The second deputy village head is responsible for 3 formal mass organizations such as Lao Women’s Union (LWU), Lao National Front and Youth Association, and Health, Education, and Social welfare. A council of elders is an independent voluntary unit as an adviser group of the village.
In addition to the above village administration structure, a Village Party Secretariat is established by the party. There are two secretaries of the Party because there are more than 30 party members in the village.
The Village Arbitration Committee is composed of i) Village Head, ii) Lao Women’s Union, iii) Lao National Front, and vi) Youth Association, and v) Village Police, and responsible for solving all the cases of social conflicts in the village. The village organization structure of Natak is presented in Figure 1 and the names of the village organizational key members are as follows.
Village Organizational Key Members
Position Name 1) Village Head Mr. Xieng Phan 2) Deputy Village Head (Economy) Mr. Thong Daeng 3) Deputy Village Head Mr. Kham Saeng 4) Head of Lao National Front (Neo Hom) Mr. Thong Di 5) Head of Women’s Union Ms. Pin 6) Head of Youth Association Mr. Phan Noy 7) Head of Village Police Mr. Kham Pan 8) Head of Village Army Mr. Som Di
V8-4
9) Head of Council of Elder’s Mr. Xieng Mon 10) Secretary of the Party for the Village Mr. Xieng Phan 11) Deputy Secretary of the Party for the Village Mr. Kham Daeng
1.5 Informal (ethnic) organization for administration, agriculture and/or religion
None
1.6 Food security
Four (4) households don’t have enough labor force (small households and most members are the old). Sayaboury district government gives these four households 30 kg of rice and clothes once a year. Except them, some shifting cultivators are in short of rice for a couple of months (July and August). But they still have enough money to buy rice because they plant cash crop like sesame, Job’s tear or many other kinds of vegetables.
1.7 Illiteracy rate
The illiteracy rate of the village is 3.5 % with 14 illiterate persons (15~45 years old) against a total of 1,275 villagers.
1.8 Major diseases
Many cases of malaria, diarrhea and red eyes were seen before. But all of diseases or symptoms have decreased for last 15~20 years due to following reasons.
i) Health advisers began to visit the village in the middle of 1980s. At first, they visited the village once for a couple of years. But they visit once a year in the 1990s and 2000s. Children in the village get 6 kinds of vaccination by health advisers.
ii) Gravity-fed water supply system was set up with assistance of an Australian NGO in 1992.
iii) Mosquito nets were provided at reasonable price (8,000 Kip including mosquito repellent liquid) with an assistance of EU in 2000.
1.9 Traditional custom, culture, event, cooperative works in the village
(1) Cooperative works Agricultural works: Labor exchange among families is still widely conducted for lowland rice and upland shifting cultivation. Labor exchange in Natak is conducted in a very flexible way. A workforce for lowland rice cultivation can be exchanged that for shifting cultivation, and vice versa. There are 3 large rice field groups but labor can be exchanged beyond the groups. (See section 4.1 “farmers management unit” of organizations available in the village).
V8-5
Bamboo bridge: Every year, villagers cooperatively make a bridge over Nam Hung river with bamboo in November. The bamboo-made bridge is usually swept away by increased water in May. During the rainy season, villagers cross the river by boat (500 Kip/person, 3,000 Kip/motor bike). They began to make bridge in the middle of 1980s. The members of the Youth union participate in repairing/maintaining the bridge once a month from December to May. Others: The villagers also help/cooperate each other in case of diseases, funeral, marriage, building house, and constructing/or repairing road, traditional irrigation facilities, water supply system, school and temple.
(2) Festivals They celebrate Boat Racing Festival in February, Yearly Festival in February and New Year for Lao Loum in April.
2. Livelihood and Natural Resource Management
2.1 Topography
Natak is a basin surrounded by relatively low hills and mountains. The elevation of Natak village habitat is about 360 m. Nam Hung river is a big river crossing the village from west to south. Mountain range in the northeast is a border with Vang Sai village. The mountain range is sources of Houay Van, Houay On and Houay Daek streams and the streams flow through the village into Nam Hung river. Several pieces of rice field scatter along the streams and are divided by hills. Nam Hung river has water throughout the year with a minimum flow in March and April and a maximum flow in August and September. Houay Van stream usually has water all the year. But it has dried up for one month in its history in April 2000. Houay On stream usually has no water from February to April.
As for seasonal natural disaster, Natak had only one big flood for a half century. In September 2002, Houay Daek and Houay Van streams flooded and about 30% of rice on the field was covered with water. Forest fires are likely to happen in March and April.
2.2 Meteorological data
Annual rainfall records at Sayaboury station in last 10 years (1993-2002) vary from 973 mm in 1998 to 1,610 mm in 2001 with an average of 1,297 mm. Detailed meteorological data including the maximum, minimum, and mean monthly average temperatures at Sayaboury station for recent 5 years are presented in Table 1.
2.3 Land allocation
Investigation for land classification was conducted in 1995. In 1996, every household in the village was allocated agricultural land in production land. According to DAFO staff, the documents for allocated land consist of i) Temporary Certificate for the use of each plot, signed by Land Allocation Committee at village level, the village head,
V8-6
and villagers concerned, and ii) Temporary Agreement for the use of each plot, signed by DAFO, the village head, and the villagers. In the documents, there is a section for drawing a sketch of the plot with its measurements. Since the temporary agreement for the use of each plot is valid for three (3) years, there must be some further processes. According to DAFO staff, it is planned that after three years, the district land office will assess the actual use of the land as well as the tax payment situation for issuing the permanent certificate. However, no process is undertaken after issuing temporary certificates.
According to the village head, if you use all the allocated land, they ask him to use more area. Total allocated area (including additional area) for one household is up to 7 ha (depending on ability).
Sixteen (16) households of Natak were allocated irrigated rice field and 10 of them are also allocated agricultural land in production forest of Na Ngiu village. They have cultivated the lands long before the allocation. The households pay their land tax to Natak village though they cultivate land in Na Ngiu. The Study team could not find out more detailed information about the historical relations between Ban Natak and Ban Nagiu during the survey period.
2.4 Land classification and distribution of each land use category
2.4.1 Data of DAFO
According to the data from DAFO of Sayaboury district, the original plan as of 1996 for each category of agricultural land and forest land in Natak village is as follows.
Area by Land Classification (as of 1996)
Land Classification No. of Plots Area (ha) A. Agricultural Land 1) Lowland paddy (Existing) 80 73.4 2) Upland for other than rice “Suan” 169 98.47 3) Upland for rice by slash and burn “Hai” 25 23.07 4) New open paddy field 60 26.31 5) Paper mulberry “Suan Posa” 17 9.45
6) Sesame “Suan Makga” 53 29.55 7) Banana, Sugarcane “Suan” 4 3.70 8) Beans“Suan” 2 2.20
B. Forest Land 1) Conservation Forest “Pa SaNgouan” 1 1,251 2) Watershed Protection Forest “Pa Haksa Len Lam” 1 3,240 3) Production Forest “Pa Somsai” 2 1,250 4) Rehabilitation Forest “Pa Feumfu” 1 320
Source: DAFO of Sayaboury district (17 May 2004)
2.4.2 Information from the village
The village profile survey team obtained the following information through the interview with the village head.
V8-7
Area by Land Classification by the Village Land Classification Area (ha)
A. Agricultural Land 1) Lowland paddy field (Wet season) 109.17 2) Lowland paddy field (Dry season irrigated) 0 3) Upland rice “Hai” 74.37 4) Upland crops other than rice “Suan” 48.72 B. Forest Land
1) Conservation Forest “Pa SaNgouan” and Protection Forest “Pa Pongkanh”
3,790
2) Community Production Forest “Pa Somsai” 1,250 4) Rehabilitation Forest “Pa Feumfu” 320 5) Teak plantation 7
C. Residential area 14.6 Source: Village head (17 May 2004) Note: */The areas obtained from the village are not accurate figures based on the actual topographical survey.
The land use categories by the village authority are as follows.
(A) Agricultural land: Thirty (30) households engage in only lowland rice cultivation, while 70 households engage in only shifting cultivation. 120 households do both lowland rice and shifting cultivation.
(1) Lowland rice field (2003): 109.17 ha (150households) (2) Dry season irrigated rice field (2003-04): 0 ha (Dry season irrigated rice cultivation
is not done due to limited water.) (3) “Hai” (upland rice) (2003): 74.37 ha (190households) (4) “Suan” (upland corps other than rice) (2003): 48.72 ha
(B) Forest land: (1) “Pa SaNgouan and Pa Pongkanh” (Conservation and Protection Forest): 3,790 ha
Both “Pa SaNgouan” (Conservation Forest) and “Pa Pongkanh”(Protection Forest) in Natak are located along upstream of Houay Van stream on the slope of Pha Khat mountain. The meanings of “Pa SaNgouan” and “Pa Pongkanh” are almost same and statistics of the village is not divided between “Pa SaNgouan” and “Pa Pongkanh”. Cutting trees and catching wild animals are prohibited. But collecting bamboo shoots, mushrooms and other NTFPs are allowed.
(2) “Pa Somsai” (Community Production Forest)1: 1,250 ha “Pa Somsai” in Natak is so-called community forest. Villagers usually go to collect fuel wood, bamboo shoots, mushrooms and resin in the forest. Trees can be cut for building house. Typical trees for building house are “Mai Pao”(Cephalostachyum sp.
1 Italics are Lao names of trees and animals obtained from the village key informants. Only identified
common/or genus/or family names are described in the following parentheses.
V8-8
Gramineae, Bamboo), “Mai Hao”(Parashorea sp.) and “Mai Nyaan”. Birds, wild chicken and mole can be captured with traps.
(3) “Pa Feumfu” (Rehabilitation Forest): 320 ha “Pa Feumfu”(Rehabilitation Forest) in Natak is forest land used for slash and burn cultivation until 1996 and now protected for rehabilitation. Typical plants in “Pa Feumfu” are bamboos and cogon. Wild animals are rare in the forest.
(4) Teak Plantation: 7 ha More than 20 households have small number of teak trees (50~100 trees). One household has totally more than 4 ha of 3 teak plantations.
(C) Residential area: 14.6 ha
2.5 Farming activity and production of major crops and livestock in the area
2.5.1 Farming activity
There are 109 ha of lowland paddy fields in Natak, owned by 150 households. It is simply calculated that among total 227 households, 66 % of households own 0.73 ha of lowland paddy fields in average. The farmers who own lowland paddy field, grow rice in lowland and cash crops in upland areas. However, the farmers who do not own lowland paddy field, grow mainly upland rice in “Hai” area.
Each household is allocated basically 3 plots (0.6~0.8 ha per plot) for 3-year rotation shifting cultivation system depending on family labor availability. The farmers who own lowland paddy filed, are not always allocated 3 plots but one or two plots depending on available family labor as well.
In “Hai” area they grow various kinds of crops like rice, sesame, Job’s tear, corn, cassava, taro, pumpkin, chili, egg plant and cucumber. Among these, sesame and Job’s tear are major cash crops and corn, taro and cassava are also important for household consumption as well as for feeding animals. All those crops are planted just before the rainy season in end April and May. Firstly, rice is planted in the main area (sometimes together with cucumber and other vegetable crops) followed by sesame, corn, Job’s tear, and others. Sometimes, corn is firstly planted before rice. Sesame, Job’s tear and corn are normally planted around the rice plantation area as a boundary and also in small plots, so called “Suan”(gardens).
Some households began to use chemical fertilizer in the end of 1990s. About 30% of households in Natak used chemical fertilizer in 2003.
2.5.2 Major crops
(1) Lowland rice The yield of lowland rice in Natak is 4 ton/ha if enough water is available. It may drop to 2~2.5 ton/ha in drought year. About 30 households sell rice to middlemen from Sayaboury now. They began to sell rice in the beginning of 1990s.
V8-9
(2) Upland rice
Households without or insufficient lowland rice field (70 HHs and 40 HHs respectively) plant upland rice at their allocated plot. The yield of upland rice is 2.5 ton/ha with moderate rain (2 of 3 years) but only 1.5~1.7 ton/ha in drought year (1 of 3 years). Some households plant upland rice in paper mulberry plantation when the trees (saplings) are not high. Such upland rice is called “Kao suan” or garden rice.
(3) Corn About 60% of households grow corn (traditional species) for both family consumption and feed of their livestock. In 2004, DAFO introduced new hybrid species to villagers and 4~5 households tried to grow hybrid corn for sale. These households have not planted corn until this year. Now many households prefer corn to upland rice.
(4) Job’s tear They began to grow Job’s tear in 1997-98 when a couple of middlemen came to buy in the village. About 70% of households plant Job’s tear in 2004. High price in 2003 (from 1,300 Kip in 2002 to 2,200 Kip in December 2003) provoked villagers to plant Job’s tear this year.
(5) Sesame A couple of companies in Sayaboury began to buy sesame in the village around 1990. About 70% of households plant sesame in 2004.
(6) Cotton Cotton has been traditionally planted in Natak for family use. At present, about 30 households plant cotton in the village.
(7) Paper mulberry About 10 households have planted paper mulberry for several years. Recent price rising of paper mulberry provoked 40 households to plant paper mulberry for last couple of years. Paper mulberry is usually harvested after 3 years from sapling and can be sold for more than 1 million Kip (income is, of course, dependent on its plantation size) per household per year. Many paper mulberry trees are planted near Na Ngiu village and along Nam Hung river.
(8) Vegetables (onions, garlic, and “Pak Ga”, “Pak Si”, “Pak Hoom”) Many kinds of vegetables are planted during the dry season after harvest of rainy season rice. About 10% of paddy field is used as vegetable garden. They began to plant vegetables during the dry season in the middle of 1990s due to increasing demand in Sayaboury town. Mostly buyers in Sayaboury come to buy vegetables to the village, but some villagers go to sell vegetables at the market (only 6 km from the village) by themselves in Sayaboury. An informant told that even poor households now stop planting upland rice and buy rice at the market with income from cash crops (vegetables, sesame, Job’s tear etc.).
(9) Fertilizer, herbicide and pesticide in Natak Some households began to use chemical fertilizer in the end of 1990s. About 30% of
V8-10
households in Natak used chemical fertilizer in 2003. In 2004, 87 households bought 96 “pao”(bag) (1 bag=12kg) of chemical fertilizer from a Thai company. Buffalo excrements and leaf mold of cogon “Nya kilo” also have been used as natural fertilizers for a decade with advice of DAFO. According to key informants, herbicide is not used in the village because it harm to their livestock and wild vegetables they eat daily. Villagers usually consult DAFO when insects spread among their crops. DAFO technical staffs come to sprinkle insecticide. But they buy and use insecticide by themselves if DAFO staffs are not available immediately.
2.5.3 Livestock
The numbers of each livestock in the village are summarized below.
Number of Livestock
Livestock Number (Heads)
1) Buffalo 374 2) Cattle 1 3) Pig 344 4) Poultry 7,560 5) Goat 15 6) Horse 3 7) Elephant 1
(1) Buffalo: 374 heads
Number of buffalo got increased from just more than 100 in 1990 to more than 300 heads in 2004. More than 10 heads of buffalo are sold to traders from Sayaboury every year. DAFO came and got buffalo vaccinated in Natak in middle of 1990s. Ratio of vaccinated buffalo at that time was already as high as that of today. Mr. Xiendi went training at DAFO for a week in 1997 and serve as a veterinarian since then. Cases of diseases have sharply decreased. Now about 70% of buffalo has got vaccinated.
(2) Cattle: 1 head (1 household) Villagers in Natak have never kept a lot of cattle in their history (maximum number is 4~5 heads). They don’t like to keep cattle because they enter shifting and irrigated rice cultivation area and eat their crops. They say buffalo don’t eat crops like cattle do.
(3) Pig: 344 heads Number of pig also gets increasing in Natak. The reason is that pig’s price is getting higher year by year. More than 100 pigs are sold every year. Many of pigs in Natak do not get vaccinated. They say pigs in Natak suffer from epidemics less than Namon because they keep their pigs in pens in Natak instead of pasturing. This opinion is opposed to many other villages that pigs raised in the pasture/fallow land less suffer from epidemics those in pens. Now 20~30% of pigs got vaccinated. Vaccination for pigs has just begun this year.
(4) Poultry (chicken, duck and turkey): 7,560 heads (Almost all households)
V8-11
Number of poultry also increased from some 5,000 in 2002 to 7,500 at present. (But the number of poultry can easily drop to around 3,500 heads because epidemics.) More than 700 poultry are sold to traders from Sayaboury each year. But this number is changeable due to spread of epidemic diseases. Several traders come to buy poultry and other livestock every day.
(5) Goat: 15 heads (4 households) Natak villagers don’t like to keep goats because they eat anything like teak sapling, paper mulberry leaves and crops in rice field and shifting cultivation area.
(6) Horse: 3 heads (2 households) They began to keep horses several years ago. Horses are used to carry things like agricultural products, NTFPs or anything else from/to upland farm, rice field and forests.
(7) Elephant: 1 head (3~4 households cooperatively keep an elephant) Two (2) households of relatives used to keep an elephant and let their children to raise now. An elephant carry 300 m3 of logs every year and earn 300,000 Baht (about US$7,500). The owners share the money equally. So the elephant’s owners are the richest households in Natak.
2.6 Collecting NTFPs2
Major NTFPs collected in the village are as follows.
NTFPs collected in the Village
Major NTFPs Description 1) Paper mulberry Wild paper mulberry trees along streams have got
decreased in Natak. So villagers began to plant its seedlings. They plant additional seedlings to make plantation where many wild paper mulberry trees already grow.
2) Bamboo shoots Bamboo trees like “Mai Pai”,” Mai Fak”, “Mai Sanpai”, “Mai Mon” and “Mai Samkan” are planted for harvest of bamboo shoots. These bamboo shoots are collected mainly for family consumption during rainy season (food shortage season). Wild bamboo shoots like “Mai Hok” (Dendrocalamus sp.), “Mai San”, “Mai Kalao”, “Mai Lai” and “Mai Bon” are collected for sales and family consumption.
Bamboo shoots are collected in bamboo bushes near slash and burn cultivation area and rice field along Houay Van and Houay Put streams.
3) Mushrooms Typical mushrooms collected in the village are “Het Puak” (March and April), “Het Po” (May), “Het Khao” (Lentinus sp.)(rainy season), “Het Bot” (Lentinus sp.) (rainy season), and “Het Sanun”(Auricularia polytricha) (Jew’s ear, rainy
2 Italics are Lao names of NTFPs and animals obtained from the village key informants. Only identified
common/or genus/or family names are described in the following parentheses.
V8-12
season). A lot of mushrooms are collected in Community Production Forest. There is a little volume of mushrooms in Watershed Protection Forest.
4) Worm in bamboo
“Me Nomai”
About 10% of households collect “Me Nomai”. Traders come to buy in the village. The price was 20,000 Kip/kg in the village last year.
5) Resin Villagers began to collect resin from “Mai Pao” (Cephalostachyum sp.)trees in the beginning of 1990s. Production of resin increased in the middle of 1990s. Now about 30% of households collect resin in Natak. The price is about 2,500 Kip/kg.
6) Frog Frog is captured in rice field from April to June for family consumption. According to key informants, number of frogs is still as many as before. Capturing of tadpoles is prohibited anywhere (including forests, streams and rice fields) in the village to promote reproduction of frogs.
7) Tree bark There is “tree bark” in the forest. But they don’t collect because buyers don’t need it.
8) Rattan There is a little volume of rattan in forest. Rattan is collected for family use but not for sale.
9) Cardamon According to key informants, there is no cardamon in Natak.
10) Benzoin According to key informants, there is no benzoin in Natak.
11) Bat Bat is captured for food. But the number is small because there is no cave in the village.
2.7 Use of water products
(1) Fishing3 Men go fishing with big nets from February to April in Nam Hung river. Typical fishes in Nam Hung river are “Pa Chat”(Acrossocheilus deauratus),” Pa Pan”,” Pa King”(Onychostoma sp.) and “Pa Mom”(Scaphiodontichtys sp.). During rainy season (from May to October), it’s difficult to catch fishes in Nam Hung river due to high water level. Women use small handy nets to catch fishes in streams during the season. Typical fishes in Houay Van stream are “Pa Chat”, “Pa Pan” and “Pa Kang” (Channa gachua: Snaked head). Fishes are also caught in rice field. Fishes go up Nam Hung river and other streams in June and down in October and November.
(2) Aquaculture Fish ponds were made since the middle of 1990s. Now there are 15 fish ponds in Natak. Fishes raised in ponds are mostly consumed in the village. Typical fishes for aquaculture are “Pa Nin”, Pa Kinyaa” and “Pa Keplep”.
(3) Others Shrimp is also captured during the rainy season in Houay Van stream and Nam Hung river. More crabs live in streams like Houay Van than Nam Hung river. Crab is also
3 Italics are Lao names of fish obtained from the village key informants. Only identified common/or genus/or
family names are described in the following parentheses.
V8-13
captured during the rainy season. Typical crab captured in the village is “Pu Ho”. Shell is collected in rice field and streams. There are no shells in Nam Hung river. Riverweed is collected only in Nam Hung river during the dry season (from January to April).
2.8 Other activities
(1) Weaving Women in about 60% of households in the village engage in weaving. They use their hand-made cotton thread (cotton is also planted by themselves) and weave simple textile used for bathing, and making bag and clothes. Most of them are made for family use.
(2) Blacksmith There are five households engaged in blacksmith. Both labor exchange and cash payment have been practiced for a long time. Making two sickles/hatches is worth one day’s labor in the field. Blacksmith usually make 4~5 scythes a day.
(3) Embroidery Women in about 50% households in the village engage in commercial embroidery. Commercial embroidery began in 2001 and sharply increased in 2004. Traders from Sayaboury take samples and all materials to the village. Payment for embroidering one textile varies from 15,000 to 100,000 Kip depending on its size and difficulty.
(4) Taylor/Cloth Maker More than 10 households make clothes including school uniform and Lao traditional skirt “sin” for small scale. Two sisters (different households due to marriage) in the village make clothes as a family business. (Elder sister leant making cloths from her farther about ten years ago. And she taught her younger sister a couple years ago). They are especially busy in August because new school year begins on 1st September. The sisters respectively earn 4~5 million Kip per year.
(5) Rice Wine Seven households make rice wine “Lao Lao” and sell in the village. April is the busiest month for them because of Lao New Year.
2.9 Collective activities by the village for forest conservation
(1) Forest Fire Fighting Unit All households in the village cooperatively fight for a big fire in forest. CESVI assisted in organizing such a unit with equipment used for forest fire fighting.
2.10 Seasonal calendar
Seasonal calendar, which shows various activities/issues/ events related to livelihood and natural resource management is presented in Figure 2.
V8-14
3. Infrastructure
3.1 Location, current condition of social infrastructure
(1) Water supply A gravity-fed water supply system with 9 faucets (including one in the school) was made with assistance of Meradec of Australia in 1992. Each faucet has a caretaker. Except them, there are 3 technicians in the village. If a faucet is out of order, the faucet caretaker and 3 technicians talk together and ask the village head for repair. Each household pays 2,000 Kip/year and the money is spent for buying spare parts or cement.
(2) School First education in the village was offered in the temple between 1964 and 1966. Primary school and high school were built in 1966 and 1992 respectively. Villagers cut trees and built school building by themselves without any assistance from outside. Each household donated 2 iron sheets for building school building.
(3) Clinic/Hospital There used to be a clinic from 1982 to 1987 in Natak. But the clinic moved to Saisawat village (upstream of Nam Hung river) because Natak is not far from provincial hospital in Sayaboury town. The clinic moved to Namon in 1996. No villagers go to the clinic in Namon. But statistics on population and cases of disease of the village are reported to the clinic in Namon every year.
(4) Road In 1994~95, the road from Sayaboury via Ban Soy was built with assistance of ADB. The reason why the road was built via Ban Soy was to build the bridge over Hung River on the road No.4-A between Xieng Ngun and Sayaboury. Villagers still use the old road (6 km) more than the detour (14 km) to go to the market in Sayaboury. One of the problems of the old road is that there is no permanent bridge over Hung river in Natak village. ADB’s 10th road improvement project will be begun in 2004.
(5) Market There has not been any market (including periodical market) in Natak’s history. Villagers often go to the market in Sayaboury. The market is about 6 km from Natak.
(6) Electricity Public electricity came to the village in 2003. At first, 48 households were supplied with electricity. Now the number has increased to about 60 households. A rather big installation cost for an individual service line (about 1.5million Kip) prevents more than 160 households from electrification. An average household pays 4,000~5,000 Kip per month. They have electricity for 24 hours a day.
3.2 Agricultural infrastructure
(1) Irrigation There are 20 traditional irrigation facilities in Natak (6 in Houay Van stream, 8 in Houay Daet stream, 4 in Houay Phuut stream and 2 in Houay On steream).
V8-15
Each irrigation system has 3 leaders to manage it. Traditional irrigation facilities don’t need to buy cement or any other materials for repair. So the village doesn’t collect any money for maintaining irrigation facilities. 3 leaders of each irrigation system don’t receive any salary, either. Villagers cooperatively work for repair of such facilities.
(2) Rice mill There are 14 units of rice mill in the village. First rice mill in the village was set up in 1991 and there had been only one rice mill for several years. Many rice mills were purchased after 2000.
(3) Tractor There are 9 tractors in the village. Mr. Xieng Di bought the first tractor in the village in the middle of 1980s and there had been only one tractor until 2000. Many tractors were purchased after 2002.
3.3 Infrastructure development plan
ADB 10th road improvement project (The project will be start in 2004.)
4. Organization related to the Project Activities
4.1 Organizations available in the village
(1) Water management unit Each irrigation system has three management leaders. Users repair by themselves for minor works. But members of rice field owners’ group cooperatively repair when the works are rather serious.
(2) Forest management unit None. Mr. Xieng Di is in charge of forest matter. He is a veterinarian as well.
(3) Farmer’s management unit i) Rice field owners’ group: Three large irrigated rice fields (Na Lek, Na Tak and Na Ngiu) have owners’ group respectively. Each group has 10~30 owners and 3 committee members. The committees have five major activities as follow.
a) Borrowing fertilizer from APB (Agricultural Promotion Bank): Each group collectively borrows chemical fertilizer from APB through DAFO. Villagers usually don’t have any collateral so owners of the same rice field collectively are responsible for repayment. (Villagers borrow only fertilizer, not money from APB. When they have enough money, they will buy fertilizer at the market by themselves).
b) Water user’s group management: Users of the irrigation facilities cooperatively work for minor repairs. For major repairs, members of the rice field group work together.
c) Livestock management: When livestock suffers from diseases, each rice field group collectively solves the problem.
V8-16
d) Labor share: Household is a basic unit of labor exchange. And labor is usually exchanged within the same rice field group.
e) Crop management: When crops suffer from diseases or insects, each rice field group collectively solves the problem.
ii) Slash and burn cultivation: There is no farmers’ organization for slash and burn cultivation in Natak. Labor is exchanged among households freely. If you don’t have enough labor force to exchange, you hire other farmers. You will pay 10,000 Kip/day/person and have to offer lunch.
4.2 Any on-going/ implemented rural development project in the area
Sayaboury district is one of the 72 poorest districts in Lao PDR and target of NPEP (National Poverty Eradication Programme).
4.3 International organizations and/or local NGOs working in the area
a) CESVI: equipment for forest fire fighting b) EU: mosquito nets and mosquito repellent liquid c) AUSAID/Meradic: rice bank through Women’s Union since 1999. When
villagers face rice shortage during the rainy season, they can borrow rice. They have to repay at 30% interest within 3 years.
4.4 Any agricultural promotion activities
None.(except for DAFO staff activities)
4.5 Availability of agricultural technicians
Nobody in Natak village has ever studied agriculture or forestry at college or university. As for a veterinarian, Mr. Xieng Di; He is a village veterinarian since 1997. He was trained for a week at DAFO in Sayaboury.
5. Others
5.1 DAFO extension staff activities to the village
DAFO staffs come to teach and train villagers several times a year. They introduce new cash crops and hybrid seeds, and teach how to raise livestock and plant cash crops. DAFO staffs also sell hybrid seeds to villagers. When a Thai company sold chemical fertilizer this year, DAFO staffs came to the village with the company.
5.2 Any migration project in the future
Not exist.
V8-17
5.3 Situation of tax collection (land tax etc.)
Total Tax Revenue: 8,012,056 Kip as of 20 February 2004, of which 7,210,850 Kip (90 %) are transferred to Sayaboury district, and 801,206 Kip (10 %) were kept in Natak village. Among 801,206 Kip in Natak village, 480,700 Kip (60%) are used for the village officers (salaries), and 320,506 Kip (40%) are reserved for the village.
V8-18
PART 2 PARTICIPATORY VILLAGE SURVEY
- Survey period : 17 to 19 May 2004 - Resource map and social map : 17 May 2004 - Venn diagram for marketing products : 17 May 2004 - Dependence on resources by well-being level : 18 May 2004 - Present rules on the use of resources : 19 May 2004
1. Resource Map and Transect
In order to clarify the present use of lands and other resources, a resource map was drawn by the villagers through a participatory process. A total of 15 villagers (representatives of 15 “Nouays”) participated in this session on 17 May 2004. Based on the resource map, a transect walk was conducted together with some village key informants on 18 May 2004. During the transect walk, the present use of lands and other resources were clarified by observing actual conditions of the sites. The resource map shows the different land types, in addition to roads, rivers, streams and habitation and the transect shows cross-sectional view of the different zones and provides comparative information such as main activities and problems for each land category as presented in Figure 3 and 4.
2. Resources Utilization and Major Products
Major products in each resource are summarized in the following table, the information of which were obtained through Transect Walk, Venn Diagram preparation and some informal discussions.
Major Products by each Land Category
No. Resources Products 1. Conservation Forest: Tiger grass “Pa SaNgouan” Mushroom
2. Production Forests: Tiger grass “ Pa Somsai” Bamboo shoot Large timber for house construction material Pole and bamboo for minor construction Small wild animal Roofing thatch Paper mulberry Resin
3. Agricultural Land for Upland rice upland cultivation: Maize “Hai” and “Suan” Job’s tear (3 places per household, Sesame 1.0 ha for place/piece) Paper mulberry or Fallow land for Bamboo shoot Slash and burn “Lao Orn” Wet season vegetables or “Pa Phalit” Chill Buffalo (in the fallow land) Pig (in the fallow land)
V8-19
Poultry (in the fallow land) 4. Watershed Protection No encroachment except collection of Forest “Pa Pongkanh” Wild vegetables
5. Rivers (Nam Houng, Fish Houay Daek) Small shrimp Shell
6. River sides Dry season vegetables (non-watershed)
7. Lowland paddy fields Lowland rice Garlic Onion Dry season vegetables Buffalo (after post harvest) Pig (after post harvest) Poultry (after post harvest)
3. Venn Diagram
3.1 Importance of major products/resources
In order to clarify major products/resources in the village, the survey team organized group discussions through Venn Diagram preparation process in the afternoon on 17 May 2004. Thirty (30) participants (two each of 15 “Nouays”) were divided into two groups, namely a male group (15 persons) and a female group (15 persons) and were asked about major products/resources for each group, their importance and its reason, and their market situation as well.
Regarding importance of the major products/resources, both groups described “rice” as the 1st priority like other villages. Rice is the most important crop for the villagers mainly for HH consumption as well as for sale. Totally, this village produces surplus rice owing to 109 ha of lowland paddy field, and sells the surplus rice to the local markets, mainly to Sayaboury district market. Importance ranking after rice is followed by “poultry” as the 2nd, “pig” as the 3rd, “sesame” as the 4th, and “Job’s tear” as the 5th, for male group. On the other hand, the female group listed up “sesame” as the 2nd priority, “paper mulberry” as the 3rd, “Job’s tear” is the 4th, and “buffalo” is the 5th.
“Pig and poultry” were ranked as high priorities by male group because they thought such small animals were easily sold with rather short raising periods than large animals like cattle and buffalo. Following small animals, the both male and female groups listed up cash crops/NTFPs as important products such as sesame, Job’s tear and paper mulberry. It seems that the villagers are very familiar with marketing products due to an good advantage location from Sayaboury town (6 km).
Differences of major products/resources between male and female, and their priority, reasons and problems are summarized in the following table.
Difference of Major Products/Resources between Male and Female, and their Priority, Reasons and Problems
Male Female Major Products Claimed Priority Claimed Priority
Reasons, */ Problems
V8-20
1. Cultivated Crops
- Rice O 1 O 1 HH consumption and sale (about 30% of rice production in the village are sold out).
- Job’s tear O 5 O 4 Sale, 80% of HHs produce Job’s tear.
- Sesame O 4 O 2 Sale, 70% of HHs produce sesame.
- Maize O 8 O 8 Sale, and HH consumption.
They just started growing yellow corn this year.
- Chili O 9 -- -- Sale, and HH consumption
- Egg plant, Chinese Cabbage
O 12 -- -- Sale, and HH consumption
- Fruit O 8 O 13 Sale, and HH consumption
- Banana O 14 O 12 Sale, and HH consumption
- Sugar cane O 14 -- -- Sale, and HH consumption
- Dry and wet season vegetables
-- -- O 12 Sale, and HH consumption
- Garlic O 10 -- -- Sale, and HH consumption
- Onion O 10 -- -- Sale, and HH consumption
2. NTFPs - Paper mulberry O 6 O 3 Sale, 60% of HHs
own paper mulberry garden, and about 10% of HHs collect natural paper mulberry.
- Tiger grass O 15 O 10 Sale - “Yang Bong” O 11 O 9 Sale, only 10 HHs
collect Yang Bong
- Resin O 11 O 11 Sale, about 40% of HHs collect resin.
3. Livestock - Buffalo O 7 O 5 Sale and use as
draught animal, about 70% of HHs own buffalos.
30 buffalos died in 2001, and animal vaccination started this year.
- Pig O 3 -- -- Sale, and HH consumption
Hog cholera and stomach problem during April to June.
- Poultry O 2 O 7 HH consumption and sale
Chicken often suffer from chicken cholera in the hot season.
4. Others
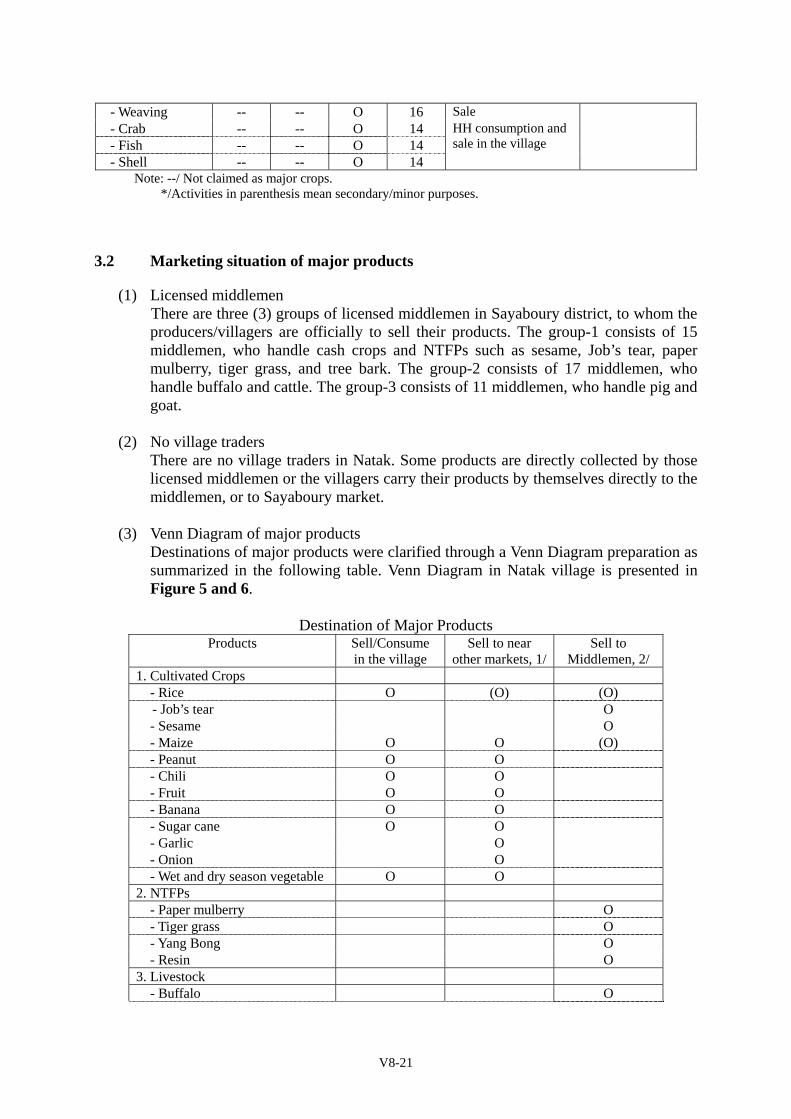
V8-21
- Weaving -- -- O 16 Sale - Crab -- -- O 14 - Fish -- -- O 14 - Shell -- -- O 14
HH consumption and sale in the village
Note: --/ Not claimed as major crops.
*/Activities in parenthesis mean secondary/minor purposes.
3.2 Marketing situation of major products
(1) Licensed middlemen There are three (3) groups of licensed middlemen in Sayaboury district, to whom the producers/villagers are officially to sell their products. The group-1 consists of 15 middlemen, who handle cash crops and NTFPs such as sesame, Job’s tear, paper mulberry, tiger grass, and tree bark. The group-2 consists of 17 middlemen, who handle buffalo and cattle. The group-3 consists of 11 middlemen, who handle pig and goat.
(2) No village traders There are no village traders in Natak. Some products are directly collected by those licensed middlemen or the villagers carry their products by themselves directly to the middlemen, or to Sayaboury market.
(3) Venn Diagram of major products Destinations of major products were clarified through a Venn Diagram preparation as summarized in the following table. Venn Diagram in Natak village is presented in Figure 5 and 6.
Destination of Major Products
Products Sell/Consume in the village
Sell to near other markets, 1/
Sell to Middlemen, 2/
1. Cultivated Crops - Rice O (O) (O)
- Job’s tear O - Sesame O - Maize O O (O) - Peanut O O - Chili O O - Fruit O O - Banana O O - Sugar cane O O - Garlic O - Onion O - Wet and dry season vegetable O O 2. NTFPs - Paper mulberry O - Tiger grass O - Yang Bong O - Resin O 3. Livestock - Buffalo O
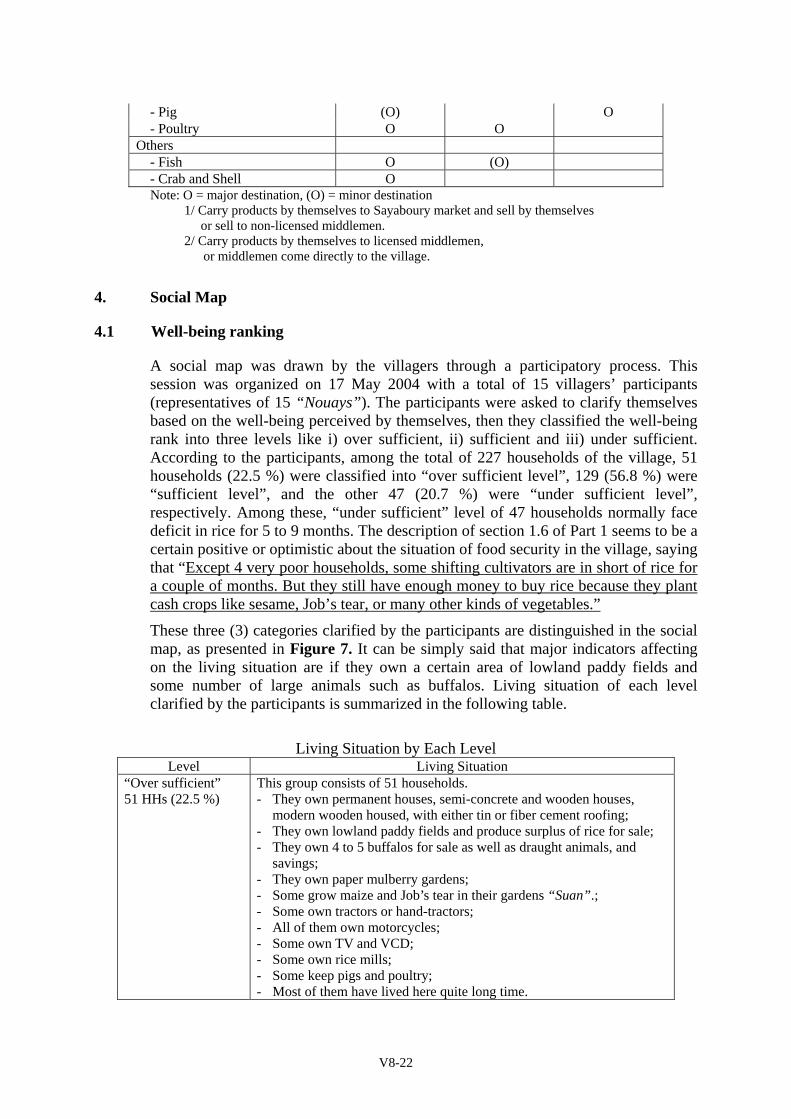
V8-22
- Pig (O) O - Poultry O O Others - Fish O (O) - Crab and Shell O
Note: O = major destination, (O) = minor destination 1/ Carry products by themselves to Sayaboury market and sell by themselves
or sell to non-licensed middlemen. 2/ Carry products by themselves to licensed middlemen,
or middlemen come directly to the village.
4. Social Map
4.1 Well-being ranking
A social map was drawn by the villagers through a participatory process. This session was organized on 17 May 2004 with a total of 15 villagers’ participants (representatives of 15 “Nouays”). The participants were asked to clarify themselves based on the well-being perceived by themselves, then they classified the well-being rank into three levels like i) over sufficient, ii) sufficient and iii) under sufficient. According to the participants, among the total of 227 households of the village, 51 households (22.5 %) were classified into “over sufficient level”, 129 (56.8 %) were “sufficient level”, and the other 47 (20.7 %) were “under sufficient level”, respectively. Among these, “under sufficient” level of 47 households normally face deficit in rice for 5 to 9 months. The description of section 1.6 of Part 1 seems to be a certain positive or optimistic about the situation of food security in the village, saying that “Except 4 very poor households, some shifting cultivators are in short of rice for a couple of months. But they still have enough money to buy rice because they plant cash crops like sesame, Job’s tear, or many other kinds of vegetables.”
These three (3) categories clarified by the participants are distinguished in the social map, as presented in Figure 7. It can be simply said that major indicators affecting on the living situation are if they own a certain area of lowland paddy fields and some number of large animals such as buffalos. Living situation of each level clarified by the participants is summarized in the following table.
Living Situation by Each Level
Level Living Situation “Over sufficient” 51 HHs (22.5 %)
This group consists of 51 households. - They own permanent houses, semi-concrete and wooden houses,
modern wooden housed, with either tin or fiber cement roofing; - They own lowland paddy fields and produce surplus of rice for sale; - They own 4 to 5 buffalos for sale as well as draught animals, and
savings; - They own paper mulberry gardens; - Some grow maize and Job’s tear in their gardens “Suan”.; - Some own tractors or hand-tractors; - All of them own motorcycles; - Some own TV and VCD; - Some own rice mills; - Some keep pigs and poultry; - Most of them have lived here quite long time.
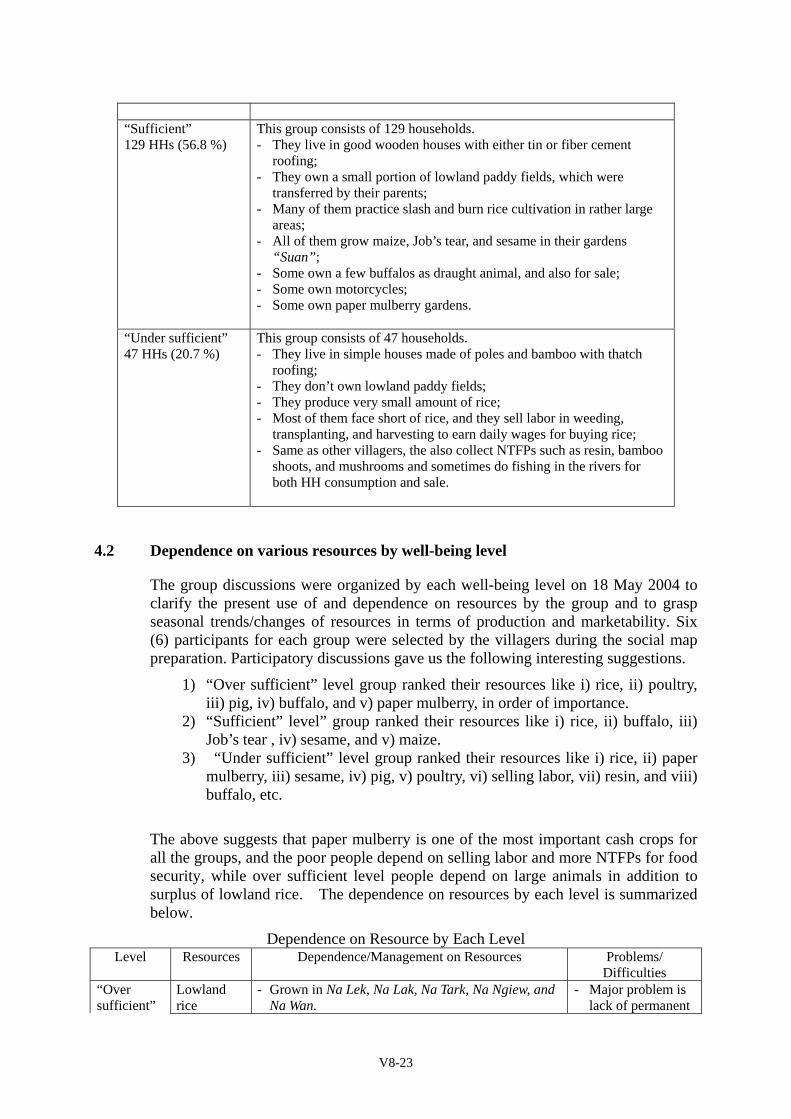
V8-23
“Sufficient” 129 HHs (56.8 %)
This group consists of 129 households. - They live in good wooden houses with either tin or fiber cement
roofing; - They own a small portion of lowland paddy fields, which were
transferred by their parents; - Many of them practice slash and burn rice cultivation in rather large
areas; - All of them grow maize, Job’s tear, and sesame in their gardens
“Suan”; - Some own a few buffalos as draught animal, and also for sale; - Some own motorcycles; - Some own paper mulberry gardens.
“Under sufficient” 47 HHs (20.7 %)
This group consists of 47 households. - They live in simple houses made of poles and bamboo with thatch
roofing; - They don’t own lowland paddy fields; - They produce very small amount of rice; - Most of them face short of rice, and they sell labor in weeding,
transplanting, and harvesting to earn daily wages for buying rice; - Same as other villagers, the also collect NTFPs such as resin, bamboo
shoots, and mushrooms and sometimes do fishing in the rivers for both HH consumption and sale.
4.2 Dependence on various resources by well-being level
The group discussions were organized by each well-being level on 18 May 2004 to clarify the present use of and dependence on resources by the group and to grasp seasonal trends/changes of resources in terms of production and marketability. Six (6) participants for each group were selected by the villagers during the social map preparation. Participatory discussions gave us the following interesting suggestions.
1) “Over sufficient” level group ranked their resources like i) rice, ii) poultry, iii) pig, iv) buffalo, and v) paper mulberry, in order of importance.
2) “Sufficient” level” group ranked their resources like i) rice, ii) buffalo, iii) Job’s tear , iv) sesame, and v) maize.
3) “Under sufficient” level group ranked their resources like i) rice, ii) paper mulberry, iii) sesame, iv) pig, v) poultry, vi) selling labor, vii) resin, and viii) buffalo, etc.
The above suggests that paper mulberry is one of the most important cash crops for all the groups, and the poor people depend on selling labor and more NTFPs for food security, while over sufficient level people depend on large animals in addition to surplus of lowland rice. The dependence on resources by each level is summarized below.
Dependence on Resource by Each Level Level Resources Dependence/Management on Resources Problems/
Difficulties “Over sufficient”
Lowland rice
- Grown in Na Lek, Na Lak, Na Tark, Na Ngiew, and Na Wan.
- Major problem is lack of permanent
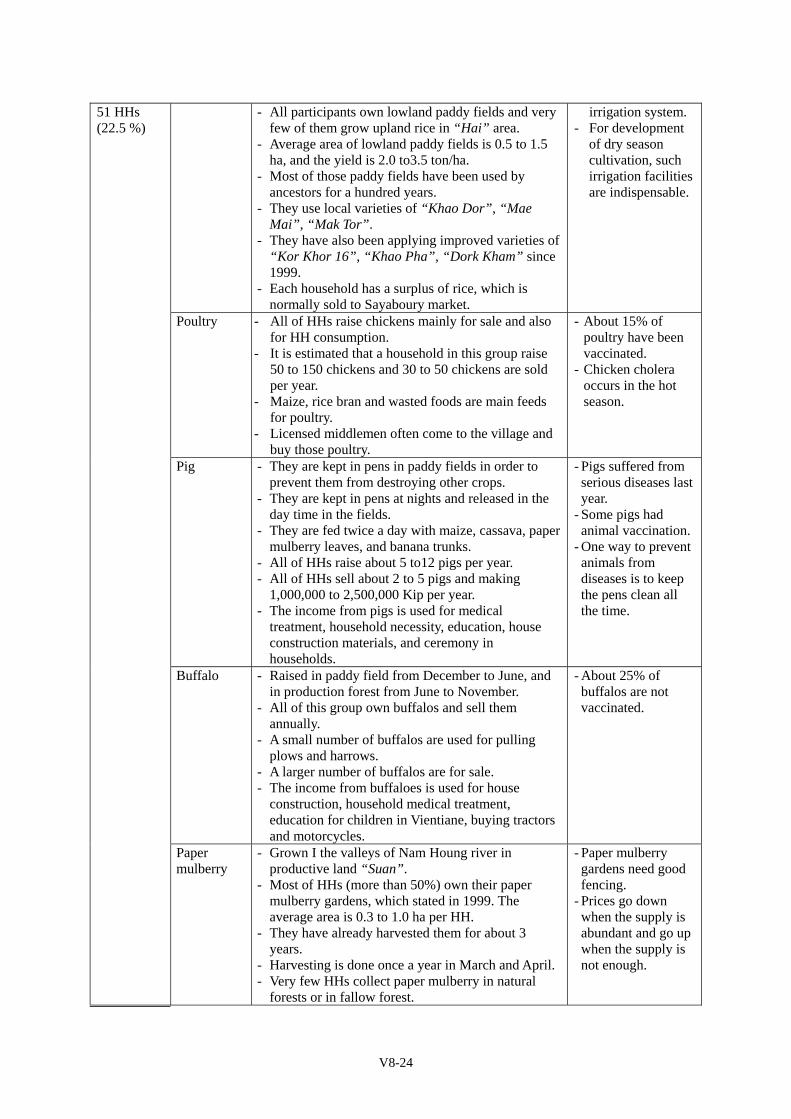
V8-24
51 HHs (22.5 %)
- All participants own lowland paddy fields and very few of them grow upland rice in “Hai” area.
- Average area of lowland paddy fields is 0.5 to 1.5 ha, and the yield is 2.0 to3.5 ton/ha.
- Most of those paddy fields have been used by ancestors for a hundred years.
- They use local varieties of “Khao Dor”, “Mae Mai”, “Mak Tor”.
- They have also been applying improved varieties of “Kor Khor 16”, “Khao Pha”, “Dork Kham” since 1999.
- Each household has a surplus of rice, which is normally sold to Sayaboury market.
irrigation system. - For development
of dry season cultivation, such irrigation facilities are indispensable.
Poultry - All of HHs raise chickens mainly for sale and also for HH consumption.
- It is estimated that a household in this group raise 50 to 150 chickens and 30 to 50 chickens are sold per year.
- Maize, rice bran and wasted foods are main feeds for poultry.
- Licensed middlemen often come to the village and buy those poultry.
- About 15% of poultry have been vaccinated.
- Chicken cholera occurs in the hot season.
Pig - They are kept in pens in paddy fields in order to prevent them from destroying other crops.
- They are kept in pens at nights and released in the day time in the fields.
- They are fed twice a day with maize, cassava, paper mulberry leaves, and banana trunks.
- All of HHs raise about 5 to12 pigs per year. - All of HHs sell about 2 to 5 pigs and making
1,000,000 to 2,500,000 Kip per year. - The income from pigs is used for medical
treatment, household necessity, education, house construction materials, and ceremony in households.
- Pigs suffered from serious diseases last year.
- Some pigs had animal vaccination.
- One way to prevent animals from diseases is to keep the pens clean all the time.
Buffalo - Raised in paddy field from December to June, and in production forest from June to November.
- All of this group own buffalos and sell them annually.
- A small number of buffalos are used for pulling plows and harrows.
- A larger number of buffalos are for sale. - The income from buffaloes is used for house
construction, household medical treatment, education for children in Vientiane, buying tractors and motorcycles.
- About 25% of buffalos are not vaccinated.
Paper mulberry
- Grown I the valleys of Nam Houng river in productive land “Suan”.
- Most of HHs (more than 50%) own their paper mulberry gardens, which stated in 1999. The average area is 0.3 to 1.0 ha per HH.
- They have already harvested them for about 3 years.
- Harvesting is done once a year in March and April. - Very few HHs collect paper mulberry in natural
forests or in fallow forest.
- Paper mulberry gardens need good fencing.
- Prices go down when the supply is abundant and go up when the supply is not enough.
V8-25
“Sufficient” 129 HHs (56.8 %)
Rice - All the participants have sufficient rice for 12 months. Some of them do not produce rice by themselves but earn cash to buy rice.
- Two households practice both lowland paddy and gardens, producing surplus rice of 1.0 ton, making 1,000,000 Kip.
- One is a trader, earning money from trading to buy rice.
- Two are dress makers, who earned 4,500,000 Kip per year to buy rice.
Buffalo - In 2004, two households sold 2 buffalos making 4,600,000 Kip and another one sold one buffalo and made 3,000,000 Kip.
Job’s tear - A trader collected 7 tons of sesame and made 3,500,000 Kip of profit from sesame last year.
Sesame - A trader collected and made 2,500,000 Kip of profit from sesame last year.
Maize - DAFO together with a licensed trader introduced seeds of maize (yellow corn) to 2 participants this year.
- One planted 2.0 ha and the other planted 1.5 ha. - The licensed trader is supposed to come back and
collect when maize is harvested.
Resin - A trader collected 3 tons of resin, making 1,500,000 Kip of profit last year.
“Under sufficient” 47 HHs (20.7 %)
Rice - Rice deficit is about 1 to 2 months for the participants.
- They don’t own lowland paddy fields, practicing slash and burn rice cultivation in “Hai” area.
- Because of rice deficit as well as necessity of cash income, they look for the following activities and resources.
One of the participants used own his paddy field, but he left it behind because it was flooded in 2001.
Paper mulberry
- They collected paper mulberry for sale, making about 350,000 Kip last year in average.
- They established paper mulberry gardens, one planted 2000 seedlings, and the other planted 200 seedlings.
- They are interested in producing paper mulberry because mulberry production and selling is easy and the selling price is good for them.
No more paper mulberry is found in the natural forest.
Sesame - One participant produced 56 kg of sesame making about 280,000 Kip last year
Weeding is hard work.
Pig - All participants keep pigs but not sold yet. Hog cholera occurs in hot season.
Poultry - All participants keep chickens but all died. Chicken cholera epidemic often occur. No vaccination has been given to poultry.
Selling labor
- One participant worked at Sayaboury market from March to April making 400,000 Kip.
Resin - One collected about 10 kg, making 25,000 Kip, and the other made about 150,000 Kip last year from collecting resin.
Before, only the poor collected resin. Now, many people are collecting resin.
Bamboo - All collected bamboo shoot from June to Bamboo shoot is
V8-26
shoot September. - They made about 300,000 Kip last year in average. - Bamboo shoots are located in distance.
decreasing these days because of over harvest by many people.
Cucumber - They made about 200,000 Kip from selling cucumber last year in average.
Mushroom - All collected mash room in May. - They made about 250,000 to 800,000 Kip from
mash room last year.
5. Present Rules on the Management/Use of Lands and Resources
A plenary discussion with a total of 30 participants (two each of 15 “Nouays”) was organized on 19 May 2004 to clarify i) present rules on the management/use of lands and resources, and any changes or cases of them, and ii) any problems and issues on land allocation program.
5.1 Land allocation program
As described in Section 2.3 of Part 1, “land zoning” was conducted in 1996 by DAFO, and in 1996 DAFO regulated each household to cultivate allocated plots only. So far, there are five (5) forest types or land use types designated by the village as below.
i) Lowland Paddy Field “Na” = 109.17 ha; ii) Agricultural Land “Hai”and “Suan” = 123.79 ha; iii) Conservation Forest “Pa SaNgouan” = 3,790 ha; iv) Community Production Forest “Pa Somsai” and
Production Forest “Pa Phalith” = 1,250 ha; v) Rehabilitation Forest “Pa Feumfu” = 320 ha.
Because there is no detailed map available specifying each area, there are some misunderstandings between DAFO and the villagers about land categories. The villagers present understanding is described in the following section.
5.2 Present rules on the management/use of lands and resources
(1) “Pa SaNgouan”(Conservation forest) - The meaning of “Pa SaNgouan” and “Pa Pongkanh” are almost same in the
village. - No felling of any poles and large tree are allowed in this forest.
(2) “Pa Somsai” (Community Production forest) and “Pa Phaloth” (Production Forest)
- This forest is used for collecting large trees, poles, bamboo and other related
V8-27
construction materials. - Used for collecting wild vegetables such as mushrooms, bamboo shoots and
small animals. - Used for collecting NTFPs such as Yang Bong, resin and paper mulberry. - It is used for animal grazing. - Felling a large tree for house construction requires an official request from
the village head and, if it is a large quantity, approval by DAFO is required.
5.3 Before and after “land zoning”
In the session, the participants were asked about the changes of the land before and after land zoning. Some supplemental information was also obtained from the village head. The clarification about the changes is below.
Changes before and after “Land Zoning”
Before Land Zoning After Land Zoning in 1997 and land allocation in 20011. More people practiced “Hai” than lowland paddy
cultivation because the forest was good for upland cultivation.
2. No rules and restriction of shifting cultivation existed.
3. It was free to select the forest to encroach and slash and burn.
4. The area available for “Hai” was much larger.
5. The yield was high and the production amount was sufficient.
6. Large trees for house construction were felled in the nearby forest around the village.
7. No NTFPs were collected because no market demands and no access roads.
1. Fallow forest lands derived from the past generations.
2. Some households have been allocated with three or two plots depending on ownership of lowland paddy fields as well as available family labor.
3. These plots are used for growing upland rice, Job’s tear, sesame, cotton, chili, egg plant, cassava, sweet potato, maize, peanut, banana, sugar cane, pineapple, and paper mulberry, etc.
4. Animals such as pig, buffalo and poultry are also raised in these lands.
5. Each plot is taxed with 17,000 Kip/ha per year.
The villagers further indicated the problems/issues in their areas as follows.
- The villagers don’t think the village land would be enough for their children. - They think that if the land is not available enough, they have to earn their living
outside the village.
V8-28
PART 3 HOUSEHOLD INTERVIEW SURVEY
Survey period: 17to 19 May 2004 Total Household: 227 HHs Total Number of Sampled HHs: 52 HHs A. HOUSEHOLD INTERVIEW SURVEY 1. General Information 1.1 Interviewees
Total number of interviewees is 52 persons, among which 49 are Lao Loum and 3 are Lao Theung, and 44 are male and 8 are female. Among those interviewees, the youngest one is 17 years old and the oldest is 68, as summarized below.
Summary of Interviewees Total No.of Ethnic group Sex Age interviewees Lao Sung Lao Theung Lao Loum Male Female Min Max
52 0 3 49 44 8 17 68 1.2 Households members
Total number of households members surveyed is 309 persons, among which 158 (51.1%) are male and 151 (48.9%) are female, and 4 are temporarily absentees.
1.3 Household age structure As per household, the average number of household is 5.9 persons, among which 2.2 (37.3%) are less than 12 years old, 3.2 (54.2%) are between 12 and 45 years old, and 0.5 (8.5%) are more than 45 years old, as summarized below.
Summary of Household Age Structure Age Structure Total Average per HH
Number Male Female Family Member (%) 1. Less than 12 years old 116 70 46 2.2 37.3 2. 12 to 45 years old 168 73 95 3.2 54.2 3. More than 45 years old 25 15 10 0.5 8.5
Total 309 158 151 5.9 100
1.4 Living period Among all the 52 interviewed households, 34 households (65.4%) have lived more than 10 years in the present location, as summarized below.
V8-29
Living Period Period Number of HH
interviewed %
1. Within the last 10 years 2. From 10 to 20 years ago 3. From 20 to 30 years ago 4. More than 30 years ago
18 7
12 15
34.6 13.5 23.1 28.8
Total 52 100.0
1.5 Educational background Among all the 309 household members, 186 persons (60.1%) are primary school graduated/or attending, or drop out of primary school level, 75 (24.4%) are more than secondary school graduated/or attending level, and the remaining 48 (15.5%) are below school age or have not received formal education, as summarized below.
Summary of Educational Background Educational Level Male Female Total (%)
1. No formal education 22 26 48 15.5 2. Drop out of primary school 14 13 27 8.7 3. Primary school graduated/ Attending 78 81 159 51.4 4. Drop out of secondary 9 5 14 4.5 5. Secondary school graduated/ Attending 27 18 45 14.6 6. Drop out of high school 1 1 2 0.7 7. High school graduated/ Attending 4 4 8 2.6 8. Graduate of professional high school/ Attending 0 2 2 0.7 9. More than high school/ Attending 3 1 4 1.3
Total 158 151 309 100
1.6 Farming Among all the 309 household members, 187 persons (60.5%) are engaging in farming.
1.7 Occupation Among all the 309 household members, 127 persons (41.1%) are farmers, 5 persons (1.6%) are private business workers, 116 (37.5%) are pupils/students, 27 (8.7%) are below school age children, and 8 (2.6%) have no job (including housework), and 26 (8.4%) are others, as summarized below.
Summary of Occupation Occupation Number (%)
1. Farmer 127 41.1 2. Wage labor 0 - 3. Salary worker 0 - 4. Private business 5 1.6 5. Pupil/Student 116 37.5 6. Child (below school age children) 27 8.7 7. No job (including house work) 8 2.6
V8-30
8. Others 26 8.4 Total 309 100
1.8 Organization Among all the 309 household members, more than 83% of people do not belong to any specific organizations, but 40 persons (12.9%) are members of Women’s union, Youth organization, Elder’s group, Water user’s group, Village committee, or Ethnic organization. In addition, 11 persons are members belonging to “Others” like i) security unit, ii) voluntary village vigilante corps, etc., and iii) party. The villager’s membership of organizations is summarizes below.
Villager’s Membership of Organizations Organization Number %
1. Member of Women’s Union 24 7.8 2. Member of Youth Organization 4 1.3 3. Member of Elder’s Group 4 1.3 4. Member of Water Users Group 1 0.3 5. Member of Village Committee 5 1.6 6. Member of Ethnic Organization 2 0.6 7. Member of religious Organization 0 0.0 8. Others (security unit, vigilante, etc.) 11 3.6 9. No member 258 83.5
Total 309 100
2. Living Condition 2.1 Drinking water
Among the 52 interviewed households, 27 households (50%) use a gravity piped water system for getting drinking water. These water sources are located within 0.5 to 15 minutes walking distance and the water is sufficient or just enough except 4 households in the dry season. The other 27 households use various water sources depending on their living locations such as river, open dug wells, tube wells, PGW and combinations of these water sources as summarized below.
Drinking Water
Household Distance No.of HH sufficiency Season Main Source No. (%) Min.
(min.)Max. (min.)
Sufficient
Just enough
Short Very short
a. Piped gravity water 26 50.0 0.5 15 14 8 4 - b. River + PGW,*/ 7 13.5 5 15 6 1 - - c. River 1 1.9 10 10 - 1 - - d. Open dug well 1 1.9 0.5 0.5 1 - - - e. Tube well 9 17.3 1 5 5 3 1 - f. Tube well + PGW 7 13.5 1 5 7 - - -
Dry
g. PGW + ODW 1 1.9 1 1 1 - - - a. Piped gravity water 27 50.0 0.5 15 19 8 - - b. River + PGW 7 13.4 5 15 6 1 - -
Wet
c. River 1 1.9 10 10 - 1 - -
V8-31
d. Open dug well 1 1.9 0.5 0.5 1 - - - e. Tube well 8 15.3 1 5 5 3 - - f. Tube well + PGW 7 13.4 1 5 7 - - -
g. PGW + ODW 1 1.9 1 1 1 - - - Note: PGW: Piped gravity water, ODW: Open dug well
2.2 Fuel for cooking/heating
All the 52 interviewed households answer that they normally use fuel wood for cooking/heating and 47 households (90.4%) of them reply that they can collect fuel wood easily but 5 households (9.6%) reply that fuel wood is difficult to obtain. In addition, 17 households use kerosene, and another 17 households use electricity for cooking/heating, as summarized below.
Fuel for Cooking/Heating Sources of fuel No
of HH
% Availability No
of HH
% Fuel wood 52 100 a. Easy to obtain 47 90.4 b. Difficult to obtain 5 9.6 Kerosene 17 32.7 a. Easy to obtain 9 17.3 b. Difficult to obtain 8 15.4 Electricity 17 32.7 a. Easy to obtain 13 25.0 b. Difficult to obtain 4 7.7
2.3 Food availability 2.3.1 Rice
Among all the 52 interviewed households, 8 households (15.4%) can produce rice more than the household demand and 30 households (57.7%) can produce rice just enough to meet the household demand. However, 9 households (17.3%) cannot produce rice to meet the household demand. Further, there are 4 households (7.7%) who do not produce rice. However, those 13 households above (9 + 4 = 13 households) reply that they purchase rice depending on their needs and no households face a shortage of rice. The future of rice availability is summarized below.
Rice Availability
Rice Production Situation No.
of HH
(%) No.of HH
of Rice Shortage
(%)
Total Shortage (months)
Average Shortage (months)
1. Product exceeds the HH demand 8 15.4 - - - - 2. Product is just enough to meet the HH demand 30 57.7 - - - - 3. Product is not enough to meet the HH demand 9 17.3 - - - - 4. No product 4 7.7 - - - -
Total 52 100.0 - - - -
2.3.2 Other than rice
V8-32
Other cereals, root and tube crops, and vegetables: Products other than paddy such as other cereals, root and tube crops and vegetables are generally not serious like rice for the farmers because they can try to manage with their products, and a large part of interviewed households (86-96%) feel that such products are enough to meet the household demand or exceed the household demand. Further, there are some households who do not produce such other products than rice, 7 households (13.4%) for other cereals, 5 households (9.6%) for root and tube crops, 2 households (3.8%) for vegetables. However, they reply that they purchase or exchange such products depending on their needs and no households face a shortage of such products. Meat: Twenty-six (26) households (50%) reply that the product of meat is enough to meet the household demand or exceed the household demand. On the other hand, 11 households (21.2%) reply that the product of meat is not enough to meet the household demand, and 15 households (28.8%) do not produce any meat. However, all of those households above (11 + 15 = 26 households) reply that they purchase or exchange meat depending on their needs and no households face a shortage of meat. Fish: Twenty-five (25) households (48.1%) reply that the product of fish is enough to meet the household demand or exceed the household demand. On the other hand, 5 households (9.6%) reply that the product of fish is not enough to meet the household demand, and 22 households (42.3%) do not produce/ catch any fish. However, all of those households above (5 + 22 = 27 households) reply that they purchase or exchange fish depending on their needs and on households face a shortage of fish. Food availability other than rice is summarized below.
Food Availability other than Rice No.of HH for production of
Rice Production Situation Other Cereals
Root, Tube Crops
Vege- tables
Meat
Fish
1. Product exceeds the HH demand 3 1 4 1 4 2. Product is just enough to meet the HH demand 42 46 46 25 21 3. Product is not enough to meet the HH demand 0 0 0 11 5 4. No product 7 5 2 15 22
Total 52 52 52 52 52 5. No.of HHs having a shortage of each product 0 0 0 0 0 6. Average shortage period per HH above (month) 0 0 0 0 0
2.4 Availability of facilities
Availability of major facilities in each household is summarized below.
Major Available Facilities in Each Household Available Facilities Nos.of Unit (%)
1. Radio/radio cassette 31 59.6 2. VCD 10 19.2
V8-33
3. TV 9 17.3 4. Bicycle 34 65.4 5. Motorcycle 11 21.2 6. Car 1 1.9 7. Refrigerator 3 5.8 8. Electric fan 10 19.2 9. Sewing machine 10 19.2 10. Gas stove 0 0 11. Toilet 44 84.6 12. Hand tractor 2 3.8 13. Rice mill 3 5.8 14. Small hydro generator 0 0 15. Fishing Net 2 3.8
2.5 Health situation 2.5.1 Major diseases
The interviewees were asked to enumerate 2 major diseases for children and adults, respectively. Major diseases for children under 15 years old are i) cold, ii) dysentery, iii) body aches, and those for adults are i) cold, ii) body aches, iii) dysentery as summarized below.
Major Diseases Children under 15 years old Adults
Major diseases No.of HH % Major diseases No.of HH % 1. Cold 39 75.0 1. Cold 23 44.2 2. Dysentery 7 13.5 2. Body aches 11 21.2 3. Body aches 6 11.5 3. Dysentery 6 11.5 4. ……….. … … 4. ………. … …
2.5.2 Treatment for diseases
Major treatments for slight diseases are i) buy medicine and ii) go to the village’s health worker, and those for severe diseases are i) go to the provincial hospital and ii) go to the district hospital, as summarized below.
Treatment of Diseases Slight diseases Severe diseases
Major treatment No.of HH
% Major treatment No.of HH
%
1. Buy medicine 44 84.6 1. Go to the provincial hospital 43 82.72. Go to the village health worker 4 7.7 2. Go to the district hospital 3 5.8 3. ………. … … 3. ………. … …
3 Agriculture and Forestry Production
3.1 Land tenure 3.1.1 Farm land operated
V8-34
In this survey, the farm lands are categorized into four (4), i) “Hai-A” (upland slash and burn field, mainly for paddy), ii) “Hai-B” (upland slash and burn field, mainly for other crops than paddy), iii) “Na” (lowland paddy field), and iv) “Fruits/Vegetable”. “Hai-A”: Among all the 52 households, 47 households have ownership for “Hai-A”. Total area of “Hai-A” is 33.58 ha with a total of 47 plots and an average area of 0.71 ha/plot and 0.65 ha/HH. Further, there are 3.2 ha of lands rented from others, thus the average operated land is 0.71 ha/HH. “Hai-B”: Among all the 52 households, 24 households have ownership for “Hai-B”. Total area of “Hai-B” is 21.72 ha with a total of 24 plots and an average area of 0.59 ha/plot and 0.42 ha/HH. Further, there are 1.8 ha of land rented from others, thus the average operated land is 0.45 ha/HH. “Na” (Lowland paddy field): Among all the 52 households, 39 households have ownership for the lowland paddy field. Total area of the lowland paddy field is 26.37 ha with a total of 47 plots and an average area of 0.56 ha/plot and 0.51 ha/HH. Further, there are 2.29 ha of lands rented from others, and 0.21 ha of lands leased to others, thus the average operated land is the same as that of owned land, 0.55 ha/HH. “Fruits/ vegetables” field: Among all the 52 households, 12 households have ownership for “Fruits/ vegetables” field. Total area of “Fruits/ vegetables” field is 7.86 ha with a total of 15 plots and an average area of 0.52 ha/plot and 0.15 ha/HH. Further, there are 1.30 ha of rented lands of “Fruits/ vegetables” field, the average operated land of “Fruits/ vegetables” fields is 0.18 ha/HH. The feature of farm land holding is summarized below.
Farm Land Operated
Land Owned by the HH Average Area per HH
Land Category No. of
HH
No. of
Plots
TotalArea (a)
(ha)
Averagearea
per Plot(ha/plot)
LandRent-
ed (b) (ha)
LandLea-sed (c)
(ha)
Land Ope- rated
(d) (ha)= (a)+(b)
-(c)
Land Owned (ha) (a)/52
Land Operated (ha(d)/52
1. Hai-A, 1/ 26 47 33.58 0.71 3.20 0 36.78 0.65 0.71
2. Hai-B, 2/ 24 37 21.72 0.59 1.80 0 23.52 0.42 0.45
3. Na (Lowland paddy) 39 47 26.37 0.56 2.29 0.21 28.45 0.51 0.55
4. Fruit/Vegetable, 3/ 12 15 7.86 0.52 1.30 0 9.16 0.15 0.18
Total/Average - 146 89.53 0.61 8.59 0 97.91 1.73 1.89 Note: 1/ Upland slash and burn cultivation field, mainly for rice. 2/ Upland slash and bun cultivation field, mainly for other crops than rice. 3/ Except home garden
V8-35
3.1.2 Land ownership
The answers about the land title of the “owned land” vary by interviewees. It was found that the owned lands were not always privately owned but some are i) government land but they have a right to cultivate traditionally, ii) government land but allocated by the village committee, and iii) they don’t know whose land that is, but they cultivate.
Among the “Hai-A” of 26 households, the lands of 19 households (73.1%) are “privately owned”, and the lands of 7 households (26.9%) are “government land but allocated by the village committee. In addition, there are 6 households who rent the lands with a total of 3.20 ha for farming practice in “Hai-A” Among the “Hai-B” of 24 households, the lands of 16 households (66.7%) are “privately owned” and the lands of 8 households (33.3%) are “government land but allocated by the village committee. In addition, there are 4 households who rent the land with a total of 1.80 ha for farming practice in “Hai-B” As for the lowland paddy fields, all the lands of 39 households (100%) are “privately owned”. In addition, there are 3 households who rent the lands from others with a total of 2.29 ha for farming practice in “Na”. As for the “Fruits/ vegetables” fields, all the lands of 12 households (100%) are “privately owned”. In addition, there are 2 households who rent the lands from others with a total of 1.30 ha for farming practice in Fruits/vegetable fields. The feature of the land title of the “owned land” is summarized below.
Future of the Land Ownership
Land Owned by the HH Others, Land Category No.of
HHs Private,
4/ Gov.(1),
5/ Gov.(2),
6/ Unclear,
7/
8/ 1. Hai-A, 1/ 26 19 0 7 0 6
2. Hai-B, 2/ 24 16 0 8 0 4
3. Na (Lowland paddy) 39 39 0 0 0 3
4. Fruit/Vegetable, 3/ 12 12 0 0 0 2 Note: 1/ Upland slash and burn cultivation field, mainly for rice. 2/ Upland slash and bun cultivation field, mainly for other crops than rice. 3/ Except home garden. 4/ Privately owned (they can sell it when ever you want). 5/ Government land but they have a right to cultivate traditionally. 6/ Government land but allocated by the village committee. 7/They don’t know whose land that is, but they cultivate. 8/ Others (households rent from relarives)
3.2 “Hai” area (upland slash and burn field)
V8-36
3.2.1 Time required Among all the 52 households, 36 households have replied to the times required to go to their “Hai”area, which vary from 5 min. to 150 min. with an average of 75 minutes.
3.2.2 Repeated use of “Hai” area
“Hai-A”: Among 31 households who cultivated Hai-A in 2003, all of them answered that they would use the same lands within 1 to 3 years for cropping upland rice or field crops, and no households answered that they would not use those lands in near future. Among 31 households above, 18 households used the same lands in 2001 and 19 households used the same land in 2002.
“Hai-B”: Among 25 households who cultivated Hai-B in 2003, all of them answered that they would use the same lands within 1 to 3 years for cropping upland field crops or teak tree plantation, and no households answered that they would not use the same lands in near future. Among 25 households above, 15 households used the same land in 2001 and 16 households used the same land in 2002.
The future of the repeated use of “Hai” area is summarized below.
Repeated Use of “Hai” Area Repeated Use Don’t Use Used in
“Hai” Category
No. of
HH
How many years later
For what crops
No. of
HH
Purpose/reason
Year 2002 (HH)
Year 2001 (HH)
“Hai-A” 31 1 to 3 Paddy 0 - 19 18 “Hai-B” 25 1 to 3 Upland crops 0 - 16 15
3.2.3 Total “Hai” (A+B) areas used per HH in last 4 years Total “Hai” (A+B) areas used per HH in last 4 years vary from 0.57 ha/HH in 2001 to 0.86 ha/HH in 2003, with an average of 0.68 ha/HH, as summarized below.
Total “Hai” (A+B) Used Area Year Total Used Area (ha) Used Area per HH (ha) 2000 32.35 0.62 2001 29.55 0.57 2002 34.11 0.66 2003 44.83 0.86
Average 35.21 0.68
3.2.4 Staying “Hai” area
Among the 52 households, only one household replied that they stay in the field continuously from “slash and burn” to “harvest”, whose living and working bases are basically in the field, including raising animals. On the other hand, 25 households do
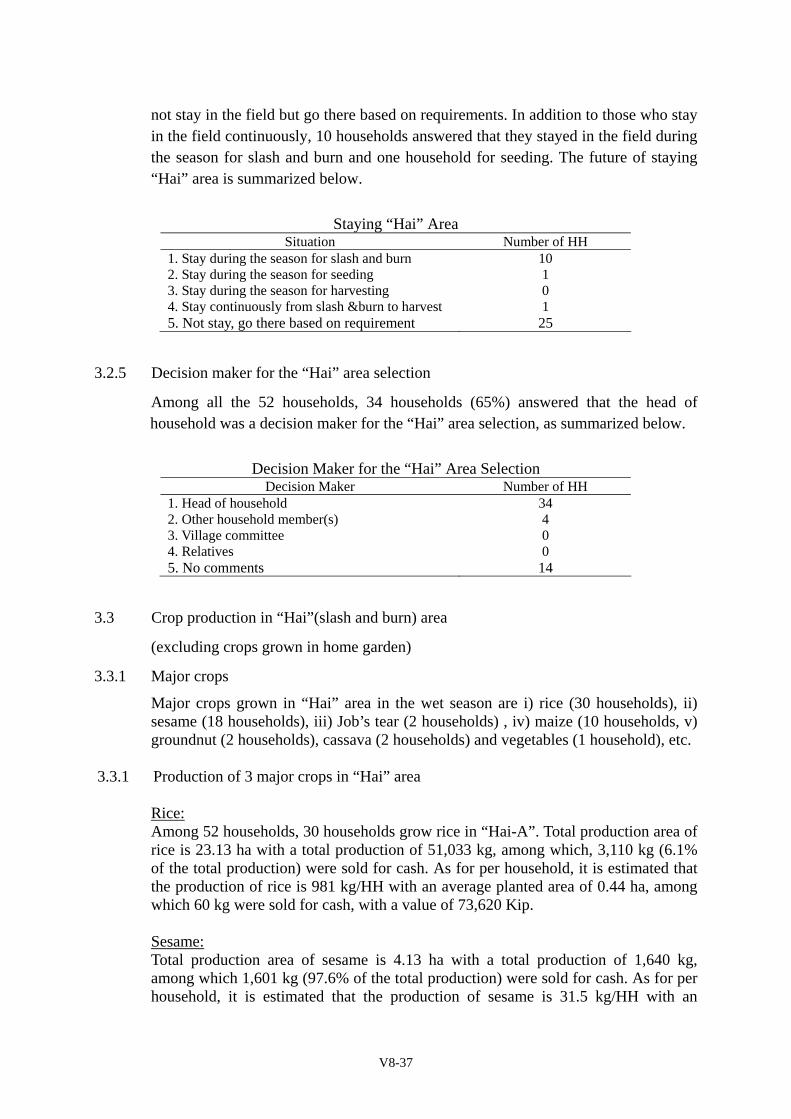
V8-37
not stay in the field but go there based on requirements. In addition to those who stay in the field continuously, 10 households answered that they stayed in the field during the season for slash and burn and one household for seeding. The future of staying “Hai” area is summarized below.
Staying “Hai” Area
Situation Number of HH 1. Stay during the season for slash and burn 10 2. Stay during the season for seeding 1 3. Stay during the season for harvesting 0 4. Stay continuously from slash &burn to harvest 1 5. Not stay, go there based on requirement 25
3.2.5 Decision maker for the “Hai” area selection
Among all the 52 households, 34 households (65%) answered that the head of household was a decision maker for the “Hai” area selection, as summarized below.
Decision Maker for the “Hai” Area Selection
Decision Maker Number of HH 1. Head of household 34 2. Other household member(s) 4 3. Village committee 0 4. Relatives 0 5. No comments 14
3.3 Crop production in “Hai”(slash and burn) area
(excluding crops grown in home garden)
3.3.1 Major crops
Major crops grown in “Hai” area in the wet season are i) rice (30 households), ii) sesame (18 households), iii) Job’s tear (2 households) , iv) maize (10 households, v) groundnut (2 households), cassava (2 households) and vegetables (1 household), etc.
3.3.1 Production of 3 major crops in “Hai” area
Rice: Among 52 households, 30 households grow rice in “Hai-A”. Total production area of rice is 23.13 ha with a total production of 51,033 kg, among which, 3,110 kg (6.1% of the total production) were sold for cash. As for per household, it is estimated that the production of rice is 981 kg/HH with an average planted area of 0.44 ha, among which 60 kg were sold for cash, with a value of 73,620 Kip. Sesame: Total production area of sesame is 4.13 ha with a total production of 1,640 kg, among which 1,601 kg (97.6% of the total production) were sold for cash. As for per household, it is estimated that the production of sesame is 31.5 kg/HH with an
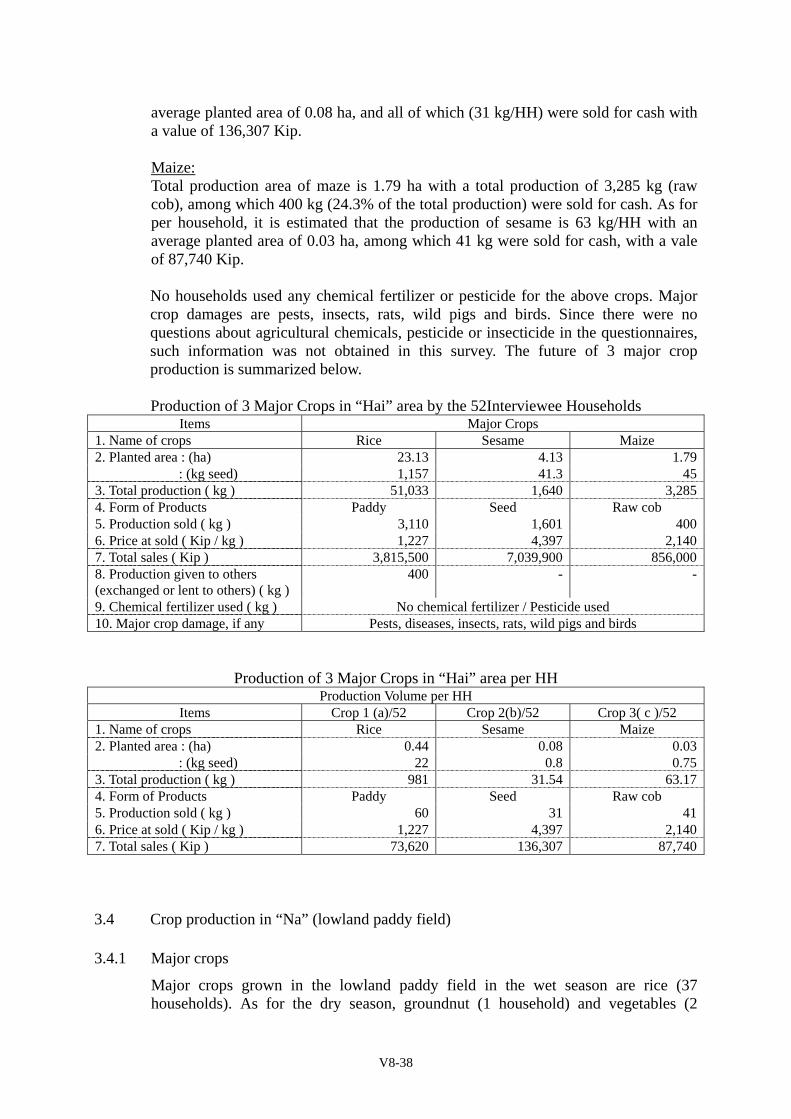
V8-38
average planted area of 0.08 ha, and all of which (31 kg/HH) were sold for cash with a value of 136,307 Kip. Maize: Total production area of maze is 1.79 ha with a total production of 3,285 kg (raw cob), among which 400 kg (24.3% of the total production) were sold for cash. As for per household, it is estimated that the production of sesame is 63 kg/HH with an average planted area of 0.03 ha, among which 41 kg were sold for cash, with a vale of 87,740 Kip. No households used any chemical fertilizer or pesticide for the above crops. Major crop damages are pests, insects, rats, wild pigs and birds. Since there were no questions about agricultural chemicals, pesticide or insecticide in the questionnaires, such information was not obtained in this survey. The future of 3 major crop production is summarized below. Production of 3 Major Crops in “Hai” area by the 52Interviewee Households
Items Major Crops 1. Name of crops Rice Sesame Maize 2. Planted area : (ha) 23.13 4.13 1.79 : (kg seed) 1,157 41.3 453. Total production ( kg ) 51,033 1,640 3,2854. Form of Products Paddy Seed Raw cob 5. Production sold ( kg ) 3,110 1,601 4006. Price at sold ( Kip / kg ) 1,227 4,397 2,1407. Total sales ( Kip ) 3,815,500 7,039,900 856,0008. Production given to others (exchanged or lent to others) ( kg )
400 - -
9. Chemical fertilizer used ( kg ) No chemical fertilizer / Pesticide used 10. Major crop damage, if any Pests, diseases, insects, rats, wild pigs and birds
Production of 3 Major Crops in “Hai” area per HH Production Volume per HH
Items Crop 1 (a)/52 Crop 2(b)/52 Crop 3( c )/52 1. Name of crops Rice Sesame Maize 2. Planted area : (ha) 0.44 0.08 0.03 : (kg seed) 22 0.8 0.753. Total production ( kg ) 981 31.54 63.174. Form of Products Paddy Seed Raw cob 5. Production sold ( kg ) 60 31 416. Price at sold ( Kip / kg ) 1,227 4,397 2,1407. Total sales ( Kip ) 73,620 136,307 87,740
3.4 Crop production in “Na” (lowland paddy field) 3.4.1 Major crops
Major crops grown in the lowland paddy field in the wet season are rice (37 households). As for the dry season, groundnut (1 household) and vegetables (2
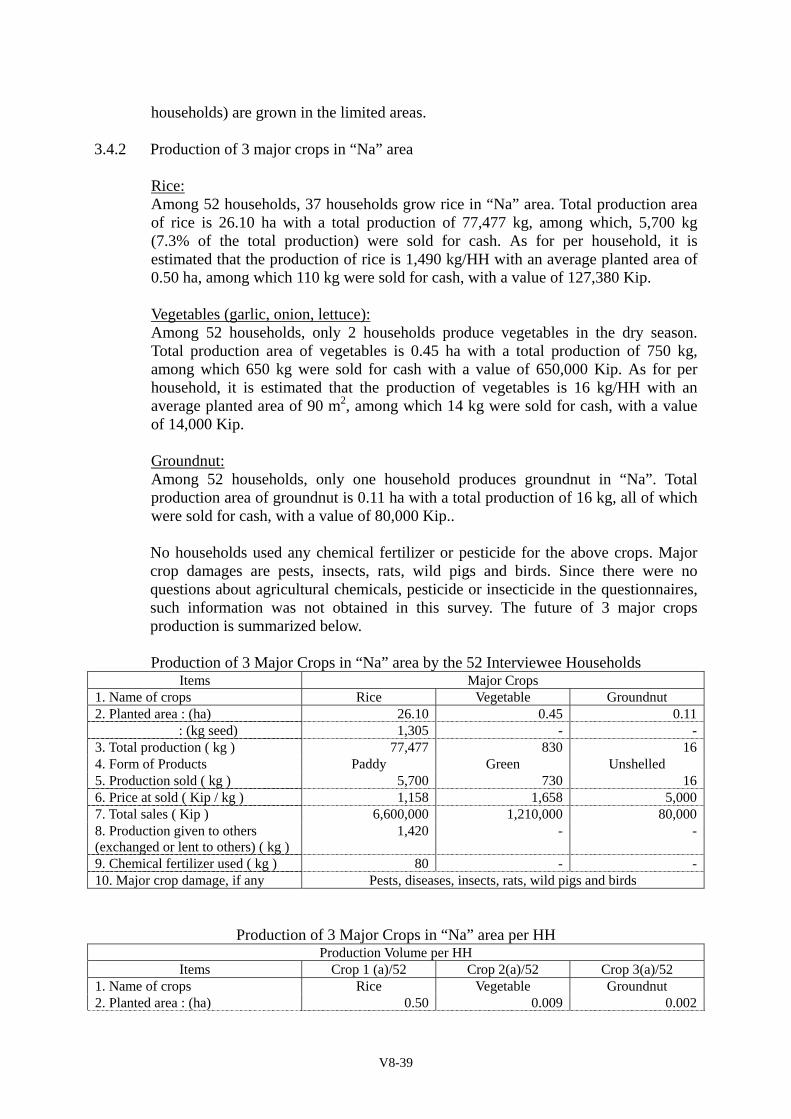
V8-39
households) are grown in the limited areas. 3.4.2 Production of 3 major crops in “Na” area
Rice: Among 52 households, 37 households grow rice in “Na” area. Total production area of rice is 26.10 ha with a total production of 77,477 kg, among which, 5,700 kg (7.3% of the total production) were sold for cash. As for per household, it is estimated that the production of rice is 1,490 kg/HH with an average planted area of 0.50 ha, among which 110 kg were sold for cash, with a value of 127,380 Kip. Vegetables (garlic, onion, lettuce): Among 52 households, only 2 households produce vegetables in the dry season. Total production area of vegetables is 0.45 ha with a total production of 750 kg, among which 650 kg were sold for cash with a value of 650,000 Kip. As for per household, it is estimated that the production of vegetables is 16 kg/HH with an average planted area of 90 m2, among which 14 kg were sold for cash, with a value of 14,000 Kip. Groundnut: Among 52 households, only one household produces groundnut in “Na”. Total production area of groundnut is 0.11 ha with a total production of 16 kg, all of which were sold for cash, with a value of 80,000 Kip.. No households used any chemical fertilizer or pesticide for the above crops. Major crop damages are pests, insects, rats, wild pigs and birds. Since there were no questions about agricultural chemicals, pesticide or insecticide in the questionnaires, such information was not obtained in this survey. The future of 3 major crops production is summarized below. Production of 3 Major Crops in “Na” area by the 52 Interviewee Households
Items Major Crops 1. Name of crops Rice Vegetable Groundnut 2. Planted area : (ha) 26.10 0.45 0.11 : (kg seed) 1,305 - -3. Total production ( kg ) 77,477 830 164. Form of Products Paddy Green Unshelled 5. Production sold ( kg ) 5,700 730 166. Price at sold ( Kip / kg ) 1,158 1,658 5,0007. Total sales ( Kip ) 6,600,000 1,210,000 80,0008. Production given to others (exchanged or lent to others) ( kg )
1,420 - -
9. Chemical fertilizer used ( kg ) 80 - -10. Major crop damage, if any Pests, diseases, insects, rats, wild pigs and birds
Production of 3 Major Crops in “Na” area per HH Production Volume per HH
Items Crop 1 (a)/52 Crop 2(a)/52 Crop 3(a)/52 1. Name of crops Rice Vegetable Groundnut 2. Planted area : (ha) 0.50 0.009 0.002
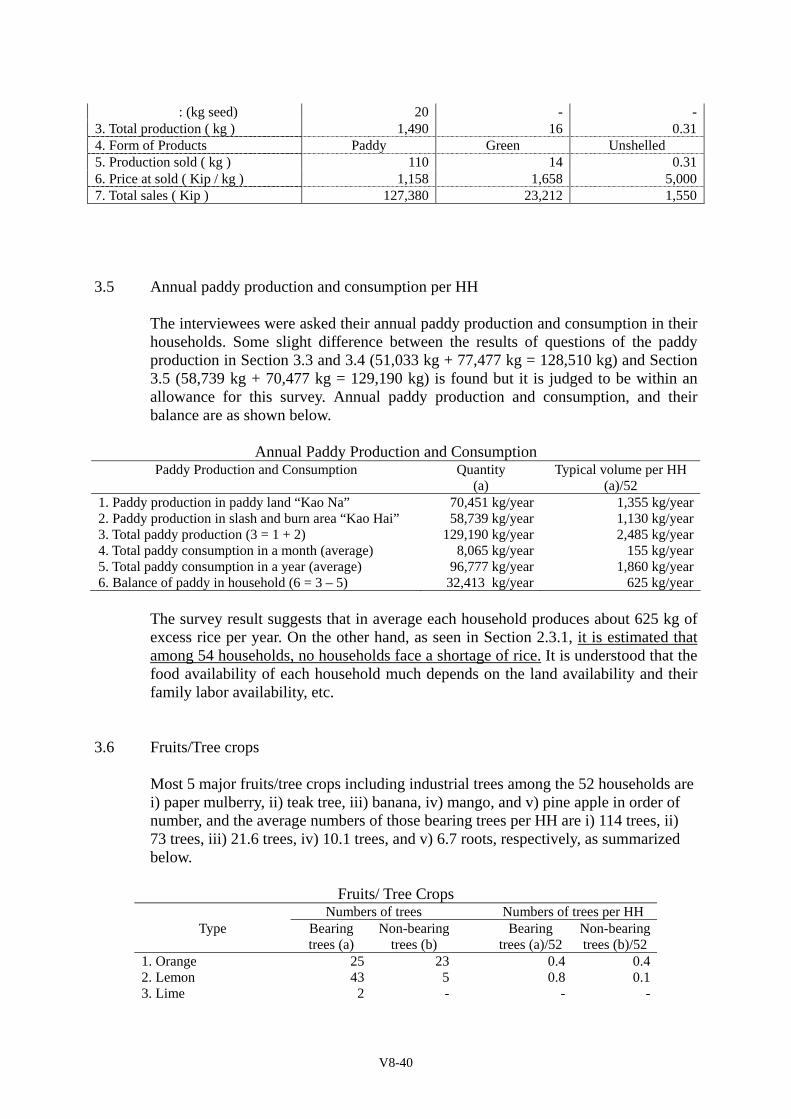
V8-40
: (kg seed) 20 - -3. Total production ( kg ) 1,490 16 0.314. Form of Products Paddy Green Unshelled 5. Production sold ( kg ) 110 14 0.316. Price at sold ( Kip / kg ) 1,158 1,658 5,0007. Total sales ( Kip ) 127,380 23,212 1,550 3.5 Annual paddy production and consumption per HH The interviewees were asked their annual paddy production and consumption in their
households. Some slight difference between the results of questions of the paddy production in Section 3.3 and 3.4 (51,033 kg + 77,477 kg = 128,510 kg) and Section 3.5 (58,739 kg + 70,477 kg = 129,190 kg) is found but it is judged to be within an allowance for this survey. Annual paddy production and consumption, and their balance are as shown below.
Annual Paddy Production and Consumption
Paddy Production and Consumption Quantity (a)
Typical volume per HH (a)/52
1. Paddy production in paddy land “Kao Na” 70,451 kg/year 1,355 kg/year2. Paddy production in slash and burn area “Kao Hai” 58,739 kg/year 1,130 kg/year3. Total paddy production (3 = 1 + 2) 129,190 kg/year 2,485 kg/year4. Total paddy consumption in a month (average) 8,065 kg/year 155 kg/year5. Total paddy consumption in a year (average) 96,777 kg/year 1,860 kg/year6. Balance of paddy in household (6 = 3 – 5) 32,413 kg/year 625 kg/year
The survey result suggests that in average each household produces about 625 kg of excess rice per year. On the other hand, as seen in Section 2.3.1, it is estimated that among 54 households, no households face a shortage of rice. It is understood that the food availability of each household much depends on the land availability and their family labor availability, etc.
3.6 Fruits/Tree crops Most 5 major fruits/tree crops including industrial trees among the 52 households are
i) paper mulberry, ii) teak tree, iii) banana, iv) mango, and v) pine apple in order of number, and the average numbers of those bearing trees per HH are i) 114 trees, ii) 73 trees, iii) 21.6 trees, iv) 10.1 trees, and v) 6.7 roots, respectively, as summarized below.
Fruits/ Tree Crops
Numbers of trees Numbers of trees per HH Type Bearing
trees (a) Non-bearing
trees (b) Bearing
trees (a)/52 Non-bearing trees (b)/52
1. Orange 25 23 0.4 0.4 2. Lemon 43 5 0.8 0.1 3. Lime 2 - - -
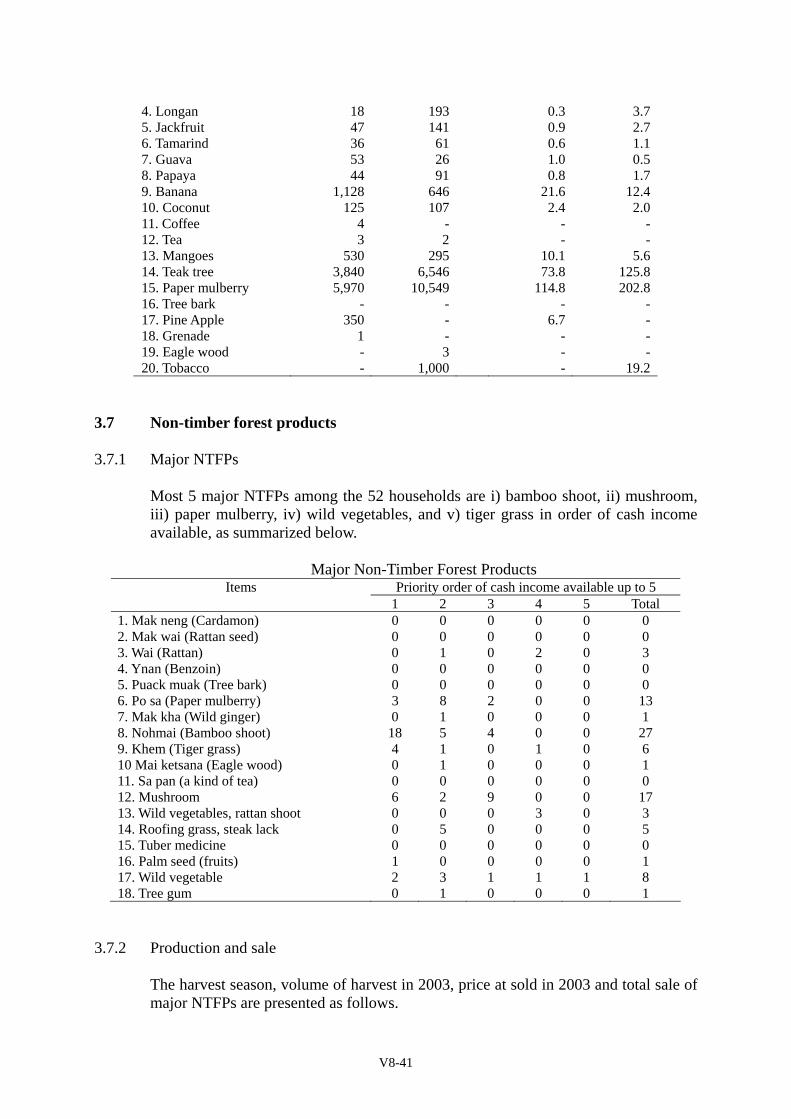
V8-41
4. Longan 18 193 0.3 3.7 5. Jackfruit 47 141 0.9 2.7 6. Tamarind 36 61 0.6 1.1 7. Guava 53 26 1.0 0.5 8. Papaya 44 91 0.8 1.7 9. Banana 1,128 646 21.6 12.4 10. Coconut 125 107 2.4 2.0 11. Coffee 4 - - - 12. Tea 3 2 - - 13. Mangoes 530 295 10.1 5.6 14. Teak tree 3,840 6,546 73.8 125.8 15. Paper mulberry 5,970 10,549 114.8 202.8 16. Tree bark - - - - 17. Pine Apple 350 - 6.7 - 18. Grenade 1 - - - 19. Eagle wood - 3 - - 20. Tobacco - 1,000 - 19.2
3.7 Non-timber forest products 3.7.1 Major NTFPs
Most 5 major NTFPs among the 52 households are i) bamboo shoot, ii) mushroom, iii) paper mulberry, iv) wild vegetables, and v) tiger grass in order of cash income available, as summarized below.
Major Non-Timber Forest Products Items Priority order of cash income available up to 5
1 2 3 4 5 Total 1. Mak neng (Cardamon) 0 0 0 0 0 0 2. Mak wai (Rattan seed) 0 0 0 0 0 0 3. Wai (Rattan) 0 1 0 2 0 3 4. Ynan (Benzoin) 0 0 0 0 0 0 5. Puack muak (Tree bark) 0 0 0 0 0 0 6. Po sa (Paper mulberry) 3 8 2 0 0 13 7. Mak kha (Wild ginger) 0 1 0 0 0 1 8. Nohmai (Bamboo shoot) 18 5 4 0 0 27 9. Khem (Tiger grass) 4 1 0 1 0 6 10 Mai ketsana (Eagle wood) 0 1 0 0 0 1 11. Sa pan (a kind of tea) 0 0 0 0 0 0 12. Mushroom 6 2 9 0 0 17 13. Wild vegetables, rattan shoot 0 0 0 3 0 3 14. Roofing grass, steak lack 0 5 0 0 0 5 15. Tuber medicine 0 0 0 0 0 0 16. Palm seed (fruits) 1 0 0 0 0 1 17. Wild vegetable 2 3 1 1 1 8 18. Tree gum 0 1 0 0 0 1
3.7.2 Production and sale
The harvest season, volume of harvest in 2003, price at sold in 2003 and total sale of major NTFPs are presented as follows.
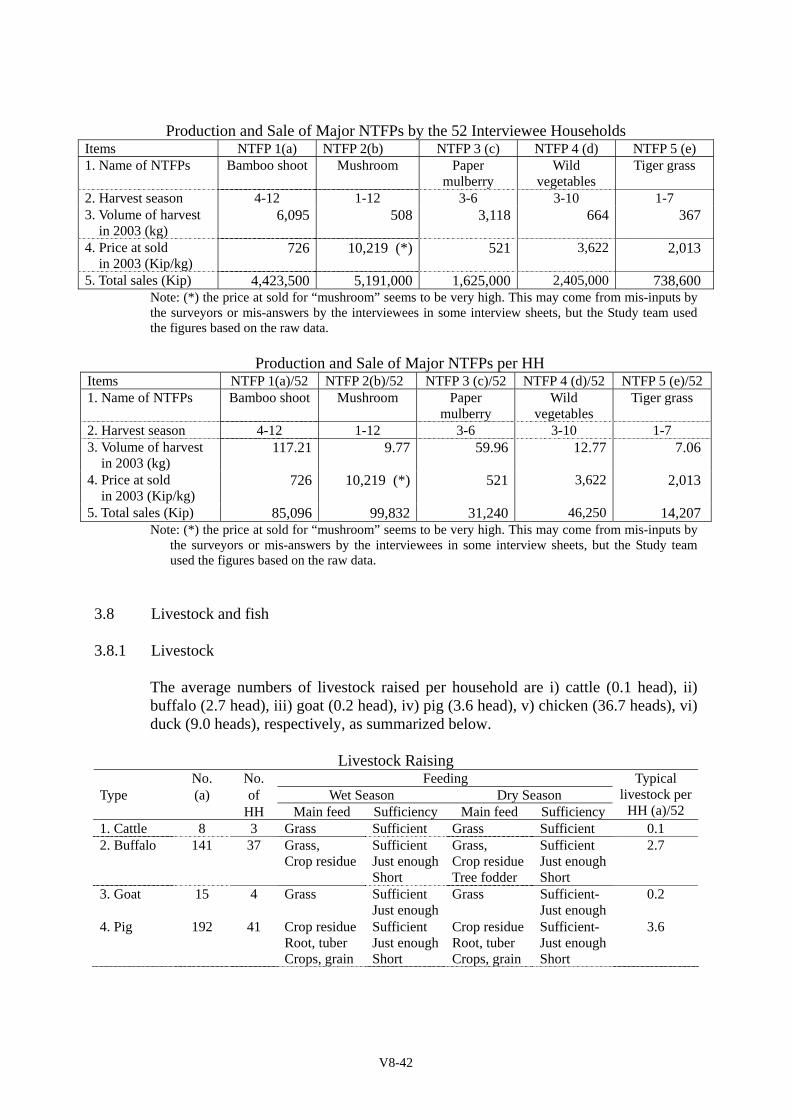
V8-42
Production and Sale of Major NTFPs by the 52 Interviewee Households
Items NTFP 1(a) NTFP 2(b) NTFP 3 (c) NTFP 4 (d) NTFP 5 (e) 1. Name of NTFPs Bamboo shoot Mushroom Paper
mulberry Wild
vegetables Tiger grass
2. Harvest season 4-12 1-12 3-6 3-10 1-7 3. Volume of harvest
in 2003 (kg) 6,095 508 3,118 664 367
4. Price at sold in 2003 (Kip/kg)
726 10,219 (*) 521 3,622 2,013
5. Total sales (Kip) 4,423,500 5,191,000 1,625,000 2,405,000 738,600 Note: (*) the price at sold for “mushroom” seems to be very high. This may come from mis-inputs by the surveyors or mis-answers by the interviewees in some interview sheets, but the Study team used the figures based on the raw data.
Production and Sale of Major NTFPs per HH Items NTFP 1(a)/52 NTFP 2(b)/52 NTFP 3 (c)/52 NTFP 4 (d)/52 NTFP 5 (e)/521. Name of NTFPs Bamboo shoot Mushroom Paper
mulberry Wild
vegetables Tiger grass
2. Harvest season 4-12 1-12 3-6 3-10 1-7 3. Volume of harvest
in 2003 (kg) 117.21 9.77 59.96 12.77 7.06
4. Price at sold in 2003 (Kip/kg)
726 10,219 (*) 521 3,622 2,013
5. Total sales (Kip) 85,096 99,832 31,240 46,250 14,207Note: (*) the price at sold for “mushroom” seems to be very high. This may come from mis-inputs by
the surveyors or mis-answers by the interviewees in some interview sheets, but the Study team used the figures based on the raw data.
3.8 Livestock and fish 3.8.1 Livestock
The average numbers of livestock raised per household are i) cattle (0.1 head), ii) buffalo (2.7 head), iii) goat (0.2 head), iv) pig (3.6 head), v) chicken (36.7 heads), vi) duck (9.0 heads), respectively, as summarized below.
Livestock Raising No. No. Feeding Type (a) of Wet Season Dry Season HH Main feed Sufficiency Main feed Sufficiency
Typical livestock per
HH (a)/52 1. Cattle 8 3 Grass Sufficient Grass Sufficient 0.1 2. Buffalo 141 37 Grass,
Crop residueSufficient Just enoughShort
Grass, Crop residueTree fodder
Sufficient Just enough Short
2.7
3. Goat 15 4 Grass Sufficient Just enough
Grass Sufficient- Just enough
0.2
4. Pig 192 41 Crop residueRoot, tuber Crops, grain
Sufficient Just enoughShort
Crop residueRoot, tuber Crops, grain
Sufficient- Just enough Short
3.6
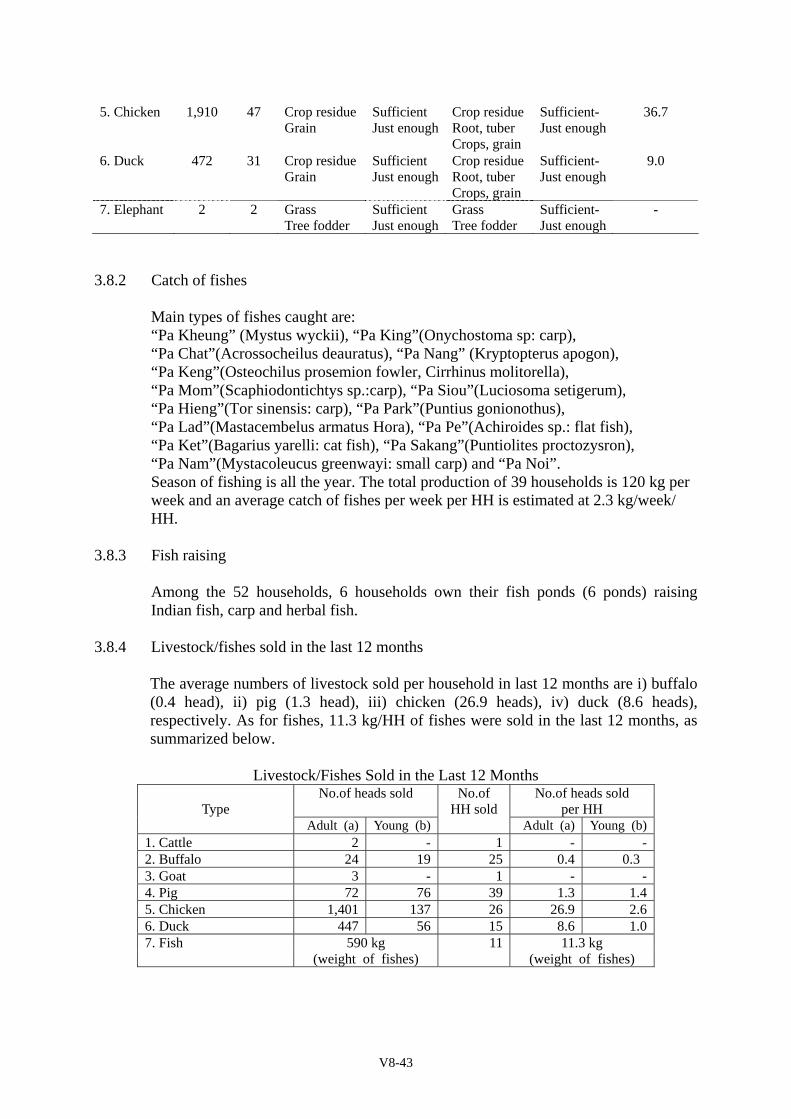
V8-43
5. Chicken 1,910 47 Crop residueGrain
Sufficient Just enough
Crop residueRoot, tuber Crops, grain
Sufficient- Just enough
36.7
6. Duck 472 31 Crop residueGrain
Sufficient Just enough
Crop residueRoot, tuber Crops, grain
Sufficient- Just enough
9.0
7. Elephant 2 2 Grass Tree fodder
Sufficient Just enough
Grass Tree fodder
Sufficient- Just enough
-
3.8.2 Catch of fishes
Main types of fishes caught are: “Pa Kheung” (Mystus wyckii), “Pa King”(Onychostoma sp: carp), “Pa Chat”(Acrossocheilus deauratus), “Pa Nang” (Kryptopterus apogon), “Pa Keng”(Osteochilus prosemion fowler, Cirrhinus molitorella), “Pa Mom”(Scaphiodontichtys sp.:carp), “Pa Siou”(Luciosoma setigerum), “Pa Hieng”(Tor sinensis: carp), “Pa Park”(Puntius gonionothus), “Pa Lad”(Mastacembelus armatus Hora), “Pa Pe”(Achiroides sp.: flat fish), “Pa Ket”(Bagarius yarelli: cat fish), “Pa Sakang”(Puntiolites proctozysron), “Pa Nam”(Mystacoleucus greenwayi: small carp) and “Pa Noi”. Season of fishing is all the year. The total production of 39 households is 120 kg per week and an average catch of fishes per week per HH is estimated at 2.3 kg/week/ HH.
3.8.3 Fish raising
Among the 52 households, 6 households own their fish ponds (6 ponds) raising Indian fish, carp and herbal fish.
3.8.4 Livestock/fishes sold in the last 12 months The average numbers of livestock sold per household in last 12 months are i) buffalo (0.4 head), ii) pig (1.3 head), iii) chicken (26.9 heads), iv) duck (8.6 heads), respectively. As for fishes, 11.3 kg/HH of fishes were sold in the last 12 months, as summarized below.
Livestock/Fishes Sold in the Last 12 Months
Type No.of heads sold No.of
HH sold No.of heads sold
per HH Adult (a) Young (b) Adult (a) Young (b) 1. Cattle 2 - 1 - - 2. Buffalo 24 19 25 0.4 0.3 3. Goat 3 - 1 - - 4. Pig 72 76 39 1.3 1.4 5. Chicken 1,401 137 26 26.9 2.6 6. Duck 447 56 15 8.6 1.0 7. Fish 590 kg 11 11.3 kg (weight of fishes) (weight of fishes)
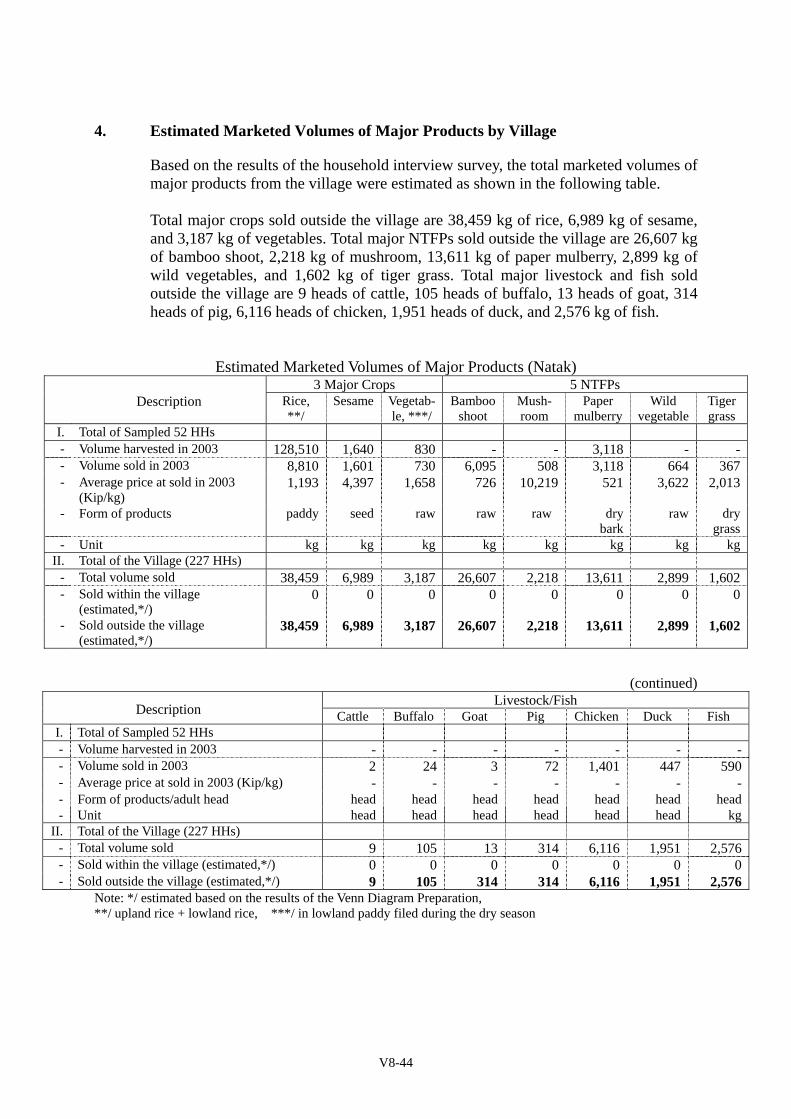
V8-44
4. Estimated Marketed Volumes of Major Products by Village
Based on the results of the household interview survey, the total marketed volumes of major products from the village were estimated as shown in the following table. Total major crops sold outside the village are 38,459 kg of rice, 6,989 kg of sesame, and 3,187 kg of vegetables. Total major NTFPs sold outside the village are 26,607 kg of bamboo shoot, 2,218 kg of mushroom, 13,611 kg of paper mulberry, 2,899 kg of wild vegetables, and 1,602 kg of tiger grass. Total major livestock and fish sold outside the village are 9 heads of cattle, 105 heads of buffalo, 13 heads of goat, 314 heads of pig, 6,116 heads of chicken, 1,951 heads of duck, and 2,576 kg of fish.
Estimated Marketed Volumes of Major Products (Natak) 3 Major Crops 5 NTFPs Description Rice,
**/ Sesame Vegetab-
le, ***/Bamboo
shoot Mush- room
Paper mulberry
Wild vegetable
Tigergrass
I. Total of Sampled 52 HHs - Volume harvested in 2003 128,510 1,640 830 - - 3,118 - -- Volume sold in 2003 8,810 1,601 730 6,095 508 3,118 664 367- Average price at sold in 2003
(Kip/kg) 1,193 4,397 1,658 726 10,219 521 3,622 2,013
- Form of products paddy seed raw raw raw
dry bark
raw drygrass
- Unit kg kg kg kg kg kg kg kgII. Total of the Village (227 HHs)
- Total volume sold 38,459 6,989 3,187 26,607 2,218 13,611 2,899 1,602- Sold within the village
(estimated,*/) 0 0 0 0 0 0 0 0
- Sold outside the village (estimated,*/)
38,459 6,989 3,187 26,607 2,218 13,611 2,899 1,602
(continued)
Livestock/Fish Description Cattle Buffalo Goat Pig Chicken Duck Fish I. Total of Sampled 52 HHs - Volume harvested in 2003 - - - - - - -- Volume sold in 2003 2 24 3 72 1,401 447 590- Average price at sold in 2003 (Kip/kg) - - - - - - -- Form of products/adult head head head head head head head head- Unit head head head head head head kg
II. Total of the Village (227 HHs) - Total volume sold 9 105 13 314 6,116 1,951 2,576- Sold within the village (estimated,*/) 0 0 0 0 0 0 0- Sold outside the village (estimated,*/) 9 105 314 314 6,116 1,951 2,576
Note: */ estimated based on the results of the Venn Diagram Preparation, **/ upland rice + lowland rice, ***/ in lowland paddy filed during the dry season
V8-45
5. Income and Expenditure 5.1 Sources of major income
The interviewees were asked to enumerate major income sources no more than 5, and their annual amounts. Major income sources enumerated by the interviewees were i) selling livestock/poultry (49 households), ii) private business (10 households), iii) salary from permanent job (11 households), iv) selling NTFPs (35 households), and v) wage from temporary job out of farm (15 households), in order of amount of income. Average amounts of major income sources per household are presented as shown below.
Average Amount of Major Income Sources per HH
No.of Amount of Annual Average Income Sources HHs Major Income per HH (a)/52
(Kip/year) (a) (Kip/year/HH) 1. Selling livestock/ poultry products 49 167,950,000 3,229,808 2. Private business (trading, shop, etc…) 10 60,546,000 1,164,346 3. Salary from permanent job 11 48,144,000 925,846 4. Selling NTFPs 35 22,953,000 441,404 5. Wage from temporary job out of farm 15 20,500,000 394,231
5.2 Major income per HH Annual amounts of major income per household vary from 650,000 Kip/year to 26,500,000 Kip/year with an average of 7,034,756 Kip/year/HH (a total of 365,807,300 Kip/year by the 52 households).
Major Cash Income per HH Range of Cash Income Kip/year/HH
1. Maximum 26,500,000 2. Minimum 650,000 3. Average 7,034,756
5.3 Major income of sample households
In order to grasp the typical major income per HH, three typical samples (high, medium and low levels) of major income per household are presented below.
Major Income of Typical Sample Household (High Level) Income Sources Kip/year/HH
1. Selling livestock/ poultry products 19,000,000 2. Private business (trading, shop, etc.) 7,500,000 3. - - 4. - - 5. - -
Total 26,500,000
V8-46
Major Income of Typical Sample Household (Medium Level)
Income Sources Kip/year/HH 1. Salary from permanent job 3,840,000 2. Selling livestock/ poultry products 3,200,000 3. Selling paddy low land rice 2,400,000 4. Private business (trading, shop, etc.) 600,000 5. Selling NTFPs 300,000
Total 10,340,000
Major Income of Typical Sample Household (Low Level) Income Sources Kip/year/HH
1. Selling paddy low land rice 200,000 2. Wage from temporary job out of farm 100,000 3. Selling fishes 100,000 4. Remittance from family members 100,000 5. Selling fruits 50,000
Total 650,000
5.4 Items of major expenditure
The interviewees were asked to enumerate major expenditure no more than 5, and their annual amounts. Major expenditure enumerated by the interviewees were those for i) food (51 households) ii) health (42 households), iii) clothes (44 households), iv) education (37 households) and v) Fuel wood/ Kerosene/ Electricity (21 households), in order of amount of expenditure. Average amount of major expenditure item per household are shown below.
Average Amounts per Expenditure Item per HH No.of Amount of Annual Average
Expenditure Item HHs Major Expenditure per HH (a)/52 (Kip/year) (a) (Kip/year/HH)
1. Food 51 40,380,000 776,538 2. Health 42 26,158,000 503,038 3. Clothes 44 20,330,000 390,961 4. Education 37 19,817,000 381,096 5. Fuel wood / Kerosene / Electricity 21 4,571,000 87,904
5.5 Major expenditure per HH Annual amounts of major expenditure per household vary from 200,000 Kip/year to 10,750,000 Kip/year with an average of 2,256,404 Kip/year/HH (a total of 117,333,000 Kip/year by the 52 households).
Major Expenditure per HH Range of Expenditure Amount Kip/year/HH
1. Maximum 10,750,000 2. Minimum 200,000 3. Average 2,256,404
V8-47
5.6 Major Expenditure of Sample Households
In order to grasp the general future of expenditures per household, three levels (high, medium, and low) of major expenditure of typical sample households are selected as shown below.
Major Expenditure of Typical Sample Household (High Level) Expenditure Items Kip/year/HH
1. Education 8,000,000 2. Clothes 1,200,000 3. Food 800,000 4. Health 700,000 5. Tax payment 50,000
Total 10,750,000
Major Expenditure of Typical Sample Household (Medium Level) Expenditure Items Kip/year/HH
1. Food 1,440,000 2. Clothes 300,000 3. Transportation/ travel 300,000 4. Health 200,000 5. Social activities/ events 200,000
Total 2,440,000
Major Expenditure of Typical Sample Household (Low Level) Expenditure Items Kip/year/HH
1 Clothes 140,000 2. Food 100,000 3. Health 100,000 4. Fuel wood/ Kerosene / Electricity 50,000 5. Tax payment 28,000
Total 418,000
5.7 Major investment of productive and fixed assets
The interviewees were asked to enumerate major investments of productive and fixed assets in the last year no more than 3, and their annual amounts. Major investments enumerated by the interviewees were those for i) housing (improvement) (16 households) ii) household appliance (30 households), and iii) livestock (21 households), in order of amount of investment. On the other hand, among 52 households, 10 households did not invest any money for the last year. Average amounts per investment item per household are shown below.
Average Amounts per Investment Item per HH No.of Amount of Last Year Average
Investment Item HHs Major Investments per HH (a)/52 (Kip/year) (a) (Kip/year/HH) 1. Housing (improvement) 16 42,520,500 817,702 2. Household appliance 30 12,525,000 240,865 3. Livestock 21 10,398,000 199,961
V8-48
5.8 Major investment per HH Annual amounts of major investment per household vary from 14,000 Kip/year (excluding 10 households, who did not invest any money last year) to 14,716,500 Kip/year with an average of 2,007,202 Kip/year/HH (a total of 104,374,500 Kip/year by the 52 households).
Major Investment per HH Range of Investment Amount Kip/year/HH
1. Maximum 14,716,500 2. Minimum 14,000 3. Average 2,007,202
5.9 Major investment of sample households
In order to grasp the general future of investment per household, three levels (high, medium, and low) of major investments of typical sample households are selected as shown below, excluding 10 households, who did not invest any money last year.
Major Investment of Typical Sample Household (High Level) Investment Items Kip/year/HH
1. Housing (improvement) 13,116,500 2. Private business 1,200,000 3. Household appliance 400,000
Total 14,716,500
Major Investment of Typical Sample Household (Medium Level) Investment Items Kip/year/HH
1. Household appliance 2,500,000 2. Housing (improvement) 1,054,000 3. Land 89,000
Total 3,643,000
Major Investment of Typical Sample Household (Low Level) Investment Items Kip/year/HH
1. Livestock 100,000 2. Farm machinery / tools 60,000 3. Land 20,000
Total 180,000 6. Utilization of Credit/Loan
Among all the 52 interviewees, one household has borrowed money from Bank for purchasing crop production materials. The borrowed amount was 200,000 Kip with a
V8-49
monthly interest of 5.0% and all of the borrowed money have already been paid off. “Relative”: Three (3) households have borrowed money from their relatives for medical treatment or repairing house. The borrowed amounts vary from 200,000 Kip to 1,000,000 Kip with a monthly interest of 0 to 0.5% and all of the borrowed money have already been paid off. “Trader/Dealer”: One household has borrowed 3,000,000 Kip from a trader with a monthly interest of 10% for private business operation. All of the borrowed money have been paid off. “Mutual aid group”: Four (4) households borrowed money from the mutual aid group for crop production. The borrowed amounts vary from 100,000 Kip to 700,000 Kip with a monthly interest of 0 to 3.0% and all of the borrowed money have already been paid off. In addition above, one household borrowed 100,000 Kip from “others” like a project fund without interest for medical treatment and all of the borrowed money have already been paid off. The future of the utilization of credit/loan is summarized below.
Utilization of Credit/Loan Number Purpose Amount Monthly Status of Loan Possible Source of of of Interest Paid off Remaining Borrower Loan Loan (Kip) (%) (Kip) (Kip) 1. Bank 1 Crop production 200,000 5 200,000 - 2. Cooperative - - - - - - 3. Relative 3 Medical
treatment, Repair of house
1,500,000 0-0.5 1,500,000 -
4. Neighbor / Friend - - - - - - 5. Trader / Dealer 1 Private business 3,000,000 10 3,000,000 - 6. Mutual aid group 4 Crop production 1,200,000 0-3.0 1,200,000 - 7. Others (a project fund)
1 Medical treatment
100,000 0 100,000 -
7. Extension
Among the 52 interviewees, 20 (38%) have never received any training or technical advice from DAFO extension staff. The other 32 have received training or technical advice one to three times before, like 1 time (6 persons), 2 times (20 persons) and 3 times (6 persons), respectively, as summarized below.
V8-50
B. HOUSEHOLD MEMBER SURVEY Among the sampled 52 households for Household Interview Survey, a half of households (26 households) were further selected for Household Member Survey (HMS) (26 males and 26 females) for clarifying i) participation/ engagement of household members and ii) activities to make easy, the results of the HMS are summarized below. 8. Participation/ Engagement of Household Members
The participation of the household members in each activity can be defined as follows.
(1) Home activities: Females especially wives are responsible for almost home activities such as fetching of drinking water, cooking, washing, sweeping the house, child / elderly care, except house repair for which males or the heads of the household seem to be responsible. On the other hand, kitchen gardening activities are responsible by both males and females.
(2) Farming activities (concerned low land rice cultivation): Males are mainly responsible for lowland rice cultivation and females also play important roles particularly for transplanting, weeding and harvesting.
(3) Slash and burn activities: Males especially the heads of the household are responsible for all the slash and burn activities with important assistance from females or their wives.
(4) Livestock and poultry raising activities: Females, especially wives are responsible for all of the activities of livestock and poultry raising activities such as feeding, watering and other activities on this field. However, sweeping of livestock and poultry stall is responsible by both males and females.
(5) Fishing activities: Males are responsible for all of fishing activities.
(6) Forestry activities:
Received training and technical advice Times of visit by the extension staff
Total HH interviewed
Have not received any training (HH)
Total HH 1 time 2 times 3 times 4 times
52 20 32 6 HHs 20 HHs 6 HHs -
V8-51
Females are responsible for collection of forest vegetables/ crops, and both of males and females are responsible for collection of fuel wood, while timber harvest and charcoal production are almost not being practiced among the interviewees.
(7) Post-harvest & marketing activities: Females are responsible for post-harvest and marketing activities such as processing products for selling with the assistance from males.
(8) Domestic business activities: Males are basically responsible for rice mill management, but other domestic business activities such as trading and shop keeping are responsible by females.
(9) Communication activities: Both males and females, but if any, males are responsible for attending community meeting, getting information from media, discussions among villagers, and the resolving in-village conflicts.
(10) Religious / cultural activities: Both of males and females, but if any, males are responsible for religious / cultural activities.
Summary of Participation/Engagement of Household Member Survey (HMS) is presented below.
Summary of Participation/ Engagement of Household Member Survey
Activities
Usually, responsible
Usually, assistant
Sometimes None Total
M F M F M F M F M F Home activities 1. Fetching of drinking water 0 24 16 1 6 0 4 1 26 262. Cooking 1 25 13 1 7 0 5 0 26 263. Washing 1 25 12 1 7 0 6 0 26 264. Sweeping the house 0 25 13 1 6 0 7 0 26 265. House repair 25 1 1 8 0 7 0 10 26 266. Child / elderly care 8 24 13 1 2 0 3 1 26 267. Kitchen gardening 15 15 5 5 1 2 5 4 26 268. Sewing and knitting 0 4 0 0 1 9 25 13 26 269. Shopping in market 3 13 3 3 17 10 3 0 26 26
Total 53 156 76 21 47 28 63 29 234 234Farming activities 10. Plowing 21 0 1 2 0 0 4 24 26 2611. Seeding/ transplanting 19 12 1 10 0 0 6 4 26 2612. Weeding 22 10 0 11 0 0 4 5 26 2613. Application of chemical
fertilizers 15 8 0 3 0 0 11 15 26 26
14. Harvesting 22 11 0 10 0 0 4 4 26 2515. Repairing of farm 22 6 0 9 0 2 4 8 26 25
Total 121 47 2 45 0 2 33 60 156 156Slash & burn activities 16. Slashing 15 7 1 5 0 0 9 14 25 2617. Burning 15 2 1 2 0 0 10 22 26 2618. Clearing 16 9 1 5 0 1 9 11 26 26
V8-52
19. Fencing 16 6 1 5 0 0 9 15 26 2620. Seeding 15 10 1 5 0 0 10 11 26 2621. Weeding 15 10 1 6 0 0 10 10 26 2622. Harvesting 15 9 1 6 0 1 10 10 26 26
Total 107 53 7 34 0 2 67 93 181 182Livestock & poultry raising activities
23. Grazing control 9 4 3 3 0 0 14 19 26 2624. Feeding 6 22 15 3 3 1 2 0 26 2625. Watering 6 21 14 3 3 1 3 1 26 2626. Collection/ production of fodder 5 4 3 2 0 2 18 18 26 2627. Sweeping of livestock &
poultry stall 12 12 9 3 2 3 3 8 26 26
Total 38 63 44 14 8 7 40 46 130 130Fishing activities 28. Fish catching in dam reservoir 4 0 0 4 1 1 20 21 25 2629. Fish catching in river 12 1 0 4 2 5 12 16 26 2630. Fish production in pond 2 1 0 0 1 1 23 24 26 2631. Maintenance of boat / engine 0 0 0 0 0 0 26 26 26 2632. Maintenance of pond 2 1 0 0 0 1 24 24 26 26
Total 20 3 0 8 4 8 105 111 129 130Forestry activities 33. Collection of fuel wood 13 14 10 8 2 4 1 0 26 2634. Collection of forest
vegetable/crops 6 15 6 3 11 7 3 1 26 26
35. Timber harvest 0 0 0 0 0 0 26 26 26 2636. Charcoal production 0 0 0 0 0 0 26 26 26 26
Total 19 29 16 11 13 11 56 55 104 104Post-harvest & marketing activities
37. Threshing of cereals 22 12 0 11 1 0 3 3 26 2638. Processing livestock & poultry
products 2 15 5 0 3 8 16 3 26 26
39. Processing fishes 2 15 5 0 4 8 15 2 26 2640. Processing of forest
vegetables/crops 2 16 4 0 4 8 16 2 26 26
41. Selling crops 2 13 4 0 6 6 14 7 26 2642. Selling livestock & poultry
products 4 9 5 0 3 6 14 11 26 26
43. Selling fishes & fishery products
0 4 1 0 2 2 23 20 26 26
44. Selling forest vegetables/crops 2 10 4 0 4 6 16 10 26 2645. Selling of fuel wood/charcoal 0 2 0 0 0 0 26 24 26 26
Total 36 96 28 11 27 44 143 82 234 234Domestic business activities 46. Rice mill 4 1 0 2 0 0 22 23 26 2647. Trading 3 6 4 2 3 3 16 15 26 2648. Shop keeping 0 2 1 0 0 0 25 24 26 2649. Handicraft 0 1 0 0 0 2 26 23 26 26
Total 7 10 5 4 3 5 89 85 104 104Communication activities 50. Attending community meetings 22 8 1 7 3 11 0 0 26 2651. Resolving in-village conflicts 6 3 1 0 3 1 16 22 26 2652. Getting information from TV 5 5 0 0 9 7 12 14 26 2653. Getting information from Radio 7 8 3 0 9 12 7 6 26 2654. Political discussion with others 13 9 0 2 8 5 5 10 26 2655. Official letter writing 2 1 0 1 3 1 21 23 26 26
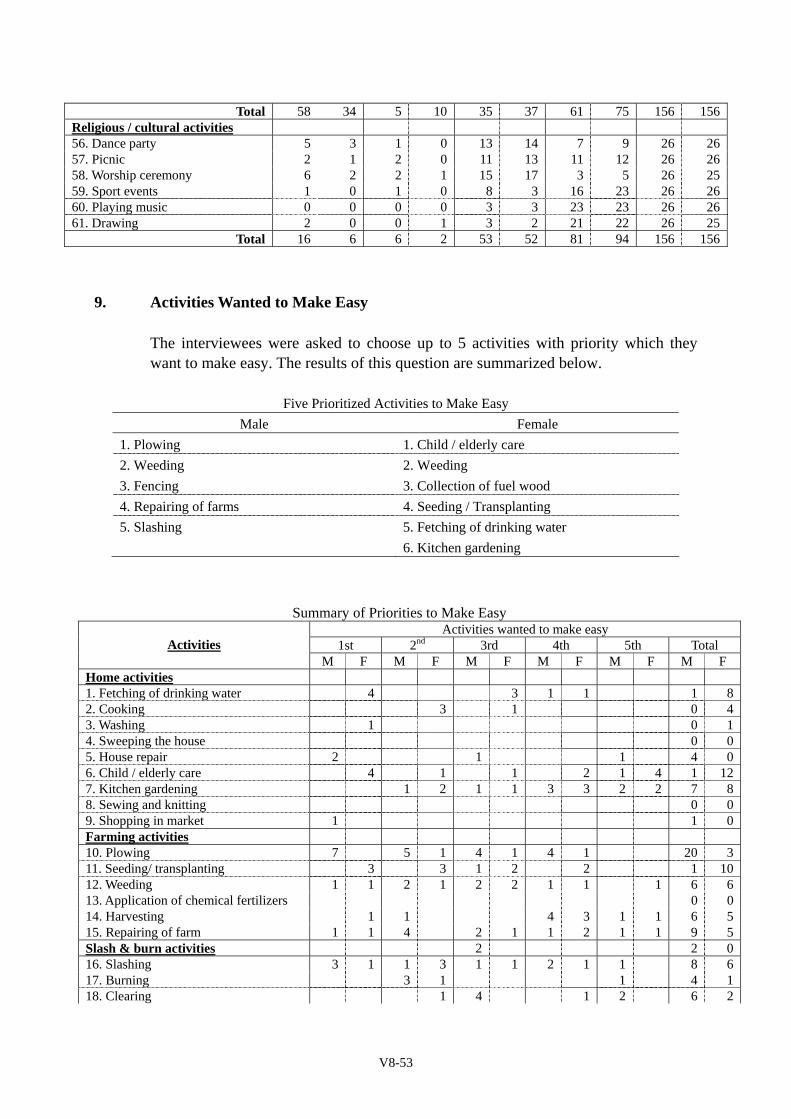
V8-53
Total 58 34 5 10 35 37 61 75 156 156Religious / cultural activities 56. Dance party 5 3 1 0 13 14 7 9 26 2657. Picnic 2 1 2 0 11 13 11 12 26 2658. Worship ceremony 6 2 2 1 15 17 3 5 26 2559. Sport events 1 0 1 0 8 3 16 23 26 2660. Playing music 0 0 0 0 3 3 23 23 26 2661. Drawing 2 0 0 1 3 2 21 22 26 25
Total 16 6 6 2 53 52 81 94 156 156 9. Activities Wanted to Make Easy
The interviewees were asked to choose up to 5 activities with priority which they want to make easy. The results of this question are summarized below.
Five Prioritized Activities to Make Easy Male Female
1. Plowing 1. Child / elderly care 2. Weeding 2. Weeding 3. Fencing 3. Collection of fuel wood 4. Repairing of farms 4. Seeding / Transplanting 5. Slashing 5. Fetching of drinking water 6. Kitchen gardening
Summary of Priorities to Make Easy Activities wanted to make easy
1st 2nd 3rd 4th 5th Total
Activities M F M F M F M F M F M F
Home activities 1. Fetching of drinking water 4 3 1 1 1 82. Cooking 3 1 0 43. Washing 1 0 14. Sweeping the house 0 05. House repair 2 1 1 4 06. Child / elderly care 4 1 1 2 1 4 1 127. Kitchen gardening 1 2 1 1 3 3 2 2 7 88. Sewing and knitting 0 09. Shopping in market 1 1 0Farming activities 10. Plowing 7 5 1 4 1 4 1 20 311. Seeding/ transplanting 3 3 1 2 2 1 1012. Weeding 1 1 2 1 2 2 1 1 1 6 613. Application of chemical fertilizers 0 014. Harvesting 1 1 4 3 1 1 6 515. Repairing of farm 1 1 4 2 1 1 2 1 1 9 5Slash & burn activities 2 2 016. Slashing 3 1 1 3 1 1 2 1 1 8 617. Burning 3 1 1 4 118. Clearing 1 4 1 2 6 2
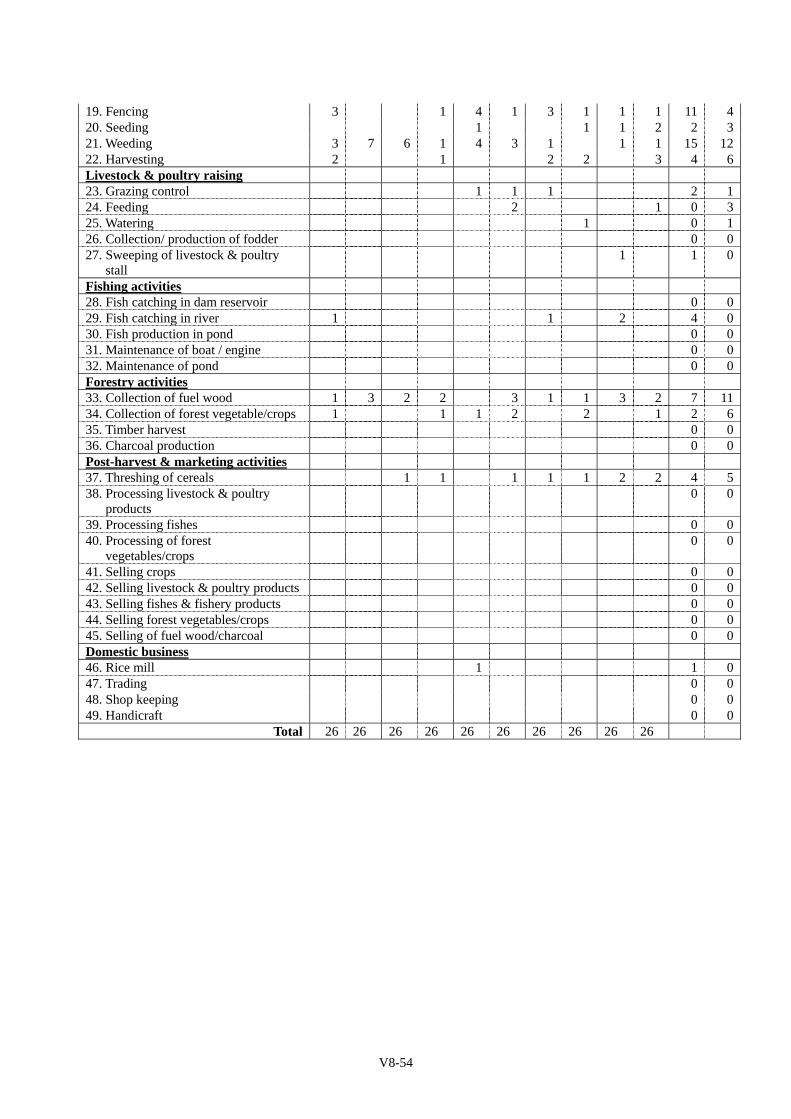
V8-54
19. Fencing 3 1 4 1 3 1 1 1 11 420. Seeding 1 1 1 2 2 321. Weeding 3 7 6 1 4 3 1 1 1 15 1222. Harvesting 2 1 2 2 3 4 6Livestock & poultry raising 23. Grazing control 1 1 1 2 124. Feeding 2 1 0 325. Watering 1 0 126. Collection/ production of fodder 0 027. Sweeping of livestock & poultry
stall 1 1 0
Fishing activities 28. Fish catching in dam reservoir 0 029. Fish catching in river 1 1 2 4 030. Fish production in pond 0 031. Maintenance of boat / engine 0 032. Maintenance of pond 0 0Forestry activities 33. Collection of fuel wood 1 3 2 2 3 1 1 3 2 7 1134. Collection of forest vegetable/crops 1 1 1 2 2 1 2 635. Timber harvest 0 036. Charcoal production 0 0Post-harvest & marketing activities 37. Threshing of cereals 1 1 1 1 1 2 2 4 538. Processing livestock & poultry
products 0 0
39. Processing fishes 0 040. Processing of forest
vegetables/crops 0 0
41. Selling crops 0 042. Selling livestock & poultry products 0 043. Selling fishes & fishery products 0 044. Selling forest vegetables/crops 0 045. Selling of fuel wood/charcoal 0 0Domestic business 46. Rice mill 1 1 047. Trading 0 048. Shop keeping 0 049. Handicraft 0 0
Total 26 26 26 26 26 26 26 26 26 26

Table & Figures
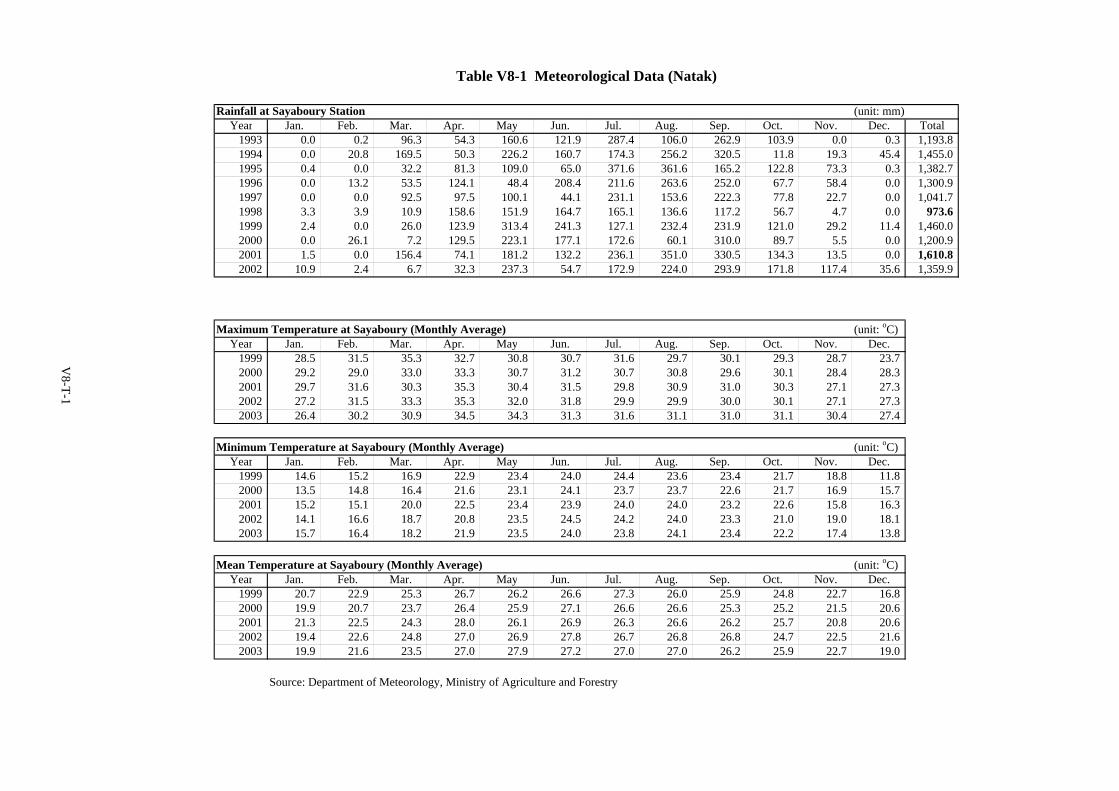
Rainfall at Sayaboury Station (unit: mm)Year Jan. Feb. Mar. Apr. May Jun. Jul. Aug. Sep. Oct. Nov. Dec. Total
1993 0.0 0.2 96.3 54.3 160.6 121.9 287.4 106.0 262.9 103.9 0.0 0.3 1,193.81994 0.0 20.8 169.5 50.3 226.2 160.7 174.3 256.2 320.5 11.8 19.3 45.4 1,455.01995 0.4 0.0 32.2 81.3 109.0 65.0 371.6 361.6 165.2 122.8 73.3 0.3 1,382.71996 0.0 13.2 53.5 124.1 48.4 208.4 211.6 263.6 252.0 67.7 58.4 0.0 1,300.91997 0.0 0.0 92.5 97.5 100.1 44.1 231.1 153.6 222.3 77.8 22.7 0.0 1,041.71998 3.3 3.9 10.9 158.6 151.9 164.7 165.1 136.6 117.2 56.7 4.7 0.0 973.61999 2.4 0.0 26.0 123.9 313.4 241.3 127.1 232.4 231.9 121.0 29.2 11.4 1,460.02000 0.0 26.1 7.2 129.5 223.1 177.1 172.6 60.1 310.0 89.7 5.5 0.0 1,200.92001 1.5 0.0 156.4 74.1 181.2 132.2 236.1 351.0 330.5 134.3 13.5 0.0 1,610.82002 10.9 2.4 6.7 32.3 237.3 54.7 172.9 224.0 293.9 171.8 117.4 35.6 1,359.9
Maximum Temperature at Sayaboury (Monthly Average) (unit: oC)Year Jan. Feb. Mar. Apr. May Jun. Jul. Aug. Sep. Oct. Nov. Dec.
1999 28.5 31.5 35.3 32.7 30.8 30.7 31.6 29.7 30.1 29.3 28.7 23.72000 29.2 29.0 33.0 33.3 30.7 31.2 30.7 30.8 29.6 30.1 28.4 28.32001 29.7 31.6 30.3 35.3 30.4 31.5 29.8 30.9 31.0 30.3 27.1 27.32002 27.2 31.5 33.3 35.3 32.0 31.8 29.9 29.9 30.0 30.1 27.1 27.32003 26.4 30.2 30.9 34.5 34.3 31.3 31.6 31.1 31.0 31.1 30.4 27.4
Minimum Temperature at Sayaboury (Monthly Average) (unit: oC)Year Jan. Feb. Mar. Apr. May Jun. Jul. Aug. Sep. Oct. Nov. Dec.
1999 14.6 15.2 16.9 22.9 23.4 24.0 24.4 23.6 23.4 21.7 18.8 11.82000 13.5 14.8 16.4 21.6 23.1 24.1 23.7 23.7 22.6 21.7 16.9 15.72001 15.2 15.1 20.0 22.5 23.4 23.9 24.0 24.0 23.2 22.6 15.8 16.32002 14.1 16.6 18.7 20.8 23.5 24.5 24.2 24.0 23.3 21.0 19.0 18.12003 15.7 16.4 18.2 21.9 23.5 24.0 23.8 24.1 23.4 22.2 17.4 13.8
Mean Temperature at Sayaboury (Monthly Average) (unit: oC)Year Jan. Feb. Mar. Apr. May Jun. Jul. Aug. Sep. Oct. Nov. Dec.
1999 20.7 22.9 25.3 26.7 26.2 26.6 27.3 26.0 25.9 24.8 22.7 16.82000 19.9 20.7 23.7 26.4 25.9 27.1 26.6 26.6 25.3 25.2 21.5 20.62001 21.3 22.5 24.3 28.0 26.1 26.9 26.3 26.6 26.2 25.7 20.8 20.62002 19.4 22.6 24.8 27.0 26.9 27.8 26.7 26.8 26.8 24.7 22.5 21.62003 19.9 21.6 23.5 27.0 27.9 27.2 27.0 27.0 26.2 25.9 22.7 19.0
Source: Department of Meteorology, Ministry of Agriculture and Forestry
Table V8-1 Meteorological Data (Natak)
V8-T-1
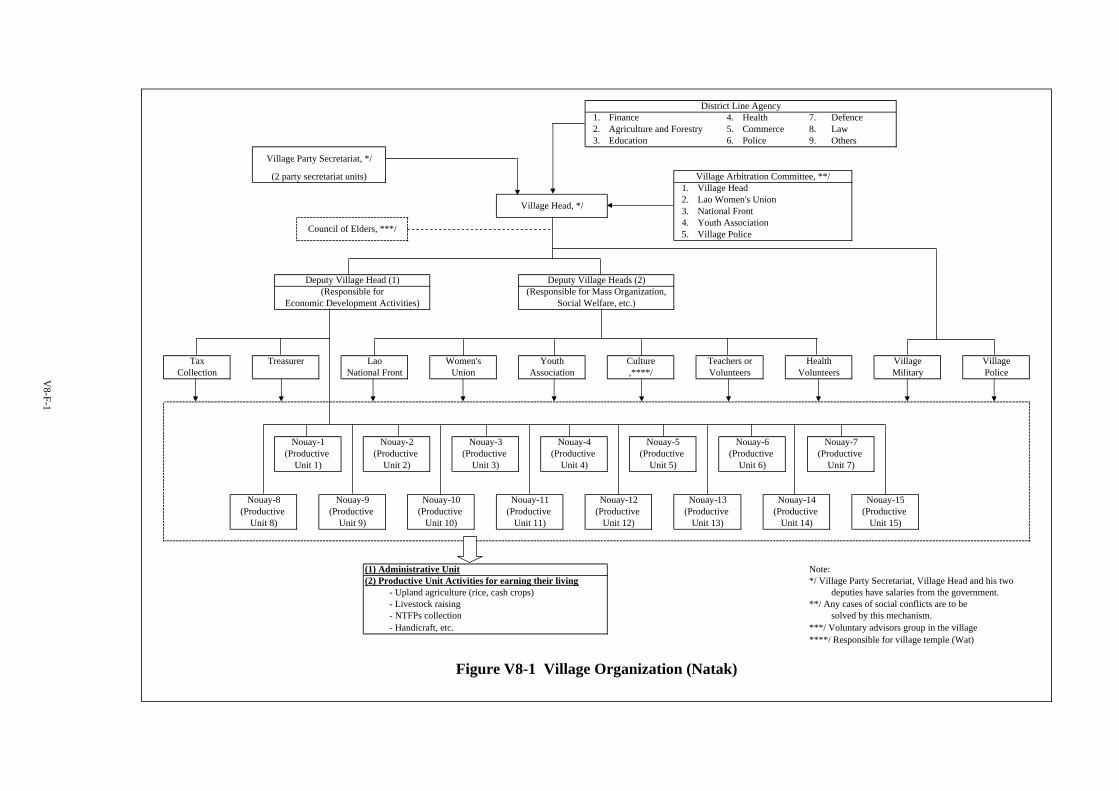
1. Finance 4. Health 7. Defence2. Agriculture and Forestry 5. Commerce 8. Law3. Education 6. Police 9. Others
1. Village Head2. Lao Women's Union3. National Front 4. Youth Association5. Village Police
Note: (2) Productive Unit Activities for earning their living */ Village Party Secretariat, Village Head and his two
- Upland agriculture (rice, cash crops) deputies have salaries from the government.- Livestock raising **/ Any cases of social conflicts are to be- NTFPs collection solved by this mechanism.- Handicraft, etc. ***/ Voluntary advisors group in the village
****/ Responsible for village temple (Wat)
V8-F-1
(2 party secretariat units)
Nouay-6(Productive
Unit 6)
Nouay-5(Productive
Unit 5)
Nouay-3(Productive
Nouay-7(Productive
Unit 7)Unit 3)
Nouay-4(Productive
Unit 4)
Nouay-14(Productive
Unit 14)
Nouay-15(Productive
Unit 15)
TaxCollection
District Line Agency
Treasurer Village
Village Party Secretariat, */
Military
Village Arbitration Committee, **/
Council of Elders, ***/
Volunteers Police
(1) Administrative Unit
Deputy Village Heads (2)(Responsible for Mass Organization,
Lao
Economic Development Activities) Social Welfare, etc.)
Teachers orAssociation
Village
Deputy Village Head (1)(Responsible for
YouthWomen's Culture Health
Figure V8-1 Village Organization (Natak)
Unit 11)(Productive
Unit 13)(Productive
Unit 12)(Productive
Unit 9)(Productive
Unit 10)(Productive
Unit 8)
,****/ Volunteers
Nouay-11(Productive
National Front Union
Nouay-8
Unit 2)
Village Head, */
Nouay-13Nouay-12Nouay-9 Nouay-10
Nouay-1(Productive
Unit 1)
Nouay-2(Productive
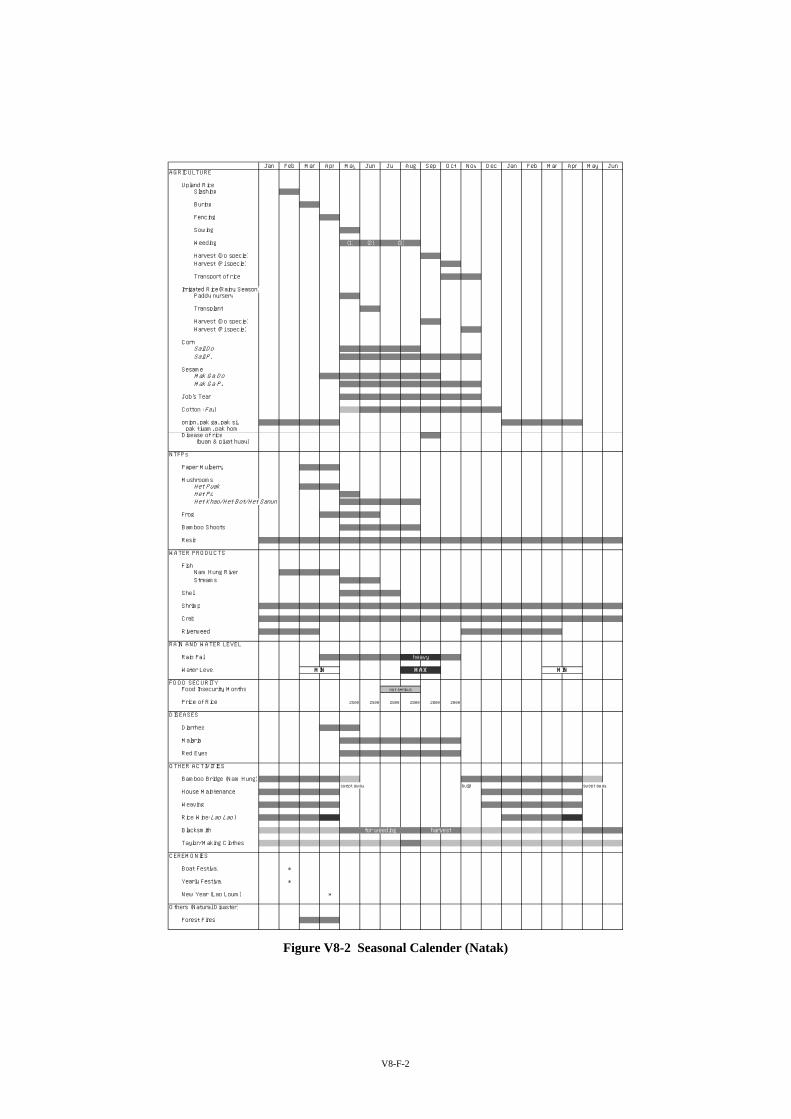
Jan Feb Mar Apr May Jun Jul Aug Sep Oct Nov Dec Jan Feb Mar Apr May JunAGRICULTURE
Upland RiceSlashing
Buring
Fencing
Sowing
Weeding (1) (2)
Harvest (Do specie)Harvest (Pi specie)
Transport of rice
Irrigated Rice(Rainy Season)Paddy nursery
Transplant
Harvest (Do specie)Harvest (Pi specie)
CornSali DoSali Pi
SesameMak Ga DoMak Ga Pi
Job's Tear
Cotton (Fai )
onion, pak ga, pak si, pak tiyam, pak homDisease of rice (buan & piyat huay)
NTFPs
Paper Mulberry
MushroomsHet PuakHet PoHet Khao/Het Bot/Het Sanun
Frog
Bamboo Shoots
Resin
WATER PRODUCTS
FishNam Hung RiverStreams
Shell
Shrimp
Crab
Riverweed
RAIN AND WATER LEVEL
Rain Fall
Water Level
FOOD SECURITYFood Insecurity Months
Price of Rice 2500 2500 2800 2800 2800 2000
DISEASES
Diarrhea
Malaria
Red Eyes
OTHER ACTIVITIES
Bamboo Bridge (Nam Hung)swept away build swept away
House Maintenance
Weaving
Rice Wine(Lao Lao )
Blacksmith
Taylor/Making Clothes
CEREMONIES
Boat Festival *
Yearly Festival *
New Year (Lao Loum) *
Others (Natural Disaster)
Forest Fires
(3)
MIN MINMAX
heavy
Figure V8-2 Seasonal Calender (Natak)
for weeding harvest
not serious
V8-F-2
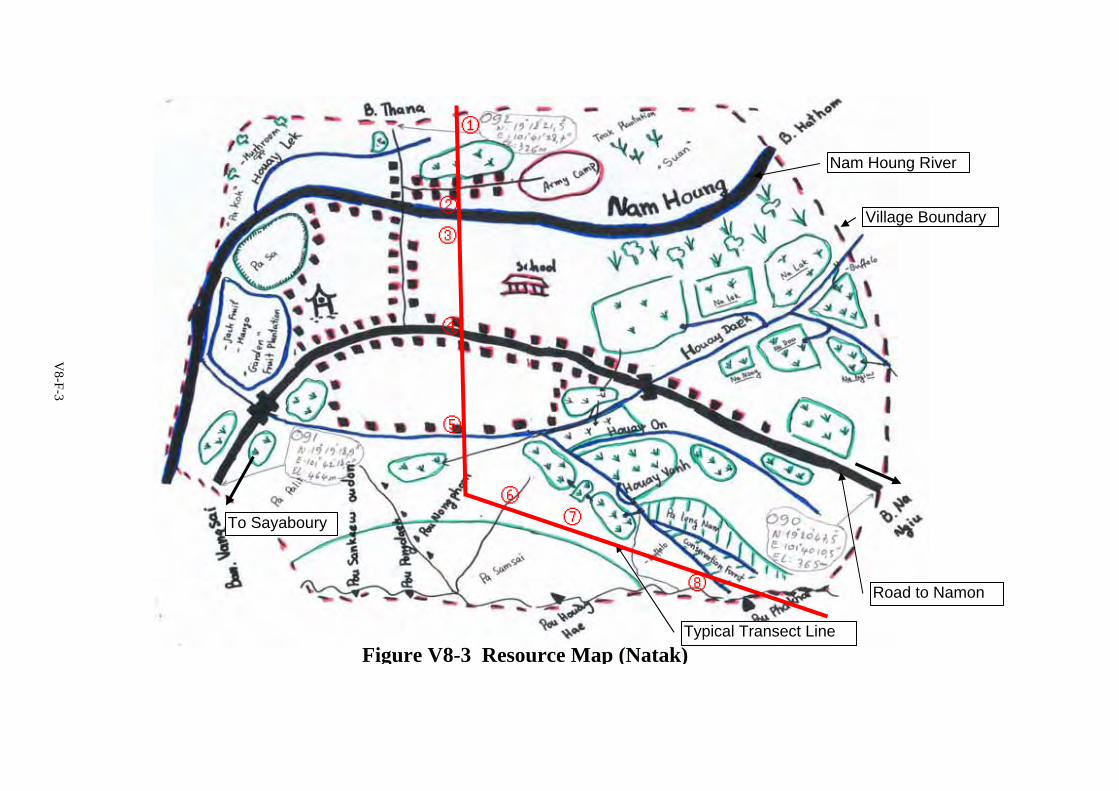
V8-F-3
Road to Namon
Nam Houng River
①
②
③
⑤
④
Typical Transect LineFigure V8-3 Resource Map (Natak)
⑥⑦
⑧
Village Boundary
To Sayaboury
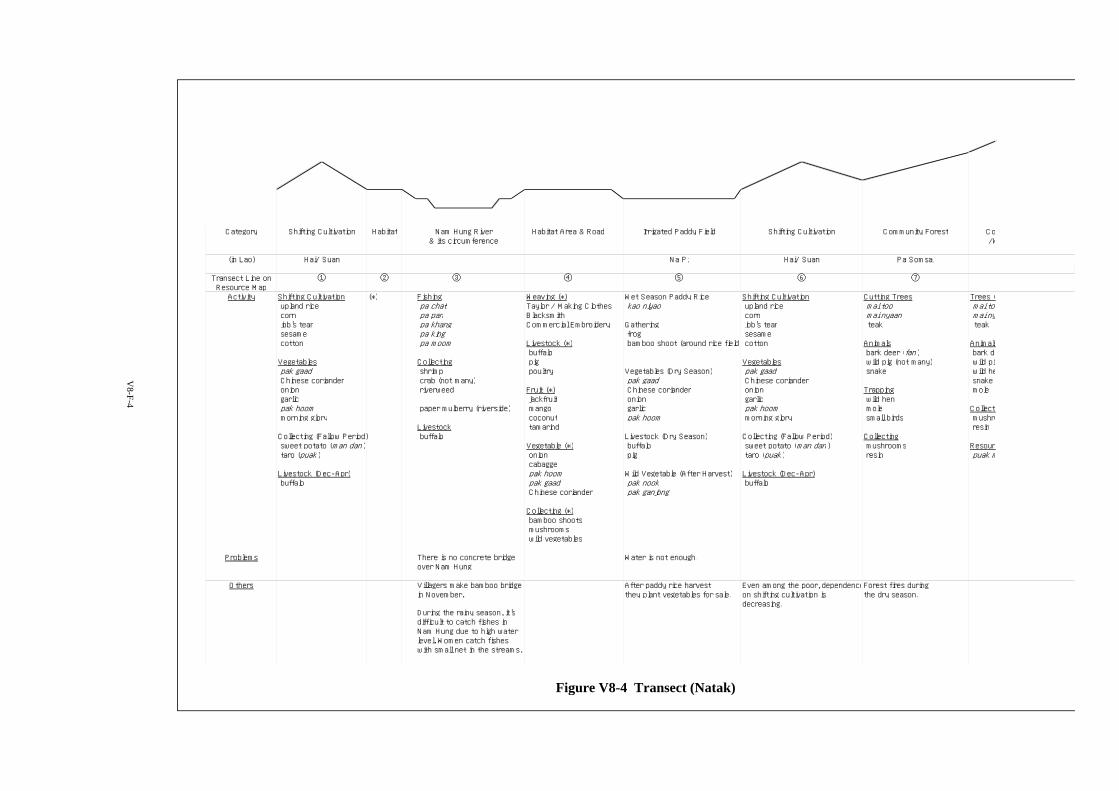
Category Habitat Habitat Area & Road Irrigated Paddy Field Community Forest Co/W
(in Lao) Na Pi Pa Somsai/
Transect Line on ② ④ ⑤ ⑦Resource MapActivity Shifting Cultivation (*) Fishing Weaving (*) Wet Season Paddy Rice Shifting Cultivation Cutting Trees Trees (
upland rice pa chat Taylor / Making Clothes kao niyao upland rice mai too mai too corn pa pan Blacksmith corn mai nyaan mai ny job's tear pa khang Commercial Embroidery Gathering job's tear teak teak sesame pa king frog sesame cotton pa moom Livestock (*) bamboo shoot (around rice field) cotton Animals Animals
buffalo bark deer (fan ) bark deVegetables Collecting pig Vegetables wild pig (not many) wild pig pak gaad shrimp poultry Vegetables (Dry Season) pak gaad snake wild he Chinese coriander crab (not many) pak gaad Chinese coriander snake onion riverweed Fruit (*) Chinese coriander onion Trapping mole garlic jackfruit onion garlic wild hen pak hoom paper mulberry (riverside) mango garlic pak hoom mole Collecti morning glory coconut pak hoom morning glory small birds mushro
Livestock tamarind resinCollecting (Fallow Period) buffalo Livestock (Dry Season) Collecting (Fallow Period) Collecting sweet potato (man dan ) Vegetable (*) buffalo sweet potato (man dan ) mushrooms Resourc taro (puak ) onion pig taro (puak ) resin puak m
cabaggeLivestock (Dec-Apr) pak hoom Wild Vegetable (After Harvest) Livestock (Dec-Apr) buffalo pak gaad pak nook buffalo
Chinese coriander pak ganjong
Collecting (*) bamboo shoots mushrooms wild vegetables
Problems There is no concrete bridge Water is not enough.over Nam Hung.
Others Villagers make bamboo bridge After paddy rice harvest, Even among the poor, dependenceForest fires during they plant vegetables for sale. on shifting cultivation is the dry season.
decreasing.
V8-F-4
① ③ ⑥
Nam Hung River& its circumference
During the rainy season, it'sdifficult to catch fishes inNam Hung due to high waterlevel. Women catch fisheswith small net in the streams.
Figure V8-4 Transect (Natak)
in November.
Shifting Cultivation
Hai/ Suan
Shifting Cultivation
Hai/ Suan
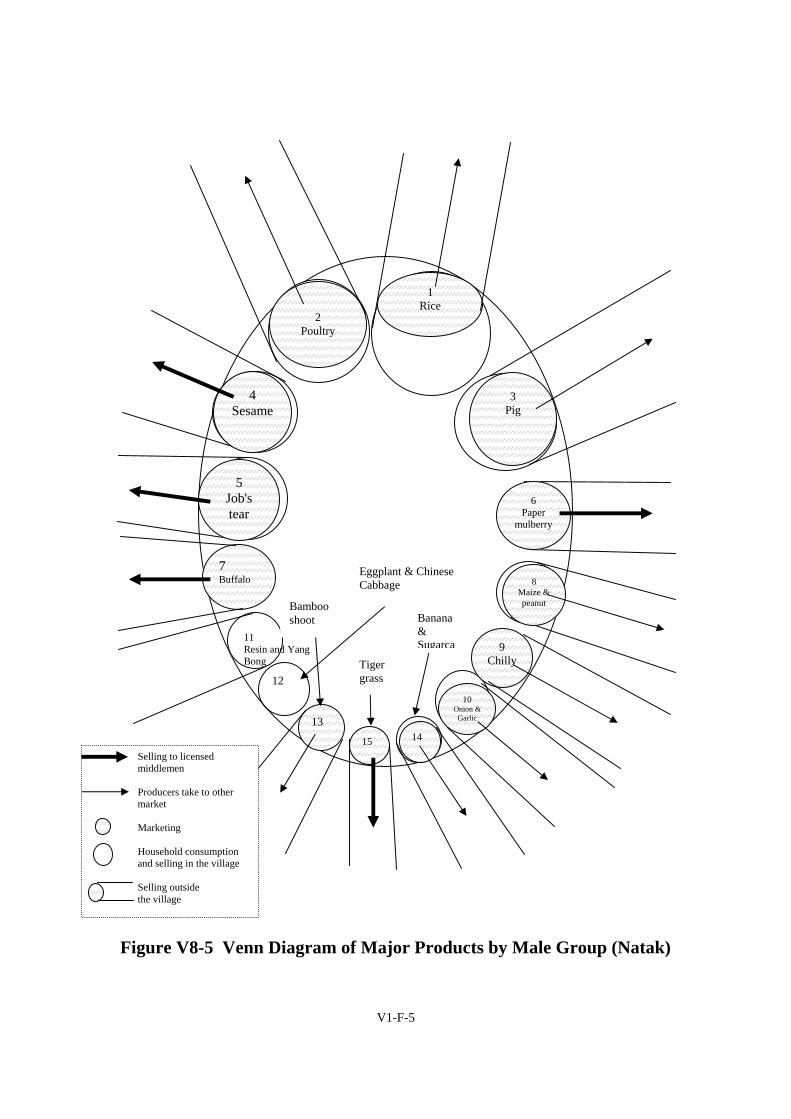
V1-F-5
8
9 Chilly
1 Rice
2 Poultry
4 Sesame
7 Buffalo
15
13
10 Onion &
Garlic
12
11 Resin and Yang Bong
14
3 Pig
6 Paper
mulberry
4 Sesame
5 Job's tear
8 Maize & peanut
14
Eggplant & Chinese Cabbage
Bamboo shoot
Tiger grass
Banana & Sugarca
Selling to licensed middlemen
Producers take to other market
Marketing Household consumption and selling in the village Selling outside the village
Figure V8-5 Venn Diagram of Major Products by Male Group (Natak)
V1-F-5
3 Paper
mulberry
7 Poultry
1 Rice
5 Buffalo
2 Sesame
4 Job’s tear
6 Pig
8 Corn
9 Yang Bong
10Tige
r
11Resi
12 Vegetable
13 Fruits
16 Weavin
g
14 Fish
Shrimp
15 Kapok
17 Cotton
Selling to licensed middlemen
Producers take to other market
Marketing Household consumption and selling in the village Selling outside the village
Figure V8-6 Venn Diagram of Major Products by Female Group (Natak)
V8-F-7
Figure V8-7 Social Map (Natak)
Legend Over Sufficient Sufficient Under Sufficient Gravityfed Water Supply Household Interviewee1 2 n
Tables
NanPakseng Hat Houay Samton Vangheung Pongdong Namtiao Namon Natak
Apr 22-24 Apr 25-27 Apr 29-May 01 May 02-04 May06-08 May 10-12 May 13-15 May 17-19Household 129 90 77 54 102 59 247 227Population 715 493 471 292 526 417 1,553 1,275
Lao Loum: 49% Lao Loum: 23% Lao Loum: 0.08% Lao Loum: 81% Lao Loum: 100% Lao Loum: 0% Lao Loum: 93% Lao Loum: 94.4%Ethnic group Lao Theung: 51% Lao Theung: 77% Lao Theung: 99.92% Lao Theung: 19% Lao Theung: 0% Lao Theung: 0% Lao Theung: 6.8% Lao Theung: 5.3%
Lao Sung: 0% Lao Sung: 0% Lao Sung: 0.00% Lao Sung: 0% Lao Sung: 0% Lao Sung: 100% Lao Sung: 0.2% Lao Sung: 0.3%
History
The village was builtmore than 100 yearsago. Two villagesware combined in1975.
The village was builtin 1846. In 2001,Houay Ouang villagemerged into thevillage.
After constructing ofNational Road No.1,8 householdsmigrated the village.In middle of 1980'smany householdsmigrated.
The village was builtin 1971. In 1981-82,the villagers stoppedaccepting newcomers.
The village was built90 years ago. Sincethen, no significantmigration was done.
In 1990, 5 familiesmoved from HouayKen (Sayabourydist.). In 1994, theyestablished newvillage at presentlocation and havebeen accepting a fewnew comers everyyear.
The village was builtin1530 by 3 families.100 years ago, acanal wasconstructed for fireprevention and isused for irrigationnow. Since 1997,Lao Theung fromPakseng migrated tothe village.
The village was builtin 1887. In 1960s,the total householdnumber was only 20-30 HHs. AfterSayaboury-Hong Saroad was constructedin 1995, migrationinto the villagebegan and still isgoing on.
Villageorganizationother thanformal one
none Water managementunit, Farmers'organization, Villagefinancialorganization..
Water managementunit, Forestmanagement unit,Farmersmanagement unit.
Forest managementunit, Farmers'management unit.
Water managementunit, Forestmanagement unit.
Water managementunit.
A village firefighting organizationwith 53 members.
Water managementunit, Rice fieldowners groups.
Topography
The village is locatedat the confluence oftwo rivers. Thehabitat area issurrounded bymountains, theelevation of which isaround 350 m a.s.l.There is no paddyfiled.
The village issurrounded bymountains. There aretwo paddy fieldareas. The main roadand Nam Suang rivercross southeast of thevillage. The habitatarea is located inaround 320 m a.s.l.
The habitat area islocated in around800 m a.s.l. alongNational Road No.1.Two streams flowthrough the bottomof valleys parallel tothe habitat area.
The habitat area ison the Nam Sengriver bank, witharound 430 m a.s.l.Nam Seng river andHouay Noy streamflow from north tosouth through thevillage. There is alittle flat land alongHouay Noy stream,which can bedevelop as lowlandpaddy field.
The village is locatedin mountainous area.The habitat area islocated along Road4-A with around 580m of a.s.l. Houay Fastream and Pongongstream have waterthroughout the year.Some rive fields arelocated along therivers.
The village is locatedin steep mountainswith deep forest andcovers huge area.The elevation of thehabitat area is around390 m a.s.l. RoadSayaboury-Hong Sagoes through thevillage and Nam Metriver runs along.
The village issurrounded bymountain range.Nam Ping river andtwo streams flowthrough habitat area.Irrigated rice fieldsspread along therivers. The habitatarea is located ataround 520 m a.s.l.
The village is locatedin basin surroundedrelatively lo hills andmountains. A bigriver Nam Hung runsthrough the villageand paddy fieldspreads along it. Thehabitat are is locatedat around 360 ma.s.l.
Total Area(ha)
1,890 (PAFO) 2,912 (PAFO) 1,335 (PAFO) 494 (PAFO) 278 (PAFO) Not available 2,775 (DAFO) 6,327 (DAFO)
AgriculturalLand (ha)
400 (PAFO) 250 (PAFO) 223 (PAFO) 138 (PAFO) 106 (PAFO) 70 (DAFO) 293 (DAFO) 266 (DAFO)
Forest Land(ha)
1,480 (PAFO) 2,652 (PAFO) 1,012 (PAFO) 356 (PAFO) 169 (PAFO) Not available 2,482 (DAFO) 6,061 (DAFO)
Survey Date
Table 1 Summary of Village Profile for 8 Candidate Villages (1/2)ProvinceDistrictVillage
Luangprabang XayabouryXayaboury
T-1
Soci
al D
ata
Land
Pakseng Viengkham
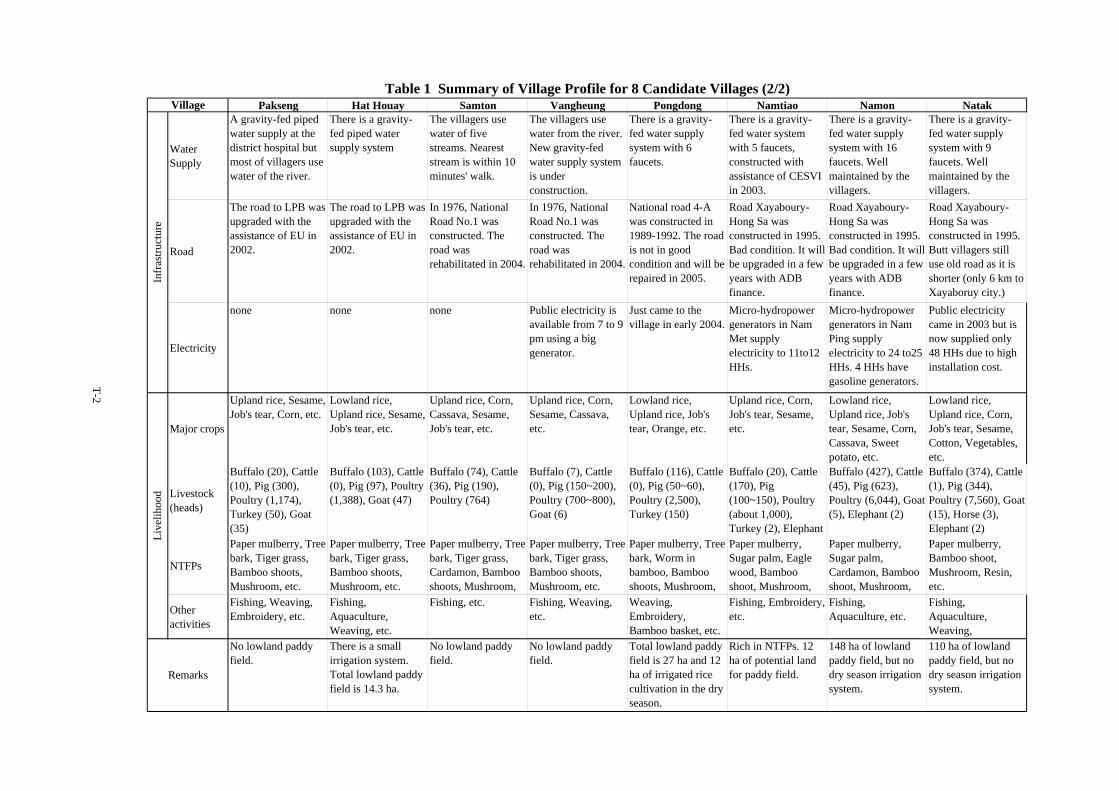
Pakseng Hat Houay Samton Vangheung Pongdong Namtiao Namon Natak
WaterSupply
A gravity-fed pipedwater supply at thedistrict hospital butmost of villagers usewater of the river.
There is a gravity-fed piped watersupply system
The villagers usewater of fivestreams. Neareststream is within 10minutes' walk.
The villagers usewater from the river.New gravity-fedwater supply systemis underconstruction.
There is a gravity-fed water supplysystem with 6faucets.
There is a gravity-fed water systemwith 5 faucets,constructed withassistance of CESVIin 2003.
There is a gravity-fed water supplysystem with 16faucets. Wellmaintained by thevillagers.
There is a gravity-fed water supplysystem with 9faucets. Wellmaintained by thevillagers.
Road
The road to LPB wasupgraded with theassistance of EU in2002.
The road to LPB wasupgraded with theassistance of EU in2002.
In 1976, NationalRoad No.1 wasconstructed. Theroad wasrehabilitated in 2004.
In 1976, NationalRoad No.1 wasconstructed. Theroad wasrehabilitated in 2004.
National road 4-Awas constructed in1989-1992. The roadis not in goodcondition and will berepaired in 2005.
Road Xayaboury-Hong Sa wasconstructed in 1995.Bad condition. It willbe upgraded in a fewyears with ADBfinance.
Road Xayaboury-Hong Sa wasconstructed in 1995.Bad condition. It willbe upgraded in a fewyears with ADBfinance.
Road Xayaboury-Hong Sa wasconstructed in 1995.Butt villagers stilluse old road as it isshorter (only 6 km toXayaboruy city.)
Electricity
none none none Public electricity isavailable from 7 to 9pm using a biggenerator.
Just came to thevillage in early 2004.
Micro-hydropowergenerators in NamMet supplyelectricity to 11to12HHs.
Micro-hydropowergenerators in NamPing supplyelectricity to 24 to25HHs. 4 HHs havegasoline generators.
Public electricitycame in 2003 but isnow supplied only48 HHs due to highinstallation cost.
Major crops
Upland rice, Sesame,Job's tear, Corn, etc.
Lowland rice,Upland rice, Sesame,Job's tear, etc.
Upland rice, Corn,Cassava, Sesame,Job's tear, etc.
Upland rice, Corn,Sesame, Cassava,etc.
Lowland rice,Upland rice, Job'stear, Orange, etc.
Upland rice, Corn,Job's tear, Sesame,etc.
Lowland rice,Upland rice, Job'stear, Sesame, Corn,Cassava, Sweetpotato, etc.
Lowland rice,Upland rice, Corn,Job's tear, Sesame,Cotton, Vegetables,etc.
Livestock(heads)
Buffalo (20), Cattle(10), Pig (300),Poultry (1,174),Turkey (50), Goat(35)
Buffalo (103), Cattle(0), Pig (97), Poultry(1,388), Goat (47)
Buffalo (74), Cattle(36), Pig (190),Poultry (764)
Buffalo (7), Cattle(0), Pig (150~200),Poultry (700~800),Goat (6)
Buffalo (116), Cattle(0), Pig (50~60),Poultry (2,500),Turkey (150)
Buffalo (20), Cattle(170), Pig(100~150), Poultry(about 1,000),Turkey (2), Elephant
Buffalo (427), Cattle(45), Pig (623),Poultry (6,044), Goat(5), Elephant (2)
Buffalo (374), Cattle(1), Pig (344),Poultry (7,560), Goat(15), Horse (3),Elephant (2)
NTFPs
Paper mulberry, Treebark, Tiger grass,Bamboo shoots,Mushroom, etc.
Paper mulberry, Treebark, Tiger grass,Bamboo shoots,Mushroom, etc.
Paper mulberry, Treebark, Tiger grass,Cardamon, Bambooshoots, Mushroom,
Paper mulberry, Treebark, Tiger grass,Bamboo shoots,Mushroom, etc.
Paper mulberry, Treebark, Worm inbamboo, Bambooshoots, Mushroom,
Paper mulberry,Sugar palm, Eaglewood, Bambooshoot, Mushroom,
Paper mulberry,Sugar palm,Cardamon, Bambooshoot, Mushroom,
Paper mulberry,Bamboo shoot,Mushroom, Resin,etc.
Otheractivities
Fishing, Weaving,Embroidery, etc.
Fishing,Aquaculture,Weaving, etc.
Fishing, etc. Fishing, Weaving,etc.
Weaving,Embroidery,Bamboo basket, etc.
Fishing, Embroidery,etc.
Fishing,Aquaculture, etc.
Fishing,Aquaculture,Weaving,
No lowland paddyfield.
There is a smallirrigation system.Total lowland paddyfield is 14.3 ha.
No lowland paddyfield.
No lowland paddyfield.
Total lowland paddyfield is 27 ha and 12ha of irrigated ricecultivation in the dryseason.
Rich in NTFPs. 12ha of potential landfor paddy field.
148 ha of lowlandpaddy field, but nodry season irrigationsystem.
110 ha of lowlandpaddy field, but nodry season irrigationsystem.
Live
lihoo
d
T-2
VillageTable 1 Summary of Village Profile for 8 Candidate Villages (2/2)
Infr
astru
ctur
e
Remarks
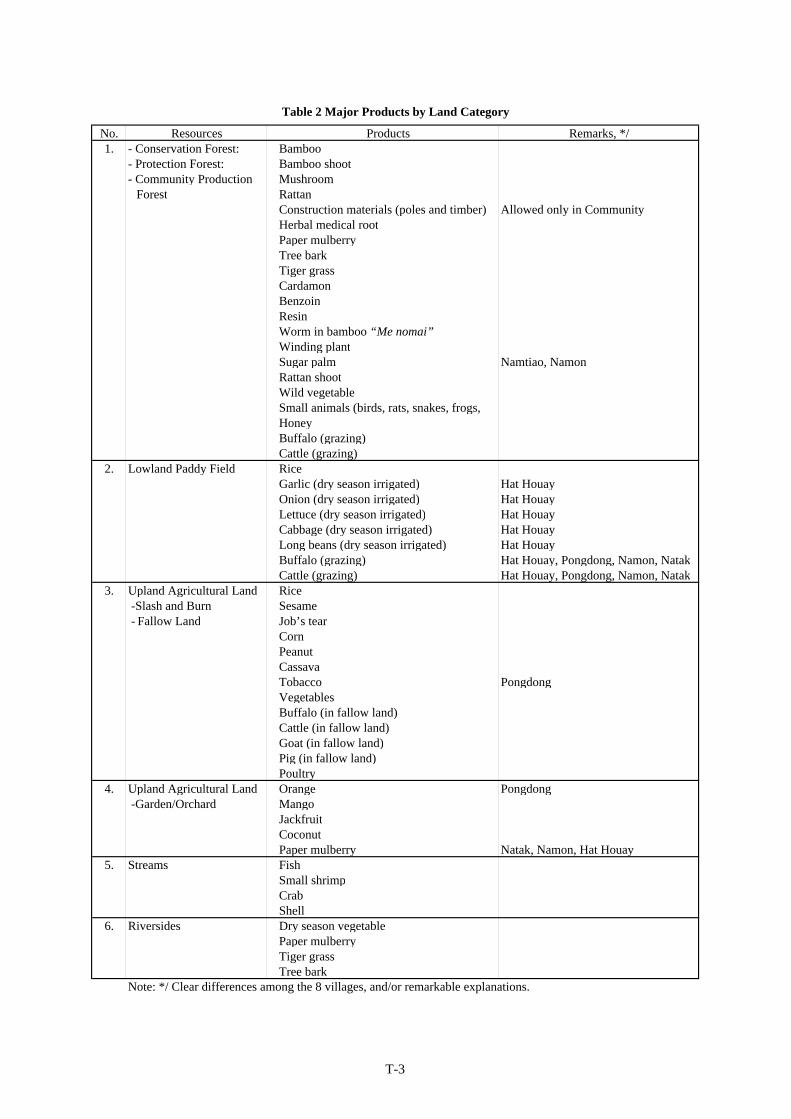
No. Resources Products Remarks, */1. - Conservation Forest: Bamboo
- Protection Forest: Bamboo shoot- Community Production Mushroom Forest Rattan
Construction materials (poles and timber) Allowed only in CommunityHerbal medical rootPaper mulberryTree barkTiger grassCardamonBenzoinResinWorm in bamboo “Me nomai”Winding plantSugar palm Namtiao, NamonRattan shootWild vegetableSmall animals (birds, rats, snakes, frogs,HoneyBuffalo (grazing)Cattle (grazing)
2. Lowland Paddy Field RiceGarlic (dry season irrigated) Hat HouayOnion (dry season irrigated) Hat HouayLettuce (dry season irrigated) Hat HouayCabbage (dry season irrigated) Hat HouayLong beans (dry season irrigated) Hat HouayBuffalo (grazing) Hat Houay, Pongdong, Namon, NatakCattle (grazing) Hat Houay, Pongdong, Namon, Natak
3. Upland Agricultural Land Rice -Slash and Burn Sesame - Fallow Land Job’s tear
CornPeanutCassavaTobacco PongdongVegetablesBuffalo (in fallow land)Cattle (in fallow land)Goat (in fallow land)Pig (in fallow land)Poultry
4. Upland Agricultural Land Orange Pongdong -Garden/Orchard Mango
JackfruitCoconutPaper mulberry Natak, Namon, Hat Houay
5. Streams FishSmall shrimpCrabShell
6. Riversides Dry season vegetablePaper mulberryTiger grassTree bark
Note: */ Clear differences among the 8 villages, and/or remarkable explanations.
Table 2 Major Products by Land Category
T-3
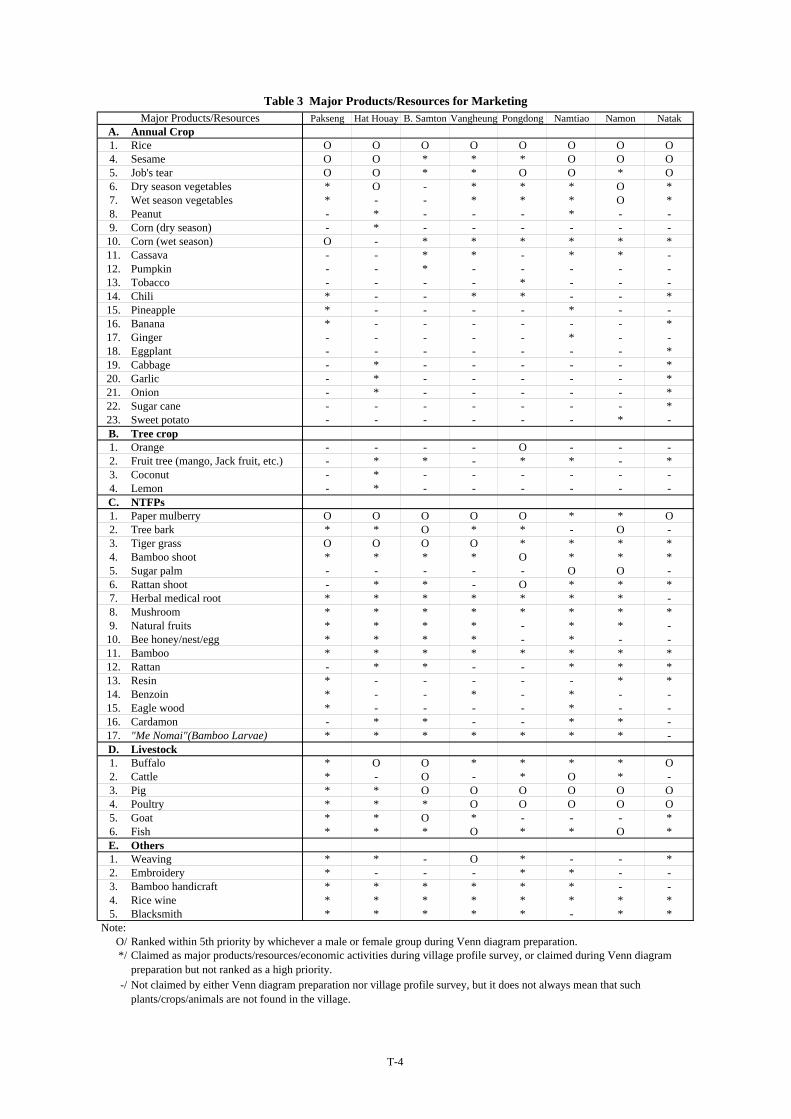
Pakseng Hat Houay B. Samton Vangheung Pongdong Namtiao Namon NatakA. Annual Crop1. Rice O O O O O O O O4. Sesame O O * * * O O O5. Job's tear O O * * O O * O6. Dry season vegetables * O - * * * O *7. Wet season vegetables * - - * * * O *8. Peanut - * - - - * - -9. Corn (dry season) - * - - - - - -10. Corn (wet season) O - * * * * * *11. Cassava - - * * - * * -12. Pumpkin - - * - - - - -13. Tobacco - - - - * - - -14. Chili * - - * * - - *15. Pineapple * - - - - * - -16. Banana * - - - - - - *17. Ginger - - - - - * - -18. Eggplant - - - - - - - *19. Cabbage - * - - - - - *20. Garlic - * - - - - - *21. Onion - * - - - - - *22. Sugar cane - - - - - - - *23. Sweet potato - - - - - - * -B. Tree crop1. Orange - - - - O - - -2. Fruit tree (mango, Jack fruit, etc.) - * * - * * - *3. Coconut - * - - - - - -4. Lemon - * - - - - - -C. NTFPs1. Paper mulberry O O O O O * * O2. Tree bark * * O * * - O -3. Tiger grass O O O O * * * *4. Bamboo shoot * * * * O * * *5. Sugar palm - - - - - O O -6. Rattan shoot - * * - O * * *7. Herbal medical root * * * * * * * -8. Mushroom * * * * * * * *9. Natural fruits * * * * - * * -10. Bee honey/nest/egg * * * * - * - -11. Bamboo * * * * * * * *12. Rattan - * * - - * * *13. Resin * - - - - - * *14. Benzoin * - - * - * - -15. Eagle wood * - - - - * - -16. Cardamon - * * - - * * -17. "Me Nomai"(Bamboo Larvae) * * * * * * * -D. Livestock1. Buffalo * O O * * * * O2. Cattle * - O - * O * -3. Pig * * O O O O O O4. Poultry * * * O O O O O5. Goat * * O * - - - *6. Fish * * * O * * O *E. Others1. Weaving * * - O * - - *2. Embroidery * - - - * * - -3. Bamboo handicraft * * * * * * - -4. Rice wine * * * * * * * *5. Blacksmith * * * * * - * *
Note:O/*/
-/
Claimed as major products/resources/economic activities during village profile survey, or claimed during Venn diagrampreparation but not ranked as a high priority.
Major Products/Resources
Not claimed by either Venn diagram preparation nor village profile survey, but it does not always mean that suchplants/crops/animals are not found in the village.
Table 3 Major Products/Resources for Marketing
Ranked within 5th priority by whichever a male or female group during Venn diagram preparation.
T-4
Attachment-1: Questionnaire Formfor Household Interview Survey
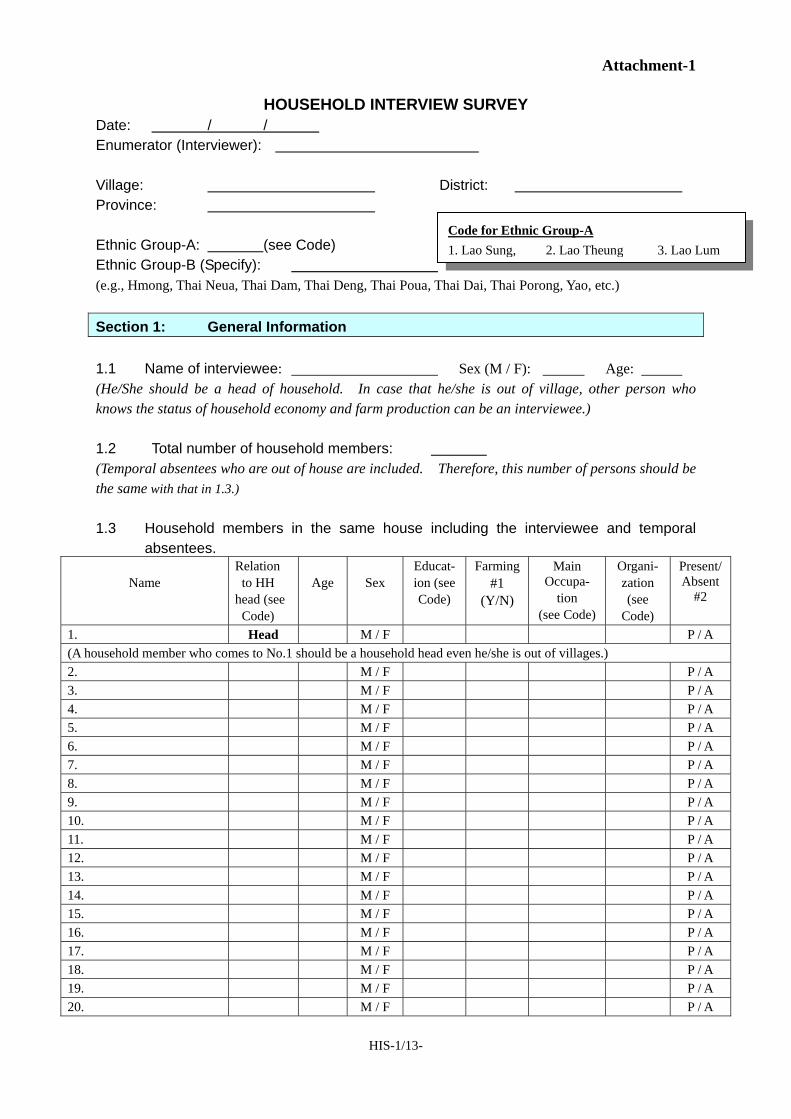
Attachment-1
HIS-1/13-
HOUSEHOLD INTERVIEW SURVEY Date: / / Enumerator (Interviewer): Village: District: Province: Ethnic Group-A: (see Code) Ethnic Group-B (Specify): (e.g., Hmong, Thai Neua, Thai Dam, Thai Deng, Thai Poua, Thai Dai, Thai Porong, Yao, etc.) Section 1: General Information 1.1 Name of interviewee: Sex (M / F): Age: (He/She should be a head of household. In case that he/she is out of village, other person who knows the status of household economy and farm production can be an interviewee.) 1.2 Total number of household members: (Temporal absentees who are out of house are included. Therefore, this number of persons should be the same with that in 1.3.) 1.3 Household members in the same house including the interviewee and temporal
absentees.
Name Relation to HH head (see Code)
Age
Sex
Educat-ion (seeCode)
Farming#1
(Y/N)
Main Occupa-
tion (see Code)
Organi-zation (see
Code)
Present/ Absent
#2
1. Head M / F P / A (A household member who comes to No.1 should be a household head even he/she is out of villages.) 2. M / F P / A 3. M / F P / A 4. M / F P / A 5. M / F P / A 6. M / F P / A 7. M / F P / A 8. M / F P / A 9. M / F P / A 10. M / F P / A 11. M / F P / A 12. M / F P / A 13. M / F P / A 14. M / F P / A 15. M / F P / A 16. M / F P / A 17. M / F P / A 18. M / F P / A 19. M / F P / A 20. M / F P / A
Code for Ethnic Group-A 1. Lao Sung, 2. Lao Theung 3. Lao Lum
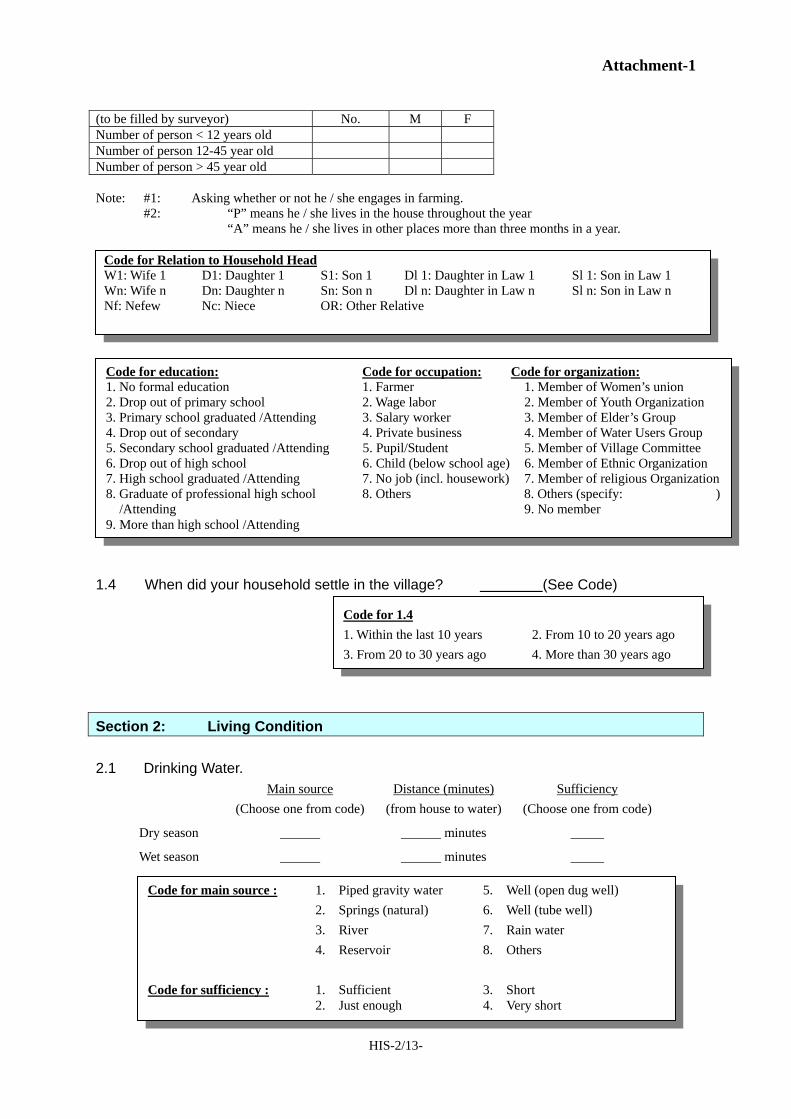
Attachment-1
HIS-2/13-
(to be filled by surveyor) No. M F Number of person < 12 years old Number of person 12-45 year old Number of person > 45 year old Note: #1: Asking whether or not he / she engages in farming. #2: “P” means he / she lives in the house throughout the year “A” means he / she lives in other places more than three months in a year. 1.4 When did your household settle in the village? (See Code) Section 2: Living Condition 2.1 Drinking Water.
Main source (Choose one from code)
Distance (minutes) (from house to water)
Sufficiency (Choose one from code)
Dry season ______ ______ minutes _____
Wet season ______ ______ minutes _____
Code for education: Code for occupation: Code for organization: 1. No formal education 1. Farmer 1. Member of Women’s union 2. Drop out of primary school 2. Wage labor 2. Member of Youth Organization 3. Primary school graduated /Attending 3. Salary worker 3. Member of Elder’s Group 4. Drop out of secondary 4. Private business 4. Member of Water Users Group 5. Secondary school graduated /Attending 5. Pupil/Student 5. Member of Village Committee 6. Drop out of high school 6. Child (below school age) 6. Member of Ethnic Organization 7. High school graduated /Attending 7. No job (incl. housework) 7. Member of religious Organization8. Graduate of professional high school 8. Others 8. Others (specify: ) /Attending 9. No member 9. More than high school /Attending
Code for main source : 1. Piped gravity water 5. Well (open dug well) 2. Springs (natural) 6. Well (tube well) 3. River 7. Rain water 4. Reservoir 8. Others Code for sufficiency : 1. Sufficient 3. Short 2. Just enough 4. Very short
Code for 1.4 1. Within the last 10 years 2. From 10 to 20 years ago 3. From 20 to 30 years ago 4. More than 30 years ago
Code for Relation to Household Head W1: Wife 1 D1: Daughter 1 S1: Son 1 Dl 1: Daughter in Law 1 Sl 1: Son in Law 1 Wn: Wife n Dn: Daughter n Sn: Son n Dl n: Daughter in Law n Sl n: Son in Law n Nf: Nefew Nc: Niece OR: Other Relative
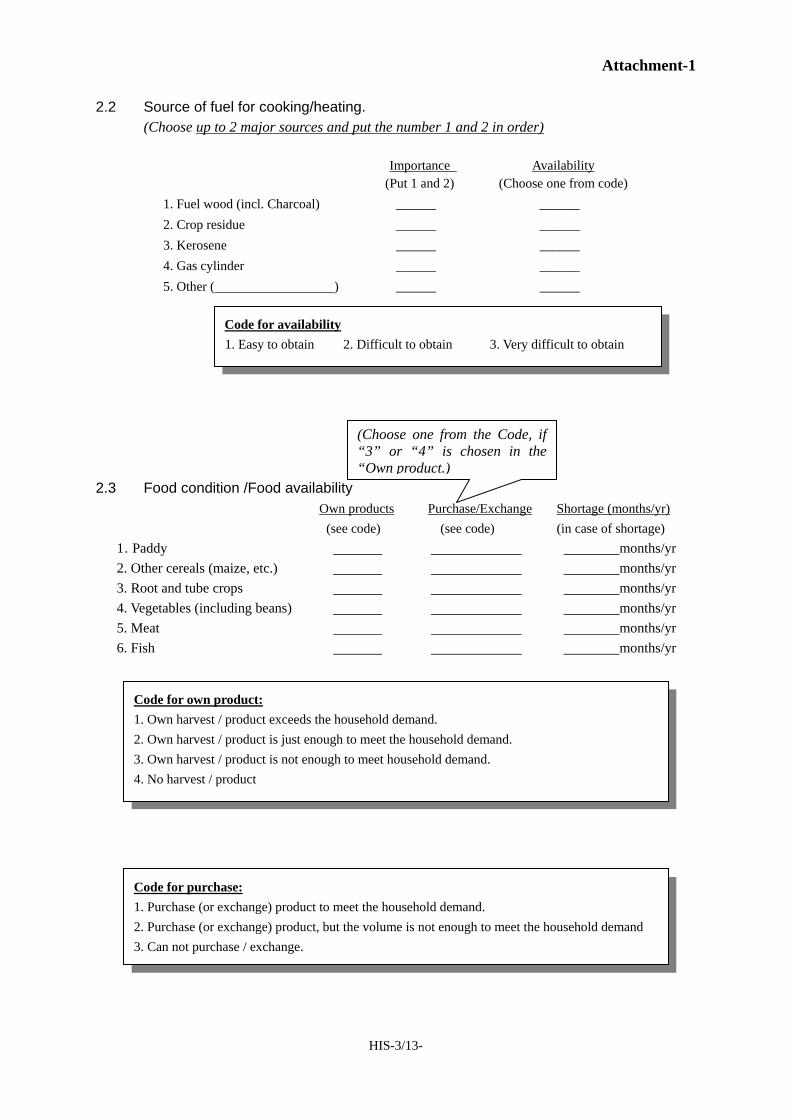
Attachment-1
HIS-3/13-
2.2 Source of fuel for cooking/heating. (Choose up to 2 major sources and put the number 1 and 2 in order)
Importance (Put 1 and 2)
Availability (Choose one from code)
1. Fuel wood (incl. Charcoal) ______ ______ 2. Crop residue ______ ______ 3. Kerosene ______ ______ 4. Gas cylinder ______ ______ 5. Other ( ) ______ ______
2.3 Food condition /Food availability Own products Purchase/Exchange Shortage (months/yr) (see code) (see code) (in case of shortage) 1. Paddy months/yr 2. Other cereals (maize, etc.) months/yr 3. Root and tube crops months/yr 4. Vegetables (including beans) months/yr 5. Meat months/yr 6. Fish months/yr
Code for availability 1. Easy to obtain 2. Difficult to obtain 3. Very difficult to obtain
Code for own product: 1. Own harvest / product exceeds the household demand. 2. Own harvest / product is just enough to meet the household demand. 3. Own harvest / product is not enough to meet household demand. 4. No harvest / product
Code for purchase: 1. Purchase (or exchange) product to meet the household demand. 2. Purchase (or exchange) product, but the volume is not enough to meet the household demand 3. Can not purchase / exchange.
(Choose one from the Code, if “3” or “4” is chosen in the “Own product.)
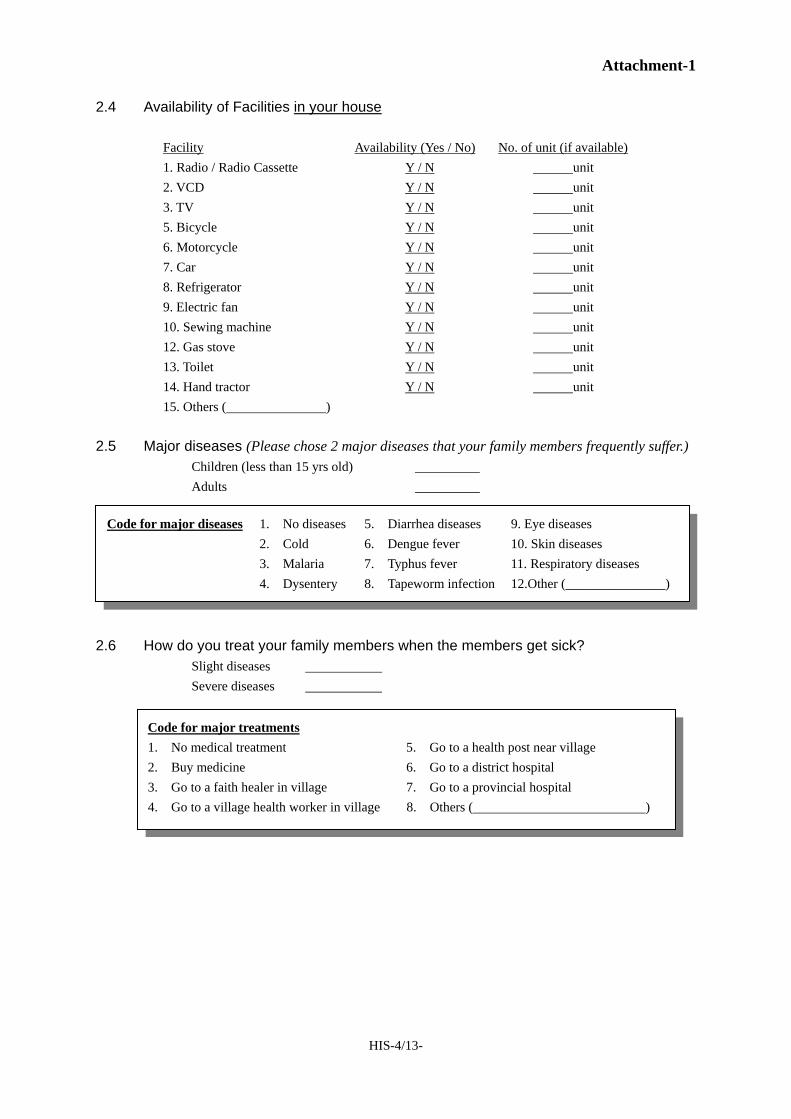
Attachment-1
HIS-4/13-
2.4 Availability of Facilities in your house
Facility Availability (Yes / No) No. of unit (if available) 1. Radio / Radio Cassette Y / N unit 2. VCD Y / N unit 3. TV Y / N unit 5. Bicycle Y / N unit 6. Motorcycle Y / N unit 7. Car Y / N unit 8. Refrigerator Y / N unit 9. Electric fan Y / N unit 10. Sewing machine Y / N unit 12. Gas stove Y / N unit 13. Toilet Y / N unit 14. Hand tractor 15. Others ( )
Y / N unit
2.5 Major diseases (Please chose 2 major diseases that your family members frequently suffer.) Children (less than 15 yrs old) Adults 2.6 How do you treat your family members when the members get sick? Slight diseases Severe diseases
Code for major diseases 1. No diseases 5. Diarrhea diseases 9. Eye diseases 2. Cold 6. Dengue fever 10. Skin diseases 3. Malaria 7. Typhus fever 11. Respiratory diseases 4. Dysentery 8. Tapeworm infection 12.Other (_______________)
Code for major treatments 1. No medical treatment 5. Go to a health post near village 2. Buy medicine 6. Go to a district hospital 3. Go to a faith healer in village 7. Go to a provincial hospital 4. Go to a village health worker in village 8. Others ( )
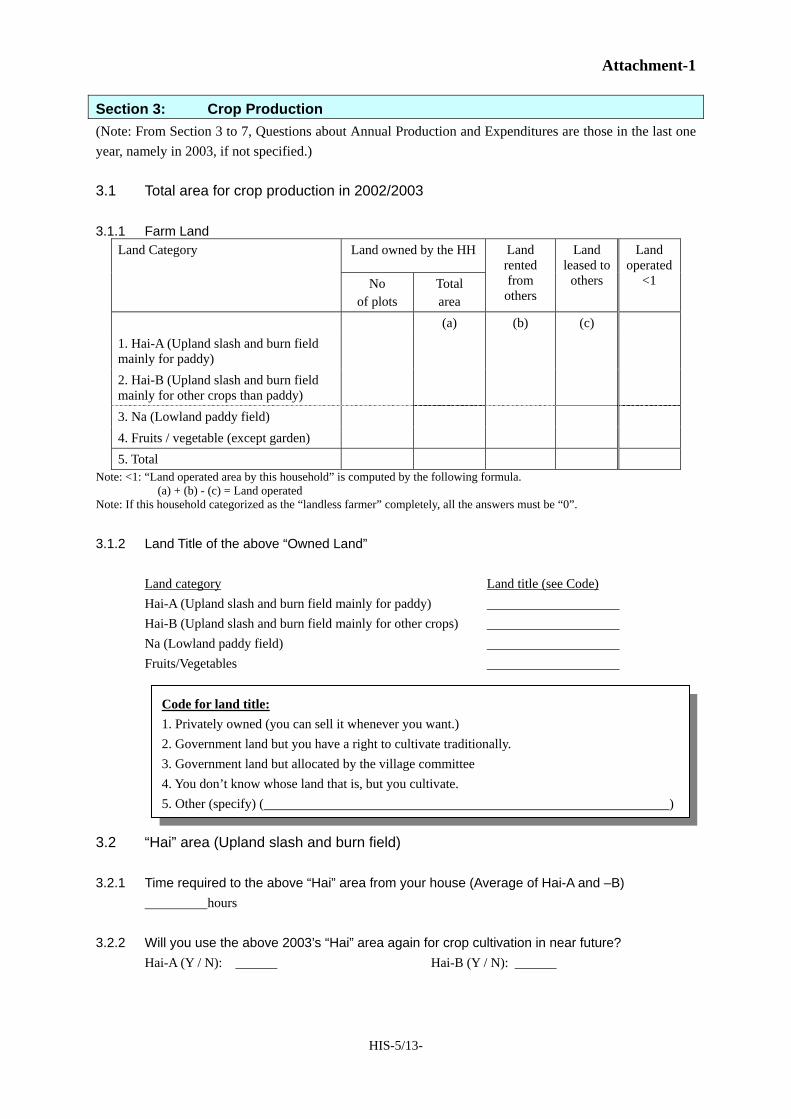
Attachment-1
HIS-5/13-
Section 3: Crop Production (Note: From Section 3 to 7, Questions about Annual Production and Expenditures are those in the last one year, namely in 2003, if not specified.) 3.1 Total area for crop production in 2002/2003 3.1.1 Farm Land
Land owned by the HHLand Category
No of plots
Total area
Land rented from
others
Land leased to
others
Land operated
<1
(a) (b) (c) 1. Hai-A (Upland slash and burn field mainly for paddy)
2. Hai-B (Upland slash and burn field mainly for other crops than paddy)
3. Na (Lowland paddy field) 4. Fruits / vegetable (except garden) 5. Total
Note: <1: “Land operated area by this household” is computed by the following formula. (a) + (b) - (c) = Land operated Note: If this household categorized as the “landless farmer” completely, all the answers must be “0”.
3.1.2 Land Title of the above “Owned Land” Land category Land title (see Code) Hai-A (Upland slash and burn field mainly for paddy) Hai-B (Upland slash and burn field mainly for other crops) Na (Lowland paddy field) Fruits/Vegetables 3.2 “Hai” area (Upland slash and burn field) 3.2.1 Time required to the above “Hai” area from your house (Average of Hai-A and –B) hours 3.2.2 Will you use the above 2003’s “Hai” area again for crop cultivation in near future? Hai-A (Y / N): Hai-B (Y / N):
Code for land title: 1. Privately owned (you can sell it whenever you want.) 2. Government land but you have a right to cultivate traditionally. 3. Government land but allocated by the village committee 4. You don’t know whose land that is, but you cultivate. 5. Other (specify) ( )
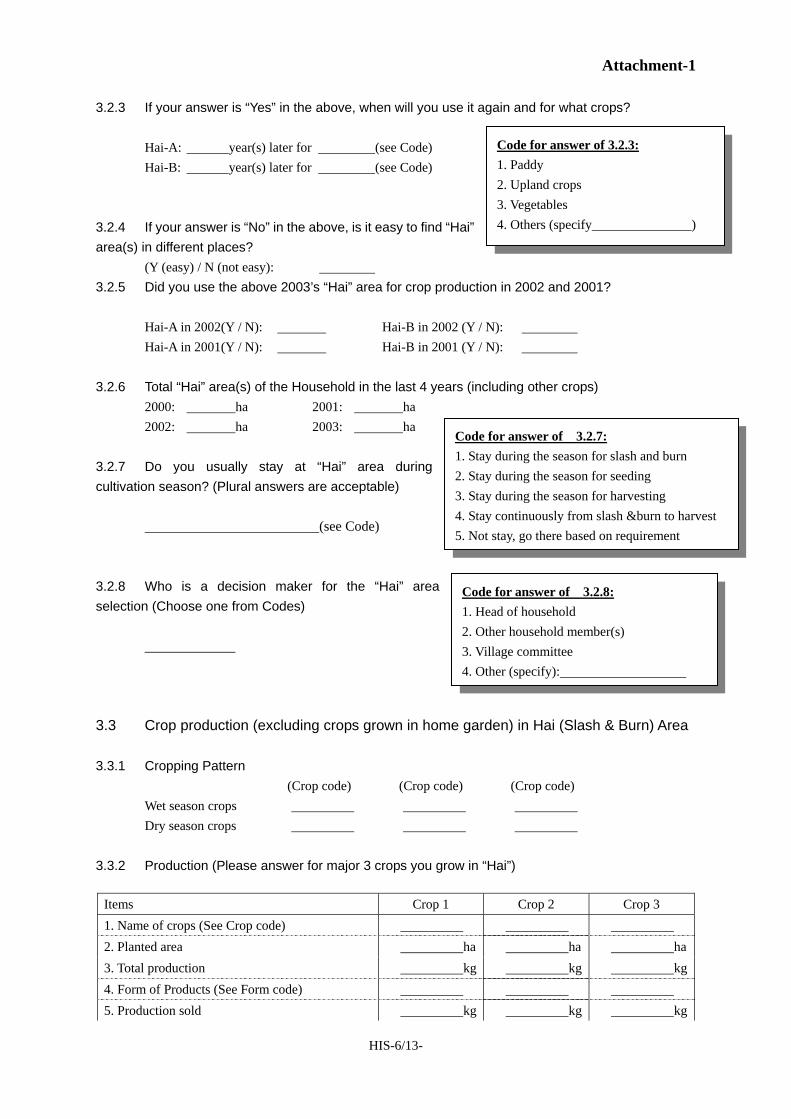
Attachment-1
HIS-6/13-
3.2.3 If your answer is “Yes” in the above, when will you use it again and for what crops? Hai-A: year(s) later for (see Code) Hai-B: year(s) later for (see Code) 3.2.4 If your answer is “No” in the above, is it easy to find “Hai” area(s) in different places? (Y (easy) / N (not easy): 3.2.5 Did you use the above 2003’s “Hai” area for crop production in 2002 and 2001? Hai-A in 2002(Y / N): Hai-B in 2002 (Y / N): Hai-A in 2001(Y / N): Hai-B in 2001 (Y / N): 3.2.6 Total “Hai” area(s) of the Household in the last 4 years (including other crops) 2000: ha 2001: ha 2002: ha 2003: ha 3.2.7 Do you usually stay at “Hai” area during cultivation season? (Plural answers are acceptable) (see Code) 3.2.8 Who is a decision maker for the “Hai” area selection (Choose one from Codes) 3.3 Crop production (excluding crops grown in home garden) in Hai (Slash & Burn) Area 3.3.1 Cropping Pattern (Crop code) (Crop code) (Crop code) Wet season crops Dry season crops 3.3.2 Production (Please answer for major 3 crops you grow in “Hai”)
Items Crop 1 Crop 2 Crop 3 1. Name of crops (See Crop code) 2. Planted area ha ha ha3. Total production kg kg kg4. Form of Products (See Form code) 5. Production sold kg kg kg
Code for answer of 3.2.3: 1. Paddy 2. Upland crops 3. Vegetables 4. Others (specify )
Code for answer of 3.2.7: 1. Stay during the season for slash and burn 2. Stay during the season for seeding 3. Stay during the season for harvesting 4. Stay continuously from slash &burn to harvest 5. Not stay, go there based on requirement
Code for answer of 3.2.8: 1. Head of household 2. Other household member(s) 3. Village committee 4. Other (specify):
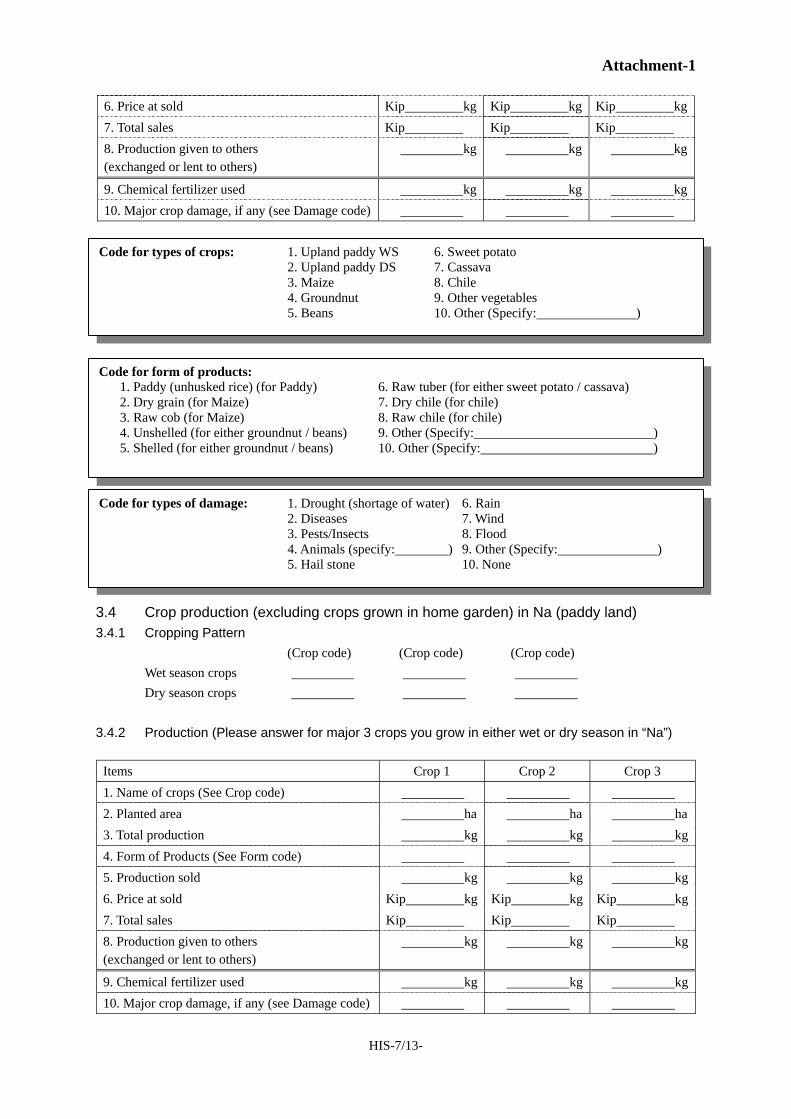
Attachment-1
HIS-7/13-
6. Price at sold Kip kg Kip kg Kip kg7. Total sales Kip Kip Kip 8. Production given to others (exchanged or lent to others)
kg kg kg
9. Chemical fertilizer used kg kg kg10. Major crop damage, if any (see Damage code)
3.4 Crop production (excluding crops grown in home garden) in Na (paddy land) 3.4.1 Cropping Pattern (Crop code) (Crop code) (Crop code) Wet season crops Dry season crops 3.4.2 Production (Please answer for major 3 crops you grow in either wet or dry season in “Na”)
Items Crop 1 Crop 2 Crop 3 1. Name of crops (See Crop code) 2. Planted area ha ha ha3. Total production kg kg kg4. Form of Products (See Form code) 5. Production sold kg kg kg6. Price at sold Kip kg Kip kg Kip kg7. Total sales Kip Kip Kip 8. Production given to others (exchanged or lent to others)
kg kg kg
9. Chemical fertilizer used kg kg kg10. Major crop damage, if any (see Damage code)
Code for types of crops: 1. Upland paddy WS 6. Sweet potato 2. Upland paddy DS 7. Cassava 3. Maize 8. Chile 4. Groundnut 9. Other vegetables 5. Beans 10. Other (Specify: )
Code for types of damage: 1. Drought (shortage of water) 6. Rain 2. Diseases 7. Wind 3. Pests/Insects 8. Flood 4. Animals (specify: ) 9. Other (Specify: ) 5. Hail stone 10. None
Code for form of products: 1. Paddy (unhusked rice) (for Paddy) 6. Raw tuber (for either sweet potato / cassava) 2. Dry grain (for Maize) 7. Dry chile (for chile) 3. Raw cob (for Maize) 8. Raw chile (for chile) 4. Unshelled (for either groundnut / beans) 9. Other (Specify: ) 5. Shelled (for either groundnut / beans) 10. Other (Specify: )
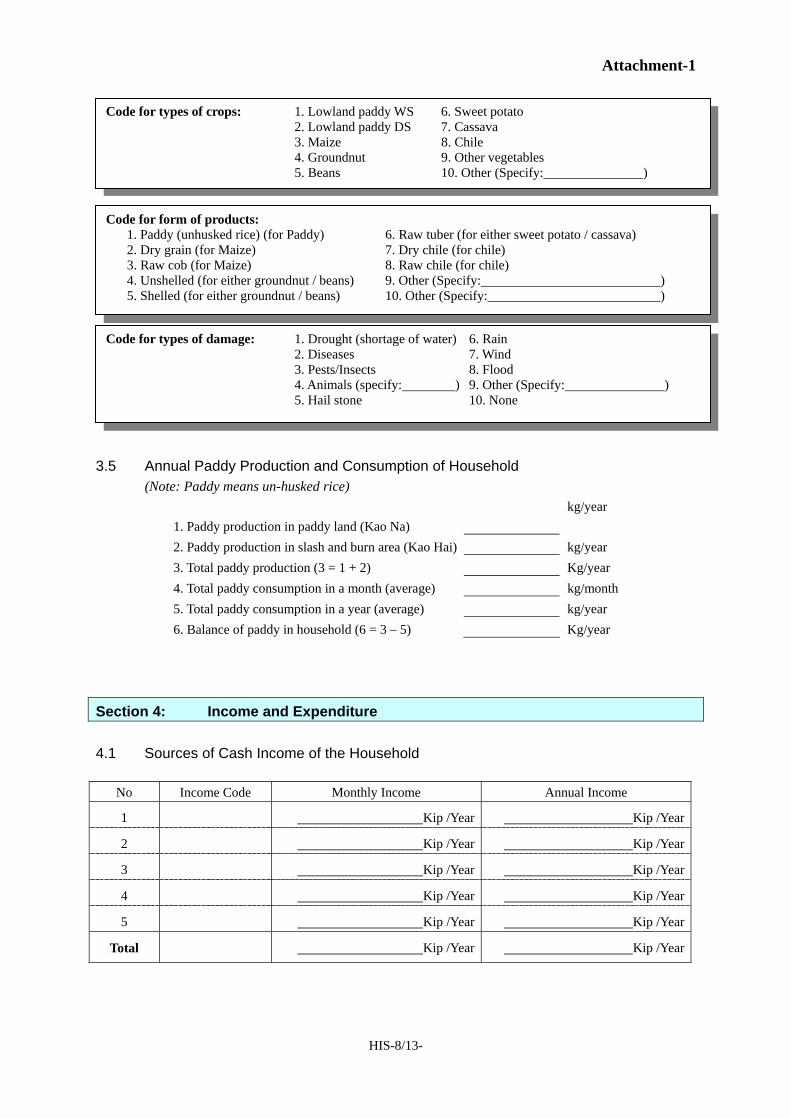
Attachment-1
HIS-8/13-
3.5 Annual Paddy Production and Consumption of Household (Note: Paddy means un-husked rice)
1. Paddy production in paddy land (Kao Na)
kg/year
2. Paddy production in slash and burn area (Kao Hai) kg/year 3. Total paddy production (3 = 1 + 2) Kg/year 4. Total paddy consumption in a month (average) kg/month 5. Total paddy consumption in a year (average) kg/year 6. Balance of paddy in household (6 = 3 – 5) Kg/year
Section 4: Income and Expenditure 4.1 Sources of Cash Income of the Household
No Income Code Monthly Income Annual Income
1 Kip /Year Kip /Year
2 Kip /Year Kip /Year
3 Kip /Year Kip /Year
4 Kip /Year Kip /Year
5 Kip /Year Kip /Year
Total Kip /Year Kip /Year
Code for types of crops: 1. Lowland paddy WS 6. Sweet potato 2. Lowland paddy DS 7. Cassava 3. Maize 8. Chile 4. Groundnut 9. Other vegetables 5. Beans 10. Other (Specify: )
Code for types of damage: 1. Drought (shortage of water) 6. Rain 2. Diseases 7. Wind 3. Pests/Insects 8. Flood 4. Animals (specify: ) 9. Other (Specify: ) 5. Hail stone 10. None
Code for form of products: 1. Paddy (unhusked rice) (for Paddy) 6. Raw tuber (for either sweet potato / cassava) 2. Dry grain (for Maize) 7. Dry chile (for chile) 3. Raw cob (for Maize) 8. Raw chile (for chile) 4. Unshelled (for either groundnut / beans) 9. Other (Specify: ) 5. Shelled (for either groundnut / beans) 10. Other (Specify: )
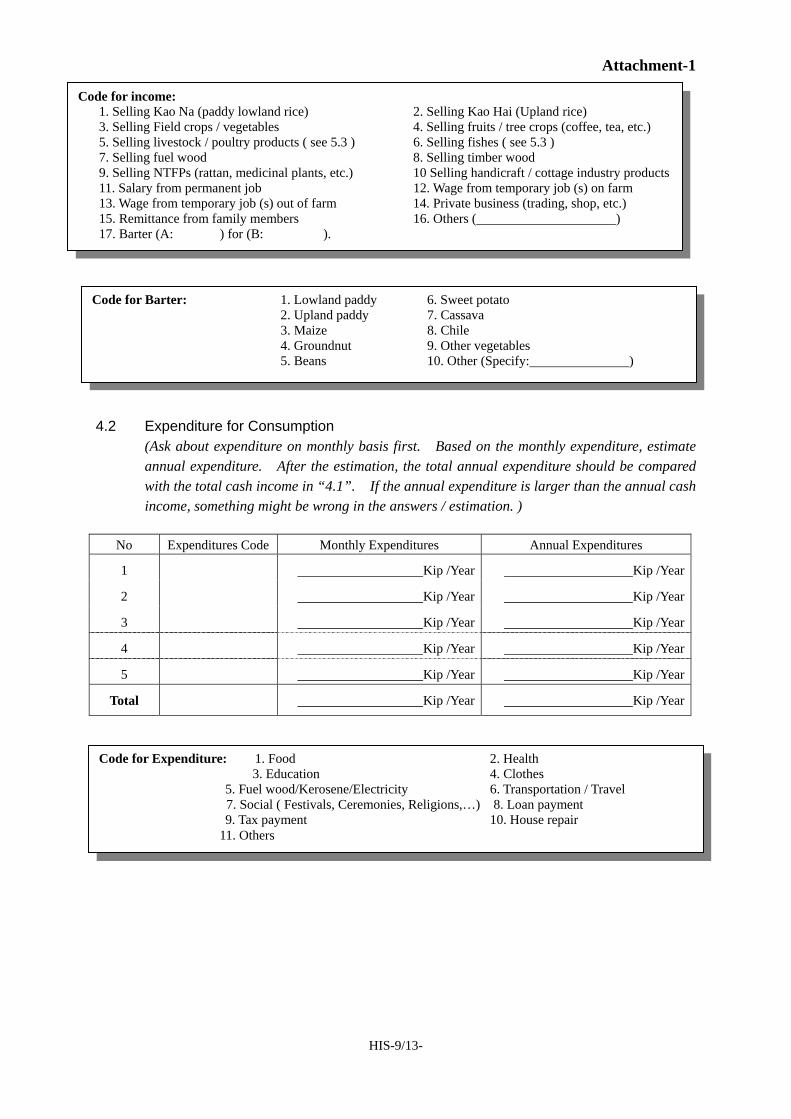
Attachment-1
HIS-9/13-
4.2 Expenditure for Consumption (Ask about expenditure on monthly basis first. Based on the monthly expenditure, estimate
annual expenditure. After the estimation, the total annual expenditure should be compared with the total cash income in “4.1”. If the annual expenditure is larger than the annual cash income, something might be wrong in the answers / estimation. )
No Expenditures Code Monthly Expenditures Annual Expenditures
1 Kip /Year Kip /Year
2 Kip /Year Kip /Year
3 Kip /Year Kip /Year
4 Kip /Year Kip /Year
5 Kip /Year Kip /Year
Total Kip /Year Kip /Year
Code for income: 1. Selling Kao Na (paddy lowland rice) 2. Selling Kao Hai (Upland rice) 3. Selling Field crops / vegetables 4. Selling fruits / tree crops (coffee, tea, etc.) 5. Selling livestock / poultry products ( see 5.3 ) 6. Selling fishes ( see 5.3 ) 7. Selling fuel wood 8. Selling timber wood 9. Selling NTFPs (rattan, medicinal plants, etc.) 10 Selling handicraft / cottage industry products 11. Salary from permanent job 12. Wage from temporary job (s) on farm 13. Wage from temporary job (s) out of farm 14. Private business (trading, shop, etc.) 15. Remittance from family members 16. Others ( ) 17. Barter (A: ) for (B: ).
Code for Barter: 1. Lowland paddy 6. Sweet potato 2. Upland paddy 7. Cassava 3. Maize 8. Chile 4. Groundnut 9. Other vegetables 5. Beans 10. Other (Specify: )
Code for Expenditure: 1. Food 2. Health 3. Education 4. Clothes 5. Fuel wood/Kerosene/Electricity 6. Transportation / Travel 7. Social ( Festivals, Ceremonies, Religions,…) 8. Loan payment 9. Tax payment 10. House repair 11. Others
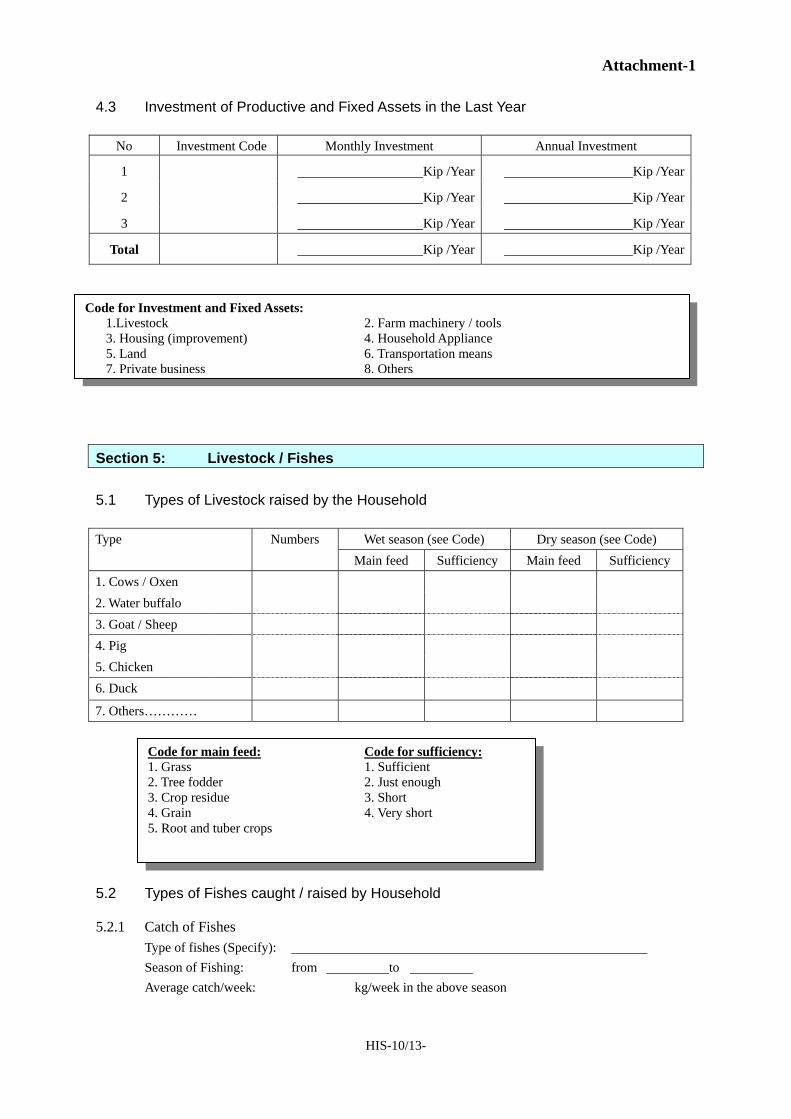
Attachment-1
HIS-10/13-
4.3 Investment of Productive and Fixed Assets in the Last Year
No Investment Code Monthly Investment Annual Investment
1 Kip /Year Kip /Year
2 Kip /Year Kip /Year
3 Kip /Year Kip /Year
Total Kip /Year Kip /Year
Section 5: Livestock / Fishes 5.1 Types of Livestock raised by the Household Type Numbers Wet season (see Code) Dry season (see Code) Main feed Sufficiency Main feed Sufficiency 1. Cows / Oxen 2. Water buffalo 3. Goat / Sheep 4. Pig 5. Chicken 6. Duck
7. Others…………
5.2 Types of Fishes caught / raised by Household 5.2.1 Catch of Fishes Type of fishes (Specify): Season of Fishing: from to Average catch/week: kg/week in the above season
Code for main feed: Code for sufficiency: 1. Grass 1. Sufficient 2. Tree fodder 2. Just enough 3. Crop residue 3. Short 4. Grain 4. Very short 5. Root and tuber crops
Code for Investment and Fixed Assets: 1.Livestock 2. Farm machinery / tools 3. Housing (improvement) 4. Household Appliance 5. Land 6. Transportation means
7. Private business 8. Others
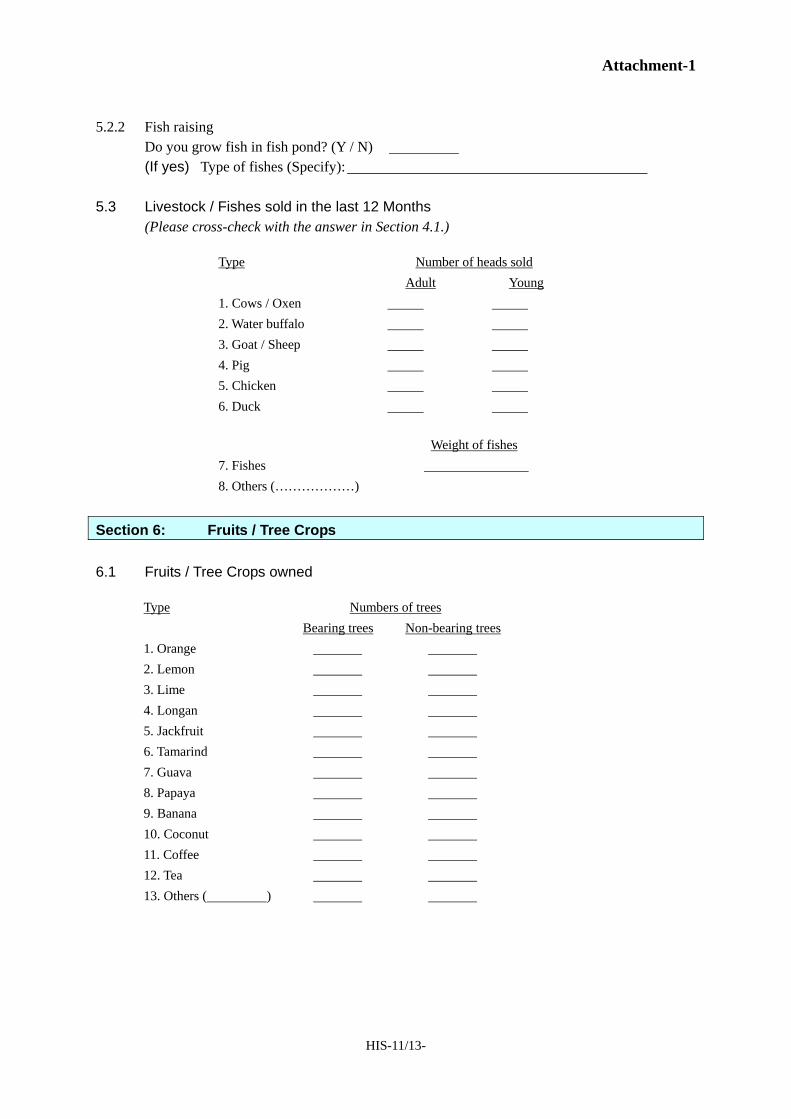
Attachment-1
HIS-11/13-
5.2.2 Fish raising Do you grow fish in fish pond? (Y / N) (If yes) Type of fishes (Specify): 5.3 Livestock / Fishes sold in the last 12 Months (Please cross-check with the answer in Section 4.1.)
Type Number of heads sold Adult Young 1. Cows / Oxen 2. Water buffalo 3. Goat / Sheep 4. Pig 5. Chicken 6. Duck
Weight of fishes 7. Fishes 8. Others (………………)
Section 6: Fruits / Tree Crops 6.1 Fruits / Tree Crops owned
Type Numbers of trees Bearing trees Non-bearing trees1. Orange 2. Lemon 3. Lime 4. Longan 5. Jackfruit 6. Tamarind 7. Guava 8. Papaya 9. Banana 10. Coconut 11. Coffee 12. Tea 13. Others ( )
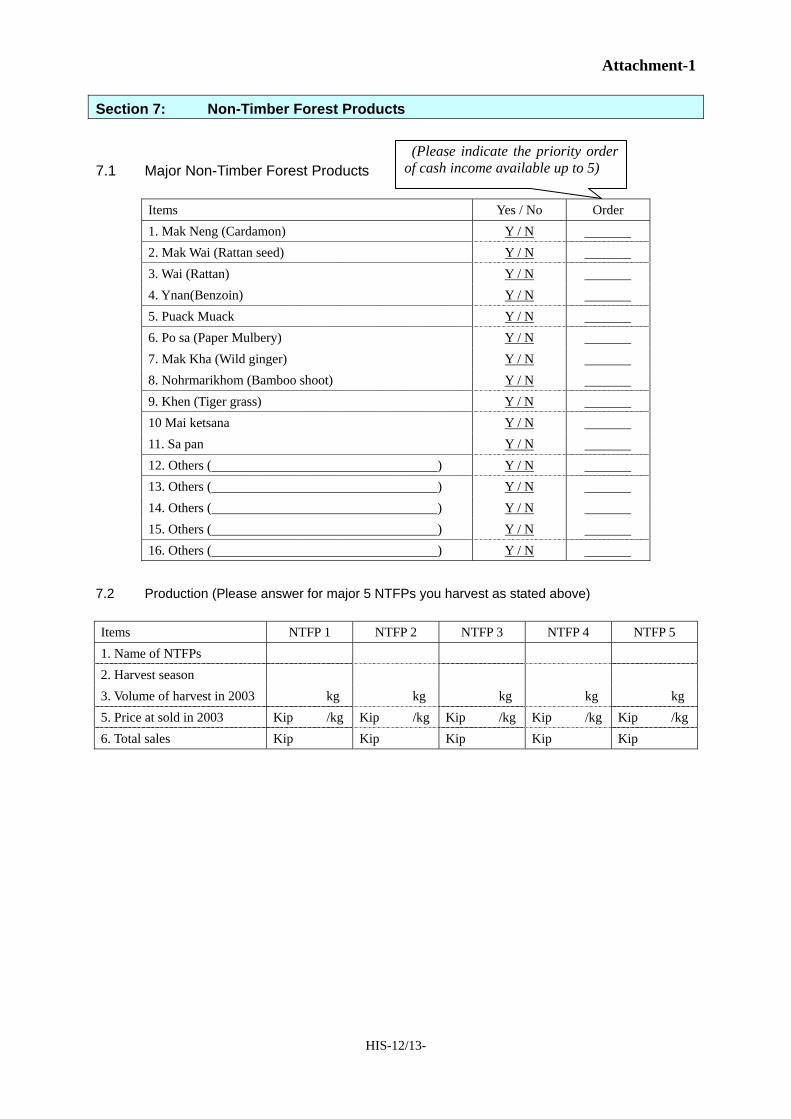
Attachment-1
HIS-12/13-
Section 7: Non-Timber Forest Products 7.1 Major Non-Timber Forest Products
Items Yes / No Order 1. Mak Neng (Cardamon) Y / N 2. Mak Wai (Rattan seed) Y / N 3. Wai (Rattan) Y / N 4. Ynan(Benzoin) Y / N 5. Puack Muack Y / N 6. Po sa (Paper Mulbery) Y / N 7. Mak Kha (Wild ginger) Y / N 8. Nohrmarikhom (Bamboo shoot) Y / N 9. Khen (Tiger grass) Y / N 10 Mai ketsana Y / N 11. Sa pan Y / N 12. Others ( ) Y / N 13. Others ( ) Y / N 14. Others ( ) Y / N 15. Others ( ) Y / N 16. Others ( ) Y / N
7.2 Production (Please answer for major 5 NTFPs you harvest as stated above) Items NTFP 1 NTFP 2 NTFP 3 NTFP 4 NTFP 5 1. Name of NTFPs 2. Harvest season 3. Volume of harvest in 2003 kg kg kg kg kg 5. Price at sold in 2003 Kip /kg Kip /kg Kip /kg Kip /kg Kip /kg6. Total sales Kip Kip Kip Kip Kip
(Please indicate the priority order of cash income available up to 5)
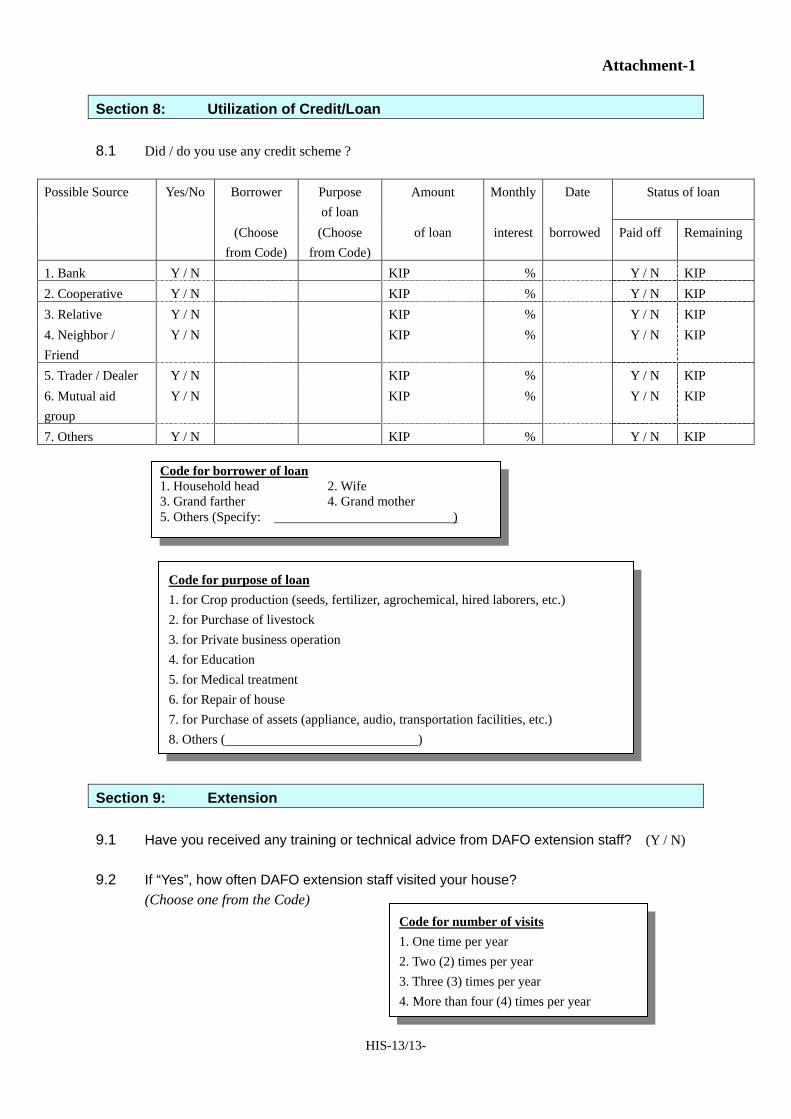
Attachment-1
HIS-13/13-
Section 8: Utilization of Credit/Loan 8.1 Did / do you use any credit scheme ?
Possible Source Yes/No Borrower Purpose of loan
Amount Monthly Date Status of loan
(Choose from Code)
(Choose from Code)
of loan interest borrowed Paid off Remaining
1. Bank Y / N KIP % Y / N KIP 2. Cooperative Y / N KIP % Y / N KIP 3. Relative Y / N KIP % Y / N KIP 4. Neighbor / Friend
Y / N KIP % Y / N KIP
5. Trader / Dealer Y / N KIP % Y / N KIP 6. Mutual aid group
Y / N KIP % Y / N KIP
7. Others Y / N KIP % Y / N KIP Section 9: Extension 9.1 Have you received any training or technical advice from DAFO extension staff? (Y / N) 9.2 If “Yes”, how often DAFO extension staff visited your house? (Choose one from the Code)
Code for purpose of loan 1. for Crop production (seeds, fertilizer, agrochemical, hired laborers, etc.) 2. for Purchase of livestock 3. for Private business operation 4. for Education 5. for Medical treatment 6. for Repair of house 7. for Purchase of assets (appliance, audio, transportation facilities, etc.) 8. Others ( )
Code for number of visits 1. One time per year 2. Two (2) times per year 3. Three (3) times per year 4. More than four (4) times per year
Code for borrower of loan 1. Household head 2. Wife 3. Grand farther 4. Grand mother 5. Others (Specify: )
Attachment-2: Questionnaire Formfor Household Member Survey
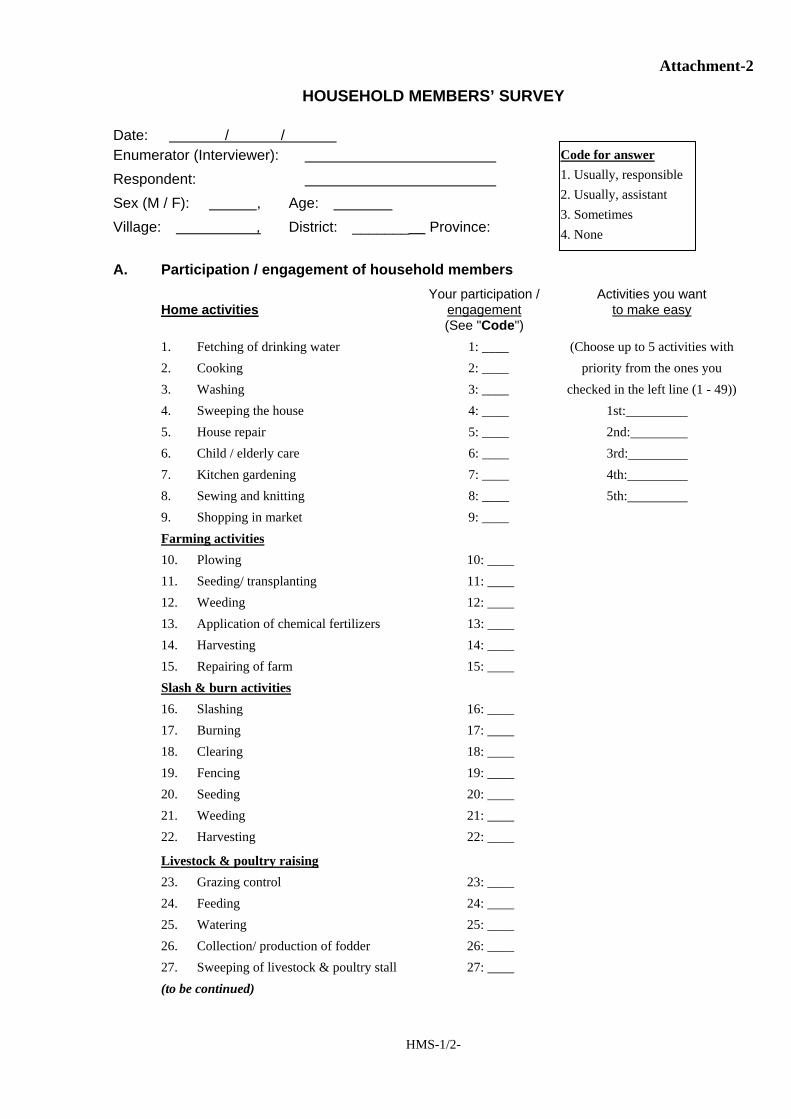
Attachment-2
HMS-1/2-
HOUSEHOLD MEMBERS’ SURVEY Date: / / Enumerator (Interviewer): Respondent: Sex (M / F): , Age: Village: , District: _________ Province:
A. Participation / engagement of household members Your participation / Activities you want Home activities engagement to make easy (See "Code") 1. Fetching of drinking water 1: ____ (Choose up to 5 activities with 2. Cooking 2: ____ priority from the ones you 3. Washing 3: ____ checked in the left line (1 - 49)) 4. Sweeping the house 4: ____ 1st: 5. House repair 5: ____ 2nd: 6. Child / elderly care 6: ____ 3rd: 7. Kitchen gardening 7: ____ 4th: 8. Sewing and knitting 8: ____ 5th: 9. Shopping in market 9: ____ Farming activities 10. Plowing 10: ____ 11. Seeding/ transplanting 11: ____ 12. Weeding 12: ____ 13. Application of chemical fertilizers 13: ____ 14. Harvesting 14: ____ 15. Repairing of farm 15: ____ Slash & burn activities 16. Slashing 16: ____ 17. Burning 17: ____ 18. Clearing 18: ____ 19. Fencing 19: ____ 20. Seeding 20: ____ 21. Weeding 21: ____ 22. Harvesting 22: ____
Livestock & poultry raising 23. Grazing control 23: ____ 24. Feeding 24: ____ 25. Watering 25: ____ 26. Collection/ production of fodder 26: ____ 27. Sweeping of livestock & poultry stall 27: ____ (to be continued)
Code for answer1. Usually, responsible 2. Usually, assistant 3. Sometimes 4. None
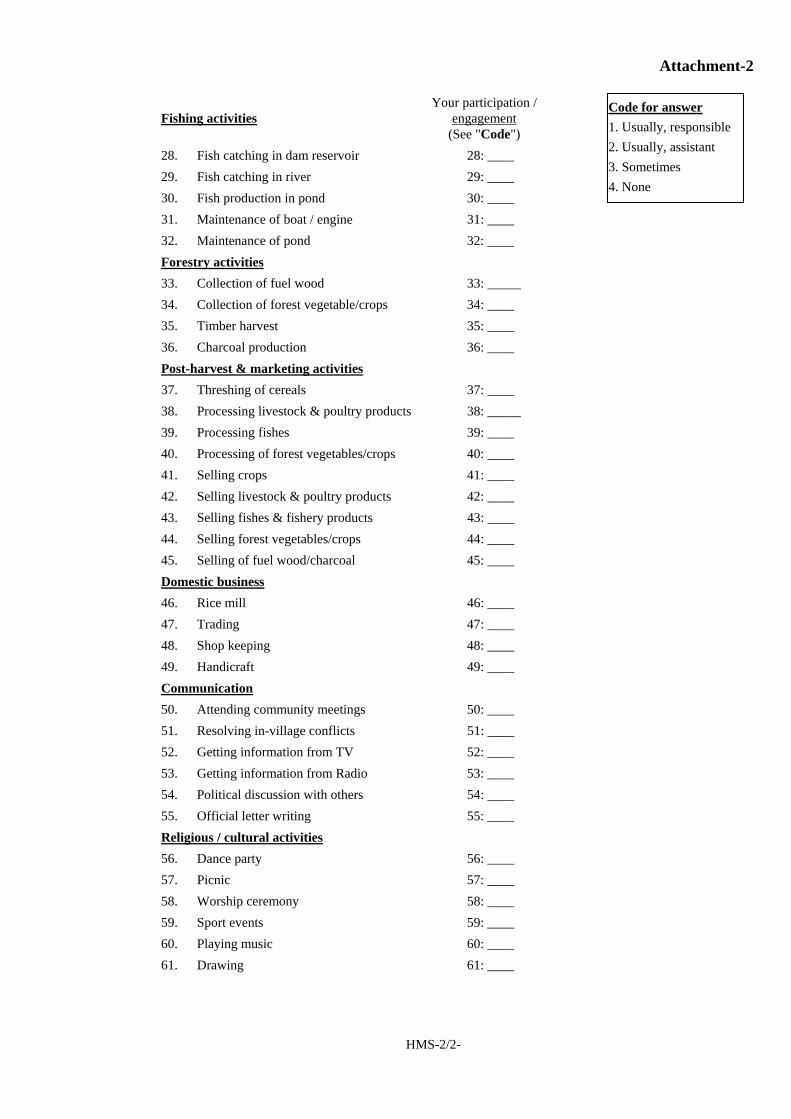
Attachment-2
HMS-2/2-
Your participation / Fishing activities engagement (See "Code") 28. Fish catching in dam reservoir 28: ____ 29. Fish catching in river 29: ____ 30. Fish production in pond 30: ____ 31. Maintenance of boat / engine 31: ____ 32. Maintenance of pond 32: ____ Forestry activities 33. Collection of fuel wood 33: _____ 34. Collection of forest vegetable/crops 34: ____ 35. Timber harvest 35: ____ 36. Charcoal production 36: ____ Post-harvest & marketing activities 37. Threshing of cereals 37: ____ 38. Processing livestock & poultry products 38: _____ 39. Processing fishes 39: ____ 40. Processing of forest vegetables/crops 40: ____ 41. Selling crops 41: ____ 42. Selling livestock & poultry products 42: ____ 43. Selling fishes & fishery products 43: ____ 44. Selling forest vegetables/crops 44: ____ 45. Selling of fuel wood/charcoal 45: ____ Domestic business 46. Rice mill 46: ____ 47. Trading 47: ____ 48. Shop keeping 48: ____ 49. Handicraft 49: ____ Communication 50. Attending community meetings 50: ____ 51. Resolving in-village conflicts 51: ____ 52. Getting information from TV 52: ____ 53. Getting information from Radio 53: ____ 54. Political discussion with others 54: ____ 55. Official letter writing 55: ____ Religious / cultural activities 56. Dance party 56: ____ 57. Picnic 57: ____ 58. Worship ceremony 58: ____ 59. Sport events 59: ____ 60. Playing music 60: ____ 61. Drawing 61: ____
Code for answer1. Usually, responsible 2. Usually, assistant 3. Sometimes 4. None