vertical and horizontal extension of the oxygen minimum zone in the eastern south pacific ocean
TRANSCRIPT
ARTICLE IN PRESS
Deep-Sea Research II 56 (2009) 1027–1038
Contents lists available at ScienceDirect
Deep-Sea Research II
0967-06
doi:10.1
� Corr
del Mar
fax: +56
E-m
journal homepage: www.elsevier.com/locate/dsr2
Vertical and horizontal extension of the oxygen minimum zone in the easternSouth Pacific Ocean
Rosalino Fuenzalida a,b,c,�, Wolfgang Schneider c,d, Jose Garces-Vargas c,e, Luis Bravo c, Carina Lange c,d
a Programa de Postgrado en Oceanografıa, Departamento de Oceanografıa, Universidad de Concepcion, Casilla 160-C, Concepcion, Chileb Departamento de Ciencias del Mar, Universidad Arturo Prat, Avenida Arturo Prat 2120, Casilla 121, Iquique, Chilec Centro de Investigacion Oceanografica en el Pacıfico Sur-Oriental (FONDAP-COPAS), Universidad de Concepcion, Casilla 160-C, Concepcion, Chiled Facultad de Ciencias Naturales y Oceanograficas, Departamento de Oceanografıa, Universidad de Concepcion, Casilla 160-C, Concepcion, Chilee Instituto de Biologıa Marina ‘‘Dr. Jurgen Winter’’, Universidad Austral de Chile, Casilla 567, Valdivia, Chile
a r t i c l e i n f o
Article history:
Accepted 11 September 2008Recent hydrographic measurements within the eastern South Pacific (1999–2001) were combined with
vertically high-resolution data from the World Ocean Circulation Experiment, high-resolution profiles
Available online 5 November 2008Keywords:
Oxygen minimum zone
Dissolved oxygen
Coastal upwelling
Eastern South Pacific
Peru
Chile
45/$ - see front matter & 2008 Elsevier Ltd. A
016/j.dsr2.2008.11.001
esponding author at: Universidad Arturo Pra
, Avenida Arturo Prat 2120, Casilla 121, Iquiqu
57380393.
ail address: [email protected] (R. Fuenzalida).
a b s t r a c t
and bottle casts from the World Ocean Database 2001, and the World Ocean Atlas 2001 in order to
evaluate the vertical and horizontal extension of the oxygen minimum zone (o20mmol kg�1). These
new calculations estimate the total area and volume of the oxygen minimum zone to be
9.8273.60�106 km2 and 2.1870.66�106 km3, respectively. The oxygen minimum zone is thickest
(4600 m) off Peru between 5 and 131S and to about 1000 km offshore. Its upper boundary is shallowest
(o150 m) off Peru, shoaling towards the coast and extending well into the euphotic zone in some places.
Offshore, the thickness and meridional extent of the oxygen minimum zone decrease until it finally
vanishes at 1401W between 21 and 81S. Moving southward along the coast of South America, the zonal
extension of the oxygen minimum zone gradually diminishes from 3000 km (151S) to 1200 km (201S)
and then to 25 km (301S); only a thin band is detected at �371S off Concepcion, Chile. Simultaneously,
the oxygen minimum zone’s maximum thickness decreases from 300 m (201S) to less than 50 m (south
of 301S). The spatial distribution of Ekman suction velocity and oxygen minimum zone thickness
correlate well, especially in the core. Off Chile, the eastern South Pacific Intermediate Water mass
introduces increased vertical stability into the upper water column, complicating ventilation of the
oxygen minimum zone from above. In addition, oxygen-enriched Antarctic Intermediate Water clashes
with the oxygen minimum zone at around 301S, causing a pronounced sub-surface oxygen front. The
new estimates of vertical and horizontal oxygen minimum zone distribution in the eastern South Pacific
complement the global quantification of naturally hypoxic continental margins by Helly and Levin
[2004. Global distribution of naturally occurring marine hypoxia on continental margins. Deep-Sea
Research I 51, 1159–1168] and provide new baseline data useful for studies on the role of oxygen in the
degradation of organic matter in the water column and the related implications for biogeochemical
cycles. Coastal upwelling zones along the eastern Pacific combine with general circulation to provide a
mechanism that allows renewal of upper Pacific Deep Water, the most oxygen-poor and oldest water
mass of the world oceans.
& 2008 Elsevier Ltd. All rights reserved.
1. Introduction
The eastern South Pacific Ocean (ESP) hosts upwellingecosystems off the coasts of Peru and Chile that are recognizedas the most productive systems of the world oceans. The entireregion is characterized by high primary production, which is
ll rights reserved.
t, Departamento de Ciencias
e, Chile, Tel.: +56 57394562;
decomposed in the water column, consuming dissolvedoxygen. The high oxygen demand in this region combineswith sluggish ventilation to produce the sub-surface/mid-waterESP oxygen minimum zone (OMZ; Wyrtki, 1962; Helly andLevin, 2004).
The OMZ is thick (�500 m), very intense (o20mmol kg�1), andattains its shallowest upper boundary depth (25–50 m) off thecoasts of Peru and northern Chile (e.g., Morales et al., 1996; Strubet al., 1998). Its intensity diminishes and its upper boundarydeepens further south (e.g., �100 m off Concepcion at �371S;Atkinson et al., 2002).
ARTICLE IN PRESS
R. Fuenzalida et al. / Deep-Sea Research II 56 (2009) 1027–10381028
The OMZ off Chile is associated with Equatorial SubsurfaceWater (ESSW), which is transported from north to south along thecontinental slope by the Peru-Chile Undercurrent (PUC) as farsouth as 481S (Silva and Neshyba, 1979). ESSW is bound by low-salinity, high-oxygen waters with Eastern South Pacific Inter-mediate Water (ESPIW; Emery and Meincke, 1986) or ShallowSalinity Minimum Water (SSMW; Reid, 1973) above and AntarcticIntermediate Water (AAIW; McCartney, 1977) below. Both upperand lower layers are potential candidates for ventilating the OMZ.
OMZs might restrict animal life and also initiate geochemicalreactions. In oxygen-depleted oceans, denitrification takes placesand nitrate is converted to NO2 or N2 (e.g., Codispoti and Richards,1976), thus resulting in a nitrate deficit relative to phosphate. Thepresence of an OMZ also determines the characteristics of mostpelagic as well as benthic populations (Grantham et al., 2004). Thenumber and intensity of OMZs are likely to increase as globalwarming and nutrient enrichment rob the ocean of oxygen (Levin,2002). Levin has stated repeatedly that the expansion of OMZscould have a devastating effect on commercial fishing. Enhancedbiological and biogeochemical activity is also often observed nearupper and lower OMZ boundaries (Mullins et al., 1985; Thompsonet al., 1985; Wishner et al., 1990; Levin et al., 1991).
In a recent review of the OMZs in the eastern Pacific,southeastern Atlantic, Arabian Sea, and Indian Ocean, Helly andLevin (2004) quantified the area of the continental margin’sseafloor covered by permanent marine hypoxia. Their calculationsrevealed that the OMZs have a total seafloor coverage of1.148�106 km2 (using dissolved oxygen of o0.5 ml l�1); roughly10% of this is in the ESP. The authors point out the impact thatchanges in the OMZ may have on the distribution of marineresources. The position, strength, and thickness of the OMZ in thewater column can be greatly modified by El Nino/La Nina, leadingto large shifts in community structure and trophic transfers aswell as changes in productivity and biogeochemical cycling (e.g.,Morales et al., 1999; Ulloa et al., 2001; Escribano et al., 2004).
Despite the importance of the eastern South Pacific OMZ, itstotal horizontal and vertical extensions have not been previouslyestimated. Here we present a complete volumetric analysis of thesize of the OMZ in the ESP based on three estimates employing theWorld Ocean Atlas 2001, high-resolution conductivity/tempera-ture/depth/oxygen (CTDO) profiles, and bottles casts. Further-more, the maintenance of the OMZ in the ESP is addressed. Webelieve that this new quantification will be helpful for studies thataim to understand preservation of organic matter, adaptation anddistribution of pelagic organisms, and biogeochemical cycles, e.g.,determination of oxic and hypoxic degradation (Pantoja et al.,2004) and sedimentation rates, as well as the estimate of N2Oemissions out of OMZs.
2. Data and methods
With the goal of placing the OMZ of the ESP in a global context,we first analyzed the vertical and horizontal extension of theworld ocean OMZs as defined by dissolved oxygen concentrationso20mmol kg�1 (we followed the definition of OMZs given byKamykowski and Zentara (1990), and quantified dissolved oxygenconcentrations o20mmol kg�1, which corresponds to �0.5 ml l�1).We based these calculations on the annual mean analyzed fieldsof dissolved oxygen concentrations of the World Ocean Atlas 2001(WOA01, Conkright et al., 2002a, b). The WOA01 dissolved oxygenproduct is based on observed data (CTDO, bottle casts) submittedto the National Oceanographic Data Center (NODC) during thetwentieth century and up to August 2001. WOA01 scientistsapplied a quality control to the data and then verticallyinterpolated ocean profile data and bottle casts from ‘‘observed’’
depth levels to standard depth levels. They define 33 standarddepth levels extending from the sea surface to 5500 m depth. Thearithmetic mean of dissolved oxygen concentration in each one-degree square of the world ocean at each standard depth levelprovides the so-called ‘‘unanalyzed mean’’. The fields of unana-lyzed one-degree square means at each standard depth level wereobjectively analyzed to fill in one-degree squares that do notcontain any data through an interpolation and smoothing processas outlined in the World Ocean Atlas 2001: Volume 1 (Stephenset al., 2002). The resulting fields, referred to as ‘‘analyzed fields’’,are used herein. We computed the 20mmol kg�1 intercepts of theWOA01 vertical dissolved oxygen profiles, which are based on the33 standard depth levels, in each one-degree square of the worldocean by means of linear interpolation. This resulted in anestimate of the upper and lower base of the OMZ from whichits thickness was inferred (the maximal difference betweenindividual standard depth levels in the depth ranges underconsideration is 100 m). The area occupied by each geographicallydefined OMZ of the world ocean was computed as the sum of thearea represented by each one-degree square for which dissolvedoxygen concentrations of o20mmol kg�1 were detected. Thevolume occupied by each individual OMZ resulted from the areaoccupied multiplied by the mean thickness.
In order to facilitate a second estimate of the eastern SouthPacific OMZ (o20mmol kg�1), its geometry was calculated oncemore using only vertically high-resolution (1–2 m) and high-quality CTDO profiles between the coast of South America and1501W, and between the equator and 501S (these maximal limitswere adopted from the first estimation based on WOA01). A totalof 1058 hydrographic stations collected during 1991–2001 wereemployed. In order to fill certain gaps in the data distribution andto avoid spurious interpolation effects, 136 (1979–1987) and 79(1960–1986) additional quality-controlled bottle casts from theWorld Ocean Data 2001 data bank (WOD01) were incorporatedinto the data set, resulting in a total of 1273 hydro casts analyzed.All data used and their sources are listed in Table 1.
The upper and lower OMZ (o20mmol kg�1) boundaries andthe OMZ thickness were determined for each profile and bottlecast (in the latter case, by linear interpolation). The depth of theupper boundary and the thickness of the hypoxic layer wereobjectively interpolated via a gridding algorithm, and the areacovered and volume occupied were calculated by means of theTrapezoidal Rule, extended Simpson’s Rule, and extended Simp-son’s 3/8 Rule (see, e.g., Press et al., 1988). Area and volumeestimates consist of the average of the results obtained by thesethree rules; results from each rule only differed by less than 1%.The gridding algorithm analyzes the distribution of the datapoints and constructs a variable resolution rectangular grid,where grid-spacing along the X and Y axes vary according to datadensity. The upper boundary and thickness are then estimated atevery grid point by applying a weighted-average scheme usingdata values from a neighborhood of the grid point. TheTrapezoidal Rule fits a trapezoid to each successive pair of valuesof [x, f(x)] and estimates the integral as the sum of the areas of thetrapezoids. Simpson’s Rules fit a parabola (second order poly-nomial) to each interval between [xi, f(xi)] and [xi+2, f(xi+2)] andestimate the integral as the sum of the areas under the parabolas.
To increase the data density, earlier data from WOD01 wereincluded in the collection of the second estimation, resulting in athird estimation. We restricted the search to data flagged as verygood, to profiles with a vertical resolution corresponding to atleast standard depth levels (WOA01), and to profiles covering atleast the first 1000 m of the water column. The database for thethird estimation includes 5476 CTDO profiles or bottle casts,namely the database for the second estimation (1273 profiles),plus 859 CTDO casts sampled from 1979 to 1990, and 3344 bottle
ARTICLE IN PRESS
Table 1Research cruises and data sources included in estimation 2.
Expedition Year Transect (along) From To Station numbers
ENOS-5 2001 26.31S Chile 74.51W 14
ENOS-5 2001 27.61S Chile 75.01W 13
ENOS-5 2001 29.01S Chile 75.01W 9
ENOS-5 2001 30.31S Chile 75.01W 9
ENOS-5 2001 31.61S Chile 76.01W 11
VTN 2001 33.51S/34.51S Chile 75.01W 19
VTS 2001 35.01S/36.251S Chile 74.01W 29
CIMAR-6 2000 33.01S Chile 80.51W 13
CIMAR-6 2000 80.01W 33.61S 27.61S 10
COOK-2 2000 20.01S 711W 85.01W 13
CIMAR-5 1999 27.01S Chile 110.01W 32
WOCE P21 1994 17.01S Peru 150.01W 144
WOCE P6 1992 32.51S Chile 150.01W 117
WOCE P18 1994 103.01W 50.01S 5.01S/110.01W 106
WOCE P19 1993 88.01W 50.01S 5.01S/85.01W 109
WOCE P17 1991–1992 135.01W 50.01S 01S/135.01W 109
WODATA 1991–1996 Ecuador/Peru/Chile 301
WODATA 1979–1987 Ecuador/Peru/Chile 136
WODATA 1960–1986 Ecuador/Peru/Chile 79
Total 1273
R. Fuenzalida et al. / Deep-Sea Research II 56 (2009) 1027–1038 1029
casts from 1960 to 1988. Volume and area occupied by the OMZwere calculated as for estimation 2.
To determine convergence and divergence zones within thestudy region, we calculated the annual average Ekman pumping/suction velocity at the sea surface following Tomczak and Godfrey(1994; equation 4.2). Ekman pumping/suction velocity is relatedto the vertical curl of the wind stress and the Coriolis parameter.Positive velocities (upward, suction) correspond to divergencezones and negative ones (downward, pumping) to convergencezones. We limited our calculations to 5–501S since the Coriolisparameter, which enters the equation, vanishes at the equator.The vertical curl of wind stress necessary for this calculationcame from the analysis of weekly wind fields (August 1999–July 2005) based on QuikSCAT, with a horizontal resolution of0.51�0.51 in latitude and longitude, provided by CERSAT, atIFREMER, Plouzane (France).
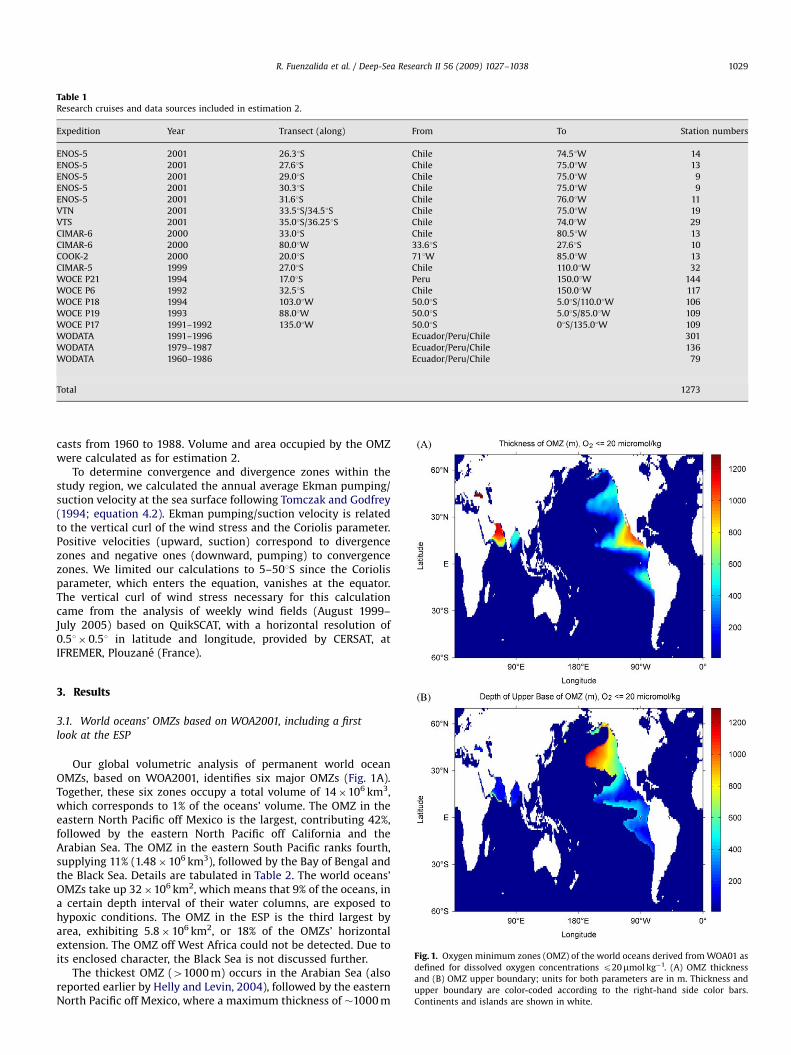
Fig. 1. Oxygen minimum zones (OMZ) of the world oceans derived from WOA01 as
defined for dissolved oxygen concentrations p20mmol kg�1. (A) OMZ thickness
and (B) OMZ upper boundary; units for both parameters are in m. Thickness and
upper boundary are color-coded according to the right-hand side color bars.
Continents and islands are shown in white.
3. Results
3.1. World oceans’ OMZs based on WOA2001, including a first
look at the ESP
Our global volumetric analysis of permanent world oceanOMZs, based on WOA2001, identifies six major OMZs (Fig. 1A).Together, these six zones occupy a total volume of 14�106 km3,which corresponds to 1% of the oceans’ volume. The OMZ in theeastern North Pacific off Mexico is the largest, contributing 42%,followed by the eastern North Pacific off California and theArabian Sea. The OMZ in the eastern South Pacific ranks fourth,supplying 11% (1.48�106 km3), followed by the Bay of Bengal andthe Black Sea. Details are tabulated in Table 2. The world oceans’OMZs take up 32�106 km2, which means that 9% of the oceans, ina certain depth interval of their water columns, are exposed tohypoxic conditions. The OMZ in the ESP is the third largest byarea, exhibiting 5.8�106 km2, or 18% of the OMZs’ horizontalextension. The OMZ off West Africa could not be detected. Due toits enclosed character, the Black Sea is not discussed further.
The thickest OMZ (41000 m) occurs in the Arabian Sea (alsoreported earlier by Helly and Levin, 2004), followed by the easternNorth Pacific off Mexico, where a maximum thickness of �1000 m
ARTICLE IN PRESS
Table 2Oxygen minimum zones of the world oceans based on WOA01: volume and area
occupied.
OMZ Volume
(106 km3)
% Area
(106 km2)
%
Eastern North Pacific off Mexico 5.88 42.1 11.86 36.9
Eastern North Pacific off California 3.35 24.0 9.92 30.9
Arabian Sea 2.13 15.3 2.57 8.0
Eastern South Pacific 1.48 10.6 5.81 18.1
Bay of Bengal 0.60 4.3 1.58 4.9
Others 0.53 3.7 0.40 1.2
Total 13.97 100 32.14 100
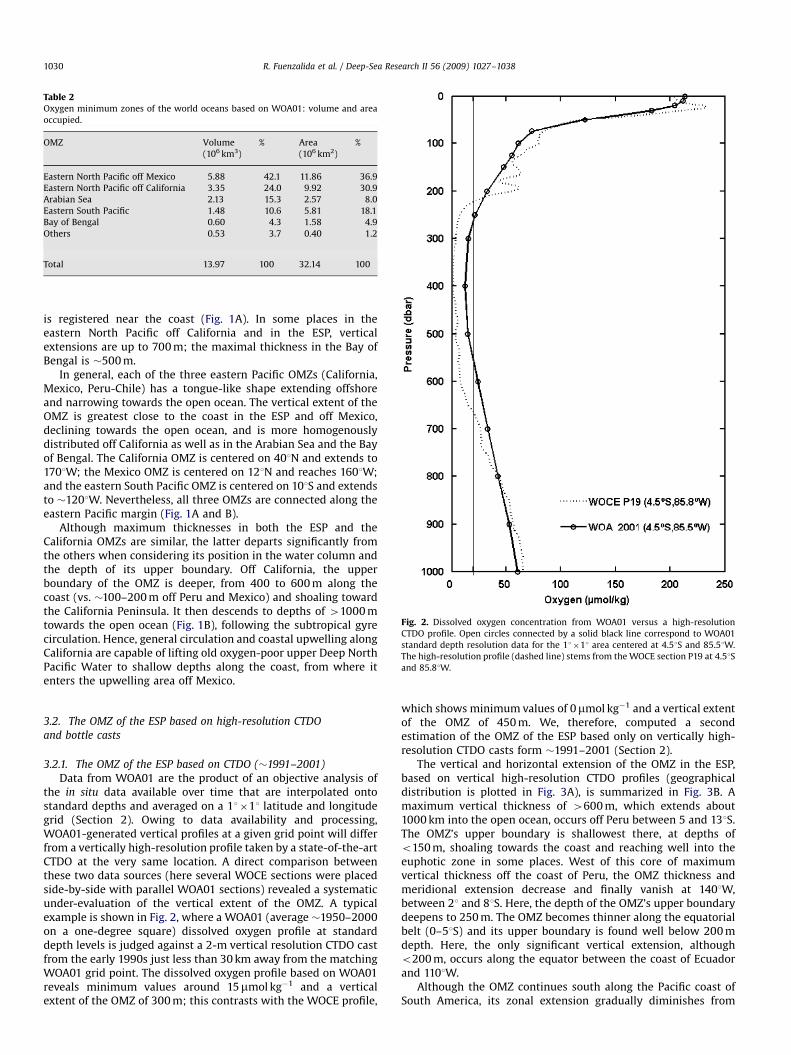
Fig. 2. Dissolved oxygen concentration from WOA01 versus a high-resolution
CTDO profile. Open circles connected by a solid black line correspond to WOA01
standard depth resolution data for the 11�11 area centered at 4.51S and 85.51W.
The high-resolution profile (dashed line) stems from the WOCE section P19 at 4.51S
and 85.81W.
R. Fuenzalida et al. / Deep-Sea Research II 56 (2009) 1027–10381030
is registered near the coast (Fig. 1A). In some places in theeastern North Pacific off California and in the ESP, verticalextensions are up to 700 m; the maximal thickness in the Bay ofBengal is �500 m.
In general, each of the three eastern Pacific OMZs (California,Mexico, Peru-Chile) has a tongue-like shape extending offshoreand narrowing towards the open ocean. The vertical extent of theOMZ is greatest close to the coast in the ESP and off Mexico,declining towards the open ocean, and is more homogenouslydistributed off California as well as in the Arabian Sea and the Bayof Bengal. The California OMZ is centered on 401N and extends to1701W; the Mexico OMZ is centered on 121N and reaches 1601W;and the eastern South Pacific OMZ is centered on 101S and extendsto �1201W. Nevertheless, all three OMZs are connected along theeastern Pacific margin (Fig. 1A and B).
Although maximum thicknesses in both the ESP and theCalifornia OMZs are similar, the latter departs significantly fromthe others when considering its position in the water column andthe depth of its upper boundary. Off California, the upperboundary of the OMZ is deeper, from 400 to 600 m along thecoast (vs. �100–200 m off Peru and Mexico) and shoaling towardthe California Peninsula. It then descends to depths of 41000 mtowards the open ocean (Fig. 1B), following the subtropical gyrecirculation. Hence, general circulation and coastal upwelling alongCalifornia are capable of lifting old oxygen-poor upper Deep NorthPacific Water to shallow depths along the coast, from where itenters the upwelling area off Mexico.
3.2. The OMZ of the ESP based on high-resolution CTDO
and bottle casts
3.2.1. The OMZ of the ESP based on CTDO (�1991–2001)
Data from WOA01 are the product of an objective analysis ofthe in situ data available over time that are interpolated ontostandard depths and averaged on a 11�11 latitude and longitudegrid (Section 2). Owing to data availability and processing,WOA01-generated vertical profiles at a given grid point will differfrom a vertically high-resolution profile taken by a state-of-the-artCTDO at the very same location. A direct comparison betweenthese two data sources (here several WOCE sections were placedside-by-side with parallel WOA01 sections) revealed a systematicunder-evaluation of the vertical extent of the OMZ. A typicalexample is shown in Fig. 2, where a WOA01 (average �1950–2000on a one-degree square) dissolved oxygen profile at standarddepth levels is judged against a 2-m vertical resolution CTDO castfrom the early 1990s just less than 30 km away from the matchingWOA01 grid point. The dissolved oxygen profile based on WOA01reveals minimum values around 15mmol kg�1 and a verticalextent of the OMZ of 300 m; this contrasts with the WOCE profile,
which shows minimum values of 0mmol kg�1 and a vertical extentof the OMZ of 450 m. We, therefore, computed a secondestimation of the OMZ of the ESP based only on vertically high-resolution CTDO casts form �1991–2001 (Section 2).
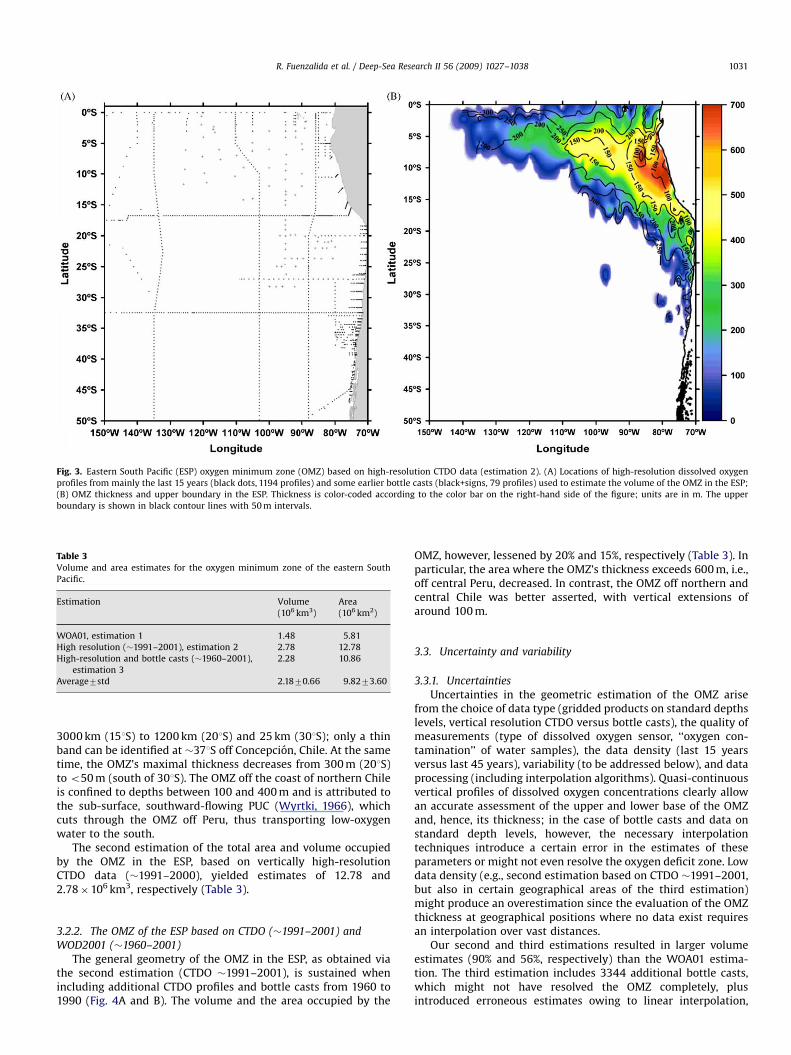
The vertical and horizontal extension of the OMZ in the ESP,based on vertical high-resolution CTDO profiles (geographicaldistribution is plotted in Fig. 3A), is summarized in Fig. 3B. Amaximum vertical thickness of 4600 m, which extends about1000 km into the open ocean, occurs off Peru between 5 and 131S.The OMZ’s upper boundary is shallowest there, at depths ofo150 m, shoaling towards the coast and reaching well into theeuphotic zone in some places. West of this core of maximumvertical thickness off the coast of Peru, the OMZ thickness andmeridional extension decrease and finally vanish at 1401W,between 21 and 81S. Here, the depth of the OMZ’s upper boundarydeepens to 250 m. The OMZ becomes thinner along the equatorialbelt (0–51S) and its upper boundary is found well below 200 mdepth. Here, the only significant vertical extension, althougho200 m, occurs along the equator between the coast of Ecuadorand 1101W.
Although the OMZ continues south along the Pacific coast ofSouth America, its zonal extension gradually diminishes from
ARTICLE IN PRESS
Fig. 3. Eastern South Pacific (ESP) oxygen minimum zone (OMZ) based on high-resolution CTDO data (estimation 2). (A) Locations of high-resolution dissolved oxygen
profiles from mainly the last 15 years (black dots, 1194 profiles) and some earlier bottle casts (black+signs, 79 profiles) used to estimate the volume of the OMZ in the ESP;
(B) OMZ thickness and upper boundary in the ESP. Thickness is color-coded according to the color bar on the right-hand side of the figure; units are in m. The upper
boundary is shown in black contour lines with 50 m intervals.
Table 3Volume and area estimates for the oxygen minimum zone of the eastern South
Pacific.
Estimation Volume
(106 km3)
Area
(106 km2)
WOA01, estimation 1 1.48 5.81
High resolution (�1991–2001), estimation 2 2.78 12.78
High-resolution and bottle casts (�1960–2001),
estimation 3
2.28 10.86
Average7std 2.1870.66 9.8273.60
R. Fuenzalida et al. / Deep-Sea Research II 56 (2009) 1027–1038 1031
3000 km (151S) to 1200 km (201S) and 25 km (301S); only a thinband can be identified at �371S off Concepcion, Chile. At the sametime, the OMZ’s maximal thickness decreases from 300 m (201S)to o50 m (south of 301S). The OMZ off the coast of northern Chileis confined to depths between 100 and 400 m and is attributed tothe sub-surface, southward-flowing PUC (Wyrtki, 1966), whichcuts through the OMZ off Peru, thus transporting low-oxygenwater to the south.
The second estimation of the total area and volume occupiedby the OMZ in the ESP, based on vertically high-resolutionCTDO data (�1991–2000), yielded estimates of 12.78 and2.78�106 km3, respectively (Table 3).
3.2.2. The OMZ of the ESP based on CTDO (�1991–2001) and
WOD2001 (�1960–2001)
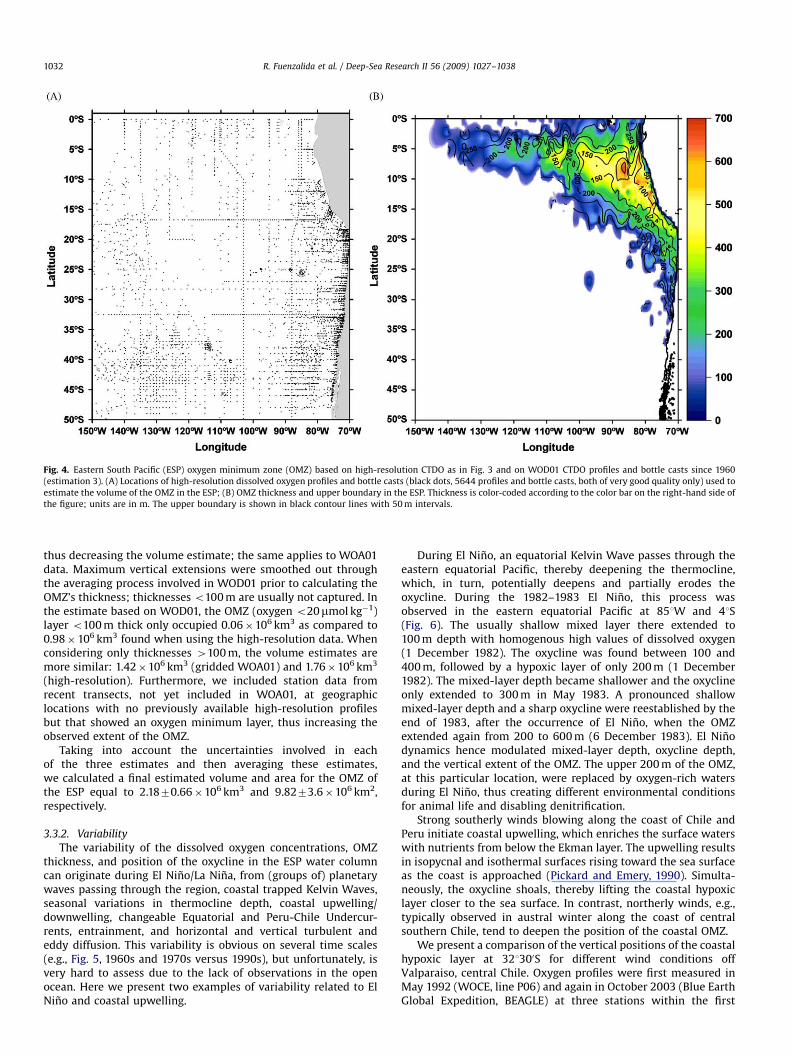
The general geometry of the OMZ in the ESP, as obtained viathe second estimation (CTDO �1991–2001), is sustained whenincluding additional CTDO profiles and bottle casts from 1960 to1990 (Fig. 4A and B). The volume and the area occupied by the
OMZ, however, lessened by 20% and 15%, respectively (Table 3). Inparticular, the area where the OMZ’s thickness exceeds 600 m, i.e.,off central Peru, decreased. In contrast, the OMZ off northern andcentral Chile was better asserted, with vertical extensions ofaround 100 m.
3.3. Uncertainty and variability
3.3.1. Uncertainties
Uncertainties in the geometric estimation of the OMZ arisefrom the choice of data type (gridded products on standard depthslevels, vertical resolution CTDO versus bottle casts), the quality ofmeasurements (type of dissolved oxygen sensor, ‘‘oxygen con-tamination’’ of water samples), the data density (last 15 yearsversus last 45 years), variability (to be addressed below), and dataprocessing (including interpolation algorithms). Quasi-continuousvertical profiles of dissolved oxygen concentrations clearly allowan accurate assessment of the upper and lower base of the OMZand, hence, its thickness; in the case of bottle casts and data onstandard depth levels, however, the necessary interpolationtechniques introduce a certain error in the estimates of theseparameters or might not even resolve the oxygen deficit zone. Lowdata density (e.g., second estimation based on CTDO �1991–2001,but also in certain geographical areas of the third estimation)might produce an overestimation since the evaluation of the OMZthickness at geographical positions where no data exist requiresan interpolation over vast distances.
Our second and third estimations resulted in larger volumeestimates (90% and 56%, respectively) than the WOA01 estima-tion. The third estimation includes 3344 additional bottle casts,which might not have resolved the OMZ completely, plusintroduced erroneous estimates owing to linear interpolation,
ARTICLE IN PRESS
Fig. 4. Eastern South Pacific (ESP) oxygen minimum zone (OMZ) based on high-resolution CTDO as in Fig. 3 and on WOD01 CTDO profiles and bottle casts since 1960
(estimation 3). (A) Locations of high-resolution dissolved oxygen profiles and bottle casts (black dots, 5644 profiles and bottle casts, both of very good quality only) used to
estimate the volume of the OMZ in the ESP; (B) OMZ thickness and upper boundary in the ESP. Thickness is color-coded according to the color bar on the right-hand side of
the figure; units are in m. The upper boundary is shown in black contour lines with 50 m intervals.
R. Fuenzalida et al. / Deep-Sea Research II 56 (2009) 1027–10381032
thus decreasing the volume estimate; the same applies to WOA01data. Maximum vertical extensions were smoothed out throughthe averaging process involved in WOD01 prior to calculating theOMZ’s thickness; thicknesses o100 m are usually not captured. Inthe estimate based on WOD01, the OMZ (oxygen o20mmol kg�1)layer o100 m thick only occupied 0.06�106 km3 as compared to0.98�106 km3 found when using the high-resolution data. Whenconsidering only thicknesses 4100 m, the volume estimates aremore similar: 1.42�106 km3 (gridded WOA01) and 1.76�106 km3
(high-resolution). Furthermore, we included station data fromrecent transects, not yet included in WOA01, at geographiclocations with no previously available high-resolution profilesbut that showed an oxygen minimum layer, thus increasing theobserved extent of the OMZ.
Taking into account the uncertainties involved in eachof the three estimates and then averaging these estimates,we calculated a final estimated volume and area for the OMZ ofthe ESP equal to 2.1870.66�106 km3 and 9.8273.6�106 km2,respectively.
3.3.2. Variability
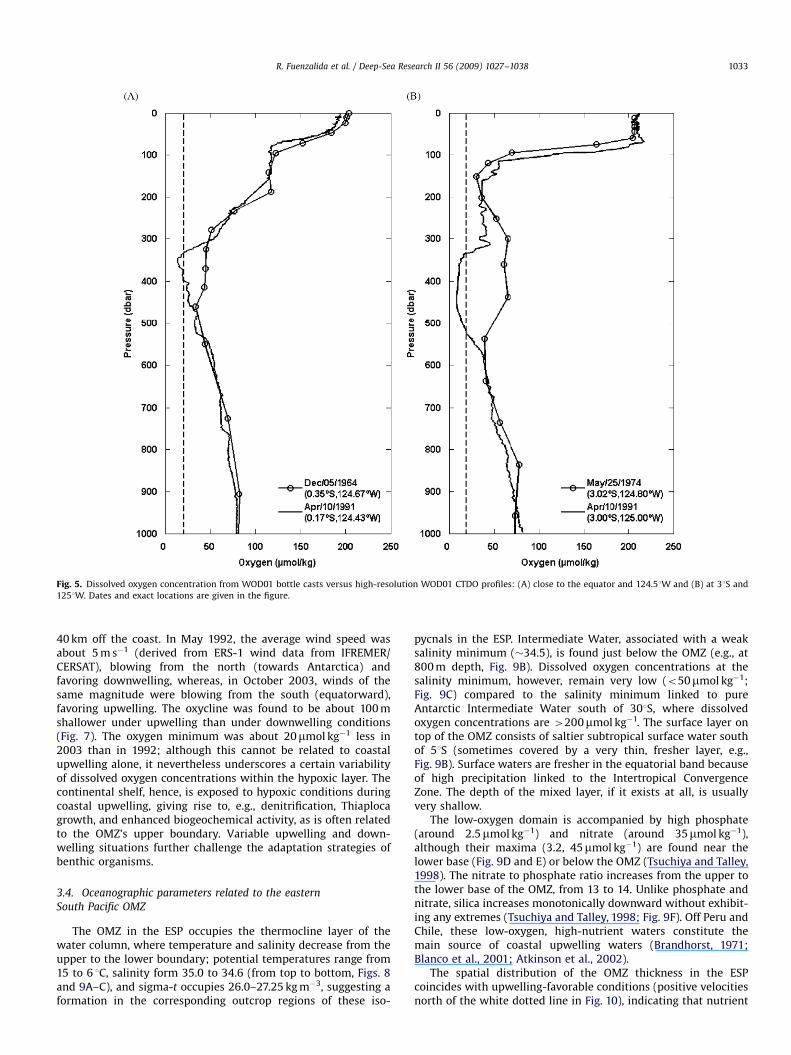
The variability of the dissolved oxygen concentrations, OMZthickness, and position of the oxycline in the ESP water columncan originate during El Nino/La Nina, from (groups of) planetarywaves passing through the region, coastal trapped Kelvin Waves,seasonal variations in thermocline depth, coastal upwelling/downwelling, changeable Equatorial and Peru-Chile Undercur-rents, entrainment, and horizontal and vertical turbulent andeddy diffusion. This variability is obvious on several time scales(e.g., Fig. 5, 1960s and 1970s versus 1990s), but unfortunately, isvery hard to assess due to the lack of observations in the openocean. Here we present two examples of variability related to ElNino and coastal upwelling.
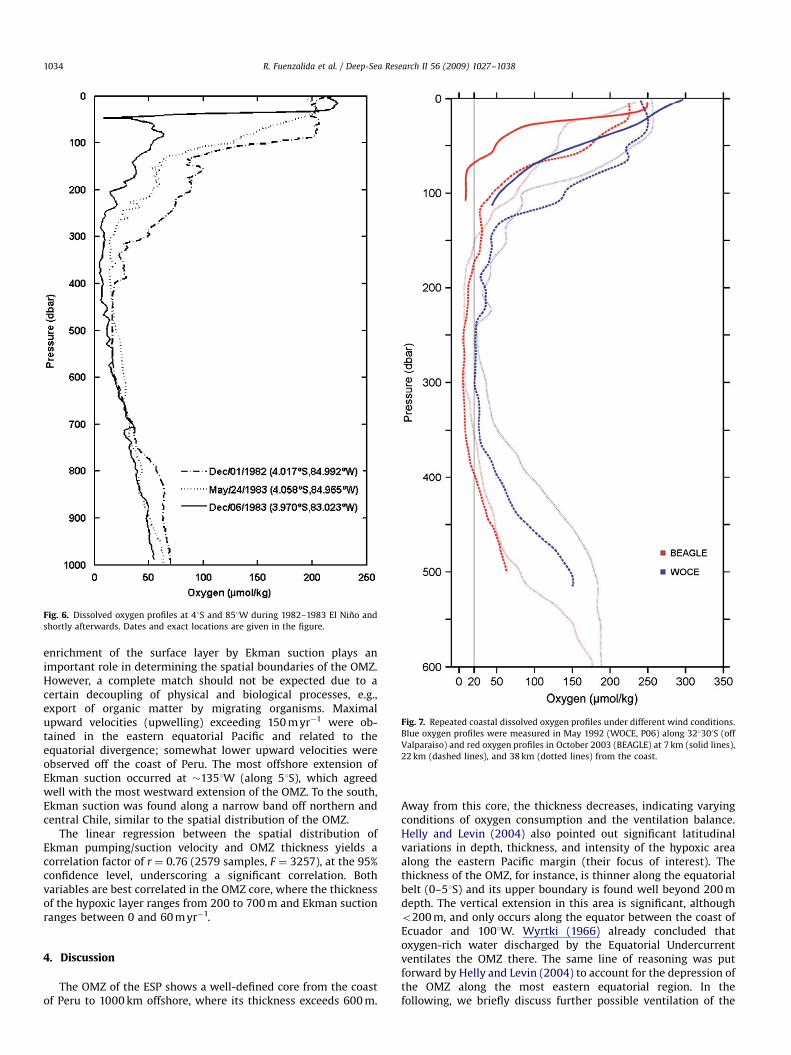
During El Nino, an equatorial Kelvin Wave passes through theeastern equatorial Pacific, thereby deepening the thermocline,which, in turn, potentially deepens and partially erodes theoxycline. During the 1982–1983 El Nino, this process wasobserved in the eastern equatorial Pacific at 851W and 41S(Fig. 6). The usually shallow mixed layer there extended to100 m depth with homogenous high values of dissolved oxygen(1 December 1982). The oxycline was found between 100 and400 m, followed by a hypoxic layer of only 200 m (1 December1982). The mixed-layer depth became shallower and the oxyclineonly extended to 300 m in May 1983. A pronounced shallowmixed-layer depth and a sharp oxycline were reestablished by theend of 1983, after the occurrence of El Nino, when the OMZextended again from 200 to 600 m (6 December 1983). El Ninodynamics hence modulated mixed-layer depth, oxycline depth,and the vertical extent of the OMZ. The upper 200 m of the OMZ,at this particular location, were replaced by oxygen-rich watersduring El Nino, thus creating different environmental conditionsfor animal life and disabling denitrification.
Strong southerly winds blowing along the coast of Chile andPeru initiate coastal upwelling, which enriches the surface waterswith nutrients from below the Ekman layer. The upwelling resultsin isopycnal and isothermal surfaces rising toward the sea surfaceas the coast is approached (Pickard and Emery, 1990). Simulta-neously, the oxycline shoals, thereby lifting the coastal hypoxiclayer closer to the sea surface. In contrast, northerly winds, e.g.,typically observed in austral winter along the coast of centralsouthern Chile, tend to deepen the position of the coastal OMZ.
We present a comparison of the vertical positions of the coastalhypoxic layer at 321300S for different wind conditions offValparaiso, central Chile. Oxygen profiles were first measured inMay 1992 (WOCE, line P06) and again in October 2003 (Blue EarthGlobal Expedition, BEAGLE) at three stations within the first
ARTICLE IN PRESS
Fig. 5. Dissolved oxygen concentration from WOD01 bottle casts versus high-resolution WOD01 CTDO profiles: (A) close to the equator and 124.51W and (B) at 31S and
1251W. Dates and exact locations are given in the figure.
R. Fuenzalida et al. / Deep-Sea Research II 56 (2009) 1027–1038 1033
40 km off the coast. In May 1992, the average wind speed wasabout 5 m s�1 (derived from ERS-1 wind data from IFREMER/CERSAT), blowing from the north (towards Antarctica) andfavoring downwelling, whereas, in October 2003, winds of thesame magnitude were blowing from the south (equatorward),favoring upwelling. The oxycline was found to be about 100 mshallower under upwelling than under downwelling conditions(Fig. 7). The oxygen minimum was about 20mmol kg�1 less in2003 than in 1992; although this cannot be related to coastalupwelling alone, it nevertheless underscores a certain variabilityof dissolved oxygen concentrations within the hypoxic layer. Thecontinental shelf, hence, is exposed to hypoxic conditions duringcoastal upwelling, giving rise to, e.g., denitrification, Thiaplocagrowth, and enhanced biogeochemical activity, as is often relatedto the OMZ’s upper boundary. Variable upwelling and down-welling situations further challenge the adaptation strategies ofbenthic organisms.
3.4. Oceanographic parameters related to the eastern
South Pacific OMZ
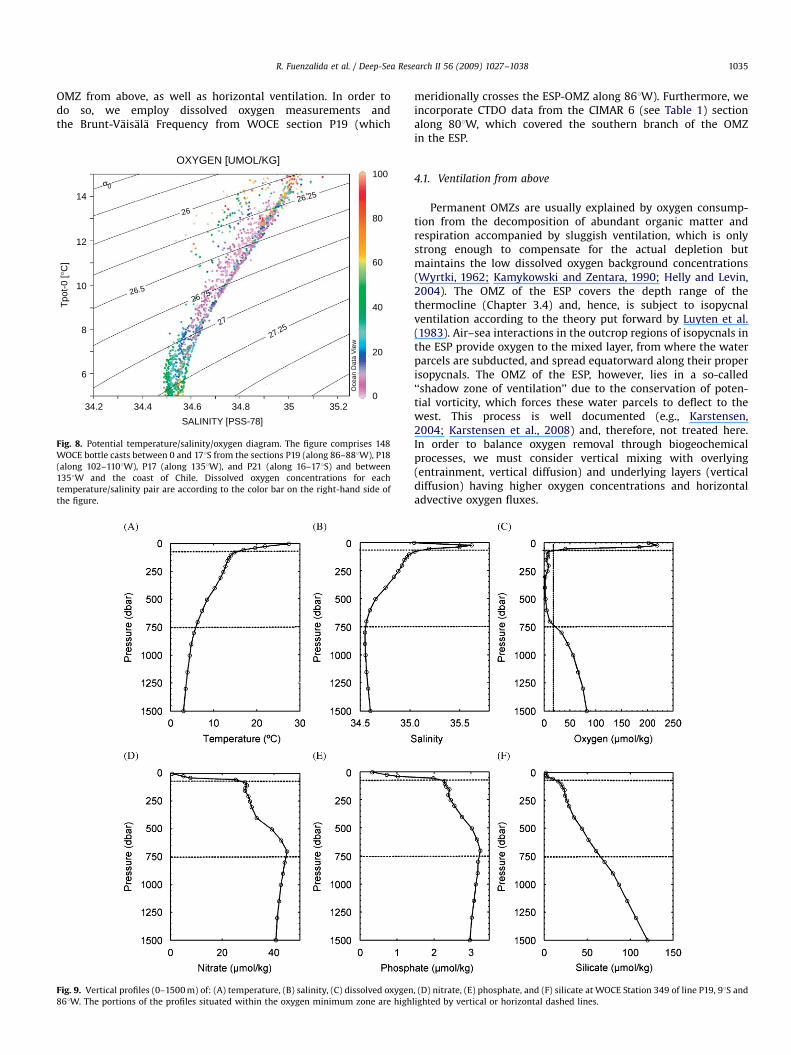
The OMZ in the ESP occupies the thermocline layer of thewater column, where temperature and salinity decrease from theupper to the lower boundary; potential temperatures range from15 to 6 1C, salinity form 35.0 to 34.6 (from top to bottom, Figs. 8and 9A–C), and sigma-t occupies 26.0–27.25 kg m�3, suggesting aformation in the corresponding outcrop regions of these iso-
pycnals in the ESP. Intermediate Water, associated with a weaksalinity minimum (�34.5), is found just below the OMZ (e.g., at800 m depth, Fig. 9B). Dissolved oxygen concentrations at thesalinity minimum, however, remain very low (o50mmol kg�1;Fig. 9C) compared to the salinity minimum linked to pureAntarctic Intermediate Water south of 301S, where dissolvedoxygen concentrations are 4200mmol kg�1. The surface layer ontop of the OMZ consists of saltier subtropical surface water southof 51S (sometimes covered by a very thin, fresher layer, e.g.,Fig. 9B). Surface waters are fresher in the equatorial band becauseof high precipitation linked to the Intertropical ConvergenceZone. The depth of the mixed layer, if it exists at all, is usuallyvery shallow.
The low-oxygen domain is accompanied by high phosphate(around 2.5mmol kg�1) and nitrate (around 35mmol kg�1),although their maxima (3.2, 45mmol kg�1) are found near thelower base (Fig. 9D and E) or below the OMZ (Tsuchiya and Talley,1998). The nitrate to phosphate ratio increases from the upper tothe lower base of the OMZ, from 13 to 14. Unlike phosphate andnitrate, silica increases monotonically downward without exhibit-ing any extremes (Tsuchiya and Talley, 1998; Fig. 9F). Off Peru andChile, these low-oxygen, high-nutrient waters constitute themain source of coastal upwelling waters (Brandhorst, 1971;Blanco et al., 2001; Atkinson et al., 2002).
The spatial distribution of the OMZ thickness in the ESPcoincides with upwelling-favorable conditions (positive velocitiesnorth of the white dotted line in Fig. 10), indicating that nutrient
ARTICLE IN PRESS
Fig. 6. Dissolved oxygen profiles at 41S and 851W during 1982–1983 El Nino and
shortly afterwards. Dates and exact locations are given in the figure.
Fig. 7. Repeated coastal dissolved oxygen profiles under different wind conditions.
Blue oxygen profiles were measured in May 1992 (WOCE, P06) along 321300S (off
Valparaiso) and red oxygen profiles in October 2003 (BEAGLE) at 7 km (solid lines),
22 km (dashed lines), and 38 km (dotted lines) from the coast.
R. Fuenzalida et al. / Deep-Sea Research II 56 (2009) 1027–10381034
enrichment of the surface layer by Ekman suction plays animportant role in determining the spatial boundaries of the OMZ.However, a complete match should not be expected due to acertain decoupling of physical and biological processes, e.g.,export of organic matter by migrating organisms. Maximalupward velocities (upwelling) exceeding 150 m yr�1 were ob-tained in the eastern equatorial Pacific and related to theequatorial divergence; somewhat lower upward velocities wereobserved off the coast of Peru. The most offshore extension ofEkman suction occurred at �1351W (along 51S), which agreedwell with the most westward extension of the OMZ. To the south,Ekman suction was found along a narrow band off northern andcentral Chile, similar to the spatial distribution of the OMZ.
The linear regression between the spatial distribution ofEkman pumping/suction velocity and OMZ thickness yields acorrelation factor of r ¼ 0.76 (2579 samples, F ¼ 3257), at the 95%confidence level, underscoring a significant correlation. Bothvariables are best correlated in the OMZ core, where the thicknessof the hypoxic layer ranges from 200 to 700 m and Ekman suctionranges between 0 and 60 m yr�1.
4. Discussion
The OMZ of the ESP shows a well-defined core from the coastof Peru to 1000 km offshore, where its thickness exceeds 600 m.
Away from this core, the thickness decreases, indicating varyingconditions of oxygen consumption and the ventilation balance.Helly and Levin (2004) also pointed out significant latitudinalvariations in depth, thickness, and intensity of the hypoxic areaalong the eastern Pacific margin (their focus of interest). Thethickness of the OMZ, for instance, is thinner along the equatorialbelt (0–51S) and its upper boundary is found well beyond 200 mdepth. The vertical extension in this area is significant, althougho200 m, and only occurs along the equator between the coast ofEcuador and 1001W. Wyrtki (1966) already concluded thatoxygen-rich water discharged by the Equatorial Undercurrentventilates the OMZ there. The same line of reasoning was putforward by Helly and Levin (2004) to account for the depression ofthe OMZ along the most eastern equatorial region. In thefollowing, we briefly discuss further possible ventilation of the
ARTICLE IN PRESS
R. Fuenzalida et al. / Deep-Sea Research II 56 (2009) 1027–1038 1035
OMZ from above, as well as horizontal ventilation. In order todo so, we employ dissolved oxygen measurements andthe Brunt-Vaisala Frequency from WOCE section P19 (which
14
12
10
8
6
34.2 34.4 34.6 34.8 35 35.2
Tpot
-0 [°
C]
SALINITY [PSS-78]
OXYGEN [UMOL/KG]
σ0
2626.25
26.5
27.2527
26.75
100
80
60
40
20
0
Oce
an D
ata
View
Fig. 8. Potential temperature/salinity/oxygen diagram. The figure comprises 148
WOCE bottle casts between 0 and 171S from the sections P19 (along 86–881W), P18
(along 102–1101W), P17 (along 1351W), and P21 (along 16–171S) and between
1351W and the coast of Chile. Dissolved oxygen concentrations for each
temperature/salinity pair are according to the color bar on the right-hand side of
the figure.
Fig. 9. Vertical profiles (0–1500 m) of: (A) temperature, (B) salinity, (C) dissolved oxygen
861W. The portions of the profiles situated within the oxygen minimum zone are high
meridionally crosses the ESP-OMZ along 861W). Furthermore, weincorporate CTDO data from the CIMAR 6 (see Table 1) sectionalong 801W, which covered the southern branch of the OMZin the ESP.
4.1. Ventilation from above
Permanent OMZs are usually explained by oxygen consump-tion from the decomposition of abundant organic matter andrespiration accompanied by sluggish ventilation, which is onlystrong enough to compensate for the actual depletion butmaintains the low dissolved oxygen background concentrations(Wyrtki, 1962; Kamykowski and Zentara, 1990; Helly and Levin,2004). The OMZ of the ESP covers the depth range of thethermocline (Chapter 3.4) and, hence, is subject to isopycnalventilation according to the theory put forward by Luyten et al.(1983). Air–sea interactions in the outcrop regions of isopycnals inthe ESP provide oxygen to the mixed layer, from where the waterparcels are subducted, and spread equatorward along their properisopycnals. The OMZ of the ESP, however, lies in a so-called‘‘shadow zone of ventilation’’ due to the conservation of poten-tial vorticity, which forces these water parcels to deflect to thewest. This process is well documented (e.g., Karstensen,2004; Karstensen et al., 2008) and, therefore, not treated here.In order to balance oxygen removal through biogeochemicalprocesses, we must consider vertical mixing with overlying(entrainment, vertical diffusion) and underlying layers (verticaldiffusion) having higher oxygen concentrations and horizontaladvective oxygen fluxes.
, (D) nitrate, (E) phosphate, and (F) silicate at WOCE Station 349 of line P19, 91S and
lighted by vertical or horizontal dashed lines.
ARTICLE IN PRESS
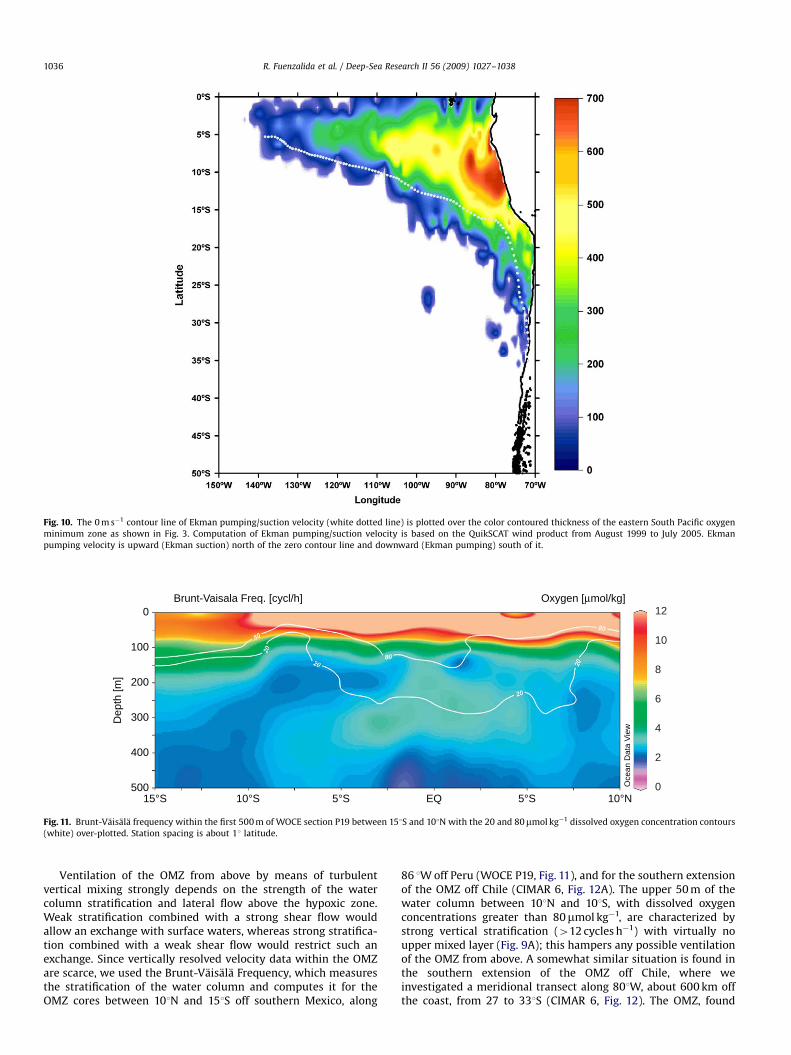
Fig. 10. The 0 m s�1 contour line of Ekman pumping/suction velocity (white dotted line) is plotted over the color contoured thickness of the eastern South Pacific oxygen
minimum zone as shown in Fig. 3. Computation of Ekman pumping/suction velocity is based on the QuikSCAT wind product from August 1999 to July 2005. Ekman
pumping velocity is upward (Ekman suction) north of the zero contour line and downward (Ekman pumping) south of it.
0
100
200
300
400
50015°S 10°S 5°S 5°S 10°NEQ
Dep
th [m
]
Brunt-Vaisala Freq. [cycl/h] Oxygen [μmol/kg]12
10
8
6
2
4
0Oce
an D
ata
View
Fig. 11. Brunt-Vaisala frequency within the first 500 m of WOCE section P19 between 151S and 101N with the 20 and 80mmol kg�1 dissolved oxygen concentration contours
(white) over-plotted. Station spacing is about 11 latitude.
R. Fuenzalida et al. / Deep-Sea Research II 56 (2009) 1027–10381036
Ventilation of the OMZ from above by means of turbulentvertical mixing strongly depends on the strength of the watercolumn stratification and lateral flow above the hypoxic zone.Weak stratification combined with a strong shear flow wouldallow an exchange with surface waters, whereas strong stratifica-tion combined with a weak shear flow would restrict such anexchange. Since vertically resolved velocity data within the OMZare scarce, we used the Brunt-Vaisala Frequency, which measuresthe stratification of the water column and computes it for theOMZ cores between 101N and 151S off southern Mexico, along
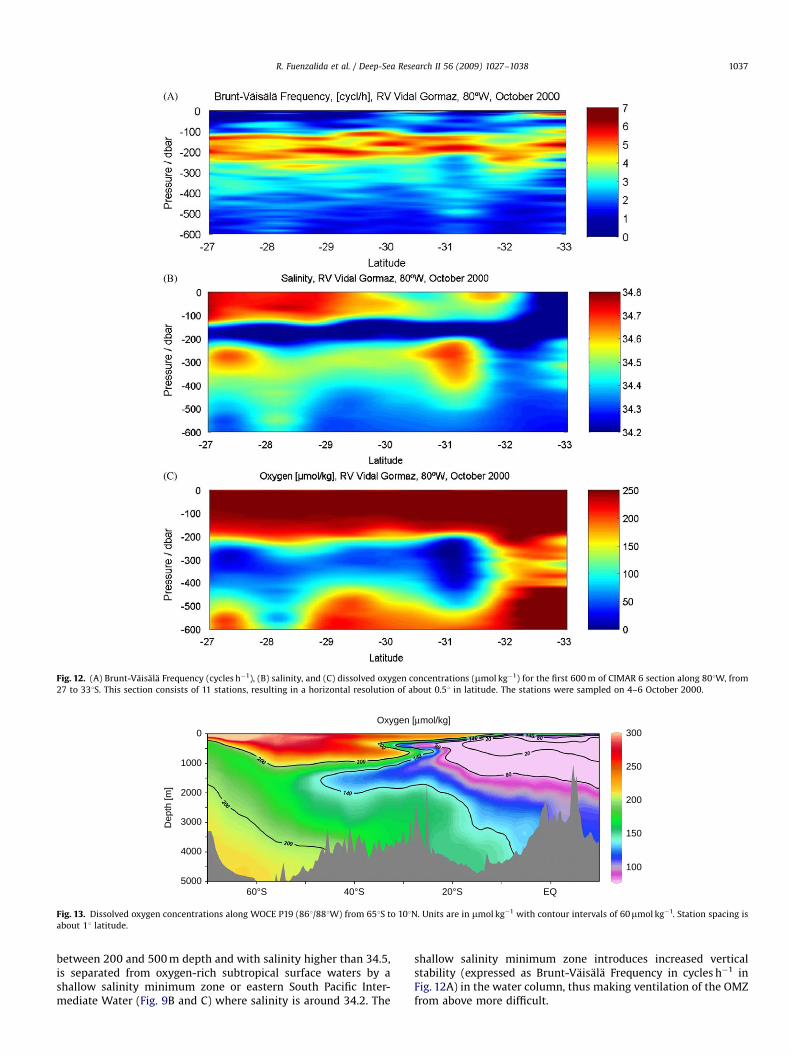
86 1W off Peru (WOCE P19, Fig. 11), and for the southern extensionof the OMZ off Chile (CIMAR 6, Fig. 12A). The upper 50 m of thewater column between 101N and 101S, with dissolved oxygenconcentrations greater than 80mmol kg�1, are characterized bystrong vertical stratification (412 cycles h�1) with virtually noupper mixed layer (Fig. 9A); this hampers any possible ventilationof the OMZ from above. A somewhat similar situation is found inthe southern extension of the OMZ off Chile, where weinvestigated a meridional transect along 801W, about 600 km offthe coast, from 27 to 331S (CIMAR 6, Fig. 12). The OMZ, found
ARTICLE IN PRESS
Fig. 12. (A) Brunt-Vaisala Frequency (cycles h�1), (B) salinity, and (C) dissolved oxygen concentrations (mmol kg�1) for the first 600 m of CIMAR 6 section along 801W, from
27 to 331S. This section consists of 11 stations, resulting in a horizontal resolution of about 0.51 in latitude. The stations were sampled on 4–6 October 2000.
0
1000
2000
3000
4000
500060°S 40°S 20°S EQ
Dep
th [m
]
Oxygen [μmol/kg]300
250
200
150
100
Fig. 13. Dissolved oxygen concentrations along WOCE P19 (861/881W) from 651S to 101N. Units are in mmol kg�1 with contour intervals of 60mmol kg�1. Station spacing is
about 11 latitude.
R. Fuenzalida et al. / Deep-Sea Research II 56 (2009) 1027–1038 1037
between 200 and 500 m depth and with salinity higher than 34.5,is separated from oxygen-rich subtropical surface waters by ashallow salinity minimum zone or eastern South Pacific Inter-mediate Water (Fig. 9B and C) where salinity is around 34.2. The
shallow salinity minimum zone introduces increased verticalstability (expressed as Brunt-Vaisala Frequency in cycles h�1 inFig. 12A) in the water column, thus making ventilation of the OMZfrom above more difficult.
ARTICLE IN PRESS
R. Fuenzalida et al. / Deep-Sea Research II 56 (2009) 1027–10381038
4.2. Horizontal ventilation
Horizontal ventilation of the OMZ requires a sub-surfacehorizontal flow combined with positive horizontal gradients ofdissolved oxygen concentrations. Although the most westwardextensions of the OMZs off Mexico and Peru are distinct, both areconnected along the eastern Pacific coast within at least the first1000 km of their individual offshore extensions (Fig. 13, WOCE P19).The hypoxic layer stretches down from well up the North Pacific,crossing the equator into the South Pacific along 861W. The80mmol kg�1 lower boundary reaches depths of about 1500 mbelow the equator and in the entire Peru Basin. The isolated PeruBasin appears to be poorly ventilated, being shut off by ocean risesfrom oxygen-rich Antarctic Bottom and lower Circumpolar Water. Anintermediate strong sub-surface oxygen front develops at 301S,where Antarctic Intermediate Water clashes with the OMZ. Reid(1997) depicted a weak southward flow off Peru at 800 m depth thatturns west off northern Chile. Such a weak flow, considering thehomogenous meridional dissolved oxygen distribution at intermedi-ate depths, does not have the capacity to ventilate the OMZ.
5. Conclusion
Of the six permanent hypoxic regions in the world oceans, theeastern South Pacific OMZ is volumetrically the fourth largest,occupying 2.1870.66�106 km3 and accounting for �11% globally.Its core is centered off Peru, where the upper boundary is shallow(p100 m) and the vertical extension reaches 700 m. The OMZ inthe ESP develops from the old, low-oxygen waters advected intothe region along the east Pacific coast; these originated fromintermediate depths of the North Pacific Ocean and were furtherdepleted in the intense OMZ off Mexico. Ekman suction, coastalupwelling off Peru, and upwelling along the eastern equatorialdivergence cause a nutrient-rich ocean surface environmentleading to high primary production. In situ oxygen consumptiondue to the decomposition of organic matter and respiration isbalanced, in part, by mixing with oxygen-rich surface waters andweak horizontal ventilation. The southward-flowing PUC cutsthrough the OMZ along the continental slope, extending itssouthern boundaries along the Chilean coast to �371S. Coastalupwelling zones along the eastern Pacific combined with generalcirculation provide a mechanism that allows renewal of upperPacific Deep Water, the most oxygen-poor, oldest water mass ofthe world oceans.
Acknowledgments
This work was supported by the universities Arturo Prat andConcepcion, and by the Chilean National Research Councilthrough the FONDAP-COPAS Center (Project no. 15010007).R. Fuenzalida was financed by the MECESUP/UAP001 scholarshipprogram from 2002 to 2004. We acknowledge the ComiteOceanografico Nacional (National Oceanographic Committee) ofChile for the CIMAR 5 and CIMAR 6 cruises.
References
Atkinson, L.P., Valle-Levison, A., Figueroa, D., De Pol-Holz, R., Gallardo, V.A.,Schneider, W., Schmidt, M., 2002. Oceanographic observations in Chileancoastal waters between Valdivia and Concepcion. Journal of GeophysicalResearch 107.
Blanco, J.L., Thomas, A.C., Carr, M.E., Strub, P.T., 2001. Seasonal climatology ofhydrographic conditions in the upwelling region off northern Chile. Journal ofGeophysical Research 106, 11451–11467.
Brandhorst, W., 1971. Condiciones oceanograficas estivales frente a la costa deChile. Revista de Biologıa Marina Valparaıso 14 (3), 45–84.
Codispoti, L.A., Richards, F.A., 1976. An analysis of the horizontal regime ofdenitrification in the eastern tropical North Pacific. Limnology and Oceano-graphy 21, 379–388.
Conkright, M.E., Antonov, J.I., Baranova, O., Boyer, T.P., Garcia, H.E., Gelfeld, R.,Jonson, D., Locarnini, R.A., Murphy, P.P., O’Brien, T.D., Smolyar, I., Stephens, C.,2002a. World Ocean Database 2001, NOAA Atlas NESDIS 42. US GovernmentPrinting Office, Washington, DC, 167pp.
Conkright, M.E., Locarnini, R.A., Garcia, H.E., O’Brien, T.D., Boyer, T.P., Stephens, C.,Antonov, J.I., 2002b. World Ocean Atlas 2001: Objective Analyses, DataStatistics, and Figures, CD-ROM Documentation. National Oceanographic DataCenter, Silver Spring, MD, 17pp.
Emery, W.J., Meincke, J., 1986. Global water masses: summary and review.Oceanologica Acta 9 (4), 383–391.
Escribano, R., Daneri, G., Farias, L., Gallardo, V., Gonzalez, H., Gutierrez, D., Lange, C.,Morales, C., Pizarro, O., Ulloa, O., Braun, M., 2004. Biological and chemicalconsequences of the 1997-1998 El Nino in the Chilean coastal upwellingsystem: a synthesis. Deep-Sea Research II 51, 2389–2411.
Grantham, B., Chan, F., Nielsen, K., Fox, D., Barth, J., Huyer, A., Lubchenco, J., Menge,B., 2004. Upwelling-driven nearshore hypoxia signals ecosystem and oceano-graphic changes in the northeast Pacific. Nature 429, 749–754.
Helly, J.J., Levin, L.A., 2004. Global distribution of naturally occurring marinehypoxia on continental margins. Deep-Sea Research I 51, 1159–1168.
Kamykowski, D.Z., Zentara, S.J., 1990. Hypoxia in the world ocean as recorded in thehistorical data set. Deep-Sea Research 37, 1861–1874.
Karstensen, J., 2004. Formation of the South Pacific shallow salinity minimum:a Southern Ocean pathway to the Tropical Pacific. Journal of PhysicalOceanography 34, 2398–2412.
Karstensen, J., Stramma, L., Visbeck, M., 2008. Oxygen minimum zones in the easterntropical Atlantic and Pacific Oceans. Progress in Oceanography 77, 331–350.
Levin, L.A., 2002. Deep-ocean life where oxygen is scarce. American Scientist 90,436–444.
Levin, L.A., Huggett, C.L., Wishner, K.F., 1991. Control of deep-sea benthiccommunity structure by oxygen and organic-matter gradients in the easternPacific Ocean. Journal of Marine Research 49, 763–800.
Luyten, J.R., Pedlosky, J., Stommel, H., 1983. The ventilated thermocline. Journal ofPhysical Oceanography 13, 292–309.
McCartney, M.S., 1977. Subantarctic mode water. In: Angel, M. (Ed.), A Voyage ofDiscovery. Pergamon Press, Oxford, pp. 103–119.
Morales, C., Braun, M., Reyes, H., Blanco, J.L., Davies, A.G., 1996. Anchovy larvaldistribution in the coastal zone off northern Chile: the effect of low dissolvedoxygen concentration and of a cold–warm sequence (1990-1995). Investiga-ciones Pesqueras (Chile) 24, 77–96.
Morales, C., Hormazabal, S., Blanco, J.L., 1999. Interannual variability in themesoscale distribution of the depth of the upper boundary of the oxygenminimum layer off northern Chile (18–24
%oS): Implications for the pelagic
system and biogeochemical cycling. Journal of Marine Research 57, 909–932.Mullins, H.T., Thompson, J.B., McDougall, K., Vercoutere, T.L., 1985. Oxygen-
minimum zone edge effects, evidence from the central California coastalupwelling system. Geology 13, 491–494.
Pantoja, S., Sepulveda, J., Gonzalez, H., 2004. Decomposition of sinking proteinac-eous material during fall in the oxygen minimum zone off northern Chile.Deep-Sea Research I 51, 55–70.
Pickard, G.L., Emery, W.J., 1990. Descriptive Physical Oceanography, fifth ed.Pergamon Press, Oxford.
Press, W.H., Flannery, B.P., Teukolsky, S.A., Vetterling, W.T., 1988. Numerical Recipesin C. Cambridge University Press, Cambridge.
Reid, J.L., 1973. Transpacific hydrographic sections at Lats. 431S and 281S: theScorpio Expedition III. Upper water and a note on southward flow at mid-depth. Deep-Sea Research 20 (1), 39–49.
Reid, J.L., 1997. On the total geostrophic circulation of the Pacific Ocean: flowpatterns, tracers, and transports. Progress in Oceanography 39, 263–352.
Silva, N., Neshyba, S., 1979. On the southernmost extension of the Peru-ChileUndercurrent. Deep-Sea Research A 26, 1387–1393.
Stephens, C., Antonov, J.I., Boyer, T.P., Conkright, M.E., Locarnini, R.A., O’Brien, T.D.,Garcia, H.E., 2002. World Ocean Atlas 2001, Volume 1: Temperature. In:Levitus, S. (Ed.), NOAA Atlas NESDIS 49. US Government Printing Office,Washington, DC 167pp., CD-ROMs.
Strub, P.T., Mesias, J.M., Montecino, V., Rutllant, J., Salinas, S., 1998. Coastal oceancirculation off western South America. Coastal segment (6,E). In: Robinson,A.R., Brink, K.H. (Eds.), The Sea, vol. 11. Wiley, New York, pp. 273–313.
Thompson, J.B., Mullins, H.T., Newton, C.R., Vercoutere, T., 1985. Alternativebiofacies model for dysaerobic communities. Lethaia 18, 167–179.
Tomczak, M., Godfrey, J.S., 1994. Regional Oceanography: An Introduction.Pergamon Press, Oxford, 422pp.
Tsuchiya, M., Talley, L.D., 1998. A Pacific hydrographic section at 881W: water-property distribution. Journal of Geophysical Research 103, 12899–12918.
Ulloa, O., Escribano, R., Hormazabal, S., Quinones, R.A., Gonzalez, R.R., Ramos, M.,2001. Evolution and biological effects of the 1997–98 El Nino in the upwellingecosystem off northern Chile. Geophysical Research Letters 28, 1591–1594.
Wishner, K., Levin, L.A., Gowing, M., Mullineaux, L., 1990. Involvement of theoxygen minimum in the benthic zonation on a deep seamount. Nature 346,57–59.
Wyrtki, K., 1962. The oxygen minima in relation to ocean circulation. Deep-SeaResearch 9, 11–23.
Wyrtki, K., 1966. Oceanography of eastern Equatorial Pacific Ocean. Oceanographyand Marine Biology Annual Review 4, 33–68.