using semantic web technologies to access soft aec data
TRANSCRIPT

Advanced Engineering Informatics xxx (2014) xxx–xxx
Contents lists available at ScienceDirect
Advanced Engineering Informatics
journal homepage: www.elsevier .com/ locate/ae i
Using semantic web technologies to access soft AEC data q
http://dx.doi.org/10.1016/j.aei.2014.05.0021474-0346/� 2014 Elsevier Ltd. All rights reserved.
q Handled by W.O. O’Brien.⇑ Corresponding author. Tel.: +353 656823721.
E-mail addresses: [email protected] (E. Corry), [email protected](J. O’Donnell), [email protected] (E. Curry), [email protected](D. Coakley), [email protected] (P. Pauwels), [email protected] (M. Keane).
Please cite this article in press as: E. Corry et al., Using semantic web technologies to access soft AEC data, Adv. Eng. Informat. (2014), http://dx.d10.1016/j.aei.2014.05.002
Edward Corry a,⇑, James O’Donnell b,c, Edward Curry d, Daniel Coakley a, Pieter Pauwels e, Marcus Keane a
a Informatics Research Unit for Sustainable Engineering, National University of Ireland Galway, Galway, Irelandb Electricity Research Centre and UCD Energy Institute, School of Mechanical and Materials Engineering, University College Dublin, Belfield, Dublin 4, Irelandc Building Technologies and Urban Systems Department, Lawrence Berkeley National Laboratory, 1 Cyclotron Road, MS 90R3111, Berkeley, CA 94720, United Statesd Digital Enterprise Research Institute, National University of Ireland Galway, IDA Business Park, Lower Dangan, Galway, Irelande Department of Architecture and Urban Planning, Ghent University, Ghent, Belgium
a r t i c l e i n f o
Article history:Received 13 August 2013Received in revised form 5 May 2014Accepted 21 May 2014Available online xxxx
Keywords:Social mediaTwitterLinked dataPerformance metricsBuilding performanceRDF
a b s t r a c t
Building related data tends to be generated, used and retained in a domain-specific manner. The lack ofinteroperability between data domains in the architecture, engineering and construction (AEC) industryinhibits the cross-domain use of data at an enterprise level. Semantic web technologies provide a possiblesolution to some of the noted interoperability issues. Traditional methods of information capture fail totake into account the wealth of soft information available throughout a building. Several sources ofinformation are not included in performance assessment frameworks, including social media, occupantcommunication, mobile communication devices, occupancy patterns, human resource allocations andfinancial information.
The paper suggests that improved data interoperability can aid the integration of untapped silos ofinformation into existing structured performance measurement frameworks, leading to greater awarenessof stakeholder concerns and building performance. An initial study of how building-related data can bepublished following semantic web principles and integrated with other ‘soft-data’ sources in a cross-domain manner is presented. The paper goes on to illustrate how data sources from outside the buildingoperation domain can be used to supplement existing sources. Future work will include the creation of asemantic web based performance framework platform for building performance optimisation.
� 2014 Elsevier Ltd. All rights reserved.
1. Introduction
‘‘You cannot manage what you do not measure.’’ Many interestedparties in the AEC domain have long placed this timeless conceptas a central driver of their work [1]. In order to produce, and moreimportantly, operate buildings to the satisfaction of owners,occupants and legislators, a keen understanding of performanceassessment and measurement is required. Decision makers needaccess to the information and tools required to cost-effectivelyassure the desired performance of buildings [2]. The lack ofinteroperability manifested in poor electronic data exchange,management and access has a significant cost [3] to the decisionmaking process in general. In order to ensure optimal performance,several studies have shown that one must continually measureand monitor performance [4–6]. Modelling, measuring and
benchmarking of building performance is set to become the indus-try norm [7] as more types of data become more available. Buildingperformance, in the context of this paper, is defined as the deliverof functional intent of each zone in the building while accountingfor the energy and cost of delivering this functional intent.
Traditionally, buildings have been managed using a smallsubset of the data available in a building, namely the data that ismade available via building management systems (BMS). Well-recognised interoperability issues and a lack of cross-domain dataexchange [8] preclude the integration of many other building datasources with existing BMS information. Successful optimisationefforts require an integrated solution including a performanceassessment framework, integrated data sources and an informa-tion delivery system tailored to the skill-set of the key buildingstakeholder(s) [9].
This work is primarily intended to show how diverse streams ofinformation can be captured and linked with other building data tobroaden the range of data silos available for building performanceoptimisation. Two very different ‘soft’ information sources,scheduling data and continuous occupant feedback, are used asinitial examples of the type of soft information available in
oi.org/

2 E. Corry et al. / Advanced Engineering Informatics xxx (2014) xxx–xxx
buildings. by way of a case study, the paper illustrates how thesesources might be integrated into an overall assessment strategy.The paper shows primarily how semantic web technologies canbe used to facilitate the required type of cross-domain data use.Finally, the paper discusses how the integration of softer datasources with such an assessment strategy could potentially resolvesome of the issues outlined in this introduction.
The integration of building data using semantic web technolo-gies was previously explored [10,9,11]. The resulting data structurewas used to drive a building energy assessment dashboard [9]. Acomprehensive performance assessment framework was illus-trated in [10] for use throughout the life-cycle of the building. Itshowed how this approach could be integrated with existing datasources available in buildings. This paper suggests that othersources of data, outside the traditional building management sys-tems (BMS), are available in modern buildings, often in electronicformat and represent an untapped resource which can enable agreater level of cross-domain communication and engagementamongst building stakeholders. The paper explores how some ofthese sources could be incorporated with other building data usingsemantic web technologies.
These data sources are often not used in a cross-domain mannerdue to inertia, interoperability issues and a lack of an adequateframework into which the sources can be added. Some of thesources also tend to be hard to interpret due to the qualitative nat-ure of the data and the lower level of trustworthiness in somecases. The paper illustrates how some of these issues can be over-come and pose the question, what can be achieved with these extradata sources?
Robust building management techniques and systems can besupplemented to include a broader interpretation of building per-formance, beyond typical concerns, such as energy consumptionand system performance. Broader concerns regarding buildingoperation, including cross-domain data sharing and stakeholderinteraction, can also be considered when data is more easily acces-sible. Efforts have been made to improve interoperability in theAEC domain, particularly the various building information model-ling (BIM) initiatives and processes used to describe informationtransfers between domains [12]. The paper generally describesthe problems associated with current methods of informationexchange in the AEC industry and in particular around the dis-jointed area of building performance assessment. Building on pre-vious work [9,11], the paper briefly describes how currentlyuntapped data sources may be exposed using semantic web tech-nologies, and interpreted using a proven technique to provide amore structured assessment of building performance, togetherwith the more traditional sources of building performance data.The paper goes on to show how this technique may be extendedto include a range of ‘soft’ data sources, along with more traditionalhard data sources.
2. Accessing diverse data sources in the building operationphase
2.1. Information exchange in buildings: semantic web technologies inthe performance framework tool
The Performance Framework Tool (PFT) has been conceived bythe authors as a means for deriving enhanced meaning from build-ing data sources, based on the performance metric concept [13].The structured decision making framework is mainly aimed atproviding the key building stakeholder, the building manager, withthe information needed to make informed and repeatable decisionsregarding the operation of a facility. It does this by providingthe end user with useful information from diverse domains.
Please cite this article in press as: E. Corry et al., Using semantic web technolo10.1016/j.aei.2014.05.002
Furthermore, the tool is intended to serve as an aid to building per-formance assessment across the building life cycle, allowing theintegration of design and simulation data sources with real perfor-mance data. The PFT depends on access to various data sourcesfrom the building and the greater the range available, the moreinformative the tool may become.
Central to the PFT (and building management) is the integrationof information from various domains. No building stakeholderretains (or can retain) a complete picture of all building-relatedinformation and although the building manager can access perhapsthe greatest range of information about a building and its perfor-mance, typically, building information is created, maintained andlost by many stakeholders throughout the building life-cycle[12]. This loss of information and lack of interoperability acrossdomains has been well documented [14,15,3]. Several initiativeshave been made to develop technologies [16–20,11,9] and defineprocedures [13,21] to capture and retain information amongst var-ious stakeholders and across domains. However, due to the lack ofinformation interoperability, it is (near to) impossible to get across-domain view of a building in terms of interaction of datastreams in a clear and structured manner. It is not the purpose ofthis tool to provide such a complete view. Instead, the PFT toolaims at providing access to various information sources, so thatthe building manager gets the option to choose the criteria accord-ing to which he assesses building performance.
Considering the building as a whole, there are several streamsof data that currently exist to serve particular domains and remainuntapped in the building performance sphere. A detailed analysisof the integration challenges is provided by Shen et al. [8]. Technol-ogies are emerging which can bridge the interoperability gapacross several domains in the AEC industry. New informationexchange definitions are being generated to describe all mannerof domains, including such diverse areas as curtain wall modellingand information handover protocols [22]. Industry and nationallevel organisations have recognised the importance of data man-agement and building information modelling (BIM) in particularand are driving advances in this area by making BIM a requirementof projects [23,24]. Taken as a whole, advances in the interopera-bility question pose some very interesting questions as to whatuse may be made of these technologies to generate an enhancedview of building performance.
Fig. 3 illustrates the concept behind exposing previously remotedata sources in a Resource Description Framework (RDF) format[25]. The paper identifies ways in which semantic web technolo-gies can serve as a unifying set of technologies aiding interopera-bility across previously remote data sources. Utilising semanticweb technologies, previously unused sets of building data areexposed and integrated with relating datasets. Fig. 3 is a represen-tation of the platform this research effort is currently workingtowards with a view to semantically integrating building data intoa performance assessment platform.
2.2. Semantic web technologies
The semantic web was conceived in [26] as a network thatdescribes the meaning of its concepts through a directed, labelledgraph. Each node in this graph represents a particular concept orobject in the world and each arc in this graph represents the logicalrelation between two of these concepts or objects. When viewedtogether, the graph represents a set of logic-based declarative sen-tences. Relationships can then be created between these sentencesor ‘triples’.
All kinds of data can thus be linked together, resulting in a webof information that both humans and machines can read.
The Resource Description Framework (RDF) [20] is the datamodel used for information representation. An RDF graph is
gies to access soft AEC data, Adv. Eng. Informat. (2014), http://dx.doi.org/

E. Corry et al. / Advanced Engineering Informatics xxx (2014) xxx–xxx 3
constructed by applying a logical AND operator to a range of logicalstatements containing concepts or objects in the world and theirrelations. These statements are often referred to as RDF triples,consisting of a subject, a predicate and an object, implying direc-tionality in the RDF graph Fig. 4. Every concept described in anRDF graph, whether this be an object, subject or predicate, isuniquely defined through a uniform resource identifier (URI). Theresulting RDF graph can be converted into a textual representationthat follows a specific syntax [27].
Several triples can be joined together and, in this manner, a col-lection of information can be exposed. For instance, other informa-tion can be published relating to the room, or the other occupants.The strength of the technique lies in the ability to uniquely refer-ence the subject, predicate and object using a URI, allowing datasharing to take place at the data level, rather than the applicationlevel.
RDF is especially powerfully when attempting to integratecross-domain data as a series of triples can be quickly accumulatedconcerning the same object. Several vocabularies or ontologieshave emerged to describe specific domains of data including FOAF,Dublin Core and SIOC. These vocabularies provide further meaningto domain objects and relationships. An object may be referencedin a number of domains, using different ontologies. This researchapplies semantic web techniques in the AEC sector to enablegreater cross-domain data sharing.
2.3. Hard and soft building data
Hard data sources are understood as sources which are readilyaccessible to the existing BMS and consist of quantifiable data thatis easy to aggregate and infer information from. On the other hand,soft data sources are sources that are not generally accessible to thebuilding management infrastructure and are often qualitativerather than quantitative in nature, making it difficult to draw par-ticular inferences from.
Modern buildings encompass a diverse range of informationdomains, between which an acknowledged interoperability deficitexists [3], as illustrated in Fig. 1. The list of building-related data inFig. 1 is far from exhaustive, but it illustrates how the variousdomains independently retain an array of building-related datathat is most often not integrated with the building managementstructure or made available on a cross-domain basis. These datasources can serve a purpose in the optimisation of building perfor-mance when incorporated into a comprehensive performance
Fig. 1. Semantic web based building p
Please cite this article in press as: E. Corry et al., Using semantic web technolo10.1016/j.aei.2014.05.002
management platform [28], by supplementing the existing harddata sources in the performance assessment framework.
While a performance framework aimed at optimising buildingperformance can certainly benefit from enhanced building dataaccess, a building should engage with all building stakeholdersand not just the building manager. There is significant scope touse qualitative, soft data sources to inform building users as tothe impact of their preferences on building performance and topersuade them to modify behaviour accordingly. Ultimately, thepurpose of most buildings is to provide a comfortable and safeenvironment for occupants to live and work. By enabling buildingoccupants to engage with the building and understand the impactsof their actions on building performance, it is possible to engendera sense of involvement with the building community.
Some of the hard data sources currently used in the buildingperformance optimisation space are illustrated in Fig. 2, togetherwith some of the possible softer data sources. These additionalsources could complement existing hard data sources by providinga further layer of data, for example in the area of fault detection.There is a wide spectrum of data sources available throughout abuilding, even when just considering the narrow area of schedulingand occupancy patterns. Some of these sources are readily accessi-ble and exist in a format that lends itself to analysis, whilst othersrequire a greater degree of assessment and interpretation beforethey can be used to drive performance optimisation efforts.
The paper explores how two of these data sources could be inte-grated with existing data sources using semantic web technologies.The authors have developed a number of software tools aimed atdisplaying building data in an informative and structured manner.These solutions are tailored to suit the needs of the end user orbuilding stakeholder and in the case of [9], are aimed at motivatingthe building occupant to pursue specific energy saving measures.
3. Demonstrators
In the remainder of this paper, two demonstrators are docu-mented to show how cross-domain data could be integrated withexisting data sources using semantic web technologies. Thesedemonstrators illustrate the concept and work is on-going on thetechnical implementation of these data exchanges. The demonstra-tors are not intended to serve as an exhaustive exploration of theviability of these data sources as indicators of building perfor-mance but as an illustration of how diverse data sources can beaccessed and transformed using semantic web technologies. The
erformance assessment platform.
gies to access soft AEC data, Adv. Eng. Informat. (2014), http://dx.doi.org/

Fig. 2. A triple consists of a subject, predicate and object. Each of these has a uniqueURI. A sample RDF graph is given in three forms: graph syntax, RDF/XML syntax andN3 syntax.
HVACLightingCO2RHAir Temp
Building Manager
StakeholderInformation SiloDomain
Financial Controller
PhonesLANsWirelessInternet
Utility BillsMaintenanceContractsPayroll
Staff IDAddressTransport Location
ScheduleDemandOccupancyArchive
Operations
Communication
Finance
HR
Scheduling
Information Exchange
General Manager
HR Manager
Paper
Manual Reading
BMS
Database
Paper
Spreadsheet
Database
All Stakeholders
Fig. 3. Some of the disconnected data silos across AEC domains resulting inincomplete representations of building performance.
4 E. Corry et al. / Advanced Engineering Informatics xxx (2014) xxx–xxx
demonstrators illustrate how data from random sources can beeasily transformed into RDF and integrated with other data.
3.1. Demonstrator motivation
In the first demonstrator, the paper explores how schedulingdata might be integrated with building operation data to illustratehow such data can be used in a cross-domain manner. This exper-iment is not intended to predict actual savings from the integrationof cross-domain occupancy data, but is designed to show how datafrom non-connected domains can be integrated to allow a greaterdegree of understanding of building requirements.
Please cite this article in press as: E. Corry et al., Using semantic web technolo10.1016/j.aei.2014.05.002
In a typical university or other large scale campus, the schedul-ing software built into the individual building’s BMS is manuallypopulated. In many cases, the system is configured to operate dur-ing office hours, when the facility is occupied, taking account ofholidays, etc. During the design phase of the project life-cycle,expected occupancy patterns are taken into account when decidingon the optimum schedule. Often, little attention is actually paid tooccupancy patterns during the operational phase of a facility, lead-ing to uncomfortable and over-conditioned situations in the build-ing. Controlling HVAC systems using occupancy data is arecognised means of optimising performance [29]. At the sametime, room occupancy numbers are often scheduled by a differentfunction in the university, the admissions office. The schedule andoccupancy pattern changes from year to year, but this is notreflected in the BMS settings. Essentially, the activities of onedomain can have knock on effects on other domains in thebuilding.
The second demonstrator focuses on soft data related to build-ing use which is difficult to quantify and integrate with existingoperational structures. The idea behind this demonstrator is togenerate a sense of ownership and ambient awareness amongst agroup of building occupants and to encourage them to post tweetsdescribing some of their interactions with the building. It is feltthat this type of feedback would provide building managers withinstant feedback on building issues as they arise and could alsoserve as a type of barometer for occupant satisfaction. Again, thisis not a typical source of data for building managers. In thisdemonstration the paper illustrates how this type of data can becaptured and transformed using semantic web technologies.
The outcome from both demonstrators is a set of building-related data exposed in RDF graphs, which can then be easilyaccessed and queried using semantic web technologies. In the con-cluding section, the paper describes how semantic web technolo-gies forms the basis of a performance management tool used tointegrate these data sets in a cross-domain manner.
3.2. Demonstration building at the National University of Ireland,Galway campus
The building used to carry out the demonstrations is the14,000 m2 New Engineering Building (NEB) on the National Uni-versity of Ireland, Galway campus (Fig. 4). This is an ideal demon-strator as it is a heavily instrumented building and utilises acomplex mixed-mode heating and cooling system together withan innovative climate facade used to provide extensive naturalventilation.
The NEB is particularly interesting given that 90% of the build-ing’s occupants are students who attend lectures and engage inpractical coursework in the building. They generally do not seethemselves as stakeholders in the building and are often not awareof the controls available to them in the building or how the build-ing management function operates. The building is managed remo-tely based entirely on hard data emanating from the BMS. Theonsite building manager on the other hand deals almost entirelywith soft data feedback in the form of queries from the buildingoccupants.
4. Demonstrator 1: Integrating scheduling data with buildingoperating strategy
4.1. Available data
The university admissions office uses timetabling software (MSExcel) to administer the use of university lecturing facilities. Thiscentralised room booking/scheduling service operates separately
gies to access soft AEC data, Adv. Eng. Informat. (2014), http://dx.doi.org/

Occupancy Patterns
Wireless RoutersOccupant Interaction
Social MediaBuilding Feedback
Schedule Data
Room AllocationWeather ForecastFinancial Pricing
BMS Data
Air TempHumidityCO2
Currently Accessed Data
Readily Available Data
Capture & Analysis System Required
Combine using Linked Data Approach
Soft Data
Hard Data
Fig. 4. Continuum of hard and soft data sources relating to occupancy andscheduling currently not integrated in any meaningful way during buildingoperation.
Table 1BMS schedule of operation for lecture theatre G018. Cells coloured grey representtimes when the space is conditioned.
Table 2BMS schedule overlaid with occupancy pattern. The grey background indicated whenthe room is conditioned and the numbers relate to the amount of students scheduledto be in the room at that time.
E. Corry et al. / Advanced Engineering Informatics xxx (2014) xxx–xxx 5
from the BMS, a Cylon Unitron System [30]. The room bookingschedule changes from year to year and as a result, spaces are con-ditioned when no occupants are present, whilst others are not con-ditioned, despite students being present. This type of schedulingmismatch is replicated in many buildings.
Some studies show that occupancy can be used as an indicatorto schedule demand-led air conditioning systems, together withthe traditional air temperature, external air temperature and rela-tive humidity readings [31,32], whilst others suggest methods ofinterpreting occupant satisfaction with indoor ambient tempera-tures [33]. Buildings are generally conditioned to satisfy maximumoccupancy, but this level often does not describe occupancy pat-terns. Existing systems used in other domains that provide ordinaldata can provide a basis for performance analysis [34] and, whenconsidered with other hard data sources, can provide further qual-ifying data about performance. Sources of this sort of data includefacility scheduling software, infrared sensors, swipe card systems,wireless routers and personal radio frequency identification (RFID)trackers. Other studies have investigated methods of measuringreal time occupancy using a variety of technologies, includinginfrared detectors and door and window opening sensors [35],RFID sensors [36] and Wi-Fi connection hotspots [37].
Many of these technologies are highly complex and rely oncomplex algorithms to determine the occupancy level of a space.Furthermore, these methods do not overcome the interoperabilityissues associated with cross-domain data analysis. The paper illus-trates how semantic web technologies can be used to expose occu-pancy scheduling data from a completely separate, autonomousbuilding domain and deliver it to other interested parties in thefacility. Although questions exist over the usefulness of static occu-pancy schedules to drive HVAC scheduling, this type of softer datacan serve as an indicator of building use and, when viewed in con-junction with other traditional hard data sources, can serve animportant function.
Table 1 shows the BMS schedule for the lecture theater G018,indicating the hours when the space is being conditioned. This pat-tern reflects an effort on behalf of the university to maintain a con-ditioned space, whilst keeping costs low. This is the type ofinformation currently available to the building manager about thisspace, as returned by the BMS.
By comparing this schedule to the room booking schedule(Table 2), those moments in the week can be found when a fullyoccupied room is conditioned and when an empty room is notconditioned.
4.2. Combining the data sets
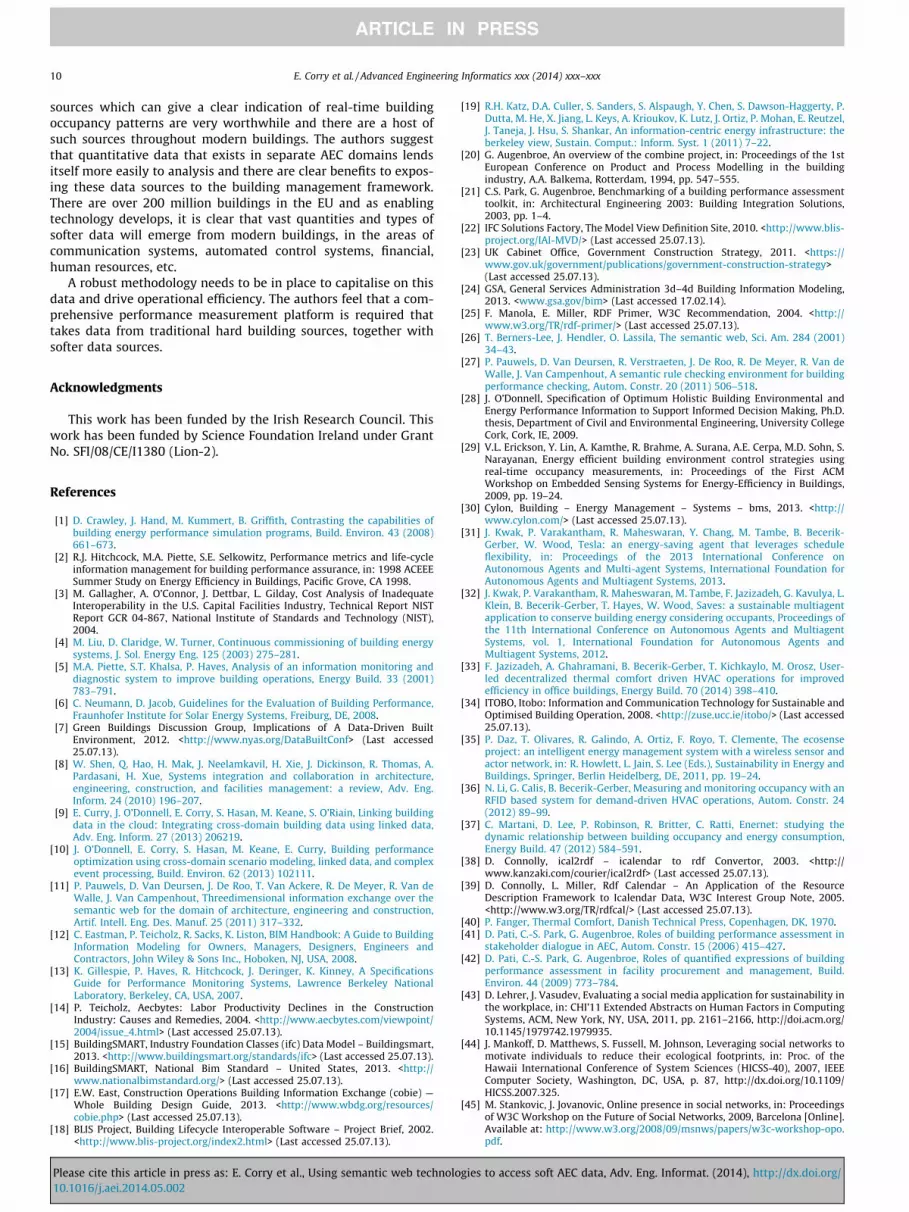
Using semantic web technologies, it is possible to explicitly linksemantic representations of building objects, such as rooms, whilethey are retained in various different data silos. In Fig. 6, the room
Please cite this article in press as: E. Corry et al., Using semantic web technolo10.1016/j.aei.2014.05.002
concept is used by four different data models, each model repre-senting a different context. Firstly, the BMS uses the concept ofthe room to represent the location of sensors and HVAC services.Human resource management (HRM) software uses the room con-cept to define where a staff member is based. The BIM modellingenvironment uses the room concept to define a geometric spacewith respect to the remainder of the building, while the campusscheduling software uses the room concept to define where anevent, in this case a lecture, takes place with a given number ofparticipants.
By exposing these four diverse data streams in RDF and linkingthem together as in Fig. 5, ways of analysing this data with a viewto greater operational efficiency in the space, based on optimisingthe BMS schedule can be explored. Taking the BMS schedulingdata, a rudimentary calendar using Google calendar and exportedto the iCal file format (Listing 1). The iCal file format was used asa means to capture calendar data as it is a schema which can beeasily transformed to RDF, using an existing conversion service.One of the key pillars of the semantic web initiative is the reuseof existing ontologies to describe data.
The web-based iCaltoRDF converter [38] is used to convert thisoutput to RDF, using the RDF calendar ontology [39] (Listing 2).This system uses the RDF Calendar [39] to integrate calendar datawith other semantic web data.
gies to access soft AEC data, Adv. Eng. Informat. (2014), http://dx.doi.org/
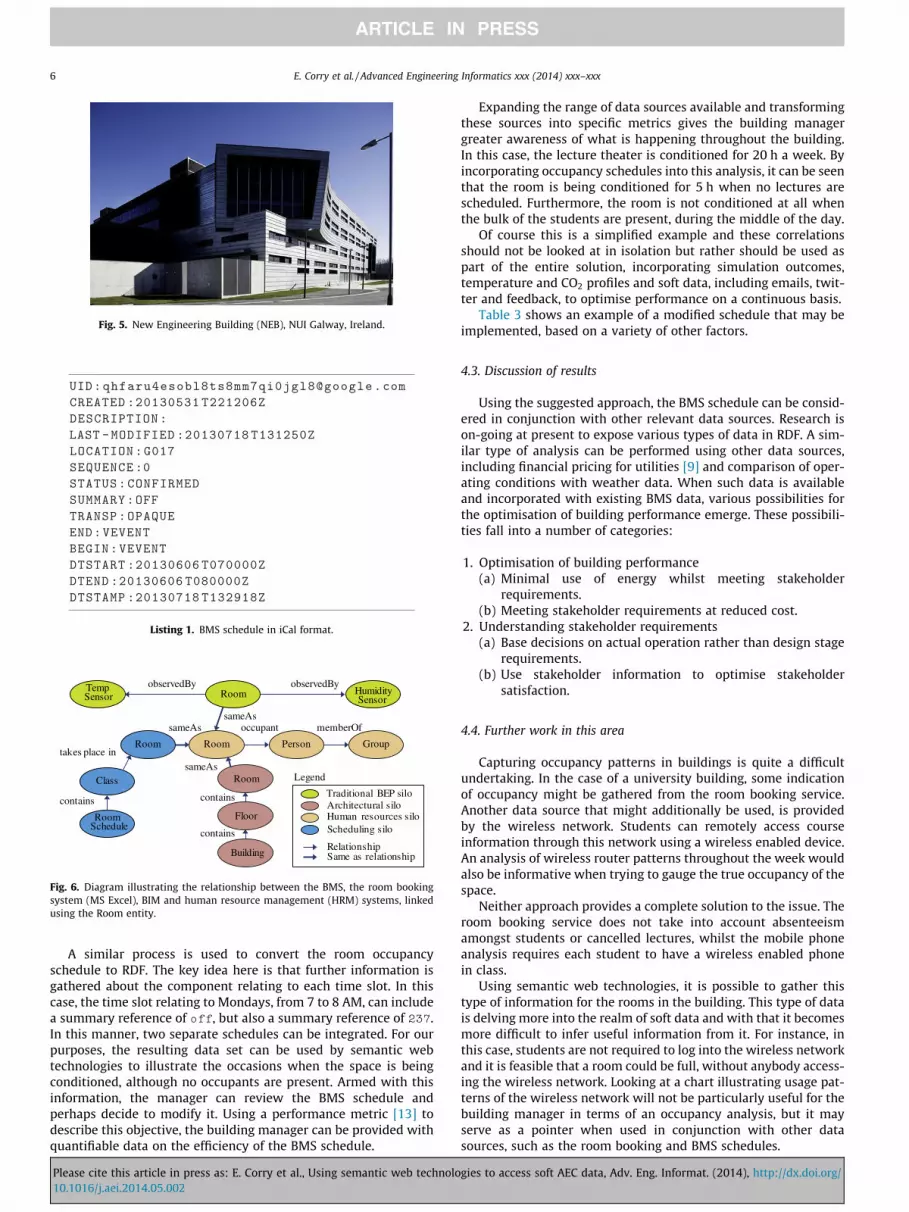
Fig. 5. New Engineering Building (NEB), NUI Galway, Ireland.
Listing 1. BMS schedule in iCal format.
RoomobservedBy observedBy
Group
memberOf
Room
Person
Building
Floor
contains
contains
sameAs
Legend
TempSensor
Traditional BEP silo
Human resources siloScheduling silo
RelationshipSame as relationship
Room
occupant
Architectural silo
sameAs
HumiditySensor
Room
Room Schedule
Class
takes place in
sameAs
contains
Fig. 6. Diagram illustrating the relationship between the BMS, the room bookingsystem (MS Excel), BIM and human resource management (HRM) systems, linkedusing the Room entity.
6 E. Corry et al. / Advanced Engineering Informatics xxx (2014) xxx–xxx
A similar process is used to convert the room occupancyschedule to RDF. The key idea here is that further information isgathered about the component relating to each time slot. In thiscase, the time slot relating to Mondays, from 7 to 8 AM, can includea summary reference of off, but also a summary reference of 237.In this manner, two separate schedules can be integrated. For ourpurposes, the resulting data set can be used by semantic webtechnologies to illustrate the occasions when the space is beingconditioned, although no occupants are present. Armed with thisinformation, the manager can review the BMS schedule andperhaps decide to modify it. Using a performance metric [13] todescribe this objective, the building manager can be provided withquantifiable data on the efficiency of the BMS schedule.
Please cite this article in press as: E. Corry et al., Using semantic web technolo10.1016/j.aei.2014.05.002
Expanding the range of data sources available and transformingthese sources into specific metrics gives the building managergreater awareness of what is happening throughout the building.In this case, the lecture theater is conditioned for 20 h a week. Byincorporating occupancy schedules into this analysis, it can be seenthat the room is being conditioned for 5 h when no lectures arescheduled. Furthermore, the room is not conditioned at all whenthe bulk of the students are present, during the middle of the day.
Of course this is a simplified example and these correlationsshould not be looked at in isolation but rather should be used aspart of the entire solution, incorporating simulation outcomes,temperature and CO2 profiles and soft data, including emails, twit-ter and feedback, to optimise performance on a continuous basis.
Table 3 shows an example of a modified schedule that may beimplemented, based on a variety of other factors.
4.3. Discussion of results
Using the suggested approach, the BMS schedule can be consid-ered in conjunction with other relevant data sources. Research ison-going at present to expose various types of data in RDF. A sim-ilar type of analysis can be performed using other data sources,including financial pricing for utilities [9] and comparison of oper-ating conditions with weather data. When such data is availableand incorporated with existing BMS data, various possibilities forthe optimisation of building performance emerge. These possibili-ties fall into a number of categories:
1. Optimisation of building performance(a) Minimal use of energy whilst meeting stakeholder
requirements.(b) Meeting stakeholder requirements at reduced cost.
2. Understanding stakeholder requirements(a) Base decisions on actual operation rather than design stage
requirements.(b) Use stakeholder information to optimise stakeholder
satisfaction.
4.4. Further work in this area
Capturing occupancy patterns in buildings is quite a difficultundertaking. In the case of a university building, some indicationof occupancy might be gathered from the room booking service.Another data source that might additionally be used, is providedby the wireless network. Students can remotely access courseinformation through this network using a wireless enabled device.An analysis of wireless router patterns throughout the week wouldalso be informative when trying to gauge the true occupancy of thespace.
Neither approach provides a complete solution to the issue. Theroom booking service does not take into account absenteeismamongst students or cancelled lectures, whilst the mobile phoneanalysis requires each student to have a wireless enabled phonein class.
Using semantic web technologies, it is possible to gather thistype of information for the rooms in the building. This type of datais delving more into the realm of soft data and with that it becomesmore difficult to infer useful information from it. For instance, inthis case, students are not required to log into the wireless networkand it is feasible that a room could be full, without anybody access-ing the wireless network. Looking at a chart illustrating usage pat-terns of the wireless network will not be particularly useful for thebuilding manager in terms of an occupancy analysis, but it mayserve as a pointer when used in conjunction with other datasources, such as the room booking and BMS schedules.
gies to access soft AEC data, Adv. Eng. Informat. (2014), http://dx.doi.org/

Listing 2. BMS schedule in iCal format converted to RDF data.
Table 3A modified BMS schedule, still operating for 20 h. Cells coloured grey represent timeswhen the space is conditioned.
E. Corry et al. / Advanced Engineering Informatics xxx (2014) xxx–xxx 7
5. Demonstrator 2: Determining occupant comfort levels
5.1. Assessing occupant comfort
The second demonstrator identifies a range of data sourceswhich may be generated around the area of occupant comfort.These data sources tend to be more qualitative in nature and insome cases may be difficult to derive meaning from. The purposeof this demonstrator is to outline how these sources might be cap-tured and interpreted using semantic web tools. The study wasbased on the area of occupant comfort, particularly thermal com-fort. This work consisted of a Twitter survey, a measurement-basedpredicted mean vote (PMV) [40] study, a survey-based PMV study,and a simulation-based PMV study [47].
With the advent of social media, a new range of data sourceshave now emerged, providing softer, but no less useful information
Please cite this article in press as: E. Corry et al., Using semantic web technolo10.1016/j.aei.2014.05.002
in the form of chatter and instant feedback. These informationsources represent an opportunity to engender a sense of connec-tion amongst all stakeholders in a building community. It is nowpossible to open dialogue with building stakeholders and thesedialogues can be focused to encourage feedback, on a range of top-ics, not least being building operation.
Furthermore, dialogue can be instigated outside the traditionalformal channels of information transfer of building operationwhere information is restricted to a hierarchical gatekeeperapproach, where all information is diverted to a centrally placedmanager who interprets or filters this information. The paper pro-poses a range of scenarios which outline the relevance of socialmedia to stakeholder dialogue and demonstrate how these scenar-ios might be realised by linking the social media information silowith existing building information silos.
5.2. Available data
An aspect of building performance that is studied in the seconddemonstrator is that of stakeholder satisfaction [41,42]. More pre-cisely, an experiment was carried out using the Twitter micro-blogging site. Using the NEB as a test bed (Fig. 4), a group of 65 finalyear engineering undergraduates were encouraged to follow a par-ticular Twitter account (CE454) and to post commentary on build-ing performance as they encountered it, throughout the day. Thiswork differs from other studies [43,44] in this area by the mannerin which the data is extracted from the social media domain andexposed in RDF. The key point of this work is to make informationmore accessible using semantic web technologies.
Based on an initial survey of the group, 35% declared that theyused social media more than 8 h per week, with Facebook (89%),YouTube (78%) and Twitter (78%) being the dominant sitesaccessed. Although almost half the respondents to the surveydeclared that they never or rarely accessed social media sites dur-ing class time, the remainder of respondents accessed such sitesthroughout the college day. It is important to note here that thegroup of students surveyed take an Energy Systems course and
gies to access soft AEC data, Adv. Eng. Informat. (2014), http://dx.doi.org/

Fig. 7. Twitter response relating to the main lecture theater.
8 E. Corry et al. / Advanced Engineering Informatics xxx (2014) xxx–xxx
should thus not only be more keen to use information technology,including social media, but they should also be more aware of theEnergy Systems surrounding them in a building.
The students were asked to comment specifically on a numberof zones within the building and these were each given a specified# name. The zones included a large lecture hall (#NEBG017), twocomputer suites (#NEBCompG and #NEBComp1) and the restaurantarea (#NEBCanteen). The students were asked to reply using thefollowing format: @CE454 #Location, PMV, comment. In thisway, related tweets could be identified easily on Twitter. The stu-dents tended to spend a lot of time in these spaces and they wereencouraged to comment on the thermal comfort conditions in thespaces, based on the PMV thermal comfort scale [40], ranging from+3 to �3 as shown in Table 4. It is important to add here that thecomputer suites (#NEBCompG and #NEBComp1) tend to be consid-erably warmer than the other rooms.
By encouraging building occupants to tweet about the comfortlevels in the building and comment on general building issues, aTwitter feed can be created for the building (example in Fig. 7).These tweets can also be structured in a particular format whichlends itself to analysis.
Students were also asked to comment generally on the buildingand in this case, the #NEBGen tag was used. It was unclear whattype of feedback would emerge from this channel and whether itcould be a useful flow of information about unknown issuesencountered by building occupants.
Fig. 8. Twitter results for #NEBComp1, indicating an issue with the thermal comfortlevels in the space.
Fig. 9. Twitter feedback on uncomfortable computer room.
5.3. Findings of social media experiment
Although most students in the group signed up to Twitter andfollowed the research account, there was little activity on theaccount regarding spaces where the thermal conditions were neu-tral, or classed as 0 on the PMV scale. The twitter handle CE454
was used to post 26 tweets in total. The twitter response to themain lecture theater, #NEBG017, was quite limited, with perhaps3 tweets in total, and consistently placed the occupant satisfactionlevel at 0. This corresponded strongly with actual thermal comfortmeasurements in the space, suggesting a PMV reading between�0.8 and 0, throughout the day.
In contrast to this, the computer suite 1, #NEBComp1, generatedmuch more comment on Twitter, around 10 tweets (Fig. 7). Manyof the respondents felt the temperature in the space was too hot.This correlated strongly with the thermal comfort analysis of thespace, which tended toward a PMV of +3 (too hot) (see Fig. 8).
When students were asked specifically about the thermal con-ditions in the computer room, some evidence of ambient aware-ness was evident, where a user could see a relevant response andrespond to that also (Fig. 9).
52 responses were received in total, over a period of threeweeks. Users seemed to respond only when something was makingthem uncomfortable. For example, ‘loud mechanical’ and excessive‘wind’ noises were reported, together with high temperatures inthe computer suites. People were less motivated to respond whenconditions were satisfactory.
Table 4PMV thermal comfort scale.
PMV value Thermal comfort
+3 Too hot+2 Warm+1 Slightly warm
0 Neutral�1 Slightly cool�2 Cool�3 Cold
Please cite this article in press as: E. Corry et al., Using semantic web technolo10.1016/j.aei.2014.05.002
Some of the responses were quite interesting from a buildingmanagement perspective. For instance, the building has a mainfresh water supply that is used to service a number of water dis-pensers located throughout the building. This system was inoper-ative recently and this featured in a couple of tweets. Similarly,unusual noises were reported in a tweet, including excessive windnoise and loud mechanical sounds. When these issues were dis-cussed with the building manager, he described an on-going issuewith the fountain system in the building and an air handling using(AHU) problem with the computer suite. The Twitter experiment ison-going and is being used to ascertain occupant satisfaction levelson a range of issues throughout the building.
5.4. Combining the data sets
Having identified the Twitter data source, this informationcould be exposed semantically. The Online Presence Ontology
gies to access soft AEC data, Adv. Eng. Informat. (2014), http://dx.doi.org/

Listing 3. RDF representation of a Twitter message sent by the CE454 account, based on examples created by the Online Presence Ontology working group.
E. Corry et al. / Advanced Engineering Informatics xxx (2014) xxx–xxx 9
[45,46] can be used to describe a twitter message as an RDF state-ment (Listing 3). This statement can then be interpreted usingsemantic webs tools. The aim of Modelling Online Presence is toenable the integration and exchange of Online Presence relateddata and utilises a semantic web ontology (OPO) to represent dataabout Online Presence in RDF. This ontology describes data gener-ated using various online messaging and blogging services andhow it might be published in RDF. Again, the goal of the semanticweb initiative is to utilise existing ontologies to expose data usingRDF.
5.5. Discussion of results
There are a number of findings from this experiment. First of all,it is not clear that Twitter or micro-blogging in general can be used toaccurately survey the population of a large building. Taking the engi-neering building as an example, it is inhabited by a large group oftechnically capable people, with access to a free building-widewireless network. The group of students surveyed are positivelydisposed to the question of building operation as they take anEnergy Systems course. Despite this, the participation levels ofthe group were low. Perhaps the main observation was that peoplewere more motivated to respond when directly affected by a spe-cific issue.
Second, the experiment showed some potential in the area of faultdetection, or issues in the building that may not be obvious to thebuilding manager. The feed returned some unexpected responses,including feedback on noise levels throughout the building andthe quality of the fresh water. As an information source, however,the Twitter feed can only be analysed to a limited level. No matterhow many predefined hash-tag names (#) are used, the informa-tion will always be qualitative in nature rather than quantitative.
A third conclusion that can be made, is that micro-blogging occu-pants could easily become a type of mobile sensor, identifying issues
Please cite this article in press as: E. Corry et al., Using semantic web technolo10.1016/j.aei.2014.05.002
with building performance and posting those issues in a visibleway to the wider building community, focusing the attention ofthe building manager on the issue. The authors feel that this isthe area in which Twitter might be most useful, the identificationand publication of issues as they arise. Further research is ongoinginto the concept of people as mobile actuators [48].
Lastly, it can be concluded that semantic web ontologies existwhich allow the interpretation of micro-blog posts semantically. Theseontologies can then be used by the appropriate semantic web tech-nologies to form an improved and integrated perspective on avail-able building data.
6. Conclusion
In conclusion, identifying and accessing other data sources is avery relevant step in trying to optimise building performance. Ithas been illustrated, using just two examples of building-relateddata, how cross-domain scheduling data can be captured and usedand also, how micro-blogging sites such as Twitter could be used toidentify occupant issues with building performance.
When integrated into a wider building management frame-work, these extra data sources are particularly useful. Developingthis level of integration has proved to be a significant challenge,particularly when integrating cross-domain data. The paper hasillustrated the benefits of using semantic web technologies toresolve some of these interoperability issues. This work is on-goingand focuses on converting remote data silos to RDF and developinga performance framework platform capable of capturing and inter-preting these streams of data. This work requires a performanceframework ontology to describe this process and will be presentedin a further paper.
Ultimately, not all building-related data sources will be of equaluse and developing interoperability between some of the morequalitative sources is of limited value. By the same token, data
gies to access soft AEC data, Adv. Eng. Informat. (2014), http://dx.doi.org/
10 E. Corry et al. / Advanced Engineering Informatics xxx (2014) xxx–xxx
sources which can give a clear indication of real-time buildingoccupancy patterns are very worthwhile and there are a host ofsuch sources throughout modern buildings. The authors suggestthat quantitative data that exists in separate AEC domains lendsitself more easily to analysis and there are clear benefits to expos-ing these data sources to the building management framework.There are over 200 million buildings in the EU and as enablingtechnology develops, it is clear that vast quantities and types ofsofter data will emerge from modern buildings, in the areas ofcommunication systems, automated control systems, financial,human resources, etc.
A robust methodology needs to be in place to capitalise on thisdata and drive operational efficiency. The authors feel that a com-prehensive performance measurement platform is required thattakes data from traditional hard building sources, together withsofter data sources.
Acknowledgments
This work has been funded by the Irish Research Council. Thiswork has been funded by Science Foundation Ireland under GrantNo. SFI/08/CE/I1380 (Lion-2).
References
[1] D. Crawley, J. Hand, M. Kummert, B. Griffith, Contrasting the capabilities ofbuilding energy performance simulation programs, Build. Environ. 43 (2008)661–673.
[2] R.J. Hitchcock, M.A. Piette, S.E. Selkowitz, Performance metrics and life-cycleinformation management for building performance assurance, in: 1998 ACEEESummer Study on Energy Efficiency in Buildings, Pacific Grove, CA 1998.
[3] M. Gallagher, A. O’Connor, J. Dettbar, L. Gilday, Cost Analysis of InadequateInteroperability in the U.S. Capital Facilities Industry, Technical Report NISTReport GCR 04-867, National Institute of Standards and Technology (NIST),2004.
[4] M. Liu, D. Claridge, W. Turner, Continuous commissioning of building energysystems, J. Sol. Energy Eng. 125 (2003) 275–281.
[5] M.A. Piette, S.T. Khalsa, P. Haves, Analysis of an information monitoring anddiagnostic system to improve building operations, Energy Build. 33 (2001)783–791.
[6] C. Neumann, D. Jacob, Guidelines for the Evaluation of Building Performance,Fraunhofer Institute for Solar Energy Systems, Freiburg, DE, 2008.
[7] Green Buildings Discussion Group, Implications of A Data-Driven BuiltEnvironment, 2012. <http://www.nyas.org/DataBuiltConf> (Last accessed25.07.13).
[8] W. Shen, Q. Hao, H. Mak, J. Neelamkavil, H. Xie, J. Dickinson, R. Thomas, A.Pardasani, H. Xue, Systems integration and collaboration in architecture,engineering, construction, and facilities management: a review, Adv. Eng.Inform. 24 (2010) 196–207.
[9] E. Curry, J. O’Donnell, E. Corry, S. Hasan, M. Keane, S. O’Riain, Linking buildingdata in the cloud: Integrating cross-domain building data using linked data,Adv. Eng. Inform. 27 (2013) 206219.
[10] J. O’Donnell, E. Corry, S. Hasan, M. Keane, E. Curry, Building performanceoptimization using cross-domain scenario modeling, linked data, and complexevent processing, Build. Environ. 62 (2013) 102111.
[11] P. Pauwels, D. Van Deursen, J. De Roo, T. Van Ackere, R. De Meyer, R. Van deWalle, J. Van Campenhout, Threedimensional information exchange over thesemantic web for the domain of architecture, engineering and construction,Artif. Intell. Eng. Des. Manuf. 25 (2011) 317–332.
[12] C. Eastman, P. Teicholz, R. Sacks, K. Liston, BIM Handbook: A Guide to BuildingInformation Modeling for Owners, Managers, Designers, Engineers andContractors, John Wiley & Sons Inc., Hoboken, NJ, USA, 2008.
[13] K. Gillespie, P. Haves, R. Hitchcock, J. Deringer, K. Kinney, A SpecificationsGuide for Performance Monitoring Systems, Lawrence Berkeley NationalLaboratory, Berkeley, CA, USA, 2007.
[14] P. Teicholz, Aecbytes: Labor Productivity Declines in the ConstructionIndustry: Causes and Remedies, 2004. <http://www.aecbytes.com/viewpoint/2004/issue_4.html> (Last accessed 25.07.13).
[15] BuildingSMART, Industry Foundation Classes (ifc) Data Model – Buildingsmart,2013. <http://www.buildingsmart.org/standards/ifc> (Last accessed 25.07.13).
[16] BuildingSMART, National Bim Standard – United States, 2013. <http://www.nationalbimstandard.org/> (Last accessed 25.07.13).
[17] E.W. East, Construction Operations Building Information Exchange (cobie) —Whole Building Design Guide, 2013. <http://www.wbdg.org/resources/cobie.php> (Last accessed 25.07.13).
[18] BLIS Project, Building Lifecycle Interoperable Software – Project Brief, 2002.<http://www.blis-project.org/index2.html> (Last accessed 25.07.13).
Please cite this article in press as: E. Corry et al., Using semantic web technolo10.1016/j.aei.2014.05.002
[19] R.H. Katz, D.A. Culler, S. Sanders, S. Alspaugh, Y. Chen, S. Dawson-Haggerty, P.Dutta, M. He, X. Jiang, L. Keys, A. Krioukov, K. Lutz, J. Ortiz, P. Mohan, E. Reutzel,J. Taneja, J. Hsu, S. Shankar, An information-centric energy infrastructure: theberkeley view, Sustain. Comput.: Inform. Syst. 1 (2011) 7–22.
[20] G. Augenbroe, An overview of the combine project, in: Proceedings of the 1stEuropean Conference on Product and Process Modelling in the buildingindustry, A.A. Balkema, Rotterdam, 1994, pp. 547–555.
[21] C.S. Park, G. Augenbroe, Benchmarking of a building performance assessmenttoolkit, in: Architectural Engineering 2003: Building Integration Solutions,2003, pp. 1–4.
[22] IFC Solutions Factory, The Model View Definition Site, 2010. <http://www.blis-project.org/IAI-MVD/> (Last accessed 25.07.13).
[23] UK Cabinet Office, Government Construction Strategy, 2011. <https://www.gov.uk/government/publications/government-construction-strategy>(Last accessed 25.07.13).
[24] GSA, General Services Administration 3d–4d Building Information Modeling,2013. <www.gsa.gov/bim> (Last accessed 17.02.14).
[25] F. Manola, E. Miller, RDF Primer, W3C Recommendation, 2004. <http://www.w3.org/TR/rdf-primer/> (Last accessed 25.07.13).
[26] T. Berners-Lee, J. Hendler, O. Lassila, The semantic web, Sci. Am. 284 (2001)34–43.
[27] P. Pauwels, D. Van Deursen, R. Verstraeten, J. De Roo, R. De Meyer, R. Van deWalle, J. Van Campenhout, A semantic rule checking environment for buildingperformance checking, Autom. Constr. 20 (2011) 506–518.
[28] J. O’Donnell, Specification of Optimum Holistic Building Environmental andEnergy Performance Information to Support Informed Decision Making, Ph.D.thesis, Department of Civil and Environmental Engineering, University CollegeCork, Cork, IE, 2009.
[29] V.L. Erickson, Y. Lin, A. Kamthe, R. Brahme, A. Surana, A.E. Cerpa, M.D. Sohn, S.Narayanan, Energy efficient building environment control strategies usingreal-time occupancy measurements, in: Proceedings of the First ACMWorkshop on Embedded Sensing Systems for Energy-Efficiency in Buildings,2009, pp. 19–24.
[30] Cylon, Building – Energy Management – Systems – bms, 2013. <http://www.cylon.com/> (Last accessed 25.07.13).
[31] J. Kwak, P. Varakantham, R. Maheswaran, Y. Chang, M. Tambe, B. Becerik-Gerber, W. Wood, Tesla: an energy-saving agent that leverages scheduleflexibility, in: Proceedings of the 2013 International Conference onAutonomous Agents and Multi-agent Systems, International Foundation forAutonomous Agents and Multiagent Systems, 2013.
[32] J. Kwak, P. Varakantham, R. Maheswaran, M. Tambe, F. Jazizadeh, G. Kavulya, L.Klein, B. Becerik-Gerber, T. Hayes, W. Wood, Saves: a sustainable multiagentapplication to conserve building energy considering occupants, Proceedings ofthe 11th International Conference on Autonomous Agents and MultiagentSystems, vol. 1, International Foundation for Autonomous Agents andMultiagent Systems, 2012.
[33] F. Jazizadeh, A. Ghahramani, B. Becerik-Gerber, T. Kichkaylo, M. Orosz, User-led decentralized thermal comfort driven HVAC operations for improvedefficiency in office buildings, Energy Build. 70 (2014) 398–410.
[34] ITOBO, Itobo: Information and Communication Technology for Sustainable andOptimised Building Operation, 2008. <http://zuse.ucc.ie/itobo/> (Last accessed25.07.13).
[35] P. Daz, T. Olivares, R. Galindo, A. Ortiz, F. Royo, T. Clemente, The ecosenseproject: an intelligent energy management system with a wireless sensor andactor network, in: R. Howlett, L. Jain, S. Lee (Eds.), Sustainability in Energy andBuildings, Springer, Berlin Heidelberg, DE, 2011, pp. 19–24.
[36] N. Li, G. Calis, B. Becerik-Gerber, Measuring and monitoring occupancy with anRFID based system for demand-driven HVAC operations, Autom. Constr. 24(2012) 89–99.
[37] C. Martani, D. Lee, P. Robinson, R. Britter, C. Ratti, Enernet: studying thedynamic relationship between building occupancy and energy consumption,Energy Build. 47 (2012) 584–591.
[38] D. Connolly, ical2rdf – icalendar to rdf Convertor, 2003. <http://www.kanzaki.com/courier/ical2rdf> (Last accessed 25.07.13).
[39] D. Connolly, L. Miller, Rdf Calendar – An Application of the ResourceDescription Framework to Icalendar Data, W3C Interest Group Note, 2005.<http://www.w3.org/TR/rdfcal/> (Last accessed 25.07.13).
[40] P. Fanger, Thermal Comfort, Danish Technical Press, Copenhagen, DK, 1970.[41] D. Pati, C.-S. Park, G. Augenbroe, Roles of building performance assessment in
stakeholder dialogue in AEC, Autom. Constr. 15 (2006) 415–427.[42] D. Pati, C.-S. Park, G. Augenbroe, Roles of quantified expressions of building
performance assessment in facility procurement and management, Build.Environ. 44 (2009) 773–784.
[43] D. Lehrer, J. Vasudev, Evaluating a social media application for sustainability inthe workplace, in: CHI’11 Extended Abstracts on Human Factors in ComputingSystems, ACM, New York, NY, USA, 2011, pp. 2161–2166, http://doi.acm.org/10.1145/1979742.1979935.
[44] J. Mankoff, D. Matthews, S. Fussell, M. Johnson, Leveraging social networks tomotivate individuals to reduce their ecological footprints, in: Proc. of theHawaii International Conference of System Sciences (HICSS-40), 2007, IEEEComputer Society, Washington, DC, USA, p. 87, http://dx.doi.org/10.1109/HICSS.2007.325.
[45] M. Stankovic, J. Jovanovic, Online presence in social networks, in: Proceedingsof W3C Workshop on the Future of Social Networks, 2009, Barcelona [Online].Available at: http://www.w3.org/2008/09/msnws/papers/w3c-workshop-opo.pdf.
gies to access soft AEC data, Adv. Eng. Informat. (2014), http://dx.doi.org/

E. Corry et al. / Advanced Engineering Informatics xxx (2014) xxx–xxx 11
[46] M. Stankovic, J. Jovanovic, A. Passant, N. Milikic, F. Radulovic, The OnlinePresence Project, 2013. <http://online-presence.net/ontology.php> (Lastaccessed 25.07.13).
[47] D. Coakley, E. Corry, M.M. Keane, Validation of Simulated Thermal Comfortusing a Calibrated Building Energy Simulation (BES) model in the context of
Please cite this article in press as: E. Corry et al., Using semantic web technolo10.1016/j.aei.2014.05.002
Building Performance Evaluation & Optimisation, in ICEBO-InternationalConference for Enhanced Building Operations, Montréal, Canada, 2013.
[48] D. Crowley, E. Curry, J. Breslin, Closing the Loop-From Citizen Sensing toCitizen Actuation, in: 7th IEEE International Conference on Digital Ecosystemsand Technologies (IEEE DEST 2013), 2013.
gies to access soft AEC data, Adv. Eng. Informat. (2014), http://dx.doi.org/