using communication technologies to deliver public health
TRANSCRIPT
1
Using communication technologies to deliver public health agendas in
National Health Service food and drink automated vending
Lucy Zarina Campbell
UCL Institute for Environmental Design and Engineering (IEDE) The Bartlett
University College London
A Thesis Submitted for the Degree of Doctor of Engineering
University College London University of London 2017

2
Student Declaration The author of this thesis, Lucy Zarina Campbell, confirms that the work presented in this thesis is her own. Where information has been derived from other sources, the author confirms that this has been indicated in the thesis. Signature: 14/05/2017 .....................................................................................................
3
Abstract This research responded to a National Health Service (NHS) wide problem. The problem is how to create healthier automated food and drink vending services. The research’s’ interpretation of this central research problem is embedded in the Facilities Management (FM) perspective. Vending retail products do not support government healthy lifestyle policies and initiatives. FMs have to change this through catering contracts. However, there is little guidance on how to design, evidence and operationalise improvement. The research tested vending point of sale designs over a year, trying to reduce the sale of unhealthy products. Secondly, it developed a novel application of a nutritional profile to enable the service design process and evidence change. Thirdly, the research baselined service level information through survey n=1,292. Night shift staff were a key stakeholder as it was thought that vending was their only retail catering and the impact was unknown. Regression modelling and multivariate analysis was used in the survey and design tests. Linear regression was used to understand the impact of vending point of sale design on sales. Logistic regression was used to test service level perceptions in the survey. The statistical methods used were flexible. The survey design and analysis is widely applicable to evaluate many services. The research found that in combination, changing product ranges, adding nutritional labels, and moving water to eye level significantly reduces unhealthy sales. However real change requires healthier vending products. The nutritional profile adapted is highly suitable to standardise service and evaluate how healthy vending products really are. The survey was a novel and statistically robust addition to FM service evaluation. It proved staff perception of poor catering, inadequate breaks, innutritious food and need for staff food education. Vending was central. Finally, making meaningful service improvements and setting thresholds in the statistical models confidently required in depth first-hand knowledge.

4
Acknowledgements Thank you to everyone on the project, friends, family and colleagues. Michael Pitt and Peter McLennan from UCL and Fiona Daly from Barts Health NHS Trust supervised the project. They opened all the doors for the project and changed my life in the process. And thanks to my friends at UCL and Barts, it’s been a privilege. The UK Engineering and Physical Sciences Research Council and Barts Health NHS Trust jointly funded this research, making it at all possible. The teaching, administration and technical support at UCL gave me the tools I needed to return the value. My family, my mum, dad, brother, sister and partner supported me personally. Thank you I love you guys and thanks especially mum and dad.
5
Table of Contents
Abstract ......................................................................................................................................... 3
Acknowledgements ....................................................................................................................... 4
Table of Figures ............................................................................................................................. 6
Chapter 1 Introduction ................................................................................................................. 9
Chapter 2 Defining the theoretical research problem space ...................................................... 24
Chapter 3 Literature review of communication solutions across vending services ................... 36
Chapter 4 Method ....................................................................................................................... 55
Chapter 5 Results ........................................................................................................................ 85
Chapter 6. Discussion and Conclusions ..................................................................................... 122
Appendix A Bibliography ........................................................................................................... 140
Appendix B MRES Dissertation ................................................................................................. 163
Appendix C Ethics approval ....................................................................................................... 234
Appendix D Staff Survey Questions .......................................................................................... 235
Appendix E Staff Survey Dimensions ........................................................................................ 237
Appendix F Inferential results for staff catering survey ............................................................ 240
6
Table of Figures Figure 1 Diagram of vending service improvement opportunities ............................................. 10 Figure 2 Diagram of vending service improvement opportunities ............................................. 26 Figure 3 Spheres of sustainability (Rodriguez et al 2002) ........................................................... 27 Figure 4 Service Package (Fitzimmons and Fitzimmons 2011) ................................................... 28 Figure 5 Behaviour model of motivation, ability and triggers (Fogg 2009) ................................ 30 Figure 6 SRK Framework for decision making (Ramussen 1983) ................................................ 31 Figure 7 Socio-technical model of vending ................................................................................. 33 Figure 8 Common themes within the literature addressing improvement goals....................... 34 Figure 9 Diagram of vending service improvement opportunities ............................................. 36 Figure 10 Nutrient specifications for smaller portion sizes (less than 100 grams) (DEFRA 2015)
............................................................................................................................................ 38 Figure 11 Healthier and More Sustainable Catering snack guidance (PHE 2014) ...................... 44 Figure 12 Comparison of a sample of NHS trust food and drink strategies with Barts Health .. 45 Figure 13 Vending specific questions in the SRA and FFLP audit ................................................ 46 Figure 14 PHE Eatwell Plate 2014 ............................................................................................... 49 Figure 15 Food Shopping Card (FSA 2005) .................................................................................. 50 Figure 16 Areas of potential improvements to high level advice for vending service
improvement ...................................................................................................................... 53 Figure 17 First iteration of nutritional profile ............................................................................. 65 Figure 18 Vending machine image .............................................................................................. 66 Figure 19 Intervention poster 1 .................................................................................................. 67 Figure 20 Intervention experiment poster 2 .............................................................................. 67 Figure 21 Vending display hotspots (Anonymous) ..................................................................... 68 Figure 22 Rude food product colour codes ................................................................................. 69 Figure 23 Vending sales report example .................................................................................... 71 Figure 24 Machine list with times and location .......................................................................... 71 Figure 25 Point of sale variables list............................................................................................ 72 Figure 26 Calculating if a location was busy by quartiles ........................................................... 72 Figure 27 table of variables describing the data on which normality tests were performed .... 74 Figure 28 SRA audit questions about vending ............................................................................ 77 Figure 29 Job roles addressed in the survey ............................................................................... 80 Figure 30 Staff survey variable summary .................................................................................... 81 Figure 31 Vending opinion frequencies represented as those who gave vending food a score of
3 or less out of a possible 5 ................................................................................................. 85 Figure 32 Felt that the vending prices were too high ................................................................. 86 Figure 33 Graph of responses to questions about vending ........................................................ 87 Figure 34 Reported using hospital vending more than a few times a month ............................ 87 Figure 35 Indicated that they are receiving insufficient food or drink during night shifts ......... 88 Figure 36 Indicated that they would ideally be receiving insufficient food or drink .................. 88 Figure 37 Graph of what staff currently eat and drink on night shift ......................................... 89 Figure 38 Night staff who Indicated that they are receiving poor breaks during night shifts .... 89 Figure 39 Graph of staff break times .......................................................................................... 90 Figure 40 Graph of where food and drink is eaten on night shift............................................... 90 Figure 41 Night shift who bought brought in food from outside the hospital more than a few
times a month ..................................................................................................................... 91 Figure 42 Spend above £4 on retail outside the hospital more than a few times a month ....... 91 Figure 43 Night shift food purchases outside of canteen ........................................................... 91 Figure 44 All staff word frequency for what they would change about food and drink ............ 92 Figure 45 Top ten-word frequency for night staff ...................................................................... 92 Figure 46 Night staff word frequency for what they would change about food and drink ........ 93
7
Figure 47 Top ten-word frequency for night staff feedback ...................................................... 93 Figure 48 Word frequencie diagrams for respondents who answered other for any question . 94 Figure 49 Odds of having a negative opinion of hospital vending food ..................................... 95 Figure 50 Graph of odds of having a negative opinion of hospital vending food by shift time . 96 Figure 51 Odds of having a negative opinion of hospital vending drinks ................................... 96 Figure 52 Graph of odds of having a negative opinion of hospital vending food by worksite ... 97 Figure 53 Odds of using vending a few times a month or more ................................................. 97 Figure 54 Graph of odds of using vending a few times a month or more by job role ................ 98 Figure 55 Graph of odds of day shift workers using vending a few times a month or more
compared to night shift workers ........................................................................................ 98 Figure 56 odds of spending over ay on food and drink or more or more shi ............................. 99 Figure 57 Graph of odds of spending over ces at Prescott street more shift timee worksit ...... 99 Figure 58 Odds of perceiving vending costs as high ................................................................. 100 Figure 59 Table of odds of perceiving vending costs as high .................................................... 100 Figure 60 Graph of odds of perceiving vending costs as high by shift time ............................. 101 Figure 61 Graph of responses for vending costs were perceived as high by main worksite .... 101 Figure 62 The odds of night shift staff reporting that they receive poor nutrition on night shifts
.......................................................................................................................................... 102 Figure 63 Staff reporting that they receive insufficient breaks on night shifts ........................ 103 Figure 64 Graph of staff reporting insufficient breaks on night shifts by job role ................... 103 Figure 65 The odds of night shift staff reporting a poor ideal catering situation ..................... 104 Figure 66 Graph of the odds of reporting a poor ideal catering situation by job role ............. 104 Figure 67 The odds of getting food and drink from outside of the hospital canteen .............. 105 Figure 68 Graph of the odds of getting food and drink from outside of the hospital canteen by
job role .............................................................................................................................. 105 Figure 69 Sum of stock levels for the year long period across the 30 locations ....................... 106 Figure 70 Annual sale break down by nutritional value ........................................................... 107 Figure 71 Proportion of red products being sold as a % of the total sales ............................... 107 Figure 72 Image of vending machine frontage ......................................................................... 108 Figure 73 Summary of top selling half of locations with stock in actual values ....................... 109 Figure 74 Summary of top selling half of locations with stock in % of red products................ 109 Figure 75 Table of % all red products changing according to intervention and intervention type
.......................................................................................................................................... 110 Figure 76 % red food changing according to intervention and intervention type ................... 111 Figure 77 % red drink changing according to intervention and intervention type ................... 111 Figure 78 T-test results for all red products for point of sale intervention .............................. 112 Figure 79 T-test results for red drink for point of sale intervention ......................................... 113 Figure 80 Mixed-effects analysis of % of all red products sales ............................................... 114 Figure 81 Graph of sale of % of all red products by time period .............................................. 114 Figure 82 Graph of sale of % of all red products by time period comparing intervention of
product range.................................................................................................................... 115 Figure 83 Graph of sale of % of all red products before and during, comparing clinical spaces
.......................................................................................................................................... 115 Figure 84 Mixed-effects analysis of % of red food sales ........................................................... 116 Figure 85 Graph of sale of % of red food by time period ......................................................... 117 Figure 86 Graph of sale of % of red food by time period comparing intervention of product
range ................................................................................................................................. 117 Figure 87 Graph of % of sale of red food during and after comparing intervention of product
labels ................................................................................................................................. 118 Figure 88 Graph of % of sale of red food during before and after periods comparing busy and
quiet locations................................................................................................................... 118 Figure 89 Mixed-effects analysis of % of red drinks sales ........................................................ 119 Figure 90 Graph of sale of % of red drinks by time ................................................................... 119

8
Figure 91 Graph of sale of % of red food by time period comparing intervention of product range ................................................................................................................................. 120
Figure 92 Service Package (Fitzimmons and Fitzimmons 2011) ............................................... 134
9
Chapter 1 Introduction
1.1 Introduction The pillars that form the context of this research are facilities management (FM) services, snack and drink automated vending technologies, public health, and government policy. These pillars are part of the same system of communication and this system will be explored and influenced in this research in key areas, in order to understand how to deliver public health agendas in National Health Service (NHS) food and drink automated vending. Charles West Churchman, an early system thinking researcher, outlined the overarching considerations of studying a system such as healthier automated food and drink vending services, allowing one to consider it a design problem (Churchman 1971). He describes a wicked problem, a ‘Class of social system problems which are ill-formulated, where the information is confusing, where there are many clients and decision makers with conflicting values, and where the ramifications in the whole items are thoroughly confusing and further, where "solutions" often turn out to be worse than the symptoms’ (Churchman 1967, Rittel and Webber 1973). This statement candidly summarises the complexities of researching a communication system such as public health agendas in NHS snack and drink vending. ‘Conflicting values’ in this research are many. Improving diets is inextricably linked to the economic drivers of a cost-effective and profitable retail service such as vending, as well as numerous financial incentives for change. There are legal constraints, compliance issues and government policy agendas. There are also underlying values to do with improving people’s long term health and reducing the cost of treating preventable illnesses in the NHS, as well ass the potential increased productivity of a thriving and innovative infrastructure for people to work in (DECC 2012, World Resources SIM Centre 2002, BIFM 2013, Hodges 2002, Marmot 2010). This level of complexity cannot be accounted for by traditional approaches to public administration, which rely on linear rational models (Oborn et al 2011). Given that conflicting values exist this research must ask; how can they be addressed in vending service improvements so that none create a negative impact on the others? The key issue is about aligning values of different groups invested in vending services to create an overall positive and tangible outcome. It may remain impossible to prove an outcome ‘true’ or ‘false’. Communication creates the hinge upon which these issues balance. Churchman also draws attention to confusing information. Measures of public health, health care costs, policy and catering procurement (all involved in vending services in the NHS) allude to different data sets with varying degrees of supply chain transparency inherent. The volume of information being gathered, given the wide range of service agendas, needs to reflect government policy change towards healthier diets and disparate or ill-defined measures of success. Variations in methods of correlation and analysis must be attuned to disparate agendas (Gase et al 2011). The ideal balance within this system is that by serving nutritious food and drink, specifically at the research site at Barts Health NHS Trust, it will help reduce preventable long-term illnesses caused by poor diet and help to maintain a nourished and engaged workforce (NHS 2014, Marmot 2010). It is also hoped that it can serve the economic drivers of a cost-effective and profitable retail service, meet the legal constraints that are linked to compliance, reduce the risks of the increased financial burden of treating long-term illness, improve alignment with government policy and increase productivity, creating a thriving and innovative infrastructure
10
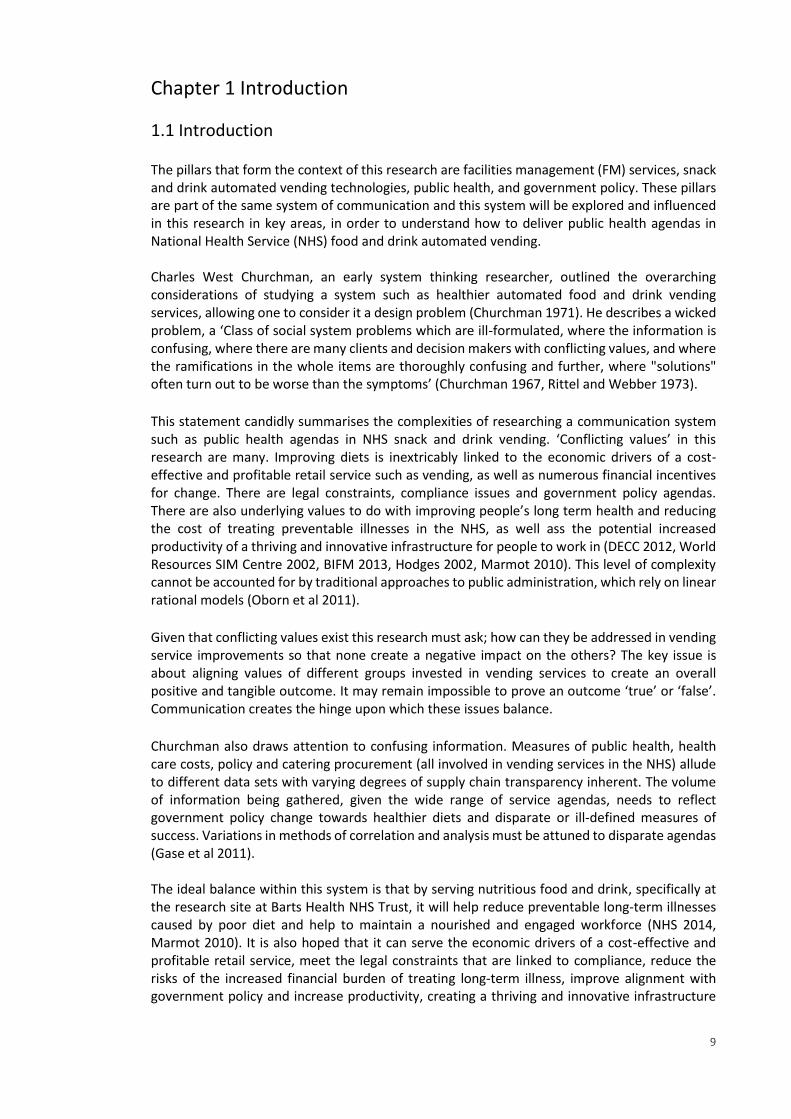
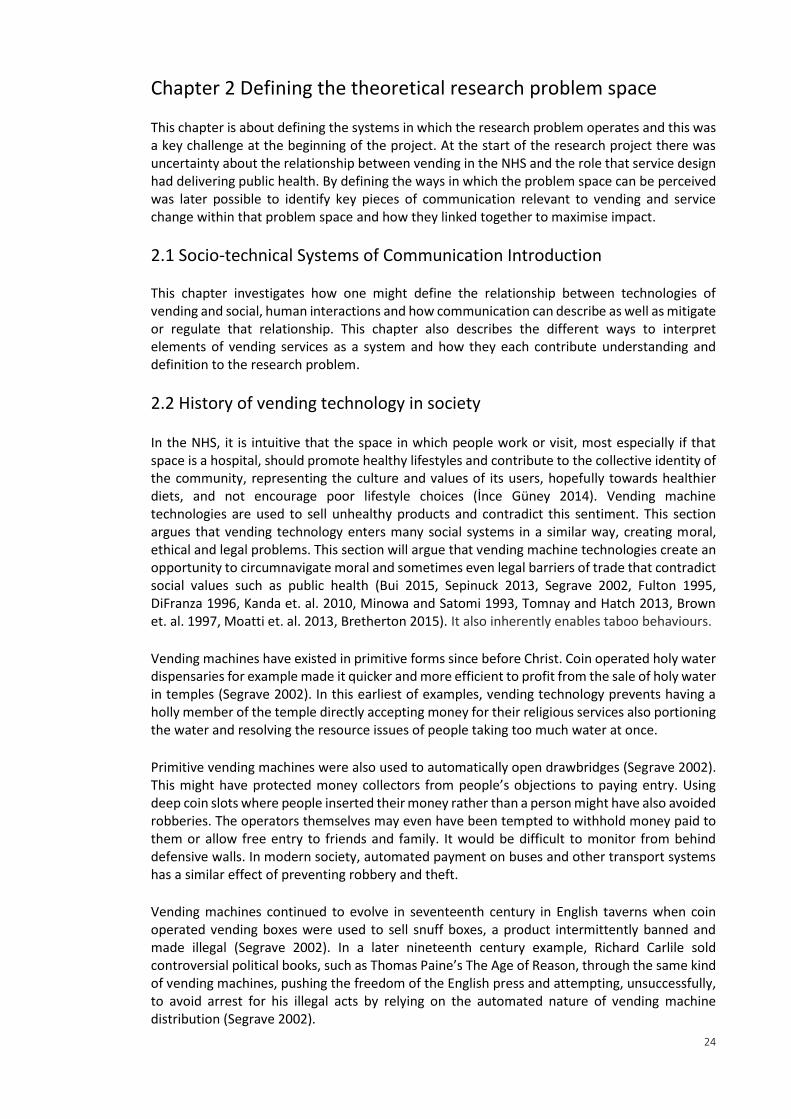
for people to work in, and to support healthy lifestyles (DECC 2012, Rodriguez et al 2002, BIFM 2013, Hodges 2002). The diagram below reimagines the system being interrogated and influenced in this research as a set of elements, each rooted in communication that can help make improvements.
Figure 1 Diagram of vending service improvement opportunities
The first square in the top left corner is the symptom of the root cause of the problem. The assumption of this research is that at best, in a highly visible service like vending, the image of chocolates and crisps does not support the ideals of healthcare or long term health, and seeing staff and members of the public buying and eating unhealthy food from retail outlets on NHS sites sets a poor example. It is similar to seeing nurses, patients and visitors smoking or drinking alcohol on the premises, while treating liver failure and lung cancer. The following squares each relate to documents or physical situations where communication can help improve vending services. The second square references the central government policy and strategy for change in the NHS, all part of the NHS Five Year Forward View Report (NHS England 2014). This strategic policy document sets forth ways that the NHS was preventing long-term preventable illness at the time. The 5yfv report sets forth agendas for a sustainable model of healthcare and poor lifestyle choices are a focal concern within it. The major influencers of poor lifestyle choices are identified in the report as poor diet, smoking and alcohol consumption. After the first two squares, the problem space becomes ill or undefined. It is in relation to this system of communication that FM services, snack and drink vending technologies, end users, service environments must all change to align with government policy and attitudes to public health. This thesis will address these areas throughout and consider each as a communication
11
design problem, either rewriting strategies, testing industry leading point of sale designs, communicating directly with service users, or writing new and more effective measures into contracts. These can all be considered communication design problems.
1.2 Research objectives The primary research focused on the latter elements of the diagram above, given that the first two are already well established through the Five Year Forwards View and the government’s focus on preventative care by the time FMs take an active role (NHS England 2014). Scientific knowledge is explored and it will be grouped and applied to improve the latter elements of communication, working from NHS FM vending services perspective towards more effective delivery of public health policy. Specifically, the primary research objective was to test a communication and product placement approach designed to encourage customers to purchase healthier alternatives from vending machines where their purchases were unsupervised. The measure was sales data, applying statistical tests to an experiment that followed deductive research approach. The second objective was to take a survey based research approach to understand user perceptions of the provision of vending services within hospital facilities. Statistical methods were used to analyse a targeted portion of a wider catering survey that was undertaken to contribute to an overall drive for catering service improvement. As well as the two primary research activities, communication design areas being actively explored included policy, strategy, supply chain, service contracting, point of sale, and end service user engagement. This exploratory portion of the research enabled holistic consideration of how the two pieces of primary research could best be designed and executed to contribute to the overall need for catering service improvement, with the unhealthy product sold in vending services at the heart of challenges. This exploratory, ground up research constitutes the majority of the contents of the literature review. Not all the activities carried out in this research project were developed through formalised appropriations and applications of scientific knowledge. They will, however, be reflected throughout this document as a way to frame the review and discussion of relevant research that could enable service improvement. Projects were taken on by the researcher to support wider developments in catering improvement, and this grounded approach was the framework of the literature review and combined with the literature review formed the basis of the primary research design decisions. It was felt that this grounded approach to creating the primary research, with continual reflection upon its’ usefulness, applicability in context, and impact on services in the NHS, was a key strength in the project that gave confidence to the decision making. The first piece of primary research was focused on the point of sale and purchasing environment. The research objective was to design and test current intervention methods that might encourage healthier product choices. The aim was to gather point of sale information, including product sales, and use it to quantitatively test leading policy approaches that encourage healthier eating and healthier choices in NHS vending services.
12
Point of sale hypothesis The main hypothesis in this experiment was that planned communication-based interventions using different technologies to change the point of sale vending machine environment can influence users to make healthier choices. The null hypothesis was that the interventions make no difference.
Staff survey research problem The second piece of primary research was to do with end service user engagement. The research hypothesis was that aspects of the current catering provision were unsatisfactory to staff in meeting their nutritional needs, especially on night shifts. The null hypothesis was that staff were satisfied and reported their nutritional needs were being met. The survey was designed to understand user perceptions and satisfaction with service by conducting a large-scale catering survey. Quantitatively analysing satisfaction levels would allow one to inform internal catering strategies.
The contextual work surrounding tasks, and the literature review, allowed the primary research to gain impact and validity, and to make methodological choices. There was no point testing an option that could not them be adopted into service design. Vending services were viewed in the wider context of retail and catering, focusing on management practice and the research allowed for understanding and meaningful reflection on measures that could be used and have impact at this broad level.
1.3 Research design context The primary research design focuses on end service users of vending services. It continuously reflected on how the knowledge created could then move back towards policy analysis and review key communication. This also meant taking insights from high level government communication documents and using them in the design of the primary research and informing the intended outcomes. It was the first-hand experience of the researcher that brought these elements together, and this merging of different sources of knowledge is often described as a mixed methods approach. It was not possible to formalise the latter first hand elements of the research project, simply due to restrictions of the scope of the project. It was, however, possible to reflect on what the findings of the user-focused research implied for the areas of policy, supply chain and contract information. The focus on end service users was significant and reflected the industry focus. End service change was viewed as an easier, less controlled or resource-heavy area of work than, for example, changing contracts or directly challenging policy. There has also been an explicit call for more understanding of how to influence user choices in vending interventions, as well as a call for more understanding of how to influence vending choices in healthcare settings specifically, which drove the research focus (Skov et al 2013, Hua
and Ickovics 2016). A final reason behind the research focus is that it creates an evidence-based, user-centred approach to service change discussions that might inform service design. This bottom-up approach is especially vital in FM, which exists solely due to end service user needs and is bound to operational conflicts and problem solving in real time. Moving through the problem space and using communication as the guiding principal to inform the research agendas, from service use to service design, this research required both qualitative and quantitative instruments throughout, using a mixed methods design to bring them together (Creswell 2013, Ritchie et al 2013 p39-47, Tashakori and Teddlie 2010, Morgan 2007). 1.4 Health context
13
The first element in Figure 1 addresses the deterioration of long-term health on a large scale, one of the biggest healthcare challenges in the UK and across the developed world (NHS England 2014). One of the central causes of a deterioration of long-term health is the poor lifestyle choices people make. Diet is one part of this and, combined with the other lifestyle of choices of smoking, lack of exercise and alcohol consumption, it forms the focus of government concern over long-term health (Opie 2011, Marmot 2010). Naturally, the health problems resulting from poor diet are tied into a poor lifestyle where diet is only one, if a very important element. It is up to FMs to take this focus and translate it into service design. There is good cause for concern over people’s diet, given that it can, largely through the development of obesity, lead to diabetes (type 2), cardiovascular disease, joint pain, respiratory problems, sores, mobility issues, risk of heart attack, early mortality, hypertension, stroke, cancer, and psychological problems (Björntorp 2001 p. 485–510). Vending machines, and the kinds of products sold in vending machines such as confectionary, salted snacks and sugary drinks, have been linked through numerous pieces of research with the kind of poor diet that causes such illnesses (Ermetici et al 2016, Kelly et al 2012, Maliderou et al 2006, O'Hare 2015, Almeida et al 2014, Gemmil and Cotugna 2005, Capacci et. al. 2012, Chauliac and Hercberg 2012, Mesas et. al. 2012, Muñoz-Pareja et. al. 2013, Martin and Chauliac 2014). Connecting vending to diet and lifestyle-created health concerns, research in Spain, accounting for over 11,000 individuals over a two-year period classed vending purchases as an obesity-related eating behavior (OREB), and found links between the presence of vending and higher energy intake, consumption of sugary drinks and even alcohol consumption, as well as the likelihood of obesity (Mesas et. al. 2012, Muñoz-Pareja et. al. 2013). The limited kinds of products sold, and the way they are sold – automatically, with optimal convenience and availability – all are likely factors as to why vending machines contribute to poor lifestyle choices. Vending machine prices are often greatly inflated, however this does not seem to deter consumption. The presence of vending machines in lower socioeconomic areas, particularly in urban locations, has been shown to be a predictor of poor dental health among children living in inner city London and obesity in low income children in the USA (Maliderou et al 2006, O'hara and Haynes-Maslow 2015).
This chapter will begin by discussing the ingredients and products in vending machines and their impact upon health, and then move on to consider vending technology as an enabler of poor dietary decisions in the section on ‘vending technologies in context’. Both have a different role to play in the system of communication that might be used to create improvements, both are important ellements in the underlying problems. The main ingredients of vending products linked to poor health are fat, saturated fat, sugar and salt. This opening discussion is concerned with some of the negative health impacts of over
consumption of these ingredients. Firstly, sugar is linked to dental disease, obesity, both type 2 diabetes and heart disease (NHS 2015). Secondly, fat, in the form of trans fatty acid, is one of the main culprits associated with severe health complications (NHS 2015). In contrast to this type of fat, fat associated with a Mediterranean diet, such as oils extracted from nuts, fish and olives, have been strongly linked with positive health outcomes (Hoffman and Gerber 2012). Thirdly, salt, which consumed in high proportion and sustained over the recommended levels, has been linked to high blood pressure, heart failure, kidney problems and kidney stones, oedema (fluid retention), stroke, stomach cancer, left ventricular hypertrophy (thickening of heart muscle), osteoporosis, and increased risk of fracture (State Government of Victoria 2015,
14
Kristy 2014, Goldstein and Leshem 2014, Nutrition Australia 2015, Medline Plus 2015, FSA 2014, WHO 2015, CDC 2012).
Overconsumption of sugar and fat are also especially linked to weight gain over time, leading to a chronic positive energy balance – what is commonly known as obesity (Weise et al 2014 NHS 2015). Obesity comes with its own potentially lethal health complications, both to the internal organs and the musculoskeletal system, and is most commonly linked with heart disease (EUFIC 2015, State Government of Victoria 2015, Nutrition Australia 2015, Medlineplus 2015, FSA 2014, WHO 2015, CDC 2012, Zock 2006). In the UK, obesity is a common marker for public health linked with poor diet and lifestyle. In England, for example, government reports show that 24% of women and 26% of men are obese (Barts 2016). As with the UK, the main public health aim in many developed countries has become the prevention of chronic (metabolic) diseases associated with obesity (EUFIC 2015). While obesity is a widespread indication of poor diet and lifestyle, it is important to consider malnutrition or ‘undernutrition’ as well, as this is also a problem across the UK caused by poor diet (Barts 2016). One can, in fact, be malnourished and obese at the same time.
Poor long-term health also has several associated negative costs and healthcare costs created, in part or wholly, by diet are causing concern for the UK government. ‘To take just one example, Diabetes UK estimate that the NHS is already spending about £10 billion a year on diabetes’, and type 2 diabetes is strongly linked with poor diet and lifestyle (NHS 2014). For 2015/16, the overall NHS budget was around £116.4 billion so this represents a significant proportion of the overall spend (NHS 2016). The health concerns linked to the kinds of confectionary products sold in automated food and drink vending machines raises a moral question as to whether vending should be available in a hospital (Kibblewhite et al 2010; Norton 2014). It also raises a reputational question as to whether the NHS can be seen to sell and support consumption of these products. Given that vending machines are not banned in the UK, and neither are the products commonly sold in them, the negative effects of poor lifestyle choices are a concern for NHS Trusts like Barts Health NHS Trust (Barts Health). The NHS protect and care for public health and yet many hospitals have vending in every building and use it as the sole means to provide out-of-hours catering for staff. It is these concerns and conflict, and the widespread use of vending which gave rise to this research. NHS Trusts are dedicated to looking after and saving lives but they sell unhealthy food and this reflects a deep moral dilemma in the way service is provided in the NHS. In vending in particular, there was a widespread lack of understanding over how best to proceed in service improvements at the time this project began.
1.4 Regional demographics of Barts Health Poor lifestyle choices are a particular problem in low income areas including Barts Health constituencies. Barts Health hospitals are situated in the boroughs of Newham, Tower Hamlets, Waltham Forest and the City of London. The Trust has its own unique demographic, with especially high concerns over the health risks of a poor diet and unhealthy lifestyle in these low-income areas. In Barts Health constituencies, deprivation is higher than the average across England (save the City of London) and this is a precursor for the kinds of diseases strongly associated with poor lifestyle choices (PHE 2012). According to the 2015 Health Profiles from Public Health England (PHE), the local incidence of diabetes is above the national average for Barts Health, as is mortality in those under 75 years from both cardiovascular disease and cancer (PHE 2015). Adult obesity levels in 2012 were
15
below the average in England but remain a significant health risk both locally and nationally (Barts 2016). The levels of childhood obesity for Barts Health were found to be significantly worse than the national average, highlighting the risks to future health (Barts 2016). Linking these concerns back to vending, the presence of vending machines in lower socioeconomic areas, particularly in urban locations, has been shown to be a predictor of poor dental health among children living in inner city London and obesity in low income children in the USA (Maliderou et al 2006, O'hara and Haynes-Maslow 2015). For Barts Health, with a low income-dominated demographic, promoting healthy lifestyles is especially important and the trend of childhood obesity suggests that it will become a greater problem in the future. Making a change to Barts Health vending would have a wide-reaching effect as it is the largest UK NHS Trust. Figures from 2012 showed that Barts Health ‘saw 1.3 million outpatients, cared for 420,000 emergency patients, delivered over 15,000 babies, undertook over 213,000 diagnostic tests and performed over 53,000 operations’ as well as treating over 260,000 inpatients (Barts 2014). The number of staff at the Trust is currently just under 16,000. Given that there are vending machines in a high proportion of the waiting rooms, cafes, staff rooms and other public spaces across the entire Trust, and that they serve this large population under a high-value contract, the scale of the potential impact of this research in making vending service improvements is significant.
1.5 Policy context The second point in Figure 1 signposts to the approach the government takes to preventing long-term illness. This is a key concern for the NHS and is reflected in policy, with guidance strongly geared towards reducing salt, fat, saturated fat, and sugar. Just like alcohol, and the many toxic ingredients found in tobacco smoke, these ingredients are over-consumed by the population and create grave concerns for public health. The World Health Organisation (WHO) has also demonstrated their support for dietary changes, asking governments to encourage consumer demand for healthy foods and meals, and to coordinate trade, food and agricultural policies with the protection and promotion of public health (WHO 2015). The 5yfv report covers many different areas of healthcare services. Specific to this research, it explains that Public Health England (PHE) ‘Will actively support comprehensive, hard-hitting and broad-based national action (for the improvement of food and drink services), to include clear information and labelling, targeted personal support and wider changes to distribution, marketing, pricing, and product formulation. We will also use the substantial combined purchasing power of the NHS to reinforce these measures’ (NHS England 2014). It advises to cut access to unhealthy products, implement food standards and provide healthy options for night staff for improved staff health and well-being (NHS England 2014). There is increasing drive to govern catering services in the NHS in light of this policy and, within this development, there has been scrutiny over how vending machines fit into a public health message for NHS staff and visitors, and how NHS Trusts can deliver strategic vision for their catering services (HFSP 2014). Vending is a key area of focus as it is the sole retail outlet for staff for significant periods of operational time, and sells some of the least nutritious products available. This is at odds with the NHS drive for sustainable care and long-term health. Due to policy focus on preventative care and creating a healthy culture in the NHS, there was a £1.5m financial incentive available for Trusts like Barts Health to make improvements to food and drink sold on hospital premises as part of the new Commissioning for Quality and Innovation
16
4 (CQUIN) (DoH 2014). CQUIN is a payment framework that enables commissioners to reward excellence by linking a proportion of English healthcare providers' income to the achievement of local quality improvement goals such as those associated with public health agendas. To be awarded this funding, Trusts must demonstrate to the Department of Health (DoH) that less healthy food and drink was being restricted, and healthier choices promoted in non-patient food like retail and vending (DoH 2014). The incentive is also given based on the Trust’s ability to gather baseline data about providers for the DoH (DoH 2014). Potential additional financial support to change service delivery is a universally critical motivation for facilities managers (FMs), who are under continuous pressure to deliver cost-efficient and commercially attractive services (Prodgers 2009; Davies 2011; Hall 96; Mclennan 2004; Coenen and von Felton 2014).
Focus on staff Vending service improvement is largely for the benefit of the nearly 16,000 members of staff at Barts Health. Three quarters of hospitals in the NHS do not offer healthy food to staff working night shifts, when often vending is the only available retail outlet (NHS England 2014). Better nourished staff can also provide better care and work more efficiently, improving the overall efficiency of the NHS, clinical care, financial performance and levels of patient mortality (West and Dawson 2012 in Kings Fund 2015; Marmot 2010, NHS England 2014). It has previously been estimated the NHS could reduce its overall sickness rate by a third – the equivalent of adding almost 15,000 staff and 3.3 million working days at a cost saving of £550m, by improving the health and well-being of staff (NHS England 2014). Improvements in staff diets might even influence friends and families of staff too (Marmot 2010). The role of vending in poor lifestyles and the links to work performance and public health is widely acknowledged, and vending is especially influential in determining eating behaviours where there is a captive audience (Kelly et al 2012, Apostolopoulos et al 2011, Escoto et al 2010). This includes those working long, unsociable hours and exposed most frequently to the poor nutritional quality of the products presented in vending machines. Many members of staff in the NHS working in 24-hour wards fit this description well. There is also concern at Barts Health that staff have little time to take proper breaks. This was the focus of the staff survey. Finally, in addition to staff, vending services also impact visitors and patients, and patients can be gravely affected by consuming the products sold in vending machines at certain stages in their treatment. This is especially true in renal, where one of the busiest vending machines at one Barts Health site was situated. It can, therefore, be seen that improving vending services, which are often in the most highly visible areas of the hospital, might positively impact patients, staff and visitors, as well as the culture of the healthcare environment and the reputation of Barts Health as a health care provider. The impact that FM services have on these wider issues is significant, even though service management may not reflect this wider picture, it could. There might, this research would argue, be a way to use service measures and performance evaluations of vending services to factor in user behaviours such as night shift requirements.
17
1.6 Putting policy into practice Although there is widespread acknowledgement that long term health is a concern and diet is a vital contributing factor, it is unclear how public health agendas in retail catering and prevention of long-term illnesses through better lifestyle choices could be represented in the design and delivery of vending services at Barts Health. Little was known at the start of the project about how to improve vending based on the overall assertions made by reports such as the 5yfv. There was work done historically at Barts Health that touches on the policy issues being raised. For example, the Trust commissioned the Marmot report in 2010. It focuses on staff health and well-being which is appropriate given that they represent the largest consumer of retail catering such as vending. Staff are, therefore, recognised by the UK government and at Barts Health as a critical group who should be encouraged to adopt healthier lifestyles during their time working in healthcare facilities (DoH 2014, Marmot 2010). The report focuses on the positive impact of improving retail catering and staff diet. One of the overarching pieces of advice in the report is to focus on the role of communication as a way to make improvements across services. It also specifically advises healthier food and less unhealthy food be made available by the Trust similar to the CQUIN 4 agenda. It goes into more detail, with mention of the use of traffic light food labels in vending machines alongside other specific actions such as food and weight loss education programs, and improved nutritional value of food (Marmot 2010). The Marmot report was published before much of the new government policy but remains relevant today, and has since been reinforced on a national level with the publication of the 5yfv. FM leaders in the estates and facilities department at Barts Health supported this EngD research project, driven by the significant opportunities to improve staff diet which still remains through the improvement of retail catering and vending which were described in the Marmot report but never tested in vending services. Another key motivator was that, at the time of this research, changes in catering were imminent as the contract was being retendered. This period of change created an opportunity to deliver a rigorous investigation, to test and to intervene to create system-wide improvements. The retender was part of a large-scale change for the Trust with all soft FM services being renewed under one contract, including cleaning, security and parking. The contract has a reported value of £600m over ten years (FMJ 2016). In the past, vending had been part of this package but retail was being split off into a separate contract for the first time. With policy changes and an increase in scrutiny occurring simultaneously, this change over presented a significant opportunity for vending service improvement.
Using the Barts Health estates team as the basis of the research perspective provided much needed, and pragmatic boundaries to the research. This research explored the potential for service improvement and delivery of public health policies throughout vending services within the scope of the in-house FM function at Barts Health, current vending service provision, and the available guidance and research. The research behind policy advice was explored, and some of it tested, to find supporting methods and contemporary approaches that were potentially well-suited to application in this unique context. Policy changes and the upcoming tender were both major developments which resulted in high-level support from the Trust and the estates team. This created a unique opportunity for this research to have significant impact. One experience which sums up this support, and also reveals the challenges faced by similar efforts, occurred during a meeting as a representative for Barts Health in the Department for Environment, Food & Rural Affairs (DEFRA) Government Buying Standards (GBS) working group.
18
The position of Barts Health representative on the DEFRA working group was given to this researcher by the industrial supervisor of this research project and environmental manager at Barts Health. It was an ongoing role throughout the research project. It was an opportunity to sit and discuss ideas at a table with representatives from across the public sector, including from DEFRA, the judicial system, immigration, the education sector and the NHS. The challenge revealed in these meetings with DEFRA was that government efforts and policies are continuously and cyclically presented to public sector organisations but are not embedded which creates fatigue among public sector organisations. Two representatives from another large scale public sector organisation expressed their frustration that the focus on government buying standards was a repetition of prior efforts and we were ‘rehashing’ a similar process undertaken fifteen years earlier. To someone relatively new to government policy it revealed the frequent repetition of government policy and the frustration created when it is not fully implemented. More subtle lessons from this experience emerged too, specifically that policy makers might struggle to collate and apply experiences more widely and that vending services must be capable of dealing with recurring and changing political agendas, yet maintain the core values of public health at its centre. For example, in previous generations the idea of reducing fat intake would have been completely at odds with public health, when the focus was ensuring people were not too far underweight or even starving. Using communication as a core focus in this research meant that the effective capture and communication of information remained central as a means of meeting the challenge of changing policy landscapes. Communication was viewed as a balancer of a flexible system that reassesses and absorbs change. Service improvement itself is justifiably a continuous improvement process, given that it is time-dependent, part mechanical and material, and part conceptual (Fitzimmons and Fitzimmons 2011). The comment made during the DEFRA meeting also highlighted the importance of connecting organisations together to share insights gained, which, with appropriate, context-specific testing and corroboration, could lead to improved practices.
1.7 Vending technologies context The UK automated food and drink vending sector, like many countries both developing and developed, is now substantial. There are approximately 462,700 machines vending around 6bn snack and drink products per year in the UK (Vogue 2016). The ratio of machines to people is 1:139 in the UK, and is even higher in other countries. For example, 1:23 in Japan and 1:55 in the USA (Automatic Vending Association 2016). The UK vending machine industry employs over 15,000 people and turns over approximately £1.65bn per year, while the European turnover is € 11.8bn (European Vending Association 2016). Vending contradicts traditional retail technologies for a number of reasons. A vending machine can be stored easily, tightly controlled, and counted as a tangible asset that one can own and resource (Van Looy et al 2003 p10-11). Secondly, it replaces the need for a person to manage each retail outlet, often with low stock rotation requirements and products with long expiry dates, saving money on personnel, especially in countries where labour costs are considered high. Thirdly, vending services are, at point of sale, mechanical and material yet able to appeal to the customer’s emotions through marketing and advertising (Fitzimmons and Fitzimmons 2011). Finally, vending removes the traditional need for time-dependent opening hours, yet retains the ability to transact goods on the ‘there and then’. These features are at the heart of the swift and widespread adoption of vending machine technology, making it a unique retail
19
innovation. (Oinas-Kukkonen Harjumaa 2008a, 2008b, Fitzimmons and Fitzimmons 2011, Kim 2003). These features may (although it is not clear at this stage) also impact the design of effective contracts and services, and the way that one might communicate with end service users and design the point of sale environment. Each of these unknowns it essentially a communication problem. It is through FM services such as vending that communication problems can lead to poor services that don’t meet public health agendas.
1.8 FM services context FM is the ‘Integration of processes within an organisation to maintain and develop the agreed services which support and improve the effectiveness of its primary activities’, and fits into many interpretations (IFMA 2012, BSI 2006, FM Link 2014, CEN 2006, Prodgers 2009, Davies 2011, Hall 1996, Mclennan 2004, Coenen and von Felton 2014). FM services in public sector health caring organisations such as the NHS are highly user-centric, and the complex technical medical systems and large workforces that lie within necessitate highly specified and variable service standards that are ultimately centred on the core organisational goal of providing care for the health of patients. Vending services are managed in a way typical way of soft FM services at Barts Health Health: the service is subcontracted and managed as part of a bundled service, largely under a PFI agreement. In-house FM teams monitor services by collecting, analysing and reporting data, representing and ensuring the continuous meeting of service level agreements (SLAs). A service agreement is the agreement between the service provider and its customers quantifying the minimum acceptable service to the customer (Van Looy et al 2003 p169). In comparison to SLAs, key performance indicators (KPIs) ensure that the organisational targets for success are being met. Often, the contractor is responsible for delivering the KPIs as well, and they are written into the contract as SLAs between the contractor and the Trust. This can lead to a dilution of intentions and service outcomes. In regards to vending, for example, the contract only stipulates that the service provider will ensure out-of-hours catering for staff, although the policies focus on well-being, nutrition, health and public health. Without any further specification in the contract, out-of-hours catering is achieved through vending and this results in a staff who only have access to confectionary, salty snacks and sugary drinks for large proportion of the time given that Barts Health is a 24-hour organisation. Vending services being provided by outsourced companies look very different from what is implied in the contract. This is indicative of output-specified contracts that do not contain detailed requirements, but are instead set to represent minimum standards and retain focus on cost-saving measures. From an FM perspective, it is most important to maintain and develop the agreed services which support and improve the effectiveness of the NHS’s primary activities as a carer of health (IFMA 2012, BSI 2006, FM Link 2014, CEN 2006, Prodgers 2009, Davies 2011, Hall 1996, Mclennan 2004, Coenen and von Felton 2014). FMs play a mediating role between potentially restrictive output-orientated service contracts, cost improvement plans (CIPS) and public health agendas. They must also meet building user needs and core organisational objectives of patient care on a daily basis, working in partnership with contracted service providers. This is a complex and challenging role and not enough was known as to how to improve vending services within this commercially-driven environment at the start of the project, and what the opportunities and restrictions may be.
20
The first part of this chapter has described some of the characteristics of vending services and the nature of the underlying problems using tangible examples and explanations. The second part does similarly but in research and analysis terms, introducing the problems from the perspective of the research communities who have strove to find solutions to similar problems.
1.9 The role of the primary research in witnessing the need for change One role of this research project is to bear witness and to evidence the need for change in vending services that can be used to plan, build and implement effective performance measures. The concept of witness pervades many social constructs and is a powerful idea used in political theory, legal practice and performance art (Bretherton 2015, Bui 2015, Sepinuck 2013).
In managing an outsourced service, with monitoring and contract compliance management at the fore of activities, FM itself is a practice of witness. When these structures of FM reporting practices do not capture an emergent service delivery problem, such as the need for improved catering for night shift staff, capturing staff feedback is crucial to understand the service faults. Data-driven communication systems are often reliant on staff to report faults in a timely and correctly formatted manner and this in itself is another form of witness, has been noted as a particular area for improvement at Barts Health (Marmot 2010). Outsourced services that are driven by data collection can only function successfully given that they are input with accurate and timely data. FMs use this data to justify service change from within contract governance structures, that place their services under financial and resource constraints. As mentioned earlier, one of the key targets for policy is to understand and collect catering service data better in the NHS, and so meeting this goal services a strategic as well as operational purpose. The staff survey achieves this vital feedback. A second type of FM data is that collected by service providers, such as sales records. Using commercially sensitive data such as sales records to justify service changes might be challenging as in-house teams may have limited access to such commercially protected data sets held by the outsourced contractors. This is common in FM with high volumes of outsourcing (Cotts et. al. 2010 p232-233). As this research is conducted from the perspective of in-house FM teams at Barts Health, the same hurdles might have affected the kinds of methods and tests available to use in this project. By focusing on the public health and research, rather than the revenue agenda, throughout the research, the problem was circumnavigated. The researcher formed a trusting relationship with suppliers that enabled access to sale records. Analysing sales data to judge point of sales interventions was the second form of witness that this research provided for the purpose of service improvement. Without effective information gathering in vending, organisations such as the NHS are vulnerable to criticism as they may be failing to deliver public health agendas without even realising. Given that it is subcontracted service it therefore inherently lacks transparency. This research might provide the in-depth understanding needed to quantify the many unknowns of how to improve vending at Barts Health. In summary, this research hopes to contribute witness to the problems faced in delivering public health agendas through the primary research undertaken.
21
1.10 Connecting themes that run throughout the research There are five connecting themes that run through this research. These are:
Process
Context
Data
Aesthetics
Users These connecting themes were first developed in the dissertation portion of this research project. The dissertation looked at a staff energy-saving behaviour change programme at Barts Health, called operations TLC. Similar to this research, a service change was needed in order to deliver government policy changes and service change was centred upon service user behaviours. This researcher combined a literature review with first-hand experience delivering the project. It conducted n-depth interviews with key stakeholders that were transcribed and coded to find emergent themes that either matched or diverged from the literature. The five factors were revealed to be central in understanding opportunities for service improvement through end service user engagement using communication technologies. A full copy of the dissertation and appendixes can be found in appendix B. The five themes were found to be essential considerations in how communication can be a driver for positive service change and a focus on the end service user, as well as capturing all the linked opportunities. This set of five themes has been a useful tool in the thesis portion of this project, to understand and navigate the literature about communication and form a foundation of knowledge applicable to all types of communication. This was the point from where this researcher drew bespoke examples fitting to vending service improvement questions and communication opportunities. The dissertation was therefore a broader review of communication and its varying technologies, from where the thesis developed more narrow examples relating to vending. The dissertation was not vital to the thesis, but was instrumental in ensuring that the thesis addressed communication literature holistically and not only from the narrow perspective of the research problem. The dissertation was therefore largely out of the scope of the thesis.
The five themes that guide the research were:
Data - this should form the foundation of service delivery mechanisms such as contracts, policies and supply chains, creating an accurate idea of service requirements from the user perspective.
Aesthetics - the chosen mode by which knowledge is communicated in its applied environment; the colour one uses in a graph, the way signs are displayed in public areas.
Users - central to all aspects of communication and often considered in terms of internal motivations for acting or changing behaviours towards an end goal.
Context - the environment within which a service like vending is delivered, how it is designed and formally analysed and understood as a way to enrich service goals and apply communication technology.
Process - might either be the processes of internal change that people go through when reassessing their behaviours, actions and/or decisions, and or the technical systems of processes within which vending services improvement takes place. Systems of processes tie together the service as a whole.
22
These are the five overarching agendas of communication that were found to impact end service user improvement plans in the dissertation: aesthetic, context, data, process, and users. This model creates a pathway to move from strategy, policy, contract and audit requirements, to operational change that delivers public health in a tangible way. For example, the first piece of primary research, redesigning the point of sale and measuring impact, absorbs and considers elements from all five factors. Firstly, what the impact of the context in which vending machines are located has. Secondly, the way data is analysed and the appropriate statistical methods. Thirdly, the aesthetic of the interventions and how their design might be optimised to encourage healthier choices. Fourthly the processes, linking the elements of vending as a system and the individual process of change needed to create healthier lifestyle choices. And finally, the end user and their input explored through the survey. The five factors model ensures that the elements of the research projects maintain a communication focus and capture the necessary controls required for change.
1.11 Conclusion The presence of vending traditionally encourages poor lifestyle choices, and automated food and drink vending is a serious concern for NHS Trusts like Barts Health, especially but not only for staff. The negative effects of poor lifestyle choices, such as having a bad diet, are exacerbated by the presence of vending machines (Ermetici et al 2016, Kelly et al 2012, Maliderou et al 2006, O'Hare 2015, Almeida et al 2014, Gemmil and Cotugna 2005, Capacci et. al. 2012, Chauliac and Hercberg 2012, Mesas et. al. 2012, Muñoz-Pareja et. al. 2013, Martin and Chauliac 2014). Their presence is an especially strong marker of poor diets and lifestyle choices in low income areas such as Barts Health constituencies, where obesity and other linked medical diseases to do with long-term health is also higher (O'Hare 2015, Barts 2016). The health concerns linked to the kinds of confectionary products sold in automated food and drink vending machines raises a moral and reputational question as to whether vending should be available in a hospital (Kibblewhite et al 2010; Norton 2014). Making improvements is an attractive challenge for the NHS, as improving people’s lifestyles and resultant long-term health might also reduce the costly burden of treating diet-related health problems as well as representing its core values of preventative health, as set forth in the 5yfv (NHS 2014 NHS England 2014). There are several key service users who can benefit from improvements in vending services. The most critical group that this research hopes to influence, in accordance with policy and contracts currently in place, are staff working out-of-hours (Marmot 2010, Barts 2016, Kibblewhite et al 2010, Norton 2014, NHS England 2014). The hospital can also promote healthy lifestyles in the shared spaces where vending machines are situated and contribute to the collective identity of its community, directing the culture and values of its users towards healthier diets, rather than encourage poor choices (İnce Güney 2014). Better nourished staff can also provide better care and work more efficiently and take less time off sick, with significant financial savings attached (NHS England 2014, Marmot 2010, İnce Güney 2014). Funding opportunities for the Trust through QCUINs might become available by demonstrating improvements as well (Maruthappu 2015). Finally, the soft FM tender is a key opportunity to use this research to influence the contract structure. There is active debate at policy and practice level about how to make improvements, given that vending is a complex, changeable system within Barts Health and the NHS (Churchman 1967, Rittel and Webber 1973, WHO 2015, Nice 2016, Nice 2015, The NHS England 2014, NHS England 2016, Maruthappu 2016, HPH 2015, DoH 2014, Boorman 2009). Traditional approaches to public administration may not be suitable as they rely on linear rational models with narrow measures
23
of success to fit into contractual frameworks, whilst public health measures and outcomes are ill-defined (French ministry of health 2012, EUFIC 2015, State Government of Victoria 2015, Nutrition Australia 2015, Medlineplus 2015, FSA 2014, WHO 2015, CDC 2012, Zock 2006, Phillips et al 2003, ten Have et al 2010, Terry-McElrath et al; Oborn et al 2011). The key issue is creating a resilient vending service that is both responsive and well designed, with built-in, achievable monitoring, so that people understand how to use and provide services to the best of their ability. And to design and implement a service that accounts for hidden complexities in a changeable setting such as the NHS. There are a wide set of independent variables and human agendas and one must search for dynamic solutions and measurement tools that account for the entire service package. Communication is an excellent area from which to draw solutions from as it cuts across every aspect of services and Barts Health should adopt communication technology to improve staff health and well-being through catering (Marmot 2010). Although there is clear motivation to improve automated food and drink vending through communication, making tangible changes to service is a far more complex challenge than it first seems. Churchman’s theory of wicked problems is an excellent description of the complexities in the research context. This research might provide the in-depth understanding needed to quantify the many unknowns of how to improve vending at Barts Health. This will contribute witness to the problems faced in delivering public health agendas and test the efficacy of potential communication solutions. The first piece of primary research will design and test current intervention methods that might encourage healthier product choices. The aim was to gather point of sale information, including product sales, and use it to quantitatively test leading policy approaches that encourage healthier eating and healthier choices in NHS vending services at the service delivery and operational end of services. The second piece of primary research will provide understanding of staff satisfaction levels with vending and demand and appetite for changes to retail night shift staff. Quantitatively analysing both data sets will contribute to policy, strategy, supply chain, service contracting, point of sale, and end service user engagement regarding vending service improvement and public health agendas.
24
Chapter 2 Defining the theoretical research problem space This chapter is about defining the systems in which the research problem operates and this was a key challenge at the beginning of the project. At the start of the research project there was uncertainty about the relationship between vending in the NHS and the role that service design had delivering public health. By defining the ways in which the problem space can be perceived was later possible to identify key pieces of communication relevant to vending and service change within that problem space and how they linked together to maximise impact.
2.1 Socio-technical Systems of Communication Introduction This chapter investigates how one might define the relationship between technologies of vending and social, human interactions and how communication can describe as well as mitigate or regulate that relationship. This chapter also describes the different ways to interpret elements of vending services as a system and how they each contribute understanding and definition to the research problem.
2.2 History of vending technology in society In the NHS, it is intuitive that the space in which people work or visit, most especially if that space is a hospital, should promote healthy lifestyles and contribute to the collective identity of the community, representing the culture and values of its users, hopefully towards healthier diets, and not encourage poor lifestyle choices (İnce Güney 2014). Vending machine technologies are used to sell unhealthy products and contradict this sentiment. This section argues that vending technology enters many social systems in a similar way, creating moral, ethical and legal problems. This section will argue that vending machine technologies create an opportunity to circumnavigate moral and sometimes even legal barriers of trade that contradict social values such as public health (Bui 2015, Sepinuck 2013, Segrave 2002, Fulton 1995, DiFranza 1996, Kanda et. al. 2010, Minowa and Satomi 1993, Tomnay and Hatch 2013, Brown et. al. 1997, Moatti et. al. 2013, Bretherton 2015). It also inherently enables taboo behaviours. Vending machines have existed in primitive forms since before Christ. Coin operated holy water dispensaries for example made it quicker and more efficient to profit from the sale of holy water in temples (Segrave 2002). In this earliest of examples, vending technology prevents having a holly member of the temple directly accepting money for their religious services also portioning the water and resolving the resource issues of people taking too much water at once. Primitive vending machines were also used to automatically open drawbridges (Segrave 2002). This might have protected money collectors from people’s objections to paying entry. Using deep coin slots where people inserted their money rather than a person might have also avoided robberies. The operators themselves may even have been tempted to withhold money paid to them or allow free entry to friends and family. It would be difficult to monitor from behind defensive walls. In modern society, automated payment on buses and other transport systems has a similar effect of preventing robbery and theft. Vending machines continued to evolve in seventeenth century in English taverns when coin operated vending boxes were used to sell snuff boxes, a product intermittently banned and made illegal (Segrave 2002). In a later nineteenth century example, Richard Carlile sold controversial political books, such as Thomas Paine’s The Age of Reason, through the same kind of vending machines, pushing the freedom of the English press and attempting, unsuccessfully, to avoid arrest for his illegal acts by relying on the automated nature of vending machine distribution (Segrave 2002).
25
In 1833, Percival Everitt developed vending machine technology further, to supply products such as postage stamps, handkerchiefs, cigarettes, confections and even fortunes on Sundays, when shops were closed in accordance with religious law at the time (Segrave 2002). Soon Everitt had to develop patents to protect against the regular vandalism of vending machines. People pushed paper, orange peel and other rubbish in the coin slots. In the 1990s, a flurry of research in places such as Japan appeared regarding how to stop tobacco being sold to under age people who were buying it illegally it from vending machines, before it was eventually banned in many countries including the UK (Fulton 1995, DiFranza 1996, Kanda et. al. 2010, Minowa and Satomi 1993). Research also exists on the sale of contraceptives through vending machines in religious communities in the USA, where, again, underage young people were regular customers (Tomnay and Hatch 2013, Brown et. al. 1997). In Japan, vending machines even sold used panties before their eventual ban and replacement by synthetic
versions. Finally, the distribution of syringes via vending machines has been another subject of research in France and other countries to encourage use of clean needles for heroin use and combat HIV (Moatti et. al. 2013). Vending machines offer both the distributors and customers anonymity. In the NHS today, confectionary, salty snacks and sugary drinks are the taboo products that might one day become prohibited. France has already banned vending in its schools, for example (Capacci et. al. 2012). Not only are they at odds with the health caring role of the organisation, there is also the underlying consideration that the raw ingredients, especially sugar, are manufactured based on the systematic exploitation of farming communities and human rights violations spanning centuries (Fairtrade 2016).
In conclusion, the historical evidence strongly suggests that the role of vending in society has been to circumnavigate a range of moral and legal dilemmas dictated by the societies in which they have appeared throughout history. As a vehicle for taboo, and even illegal, retail it is perhaps the case that bespoke, morally-guided retail standards are needed to control this impressive and large global sector more tightly. In the context of the NHS, the boundaries of what is and is not morally acceptable to public health are changeable, especially given that preventative healthcare policies are new and evolving. FMs will have to adapt and move with these changes in the way that vending, and all FM services are designed and delivered.
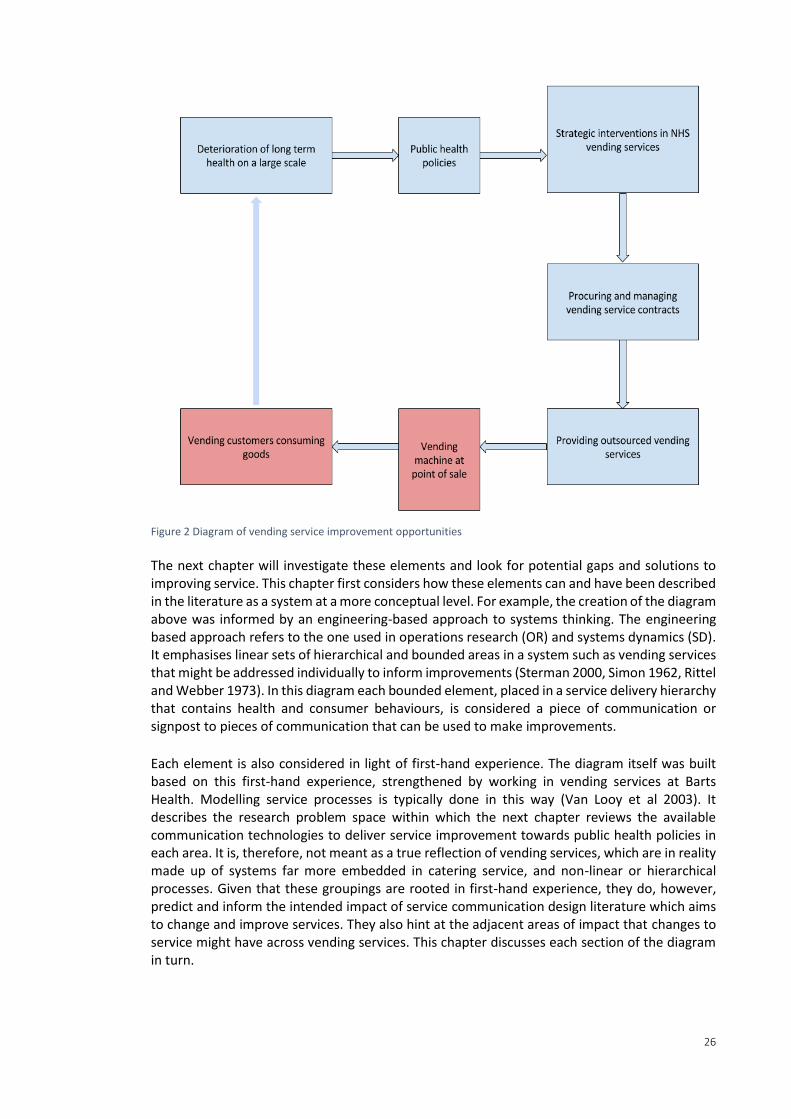
2.3 The system of communication in which vending is regulated in the NHS In the context of the NHS there are several formal elements of communication that exist to regulate vending. The previous section was a broad look at the relationship between vending technology and society, however this section focuses only on that relationship in the context of the NHS. It focuses on elements of communication that form a system by which to deliver public health agendas in NHS food and drink automated vending. The diagram presented in the diagram below represents these formal elements of communication as a system, describing the set of mechanisms through which vending might become more effectively regulated and designed.
26
Figure 2 Diagram of vending service improvement opportunities
The next chapter will investigate these elements and look for potential gaps and solutions to improving service. This chapter first considers how these elements can and have been described in the literature as a system at a more conceptual level. For example, the creation of the diagram above was informed by an engineering-based approach to systems thinking. The engineering based approach refers to the one used in operations research (OR) and systems dynamics (SD). It emphasises linear sets of hierarchical and bounded areas in a system such as vending services that might be addressed individually to inform improvements (Sterman 2000, Simon 1962, Rittel and Webber 1973). In this diagram each bounded element, placed in a service delivery hierarchy that contains health and consumer behaviours, is considered a piece of communication or signpost to pieces of communication that can be used to make improvements.
Each element is also considered in light of first-hand experience. The diagram itself was built based on this first-hand experience, strengthened by working in vending services at Barts Health. Modelling service processes is typically done in this way (Van Looy et al 2003). It describes the research problem space within which the next chapter reviews the available communication technologies to deliver service improvement towards public health policies in each area. It is, therefore, not meant as a true reflection of vending services, which are in reality made up of systems far more embedded in catering service, and non-linear or hierarchical processes. Given that these groupings are rooted in first-hand experience, they do, however, predict and inform the intended impact of service communication design literature which aims to change and improve services. They also hint at the adjacent areas of impact that changes to service might have across vending services. This chapter discusses each section of the diagram in turn.
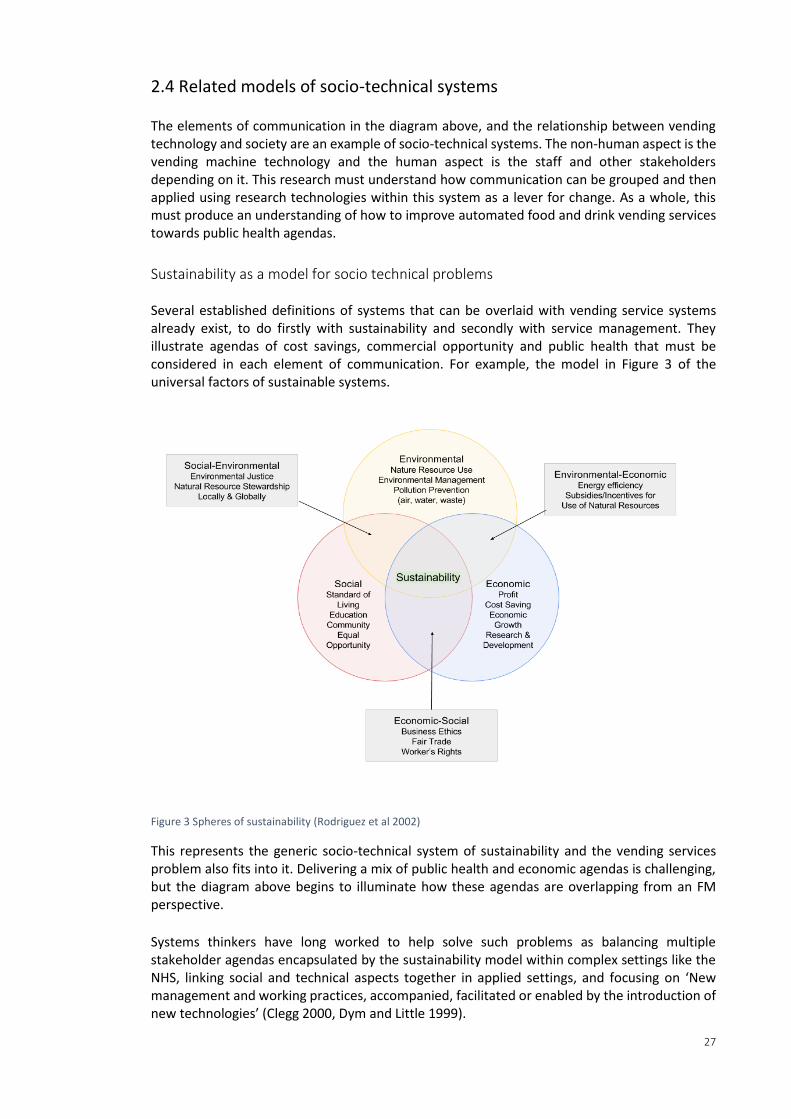
27
2.4 Related models of socio-technical systems The elements of communication in the diagram above, and the relationship between vending technology and society are an example of socio-technical systems. The non-human aspect is the vending machine technology and the human aspect is the staff and other stakeholders depending on it. This research must understand how communication can be grouped and then applied using research technologies within this system as a lever for change. As a whole, this must produce an understanding of how to improve automated food and drink vending services towards public health agendas.
Sustainability as a model for socio technical problems Several established definitions of systems that can be overlaid with vending service systems already exist, to do firstly with sustainability and secondly with service management. They illustrate agendas of cost savings, commercial opportunity and public health that must be considered in each element of communication. For example, the model in Figure 3 of the universal factors of sustainable systems.
Figure 3 Spheres of sustainability (Rodriguez et al 2002)
This represents the generic socio-technical system of sustainability and the vending services problem also fits into it. Delivering a mix of public health and economic agendas is challenging, but the diagram above begins to illuminate how these agendas are overlapping from an FM perspective. Systems thinkers have long worked to help solve such problems as balancing multiple stakeholder agendas encapsulated by the sustainability model within complex settings like the NHS, linking social and technical aspects together in applied settings, and focusing on ‘New management and working practices, accompanied, facilitated or enabled by the introduction of new technologies’ (Clegg 2000, Dym and Little 1999).
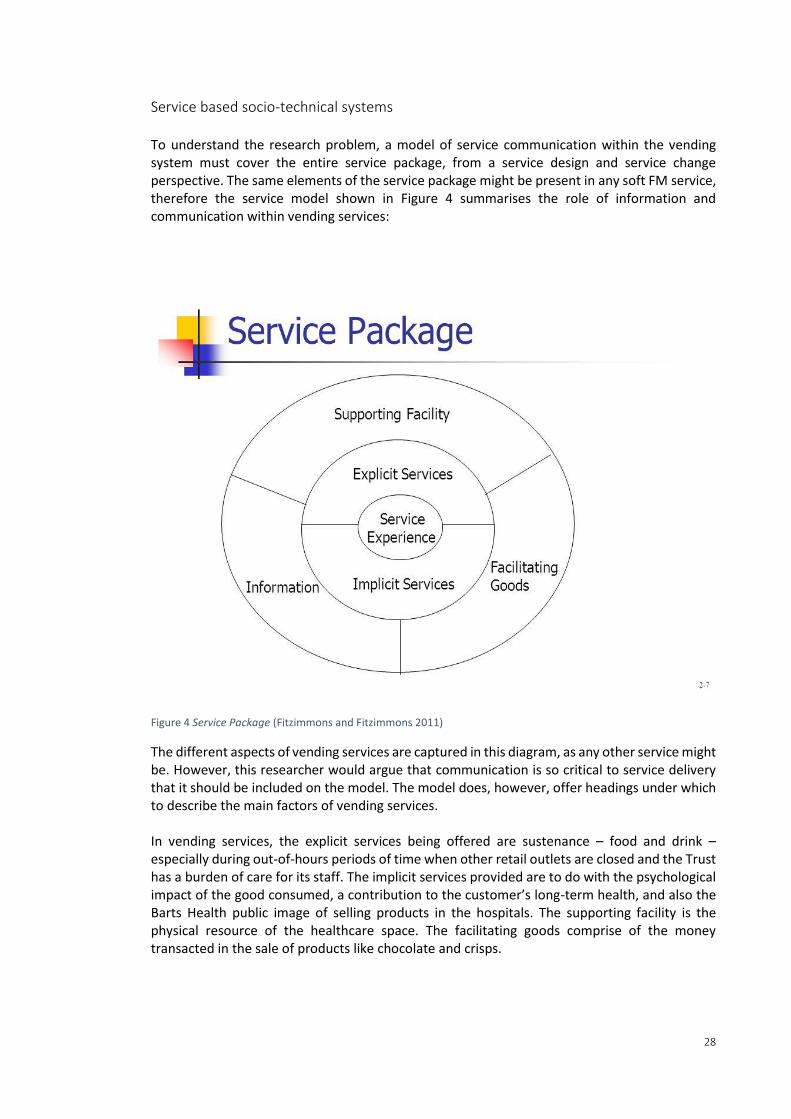
28
Service based socio-technical systems To understand the research problem, a model of service communication within the vending system must cover the entire service package, from a service design and service change perspective. The same elements of the service package might be present in any soft FM service, therefore the service model shown in Figure 4 summarises the role of information and communication within vending services:
Figure 4 Service Package (Fitzimmons and Fitzimmons 2011)
The different aspects of vending services are captured in this diagram, as any other service might be. However, this researcher would argue that communication is so critical to service delivery that it should be included on the model. The model does, however, offer headings under which to describe the main factors of vending services. In vending services, the explicit services being offered are sustenance – food and drink – especially during out-of-hours periods of time when other retail outlets are closed and the Trust has a burden of care for its staff. The implicit services provided are to do with the psychological impact of the good consumed, a contribution to the customer’s long-term health, and also the Barts Health public image of selling products in the hospitals. The supporting facility is the physical resource of the healthcare space. The facilitating goods comprise of the money transacted in the sale of products like chocolate and crisps.
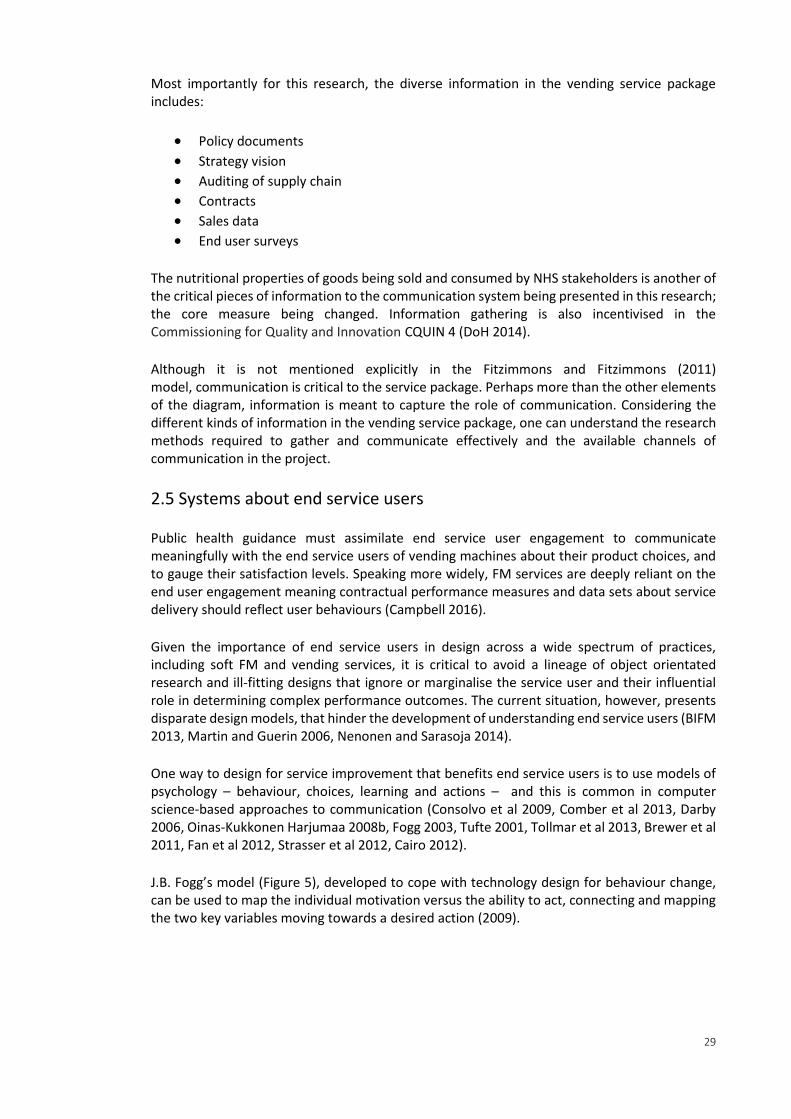
29
Most importantly for this research, the diverse information in the vending service package includes:
Policy documents
Strategy vision Auditing of supply chain Contracts Sales data End user surveys
The nutritional properties of goods being sold and consumed by NHS stakeholders is another of the critical pieces of information to the communication system being presented in this research; the core measure being changed. Information gathering is also incentivised in the Commissioning for Quality and Innovation CQUIN 4 (DoH 2014). Although it is not mentioned explicitly in the Fitzimmons and Fitzimmons (2011) model, communication is critical to the service package. Perhaps more than the other elements of the diagram, information is meant to capture the role of communication. Considering the different kinds of information in the vending service package, one can understand the research methods required to gather and communicate effectively and the available channels of communication in the project.
2.5 Systems about end service users Public health guidance must assimilate end service user engagement to communicate meaningfully with the end service users of vending machines about their product choices, and to gauge their satisfaction levels. Speaking more widely, FM services are deeply reliant on the end user engagement meaning contractual performance measures and data sets about service delivery should reflect user behaviours (Campbell 2016). Given the importance of end service users in design across a wide spectrum of practices, including soft FM and vending services, it is critical to avoid a lineage of object orientated research and ill-fitting designs that ignore or marginalise the service user and their influential role in determining complex performance outcomes. The current situation, however, presents disparate design models, that hinder the development of understanding end service users (BIFM 2013, Martin and Guerin 2006, Nenonen and Sarasoja 2014). One way to design for service improvement that benefits end service users is to use models of psychology – behaviour, choices, learning and actions – and this is common in computer science-based approaches to communication (Consolvo et al 2009, Comber et al 2013, Darby 2006, Oinas-Kukkonen Harjumaa 2008b, Fogg 2003, Tufte 2001, Tollmar et al 2013, Brewer et al 2011, Fan et al 2012, Strasser et al 2012, Cairo 2012). J.B. Fogg’s model (Figure 5), developed to cope with technology design for behaviour change, can be used to map the individual motivation versus the ability to act, connecting and mapping the two key variables moving towards a desired action (2009).
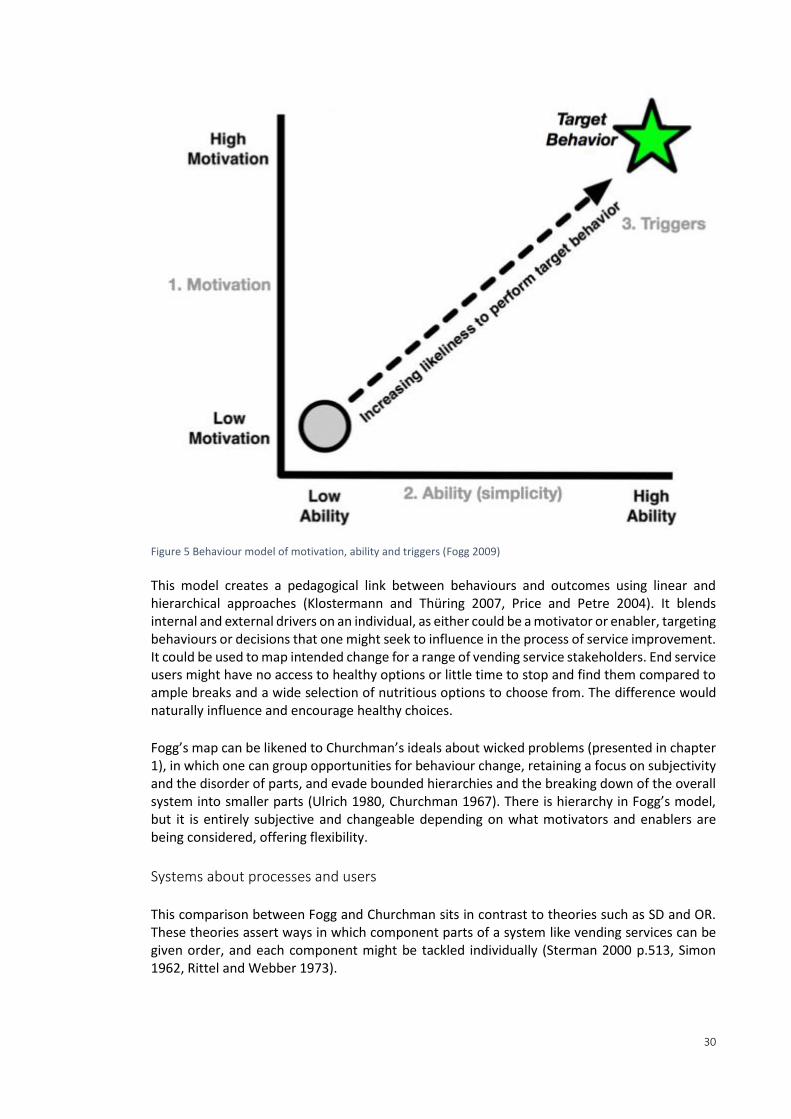
30
Figure 5 Behaviour model of motivation, ability and triggers (Fogg 2009) This model creates a pedagogical link between behaviours and outcomes using linear and hierarchical approaches (Klostermann and Thüring 2007, Price and Petre 2004). It blends internal and external drivers on an individual, as either could be a motivator or enabler, targeting behaviours or decisions that one might seek to influence in the process of service improvement. It could be used to map intended change for a range of vending service stakeholders. End service users might have no access to healthy options or little time to stop and find them compared to ample breaks and a wide selection of nutritious options to choose from. The difference would naturally influence and encourage healthy choices. Fogg’s map can be likened to Churchman’s ideals about wicked problems (presented in chapter 1), in which one can group opportunities for behaviour change, retaining a focus on subjectivity and the disorder of parts, and evade bounded hierarchies and the breaking down of the overall system into smaller parts (Ulrich 1980, Churchman 1967). There is hierarchy in Fogg’s model, but it is entirely subjective and changeable depending on what motivators and enablers are being considered, offering flexibility.
Systems about processes and users This comparison between Fogg and Churchman sits in contrast to theories such as SD and OR. These theories assert ways in which component parts of a system like vending services can be given order, and each component might be tackled individually (Sterman 2000 p.513, Simon 1962, Rittel and Webber 1973).
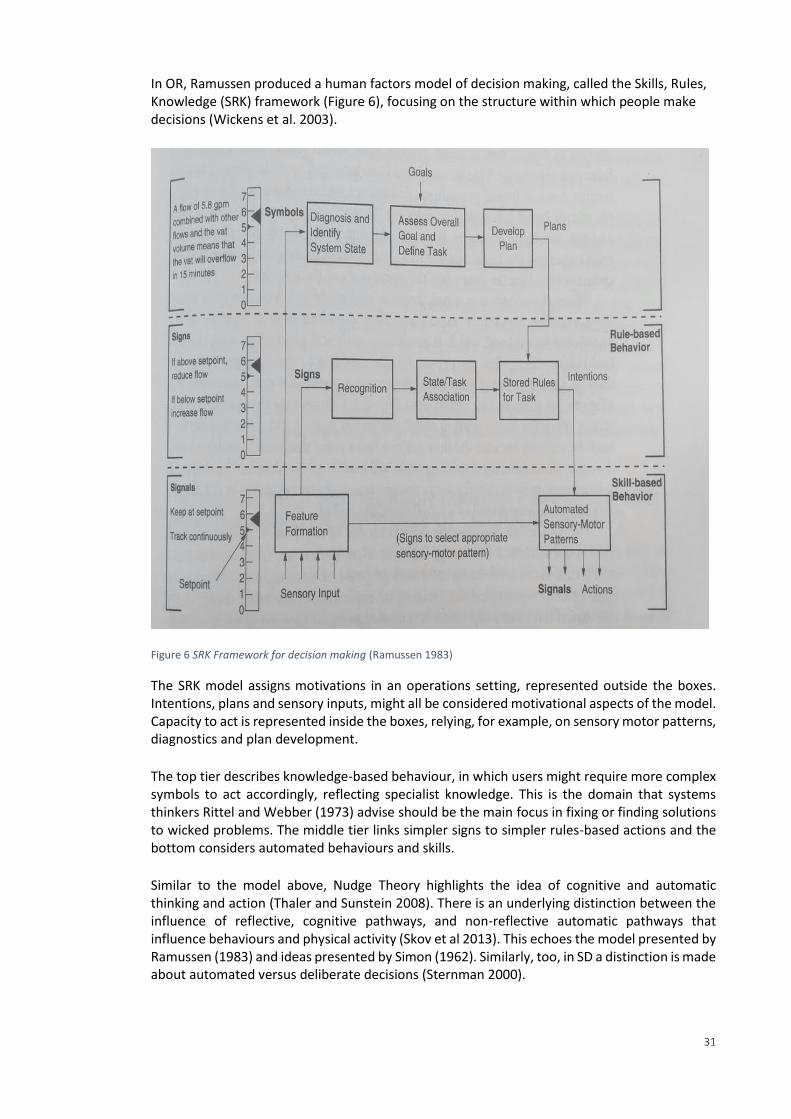
31
In OR, Ramussen produced a human factors model of decision making, called the Skills, Rules, Knowledge (SRK) framework (Figure 6), focusing on the structure within which people make decisions (Wickens et al. 2003).
Figure 6 SRK Framework for decision making (Ramussen 1983)
The SRK model assigns motivations in an operations setting, represented outside the boxes. Intentions, plans and sensory inputs, might all be considered motivational aspects of the model. Capacity to act is represented inside the boxes, relying, for example, on sensory motor patterns, diagnostics and plan development. The top tier describes knowledge-based behaviour, in which users might require more complex symbols to act accordingly, reflecting specialist knowledge. This is the domain that systems thinkers Rittel and Webber (1973) advise should be the main focus in fixing or finding solutions to wicked problems. The middle tier links simpler signs to simpler rules-based actions and the bottom considers automated behaviours and skills. Similar to the model above, Nudge Theory highlights the idea of cognitive and automatic thinking and action (Thaler and Sunstein 2008). There is an underlying distinction between the influence of reflective, cognitive pathways, and non-reflective automatic pathways that influence behaviours and physical activity (Skov et al 2013). This echoes the model presented by Ramussen (1983) and ideas presented by Simon (1962). Similarly, too, in SD a distinction is made about automated versus deliberate decisions (Sternman 2000).
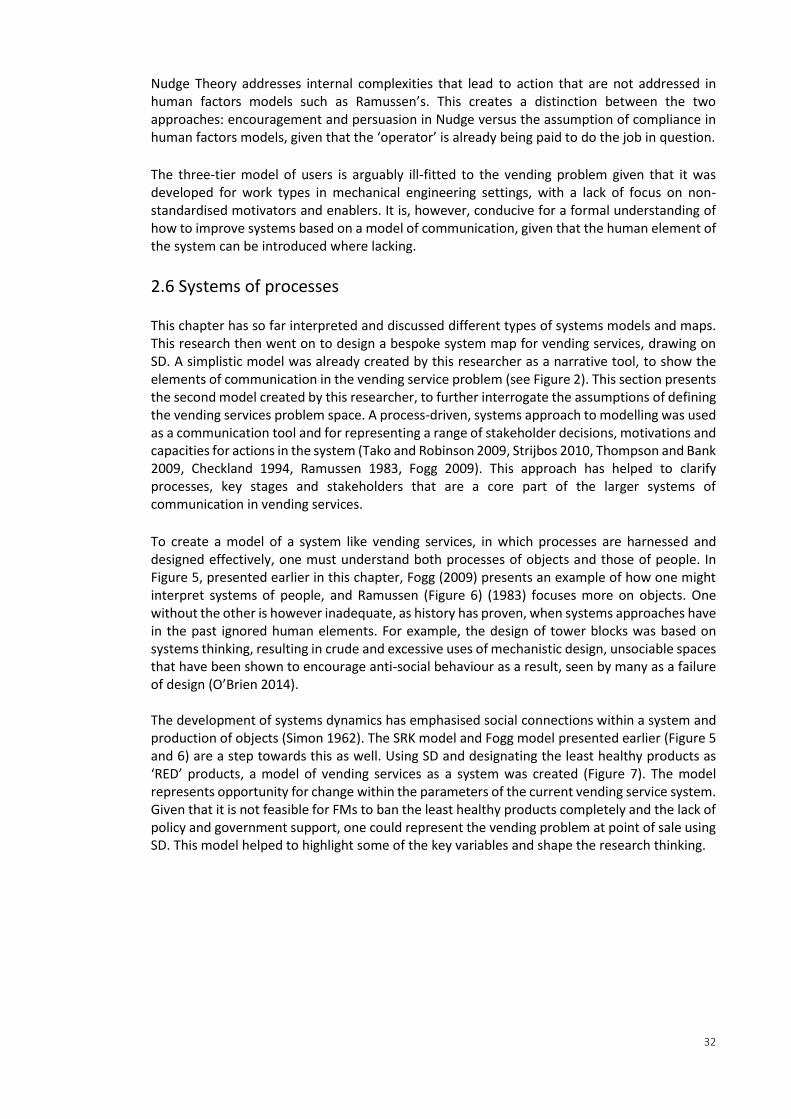
32
Nudge Theory addresses internal complexities that lead to action that are not addressed in human factors models such as Ramussen’s. This creates a distinction between the two approaches: encouragement and persuasion in Nudge versus the assumption of compliance in human factors models, given that the ‘operator’ is already being paid to do the job in question. The three-tier model of users is arguably ill-fitted to the vending problem given that it was developed for work types in mechanical engineering settings, with a lack of focus on non-standardised motivators and enablers. It is, however, conducive for a formal understanding of how to improve systems based on a model of communication, given that the human element of the system can be introduced where lacking.
2.6 Systems of processes This chapter has so far interpreted and discussed different types of systems models and maps. This research then went on to design a bespoke system map for vending services, drawing on SD. A simplistic model was already created by this researcher as a narrative tool, to show the elements of communication in the vending service problem (see Figure 2). This section presents the second model created by this researcher, to further interrogate the assumptions of defining the vending services problem space. A process-driven, systems approach to modelling was used as a communication tool and for representing a range of stakeholder decisions, motivations and capacities for actions in the system (Tako and Robinson 2009, Strijbos 2010, Thompson and Bank 2009, Checkland 1994, Ramussen 1983, Fogg 2009). This approach has helped to clarify processes, key stages and stakeholders that are a core part of the larger systems of communication in vending services. To create a model of a system like vending services, in which processes are harnessed and designed effectively, one must understand both processes of objects and those of people. In Figure 5, presented earlier in this chapter, Fogg (2009) presents an example of how one might interpret systems of people, and Ramussen (Figure 6) (1983) focuses more on objects. One without the other is however inadequate, as history has proven, when systems approaches have in the past ignored human elements. For example, the design of tower blocks was based on systems thinking, resulting in crude and excessive uses of mechanistic design, unsociable spaces that have been shown to encourage anti-social behaviour as a result, seen by many as a failure of design (O’Brien 2014). The development of systems dynamics has emphasised social connections within a system and production of objects (Simon 1962). The SRK model and Fogg model presented earlier (Figure 5 and 6) are a step towards this as well. Using SD and designating the least healthy products as ‘RED’ products, a model of vending services as a system was created (Figure 7). The model represents opportunity for change within the parameters of the current vending service system. Given that it is not feasible for FMs to ban the least healthy products completely and the lack of policy and government support, one could represent the vending problem at point of sale using SD. This model helped to highlight some of the key variables and shape the research thinking.
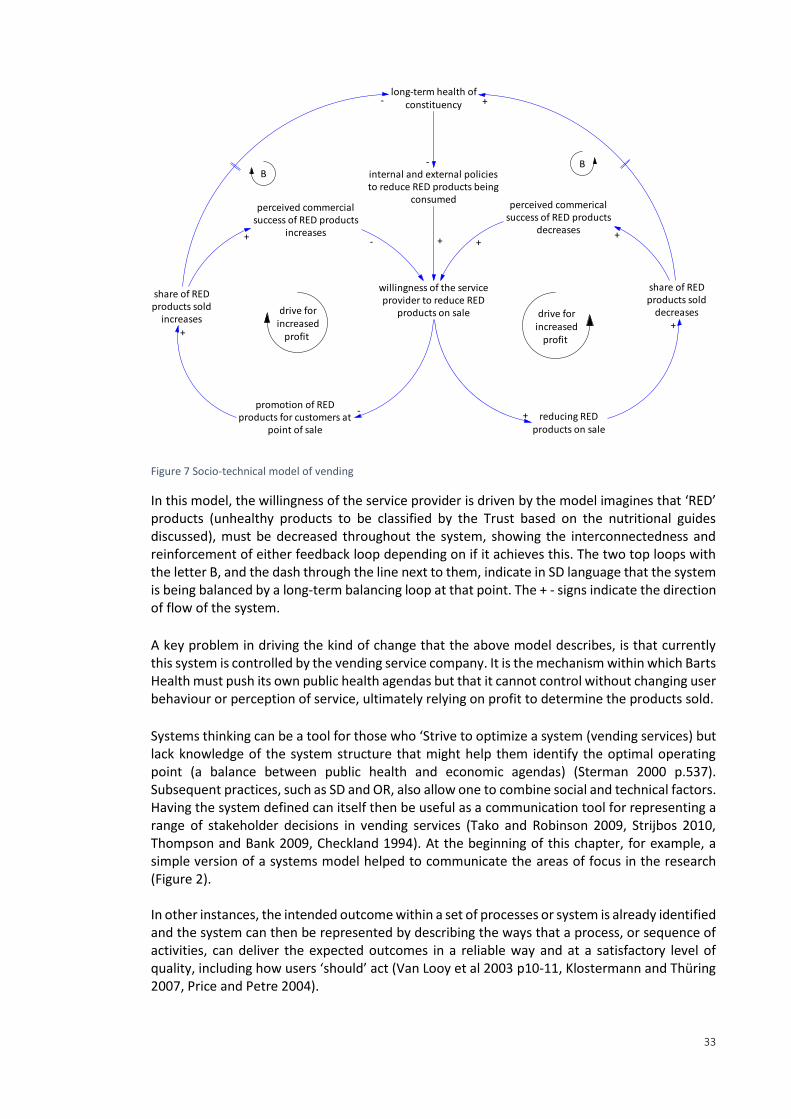
33
Figure 7 Socio-technical model of vending
In this model, the willingness of the service provider is driven by the model imagines that ‘RED’ products (unhealthy products to be classified by the Trust based on the nutritional guides discussed), must be decreased throughout the system, showing the interconnectedness and reinforcement of either feedback loop depending on if it achieves this. The two top loops with the letter B, and the dash through the line next to them, indicate in SD language that the system is being balanced by a long-term balancing loop at that point. The + - signs indicate the direction of flow of the system. A key problem in driving the kind of change that the above model describes, is that currently this system is controlled by the vending service company. It is the mechanism within which Barts Health must push its own public health agendas but that it cannot control without changing user behaviour or perception of service, ultimately relying on profit to determine the products sold. Systems thinking can be a tool for those who ‘Strive to optimize a system (vending services) but lack knowledge of the system structure that might help them identify the optimal operating point (a balance between public health and economic agendas) (Sterman 2000 p.537). Subsequent practices, such as SD and OR, also allow one to combine social and technical factors. Having the system defined can itself then be useful as a communication tool for representing a range of stakeholder decisions in vending services (Tako and Robinson 2009, Strijbos 2010, Thompson and Bank 2009, Checkland 1994). At the beginning of this chapter, for example, a simple version of a systems model helped to communicate the areas of focus in the research (Figure 2). In other instances, the intended outcome within a set of processes or system is already identified and the system can then be represented by describing the ways that a process, or sequence of activities, can deliver the expected outcomes in a reliable way and at a satisfactory level of quality, including how users ‘should’ act (Van Looy et al 2003 p10-11, Klostermann and Thüring 2007, Price and Petre 2004).
share of REDproducts sold
decreases
share of REDproducts sold
increases
willingness of the serviceprovider to reduce RED
products on sale
perceived commericalsuccess of RED products
decreases
perceived commercialsuccess of RED products
increases
reducing REDproducts on sale
+ -+
+
drive forincreased
profit +
long-term health ofconstituency +-
BB
internal and external policiesto reduce RED products being
consumed
-
+
promotion of REDproducts for customers at
point of sale
+
- +
drive forincreased
profit
34
In the vending system, the service was defined in the course of the scoping of the research, forming the preliminary work. While the mechanisms were relatively straightforward to define, the core measures, as well as measures of the intended outcome, were not yet clarified. The use of ‘RED’ products is a substitute where these elements are lacking, but is as yet untested. This makes it very difficult to validate or justify why an SD approach is suitable here. The key theorist dealing with decision making, information and communication in SD, Simon (1962), embraced bounded hierarchies, similar to systems thinkers Rittel and Webber’s, who furthered Churchman’s work (Sterman 2000 p.537, Rittel and Webber 1973). This is in keeping with the model presented above, where the measures (imagined in this case) are well-defined and there are links to an overarching outcome.
2.7 Conclusion This chapter has discussed the types of models of socio-technical systems that have been developed in differing fields to account for the role of people and technology, in this instance end service users and vending machines. Throughout the chapter it has become clear that the literature often searches for ways to bring together social and technical elements of a system in order to influence end users towards improvement goals and to solve industry focused problems such as vending service improvement. This has been discussed in several different but overlapping ways.
Figure 8 Common themes within the literature addressing improvement goals
Often the terms being discussed in the literature are closely related. Examples are given for each in brackets in the diagram in Figure 8. These three pairs of terms were used frequently as interchangeable and they often appear in similar discussions. In order to test what a system map might look like for vending this chapter a more recent development in engineering, SD. This approach blends the overlapping agendas presented in the diagram in Figure 8 and serves to highlight the dominant relationships influencing potential improvement in vending services. It describes the problems and potential pathways to solutions but does not however show actions of how to make improvements. SD would only be appropriate where clear and singular measurements have been defined, which is not the case in NHS vending. The measures for what is healthy have not yet been discovered, and this is one of the problems that will be explored in the next chapter. In the primary research, redesigning point of sale helps to move people towards the desired behaviour, increasing capacity and motivation to make healthier choices by creating favourable design of the point of sale environment. The survey analysed what staff motivation to act may
35
be given potential constriction on capacity to act within the current service design for out-of-hours retail catering. It is likely to be low given that vending is the only retail option out-of-hours. In regards to the SRK model, the interventions encouraged people's intuitive and automated decision making. The next chapter will elaborate on the detailed design of each intervention. The survey baselined how the rules of working practice are currently helping or hindering desirable public health outcomes and both allow evidence-based and measurement-driven controls to be put in place at the planning level of the SRK model. In comparison to the systems mapping or modelling approaches presented in this chapter, Churchman’s work on Wicked Problems that was quoted at the beginning of the introduction to this thesis strongly warned against bounding and creating hierarchies for complex problems. In this research, whilst the models presented in the chapter have been useful as communication tools in their own right and opened up thinking over the nature of the research problem, the models produced do not offer tangible instruction on implementing change, much like the policies, strategies, contracts and supply chain audits currently in place themselves. The are essentially a high-level set of tools with little link to operational practice or FM. Churchman’s emphasis on subjectivity and the disorder of parts and warnings not to oversimplify are, however, more reflective of the current state of vending services (Ulrich 1980, Churchman 1967). A model must combine objective and subjective and social and technical to accurately represent vending services, as well incorporating expected outcomes and the interconnected parts using hierarchies and different bounded processes, but at the same time acknowledging the limitation of a model that could never describe the reality fully (Strijbos 2010, RAE 2015, Simon 1962, Sterman 2000 p.513, Rittel and Webber 1973, Churchman 1967, Ulrich 1980, O’Brien 2014). The implied rationale is that this requires agreed measurements and preparedness to bound subsections within a system, both major assumptions given the overlapping, ill-defined changeable nature of FM services such as vending. In conclusion, the systems approach has reached its limit of usefulness in this project when it has been used as a communication tool to define and describe the system of the problem space, rather than to change or improve the system. It is a vital step towards reaching a conclusion about the potential improvements that one might make, but not in itself a solution. The primary research will offer this opportunity independently and the next chapter will look in detail at the specific communication available within the vending system to leverage improvements. This involves the strategy documents, end service user engagement, point of sale environment, audits and contracts that are all essentially communication.
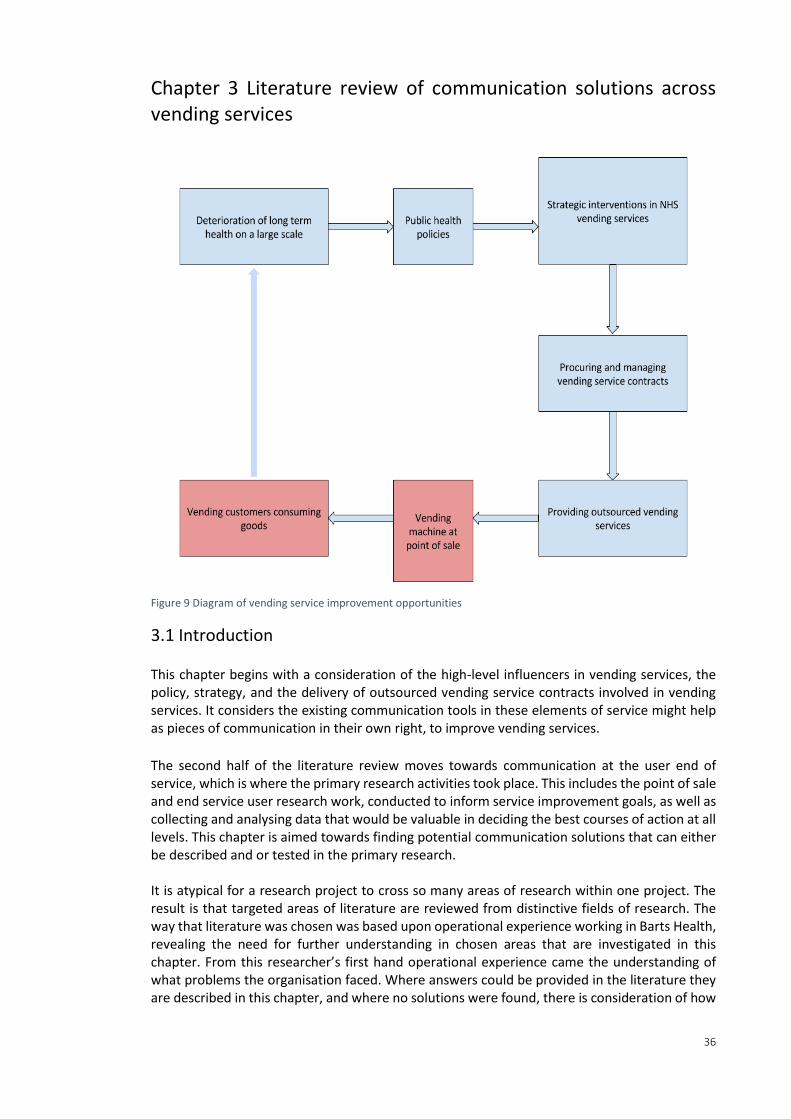
36
Chapter 3 Literature review of communication solutions across vending services
Figure 9 Diagram of vending service improvement opportunities
3.1 Introduction This chapter begins with a consideration of the high-level influencers in vending services, the policy, strategy, and the delivery of outsourced vending service contracts involved in vending services. It considers the existing communication tools in these elements of service might help as pieces of communication in their own right, to improve vending services.
The second half of the literature review moves towards communication at the user end of service, which is where the primary research activities took place. This includes the point of sale and end service user research work, conducted to inform service improvement goals, as well as collecting and analysing data that would be valuable in deciding the best courses of action at all levels. This chapter is aimed towards finding potential communication solutions that can either be described and or tested in the primary research. It is atypical for a research project to cross so many areas of research within one project. The result is that targeted areas of literature are reviewed from distinctive fields of research. The way that literature was chosen was based upon operational experience working in Barts Health, revealing the need for further understanding in chosen areas that are investigated in this chapter. From this researcher’s first hand operational experience came the understanding of what problems the organisation faced. Where answers could be provided in the literature they are described in this chapter, and where no solutions were found, there is consideration of how
37
the primary research might offer solution. This chapter is therefore part literature review, part method development.
3.2 Establishing the role of public health policy in service improvement This section evaluates some of the available policy guides and isolates guidance that provides promising measures that can be used towards vending service improvement by FMs. The Government Buying Standards (GBS) are a special focus, given that it is targeted at FMs and service providers making and governing healthier procurement decisions and it can be applied to vending specifically.
Overview of related UK policy guides The UK government has called for comprehensive, hard-hitting and broad-based national action for the improvement of food and drink services in the NHS, aimed, amongst other agendas, at preventing the deterioration of long-term health. NHS catering improvement plans, including vending, began primarily from dissatisfaction with patient catering, and have since grown to include and coordinate with public health policies. Healthier behaviour is being incentivised and supported by the NHS in the context of preventative measures, particularly targeting issues such as smoking, alcohol consumption and poor diets in healthcare, and encouraging staff lifestyle improvements internally (NHS 2016, Marmot 2010; NHS England 2016 b). Non-patient catering service improvement plans also overlap with preventative models of healthcare: initiatives to link with the community, health education, and supporting staff, patients and stakeholders in healthcare facilities to make the ‘right’ choices (WHO 2015, Nice 2016, FFLP 2016, Nice 2015, NHS England 2014, Maruthappu 2016 HPH 2015, NHS 2016, NHS England 2016 b.). Several guides lead in communicating policy such as the formation of the Hospital Food Standards panel (HFSP) marks the formal union of a wide range of policy agendas aimed at NHS catering improvement combined in a guideline report for industry. Meeting Food Standards Guidance produced by the HFSP is a mandated requirement of catering service provision in the NHS, as stipulated in the NHS Standard Contract. Section SC19 of the Standard Contract now stipulates that that service providers must develop and maintain a food and drink strategy as well as meeting the Food Standards Guidance produced by the HFSP (HFSP 2014). Another piece of policy documentation that is significant in catering improvement is the GBS, produced by the Department of Environment, Food and Rural Affairs (DEFRA). For FMs, the GBS is especially important as it can directly influence procurement practices and is mentioned in the HFSP report in the sustainable food and catering services section as a core goal that FMs should meet. At the same time, the GBS is in a developmental stage and is also currently voluntary. It requires testing and reflection to understand whether it is fit for purpose. Amid changing public health agendas, FMs in healthcare must work with other departments to deliver this change while at the same time taking ownership of policy guides that specifically target FM practice and improvement.
The GBS published by DEFRA 2005 In accordance with policy guidance, it is hoped that applying collective local efforts such as healthy food procurement might cumulatively lead to a shift in the demand for healthier foods, thereby nudging the food supply toward a healthier norm (Robles et al. 2012).
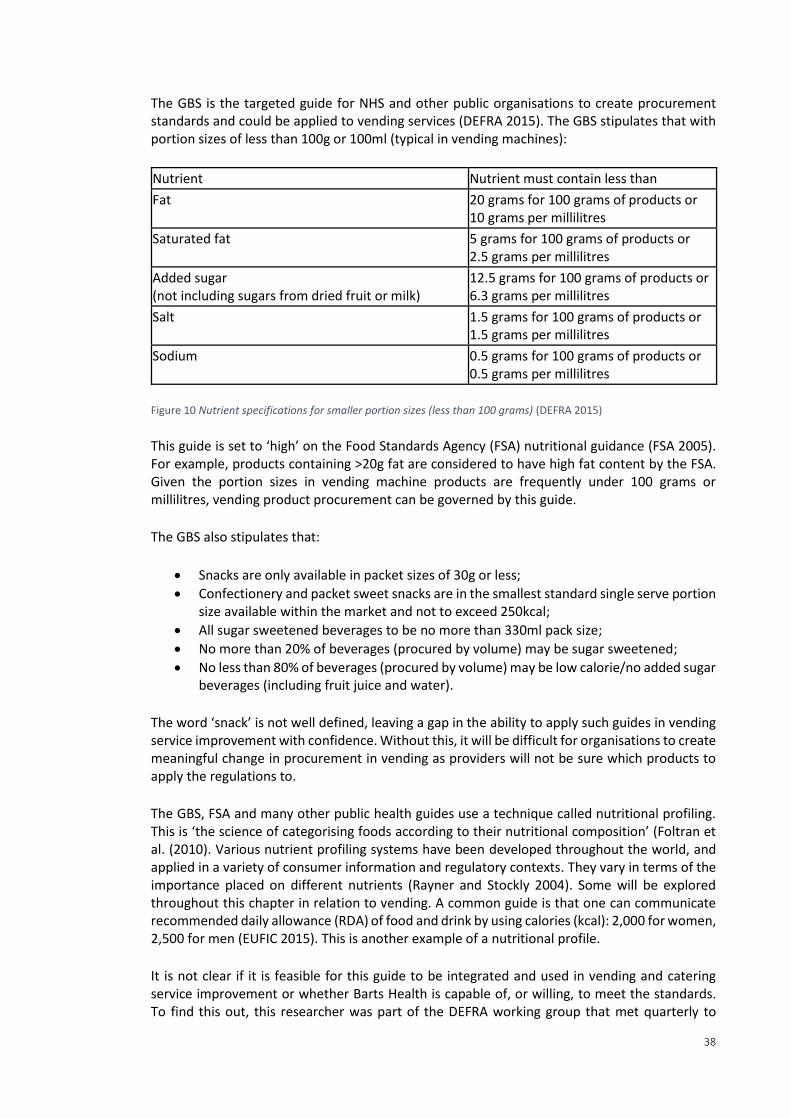
38
The GBS is the targeted guide for NHS and other public organisations to create procurement standards and could be applied to vending services (DEFRA 2015). The GBS stipulates that with portion sizes of less than 100g or 100ml (typical in vending machines):
Nutrient Nutrient must contain less than
Fat 20 grams for 100 grams of products or 10 grams per millilitres
Saturated fat 5 grams for 100 grams of products or 2.5 grams per millilitres
Added sugar (not including sugars from dried fruit or milk)
12.5 grams for 100 grams of products or 6.3 grams per millilitres
Salt 1.5 grams for 100 grams of products or 1.5 grams per millilitres
Sodium 0.5 grams for 100 grams of products or 0.5 grams per millilitres
Figure 10 Nutrient specifications for smaller portion sizes (less than 100 grams) (DEFRA 2015)
This guide is set to ‘high’ on the Food Standards Agency (FSA) nutritional guidance (FSA 2005). For example, products containing >20g fat are considered to have high fat content by the FSA. Given the portion sizes in vending machine products are frequently under 100 grams or millilitres, vending product procurement can be governed by this guide. The GBS also stipulates that:
Snacks are only available in packet sizes of 30g or less;
Confectionery and packet sweet snacks are in the smallest standard single serve portion size available within the market and not to exceed 250kcal;
All sugar sweetened beverages to be no more than 330ml pack size;
No more than 20% of beverages (procured by volume) may be sugar sweetened;
No less than 80% of beverages (procured by volume) may be low calorie/no added sugar beverages (including fruit juice and water).
The word ‘snack’ is not well defined, leaving a gap in the ability to apply such guides in vending service improvement with confidence. Without this, it will be difficult for organisations to create meaningful change in procurement in vending as providers will not be sure which products to apply the regulations to. The GBS, FSA and many other public health guides use a technique called nutritional profiling. This is ‘the science of categorising foods according to their nutritional composition’ (Foltran et al. (2010). Various nutrient profiling systems have been developed throughout the world, and applied in a variety of consumer information and regulatory contexts. They vary in terms of the importance placed on different nutrients (Rayner and Stockly 2004). Some will be explored throughout this chapter in relation to vending. A common guide is that one can communicate recommended daily allowance (RDA) of food and drink by using calories (kcal): 2,000 for women, 2,500 for men (EUFIC 2015). This is another example of a nutritional profile. It is not clear if it is feasible for this guide to be integrated and used in vending and catering service improvement or whether Barts Health is capable of, or willing, to meet the standards. To find this out, this researcher was part of the DEFRA working group that met quarterly to

39
discuss the guide and its usefulness. This researcher was an active member of the working group throughout the four years of thesis project. To embed the guide and report back on its efficacy in the Barts Health setting, this researcher worked with the senior management teams. This was also to evaluate Barts Health’s capacity to meet the standards.
Outside of the primary research activities in this project, the researcher developed questionnaires based on the GBS policy guidance and used them to conduct in-depth interviews with a critical sample of service delivery, contracting and management representatives, creating a gap analysis of the policy position versus supplier service standards and current provision for the Trust and DEFRA. This meant engaging vending and catering supply chain representatives and convincing them of the value of the work being done during a sensitive period of soft FM retendering. The answers from the questionnaires resulted in an internal report for senior management, as well as feedback to DEFRA about the guide. The same report was then adapted into a ‘policy pack’, and distributed to companies submitting to tender for the soft FM contract at Barts Health. This is an example of where the in depth scoping and close working with Barts Health meant that the researcher was working on projects outside of the primary research that helped the overall aim of service improvement. It might, given a larger project scope, have been made into a whole other primary research activity with qualitative methods being explored and applied.
Wider UK policy guidance for NHS catering including vending The main points of guidance from the available policy guides on NHS catering improvement, other than the GBS, which might inform vending service improvement, are listed below. These are some of the most common policy goals and measures found in the literature, discussed in more detail later: Public Health Policies:
Comprehensive, hard-hitting and broad-based national action (for the improvement of food and drink services).
Strategic Interventions in NHS Vending Services:
Deliver strategic vision for their catering services. Procuring and Managing Vending Service Contracts Compliantly:
Product formulation; Pricing.
Providing Outsourced Vending Services:
Wider changes to distribution; Use of the substantial purchasing power of the NHS to reinforce measures;
Coordinate trade, food and agricultural policies with the protection and promotion of public health;
Gather baseline data about providers. Vending Machine Point of Sale:
Clear information and labelling; Use of traffic light food labels in vending machines; Marketing; Healthier food and drink and less unhealthy food be promoted in non-patient food like
retail and vending;
Healthier food and drink and less unhealthy food be made available in non-patient food like retail and vending.
40
Vending Customers Consuming Goods:
Food and weight loss education programs;
Targeted personal support; Encourage consumer demand for healthy foods and meals; Improve staff health and well-being (key stakeholders in vending service
improvements). (HFSP 2014, NHS England 2014, WHO 2015, DoH 2014, Marmot 2010) This chapter sets out to investigate some of these areas of policy guidance and how potential changes have been, or are yet to be, tested, at Barts Health, at an NHS, public sector, national and international level. By defining what work already exists and areas still to be tested the research can identify its main contributions to knowledge. Each potential change, and at each level, may have its own unique dilemmas and even be tangential to global dilemmas. Baselining the policies and research publications, and understanding the ‘shop floor’, was essential to what work had already been done and where work was most immediately required from the Barts Health perspective.
Review of wider policy approaches The changes in NHS retail catering are new and largely untested. In comparison, educational settings in the UK have a long history of formal inquiry, and this might provide insight (Nice 2016, WHO 2006). Soft FM and retail companies, policy implementation organisations and researchers work across both sectors, adding weight to this idea (FFLP 2016, fyfv 2014). Furthermore, service evaluation methods can be appropriated and adapted, especially where there are no other available methods developed given that the focus in healthcare is comparatively new (Kelly et al 2012). The levy on sugary drinks is one example of a public health initiative that impacts vending services that began in schools. Research in schools has yielded unpromising results: it has no impact on BMI nor a consistently positive impact on healthy choice (French et al 2001 and 2011, Powell and Chaloupka 2009). This suggests caution should be adopted in appropriating such methods in NHS retail. To consider the best potential approaches for the NHS retail sector, other more overarching approaches can be compared from education. In both France and the US, there have been differing approaches to public health in school catering that can be considered in light of vending in the NHS. The approaches taken by France and the US in schools offers a starkly contrasting potential government approaches (Phillips et al 2003, ten Have et al 2010, Terry-McElrath et al. 2014, Chauliac and Hercberg 2012, Capacci et. al. 2012, Dubuisson et al. 2012, Martin and Chauliac 2014). The two strategies both build on the empirical evidence of the impact of vending services on health (Ermetici et al 2016, Kelly et al 2012, Maliderou et al 2006, O'Hare 2015, Almeida et al 2014, Gemmil and Cotugna 2005, Capacci et. al. 2012, Chauliac and Hercberg 2012, Mesas et. al. 2012, Muñoz-Pareja et. al. 2013, Martin and Chauliac 2014). In the US, as in many other countries, the common measure of a poor diet is BMI and obesity, which has specifically been linked to the presence of vending machines in schools, with a focus on low income demographics (Gemmil and Cotugna 2005, O'Hare 2015).
41
Act 1220 is the main policy guide to public health and catering in schools in the US, advising that schools should:
Weigh children;
Implement mandatory sports classes;
Restrict but not prevent access to vending (to protect commercial interests and revenue).
(Phillips et al 2003, ten Have et al 2010, Terry-McElrath et al. 2014) These types of interventions focus on decreasing the BMI of the overall population. This approach is questionable, as it does not acknowledge why or how children might have become fat. In contrast, France, takes a preventative, long-term approach to policy on school catering and public health through the 15 year-long French National Nutrition and Health Program (PNNS) which began in 2001. The programme’s main aims included:
Ban vending machines in schools 2005;
Proper meals without unhealthy snacking. Lunch attendance in French schools has been associated with healthier overall eating habits and less sedentary behaviour such as vending machine snacking;
Encourage physical activity;
Education and provision of information;
Make healthy choice easier;
Improve food and the physical environment;
Ban the stigmatisation of eating habits, address eating disorders;
Define the word nutrition;
Focus on nutritional quality by ‘providing products with low energy density and high nutrient density (e.g., fruits, grains, a variety of breads, dairy products without added sugar or fat, fruit juices)’, which started in 2009;
Take an evidence-based approach;
Adopt a complex inter-ministerial and inter-sectoral approach, to ensure the holistic approach to public health is achieved.
(Ungureanu et al 2014, Chauliac and Hercberg 2012, Martin and Chauliac 2014, Dubuisson et al. 2012, (French ministry of health 2012). Capacci et. al. (2012) performed three forms of statistical analysis to compare pre- and post-nutrition surveys from before and after the vending ban in France. Acknowledging the difficulty of linking such a change with people’s health, the research suggested the vending ban had a small yet significant impact on the fat intake of adolescents (Capacci et. al. 2012). Other reported changes since the PNNS have been reduced salt, meat, alcohol and sugar intake at a national level, increased and sustained consumption of fruit, and a levelling off, or decrease below other European countries, of obesity in children (Chauliac and Hercberg 2012, Martin and Chauliac 2014). The guidance from both countries approaches to healthier catering in school systems partially echoes UK policy for NHS catering, and suggests potential ways that this guidance might be furthered. In comparison with these approaches, UK guidance for NHS catering is often voluntary and has yet to be tested. Like the US, the UK has decided not to ban vending all together, and so intermediary measures must be the focus here. The level of policy guidance in
42
vending services in healthcare is currently low (Skov et al 2013, Hua and Ickovics 2016). This leaves scope for potential improvement to the existing, closely aligned literature about education systems. Later, when reflecting upon the results of the primary research, an important aspect of discussion will be to understand how the findings might be incorporated into government policy. The two approaches discussed here offer some frame of reference to the different possibilities
Key considerations of health in policy communication Given that policy guides on vending in the NHS are evolving, there is fundamental work to be done in deciding the best and worst approaches. Delivering policy guidance through catering services, for example, requires agreed standards of what can be termed healthy, and the different options will be evaluated throughout this chapter. This is a deceptively complex challenge. Despite political pressure and guidance for improved public health, and healthier NHS catering services including vending, there is continued debate over how to develop policy guides that ultimately improve people’s diet in the NHS and little vending-specific guidance with defined nutritional standards (DoH 2014, Boorman 2009). This is despite the fact that the negative impact of the kinds of unhealthy food products sold in vending machines has been regularly mentioned and acknowledged in these debates (WHO 2015, Nice 2016, Nice 2015, the NHS England 2014, NHS England 2015, HPH 2015). Policy guides can be ambiguous as there is little specific guidance on what ‘healthy’ is or regulation about how to make improvements to vending in the public sector specifically (WHO 2015, Nice 2016, Nice 2015, The NHS England 2014, NHS England 2016, HPH 2015, Boorman 2009). The situation is similar in the US (Winston et. al. 2012). Products deemed ‘healthy’ might in fact be less nutritious than traditional ones in some cases. For example, baked crisps may contain more sugar than traditional types, and fruit juices can contain as much or more sugar than traditional fizzy drinks (Centers for Disease Control and Prevention 2014). Nutrition is mentioned 32 times in the HFSP report section on patient nutrition and hydration, but only four times in the healthier eating, and five in the sustainable food and catering services sections. These latter two sections, with less discussion of healthy eating, essentially cover FM services and vending. This suggests that that healthy eating is not central to food and drink strategy in non-patient catering and that good nutrition is not a fully integrated concept across the policy approach to NHS catering service delivery. Approaches to areas of non-patient catering like vending are likely to lack clear standards for FMs to follow as will be proven later in the chapter. This is a problem as Barts Health must close the policy gap between guidance and delivery, and demonstrate how best to deliver change in vending. A key output of this research will be to evaluate existing definitions of healthy and assess how these might be worked into the service at all levels. This section has already addressed the first area to be looked at: policy. While terms such as healthy are ambiguous in policy guidance, several options for service improvement have been put forward in the policy documents discussed so far. Following on from this guidance, the rest of the vending service system must find ways to deliver the guidance, to be awarded CQUIN funding opportunities, maintain compliance, and produce an effective soft FM contract for vending service. Through the related literature, the rest of the chapter will continue to evaluate how service might be improved across vending services. Strategy, discussed next, is the key piece of communication that moves from policy advice to the Trust level of improvement through operational management systems. There is a policy gap because the reports on healthier lifestyles do not tell Trusts how they should deliver change. FMs and other delivery teams such as the public health department at
43
Barts Health must find ways to meet policy on their own. Taking this gap into account, the next section looks at literature on strategy development at organisational level and the different potential approaches. Creating strategy is one of the core objectives that Trusts must meet for food and drink services across the NHS. The primary research questions, exploring interventions that promise to deliver positive change at the point of sale, and the survey which offers an understanding of the end user demands and opportunities for service change, will inform the way Barts Health and other Trusts deliver the necessary changes at an operational level. These insights will be directly linked to the policy demands of catering service improvement and public health.
3.3 Defining strategy Among many recommendations for improvement, policy guidance recommended in 2014 that NHS trusts should deliver a strategic vision for healthier catering services (HFSP 2014, NHS England 2014, WHO 2015, HFSP 2014, DoH 2014, Marmot 2010, Sustain 2015). This researcher represented the FM team in a cross department senior management working group to produce the Trust's first food and drink strategy, and provided formal reflection on the strategy development process (DoH 2016). As a result, the strategy incorporated the insights from this research, especially the results from the end service user survey. The key decision-makers for catering were represented by dietetics, public health, and FMs. This experience revealed the potential for strategy as a piece of communication, to best improve catering services in the NHS and how using end service user feedback was vital to evidence that the Trust’s vision was supported by staff, and that it listened to their needs. A strategy document is a communication tool that enables new ways of thinking and ways of using information to guide and create patterns of decision making, as well as capturing a vision for the organisation in a clear and consolidated form (Brown 2010, Lee 2014, Mintzberg and Waters 1985 Johnson and Scholes 2008) In the public sector, it is both a public and internal document and must align with changeable political leadership within powerful bureaucracies that resist change (Rose and Cray 2010, Bichard 2013, Boyne and Walker 2004). Social and financial expectations of value for money and a host of stakeholder needs are also characteristic of public sector strategy that can constrain services and lead to rigid management frameworks, limiting the managerial discretion needed to execute strategy (Boyne and Walker 2004, Rose and Cray 2010, Brown 2010). Government organisations are reportedly less equipped to deal with non-routine and nonstandard service challenges, which ties in with this view of strategy development in the public sector (Head and Alford 2015). Out-of-hours catering for staff and vending services is a good example of a service area that can be described as difficult to standardise, non-routine and a non-core element of catering services. It requires strategic vision to foster improvement, but one that aligns with the entire catering service.
Deliberate and emergent strategy development To develop a strategic vision, public policy in the UK since 2000 has become increasingly reliant on interaction with organisational stakeholders, such as Barts Health, to co-create strategies that can act as delivery mechanisms for centrally designed changes (Oborn et al 2011). This includes planned changes to catering and vending, requiring an evolutionary interaction between stakeholders and an overarching centralised design (Oborn et al 2011, Mintzberg and Waters 1985).
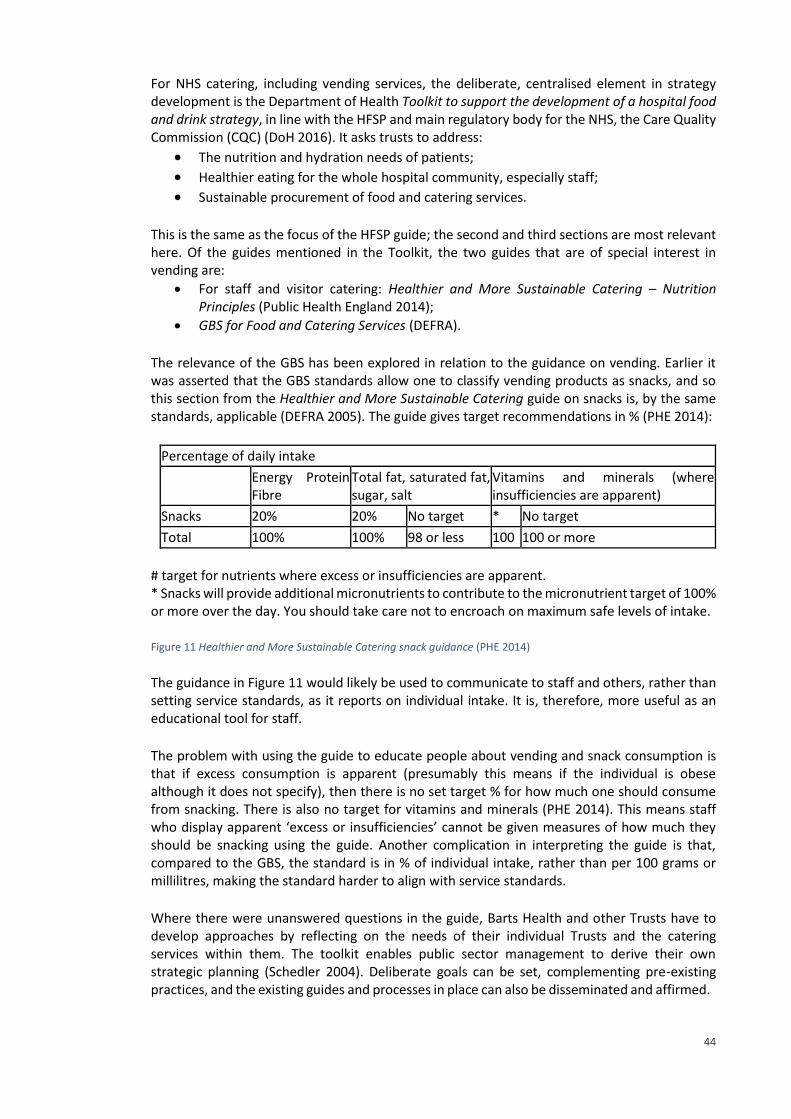
44
For NHS catering, including vending services, the deliberate, centralised element in strategy development is the Department of Health Toolkit to support the development of a hospital food and drink strategy, in line with the HFSP and main regulatory body for the NHS, the Care Quality Commission (CQC) (DoH 2016). It asks trusts to address:
The nutrition and hydration needs of patients; Healthier eating for the whole hospital community, especially staff; Sustainable procurement of food and catering services.
This is the same as the focus of the HFSP guide; the second and third sections are most relevant here. Of the guides mentioned in the Toolkit, the two guides that are of special interest in vending are:
For staff and visitor catering: Healthier and More Sustainable Catering – Nutrition Principles (Public Health England 2014);
GBS for Food and Catering Services (DEFRA).
The relevance of the GBS has been explored in relation to the guidance on vending. Earlier it was asserted that the GBS standards allow one to classify vending products as snacks, and so this section from the Healthier and More Sustainable Catering guide on snacks is, by the same standards, applicable (DEFRA 2005). The guide gives target recommendations in % (PHE 2014):
Percentage of daily intake
Energy Protein Fibre
Total fat, saturated fat, sugar, salt
Vitamins and minerals (where insufficiencies are apparent)
Snacks 20% 20% No target * No target
Total 100% 100% 98 or less 100 100 or more
# target for nutrients where excess or insufficiencies are apparent. * Snacks will provide additional micronutrients to contribute to the micronutrient target of 100% or more over the day. You should take care not to encroach on maximum safe levels of intake. Figure 11 Healthier and More Sustainable Catering snack guidance (PHE 2014) The guidance in Figure 11 would likely be used to communicate to staff and others, rather than setting service standards, as it reports on individual intake. It is, therefore, more useful as an educational tool for staff. The problem with using the guide to educate people about vending and snack consumption is that if excess consumption is apparent (presumably this means if the individual is obese although it does not specify), then there is no set target % for how much one should consume from snacking. There is also no target for vitamins and minerals (PHE 2014). This means staff who display apparent ‘excess or insufficiencies’ cannot be given measures of how much they should be snacking using the guide. Another complication in interpreting the guide is that, compared to the GBS, the standard is in % of individual intake, rather than per 100 grams or millilitres, making the standard harder to align with service standards.
Where there were unanswered questions in the guide, Barts Health and other Trusts have to develop approaches by reflecting on the needs of their individual Trusts and the catering services within them. The toolkit enables public sector management to derive their own strategic planning (Schedler 2004). Deliberate goals can be set, complementing pre-existing practices, and the existing guides and processes in place can also be disseminated and affirmed.
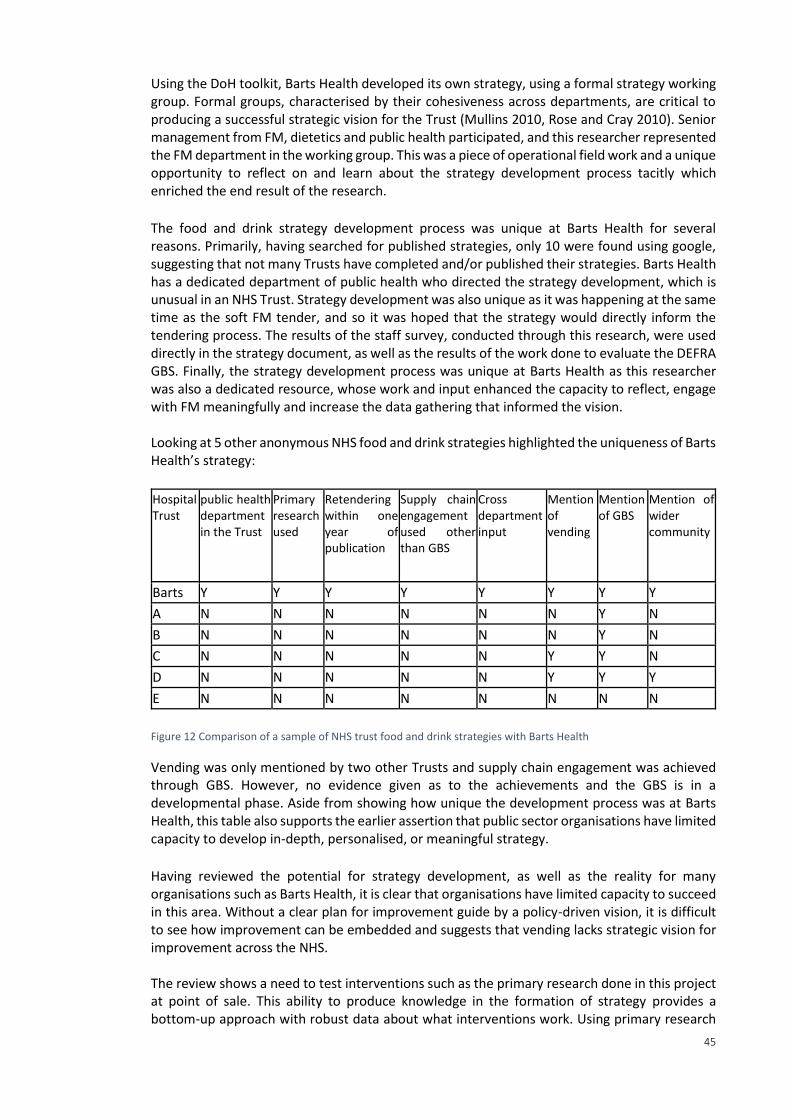
45
Using the DoH toolkit, Barts Health developed its own strategy, using a formal strategy working group. Formal groups, characterised by their cohesiveness across departments, are critical to producing a successful strategic vision for the Trust (Mullins 2010, Rose and Cray 2010). Senior management from FM, dietetics and public health participated, and this researcher represented the FM department in the working group. This was a piece of operational field work and a unique opportunity to reflect on and learn about the strategy development process tacitly which enriched the end result of the research.
The food and drink strategy development process was unique at Barts Health for several reasons. Primarily, having searched for published strategies, only 10 were found using google, suggesting that not many Trusts have completed and/or published their strategies. Barts Health has a dedicated department of public health who directed the strategy development, which is unusual in an NHS Trust. Strategy development was also unique as it was happening at the same time as the soft FM tender, and so it was hoped that the strategy would directly inform the tendering process. The results of the staff survey, conducted through this research, were used directly in the strategy document, as well as the results of the work done to evaluate the DEFRA GBS. Finally, the strategy development process was unique at Barts Health as this researcher was also a dedicated resource, whose work and input enhanced the capacity to reflect, engage with FM meaningfully and increase the data gathering that informed the vision. Looking at 5 other anonymous NHS food and drink strategies highlighted the uniqueness of Barts Health’s strategy: Hospital Trust
public health department in the Trust
Primary research used
Retendering within one year of publication
Supply chain engagement used other than GBS
Cross department input
Mention of vending
Mention of GBS
Mention of wider community
Barts Y Y Y Y Y Y Y Y
A N N N N N N Y N
B N N N N N N Y N
C N N N N N Y Y N
D N N N N N Y Y Y
E N N N N N N N N
Figure 12 Comparison of a sample of NHS trust food and drink strategies with Barts Health
Vending was only mentioned by two other Trusts and supply chain engagement was achieved through GBS. However, no evidence given as to the achievements and the GBS is in a developmental phase. Aside from showing how unique the development process was at Barts Health, this table also supports the earlier assertion that public sector organisations have limited capacity to develop in-depth, personalised, or meaningful strategy. Having reviewed the potential for strategy development, as well as the reality for many organisations such as Barts Health, it is clear that organisations have limited capacity to succeed in this area. Without a clear plan for improvement guide by a policy-driven vision, it is difficult to see how improvement can be embedded and suggests that vending lacks strategic vision for improvement across the NHS. The review shows a need to test interventions such as the primary research done in this project at point of sale. This ability to produce knowledge in the formation of strategy provides a bottom-up approach with robust data about what interventions work. Using primary research
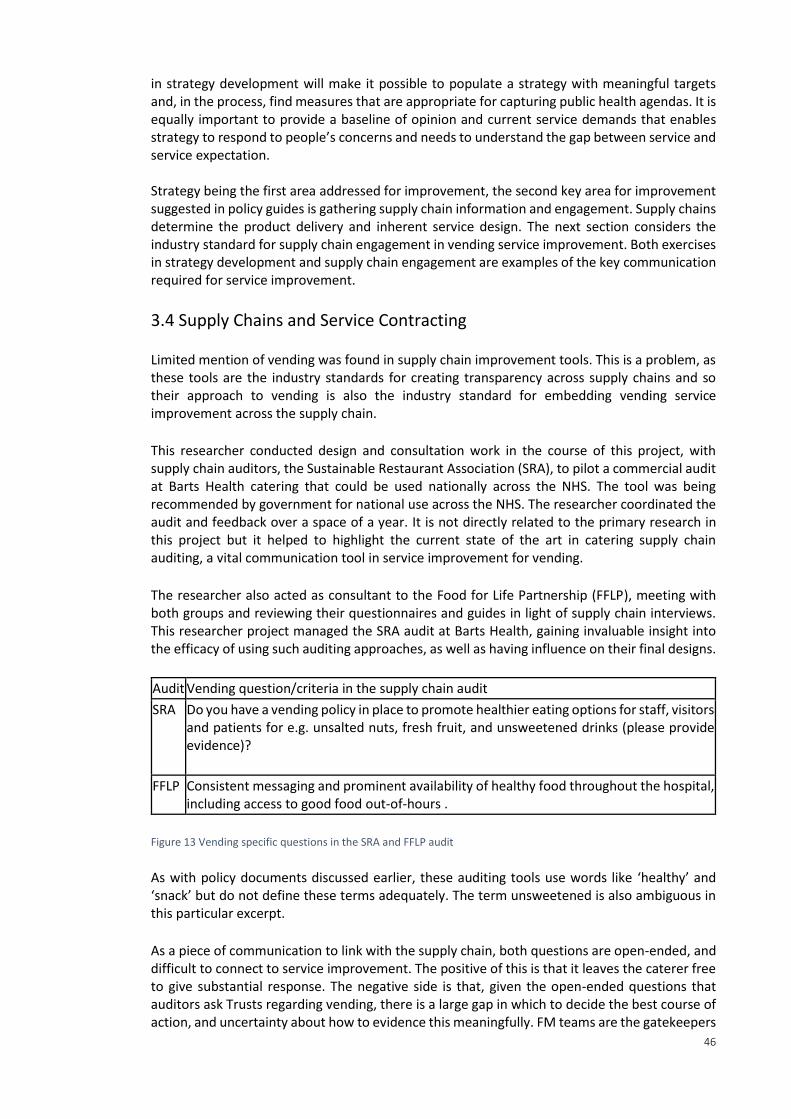
46
in strategy development will make it possible to populate a strategy with meaningful targets and, in the process, find measures that are appropriate for capturing public health agendas. It is equally important to provide a baseline of opinion and current service demands that enables strategy to respond to people’s concerns and needs to understand the gap between service and service expectation. Strategy being the first area addressed for improvement, the second key area for improvement suggested in policy guides is gathering supply chain information and engagement. Supply chains determine the product delivery and inherent service design. The next section considers the industry standard for supply chain engagement in vending service improvement. Both exercises in strategy development and supply chain engagement are examples of the key communication required for service improvement.
3.4 Supply Chains and Service Contracting Limited mention of vending was found in supply chain improvement tools. This is a problem, as these tools are the industry standards for creating transparency across supply chains and so their approach to vending is also the industry standard for embedding vending service improvement across the supply chain. This researcher conducted design and consultation work in the course of this project, with supply chain auditors, the Sustainable Restaurant Association (SRA), to pilot a commercial audit at Barts Health catering that could be used nationally across the NHS. The tool was being recommended by government for national use across the NHS. The researcher coordinated the audit and feedback over a space of a year. It is not directly related to the primary research in this project but it helped to highlight the current state of the art in catering supply chain auditing, a vital communication tool in service improvement for vending. The researcher also acted as consultant to the Food for Life Partnership (FFLP), meeting with both groups and reviewing their questionnaires and guides in light of supply chain interviews. This researcher project managed the SRA audit at Barts Health, gaining invaluable insight into the efficacy of using such auditing approaches, as well as having influence on their final designs.
Audit Vending question/criteria in the supply chain audit
SRA Do you have a vending policy in place to promote healthier eating options for staff, visitors and patients for e.g. unsalted nuts, fresh fruit, and unsweetened drinks (please provide evidence)?
FFLP Consistent messaging and prominent availability of healthy food throughout the hospital, including access to good food out-of-hours .
Figure 13 Vending specific questions in the SRA and FFLP audit
As with policy documents discussed earlier, these auditing tools use words like ‘healthy’ and ‘snack’ but do not define these terms adequately. The term unsweetened is also ambiguous in this particular excerpt. As a piece of communication to link with the supply chain, both questions are open-ended, and difficult to connect to service improvement. The positive of this is that it leaves the caterer free to give substantial response. The negative side is that, given the open-ended questions that auditors ask Trusts regarding vending, there is a large gap in which to decide the best course of action, and uncertainty about how to evidence this meaningfully. FM teams are the gatekeepers
47
to service delivery mechanisms, data sets, permissions, and resources that allow for a meaningful change in the supply chain and this varies from Trust to Trust. They need to be asked questions that guide them in what to be focusing on when making improvements. As the link between policy, strategy, and the supply chain, there is not enough guidance available in these audits to help Trusts make positive improvements. Given the level of uncertainty within the supply chain, one must consider the reliability of data being shared by various stakeholders too. The next section looks at another critical piece of communication in service improvement: contracts. These are especially important in Barts Health, where the service was being retendered. Much of the work done was to engage applicants with current policy and with Barts Health’s vision for catering. This is vital to ensure opportunities for improvement are enforceable, and the Trust has mechanisms to effect change in outsourced contract structures.
Obtaining audit ratings is a way to certify that the Trust, and any NHS Trust, is meeting their obligation to improve vending services as part of wider catering improvements. There are funding opportunities created by the capacity to achieve such audit standards, but no guidance how to engage supply chains or achieve service improvement, or what approaches should populate Trust-level vending policies. As with strategy development, and the capacity to meet policy agendas, primary research will enable a content and evidence-driven approach to meeting audit demands. It also ensures that the meaning and intention of public health improvements set forth in these communication tools is delivered. The primary research ensures that approaches are embedded, proven and connected to the end service user.
3.5 Context: Contextualising the design of vending machine point of sale This second half of the literature review is centred on the service user. In developing new methods of service improvement through communication, both through research and in operational practice, demographic information about the intended users, the contexts and processes within which data will be collected and or shared, as well as the aesthetic choices about how to represent data to people, are the central factors in determining the appropriate methods and resultant impact of communication. Government policy guidance advises, among other initiatives, that at point of sale, clear information and labelling and use of traffic light food labels in vending machine services might aid service improvement (HFSP 2014, NHS England 2014, WHO 2015, DoH 2014, Marmot 2010). As well as evaluating the kinds of labelling techniques that one might wish to employ, this research also views the matter as an essentially context-driven research problem, focusing on the broader goals of encouraging healthier choices. There are also many wider methods associated with the design of the point of sale environment influencing users and customers. There is much existing research that tries to understand and quantify the environmental and contextual aspects of communication in the built environment, asking how designs are actually being used and influencing user behaviour. Intuitively, the context within which designs are used can greatly influence the way people use them, and their perceptions of designs (Thaler and Sunstein 2008, Sterman 2000 p.537, Lockton et al 2010, 2008). Among other research fields, FM researchers have called for greater consideration of the environmental factors that can influence design (RAE 2016, Nenonen and Sarasoja 2014, BIFM 2013, Martin and Guerin 2006, Coenen and von Felton 2014, Mclennan 2004). Theories about Nudge or choice architecture, Harmonic Structure, Space Syntax, and Designing with Intent are the wider theories dealing with ideas about the design of user environments
48
discussed in this section (Thaler and Sunstein 2008, Sterman 2000 p.537, Lockton et al 2010, 2008). They will be summarised in turn. Choice architecture operates on the assumptions that people's behavioural preferences can be influenced by redesigning the environment using a range of technologies in the context in which they make their choices (Thaler and Sunstein 2008, Skov et al 2013, Terlutter and Capella 2013, Darby 2006). Incentives are also discussed in Nudge Theory in terms of the value they add to an option, although they differ from ‘nudges’, as they are interpreted cognitively, they are part of the persuasion process. Nutritional labelling is one example that was tested in the primary research. Designing with Intent uniquely incorporates product design theory, treating computer science-based communication technologies as physically present and used objects (Lockton et al 2010, 2008). This echoes the attention paid in the primary research towards the installation and engagement with stockists to ensure the experiment was fully implemented with minimum error. Space Syntax describes how people move within the built environment, as a performer among many, sharing a collective pattern of behaviour, and the social significance of space, given its structural properties (Fata gen. Schiek et al 2009, Fata gen. Schiek et al 2008, Schnädelbach et al 2007, Schnädelbach et al 2006, Hillier and Hanson 1989, McCarthy and Write 2004). These ideas were used to differentiate the spaces in the experiment. For example, most and least busy areas, either with a high or fast flow of people, or slow moving areas such as waiting rooms, were differentiated in the analysis. Closely related to Space Syntax, Harmonic Structure Theory is interested in user-centred, Vitruvian proportions of design in architecture and computer science, using Laban’s theories of movement, which were originally developed in fields of dance and choreography (Spier 2005, İnce Güney 2014, Al-Sayed and Fatah Gen Schieck 2013, Vinayagamoorthy 2006, Lavie and Tractinsky 2004, Gao et al 2012, Longstaff 2000, Fagerberg et al 2003, Sundström et al 2007, Sutil 2013, Grabska 1996). An experiment in the dissertation portion of the research project considered screen placement according to the predicted eye line of customers, and where best to place staff behaviour change messages for maximum impact. The aim was for best opportunity for fixed gaze, determined by height and length of time people were likely to have to look at the screen. £2,000 was awarded to install screens for healthy eating messaging and energy saving messages as a result. Given that the project was outsided of the scope of the research question, it was not incorporated as primary research in the project. The project did however use observational techiques from space syntax and conclude that the speed at which people travel and the business of the location did impact their likelihood of seeing a message. Further information can be found in section 6.3 of the Dissertation in appendix B. In this research, it is yet to be seen how these latter theories inform vending machine design, given that the focus in policy is on nutrient labelling and choice architecture (Skov et al 2013, Hua and Ickovics 2016). The interventions at point of sale in the primary research will incorporate variables of the context in which vending machines are located and use the design to encourage healthier choices. This will relate to theories such as Nudge and Space Syntax. The next section continues with the discussion of the point of sale environment and the role of different communication techniques and technologies. Ideas about space syntax, and the context of the point of sale will be reflected on further in the design of the labelling interventions.
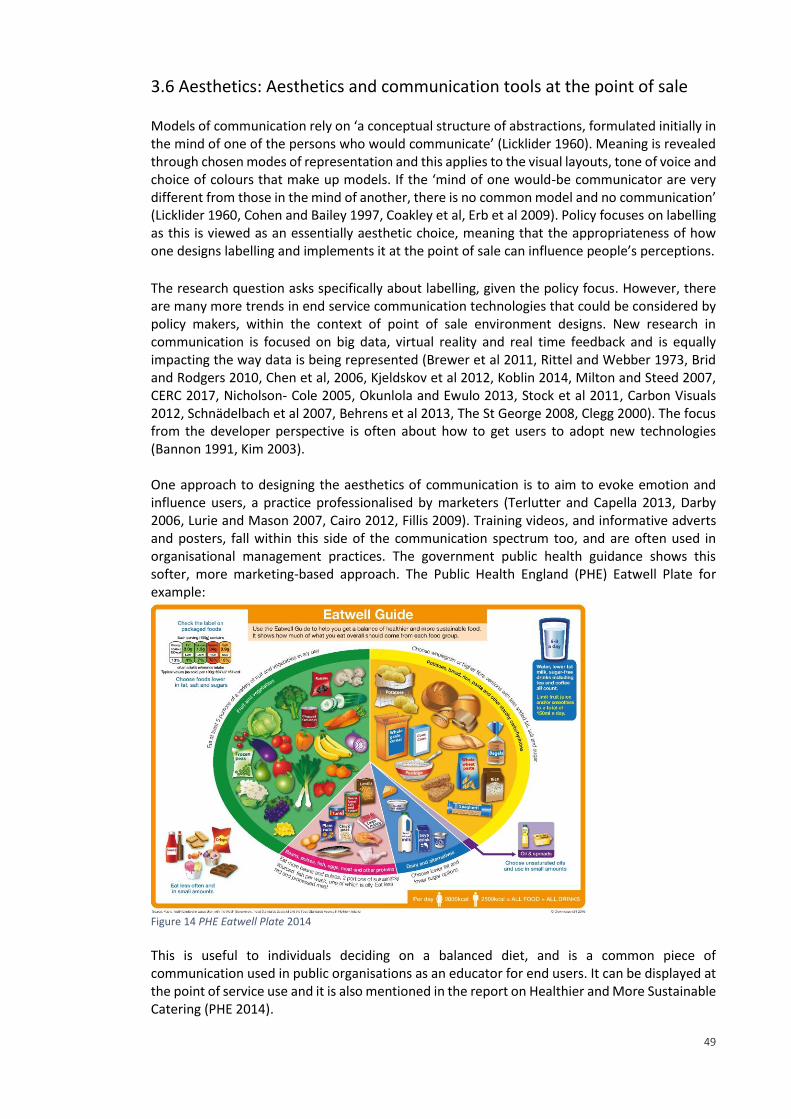
49
3.6 Aesthetics: Aesthetics and communication tools at the point of sale Models of communication rely on ‘a conceptual structure of abstractions, formulated initially in the mind of one of the persons who would communicate’ (Licklider 1960). Meaning is revealed through chosen modes of representation and this applies to the visual layouts, tone of voice and choice of colours that make up models. If the ‘mind of one would-be communicator are very different from those in the mind of another, there is no common model and no communication’ (Licklider 1960, Cohen and Bailey 1997, Coakley et al, Erb et al 2009). Policy focuses on labelling as this is viewed as an essentially aesthetic choice, meaning that the appropriateness of how one designs labelling and implements it at the point of sale can influence people’s perceptions. The research question asks specifically about labelling, given the policy focus. However, there are many more trends in end service communication technologies that could be considered by policy makers, within the context of point of sale environment designs. New research in communication is focused on big data, virtual reality and real time feedback and is equally impacting the way data is being represented (Brewer et al 2011, Rittel and Webber 1973, Brid and Rodgers 2010, Chen et al, 2006, Kjeldskov et al 2012, Koblin 2014, Milton and Steed 2007, CERC 2017, Nicholson- Cole 2005, Okunlola and Ewulo 2013, Stock et al 2011, Carbon Visuals 2012, Schnädelbach et al 2007, Behrens et al 2013, The St George 2008, Clegg 2000). The focus from the developer perspective is often about how to get users to adopt new technologies (Bannon 1991, Kim 2003). One approach to designing the aesthetics of communication is to aim to evoke emotion and influence users, a practice professionalised by marketers (Terlutter and Capella 2013, Darby 2006, Lurie and Mason 2007, Cairo 2012, Fillis 2009). Training videos, and informative adverts and posters, fall within this side of the communication spectrum too, and are often used in organisational management practices. The government public health guidance shows this softer, more marketing-based approach. The Public Health England (PHE) Eatwell Plate for example:
Figure 14 PHE Eatwell Plate 2014
This is useful to individuals deciding on a balanced diet, and is a common piece of communication used in public organisations as an educator for end users. It can be displayed at the point of service use and it is also mentioned in the report on Healthier and More Sustainable Catering (PHE 2014).
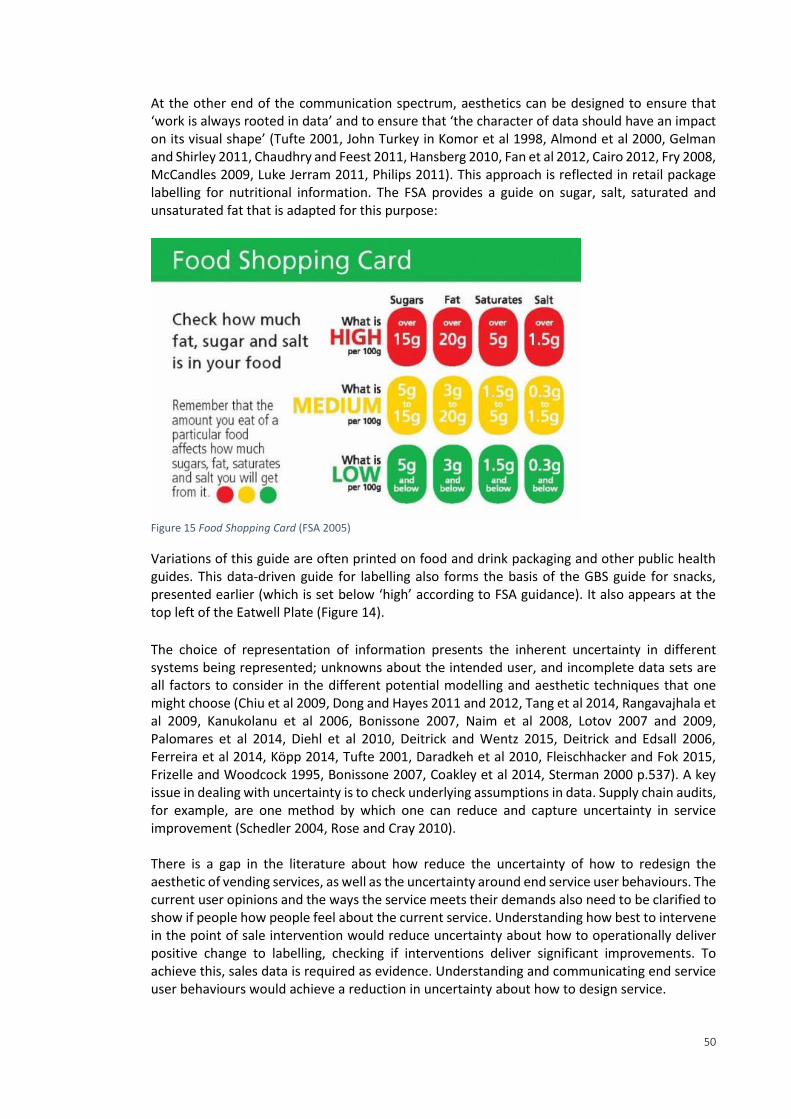
50
At the other end of the communication spectrum, aesthetics can be designed to ensure that ‘work is always rooted in data’ and to ensure that ‘the character of data should have an impact on its visual shape’ (Tufte 2001, John Turkey in Komor et al 1998, Almond et al 2000, Gelman and Shirley 2011, Chaudhry and Feest 2011, Hansberg 2010, Fan et al 2012, Cairo 2012, Fry 2008, McCandles 2009, Luke Jerram 2011, Philips 2011). This approach is reflected in retail package labelling for nutritional information. The FSA provides a guide on sugar, salt, saturated and unsaturated fat that is adapted for this purpose:
Figure 15 Food Shopping Card (FSA 2005)
Variations of this guide are often printed on food and drink packaging and other public health guides. This data-driven guide for labelling also forms the basis of the GBS guide for snacks, presented earlier (which is set below ‘high’ according to FSA guidance). It also appears at the top left of the Eatwell Plate (Figure 14). The choice of representation of information presents the inherent uncertainty in different systems being represented; unknowns about the intended user, and incomplete data sets are all factors to consider in the different potential modelling and aesthetic techniques that one might choose (Chiu et al 2009, Dong and Hayes 2011 and 2012, Tang et al 2014, Rangavajhala et al 2009, Kanukolanu et al 2006, Bonissone 2007, Naim et al 2008, Lotov 2007 and 2009, Palomares et al 2014, Diehl et al 2010, Deitrick and Wentz 2015, Deitrick and Edsall 2006, Ferreira et al 2014, Köpp 2014, Tufte 2001, Daradkeh et al 2010, Fleischhacker and Fok 2015, Frizelle and Woodcock 1995, Bonissone 2007, Coakley et al 2014, Sterman 2000 p.537). A key issue in dealing with uncertainty is to check underlying assumptions in data. Supply chain audits, for example, are one method by which one can reduce and capture uncertainty in service improvement (Schedler 2004, Rose and Cray 2010). There is a gap in the literature about how reduce the uncertainty of how to redesign the aesthetic of vending services, as well as the uncertainty around end service user behaviours. The current user opinions and the ways the service meets their demands also need to be clarified to show if people how people feel about the current service. Understanding how best to intervene in the point of sale intervention would reduce uncertainty about how to operationally deliver positive change to labelling, checking if interventions deliver significant improvements. To achieve this, sales data is required as evidence. Understanding and communicating end service user behaviours would achieve a reduction in uncertainty about how to design service.
51
3.7 Support for across-the-board nutritional profiling in product labelling for vending Although there are many industry standards, finding appropriate labelling for vending is difficult as customers can’t pick up and look at the information usually printed on the back of products. Even printed information can be absent, as product manufacturers were only voluntarily required to use nutrient labelling before December 2016 (unless a request was made for information, when making a health claim, or when minerals and or vitamins were added) (FDF 2013, FSA 2016). This means that finding nutritional measures of improvement that focus on public health is a challenge. For vending, a summary of information is needed to achieve effective labelling, given that people cannot see the back of packet. With limited space on vending machines to display information, easy to understand summaries are critical to communication. Nutrients would have to be combined and given a new summary of their nutritional properties, a process termed across-the-board nutritional profiling. Across-the-board nutritional profiling allows each product or dish to be given a score based on its nutrients, and this individual value can then be compared to other products quickly and easily. In this research, products could then be split up into red, amber or green to show least to most healthy, just as the FSA currently do on packaging. This is the first time that this profile has been adapted in this specific way, in a healthcare setting for vending, and with the rigour of a method and suitable analysis, although many other closely related applications exist. Examples of across-the-board profiling can be seen in the US (Healthy Eating Index 2010) and many other countries including the UK. The most prominent profile used in the UK, and internationally, and in healthcare settings as well, is published by the FSA and Ofcom, the UK communication regulator. Developing across-the-board profiling involves combining and weighting nutrients, requiring large amounts of expertise and consensus. This expert work was achieved by Mike Rayner et al. (2005). It was developed in consultation and through working groups with a panel of dieticians across the UK. The British Heart Foundation coordinated the work in collaboration with the Department of Health and the FSA, which reinforces that there is a vital link between cardiac health and diet. The publication by Rayner et al (2009) gives a copy of the profile in full. The Rayner model has been used in public health campaigns internationally, in countries such as Australia and France, in World Health Organisation campaigns, as well as in a specialist NHS Wales vending project (although this was not a formal piece of research) (ANSES 2015, Jewell 2008, Sloane 2014, Bolton NHS Foundation Trust 2010, Rayner 2014, Rayner 2013). All report favourably on the profile. However, none have produced an experiment that tests it as a vehicle for point of sale vending labels, and not in healthcare. This means that the profile is well suited to this research problem but remains untested, and therefore the research makes a novel contribution to the development of the application of the profile. The profiling was originally developed to be used by Ofcom in defining ‘healthy’ and ‘unhealthy’ foods and drinks for TV advertising to children. Like other examples of nutritional profiling in US healthcare, the Ofcom model has been taken from work with young people and children and since been widely adopted in public health initiatives (Winston et. al. 2012). This may indicate a methodological flaw in the profile. However, being the best method found by this researcher for across-the-board profiling, and having been applied in many different relevant examples, it was still used in this research.
52
The system allows one to add up values of different nutrients in each product per 100ml or 100g, then assign a final score for each product. Products in grams and millilitres are ranked separately. The system takes into account both positive and negative nutrients, fat, sugar, salt, fibre, protein and others. There is cause to believe that adopting an across-the-board nutritional profile is ideal for vending. Having developed this approach, the research can base the communication interventions at the service user interface on this profile, combining it with other insights such as those offered by Nudge Theory (discussed earlier in this section). The end service user interventions involved collecting sales data and trialling a range of approaches to encourage healthier choices, and will be discussed further in the Method chapter. The insights from this primary research may inform the entire vending system. This because at the beginning of the project it was unclear if the profile would be useful in other areas of the research such as contracting and supply chain, and setting SLAs. Reflecting on nutritional profiling was also useful in reviewing where in policy, contract, strategy, and supply chain audits improved definitions of terms such as healthy could be made. By using the profile to create nutritional labels for the point of sale interventions, this research will find out if the model is effective at the most important level of operational service delivery to positively influence behaviour. This bottom-up approach to developing appropriate measures for service improvement ensures that end users and public health are central and can then be used to build up control throughout the vending system.
3.8 Conclusion This chapter has highlighted much of the communication within vending services that can effect improvement in healthcare. By reviewing this literature, and linking it with first hand experience in the sponsor company, many of the primary research decisions have emerged organically. For example, the support for accorss the board nutritional profiling has emerged with a strong likelihood of inclusion in the primary research design for point of sale labelling. The review of government guidance has indicated the need for more detailed information collection about service in use, and so a survey of survey users would be an ideal way to meet this demand from government. The primary research approaches the research problem by focusing firstly on the end service user through the large-scale survey and secondly on designing point of sale to influence choice. Both are concerned with the user behaviour from the perspective of service controls and measurements. This chapter has linked the literature about the vending service as a system to these activities, focusing on the policy, strategy and supply chain auditing and contracts in place, and viewing them as pieces of communication. The chapter has discussed work ongoing to combat the negative impact of the kinds of confectionary and crisp products sold in vending machines, and highlighted ways in which the NHS is incentivising and supporting healthier behaviour in the context of preventative healthcare measures and a concern for staff health and well-being currently (NHS 2016, Marmot 2010; NHS England 2016 b., WHO 2015, Nice 2016, Nice 2015, The NHS England 2014, NHS England 2016, HPH 2015.b). A gap was found between these pieces of communication and FM and operational practices.
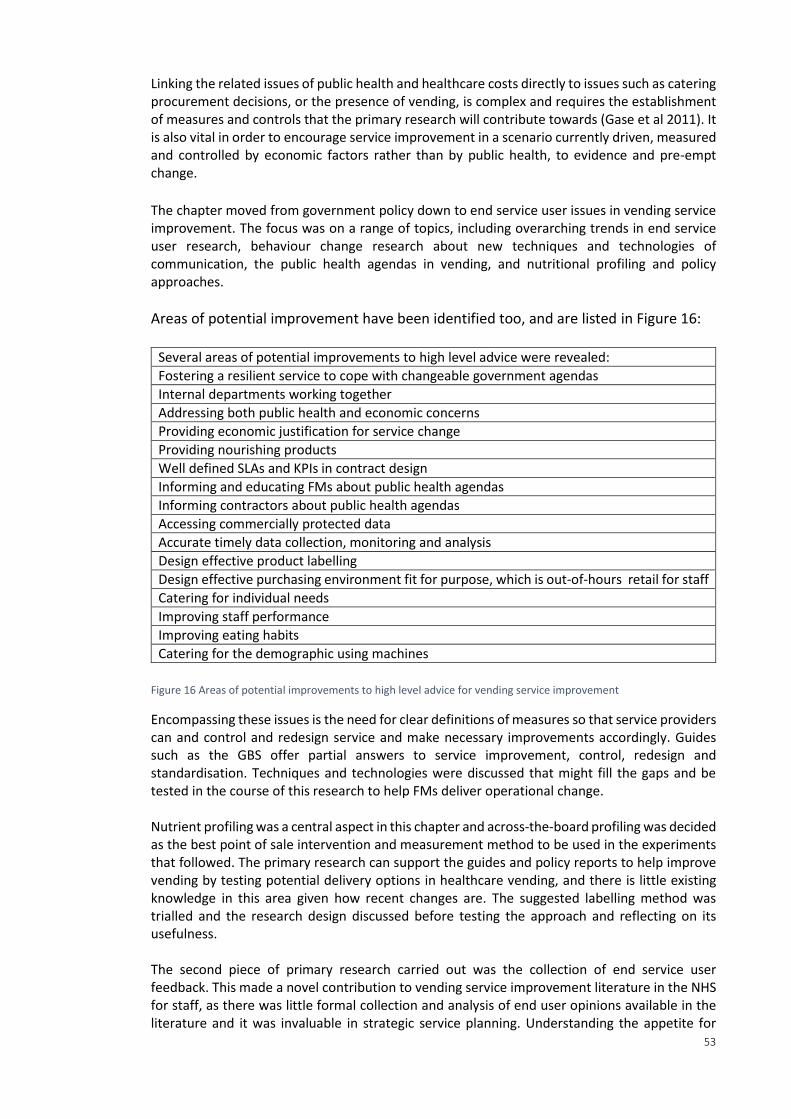
53
Linking the related issues of public health and healthcare costs directly to issues such as catering procurement decisions, or the presence of vending, is complex and requires the establishment of measures and controls that the primary research will contribute towards (Gase et al 2011). It is also vital in order to encourage service improvement in a scenario currently driven, measured and controlled by economic factors rather than by public health, to evidence and pre-empt change. The chapter moved from government policy down to end service user issues in vending service improvement. The focus was on a range of topics, including overarching trends in end service user research, behaviour change research about new techniques and technologies of communication, the public health agendas in vending, and nutritional profiling and policy approaches.
Areas of potential improvement have been identified too, and are listed in Figure 16:
Several areas of potential improvements to high level advice were revealed: Fostering a resilient service to cope with changeable government agendas Internal departments working together Addressing both public health and economic concerns Providing economic justification for service change Providing nourishing products Well defined SLAs and KPIs in contract design
Informing and educating FMs about public health agendas Informing contractors about public health agendas Accessing commercially protected data Accurate timely data collection, monitoring and analysis
Design effective product labelling Design effective purchasing environment fit for purpose, which is out-of-hours retail for staff Catering for individual needs Improving staff performance Improving eating habits Catering for the demographic using machines
Figure 16 Areas of potential improvements to high level advice for vending service improvement
Encompassing these issues is the need for clear definitions of measures so that service providers can and control and redesign service and make necessary improvements accordingly. Guides such as the GBS offer partial answers to service improvement, control, redesign and standardisation. Techniques and technologies were discussed that might fill the gaps and be tested in the course of this research to help FMs deliver operational change. Nutrient profiling was a central aspect in this chapter and across-the-board profiling was decided as the best point of sale intervention and measurement method to be used in the experiments that followed. The primary research can support the guides and policy reports to help improve vending by testing potential delivery options in healthcare vending, and there is little existing knowledge in this area given how recent changes are. The suggested labelling method was trialled and the research design discussed before testing the approach and reflecting on its usefulness. The second piece of primary research carried out was the collection of end service user feedback. This made a novel contribution to vending service improvement literature in the NHS for staff, as there was little formal collection and analysis of end user opinions available in the literature and it was invaluable in strategic service planning. Understanding the appetite for

54
service change, and the current capacity for staff to make healthy choices, is key in understanding what measures will increase their capacity to act. It might also illuminate commercially attractive opportunities where service might be redesigned around underlying demands for more retail out-of-hours. Through the two pieces of primary research, the project links advice and governance to practice and operational management. The findings will be valuable in each of the key communication documents in vending, policy, audit tools and contracts.
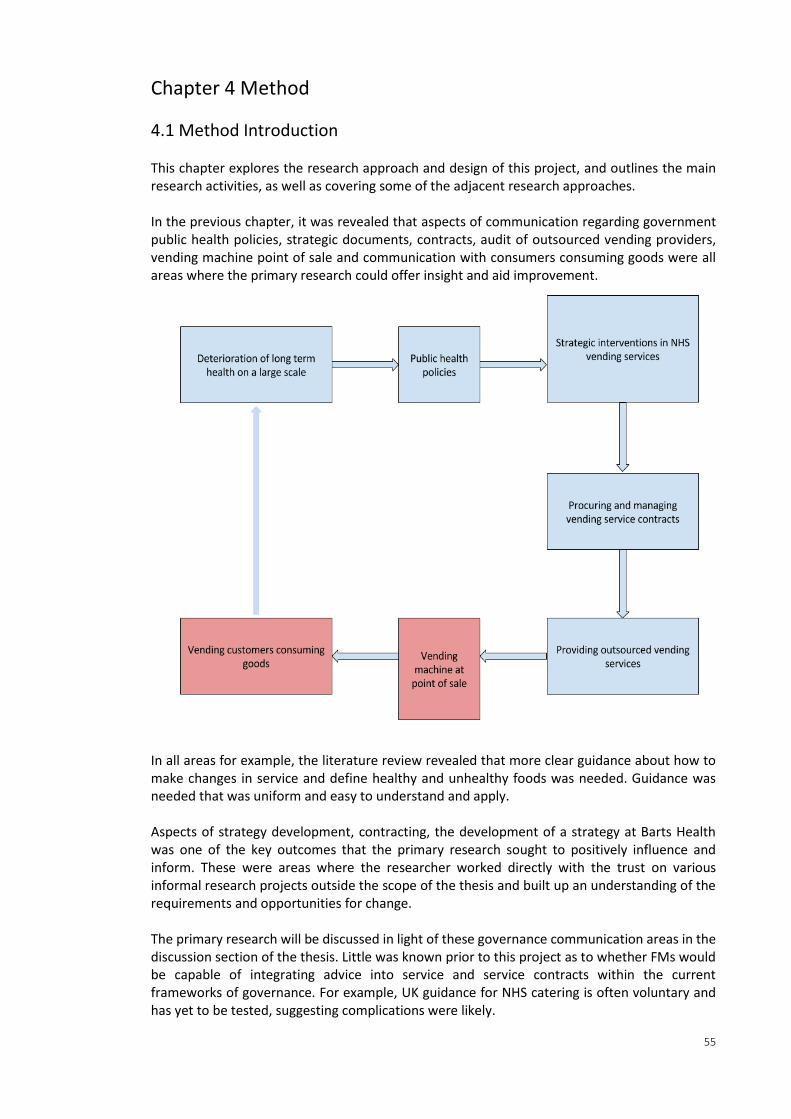
55
Chapter 4 Method
4.1 Method Introduction This chapter explores the research approach and design of this project, and outlines the main research activities, as well as covering some of the adjacent research approaches. In the previous chapter, it was revealed that aspects of communication regarding government public health policies, strategic documents, contracts, audit of outsourced vending providers, vending machine point of sale and communication with consumers consuming goods were all areas where the primary research could offer insight and aid improvement.
In all areas for example, the literature review revealed that more clear guidance about how to make changes in service and define healthy and unhealthy foods was needed. Guidance was needed that was uniform and easy to understand and apply. Aspects of strategy development, contracting, the development of a strategy at Barts Health was one of the key outcomes that the primary research sought to positively influence and inform. These were areas where the researcher worked directly with the trust on various informal research projects outside the scope of the thesis and built up an understanding of the requirements and opportunities for change. The primary research will be discussed in light of these governance communication areas in the discussion section of the thesis. Little was known prior to this project as to whether FMs would be capable of integrating advice into service and service contracts within the current frameworks of governance. For example, UK guidance for NHS catering is often voluntary and has yet to be tested, suggesting complications were likely.
56
The need for clearer definitions of what is healthy was identified in the literature review. It was decided that the results of the primary research would be used to evaluate existing definitions of healthy and assess how these might be worked into the service at all levels. This next chapter on methods seeks to better understand how such formal primary and informal research activities can be brought together in one project, and the different approaches that have had the same or similarly ambitions. In this next chapter, discussion works from a high-level discussion of methodology, through the mixed methods design and some other potential approaches, down to the detailed discussion of approaches taken in each of the primary research activities. This research uses quantitative methods in the primary research. However, much of the supporting work, which has not been formalised through primary research, was equally important and would have naturally encompassed qualitative methods. A mix of in-depth first-hand experience working in vending services was combined with the opportunity to conduct primary research and reflect critically on the findings in a wider context. This combination of activities in the project created a unique set of tools and solutions that deal with the challenges faced by in-house service delivery teams delivering public health agendas through outsourced service contracts like vending, as well as contributing to knowledge through rigorous research methods at the end service user end. It is unusual for a hospital Trust to have a dedicated researcher to offer in-depth reflective thinking to add value to projects and cross-departmental working. Several approaches are closely related to this research project and were discussed as potential methods. Given that industry demand preceded research design in this project, there was much reflection of potential methods, the ordering of methods, and areas of the project which took on differing methodological characteristics (Tashakori and Teddlie 2010). Mixed methodologies is the umbrella approach in which this kind of exploratory work is possible (Creswell 2013). The challenge will be at the end to reconcile the various populations into one set of observations. The method of deductive logic, a top-down process whereby logically derived propositions or hypotheses are tested against observations (Ritchie et al. 2013 p.8), was used to design and implement each of the primary research activities, creating detail and methodological consistency to the data collection and analysis procedures. These were centred on service user feedback surveys and point of sale design and intervention to influence user purchasing behaviour. A nutritional profile was also used. Describing the methods of the primary research cases will take most of this chapter but first some consideration is given to the contextualising work that was carried out and the various approaches that were considered and ultimately not developed into primary research.
Inductive Reasoning Inductive reasoning is a bottom-up knowledge acquisition process through which patterns are derived from observations of the world and is ideal in capturing and representing knowledge about an ill-defined research problem (Ritchie et al. 2013 p.2, Stove 1973). Inductive approaches are uncommon in FM research (Campbell 2017). First-hand inductive knowledge was not analysed formally in this project and was peripheral to the central contribution to knowledge. It was, however, considered as informal research which greatly informed the project. Operational consultancy was undertaken in order to capture and embed the knowledge being generated throughout the research project and formal communication were contributed to. These included the DEFRA GBS, policy pack, food and drink strategy, new soft FM contract and industry-wide standard supply chain audits by the SRA and
57
FFLP. Much of this involved collecting and disseminating expert opinions throughout the NHS catering and public sector procurement system. Informal inductive approaches were vital in scoping this research as little was understood about the service itself or the capacity for improvement at the beginning of the research, given that vending is a subcontracted, non-core service for which the Trust does not receive any profit. Secondly, it was a way to interpret how the research would impact the ecologies of the Trust. It was also a way to reflect on the research methods in the primary research with the main influencers, including service delivery teams, service users, those who have researched relevant aspects of the service, policy makers, contract teams and supply chain specialists (Crotty 1998). For example, deciding the nutritional model involved numerous meetings with Barts Health nutritionists throughout the point of sale experiment.
The Researcher The role of the researcher was actively considered throughout the project. In accordance with Tashakori and Teddlie (2010), the researcher was viewed under a transformative and constructivist methodological viewpoint, responsible for:
Guiding the progression of the work to its final arguments and proposed solutions;
Ensuring maximal reach to the intended audiences;
Gathering expert opinion and first-hand experience into the research direction and insights;
Testing the research assumptions and chosen approaches;
Finding ways of feeding back the research findings;
Influencing change and disseminating approaches;
Delivering policies and organisational objectives in line with the research aims
(Tashakori and Teddlie 2010). The researcher can, from this understanding, be viewed as a legitimate, peripheral participant in the research; a learner, contributor, influencer, acting expert, and recipient of informal knowledge, acting within the research subject domain (Ritchie et al. 2013 p22, Tashakkori and Teddlie 2009, Lave and Wegner 1991). The researcher went through the in-depth experience of working in the in-house facilities offices for extensive periods of time, two days per week for over three years and then intermittently for the remainder of this project, while the analysis and writing were being completed. This meant integrating into the team, taking regular site visits and attending department meetings in the operational hospital spaces, and getting to know the people using and delivering many facets of the service. Often the nature of jobs undertaken were far out with the research objectives. The research project managed the Christmas winter fair, commissioning local farmers and businesses, with a budget of around £7,000. The researcher also bid for and project managed a £20,000 charity-funded food education project in schools. The reason the researcher undertook seemingly unrelated work in operations and dealt with the wider catering system was because it was a unique opportunity to have regular contact with core service providers and senior management. For example, in one memorable instance, while filming and interviewing the head of nursing at Barts Health for a staff training video on the correct disposal of needle sticks and sharps, the researcher assisted a patient who slipped into cardiac arrest while passing by. The experience was not only personally rewarding, but also led to a trust between the researcher and the sponsor company, including free access to all buildings and areas, computer
58
systems, records, contracts, and to the subcontracted vending service operators financial and stock recording systems.
Ways to formalise first-hand experience in qualitative research traditions With more time and resource, the next stage in this research would be to formalise the informal scoping and consultancy work conducted as part of this research. Several approaches are closely related to the inductive elements of the research approach, drawing on qualitative research traditions (Patton 2015). Given that industry demand preceded research design in this project, it took some time to arrive at a methodology and there was much reflection on potential qualitative methods so a short description of each is given here. Grounded theory uses induction to build complementary methods to create in-depth understanding of the ‘real world’. It is an attempt to capture a rich body of professional practice, and the in-depth knowledge of practice, and avoiding top-down theoretical constructs (Ritchie et al 2013 p22, Patton 2015, Robson 1991). In accordance with the criteria of Williamson et al. (2011), actioned research:
Is Educative;
Deals with individuals as members of social groups;
Involves a change intervention;
Aims at improvement and involvement;
Involves a cyclical process in which research, action and evaluation are interlinked;
Is founded on a research relationship in which those involved are participants in the change process.
The case study method is difficult to define (Patton 2015). Looking at what this research is not concerned with provides the clarification to see how the case study method sits within this project. The question this research addressed was how can one use communication technologies to deliver public health agendas in National Health Service food and drink automated vending? In interpreting the question, this project was not concerned with comparisons between cases, and so cannot be described as a case study piece of research (Gerring McDermott 2007). Given the research context, the work took place in one location giving within case variability and allowing one to see differences in specialist areas on one site. It would however be possible to replicate this study across multiple sites in the future with a small team rather than a single researcher. The research also did not conduct the experiment at multiple time intervals as the duration of the project was not long enough. Had the project been longer, one could conduct the experiment as a case study by repeating it multiple times and comparing each set of results. A case study approach could have been taken to formally evaluate if the findings of the primary research were embedded in the organisation to ensure effective delivery of policy. The research question would have had to ask what impact had been made by the policy changes over time, for example. Case study method may have been used to launch future comparisons between NHS Trusts using this project as a pilot study to formulate a framework of analysis and the basis of a larger scale project. This could be a future approach, extending the scope and impact of the project.
59
Quantitative, qualitative and mixed methods The binary positions of research method design are either qualitative open-ended or quantitative closed ended (Creswell 2013). Quantitative methods are common to traditional FM research, resulting in easy to measure, department specific outcomes (Campbell 2017). Collection and analysis of the stock records in the point of sale experiment and the large-scale survey of staff as key end service users are both quantitative pieces of primary research work. The worldview underpinning these activities is positivism because it allows for statistical validation of results and material measures and quantities attributed to sensory experiences (Ritchie et al 2013 p.8). In comparison to quantitative research methods, qualitative methods interpret and foster in-depth understanding and representation of the social world. They draw on adaptable methods and emergent issues, resulting in data that is detailed and rich with cross-cutting themes from complex and unique participant perspectives and emergent categories and theories. It also is a reflexive approach which acknowledges the role of researcher (Ritchie et al 2013 p22). Qualitative methods are also essential to understand the impact and overall success of changes made (Schedler 2004, Rose and Cray 2010). The informal research in this project was well-suited to qualitative methods. If the research were to develop the qualitative work done further, mixed methods can combine qualitative and quantitative methods and offers flexibility and a breadth of research design options and array of tools, once specific research questions have been formulated (Howe, 1988, Tashakkori and Teddlie 2010). Mixed methods research is associated with a bottom-up, realist, pragmatic and/or grounded approach to connecting abstract epistemologies to mechanical levels of actual methods (Ritchie et al. 2014 p.39-47, Tashakori and Teddlie 2010, Cameron 2011, Morgan 2007). This approach is part of a wider debate across many different subject areas, institutions, governing bodies and funding partners about the divides between academic disciplines and how they might be brought closer together (Nenonen and Sarasoja 2014, Davies 2011, Moran 2002, Strijbos 2010, Fredericks 2010, The Bartlett 2014 Wagner et. al. 2011, Klein 2004, Klein 2006, Falk-Krzesinski et. al. 2011, Hadron et. al. 2010, Huutoniemi et. al. 2010, Nenonen, Truffer et. al. 2008, NRC 2004, Culligan and Pena-Mora 2010). The literature on mixed methods and other related fields, such as actioned research, emphasises the topology of research methods; the weighting, looping, cyclical, linear or nested order in which events are introduced and continue through a project (Hall and Howard 2008, Hall et al 2008, Williamson et al. 2011). Describing the topology of primary and non-primary, quantitative, informal and/or qualitative research methods that one might use to produce new knowledge creates a narrative to the investigatory path being taken (Tashakori and Teddlie 2010). This research took opportunities for informal research continuously wherever possible and, at the same time, produced the quantitative research linearly, from scoping to implementation and analysis.
Sampling strategy and generalisability If an order had to be given to this research, it could be said that it uses a multiple case sampling method, prioritising informal research case information with quantitative experiments and data collection to back up, test and prove the approaches taken, and to elaborate on critical aspects of service delivery from within (Tashakori and Teddlie 2010). In this instance the informal data collection would be described in stages, each stage a distinctive case. Each quantitative collection and analysis also a distinct case, and these defined areas of work placed linearly to show the decision making path more clearly and formally. The sampling strategy would,
60
therefore, split into two and be applied across the different cases. Samples either represent the end service user or the governance and service provider groups. End service users quantitatively analysed and the latter analysed using qualitative methods, layering design decisions by researching across both samples, reflecting on design proposals, adjusting and retesting solutions. Within the two samples, broadly internal and external groups, there are a number of different potential studies with unique sample populations and bringing them together into a unified research framework, beyond descriptive qualitative work, would require a larger project scope than this project alone. The strategies chosen for each piece of primary research captured in-depth knowledge that can be used to inform the aims of the research across the entire service, as well as the development of interventions that can be used and simulated by other vending service providers across NHS Trusts.
Reflection on the ethics Ethics approval was sought out and granted from the ethics approach committee at University College London. The approval letter can be found in Appendix C. The ethical consideration of the point of sale experiment was that it applied subtle methods to influence people’s choice of food. This could, in turn, influence their health. Using the proven Rayner (2005) nutritional profiling method of choosing which products to promote and encouraging people to buy the healthiest items ensures that ethical issues are addressed. Futhermore, the experiment does not in any way promote the use of the vending machines. Rather, it is only once someone has decided to use the machines that they are encouraged to choose the healthiest possible item. Regarding the survey of staff for catering services, names were removed to preserve anonymity. Full permission was received from the Trust and contractors for the data gathered.
4.2 Point of sale experiment overview There has been explicit call for more understanding of how to influence user choices in vending interventions, as well as a call for more understanding of how to influence vending choices in healthcare settings specifically (Skov et al 2013, Hua and Ickovics 2016). This experiment tested Nudge or choice architecture-style interventions for the improvement of vending services within Barts Health. The premise was to influence product choice by redesigning the point of sale environment using a range of technologies (Thaler and Sunstein 2008, Skov et al 2013, Terlutter and Capella 2013, Darby 2006). Thaler and Sunstein (2008) highlight a number of barriers that can impact people’s choices, such as a lack of free cognitive capacity, information, self-control or attention. These are particularly significant in vending in healthcare. Often machines are situated in busy, loud environments where people may be distracted, stressed, emotional, unpredictable, working long hours or waiting for long periods of time. Full information is also likely to be missing as the product as behind a glass screen. Nutritional information on the back of packet, for example, cannot be accessed. Finally, the design of vending machines is such that they are intuitive to use and automated, making people more likely to pay less attention while making choices. One of the central technologies used in the design of interventions was a nutritional profile, allowing products to be ranked most to least healthy, and split into either red, amber or green labelling categories. This has been trialled in catering settings before, but not for vending and not in healthcare (Skov et al 2013, Hua and Ickovics 2016). The literature review of the thesis gave in-depth consideration of the appropriate nutritional profile to use, opting for the Rayner (2005) across-the-board profile. This is the first time the profile has been formally applied to vending, making it a novel contribution to knowledge. The experimental period of the point of
61
sale experiment spanned 36 weeks out of the 54 weeks where data were collected. Product stock level data was used as the measure for testing interventions. The interventions that were tested were product replacement, traffic light labels, and product placement of water in the vending machines. The overall impact on revenue was also included to show if the interventions had a negative impact on sales. Finally, different locations were considered. For example, staff only, busy or quiet areas. The experiment used multilevel statistical analysis to achieve this.
Point of Sale Hypotheses The main hypothesis in this experiment was that planned communication-based interventions using different technologies to change the point of sale vending machine environment can influence users to make healthier choices. In this experiment, the feedback that consumers got about nutritional content occurred prior to their purchasing choice, equipping them with the knowledge that they need to make the best decision. The main measures that required testing, chosen in collaboration with Barts Health and with reference to the literature, were:
Nutritional value of products;
Product placement, location of food in vending machines;
Substituting for healthier options. The null hypotheses for the point of sale interventions were:
Any intervention would have no impact on red product sales, red drink or red food sales.
Adding nutritional traffic light labels would have no impact on red product sales, red drink or red food sales.
Adding a change to make water closer to eye level in the vending machine would have no impact on red product sales, red drink or red food sales.
Adding a new product range would have no impact on red product sales, red drink or red food sales.
The outcome measures could be analysed in terms of whether the space was busy, if it was a clinical space, or if it was a staff space. This would allow service to be designed in targeted ways. For example, if the null hypothesis for label interventions was only disproved in busy locations, then with limited resource available, labelling efforts could target busy hospital areas to maximise resource. If an intervention worked universally, then it might be written in to policy or contract communication, or carried forwards for wider testing. There were other sub-hypotheses that were considered but not tested in this experiment. Firstly, if the ethical qualities of food including fair trade and food miles impacted choice. And secondly, whether cost would influence. These were not feasible as ethical information labelling would conflict with nutritional labelling and price would have too big an impact on revenue for contractors to agree to. The individual intervention designs, and their development and accompanying literature, will be discussed in further detail later on in this chapter. First, there is a discussion of the overall research design and the population and sample.
62
Research design and major research activities for point of sale interventions The work intervened at point of sale. This required a top-down, deductive research approach (Ritchie et al. 2013 p8). The design of this research activity was informed by the wider inductive research work done, much of which was discussed in the literature review given that it was not formalised in the primary research portion of the research project and was largely exploratory, partially following research traditions of grounded theory.
Major research activities:
Establish interventions design based on feedback with key service stakeholders and literature;
Design experiment structure spanning 54 weeks and 30 locations within Barts Health hospitals;
Carry out and monitor experiment, working directly with vending stockists on site;
Analyse data using linear regression modelling to allow inclusion of several locational factors;
Reflect on capacity of the innovations to reduce the least healthy vending.
Population The target population was staff, especially night shift staff, given that the reason vending is installed is to provide meals during out of hours’ periods to staff. In reality far more people use vending that it was originally contracted to serve. The population were made up of vending machine users at St Bartholomew’s and the Royal London University Hospital (RLH), anyone making a purchase in the period of the year that data was collected. It was thought that vending machines at Barts Health would be for staff only given that they are contractually meant to be there to provide catering to out-of-hours staff. Staff are, however, not the only users of vending machines, and machines have been placed across the entire Trust, including in areas that are mainly occupied by patients and visitors, such as family waiting rooms. Therefore, the results of the experiment were applicable to more than just staff. The analysis did however divide analysis between machines in staff only vs publicly accessible locations. Incorporating unexpected population was an opportunity for the research to impact a wider more diverse population. The population using vending machines varies between different locations. For example, in paediatrics there will be more children in the population and in staff rooms there will no members of the public. Furthermore, in renal there will be more repeat visitors with specialist restricted diets and in A&E there will be more one-time visitors. In different areas, the profile of users will also change. For instance, stress levels may be higher in areas such as A&E. And finally, there will be less user traffic at machines in remote locations within the building. The experimental interventions were installed at the busiest Barts Health site, the RLH. Observations, revealed that there are 40 vending machines selling predominantly high fat, high sugar, high salt or artificially sweetened products across the various locations in the hospital. 30 vending machines in the main building had interventions placed within them. The RLH has a growing constituency of people, including those communities who work there, receive treatment and visit the hospital sites, with the lowest life expectancy and highest incidence of long-term preventable health problems such as obesity, in the UK. This places Barts Health and its staff under considerable pressure, not only in the care being provided, but also to create a culture of healthy eating that inherently promotes long-term health at the same time. By making healthy choice the norm in vending services, Barts Health is creating a culture that promotes long-term health for the local communities who work, receive treatment and visit the
63
hospital sites and setting an example of how to live a healthier life. The project particularly targets staff as a majority of the machines are located in the non-clinical spaces and staff only areas. Regarding the vending machines themselves, and specific locations in the RLH, a number of population and sample features were revealed in informal discussions and observations that further define the population being studied. Discussion with the security manager at Barts Health, with access to the security access cardholder records for the RLH, confirmed that 14,000 members of staff have security access the RLH and Barts Health in total. There are approximately 8,000 members of staff at the RLH.
Sampling Stock levels were recorded from 30 vending machines across 28 locations (busy locations had separate machines for food and drink) within the main building the Royal London and St Bartholomew’s hospitals. As all machines were included from one site, vending machine sampling was not random. The sampling scheme of the hospital population of people using those machines was random in the sense that anyone on the site was able to use the machines at any time during the experiment. While it was important from a policy perspective to look at staff using machines, there was also opportunity to understand the wider population use. Although it is not a direct focus of policy it remains a public health concern for the dieticians that this researcher consulted in Bats Health and so the decision was made to include the broader population. The hospital site serves approximately 1 million outpatients per year, plus inpatients, visitors and staff. The sampling scheme was therefore of a large sample size. Vending machines were located across the main building of the hospital. Some machines have distinct populations, such as staff, non-staff, and clinical or non-clinical staff. The large population size increased the power of this research, and reduces the standard error, which ultimately increases the supposed validity of the findings.
4.3 Scoping point of sale interventions This section includes detailed description of the procedures starting with the development of each intervention design and then discussing the overall procedures.
Decisions made in the literature review chapter The literature review determined that labelling products was going to be a key aspect to the primary research. Government policy guidance advises, among other initiatives, that at point of sale, clear information and labelling and use of traffic light food labels in vending machine services might aid service improvement (HFSP 2014, NHS England 2014, WHO 2015, DoH 2014, Marmot 2010). it is yet to be seen how these latter theories inform vending machine design, given that the focus in policy is on nutrient labelling and choice architecture (Skov et al 2013, Hua and Ickovics 2016). It was also decided in chapter two that across the board nutritional profiling would be the best way to create nutritional labels. It was decided that the user environment was a key way to influence user choices. The decision to use busy and quiet areas as a conditional variable in the point of sale experiment was also something derived from space syntax theory. Space Syntax describes how people move within the built environment, as a performer among many, sharing a collective pattern of behaviour, and the social significance of space, given its structural properties (Fata gen. Schiek et al 2009,
64
Fata gen. Schiek et al 2008, Schnädelbach et al 2007, Schnädelbach et al 2006, Hillier and Hanson 1989, McCarthy and Write 2004). These ideas were used to differentiate the spaces in the experiment. For example, most and least busy areas, either with a high or fast flow of people, or slow moving areas such as waiting rooms, were differentiated in the analysis. The decision to test if moving products to eye level encouraged product purchase was derived from the research discussed in ‘Further ideas for developing measures of public health in vending’, to do with tracking visual gaze using biometric data.
Developing the traffic light labelling The first step in creating a meaningful way to summarise and communicate a nutritional profile to end service users was to find out what the nutritional properties of the products were. A list of all the products in vending machines at the research sites was gathered by accessing the vending contractor's records and doing checks on the machines in the hospitals. A database was created in a spreadsheet. Filling in the nutritional properties of each product revealed that different sources reported nutrition differently. Nutritional values were sourced online, as it was not possible to open up vending machines and check the products individually. Nutritional values were ideally sourced from the product company web pages. If not, then from the webpages of supermarkets Waitrose, Tesco and Sainsbury’s. This lack of information negatively impacted the robustness of the profile however it was felt that all reasonable steps were taken to mitigate the inaccuracies and omissions found from nutritional records. It was found that nutrients on these different sites were sometimes rounded up or down per portion size and, when the value was scaled up to represent 100g/ml, the difference in reported nutrients was exacerbated. Errors in nutrient reporting were also found comparing the different supermarket websites in different cases. The database collection also revealed that portion size of product was recorded differently by one or two grams on different websites in some cases, and portion size was difficult to find or, in some instances, absent. There was a lack uniformity overall in the nutritional values being presented online. There was also less information available from smaller manufacturers and some did not provide any information at all. New companies selling more ethical or healthier foods might be placed at a disadvantage due to their poor nutritional reporting as a result. Where discrepancies occurred, they were highlighted on the spreadsheet. To calculate salt and sodium the following calculation was used, sourced from the NHS 2014 ‘live well’ site. Salt = sodium x 2.5 This is, however, not the only way to calculate salt. This approach was chosen as it represents the government’s policy position on salt calculation. The research tried to use the policy as its’ guide in design given that the aims were about policy delivery. Fibre is also reported in different ways. Some of the larger companies were contacted during this research to ask which they used. Mars replied that they use Association of Official Analytical Chemists (AOAC) fibre so an assumption was made that this was the kind used by all. It cannot be said for certain that all companies reported in this way and it was not possible to check.
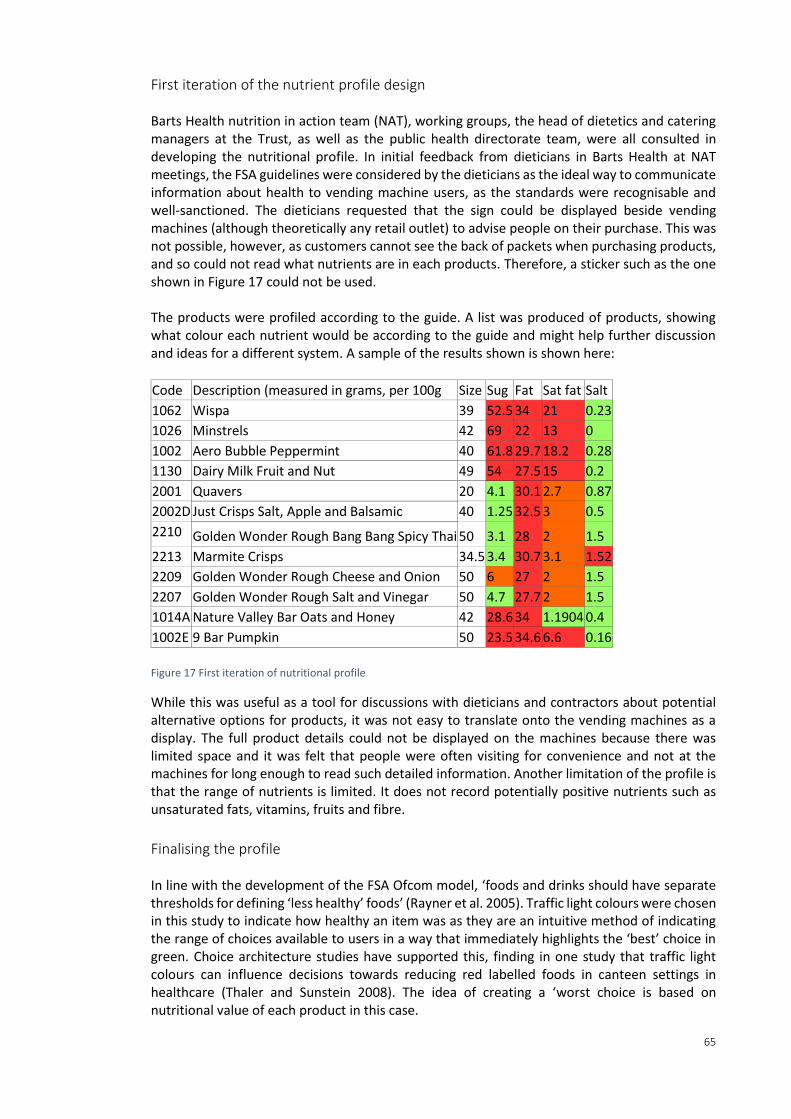
65
First iteration of the nutrient profile design Barts Health nutrition in action team (NAT), working groups, the head of dietetics and catering managers at the Trust, as well as the public health directorate team, were all consulted in developing the nutritional profile. In initial feedback from dieticians in Barts Health at NAT meetings, the FSA guidelines were considered by the dieticians as the ideal way to communicate information about health to vending machine users, as the standards were recognisable and well-sanctioned. The dieticians requested that the sign could be displayed beside vending machines (although theoretically any retail outlet) to advise people on their purchase. This was not possible, however, as customers cannot see the back of packets when purchasing products, and so could not read what nutrients are in each products. Therefore, a sticker such as the one shown in Figure 17 could not be used. The products were profiled according to the guide. A list was produced of products, showing what colour each nutrient would be according to the guide and might help further discussion and ideas for a different system. A sample of the results shown is shown here:
Code Description (measured in grams, per 100g Size Sug Fat Sat fat Salt
1062 Wispa 39 52.5 34 21 0.23
1026 Minstrels 42 69 22 13 0
1002 Aero Bubble Peppermint 40 61.8 29.7 18.2 0.28
1130 Dairy Milk Fruit and Nut 49 54 27.5 15 0.2
2001 Quavers 20 4.1 30.1 2.7 0.87
2002D Just Crisps Salt, Apple and Balsamic 40 1.25 32.5 3 0.5
2210 Golden Wonder Rough Bang Bang Spicy Thai 50 3.1 28 2 1.5
2213 Marmite Crisps 34.5 3.4 30.7 3.1 1.52
2209 Golden Wonder Rough Cheese and Onion 50 6 27 2 1.5
2207 Golden Wonder Rough Salt and Vinegar 50 4.7 27.7 2 1.5
1014A Nature Valley Bar Oats and Honey 42 28.6 34 1.1904 0.4
1002E 9 Bar Pumpkin 50 23.5 34.6 6.6 0.16
Figure 17 First iteration of nutritional profile
While this was useful as a tool for discussions with dieticians and contractors about potential alternative options for products, it was not easy to translate onto the vending machines as a display. The full product details could not be displayed on the machines because there was limited space and it was felt that people were often visiting for convenience and not at the machines for long enough to read such detailed information. Another limitation of the profile is that the range of nutrients is limited. It does not record potentially positive nutrients such as unsaturated fats, vitamins, fruits and fibre.
Finalising the profile In line with the development of the FSA Ofcom model, ‘foods and drinks should have separate thresholds for defining ‘less healthy’ foods’ (Rayner et al. 2005). Traffic light colours were chosen in this study to indicate how healthy an item was as they are an intuitive method of indicating the range of choices available to users in a way that immediately highlights the ‘best’ choice in green. Choice architecture studies have supported this, finding in one study that traffic light colours can influence decisions towards reducing red labelled foods in canteen settings in healthcare (Thaler and Sunstein 2008). The idea of creating a ‘worst choice is based on nutritional value of each product in this case.
66
The range of available items that were available across the whole vending service were scored according to the profile and placed into order from smallest to largest scores, then split into three even groups based on frequency. For drinks, anything scoring zero or less was green, one was amber and two or above was red. Food items with a point falling into the lowest third of possible scores were attributed green, then amber, then red for those items within the top third of available points. Once the profile has been applied to the product range, a small red amber or green dot could be affixed below each product. The image in Figure 18 shows there is a round space where the stickers fit.
Figure 18 Vending machine image
This was discussed with the public health department and the estates management and communication teams to get feedback about how to display information before proceeding. It was agreed that a poster detailing the researcher’s contact details along with the product score and a brief description of the experiment should be placed as close to the machines as possible.
Design of supporting communication When the NAT group were consulted about the case study they gave the feedback that traffic light colours could potentially be misleading, suggesting that a green item is healthy and indicating ‘go’ to the user, rather than highlighting the healthiest options available. To address this concern, an A6 poster was placed on the machine with ‘least healthy’, ‘mid-range healthy’, ‘most healthy’ written beside corresponding red, amber and green circled stickers (Figure 19):
67
Figure 19 Intervention poster 1
Another more detailed poster (Figure 20) was placed in the nearest space beside the machine explaining the trial, giving a list of products and their nutritional rating, and contact details for anyone wishing to discuss the trial.
Figure 20 Intervention experiment poster 2
The poster in Figure 20 reads: The red, amber green colour code in your vending machine is there to help you choose more nutritious snacks. The colours are assigned according to a nutrient profiling (NP) that was developed by the Food Standards Agency in 2004-2005. The NP model was subject to rigorous scientific scrutiny, extensive consultation by the Independent Scientific Advisory Committee on Nutrition (SACN) and a wide range of nutrition experts. Both posters also read: This table shows the nutritional point for each item in your vending machine. For more information please email [email protected]. Emails were received from several members of staff complaining about the machines being unhealthy for their patients and also to ask that
68
vending machines be installed in their wards. This will be considered in the results section of the thesis. The posters were compliant with the Trust’s communication team poster format as much as possible, based on the template provided by the communication department. Posters were placed as close as possible to the machines and, where possible, on the vending machine itself a more detailed poster was put up, explaining the experimental design in more detail.
Designing product placement to make healthy products easier to see than others The interventions drew on the intuitive understanding that placing products at eye level will encourage people to choose them. This has been trialled and proven successful in similar scenarios (Thaler and Sunsain 2008). Nestle produce the following guidance for vending Figure 21:
Figure 21 Vending display hotspots (Anonymous)
This was provided in unpublished third party correspondence between Nestle and the vending contractor Vending Solutions, sent by company director via email to the primary researcher at [email protected] 02/12/15. It was later verified by this research in a phone call to Nestle, and affirmed that the same systems are used by Mars and Cadbury. Essentially it represents the widely accepted idea that products at or closer to the centre of the users field of vision are more likely to be sold. Water was chosen as the drink product to move as it is truly the healthiest drink option. The green snacks were already at eye level in the machines so these were not tested.
Changing products for healthier option It may seem intuitive that one might remove unhealthy options completely from the vending machines and only sell green products. However, this was not an option due to contractual restrictions, and policy does not advise that this approach should be taken. In reality, the ‘healthy’ product range option was assigned by the vending contractor, under their sister company for healthy vending called Rude Food. The Rude Food range contained a higher proportion of green products but not entirely green products.
69
colour rude food traditional
red 13 56
amber 18 31
green 119 62 Figure 22 Rude food product colour codes
The table in Figure 22 shows that the majority of rude food products were green.
4.4 Procedure for point for sale experiment Of the 30 machines, all contained this labelling intervention, 13 machines also had product placement interventions, moving water either completely to eye level or as close as possible. Four of the machines had machines had product replacement, using the vending machine company’s standard healthier range, to replace the traditional one. These four machines also included water placement. 12 weeks of baseline data was collected, then 12 weeks of trial data for labelling interventions, 42 weeks of water interventions and 42 weeks of product placement intervention, and 30 weeks of post labelling interventions. This meant that interventions happened at different times in different machines for different durations of time. This variation was largely to accommodate for service demand and capacity for change among the service provider. The interventions were installed by the researcher, who worked alongside the vending stockist to install the interventions. The stockist then maintained the interventions until the end of the 12-week trial period when the researcher uninstalled the trial. The company who control stock records and deliver vending services at the study site were Vending Solutions, and their sister company, The Rude Food Company. They were contracted by Carillion, who manage soft FM services at Barts Health. Gaining permission required building good working relationships with the company, as well as managerial support across companies and departments, supported by the environmental manager at Barts Health and Public Health director. Vending machines were restocked and cashed up frequently, with the busiest locations are serviced every day. The ‘healthy’ Rude Food versus ‘traditional’ Vending Solutions products are stocked by two different people. Stock is stored in a cupboard in the basement of the RLH and brought up in trolleys. When the machines are restocked, the stockist uses an electronic hand held device with software installed to record the location, time, product description, product code and quantity electronically. The information is sent to a central database called Opera. Any faults are also reported via this system. Notes about machine movement, profits and historical data are stored in this database. Working with the primary stockist on site made it easier to liaise over practical measures of the trial, such as changing stock around. The company director was enthusiastic to help with the experiment. Vending Solutions explained that the products typically sold in the vending machines are chosen for their long shelf life, popularity and high profit margins. They reported that healthier, more ethical products are often more expensive to buy, less popular, and have shorter shelf lives.
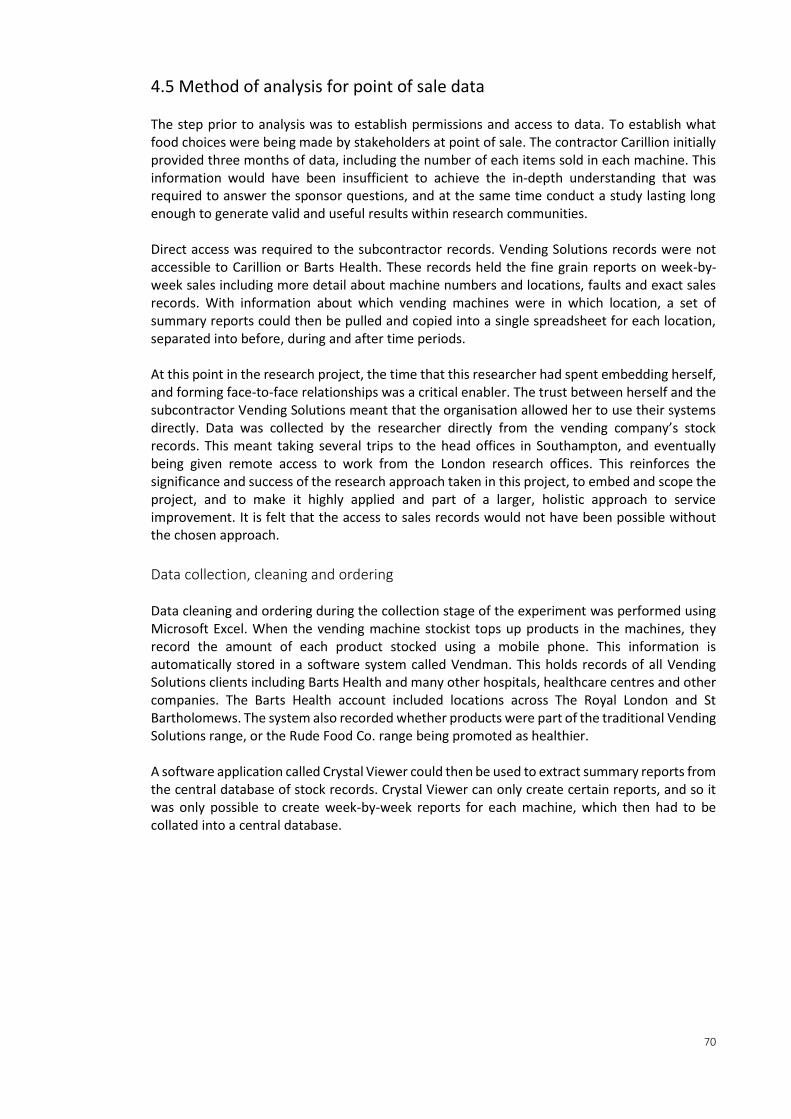
70
4.5 Method of analysis for point of sale data The step prior to analysis was to establish permissions and access to data. To establish what food choices were being made by stakeholders at point of sale. The contractor Carillion initially provided three months of data, including the number of each items sold in each machine. This information would have been insufficient to achieve the in-depth understanding that was required to answer the sponsor questions, and at the same time conduct a study lasting long enough to generate valid and useful results within research communities. Direct access was required to the subcontractor records. Vending Solutions records were not accessible to Carillion or Barts Health. These records held the fine grain reports on week-by-week sales including more detail about machine numbers and locations, faults and exact sales records. With information about which vending machines were in which location, a set of summary reports could then be pulled and copied into a single spreadsheet for each location, separated into before, during and after time periods. At this point in the research project, the time that this researcher had spent embedding herself, and forming face-to-face relationships was a critical enabler. The trust between herself and the subcontractor Vending Solutions meant that the organisation allowed her to use their systems directly. Data was collected by the researcher directly from the vending company’s stock records. This meant taking several trips to the head offices in Southampton, and eventually being given remote access to work from the London research offices. This reinforces the significance and success of the research approach taken in this project, to embed and scope the project, and to make it highly applied and part of a larger, holistic approach to service improvement. It is felt that the access to sales records would not have been possible without the chosen approach.
Data collection, cleaning and ordering Data cleaning and ordering during the collection stage of the experiment was performed using Microsoft Excel. When the vending machine stockist tops up products in the machines, they record the amount of each product stocked using a mobile phone. This information is automatically stored in a software system called Vendman. This holds records of all Vending Solutions clients including Barts Health and many other hospitals, healthcare centres and other companies. The Barts Health account included locations across The Royal London and St Bartholomews. The system also recorded whether products were part of the traditional Vending Solutions range, or the Rude Food Co. range being promoted as healthier. A software application called Crystal Viewer could then be used to extract summary reports from the central database of stock records. Crystal Viewer can only create certain reports, and so it was only possible to create week-by-week reports for each machine, which then had to be collated into a central database.
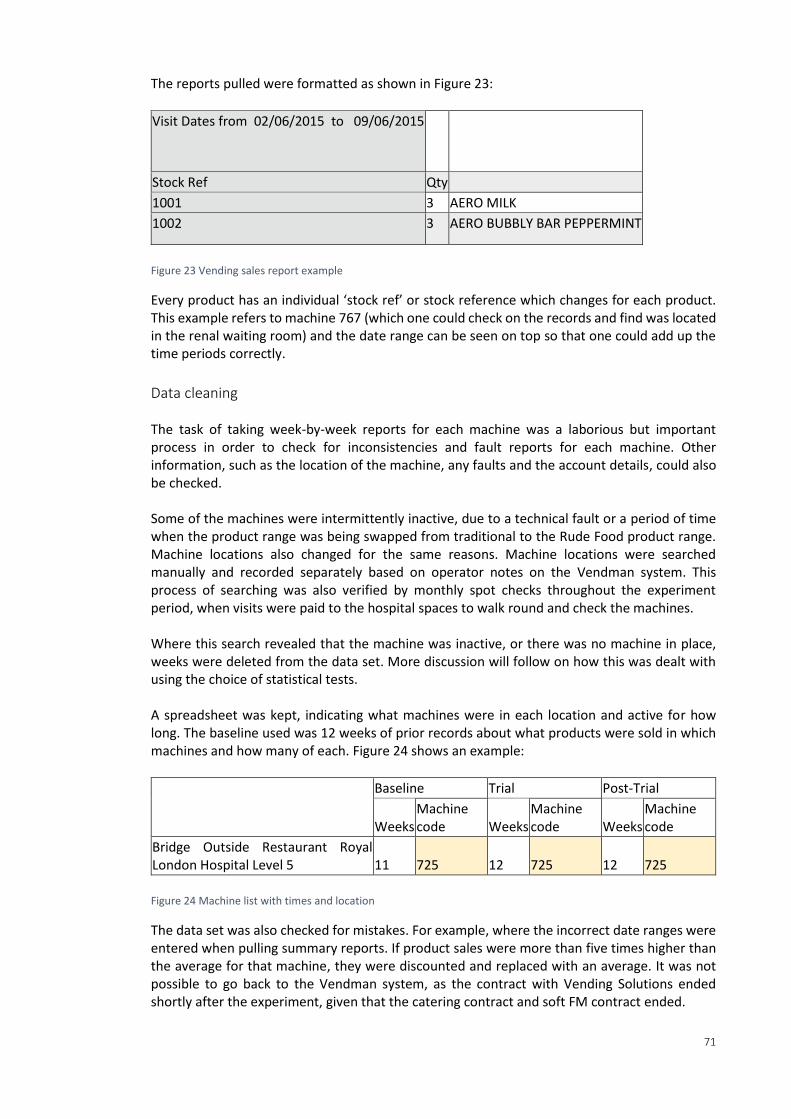
71
The reports pulled were formatted as shown in Figure 23:
Visit Dates from 02/06/2015 to 09/06/2015
Stock Ref Qty
1001 3 AERO MILK
1002 3 AERO BUBBLY BAR PEPPERMINT
Figure 23 Vending sales report example
Every product has an individual ‘stock ref’ or stock reference which changes for each product. This example refers to machine 767 (which one could check on the records and find was located in the renal waiting room) and the date range can be seen on top so that one could add up the time periods correctly.
Data cleaning The task of taking week-by-week reports for each machine was a laborious but important process in order to check for inconsistencies and fault reports for each machine. Other information, such as the location of the machine, any faults and the account details, could also be checked. Some of the machines were intermittently inactive, due to a technical fault or a period of time when the product range was being swapped from traditional to the Rude Food product range. Machine locations also changed for the same reasons. Machine locations were searched manually and recorded separately based on operator notes on the Vendman system. This process of searching was also verified by monthly spot checks throughout the experiment period, when visits were paid to the hospital spaces to walk round and check the machines. Where this search revealed that the machine was inactive, or there was no machine in place, weeks were deleted from the data set. More discussion will follow on how this was dealt with using the choice of statistical tests. A spreadsheet was kept, indicating what machines were in each location and active for how long. The baseline used was 12 weeks of prior records about what products were sold in which machines and how many of each. Figure 24 shows an example:
Baseline Trial Post-Trial
Weeks Machine code Weeks
Machine code Weeks
Machine code
Bridge Outside Restaurant Royal London Hospital Level 5 11 725 12 725 12 725
Figure 24 Machine list with times and location
The data set was also checked for mistakes. For example, where the incorrect date ranges were entered when pulling summary reports. If product sales were more than five times higher than the average for that machine, they were discounted and replaced with an average. It was not possible to go back to the Vendman system, as the contract with Vending Solutions ended shortly after the experiment, given that the catering contract and soft FM contract ended.
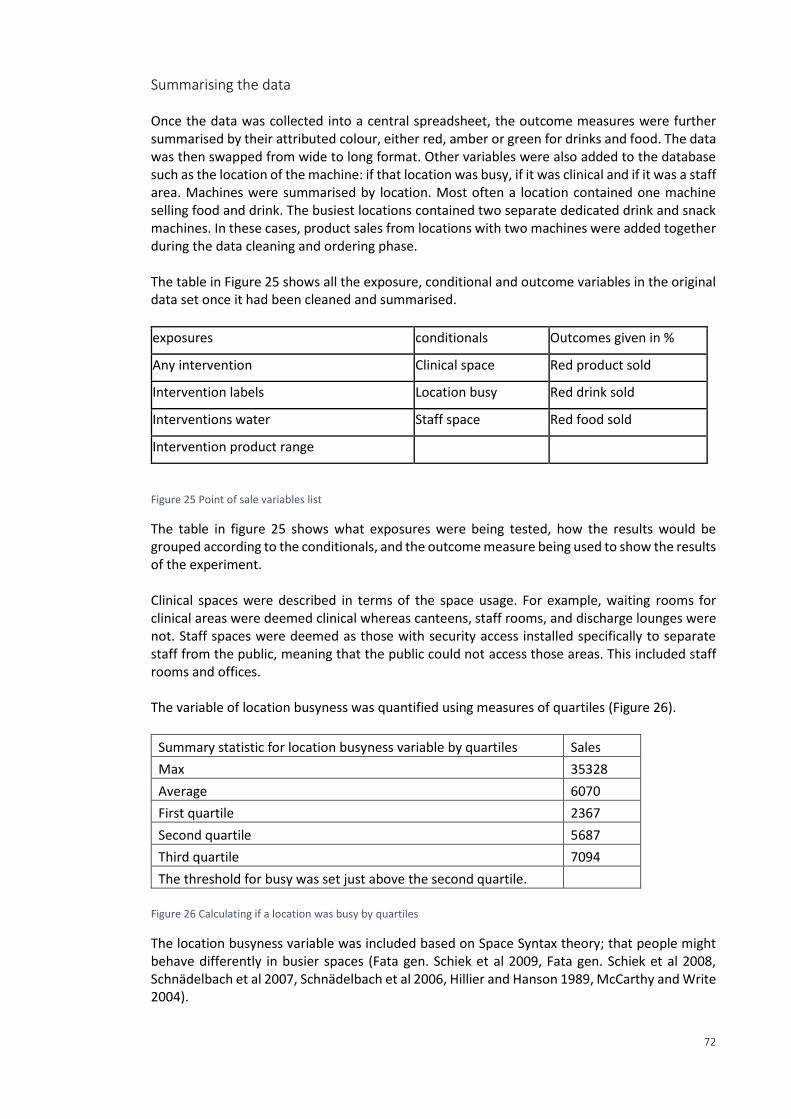
72
Summarising the data Once the data was collected into a central spreadsheet, the outcome measures were further summarised by their attributed colour, either red, amber or green for drinks and food. The data was then swapped from wide to long format. Other variables were also added to the database such as the location of the machine: if that location was busy, if it was clinical and if it was a staff area. Machines were summarised by location. Most often a location contained one machine selling food and drink. The busiest locations contained two separate dedicated drink and snack machines. In these cases, product sales from locations with two machines were added together during the data cleaning and ordering phase. The table in Figure 25 shows all the exposure, conditional and outcome variables in the original data set once it had been cleaned and summarised.
exposures conditionals Outcomes given in %
Any intervention Clinical space Red product sold
Intervention labels Location busy Red drink sold
Interventions water Staff space Red food sold
Intervention product range
Figure 25 Point of sale variables list
The table in figure 25 shows what exposures were being tested, how the results would be grouped according to the conditionals, and the outcome measure being used to show the results of the experiment. Clinical spaces were described in terms of the space usage. For example, waiting rooms for clinical areas were deemed clinical whereas canteens, staff rooms, and discharge lounges were not. Staff spaces were deemed as those with security access installed specifically to separate staff from the public, meaning that the public could not access those areas. This included staff rooms and offices. The variable of location busyness was quantified using measures of quartiles (Figure 26).
Summary statistic for location busyness variable by quartiles Sales
Max 35328
Average 6070
First quartile 2367
Second quartile 5687
Third quartile 7094
The threshold for busy was set just above the second quartile.
Figure 26 Calculating if a location was busy by quartiles
The location busyness variable was included based on Space Syntax theory; that people might behave differently in busier spaces (Fata gen. Schiek et al 2009, Fata gen. Schiek et al 2008, Schnädelbach et al 2007, Schnädelbach et al 2006, Hillier and Hanson 1989, McCarthy and Write 2004).
73
The variables were listed on the top row of the database. The columns of those that required yes or no information were coded using a nominal scale of 0 or 1. 0 represented no, 1 represented yes. For example, a 1 under the variable staff space would mean that that row of data was about a staff only space in the hospital. A few other summations were made. Time was placed into an ordinal scale of before, during and after the interventions were installed. Each of the three time periods is a discrete classification of the data. Finally, the data were reported as percent frequencies. For example, in the before intervention time period in location 1, x% of red products, y% of amber products, and z% of green products were sold, making a total of 100%.
4.6 Inferential and descriptive statistics for point of sale intervention The tool used for analysis was Stata. This was chosen as supervision of statistical methods was provided in Stata. It used a retroductive logic governed analysis. Retroductive logic is about ‘Identifying the structures or mechanisms that may have produced patterns in the data, trying different models for ‘fit’’ (Ritchie et al. 2014 p6). This models of ‘fit’ approach, was used to determine the relationship between different exposures and conditions, and the outcome variables. The actors included location purpose, population features, intervention type. The exposures were tested first individually in univariate analysis. The mixture of exposure and conditionals was then tested in a multivariate analysis. This approach allowed insight into the reason behind solutions. To deliver healthier products and increase demand for them might be made more or less possible depending on the intervention, and the characteristics of the location. This retroductive approach was ideal as it might lead to optimal point of sale design where little was known in the context of healthcare vending prior (Ritchie et al. 2013 p6, Skov et al 2013, Hua and Ickovics 2016).
Descriptive statistics A number of preliminary calculations would be performed on the data once they had been ordered and tabulated in summary form. These included the number of weeks of data in each category of conditional variables. For example, the number of weeks of data describing clinical compared to non-clinical spaces.
Inferential statistics using univariate analysis for point for sale data The subject in the statistical analysis was the change of product choices over time. The statistical methods to measure this were split into univariate and multivariate analysis. The first tests to design were for univariate analysis. The choice of an ordinal scale of time, grouping results into before, during and after periods, made it possible to give one measure per period. This measure was the mean of the % frequency for each outcome measure. For example, before the intervention, x% of products sold were red. Each measure was regarding the same subject and so was paired. Pairs were calculated as before and during, during and after, and before and after. However, these paired tests would have to be performed for several outcome measures. The typical test for a before, during and after style-intervention study of paired data would be a paired t-test or a Wilcoxon test, depending on whether the data were normally distributed. To check the normality of distribution for each outcome measure in the before, during and after categories, a Shapiro–Wilk test for normality was used. The Shapiro-Wilk test (typically called
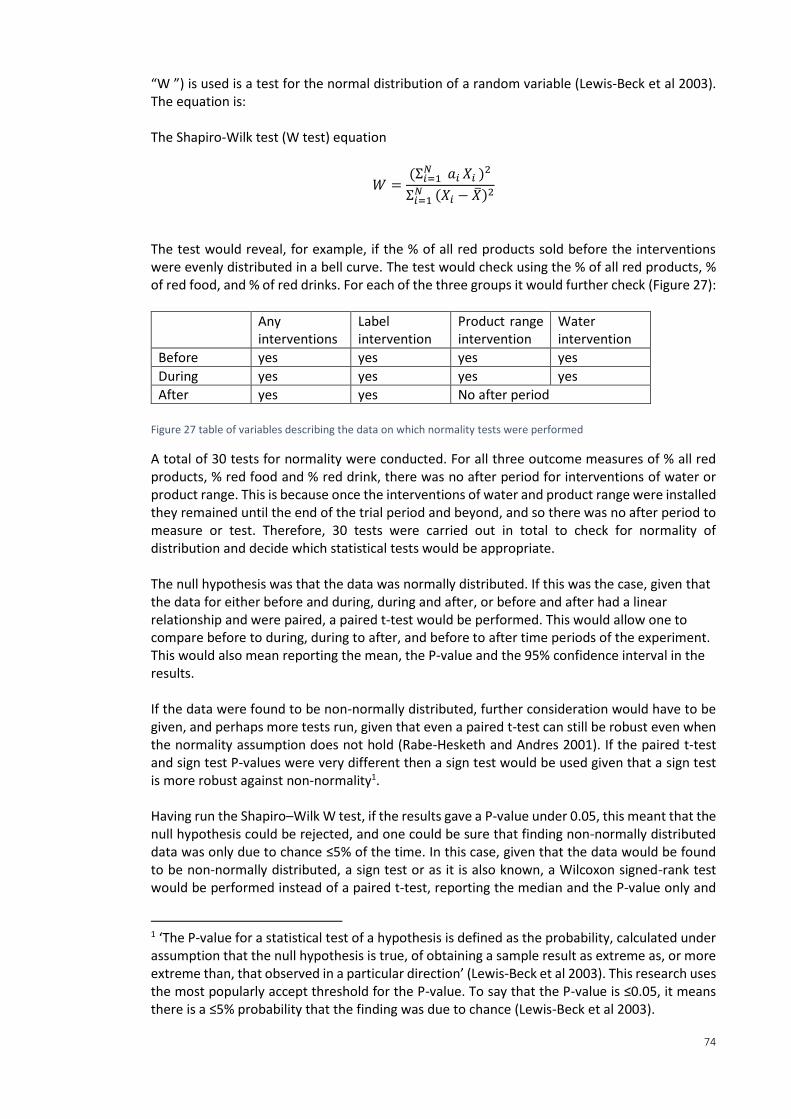
74
“W ”) is used is a test for the normal distribution of a random variable (Lewis-Beck et al 2003). The equation is: The Shapiro-Wilk test (W test) equation
𝑊 =(Σ𝑖=1
𝑁 𝑎𝑖 𝑋𝑖 )2
Σ𝑖=1 𝑁 (𝑋𝑖 − �̅�)2
The test would reveal, for example, if the % of all red products sold before the interventions were evenly distributed in a bell curve. The test would check using the % of all red products, % of red food, and % of red drinks. For each of the three groups it would further check (Figure 27):
Any interventions
Label intervention
Product range intervention
Water intervention
Before yes yes yes yes
During yes yes yes yes
After yes yes No after period
Figure 27 table of variables describing the data on which normality tests were performed
A total of 30 tests for normality were conducted. For all three outcome measures of % all red products, % red food and % red drink, there was no after period for interventions of water or product range. This is because once the interventions of water and product range were installed they remained until the end of the trial period and beyond, and so there was no after period to measure or test. Therefore, 30 tests were carried out in total to check for normality of distribution and decide which statistical tests would be appropriate. The null hypothesis was that the data was normally distributed. If this was the case, given that the data for either before and during, during and after, or before and after had a linear relationship and were paired, a paired t-test would be performed. This would allow one to compare before to during, during to after, and before to after time periods of the experiment. This would also mean reporting the mean, the P-value and the 95% confidence interval in the results. If the data were found to be non-normally distributed, further consideration would have to be given, and perhaps more tests run, given that even a paired t-test can still be robust even when the normality assumption does not hold (Rabe-Hesketh and Andres 2001). If the paired t-test and sign test P-values were very different then a sign test would be used given that a sign test is more robust against non-normality1. Having run the Shapiro–Wilk W test, if the results gave a P-value under 0.05, this meant that the null hypothesis could be rejected, and one could be sure that finding non-normally distributed data was only due to chance ≤5% of the time. In this case, given that the data would be found to be non-normally distributed, a sign test or as it is also known, a Wilcoxon signed-rank test would be performed instead of a paired t-test, reporting the median and the P-value only and
1 ‘The P-value for a statistical test of a hypothesis is defined as the probability, calculated under assumption that the null hypothesis is true, of obtaining a sample result as extreme as, or more extreme than, that observed in a particular direction’ (Lewis-Beck et al 2003). This research uses the most popularly accept threshold for the P-value. To say that the P-value is ≤0.05, it means there is a ≤5% probability that the finding was due to chance (Lewis-Beck et al 2003).
75
not the 95% confidence interval. This sign test is weaker than the t-test, however, it is the alternative in instances of non-normal distribution of data. The sign test provides a comparison of the probabilities of two types of outcomes and can be used to make inferences about the mean of a population of differences (see Lewis-Beck et al 2003 for a full explanation of the procedure). The P-value reveals whether a finding represents the probability of the median value having happened by chance in this case.
Inferential statistics using mixed-effects for point of sale data The second set of tests carried out were for a mixed-effects multilevel regression. In comparison to mixed-effects, using independent pairwise comparisons would mean multiple exposures and outcomes had to be given, performing pairwise comparisons many times. This would also increase the error rate. Therefore, pairwise comparisons were only useful for univariate analysis. Using repeated measures allowed for a dependent structure to be created, and was more sensitive to detecting difference between groups than if one were only to use a single point (as was the case in the univariate analysis). Favourably, repeated measures also allow one to answer questions about the entire profile over time. Mixed-effects is useful for categorical and continuous outcome measures, for multiple exposures and conditionals that can also be a mix of categorical or continuous. In this case, the measure was continuous and the outcomes were categorical. Mixed-effects also accounts for the fact that outcome measures are grouped within subjects, can be used on complex data and also where data is missing. There are two types of potential analysis for repeated measures, anova and regression. Anova, was discounted as it does not allow for missing data. For example, if a week of stock records were missing from a certain vending machine location, that location would be unusable via anova methods. In total, the two models used were: 𝑌 = 𝑎 + 𝐷 ∗ 𝑡𝑖𝑚𝑒 𝑝𝑒𝑟𝑖𝑜𝑑 + 𝐸 ∗ 𝑠𝑡𝑎𝑓𝑓 𝑠𝑝𝑎𝑐𝑒 + 𝐹 ∗ 𝑏𝑢𝑠𝑦 𝑠𝑝𝑎𝑐𝑒 + 𝐺 ∗ 𝑐𝑙𝑖𝑛𝑖𝑐𝑎𝑙 𝑠𝑝𝑎𝑐𝑒
𝑌 = 𝑎 + 𝐶 ∗ 𝑖𝑛𝑡𝑒𝑟𝑣𝑒𝑛𝑡𝑖𝑜𝑛 𝑙𝑎𝑏𝑒𝑙𝑠 + 𝐻 ∗ 𝑖𝑛𝑡𝑒𝑟𝑣𝑒𝑛𝑡𝑖𝑜𝑛 𝑝𝑟𝑜𝑑𝑢𝑐𝑡 𝑟𝑎𝑛𝑔𝑒 + 𝐶
∗ 𝑖𝑛𝑡𝑒𝑟𝑣𝑒𝑛𝑡𝑖𝑜𝑛 𝑤𝑎𝑡𝑒𝑟 𝑝𝑙𝑎𝑐𝑒𝑚𝑒𝑛𝑡 + 𝐸 ∗ 𝑠𝑡𝑎𝑓𝑓 𝑠𝑝𝑎𝑐𝑒 + 𝐹 ∗ 𝑏𝑢𝑠𝑦 𝑠𝑝𝑎𝑐𝑒 + 𝐺 ∗ 𝑐𝑙𝑖𝑛𝑖𝑐𝑎𝑙 𝑠𝑝𝑎𝑐𝑒
The second equation was run in order to compare before to during, during to after, and before to after. The sums used for mixed-effects were as follows, given that regression assumes:
𝑌 = 𝑎 In regression, a is the intercept and Y is the outcome. For linear regression, a binary outcome (2 levels counting) includes:
+ 𝐶 ∗ 𝑖𝑛𝑡𝑒𝑟𝑣𝑒𝑛𝑡𝑖𝑜𝑛 𝑙𝑎𝑏𝑒𝑙𝑠
76
Intervention might be zero or one. C is the mean difference in Y between no labelling intervention and with labelling intervention. For example, mean red stock in machines where labels were not added minus mean red stock in intervention machines where labels were added. In linear regression, a categorical (≥3 levels) includes:
+ 𝐷 ∗ 𝑡𝑖𝑚𝑒 𝑝𝑒𝑟𝑖𝑜𝑑 Time period might be before, during or after the interventions in this example, represented as zero, one or two, so there will be three values for D. Each one is the mean difference in Y between the reference group (which was chosen before) and each of the other categories. For the categorical variable of time period, the control was counted as the baseline period before the interventions were installed. And the active periods were when interventions were installed. This analysis also included post-interventions in the analysis, and so in another model, where only binary variables were used such as intervention and no intervention, before was compared to during, during to after, and before to after. The subject in the multivariate analysis was the change of red product choices, given in separate models for the different time period comparisons, and also for all products, and food and drink products. There was a further set of binary variables representing the conditions of the vending machine location. For example:
+ 𝐸 ∗ 𝑠𝑡𝑎𝑓𝑓 𝑠𝑝𝑎𝑐𝑒 Staff space could be zero representing that the machine was not located in a staff space, or one, representing that it was located in a staff space. There are several ways to report outcome measures from regression. One is by using the averages of intercepts, or the average slope of all slopes. The intercept was not used in the point of sale interventions analysis given that the exposure and conditional variables were categorical. The reported values were the coefficient, where the attached P-value was below or almost on the 5% significance level to reject the null hypothesis, and 95% confidence interval in table form. The coefficient represents the average increase or decrease in percent of red products sold in the group of vending machine locations being looked at, comparing different time periods, and adjusting for repeated measures. The results were also given as plots that included the 95% confidence interval, for visual comparison of the categorical and binary outcome variables. Finally, the results from the tests for normality already conducted to decide on using t-test or sign test would also be used to determine if any transformation of the data (to normalise it) were needed during the mixed-effects modelling part of the analysis. If the assumptions of normality did not hold, it would be necessary to transform the outcome variable. For example, use natural log of the average weekly number products sold. Further consideration of this potential method of normalisation would have to be considered in more detail if the data were found to be non-normally distributed via the Shapiro-Wilk test, given that mixed model assumptions can still hold even if the data is not normally distributed. In the first instance, if the initial test for normality did hold, no transformation would be necessary. Linking back to the purpose of this research, a multilevel model allowed the exposures that worked best in the point of sale interventions to be isolated, and a check on whether the conditionals were impacting them in any way to be performed. This insight could then inform policy as proof of the influential aspects of the point of sale design that were impacting on
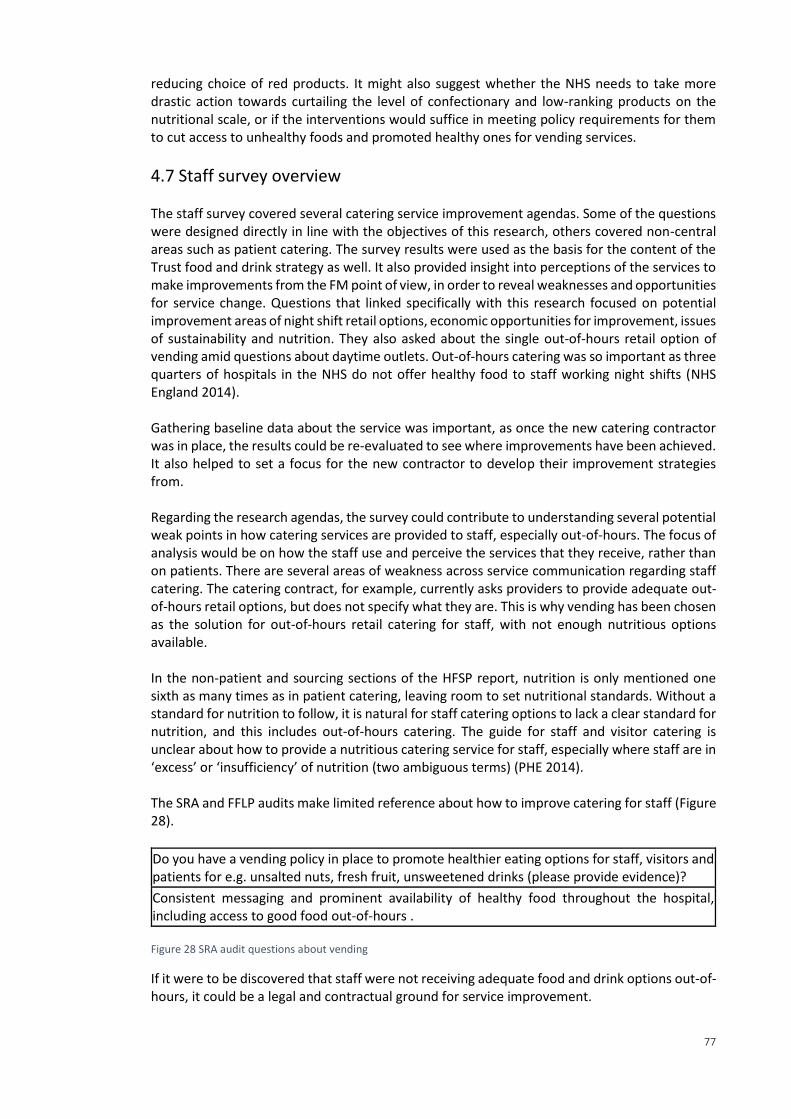
77
reducing choice of red products. It might also suggest whether the NHS needs to take more drastic action towards curtailing the level of confectionary and low-ranking products on the nutritional scale, or if the interventions would suffice in meeting policy requirements for them to cut access to unhealthy foods and promoted healthy ones for vending services.
4.7 Staff survey overview The staff survey covered several catering service improvement agendas. Some of the questions were designed directly in line with the objectives of this research, others covered non-central areas such as patient catering. The survey results were used as the basis for the content of the Trust food and drink strategy as well. It also provided insight into perceptions of the services to make improvements from the FM point of view, in order to reveal weaknesses and opportunities for service change. Questions that linked specifically with this research focused on potential improvement areas of night shift retail options, economic opportunities for improvement, issues of sustainability and nutrition. They also asked about the single out-of-hours retail option of vending amid questions about daytime outlets. Out-of-hours catering was so important as three quarters of hospitals in the NHS do not offer healthy food to staff working night shifts (NHS England 2014). Gathering baseline data about the service was important, as once the new catering contractor was in place, the results could be re-evaluated to see where improvements have been achieved. It also helped to set a focus for the new contractor to develop their improvement strategies from. Regarding the research agendas, the survey could contribute to understanding several potential weak points in how catering services are provided to staff, especially out-of-hours. The focus of analysis would be on how the staff use and perceive the services that they receive, rather than on patients. There are several areas of weakness across service communication regarding staff catering. The catering contract, for example, currently asks providers to provide adequate out-of-hours retail options, but does not specify what they are. This is why vending has been chosen as the solution for out-of-hours retail catering for staff, with not enough nutritious options available. In the non-patient and sourcing sections of the HFSP report, nutrition is only mentioned one sixth as many times as in patient catering, leaving room to set nutritional standards. Without a standard for nutrition to follow, it is natural for staff catering options to lack a clear standard for nutrition, and this includes out-of-hours catering. The guide for staff and visitor catering is unclear about how to provide a nutritious catering service for staff, especially where staff are in ‘excess’ or ‘insufficiency’ of nutrition (two ambiguous terms) (PHE 2014). The SRA and FFLP audits make limited reference about how to improve catering for staff (Figure 28).
Do you have a vending policy in place to promote healthier eating options for staff, visitors and patients for e.g. unsalted nuts, fresh fruit, unsweetened drinks (please provide evidence)?
Consistent messaging and prominent availability of healthy food throughout the hospital, including access to good food out-of-hours . Figure 28 SRA audit questions about vending
If it were to be discovered that staff were not receiving adequate food and drink options out-of-hours, it could be a legal and contractual ground for service improvement.
78
There is a wide range of agendas presented in government policy which a staff survey could help to support and clarify. For example, where nutrition guidance is vague, staff feedback that there is not enough nutrition would support the argument for change. There was a wide scope of information that was being looked at in the staff catering survey, not only the areas mentioned above, but also patient catering, on behalf of dietetics, for example. The results of the staff survey, conducted through this research, were used directly in the strategy document, as well as the results of the work done to evaluate the DEFRA GBS. Healthier behaviour is being incentivised through the CQUIN 4 for non-patient catering, and supported by the NHS, in the context of preventative measures, particularly targeting issues such as smoking, alcohol consumption and poor diets in healthcare, and encouraging staff lifestyle improvements internally for health and well-being (NHS 2016, Marmot 2010; NHS England 2016 b). Non-patient catering service improvement plans also overlap with preventative models of healthcare such as initiatives to link with the community, health education, and supporting staff, patients and stakeholders in healthcare facilities to make the ‘right’ choices (WHO 2015, Nice 2016, FFLP 2016, Nice 2015, NHS England 2014, NHS England 2016, Maruthappu 2016 HPH 2015, NHS 2016, NHS England 2016 b.). It was an invaluable snapshot for Barts Health to work on making improvements. The next section goes into detail about the method design.
4.8 Survey hypotheses method and design The survey aimed to disprove the null hypothesis that:
1. Staff had a positive opinion of hospital vending drinks This would still raise the question as to whether vending was acceptably healthy but suggest changes may be unpopular.
2. Staff would report using vending less than a few times a month This would mean that vending does not fulfil its’ objective to service staff and so may be ground for removal.
3. Staff, especially night shift staff would report spending less £4 a day on food and drink. If the null hypothesis could be disproved to show that there were significant odds of night shift staff spending over £4 per day on food, there may be a commercially attractive opportunity to create a better retail catering offering for night shift staff.
4. Staff would perceive vending costs as reasonable.
Disproof of this null hypothesis would show which members of the survey population expected lower priced vending, and help service designers understand the potential reaction to more expensive healthier product options.
5. Night shift staff would report that they receive sufficient nutrition on night shifts If this was disproved and night shift staff felt that they did not receive sufficient nutrition on night shifts then there would be grounds to use policy guidance and public health funding incentives to argue for service change. This may even potentially be subsidised given there are CQUIN funding opportunities available for healthier eating initiatives for non-patient catering.
6. Night shift staff reporting that they receive sufficient breaks on night shifts. The analysis sought out statistically significant odds of night shift staff reporting that they received insufficient breaks on night shifts. If staff reported receiving insufficient breaks and the null hypothesis could be disproved, there would be grounds for service change on the basis that their wellbeing was being impacted and could in turn impact their ability to provide care.
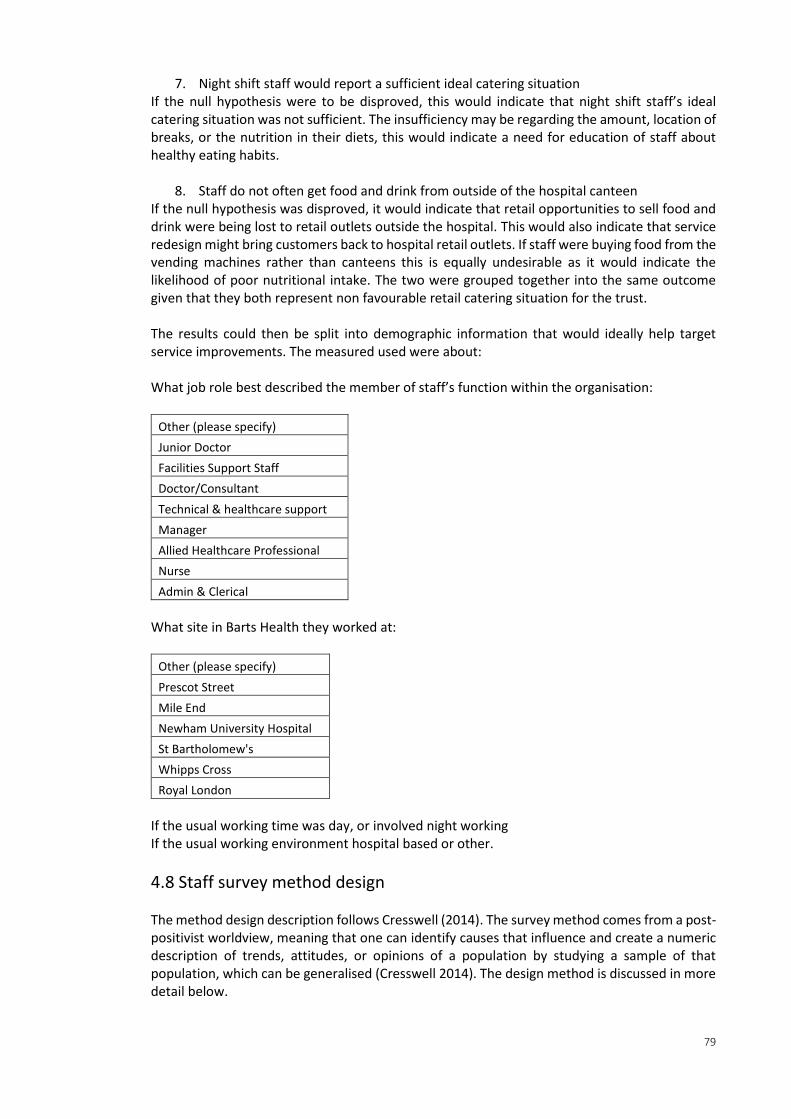
79
7. Night shift staff would report a sufficient ideal catering situation If the null hypothesis were to be disproved, this would indicate that night shift staff’s ideal catering situation was not sufficient. The insufficiency may be regarding the amount, location of breaks, or the nutrition in their diets, this would indicate a need for education of staff about healthy eating habits.
8. Staff do not often get food and drink from outside of the hospital canteen If the null hypothesis was disproved, it would indicate that retail opportunities to sell food and drink were being lost to retail outlets outside the hospital. This would also indicate that service redesign might bring customers back to hospital retail outlets. If staff were buying food from the vending machines rather than canteens this is equally undesirable as it would indicate the likelihood of poor nutritional intake. The two were grouped together into the same outcome given that they both represent non favourable retail catering situation for the trust. The results could then be split into demographic information that would ideally help target service improvements. The measured used were about: What job role best described the member of staff’s function within the organisation:
Other (please specify)
Junior Doctor
Facilities Support Staff
Doctor/Consultant
Technical & healthcare support
Manager
Allied Healthcare Professional
Nurse
Admin & Clerical
What site in Barts Health they worked at:
Other (please specify)
Prescot Street
Mile End
Newham University Hospital
St Bartholomew's
Whipps Cross
Royal London
If the usual working time was day, or involved night working If the usual working environment hospital based or other.
4.8 Staff survey method design The method design description follows Cresswell (2014). The survey method comes from a post-positivist worldview, meaning that one can identify causes that influence and create a numeric description of trends, attitudes, or opinions of a population by studying a sample of that population, which can be generalised (Cresswell 2014). The design method is discussed in more detail below.
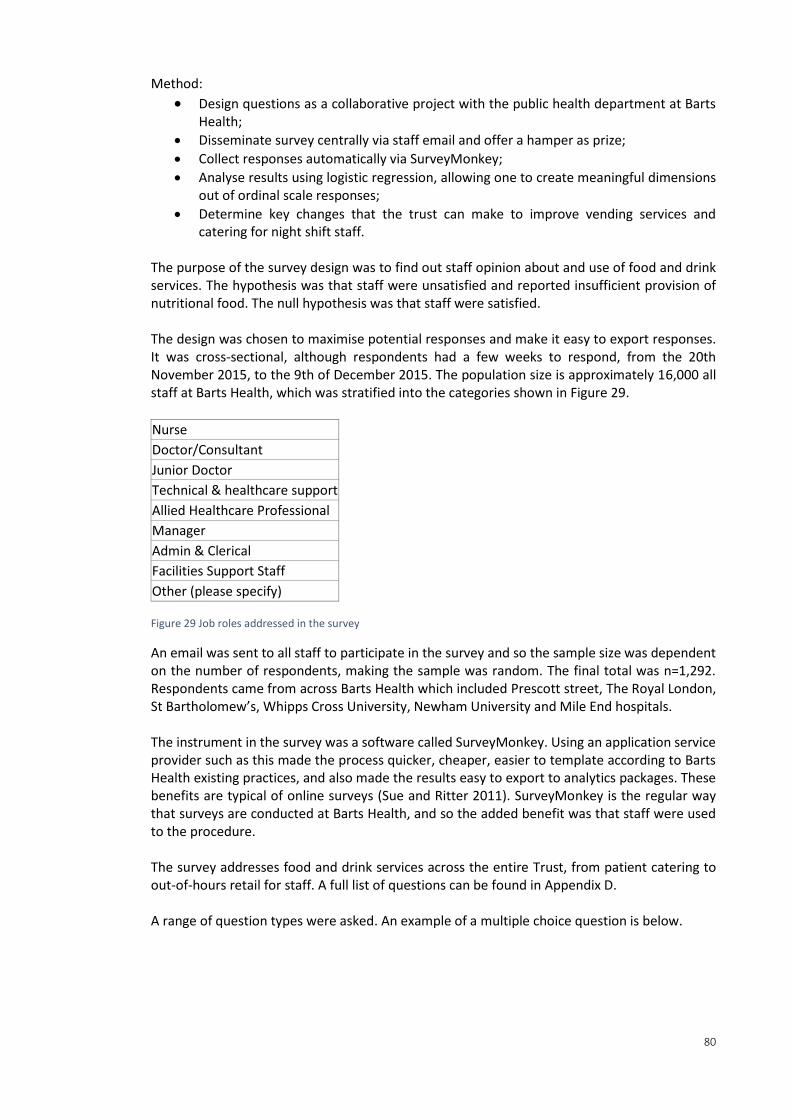
80
Method:
Design questions as a collaborative project with the public health department at Barts Health;
Disseminate survey centrally via staff email and offer a hamper as prize;
Collect responses automatically via SurveyMonkey;
Analyse results using logistic regression, allowing one to create meaningful dimensions out of ordinal scale responses;
Determine key changes that the trust can make to improve vending services and catering for night shift staff.
The purpose of the survey design was to find out staff opinion about and use of food and drink services. The hypothesis was that staff were unsatisfied and reported insufficient provision of nutritional food. The null hypothesis was that staff were satisfied. The design was chosen to maximise potential responses and make it easy to export responses. It was cross-sectional, although respondents had a few weeks to respond, from the 20th November 2015, to the 9th of December 2015. The population size is approximately 16,000 all staff at Barts Health, which was stratified into the categories shown in Figure 29.
Nurse
Doctor/Consultant
Junior Doctor
Technical & healthcare support
Allied Healthcare Professional
Manager
Admin & Clerical
Facilities Support Staff
Other (please specify) Figure 29 Job roles addressed in the survey
An email was sent to all staff to participate in the survey and so the sample size was dependent on the number of respondents, making the sample was random. The final total was n=1,292. Respondents came from across Barts Health which included Prescott street, The Royal London, St Bartholomew’s, Whipps Cross University, Newham University and Mile End hospitals. The instrument in the survey was a software called SurveyMonkey. Using an application service provider such as this made the process quicker, cheaper, easier to template according to Barts Health existing practices, and also made the results easy to export to analytics packages. These benefits are typical of online surveys (Sue and Ritter 2011). SurveyMonkey is the regular way that surveys are conducted at Barts Health, and so the added benefit was that staff were used to the procedure. The survey addresses food and drink services across the entire Trust, from patient catering to out-of-hours retail for staff. A full list of questions can be found in Appendix D. A range of question types were asked. An example of a multiple choice question is below.
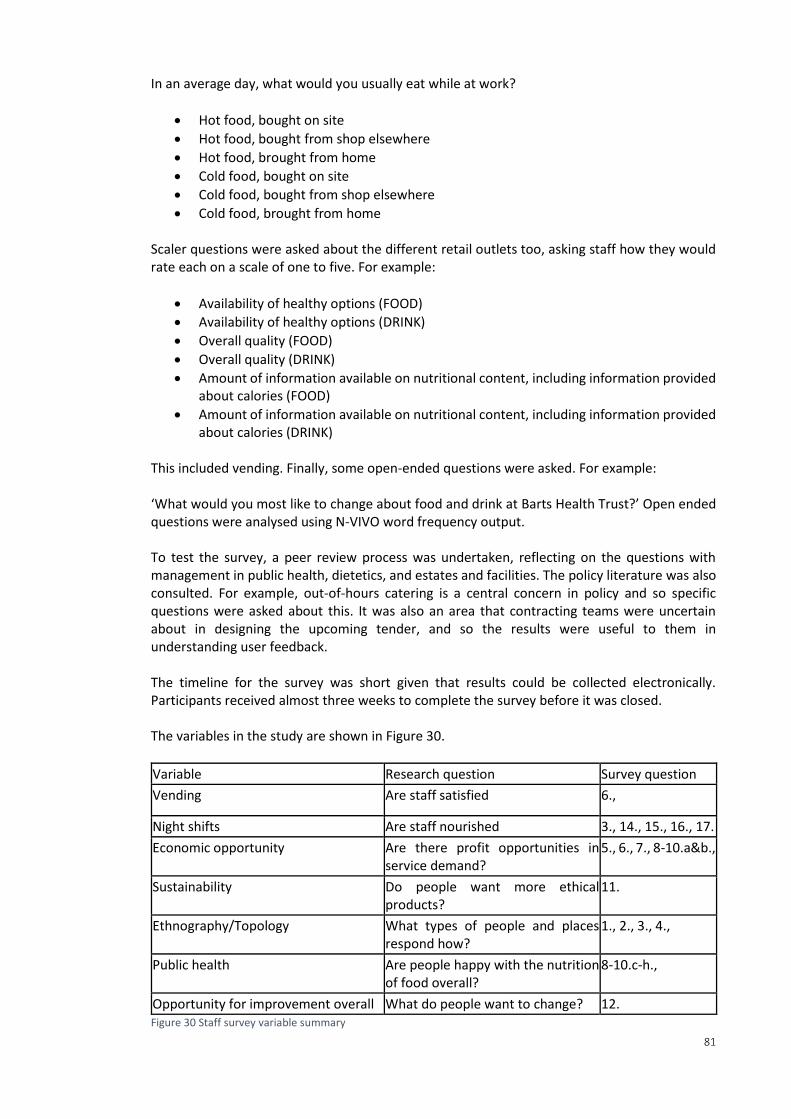
81
In an average day, what would you usually eat while at work?
Hot food, bought on site
Hot food, bought from shop elsewhere
Hot food, brought from home
Cold food, bought on site
Cold food, bought from shop elsewhere
Cold food, brought from home Scaler questions were asked about the different retail outlets too, asking staff how they would rate each on a scale of one to five. For example:
Availability of healthy options (FOOD)
Availability of healthy options (DRINK)
Overall quality (FOOD)
Overall quality (DRINK)
Amount of information available on nutritional content, including information provided about calories (FOOD)
Amount of information available on nutritional content, including information provided about calories (DRINK)
This included vending. Finally, some open-ended questions were asked. For example: ‘What would you most like to change about food and drink at Barts Health Trust?’ Open ended questions were analysed using N-VIVO word frequency output. To test the survey, a peer review process was undertaken, reflecting on the questions with management in public health, dietetics, and estates and facilities. The policy literature was also consulted. For example, out-of-hours catering is a central concern in policy and so specific questions were asked about this. It was also an area that contracting teams were uncertain about in designing the upcoming tender, and so the results were useful to them in understanding user feedback. The timeline for the survey was short given that results could be collected electronically. Participants received almost three weeks to complete the survey before it was closed. The variables in the study are shown in Figure 30.
Variable Research question Survey question
Vending Are staff satisfied 6.,
Night shifts Are staff nourished 3., 14., 15., 16., 17.
Economic opportunity Are there profit opportunities in service demand?
5., 6., 7., 8-10.a&b.,
Sustainability Do people want more ethical products?
11.
Ethnography/Topology What types of people and places respond how?
1., 2., 3., 4.,
Public health Are people happy with the nutrition of food overall?
8-10.c-h.,
Opportunity for improvement overall What do people want to change? 12. Figure 30 Staff survey variable summary
82
Only certain questions were included from the survey in analysis, those relating specifically to the concerns around vending, night shift work and those that might be compared to the vending scores as point of reference. Those included are listed in the next sections. Questions about sustainability, patient catering and day shift catering facilities were not analysed. The same methods would apply to these questions and could be performed at a later date for the interest of Barts Health.
4.9 Inferential statistics for survey For the staff survey, data was collected electronically via Survey Monkey. The member of staff who administrates all staff communication for Barts Health sent an email to the 16,000 members of staff at Barts Health with a link to the survey, and a picture of the hamper they might win for participating. The data was exported form SurveyMonkey in long format in the first instance. Codes were created for the dataset, swapping string variables with numerical. For example, a question about rating the food in vending machines asked for respondents to rate the food from 1 (Poor) to 5 (Excellent). They rated it on the availability of healthy options (FOOD), overall quality (FOOD) and finally, the amount of information available on nutritional content, including information provided about calories (FOOD). There was another question relating to the price of food. However, this was not analysed separately as it relates to the underlying metric of money rather than nutrition. Both were included in the analysis, only grouped as separate dimensions. The responses were changed to purely numerical values of 1, 2, 3, 4 and 5. This numerical dataset was later required to set dimensions for each question. If a respondent answered 3 or less, for example, as to what they thought of vending, the response was placed in the dimension ‘vendFoodBad’==1. If they answered 4 or 5, ‘vendFoodBad’==0. These dimensions were then used in the further analysis. The logic and process behind this is explained in more detail below. Creating dimensions allowed for meaningful analysis that linked the responses to the hypothesis questions about how staff felt about catering. If an ordinal scale had been kept instead of using a binary approach, the difference between 1 and 2 would be quite small and it would be difficult to extrapolate any conclusions from their comparison. Using thresholds that separate responses into ≤3 and ≥4 gives a clear cut off to indicate the acceptable level of opinion before it becomes clear the respondent's views fall below service standards. The new dimension gave a clear differential between good versus bad opinions where an ordinal scale could not. The threshold of 3 and below was chosen, and this includes the negative options of 1 and 2, as well as the indifferent (which is also not favourable). The approach was based on finding and analysing negative feedback. Positive feedback was taken to mean that there was not a problem and was used as support of the null hypothesis: Staff opinion is positive, there is no problem and do nothing. Choosing the threshold based on this logic of finding non-positive responses gave the dimensions inherent and straightforward logic one can see in the formation of each dimension. Each dimension might include several questions. For example, to create a dimension that added up all the negative responses to staff’s opinion of vending food, the focus was on nutrition and health of the food or drink. A separate dimension was used to summarise opinion of vending costs, given that this is fundamentally different from opinions about nutrition. The vending food
83
dimension was nicknamed ‘vendFoodBad’, which means, respondents indicated they felt vending food was bad if they responded ≤3 to the following questions about: Availability of healthy options (FOOD) Overall quality (FOOD) Amount of information available on nutritional content, including information provided about calories (FOOD) If the response was ≤3 and was not left blank for any of these questions, the respondent was counted as 1 in the ‘vendFoodBad’ dimension. If the response for all three questions was ≥4 the value of 0 was attributed to the dimension. Each respondent’s answers were added up to create the total for this dimension. ‘vendFoodBad’ would be equal to the number of respondents falling who were given a value of 1. The same type of questions were asked for vending drinks. For a full list of dimensions see Appendix E. Once the dimensions had been created, the number of people who thought different aspects of the catering services were bad could be counted. The large sample (n=1292) made it possible to perform meaningful analysis. The type of data created is suited to performance of a chi-squared test. This allows one to assess the relationship between two categorical variables (Lewis-Beck et al 2003). The chi-squared test equation is: Chi-squared test equation
𝑋2 = ∑(𝑓0 − 𝑓𝑒)2
𝑓𝑒
This type of analysis is appropriate where the data is about counting people, in this case the number of people who responded ‘vendFoodBad’ (a number ≤3) to the corresponding questions. This kind of data is binary and so requires the reporting of the odds ratio, rather than a coefficient value for analysis. It allows one to understand the factors that predict an event. In this case the predictive factors that were being understood were ‘Shift time’, which was split into two. The first was Daytime and second included both night time or a mix of day and night. ‘Work environment’ was another independent variable, it was split into Other, Out in the community, Office or Hospital. There were also two more independent factor variables predicting response. These were ‘Job Role’, with nine different job roles including, for example, an administrative and clerical role, which was used as the baseline, and nurses. There was also ‘Work Site’, with seven sites including the administrative offices of Prescot Street, which were also used as the baseline, and others such as the Royal London Hospital. Using binary outcome variables, and the categorical predictor (independent) variables listed above, the chi-square test could be used as the foundation to build a logistical regression model. Regression assumes:
𝑌 = 𝑎 In regression, a is the intercept and Y is the outcome. Y is a negative or unwanted opinion that represents a negative aspect of the current vending and night shift service, represented by the value 1 for each question. If Y was equal to zero it represented a positive opinion and was not of interest in the analysis.
84
For non-linear regression, a binary outcome (2levels counting) includes:
+ 𝐶 ∗ 𝑠ℎ𝑖𝑓𝑡 𝑡𝑖𝑚𝑒 Shift time could be zero, representing day shift workers, or one, representing night shift workers. Again, as with the linear regression used for the point of sale intervention analysis, one is the variable of interest, zero is the comparator. In this case, C is the odds ratio (log scale) of Y (eg. positive negative opinion) for day compared to night shift. EG if OR=0.75, then the risk of having a negative opinion in night shift is 25% lower than the risk for day shift workers. In non-linear regression, a categorical (≥3 levels) includes:
+ 𝐷 ∗ 𝑤𝑜𝑟𝑘𝑠𝑖𝑡𝑒 There are seven potential worksites labelled zero through six, Prescott Street, the administrative offices, were used as a baseline. Categorical variables describing administrative roles were used as the baseline throughout. D is the odds ratio (log scale) of Y (eg negative opinion) between the reference group which you choose (e.g. admin Prescot Street) and each of the other categories with the same intercept as C. The mathematical equation for a logistic regression is: Logistic regression equation
𝑙𝑜𝑔𝑖𝑡(𝑝) = 𝑙𝑜 𝑔 (𝑝
1− 𝑝) = 𝑎 + 𝑏𝑋1 + 𝑐𝑋2 + 𝑑𝑋3 + ⋯
Using a logistic regression in the binary case (eg. vendingFood = 1 or 0), allows one to adjust for confounders where looking at a single factor like the job role of nurse or night shift. For example, one can check if being a night shift worker gives one a higher probability of being dissatisfied with vending machine food and drink.
4.10 Conclusion The methodology of this research was drawn a from mixed methods approach, using quantitative analysisas well as identifying with a grounded theory approach to build from the actual situation (Patton 2015, Robson 1991, Tashakori and Teddlie 2010). The methodology had to fit the research project, the industry demand for change, and work for change from within the system (Patton 2015, Robson 1991, Wagner et. al. 2011, O’Brien 2014). Broadly, the existing service measures in place fit a traditionally quantitative set of approaches, while the service evaluation methods and quality checks, scoping and consultancy, were broadly qualitative (Schedler 2004, Rose and Cray 2010, Coakley et al 2014, Morgan 2007). Finally, the sampling strategy uses a multiple case sampling method, prioritising qualitative information for service improvement, with primary, quantitative research, to back up and elaborate on critical aspects of service delivery (Tashakori and Teddlie 2010).
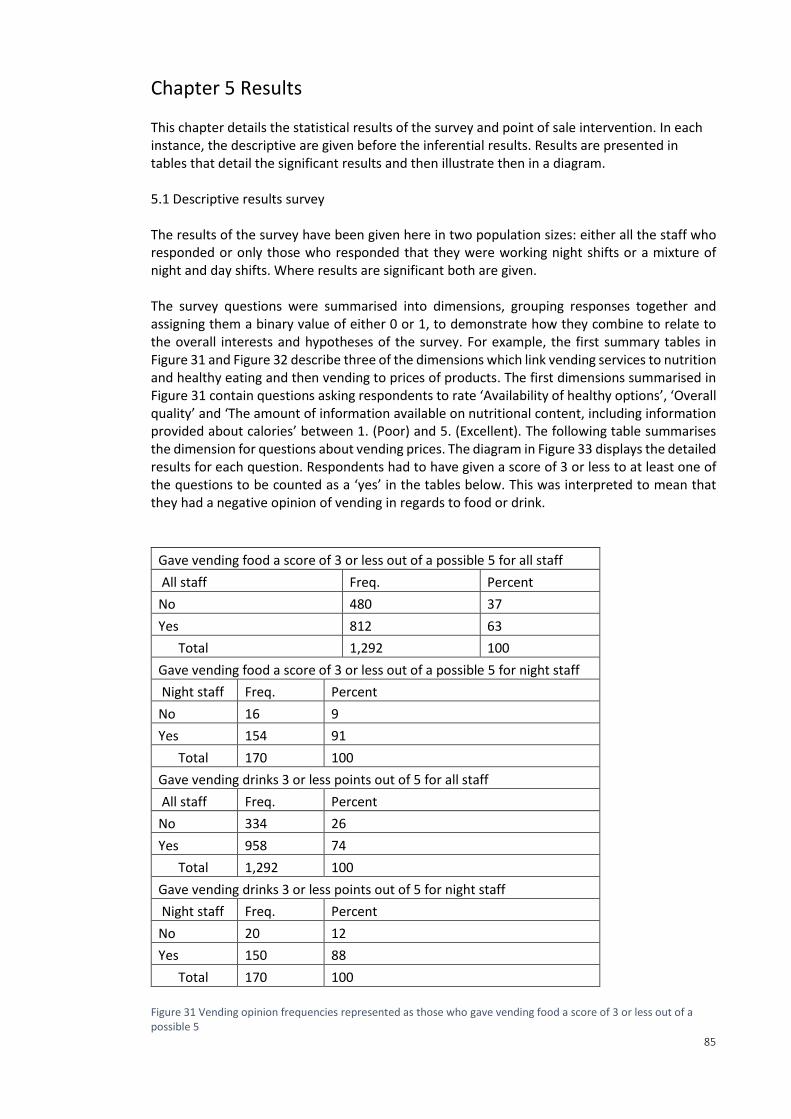
85
Chapter 5 Results This chapter details the statistical results of the survey and point of sale intervention. In each instance, the descriptive are given before the inferential results. Results are presented in tables that detail the significant results and then illustrate then in a diagram. 5.1 Descriptive results survey The results of the survey have been given here in two population sizes: either all the staff who responded or only those who responded that they were working night shifts or a mixture of night and day shifts. Where results are significant both are given. The survey questions were summarised into dimensions, grouping responses together and assigning them a binary value of either 0 or 1, to demonstrate how they combine to relate to the overall interests and hypotheses of the survey. For example, the first summary tables in Figure 31 and Figure 32 describe three of the dimensions which link vending services to nutrition and healthy eating and then vending to prices of products. The first dimensions summarised in Figure 31 contain questions asking respondents to rate ‘Availability of healthy options’, ‘Overall quality’ and ‘The amount of information available on nutritional content, including information provided about calories’ between 1. (Poor) and 5. (Excellent). The following table summarises the dimension for questions about vending prices. The diagram in Figure 33 displays the detailed results for each question. Respondents had to have given a score of 3 or less to at least one of the questions to be counted as a ‘yes’ in the tables below. This was interpreted to mean that they had a negative opinion of vending in regards to food or drink.
Gave vending food a score of 3 or less out of a possible 5 for all staff
All staff Freq. Percent
No 480 37
Yes 812 63
Total 1,292 100
Gave vending food a score of 3 or less out of a possible 5 for night staff
Night staff Freq. Percent
No 16 9
Yes 154 91
Total 170 100
Gave vending drinks 3 or less points out of 5 for all staff
All staff Freq. Percent
No 334 26
Yes 958 74
Total 1,292 100
Gave vending drinks 3 or less points out of 5 for night staff
Night staff Freq. Percent
No 20 12
Yes 150 88
Total 170 100
Figure 31 Vending opinion frequencies represented as those who gave vending food a score of 3 or less out of a possible 5
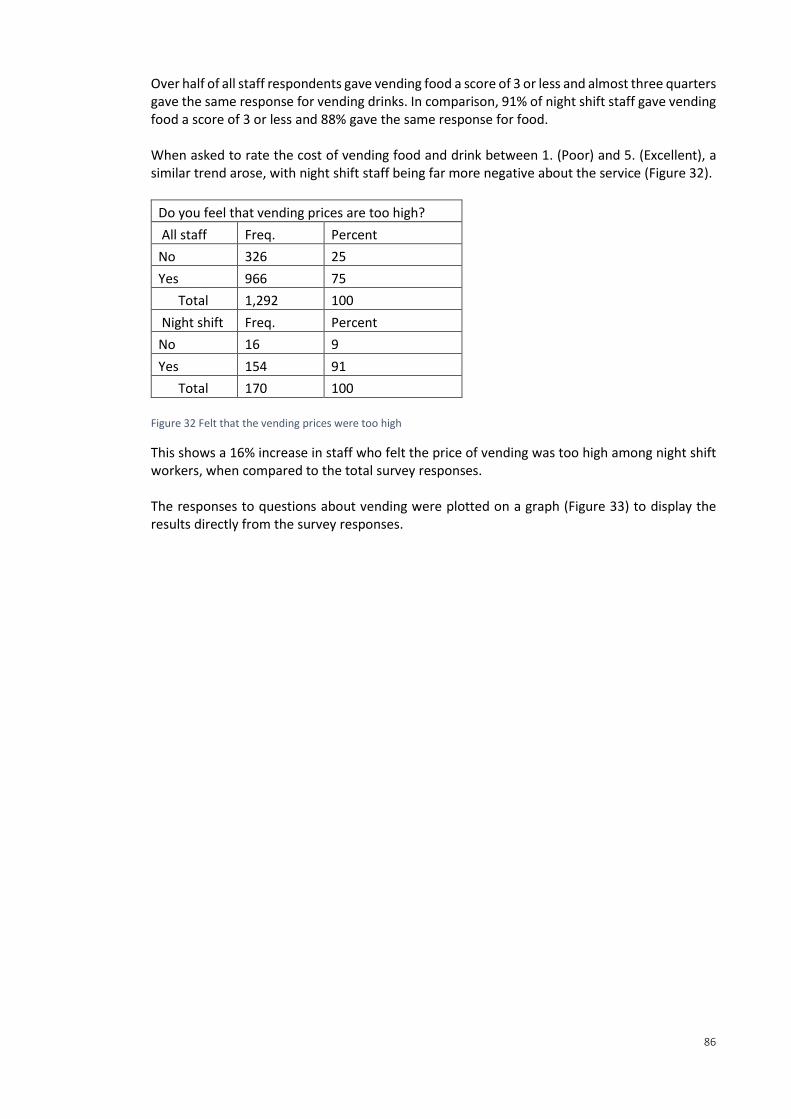
86
Over half of all staff respondents gave vending food a score of 3 or less and almost three quarters gave the same response for vending drinks. In comparison, 91% of night shift staff gave vending food a score of 3 or less and 88% gave the same response for food. When asked to rate the cost of vending food and drink between 1. (Poor) and 5. (Excellent), a similar trend arose, with night shift staff being far more negative about the service (Figure 32).
Do you feel that vending prices are too high?
All staff Freq. Percent
No 326 25
Yes 966 75
Total 1,292 100
Night shift Freq. Percent
No 16 9
Yes 154 91
Total 170 100
Figure 32 Felt that the vending prices were too high
This shows a 16% increase in staff who felt the price of vending was too high among night shift workers, when compared to the total survey responses. The responses to questions about vending were plotted on a graph (Figure 33) to display the results directly from the survey responses.
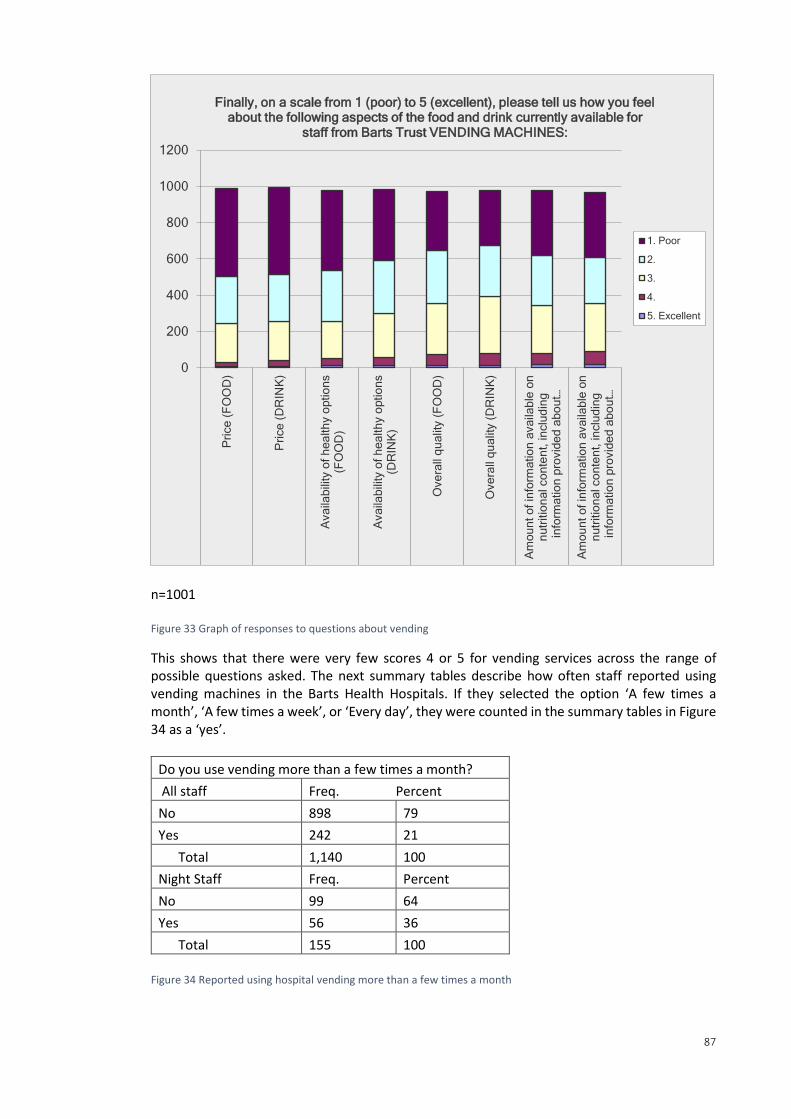
87
n=1001 Figure 33 Graph of responses to questions about vending
This shows that there were very few scores 4 or 5 for vending services across the range of possible questions asked. The next summary tables describe how often staff reported using vending machines in the Barts Health Hospitals. If they selected the option ‘A few times a month’, ‘A few times a week’, or ‘Every day’, they were counted in the summary tables in Figure 34 as a ‘yes’.
Do you use vending more than a few times a month?
All staff Freq. Percent
No 898 79
Yes 242 21
Total 1,140 100
Night Staff Freq. Percent
No 99 64
Yes 56 36
Total 155 100
Figure 34 Reported using hospital vending more than a few times a month
0
200
400
600
800
1000
1200
Pri
ce
(F
OO
D)
Pri
ce
(D
RIN
K)
Ava
ilab
ility
of
he
alth
y o
ptio
ns
(FO
OD
)
Ava
ilab
ility
of
he
alth
y o
ptio
ns
(DR
INK
)
Ove
rall
qu
alit
y (
FO
OD
)
Ove
rall
qu
alit
y (
DR
INK
)
Am
ou
nt
of
info
rma
tio
n a
va
ilab
le o
nn
utr
itio
na
l co
nte
nt,
in
clu
din
gin
form
atio
n p
rovid
ed
ab
ou
t…
Am
ou
nt
of
info
rma
tio
n a
va
ilab
le o
nn
utr
itio
na
l co
nte
nt,
in
clu
din
gin
form
atio
n p
rovid
ed
ab
ou
t…
Price (FOOD)Price (DRINK)Availability of healthy options (FOOD)Availability of healthy options (DRINK)Overall quality (FOOD)Overall quality (DRINK)Amount of information available on nutritionalAmount of information available on nutritional
Finally, on a scale from 1 (poor) to 5 (excellent), please tell us how you feel about the following aspects of the food and drink currently available for
staff from Barts Trust VENDING MACHINES:
1. Poor
2.
3.
4.
5. Excellent
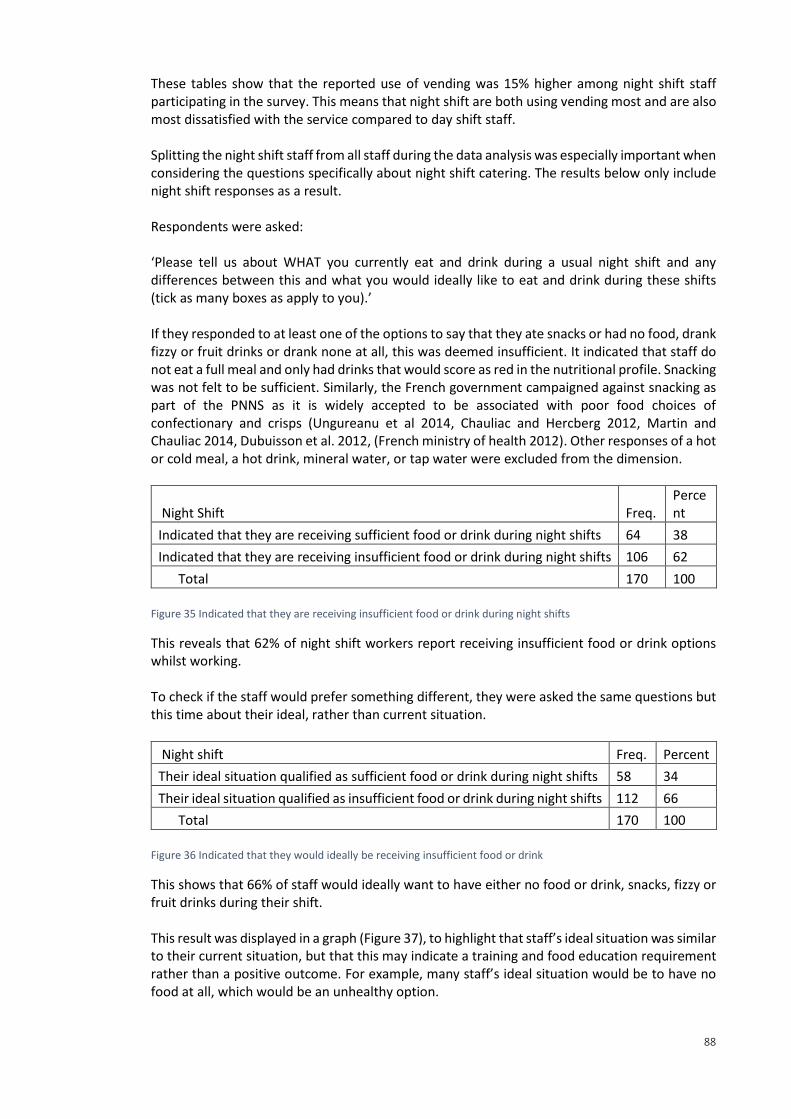
88
These tables show that the reported use of vending was 15% higher among night shift staff participating in the survey. This means that night shift are both using vending most and are also most dissatisfied with the service compared to day shift staff. Splitting the night shift staff from all staff during the data analysis was especially important when considering the questions specifically about night shift catering. The results below only include night shift responses as a result. Respondents were asked: ‘Please tell us about WHAT you currently eat and drink during a usual night shift and any differences between this and what you would ideally like to eat and drink during these shifts (tick as many boxes as apply to you).’ If they responded to at least one of the options to say that they ate snacks or had no food, drank fizzy or fruit drinks or drank none at all, this was deemed insufficient. It indicated that staff do not eat a full meal and only had drinks that would score as red in the nutritional profile. Snacking was not felt to be sufficient. Similarly, the French government campaigned against snacking as part of the PNNS as it is widely accepted to be associated with poor food choices of confectionary and crisps (Ungureanu et al 2014, Chauliac and Hercberg 2012, Martin and Chauliac 2014, Dubuisson et al. 2012, (French ministry of health 2012). Other responses of a hot or cold meal, a hot drink, mineral water, or tap water were excluded from the dimension.
Night Shift Freq. Percent
Indicated that they are receiving sufficient food or drink during night shifts 64 38
Indicated that they are receiving insufficient food or drink during night shifts 106 62
Total 170 100
Figure 35 Indicated that they are receiving insufficient food or drink during night shifts
This reveals that 62% of night shift workers report receiving insufficient food or drink options whilst working. To check if the staff would prefer something different, they were asked the same questions but this time about their ideal, rather than current situation.
Night shift Freq. Percent
Their ideal situation qualified as sufficient food or drink during night shifts 58 34
Their ideal situation qualified as insufficient food or drink during night shifts 112 66
Total 170 100
Figure 36 Indicated that they would ideally be receiving insufficient food or drink
This shows that 66% of staff would ideally want to have either no food or drink, snacks, fizzy or fruit drinks during their shift. This result was displayed in a graph (Figure 37), to highlight that staff’s ideal situation was similar to their current situation, but that this may indicate a training and food education requirement rather than a positive outcome. For example, many staff’s ideal situation would be to have no food at all, which would be an unhealthy option.
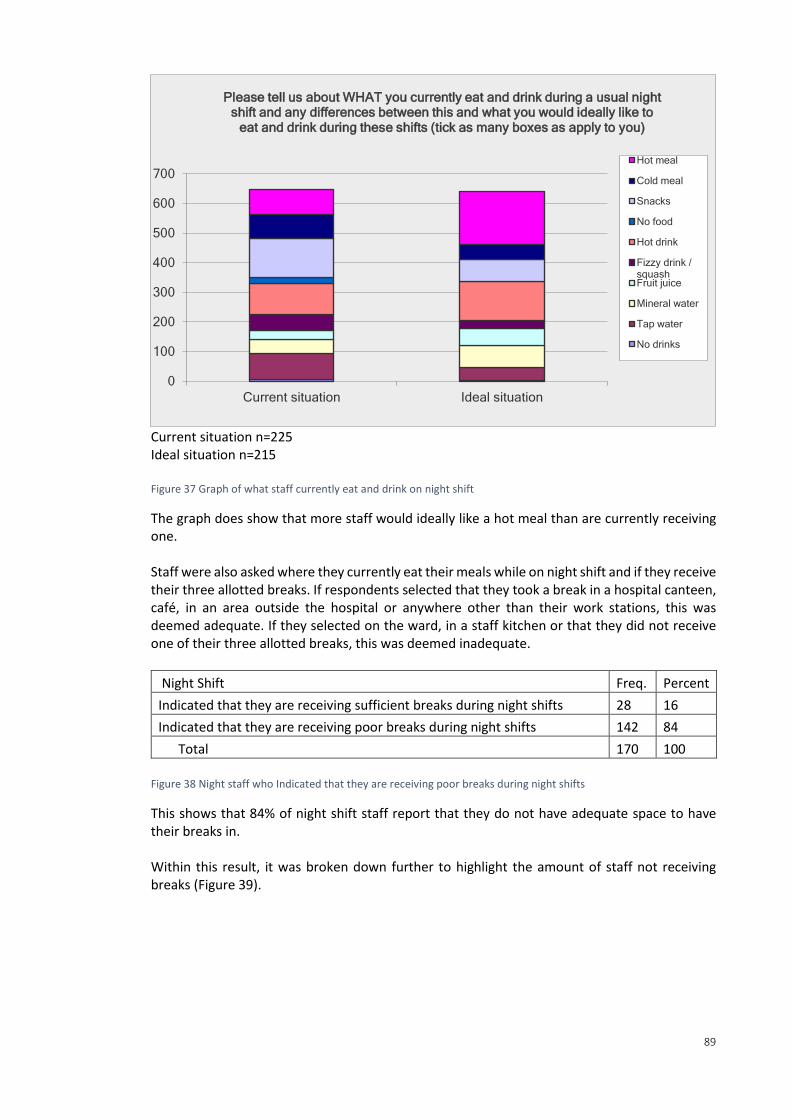
89
Current situation n=225 Ideal situation n=215 Figure 37 Graph of what staff currently eat and drink on night shift
The graph does show that more staff would ideally like a hot meal than are currently receiving one. Staff were also asked where they currently eat their meals while on night shift and if they receive their three allotted breaks. If respondents selected that they took a break in a hospital canteen, café, in an area outside the hospital or anywhere other than their work stations, this was deemed adequate. If they selected on the ward, in a staff kitchen or that they did not receive one of their three allotted breaks, this was deemed inadequate.
Night Shift Freq. Percent
Indicated that they are receiving sufficient breaks during night shifts 28 16
Indicated that they are receiving poor breaks during night shifts 142 84
Total 170 100
Figure 38 Night staff who Indicated that they are receiving poor breaks during night shifts
This shows that 84% of night shift staff report that they do not have adequate space to have their breaks in. Within this result, it was broken down further to highlight the amount of staff not receiving breaks (Figure 39).
0
100
200
300
400
500
600
700
Current situation Ideal situation
Please tell us about WHAT you currently eat and drink during a usual night shift and any differences between this and what you would ideally like to
eat and drink during these shifts (tick as many boxes as apply to you)
Hot meal
Cold meal
Snacks
No food
Hot drink
Fizzy drink /squashFruit juice
Mineral water
Tap water
No drinks
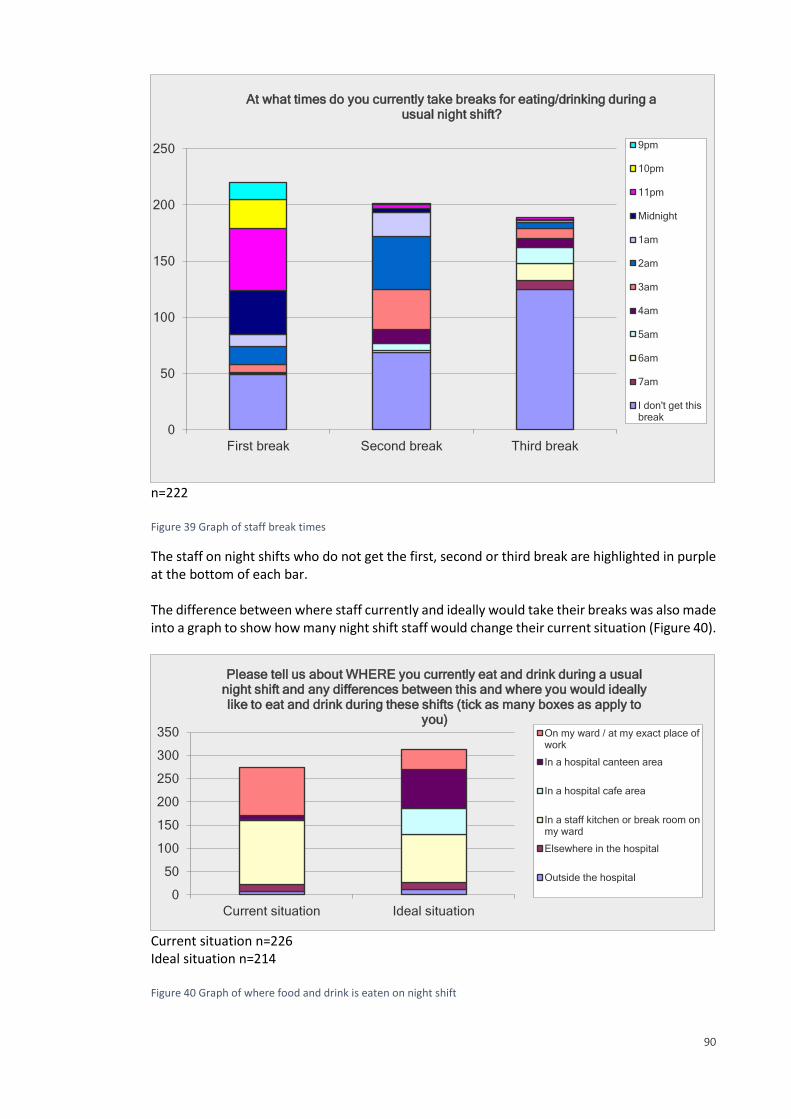
90
n=222 Figure 39 Graph of staff break times
The staff on night shifts who do not get the first, second or third break are highlighted in purple at the bottom of each bar. The difference between where staff currently and ideally would take their breaks was also made into a graph to show how many night shift staff would change their current situation (Figure 40).
Current situation n=226 Ideal situation n=214 Figure 40 Graph of where food and drink is eaten on night shift
0
50
100
150
200
250
First break Second break Third break
At what times do you currently take breaks for eating/drinking during a usual night shift?
9pm
10pm
11pm
Midnight
1am
2am
3am
4am
5am
6am
7am
I don't get thisbreak
0
50
100
150
200
250
300
350
Current situation Ideal situation
Please tell us about WHERE you currently eat and drink during a usual night shift and any differences between this and where you would ideally like to eat and drink during these shifts (tick as many boxes as apply to
you)On my ward / at my exact place ofwork
In a hospital canteen area
In a hospital cafe area
In a staff kitchen or break room onmy ward
Elsewhere in the hospital
Outside the hospital
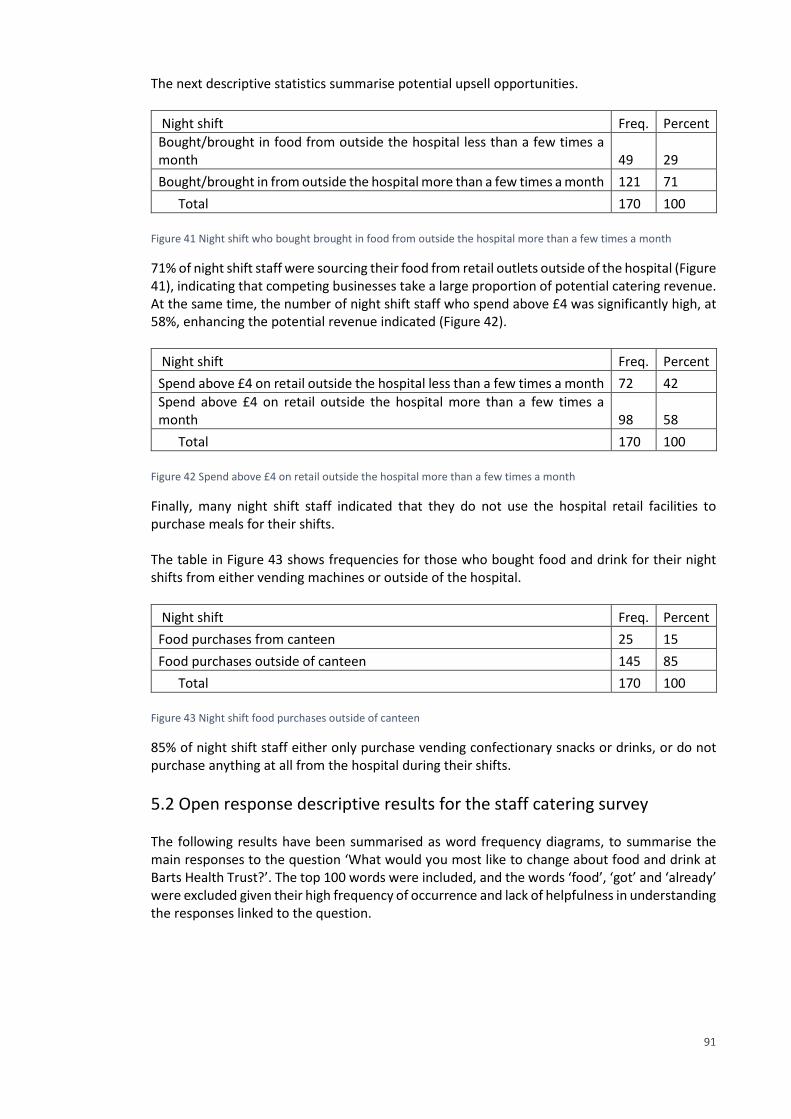
91
The next descriptive statistics summarise potential upsell opportunities.
Night shift Freq. Percent
Bought/brought in food from outside the hospital less than a few times a month 49 29
Bought/brought in from outside the hospital more than a few times a month 121 71
Total 170 100
Figure 41 Night shift who bought brought in food from outside the hospital more than a few times a month
71% of night shift staff were sourcing their food from retail outlets outside of the hospital (Figure 41), indicating that competing businesses take a large proportion of potential catering revenue. At the same time, the number of night shift staff who spend above £4 was significantly high, at 58%, enhancing the potential revenue indicated (Figure 42).
Night shift Freq. Percent
Spend above £4 on retail outside the hospital less than a few times a month 72 42
Spend above £4 on retail outside the hospital more than a few times a month 98 58
Total 170 100
Figure 42 Spend above £4 on retail outside the hospital more than a few times a month
Finally, many night shift staff indicated that they do not use the hospital retail facilities to purchase meals for their shifts. The table in Figure 43 shows frequencies for those who bought food and drink for their night shifts from either vending machines or outside of the hospital.
Night shift Freq. Percent
Food purchases from canteen 25 15
Food purchases outside of canteen 145 85
Total 170 100
Figure 43 Night shift food purchases outside of canteen
85% of night shift staff either only purchase vending confectionary snacks or drinks, or do not purchase anything at all from the hospital during their shifts.
5.2 Open response descriptive results for the staff catering survey The following results have been summarised as word frequency diagrams, to summarise the main responses to the question ‘What would you most like to change about food and drink at Barts Health Trust?’. The top 100 words were included, and the words ‘food’, ‘got’ and ‘already’ were excluded given their high frequency of occurrence and lack of helpfulness in understanding the responses linked to the question.
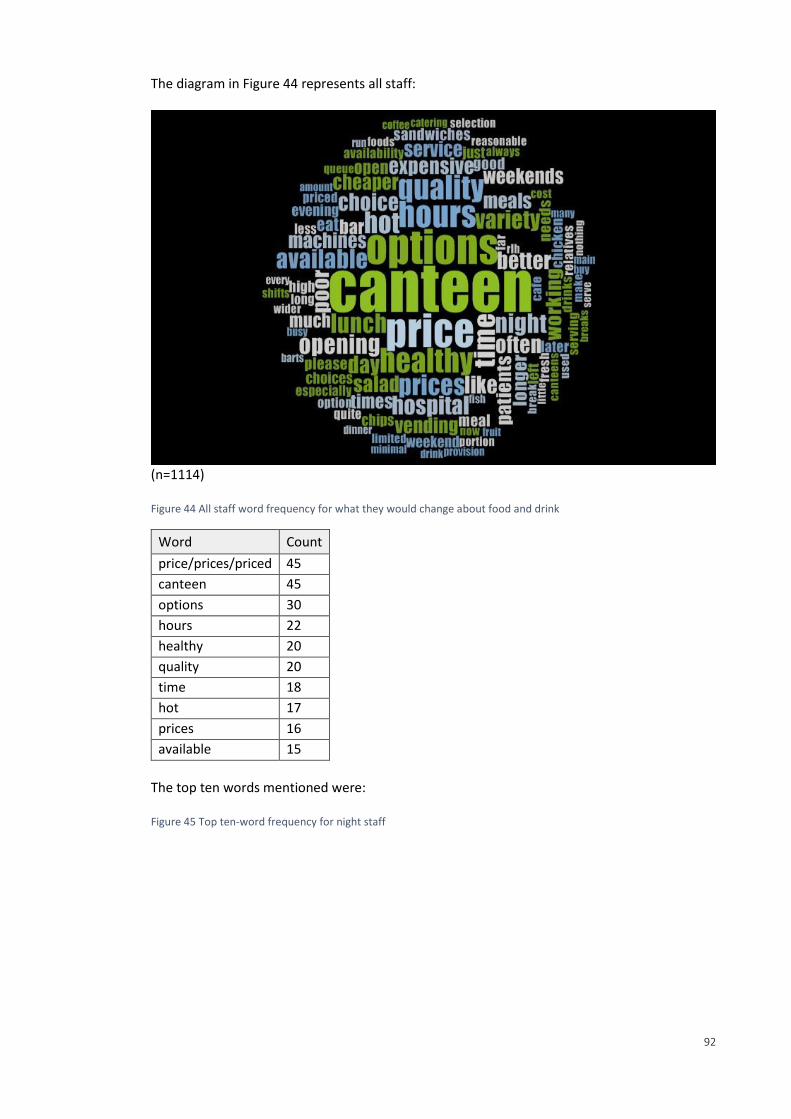
92
The diagram in Figure 44 represents all staff:
(n=1114) Figure 44 All staff word frequency for what they would change about food and drink
Word Count
price/prices/priced 45
canteen 45
options 30
hours 22
healthy 20
quality 20
time 18
hot 17
prices 16
available 15
The top ten words mentioned were: Figure 45 Top ten-word frequency for night staff
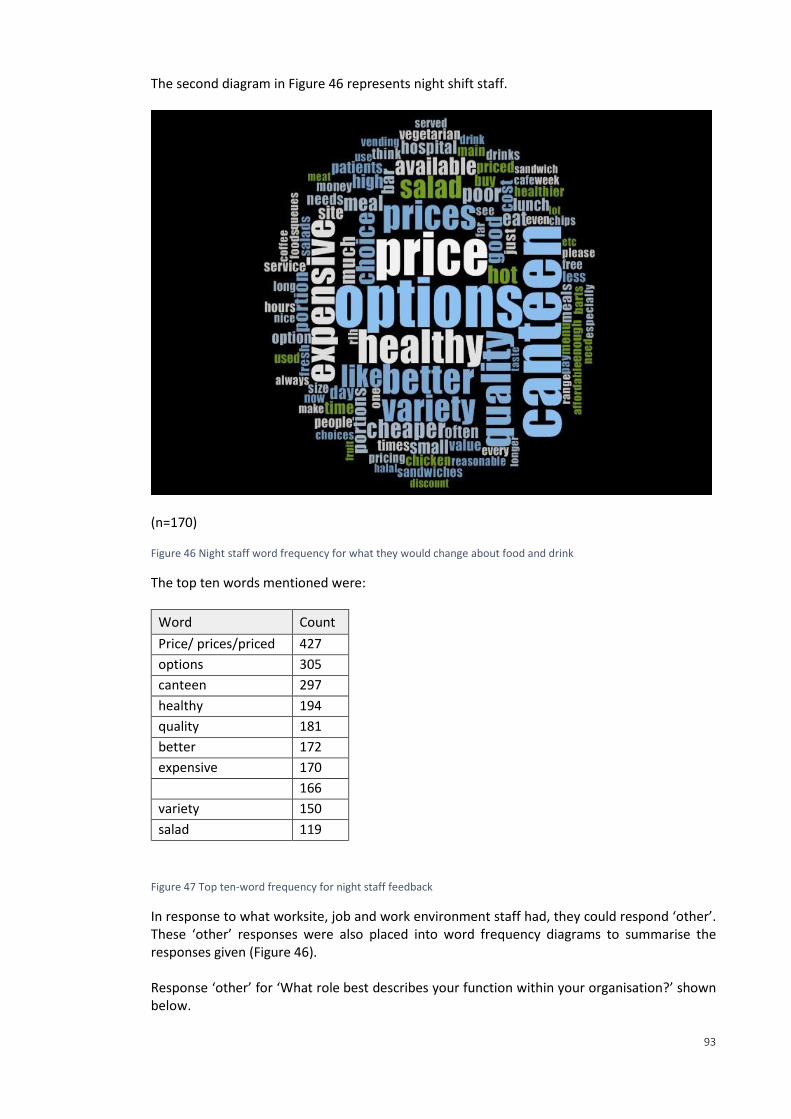
93
The second diagram in Figure 46 represents night shift staff.
(n=170) Figure 46 Night staff word frequency for what they would change about food and drink
The top ten words mentioned were:
Word Count
Price/ prices/priced 427
options 305
canteen 297
healthy 194
quality 181
better 172
expensive 170
166
variety 150
salad 119
Figure 47 Top ten-word frequency for night staff feedback
In response to what worksite, job and work environment staff had, they could respond ‘other’. These ‘other’ responses were also placed into word frequency diagrams to summarise the responses given (Figure 46). Response ‘other’ for ‘What role best describes your function within your organisation?’ shown below.
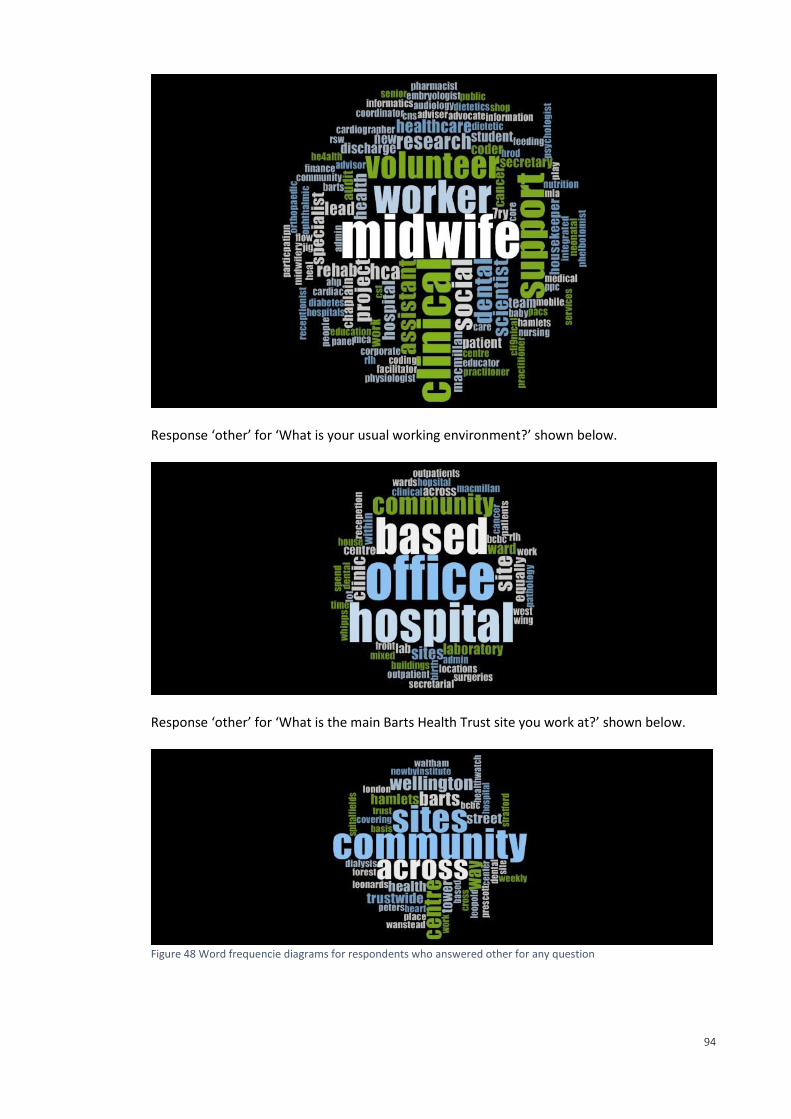
94
Response ‘other’ for ‘What is your usual working environment?’ shown below.
Response ‘other’ for ‘What is the main Barts Health Trust site you work at?’ shown below.
Figure 48 Word frequencie diagrams for respondents who answered other for any question
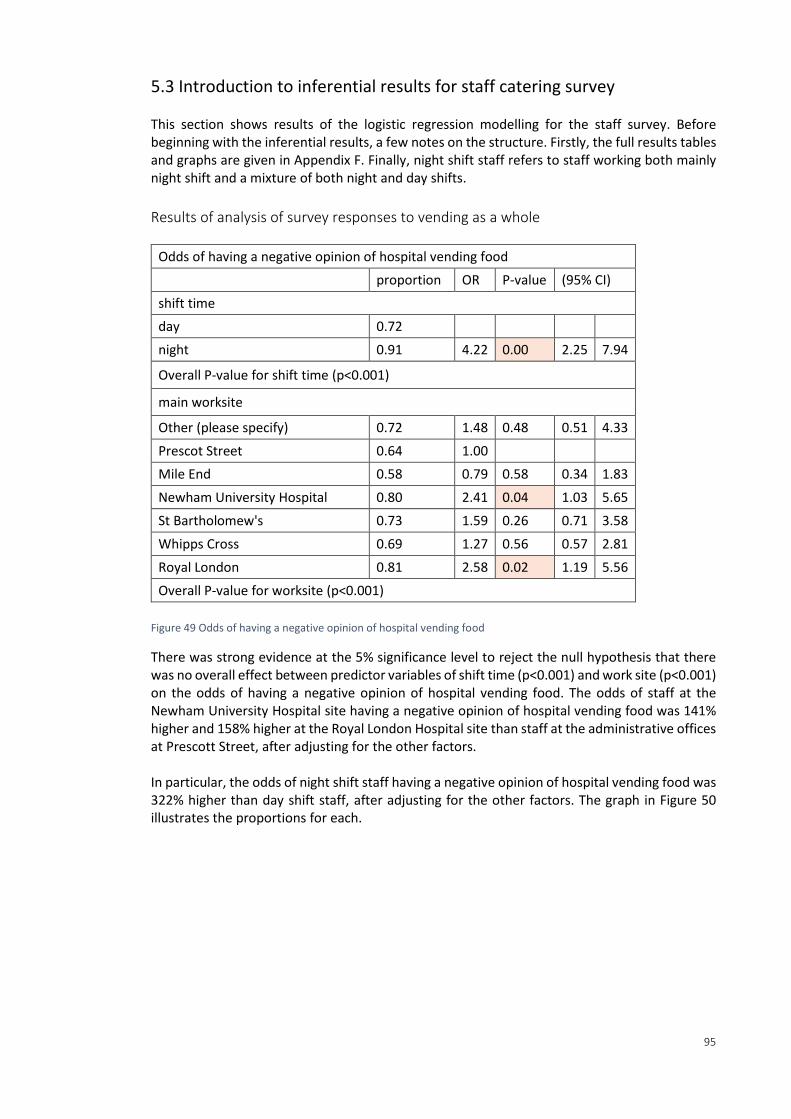
95
5.3 Introduction to inferential results for staff catering survey This section shows results of the logistic regression modelling for the staff survey. Before beginning with the inferential results, a few notes on the structure. Firstly, the full results tables and graphs are given in Appendix F. Finally, night shift staff refers to staff working both mainly night shift and a mixture of both night and day shifts.
Results of analysis of survey responses to vending as a whole
Odds of having a negative opinion of hospital vending food
proportion OR P-value (95% CI)
shift time
day 0.72
night 0.91 4.22 0.00 2.25 7.94
Overall P-value for shift time (p<0.001)
main worksite
Other (please specify) 0.72 1.48 0.48 0.51 4.33
Prescot Street 0.64 1.00
Mile End 0.58 0.79 0.58 0.34 1.83
Newham University Hospital 0.80 2.41 0.04 1.03 5.65
St Bartholomew's 0.73 1.59 0.26 0.71 3.58
Whipps Cross 0.69 1.27 0.56 0.57 2.81
Royal London 0.81 2.58 0.02 1.19 5.56
Overall P-value for worksite (p<0.001)
Figure 49 Odds of having a negative opinion of hospital vending food
There was strong evidence at the 5% significance level to reject the null hypothesis that there was no overall effect between predictor variables of shift time (p<0.001) and work site (p<0.001) on the odds of having a negative opinion of hospital vending food. The odds of staff at the Newham University Hospital site having a negative opinion of hospital vending food was 141% higher and 158% higher at the Royal London Hospital site than staff at the administrative offices at Prescott Street, after adjusting for the other factors. In particular, the odds of night shift staff having a negative opinion of hospital vending food was 322% higher than day shift staff, after adjusting for the other factors. The graph in Figure 50 illustrates the proportions for each.
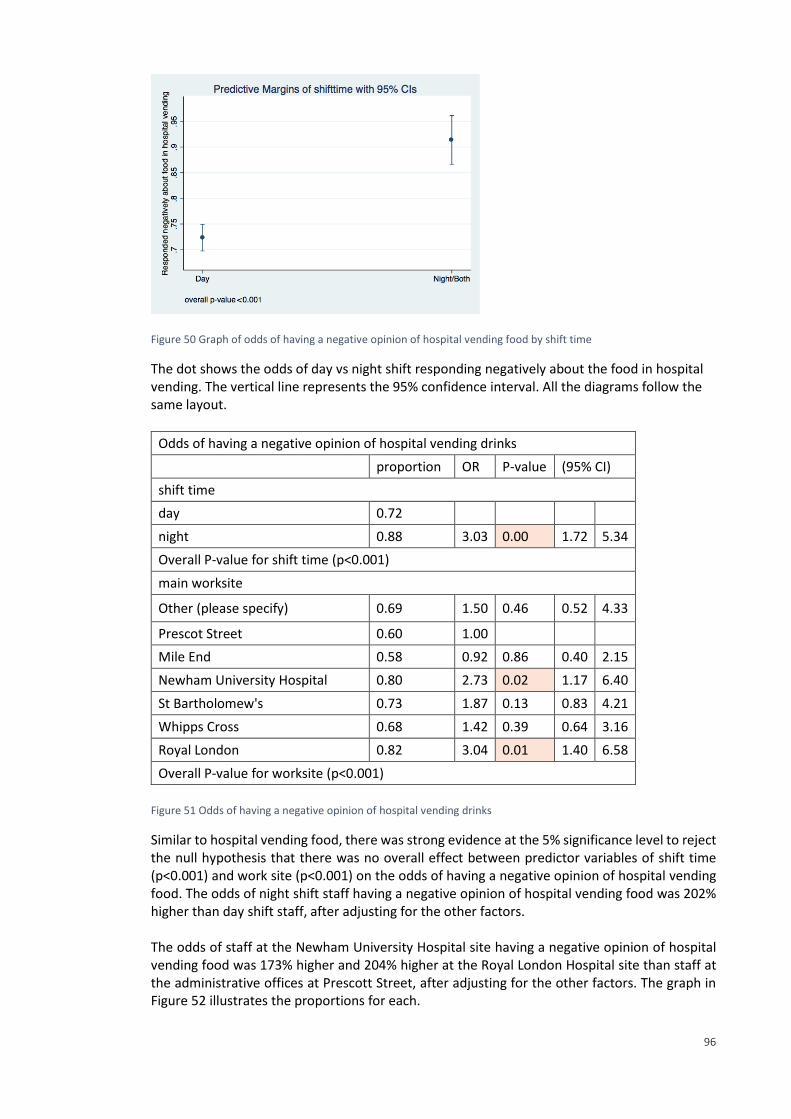
96
Figure 50 Graph of odds of having a negative opinion of hospital vending food by shift time
The dot shows the odds of day vs night shift responding negatively about the food in hospital vending. The vertical line represents the 95% confidence interval. All the diagrams follow the same layout.
Odds of having a negative opinion of hospital vending drinks
proportion OR P-value (95% CI)
shift time
day 0.72
night 0.88 3.03 0.00 1.72 5.34
Overall P-value for shift time (p<0.001)
main worksite
Other (please specify) 0.69 1.50 0.46 0.52 4.33
Prescot Street 0.60 1.00
Mile End 0.58 0.92 0.86 0.40 2.15
Newham University Hospital 0.80 2.73 0.02 1.17 6.40
St Bartholomew's 0.73 1.87 0.13 0.83 4.21
Whipps Cross 0.68 1.42 0.39 0.64 3.16
Royal London 0.82 3.04 0.01 1.40 6.58
Overall P-value for worksite (p<0.001)
Figure 51 Odds of having a negative opinion of hospital vending drinks
Similar to hospital vending food, there was strong evidence at the 5% significance level to reject the null hypothesis that there was no overall effect between predictor variables of shift time (p<0.001) and work site (p<0.001) on the odds of having a negative opinion of hospital vending food. The odds of night shift staff having a negative opinion of hospital vending food was 202% higher than day shift staff, after adjusting for the other factors. The odds of staff at the Newham University Hospital site having a negative opinion of hospital vending food was 173% higher and 204% higher at the Royal London Hospital site than staff at the administrative offices at Prescott Street, after adjusting for the other factors. The graph in Figure 52 illustrates the proportions for each.
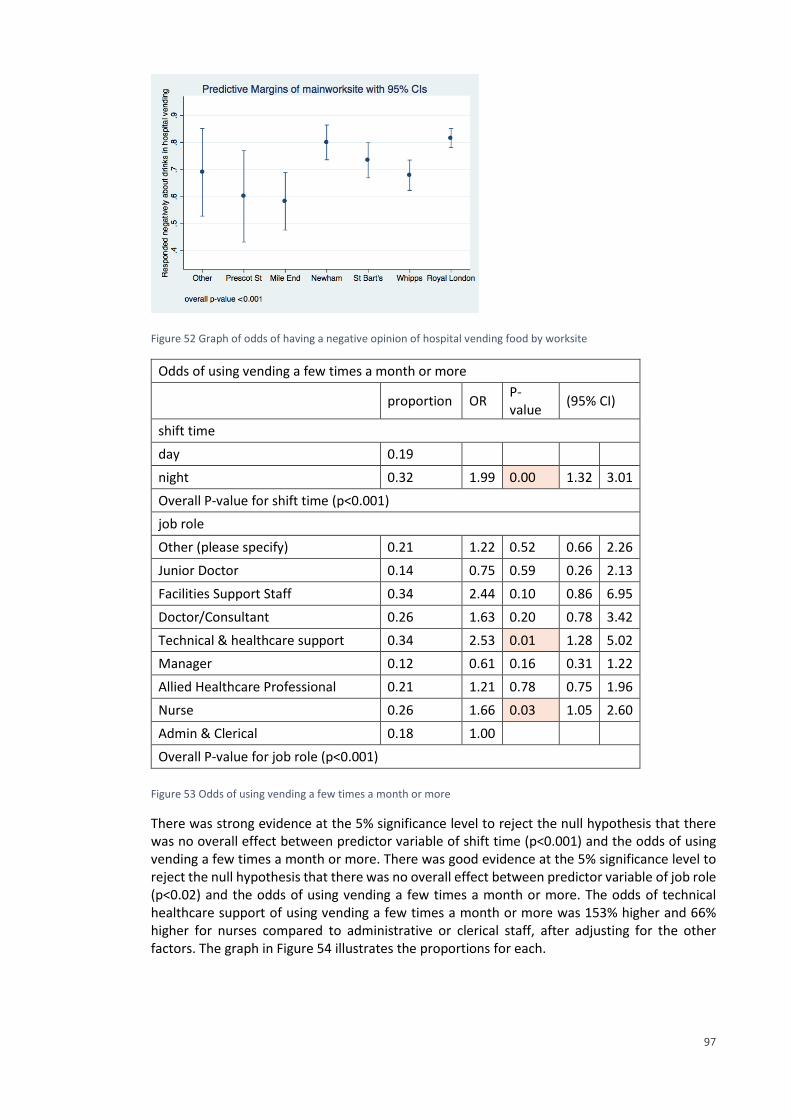
97
Figure 52 Graph of odds of having a negative opinion of hospital vending food by worksite
Odds of using vending a few times a month or more
proportion OR P-value
(95% CI)
shift time
day 0.19
night 0.32 1.99 0.00 1.32 3.01
Overall P-value for shift time (p<0.001)
job role
Other (please specify) 0.21 1.22 0.52 0.66 2.26
Junior Doctor 0.14 0.75 0.59 0.26 2.13
Facilities Support Staff 0.34 2.44 0.10 0.86 6.95
Doctor/Consultant 0.26 1.63 0.20 0.78 3.42
Technical & healthcare support 0.34 2.53 0.01 1.28 5.02
Manager 0.12 0.61 0.16 0.31 1.22
Allied Healthcare Professional 0.21 1.21 0.78 0.75 1.96
Nurse 0.26 1.66 0.03 1.05 2.60
Admin & Clerical 0.18 1.00
Overall P-value for job role (p<0.001)
Figure 53 Odds of using vending a few times a month or more
There was strong evidence at the 5% significance level to reject the null hypothesis that there was no overall effect between predictor variable of shift time (p<0.001) and the odds of using vending a few times a month or more. There was good evidence at the 5% significance level to reject the null hypothesis that there was no overall effect between predictor variable of job role (p<0.02) and the odds of using vending a few times a month or more. The odds of technical healthcare support of using vending a few times a month or more was 153% higher and 66% higher for nurses compared to administrative or clerical staff, after adjusting for the other factors. The graph in Figure 54 illustrates the proportions for each.
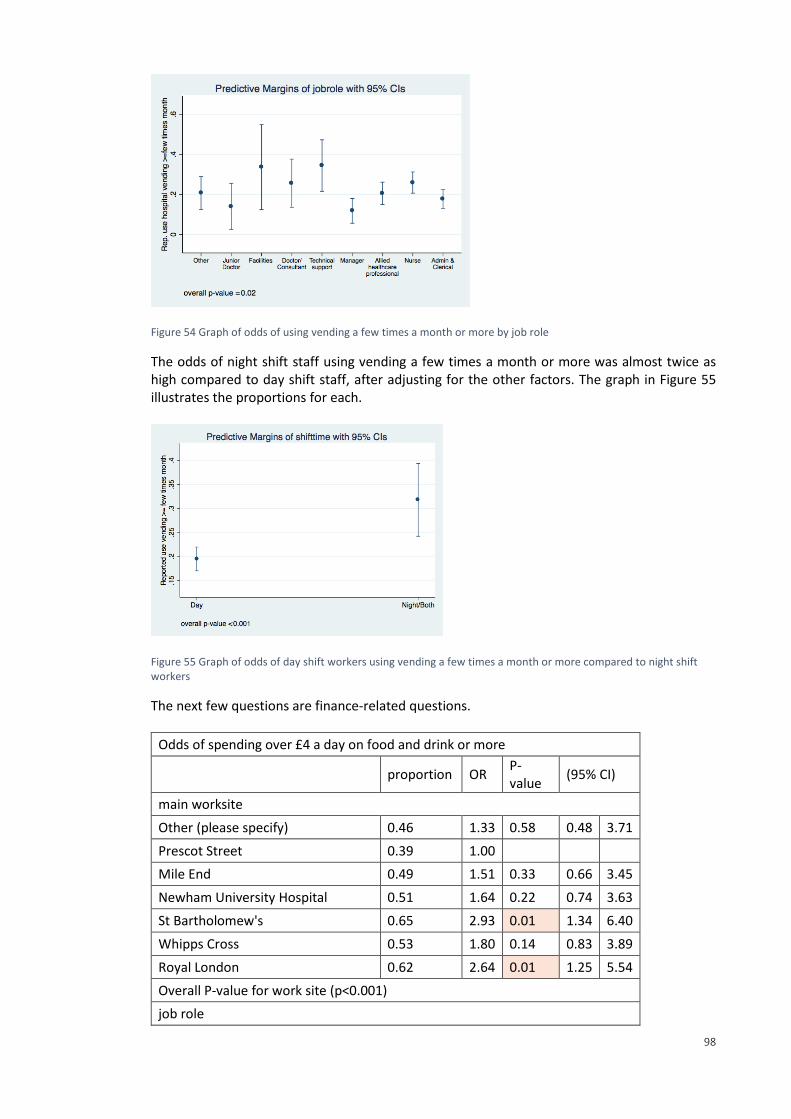
98
Figure 54 Graph of odds of using vending a few times a month or more by job role
The odds of night shift staff using vending a few times a month or more was almost twice as high compared to day shift staff, after adjusting for the other factors. The graph in Figure 55 illustrates the proportions for each.
Figure 55 Graph of odds of day shift workers using vending a few times a month or more compared to night shift workers
The next few questions are finance-related questions.
Odds of spending over £4 a day on food and drink or more
proportion OR P-value
(95% CI)
main worksite
Other (please specify) 0.46 1.33 0.58 0.48 3.71
Prescot Street 0.39 1.00
Mile End 0.49 1.51 0.33 0.66 3.45
Newham University Hospital 0.51 1.64 0.22 0.74 3.63
St Bartholomew's 0.65 2.93 0.01 1.34 6.40
Whipps Cross 0.53 1.80 0.14 0.83 3.89
Royal London 0.62 2.64 0.01 1.25 5.54
Overall P-value for work site (p<0.001)
job role
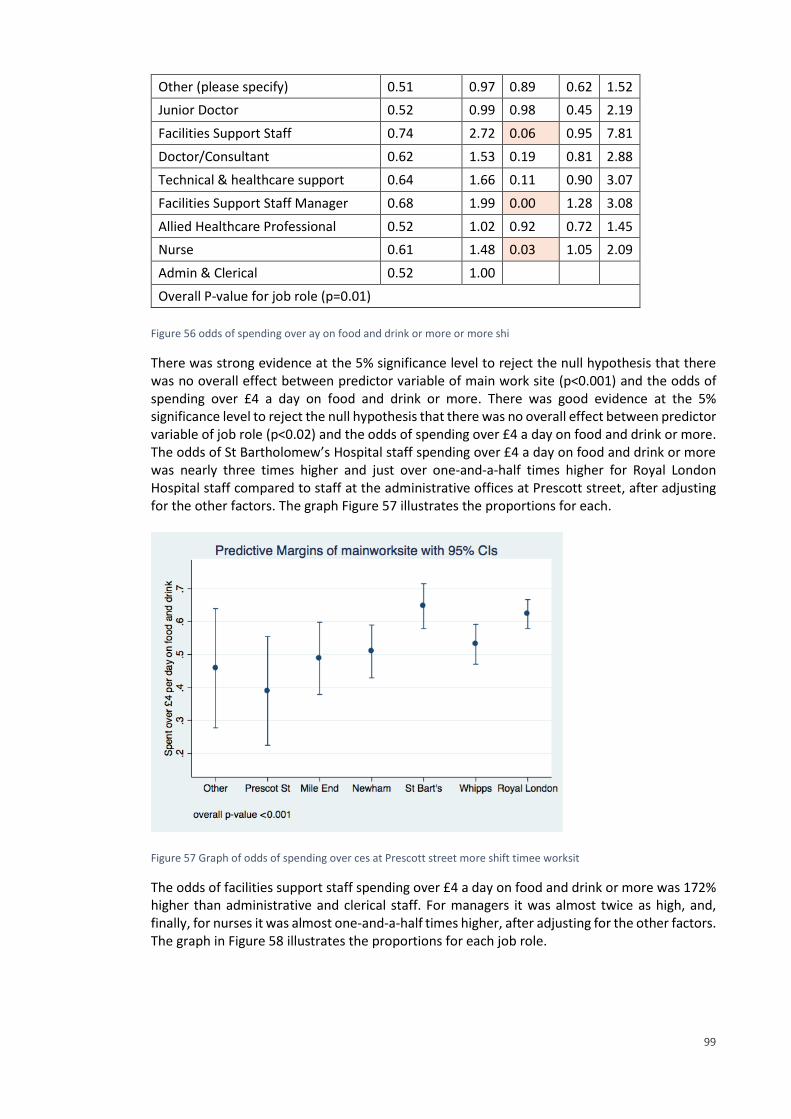
99
Other (please specify) 0.51 0.97 0.89 0.62 1.52
Junior Doctor 0.52 0.99 0.98 0.45 2.19
Facilities Support Staff 0.74 2.72 0.06 0.95 7.81
Doctor/Consultant 0.62 1.53 0.19 0.81 2.88
Technical & healthcare support 0.64 1.66 0.11 0.90 3.07
Facilities Support Staff Manager 0.68 1.99 0.00 1.28 3.08
Allied Healthcare Professional 0.52 1.02 0.92 0.72 1.45
Nurse 0.61 1.48 0.03 1.05 2.09
Admin & Clerical 0.52 1.00
Overall P-value for job role (p=0.01)
Figure 56 odds of spending over ay on food and drink or more or more shi
There was strong evidence at the 5% significance level to reject the null hypothesis that there was no overall effect between predictor variable of main work site (p<0.001) and the odds of spending over £4 a day on food and drink or more. There was good evidence at the 5% significance level to reject the null hypothesis that there was no overall effect between predictor variable of job role (p<0.02) and the odds of spending over £4 a day on food and drink or more. The odds of St Bartholomew’s Hospital staff spending over £4 a day on food and drink or more was nearly three times higher and just over one-and-a-half times higher for Royal London Hospital staff compared to staff at the administrative offices at Prescott street, after adjusting for the other factors. The graph Figure 57 illustrates the proportions for each.
Figure 57 Graph of odds of spending over ces at Prescott street more shift timee worksit
The odds of facilities support staff spending over £4 a day on food and drink or more was 172% higher than administrative and clerical staff. For managers it was almost twice as high, and, finally, for nurses it was almost one-and-a-half times higher, after adjusting for the other factors. The graph in Figure 58 illustrates the proportions for each job role.
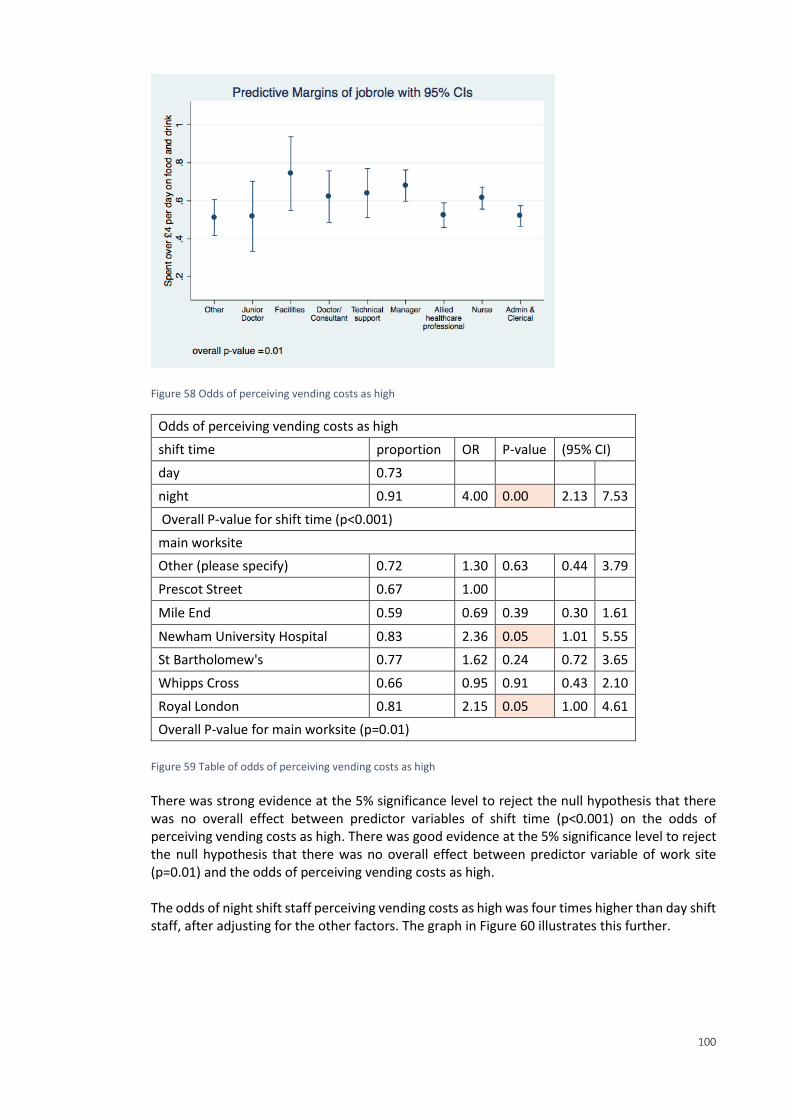
100
Figure 58 Odds of perceiving vending costs as high
Odds of perceiving vending costs as high
shift time proportion OR P-value (95% CI)
day 0.73
night 0.91 4.00 0.00 2.13 7.53
Overall P-value for shift time (p<0.001)
main worksite
Other (please specify) 0.72 1.30 0.63 0.44 3.79
Prescot Street 0.67 1.00
Mile End 0.59 0.69 0.39 0.30 1.61
Newham University Hospital 0.83 2.36 0.05 1.01 5.55
St Bartholomew's 0.77 1.62 0.24 0.72 3.65
Whipps Cross 0.66 0.95 0.91 0.43 2.10
Royal London 0.81 2.15 0.05 1.00 4.61
Overall P-value for main worksite (p=0.01)
Figure 59 Table of odds of perceiving vending costs as high
There was strong evidence at the 5% significance level to reject the null hypothesis that there was no overall effect between predictor variables of shift time (p<0.001) on the odds of perceiving vending costs as high. There was good evidence at the 5% significance level to reject the null hypothesis that there was no overall effect between predictor variable of work site (p=0.01) and the odds of perceiving vending costs as high. The odds of night shift staff perceiving vending costs as high was four times higher than day shift staff, after adjusting for the other factors. The graph in Figure 60 illustrates this further.
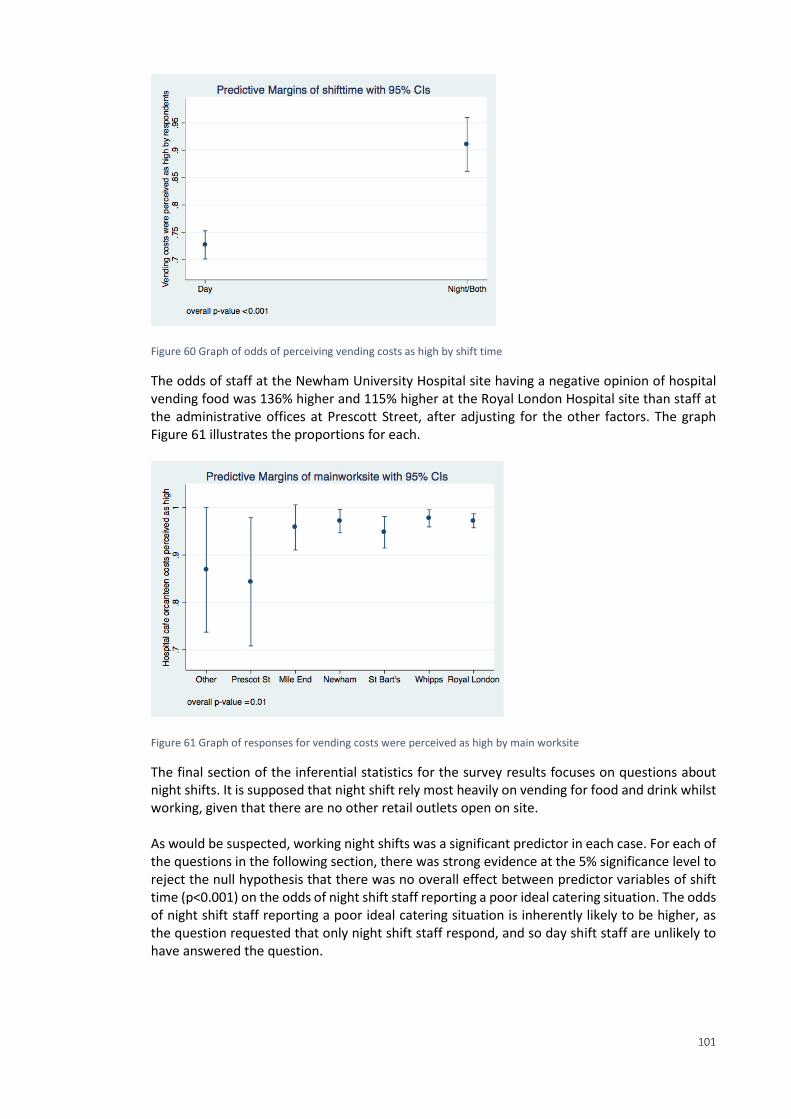
101
Figure 60 Graph of odds of perceiving vending costs as high by shift time
The odds of staff at the Newham University Hospital site having a negative opinion of hospital vending food was 136% higher and 115% higher at the Royal London Hospital site than staff at the administrative offices at Prescott Street, after adjusting for the other factors. The graph Figure 61 illustrates the proportions for each.
Figure 61 Graph of responses for vending costs were perceived as high by main worksite
The final section of the inferential statistics for the survey results focuses on questions about night shifts. It is supposed that night shift rely most heavily on vending for food and drink whilst working, given that there are no other retail outlets open on site. As would be suspected, working night shifts was a significant predictor in each case. For each of the questions in the following section, there was strong evidence at the 5% significance level to reject the null hypothesis that there was no overall effect between predictor variables of shift time (p<0.001) on the odds of night shift staff reporting a poor ideal catering situation. The odds of night shift staff reporting a poor ideal catering situation is inherently likely to be higher, as the question requested that only night shift staff respond, and so day shift staff are unlikely to have answered the question.
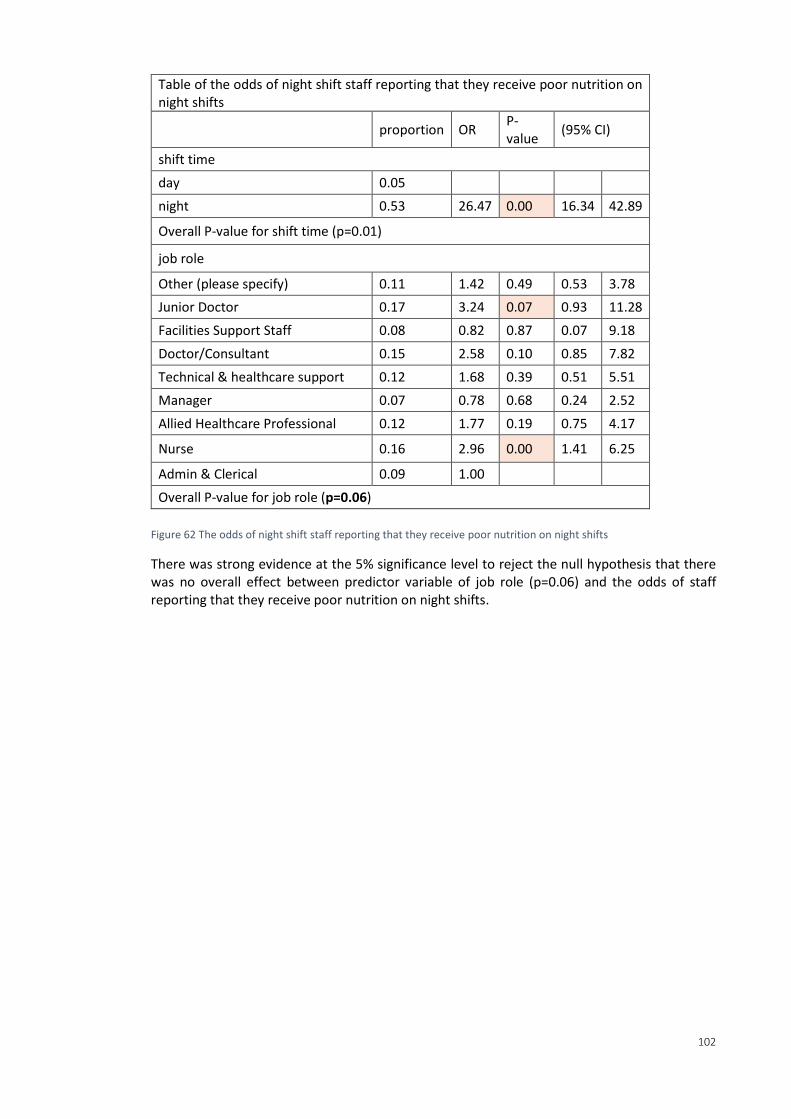
102
Table of the odds of night shift staff reporting that they receive poor nutrition on night shifts
proportion OR P-value
(95% CI)
shift time
day 0.05
night 0.53 26.47 0.00 16.34 42.89
Overall P-value for shift time (p=0.01)
job role
Other (please specify) 0.11 1.42 0.49 0.53 3.78
Junior Doctor 0.17 3.24 0.07 0.93 11.28
Facilities Support Staff 0.08 0.82 0.87 0.07 9.18
Doctor/Consultant 0.15 2.58 0.10 0.85 7.82
Technical & healthcare support 0.12 1.68 0.39 0.51 5.51
Manager 0.07 0.78 0.68 0.24 2.52
Allied Healthcare Professional 0.12 1.77 0.19 0.75 4.17
Nurse 0.16 2.96 0.00 1.41 6.25
Admin & Clerical 0.09 1.00
Overall P-value for job role (p=0.06)
Figure 62 The odds of night shift staff reporting that they receive poor nutrition on night shifts
There was strong evidence at the 5% significance level to reject the null hypothesis that there was no overall effect between predictor variable of job role (p=0.06) and the odds of staff reporting that they receive poor nutrition on night shifts.
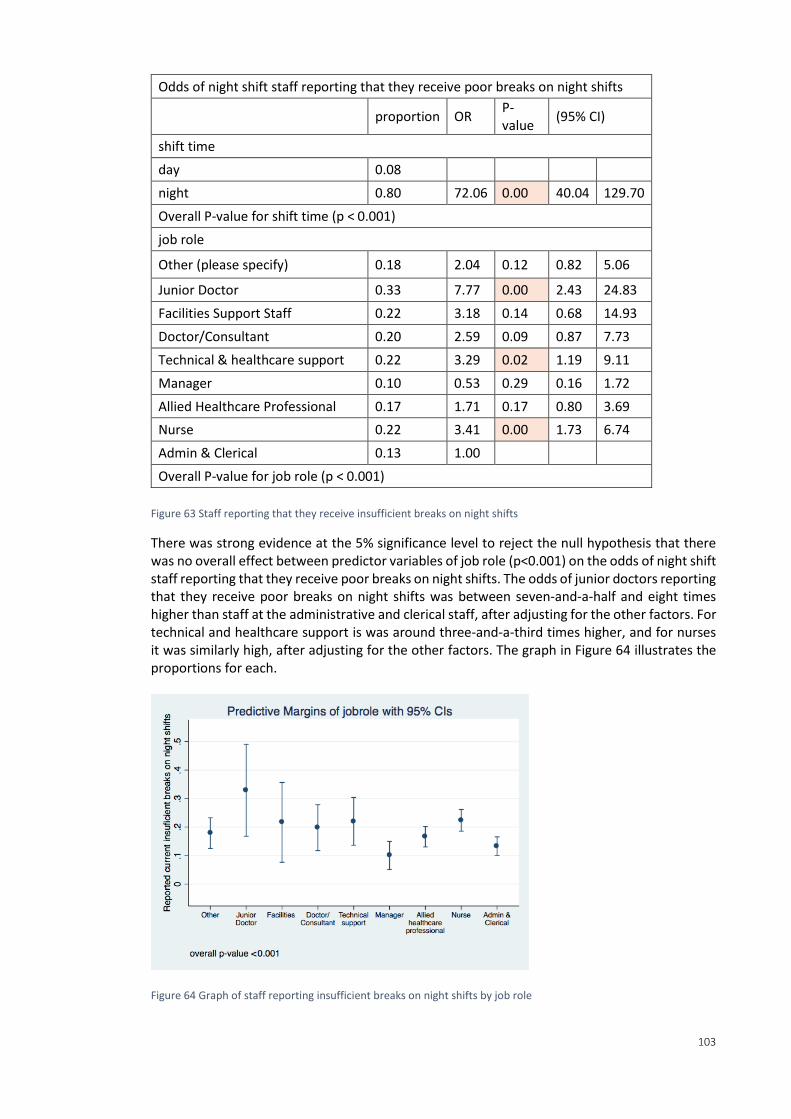
103
Odds of night shift staff reporting that they receive poor breaks on night shifts
proportion OR P-value
(95% CI)
shift time
day 0.08
night 0.80 72.06 0.00 40.04 129.70
Overall P-value for shift time (p < 0.001)
job role
Other (please specify) 0.18 2.04 0.12 0.82 5.06
Junior Doctor 0.33 7.77 0.00 2.43 24.83
Facilities Support Staff 0.22 3.18 0.14 0.68 14.93
Doctor/Consultant 0.20 2.59 0.09 0.87 7.73
Technical & healthcare support 0.22 3.29 0.02 1.19 9.11
Manager 0.10 0.53 0.29 0.16 1.72
Allied Healthcare Professional 0.17 1.71 0.17 0.80 3.69
Nurse 0.22 3.41 0.00 1.73 6.74
Admin & Clerical 0.13 1.00
Overall P-value for job role (p < 0.001)
Figure 63 Staff reporting that they receive insufficient breaks on night shifts
There was strong evidence at the 5% significance level to reject the null hypothesis that there was no overall effect between predictor variables of job role (p<0.001) on the odds of night shift staff reporting that they receive poor breaks on night shifts. The odds of junior doctors reporting that they receive poor breaks on night shifts was between seven-and-a-half and eight times higher than staff at the administrative and clerical staff, after adjusting for the other factors. For technical and healthcare support is was around three-and-a-third times higher, and for nurses it was similarly high, after adjusting for the other factors. The graph in Figure 64 illustrates the proportions for each.
Figure 64 Graph of staff reporting insufficient breaks on night shifts by job role
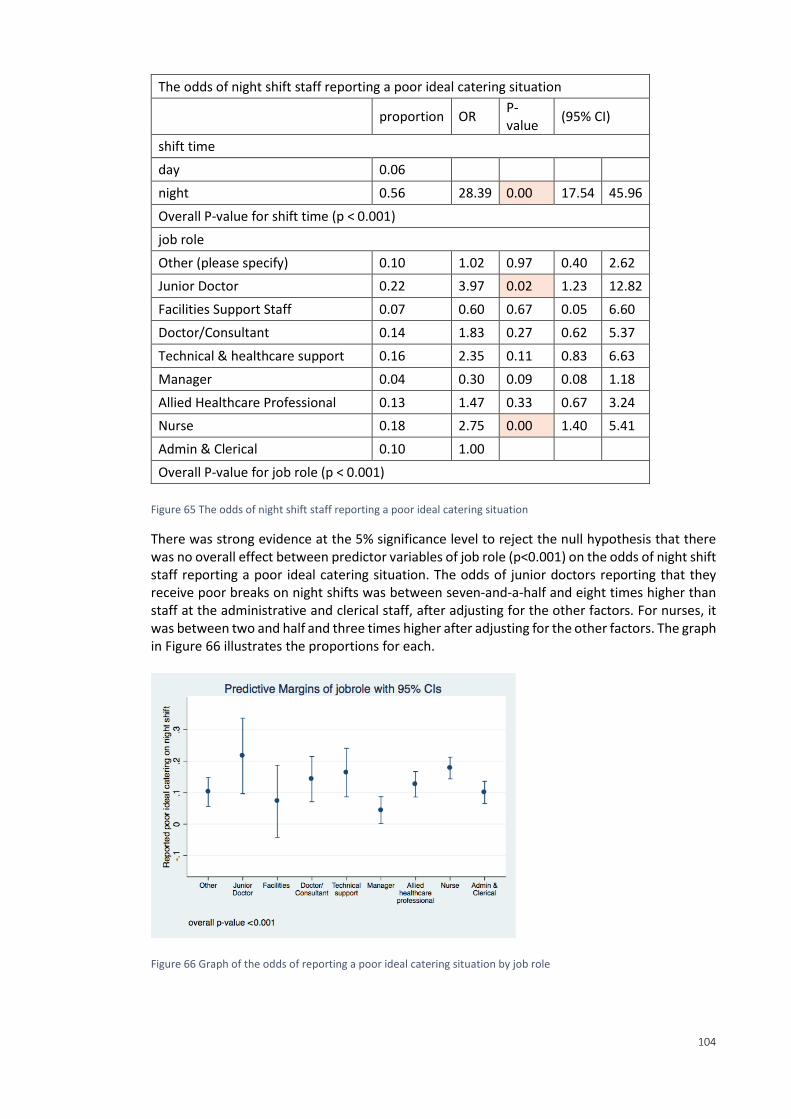
104
The odds of night shift staff reporting a poor ideal catering situation
proportion OR P-value
(95% CI)
shift time
day 0.06
night 0.56 28.39 0.00 17.54 45.96
Overall P-value for shift time (p < 0.001)
job role
Other (please specify) 0.10 1.02 0.97 0.40 2.62
Junior Doctor 0.22 3.97 0.02 1.23 12.82
Facilities Support Staff 0.07 0.60 0.67 0.05 6.60
Doctor/Consultant 0.14 1.83 0.27 0.62 5.37
Technical & healthcare support 0.16 2.35 0.11 0.83 6.63
Manager 0.04 0.30 0.09 0.08 1.18
Allied Healthcare Professional 0.13 1.47 0.33 0.67 3.24
Nurse 0.18 2.75 0.00 1.40 5.41
Admin & Clerical 0.10 1.00
Overall P-value for job role (p < 0.001)
Figure 65 The odds of night shift staff reporting a poor ideal catering situation
There was strong evidence at the 5% significance level to reject the null hypothesis that there was no overall effect between predictor variables of job role (p<0.001) on the odds of night shift staff reporting a poor ideal catering situation. The odds of junior doctors reporting that they receive poor breaks on night shifts was between seven-and-a-half and eight times higher than staff at the administrative and clerical staff, after adjusting for the other factors. For nurses, it was between two and half and three times higher after adjusting for the other factors. The graph in Figure 66 illustrates the proportions for each.
Figure 66 Graph of the odds of reporting a poor ideal catering situation by job role
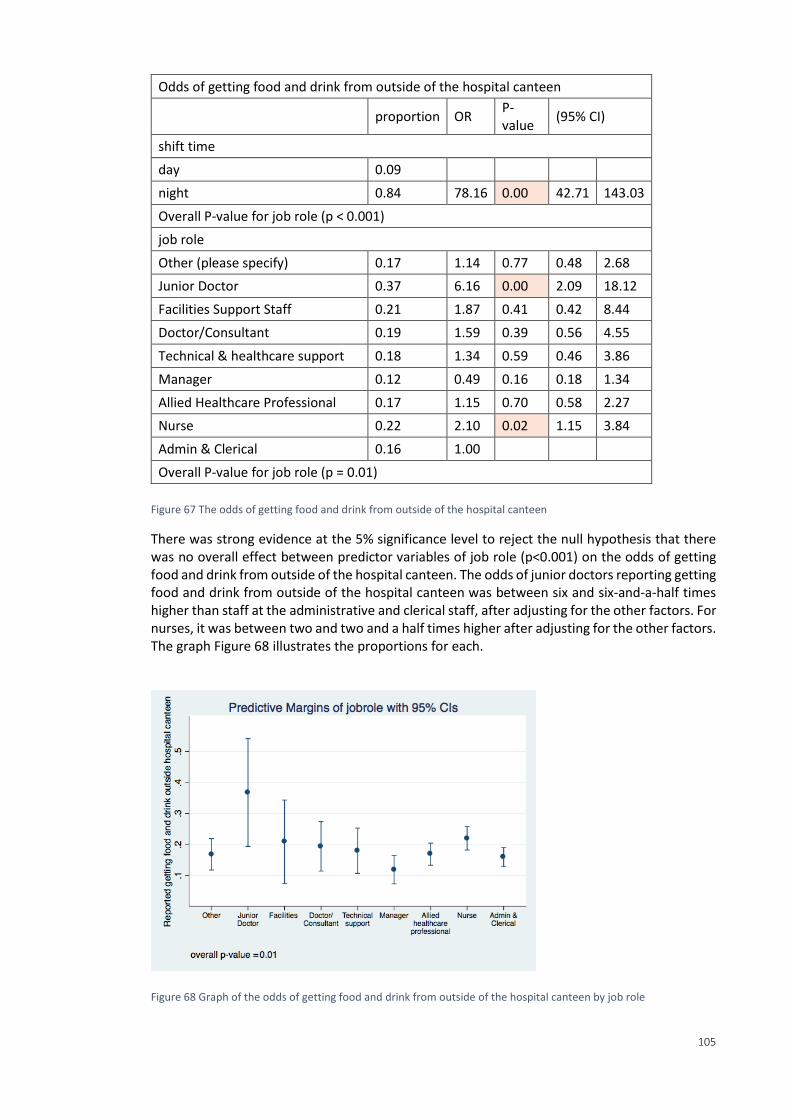
105
Odds of getting food and drink from outside of the hospital canteen
proportion OR P-value
(95% CI)
shift time
day 0.09
night 0.84 78.16 0.00 42.71 143.03
Overall P-value for job role (p < 0.001)
job role
Other (please specify) 0.17 1.14 0.77 0.48 2.68
Junior Doctor 0.37 6.16 0.00 2.09 18.12
Facilities Support Staff 0.21 1.87 0.41 0.42 8.44
Doctor/Consultant 0.19 1.59 0.39 0.56 4.55
Technical & healthcare support 0.18 1.34 0.59 0.46 3.86
Manager 0.12 0.49 0.16 0.18 1.34
Allied Healthcare Professional 0.17 1.15 0.70 0.58 2.27
Nurse 0.22 2.10 0.02 1.15 3.84
Admin & Clerical 0.16 1.00
Overall P-value for job role (p = 0.01)
Figure 67 The odds of getting food and drink from outside of the hospital canteen
There was strong evidence at the 5% significance level to reject the null hypothesis that there was no overall effect between predictor variables of job role (p<0.001) on the odds of getting food and drink from outside of the hospital canteen. The odds of junior doctors reporting getting food and drink from outside of the hospital canteen was between six and six-and-a-half times higher than staff at the administrative and clerical staff, after adjusting for the other factors. For nurses, it was between two and two and a half times higher after adjusting for the other factors. The graph Figure 68 illustrates the proportions for each.
Figure 68 Graph of the odds of getting food and drink from outside of the hospital canteen by job role
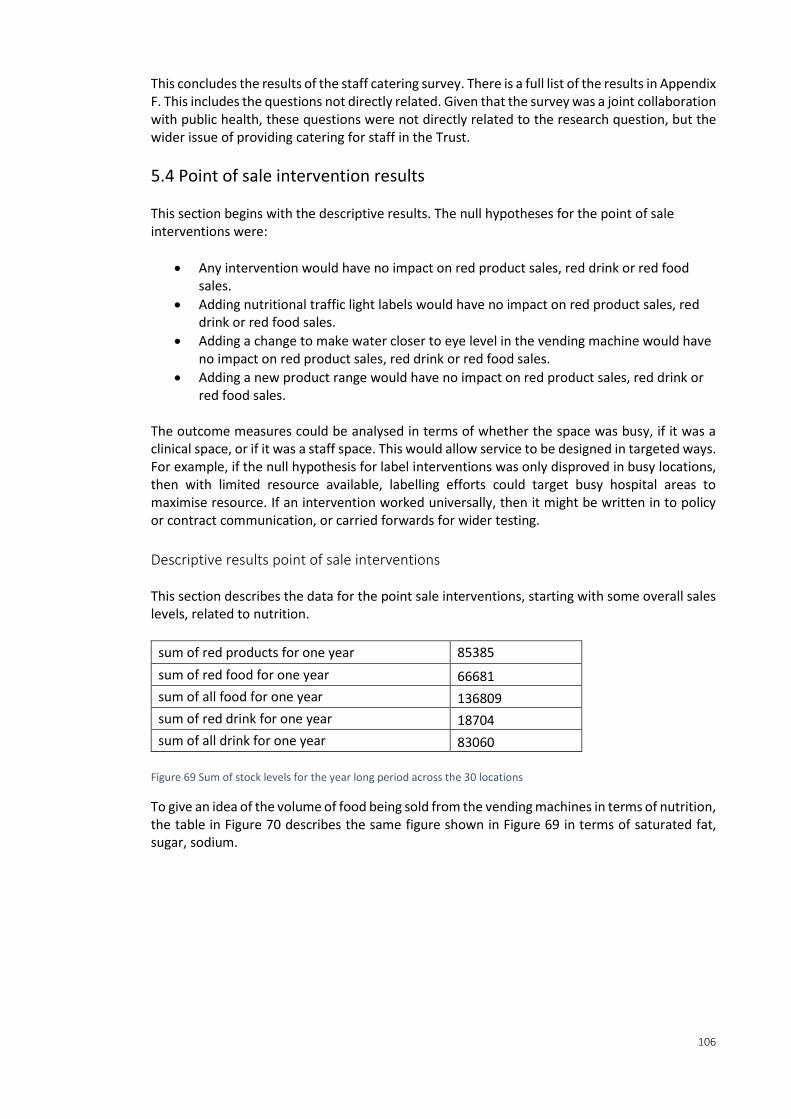
106
This concludes the results of the staff catering survey. There is a full list of the results in Appendix F. This includes the questions not directly related. Given that the survey was a joint collaboration with public health, these questions were not directly related to the research question, but the wider issue of providing catering for staff in the Trust.
5.4 Point of sale intervention results This section begins with the descriptive results. The null hypotheses for the point of sale interventions were:
Any intervention would have no impact on red product sales, red drink or red food sales.
Adding nutritional traffic light labels would have no impact on red product sales, red drink or red food sales.
Adding a change to make water closer to eye level in the vending machine would have no impact on red product sales, red drink or red food sales.
Adding a new product range would have no impact on red product sales, red drink or red food sales.
The outcome measures could be analysed in terms of whether the space was busy, if it was a clinical space, or if it was a staff space. This would allow service to be designed in targeted ways. For example, if the null hypothesis for label interventions was only disproved in busy locations, then with limited resource available, labelling efforts could target busy hospital areas to maximise resource. If an intervention worked universally, then it might be written in to policy or contract communication, or carried forwards for wider testing.
Descriptive results point of sale interventions This section describes the data for the point sale interventions, starting with some overall sales levels, related to nutrition.
sum of red products for one year 85385
sum of red food for one year 66681
sum of all food for one year 136809
sum of red drink for one year 18704
sum of all drink for one year 83060
Figure 69 Sum of stock levels for the year long period across the 30 locations
To give an idea of the volume of food being sold from the vending machines in terms of nutrition, the table in Figure 70 describes the same figure shown in Figure 69 in terms of saturated fat, sugar, sodium.
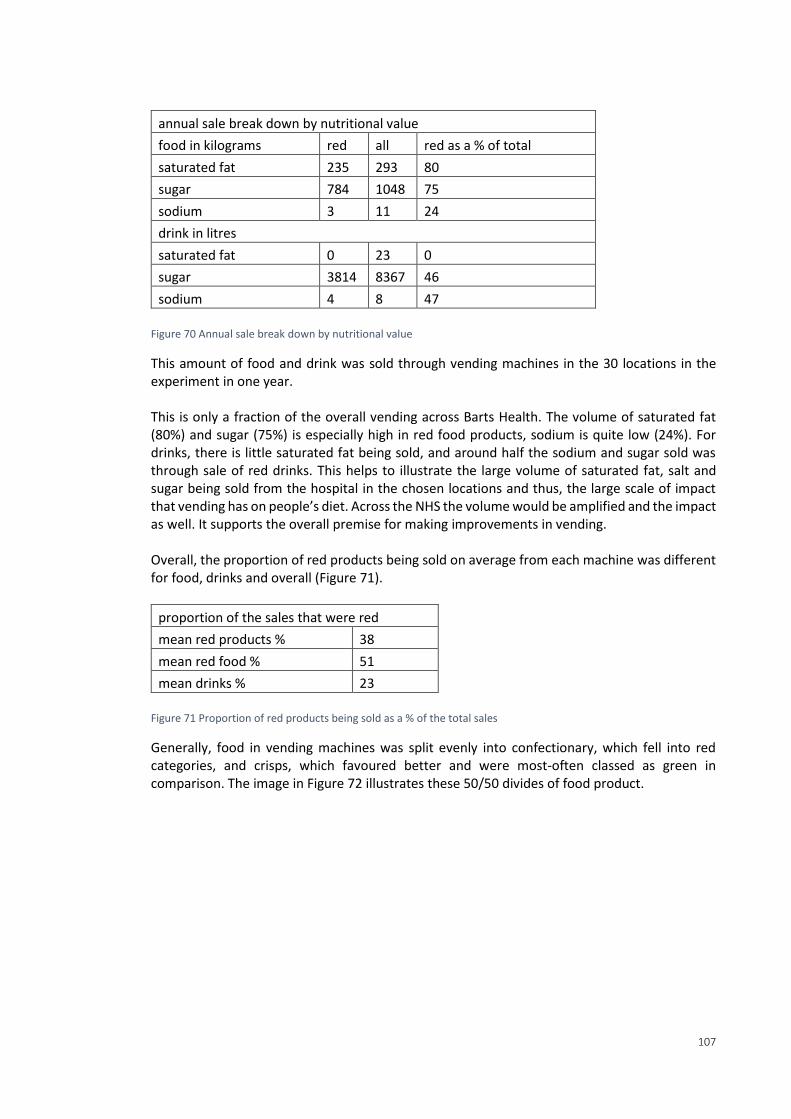
107
annual sale break down by nutritional value
food in kilograms red all red as a % of total
saturated fat 235 293 80
sugar 784 1048 75
sodium 3 11 24
drink in litres
saturated fat 0 23 0
sugar 3814 8367 46
sodium 4 8 47
Figure 70 Annual sale break down by nutritional value
This amount of food and drink was sold through vending machines in the 30 locations in the experiment in one year. This is only a fraction of the overall vending across Barts Health. The volume of saturated fat (80%) and sugar (75%) is especially high in red food products, sodium is quite low (24%). For drinks, there is little saturated fat being sold, and around half the sodium and sugar sold was through sale of red drinks. This helps to illustrate the large volume of saturated fat, salt and sugar being sold from the hospital in the chosen locations and thus, the large scale of impact that vending has on people’s diet. Across the NHS the volume would be amplified and the impact as well. It supports the overall premise for making improvements in vending. Overall, the proportion of red products being sold on average from each machine was different for food, drinks and overall (Figure 71).
proportion of the sales that were red
mean red products % 38
mean red food % 51
mean drinks % 23
Figure 71 Proportion of red products being sold as a % of the total sales
Generally, food in vending machines was split evenly into confectionary, which fell into red categories, and crisps, which favoured better and were most-often classed as green in comparison. The image in Figure 72 illustrates these 50/50 divides of food product.
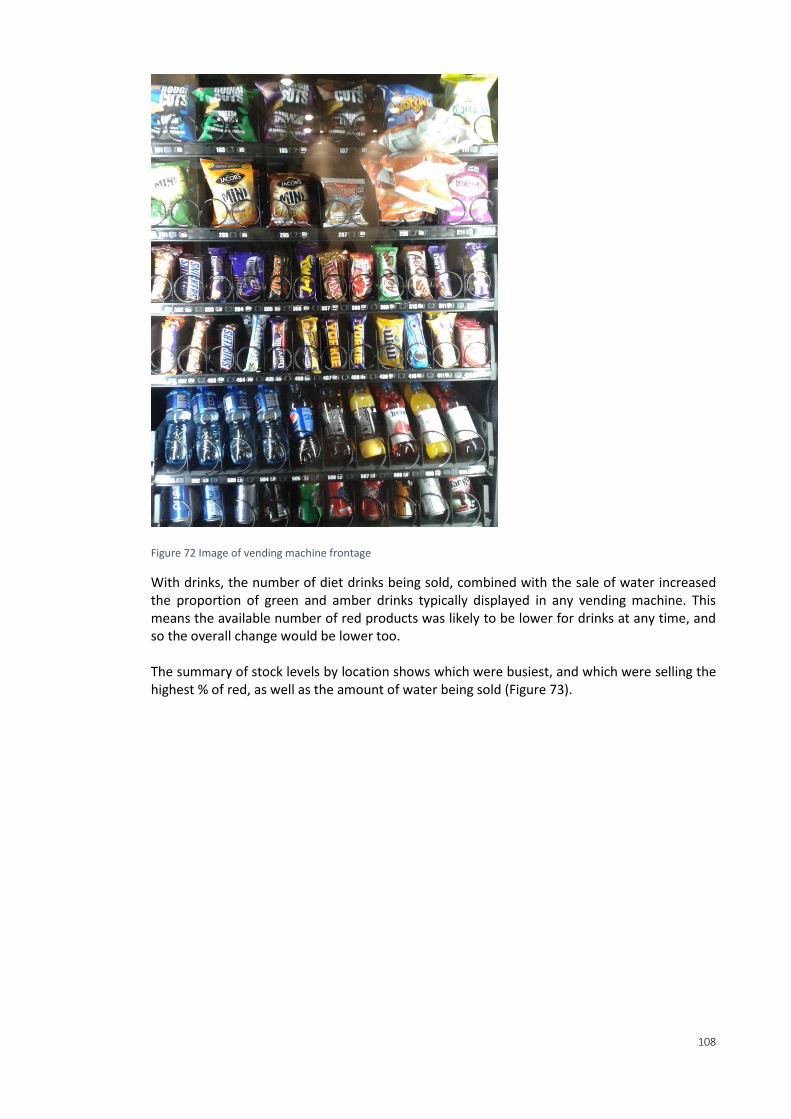
108
Figure 72 Image of vending machine frontage
With drinks, the number of diet drinks being sold, combined with the sale of water increased the proportion of green and amber drinks typically displayed in any vending machine. This means the available number of red products was likely to be lower for drinks at any time, and so the overall change would be lower too. The summary of stock levels by location shows which were busiest, and which were selling the highest % of red, as well as the amount of water being sold (Figure 73).
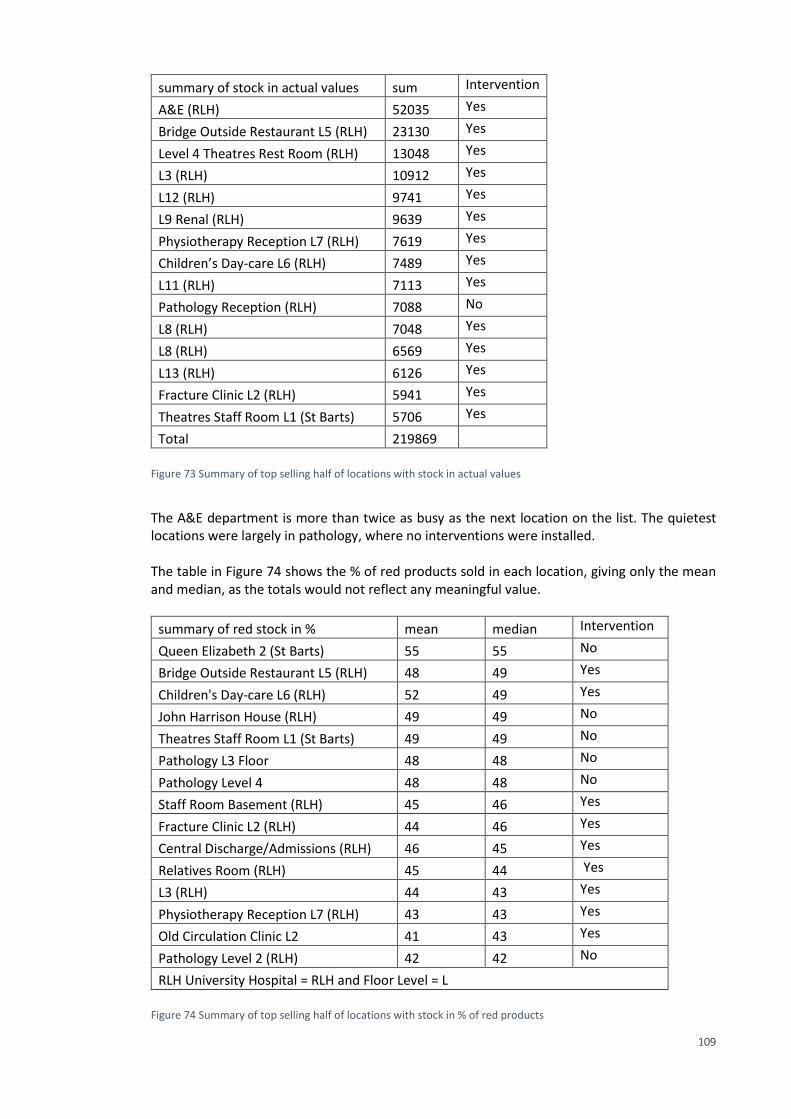
109
summary of stock in actual values sum Intervention
A&E (RLH) 52035 Yes
Bridge Outside Restaurant L5 (RLH) 23130 Yes
Level 4 Theatres Rest Room (RLH) 13048 Yes
L3 (RLH) 10912 Yes
L12 (RLH) 9741 Yes
L9 Renal (RLH) 9639 Yes
Physiotherapy Reception L7 (RLH) 7619 Yes
Children’s Day-care L6 (RLH) 7489 Yes
L11 (RLH) 7113 Yes
Pathology Reception (RLH) 7088 No
L8 (RLH) 7048 Yes
L8 (RLH) 6569 Yes
L13 (RLH) 6126 Yes
Fracture Clinic L2 (RLH) 5941 Yes
Theatres Staff Room L1 (St Barts) 5706 Yes
Total 219869
Figure 73 Summary of top selling half of locations with stock in actual values
The A&E department is more than twice as busy as the next location on the list. The quietest locations were largely in pathology, where no interventions were installed. The table in Figure 74 shows the % of red products sold in each location, giving only the mean and median, as the totals would not reflect any meaningful value.
summary of red stock in % mean median Intervention
Queen Elizabeth 2 (St Barts) 55 55 No
Bridge Outside Restaurant L5 (RLH) 48 49 Yes
Children's Day-care L6 (RLH) 52 49 Yes
John Harrison House (RLH) 49 49 No
Theatres Staff Room L1 (St Barts) 49 49 No
Pathology L3 Floor 48 48 No
Pathology Level 4 48 48 No
Staff Room Basement (RLH) 45 46 Yes
Fracture Clinic L2 (RLH) 44 46 Yes
Central Discharge/Admissions (RLH) 46 45 Yes
Relatives Room (RLH) 45 44 Yes
L3 (RLH) 44 43 Yes
Physiotherapy Reception L7 (RLH) 43 43 Yes
Old Circulation Clinic L2 41 43 Yes
Pathology Level 2 (RLH) 42 42 No
RLH University Hospital = RLH and Floor Level = L
Figure 74 Summary of top selling half of locations with stock in % of red products
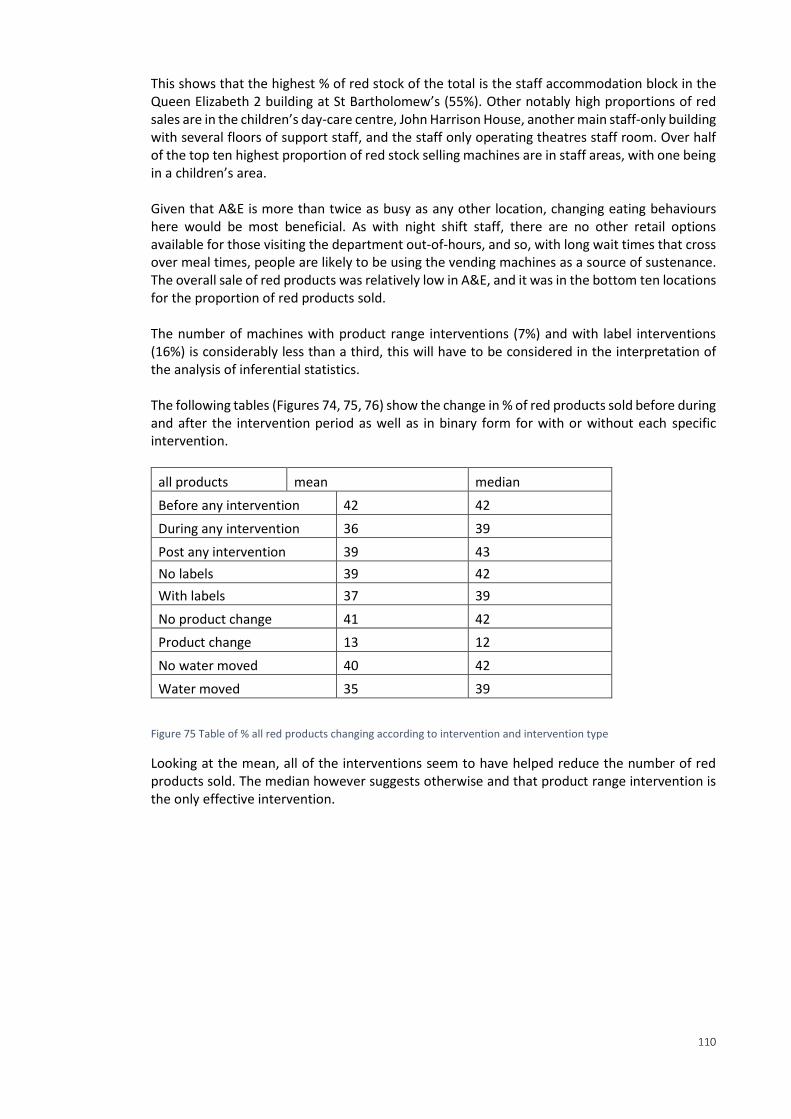
110
This shows that the highest % of red stock of the total is the staff accommodation block in the Queen Elizabeth 2 building at St Bartholomew’s (55%). Other notably high proportions of red sales are in the children’s day-care centre, John Harrison House, another main staff-only building with several floors of support staff, and the staff only operating theatres staff room. Over half of the top ten highest proportion of red stock selling machines are in staff areas, with one being in a children’s area. Given that A&E is more than twice as busy as any other location, changing eating behaviours here would be most beneficial. As with night shift staff, there are no other retail options available for those visiting the department out-of-hours, and so, with long wait times that cross over meal times, people are likely to be using the vending machines as a source of sustenance. The overall sale of red products was relatively low in A&E, and it was in the bottom ten locations for the proportion of red products sold. The number of machines with product range interventions (7%) and with label interventions (16%) is considerably less than a third, this will have to be considered in the interpretation of the analysis of inferential statistics. The following tables (Figures 74, 75, 76) show the change in % of red products sold before during and after the intervention period as well as in binary form for with or without each specific intervention.
all products mean median
Before any intervention 42 42
During any intervention 36 39
Post any intervention 39 43
No labels 39 42
With labels 37 39
No product change 41 42
Product change 13 12
No water moved 40 42
Water moved 35 39
Figure 75 Table of % all red products changing according to intervention and intervention type
Looking at the mean, all of the interventions seem to have helped reduce the number of red products sold. The median however suggests otherwise and that product range intervention is the only effective intervention.
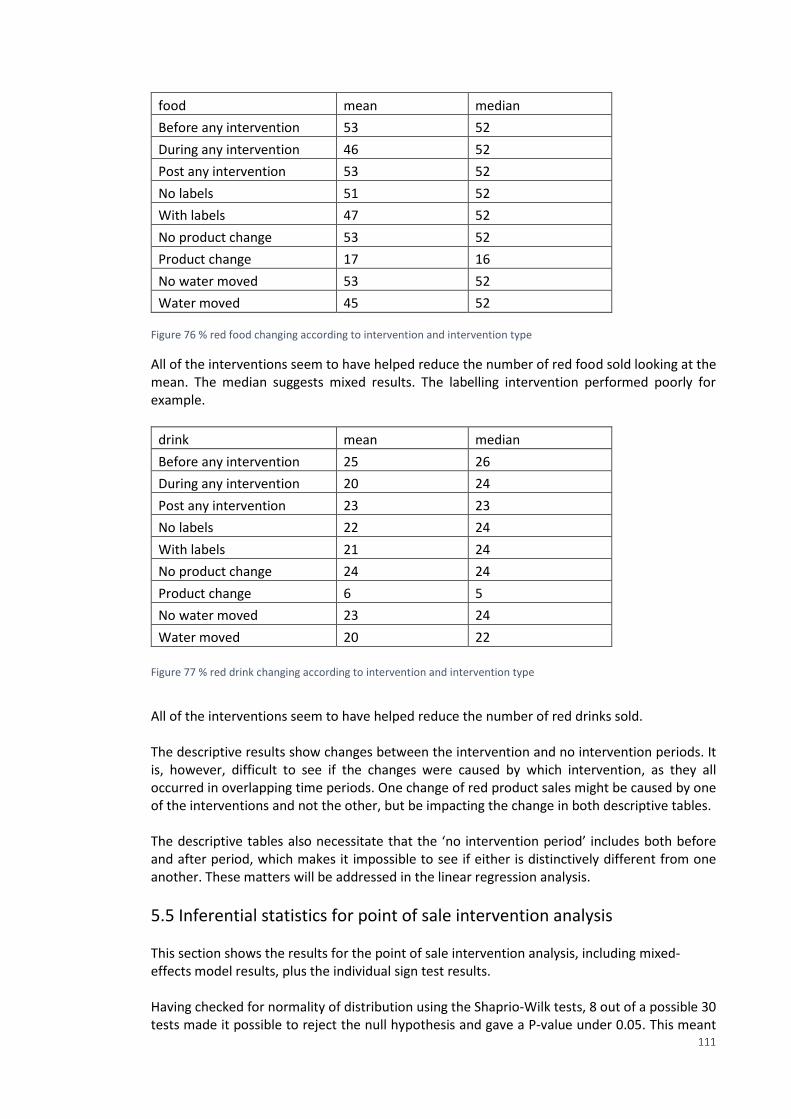
111
food mean median
Before any intervention 53 52
During any intervention 46 52
Post any intervention 53 52
No labels 51 52
With labels 47 52
No product change 53 52
Product change 17 16
No water moved 53 52
Water moved 45 52 Figure 76 % red food changing according to intervention and intervention type
All of the interventions seem to have helped reduce the number of red food sold looking at the mean. The median suggests mixed results. The labelling intervention performed poorly for example.
drink mean median
Before any intervention 25 26
During any intervention 20 24
Post any intervention 23 23
No labels 22 24
With labels 21 24
No product change 24 24
Product change 6 5
No water moved 23 24
Water moved 20 22
Figure 77 % red drink changing according to intervention and intervention type
All of the interventions seem to have helped reduce the number of red drinks sold. The descriptive results show changes between the intervention and no intervention periods. It is, however, difficult to see if the changes were caused by which intervention, as they all occurred in overlapping time periods. One change of red product sales might be caused by one of the interventions and not the other, but be impacting the change in both descriptive tables. The descriptive tables also necessitate that the ‘no intervention period’ includes both before and after period, which makes it impossible to see if either is distinctively different from one another. These matters will be addressed in the linear regression analysis.
5.5 Inferential statistics for point of sale intervention analysis This section shows the results for the point of sale intervention analysis, including mixed-effects model results, plus the individual sign test results. Having checked for normality of distribution using the Shaprio-Wilk tests, 8 out of a possible 30 tests made it possible to reject the null hypothesis and gave a P-value under 0.05. This meant
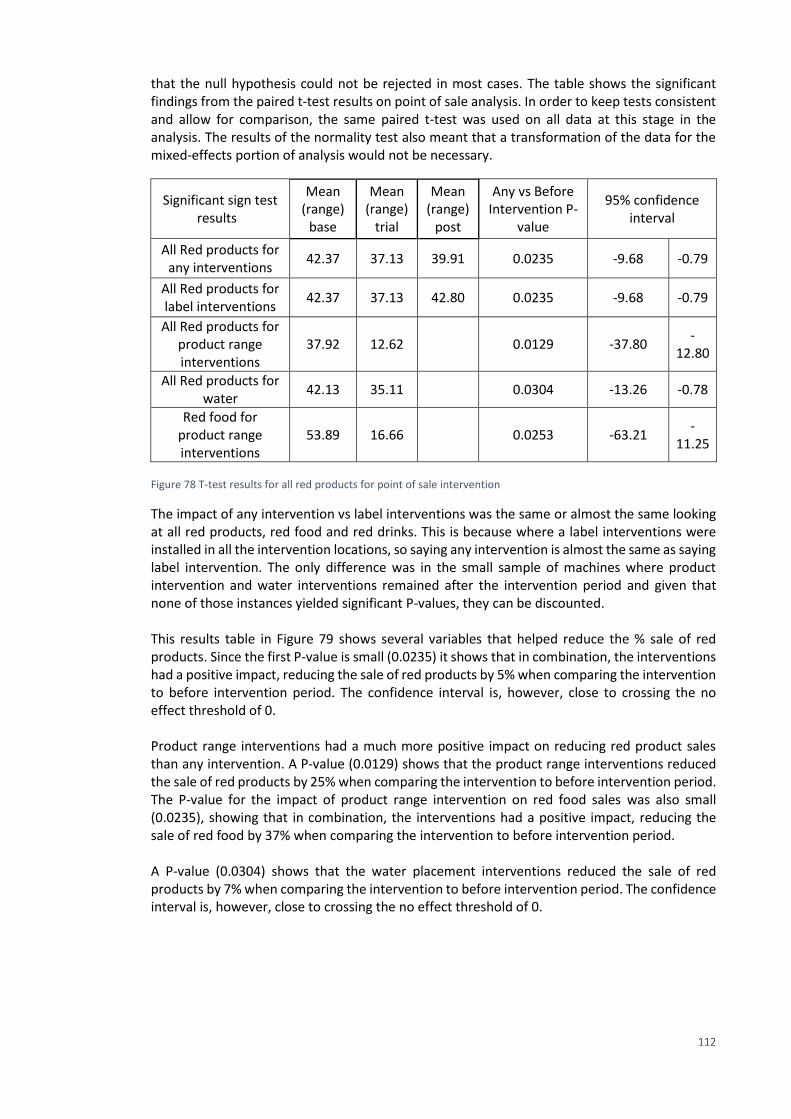
112
that the null hypothesis could not be rejected in most cases. The table shows the significant findings from the paired t-test results on point of sale analysis. In order to keep tests consistent and allow for comparison, the same paired t-test was used on all data at this stage in the analysis. The results of the normality test also meant that a transformation of the data for the mixed-effects portion of analysis would not be necessary.
Significant sign test results
Mean (range)
base
Mean (range)
trial
Mean (range)
post
Any vs Before Intervention P-
value
95% confidence interval
All Red products for any interventions
42.37 37.13 39.91 0.0235 -9.68 -0.79
All Red products for label interventions
42.37 37.13 42.80 0.0235 -9.68 -0.79
All Red products for product range interventions
37.92 12.62 0.0129 -37.80 -
12.80
All Red products for water
42.13 35.11 0.0304 -13.26 -0.78
Red food for product range interventions
53.89 16.66 0.0253 -63.21 -
11.25
Figure 78 T-test results for all red products for point of sale intervention
The impact of any intervention vs label interventions was the same or almost the same looking at all red products, red food and red drinks. This is because where a label interventions were installed in all the intervention locations, so saying any intervention is almost the same as saying label intervention. The only difference was in the small sample of machines where product intervention and water interventions remained after the intervention period and given that none of those instances yielded significant P-values, they can be discounted. This results table in Figure 79 shows several variables that helped reduce the % sale of red products. Since the first P-value is small (0.0235) it shows that in combination, the interventions had a positive impact, reducing the sale of red products by 5% when comparing the intervention to before intervention period. The confidence interval is, however, close to crossing the no effect threshold of 0. Product range interventions had a much more positive impact on reducing red product sales than any intervention. A P-value (0.0129) shows that the product range interventions reduced the sale of red products by 25% when comparing the intervention to before intervention period. The P-value for the impact of product range intervention on red food sales was also small (0.0235), showing that in combination, the interventions had a positive impact, reducing the sale of red food by 37% when comparing the intervention to before intervention period. A P-value (0.0304) shows that the water placement interventions reduced the sale of red products by 7% when comparing the intervention to before intervention period. The confidence interval is, however, close to crossing the no effect threshold of 0.
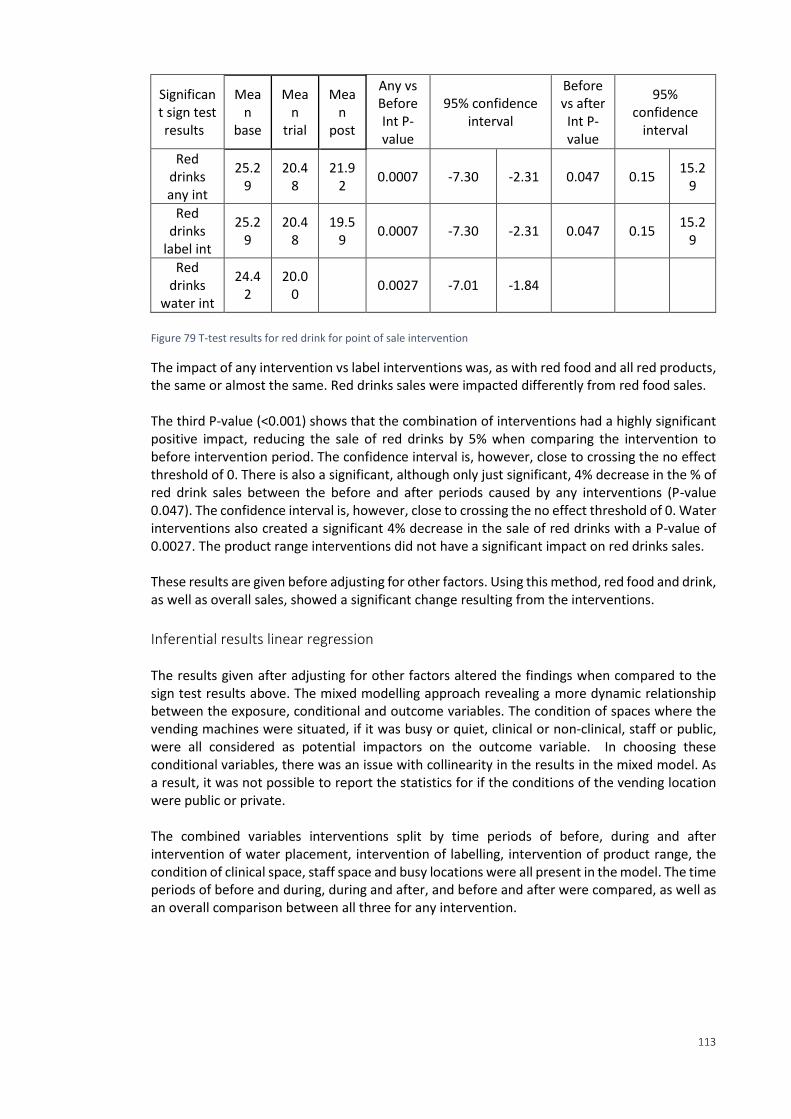
113
Significant sign test results
Mean
base
Mean
trial
Mean
post
Any vs Before Int P-value
95% confidence interval
Before vs after Int P-value
95% confidence
interval
Red drinks any int
25.29
20.48
21.92
0.0007 -7.30 -2.31 0.047 0.15 15.2
9
Red drinks
label int
25.29
20.48
19.59
0.0007 -7.30 -2.31 0.047 0.15 15.2
9
Red drinks
water int
24.42
20.00
0.0027 -7.01 -1.84
Figure 79 T-test results for red drink for point of sale intervention
The impact of any intervention vs label interventions was, as with red food and all red products, the same or almost the same. Red drinks sales were impacted differently from red food sales. The third P-value (<0.001) shows that the combination of interventions had a highly significant positive impact, reducing the sale of red drinks by 5% when comparing the intervention to before intervention period. The confidence interval is, however, close to crossing the no effect threshold of 0. There is also a significant, although only just significant, 4% decrease in the % of red drink sales between the before and after periods caused by any interventions (P-value 0.047). The confidence interval is, however, close to crossing the no effect threshold of 0. Water interventions also created a significant 4% decrease in the sale of red drinks with a P-value of 0.0027. The product range interventions did not have a significant impact on red drinks sales. These results are given before adjusting for other factors. Using this method, red food and drink, as well as overall sales, showed a significant change resulting from the interventions.
Inferential results linear regression The results given after adjusting for other factors altered the findings when compared to the sign test results above. The mixed modelling approach revealing a more dynamic relationship between the exposure, conditional and outcome variables. The condition of spaces where the vending machines were situated, if it was busy or quiet, clinical or non-clinical, staff or public, were all considered as potential impactors on the outcome variable. In choosing these conditional variables, there was an issue with collinearity in the results in the mixed model. As a result, it was not possible to report the statistics for if the conditions of the vending location were public or private. The combined variables interventions split by time periods of before, during and after intervention of water placement, intervention of labelling, intervention of product range, the condition of clinical space, staff space and busy locations were all present in the model. The time periods of before and during, during and after, and before and after were compared, as well as an overall comparison between all three for any intervention.
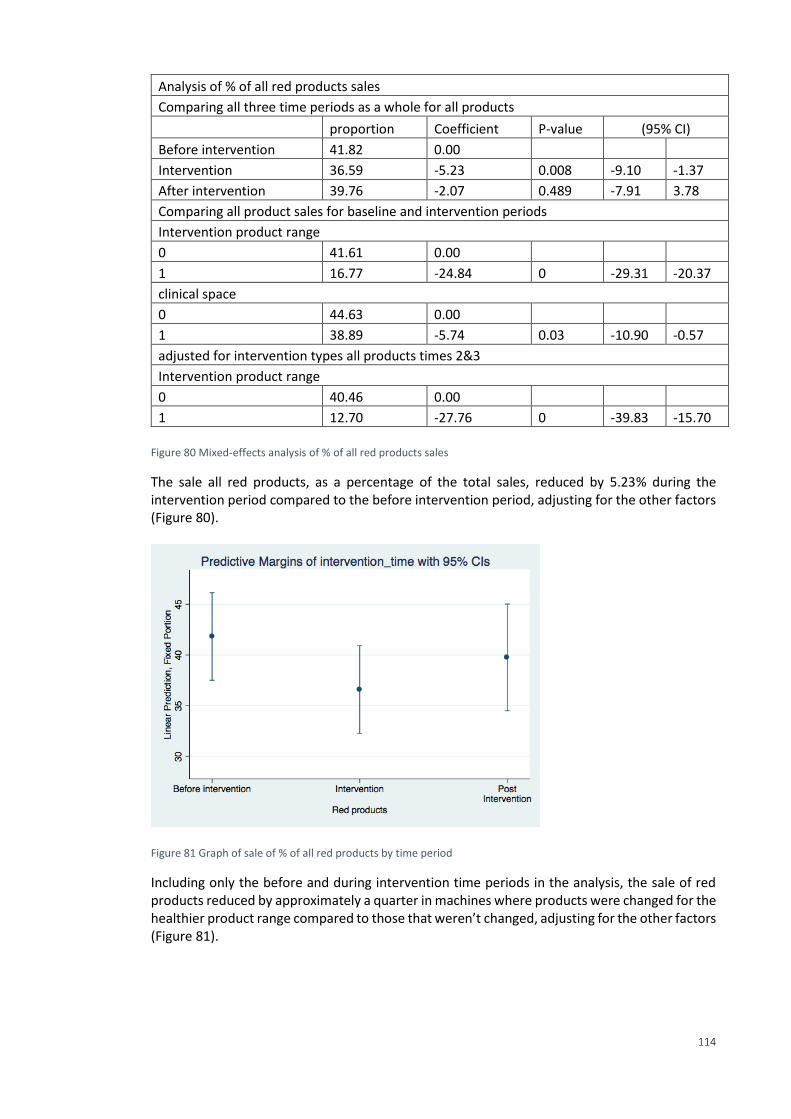
114
Analysis of % of all red products sales
Comparing all three time periods as a whole for all products
proportion Coefficient P-value (95% CI)
Before intervention 41.82 0.00
Intervention 36.59 -5.23 0.008 -9.10 -1.37
After intervention 39.76 -2.07 0.489 -7.91 3.78
Comparing all product sales for baseline and intervention periods
Intervention product range
0 41.61 0.00
1 16.77 -24.84 0 -29.31 -20.37
clinical space
0 44.63 0.00
1 38.89 -5.74 0.03 -10.90 -0.57
adjusted for intervention types all products times 2&3
Intervention product range
0 40.46 0.00
1 12.70 -27.76 0 -39.83 -15.70
Figure 80 Mixed-effects analysis of % of all red products sales
The sale all red products, as a percentage of the total sales, reduced by 5.23% during the intervention period compared to the before intervention period, adjusting for the other factors (Figure 80).
Figure 81 Graph of sale of % of all red products by time period
Including only the before and during intervention time periods in the analysis, the sale of red products reduced by approximately a quarter in machines where products were changed for the healthier product range compared to those that weren’t changed, adjusting for the other factors (Figure 81).
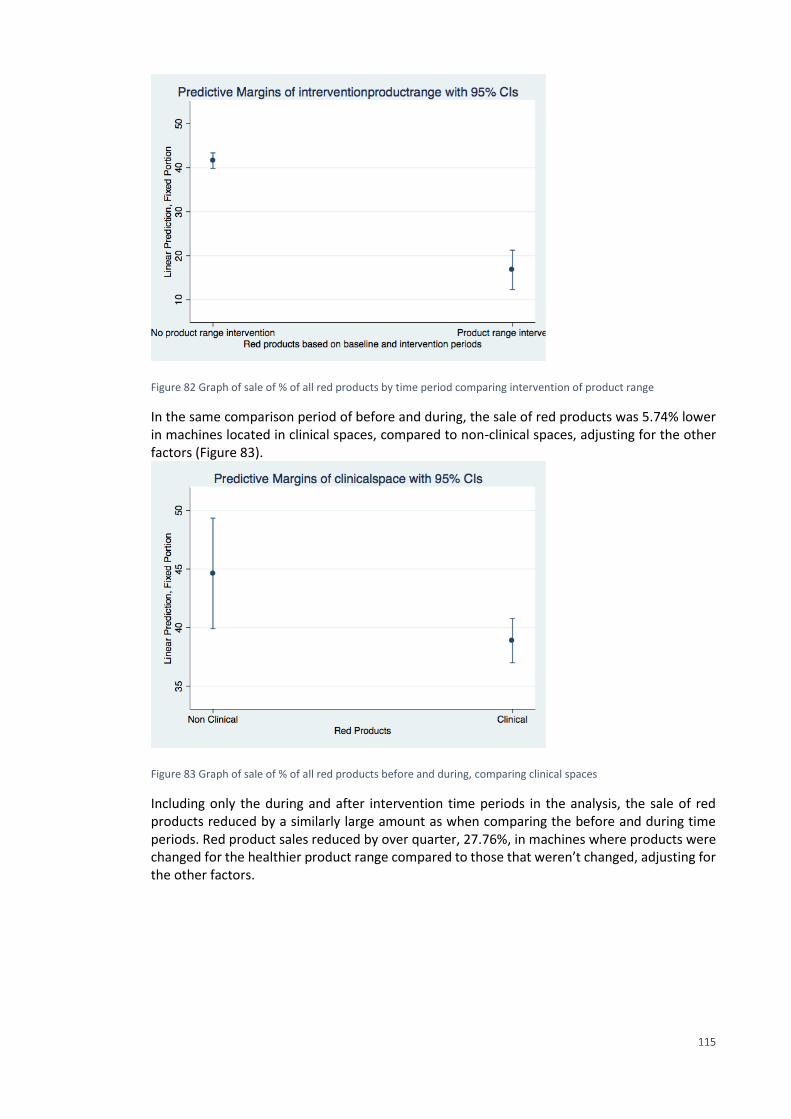
115
Figure 82 Graph of sale of % of all red products by time period comparing intervention of product range
In the same comparison period of before and during, the sale of red products was 5.74% lower in machines located in clinical spaces, compared to non-clinical spaces, adjusting for the other factors (Figure 83).
Figure 83 Graph of sale of % of all red products before and during, comparing clinical spaces
Including only the during and after intervention time periods in the analysis, the sale of red products reduced by a similarly large amount as when comparing the before and during time periods. Red product sales reduced by over quarter, 27.76%, in machines where products were changed for the healthier product range compared to those that weren’t changed, adjusting for the other factors.
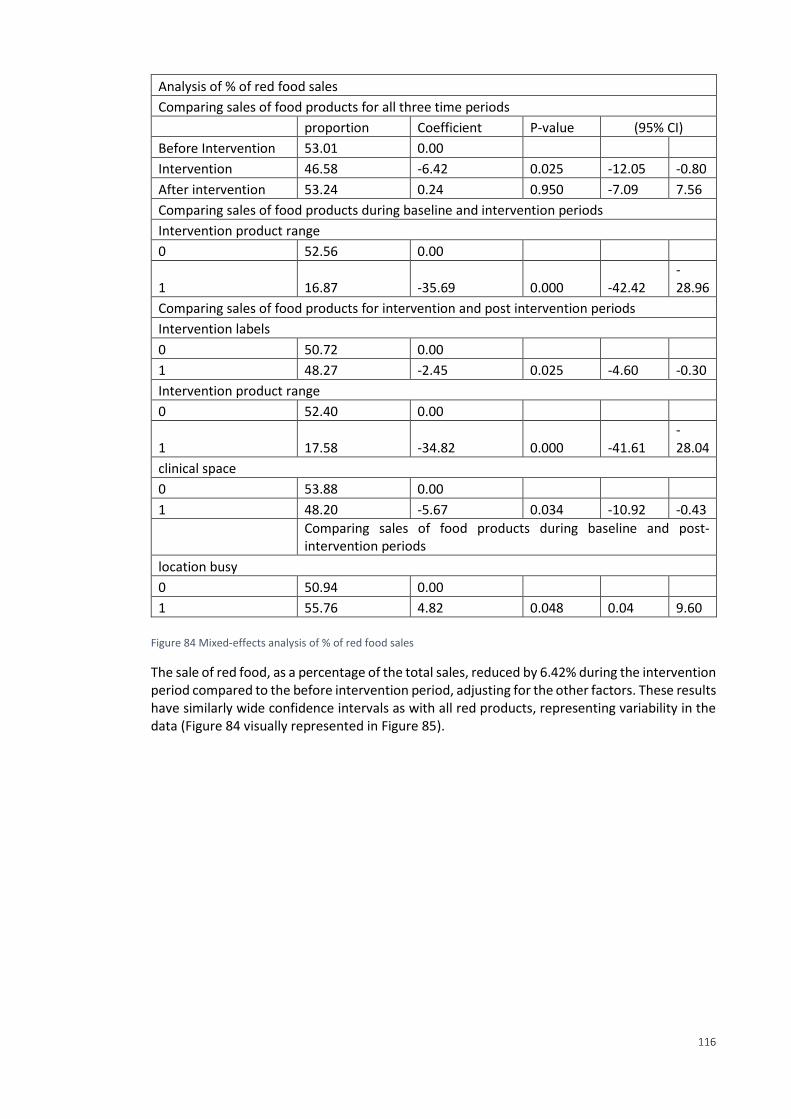
116
Analysis of % of red food sales
Comparing sales of food products for all three time periods
proportion Coefficient P-value (95% CI)
Before Intervention 53.01 0.00
Intervention 46.58 -6.42 0.025 -12.05 -0.80
After intervention 53.24 0.24 0.950 -7.09 7.56
Comparing sales of food products during baseline and intervention periods
Intervention product range
0 52.56 0.00
1 16.87 -35.69 0.000 -42.42 -28.96
Comparing sales of food products for intervention and post intervention periods
Intervention labels
0 50.72 0.00
1 48.27 -2.45 0.025 -4.60 -0.30
Intervention product range
0 52.40 0.00
1 17.58 -34.82 0.000 -41.61 -28.04
clinical space
0 53.88 0.00
1 48.20 -5.67 0.034 -10.92 -0.43
Comparing sales of food products during baseline and post-intervention periods
location busy
0 50.94 0.00
1 55.76 4.82 0.048 0.04 9.60
Figure 84 Mixed-effects analysis of % of red food sales
The sale of red food, as a percentage of the total sales, reduced by 6.42% during the intervention period compared to the before intervention period, adjusting for the other factors. These results have similarly wide confidence intervals as with all red products, representing variability in the data (Figure 84 visually represented in Figure 85).
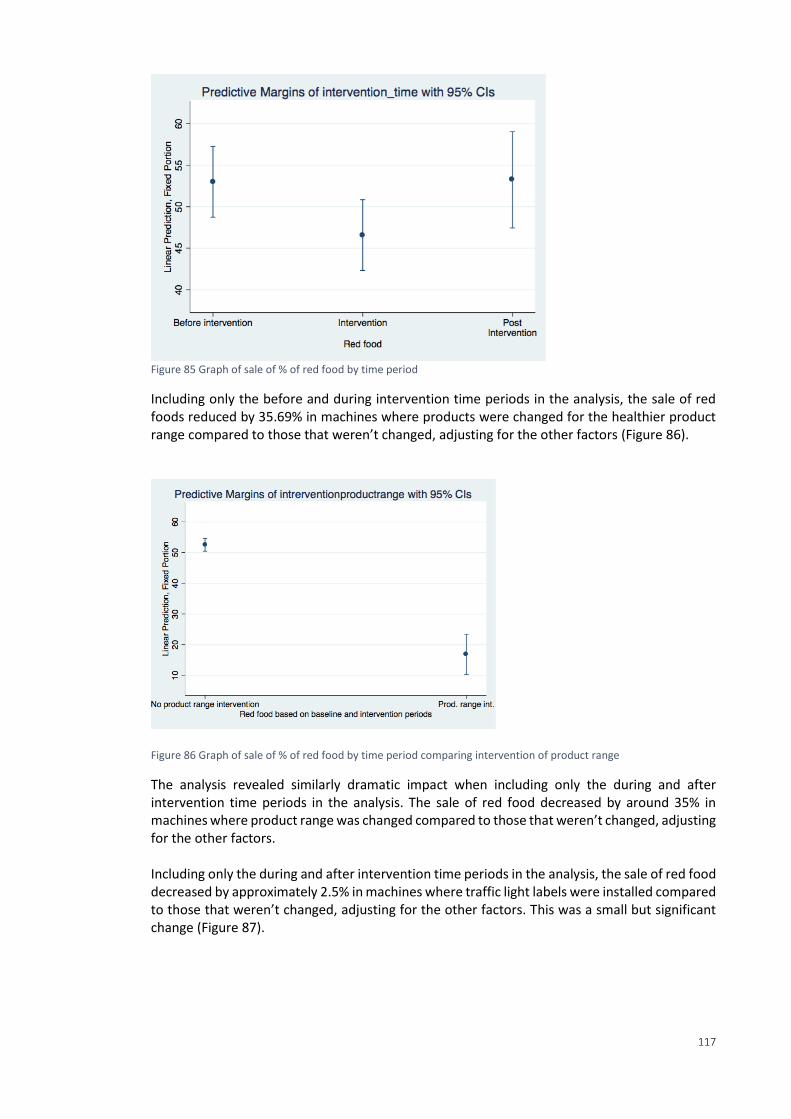
117
Figure 85 Graph of sale of % of red food by time period
Including only the before and during intervention time periods in the analysis, the sale of red foods reduced by 35.69% in machines where products were changed for the healthier product range compared to those that weren’t changed, adjusting for the other factors (Figure 86).
Figure 86 Graph of sale of % of red food by time period comparing intervention of product range
The analysis revealed similarly dramatic impact when including only the during and after intervention time periods in the analysis. The sale of red food decreased by around 35% in machines where product range was changed compared to those that weren’t changed, adjusting for the other factors. Including only the during and after intervention time periods in the analysis, the sale of red food decreased by approximately 2.5% in machines where traffic light labels were installed compared to those that weren’t changed, adjusting for the other factors. This was a small but significant change (Figure 87).
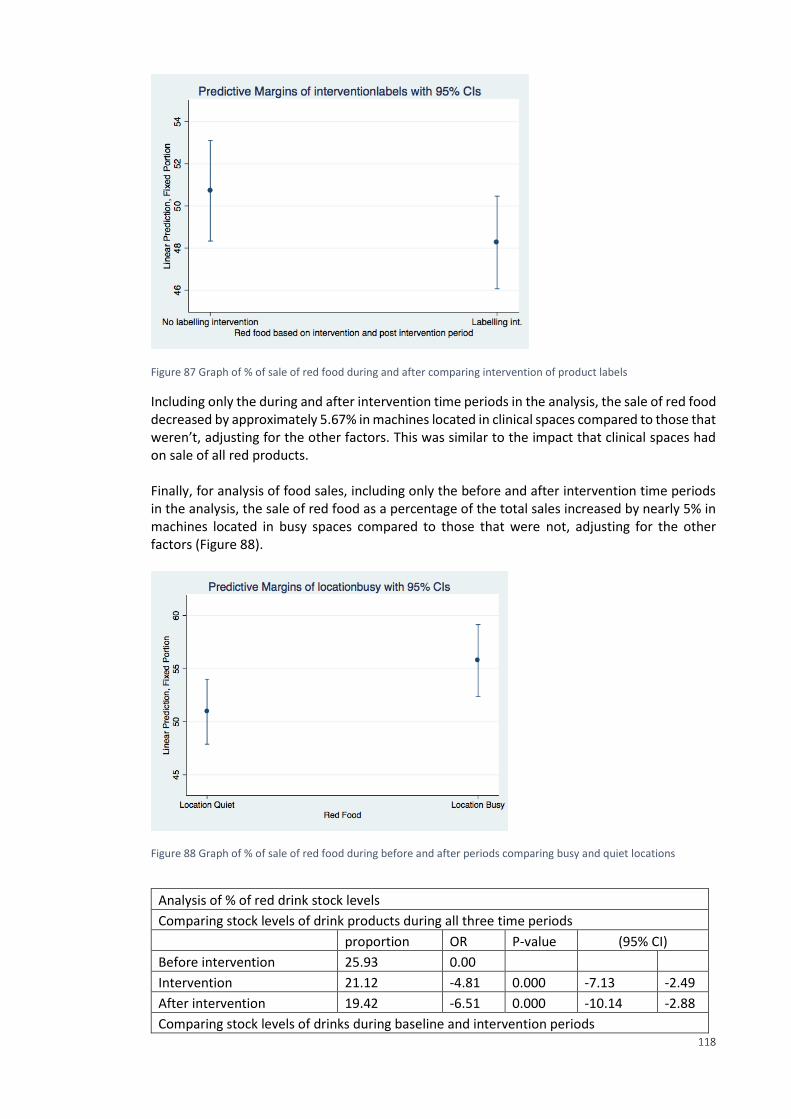
118
Figure 87 Graph of % of sale of red food during and after comparing intervention of product labels
Including only the during and after intervention time periods in the analysis, the sale of red food decreased by approximately 5.67% in machines located in clinical spaces compared to those that weren’t, adjusting for the other factors. This was similar to the impact that clinical spaces had on sale of all red products. Finally, for analysis of food sales, including only the before and after intervention time periods in the analysis, the sale of red food as a percentage of the total sales increased by nearly 5% in machines located in busy spaces compared to those that were not, adjusting for the other factors (Figure 88).
Figure 88 Graph of % of sale of red food during before and after periods comparing busy and quiet locations
Analysis of % of red drink stock levels
Comparing stock levels of drink products during all three time periods
proportion OR P-value (95% CI)
Before intervention 25.93 0.00
Intervention 21.12 -4.81 0.000 -7.13 -2.49
After intervention 19.42 -6.51 0.000 -10.14 -2.88
Comparing stock levels of drinks during baseline and intervention periods
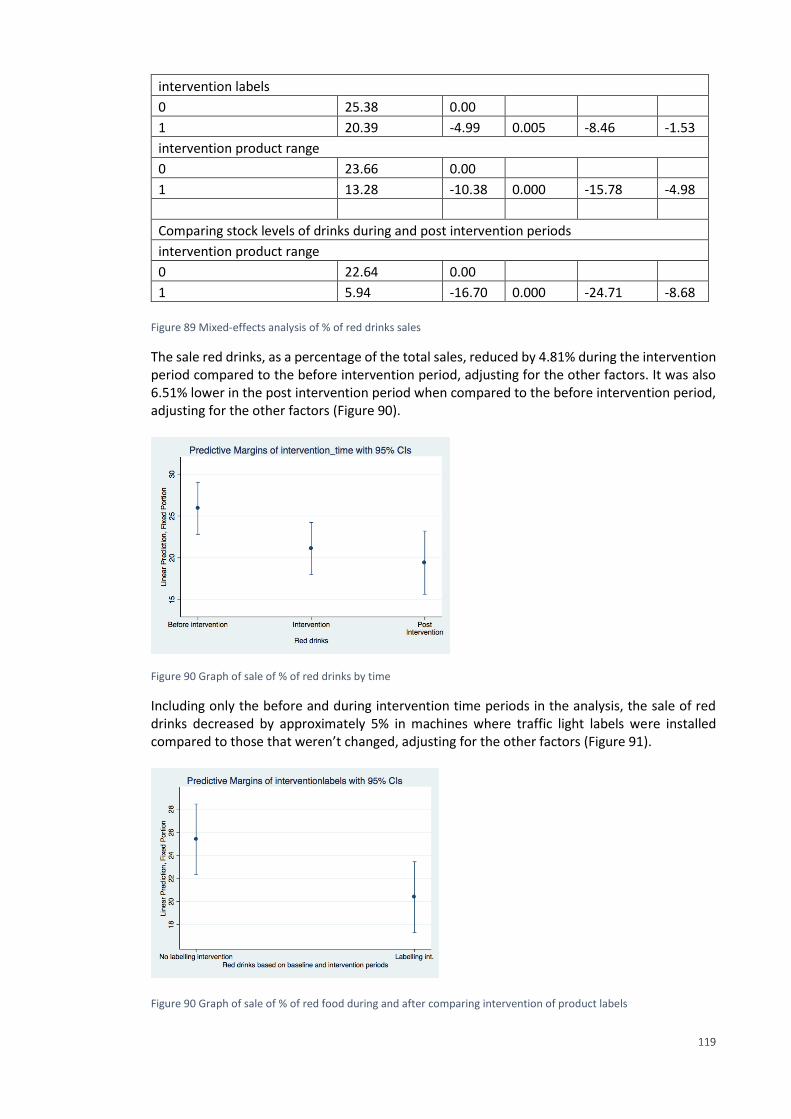
119
intervention labels
0 25.38 0.00
1 20.39 -4.99 0.005 -8.46 -1.53
intervention product range
0 23.66 0.00
1 13.28 -10.38 0.000 -15.78 -4.98
Comparing stock levels of drinks during and post intervention periods
intervention product range
0 22.64 0.00
1 5.94 -16.70 0.000 -24.71 -8.68
Figure 89 Mixed-effects analysis of % of red drinks sales
The sale red drinks, as a percentage of the total sales, reduced by 4.81% during the intervention period compared to the before intervention period, adjusting for the other factors. It was also 6.51% lower in the post intervention period when compared to the before intervention period, adjusting for the other factors (Figure 90).
Figure 90 Graph of sale of % of red drinks by time
Including only the before and during intervention time periods in the analysis, the sale of red drinks decreased by approximately 5% in machines where traffic light labels were installed compared to those that weren’t changed, adjusting for the other factors (Figure 91).
Figure 90 Graph of sale of % of red food during and after comparing intervention of product labels
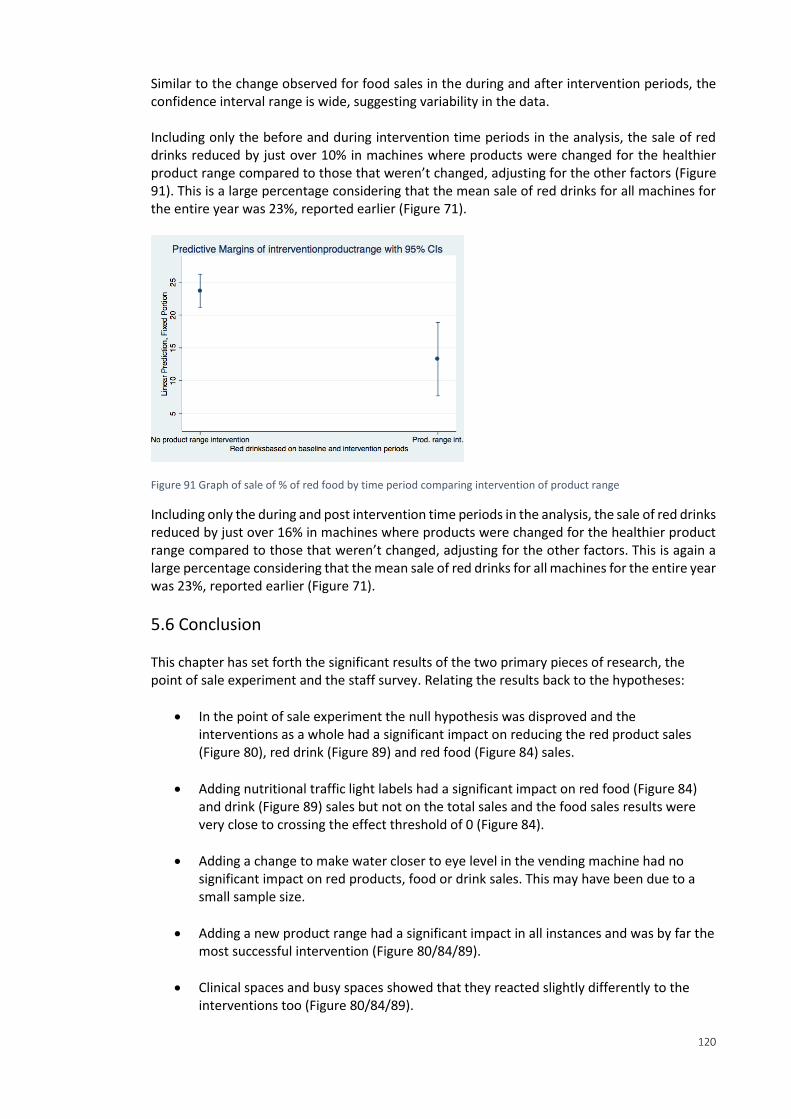
120
Similar to the change observed for food sales in the during and after intervention periods, the confidence interval range is wide, suggesting variability in the data. Including only the before and during intervention time periods in the analysis, the sale of red drinks reduced by just over 10% in machines where products were changed for the healthier product range compared to those that weren’t changed, adjusting for the other factors (Figure 91). This is a large percentage considering that the mean sale of red drinks for all machines for the entire year was 23%, reported earlier (Figure 71).
Figure 91 Graph of sale of % of red food by time period comparing intervention of product range
Including only the during and post intervention time periods in the analysis, the sale of red drinks reduced by just over 16% in machines where products were changed for the healthier product range compared to those that weren’t changed, adjusting for the other factors. This is again a large percentage considering that the mean sale of red drinks for all machines for the entire year was 23%, reported earlier (Figure 71).
5.6 Conclusion This chapter has set forth the significant results of the two primary pieces of research, the point of sale experiment and the staff survey. Relating the results back to the hypotheses:
In the point of sale experiment the null hypothesis was disproved and the interventions as a whole had a significant impact on reducing the red product sales (Figure 80), red drink (Figure 89) and red food (Figure 84) sales.
Adding nutritional traffic light labels had a significant impact on red food (Figure 84) and drink (Figure 89) sales but not on the total sales and the food sales results were very close to crossing the effect threshold of 0 (Figure 84).
Adding a change to make water closer to eye level in the vending machine had no significant impact on red products, food or drink sales. This may have been due to a small sample size.
Adding a new product range had a significant impact in all instances and was by far the most successful intervention (Figure 80/84/89).
Clinical spaces and busy spaces showed that they reacted slightly differently to the interventions too (Figure 80/84/89).
121
In the survey, staff at the Royal London, Newham and night soft staff had a significantly worse opinion of vending including vending drinks compared to the baseline (Figure 49/51).
Staff who reported using vending more than a few times a month were significantly higher among night shift staff, technical & healthcare support and nurses compared to the baseline (Figure 53).
Staff, especially those at St Bartholomew’s, the Royal London, nurses, facilities support staff and managers were significantly more likely to report spending more than £4 a day on food and drink than the baseline (Figure 56).
Staff were more likely to perceive vending costs as high if working night shifts, or at Newham or Whipps Cross, compared to the baseline (Figure 59).
Night shift staff, junior doctors and nurses were significantly more likely to report that they received insufficient nutrition on shift compared to the baseline (Figure 62).
Night shift staff, technical & healthcare support, junior doctors and nurses all had a significantly higher chance of reporting that they receive insufficient breaks compared to the baseline (Figure 63).
Night shift staff, junior Doctors and nurses had a significantly high chance of reporting an insufficient ideal catering situation (Figure 65).
Night shift staff, junior doctors and nurses were significantly more likely to report that they get food and drink from outside of the hospital canteen more than a few times a month compared to the baseline (Figure 67).
These findings will be discussed further in the next chapter.
122
Chapter 6. Discussion and Conclusions
6.1 Introduction to discussion of survey results This research surveyed a key population of vending service users, in this case focusing on staff. The survey was an exploratory piece of work, to baseline staff opinion of the service and find areas for targeted service improvement. The exercise of conducting and formally analysing the staff catering survey could itself be viewed as a benchmark, creating a standardised method of conducting and analysing end service user opinions in NHS catering. The survey was also timely, as there is currently very little understanding about the role of vending in healthcare, and its relation to staff health and well-being especially in a night shift scenario. The survey results showed an overall negative opinion towards vending, especially at the Royal London and Newham University hospital (see Figure 49 and Figure 51). Compared to the locations in the point of sale study, the survey was able to include all the lcoations in Barts Health NHS Trust, not just the Royal London and St Bartholomew’s. These two locations have recently been the focus of vending improvement initiatives, suggesting that the increased attention and changes to service may have highlighted dissatisfaction among staff in those locations. Regardless of speculation, the levels of dissatisfaction are helpful indicators of where changes might begin if the service were to be improved. Another key area where improvements should be focused was revealed to be for night shift staff. There was strong evidence that their opinion of vending services was significantly lower than day shift staff (see Figure 49 and Figure 51). The survey also revealed that night shift staff were using vending significantly more than day shift staff (see Figure 53).
Health The survey was part of a larger effort to improve catering at Barts Health and across the NHS. Improving staff catering is especially vital. It has previously been estimated the NHS could reduce its overall sickness rate by a third – the equivalent of adding almost 15,000 staff and 3.3 million working days at a cost saving of £550m, by improving the health and well-being of staff (NHS England 2014, Marmot 2010, DoH 2014, Barts 2016, Kibblewhite et al 2010, Norton 2014). The same policy focus on improving staff diets for overall well-being has been linked with the overall efficiency of the NHS, clinical care, stronger financial performance and lower levels of patient mortality (West and Dawson 2012 in Kings Fund 2015, Marmot 2010, NHS England 2014). As well as linking with an overall drive for better catering, healthier behaviour is being incentivised and supported by the NHS, in the context of preventative measures, particularly targeting issues such as smoking, alcohol consumption and poor diets in healthcare, and encouraging staff lifestyle improvements internally (NHS 2016, Marmot 2010; NHS England 2016 b İnce Güney 2014). Staff and non-patient catering service improvement plans overlap with preventative models of healthcare, initiatives to link with the community, health education, and supporting staff, patients and stakeholders in healthcare facilities to make the ‘right’ choices (WHO 2015, Nice 2016, FFLP 2016, Nice 2015, NHS England 2014, NHS England 2016, Maruthappu 2016 HPH 2015, NHS 2016, NHS England 2016 b.). Amid increasing policy to govern catering services in the NHS and drive towards staff health and well-being and preventative models of care and healthy lifestyle choice, there has been scrutiny over how vending machines fit into a public health message and strategic vision for catering in the NHS (HFSP 2014). The role of vending as an enabler in making poor lifestyle decisions has
123
been linked through various research to agendas such as work performance and public health. This research highlights the importance of vending as an enabling factor of poor lifestyle choices amid people who are a captive audience, and/or those working long, unsociable hours (Kelly et al 2012, Apostolopoulos et al 2011, Escoto et al 2010). This survey focused on staff working unsociable hours and the link to vending. It is the sole retail outlet for staff working night shifts and for significant periods of operational time and sells some of the least nutritious products available on the retail catering market. The explicit link between vending and night shift staff can be seen at Barts Health as the catering contract at the time of this research stipulated that the catering service provider would ensure out-of-hours catering for staff, and this was being achieved through vending. This solution to night shift catering is at odds with the NHS drive for sustainable care and long-term health. Improving vending is mainly for the benefit of staff when considered at a contractual level. A large issue such as preventable care and staff health and well-being, can be directly related to vending services as a result. It is common in the NHS for night shift staff to experience similar problems with catering. Three quarters of hospitals in the NHS do not offer healthy food to staff working night shifts (NHS England 2014). The results of the survey confirmed this as 62% of night shift staff reported that they received insufficient nutrition on shift (Figure 35). The problem in the findings of the survey were that, as well as not currently receiving sufficient nutrition on night shift, staff had an ideal that was also below the acceptable level of catering for them to remain nourished whilst working. 66% of night shift staff reported an ideal catering situation that was inadequate (Figure 36). In this instance, it suggests that an educational requirement exists with night shift staff. Referring back to the Marmot 2010 report for Barts Health, communication is an excellent area from which to draw solutions from as it cuts across every aspect of services and Barts Health should adopt communication to improve staff health and well-being through catering (Marmot 2010). An education strategy for healthy lifestyles for night shift staff based around communication and learning would be of benefit. While there is existing guidance on how to improve staff health and well-being, this survey allowed one to link it with vending services. The advice issued to NHS Trusts to cut access to unhealthy products on NHS premises, implement food standards, and provide healthy options for night staff for improved staff health and well-being must to be followed by tangible changes (NHS England 2014). Another key area of the survey was the revelation that staff were receiving poor breaks on night shifts, not enough breaks being taken in unsuitable spaces and consuming innutritious food and drink. This could be remedied with stronger messages to managers to ensure staff are taking breaks and taking them off the ward in order to refresh and relax away from the work environment. The most startling figure of the survey was that 84% of night shift staff currently receive insufficient breaks. This is a critical area to target in the event of improving the overall health and well-being of night shift staff. Out-of-hours catering for staff and vending services is a good example of a service area that is standardised with non-routine and non-core elements of catering and healthcare services that do not fit with the regular day time approach to management. It requires strategic vision to foster improvement, but one that aligns with the entire catering service as a whole. The development of a food and drink strategy at Barts Health for example must consider the flexibility required to meet the non-standardised aspects of the service such as night shift working. It is not sufficient to say to provide healthy food for all staff, it must be clear that extra consideration and resource will be required to develop night shift meals as they are currently
124
underprovided for. Making changes such as targeted improvements to break taking and continuously engaging night shift staff in their health and well-being would be an ideal goal for any strategic vision. There was concern at Barts Health before the survey that staff had little time to take proper breaks and were especially dissatisfied with the choices available out-of-hours. This has been proven to be true via the staff survey.
Service upsell There were several aspects of the survey that would help leverage change in service in commercially attractive ways. These would help in-house FMs at Barts Health who were looking for ways to improve automated automated food and drink vending services and meet public health agendas for healthier retail catering for all. The utilitarian stance is to ultimately contributing to the goal of staff well-being. However, there is a strong need for cost saving or commercially attractive service changes to meet cost improvement targets, but also to show potential revenue streams. An early indicator that there may be a missed retail opportunity was when staff could often be seen carrying takeaway boxes into hospital during out-of-hours periods. This suggested that vending is not sufficient for their dietary needs (as one would expect), and that this gap in the market was creating an unhealthy eating culture among night shift staff. The lack of adequate onsite provision is not only unhealthy; it is also taking potential retail catering business away from Barts Health. In terms of potential revenue, nurses, facilities and management staff were those strongly linked to spending the most on food and drink (see figure 56). As would be expected, central hospitals were the sites where staff were spending the most (see figure 56). This reveals where the most money is being spent by staff, and potential groups and sites to target more diverse catering options. 58% of night shift staff also spent £4 or more on average per day on food and drink, showing that they too might be potential customers for a new catering service aimed at upselling and profit increases (see Figure 42). 71% get food elsewhere than the hospital canteen (see figure 41). This indicates that there is a potential opportunity to create a night shift catering option, as most staff go elsewhere currently. Another aside to consider is that the fridges and microwaves provided in staff rooms require regular maintenance and cleaning which would be less of a burden if staff were using retail outlets onsite instead of bringing food from home. If the entire service was kept under one service structure, the cleaning of staff rooms and catering facilities might be scheduled simultaneously to pool resources. In reality, it is likely that a restrictive contractual structure, one of cleaning and one for catering, would prevent this kind of innovative resource sharing.
The tangible impact of the survey This researcher tested and developed guidance at the end service user end, given that little tangible advice is given on actual improvement initiatives that have been evidenced through primary research, and little was understood about the end service users of staff at Barts Health for catering. The results of the staff survey, conducted through this research, were used directly in the strategy document for food and drink services, as well as the results of the work done to evaluate the DEFRA GBS as part of the working group. Using end service user feedback was vital to evidence that the Trust’s vision was supported by staff, and that it listened to their needs.
125
This section has identified several specific areas such as improving night shift breaks which could also be more strongly argued for incorporation into service design at the FM-end of catering in Barts Health and the wider NHS. Targeted retail opportunities may exist for night shift catering and these could be timed in alignment with staff break times.
6.2 Discussion of point of sale interventions This research set out to evaluate how communication technologies can deliver public health agendas in National Health Service food and drink automated vending. This experiment trialled nutritional labelling, product placement of water and product range changes, each of which are a communication based design at the point of sale. It also considered whether the location of the vending machines, whether they were situated in a clinical space or in a staff space, made an impact on the trials. The research focused on where scientific knowledge can be grouped and applied to improve communication within NHS FM vending services towards public health policy. As a result, new knowledge was generated. The group of knowledge generated by the point of sale interventions was based on communication and service design and can inform areas of policy, strategy, supply chain, service contracting, point of sale, and end service user engagement. The experiment pinpointed vending machine point of sale as a key area where the government has identified that NHS trusts such as Barts Health can and should improve service towards public health outcomes (HFSP 2014, NHS England 2014, WHO 2015, DoH 2014, Marmot 2010). Understanding how the current knowledge can meet these goals and improve vending in healthcare was an unknown quantity prior to this research. Therefore, the results of the several variables that were tested at the point of sale can now inform a more detailed description of how hospital Trusts in the NHS can improve their vending services and meet government goals The main findings that could be used as the basis for further discussion are highlighted below. The summary statistics for the vending sales are useful communication tools in getting attention from the board for permission for changes in service. Models of communication rely on conceptual structures of abstractions and modes of representation in order to create meaning between people that can lead to action (Licklider 1960, Cohen and Bailey 1997, Coakley et al, Erb et al 2009). The message must be easy to understand where audiences operate on a national population level. This was discussed in section 2.7 Aesthetics: Aesthetics and communication tools at the point of sale. In these results of the point of sale experiment, the amount of sugar sold out of vending machines in one year at one of the Barts Health sites is as heavy as a man in a white van. Using the example of a man in a white van is meant to be memorable and engage people’s imaginations and white vans are an everyday site that people can relate to. Finding memorable ways to engage people in the need for service change is crucial, especially when delivering messages at board level, where background knowledge is limited and attention likely to be brief. A strong focus on communication ensures that messages are tailored to the correct audiences. According to the results of the paired t-tests, several of the interventions had a favourable impact on the reduced % of red food being sold. Red products are those scoring least healthy according to the across the board nutritional profile used. Labels positively impacted the sale of red food and drink although the confidence interval for red food sales was close to crossing the no effect boundary of 0 (figure 78 and 79). Product range interventions strongly and positively impacts the % of red food sales (figure 78). The product range interventions did not
126
significantly impact the % of red drink sales (figure 79). Finally, water interventions significantly reduced red product sales by 4% (P-value 0.0027). This shows that water interventions were effective for reducing the number of red drinks sold and there was an overall positive relationship between the reduced sale of red products and the interventions. Based on the results of the mixed-effects modelling, the interventions as a whole had an impact on reducing the amount of red products being sold by just over 5%. Product range changes impacted red product sales most strongly. Given that a higher proportion of the food being sold in vending machines was classified as red, there were more dramatic reductions to be made in the amount of red food products than for drinks. For example, comparing the before and during time periods, red food sales decreased 25.31% more than red drink sales. Clinical areas sold significantly less red products when comparing before to during intervention periods, although this trend did not hold for red drinks. There was a significant reduction in the sale of red drinks by 5% created by the introduction of traffic light labels, comparing before and during intervention time periods, although there was a wide confidence interval for this result suggesting variability in the success of using traffic light labels. The water interventions might have made an impact, especially given the significance of the findings using the t-tests. This was not carried over in the regression analysis and so, given the conflicting results, more testing using a larger sample may be required to confirm if the water intervention did or did not have an impact. The results suggest that a larger sample size would confirm that moving products to eye level does have a positive impact on encouraging sales. Water placement changes were also further potentially limited due to the make of the vending machines. It was only possible to move the water in most machines part way to eye level. Policy guidance advises, among other initiatives, that at point of sale clear information and labelling and use of traffic light food labels in vending machine services might aid service improvement (HFSP 2014, NHS England 2014, WHO 2015, HFSP 2014, DoH 2014, Marmot 2010). The results of this experiment show that using the across-the-board nutritional profile, traffic light labelling does have a positive impact and is a viable method by which Trusts can achieve clear and informative labelling.
Wider implications of the point of sale interventions As well as evaluating the kinds of labelling techniques that one might wish to employ, this research also viewed the matter as an essentially context-driven research problem, focusing on the broader goals of encouraging healthier choices in the context of different communication. Introducing the nutritional profile is a way to create a shared foundation that can be written explicitly into policy guidance such as the DEFRA balanced scorecard, the SRA catering audit questions, the soft FM tender, and communication with end service users. This forms a solid foundation from which to have tangible discussion over service change. The Rayner model is ideal as it has already been used successfully in public health campaigns by the World Health Organisation, in countries such as in Australia and France, as well as in small scale informal studies such as the NHS Wales vending project (ANSES 2015, Jewell 2008, Sloane 2014, Bolton NHS Foundation Trust 2010, Rayner 2014, Rayner 2013). All report favourably on the profile. However, none have produced an experiment that tests it as a vehicle for point of sale vending labels, and not in healthcare. This means that the profile is well suited to this research problem, but remains untested, and therefore the research makes a novel contribution to the development of the application of the profile.
127
Applying the model to create traffic light labels is a low-cost way to make a positive change in vending. Fixing product lists with the colour coded labels on them in vending stock rooms would make it possible for stockists to check where they place products. There are also many wider methods associated with the design of the point of sale environment and influencing user and customers. Some locations, such as A&E require slightly different product ranges given that the sales show people prefer non-red products, and purchase large volumes of water. A dedicated water vending machine, plus a focus on more substantial products such as milk-based drinks, confectionary with grains inside such as biscuits and flapjacks, would, this research predicts, be commercially successful products to trial in A&E. They are also better scoring on the nutritional profile, creating a ‘win-win’ situation. One of the most significant barriers to improving vending towards public health is the costs. It is a short calculation to see how much revenue the machine made. The overall sales in the machines tested was 85,385 products in 12 months. The price of confectionary and savoury snacks was £1.00 each (with slight variations due to mislabelling). The price of drinks between £1.20 and £1.70 with around a quarter of the shelf space dedicated to £1.20 water making an approximate average price of drinks £1.55. Given the total sales, the revenue would be around £42,600. Given that the trial took place mostly in one hospital and a small number of locations in another, and there are five hospitals in total in the Trust, Barts Health vending might present a significant revenue opportunity. With more time and a wider research aim, a detailed analysis of the cost and revenue impact would be incorporated into the analysis.
Commissioning for Quality and Innovation (CQUIN) 4 The CQUIN 4 is important to this research. The findings from the two pieces of primary research contribute to Barts Health being able to demonstrate that it meets the funding requirements and potentially be awarded the CQUIN funding. The CQUIN 4, set up to provide funding to create improvements, is a positive tool in current NHS provision to work towards improvement. Targeting breaks and catering for night shift staff would be an ideal way to showcase efforts towards applications of the CQUIN 4. The survey provides evidence for why a strategy would be launched too and therefore this research itself is an example of the Trust’s efforts to meet the standard. Given the new policy focus on staff and retail catering, the failure to meet demand for out-of-hours catering may, in the future, become a legal and contractual ground for service improvement across the NHS.
6.3 Discussion of the nutritional profile adoption in the NHS The research set out to reduce unhealthy vending. In chapter 2, the systems model that this researcher created was based around reducing red products, for example. One may wish to increase healthy choices, however given the limit of product types available in vending machines, the NAT group at Barts Health advised none of the products in vending machines could ethically be termed healthy. This highlights the restrictions of the context in which improvement must take place, and the nature of the products being sold. It was only ethically possible to reduce the least healthy products sold. Finally, using the profile might, given the experience working in the NHS, be too complex and resource-consuming to apply. Churchman warns against creating confusing information, and the volume of data and disparity of measures can work against improvements (Gase et al 2011). If the nutritional profile were to be adopted, a central service would be required with lists of
128
products and their ratings. The model could not be applied individually by NHS Trusts or contractors themselves. Measures of public health, health care costs, policy and catering procurement allude to different data sets with varying degrees of supply chain transparency inherent. Creating a product list and enquiry service where products could be reported and centrally given a rating would negate this complexity. This is similar to the adoption of the profile in France and Australia.
Further critiquing the available guides and profiles In the simple FSA guide for public health communication, the fat, saturated fat, sugar and salt focus in public health guidance does not account for other ingredients such as fiber, vitamins, minerals and proteins essential for a healthy diet. These kinds of nutrients have less obvious impact on public health measures such as obesity or caloric intake. Also, additives, chemical and sweeteners may have negative health impacts, yet little or no calories in them to potentially increase one’s weight. With the attention on obesity, nutrition is circumvented in public health guidance. There are also international discrepancies in measurement methods. In comparison to the UK use of grams per 100g on labels, European guides use total energy (%E) instead of grams and calories (WHO 2015, EUFIC 201). This differing approach to measurement can change in other ways as well. The measurement, terminology, adjoining research and government approaches to targeting certain nutrients regularly changes (FSA 2015, EUFIC 2015, Hoffman and Gerber 2012). These variations naturally confound standardisation of healthy products, as well as people’s understanding of nutrition. Despite the conflicts and changeability of public health guidance on nutrition, the typical products in vending machines are still frequently above the ‘high’ levels of fat, sugar, salt and saturated fat, according to FSA rating. There is also evidence to show that regular consumption of these nutrients, at a high level, can lead to serious and life-threatening health complications (NHS 2015, Bundrick et al 2014, Davy et al 2014, Fletcher et al 2010, Kubik et al 2012, State Government of Victoria 2015, Kristy 2014, Goldstein and Leshem 2014, Nutrition Australia 2015, Medline Plus 2015, FSA 2014, WHO 2015, CDC 2012). The health risk of a poor diet is attached to healthcare costs. Reducing intake of ingredients, for example salt, has even been linked positively to health care spending (Gase et al. 2011). Against increased policies on diet and NHS catering, this is presents a serious problem for Trusts. They risk their reputation endorsing such products, as well as contributing to the overall landscape of the UK’s unhealthy lifestyles. It would seem that of the guidance presented, much work is needed to understand and incorporate it into service design, flawed and changeable as it is. The examples given above, in their current format, would have to be explicitly linked to service management contract performance measures, and embedded into service culture to yield results. Even still, it is not certain that the available guides will be adequate or suitable.
Reflection on the role of portion size in future work Portion size was not factored into the experiment, as it has not been proven to be a successful method of influencing choice. The literature review by Skov et al. (2013) of studies that address eating behaviour in self-service setting highlights this issue. Skov et al (2013) discuss the matter within a theoretical framework of choice architecture, part of Nudge Theory. Taking twelve studies, sourced from a search across twelve different databases, revealed that of the studies
129
factoring in issues such as bowl shape, portion size and utensil size, the results did not conclude any healthier eating habits. The only caveat to this is that the review only details one experiment (written up in two separate papers, Freedman 2011; Freedman and Brochado 2010), where portion size was the specific measure (Skov et al. 2013). The experimental design was to pair different portion sizes with corresponding nutritional information. The experiment was more to do with reducing portion size to save costs and food waste in a pre-paid, all-you-can-eat catering environment. It also showed a reduction in the consumption of the high fat, high salt choice of French fries. The average level of food consumption and plate waste decreased. The nature of vending would not allow for a study of this factor as users do not typically consume food at point of sale. Portion size may be incorporated at a later stage, using a similar method to Freedman and Brochado (2010) where plate sizes, or in this case snack and drink item sizes, were drawn with nutritional values adjoining them. This requires further consideration. It is important to recognise that portion size is a significant concern, as the guidance provided by the Department of Health (DoH) (Gov 2014) incorporates it in policy development. This was confirmed by DoH representative Jane Crossley, Senior Strategy and Policy Manager Patient Environment Team Department of Health. Following on from this, the trial mentioned in the DoH report Establishing Food Standards for NHS Hospitals, was initially used to create a prototype that would allow for portion size to be input as a variable to the model (Gov 2014). Eventually, the idea was not implemented as it cannot be validated. If portion size were to be incorporated into the nutritional profiles, the idea would be to attribute points to each potential food portion size to account for the different measurements of millilitres and grams in food and drinks separately. For example, 500ml drinks might be 0.5 points, 1 litre 1 point whereas for food it could have been 100g is equal to 1 point, 50g equal to 0.5 points etc. Once points for portion size have been attributed to each product, this could then be added to the nutritional point to give a new total that factors in both the overall nutritional value of each item based on the FSA Ofcom model as well as portion size. In practice, this approach would have to be discussed with the extensive group of dieticians who originally developed the model. Portion size is completely unrelated to the nutritional scoring system and would skew the model without linking the new addition to the existing and detailed methods of calculating scores for each nutritional variable, from sugar to fibre etc.
6.4 Discussion of contract factors An example of the result of output-specified contracts in catering in the NHS is that allergen information about food must legally be made available on request, as is also the case in the US (DoH 2014, Redhead and Williams 2010). At Barts Health, the contractor is free to meet this requirement in any way: to store information online, or on printed menu cards, for instance. These two approaches may produce better or worse levels of consumer awareness of allergens. However, contractually either is acceptable so the contractor is free to choose the cheapest option. This shows that contract management alone is not enough to ensure the best possible service. In relation to vending, a key concern is that automated food and drink vending are used as a cost-efficient way to deliver out-of-hours catering to staff. This method of providing retail service is in line with the NHS Standard Contract, and vending machines are ideal as they do not require continuous staffing and the products have long shelf lives, so wastage is minimal. This is
130
attractive where service has a low turnover and can, therefore, be costly to run with little profit returns. Although the contract is being met, traditional vending services are not a healthy way to nourish staff out-of-hours. Understanding the way that staff are using vending machines is key to evidencing the need for change in this area. The impact of the contractual structure can prohibit information sharing, creating hurdles to effective service delivery. Service records held by contracted and subcontracted service providers, such as costs of running services, supply chain information and retail profits, may be contractually protected from the NHS. Even the locations of vending machines are not decided by Barts Health, but by the PFI partners who built and manage much of Barts Health properties, Capital Hospitals Ltd (CHL). Contracted service providers such as Carillion plc are given broad goals that meet only the legal requirements of service and these can be interpreted in the most cost effective way. This is called an output-specified contract which helps keeps costs to a minimum. The existing contract is not adequate to implement policy recommendations such as selling and promoting healthier food and increasing labelling. Out-of-hours staff catering highlights the dilemma as FMs are being asked to deliver value outside of the contract structure, and, therefore, have little power to ensure its successful implementation. Running the out-of-hours catering service for smaller amounts of people is less resource efficient and is also not a part of the core NHS offering, which takes precedence in the way services are managed by FMs. Complex governance agreements between the Trust and several third-party governance organisations can prohibit positive change. The impact of the contract structures can also prohibit information sharing as service records are held by contracted and subcontracted service providers. The costs of running services, supply chain information and profit level may be contractually protected which means FMs have no access to the information. Contracted service providers who subcontract vending are given broad goals that meet only the legal requirements of service, and these can be interpreted in the most cost effective way, to help keep costs to a minimum. In a retail service like vending, this is a poorly-aligned approach, as the profits from service might be used to ensure subsidies for healthier products rather than being drained out of the NHS by third party contractors. Guides such as the GBS can be written into contracted service provider agreements, and can be used to communicate service level agreements (SLAs) and key performance indicators (KPIs). However, the GBS itself is undergoing pilot testing and active debate as to its usefulness. It is at an early stage of development. A singular mode of advising on public health communication in vending services is necessary. Finally, the contract can be used to excuse a lack of initiative and effort on both sides towards improvement. This is unacceptable and unnecessary. In launching the primary research project for point of sale interventions, this research was working outside of the current contract specifications. There is no current agreement for contractors to provide support or resource for public health-driven point of sale designs. Similarly, in surveying out-of-hours service users, the research was exploring a potential service improvement that is outside of the current contract agreement between the Trust and its catering supply chain to provide out-of-hours catering. The research interrogates what out-of-hours catering is in detail from the user perspective, and holds it against the policy driven standards for public health. Immediately this reveals a gap between contracts and policy that leaves Trusts vulnerable to criticism.
131
Conducting research that is not restricted by the specifications of the contract is essential in moving the service from current level of compliance towards potential future tightening and increased requirement for compliance, or perhaps even a radical change of service to protect public health and ensure the NHS promotes the correct image in its premises. This research proves that it is possible to conduct this type of research successfully and that buy in can be achieved outside of rigid contract frameworks.
6.5 Reflection on policy through international approaches to public health and vending The French and the US approaches to vending, banning it all together in the former and allowing relative freedom of use in the latter, offer polarity within which to consider potential development of policy in the UK. It would be overly simplistic to say that the French approach is better than the US. Firstly, the US has a far more serious problem with chronic obesity, for example, and so must deal reactively to weight gain and with ingrained poor eating habits. Governments must set achievable and meaningful targets that reflect the current state of public health in the country at the time, and these may change. Secondly, it remains unclear from the literature what the impact of vending machine bans on revenue in the French example, or the cost of service change. Thirdly, considering the NHS, it is unclear how one would operationally deal with a vending ban, given the need for out-of-hours catering. Vending also supplies much needed water around the hospital, in places such as A&E, which would need to be suitably replaced. Finally, dealing with adult populations, the end user perception of a vending ban is more of a factor than in schools. It may be argued to be unethical to remove choice all together. It might equally cause unrest and dissatisfaction among service users, something frontline FM staff would bear the weight of on a daily basis. All of these unknowns would greatly impact FM services and the way they are designed and run. One last consideration it that, although vending machine services are not strictly there to service patients, often malnourished patients might be more willing to eat the types of foods sold in vending machines, and people may find emotional comfort in them too. The Nutrition in Action Team (NAT) at Barts Health themselves expressed their concern over this matter during consultations with this researcher during the project. Increased craving for salt has even been linked by researchers to attempts to moderate depression (Goldstein and Leshem 2014) Given that France and the US both used BMI as a measure (if in very different ways), one might assume that this research would seek to incorporate BMI into the work. This is feasible given that BMI data was available about staff at Barts Health. A recent review of vending research stated that ‘research is urgently required to better understand the features of successful point-of-purchase nutrition interventions and whether these interventions can reduce BMI or prevent weight gain’ (Grech and Allman-Farinelli 2015). The feasibility and usefulness of doing this is yet to be evaluated, given the more immediate research need in the areas listed at the beginning of chapter one. BMI is also a remote measure considering FM performance and service design measures that are in place.
Further ideas for developing measures of public health in vending Biometric data and technologies to measure and influence it are a rapidly expanding area of research. Biometric data is a central part of technology design aimed at effective communication in contemporary research with cutting edge examples including eye tracking and fMRI
132
technologies (Ripoll et al 1995, VanRullen and Thorpe 2001, Ballard et al 1997, Turner et al 1998, Coe et al 2002, Lim et al 2011, Recarte and Nunes 2003, Law and Gold 2009, Ditterich et al 2003, Glimcher 2003, Vaeyens et al 2007, Krajbich and Rangel 2011, Pezzulo and Barca 2012, Vargo and Lusch 2004, Huddleston et al 2015, Chandon et al 2009, Feiereisen et al 2008, Clement 2007, van der Laan et al 2015, Zhang et al 2009, Otterbring et al 2014, Kuai et al 2013). The work on FMRI scans and visual fixations shows that placing products in prominent easy to see locations may improve sale of products there. One must consider how these technologies will influence and potentially improve public health agendas, service design and positive change to people’s long-term health in public sector settings in future. The level of user information that might be gathered at point of sale for example could be highly diverse, allowing the machine to select products appropriate to the user. Another area of research that was not formally developed but that was undertaken by this research in the course of the project was in engaging the sponsor company at an operational level in their work around catering service improvement. For example engaging contractors in new government policy guidelines. This researcher produced a policy pack for those tendering for the new soft FM and retail contracts. The pack reported about the research work done, including all areas of research on policy, strategy, supply chain, point of sale and end service user research. The researcher attended meetings with senior management teams around contract design, to plan the soft FM and retail catering retender. Key terms like ‘healthy’ and ‘snacks’, or ‘sweetened’, were still undefined in the proposed contract, initially. This was fed back formally in the strategy development and contract consultation meetings with senior management. Terms such as these would surely require definition, when, for example setting, SLAs or KPIs around healthier vending. This aspect of the project was periphery but in understanding what creates successful research it was essential. Part of the research is to reflect upon the process. One aspect of research that has been successful in this case is continually engaging in the periphery research activities that add value to the project from the perspective of the sponsor. This reflective element of the project could constitute its own area of research and was too complex to formally reflect on given that the research problem was to improve vending services.
6.6 Development of the FM research context FM research can contribute to the adjacent disciplines to help understand design in use, the end user and their environment better, as this is where FMs operate and hold valuable expertise (RAE 2015, BIFM 2013, Martin and Guerin 2006, Nenonen and Sarasoja 2014, O’Brien 2014, Lockton et al 2010, 2008, McCarthy and Write 2004). In the example of vending services, FMs championed this research project as providing critical insight into catering in the NHS, which was being called for by government (DoH 2014). Evolving out of commercially funded research programs, FM research communities have recommended a clear delineation of methodological issues that meet organisational demands, the adoption of a recognised set of scientific methods, more hypothesis testing, robust data analysis techniques and reporting methods, and more valid conclusions (Nenonen and Sarasoja 2014, Junghans and Olsson 2014, Pullen et. al. 2009, Mclennan 2004). This is vital. However, in contrast to this statement, the discussion of technologies of service communication so far has emphasised social, psychological and user-focused approaches. The methods of analysis must compliment and retain focus on these factors. This research has attempted to maintain a focus on merging technical and social systems. There has been less emphasis on strictly scientific methods development, and more on solving the sociotechnical problems.
133
Although FM, in the context of this research, is heavily concerned with people and social systems, FM research has thus far developed largely in line with objective, scientific ways of thinking (Price 2002, Pullen et. al. 2009). The underlying logic of FM research is defined by the nature of science itself; pertaining to a central problem, with items considered to be facts, explanations, goals, and theories related to that problem, and, like FM, science has developed as ‘a response to the demand for specialists in capitalist societies’ (Moran 2002, Wagner et al. 2011, Klein 2006). Like any young profession, FM has sought out ‘finance and status as well as business attention’, and scientific methods offer a way to harvest knowledge and justify such increased nationalised and commercial funding and business attention (Price 2002, Moran 2002, Strijbos 2010, Klein 2006, Sullivan et. al. 2010, Junghans and Olsson 2014, FM Link 2014, ICE 2014, Pathirage et al. 2008, Mclennan 2004, IFMA 2012; Nenonen and Sarasoja 2014). This research has at its’ centre been about FM services, and has been carried out in line with the requirements and constraints of FM practitioners. FM research is traditionally aligned with hard FM and science based (deductive) research methods (Campbell 2017). An ‘evidence based’ scientific, hard FM body of knowledge responds to organisational problems, in the form of empirically-tested theories, business cases, best practices, financial savings proposals, and decision support tools on different levels that are strategic, tactical and operational (Price 2002, Pullen et. al. 2009). The development of FM knowledge in this tradition is, as a result, well-aligned with a drive from governments, private industry and policy across the world to engage academic institutions with surrounding commercial markets, fuelled by underlying increases in competition between academic institutions as well as competing national economies (Rudzki 1995, Hemsley-Brown et. al. 2006, Palfreyman 2004).
Soft FM research Research agendas and research approaches to do with soft FM are less easily quantified. Soft FM services like cleaning and catering are also more likely to the subcontracted, so this adds a new contract-focused set of agendas to soft FM research (Cotts et. al. 2010 p232-233). Soft FM research problems are rooted in scientific research thinking and often centred on contractual performance measures. Organisations might have limited access to outsourced data sets, which makes research even less likely to happen from an in-house FM perspective, as is the case in this research project. This lack of soft FM research is exacerbated as the humanities research approaches that might compliment soft FM research are less likely to gain government funding, compared with commercially competitive science-based research (Fredericks 2010, Moran 2002, Huutoniemi et. al. 2010). These combined barriers make it difficult to see how one can research soft FM problems from the in-house FM perspective, with public health agendas at stake. These pertinent issues to FM practice do not fit neatly into contractual analysis or scientific methods. One of the most influential current approach to soft FM research is service management (Campbell 2017 Grönroos 2007). It offers a framework of analysis that is well suited to this research problem, as defined in Chapter 2 (Figure 92).
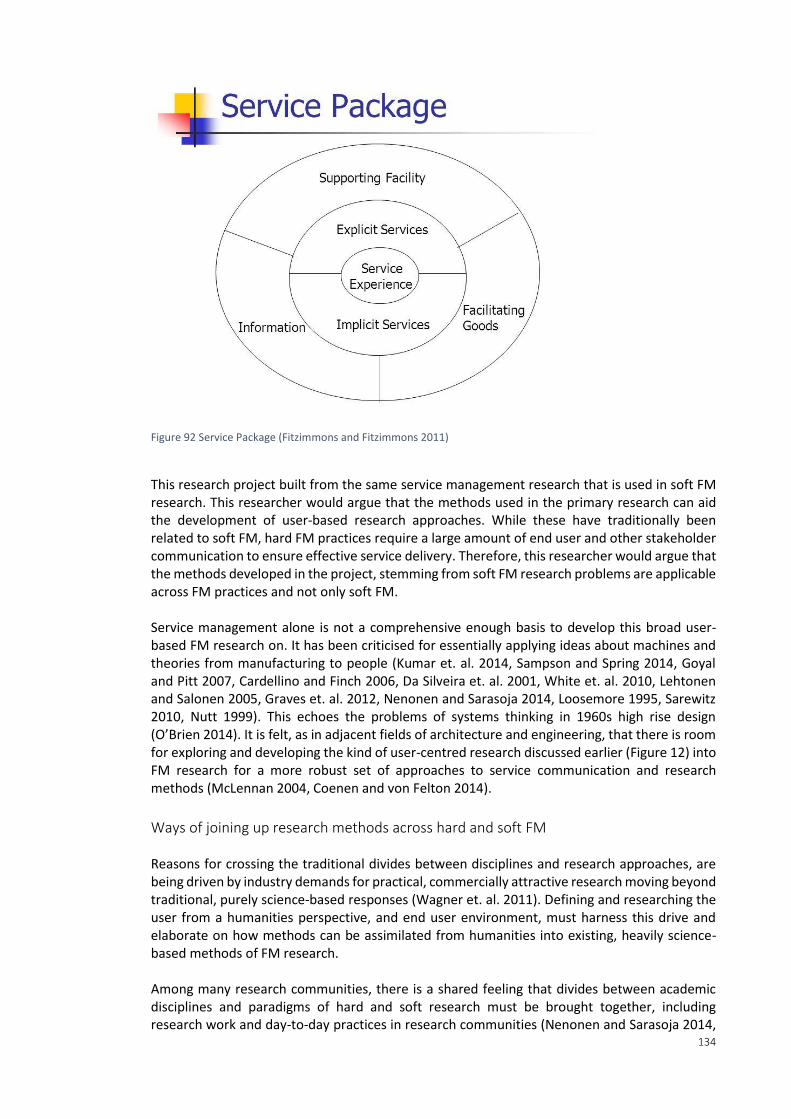
134
Figure 92 Service Package (Fitzimmons and Fitzimmons 2011)
This research project built from the same service management research that is used in soft FM research. This researcher would argue that the methods used in the primary research can aid the development of user-based research approaches. While these have traditionally been related to soft FM, hard FM practices require a large amount of end user and other stakeholder communication to ensure effective service delivery. Therefore, this researcher would argue that the methods developed in the project, stemming from soft FM research problems are applicable across FM practices and not only soft FM. Service management alone is not a comprehensive enough basis to develop this broad user-based FM research on. It has been criticised for essentially applying ideas about machines and theories from manufacturing to people (Kumar et. al. 2014, Sampson and Spring 2014, Goyal and Pitt 2007, Cardellino and Finch 2006, Da Silveira et. al. 2001, White et. al. 2010, Lehtonen and Salonen 2005, Graves et. al. 2012, Nenonen and Sarasoja 2014, Loosemore 1995, Sarewitz 2010, Nutt 1999). This echoes the problems of systems thinking in 1960s high rise design (O’Brien 2014). It is felt, as in adjacent fields of architecture and engineering, that there is room for exploring and developing the kind of user-centred research discussed earlier (Figure 12) into FM research for a more robust set of approaches to service communication and research methods (McLennan 2004, Coenen and von Felton 2014).
Ways of joining up research methods across hard and soft FM Reasons for crossing the traditional divides between disciplines and research approaches, are being driven by industry demands for practical, commercially attractive research moving beyond traditional, purely science-based responses (Wagner et. al. 2011). Defining and researching the user from a humanities perspective, and end user environment, must harness this drive and elaborate on how methods can be assimilated from humanities into existing, heavily science-based methods of FM research. Among many research communities, there is a shared feeling that divides between academic disciplines and paradigms of hard and soft research must be brought together, including research work and day-to-day practices in research communities (Nenonen and Sarasoja 2014,
135
Davies 2011, Moran 2002, Strijbos 2010, Fredericks 2010, The Bartlett 2014 Wagner et. al. 2011, Klein 2004, Klein 2006, Falk-Krzesinski et. al. 2011, Hadron et. al. 2010, Huutoniemi et. al. 2010, Nenonen, Truffer et. al. 2008, NRC 2004, Culligan and Pena-Mora 2010, Huutoniemi et. al. 2010, NRC 2004). This can ensure meaningful crossing of disciplinary boundaries takes place. One of the challenges is group working within research projects as a hard/soft paradigm means different definitions, models, methods and even journals in which they publish from within disciplines (Wagner et. al. 2011, Klein 2006, Hadron et. al. 2010, NRC 2004), It is crucial to discuss research across these boundaries and find overlapping themes, practices and resources that each side lays claim to (Price 2002, Pullen et. al. 2009 Martin and Guerin 2006, Klein 2006). Improved cross working research practices might enhance one’s ability to produce, find and publish relevant work in a timely manner, or acquire funding from different disciplines and their connections, to define the inputs, processes, outputs, and outcomes of one’s research (Davies 2011, The Bartlett 2014, Klein 2006, NRC 2004, Wagner et. al. 2011, Klein 2006, Huutoniemi et. al. 2010). Several methods have developed to help this process of cross disciplinary research. Dedicated methods such as bibliometrics and visual mapping of disciplines and research, find ways to factor in differences in granularity and dimensions of measurement and assessment of research practices (Wagner et. al. 2011). Terms such as interdisciplinary, multidisciplinary or, transdisciplinary research are used to allude to the wide range of efforts being made to bring together and forge new research practices. This is work being led by research administrators and policy-makers (Huutoniemi et. al. 2010, NRC 2004). It ties with mixed methods research practices, discussed in the Methods chapter. This project crossed many disciplines and so these high level discussions about the practice of research are related to this project. A project with more scope would have developed this discussion further, although the literature is itself in a formative state. In FM practice, cross-departmental working can be viewed as a parallel. In research terms, science deals with how best to bring together groups of researchers to conduct research, and might be harnessed to create dedicated FM research agendas and structure projects (FalkKrzesinski et. al. 2011, Stokols et. al. 2010). In an organiosational setting, Mullins and Christy (2010) metioned in section 2.3 of this document applies. In publishing FM research, databases and technologies are necessary to help identify FM-related theory too. FM research groups are in the early stages of collecting and categorising the broad and varied range of processes involved in FM and linking them to different areas of research and associated methods in order to begin the process of creating an effective set of FM theories (IFMA 2012, Nenonen and Sarasoja 2014, Sullivan et. al. 2010, Pullen et. al. 2006, Price 2002). Nenonen and Sarasoja (2014) bring discussions about interdisciplinary research together with FM, focusing on the challenge in FM in Finland in the development of competencies towards shared understandings, unified methods and intensive collaboration, not only between industry and research or internationally but in knowledge exchange across disciplines as well (Nenonen and Sarasoja 2014). This kind of approach to FM is perhaps influenced by interdisciplinary research in the same country such as the AFIR (Klein 2006). No other relevant peer reviewed work being done to link cross disciplinary research practices, TDR and FM was found in literature searches. Martin et al. (2006) have produced a search engine for designers of infrastructure, seeking papers that report on the design outcomes and evidence of how design affects people, an essential FM-based problem (Caren et. al. 2006). They report on the problem that designers face, that research of buildings in use does not communicate well with designers or make
136
understandable criteria for their work, highlighting the gap between research and practice that more robust FM research methods might help fill (Martin and Guerin 2006, Caren et. al. 2006). A final consideration in creating meaningful FM research is that commercially sensitive findings in research can slow or prevent production and publication of meaningful and useful research (Nenonen and Sarasoja 2014). This is especially important given that FM is inherently an applied field of research. Given that many soft services are outsourced, active consideration is required about how to bring commercially protected data and remotely managed teams with in-house expertise to create a unified understanding of FM problems.
6.7 Research limitations There were several limitations to the research. Firstly, the sample sizes of the two primary pieces of research were not the same, limiting the potential to create crossover analysis. The survey addressed the whole of Barts Health NHS Trust, the point of sale intervention addressed only St Bartholomews and the Royal London. Secondly, in the vending point of sale experiment the intervention period for product range interventions was not large enough to make meaningful conclusions about the impact of the interventions long-term. Thirdly, there was a lack of sales and revenue analysis. This would have empowered more decision making at contractual level. The research prioritised nutritional measurement and was not able to complete further analysis of sales within the project timeframe and focus. In future, it would be favourable to trial more interventions with different intervention designs, perhaps colour an entire row of products in one colour. In order to focus more on out-of-hours staff, it would be optimal to have timed sales data for product purchases. This would mean that the interventions could be tested to see what time of day they were most successful and if there were changes in behaviour between out-of-hours and operational retail catering times.
6.8 Contributions to knowledge There were six areas in which this research contributed to the creation of new knowledge.
1. The research responded to a call for more understanding of how to influence healthier user choices in vending interventions, as well as a call for more understanding of how to influence vending choices in healthcare settings specifically (Skov et al 2013, Hua and Ickovics 2016). The point of sale research experiment in this research trialled vending machine interventions in novel ways to encourage healthier eating habits. It showed which of the interventions were and were not suitable in an NHS setting.
2. The research built understanding around the interventions that was novel, as it factored in location and its designation as a staff or public area. Understanding if these variables had any bearing on the success of these types of nudge interventions has not been trialled before for public health.
3. The use of fixed effects modelling was novel for research on vending in healthcare and
is a new way to analyse findings in nudge interventions for this setting (Thaler and Sunstein 2008). Similar methods of regression modelling have been used to measure the association between school vending machines and children's BMI by socioeconomic status, showing that the analysis methods are suitable for comparison across public health and vending research (O'Hara and Haynes-Maslow 2015). In this case, using mixed-effects modelling allowed the interrogation of conditional variables
137
to see whether the characteristics of the location or intervention type made an impact on the efficacy of the intervention outcomes.
4. The nutritional model that was used was trialled in a novel environment. The prior examples of the application of the Rayner across-the-board nutritional profile report favourably. However, none have tested it as a vehicle for point of sale vending labels, and not in healthcare (ANSES 2015, Jewell 2008, Sloane 2014, Bolton NHS Foundation Trust 2010, Rayner 2014, Rayner 2013). Vending is uniquely suited to across-the-board nutritional profiling. Having a single score for each product that can be displayed on the machine is ideal as there is limited space to look at package labelling at point of sale for vending. Therefore, the research makes a novel contribution to the development of the application of the Rayner across-the-board nutritional profile for vending service improvement where the intended outcome is healthier product choices.
5. Another contribution was made through the catering survey, which collected and analysed end service user feedback. This makes a novel contribution to vending service improvement literature in the NHS for staff, as there is little formal collection and analysis of end user opinions available in the literature, and it was invaluable in strategic service planning in Barts Health. The same approach and the findings may be used to contribute to discussion at a national level about catering for night shift staff, adding to the evidence base for positive change.
6. The final area of contribution to knowledge was in the development of service design analysis in FM (Campbell 2017). The research advocates the capture of invaluable, in-depth personal knowledge about service design through scoping and engagement with the subject. It suggests that coupling this with robust statistical tests and quantitative analysis that drives service change is optimal in FM service design research. Public health agendas are only one of many agendas that FMs must adapt to in the varied organisational settings where they operate. The methods and research approach applied in this research are highly translatable to other FM service design research problems.
In a broader sense, the research meets the gap between strategy and practice, developing methods and approaches to achieve this. Some specific gaps filled in vending services were the adoption of a suitable nutritional profile and detailed user opinion review to illustrate goals for change, as well as evidence for why and how nudge style interventions were successful. The research approach created a blend of actioned research and evidence-based quantitative analysis and actively intervened to bridge the gap. This mix is ideal where FMs need to understand and influence operational delivery of strategy to meet new governance demands within a restricted management structure. Inherent to the research approach has been the role of communication. Communication was essential in influencing and understanding behaviours, as well as providing the measures and techniques needed to operationalise and analyse data. The research methods have now been trialled and used to link strategy, policy, contracting and supply chain auditing to the business framework and deliver and honour meaningful operational changes towards public health outcomes. Finally, an outcome of the chosen research approach, combining communication, actioned research and quantitative analysis, focusing on public health and not commercial outcomes, was the cooperation and resource given by subcontractors. The engagement fostered was outside of the contractual agreement. Having access to the sales database for vending and the dedicated
138
time of the subcontractor goes against convention as it is not within the contractual agreement to do so. The level of subcontractor and supply chain engagement, time spent face-to-face and trust built between stakeholders and the primary researcher was pivotal to the research. One may speculate as to the reasons for high levels of buy in. It may also have been due to the leadership and strength of the working relationship between the industry supervisor, who was at an appropriate associate director level to command business attention, and the primary researcher. It may equally have been due to strongly aligned research and organisational goals. Thirdly, it may have been the result of the forward-facing nature of the research, an opportunity to lead amid anticipated increases of the role of public health agendas in non-core NHS services such as vending. For these reasons, the project was well integrated and strongly applicable to the present problem of vending service improvement in the NHS towards public health agendas.
6.9 Conclusion In a highly visible service like vending, the sight of chocolates and crisps for sale does not support the ideals of healthcare, and staff, patients and visitors buying unhealthy food from retail outlets on NHS sites sets a poor example for preventative models of healthcare (İnce Güney 2014). From the outset, the research surmised that the fact that vending machine point of sale removes the need for face-to-face transactions can mean transactions go unnoticed and perhaps even manifest into vending being an inherently taboo or immoral service (Segrave 2002). The research went on to shed light on the impact of vending on public health agendas in the NHS and found they do play a significant and detrimental role, especially for staff working night shifts. It also showed the large volume of sugar, saturated fat and sodium being consumed via this often forgotten and difficult to standardise retail outlet. Both pieces of research bore witness to the need for change, providing quantitative evidence. The project strove to provide the kinds of linear rational models that the public sector can use to influence and positively change decision making and to contribute, through FM service design to preventative models of care and public health (Oborn et al 2011). The research was conducted in order to inform service improvement goals for in-house FMs, collecting and analysing data that would be valuable in deciding the best courses of action at all levels from the in-house FM perspective. This is because FM is most importantly a function to maintain and develop the agreed services which support and improve the effectiveness of the NHS’s primary activities as a carer of health (IFMA 2012, BSI 2006, FM Link 2014, CEN 2006, Prodgers 2009, Davies 2011, Hall 96, Mclennan 2004, Coenen and von Felton 2014). Data-driven communication systems such as outsourced service contracts are often reliant on staff engagement to understand how to change services through reporting and feedback. This was noted as a particular area for improvement at Barts Health and one which the staff survey contributed towards (Marmot 2010). For example, the staff survey captured staff feedback which was crucial to understanding the service faults and was included in the food and drink strategy for the Trust. Contracts and policy guidance in place to ensure compliance and effective governance must be informed by these kinds of ground up analyses to ensure resource is prioritised correctly. For example, a food education need was detected among night shift staff that, left unmet, could negate any efforts to provide better catering services and damage retail profits in the process. The primary research carried out was a rare opportunity to test the efficacy of the point of sale interventions and understand formally if they were appropriate in a healthcare setting by using in-depth statistical analysis. The results showed several promising changes that could be made amidst the rigid management frameworks in place. The changes were relatively cost-free, and resource-lite to implement. Until any more drastic changes to the way that vending machine
139
services are governed are made, these changes present a positive compromise to the tension between commercial and public health agendas. Given that vending is a non-core service, these changes should be seen as a successful effort to improve and should be embraced, retested and developed further NHS wide. Finally, activities in this project were focused on the user end of service communication and engagement and on understanding the impact of vending services on staff. This is where FM services create their value-add in organisations. Placing quantitative research at the heart of a more complex and qualitative understanding of this everyday context meant that the research gained clarity and applicability. The in-depth knowledge of the operational and contractual restraints allowed the research to work around problems and design solutions that had real potential to be used. Ensuring that ample consideration was given to the extenuating and contextual factors of the vending services as a system was also a way to align values of different groups in vending services, create an overall positive outcome and avoid creating a solution worse that the symptoms of the problem (Churchman 1967, Rittel and Webber 1973). Some of the unintended outcomes of the project were also positive, if difficult to quantify. For example, water was added to the machines in the children’s day care unit. Renal were given a bespoke set of products that fit their patient profiles, as the previous one was in fact life-threatening at certain stages of treatment. A healthy product range was placed into maternity on request as well. Vandalism issues impacting the vending machines were escalated and communicated and discussed more frequently, leading to more in-depth consideration of how the spaces where vending machines were situated were being policed. Without taking a hands-on approach to the project, these benefits would not have been made possible and, most importantly, the project fostered communication between FM and clinical departments, contributing positively to the open discussion and partnered working throughout the strategy development and contract renewal phase. The changes needed in vending services may be unresolved but the underlying systems of communication have been enriched through this project, and the evidence base for change strengthened.
140
Appendix A Bibliography
1. Adams, S., 2013. A study of childhood eating habits in the United States and their association with race and gender (Doctoral dissertation, California State University, Long Beach).
2. Almeida FA, Wall SS, You W, Harden SM, Hill JL, Krippendorf BE 2014. The association between worksite physical environment and employee nutrition, and physical activity behavior and weight status. Journal of occupational and environmental medicine/American College of Occupational and Environmental Medicine 56(7):779.
3. Almond K, Wait R, Thombre A, Shaw R 2000. Development system providing methods for managing different versions of objects with a meta model. Google Patents.
4. ANSES 2015. Nutrition labelling: ANSES evaluates the feasibility of implementing the Rayner score available at: https://www.anses.fr/fr/content/etiquetage-nutritionnel-l%E2%80%99anses-%C3%A9value-la-faisabilit%C3%A9-de-la-mise-en-%C5%93uvre-du-score-de-rayner (accessed 13.05.17)
5. Antje Junghans D, Junghans A, OE Olsson N 2014. Discussion of facilities management as an academic discipline. Facilities 32(1/2):67-79.
6. Antje Junghans D, Nenonen S, Sarasoja A-L 2014. Facilities management research in Finland–state-of-art about current Finnish PhD-projects. Facilities 32(1/2):58-66.
7. Apostolopoulos Y, Sönmez S, Shattell M, Haldeman L, Strack R, Jones V 2011. Barriers to truck drivers' healthy eating: Environmental influences and health promotion strategies. Journal of Workplace Behavioral Health 26(2):122-43.
8. Atkin B, Brooks A 2009. Total facilities management: John Wiley & Sons.
9. Atkinson BM 2006. Captology: A critical review. International Conference on Persuasive Technology: Springer.
10. Automatic Vending Association 2016. About Vending. Available at http://the-ava.com/,
accessed 03/04/17
11. Ballard DH, Hayhoe MM, Pook PK, Rao RP 1997. Deictic codes for the embodiment of cognition. Behavioral and Brain Sciences 20(04):723-42.
12. Bannon L 1991. From human factors to human actors: The role of psychology and human-computer interaction studies in system design. Design at work: Cooperative design of computer systems p25:44.
13. Barca L, Pezzulo G 2012. Unfolding visual lexical decision in time. PloS one 7(4):e35932.
14. Barrett P 2000. Achieving strategic facilities management through strong relationships. Facilities 18(10/11/12):421-6.
15. The Bartlett (University College London), 2014. PhD conference(conference). Available
at:http://www.bartlett.ucl.ac.uk/events/bartlett-phd-conference-2014 , accessed 25 April 2014.
141
16. Bate P, Robert G 2006. Experience-based design: from redesigning the system around the patient to co-designing services with the patient. Quality and Safety in Health Care 15(5):307-10.
17. Barts (Barts Health NHS Trust) 2016 Food and Drink Strategy: Published internally awaiting public publication.
18. Behrens M, Fatah gen Schieck A, Kostopoulou E, North S, Motta W, Ye L 2013. Exploring the effect of spatial layout on mediated urban interactions. Proceedings of the 2Nd ACM International Symposium on Pervasive Displays: ACM.
19. Bell C, Pond N, Davies L, Francis JL, Campbell E, Wiggers J 2013. Healthier choices in an Australian health service: a pre-post audit of an intervention to improve the nutritional value of foods and drinks in vending machines and food outlets. BMC health services research 13(1):492.
20. Bichard L. Editorial: The need for a public service strategy. Taylor & Francis; 2013.
21. BIFM (British Institute of Facilities Management) 2013. Sustainability in Facilities Management Report 2013. UK: BIFM. Available at http://www.sustainabilityinfm.org.uk/news/view/40 , accessed 14/08/15.
22. Bird J, Rogers Y 2010. The pulse of tidy street: Measuring and publicly displaying domestic electricity consumption. workshop on energy awareness and conservation through pervasive applications (Pervasive 2010).
23. Birkinshaw J, Nobel R, Ridderstråle J 2002. Knowledge as a contingency variable: do the characteristics of knowledge predict organization structure? Organization science 13(3):274-89.
24. Björntorp P 2001. International textbook of obesity p.485–510: cabdirect.org.
25. Bock L 2014. Google’s scientific approach to work-life balance (and much more). Harvard Business Review 27.
26. Bolton NHS Foundation Trust 2010. Changing the ‘whole’ food environment ‘. Slide presentation available at https://www.slideshare.net/departmentofhealth/royal-bolton-hospital-changing-the-whole-food-environment
27. Bonissone PP 2007. Multi-criteria decision-making: The intersection of search, preference tradeoff, and interaction visualization processes. Computational Intelligence in Multicriteria Decision Making, IEEE Symposium on: IEEE.
28. Boradkar P 2010. Design as problem solving. The Oxford handbook of interdisciplinarity 273-87.
29. Boorman 2010. The Boorman Report on the Health and Well-Being of NHS Staff: Practical advice for implementing its recommendations. Available at http://www.robertsoncooper.com/files/boorman_download.pdf. Accessed 24/05/16
30. Bowen S, McSeveny K, Lockley E, Wolstenholme D, Cobb M, Dearden A 2013. How was it for you? Experiences of participatory design in the UK health service. CoDesign 9(4):230-46.
142
31. Boyne GA, Walker RM 2004. Strategy content and public service organizations. Journal of Public Administration Research and Theory 14(2):231-52.
32. Brändström M, Dueso Tejero A 2014. How to encourage stretching and breaks at work: Understanding long term usage of a behaviour change support system. Informatik Student Paper Master (INFSPM), SPM p.51
33. Bretherton L 2015. Poverty, Politics, and Faithful Witness in the Age of Humanitarianism. Interpretation 69(4):447-59.
34. Brewer RS, Lee GE, Johnson PM 2011. The Kukui Cup: a dorm energy competition focused on sustainable behavior change and energy literacy. System Sciences (HICSS), 2011 44th Hawaii International Conference IEEE.
35. Brid, J., Y Rodgers, Y., 2010. The pulse of tidy street: Measuring and publicly displaying
domestic electricity consumption. Workshop on Enenrgy Awareness and Conservation through Persuasive Applications: Persuasive 2010.
36. Bröchner J. Innovation and ancient Roman facilities management. Journal of Facilities
Management. 2010;8(4):246-55.
37. Brown, T.L., 2010. The evolution of public sector strategy. Public Administration Review, 70:S212-S214.
38. Brown NL, Pennylegion MT, Hillard P. A process evaluation of condom availability in the Seattle, Washington public schools. Journal of School Health. 1997;67(8):336-40.
39. Brown TL 2010. The evolution of public sector strategy. Public Administration Review 70:S212-S4.
40. Bryan S, Mitton C, Donaldson C 2014. Breaking the addiction to technology adoption. Health economics 23(4):379-83.
41. BSI (British Standards Institute) 2006 . BS EN 15221-1:2006 Facility management. Terms and
definitions
42. Bui L 2015. Theatre of witness. British Journal of Community Justice 12(1):79-81.
43. Bundrick SC, Thearle MS, Venti CA, Krakoff J, Votruba SB 2014. Soda consumption during ad libitum food intake predicts weight change. Journal of the Academy of Nutrition and Dietetics 114(3):444-9.
44. Burton M 2003. Systemic Intervention: Philosophy, Methodology, and Practice Midgley, G.(2001) Kluwer Academic/Plenum, New York, 461pp,£ 28 ISBN 0‐306‐46488‐8 (hardback). Journal of Community & Applied Social Psychology 13(4):330-3.
45. Cairo A 2012. The Functional Art: An introduction to information graphics and visualization: New Riders.
46. Cameron R 2011. Mixed methods research: The five Ps framework. The electronic journal of business research methods 9(2):96-108.
143
47. Campbell LZ 2017 (2016). An exploration of how research can aid the development of Facilities Management. Facilities 35(5/6).
48. Capacci S, Mazzocchi M, Shankar B 2012. Evaluation with Inadequate Data: The Impact of the French Vending Machine Ban. 2012 AAEA/EAAE Food Environment Symposium, May 30-31, Boston, MA: Agricultural and Applied Economics Association.
49. Carbon Visuals, 2012. Visualising the greenhouse gas emissions for London’s Strategic Health
Authority, London: Bluesky; TerraMetrics; Getmapping plc. (Online) Available at http:// www.carbonvisuals.com/work/ communicating-the-carbon-footprint-of-londons-hospitals, accessed 15 June 2013.
50. Cardellino P, Finch E 2006. Evidence of systematic approaches to innovation in facilities
management. Journal of Facilities Management 4(3):150-66.
51. Caren S. Martin, Denise A. Guerin, (2006) Using research to inform design solutions, Journal of Facilities Management 4:167 – 180.
52. CDC (Centre for Disease Control and Prevention) Overweight & Obesity https://www.cdc.gov/obesity/index.html accessed 29/08/2013
53. CEN (European Committee for Standardization) 2006, EN 15221-1: European Standard in Facility Management-Part 1: Terms and Definitions, CEN, Brussels.
54. CERC 2017 http://www.cerc-conference.eu/ (webpage) accessed 19/02/17.
55. Chandon P, Hutchinson JW, Bradlow ET, Young SH 2009. Does in-store marketing work? Effects
of the number and position of shelf facings on brand attention and evaluation at the point of purchase. Journal of Marketing 73(6):1-17.
56. Chaudhry A, Feest T 2011. Enhancing Access to UK Renal Registry Data through Innovative Online Data Visualisations. Nephron Clinical Practice 119(Suppl. 2):c249-c54.
57. Chauliac M, Hercberg S 2012. Changing the food environment: the French experience. Advances in Nutrition: An International Review Journal 3(4):605s-10s.
58. Checkland P 1994. Systems theory and management thinking. American Behavioral Scientist 38(1):75-91.
59. Chen C-J, Huang J-W 2007. How organizational climate and structure affect knowledge management—The social interaction perspective. International Journal of Information Management 27(2):104-18.
60. Chen S, Duan Y, Edwards JS, Lehaney B 2006. Toward understanding inter-organizational knowledge transfer needs in SMEs: insight from a UK investigation. Journal of knowledge management 10(3):6-23.
61. Chiu PW, Naim AM, Lewis, KE, Bloebaum CL 2009. The hyper-radial visualisation method for multi-attribute decision-making under uncertainty. International Journal of Product Development, 9(1-3):4-31.
62. Churchman CW 1967. Guest editorial: Wicked problems: JSTOR
144
63. Clegg, C.W., 2000. Sociotechnical principles for system design. Applied ergonomics, 31(5), pp.463-477.
64. Clement J. Visual influence on in-store buying decisions: an eye-track experiment on the visual
influence of packaging design. Journal of marketing management. 2007;23(9-10):917-28.
65. Coakley D, Raftery P, Keane M 2014. A review of methods to match building energy simulation models to measured data. Renewable and sustainable energy reviews 37:123-41.
66. Coe B, Tomihara K, Matsuzawa M, Hikosaka O 2002. Visual and anticipatory bias in three
cortical eye fields of the monkey during an adaptive decision-making task. The Journal of neuroscience : the official journal of the Society for Neuroscience 22(12)5081-5090.
67. Coenen C, von Felten D 2014. A service-oriented perspective of facility management. Facilities 32(9/10):554-64.
68. Cohen SG, Bailey DE 1997. What makes teams work: Group effectiveness research from the shop floor to the executive suite. Journal of management 23(3):239-90.
69. Comber R, Thieme A, Rafiev A, Taylor N, Krämer NC, Olivier P 2013. BinCam: Designing for Engagement with Facebook for Behavior Change. INTERACT (2).
70. Consolvo S, McDonald DW, Landay JA 2009. Theory-driven design strategies for technologies that support behavior change in everyday life. Proceedings of the SIGCHI Conference on Human Factors in Computing Systems ACM.
71. Cotts D, Roper K, Payment R 2009. The facility management handbook p232-233: AMACOM.
72. Creswell JW 2013. Research design: Qualitative, quantitative, and mixed methods approaches p215-241: Sage publications.
73. Crotty M 1998. The foundations of social research: Meaning and perspective in the research process p42-63: Sage.
74. Culligan PJ, Pena-Mora F 2010. Interdisciplinarity in engineering. In the Oxford Handbook of Interdisciplinarity. Frodeman R, Klein JT, Mitcham, C, Holbrook J B Published: Oxord University press.
75. Cummings JN 2004. Work groups, structural diversity, and knowledge sharing in a global
organization. Management science 50(3):352-64.
76. Da Silveira G, Borenstein D, Fogliatto FS 2001. Mass customization: Literature review and research directions. International journal of production economics 72(1):1-13.
77. Dalton N, Marshall P, Dalton R 2013. Extending architectural theories of space syntax to understand the effect of environment on the salience of situated displays. Proceedings of the 2nd ACM International Symposium on Pervasive Displays ACM.
78. Daradkeh M, McKinnon A, Churcher C 2010. Visualisation tools for exploring the uncertainty-risk relationship in the decision-making process: a preliminary empirical evaluation. Proceedings of the Eleventh Australasian Conference on User Interface-Volume 106: Australian Computer Society, Inc.
145
79. Darby S 2006. The effectiveness of feedback on energy consumption. A Review for DEFRA of the Literature on Metering, Billing and direct Displays p486: Environmental Change Institute Oxford
80. Davies J 2011. Evidence, Inference and Enquiry. Proceedings of the British Academy (online conference paper) 171:37-72.
81. Davy BM, You W, Almeida F, Wall S, Harden S, Comber DL 2014. Impact of Individual and
Worksite Environmental Factors on Water and Sugar-Sweetened Beverage Consumption Among Overweight Employees. Preventing Chronic Disease 11:130207. Published: Centre for Disease Control and prevention.
82. Dawid P, Twining W, Vasilaki M 2011. Evidence, inference and enquiry. Proceedings of the British Academy 171.
83. DECC (Department of Energy and Climate Change) 2012. Consultation on simplifying the CRC Energy Efficiency Scheme, (Online). UK: The Stationery Office.
84. DEFRA (Department for Environment, Food & Rural Affairs) 2015. Sustainable procurement:
the GBS for food and catering services. Available at: https://www.gov.uk/government/publications/sustainable-procurement-the-gbs-for-food-and-catering-services, accessed 19/02/16.
85. Deitrick S, Edsall R 2006. The influence of uncertainty visualization on decision making: An
empirical evaluation. Progress in spatial data handling: Springer. p. 719-38.
86. Deitrick S, Wentz EA 2015. Developing Implicit Uncertainty Visualization Methods Motivated by Theories in Decision Science. Annals of the Association of American Geographers 105(3):531-51.
87. Dick M, Lee A, Bright M, Turner K, Edwards R, Dawson J 2012. Evaluation of implementation of a healthy food and drink supply strategy throughout the whole school environment in Queensland state schools, Australia. European journal of clinical nutrition 66(10):1124-9.
88. Diehl S, Beck F, Burch M. Uncovering strengths and weaknesses of radial visualizations---an empirical approach. IEEE Transactions on Visualization and Computer Graphics. 2010;16(6):935-42.
89. DiFranza JR, Savageau JA, Aisquith BF 1996. Youth access to tobacco: the effects of age, gender, vending machine locks, and" it's the law" programs. American Journal of Public Health 86(2):221-4.
90. Ditterich J, Mazurek ME, Shadlen MN 2003. Microstimulation of visual cortex affects the speed of perceptual decisions. Nature neuroscience 6(8):891-8.
91. DoH (Department of Health) 2014. NHS staff health & wellbeing: CQUIN Supplementary
guidance. Available at: https://www.england.nhs.uk/wp-content/uploads/2016/03/HWB-CQUIN-Guidance.pdf, accessed 03/04/17, accessed 03/04/17
92. DoH (Department of Health) 2016. Health Toolkit to support the development of a hospital
food and drink strategy. Available at: http://www.hospitalcaterers.org/media/1151/hospital-food-drink-strategy.pdf, accessed 29/07/16.
146
93. Dong X, Hayes CC 2012. Uncertainty visualizations: Helping decision makers become more aware of uncertainty and its implications. Journal of Cognitive Engineering and Decision Making 6(1):30-56.
94. Dos Santos Paulino V 2014. Influence of risk on technology adoption: inertia strategy in the space industry. European Journal of Innovation Management 17(1):41-60.
95. Dubuisson C, Lioret S, Dufour A, Volatier J, Lafay L, Turck D 2012. Associations between usual school lunch attendance and eating habits and sedentary behaviour in French children and adolescents. European journal of clinical nutrition 66(12):1335-41.
96. Dumortier J, Hayes DJ, Carriquiry M, Dong F, Du X, Elobeid A 2011. Sensitivity of carbon emission estimates from indirect land-use change. Applied Economic Perspectives and Policy 428-48. Dym C, Little P 1999(2008) Engineering Design Third Edition: Third Edition: A Project Based Introduction pp.13. John Wiley & Sons.
97. Elmualim A, Shockley D, Valle R, Ludlow G, Shah S 2010. Barriers and commitment of facilities management profession to the sustainability agenda. Building and Environment 45(1):58-64.
98. Erb K-H, Krausmann F, Lucht W, Haberl H 2009. Embodied HANPP: Mapping the spatial disconnect between global biomass production and consumption. Ecological Economics 69(2):328-34.
99. Ermetici F, Zelaschi RF, Briganti S, Dozio E, Gaeta M, Ambrogi F 2016. Association between a school‐based intervention and adiposity outcomes in adolescents: The Italian “EAT” project. Obesity 24(3):687-95.
100. Escoto KH, French SA, Harnack LJ, Toomey TL, Hannan PJ, Mitchell NR 2010. Work hours, weight status, and weight-related behaviors: a study of metro transit workers. International Journal of Behavioral Nutrition and Physical Activity 7(1):91.
101. EUFIC (The European Food Information Council) 2015. Obesity. Available at
http://www.eufic.org/en/healthy-living/category/obesity, accessed 14/06/16.
102. European Vending Association 2016. 7 key figures on the European Vending Market. Available at http:http://www.vending-europe.eu/en/7-key-figures-on-the-european-vending-market.html?cmp_id=66&news_id=794, accessed 03/04/17
103. Eysenbach G, Moorhead SA, Hazlett DE, Harrison L, Carroll JK, Irwin A, Hoving C 2013. A new
dimension of health care: systematic review of the uses, benefits, and limitations of social media for health communication. Journal of medical Internet research 15 (4)
104. Fagerberg P, Ståhl A, Höök K 2003. Designing gestures for affective input: an analysis of shape, effort and valence. MUM 2003.
105. Fairtrade 2016. About Sugar. Available at http://www.fairtrade.org.uk/en/farmers-and-workers/sugar/about-sugar, accessed 03/04/17
106. Falk-Krzesinski HJ, Contractor N, Fiore SM, Hall KL, Kane C, Keyton J 2011. Mapping a research
agenda for the science of team science. Research Evaluation 20(2):145-58.
147
107. Fan C, Forlizzi J, Dey AK 2012. A spark of activity: exploring informative art as visualization for physical activity. Proceedings of the 2012 ACM Conference on Ubiquitous Computing; 2012: ACM.
108. Fatah gen Schieck A 2009. Towards an integrated architectural media space: the urban screen as a socialising platform. Urban Screens Reader p. 243-260: Institute of Network Cultures: Amsterdam.
109. Fatah gen Schieck A, Al-Sayed K, Kostopoulou E, Behrens M, Motta W 2013. Networked
architectural interfaces: Exploring the effect of spatial configuration on urban screen placement. Available at: http://discovery.ucl.ac.uk/1410314/1/SSS9_Networked%20Architectural%20Interfaces_FInalV2.pdf, accessed 13.05.17.
110. FDF (Food and Drink Federation) 2013. Front of Pack Labelling Policy Position. Available at:
https://www.fdf.org.uk/keyissues.aspx?issue=636, accessed 13.05.17.
111. Feiereisen S, Wong V, Broderick AJ 2008. Analogies and mental simulations in learning for really new products: The role of visual attention. Journal of Product Innovation Management 25(6):593-607.
112. Ferreira N, Fisher D, Konig AC 2014. Sample-oriented task-driven visualizations: allowing users to make better, more confident decisions. Proceedings of the SIGCHI Conference on Human Factors in Computing Systems ACM.
113. FFLP (Food for Life Partnership) 2016. Available at http://www.foodforlife.org.uk/ accessed
18/02/17.
114. Fillis I 2009. An Evaluation of Artistic Influences on Marketing Theory and Practice. Marketing Intelligence and Planning 27(6):753-774.
115. Fiorino DJ, Bhan M 2016. Supply Chain Management as Private Sector Regulation: What does it Mean for Business Strategy and Public Policy? Business Strategy and the Environment 25(5):310-22.
116. Fitzsimmons JA, Fitzsimmons MJ, Bordoloi S 2006. Service management: Operations, strategy, and information technology. McGraw-Hill New York.
117. Fleischhacker AJ, Fok P-W 2015. On the relationship between entropy, demand uncertainty, and expected loss. European Journal of Operational Research 245(2):623-8.
118. Fletcher JM, Frisvold D, Tefft N 2010. Taxing soft drinks and restricting access to vending machines to curb child obesity. Health Affairs 10.1377/hlthaff. 2009.0725.
119. FMJ (Facilities Management Journal) 2015. Barts Health to put its Trust in the hands of
Serco. Available athttp://www.fmj.co.uk/barts-health-put-trust-hands-serco/, accessed 03/04/17
120. FM Link 2014. http://www.fmlink.com/, accessed 03/04/17
121. Fogg BJ. 2003 Persuasive technology: using computers to change what we think and do.
Ubiquity :5. Presenting from Fogg BJ 1998. Persuasive computers: perspectives and research
148
directions. Proceedings of the SIGCHI conference on Human factors in computing systems: ACM Press/Addison-Wesley Publishing Co.
122. Fogg, B., 2009. A behavior model for persuasive design. In Proceedings of the 4th International Conference on Persuasive Technology. Persuasive ’09: New York, New York, USA: ACM Press.
123. Foltran F, Verduci E, Ghidina M, Campoy C, Jany K-D, Widhalm K 2010. Nutritional profiles in a public health perspective: a critical review. Journal of International Medical Research 38(2):318-85.
124. Fredericks SE 2010. Religious studies (book chapter). In The Oxford Handbook of Interdisciplinarity, Frodeman, R, Klein JT, Mitcham, C, Holbrook JB Published: Oxord University press.
125. French ministry of health 2012 France Health Systems Review. Health Systems in Transition
17(3) http://www.euro.who.int/__data/assets/pdf_file/0011/297938/France-HiT.pdf: World Health Organisation
126. French SA, Jeffery RW, Story M, Breitlow KK, Baxter JS, Hannan P 2001. Pricing and promotion
effects on low-fat vending snack purchases: the CHIPS Study. American journal of public health 91(1):112.
127. Frizelle G, Woodcock E 1995. Measuring complexity as an aid to developing operational strategy. International Journal of Operations & Production Management 15(5):26-39.
128. Fry B, 2008. Visualizing data: Exploring and explaining data with the processing environment:
O'Reilly Media, Inc.
129. FSA (Food Standards Agency) 2005. Nutritional Guidelines for Food Served in Public Institutions. Available at https://www.food.gov.uk/science/allergy-intolerance/label, accessed 24/03/16.
130. FSA (Food Standards Agency) 2014. Food Allergen Labelling. Available at https://www.food.gov.uk/sites/default/files/multimedia/pdfs/walkertrustreport.pdf, accessed 24/03/16.
131. Fulton JP, 1995. The tobacco vending machine: an idea whose time has passed. Rhode Island
medicine, 78(3):98-98.
132. Gao Y, Bianchi-Berthouze N, Meng, H 2012. What Does Touch Tell Us about Emotions in Touchscreen-Based Gameplay? ACM Transactions on Computer-Human Interaction (conference proceedings} 19(4):1-30.
133. Garicano L 2000. Hierarchies and the Organization of Knowledge in Production. Journal of political economy 108(5):874-904.
134. Gase LN, Kuo T, Dunet, D, Schmidt SM, Simon PA, Fielding JE 2011. Estimating the potential health impact and costs of implementing a local policy for food procurement to reduce the consumption of sodium in the county of Los Angeles. American journal of public health, 101(8), pp.1501-1507.
135. Gerring J, McDermott R 2007. An experimental template for case study research. American
Journal of Political Science 51(3):688-701.
149
136. Gelman A, Shirley K 2011. Inference from simulations and monitoring convergence. Handbook
of markov chain monte carlo p.163-74.
137. Gemmil E, Cotugna N 2005 Vending machine policies and practices in Delaware. Journal of School Nursing, 21(2):94-9.
138. Gillilan R, Ripoll D 1995. Visualizing enzyme electrostatics with IBM visualization data explorer. Data Visualization in Molecular Science p:61-81: Greenwich, Connecticut: Manning Publications Co and Addison-Wesley Publishing Company, Inc..
139. Glimcher PW 2004. Decisions, uncertainty, and the brain: The science of neuroeconomics: MIT press.
140. Gold AH, Arvind Malhotra AHS 2001. Knowledge management: An organizational capabilities perspective. Journal of management information systems 18(1):185-214.
141. Goldstein P, Leshem M 2014. Dietary sodium, added salt, and serum sodium associations with growth and depression in the U.S. general population. Appetite 79:83-90
142. Goodhew J, Goodhew S, Auburn T, De Wilde P, Pahl S 2009. A preliminary investigation of the
potential for thermographic images to influence householders understanding of home energy consumption. Dainty (Ed) Procs 25th Annual ARCOM Conference: ARCOM Nottingham, UK.
143. Goyal S, Pitt M 2007. Determining the role of innovation management in facilities management. Facilities 25(1/2):48-60.
144. Grabska E, Borkowski A 1996. Assisting creativity by composite representation. Artificial Intelligence in Design’96 p. 743-59: Springer.
145. Graves, H., Armstrong, Becker, 2012. The past, present and future of facility management in
Europe (online) EuroFM European Facility Management Network. Available at http:// www.eurofm.org/about-us/what-is-fm/ Accessed 25 April 2014.
146. Grech A, Allman-Farinelli M 2015. A systematic literature review of nutrition interventions in
vending machines that encourage consumers to make healthier choices. Obesity Reviews 16(12):1030–1041.
147. Green A, Price I 2000. Whither FM? A Delphi study of the profession and the industry. Facilities 18(7/8):281-93.
148. Grönroos C 2007. Service management and marketing: customer management in service competition p1-20: John Wiley & Sons.
149. Grönvall E, Verdezoto N 2013. Understanding challenges and opportunities of preventive blood pressure self-monitoring at home. Proceedings of the 31st European Conference on Cognitive Ergonomics ACM.
150. Haberl H, Fischer-Kowalski M, Krausmann F, Weisz H, Winiwarter V 2004. Progress towards sustainability? What the conceptual framework of material and energy flow accounting (MEFA) can offer. Land Use Policy 21(3):199-213.
151. Hall, E. T., 1966. The Hidden Dimension (book). Anchor Books Editions.
150
152. Hall B, Howard K 2008. A synergistic approach: Conducting mixed methods research with
typological and systemic design considerations. Journal of mixed methods research 2(3):248-69.
153. Hall B, Howard K 2008. A synergistic approach: Conducting mixed methods research with
typological and systemic design considerations. Journal of mixed methods research, 2(3):248-269.
154. Hansberg, R. 2010. The Joy of Statistics (online documentary). UK: BBC Horizon.
155. Hansen PG, Skov KL, Schmidt K, Skov LR, Mikkelsen BE, Pérez-Cueto FJA 2013. The smaller the pieces the healthier their consumption. 20th International Congress of Nutrition.
156. Head BW, Alford J 2015. Wicked problems: Implications for public policy and management. Administration & Society 47(6):711-39.
157. Healthy Eating Index 2010. Healthy Eating Index (HEI). Available at
https://www.cnpp.usda.gov/healthyeatingindex, accessed 05/07/2013.
158. Hemsley-Brown J, Oplatka I 2010. Market orientation in universities: A comparative study of two national higher education systems. International Journal of Educational Management 24(3):204-220.
159. HFSP (Hospital Food Standards Pan)el 2014 Establishing food standards for NHS hospitals:
Department of Health (DoH).
160. Hillier B, Hanson J 1989. The social logic of space p198-206: Cambridge university press.
161. Hodges CP 2005. A facility manager's approach to sustainability. Journal of Facilities Management 3(4):312-24.
162. Hoffman R, Gerber M 2012. The Mediterranean diet: health and science p1-20: John Wiley & Sons.
163. HPH (Health Promoting Hospitals) 2015. Scope and Purpose. Available at: <http://www.hphconferences.org/oslo2015.html, accessed 14.08.15.
164. Hua SV, Ickovics JR 2016. Vending Machines: A Narrative Review of Factors Influencing Items
Purchased. Journal of the Academy of Nutrition and Dietetics, 116(10):1578-1588.
165. Huddleston J, Ranade S, Malig M, Antonacci F, Chaisson M, Hon L, Sudmant PH, Graves TA, Alkan, C, Dennis MY, Wilson RK, 2014. Reconstructing complex regions of genomes using long-read sequencing technology. Genome research, 24(4):688-696.
166. Huutoniemi K, Klein JT, Bruun H, Hukkinen J 2010. Analyzing interdisciplinarity: Typology and
indicators. Research Policy 39(1):79-88.
167. ICE (Institute of Civil Engineering) 2014. http://www.ice.org.uk/(webpage).
168. IFMA 2012. What is FM? Available at http://www.ifma.org/about/what-is-facility-management, accessed 05/07/2013.
151
İnce Güney, Y 2014. Toplumsal cinsiyet ve kamusal mekan: Bir Anadolu kenti incelemesi. A/Z ITU Journal of the Faculty of Architecture 11(2):153-172.
169. Jääskeläinen A, Laihonen H 2014. A strategy framework for performance measurement in the public sector. Public Money & Management 34(5):355-62.
170. Jewell 2008. The chief medical officer for NHS Wales in his public letter on ‘The Health
Promoting Hospital Vending Directions to NHS Trusts’ Welsh Assembly Government: Cardif.
171. Johnson G, Scholes K, Whittington R 2008. Exploring corporate strategy p29-40: text & cases. Pearson Education.
172. Kanda H, Osaki Y, Ohida T, Kaneita Y, Munezawa T 2010. Age verification cards fail to fully prevent minors from accessing tobacco products. Tobacco control 2010.036947.
173. Kanukolanu D, Lewis KE, Winer EH 2006. A multidimensional visualization interface to aid in trade-off decisions during the solution of coupled subsystems under uncertainty. Journal of computing and information science in engineering 6(3):288-99.
174. Kelley B, Flood VM, Bicego C, Yeatman H 2012. Derailing healthy choices: an audit of vending machines at train stations in NSW. Health Promotion Journal of Australia 23(1):73-5.
175. Khaled R, Barr P, Noble J, Fischer R, Biddle R 2006. Our place or mine? Exploration into collectivism-focused persuasive technology design. International Conference on Persuasive Technology: Springer.
176. Kibblewhite S, Bowker S, Jenkins HR 2010. Vending machines in hospitals–are they healthy? Nutrition & Food Science 40(1):26-8.
177. Kim B. 2003 Managing the transition of technology life cycle. Technovation 23(5):371-81.
178. Kincaid D 1994. Integrated facility management. Facilities 12(8):20-3.
179. Kjeldskov J, Stage J 2012. Combining ethnography and object-orientation for mobile interaction design: Contextual richness and abstract models. International Journal of Human-Computer Studies 70(3):197-217.
180. Klein JT 2004. Prospects for transdisciplinarity. Futures 36(4):515-26.
181. Klein JT 2006. Afterword: the emergent literature on interdisciplinary and transdisciplinary research evaluation Research Evaluation, 15(1), 75-80.
182. Klostermann A, Thuering M 2007. Visualisation of topological structures as a training tool for
acquiring causal models of complex systems Conference Paper Human Factors The Journal of the Human Factors and Ergonomics Society.
183. Korblin A 2014. http://www.aaronkoblin.com/work/flightpatterns/ (website) accessed
02/05/14.
184. Krajbich I, Rangel A 2011. Multialternative drift-diffusion model predicts the relationship between visual fixations and choice in value-based decisions. Proceedings of the National Academy of Sciences, 108(33):13852-13857.
152
185. Kristy ML 2014. Sodium reduction: an important public health strategy for heart health. Journal of public health management and practice: JPHMP, 20.1 0 1(S1).
186. Kuai SG, Levi D, Kourtzi Z 2013. Learning optimizes decision templates in the human visual
cortex. Currentbiology : CB 23(18):1799-1804.
187. Kubik RN, Martha Y, Davey C, Nanney M S 2012. Association Between Student Body Mass Index and Access to Sports Drinks in Minnesota Secondary Schools. BRIEF vol.12.
188. Kumar A, Jain V, Kumar S 2014. A comprehensive environment friendly approach for supplier selection. Omega 42(1):109-23.
189. Lave J, Wenger E 1991. Situated Learning: Legitimate Peripheral Participation. Cambridge: Cambridge University Press. Institute for Research on Learning report 90-0013
190. Lavie T, Tractinsky N 2004. Assessing dimensions of perceived visual aesthetics of web sites.
International journal of human-computer studies 60(3):269-98.
191. Law C-T, Gold JI 2003. Reinforcement learning can account for associative and perceptual learning on a visual-decision task. Nature neuroscience 12(5):655-63.
192. Lee, T.H., 2014. The strategy that will fix health care. Available at https://nic24thnationalconf.pathable.com/static/attachments/106805/1412353682.pdf, accessed 10/09/15
193. Lehtonen TJ, Salonen AI 2005. Procurement and relationship management trends in FM
services. 21st Industrial Marketing and Purchasing Conference.
194. Lewis-Beck M, Bryman AE, Liao TF 2003. The Sage encyclopedia of social science research methods: Sage Publications.
195. Li I, Dey A, Forlizzi J 2010. A stage-based model of personal informatics systems. Proceedings of the SIGCHI Conference on Human Factors in Computing Systems: ACM.
196. Licklider JC 1960. Man-computer symbiosis. IRE transactions on human factors in electronics (1):4-11.
197. Licklider JC, Taylor RW 1968. The computer as a communication device. Science and technology 76(2):1-3.
198. Lim SL, O’Doherty JP, Rangel A 2001. The Decision Value Computations in the vmPFC and
Striatum Use a Relative Value Code That is Guided by Visual Attention. The Journal of neuroscience: the official. Journal of the Society for Neuroscience. 31(37):13214-13223.
199. Little, G 2012. Managing the data deluge. The Journal of Academic Librarianship, 38(5):263-
264.
200. Lockton D, Harrison D, Stanton N 2008. Design with intent: Persuasive technology in a wider context. International Conference on Persuasive Technology: Springer.
201. Lockton D, Harrison D, Stanton NA 2010. Design with intent: 101 patterns for influencing behaviour through design: Dan Lockton.
153
202. Longstaff JS 2000. Re-evaluating Rudolf Laban's choreutics. Perceptual and motor skills 91(1):191-210.
203. Loosemore M 1995. Reactive management: communication and behavioural issues in dealing with the occurrence of client risks. Construction Management and Economics, 13(1):65-80.
204. Lotov A 2009. Multicriteria optimization of convex dynamical systems. Differential Equations 45(11):1669.
205. Lotov K 2007. Acceleration of positrons by electron beam-driven wakefields in a plasma. Physics of plasmas 14(2):023101.
206. Luke Jerram 2011. Tōhoku Japanese Earthquake (artwork) information available at
https://www.lukejerram.com/tohoku-japanese-earthquake/.
207. Lurie NH, Mason CH 2007. Visual representation: Implications for decision making. Journal of Marketing 71(1):160-77.
208. Maliderou M, Reeves S, Noble C 2006. The effect of social demographic factors, snack consumption and vending machine use on oral health of children living in London. British dental journal 201(7):441-4.
209. Marmot 2010 Changing Lives, Our Vision for Public Health: Barts Health NHS Trust containing
the Marmot Review Team for Barts and The London NHS Trust 2010. Strategy for Health-promoting Hospitals Step 1: A framework for promoting staff health and well-being
210. Maruthappu, M 2016. Delivering Triple Prevention: a Health System Responsibility. Available at https://www.england.nhs.uk/blog/mahiben-maruthappu-10/ accessed 02.05/17.
211. Marsella SC, Gratch J. EMA: A process model of appraisal dynamics. Cognitive Systems
Research. 2009;10(1):70-90.
212. Marshall P, Cain R, Payne S 2011. Situated crowdsourcing: a pragmatic approach to encouraging participation in healthcare design. Pervasive Computing Technologies for Healthcare (PervasiveHealth), 5th International Conference on: IEEE.
213. Martin A, Chauliac M, Combris P, Delamaire C, Razanamahefa L, Soler L-G 2011. Le Programme National Nutrition Santé (PNNS) et l’offre alimentaire. Cahiers de Nutrition et de Diététique 46(2):S26-S35.
214. Martin CS, Guerin DA 2006. Using research to inform design solutions. Journal of Facilities Management 4(3):167-80.
215. McCandles D 2009. Information is Beautiful. Harper Collins.
216. McCarthy J, Wright P 2004. Technology as experience. Interactions 11(5):42-3.
217. McDaid D, Curran C, Knapp M 2005. Promoting mental well-being in the workplace: a
European policy perspective. International review of psychiatry 17(5):365-73.
218. McLennan P 2004. Service operations management as a conceptual framework for facility management. Facilities 22(13/14):344-8.
154
219. Medlineplus 2015. Obesity. Available at: https://medlineplus.gov/obesity.html, accessed 03/04/17
220. Mesas AE, Guallar-Castillón P, León-Muñoz LM, Graciani A, López-García E, Gutiérrez-Fisac JL 2012. Obesity-related eating behaviors are associated with low physical activity and poor diet quality in Spain. The Journal of nutrition 142(7):1321-8.
221. Milton R, Steed A 2007. Mapping carbon monoxide using GPS tracked sensors. Environmental monitoring and Assessment 124(1):1-19.
222. Minowa M, Satomi H 1993. Illegal sale of tobacco to minors in Japan. (Nihon koshu eisei zasshi) Japanese journal of public health 40(1):49-52.
223. Mintzberg H, Waters JA 1985. Of strategies, deliberate and emergent. Strategic management journal 6(3):257-72.
224. Moatti J, Vlahov D, Feroni I, Perrin V, Obadia Y 2001. Multiple access to sterile syringes for injection drug users: vending machines, needle exchange programs and legal pharmacy sales in Marseille, France. European addiction research 7(1):40-5.
225. Moran J 2002. Interdisciplinarity: The New Critical Idiom (book). Routledge
226. Morgan, D. L. (2007). Paradigms lost and pragmatism regained. Methodological implications of combining qualitative and quantitative methods. Journal of Mixed Methods Research 1, 48 – 76.
227. Mullins LJ 2007. Management and organisational behaviour p306-339: Pearson education.
228. Mullins L, Christy G 2010. Management and Organisational Behaviour p306-339. Pearson
Education Limited.
229. Mulrow EJ. The visual display of quantitative information. Taylor & Francis; 2002.
230. Muñoz-Pareja M, Guallar-Castillón P, Mesas AE, López-García E, Rodríguez-Artalejo F 2013. Obesity-related eating behaviors are associated with higher food energy density and higher consumption of sugary and alcoholic beverages: a cross-sectional study. PloS one 8(10):e77137.
231. Murdock A. Stakeholder theory, partnerships and alliances in the health care sector of the UK and Scotland. Strategies for Public Management Reform: Emerald Group Publishing Limited; 2004. p. 85-104.
232. Naim (Ben-Naim) A 2008. A Farewell to Entropy: Statistical Thermodynamics Based on Information p9-19 S. World Scientific.
233. Nenonen S, Sarasoja AL 2014. Facilities management research in Finland – state-of-art
about current Finnish PhD-projects. Facilities 32(1/2)58-66.
234. NHS England 2014. NHS Five Year Forward View Report (5yfv):NHS England
235. NHS 2015 What are trans fats?: Available at: http://www.nhs.uk/chq/Pages/2145.aspx?CategoryID=51, accessed 03/04/17
155
236. NHS 2016. The top 5 causes of premature death. Published online: NHS CHoices Your health, your choices. Available at http://www.nice.org.uk/guidance/ng13, accessed 14/08/15.
237. NHS England 2016 b. NHS staff health & wellbeing: CQUIN Supplementary guidance. NHS England.
238. Nicholson-Cole SA 2005. Representing climate change futures: a critique on the use of images for visual communication. Computers, environment and urban systems 29(3):255-73.
239. NICE 2015. Workplace policy and management practices to improve the health and wellbeing of employees (Onlinepdf). Available at http://www.nice.org.uk/guidance/ng13, accessed 14/08/15.
240. NICE 2016 Healthier food and drink in a hospital setting. Available at
https://www.nice.org.uk/sharedlearning/healthier-food-and-drink-in-a-hospital-setting, accessed 20/11/16.
241. Nonaka I 1994. A dynamic theory of organizational knowledge creation. Organization science 5(1):14-37.
242. Norton S 2014. NHS hospitals, does a spoonful of sugar help the medicine go down? BMJ
Opinion. Available at http://blogs.bmj.com/bmj/2014/09/02/sally-norton-nhs-hospitals-does-a-spoonful-of-sugar-help-the-medicine-go-down/, accessed 17/04/17
243. Nowak M, Jeanes Y, Reeves S 2012. The food environment in leisure centres and health clubs: how appropriate is it for children? Nutrition & Food Science 42(5):307-14.
244. NRC (National Research Council) 2004. Facilitating Interdisciplinary Research. Published:
Washington, DC: The National Academies Press.
245. Nutrition Australia 2015. Healthy Weight. Available at: http://www.nutritionaustralia.org/national/resource/healthy-weight, accessed 03/04/17
246. Nutt B 1999. Linking FM practice and research. Facilities 17(1/2):11-7.
247. O’Brien J 2014. Shaping Knowledge: Complex Socio-spatial Modelling for Adaptive Organizations p65-88: Elsevier.
248. O'hara JK, Haynes-Maslow L 2015. Examining the Association Between School Vending Machines and Children's Body Mass Index by Socioeconomic Status. Journal of nutrition education and behaviour 47(6):526-31e1.
249. Oborn E, Barrett M, Exworthy M. Policy entrepreneurship in the development of public sector strategy: the case of London health reform. Public Administration. 2011;89(2):325-44.
250. Oinas-Kukkonen H, Harjumaa M 2008a. A systematic framework for designing and evaluating persuasive systems. International Conference on Persuasive Technology: Springer.
251. Oinas-Kukkonen H, Harjumaa M 2008b. Towards deeper understanding of persuasion in software and information systems. Advances in Computer-Human Interaction. First International Conference on IEEE.
156
252. Okunlola A, Ewulo T 2013. Gis–base method of landscape visualization: a tool for environmental management. Journal of Environmental Science and Water Resources 2(5):133-137.
253. Opie LH 2012. Cardio protection from metabolism to molecules to certainties. SAMJ: South
African Medical Journal, 102(6):491-492.
254. Ortony A, Clore GL, Collins A 1990. The cognitive structure of emotions: Cambridge university press.
255. Otterbring T, Wästlund E, Gustafsson A, Shams P 2014. Vision (im) possible? The effects of in-store signage on customers’ visual attention. Journal of Retailing and Consumer Services 21(5):676-84.
256. Palfreyman D 2004. The Economics of Higher Education: Affordability & Access; Costing, Pricing & Accountability. Oxford: OxCHEPS.
257. Palomares I, Martinez L, Herrera F 2014. A consensus model to detect and manage
noncooperative behaviors in large-scale group decision making. IEEE Transactions on Fuzzy Systems 22(3):516-30.
258. Park S, Sappenfield WM, Huang Y, Sherry B, Bensyl DM. The impact of the availability of school vending machines on eating behavior during lunch: the Youth Physical Activity and Nutrition Survey. Journal of the American dietetic association. 2010;110(10):1532-6.
259. Petala E, Wever R, Dutilh C, Brezet H 2010. The role of new product development briefs in implementing sustainability: A case study. Journal of Engineering and Technology Management 27(3):172-82.
260. Pathirage C, Haigh R, Amaratunga D, Baldry D 2008. Knowledge management practices in facilities organisations: a case study. Journal of Facilities Management 6(1):5-22.
261. Patton, M.Q., 2015. Qualitative research and Evaluation Methods p3-37. John Wiley & Sons, Ltd.
262. PHE (Public Health England) 2014. Healthier and more sustainable catering. Available at: https://www.gov.uk/government/publications/healthier-and-more-sustainable-catering-a-toolkit-for-serving-food-to-adults. Accessed 26/04/15.
263. Phillips MM, Kevin Ryan J, Raczynski JM 2011. Public policy versus individual rights in childhood obesity interventions: perspectives from the Arkansas experience with Act 1220 of 2003. Public Policy 8(5).
264. Philips 2011. Adaptive Healing Rooms project - improving patient recovery through the use of
smart patient rooms. <available at> http://www.newscenter.philips.com/main/standard/news/ backgrounders/ 2011/20111018_philips_adaptive_healing_rooms_project.wpd#.U_8Ysm-SwLmN.
265. Powell LM, Chriqui J, Chaloupka FJ 2009. Associations between state-level soda taxes and adolescent body mass index. Journal of adolescent health 45(3):S57-S63.
266. Price I 2002. Can FM evolve? If not, what future? Journal of Facilities Management 1(1):56-69.
157
267. Price B, Petre M 2004. Using robotics to motivate ‘back door’learning. Education and
information technologies 9(2):147-58.
268. Prodgers, L., 2009. The History of Facilities Management in 5 Minutes. Text of talk delivered on World FM Day at Google’s HQ in London.
269. Pullen WR, van der Voordt TJ, Hanekamp J 2009. Input for the 2015 FM research and action
agenda. Proceedings of EFMC 2009 Research Symposium: Amsterdam, The Netherlands.
270. Rabe-Hesketh S, Skrondal A 2012. Multilevel and Longitudinal Modelling Using Stata, Volume I: Continuous Responses, Third Edition: 1 (Paperback). Stata Press.
271. RAE (Royal Academy of Engineering) and ARUP 2015. Built for living: Understanding behaviour
and the built environment through engineering and design. (online pdf).
272. Rangavajhala S, Mullur AA, Messac A 2009. Equality constraints in multiobjective robust design optimization: Decision making problem. Journal of optimization theory and applications 140(2):315-37.
273. Ramussen J 1983. Skills, rules, and knowledge; signals, signs, and symbols, and other distinctions in human performance models. IEEE transactions on systems, man, and cybernetics (3):257-66.
274. Rasmussen N 2015. Stigma and the addiction paradigm for obesity: lessons from 1950s America. Addiction 110(2):217-25.
275. Rayner M, Stockley L 2004. Nutrient profiles: options for definitions for use in relation to food promotion and children’s diets. London: Food Standards Agency.
276. Rayner M, 2005. The UK Ofcom Nutrient Profiling Model. Oxford, UK: British Heart Foundation Health Promotion Research Group.
277. Recarte MA, Nunes LM 2003. Mental workload while driving: effects on visual search, discrimination, and decision making. Journal of experimental psychology: Applied 9(2):119.
278. Redhead C, Williams E 2010. Public Health, workforce, quality, and related provisions in the Patient Protection and Affordable Care Act (PL 111-148) R40943 Washington, DC: Congressional Research Service.
279. Reno RR, Cialdini RB, Kallgren CA 1993. The transsituational influence of social norms. Journal of personality and social psychology 64(1):104.
280. Richardson PR 1995. Public sector strategic planning: Creating the future in an uncertain, turbulent environment: Unpublished manuscript.
281. Riege A 2005. Three-dozen knowledge-sharing barriers managers must consider. Journal of knowledge management 9(3):18-35.
282. Ripoll H, Kerlirzin Y, Stein JF, Reine B 1995. Analysis of information processing, decision
making, and visual strategies in complex problem solving sport situations. Human Movement Science 14(3):325-349.
158
283. Ritchie J, Lewis J, Nicholls CM, Ormston R 2013. Qualitative research practice: A guide for social science students and researchers p2-8; p22; p39-47 : Sage.
284. Rittel H, Webber MM 1973. 2.3 planning problems are wicked. Polity 4:155-69.
285. Robles B, Wood M, Kimmons J, Kuo T, 2012. Comparison of nutrition standards and other recommended procurement practices for improving institutional food offerings in Los Angeles County, 2010–2012. Advances in Nutrition: An International Review Journal, 4(2):191-202.
286. Robson C, 1991. Real world research p163-199. John Wiley & Sons.
287. Rodriguez, S.I., Roman, M.S., Sturhahn, S.C. and Terry, E.H., 2002. Sustainability assessment
and reporting for the University of Michigan's Ann Arbor Campus. Centre for Sustainable Systems, Report No. CSS02-04. University of Michigan, Ann Arbor, Michigan.
288. Rogers H, Pickles J, Hide E, Maher L 2008. Experience based design: a practical method of
working with patients to redesign services. Clinical Governance: An International Journal 13(1):51-8.
289. Rose WR, Cray D 2010. Public‐sector strategy formulation. Canadian Public Administration 53(4):453-66.
290. Rudzki RE 1995. The application of a strategic management model to the internationalization
of higher education institutions. Higher Education 29(4):421-41.
291. Sampson SE, Spring M 2014. Service supply chains: Introducing the special topic forum. Journal of Supply Chain Management 48(4):3-7.
292. Sanna A, Vicini S, Bellini S, Baroni I, Rosi A 2013. Engineering awareness tm: An e-service design approach for behavioral change in healthcare and well-being. International Conference of Design, User Experience, and Usability: Springer.
293. Sarasoja AL 2014 (Nenonen S Sarasoja AL 2014). Facilities management research in Finland – state-of-art about current Finnish PhD-projects. Facilities 32(1/2)58-66.
294. Sarewitz, D., 2010. Against Holism (book chapter). In The Oxford Handbook of Interdisciplinarity, Frodeman, R., Klein, J. T., Mitcham., C., Holbrook, J. B. Published: Oxord University press.
295. Scarborough P, Bhatnagar P, Wickramasinghe KK, Allender S, Foster C, Rayner M 2011. The
economic burden of ill health due to diet, physical inactivity, smoking, alcohol and obesity in the UK: an update to 2006–07 NHS costs. Journal of Public Health 33(4):527-35.
296. Schedler K 2004. Developing performance indicators and measurement systems in public institutions. Strategies for Public Management Reform p.371-94: Emerald Group Publishing Limited .
297. Schieck AFG, Briones C, Mottram C 2008. The urban screen as a socialising platform: exploring the role of place within the urban space: Frank & Timme GmbH: Citeseer.
298. Schnädelbach H, Penn A, Steadman P 2007. Mixed reality architecture: A dynamic architectural topology.
159
299. Schnädelbach H, Penn A, Steadman P, Benford S, Koleva B, Rodden T 2006. Moving office: inhabiting a dynamic building. Proceedings of the 2006 20th anniversary conference on Computer supported cooperative work: ACM.
300. Schultz PW, Nolan JM, Cialdini RB, Goldstein NJ, Griskevicius V 2007. The constructive, destructive, and reconstructive power of social norms. Psychological science 18(5):429-34.
301. Segrave, K., 2002. Vending machines: an American social history. McFarland.
302. Sepinuck T 2013. Theatre of Witness. Published: London: Jessica Kingsley.
303. Simon HA 1962. The architecture of complexity. Proceedings of the American philosophical
society, 106(6):467-482.
304. Skov LR., Lourenço S, Hansen GL, Mikkelsen BE, Schofield C 2013. Choice architecture as a means to change eating behaviour in self-service settings: a systematic review. Obesity Prevention/Treatment 14:187–196.
305. Sloane K 2014. Will the Health Star Rating labels improve people’s diets? Public Health Expert.
Published: University of Otago.
306. Spier S 2005. Dancing and drawing, choreography and architecture. The Journal of Architecture 10(4):349-64.
307. St George (2008) The Telectroscope. (art performance sculpture) information available at
http://www.artichoke.uk.com/events/the_telectroscope/ accessed 09/11/17
308. State Government of Victoria 2015 Obesity. Available at: https://www.betterhealth.vic.gov.au/health/healthyliving/obesity, accessed 03/04/17
309. Stephens LD, McNaughton SA, Crawford D, Ball K 2014. Longitudinal predictors of frequent vegetable and fruit consumption among socio-economically disadvantaged Australian adolescents. Appetite 78:165-71.
310. Sterman JD 2000. Business dynamics: systems thinking and modelling for a complex world. Report No.: 0072311355.
311. Stock C, Bishop I, Chen H, Nino-Ruiz M, Wang P 2011. Web-based collaboration and decision making in GIS-built virtual environments. Advances in Web-based GIS, Mapping Services and Applications 9:293.
312. Stove DC 1973. Probability and Hume's inductive scepticism Chapter 1.
313. Strasser E, Weiss A, Grill T, Osswald S, Tscheligi M 2012. Combining implicit and explicit methods for the evaluation of an ambient persuasive factory display. International Joint Conference on Ambient Intelligence: Springer.
314. Strijbos S 2010, Systems thinking (book chapter). In the Oxford Handbook of Interdisciplinarity. Frodeman R, Klein JT, Mitcham C, Holbrook JB. Published: Oxord University press.
315. Sue VM, Ritter LA 2011. Conducting online surveys p5-7: Sage Publications.
160
316. Sullivan K, Georgoulis SW, Lines B 2010. Empirical study of the current United States facilities management profession. Journal of Facilities Management 8(2):91-103.
317. Sundström P, Ståhl A, Höök K 2007. In situ informants exploring an emotional mobile messaging system in their everyday practice. International Journal of Human-Computer Studies 65(4):388-403.
318. Sustain 2015. Time to come clean about hospital food. Campaign for Better Hospital Food.
https://www.sustainweb.org/publications/time_to_come_clean/
319. Sutil NS 2013. Rudolf Laban and topological movement: a videographic analysis. Space and Culture 16(2):173-93.
320. Tako AA, Robinson S 2009. Comparing model development in discrete event simulation and system dynamics. Winter Simulation Conference, Winter Simulation Conference.
321. Tang D, Wei F, Qin B, Liu T, Zhou M 2014. Coooolll: A deep learning system for twitter sentiment classification. Proceedings of the 8th International Workshop on Semantic Evaluation (SemEval 2014).
322. Tashakkori A, Teddlie C 2009. Putting the human back in ‘‘human research methodology’’: The researcher in mixed methods research. Journal of Mixed Methods Research 4(4) 271–277 SAGE Publications Sage CA: Los Angeles, CA.
323. Tashakkori A, Teddlie C 2010. Sage handbook of mixed methods in social & behavioral research p1-45: Sage.
324. Ten Have M, de Beaufort I, Holm S, 2010. No Country for Fat Children? Ethical Questions Concerning Community‐Based Programs to Prevent Obesity. Preventing childhood obesity: Evidence policy and practice, pp.31-39.
325. Terlutter R, Capella ML 2013. The gamification of advertising: analysis and research directions
of in-game advertising, advergames, and advertising in social network games. Journal of Advertising 42(2-3):95-112.
326. Terry‐McElrath YM, Hood NE, Colabianchi N, O'Malley PM, Johnston LD 2014. Profits, commercial food supplier involvement, and school vending machine snack food availability: implications for implementing the new competitive foods rule. Journal of School Health 84(7):451-8.
327. Thaler, Cass R. Sunstein 2008. Nudge: Improving decisions about health, wealth, and happiness. Constitutional Political Economy 19(4):356-60.
328. Thompson BP, Bank LC 2010. Use of system dynamics as a decision-making tool in building
design and operation. Building and Environment 45(4):1006-15.
329. Tippett J, Farnsworth V 2009. Improving Sustainability Skills and Knowledge in the Workplace. Manchester: Sustainable Consumption Institute. Available at: http://www. sci. manchester. ac. uk/medialibrary/Skills_in_the_workplace_SCI_Project_Report_Jul y2009. pdf.(Accessed 5 April 2010);.
161
330. Tollmar K, Bentley F, Viedma C 2012. Mobile Health Mashups: Making sense of multiple streams of wellbeing and contextual data for presentation on a mobile device. Pervasive Computing Technologies for Healthcare (PervasiveHealth) 6th International Conference: IEEE.
331. Tomnay JE, Hatch B 2013. Council-supported condom vending machines: are they acceptable to rural communities? Sexual health 10(5):465-6.
332. Truffer B, Voß J-P, Konrad K 2008. Mapping expectations for system transformations: Lessons from Sustainability Foresight in German utility sectors. Technological Forecasting and Social Change 75(9):1360-72.
333. Tufte E 1942 (ed. 2001). The visual display of quantitative information. America: Graphics
Press.
334. Turner JE, Valentine T, Ellis AW 1998. Contrasting effects of age of acquisition and word frequency on auditory and visual lexical decision. Memory & cognition 26(6)1282-1291.
335. Ulrich W 1980. The metaphysics of design: A Simon-Churchman “debate”. Interfaces 10(2):35-40.
336. Vaeyens R, Lenoir M, Williams AM, Philippaerts RM 2007. Mechanisms underpinning successful decision making in skilled youth soccer players: An analysis of visual search behaviors. Journal of Motor Behavior 39(5):395-408.
337. Van der Laan LN, Hooge IT, De Ridder DT, Viergever MA, Smeets PA 2015. Do you like what you see? The role of first fixation and total fixation duration in consumer choice. Food Quality and Preference 39:46-55.
338. Van Looy B, Gemmel P, Dierdonck R 2003. Services management: An integrated approach p:10-11;168: Pearson Education.
339. Vanrullen R, Thorpe SJ 2001. The time course of visual processing: from early perception to decision-making. Journal of cognitive neuroscience 13(4):454-61.
340. Vargo SL, Lusch RF 2004. Evolving to a new dominant logic for marketing. Journal of marketing 68(1)1-17.
341. Vicini S, Bellini S, Rosi A, Sanna A 2013. Engineering Awareness TM: An e-Service Design
Approach for Behavioral Change in Healthcare and Well-Being. In: Marcus, A 2013. Lecture Notes in Computer Science vol.8014:594-603: Design, User Experience, and Usability. User Experience in Novel Technological Environments.
342. Vinayagamoorthy V, Gillies M, Steed A, Tanguy E, Pan X, Loscos C 2006. Building expression into virtual characters Eurogrpahics: STAR – State of The Art Report.
343. Vogue 2016 Healthy Vending Machines. Available at http://www.vogue.co.uk/gallery/calgary-
avansino-healthy-vending-machines, accessed 03/04/17
344. Wagner CS, Roessner JD, Bobb K, Klein JT, Boyack KW, Keyton J 2011. Approaches to understanding and measuring interdisciplinary scientific research (IDR): A review of the literature. Journal of informetrics 5(1):14-26.
162
345. Weick KE, Sutcliffe KM, Obstfeld D 2008. Organizing for high reliability: Processes of collective mindfulness. Crisis management 3(1):81-123.
346. Weise CM, Hohenadel MG, Krakoff J, Votruba SB 2014. Body composition and energy expenditure predict ad-libitum food and macronutrient intake in humans. International journal of obesity 38(2):243-51.
347. West M, Dawson JF 2012. Employee engagement and NHS performance. London: The King’s Fund. Available at: www.kingsfund. org.uk/publications/leadership-engagement-for-improvement-nhs (accessed on 20 January 2015)
348. White L, Smith H, Currie C 2010. OR in developing countries: A review. European Journal of Operational Research 208(1):1-11.
349. WHO (World Health Organisation) 2016. WHO Regional Office for Europe nutrient profile model. Available online at: http://www.euro.who.int/__data/assets/pdf_file/0005/270716/Europe-nutrient-profile-model-2015-en.pdf .
350. WHO (World Health Organisation) 2015. Collaborating Centre on Publication Approaches for Non-Communicable Disease Prevention. Available at: http://www.who.int/ncds/prevention/introduction/en/.
351. Wickens CD, Gordon SE, Liu Y, Lee J 2003 (1998). An introduction to human factors engineering chapter 6.
352. Williamson GR, Bellman L, Webster J 2011. Action research in nursing and healthcare p.193: Sage.
353. Winston CP, Sallis JF, Swartz MD, Hoelscher DM, Peskin MF 2012. Reliability of the hospital nutrition environment scan for cafeterias, vending machines, and gift shops. Journal of the Academy of Nutrition and Dietetics, 113(8):1069-75.
354. Wolske M 2013. Research Methods: Information, systems and contexts. The Journal of Community Informatics 10(1).
355. Zander U, Kogut B. Knowledge and the speed of the transfer and imitation of organizational capabilities: An empirical test. Organization science, 1995;6(1):76-92.
356. Zhang Y, Feick L, Price LJ 2009. Sales Effects of Attention to Feature Advertisements: A
Bayesian Mediation Analysis. Journal of Marketing Research 46(5)669-681.
357. Zhou AZ, Fink D 2003. The intellectual capital web: a systematic linking of intellectual capital and knowledge management. Journal of intellectual capital 4(1):34-48.
163
Appendix B MRES Dissertation
164
165
166
167
168
169
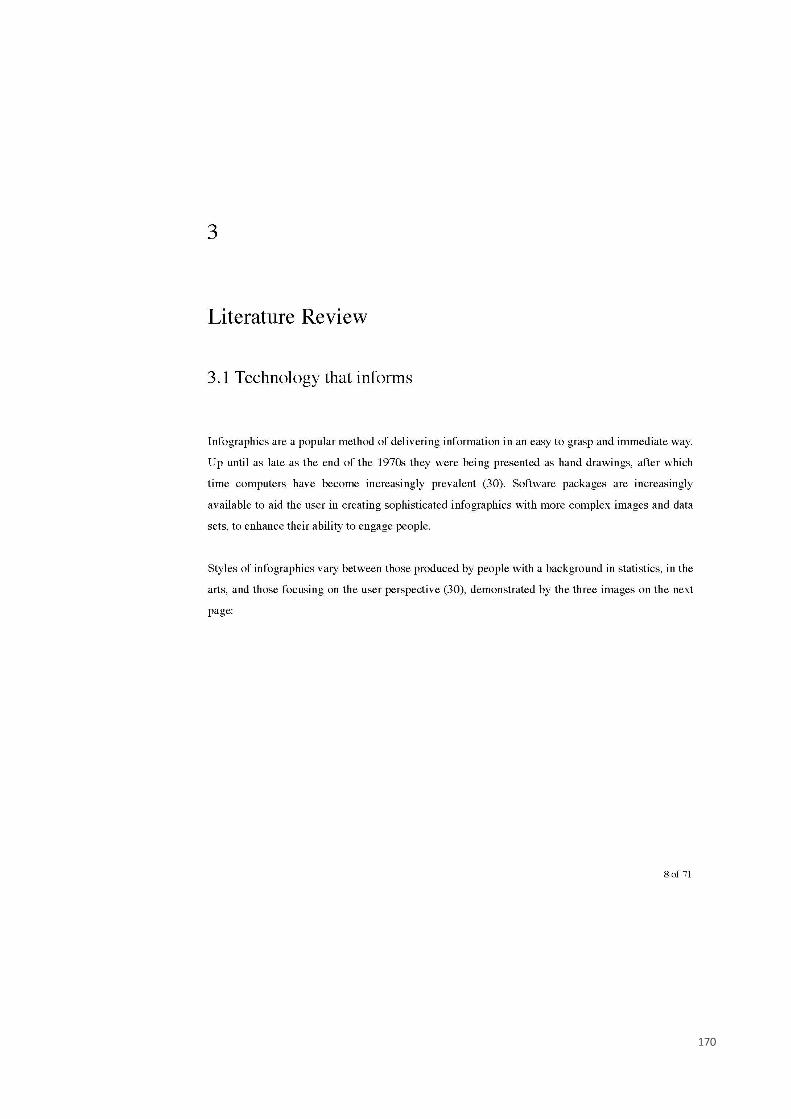
170
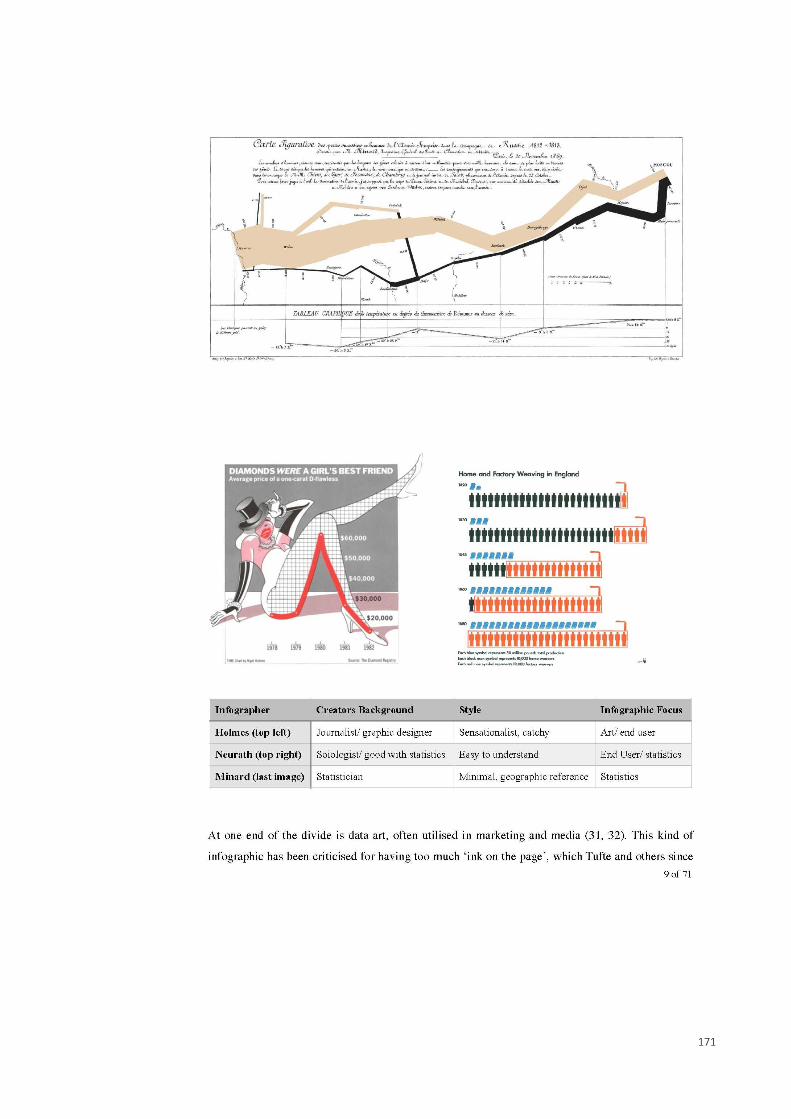
171
172
173
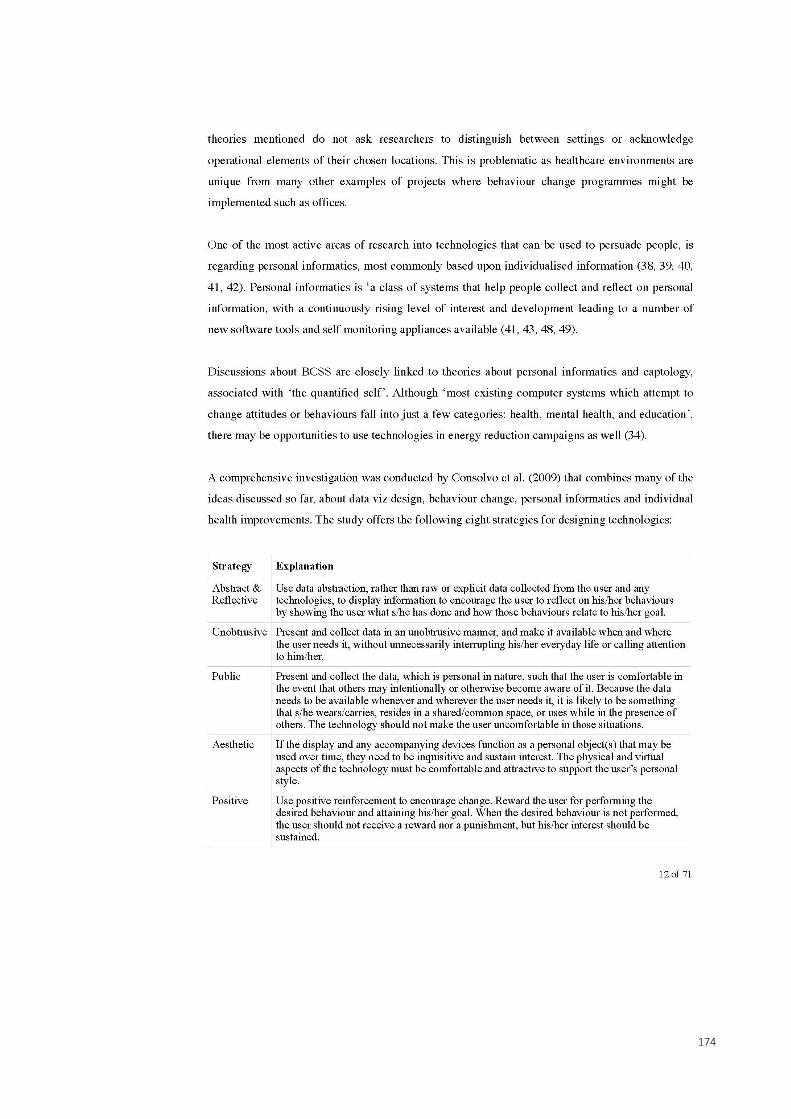
174
175
176
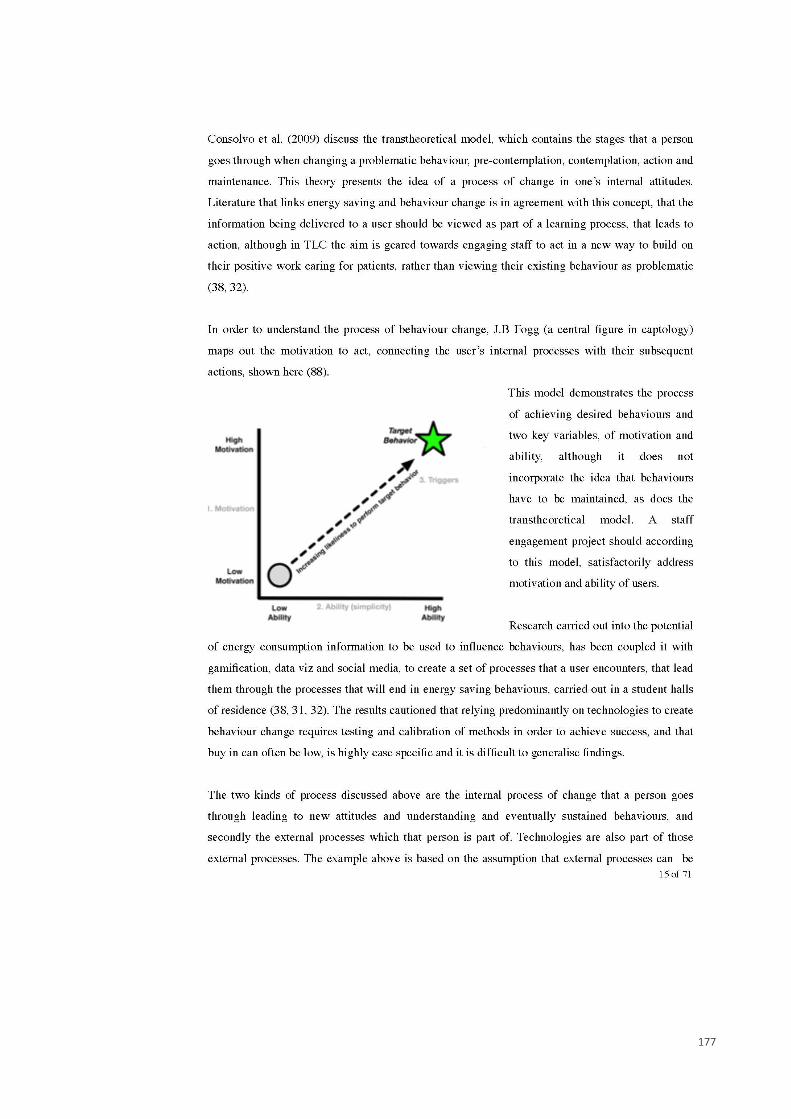
177
178
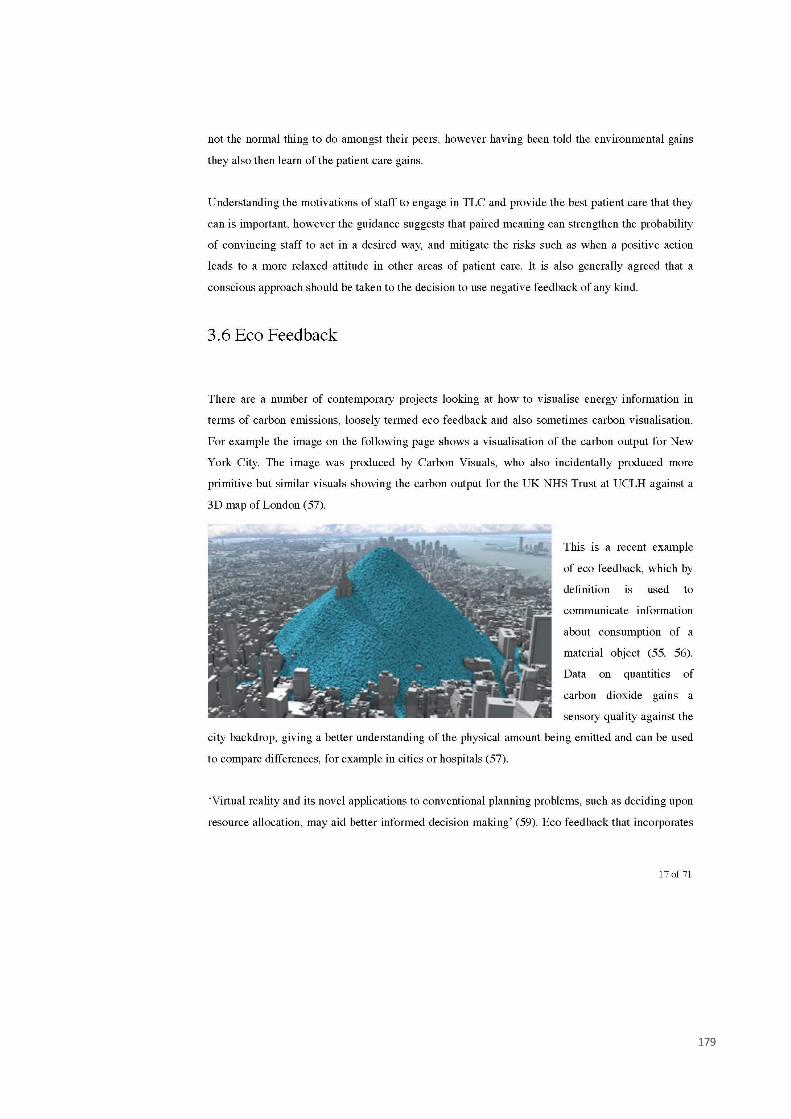
179
180
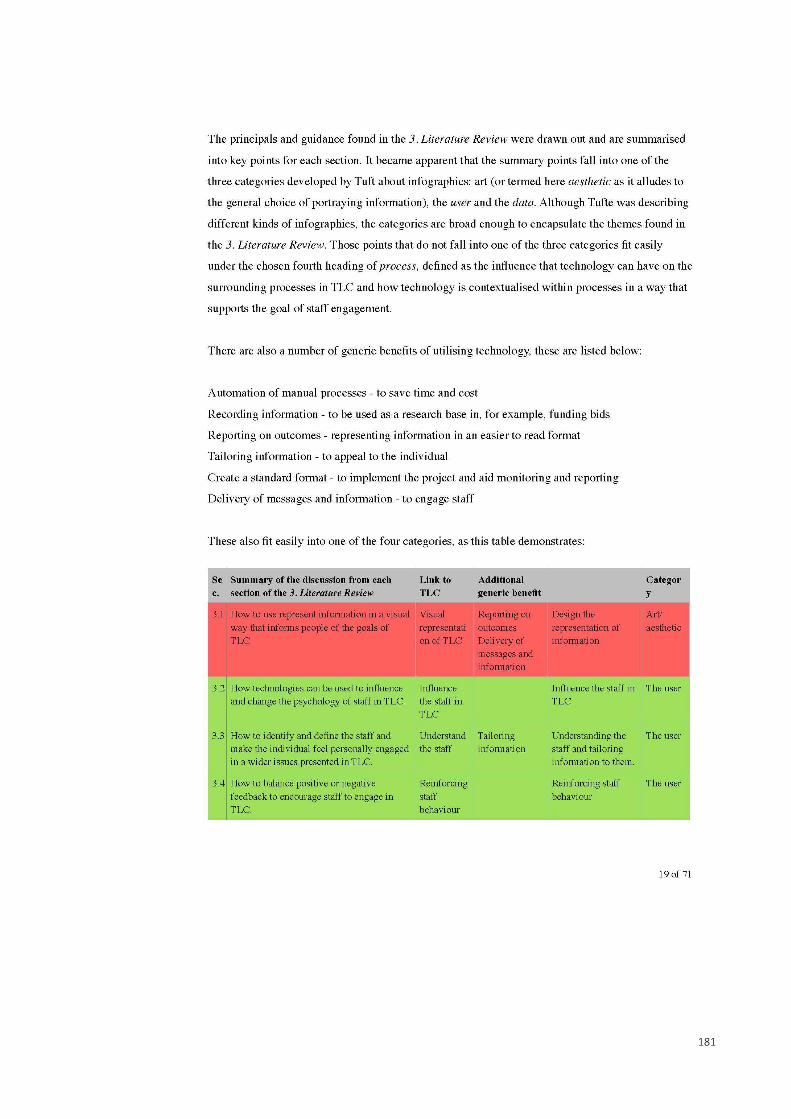
181
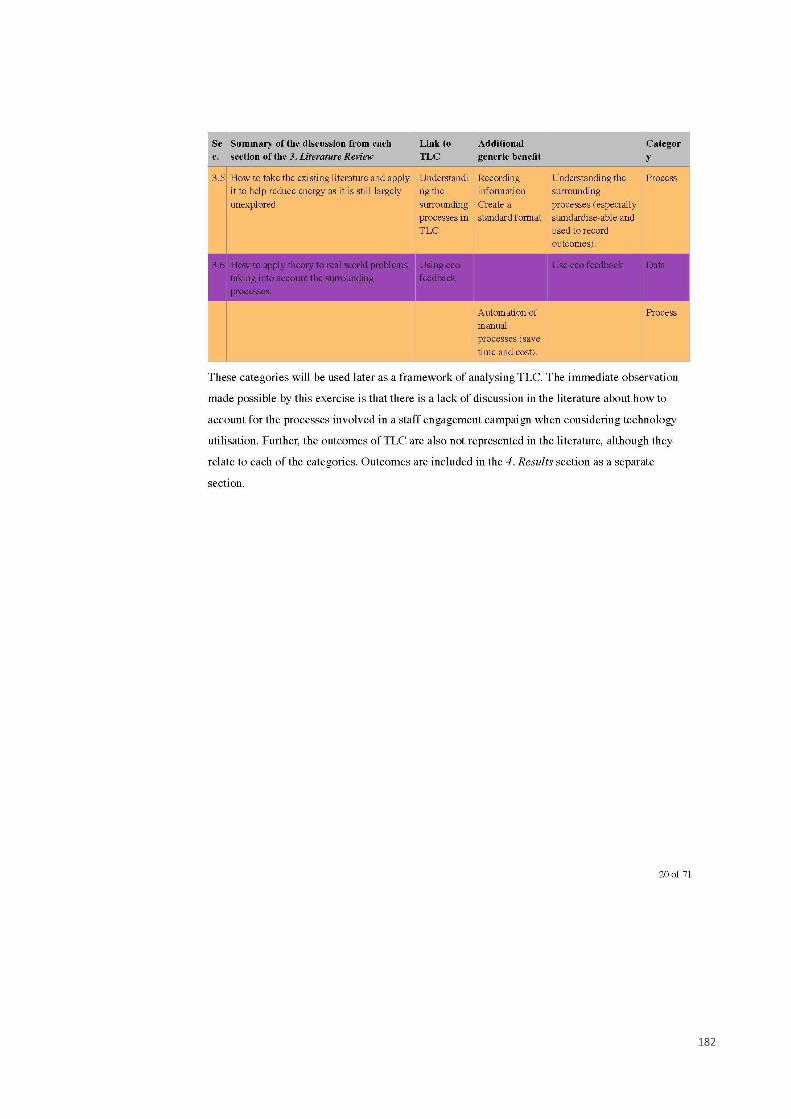
182
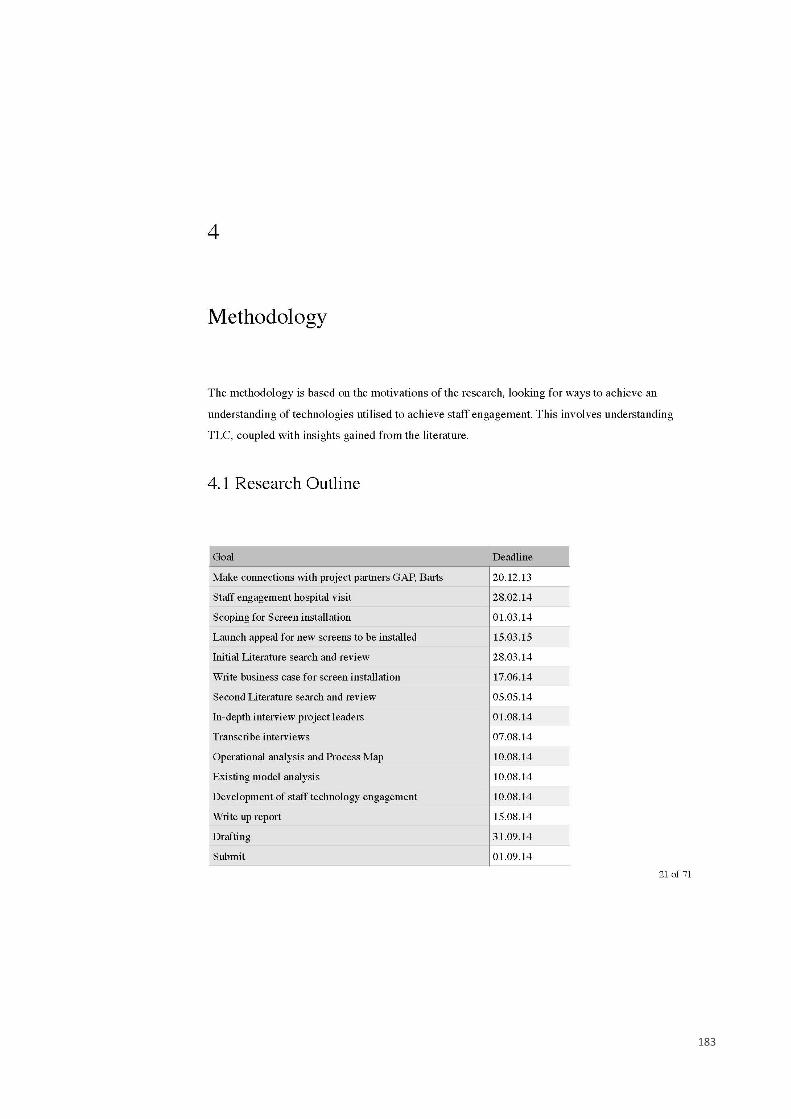
183
184
185
186
187
188
189
190
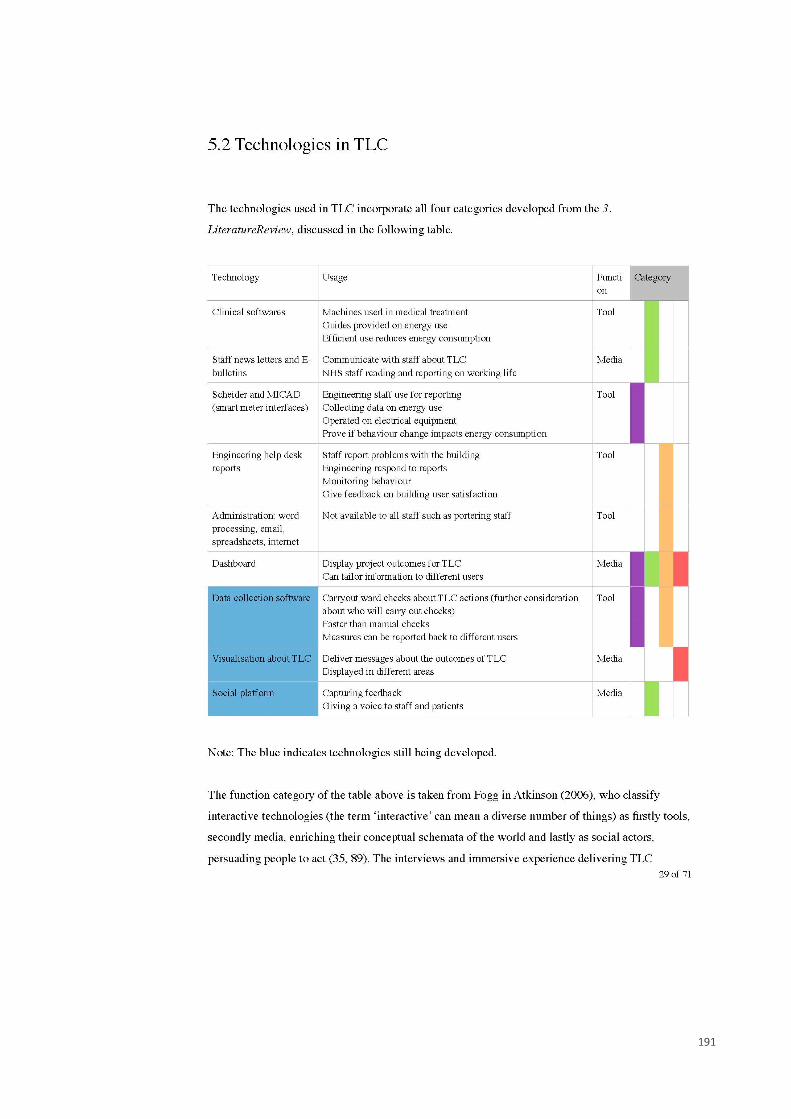
191
192
193
194
195
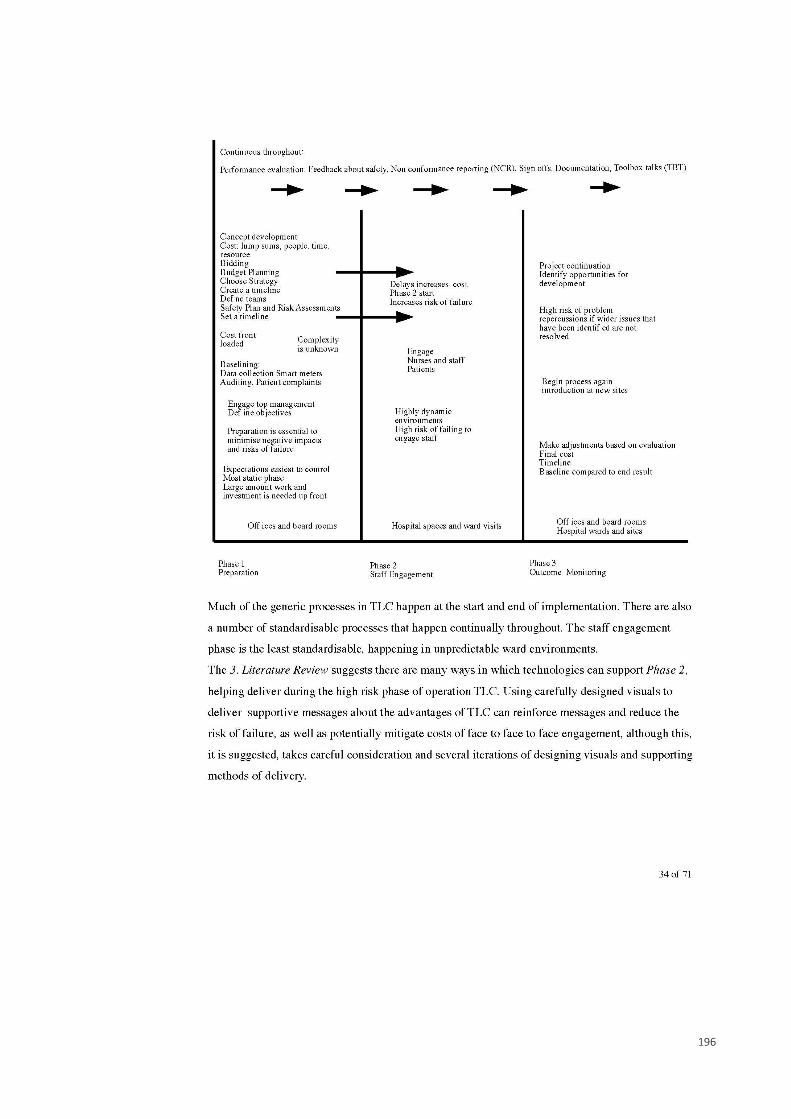
196
197
198
199
200
201
202
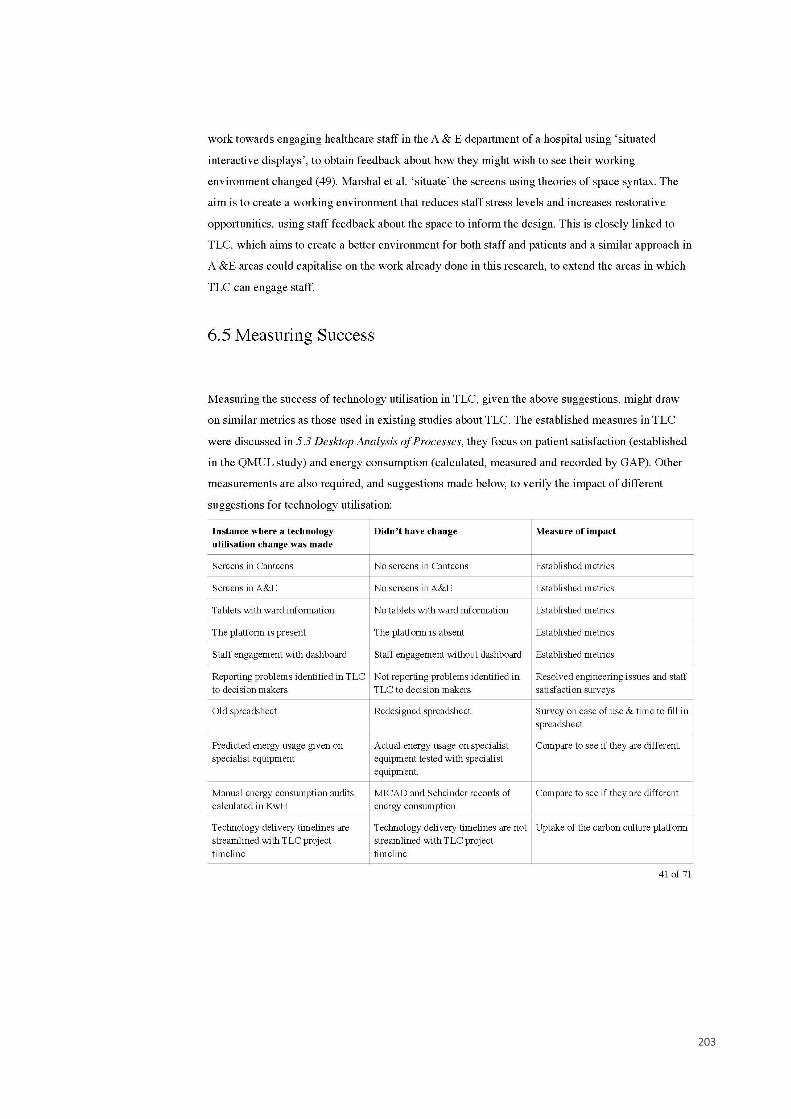
203
204
205
206
207
208
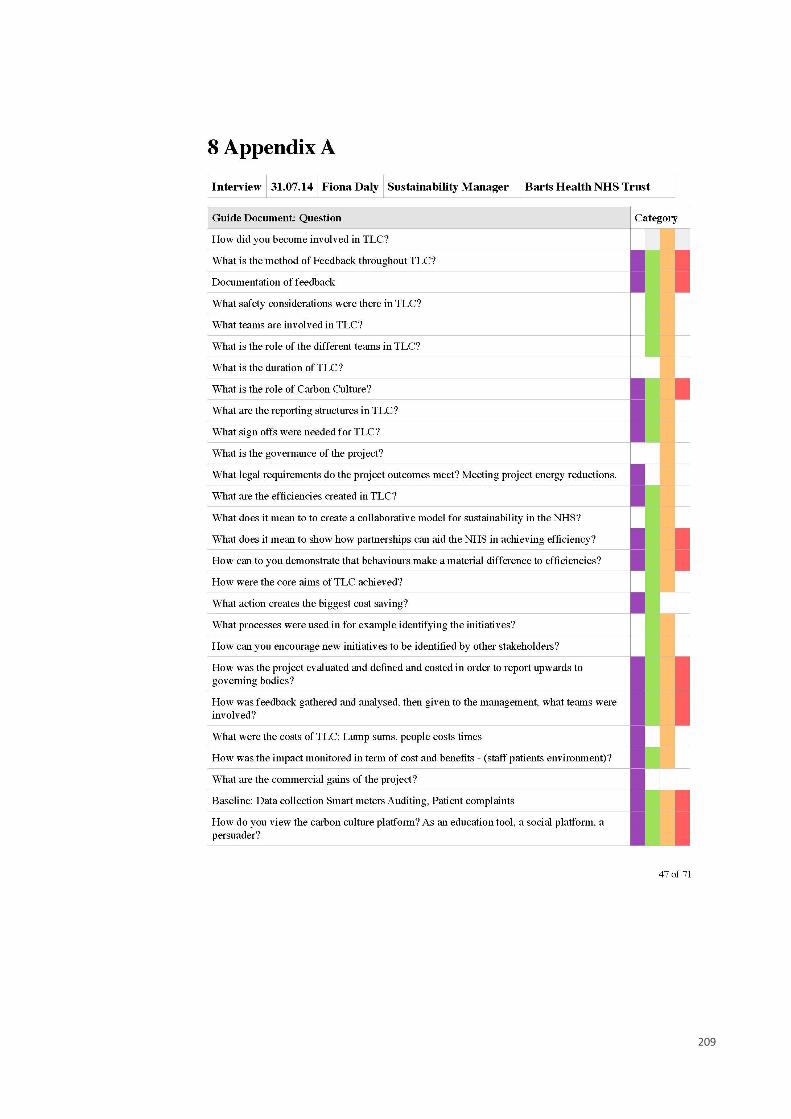
209
210
211
212
213
214
215
216
217
218
219
220
221
222
223
224
225
226
227
228
229
230
231
232
233
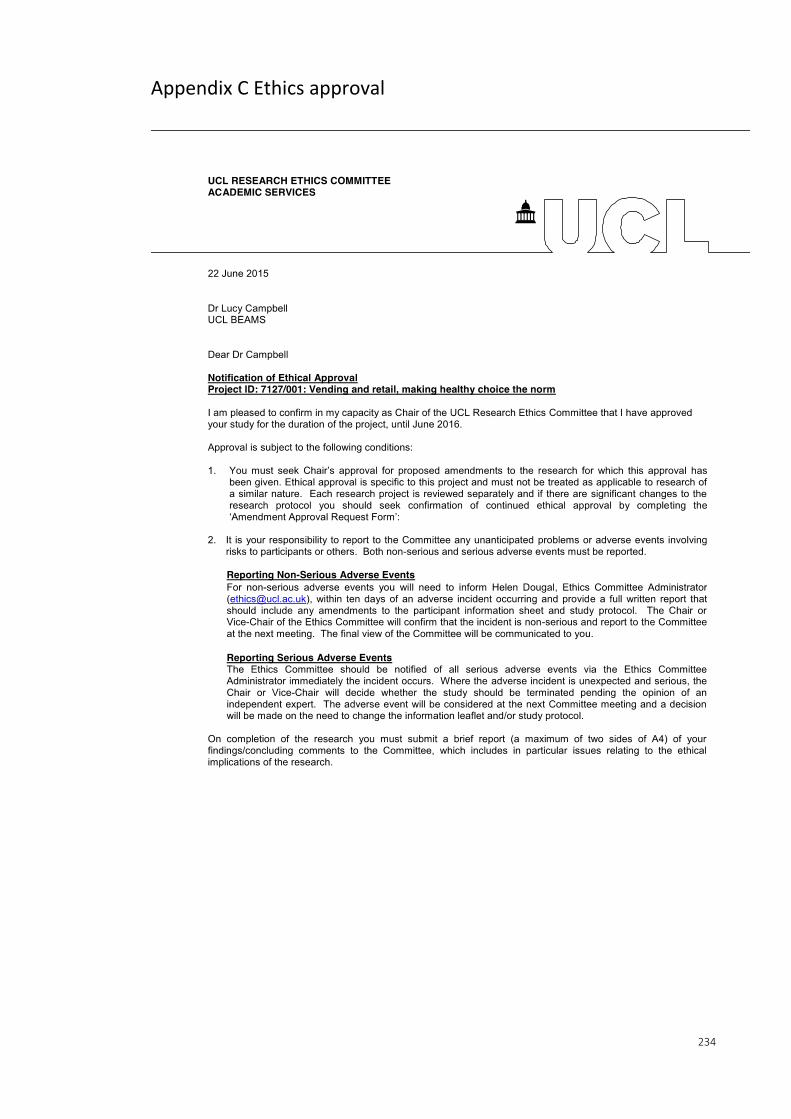
234
Appendix C Ethics approval
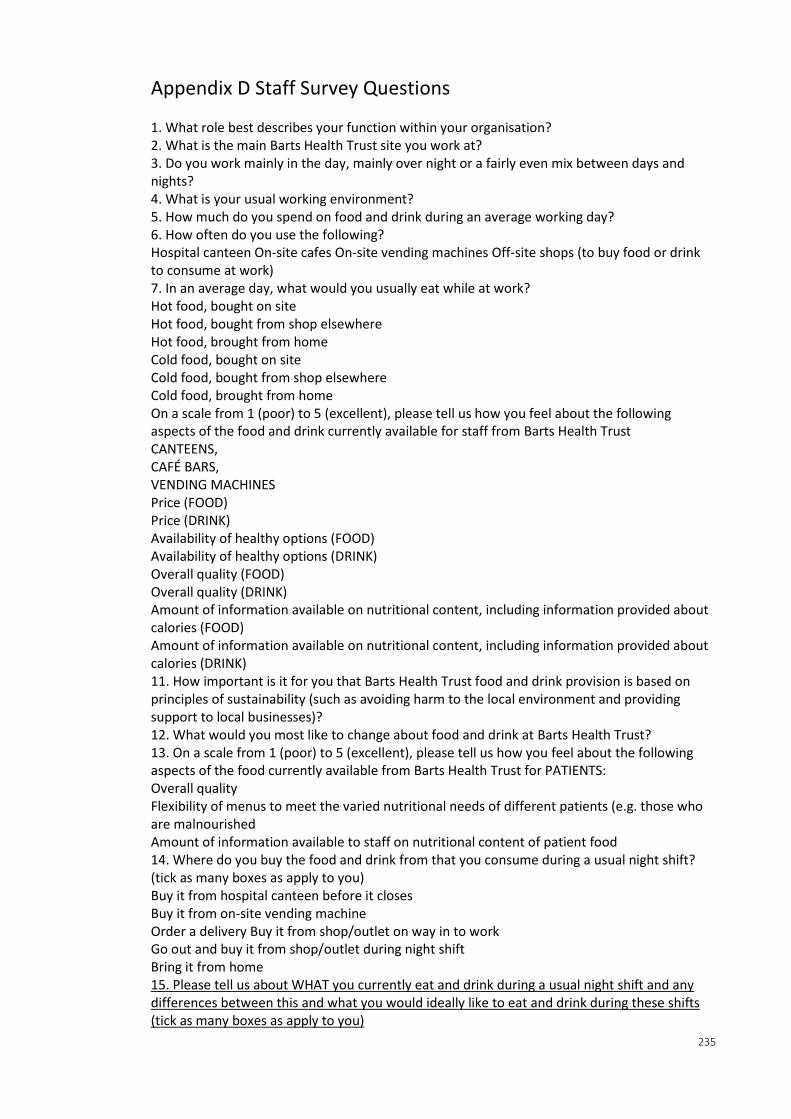
235
Appendix D Staff Survey Questions 1. What role best describes your function within your organisation? 2. What is the main Barts Health Trust site you work at? 3. Do you work mainly in the day, mainly over night or a fairly even mix between days and nights? 4. What is your usual working environment? 5. How much do you spend on food and drink during an average working day? 6. How often do you use the following? Hospital canteen On-site cafes On-site vending machines Off-site shops (to buy food or drink to consume at work) 7. In an average day, what would you usually eat while at work? Hot food, bought on site Hot food, bought from shop elsewhere Hot food, brought from home Cold food, bought on site Cold food, bought from shop elsewhere Cold food, brought from home On a scale from 1 (poor) to 5 (excellent), please tell us how you feel about the following aspects of the food and drink currently available for staff from Barts Health Trust CANTEENS, CAFÉ BARS, VENDING MACHINES Price (FOOD) Price (DRINK) Availability of healthy options (FOOD) Availability of healthy options (DRINK) Overall quality (FOOD) Overall quality (DRINK) Amount of information available on nutritional content, including information provided about calories (FOOD) Amount of information available on nutritional content, including information provided about calories (DRINK) 11. How important is it for you that Barts Health Trust food and drink provision is based on principles of sustainability (such as avoiding harm to the local environment and providing support to local businesses)? 12. What would you most like to change about food and drink at Barts Health Trust? 13. On a scale from 1 (poor) to 5 (excellent), please tell us how you feel about the following aspects of the food currently available from Barts Health Trust for PATIENTS: Overall quality Flexibility of menus to meet the varied nutritional needs of different patients (e.g. those who are malnourished Amount of information available to staff on nutritional content of patient food 14. Where do you buy the food and drink from that you consume during a usual night shift? (tick as many boxes as apply to you) Buy it from hospital canteen before it closes Buy it from on-site vending machine Order a delivery Buy it from shop/outlet on way in to work Go out and buy it from shop/outlet during night shift Bring it from home 15. Please tell us about WHAT you currently eat and drink during a usual night shift and any differences between this and what you would ideally like to eat and drink during these shifts (tick as many boxes as apply to you)
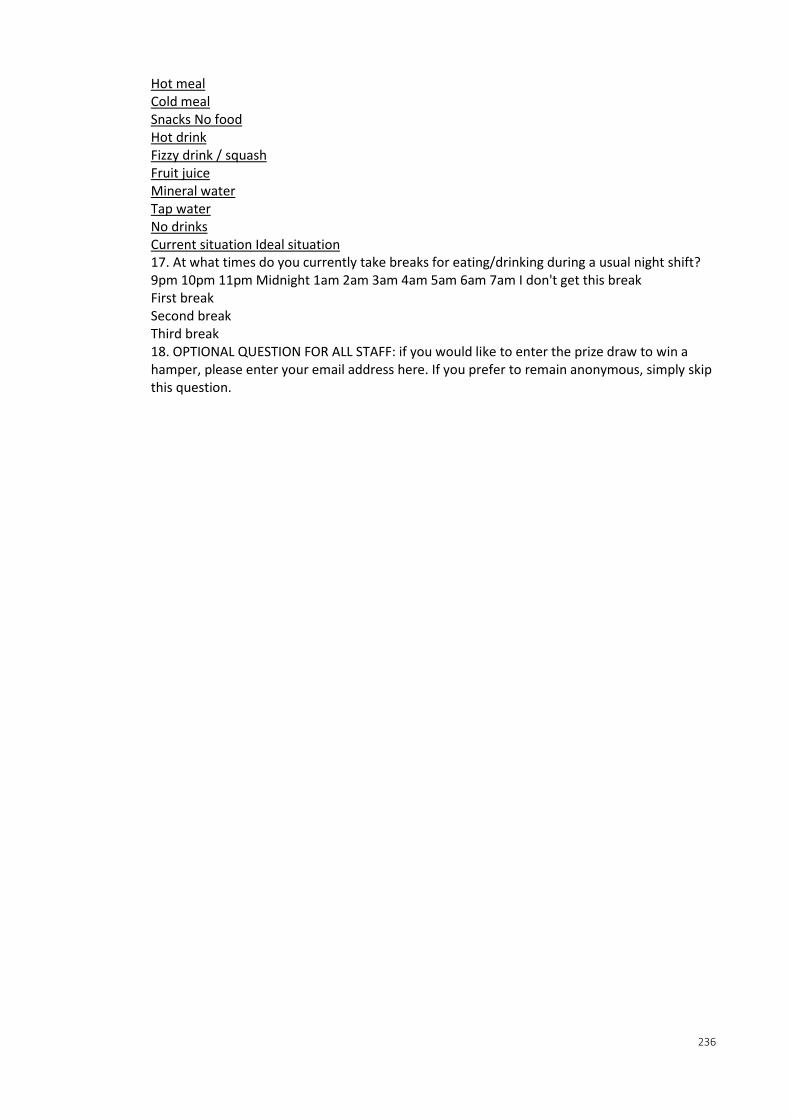
236
Hot meal Cold meal Snacks No food Hot drink Fizzy drink / squash Fruit juice Mineral water Tap water No drinks Current situation Ideal situation 17. At what times do you currently take breaks for eating/drinking during a usual night shift? 9pm 10pm 11pm Midnight 1am 2am 3am 4am 5am 6am 7am I don't get this break First break Second break Third break 18. OPTIONAL QUESTION FOR ALL STAFF: if you would like to enter the prize draw to win a hamper, please enter your email address here. If you prefer to remain anonymous, simply skip this question.
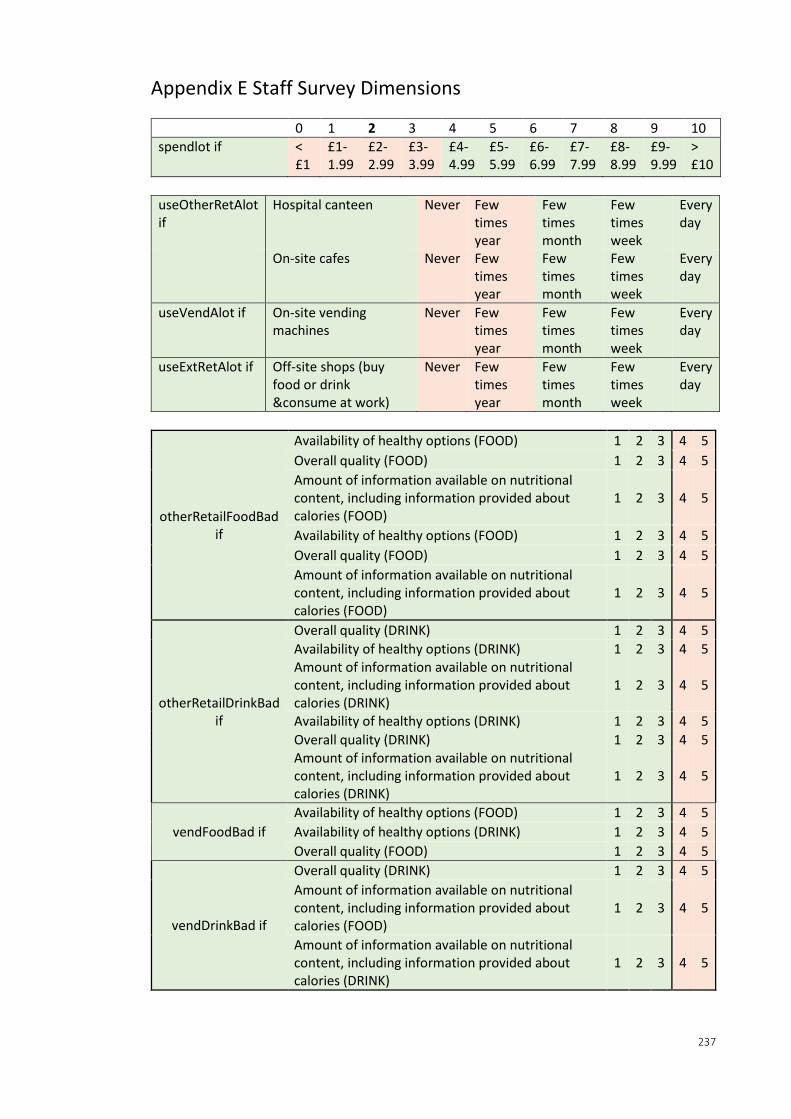
237
Appendix E Staff Survey Dimensions
0 1 2 3 4 5 6 7 8 9 10
spendlot if < £1
£1-1.99
£2-2.99
£3-3.99
£4-4.99
£5-5.99
£6-6.99
£7-7.99
£8-8.99
£9-9.99
> £10
useOtherRetAlot if
Hospital canteen Never Few times year
Few times month
Few times week
Every day
On-site cafes Never Few times year
Few times month
Few times week
Every day
useVendAlot if On-site vending machines
Never Few times year
Few times month
Few times week
Every day
useExtRetAlot if Off-site shops (buy food or drink &consume at work)
Never Few times year
Few times month
Few times week
Every day
otherRetailFoodBad if
Availability of healthy options (FOOD) 1 2 3 4 5
Overall quality (FOOD) 1 2 3 4 5
Amount of information available on nutritional content, including information provided about calories (FOOD)
1 2 3 4 5
Availability of healthy options (FOOD) 1 2 3 4 5
Overall quality (FOOD) 1 2 3 4 5
Amount of information available on nutritional content, including information provided about calories (FOOD)
1 2 3 4 5
otherRetailDrinkBad if
Overall quality (DRINK) 1 2 3 4 5
Availability of healthy options (DRINK) 1 2 3 4 5 Amount of information available on nutritional content, including information provided about calories (DRINK)
1 2 3 4 5
Availability of healthy options (DRINK) 1 2 3 4 5
Overall quality (DRINK) 1 2 3 4 5 Amount of information available on nutritional content, including information provided about calories (DRINK)
1 2 3 4 5
vendFoodBad if
Availability of healthy options (FOOD) 1 2 3 4 5
Availability of healthy options (DRINK) 1 2 3 4 5
Overall quality (FOOD) 1 2 3 4 5
vendDrinkBad if
Overall quality (DRINK) 1 2 3 4 5
Amount of information available on nutritional content, including information provided about calories (FOOD)
1 2 3 4 5
Amount of information available on nutritional content, including information provided about calories (DRINK)
1 2 3 4 5
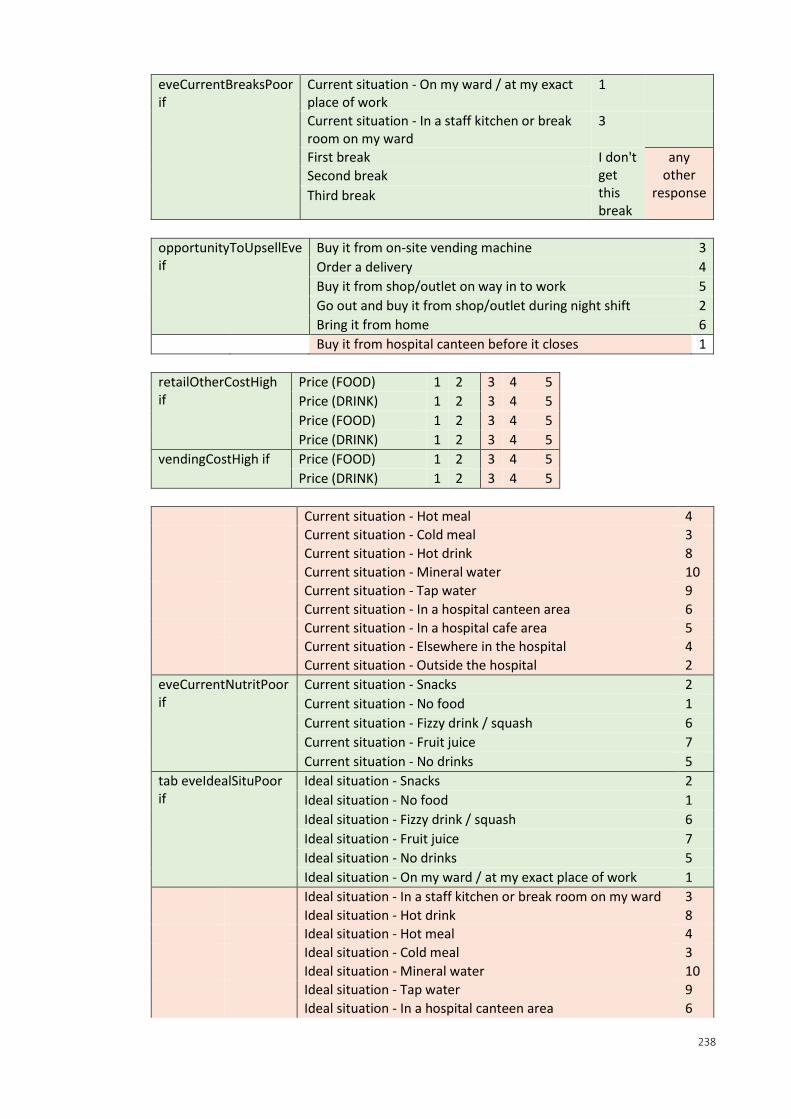
238
eveCurrentBreaksPoor if
Current situation - On my ward / at my exact place of work
1
Current situation - In a staff kitchen or break room on my ward
3
First break I don't get this break
any other
response Second break
Third break
opportunityToUpsellEve if
Buy it from on-site vending machine 3
Order a delivery 4
Buy it from shop/outlet on way in to work 5
Go out and buy it from shop/outlet during night shift 2
Bring it from home 6
Buy it from hospital canteen before it closes 1
retailOtherCostHigh if
Price (FOOD) 1 2 3 4 5
Price (DRINK) 1 2 3 4 5
Price (FOOD) 1 2 3 4 5
Price (DRINK) 1 2 3 4 5
vendingCostHigh if Price (FOOD) 1 2 3 4 5
Price (DRINK) 1 2 3 4 5
Current situation - Hot meal 4
Current situation - Cold meal 3
Current situation - Hot drink 8
Current situation - Mineral water 10
Current situation - Tap water 9
Current situation - In a hospital canteen area 6
Current situation - In a hospital cafe area 5
Current situation - Elsewhere in the hospital 4
Current situation - Outside the hospital 2
eveCurrentNutritPoor if
Current situation - Snacks 2
Current situation - No food 1
Current situation - Fizzy drink / squash 6
Current situation - Fruit juice 7
Current situation - No drinks 5
tab eveIdealSituPoor if
Ideal situation - Snacks 2
Ideal situation - No food 1
Ideal situation - Fizzy drink / squash 6
Ideal situation - Fruit juice 7
Ideal situation - No drinks 5
Ideal situation - On my ward / at my exact place of work 1
Ideal situation - In a staff kitchen or break room on my ward 3
Ideal situation - Hot drink 8
Ideal situation - Hot meal 4
Ideal situation - Cold meal 3
Ideal situation - Mineral water 10
Ideal situation - Tap water 9
Ideal situation - In a hospital canteen area 6
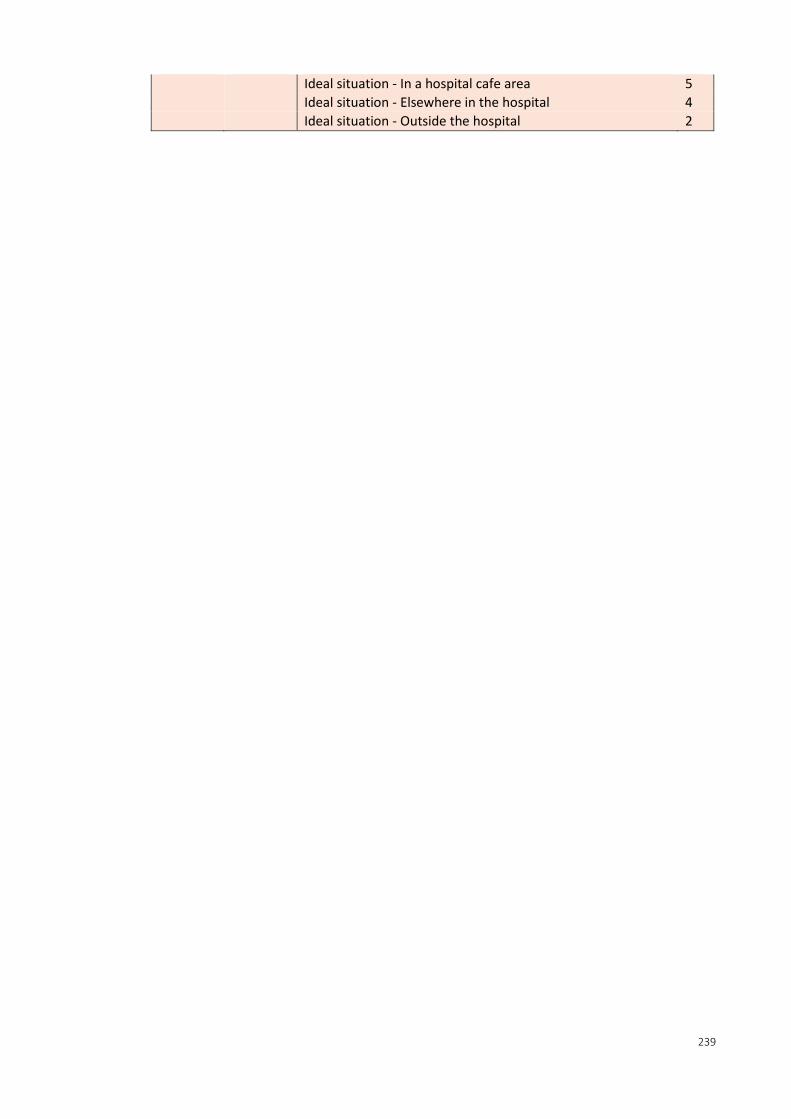
239
Ideal situation - In a hospital cafe area 5
Ideal situation - Elsewhere in the hospital 4
Ideal situation - Outside the hospital 2
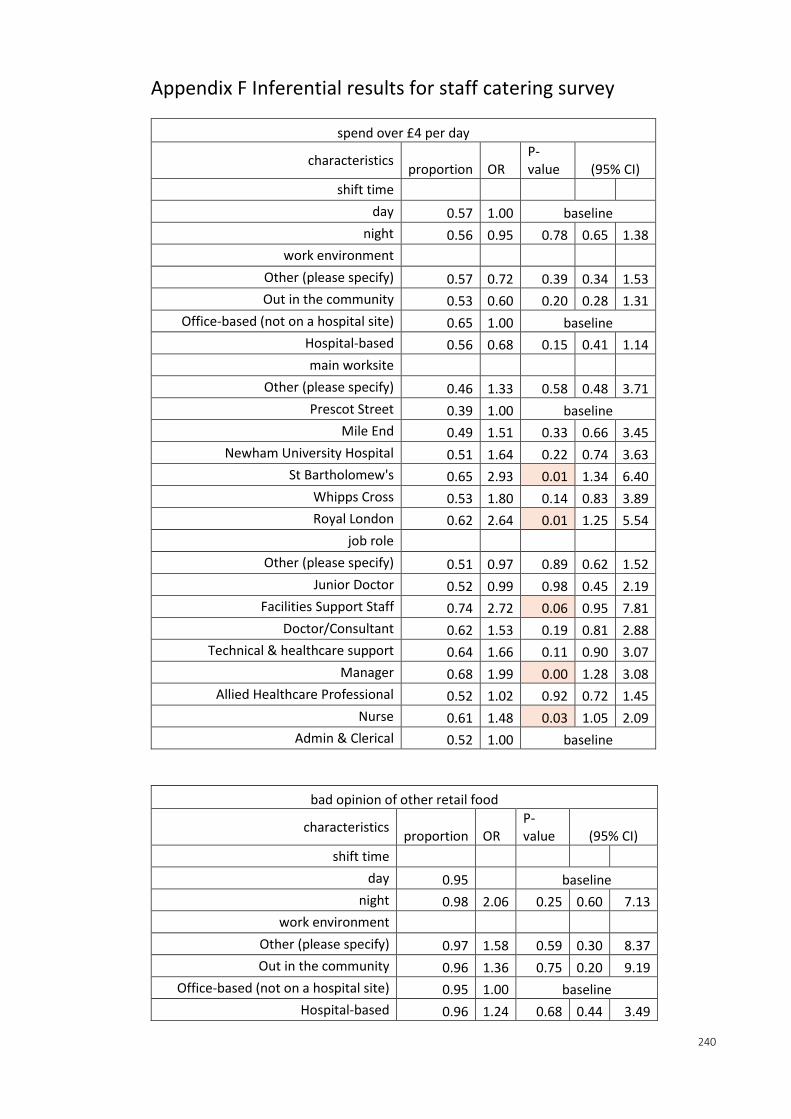
240
Appendix F Inferential results for staff catering survey
spend over £4 per day
characteristics proportion OR
P-value (95% CI)
shift time
day 0.57 1.00 baseline
night 0.56 0.95 0.78 0.65 1.38
work environment
Other (please specify) 0.57 0.72 0.39 0.34 1.53
Out in the community 0.53 0.60 0.20 0.28 1.31
Office-based (not on a hospital site) 0.65 1.00 baseline
Hospital-based 0.56 0.68 0.15 0.41 1.14
main worksite
Other (please specify) 0.46 1.33 0.58 0.48 3.71
Prescot Street 0.39 1.00 baseline
Mile End 0.49 1.51 0.33 0.66 3.45
Newham University Hospital 0.51 1.64 0.22 0.74 3.63
St Bartholomew's 0.65 2.93 0.01 1.34 6.40
Whipps Cross 0.53 1.80 0.14 0.83 3.89
Royal London 0.62 2.64 0.01 1.25 5.54
job role
Other (please specify) 0.51 0.97 0.89 0.62 1.52
Junior Doctor 0.52 0.99 0.98 0.45 2.19
Facilities Support Staff 0.74 2.72 0.06 0.95 7.81
Doctor/Consultant 0.62 1.53 0.19 0.81 2.88
Technical & healthcare support 0.64 1.66 0.11 0.90 3.07
Manager 0.68 1.99 0.00 1.28 3.08
Allied Healthcare Professional 0.52 1.02 0.92 0.72 1.45
Nurse 0.61 1.48 0.03 1.05 2.09
Admin & Clerical 0.52 1.00 baseline
bad opinion of other retail food
characteristics proportion OR
P-value (95% CI)
shift time
day 0.95 baseline
night 0.98 2.06 0.25 0.60 7.13
work environment
Other (please specify) 0.97 1.58 0.59 0.30 8.37
Out in the community 0.96 1.36 0.75 0.20 9.19
Office-based (not on a hospital site) 0.95 1.00 baseline
Hospital-based 0.96 1.24 0.68 0.44 3.49
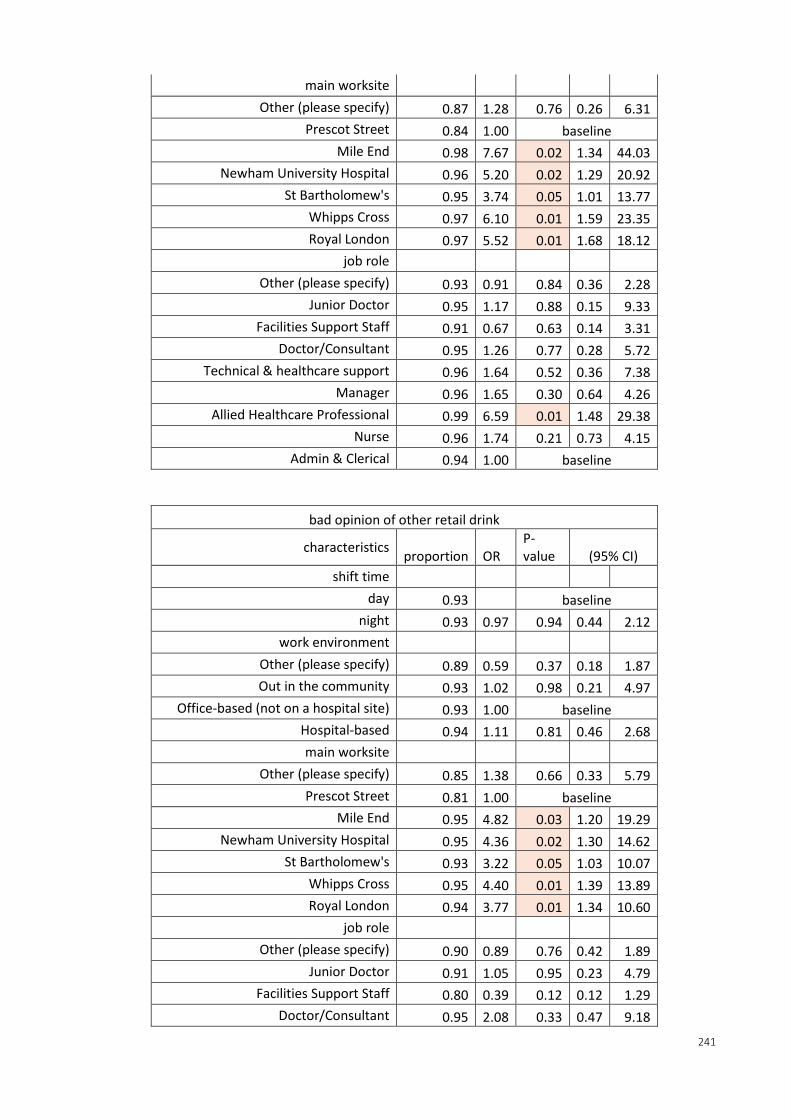
241
main worksite
Other (please specify) 0.87 1.28 0.76 0.26 6.31
Prescot Street 0.84 1.00 baseline
Mile End 0.98 7.67 0.02 1.34 44.03
Newham University Hospital 0.96 5.20 0.02 1.29 20.92
St Bartholomew's 0.95 3.74 0.05 1.01 13.77
Whipps Cross 0.97 6.10 0.01 1.59 23.35
Royal London 0.97 5.52 0.01 1.68 18.12
job role
Other (please specify) 0.93 0.91 0.84 0.36 2.28
Junior Doctor 0.95 1.17 0.88 0.15 9.33
Facilities Support Staff 0.91 0.67 0.63 0.14 3.31
Doctor/Consultant 0.95 1.26 0.77 0.28 5.72
Technical & healthcare support 0.96 1.64 0.52 0.36 7.38
Manager 0.96 1.65 0.30 0.64 4.26
Allied Healthcare Professional 0.99 6.59 0.01 1.48 29.38
Nurse 0.96 1.74 0.21 0.73 4.15
Admin & Clerical 0.94 1.00 baseline
bad opinion of other retail drink
characteristics proportion OR
P-value (95% CI)
shift time
day 0.93 baseline
night 0.93 0.97 0.94 0.44 2.12
work environment
Other (please specify) 0.89 0.59 0.37 0.18 1.87
Out in the community 0.93 1.02 0.98 0.21 4.97
Office-based (not on a hospital site) 0.93 1.00 baseline
Hospital-based 0.94 1.11 0.81 0.46 2.68
main worksite
Other (please specify) 0.85 1.38 0.66 0.33 5.79
Prescot Street 0.81 1.00 baseline
Mile End 0.95 4.82 0.03 1.20 19.29
Newham University Hospital 0.95 4.36 0.02 1.30 14.62
St Bartholomew's 0.93 3.22 0.05 1.03 10.07
Whipps Cross 0.95 4.40 0.01 1.39 13.89
Royal London 0.94 3.77 0.01 1.34 10.60
job role
Other (please specify) 0.90 0.89 0.76 0.42 1.89
Junior Doctor 0.91 1.05 0.95 0.23 4.79
Facilities Support Staff 0.80 0.39 0.12 0.12 1.29
Doctor/Consultant 0.95 2.08 0.33 0.47 9.18
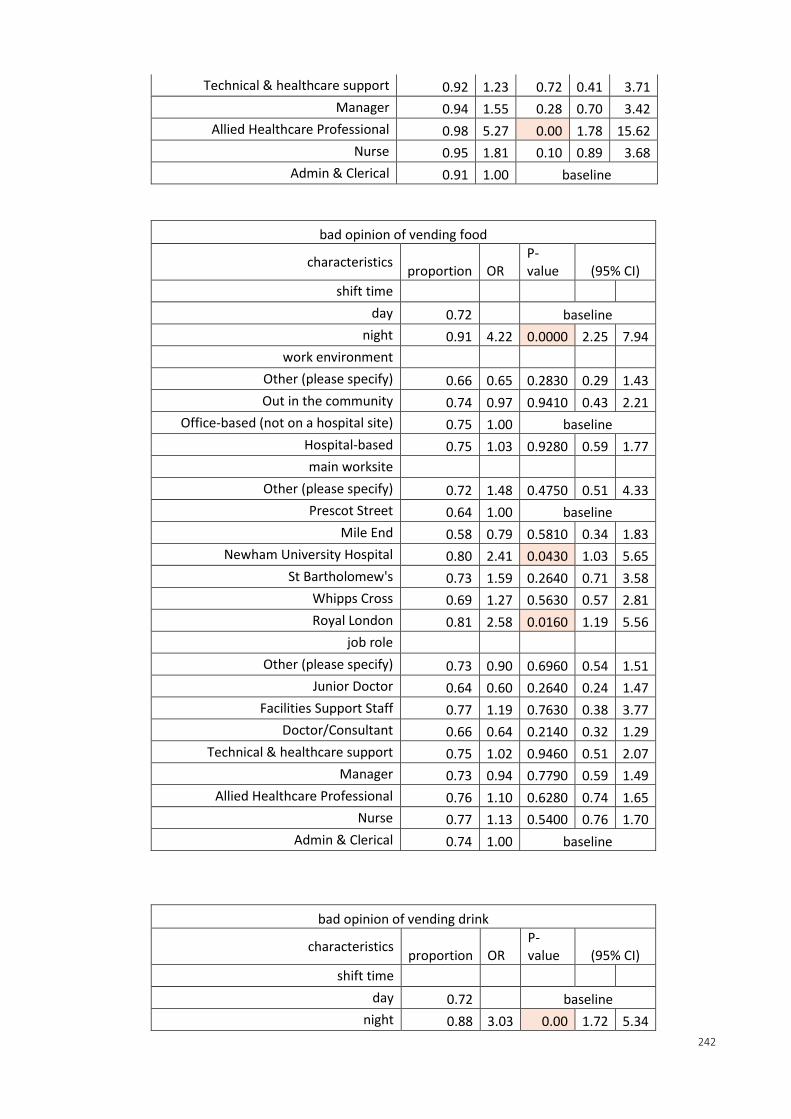
242
Technical & healthcare support 0.92 1.23 0.72 0.41 3.71
Manager 0.94 1.55 0.28 0.70 3.42
Allied Healthcare Professional 0.98 5.27 0.00 1.78 15.62
Nurse 0.95 1.81 0.10 0.89 3.68
Admin & Clerical 0.91 1.00 baseline
bad opinion of vending food
characteristics proportion OR
P-value (95% CI)
shift time
day 0.72 baseline
night 0.91 4.22 0.0000 2.25 7.94
work environment
Other (please specify) 0.66 0.65 0.2830 0.29 1.43
Out in the community 0.74 0.97 0.9410 0.43 2.21
Office-based (not on a hospital site) 0.75 1.00 baseline
Hospital-based 0.75 1.03 0.9280 0.59 1.77
main worksite
Other (please specify) 0.72 1.48 0.4750 0.51 4.33
Prescot Street 0.64 1.00 baseline
Mile End 0.58 0.79 0.5810 0.34 1.83
Newham University Hospital 0.80 2.41 0.0430 1.03 5.65
St Bartholomew's 0.73 1.59 0.2640 0.71 3.58
Whipps Cross 0.69 1.27 0.5630 0.57 2.81
Royal London 0.81 2.58 0.0160 1.19 5.56
job role
Other (please specify) 0.73 0.90 0.6960 0.54 1.51
Junior Doctor 0.64 0.60 0.2640 0.24 1.47
Facilities Support Staff 0.77 1.19 0.7630 0.38 3.77
Doctor/Consultant 0.66 0.64 0.2140 0.32 1.29
Technical & healthcare support 0.75 1.02 0.9460 0.51 2.07
Manager 0.73 0.94 0.7790 0.59 1.49
Allied Healthcare Professional 0.76 1.10 0.6280 0.74 1.65
Nurse 0.77 1.13 0.5400 0.76 1.70
Admin & Clerical 0.74 1.00 baseline
bad opinion of vending drink
characteristics proportion OR
P-value (95% CI)
shift time
day 0.72 baseline
night 0.88 3.03 0.00 1.72 5.34
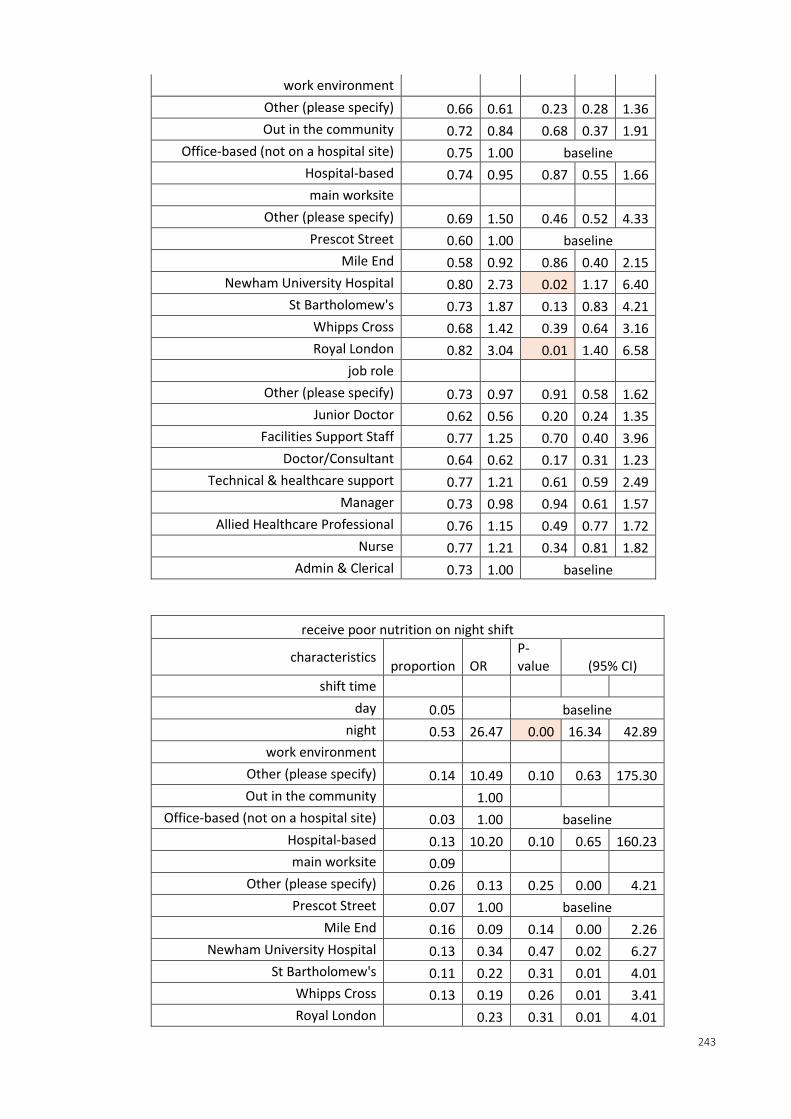
243
work environment
Other (please specify) 0.66 0.61 0.23 0.28 1.36
Out in the community 0.72 0.84 0.68 0.37 1.91
Office-based (not on a hospital site) 0.75 1.00 baseline
Hospital-based 0.74 0.95 0.87 0.55 1.66
main worksite
Other (please specify) 0.69 1.50 0.46 0.52 4.33
Prescot Street 0.60 1.00 baseline
Mile End 0.58 0.92 0.86 0.40 2.15
Newham University Hospital 0.80 2.73 0.02 1.17 6.40
St Bartholomew's 0.73 1.87 0.13 0.83 4.21
Whipps Cross 0.68 1.42 0.39 0.64 3.16
Royal London 0.82 3.04 0.01 1.40 6.58
job role
Other (please specify) 0.73 0.97 0.91 0.58 1.62
Junior Doctor 0.62 0.56 0.20 0.24 1.35
Facilities Support Staff 0.77 1.25 0.70 0.40 3.96
Doctor/Consultant 0.64 0.62 0.17 0.31 1.23
Technical & healthcare support 0.77 1.21 0.61 0.59 2.49
Manager 0.73 0.98 0.94 0.61 1.57
Allied Healthcare Professional 0.76 1.15 0.49 0.77 1.72
Nurse 0.77 1.21 0.34 0.81 1.82
Admin & Clerical 0.73 1.00 baseline
receive poor nutrition on night shift
characteristics proportion OR
P-value (95% CI)
shift time
day 0.05 baseline
night 0.53 26.47 0.00 16.34 42.89
work environment
Other (please specify) 0.14 10.49 0.10 0.63 175.30
Out in the community 1.00
Office-based (not on a hospital site) 0.03 1.00 baseline
Hospital-based 0.13 10.20 0.10 0.65 160.23
main worksite 0.09
Other (please specify) 0.26 0.13 0.25 0.00 4.21
Prescot Street 0.07 1.00 baseline
Mile End 0.16 0.09 0.14 0.00 2.26
Newham University Hospital 0.13 0.34 0.47 0.02 6.27
St Bartholomew's 0.11 0.22 0.31 0.01 4.01
Whipps Cross 0.13 0.19 0.26 0.01 3.41
Royal London 0.23 0.31 0.01 4.01
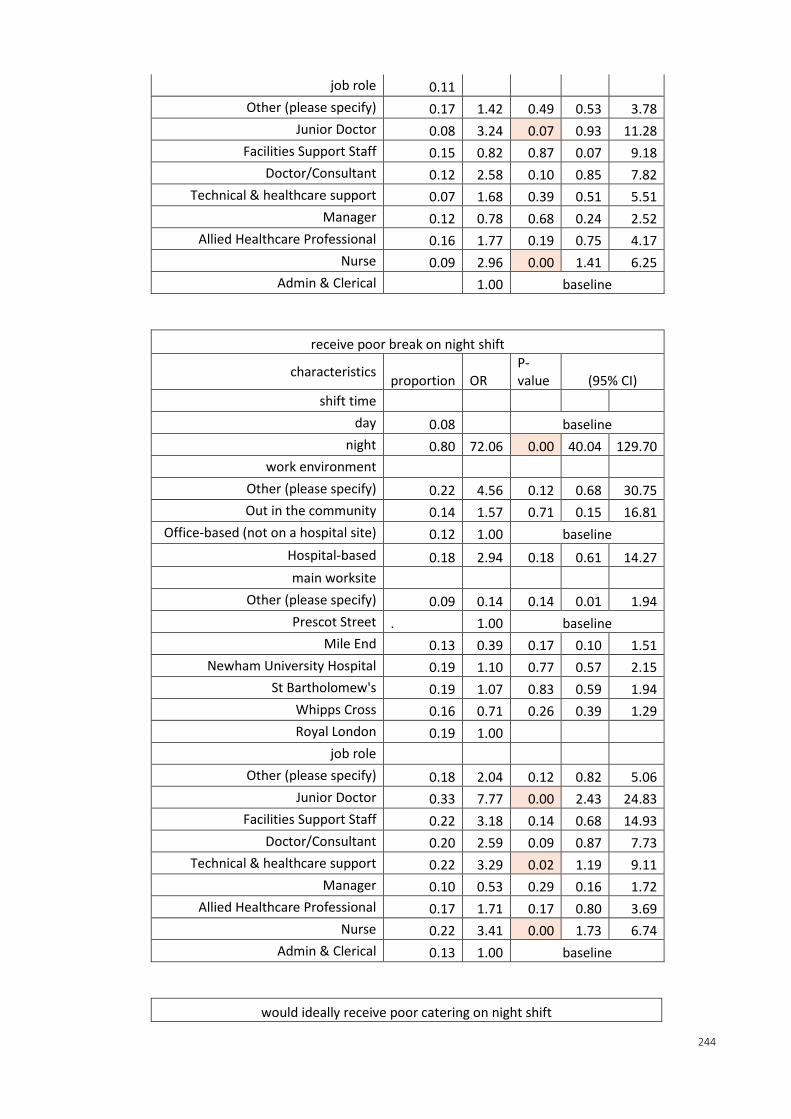
244
job role 0.11
Other (please specify) 0.17 1.42 0.49 0.53 3.78
Junior Doctor 0.08 3.24 0.07 0.93 11.28
Facilities Support Staff 0.15 0.82 0.87 0.07 9.18
Doctor/Consultant 0.12 2.58 0.10 0.85 7.82
Technical & healthcare support 0.07 1.68 0.39 0.51 5.51
Manager 0.12 0.78 0.68 0.24 2.52
Allied Healthcare Professional 0.16 1.77 0.19 0.75 4.17
Nurse 0.09 2.96 0.00 1.41 6.25
Admin & Clerical 1.00 baseline
receive poor break on night shift
characteristics proportion OR
P-value (95% CI)
shift time
day 0.08 baseline
night 0.80 72.06 0.00 40.04 129.70
work environment
Other (please specify) 0.22 4.56 0.12 0.68 30.75
Out in the community 0.14 1.57 0.71 0.15 16.81
Office-based (not on a hospital site) 0.12 1.00 baseline
Hospital-based 0.18 2.94 0.18 0.61 14.27
main worksite
Other (please specify) 0.09 0.14 0.14 0.01 1.94
Prescot Street . 1.00 baseline
Mile End 0.13 0.39 0.17 0.10 1.51
Newham University Hospital 0.19 1.10 0.77 0.57 2.15
St Bartholomew's 0.19 1.07 0.83 0.59 1.94
Whipps Cross 0.16 0.71 0.26 0.39 1.29
Royal London 0.19 1.00
job role
Other (please specify) 0.18 2.04 0.12 0.82 5.06
Junior Doctor 0.33 7.77 0.00 2.43 24.83
Facilities Support Staff 0.22 3.18 0.14 0.68 14.93
Doctor/Consultant 0.20 2.59 0.09 0.87 7.73
Technical & healthcare support 0.22 3.29 0.02 1.19 9.11
Manager 0.10 0.53 0.29 0.16 1.72
Allied Healthcare Professional 0.17 1.71 0.17 0.80 3.69
Nurse 0.22 3.41 0.00 1.73 6.74
Admin & Clerical 0.13 1.00 baseline
would ideally receive poor catering on night shift
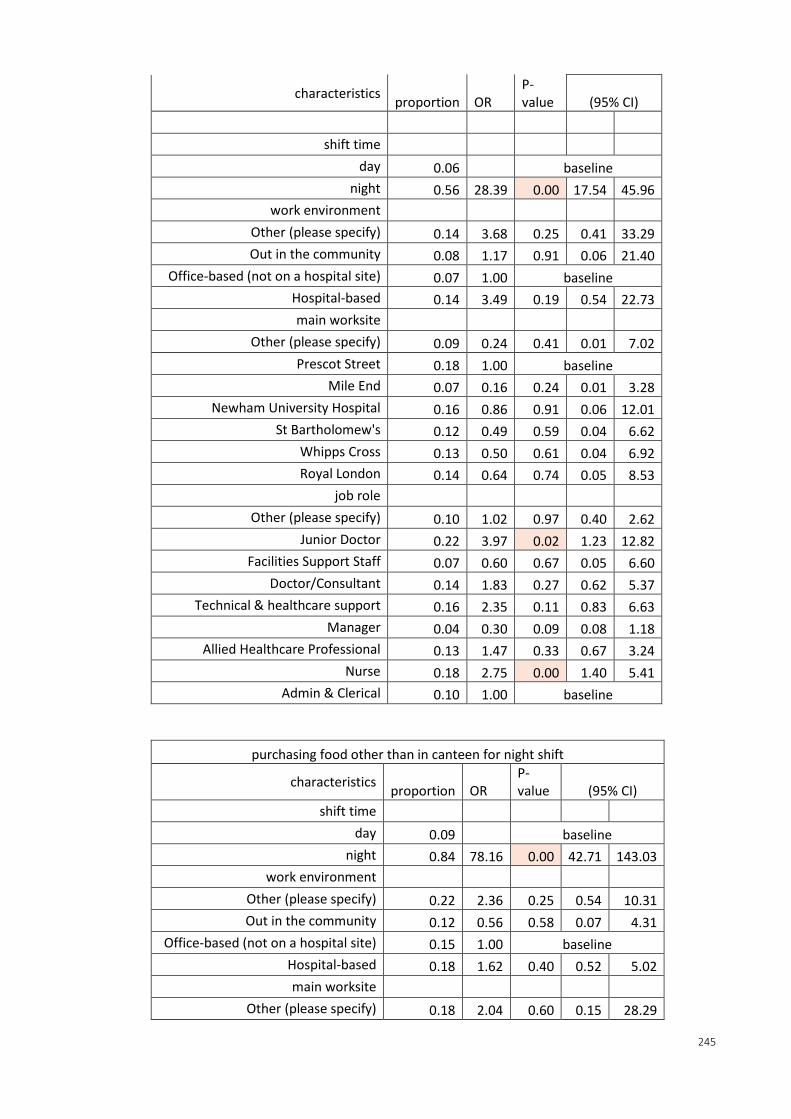
245
characteristics proportion OR
P-value (95% CI)
shift time
day 0.06 baseline
night 0.56 28.39 0.00 17.54 45.96
work environment
Other (please specify) 0.14 3.68 0.25 0.41 33.29
Out in the community 0.08 1.17 0.91 0.06 21.40
Office-based (not on a hospital site) 0.07 1.00 baseline
Hospital-based 0.14 3.49 0.19 0.54 22.73
main worksite
Other (please specify) 0.09 0.24 0.41 0.01 7.02
Prescot Street 0.18 1.00 baseline
Mile End 0.07 0.16 0.24 0.01 3.28
Newham University Hospital 0.16 0.86 0.91 0.06 12.01
St Bartholomew's 0.12 0.49 0.59 0.04 6.62
Whipps Cross 0.13 0.50 0.61 0.04 6.92
Royal London 0.14 0.64 0.74 0.05 8.53
job role
Other (please specify) 0.10 1.02 0.97 0.40 2.62
Junior Doctor 0.22 3.97 0.02 1.23 12.82
Facilities Support Staff 0.07 0.60 0.67 0.05 6.60
Doctor/Consultant 0.14 1.83 0.27 0.62 5.37
Technical & healthcare support 0.16 2.35 0.11 0.83 6.63
Manager 0.04 0.30 0.09 0.08 1.18
Allied Healthcare Professional 0.13 1.47 0.33 0.67 3.24
Nurse 0.18 2.75 0.00 1.40 5.41
Admin & Clerical 0.10 1.00 baseline
purchasing food other than in canteen for night shift
characteristics proportion OR
P-value (95% CI)
shift time
day 0.09 baseline
night 0.84 78.16 0.00 42.71 143.03
work environment
Other (please specify) 0.22 2.36 0.25 0.54 10.31
Out in the community 0.12 0.56 0.58 0.07 4.31
Office-based (not on a hospital site) 0.15 1.00 baseline
Hospital-based 0.18 1.62 0.40 0.52 5.02
main worksite
Other (please specify) 0.18 2.04 0.60 0.15 28.29
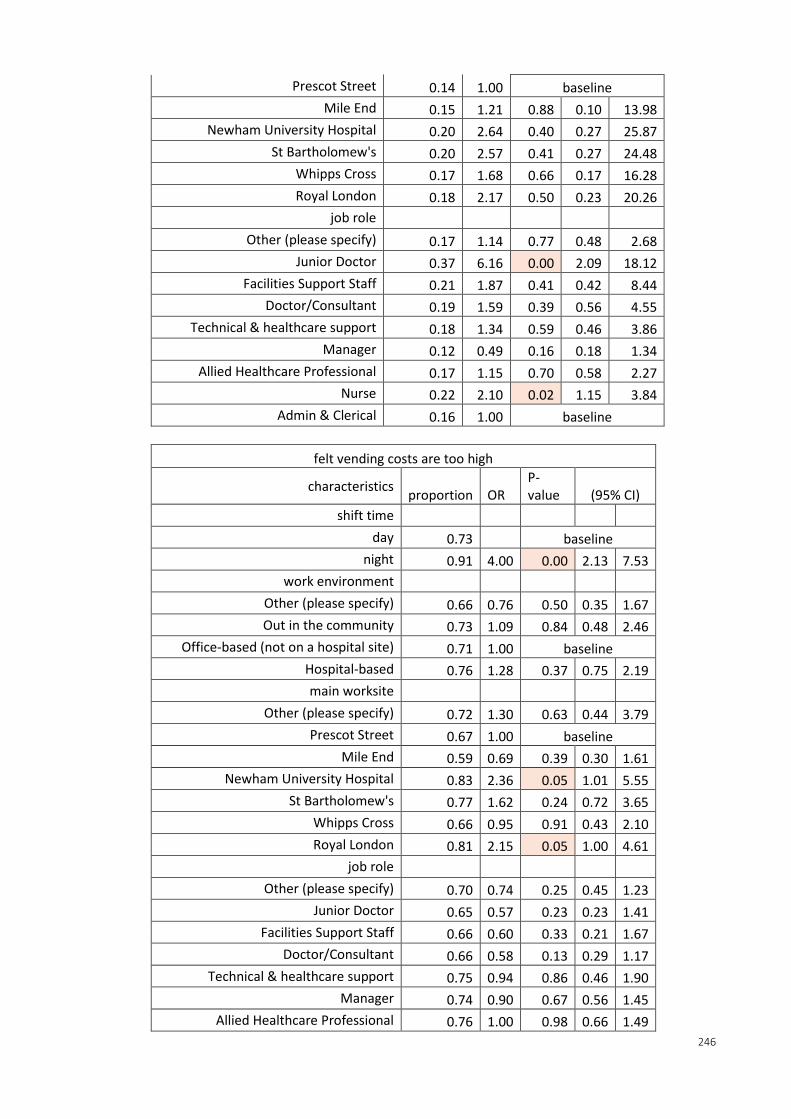
246
Prescot Street 0.14 1.00 baseline
Mile End 0.15 1.21 0.88 0.10 13.98
Newham University Hospital 0.20 2.64 0.40 0.27 25.87
St Bartholomew's 0.20 2.57 0.41 0.27 24.48
Whipps Cross 0.17 1.68 0.66 0.17 16.28
Royal London 0.18 2.17 0.50 0.23 20.26
job role
Other (please specify) 0.17 1.14 0.77 0.48 2.68
Junior Doctor 0.37 6.16 0.00 2.09 18.12
Facilities Support Staff 0.21 1.87 0.41 0.42 8.44
Doctor/Consultant 0.19 1.59 0.39 0.56 4.55
Technical & healthcare support 0.18 1.34 0.59 0.46 3.86
Manager 0.12 0.49 0.16 0.18 1.34
Allied Healthcare Professional 0.17 1.15 0.70 0.58 2.27
Nurse 0.22 2.10 0.02 1.15 3.84
Admin & Clerical 0.16 1.00 baseline
felt vending costs are too high
characteristics proportion OR
P-value (95% CI)
shift time
day 0.73 baseline
night 0.91 4.00 0.00 2.13 7.53
work environment
Other (please specify) 0.66 0.76 0.50 0.35 1.67
Out in the community 0.73 1.09 0.84 0.48 2.46
Office-based (not on a hospital site) 0.71 1.00 baseline
Hospital-based 0.76 1.28 0.37 0.75 2.19
main worksite
Other (please specify) 0.72 1.30 0.63 0.44 3.79
Prescot Street 0.67 1.00 baseline
Mile End 0.59 0.69 0.39 0.30 1.61
Newham University Hospital 0.83 2.36 0.05 1.01 5.55
St Bartholomew's 0.77 1.62 0.24 0.72 3.65
Whipps Cross 0.66 0.95 0.91 0.43 2.10
Royal London 0.81 2.15 0.05 1.00 4.61
job role
Other (please specify) 0.70 0.74 0.25 0.45 1.23
Junior Doctor 0.65 0.57 0.23 0.23 1.41
Facilities Support Staff 0.66 0.60 0.33 0.21 1.67
Doctor/Consultant 0.66 0.58 0.13 0.29 1.17
Technical & healthcare support 0.75 0.94 0.86 0.46 1.90
Manager 0.74 0.90 0.67 0.56 1.45
Allied Healthcare Professional 0.76 1.00 0.98 0.66 1.49
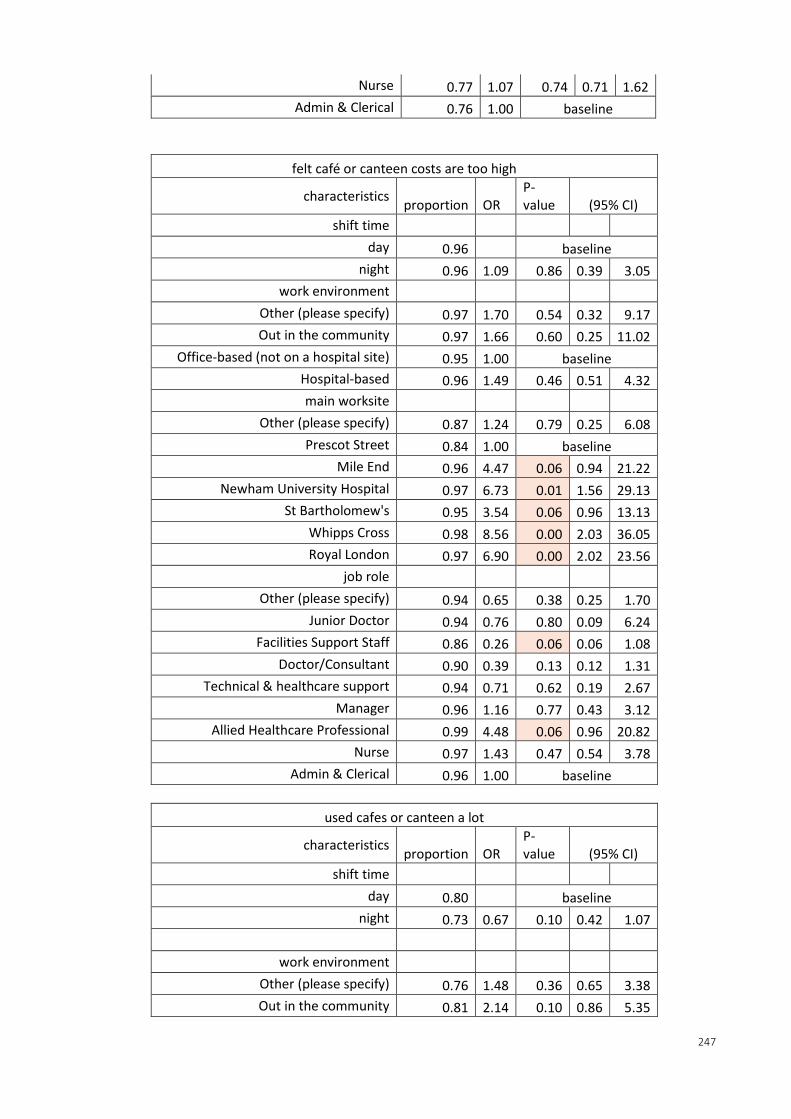
247
Nurse 0.77 1.07 0.74 0.71 1.62
Admin & Clerical 0.76 1.00 baseline
felt café or canteen costs are too high
characteristics proportion OR
P-value (95% CI)
shift time
day 0.96 baseline
night 0.96 1.09 0.86 0.39 3.05
work environment
Other (please specify) 0.97 1.70 0.54 0.32 9.17
Out in the community 0.97 1.66 0.60 0.25 11.02
Office-based (not on a hospital site) 0.95 1.00 baseline
Hospital-based 0.96 1.49 0.46 0.51 4.32
main worksite
Other (please specify) 0.87 1.24 0.79 0.25 6.08
Prescot Street 0.84 1.00 baseline
Mile End 0.96 4.47 0.06 0.94 21.22
Newham University Hospital 0.97 6.73 0.01 1.56 29.13
St Bartholomew's 0.95 3.54 0.06 0.96 13.13
Whipps Cross 0.98 8.56 0.00 2.03 36.05
Royal London 0.97 6.90 0.00 2.02 23.56
job role
Other (please specify) 0.94 0.65 0.38 0.25 1.70
Junior Doctor 0.94 0.76 0.80 0.09 6.24
Facilities Support Staff 0.86 0.26 0.06 0.06 1.08
Doctor/Consultant 0.90 0.39 0.13 0.12 1.31
Technical & healthcare support 0.94 0.71 0.62 0.19 2.67
Manager 0.96 1.16 0.77 0.43 3.12
Allied Healthcare Professional 0.99 4.48 0.06 0.96 20.82
Nurse 0.97 1.43 0.47 0.54 3.78
Admin & Clerical 0.96 1.00 baseline
used cafes or canteen a lot
characteristics proportion OR
P-value (95% CI)
shift time
day 0.80 baseline
night 0.73 0.67 0.10 0.42 1.07
work environment
Other (please specify) 0.76 1.48 0.36 0.65 3.38
Out in the community 0.81 2.14 0.10 0.86 5.35
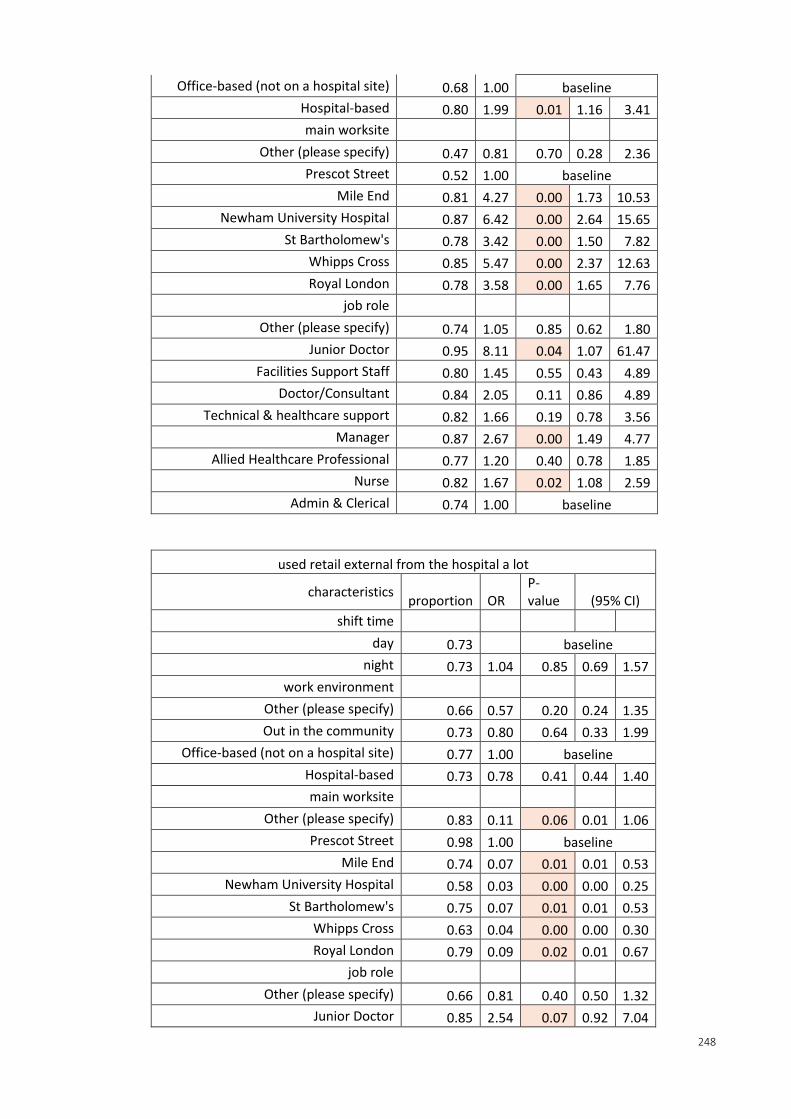
248
Office-based (not on a hospital site) 0.68 1.00 baseline
Hospital-based 0.80 1.99 0.01 1.16 3.41
main worksite
Other (please specify) 0.47 0.81 0.70 0.28 2.36
Prescot Street 0.52 1.00 baseline
Mile End 0.81 4.27 0.00 1.73 10.53
Newham University Hospital 0.87 6.42 0.00 2.64 15.65
St Bartholomew's 0.78 3.42 0.00 1.50 7.82
Whipps Cross 0.85 5.47 0.00 2.37 12.63
Royal London 0.78 3.58 0.00 1.65 7.76
job role
Other (please specify) 0.74 1.05 0.85 0.62 1.80
Junior Doctor 0.95 8.11 0.04 1.07 61.47
Facilities Support Staff 0.80 1.45 0.55 0.43 4.89
Doctor/Consultant 0.84 2.05 0.11 0.86 4.89
Technical & healthcare support 0.82 1.66 0.19 0.78 3.56
Manager 0.87 2.67 0.00 1.49 4.77
Allied Healthcare Professional 0.77 1.20 0.40 0.78 1.85
Nurse 0.82 1.67 0.02 1.08 2.59
Admin & Clerical 0.74 1.00 baseline
used retail external from the hospital a lot
characteristics proportion OR
P-value (95% CI)
shift time
day 0.73 baseline
night 0.73 1.04 0.85 0.69 1.57
work environment
Other (please specify) 0.66 0.57 0.20 0.24 1.35
Out in the community 0.73 0.80 0.64 0.33 1.99
Office-based (not on a hospital site) 0.77 1.00 baseline
Hospital-based 0.73 0.78 0.41 0.44 1.40
main worksite
Other (please specify) 0.83 0.11 0.06 0.01 1.06
Prescot Street 0.98 1.00 baseline
Mile End 0.74 0.07 0.01 0.01 0.53
Newham University Hospital 0.58 0.03 0.00 0.00 0.25
St Bartholomew's 0.75 0.07 0.01 0.01 0.53
Whipps Cross 0.63 0.04 0.00 0.00 0.30
Royal London 0.79 0.09 0.02 0.01 0.67
job role
Other (please specify) 0.66 0.81 0.40 0.50 1.32
Junior Doctor 0.85 2.54 0.07 0.92 7.04
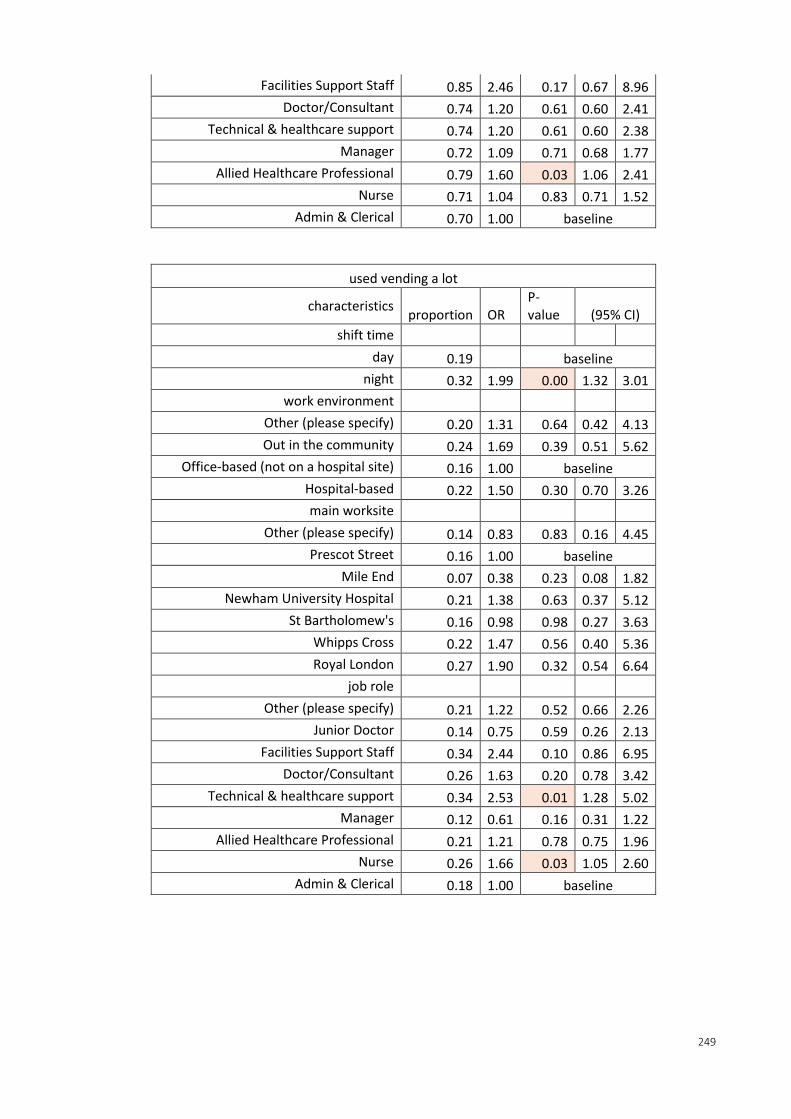
249
Facilities Support Staff 0.85 2.46 0.17 0.67 8.96
Doctor/Consultant 0.74 1.20 0.61 0.60 2.41
Technical & healthcare support 0.74 1.20 0.61 0.60 2.38
Manager 0.72 1.09 0.71 0.68 1.77
Allied Healthcare Professional 0.79 1.60 0.03 1.06 2.41
Nurse 0.71 1.04 0.83 0.71 1.52
Admin & Clerical 0.70 1.00 baseline
used vending a lot
characteristics proportion OR
P-value (95% CI)
shift time
day 0.19 baseline
night 0.32 1.99 0.00 1.32 3.01
work environment
Other (please specify) 0.20 1.31 0.64 0.42 4.13
Out in the community 0.24 1.69 0.39 0.51 5.62
Office-based (not on a hospital site) 0.16 1.00 baseline
Hospital-based 0.22 1.50 0.30 0.70 3.26
main worksite
Other (please specify) 0.14 0.83 0.83 0.16 4.45
Prescot Street 0.16 1.00 baseline
Mile End 0.07 0.38 0.23 0.08 1.82
Newham University Hospital 0.21 1.38 0.63 0.37 5.12
St Bartholomew's 0.16 0.98 0.98 0.27 3.63
Whipps Cross 0.22 1.47 0.56 0.40 5.36
Royal London 0.27 1.90 0.32 0.54 6.64
job role
Other (please specify) 0.21 1.22 0.52 0.66 2.26
Junior Doctor 0.14 0.75 0.59 0.26 2.13
Facilities Support Staff 0.34 2.44 0.10 0.86 6.95
Doctor/Consultant 0.26 1.63 0.20 0.78 3.42
Technical & healthcare support 0.34 2.53 0.01 1.28 5.02
Manager 0.12 0.61 0.16 0.31 1.22
Allied Healthcare Professional 0.21 1.21 0.78 0.75 1.96
Nurse 0.26 1.66 0.03 1.05 2.60
Admin & Clerical 0.18 1.00 baseline