user guide - x-rite
TRANSCRIPT

Instrument
User Guide

X - R i t e e X a c t ™ I n s t r u m e n t
1
Consult this documentation in all cases where the Attention symbol appears. This symbol is used to inform you of any potential HAZARD or actions that may require your attention.
CE Declaration
Hereby, X-Rite, Incorporated, declares that this NGH (eXact) Series is in compliance with the essential requirements and other relevant provisions of Directive(s) 2014/35/EU (LVD), 2014/30/EU (EMC), and RoHS EU 2015/863.
Federal Communications Commission Notice NOTE: This equipment has been tested and found to comply with the limits for a Class A digital device, pursuant to Part 15 of the FCC Rules. These limits are designed to provide reasonable protection against harmful interference when the equipment is operated in a commercial environment. This equipment generates, uses, and can radiate radio frequency energy and, if not installed and used in accordance with the instruction manual, may cause harmful interference to radio communications. Operation of this equipment in a residential area is likely to cause harmful interference in which case the user will be required to correct the interference at his own expense.
Industry Canada Compliance Statement CAN ICES-1 (A) / NMB-1 (A)
Equipment Information Use of this equipment in a manner other than that specified by X-Rite, Incorporated may compromise design integrity and become unsafe. WARNING: This instrument is not for use in explosive environments. Do not look directly into the measurement optics when the instrument is on.
Connect the power plug to an easily accessible outlet. Discontinue use if AC cord is damaged. Instructions for disposal: Please dispose of Waste Electrical and Electronic Equipment (WEEE) at designated collection points for the recycling of such equipment.
If your device is equipped with a Bluetooth wireless transmitter, it contains the following module. This Device Contains Transmitter Module: RN42 Manufactured by Microchip Technology Microchip Technology Inc. 2355 West Chandler Blvd. Chandler, Arizona 85224 TEL: 480-792-7200
X - R i t e e X a c t ™ I n s t r u m e n t
2
FCC: FCC Identifier: T9J-RN42 Microchip Technology Operating Frequency: 2.402 – 2.480 GHz IC: RN42: Roving Networks, Inc. / Microchip Technology IC Certification: 6514A-RN42 CE Mark: RED 2014/53/EU: EN 300328 V2.1.1 (2016) EN 301489-1 V2.11/V2.2.0 (2017) EN 301489-17 V3.1.1/V3.2.0 (2017 EN 60950-1:2006 A11:2009/A1:2010/A12:2011/A2:2013 EN 62479 (2010) Japan: RN42 Microchip Technology
Korea: RN-4020 Microchip Technology
KCC-REM-XRT-NGH Taiwan: RN42 Microchip Technology
注意 !
依據低功率電波輻射性電機管理辦法第十二條經型式認證合格之低功率射頻電機,非經許可,公司、商號或使用者均
不得擅自變更頻率、加大功率或變更原設計之特性及功能。第十四條低功率射頻電機之使用不得影響飛航安全及干擾
合法通信;經發現有干擾現象時,應立即停用,並改善至無干擾時方得繼續使用。前項合法通信,指依電信規定作業
之無線電信。低功率射頻電機須忍受合法通信或工業、科學及醫療用電波輻射性電機設備之干擾。
China: Model: NGH (eXact) CMIIT ID: 2012DJ6195
X - R i t e e X a c t ™ I n s t r u m e n t
3
Proprietary Notice The information contained in this manual is copyrighted information proprietary to X-Rite, Incorporated. Publication of this information does not imply any rights to reproduce or use it for purposes other than installing, operating, or maintaining this instrument described herein. No part of this manual may be reproduced, transcribed or translated into any language or computer language in any form or by any means: electronic, magnetic, mechanical, optical, manual, or otherwise; without the prior written permission of an authorized officer of X-Rite, Incorporated. Patents: www.xrite.com/ip “© 2021, X-Rite, Incorporated. All rights reserved” X-Rite, the X-Rite logo, eXact, and the eXact logo are trademarks or registered trademarks of X-Rite, Incorporated in the United States and/or other countries. All other trademarks are properties of their respective owners.
Warranty X-Rite warrants this Product against defects in material and workmanship for a period of twelve (12) months from the date of shipment from X-Rite’s facility, unless mandatory law provides for longer periods. During such time, X-Rite will either replace or repair at its discretion defective parts free of charge. X-Rite’s warranties herein do not cover failure of warranted goods resulting from: (i) damage after shipment, accident, abuse, misuse, neglect, alteration or any other use not in accordance with X-Rite’s recommendations, accompanying documentation, published specifications, and standard industry practice; (ii) using the device in an operating environment outside the recommended specifications or failure to follow the maintenance procedures in X-Rite’s accompanying documentation or published specifications; (iii) repair or service by anyone other than X-Rite or its authorized representatives; (iv) the failure of the warranted goods caused by use of any parts or consumables not manufactured, distributed, or approved by X-Rite; (v) any attachments or modifications to the warranted goods that are not manufactured, distributed or approved by X-Rite. Consumable parts and Product cleaning are also not covered by the warranty. X-Rite‘s sole and exclusive obligation for breach of the above warranties shall be the repair or replacement of any part, without charge, which within the warranty period is proven to X-Rite‘s reasonable satisfaction to have been defective. Repairs or replacement by X-Rite shall not revive an otherwise expired warranty, nor shall the same extend the duration of a warranty. Customer shall be responsible for packaging and shipping the defective product to the service center designated by X-Rite. X-Rite shall pay for the return of the product to Customer if the shipment is to a location within the region in which the X-Rite service center is located. Customer shall be responsible for paying all shipping charges, duties, taxes, and any other charges for products returned to any other locations. Proof of purchase in the form of a bill of sale or receipted invoice which is evidence that the unit is within the Warranty period must be presented to obtain warranty service. Do not try to dismantle the Product. Unauthorized dismantling of the equipment will void all warranty claims. Contact the X-Rite Support or the nearest X-Rite Service Center, if you believe that the unit does not work anymore or does not work correctly. THESE WARRANTIES ARE GIVEN SOLELY TO BUYER AND ARE IN LIEU OF ALL OTHER WARRANTIES, EXPRESSED OR IMPLIED, INCLUDING BUT NOT LIMITED TO THE IMPLIED WARRANTIES OF MERCHANTABILITY, FITNESS FOR A PARTICULAR PURPOSE OR APPLICATION,
X - R i t e e X a c t ™ I n s t r u m e n t
4
AND NON-INFRINGEMENT. NO EMPLOYEE OR AGENT OF X-RITE, OTHER THAN AN OFFICER OF X-RITE, IS AUTHORIZED TO MAKE ANY WARRANTY IN ADDITION TO THE FOREGOING. IN NO EVENT WILL X-RITE BE LIABLE FOR ANY OF BUYER’S MANUFACTURING COSTS, OVERHEAD, LOST PROFITS, GOODWILL, OTHER EXPENSES OR ANY INDIRECT, SPECIAL, INCIDENTAL OR CONSEQUENTIAL DAMAGES BASED UPON BREACH OF ANY WARRANTY, BREACH OF CONTRACT, NEGLIGENCE, STRICT TORT, OR ANY OTHER LEGAL THEORY. IN ANY EVENT OF LIABILITY, X-RITE’S MAXIMUM LIABILITY HEREUNDER WILL NOT EXCEED THE PRICE OF THE GOODS OR SERVICES FURNISHED BY X-RITE GIVING RISE TO THE CLAIM.
X - R i t e e X a c t ™ I n s t r u m e n t
5
Table of Contents
Introduction and Setup 11 User Manual Information 12 Packaging 12 Target Base Lock Operation 13 Measurement Conditions Selection 13 Power Button 14 eXact Software Applications 15
System Requirements 15 Installing the Software 15
Charging the Battery Pack 16 Connecting the Power Supply 17 Connecting the USB Cable 18 Bluetooth Wireless Mode 18
User Interface 19 Navigating the Screen 19
Opening Quick Tools 19 Opening Enhanced Tools 19 Opening Setup Tools 19 Viewing Enhanced Menus 20 Viewing the Functions 20 Scrolling through Options 20 Accessing Current Options 21 Naming Screen 21
Icon Descriptions 22 Main Measurement Screen 26 Initial Wizard Setup 27 Measuring a Sample 29 Calibration 29
Performing a Calibration 30
Quick Measurement Functions 31 Quick Measurement Tool Setup 31
Measurement Condition 31 Tone Value (Density / TV Tool only) 31 Tone Value Increase (Density / TV Tool only) 31 Density Status (Density / TV Tool only) 32 Density White Base (Density / TV Tool only) 32 Density Precision (Density / TV Tool only) 32 All Densities (Density / TV Tool only) 32 Density / TV (Density / TV Tool only) 32 Illuminant/Observer (CIE L*a*b* Tool only) 32 ∆E Method (CIE L*a*b* Tool only) 32
Density / TV Tool 32 Density / TV Measurement 33 Density Only Measurement 34
CIE-L*a*b* Tool 34 CIE L*a*b* Measurement 34
X - R i t e e X a c t ™ I n s t r u m e n t
6
Enhanced Measurement Tool Setup 36 Active Functions 36 Settings 37
Change Name 37 Restore Tool Default Settings 37 Color Settings 37
Measurement Condition 38 Illuminant/Observer 38 ∆E Method 38 Density Status 38 Density White Base 38 Density Precision 38 Ink Order (Auto Patch tools only) 38 Pass/Fail Indication 39 Averaging 39
Function Settings 39
Enhanced Measurement Functions 40 Density 40
Density Measurement 40 Density Trend 40 All Densities 41
All Densities Tool Function 41 CMY Balance 41
CMY Balance Function Setting 41 CMY Balance Measurement 41
Tone Value (Dot Area) Function 42 Tone Value Function Setting 42 Tone Value (Dot Area) Measurement 42
Tone Value Increase (Dot Gain) Function 43 Tone Value Increase Function Setting 43 Tone Value Increase (Dot Gain) Measurement 43
Trapping Function 44 Trapping Function Setting 44 Trapping Measurement 44
Print Characteristics Function 45 Print Characteristics Function Setting 45 Print Characteristics Measurement 45
Contrast Function 45 Contrast Measurement 45
Hue Error and Grayness Function 46 Hue Error and Grayness Measurement 46
Colorimetric Functions 47 CIE L*a*b* 47 Density & L*a*b* 47 Density & L*C*h° 47 CIE L*C*h° 47 CIE XYZ 47
X - R i t e e X a c t ™ I n s t r u m e n t
7
CIE Yxy 47 CIE L*a*b* Graph and CIE L*C*h° Graph 47 Colorimetric Measurement 48
Paper Indices Function 48 Paper Indices Function Setting 48 Paper Indices Measurement 49
Opacity Function 49 Opacity Measurement 49
Printing Plate Function 49 Printing Plate Function Setting 49 Printing Plate Measurement 50
Reflectance Graph Function 50 Reflectance Graph Function Setting 50 Reflectance Graph Measurement 50
Brightener Index Function 51 Brightener Index Measurement 51
BestMatch Function 51 BestMatch Function Setting 52 BestMatch Measurement 52
∆E Trend Function 53 ∆E Trend Measurement 53
Metamerism Function 53 Metamerism Function Setting 54 Metamerism Measurement 54
Absolute Color Strength Function 54 Color Strength Function Setting 54 Absolute Color Strength Measurement 54
Relative Color Strength Function 55 Color Strength Function Settings 55 Relative Color Strength Measurement 55
Paper QC Function (Job tools only) 56 Paper QC Function Setting (Job only) 56 Paper QC Measurement 56
BestMatch Table (Job tools only, Solid functions) 56 BestMatch Function Setting 56 BestMatch Table Measurement 56
Inks QC (Job tools only, Overprint and Solid functions) 57 Inks QC Measurement 57 Inks QC Graph 57
TVI Table (Job tools only, Tint functions) 57 TVI Table Function Setting (Job only) 58 TVI Measurement 58
Gray Balance QC (Job tools only, Gray Balance functions) 58 Gray Balance QC Function Setting (Job only) 58 Gray Balance QC Measurement 58
Enhanced Measurement Tool Option Icons 59 Paper icon 59 Function icon 59 Measure Standard icon (Compare tool only) 60
X - R i t e e X a c t ™ I n s t r u m e n t
8
Sheet Selection icon (Job tools) 60 Patch Type icons (Job tools only) 61 Color Mode icons 61 View Standard or Patch icon 62 Change Standard or Patch icon 63
Enhanced Basic Tool 64 General Information 64
Enhanced Compare Tool 65 Basic Compare Measurement 65 Pass/Fail Measurement 66 Averaging Measurement 67
Enhanced Search Tool 69 Search Measurement 69 Changing the Standard 70 Sample Storage 70
Enhanced Auto Patch Tool 72 General Information 72
Enhanced Job Tool 73 General Information 73 Reviewing/Editing Job Parameters 75 Sample Storage 76 Other Job Options 76 Running a Job 78
Enhanced Add Tool 82 Creating a Tool 82 Additional Tool Options 82
Setup Users Tool 83 Creating a New User 83 Editing a User 83
Account Settings 84 Set User Name 85 Delete 85 Copy 85
Setup My Settings Tool 86 Account 86 Language 86 Color Defaults 87 Function Defaults 87 Instrument 88
Setup Job Templates Tool 89 Creating a Job Template 89
Job Template Settings 89
X - R i t e e X a c t ™ I n s t r u m e n t
9
Defining the Paper and CMYK Patches using Auto Detection 91 Creating a Spot Color 92 Entering Color Values 93 Importing a Color from a Color Library 93 Editing Tolerance Values 93
Editing a Job Template 94 Copying a Job Template 95 Deleting a Job Template 95
Setup Color Libraries Tool 96 Creating a Color Library 96
Creating a Standard 96 Color Library Settings 97 Entering Color Values 98 Importing a Color from a Color Library 98
Editing a Color Library 99 Copying a Color Library 99 Deleting a Color Library 100
Setup Diagnostics Tool 101 Calibration Summary 101 Regional Settings 101 Instrument Summary 102 Instrument Condition 102 Battery Summary 102
Scan Option 103 Overview 103 Setup 104 Operation 104
Best Practices 104 Performing a Spot Color Measurement 105 Performing a Color Bar Measurement 105 Instrument Screen Description 107
Optional Alignment Bar 108
Appendices 110 Information 110
Recertification 110 Warranty Registration 110 Service 110 Support 110
Cleaning the Instrument 111 General Cleaning 111 Cleaning the Touch Display 111 Cleaning the Target Window 111 Cleaning the Optics 111 Cleaning Calibration Plaque 112 Cleaning Scan Chassis Timing Wheel 112
Replacing the Battery Pack 113
X - R i t e e X a c t ™ I n s t r u m e n t
10
Replacing the Scan Chassis Timing Wheel 114 Bluetooth Installation 115
eXact Bluetooth Setup 115 Windows 7 & 8 115 Windows 10 117 Mac OS X Setup 119 Troubleshooting 120
Resetting the Instrument 121 Technical Specifications 122 Patch and Aperture Size Recommendations 124
X - R i t e e X a c t ™ I n s t r u m e n t
11
INTRODUCTION AND SETUP
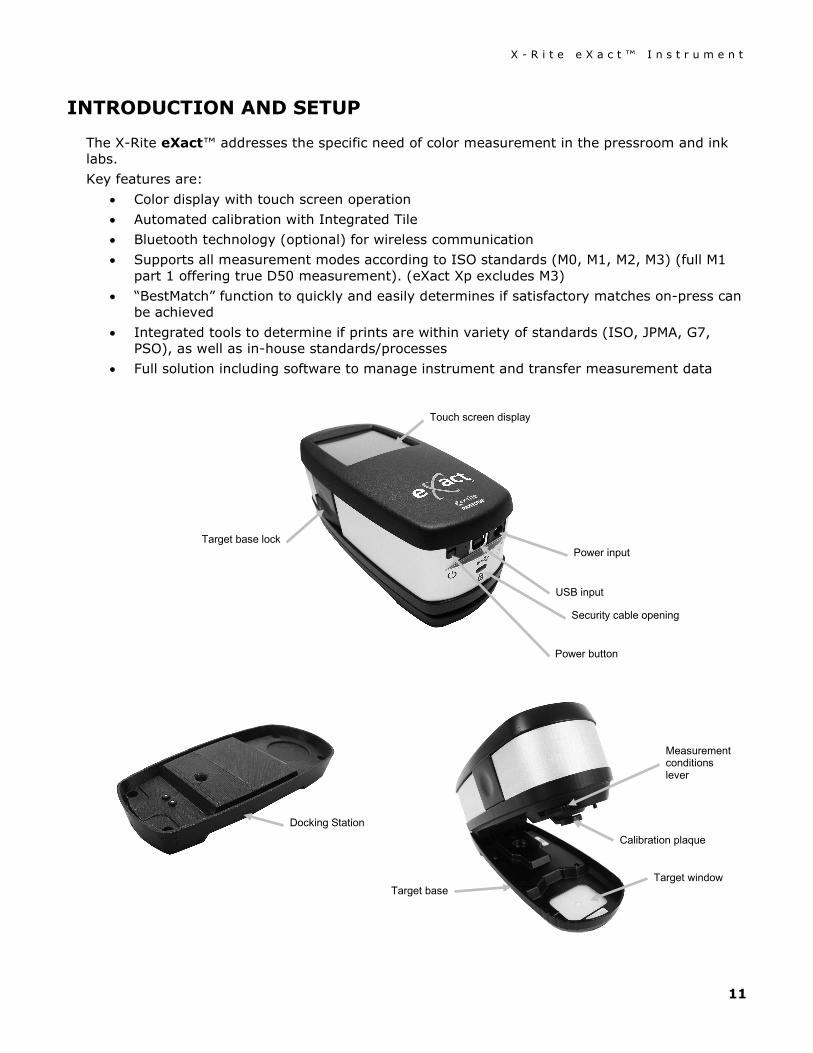
The X-Rite eXact™ addresses the specific need of color measurement in the pressroom and ink labs. Key features are:
• Color display with touch screen operation • Automated calibration with Integrated Tile • Bluetooth technology (optional) for wireless communication • Supports all measurement modes according to ISO standards (M0, M1, M2, M3) (full M1
part 1 offering true D50 measurement). (eXact Xp excludes M3) • “BestMatch” function to quickly and easily determines if satisfactory matches on-press can
be achieved • Integrated tools to determine if prints are within variety of standards (ISO, JPMA, G7,
PSO), as well as in-house standards/processes • Full solution including software to manage instrument and transfer measurement data
Target window
Power button
USB input
Measurement conditions lever
Power input
Touch screen display
Calibration plaque
Target base lock
Docking Station
Security cable opening
Target base
X - R i t e e X a c t ™ I n s t r u m e n t
12
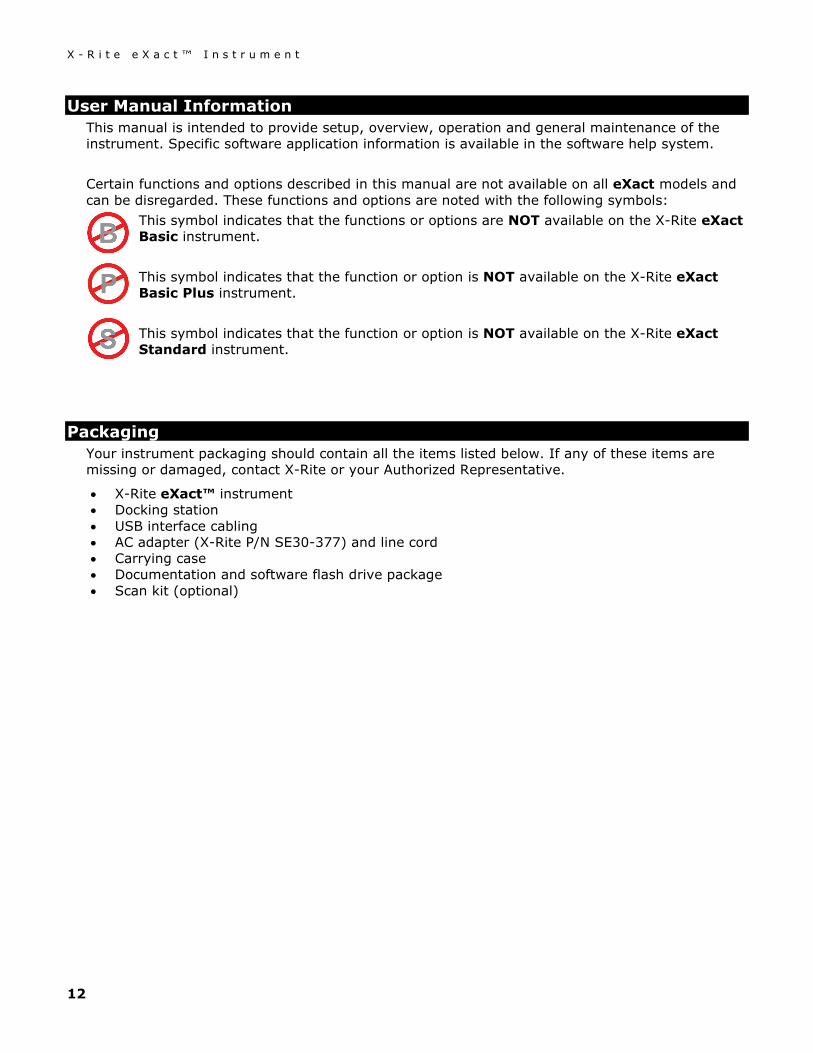
User Manual Information This manual is intended to provide setup, overview, operation and general maintenance of the instrument. Specific software application information is available in the software help system. Certain functions and options described in this manual are not available on all eXact models and can be disregarded. These functions and options are noted with the following symbols:
This symbol indicates that the functions or options are NOT available on the X-Rite eXact Basic instrument. This symbol indicates that the function or option is NOT available on the X-Rite eXact Basic Plus instrument. This symbol indicates that the function or option is NOT available on the X-Rite eXact Standard instrument.
Packaging Your instrument packaging should contain all the items listed below. If any of these items are missing or damaged, contact X-Rite or your Authorized Representative.
• X-Rite eXact™ instrument • Docking station • USB interface cabling • AC adapter (X-Rite P/N SE30-377) and line cord • Carrying case • Documentation and software flash drive package • Scan kit (optional)
X - R i t e e X a c t ™ I n s t r u m e n t
13
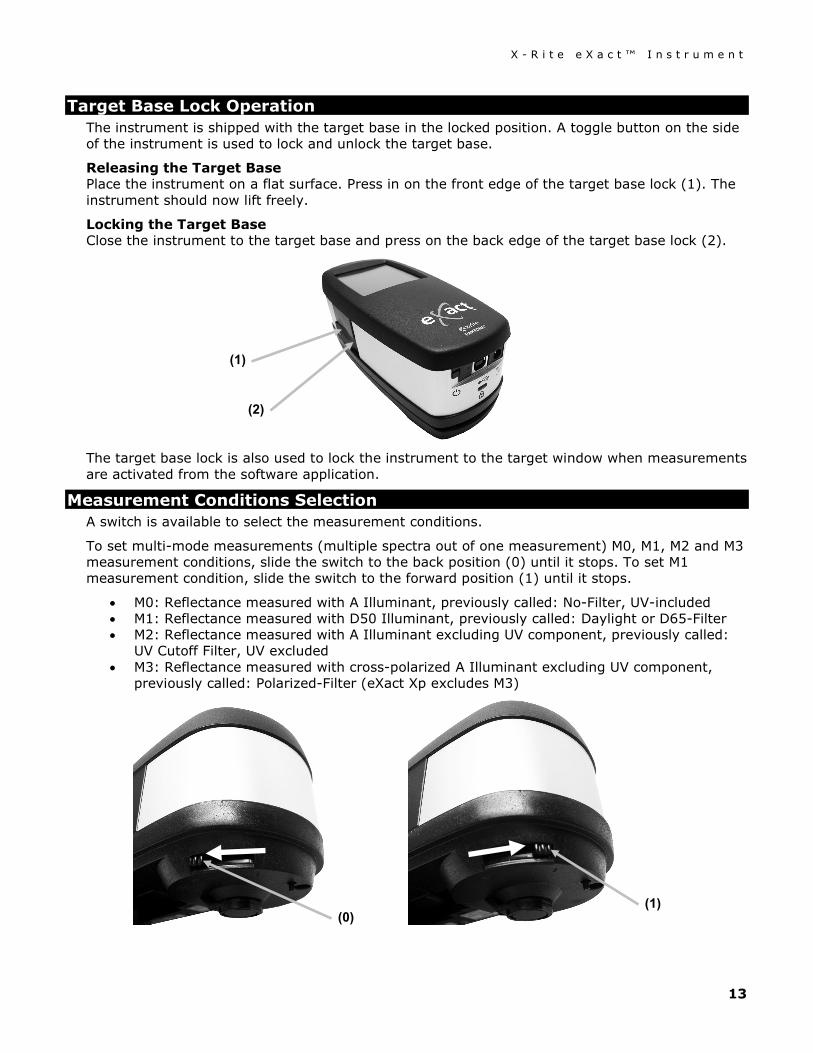
Target Base Lock Operation The instrument is shipped with the target base in the locked position. A toggle button on the side of the instrument is used to lock and unlock the target base.
Releasing the Target Base Place the instrument on a flat surface. Press in on the front edge of the target base lock (1). The instrument should now lift freely.
Locking the Target Base Close the instrument to the target base and press on the back edge of the target base lock (2).
The target base lock is also used to lock the instrument to the target window when measurements are activated from the software application.
Measurement Conditions Selection A switch is available to select the measurement conditions.
To set multi-mode measurements (multiple spectra out of one measurement) M0, M1, M2 and M3 measurement conditions, slide the switch to the back position (0) until it stops. To set M1 measurement condition, slide the switch to the forward position (1) until it stops.
• M0: Reflectance measured with A Illuminant, previously called: No-Filter, UV-included • M1: Reflectance measured with D50 Illuminant, previously called: Daylight or D65-Filter • M2: Reflectance measured with A Illuminant excluding UV component, previously called:
UV Cutoff Filter, UV excluded • M3: Reflectance measured with cross-polarized A Illuminant excluding UV component,
previously called: Polarized-Filter (eXact Xp excludes M3)
(1)
(2)
(1) (0)
X - R i t e e X a c t ™ I n s t r u m e n t
14
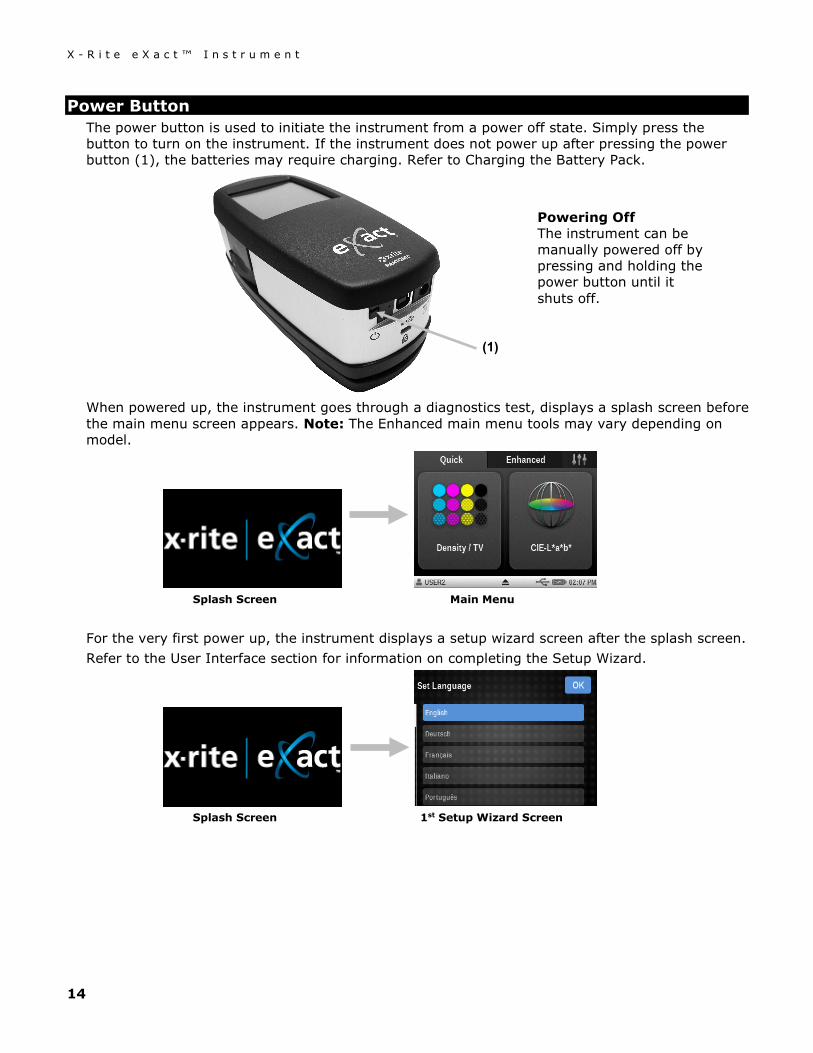
Power Button The power button is used to initiate the instrument from a power off state. Simply press the button to turn on the instrument. If the instrument does not power up after pressing the power button (1), the batteries may require charging. Refer to Charging the Battery Pack.
When powered up, the instrument goes through a diagnostics test, displays a splash screen before the main menu screen appears. Note: The Enhanced main menu tools may vary depending on model.
Splash Screen Main Menu
For the very first power up, the instrument displays a setup wizard screen after the splash screen. Refer to the User Interface section for information on completing the Setup Wizard.
Splash Screen 1st Setup Wizard Screen
(1)
Powering Off The instrument can be manually powered off by pressing and holding the power button until it shuts off.
X - R i t e e X a c t ™ I n s t r u m e n t
15
eXact Software Applications The eXact flash drive contains three software applications. X-Rite eXact™ Manager Allows you to run and set several instrument configuration options in the instrument, such as:
• View and edit all configuration settings • Backup/Restore configuration settings • Review instrument condition and run diagnostics • Update instrument firmware, color libraries, process tools and more
NOTE: It is recommended that you regularly backup the instrument settings with the X-Rite eXact™ Manager. Refer to the application help file for the procedure. DataCatcher Allows you to capture spot measurements from eXact instruments and transfer the data directly to an application, such as Microsoft® Excel. DataMeasure DataMeasure is an application that allows you to perform a series of scans. Scanned results can be visually viewed and then exported, for example to a spreadsheet. NOTE: You should install the software applications before connecting the instrument to your computer.
System Requirements • Windows 7 (32 or 64 bit), RAM 2 GB • Windows 8 (32 or 64 bit), RAM 2 GB • Windows 10 (32 or 64 bit), RAM 2 GB • macOS 10.10 (Yosemite), macOS 10.11 (El Capitan), macOS 10.12 (Sierra), macOS
10.13 (High Sierra), macOS 10.14 (Mohave) • Monitor screen resolution of 1024 x 768 • 4 GB hard disk free
Installing the Software IMPORTANT: You must be logged on as an administrator or a member of the Administrators group in order to install the software on a Windows 7, Windows 8, or Windows 10 system.
1. Insert the software flash drive into the USB port and browse to the desired application. 2. Follow the on screen prompts to install the software. 3. Install remaining applications. 4. Refer to the on-line help for information on using the applications.
X - R i t e e X a c t ™ I n s t r u m e n t
16
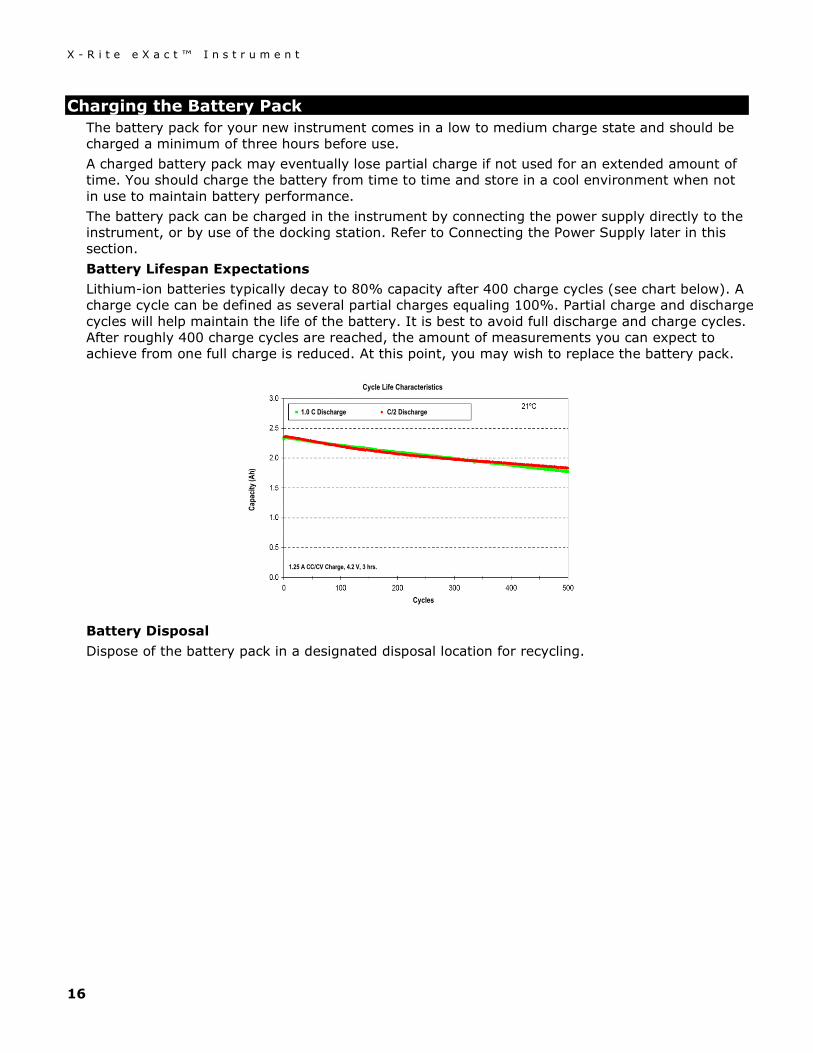
Charging the Battery Pack The battery pack for your new instrument comes in a low to medium charge state and should be charged a minimum of three hours before use. A charged battery pack may eventually lose partial charge if not used for an extended amount of time. You should charge the battery from time to time and store in a cool environment when not in use to maintain battery performance. The battery pack can be charged in the instrument by connecting the power supply directly to the instrument, or by use of the docking station. Refer to Connecting the Power Supply later in this section. Battery Lifespan Expectations Lithium-ion batteries typically decay to 80% capacity after 400 charge cycles (see chart below). A charge cycle can be defined as several partial charges equaling 100%. Partial charge and discharge cycles will help maintain the life of the battery. It is best to avoid full discharge and charge cycles. After roughly 400 charge cycles are reached, the amount of measurements you can expect to achieve from one full charge is reduced. At this point, you may wish to replace the battery pack.
Battery Disposal Dispose of the battery pack in a designated disposal location for recycling.
Cycle Life Characteristics
Cycles
1.0 C Discharge C/2 Discharge
1.25 A CC/CV Charge, 4.2 V, 3 hrs.
Capa
city (
Ah)
X - R i t e e X a c t ™ I n s t r u m e n t
17
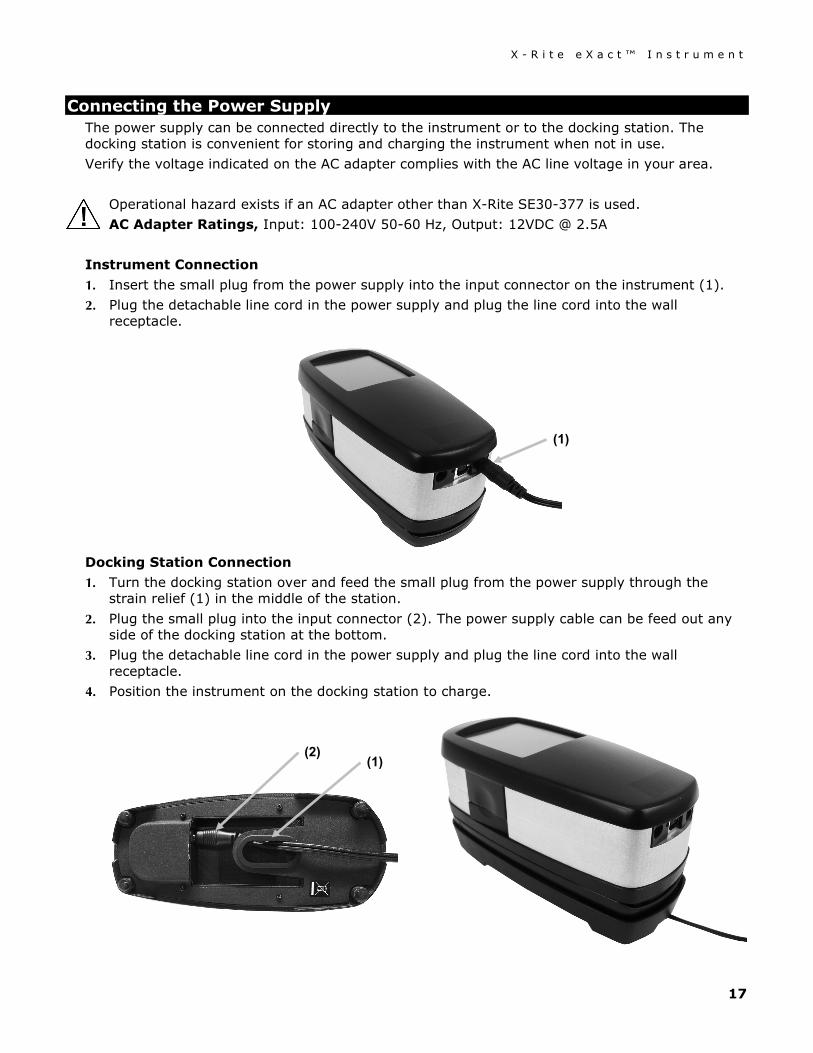
Connecting the Power Supply The power supply can be connected directly to the instrument or to the docking station. The docking station is convenient for storing and charging the instrument when not in use. Verify the voltage indicated on the AC adapter complies with the AC line voltage in your area.
Operational hazard exists if an AC adapter other than X-Rite SE30-377 is used. AC Adapter Ratings, Input: 100-240V 50-60 Hz, Output: 12VDC @ 2.5A
Instrument Connection 1. Insert the small plug from the power supply into the input connector on the instrument (1). 2. Plug the detachable line cord in the power supply and plug the line cord into the wall
receptacle.
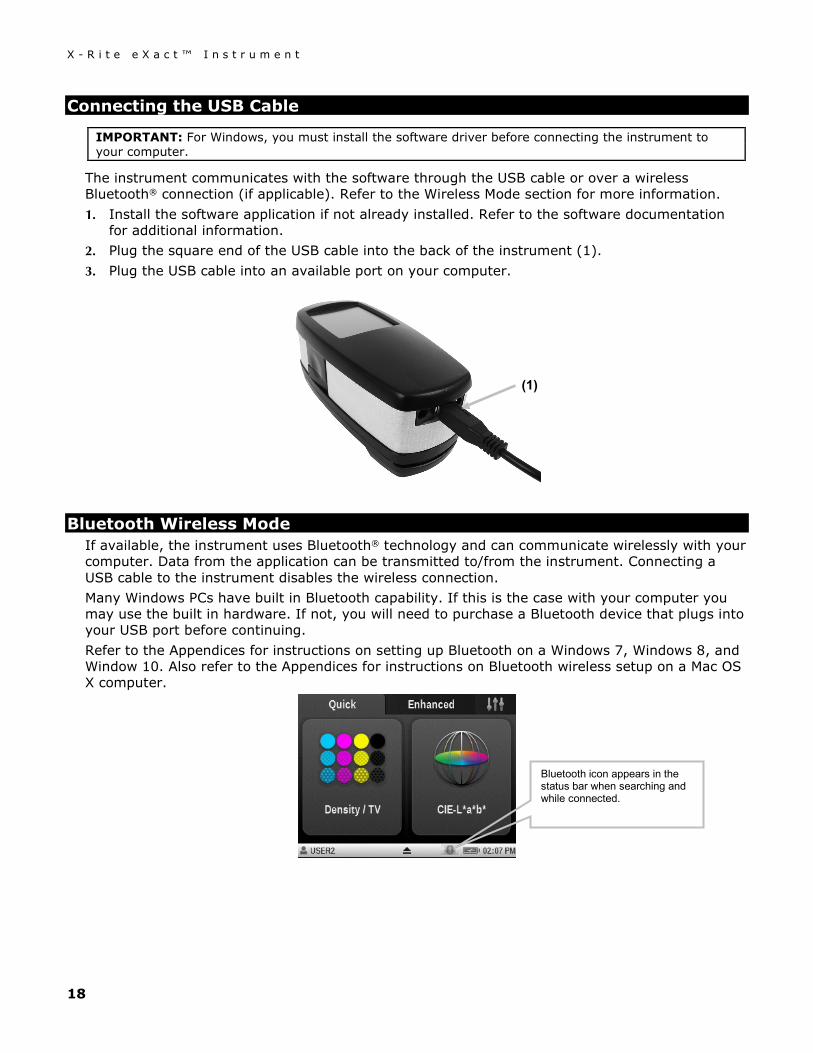
Docking Station Connection 1. Turn the docking station over and feed the small plug from the power supply through the
strain relief (1) in the middle of the station. 2. Plug the small plug into the input connector (2). The power supply cable can be feed out any
side of the docking station at the bottom. 3. Plug the detachable line cord in the power supply and plug the line cord into the wall
receptacle. 4. Position the instrument on the docking station to charge.
(2)
(1)
(1)
X - R i t e e X a c t ™ I n s t r u m e n t
18
Connecting the USB Cable
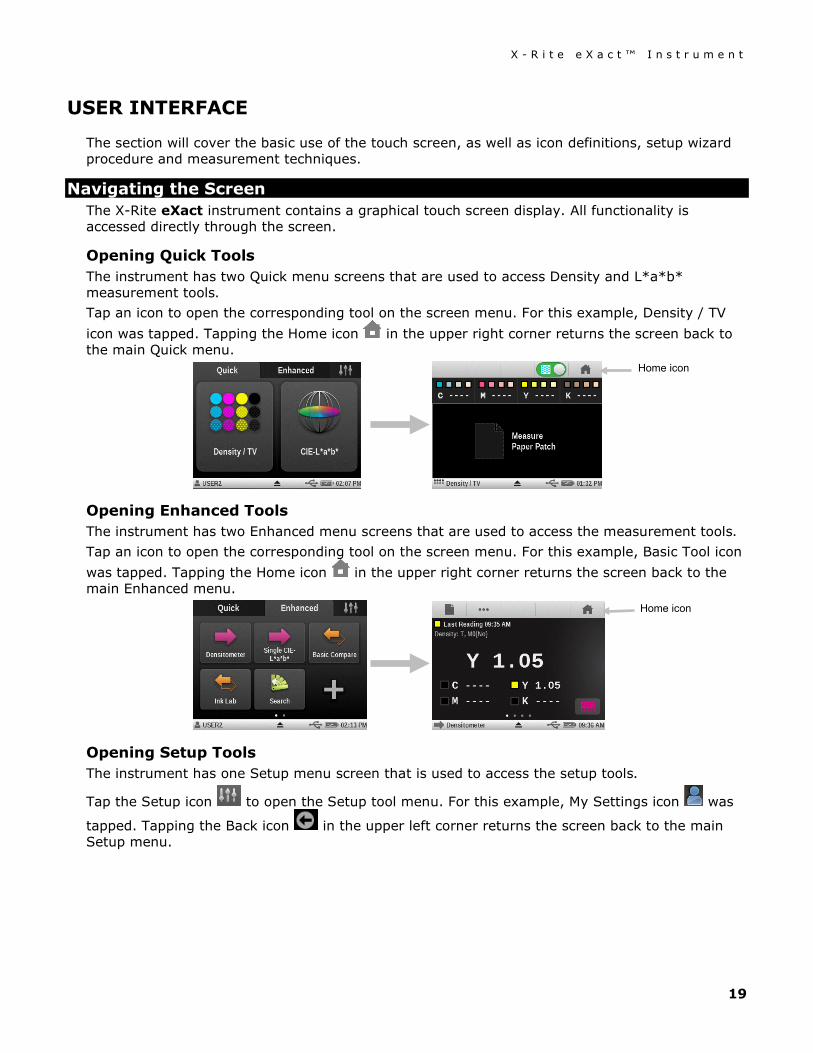
IMPORTANT: For Windows, you must install the software driver before connecting the instrument to your computer.
The instrument communicates with the software through the USB cable or over a wireless Bluetooth® connection (if applicable). Refer to the Wireless Mode section for more information. 1. Install the software application if not already installed. Refer to the software documentation
for additional information. 2. Plug the square end of the USB cable into the back of the instrument (1). 3. Plug the USB cable into an available port on your computer.
Bluetooth Wireless Mode If available, the instrument uses Bluetooth® technology and can communicate wirelessly with your computer. Data from the application can be transmitted to/from the instrument. Connecting a USB cable to the instrument disables the wireless connection. Many Windows PCs have built in Bluetooth capability. If this is the case with your computer you may use the built in hardware. If not, you will need to purchase a Bluetooth device that plugs into your USB port before continuing. Refer to the Appendices for instructions on setting up Bluetooth on a Windows 7, Windows 8, and Window 10. Also refer to the Appendices for instructions on Bluetooth wireless setup on a Mac OS X computer.
(1)
Bluetooth icon appears in the status bar when searching and while connected.
X - R i t e e X a c t ™ I n s t r u m e n t
19
USER INTERFACE
The section will cover the basic use of the touch screen, as well as icon definitions, setup wizard procedure and measurement techniques.
Navigating the Screen The X-Rite eXact instrument contains a graphical touch screen display. All functionality is accessed directly through the screen.
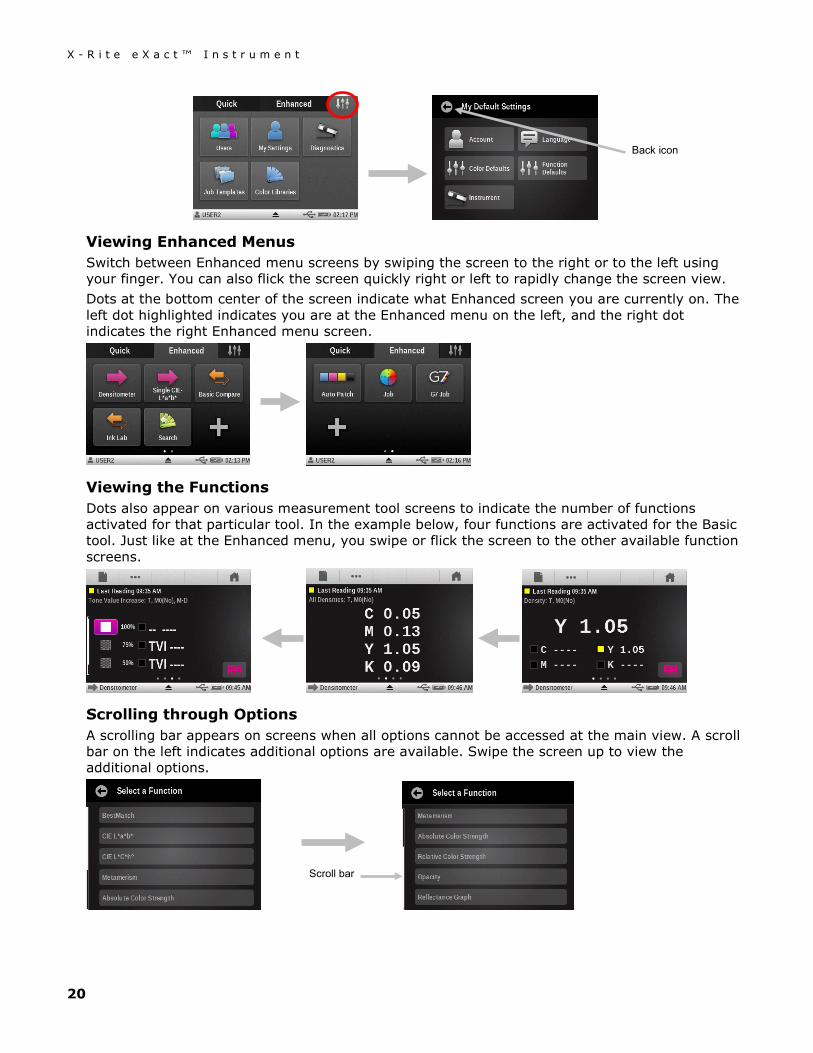
Opening Quick Tools The instrument has two Quick menu screens that are used to access Density and L*a*b* measurement tools. Tap an icon to open the corresponding tool on the screen menu. For this example, Density / TV icon was tapped. Tapping the Home icon in the upper right corner returns the screen back to the main Quick menu.
Opening Enhanced Tools The instrument has two Enhanced menu screens that are used to access the measurement tools. Tap an icon to open the corresponding tool on the screen menu. For this example, Basic Tool icon was tapped. Tapping the Home icon in the upper right corner returns the screen back to the main Enhanced menu.
Opening Setup Tools The instrument has one Setup menu screen that is used to access the setup tools.
Tap the Setup icon to open the Setup tool menu. For this example, My Settings icon was
tapped. Tapping the Back icon in the upper left corner returns the screen back to the main Setup menu.
Home icon
Home icon
X - R i t e e X a c t ™ I n s t r u m e n t
20
Viewing Enhanced Menus Switch between Enhanced menu screens by swiping the screen to the right or to the left using your finger. You can also flick the screen quickly right or left to rapidly change the screen view. Dots at the bottom center of the screen indicate what Enhanced screen you are currently on. The left dot highlighted indicates you are at the Enhanced menu on the left, and the right dot indicates the right Enhanced menu screen.
Viewing the Functions Dots also appear on various measurement tool screens to indicate the number of functions activated for that particular tool. In the example below, four functions are activated for the Basic tool. Just like at the Enhanced menu, you swipe or flick the screen to the other available function screens.
Scrolling through Options A scrolling bar appears on screens when all options cannot be accessed at the main view. A scroll bar on the left indicates additional options are available. Swipe the screen up to view the additional options.
Scroll bar
Back icon
X - R i t e e X a c t ™ I n s t r u m e n t
21
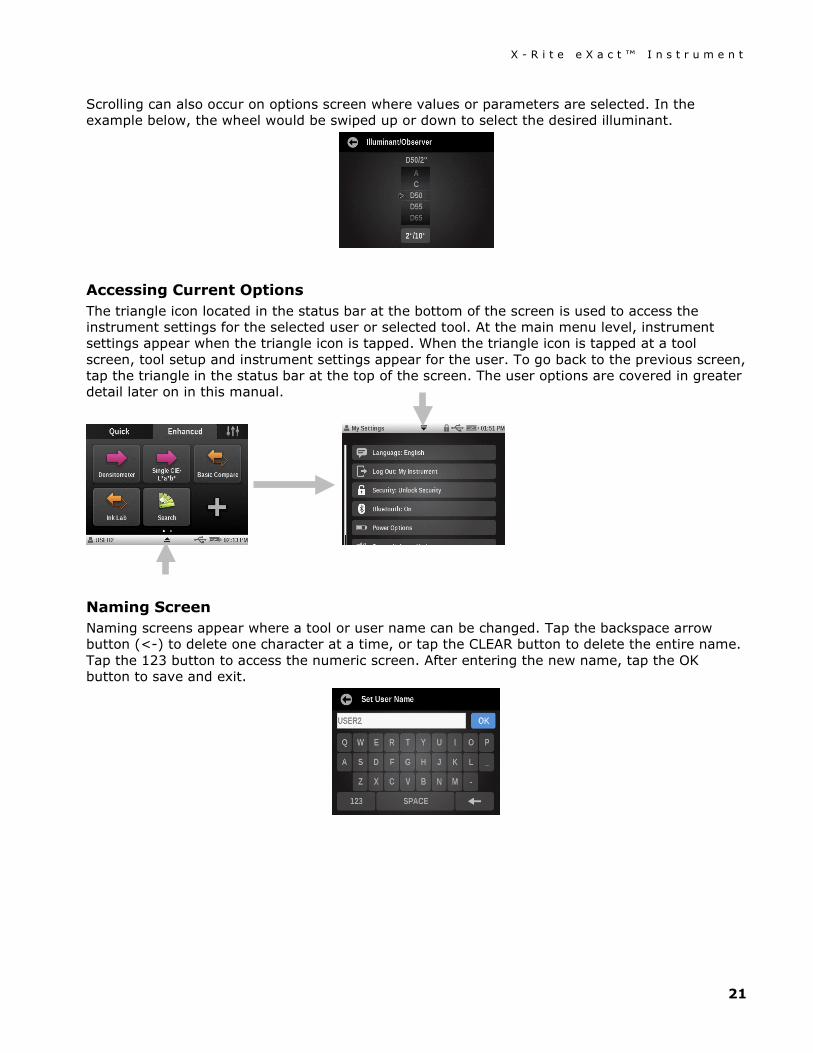
Scrolling can also occur on options screen where values or parameters are selected. In the example below, the wheel would be swiped up or down to select the desired illuminant.
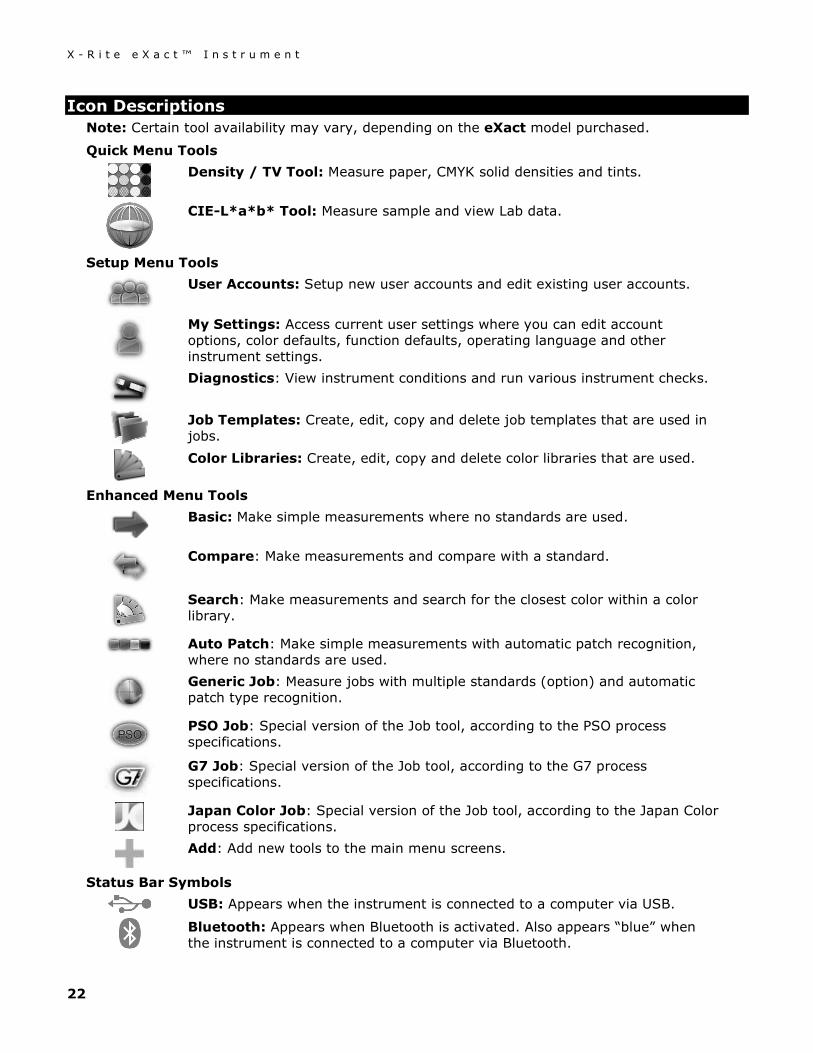
Accessing Current Options The triangle icon located in the status bar at the bottom of the screen is used to access the instrument settings for the selected user or selected tool. At the main menu level, instrument settings appear when the triangle icon is tapped. When the triangle icon is tapped at a tool screen, tool setup and instrument settings appear for the user. To go back to the previous screen, tap the triangle in the status bar at the top of the screen. The user options are covered in greater detail later on in this manual.
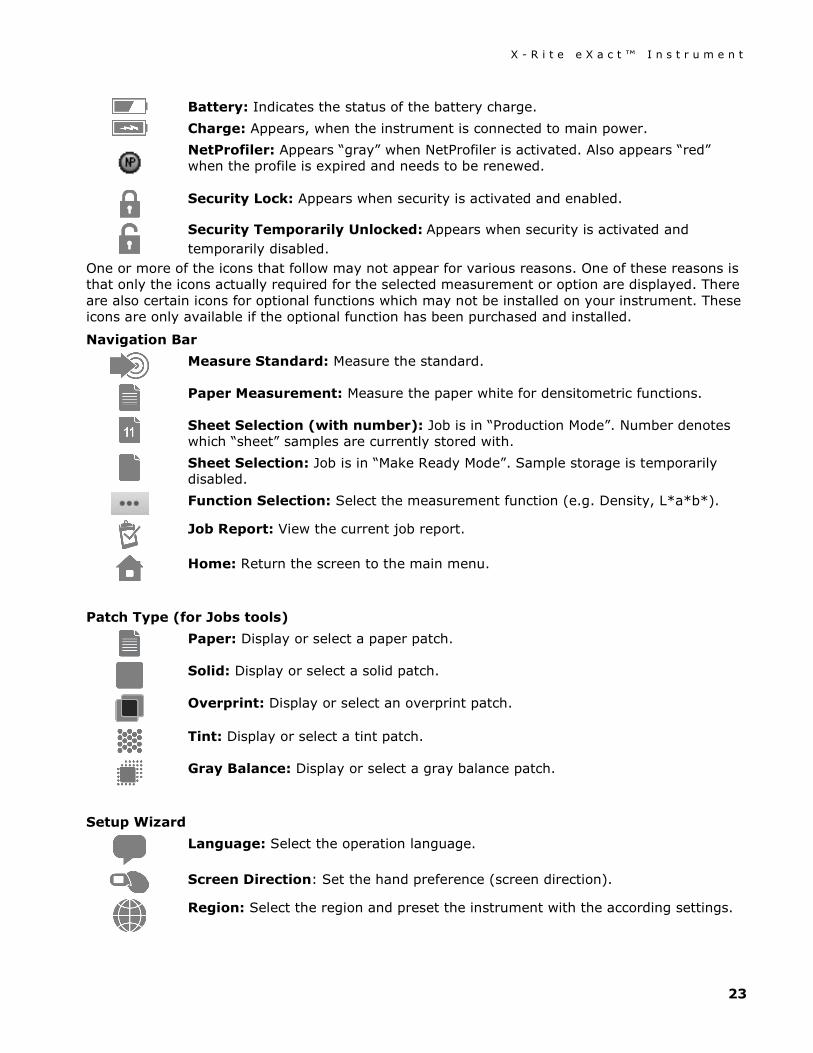
Naming Screen Naming screens appear where a tool or user name can be changed. Tap the backspace arrow button (<-) to delete one character at a time, or tap the CLEAR button to delete the entire name. Tap the 123 button to access the numeric screen. After entering the new name, tap the OK button to save and exit.
X - R i t e e X a c t ™ I n s t r u m e n t
22
Icon Descriptions Note: Certain tool availability may vary, depending on the eXact model purchased.
Quick Menu Tools
Density / TV Tool: Measure paper, CMYK solid densities and tints.
CIE-L*a*b* Tool: Measure sample and view Lab data.
Setup Menu Tools
User Accounts: Setup new user accounts and edit existing user accounts.
My Settings: Access current user settings where you can edit account options, color defaults, function defaults, operating language and other instrument settings.
Diagnostics: View instrument conditions and run various instrument checks.
Job Templates: Create, edit, copy and delete job templates that are used in jobs.
Color Libraries: Create, edit, copy and delete color libraries that are used.
Enhanced Menu Tools
Basic: Make simple measurements where no standards are used.
Compare: Make measurements and compare with a standard.
Search: Make measurements and search for the closest color within a color library.
Auto Patch: Make simple measurements with automatic patch recognition, where no standards are used.
Generic Job: Measure jobs with multiple standards (option) and automatic patch type recognition.
PSO Job: Special version of the Job tool, according to the PSO process specifications.
G7 Job: Special version of the Job tool, according to the G7 process specifications.
Japan Color Job: Special version of the Job tool, according to the Japan Color process specifications.
Add: Add new tools to the main menu screens.
Status Bar Symbols
USB: Appears when the instrument is connected to a computer via USB.
Bluetooth: Appears when Bluetooth is activated. Also appears “blue” when the instrument is connected to a computer via Bluetooth.
X - R i t e e X a c t ™ I n s t r u m e n t
23
Battery: Indicates the status of the battery charge.
Charge: Appears, when the instrument is connected to main power.
NetProfiler: Appears “gray” when NetProfiler is activated. Also appears “red” when the profile is expired and needs to be renewed.
Security Lock: Appears when security is activated and enabled.
Security Temporarily Unlocked: Appears when security is activated and temporarily disabled.
One or more of the icons that follow may not appear for various reasons. One of these reasons is that only the icons actually required for the selected measurement or option are displayed. There are also certain icons for optional functions which may not be installed on your instrument. These icons are only available if the optional function has been purchased and installed.
Navigation Bar
Measure Standard: Measure the standard.
Paper Measurement: Measure the paper white for densitometric functions.
Sheet Selection (with number): Job is in “Production Mode”. Number denotes which “sheet” samples are currently stored with.
Sheet Selection: Job is in “Make Ready Mode”. Sample storage is temporarily disabled.
Function Selection: Select the measurement function (e.g. Density, L*a*b*).
Job Report: View the current job report.
Home: Return the screen to the main menu.
Patch Type (for Jobs tools)
Paper: Display or select a paper patch.
Solid: Display or select a solid patch.
Overprint: Display or select an overprint patch.
Tint: Display or select a tint patch.
Gray Balance: Display or select a gray balance patch.
Setup Wizard
Language: Select the operation language.
Screen Direction: Set the hand preference (screen direction).
Region: Select the region and preset the instrument with the according settings.
X - R i t e e X a c t ™ I n s t r u m e n t
24
Date: Set the date.
Time: Set the time.
Main Settings
Language: Select the operation language.
Logout: Log out the current user or log in a new user.
Security: Define the security level.
Bluetooth: Access Bluetooth selection options.
Power Setting: Access battery power saving options.
Beeper Volume: Access beeper volume setting options.
Measurement Screen
Standard: Access the standard selection and view screen.
Change Standard (for Compare and Search tools) or Change Patch (for Job tools): Change the selection in case the automatic recognition assigned the measurement to the wrong standard or patch.
Back: Go back to the previous screen.
Auto Color: Indicates auto color or auto patch is selected. Also used to access the color mode or patch recognition screen.
Color: Access the color mode or patch recognition screen.
Delta/Absolute: Switch between Delta and absolute values.
Pass/Fail Indication
Tolerance Pass: Indicates that the sample is within the tolerance set.
Tolerance Action Alert: Indicates that the sample passed. However, it is within the action limit set.
Tolerance Fail Alert: Indicates that the sample failed the tolerance set.
Standard Screen
Color Library: Select a color library.
Information: View information on the current standard (e.g. recipe information).
Tolerance: Access the tolerance settings for the current standard. Values can be edited from this screen.
X - R i t e e X a c t ™ I n s t r u m e n t
25
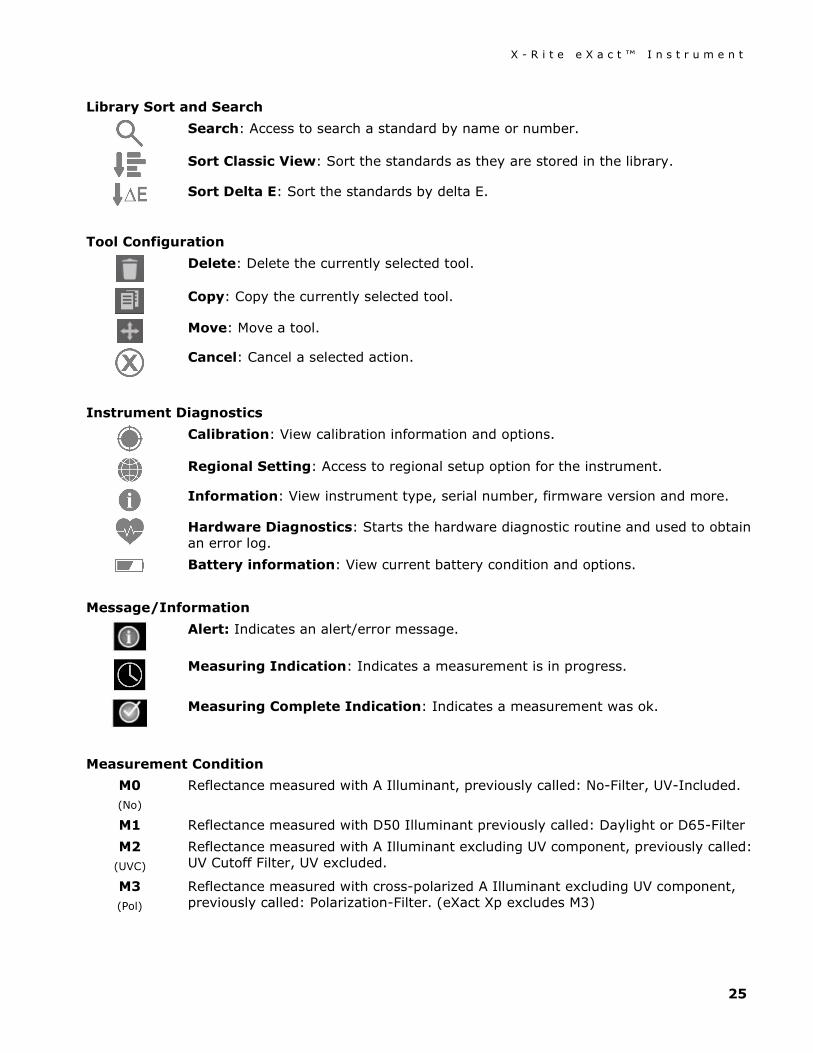
Library Sort and Search
Search: Access to search a standard by name or number.
Sort Classic View: Sort the standards as they are stored in the library.
Sort Delta E: Sort the standards by delta E.
Tool Configuration
Delete: Delete the currently selected tool.
Copy: Copy the currently selected tool.
Move: Move a tool.
Cancel: Cancel a selected action.
Instrument Diagnostics
Calibration: View calibration information and options.
Regional Setting: Access to regional setup option for the instrument.
Information: View instrument type, serial number, firmware version and more.
Hardware Diagnostics: Starts the hardware diagnostic routine and used to obtain an error log.
Battery information: View current battery condition and options.
Message/Information
Alert: Indicates an alert/error message.
Measuring Indication: Indicates a measurement is in progress.
Measuring Complete Indication: Indicates a measurement was ok.
Measurement Condition
M0 (No)
Reflectance measured with A Illuminant, previously called: No-Filter, UV-Included.
M1 Reflectance measured with D50 Illuminant previously called: Daylight or D65-Filter M2
(UVC) Reflectance measured with A Illuminant excluding UV component, previously called: UV Cutoff Filter, UV excluded.
M3 (Pol)
Reflectance measured with cross-polarized A Illuminant excluding UV component, previously called: Polarization-Filter. (eXact Xp excludes M3)
X - R i t e e X a c t ™ I n s t r u m e n t
26
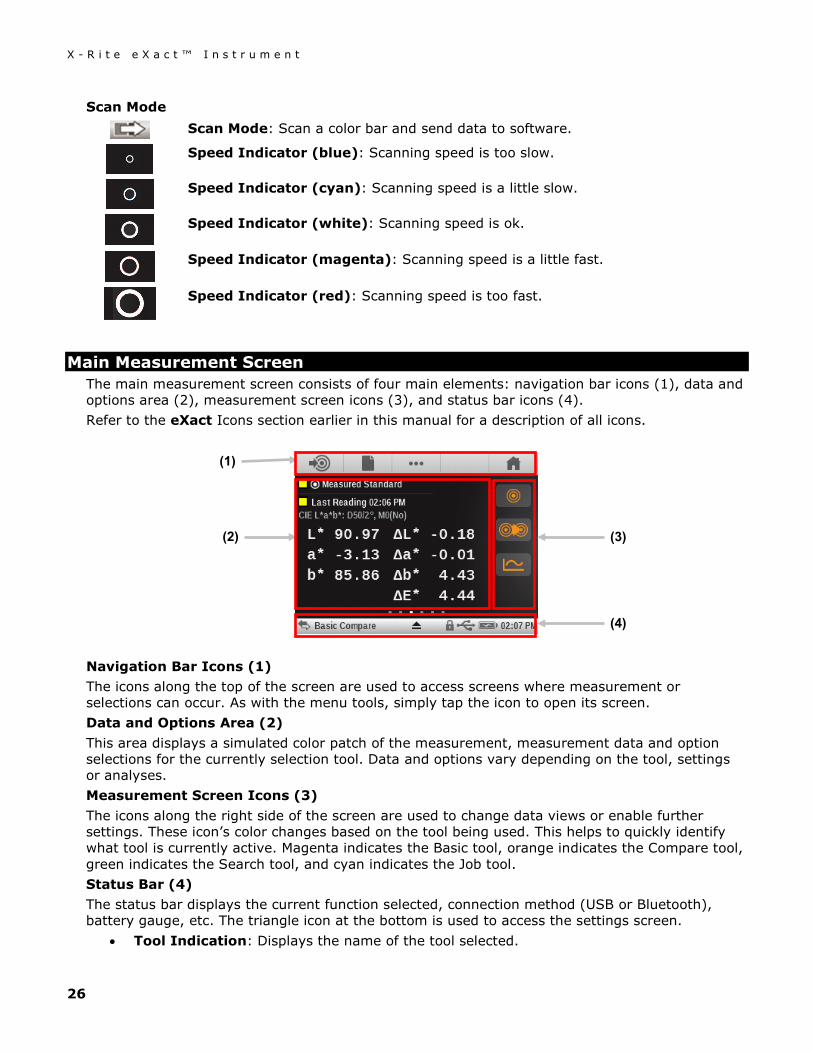
Scan Mode
Scan Mode: Scan a color bar and send data to software.
Speed Indicator (blue): Scanning speed is too slow.
Speed Indicator (cyan): Scanning speed is a little slow.
Speed Indicator (white): Scanning speed is ok.
Speed Indicator (magenta): Scanning speed is a little fast.
Speed Indicator (red): Scanning speed is too fast.
Main Measurement Screen The main measurement screen consists of four main elements: navigation bar icons (1), data and options area (2), measurement screen icons (3), and status bar icons (4). Refer to the eXact Icons section earlier in this manual for a description of all icons.
Navigation Bar Icons (1) The icons along the top of the screen are used to access screens where measurement or selections can occur. As with the menu tools, simply tap the icon to open its screen. Data and Options Area (2) This area displays a simulated color patch of the measurement, measurement data and option selections for the currently selection tool. Data and options vary depending on the tool, settings or analyses. Measurement Screen Icons (3) The icons along the right side of the screen are used to change data views or enable further settings. These icon’s color changes based on the tool being used. This helps to quickly identify what tool is currently active. Magenta indicates the Basic tool, orange indicates the Compare tool, green indicates the Search tool, and cyan indicates the Job tool. Status Bar (4) The status bar displays the current function selected, connection method (USB or Bluetooth), battery gauge, etc. The triangle icon at the bottom is used to access the settings screen.
• Tool Indication: Displays the name of the tool selected.
(1)
(2)
(3)
(4)
X - R i t e e X a c t ™ I n s t r u m e n t
27
• USB or Bluetooth Connection: The USB icon appears when the instrument is plugged into the USB port on the computer. The Bluetooth® icon appears when searching for a connection and when a connection is established to the computer.
• Security Icon (locked or unlocked): Indicates if the security is active for the current user, and if the user currently has security temporarily disabled (unlocked) or active (locked).
• NetProfiler Icon: Indicates if the NetProfiler is active, out of date, etc. • Battery Gauge: Depicts the current condition of the battery pack.
Indicates the battery pack is fully charged.
Indicates the battery pack has a sufficient charge for a substantial number of measurements.
Indicates the battery pack is low, but measurements are still possible. Battery pack should be charged soon.
Indicates the battery pack is very low and only a few measurements remain. Battery pack should be charged immediately. Indicator will appear red during this condition.
Indicates the AC adapter is plugged in and the battery pack is charging.
Indicates the AC adapter is plugged in and no battery pack is installed.
• Triangle Icon: Accesses the instrument settings screen for the current user or tool. • Time: Displays the current time.
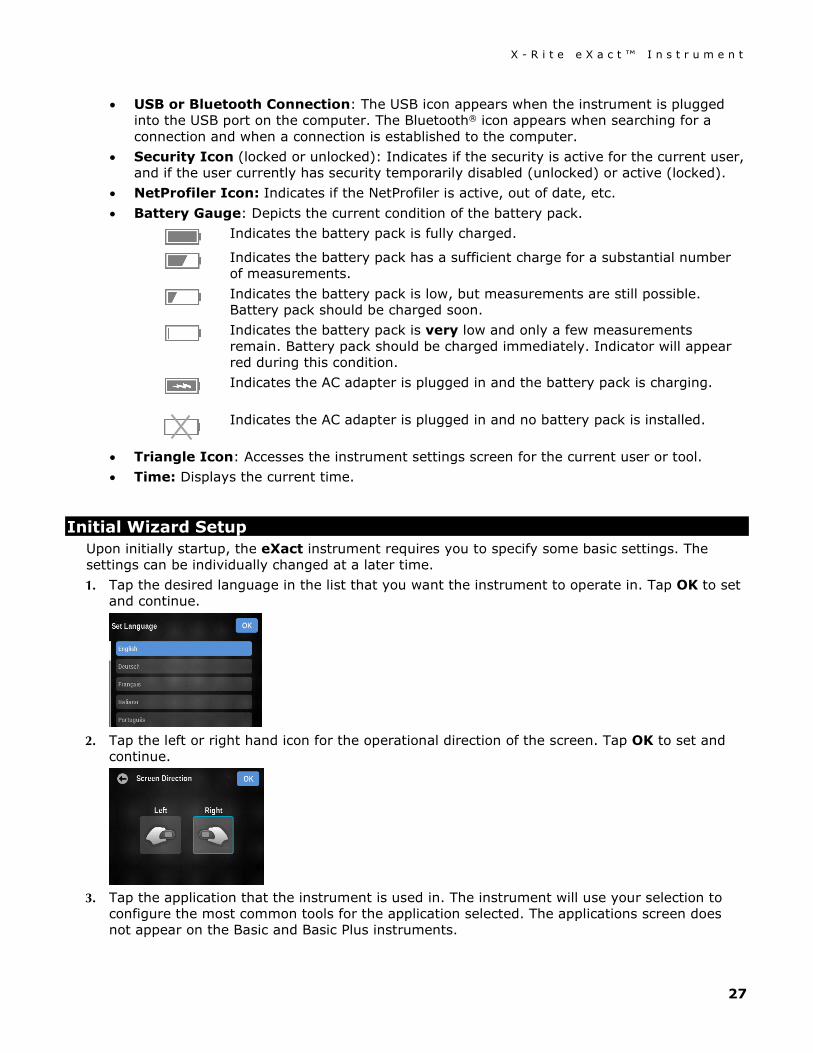
Initial Wizard Setup Upon initially startup, the eXact instrument requires you to specify some basic settings. The settings can be individually changed at a later time. 1. Tap the desired language in the list that you want the instrument to operate in. Tap OK to set
and continue.
2. Tap the left or right hand icon for the operational direction of the screen. Tap OK to set and
continue.
3. Tap the application that the instrument is used in. The instrument will use your selection to
configure the most common tools for the application selected. The applications screen does not appear on the Basic and Basic Plus instruments.
X - R i t e e X a c t ™ I n s t r u m e n t
28
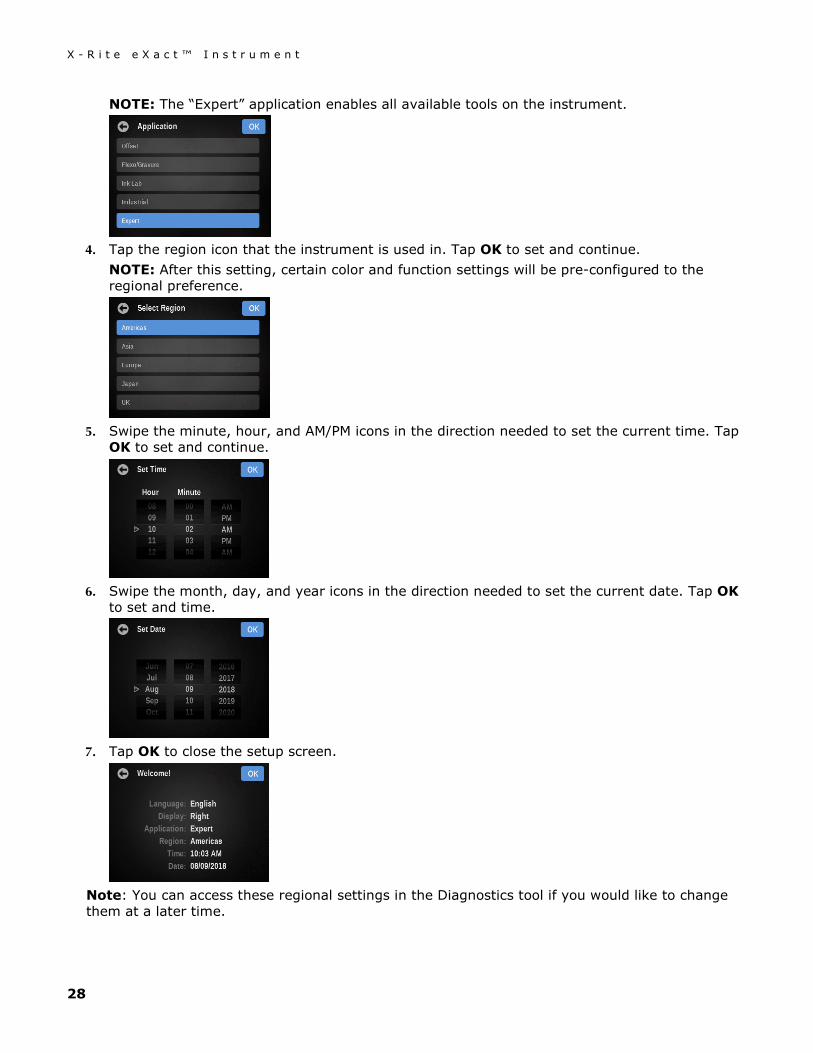
NOTE: The “Expert” application enables all available tools on the instrument.
4. Tap the region icon that the instrument is used in. Tap OK to set and continue.
NOTE: After this setting, certain color and function settings will be pre-configured to the regional preference.
5. Swipe the minute, hour, and AM/PM icons in the direction needed to set the current time. Tap
OK to set and continue.
6. Swipe the month, day, and year icons in the direction needed to set the current date. Tap OK
to set and time.
7. Tap OK to close the setup screen.
Note: You can access these regional settings in the Diagnostics tool if you would like to change them at a later time.
X - R i t e e X a c t ™ I n s t r u m e n t
29
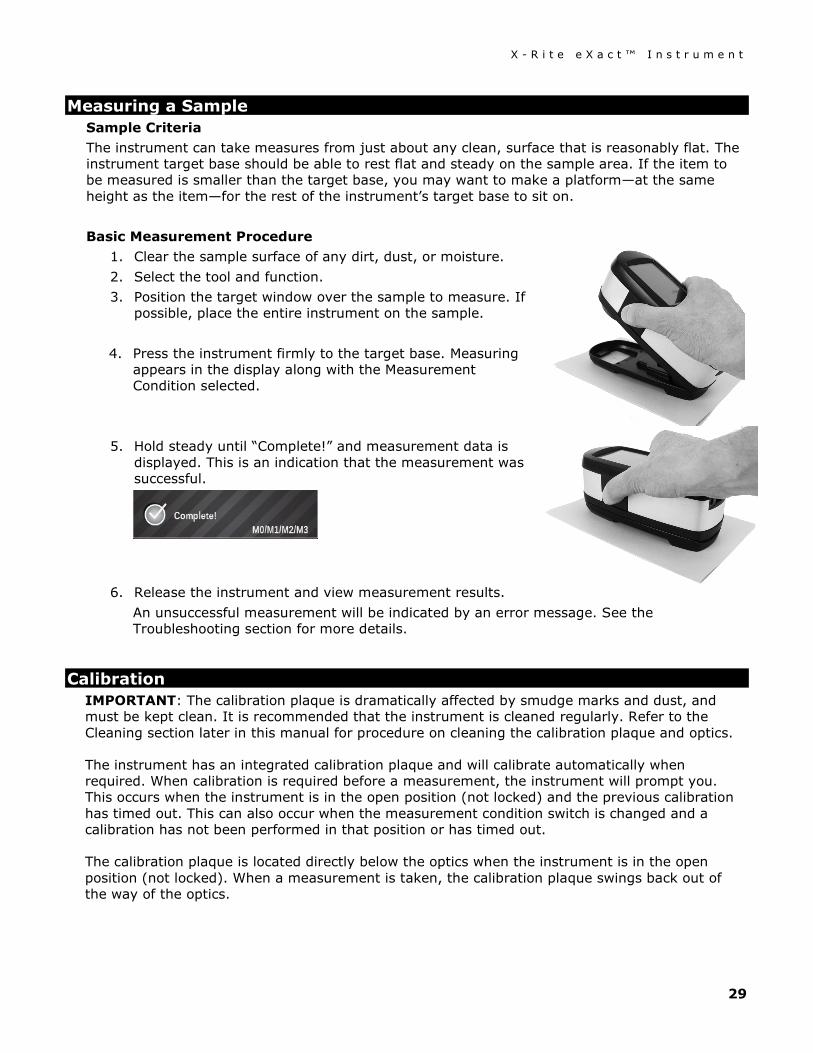
Measuring a Sample Sample Criteria The instrument can take measures from just about any clean, surface that is reasonably flat. The instrument target base should be able to rest flat and steady on the sample area. If the item to be measured is smaller than the target base, you may want to make a platform—at the same height as the item—for the rest of the instrument’s target base to sit on. Basic Measurement Procedure
1. Clear the sample surface of any dirt, dust, or moisture. 2. Select the tool and function. 3. Position the target window over the sample to measure. If
possible, place the entire instrument on the sample.
4. Press the instrument firmly to the target base. Measuring appears in the display along with the Measurement Condition selected.
5. Hold steady until “Complete!” and measurement data is displayed. This is an indication that the measurement was successful.
6. Release the instrument and view measurement results. An unsuccessful measurement will be indicated by an error message. See the Troubleshooting section for more details.
Calibration IMPORTANT: The calibration plaque is dramatically affected by smudge marks and dust, and must be kept clean. It is recommended that the instrument is cleaned regularly. Refer to the Cleaning section later in this manual for procedure on cleaning the calibration plaque and optics.
The instrument has an integrated calibration plaque and will calibrate automatically when required. When calibration is required before a measurement, the instrument will prompt you. This occurs when the instrument is in the open position (not locked) and the previous calibration has timed out. This can also occur when the measurement condition switch is changed and a calibration has not been performed in that position or has timed out.
The calibration plaque is located directly below the optics when the instrument is in the open position (not locked). When a measurement is taken, the calibration plaque swings back out of the way of the optics.
X - R i t e e X a c t ™ I n s t r u m e n t
30
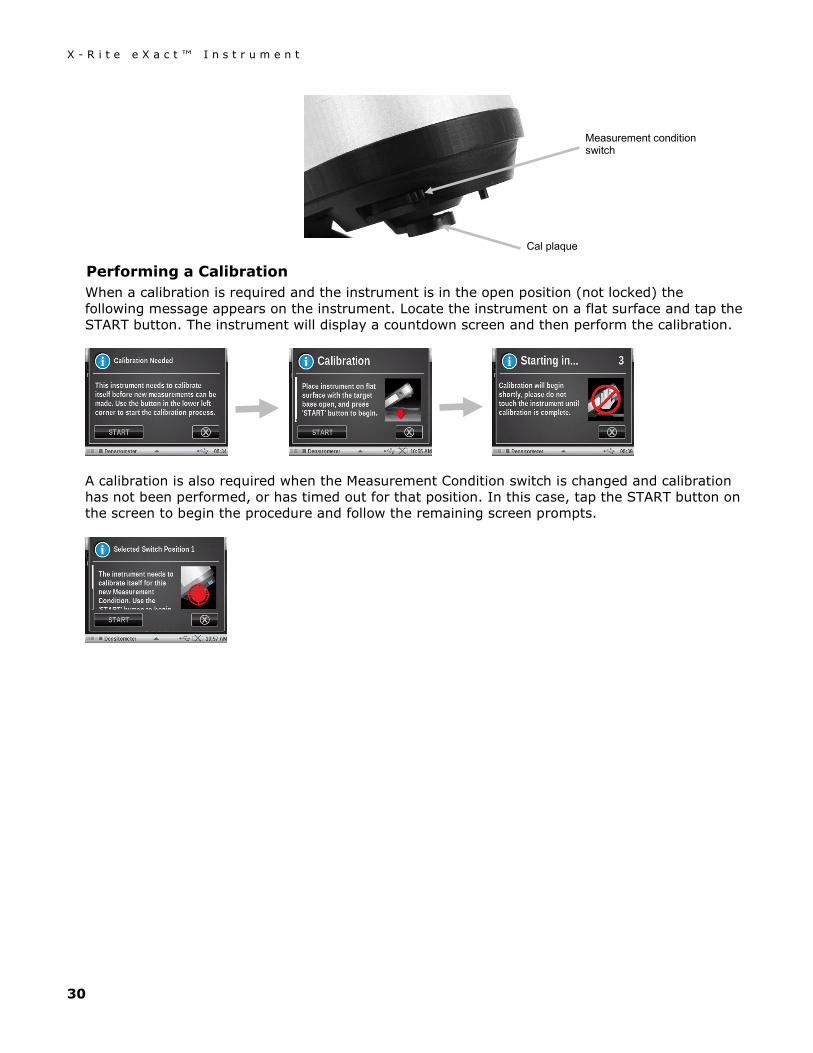
Performing a Calibration When a calibration is required and the instrument is in the open position (not locked) the following message appears on the instrument. Locate the instrument on a flat surface and tap the START button. The instrument will display a countdown screen and then perform the calibration.
A calibration is also required when the Measurement Condition switch is changed and calibration has not been performed, or has timed out for that position. In this case, tap the START button on the screen to begin the procedure and follow the remaining screen prompts.
Cal plaque
Measurement condition switch
X - R i t e e X a c t ™ I n s t r u m e n t
31
QUICK MEASUREMENT FUNCTIONS
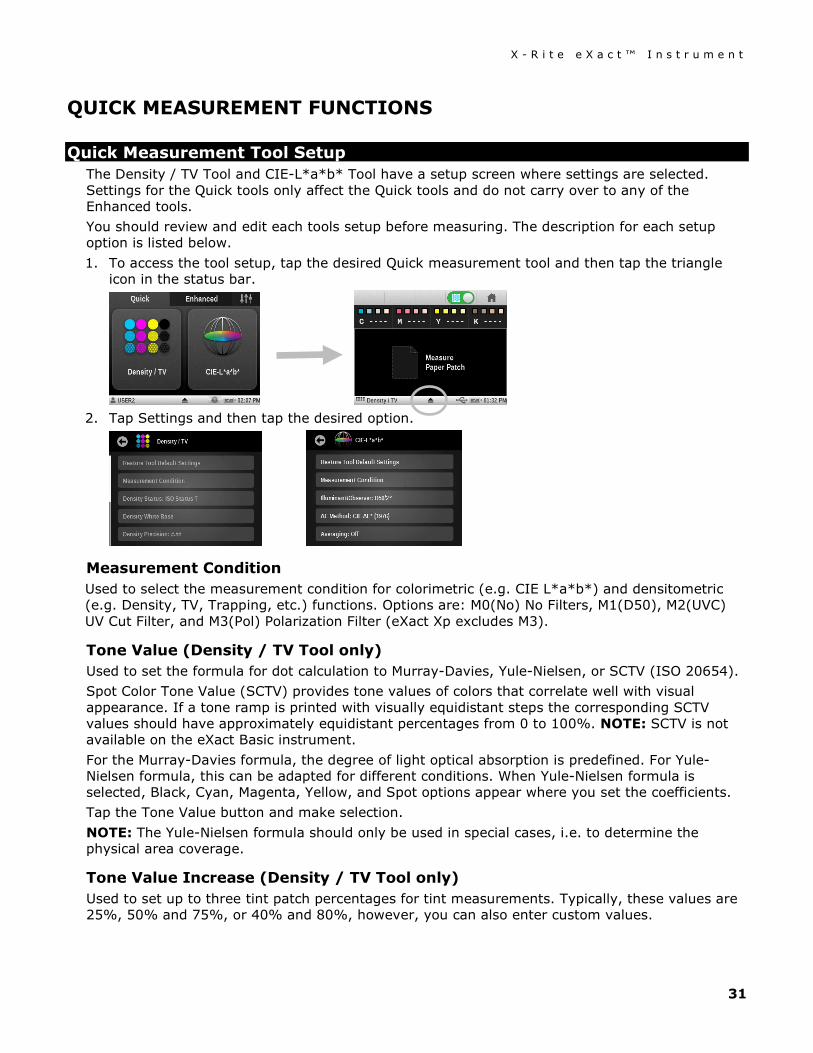
Quick Measurement Tool Setup The Density / TV Tool and CIE-L*a*b* Tool have a setup screen where settings are selected. Settings for the Quick tools only affect the Quick tools and do not carry over to any of the Enhanced tools. You should review and edit each tools setup before measuring. The description for each setup option is listed below. 1. To access the tool setup, tap the desired Quick measurement tool and then tap the triangle
icon in the status bar.
2. Tap Settings and then tap the desired option.
Measurement Condition Used to select the measurement condition for colorimetric (e.g. CIE L*a*b*) and densitometric (e.g. Density, TV, Trapping, etc.) functions. Options are: M0(No) No Filters, M1(D50), M2(UVC) UV Cut Filter, and M3(Pol) Polarization Filter (eXact Xp excludes M3).
Tone Value (Density / TV Tool only) Used to set the formula for dot calculation to Murray-Davies, Yule-Nielsen, or SCTV (ISO 20654). Spot Color Tone Value (SCTV) provides tone values of colors that correlate well with visual appearance. If a tone ramp is printed with visually equidistant steps the corresponding SCTV values should have approximately equidistant percentages from 0 to 100%. NOTE: SCTV is not available on the eXact Basic instrument. For the Murray-Davies formula, the degree of light optical absorption is predefined. For Yule-Nielsen formula, this can be adapted for different conditions. When Yule-Nielsen formula is selected, Black, Cyan, Magenta, Yellow, and Spot options appear where you set the coefficients. Tap the Tone Value button and make selection. NOTE: The Yule-Nielsen formula should only be used in special cases, i.e. to determine the physical area coverage.
Tone Value Increase (Density / TV Tool only) Used to set up to three tint patch percentages for tint measurements. Typically, these values are 25%, 50% and 75%, or 40% and 80%, however, you can also enter custom values.
X - R i t e e X a c t ™ I n s t r u m e n t
32
Density Status (Density / TV Tool only) Used to select the status for all densitometric functions. Options are: Status A, E, I, T, and G.
Density White Base (Density / TV Tool only) Used to set a paper or absolute requirement. lf you select Paper, as white base, all subsequent measurements will refer exclusively to the printed ink layer, while the paper color effect will not be included. lf you select Absolute, besides the printed ink layer, the measurement will also include the paper effect. To select a paper measurement requirement, select the Paper check box. To select no paper requirements, select the Absolute check box.
Density Precision (Density / TV Tool only) Used to select the density value display precision. Options are: Normal (x.xx) and High (x.xxx).
Averaging Used to set the number of measurements required to obtain an average. The number of readings can be set from 2 to 5 and off. Refer to Averaging Measure procedure in the Compare Tool section for additional information.
All Densities (Density / TV Tool only) Used to display the density values for the measured sample for all filters (Cyan, Magenta, Yellow and Black). This function can be configured to show additionally the density value at the wavelength of maximum density for the spectral curve. Options are: CMYK and CMYK+SPOT.
Density / TV (Density / TV Tool only) Used to select the tint and solid ink display methods. For tint you can choose Tone Value Increase (TVI) or Tone Value (TV). For solid you can choose AUTO or CMYK. AUTO color displays the dominate process color measured. CMYK displays the density values for the measured sample for all filters (Cyan, Magenta, Yellow and Black).
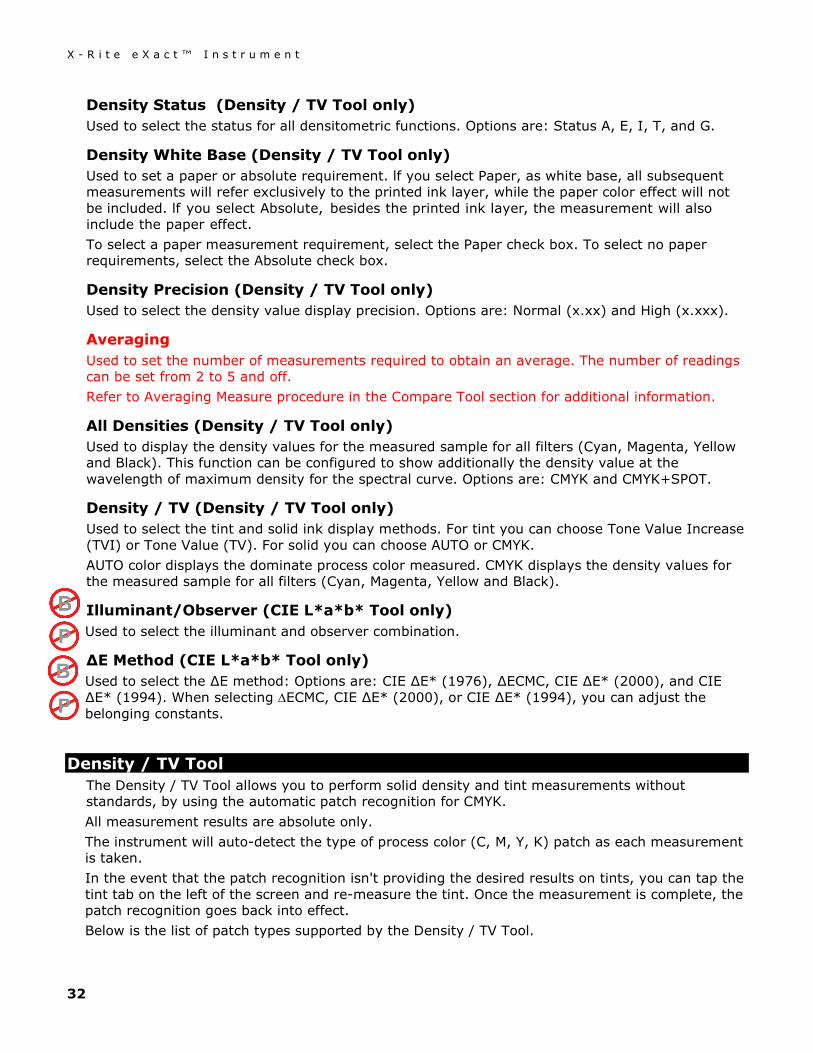
Illuminant/Observer (CIE L*a*b* Tool only) Used to select the illuminant and observer combination.
∆E Method (CIE L*a*b* Tool only) Used to select the ∆E method: Options are: CIE ∆E* (1976), ∆ECMC, CIE ∆E* (2000), and CIE ∆E* (1994). When selecting ∆ECMC, CIE ∆E* (2000), or CIE ∆E* (1994), you can adjust the belonging constants.
Density / TV Tool The Density / TV Tool allows you to perform solid density and tint measurements without standards, by using the automatic patch recognition for CMYK. All measurement results are absolute only. The instrument will auto-detect the type of process color (C, M, Y, K) patch as each measurement is taken. In the event that the patch recognition isn't providing the desired results on tints, you can tap the tint tab on the left of the screen and re-measure the tint. Once the measurement is complete, the patch recognition goes back into effect. Below is the list of patch types supported by the Density / TV Tool.
X - R i t e e X a c t ™ I n s t r u m e n t
33
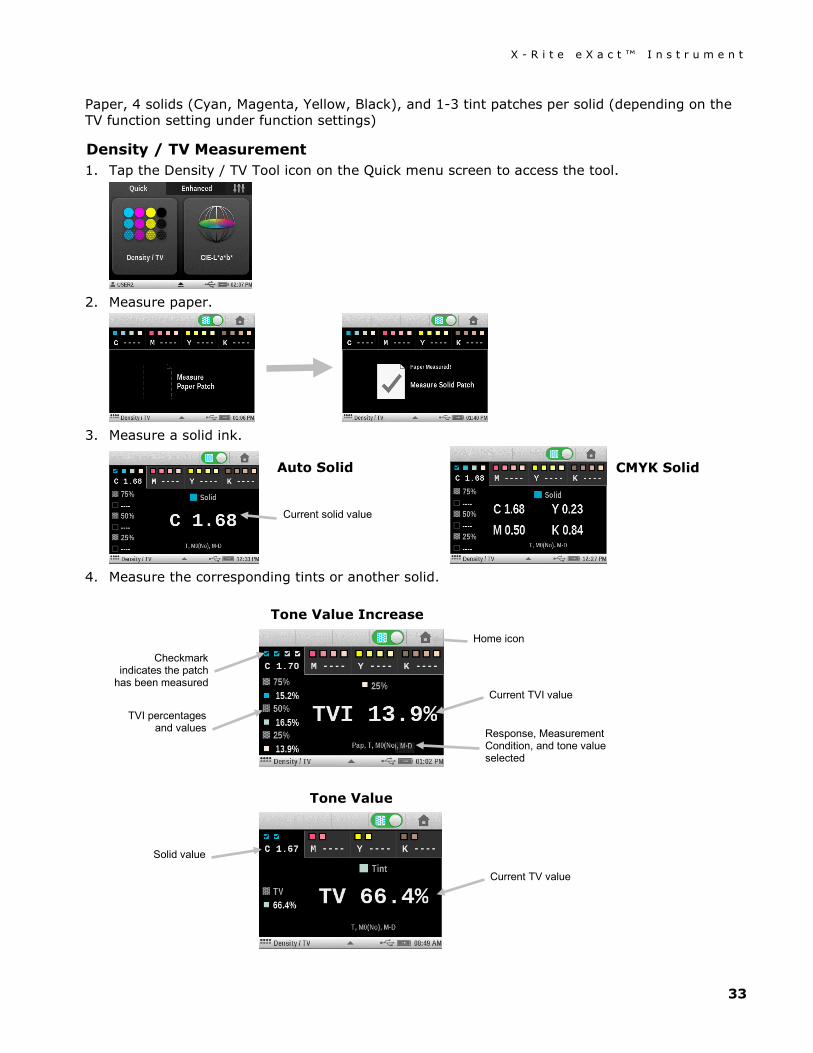
Paper, 4 solids (Cyan, Magenta, Yellow, Black), and 1-3 tint patches per solid (depending on the TV function setting under function settings)
Density / TV Measurement 1. Tap the Density / TV Tool icon on the Quick menu screen to access the tool.
2. Measure paper.
3. Measure a solid ink.
4. Measure the corresponding tints or another solid.
Checkmark indicates the patch
has been measured
TVI percentages and values
Current solid value
Current TVI value
Response, Measurement Condition, and tone value selected
Home icon
Auto Solid CMYK Solid
Tone Value Increase
Tone Value
Solid value
Current TV value
X - R i t e e X a c t ™ I n s t r u m e n t
34
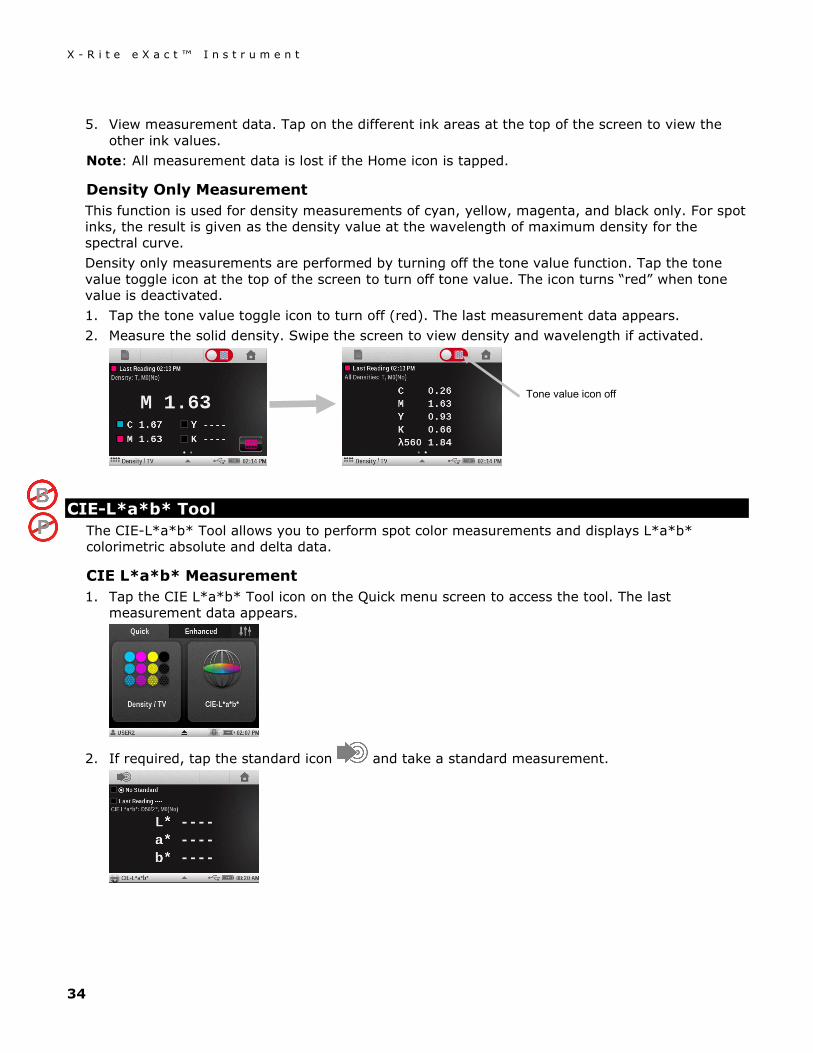
5. View measurement data. Tap on the different ink areas at the top of the screen to view the
other ink values. Note: All measurement data is lost if the Home icon is tapped.
Density Only Measurement This function is used for density measurements of cyan, yellow, magenta, and black only. For spot inks, the result is given as the density value at the wavelength of maximum density for the spectral curve. Density only measurements are performed by turning off the tone value function. Tap the tone value toggle icon at the top of the screen to turn off tone value. The icon turns “red” when tone value is deactivated. 1. Tap the tone value toggle icon to turn off (red). The last measurement data appears. 2. Measure the solid density. Swipe the screen to view density and wavelength if activated.
CIE-L*a*b* Tool The CIE-L*a*b* Tool allows you to perform spot color measurements and displays L*a*b* colorimetric absolute and delta data.
CIE L*a*b* Measurement 1. Tap the CIE L*a*b* Tool icon on the Quick menu screen to access the tool. The last
measurement data appears.
2. If required, tap the standard icon and take a standard measurement.
Tone value icon off
X - R i t e e X a c t ™ I n s t r u m e n t
35
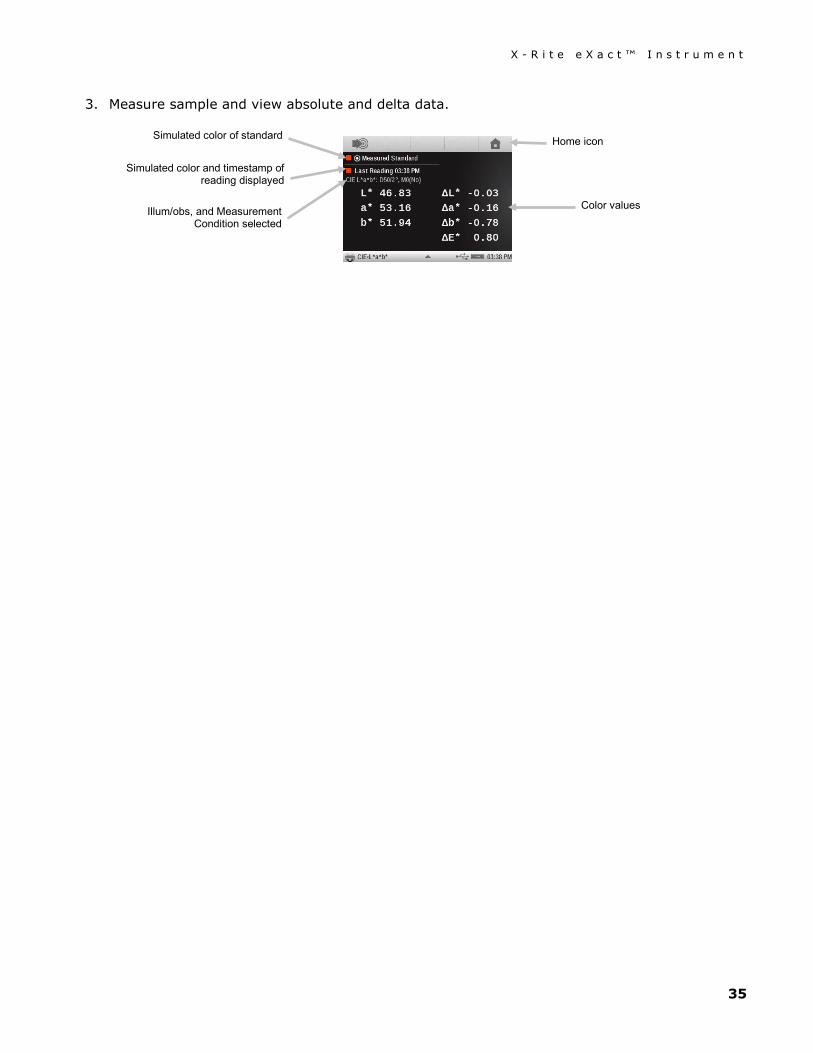
3. Measure sample and view absolute and delta data.
Color values
Simulated color and timestamp of reading displayed
Illum/obs, and Measurement Condition selected
Home icon Simulated color of standard
X - R i t e e X a c t ™ I n s t r u m e n t
36
ENHANCED MEASUREMENT TOOL SETUP
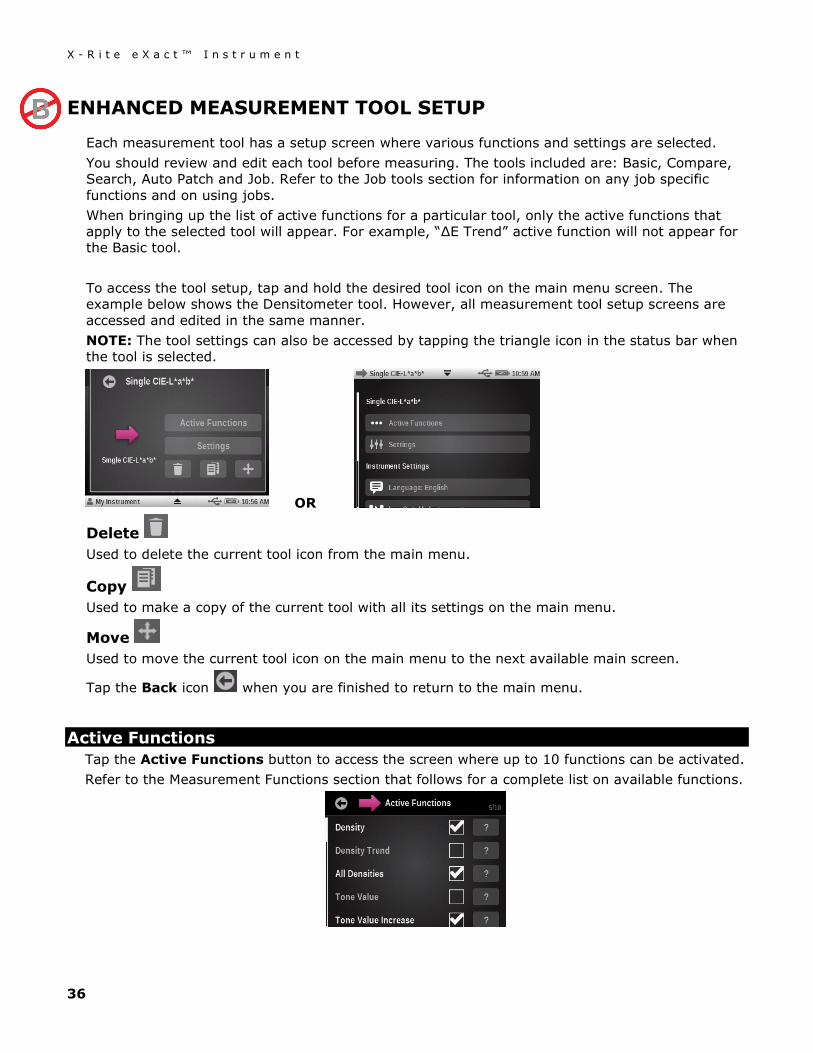
Each measurement tool has a setup screen where various functions and settings are selected. You should review and edit each tool before measuring. The tools included are: Basic, Compare, Search, Auto Patch and Job. Refer to the Job tools section for information on any job specific functions and on using jobs. When bringing up the list of active functions for a particular tool, only the active functions that apply to the selected tool will appear. For example, “∆E Trend” active function will not appear for the Basic tool. To access the tool setup, tap and hold the desired tool icon on the main menu screen. The example below shows the Densitometer tool. However, all measurement tool setup screens are accessed and edited in the same manner. NOTE: The tool settings can also be accessed by tapping the triangle icon in the status bar when the tool is selected.
OR
Delete Used to delete the current tool icon from the main menu.
Copy Used to make a copy of the current tool with all its settings on the main menu.
Move Used to move the current tool icon on the main menu to the next available main screen.
Tap the Back icon when you are finished to return to the main menu.
Active Functions Tap the Active Functions button to access the screen where up to 10 functions can be activated. Refer to the Measurement Functions section that follows for a complete list on available functions.
X - R i t e e X a c t ™ I n s t r u m e n t
37
Activated functions are available for selection during tool measurements. Functions appear in the order that they are selected. If one or more functions are added to an existing list, those functions will appear at the end of the list when viewing. When more than 10 functions are required for the tool, you must add a new tool for the additional functions. Refer to Add Tool section later in this manual. For Job tools, 10 functions can be activated for each available patch type. Refer to the Job Tool section for additional information on activating functions for patch types. A check mark next to a function indicates that it is currently selected. To activate a function, tap the empty box to add a check mark. To deactivate a function, tap the “checked” box to clear the check mark. Tap a (?) box to view additional information about the function. A scroll bar on the left indicates that additional functions are available. Swipe the screen up or down to view the additional functions.
When finished, tap the Back icon to return to the tool edit screen.
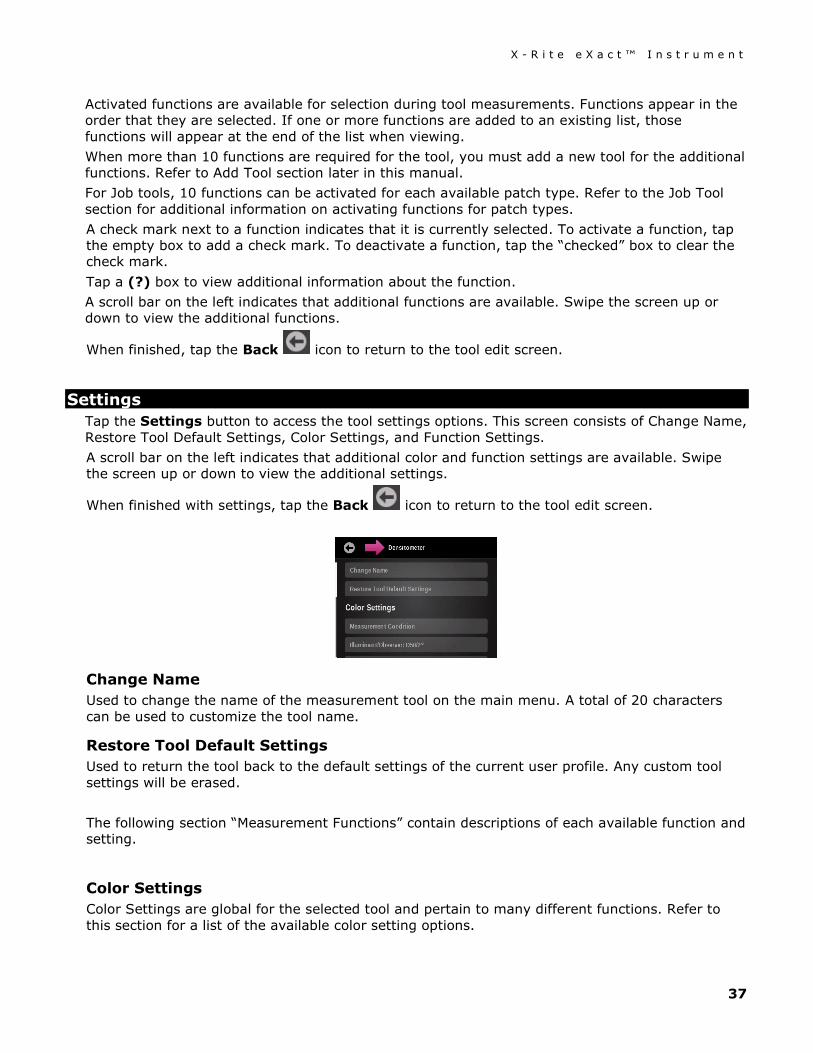
Settings Tap the Settings button to access the tool settings options. This screen consists of Change Name, Restore Tool Default Settings, Color Settings, and Function Settings. A scroll bar on the left indicates that additional color and function settings are available. Swipe the screen up or down to view the additional settings.
When finished with settings, tap the Back icon to return to the tool edit screen.
Change Name Used to change the name of the measurement tool on the main menu. A total of 20 characters can be used to customize the tool name.
Restore Tool Default Settings Used to return the tool back to the default settings of the current user profile. Any custom tool settings will be erased. The following section “Measurement Functions” contain descriptions of each available function and setting.
Color Settings Color Settings are global for the selected tool and pertain to many different functions. Refer to this section for a list of the available color setting options.
X - R i t e e X a c t ™ I n s t r u m e n t
38
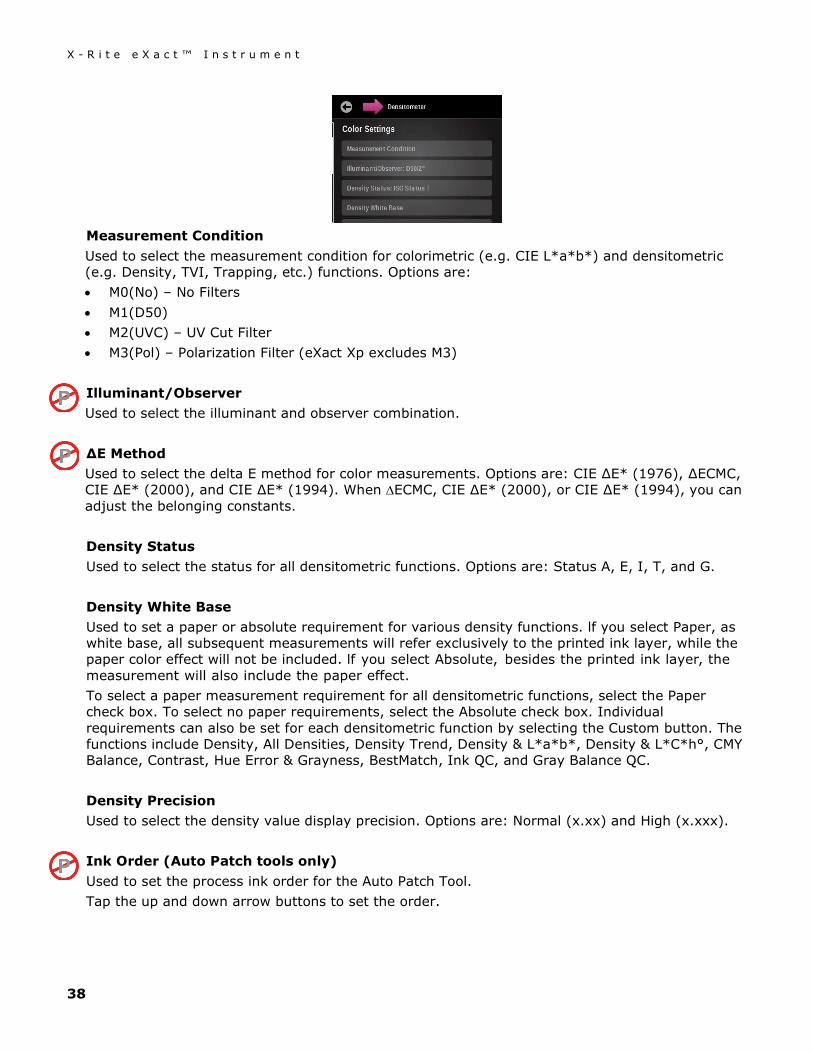
Measurement Condition Used to select the measurement condition for colorimetric (e.g. CIE L*a*b*) and densitometric (e.g. Density, TVI, Trapping, etc.) functions. Options are: • M0(No) – No Filters • M1(D50) • M2(UVC) – UV Cut Filter • M3(Pol) – Polarization Filter (eXact Xp excludes M3) Illuminant/Observer Used to select the illuminant and observer combination. ∆E Method Used to select the delta E method for color measurements. Options are: CIE ∆E* (1976), ∆ECMC, CIE ∆E* (2000), and CIE ∆E* (1994). When ∆ECMC, CIE ∆E* (2000), or CIE ∆E* (1994), you can adjust the belonging constants. Density Status Used to select the status for all densitometric functions. Options are: Status A, E, I, T, and G. Density White Base Used to set a paper or absolute requirement for various density functions. lf you select Paper, as white base, all subsequent measurements will refer exclusively to the printed ink layer, while the paper color effect will not be included. lf you select Absolute, besides the printed ink layer, the measurement will also include the paper effect. To select a paper measurement requirement for all densitometric functions, select the Paper check box. To select no paper requirements, select the Absolute check box. Individual requirements can also be set for each densitometric function by selecting the Custom button. The functions include Density, All Densities, Density Trend, Density & L*a*b*, Density & L*C*h°, CMY Balance, Contrast, Hue Error & Grayness, BestMatch, Ink QC, and Gray Balance QC. Density Precision Used to select the density value display precision. Options are: Normal (x.xx) and High (x.xxx). Ink Order (Auto Patch tools only) Used to set the process ink order for the Auto Patch Tool. Tap the up and down arrow buttons to set the order.
X - R i t e e X a c t ™ I n s t r u m e n t
39
Pass/Fail Indication Used to activate the pass/fail indication for comparison measurements. Options are: On and Off. If activated, pass/fail is indicated in the upper right corner of the screen (near the view standard icon). Refer to Pass/Fail Measure procedure in the Compare Tool section for additional information. Averaging Used to set the number of measurements required to obtain an average. The number of readings can be set from 2 to 5 and off. Refer to Averaging Measure procedure in the Compare Tool section for additional information.
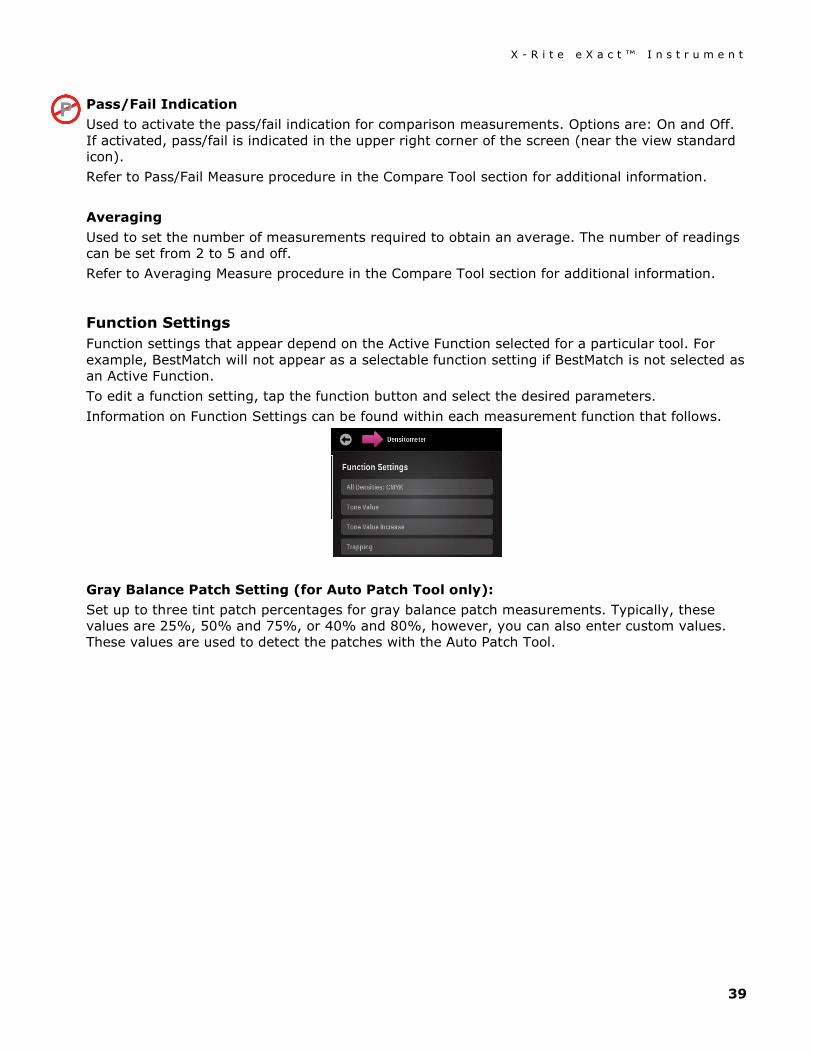
Function Settings Function settings that appear depend on the Active Function selected for a particular tool. For example, BestMatch will not appear as a selectable function setting if BestMatch is not selected as an Active Function. To edit a function setting, tap the function button and select the desired parameters. Information on Function Settings can be found within each measurement function that follows.
Gray Balance Patch Setting (for Auto Patch Tool only): Set up to three tint patch percentages for gray balance patch measurements. Typically, these values are 25%, 50% and 75%, or 40% and 80%, however, you can also enter custom values. These values are used to detect the patches with the Auto Patch Tool.
X - R i t e e X a c t ™ I n s t r u m e n t
40
ENHANCED MEASUREMENT FUNCTIONS
Density This function is the measure of the ink thickness. For the process colors Cyan, Yellow, Magenta, or Black the desired Density Status (A, E, I, T, G) needs to be configured. For spot inks the result is given as the density value at the wavelength of maximum density for the spectral curve. This function can be optionally configured to subtract the white base/substrate. For Basic, Search and Compare tools, you can configure which color responses are shown. Auto color picks the dominant color response and also displays the last measurements for the other colors (C, M, Y, and K). Spot color picks the dominant spectral density wavelength. You can manually select the color response as well (C, M, Y, or K). In Job tools, the color response shown depends on the particular patch measured. When a standard is present, delta Density values are shown. If the color filter setting is Auto or Spot, then the color response of the standard is shown.
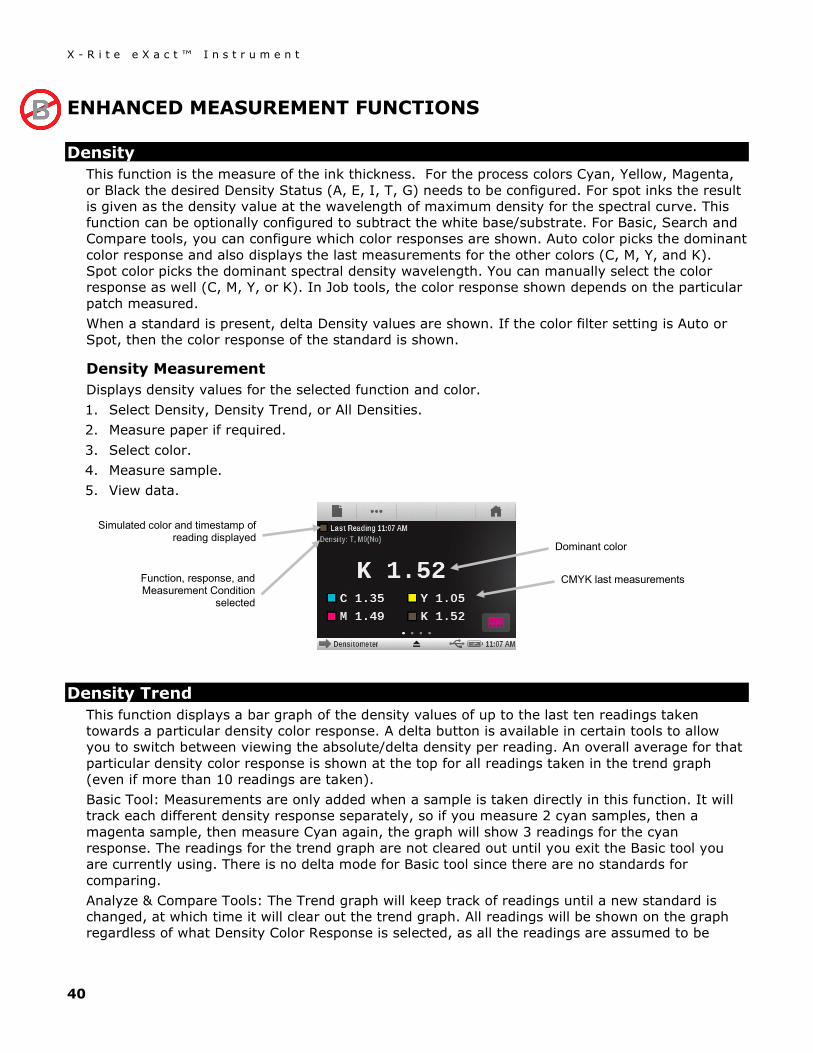
Density Measurement Displays density values for the selected function and color. 1. Select Density, Density Trend, or All Densities. 2. Measure paper if required. 3. Select color. 4. Measure sample. 5. View data.
Density Trend This function displays a bar graph of the density values of up to the last ten readings taken towards a particular density color response. A delta button is available in certain tools to allow you to switch between viewing the absolute/delta density per reading. An overall average for that particular density color response is shown at the top for all readings taken in the trend graph (even if more than 10 readings are taken). Basic Tool: Measurements are only added when a sample is taken directly in this function. It will track each different density response separately, so if you measure 2 cyan samples, then a magenta sample, then measure Cyan again, the graph will show 3 readings for the cyan response. The readings for the trend graph are not cleared out until you exit the Basic tool you are currently using. There is no delta mode for Basic tool since there are no standards for comparing. Analyze & Compare Tools: The Trend graph will keep track of readings until a new standard is changed, at which time it will clear out the trend graph. All readings will be shown on the graph regardless of what Density Color Response is selected, as all the readings are assumed to be
Dominant color
Simulated color and timestamp of reading displayed
Function, response, and Measurement Condition
selected
CMYK last measurements
X - R i t e e X a c t ™ I n s t r u m e n t
41
made against the same patch (same standard). Like the Basic tool, readings will only be added to the trend graph if it’s the current function on screen. Job Tools: All readings will be tracked and remembered for each Patch, even if it’s not the current active function on screen at the time. For example, if Density Trend is one of the active functions for solid patches, any measurement made against a solid patch will be added to the trend graph. Any readings not stored as a sample for the current sheet will be lost from the trend graph if the Job tool is exited completely. (Any stored samples for the current sheet will be restored to their respective trend graphs upon continuation of a job).
All Densities This function displays the density values for the measured sample for all filters (Cyan, Magenta, Yellow and Black). This function can be configured to show additionally the density value at the wavelength of maximum density for the spectral curve.
All Densities Tool Function Tap the All Densities button to select the displayed density values. Options are: CMYK and CMYK+SPOT.
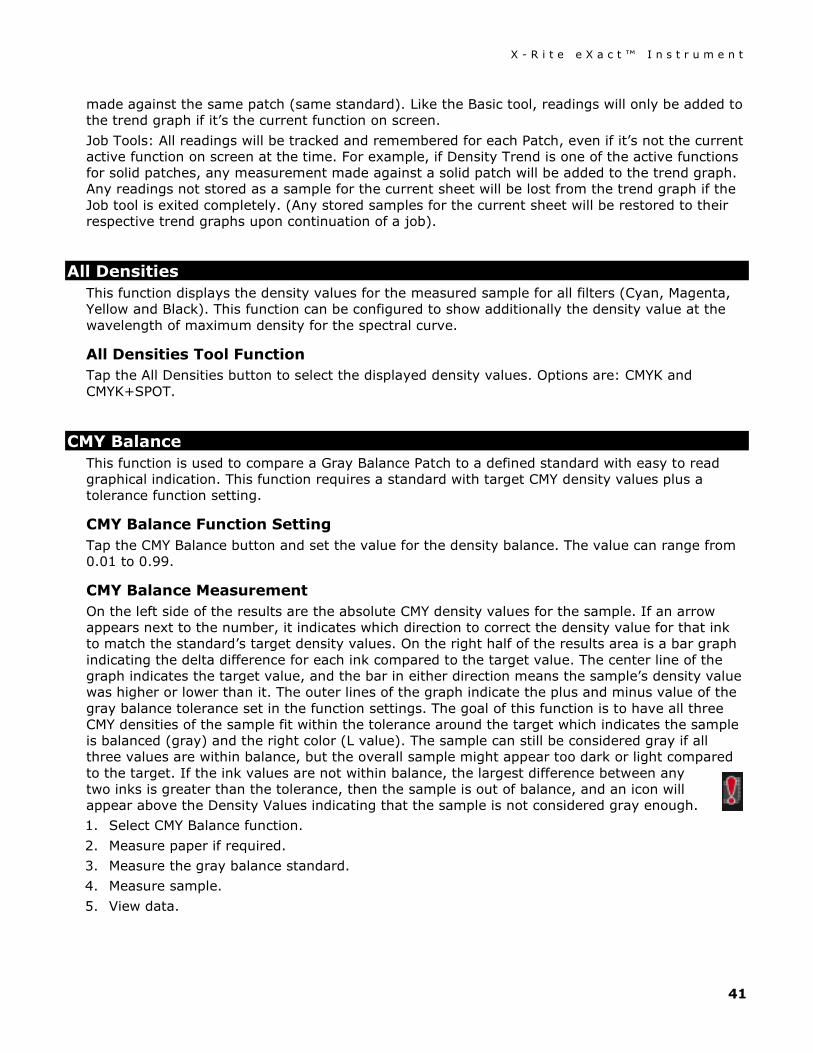
CMY Balance This function is used to compare a Gray Balance Patch to a defined standard with easy to read graphical indication. This function requires a standard with target CMY density values plus a tolerance function setting.
CMY Balance Function Setting Tap the CMY Balance button and set the value for the density balance. The value can range from 0.01 to 0.99.
CMY Balance Measurement On the left side of the results are the absolute CMY density values for the sample. If an arrow appears next to the number, it indicates which direction to correct the density value for that ink to match the standard’s target density values. On the right half of the results area is a bar graph indicating the delta difference for each ink compared to the target value. The center line of the graph indicates the target value, and the bar in either direction means the sample’s density value was higher or lower than it. The outer lines of the graph indicate the plus and minus value of the gray balance tolerance set in the function settings. The goal of this function is to have all three CMY densities of the sample fit within the tolerance around the target which indicates the sample is balanced (gray) and the right color (L value). The sample can still be considered gray if all three values are within balance, but the overall sample might appear too dark or light compared to the target. If the ink values are not within balance, the largest difference between any two inks is greater than the tolerance, then the sample is out of balance, and an icon will appear above the Density Values indicating that the sample is not considered gray enough. 1. Select CMY Balance function. 2. Measure paper if required. 3. Measure the gray balance standard. 4. Measure sample. 5. View data.
X - R i t e e X a c t ™ I n s t r u m e n t
42
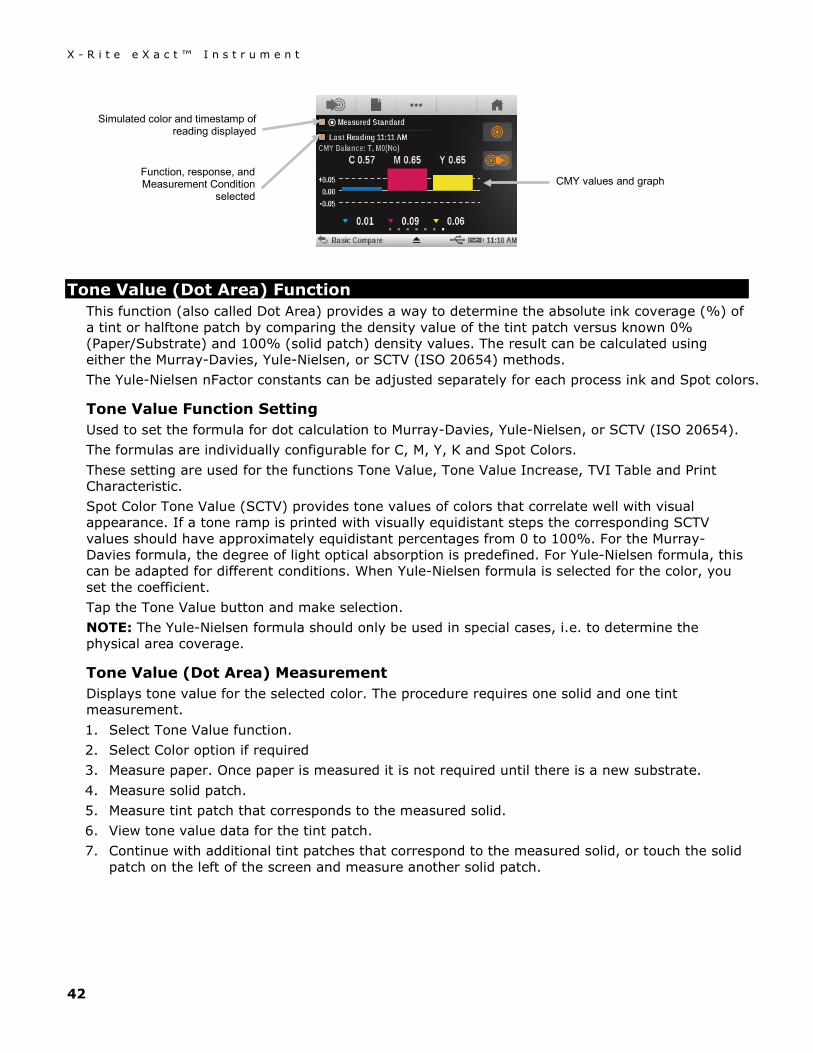
Tone Value (Dot Area) Function This function (also called Dot Area) provides a way to determine the absolute ink coverage (%) of a tint or halftone patch by comparing the density value of the tint patch versus known 0% (Paper/Substrate) and 100% (solid patch) density values. The result can be calculated using either the Murray-Davies, Yule-Nielsen, or SCTV (ISO 20654) methods. The Yule-Nielsen nFactor constants can be adjusted separately for each process ink and Spot colors.
Tone Value Function Setting Used to set the formula for dot calculation to Murray-Davies, Yule-Nielsen, or SCTV (ISO 20654). The formulas are individually configurable for C, M, Y, K and Spot Colors. These setting are used for the functions Tone Value, Tone Value Increase, TVI Table and Print Characteristic. Spot Color Tone Value (SCTV) provides tone values of colors that correlate well with visual appearance. If a tone ramp is printed with visually equidistant steps the corresponding SCTV values should have approximately equidistant percentages from 0 to 100%. For the Murray-Davies formula, the degree of light optical absorption is predefined. For Yule-Nielsen formula, this can be adapted for different conditions. When Yule-Nielsen formula is selected for the color, you set the coefficient. Tap the Tone Value button and make selection. NOTE: The Yule-Nielsen formula should only be used in special cases, i.e. to determine the physical area coverage.
Tone Value (Dot Area) Measurement Displays tone value for the selected color. The procedure requires one solid and one tint measurement. 1. Select Tone Value function. 2. Select Color option if required 3. Measure paper. Once paper is measured it is not required until there is a new substrate. 4. Measure solid patch. 5. Measure tint patch that corresponds to the measured solid. 6. View tone value data for the tint patch. 7. Continue with additional tint patches that correspond to the measured solid, or touch the solid
patch on the left of the screen and measure another solid patch.
CMY values and graph
Simulated color and timestamp of reading displayed
Function, response, and Measurement Condition
selected
X - R i t e e X a c t ™ I n s t r u m e n t
43
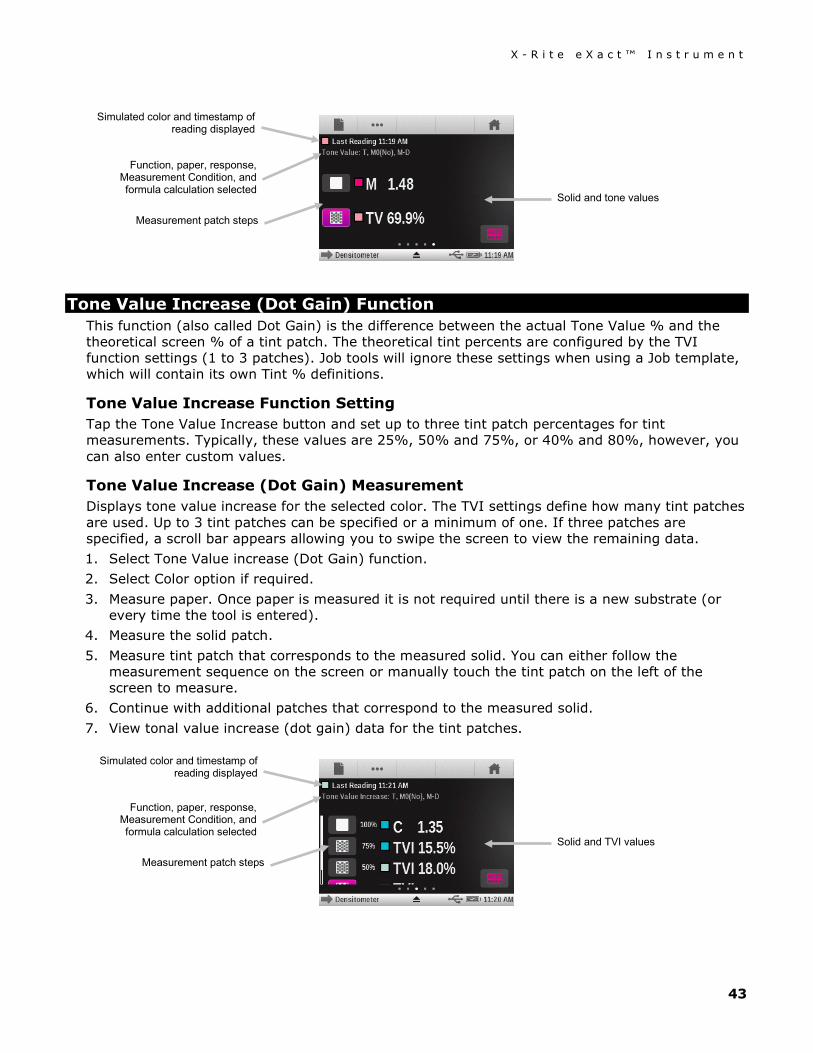
Tone Value Increase (Dot Gain) Function This function (also called Dot Gain) is the difference between the actual Tone Value % and the theoretical screen % of a tint patch. The theoretical tint percents are configured by the TVI function settings (1 to 3 patches). Job tools will ignore these settings when using a Job template, which will contain its own Tint % definitions.
Tone Value Increase Function Setting Tap the Tone Value Increase button and set up to three tint patch percentages for tint measurements. Typically, these values are 25%, 50% and 75%, or 40% and 80%, however, you can also enter custom values.
Tone Value Increase (Dot Gain) Measurement Displays tone value increase for the selected color. The TVI settings define how many tint patches are used. Up to 3 tint patches can be specified or a minimum of one. If three patches are specified, a scroll bar appears allowing you to swipe the screen to view the remaining data. 1. Select Tone Value increase (Dot Gain) function. 2. Select Color option if required. 3. Measure paper. Once paper is measured it is not required until there is a new substrate (or
every time the tool is entered). 4. Measure the solid patch. 5. Measure tint patch that corresponds to the measured solid. You can either follow the
measurement sequence on the screen or manually touch the tint patch on the left of the screen to measure.
6. Continue with additional patches that correspond to the measured solid. 7. View tonal value increase (dot gain) data for the tint patches.
Solid and tone values
Simulated color and timestamp of reading displayed
Function, paper, response, Measurement Condition, and formula calculation selected
Measurement patch steps
Solid and TVI values
Simulated color and timestamp of reading displayed
Function, paper, response, Measurement Condition, and formula calculation selected
Measurement patch steps
X - R i t e e X a c t ™ I n s t r u m e n t
44
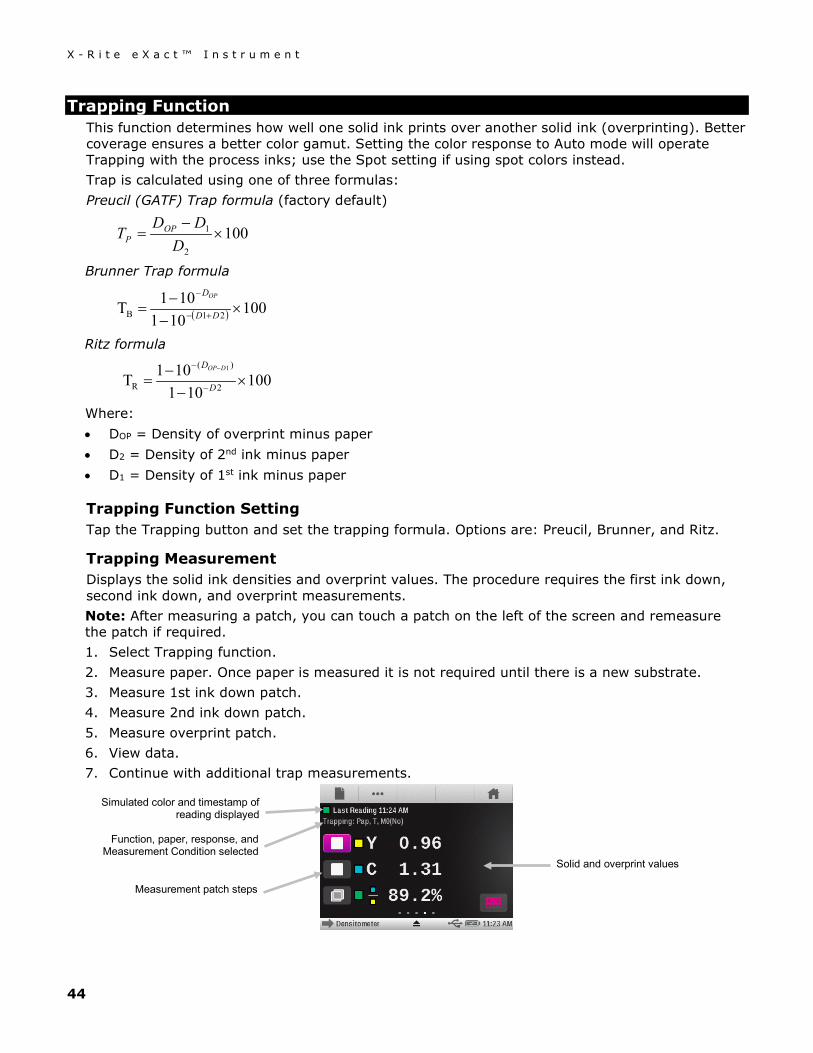
Trapping Function This function determines how well one solid ink prints over another solid ink (overprinting). Better coverage ensures a better color gamut. Setting the color response to Auto mode will operate Trapping with the process inks; use the Spot setting if using spot colors instead. Trap is calculated using one of three formulas: Preucil (GATF) Trap formula (factory default)
1002
1 ×−
=D
DDT OP
P
Brunner Trap formula
( ) 100101
101T 21B ×−
−= +−
−
DD
DOP
Ritz formula
100101
101T 2
)(
R
1
×−
−= −
− −
D
D DOP
Where: • DOP = Density of overprint minus paper • D2 = Density of 2nd ink minus paper • D1 = Density of 1st ink minus paper
Trapping Function Setting Tap the Trapping button and set the trapping formula. Options are: Preucil, Brunner, and Ritz.
Trapping Measurement Displays the solid ink densities and overprint values. The procedure requires the first ink down, second ink down, and overprint measurements. Note: After measuring a patch, you can touch a patch on the left of the screen and remeasure the patch if required. 1. Select Trapping function. 2. Measure paper. Once paper is measured it is not required until there is a new substrate. 3. Measure 1st ink down patch. 4. Measure 2nd ink down patch. 5. Measure overprint patch. 6. View data. 7. Continue with additional trap measurements.
Solid and overprint values
Function, paper, response, and Measurement Condition selected
Measurement patch steps
Simulated color and timestamp of reading displayed
X - R i t e e X a c t ™ I n s t r u m e n t
45
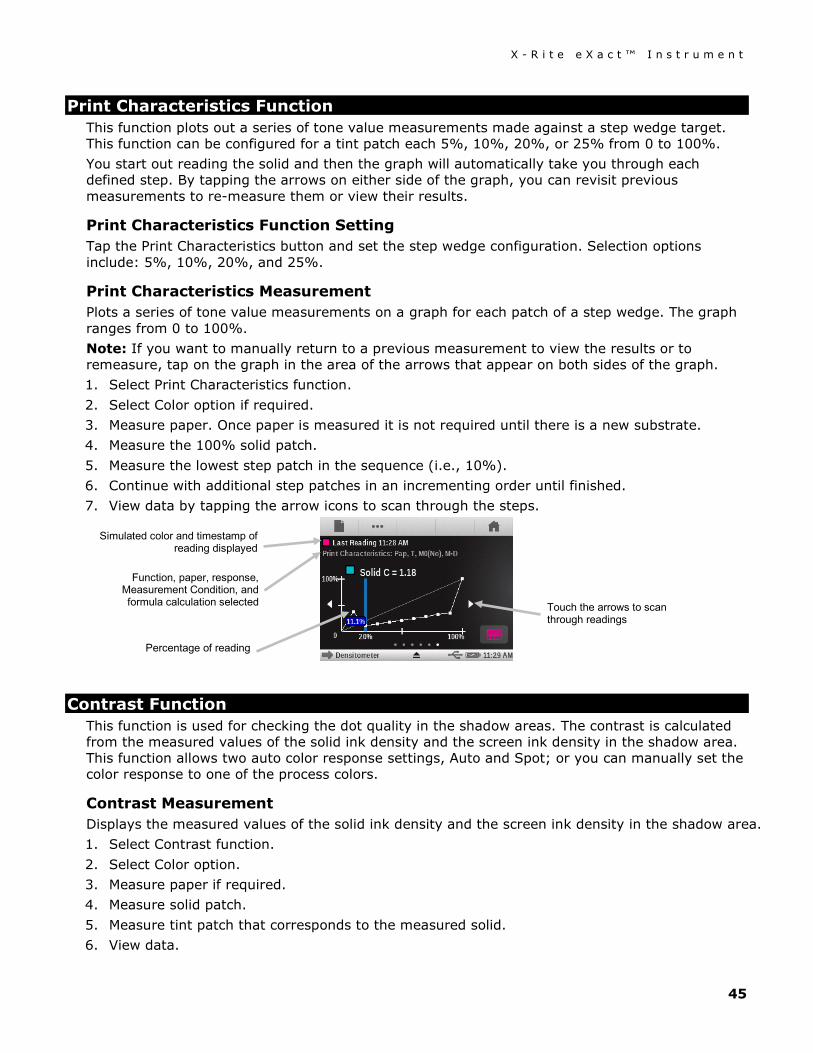
Print Characteristics Function This function plots out a series of tone value measurements made against a step wedge target. This function can be configured for a tint patch each 5%, 10%, 20%, or 25% from 0 to 100%. You start out reading the solid and then the graph will automatically take you through each defined step. By tapping the arrows on either side of the graph, you can revisit previous measurements to re-measure them or view their results.
Print Characteristics Function Setting Tap the Print Characteristics button and set the step wedge configuration. Selection options include: 5%, 10%, 20%, and 25%.
Print Characteristics Measurement Plots a series of tone value measurements on a graph for each patch of a step wedge. The graph ranges from 0 to 100%. Note: If you want to manually return to a previous measurement to view the results or to remeasure, tap on the graph in the area of the arrows that appear on both sides of the graph. 1. Select Print Characteristics function. 2. Select Color option if required. 3. Measure paper. Once paper is measured it is not required until there is a new substrate. 4. Measure the 100% solid patch. 5. Measure the lowest step patch in the sequence (i.e., 10%). 6. Continue with additional step patches in an incrementing order until finished. 7. View data by tapping the arrow icons to scan through the steps.
Contrast Function This function is used for checking the dot quality in the shadow areas. The contrast is calculated from the measured values of the solid ink density and the screen ink density in the shadow area. This function allows two auto color response settings, Auto and Spot; or you can manually set the color response to one of the process colors.
Contrast Measurement Displays the measured values of the solid ink density and the screen ink density in the shadow area. 1. Select Contrast function. 2. Select Color option. 3. Measure paper if required. 4. Measure solid patch. 5. Measure tint patch that corresponds to the measured solid. 6. View data.
Simulated color and timestamp of reading displayed
Function, paper, response, Measurement Condition, and formula calculation selected
Percentage of reading
Touch the arrows to scan through readings
X - R i t e e X a c t ™ I n s t r u m e n t
46
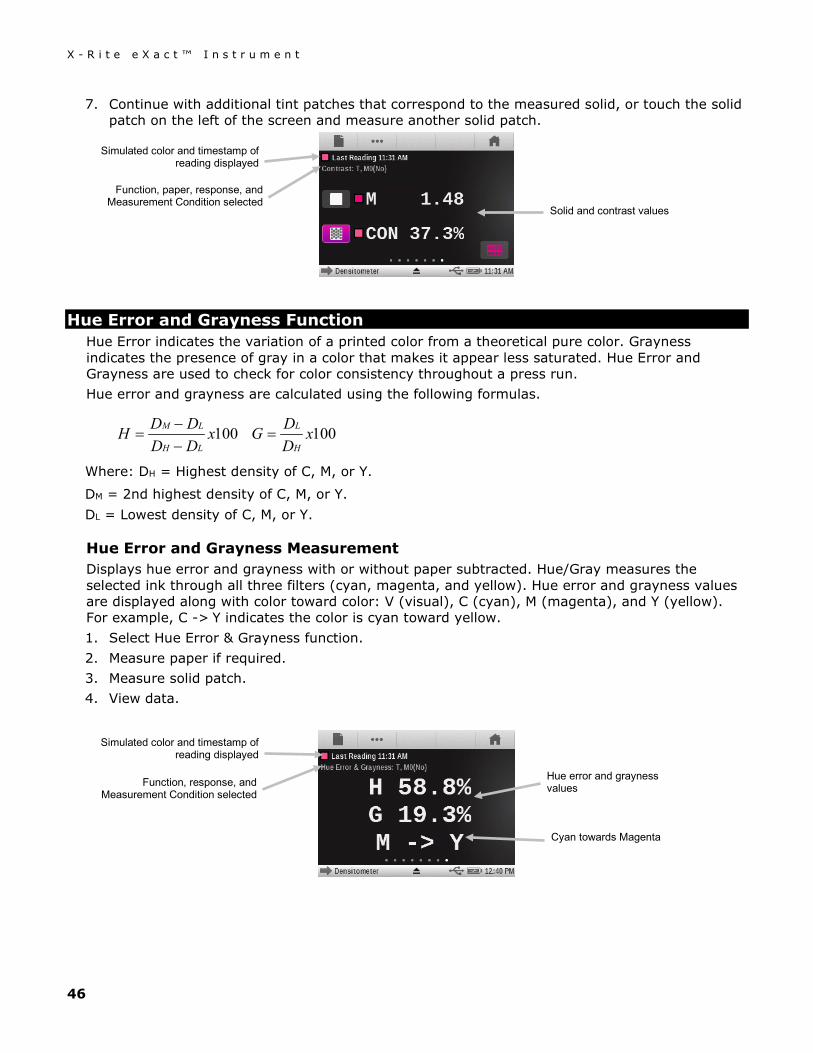
7. Continue with additional tint patches that correspond to the measured solid, or touch the solid patch on the left of the screen and measure another solid patch.
Hue Error and Grayness Function Hue Error indicates the variation of a printed color from a theoretical pure color. Grayness indicates the presence of gray in a color that makes it appear less saturated. Hue Error and Grayness are used to check for color consistency throughout a press run. Hue error and grayness are calculated using the following formulas.
100xDDDDH
LH
LM
−−
= 100xDDG
H
L=
Where: DH = Highest density of C, M, or Y.
DM = 2nd highest density of C, M, or Y. DL = Lowest density of C, M, or Y.
Hue Error and Grayness Measurement Displays hue error and grayness with or without paper subtracted. Hue/Gray measures the selected ink through all three filters (cyan, magenta, and yellow). Hue error and grayness values are displayed along with color toward color: V (visual), C (cyan), M (magenta), and Y (yellow). For example, C -> Y indicates the color is cyan toward yellow. 1. Select Hue Error & Grayness function. 2. Measure paper if required. 3. Measure solid patch. 4. View data.
Simulated color and timestamp of reading displayed
Function, paper, response, and Measurement Condition selected
Solid and contrast values
Simulated color and timestamp of reading displayed
Function, response, and Measurement Condition selected
Hue error and grayness values
Cyan towards Magenta
X - R i t e e X a c t ™ I n s t r u m e n t
47
Colorimetric Functions
CIE L*a*b* This function is derived from the CIE 1931 XYZ color space in an effort to be perceptually uniform. The L* dimension related to Lightness while a*(red/green) and b* (yellow/blue) are for color. Perceptually uniform means that a change of the same amount in a color value should produce a change of about the same visual importance. When a valid standard is present, the delta values will be included along with the delta E type that is configured.
Density & L*a*b* This function allows you to view a density result as well as L*a*b* values in the same results area. The modes (Auto and Spot) will display either the dominant process ink (C, M, Y, or K) or the dominant spectral density response. When a valid standard is present, a Delta/Absolute button will appear that lets you change the results between absolute and delta results of the latest sample.
Density & L*C*h° This function allows you to view a density result as well as L*C*h° values in the same results area. The modes (Auto and Spot) will display either the dominant process ink (C, M, Y, or K) or the dominant spectral density response. When a valid standard is present, a Delta/Absolute button will appear that lets you change the results between absolute and delta results of the latest sample.
CIE L*C*h° This function is a colorspace equivalent to CIEL*a*b*, the main difference is that in L*a*b* the color values are plotted in a Cartesian coordinate system, while L*C*h° is polar coordinate system. L* stays the same, but C* refers to chroma or strength which is the radius and h° is the hue angle. When a valid standard is present, the delta values will be included along with the delta E type that is configured.
CIE XYZ These tristimulus values of a color are the amounts of three primary colors in a three-component additive model needed to match that test color. CIE XYZ serves as the basis from which many other color spaces are defined. Shows delta XYZ values if a valid standard is present.
CIE Yxy This function is directly derived from XYZ values. Y still represents luminance or brightness of a color. The x and y are calculated from the XYZ values to define chromaticity of a color represent normalized values of X and Z. A plot of x and y values for solid and overprint patches can reveal the color gamut that can be achieved. The x and y values are also used as part of other functions for estimating appearances of inks at varying thickness/concentrations. Delta Yxy values are also shown if a valid standard is present.
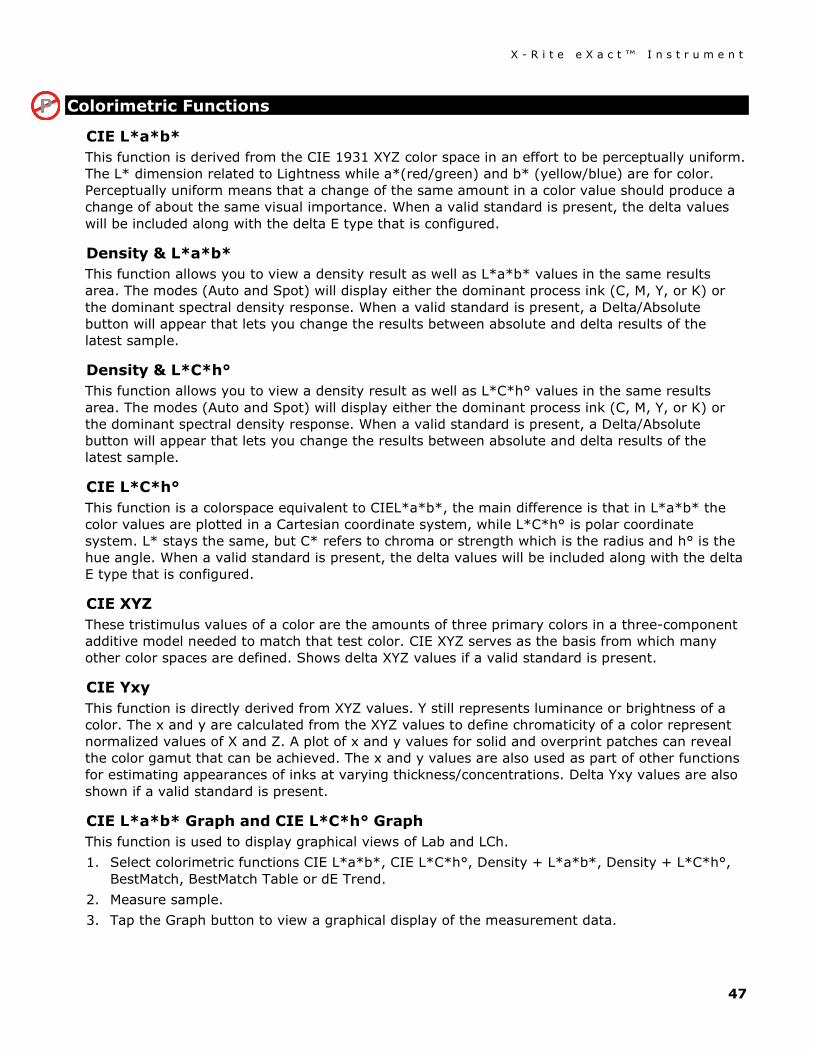
CIE L*a*b* Graph and CIE L*C*h° Graph This function is used to display graphical views of Lab and LCh. 1. Select colorimetric functions CIE L*a*b*, CIE L*C*h°, Density + L*a*b*, Density + L*C*h°,
BestMatch, BestMatch Table or dE Trend. 2. Measure sample. 3. Tap the Graph button to view a graphical display of the measurement data.
X - R i t e e X a c t ™ I n s t r u m e n t
48
For the BestMatch graph, the current view deviation displays as a “black x” and the BestMatch deviation displays as a “green x”.
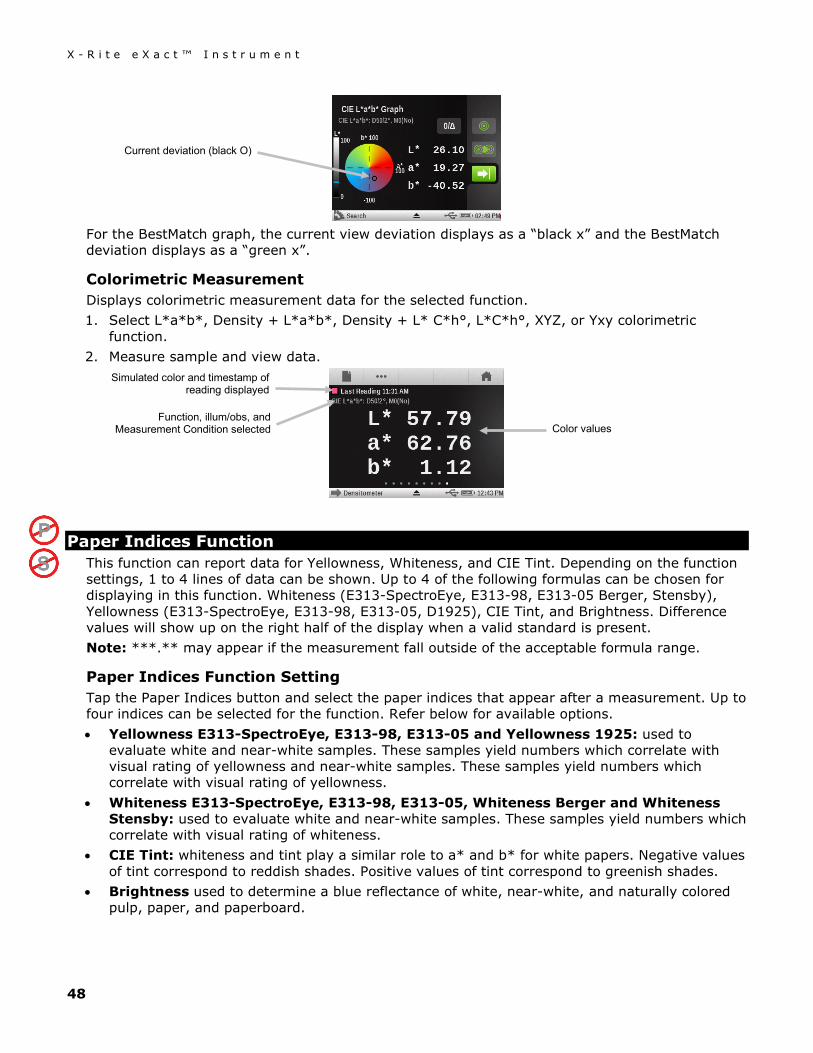
Colorimetric Measurement Displays colorimetric measurement data for the selected function. 1. Select L*a*b*, Density + L*a*b*, Density + L* C*h°, L*C*h°, XYZ, or Yxy colorimetric
function. 2. Measure sample and view data.
Paper Indices Function This function can report data for Yellowness, Whiteness, and CIE Tint. Depending on the function settings, 1 to 4 lines of data can be shown. Up to 4 of the following formulas can be chosen for displaying in this function. Whiteness (E313-SpectroEye, E313-98, E313-05 Berger, Stensby), Yellowness (E313-SpectroEye, E313-98, E313-05, D1925), CIE Tint, and Brightness. Difference values will show up on the right half of the display when a valid standard is present. Note: ***.** may appear if the measurement fall outside of the acceptable formula range.
Paper Indices Function Setting Tap the Paper Indices button and select the paper indices that appear after a measurement. Up to four indices can be selected for the function. Refer below for available options. • Yellowness E313-SpectroEye, E313-98, E313-05 and Yellowness 1925: used to
evaluate white and near-white samples. These samples yield numbers which correlate with visual rating of yellowness and near-white samples. These samples yield numbers which correlate with visual rating of yellowness.
• Whiteness E313-SpectroEye, E313-98, E313-05, Whiteness Berger and Whiteness Stensby: used to evaluate white and near-white samples. These samples yield numbers which correlate with visual rating of whiteness.
• CIE Tint: whiteness and tint play a similar role to a* and b* for white papers. Negative values of tint correspond to reddish shades. Positive values of tint correspond to greenish shades.
• Brightness used to determine a blue reflectance of white, near-white, and naturally colored pulp, paper, and paperboard.
Color values
Simulated color and timestamp of reading displayed
Function, illum/obs, and Measurement Condition selected
Current deviation (black O)

X - R i t e e X a c t ™ I n s t r u m e n t
49
Paper Indices Measurement Paper Indices measurement displays the index value(s) for the measured surface. Up to four indices values can be displayed at one time. 1. Select Paper Indices function. 2. Measure paper sample. 3. View data.
Opacity Function This function is used to determine how opaque a given ink or material is. It looks at how different the luminance (Y from CIEXYZ) of a given sample changes when printed over a white or black substrate. Once the ink is measured over both substrates, the opacity % result is provided (0 = completely transparent, 100% = completely opaque). This function is not available in the Job Tool.
Opacity Measurement The Opacity function displays the percent opacity of a drawn down sample on an opacity card. 1. Measure the sample over the black portion of the opacity card. 2. Measure the sample over the white portion of the opacity card. 3. View data.
Printing Plate Function This function is used to determine the dot area coverage of a tint or halftone patch on a printing plate. The Yule-Nielsen needs to be configured in the function settings.
Printing Plate Function Setting Tap the Printing Plate button and set the plate type (negative or positive) and Yule-Nielson factor that is used to calculate the physical dot area coverage of your printing plate. The factory default value is set at 1.15. The numeric value can range from 0.50 to 9.90.
Function, illum/obs, and Measurement Condition selected Whiteness E313-SE (SpectroEye)
value
Simulated color and timestamp of reading displayed
Function, illum/obs, and Measurement Condition selected
Simulated color and timestamp of reading displayed
Opacity percentage
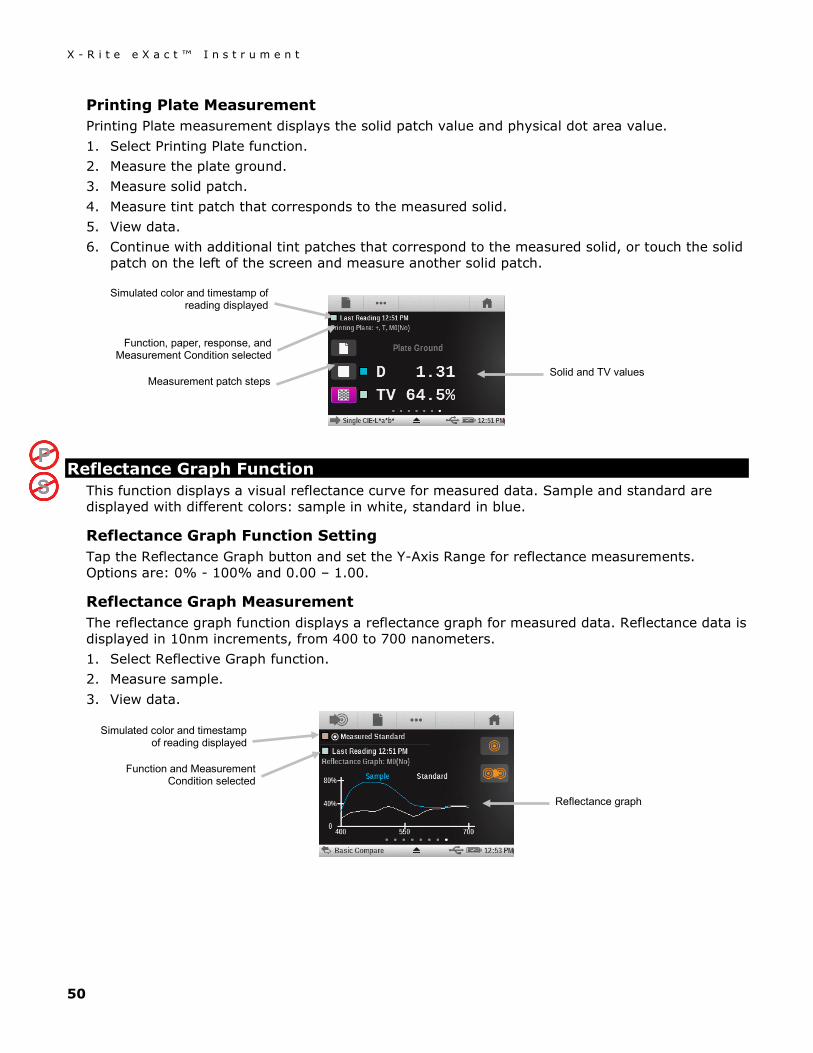
X - R i t e e X a c t ™ I n s t r u m e n t
50
Printing Plate Measurement Printing Plate measurement displays the solid patch value and physical dot area value. 1. Select Printing Plate function. 2. Measure the plate ground. 3. Measure solid patch. 4. Measure tint patch that corresponds to the measured solid. 5. View data. 6. Continue with additional tint patches that correspond to the measured solid, or touch the solid
patch on the left of the screen and measure another solid patch.
Reflectance Graph Function This function displays a visual reflectance curve for measured data. Sample and standard are displayed with different colors: sample in white, standard in blue.
Reflectance Graph Function Setting Tap the Reflectance Graph button and set the Y-Axis Range for reflectance measurements. Options are: 0% - 100% and 0.00 – 1.00.
Reflectance Graph Measurement The reflectance graph function displays a reflectance graph for measured data. Reflectance data is displayed in 10nm increments, from 400 to 700 nanometers. 1. Select Reflective Graph function. 2. Measure sample. 3. View data.
Solid and TV values
Simulated color and timestamp of reading displayed
Function, paper, response, and Measurement Condition selected
Measurement patch steps
Simulated color and timestamp of reading displayed
Function and Measurement Condition selected
Reflectance graph
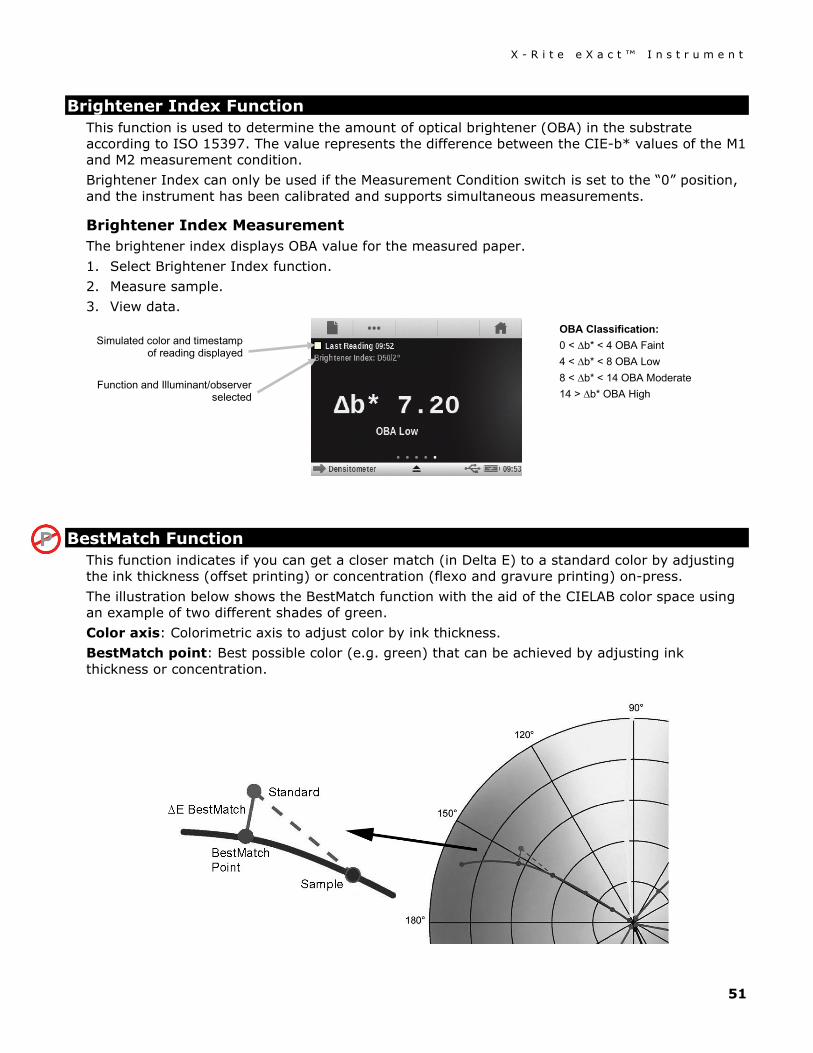
X - R i t e e X a c t ™ I n s t r u m e n t
51
Brightener Index Function This function is used to determine the amount of optical brightener (OBA) in the substrate according to ISO 15397. The value represents the difference between the CIE-b* values of the M1 and M2 measurement condition. Brightener Index can only be used if the Measurement Condition switch is set to the “0” position, and the instrument has been calibrated and supports simultaneous measurements.
Brightener Index Measurement The brightener index displays OBA value for the measured paper. 1. Select Brightener Index function. 2. Measure sample. 3. View data.
BestMatch Function This function indicates if you can get a closer match (in Delta E) to a standard color by adjusting the ink thickness (offset printing) or concentration (flexo and gravure printing) on-press. The illustration below shows the BestMatch function with the aid of the CIELAB color space using an example of two different shades of green. Color axis: Colorimetric axis to adjust color by ink thickness. BestMatch point: Best possible color (e.g. green) that can be achieved by adjusting ink thickness or concentration.
Simulated color and timestamp of reading displayed
Function and Illuminant/observer selected
OBA Classification: 0 < ∆b* < 4 OBA Faint 4 < ∆b* < 8 OBA Low 8 < ∆b* < 14 OBA Moderate 14 > ∆b* OBA High
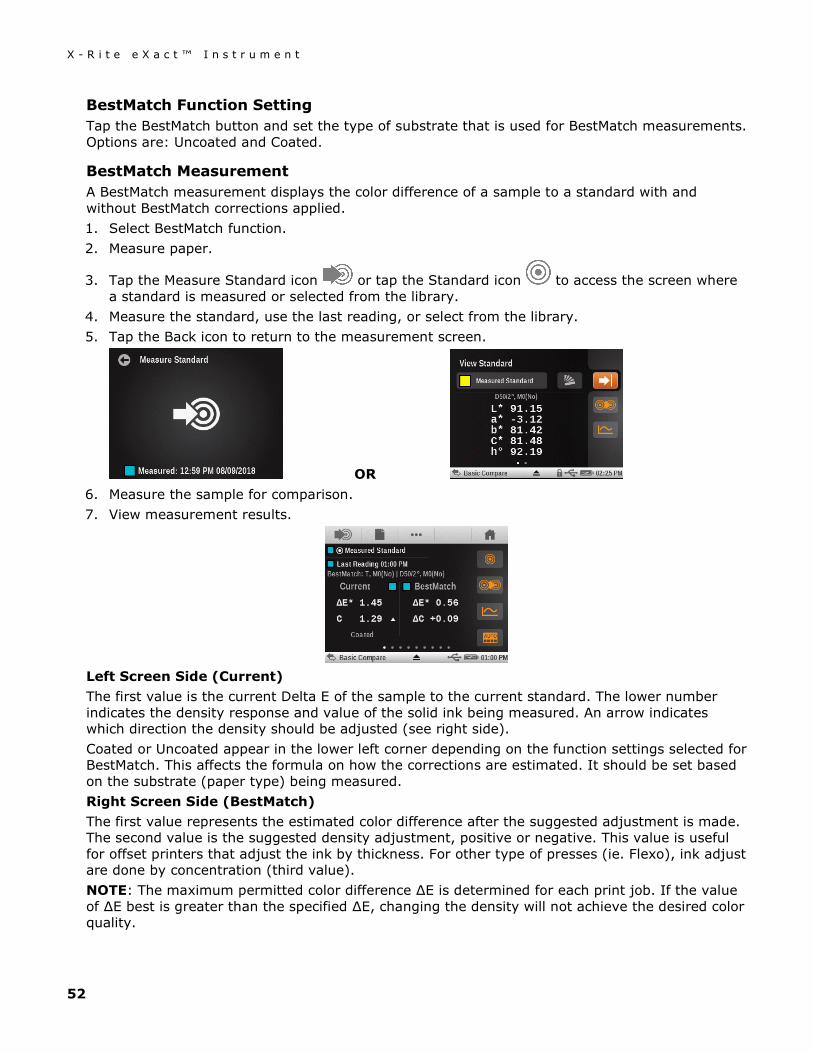
X - R i t e e X a c t ™ I n s t r u m e n t
52
BestMatch Function Setting Tap the BestMatch button and set the type of substrate that is used for BestMatch measurements. Options are: Uncoated and Coated.
BestMatch Measurement A BestMatch measurement displays the color difference of a sample to a standard with and without BestMatch corrections applied. 1. Select BestMatch function. 2. Measure paper.
3. Tap the Measure Standard icon or tap the Standard icon to access the screen where a standard is measured or selected from the library.
4. Measure the standard, use the last reading, or select from the library. 5. Tap the Back icon to return to the measurement screen.
OR 6. Measure the sample for comparison. 7. View measurement results.
Left Screen Side (Current) The first value is the current Delta E of the sample to the current standard. The lower number indicates the density response and value of the solid ink being measured. An arrow indicates which direction the density should be adjusted (see right side). Coated or Uncoated appear in the lower left corner depending on the function settings selected for BestMatch. This affects the formula on how the corrections are estimated. It should be set based on the substrate (paper type) being measured. Right Screen Side (BestMatch) The first value represents the estimated color difference after the suggested adjustment is made. The second value is the suggested density adjustment, positive or negative. This value is useful for offset printers that adjust the ink by thickness. For other type of presses (ie. Flexo), ink adjust are done by concentration (third value). NOTE: The maximum permitted color difference ∆E is determined for each print job. If the value of ∆E best is greater than the specified ∆E, changing the density will not achieve the desired color quality.
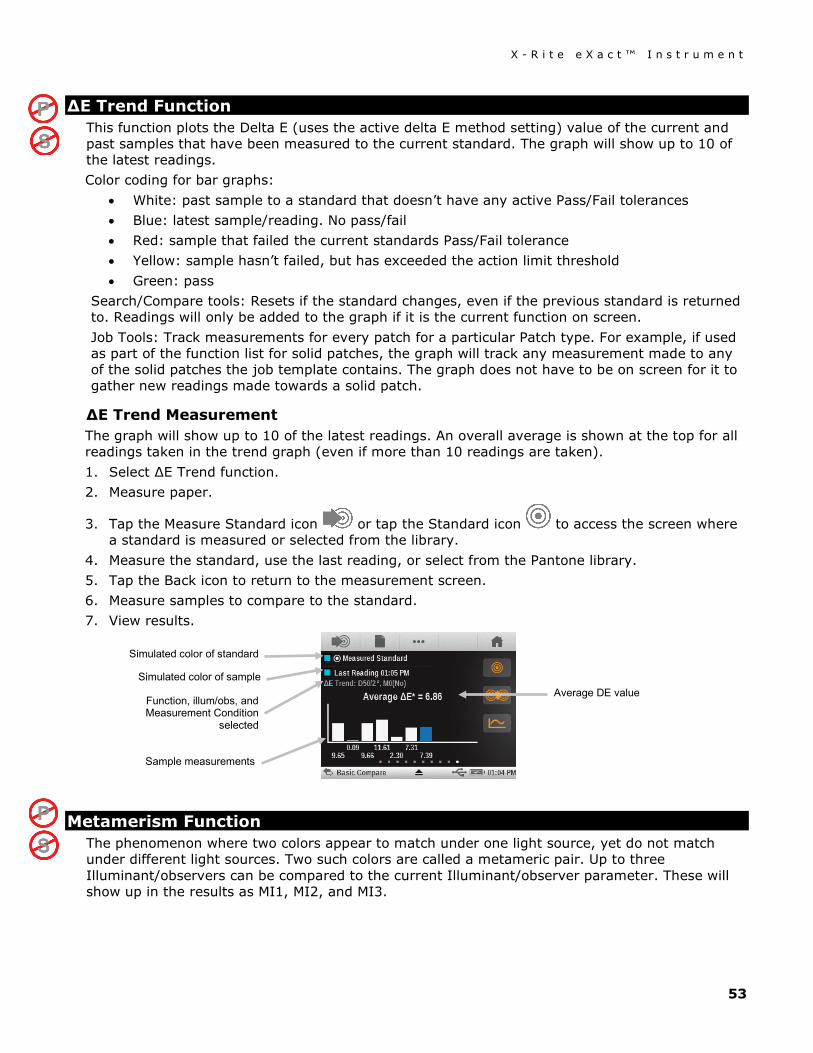
X - R i t e e X a c t ™ I n s t r u m e n t
53
∆E Trend Function This function plots the Delta E (uses the active delta E method setting) value of the current and past samples that have been measured to the current standard. The graph will show up to 10 of the latest readings. Color coding for bar graphs:
• White: past sample to a standard that doesn’t have any active Pass/Fail tolerances • Blue: latest sample/reading. No pass/fail • Red: sample that failed the current standards Pass/Fail tolerance • Yellow: sample hasn’t failed, but has exceeded the action limit threshold • Green: pass
Search/Compare tools: Resets if the standard changes, even if the previous standard is returned to. Readings will only be added to the graph if it is the current function on screen. Job Tools: Track measurements for every patch for a particular Patch type. For example, if used as part of the function list for solid patches, the graph will track any measurement made to any of the solid patches the job template contains. The graph does not have to be on screen for it to gather new readings made towards a solid patch.
∆E Trend Measurement The graph will show up to 10 of the latest readings. An overall average is shown at the top for all readings taken in the trend graph (even if more than 10 readings are taken). 1. Select ∆E Trend function. 2. Measure paper.
3. Tap the Measure Standard icon or tap the Standard icon to access the screen where a standard is measured or selected from the library.
4. Measure the standard, use the last reading, or select from the Pantone library. 5. Tap the Back icon to return to the measurement screen. 6. Measure samples to compare to the standard. 7. View results.
Metamerism Function The phenomenon where two colors appear to match under one light source, yet do not match under different light sources. Two such colors are called a metameric pair. Up to three Illuminant/observers can be compared to the current Illuminant/observer parameter. These will show up in the results as MI1, MI2, and MI3.
Average DE value
Simulated color of standard
Function, illum/obs, and Measurement Condition
selected
Simulated color of sample
Sample measurements
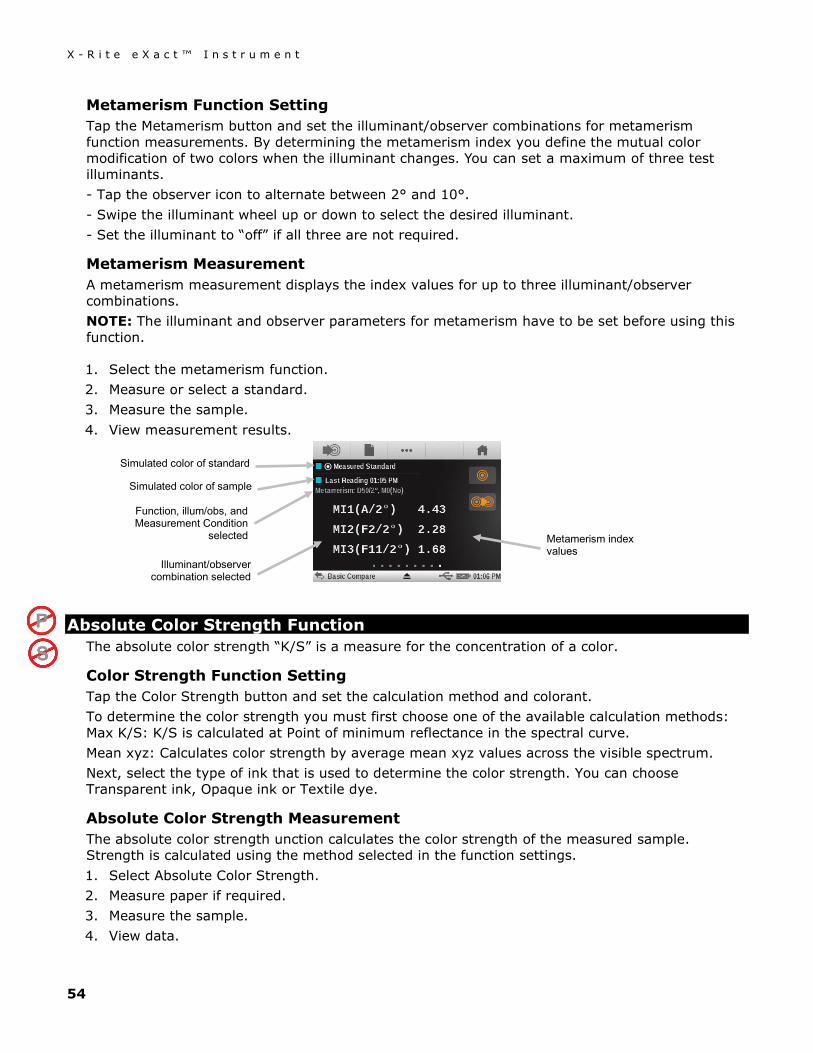
X - R i t e e X a c t ™ I n s t r u m e n t
54
Metamerism Function Setting Tap the Metamerism button and set the illuminant/observer combinations for metamerism function measurements. By determining the metamerism index you define the mutual color modification of two colors when the illuminant changes. You can set a maximum of three test illuminants. - Tap the observer icon to alternate between 2° and 10°. - Swipe the illuminant wheel up or down to select the desired illuminant. - Set the illuminant to “off” if all three are not required.
Metamerism Measurement A metamerism measurement displays the index values for up to three illuminant/observer combinations. NOTE: The illuminant and observer parameters for metamerism have to be set before using this function.
1. Select the metamerism function. 2. Measure or select a standard. 3. Measure the sample. 4. View measurement results.
Absolute Color Strength Function The absolute color strength “K/S” is a measure for the concentration of a color.
Color Strength Function Setting Tap the Color Strength button and set the calculation method and colorant. To determine the color strength you must first choose one of the available calculation methods: Max K/S: K/S is calculated at Point of minimum reflectance in the spectral curve. Mean xyz: Calculates color strength by average mean xyz values across the visible spectrum. Next, select the type of ink that is used to determine the color strength. You can choose Transparent ink, Opaque ink or Textile dye.
Absolute Color Strength Measurement The absolute color strength unction calculates the color strength of the measured sample. Strength is calculated using the method selected in the function settings. 1. Select Absolute Color Strength. 2. Measure paper if required. 3. Measure the sample. 4. View data.
Simulated color of standard
Function, illum/obs, and Measurement Condition
selected
Simulated color of sample
Illuminant/observer combination selected
Metamerism index values

X - R i t e e X a c t ™ I n s t r u m e n t
55
Relative Color Strength Function The relative color strength "DS" is a measure which compares the concentration of a color with the concentration of a standard. DS is the ratio between the absolute color strength K/S of a sample and the absolute color strength K/S of the standard color. The relative color strength DS indicates the extent to which a color is concentrated in comparison with the standard color. If for example DS = 50% means that the sample color is only half as concentrated as the standard color. Depending on the circumstances, different formulas can be selected for the calculation of the absolute color strength K/S. For transparent inks, the sample color must be applied in an equally thick layer as the standard color. Only in this way can a statement be made regarding the color concentration. Concentration (conc) indicates the extent to which a color should be concentrated to correspond as accurately as possible to the standard. Residual color difference (rsΔE) is used to investigate whether the sample is actually the same as the standard. It compensates the sample to the concentration of the standard and calculates a CIE delta E76 to it. This function requires a valid standard so it cannot be used in the Basic Tool.
Color Strength Function Settings See Color Strength Function Settings for the Absolute Color Strength Function description.
Relative Color Strength Measurement 1. Select Relative Color Strength. 2. Measure paper if required. 3. Select or measure a standard. 4. Measure the sample. 5. View data.
Color strength
Concentration value
Residual color difference value
Simulated color of standard
Function, illum/obs, and Measurement Condition
selected
Simulated color of sample
K/S value at wavelength
Function, illum/obs, and Measurement Condition selected K/S value at wavelength
Simulated color and timestamp of reading displayed
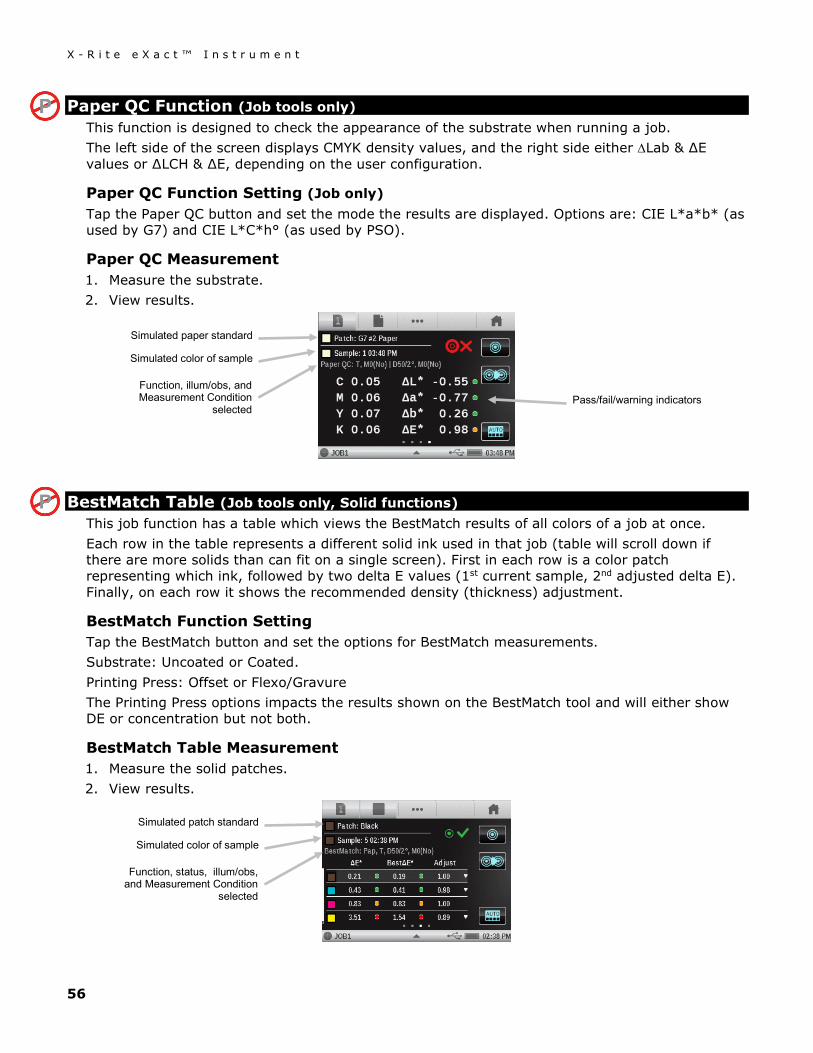
X - R i t e e X a c t ™ I n s t r u m e n t
56
Paper QC Function (Job tools only) This function is designed to check the appearance of the substrate when running a job. The left side of the screen displays CMYK density values, and the right side either ∆Lab & ∆E values or ∆LCH & ∆E, depending on the user configuration.
Paper QC Function Setting (Job only) Tap the Paper QC button and set the mode the results are displayed. Options are: CIE L*a*b* (as used by G7) and CIE L*C*h° (as used by PSO).
Paper QC Measurement 1. Measure the substrate. 2. View results.
BestMatch Table (Job tools only, Solid functions) This job function has a table which views the BestMatch results of all colors of a job at once. Each row in the table represents a different solid ink used in that job (table will scroll down if there are more solids than can fit on a single screen). First in each row is a color patch representing which ink, followed by two delta E values (1st current sample, 2nd adjusted delta E). Finally, on each row it shows the recommended density (thickness) adjustment.
BestMatch Function Setting Tap the BestMatch button and set the options for BestMatch measurements. Substrate: Uncoated or Coated. Printing Press: Offset or Flexo/Gravure The Printing Press options impacts the results shown on the BestMatch tool and will either show DE or concentration but not both.
BestMatch Table Measurement 1. Measure the solid patches. 2. View results.
Simulated paper standard
Function, illum/obs, and Measurement Condition
selected
Simulated color of sample
Pass/fail/warning indicators
Simulated patch standard
Function, status, illum/obs, and Measurement Condition
selected
Simulated color of sample
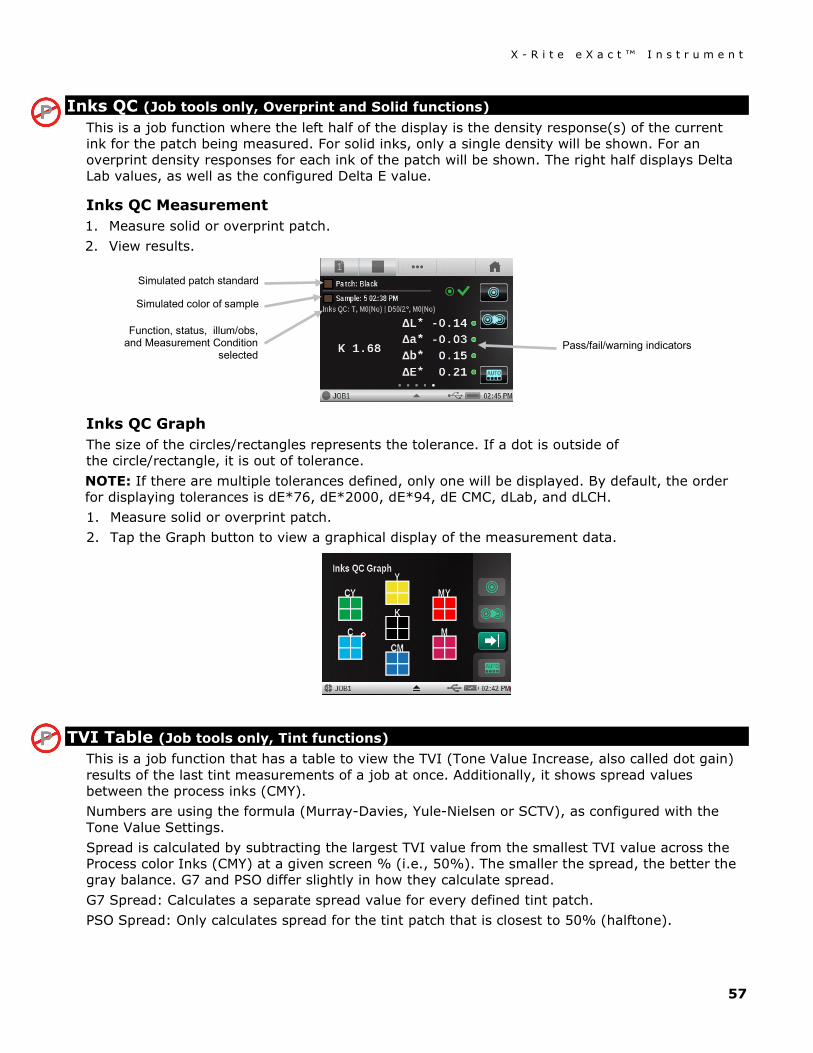
X - R i t e e X a c t ™ I n s t r u m e n t
57
Inks QC (Job tools only, Overprint and Solid functions) This is a job function where the left half of the display is the density response(s) of the current ink for the patch being measured. For solid inks, only a single density will be shown. For an overprint density responses for each ink of the patch will be shown. The right half displays Delta Lab values, as well as the configured Delta E value.
Inks QC Measurement 1. Measure solid or overprint patch. 2. View results.
Inks QC Graph The size of the circles/rectangles represents the tolerance. If a dot is outside of the circle/rectangle, it is out of tolerance. NOTE: If there are multiple tolerances defined, only one will be displayed. By default, the order for displaying tolerances is dE*76, dE*2000, dE*94, dE CMC, dLab, and dLCH. 1. Measure solid or overprint patch. 2. Tap the Graph button to view a graphical display of the measurement data.
TVI Table (Job tools only, Tint functions) This is a job function that has a table to view the TVI (Tone Value Increase, also called dot gain) results of the last tint measurements of a job at once. Additionally, it shows spread values between the process inks (CMY). Numbers are using the formula (Murray-Davies, Yule-Nielsen or SCTV), as configured with the Tone Value Settings. Spread is calculated by subtracting the largest TVI value from the smallest TVI value across the Process color Inks (CMY) at a given screen % (i.e., 50%). The smaller the spread, the better the gray balance. G7 and PSO differ slightly in how they calculate spread. G7 Spread: Calculates a separate spread value for every defined tint patch. PSO Spread: Only calculates spread for the tint patch that is closest to 50% (halftone).
Simulated patch standard
Function, status, illum/obs, and Measurement Condition
selected
Simulated color of sample
Pass/fail/warning indicators
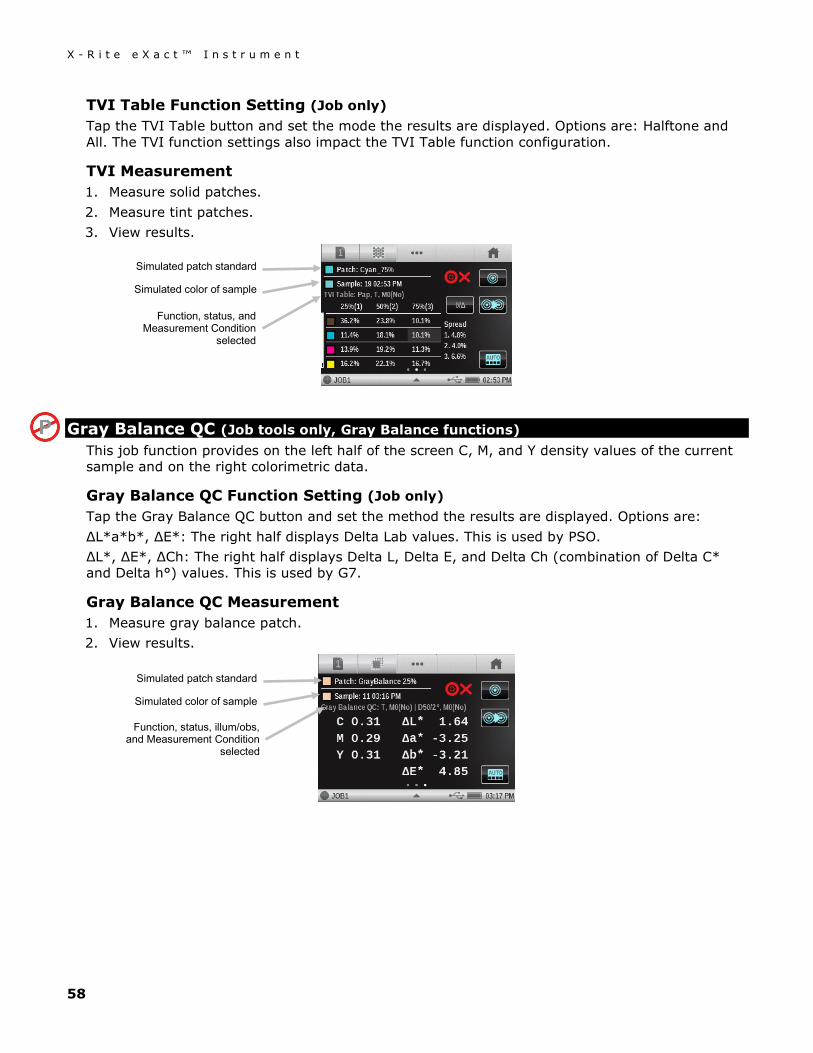
X - R i t e e X a c t ™ I n s t r u m e n t
58
TVI Table Function Setting (Job only) Tap the TVI Table button and set the mode the results are displayed. Options are: Halftone and All. The TVI function settings also impact the TVI Table function configuration.
TVI Measurement 1. Measure solid patches. 2. Measure tint patches. 3. View results.
Gray Balance QC (Job tools only, Gray Balance functions) This job function provides on the left half of the screen C, M, and Y density values of the current sample and on the right colorimetric data.
Gray Balance QC Function Setting (Job only) Tap the Gray Balance QC button and set the method the results are displayed. Options are: ΔL*a*b*, ΔE*: The right half displays Delta Lab values. This is used by PSO. ΔL*, ΔE*, ΔCh: The right half displays Delta L, Delta E, and Delta Ch (combination of Delta C* and Delta h°) values. This is used by G7.
Gray Balance QC Measurement 1. Measure gray balance patch. 2. View results.
Simulated patch standard
Function, status, and Measurement Condition
selected
Simulated color of sample
Simulated patch standard
Function, status, illum/obs, and Measurement Condition
selected
Simulated color of sample
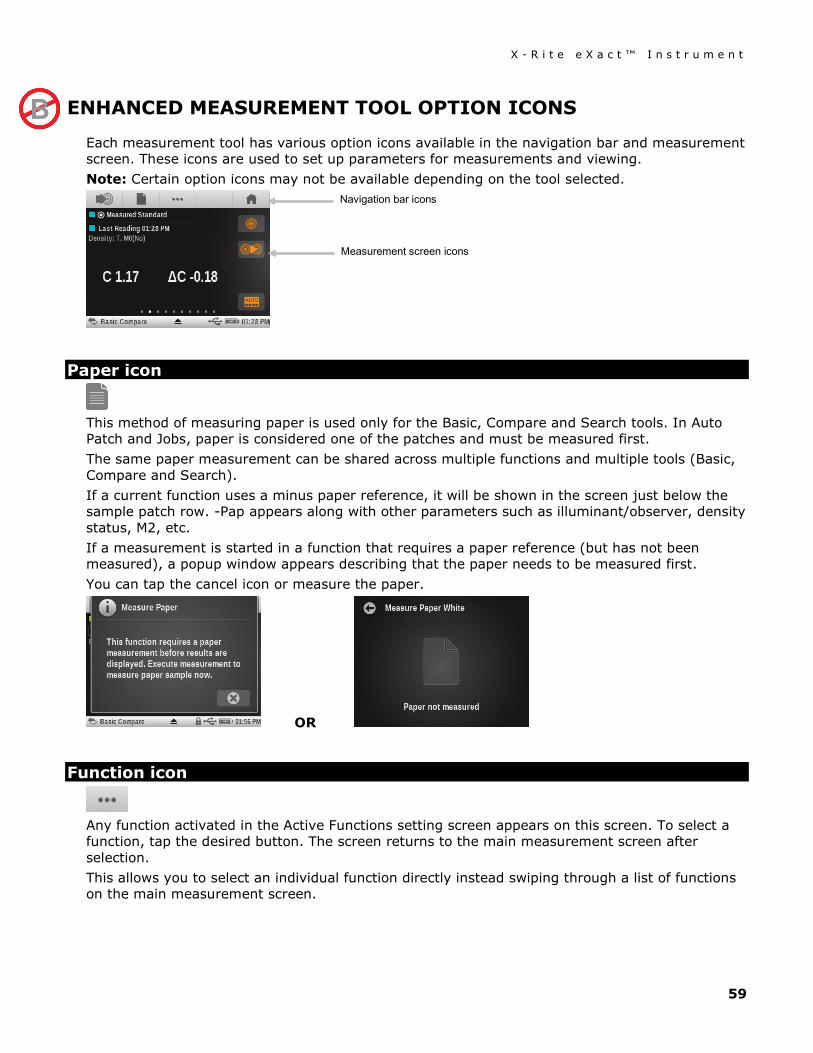
X - R i t e e X a c t ™ I n s t r u m e n t
59
ENHANCED MEASUREMENT TOOL OPTION ICONS
Each measurement tool has various option icons available in the navigation bar and measurement screen. These icons are used to set up parameters for measurements and viewing. Note: Certain option icons may not be available depending on the tool selected.
Paper icon
This method of measuring paper is used only for the Basic, Compare and Search tools. In Auto Patch and Jobs, paper is considered one of the patches and must be measured first. The same paper measurement can be shared across multiple functions and multiple tools (Basic, Compare and Search). If a current function uses a minus paper reference, it will be shown in the screen just below the sample patch row. -Pap appears along with other parameters such as illuminant/observer, density status, M2, etc. If a measurement is started in a function that requires a paper reference (but has not been measured), a popup window appears describing that the paper needs to be measured first. You can tap the cancel icon or measure the paper.
OR
Function icon
Any function activated in the Active Functions setting screen appears on this screen. To select a function, tap the desired button. The screen returns to the main measurement screen after selection. This allows you to select an individual function directly instead swiping through a list of functions on the main measurement screen.
Navigation bar icons
Measurement screen icons
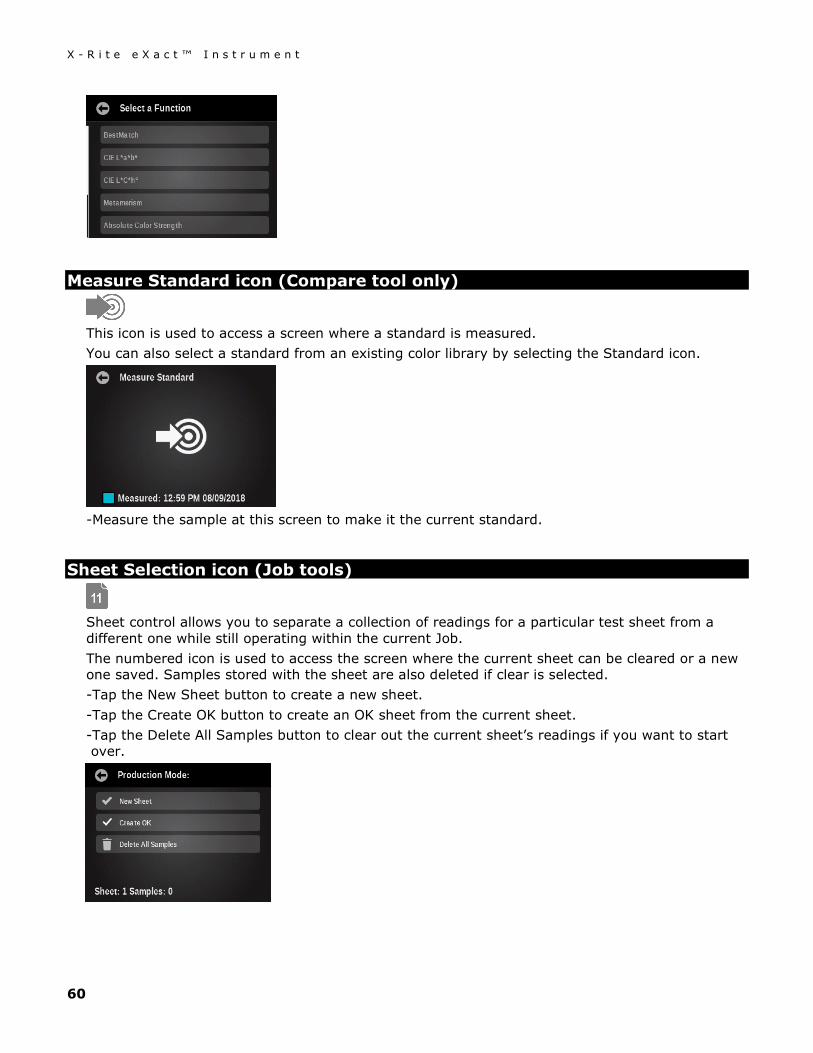
X - R i t e e X a c t ™ I n s t r u m e n t
60
Measure Standard icon (Compare tool only)
This icon is used to access a screen where a standard is measured. You can also select a standard from an existing color library by selecting the Standard icon.
-Measure the sample at this screen to make it the current standard.
Sheet Selection icon (Job tools)
Sheet control allows you to separate a collection of readings for a particular test sheet from a different one while still operating within the current Job. The numbered icon is used to access the screen where the current sheet can be cleared or a new one saved. Samples stored with the sheet are also deleted if clear is selected. -Tap the New Sheet button to create a new sheet. -Tap the Create OK button to create an OK sheet from the current sheet. -Tap the Delete All Samples button to clear out the current sheet’s readings if you want to start over.
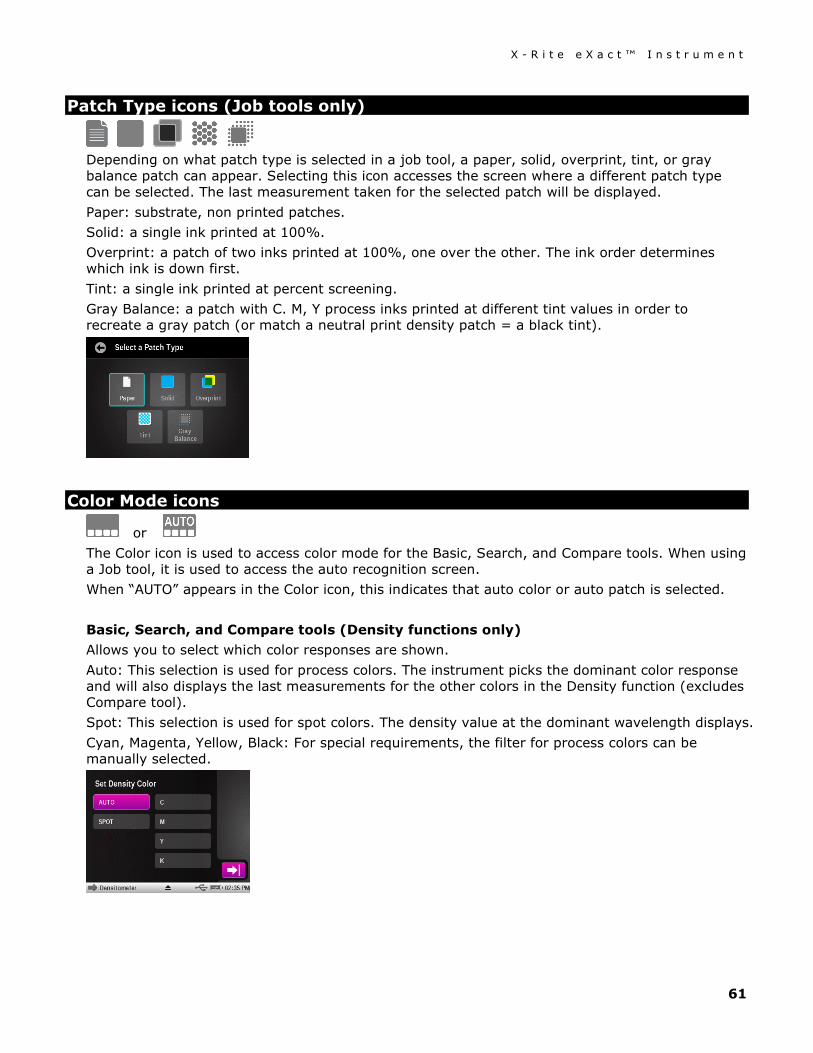
X - R i t e e X a c t ™ I n s t r u m e n t
61
Patch Type icons (Job tools only)
Depending on what patch type is selected in a job tool, a paper, solid, overprint, tint, or gray balance patch can appear. Selecting this icon accesses the screen where a different patch type can be selected. The last measurement taken for the selected patch will be displayed. Paper: substrate, non printed patches. Solid: a single ink printed at 100%. Overprint: a patch of two inks printed at 100%, one over the other. The ink order determines which ink is down first. Tint: a single ink printed at percent screening. Gray Balance: a patch with C. M, Y process inks printed at different tint values in order to recreate a gray patch (or match a neutral print density patch = a black tint).
Color Mode icons
or The Color icon is used to access color mode for the Basic, Search, and Compare tools. When using a Job tool, it is used to access the auto recognition screen. When “AUTO” appears in the Color icon, this indicates that auto color or auto patch is selected. Basic, Search, and Compare tools (Density functions only) Allows you to select which color responses are shown. Auto: This selection is used for process colors. The instrument picks the dominant color response and will also displays the last measurements for the other colors in the Density function (excludes Compare tool). Spot: This selection is used for spot colors. The density value at the dominant wavelength displays. Cyan, Magenta, Yellow, Black: For special requirements, the filter for process colors can be manually selected.
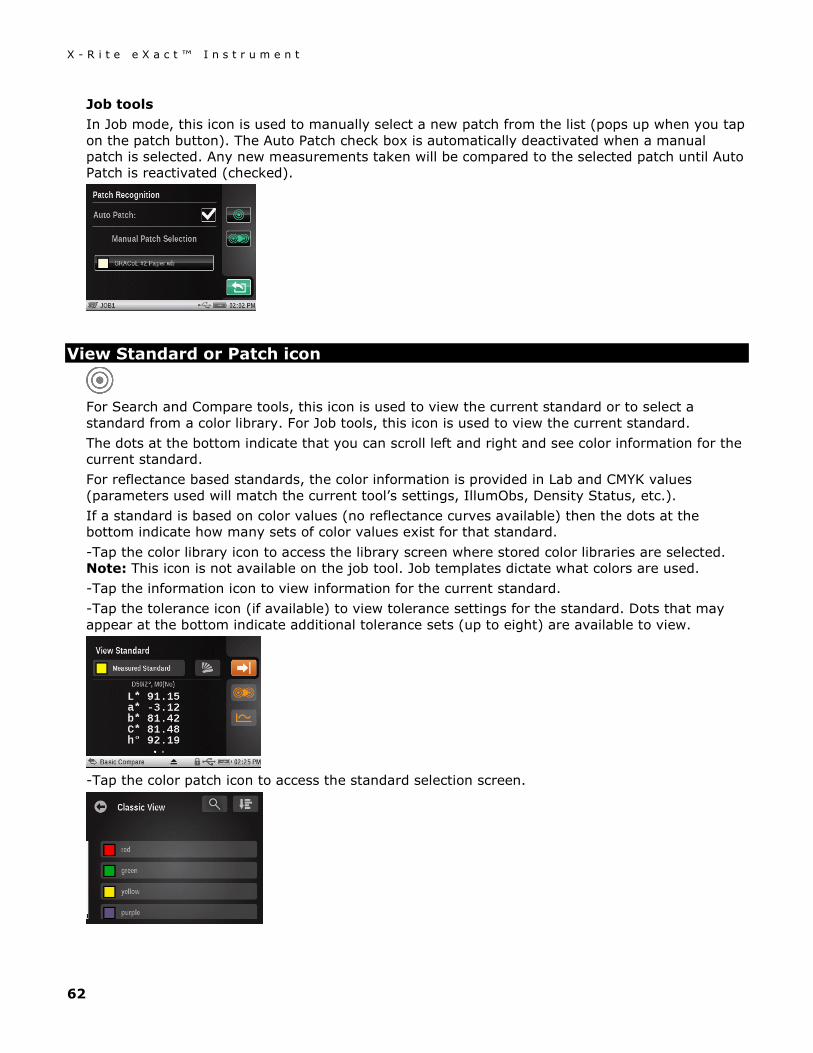
X - R i t e e X a c t ™ I n s t r u m e n t
62
Job tools In Job mode, this icon is used to manually select a new patch from the list (pops up when you tap on the patch button). The Auto Patch check box is automatically deactivated when a manual patch is selected. Any new measurements taken will be compared to the selected patch until Auto Patch is reactivated (checked).
View Standard or Patch icon
For Search and Compare tools, this icon is used to view the current standard or to select a standard from a color library. For Job tools, this icon is used to view the current standard. The dots at the bottom indicate that you can scroll left and right and see color information for the current standard. For reflectance based standards, the color information is provided in Lab and CMYK values (parameters used will match the current tool’s settings, IllumObs, Density Status, etc.). If a standard is based on color values (no reflectance curves available) then the dots at the bottom indicate how many sets of color values exist for that standard. -Tap the color library icon to access the library screen where stored color libraries are selected. Note: This icon is not available on the job tool. Job templates dictate what colors are used. -Tap the information icon to view information for the current standard. -Tap the tolerance icon (if available) to view tolerance settings for the standard. Dots that may appear at the bottom indicate additional tolerance sets (up to eight) are available to view.
-Tap the color patch icon to access the standard selection screen.
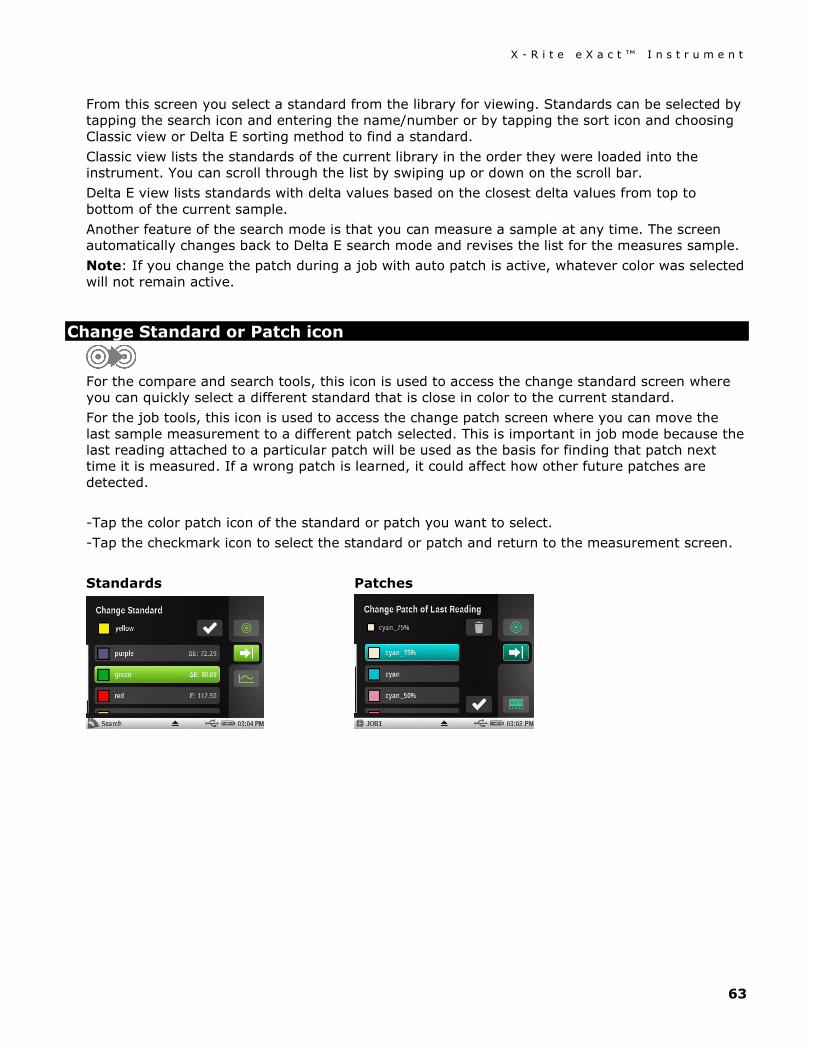
X - R i t e e X a c t ™ I n s t r u m e n t
63
From this screen you select a standard from the library for viewing. Standards can be selected by tapping the search icon and entering the name/number or by tapping the sort icon and choosing Classic view or Delta E sorting method to find a standard. Classic view lists the standards of the current library in the order they were loaded into the instrument. You can scroll through the list by swiping up or down on the scroll bar. Delta E view lists standards with delta values based on the closest delta values from top to bottom of the current sample. Another feature of the search mode is that you can measure a sample at any time. The screen automatically changes back to Delta E search mode and revises the list for the measures sample. Note: If you change the patch during a job with auto patch is active, whatever color was selected will not remain active.
Change Standard or Patch icon
For the compare and search tools, this icon is used to access the change standard screen where you can quickly select a different standard that is close in color to the current standard. For the job tools, this icon is used to access the change patch screen where you can move the last sample measurement to a different patch selected. This is important in job mode because the last reading attached to a particular patch will be used as the basis for finding that patch next time it is measured. If a wrong patch is learned, it could affect how other future patches are detected. -Tap the color patch icon of the standard or patch you want to select. -Tap the checkmark icon to select the standard or patch and return to the measurement screen. Standards Patches
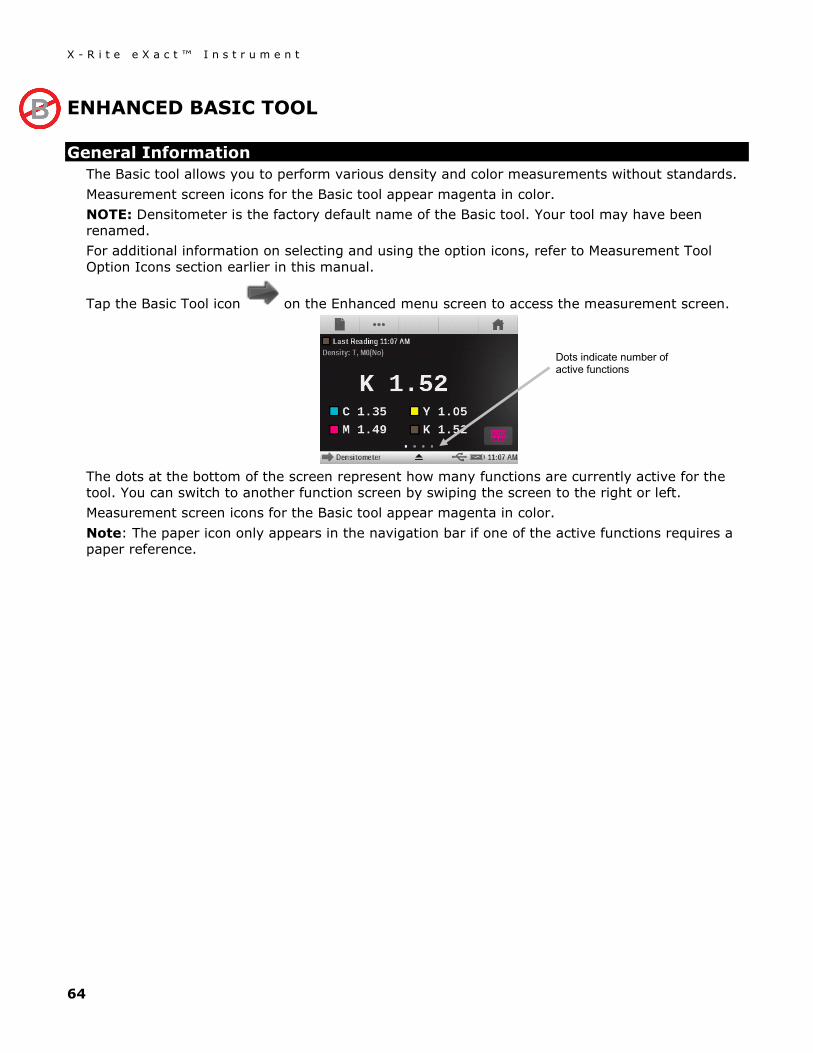
X - R i t e e X a c t ™ I n s t r u m e n t
64
ENHANCED BASIC TOOL
General Information The Basic tool allows you to perform various density and color measurements without standards. Measurement screen icons for the Basic tool appear magenta in color. NOTE: Densitometer is the factory default name of the Basic tool. Your tool may have been renamed. For additional information on selecting and using the option icons, refer to Measurement Tool Option Icons section earlier in this manual.
Tap the Basic Tool icon on the Enhanced menu screen to access the measurement screen.
The dots at the bottom of the screen represent how many functions are currently active for the tool. You can switch to another function screen by swiping the screen to the right or left. Measurement screen icons for the Basic tool appear magenta in color. Note: The paper icon only appears in the navigation bar if one of the active functions requires a paper reference.
Dots indicate number of active functions
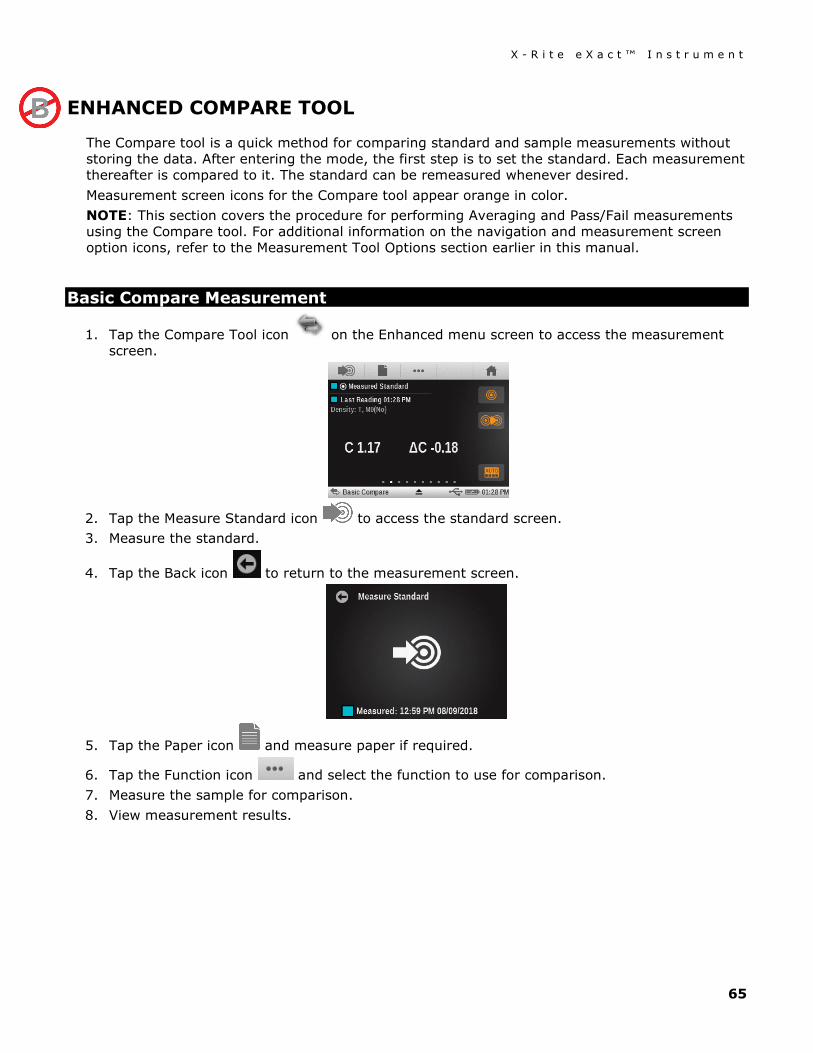
X - R i t e e X a c t ™ I n s t r u m e n t
65
ENHANCED COMPARE TOOL
The Compare tool is a quick method for comparing standard and sample measurements without storing the data. After entering the mode, the first step is to set the standard. Each measurement thereafter is compared to it. The standard can be remeasured whenever desired. Measurement screen icons for the Compare tool appear orange in color. NOTE: This section covers the procedure for performing Averaging and Pass/Fail measurements using the Compare tool. For additional information on the navigation and measurement screen option icons, refer to the Measurement Tool Options section earlier in this manual.
Basic Compare Measurement
1. Tap the Compare Tool icon on the Enhanced menu screen to access the measurement screen.
2. Tap the Measure Standard icon to access the standard screen. 3. Measure the standard.
4. Tap the Back icon to return to the measurement screen.
5. Tap the Paper icon and measure paper if required.
6. Tap the Function icon and select the function to use for comparison. 7. Measure the sample for comparison. 8. View measurement results.
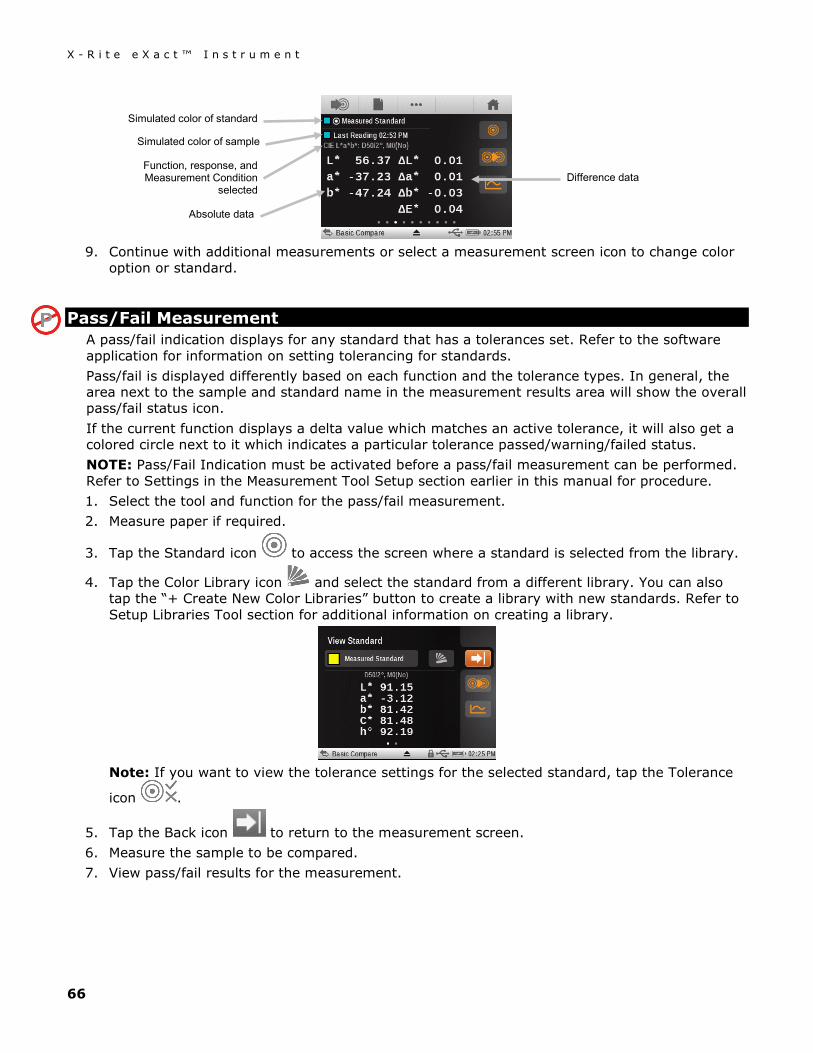
X - R i t e e X a c t ™ I n s t r u m e n t
66
9. Continue with additional measurements or select a measurement screen icon to change color
option or standard.
Pass/Fail Measurement A pass/fail indication displays for any standard that has a tolerances set. Refer to the software application for information on setting tolerancing for standards. Pass/fail is displayed differently based on each function and the tolerance types. In general, the area next to the sample and standard name in the measurement results area will show the overall pass/fail status icon. If the current function displays a delta value which matches an active tolerance, it will also get a colored circle next to it which indicates a particular tolerance passed/warning/failed status. NOTE: Pass/Fail Indication must be activated before a pass/fail measurement can be performed. Refer to Settings in the Measurement Tool Setup section earlier in this manual for procedure. 1. Select the tool and function for the pass/fail measurement. 2. Measure paper if required.
3. Tap the Standard icon to access the screen where a standard is selected from the library.
4. Tap the Color Library icon and select the standard from a different library. You can also tap the “+ Create New Color Libraries” button to create a library with new standards. Refer to Setup Libraries Tool section for additional information on creating a library.
Note: If you want to view the tolerance settings for the selected standard, tap the Tolerance
icon .
5. Tap the Back icon to return to the measurement screen. 6. Measure the sample to be compared. 7. View pass/fail results for the measurement.
Difference data
Simulated color of standard
Function, response, and Measurement Condition
selected
Simulated color of sample
Absolute data
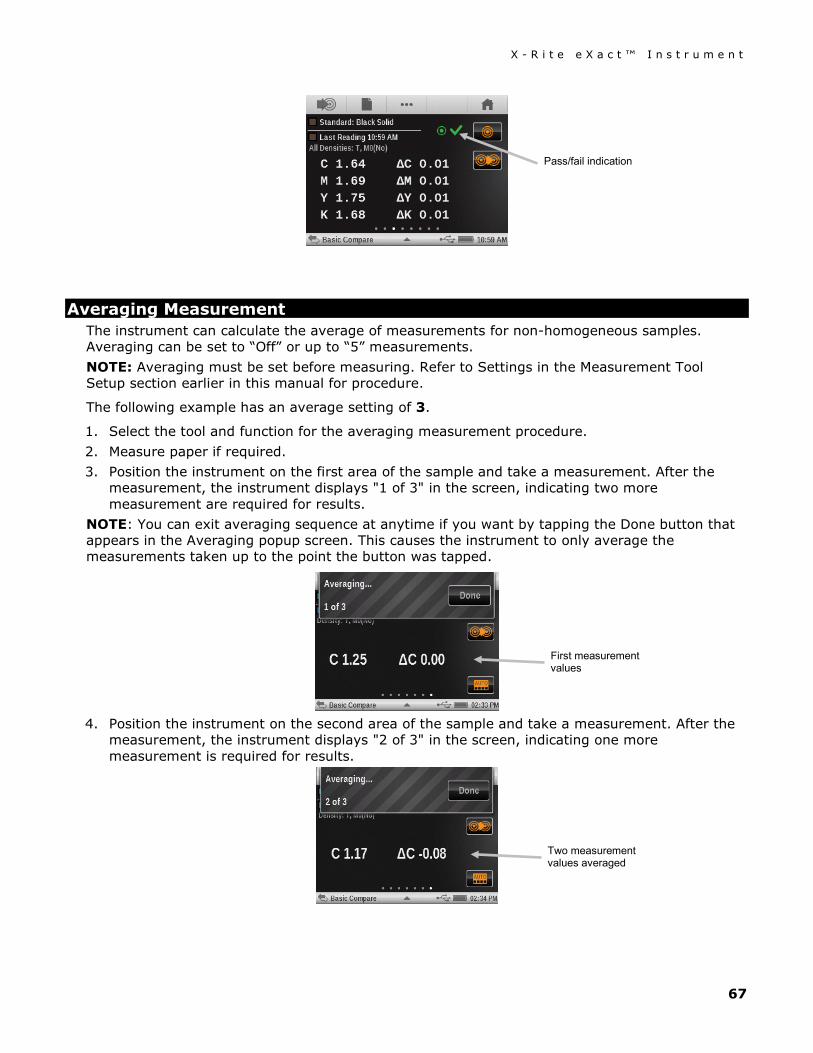
X - R i t e e X a c t ™ I n s t r u m e n t
67
Averaging Measurement The instrument can calculate the average of measurements for non-homogeneous samples. Averaging can be set to “Off” or up to “5” measurements. NOTE: Averaging must be set before measuring. Refer to Settings in the Measurement Tool Setup section earlier in this manual for procedure.
The following example has an average setting of 3.
1. Select the tool and function for the averaging measurement procedure. 2. Measure paper if required. 3. Position the instrument on the first area of the sample and take a measurement. After the
measurement, the instrument displays "1 of 3" in the screen, indicating two more measurement are required for results.
NOTE: You can exit averaging sequence at anytime if you want by tapping the Done button that appears in the Averaging popup screen. This causes the instrument to only average the measurements taken up to the point the button was tapped.
4. Position the instrument on the second area of the sample and take a measurement. After the
measurement, the instrument displays "2 of 3" in the screen, indicating one more measurement is required for results.
Two measurement values averaged
First measurement values
Pass/fail indication
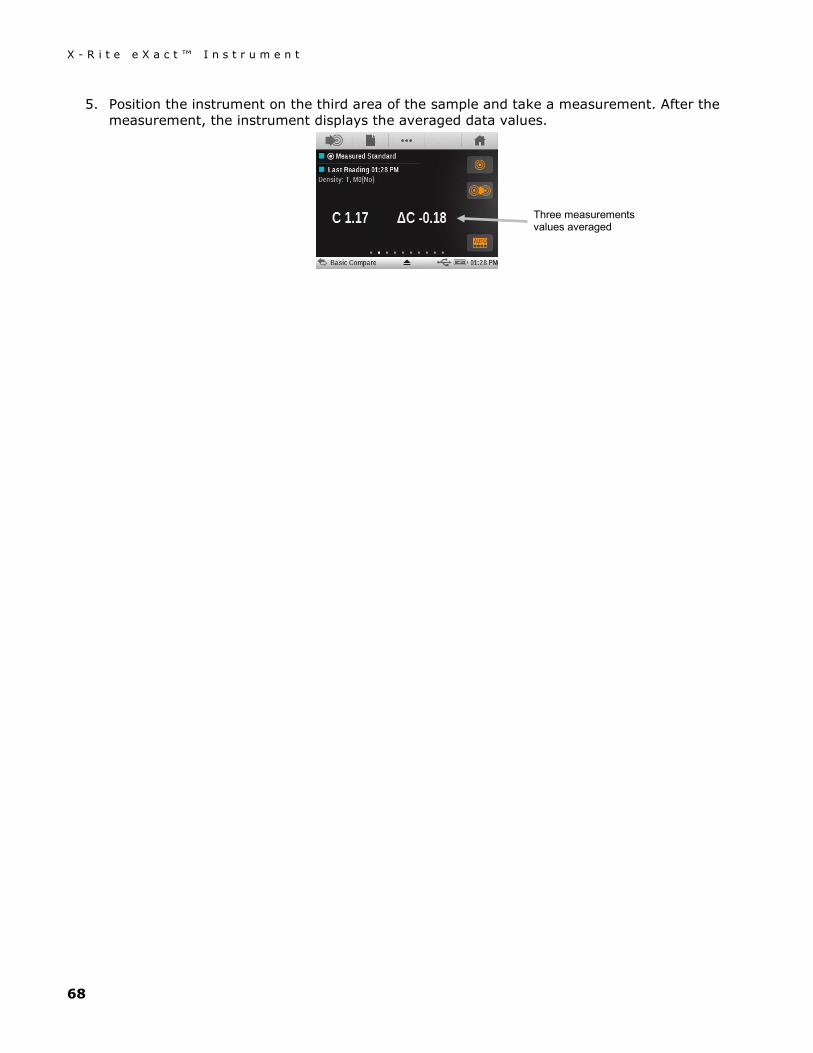
X - R i t e e X a c t ™ I n s t r u m e n t
68
5. Position the instrument on the third area of the sample and take a measurement. After the measurement, the instrument displays the averaged data values.
Three measurements values averaged
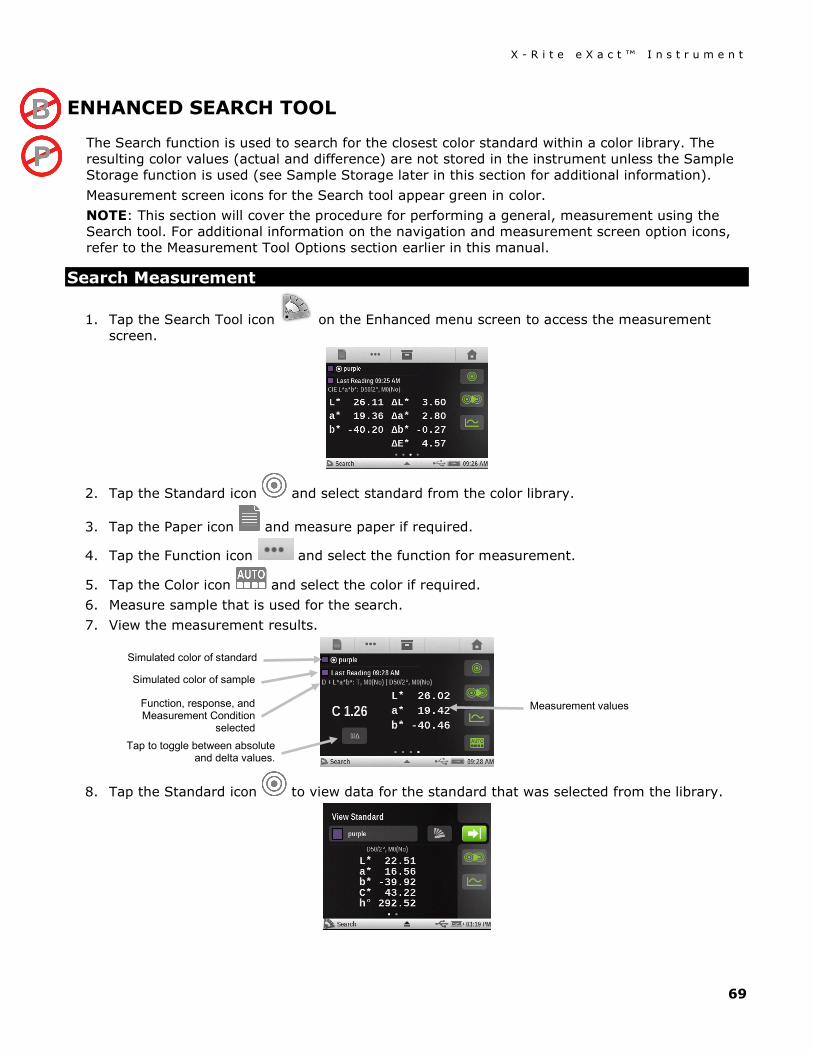
X - R i t e e X a c t ™ I n s t r u m e n t
69
ENHANCED SEARCH TOOL
The Search function is used to search for the closest color standard within a color library. The resulting color values (actual and difference) are not stored in the instrument unless the Sample Storage function is used (see Sample Storage later in this section for additional information). Measurement screen icons for the Search tool appear green in color. NOTE: This section will cover the procedure for performing a general, measurement using the Search tool. For additional information on the navigation and measurement screen option icons, refer to the Measurement Tool Options section earlier in this manual.
Search Measurement
1. Tap the Search Tool icon on the Enhanced menu screen to access the measurement screen.
2. Tap the Standard icon and select standard from the color library.
3. Tap the Paper icon and measure paper if required.
4. Tap the Function icon and select the function for measurement.
5. Tap the Color icon and select the color if required. 6. Measure sample that is used for the search. 7. View the measurement results.
8. Tap the Standard icon to view data for the standard that was selected from the library.
Simulated color of standard
Function, response, and Measurement Condition
selected
Simulated color of sample
Measurement values
Tap to toggle between absolute and delta values.
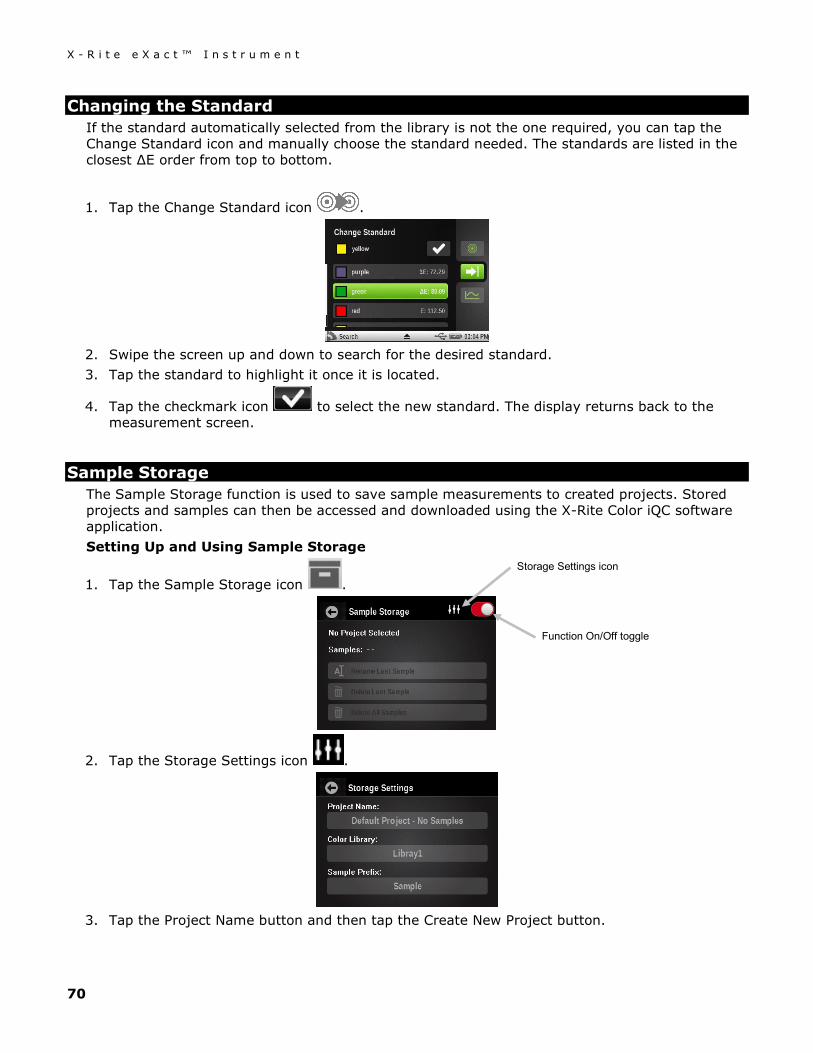
X - R i t e e X a c t ™ I n s t r u m e n t
70
Changing the Standard If the standard automatically selected from the library is not the one required, you can tap the Change Standard icon and manually choose the standard needed. The standards are listed in the closest ∆E order from top to bottom.
1. Tap the Change Standard icon .
2. Swipe the screen up and down to search for the desired standard. 3. Tap the standard to highlight it once it is located.
4. Tap the checkmark icon to select the new standard. The display returns back to the measurement screen.
Sample Storage The Sample Storage function is used to save sample measurements to created projects. Stored projects and samples can then be accessed and downloaded using the X-Rite Color iQC software application. Setting Up and Using Sample Storage
1. Tap the Sample Storage icon .
2. Tap the Storage Settings icon .
3. Tap the Project Name button and then tap the Create New Project button.
Function On/Off toggle
Storage Settings icon
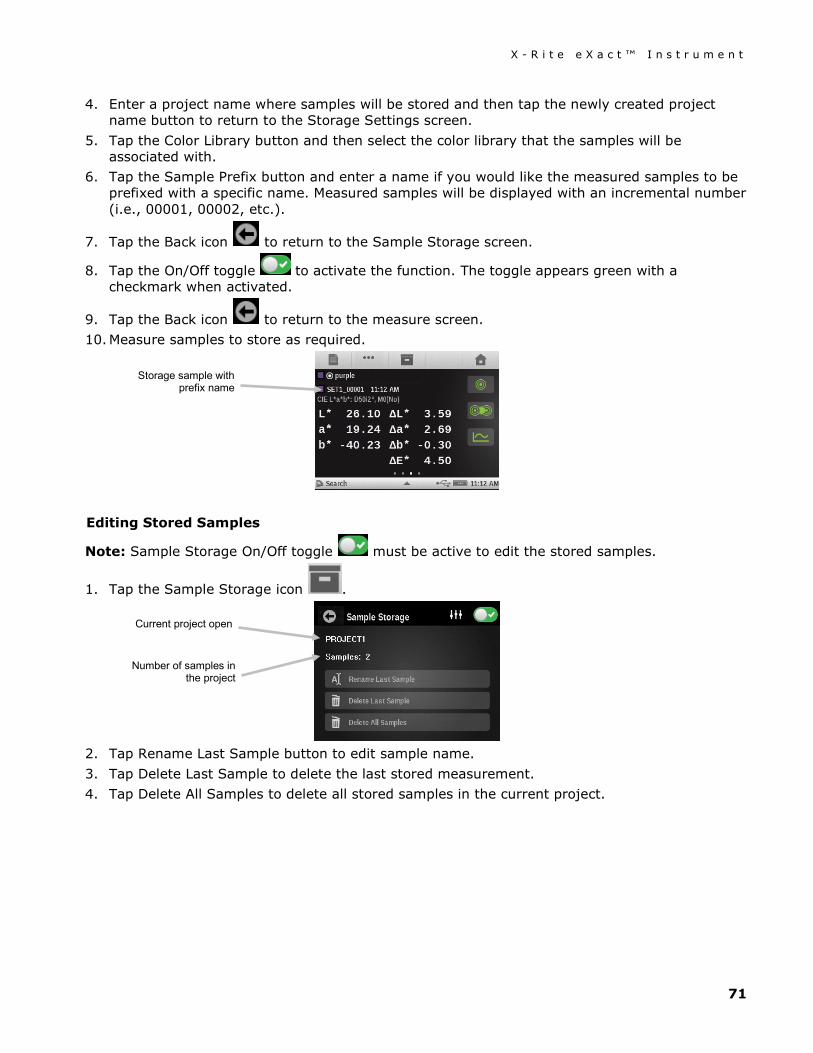
X - R i t e e X a c t ™ I n s t r u m e n t
71
4. Enter a project name where samples will be stored and then tap the newly created project name button to return to the Storage Settings screen.
5. Tap the Color Library button and then select the color library that the samples will be associated with.
6. Tap the Sample Prefix button and enter a name if you would like the measured samples to be prefixed with a specific name. Measured samples will be displayed with an incremental number (i.e., 00001, 00002, etc.).
7. Tap the Back icon to return to the Sample Storage screen.
8. Tap the On/Off toggle to activate the function. The toggle appears green with a checkmark when activated.
9. Tap the Back icon to return to the measure screen. 10. Measure samples to store as required.
Editing Stored Samples
Note: Sample Storage On/Off toggle must be active to edit the stored samples.
1. Tap the Sample Storage icon .
2. Tap Rename Last Sample button to edit sample name. 3. Tap Delete Last Sample to delete the last stored measurement. 4. Tap Delete All Samples to delete all stored samples in the current project.
Storage sample with prefix name
Current project open
Number of samples in the project
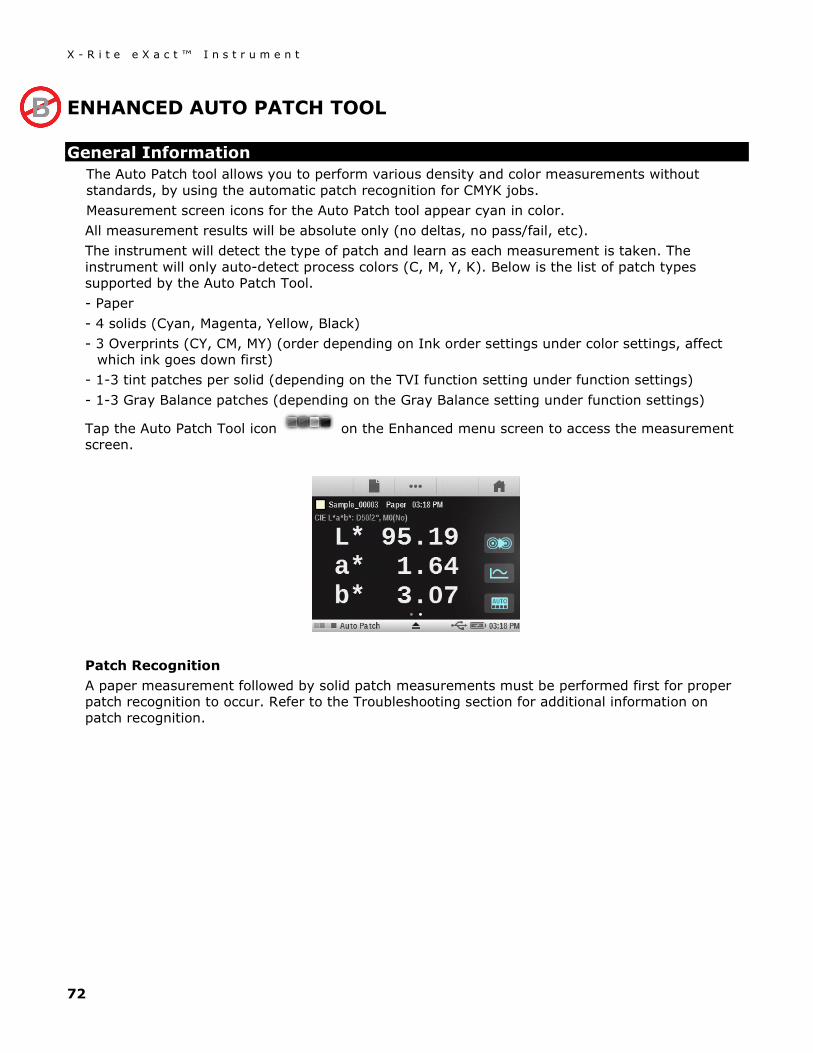
X - R i t e e X a c t ™ I n s t r u m e n t
72
ENHANCED AUTO PATCH TOOL
General Information The Auto Patch tool allows you to perform various density and color measurements without standards, by using the automatic patch recognition for CMYK jobs. Measurement screen icons for the Auto Patch tool appear cyan in color. All measurement results will be absolute only (no deltas, no pass/fail, etc). The instrument will detect the type of patch and learn as each measurement is taken. The instrument will only auto-detect process colors (C, M, Y, K). Below is the list of patch types supported by the Auto Patch Tool. - Paper - 4 solids (Cyan, Magenta, Yellow, Black) - 3 Overprints (CY, CM, MY) (order depending on Ink order settings under color settings, affect
which ink goes down first) - 1-3 tint patches per solid (depending on the TVI function setting under function settings) - 1-3 Gray Balance patches (depending on the Gray Balance setting under function settings)
Tap the Auto Patch Tool icon on the Enhanced menu screen to access the measurement screen.
Patch Recognition A paper measurement followed by solid patch measurements must be performed first for proper patch recognition to occur. Refer to the Troubleshooting section for additional information on patch recognition.
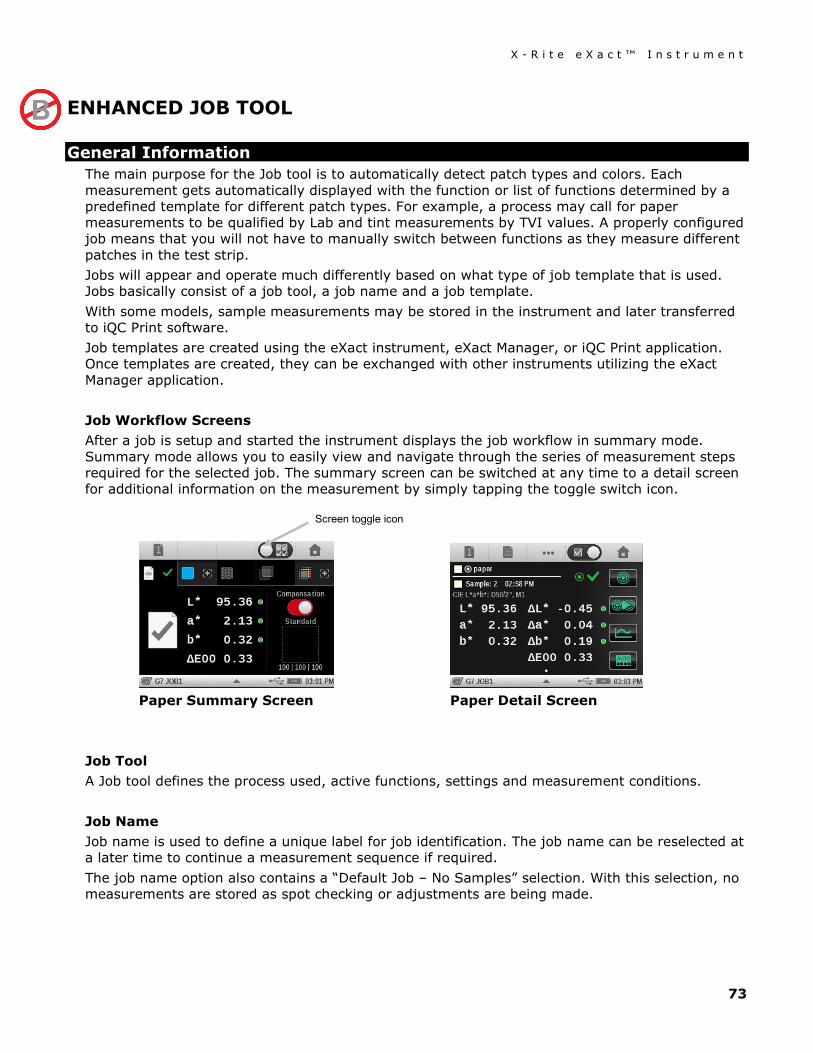
X - R i t e e X a c t ™ I n s t r u m e n t
73
ENHANCED JOB TOOL
General Information The main purpose for the Job tool is to automatically detect patch types and colors. Each measurement gets automatically displayed with the function or list of functions determined by a predefined template for different patch types. For example, a process may call for paper measurements to be qualified by Lab and tint measurements by TVI values. A properly configured job means that you will not have to manually switch between functions as they measure different patches in the test strip. Jobs will appear and operate much differently based on what type of job template that is used. Jobs basically consist of a job tool, a job name and a job template. With some models, sample measurements may be stored in the instrument and later transferred to iQC Print software. Job templates are created using the eXact instrument, eXact Manager, or iQC Print application. Once templates are created, they can be exchanged with other instruments utilizing the eXact Manager application. Job Workflow Screens After a job is setup and started the instrument displays the job workflow in summary mode. Summary mode allows you to easily view and navigate through the series of measurement steps required for the selected job. The summary screen can be switched at any time to a detail screen for additional information on the measurement by simply tapping the toggle switch icon.
Paper Summary Screen Paper Detail Screen
Job Tool A Job tool defines the process used, active functions, settings and measurement conditions. Job Name Job name is used to define a unique label for job identification. The job name can be reselected at a later time to continue a measurement sequence if required. The job name option also contains a “Default Job – No Samples” selection. With this selection, no measurements are stored as spot checking or adjustments are being made.
Screen toggle icon
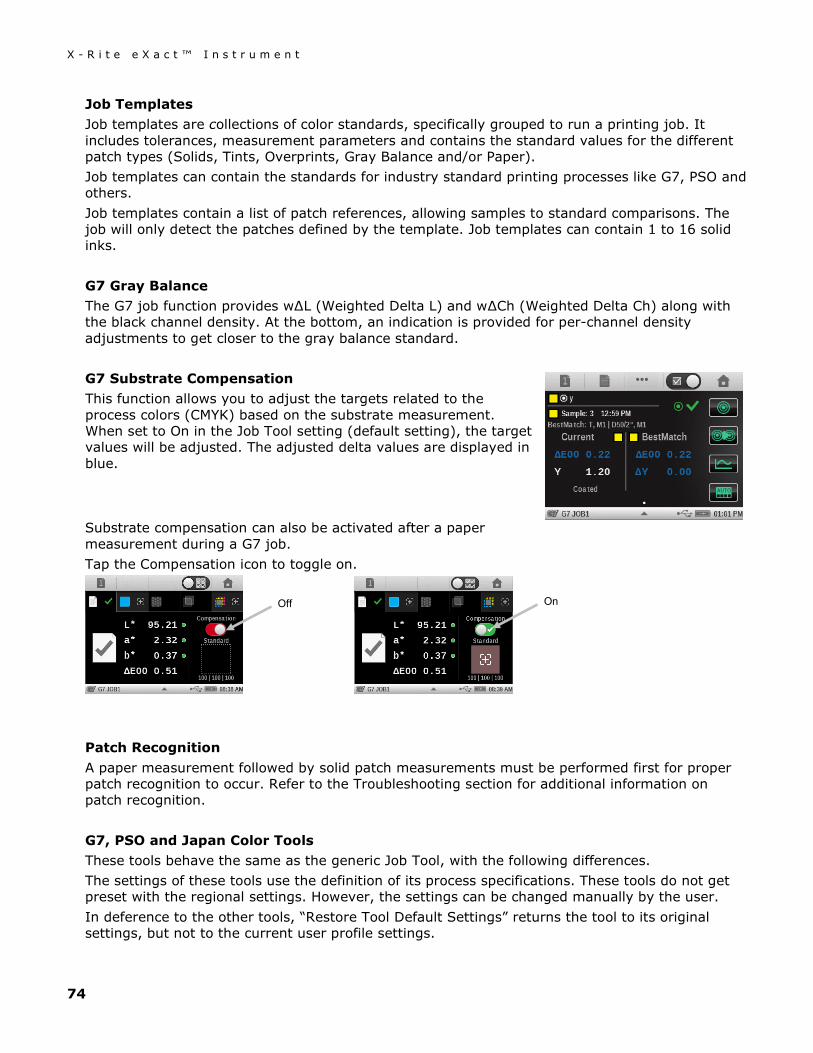
X - R i t e e X a c t ™ I n s t r u m e n t
74
Job Templates Job templates are collections of color standards, specifically grouped to run a printing job. It includes tolerances, measurement parameters and contains the standard values for the different patch types (Solids, Tints, Overprints, Gray Balance and/or Paper). Job templates can contain the standards for industry standard printing processes like G7, PSO and others. Job templates contain a list of patch references, allowing samples to standard comparisons. The job will only detect the patches defined by the template. Job templates can contain 1 to 16 solid inks. G7 Gray Balance The G7 job function provides w∆L (Weighted Delta L) and w∆Ch (Weighted Delta Ch) along with the black channel density. At the bottom, an indication is provided for per-channel density adjustments to get closer to the gray balance standard. G7 Substrate Compensation This function allows you to adjust the targets related to the process colors (CMYK) based on the substrate measurement. When set to On in the Job Tool setting (default setting), the target values will be adjusted. The adjusted delta values are displayed in blue.
Substrate compensation can also be activated after a paper measurement during a G7 job. Tap the Compensation icon to toggle on.
Patch Recognition A paper measurement followed by solid patch measurements must be performed first for proper patch recognition to occur. Refer to the Troubleshooting section for additional information on patch recognition. G7, PSO and Japan Color Tools These tools behave the same as the generic Job Tool, with the following differences. The settings of these tools use the definition of its process specifications. These tools do not get preset with the regional settings. However, the settings can be changed manually by the user. In deference to the other tools, “Restore Tool Default Settings” returns the tool to its original settings, but not to the current user profile settings.
Off On
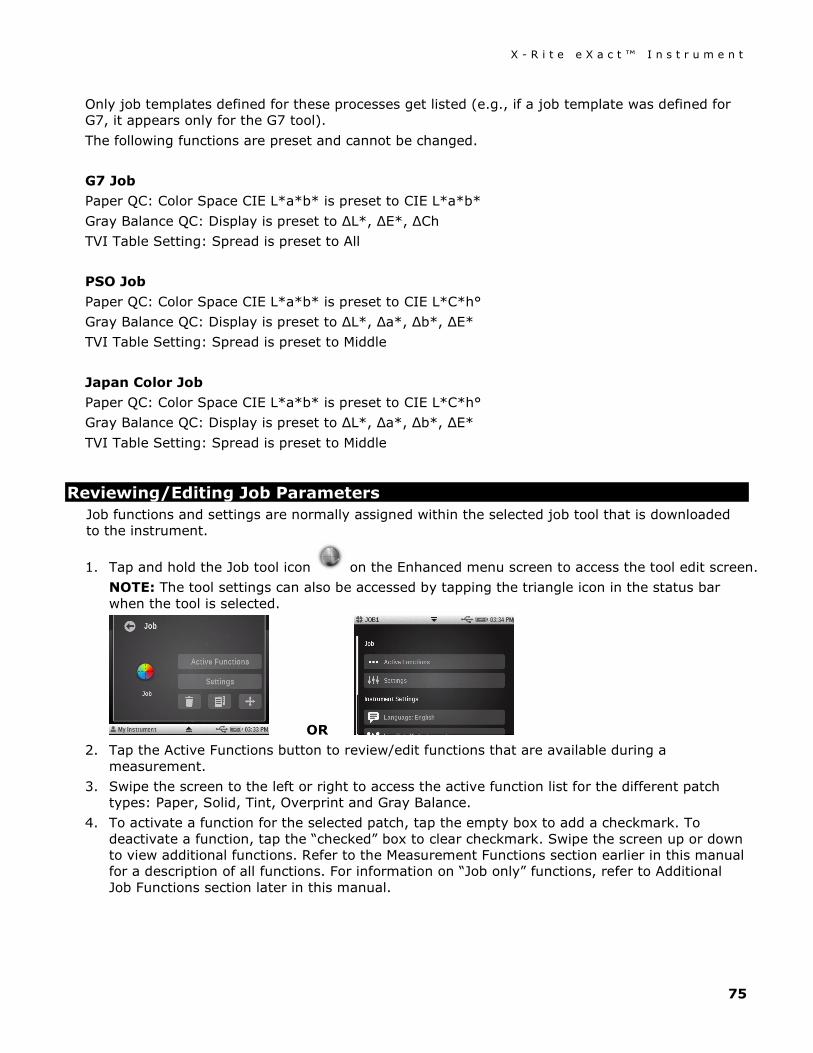
X - R i t e e X a c t ™ I n s t r u m e n t
75
Only job templates defined for these processes get listed (e.g., if a job template was defined for G7, it appears only for the G7 tool). The following functions are preset and cannot be changed. G7 Job Paper QC: Color Space CIE L*a*b* is preset to CIE L*a*b* Gray Balance QC: Display is preset to ΔL*, ΔE*, ΔCh TVI Table Setting: Spread is preset to All PSO Job Paper QC: Color Space CIE L*a*b* is preset to CIE L*C*h° Gray Balance QC: Display is preset to ΔL*, Δa*, Δb*, ΔE* TVI Table Setting: Spread is preset to Middle Japan Color Job Paper QC: Color Space CIE L*a*b* is preset to CIE L*C*h° Gray Balance QC: Display is preset to ΔL*, Δa*, Δb*, ΔE* TVI Table Setting: Spread is preset to Middle
Reviewing/Editing Job Parameters Job functions and settings are normally assigned within the selected job tool that is downloaded to the instrument.
1. Tap and hold the Job tool icon on the Enhanced menu screen to access the tool edit screen. NOTE: The tool settings can also be accessed by tapping the triangle icon in the status bar when the tool is selected.
OR 2. Tap the Active Functions button to review/edit functions that are available during a
measurement. 3. Swipe the screen to the left or right to access the active function list for the different patch
types: Paper, Solid, Tint, Overprint and Gray Balance. 4. To activate a function for the selected patch, tap the empty box to add a checkmark. To
deactivate a function, tap the “checked” box to clear checkmark. Swipe the screen up or down to view additional functions. Refer to the Measurement Functions section earlier in this manual for a description of all functions. For information on “Job only” functions, refer to Additional Job Functions section later in this manual.
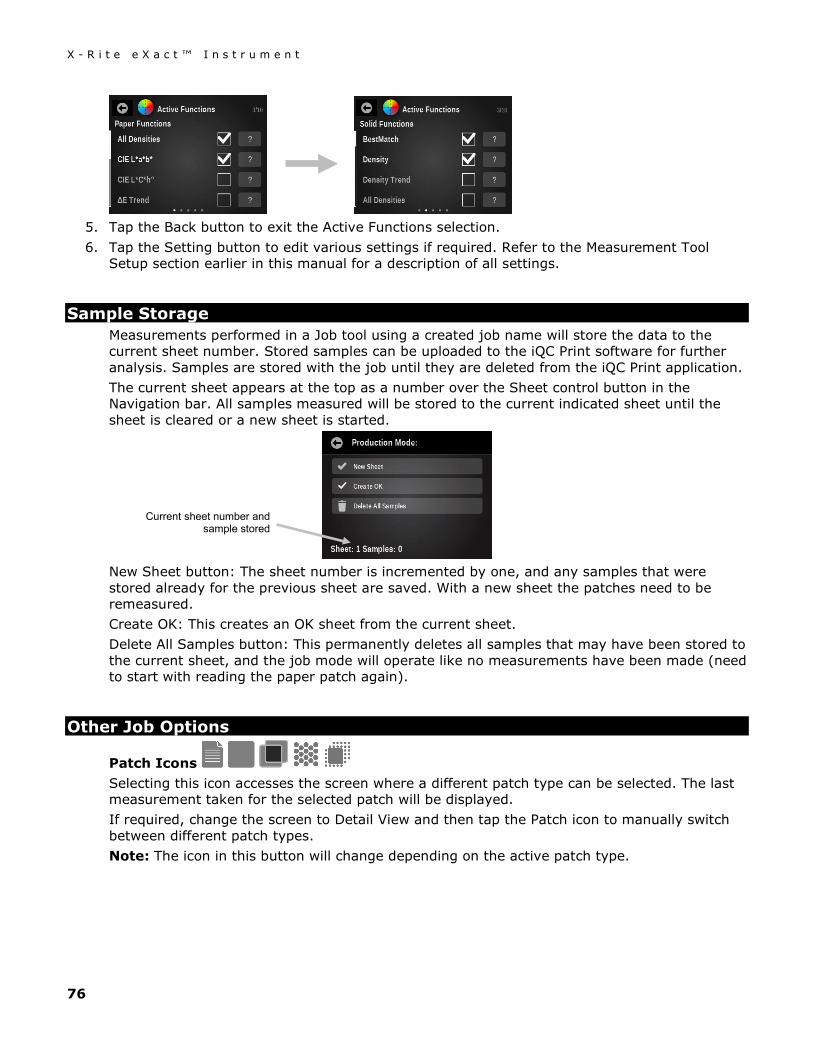
X - R i t e e X a c t ™ I n s t r u m e n t
76
5. Tap the Back button to exit the Active Functions selection. 6. Tap the Setting button to edit various settings if required. Refer to the Measurement Tool
Setup section earlier in this manual for a description of all settings.
Sample Storage Measurements performed in a Job tool using a created job name will store the data to the current sheet number. Stored samples can be uploaded to the iQC Print software for further analysis. Samples are stored with the job until they are deleted from the iQC Print application. The current sheet appears at the top as a number over the Sheet control button in the Navigation bar. All samples measured will be stored to the current indicated sheet until the sheet is cleared or a new sheet is started.
New Sheet button: The sheet number is incremented by one, and any samples that were stored already for the previous sheet are saved. With a new sheet the patches need to be remeasured. Create OK: This creates an OK sheet from the current sheet. Delete All Samples button: This permanently deletes all samples that may have been stored to the current sheet, and the job mode will operate like no measurements have been made (need to start with reading the paper patch again).
Other Job Options
Patch Icons Selecting this icon accesses the screen where a different patch type can be selected. The last measurement taken for the selected patch will be displayed. If required, change the screen to Detail View and then tap the Patch icon to manually switch between different patch types. Note: The icon in this button will change depending on the active patch type.
Current sheet number and sample stored
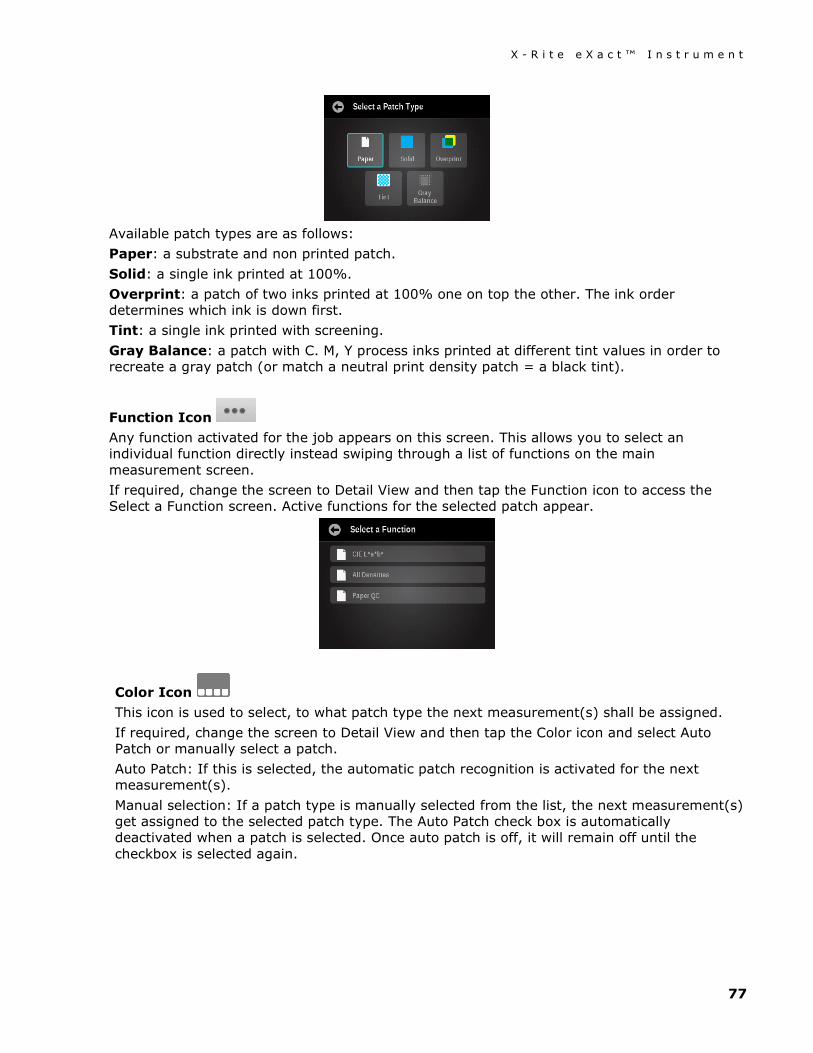
X - R i t e e X a c t ™ I n s t r u m e n t
77
Available patch types are as follows: Paper: a substrate and non printed patch. Solid: a single ink printed at 100%. Overprint: a patch of two inks printed at 100% one on top the other. The ink order determines which ink is down first. Tint: a single ink printed with screening. Gray Balance: a patch with C. M, Y process inks printed at different tint values in order to recreate a gray patch (or match a neutral print density patch = a black tint).
Function Icon Any function activated for the job appears on this screen. This allows you to select an individual function directly instead swiping through a list of functions on the main measurement screen. If required, change the screen to Detail View and then tap the Function icon to access the Select a Function screen. Active functions for the selected patch appear.
Color Icon This icon is used to select, to what patch type the next measurement(s) shall be assigned. If required, change the screen to Detail View and then tap the Color icon and select Auto Patch or manually select a patch. Auto Patch: If this is selected, the automatic patch recognition is activated for the next measurement(s). Manual selection: If a patch type is manually selected from the list, the next measurement(s) get assigned to the selected patch type. The Auto Patch check box is automatically deactivated when a patch is selected. Once auto patch is off, it will remain off until the checkbox is selected again.
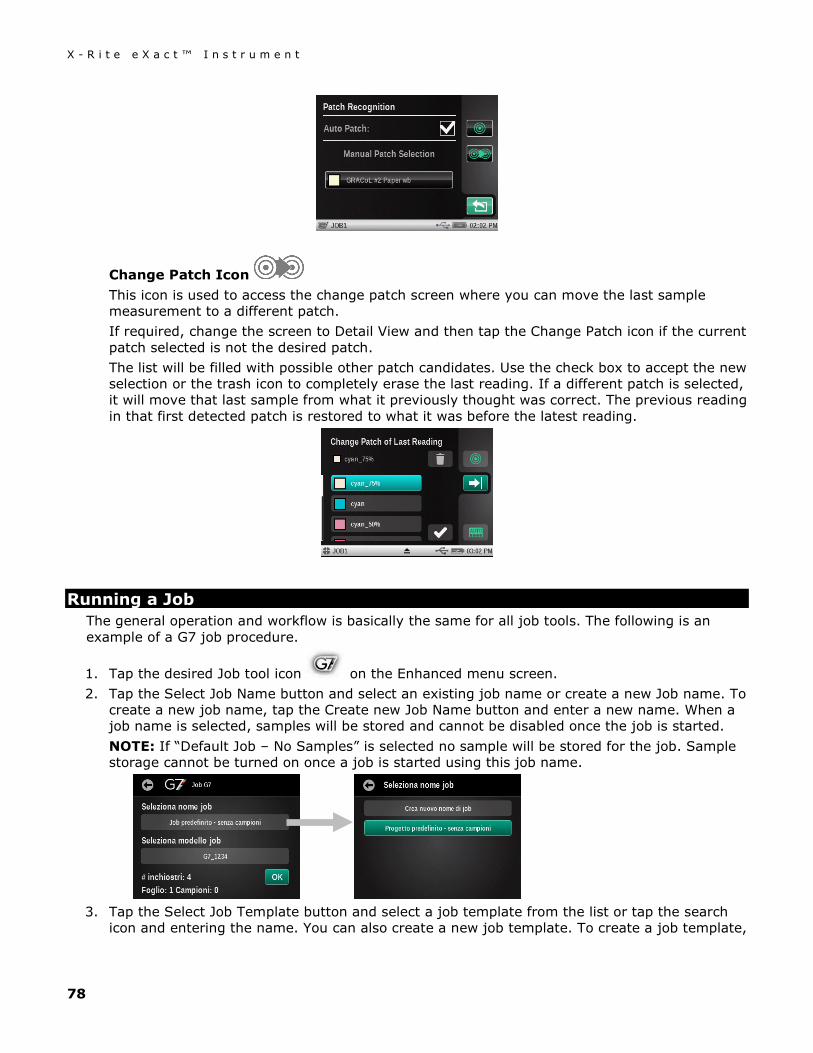
X - R i t e e X a c t ™ I n s t r u m e n t
78
Change Patch Icon This icon is used to access the change patch screen where you can move the last sample measurement to a different patch. If required, change the screen to Detail View and then tap the Change Patch icon if the current patch selected is not the desired patch. The list will be filled with possible other patch candidates. Use the check box to accept the new selection or the trash icon to completely erase the last reading. If a different patch is selected, it will move that last sample from what it previously thought was correct. The previous reading in that first detected patch is restored to what it was before the latest reading.
Running a Job The general operation and workflow is basically the same for all job tools. The following is an example of a G7 job procedure.
1. Tap the desired Job tool icon on the Enhanced menu screen. 2. Tap the Select Job Name button and select an existing job name or create a new Job name. To
create a new job name, tap the Create new Job Name button and enter a new name. When a job name is selected, samples will be stored and cannot be disabled once the job is started. NOTE: If “Default Job – No Samples” is selected no sample will be stored for the job. Sample storage cannot be turned on once a job is started using this job name.
3. Tap the Select Job Template button and select a job template from the list or tap the search
icon and entering the name. You can also create a new job template. To create a job template,
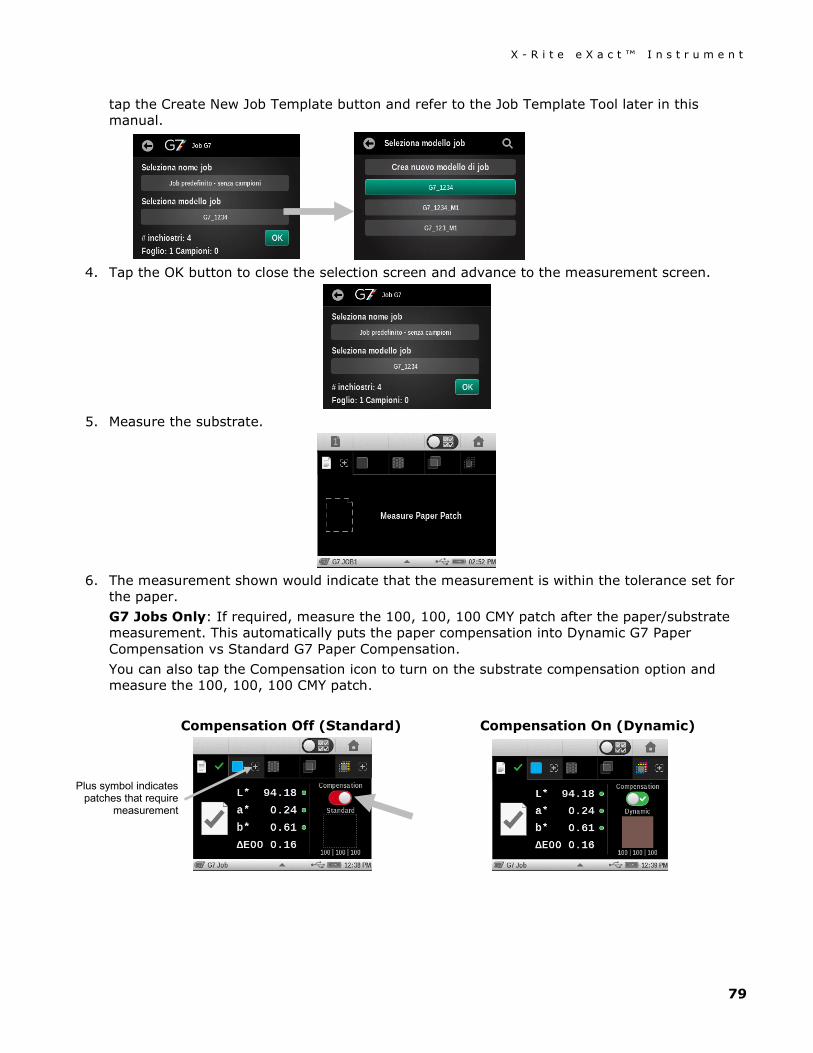
X - R i t e e X a c t ™ I n s t r u m e n t
79
tap the Create New Job Template button and refer to the Job Template Tool later in this manual.
4. Tap the OK button to close the selection screen and advance to the measurement screen.
5. Measure the substrate.
6. The measurement shown would indicate that the measurement is within the tolerance set for
the paper. G7 Jobs Only: If required, measure the 100, 100, 100 CMY patch after the paper/substrate measurement. This automatically puts the paper compensation into Dynamic G7 Paper Compensation vs Standard G7 Paper Compensation. You can also tap the Compensation icon to turn on the substrate compensation option and measure the 100, 100, 100 CMY patch.
Compensation Off (Standard) Compensation On (Dynamic)
Plus symbol indicates patches that require
measurement
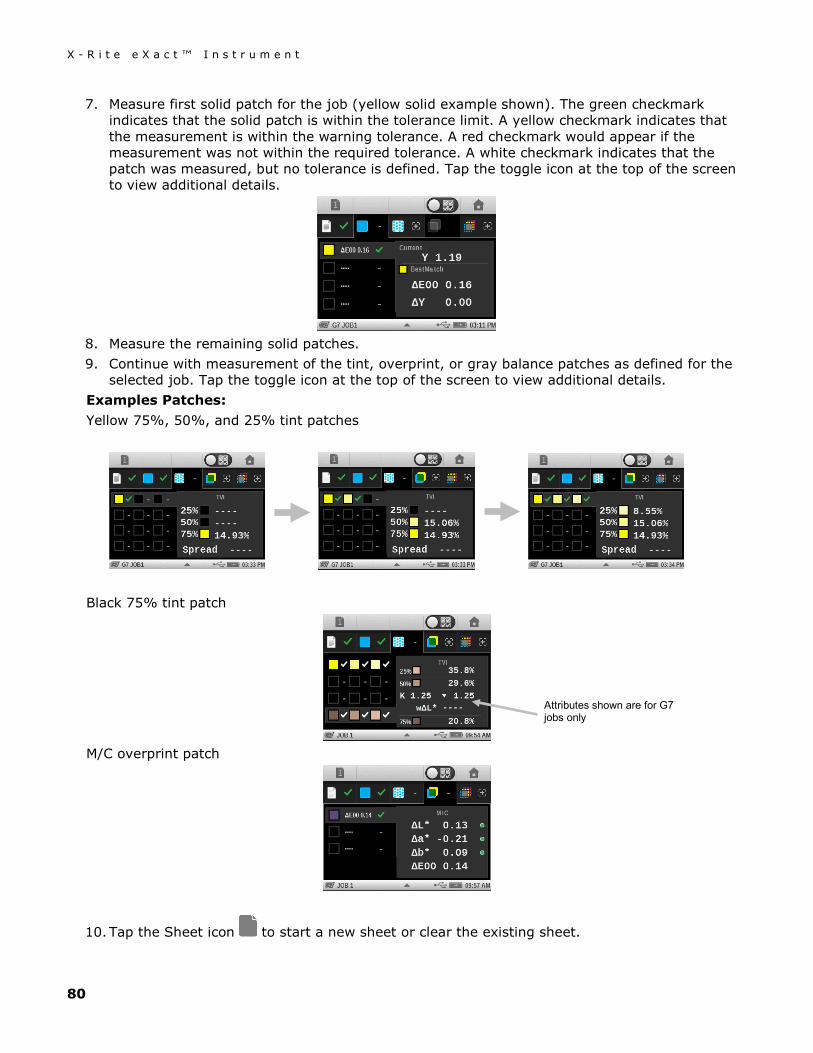
X - R i t e e X a c t ™ I n s t r u m e n t
80
7. Measure first solid patch for the job (yellow solid example shown). The green checkmark indicates that the solid patch is within the tolerance limit. A yellow checkmark indicates that the measurement is within the warning tolerance. A red checkmark would appear if the measurement was not within the required tolerance. A white checkmark indicates that the patch was measured, but no tolerance is defined. Tap the toggle icon at the top of the screen to view additional details.
8. Measure the remaining solid patches. 9. Continue with measurement of the tint, overprint, or gray balance patches as defined for the
selected job. Tap the toggle icon at the top of the screen to view additional details. Examples Patches: Yellow 75%, 50%, and 25% tint patches
Black 75% tint patch
M/C overprint patch
10. Tap the Sheet icon to start a new sheet or clear the existing sheet.
Attributes shown are for G7 jobs only
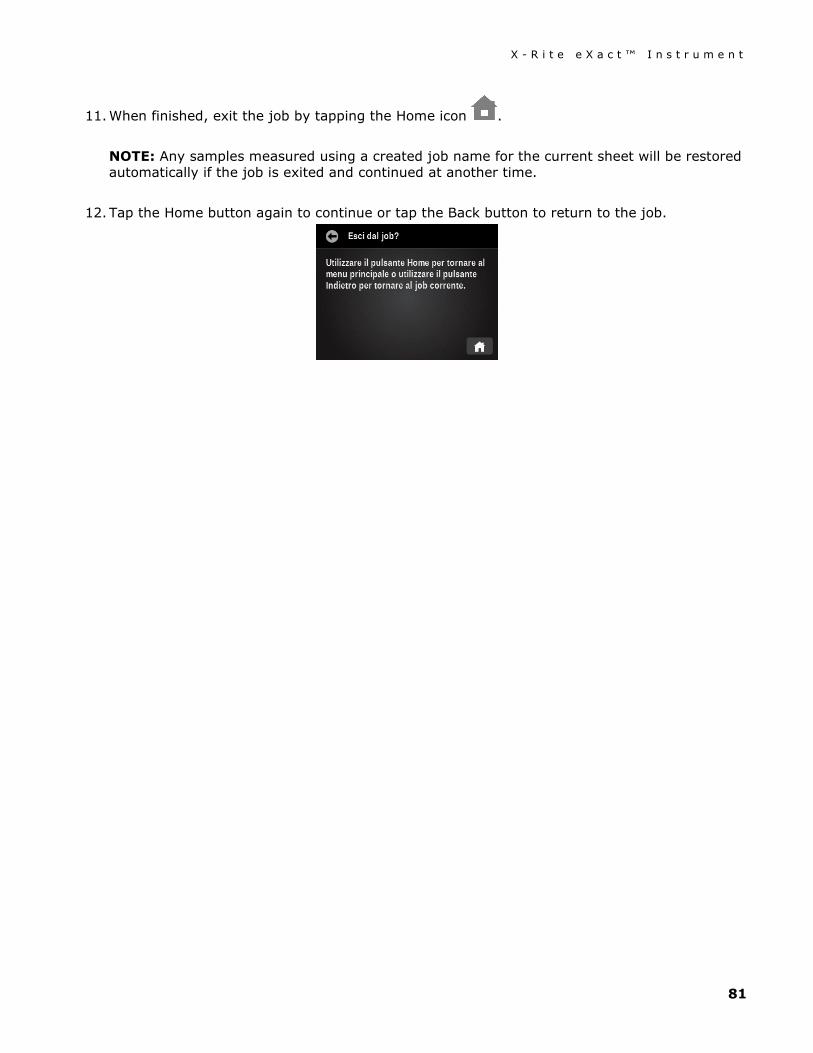
X - R i t e e X a c t ™ I n s t r u m e n t
81
11. When finished, exit the job by tapping the Home icon . NOTE: Any samples measured using a created job name for the current sheet will be restored automatically if the job is exited and continued at another time.
12. Tap the Home button again to continue or tap the Back button to return to the job.
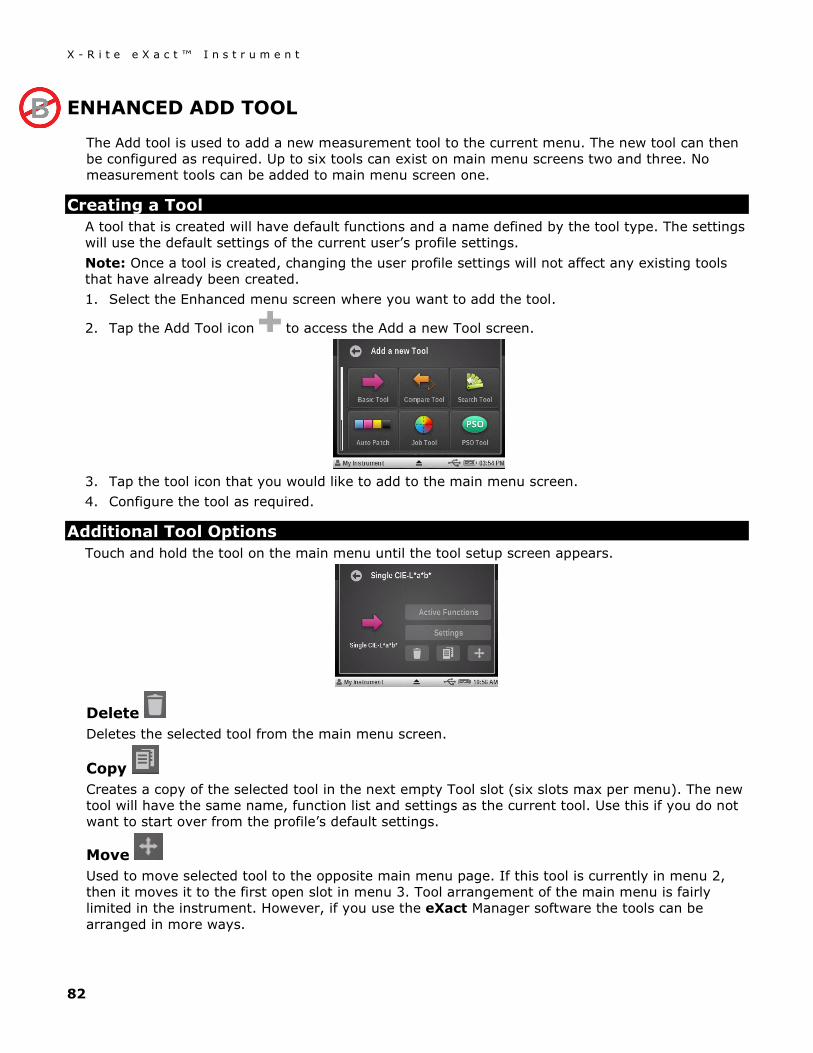
X - R i t e e X a c t ™ I n s t r u m e n t
82
ENHANCED ADD TOOL
The Add tool is used to add a new measurement tool to the current menu. The new tool can then be configured as required. Up to six tools can exist on main menu screens two and three. No measurement tools can be added to main menu screen one.
Creating a Tool A tool that is created will have default functions and a name defined by the tool type. The settings will use the default settings of the current user’s profile settings. Note: Once a tool is created, changing the user profile settings will not affect any existing tools that have already been created. 1. Select the Enhanced menu screen where you want to add the tool.
2. Tap the Add Tool icon to access the Add a new Tool screen.
3. Tap the tool icon that you would like to add to the main menu screen. 4. Configure the tool as required.
Additional Tool Options Touch and hold the tool on the main menu until the tool setup screen appears.
Delete Deletes the selected tool from the main menu screen.
Copy Creates a copy of the selected tool in the next empty Tool slot (six slots max per menu). The new tool will have the same name, function list and settings as the current tool. Use this if you do not want to start over from the profile’s default settings.
Move Used to move selected tool to the opposite main menu page. If this tool is currently in menu 2, then it moves it to the first open slot in menu 3. Tool arrangement of the main menu is fairly limited in the instrument. However, if you use the eXact Manager software the tools can be arranged in more ways.
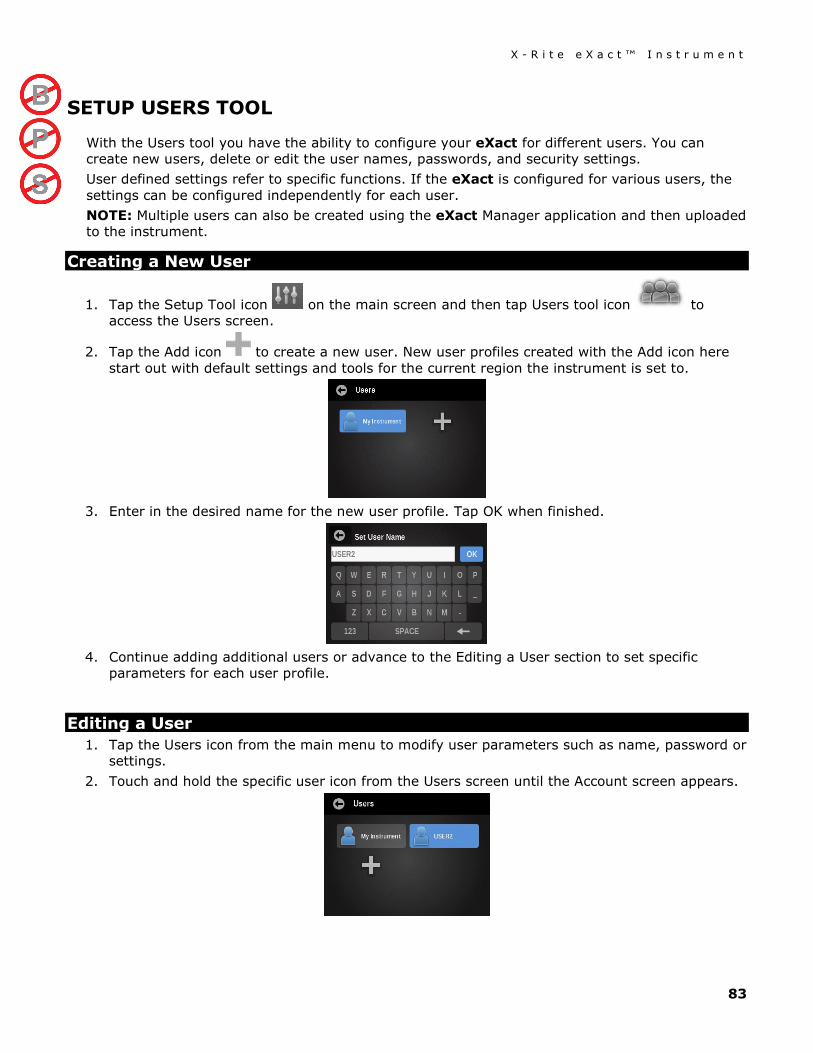
X - R i t e e X a c t ™ I n s t r u m e n t
83
SETUP USERS TOOL
With the Users tool you have the ability to configure your eXact for different users. You can create new users, delete or edit the user names, passwords, and security settings. User defined settings refer to specific functions. If the eXact is configured for various users, the settings can be configured independently for each user. NOTE: Multiple users can also be created using the eXact Manager application and then uploaded to the instrument.
Creating a New User
1. Tap the Setup Tool icon on the main screen and then tap Users tool icon to access the Users screen.
2. Tap the Add icon to create a new user. New user profiles created with the Add icon here start out with default settings and tools for the current region the instrument is set to.
3. Enter in the desired name for the new user profile. Tap OK when finished.
4. Continue adding additional users or advance to the Editing a User section to set specific
parameters for each user profile.
Editing a User 1. Tap the Users icon from the main menu to modify user parameters such as name, password or
settings. 2. Touch and hold the specific user icon from the Users screen until the Account screen appears.
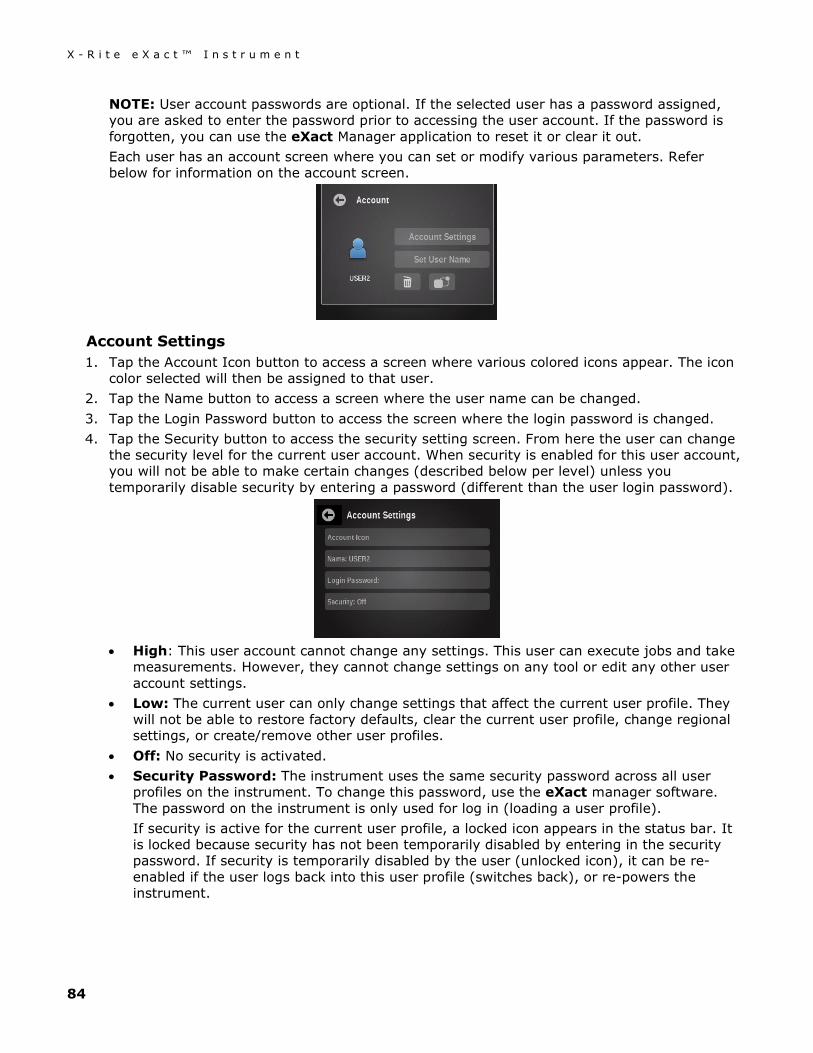
X - R i t e e X a c t ™ I n s t r u m e n t
84
NOTE: User account passwords are optional. If the selected user has a password assigned, you are asked to enter the password prior to accessing the user account. If the password is forgotten, you can use the eXact Manager application to reset it or clear it out. Each user has an account screen where you can set or modify various parameters. Refer below for information on the account screen.
Account Settings 1. Tap the Account Icon button to access a screen where various colored icons appear. The icon
color selected will then be assigned to that user. 2. Tap the Name button to access a screen where the user name can be changed. 3. Tap the Login Password button to access the screen where the login password is changed. 4. Tap the Security button to access the security setting screen. From here the user can change
the security level for the current user account. When security is enabled for this user account, you will not be able to make certain changes (described below per level) unless you temporarily disable security by entering a password (different than the user login password).
• High: This user account cannot change any settings. This user can execute jobs and take
measurements. However, they cannot change settings on any tool or edit any other user account settings.
• Low: The current user can only change settings that affect the current user profile. They will not be able to restore factory defaults, clear the current user profile, change regional settings, or create/remove other user profiles.
• Off: No security is activated. • Security Password: The instrument uses the same security password across all user
profiles on the instrument. To change this password, use the eXact manager software. The password on the instrument is only used for log in (loading a user profile). If security is active for the current user profile, a locked icon appears in the status bar. It is locked because security has not been temporarily disabled by entering in the security password. If security is temporarily disabled by the user (unlocked icon), it can be re-enabled if the user logs back into this user profile (switches back), or re-powers the instrument.
X - R i t e e X a c t ™ I n s t r u m e n t
85
Set User Name Tap the Set User Name button to access a screen where the user name can be changed.
Delete The Delete icon is used to delete the selected user from the Users menu screen. NOTE: If the last user account profile is deleted, a new profile is created in its place and settings revert back to the default settings of the current region settings. One profile always remains in the instrument.
Copy The Copy icon is used to make a copy of the current user. The copy will be added to the Users menu screen with the same name and number appending it.
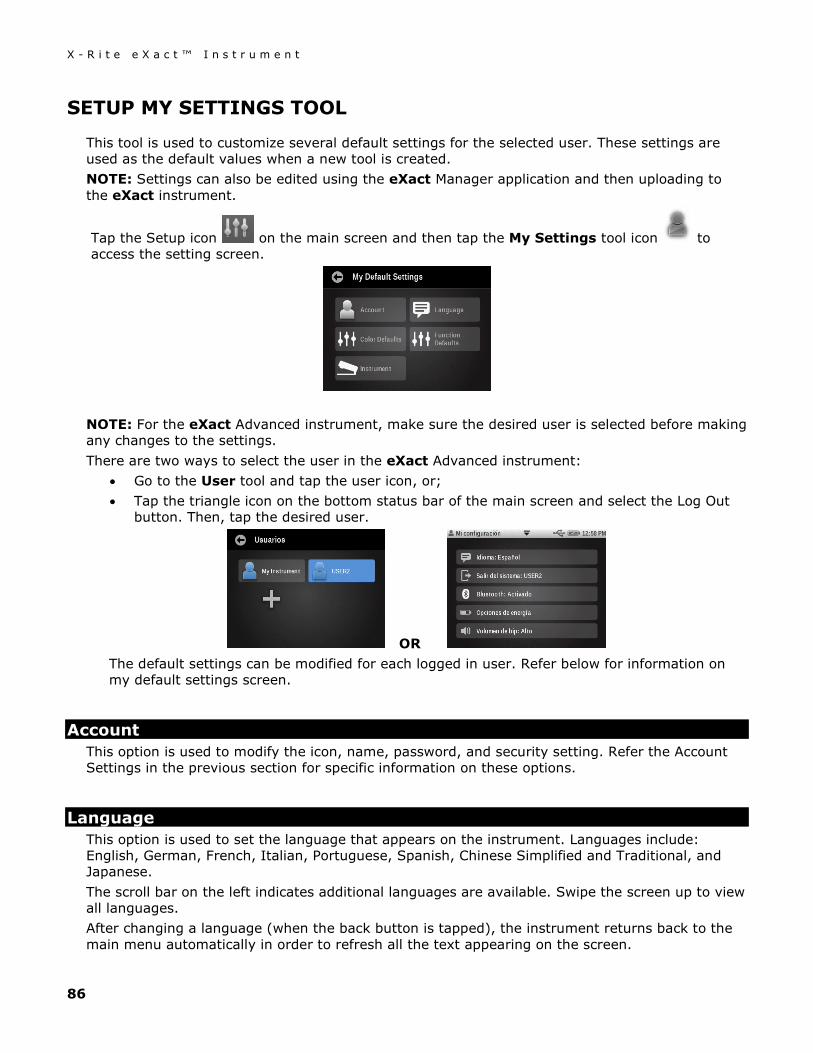
X - R i t e e X a c t ™ I n s t r u m e n t
86
SETUP MY SETTINGS TOOL
This tool is used to customize several default settings for the selected user. These settings are used as the default values when a new tool is created. NOTE: Settings can also be edited using the eXact Manager application and then uploading to the eXact instrument.
Tap the Setup icon on the main screen and then tap the My Settings tool icon to access the setting screen.
NOTE: For the eXact Advanced instrument, make sure the desired user is selected before making any changes to the settings. There are two ways to select the user in the eXact Advanced instrument:
• Go to the User tool and tap the user icon, or; • Tap the triangle icon on the bottom status bar of the main screen and select the Log Out
button. Then, tap the desired user.
OR The default settings can be modified for each logged in user. Refer below for information on my default settings screen.
Account This option is used to modify the icon, name, password, and security setting. Refer the Account Settings in the previous section for specific information on these options.
Language This option is used to set the language that appears on the instrument. Languages include: English, German, French, Italian, Portuguese, Spanish, Chinese Simplified and Traditional, and Japanese. The scroll bar on the left indicates additional languages are available. Swipe the screen up to view all languages. After changing a language (when the back button is tapped), the instrument returns back to the main menu automatically in order to refresh all the text appearing on the screen.
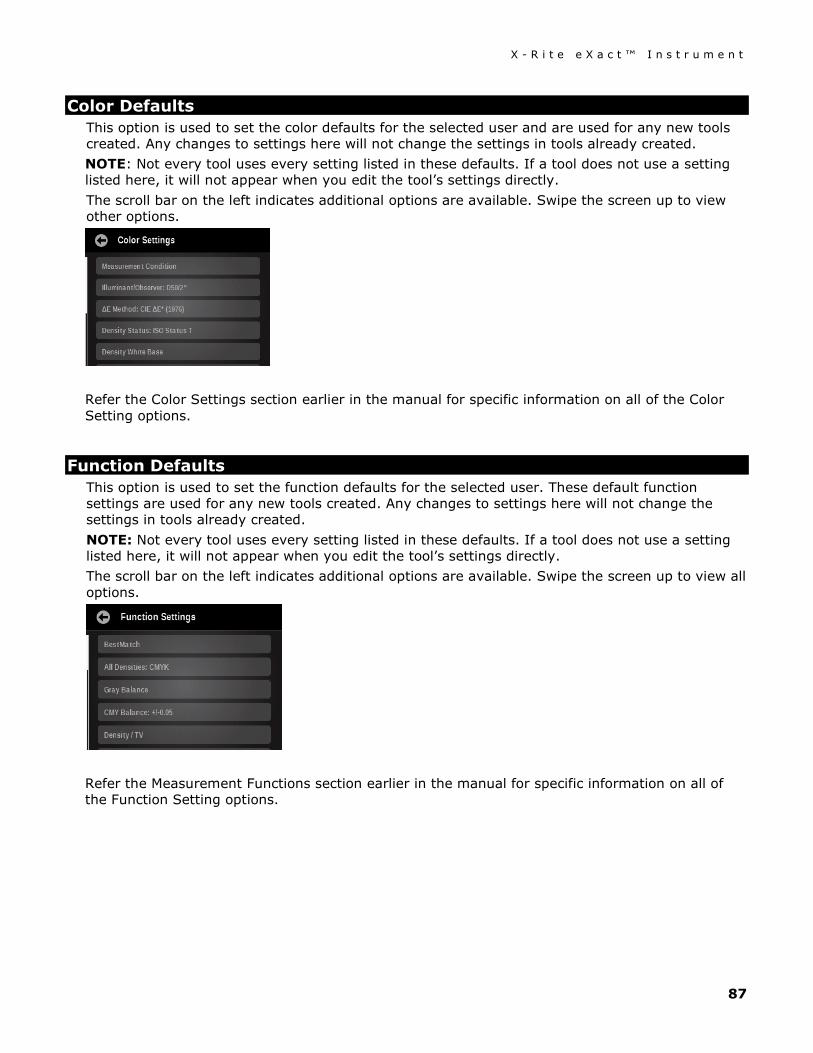
X - R i t e e X a c t ™ I n s t r u m e n t
87
Color Defaults This option is used to set the color defaults for the selected user and are used for any new tools created. Any changes to settings here will not change the settings in tools already created. NOTE: Not every tool uses every setting listed in these defaults. If a tool does not use a setting listed here, it will not appear when you edit the tool’s settings directly. The scroll bar on the left indicates additional options are available. Swipe the screen up to view other options.
Refer the Color Settings section earlier in the manual for specific information on all of the Color Setting options.
Function Defaults This option is used to set the function defaults for the selected user. These default function settings are used for any new tools created. Any changes to settings here will not change the settings in tools already created. NOTE: Not every tool uses every setting listed in these defaults. If a tool does not use a setting listed here, it will not appear when you edit the tool’s settings directly. The scroll bar on the left indicates additional options are available. Swipe the screen up to view all options.
Refer the Measurement Functions section earlier in the manual for specific information on all of the Function Setting options.
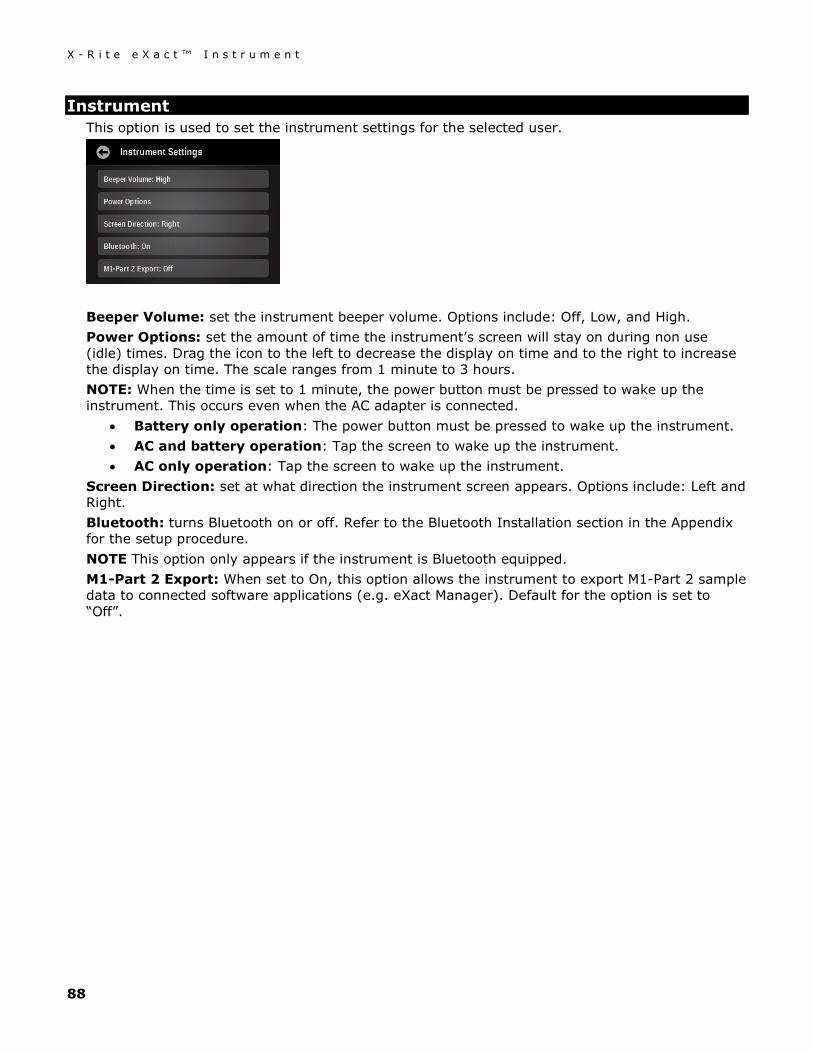
X - R i t e e X a c t ™ I n s t r u m e n t
88
Instrument This option is used to set the instrument settings for the selected user.
Beeper Volume: set the instrument beeper volume. Options include: Off, Low, and High. Power Options: set the amount of time the instrument’s screen will stay on during non use (idle) times. Drag the icon to the left to decrease the display on time and to the right to increase the display on time. The scale ranges from 1 minute to 3 hours. NOTE: When the time is set to 1 minute, the power button must be pressed to wake up the instrument. This occurs even when the AC adapter is connected.
• Battery only operation: The power button must be pressed to wake up the instrument. • AC and battery operation: Tap the screen to wake up the instrument. • AC only operation: Tap the screen to wake up the instrument.
Screen Direction: set at what direction the instrument screen appears. Options include: Left and Right. Bluetooth: turns Bluetooth on or off. Refer to the Bluetooth Installation section in the Appendix for the setup procedure. NOTE This option only appears if the instrument is Bluetooth equipped. M1-Part 2 Export: When set to On, this option allows the instrument to export M1-Part 2 sample data to connected software applications (e.g. eXact Manager). Default for the option is set to “Off”.
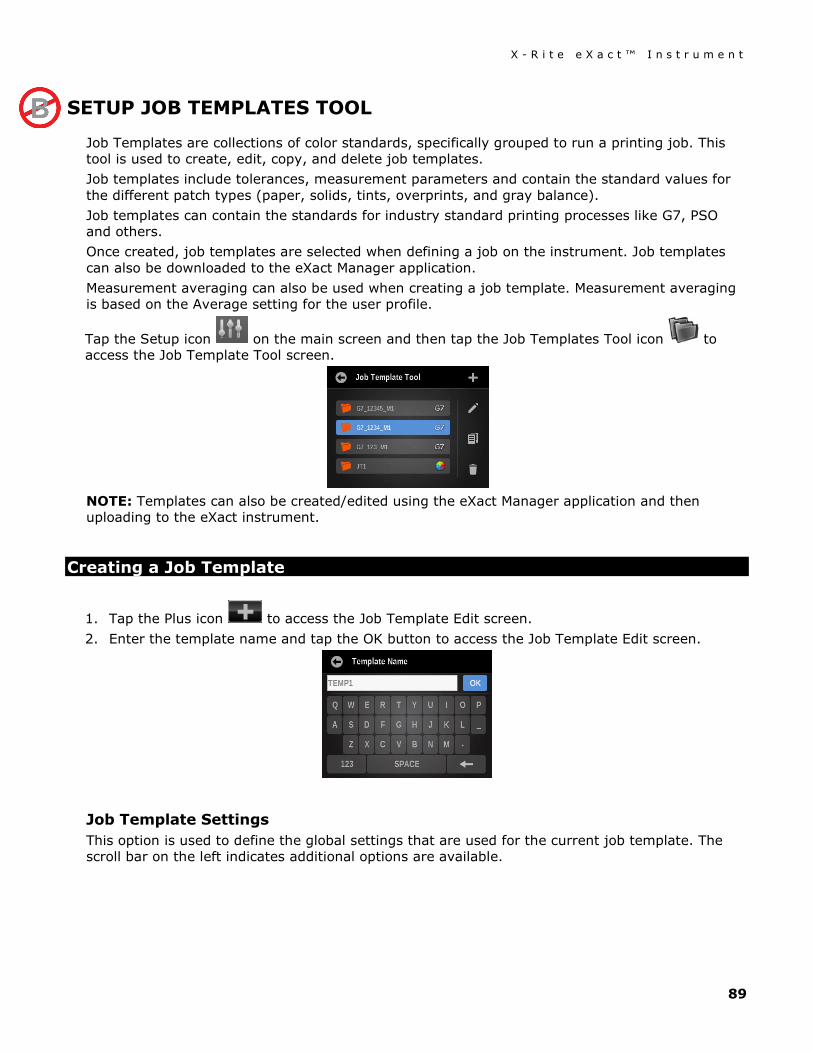
X - R i t e e X a c t ™ I n s t r u m e n t
89
SETUP JOB TEMPLATES TOOL
Job Templates are collections of color standards, specifically grouped to run a printing job. This tool is used to create, edit, copy, and delete job templates. Job templates include tolerances, measurement parameters and contain the standard values for the different patch types (paper, solids, tints, overprints, and gray balance). Job templates can contain the standards for industry standard printing processes like G7, PSO and others. Once created, job templates are selected when defining a job on the instrument. Job templates can also be downloaded to the eXact Manager application. Measurement averaging can also be used when creating a job template. Measurement averaging is based on the Average setting for the user profile.
Tap the Setup icon on the main screen and then tap the Job Templates Tool icon to access the Job Template Tool screen.
NOTE: Templates can also be created/edited using the eXact Manager application and then uploading to the eXact instrument.
Creating a Job Template
1. Tap the Plus icon to access the Job Template Edit screen. 2. Enter the template name and tap the OK button to access the Job Template Edit screen.
Job Template Settings This option is used to define the global settings that are used for the current job template. The scroll bar on the left indicates additional options are available.
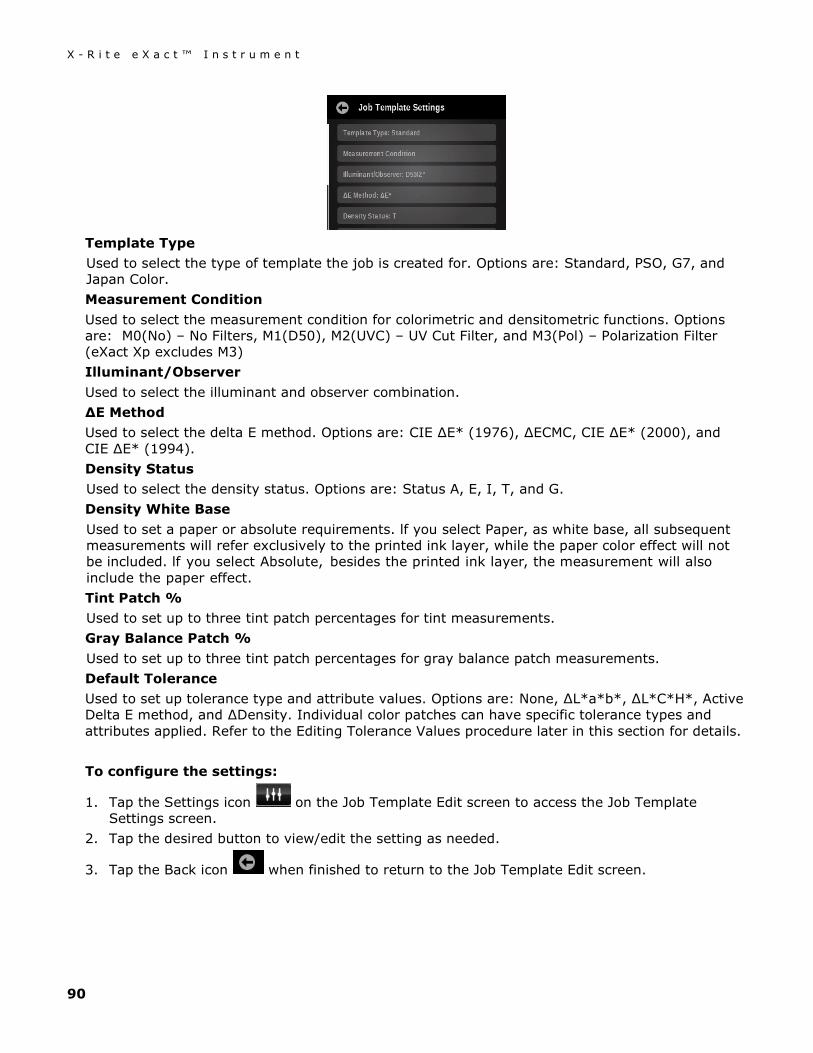
X - R i t e e X a c t ™ I n s t r u m e n t
90
Template Type Used to select the type of template the job is created for. Options are: Standard, PSO, G7, and Japan Color. Measurement Condition Used to select the measurement condition for colorimetric and densitometric functions. Options are: M0(No) – No Filters, M1(D50), M2(UVC) – UV Cut Filter, and M3(Pol) – Polarization Filter (eXact Xp excludes M3) Illuminant/Observer Used to select the illuminant and observer combination. ∆E Method Used to select the delta E method. Options are: CIE ∆E* (1976), ∆ECMC, CIE ∆E* (2000), and CIE ∆E* (1994). Density Status Used to select the density status. Options are: Status A, E, I, T, and G. Density White Base Used to set a paper or absolute requirements. lf you select Paper, as white base, all subsequent measurements will refer exclusively to the printed ink layer, while the paper color effect will not be included. lf you select Absolute, besides the printed ink layer, the measurement will also include the paper effect. Tint Patch % Used to set up to three tint patch percentages for tint measurements. Gray Balance Patch % Used to set up to three tint patch percentages for gray balance patch measurements. Default Tolerance Used to set up tolerance type and attribute values. Options are: None, ∆L*a*b*, ∆L*C*H*, Active Delta E method, and ∆Density. Individual color patches can have specific tolerance types and attributes applied. Refer to the Editing Tolerance Values procedure later in this section for details. To configure the settings:
1. Tap the Settings icon on the Job Template Edit screen to access the Job Template Settings screen.
2. Tap the desired button to view/edit the setting as needed.
3. Tap the Back icon when finished to return to the Job Template Edit screen.
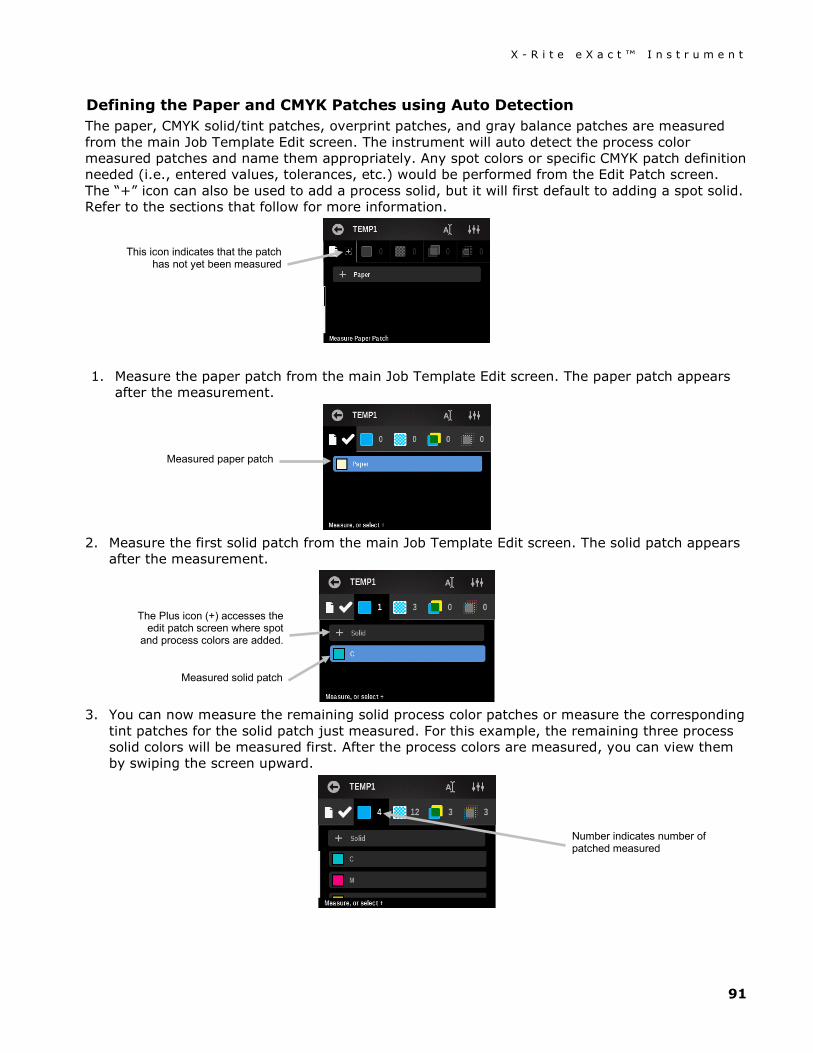
X - R i t e e X a c t ™ I n s t r u m e n t
91
Defining the Paper and CMYK Patches using Auto Detection The paper, CMYK solid/tint patches, overprint patches, and gray balance patches are measured from the main Job Template Edit screen. The instrument will auto detect the process color measured patches and name them appropriately. Any spot colors or specific CMYK patch definition needed (i.e., entered values, tolerances, etc.) would be performed from the Edit Patch screen. The “+” icon can also be used to add a process solid, but it will first default to adding a spot solid. Refer to the sections that follow for more information.
1. Measure the paper patch from the main Job Template Edit screen. The paper patch appears
after the measurement.
2. Measure the first solid patch from the main Job Template Edit screen. The solid patch appears
after the measurement.
3. You can now measure the remaining solid process color patches or measure the corresponding
tint patches for the solid patch just measured. For this example, the remaining three process solid colors will be measured first. After the process colors are measured, you can view them by swiping the screen upward.
Measured paper patch
Measured solid patch
Number indicates number of patched measured
The Plus icon (+) accesses the edit patch screen where spot
and process colors are added.
This icon indicates that the patch has not yet been measured
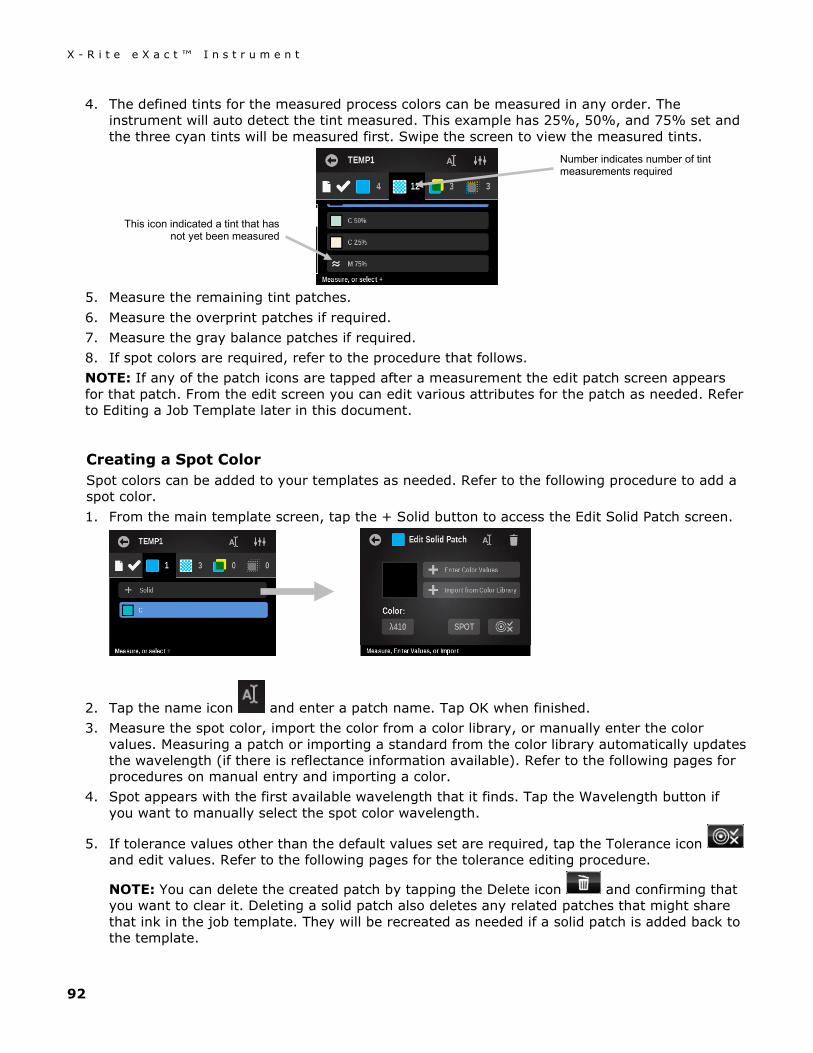
X - R i t e e X a c t ™ I n s t r u m e n t
92
4. The defined tints for the measured process colors can be measured in any order. The instrument will auto detect the tint measured. This example has 25%, 50%, and 75% set and the three cyan tints will be measured first. Swipe the screen to view the measured tints.
5. Measure the remaining tint patches. 6. Measure the overprint patches if required. 7. Measure the gray balance patches if required. 8. If spot colors are required, refer to the procedure that follows. NOTE: If any of the patch icons are tapped after a measurement the edit patch screen appears for that patch. From the edit screen you can edit various attributes for the patch as needed. Refer to Editing a Job Template later in this document.
Creating a Spot Color Spot colors can be added to your templates as needed. Refer to the following procedure to add a spot color. 1. From the main template screen, tap the + Solid button to access the Edit Solid Patch screen.
2. Tap the name icon and enter a patch name. Tap OK when finished. 3. Measure the spot color, import the color from a color library, or manually enter the color
values. Measuring a patch or importing a standard from the color library automatically updates the wavelength (if there is reflectance information available). Refer to the following pages for procedures on manual entry and importing a color.
4. Spot appears with the first available wavelength that it finds. Tap the Wavelength button if you want to manually select the spot color wavelength.
5. If tolerance values other than the default values set are required, tap the Tolerance icon and edit values. Refer to the following pages for the tolerance editing procedure.
NOTE: You can delete the created patch by tapping the Delete icon and confirming that you want to clear it. Deleting a solid patch also deletes any related patches that might share that ink in the job template. They will be recreated as needed if a solid patch is added back to the template.
Number indicates number of tint measurements required
This icon indicated a tint that has not yet been measured
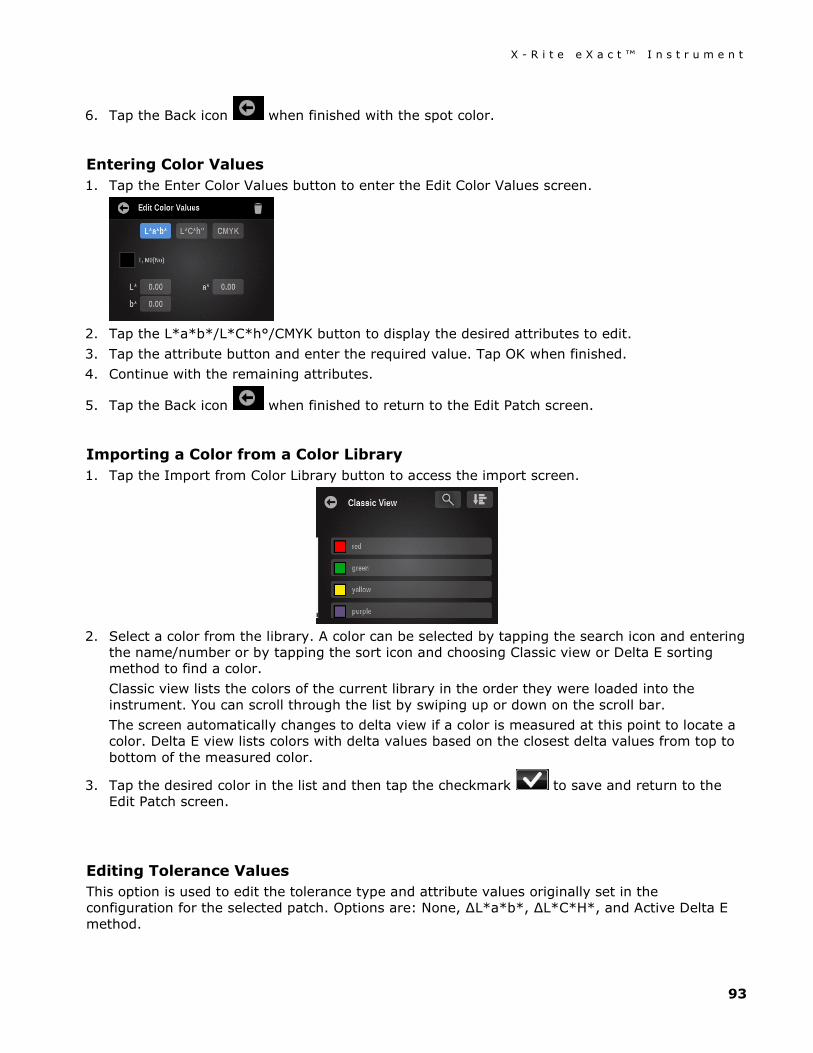
X - R i t e e X a c t ™ I n s t r u m e n t
93
6. Tap the Back icon when finished with the spot color.
Entering Color Values 1. Tap the Enter Color Values button to enter the Edit Color Values screen.
2. Tap the L*a*b*/L*C*h°/CMYK button to display the desired attributes to edit. 3. Tap the attribute button and enter the required value. Tap OK when finished. 4. Continue with the remaining attributes.
5. Tap the Back icon when finished to return to the Edit Patch screen.
Importing a Color from a Color Library 1. Tap the Import from Color Library button to access the import screen.
2. Select a color from the library. A color can be selected by tapping the search icon and entering
the name/number or by tapping the sort icon and choosing Classic view or Delta E sorting method to find a color. Classic view lists the colors of the current library in the order they were loaded into the instrument. You can scroll through the list by swiping up or down on the scroll bar. The screen automatically changes to delta view if a color is measured at this point to locate a color. Delta E view lists colors with delta values based on the closest delta values from top to bottom of the measured color.
3. Tap the desired color in the list and then tap the checkmark to save and return to the Edit Patch screen.
Editing Tolerance Values This option is used to edit the tolerance type and attribute values originally set in the configuration for the selected patch. Options are: None, ∆L*a*b*, ∆L*C*H*, and Active Delta E method.
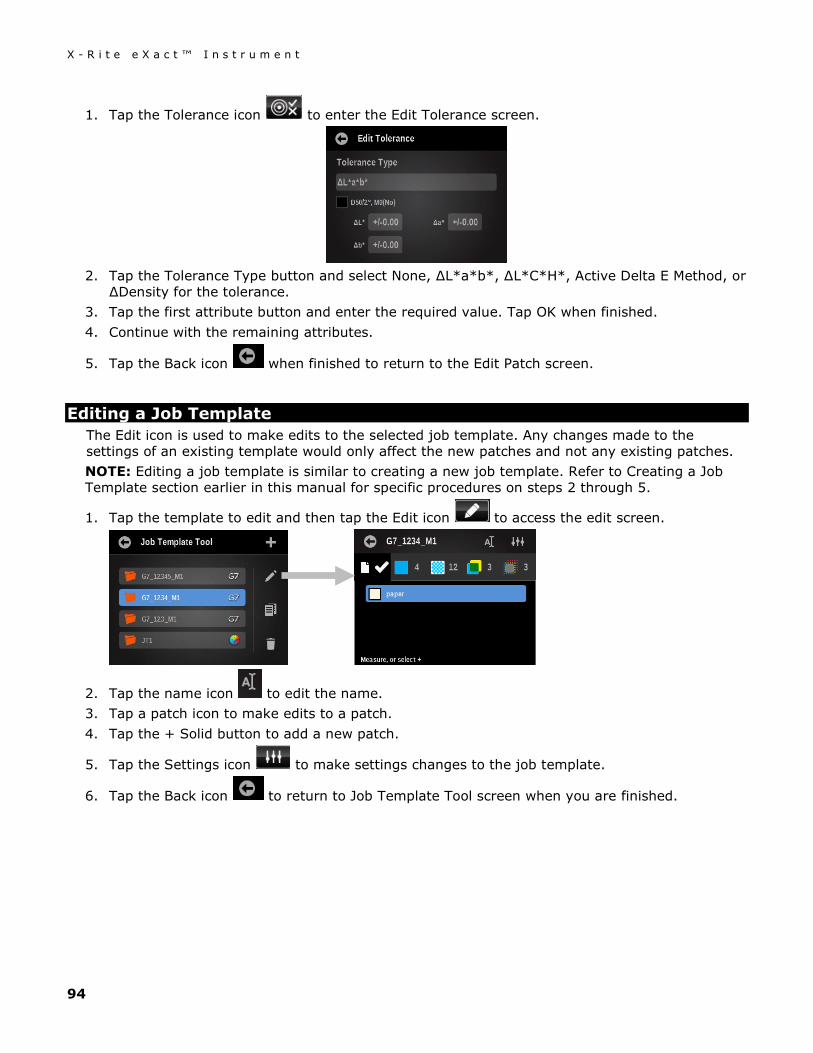
X - R i t e e X a c t ™ I n s t r u m e n t
94
1. Tap the Tolerance icon to enter the Edit Tolerance screen.
2. Tap the Tolerance Type button and select None, ∆L*a*b*, ∆L*C*H*, Active Delta E Method, or
∆Density for the tolerance. 3. Tap the first attribute button and enter the required value. Tap OK when finished. 4. Continue with the remaining attributes.
5. Tap the Back icon when finished to return to the Edit Patch screen.
Editing a Job Template The Edit icon is used to make edits to the selected job template. Any changes made to the settings of an existing template would only affect the new patches and not any existing patches. NOTE: Editing a job template is similar to creating a new job template. Refer to Creating a Job Template section earlier in this manual for specific procedures on steps 2 through 5.
1. Tap the template to edit and then tap the Edit icon to access the edit screen.
2. Tap the name icon to edit the name. 3. Tap a patch icon to make edits to a patch. 4. Tap the + Solid button to add a new patch.
5. Tap the Settings icon to make settings changes to the job template.
6. Tap the Back icon to return to Job Template Tool screen when you are finished.
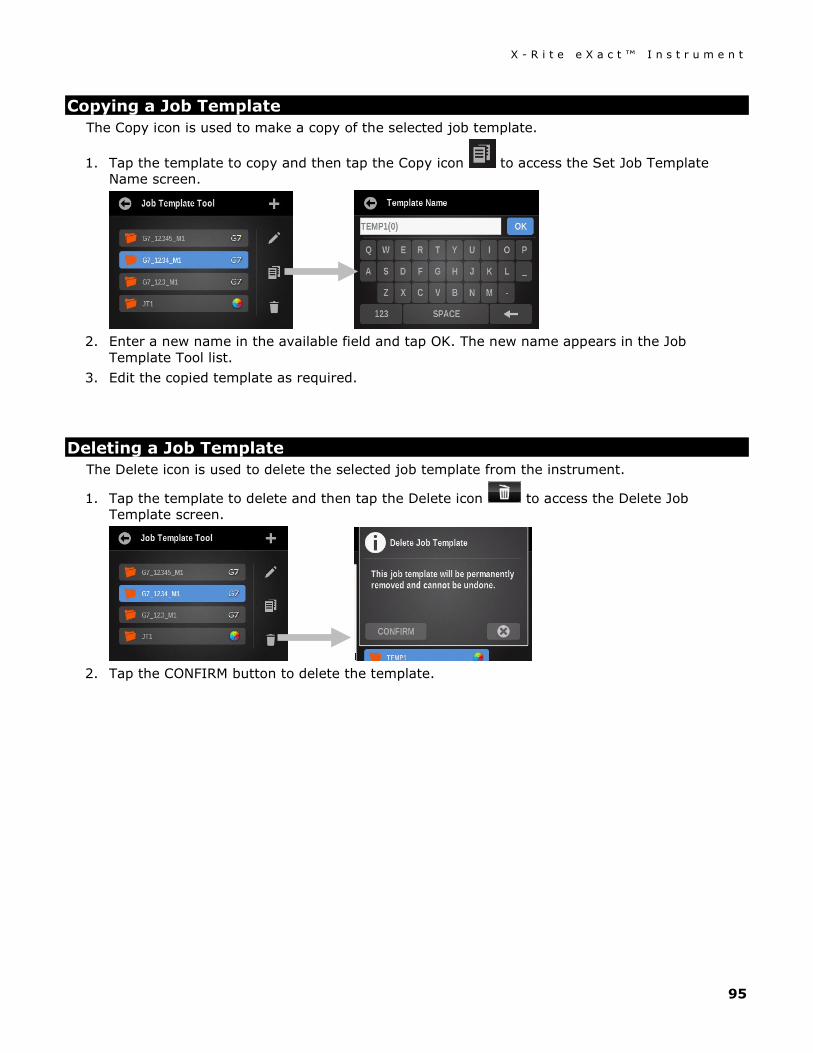
X - R i t e e X a c t ™ I n s t r u m e n t
95
Copying a Job Template The Copy icon is used to make a copy of the selected job template.
1. Tap the template to copy and then tap the Copy icon to access the Set Job Template Name screen.
2. Enter a new name in the available field and tap OK. The new name appears in the Job
Template Tool list. 3. Edit the copied template as required.
Deleting a Job Template The Delete icon is used to delete the selected job template from the instrument.
1. Tap the template to delete and then tap the Delete icon to access the Delete Job Template screen.
2. Tap the CONFIRM button to delete the template.
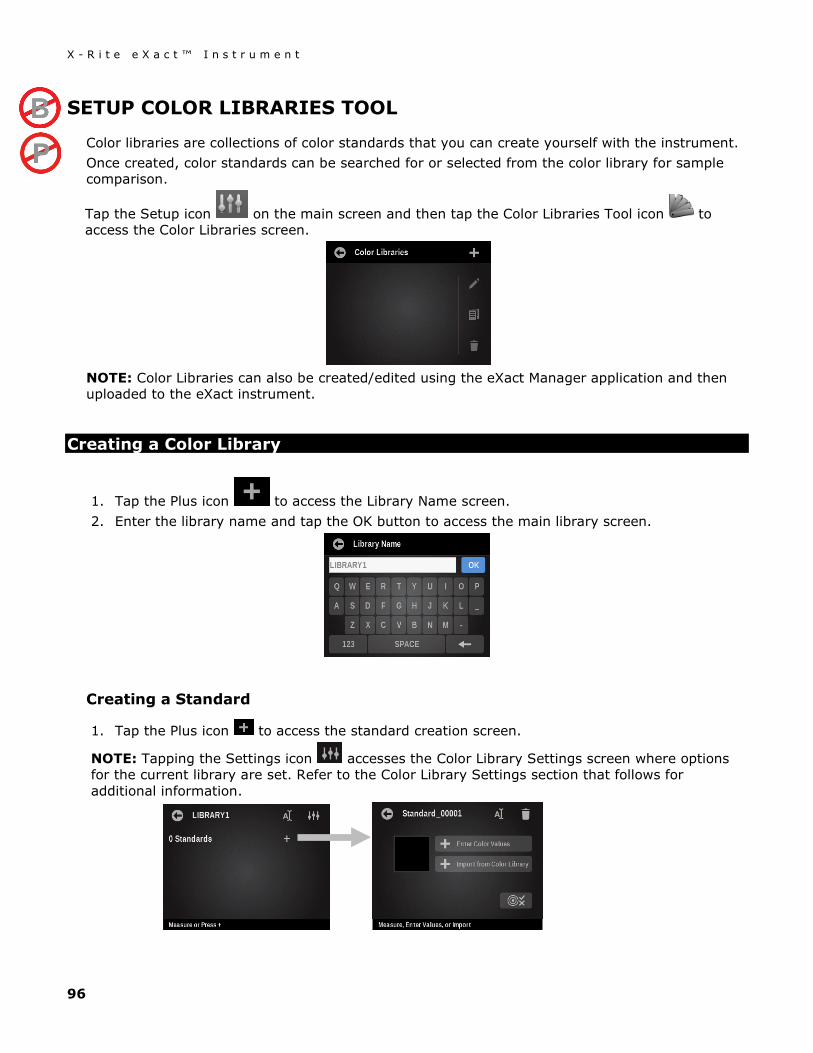
X - R i t e e X a c t ™ I n s t r u m e n t
96
SETUP COLOR LIBRARIES TOOL
Color libraries are collections of color standards that you can create yourself with the instrument. Once created, color standards can be searched for or selected from the color library for sample comparison.
Tap the Setup icon on the main screen and then tap the Color Libraries Tool icon to access the Color Libraries screen.
NOTE: Color Libraries can also be created/edited using the eXact Manager application and then uploaded to the eXact instrument.
Creating a Color Library
1. Tap the Plus icon to access the Library Name screen. 2. Enter the library name and tap the OK button to access the main library screen.
Creating a Standard
1. Tap the Plus icon to access the standard creation screen.
NOTE: Tapping the Settings icon accesses the Color Library Settings screen where options for the current library are set. Refer to the Color Library Settings section that follows for additional information.
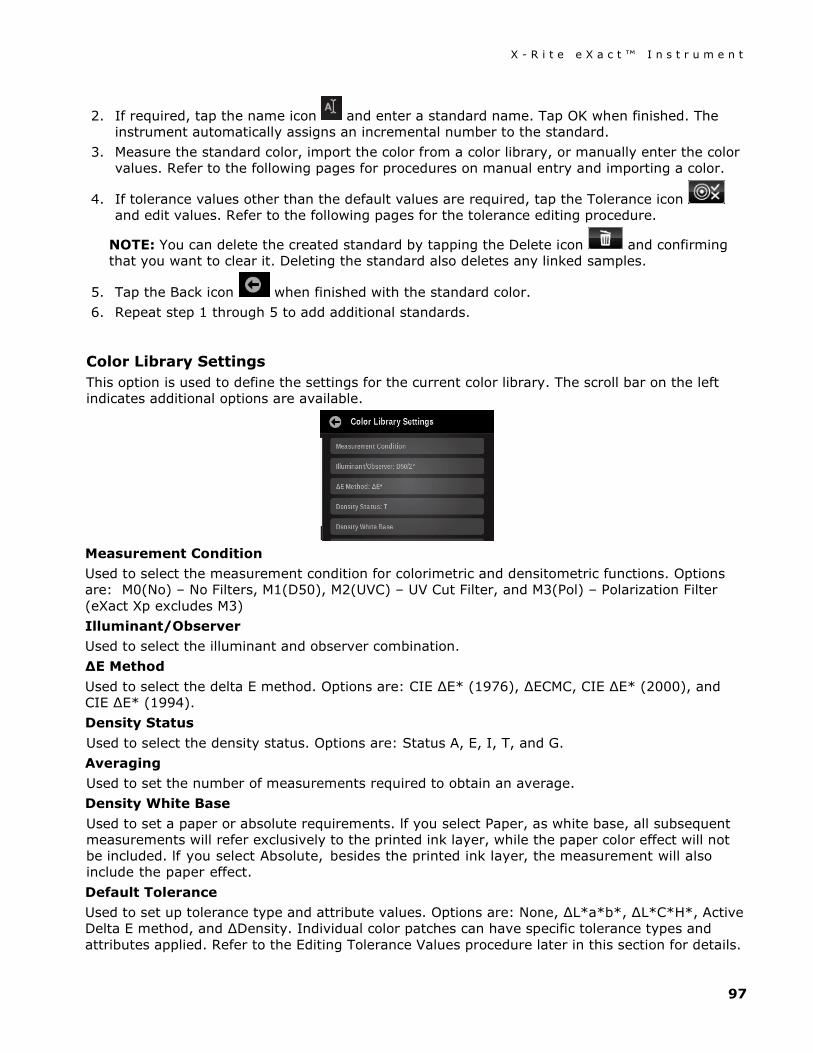
X - R i t e e X a c t ™ I n s t r u m e n t
97
2. If required, tap the name icon and enter a standard name. Tap OK when finished. The instrument automatically assigns an incremental number to the standard.
3. Measure the standard color, import the color from a color library, or manually enter the color values. Refer to the following pages for procedures on manual entry and importing a color.
4. If tolerance values other than the default values are required, tap the Tolerance icon and edit values. Refer to the following pages for the tolerance editing procedure.
NOTE: You can delete the created standard by tapping the Delete icon and confirming that you want to clear it. Deleting the standard also deletes any linked samples.
5. Tap the Back icon when finished with the standard color. 6. Repeat step 1 through 5 to add additional standards.
Color Library Settings This option is used to define the settings for the current color library. The scroll bar on the left indicates additional options are available.
Measurement Condition Used to select the measurement condition for colorimetric and densitometric functions. Options are: M0(No) – No Filters, M1(D50), M2(UVC) – UV Cut Filter, and M3(Pol) – Polarization Filter (eXact Xp excludes M3) Illuminant/Observer Used to select the illuminant and observer combination. ∆E Method Used to select the delta E method. Options are: CIE ∆E* (1976), ∆ECMC, CIE ∆E* (2000), and CIE ∆E* (1994). Density Status Used to select the density status. Options are: Status A, E, I, T, and G. Averaging Used to set the number of measurements required to obtain an average. Density White Base Used to set a paper or absolute requirements. lf you select Paper, as white base, all subsequent measurements will refer exclusively to the printed ink layer, while the paper color effect will not be included. lf you select Absolute, besides the printed ink layer, the measurement will also include the paper effect. Default Tolerance Used to set up tolerance type and attribute values. Options are: None, ∆L*a*b*, ∆L*C*H*, Active Delta E method, and ∆Density. Individual color patches can have specific tolerance types and attributes applied. Refer to the Editing Tolerance Values procedure later in this section for details.
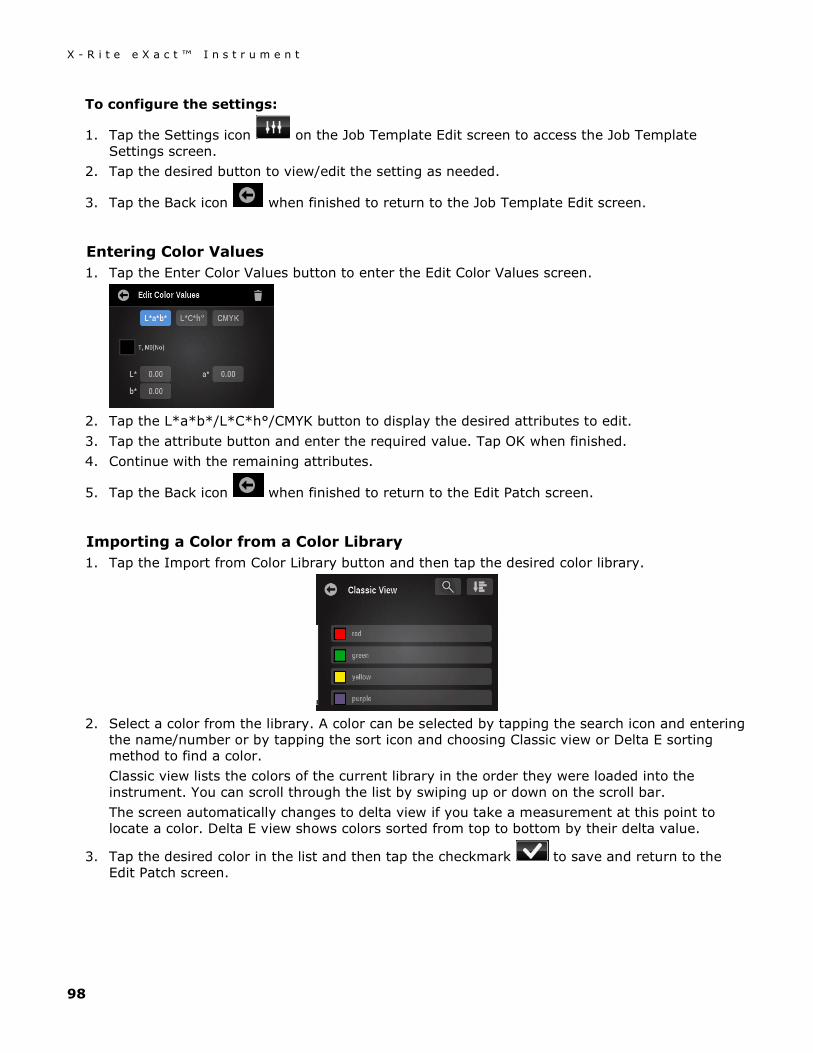
X - R i t e e X a c t ™ I n s t r u m e n t
98
To configure the settings:
1. Tap the Settings icon on the Job Template Edit screen to access the Job Template Settings screen.
2. Tap the desired button to view/edit the setting as needed.
3. Tap the Back icon when finished to return to the Job Template Edit screen.
Entering Color Values 1. Tap the Enter Color Values button to enter the Edit Color Values screen.
2. Tap the L*a*b*/L*C*h°/CMYK button to display the desired attributes to edit. 3. Tap the attribute button and enter the required value. Tap OK when finished. 4. Continue with the remaining attributes.
5. Tap the Back icon when finished to return to the Edit Patch screen.
Importing a Color from a Color Library 1. Tap the Import from Color Library button and then tap the desired color library.
2. Select a color from the library. A color can be selected by tapping the search icon and entering
the name/number or by tapping the sort icon and choosing Classic view or Delta E sorting method to find a color. Classic view lists the colors of the current library in the order they were loaded into the instrument. You can scroll through the list by swiping up or down on the scroll bar. The screen automatically changes to delta view if you take a measurement at this point to locate a color. Delta E view shows colors sorted from top to bottom by their delta value.
3. Tap the desired color in the list and then tap the checkmark to save and return to the Edit Patch screen.
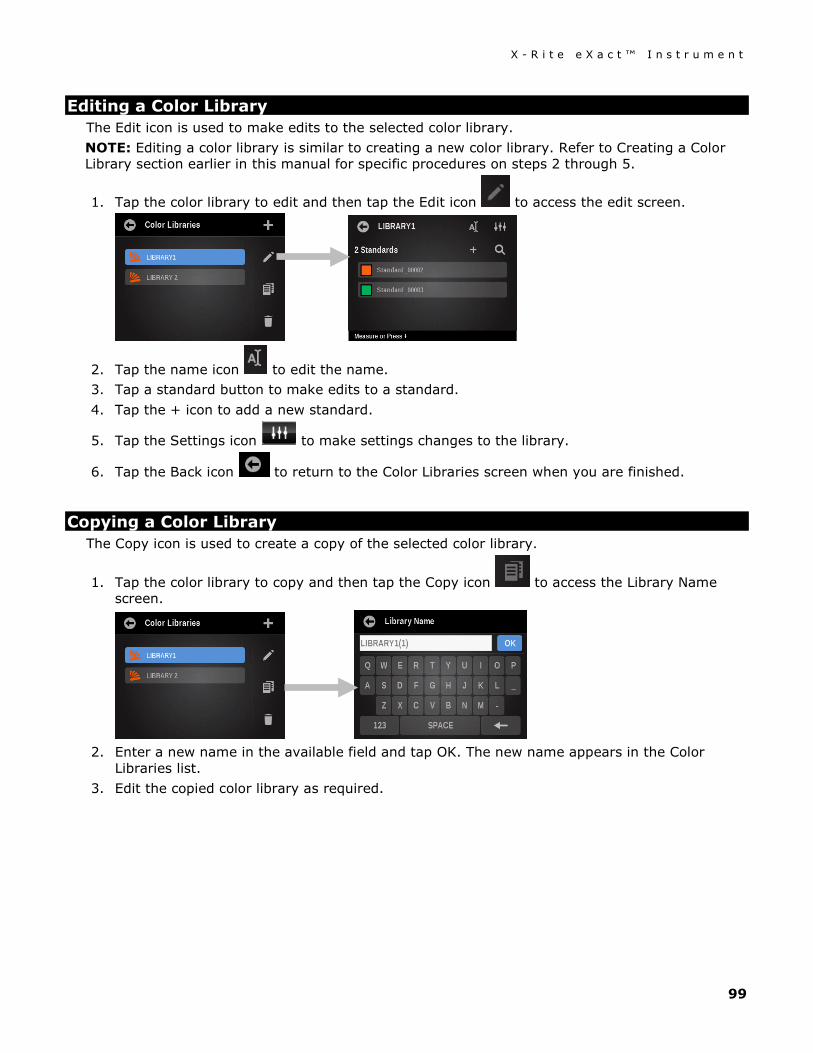
X - R i t e e X a c t ™ I n s t r u m e n t
99
Editing a Color Library The Edit icon is used to make edits to the selected color library. NOTE: Editing a color library is similar to creating a new color library. Refer to Creating a Color Library section earlier in this manual for specific procedures on steps 2 through 5.
1. Tap the color library to edit and then tap the Edit icon to access the edit screen.
2. Tap the name icon to edit the name. 3. Tap a standard button to make edits to a standard. 4. Tap the + icon to add a new standard.
5. Tap the Settings icon to make settings changes to the library.
6. Tap the Back icon to return to the Color Libraries screen when you are finished.
Copying a Color Library The Copy icon is used to create a copy of the selected color library.
1. Tap the color library to copy and then tap the Copy icon to access the Library Name screen.
2. Enter a new name in the available field and tap OK. The new name appears in the Color
Libraries list. 3. Edit the copied color library as required.
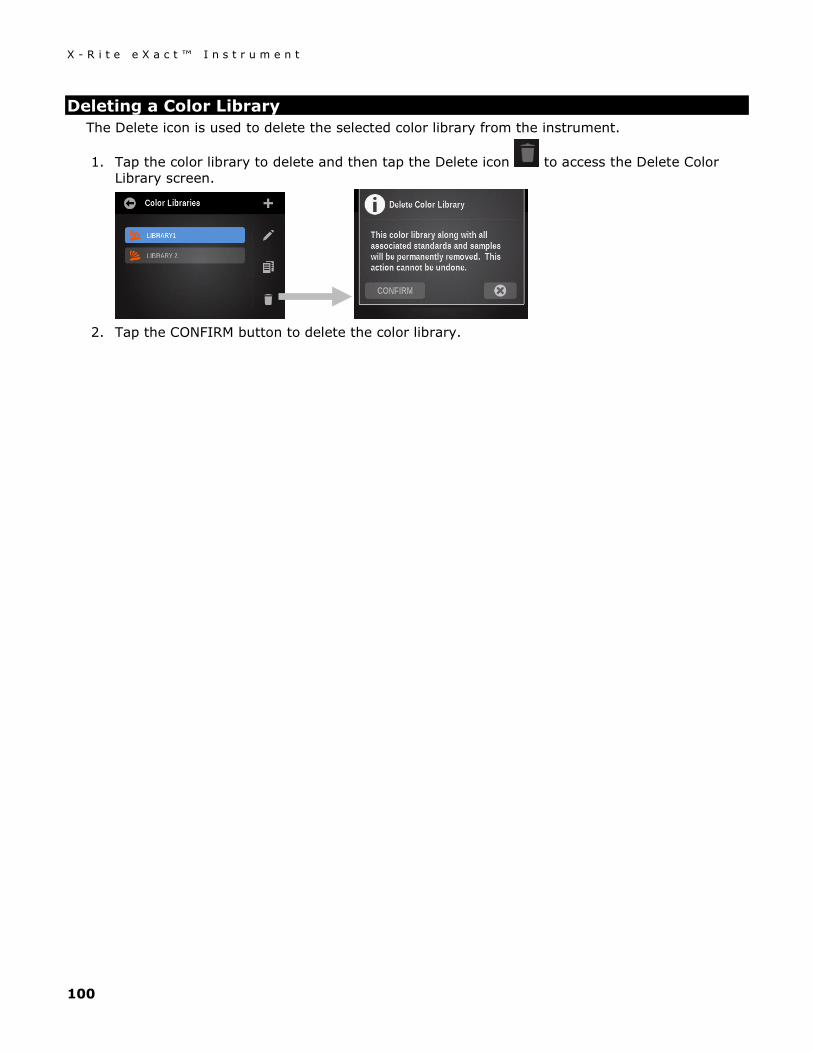
X - R i t e e X a c t ™ I n s t r u m e n t
100
Deleting a Color Library The Delete icon is used to delete the selected color library from the instrument.
1. Tap the color library to delete and then tap the Delete icon to access the Delete Color Library screen.
2. Tap the CONFIRM button to delete the color library.
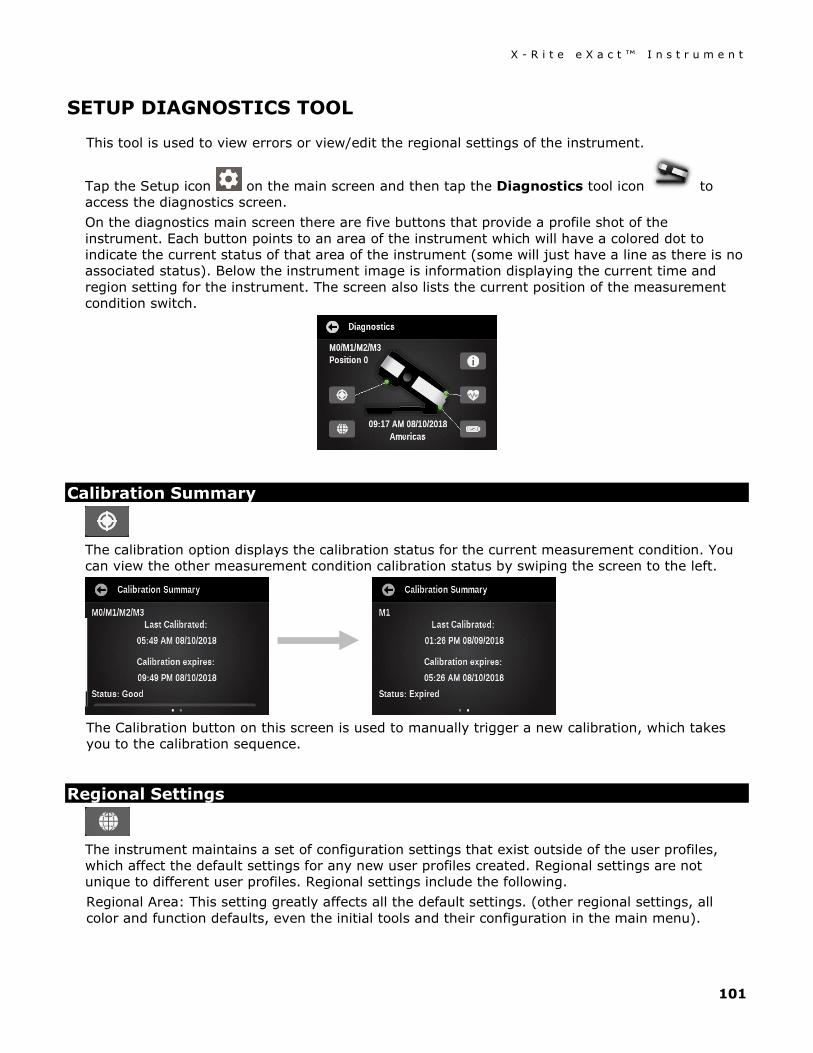
X - R i t e e X a c t ™ I n s t r u m e n t
101
SETUP DIAGNOSTICS TOOL
This tool is used to view errors or view/edit the regional settings of the instrument.
Tap the Setup icon on the main screen and then tap the Diagnostics tool icon to access the diagnostics screen. On the diagnostics main screen there are five buttons that provide a profile shot of the instrument. Each button points to an area of the instrument which will have a colored dot to indicate the current status of that area of the instrument (some will just have a line as there is no associated status). Below the instrument image is information displaying the current time and region setting for the instrument. The screen also lists the current position of the measurement condition switch.
Calibration Summary
The calibration option displays the calibration status for the current measurement condition. You can view the other measurement condition calibration status by swiping the screen to the left.
The Calibration button on this screen is used to manually trigger a new calibration, which takes you to the calibration sequence.
Regional Settings
The instrument maintains a set of configuration settings that exist outside of the user profiles, which affect the default settings for any new user profiles created. Regional settings are not unique to different user profiles. Regional settings include the following. Regional Area: This setting greatly affects all the default settings. (other regional settings, all color and function defaults, even the initial tools and their configuration in the main menu).
X - R i t e e X a c t ™ I n s t r u m e n t
102
The other settings are set to defaults when the region is changed. However, you can override any of the following regional settings if you do not like the default configuration. - Time - Time Format - Date - Date Format
Instrument Summary
View instrument type, serial number, firmware version and more. You can also restore factory settings from this screen. Important, initiating a restore will delete all user profiles, settings, tools, color libraries, samples, job names and job templates. When the instrument restarts the setup wizard screen appears.
Instrument Condition
The instrument condition option is used to run a self-diagnostics routine on the instrument’s systems.
Battery Summary
This option provides a more detailed description of the current battery. Such as, number of full charges the battery has, current battery voltage, and time/date of last battery replacement. A button is also provided to reset the date/time when the battery is replaced.
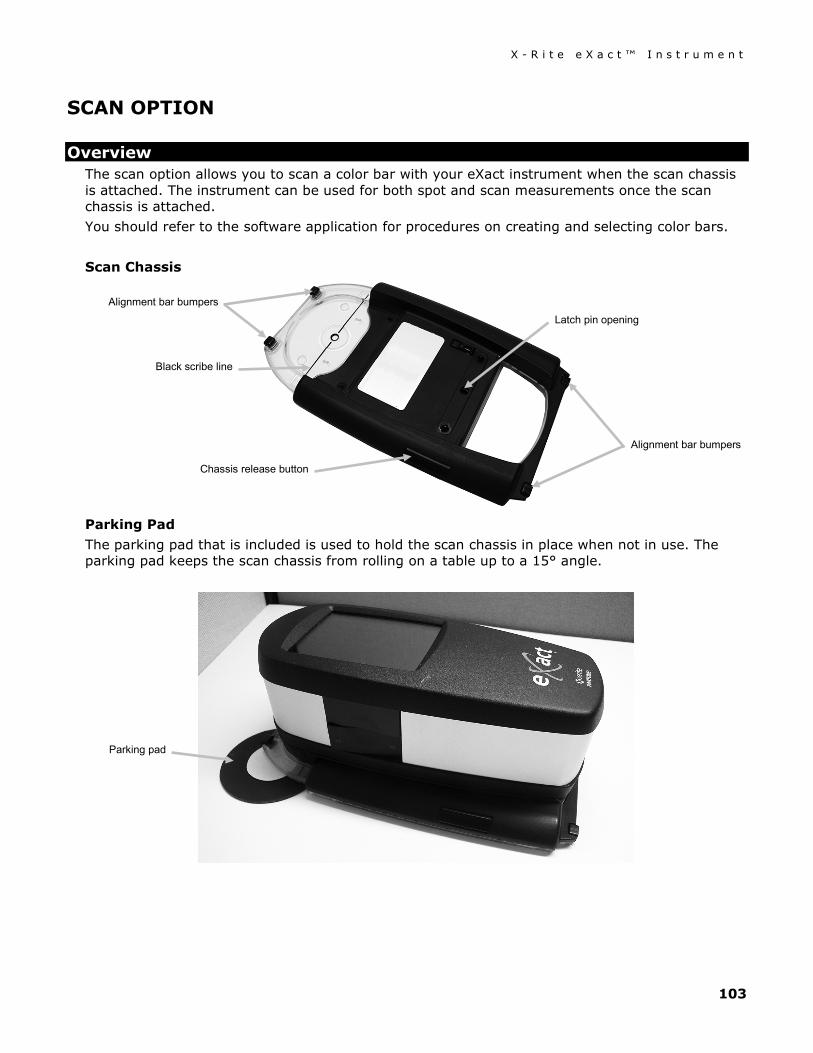
X - R i t e e X a c t ™ I n s t r u m e n t
103
SCAN OPTION
Overview The scan option allows you to scan a color bar with your eXact instrument when the scan chassis is attached. The instrument can be used for both spot and scan measurements once the scan chassis is attached. You should refer to the software application for procedures on creating and selecting color bars. Scan Chassis
Parking Pad The parking pad that is included is used to hold the scan chassis in place when not in use. The parking pad keeps the scan chassis from rolling on a table up to a 15° angle.
Alignment bar bumpers
Alignment bar bumpers
Black scribe line
Latch pin opening
Chassis release button
Parking pad
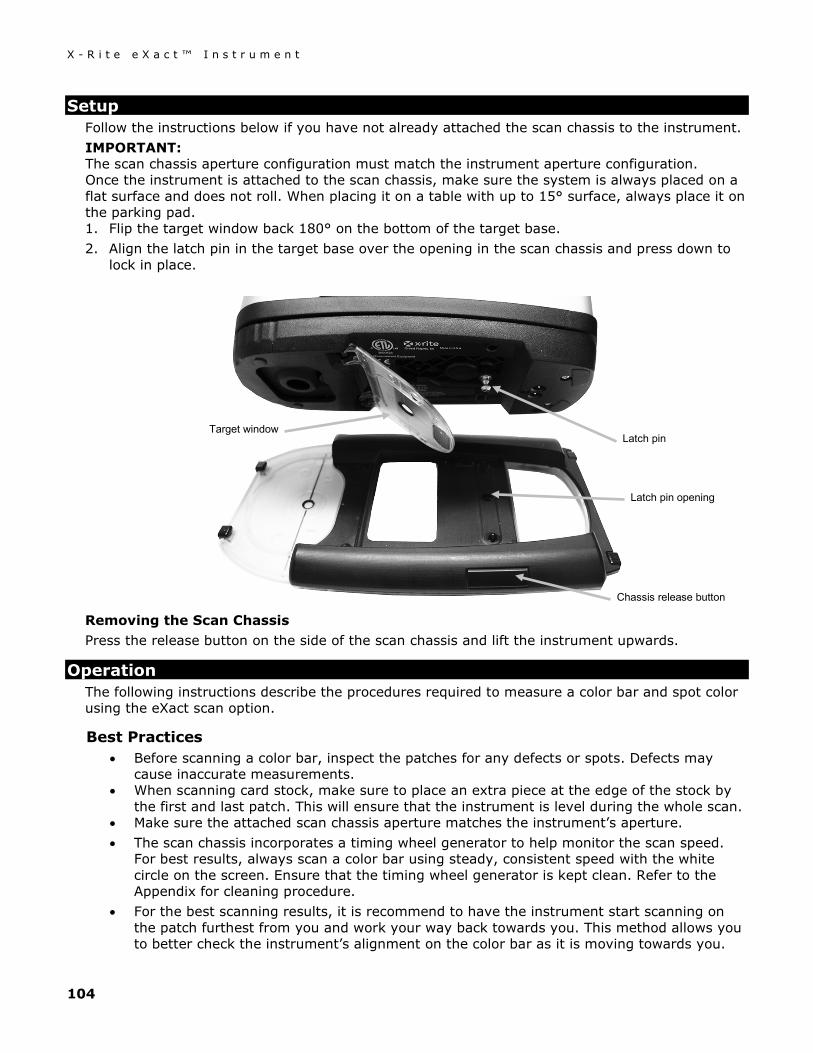
X - R i t e e X a c t ™ I n s t r u m e n t
104
Setup Follow the instructions below if you have not already attached the scan chassis to the instrument. IMPORTANT: The scan chassis aperture configuration must match the instrument aperture configuration. Once the instrument is attached to the scan chassis, make sure the system is always placed on a flat surface and does not roll. When placing it on a table with up to 15° surface, always place it on the parking pad. 1. Flip the target window back 180° on the bottom of the target base. 2. Align the latch pin in the target base over the opening in the scan chassis and press down to
lock in place.
Removing the Scan Chassis Press the release button on the side of the scan chassis and lift the instrument upwards.
Operation The following instructions describe the procedures required to measure a color bar and spot color using the eXact scan option.
Best Practices • Before scanning a color bar, inspect the patches for any defects or spots. Defects may
cause inaccurate measurements. • When scanning card stock, make sure to place an extra piece at the edge of the stock by
the first and last patch. This will ensure that the instrument is level during the whole scan. • Make sure the attached scan chassis aperture matches the instrument’s aperture. • The scan chassis incorporates a timing wheel generator to help monitor the scan speed.
For best results, always scan a color bar using steady, consistent speed with the white circle on the screen. Ensure that the timing wheel generator is kept clean. Refer to the Appendix for cleaning procedure.
• For the best scanning results, it is recommend to have the instrument start scanning on the patch furthest from you and work your way back towards you. This method allows you to better check the instrument’s alignment on the color bar as it is moving towards you.
Target window Latch pin
Latch pin opening
Chassis release button
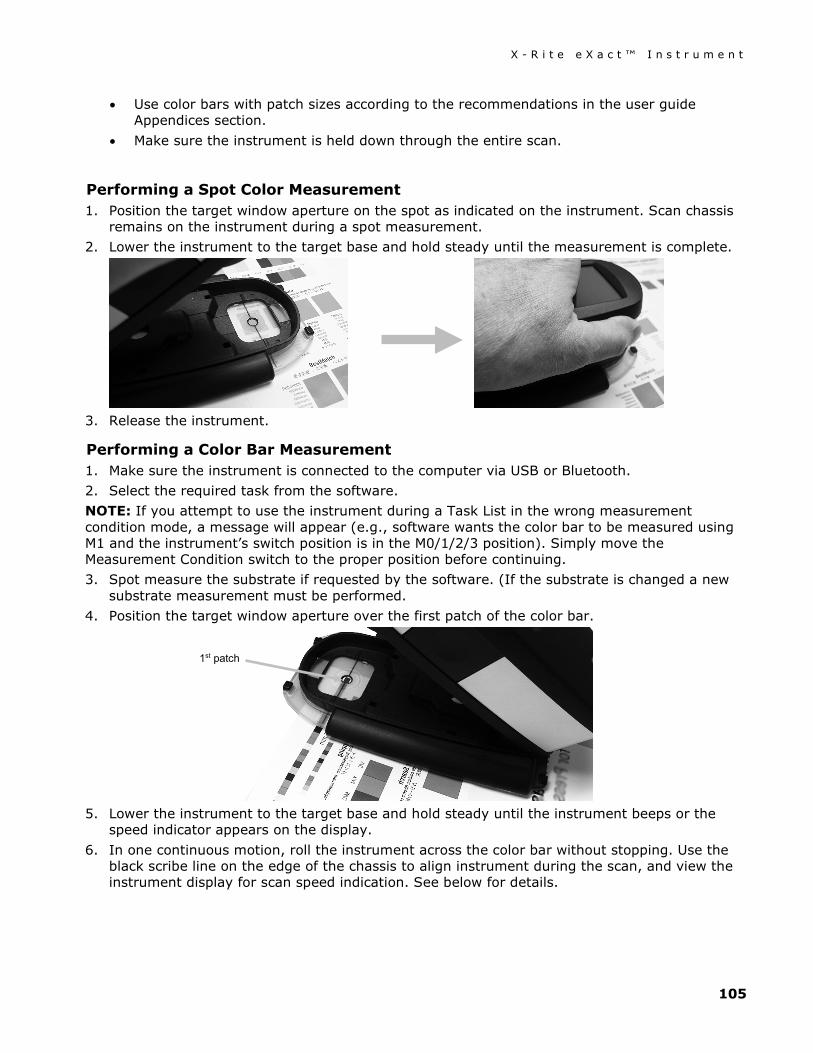
X - R i t e e X a c t ™ I n s t r u m e n t
105
• Use color bars with patch sizes according to the recommendations in the user guide Appendices section.
• Make sure the instrument is held down through the entire scan.
Performing a Spot Color Measurement 1. Position the target window aperture on the spot as indicated on the instrument. Scan chassis
remains on the instrument during a spot measurement. 2. Lower the instrument to the target base and hold steady until the measurement is complete.
3. Release the instrument.
Performing a Color Bar Measurement 1. Make sure the instrument is connected to the computer via USB or Bluetooth. 2. Select the required task from the software. NOTE: If you attempt to use the instrument during a Task List in the wrong measurement condition mode, a message will appear (e.g., software wants the color bar to be measured using M1 and the instrument’s switch position is in the M0/1/2/3 position). Simply move the Measurement Condition switch to the proper position before continuing. 3. Spot measure the substrate if requested by the software. (If the substrate is changed a new
substrate measurement must be performed. 4. Position the target window aperture over the first patch of the color bar.
5. Lower the instrument to the target base and hold steady until the instrument beeps or the
speed indicator appears on the display. 6. In one continuous motion, roll the instrument across the color bar without stopping. Use the
black scribe line on the edge of the chassis to align instrument during the scan, and view the instrument display for scan speed indication. See below for details.
1st patch
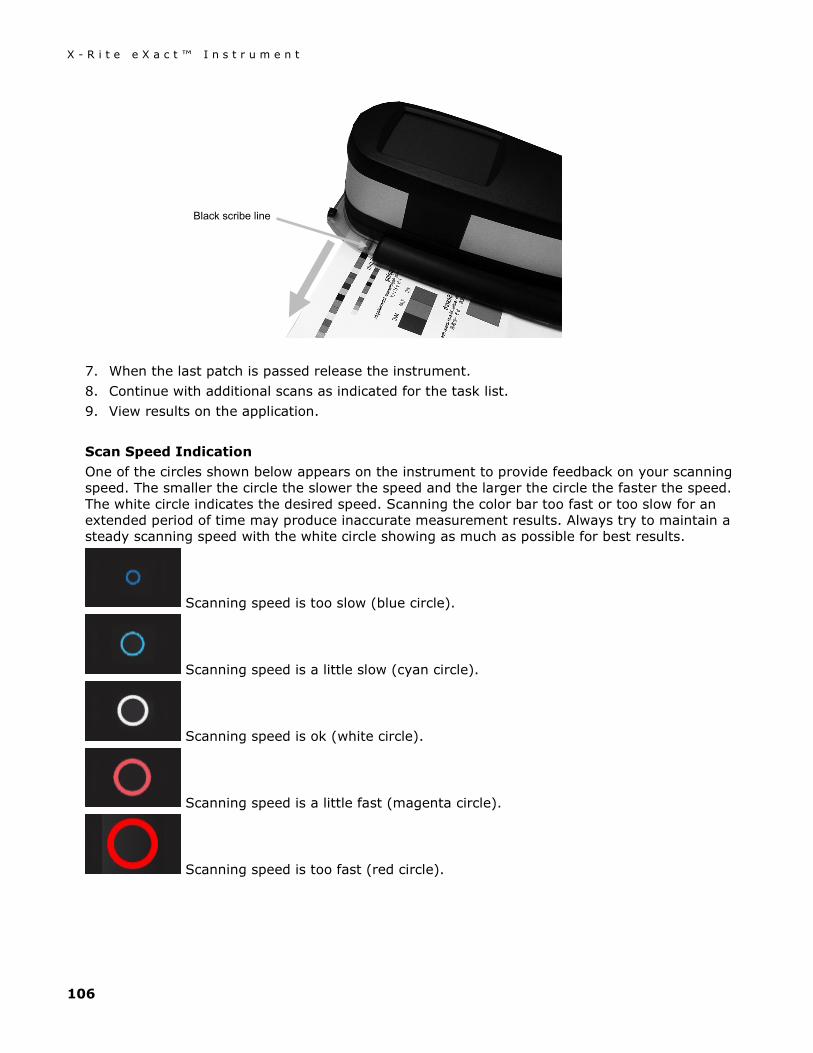
X - R i t e e X a c t ™ I n s t r u m e n t
106
7. When the last patch is passed release the instrument. 8. Continue with additional scans as indicated for the task list. 9. View results on the application. Scan Speed Indication One of the circles shown below appears on the instrument to provide feedback on your scanning speed. The smaller the circle the slower the speed and the larger the circle the faster the speed. The white circle indicates the desired speed. Scanning the color bar too fast or too slow for an extended period of time may produce inaccurate measurement results. Always try to maintain a steady scanning speed with the white circle showing as much as possible for best results.
Scanning speed is too slow (blue circle).
Scanning speed is a little slow (cyan circle).
Scanning speed is ok (white circle).
Scanning speed is a little fast (magenta circle).
Scanning speed is too fast (red circle).
Black scribe line
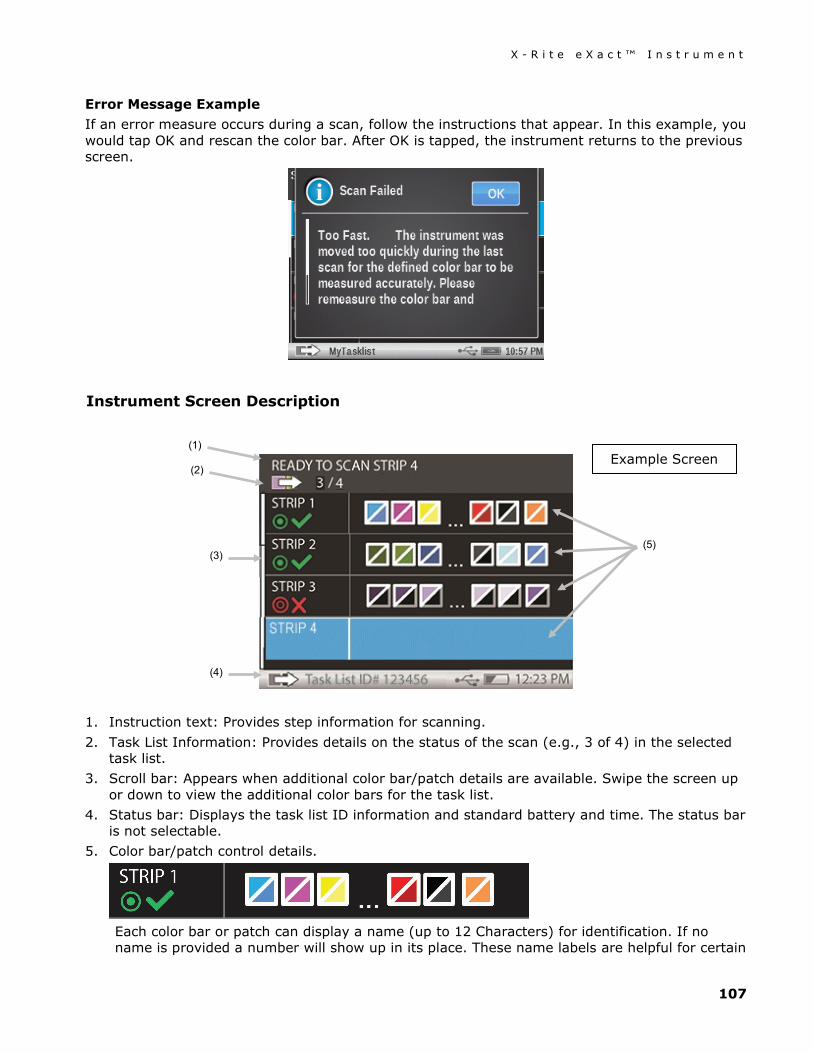
X - R i t e e X a c t ™ I n s t r u m e n t
107
Error Message Example If an error measure occurs during a scan, follow the instructions that appear. In this example, you would tap OK and rescan the color bar. After OK is tapped, the instrument returns to the previous screen.
Instrument Screen Description
1. Instruction text: Provides step information for scanning. 2. Task List Information: Provides details on the status of the scan (e.g., 3 of 4) in the selected
task list. 3. Scroll bar: Appears when additional color bar/patch details are available. Swipe the screen up
or down to view the additional color bars for the task list. 4. Status bar: Displays the task list ID information and standard battery and time. The status bar
is not selectable. 5. Color bar/patch control details.
Each color bar or patch can display a name (up to 12 Characters) for identification. If no name is provided a number will show up in its place. These name labels are helpful for certain
(2)
(3)
(4)
(5)
(1) Example Screen
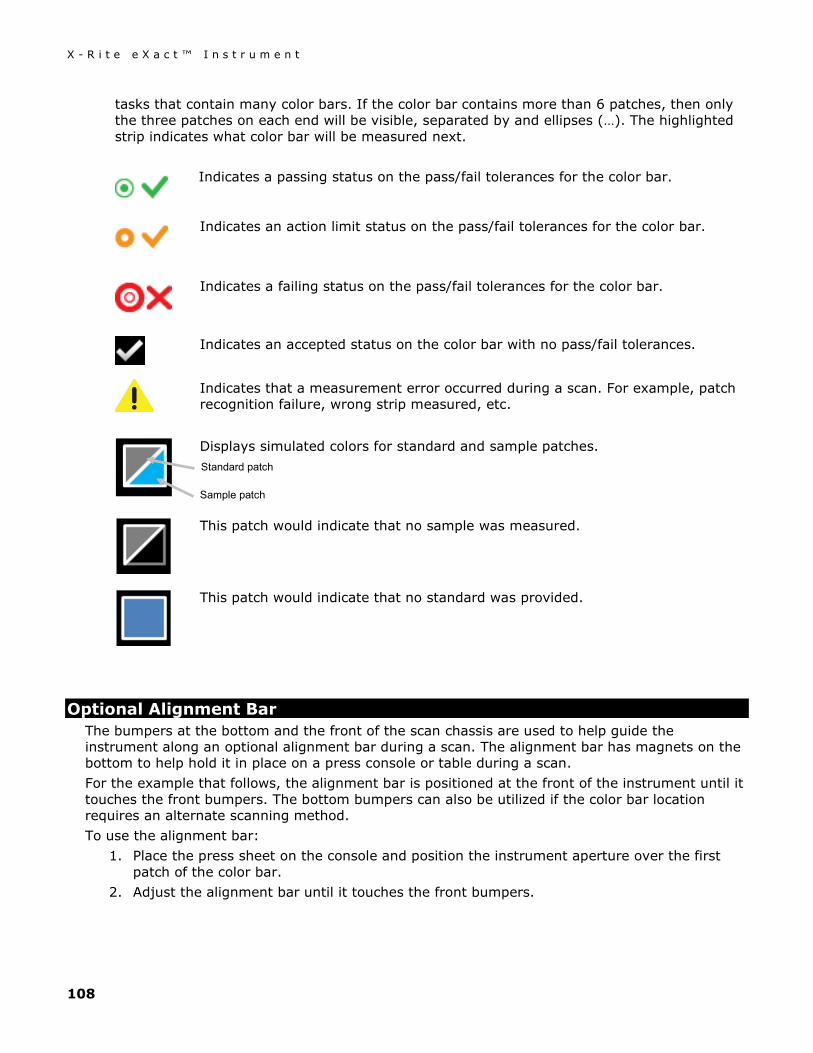
X - R i t e e X a c t ™ I n s t r u m e n t
108
tasks that contain many color bars. If the color bar contains more than 6 patches, then only the three patches on each end will be visible, separated by and ellipses (…). The highlighted strip indicates what color bar will be measured next.
Indicates a passing status on the pass/fail tolerances for the color bar.
Indicates an action limit status on the pass/fail tolerances for the color bar.
Indicates a failing status on the pass/fail tolerances for the color bar.
Indicates an accepted status on the color bar with no pass/fail tolerances.
Indicates that a measurement error occurred during a scan. For example, patch recognition failure, wrong strip measured, etc.
Displays simulated colors for standard and sample patches.
This patch would indicate that no sample was measured.
This patch would indicate that no standard was provided.
Optional Alignment Bar The bumpers at the bottom and the front of the scan chassis are used to help guide the instrument along an optional alignment bar during a scan. The alignment bar has magnets on the bottom to help hold it in place on a press console or table during a scan. For the example that follows, the alignment bar is positioned at the front of the instrument until it touches the front bumpers. The bottom bumpers can also be utilized if the color bar location requires an alternate scanning method. To use the alignment bar:
1. Place the press sheet on the console and position the instrument aperture over the first patch of the color bar.
2. Adjust the alignment bar until it touches the front bumpers.
Standard patch
Sample patch
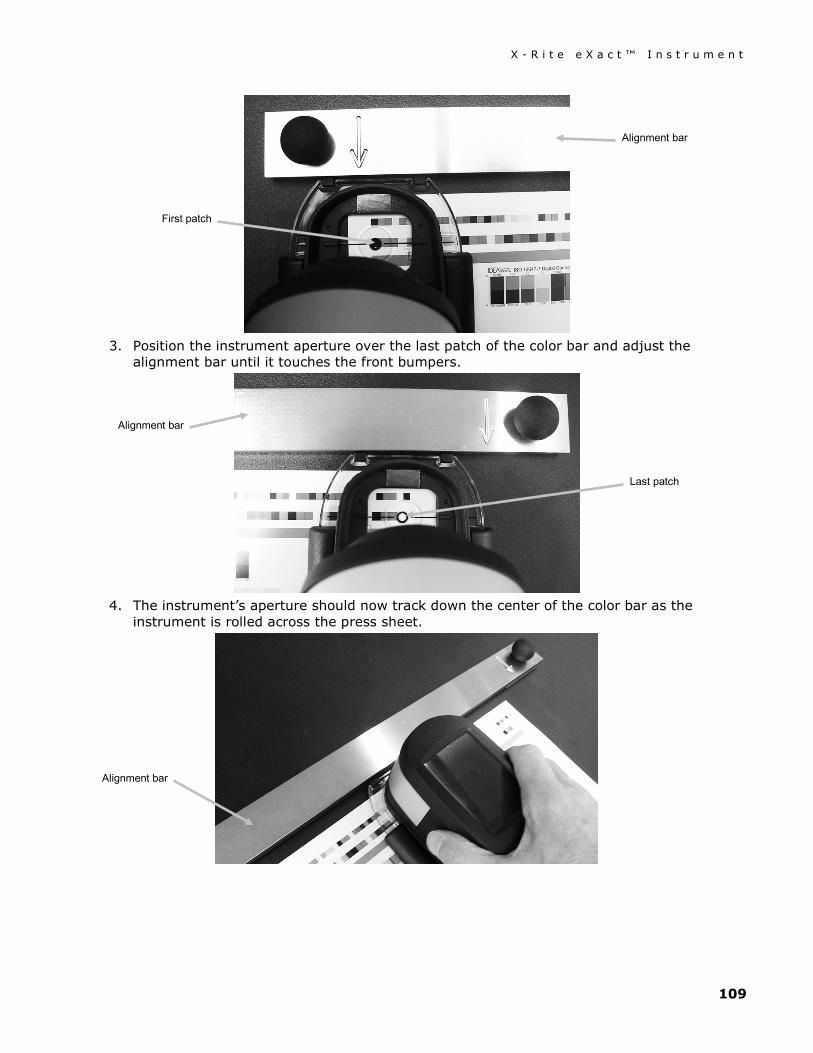
X - R i t e e X a c t ™ I n s t r u m e n t
109
3. Position the instrument aperture over the last patch of the color bar and adjust the
alignment bar until it touches the front bumpers.
4. The instrument’s aperture should now track down the center of the color bar as the
instrument is rolled across the press sheet.
Alignment bar
Alignment bar
First patch
Last patch
Alignment bar
X - R i t e e X a c t ™ I n s t r u m e n t
110
APPENDICES
Information
Recertification X-Rite recommends an annual recertification of the eXact spectrophotometer. Contact your X-Rite dealer or the nearest X-Rite Service Center to find out more about recertification.
Warranty Registration To receive technical support, obtain warranty service, and get the latest updates and product news, register your new eXact with eXact Manager (or at: www.xrite.com/register).
Service Do not try to disassemble the X-Rite eXact for any reason. Unauthorized disassembly of the equipment will void all warranty claims. Contact X-Rite Support or the nearest X-Rite Service Center, if you believe that the unit does not work anymore or does not work correctly.
Support We are confident you will be pleased with your new X-Rite product. At the same time, we understand your need for on-demand support and training in today’s complex and rapidly evolving workflows. Because of this we are making the following on-line and free support tools available to registered users. These support tools are found at: www.xrite.com/support
• Free and unlimited access to the eXact interactive training video; available within the eXact package too.
• Free and unlimited access to the X-Rite on-line Help Desk, which includes detailed and helpful support articles related to frequently asked questions.
• Free access to X-Rite’s e-mail support and call center during the warranty period for issues resulting from general product use provided:
- You are the original registered user of the product
- You are using the current version of eXact firmware and software
- You are using currently supported hardware and supported platform (operating system)
Because we recognize the need for advanced support related to using eXact and X-Rite products in various workflows, as well as support in post warranty time periods, we are happy to offer fee based support programs and training options delivered by X-Rite’s highly experienced Color Experts. For complete information, please visit www.xrite.com/exact
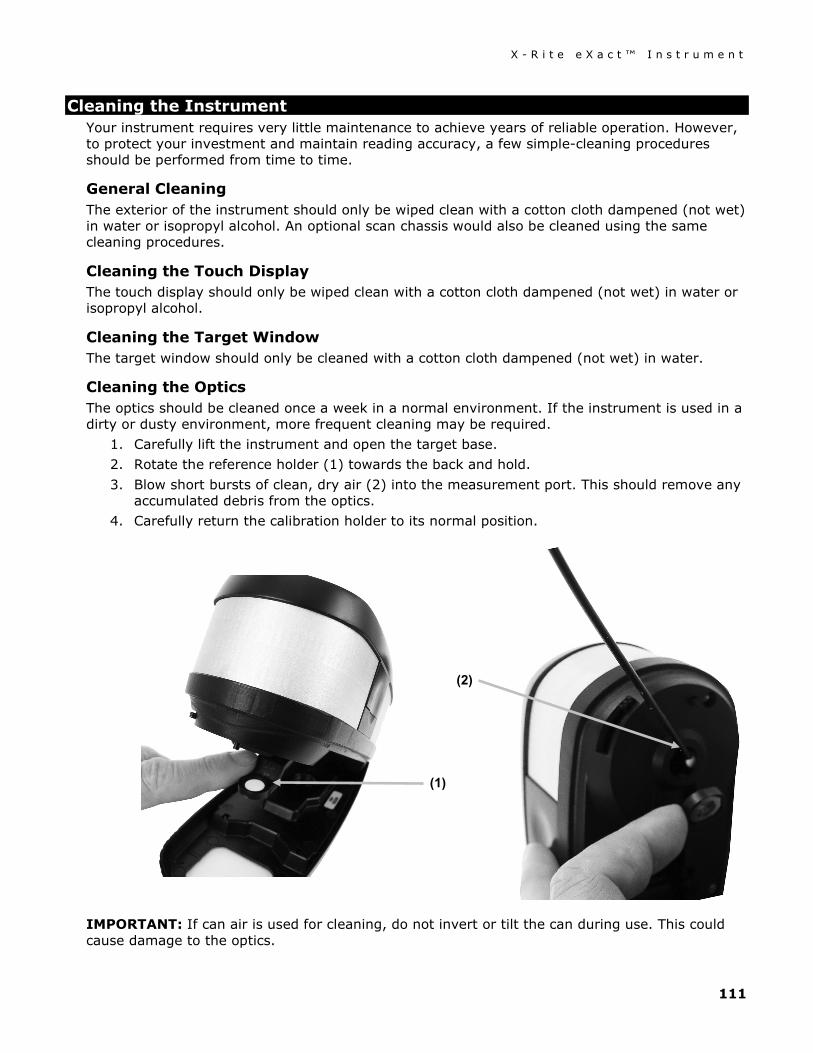
X - R i t e e X a c t ™ I n s t r u m e n t
111
Cleaning the Instrument Your instrument requires very little maintenance to achieve years of reliable operation. However, to protect your investment and maintain reading accuracy, a few simple-cleaning procedures should be performed from time to time.
General Cleaning The exterior of the instrument should only be wiped clean with a cotton cloth dampened (not wet) in water or isopropyl alcohol. An optional scan chassis would also be cleaned using the same cleaning procedures.
Cleaning the Touch Display The touch display should only be wiped clean with a cotton cloth dampened (not wet) in water or isopropyl alcohol.
Cleaning the Target Window The target window should only be cleaned with a cotton cloth dampened (not wet) in water.
Cleaning the Optics The optics should be cleaned once a week in a normal environment. If the instrument is used in a dirty or dusty environment, more frequent cleaning may be required.
1. Carefully lift the instrument and open the target base. 2. Rotate the reference holder (1) towards the back and hold. 3. Blow short bursts of clean, dry air (2) into the measurement port. This should remove any
accumulated debris from the optics. 4. Carefully return the calibration holder to its normal position.
IMPORTANT: If can air is used for cleaning, do not invert or tilt the can during use. This could cause damage to the optics.
(1)
(2)
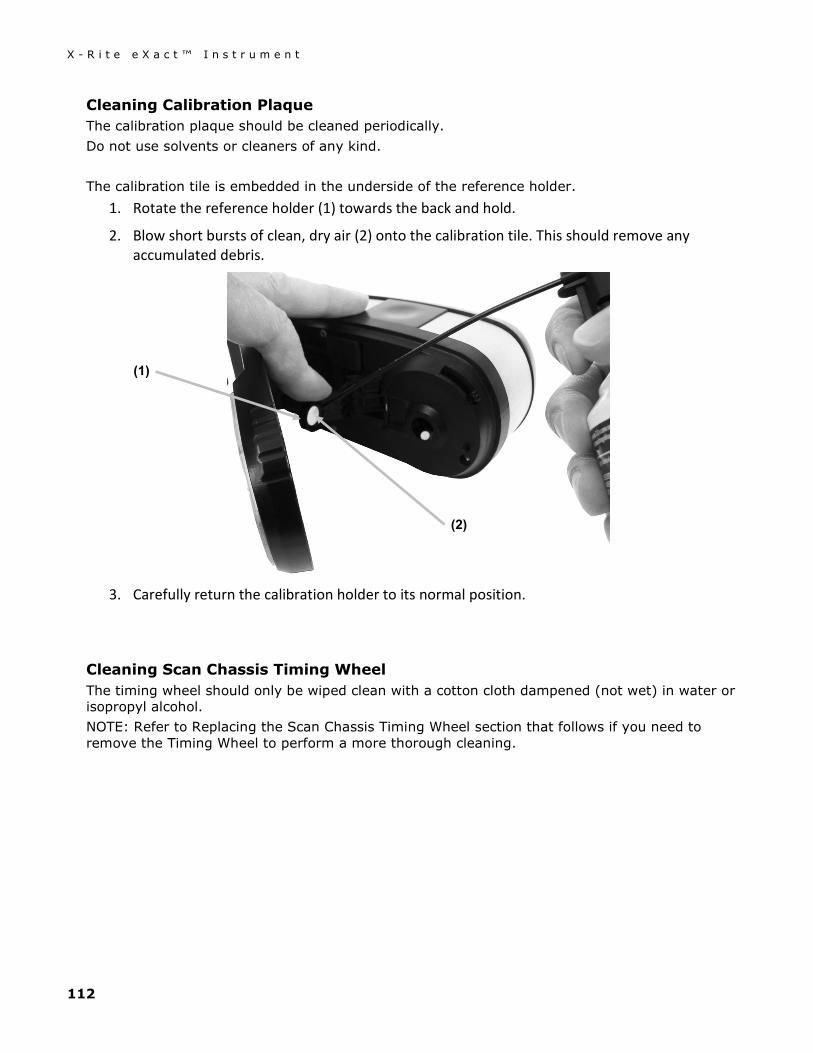
X - R i t e e X a c t ™ I n s t r u m e n t
112
Cleaning Calibration Plaque The calibration plaque should be cleaned periodically. Do not use solvents or cleaners of any kind. The calibration tile is embedded in the underside of the reference holder.
1. Rotate the reference holder (1) towards the back and hold.
2. Blow short bursts of clean, dry air (2) onto the calibration tile. This should remove any accumulated debris.
3. Carefully return the calibration holder to its normal position.
Cleaning Scan Chassis Timing Wheel The timing wheel should only be wiped clean with a cotton cloth dampened (not wet) in water or isopropyl alcohol. NOTE: Refer to Replacing the Scan Chassis Timing Wheel section that follows if you need to remove the Timing Wheel to perform a more thorough cleaning.
(1)
(2)
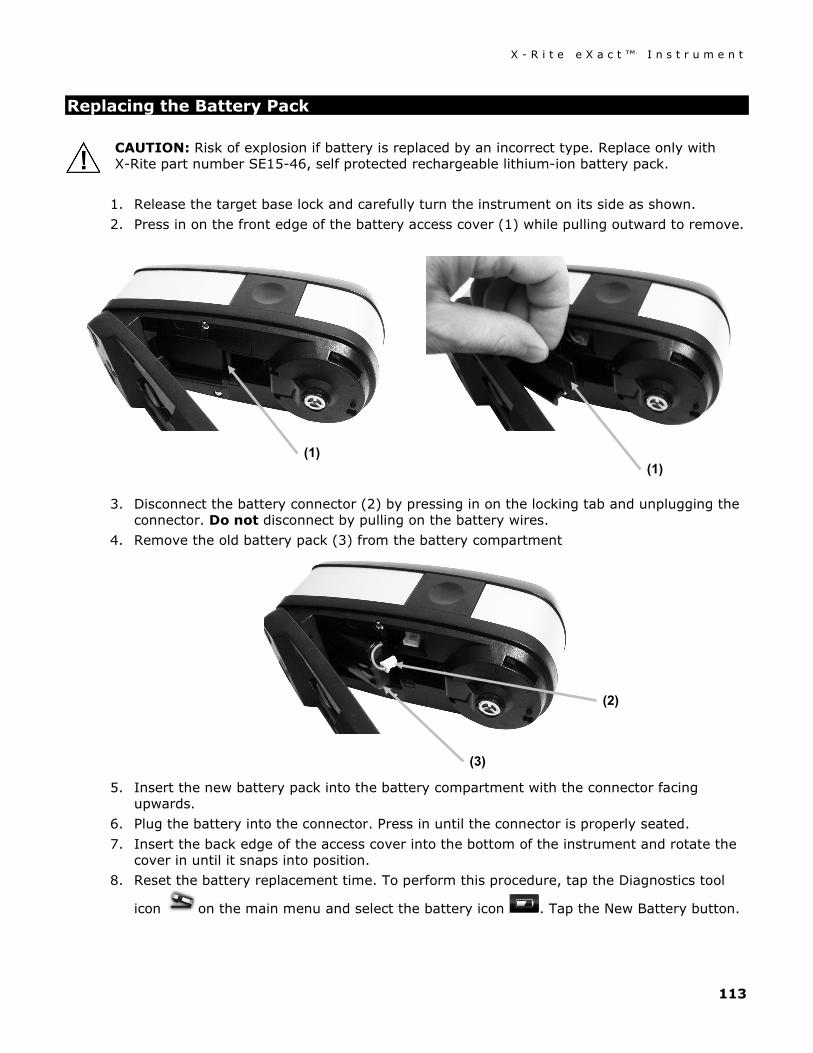
X - R i t e e X a c t ™ I n s t r u m e n t
113
Replacing the Battery Pack
CAUTION: Risk of explosion if battery is replaced by an incorrect type. Replace only with X-Rite part number SE15-46, self protected rechargeable lithium-ion battery pack.
1. Release the target base lock and carefully turn the instrument on its side as shown. 2. Press in on the front edge of the battery access cover (1) while pulling outward to remove.
3. Disconnect the battery connector (2) by pressing in on the locking tab and unplugging the connector. Do not disconnect by pulling on the battery wires.
4. Remove the old battery pack (3) from the battery compartment
5. Insert the new battery pack into the battery compartment with the connector facing upwards.
6. Plug the battery into the connector. Press in until the connector is properly seated. 7. Insert the back edge of the access cover into the bottom of the instrument and rotate the
cover in until it snaps into position. 8. Reset the battery replacement time. To perform this procedure, tap the Diagnostics tool
icon on the main menu and select the battery icon . Tap the New Battery button.
(1) (1)
(3)
(2)
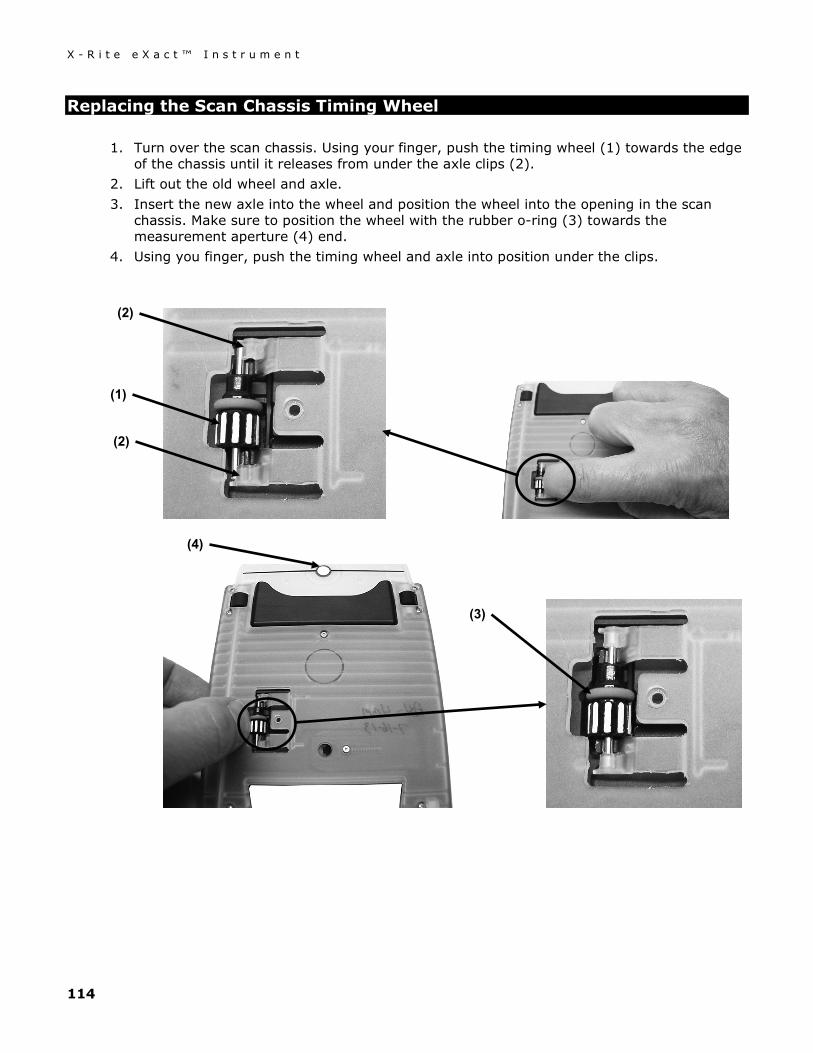
X - R i t e e X a c t ™ I n s t r u m e n t
114
Replacing the Scan Chassis Timing Wheel
1. Turn over the scan chassis. Using your finger, push the timing wheel (1) towards the edge of the chassis until it releases from under the axle clips (2).
2. Lift out the old wheel and axle. 3. Insert the new axle into the wheel and position the wheel into the opening in the scan
chassis. Make sure to position the wheel with the rubber o-ring (3) towards the measurement aperture (4) end.
4. Using you finger, push the timing wheel and axle into position under the clips.
(2)
(1)
(2)
(3)
(4)
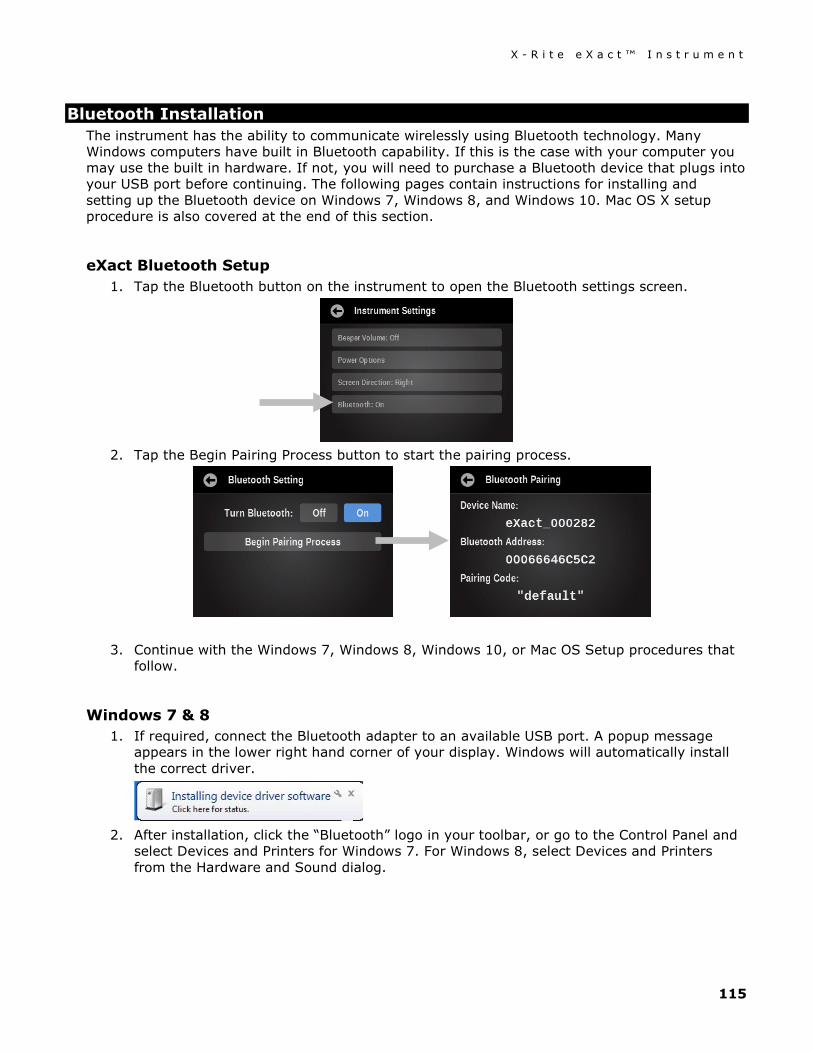
X - R i t e e X a c t ™ I n s t r u m e n t
115
Bluetooth Installation The instrument has the ability to communicate wirelessly using Bluetooth technology. Many Windows computers have built in Bluetooth capability. If this is the case with your computer you may use the built in hardware. If not, you will need to purchase a Bluetooth device that plugs into your USB port before continuing. The following pages contain instructions for installing and setting up the Bluetooth device on Windows 7, Windows 8, and Windows 10. Mac OS X setup procedure is also covered at the end of this section.
eXact Bluetooth Setup 1. Tap the Bluetooth button on the instrument to open the Bluetooth settings screen.
2. Tap the Begin Pairing Process button to start the pairing process.
3. Continue with the Windows 7, Windows 8, Windows 10, or Mac OS Setup procedures that follow.
Windows 7 & 8 1. If required, connect the Bluetooth adapter to an available USB port. A popup message
appears in the lower right hand corner of your display. Windows will automatically install the correct driver.
2. After installation, click the “Bluetooth” logo in your toolbar, or go to the Control Panel and
select Devices and Printers for Windows 7. For Windows 8, select Devices and Printers from the Hardware and Sound dialog.
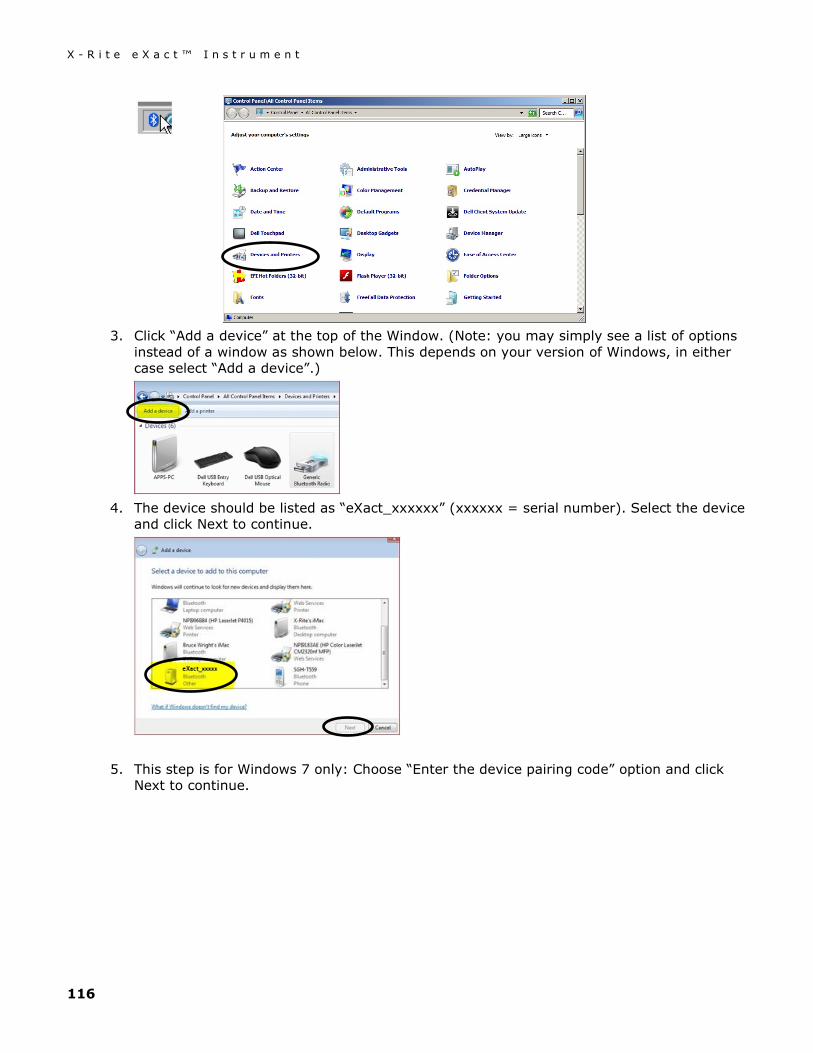
X - R i t e e X a c t ™ I n s t r u m e n t
116
3. Click “Add a device” at the top of the Window. (Note: you may simply see a list of options
instead of a window as shown below. This depends on your version of Windows, in either case select “Add a device”.)
4. The device should be listed as “eXact_xxxxxx” (xxxxxx = serial number). Select the device
and click Next to continue.
5. This step is for Windows 7 only: Choose “Enter the device pairing code” option and click Next to continue.
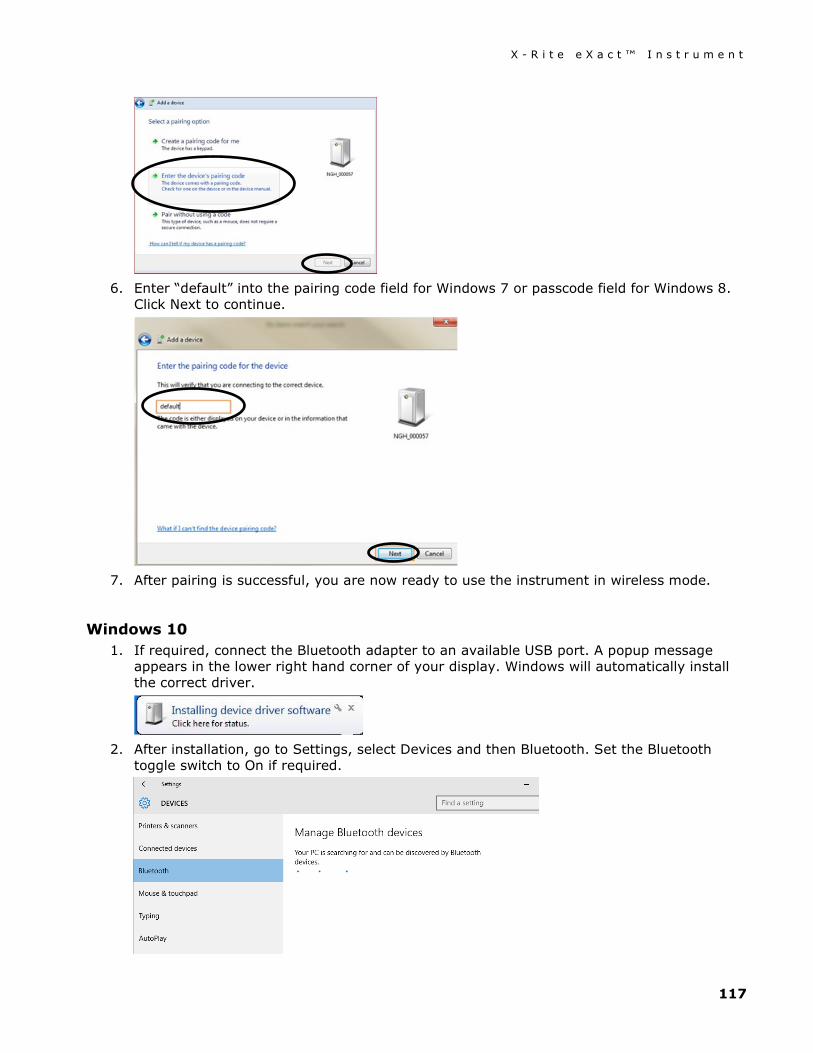
X - R i t e e X a c t ™ I n s t r u m e n t
117
6. Enter “default” into the pairing code field for Windows 7 or passcode field for Windows 8.
Click Next to continue.
7. After pairing is successful, you are now ready to use the instrument in wireless mode.
Windows 10 1. If required, connect the Bluetooth adapter to an available USB port. A popup message
appears in the lower right hand corner of your display. Windows will automatically install the correct driver.
2. After installation, go to Settings, select Devices and then Bluetooth. Set the Bluetooth
toggle switch to On if required.
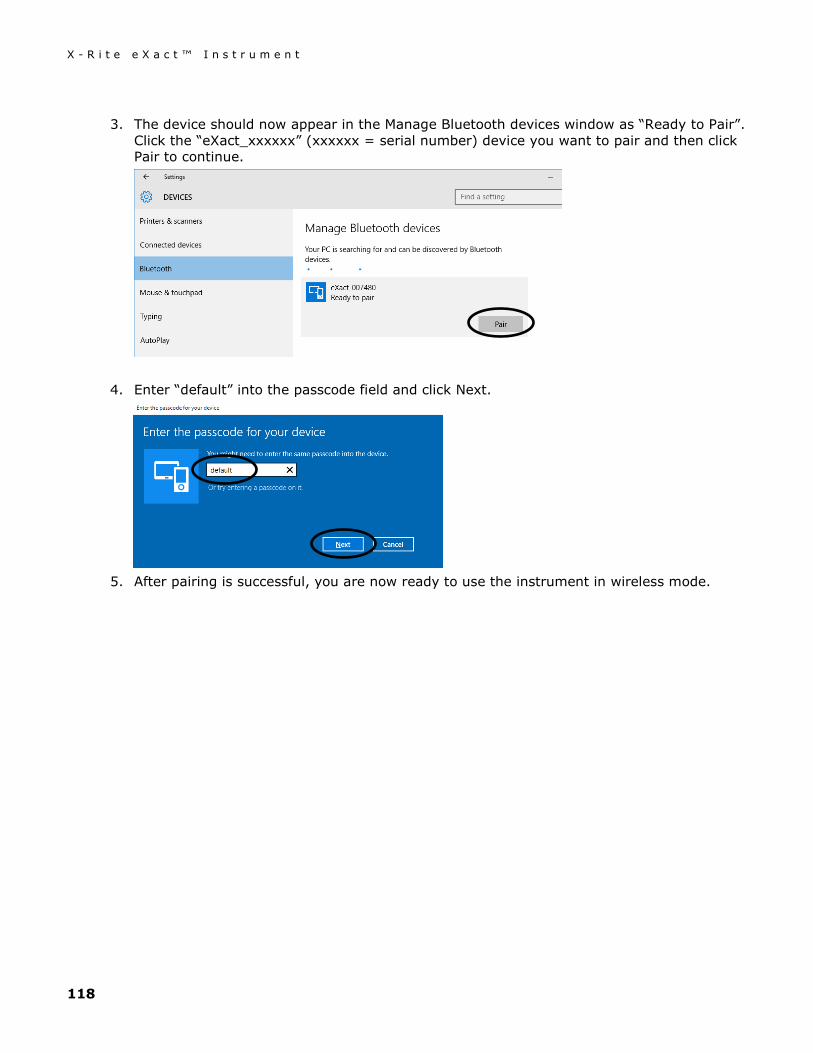
X - R i t e e X a c t ™ I n s t r u m e n t
118
3. The device should now appear in the Manage Bluetooth devices window as “Ready to Pair”.
Click the “eXact_xxxxxx” (xxxxxx = serial number) device you want to pair and then click Pair to continue.
4. Enter “default” into the passcode field and click Next.
5. After pairing is successful, you are now ready to use the instrument in wireless mode.
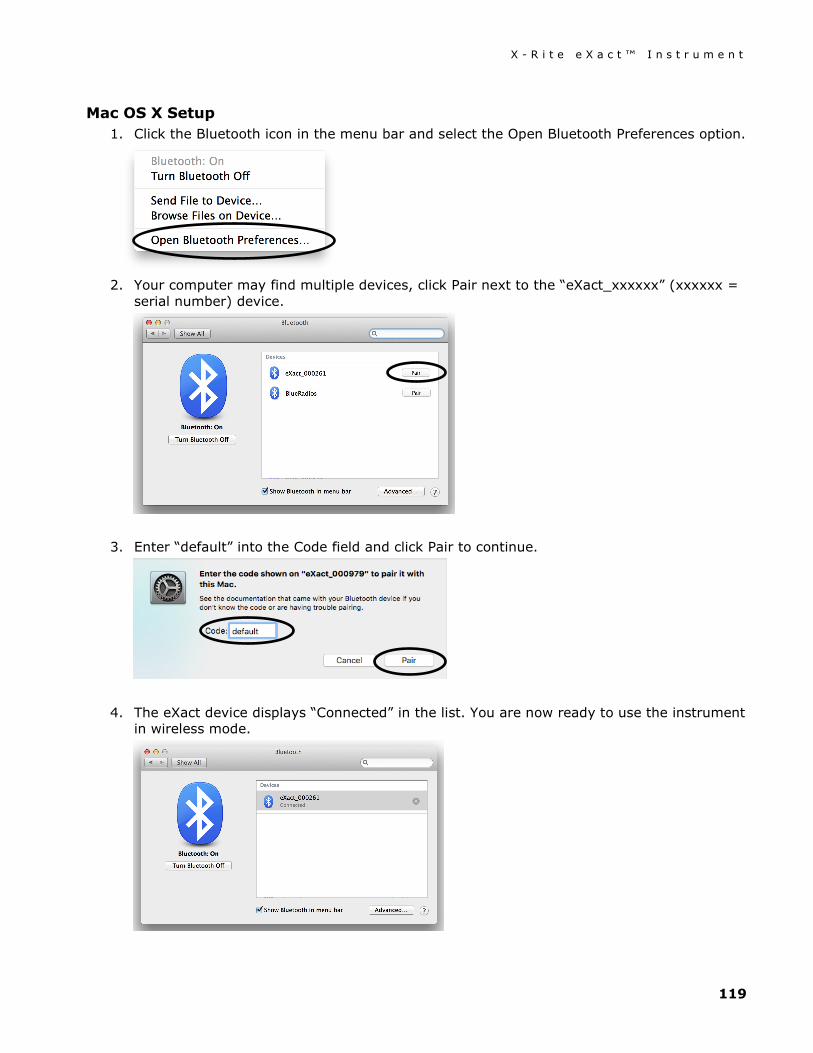
X - R i t e e X a c t ™ I n s t r u m e n t
119
Mac OS X Setup 1. Click the Bluetooth icon in the menu bar and select the Open Bluetooth Preferences option.
2. Your computer may find multiple devices, click Pair next to the “eXact_xxxxxx” (xxxxxx =
serial number) device.
3. Enter “default” into the Code field and click Pair to continue.
4. The eXact device displays “Connected” in the list. You are now ready to use the instrument in wireless mode.
X - R i t e e X a c t ™ I n s t r u m e n t
120
Troubleshooting Prior to contacting the support department for instrument problems, try the applicable solution(s) described below. If the condition persists, contact us using one of the methods listed in the Service Information section.
You can also refer to the instrument Diagnostics function within the eXact Manager application for additional troubleshooting information.
Problem Cause/Solution
Instrument not responding (no display).
Instrument in sleep mode. • Touch display or take measurement. Instrument in power down mode. • Press the power button until the splash screen appears. Battery is very low. • Charge the battery.
Instrument and software not communicating (USB connection).
Interface cable not connected. • Connect the interface cable between the computer and the instrument. • Close and restart the software application. If this does not work, reboot
the computer. • Remove power from the instrument, reapply power and see if the
condition is corrected. Instrument and software not communicating (wireless connection).
Wireless function not activated. • Activate Bluetooth wireless connection in the device. Refer to the
Bluetooth Installation section for information. • Activate Bluetooth wireless connection on your computer. Refer to the
manufacturer's manual of your computer. • Close and restart the software application. If this does not work, reboot
the computer.
Calibration procedure fails.
Calibration plaque is dirty or damaged. • Clean the plaque per procedure in Appendix.
Measurement error or results appear inaccurate.
Sample being measured is dirty or damaged (e.g. scratched). • Obtain new sample. Instrument requires calibration. • Perform a calibration on the instrument (see Diagnostics tool section). Instrument optics are dirty. • Clean instrument optics (see General Cleaning).
Patch recognition problems.
If the instrument has a problem properly detecting a particular patch the first time, you can manually change the patch (refer to Change Standard or Patch icon section earlier in the manual for details). The instrument will also automatically adjust what it estimates different patches will appear like based on the paper and solid measurements. Therefore, paper should be the first patch measured in any job and then a solid before other patch types. If a wrong measurement is “taught” to the wrong patch type, it
X - R i t e e X a c t ™ I n s t r u m e n t
121
could throw off the proper detection of other patches. Every effort is made to properly detect patches and predict other patches properly. However, if auto detection does not initially produce satisfactory results, the Change Patch feature should be used along with disabling auto patch. After the learning process is complete, auto patch can be reactivated. The instrument will prompt you to measure a particular (prerequisite) patch. Below is a list of typical prerequisite patch measurements.
• Paper: First reading of the Job always needs to be paper. If a different patch is detected first, a popup message will occur.
• Solids: After Paper measurement, solids should be measured, as it is a prerequisite for tint and overprint measurements.
• Tints: Paper and solid patches need to be measured first. • Overprint: Paper and both solid patches for each ink being measured
needs to be measured before the overprint. • Gray Balance: In some cases it helps to measure the Black solid
patch after paper as it assists in the patch detection. However, it is not always required. Black is not always used in a job.
Resetting the Instrument To reset the instrument:
1. Unplug the interface cable and AC adapter from the instrument if connected. 2. Press and hold the power button for at least 15 seconds. 3. After 15 seconds, release the power button and then press it again to turn the instrument
back on. If you are still experiencing problems after a reset, contact X-Rite support using one of the methods listed in the Appendix Information section.
X - R i t e e X a c t ™ I n s t r u m e n t
122
Technical Specifications
SPECTRAL ENGINE Spectral analyzer: DRS spectral engine Spectral range: 400 nm - 700 nm with 10 nm interval
OPTICS Measurement geometry: 45°:0° ring illumination optics, ISO 5-4:2009(E) Measurement aperture: 1.5 mm, 2 mm, 4 mm or 6 mm Light source: Gas filled tungsten (illuminant type A) and UV LED
REFLECTANCE MEASUREMENT Measurement Conditions: According to ISO 13655:2009):
• M0: Unpolarized, No filter, UV included • M1: D50 • M2: UV excluded Filter • M3: Polarization Filter (eXact Xp excludes M3)
Calibration: Automatic on integrated white reference
Inter instrument agreement: Average:0.25 ∆E*ab, Max: 0.45 ΔE*ab (M3 0.55 ΔE*ab) (Measurements using X-Rite manufacturing standards at a temperature of 23°C +/- 1°C, 40-60% RH for all measurement modes on 12 BCRA color tiles and a white ceramic reference (D50, 2°))
Short term repeatability White: 0.05 ∆E*ab, (standard deviation) White BCRA (Error compared to mean value of 10 measurements
every 5 seconds) Short term repeatability Density: +/-0.01 D for CMYK measurements
(Status E or Status T measurements) (Maximum error compared to mean value of 10 measurements every 5 seconds at 2.0 D, except for M3 Yellow at 1.7 D)
OPERATING CONDITIONS Operating Temperature Range: 50° to 95°F (10° to 35°C)
30-85% relative humidity maximum (non-condensing)
Storage Temperature Range: -4° to 122°F (-20° to 50°C)
X - R i t e e X a c t ™ I n s t r u m e n t
123
INTERFACE, DIMENSIONS AND WEIGHT Data Interface: USB 2.0
Bluetooth (optional) - Class II
Power supply: X-Rite P/N: SE30-377 100-240VAC 50/60Hz, 12VDC @ 2.5A
Battery: X-Rite P/N: SE15-46 Lithium Ion, 7.4VDC, 2200mAh
Physical Dimensions: 3.0”H (7.6 cm) 3.1”W (7.8 cm) 7.1”L (18 cm) Weight: 1.6 lbs. (0.7 kg) ENVIRONMENTAL Usage: Indoor only
Altitude: 2000m
Pollution Degree: 2
Overvoltage: Category II
ACCESSORIES PROVIDED USB cable, Power Supply, flash drive with software and documentation, Docking/Charging Station, Quick Start Guide, Carrying case
Design and specifications subject to change without notice.
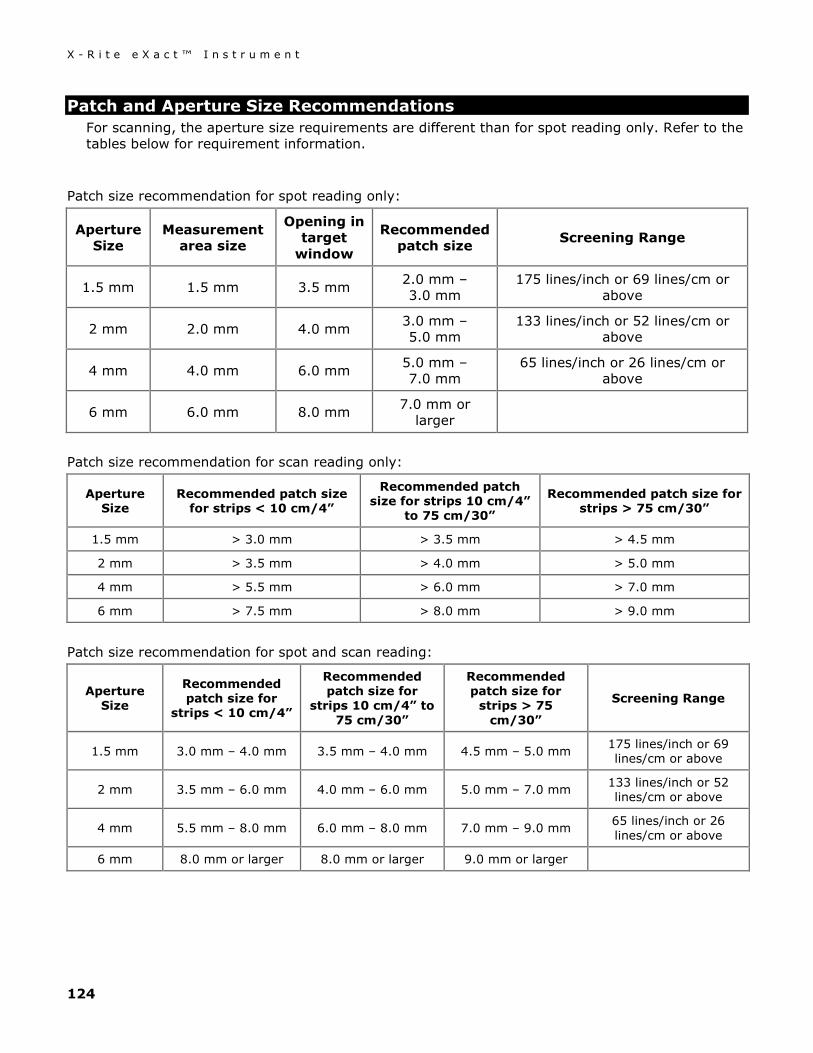
X - R i t e e X a c t ™ I n s t r u m e n t
124
Patch and Aperture Size Recommendations For scanning, the aperture size requirements are different than for spot reading only. Refer to the tables below for requirement information.
Patch size recommendation for spot reading only:
Aperture Size
Measurement area size
Opening in target
window
Recommendedpatch size Screening Range
1.5 mm 1.5 mm 3.5 mm 2.0 mm – 3.0 mm
175 lines/inch or 69 lines/cm or above
2 mm 2.0 mm 4.0 mm 3.0 mm – 5.0 mm
133 lines/inch or 52 lines/cm or above
4 mm 4.0 mm 6.0 mm 5.0 mm – 7.0 mm
65 lines/inch or 26 lines/cm or above
6 mm 6.0 mm 8.0 mm 7.0 mm or larger
Patch size recommendation for scan reading only:
Aperture Size
Recommended patch size for strips < 10 cm/4”
Recommended patch size for strips 10 cm/4”
to 75 cm/30”
Recommended patch size for strips > 75 cm/30”
1.5 mm > 3.0 mm > 3.5 mm > 4.5 mm
2 mm > 3.5 mm > 4.0 mm > 5.0 mm
4 mm > 5.5 mm > 6.0 mm > 7.0 mm
6 mm > 7.5 mm > 8.0 mm > 9.0 mm
Patch size recommendation for spot and scan reading:
Aperture Size
Recommended patch size for
strips < 10 cm/4”
Recommended patch size for
strips 10 cm/4” to 75 cm/30”
Recommended patch size for
strips > 75 cm/30”
Screening Range
1.5 mm 3.0 mm – 4.0 mm 3.5 mm – 4.0 mm 4.5 mm – 5.0 mm 175 lines/inch or 69 lines/cm or above
2 mm 3.5 mm – 6.0 mm 4.0 mm – 6.0 mm 5.0 mm – 7.0 mm 133 lines/inch or 52 lines/cm or above
4 mm 5.5 mm – 8.0 mm 6.0 mm – 8.0 mm 7.0 mm – 9.0 mm 65 lines/inch or 26 lines/cm or above
6 mm 8.0 mm or larger 8.0 mm or larger 9.0 mm or larger


Corporate Headquarters X-Rite, Incorporated 4300 44th Street SE
Grand Rapids, Michigan 49512 Phone 1 800 248 9748 or 1 616 803 2100
Fax 1 800 292 4437 or 1 616 803 2705
European Headquarters X-Rite Europe GmbH
Althardstrasse 70 8105 Regensdorf
Switzerland Phone (+41) 44 842 24 00
Fax (+41) 44 842 22 22
Asia Pacific Headquarters X-Rite Asia Pacific Limited
Suite 2801, 28th Floor, AXA Tower Landmark East, 100 How Ming Street
Kwun Tong, Kowloon, Hong Kong Phone (852) 2568 6283
Fax (852) 2885 8610
Please visit www.xrite.com for a local office near you. P/N eXact_Manual_EN Rev P