use of remote sensing to support forest and wetlands policies in the usa
TRANSCRIPT
Remote Sens. 2011, 3, 1211-1233; doi:10.3390/rs3061211
Remote Sensing ISSN 2072-4292
www.mdpi.com/journal/remotesensing
Review
Use of Remote Sensing to Support Forest and Wetlands Policies
in the USA
Audrey L. Mayer 1,
* and Ricardo D. Lopez 2,†
1 School of Forest Resources and Environmental Science, Michigan Technological University, 1400
Townsend Dr., Houghton, MI 49931, USA 2 Office of Research and Development, US Environmental Protection Agency, 944 East Harmon
Ave., EXC 129, Las Vegas, NV 89119, USA; E-Mail: [email protected]
* Author to whom correspondence should be addressed; E-Mail: [email protected];
Tel.: +1-906-487-3448; Fax: +1-906-487-2915.
† Current address: US Department of Agriculture Forest Service, 201 14th
St. SW, Washington,
DC 20250, USA.
Received: 30 March 2011; in revised form: 24 May 2011 / Accepted: 31 May 2011 /
Published: 14 June 2011
Abstract: The use of remote sensing for environmental policy development is now quite
common and well-documented, as images from remote sensing platforms are often used to
focus attention on emerging environmental issues and spur debate on potential policy
solutions. However, its use in policy implementation and evaluation has not been examined
in much detail. Here we examine the use of remote sensing to support the implementation
and enforcement of policies regarding the conservation of forests and wetlands in the USA.
Specifically, we focus on the “Roadless Rule” and “Travel Management Rules” as
enforced by the US Department of Agriculture Forest Service on national forests, and the
“No Net Loss” policy and Clean Water Act for wetlands on public and private lands, as
enforced by the US Environmental Protection Agency and the US Army Corps of
Engineers. We discuss several national and regional examples of how remote sensing for
forest and wetland conservation has been effectively integrated with policy decisions,
along with barriers to further integration. Some of these barriers are financial and technical
(such as the lack of data at scales appropriate to policy enforcement), while others are
political.
Keywords: environmental policy; remote sensing; forests; wetlands; No Net Loss
OPEN ACCESS

Remote Sens. 2011, 3
1212
1. Introduction
The diversity of technology and infrastructure to monitor environmental systems, from global to
local scales, is increasing rapidly as public and private organizations increase their investment in
them [1]. These data and images support policy by contributing to new policy development and
improvement, as new problems can be discovered or better conveyed to the public visually. Policy
implementation and evaluation requires data to ensure compliance and to monitor for policy success.
Remote sensing products (including aerial photography, airborne and satellite imagery) are
increasingly useful for monitoring and reporting requirements established by national policies and
international treaties, conventions and agreements [2].
Remote sensing is used at regional scales to improve land use policy and decision-making,
especially for agricultural and urban areas [3,4]. For example, data from AVHRR (Advanced Very
High Resolution Radiometer), MODIS (Moderate Resolution Imaging Spectroradiometer) and MISR
(Multiangle Imaging Spectroradiometer) satellite sensors have been used to monitor compliance with a
biomass burning reduction policy implemented in 2006 in Acre, Brazil [5]. Older aerial photography
and Landsat imagery can be used to establish historic baselines for land cover types, and to project the
impacts of different policies onto land use trends through alternative futures scenarios [1,6]. Satellite
sensors can also warn of excessive air pollution events [7], and aid urban planning by denoting areas in
which construction should be modified or banned to reduce flooding and fire damage risks [3].
Satellite platforms that might prove especially useful for the management of urban areas include the
fine resolution IKONOS and Quickbird satellites, as well as NASA’s Shuttle Radar Topographic
Mapping (SRTM) mission [3].
For certain global issues, environmental dynamics may only be understood by appropriately scaled
remote sensing data [8,9]. For example, satellite imagery (specifically the Total Ozone Mapping
Spectrometer (TOMS) sensors launched on Nimbus and subsequent satellite series) demonstrated the
depletion of the ozone layer over polar regions by chlorofluorocarbons, as had been
hypothesized [1,7,10]. At present, remote sensing technology is used to track these ozone layer holes
on a daily basis, by a partnership between the US National Oceanic and Atmospheric Administration
(the Earth System Research Laboratory, Global Monitoring Division) and the National Aeronautics
and Space Administration’s Laboratory for Atmospheres [11]. This program helps measure the success
of the 1981 Montreal Protocol on Substances that Deplete the Ozone Layer, phasing out the production
and use of chlorofluorocarbons [12]. The initiation of large-scale programs such as the Global
Monitoring for Environment and Security (GMES) for the European Union [2] and the National
Ecological Observatory Network (NEON) in the USA also highlight the growing importance of remote
sensing and large scale datasets. NEON makes heavy use of remote sensing information, using an
Airborne Observation Platform (supporting LiDAR, digital photography and imaging spectrometer
sensors) to observe trends in land use change, invasive species, and ecosystem functioning [13].
The Global Earth Observation System of Systems (GEOSS) aims to combine both remote sensing
and ground data into one meta-database that could be used to identify risks and evaluate policy success
at the global scale [14-16]. GEOSS provides information and tools for nine areas: disasters, health,
energy, climate, agriculture, ecosystems, biodiversity, water, and weather [17-19]. The development of
GEOSS is driven by the Group on Earth Observations (GEO), an international organization with
Remote Sens. 2011, 3
1213
members from 85 countries and numerous international organizations [16]. GEOSS is one example of
the growing movement to release large datasets to the public, such as NASA’s release of all historic
LANDSAT imagery and the European Space Agency’s intent to make all future satellite imagery free
and open access [16].
This review will describe how remote sensing data and technology are being used to implement and
evaluate environmental policy. Specifically, we focus on its use for forest management and wetland
conservation policies in the USA, as forests and wetlands are often the focus of habitat conservation
efforts. We also discuss barriers to its use. Examples of remote sensing in support of environmental
policies may be difficult to find in the peer-reviewed literature [1], but are more common in reports
generated by national and state-level regulatory agencies. Therefore, much of our descriptions are
based on these sources and agency contacts.
2. US Policies Regarding Forests and Wetlands
Policies to minimize the loss of biodiversity and ecosystem services can benefit from the large
amount of work being done by hydrologists, ecologists, and other researchers using remote sensing
and geographic information systems (GIS). Although the majority of their work is on problem
detection and monitoring, agency scientists and staff are using remote sensing and GIS tools to aid
their agency’s policy enforcement missions. Here we describe those efforts utilizing these tools by the
US Department of Agriculture’s Forest Service (US Forest Service) to enforce road-related policies,
and the efforts of several federal and state agencies and environmental organizations to prevent the loss
of wetland area and functionality.
2.1. Roads and Forests in the USA
Undisturbed forests regulate water supplies for many urban and rural areas, support populations of
endangered and threatened species, and can prevent the spread of many non-native species. Roads
influence the variety and intensity of abiotic and biotic impacts on forested ecosystems at several
scales, negatively affecting ecological processes ([20-22], but see [23,24]). The alteration of
topography and hydrology involved in road construction often results in increased flooding and
erosion, increased desiccation during dry seasons, and increased delivery of sediments and pollutants
to aquatic ecosystems [22,25]. Removal of vegetation (particularly trees) along roadsides for safety
reasons alters the microclimate of the habitat on either side of the road, providing a pathway for
sunlight and higher wind speeds to penetrate forest stands [21]. Generally, wider roads with more
traffic and surfaces that are impervious to water have more impacts than smaller and less-trafficked
dirt roads, as wider, paved roads typically have more vehicles moving at greater speeds [26]. Greater
traffic, paired with drier conditions along roadways relative to forest interiors, also increases the risk of
human-set fires, both accidental and intentional [27]. Roads impact biodiversity directly through the
loss of habitat (when this habitat is converted to a roadway), but also through the deaths of individual
animals in collisions with vehicles. Roads can also fragment animal populations if individuals avoid
crossing roads to other habitat patches [21,25]. Plants that require animal pollination may have
genetically isolated populations due to the restriction of animal pollinators in this way. Roads also
facilitate the spread of invasive species (both plant and animal), by creating disturbed or altered

Remote Sens. 2011, 3
1214
habitats (reducing competition with native species), and greatly increasing the number of propagules
(through “hitchhiking” on vehicle tires, for example; [21,22,28]). The most profound effect of roads is
as a catalyst for new impacts into the future; roads facilitate access to remote areas that often beget
more road construction and use [29]. Habitat conservation efforts for forested ecosystems often
prioritize the minimization of additional roads or widening of existing roads that might further forest
fragmentation.
Roads serve as critical social and economic connections between different communities and their
natural resources [24]. From the viewpoint of environmental impacts, roads influence up to 20% of the
land area of the USA, and 10% of the road length in the US occurs on National Forests [25]. The
density of roads in forested areas is higher in the eastern USA than in western forests; core areas of
forests without roads averaged 67 ha in the east and 92 ha in the west [20]. One study found that
almost no areas within forests were further than 5 km from a road [29], making forests only slightly
more roadless than other habitat types. Over 600,000 km of roads exist on US National Forests, the
majority of which have been constructed for logging activities [21]. The amount of unofficial or
“non-system” roads may represent an additional 97,000 km of roads; these unofficial roads are usually
a consequence of off-road-vehicle use [21]. For the past few decades, the US Forest Service has
attempted not only to limit new road construction, but also to undergo “road network contraction” [21].
In network contraction, existing roads are blocked, degraded, or even deconstructed along several
segments to prevent their use by motorized vehicles, and to improve ecosystem functioning (most
commonly to restore streambeds). However, an official road inventory for all national forests has not
been completed, and accuracy varies widely amongst management units [24].
2.1.1. Road Policies for the National Forests
Although the US Forest Service has protected forested areas from road building since the 1920s, the
1964 Wilderness Act codified this effort [30]. The Wilderness Act not only set aside 3.7 million ha of
Forest Service land into the National Wilderness Preservation System, but also directed both the US
Department of Interior and USDA to identify roadless areas larger than 5,000 acres (2,024 ha) within
their jurisdiction that could be further considered by Congress to be designated as official Wilderness
Areas [31]. Designation as a Wilderness Area prohibits any development, natural resource extraction,
or motorized access. The 1976 National Forest Management Act (NFMA) also directs the US Forest
Service to identify roadless areas for potential Wilderness Areas, and created a planning process that
determines which areas of National Forests should be used for certain purposes (e.g., recreation and
natural resource extraction). Unlike the Wilderness Act, the NFMA does not prohibit the establishment
of new roads in roadless areas (larger than 5,000 acres).
The concern over the slow pace of Congressional wilderness designation of identified areas
prompted the Clinton Administration to issue the “Roadless Area Conservation Rule” or “Roadless
Rule”. The Roadless Rule came into effect on 13 March 2001 [31]. The rule directs the Forest Service
to “establish prohibitions on road construction, road reconstruction, and timber harvesting in
inventoried roadless areas on National Forest System lands” [32]. The purpose of this rule was to
protect large, uninterrupted tracts of forests (or “inventoried roadless areas”) from roads that cause
“altering and fragmenting landscapes, resulting in immediate, long-term loss of roadless area values
Remote Sens. 2011, 3
1215
and characteristics” [32]. These 24 million ha of inventoried roadless areas constitute over one-third of
National Forests, about 2% of the land within the USA [31]. The Roadless Rule was supported by the
Forest Service, as it provided a political avenue to emphasize its routinely inadequate budget for the
construction and maintenance necessary to keep roads in compliance with environmental and safety
regulations.
The “Travel Management; Designated Routes and Areas for Motor Vehicle Use” Rule (36 CFR
parts 212, 251, 261 and 295), or “Travel Management Rule”, is a rule revision to bring the
management of national forests into compliance with Executive Orders 11644 (“Use of Off-Road
Vehicles on the Public Lands”, issued in 1972) and 11989 (an amendment to 11644 issued in 1977).
These orders direct all Federal agencies to guarantee that policies regarding off-road vehicles maintain
protection of natural resources and ensure the safety of all land users [33]. User-created trails and roads
have not been systematically inventoried, although they are estimated to include “tens of thousands of
miles” [33]. The new rule was prompted by more powerful and long-range off-road vehicles that
became widely available in the past 20 years, and the rapid growth in their popularity and use [34].
The rule identifies the need for a national inventory of all roads and trails, and the creation of a
mapping and management system to balance the use of national forests by Off-Road Vehicles (ORVs)
with the environmental integrity of the forests, and with other forest uses that may be incompatible
with ORVs.
2.1.2. Road Detection in National Forests
Much of the US Forest Service’s road identification and mapping efforts are geared towards
efficiently targeting surveying efforts (e.g., in areas where the density of unofficial roads are high or
increasing rapidly), with the ultimate goal of initiating management efforts to halt the spread of these
roads. Each National Forest is responsible for updating its National Forest Land and Resource
Management Plan, which provides a map of authorized roads and trails for public use [35]. In the past,
few plans were based on thorough inventories of roads and trails. However, with the rapid increase in
the use of off-road vehicles in National Forests, the need for comprehensive road inventories was
indicated as one of the most pressing threats to National Forests by the Service [35]. Recently, the
USDA commissioned a Remote Sensing Steering Committee to identify the most promising remote
sensing data and tools for road inventories in National Forests [35]. The committee focused on Dixie
National Forest in Utah and Nevada, and Bridger-Teton National Forest in Wyoming, as test cases for
a variety of remote sensing and GIS applications.
Werstak et al. [35] used 1 m IKONOS satellite images overlaid on GIS maps of “official” roads (the
INFRA database) to identify and monitor unofficial roads and trails created by off-road vehicle
recreational use in Dixie and Bridger-Teton National Forests. They used two methods (dot grids and
grid cells) to estimate road density per 1 acre (0.4 ha) and 5 acre (2.0 ha) grid resolutions. This method
was faster and far less labor intensive than delineating individual roads and trails, which in some cases
(due to forest cover) was difficult or impossible. Although dot grids missed roads under forest canopy,
the method estimated road density which did not require that the entirety of roads was accounted for as
uninterrupted linear features. They then used kriging (at a resolution of 2 ha) to identify “hotspots”,
areas where the density of unofficial trails are highest. In these areas, the density may be so high that

Remote Sens. 2011, 3
1216
the classification of individual trails is unnecessary; vegetation damage can be so widespread that
restoration is required over a large area. Maps of unofficial trail density can then be overlaid with maps
regarding natural resources, endangered species habitat, and streams to determine the ecological
impact of these trails on each National Forest.
While digital orthophoto quadrangles (DOQ’s) were most familiar to forest managers and therefore
easiest to interpret, most available DOQ’s were up to a decade old, and therefore did a poor job of
identifying newly emerging areas of unofficial roads and trails [35]. IKONOS imagery is very useful
to identify most roads and trails, and can be used with Feature Analyst to automate road identification
to some extent (an iterative process that requires user input between each classification). IKONOS
imagery was suitable for identifying unofficial roads, however the resolution was inadequate to
distinguish between single and double-track roads; single track indicates mostly non-motorized use
(e.g., hiking, horseback riding, and bicycling), while double-track typically indicate motorized
vehicles. Airborne digital photographs with a resolution of at least 0.16 m were found to be necessary
to make this distinction.
In Ocala National Forest in Florida, Williamson et al. [36] found that remote sensing alone was not
adequate to create maps of all of the roads and trails. This project illustrated that the resolution of
digital aerial photography dramatically influences their effectiveness for identifying roads and trails.
The emulsion process for historical aerial photographs also influenced their utility, with natural color
providing better information than color infrared; 1:24,000 scale photographs in natural color were most
useful. Use of aerial photos (and satellite images [37]) was found to result in many trails and roads
being missed under closed forest canopies, substantially reducing the accuracy of the resulting road
maps. Substantial ground survey effort (collecting road and trail locations with a GPS) was necessary
to create complete maps. In the case of Ocala National Forest, this level of accuracy was necessary to
document the impact of off-road vehicle use on sensitive wetlands.
The work completed so far in the test National Forests indicates that fine-grained aerial
photography may be necessary in most National Forests to implement the Travel Management Rule.
Given the cost of these data, and the staff hours required to collect the ground survey data necessary to
verify the classification results, it may be necessary for the US Forest Service to revisit plans to close
and decommission major roads that promote the proliferation of ORV trails, and institute other
activities that make access to roadless or sensitive areas far more difficult. If the remote sensing is
unlikely to ever be sufficient or will remain too costly to support the policies as they stand, perhaps the
programs can be altered slightly to meet the potential of staffing levels and remote sensing-based
support, at least until the cost-effectiveness of remote sensing data improves.
2.2. Wetland Loss in the USA
The coterminous USA has lost over 50% of the original 90 million ha of wetlands from draining
and conversion to other types of land use or land cover [38]. Although earlier in USA history wetlands
were primarily drained for agricultural production, more recent losses have been due to filling and
development; abandoned and flooded agricultural lands have contributed a substantial portion of the
gain in wetland area since 1998 [39]. The Midwestern states have suffered the greatest percentage loss
of wetlands on the continent. Gross wetland area losses at the national level, as well as the degradation
Remote Sens. 2011, 3
1217
of biogeochemical processes and functions of those wetlands, have led to the diminution of specific
ecosystem services to the public. These services include: water supply regulation and filtration;
protection from flood waters and storm surges; habitat provisioning for terrestrial and aquatic species;
and recreational, spiritual, and aesthetic benefits [40].
2.2.1. Wetlands Conservation Policy
The use of remote sensing to assess the loss of wetland area and conditions in the US has paralleled
the emergence of the “No Net Loss” (NNL) wetlands target. This target (which has not yet been
codified into law) traces its origins back to the National Wetlands Policy Forum (NWPF), convened at
the request of the US Environmental Protection Agency Administrator in 1987. The 20-member
NWPF developed a policy that was generally intended to “achieve no overall net loss of the nation’s
remaining wetlands base and to create and restore wetlands, where feasible, to increase the quantity
and quality of the nation's wetland resource base” [41]. The NNL policy goal was to stop the decline in
overall wetland area loss throughout the USA. However, the NNL does not specifically refer to the
ecological functions, services, or values of wetlands that are lost through destruction or degradation, or
gained through restoration or creation. Since the establishment of the NNL, several US administrations
have added the additional goal of reversing wetland losses through wetland creation and restoration,
not merely stopping the loss. Importantly, the goals of the NNL policy do not address the
comparability of wetlands that are created, restored, or destroyed, placing the emphasis on the area of
the wetlands as the sole determinant of NNL policy success, exclusive of all other wetland conditions.
Shortly after the formalization of the NNL policy, in a 1990 Memorandum of Agreement between
the US Army Corps of Engineers (ACoE) and the US Environmental Protection Agency (USEPA),
both committed to mitigate for unavoidable wetland impacts and to offset environmental losses from
those impacts that were unavoidable. The purpose of the Memorandum was to demonstrate compliance
with Clean Water Act (CWA) Section 404(b) (1) guidelines that regulate the dredging or filling of
wetlands [33 USC. 1344(b)]. Such mitigation was agreed to also provide for the functional
replacement of wetlands that were lost in the landscape, referred to as “no net loss of values”. The
Memorandum specifies a minimum area replacement ratio of 1:1 or greater if the replacement
wetlands are of lower “functional value or (if) the likelihood of success of the mitigation project is
low.” Conversely, the wetland area replacement ratio may be less than 1:1 if the affected wetland
functions and values are low or the likelihood of success of the proposed wetland mitigation is high.
The linkages between the NNL policy and Section 404 of the CWA established policies,
procedures, and programs that regulate the dredging or filling of wetlands, as well as any loss of
wetlands area and some wetland functions (e.g., biogeochemical processes within the wetlands), and
services/value(s) associated with those wetlands (i.e., those wetland functions that have human utility).
Section 404 of the CWA and/or the NNL policy comes into play whenever an activity (usually
attributed to intentional development) results in the filling or loss of wetlands. Some activity
exemptions are granted for certain farming and forestry activities. Since proposed major activities are
regulated through a permit review process, the US ACoE, the USEPA, relevant State agencies, and the
US Fish and Wildlife Service (USFWS) are usually involved. Each of the parties involved utilize a
number of techniques to inform decision making and policy determinations vis-à-vis the CWA and the
Remote Sens. 2011, 3
1218
NNL policy. These techniques frequently involve remote sensing data interpretation by regulatory
decision makers and their technical or research colleagues/staff. Since the early 1970s, the sole use of
hard-copy photography has been supplemented with both printed and digitally stored photographic
images, along with a myriad of other digital sensor data, with detailed accounts of these uses provided
in the following sections.
2.2.2. Remote Sensing and Wetlands at the National Scale
Remote sensing data have been used extensively to assess both the loss of wetland area and, to a
lesser degree, to assess the loss of wetland functions and services in the USA. These efforts have led to
a more detailed understanding of wetland conditions, such as vegetation community characteristics,
hydrologic regimes, and soil conditions. These biophysical details can identify degradation that affects
the total functional area of a wetland, as well as the ecosystem services it may provide. However, these
efforts have rarely led to anything beyond limited requirements for monitoring.
The USFWS is required by the Emergency Wetland Resources Act of 1986 to provide Congress
with a status and trends report for all of the nation’s wetlands [16 USC 3931 (a)], which was to begin
in 1990 and continue thereafter. Photogrametric techniques are utilized extensively to focus attention
on the nationwide policy goals and policies to assess wetland area loss and the fundamental
characteristics of those wetlands, coordinated by the USFWS. The survey currently combines color
infrared IKONOS and aerial imagery with field data collected at a stratified random sample of plots to
estimate wetland gains and losses for over a dozen wetland types. However, these assessments are
made every ten years, which may limit the time-sensitive needs of policy makers. The first report (for
the coterminous USA) estimated the annual rate of wetland loss at 185,346 ha from the mid-1950s to
the mid-1970s [42]. Subsequently, a national decline in the rate of wetland loss was reported by Dahl
and Johnson [43], finding that from the mid-1970s to the mid-1980s wetland losses were
approximately 117,360 ha per year. Dahl [44] provided additional evidence that wetlands losses further
declined between 1986 and 1997, at a loss rate of 23,680 ha per year, an eighty percent reduction in the
overall average annual rate of wetland loss compared with the previous decade. The most recent
assessment of the USFWS occurred for the period of 1998 to 2004, during which time there was an
approximate net gain of 77,600 wetland ha nationwide, which Dahl [39] equated to an average annual
net gain of 12,950 ha for the coterminous USA.
The USFWS used similar photogrammetric techniques to recently assess total area of wetlands in
Alaska, totaling over 70,692,000 ha, which is 43.3 percent of Alaska’s total surface area and
5.2 percent of the total surface area of the coterminous USA. Deepwater habitats (such as lakes, bays,
sounds, fjords, lagoons, and inlets) in Alaska occupy an additional 12,088,200 ha, or 7.4 percent of
Alaska's total surface area [45]. Since the 17th Century, one-tenth of one-percent of Alaska’s wetlands
have been lost. Although total wetland losses in Alaska are relatively small as a total proportion of all
wetland area, specific localities in Alaska have experienced substantial losses [46].
The stated NNL policy goals and regulatory policies and procedures articulated by Section 404 of
the CWA offer clear and unambiguous guidance for those parties that are measuring the loss of
wetland area, functions, and values. It is important to recognize that neither the NNL policy nor the
CWA specifically mandate conserving or restoring the wetland ecological functions and (to an

Remote Sens. 2011, 3
1219
increasing degree) ecosystem services that have been the focus of remote sensing research in wetlands,
even though these topics are emerging priorities for a number of regulatory and resource agencies.
These priorities are either explicit, such as the US Forest Service’s Section 2709, Food, Conservation,
and Energy Act 2008, or implicit by their programmatic emphasis on ecosystem services in wetlands,
such as USEPA’s Ecosystem Services Research Program focus on wetlands [47] and the USACoE’s
focus on ecosystem service-oriented restoration [48]. However, the primary use of remote sensing has
been the assessment of area losses, with limited application to detail regarding the biotic and abiotic
characteristics of those wetlands, except for some regional assessments of wetland functions and their
losses (e.g., 54, 93). (Here, characteristics of wetlands include the presence of hydric soils, average
hydrologic regime conditions, and coarse level vegetation types [38,39,42-45].) Attention to assessing
wetland ecosystem services and values (particularly at the regional or national levels) is almost
non-existent.
2.2.3. Regional-Scale Wetlands Programs Using Remote Sensing
A substantial number of wetland functional assessments have been conducted using a combination
of field-based measurements (e.g., soil, water, hydrologic regime, and biological data) and airborne or
satellite based remote sensing data at the local and sub-region scale, providing information about
wetland ecological functions, some of which are also ecosystem services. Much of this research
information utilizes multispectral scanners, such as Landsat, Satellite Pour l’Observation de la Terre
(SPOT), and Advanced Spaceborne Thermal Emission and Reflection Radiometer (ASTER), and is
focused on issues such as wetland change [49-53] and vegetational stress [54].
Regional Use of the National Wetlands Inventory
The Emergency Wetland Resources Act of 1986 prompted the creation of the National Wetland
Inventory (NWI) program, which provides for a series of data and maps, complementing status and
trends reports (described in Section 2.2.2) for all of the nation’s wetlands. The NWI uses relatively fine
resolution aerial photographic imagery (scales typically ranging from 1:58,000 to 1:80,000) to generate
maps and statistical analyses for the public. The maps provide trends in wetland area, as well as
information about the hydrologic regime of mapped wetlands, presence of hydric soils, and general
types of wetland (e.g., herbaceous, scrub/shrub, or woody) vegetation [55]. NWI assessments and
associated trends analyses are used by multiple Federal and State agencies, the scientific community,
the private sector, and conservation groups for decisions that relate to development, and landscape
change, to help formulate and evaluate wetland policies. Despite their potential usefulness for
jurisdictional wetland decision making, the NWI Program explicitly states that their data are not
intended for regulatory purposes and so Federal, State, or local regulatory agencies must utilize the
NWI solely as a guide, often along with additional field-based information to provide any legal
determinations about wetlands (such as their legal boundaries). In addition to the direct application of
the NWI Program’s remote sensing data and analyses to national wetland NNL and CWA policies and
procedures, many regional programs utilize the data for specific wetland policy goals and decisions.
A number of efforts are ongoing to modify and update the NWI, primarily using additional aerial
photography from overflights to address specific regional policy interests that require updates on

Remote Sens. 2011, 3
1220
wetland change. As regional modifications to the NWI are such a tremendous undertaking, consortia of
State, private, non-governmental, and federal organizations typically conduct them. For example, the
Great Lakes/Atlantic Regional Office of Ducks Unlimited (DU) and the USFWS are leading the
update of the NWI for the Great Lakes and Northeastern states, with major updates currently
completed or in progress in Michigan, Ohio, Indiana, and Illinois [56]. The updates utilize 2000’s
photography to revise the original NWI so that the region's inventory of wetlands is more current and
accurate. DU utilizes the wetlands mapping updates to advocate for the conservation of wetlands and
waterfowl habitat to Congress and State governmental agencies.
The NWI has been used as a base map for the Chesapeake Bay watershed [57], which is an
important resource for the eastern seaboard with its many coastal and inland wetlands. Working with
academic and interest group researchers, the USEPA has used airborne hyperspectral data to map
submerged aquatic vegetation (SAV), allowing for the development of semi-automated techniques in
the tidal Potomac River [58]. Landsat multispectral scanner and thematic mapper data have also been
utilized to map certain SAV plant communities [49] in the Chesapeake Bay region. SAV plant
communities provide critical food, shelter, and breeding areas for waterfowl, fish, shellfish, and other
aquatic life, which in turn provide tremendous commercial value to the public that live in, or otherwise
depend upon, the Chesapeake Bay. Policy linkages to remote sensing use is key to the Chesapeake Bay
Program’s monitoring of long-term changes of chlorophyll-a in tributaries and the bay-estuary
ecosystem, informing the Program’s (and regional partner’s) assessment of, and plans to combat,
nutrient over-enrichment of the Bay [59]. Other coastal US resource policy planning groups (e.g., The
Rhode Island Coastal Resources Management Council [60]) actively utilize remote sensing data and
methodologies to make policy decisions influencing wetland and deepwater habitat conditions in the
Narragansett Bay Watershed, with the use of remote sensing derived data in a GIS, such as the Habitat
Priority Planner (HPP). The HPP provides decision makers with wetland and other ecosystem data for
conservation, restoration, and land use planning in an understandable scenario-building environment,
allowing decision makers to visualize potential land use policy impacts upon wetlands and other
ecosystems that affect the quality of the coastal zone environment [61].
The Chesapeake Bay and Narragansett Bay Programs are representative uses of remote sensing data
for the purposes of regional and local level planning and decision making. These policy decisions use
current data about wetland resources, in addition to relatively fine-grain information (e.g., details of
the boundaries of the wetland vegetation, and current location or condition of wetland vegetation
species). These programs require remote sensing data that are more current or collected more
frequently (i.e., multiple consecutive years and/or seasons) than the NWI can provide. For specific
local or regional issues, decision makers often seek additional remote sensing data at a temporal scale
and temporal frequency that is relevant to their needs (i.e., timely and relevant budgeting of
development programs, implementation plans, or public outreach activities). For example, in the
Chesapeake Bay Program, the use of hyperspectral airborne data could be used to provide the
necessary SAV species information because of the relatively narrow bandwidth characteristics of low
altitude airborne hyperspectral scanners (e.g., HyMAP, CASI, or AVIRIS). The use of hyperspectral
scanner data could also provide relatively fine-grain delineation of wetland size and shape, compared
to the relatively coarser spatial and spectral characteristics of Landsat data currently utilized in the
Program [59]. Conversely, Landsat data may provide a broader “landscape assessment” of SAV

Remote Sens. 2011, 3
1221
communities across a relatively vast area (e.g., the entire Bay), but without distinguishing each SAV
species.
3. Implementation Barriers
As the forest and wetland conservation examples demonstrate, remote sensing data and technology
are currently being used to implement and enforce policy. Below we describe current efforts in Brazil
and the Prairie Pothole Region of the USA to suggest the extent to which remote sensing use can be
automated to prioritize areas to protect (or restore) to help achieve policy goals. These efforts suggest
that federal and state agencies are not using remote sensing for policy support to the extent that they
could to achieve their respective agency missions. There may be substantial barriers to overcome
before the application of remote sensing to policy implementation and evaluation becomes widespread
and automatic.
3.1. Emerging Opportunities for Policy Applications
The US Forest Service could more easily meet its responsibilities to identify roadless areas for
protection and generate up-to-date road network maps for the public by increasing the application of
remote sensing data and technology. Semi-automated or automated software for road detection and
road network monitoring from remote sensing data could be used to meet these responsibilities faster
and with fewer staff [62], although many of these efforts have focused on urban areas (e.g., [63,64]).
Remote sensing has been extensively used in other countries to first visualize and then track
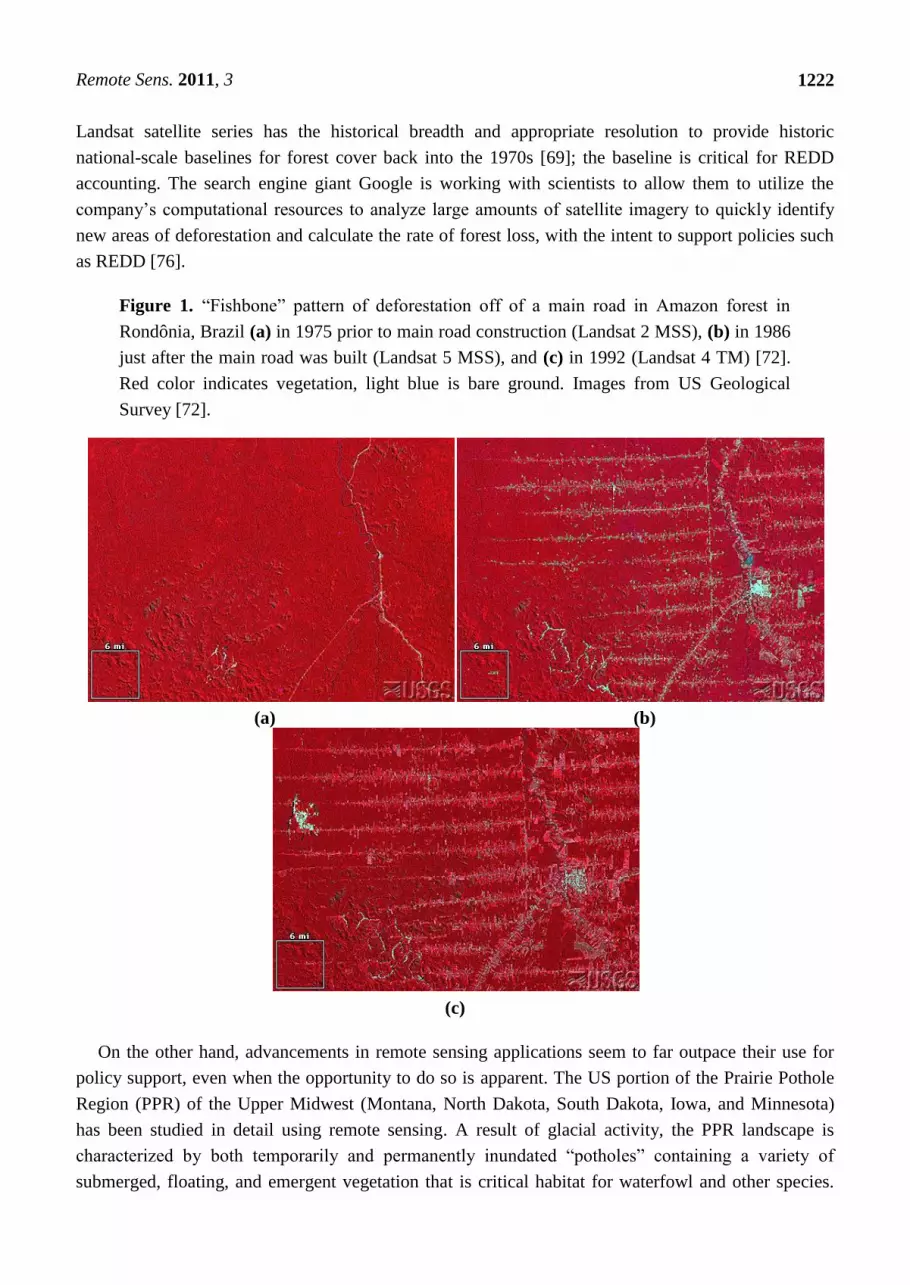
deforestation, particularly after road construction [20,65,66]. Indeed, one of the most striking examples
of the self-perpetuating impact (where disturbance begets more disturbance) of “unofficial” and
official roads was the “fishbone” pattern of forest clearing in the Amazon rainforest [67] (Figure 1).
Similar to ORV-created roads in National Forests in the US, the impact of “unofficial” (i.e., illegal)
roads may be greater than official roads [68,69]. Brazil’s National Institute for Space Research (INPE)
hosts a website with Landsat images and software (“SPRING”) which allows researchers to quickly
identify areas of the Amazon where high rates of “unofficial” (i.e., illegal) roads are encroaching on
pristine forest areas, so that these areas can be officially protected [70,71].
Policies developed more recently may be more likely to use remote sensing for implementation and
enforcement, as the technology has become more familiar to decision makers. Proposals for global
climate change policies to be implemented at the national scale are emerging as the active phase of the
Kyoto Protocol come to a close. At present, about 20% of global greenhouse gas emissions have been
traced to deforestation and degradation of tropical forests [73]. Deforestation and degradation must be
quantitatively linked to carbon emissions (later policies may add carbon sequestration due to land use
change into national evaluations of emissions). In particular, the policy development phase for the
Reducing Emissions from Deforestation and Degradation (REDD) programs under the Kyoto Protocol
has explicitly incorporated discussions on the strengths and limitations of remote sensing data to help
with policy monitoring and compliance [74]. The REDD program may be one of the most advanced
examples of the systematic use of remote sensing in all phases of the policy cycle, including evaluation
and regulation [73,75]. The Global Forest Observation Initiative will use remote sensing to support a
global accounting system for forest carbon sequestration and releases for the REDD program [16]. The
Remote Sens. 2011, 3
1222
Landsat satellite series has the historical breadth and appropriate resolution to provide historic
national-scale baselines for forest cover back into the 1970s [69]; the baseline is critical for REDD
accounting. The search engine giant Google is working with scientists to allow them to utilize the
company’s computational resources to analyze large amounts of satellite imagery to quickly identify
new areas of deforestation and calculate the rate of forest loss, with the intent to support policies such
as REDD [76].
Figure 1. “Fishbone” pattern of deforestation off of a main road in Amazon forest in
Rondônia, Brazil (a) in 1975 prior to main road construction (Landsat 2 MSS), (b) in 1986
just after the main road was built (Landsat 5 MSS), and (c) in 1992 (Landsat 4 TM) [72].
Red color indicates vegetation, light blue is bare ground. Images from US Geological
Survey [72].
(a) (b)
(c)
On the other hand, advancements in remote sensing applications seem to far outpace their use for
policy support, even when the opportunity to do so is apparent. The US portion of the Prairie Pothole
Region (PPR) of the Upper Midwest (Montana, North Dakota, South Dakota, Iowa, and Minnesota)
has been studied in detail using remote sensing. A result of glacial activity, the PPR landscape is
characterized by both temporarily and permanently inundated “potholes” containing a variety of
submerged, floating, and emergent vegetation that is critical habitat for waterfowl and other species.

Remote Sens. 2011, 3
1223
Landsat Thematic Mapper (TM) and Enhanced Thematic Mapper Plus (ETM+) have been used to map
potholes every 16 days, allowing for within and/or between-year investigation of changes in water
surface extent [77-79]. Due to its resolution, Landsat TM data can miss potholes smaller than
approximately 0.9 ha (which may make up the majority of wetlands in the PPR) [77], so researchers
have used subpixel classification techniques that allow for identifying wetland targets smaller than the
sensor’s field of view [53,78]. Winter and Rosenberry [79] used the subpixel classification techniques
with TM and ETM+ data with some success to inventory open water and lakes in the vicinity of Devils
Lake (North Dakota) of the PPR from 1991 to 2002, over a wide range of climatic conditions, making
the technology very applicable to the region’s wetland monitoring needs.
Although remote sensing methods have been extensively used to monitor changes in the surface
water extent of potholes and other terminal lakes (e.g., [80-82]), few of the results have been used to
support specific environmental policies, regulatory actions, or for setting/measuring conservation
program goals. The lack of policy linkages to the ongoing research is particularly unfortunate because
the remote sensing techniques in the PPR are very reproducible (with great potential for use in other
depressional wetlands) and require relatively simple analytical techniques, such as traditional
classification and density slice approaches (e.g., [83-86]). This lack of coordination has profound
implications for wetland related ecosystem functions; the PPR is home to more than 50% of North
American migratory waterfowl, and provides critical wetland ecosystem services such as reduction of
downstream flooding, hunting opportunities, and birding/recreation. Some of these species are
protected by the Migratory Bird Treaty Act of 1918. Without the application of remote sensing to
policy decision making, the PPR may continue to lose wetland area and ecological functions; the PPR
has already lost more than 50% of its wetlands, including their attendant ecological functions, to land
conversion and other activities [87].
3.2. Barriers to Use for Environmental Policy
One of the important outcomes of remote sensing over the past 40 years is the ever-widening array
of derived geospatial data sets that have been produced, such as topographic data, stream networks,
soils data, watershed boundaries, land cover data, and climate data, to name just a few. Consequently,
remote sensing-based geospatial datasets are now available to local, regional, and national policy
makers and their technical staff. In addition, environmental scientists of many specialties have used the
geospatial data to calculate a wide variety of landscape metrics and models, particularly related to the
assessment of stream, river, lake, and wetland condition (e.g., [88-94]). Additionally, user friendly
software tools have been developed and made available to decision makers, such as the Analytical
Tools Interface for Landscape Assessments [95]. This software is an ArcView (ESRI Inc.) extension,
and provides one of many ecosystem screening tools that can calculate landscape conditions within
wetlands and adjacent to wetlands, as well as other ecosystem types.
Despite these technological developments, the use of remote sensing for implementation and
evaluation of environmental policies remains low. While it is not possible to determine the exact
barriers for use to support a particular policy without in-depth investigation, some of the more likely
reasons may include cost and inappropriate scale of the data, and lack of policy prioritization to justify
the expense (in time, resources, and staff).
Remote Sens. 2011, 3
1224
Cost of Products: The demand for these technologies must be sufficiently high to offset their
cost [1]; this may explain why some areas of environmental policy make more regular use of these
technologies than others. While Landsat images (at 30 m resolution and ~675,000 ha extent) are
currently available for free, data requirements at finer resolutions might require aerial photographs
(with costs dependent upon both the cost of the camera or sensor equipment as well as costs of air
time) or fine-scale satellite imagery; these can run over $1,500 for an IKONOS image (at 1 m
resolution and ~16,500 ha extent), for example. Licenses for basic, popular GIS software packages can
thousands of US dollars per year per seat, and require computers with multiple, high-speed processors
to run them. In industrialized countries, ground-level surveys and data collection programs for small
areas (perhaps comparable to an IKONOS image extent), when loaded into Geographic Information
Systems, may provide the same types of information as those available from remote sensing, but with
greater accuracy and at lower cost [3]. As the monitoring area increases, the economic efficiency of
remote sensing approaches will meet (and over very large areas exceed) a monitoring program based
on ground surveys.
Inadequate Resources for Staff or Training: At the local and regional scales, government agencies
may not have the personnel, training, or resources to make use of available data [96]. An explicit
cooperation between remote sensing scientists, GIS analysts, and policymakers could overcome some
of the political barriers (e.g., the “science-policy value gap”) related to training, experience, and
resources [7]. This can include programs which place policymakers from regulatory agencies in
agencies charged with delivering and interpreting remote sensing information [7]. The use of
automated or semi-automated software that can quickly update road networks [62] could help alleviate
a staffing shortage, although whether these automated programs could effectively deal with irregularly
sized trails (commonly created by ORVs, bicycles, and horses) running under evergreen forest
canopies remains to be seen. Approaches using neural-network-based models to detect cross-border
smuggling trails may be more appropriate [97].
Data at Appropriate Scales not Available/Affordable: Barriers to the use of remote sensing data and
technology may also form due to characteristics of the data (such as accuracy, consistency, and
timeliness) [1], and whether the data are available at scales relevant to the policy’s jurisdiction and
focus. Limited use of remote sensing data for policy decisions in the past has been related to the
relatively coarse resolution of certain satellite data (e.g., Landsat, AVHRR, and MODIS), and the
prohibitively high cost of acquiring and processing more specialized, higher spatial or spectral
resolution data (e.g., hyperspectral or LiDAR), as well as the relatively specialized training/staff
required to process these data.
For example, regardless of its resolution, remote sensing imagery may not detect small roads
running under forest canopy, although pairing these data with up-to-date road maps and GPS field data
can overcome this shortcoming [36,37]. The use of coarse-scale images can cause many smaller (but
still important) roads to be missed. Working on forest fragmentation, Heilman et al. [20] found that the
length of detectable roads increased by 40% when switching from 1:100,000 scale to 1:24,000 scale
data. The utility of these products may increase if they are developed in response to requests from
potential users and a systematic survey of needs of existing policies and programs, instead of
developing the products first and making them available to users afterwards [2]. This type of survey

Remote Sens. 2011, 3
1225
also helps to illuminate where the same basic remote sensing product can be used to meet multiple
programmatic objectives of several different agencies or institutions, reducing the costs across all
agencies [2].
There are many examples of regional, state, and local remote sensing programs for monitoring and
assessing wetland conditions (such as those described above) that use a variety of high resolution and
low resolution airborne and spaceborne remote sensing data. Yet specific local, regional, or national
coordination between wetland remote sensing and policy activities are still quite rare. Rivero et al. [98]
demonstrated a very specific application of Landsat ETM+ and ASTER for mapping the spatial
variability of vegetational detritus and soil total phosphorus, using remote sensing to infer soil nutrient
status in the large wetlands of the Everglades. However, specific research applications of remote
sensing results such as these are not routinely incorporated into policy, and in this case could be very
valuable for guiding Everglades policy, plans, and programs, specifically the Florida Department of
Environmental Protection’s Comprehensive Everglades Restoration Program [99] and the Northern
Everglades and Estuaries Protection Program [100]. Both of these programs have identified
anthropogenic nutrient influx as a top priority for restoring the Everglades’ structure, function, and
resilience.
Political Reasons: There can be non-technical reasons why some policies may be difficult to support
in general, irrespective of technologies available for enforcement. The Roadless Rule has been a
politically contentious policy from the start, with numerous lawsuits that have challenged its legality
for over a decade [30]. Given a history of limited budgets within the Forest Service, dedicating staff
and resources to the development of remote sensing-based support of the rule may be difficult to
justify, even if technically straightforward. The “No Net Loss” goal has not been officially codified
into law by either the Executive nor Legislative Branches, and instead must be inferred as the “spirit”
of laws such as President Carter’s 1977 “Protection of Wetlands” Executive Order 11990 and the
Clean Water Act. The USA is a signatory to two international laws (the Migratory Bird Treaty
Act [101] and the Ramsar Convention on Wetlands of International Importance [102]) that do call for a
halt to wetlands destruction and degradation, but the practical commitment of the US Federal
Government to meeting these agreements may fluctuate with political circumstances. Indeed, the use
of remote sensing to track Prairie Potholes and other small or ephemeral wetlands would seem to be an
obvious approach for the US government to demonstrate that these treaties are being upheld.
Scientists could help decrease the impact of staffing and data resources shortages by
communicating and working more closely with policy developers and implementers. While much of
the theoretical research in remote sensing has demonstrated how these technologies and data might be
used, this research could be better designed to achieve both theoretical and applied objectives. When
scientists develop hypotheses, choose study areas, or purchase or request remote sensing imagery,
communications with local and regional regulatory agencies could increase the utility of the research
to help prioritize the agency’s ground survey efforts or changes to law enforcement. Indeed, using
policy goals as an endpoint and quantifying the distance between current and desired conditions using
experimental remote sensing techniques is an important but severely underused approach to hypothesis
testing. For example, given that all National Forests must identify roads and roadless areas in order to
generate travel management plans, researchers developing new methods to map narrow trails in

Remote Sens. 2011, 3
1226
heavily forested areas from fine-grained imagery could use National Forests as their study areas, and
use the ground survey performed by US Forest Service personnel for accuracy assessment. In this way,
the research gains an independent dataset for verification of the approach, and the US Forest Service
gains a remote sensing analysis of their area without the cost of imagery and the GIS technical staff to
analyze it. Alternatively, as stated in Section 2.1.2., it may be equally prudent to alter policies and
programs to allow for adequate remote sensing support, although it may be a compromise that is just as
politically difficult to defend as increased expenditures on remote sensing technology and data to
support existing policies.
4. Conclusions
Four decades of remote sensing data from several series of global orbiting satellites offer ample
opportunities to establish baselines for many environmental problems [1]. Habitat conservation would
seem to be a perfect candidate for the widespread use of remote sensing data and automated
technologies to ensure that conservation laws are being successfully implemented. However, the
degree to which these technologies are being used falls far short of their potential, with a variety of
technical, financial, and political reasons likely the cause of the shortfall.
Reid et al. [9] issued a call to explicitly link research on global environmental change with
sustainable development. This would encompass the use of remote sensing for not only monitoring
environmental conditions, but measuring the feedbacks between these conditions and human activity
and governance. Remote sensing data could be incorporated into large, complex models of
socioeconomic systems (to help determine the social and economic impacts of environmental
changes), and existing efforts (such as GEOSS) could be modified to include an assurance that its
products would meet the needs of decision-makers and are scaled appropriately for sustainable
development policy.
Acknowledgements
The authors would like to thank Brad Quayle at the USDA Forest Service, Remote Sensing
Applications Center for assistance with Forest Service case studies and reports.
References and Notes
1. de Leeuw, J.; Georgiadou, Y.; Kerle, N.; de Gier, A.; Inoue, Y.; Ferwerda, J.; Smies, M.;
Narantuya, D. The function of remote sensing in support of environmental policy. Remote Sens.
2010, 2, 1731-1750.
2. Backhaus, R.; Beule, B. Efficiency evaluation of satellite data products in environmental policy.
Space Policy 2005, 21, 173-183.
3. Miller, R.B.; Small, C. Cities from space: Potential applications of remote sensing in urban
environmental research and policy. Environ. Sci. Policy 2003, 6, 129-137.
4. Bryan, B.A.; Hajkowicz, S.; Marvanek, S.; Young, M.D. Mapping economic returns to
agricultural for informing environmental policy in the Murray-Darling Basin, Australia. Environ.
Model. Assess. 2009, 14, 375-390.

Remote Sens. 2011, 3
1227
5. Koren, I.; Remer, L.A.; Longo, K. Reversal of trend of biomass burning in the Amazon. Geophys.
Res. Lett. 2007, 34, L20404.
6. Baker, J.P.; Hulse, D.W.; Gregory, S.V.; White, D.; Van Sickle, J.; Berger, P.A.; Dole, D.;
Schumaker, N.H. Alternative futures for the Willamette River Basin, Oregon. Ecol. Appl. 2004,
14, 313-324.
7. Engel-Cox, J.A.; Hoff, R.M. Science-policy data compact: Use of environmental monitoring data
for air quality policy. Environ. Sci. Policy 2005, 8, 115-131.
8. Running, S.W.; Nemani, R.R.; Heinsch, F.A.; Zhao, M.; Reeves, M.; Hasimoto, H. A continuous
satellite-derived measure of global terrestrial primary production. BioScience 2004, 54, 547-560.
9. Reid, W.V.; Chen, D.; Goldfarb, L.; Hackmann, H.; Lee, Y.T.; Mokhele, K.; Ostrom, E.; Raivio, K.;
Rockström, J.; Schellnhuber, H.J.; Whyte, A. Earth system science for global sustainability:
Grand challenges. Science 2010, 330, 916-917.
10. Molina, M.J.; Rowland, F.S. Stratospheric sink for chlorofluoromethands: Chlorine
atom-catalysed destruction of ozone. Nature 1974, 249, 810-812.
11. NASA. Ozone Hole Watch; Available online: http://ozonewatch.gsfc.nasa.gov/ (accessed on 1
March 2011).
12. United Nations Environment Programme, Ozone Secretariat. Handbook for the Montreal Protocol
on Substances that Deplete the Ozone Layer; 7th ed.; 2006. Available online:
http://ozone.unep.org/Publications/MP_Handbook/Section_1.1_The_Montreal_Protocol/ (accessed
on 1 March 2011).
13. Kampe, T.U.; Johnson, B.R.; Kuester, M.; Keller, M. NEON: The first continental-scale
ecological observatory with airborne remote sensing of vegetation canopy biochemistry and
structure. J. Appl. Remote Sens. 2010, 4, 043510.
14. Herold, M.; Woodcock, C.E.; Loveland, T.R.; Townshend, J.; Brady, M.; Steenmans, C.;
Schmullius, C.C. Land-cover observations as part of a Global Earth Observation System of
Systems (GEOSS): Progress, activities, and prospects. IEEE Syst. J. 2008, 2, 414-423.
15. Nativi, S.; Mazzetti, P.; Saarenmaa, H.; Kerr, J.; Tuama, É.Ó. Biodiversity and climate change use
scenarios framework for the GEOSS interoperability pilot process. Ecol. Inform. 2009, 4, 23-33.
16. Stone, R. Earth-observation summit endorses global data sharing. Science 2010, 330, 902.
17. Christian, E. Planning for the Global Earth Observation System of Systems (GEOSS). Space
Policy 2005, 21, 105-109.
18. Lautenbacher, C.C. The Global Earth Observation System of Systems: Science serving society.
Space Policy 2006, 22, 8-11.
19. Group on Earth Observations Geo Portal: GEOSS online; Available online:
http://www.earthobservations.org/index.html (accessed on 10 March 2011).
20. Heilman, G.E., Jr.; Strittholt, J.R.; Slosser, N.C.; Dellasala, D.A. Forest fragmentation of the
conterminous USA: Assessing forest intactness through road density and spatial characteristics.
BioScience 2002, 52, 411-422.
21. Forman, R.T.T.; Sperling, D.; Bissonette, J.A.; Clevenger, A.P.; Cutshall, C.D.; Dale, V.H.;
Fahrig, L.; France, R.L.; Goldman, C.R.; Heanue, K.; Jones, J.; Swanson, F.; Turrentine, T.;
Winter, T.C. Road Ecology: Science and Solutions; Island Press: Washington, DC, USA, 2003.

Remote Sens. 2011, 3
1228
22. Coffin, A.W. From roadkill to road ecology: A review of the ecological effects of roads. J.
Transp. Geogr. 2007, 15, 396-406.
23. Lugo, A.E.; Gucinski, H. Function, effects, and management of forest roads. Forest Ecol. Manag.
2000, 133, 249-262.
24. Gucinski, H.; Furniss, M.J.; Ziemer, R.R.; Brookes, M.H. Forest Roads: A Synthesis Of Scientific
Information; General Technical Report PNW-GTR-509; Pacific Northwest Research Station,
USDA Forest Service: Portland, OR, USA, 2001; p. 103.
25. Forman, R.T.T.; Alexander, L.E. Roads and their major ecological effects. Ann. Rev. Ecol. Syst.
1998, 29, 207-231.
26. Eigenbrod, F.; Hecnar, S.J.; Fahrig, L. The relative effects of road traffic and forest cover on
anuran populations. Biol. Conserv. 2008, 141, 35-46.
27. Laurance, W.F.; Williamson, G.B. Positive feedbacks among forest fragmentation, drought, and
climate change in the Amazon. Conserv. Biol. 2001, 15, 1529-1535.
28. Hansen, M.J.; Clevenger, A.P. The influence of disturbance and habitat on the presence of
non-native plant species along transport corridors. Biol. Conserv. 2005, 125, 249-259.
29. Riitters, K.H.; Wickham, J.D. How far to the nearest road? Front. Ecol. Environ. 2003, 1, 125-129.
30. Nie, M. Administrative rulemaking and public lands conflict: The Forest Service’s Roadless Rule.
Nat. Resour. J. 2004, 44, 687-742.
31. Voicu, M. At a dead end: The need for congressional direction in the roadless area management
debate. Ecol. Law Quart. 2010, 37, 487-523.
32. Glickman, D. 36 CFR Part 294, Special Areas; Roadless Area Conservation; Final Rule. Federal
Register 12 January 2001, Volume 66, pp. 3244-3273. Available online: http://www.fs.usda.gov/
Internet/FSE_DOCUMENTS/stelprdb5050459.pdf (accessed on 20 February 2011).
33. Final Travel Management Regulations. Federal Register 9 November 2005, Volume 70,
pp. 68264-68291.
34. Cordell, H.K.; Betz, C.J.; Green, G.T.; Stephens, B. Off-Highway Vehicle Recreation in the USA
and Its Regions and States: A National Report from the National Survey on Recreation and the
Environment (NSRE); Internet Research Information Series; USDA Forest Service: Athens, GA,
USA, 2008. Available online: http://www.fs.fed.us/recreation/programs/ohv/IrisRec1rpt.pdf
(accessed on 25 February 2011).
35. Werstak, C.; Johnson, V.; Maus, P.; Lachowski, H.; Merigliano, L.; Molyneux, M.; Meier, N.
Geospatial Tools for Travel-Management Planning; RSAC-0063-RPT3; Remote Sensing
Applications Center, USDA Forest Service: Salt Lake City, UT, USA, 2004.
36. Williamson, M.; Evans, D.; Lachowski, H.; Lowery, L.; Clerke, W.; Meadows, D.; Watson, L.
Technology Evaluation for Mapping Roads and Trails in the Ocala National Forest, Florida;
RSAC-41-RPT1; Remote Sensing Applications Center, USDA Forest Service: Salt Lake City,
UT, USA; San Dimas Technology and Development Center, San Dimas, CA, USA, 2002.
37. Riitters, K.; Wickham, J.; Coulston, J. Use of road maps in national assessments of forest
fragmentation in the USA. Ecol. Soc. 2004, 9, 13.
38. Dahl, T.E. Wetland Losses in the USA, 1780’s to 1980’s; US Department of the Interior, Fish and
Wildlife Service: Washington, DC, USA, 1990; p. 21.
Remote Sens. 2011, 3
1229
39. Dahl, T.E. Status and Trends of Wetlands in the Conterminous USA 1998 to 2004; US Department
of the Interior, Fish and Wildlife Service: Washington, DC, USA, 2006; p. 112.
40. Millennium Ecosystem Assessment. Ecosystems and Human Well-Being: Wetlands and Water
Synthesis; World Resources Institute: Washington, DC, USA, 2005; p. 68.
41. The Conservation Foundation. Protection America’s Wetlands: An Action Agenda, The Final
Report of the National Wetlands Policy Forum; The Conservation Foundation: Washington, DC,
USA, 1988; p. 69.
42. Frayer, W.E.; Monahan, T.J.; Bowden, D.C.; Graybill, F.A. Status and Trends of Wetlands and
Deepwater Habitats in the Conterminous USA, 1950’s to 1970’s; Colorado State University: Fort
Collins, CO, USA, 1983; p. 32.
43. Dahl, T.E.; Johnson, C.E. Status and Trends of Wetlands in the Conterminous USA, mid-1970’s to
mid-1980’s; US Department of the Interior, Fish and Wildlife Service, Washington, DC, USA,
1991; p. 28.
44. Dahl, T.E. Status and Trends of Wetlands in the Conterminous USA 1986 to 1997; US Department
of the Interior, Fish and Wildlife Service: Washington, DC, USA, 2000; p. 82.
45. Hall, J.V.; Frayer, W.E.; Wilen, B.O. Status of Alaska Wetlands; US Department of the Interior,
Fish and Wildlife Service: Washington, DC, USA, 1994; p. 36.
46. Alaska Department of Natural Resources. Alaska’s Outdoor Legacy: Statewide Comprehensive
Outdoor Recreation Plan, 1992–1996; Department of Natural Resources, State of Alaska:
Anchorage, AK, USA, 1993; p. 80.
47. US Environmental Protection Agency, Ecosystem Services Research Program. Wetlands
Research; Available online: http://www.epa.gov/ecology/quick-finder/wetlands-research.htm
(accessed on 30 March 2011).
48. US Army Corps of Engineers. Ecosystem Restoration; Available online:
http://www.usace.army.mil/CECW/PlanningCOP/Pages/ecosystem.aspx (accessed on 30 March
2011).
49. Ackleson, S.G.; Klemas, V. Remote sensing of submerged aquatic vegetation in lower
Chesapeake Bay: A comparison of Landsat MSS to TM imagery. Remote Sens. Environ. 1987, 22,
235-248.
50. Sader, S.A.; Ahl, D.; Liou, W.S. Accuracy of Landsat-TM and GIS rule-based methods for forest
wetland classification in Maine. Remote Sens. Environ. 1995, 53, 133-144.
51. Lo, C.P.; Watson, L.J. The influence of geographic sampling methods on vegetation map accuracy
evaluation in a swampy environment. Photogramm. Eng. Remote Sensing 1998, 64, 1189-1200.
52. Townsend, P.A.; Walsh, S.J. Remote sensing of forested wetlands: Application of multitemporal
and multispectral satellite imagery to determine plant community composition and structure in
southeastern USA. Plant Ecol. 2001, 157, 129-149.
53. Ozesmi, S.L.; Bauer, M. Satellite remote sensing of wetlands. Wetl. Ecol. Manag. 2002, 10,
381-402.
54. Bernthal, T.; Willis, K. Using Landsat 7 Imagery to Map Invasive Reed Canary Grass (Phalaris
arundinacea): A Landscape Level Wetland Monitoring Methodology; Wisconsin Department of
Natural Resources: Madison, WI, USA, 2004; p. 78.
Remote Sens. 2011, 3
1230
55. Wilen, B.O.; Bates, M.K. The US Fish and Wildlife Service’s National Wetland Inventory
Project. Vegetatio 1995, 118, 153-169.
56. Ducks Unlimited. Updating the National Wetlands Inventory (NWI) for the Great Lakes
(Wisconsin, Illinois, Indiana, Michigan, and Ohio) Project Workplan; Ducks Unlimited: Ann
Arbor, MI, USA, 2008; p. 108.
57. US Environmental Protection Agency. Chesapeake Bay Program: Implementation Plan; US
Environmental Protection Agency: Annapolis, MD, USA, 1990; p.42.
58. Williams, D.J.; Rybicki, N.B.; Lombana, A.V.; O’Brien, T.M.; Gomez, R.B. Preliminary
investigation of submerged aquatic vegetation mapping using hyperspectral remote sensing.
Environ. Monit. Assess. 2003, 81, 383-392.
59. Werdell, P.J.; Bailey, S.W.; Franz, B.A.; Harding, L.W., Jr.; Feldman, G.C.; McClain, C.R.
Regional and seasonal variability of chlorophyll-a in Chesapeake Bay as observed by SeaWiFS
and MODIS-Aqua. Remote Sens. Environ. 2009, 113, 1319-1330.
60. Coastal Resources Management Council. Rhode Island Coastal and Estuarine Land Conservation
Plan; Coastal Resources Management Council: Wakefield, RI, USA, 2010; p. 35.
61. NOAA. Habitat Priority Planner; Available online: http://www.csc.noaa.gov/digitalcoast/
tools/hpp/ (accessed on 25 March 2011).
62. Quackenbush, L.J. A review of techniques for extracting linear features from imagery.
Photogramm. Eng. Remote Sensing 2004, 70, 1383-1392.
63. Harvey, W.; McGlone, J.C.; McKeown, D.M.; Irvine, J.M. User-centric evaluation of
semi-automated road network extraction. Photogramm. Eng. Remote Sensing 2004, 70, 1353-1364.
64. Priestnall, G.; Hatcher, M.J.; Morton, R.D.; Wallace, S.J.; Ley, R.G. A framework for automated
extraction and classification of linear networks. Photogramm. Eng. Remote Sensing 2004, 70,
1373-1382.
65. Read, J.M.; Clark, D.B.; Venticinque, E.M.; Moreira, M.P. Application of merged 1-m and 4-m
resolution satellite data to research and management in tropical forests. J. Appl. Ecol. 2003, 40,
592-600.
66. Wade, T.G.; Riitters, K.H.; Wickham, J.D.; Jones, K.B. Distribution and causes of global forest
fragmentation. Conserv. Ecol. 2003, 7, article 7.
67. Skole, D.; Tucker, C. Tropical deforestation and habitat fragmentation in the Amazon: Satellite
data from 1978 to 1988. Science 1993, 260, 1905-1910.
68. Brandão, A.O., Jr.; Souza, C.M., Jr. Mapping unofficial roads with Landsat images: A new tool to
improve the monitoring of the Brazilian Amazon rainforest. Int. J. Remote Sens. 2006, 27,
177-189.
69. Perz, S.; Brilhante, S.; Brown, F.; Caldas, M.; Ikeda, S.; Mendoza, E.; Overdevest, C.; Reis, V.;
Reyes, J.F.; Rojas, D.; Schmink, M.; Souza, C.; Walker, R. Road building, land use and climate
change: prospects for environmental governance in the Amazon. Phil. Trans. Roy. Soc. B 2008,
363, 1889-1895.
70. Camara, G.; Souza, R.C.M.; Freitas, U.M.; Garrido J. SPRING: Integrating remote sensing and
GIS by object-oriented data modeling. J. Comput. Graph. 1996, 20, 395-403. Available online:
http://www.dpi.inpe.br/geopro/trabalhos/spring.pdf (accessed on 9 June 2011).

Remote Sens. 2011, 3
1231
71. dos Santos Silva, M.P.; Câmara, G.; Escada, M.I.S.; de Souza, R.C.M. Remote-sensing image
mining: Detecting agents of land-use change in tropical forest areas. Int. J. Remote Sens. 2008, 29,
4803-4822.
72. Campbell, R.W. Rondônia, Brazil: 1975, 1986, 1992. In Earthshots: Satellite Images of
Environmental Change; USGS: 14 February 1997. Available online: http://earthshots.usgs.gov/
Rondonia/Rondonia (accessed on 9 June 2011).
73. Olander, L.P.; Gibbs, H.K.; Steininger, M.; Swenson, J.J.; Murray, B.C. Reference scenarios for
deforestation and forest degradation in support of REDD: A review of data and methods. Environ.
Res. Lett. 2008, 3, 025011.
74. Herold, M; Johns, T. Linking requirements with capabilities for deforestation monitoring in the
context of the UNFCCC-REDD process. Environ. Res. Lett. 2007, 2, 045025.
75. Asner, G.P.; Powell, G.V.N.; Mascaro, J.; Knapp, D.E.; Clark, J.K.; Jacobson, J.;
Kennedy-Bowdoin, T.; Balaji, A.; Paez-Acosta, G.; Victoria, E.; Secada, L.; Valqui, M.;
Hughes, R.F. High-resolution forest carbon stocks and emissions in the Amazon. Proc. Natl.
Acad. Sci. USA 2010, 107, 16738-16742.
76. Jha, A. Google unveils breakthrough technology to monitor deforestation. The Guardian 10
December 2009.
77. Johnson, R.R.; Higgins, K.F. Wetland Resources of Eastern South Dakota, Brookings, SD; South
Dakota State University: Brookings, SD, USA, 1997; p. 120.
78. Sethre, P.R.; Rundquist, B.C.; Todhunter, P.E. Remote detection of prairie pothole ponds in the
Devils Lake Basin, North Dakota. GIScience Remote Sens. 2005, 42, 277-296.
79. Winter, T.C.; Rosenberry, D.O. Hydrology of prairie wetlands during drought and deluge: A
17-year study of the Cottonwood Lake Wetland Complex in North Dakota in the perspective of
longer term measured and proxy hydrological records. Climatic Change 1998, 40, 189-209.
80. Rundquist, D.; Lawson, M.; Queen, L.; Cerveny, R. The relationship between summer-season
rainfall events and lake-surface area. Water Resour. Bull. 1987, 23, 493-508.
81. Harris, A.R. Time series remote sensing of a climatically sensitive lake. Remote Sens. Environ.
1994, 50, 83-94.
82. Birkett, C.M. Synergistic remote sensing of Lake Chad: Variability of basin inundation. Remote
Sens. Environ. 2000, 72, 218-236.
83. Work, E.A., Jr.; Gilmer, D.S.; Klett, A. Utility of ERTS for Monitoring the Breeding Habitat of
Migratory Waterfowl. In Proceedings of the Third Earth Resources Technology Satellite-1
Symposium, Washington, DC, USA, 10–14 December 1973; Volume 1, pp. 10-14.
84. Work, E.A., Jr.; Gilmer, D.S. Utilization of satellite data for inventorying prairie ponds and lakes.
Photogramm. Eng. Remote Sensing 1976, 42, 685-694.
85. Best, R.G.; Moore, D.G. Landsat interpretation of prairie lakes and wetlands of eastern South
Dakota in Satellite Hydrology. In Proceedings of the Fifth Annual William T. Pecora Memorial
Symposium on Remote Sensing, Sioux Falls, SD, USA, 10–15 June 1979; Satellite Hydrology;
Deutsch, M., Wiesnet, D.R., Rango, A., Eds.; American Water Resources Association:
Minneapolis, MN, USA, 1981; pp. 499-506.
86. Frazier, P.S.; Page, J.P. Water body detection and delineation with Landsat TM data.
Photogramm. Eng. Remote Sensing 2000, 66, 461-1468.

Remote Sens. 2011, 3
1232
87. Adamus, P.R. Condition, Values, and Loss of Natural Functions of Prairie Wetlands of the
North-Central USA; EPA/600/R-92/249; US Environmental Protection Agency: Washington, DC,
USA, 1992. Available online: http://water.epa.gov/type/wetlands/assessment/appendixb.cfm#7.0
(accessed on 20 May 2011).
88. Jones, K.B.; Neale, A.C.; Nash, M.S.; Van Remortel, R.D.; Wickham, J.D.; Ritters, K.H.;
O’Neill, R.V. Predicting nutrient and sediment loadings to streams from landscape metrics: A
multiple watershed study from the USA Mid-Atlantic Region. Landscape Ecol. 2001, 16, 301-312.
89. Kellogg, D.Q.; Golda, A.J.; Groffmanb, P.M.; Addya, K.; Stolta, M.H.; Blazejewski, G. In situ
ground water denitrification in stratified, permeable soils underlying riparian wetlands. J. Environ.
Qual. 2005, 34, 524-533.
90. Dosskey, M.G., Helmers, M.J., Eisenhauer, D.E. An approach for using soil surveys to guide the
placement of water quality buffers. J. Soil Water Conserv. 2006, 61, 344-354.
91. Vidon, P.G.F.; Hill, A.R. Landscape controls on nitrate removal in stream riparian zones. Water
Resour. Res. 2004, 40, 2473-2487.
92. Baker, M.E.; Weller, D.E.; Jordan, T.E. Improved methods for quantifying potential nutrient
interception by riparian buffers. Landscape Ecol. 2006, 21, 1327-1345.
93. Dodds, W.K.; Oakes, R.M. Headwater influences on downstream water quality. Environ. Manag.
2008, 41, 367-377.
94. Tomer, M.D.; Dosskey, M.G.; Burkhart, M.R. James, D.E.; Helmers, M.J.; Eisenhauer, D.E.
Methods to prioritize placement of riparian buffers for improved water quality. Agroforest. Syst.
2009, 75, 17-25.
95. Ebert, D.W.; Wade, T.G. Analytical Tools Interface for Landscape Assessments (ATtiLA): User
Manual; EPA/600/R-04/083; US Environmental Protection Agency: Washington, DC, USA,
2004; p. 39.
96. Macauley, M.K. The value of information: Measuring the contribution of space-derived earth
science data to resource management. Space Policy 2006, 22, 274-282.
97. Kalser, J.V.; Stow, D.A.; Cao, L. Evaluation of remote sensing techniques for mapping
transborder trails. Photogramm. Eng. Remote Sensing 2004, 70, 1441-1447.
98. Rivero, R.G.; Grunwald, S.; Binford, M.W.; Osborne, T.Z. Integrating spectral indices into
functional models to predict soil phosphorus in a subtropical wetland. Remote Sens. Environ.
2009, 113, 2389-2402.
99. Comprehensive Everglades Restoration Program; Florida Department of Environmental
Protection: Tallahassee, FL, USA. Available online: http://www.dep.state.fl.us/water/wqssp/
everglades/cerp.htm (accessed on 25 March 2011).
100. Northern Everglades and Estuaries Protection Program; Florida Department of Environmental
Protection: Tallahassee, FL, USA. Available online: http://www.sfwmd.gov/portal/page/portal/
xweb%20protecting%20and%20restoring/other%20everglades (accessed on 25 March 2011).
101. Migratory Bird Program; US Fish and Wildlife Service: Arlington, VA, USA. Available online:
http://www.fws.gov/migratorybirds/regulationspolicies/mbta/mbtintro.html (accessed on 15 May
2011).

Remote Sens. 2011, 3
1233
102. International Affairs: International Wetlands Program; US Fish and Wildlife Service: Arlington,
VA, USA. Available online: http://www.fws.gov/international/dic/global/wetlands.html (accessed
on 15 May 2011).
© 2011 by the authors; licensee MDPI, Basel, Switzerland. This article is an open access article
distributed under the terms and conditions of the Creative Commons Attribution license
(http://creativecommons.org/licenses/by/3.0/).