use of indicators to improve communication on energy systems vulnerability, resilience and...
TRANSCRIPT

1 Book Title Information © 2005 Springer. Printed in the Netherlands.
USE OF INDICATORS TO IMPROVE COMMUNICATION ON
ENERGY SYSTEMS VULNERABILITY, RESILIENCE AND
ADAPTATION TO CLIMATE CHANGE
AXEL MICHAELOWA University of Zurich and Center for International and Comparative Studies (CIS), Zurich, Switzerland
HÉLÈNE CONNOR* HELIO International, Paris, France
LAURA E. WILLIAMSON HELIO International, Greenville, NC, USA
Abstract. This paper outlines anticipated climate change impacts on energy systems. It presents a set of indicators to determine: the level of vulnerability of a particular energy system; the capacity to implement energy adaptation projects; and how successful proposed implementation measures will be in increasing energy system resilience. Wind, solar, hydro, biomass, nuclear and fossil fuel energy systems are addressed.
Keywords: climate change; energy systems; vulnerability; resilience; adaptation; wind; solar; fossil fuels; biomass; hydro; nuclear; transmission; indicators; assessment
1. Introduction
New insights have been gained over the last ten years about the essential role of energy system resilience in the prosperous development of society. A growing number of case studies have revealed the tight connection between resilience, diversity and sustainability of social and ecological systems. Currently energy policies in industrialised countries are
______ * To whom correspondence should be addressed: Hélène Connor, HELIO International, 56 rue de
Passy, 75016 Paris, France; email: [email protected]

Michaelowa et al. 2
increasingly driven by the need to mitigate greenhouse gases. However measures under the Kyoto Protocol to mitigate the climatic impacts of energy production have failed to take into account the expected consequences of increased climatic variability: cold years, flood events, seasonal droughts, storm surges, extreme wind speeds, freezing conditions, heat waves1. Adaptation is fast becoming the order of the day, not only in geographically-vulnerable countries such Bangladesh and Tuvalu, but also in northern and moderate latitudes.
Climate change directly impacts both the demand- and supply-side of energy production. Energy systems and equipment are already subject to substantial temperature and other climatic changes. Climate change can also indirectly impact any part of the energy sector. For example, a change in electricity supply can affect energy distribution and consequently energy users.
Given the importance of energy in the economy and in the promotion of ecodevelopment2. it is vital that vulnerabilities within the energy sector are reduced. Energy systems must be adapted to withstand anticipated climate change and impacts. This can be achieved by increasing the resilience of the energy system e.g., by reinforcing its technical equipment, diversifying energy supply sources, siting power equipment differently, expanding its linkages with other regions, and investing in technological change – renewables, efficiency, etc. – to further expand the portfolio of options. Moreover, given the slow rate of capital stock turnover in the energy sector and the long lifetime of equipment, it is important that energy providers, policy makers and citizens be well-informed as to the possible impacts of climate change on the energy sector so that necessary mitigation and adaptation measures can be taken. Ultimately, the resiliency of a country’s energy system is underpinned by at least two key elements: its adaptive capacity and the country’s level of ecodevelopment.
In order to better understand how to trigger and sustain positive synergies, HELIO has developed a straightforward methodology and set of indicators to assess the vulnerability and resilience of energy systems to climate change. The entry point for this work is the national level. The final
______ 1 http://data.ukcip.org.uk/resources/publications/documents/4.pdf 2 Ecodevelopment became “sustainable development”(SD) with the 1987 Brundtland
Report. The abstract notion of SD has been variously operationalised. It can be broken down into three distinct sets of activities aimed at: (1) satisfying basic human needs; (2) creating communities that establish norms, rights, and collaborative behaviour as a prerequisite for participating in social and economic development; and (3) translating the more abstract needs of future generations into action today, e.g. BRAC, Bangladesh, Sekem and a social enterprise called WasteConcern, Spain.

INDICATORS TO IMPROVE ENERGY SYSTEM RESILIENCE 3
objective is to help identify policies and measures (PAMs) that can best facilitate and support adaptation activities. This process must involve — simultaneously and on an equal footing — government officials, business, environmental non-governmental organisations (ENGOs) and relevant agencies that collectively assess whether the implemented PAMs are effective in supporting/promoting adaptation of energy systems thereby contributing to increased resilience and ecodevelopment.
2. Why a metric for vulnerability and resilience is needed
Since the development of global climate policy in the early 1990s, the process has been dominated by emissions reductions policies and measures, i.e. mitigation. It was only with the start of negotiations on the post-2012 climate policy regime, that adaptation to climate change was given as equal importance as mitigation activities. The Adaptation Fund, financed by the adaptation tax on Clean Development Mechanism (CDM) projects, was implemented in early 2008.
Compared to mitigation, where a common metric in terms of “ton of CO2 equivalent reduced” has been used for many years, evaluation of adaptation measures is still in its infancy (see Stratus Consulting and UNFCCC 2005). There are no commonly accepted parameters and indicators (see Tyndall Centre 2004, USAID 2007) to compare adaptation needs and the effectiveness of adaptation measures. Possible metrics would be the number of disability-adjusted life-years saved and the value of property protected. However, determining the baseline impacts without adaptation will be extremely challenging.
This paper aims to contribute to the development of such parameters and indicators for energy systems. It builds on HELIO’s earlier work that carried out a preliminary assessment of energy and ecosystem resilience in sub-Saharan Africa1. Based on feedback from this work and HELIO’s ten years of experience in applying indicators, HELIO has now developed a set of indicators to measure: (1) the vulnerability of energy systems; and (2) measure the effectiveness of adaptation efforts in the energy sector.
HELIO’s philosophy is that the underlying metric – the actual measurement or statistic used – must be generally available for most, if not all, countries. Data collection and vector calculation must be do-able and if calculation is required to derive an indicator, it must be simple to do.
Overall the indicators themselves must:
______ 1 A Preliminary Assessment of Energy and Ecosystem Resilience in Ten African
Countries, 2007 see: http://www.helio-international.org/energywatch/2007.cfm
Michaelowa et al. 4
• be clearly definable, simple to understand, and easily communicated to citizens and decision-makers alike;
• be relevant to actual or anticipated policies; • reflect an important aspect of the social, economic, environmental,
technological or governance elements of the energy system; • measure something of obvious value to observers and decision-makers;
and, • have robustness, durability and long-term relevance.
3. Climate induced impacts on energy systems and related vulnerabilities
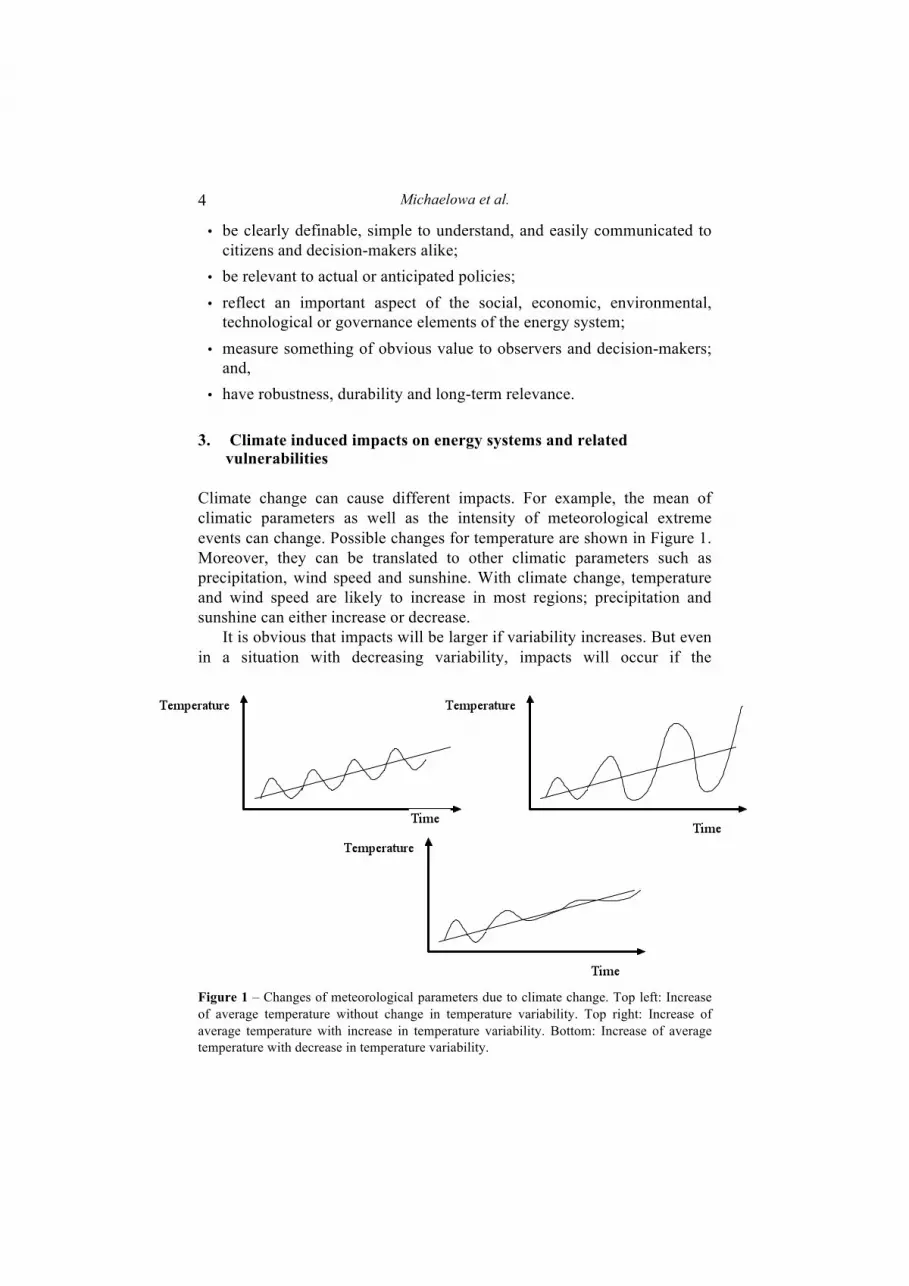
Climate change can cause different impacts. For example, the mean of climatic parameters as well as the intensity of meteorological extreme events can change. Possible changes for temperature are shown in Figure 1. Moreover, they can be translated to other climatic parameters such as precipitation, wind speed and sunshine. With climate change, temperature and wind speed are likely to increase in most regions; precipitation and sunshine can either increase or decrease.
It is obvious that impacts will be larger if variability increases. But even in a situation with decreasing variability, impacts will occur if the
Figure 1 – Changes of meteorological parameters due to climate change. Top left: Increase of average temperature without change in temperature variability. Top right: Increase of average temperature with increase in temperature variability. Bottom: Increase of average temperature with decrease in temperature variability.
INDICATORS TO IMPROVE ENERGY SYSTEM RESILIENCE 5
meteorological parameter passes the design threshold of a given infrastructure.
Impacts can also be direct or indirect. Frequently, indirect impacts are much stronger. For example, an increase in temperature alone is extremely unlikely to destroy any energy infrastructure. However, the melting of glaciers induced by temperature increase will have a strong impact on hydropower resources.
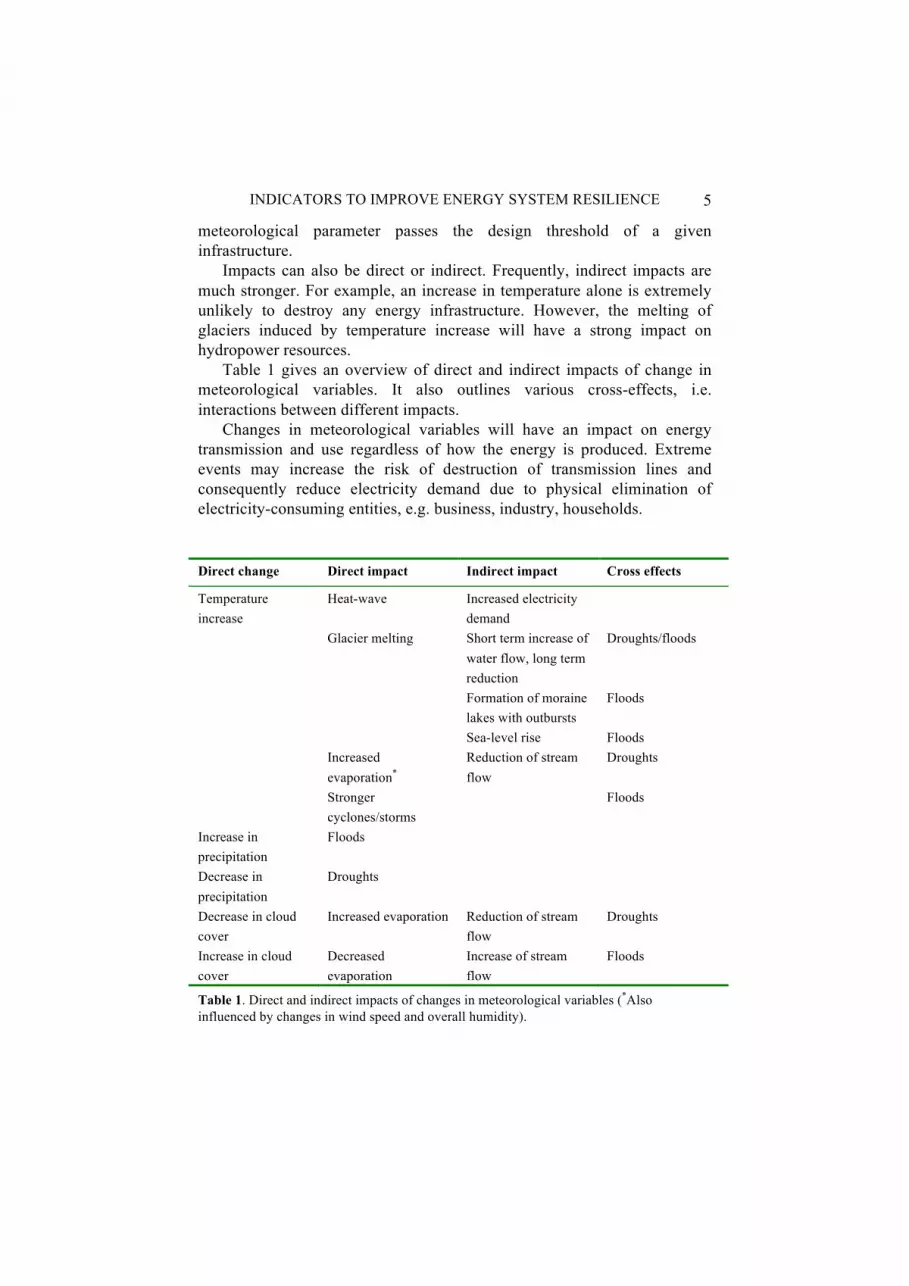
Table 1 gives an overview of direct and indirect impacts of change in meteorological variables. It also outlines various cross-effects, i.e. interactions between different impacts.
Changes in meteorological variables will have an impact on energy transmission and use regardless of how the energy is produced. Extreme events may increase the risk of destruction of transmission lines and consequently reduce electricity demand due to physical elimination of electricity-consuming entities, e.g. business, industry, households. Direct change Direct impact Indirect impact Cross effects
Temperature increase
Heat-wave Increased electricity demand
Glacier melting Short term increase of water flow, long term reduction
Droughts/floods
Formation of moraine lakes with outbursts
Floods
Sea-level rise Floods Increased
evaporation* Reduction of stream flow
Droughts
Stronger cyclones/storms
Floods
Increase in precipitation
Floods
Decrease in precipitation
Droughts
Decrease in cloud cover
Increased evaporation Reduction of stream flow
Droughts
Increase in cloud cover
Decreased evaporation
Increase of stream flow
Floods
Table 1. Direct and indirect impacts of changes in meteorological variables (*Also influenced by changes in wind speed and overall humidity).

Michaelowa et al. 6
Change in meteorological variable
Impact on electricity transmission
Change of electricity use due to change in meteorological variable
Temperature increase Some Increase due to higher cooling needs Decrease if sea-level rise displaces population and industrial production
Decrease in cloud cover None Decrease due to reduced lighting needs
Increase in cloud cover None Increase due to increased lighting needs
Increased frequency and/or strength of storms/cyclones
Failure of transmission lines
Reduced electricity demand due to damage to houses and factories
Floods Failure of transmission equipment from flooded power plants
Sharply reduced electricity demand due to interruption of production in flooded factories/cessation of electricity consumption in flooded houses
Droughts Risk of destruction of transmission lines due to forest fires.
Slightly reduced electricity demand due to interruption of production in factories whose supply of raw materials has been depleted/cessation of electricity consumption in houses of people abandoning the drought area
Table 2. Direct and indirect impacts of climate on electricity systems
In the following sections, impacts of change of meteorological
parameters are assessed for different energy production systems. They are grouped according to generation of energy and transport of energy to the user.
3.1. WIND ENERGY
Wind energy is generally harnessed in a decentralised manner and in locations chosen for their high average wind speed. Usually, wind speeds are measured for several years before investors decide to set up a wind turbine. Wind turbines start producing electricity at a certain wind speed and increase electricity generation with a power of three as wind speeds increase. At a certain maximum wind speed, the turbine automatically shuts off to prevent damage. Modern turbines can withstand wind speeds of 70 m/s before being destroyed.

INDICATORS TO IMPROVE ENERGY SYSTEM RESILIENCE 7
Climate change can affect average wind speeds. An increase in average wind speed would generally increase electricity generation unless the increase only occurs in the highest wind speed categories. A decrease in wind speeds leads to a reduction in electricity generation. An increase in the highest wind speeds increases the periods when wind turbines are stopped and raises the risk of destruction of the turbine.
3.2. SOLAR ENERGY
As in the case of wind, solar energy is generally harnessed in a decentralised manner and in locations chosen for their high average sunshine duration. Changes in cloud cover have an impact on electricity production. While photovoltaic cells and solar water heaters can produce electricity even with a certain degree of cloud cover, mirror-based solar thermal applications need full sunlight. Furthermore, the efficiency of solar power production decreases with the ambient temperatures. Thus an increase in temperature will reduce electricity production.
An increase in the strength/frequency of storms and cyclones increases the risk of destruction of solar energy generation equipment.
3.3. HYDRO-POWER ENERGY
Hydro power can be generated in a wide range of power plant sizes ranging from kWs to GWs in output. Siting of hydropower plants is usually based on multi-decadal river flow measurements. Changes in average precipitation will change river flow. However the impact on hydro power production will depend on plant-specific characteristics. While plants with large reservoirs can buffer river flow variability, run-of-the river plants are directly dependent on the actual river flow. The actual change in power production is therefore strongly dependent on the flow regime and utilisation rate of river flow which is shown in Figure 2.
Normally, hydro power plants are able to withstand flooding events by opening floodgates and shutting down turbine operation. Only in rare cases are hydro power plants and/or dams destroyed by flood events; they are less prone to flooding impacts than other power plant types if well-designed and situated in areas not prone to landslides. However, reservoirs can be filled up by debris and silt thus reducing their long-term power generation capacity.
Given that hydro-power plants are normally robust structures, an increase in the strength/frequency of storms and cyclones only marginally increases the risk of destruction of hydro power plants.

Michaelowa et al. 8
Figure 2. Scenarios for hydro-power river flow utilisation and consequent changes in the flow regime (assuming the glaciers and reservoirs remain stable). Top left: Flow regime before climate change: The power plant can only produce at full load during a limited rainy season. Top right: Flow regime after climate change: increase of flow in previously lean periods: Now the plant can considerably increase power production. Bottom: Flow regime after climate change: increase of flow in previously strong periods: In this case the plant cannot increase production at all despite the increase in river flow.
3.4. BIOMASS ENERGY
Biomass energy comes in many different forms. It can be used for heat generation in small, decentralised devices such as household stoves or for power generation in plants several MW in size. Biomass can be sourced from forests or agricultural residues; dedicated biomass plantations are also possible but rare due to the high costs involved.
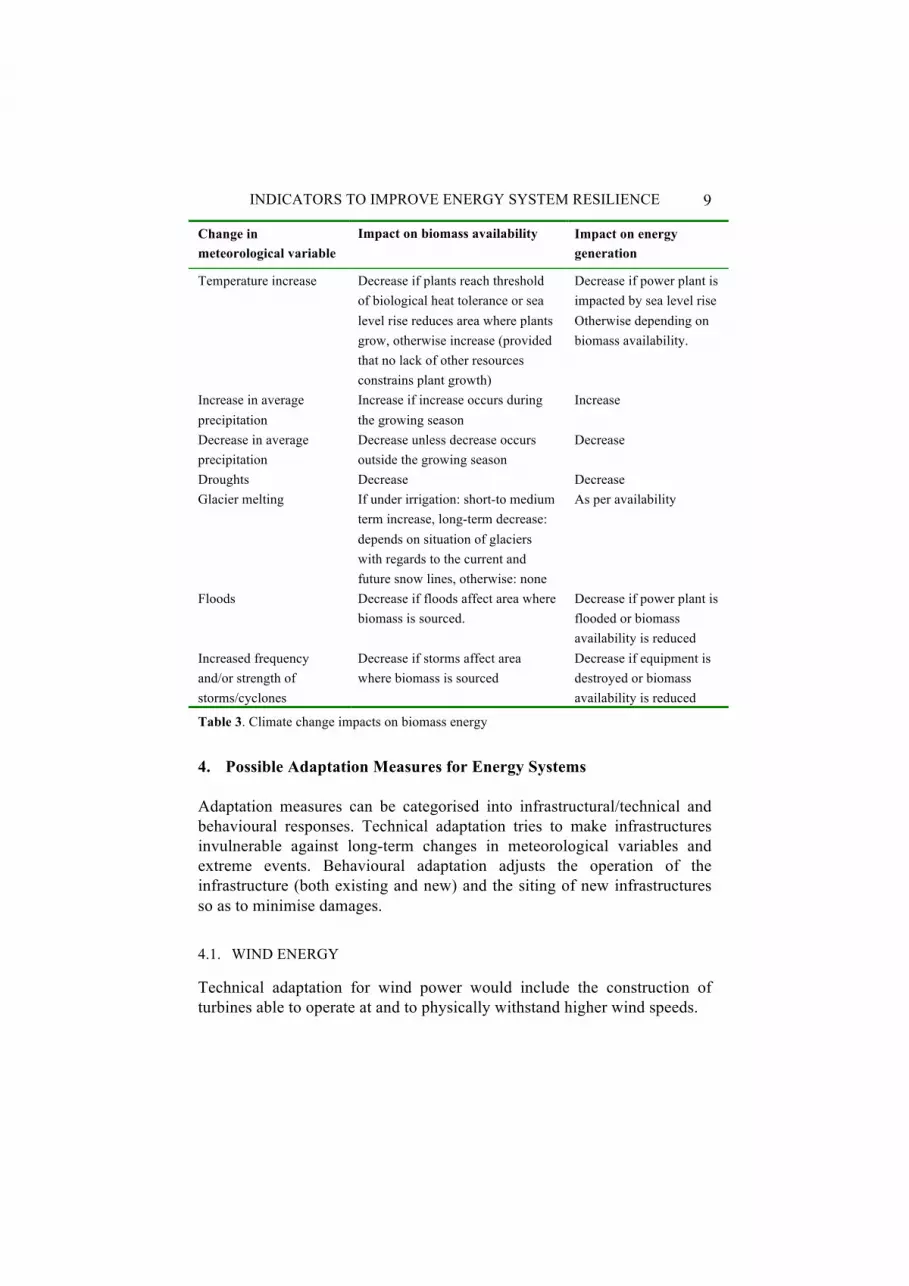
Climate change impacts the availability of biomass as well as energy generation facilities, as illustrated in Table 3.
3.5. FUEL FROM MINED RESOURCES
Current energy systems are mainly based on fossil fuels, be it solid fuels like coal or liquid fuel such as oil and gaseous fuels or uranium. Extraction of fossil fuels as well as their utilisation can be impacted by climate change, as shown in Table 4.
INDICATORS TO IMPROVE ENERGY SYSTEM RESILIENCE 9
Change in meteorological variable
Impact on biomass availability Impact on energy generation
Temperature increase Decrease if plants reach threshold of biological heat tolerance or sea level rise reduces area where plants grow, otherwise increase (provided that no lack of other resources constrains plant growth)
Decrease if power plant is impacted by sea level rise Otherwise depending on biomass availability.
Increase in average precipitation
Increase if increase occurs during the growing season
Increase
Decrease in average precipitation
Decrease unless decrease occurs outside the growing season
Decrease
Droughts Decrease Decrease Glacier melting If under irrigation: short-to medium
term increase, long-term decrease: depends on situation of glaciers with regards to the current and future snow lines, otherwise: none
As per availability
Floods Decrease if floods affect area where biomass is sourced.
Decrease if power plant is flooded or biomass availability is reduced
Increased frequency and/or strength of storms/cyclones
Decrease if storms affect area where biomass is sourced
Decrease if equipment is destroyed or biomass availability is reduced
Table 3. Climate change impacts on biomass energy
4. Possible Adaptation Measures for Energy Systems
Adaptation measures can be categorised into infrastructural/technical and behavioural responses. Technical adaptation tries to make infrastructures invulnerable against long-term changes in meteorological variables and extreme events. Behavioural adaptation adjusts the operation of the infrastructure (both existing and new) and the siting of new infrastructures so as to minimise damages.
4.1. WIND ENERGY
Technical adaptation for wind power would include the construction of turbines able to operate at and to physically withstand higher wind speeds.

Michaelowa et al. 10
Change in meteorological variable
Impact on fuel availability Impact on energy generation
Temperature increase None, unless pipelines are interrupted by melting pergelisol
Decrease of power plant efficiency due to higher temperature of cooling water
Increase in average precipitation
Reduced coal quality due to higher moisture content of opencast coal mining. Increased coal availability if coal seam fires are extinguished
None
Decrease in average precipitation
Decrease due to higher probability of coal seam fires
None
Droughts Decrease due to lack of water necessary for mining air conditioning and operations
Decrease due to reduced availability of cooling water
Glacier melting None Increase in the medium term (for power plants located close to the glaciers) due to lower cooling water temperature and higher availability of cooling water. Decrease in the long term once glaciers have vanished
Floods Decrease if floods affect mines Decrease if power plant is flooded or fuel cannot reach the plant.
Increased frequency and/or strength of storms/cyclones
Decrease if storms affect vulnerable mining equipment such as offshore oil platforms or opencast coal mine excavation equipment
Decrease if equipment is destroyed or fuel availability is reduced
Table 4. Climate change impacts on fossil-fuel/uranium based energy
Regarding behavioural adaptation, siting could take into account
expected changes in wind speeds during the lifetime of the turbines, as well as sea-level rise and changes in river flooding. Insurance schemes for long-term wind power yields and damage from storms should be developed. This would require good statistics of wind speed changes and extreme storm events from climate information (including forecasts). Moreover, rapid emergency repair teams could be set up to repair damaged turbines as quickly as possible.

INDICATORS TO IMPROVE ENERGY SYSTEM RESILIENCE 11
4.2. SOLAR ENERGY
For all solar technologies, technical adaptation is limited as they cannot be more robust than the building on which they are located. Behavioural adaptation would include siting according to expected changes in cloud cover. Large concentrating solar power (CSP) plants should be designed to make them robust with regards to storms. For distributed systems, mobile repair teams would be key to get systems operational after damage from extreme events.
4.3. HYDRO-POWER ENERGY
Technical adaptation for hydro projects can include building desilting gates to “flush” silted reservoirs. Moreover, dams can be increased in height and floodgates enlarged to accommodate increased river flow extremes and variability. Upstream land management can also reduce possible erosion and dam siltation.
The change in flow regime could allow for expanded, installed capacity. Increased flows from glacier melting should be taken into account if they are likely to persist over the technical lifetime of the system’s extra capacity. Behavioural adaptation would include changes in plant operation to account for changes in river flow patterns.
4.4. BIOMASS ENERGY
Biomass availability can only be increased if selected crops that have a higher biological heat tolerance and tolerate higher water stresses are used. The expansion of irrigation systems or improvement of efficiency of existing irrigation can counteract drought impacts provided sufficient water is available from sources outside the drought-hit area. This might necessitate tapping unconventional sources such as desalinated seawater or fossil water resources. Protection against floods can be provided by building dikes and improving drainage. Regarding biomass power plants, the robustness of the construction should be increased if they are located in storm-prone areas.
Behavioural adaptation would include early warning systems for rainfall and temperature anomalies, support for emergency harvesting of biomass in the case of an imminent extreme event as well as the provision of crop insurance systems. Biomass power plants should be sited in less flood and storm-prone areas.
Michaelowa et al. 12
4.5. FUEL FROM MINED RESOURCES
Technical adaptation for fossil fuel/uranium mining means improving the robustness of mining installations. This is especially important for offshore installations that are vulnerable to storms. Opencast as well as underground mines are also vulnerable to both flooding and shortage of water to sustain mining operation.
Behavioural adaptation would include siting of future mines in areas that have a limited exposure to flooding or drought risk. Power plants should preferably be sited at places with an ample supply of cooling water and preferably with a low water temperature. Air cooling could be used to replace water cooling.
4.6. INTERACTION OF ADAPTATION MEASURES BETWEEN DIFFERENT ENERGY FORMS
In several cases, adaptation measures of different energy forms influence each other. For example, behavioural adaptation of hydro power plants due to an improved operation schedule may conflict with an improved irrigation schedule of a downstream irrigation system. Likewise, desilting reservoirs may negatively impact the water supply used for downstream irrigation. The rush of power plant developers to claim sites with limited flood risk may result in a decrease in the number of suitable sites in the future.
5. Indicators for energy systems’ vulnerabilities to climate change
The following section presents a set of indicators for the vulnerability of each energy system.
5.1. TRANSMISSION SYSTEMS
The vulnerability of transmission systems would be shown by the following indicator: • VT1: Length of above-ground transmission lines (km) – including
provision for alternative routes Decentralised systems are much less vulnerable to failures in the transmission systems and to high temperatures (heat waves) than centralised ones (see WADE 2007).

INDICATORS TO IMPROVE ENERGY SYSTEM RESILIENCE 13
5.2. WIND ENERGY
The vulnerability of the wind energy system would be shown by the following indicators: • VW1: Number of wind turbines at less than 1 m above sea level. Sea
level rise might impact turbines below this level during their lifetime • VW2: Projected change of average wind speed over the next 20 years,
which is the average lifetime of wind turbines (%) • VW3: Projected share of average annual wind speeds over 25 m/s over
the next 20 years (at this wind speed most wind turbines have to be switched off)
• VW4: Projected likelihood of a storm with gusts over 70 m/s reaching areas where wind turbines are located (% over 20 years). At this wind speed destruction of wind turbines is likely
VW4 should be based on past experience coupled with the best tools to provide climate scenarios, e.g. using regional climate models.
5.3. SOLAR ENERGY
The vulnerability of the solar energy system would be shown by the following indicators: • VS1: Expected temperature increase over the next 20 years which is the
average lifetime of PV panels / CSP installations (°C) • VS2: Projected change in cloud cover over the next 20 years (%) • VS3: Projected likelihood of storm gusts over 70 m/s reaching areas
where solar power plants are located (% over 20 years). At this wind speed destruction of plants is likely
VS3 should be based on past experience coupled with the best tools to provide climate scenarios, e.g. using regional climate models.
5.4. HYDRO-POWER ENERGY
The vulnerability of the hydro energy system would be shown by the following indicators: • VH1: Expected precipitation change over the next 50 years,
differentiated by watersheds (%). Historical experience shows that 50 years is a good proxy for the lifetime of hydro plants.
• VH2: Projected additional runoff due to glacier melting over the next 50 years, differentiated by watersheds (million m3)

Michaelowa et al. 14
• VH3: Projected flood frequency over the next 50 years (number of floods that have a greater intensity than a flood with a 100 year recurrence cycle)
When runoff forecasts are available, VH1 should use runoff instead of precipitation.
5.5. BIOMASS ENERGY
The vulnerability of the biomass energy systems would be shown by the following indicators: • VB1: Probability of temperature increase beyond biological heat
tolerance of relevant crop over the next 20 years (%). Twenty years is the estimated average lifetime of biomass power plants.
• VB2: Expected precipitation change during the growing season over the next 20 years, differentiated by crop regions (%)
• VB3: Projected drought frequency over the next 20 years (number of droughts that would result in a reduction of crop yields by more than 20%)
• VB4: Projected flood frequency over the next 20 years (number of floods that would result in a reduction of crop yields by more than 20%)
• VB5: Number of biomass power plants located at less than 1 m above sea level and situated in an area that has a 100 year flood cycle
• VB6: Share of sheltered storage Indicators should be calculated for each crop that generates residues used for energetic purposes.
5.6. FUEL FROM MINED RESOURCES
The vulnerability of the fossil fuel/nuclear energy systems would be shown by the following indicators: • VF1: Expected temperature increase of cooling water for thermal
(including nuclear) power plants over the next 30 years (°C) • VF2: Expected number of droughts that would lead to a decrease in
capacity of thermal power plants by more than 10% over the next 30 years. Thirty years is the typical lifetime of fossil fuelled power plants
• VF3: Number of thermal power plants located by a river fed by glacial melt where the glaciers are unlikely to vanish over the next 30 years

INDICATORS TO IMPROVE ENERGY SYSTEM RESILIENCE 15
• VF4: Share of offshore oil and gas installations likely to be hit by a storm of more than 70 m/s gusts over the next 20 years (%). The lifetime of such installations is not well known, but should be shorter than that of power plants. At a wind speed of 70 m/s destruction of plants is likely
• VF5: Number of coal mines plants located at less than 1 m above sea level and situated in an area that has a 100 year flood cycle
• VF6: Number of thermal power plants located at less than 1 m above sea level and situated in an area that has a 100 year flood cycle
• VF7: Number of days of available stored stock • VF8: Share of protected storage in tanks or covered depots
6. Indicators for countries’ capacity for implementation of energy adaptation projects
Countries differ considerably in their capacity to implement adaptation measures in the energy sector. Capacity can be differentiated into monetary, technological, human and administrative components. The following section develops indicators for each type of capacity.
6.1. MONETARY CAPACITY
• CM 1: Domestic capital formation (million €/year) • CM 2: Domestic investment into the energy sector (million €/year) • CM 3: Domestic investment into renewable energy (million €/year) • CM 4: Capital of domestic insurance companies (million €)
6.2. TECHNOLOGICAL CAPACITY
• CT 1: Number of technical engineers graduating annually as a percentage of the total population
• CT 2: Number of domestic engineers specialised in energy technology (if possible separated into renewable and fossil/nuclear technology specialisations) as a percentage of the total population
• CT 3: Number of domestic companies able to construct renewable energy plants
• CT 4: Availability of hazard maps for droughts • CT 5: Availability of hazard maps for floods

Michaelowa et al. 16
• CT 6: Availability of coastal maps with a 1 metre altitude contour
6.3. HUMAN AND ADMINISTRATIVE CAPACITY
• CH 1: Number of domestic technicians trained to repair renewable energy systems
• CH 2: Number of domestic companies specialised in servicing renewable energy systems
• CH 3: Availability of early warning systems for meteorological extreme events
• CH 4: Existence of plans to react to meteorological extreme events and of mobile teams
• CH 5: Existence of siting guidelines for new power plants, taking into account climate change impacts
• CH 6: Existence of guidelines for power plant robustness with regards to storms, floods, heat waves
7. Indicators for successful interventions that increase resilience
A necessary condition for adaptation is the capacity to implement adaptation activities. In the context of developing countries, this capacity needs external support, for example through the financial mechanisms of the international climate policy regime. To avoid inefficient spending of scarce funds a set of criteria has been developed to gauge the efficiency of adaptation efforts.
7.1. WIND ENERGY
Indicators for effective adaptation efforts in the context of wind power could be as follows: • EW 1: Domestic regulation for storm-proofing wind power plants is
enacted and enforced. The regulation ensures that during the technical lifetime of the wind turbines, they withstand the highest wind speed that is likely to occur in the area during that period
• EW 2: A siting map for wind power plants has been developed, taking into account also projected changes in wind speeds, floodplains and area impacted by sea level rise
• EW3: An insurer offers insurance against wind turbine storm damage

INDICATORS TO IMPROVE ENERGY SYSTEM RESILIENCE 17
7.2. SOLAR ENERGY
• ES1: A siting map for solar power plants has been developed, taking into account also projected changes in cloud cover
• ES2: Domestic regulation for storm-proofing CSP • plants has been enacted, which ensures that during the technical
lifetime of the CSP plant it withstands the highest wind speed that is likely to occur in the area during that period
7.3. HYDRO-POWER ENERGY
• EH1: All new dams are equipped with desilting gates • EH2: Mapping of hydro plants that should expand their capacity due to
projected improvements in river flow regime has been carried out • EH3: A siting map for new hydro-power plants has been developed,
taking into account also projected changes in river flow • EH4: A plan for optimising hydro-power plant operations under
projected flow regimes has been developed and includes upstream land management to reduce possible erosion and resultant dam siltation
7.4. BIOMASS ENERGY
• EB1: An irrigation masterplan has been developed, taking into account also projected changes in drought occurrence
• EB2: A research budget for heat and drought resistant crops has been allocated and a realistic plan for this research has been drafted (for small countries: participation in Consultative Group on International Agricultural Research (CGIAR) activities for crop improvement research has been organised)
• EB3: A siting map for biomass power plants to prevent siting biomass power plants in floodplains and areas impacted by sea-level rise has been developed
• EB4: Domestic regulation for storm proof biomass power plants (e.g. ensuring that over its lifetime the biomass plant can withstand the highest wind speed that is likely to occur in the area during that period) has been enacted
Michaelowa et al. 18
7.5. FUEL FROM MINED RESOURCES
• EM1: A siting map for mines has been developed, taking into account also projected flooding and drought-prone areas
• EM2: Domestic regulation for siting of thermal power plants at sites with sufficient cooling water availability over the next 50 years has been enacted
8. Conclusion
It is possible to assess adaptation needs for the energy sector and to determine indicators for vulnerability, adaptation potential and effectiveness of adaptation support. Human resources for rapid reaction in case of meteorological extreme events are necessary, but not sufficient for successful adaptation. Energy systems are strategic infrastructure and can only be as resilient as the environment and human milieu in which they are located.
Using planning tools such as indicators to assess resilience and adaptation options is key to avoid siting future power plants in areas prone to impacts from extreme meteorological events. Moreover, understanding the vulnerabilities of a particular energy system allows for improved robustness of plant design to take into account projected changes in wind speeds, precipitation and sunshine and how to design plants to adjust to changing energy resources.
To do this, energy planners need both the tools and the knowledge of scientists, energy analysts, economists and citizens. Users who legitimately represent the needs of present and future generations and know their own needs must also be included if we are to ensure the resilience of our energy systems in the face of climate change impacts.
References
ActionAid USA, Compensating for Climate Change: Principles and Lessons for Equitable Adaptation Funding, 2007, www.actionaidusa.org
HELIO International, A preliminary assessment of energy and ecosystems resilience in ten African countries, 2007, http://www.helio-international.org/energywatch/2007.cfm
IPCC, Summary for Policy Makers of the Synthesis Report of the IPCC Fourth Assessment Report, November 2007, http://www.ipcc.ch/press/index.htm
OECD, Stocktaking of Progress on Integrating Adaptation to Climate Change into Development Co-operation Activities, 2007,

INDICATORS TO IMPROVE ENERGY SYSTEM RESILIENCE 19
http://www.oecd.org/document/34/0,3343,en_2649_37425_39313186_1_1_1_37425,00.html
SSN, SouthSouthNorth New Methodology for Community Based Adaptation (SSNAPP) 2005, http://www.southsouthnorth.org/library.asp
Stratus Consulting Inc. /- UNFCCC Secretariat, Compendium on Methods and Tools to Evaluate Impacts of, and Vulnerability and Adaptation to, Climate Change, 2005 http://unfccc.int/files/adaptation/methodologies_for/vulnerability_and_adaptation/application/pdf/consolidated_version_updated_021204.pdf
Tearfund, Christain Aid, Practical Action, Oxfam,Two degrees, One Chance – the urgent need to curb global warming, 2007, http://tilz.tearfund.org/Research/Climate+change+reports/Two+degrees+One+chance.htm
Tyndall Centre for Climate Change Research, New Indicators of Vulnerability and Adaptive Capacity, Tyndall Centre for Climate Change Research Technical Report 7, 2004 http://www.tyndall.ac.uk/theme3/final_reports/it1_11.pdf
UKCIP, Climate adaptation: Risk, uncertainty and decision-making - Technical Report, May 2003 http://www.ukcip.org.uk/resources/publications/pub_dets.asp?ID=4
UNFCCC, National Adaptation Programmes of Action, http://unfccc.int/national_reports/napa/items/2719.php
UNFCCC, National communications from Non-Annex 1 Countries http://unfccc.int/national_reports/non-annex_i_natcom/submitted_natcom/items/653.php
UNFCCC, Impacts, Vulnerabilities and Adaptation in Developing Countries, 2007 http://unfccc.int/files/essential_background/background_publications_htmlpdf/application/txt/pub_07_impacts.pdf
UN Secretary General, Millennium Development Goals, 2000, http://www.un.org/millenniumgoals/
USAID, Adapting to Climate Variability and Change: A guidance manual for development planning, 2007, www.usaid.gov
WADE: Security via Decentralised Energy, 2007, http://www.localpower.org/getreport.php?id=1020
WRI, Growing in the Greenhouse: Protecting the Climate by Putting Development First, 2005, http://archive.wri.org/item_detail.cfm?id=3744§ion=climate&page=pubs_content_text&z=?