drinking water vulnerability assessment and resilience plan
TRANSCRIPT
Drinking Water Vulnerability Assessment and Resilience PlanFairfield, New Haven, Middlesex, and New London CountiesNovember 2018
Prepared for:Connecticut Department of Public Health410 Capitol AvenueP.O. Box 340308Hartford, CT 06134-0308
Cover Photo Credit: Connecticut Department of Public Health
Drinking Water Vulnerability Assessment and Resilience PlanFairfield, New Haven, Middlesex, and New London Counties November 2018
This publication was prepared by University of Connecticut researchers, the Connecticut Institute of Resilience and Climate Adaptation and Milone & MacBroom. The publication does not express the views of the Department of Public Health or the State of Connecticut. The views and opinions expressed are those of the authors. Funding for this project was provided by the Community Development Block Grant Disaster Recovery Program, as administered by the Department of Housing and applied for by the Department of Public Health, State of Connecticut.
TABLE OF CONTENTS
ExecutiveSummary .........................................................................................ES1-ES111.0 Introduction ................................................................................................................ 1
1.1 Purpose of the Plan ..............................................................................................................................................1
1.2 Goals of the Plan ...................................................................................................................................................1
1.3 Risk and Resilience Concepts and Terminology........................................................................................2
1.4 Consistency with Other Planning Documents ...........................................................................................4
1.4.1 Consistency with Coordinated Water System Planning ..........................................................................4
1.4.2 Consistency with State Water Plan ..................................................................................................................5
1.4.3 Consistency with the State Natural Hazard Mitigation Plan .................................................................5
1.4.4 Consistency with the State Emergency Operations Plan ........................................................................5
2.0 CommunityWaterSystemVulnerabilityandRiskAssessment ......................72.1 Impacts of Recent Severe Storms and Events ............................................................................................7
2.1.1 Recent Severe Storms ...........................................................................................................................................7
2.1.2 Recent Droughts ...................................................................................................................................................13
2.2 Review of Laws, Practices, and Protocols ..................................................................................................16
2.2.1 Summary of Applicable Laws ...........................................................................................................................16
2.2.2 Critical Infrastructure Vulnerabilities, Resiliency, Planning, and Emergency Preparedness .. 20
2.2.3 State Government Emergency Preparedness and Response ............................................................. 22
2.2.4 Community Water System Emergency Preparedness and Response..............................................31
2.3 Review of Water System Emergency Planning Documents ................................................................32
2.3.1 Review of Vulnerability Assessments........................................................................................................... 32
2.3.2 Review of Emergency Contingency Plans .................................................................................................. 33
2.4 Vulnerabilities to the Quality and Quantity of Potable Water .......................................................... 34
2.4.1 General System Vulnerability .......................................................................................................................... 34
2.4.2 Survey of Community Water Systems ......................................................................................................... 37
2.4.3 Drinking Water Vulnerability Assessment Workshop ........................................................................... 38
2.4.4 Existing Flooding Risk to Community Water Systems ...........................................................................41
2.4.5 Potential Impact of Climate Change .............................................................................................................51
2.5 Assessment of Critical Assets of Small Community Water Systems .............................................. 60
2.6 Assessment of Critical Facilities Served by Community Water Systems ...................................... 62
2.7 Potential Infrastructure Upgrades to Encourage Regional Resiliency ............................................65
3.0 PrivateWellVulnerabilityAndRiskAssessment ........................................... 683.1 Private Well Vulnerability Assessment ....................................................................................................... 68
3.1.1 PrivateWellIdentificationMethodology ................................................................................................... 68
3.1.2 Flood Mapping Results ...................................................................................................................................... 70
3.2 Current State of Practice and Best Practices ............................................................................................76
3.3 Summary of Brackish Water Intrusion ...................................................................................................... 80
3.4 Resiliency Plan for Private Wells ....................................................................................................................81
3.4.1 General Methods of Adapting Private Wells .............................................................................................81
3.4.2 SpecificRecommendationsforVulnerableNeighborhoods .............................................................. 84
3.4.3 Recommendations from Findings ................................................................................................................. 87
3.4.4 Recommendations for Private Well Program Materials ....................................................................... 88
4.0Findings ...........................................................................................................................894.1 Lessons Learned from Past Events .............................................................................................................. 90
4.2 Flood Risk to Community Water System Infrastructure and Critical Facilities ........................... 90
4.3 Water Quality and Quantity Vulnerabilities ..............................................................................................91
4.4 Climate Change Impacts ..................................................................................................................................92
4.5 Community Water System Vulnerabilities and Emergency Preparedness....................................93
4.6 Drought Planning and Resilience ................................................................................................................ 94
4.7 Interconnections and Infrastructure Upgrades ...................................................................................... 94
4.8 Drinking Water Section Emergency Preparedness ................................................................................95
4.9 StateandLocalLawsAffectingDrinkingWater ......................................................................................97
4.10 Private Well Vulnerabilities ..............................................................................................................................97
4.11 Summary of Findings ........................................................................................................................................ 98
5.0Recommendations ........................................................................................................1015.1 Recommendations to Increase Resiliency for Community Water Systems ............................... 101
5.1.1 Resiliency for Public Water Supply Sources ............................................................................................103
5.1.2 Resiliency for Community Water System Distribution Systems ......................................................103
5.1.3 Resiliency for Critical Facilities Served by Community Water Systems ........................................104
5.2 Long-Term Implementation Plan ...............................................................................................................104
5.2.1 RecommendedModificationstoCurrentLaw .......................................................................................104
5.2.2 Resources to Assist with Implementation................................................................................................105
5.3 Consistency with Other Planning Documents ......................................................................................106
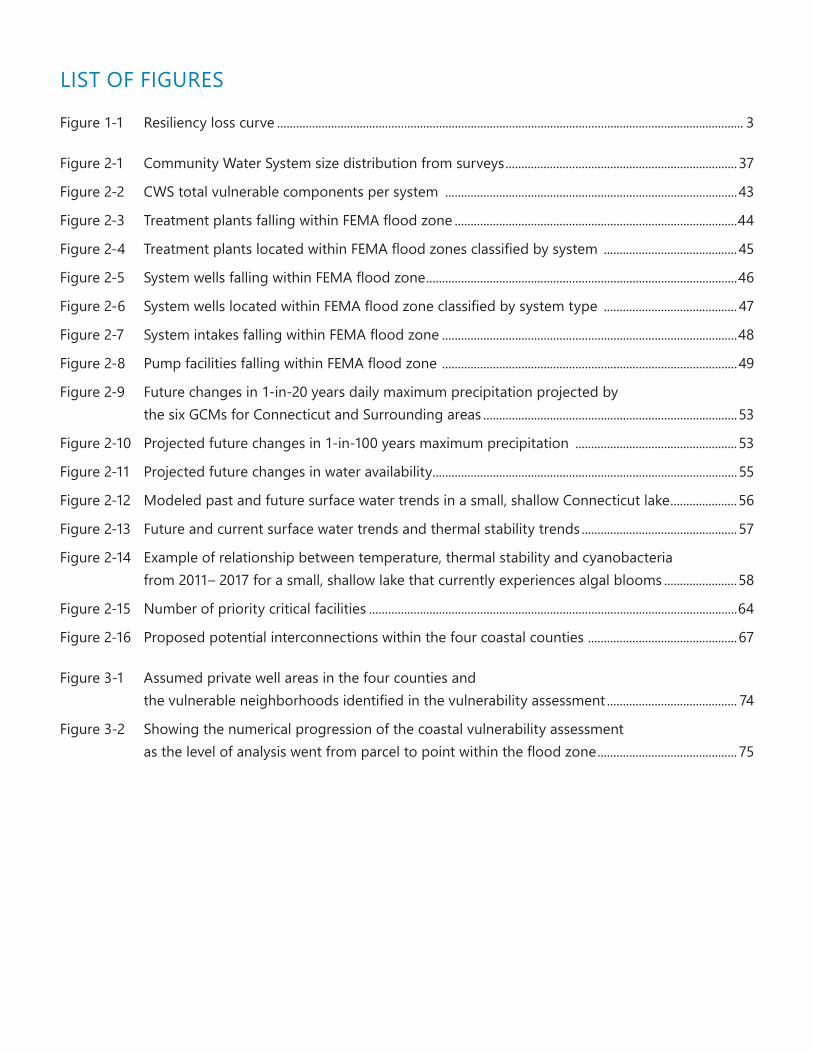
LIST OF FIGURES
Figure 1-1 Resiliency loss curve ................................................................................................................................................... 3
Figure 2-1 Community Water System size distribution from surveys ......................................................................... 37
Figure 2-2 CWS total vulnerable components per system ............................................................................................43
Figure2-3 TreatmentplantsfallingwithinFEMAfloodzone .........................................................................................44
Figure2-4 TreatmentplantslocatedwithinFEMAfloodzonesclassifiedbysystem .......................................... 45
Figure2-5 SystemwellsfallingwithinFEMAfloodzone ..................................................................................................46
Figure2-6 SystemwellslocatedwithinFEMAfloodzoneclassifiedbysystemtype .......................................... 47
Figure2-7 SystemintakesfallingwithinFEMAfloodzone .............................................................................................48
Figure2-8 PumpfacilitiesfallingwithinFEMAfloodzone .............................................................................................49
Figure 2-9 Future changes in 1-in-20 years daily maximum precipitation projected by the six GCMs for Connecticut and Surrounding areas ................................................................................53
Figure 2-10 Projected future changes in 1-in-100 years maximum precipitation ...................................................53
Figure 2-11 Projected future changes in water availability ................................................................................................55
Figure 2-12 Modeled past and future surface water trends in a small, shallow Connecticut lake .....................56
Figure 2-13 Future and current surface water trends and thermal stability trends .................................................57
Figure 2-14 Example of relationship between temperature, thermal stability and cyanobacteria from 2011– 2017 for a small, shallow lake that currently experiences algal blooms .......................58
Figure 2-15 Number of priority critical facilities ....................................................................................................................64
Figure 2-16 Proposed potential interconnections within the four coastal counties ...............................................67
Figure 3-1 Assumed private well areas in the four counties and thevulnerableneighborhoodsidentifiedinthevulnerabilityassessment ......................................... 74
Figure 3-2 Showing the numerical progression of the coastal vulnerability assessment asthelevelofanalysiswentfromparceltopointwithinthefloodzone ............................................ 75
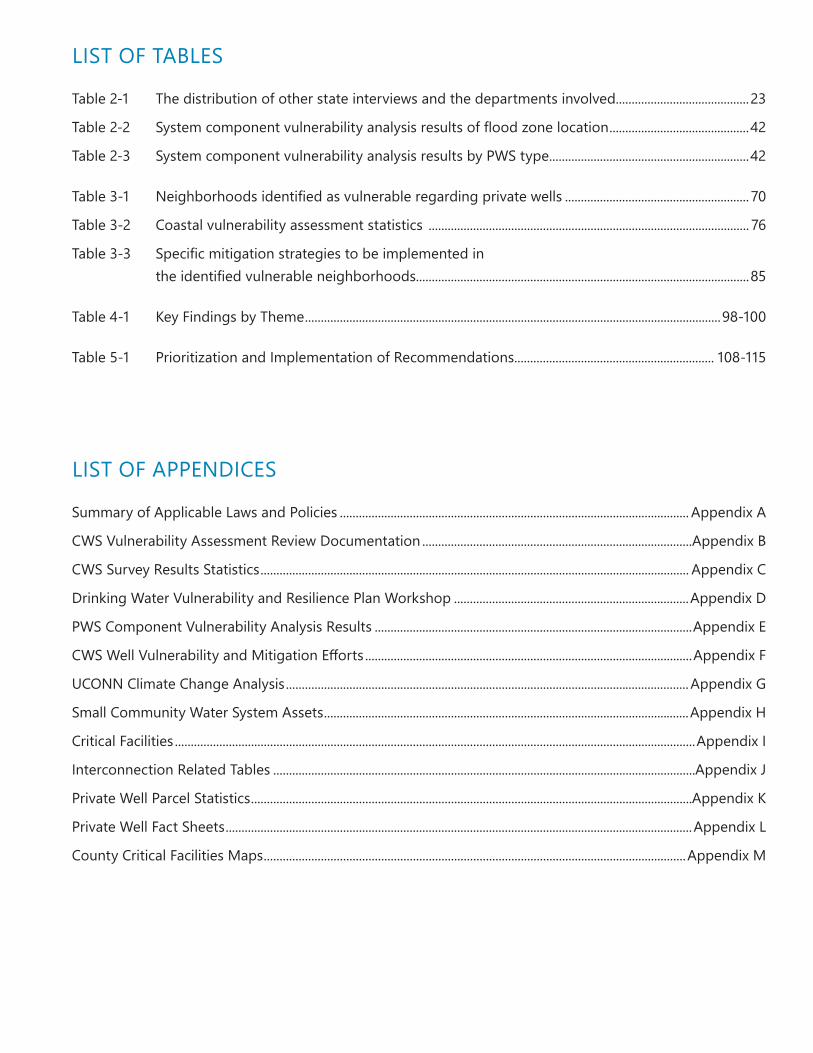
LIST OF TABLES
Table 2-1 The distribution of other state interviews and the departments involved..........................................23
Table2-2 Systemcomponentvulnerabilityanalysisresultsoffloodzonelocation ............................................42
Table 2-3 System component vulnerability analysis results by PWS type ...............................................................42
Table3-1 Neighborhoodsidentifiedasvulnerableregardingprivatewells .......................................................... 70
Table 3-2 Coastal vulnerability assessment statistics ..................................................................................................... 76
Table3-3 Specificmitigationstrategiestobeimplementedin theidentifiedvulnerableneighborhoods.........................................................................................................85
Table 4-1 Key Findings by Theme ...................................................................................................................................98-100
Table 5-1 Prioritization and Implementation of Recommendations ............................................................... 108-115
LIST OF APPENDICES
Summary of Applicable Laws and Policies .............................................................................................................. Appendix A
CWS Vulnerability Assessment Review Documentation .....................................................................................Appendix B
CWS Survey Results Statistics ....................................................................................................................................... Appendix C
Drinking Water Vulnerability and Resilience Plan Workshop ..........................................................................Appendix D
PWS Component Vulnerability Analysis Results ....................................................................................................Appendix E
CWSWellVulnerabilityandMitigationEfforts .......................................................................................................Appendix F
UCONN Climate Change Analysis ...............................................................................................................................Appendix G
Small Community Water System Assets ...................................................................................................................Appendix H
Critical Facilities ....................................................................................................................................................................Appendix I
Interconnection Related Tables .....................................................................................................................................Appendix J
Private Well Parcel Statistics ...........................................................................................................................................Appendix K
Private Well Fact Sheets ...................................................................................................................................................Appendix L
County Critical Facilities Maps .....................................................................................................................................Appendix M
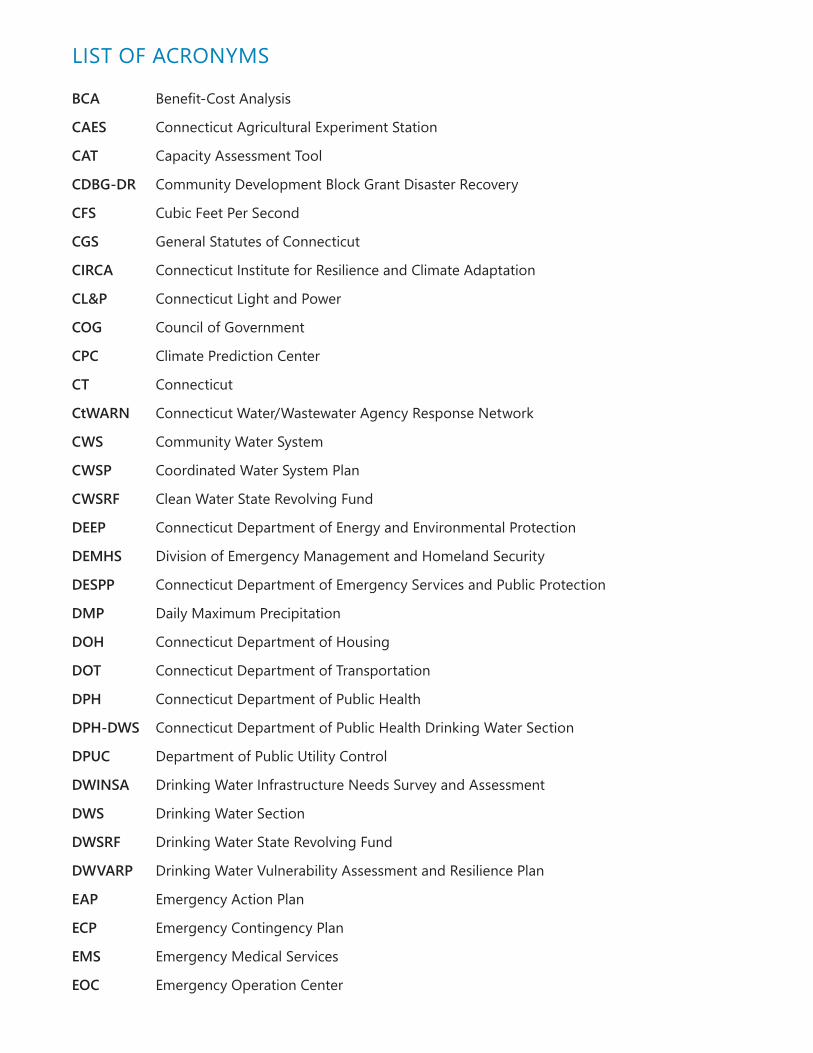
LIST OF ACRONYMS
BCA Benefit-CostAnalysis
CAES Connecticut Agricultural Experiment Station
CAT Capacity Assessment Tool
CDBG-DR Community Development Block Grant Disaster Recovery
CFS Cubic Feet Per Second
CGS General Statutes of Connecticut
CIRCA Connecticut Institute for Resilience and Climate Adaptation
CL&P Connecticut Light and Power
COG Council of Government
CPC Climate Prediction Center
CT Connecticut
CtWARN Connecticut Water/Wastewater Agency Response Network
CWS Community Water System
CWSP Coordinated Water System Plan
CWSRF Clean Water State Revolving Fund
DEEP Connecticut Department of Energy and Environmental Protection
DEMHS Division of Emergency Management and Homeland Security
DESPP Connecticut Department of Emergency Services and Public Protection
DMP Daily Maximum Precipitation
DOH Connecticut Department of Housing
DOT Connecticut Department of Transportation
DPH Connecticut Department of Public Health
DPH-DWS Connecticut Department of Public Health Drinking Water Section
DPUC Department of Public Utility Control
DWINSA Drinking Water Infrastructure Needs Survey and Assessment
DWS Drinking Water Section
DWSRF Drinking Water State Revolving Fund
DWVARP Drinking Water Vulnerability Assessment and Resilience Plan
EAP Emergency Action Plan
ECP Emergency Contingency Plan
EMS Emergency Medical Services
EOC Emergency Operation Center
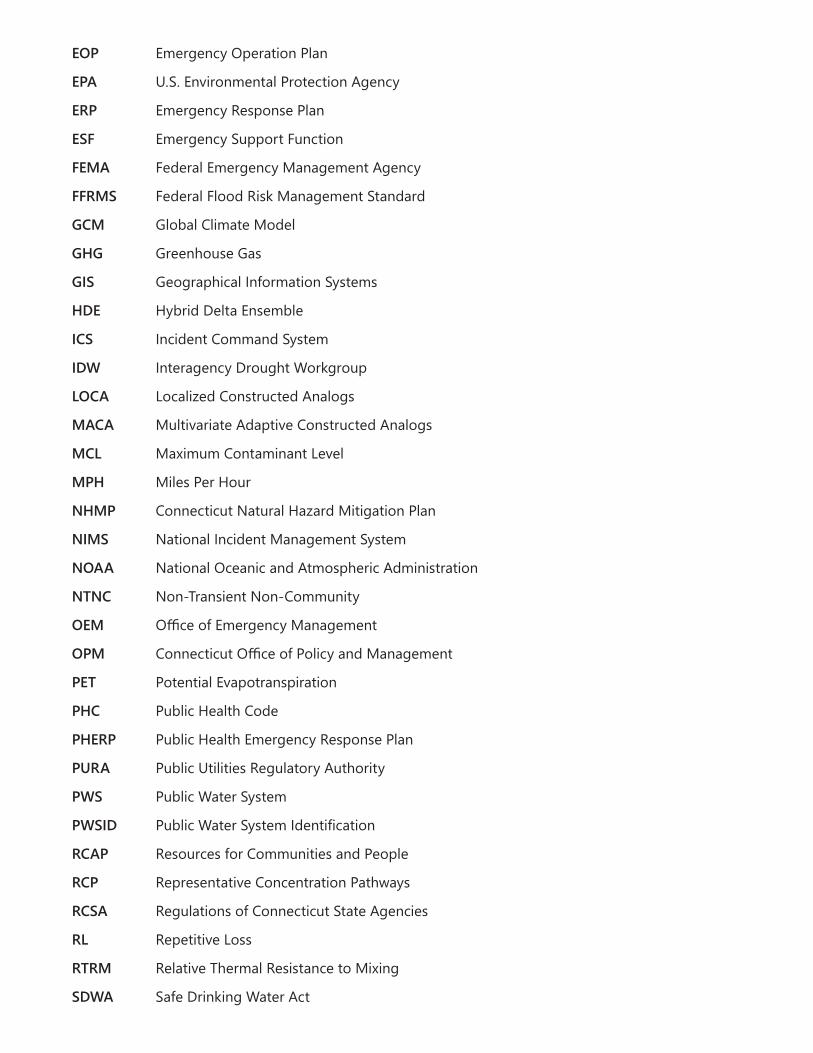
EOP Emergency Operation Plan
EPA U.S. Environmental Protection Agency
ERP Emergency Response Plan
ESF Emergency Support Function
FEMA Federal Emergency Management Agency
FFRMS Federal Flood Risk Management Standard
GCM Global Climate Model
GHG Greenhouse Gas
GIS Geographical Information Systems
HDE Hybrid Delta Ensemble
ICS Incident Command System
IDW Interagency Drought Workgroup
LOCA Localized Constructed Analogs
MACA Multivariate Adaptive Constructed Analogs
MCL Maximum Contaminant Level
MPH Miles Per Hour
NHMP Connecticut Natural Hazard Mitigation Plan
NIMS National Incident Management System
NOAA National Oceanic and Atmospheric Administration
NTNC Non-Transient Non-Community
OEM OfficeofEmergencyManagement
OPM ConnecticutOfficeofPolicyandManagement
PET Potential Evapotranspiration
PHC Public Health Code
PHERP Public Health Emergency Response Plan
PURA Public Utilities Regulatory Authority
PWS Public Water System
PWSID PublicWaterSystemIdentification
RCAP Resources for Communities and People
RCP Representative Concentration Pathways
RCSA Regulations of Connecticut State Agencies
RL Repetitive Loss
RTRM Relative Thermal Resistance to Mixing
SDWA Safe Drinking Water Act
SEOC State Emergency Operations Center
SOP Standard Operating Procedure
SRF Connecticut State Response Framework
SWP State Water Plan
TNC Transient Non-Community
UCONN University of Connecticut
USGS United States Geological Survey
WEAR Water Emergencies Assessment and Response Team
WSP Water Supply Plan
WUCC Water Utility Coordinating Committee

Drinking Water Vulnerability and Resilience Plan for Connecticut
Executive Summary

ES1
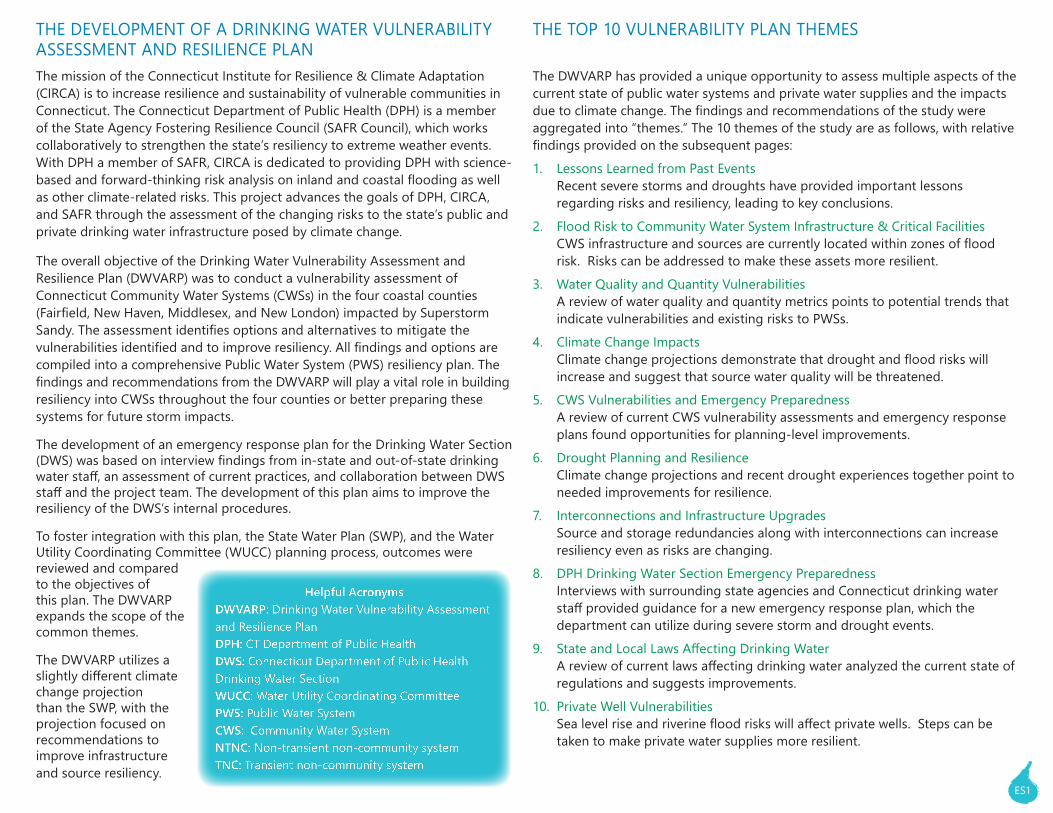
The mission of the Connecticut Institute for Resilience & Climate Adaptation (CIRCA) is to increase resilience and sustainability of vulnerable communities in Connecticut. The Connecticut Department of Public Health (DPH) is a member of the State Agency Fostering Resilience Council (SAFR Council), which works collaboratively to strengthen the state’s resiliency to extreme weather events. With DPH a member of SAFR, CIRCA is dedicated to providing DPH with science-based and forward-thinking risk analysis on inland and coastal flooding as well as other climate-related risks. This project advances the goals of DPH, CIRCA, and SAFR through the assessment of the changing risks to the state’s public and private drinking water infrastructure posed by climate change.
The overall objective of the Drinking Water Vulnerability Assessment and Resilience Plan (DWVARP) was to conduct a vulnerability assessment of Connecticut Community Water Systems (CWSs) in the four coastal counties (Fairfield, New Haven, Middlesex, and New London) impacted by Superstorm Sandy. The assessment identifies options and alternatives to mitigate the vulnerabilities identified and to improve resiliency. All findings and options are compiled into a comprehensive Public Water System (PWS) resiliency plan. The findings and recommendations from the DWVARP will play a vital role in building resiliency into CWSs throughout the four counties or better preparing these systems for future storm impacts.
The development of an emergency response plan for the Drinking Water Section (DWS) was based on interview findings from in-state and out-of-state drinking water staff, an assessment of current practices, and collaboration between DWS staff and the project team. The development of this plan aims to improve the resiliency of the DWS’s internal procedures.
To foster integration with this plan, the State Water Plan (SWP), and the Water Utility Coordinating Committee (WUCC) planning process, outcomes were reviewed and compared to the objectives of this plan. The DWVARP expands the scope of the common themes.
The DWVARP utilizes a slightly different climate change projection than the SWP, with the projection focused on recommendations to improve infrastructure and source resiliency.
The DWVARP has provided a unique opportunity to assess multiple aspects of the current state of public water systems and private water supplies and the impacts due to climate change. The findings and recommendations of the study were aggregated into “themes.” The 10 themes of the study are as follows, with relative findings provided on the subsequent pages:1. Lessons Learned from Past Events Recent severe storms and droughts have provided important lessons
regarding risks and resiliency, leading to key conclusions.2. Flood Risk to Community Water System Infrastructure & Critical Facilities CWS infrastructure and sources are currently located within zones of flood
risk. Risks can be addressed to make these assets more resilient.3. Water Quality and Quantity Vulnerabilities A review of water quality and quantity metrics points to potential trends that
indicate vulnerabilities and existing risks to PWSs.4. Climate Change Impacts Climate change projections demonstrate that drought and flood risks will
increase and suggest that source water quality will be threatened.5. CWS Vulnerabilities and Emergency Preparedness A review of current CWS vulnerability assessments and emergency response
plans found opportunities for planning-level improvements. 6. Drought Planning and Resilience Climate change projections and recent drought experiences together point to
needed improvements for resilience.7. Interconnections and Infrastructure Upgrades Source and storage redundancies along with interconnections can increase
resiliency even as risks are changing. 8. DPH Drinking Water Section Emergency Preparedness Interviews with surrounding state agencies and Connecticut drinking water
staff provided guidance for a new emergency response plan, which the department can utilize during severe storm and drought events.
9. State and Local Laws Affecting Drinking Water A review of current laws affecting drinking water analyzed the current state of
regulations and suggests improvements.10. Private Well Vulnerabilities Sea level rise and riverine flood risks will affect private wells. Steps can be
taken to make private water supplies more resilient.
Helpful AcronymsDWVARP: Drinking Water Vulnerability Assessment and Resilience PlanDPH: CT Department of Public HealthDWS: Connecticut Department of Public Health Drinking Water SectionWUCC: Water Utility Coordinating CommitteePWS: Public Water SystemCWS: Community Water SystemNTNC: Non-transient non-community systemTNC: Transient non-community system
THE DEVELOPMENT OF A DRINKING WATER VULNERABILITY ASSESSMENT AND RESILIENCE PLAN
THE TOP 10 VULNERABILITY PLAN THEMES
ES2
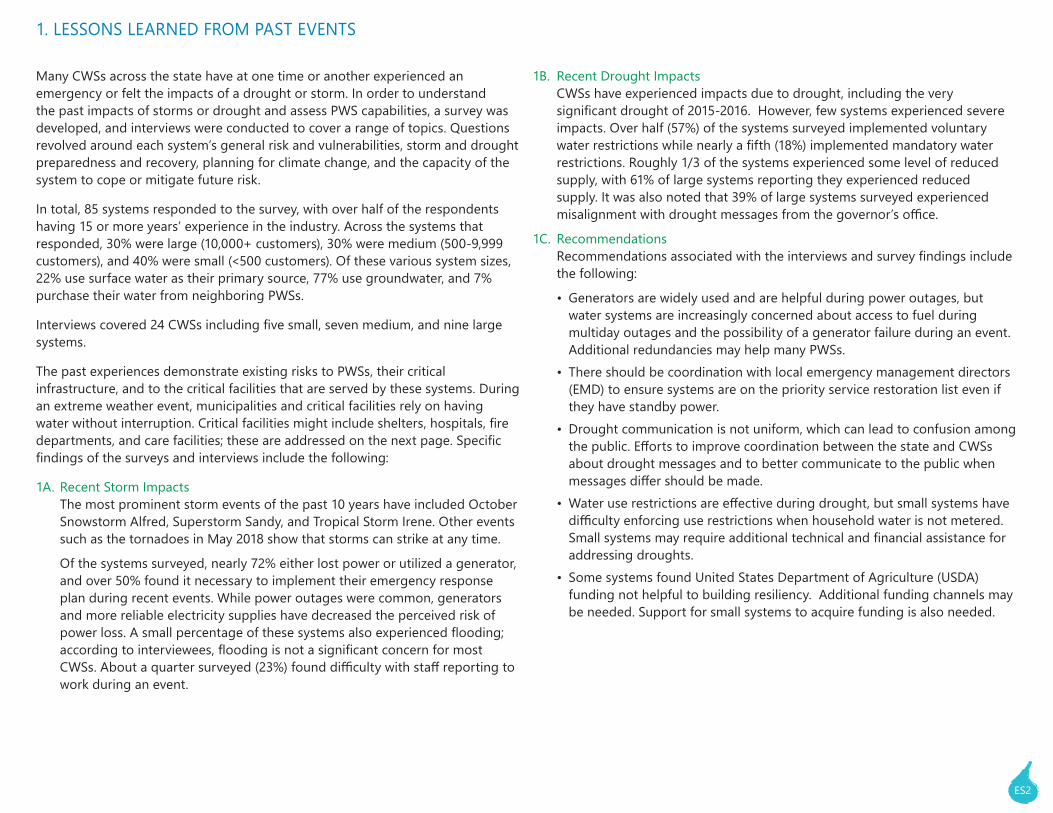
Many CWSs across the state have at one time or another experienced an emergency or felt the impacts of a drought or storm. In order to understand the past impacts of storms or drought and assess PWS capabilities, a survey was developed, and interviews were conducted to cover a range of topics. Questions revolved around each system’s general risk and vulnerabilities, storm and drought preparedness and recovery, planning for climate change, and the capacity of the system to cope or mitigate future risk.
In total, 85 systems responded to the survey, with over half of the respondents having 15 or more years’ experience in the industry. Across the systems that responded, 30% were large (10,000+ customers), 30% were medium (500-9,999 customers), and 40% were small (<500 customers). Of these various system sizes, 22% use surface water as their primary source, 77% use groundwater, and 7% purchase their water from neighboring PWSs.
Interviews covered 24 CWSs including five small, seven medium, and nine large systems.
The past experiences demonstrate existing risks to PWSs, their critical infrastructure, and to the critical facilities that are served by these systems. During an extreme weather event, municipalities and critical facilities rely on having water without interruption. Critical facilities might include shelters, hospitals, fire departments, and care facilities; these are addressed on the next page. Specific findings of the surveys and interviews include the following:
1A. Recent Storm ImpactsThe most prominent storm events of the past 10 years have included October Snowstorm Alfred, Superstorm Sandy, and Tropical Storm Irene. Other events such as the tornadoes in May 2018 show that storms can strike at any time.
Of the systems surveyed, nearly 72% either lost power or utilized a generator, and over 50% found it necessary to implement their emergency response plan during recent events. While power outages were common, generators and more reliable electricity supplies have decreased the perceived risk of power loss. A small percentage of these systems also experienced flooding; according to interviewees, flooding is not a significant concern for most CWSs. About a quarter surveyed (23%) found difficulty with staff reporting to work during an event.
1B. Recent Drought ImpactsCWSs have experienced impacts due to drought, including the very significant drought of 2015-2016. However, few systems experienced severe impacts. Over half (57%) of the systems surveyed implemented voluntary water restrictions while nearly a fifth (18%) implemented mandatory water restrictions. Roughly 1/3 of the systems experienced some level of reduced supply, with 61% of large systems reporting they experienced reduced supply. It was also noted that 39% of large systems surveyed experienced misalignment with drought messages from the governor’s office.
1C. RecommendationsRecommendations associated with the interviews and survey findings include the following:
• Generators are widely used and are helpful during power outages, but water systems are increasingly concerned about access to fuel during multiday outages and the possibility of a generator failure during an event. Additional redundancies may help many PWSs.
• There should be coordination with local emergency management directors (EMD) to ensure systems are on the priority service restoration list even if they have standby power.
• Drought communication is not uniform, which can lead to confusion among the public. Efforts to improve coordination between the state and CWSs about drought messages and to better communicate to the public when messages differ should be made.
• Water use restrictions are effective during drought, but small systems have difficulty enforcing use restrictions when household water is not metered. Small systems may require additional technical and financial assistance for addressing droughts.
• Some systems found United States Department of Agriculture (USDA) funding not helpful to building resiliency. Additional funding channels may be needed. Support for small systems to acquire funding is also needed.
1. LESSONS LEARNED FROM PAST EVENTS
ES3
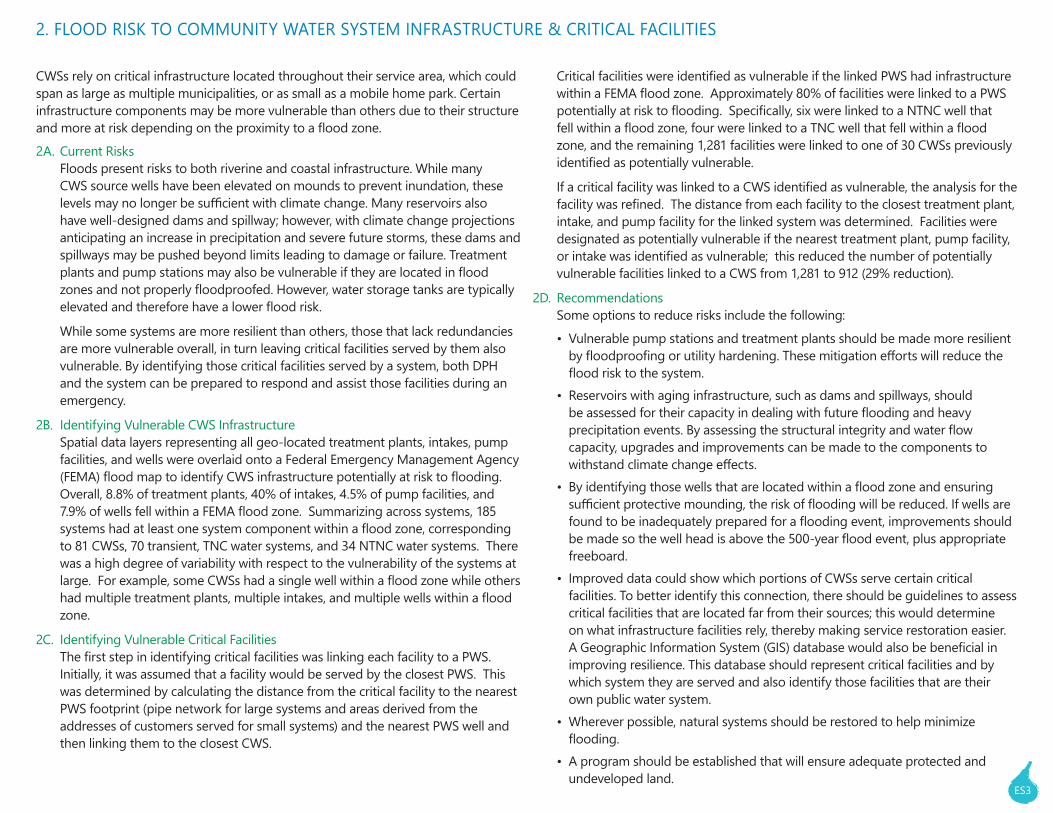
CWSs rely on critical infrastructure located throughout their service area, which could span as large as multiple municipalities, or as small as a mobile home park. Certain infrastructure components may be more vulnerable than others due to their structure and more at risk depending on the proximity to a flood zone. 2A. Current Risks
Floods present risks to both riverine and coastal infrastructure. While many CWS source wells have been elevated on mounds to prevent inundation, these levels may no longer be sufficient with climate change. Many reservoirs also have well-designed dams and spillway; however, with climate change projections anticipating an increase in precipitation and severe future storms, these dams and spillways may be pushed beyond limits leading to damage or failure. Treatment plants and pump stations may also be vulnerable if they are located in flood zones and not properly floodproofed. However, water storage tanks are typically elevated and therefore have a lower flood risk.
While some systems are more resilient than others, those that lack redundancies are more vulnerable overall, in turn leaving critical facilities served by them also vulnerable. By identifying those critical facilities served by a system, both DPH and the system can be prepared to respond and assist those facilities during an emergency.
2B. Identifying Vulnerable CWS InfrastructureSpatial data layers representing all geo-located treatment plants, intakes, pump facilities, and wells were overlaid onto a Federal Emergency Management Agency (FEMA) flood map to identify CWS infrastructure potentially at risk to flooding. Overall, 8.8% of treatment plants, 40% of intakes, 4.5% of pump facilities, and 7.9% of wells fell within a FEMA flood zone. Summarizing across systems, 185 systems had at least one system component within a flood zone, corresponding to 81 CWSs, 70 transient, TNC water systems, and 34 NTNC water systems. There was a high degree of variability with respect to the vulnerability of the systems at large. For example, some CWSs had a single well within a flood zone while others had multiple treatment plants, multiple intakes, and multiple wells within a flood zone.
2C. Identifying Vulnerable Critical FacilitiesThe first step in identifying critical facilities was linking each facility to a PWS. Initially, it was assumed that a facility would be served by the closest PWS. This was determined by calculating the distance from the critical facility to the nearest PWS footprint (pipe network for large systems and areas derived from the addresses of customers served for small systems) and the nearest PWS well and then linking them to the closest CWS.
Critical facilities were identified as vulnerable if the linked PWS had infrastructure within a FEMA flood zone. Approximately 80% of facilities were linked to a PWS potentially at risk to flooding. Specifically, six were linked to a NTNC well that fell within a flood zone, four were linked to a TNC well that fell within a flood zone, and the remaining 1,281 facilities were linked to one of 30 CWSs previously identified as potentially vulnerable.
If a critical facility was linked to a CWS identified as vulnerable, the analysis for the facility was refined. The distance from each facility to the closest treatment plant, intake, and pump facility for the linked system was determined. Facilities were designated as potentially vulnerable if the nearest treatment plant, pump facility, or intake was identified as vulnerable; this reduced the number of potentially vulnerable facilities linked to a CWS from 1,281 to 912 (29% reduction).
2D. RecommendationsSome options to reduce risks include the following:• Vulnerable pump stations and treatment plants should be made more resilient
by floodproofing or utility hardening. These mitigation efforts will reduce the flood risk to the system.
• Reservoirs with aging infrastructure, such as dams and spillways, should be assessed for their capacity in dealing with future flooding and heavy precipitation events. By assessing the structural integrity and water flow capacity, upgrades and improvements can be made to the components to withstand climate change effects.
• By identifying those wells that are located within a flood zone and ensuring sufficient protective mounding, the risk of flooding will be reduced. If wells are found to be inadequately prepared for a flooding event, improvements should be made so the well head is above the 500-year flood event, plus appropriate freeboard.
• Improved data could show which portions of CWSs serve certain critical facilities. To better identify this connection, there should be guidelines to assess critical facilities that are located far from their sources; this would determine on what infrastructure facilities rely, thereby making service restoration easier. A Geographic Information System (GIS) database would also be beneficial in improving resilience. This database should represent critical facilities and by which system they are served and also identify those facilities that are their own public water system.
• Wherever possible, natural systems should be restored to help minimize flooding.
• A program should be established that will ensure adequate protected and undeveloped land.
2. FLOOD RISK TO COMMUNITY WATER SYSTEM INFRASTRUCTURE & CRITICAL FACILITIES
ES4
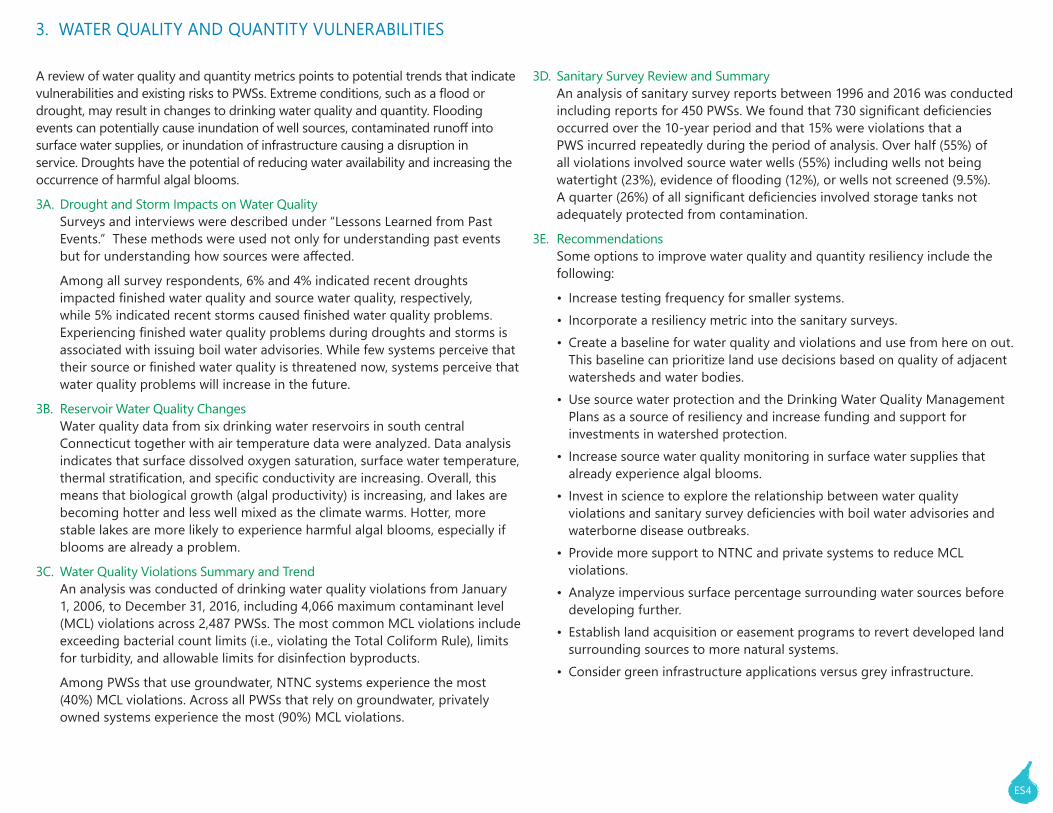
A review of water quality and quantity metrics points to potential trends that indicate vulnerabilities and existing risks to PWSs. Extreme conditions, such as a flood or drought, may result in changes to drinking water quality and quantity. Flooding events can potentially cause inundation of well sources, contaminated runoff into surface water supplies, or inundation of infrastructure causing a disruption in service. Droughts have the potential of reducing water availability and increasing the occurrence of harmful algal blooms.
3A. Drought and Storm Impacts on Water Quality Surveys and interviews were described under “Lessons Learned from Past Events.” These methods were used not only for understanding past events but for understanding how sources were affected.
Among all survey respondents, 6% and 4% indicated recent droughts impacted finished water quality and source water quality, respectively, while 5% indicated recent storms caused finished water quality problems. Experiencing finished water quality problems during droughts and storms is associated with issuing boil water advisories. While few systems perceive that their source or finished water quality is threatened now, systems perceive that water quality problems will increase in the future.
3B. Reservoir Water Quality Changes Water quality data from six drinking water reservoirs in south central Connecticut together with air temperature data were analyzed. Data analysis indicates that surface dissolved oxygen saturation, surface water temperature, thermal stratification, and specific conductivity are increasing. Overall, this means that biological growth (algal productivity) is increasing, and lakes are becoming hotter and less well mixed as the climate warms. Hotter, more stable lakes are more likely to experience harmful algal blooms, especially if blooms are already a problem.
3C. Water Quality Violations Summary and Trend An analysis was conducted of drinking water quality violations from January 1, 2006, to December 31, 2016, including 4,066 maximum contaminant level (MCL) violations across 2,487 PWSs. The most common MCL violations include exceeding bacterial count limits (i.e., violating the Total Coliform Rule), limits for turbidity, and allowable limits for disinfection byproducts.
Among PWSs that use groundwater, NTNC systems experience the most (40%) MCL violations. Across all PWSs that rely on groundwater, privately owned systems experience the most (90%) MCL violations.
3D. Sanitary Survey Review and Summary An analysis of sanitary survey reports between 1996 and 2016 was conducted including reports for 450 PWSs. We found that 730 significant deficiencies occurred over the 10-year period and that 15% were violations that a PWS incurred repeatedly during the period of analysis. Over half (55%) of all violations involved source water wells (55%) including wells not being watertight (23%), evidence of flooding (12%), or wells not screened (9.5%). A quarter (26%) of all significant deficiencies involved storage tanks not adequately protected from contamination.
3E. RecommendationsSome options to improve water quality and quantity resiliency include the following:
• Increase testing frequency for smaller systems.• Incorporate a resiliency metric into the sanitary surveys.• Create a baseline for water quality and violations and use from here on out.
This baseline can prioritize land use decisions based on quality of adjacent watersheds and water bodies.
• Use source water protection and the Drinking Water Quality Management Plans as a source of resiliency and increase funding and support for investments in watershed protection.
• Increase source water quality monitoring in surface water supplies that already experience algal blooms.
• Invest in science to explore the relationship between water quality violations and sanitary survey deficiencies with boil water advisories and waterborne disease outbreaks.
• Provide more support to NTNC and private systems to reduce MCL violations.
• Analyze impervious surface percentage surrounding water sources before developing further.
• Establish land acquisition or easement programs to revert developed land surrounding sources to more natural systems.
• Consider green infrastructure applications versus grey infrastructure.
3. WATER QUALITY AND QUANTITY VULNERABILITIES
ES5
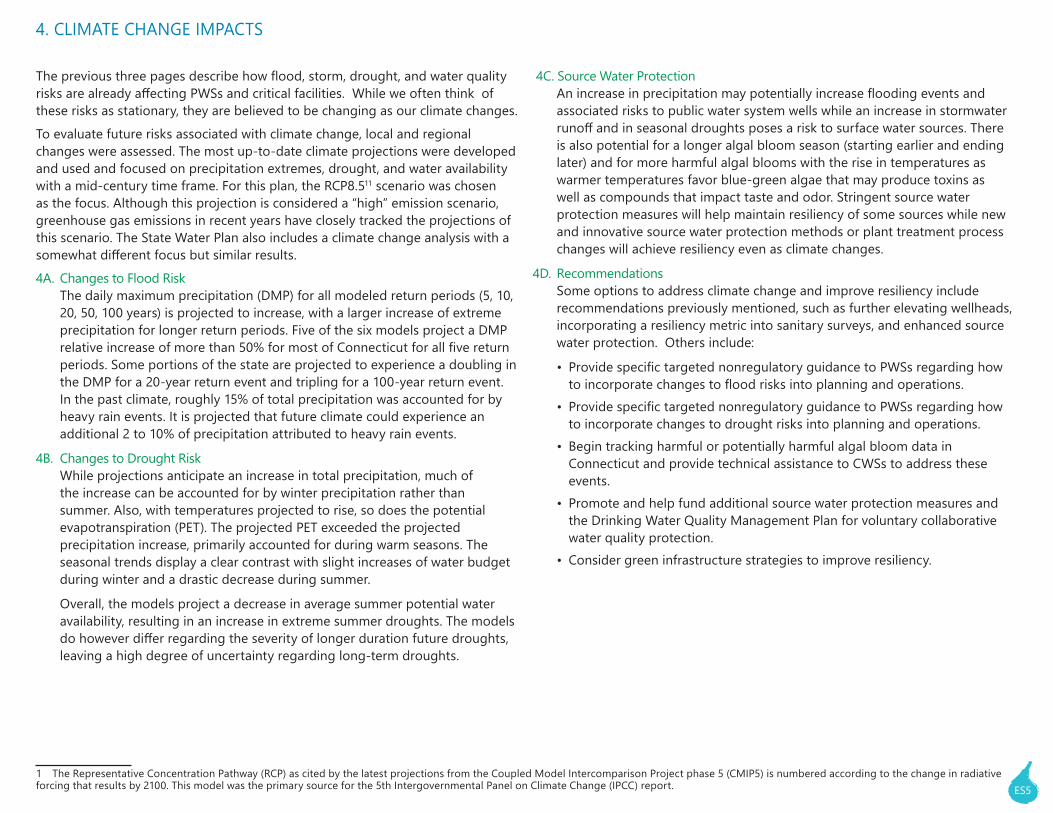
The previous three pages describe how flood, storm, drought, and water quality risks are already affecting PWSs and critical facilities. While we often think of these risks as stationary, they are believed to be changing as our climate changes.
To evaluate future risks associated with climate change, local and regional changes were assessed. The most up-to-date climate projections were developed and used and focused on precipitation extremes, drought, and water availability with a mid-century time frame. For this plan, the RCP8.511 scenario was chosen as the focus. Although this projection is considered a “high” emission scenario, greenhouse gas emissions in recent years have closely tracked the projections of this scenario. The State Water Plan also includes a climate change analysis with a somewhat different focus but similar results.4A. Changes to Flood Risk
The daily maximum precipitation (DMP) for all modeled return periods (5, 10, 20, 50, 100 years) is projected to increase, with a larger increase of extreme precipitation for longer return periods. Five of the six models project a DMP relative increase of more than 50% for most of Connecticut for all five return periods. Some portions of the state are projected to experience a doubling in the DMP for a 20-year return event and tripling for a 100-year return event. In the past climate, roughly 15% of total precipitation was accounted for by heavy rain events. It is projected that future climate could experience an additional 2 to 10% of precipitation attributed to heavy rain events.
4B. Changes to Drought RiskWhile projections anticipate an increase in total precipitation, much of the increase can be accounted for by winter precipitation rather than summer. Also, with temperatures projected to rise, so does the potential evapotranspiration (PET). The projected PET exceeded the projected precipitation increase, primarily accounted for during warm seasons. The seasonal trends display a clear contrast with slight increases of water budget during winter and a drastic decrease during summer.
Overall, the models project a decrease in average summer potential water availability, resulting in an increase in extreme summer droughts. The models do however differ regarding the severity of longer duration future droughts, leaving a high degree of uncertainty regarding long-term droughts.
1 The Representative Concentration Pathway (RCP) as cited by the latest projections from the Coupled Model Intercomparison Project phase 5 (CMIP5) is numbered according to the change in radiative forcing that results by 2100. This model was the primary source for the 5th Intergovernmental Panel on Climate Change (IPCC) report.
4C. Source Water ProtectionAn increase in precipitation may potentially increase flooding events and associated risks to public water system wells while an increase in stormwater runoff and in seasonal droughts poses a risk to surface water sources. There is also potential for a longer algal bloom season (starting earlier and ending later) and for more harmful algal blooms with the rise in temperatures as warmer temperatures favor blue-green algae that may produce toxins as well as compounds that impact taste and odor. Stringent source water protection measures will help maintain resiliency of some sources while new and innovative source water protection methods or plant treatment process changes will achieve resiliency even as climate changes.
4D. RecommendationsSome options to address climate change and improve resiliency include recommendations previously mentioned, such as further elevating wellheads, incorporating a resiliency metric into sanitary surveys, and enhanced source water protection. Others include:
• Provide specific targeted nonregulatory guidance to PWSs regarding how to incorporate changes to flood risks into planning and operations.
• Provide specific targeted nonregulatory guidance to PWSs regarding how to incorporate changes to drought risks into planning and operations.
• Begin tracking harmful or potentially harmful algal bloom data in Connecticut and provide technical assistance to CWSs to address these events.
• Promote and help fund additional source water protection measures and the Drinking Water Quality Management Plan for voluntary collaborative water quality protection.
• Consider green infrastructure strategies to improve resiliency.
4. CLIMATE CHANGE IMPACTS
ES6
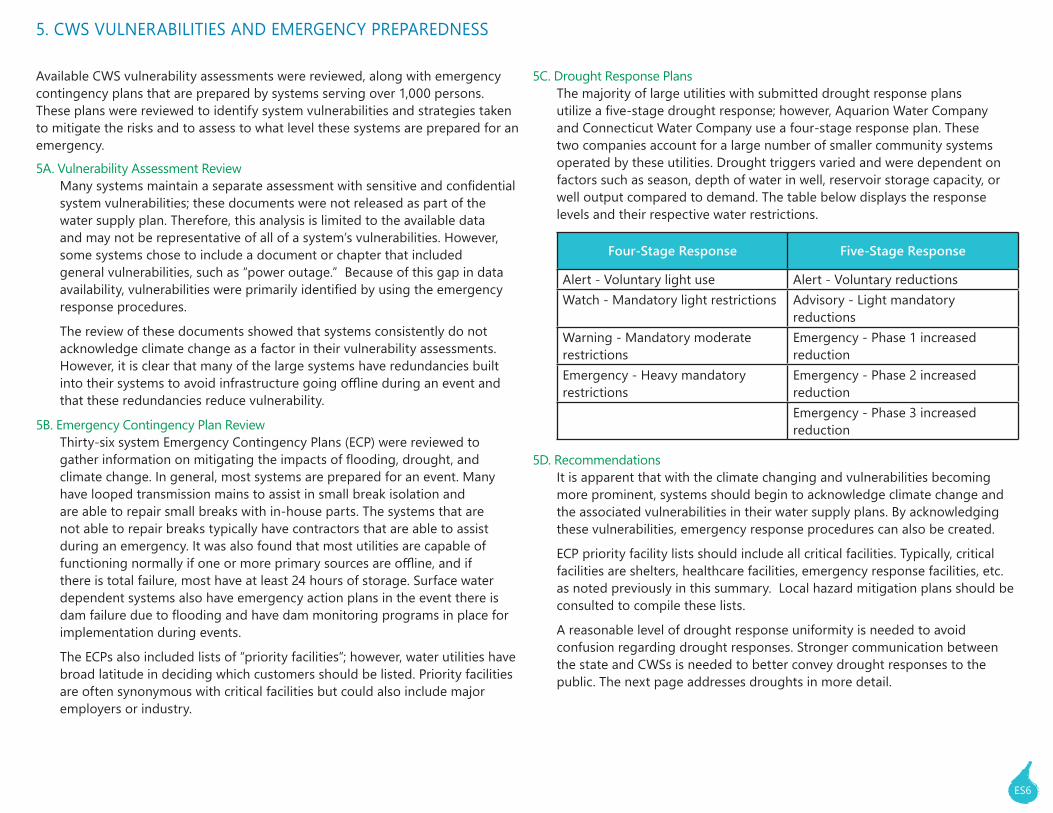
Available CWS vulnerability assessments were reviewed, along with emergency contingency plans that are prepared by systems serving over 1,000 persons. These plans were reviewed to identify system vulnerabilities and strategies taken to mitigate the risks and to assess to what level these systems are prepared for an emergency. 5A. Vulnerability Assessment Review
Many systems maintain a separate assessment with sensitive and confidential system vulnerabilities; these documents were not released as part of the water supply plan. Therefore, this analysis is limited to the available data and may not be representative of all of a system’s vulnerabilities. However, some systems chose to include a document or chapter that included general vulnerabilities, such as “power outage.” Because of this gap in data availability, vulnerabilities were primarily identified by using the emergency response procedures.
The review of these documents showed that systems consistently do not acknowledge climate change as a factor in their vulnerability assessments. However, it is clear that many of the large systems have redundancies built into their systems to avoid infrastructure going offline during an event and that these redundancies reduce vulnerability.
5B. Emergency Contingency Plan ReviewThirty-six system Emergency Contingency Plans (ECP) were reviewed to gather information on mitigating the impacts of flooding, drought, and climate change. In general, most systems are prepared for an event. Many have looped transmission mains to assist in small break isolation and are able to repair small breaks with in-house parts. The systems that are not able to repair breaks typically have contractors that are able to assist during an emergency. It was also found that most utilities are capable of functioning normally if one or more primary sources are offline, and if there is total failure, most have at least 24 hours of storage. Surface water dependent systems also have emergency action plans in the event there is dam failure due to flooding and have dam monitoring programs in place for implementation during events.
The ECPs also included lists of “priority facilities”; however, water utilities have broad latitude in deciding which customers should be listed. Priority facilities are often synonymous with critical facilities but could also include major employers or industry.
5C. Drought Response PlansThe majority of large utilities with submitted drought response plans utilize a five-stage drought response; however, Aquarion Water Company and Connecticut Water Company use a four-stage response plan. These two companies account for a large number of smaller community systems operated by these utilities. Drought triggers varied and were dependent on factors such as season, depth of water in well, reservoir storage capacity, or well output compared to demand. The table below displays the response levels and their respective water restrictions.
Four-Stage Response Five-Stage Response
Alert - Voluntary light use Alert - Voluntary reductionsWatch - Mandatory light restrictions Advisory - Light mandatory
reductionsWarning - Mandatory moderate restrictions
Emergency - Phase 1 increased reduction
Emergency - Heavy mandatory restrictions
Emergency - Phase 2 increased reductionEmergency - Phase 3 increased reduction
5D. RecommendationsIt is apparent that with the climate changing and vulnerabilities becoming more prominent, systems should begin to acknowledge climate change and the associated vulnerabilities in their water supply plans. By acknowledging these vulnerabilities, emergency response procedures can also be created.
ECP priority facility lists should include all critical facilities. Typically, critical facilities are shelters, healthcare facilities, emergency response facilities, etc. as noted previously in this summary. Local hazard mitigation plans should be consulted to compile these lists.
A reasonable level of drought response uniformity is needed to avoid confusion regarding drought responses. Stronger communication between the state and CWSs is needed to better convey drought responses to the public. The next page addresses droughts in more detail.
5. CWS VULNERABILITIES AND EMERGENCY PREPAREDNESS
ES7
With severe droughts occurring recently (2015-2016) and projected to become more frequent, PWSs need to be prepared for changes that may occur in both surface and groundwater sources. Some of these changes have been described on previous pages.6A. Drought Triggers for Response
Drought triggers vary between systems based on demand, source type, and drought response stages. During past droughts, these triggers were adequate for some systems while other systems found their triggers were provoked faster than anticipated. Among respondents to the survey described under “Lessons Learned from Past Events,” 8% found drought triggers to be inadequate overall while among large systems 26% found drought triggers inadequate. With climate change projections anticipating an increase in severe droughts, drought triggers may need revision.
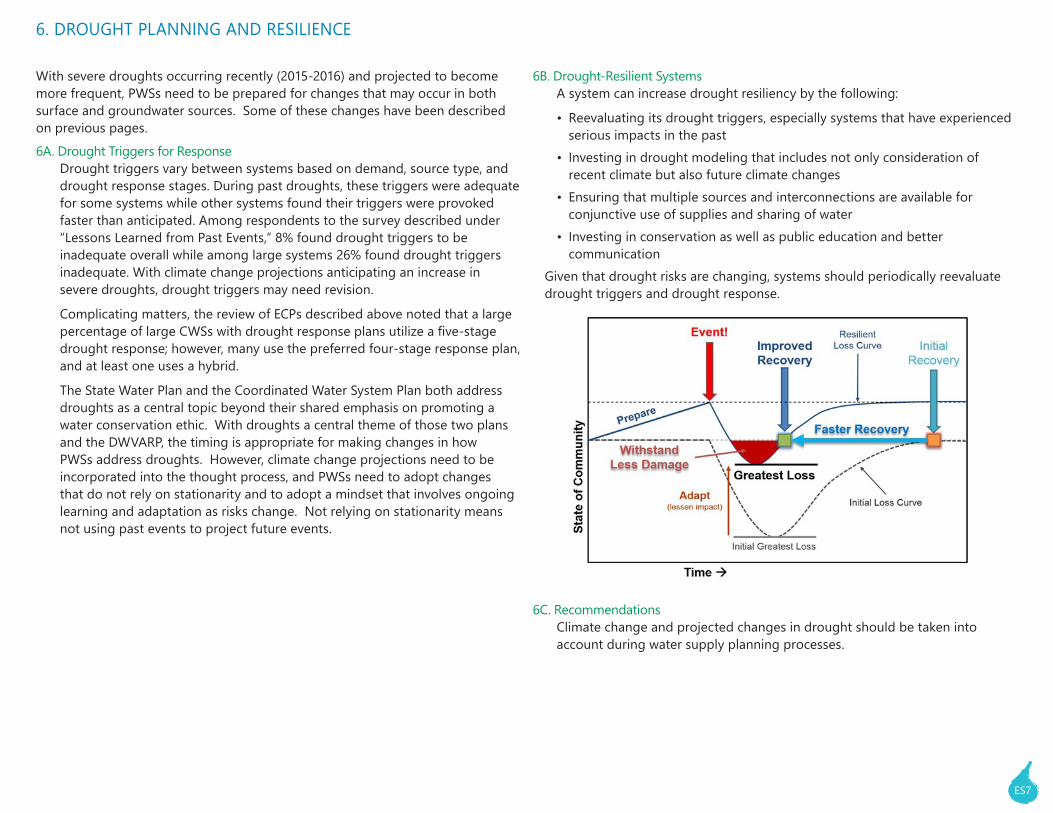
Complicating matters, the review of ECPs described above noted that a large percentage of large CWSs with drought response plans utilize a five-stage drought response; however, many use the preferred four-stage response plan, and at least one uses a hybrid.
The State Water Plan and the Coordinated Water System Plan both address droughts as a central topic beyond their shared emphasis on promoting a water conservation ethic. With droughts a central theme of those two plans and the DWVARP, the timing is appropriate for making changes in how PWSs address droughts. However, climate change projections need to be incorporated into the thought process, and PWSs need to adopt changes that do not rely on stationarity and to adopt a mindset that involves ongoing learning and adaptation as risks change. Not relying on stationarity means not using past events to project future events.
6B. Drought-Resilient SystemsA system can increase drought resiliency by the following:
• Reevaluating its drought triggers, especially systems that have experienced serious impacts in the past
• Investing in drought modeling that includes not only consideration of recent climate but also future climate changes
• Ensuring that multiple sources and interconnections are available for conjunctive use of supplies and sharing of water
• Investing in conservation as well as public education and better communication
Given that drought risks are changing, systems should periodically reevaluate drought triggers and drought response.
6C. RecommendationsClimate change and projected changes in drought should be taken into account during water supply planning processes.
6. DROUGHT PLANNING AND RESILIENCE
ES8
CWSs are comprised of integral infrastructure that ensures reliable and good quality water delivery to customers. Some of these systems, typically the smaller ones, lack internal redundancies. This makes them vulnerable during an extreme weather event. Systems were evaluated based on their level of resilience and on which assets are present. Based on this assessment, recommendations were made on which systems should pursue infrastructure upgrades. Possible future interconnections were also assessed, which may create source redundancy for smaller systems that often rely on limited sources. 7A. Critical Asset Assessment
A preliminary analysis was conducted to assess the infrastructure inventory of small CWSs. System inventory varies widely: some systems have multiple sources while others have one source, and many systems have multiple storage tanks while others have minimal storage.
7B. Potential Future InterconnectionsOf the systems surveyed, over half (53%) are interested in interconnections. Interconnections provide small systems an option to increase redundancy though for some systems increasing supply or redundancy may not be feasible due to environmental, economic, or hydrologic factors or due to lack of space and land.
A GIS assessment was conducted to identify the potential for interconnections. If the distance between systems was less than 1,000 feet, it was deemed feasible. However, if this potential interconnection was between two small systems, a potential interconnection was mapped to the nearest large system, which offers greater redundancy and resources. By reviewing potential interconnections from the Coordinated Water System Plans and evaluating potentials between small unaffiliated2, small affiliated3, and large systems, recommendations were made regarding the most feasible interconnections according to the mapping.
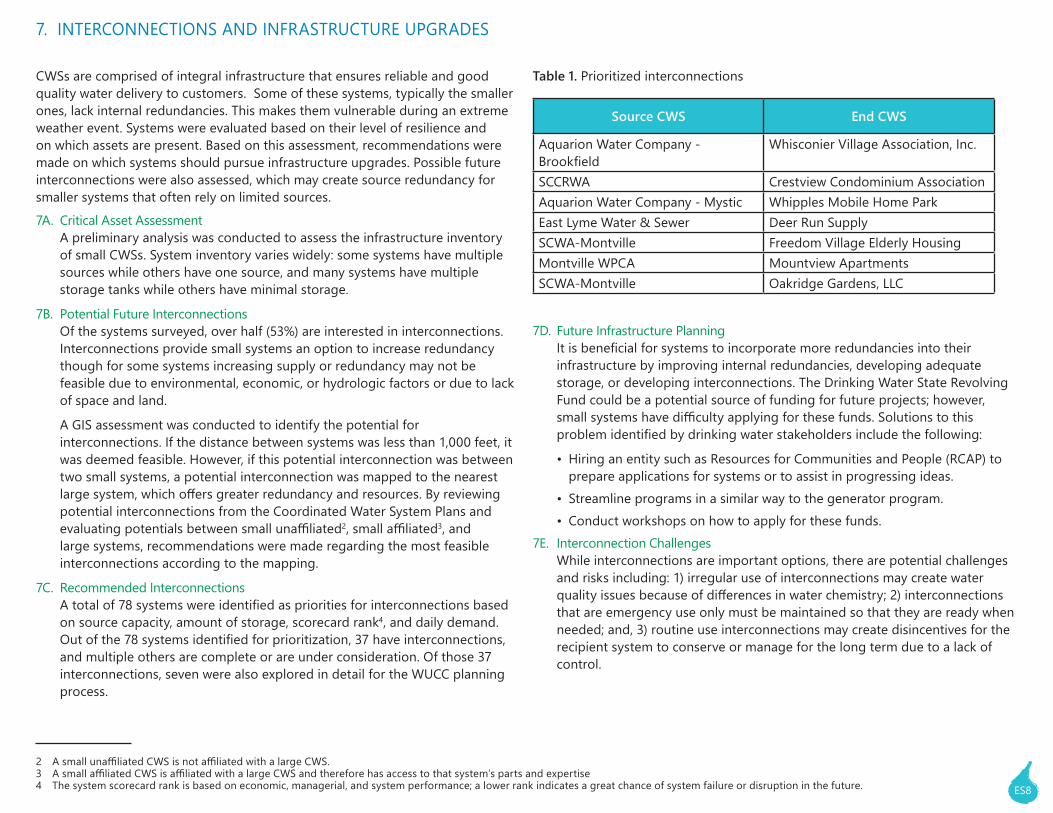
7C. Recommended InterconnectionsA total of 78 systems were identified as priorities for interconnections based on source capacity, amount of storage, scorecard rank4, and daily demand. Out of the 78 systems identified for prioritization, 37 have interconnections, and multiple others are complete or are under consideration. Of those 37 interconnections, seven were also explored in detail for the WUCC planning process.
2 A small unaffiliated CWS is not affiliated with a large CWS. 3 A small affiliated CWS is affiliated with a large CWS and therefore has access to that system’s parts and expertise 4 The system scorecard rank is based on economic, managerial, and system performance; a lower rank indicates a great chance of system failure or disruption in the future.
Table 1. Prioritized interconnections
Source CWS End CWS
Aquarion Water Company - Brookfield
Whisconier Village Association, Inc.
SCCRWA Crestview Condominium Association Aquarion Water Company - Mystic Whipples Mobile Home ParkEast Lyme Water & Sewer Deer Run Supply SCWA-Montville Freedom Village Elderly Housing Montville WPCA Mountview Apartments SCWA-Montville Oakridge Gardens, LLC
7D. Future Infrastructure PlanningIt is beneficial for systems to incorporate more redundancies into their infrastructure by improving internal redundancies, developing adequate storage, or developing interconnections. The Drinking Water State Revolving Fund could be a potential source of funding for future projects; however, small systems have difficulty applying for these funds. Solutions to this problem identified by drinking water stakeholders include the following:
• Hiring an entity such as Resources for Communities and People (RCAP) to prepare applications for systems or to assist in progressing ideas.
• Streamline programs in a similar way to the generator program.• Conduct workshops on how to apply for these funds.
7E. Interconnection ChallengesWhile interconnections are important options, there are potential challenges and risks including: 1) irregular use of interconnections may create water quality issues because of differences in water chemistry; 2) interconnections that are emergency use only must be maintained so that they are ready when needed; and, 3) routine use interconnections may create disincentives for the recipient system to conserve or manage for the long term due to a lack of control.
7. INTERCONNECTIONS AND INFRASTRUCTURE UPGRADES
ES9
An Emergency Response Plan template was developed for use by the DWS. In order to establish the practices and procedures to include in the plan, both in-state and out-of-state interviews were conducted with relevant drinking water staff. The DWS also collaborated with the project team to identify areas for improvement.8A. Current In-State Practices and Procedures
In the event of a statewide emergency, an Incident Command System (ICS) is established by the Connecticut State Department of Emergency Services & Public Protection, Division of Emergency Management and Homeland Security (DEMHS), and the Office of Emergency Management (OEM). During this emergency, the State Emergency Operations Center (SEOC) is activated, and DPH-DWS has a representative at the SEOC. A water task force is also activated during an emergency, which includes various drinking water stakeholders. If the task force finds an issue, this concern is forwarded by DPH-DWS to the SEOC so it can be addressed by regional coordinators and leaders.
Everbridge, an emergency notification system, is utilized by DPH-DWS prior to an emergency to disseminate mass communications to CWSs, including emergency preparedness tasks. DPH-DWS also makes an after-hours phone line available for systems to use for updates or questions; this information is also included in the mass communication. The key recipients of this information are the designated emergency response leads for each large CWS. Typically, small systems are sent multiple notices to ensure receipt. The DWS has also created a contact information form for systems to fill out annually.
While it is not yet online, WebEOC is an automated system that will allow systems to easily and efficiently report their status during an emergency.
The drinking water website provides information to help systems with the planning and response to an event. Typically, the website is where a majority of systems found information during past storms.
The Public Health Emergency Response Plan (PHERP) was developed to identify appropriate department responses to public health emergencies. The plan also helps to manage emergency support function (ESF) #8 to allow the state to operate and provide services effectively during an emergency.
8B. Out-of-State Best Practices and Lessons LearnedA total of 29 interviews were conducted with state drinking water staff from Maine, Vermont, Rhode Island, Pennsylvania, Massachusetts, New Jersey, New Hampshire, and Ohio. These interviews identified proven actions for before, during, and after an emergency. Some notable findings include the following:
• Establish who needs to be involved during an emergency depending on the nature and extent.
• Identify staff from other state agencies with which the department typically works, and maintain a list of current contact information.
• Maintain Standard Operating Procedures (SOPs) and keep them available in a SharePoint folder for all staff to access.
• Automated communication with water systems such as calls, emails, or online status submissions have proven effective.
• Utilize reverse 911 in the event a system is unable to notify consumers of a water advisory (boil water, etc.).
• Assist systems with communicating with FEMA and encourage them to take pictures of all damage to facilitate getting funding.
• SOPs and emergency response plans are updated annually and built upon based on experiences and lessons learned.
8C. Recommendations to ImproveThe PHERP has not been revised since 2011. The Response Plan should be revised as departmental changes occur, for example, the WEAR team is named in the PHERP; however, this team is no longer operating during an emergency.
The DWS should also fully implement WebEOC as a communication tool. Also, the protocols and flow charts developed under the DWVAR process should be used, and drills and exercises should be conducted annually.
The Emergency Response Plan developed under the DWVARP should be implemented and updated routinely, and drills should be conducted annually to ensure the plan is up to date and relevant.
8. DPH DRINKING WATER SECTION EMERGENCY PREPAREDNESS
ES10
A review of state and local laws was conducted to understand and assess the current state of regulations in regard to critical infrastructure vulnerability, resiliency, planning, and emergency preparedness. 9A. Existing Laws
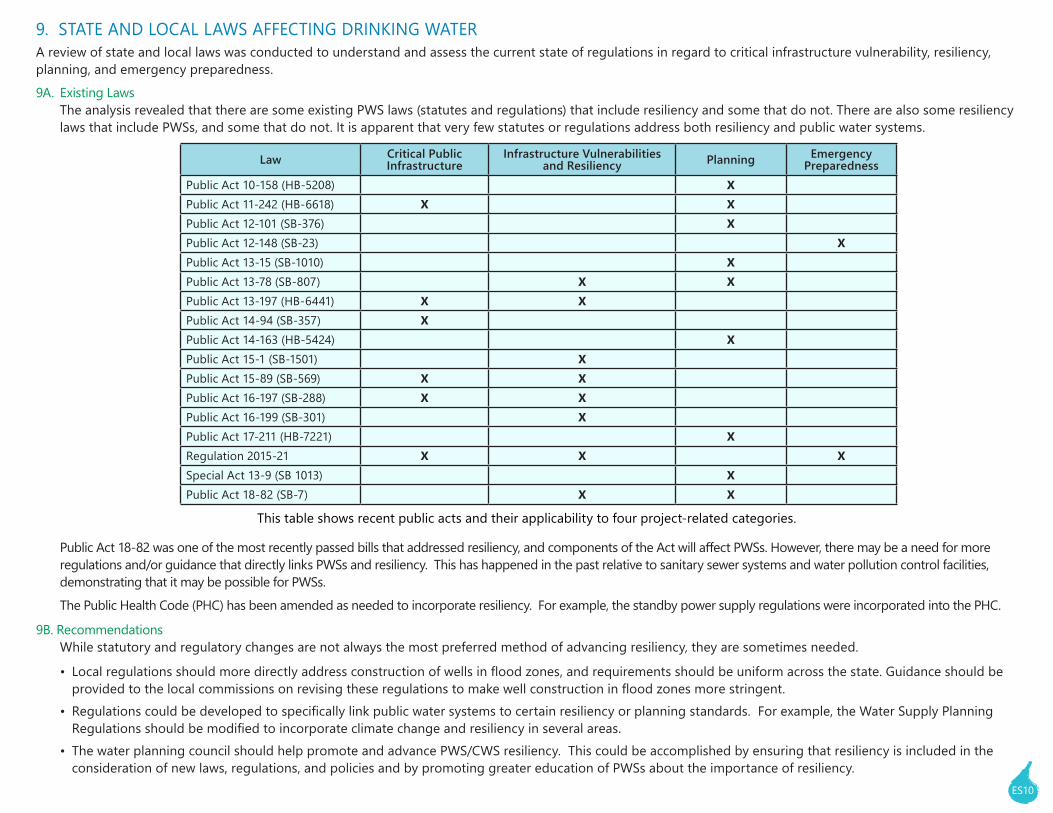
The analysis revealed that there are some existing PWS laws (statutes and regulations) that include resiliency and some that do not. There are also some resiliency laws that include PWSs, and some that do not. It is apparent that very few statutes or regulations address both resiliency and public water systems.
Law Critical Public Infrastructure
Infrastructure Vulnerabilities and Resiliency Planning Emergency
PreparednessPublic Act 10-158 (HB-5208) X Public Act 11-242 (HB-6618) X X Public Act 12-101 (SB-376) X Public Act 12-148 (SB-23) XPublic Act 13-15 (SB-1010) X Public Act 13-78 (SB-807) X X Public Act 13-197 (HB-6441) X X Public Act 14-94 (SB-357) X Public Act 14-163 (HB-5424) X Public Act 15-1 (SB-1501) X Public Act 15-89 (SB-569) X X Public Act 16-197 (SB-288) X X Public Act 16-199 (SB-301) X Public Act 17-211 (HB-7221) X Regulation 2015-21 X X XSpecial Act 13-9 (SB 1013) X Public Act 18-82 (SB-7) X X
This table shows recent public acts and their applicability to four project-related categories.
Public Act 18-82 was one of the most recently passed bills that addressed resiliency, and components of the Act will affect PWSs. However, there may be a need for more regulations and/or guidance that directly links PWSs and resiliency. This has happened in the past relative to sanitary sewer systems and water pollution control facilities, demonstrating that it may be possible for PWSs.The Public Health Code (PHC) has been amended as needed to incorporate resiliency. For example, the standby power supply regulations were incorporated into the PHC.
9B. RecommendationsWhile statutory and regulatory changes are not always the most preferred method of advancing resiliency, they are sometimes needed.
• Local regulations should more directly address construction of wells in flood zones, and requirements should be uniform across the state. Guidance should be provided to the local commissions on revising these regulations to make well construction in flood zones more stringent.
• Regulations could be developed to specifically link public water systems to certain resiliency or planning standards. For example, the Water Supply Planning Regulations should be modified to incorporate climate change and resiliency in several areas.
• The water planning council should help promote and advance PWS/CWS resiliency. This could be accomplished by ensuring that resiliency is included in the consideration of new laws, regulations, and policies and by promoting greater education of PWSs about the importance of resiliency.
9. STATE AND LOCAL LAWS AFFECTING DRINKING WATER
ES11
The DPH estimates that approximately 23% of the state’s population relies on private drinking water wells. With minimal data available in digital format, one of the biggest challenges in assessing vulnerability is identifying where these thousands of wells are located. By utilizing current public water system service area data and open space data, assumed private well parcels were found outside of these areas. Once identified, neighborhoods across the study area were assessed for vulnerabilities based on their assumed private well status and then by utilizing FEMA flood zone maps. 10A. Private Well Data Gaps
As part of this assessment, local health directors were contacted to take part in the process and provide their comments on where private wells may be located in their respective town or district and if there was any knowledge of private well areas that experience flooding. Most comments received regarding well location were minimally informative, with a majority of those who responded offering a review of paper completion records. Fairfield was the only town that offered a GIS shapefile with private well locations at the parcel level.
10B. Identifying Private Well LocationsPWS service areas are mapped in GIS, with larger systems showing the pipe network beneath roads and smaller systems using a general footprint that includes homes/facilities served within the boundaries. It was assumed that any residential parcel outside a 100-foot radius of a PWS is a private well location, resulting in 213,269 assumed wells throughout the four coastal counties. Newtown appears to have the highest number of wells, with an assumed count of 8,266. New London appears to have the fewest with an assumed count of 21 wells.
10C. Assessing Areas of ConcernWith the assumed wells throughout the area identified, neighborhoods that typically experienced flooding were identified. The FEMA flood maps were used to narrow down areas with a number of wells within a flood zone. A total of 12 areas were found, one of those being downtown West Redding, which was identified by the town health officer. The towns with areas of concern included the following:
- Southbury - Griswold- Newtown - Weston- Westport - Brookfield- Old Lyme - Guilford/North Branford- Redding - Haddam- Middlebury - Oxford
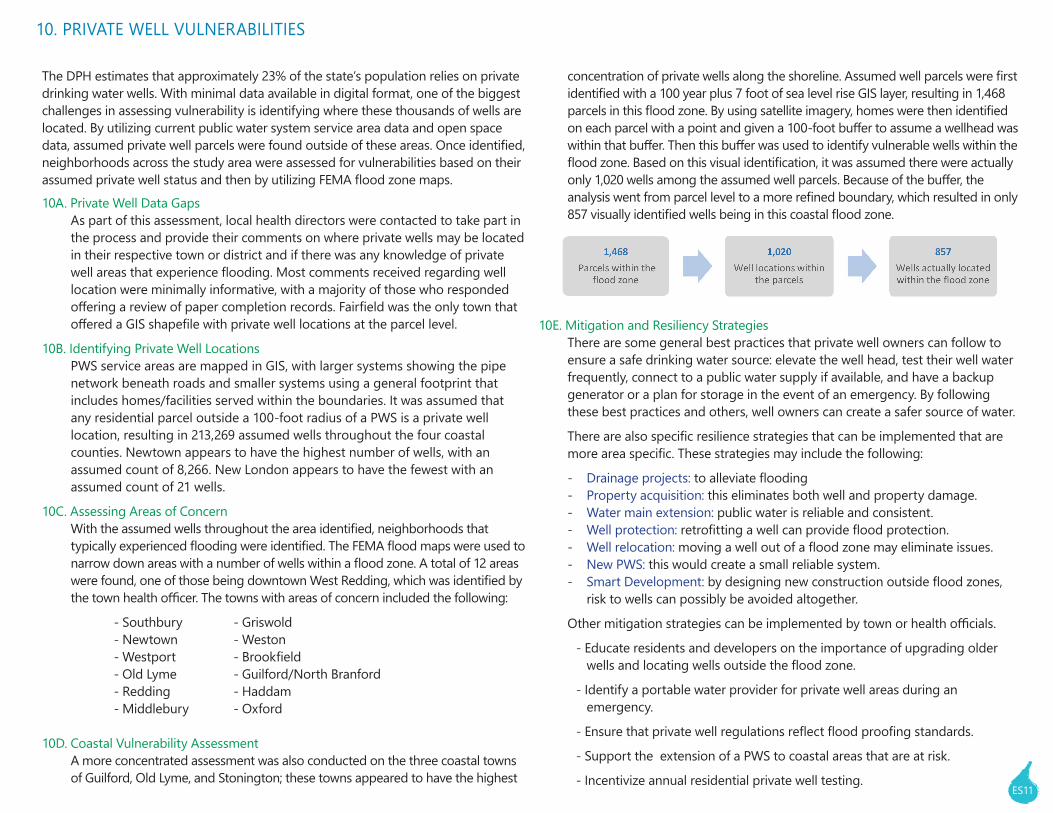
10D. Coastal Vulnerability AssessmentA more concentrated assessment was also conducted on the three coastal towns of Guilford, Old Lyme, and Stonington; these towns appeared to have the highest
concentration of private wells along the shoreline. Assumed well parcels were first identified with a 100 year plus 7 foot of sea level rise GIS layer, resulting in 1,468 parcels in this flood zone. By using satellite imagery, homes were then identified on each parcel with a point and given a 100-foot buffer to assume a wellhead was within that buffer. Then this buffer was used to identify vulnerable wells within the flood zone. Based on this visual identification, it was assumed there were actually only 1,020 wells among the assumed well parcels. Because of the buffer, the analysis went from parcel level to a more refined boundary, which resulted in only 857 visually identified wells being in this coastal flood zone.
10E. Mitigation and Resiliency StrategiesThere are some general best practices that private well owners can follow to ensure a safe drinking water source: elevate the well head, test their well water frequently, connect to a public water supply if available, and have a backup generator or a plan for storage in the event of an emergency. By following these best practices and others, well owners can create a safer source of water.
There are also specific resilience strategies that can be implemented that are more area specific. These strategies may include the following:
- Drainage projects: to alleviate flooding - Property acquisition: this eliminates both well and property damage.- Water main extension: public water is reliable and consistent.- Well protection: retrofitting a well can provide flood protection.- Well relocation: moving a well out of a flood zone may eliminate issues.- New PWS: this would create a small reliable system.- Smart Development: by designing new construction outside flood zones, risk to wells can possibly be avoided altogether.
Other mitigation strategies can be implemented by town or health officials.
- Educate residents and developers on the importance of upgrading older wells and locating wells outside the flood zone.
- Identify a portable water provider for private well areas during an emergency.
- Ensure that private well regulations reflect flood proofing standards.
- Support the extension of a PWS to coastal areas that are at risk.
- Incentivize annual residential private well testing.
10. PRIVATE WELL VULNERABILITIES

1Drinking Water Vulnerability Assessment and Resilience Plan
The Connecticut Department of Public Health (DPH) was awarded federal funding from the Community Development Block Grant Disaster Recovery (CDBG-DR) Program, which was administered by the Connecticut Department of Housing (DOH). These funds were appropriated to prepare a Drinking Water Vulnerability Assessment and Resilience Plan (DWVARP).
1.1 Purpose of the PlanConnecticut’s coastline experienced serious impacts from past storms such as Superstorm Sandy andHurricaneIrene,andinlanddrinkingwatersystemshavealsobeenseriouslyaffectedbytheimpacts of recent severe storms. The overall objective of the DWVARP is to conduct a large-scale analysis to assess current vulnerabilities of drinking water systems1 and private wells in Connecticut’sfourcoastalcounties(Fairfield,NewHaven,NewLondon,andMiddlesex)andtoidentify strategies to mitigate future storm impacts on areas with drinking water supplies.
1.2 Goals of the PlanThe primary goal of the DWVARP is to increase the preparedness of public water systems (PWSs) for future storm events, drought, and climate change. The DWVARP primarily focuses on community water systems (CWSs) as these PWSs typically serve residential populations as well as critical facilities such as hospitals and residential care facilities. Secondary goals are to develop an emergency response plan (ERP) for the DPH Drinking Water Section (DWS) under separate cover and to create a resilience plan to ensure storm- and climate change-resilient drinking water systems and sources.
The vulnerability assessment aims to identify past storm and drought impacts by way of surveys and interviews and utilizes climate change projections and document reviews to provide options and alternatives for future storm mitigation2andadaptation.TheERPwasdevelopedspecificallyfor the DPH DWS through a review of current practices within the department, in addition to resultsfrominterviewsconductedwithout-of-statedrinkingwaterstaff.Thisfinalresilienceplan is a culmination of all methods and results to make recommendations on mitigation strategies,emergencypreparednessstrategies,andpolicymodifications.
1Specifictypesofdrinkingwatersystems(communityvs.noncommunity)willbedefinedlaterinthisreport.2 This report does not address climate change mitigation, which largely includes greenhouse gas emissions reductions.
1.0 Introduction
2Drinking Water Vulnerability Assessment and Resilience Plan
1.3 Risk and Resilience Concepts and TerminologyInthecontextofnaturalhazardssuchasfloodingandseverewindstorms,“risk”iscommonlydefinedastheproductorthesumofvulnerabilityandfrequency(risk=vulnerabilityxfrequencyorrisk=vulnerability+frequency).Thus,ifaneventhasalowfrequencyandinfrastructureisnotvulnerabletotheeffectsofthatevent,thentheriskisassumedtobelow.Ifaneventhasahighfrequencyandinfrastructureisvulnerabletotheeffectsofthatevent,thentheriskisassumedtobehigh.Eitherlowfrequencycoupledwithhighvulnerabilityorhighfrequencycoupledwithlowvulnerabilitywillproducemoderaterisk.
Inthecontextofflood,wind,snow,andicehazardsandtheneedfordevelopingclimateresilience,riskwillchangeovertimebecausethefrequencywillincrease.Certainstormsarebelievedtobeincreasinginfrequency,bringingmoreintenseprecipitation,winds,andheaviersnow;floodingwillincreaseinfrequencyassealevelrisesandmoreintenseprecipitationrunsoff.Thus,evenifwatersysteminfrastructurevulnerabilitiesremainstaticbydoingnothing,riskswill increase.
Therefore, PWSs are at a crossroads with regard to reducing risk. Vulnerabilities can remain static and risk can increase, or vulnerabilities can be reduced to hold risk at bay. If vulnerabilities can be reduced even further, then risks could be lowered in the face of climate change, leading to increased resilience. The least desired combination of all would be the development of increasedvulnerabilitieswhilefrequenciesincreasebecauseriskscouldrisefasterthanexpected;this is the possible outcome if PWSs do not maintain and harden infrastructure. Private wells are also susceptible to these outcomes if owners do not ensure that their wells are becoming less vulnerable over time.
“Resilience”istypicallydefinedastheabilityofasystem,population,orcommunitytopreparefor, withstand, recover from, and adapt to stresses like natural disasters and climate change. Resiliencecanbemeasuredindifferentways,butonecommonmethodofmeasuringresilienceis the number of days or months to recover from an event. A more resilient community or infrastructuresystemcanrecovermorequickly.InthecaseofaPWS,heightenedresiliencyshortens the recovery time.
TheresiliencyofPWSsandprivatewellstoclimatechangeandnaturalhazardsisasignificantconcern particularly given the extensive power outages that occurred throughout the state during Tropical Storm Irene, Winter Storm Alfred, and Hurricane Sandy. Many smaller systems may not have standby power facilities, and numerous small systems issued boil water notices during the power outages associated with these events. While programs and regulations have been recently enacted by DPH to address standby power facilities for CWSs, all PWSs continue tobeatriskfromnaturalhazards,andmanycontinuetohavepoorresiliencetotheeffectsofsuch hazards.
Drinking Water Vulnerability Assessment and Resilience Plan3
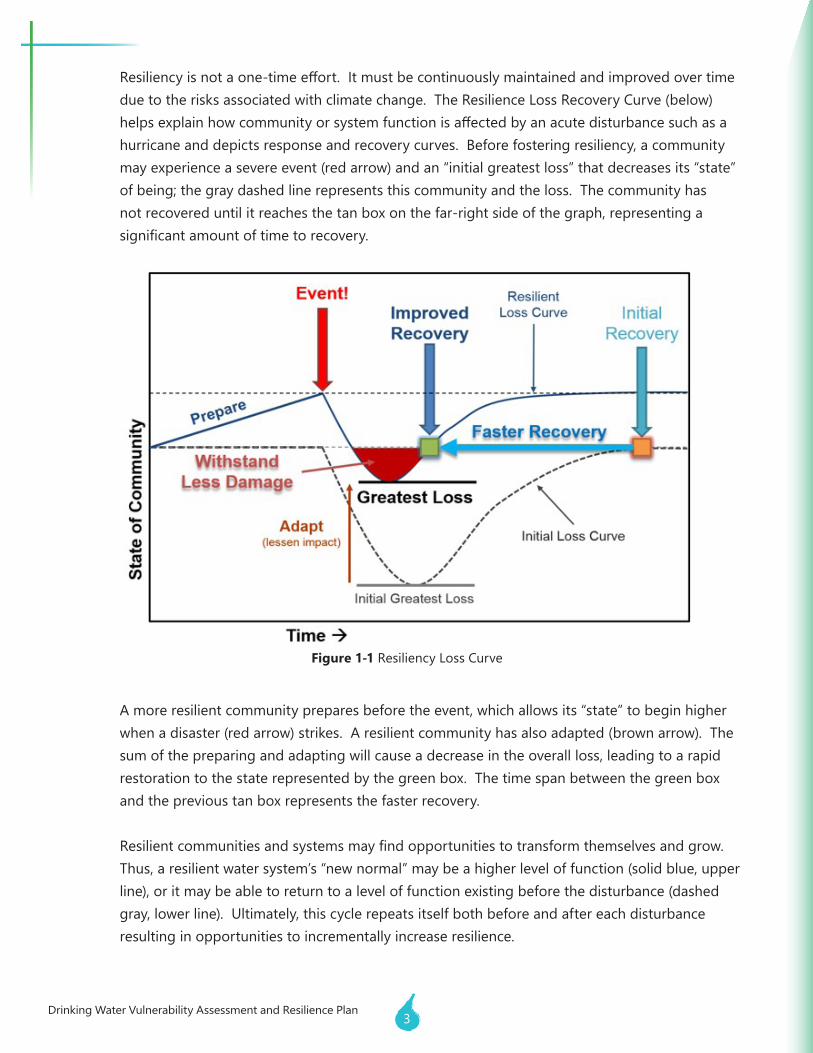
Resiliencyisnotaone-timeeffort.Itmustbecontinuouslymaintainedandimprovedovertimedue to the risks associated with climate change. The Resilience Loss Recovery Curve (below) helpsexplainhowcommunityorsystemfunctionisaffectedbyanacutedisturbancesuchasahurricane and depicts response and recovery curves. Before fostering resiliency, a community mayexperienceasevereevent(redarrow)andan“initialgreatestloss”thatdecreasesits“state”of being; the gray dashed line represents this community and the loss. The community has not recovered until it reaches the tan box on the far-right side of the graph, representing a significantamountoftimetorecovery.
Amoreresilientcommunitypreparesbeforetheevent,whichallowsits“state”tobeginhigherwhen a disaster (red arrow) strikes. A resilient community has also adapted (brown arrow). The sum of the preparing and adapting will cause a decrease in the overall loss, leading to a rapid restoration to the state represented by the green box. The time span between the green box and the previous tan box represents the faster recovery.
Resilientcommunitiesandsystemsmayfindopportunitiestotransformthemselvesandgrow.Thus,aresilientwatersystem’s“newnormal”maybeahigherleveloffunction(solidblue,upperline), or it may be able to return to a level of function existing before the disturbance (dashed gray, lower line). Ultimately, this cycle repeats itself both before and after each disturbance resulting in opportunities to incrementally increase resilience.
Figure 1-1 Resiliency Loss Curve
4Drinking Water Vulnerability Assessment and Resilience Plan
1.4 Consistency with Other Planning Documents1.4.1 Consistency with Coordinated Water System Planning
TheCoordinatedWaterSystemPlanningprocess(alsoknownas“WUCCprocess,”whichreferstotheWaterUtilityCoordinatingCommittees)isaneffortbythestateandwater utilities to conduct water supply planning on a regional scale. A formal 2-year planning process was completed in June 2018 for the three WUCC planning regions in Connecticut. Typically, larger water systems serving more than 1,000 customers or more than250serviceconnectionsarerequiredtoprepareaWaterSupplyPlan(WSP)andsubmit it to DPH for approval. The WSP evaluates the ability of a system to serve its customers now and in the future. It includes policies and procedures regarding water conservation and how the system will respond to emergencies. As smaller water systems aretypicallynotrequiredtoconductthislevelofplanning,themajorityofsmallersystems have not prepared WSPs. The WUCC process evaluated the ability of both small andlargesystemstomeetdemandsandidentifiedareaswhereadditionalsourcesofsupply or interconnections may be necessary.
LargePWSsordinarilyhavefull-timestaff,redundantsourcesofsupply,availableemergency power, multi-tiered treatment systems, and strict regulatory oversight, which help produce a safe and reliable water supply. However, some parts of the state do not have access to large PWSs due to various factors: geographical constraints, low population density, etc. Small PWSs operate throughout the state and serve customers in areas without access to large PWSs. Well maintained small PWSs can provide excellent service to customers, but compared to large PWSs, these small utilities have less access tofinancial,technical,andlaborresources.
Several of the recommendations of the WUCC process were aimed at increasing the resiliency and stability of public water supplies. This may be accomplished through grants and loans or even through the coordination and allocation of resources between large and small PWSs. For example, the WUCC process has encouraged small systems to consolidate with large systems or to consolidate with adjacent small systems when feasible. This potentially gives the combined system more redundancy, especially if sources of supply are maintained rather than retired. The WUCC process has also encouraged both large and small systems to explore additional interconnections with each other in order to increase resiliency.
Drinking Water Vulnerability Assessment and Resilience Plan5
While the DWVARP takes a more detailed look at the factors that can exploit systems that lack resiliency, the goal of the plan is similar to one of the goals of the WUCC process: that is, to ensure that PWSs are as resilient as possible so that water service is not interrupted during extreme conditions. While the WUCC process focused more on how utilities can coordinate with one another, the DWVARP focuses on the natural phenomena that will increasingly threaten PWSs. These threats are expected to increase infrequencyandseverityduetotheimpactsofclimatechange.
1.4.2 Consistency with State Water Plan
Like the WUCC process, the State Water Plan (SWP) was constructed with PWS resiliency in mind. However, the plan transcends the scope of water system planning. The SWPidentifiesthewaysthestateismanagingwatersuppliesasitpertainstohumanconsumption, environmental impact, water basin stress, and other factors. Using data from public water utilities, industrial usage, agricultural consumption, and other sources, the SWP attempts to map the use of water throughout the state and identify areas of over and under allocation. The plan then further delves into future objectives ranging from source protection to water conservation to drought management to water for ecological needs.
TheSWPdoescovertheeffectofclimatechangeonwaterresourcesinConnecticut;however, it does not address the ways that climate change directly stresses individual water systems. Rather, the state plan has invaluable projections on precipitation, temperature, and weather patterns. While this information is critical to many water utilities, especially large-scale operations, climate change may pose more insidious risks to small system operators, such as saltwater intrusion for systems along the coast.
1.4.3 Consistency with the State Natural Hazard Mitigation Plan
TheConnecticutNaturalHazardMitigationPlan(NHMP)2014updateidentifiedadetailedmitigationstrategythatisbasedonthreegoals:Promotesoundfloodplainmanagementandothernaturalhazardmitigationprinciples,implementeffectivenaturalhazard mitigation projects, and increase research and planning activities for natural hazard mitigation. These goals should be achievable at both the state and local level. The DWVARP, like the NHMP, has goals to reduce or prevent damage to infrastructure due to natural hazards.
1.4.4 Consistency with the State Emergency Operations Plan
The Connecticut State Response Framework (SRF) describes the response and coordinationeffortsbetweenstategovernmentandlocal,federal,andtribalgovernments. The framework outlines how the state will work to support local governments and residents during emergencies and disasters.
6Drinking Water Vulnerability Assessment and Resilience Plan
TheDPHhasspecificresponsibilitiesanddutiesunderthisframework,someofwhicharespecificallygearedtowarddrinkingwater.TheDPHregulatespublicwatersupplyandisresponsibleforassessingpublicdrinkingwatersystems;specifically,theDWSisresponsible for regulating public water supply provided by CWSs, non-transient non-community (NTNC) systems, and transient non-community (TNC) systems. Private wells (typically wells serving less than 25 people each day or less than 15 service connections) are the responsibility of the well owner although local health departments have authority over the siting and approval processes for private well installation.
The DWVARP, like the SRF, evaluates emergency preparedness to a certain extent. However,theDWSERP(underseparatecover)isdesignedspecificallyfortheDPHDWS,withamorespecificgoalofenhancingDWSresponsetoadrinkingwaterincidentoremergency.
7Drinking Water Vulnerability Assessment and Resilience Plan
The process of establishing system vulnerability and risk included evaluating impacts from past storms and droughts, exploring current regulations and protocols, and evaluating available system vulnerability assessments and emergency contingency plans. The process also included compiling best practices from other states’ drinking water agencies, assessing the CT DWS emergency responses processes, and gathering insight from CWSs themselves regarding preparednessandresiliency.Toassessfuturerisktosystemwaterqualityandquantity,aclimatechangeprojectionwasexecutedspecificallyforConnecticut.Spatialanalysiswasalsoconducted to identify critical infrastructure that may be vulnerable to a 100- or 500-year storm, and links were made between these vulnerable systems and the critical facilities that might be located within their service area.
2.1 Impacts of Recent Severe Storms and EventsConnecticut has seen several extreme weather events since 2011, which have caused widespread impacts throughout the state. Although it is impossible to link any particular stormtotheeffectsofhumanactivitiesandgreenhousegasses,itisimportanttonotethattherecent trend of severe storms could be indicative of a changing climate. Many models have indicated that Connecticut could see more powerful storms as the available heat energy in the atmosphere increases. Fortunately, the State of Connecticut and its PWSs have responded with improvements to infrastructure, emergency preparedness, and legislation as a result of theseextremeevents.BelowaresomeextremeweathereventsthathavesignificantlyaffectedConnecticut’s water supply system.
2.1.1 Recent Severe Storms
The year 2011 was a monumental year in Connecticut’s meteorological history. The end of the winter of 2010-2011 brought record-breaking snowfall, which collapsed roofs in January and February 2011 and hampered travel. The extreme weather continued into the summer and fall, when Hurricane Irene (striking as a Tropical Storm and described below) and the Halloween Nor’easter of 2011 (Winter Storm Alfred, also described below) impactedthestate.Bothstormscausedsignificantdamagetostateinfrastructureandexposed a fundamental lack of preparedness and coordination by major utilities within the state. Between the two storms, there were over 1.6 million power outages, and significanttraveldisruptions,whichlastedforoveraweekaftereachevent.Inresponse,theTwoStormPanel,anagencyofgovernmentofficialsandotherprofessionals,workedto identify weaknesses and produce suggestions as how to best respond to future emergencies.
2.0 Community Water System Vulnerability and Risk Assessment
8Drinking Water Vulnerability Assessment and Resilience Plan
Since 2011, several other major weather events have impacted the region, including Hurricane Sandy (striking as a post-tropical system), the February 2013 blizzard, and the2015-2017drought,amongothers.Whileitisimpossibletocomparesubsequentnaturaldisasterresponsefairlyduetohowdifferenteachsituationis,thestateatleastdemonstrated increased proactivity and communication during those events that occurred since 2011.
Hurricane IreneHurricane Irene was a powerful storm that impacted Connecticut on August 28, 2011. AlthoughithadweakenedbythetimeitreachedConnecticut,itwasstillclassifiedas a tropical storm, with wind gusts of over 50 miles per hour (mph) in many parts of the state. The storm coincided with a spring high tide and hit the region in a month with already above average rainfall. These and other factors enhanced the ability for the storm to do damage despite its relatively modest tropical storm status. The statesufferedseverecoastalflooding,withcommunitieslikeFairfieldandEastHavenhitespeciallyhard.Riverinefloodingwasalsosignificant,especiallyinwesternConnecticut. According to the Connecticut Department of Energy & Environmental Protection(DEEP),theConnecticut,Farmington,Housatonic,Pomperaug,andPequabuckRiversexperiencedthemostsevereflooding.Treedamagewaswidespread,withdowned power lines occurring in most communities throughout the state. Over 700,000customersinConnecticutlostpower,withwind-damagedtreesandfloodedinfrastructure both responsible for outages.
Halloween Nor’easterThe Halloween Nor’easter was an unusually early winter storm that struck Connecticut from October 29-30, 2011. This storm impacted the state with heavy snow and strong winds. The heavy, wet snow fell on trees that had not yet shed their autumn leaves and ledtosignificantbreakageoflimbs.Sincemanylimbswereoverhangingpowerlines,thebreakage of limbs caused extensive power outages, nearly 900,000 throughout the state. ThedamagetotreeswassignificantlygreaterthanthatofHurricaneIrenejust6weeksprior as were the number of power outages. The storm caused the greatest loss of power in Connecticut history, and many customers did not see power return for 1 to nearly 2 weeks. Damage was most widespread in the northern and western sections of the state whilethemarginaltemperatureprofilekeptsnowtotalsdownalongthecoast.
Drinking Water Vulnerability Assessment and Resilience Plan9
Review of Two Storm ReportInthewakeofHurricaneIreneandtheHalloweenNor’easter,stateofficialsandutilitycompanies came under intense scrutiny due to the length of time that many residents were left without power, heat, and water. Total damages were estimated to be nearly 1 billion dollars from both storms. To identify improvements that the state could make to its disaster response, Governor Dannel Malloy initiated the Two Storm Panel. This panel wascomposedofelectedofficials,emergencyresponders,militaryrepresentatives,andother professionals who met for several months after the disasters. The end result of their meetings was the Two Storm Report, a 42-page document that explores the failures of the disaster response to the two storms and provided recommendations to mitigate a similar situation in the future. Key recommendations of the Two Storm Report included the following:
• Tree Trimming – In both storms, tree damage was responsible for the vast majority of power outages. Connecticut’s dense tree canopies and infringement on utility pole right-of-way led to damaged poles and lines. Trees also fell and blocked roadways during storms, halting travel and delaying emergency services. The Two Storm Report recommended conducting statewide tree assessments and increasing the Department of Transportation (DOT) tree maintenance budget substantially.
• Infrastructure Hardening–Infrastructurevulnerabilityexacerbatedtheeffectsofthetree damage from both storms. The report recommended that the undergrounding of utilities be studied by DEEP. Although the report acknowledges that complete undergrounding is not feasible, selective undergrounding should be recommended to the Connecticut Public Utilities Regulatory Authority (PURA).
• General Communications and the Sharing of Information between Utilities and Municipalities – Poor communication between municipalities and utilities was a source offrustrationforbothresidentsandfirstrespondersafterthestorms.Duetothelack of information regarding the timing and extent of outages, municipalities and communityprovidersexperienceddifficultiesmaintainingsheltersandotherhumanservices. For example, shelters were unsure of when to discharge individuals whose power may have returned while opening up shelter space to those whose power may have still been interrupted. The Two Storm Report recommended the formation of a Municipal/Utility Working Group. This group would allow utilities and municipalities to establish procedures that would allow the two entities to work as a team during emergencies and increase communication throughout the event and the recovery process.
10Drinking Water Vulnerability Assessment and Resilience Plan
• Regular Meetings of Stakeholders – The Two Storm Report found that the utility representatives that were assigned to act as liaisons for each town were often unfamiliarwiththetownanddidnotpossessadequateaccesstopertinentinformation such as timetables for power restoration. The report also found that disasterresponseofficialswithinmunicipalitieswereoftenunfamiliarwithotherofficialsandhadnotplannedcoordinateddisasterresponseefforts.TheTwoStormReport recommended each town hold annual emergency preparedness meetings. Thesemeetingswouldincludekeyemergencyresponsepersonnelsuchasfirstresponders,governmentofficials,schoolsuperintendents,andsheltercoordinators,as well as representatives from the utilities. The report also recommended that utility representatives thoroughly understand the communities in which they serve and are able to update the communities with useful information by identifying how that municipality is connected to the overall grid.
• Statewide Communications – Recognized in this report were the State Emergency Operations Center (SEOC) and WebEOC. The SEOC is the coordination center for the State of Connecticut during any major emergency. This center provides a central location that allows a coordinated response from the Governor, Division of Emergency Management and Homeland Security (DEMHS), and state and federal representatives assignedspecificemergencymanagementresponsibilities.TheSEOCoperatesunder the National Incident Management System (NIMS) and is only activated at the order of the Governor or the Commissioner of DEMHS. WebEOC is a web-based emergency management system utilized by the state to record both routine and emergency activity. This system provides real-time information from those facilities that are registered and can be accessed during an emergency or a drill.
The Two Storm Report commended the state Emergency Operations Center’s (EOC) mediapresenceinbriefingresidentsondisasterreliefupdates.TheEOCwasabletouseTV,internet,radio,andprintmediatoeffectivelydistributeinformationafterthestorm.ThereportdidnotesomedeficienciesintheWebEOC,notingthatthere lacked a detailed local component, which would allow for better coordination between local, regional, and state resources. The report recommended that the state continue to bolster the dissemination of disaster information through the use of social media and other forms of communication. The report also recommended that the United Way of Connecticut expand its communication capacity through several technical updates. The report recommended that community provider organizations be prioritized in emergency situations so that services can be delivered in the homes of those needing assistance rather than transporting individuals to shelters. Lastly, the report recommended that the state provide public service announcements on the proper use of emergency generators as carbon monoxide poisoning was prevalent after the disasters.
Drinking Water Vulnerability Assessment and Resilience Plan11
• Municipal Issues–AvarietyofissuesrelatedtomunicipalitieswereidentifiedintheTwo Storm Report, including the following: 0 Preparedness and Training – The main recommendations of the report involved thetrainingofmunicipalofficials.Aswasnotedpreviously,itwasoftenfoundthatthekeyemergencyresponseofficialsinmunicipalitieswerenotaccustomedto working together and formulating a seamless disaster response plan. The reportrecommendedthatallelectedofficialsundergotraininginemergencypreparednesswithin45daysofassumingoffice.Thereportalsorecommendedthattownscreatea“towncenterdistrict”inwhichthezoninglawswouldmandate that emergency backup power be included in commercial buildings.
0 Road Safety and Downed Tree Removal – Both storms presented major challenges tomunicipalitiesduetothevastquantityoflimbsandtreesthatfellduringthestorm.Manytownpublicworksdepartmentsmaintainthestaffandequipmentto clear such debris. Unfortunately, the number of trees that fell on power lines made it impossible for towns to remove debris without the assistance of thepowercompany.Consequently,eachpowercompanytruckhadlimitedresources on board to remove the massive amounts of debris crossing the roads. The report recommended that municipalities and utilities ensure that sufficienttechniciansareavailableforeachmunicipalitysothatroadwayclearance is not halted by downed utilities. The report also recommended that localmunicipalitiesmake“trucktotruck”communicationpossiblesothatmulti-municipality response is available. This would allow multiple municipalities to respond to especially hard-hit areas.
0 Shelter Operations – Shelters were needed after both storms due to the extended power outages. The Halloween Nor’easter provided a greater challenge as the low temperatures and longer duration power outages caused more to seek shelter. The report recommended that shelters be better suited to accommodate thosewithdisabilitiesandtoidentify“atrisk”groupssuchasthosewhorequireoxygenorotherswhoaremedicallycompromised.Thereportalsorecommendedseekingtheassistanceofnonprofitgroups,whomightbeabletoprovide greater resources to shelters.
0 Utilization of Volunteers – The report recommended creating a volunteer unit within DEMHS to enhance response capabilities. It also recommended that mechanisms be developed to encourage citizen awareness of disaster preparedness.
12Drinking Water Vulnerability Assessment and Resilience Plan
• Use of Geographical Information Systems (GIS) – A common frustration during the recoveryeffortsforbothstormsinvolvedthelackofgraphicalrepresentationastowhichareaswereaffectedandtowhatextent.Forexample,therewaslittlestatewideinformationonwhichroadswereblockedoff,whichpolesweredamaged,andwhichareas were without power on a local level. The report recommended the expansion of Connecticut’s GIS Council to include utility companies. The report also recommended thattheConnecticutOfficeofPolicyandManagement(OPM)integrateGISinformationfrom all utilities to create a comprehensive planning platform. Other recommendations include better mapping by utilities and better dissemination of mapping to local EOCs.
• Health Care and Community Provider Issues – Health care personnel and community providers, such as organizations that assist individuals with disabilities, faced enormous challenges during the storm. Since many residents rely on these service providers for basic needs, it was only by the hard work of such individuals that residents in need were able to be relocated to facilities where critical services could be provided. The report contains several recommendations that would help shelters for at-risk populations ensure that they have access to supplies during emergencies. The report also recommended funding for permanent standby generators in places where at-risk populations may be served so that shortages of gasoline or diesel do not compromise the ability of these facilities to give care during extended outages.
• General State Issues–OtherfindingsoftheTwoStormReportincludedthefollowing: 0 Regulation of Utilities–AmajorfindingoftheTwoStormPanelinvolvedPURA’s
inability to enact and enforce orders regarding emergency response procedures by utilities. As an example, the report noted that PURA reviewed both UI’s and CL&P’s emergency response plans. Both plans varied; however, PURA lacks any enforcement capabilities regarding the planning structure of either utility.
0 Equipment Maintenance Issues–Standardsofequipmentmaintenance,treetrimming, system redundancy, and enforcement varies from town to town and utilitytoutility.PURAhadlimitedabilitytoeffectivelycreateandenforcerelatedregulations. The report recommended that an enforcement division be created within PURA for this purpose.
0 Review of Connecticut Department of Emergency Services and Public Protection (DESPP) – A strong DEMHS division of DESPP is recognized as being critical to robust disaster response. The report recommended that the Deputy Commissionerpositionshouldbefilledimmediately.Thereportalsorecommendedatleastoneexerciseperyearperregion,inwhichallOfficeofEmergencyManagement(OEM)staffparticipateandevaluatetheresponsetotheexercise.
Drinking Water Vulnerability Assessment and Resilience Plan13
0 Strengthening the Interaction between the State and the Community – The plan recommended that a Public/Private Initiatives Unit be formed within the DEMHS thatfacilitatesa“cultureofpreparedness.”Thisinvolvesprivateindustriesandgovernment agencies working harmoniously to provide enhanced disaster response.
DPH Three Storm StrategyFollowing Hurricane Sandy (October 2012), DPH built upon the state’s Two Storm Report and preparedits“threestorm”strategy3inordertoensuresafeandadequatepublicwatersupplyand address vulnerabilities, emergency preparedness needs, resiliency, and system capacity in CWSs.Sincethattime,DPHhasbeenaddressingits“threestorm”strategythroughavarietyofinitiativessuchasrequiringemergencygenerators(andprovidingfundingassistancetosecuregenerators);requiringdevelopmentofanemergencyplanforallCWSs;updatingcriticalfacilities lists; developing and implementing methods to evaluate technical, managerial, and financialcapacityofsmallCWSs;andfacilitatingtheCoordinatedWaterSystemPlanningprocess.Ongoingactionsincludeworkshopstoassistwiththeemergencyplanrequirement,implementing new ideas for sharing information between utilities and DPH during an emergency,updatingCertifiedOperatorresponsibilities,streamliningfundingforsmallCWSs,developingregulationsrequiringassetandfiscalmanagementandhydropneumatictankassessments, and revising the process for ordering takeovers of failing water systems.
2.1.2 Recent Droughts
Drought of 2015-2017TherecentlyresolveddroughtthataffectedmuchofthenortheasternU.S.wasoneof the most severe in recent memory. Hot summer temperatures and a stubborn precipitationdeficitmeantthatmanystreamsandriversexperiencedhistoricallylowflows.Althoughlatesummerthroughfallof2016sawthemostseveredroughtconditions in the state, the drought traces its origins to early May 2015. The U.S. Drought Monitor, run by a consortium of federal agencies including the National Oceanic and Atmospheric Administration (NOAA), the U.S. Department of Agriculture, and others, maintainsanarchiveofitsdroughtclassifications,whichwereusefulinidentifyingtheextentandseverityofthedrought.TheDroughtMonitorclassifiesdroughtconditionsthrough a combination of the Palmer Drought Severity Index, Climate Prediction Center (CPC) Soil Moisture Models, United States Geological Survey (USGS) Weekly Stream Flows, Standardized Precipitation Index, and Objective Drought Indicator Blends. These individual components give some sense of the hydrologic conditions experienced throughout the state and region.
3“DPHDrinkingWaterSectionStrategytoAddresstheEffectsofStormsIrene,Alfred,andSandyonConnecticut’sPublicWaterSystems”originallydatedDecember2011,lastupdatedApril2018
14Drinking Water Vulnerability Assessment and Resilience Plan
On the week of May 5, 2015, the Drought Monitor placed most of Connecticut in the“AbnormalDryness”categoryforthefirsttimeinseveralmonths.Thislow-levelindicatorsignifiesthatshort-termdrynesshastakenplace,witheffectsmostlylimitedtoagriculture.Just2weekslater,withlittlesubsequentrainfall,theDroughtMonitorhadclassifiedConnecticutunderamoderatedroughtcondition.TheNationalWeatherService Records indicated that May 2015 received approximately 1.25 inches of rain, on average, for the entire month. This is a nearly 3-inch departure from normal. The May 19, 2015, report shows the southern 2/3 of New England and much of the Hudson Valley under moderate drought conditions as well.
Throughout June, July, and early August of 2015, there was some recovery in most of the northeast.AnexceptionallyrainyJunehelpedalleviatemanyoftheshort-termeffectsof the recent dryness. Drought conditions were lifted in most of interior New England by early August, with just patchy areas of abnormal dryness and moderate drought. Connecticut, however, remained abnormally dry, with some areas of moderate drought persisting along the coast. By late September 2015, abnormal dryness had encompassed much of southern New England again, with moderate drought conditions thoroughly covering Connecticut. While much of northern New England recovered throughout the fall,Connecticutcouldnotshakethemoderatedroughtclassificationfortheremainderof 2015.
The beginning of 2016 brought some improvement to Connecticut’s conditions. Late season snow helped reduce the moderate drought conditions in the state, leaving just patches of abnormal dryness. February 2016 had a rainfall surplus of approximately 2.5 inches in most of the state. Six-month rainfall departures, however, remained at 3 to 4 inches below average. In contrast to February’s surplus, March 2016 was very dry, with a deficitof1.5to2inchesthroughoutthestate.Thespringandearlysummercontinuedtofeaturebelow-averageprecipitation,andbyJuly5,2016,theentirestatewasclassifiedas abnormally dry, with moderate drought extending through north central and northwest Connecticut. Central Massachusetts began to exhibit even dryer conditions, withseveredroughtclassificationsextendingthroughsoutheasternNewHampshire.
A moderately wet August of 2016 could not halt the progression of drought conditions. Hot temperatures helped extend moderate drought conditions throughout the entire state by August 30. Mild temperatures and marginal rainfall propelled the state to severe drought conditions by mid September. At this point, public water suppliesinthestatestartedfeelinggreatereffects.TheAquarionSouthwesternFairfieldCountyRegion(New
In 2016, Aquarion Water Company was experiencing a public water supply emergency in southwestern Connecticut resulting in heavy water user restrictions and water audits of the largest users.
Drinking Water Vulnerability Assessment and Resilience Plan15
Canaan, Darien, Stamford, and Greenwich) was deemed by the DPH Commissioner to be experiencing a public water supply emergency on September 29, 2016. The emergency declaration levied heavy water use restrictions, as well as water audits of the largest users within the system. CT DPH again declared a water supply emergency for the Danbury Water Department on October 25, 2016. By mid November, with many streams andriversnearingrecordlowflows,muchofwesternConnecticuthadreachedextremedrought criteria. While eastern Connecticut remained under severe drought conditions for the remainder of the year, western Connecticut continued to carry the extreme drought designation.
Early 2017 began dry; however, late season snowfall in February and March began to weakentheeffectsofthedroughtconditions.ByMarch7,2017,theextremedroughtdesignation was dropped throughout the state, and by mid May 2017, only small patches of abnormally dry conditions remained as artifacts of the drought. By early June 2017, there were no drought indicators declared by the Drought Monitor, and the State of Connecticut Interagency Drought Workgroup (IDW) ended the Statewide Drought Advisory on June 14, 2017. Despite the severity of the drought of 2016-2017, it was not believed as severe as the drought of record in the 1960s.
Drought of 2005The drought of 2005 was a relatively brief but locally severe drought that originated in May 2005 and resolved abruptly with the exceptionally heavy rain events of October 2005. After a wet start to 2005 with respect to precipitation, May was dry, with just 1.73 inches of rain recorded at the Connecticut Agricultural Experiment Station (CAES) gage inHamden.WhileJunefeaturedaverageprecipitation,itwasveryhot,witheight90+degree days. At this point, the Drought Monitor began to show some areas of abnormal dryness in the state.
July precipitation was underwhelming, but enough precipitation fell to ease any abnormal dryness. Temperatures were extremely hot, however, especially toward the end of the month. There were 7 days over 90 degrees, with 2 days of 93 degrees and 2daysof95degreesinthemonth’sfinalweek.ByearlyAugust,theabnormaldrynesshad returned according to the Drought Monitor, as had the heat. August featured an additional 9 days of heat over 90 degrees and very little precipitation, with departures from average approaching 2.5 inches. Temperatures in September remained summerlike, and by mid month, the Drought Monitor had upgraded Connecticut into a moderate drought. Moderate drought conditions persisted in certain parts of the state until mid October, when an active weather pattern brought several bouts of heavy rain to the state.Octoberrainfallapproached15inches,effectivelyerasinganyraindeficitandrestoringriverflowstonormalandfloodconditions.
16Drinking Water Vulnerability Assessment and Resilience Plan
Thedroughtwasuniqueinthatdespitenotregisteringexceptionallyseverebymostmetrics(hencetheDroughtMonitorpeakingata“moderatedrought”)theeffectonstreamflowwasverypronounced.Manymid-sizeriversthroughoutthestatesawflowdecreasetolowsingle-digitcubicfeetpersecond(cfs)orlower.Thisledtowatershortagesinsomeofthemoststronglyaffectedareas.
2.2 Review of Laws, Practices, and Protocols2.2.1 Summary of Applicable Laws
Appendix A contains an extensive summary of laws and policies that relate to PWS regulation, climate change, and resiliency. The federal government has established manylawsandregulationsconcerningwaterqualityandquantityofpublicwatersupplysystems. Most notable is the federal Safe Drinking Water Act (SDWA) of 1974. This actanditssubsequentamendmentshaveauthorizedthefederalgovernmenttosetnational drinking water standards, conduct special studies, and to generally oversee the implementation of the act. The act has led to the testing of public water supplies and has established source water protection areas, among many other functions. While resiliency has not traditionally been directly addressed in the SDWA and its amendments, elements of resiliency are included.
At the state level, the authority for regulation of public drinking water is established under Section 25-32 of the Connecticut General Statutes (CGS) and implemented through the Regulations of Connecticut State Agencies (RCSA) by DPH. These requirementsareconsistentwithfederalregulationsandhaveadditionalrequirementssuch as annual watershed surveys, annual cross connection surveys, monitoring of raw andfinishedwater,andpublicnotification.LiketheSDWA,resiliencyhasnottraditionallybeen directly addressed in the RCSA, but elements of resiliency can be found within the RCSA.
State Oversight and EnforcementConnecticut has traditionally managed its water through four regulatory agencies with separateandsometimesconflictinglegislativemandatesandauthorities.Theseagenciesinclude OPM, DEEP4, DPH, and PURA, formerly known as the Department of Public Utility Control (DPUC).
4PublicAct11-80,“AnActConcerningtheEstablishmentoftheDepartmentofEnergyandEnvironmentalProtectionandPlanningforConnecticut’sEnergyFuture”combinedtheformerDepartmentofPublicUtilityControl(DPUC)andanenergygroupfromtheOfficeofPolicyManagement(OPM)withtheDepartmentofEnvironmentalProtection(DEP)toformtheDepartment of Energy and Environmental Protection (DEEP) to better address the challenges of the modern environmental world and energy market. The former Department of Public Utility Control is now called the Public Utility Regulatory Authority (PURA)andcontinuestoperformtheregulatoryfunctionsoftheformerDPUC.TheActalsorequiredthattheDEEPestablishaBureauofEnergyandTechnologyPolicy–thefirstenergypolicyofficeindecadesforthestate.
Drinking Water Vulnerability Assessment and Resilience Plan17
• Department of Public Health–Responsibleforprotectingandregulatingthequalityandquantityofthestate’sdrinkingwaterbyregulatingtheadequacyandpurityof all public water systems in the state, including the ownership and use of water utility-owned lands, under its DWS. DPH has been granted primacy by the U.S. Environmental Protection Agency (EPA) and has many regulatory duties under the SDWA and the RCSA but also possesses key state statutory authority in the direct oversight of public water systems and planning authority relative to individual WSPs and coordinated water system plans, as well as source water protection. DPH has the statutory authority to develop regulations for private residential wells and semi-public use wells. DPH also has a role in the distribution of funds under the Drinking Water State Revolving Fund (DWSRF). DPH oversees certain subsurface sewage disposal systems, but DEEP oversees the largest of these as described later in this paper.
• Department of Energy and Environmental Protection – Responsible for the protection of the state’s natural resources, which include inland and coastal waters. DEEP manageswaterqualityandquantitythroughnumerousprogramssuchastheWaterQuality Standards. Like DPH, DEEP possesses regulatory, planning, enforcement, and fundingauthorities.Regulatoryprogramsaddresswaterquantityandwaterquality,including many of the programs described in this report. Planning programs address mainlywaterquality(forexample,overseeingwatershedmanagementplans)ratherthanwaterquantity,whichhastypicallybeenmanagedthroughregulatoryprograms.DEEP funding program examples include the Clean Water State Revolving Fund (CWSRF), the Potable Water Program, and the Section 319 grants for impaired waters, among many others.
• Public Utilities Regulatory Authority – Regulates the rates and services of Connecticut’s investor-owned water companies and is part of the Energy Branch of DEEP. PURA directly regulates the investor-owned water and wastewater utilities in Connecticut and formerly participated in the review and approval of new public water systems (with DPH). PURA regulates other utilities that have a bearing on water (for example, electricity generation).
• OfficeofPolicyandManagement – Prepares periodic revisions of the Conservation and Development Policies Plan for Connecticut and oversees various planning and environmental review processes that address water. OPM plays a key role in the approval of Environmental Impact Evaluations prepared under the Connecticut Environmental Policy Act, ensuring that state actions are consistent with the Conservation and Development Policies Plan for Connecticut as well as other planning documents.OPMisalsoakeyagencyrelativetooversightofvariousfundsthataffectwater. According to various sources5, OPM has general responsibility to coordinate all activities of DEEP, DPH, and PURA with respect to the state’s water resources policies.
5 For example, https://www.cga.ct.gov/2003/pridata/Studies/PDF/Stream_Flow_Final_Report.PDF
18Drinking Water Vulnerability Assessment and Resilience Plan
The State of Connecticut has taken a progressive approach to adapt to a changing climate.In2012,theConnecticutGeneralAssemblypassedPublicAct12-101,“AnActConcerning the Coastal Management Act and Shoreline Flood and Erosion Control Structures.”Thislegislationcombinedanumberofinitiativestoaddresssealevelriseand to revise the regulatory procedures applicable to shoreline protection. For the firsttime,theconceptofsealevelrisewasincorporatedintotheConnecticutCoastalManagement Act relative to the general goals and policies of coastal planning.
Since then, several other key public acts and initiatives have addressed climate change and severe storms. Many of these are described in Appendix A. However, one recent key piece of legislation (Public Act 18-82) is described below due to its forward-thinking contentandpotentialramifications,andonespecificPURAactionisdescribedbelowdueto its immediacy.
PublicAct18-82(“AnActConcerningClimateChangePlanningandResiliency”)establishedanewgreenhousegas(GHG)emissionsreductionrequirementandintegratesGHGreductionsintovariousstateplanningdocumentsandefforts,suchasthe state’s Integrated Resources Plan and its Plan of Conservation and Development. The bill integrates sea level change projections (determined by UConn’s Marine Sciences Division as an update of existing federal projections) into various municipal and state planning documents such as state and municipal plans of conservation and development and municipal evacuation and hazard mitigation plans. It also applies these projections tothestate’scoastalmanagementandfloodmanagementlaws.Thebillrenamesthe state’s Comprehensive Energy Strategy as the Comprehensive Climate and Energy Strategyandrequiresittobeupdatedtoaccountforthestate’sGHGreductionrequirements.ThebillestablishestheConnecticutCouncilonClimateChangeasastatutorycouncil,whichmustfacilitateandcoordinateeffortswithvariouspartiestoreduce GHG emissions and increase the state’s resiliency to climate change.
Public Act 18-82 also made many technical and conforming changes to statutes including those to account for the council’s renaming and incorporate the revised content, eliminated obsolete provisions such as a law on the Governor’s Steering Committee subcommittee on climate change, and most notably replaced a reference in thefloodmanagementstatutesto“one-hundred-yearflood”with“baseflood.”Theactdefinesthebasefloodasthelevelofthe1%annualchancefloodfor“activities”andthe0.2%annualchancefloodfor“criticalactivities.”Thisessentiallyrequiresmostcriticalfacilitiestobeevaluatedagainstthe0.2%annualchancefloodelevation.
Drinking Water Vulnerability Assessment and Resilience Plan19
Goingfurther,theactamendsthedefinitionsinChapter476A,FloodplainManagement(CGS25-68[b]through25-68[o])toincorporatefreeboarddirectlyintothedefinitionoffloodproofingasfollows:
(6) “Flood-proofing” means any combination of structural or nonstructural additions, changes or adjustments which reduce or eliminate flood damage to real estate or improved real property, to water and sanitary facilities, and to structures and their contents, including, but not limited to, for properties within the coastal boundary, as established pursuant to subsection (b) of section 22a-94, not less than an additional two feet of freeboard above base flood and any additional freeboard necessary to account for the most recent sea level change scenario updated pursuant to subsection (b) of section 25-68o, as amended by this act.
Thisactthereforerequiresthatcriticalactionsandcriticalfacilitiesshouldbeelevatedorfloodproofedatleast2feetabovethe500-yearfloodelevation,whichwillhelpbuildresilience into state-funded and state-sponsored projects.
Finally,PURAissueditsbiennial“RequestforEmergencyServiceRestorationPlans”inMay2018 pursuant to CGS Section 16-32e as tracked through Docket 18-03-29. CGS Section 16-32erequires,nolaterthanJuly1,2012,andevery2yearsthereafterthateachpublicservicecompany, telecommunications company, voice-over Internet protocol service provider, andeachmunicipalutilityshallfilewithPURA,theDepartmentofEmergencyServicesandPublic Protection, and each municipality located within the service area of the public service company an updated plan for restoring service that is interrupted as a result of an emergency.
The purpose of this proceeding is for PURA to receive and review the emergency service restoration plans as they become available. All participants were directed to fileemergencyservicerestorationplansorrevisedplanswithPURAthatsatisfyalltherequirementsoftheCGSSec.16-32eonorbeforeFriday,June29,2018.Exemptionsinclude public service companies or municipal utilities that submit a WSP pursuant to CGSSection25-32d.Thesewaterutilitiesarenotrequiredtosubmitemergencyservicerestorationplans.However,PURArequestedin2018thatsuchwaterutilitiessubmitawritten acknowledgement of their exemption to PURA.
20Drinking Water Vulnerability Assessment and Resilience Plan
WhileDPH-DWSrequireslargerPWSstohaveEmergencyContingencyPlansdevelopedandsubmittedaspartoftheirWSPs,anewregulationeffectiveDecember2015nowrequiresallCWSstodevelopanEmergencyContingencyPlan.Theseplansidentifycritical system infrastructure and establish various emergency procedures. Another recentregulationchangeresultedinallsystemsbeingrequiredtohaveanemergencygenerator. It is also important that systems realize that having the ability to hook up a generator is just as important as having the generator itself.
2.2.2 Critical Infrastructure Vulnerabilities, Resiliency, Planning, and Emergency Preparedness
TherearealsostatutesspecificallyaimedtowardPWSplanninganddamsafety.Thesestatutesrequiresystemstoplanforfutureadequatesupply,systemgrowth,andresourceuseefficiencyandtocomplywithdamregulationsandsafetyrequirements.
Individual Water Supply PlanningIn the state of Connecticut, all water companies serving greaterthan1,000peoplearerequiredtodevelopandmaintain a WSP. Plans are developed in accordance with CGS Section 25- 32d-1 and RCSA Section 25- 32d and are typically updated every 6 to 9 years. These regulations and the supporting statutes recognize that planning is a critical management activity of all water utilities. The principal
goalsofwatersystemplanningasdefinedbytheConnecticutDPHareto:(1)ensureanadequatequantityofpuredrinkingwater,nowandinthefuture;(2)ensureorderlygrowthofthesystem;and(3)makeefficientuseofavailableresources.PURA,OPM,andDEEP all provide review and comment to DPH in the agency’s review of WSPs.
All WSPs begin with a description of the water utility’s structure and assets. This section normallyincludesinformationoncompanystructure,employeecertifications,companyfinances,andassets.Thenextsectionstypicallyprovideadescriptionofwatersupplysources,supplycapacity,systemperformance,andwaterquality.Thesesectionsoftenprovidesourcesafeyieldandavailablewater,aswellasdistributionsystemspecificationsandwaterqualityrecords.
After describing company infrastructure and available output, the WSPs generally focus on present and future water demands, service area land use, and source protection. These sections often observe trends within current demographics and attempt to extrapolate them into the future to anticipate any improvements and changes that will need to be made to company infrastructure. WSPs help ensure that water utilities are able to adjust to changing human populations and environmental conditions within the supply area and are planning to meet projected demand over a 50-year period.
Connecticut’s public water supply planning process was prompted by the state’s extended drought in the early 1980s and was an outcome of a Water Resources Task Force report recommending formal water supply planning.
Drinking Water Vulnerability Assessment and Resilience Plan21
Dam SafetyThedamsafetystatutesarecodifiedinSections 22a-401 through 22a-411 inclusive of the CGS. Sections 22a-409-1 and 22a-409-2 of the RCSA have been enacted, which governtheregistration,classification,andinspection of dams. The DEEP administers the statewide Dam Safety Program and designatesaclassificationtoeachstate-registered dam based on its potential hazard.
• Class AA dams are negligible hazard potential dams that upon failure would result in no measurable damage to roadways and structures and negligible economic loss.
• Class A dams are low hazard potential dams that upon failure would result in damage to agricultural land and unimproved roadways, with minimal economic loss.
• Class BB dams are moderate hazard potential dams that upon failure would result in damage to normally unoccupied storage structures, damage to low volume roadways, and moderate economic loss.
• ClassBdamsaresignificanthazardpotentialdamsthatuponfailurewouldresultin possible loss of life; minor damage to habitable structures, residences, hospitals, convalescent homes, schools, and the like; damage or interruption of service of utilities; damagetoprimaryroadways;andsignificanteconomicloss.
• Class C dams are high potential hazard dams that upon failure would result in loss of life and major damage to habitable structures, residences, hospitals, convalescent homes, schools, and main highways, with great economic loss.
DaminspectionregulationsrequirethathundredsofdamsinConnecticutbeinspectedannually. The DEEP currently prioritizes inspections of those dams that pose the greatest potential threat to downstream persons and properties. Dams found to be unsafe under the inspection program must be repaired by the owner. Depending on the severity oftheidentifieddeficiency,anownerisallowedreasonabletimetomaketherequiredrepairs or remove the dam. If a dam owner fails to make necessary repairs to the subject structure,theDEEPmayissueanadministrativeorderrequiringtheownertorestorethestructure to a safe condition and may refer noncompliance with such an order to the AttorneyGeneral’sOfficeforenforcement.
The state’s dam safety program is closely aligned with its flood management program. Due to the relationship between dams and water supply (described above), streamflow regulations (described above), and fish passage (described below), a detailed description of the dam safety program is provided herein.
22Drinking Water Vulnerability Assessment and Resilience Plan
OwnersofClassCdamshavetraditionallybeenrequiredtomaintainEmergencyOperation Plans (EOPs). Guidelines for dam EOPs were published by DEEP in 2012, creating a uniform approach for development of EOPs. Important dam safety program changes are underway in Connecticut. Public Act No. 13-197, An Act Concerning the DamSafetyProgramandMosquitoControl,passedinJune2013anddescribesnewrequirementsfordamsrelatedtoregistration,maintenance,andEOPs,whichwillbecalledemergencyactionplans(EAPs)movingforward.Thisactrequiresownersofcertain unregistered dams or similar structures to register them by October 1, 2015. Theactgenerallyshiftsregularlyscheduledinspectionandreportingrequirementsfrom the DEEP to the owners of dams. At the present time, the owner of any high orsignificanthazarddam(ClassBandClassC)mustdevelopandimplementanEAPpursuant to regulations for EAPs adopted in 2015. The EAP shall be updated every 2years,andcopiesshallbefiledwithDEEPandthechiefexecutiveofficerofanymunicipalitythatwouldpotentiallybeaffectedintheeventofanemergency.
2.2.3 State Government Emergency Preparedness and Response
Interviews were conducted to review and assess best practices and procedures for emergency situations at DPH and other regulatory agencies overseeing water supply throughout the northeast. The interviews aimed to learn how Connecticut and other statesrespondtoandhandlestatewideemergencies.Thequestionsfortheinterviewcovered four general areas: interviewee and organizational background, emergency management, resilience, and planning.
Interviewswereconductedwith11DPHstaffand18drinkingwaterstafffromotherstates (Table 2-1). These interviews aimed to identify best practices from other states’ drinking water departments and to incorporate these practices and lessons learned into the DWS ERP. These other departments regulate anywhere from 80 to 2,000 CWSs, and between20and100staffmembersregulatethesesystems.Thelargerstatestendtohaveacentralheadquartersandregionalofficewhilesmallerstatesjustacentraloffice.
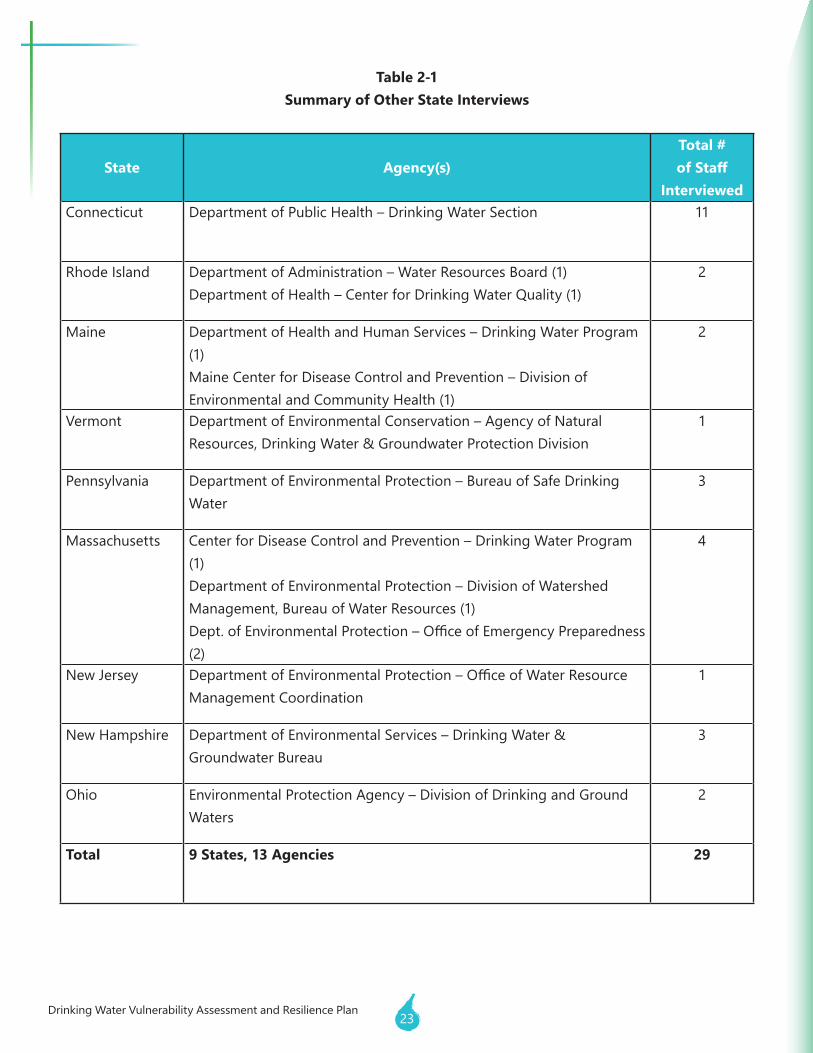
Drinking Water Vulnerability Assessment and Resilience Plan23
Table 2-1Summary of Other State Interviews
State Agency(s)Total # of Staff
InterviewedConnecticut Department of Public Health – Drinking Water Section 11
Rhode Island Department of Administration – Water Resources Board (1)Department of Health – Center for Drinking Water Quality (1)
2
Maine Department of Health and Human Services – Drinking Water Program (1)Maine Center for Disease Control and Prevention – Division of Environmental and Community Health (1)
2
Vermont Department of Environmental Conservation – Agency of Natural Resources, Drinking Water & Groundwater Protection Division
1
Pennsylvania Department of Environmental Protection – Bureau of Safe Drinking Water
3
Massachusetts Center for Disease Control and Prevention – Drinking Water Program (1)Department of Environmental Protection – Division of Watershed Management, Bureau of Water Resources (1)Dept.ofEnvironmentalProtection–OfficeofEmergencyPreparedness(2)
4
New Jersey DepartmentofEnvironmentalProtection–OfficeofWaterResourceManagement Coordination
1
New Hampshire Department of Environmental Services – Drinking Water & Groundwater Bureau
3
Ohio Environmental Protection Agency – Division of Drinking and Ground Waters
2
Total 9 States, 13 Agencies 29
24Drinking Water Vulnerability Assessment and Resilience Plan
Connecticut DPH – Drinking Water SectionThe Connecticut DPH-DWS is responsible for ensuring that drinking water systems always providesafeandadequatewater,includingduringemergencies,andfordevelopingand administering policies that work to enhance system emergency preparedness. Many of these policies and regulations pertain to larger systems. For example, larger systemsarerequiredtosetdroughttriggersandtoprovidecontactinformationforanemergency response point of contact.
TheDPH-DWShasastaffof45to50individuals,primarilyengineersandanalystswitha small number of planners and health professionals. However, the section currently does not have an emergency response coordinator. The DWS has developed an Incident CommandSystem(ICS)structureforemergencyresponse,whichdefinesstaffrolesandthereforefillsinanydepartmentalgapsinemergencycoordination.
The State Response Framework, Emergency Support Function (ESF) 12 and DPH Emergency Response Plans formally describe the current practices, responsibilities, andrequirementsforDPH-DWSemergencyresponse.Connecticut’sStateResponseFramework6 (pages 3 to 18) formally describes DPH-DWS’ responsibilities during a statewide emergency. Connecticut ESF 12 describes the Water Task Force activated during a statewide emergency and DPH-DWS’ role. The CTDPH ERP7 (page 23) formally explains the DWS’s role in emergencies with respect to the Water Emergencies Assessment andResponse(WEAR)Team,madeupof10staffrepresentativesofeachDWSProgram/Unit that are trained in all phases of emergency assessment and response.
Currently, when there is a state emergency, an ICS is established by DESPP, DEMHS, and OEM. This ICS provides a standardized response for organization collaboration. Also, during a large-scale statewide emergency, the Governor activates the SEOC, whichcoordinatesemergencyservices.Inthepast,theDPHOfficeofPublicHealthPreparedness and Response was the only DPH representative at the SEOC. However, DPH-DWS has begun to have its own representative present due to past challenges and shortcomings.
When the ICS is activated, DWS also activates and leads a Water Task Force (see Connecticut Emergency Support Function 128 [ESF12]). The task force includes multiple stakeholders including PWSs, wastewater utilities, DEEP Municipal Facilities Section, and other Connecticut water associations. Any concerns raised by this task force are then relayed to the SEOC via the DWS representative.
6 http://www.ct.gov/demhs/lib/demhs/srf_v_4_1.pdf 7 https://portal.ct.gov/DPH/Planning/Public-Health-Preparedness-and-Response/Public-Health-Emergency-Reponse-Plan8http://www.ct.gov/demhs/lib/demhs/eppi/esf_12_all-hazards_energy_and_utilities_annex_final_draft_ july_2012.pdf
Drinking Water Vulnerability Assessment and Resilience Plan25
Whenacredibleeventislikelytoaffecttheentirestate,theDPH-DWSutilizesEverbridgein advance of the event to send mass communications to CWSs using a variety of delivery methods. These communications include information and emergency preparation reminders such as checking a generator for fuel and reviewing ERPs. The DWS also provides an after-hours phone number to PWS emergency response leads so systems cancallatanytimewithupdatesorquestions.TheDPH-DWSwebsiteisalsoupdatedtoprovidegeneralandspecificinformationforsystemsregardingplanningandresponsebefore, during, and after an event. It has been utilized during past storms by a number of systems to obtain information.
The DWS also communicates with systems during events by either directly calling them or receiving information from systems that are experiencing challenges. Typically, larger systems are more likely to contact DWS with issues; therefore, the DWS tends to focus its outreach on smaller, more vulnerable systems. However, DWS has found that the contactinformationforsmallsystemsisoftenoutofdate.Toreduceeffortsnecessaryto track down system contact information during an incident, a contact form was developedforsystemstofilloutannually.Unfortunately,typicallyonlyhalfofsystemsrespond to the form.
When issues arise, the DWS works as a mediator and connects the distressed system with a partner that can assist the system. During Hurricane Irene, the DWS found it challenging to report CWS status twice daily. Also, the automated WebEOC system Drinking Water Status Controller Board has been developed by the DWS to make the processofstatusreportingmoreefficientandisbeingpromotedandutilizedinsystemsserving over 1,000 to begin using this as the primary means of communicating with the DWS during emergency events.
Communication during and immediately following a storm can be challenging, resulting in the DWS conducting visits to those systems that are being unresponsive to calls and emails. Many of these systems, typically small systems, have little knowledge on procedurestoutilizeimmediatelyfollowinganevent.Thestaffthatvisitsthesiteoffersassistance and testing and determines if notices such as boil water need to be issued.
While storms result in immediate response with an ICS structure, drought response is slightlydifferent.TheDWSChiefisusuallyindirectcontactwiththeGovernor’soffice,drinking water stakeholders, and the Commissioner of DPH. Within the DWS, a drought team is established, and at the state level, the IDW is assembled. The IDW includes a DWS representative and meets weekly during a drought.
26Drinking Water Vulnerability Assessment and Resilience Plan
Currently,systemsthatarerequiredtosetdroughttriggersdosoontheirown,sothesetriggersaresystemspecific.BecauseeachCWStakesthisresponsibility,thereisoftenlittleconsistency between system triggers. During the most recent droughts, multiple systems’ triggerswerefoundtobeinadequate;thesystemsexperiencedreducedsupply,andthesesystemsgenerallyfailedtocommunicatetheseinsufficienciestoDWS.Asmallnumberofthesesystemshadreachedlessthan50%capacityandagainstillfailedtocontact DPH-DWS. As a result, DWS now monitors those systems that have experienced negativeimpactsfromrecentdroughtsandhasalsorequiredthesesystemstorevisetheir triggers to more conservative levels.
Anotherresultofrecentdroughtsistherequirementforlargesystemstomonitorgroundwater levels, along with surface levels, on a weekly basis. Prior to these droughts, systems only monitored surface water levels; however, since recent events, therequirementshavechanged.ThesewaterlevelreportsaresenttoDWSmonthly;however, DWS is currently working on creating a database that will allow this information to be more readily available.
Before CWSs are impacted by drought, they should work with their local municipalities to get ordinances in place in order to be able to enforce any necessary water usage reductions. The IDW has promulgated a model ordinance9 that towns can use, which is located on the IDW website.
Attimes,asystemisunabletomanageitswatersupplieseffectivelyduringadroughtduetoseveralregulationsandrestrictionsHowever,a“declarationofemergency”byDPHtemporarily suspends these restrictions allowing for better management. DPH-DWS has the authority to declare an emergency on behalf of the system under CGS 25-32b andtosignoffonemergencyorders,eliminatingtheneedfortheDPHCommissionertosignoffandthereforereducingprocesstime.Watersystememergenciesaredeclaredon a case-by-case basis and involve communications with DEEP and PURA. The DPH-DWSdraftsandissuesordersspecifictothesituation,whichallowtemporarychangestobe made to existing rules, court orders, regulations, etc. for a period of 30 days; emergency declarations can be renewed if needed up to 150 days.
Other State InterviewsThe responsibilities of other state drinking water departments during an emergency are similar to those of Connecticut DPH-DWS. Most other state agencies follow an ICS structure during an emergency and typically serve as a technical consultant for their emergency management division. The other divisions also generally serve in a supporting role during a statewide emergency just as CT DPH-DWS does.
9http://www.ct.gov/waterstatus/lib/waterstatus/pdf/state_of_ct_model_water_use_restiction_ordinance-final.pdf
Drinking Water Vulnerability Assessment and Resilience Plan27
Other states’ agencies are tasked with the challenge of obtaining status updates from CWSs. Both during and after a storm, these other state agencies also follow similar procedures for obtaining updates. For example, most other state agencies utilize a contact form, send out messages before an event, and assist the systems after an event. Some of these state agencies found that automated communication systems simplify and speed up the process of obtaining CWS status updates.
However, a few of the other state agencies have more advanced methods for obtaining status updates. One state agency utilizes a web-based system that tracks system status andthenrelaysinformationtomanagers,toinspectors,andback,andtoexecutivestaffandotherstatedepartments.Whilethesesystemsprovetobeeffectiveforsharinginformation,thereisstilldifficultyingettingthesmallersystemstoinputtheirstatus.
Other state agencies, just like CT DPH-DWS, typically prioritize helping larger systems get back online after a storm due to the fact that they have larger service populations and tend to serve more critical facilities. Other state agencies have noticed that some system managers may not be able to issue notices, such as boil water, so these states assist by utilizing a reverse 911 system to notify the public of the impact.
When there is a statewide emergency, some other state agencies have streamlined communication between themselves and other agencies and departments while other state agencies feel that there is room for improvement regarding this level of communication.
Some of these best practices for communication are a result of a formal ERP. This type of plan includes an ICS structure, protocols, leadership for emergency response teams, otherstatedepartmentcontacts,andaprocedureforhowtohandofftheemergencytoanotheragencyasitbecomestoodifficulttohandlealone.Relationshipsbetweenstate agencies are well developed, and communication pathways are documented to guaranteeeasycommunicationflow.Thesepathwaystaketimetodevelopandshouldbemaintainedovertime.Fortheseplanstobeeffective,theyarepracticedannuallywithall those who would be involved in an emergency. Revisions made to the plan include adding lessons learned over the past year and updating important contact information. The agencies with successful plans emphasized the importance of including other state agencystaffduringtraining.Oneagencypointedouttheusefulnessoftraining;forexample,theirstafftookanonlinecourseaboutICSstructure,whichhasimprovedtheirresponse.
28Drinking Water Vulnerability Assessment and Resilience Plan
Several of the other state agencies said their storm and drought responses are not formalizedduetotheinfrequencyoftheevent.Someagenciesalsomentionedthatlackof experience is a potential barrier in identifying best practices for statewide response.
Moststateagencieshavedifferenttimeconstraintsregardingwhenasystemmustreportaproblem.Amajorityrequirea24-hourreportingwindow;however,onestaterequiresa1-hourreportingwindow,andasaresult,theagencyfeelsthisisessentialtoitsdepartment’sresponse.Stateagenciesalsodifferonwhotakesanemergencyreportafterhours,withsomestatesusingarotatingscheduleofqualifiedstaffthatcanhandlean emergency and others having a single person that handles these calls 24/7.
Smaller more routine emergencies do not typically result in the same response as a large-scale emergency. Some state agencies have written protocols for a variety of emergencies while other state agencies, like Connecticut DPH, do not. It appears agencies need the most assistance in determining when an emergency needs to be handedofftolargeragenciesandwhenitshouldbehandledbythedrinkingwateragency alone.
Mostofthestateagencieshaveaseparateboardthatconsistsofstafffrommultipleagencies that handle drought response. Drought policy varies between the states. For example, some state agencies have expedited procedures for approving new supplies or getting systems money during a drought while other state agencies still rely on the drawn-out process of paperwork and approval. Also, some state agencies regulate bulk water haulers while others do not.
Drought stages have been established in some states and can be issued by the governor or the drinking water agency. These triggers are typically associated with a certain level of mandatory water restrictions. Some state agencies also mentioned that enhanced conservationefforts,repairingleaks,ordevelopingnewordiversesourceshelpmitigatedroughtimpacts.Duringadrought,agencystaffcommunicatewiththeCWSstodeterminetheirstatus.Somestateagencieshavedevelopedanonlinesurveytobefilledout during a drought.
AllstatesrequirethatlargeCWSswriteanERPwhilesmallsystemsareencouragedtobutarenotrequired.Somestateagenciesholdworkshopsortrainingsessionsforthosesmallsystemsthatneedassistancewritingtheseplans.LimitedstaffcreatesabarrierforagenciestobeabletoreviewallERPs.Typically,asystemisquestionedastowhetherornot it has a plan written during its routine, 3-year inspection. One state does, however, have two agencies that share the load of reviewing ERPs. Agencies also feel their time is better spent providing technical assistance to systems rather than reviewing plans.
Drinking Water Vulnerability Assessment and Resilience Plan29
Many of the state agencies feel face-to-face sanitary survey inspections are one of the mosteffectivewaystoprepareasystemforanemergency.Theseinspectionsprovideanopportunityforprovidingtechnicalassistanceandallowstafftodeveloprelationshipswith operators and learn the system.
Otherplanningrequirementsvaryacrossstates.Somerequiredroughtplansandlong-term WSPs, infrastructure or asset management plans, and source water protection plans.Also,somestatesmayrequesttechnicalfixesincludingredundancy,alternatesources,additionalintakes,andshutoffvalvesincriticalareas.However,moststatesdonotrequiresystemshavegeneratorswhileConnecticutdoes.
One state agency has given out grants for CWSs and NTNC systems to write an Operations and Maintenance Manual (i.e., asset management plan). Some states, including Connecticut, utilize a point system where systems that take capacity development actions and stay on schedule earn points and are given a higher priority forstaterevolvingfundsandgrants.Someagencystafffeelthatthosesystemswithoutemergency response or asset management plans are not prepared to withstand natural hazard events. Many also feel that the asset management plans are geared toward daily operations and maintenance, which play importants role in storm resilience.
Whilethestafffeelsthatthesevariousplanningrequirementsareusefulforasystemiftheyarepracticedandreviewed,theagenciesareunsureofhoweffectivetheseplansare. Some of these systems hire a consultant to develop these plans, leaving the agency concerned that these reports sit on a shelf and remain unused and not reviewed.
Interview Lessons Learned• Lesson 1 – Severe weather emergencies may reduce the workforce available to respond
duringordirectlyafterthestormandmayrequirerespondingremotelysoeverythingneeded to respond should be portable or electronic. The Connecticut DPH-DWS duringWinterStormAlfredexperiencedavarietyofchallenges,includingdifficultyofstaffmakingittotheoffice.Thesestaffmemberslackedtheinformationandtoolsnecessarytorespondtoemergencies.Sincethisevent,staffarenowmoreabletowork remotely and have the access they need to provide support to systems and the section.
Another state’s agency has improved its document storage by keeping standard operatingproceduresinasecureonlinelocation.Thisagencylostcomputers,files,andotherdocumentsduetofloodingduringHurricaneIrene.Theagencystaffisalsoable to now access this information remotely during an event.
30Drinking Water Vulnerability Assessment and Resilience Plan
• Lesson 2 – State agencies have found that CWSs are not always listed on the priority power restoration list of power utilities. Small systems, such as mobile home parks and homeowner associations, were also not listed. State agencies should assist in getting CWSs on these priority power lists even if these systems have standby power capabilities.
• Lesson 3–Respondingtoaseverestatewidedroughtmayrequiresignificantdepartmentresources.Whiledroughtresponseisnottypicallyan“allhandsondeck”movement like other statewide emergencies such as hurricanes, a statewide drought doesshiftthedailyworkofDWSstaff.Forexample,prioritiesshiftedduringthemostrecentdroughtwhentherewerethreeemergencydeclarationsandstaffneededtomonitorsystemstatusandconservationefforts.DWSstaffweretakenawayfromtheirdailyworktocontactsystemsforstatusupdates;theseupdatesarerequiredundertheemergency order.
Other state agencies have experienced similar issues. However, other states felt that utilizing an online system to monitor system status was easier. This online system was primarilyasurveythatwasfoundontheagencywebsite.Systemscouldfilloutthissurveyandrequesthelporresources;agencystaffwouldthencontactthatsystemtohelp solve the problem. This system both sped up the process and freed up agency stafftime.
• Lesson 4–Respondingtostatewideemergenciesrequiresalotofcoordinationbetweenstateagencies,andthisisdifficulttodowithoutaformalERP.Statesshouldformalize emergency response, include these procedures in a living document, and implement routine training exercises. The document should also include formal guidelines that specify how the department will respond to an emergency to ensure consistency. The guidelines should show how to respond to various emergencies, who should be involved, communication pathways, and a checklist of prioritized tasks. These guidelines and the plan should be updated annually or as often as necessary. To increaseredundancyinthedrinkingwateragency,multiplestaffshouldbetrainedandincludedinreviewsandpracticestoensurethatsufficientstaffknowhowtorespond.
• Lesson 5 – Web-based communication systems streamline and speed up status updates during both storms and drought. States have experienced a reduction in wastedstaffagencytimeandanincreaseinresponseefficiencywithassistingsystemswhenonlinesystemsareutilized.Thesesystemshavealsoincreasedefficiencyincommunicationbetweenstateagencies,systemoperators,anddrinkingwaterstaff.
Drinking Water Vulnerability Assessment and Resilience Plan31
2.2.4 Community Water System Emergency Preparedness and ResponseCommunity Water System Interviews
Interviews were conducted with 24 individuals, all of whom are in a management role in a range of CWSs in the four coastal counties. Of those individuals, 11 managed a publicly owned system,10managedaprivatelyownedsystem,and3werecertifiedoperatorsthatworkwithmultiplesystems.Intermsofsystemsize,theseindividualsrepresentedfivesmallsystemsserving less than 500 people, seven medium-sized systems serving 501 to 9,999 people, and nine large systems serving over 10,000 people.
The responses were similar throughout the group regarding storm impacts. Most of the systemshavefeltstormimpacts,specificallypoweroutages;however,ingeneraltheyhavefound the addition of generators over the past few years has increased reliability. It was also apparentthatfloodingisnotasignificantconcernformostdrinkingwatersystemsandthatprimarily large or private systems conduct a poststorm analysis to update plans and procedures.
Most individuals made it clear that drought is seen as a growing concern to CWSs and that wateruserestrictionshaveproveneffectiveduringadrought,especiallyforsmallwellsystems.However, a few small systems do not utilize household meters, thereby making the enforcement ofuserestrictionsdifficultduringadrought.
Interconnections provide system redundancy; however, there are concerns regarding the use of these interconnection. Systems that utilize interconnections for a portion of their water supply experience a lack of control and concern regarding the source water and lack incentive to conserve water below the mandatory minimums in their purchase agreements. There is also the concern about irregular use of these interconnections and the resulting scouring of pipes and a potential for increased exposure to toxins. Smaller systems tended to be more interested in interconnections or selling their system.
The interviews also addressed climate change. In general, most managers are aware of the potentialchangesindroughtandstormfrequencyduetoclimatechange.Becauseitisunclearhow these changes will impact a system from a business perspective, many managers are waiting for guidance whether it be from DPH or another regulatory standpoint.
Itwasfoundthatregulatorycomplianceisasignificantdrivingforcebehindbothinvestmentsand behavioral change for all types of CWSs. However, several managers mentioned the stress of complying with regulations during an emergency or event (i.e., a boil water advisory) while their capacity is already overextended.
32Drinking Water Vulnerability Assessment and Resilience Plan
2.3 Review of Water System Emergency Planning DocumentsLarge CWSs (greater than 1,000 people served per system or 250 service connections) were thefocusofthisdocumentreview;thesesizedsystemsaretheonlyonesrequiredtoprepareand submit an Emergency Contingency Plan (ECP) per WSP Regulations. System ECPs and vulnerability assessments10 were reviewed to identify system vulnerabilities and their strategies to mitigate associated risks. Appendix B contains the documentation associated with these reviews.
2.3.1 Review of Vulnerability Assessments
Waterutilitiesapproachtheplanningprocessdifferentlyforvulnerabilitiesandemergencies. Some utilities chose to utilize a vulnerability assessment as a way to conveytheirmostsensitiveandconfidentialsystemvulnerabilities,butinthiscase,thedocument was not released as part of the WSP. However, other utilities chose to create a vulnerability assessment chapter or document that articulates hazards. The assessment inthiscasetypicallycoveredgeneralsystemvulnerabilitiesandmitigationefforts.
Aspreadsheet(AppendixB)wascompiledtolistcriticalsystemsaffected,vulnerabilitieslisted, and how the utility plans to mitigate vulnerability-associated risks. However, becausethesespecificswerenotoftendirectlyaddressed,thisinformationwasessentially backed out of the ERPs. For example, a utility might note that it is vulnerable to power failures and has an auxiliary generator in place while not specifying events that could lead to this failure.
The focus of this document review was to identify vulnerabilities to natural hazards; therefore, the research was limited to vulnerabilities that could be associated with natural disasters and climate change. The important aspect is to identify whether a system has taken steps to mitigate the risk associated with certain natural hazard vulnerabilities.
Thedocumentreviewrevealedthatinsomeplansavulnerabilitywasidentified;however,nomitigationstrategywaspresentedforthatspecificvulnerability.Thelackof mitigation strategy may indicate a system vulnerability to a certain natural hazard. Some systems did convey why no mitigation strategy was presented; however, in most instances,thatinformationwasnotprovided.Thereisalsoa“HazardLevel”classificationfound in the spreadsheet, which represents the system’s subjective analysis of its risk; most plans did not have this information, leaving this column blank.
10Inthiscontext,“VulnerabilityAssessment”doesnotmeanthevulnerabilityassessmentdevelopedpertheBioterrorismActof 2002.
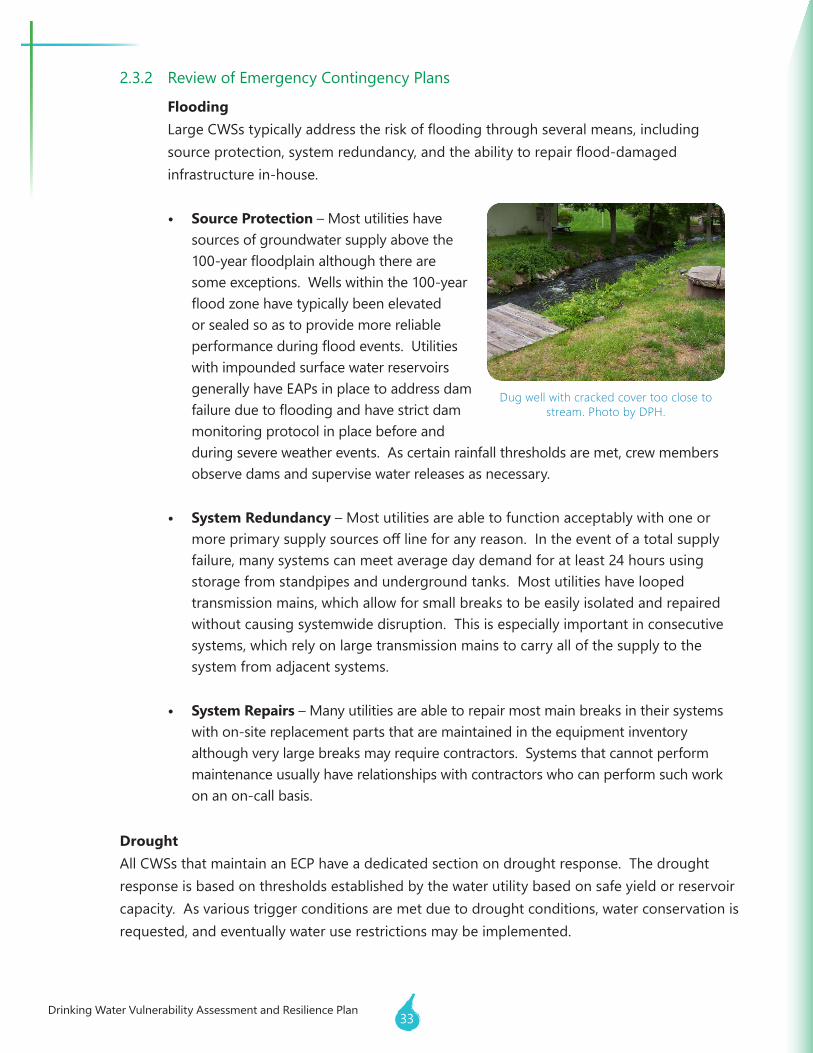
Drinking Water Vulnerability Assessment and Resilience Plan33
2.3.2 Review of Emergency Contingency Plans
FloodingLargeCWSstypicallyaddresstheriskoffloodingthroughseveralmeans,includingsourceprotection,systemredundancy,andtheabilitytorepairflood-damagedinfrastructure in-house.
• Source Protection – Most utilities have sources of groundwater supply above the 100-yearfloodplainalthoughtherearesome exceptions. Wells within the 100-year floodzonehavetypicallybeenelevatedor sealed so as to provide more reliable performanceduringfloodevents.Utilitieswith impounded surface water reservoirs generally have EAPs in place to address dam failureduetofloodingandhavestrictdammonitoring protocol in place before and during severe weather events. As certain rainfall thresholds are met, crew members observe dams and supervise water releases as necessary.
• System Redundancy – Most utilities are able to function acceptably with one or moreprimarysupplysourcesofflineforanyreason.Intheeventofatotalsupplyfailure, many systems can meet average day demand for at least 24 hours using storage from standpipes and underground tanks. Most utilities have looped transmission mains, which allow for small breaks to be easily isolated and repaired without causing systemwide disruption. This is especially important in consecutive systems, which rely on large transmission mains to carry all of the supply to the system from adjacent systems.
• System Repairs – Many utilities are able to repair most main breaks in their systems withon-sitereplacementpartsthataremaintainedintheequipmentinventoryalthoughverylargebreaksmayrequirecontractors.Systemsthatcannotperformmaintenance usually have relationships with contractors who can perform such work on an on-call basis.
DroughtAll CWSs that maintain an ECP have a dedicated section on drought response. The drought response is based on thresholds established by the water utility based on safe yield or reservoir capacity. As various trigger conditions are met due to drought conditions, water conservation is requested,andeventuallywateruserestrictionsmaybeimplemented.
Dug well with cracked cover too close to stream. Photo by DPH.
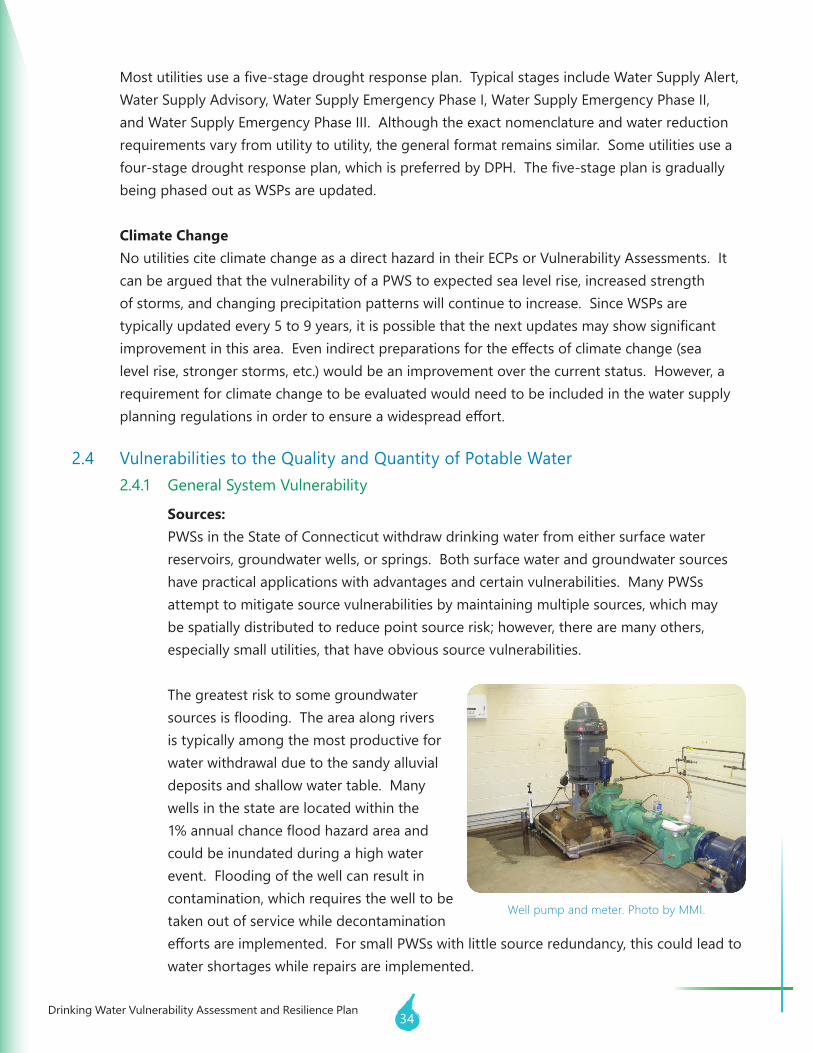
34Drinking Water Vulnerability Assessment and Resilience Plan
Mostutilitiesuseafive-stagedroughtresponseplan.TypicalstagesincludeWaterSupplyAlert,Water Supply Advisory, Water Supply Emergency Phase I, Water Supply Emergency Phase II, and Water Supply Emergency Phase III. Although the exact nomenclature and water reduction requirementsvaryfromutilitytoutility,thegeneralformatremainssimilar.Someutilitiesuseafour-stagedroughtresponseplan,whichispreferredbyDPH.Thefive-stageplanisgraduallybeing phased out as WSPs are updated.
Climate ChangeNo utilities cite climate change as a direct hazard in their ECPs or Vulnerability Assessments. It can be argued that the vulnerability of a PWS to expected sea level rise, increased strength of storms, and changing precipitation patterns will continue to increase. Since WSPs are typicallyupdatedevery5to9years,itispossiblethatthenextupdatesmayshowsignificantimprovementinthisarea.Evenindirectpreparationsfortheeffectsofclimatechange(sealevel rise, stronger storms, etc.) would be an improvement over the current status. However, a requirementforclimatechangetobeevaluatedwouldneedtobeincludedinthewatersupplyplanningregulationsinordertoensureawidespreadeffort.
2.4 Vulnerabilities to the Quality and Quantity of Potable Water2.4.1 General System Vulnerability
Sources: PWSs in the State of Connecticut withdraw drinking water from either surface water reservoirs, groundwater wells, or springs. Both surface water and groundwater sources have practical applications with advantages and certain vulnerabilities. Many PWSs attempt to mitigate source vulnerabilities by maintaining multiple sources, which may be spatially distributed to reduce point source risk; however, there are many others, especially small utilities, that have obvious source vulnerabilities.
The greatest risk to some groundwater sourcesisflooding.Theareaalongriversis typically among the most productive for water withdrawal due to the sandy alluvial deposits and shallow water table. Many wells in the state are located within the 1%annualchancefloodhazardareaandcould be inundated during a high water event. Flooding of the well can result in contamination,whichrequiresthewelltobetaken out of service while decontamination effortsareimplemented.ForsmallPWSswithlittlesourceredundancy,thiscouldleadtowater shortages while repairs are implemented.
Well pump and meter. Photo by MMI.
Drinking Water Vulnerability Assessment and Resilience Plan35
Whilesurfacewaterreservoirswithwell-maintaineddamscanberesilienttoflooding,theycanbesusceptibletocontaminationfromrunofforbydeliberatemeans.Manyreservoirs in Connecticut are adjacent to interstate highways or other highly traveled routes. For example, the Dean’s Mill/Palmer Reservoir in Stonington is bisected by Interstate 95.
Transmission Systems:As the arteries of the distribution system, transmission mains must be maintained thoroughly in order to ensure uninterrupted performance of the system. The greatest vulnerability of a transmission main is a catastrophic failure or breakage of the pipe wall. Failure of the transmission mains can be caused by a variety of natural events. While uncommoninConnecticut,earthquakeshavethepotentialtorupturemainsduetotheimmense amount of shear stress imparted by the shifting ground. Flooding can also be a major hazard to transmission mains as the ground can be washed out around the relatively fragile pipes. The most vulnerable mains are often attached to bridges over rivercrossings.Thesemainsareexposedtothedirectforceofthefloodwatersandanydebris that may accompany them.
Storage:Waterutilitiesrelyonstoragevolumetoprovideabufferforlargewaterdemands,provide water pressure, and store water for potential interruptions in supply. Storage facilities are often aboveground metal standpipes or concrete tanks, typically located at high elevations to increase pressure. As with any piece of large infrastructure, storage facilities must be maintained diligently to ensure good operation. The extreme weight of the water imparts an enormous static load on the infrastructure. Cracks in concrete tanks, corrosion of metal tanks, and shifting ground can compromise the structural integrity of storage tanks, potentially rendering them unusable.
Power Supply:All PWSs need electrical power for sustained long-term operation of the water supply system. Storage facilities can provide pressure and service in the event of minor disruptions in power, but long-term outages necessitate the implementation of auxiliary power. Power failures can be caused by natural hazards such as ice storms, heavy wind, lightningstrikes,andflooding,aswellasmechanicalfailuresandsabotage.
Distribution:The distribution system of a PWS usually consists of water mains, booster pumps, and storage facilities. The vulnerabilities of water mains are the same as those of largertransmissionmains,namely,breakageduetoeventssuchasflooding,oldage,
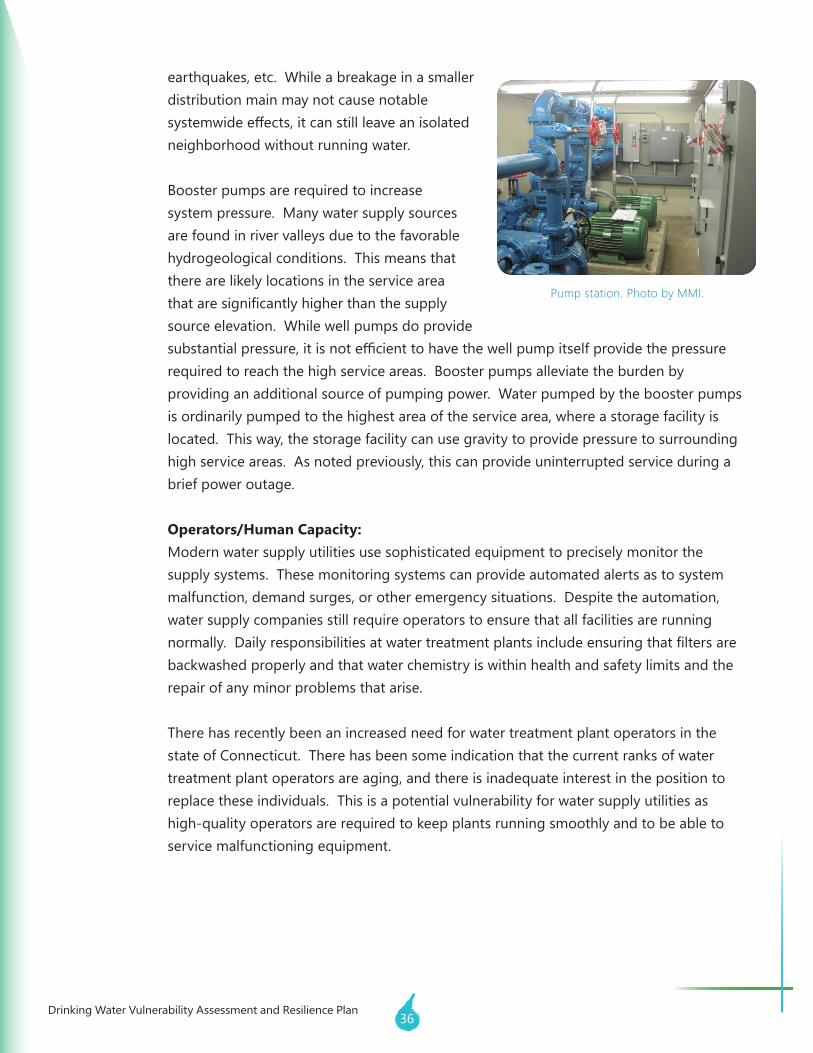
36Drinking Water Vulnerability Assessment and Resilience Plan
earthquakes,etc.Whileabreakageinasmallerdistribution main may not cause notable systemwideeffects,itcanstillleaveanisolatedneighborhood without running water.
Boosterpumpsarerequiredtoincreasesystem pressure. Many water supply sources are found in river valleys due to the favorable hydrogeological conditions. This means that there are likely locations in the service area thataresignificantlyhigherthanthesupplysource elevation. While well pumps do provide substantialpressure,itisnotefficienttohavethewellpumpitselfprovidethepressurerequiredtoreachthehighserviceareas.Boosterpumpsalleviatetheburdenbyproviding an additional source of pumping power. Water pumped by the booster pumps is ordinarily pumped to the highest area of the service area, where a storage facility is located. This way, the storage facility can use gravity to provide pressure to surrounding high service areas. As noted previously, this can provide uninterrupted service during a brief power outage.
Operators/Human Capacity:Modernwatersupplyutilitiesusesophisticatedequipmenttopreciselymonitorthesupply systems. These monitoring systems can provide automated alerts as to system malfunction, demand surges, or other emergency situations. Despite the automation, watersupplycompaniesstillrequireoperatorstoensurethatallfacilitiesarerunningnormally.Dailyresponsibilitiesatwatertreatmentplantsincludeensuringthatfiltersarebackwashed properly and that water chemistry is within health and safety limits and the repair of any minor problems that arise.
There has recently been an increased need for water treatment plant operators in the state of Connecticut. There has been some indication that the current ranks of water treatmentplantoperatorsareaging,andthereisinadequateinterestinthepositiontoreplace these individuals. This is a potential vulnerability for water supply utilities as high-qualityoperatorsarerequiredtokeepplantsrunningsmoothlyandtobeabletoservicemalfunctioningequipment.
Pump station. Photo by MMI.
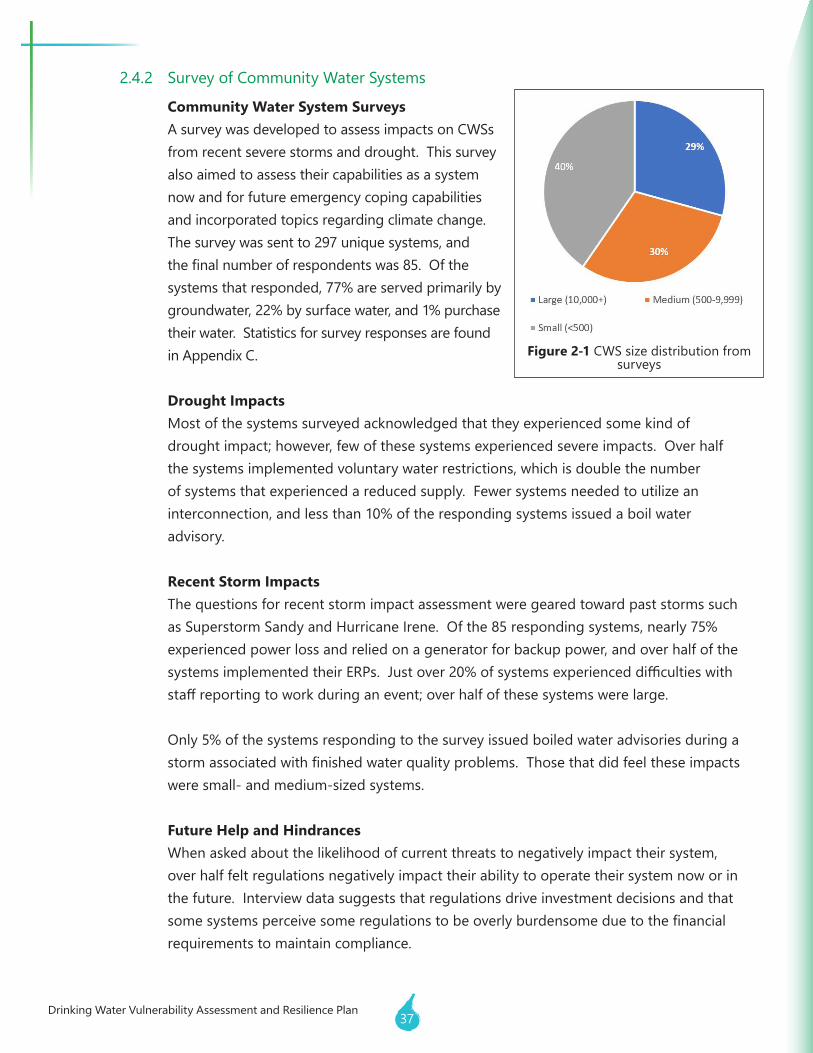
Drinking Water Vulnerability Assessment and Resilience Plan37
2.4.2 Survey of Community Water Systems
Community Water System SurveysA survey was developed to assess impacts on CWSs from recent severe storms and drought. This survey also aimed to assess their capabilities as a system now and for future emergency coping capabilities and incorporated topics regarding climate change. Thesurveywassentto297uniquesystems,andthefinalnumberofrespondentswas85.Ofthesystemsthatresponded,77%areservedprimarilybygroundwater,22%bysurfacewater,and1%purchasetheir water. Statistics for survey responses are found in Appendix C.
Drought ImpactsMost of the systems surveyed acknowledged that they experienced some kind of drought impact; however, few of these systems experienced severe impacts. Over half the systems implemented voluntary water restrictions, which is double the number of systems that experienced a reduced supply. Fewer systems needed to utilize an interconnection,andlessthan10%oftherespondingsystemsissuedaboilwateradvisory.
Recent Storm ImpactsThequestionsforrecentstormimpactassessmentweregearedtowardpaststormssuchasSuperstormSandyandHurricaneIrene.Ofthe85respondingsystems,nearly75%experienced power loss and relied on a generator for backup power, and over half of the systemsimplementedtheirERPs.Justover20%ofsystemsexperienceddifficultieswithstaffreportingtoworkduringanevent;overhalfofthesesystemswerelarge.
Only5%ofthesystemsrespondingtothesurveyissuedboiledwateradvisoriesduringastormassociatedwithfinishedwaterqualityproblems.Thosethatdidfeeltheseimpactswere small- and medium-sized systems.
Future Help and HindrancesWhen asked about the likelihood of current threats to negatively impact their system, over half felt regulations negatively impact their ability to operate their system now or in the future. Interview data suggests that regulations drive investment decisions and that somesystemsperceivesomeregulationstobeoverlyburdensomeduetothefinancialrequirementstomaintaincompliance.
Figure 2-1 CWS size distribution from surveys
38Drinking Water Vulnerability Assessment and Resilience Plan
At the same time, regulations can have a positive impact on systems. When asked whathelpssystemsrespondtothreats,overhalf(55%)ofrespondentsindicatethatregulations help (some or a lot) them respond to threats. As far as nonregulatory threats, storms were the most likely threat, with power failures being the next likely. Sea level rise was thought to be the least likely threat. Although droughts are perceived as a relatively low present threat, respondents typically associated drought with being a more distantfuturethreat(20+years).Sealevelrisewasagainseenasathreatthatwillposeadecreased threat in the future.
Systemsgenerallyfeelthatredundancy,adequatefunding,andincreasedinvestments(climate change action and conservation/watershed protection) will become increasingly useful for responding to future threats. Currently, these systems feel that funding, redundancy,andequipmentaremostusefulforrespondingtothreats.Amongthetechnical aspects, systems feel that a skilled workforce, communication with customers, and watershed protection will also prove helpful during an emergency.
Overall FindingsAccording to the survey responses, larger systems generally experience more impacts attributed to drought while smaller systems tend to feel impacts related to storms. In general,mostsystemsfeelthattheirdroughtresponseplansandERPsareadequateformanaging impacts. Roughly half of the systems surveyed feel that by addressing climate change they are better able to respond to threats. Similarly, climate change adaptation ranks highest as a method to increase their ability to respond to future threats.
2.4.3 Drinking Water Vulnerability Assessment Workshop
On April 6, 2018, the Connecticut Institute for Resilience and Climate Adaptation (CIRCA) and DPH hosted a workshop at the UConn Avery Point Campus in Groton, Connecticut, to share the results of the vulnerability assessment and to obtain feedback on the implementation of a resilience plan for drinking water systems. The workshop attendees receivedguidanceonidentifyingvulnerabilitiestoflooding,extremeweather,anddrought; adaptation approaches for PWSs; and resilience strategies to address those vulnerabilities.
The workshop was advertised on CIRCA’s website and through email lists targeting stakeholdersfordrinkingwatervulnerabilityandresilience,includingCWSsstaffandadministrators,localhealthdirectors,councilsofgovernmentsstaff,municipalplannersand engineers, and any other individuals involved with the WUCCs and the SWP.
Drinking Water Vulnerability Assessment and Resilience Plan39
The workshop was provided both as an in-person and webinar option for participation. Sixty-one people registered for the workshop, and 15 individuals registered for the webinar. Of those registered, 53 individuals attended the workshop, and 15 attendees participated via the webinar. The webinar participants were able to view the morning oral presentations, but they were not able to participate in the afternoon breakout sessions. The full list of workshop and webinar participants is in the Appendix D.
The agenda (Appendix D) featured a morning session with presentations on the best available science and local analysis at the neighborhood scale to inform decision making forCWSstoimproveresiliencetotheimpactsoffloodingandachangingclimate,aswell as tools and resources to assist with the implementation of resilience strategies. In the afternoon, breakout sessions were held with in-depth discussion of these issues and the opportunity for in-person participants to provide feedback on the research and recommendations.
The morning presentations focused on the importance of resilience, future challenges presented by climate change, and various aspects of the vulnerability assessment; these presentationspresentedfindingsfromtheassessment.Theafternoonpresentationsreviewed Connecticut’s current laws and policy pertaining to drinking water, the current state of practice for CWSs, the framework for the CWS resilience plan, and an overview of the DWSRF. Full summaries of all presentations can be found in Appendix D.
Breakout SessionsTogainfeedbackfromparticipants,fourbreakoutsessionswereofferedwitheachtopicbeingofferedtwice.FullsummariescanbefoundinAppendixD;thetopicsincludedthefollowing:
• “It’sanEmergency!KeeptheWaterSupplyRunning”• “Redundancy=Resiliency:OptionsandAlternativesforCWSs&DrinkingWaterPolicy”• “UsingClimateDatatoInformCWSDecisions”• “WhatdoWedoAboutPrivateWellResilience?”
The breakout sessions proved to be a valuable opportunity to gain feedback from workshop participants. Many issues were raised, and solutions for problems were also suggested.Manyparticipantsraisedconcernsregardingdifficultiesduringemergencies.Points discussed included: power outages are still an issue; systems experience communication issues; there have been interruptions in receiving supply deliveries when thestateclosesroadways;andsomeexperiencedifficultiesaccessingfacilitiesduringevents. Some suggested solutions to these problems included: mandatory training for multiple employees in emergency response protocols; explore alternative energy sources
40Drinking Water Vulnerability Assessment and Resilience Plan
forbackuppower;utilizeradiocommunicationmorefrequently;andutilizesocialmediato send out messages when other means of communication may be down.
Participants were also in agreement that smaller systems need assistance with grant program participation. Some suggested solutions were to hire an entity such as Resources for Communities and People (RCAP) to prepare applications or to progress ideas, streamline programs like the generator program, or conduct workshops for small systems on the grant application process.
When discussing emergency response procedures during one breakout session, there seemed to be confusion on who the responsible party is for distribution of emergency water bottles. It appears there needs to be better coordination between utilities and the municipalities they serve to identify who should distribute the emergency supply. It was suggested that Council of Government (COG) meetings be used as a platform for emergency water supply response planning.
WatersystemrepresentativesidentifiedtheimportanceofUSGSstreamgagingdataforshort-term decision making, long-term datasets, and model calibration and validation. Some systems are considering installing and managing their own stream gauges to ensure the necessary data collection.
During the private well breakout session, it was agreed that private well owners continue to be a vulnerable population regarding resilience challenges. It was also acknowledged that there seem to be gaps with private well location data and gaps in dispersing information to well owners. Some suggestions for bridging the information dispersal gap included educating children, imposing fees if wells are not tested, using social marketing to raise vulnerability awareness, or creating an incentive program for residents to test and maintain their wells.
These sessions aimed to gain feedback and knowledge from drinking water stakeholders to both incorporate into the report and to make recommendations within the resilience plan.
Findings and FeedbackWorkshop participants generally found the event to be useful and productive. As partoftheoperatortrainingcreditsofferedforthisevent,anevaluationwasissuedto gauge the pertinence of the workshop material for both the presentations and the breakout sessions. These evaluations revealed that those participating for credits felt the presentations were informative and that the breakout sessions were a good tool for progressive discussion.
Drinking Water Vulnerability Assessment and Resilience Plan41
2.4.4 Existing Flooding Risk to Community Water Systems
Relativetofloods,theStateofConnecticutadoptedasetofstandardsfollowingthe1955floodsthatwereforwardthinkingandhavehelpedleadtothecurrentsuiteofregulations that help make many state-funded projects resilient. Critical facilities must bedesignedaccordingtotheelevationofthe0.2%annualchance(500-year)floodratherthanthe1%annualchance(100-year)flood,theelevationsofwhicharetypicallydeveloped for regulatory purposes by the Federal Emergency Management Agency (FEMA). The Federal Flood Risk Management Standard (FFRMS) was issued by the Obama administration in 2015 and adopted a similar approach to be used for federally funded facilities, but the standard was rescinded in 2017 by the Trump administration. TheConnecticutPublicHealthCodedoesnotrequirethatwatersystemcomponentsorwatersupplywellsberesistanttofloodingfromthe0.2%event,butwatersupplywellsmustbeelevatedabovethe1%annualchancefloodelevation.
AsexplainedinSection2.2.1,PublicAct18-82becameeffectivein2018andmademanychangestostatutesincludingthestate’sfloodmanagementstatutesinChapter476A, Floodplain Management (CGS §25-68[b] through §25-68[o]). The act replaced a referenceinthefloodmanagementstatutesto“one-hundred-yearflood”with“baseflood.”Statestatutenowdefinesthebasefloodasthelevelofthe0.2%annualchancefloodfor“criticalactivities,”whichessentiallyrequirescriticalfacilitiestobeevaluatedagainstthe500-yearfloodelevation.
Goingfurther,theactamendsthedefinitionstoincorporatefreeboarddirectlyintothedefinitionoffloodproofingasfollows:(6)“Flood-proofing”meansanycombinationofstructural or nonstructural additions, changes or adjustments which reduce or eliminate flooddamagetorealestateorimprovedrealproperty,towaterandsanitaryfacilities,and to structures and their contents, including, but not limited to, for properties within the coastal boundary, as established pursuant to subsection (b) of section 22a-94, notlessthananadditionaltwofeetoffreeboardabovebasefloodandanyadditionalfreeboard necessary to account for the most recent sea level change scenario updated pursuanttosubsection(b)ofsection25-68o,asamendedbythisact.”Statestatutethereforerequiresthatcriticalactionsandcriticalfacilitiesshouldbeelevatedorfloodproofedatleast2feetabovethe500-yearfloodelevation,whichwillhelpbuildresilience into state-funded and state-sponsored projects.
Notwithstanding the state’s strong preexisting statutes and the revisions from Public Act18-82,manyPWSsourcesandcomponentsareatriskofflooding.Ananalysiswastherefore conducted to evaluate these risks.
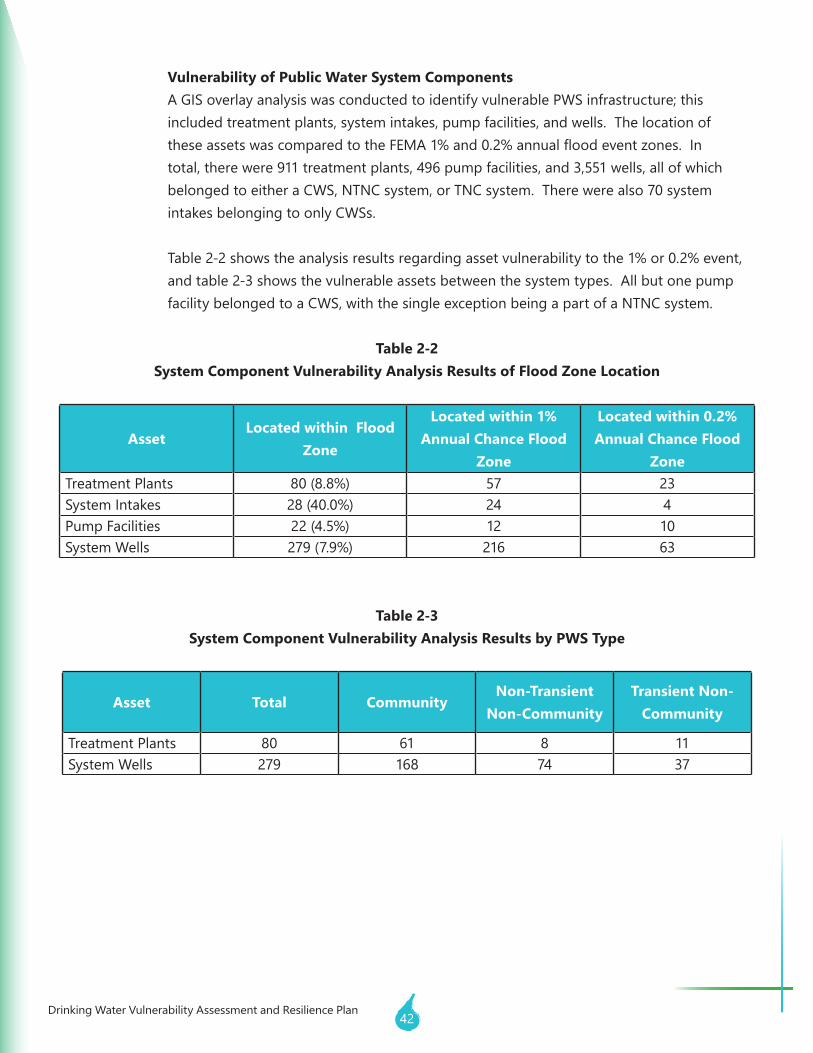
42Drinking Water Vulnerability Assessment and Resilience Plan
Vulnerability of Public Water System ComponentsA GIS overlay analysis was conducted to identify vulnerable PWS infrastructure; this included treatment plants, system intakes, pump facilities, and wells. The location of theseassetswascomparedtotheFEMA1%and0.2%annualfloodeventzones.Intotal, there were 911 treatment plants, 496 pump facilities, and 3,551 wells, all of which belonged to either a CWS, NTNC system, or TNC system. There were also 70 system intakes belonging to only CWSs.
Table2-2showstheanalysisresultsregardingassetvulnerabilitytothe1%or0.2%event,and table 2-3 shows the vulnerable assets between the system types. All but one pump facility belonged to a CWS, with the single exception being a part of a NTNC system.
Table 2-2System Component Vulnerability Analysis Results of Flood Zone Location
AssetLocated within Flood
Zone
Located within 1% Annual Chance Flood
Zone
Located within 0.2% Annual Chance Flood
ZoneTreatment Plants 80(8.8%) 57 23System Intakes 28(40.0%) 24 4Pump Facilities 22(4.5%) 12 10System Wells 279(7.9%) 216 63
Table 2-3System Component Vulnerability Analysis Results by PWS Type
Asset Total CommunityNon-Transient
Non-CommunityTransient Non-
Community
Treatment Plants 80 61 8 11System Wells 279 168 74 37
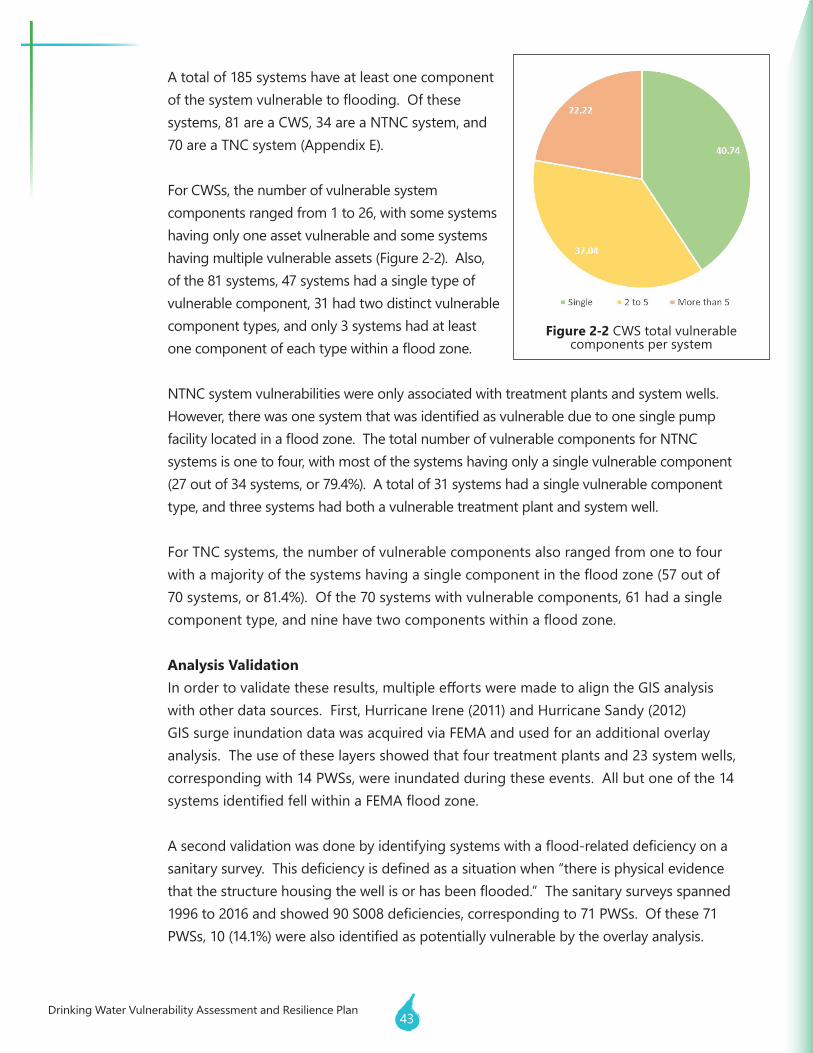
Drinking Water Vulnerability Assessment and Resilience Plan43
A total of 185 systems have at least one component ofthesystemvulnerabletoflooding.Ofthesesystems, 81 are a CWS, 34 are a NTNC system, and 70 are a TNC system (Appendix E).
For CWSs, the number of vulnerable system components ranged from 1 to 26, with some systems having only one asset vulnerable and some systems having multiple vulnerable assets (Figure 2-2). Also, of the 81 systems, 47 systems had a single type of vulnerable component, 31 had two distinct vulnerable component types, and only 3 systems had at least onecomponentofeachtypewithinafloodzone.
NTNC system vulnerabilities were only associated with treatment plants and system wells. However,therewasonesystemthatwasidentifiedasvulnerableduetoonesinglepumpfacilitylocatedinafloodzone.ThetotalnumberofvulnerablecomponentsforNTNCsystems is one to four, with most of the systems having only a single vulnerable component (27outof34systems,or79.4%).Atotalof31systemshadasinglevulnerablecomponenttype, and three systems had both a vulnerable treatment plant and system well.
For TNC systems, the number of vulnerable components also ranged from one to four withamajorityofthesystemshavingasinglecomponentinthefloodzone(57outof70systems,or81.4%).Ofthe70systemswithvulnerablecomponents,61hadasinglecomponenttype,andninehavetwocomponentswithinafloodzone.
Analysis ValidationInordertovalidatetheseresults,multipleeffortsweremadetoaligntheGISanalysiswith other data sources. First, Hurricane Irene (2011) and Hurricane Sandy (2012) GISsurgeinundationdatawasacquiredviaFEMAandusedforanadditionaloverlayanalysis. The use of these layers showed that four treatment plants and 23 system wells, corresponding with 14 PWSs, were inundated during these events. All but one of the 14 systemsidentifiedfellwithinaFEMAfloodzone.
Asecondvalidationwasdonebyidentifyingsystemswithaflood-relateddeficiencyonasanitarysurvey.Thisdeficiencyisdefinedasasituationwhen“thereisphysicalevidencethatthestructurehousingthewellisorhasbeenflooded.”Thesanitarysurveysspanned1996to2016andshowed90S008deficiencies,correspondingto71PWSs.Ofthese71PWSs,10(14.1%)werealsoidentifiedaspotentiallyvulnerablebytheoverlayanalysis.
Figure 2-2 CWS total vulnerable components per system
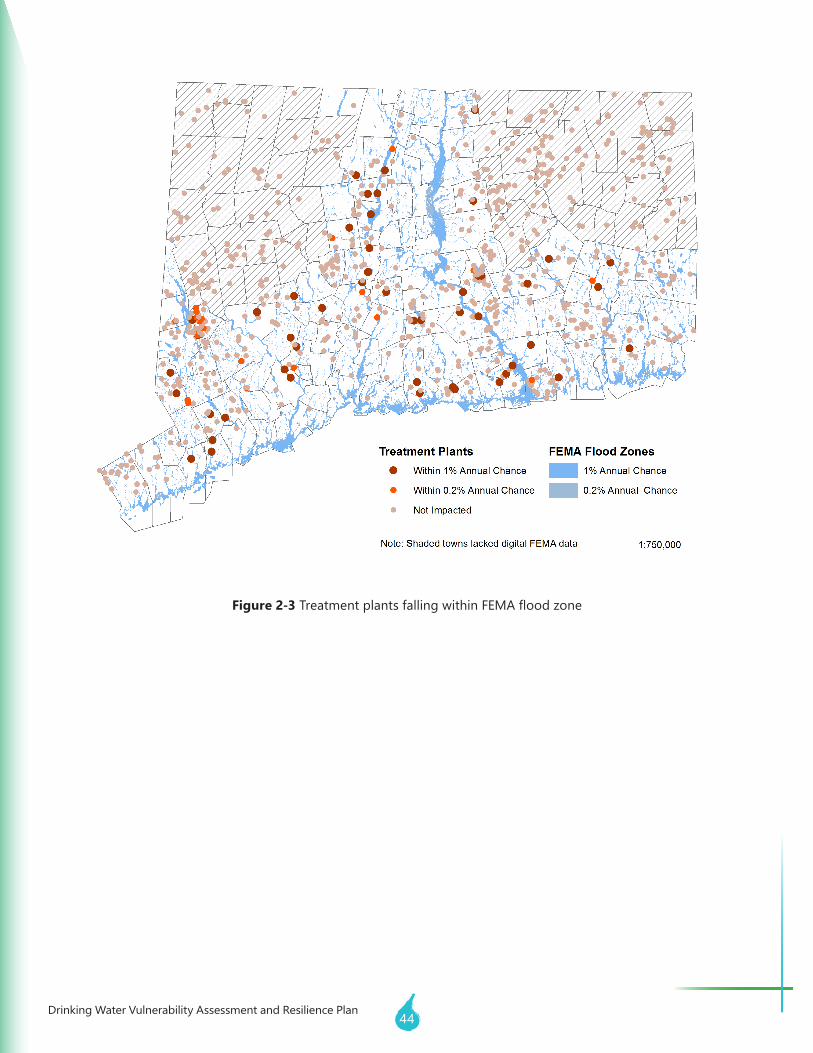
44Drinking Water Vulnerability Assessment and Resilience Plan
Figure 2-3 TreatmentplantsfallingwithinFEMAfloodzone
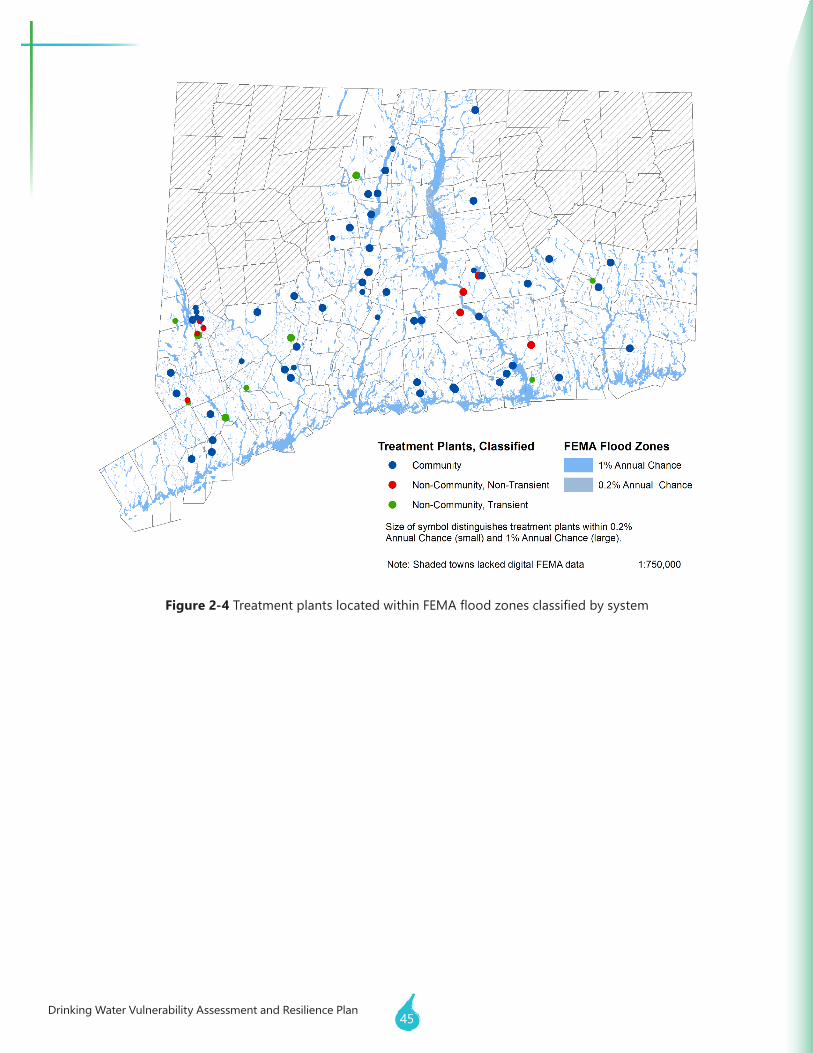
Drinking Water Vulnerability Assessment and Resilience Plan45
Figure 2-4 TreatmentplantslocatedwithinFEMAfloodzonesclassifiedbysystem
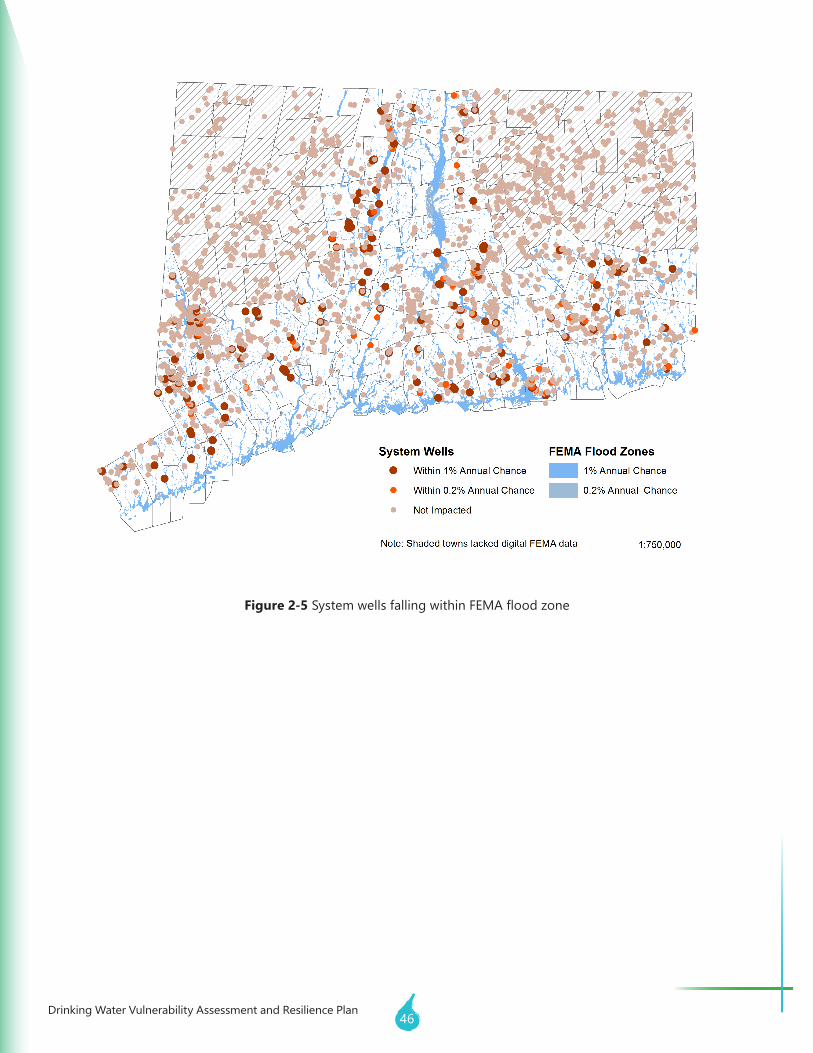
46Drinking Water Vulnerability Assessment and Resilience Plan
Figure 2-5 SystemwellsfallingwithinFEMAfloodzone
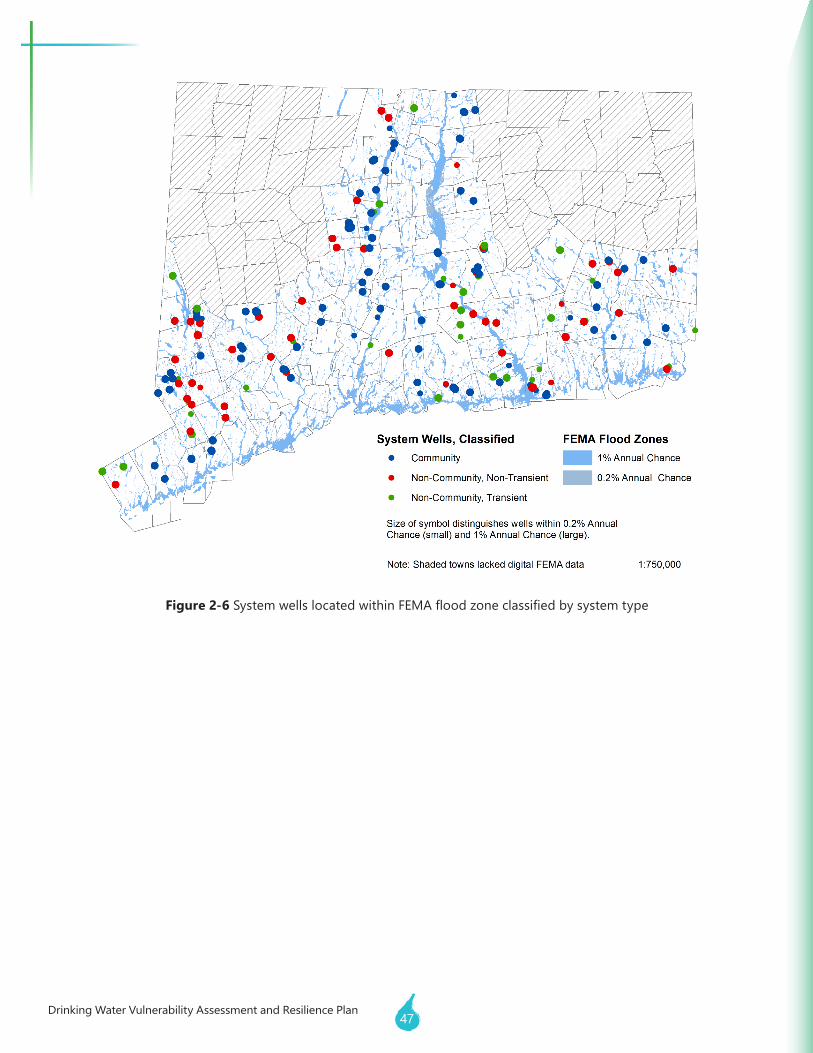
Drinking Water Vulnerability Assessment and Resilience Plan47
Figure 2-6 SystemwellslocatedwithinFEMAfloodzoneclassifiedbysystemtype
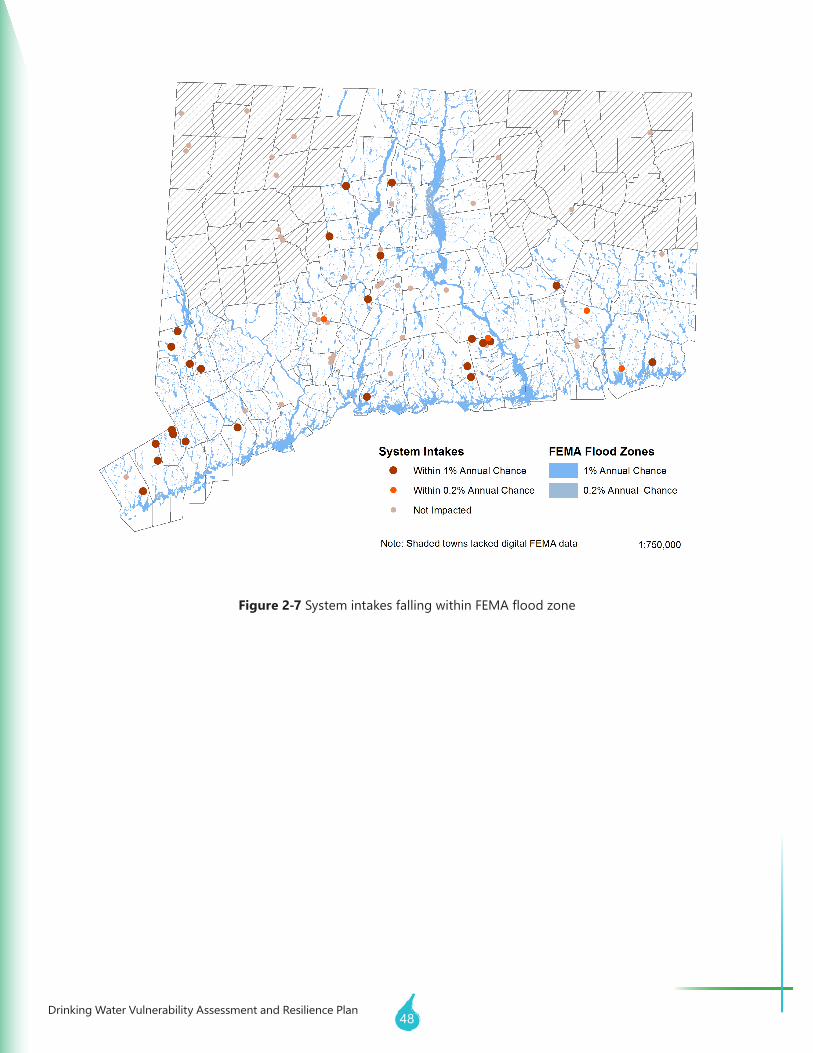
48Drinking Water Vulnerability Assessment and Resilience Plan
Figure 2-7 SystemintakesfallingwithinFEMAfloodzone
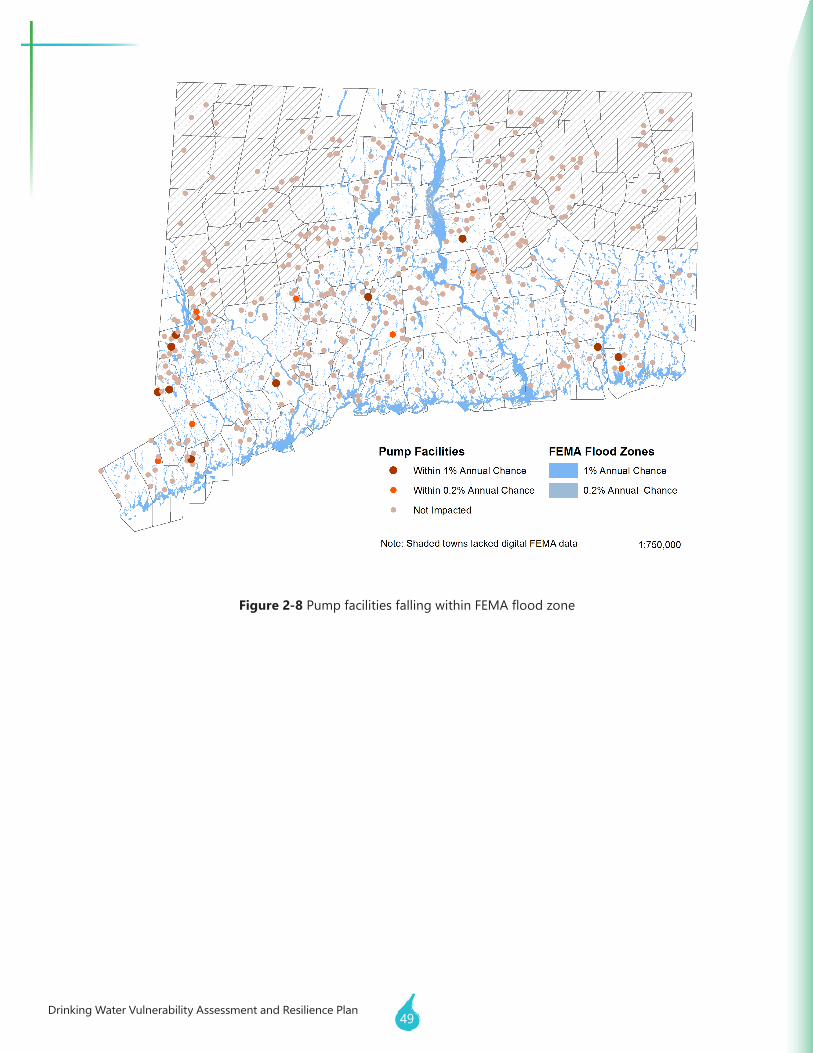
Drinking Water Vulnerability Assessment and Resilience Plan49
Figure 2-8 PumpfacilitiesfallingwithinFEMAfloodzone
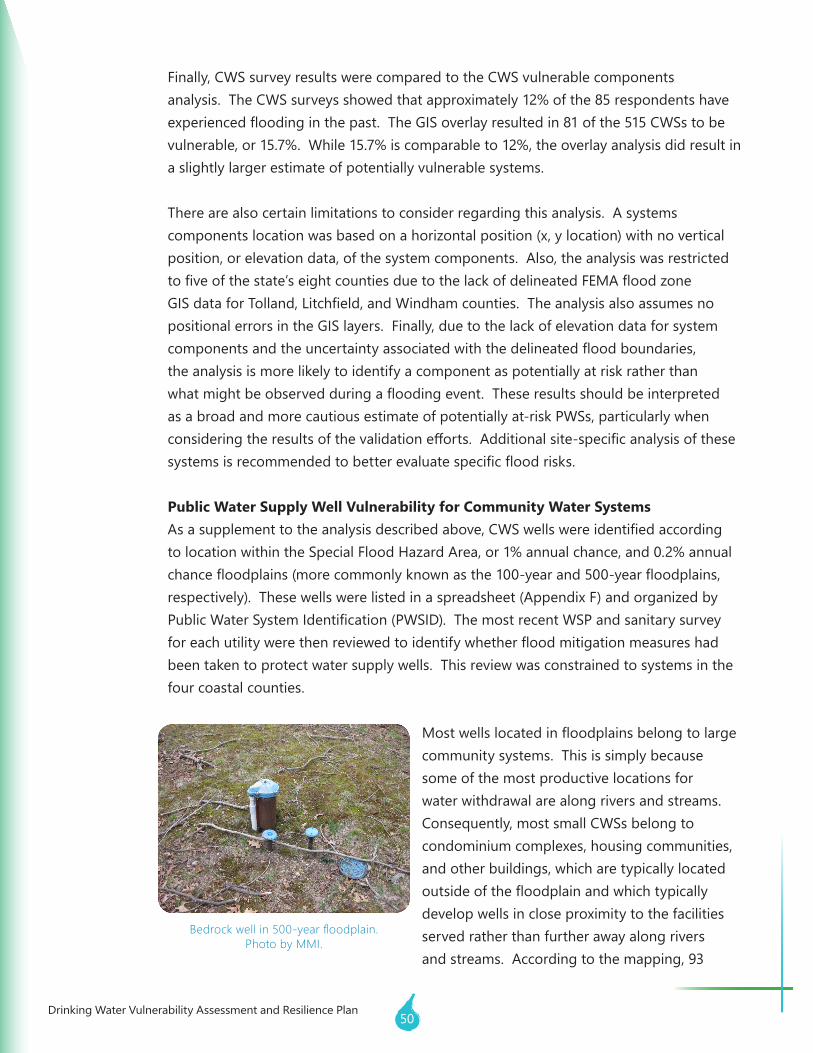
50Drinking Water Vulnerability Assessment and Resilience Plan
Finally, CWS survey results were compared to the CWS vulnerable components analysis.TheCWSsurveysshowedthatapproximately12%ofthe85respondentshaveexperiencedfloodinginthepast.TheGISoverlayresultedin81ofthe515CWSstobevulnerable,or15.7%.While15.7%iscomparableto12%,theoverlayanalysisdidresultina slightly larger estimate of potentially vulnerable systems.
There are also certain limitations to consider regarding this analysis. A systems components location was based on a horizontal position (x, y location) with no vertical position, or elevation data, of the system components. Also, the analysis was restricted tofiveofthestate’seightcountiesduetothelackofdelineatedFEMAfloodzoneGISdataforTolland,Litchfield,andWindhamcounties.Theanalysisalsoassumesnopositional errors in the GIS layers. Finally, due to the lack of elevation data for system componentsandtheuncertaintyassociatedwiththedelineatedfloodboundaries,the analysis is more likely to identify a component as potentially at risk rather than whatmightbeobservedduringafloodingevent.Theseresultsshouldbeinterpretedas a broad and more cautious estimate of potentially at-risk PWSs, particularly when consideringtheresultsofthevalidationefforts.Additionalsite-specificanalysisofthesesystemsisrecommendedtobetterevaluatespecificfloodrisks.
Public Water Supply Well Vulnerability for Community Water SystemsAsasupplementtotheanalysisdescribedabove,CWSwellswereidentifiedaccordingtolocationwithintheSpecialFloodHazardArea,or1%annualchance,and0.2%annualchancefloodplains(morecommonlyknownasthe100-yearand500-yearfloodplains,respectively). These wells were listed in a spreadsheet (Appendix F) and organized by PublicWaterSystemIdentification(PWSID).ThemostrecentWSPandsanitarysurveyforeachutilitywerethenreviewedtoidentifywhetherfloodmitigationmeasureshadbeen taken to protect water supply wells. This review was constrained to systems in the four coastal counties.
Mostwellslocatedinfloodplainsbelongtolargecommunity systems. This is simply because some of the most productive locations for water withdrawal are along rivers and streams. Consequently,mostsmallCWSsbelongtocondominium complexes, housing communities, and other buildings, which are typically located outsideofthefloodplainandwhichtypicallydevelop wells in close proximity to the facilities served rather than further away along rivers and streams. According to the mapping, 93
Bedrock well in 500-year floodplain. Photo by MMI.
Drinking Water Vulnerability Assessment and Resilience Plan51
communitywellsexistinthe1%annualchancefloodplaininthefourcoastalcounties,andanother27wellsexistinthe0.2%annualchancefloodplain.
Modernregulationsrequirewellcasingstoextendupwardabovetheelevationofthe1%annualchanceflood;however,manyproductionwellswereconstructedbeforeFEMAfloodmappingwasestablished.Althoughtherearenohistoricalregulatoryrequirementsregardingexistingwellsinthe0.2%annualchancefloodplain,newwells would be considered critical activities if state funding (such as DWSRF) is used. Therefore,statestatuteswouldrequirethattheybeprotectedtothe0.2%annualchancefloodelevationunderstatestatuteinexistencethrough2017andhigherthanthe0.2%floodelevationbeginninginexistenceafterPublicAct18-82.Inaddition,climacticconditionsandlandcoverchangescouldmeanthatthe0.2%annualchancestormbecomesamorefrequentoccurrenceinthenearfuture.Thismakesthe0.2%annualchancefloodplainanemergingconcernforwaterutilities.
Manywellcasingswithinthe1%annualchancefloodplainshavebeenextendedup above grade, have watertight turbine pump seals, or are enclosed in watertight structures.Thesemeasuresprovidesomeresiliencetofloodingalthoughtheoptimalapproach is to raise both the top of the well casing and the entire pump house well abovethe1%annualchancefloodelevationor0.2%annualchancefloodelevation.Someutilitieshadnofloodprotectionforthewellsandsimplyincludedwellshutdownand decontamination as part of their ECP. Often, utilities that used this approach had othersourcesthatwerelocatedoutsideofthe1%annualchancefloodplain,providingsome redundancy. Some utilities did not appear to acknowledge that some of their wells werewithinthe1%annualchancefloodplainintheWSPsorsanitarysurveysdespitemapping to the contrary.
Floodmitigationeffortsforwellslocatedinthe0.2%annualchancefloodplain(butoutsidethe1%annualchancefloodplain)werenottypicallyidentifiedinWSPsorsanitary surveys. In a few cases, it was noted that access roads to the well house could beinaccessibleduringfloodingevents.
2.4.5 Potential Impact of Climate Change
Climate change is being modeled on a global and local scale. Two recent local climate change analyses were performed for the State of Connecticut. An analysis conducted bytheUniversityofConnecticut(UCONN)wasdonespecificallyforthepurposesoftheDWVARP to identify future risk to drinking water systems. A second analysis, conducted by CDM Smith, was done to augment the Connecticut SWP.
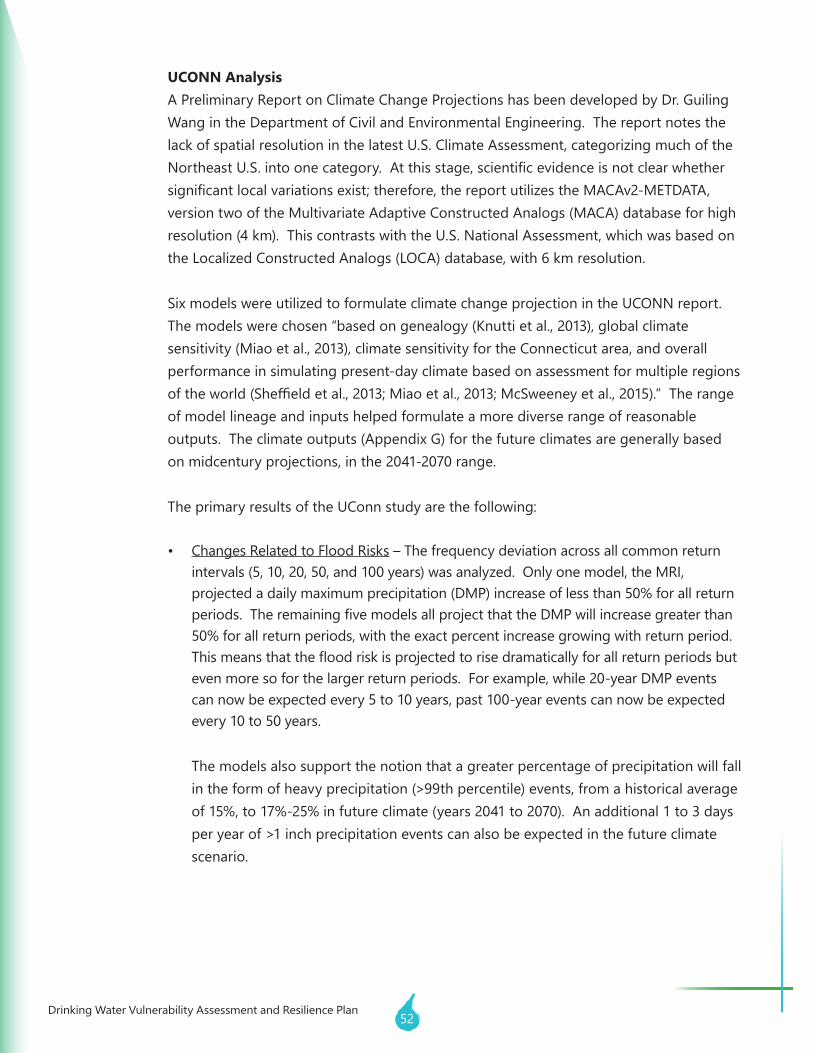
52Drinking Water Vulnerability Assessment and Resilience Plan
UCONN AnalysisA Preliminary Report on Climate Change Projections has been developed by Dr. Guiling Wang in the Department of Civil and Environmental Engineering. The report notes the lack of spatial resolution in the latest U.S. Climate Assessment, categorizing much of the NortheastU.S.intoonecategory.Atthisstage,scientificevidenceisnotclearwhethersignificantlocalvariationsexist;therefore,thereportutilizestheMACAv2-METDATA,version two of the Multivariate Adaptive Constructed Analogs (MACA) database for high resolution (4 km). This contrasts with the U.S. National Assessment, which was based on the Localized Constructed Analogs (LOCA) database, with 6 km resolution.
Six models were utilized to formulate climate change projection in the UCONN report. Themodelswerechosen“basedongenealogy(Knuttietal.,2013),globalclimatesensitivity (Miao et al., 2013), climate sensitivity for the Connecticut area, and overall performance in simulating present-day climate based on assessment for multiple regions oftheworld(Sheffieldetal.,2013;Miaoetal.,2013;McSweeneyetal.,2015).”Therangeof model lineage and inputs helped formulate a more diverse range of reasonable outputs. The climate outputs (Appendix G) for the future climates are generally based on midcentury projections, in the 2041-2070 range.
The primary results of the UConn study are the following:
• Changes Related to Flood Risks–Thefrequencydeviationacrossallcommonreturnintervals (5, 10, 20, 50, and 100 years) was analyzed. Only one model, the MRI, projectedadailymaximumprecipitation(DMP)increaseoflessthan50%forallreturnperiods.TheremainingfivemodelsallprojectthattheDMPwillincreasegreaterthan50%forallreturnperiods,withtheexactpercentincreasegrowingwithreturnperiod.Thismeansthatthefloodriskisprojectedtorisedramaticallyforallreturnperiodsbuteven more so for the larger return periods. For example, while 20-year DMP events can now be expected every 5 to 10 years, past 100-year events can now be expected every 10 to 50 years.
The models also support the notion that a greater percentage of precipitation will fall in the form of heavy precipitation (>99th percentile) events, from a historical average of15%,to17%-25%infutureclimate(years2041to2070).Anadditional1to3daysper year of >1 inch precipitation events can also be expected in the future climate scenario.
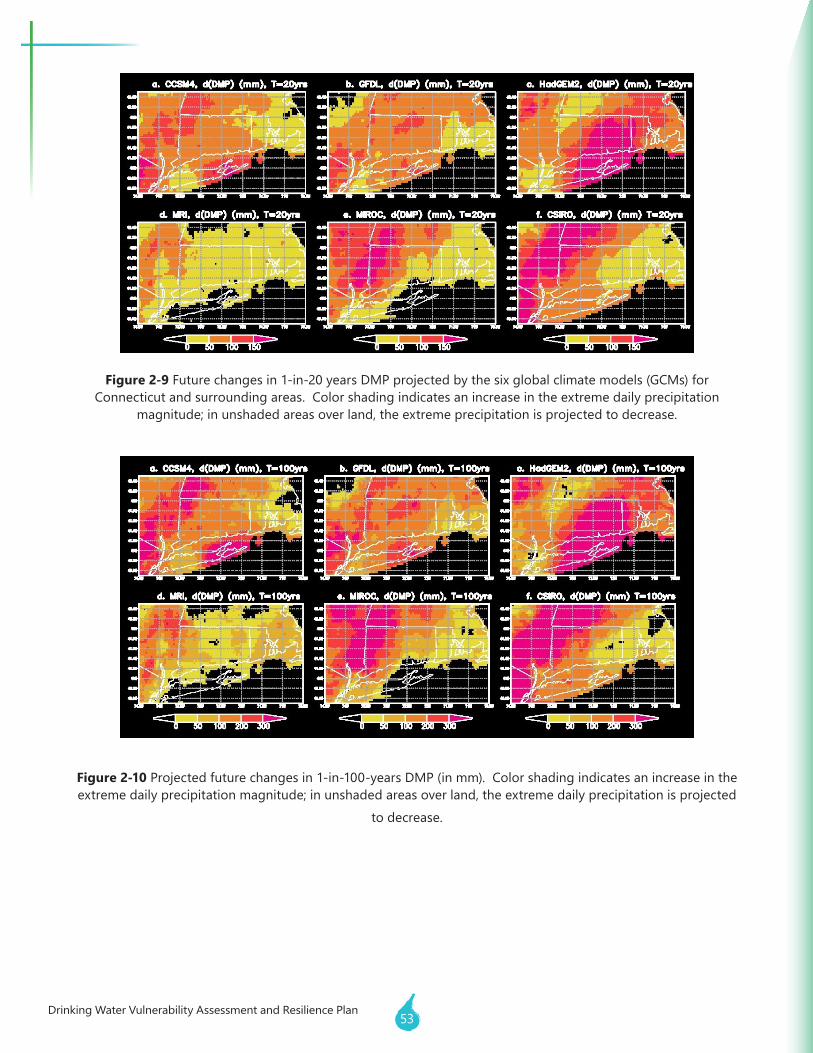
Drinking Water Vulnerability Assessment and Resilience Plan53
Figure 2-9 Future changes in 1-in-20 years DMP projected by the six global climate models (GCMs) for Connecticut and surrounding areas. Color shading indicates an increase in the extreme daily precipitation
magnitude; in unshaded areas over land, the extreme precipitation is projected to decrease.
Figure 2-10 Projected future changes in 1-in-100-years DMP (in mm). Color shading indicates an increase in the extreme daily precipitation magnitude; in unshaded areas over land, the extreme daily precipitation is projected
to decrease.
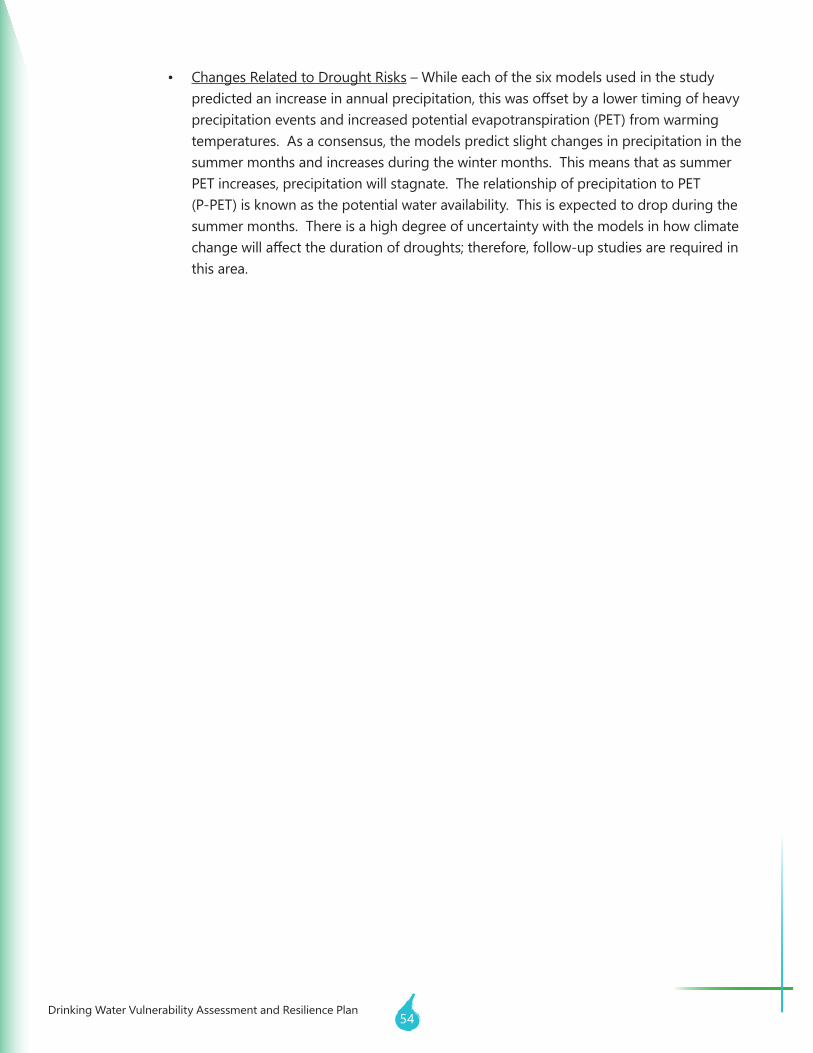
54Drinking Water Vulnerability Assessment and Resilience Plan
• Changes Related to Drought Risks – While each of the six models used in the study predictedanincreaseinannualprecipitation,thiswasoffsetbyalowertimingofheavyprecipitation events and increased potential evapotranspiration (PET) from warming temperatures. As a consensus, the models predict slight changes in precipitation in the summer months and increases during the winter months. This means that as summer PET increases, precipitation will stagnate. The relationship of precipitation to PET (P-PET) is known as the potential water availability. This is expected to drop during the summer months. There is a high degree of uncertainty with the models in how climate changewillaffectthedurationofdroughts;therefore,follow-upstudiesarerequiredinthis area.
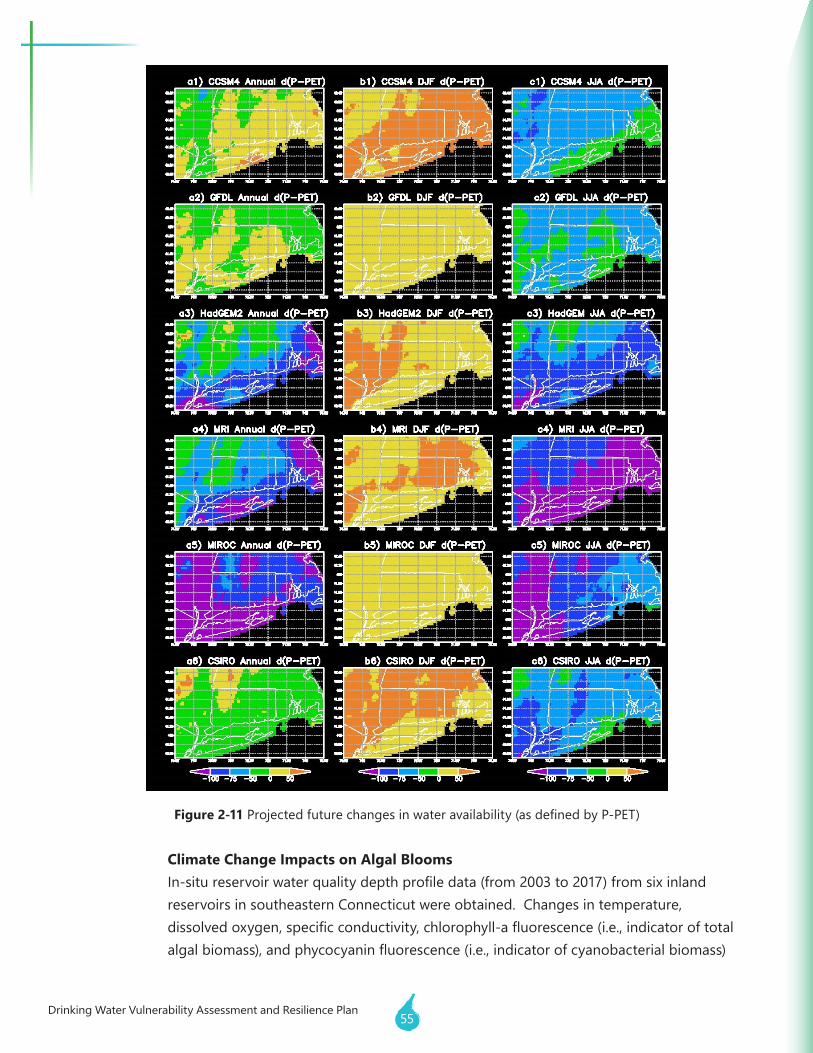
Drinking Water Vulnerability Assessment and Resilience Plan55
Figure 2-11 Projectedfuturechangesinwateravailability(asdefinedbyP-PET)
Climate Change Impacts on Algal BloomsIn-situreservoirwaterqualitydepthprofiledata(from2003to2017)fromsixinlandreservoirs in southeastern Connecticut were obtained. Changes in temperature, dissolvedoxygen,specificconductivity,chlorophyll-afluorescence(i.e.,indicatoroftotalalgalbiomass),andphycocyaninfluorescence(i.e.,indicatorofcyanobacterialbiomass)
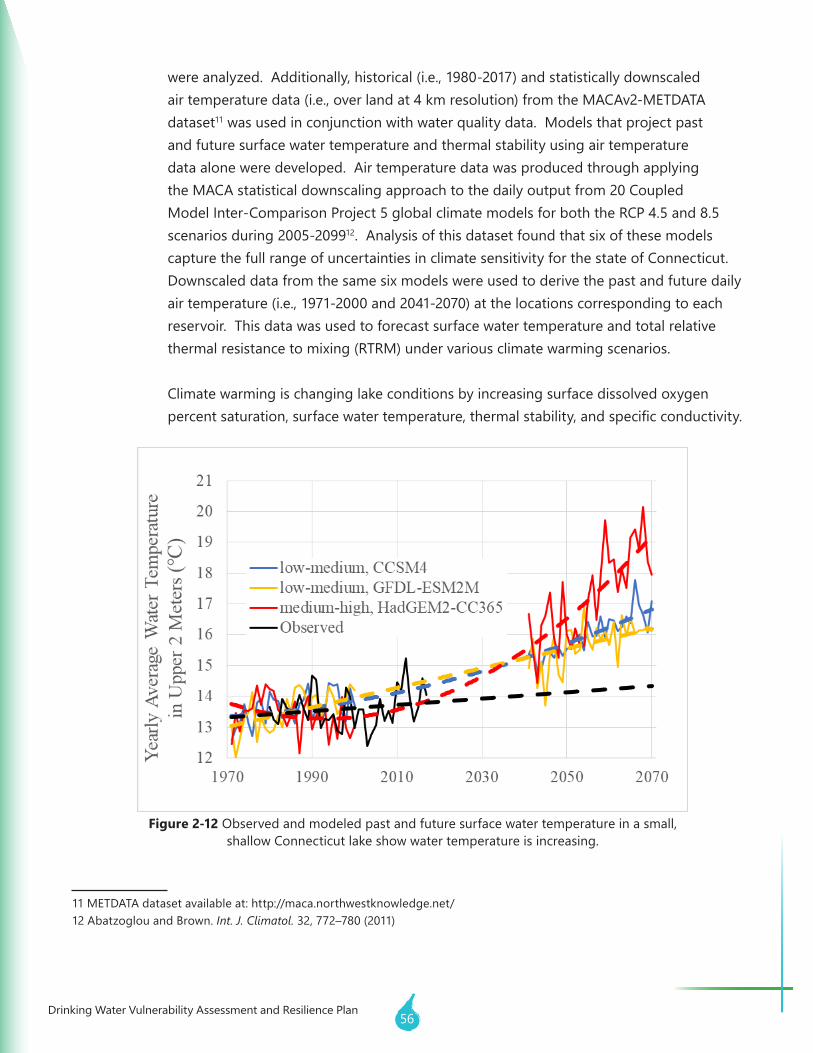
56Drinking Water Vulnerability Assessment and Resilience Plan
were analyzed. Additionally, historical (i.e., 1980-2017) and statistically downscaled air temperature data (i.e., over land at 4 km resolution) from the MACAv2-METDATA dataset11wasusedinconjunctionwithwaterqualitydata.Modelsthatprojectpastand future surface water temperature and thermal stability using air temperature data alone were developed. Air temperature data was produced through applying the MACA statistical downscaling approach to the daily output from 20 Coupled Model Inter-Comparison Project 5 global climate models for both the RCP 4.5 and 8.5 scenarios during 2005-209912. Analysis of this dataset found that six of these models capture the full range of uncertainties in climate sensitivity for the state of Connecticut. Downscaled data from the same six models were used to derive the past and future daily air temperature (i.e., 1971-2000 and 2041-2070) at the locations corresponding to each reservoir. This data was used to forecast surface water temperature and total relative thermal resistance to mixing (RTRM) under various climate warming scenarios.
Climate warming is changing lake conditions by increasing surface dissolved oxygen percentsaturation,surfacewatertemperature,thermalstability,andspecificconductivity.
11 METDATA dataset available at: http://maca.northwestknowledge.net/12 Abatzoglou and Brown. Int. J. Climatol. 32, 772–780 (2011)
Figure 2-12 Observed and modeled past and future surface water temperature in a small, shallow Connecticut lake show water temperature is increasing.
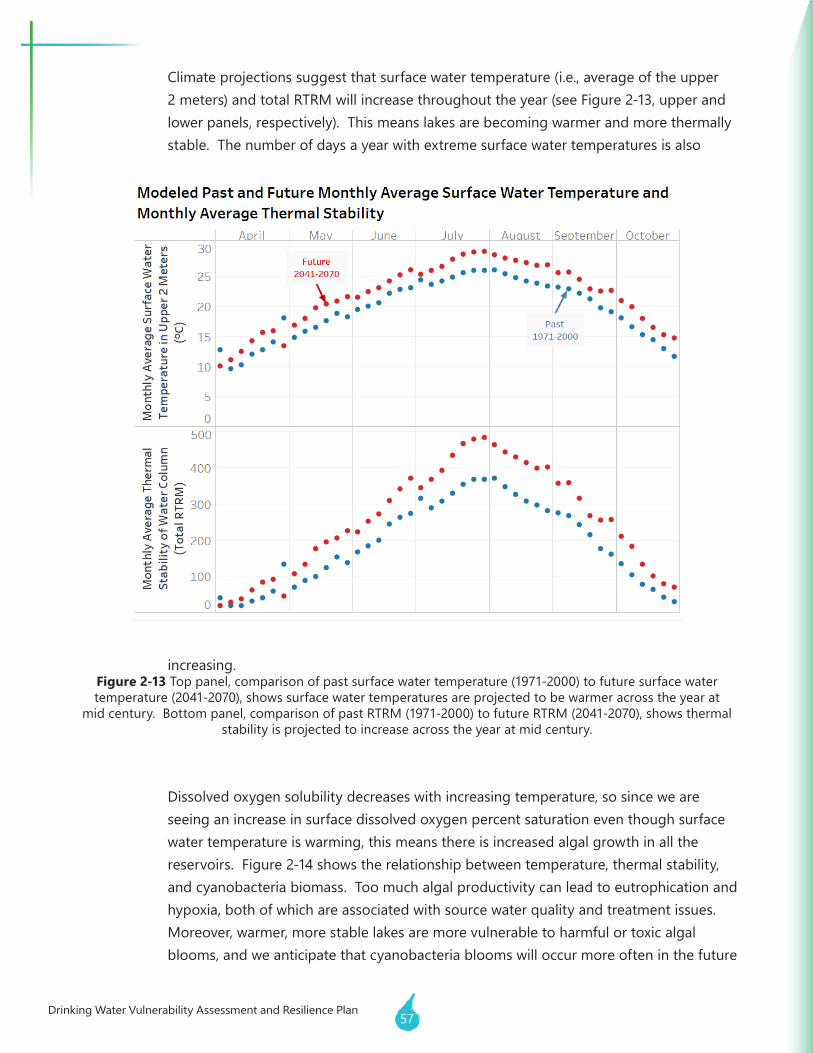
Drinking Water Vulnerability Assessment and Resilience Plan57
Climate projections suggest that surface water temperature (i.e., average of the upper 2 meters) and total RTRM will increase throughout the year (see Figure 2-13, upper and lower panels, respectively). This means lakes are becoming warmer and more thermally stable. The number of days a year with extreme surface water temperatures is also
increasing.Figure 2-13 Top panel, comparison of past surface water temperature (1971-2000) to future surface water temperature (2041-2070), shows surface water temperatures are projected to be warmer across the year at
mid century. Bottom panel, comparison of past RTRM (1971-2000) to future RTRM (2041-2070), shows thermal stability is projected to increase across the year at mid century.
Dissolved oxygen solubility decreases with increasing temperature, so since we are seeing an increase in surface dissolved oxygen percent saturation even though surface water temperature is warming, this means there is increased algal growth in all the reservoirs. Figure 2-14 shows the relationship between temperature, thermal stability, and cyanobacteria biomass. Too much algal productivity can lead to eutrophication and hypoxia,bothofwhichareassociatedwithsourcewaterqualityandtreatmentissues.Moreover, warmer, more stable lakes are more vulnerable to harmful or toxic algal blooms, and we anticipate that cyanobacteria blooms will occur more often in the future
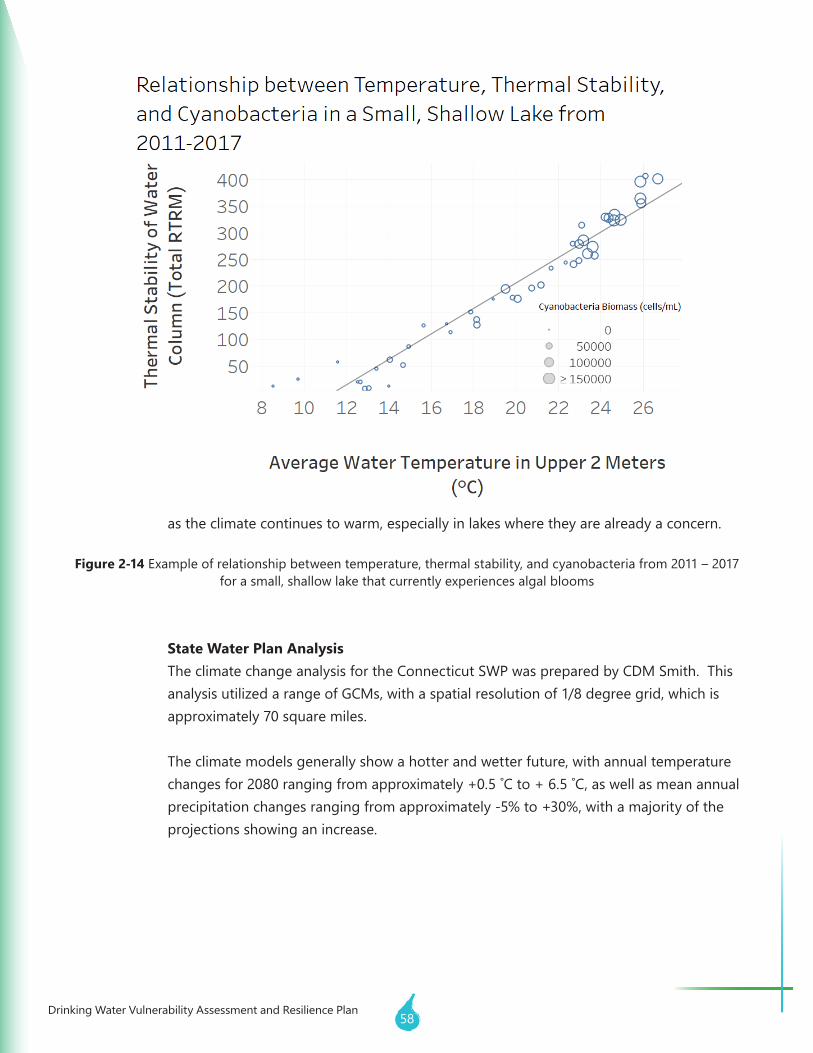
58Drinking Water Vulnerability Assessment and Resilience Plan
as the climate continues to warm, especially in lakes where they are already a concern.
Figure 2-14 Example of relationship between temperature, thermal stability, and cyanobacteria from 2011 – 2017 for a small, shallow lake that currently experiences algal blooms
State Water Plan AnalysisThe climate change analysis for the Connecticut SWP was prepared by CDM Smith. This analysis utilized a range of GCMs, with a spatial resolution of 1/8 degree grid, which is approximately70squaremiles.
The climate models generally show a hotter and wetter future, with annual temperature changesfor2080rangingfromapproximately+0.5˚Cto+6.5˚C,aswellasmeanannualprecipitationchangesrangingfromapproximately-5%to+30%,withamajorityoftheprojections showing an increase.
Drinking Water Vulnerability Assessment and Resilience Plan59
The hybrid delta ensemble (HDe) results compare historical data to a dataset adjusted for 2080. The output includes monthly time series plots of the following:
• Average temperature and total precipitation: raw output and month-to-month variability
• Mean monthly temperature and precipitation bar charts: projected seasonal changes
• Monthly temperature and precipitation percentile plots: full range of projected changes
All ensembles project a consistent increase in temperature for all calendar months. However, precipitation projections are more variable but generally show an increase for all four seasons. Winter and spring changes are projected to be higher than summer and autumn changes. The projections also show minimal changes regarding drier months in termsoffrequencyandrainfalllevel.
The projections translate into changes in future water availability. The results imply there is potential for water loss due to rising temperatures and evapotranspiration loss. However, a projected increase in rainfall, which is not consistently distributed throughout theyear,couldpotentiallyoffsetthistemperatureincrease.Thechangesinrainfallfrequencycouldaffectbothdroughtsandfloodingpotential.Climateforecastsdotendtoassociatethecoupledincreaseswithmorefrequentandintensestormsandlongerdry periods during the summer months.
The smaller reservoirs found in Connecticut may be sensitive to these changes, and demand could also be impacted. The projected increase in temperatures may result in ariseindemand;however,again,theincreaseinprecipitationcouldoffsetthisdemand.Theconclusionisalsodrawnthatwateravailabilityandstreamflowswillbeimpacteddue to less snow pack and an earlier melt. The rapid snowmelt, in conjunction with higherextremeprecipitation,couldpotentiallyresultinincreasedfloodingrisk.Also,riverwaterqualitycouldpotentiallybenegativelyimpactedduetotheimpactsofincreased temperatures such as increased bacteria and algae growth rates or lower dissolved oxygen saturation levels.
TheSWPanalysisalsotranslatedtheclimatechangeprojectionsintostreamflowprojections to provide insight into potential surface water availability. The same methods were used as the climate change projections but with a planning horizon of 2040.Theapproachapplied“griddedrunoff”projections,whichweredevelopedbyincorporating temperature and precipitation projections for the year 2040 into a rainfall-runoffmodel.
60Drinking Water Vulnerability Assessment and Resilience Plan
The“hot/wet”climatescenarioprojectsthelargestincreaseinstreamflow,withthelargest increases projected for the winter months (December through February). Springtimestreamflowisprojectedtoeitherincreaseslightlyordecreasesignificantlydue to the dynamic of greater winter precipitation and reduced snow accumulation.
The“hot/dry”scenarioprojectsadecreaseinstreamflowforamajorityofspring,summer,andfall;however,thesesignificantdecreasesareoffsetbythelargerprojectedincreasesinwinterprecipitation.Apercentileanalysisindicatesthatthelargerflowmonthswillexperiencethelargestincreasewhilethelowerflowmonthswillexperienceasignificantlysmallerincreaseinflow,ifanyatall.
2.5 Assessment of Critical Assets of Small Community Water SystemsPWSs are comprised of sources of supply, transmission pipes or mains, storage facilities, pumping facilities, and distribution systems. Some PWSs also utilize treatment. Relative to storage, PWSs typically utilize some combination of atmospheric storage (water stored at ambient pressures) and/or pressurized storage unless storage is elevated and therefore provides pressure through elevation. PWSs that lack redundancy in sources, transmission, storage, or pumping are typically less resilient than PWSs that incorporate redundant critical assets.
PWS interconnections are physical connections between systems and are common in Connecticut. Many interconnections are used for active, daily transfer of water between systems whereas some are used for only emergency supply. Interconnections are useful tools for building redundancy of public water service in a community or region because water canbeshared.AninterconnectioncanbebeneficialifaPWSlacksredundancyinsources,transmission, storage, or pumping.
There are approximately 160 small CWSs in the four southern Connecticut counties that are notaffiliatedwithalargewaterutilitysuchasAquarionWaterCompanyorConnecticutWaterCompany.WhilemanysmallCWSsprovideadequateorgoodqualityservicetotheircustomers,they inherently lack the resources and redundancy of large community systems/water utilities. Smallsystemsthatareaffiliatedwithlargesystemshaveaccesstoanextensiveinventoryofpartsandexpertise,whichareoftennotavailabletounaffiliatedsystems.
Small community systems serve as few as 25 individuals and as many as several hundred though most are small enough to operate only one source of supply. This means that nearly all parts of the water system (all assets) are critical in order to maintain consistent service, from the well and the well pump, to the storage tanks and boosters, to the distribution system. A component failurethatcouldeasilybereplacedwiththein-houseinventoryofalargesystemcouldrequiredaysofwaitingandsupplyinterruptionsinasmall,unaffiliatedsystem.Afailureofanyofthese
Drinking Water Vulnerability Assessment and Resilience Plan61
components would, at the very least, provide an unacceptable level of service to customers. Failure of critical components would often cause a complete loss of supply. Due to the small size of these systems, there is often a lack of redundancy in sources of supply, infrastructure, power supply, or human resources. System components that may not be considered critical in a large system, like a single booster pump, distribution main, or source of supply, are often critical in a small system.
DuringtheWUCCdatacollectionprocess,unaffiliatedsmallCWSsinthestatewereevaluatedthroughtheCapacityAssessmentTool(CAT)“scorecard,”whichconsiderseconomic,managerial,andsystemperformanceintheareasoftechnical,managerial,andfinancialcapacity.Whilealow scorecard rating does not necessarily mean that a water system is in danger of failure, it does mean that there is a greater chance of system disruption in the future. Small systems with low ratings are considered the highest priority for determining the means to increase capacity, including interconnections if appropriate.
Appendix H contains an analysis of small CWS assets. Table H-1 in Appendix H (Small System Checklist) provides a yes/no inventory of the assets of the 157 small systems that were rated through the CAT. The table indicates whether each system has one or more wells, interconnections, booster pumping station, contact tank, atmospheric pressure storage tank, hydropneumatic storage tank, bladder storage, and/or treatment. All small community systemsinFairfield,NewHaven,Middlesex,andNewLondonCountiessourcetheirwaterfromgroundwater supply sources or interconnections with larger utilities.
Table H-2 in Appendix H (Critical Assets List) individually inventories all of these assets. The list indicates the critical assets in each system and provides a more detailed look at the types of critical assets within each system. Critical assets listed include groundwater supply sources, interconnections, booster pumps, contact tanks, atmospheric tanks, hydropneumatic tanks, bladder tanks, and treatment. Since all systems maintain a distribution system, this piece of criticalinfrastructurewasnotincludedinthislist.Thefollowingarenotablefindings:
• Overall, just four systems maintained no storage at all. One such system is a consecutive systemofAquarionWaterCompany,meaningthatitreceivesallofitswaterthroughameteredinterconnectionwithalargeAquarionsystem.
• Just 11 systems maintain no source of active pressurized storage (hydropneumatic or bladder storage). Some of these 11 systems may have elevated atmospheric storage, which can provide some pressure by gravity. In the event of a power failure or loss of a supply source, most systems have at least some reserve water supply. The amount of pressure storage varies considerably, however, from multi-thousand-gallon hydropneumatic tanks to small 30-gallon bladder tanks.
62Drinking Water Vulnerability Assessment and Resilience Plan
• Approximately57%ofsystemsoperatesometypeofwatertreatmentsystem.Watertreatment consists of pH adjustment, chlorination, or removal of dissolved materials such as iron or manganese. Although these systems are in place as a protective measure, they also can indicate a vulnerability as the water may not be potable in the event of a failure of the system.
• A few systems have interconnections to larger water utilities. While some are consecutive systems, there are at least two examples of systems that maintain their own source of supply andalsohaveaninterconnectionwithalargesystem.Thisarrangementprovidessignificantredundancy and emergency protection for the small community system.
As a result of this assessment, multiple recommendations could be made. For example, those systemswithnostorageshouldberequiredtohavesomelevelofstoragethatiscapableof being distributed throughout the service area. Also, it is apparent some systems utilize treatment;however,therearemanythatdonot.Testingrequirementsshouldbealteredforthosesystemsthathavenotreatmentastheycouldbeatgreaterriskofwaterqualityissues.Ingeneral, this comprehensive inventory of system assets provides a foundation for identifying those systems that are in need of redundancies to ensure minimal service disruptions.
2.6 Assessment of Critical Facilities Served by Community Water SystemsCritical facilities are integral to a community during emergencies and natural disasters; therefore, understanding which facilities are more vulnerable than others based on their relative water system is imperative to better serving a community during an event. For the purposes of the DWVARP, a critical facility may include an ambulance garage, care facility, city hall, community center,emergencymedicalservices(EMS),EOC,firedepartment,hospital,policedepartment,public works, school, shelter, and town hall. A comprehensive list of critical facilities used in this analysis can be found in Appendix I.
ToassesspotentialvulnerabilityofcriticalfacilitiestoafloodeventinConnecticut’sfourcoastalcounties, a GIS analysis was conducted based on the assumption that if a PWS was potentially vulnerabletoafloodeventthenallfacilitiesservedbythatsystemwerealsopotentiallyvulnerable. Each critical facility was linked to a PWS, and it was assumed that the system nearest to the facility was the water supplier.
Drinking Water Vulnerability Assessment and Resilience Plan63
It was noted that some critical facilities in fact had their own well, which they are responsible for maintaining and therefore are considered their own CWS and are not served by an outside system. A validation check was conducted to ensure that the critical facility and PWS shared thesamenameandthattheidentificationofthissystemwascorrect.Akeywordsearchwas conducted on PWS well names, stored as an attribute in the PWS spatial data layer. The following terms were searched for within a PWS well name:
• Academy • School• College• University• Community Center• Safety• Fire• Police• Town Hall• Public Works
• Ambulance• Health Care• Hospital• Nursing• Rehab• Elderly• Manor• Senior• Assisted• Medical
Intotal,486PWSwellswereidentifiedashavingawellnamethatcontainedoneofthesekeyword phrases. The names of the 486 PWS wells were then manually compared against the names of the 1,617 priority critical facilities. When a critical facility name was matched to one of theflaggedPWSwellnames,thePWSassignmentbasedontheoverlayanalysiswaschecked.If the PWS assigned to the facility did not match the PWS well sharing the same name, the PWS assigned to the facility was edited to the matching PWS well. Thirty critical facilities were edited so that the closest PWS assigned corresponded to the PWS well of the same name.
Also, a CWS WSP priority customer list was used to compare to the GIS overlay analysis. Of the 597 priority customers, 144 appeared on the initial list of critical facilities. The PWS initially identifiedasawatersupplierwascomparedtothesupplyplanlist,andanydiscrepanciesweremanuallycorrected.Atotaloffivefacilitieswereedited,and35werechangedasaresultofthevalidationmethods(2.2%ofcriticalfacilities).
Critical facility proximity was also compared to CWS component location. All facilities were linked to the nearest treatment plan, intake, and pump facility associated with the system determinedtoservethecriticalfacility.WithoutPWSflownetworkdata,theanalysiswasbasedofftheassumptionthatafacilitywasservedbythenearestPWScomponent.IfaPWSonlyhadone component, such as only one treatment plant, that component was then associated with the critical facilities within the service area.
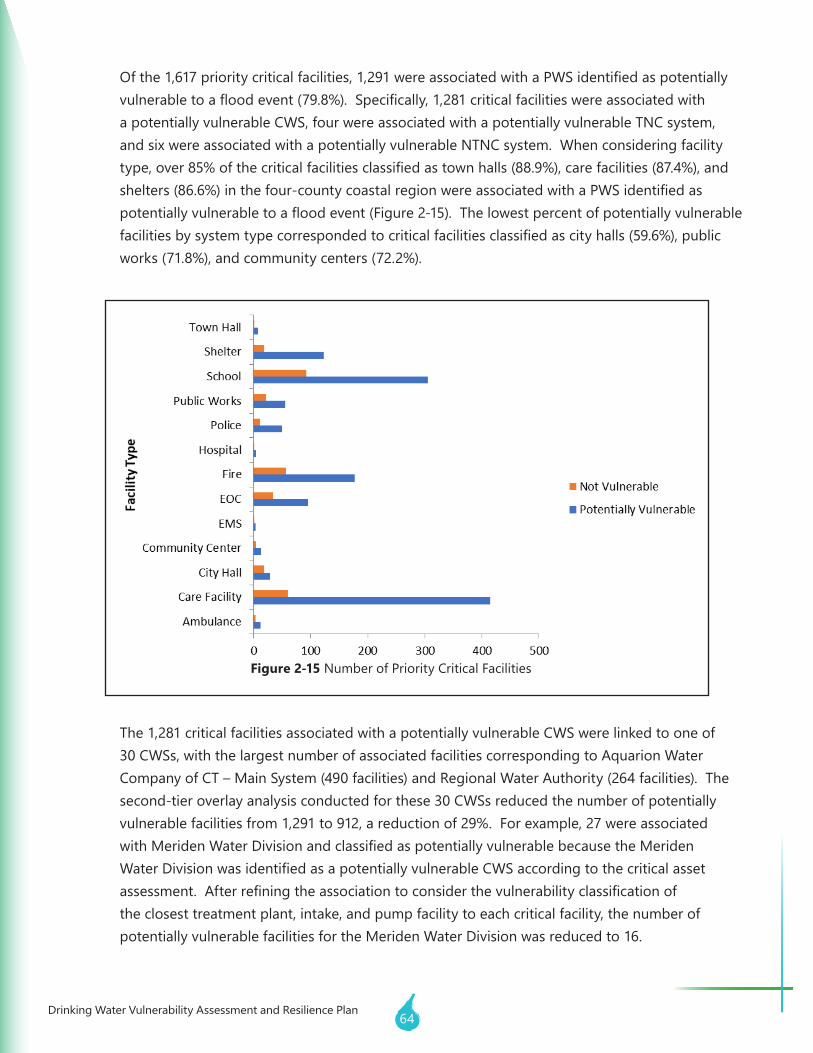
64Drinking Water Vulnerability Assessment and Resilience Plan
Ofthe1,617prioritycriticalfacilities,1,291wereassociatedwithaPWSidentifiedaspotentiallyvulnerabletoafloodevent(79.8%).Specifically,1,281criticalfacilitieswereassociatedwitha potentially vulnerable CWS, four were associated with a potentially vulnerable TNC system, and six were associated with a potentially vulnerable NTNC system. When considering facility type,over85%ofthecriticalfacilitiesclassifiedastownhalls(88.9%),carefacilities(87.4%),andshelters(86.6%)inthefour-countycoastalregionwereassociatedwithaPWSidentifiedaspotentiallyvulnerabletoafloodevent(Figure2-15).Thelowestpercentofpotentiallyvulnerablefacilitiesbysystemtypecorrespondedtocriticalfacilitiesclassifiedascityhalls(59.6%),publicworks(71.8%),andcommunitycenters(72.2%).
The 1,281 critical facilities associated with a potentially vulnerable CWS were linked to one of 30CWSs,withthelargestnumberofassociatedfacilitiescorrespondingtoAquarionWaterCompany of CT – Main System (490 facilities) and Regional Water Authority (264 facilities). The second-tier overlay analysis conducted for these 30 CWSs reduced the number of potentially vulnerablefacilitiesfrom1,291to912,areductionof29%.Forexample,27wereassociatedwithMeridenWaterDivisionandclassifiedaspotentiallyvulnerablebecausetheMeridenWaterDivisionwasidentifiedasapotentiallyvulnerableCWSaccordingtothecriticalassetassessment.Afterrefiningtheassociationtoconsiderthevulnerabilityclassificationofthe closest treatment plant, intake, and pump facility to each critical facility, the number of potentially vulnerable facilities for the Meriden Water Division was reduced to 16.
Figure 2-15 Number of Priority Critical Facilities
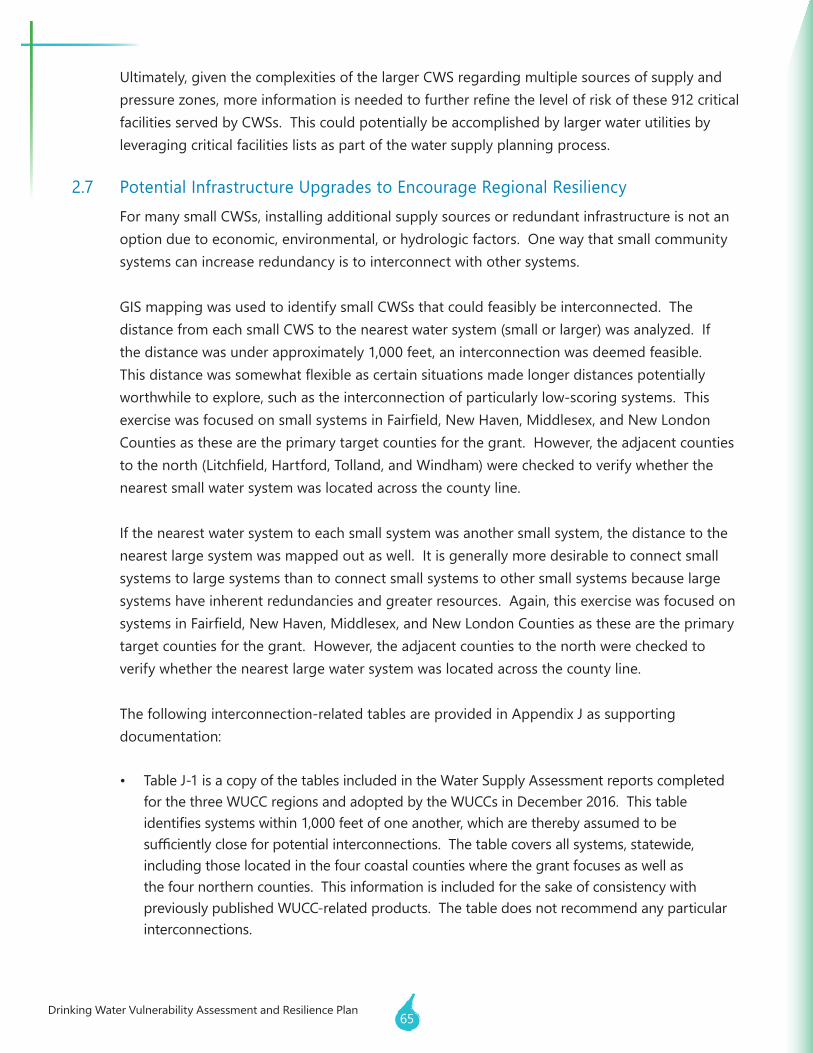
Drinking Water Vulnerability Assessment and Resilience Plan65
Ultimately, given the complexities of the larger CWS regarding multiple sources of supply and pressurezones,moreinformationisneededtofurtherrefinethelevelofriskofthese912criticalfacilities served by CWSs. This could potentially be accomplished by larger water utilities by leveraging critical facilities lists as part of the water supply planning process.
2.7 Potential Infrastructure Upgrades to Encourage Regional ResiliencyFor many small CWSs, installing additional supply sources or redundant infrastructure is not an option due to economic, environmental, or hydrologic factors. One way that small community systems can increase redundancy is to interconnect with other systems.
GIS mapping was used to identify small CWSs that could feasibly be interconnected. The distance from each small CWS to the nearest water system (small or larger) was analyzed. If the distance was under approximately 1,000 feet, an interconnection was deemed feasible. Thisdistancewassomewhatflexibleascertainsituationsmadelongerdistancespotentiallyworthwhile to explore, such as the interconnection of particularly low-scoring systems. This exercisewasfocusedonsmallsystemsinFairfield,NewHaven,Middlesex,andNewLondonCounties as these are the primary target counties for the grant. However, the adjacent counties tothenorth(Litchfield,Hartford,Tolland,andWindham)werecheckedtoverifywhetherthenearest small water system was located across the county line.
If the nearest water system to each small system was another small system, the distance to the nearest large system was mapped out as well. It is generally more desirable to connect small systems to large systems than to connect small systems to other small systems because large systems have inherent redundancies and greater resources. Again, this exercise was focused on systemsinFairfield,NewHaven,Middlesex,andNewLondonCountiesasthesearetheprimarytarget counties for the grant. However, the adjacent counties to the north were checked to verify whether the nearest large water system was located across the county line.
The following interconnection-related tables are provided in Appendix J as supporting documentation:
• Table J-1 is a copy of the tables included in the Water Supply Assessment reports completed for the three WUCC regions and adopted by the WUCCs in December 2016. This table identifiessystemswithin1,000feetofoneanother,whicharetherebyassumedtobesufficientlycloseforpotentialinterconnections.Thetablecoversallsystems,statewide,including those located in the four coastal counties where the grant focuses as well as the four northern counties. This information is included for the sake of consistency with previously published WUCC-related products. The table does not recommend any particular interconnections.
66Drinking Water Vulnerability Assessment and Resilience Plan
• TableJ-2liststhe93smallunaffiliatedsystemsthatcouldfeasiblybeinterconnectedtoanother system. The table lists the nearest PWS of any size and the nearest large system if applicable. In all cases, the nearest small or large system was in the same county or an adjacent southern county. This data was generated for this project using ArcGIS mapping.
• Table J-3 lists 78 potential interconnections that could be recommended to improve resiliency based on factors such as the CAT scores. To help draw these conclusions, this table includes key data from Tables J-1 and J-2 (described above), namely whether the system is characterized ashavinga“SingleWell,”“NoStorage,”“OnlyBladderStorage,”and/or“Hydro-PneumaticStorage.”The78interconnectionsinTableJ-3representasubsetofthe93smallsystemslistedin Table J-2.
• Table J-4 lists detailed information on the WUCC-derived potential interconnections between systems of any size (not only small systems). This data was originally generated for the WUCC project using ArcGIS mapping. Many of these potential interconnections have been mentioned in WSPs although they may seem excessively long or unnecessary in the context ofresiliency.Thetablecontainsaffiliatedsmallsysteminterconnections,unaffiliatedsmallsystem interconnections, and large system interconnections. Also included in the table are the starting CWS, ending CWS, distance of interconnection, population served, elevation change throughout interconnection route, and other information. This information is included for the sake of consistency with ongoing draft WUCC-related products.
• Table J-5 lists potential interconnections between systems in the southern counties and systems in the northern counties. Many exceed 1,000 feet and are not likely to occur unless significantneedsarise.ManyofthesepotentialinterconnectionshavebeenmentionedinWSPs just like the interconnections in Table J-4.
Thefollowingarenotablefindings:
• Approximately93potentialinterconnectionswereidentifiedbetweensmallunaffiliatedsystems and other CWSs.
• Approximately40potentialinterconnectionswereidentifiedbetweensmallunaffiliatedsystems and large CWSs. These may be prioritized for interconnection funding subject to other funding factors.
• Approximately 40 potential interconnections are within 100 feet of the nearest system, with many systems directly adjacent. In areas where more than one interconnection is possible, consolidation of multiple systems may be appropriate.
• For many small CWSs, installing additional supply sources or redundant infrastructure (such as pumping stations, storage tanks, and other system upgrades) is not an option due to lack of available land, lack of space within facilities, and/or lack of funding. In these cases, interconnections are the best option for resilience.
Drinking Water Vulnerability Assessment and Resilience Plan67
Figure 2-16 Proposed potential interconnections within the four coastal counties
68Drinking Water Vulnerability Assessment and Resilience Plan
3.1 Private Well Vulnerability AssessmentPrivatewellvulnerabilityacrossthestateisaconcernforDPH.Privatewellwaterqualityissolelythe well owner’s responsibility and testing may not be done as often as recommended. DPH recommends private wells be tested annually. For example, some wells may only be tested as part of the purchase of a property and not retested until the property is sold such that there maybemanyyearsorevendecadesbetweenwaterqualitytests.
Someprivatewellshavebeenconstructedinfloodzonesandwithinproximitytotheshoreline,resultinginfloodingvulnerabilityfrombothcoastalandriverineevents.Thereisalsotheconcern of saltwater intrusion to those wells located near Long Island Sound.
To better assess the vulnerability of these private wells throughout the four coastal counties, parcelssuspectedtobeservedbyprivatewellswereestablishedandcomparedtoFEMAfloodzonemaps.Largerneighborhoodsthatwereassumedtorelyonwellswereidentified,andspecificrecommendationsweremadetoimproveresiliencyinthatarea.Ananalysiswasalsoconducted on three coastal towns with a large number of coastal wells with recommendations made for these areas.
3.1.1 PrivateWellIdentificationMethodology
To establish the presumed locations of private wells, parcel data was collected for all townsacrossthefourcoastalcountiesofFairfield,NewHaven,Middlesex,andNewLondon. This data was obtained from multiple sources including CT DEEP, COGs, and municipalGISdepartments.ToidentifytheparcelsnotservicedbyaPWS,firstthesmallPWS service areas were overlaid with the parcel data. Any parcel that was within the small PWS13 service area was deleted; it is assumed these parcels are served by a PWS. Next, a 100-foot radius was placed around the large PWS14 service area boundary, and anyparcelsthatwerewithinthisbufferzonewerealsodeleted.Again,thiswasassumingthese parcels rely on public water and do not have a private well. This analysis resulted in 212,881 parcels outside of PWS service areas; however, not all parcels will actually have a well. Many of these parcels are open space.
13Typically,asmallPWSserveslessthan1,000andgenerallydoesnotfileWSPs;however,inthiscontext,asmallPWSisdefinedbytheGISdata.Asmallsystemisdefinedbyonelargepolygonrepresentingitsservicearea.14AlargePWSistypicallyasystemthatservesover1,000andfilesWSPs.Inthiscontext,alargePWSwasdefinedbytheGISdata;alargePWSprovidedapipes-in-the-groundlayer,whichisdistinctlydifferentthanthesmallPWSlayer.
3.0 Private Well Vulnerability And Risk Assessment
Drinking Water Vulnerability Assessment and Resilience Plan69
Openspaceparcelsthroughoutthefourcountieswereidentifiedtobetterestablishtheprivatewellareas.OpenspacedatalayerswereacquiredfromCTDEEPtooverlaywiththe private well parcel data. These layers included DEEP property, federal open space, and municipal and private open space. By including these layers into the analysis, those parcels that were thought to have a private well were distinguished from those that are open space and likely have no well. Also, parcels over 100 acres were assessed for well location using satellite imagery. If one of these large parcels contained a residence, then the residence was cut from the remainder of the open space to better identify private well location.
By utilizing the available parcel data, open space data, and satellite imagery, an estimated 192,396 parcels in the four coastal counties contain a private well, 13,979 are open space parcels, 4,515 are municipal space parcels, 1,884 are DEEP property, and 107 parcels likely contain no well per health director comments15. Parcel data statistics can be found in Appendix K. These statistics include the parcel types, the total count of that parcel type in that town, the minimum and maximum acreage among that parcel type, the mean acreage of that parcel type, the sum of acreage for that parcel type, and standard deviation and range for acreage of that parcel type.
Local Directors of Health were contacted for their input on the private well task in March 2017. This email included a letter describing the project and asking for their input and knowledge of private wells in their town and vulnerabilities in these areas. Of the 52 towns and districts contacted, 33 did not respond to the invitation, and 11 delivered responsesmerelystatingtheyhadnodataonwells,offeringtheirwellcompletionrecords, or providing reference to another source. The remaining eight districts gave minimal input on well location and available data. However, out of the eight health districtsordepartmentstoofferinput,FairfieldwastheonlytowntoofferaGISlayerrepresenting private well parcels.
All Health Directors were again contacted in September 2017 via email. This email included a letter describing the results of the analysis and maps of their respective town or district. These maps showed the assumed private well parcels, along with an overlay oftheFEMAfloodzone.Thisemailinvitedalldirectorstoprovidecommentontheaccuracyofthemapsortogiveinputonanyfloodareaswithintheirrespectivetowns.Of those contacted, 10 directors replied. Six of these replies were informative and were incorporatedinsomewayintothemaps,andfourresponsesweregeneralconfirmationof the map or merely indicated interest in the project.
15TheDarienHealthDepartmentDirector,DavidKnauf,informedthat“privatewellparcels”southofInterstate95werelikelyserved by a PWS and were not relying on a private well.
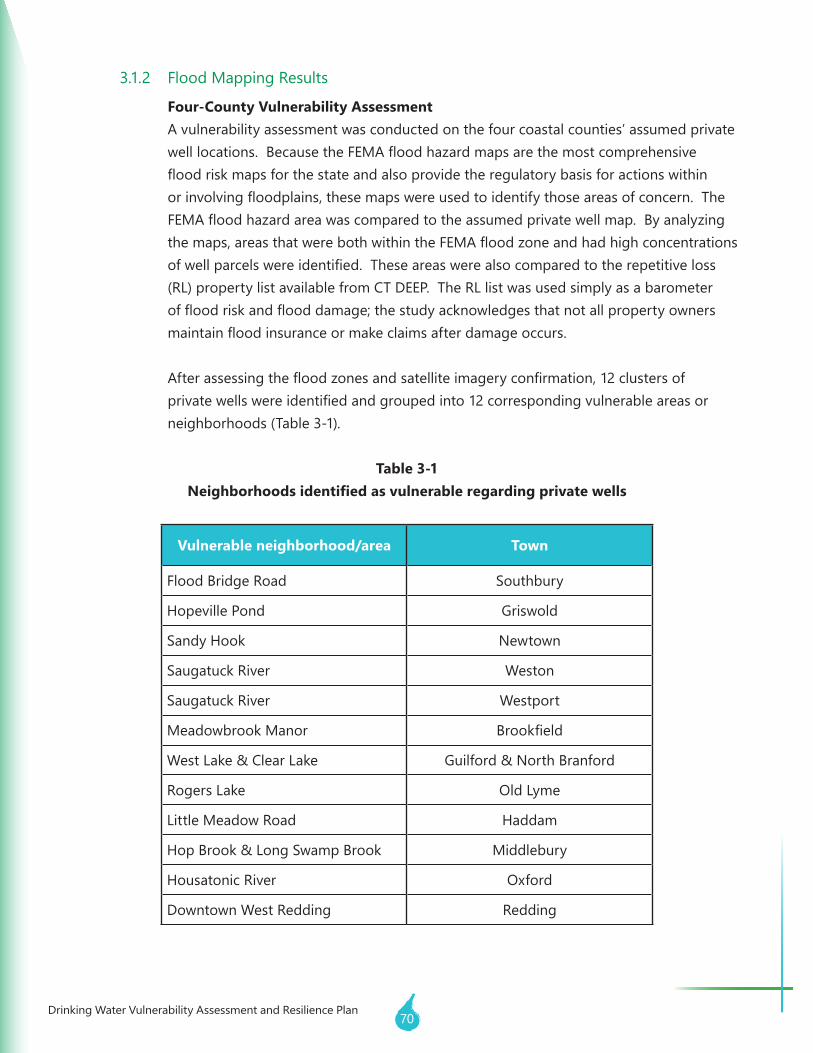
70Drinking Water Vulnerability Assessment and Resilience Plan
3.1.2 Flood Mapping Results
Four-County Vulnerability AssessmentA vulnerability assessment was conducted on the four coastal counties’ assumed private welllocations.BecausetheFEMAfloodhazardmapsarethemostcomprehensivefloodriskmapsforthestateandalsoprovidetheregulatorybasisforactionswithinorinvolvingfloodplains,thesemapswereusedtoidentifythoseareasofconcern.TheFEMAfloodhazardareawascomparedtotheassumedprivatewellmap.Byanalyzingthemaps,areasthatwerebothwithintheFEMAfloodzoneandhadhighconcentrationsofwellparcelswereidentified.Theseareaswerealsocomparedtotherepetitiveloss(RL) property list available from CT DEEP. The RL list was used simply as a barometer offloodriskandflooddamage;thestudyacknowledgesthatnotallpropertyownersmaintainfloodinsuranceormakeclaimsafterdamageoccurs.
Afterassessingthefloodzonesandsatelliteimageryconfirmation,12clustersofprivatewellswereidentifiedandgroupedinto12correspondingvulnerableareasorneighborhoods (Table 3-1).
Table 3-1Neighborhoods identified as vulnerable regarding private wells
Vulnerable neighborhood/area Town
Flood Bridge Road Southbury
Hopeville Pond Griswold
Sandy Hook Newtown
Saugatuck River Weston
Saugatuck River Westport
Meadowbrook Manor Brookfield
West Lake & Clear Lake Guilford & North Branford
Rogers Lake Old Lyme
Little Meadow Road Haddam
Hop Brook & Long Swamp Brook Middlebury
Housatonic River Oxford
Downtown West Redding Redding
Drinking Water Vulnerability Assessment and Resilience Plan71
Flood Bridge Road NeighborhoodThereisasmallrowofhousesoffFloodBridgeRoadinSouthburythatareeachlikelyreliantonaprivatewellthatmaybevulnerabletoflooding.ThesehomesarenearthePomperaug River, northwest of Main Street south. There is also a section of Riverhill Roadthatisvulnerabletofloodingfromtheriver.Thesehomesarelocatednorthofthe Flood Bridge Road homes. There are six RL properties on Flood Bridge Road. The Heritage Village Water Company has a water line that runs adjacent to this vulnerable area on Main Street South, less than 0.5 miles away.
Hopeville PondMallard Point in Griswold is situated east of Hopeville Pond. Here there are multiple homeslocatedwithintheFEMAfloodzone.TherearenoknownRLpropertieswithinthe area. The nearest drinking water system is Jewett City Water Company, and it is approximately 0.5 miles southwest of the vulnerable neighborhood.
Sandy Hook South of the Shepaug Hydro Station along the Housatonic River, there is a neighborhood inSandyHookthatlieswithinthefloodzoneandisassumedtorelyonprivatewells.The vulnerable area extends from Housatonic Drive to Hull Road and includes multiple homes. There are three known RL properties within this vulnerable neighborhood. The nearest PWS is Oakdale Manor Water Association, which is approximately 1.25 miles away. Heritage Village Water Company also has a water main approximately 2 miles awaybutisunabletoservetheSandyHookarea.AquarionWaterCompany’sNewtownSystem is approximately 2 miles away.
Saugatuck River, WestonAsmallclusterofhouseswestoftheSaugatuckRiveroffColonyRoad,FernValleyRoad,andLyonsPlainRoadinWestonlieswithintheFEMAfloodhazardareaandisvulnerabletoprivatewellflooding.ThereisatleastoneknownRLpropertywithinthisarea.Weston Water Supply lies approximately 1.25 miles northwest of the neighborhood, and AquarionWaterhasamainapproximately1.75milessoutheastoftheneighborhood.
Saugatuck River, WestportEastoftheSaugatuckRiver,therearehomesvulnerabletowellfloodingonRiverfieldDrive and Tuck Lane. These homes lie just north of the Saugatuck and Aspetuck Rivers’ convergence point. With rivers to both the east and west, private wells located here are atriskofflooding.ThereareatleastthreeknownRLpropertieswithinthisfloodhazardarea.AquarionWaterhasawatermainrunningalongColeytownRoadapproximately0.25 miles from this vulnerable neighborhood.
72Drinking Water Vulnerability Assessment and Resilience Plan
Meadowbrook ManorThis neighborhood is located west of Route 7 and distant from the Still River and is a good exampleofafloodingissuewithouttheneighborhoodbeinginamappedFEMAfloodzone.Adrainageprojecttoalleviatefloodinghasbeenimplementedinthisarea.Therewerenoknown RL properties found in this neighborhood.
West Lake and Clear LakeThis vulnerable area extends from Clear Lake, which partially lies within North Branford, easttowardWestLake,whichisinGuilford.ThefloodzonesurroundingClearLakeextendsalongthenorthshoreupClearLakeRoadandClearLakeManorRoad.TheFEMAfloodzoneiscontiguouswiththeWestLakefloodzone,whichshowsavulnerableresidentialareaalong the northwestern shore, including Putzel Avenue and Flat Iron Road, and extending northeast down Williams Drive and Cardinal Drive. This area has a large residential presence withintheFEMAfloodzone;however,noknownRLpropertieswerefoundhere.Thereisalso a smaller area of concern along the southeastern shore of West Lake on Shore Drive, wherethereisarowofhomeslocatedpartiallywithinthefloodzone.ThereisoneknownRL property located in this area. Regional Water Authority appears to have water mains running less than 0.25 miles east of the vulnerable Clear Lake neighborhoods. Connecticut Water Company’s Guilford System has a water main approximately 0.5 to 1.5 miles from the vulnerable neighborhoods along the northern coast and roughly 0.25 miles from the neighborhood along the southeast.
Rogers LakeCranberry Bottoms neighborhood in Old Lyme is located southwest of Rogers Lake. This neighborhood is also home to the Cranberry Bottoms Stream. This stream runs through a FEMAfloodzone,whichincludesmultiplehomesthatarevulnerabletoprivatewellflooding.The roads engulfed in this zone are Beta Avenue, Gamma Avenue, Delta Avenue, and Epsilon Avenue. The nearest PWS is Lymewood Elderly Housing, which is a little over a mile away, and East Lyme Water and Sewer Commission has a line approximately 2.5 miles away from the vulnerable neighborhood.
Little Meadow RoadLittle Meadow Road is located on the western bank of the Connecticut River in Haddam. This road has multiple homes that are in close proximity to the river and are within the FEMA floodzone.Thisneighborhood,locatedjustsouthofEagleLandingStatePark,likelyreliesonprivatewellsforitswatersourceandisvulnerabletoriverineflooding.ThereisoneknownRL property in this vulnerable area and three others within 0.5 miles outside of this road but withinthesamefloodzone.ThenearestCWS,SaybrookatHaddam,isapproximately1mileaway from this neighborhood, and the nearest large CWS is Connecticut Water Company Shoreline Region Chester System, which is approximately 2 miles away.

Drinking Water Vulnerability Assessment and Resilience Plan73
Hop Brook and Long Swamp BrookThere is a row of homes located on Regan Road in Middlebury that lies between Hop BrookandLongSwampBrook.ThesehomesareintheFEMAfloodzoneandarevulnerabletoprivatewellflooding.ThereisoneknownRLpropertywithinthisareaofconcern. Connecticut Water Company’s Naugatuck Region Central System has a water main less than 0.25 miles along CT Route 188.
Housatonic RiverLess than 1 mile south of Lake Zoar along the eastern bank of the Housatonic River is a floodingareaofconcern.Thisareastretchesroughly0.5milesalongRoute34.TherearethreeknownRLpropertiesthatarelocatedwithinthisfloodzoneandfourotherslocatedjustoutsideofthefloodzone.TheAquarionWaterCompany–HawkstoneSystem is located about 0.5 miles from this vulnerable area.
Downtown West ReddingThisareaofconcernwasidentifiedbytheReddingHealthOfficer,DouglasHartline.The downtown west Redding area is surrounded by the Saugatuck River, Bogus Mountain Brook, and Blackmans Pond Brook. The center of this area of concern is at the intersection of Umpawaug Road, Redding Road, and Station Road. The area extends northwest to Sidecut Road, and there is also a small neighborhood on Long Ridge Road that appears to be a combination of residential and commercial but is still located in the floodzone.Whilethisareaofconcerniswidelyspread,ithasbeennotedthatseasonalfloodingisaproblem,andthereareinfactprivatewellslocatedthroughoutthearea.There are no known RL properties located in this vulnerable neighborhood. Bethel Water Department is located about 2 miles from the downtown west Redding area, and theAquarionWaterRidgefieldSystemisabout2.5milesfromthearea.
WhiletheseneighborhoodshavebeenidentifiedwiththeutilizationofFEMAfloodmapping, it does not necessarily mean there are no other areas of concern throughout thefourcounties.Withriskschangingduetoclimatechangeeffects,theremaybeareasthatarevulnerabletofutureconditionsthathavenotbeenidentifiedwithcurrentspatialdata. Due to these changing risks, vulnerability assessments on private wells should be an ongoing venture whether it be at the state or local level or even by the homeowner.
TheneighborhoodsidentifiedundertheDWVARPshouldaddresstheirprivatewellissuesandlooktoremediateanyfloodingissuesthathaveoccurred,orthattheymayvulnerabletointhefuture,toensureacleansourceofdrinkingwater.Specificrecommendationsfortheseareasarepresentedinsubsequentsections;however,thestrategies suggested can be implemented throughout the state.
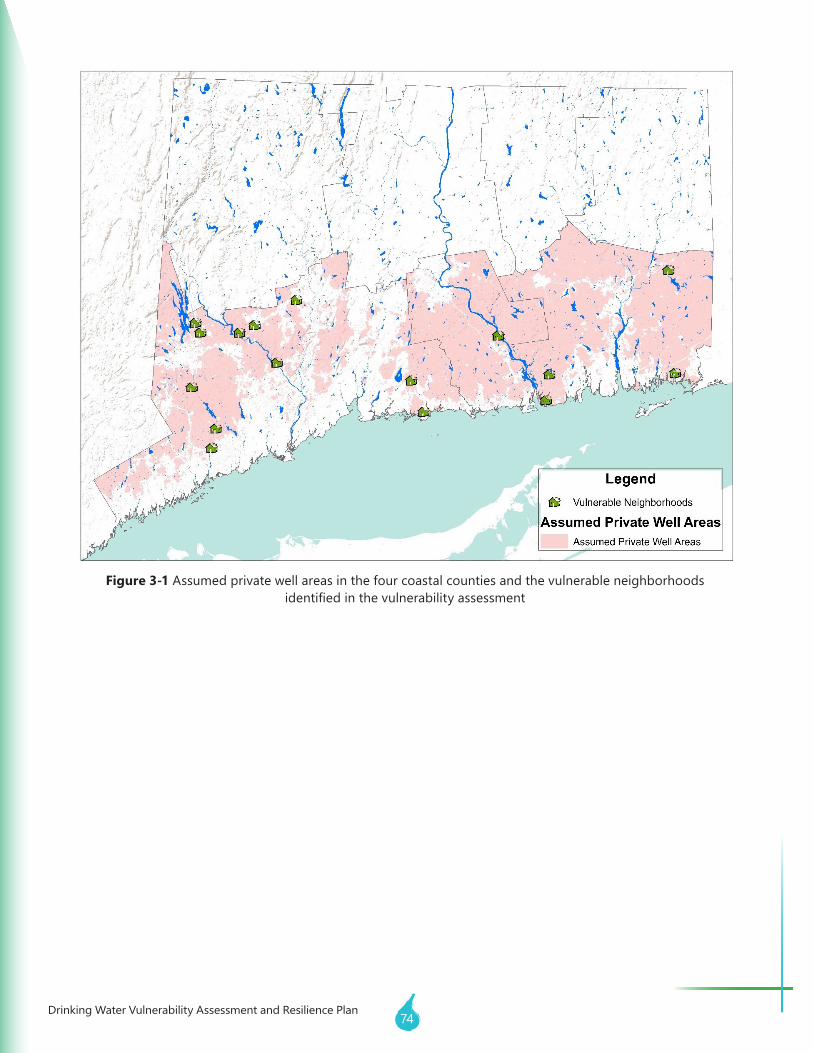
74Drinking Water Vulnerability Assessment and Resilience Plan
Figure 3-1 Assumed private well areas in the four coastal counties and the vulnerable neighborhoods identifiedinthevulnerabilityassessment
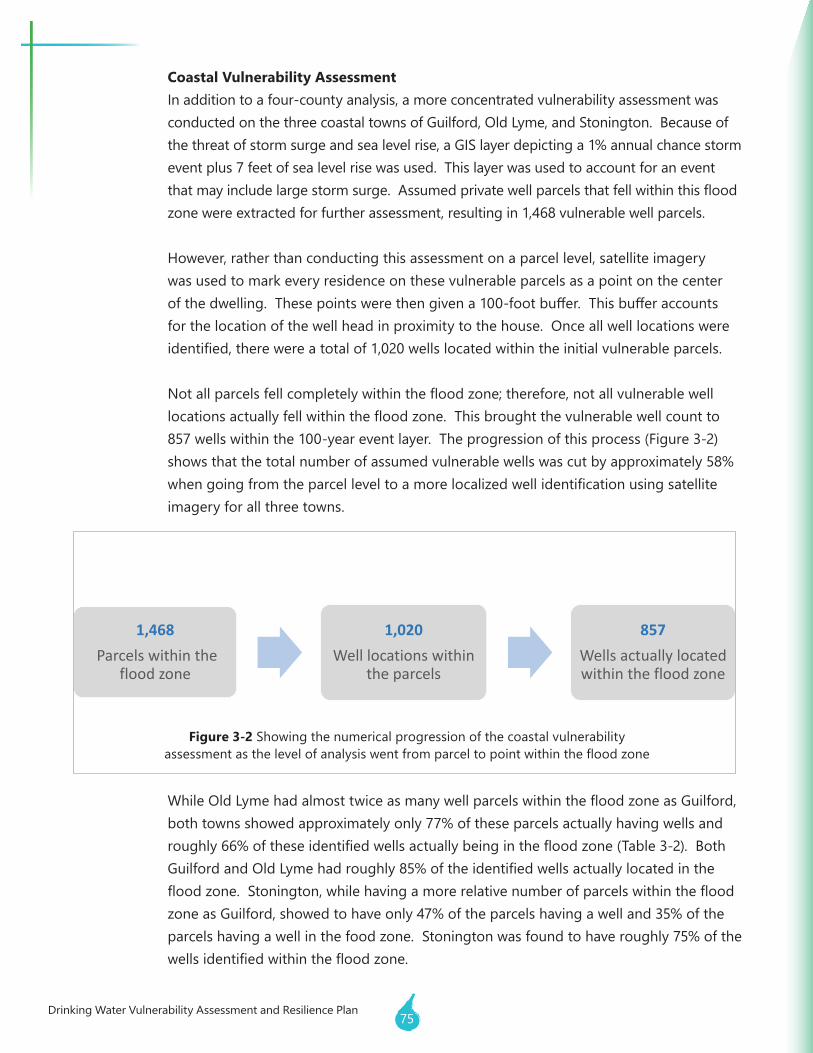
Drinking Water Vulnerability Assessment and Resilience Plan75
Coastal Vulnerability AssessmentIn addition to a four-county analysis, a more concentrated vulnerability assessment was conducted on the three coastal towns of Guilford, Old Lyme, and Stonington. Because of thethreatofstormsurgeandsealevelrise,aGISlayerdepictinga1%annualchancestormevent plus 7 feet of sea level rise was used. This layer was used to account for an event thatmayincludelargestormsurge.Assumedprivatewellparcelsthatfellwithinthisfloodzone were extracted for further assessment, resulting in 1,468 vulnerable well parcels.
However, rather than conducting this assessment on a parcel level, satellite imagery was used to mark every residence on these vulnerable parcels as a point on the center ofthedwelling.Thesepointswerethengivena100-footbuffer.Thisbufferaccountsfor the location of the well head in proximity to the house. Once all well locations were identified,therewereatotalof1,020wellslocatedwithintheinitialvulnerableparcels.
Notallparcelsfellcompletelywithinthefloodzone;therefore,notallvulnerablewelllocationsactuallyfellwithinthefloodzone.Thisbroughtthevulnerablewellcountto857 wells within the 100-year event layer. The progression of this process (Figure 3-2) showsthatthetotalnumberofassumedvulnerablewellswascutbyapproximately58%whengoingfromtheparcelleveltoamorelocalizedwellidentificationusingsatelliteimagery for all three towns.
WhileOldLymehadalmosttwiceasmanywellparcelswithinthefloodzoneasGuilford,bothtownsshowedapproximatelyonly77%oftheseparcelsactuallyhavingwellsandroughly66%oftheseidentifiedwellsactuallybeinginthefloodzone(Table3-2).BothGuilfordandOldLymehadroughly85%oftheidentifiedwellsactuallylocatedinthefloodzone.Stonington,whilehavingamorerelativenumberofparcelswithinthefloodzoneasGuilford,showedtohaveonly47%oftheparcelshavingawelland35%oftheparcelshavingawellinthefoodzone.Stoningtonwasfoundtohaveroughly75%ofthewellsidentifiedwithinthefloodzone.
1,468Parcels within the
flood zone
1,020Well locations within
the parcels
857Wells actually located within the flood zone
Figure 3-2 Showing the numerical progression of the coastal vulnerability assessmentasthelevelofanalysiswentfromparceltopointwithinthefloodzone
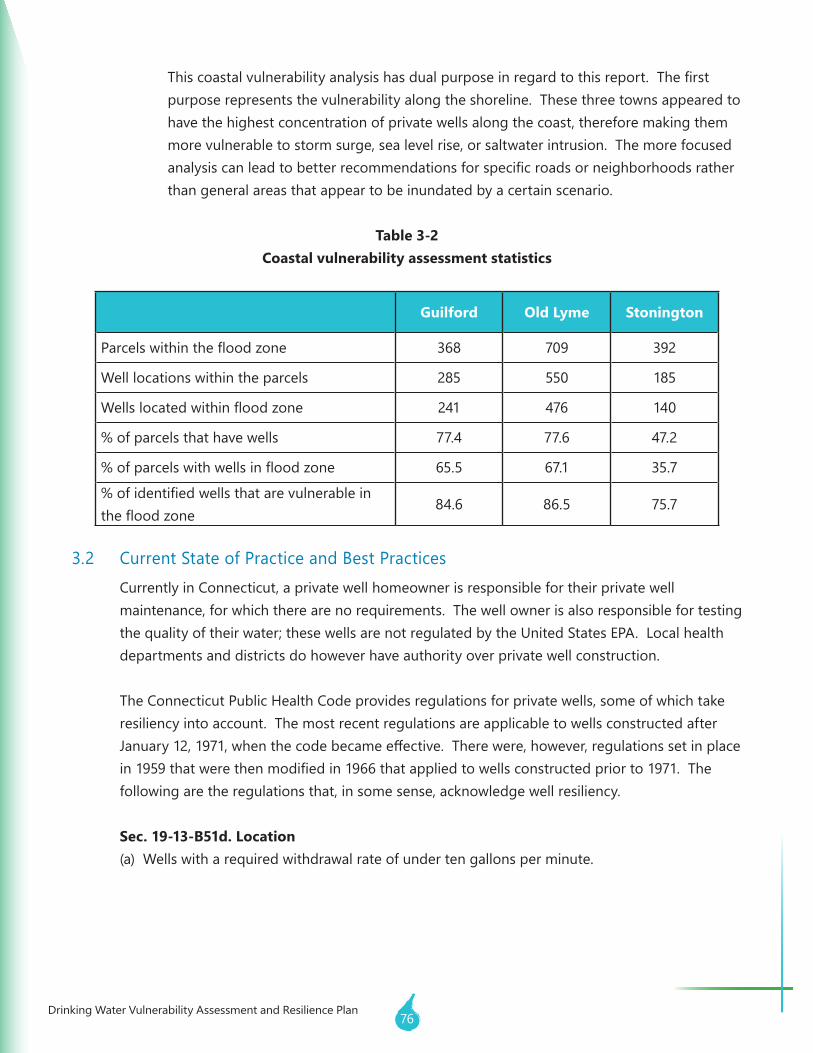
76Drinking Water Vulnerability Assessment and Resilience Plan
Thiscoastalvulnerabilityanalysishasdualpurposeinregardtothisreport.Thefirstpurpose represents the vulnerability along the shoreline. These three towns appeared to have the highest concentration of private wells along the coast, therefore making them more vulnerable to storm surge, sea level rise, or saltwater intrusion. The more focused analysiscanleadtobetterrecommendationsforspecificroadsorneighborhoodsratherthan general areas that appear to be inundated by a certain scenario.
Table 3-2Coastal vulnerability assessment statistics
Guilford Old Lyme Stonington
Parcelswithinthefloodzone 368 709 392
Well locations within the parcels 285 550 185
Wellslocatedwithinfloodzone 241 476 140
%ofparcelsthathavewells 77.4 77.6 47.2
%ofparcelswithwellsinfloodzone 65.5 67.1 35.7
%ofidentifiedwellsthatarevulnerableinthefloodzone
84.6 86.5 75.7
3.2 Current State of Practice and Best PracticesCurrently in Connecticut, a private well homeowner is responsible for their private well maintenance,forwhichtherearenorequirements.Thewellownerisalsoresponsiblefortestingthequalityoftheirwater;thesewellsarenotregulatedbytheUnitedStatesEPA.Localhealthdepartments and districts do however have authority over private well construction.
The Connecticut Public Health Code provides regulations for private wells, some of which take resiliency into account. The most recent regulations are applicable to wells constructed after January12,1971,whenthecodebecameeffective.Therewere,however,regulationssetinplacein1959thatwerethenmodifiedin1966thatappliedtowellsconstructedpriorto1971.Thefollowing are the regulations that, in some sense, acknowledge well resiliency.
Sec. 19-13-B51d. Location(a)Wellswitharequiredwithdrawalrateofundertengallonsperminute.
Drinking Water Vulnerability Assessment and Resilience Plan77
(1) Each such well shall be located at a relatively high point on the premises consistent with the general layout and surroundings; be protected against surface wash; be as far removed from any known or probable source of pollution as the general layout of the premises and the surroundings will permit; and, so far as possible, be in a direction awayfromgroundwaterflowfromanyexistingorprobablesourceofpollution.
(3) Nosuchwellshallbelocatedwithintwenty-fivefeetofthehigh-watermarkofanysurfacewaterbody,norwithintwenty-fivefeetofadraincarryingsurfacewaterorofafoundation drain.
(b)Wellswitharequiredwithdrawalratefromtentofiftygallonsperminute
(1) Each such well shall be located at a relatively high point on the premises consistent with the general layout and surroundings; be protected against surface wash; be as far removed from any known or probable source of pollution as the general layout of the premises and the surroundings will permit; and, so far as possible, be in a direction awayfromgroundwaterflowfromanyexistingorprobablesourceofpollution.
(3) No such well shall be located within 50 feet of high water mark or any surface water body,norwithinfiftyfeetofadraincarryingsurfacewaterorofafoundationdrain.
(c)Wellswitharequiredwithdrawalrateofmorethanfiftygallonsperminute.
(1) Location of such well shall be approved by the state department of health in accordance with the provisions of section 25-33 of the 1969 supplement to the general statutes and section 19-13-B39 of the public health code.
(2) Each such well shall be located at a relatively high point on the premises consistent with the general layout and surroundings; be protected against surface wash; be as far removed from any known or probable source of pollution as the general layout of the premises and the surroundings will permit; and, so far as possible, be in a direction awayfromgroundwaterflowfromanyexistingorprobablesourceofpollution.
(4) Nosuchwellshallbelocatedwithinfiftyfeetofthehigh-watermarkofanysurfacewaterbodynorwithinfiftyfeetofadraincarryingsurfacewaterorofafoundationdrain.
Sec. 19-13-B51e. PrecautionsWhile this section of the health code does state precautions that should be taken during well construction to avoid contamination, there are no regulations here that pertain to private well vulnerabilityduringafloodingevent.
Sec. 19-13-B51f. Construction(a) Materials. Pipe used for casing a well other than a dug well shall…have watertight
connections.
78Drinking Water Vulnerability Assessment and Resilience Plan
(b) Dug well. The casing or side walls of a dug well shall be constructed of watertight concrete at least four inches thick to a depth of at least ten feet below the ground surface…The annular space between the face of the excavation and the watertight sectionofcasingshallbefilledwithcleanclayorotherimperviousmaterial.
(c) Gravel well. The casing of a gravel well shall be surrounded with concrete grout to a depth of at least ten feet below the ground surface. The annular space between the casingsofagravelwellwithartificiallyplacedgravelshallbeprotectedatthetopbyawatertight covering to prevent any foreign matter entering the well through the gravel.
(d) Drilled well. The construction of a drilled well shall provide for shutting out all water except that from the water bearing formations which are intended to supply water to the well. The casing shall extend at least ten feet below ground surface. Any annular spacesurroundingthecasingpipeneededfordrillingshallbefilledwithconcretegrouttoadepthofatleasttenfeetbelowthegroundsurface.Belowtenfeet,anycleanfillmaterial can be used. Where the unconsolidated material above consolidated rock is less than twenty feet deep and the casing ends in the consolidated rock, the casing shall beeffectivelysealedintherock.
(e) Upper terminal of casing. The casing of every well shall project not less than six inches abovetheestablishedgradeatthewellorabovethepumphousefloor…Whereapitlessadapter is used, it shall be designed to, and made of materials that will, keep soil and water from entering the well during the life of the casing…
Sec. 19-13-B51h. Well pits(b) A well pit and its juncture with any other structure shall be watertight, or suitably drained
to insure dryness as provided in section 19-13-B51i.
(c) Every conduit or similar connection with a well pit shall be made watertight.
Sec. 19-13-B51i. Well pit drains (a) Wherethereisnodangeroffloodorbackflow,thewaterfromapitshallbedrainedonto
the surface of the ground. The pipe used shall be at a grade of not less than one-eighth inchperfoottowardtheoutlet.Thejunctionbetweenthepitfloorandthedrainpipeshall be made watertight. The drain pipe and joints shall be watertight to a distance of twenty-fivefeetfromthepit.Anydraintothegroundsurfaceshallbescreenedtoprevententrance of animals and insects.
Drinking Water Vulnerability Assessment and Resilience Plan79
(b) No well pit drain shall be connected directly with any sewer, house drain or storm drain. The drainage of any well pit shall not be dependent on the operation of any pumping system except where gravity drainage at the location cannot be.
(c) When a well pit is constructed in impervious soil, no porous material shall be used as a baseunderthewellpitfloor.Iffillisrequired,itshallbeclean,imperviousearth,welltamped.
Sec. 19-13B51j. Permanent appurtenances(a)Anyequipment,pipingorappurtenance,permanentlyinstalledinawell,shallbejoined
watertight to the well casing at the point of entrance to the well by a well top seal or equallyeffectivemeans.
(b)Everywellinwhichthedrawdownistenfeetormoreshallbefittedwithanadequateair vent. Such vent shall be extended to the height of at least twelve inches above any possible high-water level. The vent shall be shielded and screened in such manner as to permit the entrance of air but keep out foreign matter.
(c)Thefoundationforareciprocatingpumpshallbeconstructedwithsufficientclearancearound the well casing and the base of the power head to permit the assembly in place of awatertightwelltopseal.Thewellcasingshallextendatleastsixinchesabovethefloor.
(d) The foundation for a turbine type pump may be of concrete upon which the power head mayrestdirectly.Itshallbesoconstructedthatthewellopeningisadequatelycoveredand all openings through the base shall be sealed watertight. The well casing shall be installedatleastsixinchesabovethefloor.
(e)Ahandpumpshallbeconstructedsothatastuffingboxorotherarrangementpreventsentrance of contamination around the pump rod. The pump spout shall be of covered type.Thebaseshallbeoftheone-pieceflangetype.Provisionshallbemadeforleading waste water away from the top of the well. A hand pump shall be frostproof and shallnotrequirepriming.Ahandpumpshallbemounted:(1)Whenawelliscasedwithironpipe,uponabaseflangewhichisattachedrigidandwatertighttothewellcasing;(2) on a concrete platform or similar structure when a well is not cased with iron pipe. A metal sleeve shall be used through the concrete platform or cover slab and extend above the slab into the pump base; or (3) by other sanitary method approved by the commissioner of health.
80Drinking Water Vulnerability Assessment and Resilience Plan
ThepublichealthcodealsoidentifiesregulationsinregardtowellpermitsinSec.19-13-B51m.These regulations reveal under which circumstances a director of health has the authority to either approveordenyawellpermit.Thesecircumstancesincludedemonstratingadequatedistancefrom a septic system or the presence of public sewers and assessing the proximity of the private well parcel to a community water supply system for both residential and nonresidential premises. However, the commissioner of health services has the authority to grant an exception if the CWS is unabletoprovideadequatesupplyorifconstructionproblemswarranttheexception.
Most of these regulations have not been amended since their inception in 1971 and therefore donotconsiderthecurrentdiscussionofclimatechangeandfloodrisk.
3.3 Summary of Brackish Water Intrusion A growing concern along the Connecticut coastline is the intrusion of salt water into private wells. As these wells pump less dense fresh water and lower the groundwater level, salt water may migrate into these fresh water zones and potentially contaminate wells resulting in poor qualitydrinkingwater.Typically,wellslocatedneartheConnecticutshorelineareshallowdugwells. This well construction avoids deep drilling, which may result in brackish water; however, the shallow nature of the well also leaves it vulnerable to contamination from storm surge. In the event of saltwater contamination, it is possible that freshwater restoration could take years or may not occur at all. The USGS California Water Science Center has also presented multiple other factors that may contribute to saltwater intrusion16.
1. Rate of water withdrawal compared to freshwater recharge2. Distance between pumping location and saltwater source3. Geologyoftheaquifer4. Aquiferhydraulicproperties5. Presenceorabsenceoffine-grainedmaterial
Variousmodelsarecurrentlyavailabletosimulateintrusionintocoastalaquifers.TheUSGSsuggests multiple models that can be used for saltwater intrusion simulation including the following:
• MODFLOW is a USGS open source model that is popular among consultants, academics, and government scientists. The model is typically used to simulate three-dimensionalgroundwaterflowbutcanalsobeutilizedtocouplegroundwaterandfreshwatersystems.InConnecticut,MODFLOWisappropriateforoverburdenaquiferssuchasalluviumandoutwash;bedrockaquifersarenottypicallysimulatedwithMODFLOW.
16 https://ca.water.usgs.gov/sustainable-groundwater-management/seawater-intrusion-california.html
Drinking Water Vulnerability Assessment and Resilience Plan81
• SHARPismodelthatassumesa“sharp”interfacebetweenfreshwaterandsaltwaterzones.Thismodelalsoassumesthatwaterflowishorizontal,makingthisaquasi-three-dimensional model.
• SutraSuite includes SUTRA, which is a groundwater model that includes utilities for preprocessomg and postprocessing and can be conducted in either 2D or 3D.
• MOCDENSEisamodelspecificallyforthesimulationofsolutetransportingroundwater. This model addresses 2D, cross-sectional issues and can compute concentration changes over time.
• SEAWATisaprogramlikeMODFLOWandisalsoopenlyofferedbytheUSGS.This3Dmodel is a variable-density groundwater model that has been widely used for a variety of groundwater studies, including saltwater intrusion.
• DHITechnologiesoffersFEFLOW,whichisabroad-spectrumgroundwatermodelthatcanbeusedtosimulatesaltwaterintrusion.Thismodeldoesrequirealicense,whichisofferedatvariouslevels;however,itsapplicationsrangefromminewatermanagementto groundwater remediation/attenuation.
The USGS California Water Science Center has suggested these models as examples of useful toolsforintrusionandforgeneralflowmodels.Whilethesefewexamplesmaynotbethefullextent of available technology, there appear to be models within these suggestions that are useful for this task.
Thesemodelsarecharacteristicallydifferentandofferbenefitsrelativetotheirqualities.While most seem comprehensive, there will likely be data that is necessary for running these simulations.Forexample,MODFLOWandSHARPrequireboundaryconditions,aquiferproperties,andinitialconditions.SHARPalsorequiresspecificgravities,dynamicviscosities,bathymetry,andbaselayerelevations.Dependingonthemodelchosen,dataspecifictotheConnecticut coastline will have to be collected for input into the simulation.
3.4 Resiliency Plan for Private Wells3.4.1 General Methods of Adapting Private Wells
There are certain measures that can be taken both on a smaller scale for individual wells and on a larger scale for neighborhoods. For this report, certain strategies have been identifiedasoptimalsituation-specificsolutions.Factsheetshavealsobeencreatedfor use by the Private Well Program (Appendix L). These sheets can be distributed to provide further information on mitigation and resiliency solutions. The strategies includedinthesesheetsarewellprotection,propertyacquisition,watermainextension,drainage project, new PWS, and smart development.
82Drinking Water Vulnerability Assessment and Resilience Plan
Well ProtectionA private well owner is responsible for the maintenance of their well, and because of that, there are certain measures that can be taken, especially on older wells. Extending thewellcasingabovefloodlevels,inconjunctionwithmoundingthesurroundingearth,is a measure typically taken by public system wells; however, the method could be implemented for private residential wells. If there are any exposed portions of the well, these should be sealed to ensure the well is watertight. It is important to note that while a watertight well cap is recommended to prevent contamination it may not completely eliminate contamination due to the screen and shield air vent, which could potentially allow for inundation. Also, FEMA recommends grouting the space between the casing and the bore hole. There is also the FEMA P-348, Protecting Building Utility Systems fromFloodDamage,whichoutlinesvariousmethodsoffloodprotectionforamultitudeof systems. Well protection costs in relation to other remediation projects are relatively economical solutions, with costs ranging from 1 to 10 thousand dollars, typically on the lower end of the spectrum.
Relocate Well on a PropertyForthoseprivatewellparcelswithasectionoftheparcellocatedoutofthefloodzone,by relocating a well on the property, the resident can move the well head out of the floodzonetogreatlyreducetheriskofflooding.Whileanewwellcouldgetcostly,having a clean private water source may outweigh the initial investment. Well relocation is also another relatively economical solution with costs ranging from $5,000 and up.
PropertyAcquisitionTherewillbecertainproceduresforacquisitiondependingonwhetheritisthestateorthetownacquiringtheproperty.Acquisitionofapropertyatriskoffloodingenablesthe homeowner to relocate to an area with public water or a more resilient private watersupply.Propertyacquisitionalsocreatesmoreopenspaceandeliminatesfuturepropertydamage.Apropertyacquisitionisdependentuponlandvalue,whichcouldpotentially cost upwards of $100,000.
Water Main ExtensionWhile this option may not be viable for all vulnerable areas, there may be certain neighborhoods that are within proximity to a PWS, and extending a main could be possible. This could also be said for those homes that may be located within the service area of a PWS but have chosen to not hook up to public water.
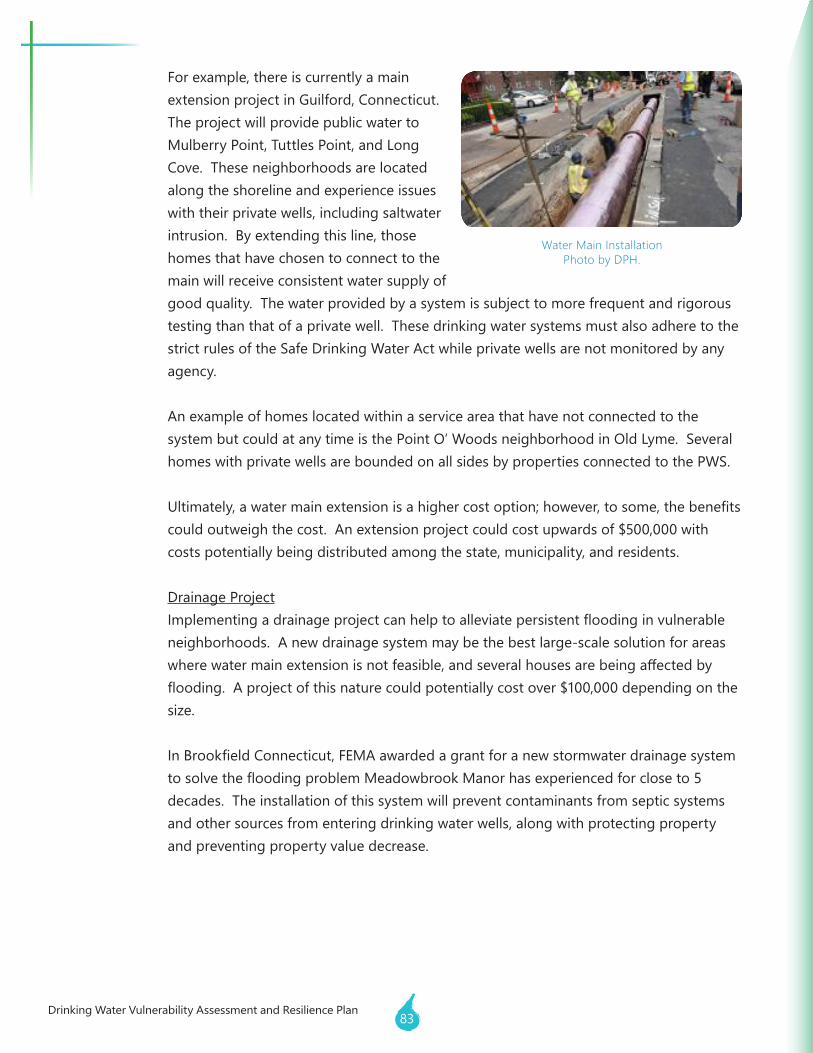
Drinking Water Vulnerability Assessment and Resilience Plan83
For example, there is currently a main extension project in Guilford, Connecticut. The project will provide public water to Mulberry Point, Tuttles Point, and Long Cove. These neighborhoods are located along the shoreline and experience issues with their private wells, including saltwater intrusion. By extending this line, those homes that have chosen to connect to the main will receive consistent water supply of goodquality.Thewaterprovidedbyasystemissubjecttomorefrequentandrigoroustesting than that of a private well. These drinking water systems must also adhere to the strict rules of the Safe Drinking Water Act while private wells are not monitored by any agency.
An example of homes located within a service area that have not connected to the system but could at any time is the Point O’ Woods neighborhood in Old Lyme. Several homes with private wells are bounded on all sides by properties connected to the PWS.
Ultimately,awatermainextensionisahighercostoption;however,tosome,thebenefitscould outweigh the cost. An extension project could cost upwards of $500,000 with costs potentially being distributed among the state, municipality, and residents.
Drainage ProjectImplementingadrainageprojectcanhelptoalleviatepersistentfloodinginvulnerableneighborhoods. A new drainage system may be the best large-scale solution for areas wherewatermainextensionisnotfeasible,andseveralhousesarebeingaffectedbyflooding.Aprojectofthisnaturecouldpotentiallycostover$100,000dependingonthesize.
InBrookfieldConnecticut,FEMAawardedagrantforanewstormwaterdrainagesystemtosolvethefloodingproblemMeadowbrookManorhasexperiencedforcloseto5decades. The installation of this system will prevent contaminants from septic systems and other sources from entering drinking water wells, along with protecting property and preventing property value decrease.
Water Main Installation Photo by DPH.
84Drinking Water Vulnerability Assessment and Resilience Plan
New Public Water SystemAnewpublicsystemasamitigationstrategycanbotheliminatetheriskoffloodingtoprivate wells and provide consumers with a reliable, clean water supply. This strategy isidealwhereausablesourceisavailableandwherethereisasignificantvulnerablepopulation. A new PWS could also serve businesses, schools, and other facilities, alleviatingfloodingrisktotheirsourcesaswell.WhileanewPWSisacostlyoptionwithestimates greater than $100,000, this option, similar to main extension, eliminates well unreliability,andbenefitsmayoutweighcosts.
Smart DevelopmentThis mitigation strategy should be implemented before a problem occurs. By utilizing floodmapping,areasofconcerncanbeidentified,andinformeddecisionsregardingdevelopment can be made. Large parcels that are being looked at for residential developmentshouldbeassessedforfloodriskpresence.Iffloodhazardareasarefound,steps should be taken to site wells outside of this zone. By using smart development, privatewellfloodingissuescanbeavoided,andtheriskofpropertydamagewillbe greatly reduced. Smart development has no direct costs; however, education and promotion of this strategy may result in expenses such as educational material, registrationfees,andstafftime.
3.4.2 SpecificRecommendationsforVulnerableNeighborhoods
Eachvulnerableneighborhoodidentifiedhasuniquecharacteristics,makinganyprivatewellmitigationrecommendationsspecificforthatarea.Notallvulnerableareasarewithin proximity to a PWS. Some areas have a few houses while other areas include multiplehomesthatexperienceflooding.Tobeeconomicalandpractical,notallvulnerable areas should implement the same mitigation application. Because these vulnerableareasarealluniqueintheirvulnerabilitiesandlocations,thereisnoonesolutionforallneighborhoods.Recommendationsforresiliencyandmitigationeffortswere made for each area based on proximity to a CWS (Table 3-3).
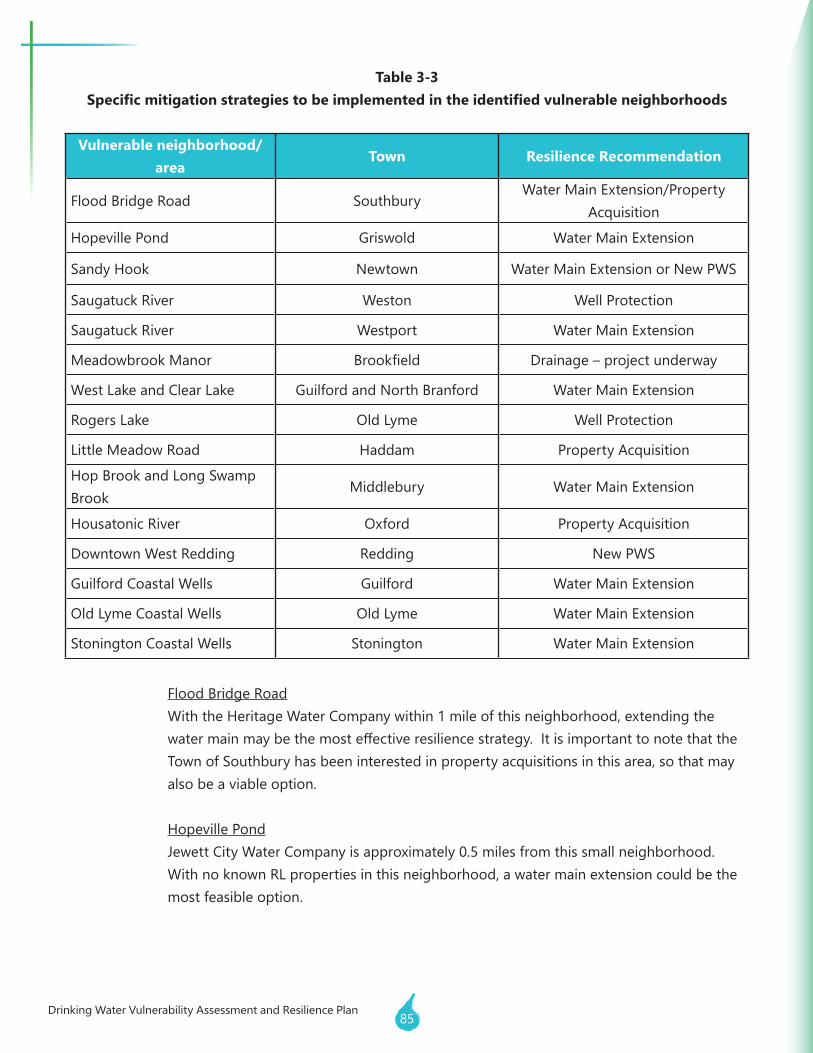
Drinking Water Vulnerability Assessment and Resilience Plan85
Table 3-3Specific mitigation strategies to be implemented in the identified vulnerable neighborhoods
Vulnerable neighborhood/area
Town Resilience Recommendation
Flood Bridge Road SouthburyWater Main Extension/Property
Acquisition
Hopeville Pond Griswold Water Main Extension
Sandy Hook Newtown Water Main Extension or New PWS
Saugatuck River Weston Well Protection
Saugatuck River Westport Water Main Extension
Meadowbrook Manor Brookfield Drainage – project underway
West Lake and Clear Lake Guilford and North Branford Water Main Extension
Rogers Lake Old Lyme Well Protection
Little Meadow Road Haddam PropertyAcquisition
Hop Brook and Long Swamp Brook
Middlebury Water Main Extension
Housatonic River Oxford PropertyAcquisition
Downtown West Redding Redding New PWS
Guilford Coastal Wells Guilford Water Main Extension
Old Lyme Coastal Wells Old Lyme Water Main Extension
Stonington Coastal Wells Stonington Water Main Extension
Flood Bridge RoadWith the Heritage Water Company within 1 mile of this neighborhood, extending the watermainmaybethemosteffectiveresiliencestrategy.ItisimportanttonotethattheTownofSouthburyhasbeeninterestedinpropertyacquisitionsinthisarea,sothatmayalso be a viable option.
Hopeville PondJewett City Water Company is approximately 0.5 miles from this small neighborhood. With no known RL properties in this neighborhood, a water main extension could be the most feasible option.
86Drinking Water Vulnerability Assessment and Resilience Plan
Sandy HookTheAquarionWaterMainSystemisapproximately2milesaway,andwiththisneighborhoodfloodingfromtheHousatonicRiver,watermainextensionmaybethe most appropriate solution. However, there are roughly 50 homes within the neighborhoodidentified,androughly50moreintheadjacentneighborhood,whichisalso settled along the river. Therefore, a new PWS could also be a viable option.
Saugatuck River – WestonThere are only a small number of homes found in this vulnerable area, and water mains are over 1 mile away. Because of these factors, homeowners should look to upgrade and protect their own wells. This may be the most economical option.
Saugatuck River – WestportWith multiple homes in this area and several RL properties, wells are likely very vulnerable.ByextendingtheAquarionwatermain,whichisroughly0.25milesaway,thiswouldbeeffectivefortheentireneighborhoodandprovidereliableandresilientwater.
Meadowbrook ManorThisneighborhoodhasalreadyidentifieditsresiliencestrategybyapplyingforandreceiving funding for a drainage project.
West Lake and Clear LakeWith both Regional Water Authority and Connecticut Water having mains nearby and the houses being relatively close, a water main extension project would cover the entire area of concern.
Rogers LakeThis area of concern is three individual streets with a few houses on each. The disconnect between streets may increase the cost of a drainage or water main extension project; therefore, well protection by the owner may be the best application for this neighborhood.
Little Meadow RoadThissmallneighborhoodontheConnecticutRiverisvulnerabletofloodingandcontainsmultiple RL properties. Because of the size of the river and the increasing risk of floodingevents,propertyacquisitionmaybethebestoptionforthisarea.
Hop Brook and Long Swamp BrookConnecticut Water has a water main less than 0.25 miles away from this neighborhood. Because of the water main proximity, extending down Regan Road may be the most economical option.
Drinking Water Vulnerability Assessment and Resilience Plan87
Housatonic RiverWith only a few houses in this area of concern and large number of RL properties, propertyacquisitionmaybethemosteconomicaldecision.
Downtown West ReddingThis area of concern is a combination of residential and commercial properties. By establishing a new PWS, this would ensure clean and resilient water to private homeowners as well as a few local businesses in the area. This PWS will allow continuous servicetoresidentsandpossiblypreventbusinessesfromclosingduringafloodingevent due to contaminated water supply.
Coastal Guilford, Old Lyme and StoningtonAll three of these vulnerable coastal areas are at risk to saltwater intrusion, sea level rise, andstormsurge.Watermainextensionislikelythemosteffectivemitigationoptionforthese private well neighborhoods.
3.4.3 Recommendations from Findings
One of the biggest challenges in assessing private well vulnerability was the data gap. There are thousands of wells across the state for which a location database is lacking. With advanced technology and programs, such as GIS, entering and maintaining private well coordinates is more feasible than 30 years ago. By implementing future reporting regulations, it may be possible to collect the coordinates of both newly constructed wells and older existing wells that apply for a permit to the local Health Department for repair work.AstaffpersonwithintheDepartmentofConsumerProtection(whichpresentlycollects and stores private well permits and logs) or within the DPH Private Well Program could collect spatial data and maintain a database.
MunicipalitiesshouldalsolooktocreateaGISdatabaselikethatofFairfield.Manytownsacross the state either have in-house GIS capabilities or contract this work out. If a town has these capabilities, then a private well layer at the parcel level should be developed.
It is also important to educate residents on the importance of upgrading older wells. This education program should target areas that are typically older construction and likely have older wells. Aside from education, there is also the potential for incentivization. Many residents do not understand the importance of private well testing. Either the state or municipalities could create a program that incentivizes the annual testing of private wells. By doing so, this would promote care and upkeep of the well while ensuring clean private water sources.
88Drinking Water Vulnerability Assessment and Resilience Plan
Private well areas are just as vulnerable to extreme weather events and more importantly power outages. If residents lose power and do not have a backup power source, their watersupplywillbeofflineuntilrestoration.Municipalitiesorthestateshouldidentifywaterbuffaloesthatcouldbeutilizedforprivatewellareasduringanemergency.Thiswouldensuresafedrinkingwaterforthoseaffecteduntilpowerhasbeenrestoredorwells have been decontaminated.
TheFEMAbenefit-costanalysis(BCA)isrequiredforFEMAfundingtobeutilizedinordertoensurethatahazardmitigationprojectiscosteffective.Thepotentialbenefitsto private wells should be included in the FEMA BCA for mitigation projects that also protect private wells and improve resiliency.
3.4.4 Recommendations for Private Well Program Materials
“Well Siting, Construction and Permitting Requirements”Drilled well construction should recommend that the top of the well casing should extendabovethefloodlevelifthewellisinadelineatedFEMAfloodzone,assumingtherecommended6inchesispotentiallyinadequate.Dugwellconstructionshouldalsorecommendthisextensionforthefloodzonerequirements.
“Private Well Water Systems in Connecticut: Best Management Practice Checklist”Whiletherecommendationtotestwaterqualityreferstoanadditionalpublication,itshouldbestatedtotestwaterqualityatleastonceayearintheeventthewellownerdoes not refer to the well testing publication.
Just like the Well Siting publication, this checklist should also recommend that the well beextendedaboutthefloodlevelsiflocatedinaFEMAfloodzone.
Drinking Water Vulnerability Assessment and Resilience Plan89
This study addresses multiple aspects of the current state of PWSs and private water supplies in the context of vulnerability, risk, and resilience. These aspects appear on the surface to be disparateandpointingtonumerousincongruentfindings.However,thefindingsofthestudycan be aggregated into 10 categories:
1. Lessons Learned from Past Events – Recent severe storms and droughts have provided important lessons regarding risks and resiliency.
2. Flood Risk to CWS Infrastructure and Critical Facilities – CWS infrastructure and sources arecurrentlylocatedwithinareasoffloodrisk.Riskscanbeaddressedtomaketheseassetsmore resilient. This will, in turn, help maintain service to critical facilities served by CWSs.
3. Water Quality and Quantity Vulnerabilities –Areviewofwaterqualityandquantitymetrics points to potential trends that indicate vulnerabilities and existing risks to PWSs.
4. Climate Change Impacts –Climatechangeprojectionsdemonstratethatdroughtandfloodriskswillincreaseandsuggestthatsourcewaterqualitywillbethreatened.
5. CWS Vulnerabilities and Emergency Preparedness – A review of current CWS vulnerability assessments and emergency response plans found opportunities for planning-level improvements.
6. Drought Planning and Resilience – Climate change projections and recent drought experiences together point to needed improvements for resilience.
7. Interconnections and Infrastructure Upgrades – Source and storage redundancies along with interconnections can increase resiliency even as risks are changing.
8. Drinking Water Section Emergency Preparedness – Interviews with surrounding state and Connecticutdrinkingwaterstaffprovidedguidanceforemergencyresponseplanningthatthe DWS can undertake to prepare for severe storm and drought events.
9. State and Local Laws Affecting Drinking Water–Areviewofcurrentlawsaffectingdrinking water found a foundation for resilience, but improvements are suggested.
10. Private Well Vulnerabilities–Sealevelriseandriverinefloodriskswillaffectprivatewells.Steps can be taken to make private water supplies more resilient.
Thesecategoriesoffindingsarebrieflydescribedbelow.Additionaldetailscanbefoundintheappropriate sections of this report.
4.0 Findings
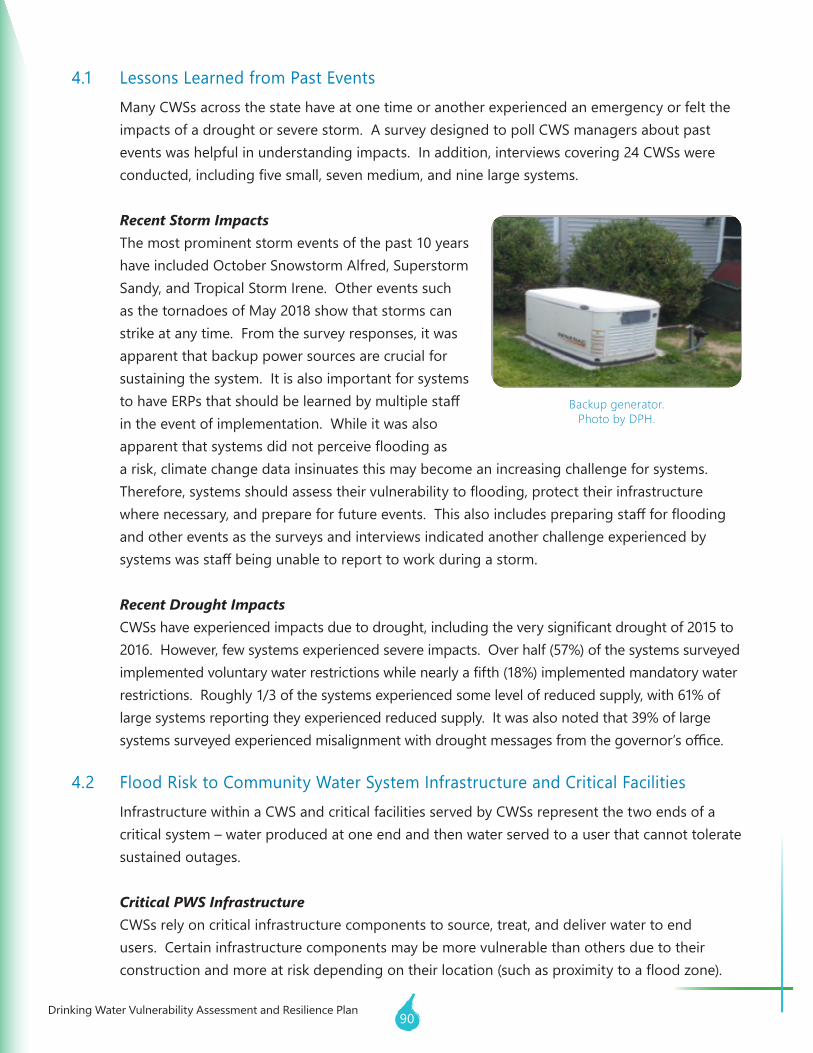
90Drinking Water Vulnerability Assessment and Resilience Plan
4.1 Lessons Learned from Past EventsMany CWSs across the state have at one time or another experienced an emergency or felt the impacts of a drought or severe storm. A survey designed to poll CWS managers about past events was helpful in understanding impacts. In addition, interviews covering 24 CWSs were conducted,includingfivesmall,sevenmedium,andninelargesystems.
Recent Storm ImpactsThe most prominent storm events of the past 10 years have included October Snowstorm Alfred, Superstorm Sandy, and Tropical Storm Irene. Other events such as the tornadoes of May 2018 show that storms can strike at any time. From the survey responses, it was apparent that backup power sources are crucial for sustaining the system. It is also important for systems tohaveERPsthatshouldbelearnedbymultiplestaffin the event of implementation. While it was also apparentthatsystemsdidnotperceivefloodingasa risk, climate change data insinuates this may become an increasing challenge for systems. Therefore,systemsshouldassesstheirvulnerabilitytoflooding,protecttheirinfrastructurewherenecessary,andprepareforfutureevents.Thisalsoincludespreparingstaffforfloodingand other events as the surveys and interviews indicated another challenge experienced by systemswasstaffbeingunabletoreporttoworkduringastorm.
Recent Drought ImpactsCWSshaveexperiencedimpactsduetodrought,includingtheverysignificantdroughtof2015to2016.However,fewsystemsexperiencedsevereimpacts.Overhalf(57%)ofthesystemssurveyedimplementedvoluntarywaterrestrictionswhilenearlyafifth(18%)implementedmandatorywaterrestrictions.Roughly1/3ofthesystemsexperiencedsomelevelofreducedsupply,with61%oflargesystemsreportingtheyexperiencedreducedsupply.Itwasalsonotedthat39%oflargesystemssurveyedexperiencedmisalignmentwithdroughtmessagesfromthegovernor’soffice.
4.2 Flood Risk to Community Water System Infrastructure and Critical FacilitiesInfrastructure within a CWS and critical facilities served by CWSs represent the two ends of a critical system – water produced at one end and then water served to a user that cannot tolerate sustained outages.
Critical PWS InfrastructureCWSs rely on critical infrastructure components to source, treat, and deliver water to end users. Certain infrastructure components may be more vulnerable than others due to their constructionandmoreatriskdependingontheirlocation(suchasproximitytoafloodzone).
Backup generator.Photo by DPH.
Drinking Water Vulnerability Assessment and Resilience Plan91
Floods present risks to both riverine and coastal infrastructure. While many CWS source wells havebeenelevatedonmoundstopreventinundation,theselevelsmaynolongerbesufficientwiththeeffectsofachangingclimate.Manyreservoirsalsohavewell-designeddamsandspillways; however, with climate change projections anticipating an increase in precipitation and heavier future storms, these dams and spillways may be pushed beyond their design limits morefrequentlyleadingtodamageorfailure.Treatmentplantsandpumpstationsmayalsobevulnerableiftheyarelocatedinfloodzonesandnotproperlyfloodproofed.Fortunately,waterstoragetanksaretypicallyelevatedandthereforehavealowerfloodrisk.
Critical Facilities Served by PWSsWhile some systems are more resilient than others, those that lack redundancies are more vulnerable overall, in turn leaving critical facilities served by them similarly more vulnerable. By identifying those critical facilities served by a system, both DPH and the system can be prepared to respond and assist those facilities during an emergency.
4.3 Water Quality and Quantity VulnerabilitiesThereviewofwaterqualityandquantitymetricspointstopotentialtrendsthatindicatevulnerabilities and existing risks to PWSs.
During the interview and surveys, some PWS managers indicated that recent droughts impacted sourcewaterqualityandthereforefinishedwaterquality,andsomealsoindicatedthatrecentstormsimpactedsourcewaterqualityandthereforecausedfinishedwaterqualityproblems.Experiencingfinishedwaterqualityproblemsduringdroughtsandstormscanbeassociatedwith the need to issue boil water advisories. While few systems perceive that their source or finishedwaterqualityiscurrentlythreatened,systemsgenerallyperceivethatwaterqualityproblems will increase in the future.
AnanalysiswasconductedofdrinkingwaterqualitydeficienciesfromJanuary1,2006,toDecember31,2016,including4,066maximumcontaminantlevel(MCL)deficienciesacross2,487PWSs.ThemostcommonMCLdeficienciesincludeexceedingbacterialcountlimits(i.e., violating the Total Coliform Rule), limits for turbidity, and allowable limits for disinfection byproducts. Turbidity limit exceedances, which are more common after heavy rainfall, have been linked to gastrointestinal illness outbreaks in other regions17.
17 De Roos, A. J., Gurian, P. L., Robinson, L. F., Rai, A., Zakeri, I., & Kondo, M. C. (2017). Review of Epidemiological Studies of Drinking-Water Turbidity in Relation to Acute Gastrointestinal Illness. Environmental health perspectives, 125(8), 086003. doi:10.1289/EHP1090Mann, A. G., Tam, C. C., Higgins, C. D., & Rodrigues, L. C. (2007). The Association Between Drinking Water Turbidity and Gastrointestinal Illness: A Systematic Review. BMC Public Health, 256(7). doi:10.1186/1471-2458-7-256
92Drinking Water Vulnerability Assessment and Resilience Plan
AmongPWSsthatusegroundwater,NTNCsystemsexperiencethemostMCLviolations(40%)but receive the fewest enforcement actions. Across all PWSs that rely on groundwater, privately ownedsystemsexperiencethemost(90%)MCLviolations.
Ananalysisofsanitarysurveyreportsbetween1996and2016found730significantdeficienciesoccurredoverthe10-yearperiodandthat15%weredeficienciesthataPWSincurredrepeatedlyduringtheperiodofanalysis.Overhalf(55%)ofalldeficienciesinvolvedsourcewaterwells(55%)includingwellsnotbeingwatertight(23%),evidenceofflooding(12%),orwellnotproperlyscreened(9.5%).Approximatelyonequarter(26%)ofallsignificantdeficienciesinvolvedstoragetanksnotbeingadequatelyprotectedfromcontamination.
Meanwhile,waterqualitydatafromsixdrinkingwaterreservoirsinsouth-centralConnecticutindicatesthatsurfacewaterdissolvedoxygensaturation,surfacewatertemperature,andspecificconductivity are increasing. Overall, this means that biological growth (algal productivity) is increasing, and lakes are becoming hotter and less well mixed as the climate warms. Hotter, more thermally stable lakes are more likely to experience harmful algal blooms, especially if blooms are already a problem.
4.4 Climate Change ImpactsThisreportclearlydocumentsthatflood,storm,drought,andwaterqualityrisksarealreadyaffectingPWSs.Whileweoftenthinkoftheserisksasstationary,theyarebelievedtobechanging as our climate changes. The climate change analysis conducted for this study is considereda“high”emissionscenario.
Changes to Flood RiskThe DMP for all modeled return periods (5, 10, 20, 50, and 100 years) is projected to increase, with a larger increase of extreme precipitation for longer return periods. Five of the six models projectaDMPrelativeincreaseofmorethan50%formostofConnecticutforallfivereturnperiods. Some portions of the state are projected to experience a doubling in the DMP for a 20-year return event and tripling for a 100-year return event. In evaluations of past climate, roughly 15%oftotalprecipitationinConnecticutwasaccountedforbyheavyrainevents.Itisprojectedthatfutureclimatechangescouldresultinanadditional2to10%ofprecipitationattributedtoheavyraineventsthatmayproducefloodinganderosion.
Changes in Drought RiskWhile projections anticipate an increase in total precipitation, much of the increase can be accounted for by winter precipitation rather than summer. Also, with temperatures projected to rise, so does the PET. The projected PET that was modeled exceeded the projected precipitation
Drinking Water Vulnerability Assessment and Resilience Plan93
increase as primarily accounted for during warm seasons. The seasonal trends display a clear contrast with slight increases of water budget during winter and a drastic decrease during summer. Overall, the models project a decrease in average summer potential water availability, resulting in the potential for an increase in extreme summer droughts. The models do however differregardingtheseverityoflongerdurationfuturedroughts,leavingahighdegreeofuncertainty regarding longer-term, sustained droughts.
Source Water ProtectionAnincreaseinprecipitationmaypotentiallyincreasefloodingeventsandassociatedriskstoPWSwellswhileanincreaseinstormwaterrunoffandinseasonaldroughtsposesarisktosurface water sources. There is also potential for a longer algal bloom season (starting earlier and ending later) and for more harmful algal blooms with the rise in temperatures as warmer temperatures favor blue-green algae that may produce toxins as well as compounds that impact taste and odor. Stringent source water protection measures will help maintain resiliency of some sources while new and innovative source water protection methods or plant treatment process changes will achieve resiliency even as climate changes.
4.5 Community Water System Vulnerabilities and Emergency PreparednessVulnerability Assessment ReviewManysystemsmaintainaseparateassessmentwithsensitiveandconfidentialsystemvulnerabilities; these documents are separate from the WSP. However, some systems chose to includeanECPorchapterthatincludedgeneralvulnerabilitiessuchas“poweroutage.”Overall,vulnerabilities were primarily characterized in these plans by focusing on the related emergency response procedures. CWSs consistently do not acknowledge climate change as a factor in their vulnerability assessments. However, it is clear that many of the large systems have redundancies builtintotheirsystemstoavoidinfrastructuregoingofflineduringaneventandthattheseredundancies reduce vulnerability.
Emergency Contingency Plan ReviewIn general, most CWSs are prepared for an event. Many have looped transmission mains to assist in small break isolation and are able to repair small breaks with in-house parts. The systems that are not able to repair breaks typically have contractors available. It was also found thatmostutilitiesarecapableoffunctioningnormallyifoneormoreprimarysourcesisoffline,and if there is total failure, most have at least 24 hours of storage. Surface water dependent systemsalsohaveEAPsintheeventthereisdamfailureduetofloodingandalsohavedammonitoringprogramsinplaceforduringtheevent.ECPsincludelistsof“priorityfacilities”for restoration of water service; however, water utilities have broad latitude in deciding which customers should be listed. Priority facilities are often synonymous with critical facilities but couldalsoincludemajoremployersorindustryinordertoenhancea“returntonormalcy”following a major storm.
94Drinking Water Vulnerability Assessment and Resilience Plan
Drought Response PlansAlargepercentageofsystemswithsubmitteddroughtresponseplansutilizeafive-stagedroughtresponse;however,AquarionWaterCompanyandConnecticutWaterCompanyuseafour-stage response plan. These two companies operate a large number of individual CWSs. Drought triggers vary and are dependent on factors such as season, depth of water in well, reservoir storage capacity or well output compared to demand, and well run time.
4.6 Drought Planning and ResilienceWithseveredroughtsoccurringrecently(2015to2016)andprojectedtobecomemorefrequent,PWSs need to be prepared for changes that may occur in both surface and groundwater sources.
Drought triggers vary between systems based on demand, source type, and drought response stages.Duringpastdroughts,thesetriggerswereadequateforsomesystemswhileothersystems found their triggers were engaged faster than anticipated. Among respondents to thesurveysdescribedinthisreport,8%founddroughttriggerstobeinadequateoverallwhileamonglargesystems26%founddroughttriggersinadequate.Withclimatechangeprojectionsanticipating an increase in severe droughts, drought triggers may need revision. Complicating matters, the review of ECPs (above) noted that a large percentage of large CWSs with drought responseplansutilizeafive-stagedroughtresponse;however,manyusethepreferredfour-stage response plan, and at least one uses a hybrid.
The SWP and the Coordinated Water System Plans address droughts as a central topic beyond their shared emphasis on promoting a water conservation ethic. With droughts a central theme of those two planning processes and this study, the timing is appropriate for making changes in how PWSs address droughts. However, climate change projections need to be incorporated into the thought process, and PWSs need to adopt changes that do not rely on static risk levels based on past events but rather adopt a mindset that involves ongoing learning and adaptation as risks change in order to properly project the risk to future events.
4.7 Interconnections and Infrastructure UpgradesCWSs are comprised of integral infrastructure that ensures reliable water delivery to customers. Some of these systems, typically the smaller ones, lack internal redundancies. This makes them vulnerable during an extreme weather event. Some PWSs should pursue infrastructure upgrades whereas others should focus on interconnections that can create source redundancy for smaller systems that often rely on limited sources.
Ofthesystemssurveyed,overhalf(53%)areinterestedininterconnections.Interconnectionsprovide small systems an option to increase redundancy though for some systems increasing supply or redundancy may not be feasible due to environmental, economic, or hydrologic factors or due to lack of space and land.
Drinking Water Vulnerability Assessment and Resilience Plan95
A GIS assessment was conducted to identify the potential for interconnections. If the distance between systems was less than 1,000 feet, it was deemed feasible. However, if this potential interconnection was between two small systems, a potential interconnection was mapped tothenearestlargesystem,whichoffersgreaterredundancyandresources.Byevaluatingpotentialinterconnectionsbetweensmallunaffiliated,smallaffiliated,andlargesystemsfromthe Coordinated Water System Plans, recommendations were made regarding the most feasible interconnections according to the mapping.
Itisbeneficialforsystemstoincorporatemoreredundanciesintotheirinfrastructurebyimprovinginternalredundancies,developingadequatestorage,ordevelopinginterconnections.The DWSRF could be a potential source of funding for future projects; however, small systems havedifficultyapplyingforthesefunds,andevenlargersystemsfeelthatapplyingmaynotbeworthitbecausefundingisnotguaranteed.Solutionstothisproblemidentifiedbydrinkingwater stakeholders include the following:
• HiringconsultantstoassistDPHwiththedevelopmentofspecificationsforcommonprojectsas was recently done by DPH for the generator program funded under DWSRF
• HoldingDWSRFapplicationworkshopswhereexpertsorDPHstaffassistsmallsystemswithpreparing applications
• Establishingagrantprogramwithlessfront-endapplicationrequirementswhichallows,forexample, payment for evaluations of necessary system upgrades
While interconnections are important options, there are potential challenges and risks including thefollowing:(1)irregularuseofinterconnectionsmaycreatetemporarywaterqualityissueswhenactivatedbecauseofdifferencesinwaterchemistry;(2)interconnectionsthatare emergency use only must be properly exercised and maintained so they are ready when needed; and, (3) routine use interconnections may create disincentives for the recipient system to conserve water due to contractual minimums.
4.8 Drinking Water Section Emergency PreparednessIn the event of a statewide emergency, an ICS is established by the Connecticut State Department of Emergency Services & Public Protection, DEMHS, and the OEM. During this emergency, the SEOC is activated, and DPH-DWS has a representative at the SEOC. A water task force is also activated during an emergency, which includes various drinking water stakeholders. Ifthetaskforcefindsanissue,thisconcernisforwardedbyDPH-DWStotheSEOCsoitcanbeaddressed by regional coordinators and leaders.
96Drinking Water Vulnerability Assessment and Resilience Plan
The Public Health Emergency Response Plan (PHERP) was developed in 2011 to identify appropriate department response to public health emergencies. The plan also helps to manage ESF#8andallowthestatetooperateandprovideserviceseffectivelyduringanemergency.However, several elements of this plan (such as the WEAR Team) are no longer utilized, and therefore, the PHERP should be updated.
Everbridge is utilized by DPH-DWS prior to an emergency to disseminate mass communications to CWSs, including emergency preparedness tasks. DPH-DWS also makes an after-hours phone lineavailableforsystemstouseforupdatesorquestions;thisinformationisalsoincludedinthe mass communication. The key recipients of this information are the designated emergency response leads for each large CWS. Typically, small systems are sent multiple notices to ensure receipt.TheDWShasalsocreatedacontactinformationformforsystemstofilloutannually.
InterviewswereconductedwithstatedrinkingwaterstafffromMaine,Vermont,RhodeIsland, Pennsylvania, Massachusetts, New Jersey, New Hampshire, and Ohio. These interviews identifiedprovenactionsforbefore,during,andafteranemergency.Somenotablefindingsinclude the following:
• Establish who needs to be involved during an emergency depending on the nature and extent.
• Identifystafffromotherstateagencieswithwhomthedepartmenttypicallyworksandmaintaina list of current contact information.
• Maintain Standard Operating Procedures (SOPs) and keep them available in a SharePoint folder forallstafftoaccess.
• Automated communication with water systems such as calls, emails, or online status submission haveproveneffective.
• Utilize reverse 911 in the event a system is unable to notify consumers of a water advisory (boil water, etc.).
• Assist systems with communicating with FEMA and encourage them to take pictures of all damage to facilitate getting funding.
• SOPs and ERPs are updated annually and built upon based on experiences and lessons learned.
TheDPH-DWShaslackeditsownunifiedsetofemergencyresponseprotocols.AdraftERPwasdeveloped for use by DPH-DWS under separate cover. The plan provides guidance to DPH-DWSstaffforevaluatingthepriorityofareportedincidentandaframeworkforincidentandemergency response.
Drinking Water Vulnerability Assessment and Resilience Plan97
4.9 StateandLocalLawsAffectingDrinkingWaterNationwide and in Connecticut, some existing laws include resiliency, and some do not, with somelawsaffectingtheresiliencyofPWSs.TheRCSAhavebeenamendedasneededtoincorporate resiliency concepts. For example, the standby power supply regulations were recently incorporated into the RCSA. It is apparent that very few statutes or regulations address both resiliency and PWSs. Public Act 18-82 was one of the most recently passed bills that addressedresiliency,andcomponentsoftheactwillaffectPWSs.However,theremaybeaneed for more regulations and/or guidance that directly links PWSs and resiliency. This has happened in the past relative to sanitary sewer systems and water pollution control facilities, demonstrating that it may be possible for PWSs.
4.10 Private Well VulnerabilitiesTheDPHestimatesthatapproximately23%ofthestate’spopulationreliesonprivatedrinkingwater wells. With minimal data available in digital format, one of the challenges in assessing vulnerability is identifying where these numerous private wells are located and what their respective vulnerability is to existing natural hazards and climate change.
Identifying Private Well LocationsAs part of this assessment, local health directors were contacted to take part in the process and provide their comments on where private wells may be located in their respective town or district and were asked if there was any knowledge of private well areas that experience flooding.Mostcommentsreceivedregardingwelllocationwereminimallyinformative,withamajorityofthosewhorespondedofferingareviewofpapercompletionrecords.FairfieldwastheonlytownthatofferedaGISshapefilewithprivatewelllocationattheparcellevel.
PWSserviceareasaremappedbyDPHinGIS,withlargersystemspresentedusingabufferof the distribution pipe network beneath roads and smaller systems typically depicted using a general footprint that includes homes/facilities served within the parcel boundaries. By assuming that any residential parcel outside a 100-foot radius of a service area had a private well, and excluding open space parcels, a map was created to depict assumed private well locations. This resulted in 192,396 assumed wells throughout the four coastal counties. Newtown appears to have the highest number of wells, with an assumed count of 8,266, and New London appears to have the fewest with an assumed count of 21 wells. However, New London currently believes that every property in the city is serviced by public water. Based on the city’s belief, the assumed 21-well count could be a result of error in the location analysis or reveal areas in the city that are still dependent on private wells.
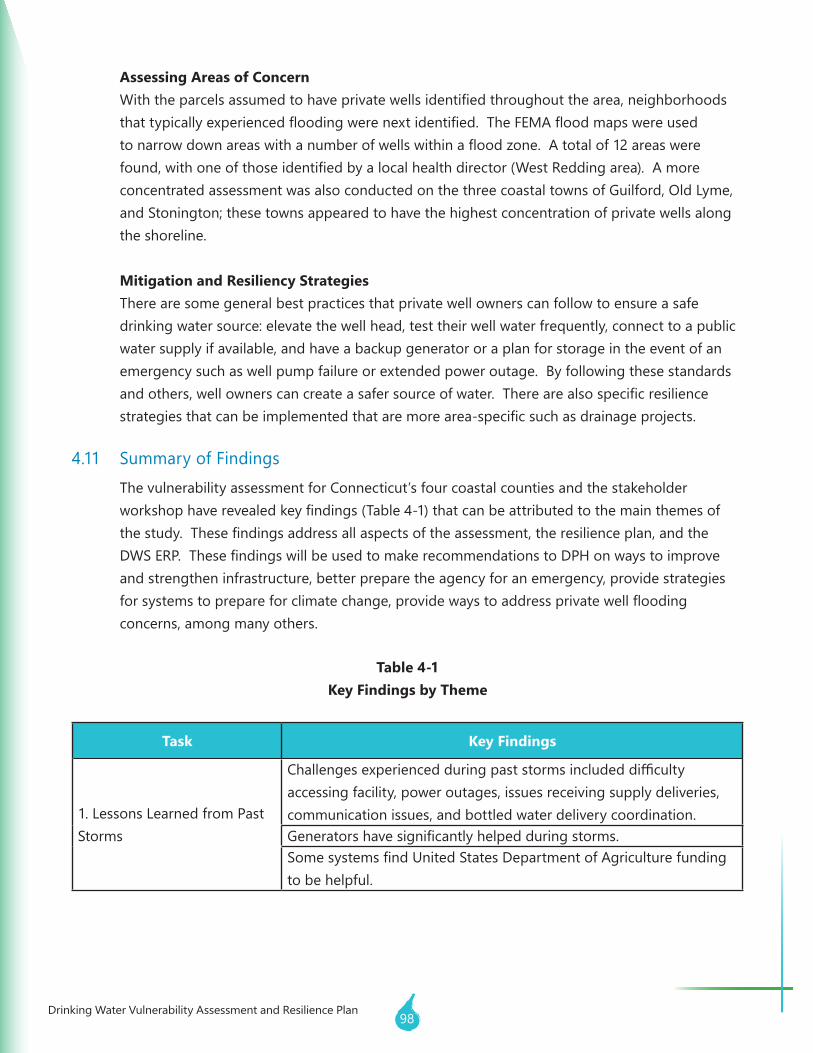
98Drinking Water Vulnerability Assessment and Resilience Plan
Assessing Areas of ConcernWiththeparcelsassumedtohaveprivatewellsidentifiedthroughoutthearea,neighborhoodsthattypicallyexperiencedfloodingwerenextidentified.TheFEMAfloodmapswereusedtonarrowdownareaswithanumberofwellswithinafloodzone.Atotalof12areaswerefound,withoneofthoseidentifiedbyalocalhealthdirector(WestReddingarea).Amoreconcentrated assessment was also conducted on the three coastal towns of Guilford, Old Lyme, and Stonington; these towns appeared to have the highest concentration of private wells along the shoreline.
Mitigation and Resiliency StrategiesThere are some general best practices that private well owners can follow to ensure a safe drinkingwatersource:elevatethewellhead,testtheirwellwaterfrequently,connecttoapublicwater supply if available, and have a backup generator or a plan for storage in the event of an emergency such as well pump failure or extended power outage. By following these standards andothers,wellownerscancreateasafersourceofwater.Therearealsospecificresiliencestrategiesthatcanbeimplementedthataremorearea-specificsuchasdrainageprojects.
4.11 Summary of FindingsThe vulnerability assessment for Connecticut’s four coastal counties and the stakeholder workshophaverevealedkeyfindings(Table4-1)thatcanbeattributedtothemainthemesofthestudy.Thesefindingsaddressallaspectsoftheassessment,theresilienceplan,andtheDWSERP.ThesefindingswillbeusedtomakerecommendationstoDPHonwaystoimproveand strengthen infrastructure, better prepare the agency for an emergency, provide strategies forsystemstoprepareforclimatechange,providewaystoaddressprivatewellfloodingconcerns, among many others.
Table 4-1Key Findings by Theme
Task Key Findings
1. Lessons Learned from Past Storms
Challengesexperiencedduringpaststormsincludeddifficultyaccessing facility, power outages, issues receiving supply deliveries, communication issues, and bottled water delivery coordination.Generatorshavesignificantlyhelpedduringstorms.SomesystemsfindUnitedStatesDepartmentofAgriculturefundingto be helpful.
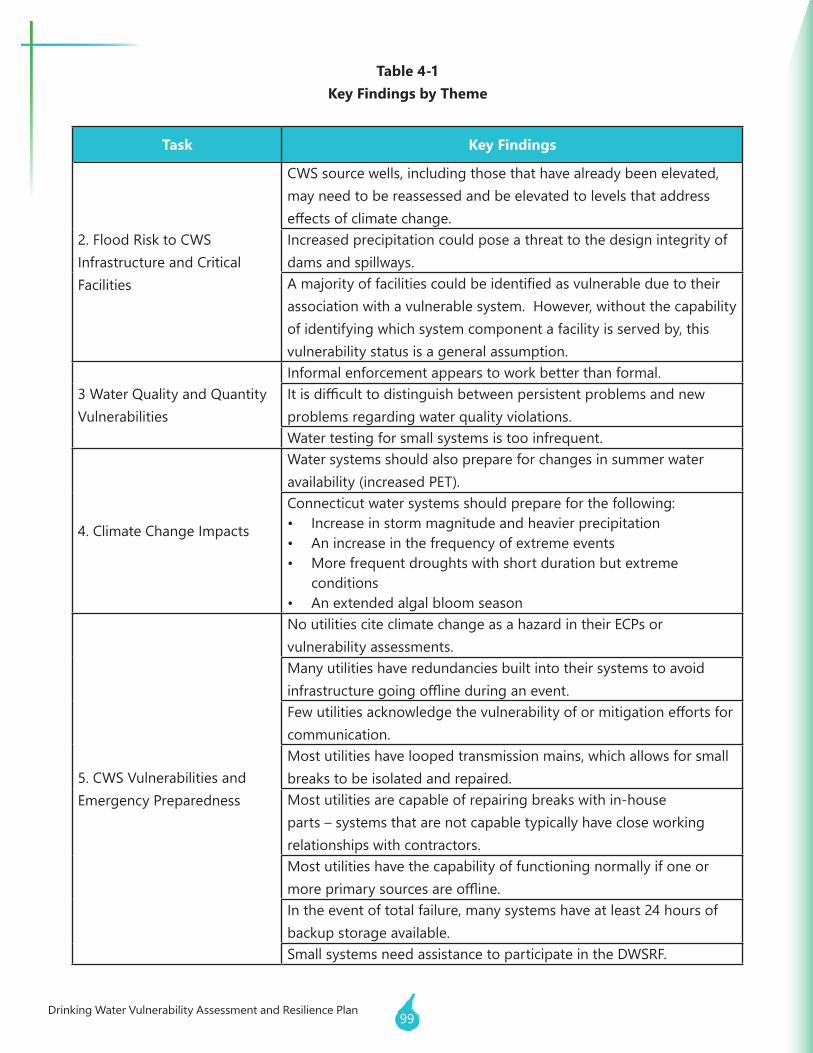
Drinking Water Vulnerability Assessment and Resilience Plan99
Table 4-1Key Findings by Theme
Task Key Findings
2. Flood Risk to CWS Infrastructure and Critical Facilities
CWS source wells, including those that have already been elevated, may need to be reassessed and be elevated to levels that address effectsofclimatechange.Increased precipitation could pose a threat to the design integrity of dams and spillways.Amajorityoffacilitiescouldbeidentifiedasvulnerableduetotheirassociation with a vulnerable system. However, without the capability of identifying which system component a facility is served by, this vulnerability status is a general assumption.
3 Water Quality and Quantity Vulnerabilities
Informal enforcement appears to work better than formal.Itisdifficulttodistinguishbetweenpersistentproblemsandnewproblemsregardingwaterqualityviolations.Watertestingforsmallsystemsistooinfrequent.
4. Climate Change Impacts
Water systems should also prepare for changes in summer water availability (increased PET).Connecticut water systems should prepare for the following: • Increase in storm magnitude and heavier precipitation • Anincreaseinthefrequencyofextremeevents• Morefrequentdroughtswithshortdurationbutextreme
conditions • An extended algal bloom season
5. CWS Vulnerabilities and Emergency Preparedness
No utilities cite climate change as a hazard in their ECPs or vulnerability assessments.Many utilities have redundancies built into their systems to avoid infrastructuregoingofflineduringanevent.Fewutilitiesacknowledgethevulnerabilityoformitigationeffortsforcommunication.Most utilities have looped transmission mains, which allows for small breaks to be isolated and repaired.Most utilities are capable of repairing breaks with in-house parts – systems that are not capable typically have close working relationships with contractors.Most utilities have the capability of functioning normally if one or moreprimarysourcesareoffline.In the event of total failure, many systems have at least 24 hours of backup storage available.Small systems need assistance to participate in the DWSRF.
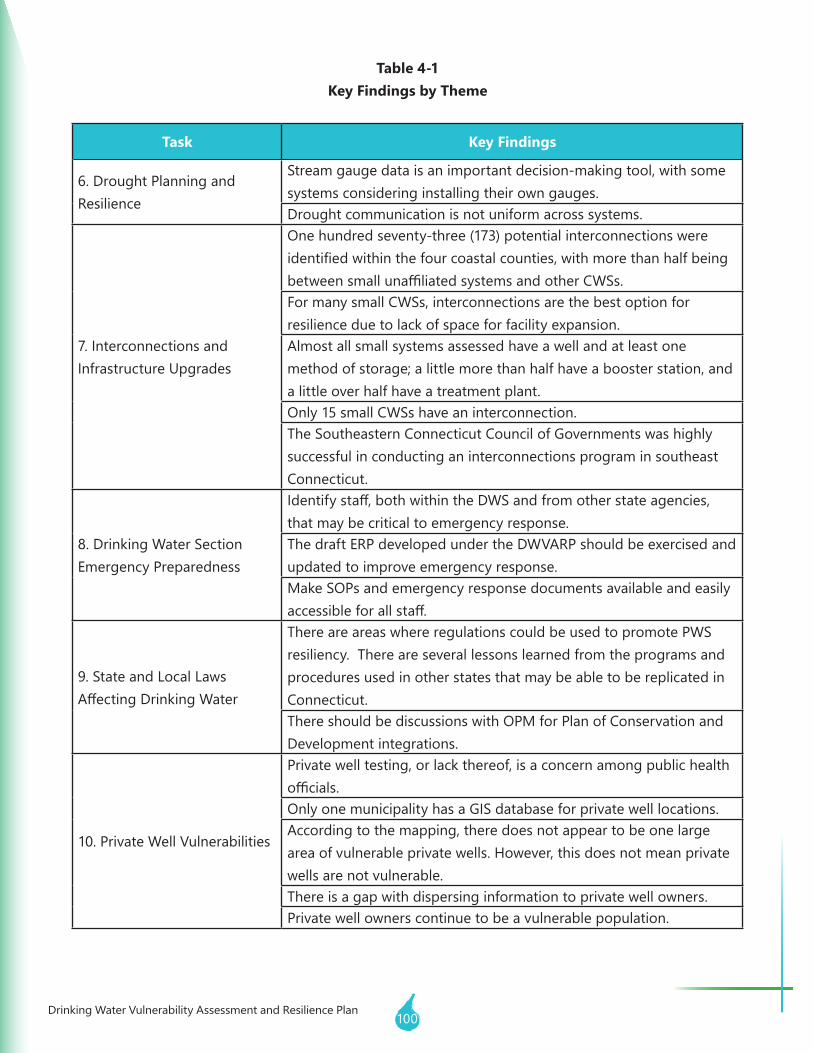
100Drinking Water Vulnerability Assessment and Resilience Plan
Table 4-1Key Findings by Theme
Task Key Findings
6. Drought Planning and Resilience
Stream gauge data is an important decision-making tool, with some systems considering installing their own gauges.Drought communication is not uniform across systems.
7. Interconnections and Infrastructure Upgrades
One hundred seventy-three (173) potential interconnections were identifiedwithinthefourcoastalcounties,withmorethanhalfbeingbetweensmallunaffiliatedsystemsandotherCWSs.For many small CWSs, interconnections are the best option for resilience due to lack of space for facility expansion.Almost all small systems assessed have a well and at least one method of storage; a little more than half have a booster station, and a little over half have a treatment plant.Only 15 small CWSs have an interconnection.The Southeastern Connecticut Council of Governments was highly successful in conducting an interconnections program in southeast Connecticut.
8. Drinking Water Section Emergency Preparedness
Identifystaff,bothwithintheDWSandfromotherstateagencies,that may be critical to emergency response.The draft ERP developed under the DWVARP should be exercised and updated to improve emergency response.Make SOPs and emergency response documents available and easily accessibleforallstaff.
9. State and Local Laws AffectingDrinkingWater
There are areas where regulations could be used to promote PWS resiliency. There are several lessons learned from the programs and procedures used in other states that may be able to be replicated in Connecticut.There should be discussions with OPM for Plan of Conservation and Development integrations.
10. Private Well Vulnerabilities
Private well testing, or lack thereof, is a concern among public health officials.Only one municipality has a GIS database for private well locations.According to the mapping, there does not appear to be one large area of vulnerable private wells. However, this does not mean private wells are not vulnerable.There is a gap with dispersing information to private well owners.Private well owners continue to be a vulnerable population.
Drinking Water Vulnerability Assessment and Resilience Plan101
Table5-1attheendofthissectionpresentsrecommendedstrategiesandspecificactionitems which, when implemented, will reduce the vulnerability and/or risk of drinking water supplysourcesandsystemstotheeffectsofnaturalhazardsandclimatechange.Therelatedrecommended general themes and strategies are presented in the following subsections.
5.1 Recommendations to Increase Resiliency for Community Water SystemsTheresiliencyofPWSstoemergenciesvarieswidelybasedonfactorssuchasthesize,financialsoundness, location, and condition of the system. The recommendations listed below were developed from the research performed in compiling this report.
Operational ResiliencyOperational resiliency can be improved via any method that reduces the risk of a loss of service in the system. Since systems include supply sources, storage, treatment, and distribution systems,thereareseveralopportunitiesforfailureinthesystem,eachofwhichaffectsthesystems with varying degrees of severity and permanence. Planning for future vulnerabilities is thefirststepindefense.CWSsshouldbegintoacknowledgeclimatechangeandtheassociatedvulnerabilities in their WSPs. Theme 1 from table 5-1 serves as a reminder of the lessons learned during recent severe events. By acknowledging these vulnerabilities, emergency response procedures can also be created. System ECPs/Vulnerability Assessments should consider the climate change results presented in this report in addition to other analyses.
ThemosteffectivemeansforincreasingresilienceinaPWSistoprovideinterconnectionswithneighboringsystems,whichcanprovideemergencyflow.Interconnectionsareespeciallyeffectivebecausetheyonlyrequirethedistributionsystemoftheailingsystemtobeoperational. Most PWSs have distribution systems that can be repaired relatively easily in emergency situations using in-house supplies. Areas of the distribution system that cannot be repaired can often be isolated or bypassed. CWSs should ensure that multiple sources and interconnections are available for conjunctive use of supplies and sharing of water. Regarding interconnections to connect large CWSs, the interconnection recommendation tables in this report and in the West, Central, and East Coordinated Water System Plans (CWSPs) should be used to prioritize future interconnections. For example, the Western CWSP recommends a tiered system of interconnections for resiliency. This should be pursued. Theme 7 in table 5-1 explores the various ways interconnections can safely aid in resiliency.
5.0 Recommendations
102Drinking Water Vulnerability Assessment and Resilience Plan
Regarding interconnections to connect small PWSs to one another or to large CWSs, the interconnection recommendation tables in this report and in the West, Central, and East CWSPs should be used to prioritize future interconnections. For example, the Western CWSP recommendsthatsmallsystemsinNewFairfieldcentershouldbeconnected.Whetherornotinterconnections are available, small CWSs should incorporate more redundancies into their infrastructure. If possible, the DWSRF should be utilized.
Emergency electrical generation is an important tool in increasing the resiliency of PWSs. The purpose of a generator is to combat a loss of service by providing power to draw water from thesourceandtopumpwatertohighservicezones.In2015,theDPHrequiredALLCWSsregardlessofsizetohaveanemergencybackupgeneratororhaveaplanforacquiringanemergency backup generator. The DWVARP takes this a step further. In addition to owning a generator, systems should plan for longer power outages by exploring the possibility of redundant fuel systems or larger fuel capacities. See Table 5-1, Theme 1-A for current recommendations on generator usage. Utilities should also coordinate with local Emergency Management Directors to ensure that PWSs are on the priority electrical service restoration list even if they have standby power.
An additional means of combatting a loss of service is to expand system storage. This can buy time during a power outage. This is especially important for systems that may not have the space or option to increase their fuel capacities for emergency electrical generation.
Drought ResiliencyDrought resiliency was brought to the forefront in Connecticut in 2016 when several large systems struggled with shortages in supply. Communication between water purveyors and state agencies was an issue during this time period. Drought communication is not uniform, which canleadtoconfusionamongthepublic.Effortstoimprovecoordinationbetweenthestateand CWSs about drought messages and to better communicate to the public when messages differshouldbemade.Areasonablelevelofdroughtresponseuniformityisneededtoavoidconfusion regarding drought responses. Stronger communication between the state and CWSs is needed to better convey drought responses to the public. Additionally, CWSs should evaluate and reset drought triggers, giving priority to those systems that have experienced serious impacts in the past decade.
CWSs should promote water conservation as well as public education and better communication tomanagedroughts.Whilewateruserestrictionsareeffectiveduringdrought,smallsystemshavedifficultyenforcinguserestrictions,especiallywhencustomerwaterisnotmetered.Smallsystemsmayrequireadditionaltechnicalandfinancialassistanceforaddressingdroughts.
Drinking Water Vulnerability Assessment and Resilience Plan103
5.1.1 Resiliency for Public Water Supply Sources
The source of supply is the heart of any PWS. Common threats to water supply sources includeaginginfrastructureandflooding.Thesetwofactorsworksynergisticallytocompoundeachotherasolder,weakerinfrastructurewilltendtobelessresilienttoflooding.
Flooding is a major issue for both small and large CWSs. Since many of the most productive supply wells are situated in alluvial deposits, these areas naturally pose a floodrisk.Itisimportanttoidentifysystemswithpublicwatersupplywellsinfloodzonesandensureadequatemeasuresaretakentoprotectwellsfromflooding.Byidentifyingthosewellsthatarelocatedwithinafloodzoneandensuringsufficientprotectivemounding,theriskoffloodingwillbereduced.Ifwellsarefoundtobeinadequatelypreparedforafloodingevent,improvementsshouldbemadesothewellheadisabovethe500-yearfloodeventplusappropriatefreeboard.
Reservoirs with aging infrastructure, such as dams and spillways should be assessed fortheircapacityindealingwithfuturefloodingandheavyprecipitationevents.Whilethe storm scenarios typically used for spillway and dam design are large events such asa1,000-yearflood,moreoftenthannotnewerprecipitationdataisnotusedfordesign. Therefore, up-to-date precipitation data should be used for new designs and reevaluationsofinfrastructure.Byassessingthestructuralintegrityandwaterflowcapacity, upgrades and improvements can be made to the components to withstand climatechangeeffects.Thisensuresthatthesystemsnotonlyfunctionasdesignedduringfloodeventsbutalsodonotcauseorexacerbatefloodingintheirownright.
5.1.2 Resiliency for Community Water System Distribution Systems
The distribution system of a PWS comprises the network of arteries that ensure that publicdrinkingwaterreachesitsdestinationwiththequalityandpressureprescribedby law and expected by the consumer. The distribution system is critical to the function of the system in an emergency; a PWS can function with no source of supply if it has a functioning interconnection. A PWS with no source of supply and a nonoperational distribution system cannot function properly even if the system has a functioning interconnection.
To maintain properly functioning distribution systems, vulnerable pump stations and treatmentplantsshouldbemademoreresilientbyfloodproofingorutilityhardening.Thesemitigationeffortswillreducethefloodrisktothesystem.Additionally,waterchemistry/compatibility should be assessed before the utilization of an interconnection. Thiswillensurethatwaterqualitywillnotbecompromisedduetointeractionsbetweenthe water and the distribution system.
104Drinking Water Vulnerability Assessment and Resilience Plan
5.1.3 Resiliency for Critical Facilities Served by Community Water Systems
Critical facilities include institutions such as hospitals, shelters, nursing homes, and other placesthatwouldbeseverelyandquicklyimpactedbyalossofpublicwaterserviceinaway that endangers human life. Identifying where and what each critical facility is that is served by public water systems is an important stepping stone to increasing resilience. A GIS database should be developed to represent critical facilities and which PWS they are served by and identify critical facilities that are their own PWS. Once the GIS database has been developed,refineddatacouldshowwhichportionsofCWSsservespecificcriticalfacilities.To better identify these connections, there should be guidelines for CWSs to assess critical facilities that are located far from their sources; this would determine what infrastructure facilities rely on, therefore making service restoration easier. Lastly, critical facilities served by a PWS must inform the PWS of upgrades in order to provide the best possible service.
5.2 Long-Term Implementation Plan5.2.1 RecommendedModificationstoCurrentLaw
CurrentlawprovidestheprovisionsformaintainingqualitydrinkingwaterintheStateof Connecticut. Nevertheless, increasing knowledge and changing climactic conditions mean that regulations may need to be updated. On a broad scale, regulations should bedevelopedtospecificallylinkpublicwatersystemstoresiliencyplanninganddesignstandards.Forexample,theWaterSupplyPlanningRegulationsshouldbemodifiedtoincorporate climate change and resiliency in several areas. The water planning council should also help promote and advance PWS/CWS resiliency. This could be accomplished by ensuring that resiliency is included in the consideration of new laws, regulations, and policies and by promoting greater education of PWS about the importance of resiliency.
Local regulations should more directly address construction of public water supply wells infloodzones,andrequirementsshouldbeuniformacrossthestate.Guidanceshouldbe provided to the local land use commissions on revising these regulations to make well constructioninfloodzonesmorestringent(asimilarrecommendationforprivatewellsisprovided below).
Since small systems tend to have less inherent redundancies than large systems, testing shouldbeincreasedinfrequencyforsmallPWSs(thisshouldbeincorporatedintoregulationsbutshouldprovideDWSwithflexibilitytonotrequireincreasedtestingforallPWSs). Additionally, the DPH can incorporate a resiliency metric into the sanitary surveys throughthesmallsystemCAT(“scorecard”).Inordertomonitorresultsovertime,createabaselineforwaterqualityandviolationsandcomparefutureresultstobaseline.Thisbaselinecanprioritizelandusedecisionsbasedonqualityofadjacentwatershedsandwaterbodies.Insurfacewaterbodies,DPHshouldincreasesourcewaterqualitymonitoring in reservoirs that experience algal blooms.
Drinking Water Vulnerability Assessment and Resilience Plan105
Additional structural improvements could improve the resiliency of public water service. AllCWSsmusthaveadequatestorageoraninterconnection.CWSsthatcompletelylackstorage should be disallowed. Critical facilities served by a PWS must inform the PWS of upgrades.
5.2.2 Resources to Assist with Implementation
Many resources exist to help implement increases in resiliency. Among the most important resources is funding. Additional funding is especially needed to help small systems address severe events. The state should invest in science to explore the relationshipbetweenwaterqualityviolationsandsanitarysurveydeficiencieswithboilwater advisories and waterborne disease outbreaks. The state should also promote and help fund additional source water protection measures and the Drinking Water Quality ManagementPlanforvoluntarycollaborativewaterqualityprotection.TheStateBondCommission is also a potential funding source for future projects; however, recent past attemptsatprocuringfundinghaveprovendifficult.In2018,thecommissiondecidedtonotfundaPWSexpansionprojectinNewFairfieldforroughly2milliondollars,however, a grant was provided for tide gate improvements in West Haven for almost 4 million dollars. While both proposals were resiliency projects, only the tide gates were funded. Therefore, future petitions for drinking water projects should be strongly cast as resiliency projects to make certain the commission realizes the importance of both new and improved drinking water infrastructure.
Nonregulatory guidance is also useful to aid in preventative PWS actions. The DPH shouldprovidespecifictargetednonregulatoryguidancetoPWSsregardinghowtoincorporatechangestofloodanddroughtrisksintoplanningandoperations.Theyshouldalso provide more support to NTNC and private systems to reduce MCL violations. For example, harmful or potentially harmful algal bloom data in Connecticut should be tracked, and DPH should provide technical assistance to CWSs to address these events.
Internal training and preparation on the part of the DPH can help public water systems increase resiliency and respond to emergency situations. The DWS should conduct DWSRF application workshops to assist systems in the application process. They should use source water protection and the Drinking Water Quality Management Plans as a source of resiliency and increase funding and support for investments in watershed protection. Other existing guidance sources should be updated. The PHERP has not been revised since 2011. The response plan should be revised as departmental changes occur, for example, the WEAR team is named in the PHERP; however, this team is no longer operating during an emergency. Utilizing new technology is critical in bolstering communication between PWSs, government agencies, and customers. The DPH should implement WebEOC and
106Drinking Water Vulnerability Assessment and Resilience Plan
provide training for using the program. Internally, DPH should revise and exercise the ERPtemplatedevelopedunderthisstudy.TheyshouldalsotrainmultipleDWSstaffin emergency response protocols and foster a culture of preparedness in the DWS by conductingweeklyremindersabouteventsthatcouldpotentiallyoccurduringthespecificseason or time of year. Externally, the DPH can form a Drinking Water Workgroup with other states.
5.3 Consistency with Other Planning DocumentsThe DWVARP addresses many important themes through both the analyses that were conducted and the recommendations to improve resilience. These themes and goals can be found within other resources that are available for resiliency projects.
TheDWSRFhasrecentlybeenmodifiedsothepriorityrankingsystemutilizedcanprioritizeprojects geared toward infrastructure resiliency and sustainability and water conservation, among others. The DWSRF priorities are based in part on EPA’s Drinking Water Infrastructure Needs Survey and Assessment (DWINSA), which estimates the 20-year capital investment requirementsforPWSsineachstate.TheDWVARPhasrecognizedthatsystemsshouldprotectvulnerableinfrastructurefromflooding,droughttriggersshouldbereevaluated,andinterconnections should be explored and that systems should plan and prepare for changes in waterquality.FoundintheappendicesoftheDWVARParetablesrepresentingsystemsthatmay have vulnerable supply wells and other system components. Therefore, if these systems were to pursue state revolving funds, the projects would be and should be prioritized. Also, systems that are looking to increase drought resiliency by investing in infrastructure to reduce water loss should also be prioritized.
The DPH Capacity Development Strategy is a federally mandated strategy to which all primacy states must adhere to, including Connecticut. This strategy is targeted toward improving capacity for new and existing PWSs and includes four main focus areas:
1. Source protection and planning2. Compliance and enforcement3. Operationcertification4. DWSRF
The DWVARP has presented multiple recommendations that coincide with this strategy. For example,toimprovesourcewaterprotection,systemscouldacquirelandtominimizepollutionto wells or to increase recharge areas or conduct source protection improvements such as stormwatertreatmentbasins.Theplanalsosuggestsincreasingwaterqualitytestingandvarious ways the DWSRF can be leveraged to execute resilience projects. The overarching goal
Drinking Water Vulnerability Assessment and Resilience Plan107
of the strategy is to provide systems with tools to succeed from a technical, managerial, and financialaspect;theDWVARPrecommendationswilllikelyaddresstheseaspectsaswelltoimprove the systems’ capacity.
The WUCC process, as described in section 1.4.1, was also aimed at improving public water system resiliency. While the DWVARP takes a more detailed look at the factors that can exploit systems which lack resiliency, the goal of the plan is similar to one of the goals of the WUCC Process: that is, to ensure that public water systems are as resilient as possible, so that water service is not interrupted during extreme conditions. While the WUCC process focused more on how utilities can coordinate with one another, the DWVARP focuses on the natural phenomenon that will increasingly threaten public water systems. These threats are expected to increase in frequencyandseverityduetotheimpactsofclimatechange.
The Coordinated Water System Plans for the west, central, and east regions suggested that somesmallsystemsshouldbeacquiredbylargersystems,andthatinterconnectionsshouldbe pursued for resiliency and/or active daily supply. The Western Coordinated Water System Plan, for example, recommended development of a network of primary and secondary interconnections throughout the west region that would connect groups of CWSs in the Torrington, Waterbury, Southbury, Newtown, Bridgeport, and Stamford areas of the region; with connections to the central region in several locations. The DWVARP recommends further exploration of potential interconnections, and if not feasible, to install other redundancies such as additional wells and tanks, and backup power sources.
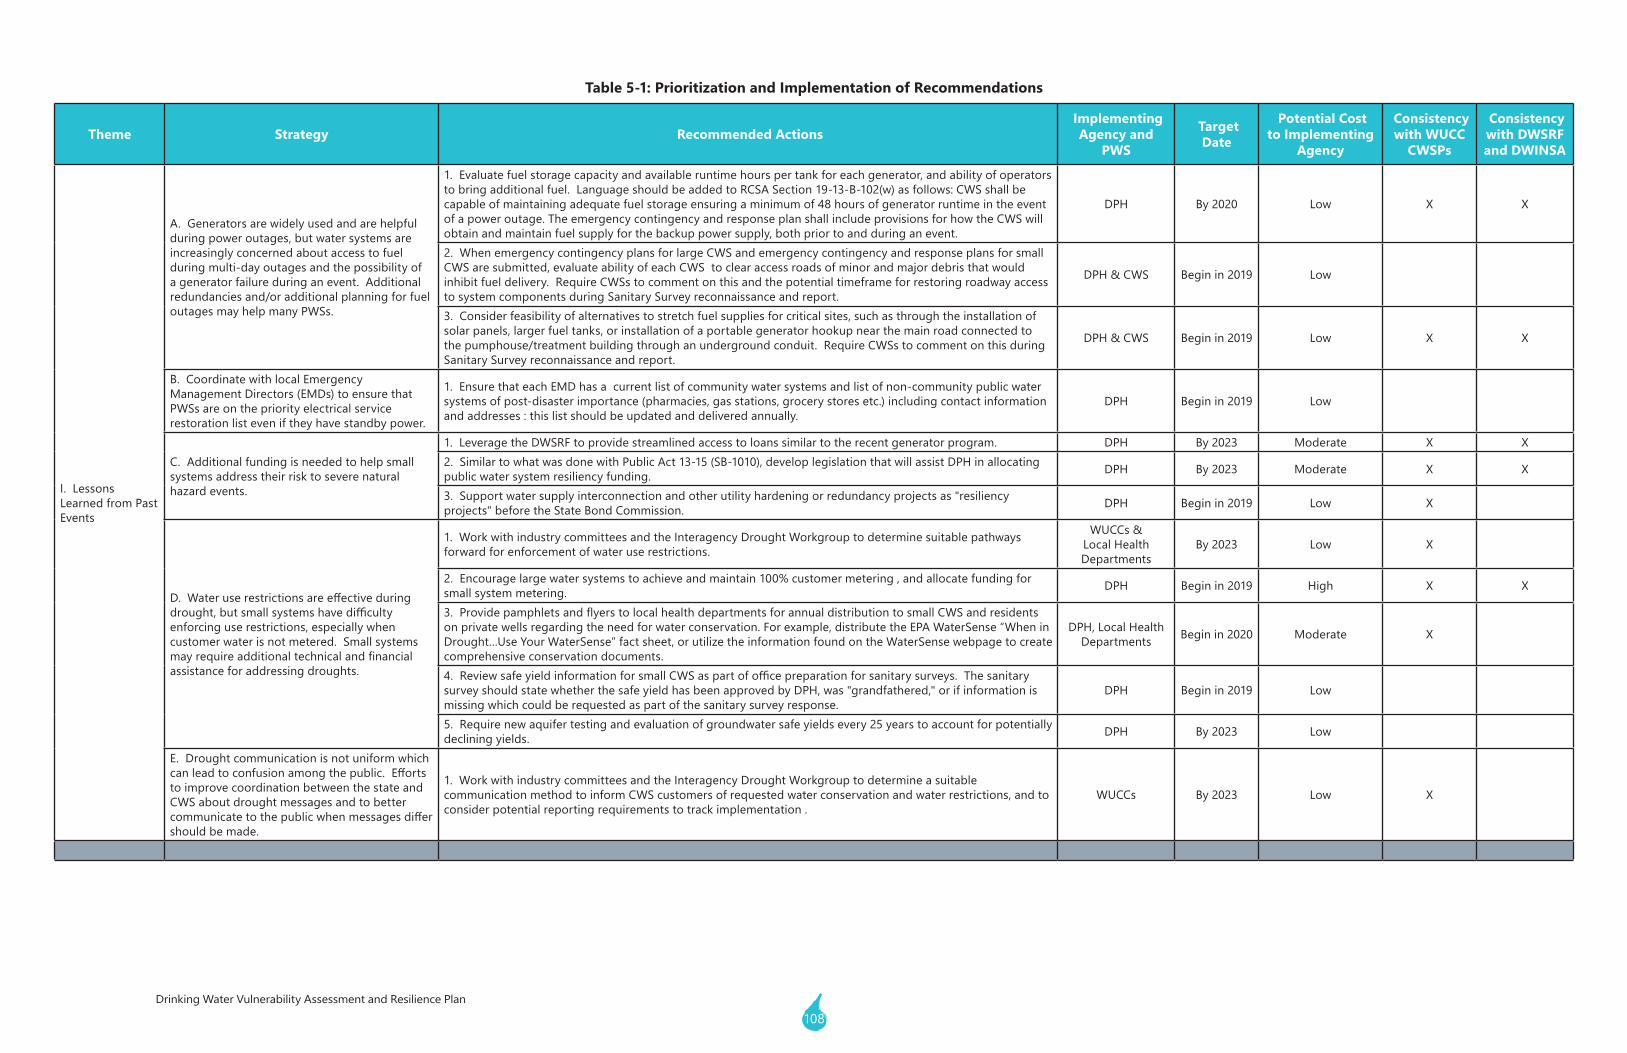
108Drinking Water Vulnerability Assessment and Resilience Plan
Table 5-1: Prioritization and Implementation of Recommendations
Theme Strategy Recommended Actions Implementing
Agency and PWS
Target Date
Potential Cost to Implementing
Agency
Consistency with WUCC
CWSPs
Consistency with DWSRF and DWINSA
I. Lessons Learned from Past Events
A. Generators are widely used and are helpful during power outages, but water systems are increasingly concerned about access to fuel during multi-day outages and the possibility of a generator failure during an event. Additional redundancies and/or additional planning for fuel outages may help many PWSs.
1. Evaluate fuel storage capacity and available runtime hours per tank for each generator, and ability of operators to bring additional fuel. Language should be added to RCSA Section 19-13-B-102(w) as follows: CWS shall be capableofmaintainingadequatefuelstorageensuringaminimumof48hoursofgeneratorruntimeintheeventof a power outage. The emergency contingency and response plan shall include provisions for how the CWS will obtain and maintain fuel supply for the backup power supply, both prior to and during an event.
DPH By 2020 Low X X
2. When emergency contingency plans for large CWS and emergency contingency and response plans for small CWS are submitted, evaluate ability of each CWS to clear access roads of minor and major debris that would inhibitfueldelivery.RequireCWSstocommentonthisandthepotentialtimeframeforrestoringroadwayaccessto system components during Sanitary Survey reconnaissance and report.
DPH & CWS Begin in 2019 Low
3. Consider feasibility of alternatives to stretch fuel supplies for critical sites, such as through the installation of solar panels, larger fuel tanks, or installation of a portable generator hookup near the main road connected to thepumphouse/treatmentbuildingthroughanundergroundconduit.RequireCWSstocommentonthisduringSanitary Survey reconnaissance and report.
DPH & CWS Begin in 2019 Low X X
B. Coordinate with local Emergency Management Directors (EMDs) to ensure that PWSs are on the priority electrical service restoration list even if they have standby power.
1. Ensure that each EMD has a current list of community water systems and list of non-community public water systems of post-disaster importance (pharmacies, gas stations, grocery stores etc.) including contact information and addresses : this list should be updated and delivered annually.
DPH Begin in 2019 Low
C. Additional funding is needed to help small systems address their risk to severe natural hazard events.
1. Leverage the DWSRF to provide streamlined access to loans similar to the recent generator program. DPH By 2023 Moderate X X2. Similar to what was done with Public Act 13-15 (SB-1010), develop legislation that will assist DPH in allocating public water system resiliency funding. DPH By 2023 Moderate X X
3. Support water supply interconnection and other utility hardening or redundancy projects as "resiliency projects" before the State Bond Commission. DPH Begin in 2019 Low X
D.Wateruserestrictionsareeffectiveduringdrought,butsmallsystemshavedifficultyenforcing use restrictions, especially when customer water is not metered. Small systems mayrequireadditionaltechnicalandfinancialassistance for addressing droughts.
1. Work with industry committees and the Interagency Drought Workgroup to determine suitable pathways forward for enforcement of water use restrictions.
WUCCs & Local Health Departments
By 2023 Low X
2.Encouragelargewatersystemstoachieveandmaintain100%customermetering,andallocatefundingforsmall system metering. DPH Begin in 2019 High X X
3.ProvidepamphletsandflyerstolocalhealthdepartmentsforannualdistributiontosmallCWSandresidentsonprivatewellsregardingtheneedforwaterconservation.Forexample,distributetheEPAWaterSense“WheninDrought…UseYourWaterSense”factsheet,orutilizetheinformationfoundontheWaterSensewebpagetocreatecomprehensive conservation documents.
DPH, Local Health Departments Begin in 2020 Moderate X
4.ReviewsafeyieldinformationforsmallCWSaspartofofficepreparationforsanitarysurveys.Thesanitarysurvey should state whether the safe yield has been approved by DPH, was "grandfathered," or if information is missingwhichcouldberequestedaspartofthesanitarysurveyresponse.
DPH Begin in 2019 Low
5.Requirenewaquifertestingandevaluationofgroundwatersafeyieldsevery25yearstoaccountforpotentiallydeclining yields. DPH By 2023 Low
E. Drought communication is not uniform which canleadtoconfusionamongthepublic.Effortsto improve coordination between the state and CWS about drought messages and to better communicatetothepublicwhenmessagesdiffershould be made.
1. Work with industry committees and the Interagency Drought Workgroup to determine a suitable communicationmethodtoinformCWScustomersofrequestedwaterconservationandwaterrestrictions,andtoconsiderpotentialreportingrequirementstotrackimplementation.
WUCCs By 2023 Low X
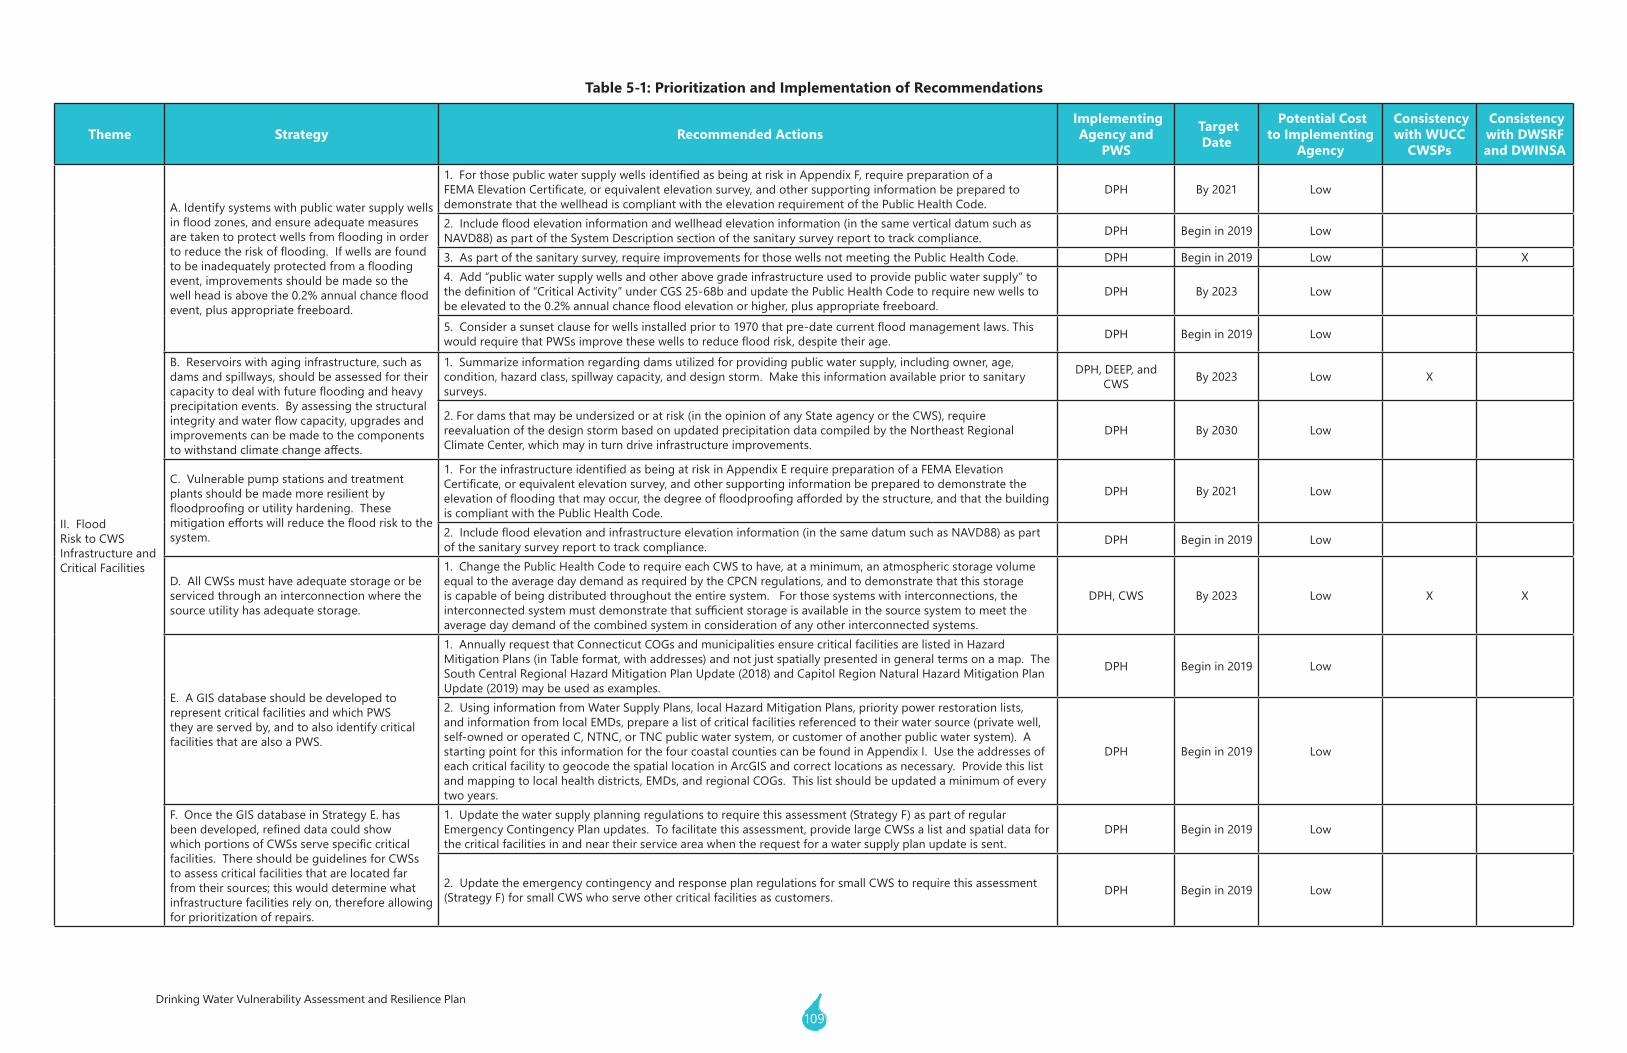
109Drinking Water Vulnerability Assessment and Resilience Plan
Table 5-1: Prioritization and Implementation of Recommendations
Theme Strategy Recommended Actions Implementing
Agency and PWS
Target Date
Potential Cost to Implementing
Agency
Consistency with WUCC
CWSPs
Consistency with DWSRF and DWINSA
II. Flood Risk to CWS Infrastructure and Critical Facilities
A. Identify systems with public water supply wells infloodzones,andensureadequatemeasuresaretakentoprotectwellsfromfloodinginordertoreducetheriskofflooding.Ifwellsarefoundtobeinadequatelyprotectedfromafloodingevent, improvements should be made so the wellheadisabovethe0.2%annualchancefloodevent, plus appropriate freeboard.
1.ForthosepublicwatersupplywellsidentifiedasbeingatriskinAppendixF,requirepreparationofaFEMAElevationCertificate,orequivalentelevationsurvey,andothersupportinginformationbepreparedtodemonstratethatthewellheadiscompliantwiththeelevationrequirementofthePublicHealthCode.
DPH By 2021 Low
2.Includefloodelevationinformationandwellheadelevationinformation(inthesameverticaldatumsuchasNAVD88) as part of the System Description section of the sanitary survey report to track compliance. DPH Begin in 2019 Low
3.Aspartofthesanitarysurvey,requireimprovementsforthosewellsnotmeetingthePublicHealthCode. DPH Begin in 2019 Low X4.Add“publicwatersupplywellsandotherabovegradeinfrastructureusedtoprovidepublicwatersupply”tothedefinitionof“CriticalActivity”underCGS25-68bandupdatethePublicHealthCodetorequirenewwellstobeelevatedtothe0.2%annualchancefloodelevationorhigher,plusappropriatefreeboard.
DPH By 2023 Low
5.Considerasunsetclauseforwellsinstalledpriorto1970thatpre-datecurrentfloodmanagementlaws.ThiswouldrequirethatPWSsimprovethesewellstoreducefloodrisk,despitetheirage. DPH Begin in 2019 Low
B. Reservoirs with aging infrastructure, such as dams and spillways, should be assessed for their capacitytodealwithfuturefloodingandheavyprecipitation events. By assessing the structural integrityandwaterflowcapacity,upgradesandimprovements can be made to the components towithstandclimatechangeaffects.
1. Summarize information regarding dams utilized for providing public water supply, including owner, age, condition, hazard class, spillway capacity, and design storm. Make this information available prior to sanitary surveys.
DPH, DEEP, and CWS By 2023 Low X
2.Fordamsthatmaybeundersizedoratrisk(intheopinionofanyStateagencyortheCWS),requirereevaluation of the design storm based on updated precipitation data compiled by the Northeast Regional Climate Center, which may in turn drive infrastructure improvements.
DPH By 2030 Low
C. Vulnerable pump stations and treatment plants should be made more resilient by floodproofingorutilityhardening.Thesemitigationeffortswillreducethefloodrisktothesystem.
1.FortheinfrastructureidentifiedasbeingatriskinAppendixErequirepreparationofaFEMAElevationCertificate,orequivalentelevationsurvey,andothersupportinginformationbepreparedtodemonstratetheelevationoffloodingthatmayoccur,thedegreeoffloodproofingaffordedbythestructure,andthatthebuildingis compliant with the Public Health Code.
DPH By 2021 Low
2.Includefloodelevationandinfrastructureelevationinformation(inthesamedatumsuchasNAVD88)aspartof the sanitary survey report to track compliance. DPH Begin in 2019 Low
D.AllCWSsmusthaveadequatestorageorbeserviced through an interconnection where the sourceutilityhasadequatestorage.
1.ChangethePublicHealthCodetorequireeachCWStohave,ataminimum,anatmosphericstoragevolumeequaltotheaveragedaydemandasrequiredbytheCPCNregulations,andtodemonstratethatthisstorageis capable of being distributed throughout the entire system. For those systems with interconnections, the interconnectedsystemmustdemonstratethatsufficientstorageisavailableinthesourcesystemtomeettheaverage day demand of the combined system in consideration of any other interconnected systems.
DPH, CWS By 2023 Low X X
E. A GIS database should be developed to represent critical facilities and which PWS they are served by, and to also identify critical facilities that are also a PWS.
1.AnnuallyrequestthatConnecticutCOGsandmunicipalitiesensurecriticalfacilitiesarelistedinHazardMitigation Plans (in Table format, with addresses) and not just spatially presented in general terms on a map. The South Central Regional Hazard Mitigation Plan Update (2018) and Capitol Region Natural Hazard Mitigation Plan Update (2019) may be used as examples.
DPH Begin in 2019 Low
2. Using information from Water Supply Plans, local Hazard Mitigation Plans, priority power restoration lists, and information from local EMDs, prepare a list of critical facilities referenced to their water source (private well, self-owned or operated C, NTNC, or TNC public water system, or customer of another public water system). A starting point for this information for the four coastal counties can be found in Appendix I. Use the addresses of each critical facility to geocode the spatial location in ArcGIS and correct locations as necessary. Provide this list and mapping to local health districts, EMDs, and regional COGs. This list should be updated a minimum of every two years.
DPH Begin in 2019 Low
F. Once the GIS database in Strategy E. has beendeveloped,refineddatacouldshowwhichportionsofCWSsservespecificcriticalfacilities. There should be guidelines for CWSs to assess critical facilities that are located far from their sources; this would determine what infrastructure facilities rely on, therefore allowing for prioritization of repairs.
1.Updatethewatersupplyplanningregulationstorequirethisassessment(StrategyF)aspartofregularEmergency Contingency Plan updates. To facilitate this assessment, provide large CWSs a list and spatial data for thecriticalfacilitiesinandneartheirserviceareawhentherequestforawatersupplyplanupdateissent.
DPH Begin in 2019 Low
2.UpdatetheemergencycontingencyandresponseplanregulationsforsmallCWStorequirethisassessment(Strategy F) for small CWS who serve other critical facilities as customers. DPH Begin in 2019 Low
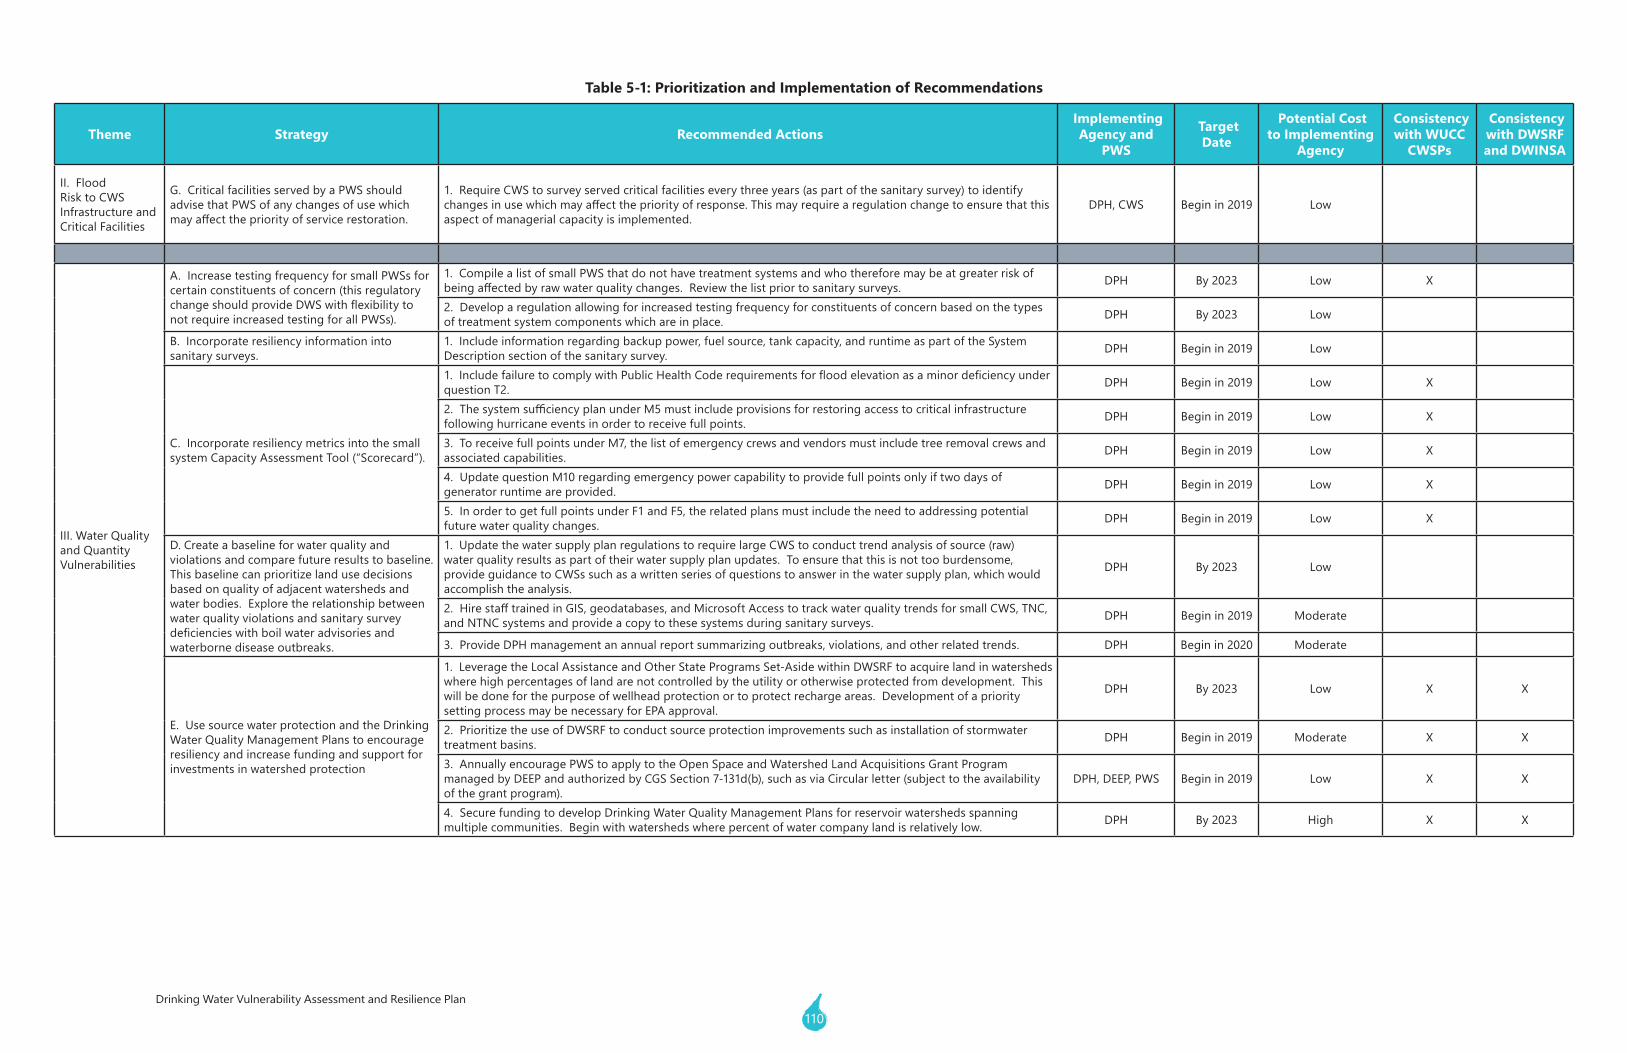
110Drinking Water Vulnerability Assessment and Resilience Plan
Table 5-1: Prioritization and Implementation of Recommendations
Theme Strategy Recommended Actions Implementing
Agency and PWS
Target Date
Potential Cost to Implementing
Agency
Consistency with WUCC
CWSPs
Consistency with DWSRF and DWINSA
II. Flood Risk to CWS Infrastructure and Critical Facilities
G. Critical facilities served by a PWS should advise that PWS of any changes of use which mayaffectthepriorityofservicerestoration.
1.RequireCWStosurveyservedcriticalfacilitieseverythreeyears(aspartofthesanitarysurvey)toidentifychangesinusewhichmayaffectthepriorityofresponse.Thismayrequirearegulationchangetoensurethatthisaspect of managerial capacity is implemented.
DPH, CWS Begin in 2019 Low
III. Water Quality and Quantity Vulnerabilities
A.IncreasetestingfrequencyforsmallPWSsforcertain constituents of concern (this regulatory changeshouldprovideDWSwithflexibilitytonotrequireincreasedtestingforallPWSs).
1. Compile a list of small PWS that do not have treatment systems and who therefore may be at greater risk of beingaffectedbyrawwaterqualitychanges.Reviewthelistpriortosanitarysurveys. DPH By 2023 Low X
2.Developaregulationallowingforincreasedtestingfrequencyforconstituentsofconcernbasedonthetypesof treatment system components which are in place. DPH By 2023 Low
B. Incorporate resiliency information into sanitary surveys.
1. Include information regarding backup power, fuel source, tank capacity, and runtime as part of the System Description section of the sanitary survey. DPH Begin in 2019 Low
C. Incorporate resiliency metrics into the small systemCapacityAssessmentTool(“Scorecard”).
1.IncludefailuretocomplywithPublicHealthCoderequirementsforfloodelevationasaminordeficiencyunderquestionT2. DPH Begin in 2019 Low X
2.ThesystemsufficiencyplanunderM5mustincludeprovisionsforrestoringaccesstocriticalinfrastructurefollowing hurricane events in order to receive full points. DPH Begin in 2019 Low X
3. To receive full points under M7, the list of emergency crews and vendors must include tree removal crews and associated capabilities. DPH Begin in 2019 Low X
4.UpdatequestionM10regardingemergencypowercapabilitytoprovidefullpointsonlyiftwodaysofgenerator runtime are provided. DPH Begin in 2019 Low X
5. In order to get full points under F1 and F5, the related plans must include the need to addressing potential futurewaterqualitychanges. DPH Begin in 2019 Low X
D.Createabaselineforwaterqualityandviolations and compare future results to baseline. This baseline can prioritize land use decisions basedonqualityofadjacentwatershedsandwater bodies. Explore the relationship between waterqualityviolationsandsanitarysurveydeficiencieswithboilwateradvisoriesandwaterborne disease outbreaks.
1.UpdatethewatersupplyplanregulationstorequirelargeCWStoconducttrendanalysisofsource(raw)waterqualityresultsaspartoftheirwatersupplyplanupdates.Toensurethatthisisnottooburdensome,provideguidancetoCWSssuchasawrittenseriesofquestionstoanswerinthewatersupplyplan,whichwouldaccomplish the analysis.
DPH By 2023 Low
2.HirestafftrainedinGIS,geodatabases,andMicrosoftAccesstotrackwaterqualitytrendsforsmallCWS,TNC,and NTNC systems and provide a copy to these systems during sanitary surveys. DPH Begin in 2019 Moderate
3. Provide DPH management an annual report summarizing outbreaks, violations, and other related trends. DPH Begin in 2020 Moderate
E. Use source water protection and the Drinking Water Quality Management Plans to encourage resiliency and increase funding and support for investments in watershed protection
1.LeveragetheLocalAssistanceandOtherStateProgramsSet-AsidewithinDWSRFtoacquirelandinwatershedswhere high percentages of land are not controlled by the utility or otherwise protected from development. This will be done for the purpose of wellhead protection or to protect recharge areas. Development of a priority setting process may be necessary for EPA approval.
DPH By 2023 Low X X
2. Prioritize the use of DWSRF to conduct source protection improvements such as installation of stormwater treatment basins. DPH Begin in 2019 Moderate X X
3.AnnuallyencouragePWStoapplytotheOpenSpaceandWatershedLandAcquisitionsGrantProgrammanaged by DEEP and authorized by CGS Section 7-131d(b), such as via Circular letter (subject to the availability of the grant program).
DPH, DEEP, PWS Begin in 2019 Low X X
4. Secure funding to develop Drinking Water Quality Management Plans for reservoir watersheds spanning multiple communities. Begin with watersheds where percent of water company land is relatively low. DPH By 2023 High X X
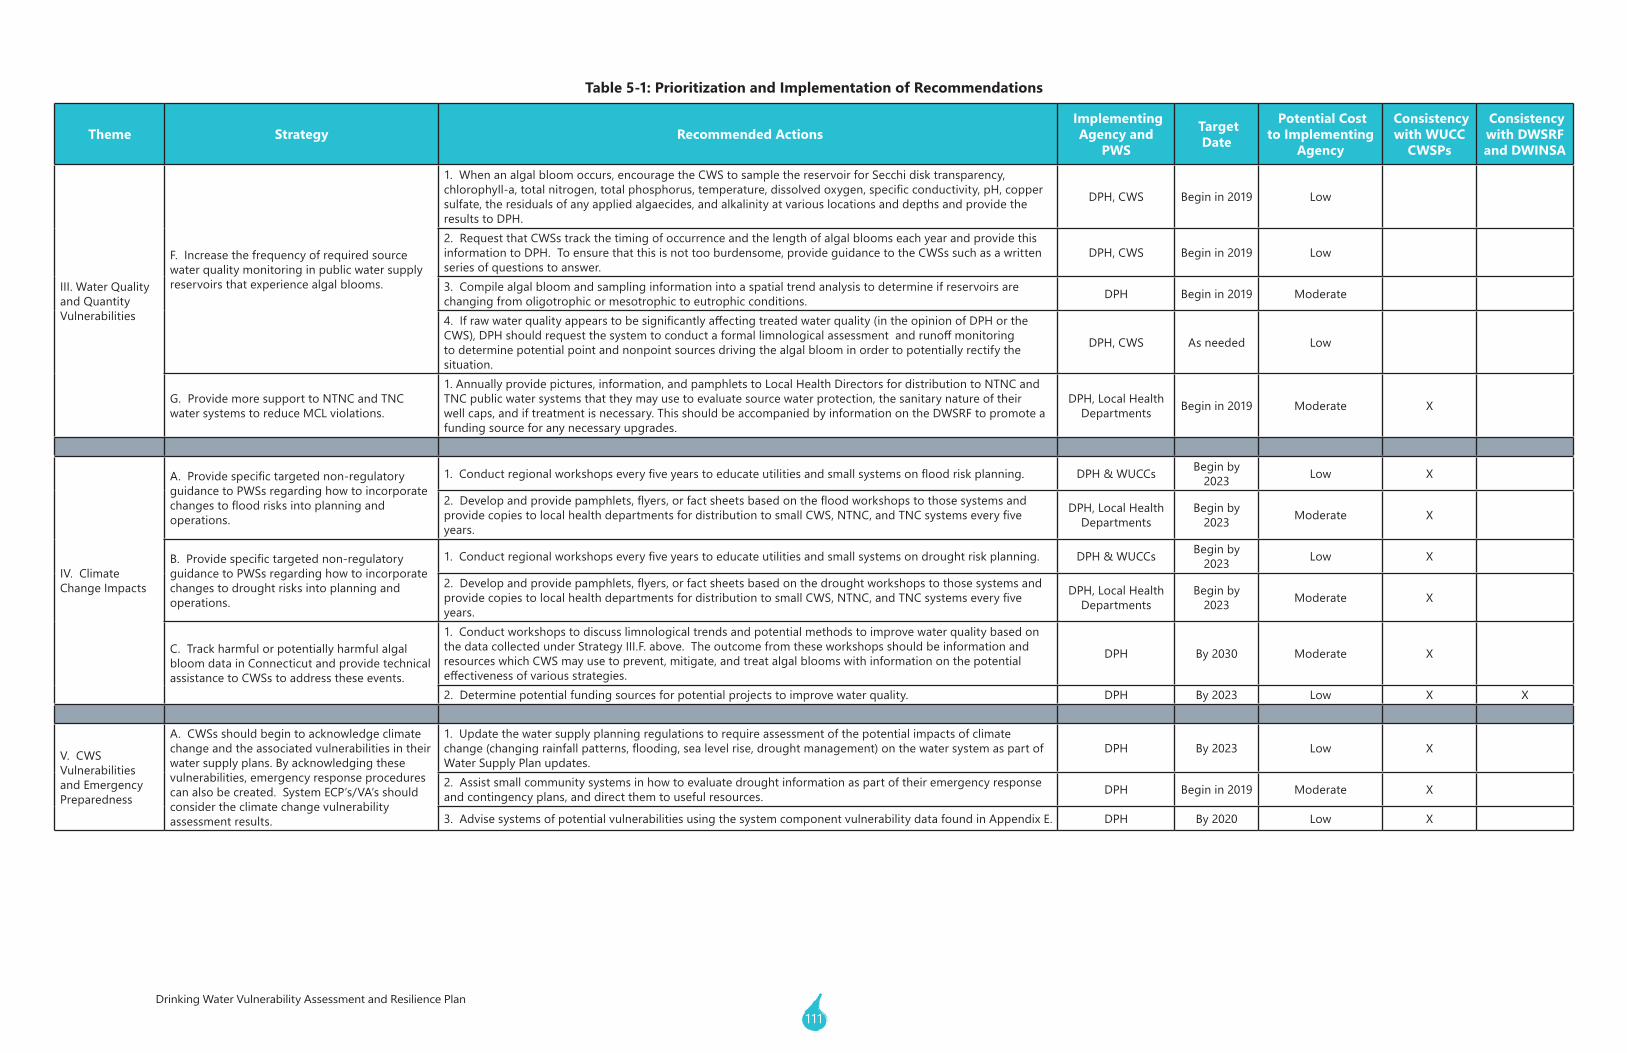
111Drinking Water Vulnerability Assessment and Resilience Plan
Table 5-1: Prioritization and Implementation of Recommendations
Theme Strategy Recommended Actions Implementing
Agency and PWS
Target Date
Potential Cost to Implementing
Agency
Consistency with WUCC
CWSPs
Consistency with DWSRF and DWINSA
III. Water Quality and Quantity Vulnerabilities
F.Increasethefrequencyofrequiredsourcewaterqualitymonitoringinpublicwatersupplyreservoirs that experience algal blooms.
1. When an algal bloom occurs, encourage the CWS to sample the reservoir for Secchi disk transparency, chlorophyll-a,totalnitrogen,totalphosphorus,temperature,dissolvedoxygen,specificconductivity,pH,coppersulfate, the residuals of any applied algaecides, and alkalinity at various locations and depths and provide the results to DPH.
DPH, CWS Begin in 2019 Low
2.RequestthatCWSstrackthetimingofoccurrenceandthelengthofalgalbloomseachyearandprovidethisinformation to DPH. To ensure that this is not too burdensome, provide guidance to the CWSs such as a written seriesofquestionstoanswer.
DPH, CWS Begin in 2019 Low
3. Compile algal bloom and sampling information into a spatial trend analysis to determine if reservoirs are changing from oligotrophic or mesotrophic to eutrophic conditions. DPH Begin in 2019 Moderate
4.Ifrawwaterqualityappearstobesignificantlyaffectingtreatedwaterquality(intheopinionofDPHortheCWS),DPHshouldrequestthesystemtoconductaformallimnologicalassessmentandrunoffmonitoringto determine potential point and nonpoint sources driving the algal bloom in order to potentially rectify the situation.
DPH, CWS As needed Low
G. Provide more support to NTNC and TNC water systems to reduce MCL violations.
1. Annually provide pictures, information, and pamphlets to Local Health Directors for distribution to NTNC and TNC public water systems that they may use to evaluate source water protection, the sanitary nature of their well caps, and if treatment is necessary. This should be accompanied by information on the DWSRF to promote a funding source for any necessary upgrades.
DPH, Local Health Departments Begin in 2019 Moderate X
IV. Climate Change Impacts
A.Providespecifictargetednon-regulatoryguidance to PWSs regarding how to incorporate changestofloodrisksintoplanningandoperations.
1.Conductregionalworkshopseveryfiveyearstoeducateutilitiesandsmallsystemsonfloodriskplanning. DPH & WUCCs Begin by 2023 Low X
2.Developandprovidepamphlets,flyers,orfactsheetsbasedonthefloodworkshopstothosesystemsandprovidecopiestolocalhealthdepartmentsfordistributiontosmallCWS,NTNC,andTNCsystemseveryfiveyears.
DPH, Local Health Departments
Begin by 2023 Moderate X
B.Providespecifictargetednon-regulatoryguidance to PWSs regarding how to incorporate changes to drought risks into planning and operations.
1.Conductregionalworkshopseveryfiveyearstoeducateutilitiesandsmallsystemsondroughtriskplanning. DPH & WUCCs Begin by 2023 Low X
2.Developandprovidepamphlets,flyers,orfactsheetsbasedonthedroughtworkshopstothosesystemsandprovidecopiestolocalhealthdepartmentsfordistributiontosmallCWS,NTNC,andTNCsystemseveryfiveyears.
DPH, Local Health Departments
Begin by 2023 Moderate X
C. Track harmful or potentially harmful algal bloom data in Connecticut and provide technical assistance to CWSs to address these events.
1.Conductworkshopstodiscusslimnologicaltrendsandpotentialmethodstoimprovewaterqualitybasedonthe data collected under Strategy III.F. above. The outcome from these workshops should be information and resources which CWS may use to prevent, mitigate, and treat algal blooms with information on the potential effectivenessofvariousstrategies.
DPH By 2030 Moderate X
2.Determinepotentialfundingsourcesforpotentialprojectstoimprovewaterquality. DPH By 2023 Low X X
V. CWS Vulnerabilities and Emergency Preparedness
A. CWSs should begin to acknowledge climate change and the associated vulnerabilities in their water supply plans. By acknowledging these vulnerabilities, emergency response procedures can also be created. System ECP’s/VA’s should consider the climate change vulnerability assessment results.
1.Updatethewatersupplyplanningregulationstorequireassessmentofthepotentialimpactsofclimatechange(changingrainfallpatterns,flooding,sealevelrise,droughtmanagement)onthewatersystemaspartofWater Supply Plan updates.
DPH By 2023 Low X
2. Assist small community systems in how to evaluate drought information as part of their emergency response and contingency plans, and direct them to useful resources. DPH Begin in 2019 Moderate X
3. Advise systems of potential vulnerabilities using the system component vulnerability data found in Appendix E. DPH By 2020 Low X
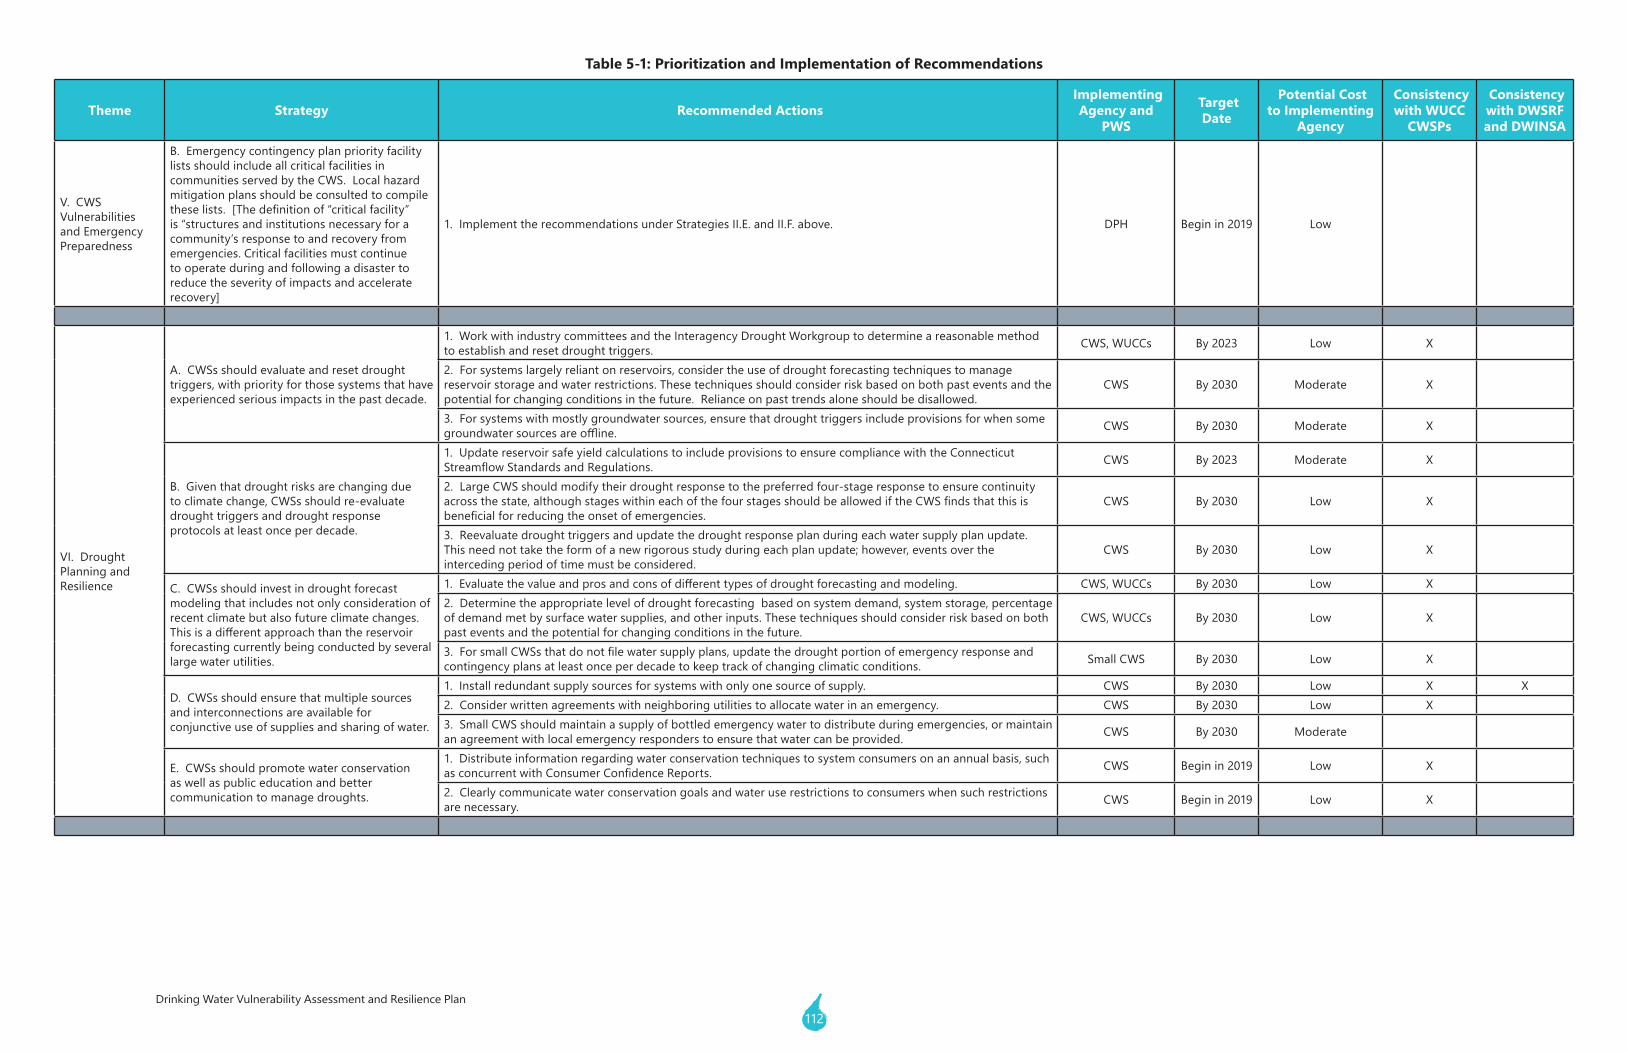
112Drinking Water Vulnerability Assessment and Resilience Plan
Table 5-1: Prioritization and Implementation of Recommendations
Theme Strategy Recommended Actions Implementing
Agency and PWS
Target Date
Potential Cost to Implementing
Agency
Consistency with WUCC
CWSPs
Consistency with DWSRF and DWINSA
V. CWS Vulnerabilities and Emergency Preparedness
B. Emergency contingency plan priority facility lists should include all critical facilities in communities served by the CWS. Local hazard mitigation plans should be consulted to compile theselists.[Thedefinitionof“criticalfacility”is“structuresandinstitutionsnecessaryforacommunity’s response to and recovery from emergencies. Critical facilities must continue to operate during and following a disaster to reduce the severity of impacts and accelerate recovery]
1. Implement the recommendations under Strategies II.E. and II.F. above. DPH Begin in 2019 Low
VI. Drought Planning and Resilience
A. CWSs should evaluate and reset drought triggers, with priority for those systems that have experienced serious impacts in the past decade.
1. Work with industry committees and the Interagency Drought Workgroup to determine a reasonable method to establish and reset drought triggers. CWS, WUCCs By 2023 Low X
2.Forsystemslargelyreliantonreservoirs,considertheuseofdroughtforecastingtechniquestomanagereservoirstorageandwaterrestrictions.Thesetechniquesshouldconsiderriskbasedonbothpasteventsandthepotential for changing conditions in the future. Reliance on past trends alone should be disallowed.
CWS By 2030 Moderate X
3. For systems with mostly groundwater sources, ensure that drought triggers include provisions for when some groundwatersourcesareoffline. CWS By 2030 Moderate X
B. Given that drought risks are changing due to climate change, CWSs should re-evaluate drought triggers and drought response protocols at least once per decade.
1. Update reservoir safe yield calculations to include provisions to ensure compliance with the Connecticut StreamflowStandardsandRegulations. CWS By 2023 Moderate X
2. Large CWS should modify their drought response to the preferred four-stage response to ensure continuity acrossthestate,althoughstageswithineachofthefourstagesshouldbeallowediftheCWSfindsthatthisisbeneficialforreducingtheonsetofemergencies.
CWS By 2030 Low X
3. Reevaluate drought triggers and update the drought response plan during each water supply plan update. This need not take the form of a new rigorous study during each plan update; however, events over the interceding period of time must be considered.
CWS By 2030 Low X
C. CWSs should invest in drought forecast modeling that includes not only consideration of recent climate but also future climate changes. Thisisadifferentapproachthanthereservoirforecasting currently being conducted by several large water utilities.
1.Evaluatethevalueandprosandconsofdifferenttypesofdroughtforecastingandmodeling. CWS, WUCCs By 2030 Low X2. Determine the appropriate level of drought forecasting based on system demand, system storage, percentage ofdemandmetbysurfacewatersupplies,andotherinputs.Thesetechniquesshouldconsiderriskbasedonbothpast events and the potential for changing conditions in the future.
CWS, WUCCs By 2030 Low X
3.ForsmallCWSsthatdonotfilewatersupplyplans,updatethedroughtportionofemergencyresponseandcontingency plans at least once per decade to keep track of changing climatic conditions. Small CWS By 2030 Low X
D. CWSs should ensure that multiple sources and interconnections are available for conjunctive use of supplies and sharing of water.
1. Install redundant supply sources for systems with only one source of supply. CWS By 2030 Low X X2. Consider written agreements with neighboring utilities to allocate water in an emergency. CWS By 2030 Low X3. Small CWS should maintain a supply of bottled emergency water to distribute during emergencies, or maintain an agreement with local emergency responders to ensure that water can be provided. CWS By 2030 Moderate
E. CWSs should promote water conservation as well as public education and better communication to manage droughts.
1.Distributeinformationregardingwaterconservationtechniquestosystemconsumersonanannualbasis,suchasconcurrentwithConsumerConfidenceReports. CWS Begin in 2019 Low X
2. Clearly communicate water conservation goals and water use restrictions to consumers when such restrictions are necessary. CWS Begin in 2019 Low X
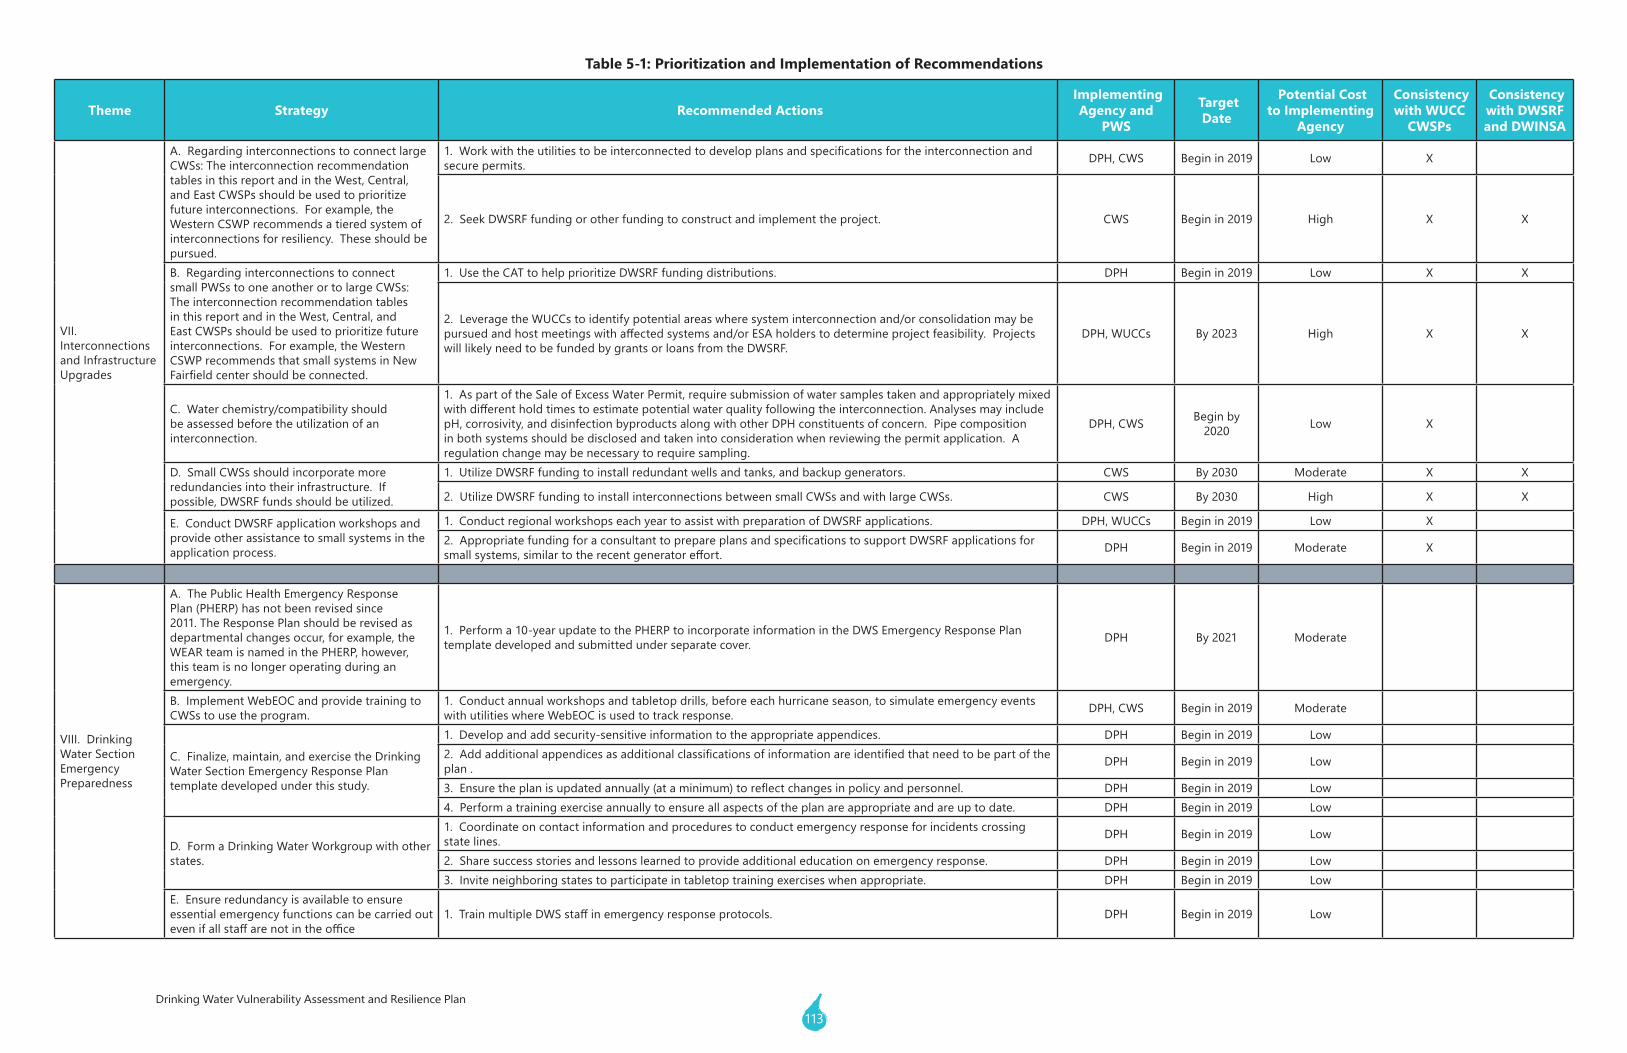
113Drinking Water Vulnerability Assessment and Resilience Plan
Table 5-1: Prioritization and Implementation of Recommendations
Theme Strategy Recommended Actions Implementing
Agency and PWS
Target Date
Potential Cost to Implementing
Agency
Consistency with WUCC
CWSPs
Consistency with DWSRF and DWINSA
VII. Interconnections and Infrastructure Upgrades
A. Regarding interconnections to connect large CWSs: The interconnection recommendation tables in this report and in the West, Central, and East CWSPs should be used to prioritize future interconnections. For example, the Western CSWP recommends a tiered system of interconnections for resiliency. These should be pursued.
1.Workwiththeutilitiestobeinterconnectedtodevelopplansandspecificationsfortheinterconnectionandsecure permits. DPH, CWS Begin in 2019 Low X
2. Seek DWSRF funding or other funding to construct and implement the project. CWS Begin in 2019 High X X
B. Regarding interconnections to connect small PWSs to one another or to large CWSs: The interconnection recommendation tables in this report and in the West, Central, and East CWSPs should be used to prioritize future interconnections. For example, the Western CSWP recommends that small systems in New Fairfieldcentershouldbeconnected.
1. Use the CAT to help prioritize DWSRF funding distributions. DPH Begin in 2019 Low X X
2. Leverage the WUCCs to identify potential areas where system interconnection and/or consolidation may be pursuedandhostmeetingswithaffectedsystemsand/orESAholderstodetermineprojectfeasibility.Projectswill likely need to be funded by grants or loans from the DWSRF.
DPH, WUCCs By 2023 High X X
C. Water chemistry/compatibility should be assessed before the utilization of an interconnection.
1.AspartoftheSaleofExcessWaterPermit,requiresubmissionofwatersamplestakenandappropriatelymixedwithdifferentholdtimestoestimatepotentialwaterqualityfollowingtheinterconnection.AnalysesmayincludepH, corrosivity, and disinfection byproducts along with other DPH constituents of concern. Pipe composition in both systems should be disclosed and taken into consideration when reviewing the permit application. A regulationchangemaybenecessarytorequiresampling.
DPH, CWS Begin by 2020 Low X
D. Small CWSs should incorporate more redundancies into their infrastructure. If possible, DWSRF funds should be utilized.
1. Utilize DWSRF funding to install redundant wells and tanks, and backup generators. CWS By 2030 Moderate X X
2. Utilize DWSRF funding to install interconnections between small CWSs and with large CWSs. CWS By 2030 High X X
E. Conduct DWSRF application workshops and provide other assistance to small systems in the application process.
1. Conduct regional workshops each year to assist with preparation of DWSRF applications. DPH, WUCCs Begin in 2019 Low X2.AppropriatefundingforaconsultanttoprepareplansandspecificationstosupportDWSRFapplicationsforsmallsystems,similartotherecentgeneratoreffort. DPH Begin in 2019 Moderate X
VIII. Drinking Water Section Emergency Preparedness
A. The Public Health Emergency Response Plan (PHERP) has not been revised since 2011. The Response Plan should be revised as departmental changes occur, for example, the WEAR team is named in the PHERP, however, this team is no longer operating during an emergency.
1. Perform a 10-year update to the PHERP to incorporate information in the DWS Emergency Response Plan template developed and submitted under separate cover. DPH By 2021 Moderate
B. Implement WebEOC and provide training to CWSs to use the program.
1. Conduct annual workshops and tabletop drills, before each hurricane season, to simulate emergency events with utilities where WebEOC is used to track response. DPH, CWS Begin in 2019 Moderate
C. Finalize, maintain, and exercise the Drinking Water Section Emergency Response Plan template developed under this study.
1. Develop and add security-sensitive information to the appropriate appendices. DPH Begin in 2019 Low2.Addadditionalappendicesasadditionalclassificationsofinformationareidentifiedthatneedtobepartoftheplan . DPH Begin in 2019 Low
3.Ensuretheplanisupdatedannually(ataminimum)toreflectchangesinpolicyandpersonnel. DPH Begin in 2019 Low4. Perform a training exercise annually to ensure all aspects of the plan are appropriate and are up to date. DPH Begin in 2019 Low
D. Form a Drinking Water Workgroup with other states.
1. Coordinate on contact information and procedures to conduct emergency response for incidents crossing state lines. DPH Begin in 2019 Low
2. Share success stories and lessons learned to provide additional education on emergency response. DPH Begin in 2019 Low3. Invite neighboring states to participate in tabletop training exercises when appropriate. DPH Begin in 2019 Low
E. Ensure redundancy is available to ensure essential emergency functions can be carried out evenifallstaffarenotintheoffice
1.TrainmultipleDWSstaffinemergencyresponseprotocols. DPH Begin in 2019 Low
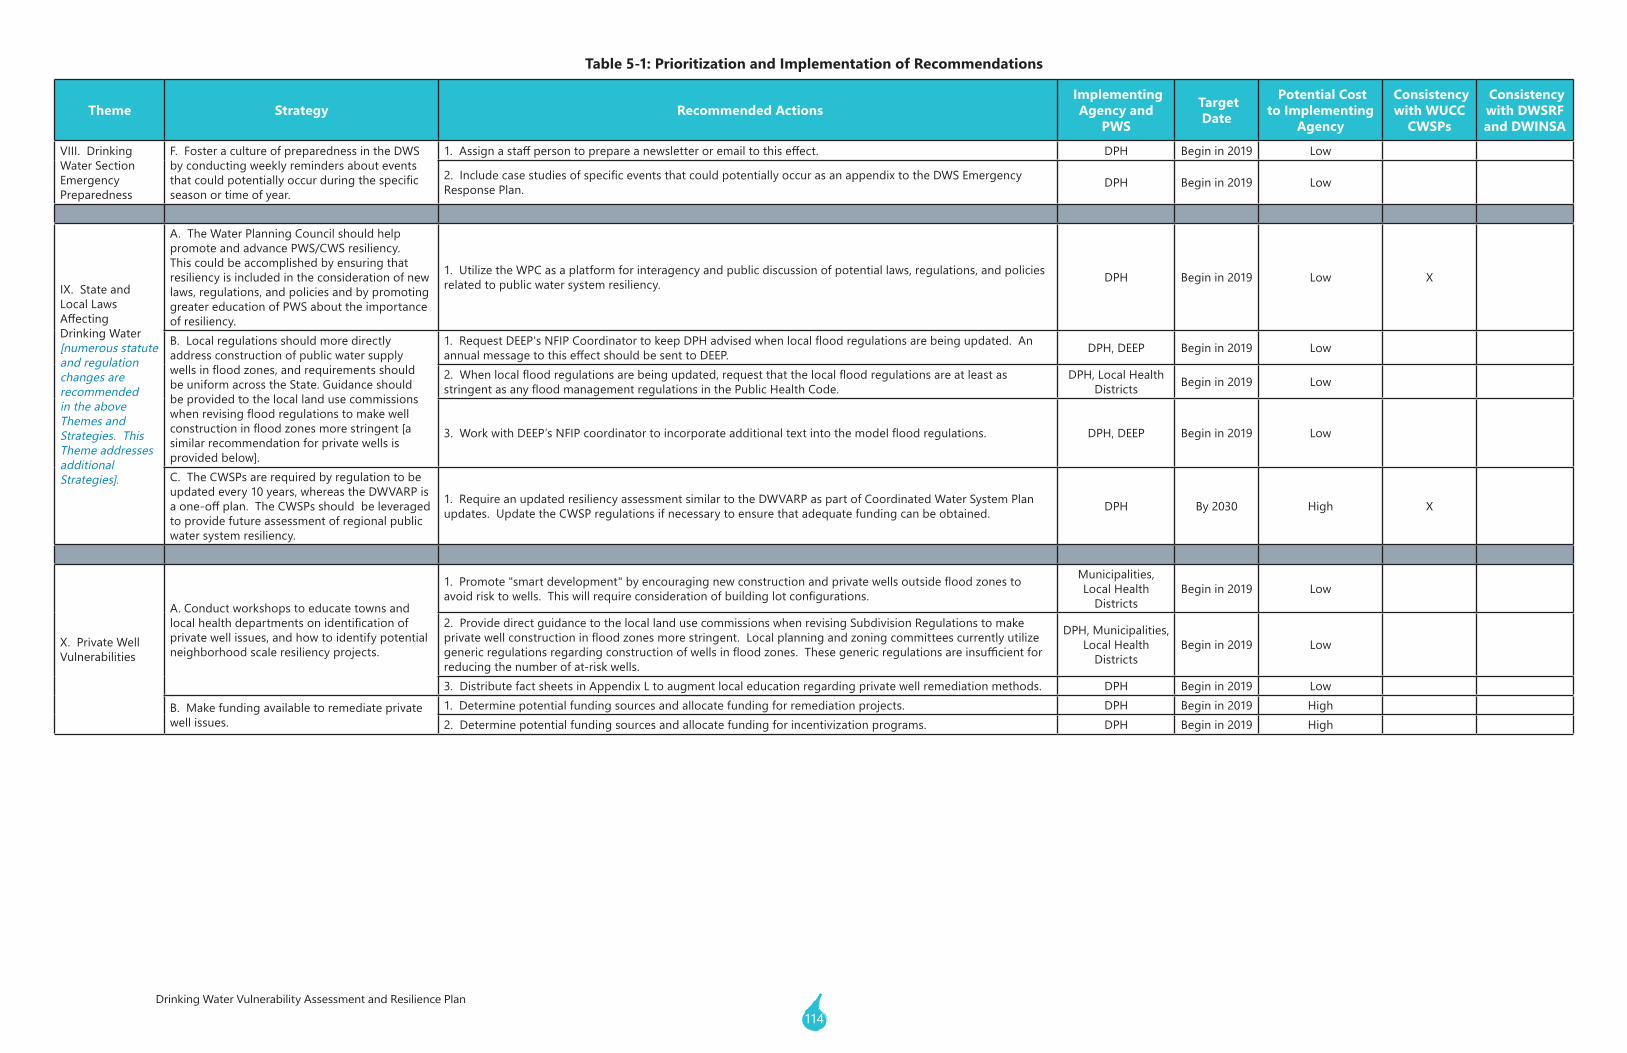
114Drinking Water Vulnerability Assessment and Resilience Plan
Table 5-1: Prioritization and Implementation of Recommendations
Theme Strategy Recommended Actions Implementing
Agency and PWS
Target Date
Potential Cost to Implementing
Agency
Consistency with WUCC
CWSPs
Consistency with DWSRF and DWINSA
VIII. Drinking Water Section Emergency Preparedness
F. Foster a culture of preparedness in the DWS by conducting weekly reminders about events thatcouldpotentiallyoccurduringthespecificseason or time of year.
1.Assignastaffpersontoprepareanewsletteroremailtothiseffect. DPH Begin in 2019 Low
2.IncludecasestudiesofspecificeventsthatcouldpotentiallyoccurasanappendixtotheDWSEmergencyResponse Plan. DPH Begin in 2019 Low
IX. State and Local Laws AffectingDrinking Water [numerous statute and regulation changes are recommended in the above Themes and Strategies. This Theme addresses additional Strategies].
A. The Water Planning Council should help promote and advance PWS/CWS resiliency. This could be accomplished by ensuring that resiliency is included in the consideration of new laws, regulations, and policies and by promoting greater education of PWS about the importance of resiliency.
1. Utilize the WPC as a platform for interagency and public discussion of potential laws, regulations, and policies related to public water system resiliency. DPH Begin in 2019 Low X
B. Local regulations should more directly address construction of public water supply wellsinfloodzones,andrequirementsshouldbe uniform across the State. Guidance should be provided to the local land use commissions whenrevisingfloodregulationstomakewellconstructioninfloodzonesmorestringent[asimilar recommendation for private wells is provided below].
1.RequestDEEP'sNFIPCoordinatortokeepDPHadvisedwhenlocalfloodregulationsarebeingupdated.AnannualmessagetothiseffectshouldbesenttoDEEP. DPH, DEEP Begin in 2019 Low
2.Whenlocalfloodregulationsarebeingupdated,requestthatthelocalfloodregulationsareatleastasstringentasanyfloodmanagementregulationsinthePublicHealthCode.
DPH, Local Health Districts Begin in 2019 Low
3.WorkwithDEEP’sNFIPcoordinatortoincorporateadditionaltextintothemodelfloodregulations. DPH, DEEP Begin in 2019 Low
C.TheCWSPsarerequiredbyregulationtobeupdated every 10 years, whereas the DWVARP is aone-offplan.TheCWSPsshouldbeleveragedto provide future assessment of regional public water system resiliency.
1.RequireanupdatedresiliencyassessmentsimilartotheDWVARPaspartofCoordinatedWaterSystemPlanupdates.UpdatetheCWSPregulationsifnecessarytoensurethatadequatefundingcanbeobtained. DPH By 2030 High X
X. Private Well Vulnerabilities
A. Conduct workshops to educate towns and localhealthdepartmentsonidentificationofprivate well issues, and how to identify potential neighborhood scale resiliency projects.
1.Promote"smartdevelopment"byencouragingnewconstructionandprivatewellsoutsidefloodzonestoavoidrisktowells.Thiswillrequireconsiderationofbuildinglotconfigurations.
Municipalities, Local Health
DistrictsBegin in 2019 Low
2. Provide direct guidance to the local land use commissions when revising Subdivision Regulations to make privatewellconstructioninfloodzonesmorestringent.Localplanningandzoningcommitteescurrentlyutilizegenericregulationsregardingconstructionofwellsinfloodzones.Thesegenericregulationsareinsufficientforreducing the number of at-risk wells.
DPH, Municipalities, Local Health
DistrictsBegin in 2019 Low
3. Distribute fact sheets in Appendix L to augment local education regarding private well remediation methods. DPH Begin in 2019 Low
B. Make funding available to remediate private well issues.
1. Determine potential funding sources and allocate funding for remediation projects. DPH Begin in 2019 High2. Determine potential funding sources and allocate funding for incentivization programs. DPH Begin in 2019 High
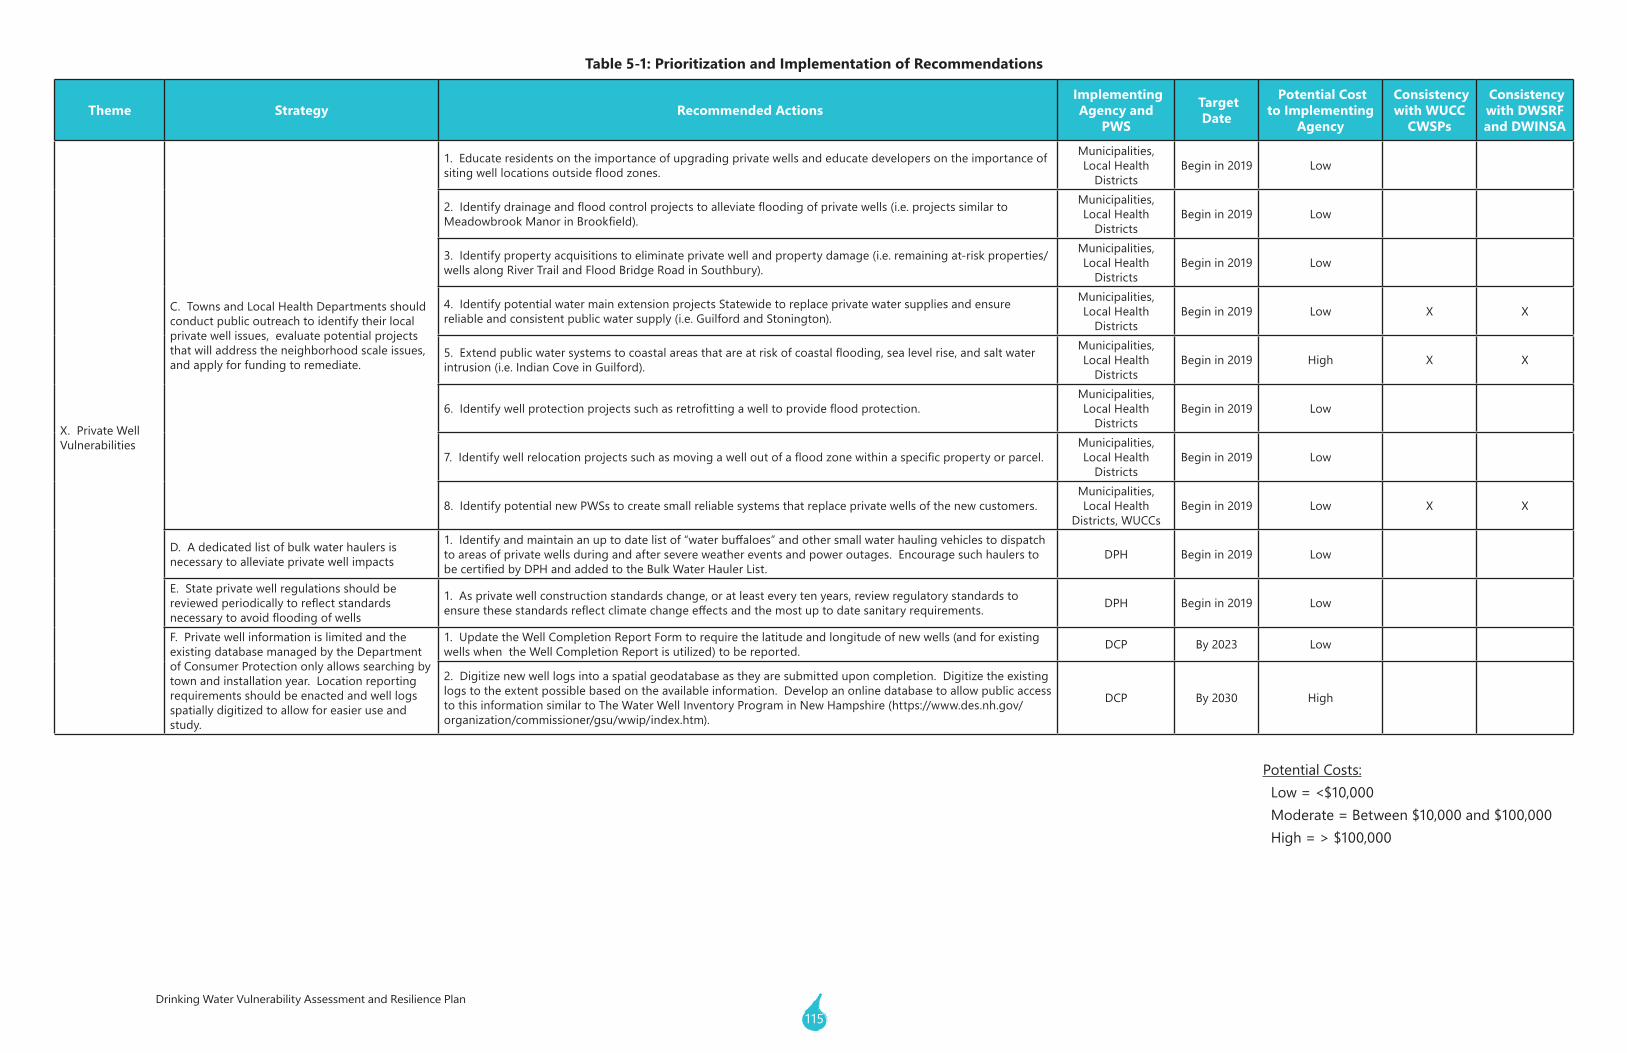
115Drinking Water Vulnerability Assessment and Resilience Plan
Table 5-1: Prioritization and Implementation of Recommendations
Theme Strategy Recommended Actions Implementing
Agency and PWS
Target Date
Potential Cost to Implementing
Agency
Consistency with WUCC
CWSPs
Consistency with DWSRF and DWINSA
X. Private Well Vulnerabilities
C. Towns and Local Health Departments should conduct public outreach to identify their local private well issues, evaluate potential projects that will address the neighborhood scale issues, and apply for funding to remediate.
1. Educate residents on the importance of upgrading private wells and educate developers on the importance of sitingwelllocationsoutsidefloodzones.
Municipalities, Local Health
DistrictsBegin in 2019 Low
2.Identifydrainageandfloodcontrolprojectstoalleviatefloodingofprivatewells(i.e.projectssimilartoMeadowbrookManorinBrookfield).
Municipalities, Local Health
DistrictsBegin in 2019 Low
3.Identifypropertyacquisitionstoeliminateprivatewellandpropertydamage(i.e.remainingat-riskproperties/wells along River Trail and Flood Bridge Road in Southbury).
Municipalities, Local Health
DistrictsBegin in 2019 Low
4. Identify potential water main extension projects Statewide to replace private water supplies and ensure reliable and consistent public water supply (i.e. Guilford and Stonington).
Municipalities, Local Health
DistrictsBegin in 2019 Low X X
5.Extendpublicwatersystemstocoastalareasthatareatriskofcoastalflooding,sealevelrise,andsaltwaterintrusion (i.e. Indian Cove in Guilford).
Municipalities, Local Health
DistrictsBegin in 2019 High X X
6.Identifywellprotectionprojectssuchasretrofittingawelltoprovidefloodprotection.Municipalities, Local Health
DistrictsBegin in 2019 Low
7.Identifywellrelocationprojectssuchasmovingawelloutofafloodzonewithinaspecificpropertyorparcel.Municipalities, Local Health
DistrictsBegin in 2019 Low
8. Identify potential new PWSs to create small reliable systems that replace private wells of the new customers.Municipalities, Local Health
Districts, WUCCsBegin in 2019 Low X X
D. A dedicated list of bulk water haulers is necessary to alleviate private well impacts
1.Identifyandmaintainanuptodatelistof“waterbuffaloes”andothersmallwaterhaulingvehiclestodispatchto areas of private wells during and after severe weather events and power outages. Encourage such haulers to becertifiedbyDPHandaddedtotheBulkWaterHaulerList.
DPH Begin in 2019 Low
E. State private well regulations should be reviewedperiodicallytoreflectstandardsnecessarytoavoidfloodingofwells
1. As private well construction standards change, or at least every ten years, review regulatory standards to ensurethesestandardsreflectclimatechangeeffectsandthemostuptodatesanitaryrequirements. DPH Begin in 2019 Low
F. Private well information is limited and the existing database managed by the Department of Consumer Protection only allows searching by town and installation year. Location reporting requirementsshouldbeenactedandwelllogsspatially digitized to allow for easier use and study.
1.UpdatetheWellCompletionReportFormtorequirethelatitudeandlongitudeofnewwells(andforexistingwells when the Well Completion Report is utilized) to be reported. DCP By 2023 Low
2. Digitize new well logs into a spatial geodatabase as they are submitted upon completion. Digitize the existing logs to the extent possible based on the available information. Develop an online database to allow public access to this information similar to The Water Well Inventory Program in New Hampshire (https://www.des.nh.gov/organization/commissioner/gsu/wwip/index.htm).
DCP By 2030 High
Potential Costs:Low=<$10,000Moderate=Between$10,000and$100,000High=>$100,000

APPENDIX A Summary of Applicable Laws
and Policies

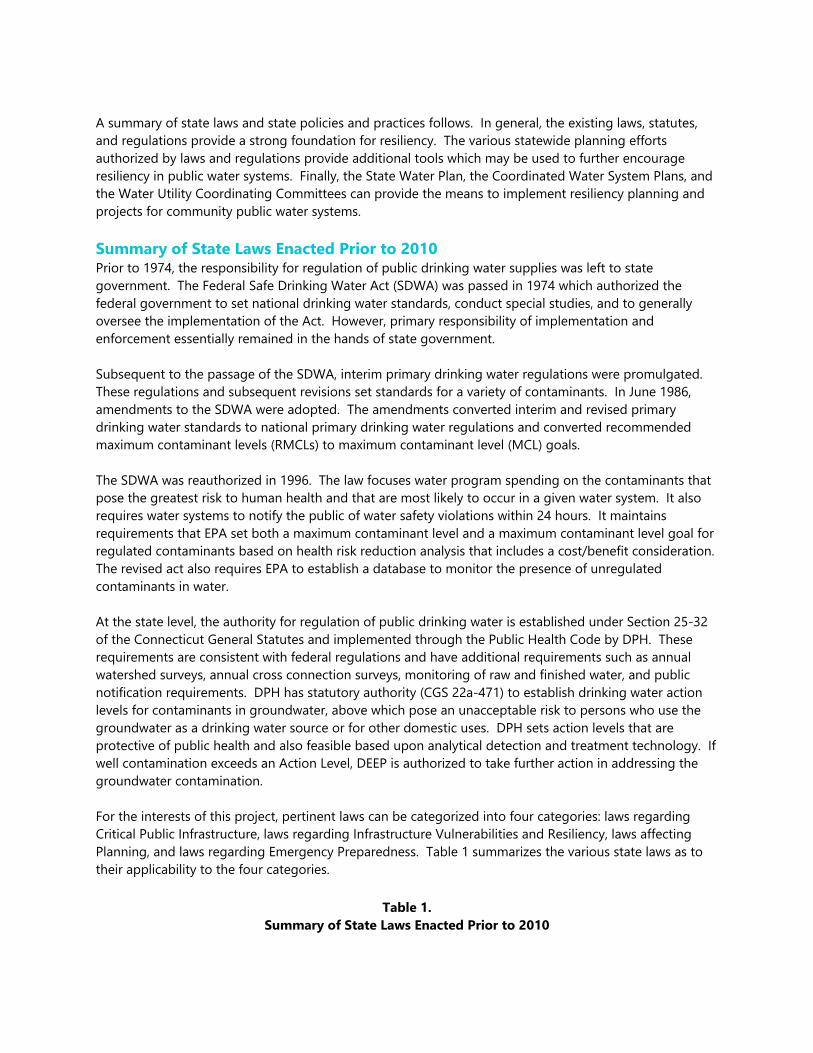
A summary of state laws and state policies and practices follows. In general, the existing laws, statutes, and regulations provide a strong foundation for resiliency. The various statewide planning efforts authorized by laws and regulations provide additional tools which may be used to further encourage resiliency in public water systems. Finally, the State Water Plan, the Coordinated Water System Plans, and the Water Utility Coordinating Committees can provide the means to implement resiliency planning and projects for community public water systems. Summary of State Laws Enacted Prior to 2010 Prior to 1974, the responsibility for regulation of public drinking water supplies was left to state government. The Federal Safe Drinking Water Act (SDWA) was passed in 1974 which authorized the federal government to set national drinking water standards, conduct special studies, and to generally oversee the implementation of the Act. However, primary responsibility of implementation and enforcement essentially remained in the hands of state government.
Subsequent to the passage of the SDWA, interim primary drinking water regulations were promulgated. These regulations and subsequent revisions set standards for a variety of contaminants. In June 1986, amendments to the SDWA were adopted. The amendments converted interim and revised primary drinking water standards to national primary drinking water regulations and converted recommended maximum contaminant levels (RMCLs) to maximum contaminant level (MCL) goals.
The SDWA was reauthorized in 1996. The law focuses water program spending on the contaminants that pose the greatest risk to human health and that are most likely to occur in a given water system. It also requires water systems to notify the public of water safety violations within 24 hours. It maintains requirements that EPA set both a maximum contaminant level and a maximum contaminant level goal for regulated contaminants based on health risk reduction analysis that includes a cost/benefit consideration. The revised act also requires EPA to establish a database to monitor the presence of unregulated contaminants in water.
At the state level, the authority for regulation of public drinking water is established under Section 25-32 of the Connecticut General Statutes and implemented through the Public Health Code by DPH. These requirements are consistent with federal regulations and have additional requirements such as annual watershed surveys, annual cross connection surveys, monitoring of raw and finished water, and public notification requirements. DPH has statutory authority (CGS 22a-471) to establish drinking water action levels for contaminants in groundwater, above which pose an unacceptable risk to persons who use the groundwater as a drinking water source or for other domestic uses. DPH sets action levels that are protective of public health and also feasible based upon analytical detection and treatment technology. If well contamination exceeds an Action Level, DEEP is authorized to take further action in addressing the groundwater contamination.
For the interests of this project, pertinent laws can be categorized into four categories: laws regarding Critical Public Infrastructure, laws regarding Infrastructure Vulnerabilities and Resiliency, laws affecting Planning, and laws regarding Emergency Preparedness. Table 1 summarizes the various state laws as to their applicability to the four categories.
Table 1.
Summary of State Laws Enacted Prior to 2010
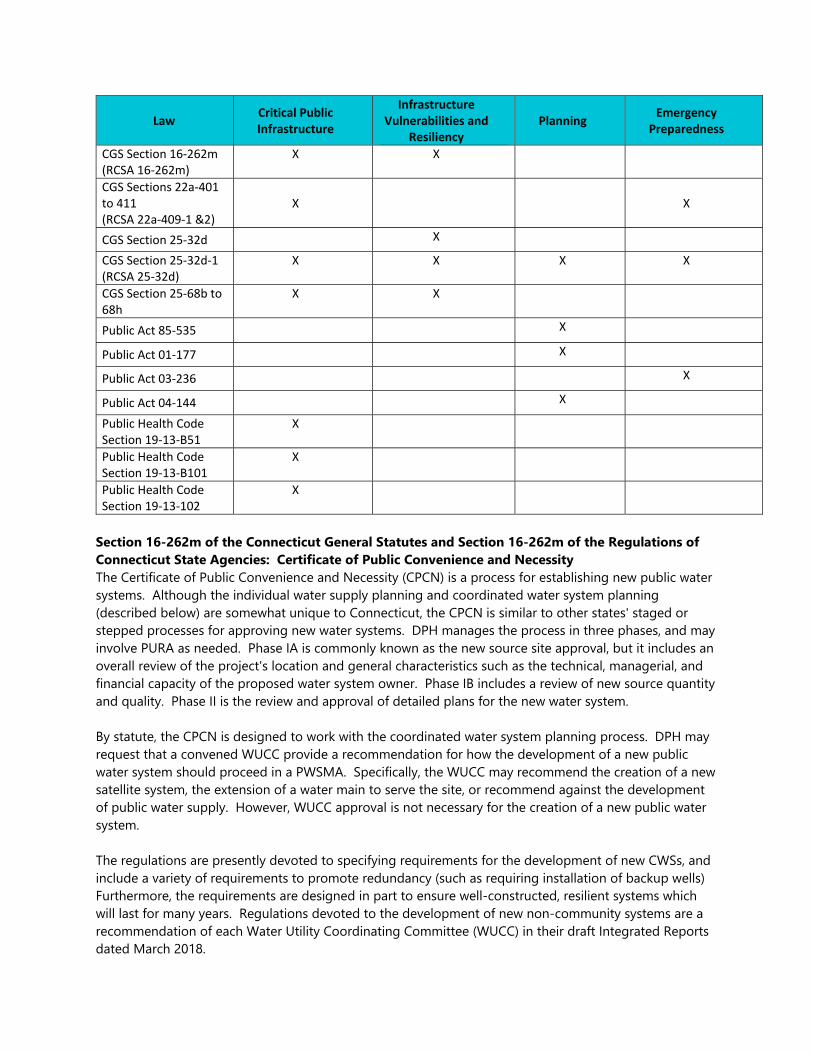
Law Critical Public Infrastructure
Infrastructure Vulnerabilities and
Resiliency Planning
Emergency Preparedness
CGS Section 16‐262m (RCSA 16‐262m)
X X
CGS Sections 22a‐401 to 411 (RCSA 22a‐409‐1 &2)
X X
CGS Section 25‐32d X
CGS Section 25‐32d‐1 (RCSA 25‐32d)
X X X X
CGS Section 25‐68b to 68h
X X
Public Act 85‐535 X
Public Act 01‐177 X
Public Act 03‐236 X
Public Act 04‐144 X
Public Health Code Section 19‐13‐B51
X
Public Health Code Section 19‐13‐B101
X
Public Health Code Section 19‐13‐102
X
Section 16-262m of the Connecticut General Statutes and Section 16-262m of the Regulations of Connecticut State Agencies: Certificate of Public Convenience and Necessity The Certificate of Public Convenience and Necessity (CPCN) is a process for establishing new public water systems. Although the individual water supply planning and coordinated water system planning (described below) are somewhat unique to Connecticut, the CPCN is similar to other states' staged or stepped processes for approving new water systems. DPH manages the process in three phases, and may involve PURA as needed. Phase IA is commonly known as the new source site approval, but it includes an overall review of the project's location and general characteristics such as the technical, managerial, and financial capacity of the proposed water system owner. Phase IB includes a review of new source quantity and quality. Phase II is the review and approval of detailed plans for the new water system.
By statute, the CPCN is designed to work with the coordinated water system planning process. DPH may request that a convened WUCC provide a recommendation for how the development of a new public water system should proceed in a PWSMA. Specifically, the WUCC may recommend the creation of a new satellite system, the extension of a water main to serve the site, or recommend against the development of public water supply. However, WUCC approval is not necessary for the creation of a new public water system.
The regulations are presently devoted to specifying requirements for the development of new CWSs, and include a variety of requirements to promote redundancy (such as requiring installation of backup wells) Furthermore, the requirements are designed in part to ensure well-constructed, resilient systems which will last for many years. Regulations devoted to the development of new non-community systems are a recommendation of each Water Utility Coordinating Committee (WUCC) in their draft Integrated Reports dated March 2018.
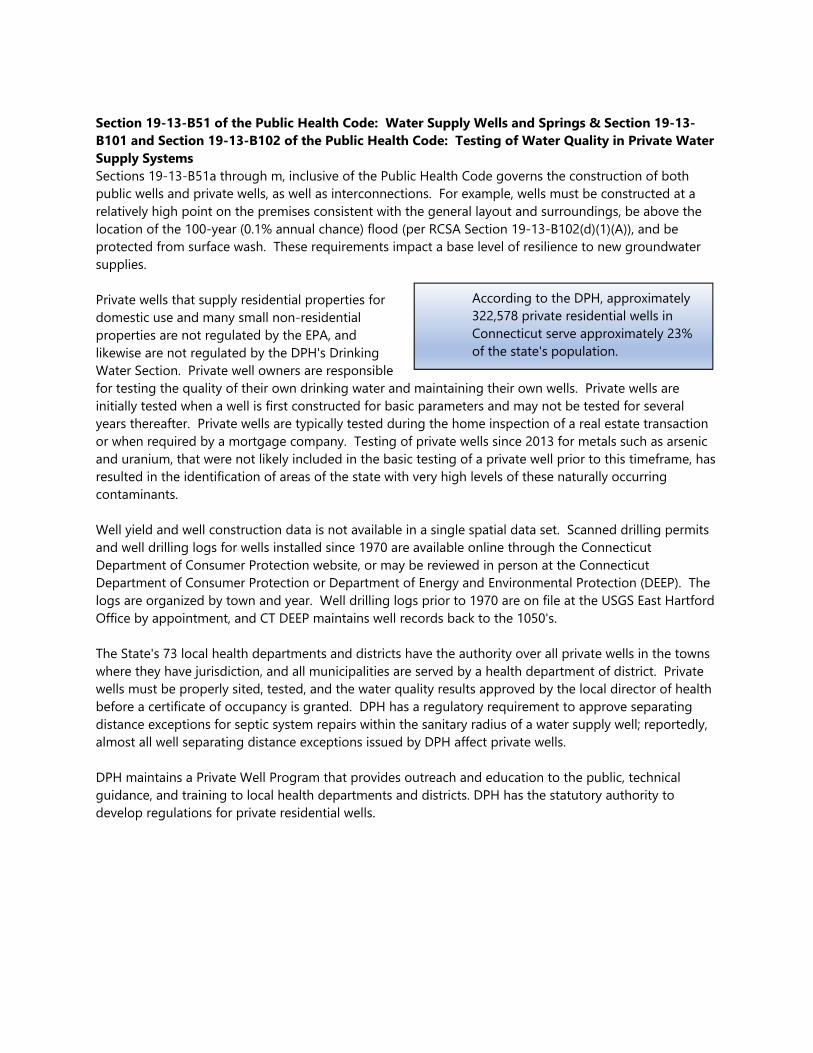
Section 19-13-B51 of the Public Health Code: Water Supply Wells and Springs & Section 19-13-B101 and Section 19-13-B102 of the Public Health Code: Testing of Water Quality in Private Water Supply Systems Sections 19-13-B51a through m, inclusive of the Public Health Code governs the construction of both public wells and private wells, as well as interconnections. For example, wells must be constructed at a relatively high point on the premises consistent with the general layout and surroundings, be above the location of the 100-year (0.1% annual chance) flood (per RCSA Section 19-13-B102(d)(1)(A)), and be protected from surface wash. These requirements impact a base level of resilience to new groundwater supplies.
Private wells that supply residential properties for domestic use and many small non-residential properties are not regulated by the EPA, and likewise are not regulated by the DPH's Drinking Water Section. Private well owners are responsible for testing the quality of their own drinking water and maintaining their own wells. Private wells are initially tested when a well is first constructed for basic parameters and may not be tested for several years thereafter. Private wells are typically tested during the home inspection of a real estate transaction or when required by a mortgage company. Testing of private wells since 2013 for metals such as arsenic and uranium, that were not likely included in the basic testing of a private well prior to this timeframe, has resulted in the identification of areas of the state with very high levels of these naturally occurring contaminants.
Well yield and well construction data is not available in a single spatial data set. Scanned drilling permits and well drilling logs for wells installed since 1970 are available online through the Connecticut Department of Consumer Protection website, or may be reviewed in person at the Connecticut Department of Consumer Protection or Department of Energy and Environmental Protection (DEEP). The logs are organized by town and year. Well drilling logs prior to 1970 are on file at the USGS East Hartford Office by appointment, and CT DEEP maintains well records back to the 1050's.
The State's 73 local health departments and districts have the authority over all private wells in the towns where they have jurisdiction, and all municipalities are served by a health department of district. Private wells must be properly sited, tested, and the water quality results approved by the local director of health before a certificate of occupancy is granted. DPH has a regulatory requirement to approve separating distance exceptions for septic system repairs within the sanitary radius of a water supply well; reportedly, almost all well separating distance exceptions issued by DPH affect private wells.
DPH maintains a Private Well Program that provides outreach and education to the public, technical guidance, and training to local health departments and districts. DPH has the statutory authority to develop regulations for private residential wells.
According to the DPH, approximately 322,578 private residential wells in Connecticut serve approximately 23% of the state's population.
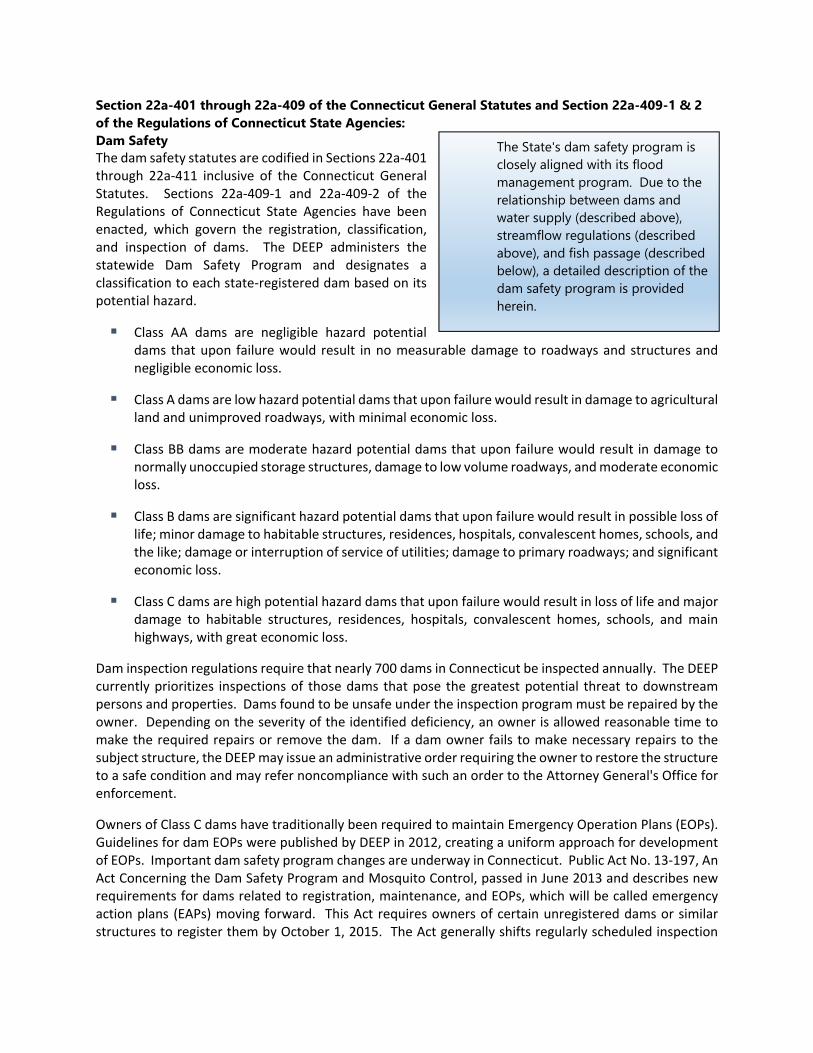
Section 22a-401 through 22a-409 of the Connecticut General Statutes and Section 22a-409-1 & 2 of the Regulations of Connecticut State Agencies: Dam Safety The dam safety statutes are codified in Sections 22a‐401 through 22a‐411 inclusive of the Connecticut General Statutes. Sections 22a‐409‐1 and 22a‐409‐2 of the Regulations of Connecticut State Agencies have been enacted, which govern the registration, classification, and inspection of dams. The DEEP administers the statewide Dam Safety Program and designates a classification to each state‐registered dam based on its potential hazard.
Class AA dams are negligible hazard potential dams that upon failure would result in no measurable damage to roadways and structures and negligible economic loss.
Class A dams are low hazard potential dams that upon failure would result in damage to agricultural land and unimproved roadways, with minimal economic loss.
Class BB dams are moderate hazard potential dams that upon failure would result in damage to normally unoccupied storage structures, damage to low volume roadways, and moderate economic loss.
Class B dams are significant hazard potential dams that upon failure would result in possible loss of life; minor damage to habitable structures, residences, hospitals, convalescent homes, schools, and the like; damage or interruption of service of utilities; damage to primary roadways; and significant economic loss.
Class C dams are high potential hazard dams that upon failure would result in loss of life and major damage to habitable structures, residences, hospitals, convalescent homes, schools, and main highways, with great economic loss.
Dam inspection regulations require that nearly 700 dams in Connecticut be inspected annually. The DEEP currently prioritizes inspections of those dams that pose the greatest potential threat to downstream persons and properties. Dams found to be unsafe under the inspection program must be repaired by the owner. Depending on the severity of the identified deficiency, an owner is allowed reasonable time to make the required repairs or remove the dam. If a dam owner fails to make necessary repairs to the subject structure, the DEEP may issue an administrative order requiring the owner to restore the structure to a safe condition and may refer noncompliance with such an order to the Attorney General's Office for enforcement.
Owners of Class C dams have traditionally been required to maintain Emergency Operation Plans (EOPs). Guidelines for dam EOPs were published by DEEP in 2012, creating a uniform approach for development of EOPs. Important dam safety program changes are underway in Connecticut. Public Act No. 13‐197, An Act Concerning the Dam Safety Program and Mosquito Control, passed in June 2013 and describes new requirements for dams related to registration, maintenance, and EOPs, which will be called emergency action plans (EAPs) moving forward. This Act requires owners of certain unregistered dams or similar structures to register them by October 1, 2015. The Act generally shifts regularly scheduled inspection
The State's dam safety program is closely aligned with its flood management program. Due to the relationship between dams and water supply (described above), streamflow regulations (described above), and fish passage (described below), a detailed description of the dam safety program is provided herein.
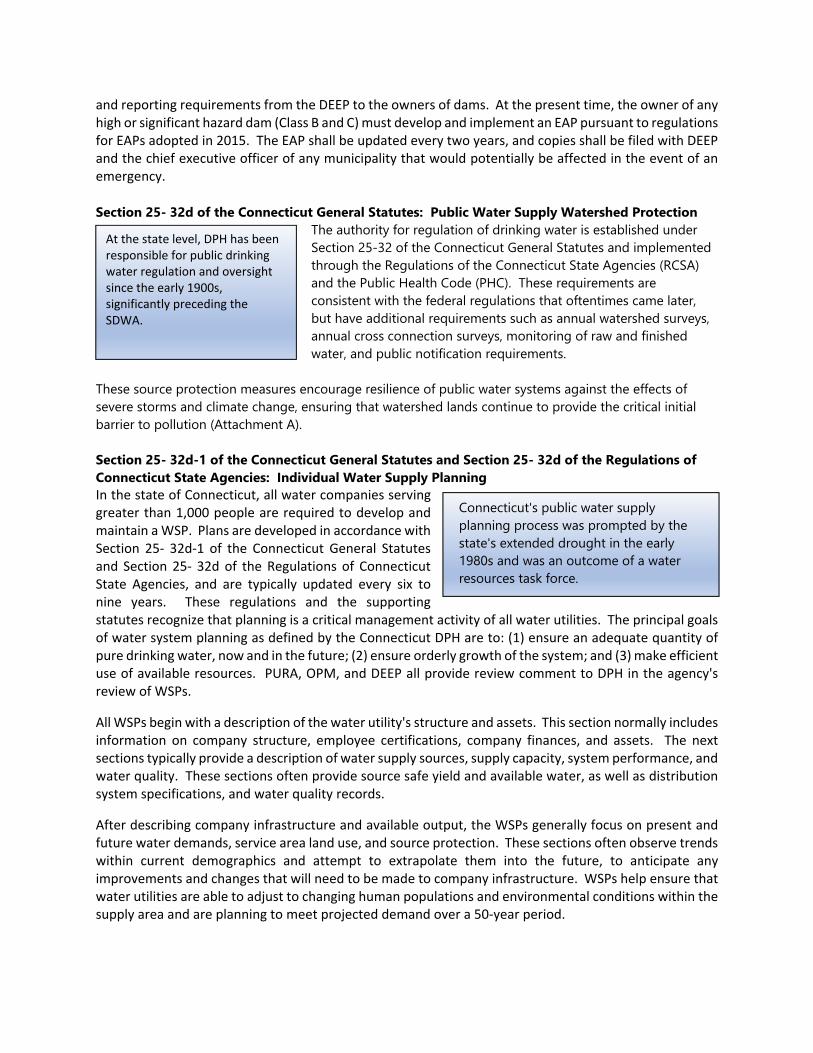
and reporting requirements from the DEEP to the owners of dams. At the present time, the owner of any high or significant hazard dam (Class B and C) must develop and implement an EAP pursuant to regulations for EAPs adopted in 2015. The EAP shall be updated every two years, and copies shall be filed with DEEP and the chief executive officer of any municipality that would potentially be affected in the event of an emergency.
Section 25- 32d of the Connecticut General Statutes: Public Water Supply Watershed Protection
The authority for regulation of drinking water is established under Section 25-32 of the Connecticut General Statutes and implemented through the Regulations of the Connecticut State Agencies (RCSA) and the Public Health Code (PHC). These requirements are consistent with the federal regulations that oftentimes came later, but have additional requirements such as annual watershed surveys, annual cross connection surveys, monitoring of raw and finished water, and public notification requirements.
These source protection measures encourage resilience of public water systems against the effects of severe storms and climate change, ensuring that watershed lands continue to provide the critical initial barrier to pollution (Attachment A).
Section 25- 32d-1 of the Connecticut General Statutes and Section 25- 32d of the Regulations of Connecticut State Agencies: Individual Water Supply Planning In the state of Connecticut, all water companies serving greater than 1,000 people are required to develop and maintain a WSP. Plans are developed in accordance with Section 25‐ 32d‐1 of the Connecticut General Statutes and Section 25‐ 32d of the Regulations of Connecticut State Agencies, and are typically updated every six to nine years. These regulations and the supporting statutes recognize that planning is a critical management activity of all water utilities. The principal goals of water system planning as defined by the Connecticut DPH are to: (1) ensure an adequate quantity of pure drinking water, now and in the future; (2) ensure orderly growth of the system; and (3) make efficient use of available resources. PURA, OPM, and DEEP all provide review comment to DPH in the agency's review of WSPs.
All WSPs begin with a description of the water utility's structure and assets. This section normally includes information on company structure, employee certifications, company finances, and assets. The next sections typically provide a description of water supply sources, supply capacity, system performance, and water quality. These sections often provide source safe yield and available water, as well as distribution system specifications, and water quality records.
After describing company infrastructure and available output, the WSPs generally focus on present and future water demands, service area land use, and source protection. These sections often observe trends within current demographics and attempt to extrapolate them into the future, to anticipate any improvements and changes that will need to be made to company infrastructure. WSPs help ensure that water utilities are able to adjust to changing human populations and environmental conditions within the supply area and are planning to meet projected demand over a 50‐year period.
Connecticut's public water supply planning process was prompted by the state's extended drought in the early 1980s and was an outcome of a water resources task force.
At the state level, DPH has been responsible for public drinking water regulation and oversight since the early 1900s, significantly preceding the SDWA.
The regulations further require the development of companion documents to address water conservation and emergency contingency planning. Water conservation plans discuss supply‐side and demand‐side water conservation methods which have or can be enacted by the utility. ECPs provide policies and general response procedures for responding to water supply emergencies, including loss of supply, power outage, and water main breaks. Lists of emergency contacts and supplies are included. The ECP also includes the utility's drought response plan. Drought preparedness and response is further described in this appendix.
Section 25-68b through 25-68h of the Connecticut General Statues: Flood Management Act The Flood Management Act outlines the flood management responsibilities of DEEP and lays out the rules and regulations to be used by all state agencies when undertaking or funding activities within or affecting floodplain areas, which are normally coincident with Special Flood Hazard Areas defined by FEMA. This law requires Flood Management Certifications for certain projects and the requirement that DWSRF-funded projects for critical facilities are built to be resilient to storms greater than the 100-year (0.1% annual chance) flood such as the 500-year event (0.2% annual chance). Public water system projects funded by the federal government and passed through the State of Connecticut, or funded by the State, must be compliant with the more stringent standards of the Flood Management Certification.
PA 85-535: An Act Concerning a Connecticut Plan for Public Water Supply Coordination Connecticut's public water supply planning process was prompted by the state's extended drought in the early 1980s. During the 1985 Legislative Session, the Connecticut General Assembly passed Public Act 85‐535, "An Act Concerning a Connecticut Plan for Public Water Supply Coordination," initiating the first statewide water supply planning program. The Connecticut DPH in consultation with the former DPUC (now PURA), DEEP, and OPM was given the charge of developing a coordinated approach to long‐range water supply planning to assure adequate future supplies. The legislative finding, as reflected in Section 25‐33c of the CGS, states the following: "In order to maximize efficient and effective development of the state's public water supply systems and to promote public health, safety, and welfare, the DPH shall administer a procedure to coordinate the planning of public water supply systems." Pursuant to Public Act 85‐535 and Section 25‐33e of the CGS, the boundaries of public water supply management areas (PWSMAs) were delineated based upon the similarity of water supply issues, population density and distribution, existing sources of public water supply, service areas or franchise areas, existing interconnections between public water systems, municipal and regional planning agency boundaries, natural drainage basins, and similar topographic and geologic characteristics. The CGS required that the Commissioner of DPH convene a Water Utility Coordinating Committee (WUCC) for each PWSMA to implement the area wide water supply planning process. Each current PWSMA boundary is consistent with the recently realigned regional planning agency boundaries completed by OPM in 2014. A "Coordinated Water System Plan" is comprised of the individual WSPs of the public water systems within the PWSMA which serve over 1,000 people or have 250 or more service connections, and an "area wide supplement" which includes a water supply assessment, delineation of exclusive service area boundaries, an integrated report, and an executive summary. The WUCC representing each PWSMA convened in June 2016 with the goal of developing new coordinated water system plans over the two‐year process from June 2016 through June 2018. The individual components of the area wide supplement (listed above) will be subject to State agency consultation and public review and comment, as required.
Resilience is addressed in the updated Coordinated Water System Plan in the following sections:
Water Supply Assessment, Section 7.0, "Issues, Needs, and Deficiencies": Impacts of Climate
Change – The resiliency of water systems to climate change and natural hazards is a significant
concern, particularly given the extensive power outages that occurred throughout the state
during Tropical Storm Irene, Winter Storm Alfred, and Hurricane Sandy. Many smaller systems
do not have standby power facilities. Future planning will be necessary to prepare for and
respond to climate change. Interconnections may become more important as part of these
efforts;
Integrated Report, Section 2.4, "Climate Change and Resiliency", specifically, the impacts of climate change on safe yield, the importance of resiliency in planning, and the importance of resiliency to long‐term viability of recommendations of the plan.
Integrated Report, Section 5.4, "Potential Interconnections Recommended to Increase Resiliency", such as large water systems to groups of smaller interconnected systems, groups of smaller interconnected systems to make larger resilient blocks, and providing options for small community systems to improve capacity;
Executive Summary and Table of Recommendations (nine recommendations regarding resiliency): o Review safe yield regulations every 10 years to determine if data inputs (e.g. evaporation
rate) and assumptions continue to be valid in light of the effects of climate change on
rainfall and runoff patterns, and revise regulations if necessary
o Encourage DEEP/USGS to monitor regional groundwater levels to detect trends that may
impact safe yield
o Update the public health code to require new wells to be elevated to the 0.2% annual
chance flood elevation
o Develop redundant infrastructure, backup power, increase system storage, and conduct
more comprehensive emergency response planning to improve resiliency
o Encourage small systems with the potential to develop emergency interconnections to do so
o Initiate planning for development of interconnections to regionally interconnect groups of
systems
o Develop regional water supply response plans for regionally interconnected systems (e.g.
Intra‐Regional Water Supply Response Plan for Southeastern Connecticut)
o Assist systems in conducting asset management planning and developing formal
infrastructure replacement programs
o Re‐evaluate reservoir release requirements in light of changing rainfall and runoff patterns
as USGS StreamStats is updated
PA 01-177 of 2002 and PA 097-4 Section 2(c) of 2007: Connecticut's Water Planning Council The Connecticut Water Planning Council was created by the Energy and Technology Committee of the Connecticut General Assembly in 2001 with representation from the four state agencies described above (DPH, OPM, and the predecessors of DEEP and PURA [DEP and DPUC]). The charge of the WPC is to "identify issues and strategies which bridge the gap between the water supply planning process and water resources management in order that water can be appropriately allocated to balance competing needs while protecting the health, safety and welfare of the people of Connecticut and minimizing adverse
economic and environmental effects."18 Therefore, the WPC inherently has a directive to consider practices and protocols regarding critical public infrastructure, infrastructure vulnerabilities and resiliency, planning, and emergency preparedness. The WPC does not receive regular, dedicated funding from the State.
The WPC initially established three Committees to investigate specific issues identified in PA 01‐177 and submitted an Issues Work Plan to the Legislature on January 28, 2002. The three committees were the Water Resource Management Committee, the Water Utility Committee, and the Technical Management Committee. Each committee supervised the work of two subcommittees that, together, evaluated 11 issues ranging from review of water rates to streamlining the diversion permit process. A full description of this process can be found in other reports. Since that time, the WPC has overseen progress in promoting policy and regulations for management of the State's water resources. The recent focus of the WPC has been on the State Water Plan (statewide water planning), water conservation, drought management, and watershed land management, topics which encourage the resilience of public water systems in reference to drought and water quality.
The WPC established the Water Planning Council Advisory Group (WPCAG) pursuant to PA 07‐4, Section 2(c) in 2007 to assist in researching and analyzing water resources issues. The WPCAG has formed a number of work groups over the years. The WPCAG typically oversees the work completed by its work groups and reports back to the WPC about specific issues.
PA 03-236: Public Health Emergency Response Act The DPH is the lead administrative and planning agency in Connecticut for public health initiatives including public health emergency preparedness. DPH works with federal, state, regional, and local partners to improve the State's ability to respond to public health emergencies. The Connecticut Public Health Emergency Response Plan (PHERP), last revised in 2011, identifies the appropriate DPH response activities during a public health emergency. This plan supports the public health and medical care component in existing state disaster and emergency plans. PA 04-144: An Act Concerning Floodplain Management and Hazard Mitigation This legislation covers many different aspects of floodplain management. It requires municipalities to revise their current floodplain zoning regulations or ordinances to include new standards for compensatory storage and equal conveyance of floodwater. The DEEP was required to develop model regulation language and allowed for municipalities to use local capital improvement (LoCIP) funds from the state to conduct floodplain management and hazard mitigation activities, and requires disclosure of flood hazard information to prospective buyers of residential real estate. Furthermore, the legislation established a new state hazard mitigation and floodplain management grant program.
The Office of Policy and Management (OPM) is required to continuously incorporate consideration of natural hazards into the revision of the Conservation & Development Policies Plan State POCD as part of the compliance with the Floodplain Management and Hazard Mitigation Act. The update of the Conservation & Development Policies Plan 2013-2018 State POCD incorporated this requirement and was adopted in June 2013. The revised natural hazards policy in the 2013-2018 State POCD was entitled "Minimize the potential risks and impacts from natural hazards, such as flooding, high winds and wildfires, when siting infrastructure and developing property. Consider potential impacts of climate change on existing and future development."
18 DEEP, http://www.ct.gov/deep/cwp/view.asp?a=2720&q=325644&depNav_GID=1654
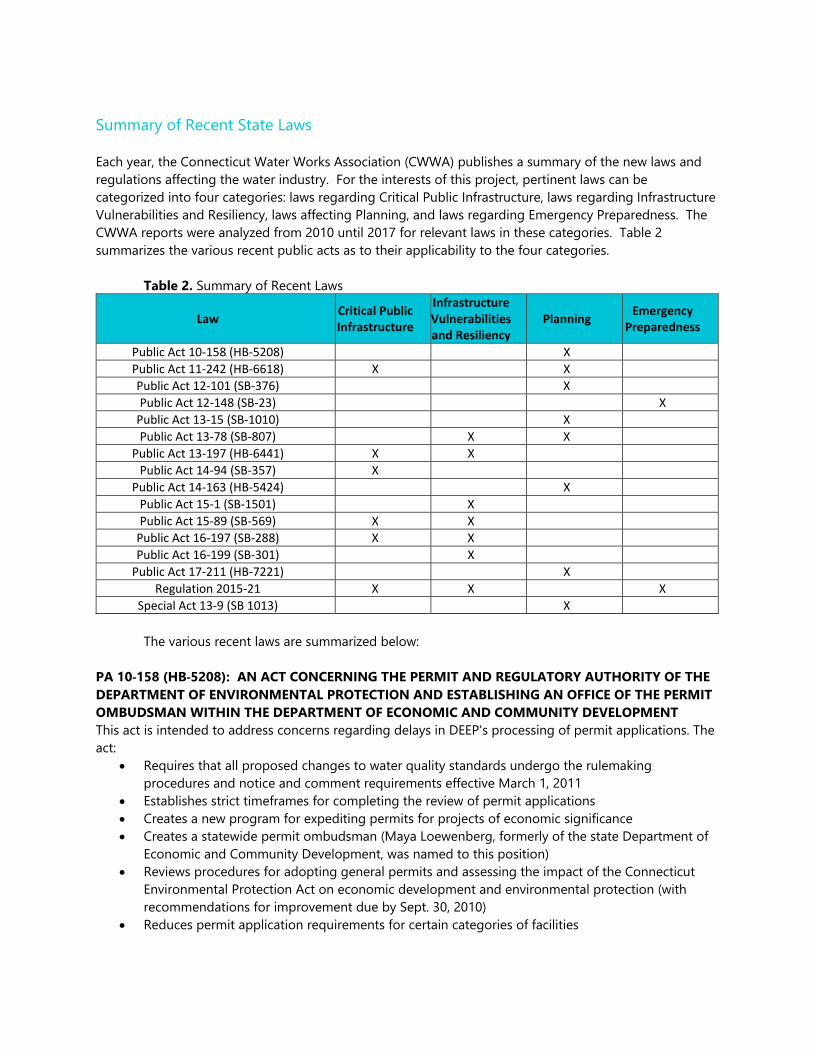
Summary of Recent State Laws
Each year, the Connecticut Water Works Association (CWWA) publishes a summary of the new laws and regulations affecting the water industry. For the interests of this project, pertinent laws can be categorized into four categories: laws regarding Critical Public Infrastructure, laws regarding Infrastructure Vulnerabilities and Resiliency, laws affecting Planning, and laws regarding Emergency Preparedness. The CWWA reports were analyzed from 2010 until 2017 for relevant laws in these categories. Table 2 summarizes the various recent public acts as to their applicability to the four categories.
Table 2. Summary of Recent Laws
Law Critical Public Infrastructure
Infrastructure Vulnerabilities and Resiliency
Planning Emergency
Preparedness
Public Act 10‐158 (HB‐5208) X
Public Act 11‐242 (HB‐6618) X X
Public Act 12‐101 (SB‐376) X
Public Act 12‐148 (SB‐23) X
Public Act 13‐15 (SB‐1010) X
Public Act 13‐78 (SB‐807) X X
Public Act 13‐197 (HB‐6441) X X
Public Act 14‐94 (SB‐357) X
Public Act 14‐163 (HB‐5424) X
Public Act 15‐1 (SB‐1501) X
Public Act 15‐89 (SB‐569) X X
Public Act 16‐197 (SB‐288) X X
Public Act 16‐199 (SB‐301) X
Public Act 17‐211 (HB‐7221) X
Regulation 2015‐21 X X X
Special Act 13‐9 (SB 1013) X
The various recent laws are summarized below:
PA 10‐158 (HB‐5208): AN ACT CONCERNING THE PERMIT AND REGULATORY AUTHORITY OF THE DEPARTMENT OF ENVIRONMENTAL PROTECTION AND ESTABLISHING AN OFFICE OF THE PERMIT OMBUDSMAN WITHIN THE DEPARTMENT OF ECONOMIC AND COMMUNITY DEVELOPMENT This act is intended to address concerns regarding delays in DEEP's processing of permit applications. The act:
Requires that all proposed changes to water quality standards undergo the rulemaking procedures and notice and comment requirements effective March 1, 2011
Establishes strict timeframes for completing the review of permit applications Creates a new program for expediting permits for projects of economic significance Creates a statewide permit ombudsman (Maya Loewenberg, formerly of the state Department of
Economic and Community Development, was named to this position) Reviews procedures for adopting general permits and assessing the impact of the Connecticut
Environmental Protection Act on economic development and environmental protection (with recommendations for improvement due by Sept. 30, 2010)
Reduces permit application requirements for certain categories of facilities
Establishes a new "consulting services program" within the DEP, modeled after the Connecticut OSHA program for non-adversarial on-site compliance assistance
Allows the DEP to extend the effective date of any general permit up to 12 months in a streamlined manner, (and to not hold a hearing on tentative determination to issue or deny a permit if the petition requesting the hearing is withdrawn);
Requires the use of various methods to reduce the impact of proposed regulations on small businesses; and
Creates a task force to make recommendations for expanding disclosure requirements regarding federal consistency with proposed regulations.
This public act encourages resiliency through streamlining of the permit process such that resiliency projects which may affect the environment can receive on-site compliance assistance and a more certain regulatory timeframe.
Public Act 11-242 (HB-6618): AN ACT CONCERNING VARIOUS REVISIONS TO PUBLIC HEALTH RELATED STATUTES Small Water, Treatment, Distribution and Systems Certification: Section 71 of the act requires DPH to certify small water systems that (1) treat or supply water for public use, (2) test backflow prevention devices, or (3) perform cross-connection surveys. DPH must already do this for water treatment plants and water distribution systems that perform these functions. The act requires DPH to adopt regulations on standards and procedures for issuing and renewing certificates for small water systems as it must already do for water treatment plants and water distribution systems. Under the act, a "small water system" serves fewer than 1,000 people and has either (1) no treatment or (2) treatment that does not require any chemical treatment, process adjustment, backwashing, or media regeneration by an operator. This action allows DPH greater oversight of the condition of small water systems which will encourage improvements to critical public infrastructure.
Private Residential Wells - Testing & Reporting Section 72 of the act requires a laboratory or firm testing a private residential well to report the results to DPH, instead of only the local health authority, in a format the department specifies. Results must be reported within 30 days, if the test is performed within six months of the property's sale. Otherwise no report is required. The act requires a property owner, before selling, exchanging, purchasing, transferring, or renting property with a residential well, to notify the buyer or tenant that educational material concerning residential well testing is available on the DPH website. It specifies that failure to provide the notice does not invalidate the property transaction. If the seller or landlord provides written notification, he or she and any real estate licensee are deemed to have satisfied the notification requirement. The act specifies that a laboratory or firm is a DPH-registered environmental laboratory.
Prior law prohibited DPH from adopting certain regulations affecting the testing of private residential wells. This act eliminates provisions barring the testing of a private residential well for:
1) Alachlor, atrazine, dicamba, ethylene dibromide, metolachlor, simazine or 2.4-d, or any other
herbicide or insecticide unless (a) a prior test showed a nitrate concentration of at least 10 milligrams per liter and (b) the local health director had reasonable grounds to suspect the presence of such chemicals, and
2) Organic chemicals unless a local health director had reasonable grounds to suspect their presence.
It instead allows a local health director to require private residential well testing for (1) radionuclides and (2) pesticides, herbicides, or organic chemicals when there are reasonable grounds to suspect the presence of such contaminants in the groundwater. The act defines "reasonable grounds" as:
1) for radionuclides, (a) the existence of a geological area known to have naturally occurring
radionuclide deposits in the bedrock or (b) when the well is located in an area known to have radionuclides in the groundwater, and
2) for pesticides, herbicides, or organic chemicals, (a) the presence of a nitrate-nitrogen groundwater concentration of at least 10 milligrams per liter or (b) when the well is located on or in proximity to land associated with past or present production, storage, use, or disposal of organic chemicals as identified in any public record.
Sample Collections The act allows private residential well samples to determine water quality to be collected only by (1) employees of a DPH-certified or -approved laboratory who are trained in sample collection techniques, (2) certified water operators, (3) local health departments and state employees trained in sample collection techniques, or (4) individuals with training and experience DPH deems as sufficient. The act creates an exception to this requirement for qualified homeowners or general contractors. Prior law allowed homeowners and general contractors of new residential construction, where private residential wells are located, to collect water samples for testing by a laboratory or firm, if the laboratory or firm found that the owner or contractor was qualified to collect the sample. The act continues to allow such sample collection if the (1) laboratory or firm provides instructions to the owner or general contractor on how to collect the samples and (2) owner or general contractor is identified to the subsequent owner on a DPH-prescribed form.
The private well sampling data improves the resiliency of public water systems through planning requirements that allow for centralized tracking of water quality trends. Public Act 12-101 (SB-376): AN ACT CONCERNING THE COASTAL MANAGEMENT ACT AND SHORELINE FLOOD AND EROSION CONTROL STRUCTURES The act makes several changes in the Coastal Management Act (CMA) and laws regulating certain activities in the state's tidal, coastal, or navigable waters. Among other things, it:
1) Modifies CMA's general goals and policies to consider (a) private property owners' rights when
developing, preserving, or using coastal resources and (b) the potential impact of a rise in sea level when planning coastal development to minimize certain needs or effects (§ 1);
2) Expands the list of land uses that can be protected by structural solutions under certain circumstances to include cemetery and burial grounds and inhabited structures built by January 1, 1995 (§ 1);
3) Requires a municipal zoning commission to approve a coastal site plan for a shoreline flood and erosion control structure under certain circumstances (§ 3);
4) Requires a municipal zoning commission or the Department of Energy and Environmental Protection (DEEP) commissioner to propose structure alternatives or mitigation measures and
techniques if they deny a shoreline flood and erosion control structure application for certain reasons (§ 1); and
5) Replaces the statutory definition of "high tide line" with one for "coastal jurisdiction line" (§§ 4-8). The act also requires the Office of Policy and Management (OPM) to consider coastal erosion when revising the state Plan of Conservation and Development after October 1, 2012, as well as a requirement for communities to consider sea level rise in their Plans of Conservation and Development.
This public act improves the coastal management regulatory process, encourages resilient shoreline communities, and expands the types of land uses eligible for funding.
Public Act 12-148 (SB-23): AN ACT ENHANCING EMERGENCY PREPAREDNESS AND RESPONSE In response to concerns following Connecticut's two major storm events in 2011, this act requires the Public Utilities Regulatory Authority (PURA) to conduct public proceedings to establish industry-specific standards for acceptable emergency preparedness and response efforts by public service companies and other utilities. The act is primarily aimed at addressing concerns with the performance of electric and gas companies, however, there are some implications for water utilities.
Emergency Service Restoration Plans Prior law required private and municipal utility companies, including water companies, to file emergency service restoration plans with PURA, DESPP, and local municipalities every five years. The act instead requires these plans to be filed every two years, with the next plan due July 1, 2012, and adds VOIP providers to the utilities subject to the mandate. In addition to the items prior law required in the plans, the act requires them to include (1) communication and coordination measures with state officials, municipalities, and other private utilities and telecommunications companies during a major disaster or emergency; (2) participation in training exercises as directed by the DESPP commissioner; and (3) responses for service outages affecting more than 10%, 30%, 50%, and 70% of customers. Under the act, any information provided in the plans is considered confidential, not subject to the Freedom of Information Act (FOIA), and cannot be transmitted to anyone unless it is needed to comply with the act. The act requires PURA, by September 1, 2012, and biannually thereafter, to summarize the plans in a report to the Energy and Technology Committee.
Microgrids Microgrids are discussed in Docket 12-01-07 and Public Act 12-148. PURA is actively planning for redundant and hardened energy infrastructure such as microgrids and to harden transmission lines. DEEP is conducting the Microgrid Grant and Loan Pilot Program which seeks projects that support local distributed energy generation for critical facilities during times of electric grid outages. To date, DEEP has issued three rounds of requests for proposals, and a fourth round of funding is expected as a result of PA 13-239 which committed the State to $30 million in bonding revenue to support microgrids after the pilot round in 2013.
Special Act 13-9 (SB-1013): AN ACT CONCERNING CLIMATE CHANGE ADAPTATION AND DATA COLLECTION This Special Act established the Connecticut Institute for Resilience and Climate Adaptation (CIRCA) to conduct research, analysis, design, outreach, and education projects to guide the development and implementation of technologies, methods, and policies that increase the protection of ecosystems, coastal properties, and other lands and attributes of the state that are subject to the effects of rising sea levels and natural hazards.
Public Act 13-15 (SB-1010): AN ACT CONCERNING SEA LEVEL RISE AND THE FUNDING OF PROJECTS BY THE CLEAN WATER FUND This Act expands the factors that the DEEP commissioner must consider when establishing the priority list and ranking system for making Clean Water Fund grants and loans for eligible water quality projects. Specifically, it requires him to consider the necessity and feasibility of implementing measures designed to mitigate sea level rise impact over a project's life span. Under existing law, he must consider, among other things, public health and safety, protecting environmental resources, and attaining state water quality goals and standards. This law essentially incorporates climate change planning into funding of wastewater projects. By law, the commissioner makes the grants and loans to municipalities based on the priority list order.
Public Act 13-78 (SB-807): AN ACT CONCERNING WATER INFRASTRUCTURE AND CONSERVATION, MUNICIPAL REPORTING REQUIREMENTS AND UNPAID UTILITY ACCOUNTS AT MULTI-FAMILY DWELLINGS The Act requires PURA, and municipal legislative bodies setting water rates, to consider: 1) demand projections that recognize conservation's effects; 2) implementing metering and measures to provide timely price signals to consumers; 3) multi‐year rate plans; 4) measures to reduce system water losses, and 5) alternative rate designs that promote conservation. The act also allows companies to recover general rate case costs if it can be proven that the costs were used to cover water conservation measures such as water meters, leak detection systems, and water audits. These measures help to improve the resiliency of public water systems.
Public Act 13-197 (HB-6441): AN ACT CONCERNING THE DAM SAFETY PROGRAM AND MOSQUITO CONTROL This Act was described on Page 6 in the context of the dam safety laws, which have been in place for decades. The Act updated the dam safety laws by requiring owners of certain unregistered dams or similar structures to register them by October 1, 2015. It generally shifts, from the commissioner to the owners of dams or similar structures, regularly scheduled inspection and reporting requirements. The Act also makes owners generally responsible for supervising and inspecting construction work and establishes new reporting requirements for owners when the work is completed. The law also authorizes up to $6 million in FY 14 and $5 million in FY 15 for DEEP for dam repairs, including state‐owned dams. It also authorizes up to $4.5 million in FY 14 and $6.9 million in FY 15 for DEEP for flood control improvements, flood repair, erosion damage repairs, and municipal dam repairs.
Public Act 14-94 (SB-357): AN ACT CONCERNING CONNECTICUT'S RECYCLING AND MATERIALS MANAGEMENT STRATEGY, THE UNDERGROUND DAMAGE PREVENTION PROGRAM AND REVISIONS TO ENERGY AND ENVIRONMENTAL STATUTES Sections 50 and 53 of the act expand the jurisdiction of the Public Utilities Regulatory Authority (PURA) over troubled water providers to include deficient well systems, under certain circumstances. It allows PURA to order an investor‐owned water company to extend its system to supply water to properties that PURA determines are served by a deficient well system. But it must do so only (1) in consultation with DPH, (2) at an investor‐owned water company's request, and (3) if the costs are reasonable. This public act thereby improves the resiliency of public water systems by providing additional options for connection to a larger system.
Public Act 14-163 (HB-5424): AN ACT CONCERNING THE RESPONSIBILITIES OF THE WATER PLANNING COUNCIL. Section 1 of this act requires the state's Water Planning Council (WPC; described on Page 9) to prepare, within available appropriations, a State Water Plan by July 1, 2017. The act specifies the State Water Plan must:
1. Identify water amounts and qualities (specifically, surface and groundwater resources available for public
water supply, health, economic, recreation, and environmental benefits for regional basins, rather than those, under prior law, that could be feasibly distributed to specific areas);
2. Identify current and future water demand for statewide and regional basins instead of for specific areas, as prior law required;
3. Recommend using the state's water resources to, instead of maximizing benefits, balance public water supply, economic development, recreation, and ecological health;
4. Recommend major engineering works or special districts, as well as technology and infrastructure upgrades and interconnections;
5. Recommend land use and other measures, that include assessing land acquisition or land protection needs, to ensure the desired water quality and quantity, as well as promoting development based on available water resources;
6. Consider desired recreational, agricultural, industrial, and commercial uses, as well as ecological uses; and
7. Try to incorporate regional and local water use and management plans and programs and water and sewerage facilities plans.
Resiliency is addressed in the climate change assessment, policy recommendations, pathway forward recommendations, "Top Ten Consensus‐Based Policy Priorities", and "Five Most Important Messages in the Plan" sections. The policy recommendations related to the water quality impacts of land use; water conservation; outreach, education, and public engagement; and regionalization are most pertinent to resiliency, as are the pathway forward recommendations related to water conservation, regionalization and interconnections, aging infrastructure, statewide drought planning, and overcoming future challenges.
Out of the "Top Ten" priorities, the following recommendations are most pertinent to encouraging resiliency:
Encourage regional water solutions where they are practical and beneficial; and
Reaffirm support for the protection of Class I and II land contributing to water supply. Expand protections to other watershed lands and land that feed aquifers used for public water supply or by private wells.
Out of the "Five Most Important Messages", the most important message for encouraging resiliency regards conservation: While Connecticut leads the nation in protections of drinking water quality, the State lags in its water conservation ethic. Outreach that builds on utility initiatives is one of the most important recommendations in this Plan.
Public Act 15-1 (SB-1501, Sec. 63-64): CLEAN WATER FUND The Bond Package includes Clean Water Fund grants‐in‐aid of $47.5 million in FY 16 and $92.5 million in FY 17 and Clean Water Fund loans (Revenue Bonds of $58 million in FY 16 and $180 million in FY 17. This funding may be used for resiliency‐related infrastructure projects.
Public Act 15-89 (SB-569): COMMUNITY WATER SYSTEMS To address ongoing concerns with CWSs, this act allows PURA, on its own initiative or at the Department of Public Health (DPH) commissioner's request, to investigate whether a small CWS's rates are sufficient for the system to maintain its economic viability and provide adequate service to its customers. The act defines "small CWSs" as those that do not have to submit a WSP (i.e., generally water companies that serve fewer than 1,000 people or 250 service connections). This public act provides a process to ensure that proper asset management and capital improvement planning is being conducted for small CWSs, which is expected to result in more resilient small water systems.
Regulation 2015-21: Regulations Concerning Public Drinking Water Quality Standards
This regulation amended CGS Section 19a-36 and CGS Section 25-32 and Section 19-13-B102 of the Public Health Code to ensure that every CWS is supported by an emergency generator or an alternative source of backup power. The amendment also requires CWSs to develop emergency contingency and response plans to guide CWSs before, during, and following power outages. These requirements are designed to help systems prevent loss of water pressure or water outages, thereby protecting the system from exposure to bacterial contamination and associated waterborne diseases.
Public Act 16-197 (SB-288): AN ACT CONCERNING THE DEPARTMENT OF PUBLIC HEALTH'S RECOMMENDATIONS ON THE EXPANSION AND CONSTRUCTION OF WATER SYSTEMS This act revises the process for issuing certificates of public convenience and necessity for water companies seeking to expand or construct their systems. Among other things, it: 1) requires certain water companies to obtain the certificate from the Department of Public Health (DPH), instead of both DPH and the Public Utilities Regulatory Authority (PURA); 2) exempts state agencies from the $100 certification fee for residential water systems; 3) under certain conditions, requires PURA to determine if a water system owner has sufficient financial resources to provide adequate service and operate reliably and efficiently; and 4) correspondingly eliminates the requirement that PURA adopt regulations on the certificate process and allows, rather than requires, DPH to adopt them. This public act has led DPH to begin developing CPCN regulations for the development of new non‐CWSs, which is expected to increase the resiliency of newly constructed systems.
Public Act 16-199 (SB-301): AN ACT MODIFYING THE THRESHOLDS FOR MANDATORY REPORTING OF ENVIRONMENTAL SPILLS The act requires the Department of Energy and Environmental Protection (DEEP) commissioner to adopt regulations specifying numerical thresholds for reporting to DEEP discharges, spills, or other releases of specified substances, materials, and waste. A person responsible for a release must report it under the act if it exceeds the applicable threshold. Current law requires anyone responsible for these events to report them to DEEP if the released substance, material, or waste may threaten human health or the environment, regardless of the amount. They must continue to do so under the act until the effective date of the regulations setting the thresholds. This public act relates to resiliency as it improves the level of protection of public water supply source water areas.
Public Act 17-211 (HB-7221): AN ACT CONCERNING ACCESS TO WATER PLANNING INFORMATION Public Act 17-211 became effective on July 1, 2017 and encourages public access to water supply planning information. To accomplish this goal, any WSP submitted after July 1, 2017 is required to be accompanied by a redacted version of such plan that omits any information related to the following topics that are considered confidential and not subject to disclosure under the FOIA. Such confidential information includes:
Security-related documentation and training procedures; ECPs and preparedness plans; incident management, mitigation, and recovery plans, and the like,
except for drought management and response plans which must be disclosed; Design drawings and maps showing the specific location of infrastructure, provided the general
location of water mains, wells, and interconnections is disclosed; Dam specifications, construction details, and emergency action plans related to dam failure response; Building floor or structural plans; Network topology maps; Specific locations of or specifications regarding electrical power, standby generators, and fuel
systems, except that general information regarding such may be disclosed; Operational specifications, schematics and procedures related to water and sewage treatment plant
processes and the use of chemicals, except that a general description of such treatment plant may be disclosed;
Logs detailing movement or assignment of personnel; Distribution system hydraulic models; and Any other record if there are reasonable grounds to believe that the disclosure of such record may
result in a safety risk, as determined by the Connecticut Department of Administrative Services.
As noted above, Public Act 17-211 requires that drought planning and response procedures developed by public water systems be available to the public, which is expected to help further understanding of the need for drought management. Connecticut Conservation and Development Policies Plan CtWARN is a Water/Wastewater Agency Response Network (WARN) comprised of utilities providing voluntarily assistance to one other in the form of personnel and resources during emergencies by means of pre-arranged mutual aid agreements. The mission of CtWARN is to support and promote statewide emergency preparedness, disaster response, and mutual assistance matters for public and private water and wastewater utilities. CtWARN accomplishes this mission by providing increased planning, coordination and enhanced access to specialized resources to enable rapid, short-term deployment of emergency services to restore critical operations of the affected water or wastewater utility. A total of 22 water and wastewater utilities and departments are members of CtWARN, covering more than half of Connecticut's geographic area. Connecticut Conservation and Development Policies Plan The Connecticut Conservation and Development Policies Plan 2018-2023 was issued in 2017 and will be adopted in 2018. Revised policies include:
• Minimize the siting of new infrastructure and development in coastal areas prone to erosion and
inundation from sea level rise or storms, as anticipated in sea level change scenarios published by the National Oceanic and Atmospheric Administration, ensure that coastal hazards are accounted for when considering options for the replacement, expansion, or reduction of existing infrastructure under Policy 1.1, and otherwise limit development activities within coastal areas to those consistent with statutory goals and policies set forth in the Connecticut Coastal Management Act.
• Discourage new development activities within areas prone to flooding and coastal erosion, manage any unavoidable activities in such areas in an environmentally sensitive manner and in compliance with applicable laws, and seek to prevent the loss of life and property by maintaining existing dikes, channels, dams, and other barriers, or removing such structures where removal would be a more cost- effective option for reducing threats to downstream property.
Proactively address climate change adaptation strategies to manage the public health and safety risks associated with the potential increased frequency and/or severity of flooding and drought conditions, including impacts to public water supplies, air quality, and agriculture/aquaculture production.
Drought Preparedness and Response Large public water systems that are required to undertake water supply planning have developed drought planning and response plans as part of their ECPs, which will need to be decoupled from those plans moving forward. Currently, the drought planning and response plans developed by public water systems are either based on the WSP regulations (RCSA Section 25-32d-3) or the parameters identified in the 2003 Connecticut Drought Preparedness and Response Plan (adopted November 2018) prepared by the
Interagency Drought Work Group, although some drought response plans appear to rely on parameters and the five-stage response protocols that predate the 2003 document and the current edition of the WSP regulations.
For public water systems primarily reliant on reservoir sources, the volume of storage in the reservoir is typically utilized to define the criteria for each drought stage. Public water systems primarily reliant on groundwater sources typically use the amount of storage in a primary storage tank over a period of days, or a combination of precipitation and groundwater levels, to define the criteria for each drought stage.
The four drought stages in the water supply planning regulations with water conservation goals from the 2003 Connecticut Drought Preparedness and Response Plan (adopted November 2018) include:
"Advisory" with a voluntary 10% reduction goal for residents and organizations; "Watch" with a voluntary 15% reduction goal for residents and organizations; "Warning" with a voluntary 20% reduction goal for residents, organizations, and state agencies; and "Emergency" with a Governor-mandated 25% reduction in water use by residents, businesses, and
state agencies.
Utilities have strengthened these goals where appropriate. For example, many utilities identify the 20% reduction goal under Drought Warning to be mandatory, as utilities have found that a better reduction in demand is realized when mandatory conservation measures are enacted. In addition, some utilities also define and utilize an "Alert" cautionary stage to prepare internally for implementation of voluntary and mandatory water conservation measures. The Interagency Drought Work Group has been working on an update to the 2003 Plan. The current draft of the update is dated June 29, 2016, and includes the following drought stages (in increasing severity): "Heightened Awareness"; "Below Normal Conditions"; "Moderate Drought"; "Severe Drought"; and "Extreme Drought". These proposed classifications are intended to align more closely with US Drought Monitor terminology and limit confusion with any individual utility drought statuses.
As noted above, some water utilities still utilize the older five-stage method with the following water conservation criteria:
"Alert" which does not include a reduction goal; "Advisory" with a voluntary 10% reduction goal; "Emergency Phase I" with a voluntary 15% reduction goal; "Emergency Phase II" with a voluntary 20% reduction goal; and "Emergency Phase III" with water rationing.
The drought of 2015‐2016 raised public awareness of voluntary and mandatory water conservation measures, which are enacted by many utilities to reduce demands during a drought. Typically, such reductions are requested on a percentage basis for each customer. One issue raised by the public as part of the recent widely reported and protested commercial bottling plant in Bloomfield was whether commercial/industrial users should be completely shut off prior to limiting water for residential customers. Utilities typically request reductions from all users concurrently. Many utilities have ECPs which focus water conservation enforcement on high‐volume users by recommending more frequent (weekly) meter readings of high‐volume customers when conservation measures are requested or mandated, and requiring large customers to file a water conservation "plan of action" with the utility to demonstrate how that customer will reduce its water usage to the requested percentage.
It has long been recognized that water utilities, particularly non-municipal (regional and investor-owned) utilities, have limited methods to enforce voluntary and mandatory conservation measures. Several utilities have noted that high volume accounts sometimes have no interest in conserving water; some residential accounts are simply willing to pay for irrigation water regardless of water conservation surcharges and voluntary or mandatory conservation requests. In some cases, residential developments have requirements to maintain green lawns as part of the ownership contract, and homeowners feel that compliance with the local requirement is more important than the restrictions put in place by a utility.
As noted in the 2003 Connecticut Drought Preparedness and Response Plan (adopted November 2018), municipal authority may be necessary to locally enforce any measures, but many municipalities do not have local ordinances in place to ensure proper implementation of water conservation measures during droughts and other emergencies. To that end, a model ordinance was developed to encourage adoption of these policies at the local level, but few municipalities have adopted the model ordinance. The model ordinance includes examples of banned uses, the procedures for announcing the need for conservation measures, and procedures for issuing fines or even curtailment of service. Because of concerns over the administrative procedures needed to enact such ordinances and potential inconsistency between local ordinances when served by a single utility, legislative authority for water utilities to enforce restrictions may be warranted. In addition, specific language prohibiting enforcement of "green lawn" requirements during declared droughts may be necessary. Summary of State and Federal Practices and Protocols A variety of practices and protocols have been developed at the state and federal levels to address critical public infrastructure, infrastructure vulnerabilities and resiliency, planning, and emergency preparedness.
State Practices and Protocols
Several statewide committees and task forces have met recently regarding critical public infrastructure, infrastructure vulnerabilities and resiliency, planning, and emergency preparedness. Many of these efforts have informed later legislation and planning efforts. A few examples include the following, with additional detail provided in the following subsections:
The Adaptation Subcommittee of the Governor's Steering Committee on Climate Change (formed in 2008);
The Connecticut GIS Council's Storm Response and Recovery Assessment Group (formed in 2011); The Connecticut Department of Public Health (DPH) last revised its Public Health Emergency
Response Plan in 2011. The Shoreline Preservation Task Force (formed in 2012); The State's Long-Term Recovery Committee (formed in 2012);
The Govenor's Two Storm Panel (2012) Governor Dannel P. Malloy announced the formation of The State Team Organized for the Review of Management ("STORM") of Tropical Storm Irene on September 13, 2011.
In the Western part of the state, municipal drought ordinances have been successful. This occurred through municipal interest prior to the drought of 2015-2016 (e.g., in Greenwich), as well as during reaction to the drought of 2015-2016 (in Stamford, Darien, and New Canaan).
The eight member Panel was charged with the following mission, "a broad, objective evaluation reviewing how Irene was handled in the state both in preparation and recovery, identify areas that can be improved upon and, most importantly, make recommendations for future disaster preparedness and response." Following the October snow storm Alfred, the Governor expanded the work of the Panel, renamed it "The Two Storm Panel," and directed it to report its findings to him by the first week of January, 2012.
The Two Storm Panel first reviewed the State Emergency Framework as well as several representative municipal emergency plans in order to benchmark state and local emergency planning. In addition, the Panel conducted eight days of hearings with over 100 witnesses providing written and/or oral testimony to the Panel. Panel hearings were also carried on CT-N so that they could be viewed by the public. In addition to the public hearings, many members of the public provided written comments to the Panel that were also considered in the preparation of the panel's report.
PURA docket 11-09-09 is the Report of the Two Storm Panel. The report acknowledged that "Tropical Storm Irene and the 'October Nor'easter' (Winter Storm Alfred) had tested Connecticut's emergency resources in ways that they had not been tested in more than 25 years. In that intervening 25 years, Connecticut's infrastructure had increased significantly, while the manpower associated with the maintenance and repair of that infrastructure had decreased significantly."
The Report of the Two Storm Panel included 82 individual recommendations that have been shaping legislative initiatives and inter-agency policies since 2012, helping to increase capabilities in Connecticut. Some of these policies have already helped, as noted during Hurricane Sandy in October 2012. Although not all of the 82 recommendations can be listed here, those listed in the Executive Summary include:
• The need to develop reasonable performance standards for utility recovery and restoration after
storms, and link recoverable costs to these standards; • Revisions to State engineering standards to accommodate predicted increases in storm surge
along coastal areas; • The need for improved worst-case planning and staffing by the State's utilities; • Connecticut's infrastructure needs to be better hardened to withstand natural disasters, and such
work should begin as quickly as possible; • The use of microgrids and other emerging technologies should be considered as potential
methods for mitigation of impacts to infrastructure; • Increased collaboration between municipalities, State resources, and electric utilities and
telecommunications service providers with respect to tree trimming; • Increased communication and planning between municipalities and utilities before a storm or
disaster is imminent; • Increased communication between labor and management in all utilities is strongly
recommended;
• Additional emergency response training and exercises for municipalities, utilities and the State; • A review of sheltering needs to ensure that at-risk populations can be served if sheltering is
required for a significant length of time; • The use of geographical information systems (GIS) should be better leveraged for both
emergency planning and response purposes; • The Public Utilities Regulatory Authority and the Connecticut Siting Council should be provided
with additional enforcement resources; • A Center for Research should be developed to study and make recommendations on storm
hazard mitigation and power system resiliency; and • Standards should be more clearly developed for backup power requirements and communication
infrastructure hardening for wireless telecommunications.
The State Vegetation Management Task Force (2012) On April 24, 2012, the State Vegetation Management Task Force held its inaugural meeting. The Mission of the Task Force is to develop standards for road side tree care in Connecticut, vegetation management practices and schedules for utility rights of way, tree/right place standards, and standards for tree wardens, municipal tree inventories and pruning schedules. This Task Force has been formed by the Commissioner of DEEP, as called for in the report of the Governor's Two Storm Panel. The goal is to develop consensus recommendations to DEEP within the stated mission. The final report of the task force dated August 2012 included numerous recommendations, but those listed in the Executive Summary include:
Developing a certification program for local tree wardens;
Requiring municipalities to develop a 5-year roadside forest management plans based on a model
ordinance;
Requiring all new trees planted within the public right-of-way and on municipal property to be reviewed and approved by the tree warden;
Developing a centralized state location for information related to tree and forest management, including to inform property owners on how to properly maintain trees and reduce potential community hazards;
Utilizing Right Tree, Right Place guidelines;
Actively managing roadside forests;
Establishing standards for tree removals;
Developing state or federal funding sources to incentivize municipal investments in tree maintenance;
Utilize 1.5% of all funds approved for utility vegetation management by PURA to fund removal of
hazard trees on private property for five years;
Encourage municipalities to develop annual budgets for roadside forest management; and
Reducing non-vegetation management costs as utility vegetation management costs are increased.
Connecticut Natural Hazard Mitigation Plan (2014) Connecticut adopted a Natural Hazards Mitigation Plan Update (CT 2014 NHMP Update) in January 2014 to meet Federal Emergency Management Agency (FEMA) guidelines set forth in the Disaster Mitigation Act of 2000. This Plan represents the State of Connecticut's efforts to approach mitigating the effects of natural disasters on a multi-hazard basis, and shifts from a disaster-response driven system to one based on effective hazard mitigation planning.
The implementation of effective mitigation of natural hazards requires on-going planning and dedicated persistence both on a state and local level to maintain what has been done in the past and to improve upon past efforts to strive for implementing the most protection possible from natural hazards. To that end, the plan is updated every five years.
Regarding climate change, the plan states that summer and winter temperatures are expected to increase, hurricanes may become more intense, thunderstorms may become more frequent and intense, and that precipitation intensities and amounts may increase. The plan reports that climate models have indiciated that fewer but more intense precipitation events will occur during the winter with more precipitation falling as rain rather than snow. The change in winter precipitation could result in less frequent but more intense snow storms with heavier snow. The plan further predicts that forests will shift northward and vegetation will change, which may change wildfire risks.
The related strategies and activities outlined in this Plan provide a guide to assist Connecticut in working towards achieving these goals that will be implemented or initiated during the time period encompassing this Natural Hazards Mitigation Plan update. The goals themselves are achievable, yet they require adequate resources such as financial and staff resources to achieve significant results. The State of Connecticut believes in the importance of natural hazards mitigation planning and implementation of hazard mitigation activities both on a state and local level in order to reduce/eliminate lives lost and property damaged as a result of natural hazards. The State also believes that climate change and adaptation techniques are an area of continued concern for which new policies and strategies will need to be developed. Some recommendations of the plan included encouraging municipalities to adopt local water restriction measures, and coordinating with water utilities to more actively promote water conservation measures with their customers.
The adoption of this Plan allows Connecticut to be eligible for Federal funding equal to 15% of the total disaster damages from a presidentially declared disaster under the FEMA Hazard Mitigation Grant Program (HMGP).
Executive Order 50 (2015) Executive Order 50 establishes the State Agencies Fostering Resilience (SAFR) Council, which is responsible for strengthening the state's resiliency from extreme weather events including tropical storms, hurricanes, storm surges, flooding, ice storms, extreme high winds, extreme heat, and slow onset events
such as sea level rise. The "SAFR Council" is responsible for working to create a Statewide Resilience Roadmap based on the best climate impact research and data and assisting OPM in the creation of a State policy on disaster resilience. SAFR interacts with CIRCA and will be involved with the NDRC-funded planning in the coming years.
Other Relevant State Policies and Practices Other relevant state policies and practices include:
• Minimize the siting of new infrastructure and development in coastal areas prone to erosion and
inundation from sea level rise or storms, encourage the preservation of undeveloped areas into which coastal wetlands can migrate, and undertake any development activities within coastal areas in an environmentally sensitive manner consistent with statutory goals and policies set forth in the Connecticut Coastal Management Act.
• Allow redevelopment and rebuilding of coastal areas consistent with coastal area management principles and regulations and prevailing federal rules and requirements.
• Discourage new development activities within floodway and floodplain areas, manage any
unavoidable activities in such areas in an environmentally sensitive manner and in compliance with applicable laws, and seek to prevent the loss of life and property by maintaining existing dikes, channels, dams, and other barriers, or removing such structures where removal would be a more cost-effective option for reducing threats to downstream property.
• Proactively address climate change adaptation strategies to manage the public health and safety
risks associated with the potential increased frequency and/or severity of flooding and drought conditions, including impacts to public water supplies, air quality and agriculture/aquaculture production.
Relative to floods, the State of Connecticut adopted a set of standards several decades ago that was forward‐thinking and has helped make many state‐funded projects resilient. Critical facilities must be designed according to the elevation of the 0.2% annual chance flood (500‐year flood) rather than the 1% annual chance (100‐year flood) the elevations of which are typically developed for regulatory purposes by the Federal Emergency Management Agency (FEMA). The Connecticut Public Health Code does not require that water system components or water supply wells be resistant to flooding from the 0.2% event, but water supply wells must be elevated above the 1% annual chance flood elevation. This creates a disparity among State laws because many public water system projects are partly funded by the State (or by federal funds passed through the State, which are subject to State requirements) and would therefore be subject to the more conservative standards.
Federal Practices and Protocols
Executive Order 11988 – Floodplain Management – This Executive Order requires Federal agencies
to evaluate the potential effects of any Federal action that may affect floodplains and to eliminate or reduce any negative effects of that action.
PL-566, Section 205 – This Public Law authorizes the USDA, NRCS and the USACE to undertake flood and erosion control projects in cooperation with the DEEP.
Executive Order 11990 – Protection of Wetlands. Executive Order 13632 – Establishing the Hurricane Sandy Rebuilding Task Force
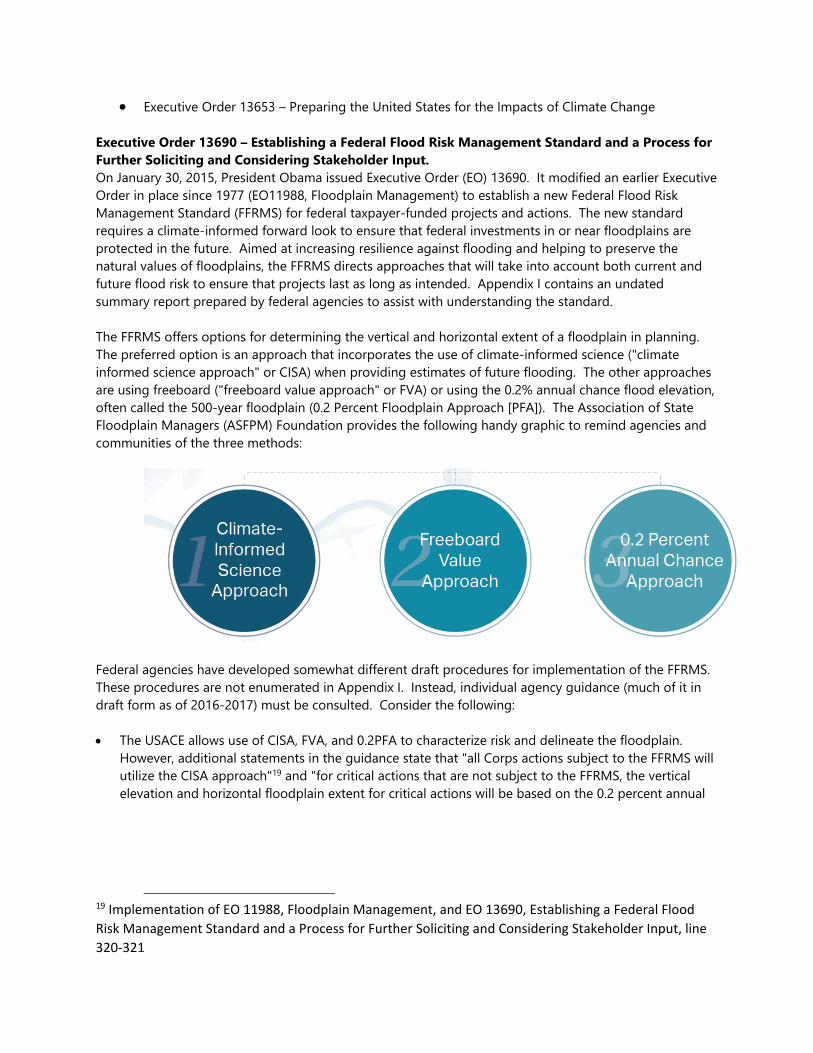
Executive Order 13653 – Preparing the United States for the Impacts of Climate Change
Executive Order 13690 – Establishing a Federal Flood Risk Management Standard and a Process for Further Soliciting and Considering Stakeholder Input. On January 30, 2015, President Obama issued Executive Order (EO) 13690. It modified an earlier Executive Order in place since 1977 (EO11988, Floodplain Management) to establish a new Federal Flood Risk Management Standard (FFRMS) for federal taxpayer-funded projects and actions. The new standard requires a climate-informed forward look to ensure that federal investments in or near floodplains are protected in the future. Aimed at increasing resilience against flooding and helping to preserve the natural values of floodplains, the FFRMS directs approaches that will take into account both current and future flood risk to ensure that projects last as long as intended. Appendix I contains an undated summary report prepared by federal agencies to assist with understanding the standard.
The FFRMS offers options for determining the vertical and horizontal extent of a floodplain in planning. The preferred option is an approach that incorporates the use of climate-informed science ("climate informed science approach" or CISA) when providing estimates of future flooding. The other approaches are using freeboard ("freeboard value approach" or FVA) or using the 0.2% annual chance flood elevation, often called the 500-year floodplain (0.2 Percent Floodplain Approach [PFA]). The Association of State Floodplain Managers (ASFPM) Foundation provides the following handy graphic to remind agencies and communities of the three methods:
Federal agencies have developed somewhat different draft procedures for implementation of the FFRMS. These procedures are not enumerated in Appendix I. Instead, individual agency guidance (much of it in draft form as of 2016-2017) must be consulted. Consider the following:
The USACE allows use of CISA, FVA, and 0.2PFA to characterize risk and delineate the floodplain.
However, additional statements in the guidance state that "all Corps actions subject to the FFRMS will utilize the CISA approach"19 and "for critical actions that are not subject to the FFRMS, the vertical elevation and horizontal floodplain extent for critical actions will be based on the 0.2 percent annual
19 Implementation of EO 11988, Floodplain Management, and EO 13690, Establishing a Federal Flood
Risk Management Standard and a Process for Further Soliciting and Considering Stakeholder Input, line
320‐321
chance flood."20 Interestingly, the USACE guidance defines the 1% annual chance flood as "equivalent to the 1 percent flood in the North Atlantic Coast Comprehensive Study (NACCS)."21
Regarding the use of the FFRMS as a design standard, the USACE guidance states that "… this vertical
elevation will not be used as a design standard or to provide a minimum vertical elevation for use in the planning or design of Corps projects that involve horizontal infrastructure including but not limited to riverine, harbor, and coastal facilities; seawalls; jetties; revetments; engineered beaches and dunes; levees; and interior drainage facilities."22 However, the guidance further states that "though not intended to be used as an explicit design standard, the identified vertical flood elevation and corresponding horizontal extent of the floodplain must be considered when implementing the eight-step decision making process."23
FEMA proposes to "use the FFRMS-FVA as the baseline approach for both critical and non-critical
FEMA federally-funded projects."24 FEMA reasons that this will help standardize its procedures in both non-disaster and post-disaster conditions, and the use of freeboard tends to compensate for unknown factors. Furthermore, the CISA is not as well established for noncoastal flood risks. FEMA is "not proposing to use the FFRMS-0.2PFA because of the limited national availability of information on the 0.2 percent annual chance flood elevation."25
FEMA states that the FVA is the 100-year BFE plus 3 feet for critical actions and the 100-year BFE plus
2 feet for noncritical actions.
In its conclusion, FEMA explains that "FEMA proposes to combine approaches and use the FFRMS-FVA to establish the floodplain for non-critical actions and allow the use of the FFRMS-FVA floodplain or the FFRMS-CISA for critical actions, but only if the elevation established under FFRMS-CISA is higher than the elevation established under FFRMS-FVA. This proposal balances flexibility with standardization…."26
On August 15, 2017, President Trump repealed Executive Order 13690, the Federal Flood Risk Management Standard (FFRMS). The repeal is part of Trump Administration's efforts to eliminate
20 Implementation of EO 11988, Floodplain Management, and EO 13690, Establishing a Federal Flood
Risk Management Standard and a Process for Further Soliciting and Considering Stakeholder Input, line
340‐343 21 Implementation of EO 11988, Floodplain Management, and EO 13690, Establishing a Federal Flood
Risk Management Standard and a Process for Further Soliciting and Considering Stakeholder Input, line
602‐603 22 Implementation of EO 11988, Floodplain Management, and EO 13690, Establishing a Federal Flood
Risk Management Standard and a Process for Further Soliciting and Considering Stakeholder Input, line
256‐263 23 Implementation of EO 11988, Floodplain Management, and EO 13690, Establishing a Federal Flood
Risk Management Standard and a Process for Further Soliciting and Considering Stakeholder Input, line
345‐348 24 Federal Register Vol. 81, No. 162, 8/22/16 Proposed Rules p. 57411 25 Federal Register Vol. 81, No. 162, 8/22/16 Proposed Rules p. 57412 26 Federal Register Vol. 81, No. 162, 8/22/16 Proposed Rules p. 57412
regulations and/or streamline permitting regulations for infrastructure projects. However, the Department of Housing and Urban Development continues to require the FFRMS for its projects.
Section 14 of the Flood Control Act of 1946 (as amended) Section 14 provides for the U.S. Army Corps of Engineers to participate in the planning and construction of economically justified stream-bank erosion control projects in situations where public facilities are threatened. Due to the emergency nature of this erosion problem, there is a streamlined implementation process allowing the project study and design to be concurrently completed. The intent is to abbreviate the time required for the completion of the project. Section 14 requires a complete and comprehensive solution that solves the immediate erosion problem in a manner that does not obligate or imply future Federal participation. Once Section 14 projects are completed, they are relinquished to the local non-federal sponsor for operation and maintenance. The goal of the process is the protection of public infrastructure from present and future erosion with minimal ecological consequences. A recent successful Section 14 project was completed at the City of Middletown Roth Wellfield.
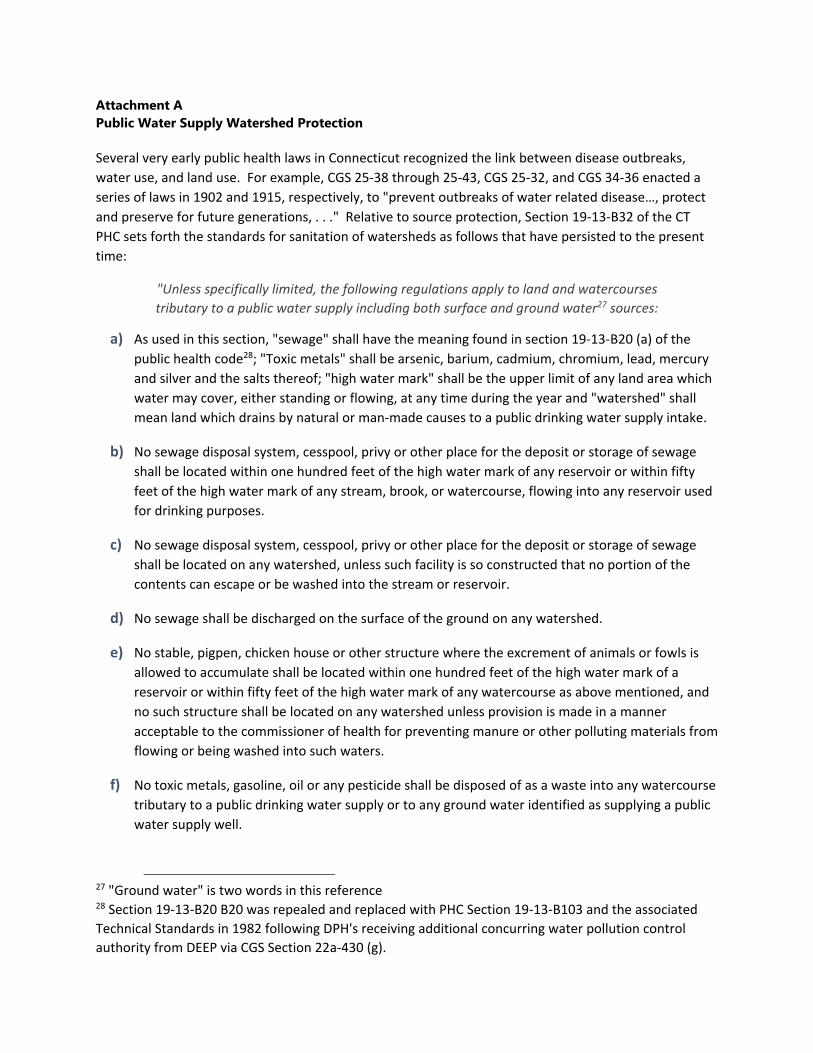
Attachment A Public Water Supply Watershed Protection
Several very early public health laws in Connecticut recognized the link between disease outbreaks,
water use, and land use. For example, CGS 25‐38 through 25‐43, CGS 25‐32, and CGS 34‐36 enacted a
series of laws in 1902 and 1915, respectively, to "prevent outbreaks of water related disease…, protect
and preserve for future generations, . . ." Relative to source protection, Section 19‐13‐B32 of the CT
PHC sets forth the standards for sanitation of watersheds as follows that have persisted to the present
time:
"Unless specifically limited, the following regulations apply to land and watercourses
tributary to a public water supply including both surface and ground water27 sources:
a) As used in this section, "sewage" shall have the meaning found in section 19‐13‐B20 (a) of the
public health code28; "Toxic metals" shall be arsenic, barium, cadmium, chromium, lead, mercury
and silver and the salts thereof; "high water mark" shall be the upper limit of any land area which
water may cover, either standing or flowing, at any time during the year and "watershed" shall
mean land which drains by natural or man‐made causes to a public drinking water supply intake.
b) No sewage disposal system, cesspool, privy or other place for the deposit or storage of sewage
shall be located within one hundred feet of the high water mark of any reservoir or within fifty
feet of the high water mark of any stream, brook, or watercourse, flowing into any reservoir used
for drinking purposes.
c) No sewage disposal system, cesspool, privy or other place for the deposit or storage of sewage
shall be located on any watershed, unless such facility is so constructed that no portion of the
contents can escape or be washed into the stream or reservoir.
d) No sewage shall be discharged on the surface of the ground on any watershed.
e) No stable, pigpen, chicken house or other structure where the excrement of animals or fowls is
allowed to accumulate shall be located within one hundred feet of the high water mark of a
reservoir or within fifty feet of the high water mark of any watercourse as above mentioned, and
no such structure shall be located on any watershed unless provision is made in a manner
acceptable to the commissioner of health for preventing manure or other polluting materials from
flowing or being washed into such waters.
f) No toxic metals, gasoline, oil or any pesticide shall be disposed of as a waste into any watercourse
tributary to a public drinking water supply or to any ground water identified as supplying a public
water supply well.
27 "Ground water" is two words in this reference 28 Section 19‐13‐B20 B20 was repealed and replaced with PHC Section 19‐13‐B103 and the associated
Technical Standards in 1982 following DPH's receiving additional concurring water pollution control
authority from DEEP via CGS Section 22a‐430 (g).
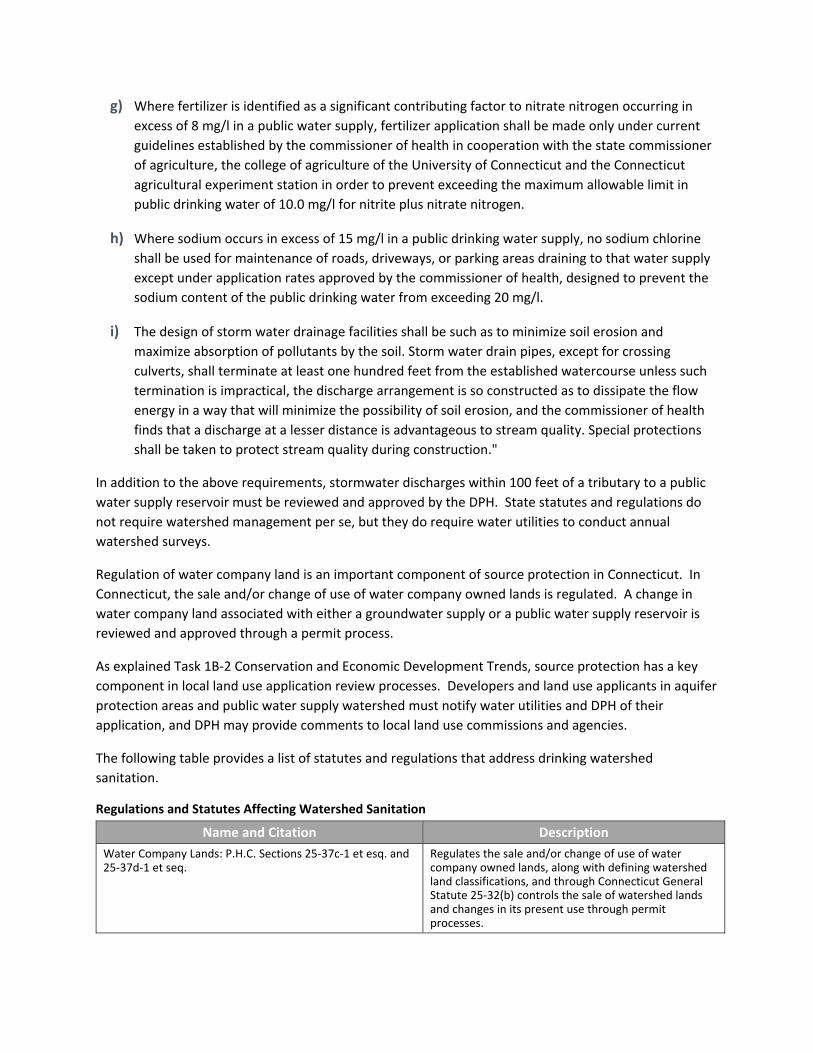
g) Where fertilizer is identified as a significant contributing factor to nitrate nitrogen occurring in
excess of 8 mg/l in a public water supply, fertilizer application shall be made only under current
guidelines established by the commissioner of health in cooperation with the state commissioner
of agriculture, the college of agriculture of the University of Connecticut and the Connecticut
agricultural experiment station in order to prevent exceeding the maximum allowable limit in
public drinking water of 10.0 mg/l for nitrite plus nitrate nitrogen.
h) Where sodium occurs in excess of 15 mg/l in a public drinking water supply, no sodium chlorine
shall be used for maintenance of roads, driveways, or parking areas draining to that water supply
except under application rates approved by the commissioner of health, designed to prevent the
sodium content of the public drinking water from exceeding 20 mg/l.
i) The design of storm water drainage facilities shall be such as to minimize soil erosion and
maximize absorption of pollutants by the soil. Storm water drain pipes, except for crossing
culverts, shall terminate at least one hundred feet from the established watercourse unless such
termination is impractical, the discharge arrangement is so constructed as to dissipate the flow
energy in a way that will minimize the possibility of soil erosion, and the commissioner of health
finds that a discharge at a lesser distance is advantageous to stream quality. Special protections
shall be taken to protect stream quality during construction."
In addition to the above requirements, stormwater discharges within 100 feet of a tributary to a public
water supply reservoir must be reviewed and approved by the DPH. State statutes and regulations do
not require watershed management per se, but they do require water utilities to conduct annual
watershed surveys.
Regulation of water company land is an important component of source protection in Connecticut. In
Connecticut, the sale and/or change of use of water company owned lands is regulated. A change in
water company land associated with either a groundwater supply or a public water supply reservoir is
reviewed and approved through a permit process.
As explained Task 1B‐2 Conservation and Economic Development Trends, source protection has a key
component in local land use application review processes. Developers and land use applicants in aquifer
protection areas and public water supply watershed must notify water utilities and DPH of their
application, and DPH may provide comments to local land use commissions and agencies.
The following table provides a list of statutes and regulations that address drinking watershed
sanitation.
Regulations and Statutes Affecting Watershed Sanitation
Name and Citation Description
Water Company Lands: P.H.C. Sections 25‐37c‐1 et esq. and 25‐37d‐1 et seq.
Regulates the sale and/or change of use of water company owned lands, along with defining watershed land classifications, and through Connecticut General Statute 25‐32(b) controls the sale of watershed lands and changes in its present use through permit processes.
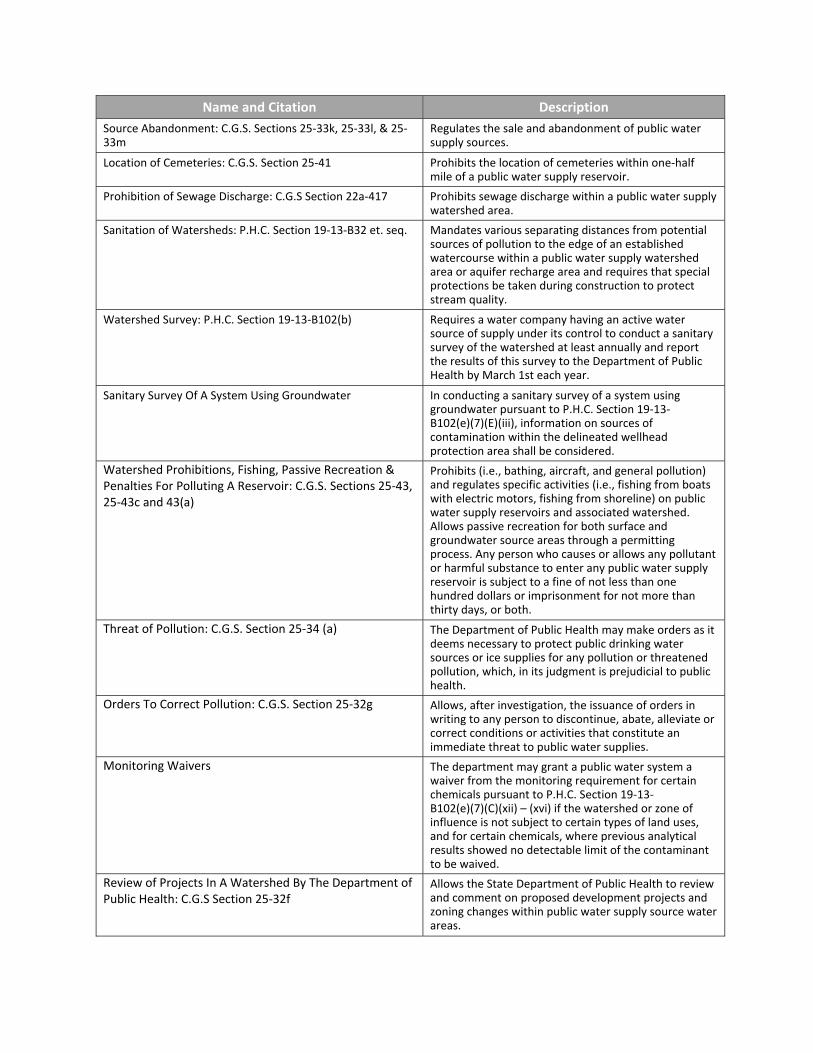
Name and Citation Description
Source Abandonment: C.G.S. Sections 25‐33k, 25‐33l, & 25‐33m
Regulates the sale and abandonment of public water supply sources.
Location of Cemeteries: C.G.S. Section 25‐41 Prohibits the location of cemeteries within one‐half mile of a public water supply reservoir.
Prohibition of Sewage Discharge: C.G.S Section 22a‐417 Prohibits sewage discharge within a public water supply watershed area.
Sanitation of Watersheds: P.H.C. Section 19‐13‐B32 et. seq. Mandates various separating distances from potential sources of pollution to the edge of an established watercourse within a public water supply watershed area or aquifer recharge area and requires that special protections be taken during construction to protect stream quality.
Watershed Survey: P.H.C. Section 19‐13‐B102(b) Requires a water company having an active water source of supply under its control to conduct a sanitary survey of the watershed at least annually and report the results of this survey to the Department of Public Health by March 1st each year.
Sanitary Survey Of A System Using Groundwater In conducting a sanitary survey of a system using groundwater pursuant to P.H.C. Section 19‐13‐B102(e)(7)(E)(iii), information on sources of contamination within the delineated wellhead protection area shall be considered.
Watershed Prohibitions, Fishing, Passive Recreation & Penalties For Polluting A Reservoir: C.G.S. Sections 25‐43, 25‐43c and 43(a)
Prohibits (i.e., bathing, aircraft, and general pollution) and regulates specific activities (i.e., fishing from boats with electric motors, fishing from shoreline) on public water supply reservoirs and associated watershed. Allows passive recreation for both surface and groundwater source areas through a permitting process. Any person who causes or allows any pollutant or harmful substance to enter any public water supply reservoir is subject to a fine of not less than one hundred dollars or imprisonment for not more than thirty days, or both.
Threat of Pollution: C.G.S. Section 25‐34 (a) The Department of Public Health may make orders as it deems necessary to protect public drinking water sources or ice supplies for any pollution or threatened pollution, which, in its judgment is prejudicial to public health.
Orders To Correct Pollution: C.G.S. Section 25‐32g Allows, after investigation, the issuance of orders in writing to any person to discontinue, abate, alleviate or correct conditions or activities that constitute an immediate threat to public water supplies.
Monitoring Waivers The department may grant a public water system a waiver from the monitoring requirement for certain chemicals pursuant to P.H.C. Section 19‐13‐B102(e)(7)(C)(xii) – (xvi) if the watershed or zone of influence is not subject to certain types of land uses, and for certain chemicals, where previous analytical results showed no detectable limit of the contaminant to be waived.
Review of Projects In A Watershed By The Department of Public Health: C.G.S Section 25‐32f
Allows the State Department of Public Health to review and comment on proposed development projects and zoning changes within public water supply source water areas.
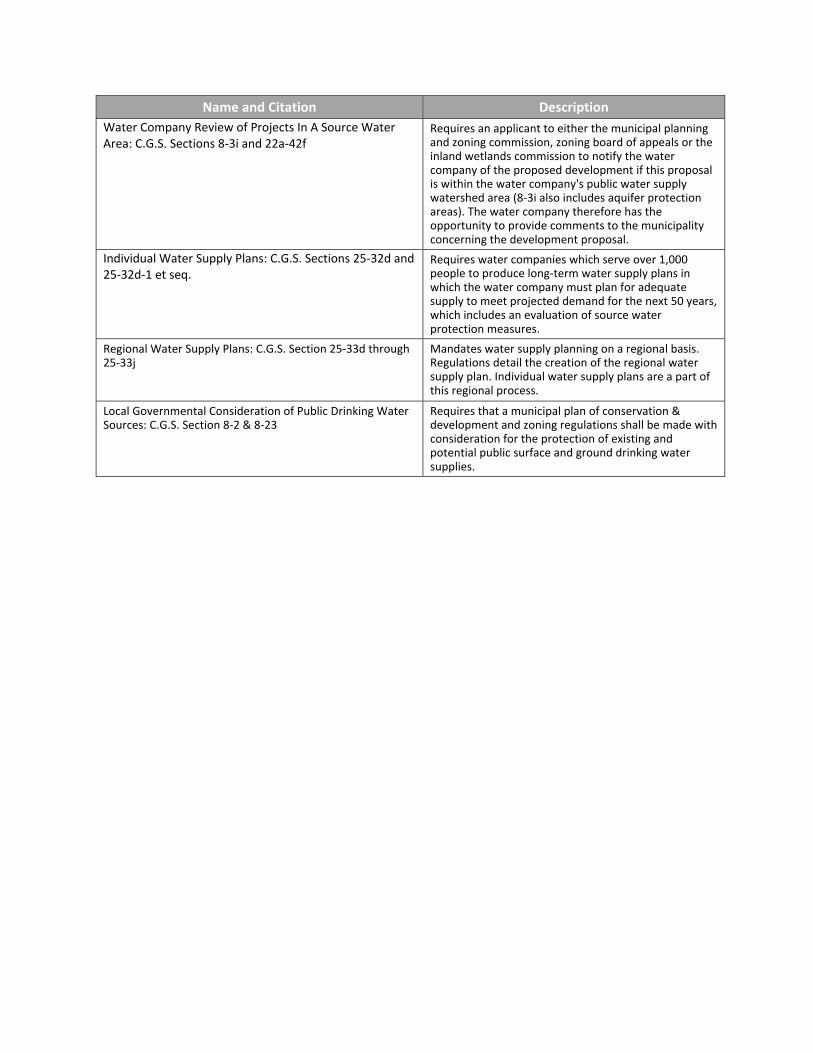
Name and Citation Description
Water Company Review of Projects In A Source Water Area: C.G.S. Sections 8‐3i and 22a‐42f
Requires an applicant to either the municipal planning and zoning commission, zoning board of appeals or the inland wetlands commission to notify the water company of the proposed development if this proposal is within the water company's public water supply watershed area (8‐3i also includes aquifer protection areas). The water company therefore has the opportunity to provide comments to the municipality concerning the development proposal.
Individual Water Supply Plans: C.G.S. Sections 25‐32d and 25‐32d‐1 et seq.
Requires water companies which serve over 1,000 people to produce long‐term water supply plans in which the water company must plan for adequate supply to meet projected demand for the next 50 years, which includes an evaluation of source water protection measures.
Regional Water Supply Plans: C.G.S. Section 25‐33d through 25‐33j
Mandates water supply planning on a regional basis. Regulations detail the creation of the regional water supply plan. Individual water supply plans are a part of this regional process.
Local Governmental Consideration of Public Drinking Water Sources: C.G.S. Section 8‐2 & 8‐23
Requires that a municipal plan of conservation & development and zoning regulations shall be made with consideration for the protection of existing and potential public surface and ground drinking water supplies.


APPENDIX B CWS Vulnerability Assessment Plan Review Documentation


APPENDIX C CWS Survey Results Statistics

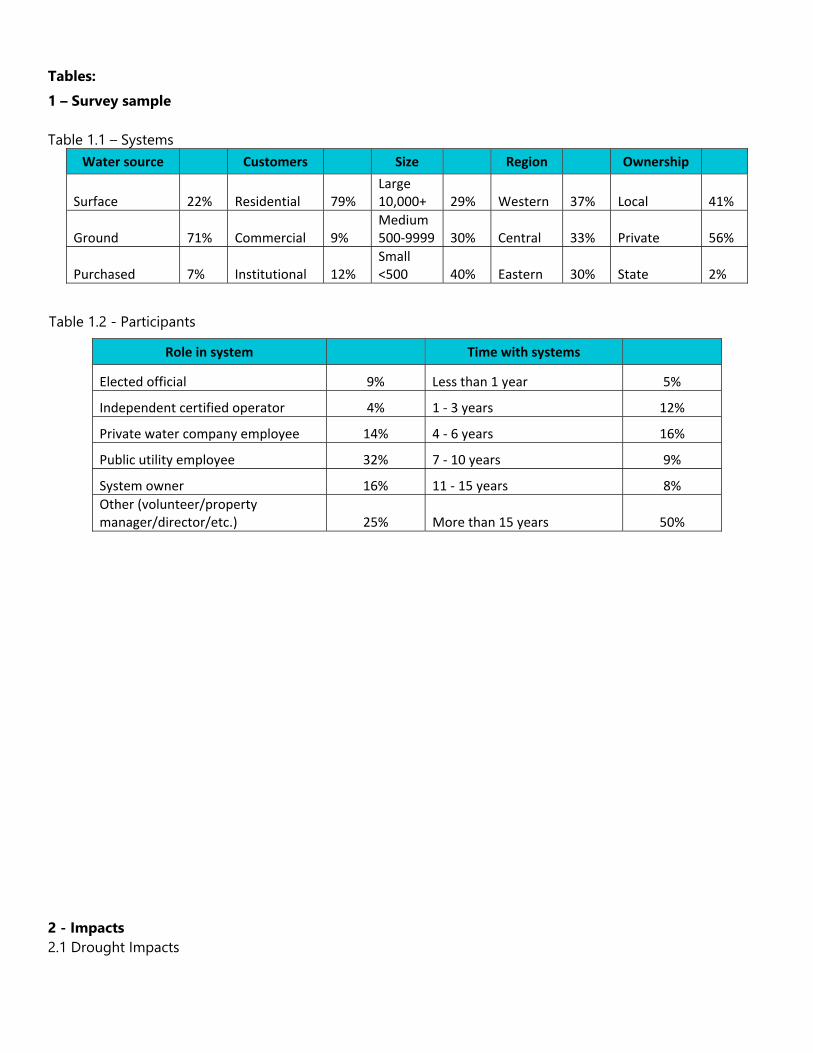
Tables: 1 – Survey sample Table 1.1 – Systems
Water source Customers Size Region Ownership
Surface 22% Residential 79% Large 10,000+ 29% Western 37% Local 41%
Ground 71% Commercial 9% Medium 500‐9999 30% Central 33% Private 56%
Purchased 7% Institutional 12% Small <500 40% Eastern 30% State 2%
Table 1.2 - Participants
Role in system Time with systems
Elected official 9% Less than 1 year 5%
Independent certified operator 4% 1 ‐ 3 years 12%
Private water company employee 14% 4 ‐ 6 years 16%
Public utility employee 32% 7 ‐ 10 years 9%
System owner 16% 11 ‐ 15 years 8%
Other (volunteer/property manager/director/etc.) 25% More than 15 years 50%
2 - Impacts 2.1 Drought Impacts
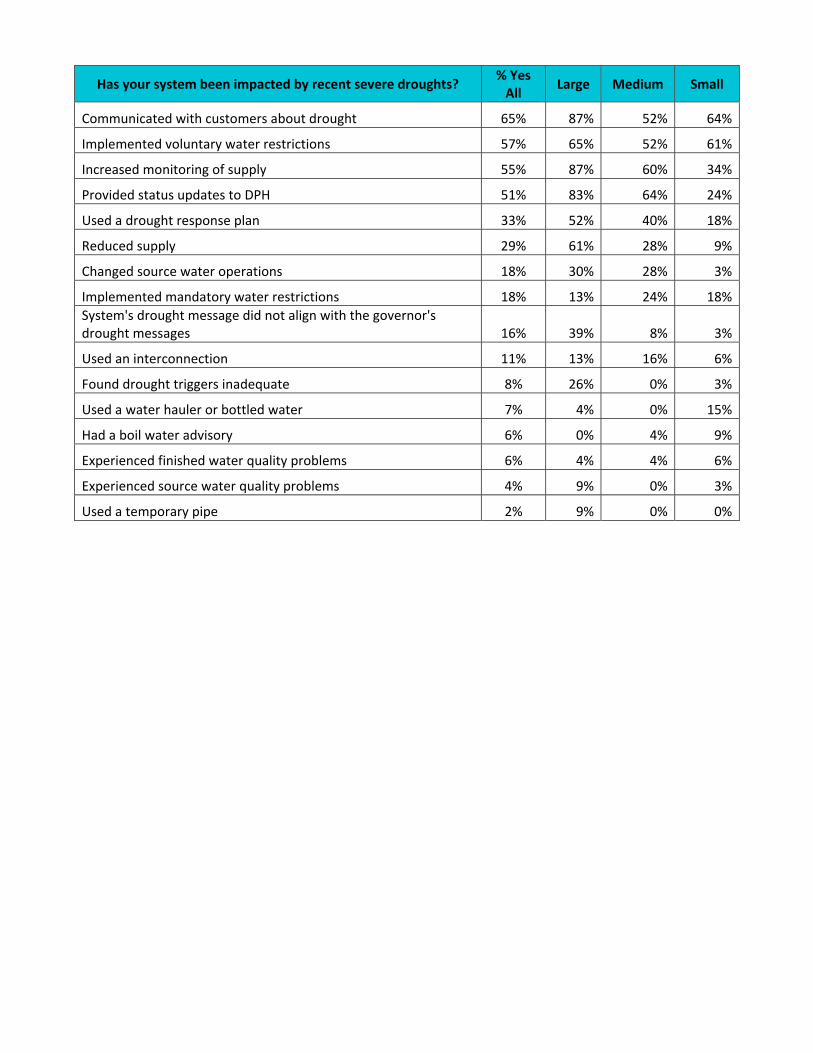
Has your system been impacted by recent severe droughts? % Yes All
Large Medium Small
Communicated with customers about drought 65% 87% 52% 64%
Implemented voluntary water restrictions 57% 65% 52% 61%
Increased monitoring of supply 55% 87% 60% 34%
Provided status updates to DPH 51% 83% 64% 24%
Used a drought response plan 33% 52% 40% 18%
Reduced supply 29% 61% 28% 9%
Changed source water operations 18% 30% 28% 3%
Implemented mandatory water restrictions 18% 13% 24% 18%
System's drought message did not align with the governor's drought messages 16% 39% 8% 3%
Used an interconnection 11% 13% 16% 6%
Found drought triggers inadequate 8% 26% 0% 3%
Used a water hauler or bottled water 7% 4% 0% 15%
Had a boil water advisory 6% 0% 4% 9%
Experienced finished water quality problems 6% 4% 4% 6%
Experienced source water quality problems 4% 9% 0% 3%
Used a temporary pipe 2% 9% 0% 0%
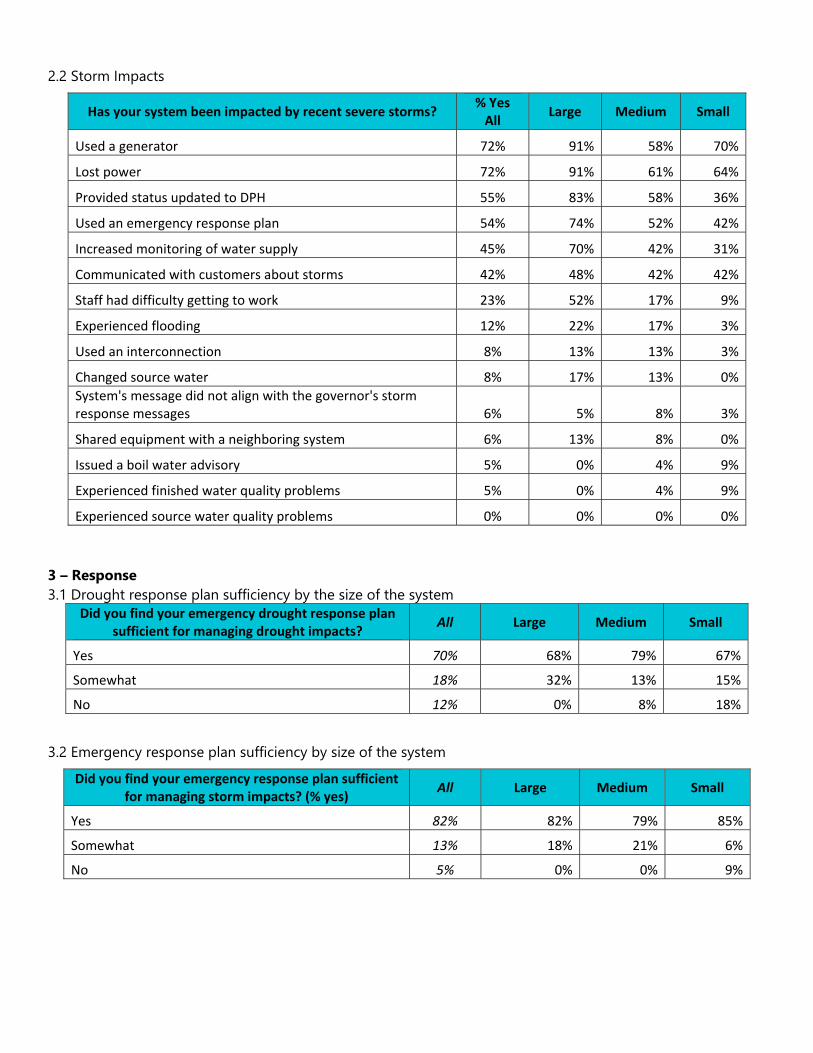
2.2 Storm Impacts
Has your system been impacted by recent severe storms? % Yes All
Large Medium Small
Used a generator 72% 91% 58% 70%
Lost power 72% 91% 61% 64%
Provided status updated to DPH 55% 83% 58% 36%
Used an emergency response plan 54% 74% 52% 42%
Increased monitoring of water supply 45% 70% 42% 31%
Communicated with customers about storms 42% 48% 42% 42%
Staff had difficulty getting to work 23% 52% 17% 9%
Experienced flooding 12% 22% 17% 3%
Used an interconnection 8% 13% 13% 3%
Changed source water 8% 17% 13% 0%
System's message did not align with the governor's storm response messages 6% 5% 8% 3%
Shared equipment with a neighboring system 6% 13% 8% 0%
Issued a boil water advisory 5% 0% 4% 9%
Experienced finished water quality problems 5% 0% 4% 9%
Experienced source water quality problems 0% 0% 0% 0%
3 – Response 3.1 Drought response plan sufficiency by the size of the system
Did you find your emergency drought response plan sufficient for managing drought impacts?
All Large Medium Small
Yes 70% 68% 79% 67%
Somewhat 18% 32% 13% 15%
No 12% 0% 8% 18%
3.2 Emergency response plan sufficiency by size of the system
Did you find your emergency response plan sufficient for managing storm impacts? (% yes)
All Large Medium Small
Yes 82% 82% 79% 85%
Somewhat 13% 18% 21% 6%
No 5% 0% 0% 9%
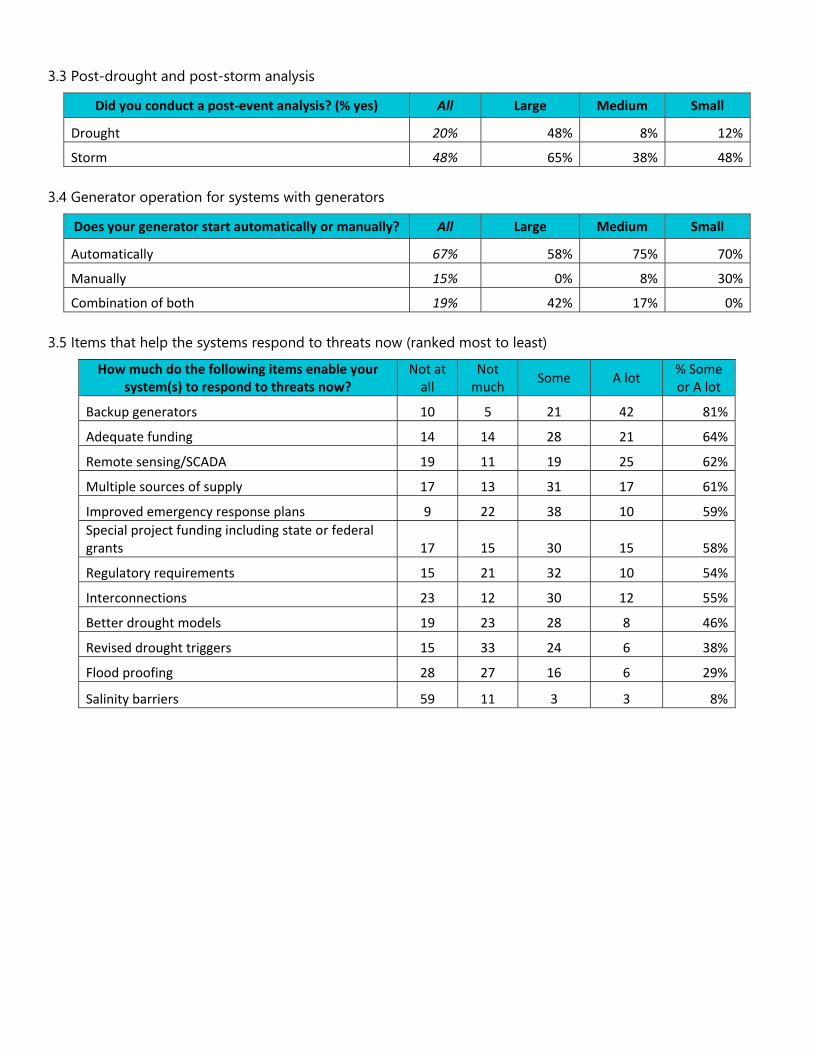
3.3 Post-drought and post-storm analysis
Did you conduct a post‐event analysis? (% yes) All Large Medium Small
Drought 20% 48% 8% 12%
Storm 48% 65% 38% 48%
3.4 Generator operation for systems with generators
Does your generator start automatically or manually? All Large Medium Small
Automatically 67% 58% 75% 70%
Manually 15% 0% 8% 30%
Combination of both 19% 42% 17% 0%
3.5 Items that help the systems respond to threats now (ranked most to least)
How much do the following items enable your system(s) to respond to threats now?
Not at all
Not much
Some A lot % Some or A lot
Backup generators 10 5 21 42 81%
Adequate funding 14 14 28 21 64%
Remote sensing/SCADA 19 11 19 25 62%
Multiple sources of supply 17 13 31 17 61%
Improved emergency response plans 9 22 38 10 59%
Special project funding including state or federal grants 17 15 30 15 58%
Regulatory requirements 15 21 32 10 54%
Interconnections 23 12 30 12 55%
Better drought models 19 23 28 8 46%
Revised drought triggers 15 33 24 6 38%
Flood proofing 28 27 16 6 29%
Salinity barriers 59 11 3 3 8%
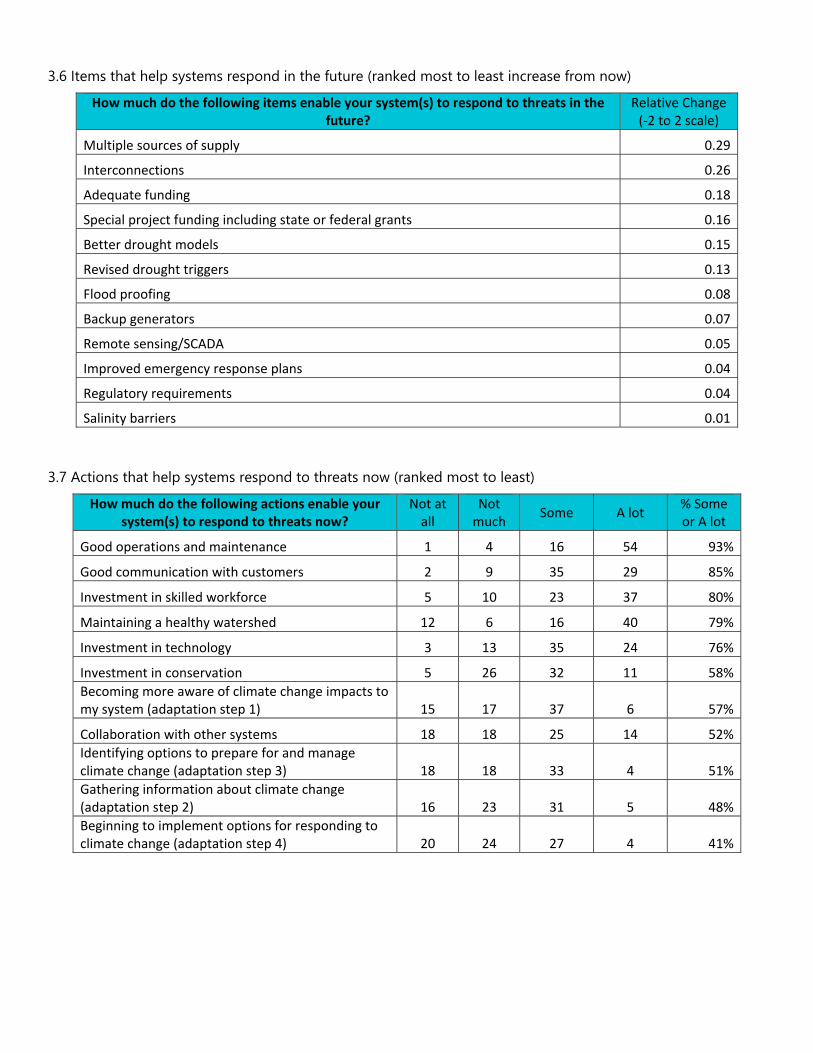
3.6 Items that help systems respond in the future (ranked most to least increase from now)
How much do the following items enable your system(s) to respond to threats in the future?
Relative Change (‐2 to 2 scale)
Multiple sources of supply 0.29
Interconnections 0.26
Adequate funding 0.18
Special project funding including state or federal grants 0.16
Better drought models 0.15
Revised drought triggers 0.13
Flood proofing 0.08
Backup generators 0.07
Remote sensing/SCADA 0.05
Improved emergency response plans 0.04
Regulatory requirements 0.04
Salinity barriers 0.01
3.7 Actions that help systems respond to threats now (ranked most to least)
How much do the following actions enable your system(s) to respond to threats now?
Not at all
Not much
Some A lot % Some or A lot
Good operations and maintenance 1 4 16 54 93%
Good communication with customers 2 9 35 29 85%
Investment in skilled workforce 5 10 23 37 80%
Maintaining a healthy watershed 12 6 16 40 79%
Investment in technology 3 13 35 24 76%
Investment in conservation 5 26 32 11 58%
Becoming more aware of climate change impacts to my system (adaptation step 1) 15 17 37 6 57%
Collaboration with other systems 18 18 25 14 52%
Identifying options to prepare for and manage climate change (adaptation step 3) 18 18 33 4 51%
Gathering information about climate change (adaptation step 2) 16 23 31 5 48%
Beginning to implement options for responding to climate change (adaptation step 4) 20 24 27 4 41%
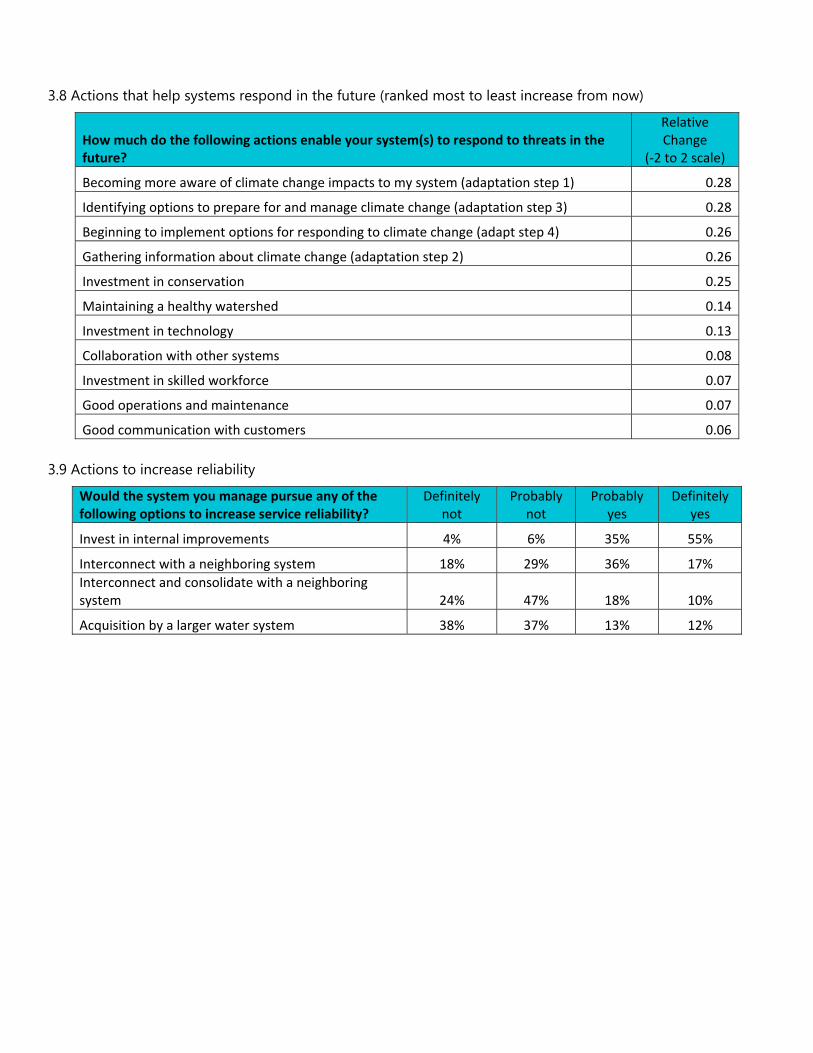
3.8 Actions that help systems respond in the future (ranked most to least increase from now)
How much do the following actions enable your system(s) to respond to threats in the future?
Relative Change
(‐2 to 2 scale)
Becoming more aware of climate change impacts to my system (adaptation step 1) 0.28
Identifying options to prepare for and manage climate change (adaptation step 3) 0.28
Beginning to implement options for responding to climate change (adapt step 4) 0.26
Gathering information about climate change (adaptation step 2) 0.26
Investment in conservation 0.25
Maintaining a healthy watershed 0.14
Investment in technology 0.13
Collaboration with other systems 0.08
Investment in skilled workforce 0.07
Good operations and maintenance 0.07
Good communication with customers 0.06
3.9 Actions to increase reliability
Would the system you manage pursue any of the following options to increase service reliability?
Definitely not
Probably not
Probably yes
Definitely yes
Invest in internal improvements 4% 6% 35% 55%
Interconnect with a neighboring system 18% 29% 36% 17%
Interconnect and consolidate with a neighboring system 24% 47% 18% 10%
Acquisition by a larger water system 38% 37% 13% 12%
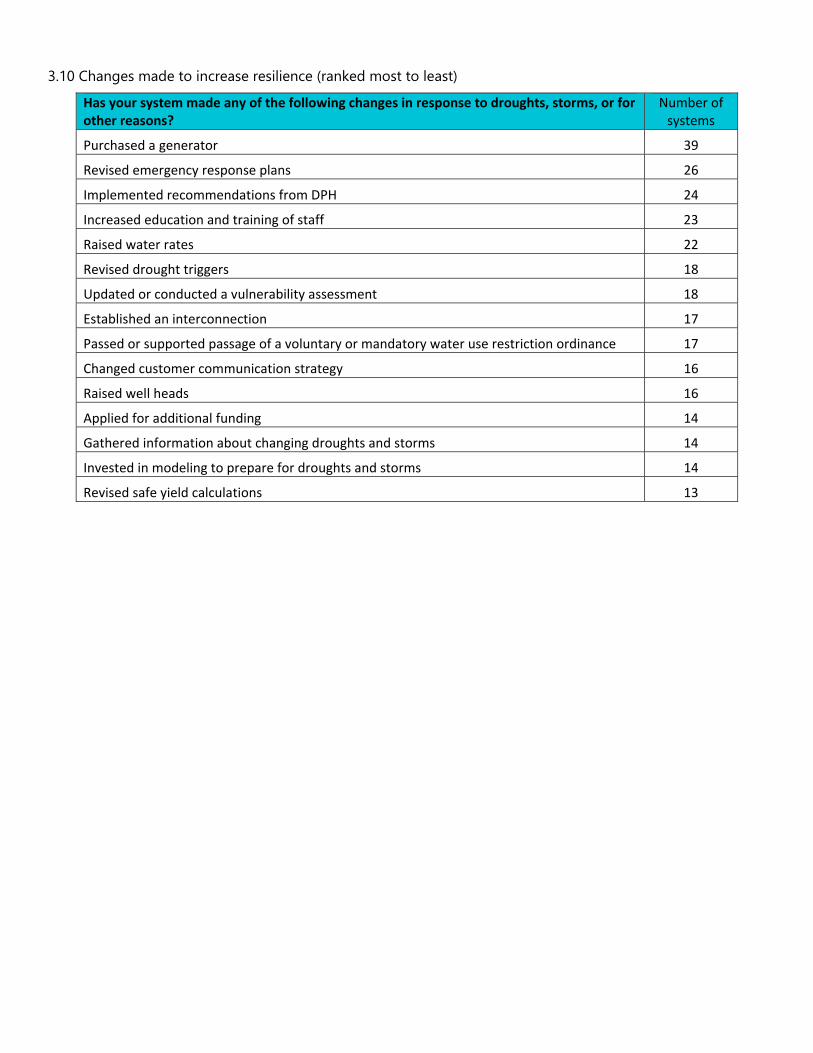
3.10 Changes made to increase resilience (ranked most to least)
Has your system made any of the following changes in response to droughts, storms, or for other reasons?
Number of systems
Purchased a generator 39
Revised emergency response plans 26
Implemented recommendations from DPH 24
Increased education and training of staff 23
Raised water rates 22
Revised drought triggers 18
Updated or conducted a vulnerability assessment 18
Established an interconnection 17
Passed or supported passage of a voluntary or mandatory water use restriction ordinance 17
Changed customer communication strategy 16
Raised well heads 16
Applied for additional funding 14
Gathered information about changing droughts and storms 14
Invested in modeling to prepare for droughts and storms 14
Revised safe yield calculations 13
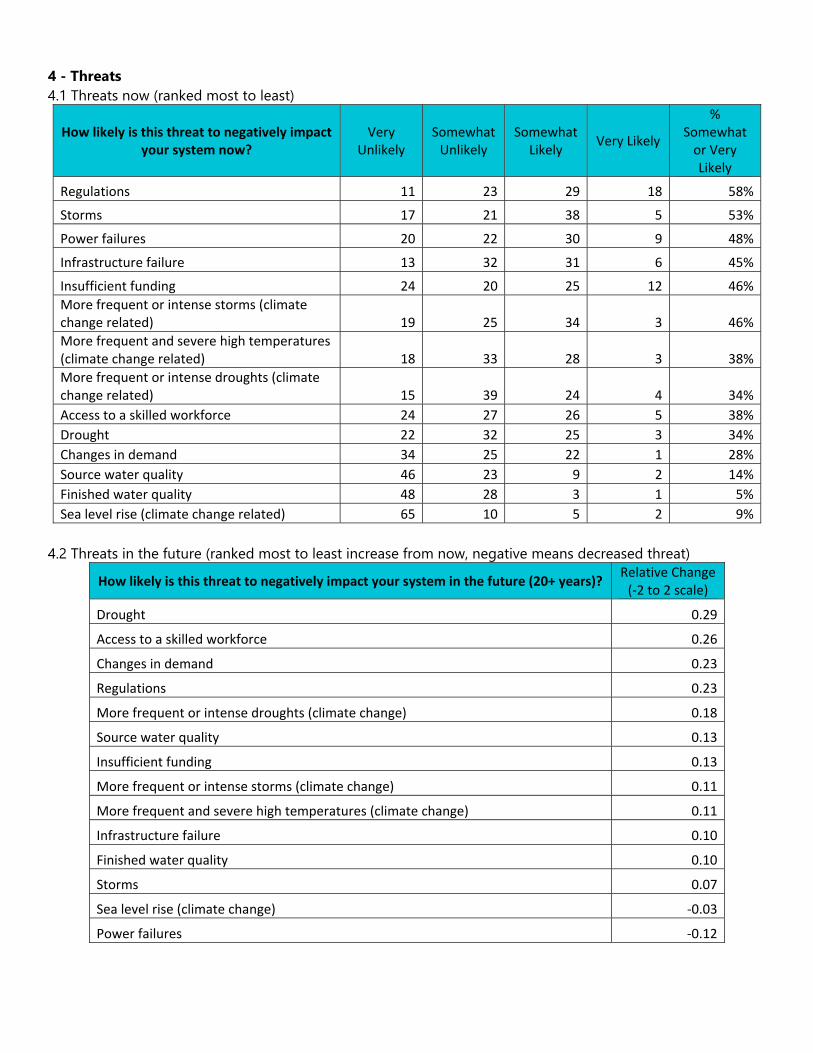
4 - Threats 4.1 Threats now (ranked most to least)
How likely is this threat to negatively impact your system now?
Very Unlikely
Somewhat Unlikely
Somewhat Likely
Very Likely
% Somewhat or Very Likely
Regulations 11 23 29 18 58%
Storms 17 21 38 5 53%
Power failures 20 22 30 9 48%
Infrastructure failure 13 32 31 6 45%
Insufficient funding 24 20 25 12 46%
More frequent or intense storms (climate change related) 19 25 34 3 46%
More frequent and severe high temperatures (climate change related) 18 33 28 3 38%
More frequent or intense droughts (climate change related) 15 39 24 4 34%
Access to a skilled workforce 24 27 26 5 38%
Drought 22 32 25 3 34%
Changes in demand 34 25 22 1 28%
Source water quality 46 23 9 2 14%
Finished water quality 48 28 3 1 5%
Sea level rise (climate change related) 65 10 5 2 9%
4.2 Threats in the future (ranked most to least increase from now, negative means decreased threat)
How likely is this threat to negatively impact your system in the future (20+ years)? Relative Change (‐2 to 2 scale)
Drought 0.29
Access to a skilled workforce 0.26
Changes in demand 0.23
Regulations 0.23
More frequent or intense droughts (climate change) 0.18
Source water quality 0.13
Insufficient funding 0.13
More frequent or intense storms (climate change) 0.11
More frequent and severe high temperatures (climate change) 0.11
Infrastructure failure 0.10
Finished water quality 0.10
Storms 0.07
Sea level rise (climate change) ‐0.03
Power failures ‐0.12

APPENDIX D
Drinking Water Vulnerability and Resilience Plan Workshop

C.1 Workshop Agenda 8:15am Breakfast and Check-in – Student Center 9am Welcome and Overview* - Academic Building 308
James O'Donnell, CIRCA Executive Director and UConn Professor of Marine Sciences Rebecca French, CIRCA Director of Community Engagement
9:10am Presentation: The Importance of Resilience - ACD 308 Lori Mathieu, Public Health Section Chief, Drinking Water Section, Department of Public Health
9:25am Part I Oral Presentations – ACD 308 Future Challenges of Climate Change for Community Water Systems: Drought, Precipitation and Coastal Flooding
James O'Donnell, CIRCA Executive Director and UConn Professor of Marine Sciences Guiling Wang, CIRCA Affiliated Faculty Member and UConn Professor of Civil & Environmental Engineering
Resilience Lessons from Community Water Systems Experience with Past Storms Christine Kirchhoff, CIRCA Affiliated Faculty Member and UConn Assistant Professor of Civil & Environmental Engineering
Keeping the Water on for Critical Facilities: Mapping Flood Risk Amy Burnicki, CIRCA Affiliated Faculty Member and UConn Assistant Professor in Residence of Civil & Environmental Engineering
Private Wells: Identifying Neighborhoods at Risk and Options to Improve Resilience Victoria Brudz, CIRCA Project Specialist
Panel Discussion with Speakers (Live Q&A with webinar and in-person participants) 10:40am Morning Break – Student Center 11:00am Part 2 Oral Presentations - ACD 308
How Well Are We Already Prepared: Reviewing the Current State of Practice for Community Water Systems
David Murphy, Manager of Water Resources Planning, Milone & MacBroom Resilience Laws and Policy – Tools to Maintain and Enhance Safe Drinking Water Compliance
David Murphy, Manager of Water Resources Planning, Milone & MacBroom A Resilience Plan for Community Water Systems
Christine Kirchhoff, CIRCA Affiliated Faculty Member and UConn Professor of Civil & Environmental Engineering
David Murphy, Manager of Water Resources Planning, Milone & MacBroom Funding Opportunities for Resilience Strategies
Cam Walden, Supervising Sanitary Engineer, Drinking Water State Revolving Fund, Department of Public Health
12:15pm Lunch Provided – Branford House 1:15pm Breakout Sessions – small group facilitated discussions on:
It's An Emergency! Keep the Water Supply Running - Branford House Oak Room Redundancy = Resilience: Options and Alternatives for CWSs & Drinking Water Policy - ACD 206 Using Climate Data to Inform CWS Decisions - ACD 207 What Do We Do About Private Well Resilience? - ACD 311
2:45pm Report Out on Breakout Sessions and Wrap-up – ACD 2nd Floor Auditorium 3:15pm End Workshop
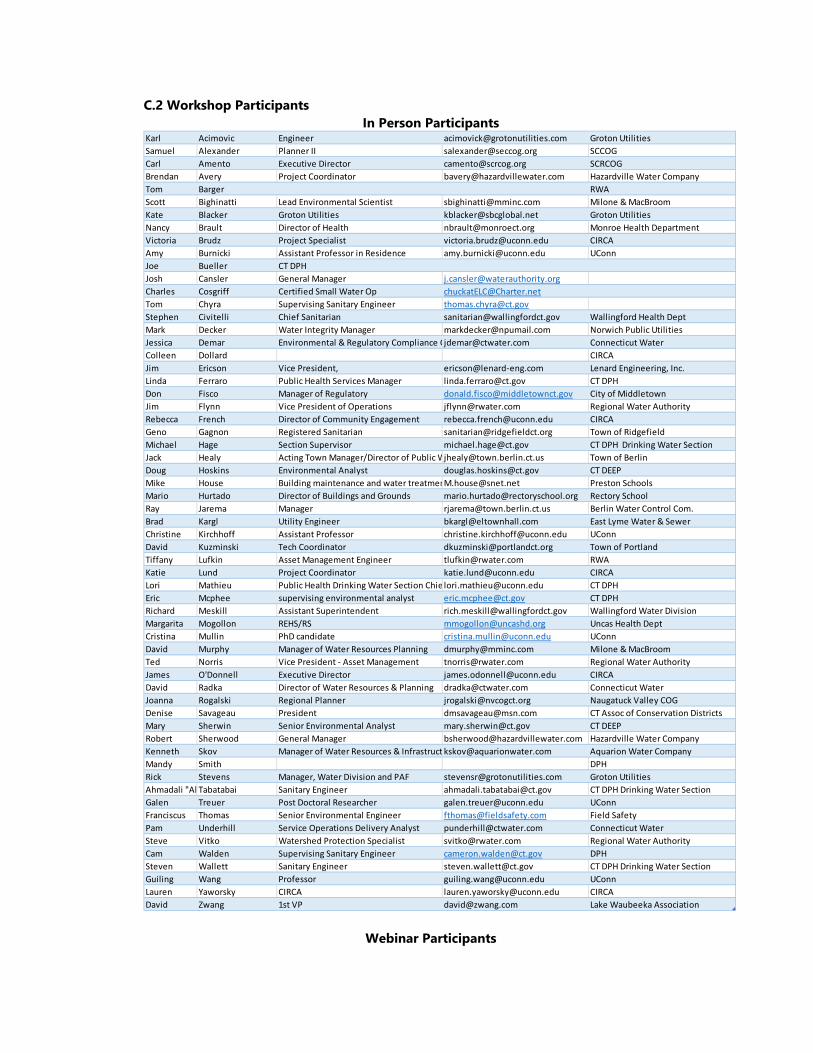
C.2 Workshop Participants In Person Participants
Webinar Participants
Karl Acimovic Engineer [email protected] Groton Utilities
Samuel Alexander Planner II [email protected] SCCOG
Carl Amento Executive Director [email protected] SCRCOG
Brendan Avery Project Coordinator [email protected] Hazardville Water Company
Tom Barger RWA
Scott Bighinatti Lead Environmental Scientist [email protected] Milone & MacBroom
Kate Blacker Groton Utilities [email protected] Groton Utilities
Nancy Brault Director of Health [email protected] Monroe Health Department
Victoria Brudz Project Specialist [email protected] CIRCA
Amy Burnicki Assistant Professor in Residence [email protected] UConn
Joe Bueller CT DPH
Josh Cansler General Manager [email protected]
Charles Cosgriff Certified Small Water Op [email protected]
Tom Chyra Supervising Sanitary Engineer [email protected]
Stephen Civitelli Chief Sanitarian [email protected] Wallingford Health Dept
Mark Decker Water Integrity Manager [email protected] Norwich Public Utilities
Jessica Demar Environmental & Regulatory Compliance [email protected] Connecticut Water
Colleen Dollard CIRCA
Jim Ericson Vice President, ericson@lenard‐eng.com Lenard Engineering, Inc.
Linda Ferraro Public Health Services Manager [email protected] CT DPH
Don Fisco Manager of Regulatory [email protected] City of Middletown
Jim Flynn Vice President of Operations [email protected] Regional Water Authority
Rebecca French Director of Community Engagement [email protected] CIRCA
Geno Gagnon Registered Sanitarian [email protected] Town of Ridgefield
Michael Hage Section Supervisor [email protected] CT DPH Drinking Water Section
Jack Healy Acting Town Manager/Director of Public [email protected] Town of Berlin
Doug Hoskins Environmental Analyst [email protected] CT DEEP
Mike House Building maintenance and water [email protected] Preston Schools
Mario Hurtado Director of Buildings and Grounds [email protected] Rectory School
Ray Jarema Manager [email protected] Berlin Water Control Com.
Brad Kargl Utility Engineer [email protected] East Lyme Water & Sewer
Christine Kirchhoff Assistant Professor [email protected] UConn
David Kuzminski Tech Coordinator [email protected] Town of Portland
Tiffany Lufkin Asset Management Engineer [email protected] RWA
Katie Lund Project Coordinator [email protected] CIRCA
Lori Mathieu Public Health Drinking Water Section Chie [email protected] CT DPH
Eric Mcphee supervising environmental analyst [email protected] CT DPH
Richard Meskill Assistant Superintendent [email protected] Wallingford Water Division
Margarita Mogollon REHS/RS [email protected] Uncas Health Dept
Cristina Mullin PhD candidate [email protected] UConn
David Murphy Manager of Water Resources Planning [email protected] Milone & MacBroom
Ted Norris Vice President ‐ Asset Management [email protected] Regional Water Authority
James O'Donnell Executive Director [email protected] CIRCA
David Radka Director of Water Resources & Planning [email protected] Connecticut Water
Joanna Rogalski Regional Planner [email protected] Naugatuck Valley COG
Denise Savageau President [email protected] CT Assoc of Conservation Districts
Mary Sherwin Senior Environmental Analyst [email protected] CT DEEP
Robert Sherwood General Manager [email protected] Hazardville Water Company
Kenneth Skov Manager of Water Resources & Infrastruct [email protected] Aquarion Water Company
Mandy Smith DPH
Rick Stevens Manager, Water Division and PAF [email protected] Groton Utilities
Ahmadali "Al Tabatabai Sanitary Engineer [email protected] CT DPH Drinking Water Section
Galen Treuer Post Doctoral Researcher [email protected] UConn
Franciscus Thomas Senior Environmental Engineer [email protected] Field Safety
Pam Underhill Service Operations Delivery Analyst [email protected] Connecticut Water
Steve Vitko Watershed Protection Specialist [email protected] Regional Water Authority
Cam Walden Supervising Sanitary Engineer [email protected] DPH
Steven Wallett Sanitary Engineer [email protected] CT DPH Drinking Water Section
Guiling Wang Professor [email protected] UConn
Lauren Yaworsky CIRCA [email protected] CIRCA
David Zwang 1st VP [email protected] Lake Waubeeka Association
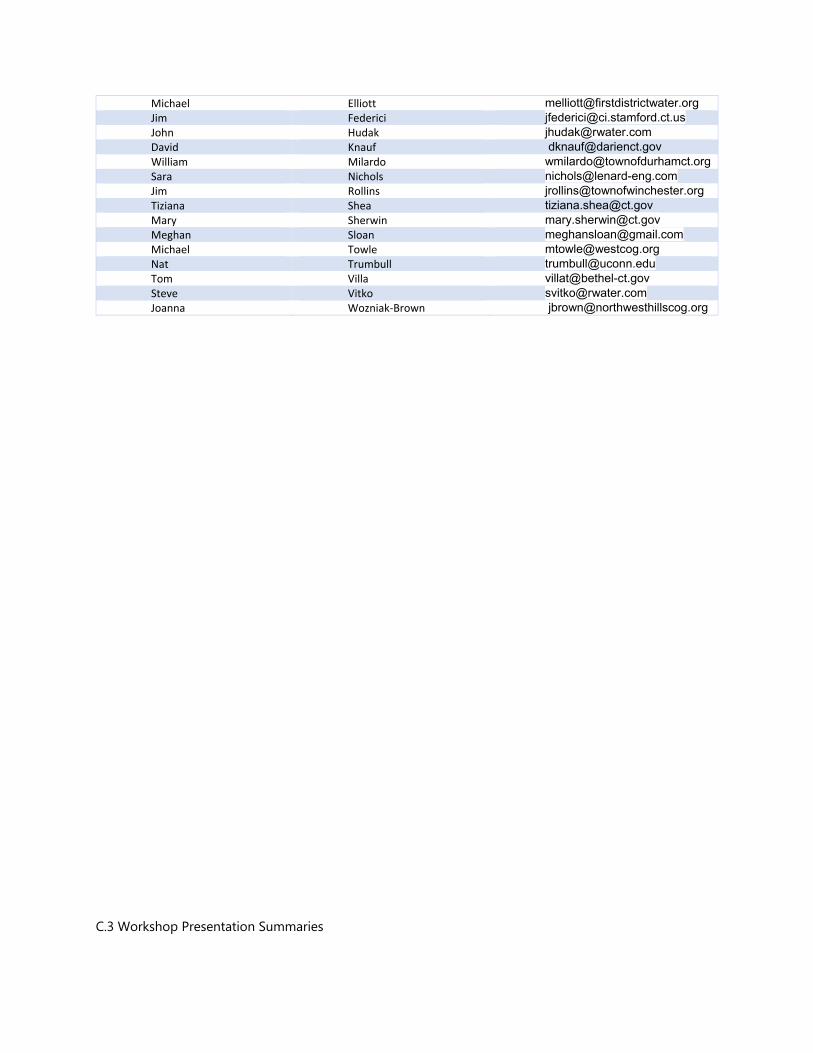
Michael Elliott [email protected] Jim Federici [email protected] John Hudak [email protected] David Knauf [email protected] William Milardo [email protected] Sara Nichols [email protected] Jim Rollins [email protected] Tiziana Shea [email protected] Mary Sherwin [email protected] Meghan Sloan [email protected] Michael Towle [email protected] Nat Trumbull [email protected] Tom Villa [email protected] Steve Vitko [email protected] Joanna Wozniak‐Brown [email protected]
C.3 Workshop Presentation Summaries
In addition to the summaries provided here, copies of all the oral presentations are posted on CIRCA's website, along with a recording of the webinar for viewing by the public. The Importance of Resilience
Lori Mathieu, Public Health Section Chief, Drinking Water Section, Department of Public Health
Ms. Mathieu reviewed the lessons learned from the prior storms of Irene, Sandy and Alfred, including a lack of capacity, planning and preparedness especially for small public water systems. In response, the Three Storm Strategy made recommendations to assure a sustained water supply for all community public water systems through better during storm status updates in WebEOC, restoration of street power, and more proactive management and oversight of small systems. Preparedness was also emphasized with requirements for emergency plans and power capacity, a subsidized loan program for generators and asset and resiliency planning, which led to the partnership with CIRCA to undertake the vulnerability assessment and resiliency plan for drinking water systems. Future Challenges of Climate Change for Community Water Systems: Drought, Precipitation and Coastal Flooding
James O'Donnell, CIRCA Executive Director and UConn Professor of Marine Sciences Professor O'Donnell reviewed changes in temperature, frost onset, discharge of rivers into Long Island Sound and CIRCA's updated sea level rise projections for Connecticut. Based on four projections updated from a NOAA 2012 report, CIRCA recommends that Connecticut plan for up to 20 inches of sea level rise by 2050. This level of sea level rise is being used in the drinking water vulnerability assessment to look at changes in 1% annual chance floodplain area with additional sea level rise.
Guiling Wang, CIRCA Affiliated Faculty Member and UConn Professor of Civil & Environmental Engineering
Precipitation information is needed at the scale where decisions are being made for drinking water systems and existing resources, such as the National Climate Assessment, are not sufficient. The approach taken by Professor Wang includes a spatially distributed assessment for Connecticut with fine temporal and spatial resolutions, assuming a worst case scenario for carbon dioxide emissions with multiple climate models compared to account for differences between model outputs. Conclusions about flood risks are that there will be substantial increases in flood risk, including today's 5% annual chance flood is at least a 20% annual chance flood in the future and the number of days per year with more than 1 inch of precipitation would increase by 1-3 days by mid-century. There was not as much agreement between climate models on drought risk. For example, some models showed generally more frequent 1-year and 2-year droughts, but some models showed they could be less frequent. However, models agreed on a more frequent occurrence of extreme June/July/August droughts. Resilience Lessons from Community Water Systems Experience with Past Storms
Christine Kirchhoff, CIRCA Affiliated Faculty Member and UConn Assistant Professor of Civil & Environmental Engineering
Professor Kirchhoff is using social science methods of interview and surveys to understand how systems have been impacted by storms and droughts, what they are doing to improve resilience and gathering lessons learned to build resilience. Preliminary results from the interviews and surveys showed that good staff, a high quality water source and a continuous and reliable water supply matter for resilience. Generators are often cited as a resilience strategy that works while
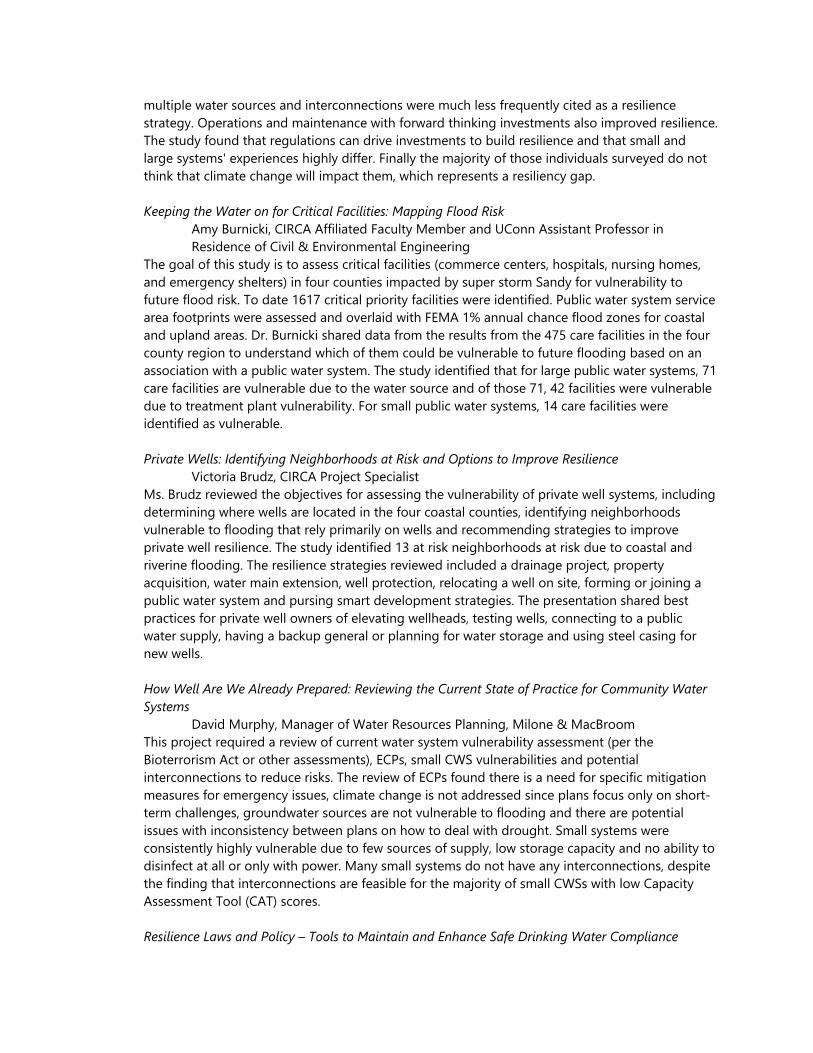
multiple water sources and interconnections were much less frequently cited as a resilience strategy. Operations and maintenance with forward thinking investments also improved resilience. The study found that regulations can drive investments to build resilience and that small and large systems' experiences highly differ. Finally the majority of those individuals surveyed do not think that climate change will impact them, which represents a resiliency gap. Keeping the Water on for Critical Facilities: Mapping Flood Risk
Amy Burnicki, CIRCA Affiliated Faculty Member and UConn Assistant Professor in Residence of Civil & Environmental Engineering
The goal of this study is to assess critical facilities (commerce centers, hospitals, nursing homes, and emergency shelters) in four counties impacted by super storm Sandy for vulnerability to future flood risk. To date 1617 critical priority facilities were identified. Public water system service area footprints were assessed and overlaid with FEMA 1% annual chance flood zones for coastal and upland areas. Dr. Burnicki shared data from the results from the 475 care facilities in the four county region to understand which of them could be vulnerable to future flooding based on an association with a public water system. The study identified that for large public water systems, 71 care facilities are vulnerable due to the water source and of those 71, 42 facilities were vulnerable due to treatment plant vulnerability. For small public water systems, 14 care facilities were identified as vulnerable. Private Wells: Identifying Neighborhoods at Risk and Options to Improve Resilience
Victoria Brudz, CIRCA Project Specialist Ms. Brudz reviewed the objectives for assessing the vulnerability of private well systems, including determining where wells are located in the four coastal counties, identifying neighborhoods vulnerable to flooding that rely primarily on wells and recommending strategies to improve private well resilience. The study identified 13 at risk neighborhoods at risk due to coastal and riverine flooding. The resilience strategies reviewed included a drainage project, property acquisition, water main extension, well protection, relocating a well on site, forming or joining a public water system and pursing smart development strategies. The presentation shared best practices for private well owners of elevating wellheads, testing wells, connecting to a public water supply, having a backup general or planning for water storage and using steel casing for new wells. How Well Are We Already Prepared: Reviewing the Current State of Practice for Community Water Systems
David Murphy, Manager of Water Resources Planning, Milone & MacBroom This project required a review of current water system vulnerability assessment (per the Bioterrorism Act or other assessments), ECPs, small CWS vulnerabilities and potential interconnections to reduce risks. The review of ECPs found there is a need for specific mitigation measures for emergency issues, climate change is not addressed since plans focus only on short-term challenges, groundwater sources are not vulnerable to flooding and there are potential issues with inconsistency between plans on how to deal with drought. Small systems were consistently highly vulnerable due to few sources of supply, low storage capacity and no ability to disinfect at all or only with power. Many small systems do not have any interconnections, despite the finding that interconnections are feasible for the majority of small CWSs with low Capacity Assessment Tool (CAT) scores. Resilience Laws and Policy – Tools to Maintain and Enhance Safe Drinking Water Compliance
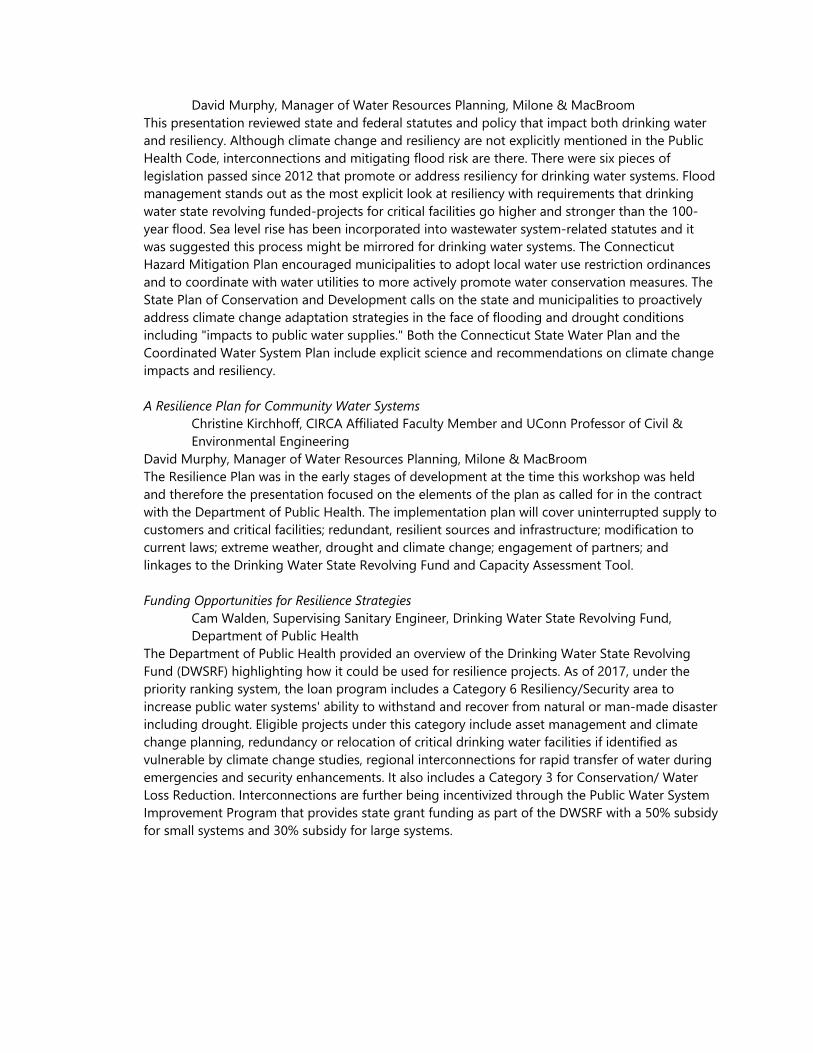
David Murphy, Manager of Water Resources Planning, Milone & MacBroom This presentation reviewed state and federal statutes and policy that impact both drinking water and resiliency. Although climate change and resiliency are not explicitly mentioned in the Public Health Code, interconnections and mitigating flood risk are there. There were six pieces of legislation passed since 2012 that promote or address resiliency for drinking water systems. Flood management stands out as the most explicit look at resiliency with requirements that drinking water state revolving funded-projects for critical facilities go higher and stronger than the 100-year flood. Sea level rise has been incorporated into wastewater system-related statutes and it was suggested this process might be mirrored for drinking water systems. The Connecticut Hazard Mitigation Plan encouraged municipalities to adopt local water use restriction ordinances and to coordinate with water utilities to more actively promote water conservation measures. The State Plan of Conservation and Development calls on the state and municipalities to proactively address climate change adaptation strategies in the face of flooding and drought conditions including "impacts to public water supplies." Both the Connecticut State Water Plan and the Coordinated Water System Plan include explicit science and recommendations on climate change impacts and resiliency. A Resilience Plan for Community Water Systems
Christine Kirchhoff, CIRCA Affiliated Faculty Member and UConn Professor of Civil & Environmental Engineering
David Murphy, Manager of Water Resources Planning, Milone & MacBroom The Resilience Plan was in the early stages of development at the time this workshop was held and therefore the presentation focused on the elements of the plan as called for in the contract with the Department of Public Health. The implementation plan will cover uninterrupted supply to customers and critical facilities; redundant, resilient sources and infrastructure; modification to current laws; extreme weather, drought and climate change; engagement of partners; and linkages to the Drinking Water State Revolving Fund and Capacity Assessment Tool. Funding Opportunities for Resilience Strategies
Cam Walden, Supervising Sanitary Engineer, Drinking Water State Revolving Fund, Department of Public Health
The Department of Public Health provided an overview of the Drinking Water State Revolving Fund (DWSRF) highlighting how it could be used for resilience projects. As of 2017, under the priority ranking system, the loan program includes a Category 6 Resiliency/Security area to increase public water systems' ability to withstand and recover from natural or man-made disaster including drought. Eligible projects under this category include asset management and climate change planning, redundancy or relocation of critical drinking water facilities if identified as vulnerable by climate change studies, regional interconnections for rapid transfer of water during emergencies and security enhancements. It also includes a Category 3 for Conservation/ Water Loss Reduction. Interconnections are further being incentivized through the Public Water System Improvement Program that provides state grant funding as part of the DWSRF with a 50% subsidy for small systems and 30% subsidy for large systems.

APPENDIX E PWS Component Vulnerability
Analysis Results


APPENDIX F CWS Well Vulnerability and
Mitigation Efforts

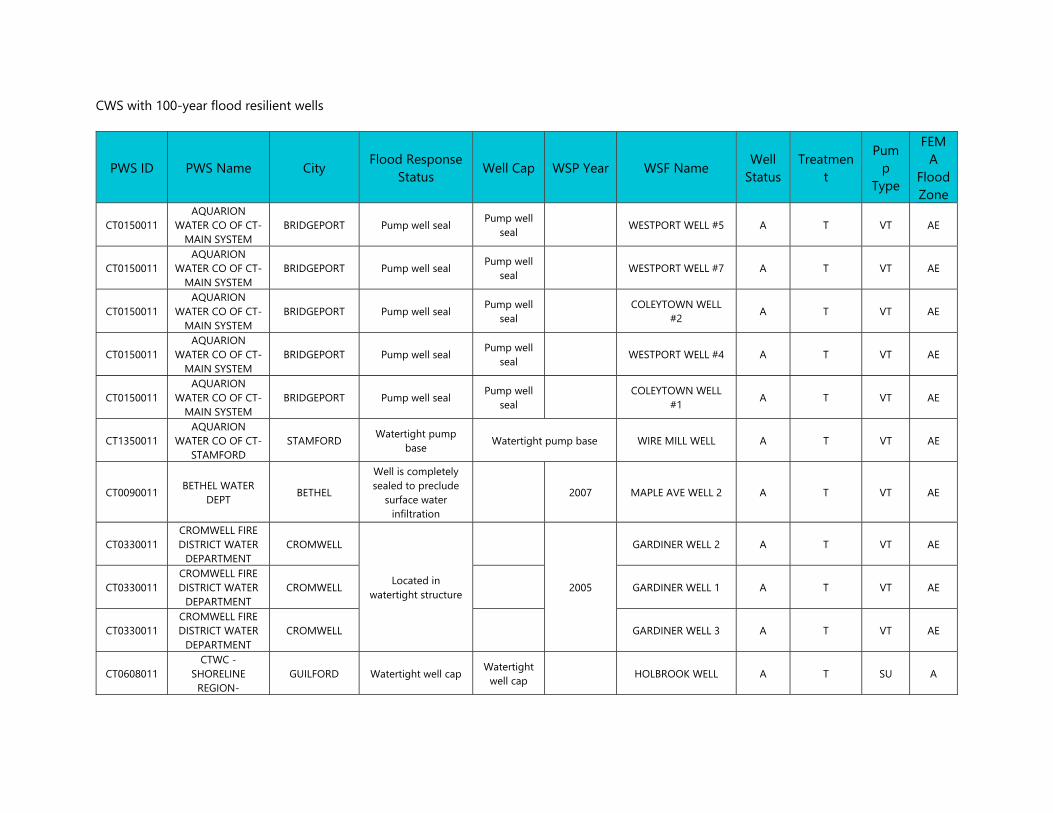
CWS with 100-year flood resilient wells
PWS ID PWS Name City Flood Response Status Well Cap WSP Year WSF Name Well
Status Treatmen
t
Pump
Type
FEMA
Flood Zone
CT0150011 AQUARION
WATER CO OF CT-MAIN SYSTEM
BRIDGEPORT Pump well seal Pump well seal WESTPORT WELL #5 A T VT AE
CT0150011 AQUARION
WATER CO OF CT-MAIN SYSTEM
BRIDGEPORT Pump well seal Pump well seal WESTPORT WELL #7 A T VT AE
CT0150011 AQUARION
WATER CO OF CT-MAIN SYSTEM
BRIDGEPORT Pump well seal Pump well seal COLEYTOWN WELL
#2 A T VT AE
CT0150011 AQUARION
WATER CO OF CT-MAIN SYSTEM
BRIDGEPORT Pump well seal Pump well seal WESTPORT WELL #4 A T VT AE
CT0150011 AQUARION
WATER CO OF CT-MAIN SYSTEM
BRIDGEPORT Pump well seal Pump well seal COLEYTOWN WELL
#1 A T VT AE
CT1350011 AQUARION
WATER CO OF CT-STAMFORD
STAMFORD Watertight pump base Watertight pump base WIRE MILL WELL A T VT AE
CT0090011 BETHEL WATER DEPT BETHEL
Well is completely sealed to preclude
surface water infiltration
2007 MAPLE AVE WELL 2 A T VT AE
CT0330011 CROMWELL FIRE DISTRICT WATER
DEPARTMENT CROMWELL
Located in watertight structure
2005
GARDINER WELL 2 A T VT AE
CT0330011 CROMWELL FIRE DISTRICT WATER
DEPARTMENT CROMWELL GARDINER WELL 1 A T VT AE
CT0330011 CROMWELL FIRE DISTRICT WATER
DEPARTMENT CROMWELL GARDINER WELL 3 A T VT AE
CT0608011 CTWC -
SHORELINE REGION-
GUILFORD Watertight well cap Watertight well cap HOLBROOK WELL A T SU A
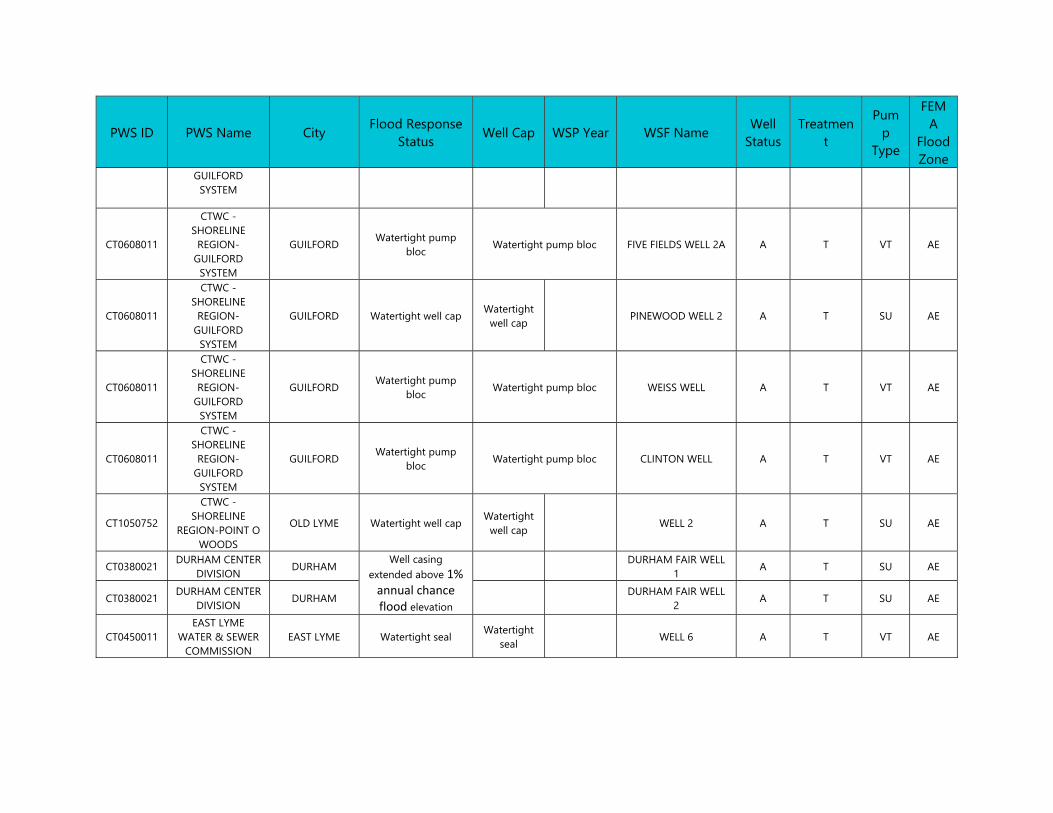
PWS ID PWS Name City Flood Response Status Well Cap WSP Year WSF Name Well
Status Treatmen
t
Pump
Type
FEMA
Flood Zone
GUILFORD SYSTEM
CT0608011
CTWC - SHORELINE
REGION-GUILFORD
SYSTEM
GUILFORD Watertight pump bloc Watertight pump bloc FIVE FIELDS WELL 2A A T VT AE
CT0608011
CTWC - SHORELINE
REGION-GUILFORD
SYSTEM
GUILFORD Watertight well cap Watertight well cap PINEWOOD WELL 2 A T SU AE
CT0608011
CTWC - SHORELINE
REGION-GUILFORD
SYSTEM
GUILFORD Watertight pump bloc Watertight pump bloc WEISS WELL A T VT AE
CT0608011
CTWC - SHORELINE
REGION-GUILFORD
SYSTEM
GUILFORD Watertight pump bloc Watertight pump bloc CLINTON WELL A T VT AE
CT1050752
CTWC - SHORELINE
REGION-POINT O WOODS
OLD LYME Watertight well cap Watertight well cap WELL 2 A T SU AE
CT0380021 DURHAM CENTER DIVISION DURHAM Well casing
extended above 1% annual chance flood elevation
DURHAM FAIR WELL 1 A T SU AE
CT0380021 DURHAM CENTER DIVISION DURHAM DURHAM FAIR WELL
2 A T SU AE
CT0450011 EAST LYME
WATER & SEWER COMMISSION
EAST LYME Watertight seal Watertight seal WELL 6 A T VT AE
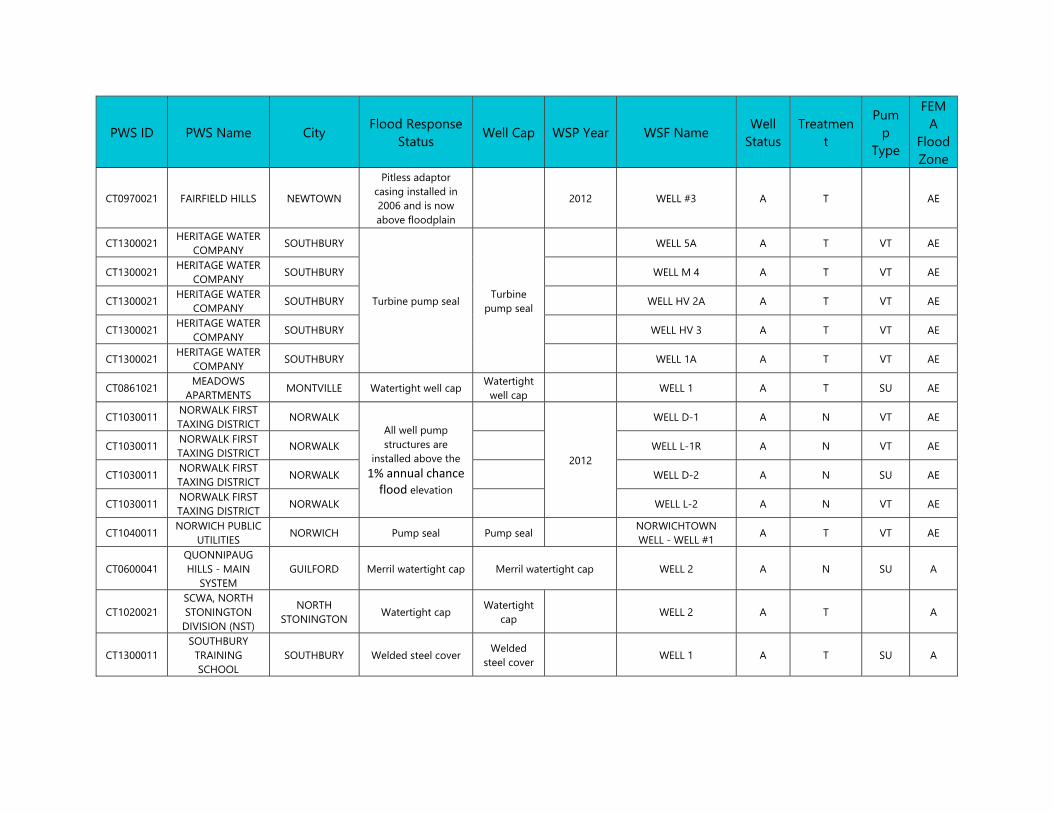
PWS ID PWS Name City Flood Response Status Well Cap WSP Year WSF Name Well
Status Treatmen
t
Pump
Type
FEMA
Flood Zone
CT0970021 FAIRFIELD HILLS NEWTOWN
Pitless adaptor casing installed in 2006 and is now above floodplain
2012 WELL #3 A T AE
CT1300021 HERITAGE WATER COMPANY SOUTHBURY
Turbine pump seal Turbine pump seal
WELL 5A A T VT AE
CT1300021 HERITAGE WATER COMPANY SOUTHBURY WELL M 4 A T VT AE
CT1300021 HERITAGE WATER COMPANY SOUTHBURY WELL HV 2A A T VT AE
CT1300021 HERITAGE WATER COMPANY SOUTHBURY WELL HV 3 A T VT AE
CT1300021 HERITAGE WATER COMPANY SOUTHBURY WELL 1A A T VT AE
CT0861021 MEADOWS APARTMENTS MONTVILLE Watertight well cap Watertight
well cap WELL 1 A T SU AE
CT1030011 NORWALK FIRST TAXING DISTRICT NORWALK
All well pump structures are
installed above the 1% annual chance flood elevation
2012
WELL D-1 A N VT AE
CT1030011 NORWALK FIRST TAXING DISTRICT NORWALK WELL L-1R A N VT AE
CT1030011 NORWALK FIRST TAXING DISTRICT NORWALK WELL D-2 A N SU AE
CT1030011 NORWALK FIRST TAXING DISTRICT NORWALK WELL L-2 A N VT AE
CT1040011 NORWICH PUBLIC UTILITIES NORWICH Pump seal Pump seal NORWICHTOWN
WELL - WELL #1 A T VT AE
CT0600041 QUONNIPAUG HILLS - MAIN
SYSTEM GUILFORD Merril watertight cap Merril watertight cap WELL 2 A N SU A
CT1020021 SCWA, NORTH STONINGTON
DIVISION (NST)
NORTH STONINGTON Watertight cap Watertight
cap WELL 2 A T A
CT1300011 SOUTHBURY
TRAINING SCHOOL
SOUTHBURY Welded steel cover Welded steel cover WELL 1 A T SU A
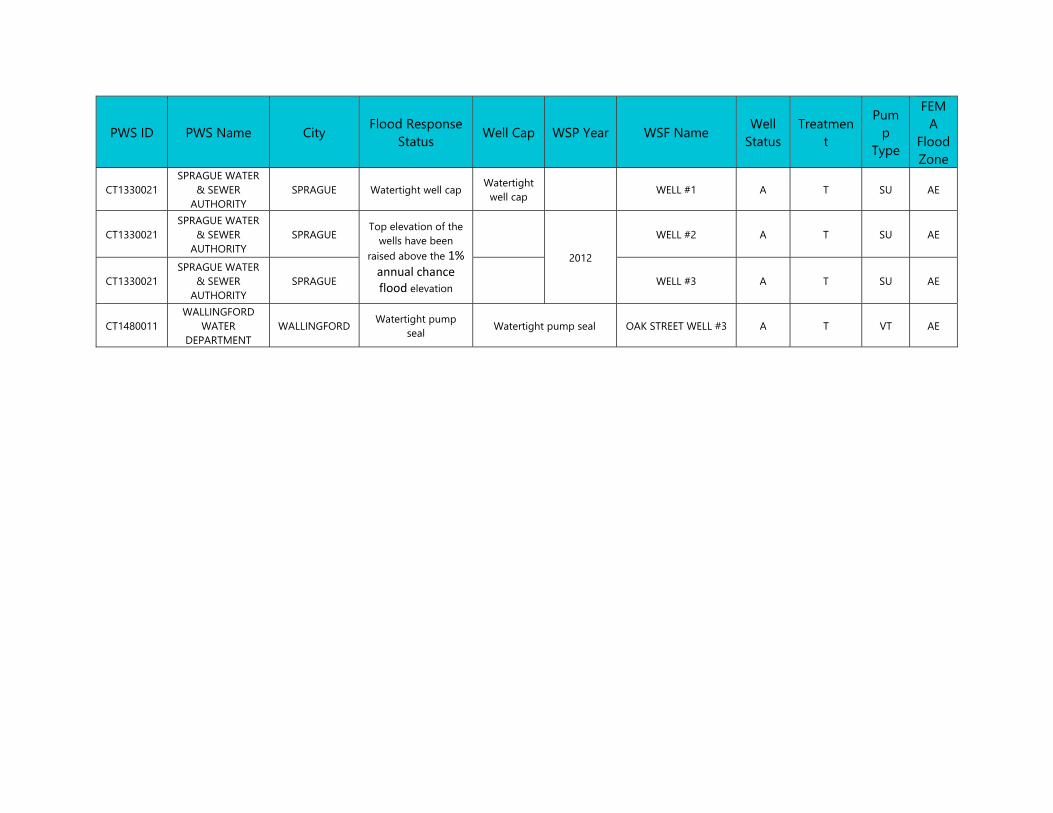
PWS ID PWS Name City Flood Response Status Well Cap WSP Year WSF Name Well
Status Treatmen
t
Pump
Type
FEMA
Flood Zone
CT1330021 SPRAGUE WATER
& SEWER AUTHORITY
SPRAGUE Watertight well cap Watertight well cap WELL #1 A T SU AE
CT1330021 SPRAGUE WATER
& SEWER AUTHORITY
SPRAGUE Top elevation of the
wells have been raised above the 1% annual chance flood elevation
2012
WELL #2 A T SU AE
CT1330021 SPRAGUE WATER
& SEWER AUTHORITY
SPRAGUE WELL #3 A T SU AE
CT1480011 WALLINGFORD
WATER DEPARTMENT
WALLINGFORD Watertight pump seal Watertight pump seal OAK STREET WELL #3 A T VT AE
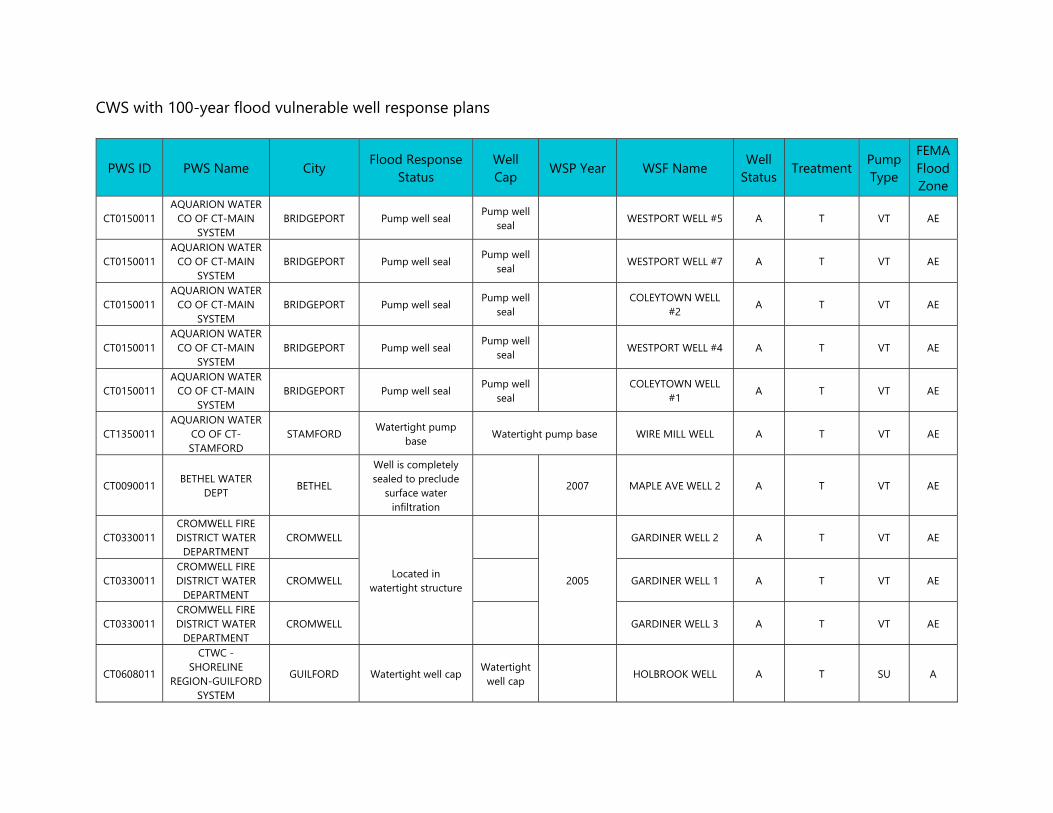
CWS with 100-year flood vulnerable well response plans
PWS ID PWS Name City Flood Response Status
Well Cap WSP Year WSF Name Well
Status Treatment Pump Type
FEMA Flood Zone
CT0150011 AQUARION WATER
CO OF CT-MAIN SYSTEM
BRIDGEPORT Pump well seal Pump well seal WESTPORT WELL #5 A T VT AE
CT0150011 AQUARION WATER
CO OF CT-MAIN SYSTEM
BRIDGEPORT Pump well seal Pump well seal WESTPORT WELL #7 A T VT AE
CT0150011 AQUARION WATER
CO OF CT-MAIN SYSTEM
BRIDGEPORT Pump well seal Pump well seal COLEYTOWN WELL
#2 A T VT AE
CT0150011 AQUARION WATER
CO OF CT-MAIN SYSTEM
BRIDGEPORT Pump well seal Pump well seal WESTPORT WELL #4 A T VT AE
CT0150011 AQUARION WATER
CO OF CT-MAIN SYSTEM
BRIDGEPORT Pump well seal Pump well seal COLEYTOWN WELL
#1 A T VT AE
CT1350011 AQUARION WATER
CO OF CT-STAMFORD
STAMFORD Watertight pump base Watertight pump base WIRE MILL WELL A T VT AE
CT0090011 BETHEL WATER DEPT BETHEL
Well is completely sealed to preclude
surface water infiltration
2007 MAPLE AVE WELL 2 A T VT AE
CT0330011 CROMWELL FIRE DISTRICT WATER
DEPARTMENT CROMWELL
Located in watertight structure
2005
GARDINER WELL 2 A T VT AE
CT0330011 CROMWELL FIRE DISTRICT WATER
DEPARTMENT CROMWELL GARDINER WELL 1 A T VT AE
CT0330011 CROMWELL FIRE DISTRICT WATER
DEPARTMENT CROMWELL GARDINER WELL 3 A T VT AE
CT0608011
CTWC - SHORELINE
REGION-GUILFORD SYSTEM
GUILFORD Watertight well cap Watertight well cap HOLBROOK WELL A T SU A
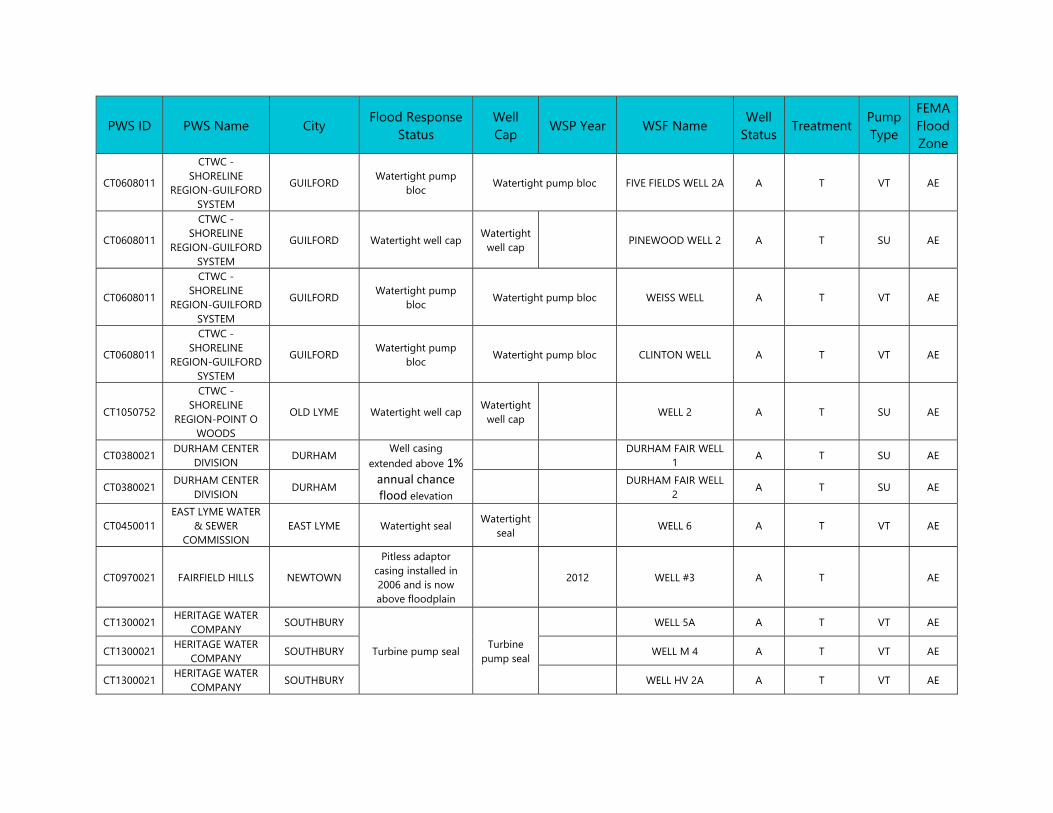
PWS ID PWS Name City Flood Response Status
Well Cap WSP Year WSF Name Well
Status Treatment Pump Type
FEMA Flood Zone
CT0608011
CTWC - SHORELINE
REGION-GUILFORD SYSTEM
GUILFORD Watertight pump bloc Watertight pump bloc FIVE FIELDS WELL 2A A T VT AE
CT0608011
CTWC - SHORELINE
REGION-GUILFORD SYSTEM
GUILFORD Watertight well cap Watertight well cap PINEWOOD WELL 2 A T SU AE
CT0608011
CTWC - SHORELINE
REGION-GUILFORD SYSTEM
GUILFORD Watertight pump bloc Watertight pump bloc WEISS WELL A T VT AE
CT0608011
CTWC - SHORELINE
REGION-GUILFORD SYSTEM
GUILFORD Watertight pump bloc Watertight pump bloc CLINTON WELL A T VT AE
CT1050752
CTWC - SHORELINE
REGION-POINT O WOODS
OLD LYME Watertight well cap Watertight well cap WELL 2 A T SU AE
CT0380021 DURHAM CENTER DIVISION DURHAM Well casing
extended above 1% annual chance flood elevation
DURHAM FAIR WELL 1 A T SU AE
CT0380021 DURHAM CENTER DIVISION DURHAM DURHAM FAIR WELL
2 A T SU AE
CT0450011 EAST LYME WATER
& SEWER COMMISSION
EAST LYME Watertight seal Watertight seal WELL 6 A T VT AE
CT0970021 FAIRFIELD HILLS NEWTOWN
Pitless adaptor casing installed in 2006 and is now above floodplain
2012 WELL #3 A T AE
CT1300021 HERITAGE WATER COMPANY SOUTHBURY
Turbine pump seal Turbine pump seal
WELL 5A A T VT AE
CT1300021 HERITAGE WATER COMPANY SOUTHBURY WELL M 4 A T VT AE
CT1300021 HERITAGE WATER COMPANY SOUTHBURY WELL HV 2A A T VT AE
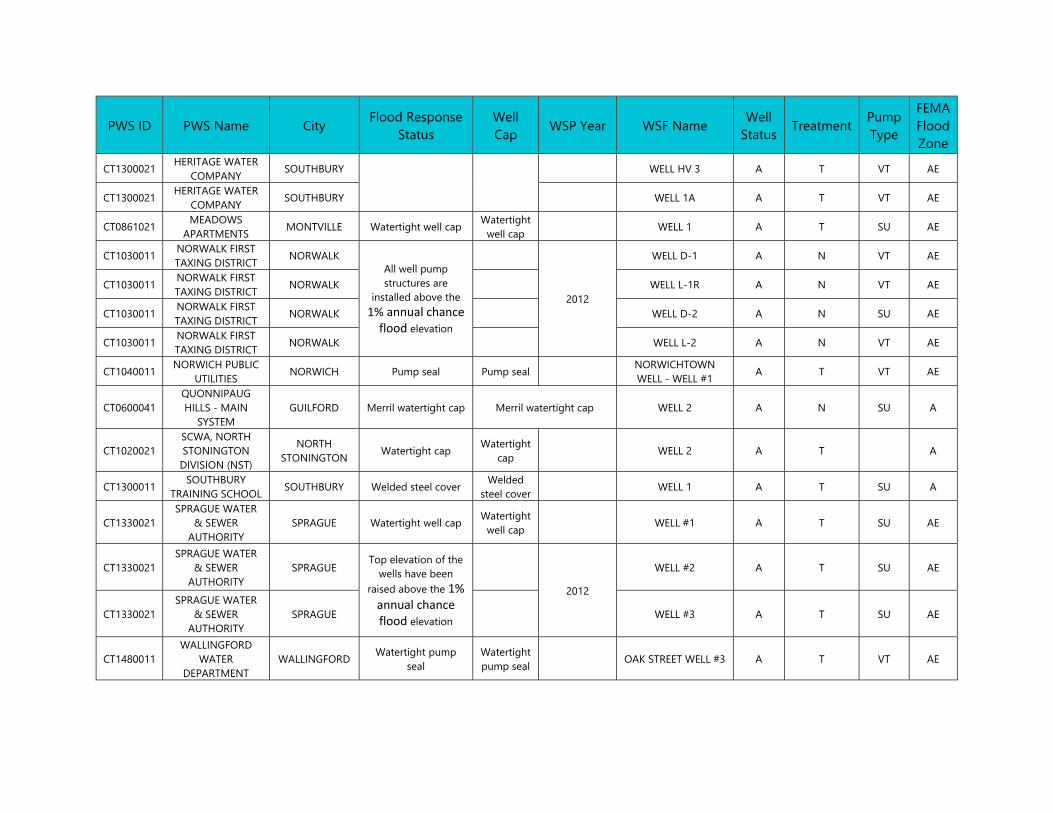
PWS ID PWS Name City Flood Response Status
Well Cap WSP Year WSF Name Well
Status Treatment Pump Type
FEMA Flood Zone
CT1300021 HERITAGE WATER COMPANY SOUTHBURY WELL HV 3 A T VT AE
CT1300021 HERITAGE WATER COMPANY SOUTHBURY WELL 1A A T VT AE
CT0861021 MEADOWS APARTMENTS MONTVILLE Watertight well cap Watertight
well cap WELL 1 A T SU AE
CT1030011 NORWALK FIRST TAXING DISTRICT NORWALK
All well pump structures are
installed above the 1% annual chance flood elevation
2012
WELL D-1 A N VT AE
CT1030011 NORWALK FIRST TAXING DISTRICT NORWALK WELL L-1R A N VT AE
CT1030011 NORWALK FIRST TAXING DISTRICT NORWALK WELL D-2 A N SU AE
CT1030011 NORWALK FIRST TAXING DISTRICT NORWALK WELL L-2 A N VT AE
CT1040011 NORWICH PUBLIC UTILITIES NORWICH Pump seal Pump seal NORWICHTOWN
WELL - WELL #1 A T VT AE
CT0600041 QUONNIPAUG HILLS - MAIN
SYSTEM GUILFORD Merril watertight cap Merril watertight cap WELL 2 A N SU A
CT1020021 SCWA, NORTH STONINGTON
DIVISION (NST)
NORTH STONINGTON Watertight cap Watertight
cap WELL 2 A T A
CT1300011 SOUTHBURY TRAINING SCHOOL SOUTHBURY Welded steel cover Welded
steel cover WELL 1 A T SU A
CT1330021 SPRAGUE WATER
& SEWER AUTHORITY
SPRAGUE Watertight well cap Watertight well cap WELL #1 A T SU AE
CT1330021 SPRAGUE WATER
& SEWER AUTHORITY
SPRAGUE Top elevation of the
wells have been raised above the 1% annual chance flood elevation
2012
WELL #2 A T SU AE
CT1330021 SPRAGUE WATER
& SEWER AUTHORITY
SPRAGUE WELL #3 A T SU AE
CT1480011 WALLINGFORD
WATER DEPARTMENT
WALLINGFORD Watertight pump seal
Watertight pump seal OAK STREET WELL #3 A T VT AE
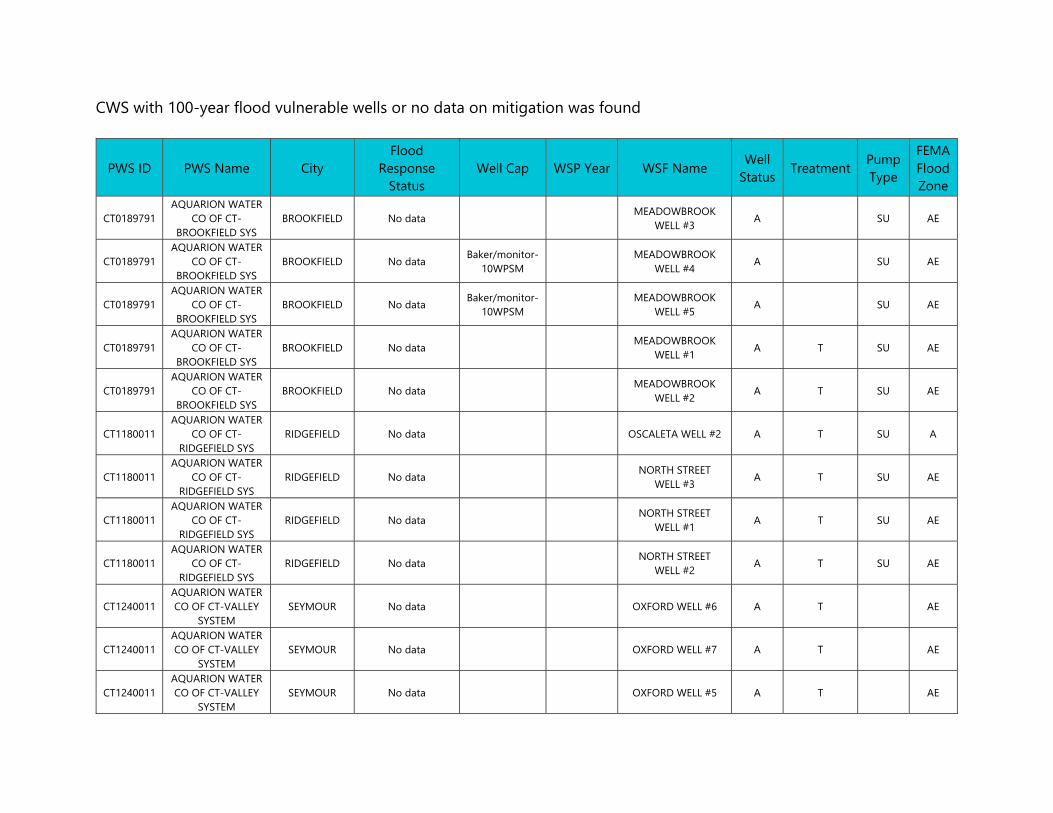
CWS with 100-year flood vulnerable wells or no data on mitigation was found
PWS ID PWS Name City Flood
Response Status
Well Cap WSP Year WSF Name Well Status Treatment Pump
Type
FEMA Flood Zone
CT0189791 AQUARION WATER
CO OF CT-BROOKFIELD SYS
BROOKFIELD No data MEADOWBROOK WELL #3 A SU AE
CT0189791 AQUARION WATER
CO OF CT-BROOKFIELD SYS
BROOKFIELD No data Baker/monitor-10WPSM MEADOWBROOK
WELL #4 A SU AE
CT0189791 AQUARION WATER
CO OF CT-BROOKFIELD SYS
BROOKFIELD No data Baker/monitor-10WPSM MEADOWBROOK
WELL #5 A SU AE
CT0189791 AQUARION WATER
CO OF CT-BROOKFIELD SYS
BROOKFIELD No data MEADOWBROOK WELL #1 A T SU AE
CT0189791 AQUARION WATER
CO OF CT-BROOKFIELD SYS
BROOKFIELD No data MEADOWBROOK WELL #2 A T SU AE
CT1180011 AQUARION WATER
CO OF CT-RIDGEFIELD SYS
RIDGEFIELD No data OSCALETA WELL #2 A T SU A
CT1180011 AQUARION WATER
CO OF CT-RIDGEFIELD SYS
RIDGEFIELD No data NORTH STREET WELL #3 A T SU AE
CT1180011 AQUARION WATER
CO OF CT-RIDGEFIELD SYS
RIDGEFIELD No data NORTH STREET WELL #1 A T SU AE
CT1180011 AQUARION WATER
CO OF CT-RIDGEFIELD SYS
RIDGEFIELD No data NORTH STREET WELL #2 A T SU AE
CT1240011 AQUARION WATER CO OF CT-VALLEY
SYSTEM SEYMOUR No data OXFORD WELL #6 A T AE
CT1240011 AQUARION WATER CO OF CT-VALLEY
SYSTEM SEYMOUR No data OXFORD WELL #7 A T AE
CT1240011 AQUARION WATER CO OF CT-VALLEY
SYSTEM SEYMOUR No data OXFORD WELL #5 A T AE
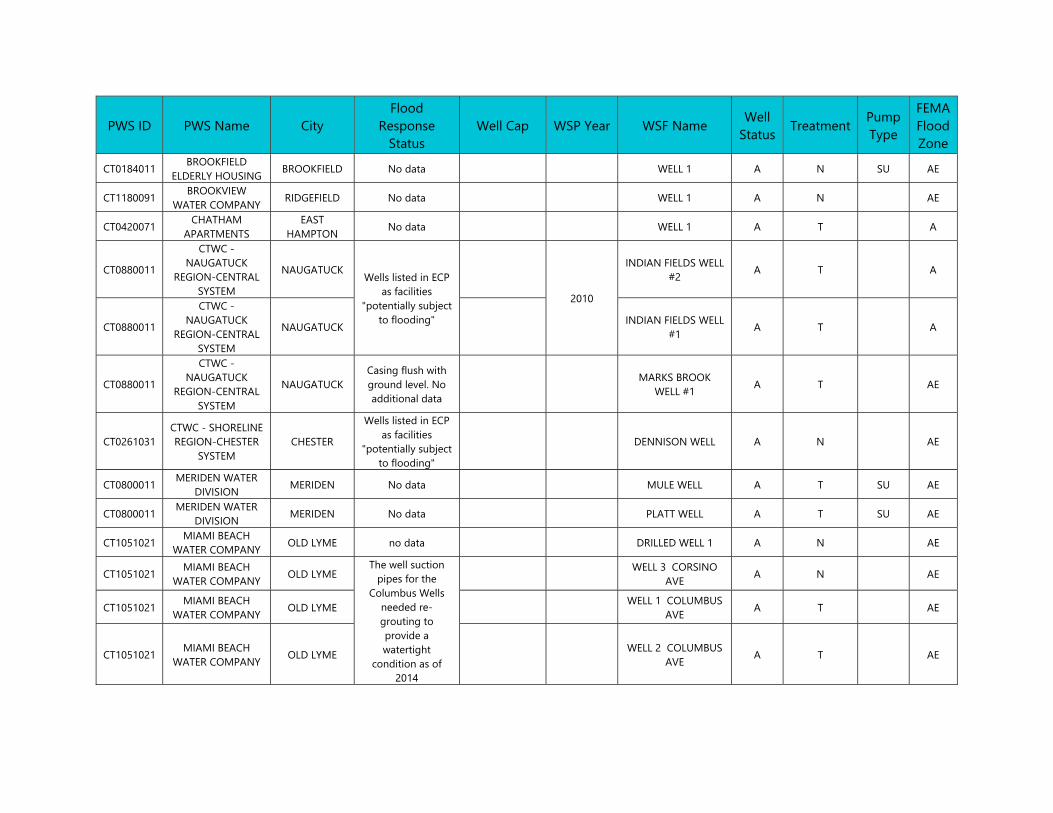
PWS ID PWS Name City Flood
Response Status
Well Cap WSP Year WSF Name Well Status Treatment Pump
Type
FEMA Flood Zone
CT0184011 BROOKFIELD ELDERLY HOUSING BROOKFIELD No data WELL 1 A N SU AE
CT1180091 BROOKVIEW WATER COMPANY RIDGEFIELD No data WELL 1 A N AE
CT0420071 CHATHAM APARTMENTS
EAST HAMPTON No data WELL 1 A T A
CT0880011
CTWC - NAUGATUCK
REGION-CENTRAL SYSTEM
NAUGATUCK Wells listed in ECP as facilities
"potentially subject to flooding"
2010
INDIAN FIELDS WELL #2 A T A
CT0880011
CTWC - NAUGATUCK
REGION-CENTRAL SYSTEM
NAUGATUCK INDIAN FIELDS WELL #1 A T A
CT0880011
CTWC - NAUGATUCK
REGION-CENTRAL SYSTEM
NAUGATUCK Casing flush with ground level. No additional data
MARKS BROOK WELL #1 A T AE
CT0261031 CTWC - SHORELINE REGION-CHESTER
SYSTEM CHESTER
Wells listed in ECP as facilities
"potentially subject to flooding"
DENNISON WELL A N AE
CT0800011 MERIDEN WATER DIVISION MERIDEN No data MULE WELL A T SU AE
CT0800011 MERIDEN WATER DIVISION MERIDEN No data PLATT WELL A T SU AE
CT1051021 MIAMI BEACH WATER COMPANY OLD LYME no data DRILLED WELL 1 A N AE
CT1051021 MIAMI BEACH WATER COMPANY OLD LYME
The well suction pipes for the
Columbus Wells needed re-grouting to provide a watertight
condition as of 2014
WELL 3 CORSINO AVE A N AE
CT1051021 MIAMI BEACH WATER COMPANY OLD LYME WELL 1 COLUMBUS
AVE A T AE
CT1051021 MIAMI BEACH WATER COMPANY OLD LYME WELL 2 COLUMBUS
AVE A T AE
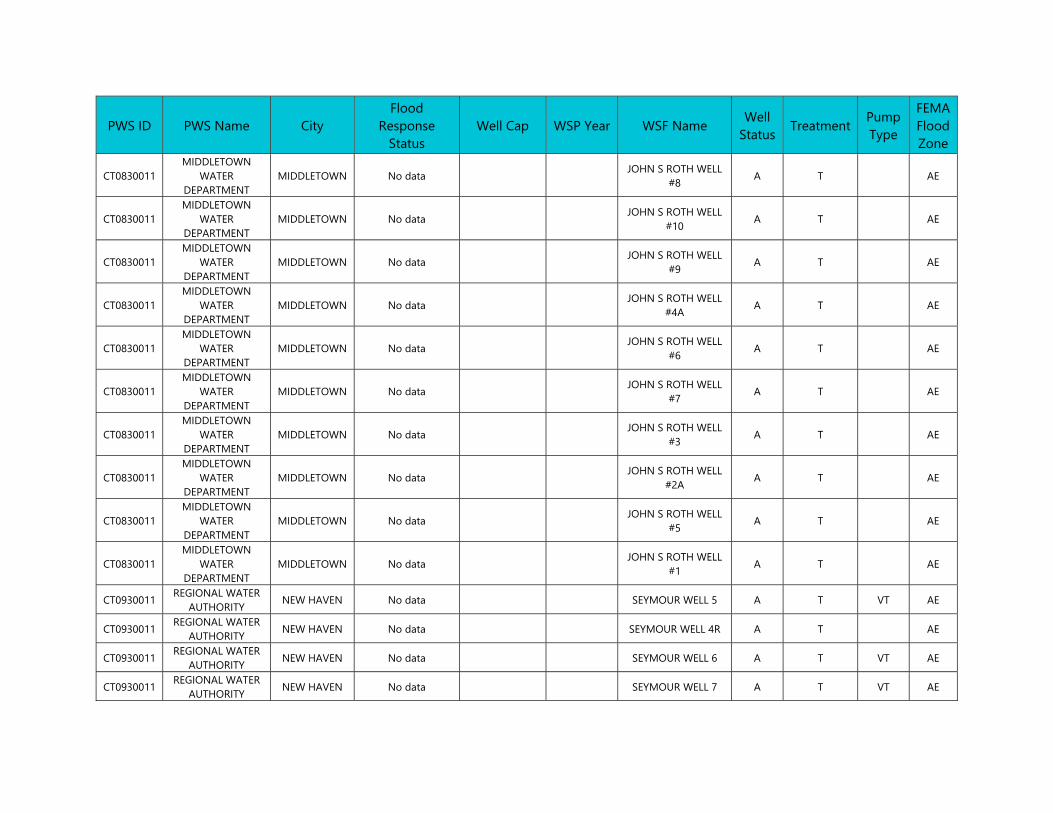
PWS ID PWS Name City Flood
Response Status
Well Cap WSP Year WSF Name Well Status Treatment Pump
Type
FEMA Flood Zone
CT0830011 MIDDLETOWN
WATER DEPARTMENT
MIDDLETOWN No data JOHN S ROTH WELL #8 A T AE
CT0830011 MIDDLETOWN
WATER DEPARTMENT
MIDDLETOWN No data JOHN S ROTH WELL #10 A T AE
CT0830011 MIDDLETOWN
WATER DEPARTMENT
MIDDLETOWN No data JOHN S ROTH WELL #9 A T AE
CT0830011 MIDDLETOWN
WATER DEPARTMENT
MIDDLETOWN No data JOHN S ROTH WELL #4A A T AE
CT0830011 MIDDLETOWN
WATER DEPARTMENT
MIDDLETOWN No data JOHN S ROTH WELL #6 A T AE
CT0830011 MIDDLETOWN
WATER DEPARTMENT
MIDDLETOWN No data JOHN S ROTH WELL #7 A T AE
CT0830011 MIDDLETOWN
WATER DEPARTMENT
MIDDLETOWN No data JOHN S ROTH WELL #3 A T AE
CT0830011 MIDDLETOWN
WATER DEPARTMENT
MIDDLETOWN No data JOHN S ROTH WELL #2A A T AE
CT0830011 MIDDLETOWN
WATER DEPARTMENT
MIDDLETOWN No data JOHN S ROTH WELL #5 A T AE
CT0830011 MIDDLETOWN
WATER DEPARTMENT
MIDDLETOWN No data JOHN S ROTH WELL #1 A T AE
CT0930011 REGIONAL WATER AUTHORITY NEW HAVEN No data SEYMOUR WELL 5 A T VT AE
CT0930011 REGIONAL WATER AUTHORITY NEW HAVEN No data SEYMOUR WELL 4R A T AE
CT0930011 REGIONAL WATER AUTHORITY NEW HAVEN No data SEYMOUR WELL 6 A T VT AE
CT0930011 REGIONAL WATER AUTHORITY NEW HAVEN No data SEYMOUR WELL 7 A T VT AE
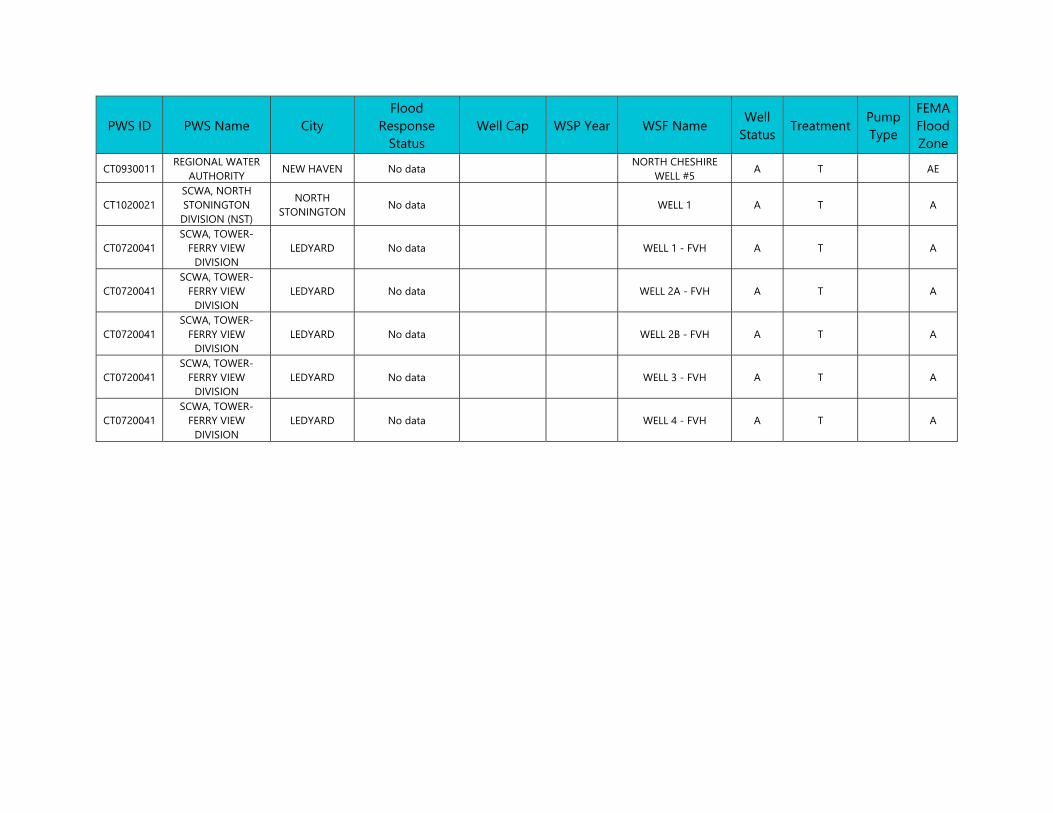
PWS ID PWS Name City Flood
Response Status
Well Cap WSP Year WSF Name Well Status Treatment Pump
Type
FEMA Flood Zone
CT0930011 REGIONAL WATER AUTHORITY NEW HAVEN No data NORTH CHESHIRE
WELL #5 A T AE
CT1020021 SCWA, NORTH STONINGTON
DIVISION (NST)
NORTH STONINGTON No data WELL 1 A T A
CT0720041 SCWA, TOWER-
FERRY VIEW DIVISION
LEDYARD No data WELL 1 - FVH A T A
CT0720041 SCWA, TOWER-
FERRY VIEW DIVISION
LEDYARD No data WELL 2A - FVH A T A
CT0720041 SCWA, TOWER-
FERRY VIEW DIVISION
LEDYARD No data WELL 2B - FVH A T A
CT0720041 SCWA, TOWER-
FERRY VIEW DIVISION
LEDYARD No data WELL 3 - FVH A T A
CT0720041 SCWA, TOWER-
FERRY VIEW DIVISION
LEDYARD No data WELL 4 - FVH A T A
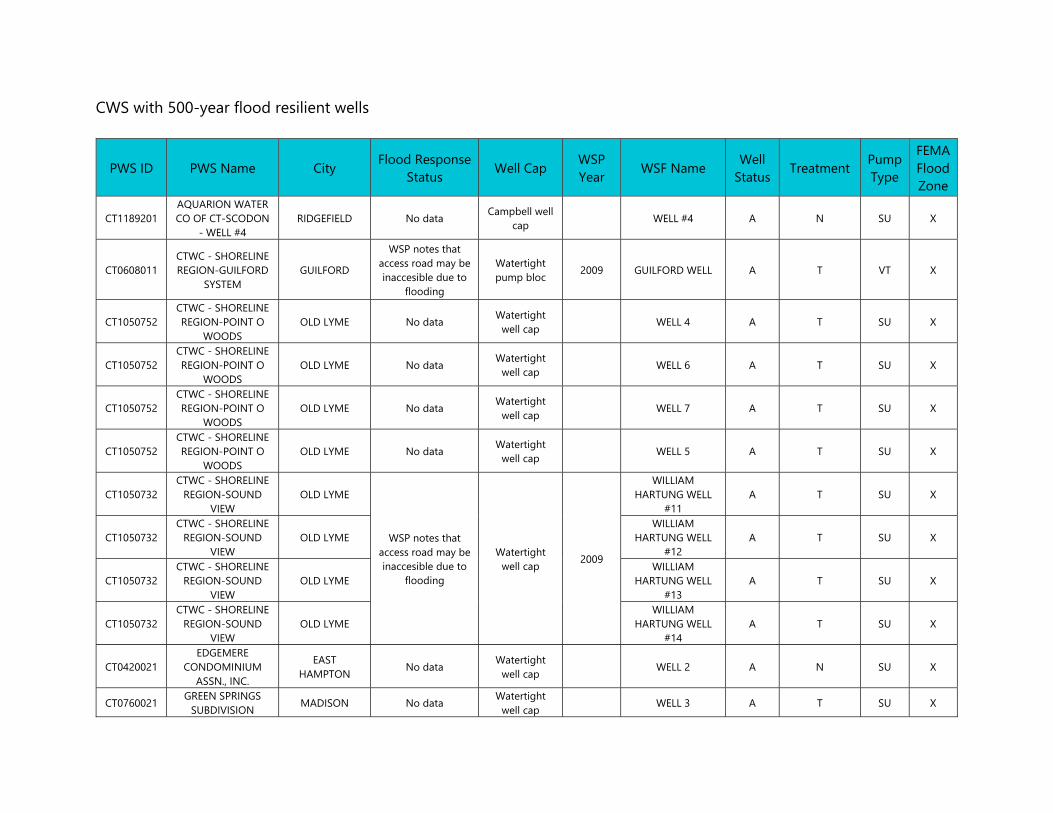
CWS with 500-year flood resilient wells
PWS ID PWS Name City Flood Response Status Well Cap WSP
Year WSF Name Well Status Treatment Pump
Type
FEMA Flood Zone
CT1189201 AQUARION WATER CO OF CT-SCODON
- WELL #4 RIDGEFIELD No data Campbell well
cap WELL #4 A N SU X
CT0608011 CTWC - SHORELINE REGION-GUILFORD
SYSTEM GUILFORD
WSP notes that access road may be inaccesible due to
flooding
Watertight pump bloc 2009 GUILFORD WELL A T VT X
CT1050752 CTWC - SHORELINE REGION-POINT O
WOODS OLD LYME No data Watertight
well cap WELL 4 A T SU X
CT1050752 CTWC - SHORELINE REGION-POINT O
WOODS OLD LYME No data Watertight
well cap WELL 6 A T SU X
CT1050752 CTWC - SHORELINE REGION-POINT O
WOODS OLD LYME No data Watertight
well cap WELL 7 A T SU X
CT1050752 CTWC - SHORELINE REGION-POINT O
WOODS OLD LYME No data Watertight
well cap WELL 5 A T SU X
CT1050732 CTWC - SHORELINE
REGION-SOUND VIEW
OLD LYME
WSP notes that access road may be inaccesible due to
flooding
Watertight well cap 2009
WILLIAM HARTUNG WELL
#11 A T SU X
CT1050732 CTWC - SHORELINE
REGION-SOUND VIEW
OLD LYME WILLIAM
HARTUNG WELL #12
A T SU X
CT1050732 CTWC - SHORELINE
REGION-SOUND VIEW
OLD LYME WILLIAM
HARTUNG WELL #13
A T SU X
CT1050732 CTWC - SHORELINE
REGION-SOUND VIEW
OLD LYME WILLIAM
HARTUNG WELL #14
A T SU X
CT0420021 EDGEMERE
CONDOMINIUM ASSN., INC.
EAST HAMPTON No data Watertight
well cap WELL 2 A N SU X
CT0760021 GREEN SPRINGS SUBDIVISION MADISON No data Watertight
well cap WELL 3 A T SU X
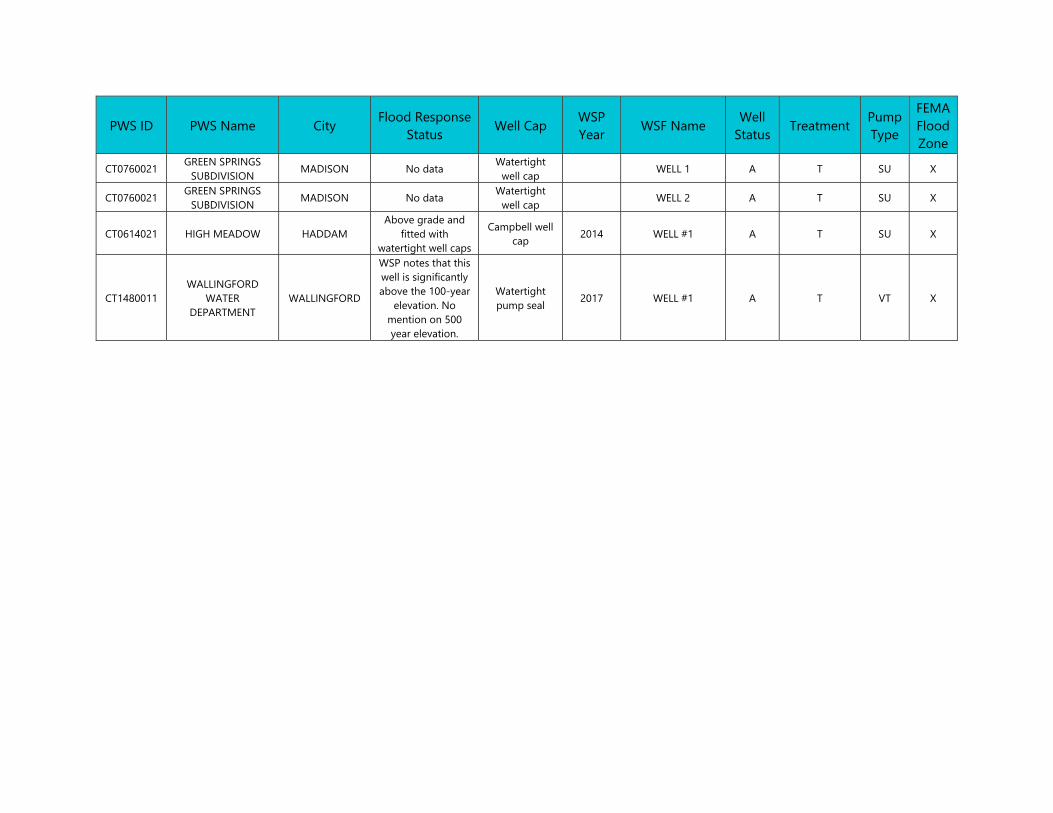
PWS ID PWS Name City Flood Response Status Well Cap WSP
Year WSF Name Well Status Treatment Pump
Type
FEMA Flood Zone
CT0760021 GREEN SPRINGS SUBDIVISION MADISON No data Watertight
well cap WELL 1 A T SU X
CT0760021 GREEN SPRINGS SUBDIVISION MADISON No data Watertight
well cap WELL 2 A T SU X
CT0614021 HIGH MEADOW HADDAM Above grade and
fitted with watertight well caps
Campbell well cap 2014 WELL #1 A T SU X
CT1480011 WALLINGFORD
WATER DEPARTMENT
WALLINGFORD
WSP notes that this well is significantly above the 100-year
elevation. No mention on 500 year elevation.
Watertight pump seal 2017 WELL #1 A T VT X
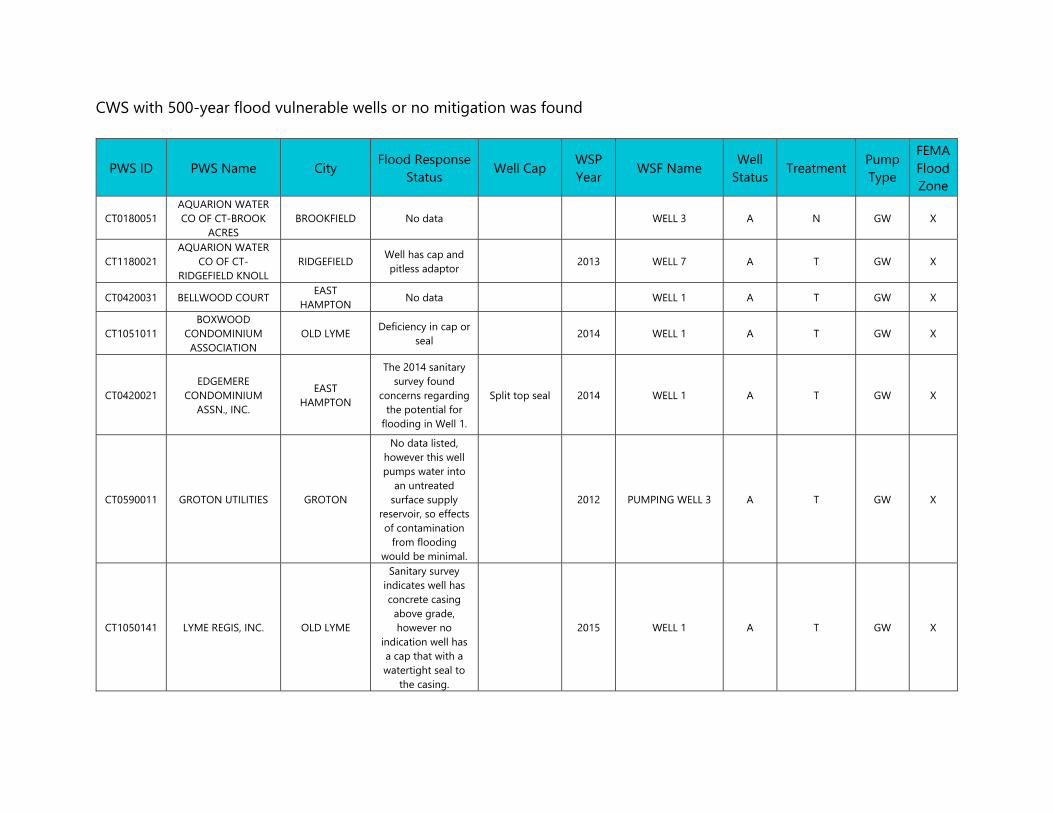
CWS with 500-year flood vulnerable wells or no mitigation was found
PWS ID PWS Name City Flood Response Status Well Cap WSP
Year WSF Name Well Status Treatment Pump
Type
FEMA Flood Zone
CT0180051 AQUARION WATER CO OF CT-BROOK
ACRES BROOKFIELD No data WELL 3 A N GW X
CT1180021 AQUARION WATER
CO OF CT-RIDGEFIELD KNOLL
RIDGEFIELD Well has cap and pitless adaptor 2013 WELL 7 A T GW X
CT0420031 BELLWOOD COURT EAST HAMPTON No data WELL 1 A T GW X
CT1051011 BOXWOOD
CONDOMINIUM ASSOCIATION
OLD LYME Deficiency in cap or seal 2014 WELL 1 A T GW X
CT0420021 EDGEMERE
CONDOMINIUM ASSN., INC.
EAST HAMPTON
The 2014 sanitary survey found
concerns regarding the potential for
flooding in Well 1.
Split top seal 2014 WELL 1 A T GW X
CT0590011 GROTON UTILITIES GROTON
No data listed, however this well pumps water into
an untreated surface supply
reservoir, so effects of contamination
from flooding would be minimal.
2012 PUMPING WELL 3 A T GW X
CT1050141 LYME REGIS, INC. OLD LYME
Sanitary survey indicates well has concrete casing
above grade, however no
indication well has a cap that with a watertight seal to
the casing.
2015 WELL 1 A T GW X
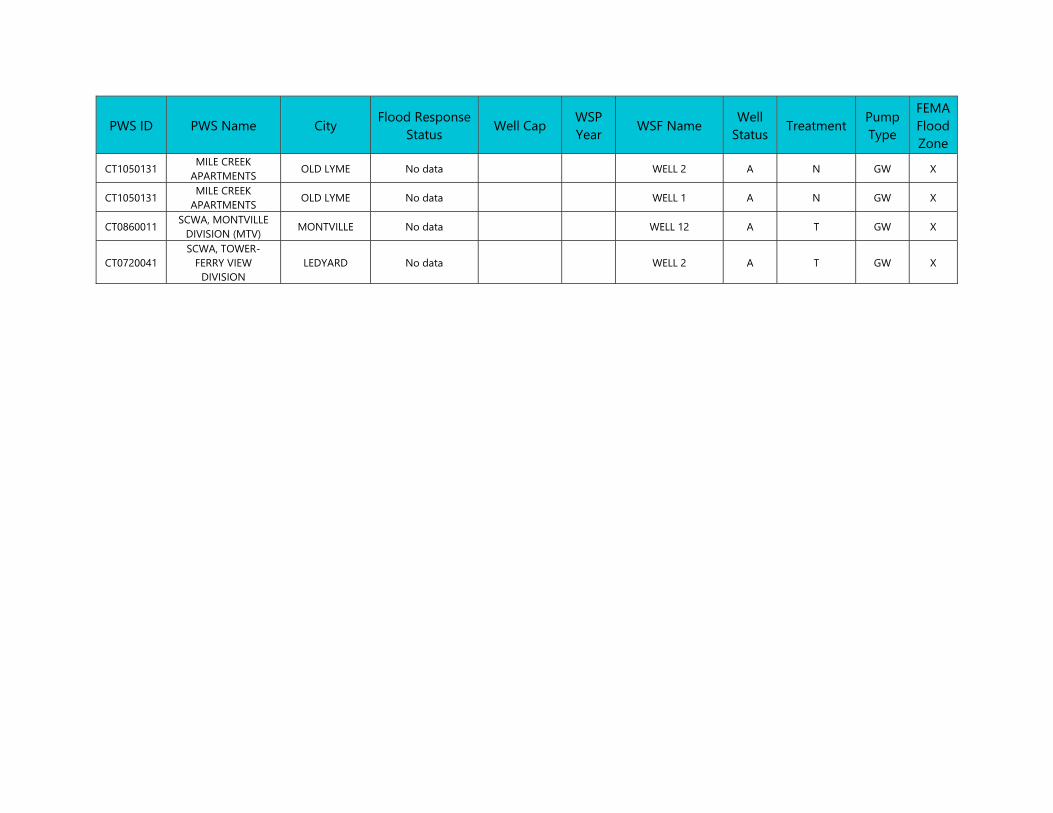
PWS ID PWS Name City Flood Response Status Well Cap WSP
Year WSF Name Well Status Treatment Pump
Type
FEMA Flood Zone
CT1050131 MILE CREEK APARTMENTS OLD LYME No data WELL 2 A N GW X
CT1050131 MILE CREEK APARTMENTS OLD LYME No data WELL 1 A N GW X
CT0860011 SCWA, MONTVILLE DIVISION (MTV) MONTVILLE No data WELL 12 A T GW X
CT0720041 SCWA, TOWER-
FERRY VIEW DIVISION
LEDYARD No data WELL 2 A T GW X

APPENDIX G UCONN Climate Change Analysis

Preliminary Report on Climate Change Projections Guiling Wang
Department of Civil and Environmental Engineering University of Connecticut
(Contacts: [email protected]; 860 486 5648) 1. Introduction
The warming of the climate system is unequivocal and it is virtually certain that this change will continue into the future (IPCC, 2013). To ensure resiliency and sustainability of the state's vulnerable communities, development of long-term planning and policy for climate adaptation has to be informed of the potential impacts of the changing climate at a suitable spatial scale. However, in the latest U.S. national assessment, quantitative climate information in each region was treated with a lumped approach (Easterling et al., 2017). For each climate change quantity of interest, Connecticut and all other states of the Northeast (from West Virginia to Maine) share the same value. It is not clear whether strong spatial heterogeneity exists within Northeast and how representative the region-lumped changes might be for Connecticut. The national assessment report therefore cannot support the development of local and state-level adaptation strategies. To bridge this gap, this sub-task assesses future changes of local and regional climate that pose risks to the state's drinking water infrastructure based on the most up-to-date future climate projections, with a focus on precipitation extremes, drought, and water availability. Consistent with the typical time frame for planning and infrastructure design, this assessment focuses on the mid-century.
Future climate projections are typically conducted using global climate models under various assumptions of future greenhouse gas (GHG) emissions. The latest projections were from the Coupled Model Intercomparison Project phase 5 (CMIP5) (Taylor et al., 2012) that included the participation of 20 climate modeling groups worldwide and was the primary source of information for the Intergovernmental Panel for Climate Change's 5th Assessment Report (IPCC, 2013). The GHGs scenarios used in CMIP5 are designated as representative concentration pathways (RCPs) that are numbered according to the change in radiative forcing (from +2.6 to +8.5 watts per square meter) that results by 2100. For the timeframe of focus in this project (mid- century), the differences between different RCP scenarios are still relatively small. CMIP5 includes model projections for all four RCP scenarios (RCP2.6, RCP4.5, RCP6, and RCP8.5) to represent the span of the radiative forcing literature at the time of their selection (~2010) when RCP8.5 was considered a high emission scenario within the space of uncertainty. However, since then the RCP2.6 has been considered unfeasible; GHGs emission in recent years has closely tracked the RCP8.5 scenario (Sanford et al., 2014), and the observed CO2 concentration also closely tracks the concentration used to drive the CMIP5 RCP8.5 future climate projections (Figure 1). This, together with the climate security recommendation to build for a higher magnitude of warming than the target of international climate policy in case mitigation policies fail (Mabey et al., 2011; Sanford et al., 2014), our assessment in this project focuses on the RCP8.5 scenario.
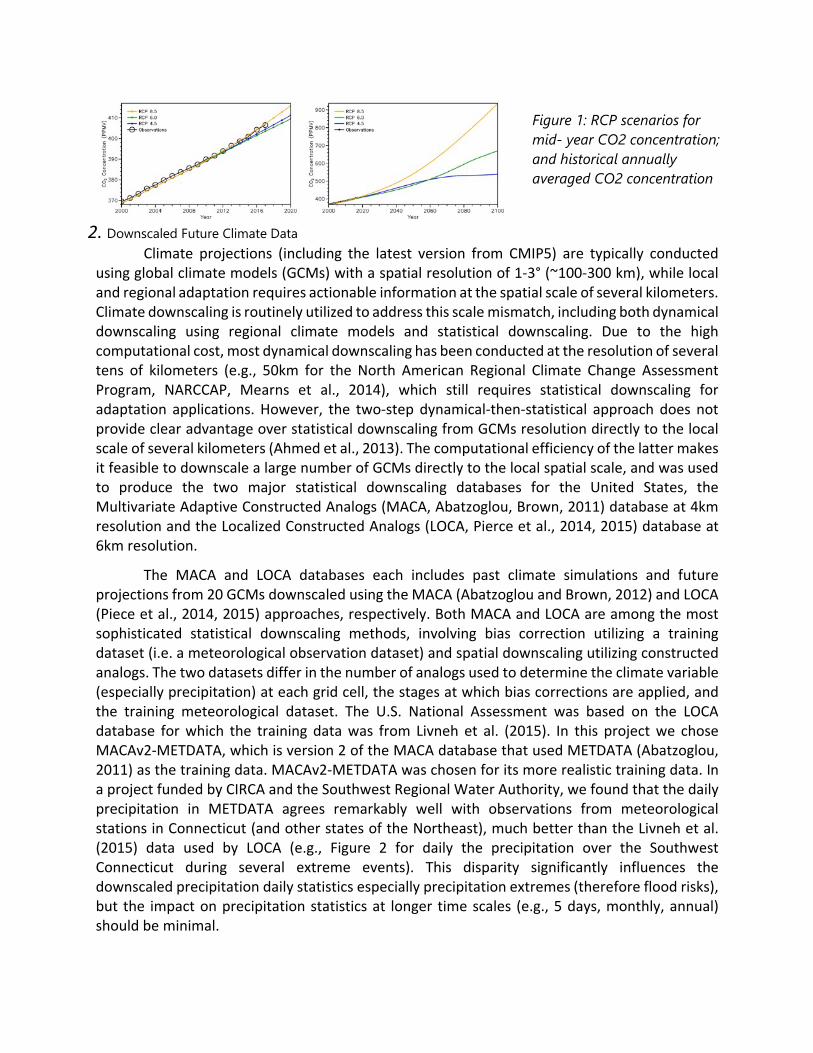
Figure 1: RCP scenarios for mid- year CO2 concentration; and historical annually averaged CO2 concentration
2. Downscaled Future Climate Data Climate projections (including the latest version from CMIP5) are typically conducted
using global climate models (GCMs) with a spatial resolution of 1-3° (~100-300 km), while local and regional adaptation requires actionable information at the spatial scale of several kilometers. Climate downscaling is routinely utilized to address this scale mismatch, including both dynamical downscaling using regional climate models and statistical downscaling. Due to the high computational cost, most dynamical downscaling has been conducted at the resolution of several tens of kilometers (e.g., 50km for the North American Regional Climate Change Assessment Program, NARCCAP, Mearns et al., 2014), which still requires statistical downscaling for adaptation applications. However, the two-step dynamical-then-statistical approach does not provide clear advantage over statistical downscaling from GCMs resolution directly to the local scale of several kilometers (Ahmed et al., 2013). The computational efficiency of the latter makes it feasible to downscale a large number of GCMs directly to the local spatial scale, and was used to produce the two major statistical downscaling databases for the United States, the Multivariate Adaptive Constructed Analogs (MACA, Abatzoglou, Brown, 2011) database at 4km resolution and the Localized Constructed Analogs (LOCA, Pierce et al., 2014, 2015) database at 6km resolution.
The MACA and LOCA databases each includes past climate simulations and future projections from 20 GCMs downscaled using the MACA (Abatzoglou and Brown, 2012) and LOCA (Piece et al., 2014, 2015) approaches, respectively. Both MACA and LOCA are among the most sophisticated statistical downscaling methods, involving bias correction utilizing a training dataset (i.e. a meteorological observation dataset) and spatial downscaling utilizing constructed analogs. The two datasets differ in the number of analogs used to determine the climate variable (especially precipitation) at each grid cell, the stages at which bias corrections are applied, and the training meteorological dataset. The U.S. National Assessment was based on the LOCA database for which the training data was from Livneh et al. (2015). In this project we chose MACAv2-METDATA, which is version 2 of the MACA database that used METDATA (Abatzoglou, 2011) as the training data. MACAv2-METDATA was chosen for its more realistic training data. In a project funded by CIRCA and the Southwest Regional Water Authority, we found that the daily precipitation in METDATA agrees remarkably well with observations from meteorological stations in Connecticut (and other states of the Northeast), much better than the Livneh et al. (2015) data used by LOCA (e.g., Figure 2 for daily the precipitation over the Southwest Connecticut during several extreme events). This disparity significantly influences the downscaled precipitation daily statistics especially precipitation extremes (therefore flood risks), but the impact on precipitation statistics at longer time scales (e.g., 5 days, monthly, annual) should be minimal.
The MACA method used to derive the MACAv2-METDATA includes epoch removal and replacement at the beginning and end of the procedure, quantile mapping approach to bias correction (before and after constructed analog downscaling), and constructed analogs for downscaling (which also partially corrects bias especially in the spatial pattern). The downscaling process involves averaging across multiple chosen analogs. More details can be found at Abatzoglou and Brown (2012).
3. Model Uncertainties Global Climate Models (GCMs) are known to produce a large spread in their future
projections, due to model dependence of both the climate sensitivity (often defined based on the global average temperature response) and the spatial pattern of such response (e.g. Knutti et al., 2010; Tebaldi et al., 2011; Miao et al., 2014). While multi-model ensemble averages are considered more reliable than projections from any individual model, for developing climate adaptation strategies it is important that policy makers are aware of the model-related uncertainty in future projections and consider a range of plausible future climate changes. The MACA database includes downscaled data from 20 GCMs. In this project, six models were chosen to represent the full range of uncertainties in future projections, including MIROC-ESM, HadGEM2-CC365, CSIRO-Mk3.6.0, CCSM4, GFDL-ESM2M, and MRI-CGCM3. These models were chosen based on genealogy (Knutti et al., 2013), global climate sensitivity (Miao et al, 2013), climate sensitivity for the Connecticut area, and overall performance in simulating present-day climate based on assessment for multiple regions of the world (Sheffield et al., 2013; Miao et al., 2013; McSweeney et al., 2015).
Continuous development and improvement of climate models have led to multiple versions of models in any major modeling group, and in some cases multiple versions from a same group participate in CMIP5. Despite often major changes in the parameterization of important processes, most models are still closely tied to their predecessors in both their control climate for preset day and future projections; moreover, some model development groups exchange ideas and code with other groups, leading to interdependence (therefore climate similarity) between some models of different origin (Masson and Knutti, 2011; Knutti et al., 2013). To better represent the full range of uncertainties in future projections, model geneaology should be considered to avoid including interdepdendent models.
Global climate sensitivity is often represented by the time when the average global temperature increase reaches 2.0 ℃ based on a given RCP scenario (e.g., based on RCP8.5 scenario in Table 1). For climate assessment supporting adaptation, sensitivity of a model's climate response at local and regional scales is more relevant, and the sensitivity of precipitation or of temperature and precipitation combined might be of greater concern than sensitivity of temperature alone. Table 1 lists the six models chosen in the order of temperature sensitivity in Connecticut (from high to low), which is similar to (but slightly different from) their ranking based on global temperature. Their precipitation sensitivity ranking is also similar. Of the six models chosen, based on performance assessment over the conterminous United States (CONUS) (Sheffield et al., 2013) and multiple other regions (McSweeny et al., 2015), the performance of the CCSM4, GFDL, and HadGEM2 is generally satisfactory; while MIROC, CSIRO, and MRI produce
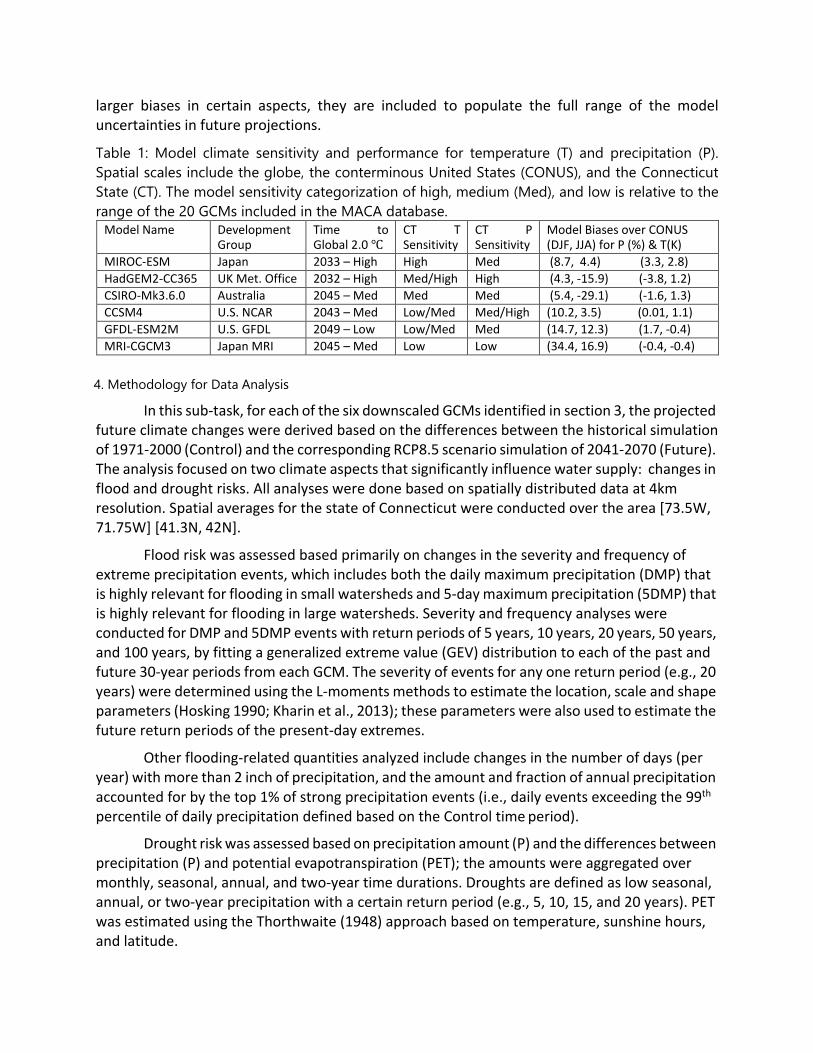
larger biases in certain aspects, they are included to populate the full range of the model uncertainties in future projections.
Table 1: Model climate sensitivity and performance for temperature (T) and precipitation (P). Spatial scales include the globe, the conterminous United States (CONUS), and the Connecticut State (CT). The model sensitivity categorization of high, medium (Med), and low is relative to the range of the 20 GCMs included in the MACA database.
Model Name Development Group
Time to Global 2.0 ℃
CT T Sensitivity
CT P Sensitivity
Model Biases over CONUS (DJF, JJA) for P (%) & T(K)
MIROC-ESM Japan 2033 – High High Med (8.7, 4.4) (3.3, 2.8) HadGEM2-CC365 UK Met. Office 2032 – High Med/High High (4.3, -15.9) (-3.8, 1.2) CSIRO-Mk3.6.0 Australia 2045 – Med Med Med (5.4, -29.1) (-1.6, 1.3) CCSM4 U.S. NCAR 2043 – Med Low/Med Med/High (10.2, 3.5) (0.01, 1.1) GFDL-ESM2M U.S. GFDL 2049 – Low Low/Med Med (14.7, 12.3) (1.7, -0.4) MRI-CGCM3 Japan MRI 2045 – Med Low Low (34.4, 16.9) (-0.4, -0.4)
4. Methodology for Data Analysis
In this sub-task, for each of the six downscaled GCMs identified in section 3, the projected future climate changes were derived based on the differences between the historical simulation of 1971-2000 (Control) and the corresponding RCP8.5 scenario simulation of 2041-2070 (Future). The analysis focused on two climate aspects that significantly influence water supply: changes in flood and drought risks. All analyses were done based on spatially distributed data at 4km resolution. Spatial averages for the state of Connecticut were conducted over the area [73.5W, 71.75W] [41.3N, 42N].
Flood risk was assessed based primarily on changes in the severity and frequency of extreme precipitation events, which includes both the daily maximum precipitation (DMP) that is highly relevant for flooding in small watersheds and 5-day maximum precipitation (5DMP) that is highly relevant for flooding in large watersheds. Severity and frequency analyses were conducted for DMP and 5DMP events with return periods of 5 years, 10 years, 20 years, 50 years, and 100 years, by fitting a generalized extreme value (GEV) distribution to each of the past and future 30-year periods from each GCM. The severity of events for any one return period (e.g., 20 years) were determined using the L-moments methods to estimate the location, scale and shape parameters (Hosking 1990; Kharin et al., 2013); these parameters were also used to estimate the future return periods of the present-day extremes.
Other flooding-related quantities analyzed include changes in the number of days (per year) with more than 2 inch of precipitation, and the amount and fraction of annual precipitation accounted for by the top 1% of strong precipitation events (i.e., daily events exceeding the 99th
percentile of daily precipitation defined based on the Control time period).
Drought risk was assessed based on precipitation amount (P) and the differences between precipitation (P) and potential evapotranspiration (PET); the amounts were aggregated over monthly, seasonal, annual, and two-year time durations. Droughts are defined as low seasonal, annual, or two-year precipitation with a certain return period (e.g., 5, 10, 15, and 20 years). PET was estimated using the Thorthwaite (1948) approach based on temperature, sunshine hours, and latitude.
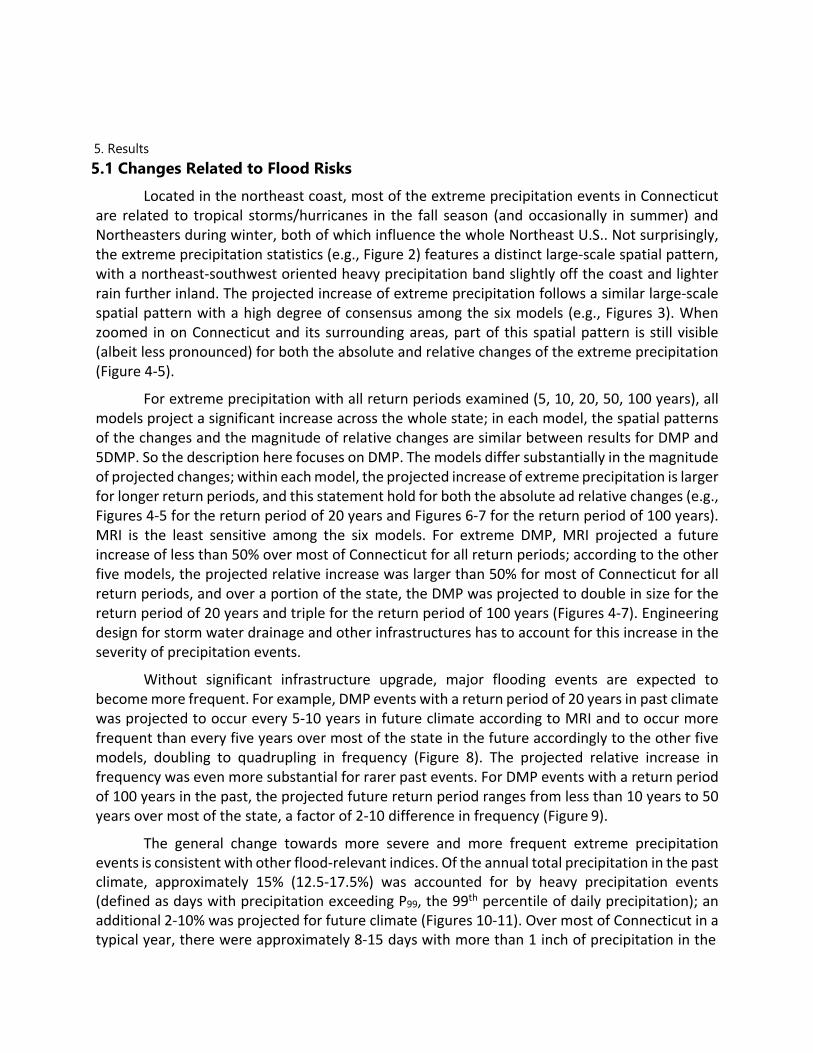
5. Results
5.1 Changes Related to Flood Risks Located in the northeast coast, most of the extreme precipitation events in Connecticut
are related to tropical storms/hurricanes in the fall season (and occasionally in summer) and Northeasters during winter, both of which influence the whole Northeast U.S.. Not surprisingly, the extreme precipitation statistics (e.g., Figure 2) features a distinct large-scale spatial pattern, with a northeast-southwest oriented heavy precipitation band slightly off the coast and lighter rain further inland. The projected increase of extreme precipitation follows a similar large-scale spatial pattern with a high degree of consensus among the six models (e.g., Figures 3). When zoomed in on Connecticut and its surrounding areas, part of this spatial pattern is still visible (albeit less pronounced) for both the absolute and relative changes of the extreme precipitation (Figure 4-5).
For extreme precipitation with all return periods examined (5, 10, 20, 50, 100 years), all models project a significant increase across the whole state; in each model, the spatial patterns of the changes and the magnitude of relative changes are similar between results for DMP and 5DMP. So the description here focuses on DMP. The models differ substantially in the magnitude of projected changes; within each model, the projected increase of extreme precipitation is larger for longer return periods, and this statement hold for both the absolute ad relative changes (e.g., Figures 4-5 for the return period of 20 years and Figures 6-7 for the return period of 100 years). MRI is the least sensitive among the six models. For extreme DMP, MRI projected a future increase of less than 50% over most of Connecticut for all return periods; according to the other five models, the projected relative increase was larger than 50% for most of Connecticut for all return periods, and over a portion of the state, the DMP was projected to double in size for the return period of 20 years and triple for the return period of 100 years (Figures 4-7). Engineering design for storm water drainage and other infrastructures has to account for this increase in the severity of precipitation events.
Without significant infrastructure upgrade, major flooding events are expected to become more frequent. For example, DMP events with a return period of 20 years in past climate was projected to occur every 5-10 years in future climate according to MRI and to occur more frequent than every five years over most of the state in the future accordingly to the other five models, doubling to quadrupling in frequency (Figure 8). The projected relative increase in frequency was even more substantial for rarer past events. For DMP events with a return period of 100 years in the past, the projected future return period ranges from less than 10 years to 50 years over most of the state, a factor of 2-10 difference in frequency (Figure 9).
The general change towards more severe and more frequent extreme precipitation events is consistent with other flood-relevant indices. Of the annual total precipitation in the past climate, approximately 15% (12.5-17.5%) was accounted for by heavy precipitation events (defined as days with precipitation exceeding P99, the 99th percentile of daily precipitation); an additional 2-10% was projected for future climate (Figures 10-11). Over most of Connecticut in a typical year, there were approximately 8-15 days with more than 1 inch of precipitation in the
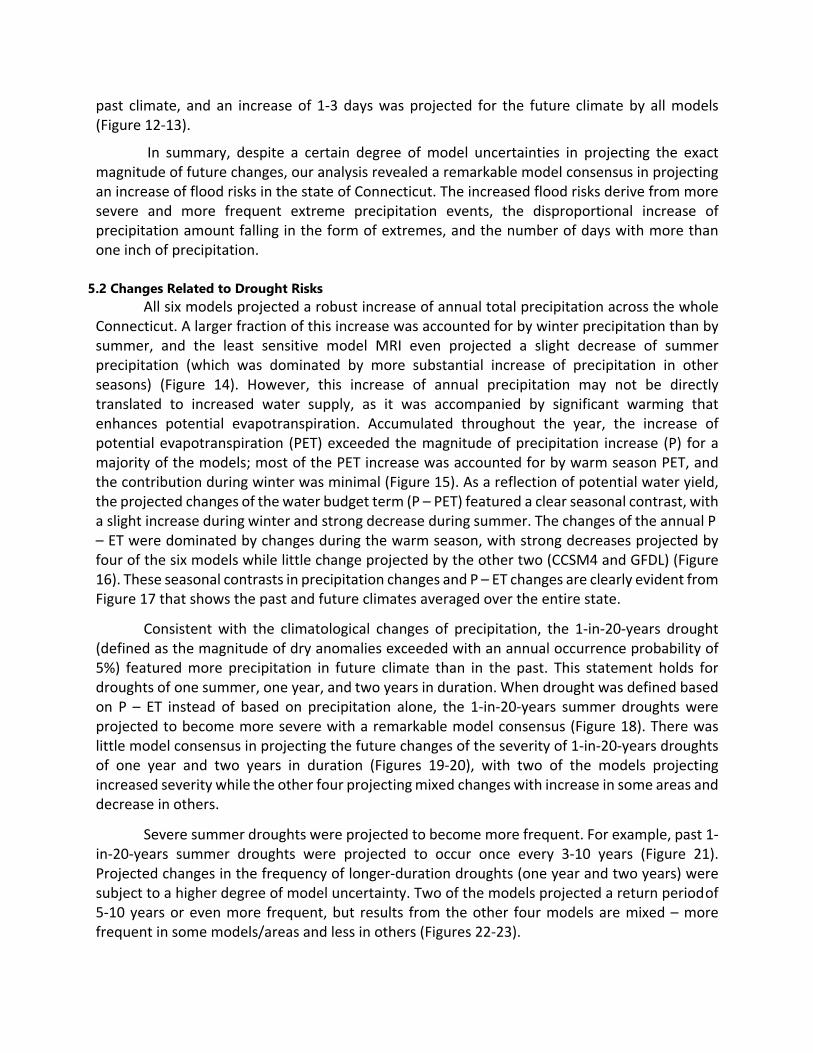
past climate, and an increase of 1-3 days was projected for the future climate by all models (Figure 12-13).
In summary, despite a certain degree of model uncertainties in projecting the exact magnitude of future changes, our analysis revealed a remarkable model consensus in projecting an increase of flood risks in the state of Connecticut. The increased flood risks derive from more severe and more frequent extreme precipitation events, the disproportional increase of precipitation amount falling in the form of extremes, and the number of days with more than one inch of precipitation.
5.2 Changes Related to Drought Risks
All six models projected a robust increase of annual total precipitation across the whole Connecticut. A larger fraction of this increase was accounted for by winter precipitation than by summer, and the least sensitive model MRI even projected a slight decrease of summer precipitation (which was dominated by more substantial increase of precipitation in other seasons) (Figure 14). However, this increase of annual precipitation may not be directly translated to increased water supply, as it was accompanied by significant warming that enhances potential evapotranspiration. Accumulated throughout the year, the increase of potential evapotranspiration (PET) exceeded the magnitude of precipitation increase (P) for a majority of the models; most of the PET increase was accounted for by warm season PET, and the contribution during winter was minimal (Figure 15). As a reflection of potential water yield, the projected changes of the water budget term (P – PET) featured a clear seasonal contrast, with a slight increase during winter and strong decrease during summer. The changes of the annual P – ET were dominated by changes during the warm season, with strong decreases projected by four of the six models while little change projected by the other two (CCSM4 and GFDL) (Figure 16). These seasonal contrasts in precipitation changes and P – ET changes are clearly evident from Figure 17 that shows the past and future climates averaged over the entire state.
Consistent with the climatological changes of precipitation, the 1-in-20-years drought (defined as the magnitude of dry anomalies exceeded with an annual occurrence probability of 5%) featured more precipitation in future climate than in the past. This statement holds for droughts of one summer, one year, and two years in duration. When drought was defined based on P – ET instead of based on precipitation alone, the 1-in-20-years summer droughts were projected to become more severe with a remarkable model consensus (Figure 18). There was little model consensus in projecting the future changes of the severity of 1-in-20-years droughts of one year and two years in duration (Figures 19-20), with two of the models projecting increased severity while the other four projecting mixed changes with increase in some areas and decrease in others.
Severe summer droughts were projected to become more frequent. For example, past 1- in-20-years summer droughts were projected to occur once every 3-10 years (Figure 21). Projected changes in the frequency of longer-duration droughts (one year and two years) were subject to a higher degree of model uncertainty. Two of the models projected a return period of 5-10 years or even more frequent, but results from the other four models are mixed – more frequent in some models/areas and less in others (Figures 22-23).
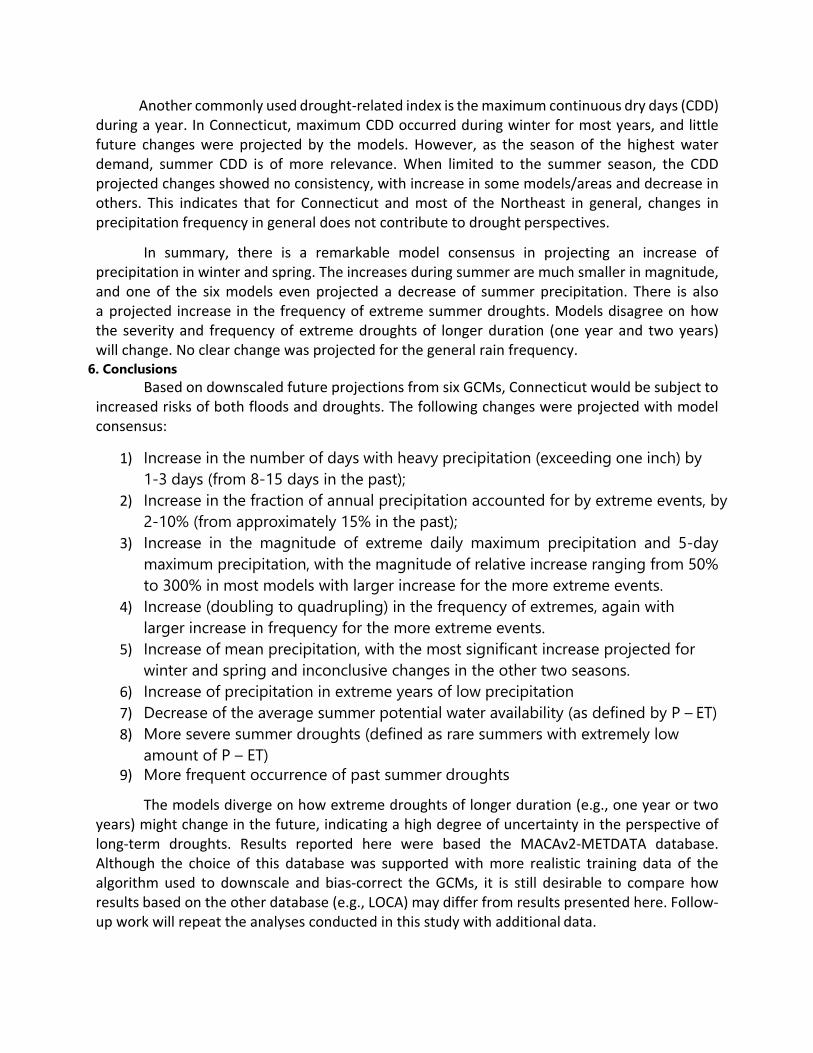
Another commonly used drought-related index is the maximum continuous dry days (CDD) during a year. In Connecticut, maximum CDD occurred during winter for most years, and little future changes were projected by the models. However, as the season of the highest water demand, summer CDD is of more relevance. When limited to the summer season, the CDD projected changes showed no consistency, with increase in some models/areas and decrease in others. This indicates that for Connecticut and most of the Northeast in general, changes in precipitation frequency in general does not contribute to drought perspectives.
In summary, there is a remarkable model consensus in projecting an increase of precipitation in winter and spring. The increases during summer are much smaller in magnitude, and one of the six models even projected a decrease of summer precipitation. There is also a projected increase in the frequency of extreme summer droughts. Models disagree on how the severity and frequency of extreme droughts of longer duration (one year and two years) will change. No clear change was projected for the general rain frequency.
6. ConclusionsBased on downscaled future projections from six GCMs, Connecticut would be subject to
increased risks of both floods and droughts. The following changes were projected with modelconsensus:
1) Increase in the number of days with heavy precipitation (exceeding one inch) by1-3 days (from 8-15 days in the past);
2) Increase in the fraction of annual precipitation accounted for by extreme events, by2-10% (from approximately 15% in the past);
3) Increase in the magnitude of extreme daily maximum precipitation and 5-daymaximum precipitation, with the magnitude of relative increase ranging from 50%to 300% in most models with larger increase for the more extreme events.
4) Increase (doubling to quadrupling) in the frequency of extremes, again withlarger increase in frequency for the more extreme events.
5) Increase of mean precipitation, with the most significant increase projected forwinter and spring and inconclusive changes in the other two seasons.
6) Increase of precipitation in extreme years of low precipitation7) Decrease of the average summer potential water availability (as defined by P – ET)8) More severe summer droughts (defined as rare summers with extremely low
amount of P – ET)9) More frequent occurrence of past summer droughts
The models diverge on how extreme droughts of longer duration (e.g., one year or twoyears) might change in the future, indicating a high degree of uncertainty in the perspective of long-term droughts. Results reported here were based the MACAv2-METDATA database. Although the choice of this database was supported with more realistic training data of the algorithm used to downscale and bias-correct the GCMs, it is still desirable to compare how results based on the other database (e.g., LOCA) may differ from results presented here. Follow- up work will repeat the analyses conducted in this study with additional data.
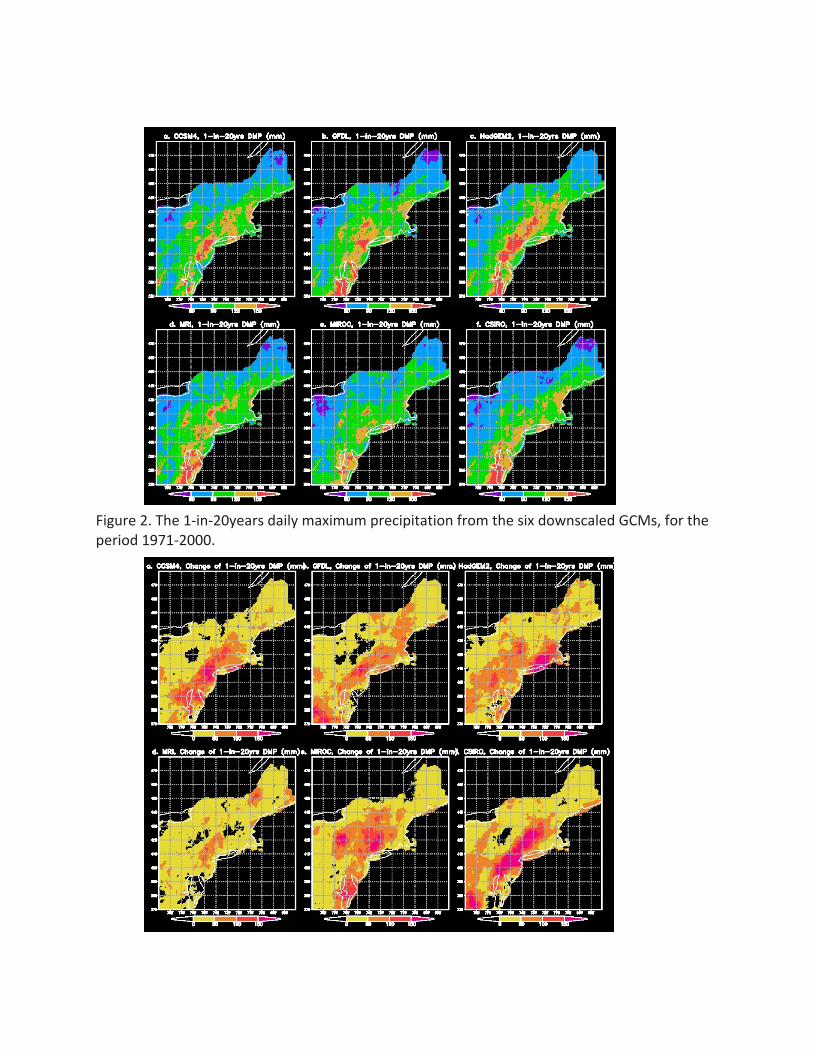
Figure 2. The 1-in-20years daily maximum precipitation from the six downscaled GCMs, for the period 1971-2000.
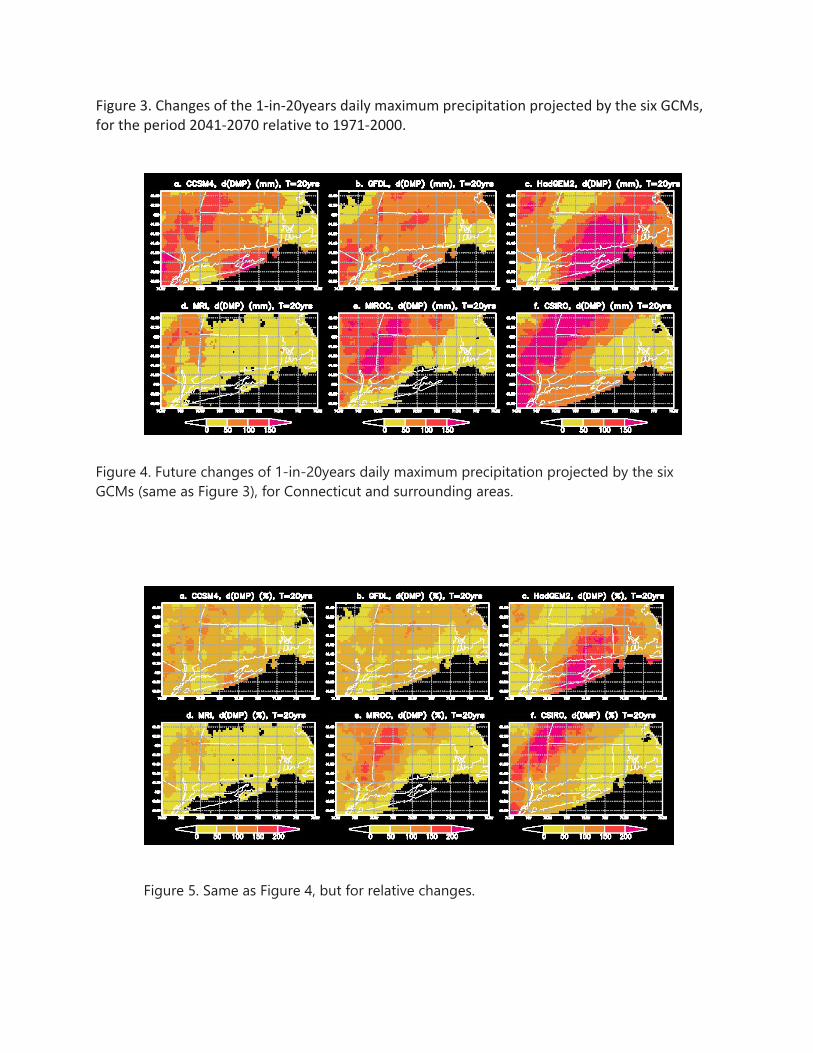
Figure 3. Changes of the 1-in-20years daily maximum precipitation projected by the six GCMs, for the period 2041-2070 relative to 1971-2000.
Figure 4. Future changes of 1-in-20years daily maximum precipitation projected by the six GCMs (same as Figure 3), for Connecticut and surrounding areas.
Figure 5. Same as Figure 4, but for relative changes.
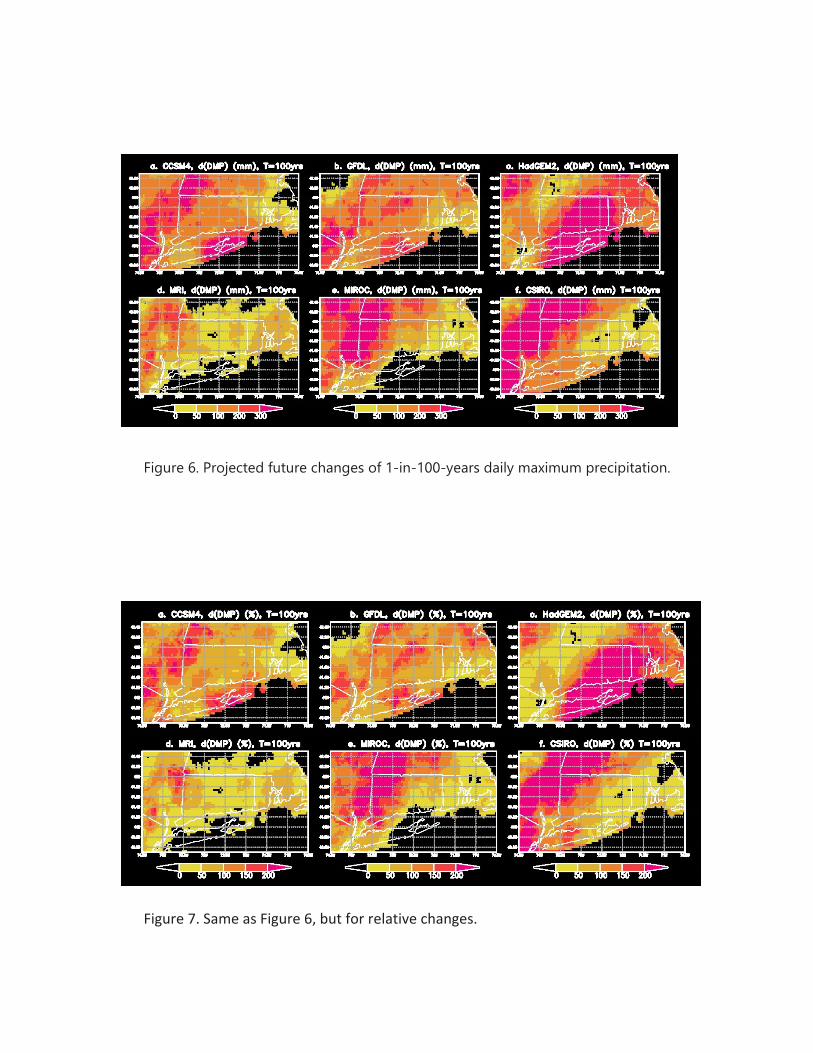
Figure 6. Projected future changes of 1-in-100-years daily maximum precipitation.
Figure 7. Same as Figure 6, but for relative changes.
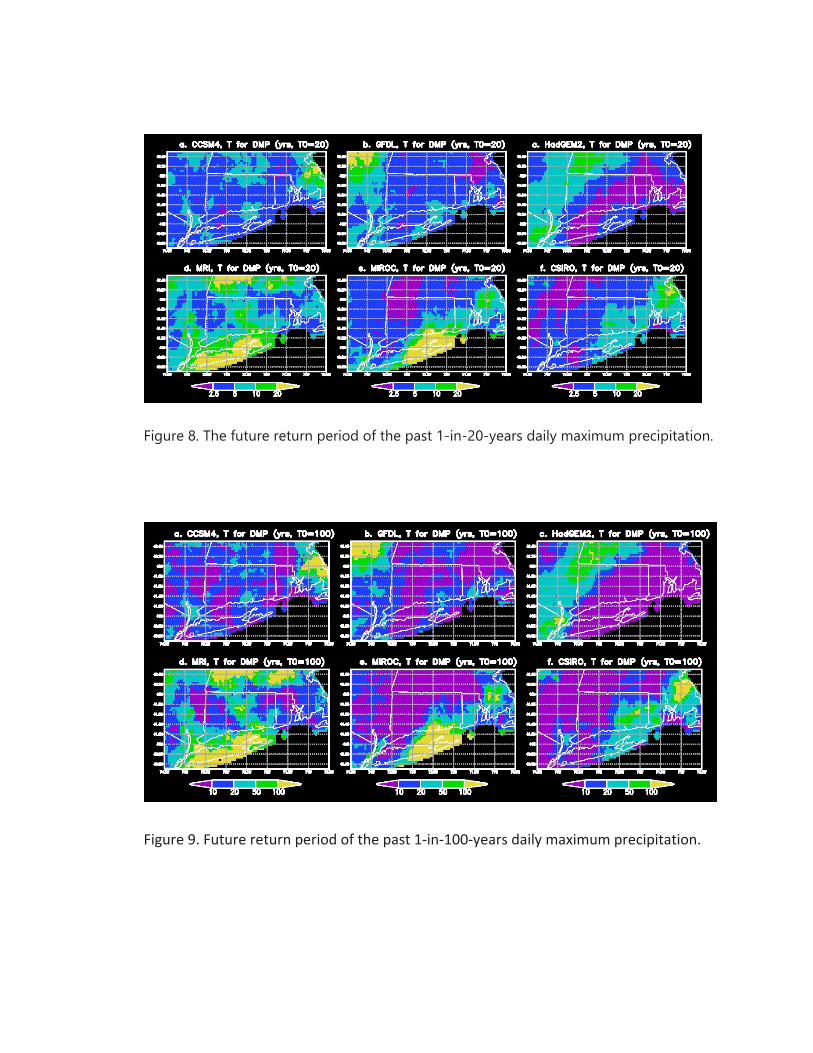
Figure 8. The future return period of the past 1-in-20-years daily maximum precipitation.
Figure 9. Future return period of the past 1-in-100-years daily maximum precipitation.
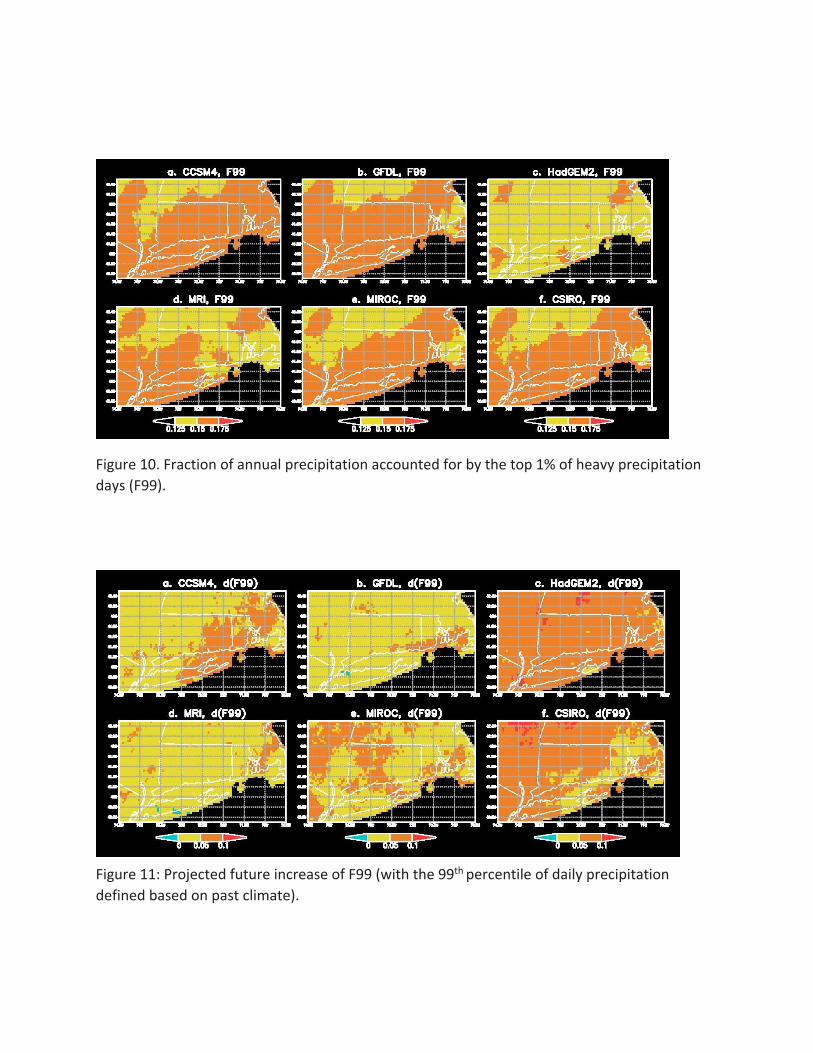
Figure 10. Fraction of annual precipitation accounted for by the top 1% of heavy precipitation days (F99).
Figure 11: Projected future increase of F99 (with the 99th percentile of daily precipitation defined based on past climate).
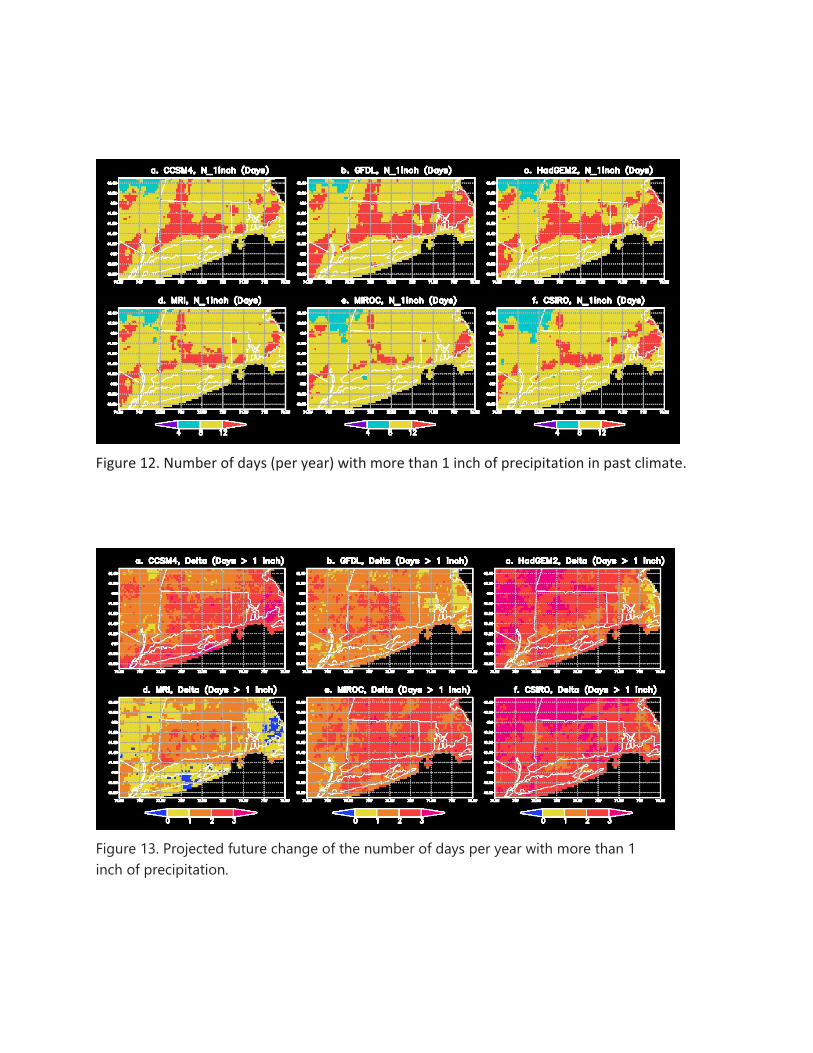
Figure 12. Number of days (per year) with more than 1 inch of precipitation in past climate.
Figure 13. Projected future change of the number of days per year with more than 1 inch of precipitation.
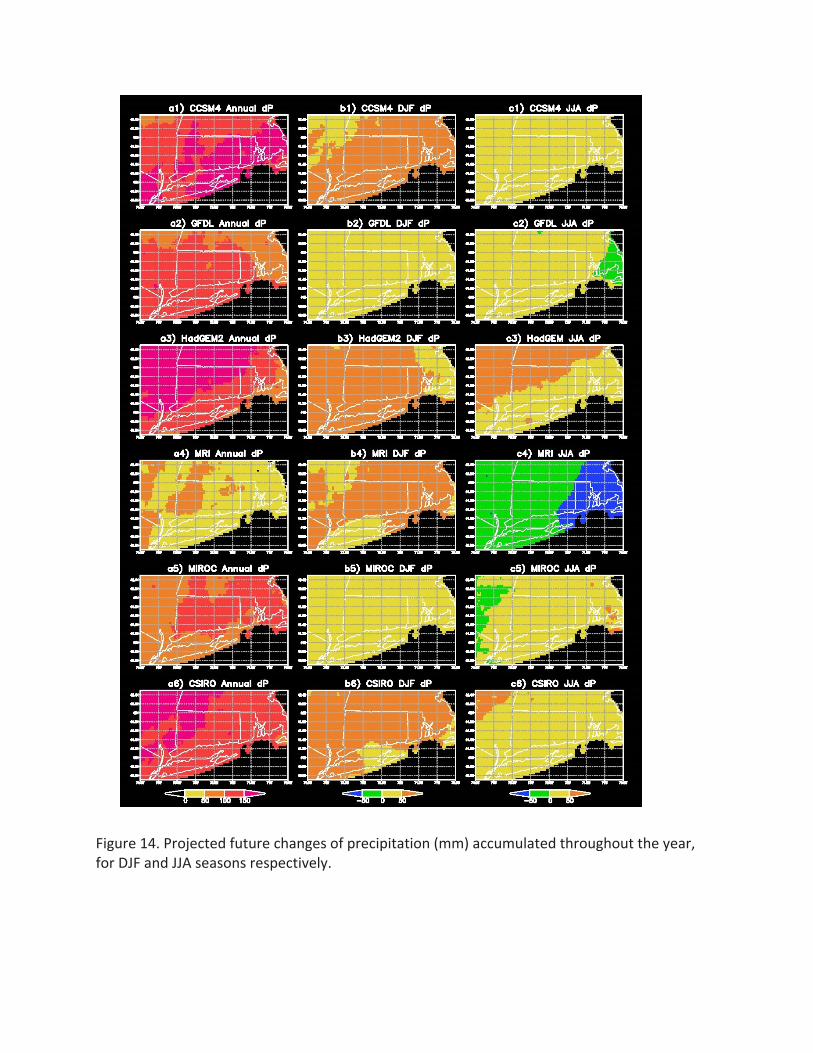
Figure 14. Projected future changes of precipitation (mm) accumulated throughout the year, for DJF and JJA seasons respectively.
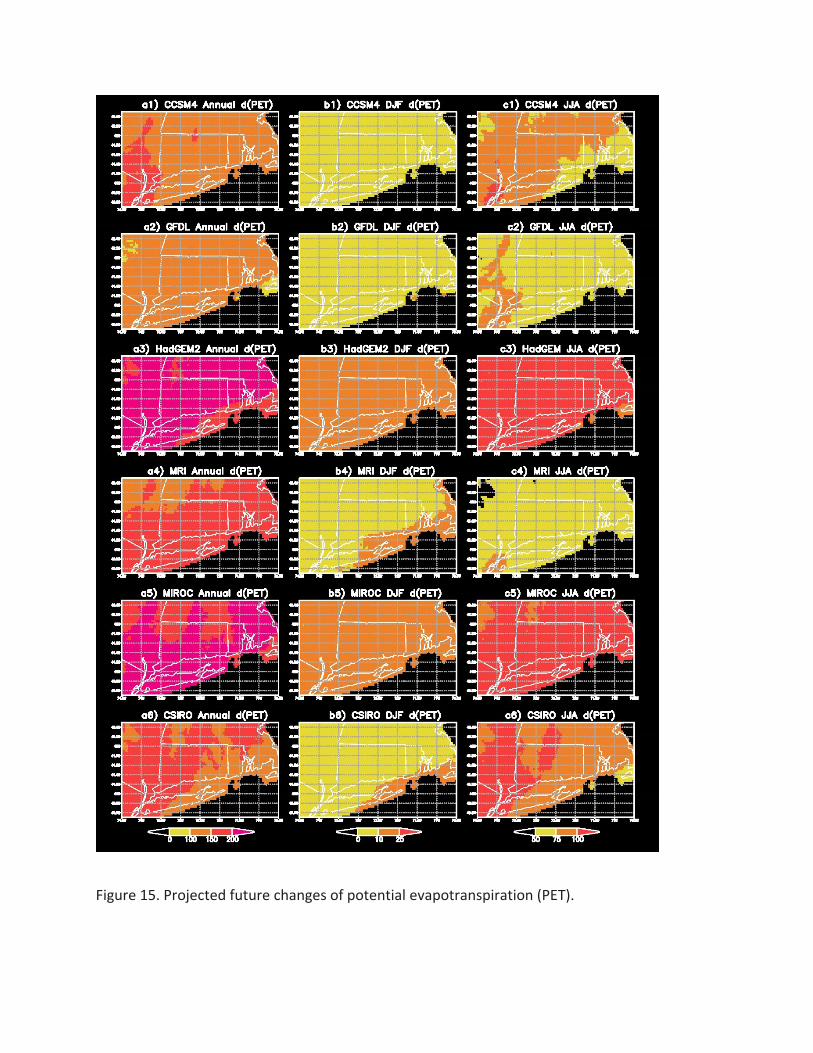
Figure 15. Projected future changes of potential evapotranspiration (PET).
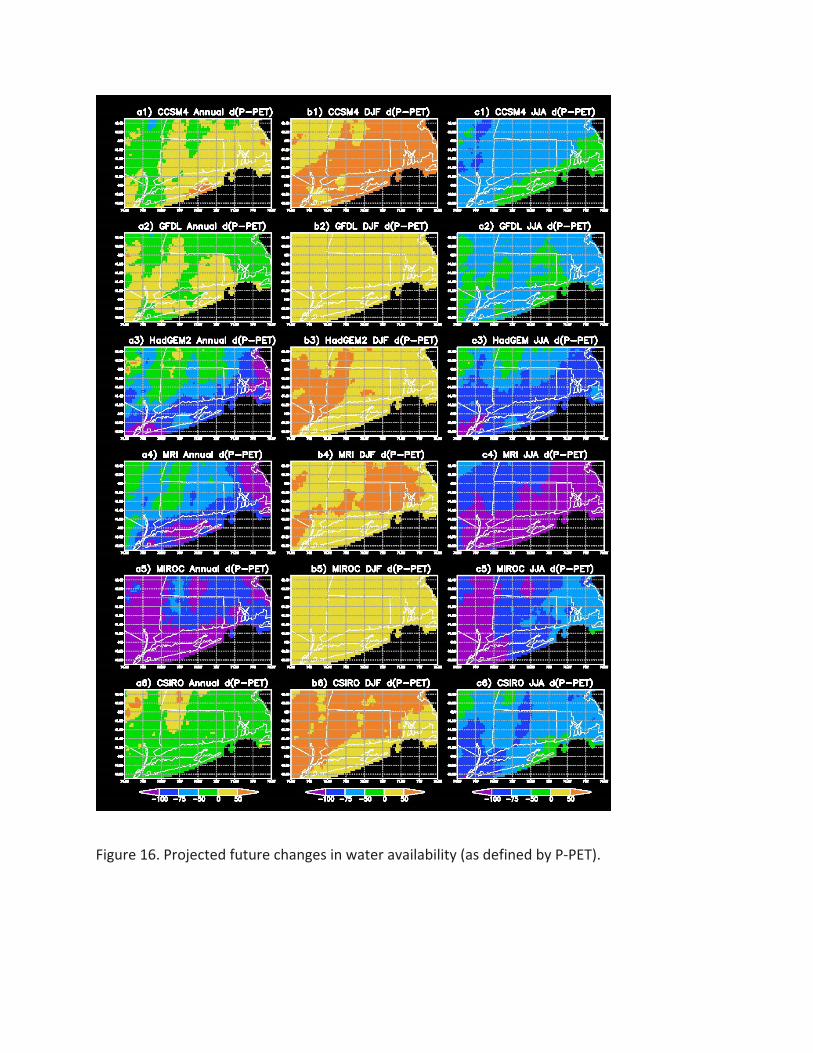
Figure 16. Projected future changes in water availability (as defined by P-PET).
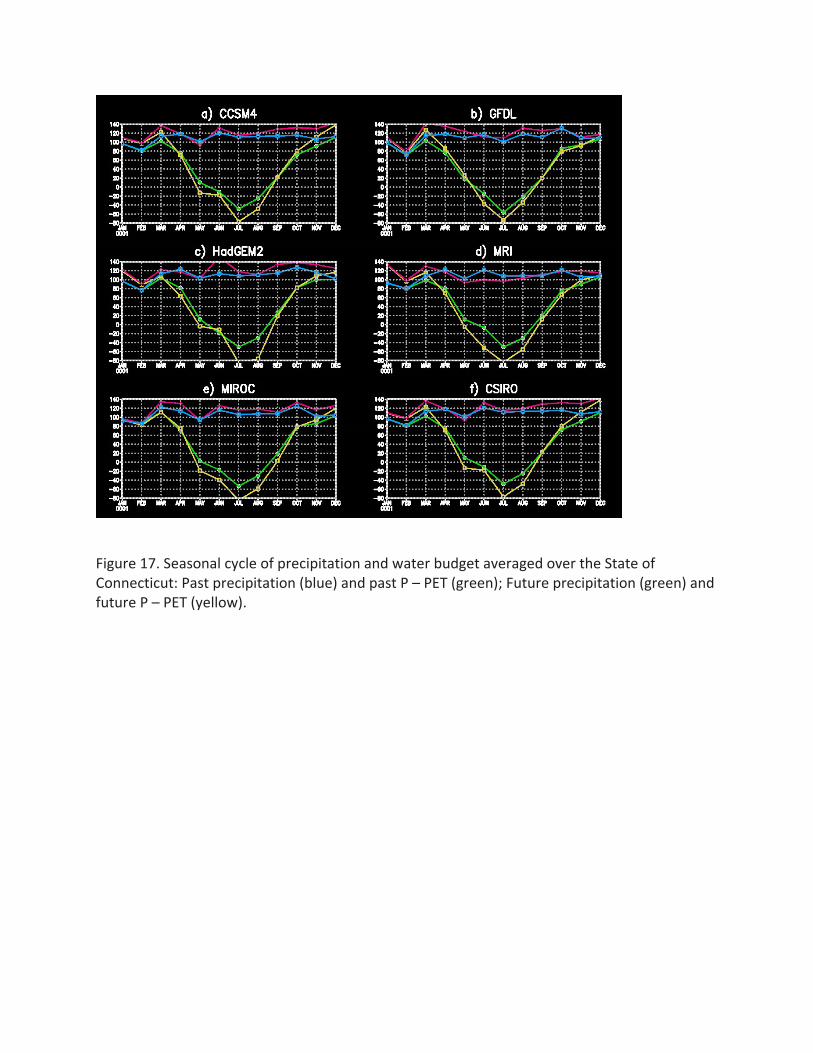
Figure 17. Seasonal cycle of precipitation and water budget averaged over the State of Connecticut: Past precipitation (blue) and past P – PET (green); Future precipitation (green) and future P – PET (yellow).
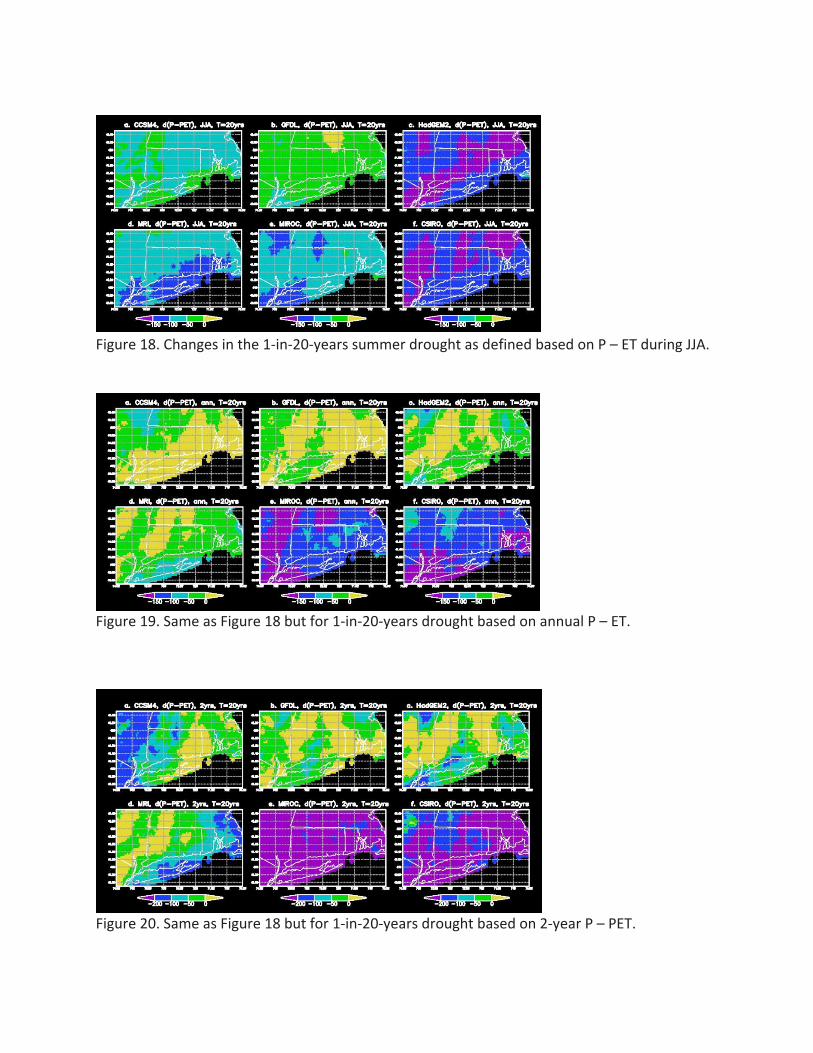
Figure 18. Changes in the 1-in-20-years summer drought as defined based on P – ET during JJA.
Figure 19. Same as Figure 18 but for 1-in-20-years drought based on annual P – ET.
Figure 20. Same as Figure 18 but for 1-in-20-years drought based on 2-year P – PET.
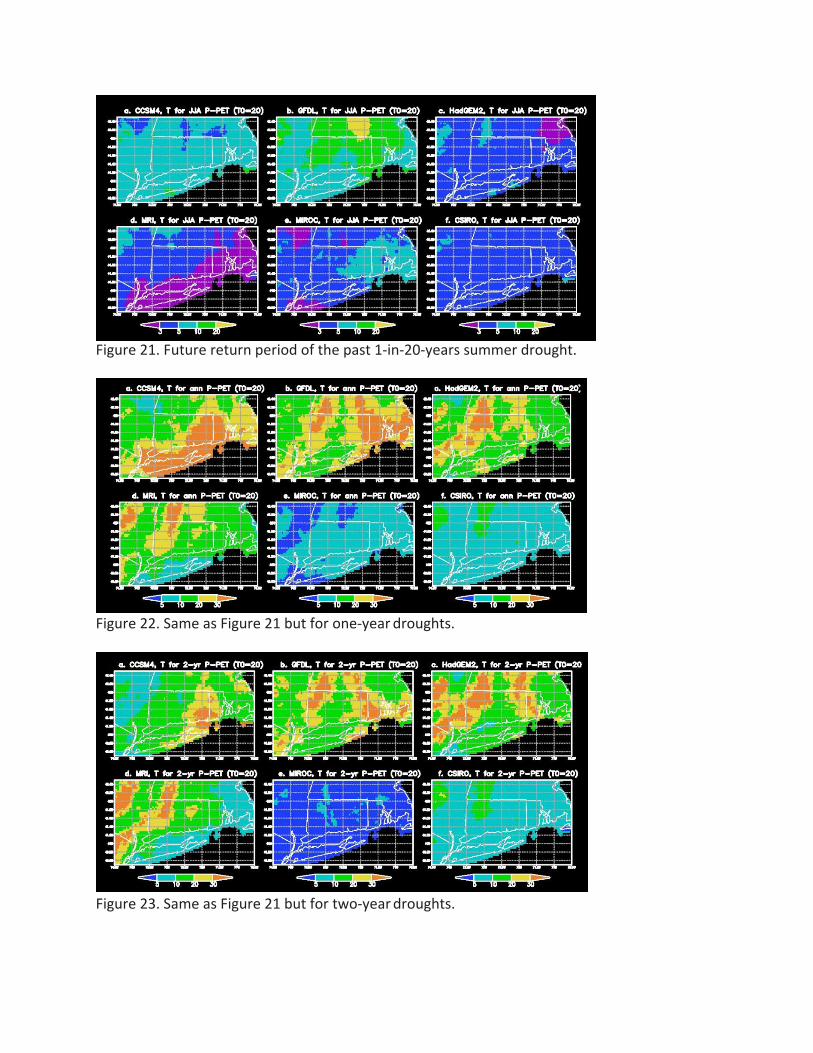
Figure 21. Future return period of the past 1-in-20-years summer drought.
Figure 22. Same as Figure 21 but for one-year droughts.
Figure 23. Same as Figure 21 but for two-year droughts.
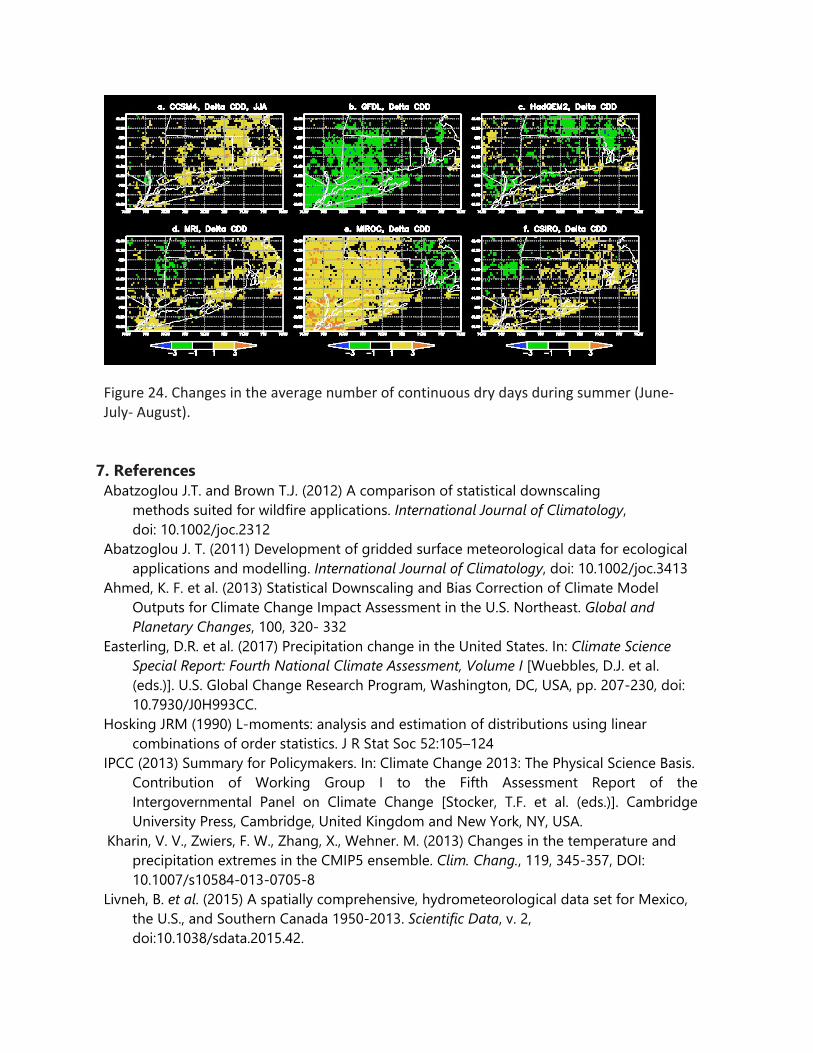
Figure 24. Changes in the average number of continuous dry days during summer (June-July- August).
7. References Abatzoglou J.T. and Brown T.J. (2012) A comparison of statistical downscaling
methods suited for wildfire applications. International Journal of Climatology, doi: 10.1002/joc.2312
Abatzoglou J. T. (2011) Development of gridded surface meteorological data for ecological applications and modelling. International Journal of Climatology, doi: 10.1002/joc.3413
Ahmed, K. F. et al. (2013) Statistical Downscaling and Bias Correction of Climate Model Outputs for Climate Change Impact Assessment in the U.S. Northeast. Global and Planetary Changes, 100, 320- 332
Easterling, D.R. et al. (2017) Precipitation change in the United States. In: Climate Science Special Report: Fourth National Climate Assessment, Volume I [Wuebbles, D.J. et al. (eds.)]. U.S. Global Change Research Program, Washington, DC, USA, pp. 207-230, doi: 10.7930/J0H993CC.
Hosking JRM (1990) L-moments: analysis and estimation of distributions using linear combinations of order statistics. J R Stat Soc 52:105–124
IPCC (2013) Summary for Policymakers. In: Climate Change 2013: The Physical Science Basis. Contribution of Working Group I to the Fifth Assessment Report of the Intergovernmental Panel on Climate Change [Stocker, T.F. et al. (eds.)]. Cambridge University Press, Cambridge, United Kingdom and New York, NY, USA.
Kharin, V. V., Zwiers, F. W., Zhang, X., Wehner. M. (2013) Changes in the temperature and precipitation extremes in the CMIP5 ensemble. Clim. Chang., 119, 345-357, DOI: 10.1007/s10584-013-0705-8
Livneh, B. et al. (2015) A spatially comprehensive, hydrometeorological data set for Mexico, the U.S., and Southern Canada 1950-2013. Scientific Data, v. 2, doi:10.1038/sdata.2015.42.
Mabey, N., Gulledge, J., Finel, B. & Silverthorne, K. (2011) Degrees of Risk: Defining a Risk Management Framework for Climate Security (E3G)
Mearns, L.O., et al. (2007, updated 2014) The North American Regional Climate Change Assessment Program dataset, National Center for Atmospheric Research Climate Data Gateway data portal, Boulder, CO. [doi:10.5065/D6RN35ST]
Pierce, D. W., D. R. Cayan, and B. L. Thrasher (2014) Statistical downscaling using Localized Constructed Analogs (LOCA). Journal of Hydrometeorology, 15, 2558-2585.
Pierce, D. W., D. R. Cayan, E. P. Maurer, J. T. Abatzoglou, and K. C. Hegewisch, 2015: Improved bias correction techniques for hydrological simulations of climate change. Journal of Hydrometeorology, 16, 2421-2442
Sanford, T., P. C. Frumhoff, A. Luers, and J. Gulledge (2014) The climate policy narrative for a dangerously warming world. Nature Climate Change, DOI: 10.1038/nclimate2148
Taylor, K.E., R.J. Stouffer, G.A. Meehl (2012) An Overview of CMIP5 and the experiment design, BAMS, doi: 10.1175/BAMS-D-11-00094.1
Thornthwaite, C. W. (1948) An approach toward a rational classification of climate. Geographical Review. 38 (1), 55–94, doi:10.2307/210739


APPENDIX H Small CWS Assets


APPENDIX I Critical Facilities

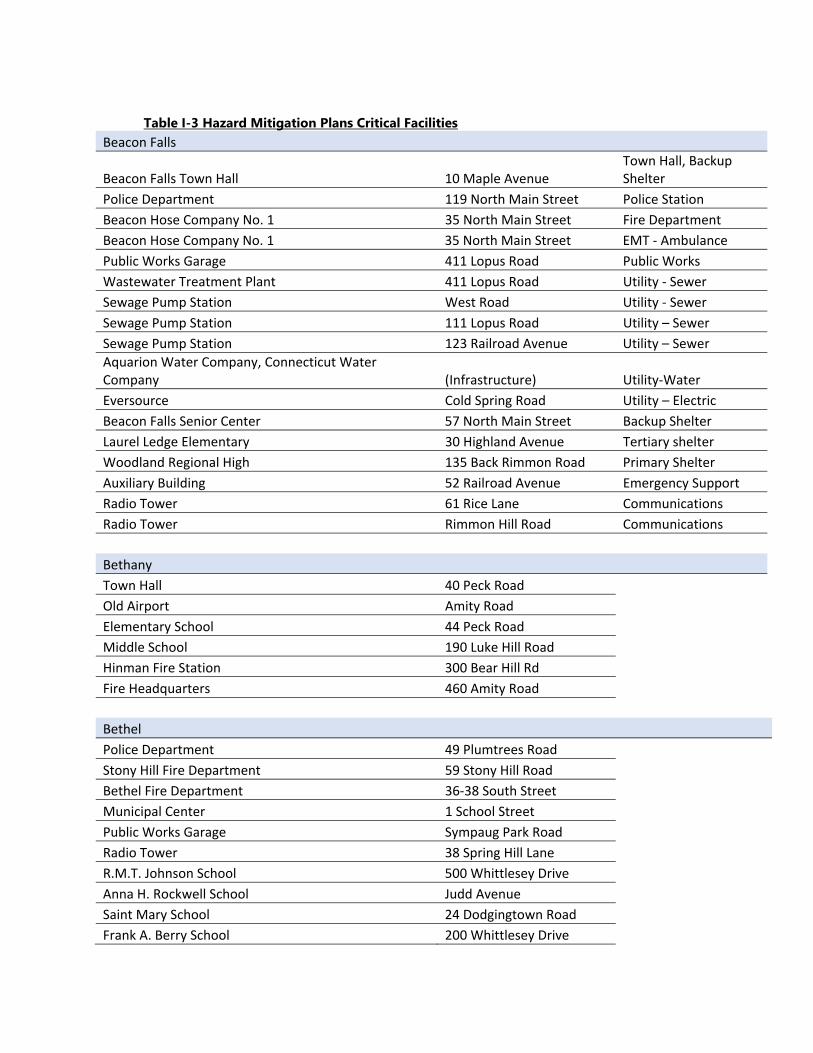
Table I-3 Hazard Mitigation Plans Critical Facilities
Beacon Falls
Beacon Falls Town Hall 10 Maple Avenue Town Hall, Backup Shelter
Police Department 119 North Main Street Police Station
Beacon Hose Company No. 1 35 North Main Street Fire Department
Beacon Hose Company No. 1 35 North Main Street EMT ‐ Ambulance
Public Works Garage 411 Lopus Road Public Works
Wastewater Treatment Plant 411 Lopus Road Utility ‐ Sewer
Sewage Pump Station West Road Utility ‐ Sewer
Sewage Pump Station 111 Lopus Road Utility – Sewer
Sewage Pump Station 123 Railroad Avenue Utility – Sewer
Aquarion Water Company, Connecticut Water Company (Infrastructure) Utility‐Water
Eversource Cold Spring Road Utility – Electric
Beacon Falls Senior Center 57 North Main Street Backup Shelter
Laurel Ledge Elementary 30 Highland Avenue Tertiary shelter
Woodland Regional High 135 Back Rimmon Road Primary Shelter
Auxiliary Building 52 Railroad Avenue Emergency Support
Radio Tower 61 Rice Lane Communications
Radio Tower Rimmon Hill Road Communications
Bethany
Town Hall 40 Peck Road
Old Airport Amity Road
Elementary School 44 Peck Road
Middle School 190 Luke Hill Road
Hinman Fire Station 300 Bear Hill Rd
Fire Headquarters 460 Amity Road
Bethel
Police Department 49 Plumtrees Road
Stony Hill Fire Department 59 Stony Hill Road
Bethel Fire Department 36‐38 South Street
Municipal Center 1 School Street
Public Works Garage Sympaug Park Road
Radio Tower 38 Spring Hill Lane
R.M.T. Johnson School 500 Whittlesey Drive
Anna H. Rockwell School Judd Avenue
Saint Mary School 24 Dodgingtown Road
Frank A. Berry School 200 Whittlesey Drive
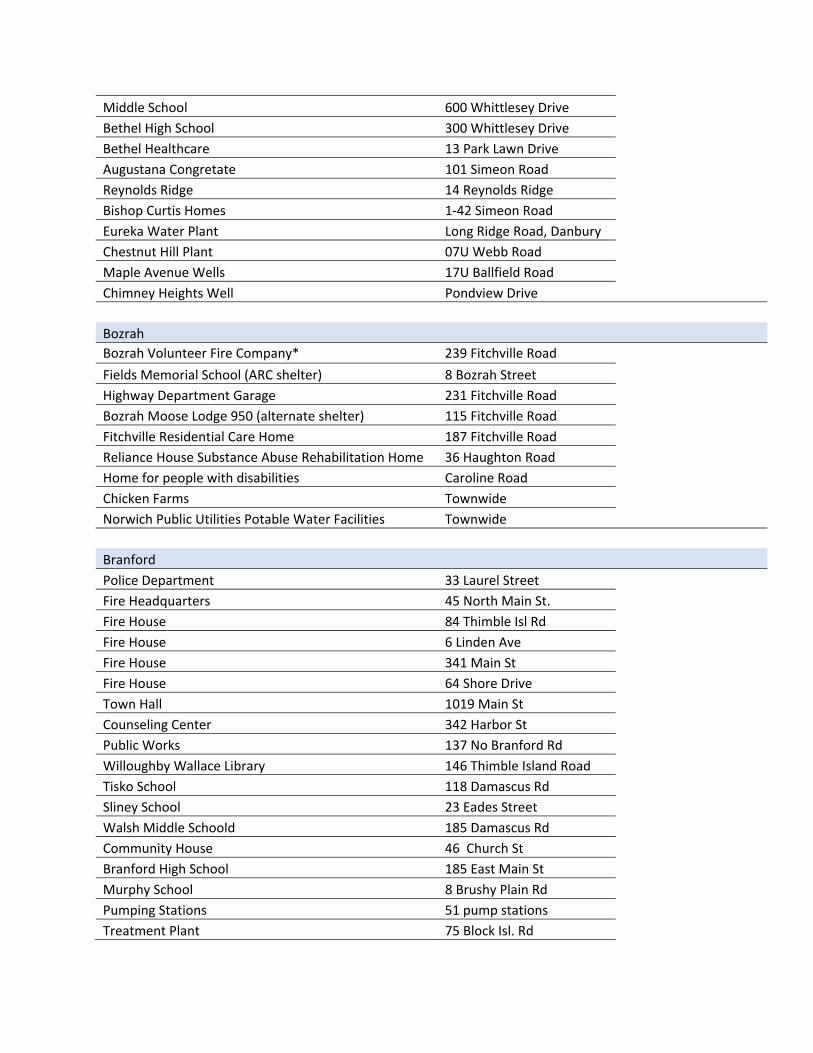
Middle School 600 Whittlesey Drive
Bethel High School 300 Whittlesey Drive
Bethel Healthcare 13 Park Lawn Drive
Augustana Congretate 101 Simeon Road
Reynolds Ridge 14 Reynolds Ridge
Bishop Curtis Homes 1‐42 Simeon Road
Eureka Water Plant Long Ridge Road, Danbury
Chestnut Hill Plant 07U Webb Road
Maple Avenue Wells 17U Ballfield Road
Chimney Heights Well Pondview Drive
Bozrah
Bozrah Volunteer Fire Company* 239 Fitchville Road
Fields Memorial School (ARC shelter) 8 Bozrah Street
Highway Department Garage 231 Fitchville Road
Bozrah Moose Lodge 950 (alternate shelter) 115 Fitchville Road
Fitchville Residential Care Home 187 Fitchville Road
Reliance House Substance Abuse Rehabilitation Home 36 Haughton Road
Home for people with disabilities Caroline Road
Chicken Farms Townwide
Norwich Public Utilities Potable Water Facilities Townwide
Branford
Police Department 33 Laurel Street
Fire Headquarters 45 North Main St.
Fire House 84 Thimble Isl Rd
Fire House 6 Linden Ave
Fire House 341 Main St
Fire House 64 Shore Drive
Town Hall 1019 Main St
Counseling Center 342 Harbor St
Public Works 137 No Branford Rd
Willoughby Wallace Library 146 Thimble Island Road
Tisko School 118 Damascus Rd
Sliney School 23 Eades Street
Walsh Middle Schoold 185 Damascus Rd
Community House 46 Church St
Branford High School 185 East Main St
Murphy School 8 Brushy Plain Rd
Pumping Stations 51 pump stations
Treatment Plant 75 Block Isl. Rd
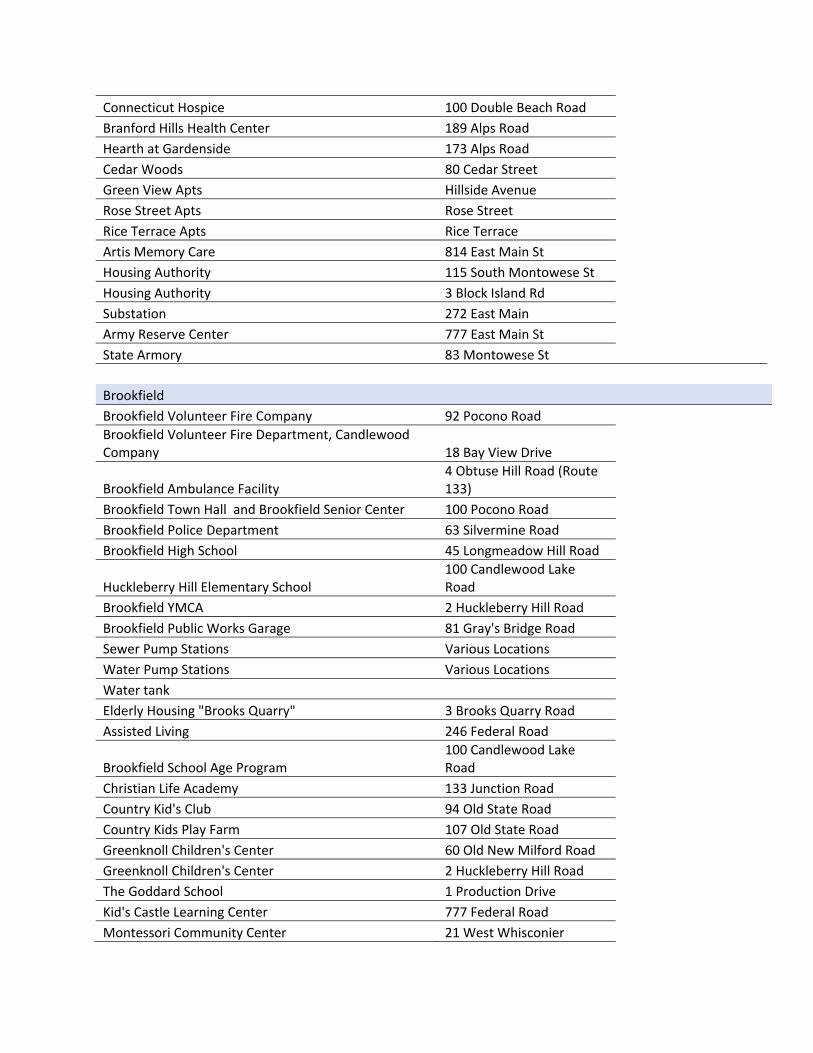
Connecticut Hospice 100 Double Beach Road
Branford Hills Health Center 189 Alps Road
Hearth at Gardenside 173 Alps Road
Cedar Woods 80 Cedar Street
Green View Apts Hillside Avenue
Rose Street Apts Rose Street
Rice Terrace Apts Rice Terrace
Artis Memory Care 814 East Main St
Housing Authority 115 South Montowese St
Housing Authority 3 Block Island Rd
Substation 272 East Main
Army Reserve Center 777 East Main St
State Armory 83 Montowese St
Brookfield
Brookfield Volunteer Fire Company 92 Pocono Road
Brookfield Volunteer Fire Department, Candlewood Company 18 Bay View Drive
Brookfield Ambulance Facility 4 Obtuse Hill Road (Route 133)
Brookfield Town Hall and Brookfield Senior Center 100 Pocono Road
Brookfield Police Department 63 Silvermine Road
Brookfield High School 45 Longmeadow Hill Road
Huckleberry Hill Elementary School 100 Candlewood Lake Road
Brookfield YMCA 2 Huckleberry Hill Road
Brookfield Public Works Garage 81 Gray's Bridge Road
Sewer Pump Stations Various Locations
Water Pump Stations Various Locations
Water tank Elderly Housing "Brooks Quarry" 3 Brooks Quarry Road
Assisted Living 246 Federal Road
Brookfield School Age Program 100 Candlewood Lake Road
Christian Life Academy 133 Junction Road
Country Kid's Club 94 Old State Road
Country Kids Play Farm 107 Old State Road
Greenknoll Children's Center 60 Old New Milford Road
Greenknoll Children's Center 2 Huckleberry Hill Road
The Goddard School 1 Production Drive
Kid's Castle Learning Center 777 Federal Road
Montessori Community Center 21 West Whisconier
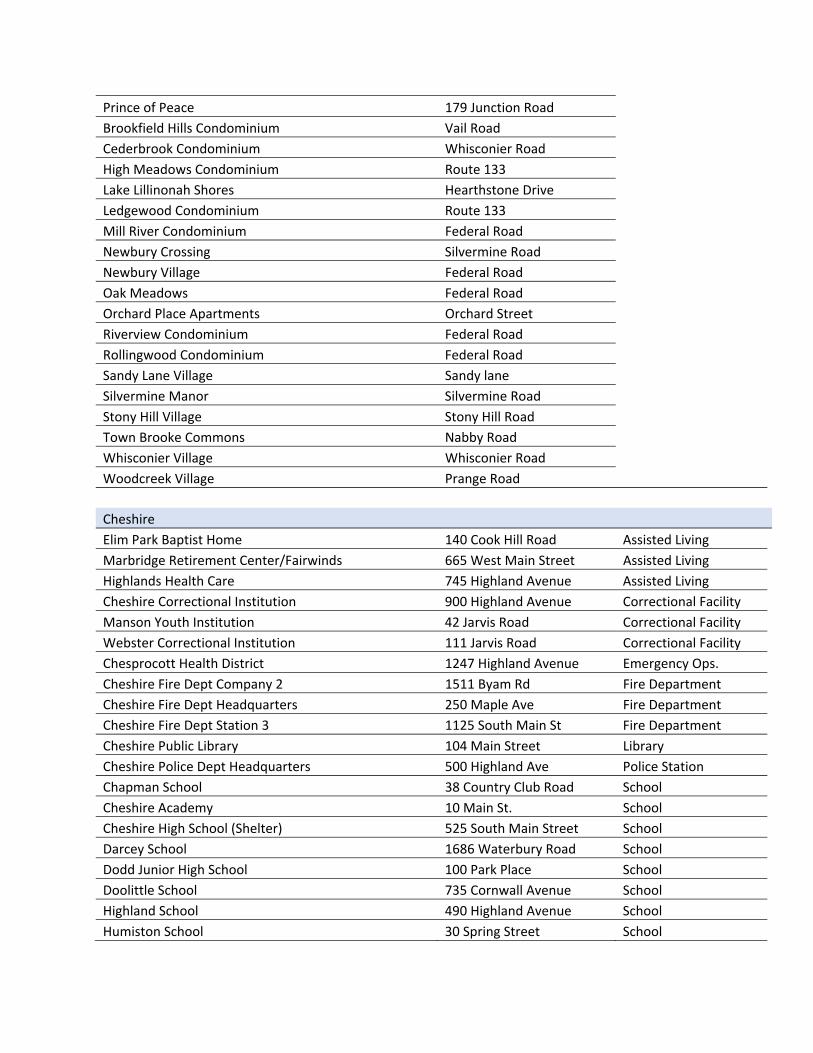
Prince of Peace 179 Junction Road
Brookfield Hills Condominium Vail Road Cederbrook Condominium Whisconier Road
High Meadows Condominium Route 133
Lake Lillinonah Shores Hearthstone Drive
Ledgewood Condominium Route 133
Mill River Condominium Federal Road
Newbury Crossing Silvermine Road
Newbury Village Federal Road
Oak Meadows Federal Road
Orchard Place Apartments Orchard Street
Riverview Condominium Federal Road
Rollingwood Condominium Federal Road
Sandy Lane Village Sandy lane
Silvermine Manor Silvermine Road
Stony Hill Village Stony Hill Road
Town Brooke Commons Nabby Road
Whisconier Village Whisconier Road
Woodcreek Village Prange Road
Cheshire
Elim Park Baptist Home 140 Cook Hill Road Assisted Living
Marbridge Retirement Center/Fairwinds 665 West Main Street Assisted Living
Highlands Health Care 745 Highland Avenue Assisted Living
Cheshire Correctional Institution 900 Highland Avenue Correctional Facility
Manson Youth Institution 42 Jarvis Road Correctional Facility
Webster Correctional Institution 111 Jarvis Road Correctional Facility
Chesprocott Health District 1247 Highland Avenue Emergency Ops.
Cheshire Fire Dept Company 2 1511 Byam Rd Fire Department
Cheshire Fire Dept Headquarters 250 Maple Ave Fire Department
Cheshire Fire Dept Station 3 1125 South Main St Fire Department
Cheshire Public Library 104 Main Street Library
Cheshire Police Dept Headquarters 500 Highland Ave Police Station
Chapman School 38 Country Club Road School
Cheshire Academy 10 Main St. School
Cheshire High School (Shelter) 525 South Main Street School
Darcey School 1686 Waterbury Road School
Dodd Junior High School 100 Park Place School
Doolittle School 735 Cornwall Avenue School
Highland School 490 Highland Avenue School
Humiston School 30 Spring Street School
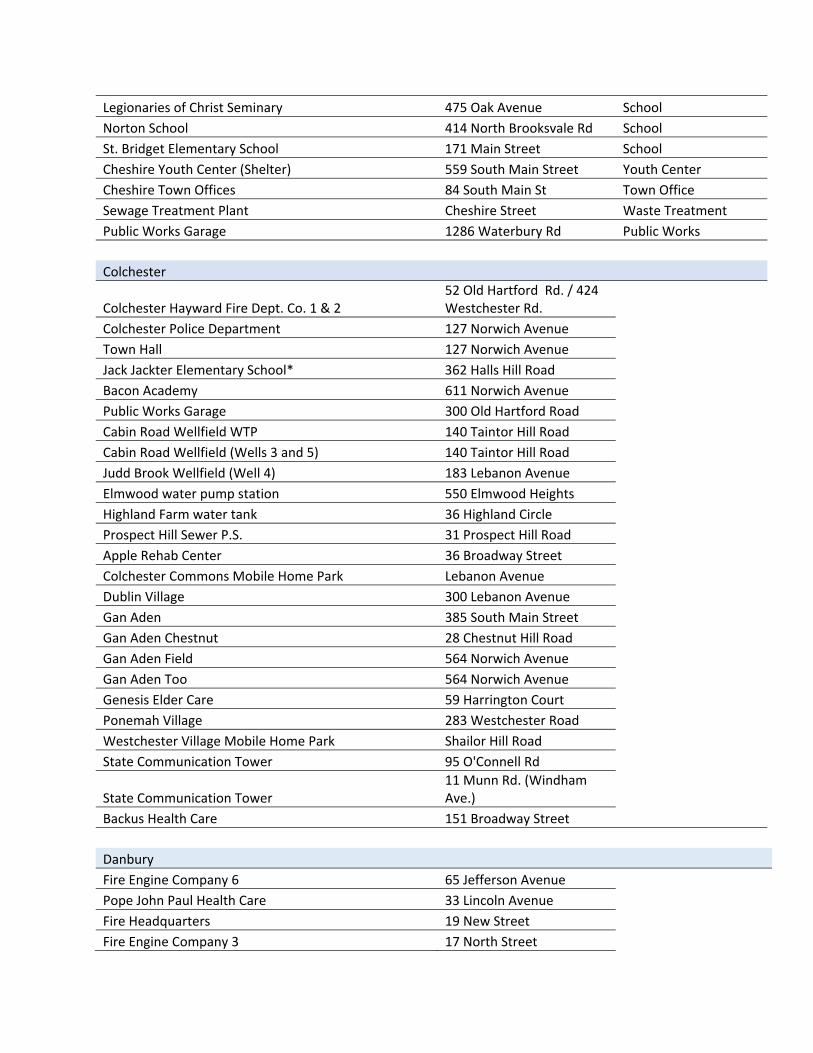
Legionaries of Christ Seminary 475 Oak Avenue School
Norton School 414 North Brooksvale Rd School
St. Bridget Elementary School 171 Main Street School
Cheshire Youth Center (Shelter) 559 South Main Street Youth Center
Cheshire Town Offices 84 South Main St Town Office
Sewage Treatment Plant Cheshire Street Waste Treatment
Public Works Garage 1286 Waterbury Rd Public Works
Colchester
Colchester Hayward Fire Dept. Co. 1 & 2 52 Old Hartford Rd. / 424 Westchester Rd.
Colchester Police Department 127 Norwich Avenue
Town Hall 127 Norwich Avenue
Jack Jackter Elementary School* 362 Halls Hill Road
Bacon Academy 611 Norwich Avenue
Public Works Garage 300 Old Hartford Road
Cabin Road Wellfield WTP 140 Taintor Hill Road
Cabin Road Wellfield (Wells 3 and 5) 140 Taintor Hill Road
Judd Brook Wellfield (Well 4) 183 Lebanon Avenue
Elmwood water pump station 550 Elmwood Heights
Highland Farm water tank 36 Highland Circle
Prospect Hill Sewer P.S. 31 Prospect Hill Road
Apple Rehab Center 36 Broadway Street
Colchester Commons Mobile Home Park Lebanon Avenue
Dublin Village 300 Lebanon Avenue
Gan Aden 385 South Main Street
Gan Aden Chestnut 28 Chestnut Hill Road
Gan Aden Field 564 Norwich Avenue
Gan Aden Too 564 Norwich Avenue
Genesis Elder Care 59 Harrington Court
Ponemah Village 283 Westchester Road
Westchester Village Mobile Home Park Shailor Hill Road
State Communication Tower 95 O'Connell Rd
State Communication Tower 11 Munn Rd. (Windham Ave.)
Backus Health Care 151 Broadway Street
Danbury
Fire Engine Company 6 65 Jefferson Avenue
Pope John Paul Health Care 33 Lincoln Avenue
Fire Headquarters 19 New Street
Fire Engine Company 3 17 North Street
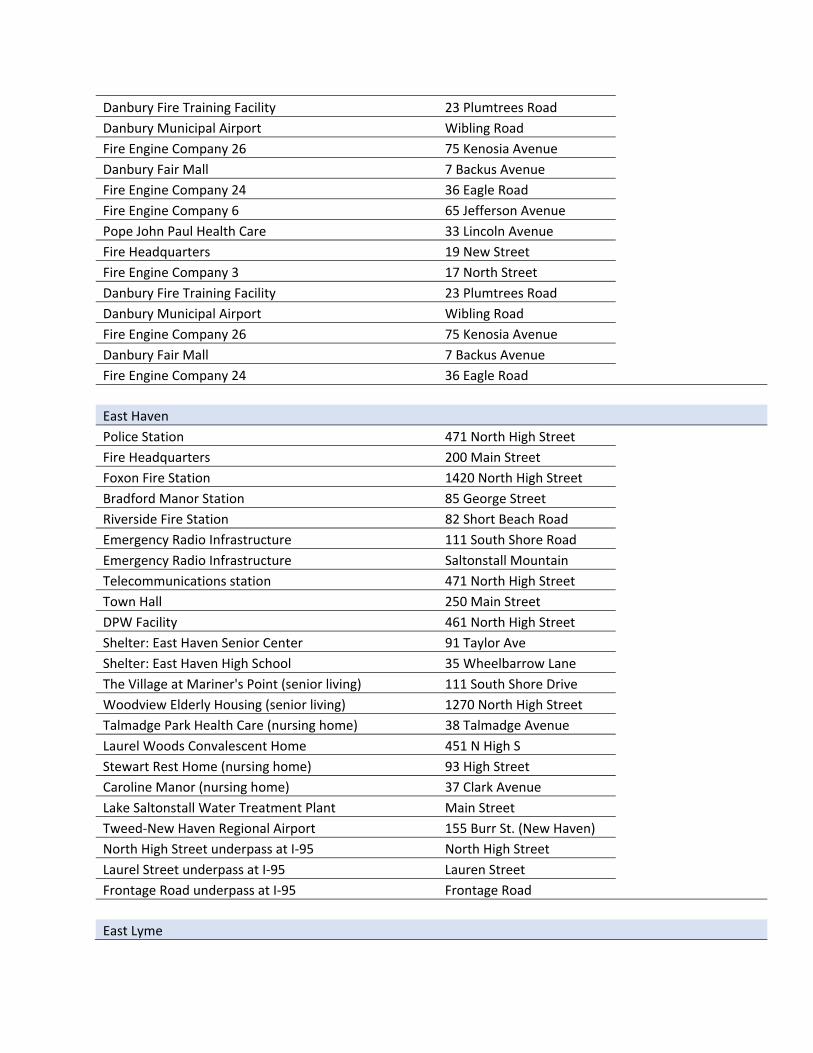
Danbury Fire Training Facility 23 Plumtrees Road
Danbury Municipal Airport Wibling Road
Fire Engine Company 26 75 Kenosia Avenue
Danbury Fair Mall 7 Backus Avenue
Fire Engine Company 24 36 Eagle Road
Fire Engine Company 6 65 Jefferson Avenue
Pope John Paul Health Care 33 Lincoln Avenue
Fire Headquarters 19 New Street
Fire Engine Company 3 17 North Street
Danbury Fire Training Facility 23 Plumtrees Road
Danbury Municipal Airport Wibling Road
Fire Engine Company 26 75 Kenosia Avenue
Danbury Fair Mall 7 Backus Avenue
Fire Engine Company 24 36 Eagle Road
East Haven
Police Station 471 North High Street
Fire Headquarters 200 Main Street
Foxon Fire Station 1420 North High Street
Bradford Manor Station 85 George Street
Riverside Fire Station 82 Short Beach Road
Emergency Radio Infrastructure 111 South Shore Road
Emergency Radio Infrastructure Saltonstall Mountain
Telecommunications station 471 North High Street
Town Hall 250 Main Street
DPW Facility 461 North High Street
Shelter: East Haven Senior Center 91 Taylor Ave
Shelter: East Haven High School 35 Wheelbarrow Lane
The Village at Mariner's Point (senior living) 111 South Shore Drive
Woodview Elderly Housing (senior living) 1270 North High Street
Talmadge Park Health Care (nursing home) 38 Talmadge Avenue
Laurel Woods Convalescent Home 451 N High S
Stewart Rest Home (nursing home) 93 High Street
Caroline Manor (nursing home) 37 Clark Avenue
Lake Saltonstall Water Treatment Plant Main Street
Tweed‐New Haven Regional Airport 155 Burr St. (New Haven)
North High Street underpass at I‐95 North High Street
Laurel Street underpass at I‐95 Lauren Street
Frontage Road underpass at I‐95 Frontage Road
East Lyme
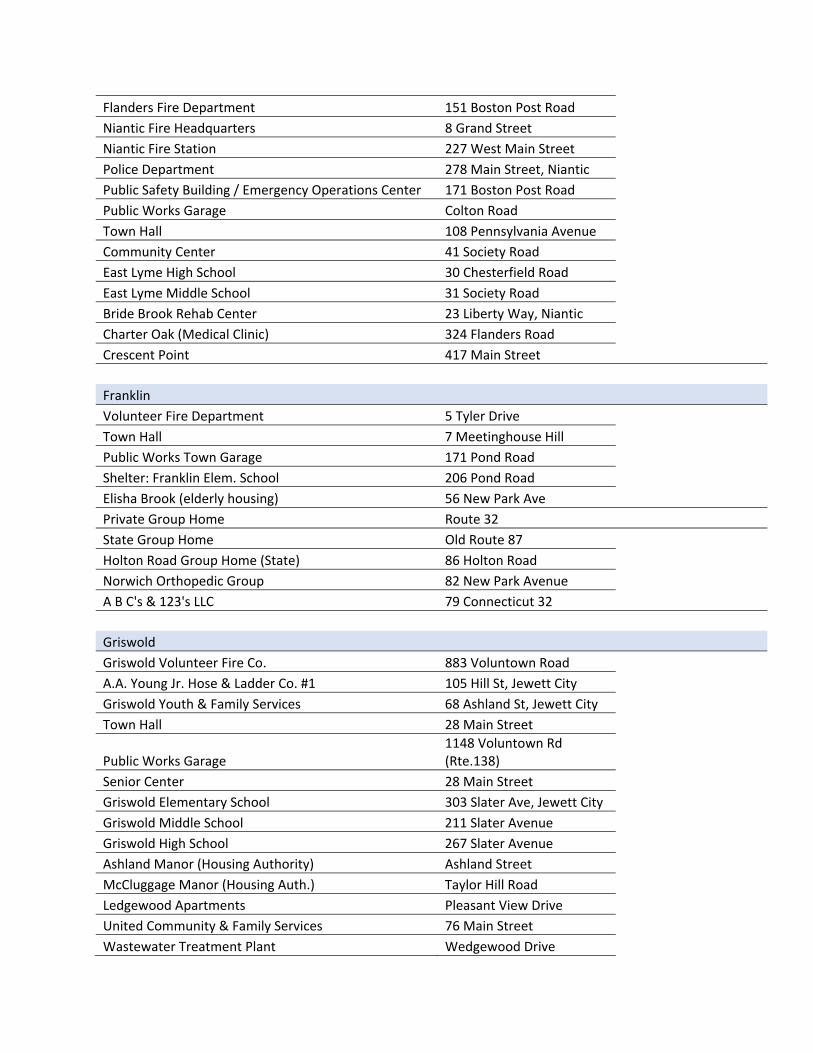
Flanders Fire Department 151 Boston Post Road
Niantic Fire Headquarters 8 Grand Street
Niantic Fire Station 227 West Main Street
Police Department 278 Main Street, Niantic
Public Safety Building / Emergency Operations Center 171 Boston Post Road
Public Works Garage Colton Road
Town Hall 108 Pennsylvania Avenue
Community Center 41 Society Road
East Lyme High School 30 Chesterfield Road
East Lyme Middle School 31 Society Road
Bride Brook Rehab Center 23 Liberty Way, Niantic
Charter Oak (Medical Clinic) 324 Flanders Road
Crescent Point 417 Main Street
Franklin
Volunteer Fire Department 5 Tyler Drive
Town Hall 7 Meetinghouse Hill
Public Works Town Garage 171 Pond Road
Shelter: Franklin Elem. School 206 Pond Road
Elisha Brook (elderly housing) 56 New Park Ave
Private Group Home Route 32
State Group Home Old Route 87
Holton Road Group Home (State) 86 Holton Road
Norwich Orthopedic Group 82 New Park Avenue
A B C's & 123's LLC 79 Connecticut 32
Griswold
Griswold Volunteer Fire Co. 883 Voluntown Road
A.A. Young Jr. Hose & Ladder Co. #1 105 Hill St, Jewett City
Griswold Youth & Family Services 68 Ashland St, Jewett City
Town Hall 28 Main Street
Public Works Garage 1148 Voluntown Rd (Rte.138)
Senior Center 28 Main Street
Griswold Elementary School 303 Slater Ave, Jewett City
Griswold Middle School 211 Slater Avenue
Griswold High School 267 Slater Avenue
Ashland Manor (Housing Authority) Ashland Street
McCluggage Manor (Housing Auth.) Taylor Hill Road
Ledgewood Apartments Pleasant View Drive
United Community & Family Services 76 Main Street
Wastewater Treatment Plant Wedgewood Drive
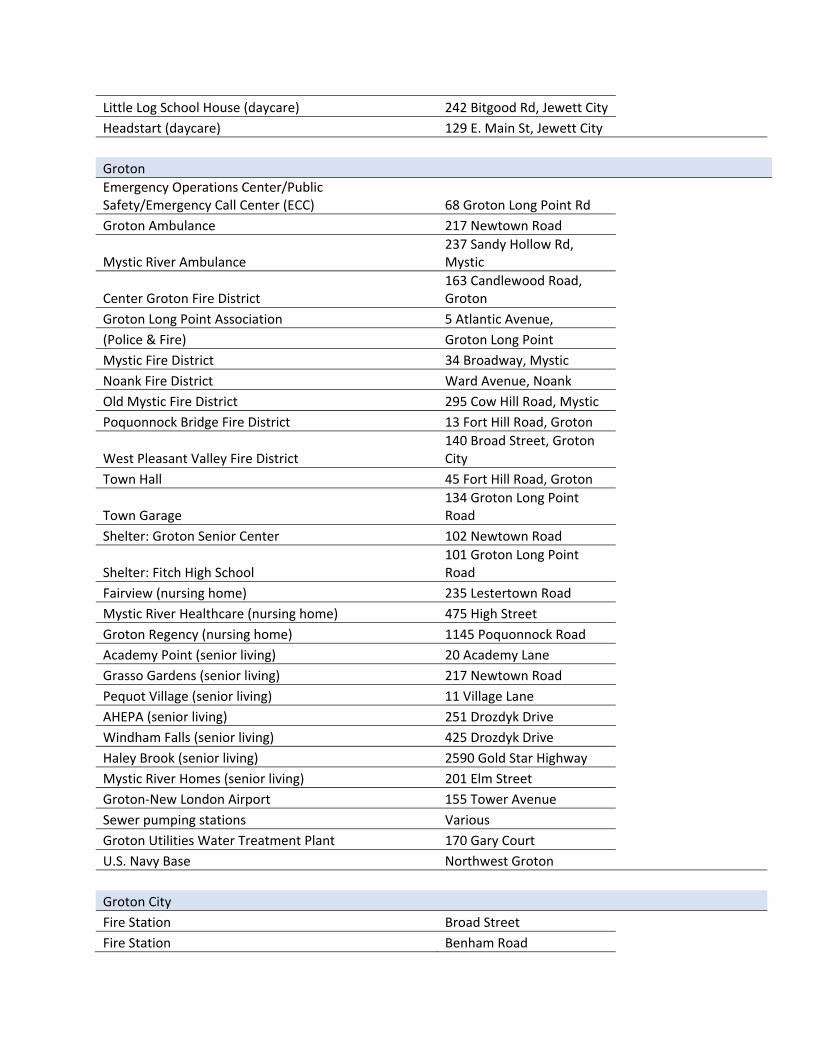
Little Log School House (daycare) 242 Bitgood Rd, Jewett City
Headstart (daycare) 129 E. Main St, Jewett City
Groton
Emergency Operations Center/Public Safety/Emergency Call Center (ECC) 68 Groton Long Point Rd
Groton Ambulance 217 Newtown Road
Mystic River Ambulance 237 Sandy Hollow Rd, Mystic
Center Groton Fire District 163 Candlewood Road, Groton
Groton Long Point Association 5 Atlantic Avenue,
(Police & Fire) Groton Long Point
Mystic Fire District 34 Broadway, Mystic
Noank Fire District Ward Avenue, Noank
Old Mystic Fire District 295 Cow Hill Road, Mystic
Poquonnock Bridge Fire District 13 Fort Hill Road, Groton
West Pleasant Valley Fire District 140 Broad Street, Groton City
Town Hall 45 Fort Hill Road, Groton
Town Garage 134 Groton Long Point Road
Shelter: Groton Senior Center 102 Newtown Road
Shelter: Fitch High School 101 Groton Long Point Road
Fairview (nursing home) 235 Lestertown Road
Mystic River Healthcare (nursing home) 475 High Street
Groton Regency (nursing home) 1145 Poquonnock Road
Academy Point (senior living) 20 Academy Lane
Grasso Gardens (senior living) 217 Newtown Road
Pequot Village (senior living) 11 Village Lane
AHEPA (senior living) 251 Drozdyk Drive
Windham Falls (senior living) 425 Drozdyk Drive
Haley Brook (senior living) 2590 Gold Star Highway
Mystic River Homes (senior living) 201 Elm Street
Groton‐New London Airport 155 Tower Avenue
Sewer pumping stations Various Groton Utilities Water Treatment Plant 170 Gary Court
U.S. Navy Base Northwest Groton
Groton City
Fire Station Broad Street
Fire Station Benham Road
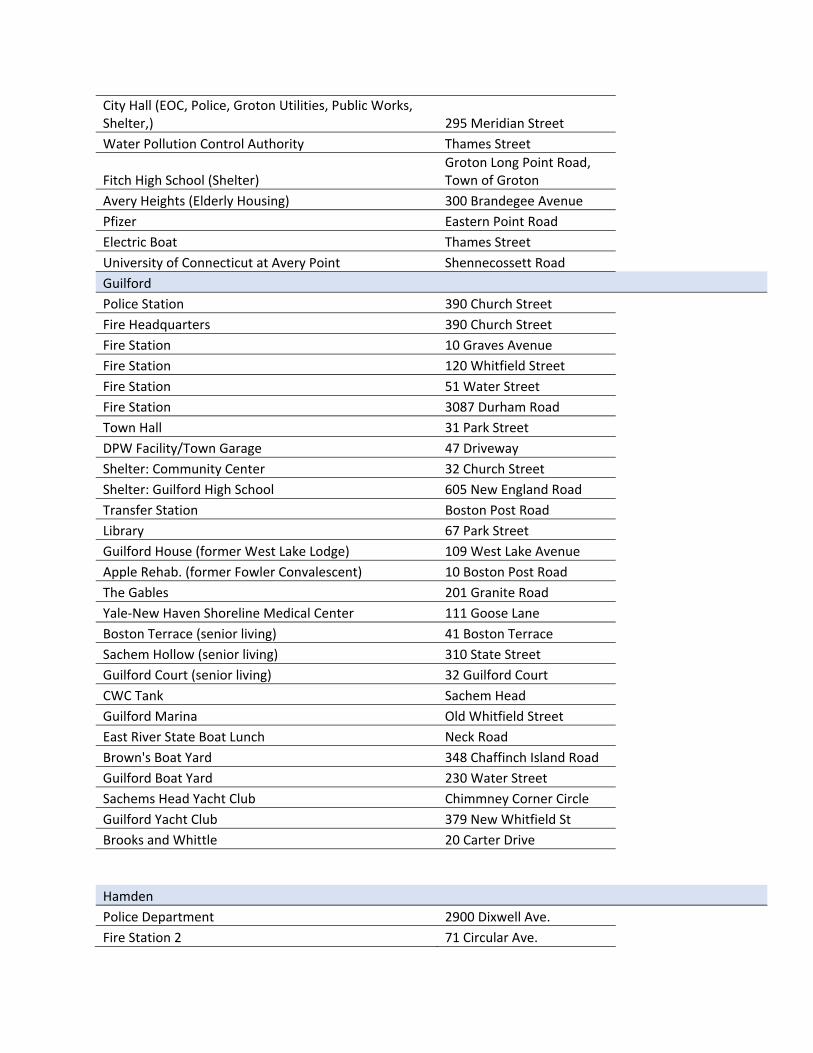
City Hall (EOC, Police, Groton Utilities, Public Works, Shelter,) 295 Meridian Street
Water Pollution Control Authority Thames Street
Fitch High School (Shelter) Groton Long Point Road, Town of Groton
Avery Heights (Elderly Housing) 300 Brandegee Avenue
Pfizer Eastern Point Road
Electric Boat Thames Street
University of Connecticut at Avery Point Shennecossett Road
Guilford
Police Station 390 Church Street
Fire Headquarters 390 Church Street
Fire Station 10 Graves Avenue
Fire Station 120 Whitfield Street
Fire Station 51 Water Street
Fire Station 3087 Durham Road
Town Hall 31 Park Street
DPW Facility/Town Garage 47 Driveway
Shelter: Community Center 32 Church Street
Shelter: Guilford High School 605 New England Road
Transfer Station Boston Post Road
Library 67 Park Street
Guilford House (former West Lake Lodge) 109 West Lake Avenue
Apple Rehab. (former Fowler Convalescent) 10 Boston Post Road
The Gables 201 Granite Road
Yale‐New Haven Shoreline Medical Center 111 Goose Lane
Boston Terrace (senior living) 41 Boston Terrace
Sachem Hollow (senior living) 310 State Street
Guilford Court (senior living) 32 Guilford Court
CWC Tank Sachem Head
Guilford Marina Old Whitfield Street
East River State Boat Lunch Neck Road
Brown's Boat Yard 348 Chaffinch Island Road
Guilford Boat Yard 230 Water Street
Sachems Head Yacht Club Chimmney Corner Circle
Guilford Yacht Club 379 New Whitfield St
Brooks and Whittle 20 Carter Drive
Hamden
Police Department 2900 Dixwell Ave.
Fire Station 2 71 Circular Ave.
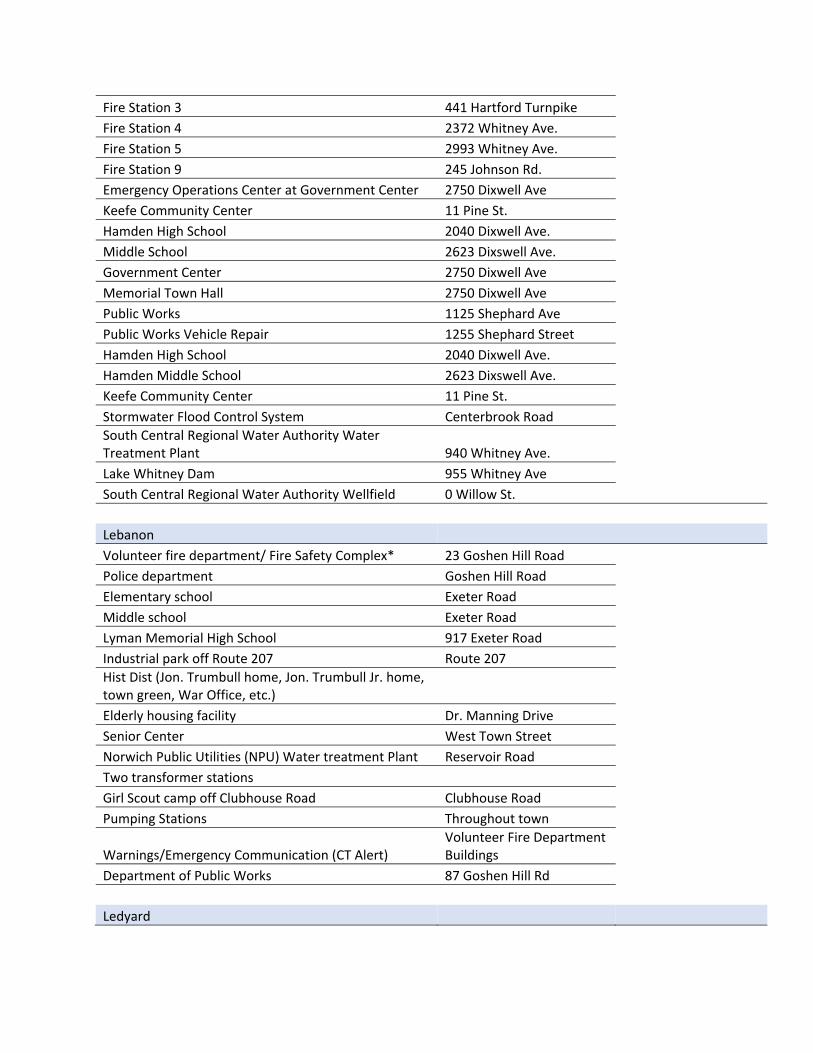
Fire Station 3 441 Hartford Turnpike
Fire Station 4 2372 Whitney Ave.
Fire Station 5 2993 Whitney Ave.
Fire Station 9 245 Johnson Rd.
Emergency Operations Center at Government Center 2750 Dixwell Ave
Keefe Community Center 11 Pine St.
Hamden High School 2040 Dixwell Ave.
Middle School 2623 Dixswell Ave.
Government Center 2750 Dixwell Ave
Memorial Town Hall 2750 Dixwell Ave
Public Works 1125 Shephard Ave
Public Works Vehicle Repair 1255 Shephard Street
Hamden High School 2040 Dixwell Ave.
Hamden Middle School 2623 Dixswell Ave.
Keefe Community Center 11 Pine St.
Stormwater Flood Control System Centerbrook Road
South Central Regional Water Authority Water Treatment Plant 940 Whitney Ave.
Lake Whitney Dam 955 Whitney Ave
South Central Regional Water Authority Wellfield 0 Willow St.
Lebanon
Volunteer fire department/ Fire Safety Complex* 23 Goshen Hill Road
Police department Goshen Hill Road
Elementary school Exeter Road
Middle school Exeter Road
Lyman Memorial High School 917 Exeter Road
Industrial park off Route 207 Route 207
Hist Dist (Jon. Trumbull home, Jon. Trumbull Jr. home, town green, War Office, etc.)
Elderly housing facility Dr. Manning Drive
Senior Center West Town Street
Norwich Public Utilities (NPU) Water treatment Plant Reservoir Road
Two transformer stations
Girl Scout camp off Clubhouse Road Clubhouse Road
Pumping Stations Throughout town
Warnings/Emergency Communication (CT Alert) Volunteer Fire Department Buildings
Department of Public Works 87 Goshen Hill Rd
Ledyard
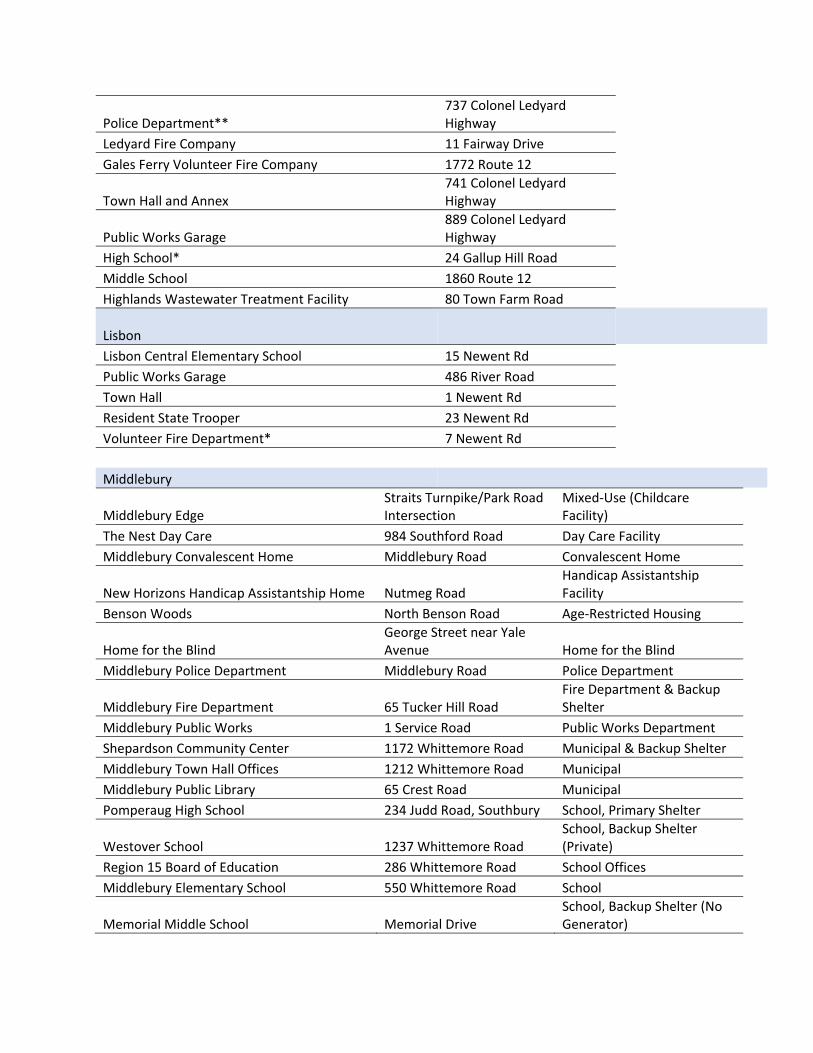
Police Department** 737 Colonel Ledyard Highway
Ledyard Fire Company 11 Fairway Drive
Gales Ferry Volunteer Fire Company 1772 Route 12
Town Hall and Annex 741 Colonel Ledyard Highway
Public Works Garage 889 Colonel Ledyard Highway
High School* 24 Gallup Hill Road
Middle School 1860 Route 12
Highlands Wastewater Treatment Facility 80 Town Farm Road
Lisbon Lisbon Central Elementary School 15 Newent Rd
Public Works Garage 486 River Road
Town Hall 1 Newent Rd
Resident State Trooper 23 Newent Rd
Volunteer Fire Department* 7 Newent Rd
Middlebury
Middlebury Edge Straits Turnpike/Park Road Intersection
Mixed‐Use (Childcare Facility)
The Nest Day Care 984 Southford Road Day Care Facility
Middlebury Convalescent Home Middlebury Road Convalescent Home
New Horizons Handicap Assistantship Home Nutmeg Road Handicap Assistantship Facility
Benson Woods North Benson Road Age‐Restricted Housing
Home for the Blind George Street near Yale Avenue Home for the Blind
Middlebury Police Department Middlebury Road Police Department
Middlebury Fire Department 65 Tucker Hill Road Fire Department & Backup Shelter
Middlebury Public Works 1 Service Road Public Works Department
Shepardson Community Center 1172 Whittemore Road Municipal & Backup Shelter
Middlebury Town Hall Offices 1212 Whittemore Road Municipal
Middlebury Public Library 65 Crest Road Municipal
Pomperaug High School 234 Judd Road, Southbury School, Primary Shelter
Westover School 1237 Whittemore Road School, Backup Shelter (Private)
Region 15 Board of Education 286 Whittemore Road School Offices
Middlebury Elementary School 550 Whittemore Road School
Memorial Middle School Memorial Drive School, Backup Shelter (No Generator)
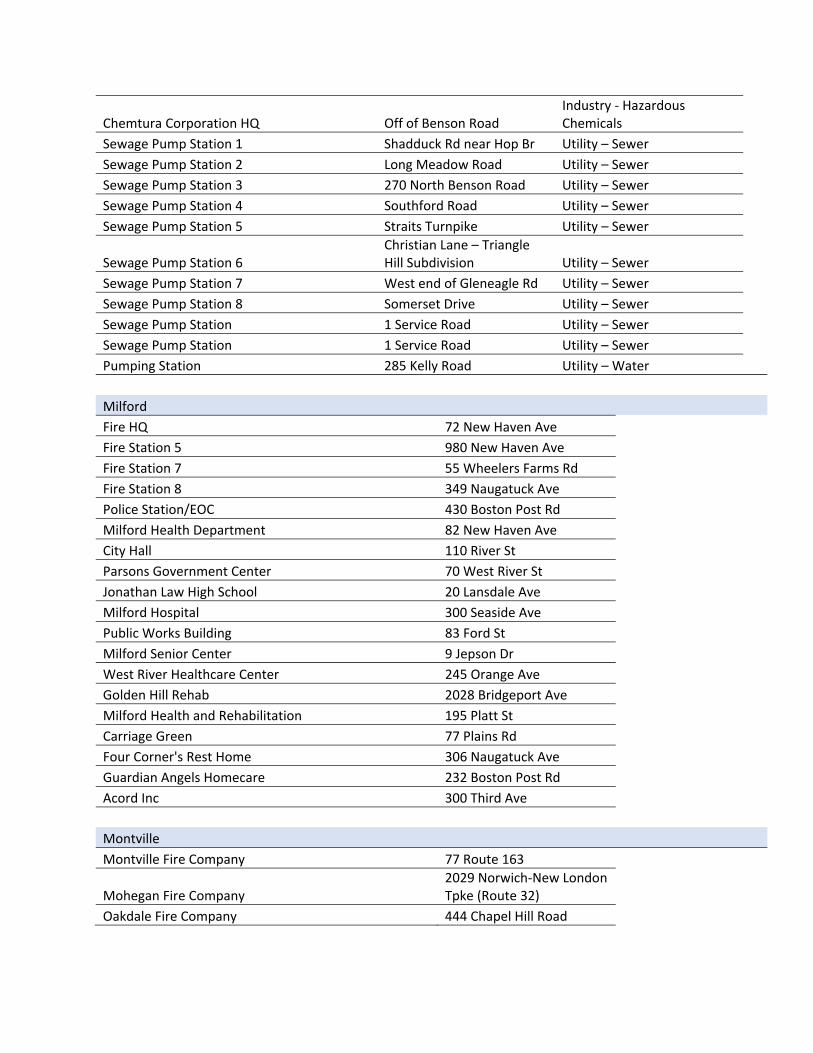
Chemtura Corporation HQ Off of Benson Road Industry ‐ Hazardous Chemicals
Sewage Pump Station 1 Shadduck Rd near Hop Br Utility – Sewer
Sewage Pump Station 2 Long Meadow Road Utility – Sewer
Sewage Pump Station 3 270 North Benson Road Utility – Sewer
Sewage Pump Station 4 Southford Road Utility – Sewer
Sewage Pump Station 5 Straits Turnpike Utility – Sewer
Sewage Pump Station 6 Christian Lane – Triangle Hill Subdivision Utility – Sewer
Sewage Pump Station 7 West end of Gleneagle Rd Utility – Sewer
Sewage Pump Station 8 Somerset Drive Utility – Sewer
Sewage Pump Station 1 Service Road Utility – Sewer
Sewage Pump Station 1 Service Road Utility – Sewer
Pumping Station 285 Kelly Road Utility – Water
Milford
Fire HQ 72 New Haven Ave
Fire Station 5 980 New Haven Ave
Fire Station 7 55 Wheelers Farms Rd
Fire Station 8 349 Naugatuck Ave
Police Station/EOC 430 Boston Post Rd
Milford Health Department 82 New Haven Ave
City Hall 110 River St
Parsons Government Center 70 West River St
Jonathan Law High School 20 Lansdale Ave
Milford Hospital 300 Seaside Ave
Public Works Building 83 Ford St
Milford Senior Center 9 Jepson Dr
West River Healthcare Center 245 Orange Ave
Golden Hill Rehab 2028 Bridgeport Ave
Milford Health and Rehabilitation 195 Platt St
Carriage Green 77 Plains Rd
Four Corner's Rest Home 306 Naugatuck Ave
Guardian Angels Homecare 232 Boston Post Rd
Acord Inc 300 Third Ave
Montville
Montville Fire Company 77 Route 163
Mohegan Fire Company 2029 Norwich‐New London Tpke (Route 32)
Oakdale Fire Company 444 Chapel Hill Road
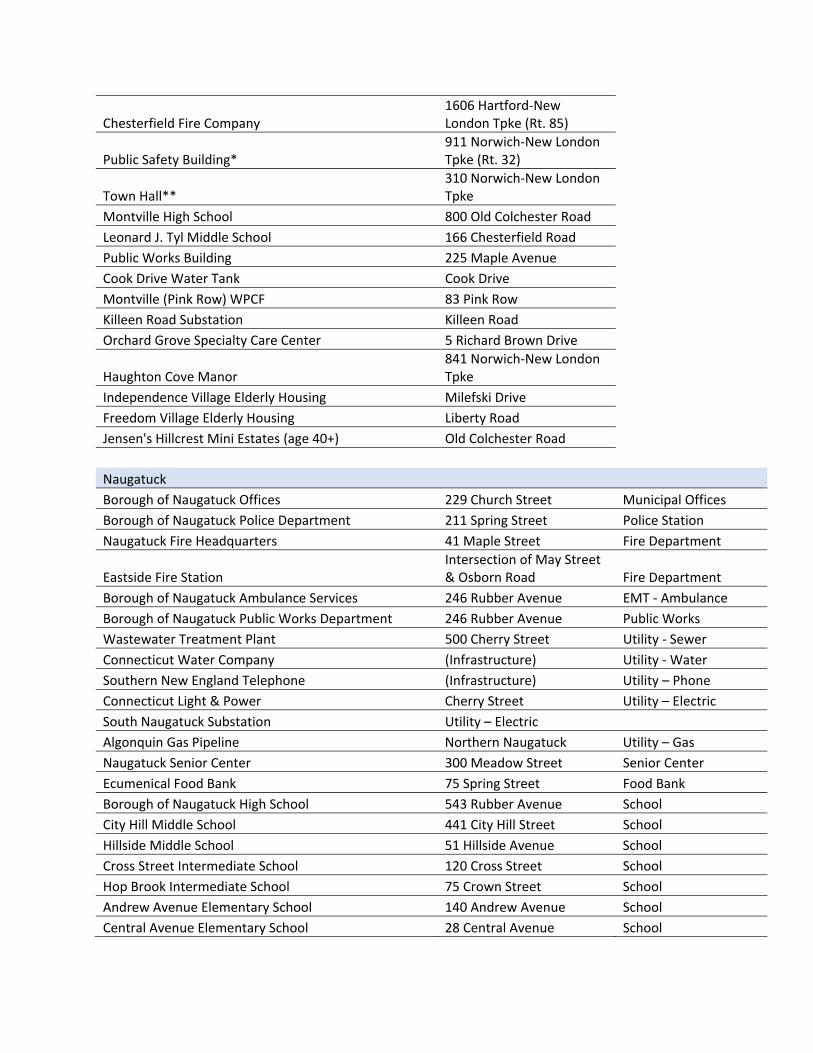
Chesterfield Fire Company 1606 Hartford‐New London Tpke (Rt. 85)
Public Safety Building* 911 Norwich‐New London Tpke (Rt. 32)
Town Hall** 310 Norwich‐New London Tpke
Montville High School 800 Old Colchester Road
Leonard J. Tyl Middle School 166 Chesterfield Road
Public Works Building 225 Maple Avenue
Cook Drive Water Tank Cook Drive
Montville (Pink Row) WPCF 83 Pink Row
Killeen Road Substation Killeen Road
Orchard Grove Specialty Care Center 5 Richard Brown Drive
Haughton Cove Manor 841 Norwich‐New London Tpke
Independence Village Elderly Housing Milefski Drive
Freedom Village Elderly Housing Liberty Road
Jensen's Hillcrest Mini Estates (age 40+) Old Colchester Road
Naugatuck
Borough of Naugatuck Offices 229 Church Street Municipal Offices
Borough of Naugatuck Police Department 211 Spring Street Police Station
Naugatuck Fire Headquarters 41 Maple Street Fire Department
Eastside Fire Station Intersection of May Street & Osborn Road Fire Department
Borough of Naugatuck Ambulance Services 246 Rubber Avenue EMT ‐ Ambulance
Borough of Naugatuck Public Works Department 246 Rubber Avenue Public Works
Wastewater Treatment Plant 500 Cherry Street Utility ‐ Sewer
Connecticut Water Company (Infrastructure) Utility ‐ Water
Southern New England Telephone (Infrastructure) Utility – Phone
Connecticut Light & Power Cherry Street Utility – Electric
South Naugatuck Substation Utility – Electric
Algonquin Gas Pipeline Northern Naugatuck Utility – Gas
Naugatuck Senior Center 300 Meadow Street Senior Center
Ecumenical Food Bank 75 Spring Street Food Bank
Borough of Naugatuck High School 543 Rubber Avenue School
City Hill Middle School 441 City Hill Street School
Hillside Middle School 51 Hillside Avenue School
Cross Street Intermediate School 120 Cross Street School
Hop Brook Intermediate School 75 Crown Street School
Andrew Avenue Elementary School 140 Andrew Avenue School
Central Avenue Elementary School 28 Central Avenue School
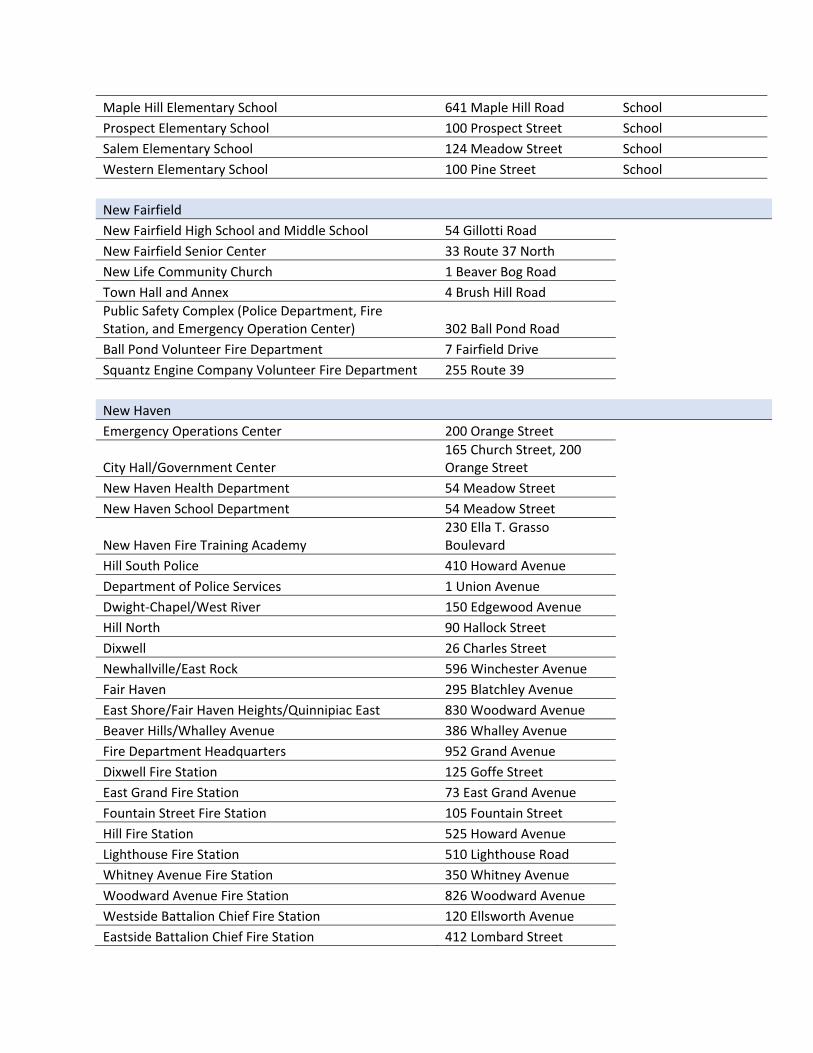
Maple Hill Elementary School 641 Maple Hill Road School
Prospect Elementary School 100 Prospect Street School
Salem Elementary School 124 Meadow Street School
Western Elementary School 100 Pine Street School
New Fairfield
New Fairfield High School and Middle School 54 Gillotti Road
New Fairfield Senior Center 33 Route 37 North
New Life Community Church 1 Beaver Bog Road
Town Hall and Annex 4 Brush Hill Road
Public Safety Complex (Police Department, Fire Station, and Emergency Operation Center) 302 Ball Pond Road
Ball Pond Volunteer Fire Department 7 Fairfield Drive
Squantz Engine Company Volunteer Fire Department 255 Route 39
New Haven
Emergency Operations Center 200 Orange Street
City Hall/Government Center 165 Church Street, 200 Orange Street
New Haven Health Department 54 Meadow Street
New Haven School Department 54 Meadow Street
New Haven Fire Training Academy 230 Ella T. Grasso Boulevard
Hill South Police 410 Howard Avenue
Department of Police Services 1 Union Avenue
Dwight‐Chapel/West River 150 Edgewood Avenue
Hill North 90 Hallock Street
Dixwell 26 Charles Street
Newhallville/East Rock 596 Winchester Avenue
Fair Haven 295 Blatchley Avenue
East Shore/Fair Haven Heights/Quinnipiac East 830 Woodward Avenue
Beaver Hills/Whalley Avenue 386 Whalley Avenue
Fire Department Headquarters 952 Grand Avenue
Dixwell Fire Station 125 Goffe Street
East Grand Fire Station 73 East Grand Avenue
Fountain Street Fire Station 105 Fountain Street
Hill Fire Station 525 Howard Avenue
Lighthouse Fire Station 510 Lighthouse Road
Whitney Avenue Fire Station 350 Whitney Avenue
Woodward Avenue Fire Station 826 Woodward Avenue
Westside Battalion Chief Fire Station 120 Ellsworth Avenue
Eastside Battalion Chief Fire Station 412 Lombard Street
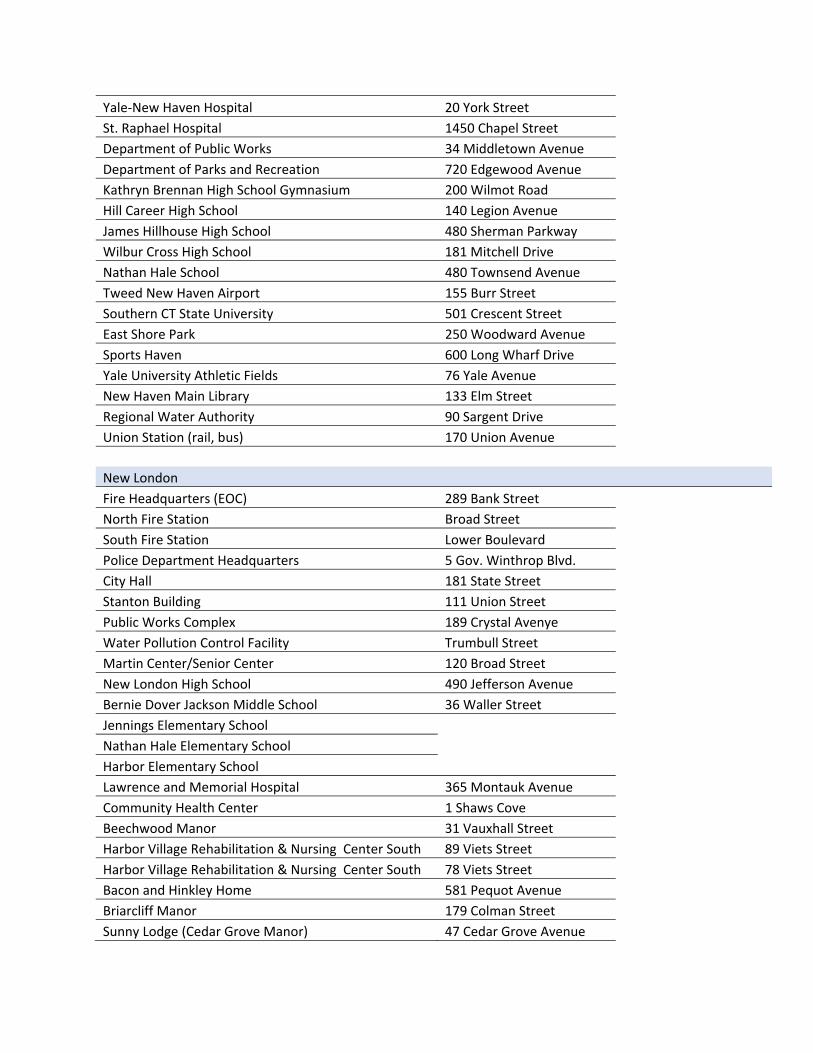
Yale‐New Haven Hospital 20 York Street
St. Raphael Hospital 1450 Chapel Street
Department of Public Works 34 Middletown Avenue
Department of Parks and Recreation 720 Edgewood Avenue
Kathryn Brennan High School Gymnasium 200 Wilmot Road
Hill Career High School 140 Legion Avenue
James Hillhouse High School 480 Sherman Parkway
Wilbur Cross High School 181 Mitchell Drive
Nathan Hale School 480 Townsend Avenue
Tweed New Haven Airport 155 Burr Street
Southern CT State University 501 Crescent Street
East Shore Park 250 Woodward Avenue
Sports Haven 600 Long Wharf Drive
Yale University Athletic Fields 76 Yale Avenue
New Haven Main Library 133 Elm Street
Regional Water Authority 90 Sargent Drive
Union Station (rail, bus) 170 Union Avenue
New London
Fire Headquarters (EOC) 289 Bank Street
North Fire Station Broad Street
South Fire Station Lower Boulevard
Police Department Headquarters 5 Gov. Winthrop Blvd.
City Hall 181 State Street
Stanton Building 111 Union Street
Public Works Complex 189 Crystal Avenye
Water Pollution Control Facility Trumbull Street
Martin Center/Senior Center 120 Broad Street
New London High School 490 Jefferson Avenue
Bernie Dover Jackson Middle School 36 Waller Street
Jennings Elementary School
Nathan Hale Elementary School
Harbor Elementary School
Lawrence and Memorial Hospital 365 Montauk Avenue
Community Health Center 1 Shaws Cove
Beechwood Manor 31 Vauxhall Street
Harbor Village Rehabilitation & Nursing Center South 89 Viets Street
Harbor Village Rehabilitation & Nursing Center South 78 Viets Street
Bacon and Hinkley Home 581 Pequot Avenue
Briarcliff Manor 179 Colman Street
Sunny Lodge (Cedar Grove Manor) 47 Cedar Grove Avenue
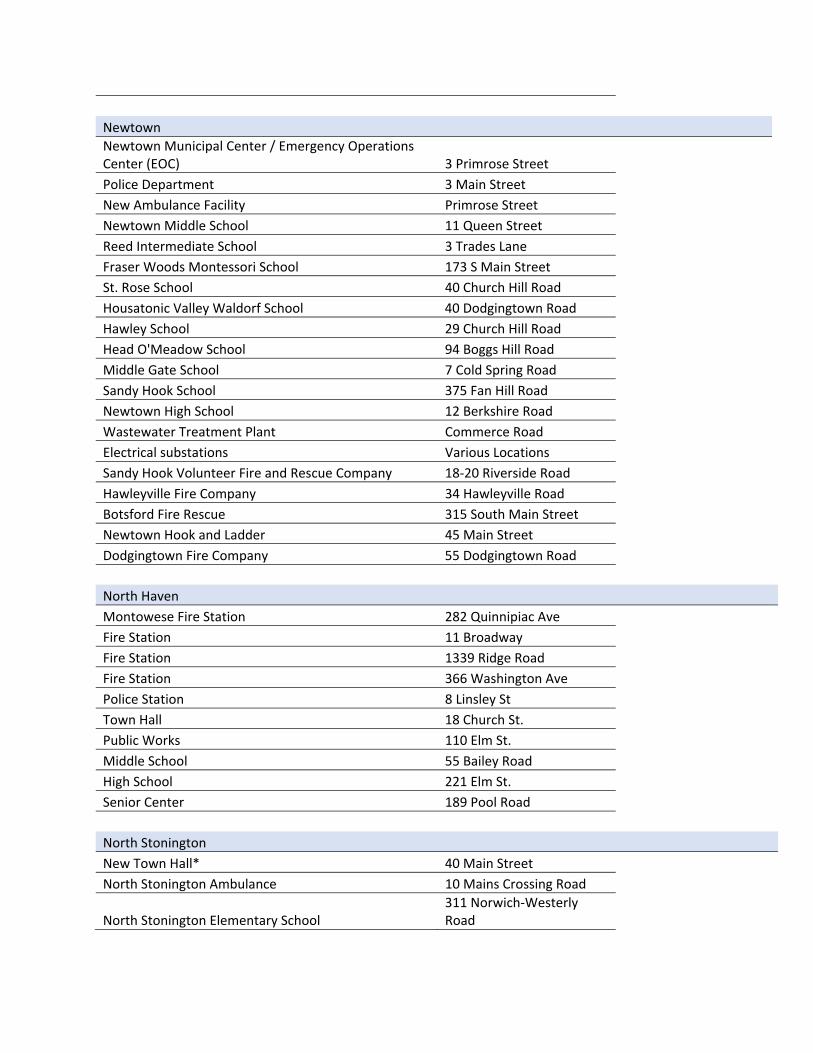
Newtown
Newtown Municipal Center / Emergency Operations Center (EOC) 3 Primrose Street
Police Department 3 Main Street
New Ambulance Facility Primrose Street
Newtown Middle School 11 Queen Street
Reed Intermediate School 3 Trades Lane
Fraser Woods Montessori School 173 S Main Street
St. Rose School 40 Church Hill Road
Housatonic Valley Waldorf School 40 Dodgingtown Road
Hawley School 29 Church Hill Road
Head O'Meadow School 94 Boggs Hill Road
Middle Gate School 7 Cold Spring Road
Sandy Hook School 375 Fan Hill Road
Newtown High School 12 Berkshire Road
Wastewater Treatment Plant Commerce Road
Electrical substations Various Locations
Sandy Hook Volunteer Fire and Rescue Company 18‐20 Riverside Road
Hawleyville Fire Company 34 Hawleyville Road
Botsford Fire Rescue 315 South Main Street
Newtown Hook and Ladder 45 Main Street
Dodgingtown Fire Company 55 Dodgingtown Road
North Haven
Montowese Fire Station 282 Quinnipiac Ave
Fire Station 11 Broadway
Fire Station 1339 Ridge Road
Fire Station 366 Washington Ave
Police Station 8 Linsley St
Town Hall 18 Church St.
Public Works 110 Elm St.
Middle School 55 Bailey Road
High School 221 Elm St.
Senior Center 189 Pool Road
North Stonington
New Town Hall* 40 Main Street
North Stonington Ambulance 10 Mains Crossing Road
North Stonington Elementary School 311 Norwich‐Westerly Road
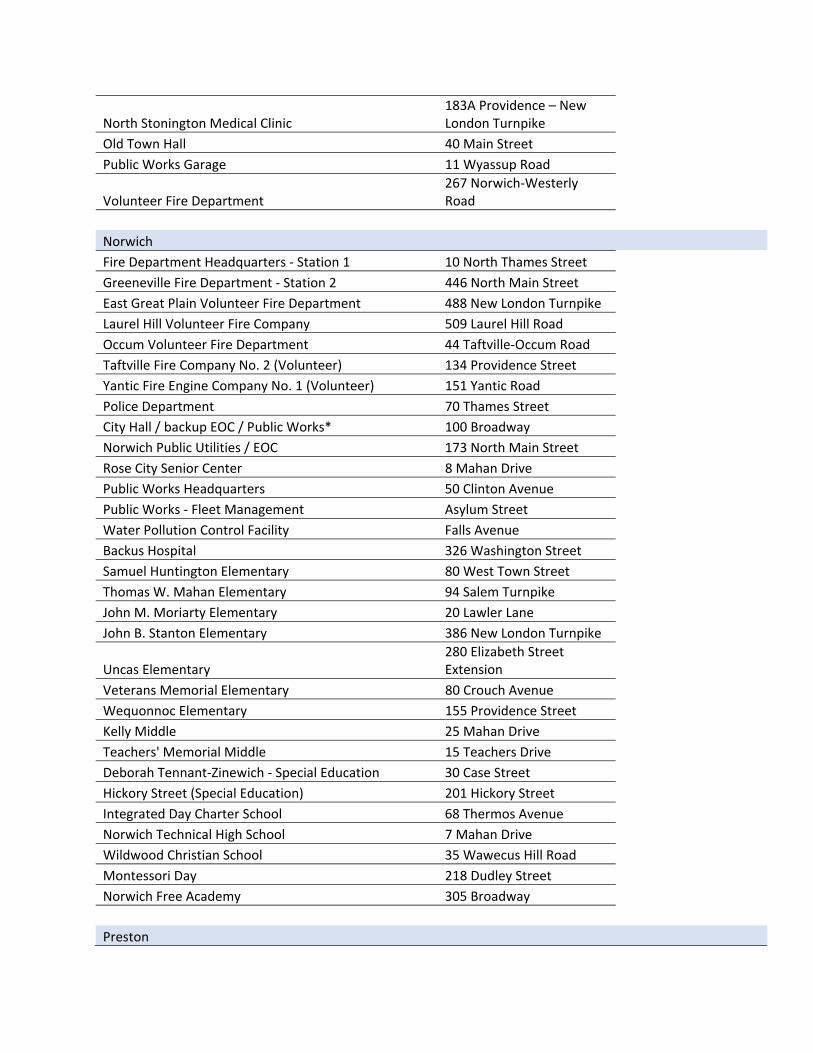
North Stonington Medical Clinic 183A Providence – New London Turnpike
Old Town Hall 40 Main Street
Public Works Garage 11 Wyassup Road
Volunteer Fire Department 267 Norwich‐Westerly Road
Norwich
Fire Department Headquarters ‐ Station 1 10 North Thames Street
Greeneville Fire Department ‐ Station 2 446 North Main Street
East Great Plain Volunteer Fire Department 488 New London Turnpike
Laurel Hill Volunteer Fire Company 509 Laurel Hill Road
Occum Volunteer Fire Department 44 Taftville‐Occum Road
Taftville Fire Company No. 2 (Volunteer) 134 Providence Street
Yantic Fire Engine Company No. 1 (Volunteer) 151 Yantic Road
Police Department 70 Thames Street
City Hall / backup EOC / Public Works* 100 Broadway
Norwich Public Utilities / EOC 173 North Main Street
Rose City Senior Center 8 Mahan Drive
Public Works Headquarters 50 Clinton Avenue
Public Works ‐ Fleet Management Asylum Street
Water Pollution Control Facility Falls Avenue
Backus Hospital 326 Washington Street
Samuel Huntington Elementary 80 West Town Street
Thomas W. Mahan Elementary 94 Salem Turnpike
John M. Moriarty Elementary 20 Lawler Lane
John B. Stanton Elementary 386 New London Turnpike
Uncas Elementary 280 Elizabeth Street Extension
Veterans Memorial Elementary 80 Crouch Avenue
Wequonnoc Elementary 155 Providence Street
Kelly Middle 25 Mahan Drive
Teachers' Memorial Middle 15 Teachers Drive
Deborah Tennant‐Zinewich ‐ Special Education 30 Case Street
Hickory Street (Special Education) 201 Hickory Street
Integrated Day Charter School 68 Thermos Avenue
Norwich Technical High School 7 Mahan Drive
Wildwood Christian School 35 Wawecus Hill Road
Montessori Day 218 Dudley Street
Norwich Free Academy 305 Broadway
Preston
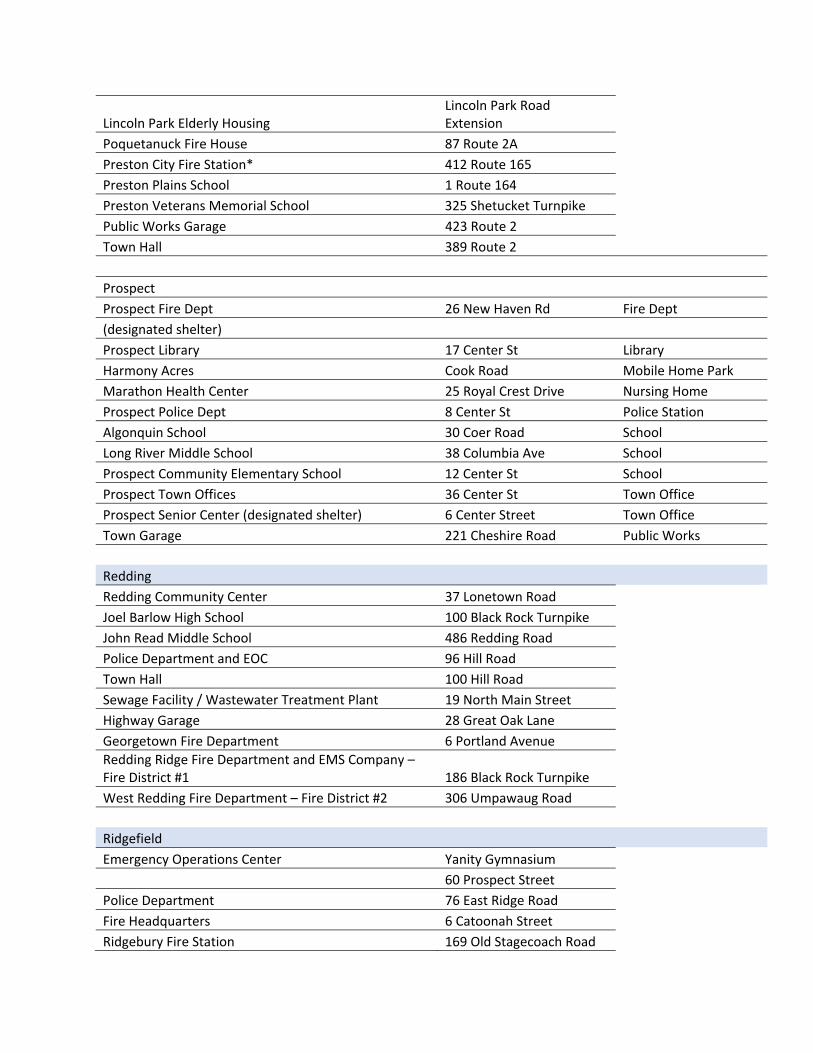
Lincoln Park Elderly Housing Lincoln Park Road Extension
Poquetanuck Fire House 87 Route 2A
Preston City Fire Station* 412 Route 165
Preston Plains School 1 Route 164
Preston Veterans Memorial School 325 Shetucket Turnpike
Public Works Garage 423 Route 2
Town Hall 389 Route 2
Prospect Prospect Fire Dept 26 New Haven Rd Fire Dept
(designated shelter)
Prospect Library 17 Center St Library
Harmony Acres Cook Road Mobile Home Park
Marathon Health Center 25 Royal Crest Drive Nursing Home
Prospect Police Dept 8 Center St Police Station
Algonquin School 30 Coer Road School
Long River Middle School 38 Columbia Ave School
Prospect Community Elementary School 12 Center St School
Prospect Town Offices 36 Center St Town Office
Prospect Senior Center (designated shelter) 6 Center Street Town Office
Town Garage 221 Cheshire Road Public Works
Redding
Redding Community Center 37 Lonetown Road
Joel Barlow High School 100 Black Rock Turnpike
John Read Middle School 486 Redding Road
Police Department and EOC 96 Hill Road
Town Hall 100 Hill Road
Sewage Facility / Wastewater Treatment Plant 19 North Main Street
Highway Garage 28 Great Oak Lane
Georgetown Fire Department 6 Portland Avenue
Redding Ridge Fire Department and EMS Company –Fire District #1 186 Black Rock Turnpike
West Redding Fire Department – Fire District #2 306 Umpawaug Road
Ridgefield
Emergency Operations Center Yanity Gymnasium
60 Prospect Street
Police Department 76 East Ridge Road
Fire Headquarters 6 Catoonah Street
Ridgebury Fire Station 169 Old Stagecoach Road
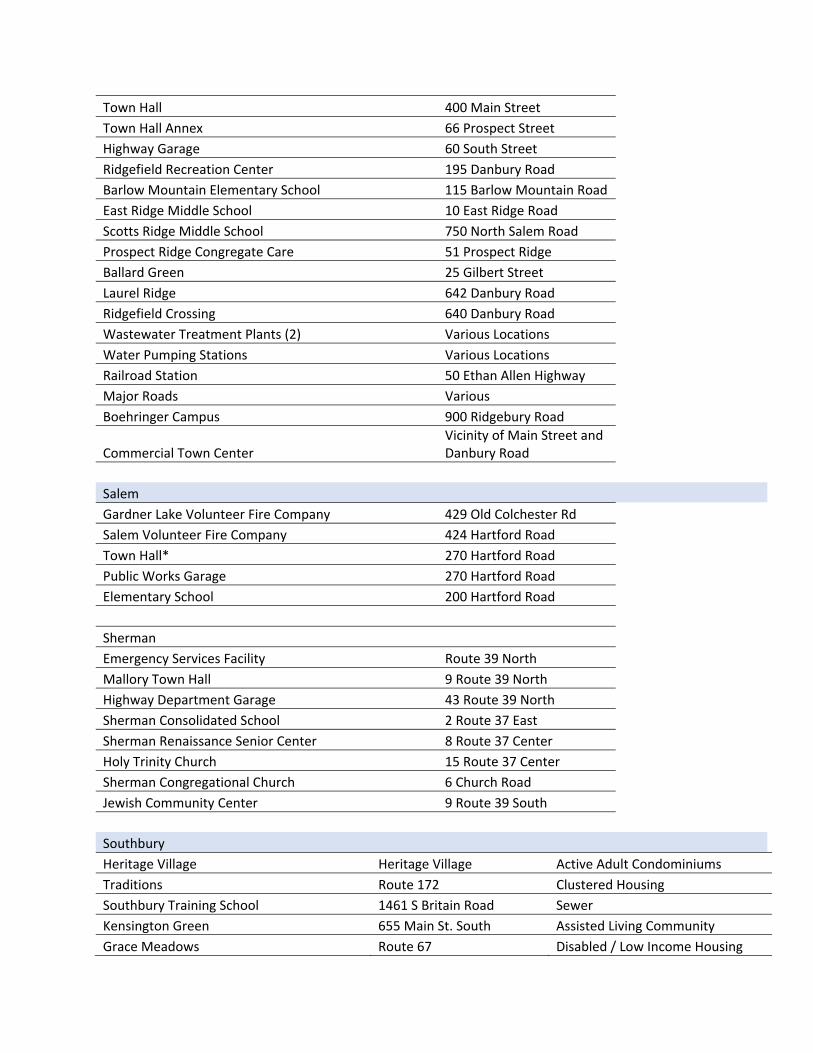
Town Hall 400 Main Street
Town Hall Annex 66 Prospect Street
Highway Garage 60 South Street
Ridgefield Recreation Center 195 Danbury Road
Barlow Mountain Elementary School 115 Barlow Mountain Road
East Ridge Middle School 10 East Ridge Road
Scotts Ridge Middle School 750 North Salem Road
Prospect Ridge Congregate Care 51 Prospect Ridge
Ballard Green 25 Gilbert Street
Laurel Ridge 642 Danbury Road
Ridgefield Crossing 640 Danbury Road
Wastewater Treatment Plants (2) Various Locations
Water Pumping Stations Various Locations
Railroad Station 50 Ethan Allen Highway
Major Roads Various Boehringer Campus 900 Ridgebury Road
Commercial Town Center Vicinity of Main Street and Danbury Road
Salem
Gardner Lake Volunteer Fire Company 429 Old Colchester Rd
Salem Volunteer Fire Company 424 Hartford Road
Town Hall* 270 Hartford Road
Public Works Garage 270 Hartford Road
Elementary School 200 Hartford Road
Sherman Emergency Services Facility Route 39 North
Mallory Town Hall 9 Route 39 North
Highway Department Garage 43 Route 39 North
Sherman Consolidated School 2 Route 37 East
Sherman Renaissance Senior Center 8 Route 37 Center
Holy Trinity Church 15 Route 37 Center
Sherman Congregational Church 6 Church Road
Jewish Community Center 9 Route 39 South
Southbury
Heritage Village Heritage Village Active Adult Condominiums
Traditions Route 172 Clustered Housing
Southbury Training School 1461 S Britain Road Sewer
Kensington Green 655 Main St. South Assisted Living Community
Grace Meadows Route 67 Disabled / Low Income Housing
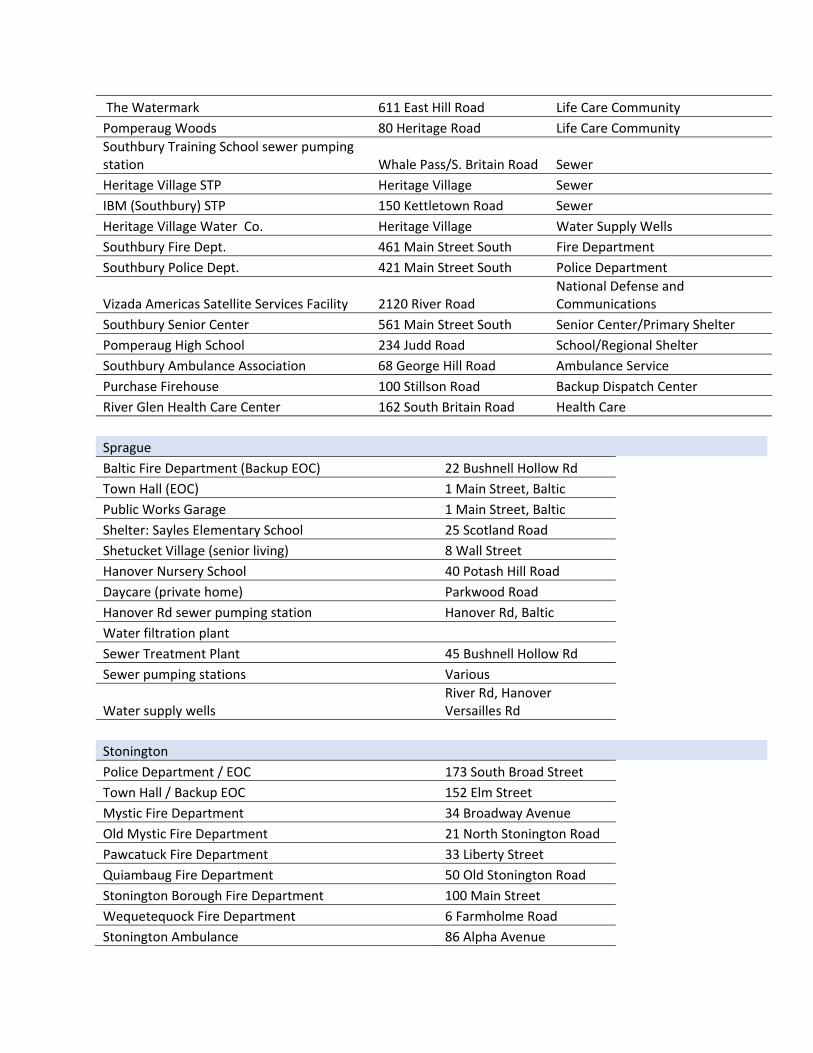
The Watermark 611 East Hill Road Life Care Community
Pomperaug Woods 80 Heritage Road Life Care Community
Southbury Training School sewer pumping station Whale Pass/S. Britain Road Sewer
Heritage Village STP Heritage Village Sewer
IBM (Southbury) STP 150 Kettletown Road Sewer
Heritage Village Water Co. Heritage Village Water Supply Wells
Southbury Fire Dept. 461 Main Street South Fire Department
Southbury Police Dept. 421 Main Street South Police Department
Vizada Americas Satellite Services Facility 2120 River Road National Defense and Communications
Southbury Senior Center 561 Main Street South Senior Center/Primary Shelter
Pomperaug High School 234 Judd Road School/Regional Shelter
Southbury Ambulance Association 68 George Hill Road Ambulance Service
Purchase Firehouse 100 Stillson Road Backup Dispatch Center
River Glen Health Care Center 162 South Britain Road Health Care
Sprague
Baltic Fire Department (Backup EOC) 22 Bushnell Hollow Rd
Town Hall (EOC) 1 Main Street, Baltic
Public Works Garage 1 Main Street, Baltic
Shelter: Sayles Elementary School 25 Scotland Road
Shetucket Village (senior living) 8 Wall Street
Hanover Nursery School 40 Potash Hill Road
Daycare (private home) Parkwood Road
Hanover Rd sewer pumping station Hanover Rd, Baltic
Water filtration plant
Sewer Treatment Plant 45 Bushnell Hollow Rd
Sewer pumping stations Various
Water supply wells River Rd, Hanover Versailles Rd
Stonington
Police Department / EOC 173 South Broad Street
Town Hall / Backup EOC 152 Elm Street
Mystic Fire Department 34 Broadway Avenue
Old Mystic Fire Department 21 North Stonington Road
Pawcatuck Fire Department 33 Liberty Street
Quiambaug Fire Department 50 Old Stonington Road
Stonington Borough Fire Department 100 Main Street
Wequetequock Fire Department 6 Farmholme Road
Stonington Ambulance 86 Alpha Avenue
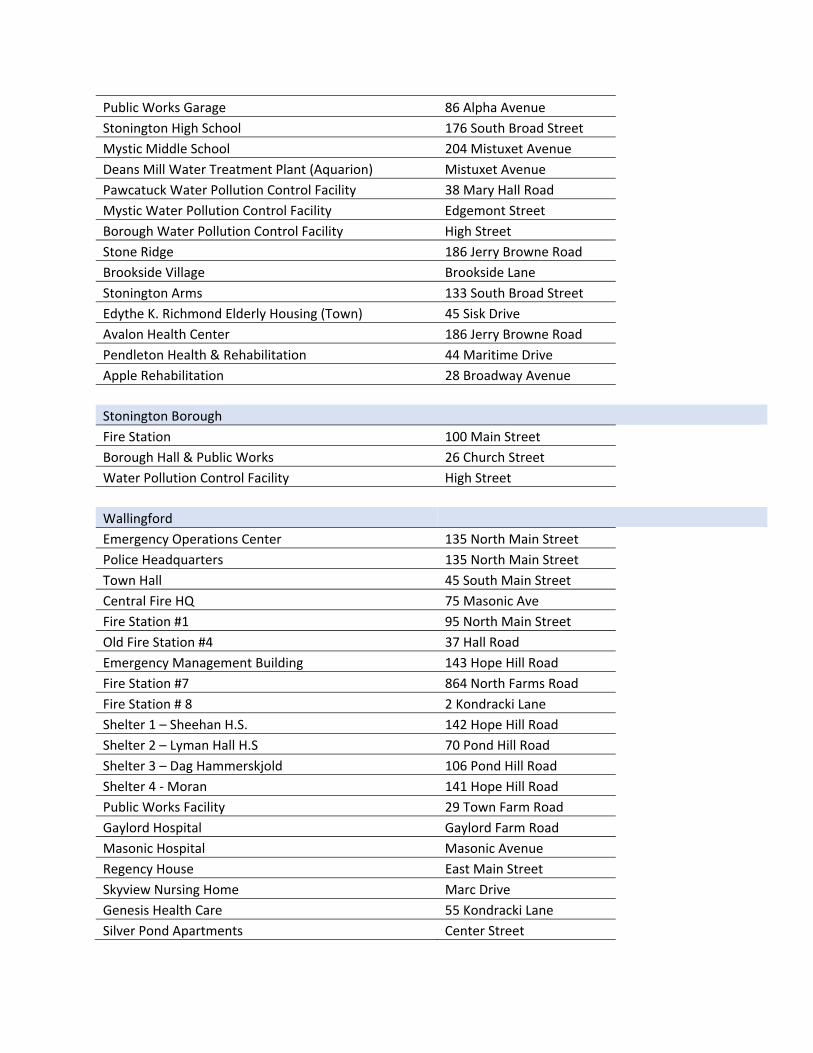
Public Works Garage 86 Alpha Avenue
Stonington High School 176 South Broad Street
Mystic Middle School 204 Mistuxet Avenue
Deans Mill Water Treatment Plant (Aquarion) Mistuxet Avenue
Pawcatuck Water Pollution Control Facility 38 Mary Hall Road
Mystic Water Pollution Control Facility Edgemont Street
Borough Water Pollution Control Facility High Street
Stone Ridge 186 Jerry Browne Road
Brookside Village Brookside Lane
Stonington Arms 133 South Broad Street
Edythe K. Richmond Elderly Housing (Town) 45 Sisk Drive
Avalon Health Center 186 Jerry Browne Road
Pendleton Health & Rehabilitation 44 Maritime Drive
Apple Rehabilitation 28 Broadway Avenue
Stonington Borough
Fire Station 100 Main Street
Borough Hall & Public Works 26 Church Street
Water Pollution Control Facility High Street
Wallingford
Emergency Operations Center 135 North Main Street
Police Headquarters 135 North Main Street
Town Hall 45 South Main Street
Central Fire HQ 75 Masonic Ave
Fire Station #1 95 North Main Street
Old Fire Station #4 37 Hall Road
Emergency Management Building 143 Hope Hill Road
Fire Station #7 864 North Farms Road
Fire Station # 8 2 Kondracki Lane
Shelter 1 – Sheehan H.S. 142 Hope Hill Road
Shelter 2 – Lyman Hall H.S 70 Pond Hill Road
Shelter 3 – Dag Hammerskjold 106 Pond Hill Road
Shelter 4 ‐ Moran 141 Hope Hill Road
Public Works Facility 29 Town Farm Road
Gaylord Hospital Gaylord Farm Road
Masonic Hospital Masonic Avenue
Regency House East Main Street
Skyview Nursing Home Marc Drive
Genesis Health Care 55 Kondracki Lane
Silver Pond Apartments Center Street
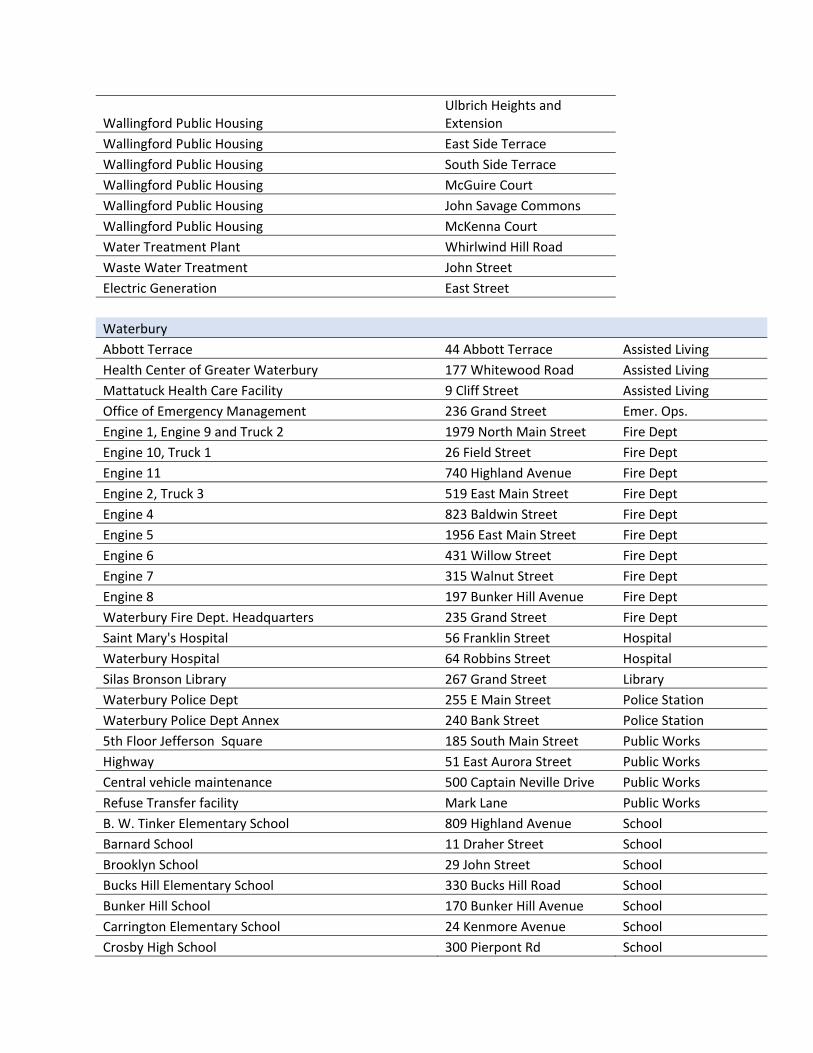
Wallingford Public Housing Ulbrich Heights and Extension
Wallingford Public Housing East Side Terrace
Wallingford Public Housing South Side Terrace
Wallingford Public Housing McGuire Court
Wallingford Public Housing John Savage Commons
Wallingford Public Housing McKenna Court
Water Treatment Plant Whirlwind Hill Road
Waste Water Treatment John Street
Electric Generation East Street
Waterbury
Abbott Terrace 44 Abbott Terrace Assisted Living
Health Center of Greater Waterbury 177 Whitewood Road Assisted Living
Mattatuck Health Care Facility 9 Cliff Street Assisted Living
Office of Emergency Management 236 Grand Street Emer. Ops.
Engine 1, Engine 9 and Truck 2 1979 North Main Street Fire Dept
Engine 10, Truck 1 26 Field Street Fire Dept
Engine 11 740 Highland Avenue Fire Dept
Engine 2, Truck 3 519 East Main Street Fire Dept
Engine 4 823 Baldwin Street Fire Dept
Engine 5 1956 East Main Street Fire Dept
Engine 6 431 Willow Street Fire Dept
Engine 7 315 Walnut Street Fire Dept
Engine 8 197 Bunker Hill Avenue Fire Dept
Waterbury Fire Dept. Headquarters 235 Grand Street Fire Dept
Saint Mary's Hospital 56 Franklin Street Hospital
Waterbury Hospital 64 Robbins Street Hospital
Silas Bronson Library 267 Grand Street Library
Waterbury Police Dept 255 E Main Street Police Station
Waterbury Police Dept Annex 240 Bank Street Police Station
5th Floor Jefferson Square 185 South Main Street Public Works
Highway 51 East Aurora Street Public Works
Central vehicle maintenance 500 Captain Neville Drive Public Works
Refuse Transfer facility Mark Lane Public Works
B. W. Tinker Elementary School 809 Highland Avenue School
Barnard School 11 Draher Street School
Brooklyn School 29 John Street School
Bucks Hill Elementary School 330 Bucks Hill Road School
Bunker Hill School 170 Bunker Hill Avenue School
Carrington Elementary School 24 Kenmore Avenue School
Crosby High School 300 Pierpont Rd School
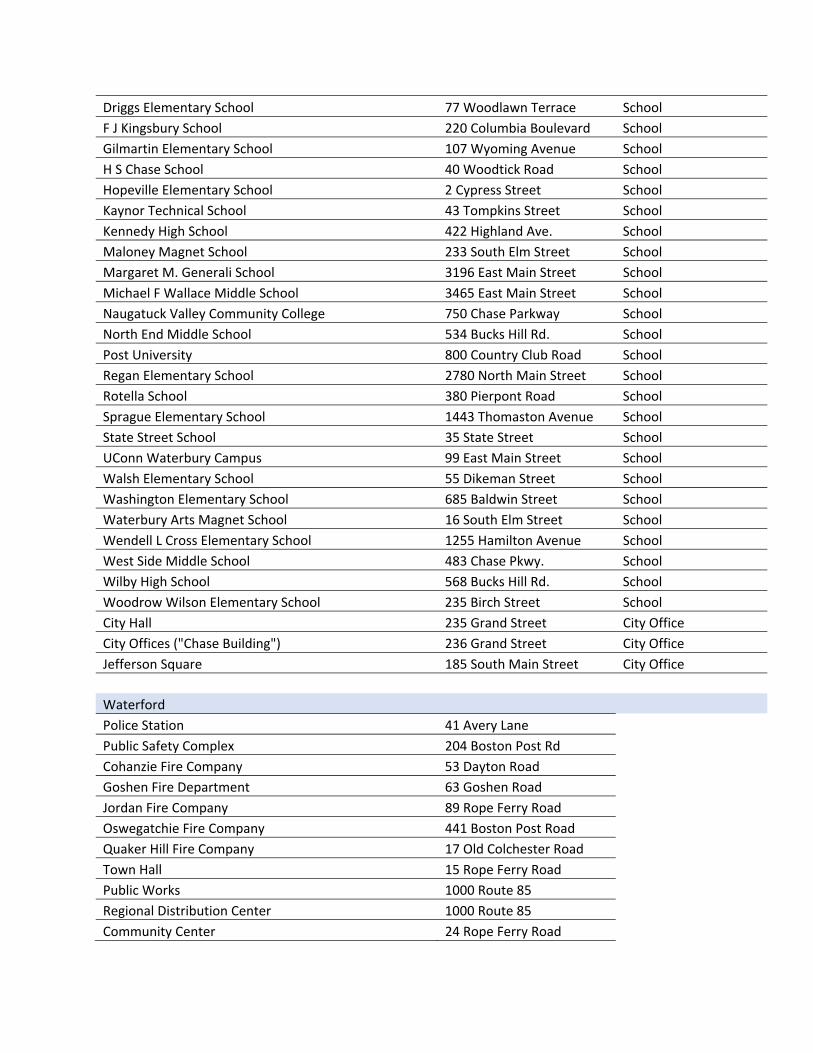
Driggs Elementary School 77 Woodlawn Terrace School
F J Kingsbury School 220 Columbia Boulevard School
Gilmartin Elementary School 107 Wyoming Avenue School
H S Chase School 40 Woodtick Road School
Hopeville Elementary School 2 Cypress Street School
Kaynor Technical School 43 Tompkins Street School
Kennedy High School 422 Highland Ave. School
Maloney Magnet School 233 South Elm Street School
Margaret M. Generali School 3196 East Main Street School
Michael F Wallace Middle School 3465 East Main Street School
Naugatuck Valley Community College 750 Chase Parkway School
North End Middle School 534 Bucks Hill Rd. School
Post University 800 Country Club Road School
Regan Elementary School 2780 North Main Street School
Rotella School 380 Pierpont Road School
Sprague Elementary School 1443 Thomaston Avenue School
State Street School 35 State Street School
UConn Waterbury Campus 99 East Main Street School
Walsh Elementary School 55 Dikeman Street School
Washington Elementary School 685 Baldwin Street School
Waterbury Arts Magnet School 16 South Elm Street School
Wendell L Cross Elementary School 1255 Hamilton Avenue School
West Side Middle School 483 Chase Pkwy. School
Wilby High School 568 Bucks Hill Rd. School
Woodrow Wilson Elementary School 235 Birch Street School
City Hall 235 Grand Street City Office
City Offices ("Chase Building") 236 Grand Street City Office
Jefferson Square 185 South Main Street City Office
Waterford
Police Station 41 Avery Lane
Public Safety Complex 204 Boston Post Rd
Cohanzie Fire Company 53 Dayton Road
Goshen Fire Department 63 Goshen Road
Jordan Fire Company 89 Rope Ferry Road
Oswegatchie Fire Company 441 Boston Post Road
Quaker Hill Fire Company 17 Old Colchester Road
Town Hall 15 Rope Ferry Road
Public Works 1000 Route 85
Regional Distribution Center 1000 Route 85
Community Center 24 Rope Ferry Road
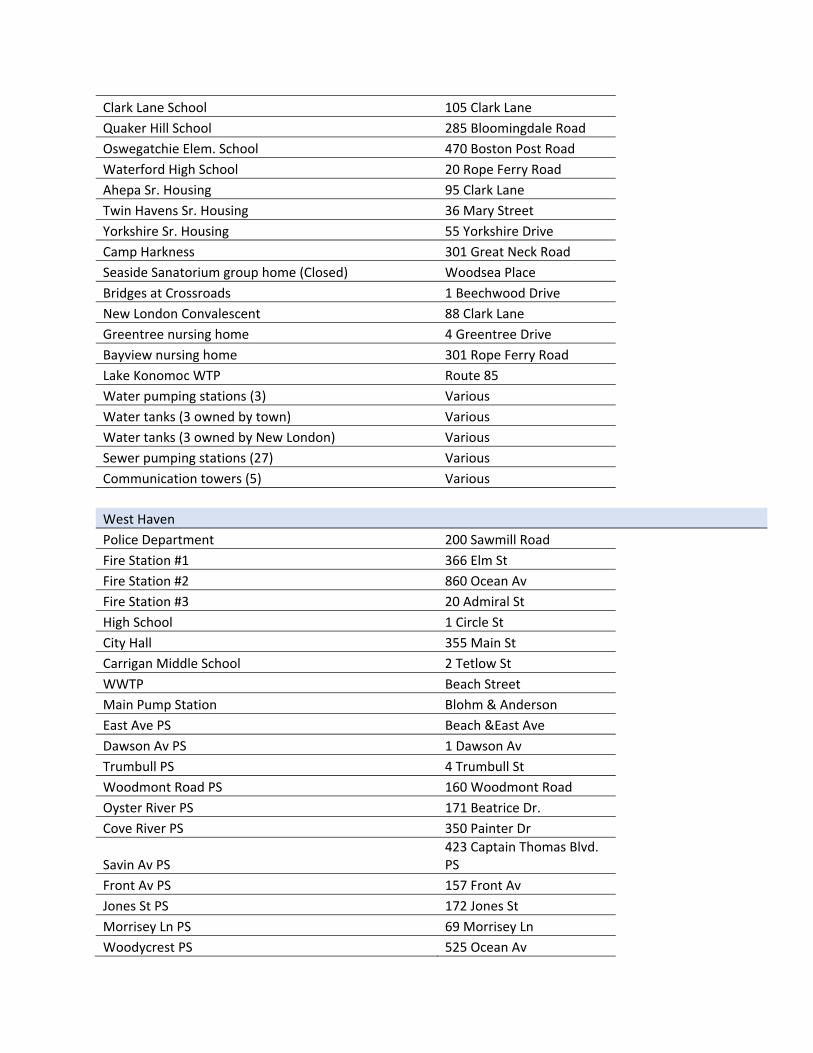
Clark Lane School 105 Clark Lane
Quaker Hill School 285 Bloomingdale Road
Oswegatchie Elem. School 470 Boston Post Road
Waterford High School 20 Rope Ferry Road
Ahepa Sr. Housing 95 Clark Lane
Twin Havens Sr. Housing 36 Mary Street
Yorkshire Sr. Housing 55 Yorkshire Drive
Camp Harkness 301 Great Neck Road
Seaside Sanatorium group home (Closed) Woodsea Place
Bridges at Crossroads 1 Beechwood Drive
New London Convalescent 88 Clark Lane
Greentree nursing home 4 Greentree Drive
Bayview nursing home 301 Rope Ferry Road
Lake Konomoc WTP Route 85 Water pumping stations (3) Various Water tanks (3 owned by town) Various Water tanks (3 owned by New London) Various Sewer pumping stations (27) Various Communication towers (5) Various
West Haven
Police Department 200 Sawmill Road
Fire Station #1 366 Elm St
Fire Station #2 860 Ocean Av
Fire Station #3 20 Admiral St
High School 1 Circle St
City Hall 355 Main St
Carrigan Middle School 2 Tetlow St
WWTP Beach Street
Main Pump Station Blohm & Anderson
East Ave PS Beach &East Ave
Dawson Av PS 1 Dawson Av
Trumbull PS 4 Trumbull St
Woodmont Road PS 160 Woodmont Road
Oyster River PS 171 Beatrice Dr.
Cove River PS 350 Painter Dr
Savin Av PS 423 Captain Thomas Blvd. PS
Front Av PS 157 Front Av
Jones St PS 172 Jones St
Morrisey Ln PS 69 Morrisey Ln
Woodycrest PS 525 Ocean Av
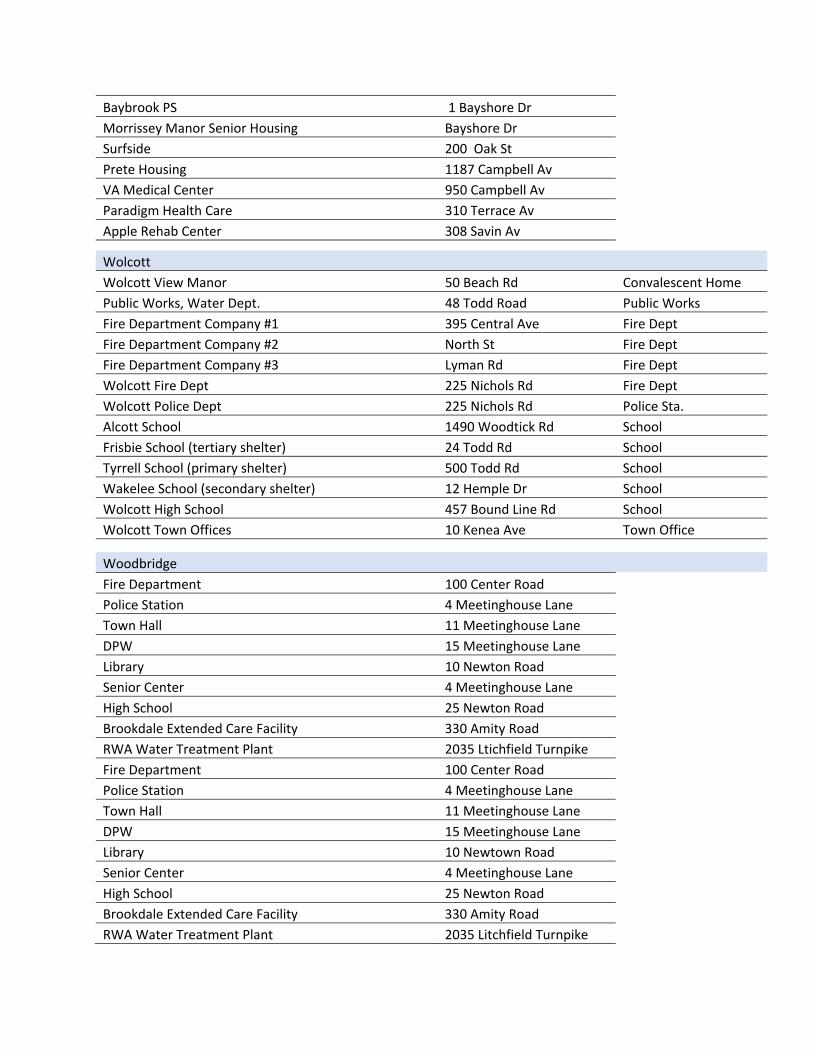
Baybrook PS 1 Bayshore Dr
Morrissey Manor Senior Housing Bayshore Dr
Surfside 200 Oak St
Prete Housing 1187 Campbell Av
VA Medical Center 950 Campbell Av
Paradigm Health Care 310 Terrace Av
Apple Rehab Center 308 Savin Av Wolcott
Wolcott View Manor 50 Beach Rd Convalescent Home
Public Works, Water Dept. 48 Todd Road Public Works
Fire Department Company #1 395 Central Ave Fire Dept
Fire Department Company #2 North St Fire Dept
Fire Department Company #3 Lyman Rd Fire Dept
Wolcott Fire Dept 225 Nichols Rd Fire Dept
Wolcott Police Dept 225 Nichols Rd Police Sta.
Alcott School 1490 Woodtick Rd School
Frisbie School (tertiary shelter) 24 Todd Rd School
Tyrrell School (primary shelter) 500 Todd Rd School
Wakelee School (secondary shelter) 12 Hemple Dr School
Wolcott High School 457 Bound Line Rd School
Wolcott Town Offices 10 Kenea Ave Town Office Woodbridge
Fire Department 100 Center Road
Police Station 4 Meetinghouse Lane
Town Hall 11 Meetinghouse Lane
DPW 15 Meetinghouse Lane
Library 10 Newton Road
Senior Center 4 Meetinghouse Lane
High School 25 Newton Road
Brookdale Extended Care Facility 330 Amity Road
RWA Water Treatment Plant 2035 Ltichfield Turnpike
Fire Department 100 Center Road
Police Station 4 Meetinghouse Lane
Town Hall 11 Meetinghouse Lane
DPW 15 Meetinghouse Lane
Library 10 Newtown Road
Senior Center 4 Meetinghouse Lane
High School 25 Newton Road
Brookdale Extended Care Facility 330 Amity Road
RWA Water Treatment Plant 2035 Litchfield Turnpike


APPENDIX J Interconnection Related Tables

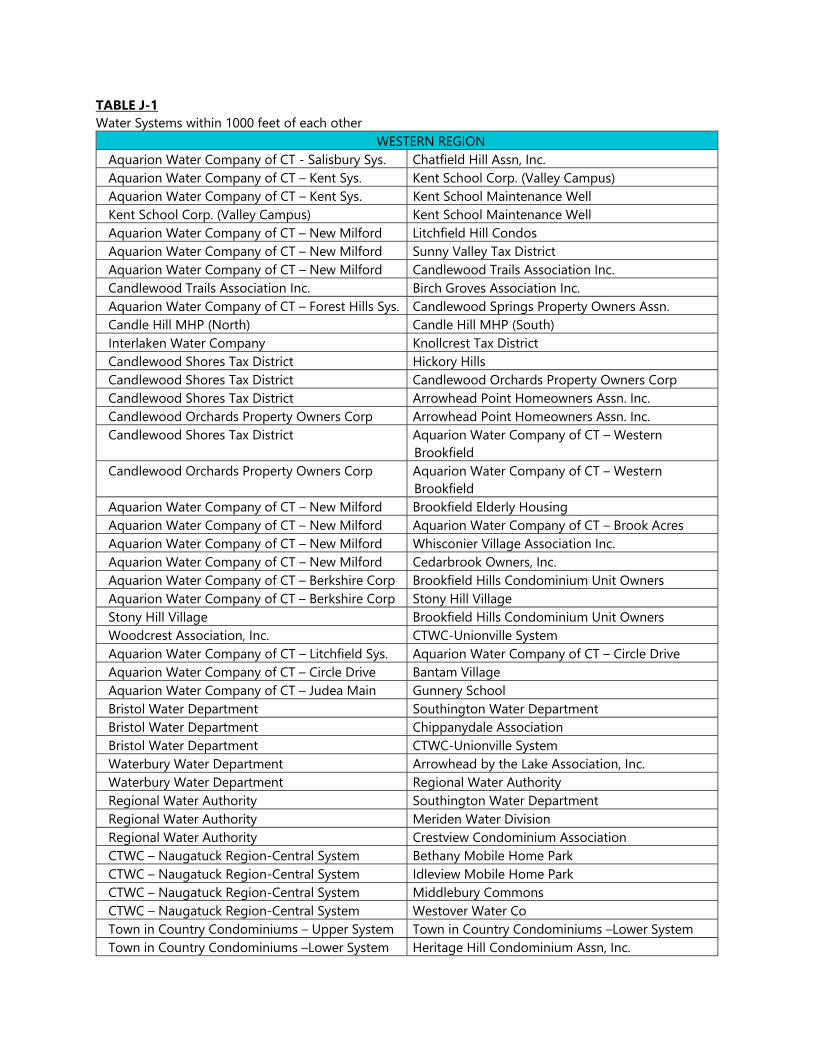
TABLE J-1 Water Systems within 1000 feet of each other
WESTERN REGION Aquarion Water Company of CT - Salisbury Sys. Chatfield Hill Assn, Inc. Aquarion Water Company of CT – Kent Sys. Kent School Corp. (Valley Campus) Aquarion Water Company of CT – Kent Sys. Kent School Maintenance Well Kent School Corp. (Valley Campus) Kent School Maintenance Well Aquarion Water Company of CT – New Milford Litchfield Hill Condos Aquarion Water Company of CT – New Milford Sunny Valley Tax District Aquarion Water Company of CT – New Milford Candlewood Trails Association Inc. Candlewood Trails Association Inc. Birch Groves Association Inc. Aquarion Water Company of CT – Forest Hills Sys. Candlewood Springs Property Owners Assn. Candle Hill MHP (North) Candle Hill MHP (South) Interlaken Water Company Knollcrest Tax District Candlewood Shores Tax District Hickory Hills Candlewood Shores Tax District Candlewood Orchards Property Owners Corp Candlewood Shores Tax District Arrowhead Point Homeowners Assn. Inc. Candlewood Orchards Property Owners Corp Arrowhead Point Homeowners Assn. Inc. Candlewood Shores Tax District Aquarion Water Company of CT – Western
Brookfield Candlewood Orchards Property Owners Corp Aquarion Water Company of CT – Western
Brookfield Aquarion Water Company of CT – New Milford Brookfield Elderly Housing Aquarion Water Company of CT – New Milford Aquarion Water Company of CT – Brook Acres Aquarion Water Company of CT – New Milford Whisconier Village Association Inc. Aquarion Water Company of CT – New Milford Cedarbrook Owners, Inc. Aquarion Water Company of CT – Berkshire Corp Brookfield Hills Condominium Unit Owners Aquarion Water Company of CT – Berkshire Corp Stony Hill Village Stony Hill Village Brookfield Hills Condominium Unit Owners Woodcrest Association, Inc. CTWC-Unionville System Aquarion Water Company of CT – Litchfield Sys. Aquarion Water Company of CT – Circle Drive Aquarion Water Company of CT – Circle Drive Bantam Village Aquarion Water Company of CT – Judea Main Gunnery School Bristol Water Department Southington Water Department Bristol Water Department Chippanydale Association Bristol Water Department CTWC-Unionville System Waterbury Water Department Arrowhead by the Lake Association, Inc. Waterbury Water Department Regional Water Authority Regional Water Authority Southington Water Department Regional Water Authority Meriden Water Division Regional Water Authority Crestview Condominium Association CTWC – Naugatuck Region-Central System Bethany Mobile Home Park CTWC – Naugatuck Region-Central System Idleview Mobile Home Park CTWC – Naugatuck Region-Central System Middlebury Commons CTWC – Naugatuck Region-Central System Westover Water Co Town in Country Condominiums – Upper System Town in Country Condominiums –Lower System Town in Country Condominiums –Lower System Heritage Hill Condominium Assn, Inc.
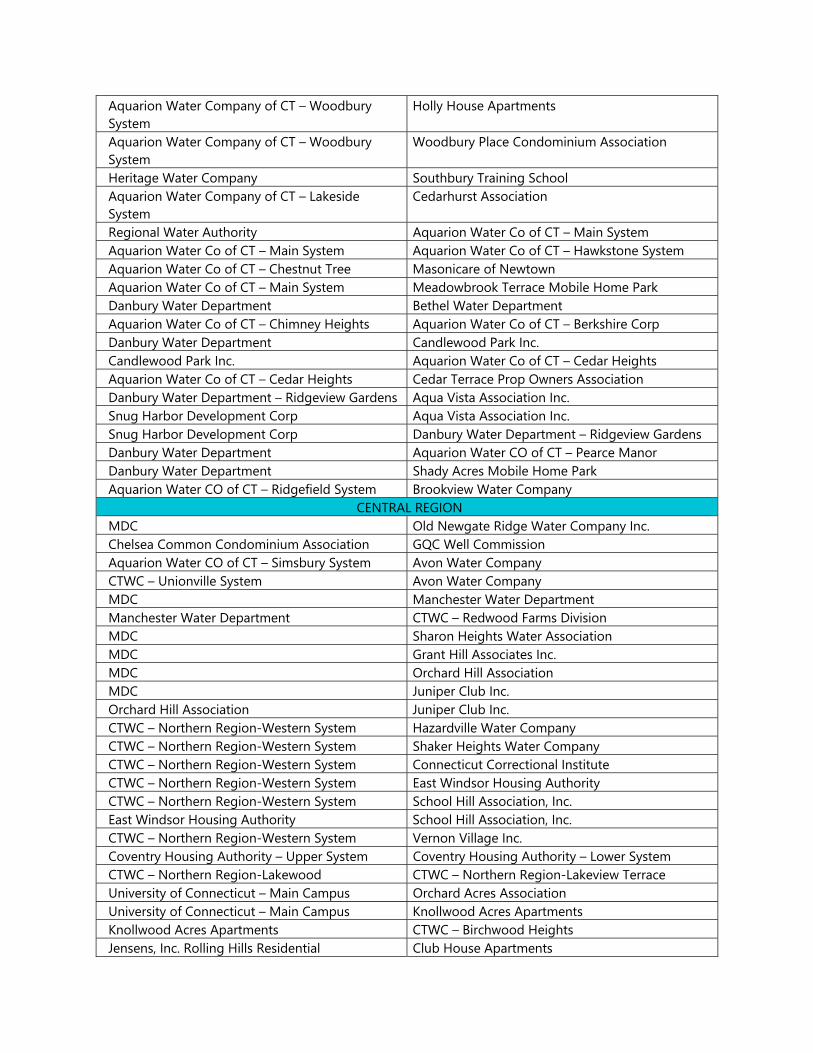
Aquarion Water Company of CT – Woodbury System
Holly House Apartments
Aquarion Water Company of CT – Woodbury System
Woodbury Place Condominium Association
Heritage Water Company Southbury Training School Aquarion Water Company of CT – Lakeside System
Cedarhurst Association
Regional Water Authority Aquarion Water Co of CT – Main System Aquarion Water Co of CT – Main System Aquarion Water Co of CT – Hawkstone System Aquarion Water Co of CT – Chestnut Tree Masonicare of Newtown Aquarion Water Co of CT – Main System Meadowbrook Terrace Mobile Home Park Danbury Water Department Bethel Water Department Aquarion Water Co of CT – Chimney Heights Aquarion Water Co of CT – Berkshire Corp Danbury Water Department Candlewood Park Inc. Candlewood Park Inc. Aquarion Water Co of CT – Cedar Heights Aquarion Water Co of CT – Cedar Heights Cedar Terrace Prop Owners Association Danbury Water Department – Ridgeview Gardens Aqua Vista Association Inc. Snug Harbor Development Corp Aqua Vista Association Inc. Snug Harbor Development Corp Danbury Water Department – Ridgeview Gardens Danbury Water Department Aquarion Water CO of CT – Pearce Manor Danbury Water Department Shady Acres Mobile Home Park Aquarion Water CO of CT – Ridgefield System Brookview Water Company
CENTRAL REGION MDC Old Newgate Ridge Water Company Inc. Chelsea Common Condominium Association GQC Well Commission Aquarion Water CO of CT – Simsbury System Avon Water Company CTWC – Unionville System Avon Water Company MDC Manchester Water Department Manchester Water Department CTWC – Redwood Farms Division MDC Sharon Heights Water Association MDC Grant Hill Associates Inc. MDC Orchard Hill Association MDC Juniper Club Inc. Orchard Hill Association Juniper Club Inc. CTWC – Northern Region-Western System Hazardville Water Company CTWC – Northern Region-Western System Shaker Heights Water Company CTWC – Northern Region-Western System Connecticut Correctional Institute CTWC – Northern Region-Western System East Windsor Housing Authority CTWC – Northern Region-Western System School Hill Association, Inc. East Windsor Housing Authority School Hill Association, Inc. CTWC – Northern Region-Western System Vernon Village Inc. Coventry Housing Authority – Upper System Coventry Housing Authority – Lower System CTWC – Northern Region-Lakewood CTWC – Northern Region-Lakeview Terrace University of Connecticut – Main Campus Orchard Acres Association University of Connecticut – Main Campus Knollwood Acres Apartments Knollwood Acres Apartments CTWC – Birchwood Heights Jensens, Inc. Rolling Hills Residential Club House Apartments
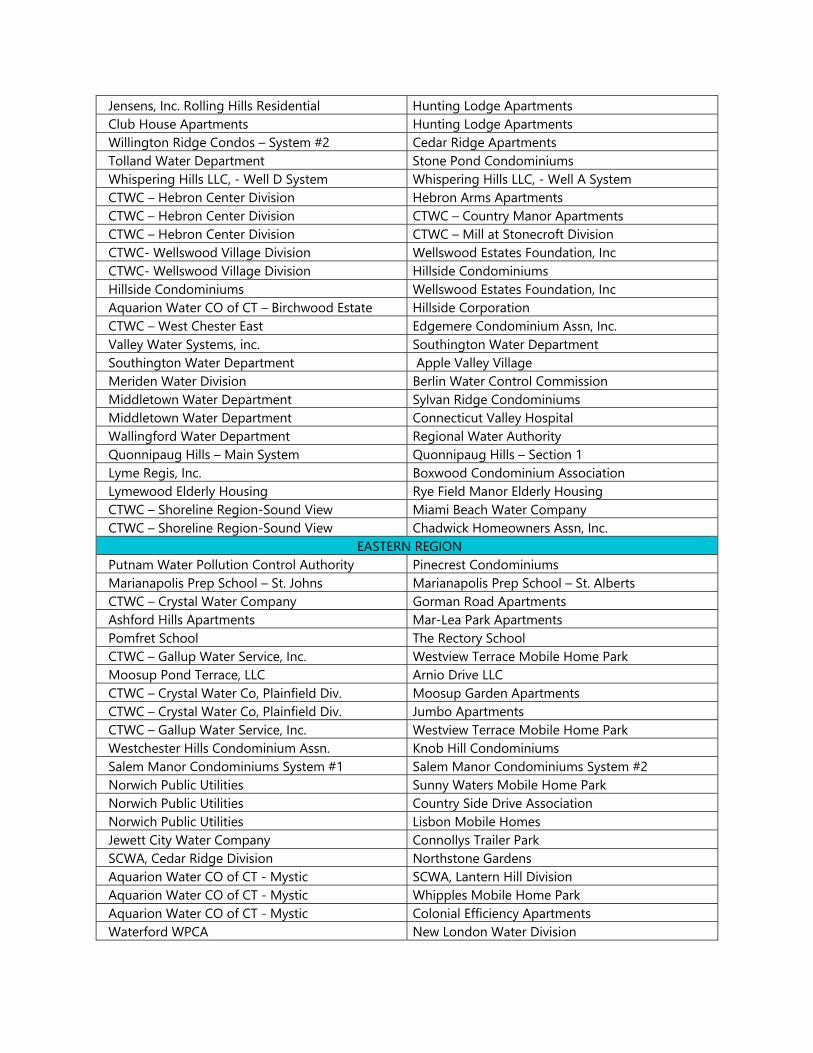
Jensens, Inc. Rolling Hills Residential Hunting Lodge Apartments Club House Apartments Hunting Lodge Apartments Willington Ridge Condos – System #2 Cedar Ridge Apartments Tolland Water Department Stone Pond Condominiums Whispering Hills LLC, - Well D System Whispering Hills LLC, - Well A System CTWC – Hebron Center Division Hebron Arms Apartments CTWC – Hebron Center Division CTWC – Country Manor Apartments CTWC – Hebron Center Division CTWC – Mill at Stonecroft Division CTWC- Wellswood Village Division Wellswood Estates Foundation, Inc CTWC- Wellswood Village Division Hillside Condominiums Hillside Condominiums Wellswood Estates Foundation, Inc Aquarion Water CO of CT – Birchwood Estate Hillside Corporation CTWC – West Chester East Edgemere Condominium Assn, Inc. Valley Water Systems, inc. Southington Water Department Southington Water Department Apple Valley Village Meriden Water Division Berlin Water Control Commission Middletown Water Department Sylvan Ridge Condominiums Middletown Water Department Connecticut Valley Hospital Wallingford Water Department Regional Water Authority Quonnipaug Hills – Main System Quonnipaug Hills – Section 1 Lyme Regis, Inc. Boxwood Condominium Association Lymewood Elderly Housing Rye Field Manor Elderly Housing CTWC – Shoreline Region-Sound View Miami Beach Water Company CTWC – Shoreline Region-Sound View Chadwick Homeowners Assn, Inc.
EASTERN REGION Putnam Water Pollution Control Authority Pinecrest Condominiums Marianapolis Prep School – St. Johns Marianapolis Prep School – St. Alberts CTWC – Crystal Water Company Gorman Road Apartments Ashford Hills Apartments Mar-Lea Park Apartments Pomfret School The Rectory School CTWC – Gallup Water Service, Inc. Westview Terrace Mobile Home Park Moosup Pond Terrace, LLC Arnio Drive LLC CTWC – Crystal Water Co, Plainfield Div. Moosup Garden Apartments CTWC – Crystal Water Co, Plainfield Div. Jumbo Apartments CTWC – Gallup Water Service, Inc. Westview Terrace Mobile Home Park Westchester Hills Condominium Assn. Knob Hill Condominiums Salem Manor Condominiums System #1 Salem Manor Condominiums System #2 Norwich Public Utilities Sunny Waters Mobile Home Park Norwich Public Utilities Country Side Drive Association Norwich Public Utilities Lisbon Mobile Homes Jewett City Water Company Connollys Trailer Park SCWA, Cedar Ridge Division Northstone Gardens Aquarion Water CO of CT - Mystic SCWA, Lantern Hill Division Aquarion Water CO of CT - Mystic Whipples Mobile Home Park Aquarion Water CO of CT - Mystic Colonial Efficiency Apartments Waterford WPCA New London Water Division
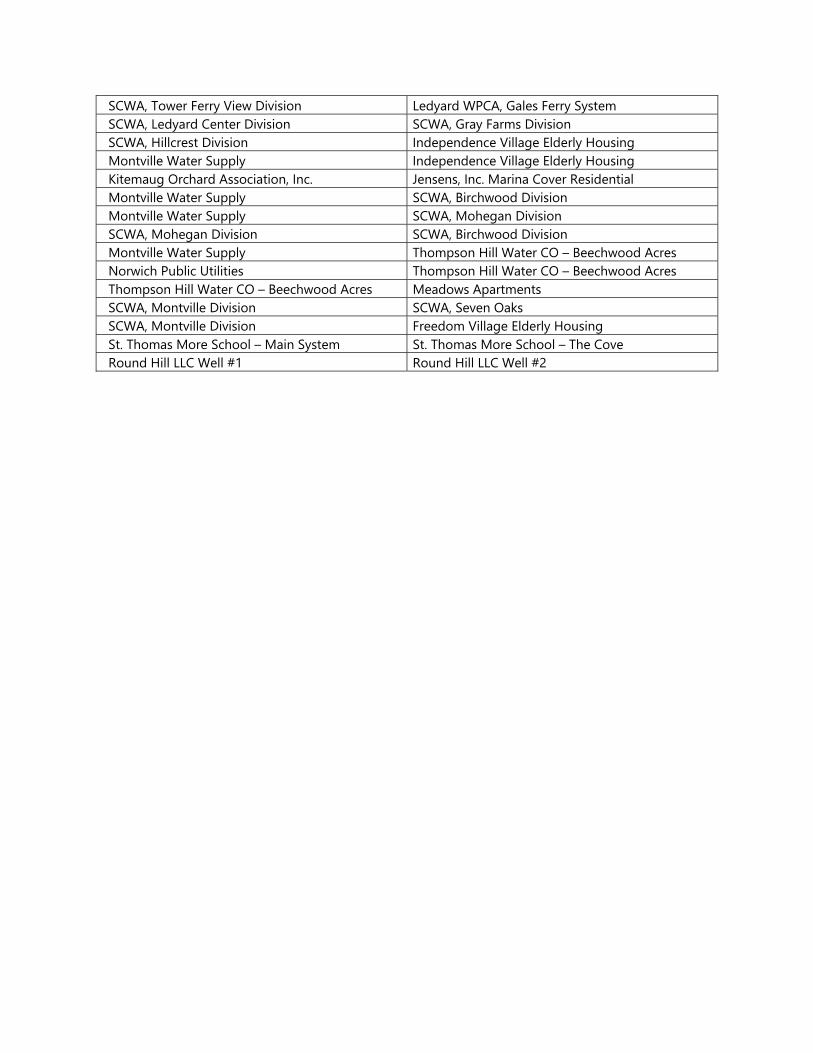
SCWA, Tower Ferry View Division Ledyard WPCA, Gales Ferry System SCWA, Ledyard Center Division SCWA, Gray Farms Division SCWA, Hillcrest Division Independence Village Elderly Housing Montville Water Supply Independence Village Elderly Housing Kitemaug Orchard Association, Inc. Jensens, Inc. Marina Cover Residential Montville Water Supply SCWA, Birchwood Division Montville Water Supply SCWA, Mohegan Division SCWA, Mohegan Division SCWA, Birchwood Division Montville Water Supply Thompson Hill Water CO – Beechwood Acres Norwich Public Utilities Thompson Hill Water CO – Beechwood Acres Thompson Hill Water CO – Beechwood Acres Meadows Apartments SCWA, Montville Division SCWA, Seven Oaks SCWA, Montville Division Freedom Village Elderly Housing St. Thomas More School – Main System St. Thomas More School – The Cove Round Hill LLC Well #1 Round Hill LLC Well #2
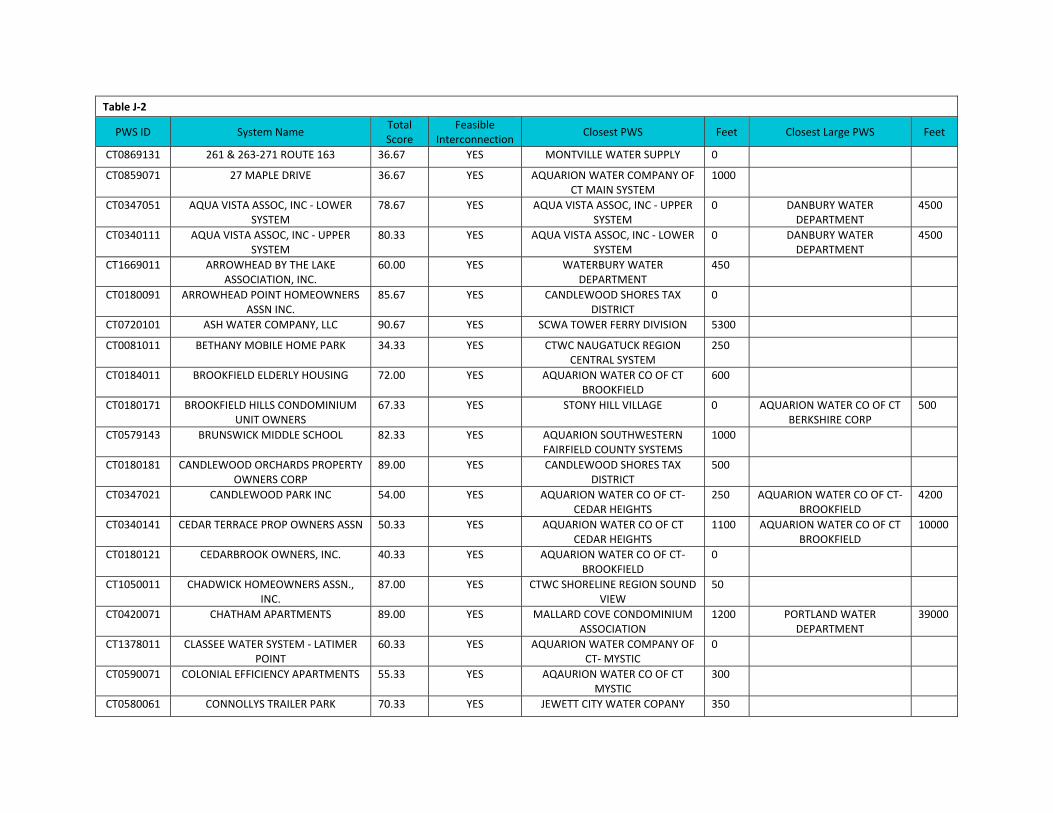
Table J‐2
PWS ID System Name Total Score
Feasible Interconnection
Closest PWS Feet Closest Large PWS Feet
CT0869131 261 & 263‐271 ROUTE 163 36.67 YES MONTVILLE WATER SUPPLY 0
CT0859071 27 MAPLE DRIVE 36.67 YES AQUARION WATER COMPANY OF CT MAIN SYSTEM
1000
CT0347051 AQUA VISTA ASSOC, INC ‐ LOWER SYSTEM
78.67 YES AQUA VISTA ASSOC, INC ‐ UPPER SYSTEM
0 DANBURY WATER DEPARTMENT
4500
CT0340111 AQUA VISTA ASSOC, INC ‐ UPPER SYSTEM
80.33 YES AQUA VISTA ASSOC, INC ‐ LOWER SYSTEM
0 DANBURY WATER DEPARTMENT
4500
CT1669011 ARROWHEAD BY THE LAKE ASSOCIATION, INC.
60.00 YES WATERBURY WATER DEPARTMENT
450
CT0180091 ARROWHEAD POINT HOMEOWNERS ASSN INC.
85.67 YES CANDLEWOOD SHORES TAX DISTRICT
0
CT0720101 ASH WATER COMPANY, LLC 90.67 YES SCWA TOWER FERRY DIVISION 5300
CT0081011 BETHANY MOBILE HOME PARK 34.33 YES CTWC NAUGATUCK REGION CENTRAL SYSTEM
250
CT0184011 BROOKFIELD ELDERLY HOUSING 72.00 YES AQUARION WATER CO OF CT BROOKFIELD
600
CT0180171 BROOKFIELD HILLS CONDOMINIUM UNIT OWNERS
67.33 YES STONY HILL VILLAGE 0 AQUARION WATER CO OF CT BERKSHIRE CORP
500
CT0579143 BRUNSWICK MIDDLE SCHOOL 82.33 YES AQUARION SOUTHWESTERN FAIRFIELD COUNTY SYSTEMS
1000
CT0180181 CANDLEWOOD ORCHARDS PROPERTY OWNERS CORP
89.00 YES CANDLEWOOD SHORES TAX DISTRICT
500
CT0347021 CANDLEWOOD PARK INC 54.00 YES AQUARION WATER CO OF CT‐CEDAR HEIGHTS
250 AQUARION WATER CO OF CT‐ BROOKFIELD
4200
CT0340141 CEDAR TERRACE PROP OWNERS ASSN 50.33 YES AQUARION WATER CO OF CT CEDAR HEIGHTS
1100 AQUARION WATER CO OF CT BROOKFIELD
10000
CT0180121 CEDARBROOK OWNERS, INC. 40.33 YES AQUARION WATER CO OF CT‐BROOKFIELD
0
CT1050011 CHADWICK HOMEOWNERS ASSN., INC.
87.00 YES CTWC SHORELINE REGION SOUND VIEW
50
CT0420071 CHATHAM APARTMENTS 89.00 YES MALLARD COVE CONDOMINIUM ASSOCIATION
1200 PORTLAND WATER DEPARTMENT
39000
CT1378011 CLASSEE WATER SYSTEM ‐ LATIMER POINT
60.33 YES AQUARION WATER COMPANY OF CT‐ MYSTIC
0
CT0590071 COLONIAL EFFICIENCY APARTMENTS 55.33 YES AQAURION WATER CO OF CT MYSTIC
300
CT0580061 CONNOLLYS TRAILER PARK 70.33 YES JEWETT CITY WATER COPANY 350
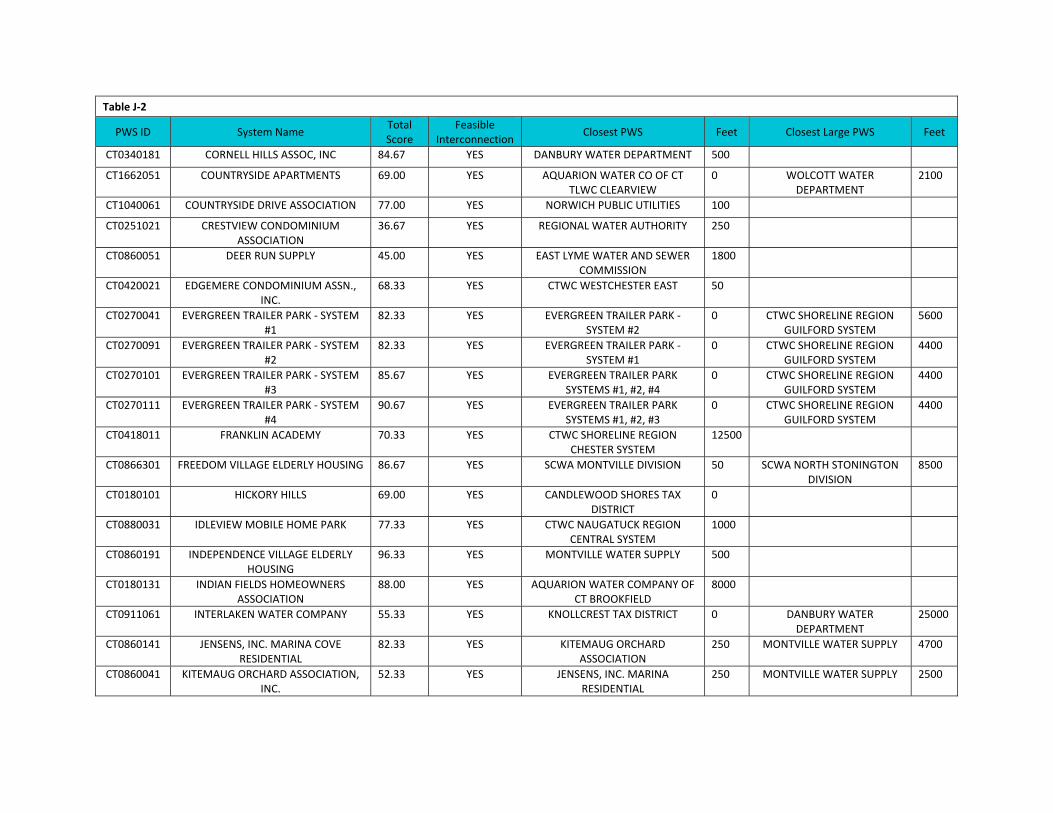
Table J‐2
PWS ID System Name Total Score
Feasible Interconnection
Closest PWS Feet Closest Large PWS Feet
CT0340181 CORNELL HILLS ASSOC, INC 84.67 YES DANBURY WATER DEPARTMENT 500
CT1662051 COUNTRYSIDE APARTMENTS 69.00 YES AQUARION WATER CO OF CT TLWC CLEARVIEW
0 WOLCOTT WATER DEPARTMENT
2100
CT1040061 COUNTRYSIDE DRIVE ASSOCIATION 77.00 YES NORWICH PUBLIC UTILITIES 100
CT0251021 CRESTVIEW CONDOMINIUM ASSOCIATION
36.67 YES REGIONAL WATER AUTHORITY 250
CT0860051 DEER RUN SUPPLY 45.00 YES EAST LYME WATER AND SEWER COMMISSION
1800
CT0420021 EDGEMERE CONDOMINIUM ASSN., INC.
68.33 YES CTWC WESTCHESTER EAST 50
CT0270041 EVERGREEN TRAILER PARK ‐ SYSTEM #1
82.33 YES EVERGREEN TRAILER PARK ‐ SYSTEM #2
0 CTWC SHORELINE REGION GUILFORD SYSTEM
5600
CT0270091 EVERGREEN TRAILER PARK ‐ SYSTEM #2
82.33 YES EVERGREEN TRAILER PARK ‐ SYSTEM #1
0 CTWC SHORELINE REGION GUILFORD SYSTEM
4400
CT0270101 EVERGREEN TRAILER PARK ‐ SYSTEM #3
85.67 YES EVERGREEN TRAILER PARK SYSTEMS #1, #2, #4
0 CTWC SHORELINE REGION GUILFORD SYSTEM
4400
CT0270111 EVERGREEN TRAILER PARK ‐ SYSTEM #4
90.67 YES EVERGREEN TRAILER PARK SYSTEMS #1, #2, #3
0 CTWC SHORELINE REGION GUILFORD SYSTEM
4400
CT0418011 FRANKLIN ACADEMY 70.33 YES CTWC SHORELINE REGION CHESTER SYSTEM
12500
CT0866301 FREEDOM VILLAGE ELDERLY HOUSING 86.67 YES SCWA MONTVILLE DIVISION 50 SCWA NORTH STONINGTON DIVISION
8500
CT0180101 HICKORY HILLS 69.00 YES CANDLEWOOD SHORES TAX DISTRICT
0
CT0880031 IDLEVIEW MOBILE HOME PARK 77.33 YES CTWC NAUGATUCK REGION CENTRAL SYSTEM
1000
CT0860191 INDEPENDENCE VILLAGE ELDERLY HOUSING
96.33 YES MONTVILLE WATER SUPPLY 500
CT0180131 INDIAN FIELDS HOMEOWNERS ASSOCIATION
88.00 YES AQUARION WATER COMPANY OF CT BROOKFIELD
8000
CT0911061 INTERLAKEN WATER COMPANY 55.33 YES KNOLLCREST TAX DISTRICT 0 DANBURY WATER DEPARTMENT
25000
CT0860141 JENSENS, INC. MARINA COVE RESIDENTIAL
82.33 YES KITEMAUG ORCHARD ASSOCIATION
250 MONTVILLE WATER SUPPLY 4700
CT0860041 KITEMAUG ORCHARD ASSOCIATION, INC.
52.33 YES JENSENS, INC. MARINA RESIDENTIAL
250 MONTVILLE WATER SUPPLY 2500
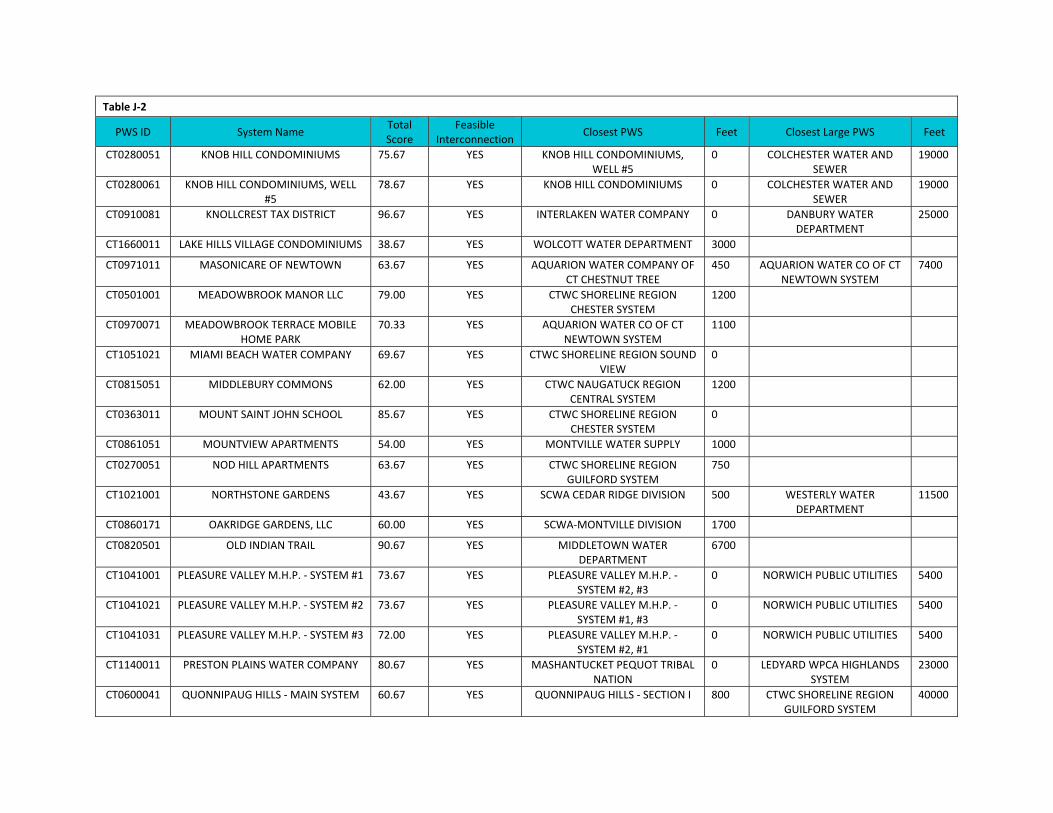
Table J‐2
PWS ID System Name Total Score
Feasible Interconnection
Closest PWS Feet Closest Large PWS Feet
CT0280051 KNOB HILL CONDOMINIUMS 75.67 YES KNOB HILL CONDOMINIUMS, WELL #5
0 COLCHESTER WATER AND SEWER
19000
CT0280061 KNOB HILL CONDOMINIUMS, WELL #5
78.67 YES KNOB HILL CONDOMINIUMS 0 COLCHESTER WATER AND SEWER
19000
CT0910081 KNOLLCREST TAX DISTRICT 96.67 YES INTERLAKEN WATER COMPANY 0 DANBURY WATER DEPARTMENT
25000
CT1660011 LAKE HILLS VILLAGE CONDOMINIUMS 38.67 YES WOLCOTT WATER DEPARTMENT 3000
CT0971011 MASONICARE OF NEWTOWN 63.67 YES AQUARION WATER COMPANY OF CT CHESTNUT TREE
450 AQUARION WATER CO OF CT NEWTOWN SYSTEM
7400
CT0501001 MEADOWBROOK MANOR LLC 79.00 YES CTWC SHORELINE REGION CHESTER SYSTEM
1200
CT0970071 MEADOWBROOK TERRACE MOBILE HOME PARK
70.33 YES AQUARION WATER CO OF CT NEWTOWN SYSTEM
1100
CT1051021 MIAMI BEACH WATER COMPANY 69.67 YES CTWC SHORELINE REGION SOUND VIEW
0
CT0815051 MIDDLEBURY COMMONS 62.00 YES CTWC NAUGATUCK REGION CENTRAL SYSTEM
1200
CT0363011 MOUNT SAINT JOHN SCHOOL 85.67 YES CTWC SHORELINE REGION CHESTER SYSTEM
0
CT0861051 MOUNTVIEW APARTMENTS 54.00 YES MONTVILLE WATER SUPPLY 1000
CT0270051 NOD HILL APARTMENTS 63.67 YES CTWC SHORELINE REGION GUILFORD SYSTEM
750
CT1021001 NORTHSTONE GARDENS 43.67 YES SCWA CEDAR RIDGE DIVISION 500 WESTERLY WATER DEPARTMENT
11500
CT0860171 OAKRIDGE GARDENS, LLC 60.00 YES SCWA‐MONTVILLE DIVISION 1700
CT0820501 OLD INDIAN TRAIL 90.67 YES MIDDLETOWN WATER DEPARTMENT
6700
CT1041001 PLEASURE VALLEY M.H.P. ‐ SYSTEM #1 73.67 YES PLEASURE VALLEY M.H.P. ‐ SYSTEM #2, #3
0 NORWICH PUBLIC UTILITIES 5400
CT1041021 PLEASURE VALLEY M.H.P. ‐ SYSTEM #2 73.67 YES PLEASURE VALLEY M.H.P. ‐ SYSTEM #1, #3
0 NORWICH PUBLIC UTILITIES 5400
CT1041031 PLEASURE VALLEY M.H.P. ‐ SYSTEM #3 72.00 YES PLEASURE VALLEY M.H.P. ‐ SYSTEM #2, #1
0 NORWICH PUBLIC UTILITIES 5400
CT1140011 PRESTON PLAINS WATER COMPANY 80.67 YES MASHANTUCKET PEQUOT TRIBAL NATION
0 LEDYARD WPCA HIGHLANDS SYSTEM
23000
CT0600041 QUONNIPAUG HILLS ‐ MAIN SYSTEM 60.67 YES QUONNIPAUG HILLS ‐ SECTION I 800 CTWC SHORELINE REGION GUILFORD SYSTEM
40000
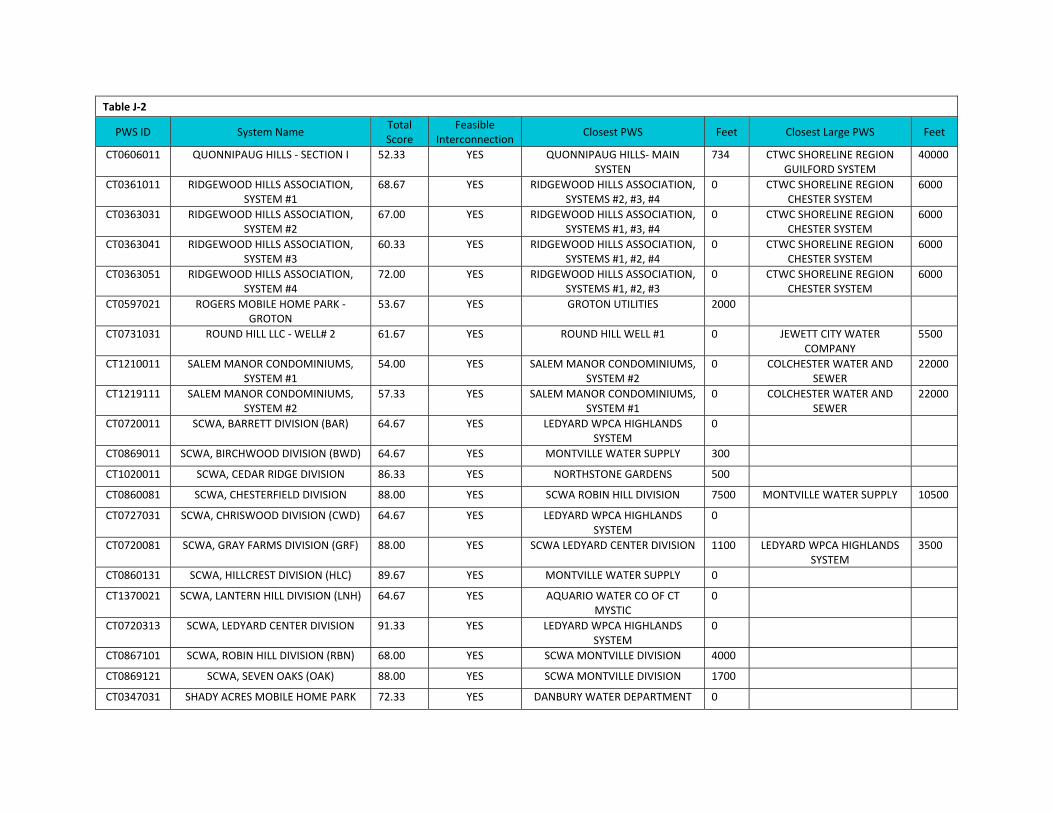
Table J‐2
PWS ID System Name Total Score
Feasible Interconnection
Closest PWS Feet Closest Large PWS Feet
CT0606011 QUONNIPAUG HILLS ‐ SECTION I 52.33 YES QUONNIPAUG HILLS‐ MAIN SYSTEN
734 CTWC SHORELINE REGION GUILFORD SYSTEM
40000
CT0361011 RIDGEWOOD HILLS ASSOCIATION, SYSTEM #1
68.67 YES RIDGEWOOD HILLS ASSOCIATION, SYSTEMS #2, #3, #4
0 CTWC SHORELINE REGION CHESTER SYSTEM
6000
CT0363031 RIDGEWOOD HILLS ASSOCIATION, SYSTEM #2
67.00 YES RIDGEWOOD HILLS ASSOCIATION, SYSTEMS #1, #3, #4
0 CTWC SHORELINE REGION CHESTER SYSTEM
6000
CT0363041 RIDGEWOOD HILLS ASSOCIATION, SYSTEM #3
60.33 YES RIDGEWOOD HILLS ASSOCIATION, SYSTEMS #1, #2, #4
0 CTWC SHORELINE REGION CHESTER SYSTEM
6000
CT0363051 RIDGEWOOD HILLS ASSOCIATION, SYSTEM #4
72.00 YES RIDGEWOOD HILLS ASSOCIATION, SYSTEMS #1, #2, #3
0 CTWC SHORELINE REGION CHESTER SYSTEM
6000
CT0597021 ROGERS MOBILE HOME PARK ‐ GROTON
53.67 YES GROTON UTILITIES 2000
CT0731031 ROUND HILL LLC ‐ WELL# 2 61.67 YES ROUND HILL WELL #1 0 JEWETT CITY WATER COMPANY
5500
CT1210011 SALEM MANOR CONDOMINIUMS, SYSTEM #1
54.00 YES SALEM MANOR CONDOMINIUMS, SYSTEM #2
0 COLCHESTER WATER AND SEWER
22000
CT1219111 SALEM MANOR CONDOMINIUMS, SYSTEM #2
57.33 YES SALEM MANOR CONDOMINIUMS, SYSTEM #1
0 COLCHESTER WATER AND SEWER
22000
CT0720011 SCWA, BARRETT DIVISION (BAR) 64.67 YES LEDYARD WPCA HIGHLANDS SYSTEM
0
CT0869011 SCWA, BIRCHWOOD DIVISION (BWD) 64.67 YES MONTVILLE WATER SUPPLY 300
CT1020011 SCWA, CEDAR RIDGE DIVISION 86.33 YES NORTHSTONE GARDENS 500
CT0860081 SCWA, CHESTERFIELD DIVISION 88.00 YES SCWA ROBIN HILL DIVISION 7500 MONTVILLE WATER SUPPLY 10500
CT0727031 SCWA, CHRISWOOD DIVISION (CWD) 64.67 YES LEDYARD WPCA HIGHLANDS SYSTEM
0
CT0720081 SCWA, GRAY FARMS DIVISION (GRF) 88.00 YES SCWA LEDYARD CENTER DIVISION 1100 LEDYARD WPCA HIGHLANDS SYSTEM
3500
CT0860131 SCWA, HILLCREST DIVISION (HLC) 89.67 YES MONTVILLE WATER SUPPLY 0
CT1370021 SCWA, LANTERN HILL DIVISION (LNH) 64.67 YES AQUARIO WATER CO OF CT MYSTIC
0
CT0720313 SCWA, LEDYARD CENTER DIVISION 91.33 YES LEDYARD WPCA HIGHLANDS SYSTEM
0
CT0867101 SCWA, ROBIN HILL DIVISION (RBN) 68.00 YES SCWA MONTVILLE DIVISION 4000
CT0869121 SCWA, SEVEN OAKS (OAK) 88.00 YES SCWA MONTVILLE DIVISION 1700
CT0347031 SHADY ACRES MOBILE HOME PARK 72.33 YES DANBURY WATER DEPARTMENT 0
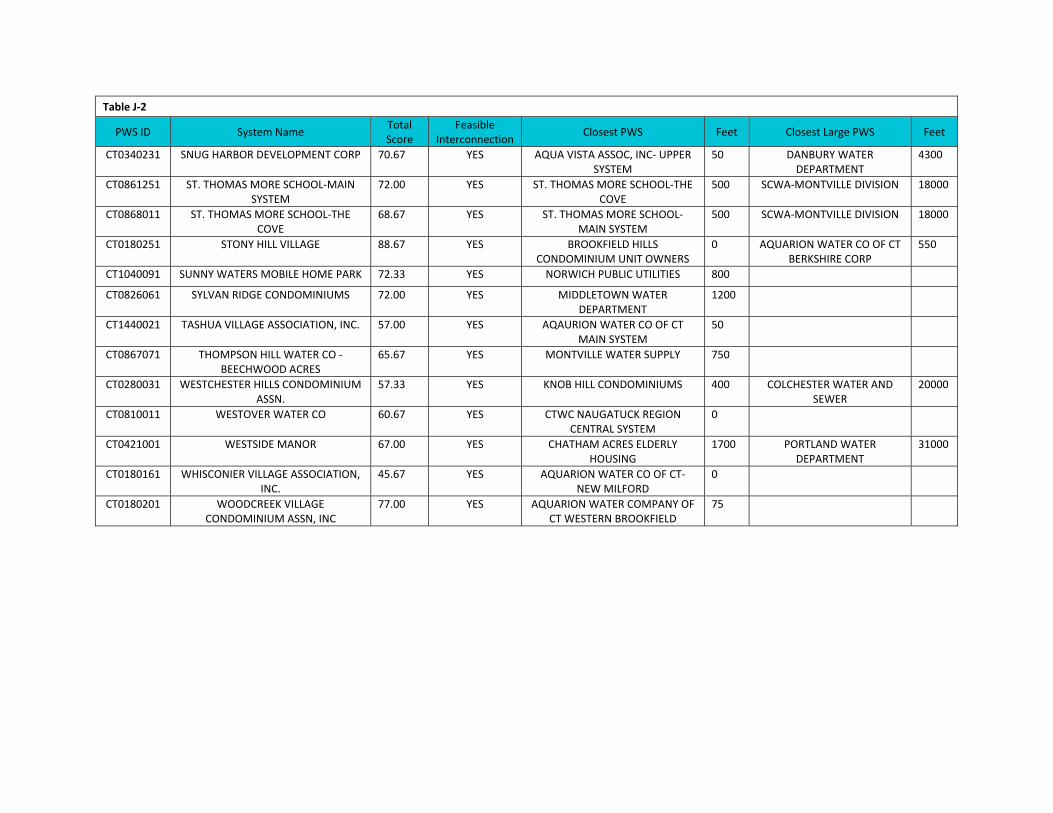
Table J‐2
PWS ID System Name Total Score
Feasible Interconnection
Closest PWS Feet Closest Large PWS Feet
CT0340231 SNUG HARBOR DEVELOPMENT CORP 70.67 YES AQUA VISTA ASSOC, INC‐ UPPER SYSTEM
50 DANBURY WATER DEPARTMENT
4300
CT0861251 ST. THOMAS MORE SCHOOL‐MAIN SYSTEM
72.00 YES ST. THOMAS MORE SCHOOL‐THE COVE
500 SCWA‐MONTVILLE DIVISION 18000
CT0868011 ST. THOMAS MORE SCHOOL‐THE COVE
68.67 YES ST. THOMAS MORE SCHOOL‐MAIN SYSTEM
500 SCWA‐MONTVILLE DIVISION 18000
CT0180251 STONY HILL VILLAGE 88.67 YES BROOKFIELD HILLS CONDOMINIUM UNIT OWNERS
0 AQUARION WATER CO OF CT BERKSHIRE CORP
550
CT1040091 SUNNY WATERS MOBILE HOME PARK 72.33 YES NORWICH PUBLIC UTILITIES 800
CT0826061 SYLVAN RIDGE CONDOMINIUMS 72.00 YES MIDDLETOWN WATER DEPARTMENT
1200
CT1440021 TASHUA VILLAGE ASSOCIATION, INC. 57.00 YES AQAURION WATER CO OF CT MAIN SYSTEM
50
CT0867071 THOMPSON HILL WATER CO ‐ BEECHWOOD ACRES
65.67 YES MONTVILLE WATER SUPPLY 750
CT0280031 WESTCHESTER HILLS CONDOMINIUM ASSN.
57.33 YES KNOB HILL CONDOMINIUMS 400 COLCHESTER WATER AND SEWER
20000
CT0810011 WESTOVER WATER CO 60.67 YES CTWC NAUGATUCK REGION CENTRAL SYSTEM
0
CT0421001 WESTSIDE MANOR 67.00 YES CHATHAM ACRES ELDERLY HOUSING
1700 PORTLAND WATER DEPARTMENT
31000
CT0180161 WHISCONIER VILLAGE ASSOCIATION, INC.
45.67 YES AQUARION WATER CO OF CT‐ NEW MILFORD
0
CT0180201 WOODCREEK VILLAGE CONDOMINIUM ASSN, INC
77.00 YES AQUARION WATER COMPANY OF CT WESTERN BROOKFIELD
75
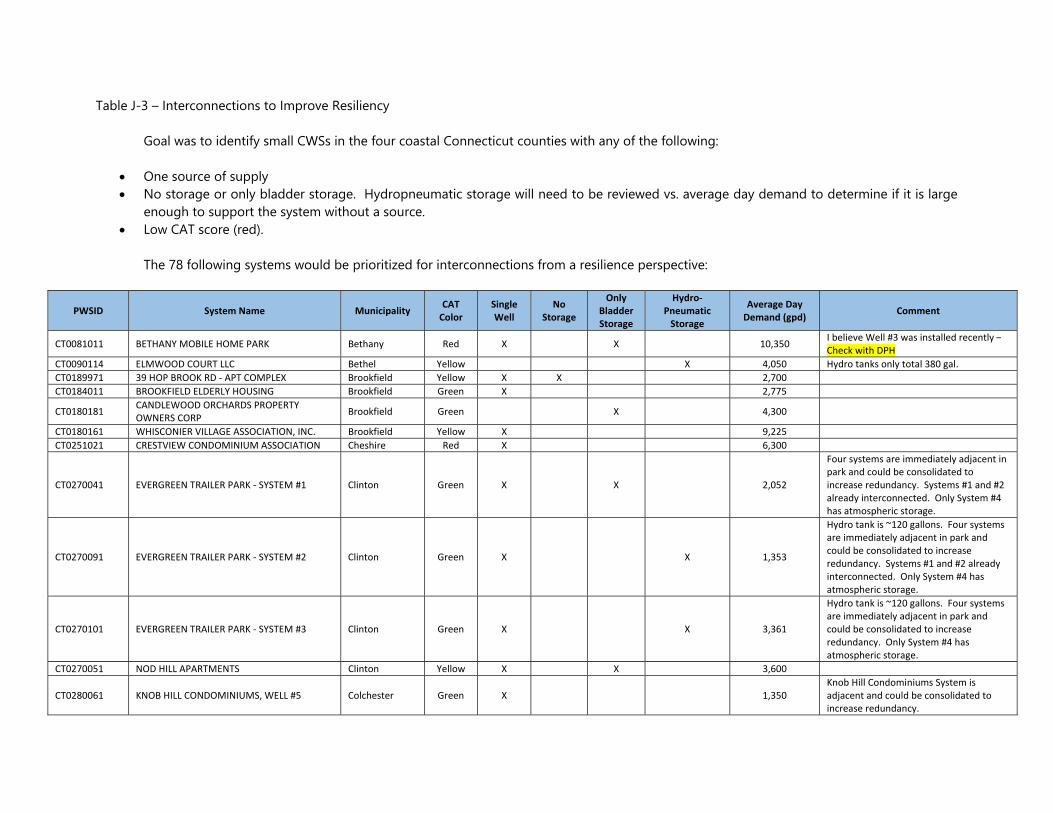
Table J-3 – Interconnections to Improve Resiliency Goal was to identify small CWSs in the four coastal Connecticut counties with any of the following:
One source of supply No storage or only bladder storage. Hydropneumatic storage will need to be reviewed vs. average day demand to determine if it is large
enough to support the system without a source. Low CAT score (red).
The 78 following systems would be prioritized for interconnections from a resilience perspective:
PWSID System Name Municipality CAT Color
Single Well
No Storage
Only Bladder Storage
Hydro‐Pneumatic Storage
Average Day Demand (gpd)
Comment
CT0081011 BETHANY MOBILE HOME PARK Bethany Red X X 10,350 I believe Well #3 was installed recently – Check with DPH
CT0090114 ELMWOOD COURT LLC Bethel Yellow X 4,050 Hydro tanks only total 380 gal.
CT0189971 39 HOP BROOK RD ‐ APT COMPLEX Brookfield Yellow X X 2,700
CT0184011 BROOKFIELD ELDERLY HOUSING Brookfield Green X 2,775
CT0180181 CANDLEWOOD ORCHARDS PROPERTY OWNERS CORP
Brookfield Green X 4,300
CT0180161 WHISCONIER VILLAGE ASSOCIATION, INC. Brookfield Yellow X 9,225
CT0251021 CRESTVIEW CONDOMINIUM ASSOCIATION Cheshire Red X 6,300
CT0270041 EVERGREEN TRAILER PARK ‐ SYSTEM #1 Clinton Green X X 2,052
Four systems are immediately adjacent in park and could be consolidated to increase redundancy. Systems #1 and #2 already interconnected. Only System #4 has atmospheric storage.
CT0270091 EVERGREEN TRAILER PARK ‐ SYSTEM #2 Clinton Green X X 1,353
Hydro tank is ~120 gallons. Four systems are immediately adjacent in park and could be consolidated to increase redundancy. Systems #1 and #2 already interconnected. Only System #4 has atmospheric storage.
CT0270101 EVERGREEN TRAILER PARK ‐ SYSTEM #3 Clinton Green X X 3,361
Hydro tank is ~120 gallons. Four systems are immediately adjacent in park and could be consolidated to increase redundancy. Only System #4 has atmospheric storage.
CT0270051 NOD HILL APARTMENTS Clinton Yellow X X 3,600
CT0280061 KNOB HILL CONDOMINIUMS, WELL #5 Colchester Green X 1,350 Knob Hill Condominiums System is adjacent and could be consolidated to increase redundancy.
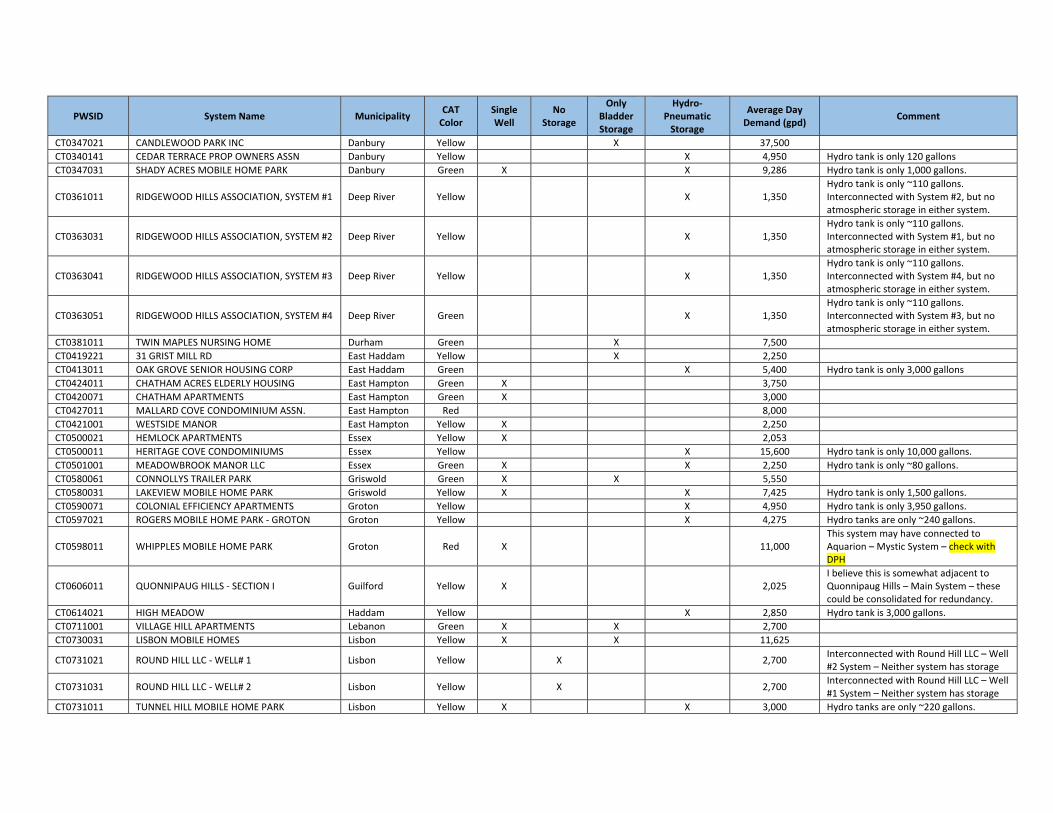
PWSID System Name Municipality CAT Color
Single Well
No Storage
Only Bladder Storage
Hydro‐Pneumatic Storage
Average Day Demand (gpd)
Comment
CT0347021 CANDLEWOOD PARK INC Danbury Yellow X 37,500
CT0340141 CEDAR TERRACE PROP OWNERS ASSN Danbury Yellow X 4,950 Hydro tank is only 120 gallons
CT0347031 SHADY ACRES MOBILE HOME PARK Danbury Green X X 9,286 Hydro tank is only 1,000 gallons.
CT0361011 RIDGEWOOD HILLS ASSOCIATION, SYSTEM #1 Deep River Yellow X 1,350 Hydro tank is only ~110 gallons. Interconnected with System #2, but no atmospheric storage in either system.
CT0363031 RIDGEWOOD HILLS ASSOCIATION, SYSTEM #2 Deep River Yellow X 1,350 Hydro tank is only ~110 gallons. Interconnected with System #1, but no atmospheric storage in either system.
CT0363041 RIDGEWOOD HILLS ASSOCIATION, SYSTEM #3 Deep River Yellow X 1,350 Hydro tank is only ~110 gallons. Interconnected with System #4, but no atmospheric storage in either system.
CT0363051 RIDGEWOOD HILLS ASSOCIATION, SYSTEM #4 Deep River Green X 1,350 Hydro tank is only ~110 gallons. Interconnected with System #3, but no atmospheric storage in either system.
CT0381011 TWIN MAPLES NURSING HOME Durham Green X 7,500
CT0419221 31 GRIST MILL RD East Haddam Yellow X 2,250
CT0413011 OAK GROVE SENIOR HOUSING CORP East Haddam Green X 5,400 Hydro tank is only 3,000 gallons
CT0424011 CHATHAM ACRES ELDERLY HOUSING East Hampton Green X 3,750
CT0420071 CHATHAM APARTMENTS East Hampton Green X 3,000
CT0427011 MALLARD COVE CONDOMINIUM ASSN. East Hampton Red 8,000
CT0421001 WESTSIDE MANOR East Hampton Yellow X 2,250
CT0500021 HEMLOCK APARTMENTS Essex Yellow X 2,053
CT0500011 HERITAGE COVE CONDOMINIUMS Essex Yellow X 15,600 Hydro tank is only 10,000 gallons.
CT0501001 MEADOWBROOK MANOR LLC Essex Green X X 2,250 Hydro tank is only ~80 gallons.
CT0580061 CONNOLLYS TRAILER PARK Griswold Green X X 5,550
CT0580031 LAKEVIEW MOBILE HOME PARK Griswold Yellow X X 7,425 Hydro tank is only 1,500 gallons.
CT0590071 COLONIAL EFFICIENCY APARTMENTS Groton Yellow X 4,950 Hydro tank is only 3,950 gallons.
CT0597021 ROGERS MOBILE HOME PARK ‐ GROTON Groton Yellow X 4,275 Hydro tanks are only ~240 gallons.
CT0598011 WHIPPLES MOBILE HOME PARK Groton Red X 11,000 This system may have connected to Aquarion – Mystic System – check with DPH
CT0606011 QUONNIPAUG HILLS ‐ SECTION I Guilford Yellow X 2,025 I believe this is somewhat adjacent to Quonnipaug Hills – Main System – these could be consolidated for redundancy.
CT0614021 HIGH MEADOW Haddam Yellow X 2,850 Hydro tank is 3,000 gallons.
CT0711001 VILLAGE HILL APARTMENTS Lebanon Green X X 2,700
CT0730031 LISBON MOBILE HOMES Lisbon Yellow X X 11,625
CT0731021 ROUND HILL LLC ‐ WELL# 1 Lisbon Yellow X 2,700 Interconnected with Round Hill LLC – Well #2 System – Neither system has storage
CT0731031 ROUND HILL LLC ‐ WELL# 2 Lisbon Yellow X 2,700 Interconnected with Round Hill LLC – Well #1 System – Neither system has storage
CT0731011 TUNNEL HILL MOBILE HOME PARK Lisbon Yellow X X 3,000 Hydro tanks are only ~220 gallons.
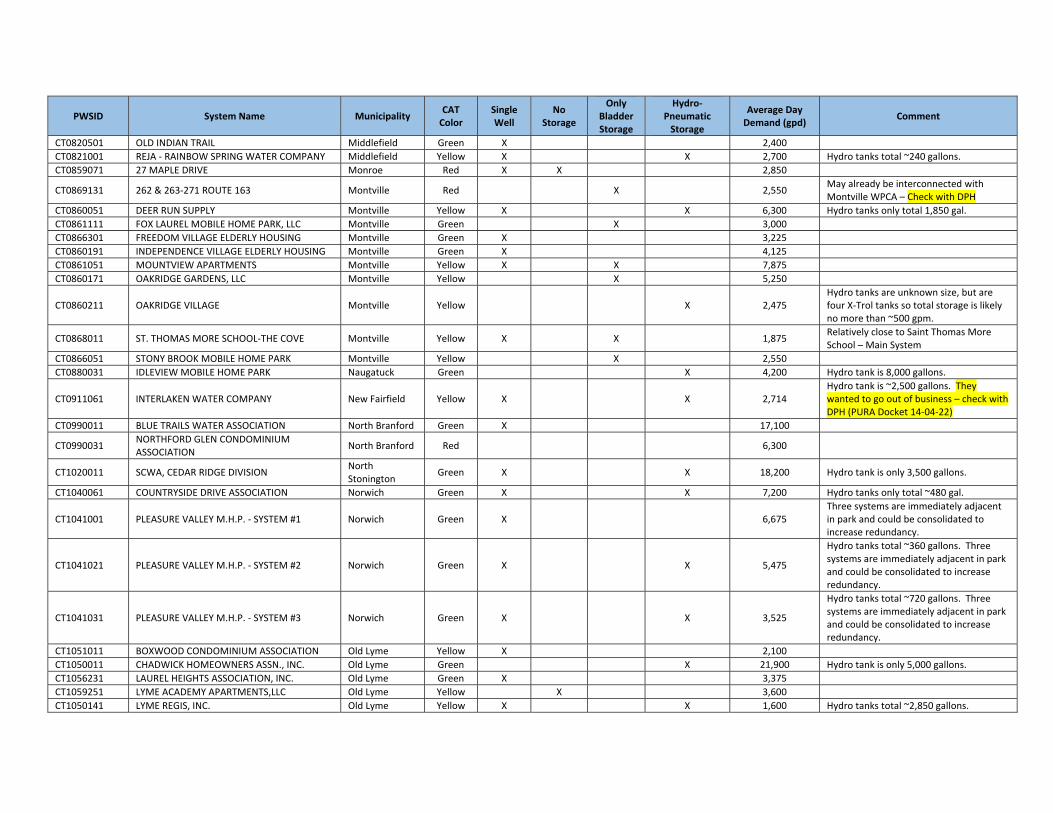
PWSID System Name Municipality CAT Color
Single Well
No Storage
Only Bladder Storage
Hydro‐Pneumatic Storage
Average Day Demand (gpd)
Comment
CT0820501 OLD INDIAN TRAIL Middlefield Green X 2,400
CT0821001 REJA ‐ RAINBOW SPRING WATER COMPANY Middlefield Yellow X X 2,700 Hydro tanks total ~240 gallons.
CT0859071 27 MAPLE DRIVE Monroe Red X X 2,850
CT0869131 262 & 263‐271 ROUTE 163 Montville Red X 2,550 May already be interconnected with Montville WPCA – Check with DPH
CT0860051 DEER RUN SUPPLY Montville Yellow X X 6,300 Hydro tanks only total 1,850 gal.
CT0861111 FOX LAUREL MOBILE HOME PARK, LLC Montville Green X 3,000
CT0866301 FREEDOM VILLAGE ELDERLY HOUSING Montville Green X 3,225
CT0860191 INDEPENDENCE VILLAGE ELDERLY HOUSING Montville Green X 4,125
CT0861051 MOUNTVIEW APARTMENTS Montville Yellow X X 7,875
CT0860171 OAKRIDGE GARDENS, LLC Montville Yellow X 5,250
CT0860211 OAKRIDGE VILLAGE Montville Yellow X 2,475 Hydro tanks are unknown size, but are four X‐Trol tanks so total storage is likely no more than ~500 gpm.
CT0868011 ST. THOMAS MORE SCHOOL‐THE COVE Montville Yellow X X 1,875 Relatively close to Saint Thomas More School – Main System
CT0866051 STONY BROOK MOBILE HOME PARK Montville Yellow X 2,550
CT0880031 IDLEVIEW MOBILE HOME PARK Naugatuck Green X 4,200 Hydro tank is 8,000 gallons.
CT0911061 INTERLAKEN WATER COMPANY New Fairfield Yellow X X 2,714 Hydro tank is ~2,500 gallons. They wanted to go out of business – check with DPH (PURA Docket 14‐04‐22)
CT0990011 BLUE TRAILS WATER ASSOCIATION North Branford Green X 17,100
CT0990031 NORTHFORD GLEN CONDOMINIUM ASSOCIATION
North Branford Red 6,300
CT1020011 SCWA, CEDAR RIDGE DIVISION North Stonington
Green X X 18,200 Hydro tank is only 3,500 gallons.
CT1040061 COUNTRYSIDE DRIVE ASSOCIATION Norwich Green X X 7,200 Hydro tanks only total ~480 gal.
CT1041001 PLEASURE VALLEY M.H.P. ‐ SYSTEM #1 Norwich Green X 6,675 Three systems are immediately adjacent in park and could be consolidated to increase redundancy.
CT1041021 PLEASURE VALLEY M.H.P. ‐ SYSTEM #2 Norwich Green X X 5,475
Hydro tanks total ~360 gallons. Three systems are immediately adjacent in park and could be consolidated to increase redundancy.
CT1041031 PLEASURE VALLEY M.H.P. ‐ SYSTEM #3 Norwich Green X X 3,525
Hydro tanks total ~720 gallons. Three systems are immediately adjacent in park and could be consolidated to increase redundancy.
CT1051011 BOXWOOD CONDOMINIUM ASSOCIATION Old Lyme Yellow X 2,100
CT1050011 CHADWICK HOMEOWNERS ASSN., INC. Old Lyme Green X 21,900 Hydro tank is only 5,000 gallons.
CT1056231 LAUREL HEIGHTS ASSOCIATION, INC. Old Lyme Green X 3,375
CT1059251 LYME ACADEMY APARTMENTS,LLC Old Lyme Yellow X 3,600
CT1050141 LYME REGIS, INC. Old Lyme Yellow X X 1,600 Hydro tanks total ~2,850 gallons.
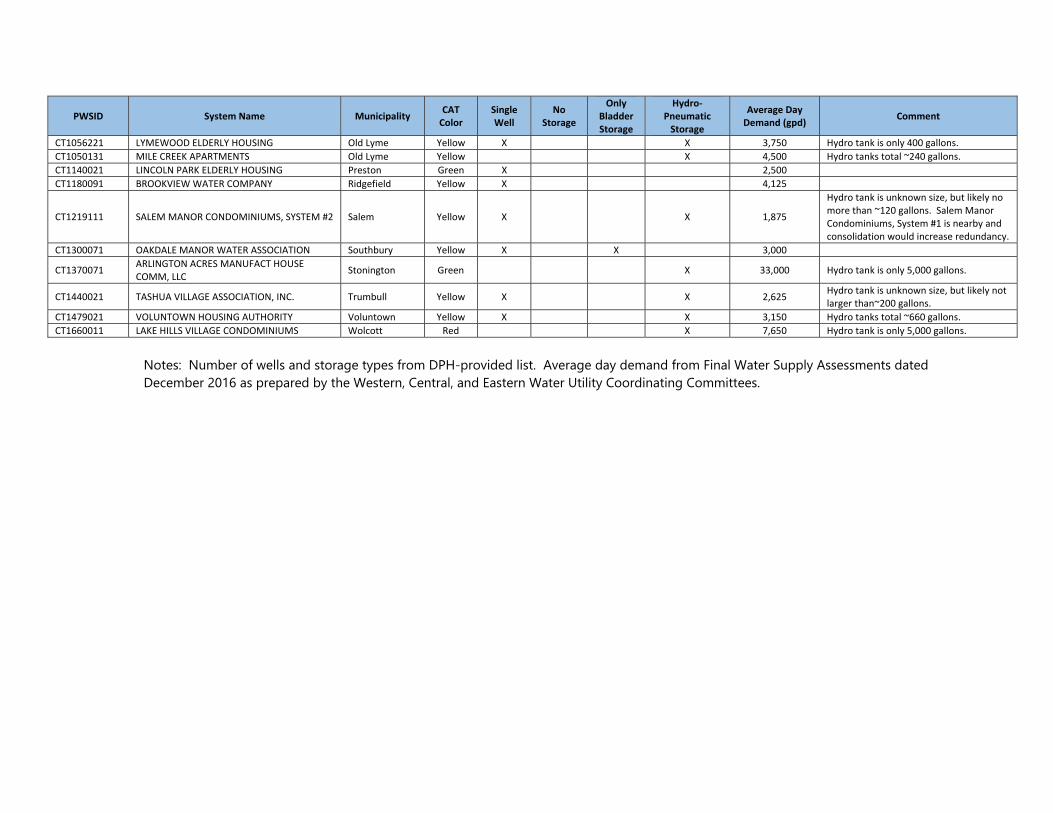
PWSID System Name Municipality CAT Color
Single Well
No Storage
Only Bladder Storage
Hydro‐Pneumatic Storage
Average Day Demand (gpd)
Comment
CT1056221 LYMEWOOD ELDERLY HOUSING Old Lyme Yellow X X 3,750 Hydro tank is only 400 gallons.
CT1050131 MILE CREEK APARTMENTS Old Lyme Yellow X 4,500 Hydro tanks total ~240 gallons.
CT1140021 LINCOLN PARK ELDERLY HOUSING Preston Green X 2,500
CT1180091 BROOKVIEW WATER COMPANY Ridgefield Yellow X 4,125
CT1219111 SALEM MANOR CONDOMINIUMS, SYSTEM #2 Salem Yellow X X 1,875
Hydro tank is unknown size, but likely no more than ~120 gallons. Salem Manor Condominiums, System #1 is nearby and consolidation would increase redundancy.
CT1300071 OAKDALE MANOR WATER ASSOCIATION Southbury Yellow X X 3,000
CT1370071 ARLINGTON ACRES MANUFACT HOUSE COMM, LLC
Stonington Green X 33,000 Hydro tank is only 5,000 gallons.
CT1440021 TASHUA VILLAGE ASSOCIATION, INC. Trumbull Yellow X X 2,625 Hydro tank is unknown size, but likely not larger than~200 gallons.
CT1479021 VOLUNTOWN HOUSING AUTHORITY Voluntown Yellow X X 3,150 Hydro tanks total ~660 gallons.
CT1660011 LAKE HILLS VILLAGE CONDOMINIUMS Wolcott Red X 7,650 Hydro tank is only 5,000 gallons.
Notes: Number of wells and storage types from DPH-provided list. Average day demand from Final Water Supply Assessments dated December 2016 as prepared by the Western, Central, and Eastern Water Utility Coordinating Committees.

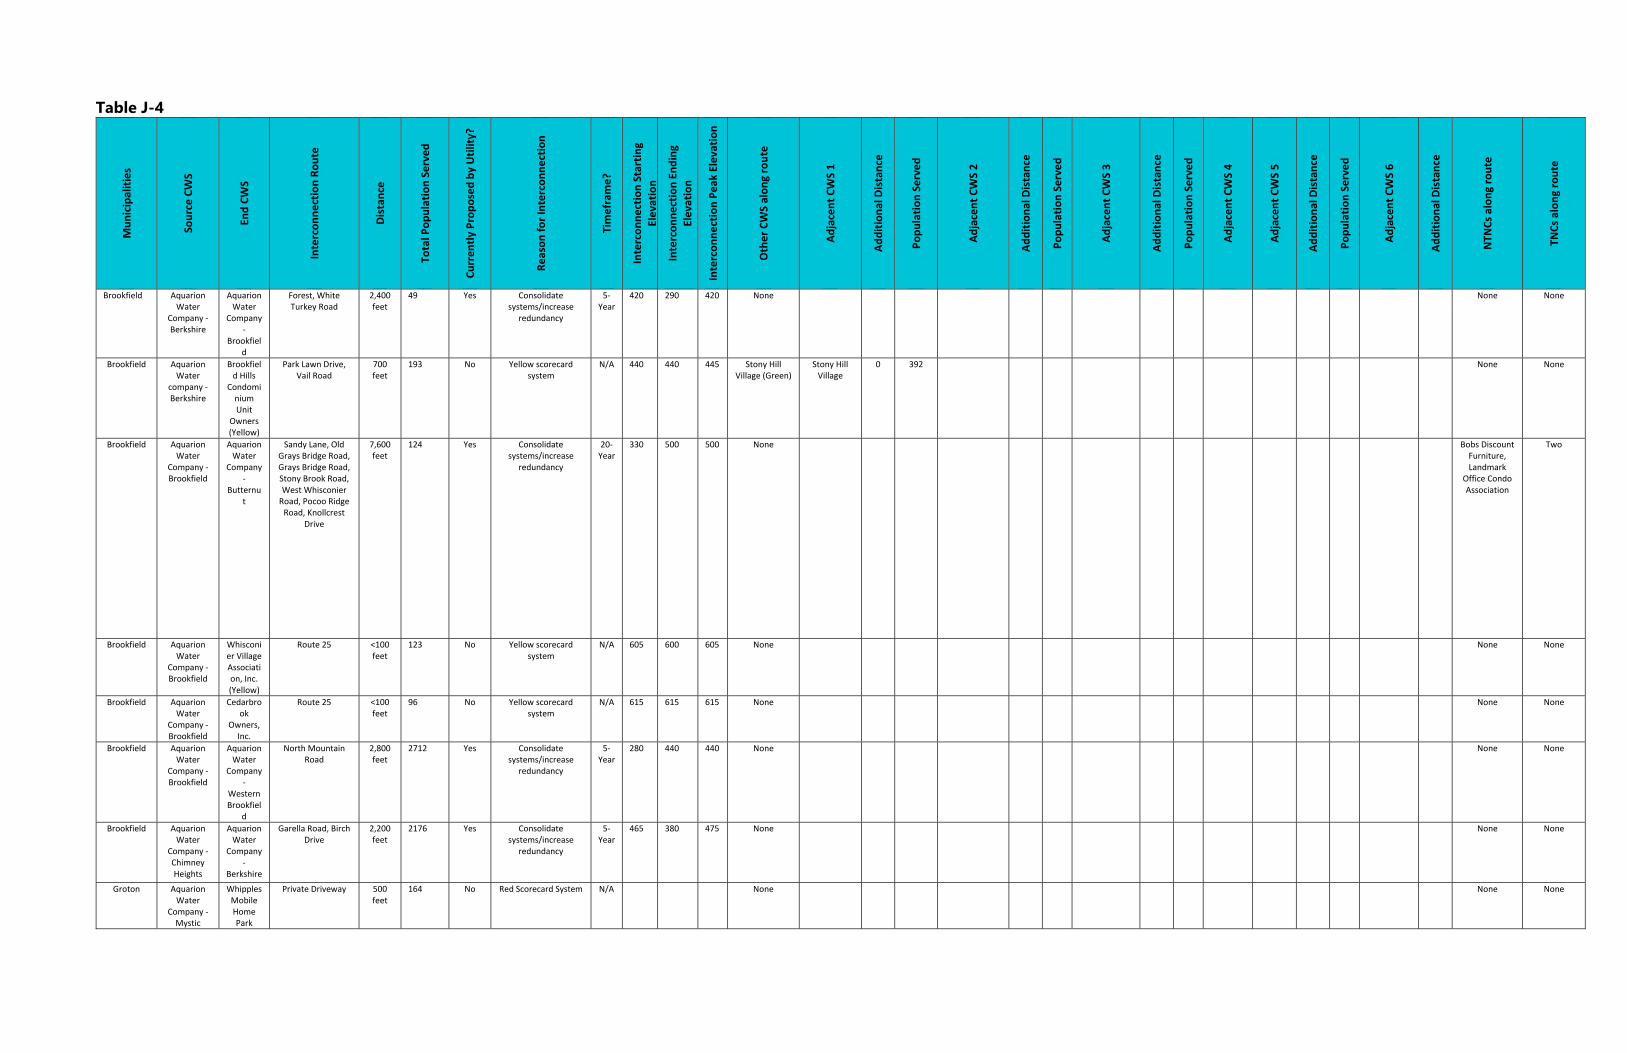
Table J-4 Municipalities
Source CWS
End CWS
Interconnection Route
Distance
Total P
opulation Served
Currently Proposed by Utility?
Reason for Interconnection
Timefram
e?
Interconnection Starting
Elevation
Interconnection Ending
Elevation
Interconnection Peak Elevation
Other CWS along route
Adjacent CWS 1
Additional Distance
Population Served
Adjacent CWS 2
Additional Distance
Population Served
Adjacent CWS 3
Additional Distance
Population Served
Adjacent CWS 4
Adjacent CWS 5
Additional Distance
Population Served
Adjacent CWS 6
Additional Distance
NTN
Cs along route
TNCs along route
Brookfield Aquarion Water
Company ‐ Berkshire
Aquarion Water
Company ‐
Brookfield
Forest, White Turkey Road
2,400 feet
49 Yes Consolidate systems/increase
redundancy
5‐Year
420 290 420 None
None None
Brookfield Aquarion Water
company ‐ Berkshire
Brookfield Hills
Condominium Unit
Owners (Yellow)
Park Lawn Drive, Vail Road
700 feet
193 No Yellow scorecard system
N/A 440 440 445 Stony Hill Village (Green)
Stony Hill Village
0 392
None None
Brookfield Aquarion Water
Company ‐ Brookfield
Aquarion Water
Company ‐
Butternut
Sandy Lane, Old Grays Bridge Road, Grays Bridge Road, Stony Brook Road, West Whisconier Road, Pocoo Ridge Road, Knollcrest
Drive
7,600 feet
124 Yes Consolidate systems/increase
redundancy
20‐Year
330 500 500 None
Bobs Discount Furniture, Landmark
Office Condo Association
Two
Brookfield Aquarion Water
Company ‐ Brookfield
Whisconier Village Association, Inc. (Yellow)
Route 25 <100 feet
123 No Yellow scorecard system
N/A 605 600 605 None
None None
Brookfield Aquarion Water
Company ‐ Brookfield
Cedarbrook
Owners, Inc.
Route 25 <100 feet
96 No Yellow scorecard system
N/A 615 615 615 None
None None
Brookfield Aquarion Water
Company ‐ Brookfield
Aquarion Water
Company ‐
Western Brookfiel
d
North Mountain Road
2,800 feet
2712 Yes Consolidate systems/increase
redundancy
5‐Year
280 440 440 None
None None
Brookfield Aquarion Water
Company ‐ Chimney Heights
Aquarion Water
Company ‐
Berkshire
Garella Road, Birch Drive
2,200 feet
2176 Yes Consolidate systems/increase
redundancy
5‐Year
465 380 475 None
None None
Groton Aquarion Water
Company ‐ Mystic
Whipples Mobile Home Park
Private Driveway 500 feet
164 No Red Scorecard System N/A None None None
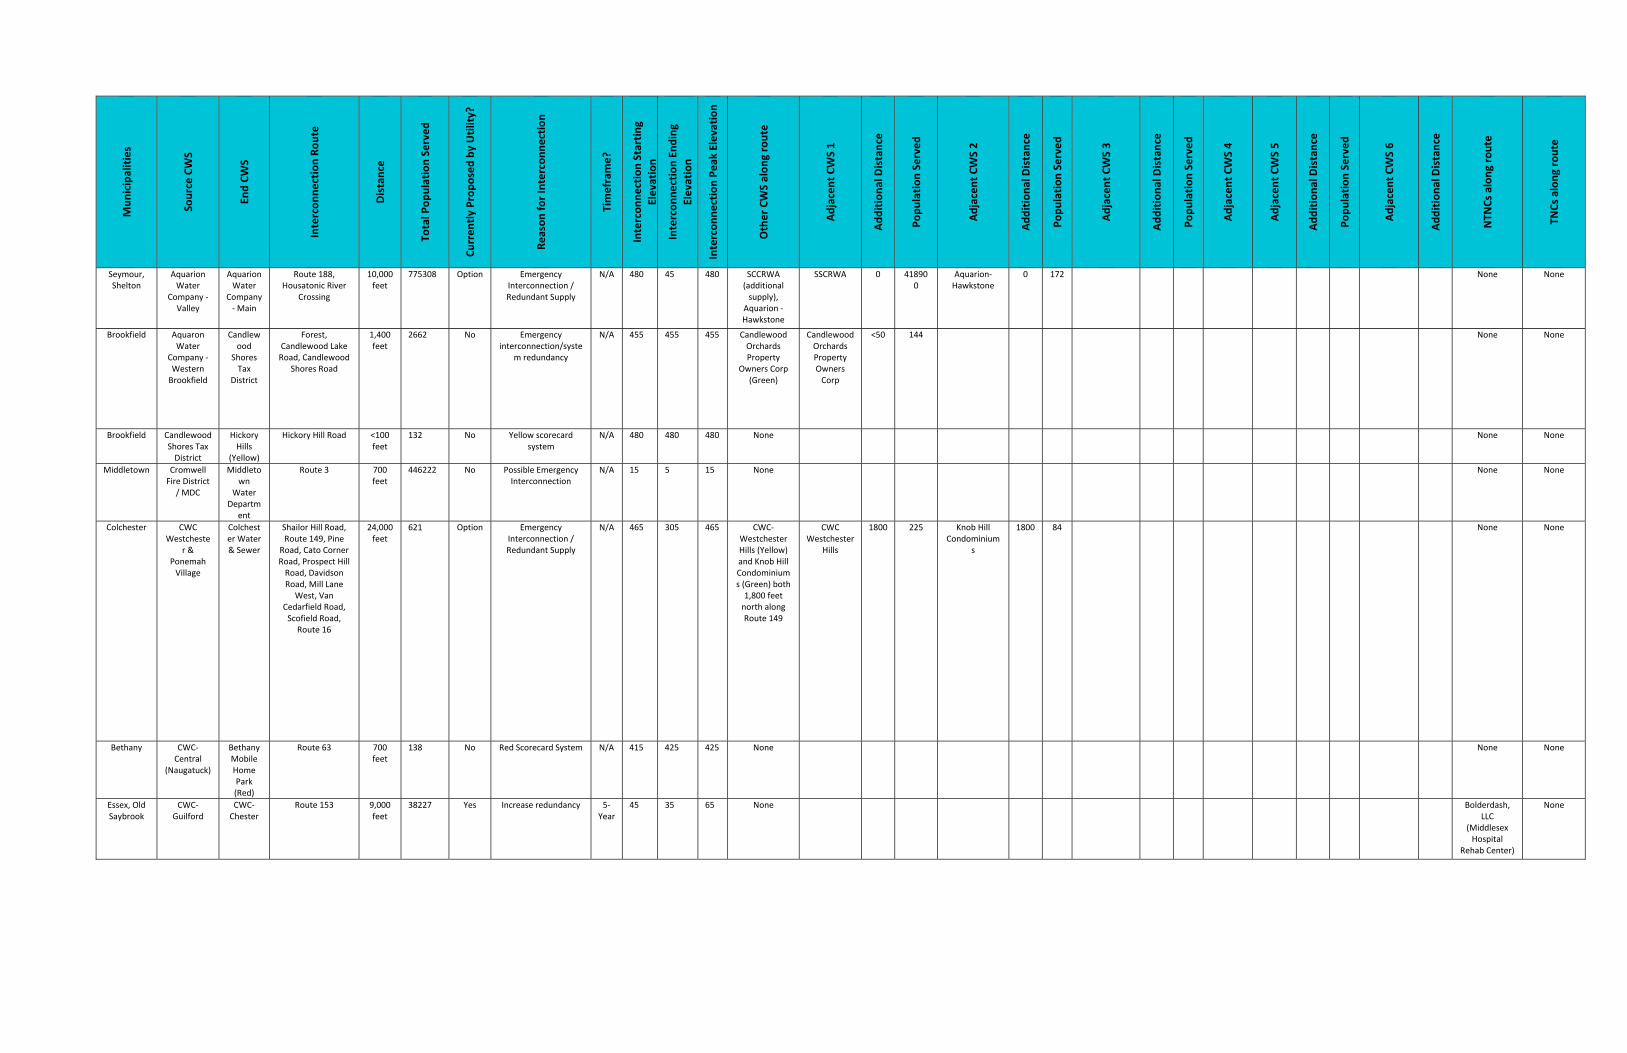
Municipalities
Source CWS
End CWS
Interconnection Route
Distance
Total P
opulation Served
Currently Proposed by Utility?
Reason for Interconnection
Timefram
e?
Interconnection Starting
Elevation
Interconnection Ending
Elevation
Interconnection Peak Elevation
Other CWS along route
Adjacent CWS 1
Additional Distance
Population Served
Adjacent CWS 2
Additional Distance
Population Served
Adjacent CWS 3
Additional Distance
Population Served
Adjacent CWS 4
Adjacent CWS 5
Additional Distance
Population Served
Adjacent CWS 6
Additional Distance
NTN
Cs along route
TNCs along route
Seymour, Shelton
Aquarion Water
Company ‐ Valley
Aquarion Water
Company ‐ Main
Route 188, Housatonic River
Crossing
10,000 feet
775308 Option Emergency Interconnection / Redundant Supply
N/A 480 45 480 SCCRWA (additional supply),
Aquarion ‐ Hawkstone
SSCRWA 0 418900
Aquarion‐Hawkstone
0 172
None None
Brookfield Aquaron Water
Company ‐ Western Brookfield
Candlewood
Shores Tax
District
Forest, Candlewood Lake Road, Candlewood
Shores Road
1,400 feet
2662 No Emergency interconnection/syste
m redundancy
N/A 455 455 455 Candlewood Orchards Property
Owners Corp (Green)
Candlewood Orchards Property Owners Corp
<50 144
None None
Brookfield Candlewood Shores Tax District
Hickory Hills
(Yellow)
Hickory Hill Road <100 feet
132 No Yellow scorecard system
N/A 480 480 480 None
None None
Middletown Cromwell Fire District
/ MDC
Middletown
Water Departm
ent
Route 3 700 feet
446222 No Possible Emergency Interconnection
N/A 15 5 15 None
None None
Colchester CWC Westcheste
r & Ponemah Village
Colchester Water & Sewer
Shailor Hill Road, Route 149, Pine
Road, Cato Corner Road, Prospect Hill Road, Davidson Road, Mill Lane
West, Van Cedarfield Road, Scofield Road,
Route 16
24,000 feet
621 Option Emergency Interconnection / Redundant Supply
N/A 465 305 465 CWC‐Westchester Hills (Yellow) and Knob Hill Condominiums (Green) both 1,800 feet north along Route 149
CWC Westchester
Hills
1800 225 Knob Hill Condominium
s
1800 84
None None
Bethany CWC‐Central
(Naugatuck)
Bethany Mobile Home Park (Red)
Route 63 700 feet
138 No Red Scorecard System N/A 415 425 425 None
None None
Essex, Old Saybrook
CWC‐Guilford
CWC‐Chester
Route 153 9,000 feet
38227 Yes Increase redundancy 5‐Year
45 35 65 None
Bolderdash, LLC
(Middlesex Hospital
Rehab Center)
None
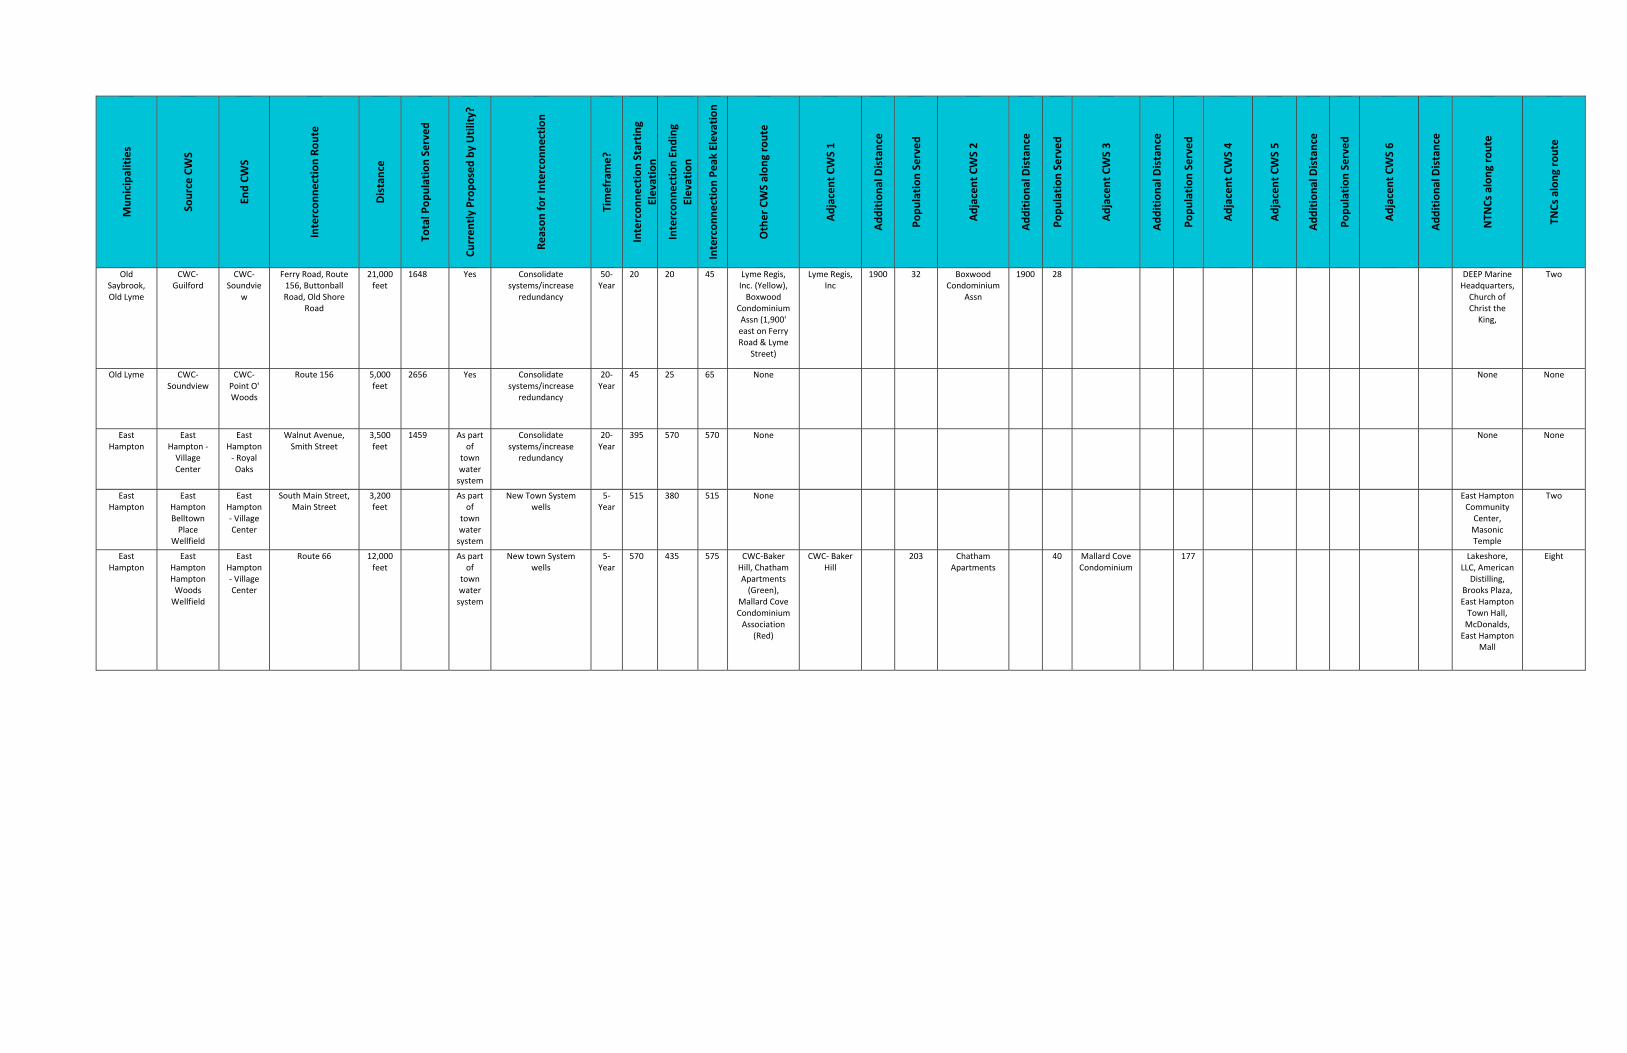
Municipalities
Source CWS
End CWS
Interconnection Route
Distance
Total P
opulation Served
Currently Proposed by Utility?
Reason for Interconnection
Timefram
e?
Interconnection Starting
Elevation
Interconnection Ending
Elevation
Interconnection Peak Elevation
Other CWS along route
Adjacent CWS 1
Additional Distance
Population Served
Adjacent CWS 2
Additional Distance
Population Served
Adjacent CWS 3
Additional Distance
Population Served
Adjacent CWS 4
Adjacent CWS 5
Additional Distance
Population Served
Adjacent CWS 6
Additional Distance
NTN
Cs along route
TNCs along route
Old Saybrook, Old Lyme
CWC‐Guilford
CWC‐Soundvie
w
Ferry Road, Route 156, Buttonball Road, Old Shore
Road
21,000 feet
1648 Yes Consolidate systems/increase
redundancy
50‐Year
20 20 45 Lyme Regis, Inc. (Yellow), Boxwood
Condominium Assn (1,900' east on Ferry Road & Lyme
Street)
Lyme Regis, Inc
1900 32 Boxwood Condominium
Assn
1900 28
DEEP Marine Headquarters, Church of Christ the King,
Two
Old Lyme CWC‐Soundview
CWC‐Point O' Woods
Route 156 5,000 feet
2656 Yes Consolidate systems/increase
redundancy
20‐Year
45 25 65 None
None None
East Hampton
East Hampton ‐ Village Center
East Hampton ‐ Royal Oaks
Walnut Avenue, Smith Street
3,500 feet
1459 As part of
town water system
Consolidate systems/increase
redundancy
20‐Year
395 570 570 None
None None
East Hampton
East Hampton Belltown Place
Wellfield
East Hampton ‐ Village Center
South Main Street, Main Street
3,200 feet
As part
of town water system
New Town System wells
5‐Year
515 380 515 None
East Hampton Community Center, Masonic Temple
Two
East Hampton
East Hampton Hampton Woods Wellfield
East Hampton ‐ Village Center
Route 66 12,000 feet
As part
of town water system
New town System wells
5‐Year
570 435 575 CWC‐Baker Hill, Chatham Apartments (Green),
Mallard Cove Condominium Association
(Red)
CWC‐ Baker Hill
203 Chatham
Apartments
40 Mallard Cove
Condominium
177
Lakeshore,
LLC, American Distilling,
Brooks Plaza, East Hampton Town Hall, McDonalds, East Hampton
Mall
Eight
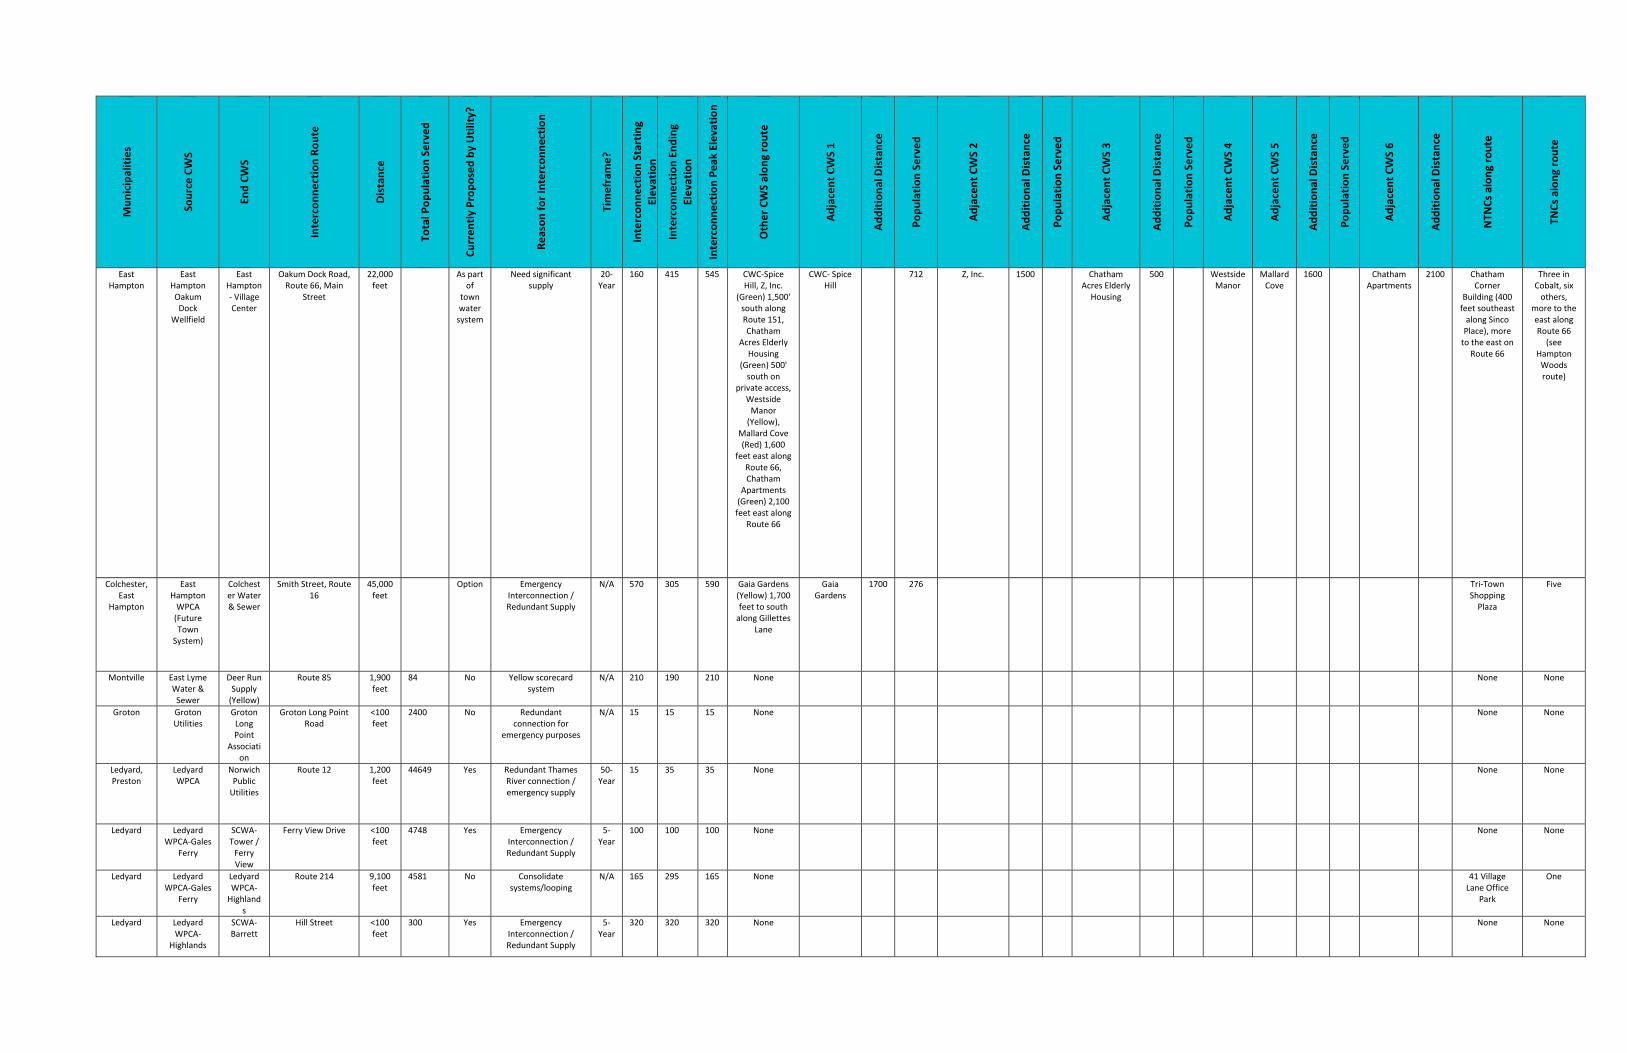
Municipalities
Source CWS
End CWS
Interconnection Route
Distance
Total P
opulation Served
Currently Proposed by Utility?
Reason for Interconnection
Timefram
e?
Interconnection Starting
Elevation
Interconnection Ending
Elevation
Interconnection Peak Elevation
Other CWS along route
Adjacent CWS 1
Additional Distance
Population Served
Adjacent CWS 2
Additional Distance
Population Served
Adjacent CWS 3
Additional Distance
Population Served
Adjacent CWS 4
Adjacent CWS 5
Additional Distance
Population Served
Adjacent CWS 6
Additional Distance
NTN
Cs along route
TNCs along route
East Hampton
East Hampton Oakum Dock
Wellfield
East Hampton ‐ Village Center
Oakum Dock Road, Route 66, Main
Street
22,000 feet
As part
of town water system
Need significant supply
20‐Year
160 415 545 CWC‐Spice Hill, Z, Inc.
(Green) 1,500' south along Route 151, Chatham
Acres Elderly Housing
(Green) 500' south on
private access, Westside Manor (Yellow),
Mallard Cove (Red) 1,600
feet east along Route 66, Chatham
Apartments (Green) 2,100 feet east along
Route 66
CWC‐ Spice Hill
712 Z, Inc. 1500
Chatham
Acres Elderly Housing
500
Westside Manor
Mallard Cove
1600
Chatham Apartments
2100 Chatham Corner
Building (400 feet southeast along Sinco Place), more to the east on
Route 66
Three in Cobalt, six others,
more to the east along Route 66
(see Hampton Woods route)
Colchester, East
Hampton
East Hampton WPCA (Future Town System)
Colchester Water & Sewer
Smith Street, Route 16
45,000 feet
Option Emergency
Interconnection / Redundant Supply
N/A 570 305 590 Gaia Gardens (Yellow) 1,700 feet to south along Gillettes
Lane
Gaia Gardens
1700 276
Tri‐Town Shopping Plaza
Five
Montville East Lyme Water & Sewer
Deer Run Supply (Yellow)
Route 85 1,900 feet
84 No Yellow scorecard system
N/A 210 190 210 None
None None
Groton Groton Utilities
Groton Long Point
Association
Groton Long Point Road
<100 feet
2400 No Redundant connection for
emergency purposes
N/A 15 15 15 None
None None
Ledyard, Preston
Ledyard WPCA
Norwich Public Utilities
Route 12 1,200 feet
44649 Yes Redundant Thames River connection / emergency supply
50‐Year
15 35 35 None
None None
Ledyard Ledyard WPCA‐Gales
Ferry
SCWA‐Tower / Ferry View
Ferry View Drive <100 feet
4748 Yes Emergency Interconnection / Redundant Supply
5‐Year
100 100 100 None
None None
Ledyard Ledyard WPCA‐Gales
Ferry
Ledyard WPCA‐Highland
s
Route 214 9,100 feet
4581 No Consolidate systems/looping
N/A 165 295 165 None
41 Village Lane Office
Park
One
Ledyard Ledyard WPCA‐
Highlands
SCWA‐Barrett
Hill Street <100 feet
300 Yes Emergency Interconnection / Redundant Supply
5‐Year
320 320 320 None
None None
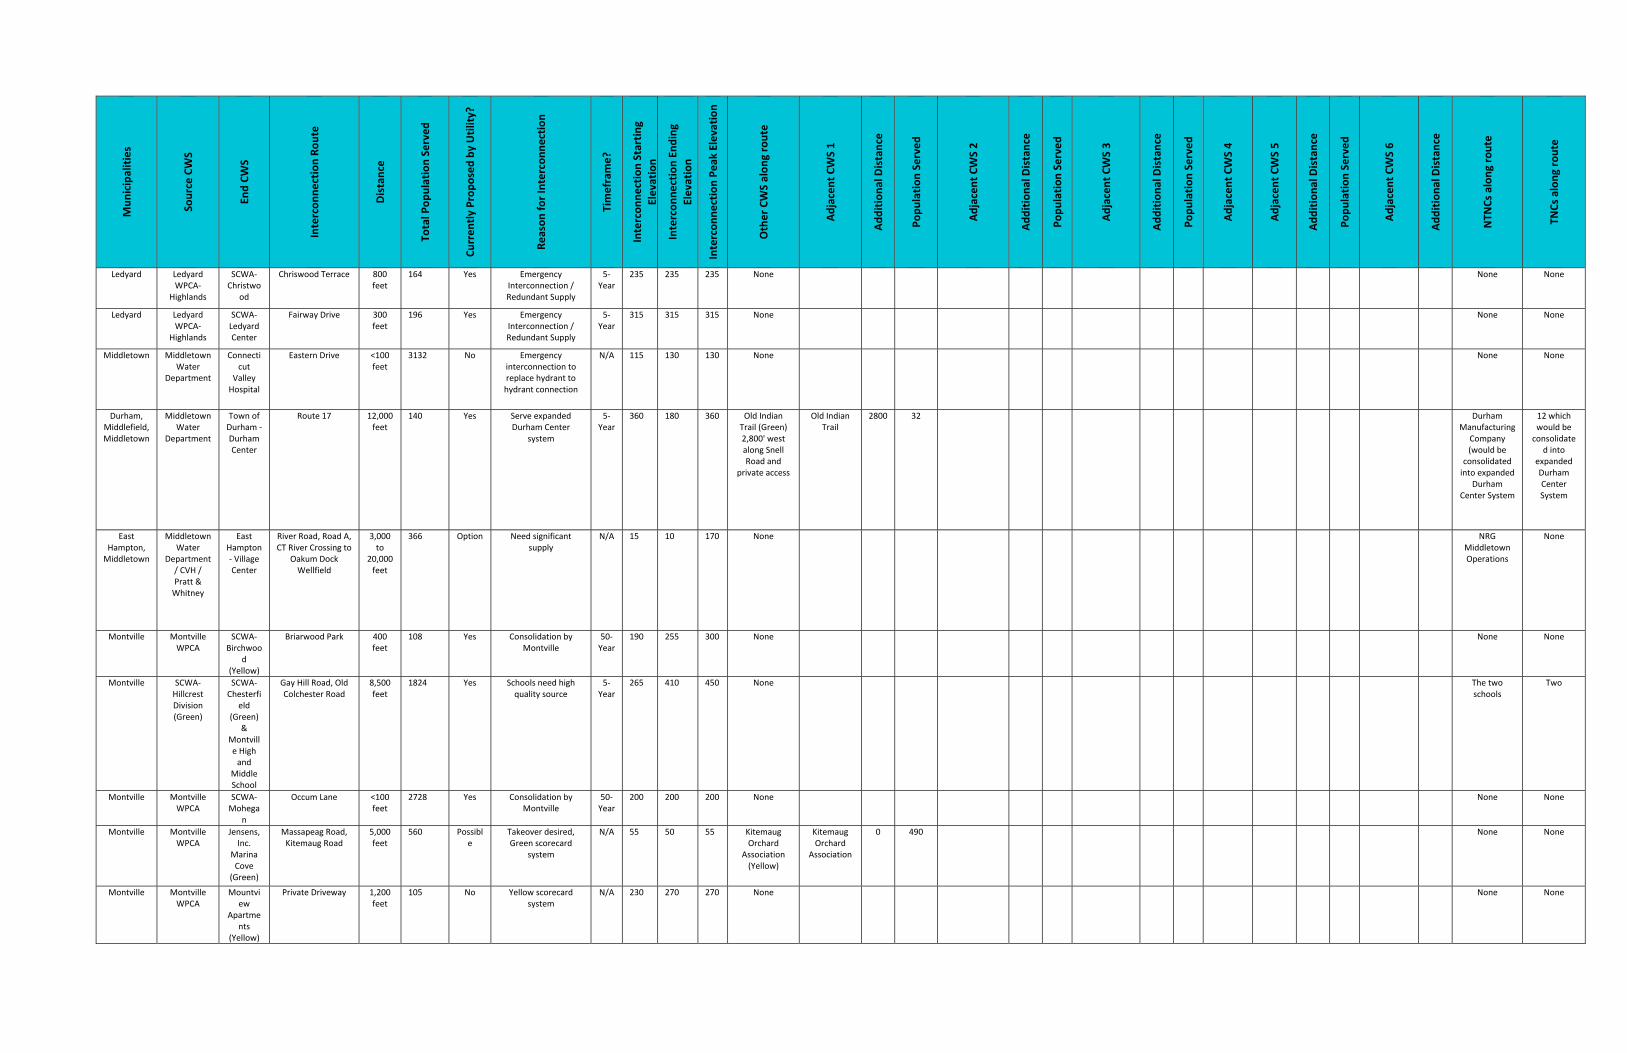
Municipalities
Source CWS
End CWS
Interconnection Route
Distance
Total P
opulation Served
Currently Proposed by Utility?
Reason for Interconnection
Timefram
e?
Interconnection Starting
Elevation
Interconnection Ending
Elevation
Interconnection Peak Elevation
Other CWS along route
Adjacent CWS 1
Additional Distance
Population Served
Adjacent CWS 2
Additional Distance
Population Served
Adjacent CWS 3
Additional Distance
Population Served
Adjacent CWS 4
Adjacent CWS 5
Additional Distance
Population Served
Adjacent CWS 6
Additional Distance
NTN
Cs along route
TNCs along route
Ledyard Ledyard WPCA‐
Highlands
SCWA‐Christwo
od
Chriswood Terrace 800 feet
164 Yes Emergency Interconnection / Redundant Supply
5‐Year
235 235 235 None
None None
Ledyard Ledyard WPCA‐
Highlands
SCWA‐Ledyard Center
Fairway Drive 300 feet
196 Yes Emergency Interconnection / Redundant Supply
5‐Year
315 315 315 None
None None
Middletown Middletown Water
Department
Connecticut
Valley Hospital
Eastern Drive <100 feet
3132 No Emergency interconnection to replace hydrant to hydrant connection
N/A 115 130 130 None
None None
Durham, Middlefield, Middletown
Middletown Water
Department
Town of Durham ‐ Durham Center
Route 17 12,000 feet
140 Yes Serve expanded Durham Center
system
5‐Year
360 180 360 Old Indian Trail (Green) 2,800' west along Snell Road and
private access
Old Indian Trail
2800 32
Durham Manufacturing
Company (would be
consolidated into expanded
Durham Center System
12 which would be consolidate
d into expanded Durham Center System
East Hampton, Middletown
Middletown Water
Department / CVH / Pratt & Whitney
East Hampton ‐ Village Center
River Road, Road A, CT River Crossing to
Oakum Dock Wellfield
3,000 to
20,000 feet
366 Option Need significant supply
N/A 15 10 170 None
NRG Middletown Operations
None
Montville Montville WPCA
SCWA‐Birchwoo
d (Yellow)
Briarwood Park 400 feet
108 Yes Consolidation by Montville
50‐Year
190 255 300 None
None None
Montville SCWA‐Hillcrest Division (Green)
SCWA‐Chesterfi
eld (Green)
& Montville High and
Middle School
Gay Hill Road, Old Colchester Road
8,500 feet
1824 Yes Schools need high quality source
5‐Year
265 410 450 None
The two schools
Two
Montville Montville WPCA
SCWA‐Mohega
n
Occum Lane <100 feet
2728 Yes Consolidation by Montville
50‐Year
200 200 200 None
None None
Montville Montville WPCA
Jensens, Inc.
Marina Cove
(Green)
Massapeag Road, Kitemaug Road
5,000 feet
560 Possible
Takeover desired, Green scorecard
system
N/A 55 50 55 Kitemaug Orchard
Association (Yellow)
Kitemaug Orchard
Association
0 490
None None
Montville Montville WPCA
Mountview
Apartments
(Yellow)
Private Driveway 1,200 feet
105 No Yellow scorecard system
N/A 230 270 270 None
None None
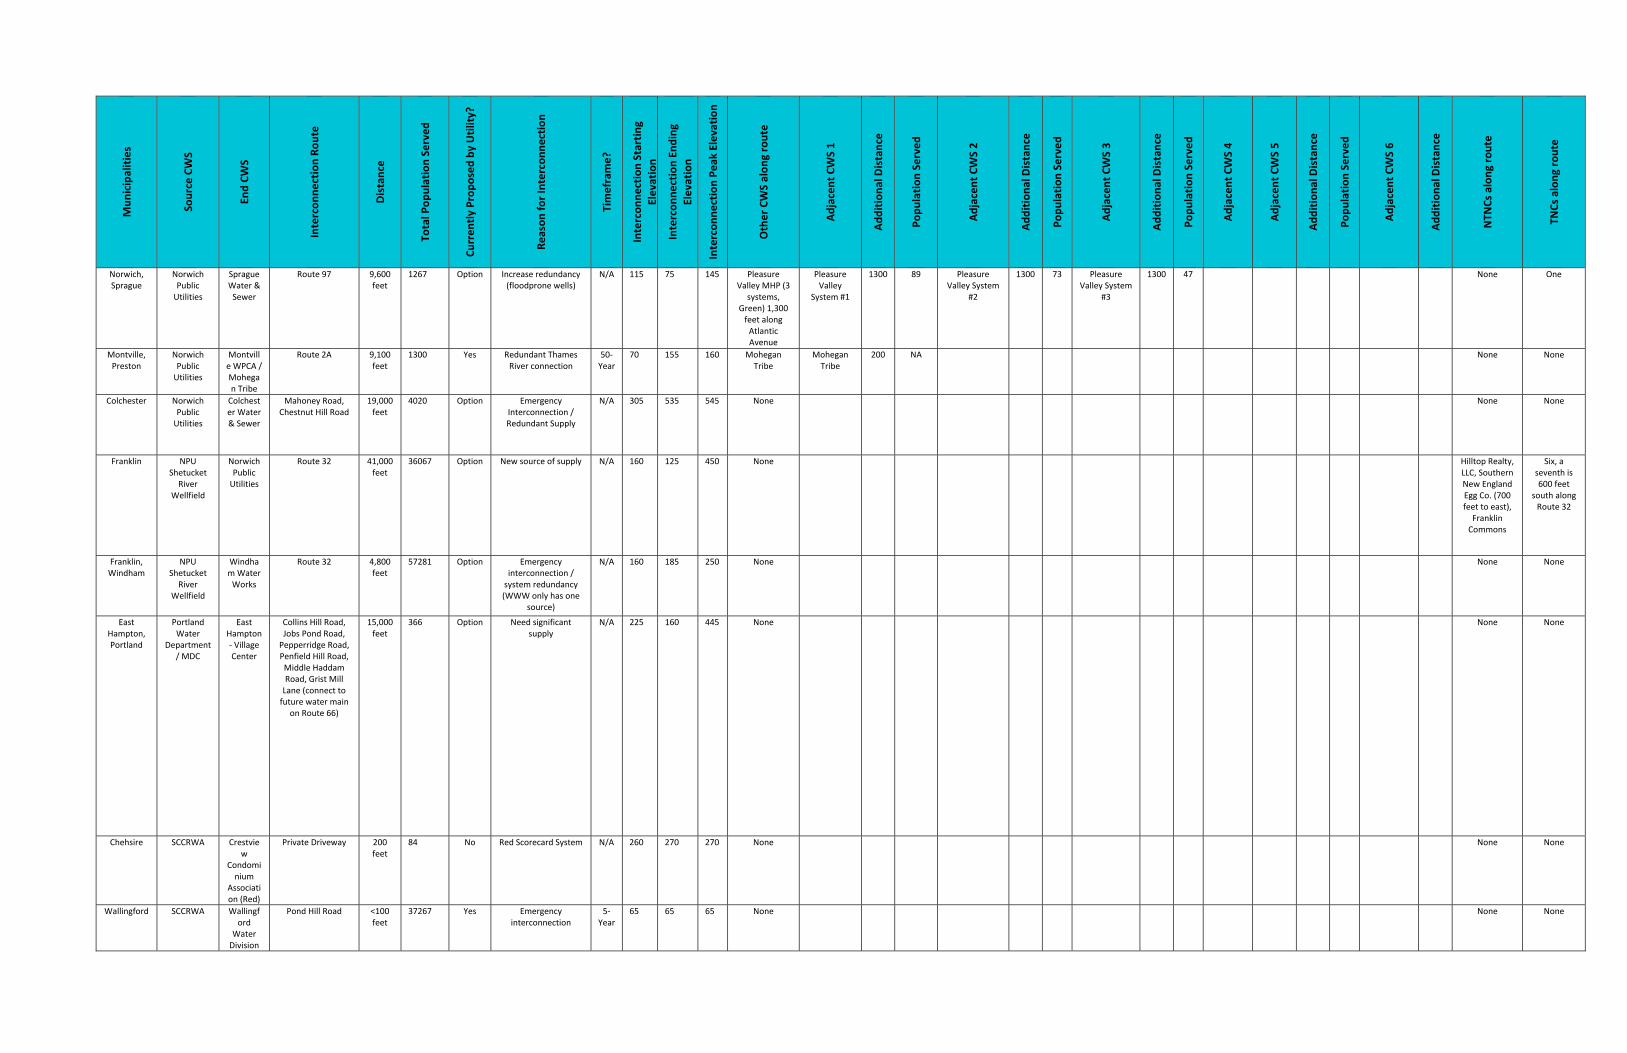
Municipalities
Source CWS
End CWS
Interconnection Route
Distance
Total P
opulation Served
Currently Proposed by Utility?
Reason for Interconnection
Timefram
e?
Interconnection Starting
Elevation
Interconnection Ending
Elevation
Interconnection Peak Elevation
Other CWS along route
Adjacent CWS 1
Additional Distance
Population Served
Adjacent CWS 2
Additional Distance
Population Served
Adjacent CWS 3
Additional Distance
Population Served
Adjacent CWS 4
Adjacent CWS 5
Additional Distance
Population Served
Adjacent CWS 6
Additional Distance
NTN
Cs along route
TNCs along route
Norwich, Sprague
Norwich Public Utilities
Sprague Water & Sewer
Route 97 9,600 feet
1267 Option Increase redundancy (floodprone wells)
N/A 115 75 145 Pleasure Valley MHP (3
systems, Green) 1,300 feet along Atlantic Avenue
Pleasure Valley
System #1
1300 89 Pleasure Valley System
#2
1300 73 Pleasure Valley System
#3
1300 47
None One
Montville, Preston
Norwich Public Utilities
Montville WPCA / Mohegan Tribe
Route 2A 9,100 feet
1300 Yes Redundant Thames River connection
50‐Year
70 155 160 Mohegan Tribe
Mohegan Tribe
200 NA
None None
Colchester Norwich Public Utilities
Colchester Water & Sewer
Mahoney Road, Chestnut Hill Road
19,000 feet
4020 Option Emergency Interconnection / Redundant Supply
N/A 305 535 545 None
None None
Franklin NPU Shetucket River
Wellfield
Norwich Public Utilities
Route 32 41,000 feet
36067 Option New source of supply N/A 160 125 450 None
Hilltop Realty, LLC, Southern New England Egg Co. (700 feet to east), Franklin Commons
Six, a seventh is 600 feet
south along Route 32
Franklin, Windham
NPU Shetucket River
Wellfield
Windham Water Works
Route 32 4,800 feet
57281 Option Emergency interconnection / system redundancy (WWW only has one
source)
N/A 160 185 250 None
None None
East Hampton, Portland
Portland Water
Department / MDC
East Hampton ‐ Village Center
Collins Hill Road, Jobs Pond Road, Pepperridge Road, Penfield Hill Road, Middle Haddam Road, Grist Mill Lane (connect to future water main
on Route 66)
15,000 feet
366 Option Need significant supply
N/A 225 160 445 None
None None
Chehsire SCCRWA Crestview
Condominium
Association (Red)
Private Driveway 200 feet
84 No Red Scorecard System N/A 260 270 270 None
None None
Wallingford SCCRWA Wallingford
Water Division
Pond Hill Road <100 feet
37267 Yes Emergency interconnection
5‐Year
65 65 65 None
None None
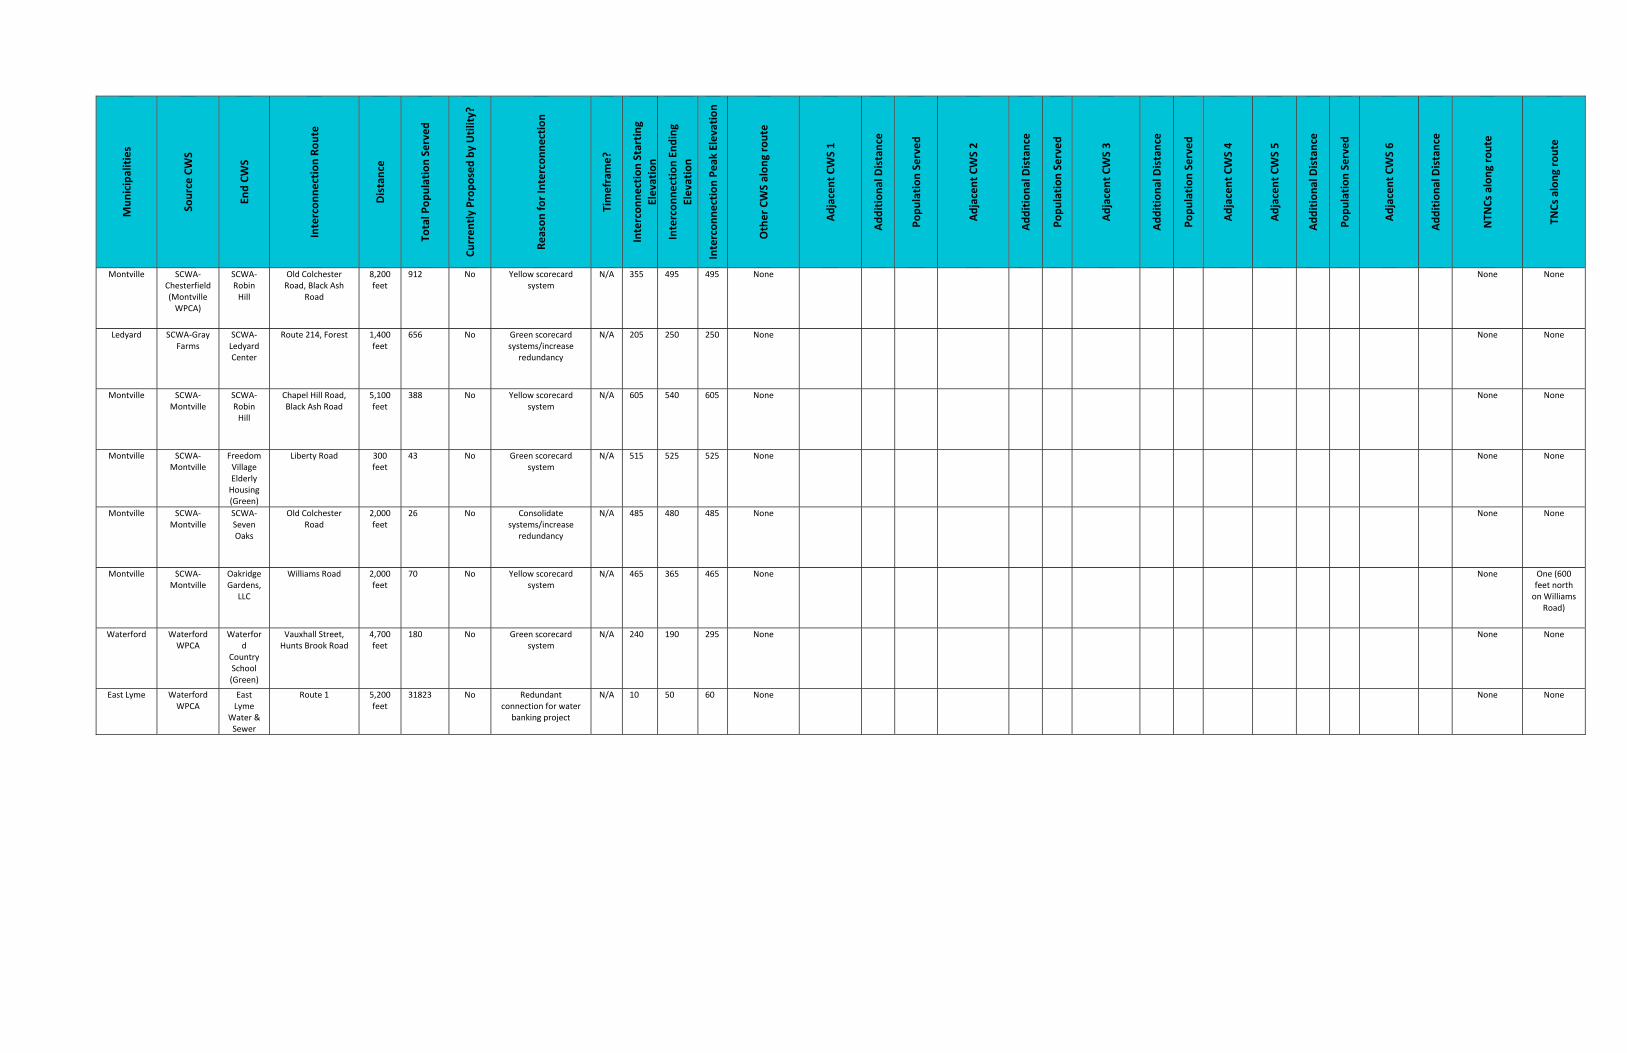
Municipalities
Source CWS
End CWS
Interconnection Route
Distance
Total P
opulation Served
Currently Proposed by Utility?
Reason for Interconnection
Timefram
e?
Interconnection Starting
Elevation
Interconnection Ending
Elevation
Interconnection Peak Elevation
Other CWS along route
Adjacent CWS 1
Additional Distance
Population Served
Adjacent CWS 2
Additional Distance
Population Served
Adjacent CWS 3
Additional Distance
Population Served
Adjacent CWS 4
Adjacent CWS 5
Additional Distance
Population Served
Adjacent CWS 6
Additional Distance
NTN
Cs along route
TNCs along route
Montville SCWA‐Chesterfield (Montville WPCA)
SCWA‐Robin Hill
Old Colchester Road, Black Ash
Road
8,200 feet
912 No Yellow scorecard system
N/A 355 495 495 None
None None
Ledyard SCWA‐Gray Farms
SCWA‐Ledyard Center
Route 214, Forest 1,400 feet
656 No Green scorecard systems/increase
redundancy
N/A 205 250 250 None
None None
Montville SCWA‐Montville
SCWA‐Robin Hill
Chapel Hill Road, Black Ash Road
5,100 feet
388 No Yellow scorecard system
N/A 605 540 605 None
None None
Montville SCWA‐Montville
Freedom Village Elderly Housing (Green)
Liberty Road 300 feet
43 No Green scorecard system
N/A 515 525 525 None
None None
Montville SCWA‐Montville
SCWA‐Seven Oaks
Old Colchester Road
2,000 feet
26 No Consolidate systems/increase
redundancy
N/A 485 480 485 None
None None
Montville SCWA‐Montville
Oakridge Gardens,
LLC
Williams Road 2,000 feet
70 No Yellow scorecard system
N/A 465 365 465 None
None One (600 feet north on Williams
Road)
Waterford Waterford WPCA
Waterford
Country School (Green)
Vauxhall Street, Hunts Brook Road
4,700 feet
180 No Green scorecard system
N/A 240 190 295 None
None None
East Lyme Waterford WPCA
East Lyme
Water & Sewer
Route 1 5,200 feet
31823 No Redundant connection for water
banking project
N/A 10 50 60 None
None None
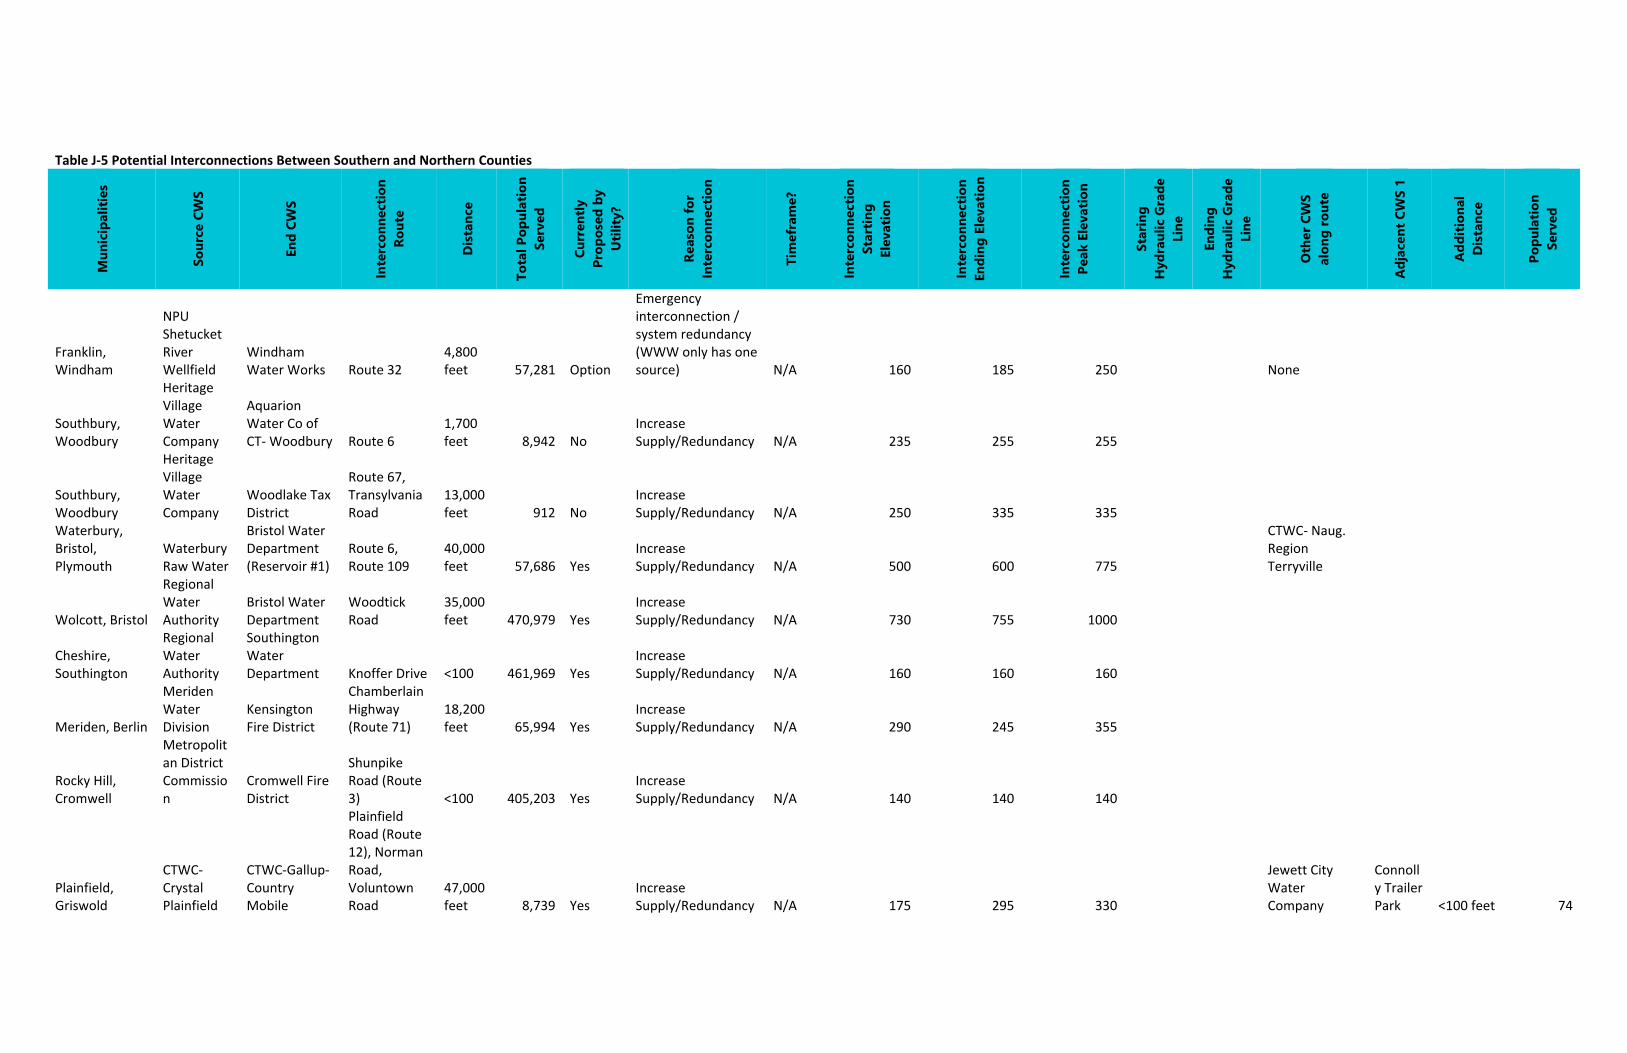
Table J‐5 Potential Interconnections Between Southern and Northern Counties
Mun
icipa
lities
Sour
ce C
WS
End
CWS
Inte
rcon
nect
ion
Rout
e
Dista
nce
Tota
l Pop
ulat
ion
Serv
ed
Curre
ntly
Prop
osed
by
Utilit
y?
Reas
on fo
r In
terc
onne
ctio
n
Tim
efra
me?
Inte
rcon
nect
ion
Star
ting
Eleva
tion
Inte
rcon
nect
ion
Endi
ng El
evat
ion
Inte
rcon
nect
ion
Peak
Elev
atio
n
Star
ing
Hydr
aulic
Gra
de
Line
Endi
ng
Hydr
aulic
Gra
de
Line
Othe
r CW
S alo
ng ro
ute
Adjac
ent C
WS 1
Addi
tiona
l Di
stanc
e
Popu
latio
n Se
rved
Franklin, Windham
NPU Shetucket River Wellfield
Windham Water Works Route 32
4,800 feet 57,281 Option
Emergency interconnection / system redundancy (WWW only has one source) N/A 160 185 250 None
Southbury, Woodbury
Heritage Village Water Company
Aquarion Water Co of CT‐ Woodbury Route 6
1,700 feet 8,942 No
Increase Supply/Redundancy N/A 235 255 255
Southbury, Woodbury
Heritage Village Water Company
Woodlake Tax District
Route 67, Transylvania Road
13,000 feet 912 No
Increase Supply/Redundancy N/A 250 335 335
Waterbury, Bristol, Plymouth
Waterbury Raw Water
Bristol Water Department (Reservoir #1)
Route 6, Route 109
40,000 feet 57,686 Yes
Increase Supply/Redundancy N/A 500 600 775
CTWC‐ Naug. Region Terryville
Wolcott, Bristol
Regional Water Authority
Bristol Water Department
Woodtick Road
35,000 feet 470,979 Yes
Increase Supply/Redundancy N/A 730 755 1000
Cheshire, Southington
Regional Water Authority
Southington Water Department Knoffer Drive <100 461,969 Yes
Increase Supply/Redundancy N/A 160 160 160
Meriden, Berlin
Meriden Water Division
Kensington Fire District
Chamberlain Highway (Route 71)
18,200 feet 65,994 Yes
Increase Supply/Redundancy N/A 290 245 355
Rocky Hill, Cromwell
Metropolitan District Commission
Cromwell Fire District
Shunpike Road (Route 3) <100 405,203 Yes
Increase Supply/Redundancy N/A 140 140 140
Plainfield, Griswold
CTWC‐ Crystal Plainfield
CTWC‐Gallup‐ Country Mobile
Plainfield Road (Route 12), Norman Road, Voluntown Road
47,000 feet 8,739 Yes
Increase Supply/Redundancy N/A 175 295 330
Jewett City Water Company
Connolly Trailer Park <100 feet 74

APPENDIX K Private Well Parcel Statistics

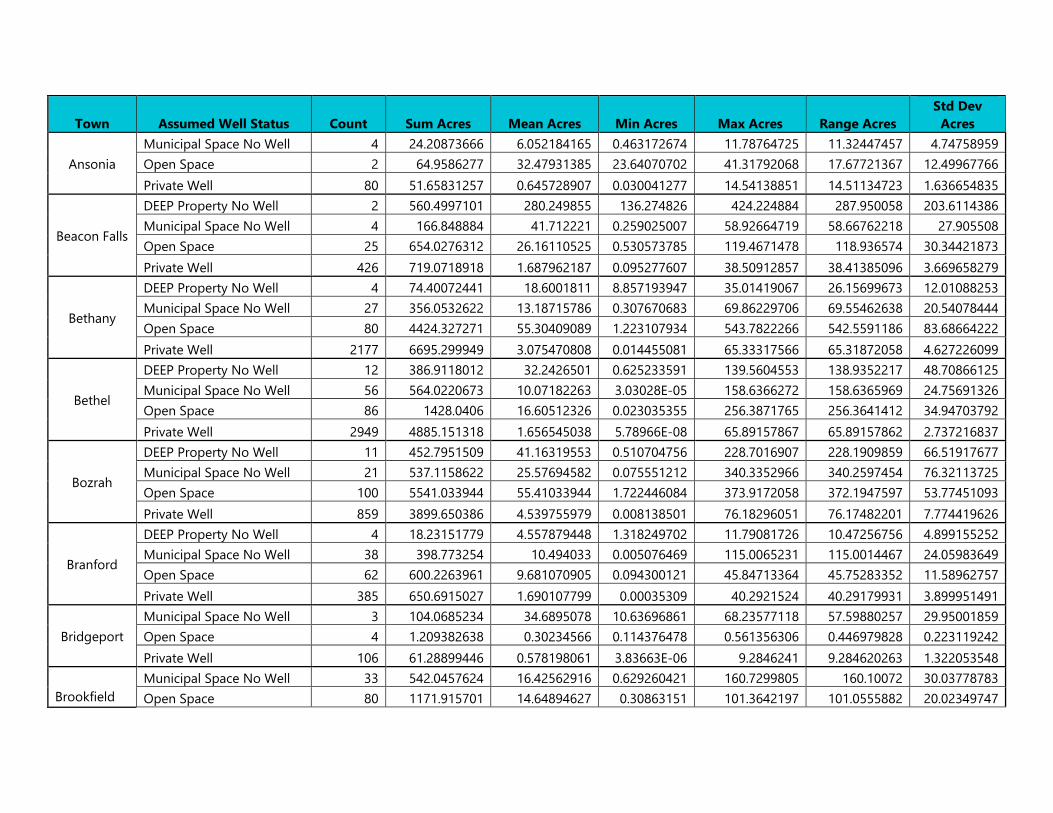
Town Assumed Well Status Count Sum Acres Mean Acres Min Acres Max Acres Range Acres
Std Dev
Acres
Ansonia
Municipal Space No Well 4 24.20873666 6.052184165 0.463172674 11.78764725 11.32447457 4.74758959
Open Space 2 64.9586277 32.47931385 23.64070702 41.31792068 17.67721367 12.49967766
Private Well 80 51.65831257 0.645728907 0.030041277 14.54138851 14.51134723 1.636654835
Beacon Falls
DEEP Property No Well 2 560.4997101 280.249855 136.274826 424.224884 287.950058 203.6114386
Municipal Space No Well 4 166.848884 41.712221 0.259025007 58.92664719 58.66762218 27.905508
Open Space 25 654.0276312 26.16110525 0.530573785 119.4671478 118.936574 30.34421873
Private Well 426 719.0718918 1.687962187 0.095277607 38.50912857 38.41385096 3.669658279
Bethany
DEEP Property No Well 4 74.40072441 18.6001811 8.857193947 35.01419067 26.15699673 12.01088253
Municipal Space No Well 27 356.0532622 13.18715786 0.307670683 69.86229706 69.55462638 20.54078444
Open Space 80 4424.327271 55.30409089 1.223107934 543.7822266 542.5591186 83.68664222
Private Well 2177 6695.299949 3.075470808 0.014455081 65.33317566 65.31872058 4.627226099
Bethel
DEEP Property No Well 12 386.9118012 32.2426501 0.625233591 139.5604553 138.9352217 48.70866125
Municipal Space No Well 56 564.0220673 10.07182263 3.03028E-05 158.6366272 158.6365969 24.75691326
Open Space 86 1428.0406 16.60512326 0.023035355 256.3871765 256.3641412 34.94703792
Private Well 2949 4885.151318 1.656545038 5.78966E-08 65.89157867 65.89157862 2.737216837
Bozrah
DEEP Property No Well 11 452.7951509 41.16319553 0.510704756 228.7016907 228.1909859 66.51917677
Municipal Space No Well 21 537.1158622 25.57694582 0.075551212 340.3352966 340.2597454 76.32113725
Open Space 100 5541.033944 55.41033944 1.722446084 373.9172058 372.1947597 53.77451093
Private Well 859 3899.650386 4.539755979 0.008138501 76.18296051 76.17482201 7.774419626
Branford
DEEP Property No Well 4 18.23151779 4.557879448 1.318249702 11.79081726 10.47256756 4.899155252
Municipal Space No Well 38 398.773254 10.494033 0.005076469 115.0065231 115.0014467 24.05983649
Open Space 62 600.2263961 9.681070905 0.094300121 45.84713364 45.75283352 11.58962757
Private Well 385 650.6915027 1.690107799 0.00035309 40.2921524 40.29179931 3.899951491
Bridgeport
Municipal Space No Well 3 104.0685234 34.6895078 10.63696861 68.23577118 57.59880257 29.95001859
Open Space 4 1.209382638 0.30234566 0.114376478 0.561356306 0.446979828 0.223119242
Private Well 106 61.28899446 0.578198061 3.83663E-06 9.2846241 9.284620263 1.322053548
Brookfield
Municipal Space No Well 33 542.0457624 16.42562916 0.629260421 160.7299805 160.10072 30.03778783
Open Space 80 1171.915701 14.64894627 0.30863151 101.3642197 101.0555882 20.02349747
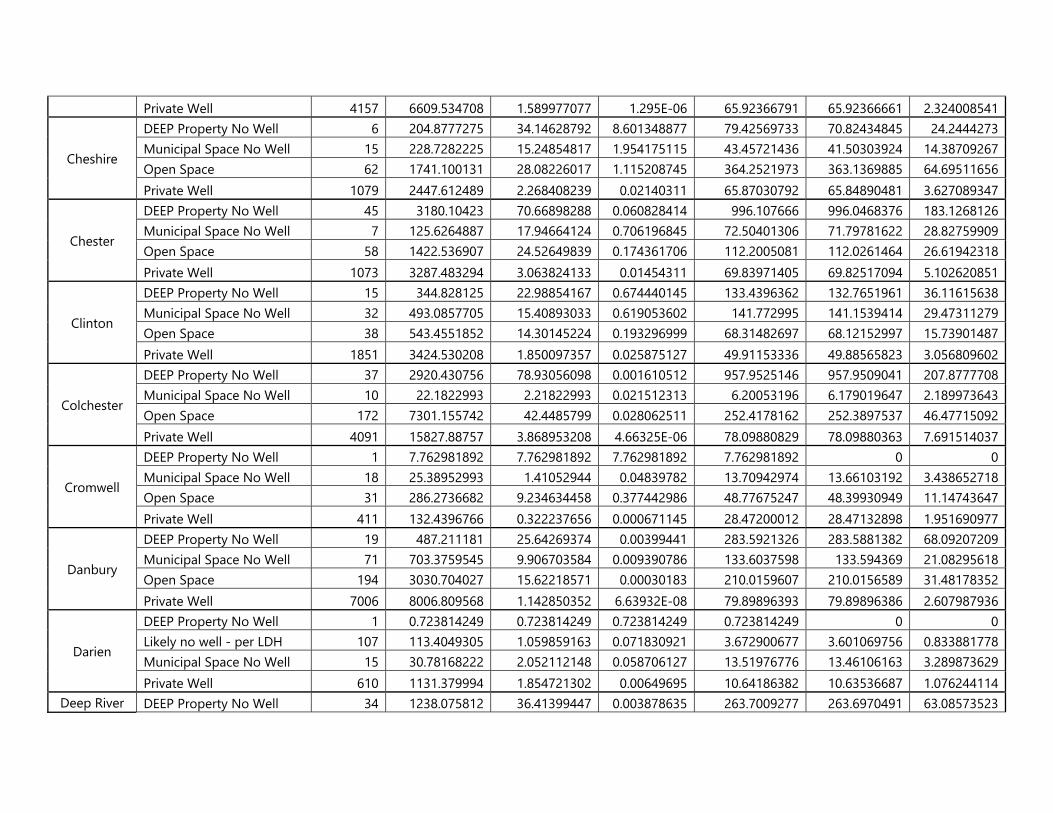
Private Well 4157 6609.534708 1.589977077 1.295E-06 65.92366791 65.92366661 2.324008541
Cheshire
DEEP Property No Well 6 204.8777275 34.14628792 8.601348877 79.42569733 70.82434845 24.2444273 Municipal Space No Well 15 228.7282225 15.24854817 1.954175115 43.45721436 41.50303924 14.38709267 Open Space 62 1741.100131 28.08226017 1.115208745 364.2521973 363.1369885 64.69511656 Private Well 1079 2447.612489 2.268408239 0.02140311 65.87030792 65.84890481 3.627089347
Chester
DEEP Property No Well 45 3180.10423 70.66898288 0.060828414 996.107666 996.0468376 183.1268126 Municipal Space No Well 7 125.6264887 17.94664124 0.706196845 72.50401306 71.79781622 28.82759909 Open Space 58 1422.536907 24.52649839 0.174361706 112.2005081 112.0261464 26.61942318 Private Well 1073 3287.483294 3.063824133 0.01454311 69.83971405 69.82517094 5.102620851
Clinton
DEEP Property No Well 15 344.828125 22.98854167 0.674440145 133.4396362 132.7651961 36.11615638 Municipal Space No Well 32 493.0857705 15.40893033 0.619053602 141.772995 141.1539414 29.47311279 Open Space 38 543.4551852 14.30145224 0.193296999 68.31482697 68.12152997 15.73901487 Private Well 1851 3424.530208 1.850097357 0.025875127 49.91153336 49.88565823 3.056809602
Colchester
DEEP Property No Well 37 2920.430756 78.93056098 0.001610512 957.9525146 957.9509041 207.8777708 Municipal Space No Well 10 22.1822993 2.21822993 0.021512313 6.20053196 6.179019647 2.189973643 Open Space 172 7301.155742 42.4485799 0.028062511 252.4178162 252.3897537 46.47715092 Private Well 4091 15827.88757 3.868953208 4.66325E-06 78.09880829 78.09880363 7.691514037
Cromwell
DEEP Property No Well 1 7.762981892 7.762981892 7.762981892 7.762981892 0 0 Municipal Space No Well 18 25.38952993 1.41052944 0.04839782 13.70942974 13.66103192 3.438652718 Open Space 31 286.2736682 9.234634458 0.377442986 48.77675247 48.39930949 11.14743647 Private Well 411 132.4396766 0.322237656 0.000671145 28.47200012 28.47132898 1.951690977
Danbury
DEEP Property No Well 19 487.211181 25.64269374 0.00399441 283.5921326 283.5881382 68.09207209 Municipal Space No Well 71 703.3759545 9.906703584 0.009390786 133.6037598 133.594369 21.08295618 Open Space 194 3030.704027 15.62218571 0.00030183 210.0159607 210.0156589 31.48178352 Private Well 7006 8006.809568 1.142850352 6.63932E-08 79.89896393 79.89896386 2.607987936
Darien
DEEP Property No Well 1 0.723814249 0.723814249 0.723814249 0.723814249 0 0 Likely no well - per LDH 107 113.4049305 1.059859163 0.071830921 3.672900677 3.601069756 0.833881778 Municipal Space No Well 15 30.78168222 2.052112148 0.058706127 13.51976776 13.46106163 3.289873629 Private Well 610 1131.379994 1.854721302 0.00649695 10.64186382 10.63536687 1.076244114
Deep River DEEP Property No Well 34 1238.075812 36.41399447 0.003878635 263.7009277 263.6970491 63.08573523
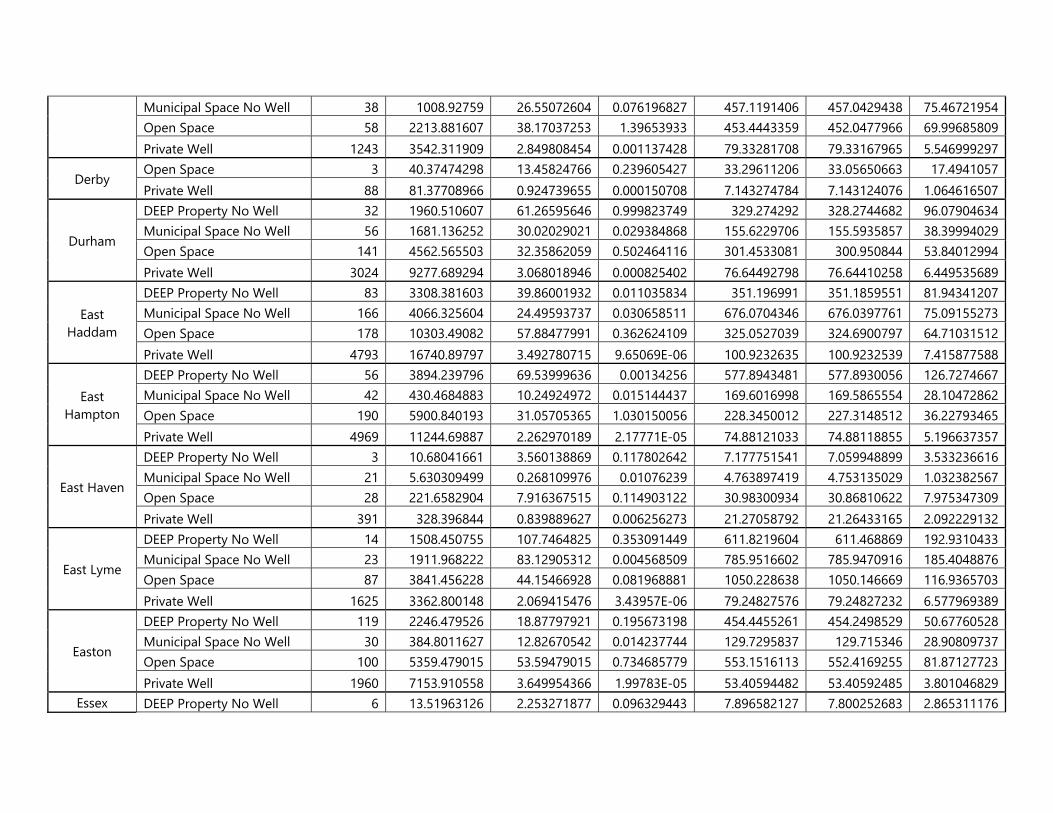
Municipal Space No Well 38 1008.92759 26.55072604 0.076196827 457.1191406 457.0429438 75.46721954 Open Space 58 2213.881607 38.17037253 1.39653933 453.4443359 452.0477966 69.99685809 Private Well 1243 3542.311909 2.849808454 0.001137428 79.33281708 79.33167965 5.546999297
Derby Open Space 3 40.37474298 13.45824766 0.239605427 33.29611206 33.05650663 17.4941057 Private Well 88 81.37708966 0.924739655 0.000150708 7.143274784 7.143124076 1.064616507
Durham
DEEP Property No Well 32 1960.510607 61.26595646 0.999823749 329.274292 328.2744682 96.07904634 Municipal Space No Well 56 1681.136252 30.02029021 0.029384868 155.6229706 155.5935857 38.39994029 Open Space 141 4562.565503 32.35862059 0.502464116 301.4533081 300.950844 53.84012994 Private Well 3024 9277.689294 3.068018946 0.000825402 76.64492798 76.64410258 6.449535689
East Haddam
DEEP Property No Well 83 3308.381603 39.86001932 0.011035834 351.196991 351.1859551 81.94341207 Municipal Space No Well 166 4066.325604 24.49593737 0.030658511 676.0704346 676.0397761 75.09155273 Open Space 178 10303.49082 57.88477991 0.362624109 325.0527039 324.6900797 64.71031512 Private Well 4793 16740.89797 3.492780715 9.65069E-06 100.9232635 100.9232539 7.415877588
East Hampton
DEEP Property No Well 56 3894.239796 69.53999636 0.00134256 577.8943481 577.8930056 126.7274667 Municipal Space No Well 42 430.4684883 10.24924972 0.015144437 169.6016998 169.5865554 28.10472862 Open Space 190 5900.840193 31.05705365 1.030150056 228.3450012 227.3148512 36.22793465 Private Well 4969 11244.69887 2.262970189 2.17771E-05 74.88121033 74.88118855 5.196637357
East Haven
DEEP Property No Well 3 10.68041661 3.560138869 0.117802642 7.177751541 7.059948899 3.533236616 Municipal Space No Well 21 5.630309499 0.268109976 0.01076239 4.763897419 4.753135029 1.032382567 Open Space 28 221.6582904 7.916367515 0.114903122 30.98300934 30.86810622 7.975347309 Private Well 391 328.396844 0.839889627 0.006256273 21.27058792 21.26433165 2.092229132
East Lyme
DEEP Property No Well 14 1508.450755 107.7464825 0.353091449 611.8219604 611.468869 192.9310433 Municipal Space No Well 23 1911.968222 83.12905312 0.004568509 785.9516602 785.9470916 185.4048876 Open Space 87 3841.456228 44.15466928 0.081968881 1050.228638 1050.146669 116.9365703 Private Well 1625 3362.800148 2.069415476 3.43957E-06 79.24827576 79.24827232 6.577969389
Easton
DEEP Property No Well 119 2246.479526 18.87797921 0.195673198 454.4455261 454.2498529 50.67760528 Municipal Space No Well 30 384.8011627 12.82670542 0.014237744 129.7295837 129.715346 28.90809737 Open Space 100 5359.479015 53.59479015 0.734685779 553.1516113 552.4169255 81.87127723 Private Well 1960 7153.910558 3.649954366 1.99783E-05 53.40594482 53.40592485 3.801046829
Essex DEEP Property No Well 6 13.51963126 2.253271877 0.096329443 7.896582127 7.800252683 2.865311176
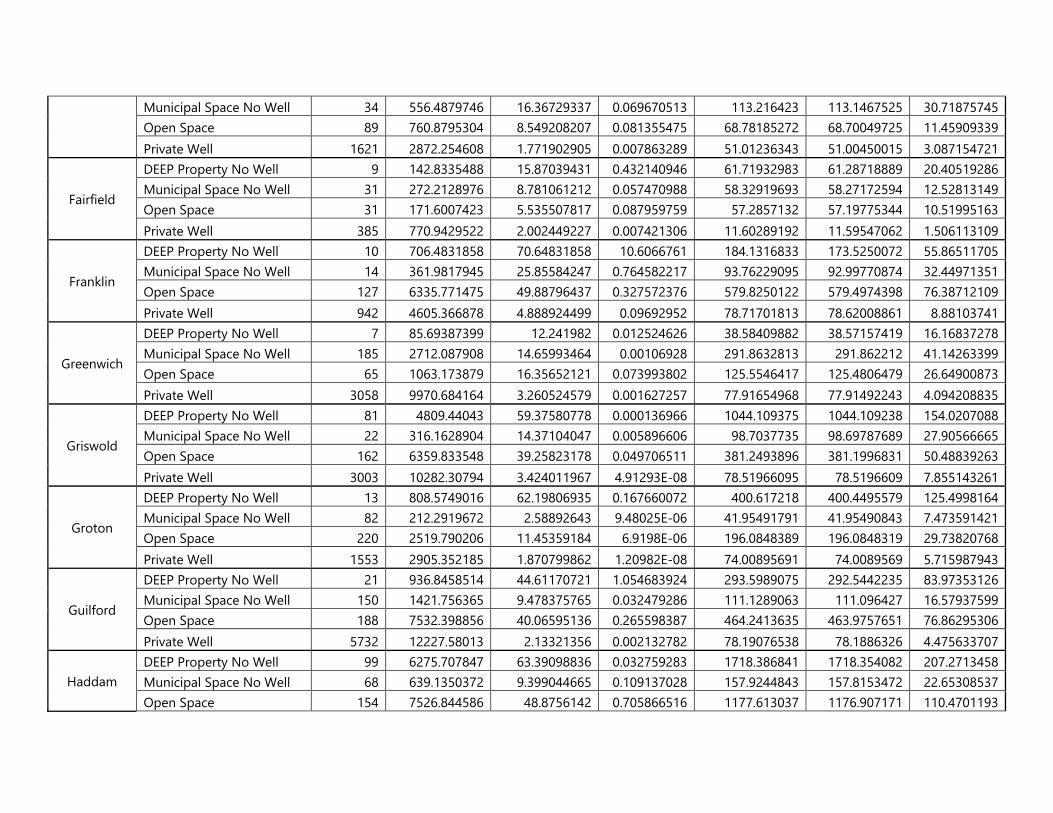
Municipal Space No Well 34 556.4879746 16.36729337 0.069670513 113.216423 113.1467525 30.71875745 Open Space 89 760.8795304 8.549208207 0.081355475 68.78185272 68.70049725 11.45909339 Private Well 1621 2872.254608 1.771902905 0.007863289 51.01236343 51.00450015 3.087154721
Fairfield
DEEP Property No Well 9 142.8335488 15.87039431 0.432140946 61.71932983 61.28718889 20.40519286 Municipal Space No Well 31 272.2128976 8.781061212 0.057470988 58.32919693 58.27172594 12.52813149 Open Space 31 171.6007423 5.535507817 0.087959759 57.2857132 57.19775344 10.51995163 Private Well 385 770.9429522 2.002449227 0.007421306 11.60289192 11.59547062 1.506113109
Franklin
DEEP Property No Well 10 706.4831858 70.64831858 10.6066761 184.1316833 173.5250072 55.86511705 Municipal Space No Well 14 361.9817945 25.85584247 0.764582217 93.76229095 92.99770874 32.44971351 Open Space 127 6335.771475 49.88796437 0.327572376 579.8250122 579.4974398 76.38712109 Private Well 942 4605.366878 4.888924499 0.09692952 78.71701813 78.62008861 8.88103741
Greenwich
DEEP Property No Well 7 85.69387399 12.241982 0.012524626 38.58409882 38.57157419 16.16837278 Municipal Space No Well 185 2712.087908 14.65993464 0.00106928 291.8632813 291.862212 41.14263399 Open Space 65 1063.173879 16.35652121 0.073993802 125.5546417 125.4806479 26.64900873 Private Well 3058 9970.684164 3.260524579 0.001627257 77.91654968 77.91492243 4.094208835
Griswold
DEEP Property No Well 81 4809.44043 59.37580778 0.000136966 1044.109375 1044.109238 154.0207088 Municipal Space No Well 22 316.1628904 14.37104047 0.005896606 98.7037735 98.69787689 27.90566665 Open Space 162 6359.833548 39.25823178 0.049706511 381.2493896 381.1996831 50.48839263 Private Well 3003 10282.30794 3.424011967 4.91293E-08 78.51966095 78.5196609 7.855143261
Groton
DEEP Property No Well 13 808.5749016 62.19806935 0.167660072 400.617218 400.4495579 125.4998164 Municipal Space No Well 82 212.2919672 2.58892643 9.48025E-06 41.95491791 41.95490843 7.473591421 Open Space 220 2519.790206 11.45359184 6.9198E-06 196.0848389 196.0848319 29.73820768 Private Well 1553 2905.352185 1.870799862 1.20982E-08 74.00895691 74.0089569 5.715987943
Guilford
DEEP Property No Well 21 936.8458514 44.61170721 1.054683924 293.5989075 292.5442235 83.97353126 Municipal Space No Well 150 1421.756365 9.478375765 0.032479286 111.1289063 111.096427 16.57937599 Open Space 188 7532.398856 40.06595136 0.265598387 464.2413635 463.9757651 76.86295306 Private Well 5732 12227.58013 2.13321356 0.002132782 78.19076538 78.1886326 4.475633707
Haddam DEEP Property No Well 99 6275.707847 63.39098836 0.032759283 1718.386841 1718.354082 207.2713458 Municipal Space No Well 68 639.1350372 9.399044665 0.109137028 157.9244843 157.8153472 22.65308537 Open Space 154 7526.844586 48.8756142 0.705866516 1177.613037 1176.907171 110.4701193
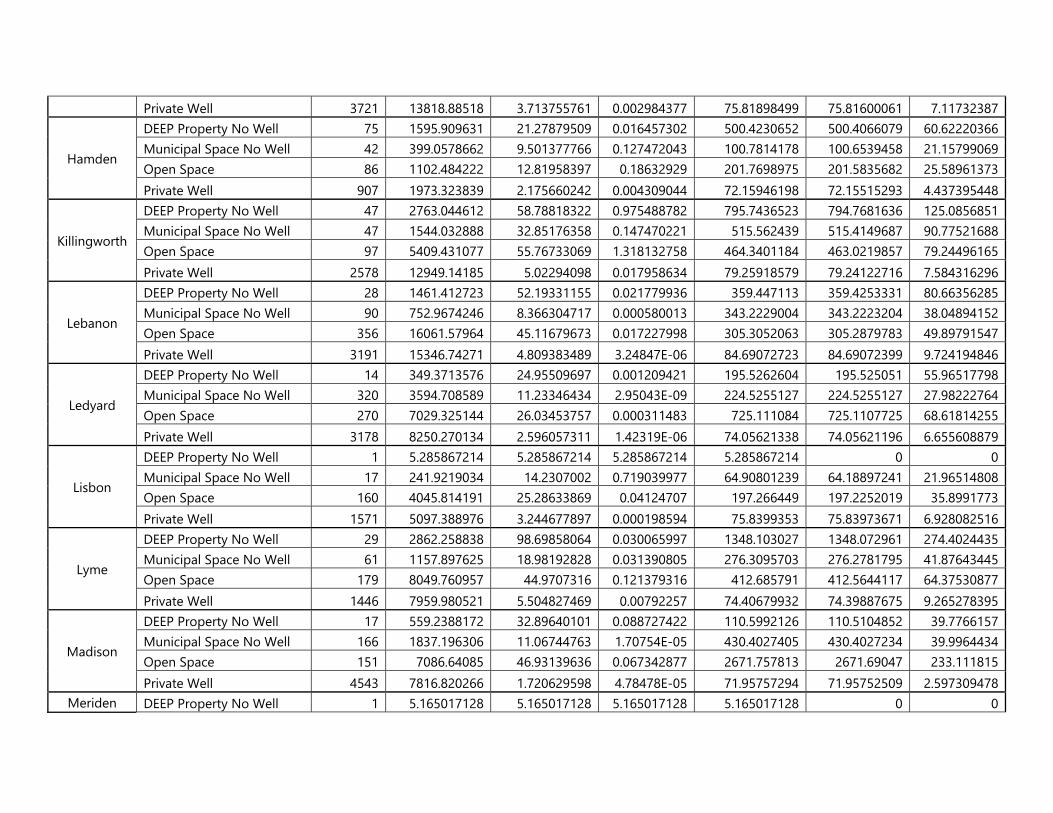
Private Well 3721 13818.88518 3.713755761 0.002984377 75.81898499 75.81600061 7.11732387
Hamden
DEEP Property No Well 75 1595.909631 21.27879509 0.016457302 500.4230652 500.4066079 60.62220366 Municipal Space No Well 42 399.0578662 9.501377766 0.127472043 100.7814178 100.6539458 21.15799069 Open Space 86 1102.484222 12.81958397 0.18632929 201.7698975 201.5835682 25.58961373 Private Well 907 1973.323839 2.175660242 0.004309044 72.15946198 72.15515293 4.437395448
Killingworth
DEEP Property No Well 47 2763.044612 58.78818322 0.975488782 795.7436523 794.7681636 125.0856851 Municipal Space No Well 47 1544.032888 32.85176358 0.147470221 515.562439 515.4149687 90.77521688 Open Space 97 5409.431077 55.76733069 1.318132758 464.3401184 463.0219857 79.24496165 Private Well 2578 12949.14185 5.02294098 0.017958634 79.25918579 79.24122716 7.584316296
Lebanon
DEEP Property No Well 28 1461.412723 52.19331155 0.021779936 359.447113 359.4253331 80.66356285 Municipal Space No Well 90 752.9674246 8.366304717 0.000580013 343.2229004 343.2223204 38.04894152 Open Space 356 16061.57964 45.11679673 0.017227998 305.3052063 305.2879783 49.89791547 Private Well 3191 15346.74271 4.809383489 3.24847E-06 84.69072723 84.69072399 9.724194846
Ledyard
DEEP Property No Well 14 349.3713576 24.95509697 0.001209421 195.5262604 195.525051 55.96517798 Municipal Space No Well 320 3594.708589 11.23346434 2.95043E-09 224.5255127 224.5255127 27.98222764 Open Space 270 7029.325144 26.03453757 0.000311483 725.111084 725.1107725 68.61814255 Private Well 3178 8250.270134 2.596057311 1.42319E-06 74.05621338 74.05621196 6.655608879
Lisbon
DEEP Property No Well 1 5.285867214 5.285867214 5.285867214 5.285867214 0 0 Municipal Space No Well 17 241.9219034 14.2307002 0.719039977 64.90801239 64.18897241 21.96514808 Open Space 160 4045.814191 25.28633869 0.04124707 197.266449 197.2252019 35.8991773 Private Well 1571 5097.388976 3.244677897 0.000198594 75.8399353 75.83973671 6.928082516
Lyme
DEEP Property No Well 29 2862.258838 98.69858064 0.030065997 1348.103027 1348.072961 274.4024435 Municipal Space No Well 61 1157.897625 18.98192828 0.031390805 276.3095703 276.2781795 41.87643445 Open Space 179 8049.760957 44.9707316 0.121379316 412.685791 412.5644117 64.37530877 Private Well 1446 7959.980521 5.504827469 0.00792257 74.40679932 74.39887675 9.265278395
Madison
DEEP Property No Well 17 559.2388172 32.89640101 0.088727422 110.5992126 110.5104852 39.7766157 Municipal Space No Well 166 1837.196306 11.06744763 1.70754E-05 430.4027405 430.4027234 39.9964434 Open Space 151 7086.64085 46.93139636 0.067342877 2671.757813 2671.69047 233.111815 Private Well 4543 7816.820266 1.720629598 4.78478E-05 71.95757294 71.95752509 2.597309478
Meriden DEEP Property No Well 1 5.165017128 5.165017128 5.165017128 5.165017128 0 0
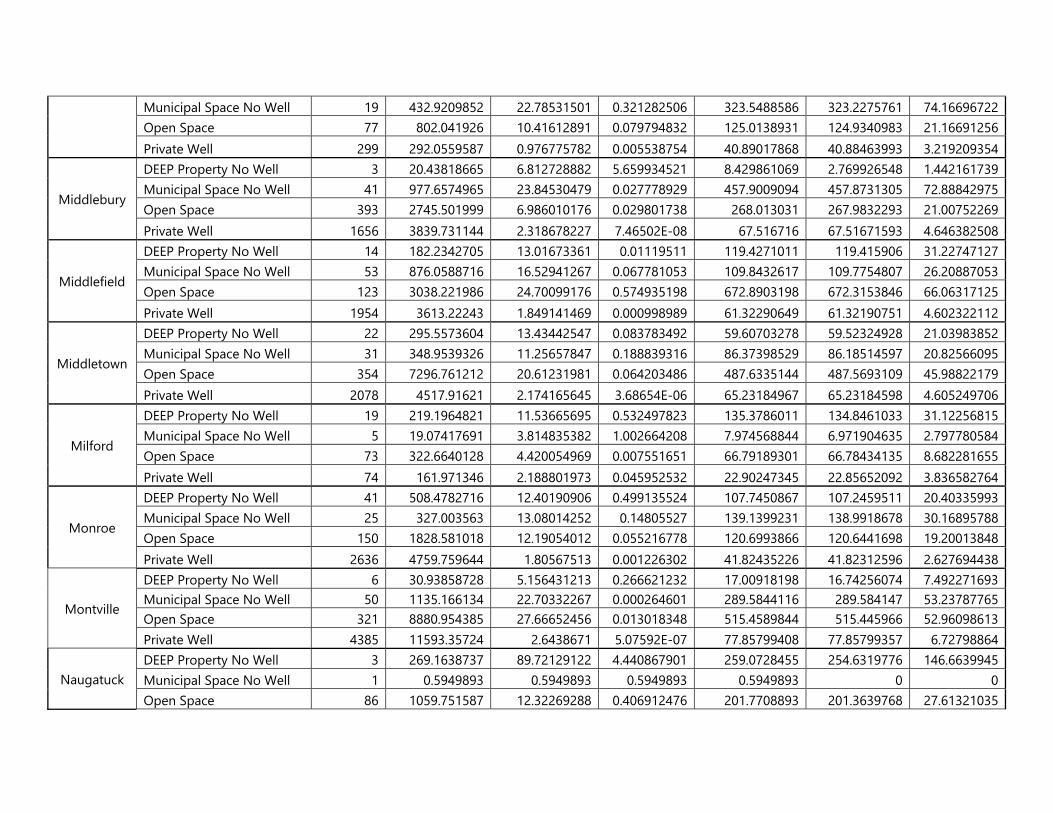
Municipal Space No Well 19 432.9209852 22.78531501 0.321282506 323.5488586 323.2275761 74.16696722 Open Space 77 802.041926 10.41612891 0.079794832 125.0138931 124.9340983 21.16691256 Private Well 299 292.0559587 0.976775782 0.005538754 40.89017868 40.88463993 3.219209354
Middlebury
DEEP Property No Well 3 20.43818665 6.812728882 5.659934521 8.429861069 2.769926548 1.442161739 Municipal Space No Well 41 977.6574965 23.84530479 0.027778929 457.9009094 457.8731305 72.88842975 Open Space 393 2745.501999 6.986010176 0.029801738 268.013031 267.9832293 21.00752269 Private Well 1656 3839.731144 2.318678227 7.46502E-08 67.516716 67.51671593 4.646382508
Middlefield
DEEP Property No Well 14 182.2342705 13.01673361 0.01119511 119.4271011 119.415906 31.22747127 Municipal Space No Well 53 876.0588716 16.52941267 0.067781053 109.8432617 109.7754807 26.20887053 Open Space 123 3038.221986 24.70099176 0.574935198 672.8903198 672.3153846 66.06317125 Private Well 1954 3613.22243 1.849141469 0.000998989 61.32290649 61.32190751 4.602322112
Middletown
DEEP Property No Well 22 295.5573604 13.43442547 0.083783492 59.60703278 59.52324928 21.03983852 Municipal Space No Well 31 348.9539326 11.25657847 0.188839316 86.37398529 86.18514597 20.82566095 Open Space 354 7296.761212 20.61231981 0.064203486 487.6335144 487.5693109 45.98822179 Private Well 2078 4517.91621 2.174165645 3.68654E-06 65.23184967 65.23184598 4.605249706
Milford
DEEP Property No Well 19 219.1964821 11.53665695 0.532497823 135.3786011 134.8461033 31.12256815 Municipal Space No Well 5 19.07417691 3.814835382 1.002664208 7.974568844 6.971904635 2.797780584 Open Space 73 322.6640128 4.420054969 0.007551651 66.79189301 66.78434135 8.682281655 Private Well 74 161.971346 2.188801973 0.045952532 22.90247345 22.85652092 3.836582764
Monroe
DEEP Property No Well 41 508.4782716 12.40190906 0.499135524 107.7450867 107.2459511 20.40335993 Municipal Space No Well 25 327.003563 13.08014252 0.14805527 139.1399231 138.9918678 30.16895788 Open Space 150 1828.581018 12.19054012 0.055216778 120.6993866 120.6441698 19.20013848 Private Well 2636 4759.759644 1.80567513 0.001226302 41.82435226 41.82312596 2.627694438
Montville
DEEP Property No Well 6 30.93858728 5.156431213 0.266621232 17.00918198 16.74256074 7.492271693 Municipal Space No Well 50 1135.166134 22.70332267 0.000264601 289.5844116 289.584147 53.23787765 Open Space 321 8880.954385 27.66652456 0.013018348 515.4589844 515.445966 52.96098613 Private Well 4385 11593.35724 2.6438671 5.07592E-07 77.85799408 77.85799357 6.72798864
Naugatuck DEEP Property No Well 3 269.1638737 89.72129122 4.440867901 259.0728455 254.6319776 146.6639945 Municipal Space No Well 1 0.5949893 0.5949893 0.5949893 0.5949893 0 0 Open Space 86 1059.751587 12.32269288 0.406912476 201.7708893 201.3639768 27.61321035
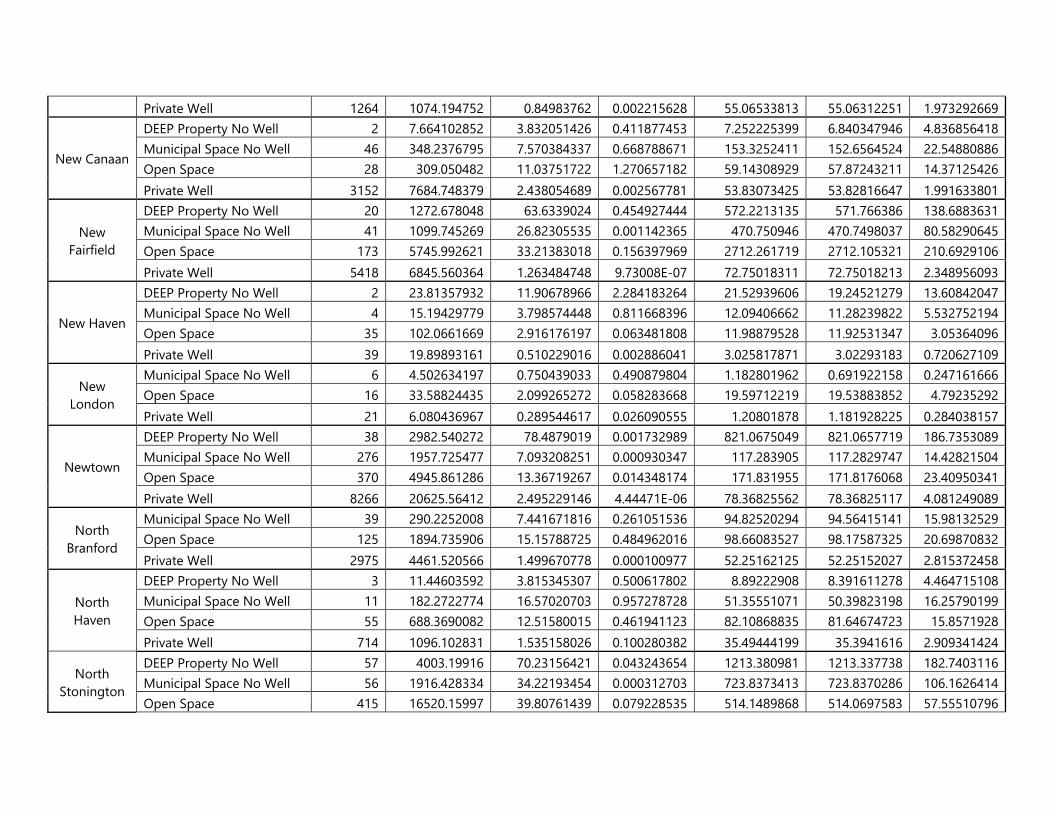
Private Well 1264 1074.194752 0.84983762 0.002215628 55.06533813 55.06312251 1.973292669
New Canaan
DEEP Property No Well 2 7.664102852 3.832051426 0.411877453 7.252225399 6.840347946 4.836856418 Municipal Space No Well 46 348.2376795 7.570384337 0.668788671 153.3252411 152.6564524 22.54880886 Open Space 28 309.050482 11.03751722 1.270657182 59.14308929 57.87243211 14.37125426 Private Well 3152 7684.748379 2.438054689 0.002567781 53.83073425 53.82816647 1.991633801
New Fairfield
DEEP Property No Well 20 1272.678048 63.6339024 0.454927444 572.2213135 571.766386 138.6883631 Municipal Space No Well 41 1099.745269 26.82305535 0.001142365 470.750946 470.7498037 80.58290645 Open Space 173 5745.992621 33.21383018 0.156397969 2712.261719 2712.105321 210.6929106 Private Well 5418 6845.560364 1.263484748 9.73008E-07 72.75018311 72.75018213 2.348956093
New Haven
DEEP Property No Well 2 23.81357932 11.90678966 2.284183264 21.52939606 19.24521279 13.60842047 Municipal Space No Well 4 15.19429779 3.798574448 0.811668396 12.09406662 11.28239822 5.532752194 Open Space 35 102.0661669 2.916176197 0.063481808 11.98879528 11.92531347 3.05364096 Private Well 39 19.89893161 0.510229016 0.002886041 3.025817871 3.02293183 0.720627109
New London
Municipal Space No Well 6 4.502634197 0.750439033 0.490879804 1.182801962 0.691922158 0.247161666 Open Space 16 33.58824435 2.099265272 0.058283668 19.59712219 19.53883852 4.79235292 Private Well 21 6.080436967 0.289544617 0.026090555 1.20801878 1.181928225 0.284038157
Newtown
DEEP Property No Well 38 2982.540272 78.4879019 0.001732989 821.0675049 821.0657719 186.7353089 Municipal Space No Well 276 1957.725477 7.093208251 0.000930347 117.283905 117.2829747 14.42821504 Open Space 370 4945.861286 13.36719267 0.014348174 171.831955 171.8176068 23.40950341 Private Well 8266 20625.56412 2.495229146 4.44471E-06 78.36825562 78.36825117 4.081249089
North Branford
Municipal Space No Well 39 290.2252008 7.441671816 0.261051536 94.82520294 94.56415141 15.98132529 Open Space 125 1894.735906 15.15788725 0.484962016 98.66083527 98.17587325 20.69870832 Private Well 2975 4461.520566 1.499670778 0.000100977 52.25162125 52.25152027 2.815372458
North Haven
DEEP Property No Well 3 11.44603592 3.815345307 0.500617802 8.89222908 8.391611278 4.464715108 Municipal Space No Well 11 182.2722774 16.57020703 0.957278728 51.35551071 50.39823198 16.25790199 Open Space 55 688.3690082 12.51580015 0.461941123 82.10868835 81.64674723 15.8571928 Private Well 714 1096.102831 1.535158026 0.100280382 35.49444199 35.3941616 2.909341424
North Stonington
DEEP Property No Well 57 4003.19916 70.23156421 0.043243654 1213.380981 1213.337738 182.7403116 Municipal Space No Well 56 1916.428334 34.22193454 0.000312703 723.8373413 723.8370286 106.1626414 Open Space 415 16520.15997 39.80761439 0.079228535 514.1489868 514.0697583 57.55510796
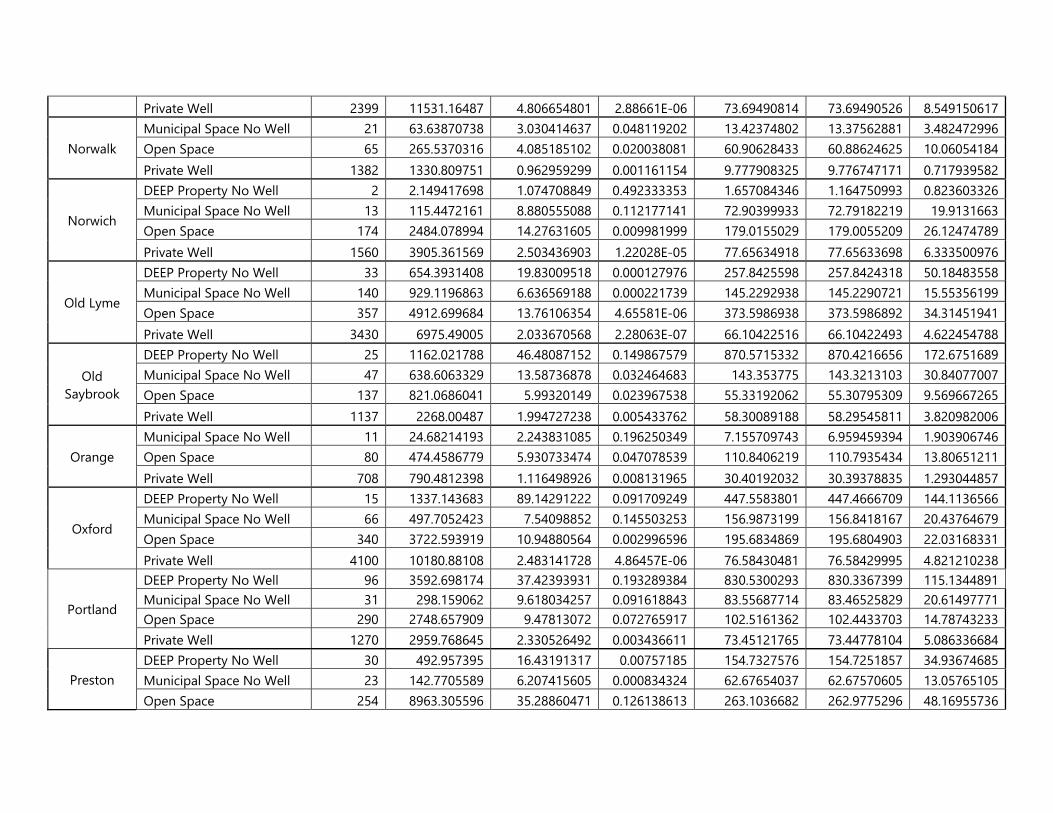
Private Well 2399 11531.16487 4.806654801 2.88661E-06 73.69490814 73.69490526 8.549150617
Norwalk Municipal Space No Well 21 63.63870738 3.030414637 0.048119202 13.42374802 13.37562881 3.482472996 Open Space 65 265.5370316 4.085185102 0.020038081 60.90628433 60.88624625 10.06054184 Private Well 1382 1330.809751 0.962959299 0.001161154 9.777908325 9.776747171 0.717939582
Norwich
DEEP Property No Well 2 2.149417698 1.074708849 0.492333353 1.657084346 1.164750993 0.823603326 Municipal Space No Well 13 115.4472161 8.880555088 0.112177141 72.90399933 72.79182219 19.9131663 Open Space 174 2484.078994 14.27631605 0.009981999 179.0155029 179.0055209 26.12474789 Private Well 1560 3905.361569 2.503436903 1.22028E-05 77.65634918 77.65633698 6.333500976
Old Lyme
DEEP Property No Well 33 654.3931408 19.83009518 0.000127976 257.8425598 257.8424318 50.18483558 Municipal Space No Well 140 929.1196863 6.636569188 0.000221739 145.2292938 145.2290721 15.55356199 Open Space 357 4912.699684 13.76106354 4.65581E-06 373.5986938 373.5986892 34.31451941 Private Well 3430 6975.49005 2.033670568 2.28063E-07 66.10422516 66.10422493 4.622454788
Old Saybrook
DEEP Property No Well 25 1162.021788 46.48087152 0.149867579 870.5715332 870.4216656 172.6751689 Municipal Space No Well 47 638.6063329 13.58736878 0.032464683 143.353775 143.3213103 30.84077007 Open Space 137 821.0686041 5.99320149 0.023967538 55.33192062 55.30795309 9.569667265 Private Well 1137 2268.00487 1.994727238 0.005433762 58.30089188 58.29545811 3.820982006
Orange Municipal Space No Well 11 24.68214193 2.243831085 0.196250349 7.155709743 6.959459394 1.903906746 Open Space 80 474.4586779 5.930733474 0.047078539 110.8406219 110.7935434 13.80651211 Private Well 708 790.4812398 1.116498926 0.008131965 30.40192032 30.39378835 1.293044857
Oxford
DEEP Property No Well 15 1337.143683 89.14291222 0.091709249 447.5583801 447.4666709 144.1136566 Municipal Space No Well 66 497.7052423 7.54098852 0.145503253 156.9873199 156.8418167 20.43764679 Open Space 340 3722.593919 10.94880564 0.002996596 195.6834869 195.6804903 22.03168331 Private Well 4100 10180.88108 2.483141728 4.86457E-06 76.58430481 76.58429995 4.821210238
Portland
DEEP Property No Well 96 3592.698174 37.42393931 0.193289384 830.5300293 830.3367399 115.1344891 Municipal Space No Well 31 298.159062 9.618034257 0.091618843 83.55687714 83.46525829 20.61497771 Open Space 290 2748.657909 9.47813072 0.072765917 102.5161362 102.4433703 14.78743233 Private Well 1270 2959.768645 2.330526492 0.003436611 73.45121765 73.44778104 5.086336684
Preston DEEP Property No Well 30 492.957395 16.43191317 0.00757185 154.7327576 154.7251857 34.93674685 Municipal Space No Well 23 142.7705589 6.207415605 0.000834324 62.67654037 62.67570605 13.05765105 Open Space 254 8963.305596 35.28860471 0.126138613 263.1036682 262.9775296 48.16955736
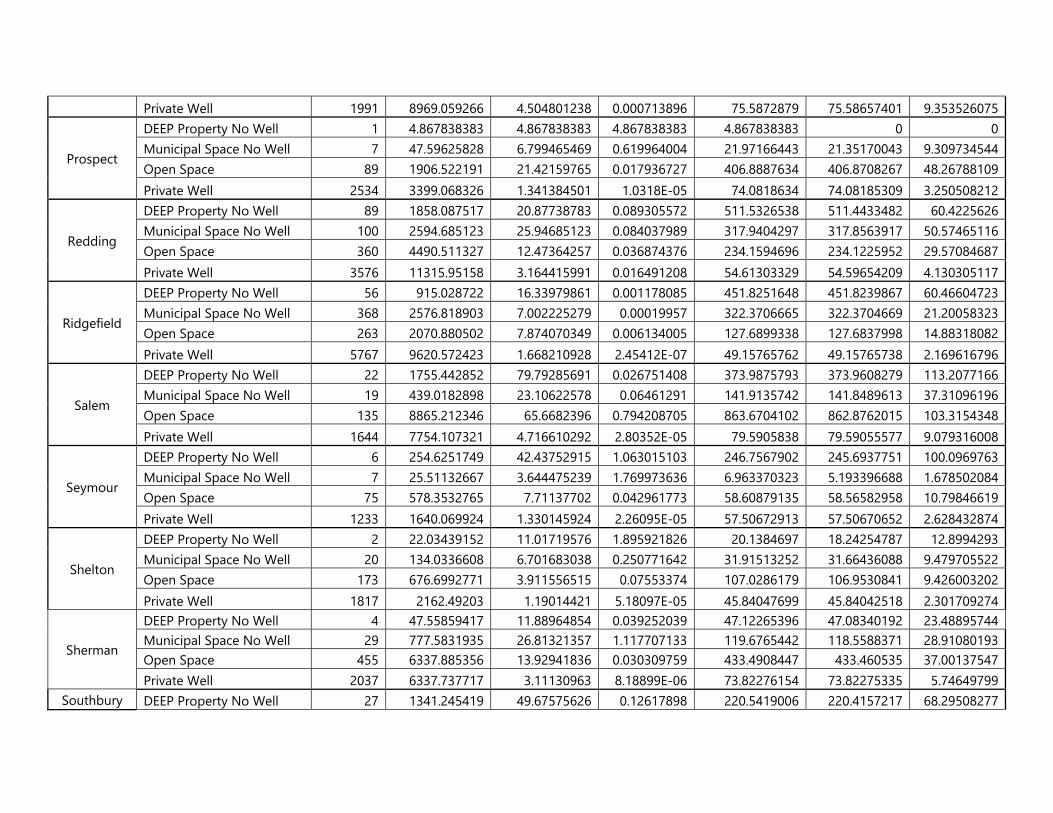
Private Well 1991 8969.059266 4.504801238 0.000713896 75.5872879 75.58657401 9.353526075
Prospect
DEEP Property No Well 1 4.867838383 4.867838383 4.867838383 4.867838383 0 0 Municipal Space No Well 7 47.59625828 6.799465469 0.619964004 21.97166443 21.35170043 9.309734544 Open Space 89 1906.522191 21.42159765 0.017936727 406.8887634 406.8708267 48.26788109 Private Well 2534 3399.068326 1.341384501 1.0318E-05 74.0818634 74.08185309 3.250508212
Redding
DEEP Property No Well 89 1858.087517 20.87738783 0.089305572 511.5326538 511.4433482 60.4225626 Municipal Space No Well 100 2594.685123 25.94685123 0.084037989 317.9404297 317.8563917 50.57465116 Open Space 360 4490.511327 12.47364257 0.036874376 234.1594696 234.1225952 29.57084687 Private Well 3576 11315.95158 3.164415991 0.016491208 54.61303329 54.59654209 4.130305117
Ridgefield
DEEP Property No Well 56 915.028722 16.33979861 0.001178085 451.8251648 451.8239867 60.46604723 Municipal Space No Well 368 2576.818903 7.002225279 0.00019957 322.3706665 322.3704669 21.20058323 Open Space 263 2070.880502 7.874070349 0.006134005 127.6899338 127.6837998 14.88318082 Private Well 5767 9620.572423 1.668210928 2.45412E-07 49.15765762 49.15765738 2.169616796
Salem
DEEP Property No Well 22 1755.442852 79.79285691 0.026751408 373.9875793 373.9608279 113.2077166 Municipal Space No Well 19 439.0182898 23.10622578 0.06461291 141.9135742 141.8489613 37.31096196 Open Space 135 8865.212346 65.6682396 0.794208705 863.6704102 862.8762015 103.3154348 Private Well 1644 7754.107321 4.716610292 2.80352E-05 79.5905838 79.59055577 9.079316008
Seymour
DEEP Property No Well 6 254.6251749 42.43752915 1.063015103 246.7567902 245.6937751 100.0969763 Municipal Space No Well 7 25.51132667 3.644475239 1.769973636 6.963370323 5.193396688 1.678502084 Open Space 75 578.3532765 7.71137702 0.042961773 58.60879135 58.56582958 10.79846619 Private Well 1233 1640.069924 1.330145924 2.26095E-05 57.50672913 57.50670652 2.628432874
Shelton
DEEP Property No Well 2 22.03439152 11.01719576 1.895921826 20.1384697 18.24254787 12.8994293 Municipal Space No Well 20 134.0336608 6.701683038 0.250771642 31.91513252 31.66436088 9.479705522 Open Space 173 676.6992771 3.911556515 0.07553374 107.0286179 106.9530841 9.426003202 Private Well 1817 2162.49203 1.19014421 5.18097E-05 45.84047699 45.84042518 2.301709274
Sherman
DEEP Property No Well 4 47.55859417 11.88964854 0.039252039 47.12265396 47.08340192 23.48895744 Municipal Space No Well 29 777.5831935 26.81321357 1.117707133 119.6765442 118.5588371 28.91080193 Open Space 455 6337.885356 13.92941836 0.030309759 433.4908447 433.460535 37.00137547 Private Well 2037 6337.737717 3.11130963 8.18899E-06 73.82276154 73.82275335 5.74649799
Southbury DEEP Property No Well 27 1341.245419 49.67575626 0.12617898 220.5419006 220.4157217 68.29508277
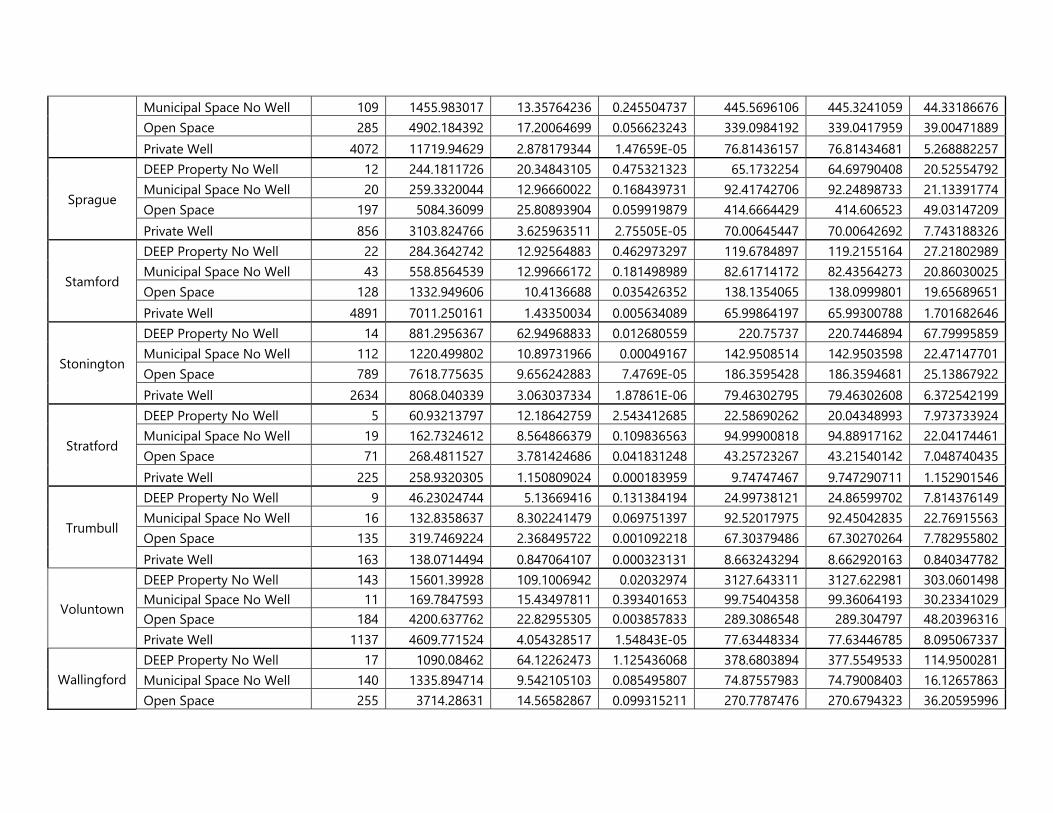
Municipal Space No Well 109 1455.983017 13.35764236 0.245504737 445.5696106 445.3241059 44.33186676 Open Space 285 4902.184392 17.20064699 0.056623243 339.0984192 339.0417959 39.00471889 Private Well 4072 11719.94629 2.878179344 1.47659E-05 76.81436157 76.81434681 5.268882257
Sprague
DEEP Property No Well 12 244.1811726 20.34843105 0.475321323 65.1732254 64.69790408 20.52554792 Municipal Space No Well 20 259.3320044 12.96660022 0.168439731 92.41742706 92.24898733 21.13391774 Open Space 197 5084.36099 25.80893904 0.059919879 414.6664429 414.606523 49.03147209 Private Well 856 3103.824766 3.625963511 2.75505E-05 70.00645447 70.00642692 7.743188326
Stamford
DEEP Property No Well 22 284.3642742 12.92564883 0.462973297 119.6784897 119.2155164 27.21802989 Municipal Space No Well 43 558.8564539 12.99666172 0.181498989 82.61714172 82.43564273 20.86030025 Open Space 128 1332.949606 10.4136688 0.035426352 138.1354065 138.0999801 19.65689651 Private Well 4891 7011.250161 1.43350034 0.005634089 65.99864197 65.99300788 1.701682646
Stonington
DEEP Property No Well 14 881.2956367 62.94968833 0.012680559 220.75737 220.7446894 67.79995859 Municipal Space No Well 112 1220.499802 10.89731966 0.00049167 142.9508514 142.9503598 22.47147701 Open Space 789 7618.775635 9.656242883 7.4769E-05 186.3595428 186.3594681 25.13867922 Private Well 2634 8068.040339 3.063037334 1.87861E-06 79.46302795 79.46302608 6.372542199
Stratford
DEEP Property No Well 5 60.93213797 12.18642759 2.543412685 22.58690262 20.04348993 7.973733924 Municipal Space No Well 19 162.7324612 8.564866379 0.109836563 94.99900818 94.88917162 22.04174461 Open Space 71 268.4811527 3.781424686 0.041831248 43.25723267 43.21540142 7.048740435 Private Well 225 258.9320305 1.150809024 0.000183959 9.74747467 9.747290711 1.152901546
Trumbull
DEEP Property No Well 9 46.23024744 5.13669416 0.131384194 24.99738121 24.86599702 7.814376149 Municipal Space No Well 16 132.8358637 8.302241479 0.069751397 92.52017975 92.45042835 22.76915563 Open Space 135 319.7469224 2.368495722 0.001092218 67.30379486 67.30270264 7.782955802 Private Well 163 138.0714494 0.847064107 0.000323131 8.663243294 8.662920163 0.840347782
Voluntown
DEEP Property No Well 143 15601.39928 109.1006942 0.02032974 3127.643311 3127.622981 303.0601498 Municipal Space No Well 11 169.7847593 15.43497811 0.393401653 99.75404358 99.36064193 30.23341029 Open Space 184 4200.637762 22.82955305 0.003857833 289.3086548 289.304797 48.20396316 Private Well 1137 4609.771524 4.054328517 1.54843E-05 77.63448334 77.63446785 8.095067337
Wallingford DEEP Property No Well 17 1090.08462 64.12262473 1.125436068 378.6803894 377.5549533 114.9500281 Municipal Space No Well 140 1335.894714 9.542105103 0.085495807 74.87557983 74.79008403 16.12657863 Open Space 255 3714.28631 14.56582867 0.099315211 270.7787476 270.6794323 36.20595996
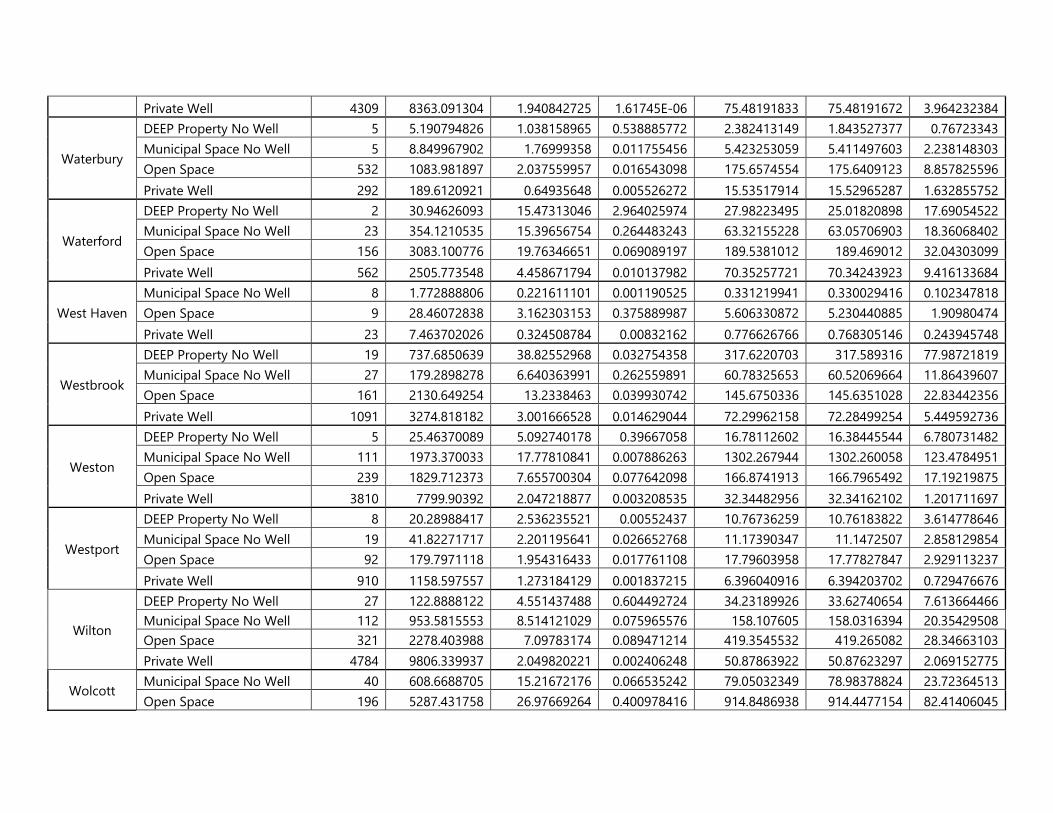
Private Well 4309 8363.091304 1.940842725 1.61745E-06 75.48191833 75.48191672 3.964232384
Waterbury
DEEP Property No Well 5 5.190794826 1.038158965 0.538885772 2.382413149 1.843527377 0.76723343 Municipal Space No Well 5 8.849967902 1.76999358 0.011755456 5.423253059 5.411497603 2.238148303 Open Space 532 1083.981897 2.037559957 0.016543098 175.6574554 175.6409123 8.857825596 Private Well 292 189.6120921 0.64935648 0.005526272 15.53517914 15.52965287 1.632855752
Waterford
DEEP Property No Well 2 30.94626093 15.47313046 2.964025974 27.98223495 25.01820898 17.69054522 Municipal Space No Well 23 354.1210535 15.39656754 0.264483243 63.32155228 63.05706903 18.36068402 Open Space 156 3083.100776 19.76346651 0.069089197 189.5381012 189.469012 32.04303099 Private Well 562 2505.773548 4.458671794 0.010137982 70.35257721 70.34243923 9.416133684
West Haven Municipal Space No Well 8 1.772888806 0.221611101 0.001190525 0.331219941 0.330029416 0.102347818 Open Space 9 28.46072838 3.162303153 0.375889987 5.606330872 5.230440885 1.90980474 Private Well 23 7.463702026 0.324508784 0.00832162 0.776626766 0.768305146 0.243945748
Westbrook
DEEP Property No Well 19 737.6850639 38.82552968 0.032754358 317.6220703 317.589316 77.98721819 Municipal Space No Well 27 179.2898278 6.640363991 0.262559891 60.78325653 60.52069664 11.86439607 Open Space 161 2130.649254 13.2338463 0.039930742 145.6750336 145.6351028 22.83442356 Private Well 1091 3274.818182 3.001666528 0.014629044 72.29962158 72.28499254 5.449592736
Weston
DEEP Property No Well 5 25.46370089 5.092740178 0.39667058 16.78112602 16.38445544 6.780731482 Municipal Space No Well 111 1973.370033 17.77810841 0.007886263 1302.267944 1302.260058 123.4784951 Open Space 239 1829.712373 7.655700304 0.077642098 166.8741913 166.7965492 17.19219875 Private Well 3810 7799.90392 2.047218877 0.003208535 32.34482956 32.34162102 1.201711697
Westport
DEEP Property No Well 8 20.28988417 2.536235521 0.00552437 10.76736259 10.76183822 3.614778646 Municipal Space No Well 19 41.82271717 2.201195641 0.026652768 11.17390347 11.1472507 2.858129854 Open Space 92 179.7971118 1.954316433 0.017761108 17.79603958 17.77827847 2.929113237 Private Well 910 1158.597557 1.273184129 0.001837215 6.396040916 6.394203702 0.729476676
Wilton
DEEP Property No Well 27 122.8888122 4.551437488 0.604492724 34.23189926 33.62740654 7.613664466 Municipal Space No Well 112 953.5815553 8.514121029 0.075965576 158.107605 158.0316394 20.35429508 Open Space 321 2278.403988 7.09783174 0.089471214 419.3545532 419.265082 28.34663103 Private Well 4784 9806.339937 2.049820221 0.002406248 50.87863922 50.87623297 2.069152775
Wolcott Municipal Space No Well 40 608.6688705 15.21672176 0.066535242 79.05032349 78.98378824 23.72364513 Open Space 196 5287.431758 26.97669264 0.400978416 914.8486938 914.4477154 82.41406045
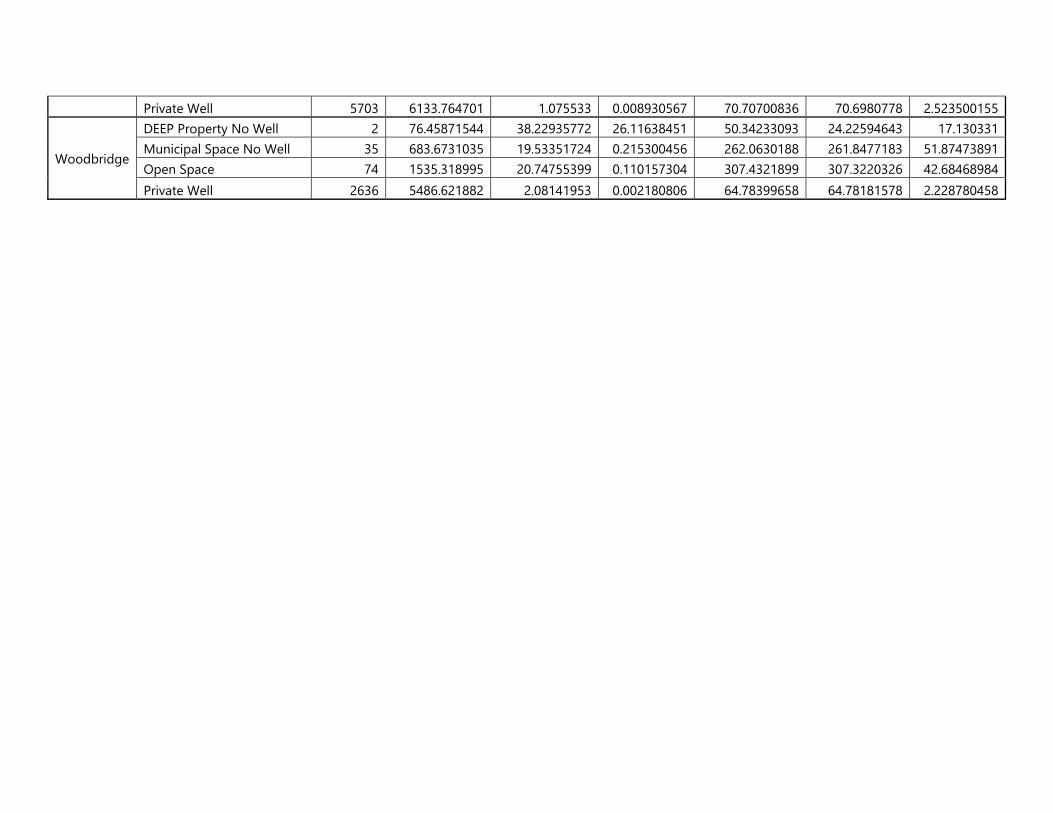
Private Well 5703 6133.764701 1.075533 0.008930567 70.70700836 70.6980778 2.523500155
Woodbridge
DEEP Property No Well 2 76.45871544 38.22935772 26.11638451 50.34233093 24.22594643 17.130331 Municipal Space No Well 35 683.6731035 19.53351724 0.215300456 262.0630188 261.8477183 51.87473891 Open Space 74 1535.318995 20.74755399 0.110157304 307.4321899 307.3220326 42.68468984 Private Well 2636 5486.621882 2.08141953 0.002180806 64.78399658 64.78181578 2.228780458

APPENDIX L Private Well Fact Sheets

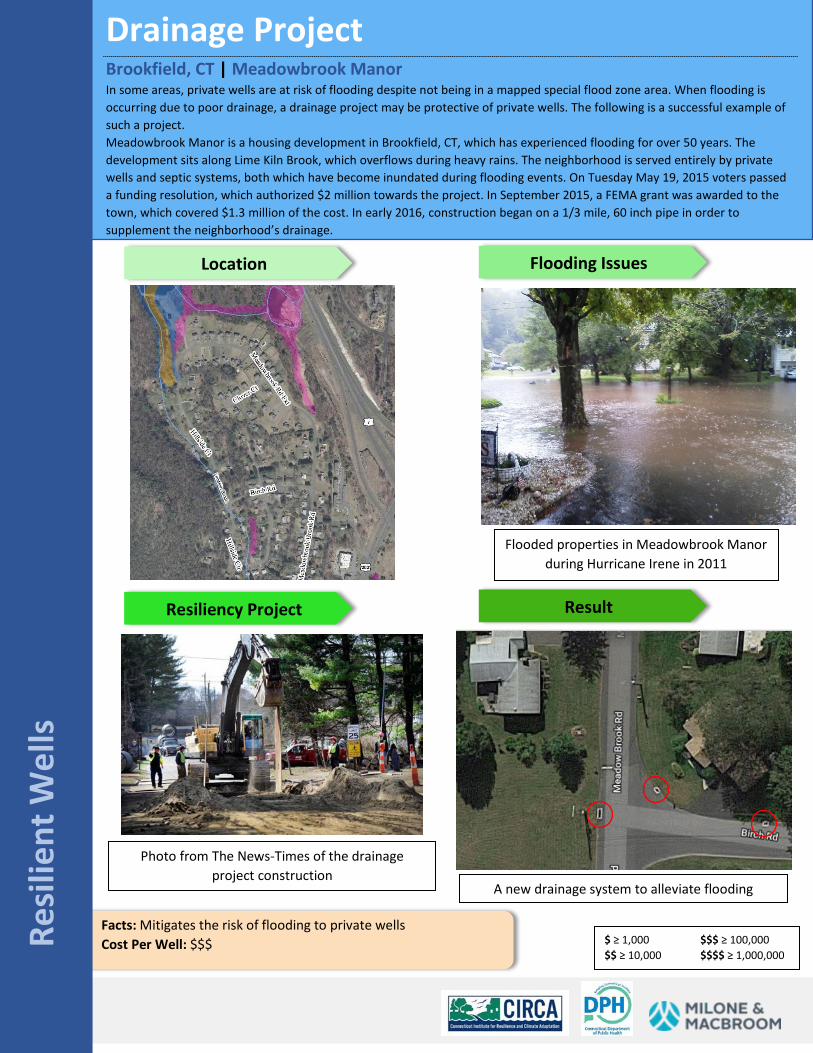
Drainage Project Brookfield, CT | Meadowbrook Manor In some areas, private wells are at risk of flooding despite not being in a mapped special flood zone area. When flooding is occurring due to poor drainage, a drainage project may be protective of private wells. The following is a successful example of such a project. Meadowbrook Manor is a housing development in Brookfield, CT, which has experienced flooding for over 50 years. The development sits along Lime Kiln Brook, which overflows during heavy rains. The neighborhood is served entirely by private wells and septic systems, both which have become inundated during flooding events. On Tuesday May 19, 2015 voters passed a funding resolution, which authorized $2 million towards the project. In September 2015, a FEMA grant was awarded to the town, which covered $1.3 million of the cost. In early 2016, construction began on a 1/3 mile, 60 inch pipe in order to supplement the neighborhood’s drainage.
Resi
lient
Wel
ls
Location Flooding Issues
Resiliency Project Result
Facts: Mitigates the risk of flooding to private wells Cost Per Well: $$$
Flooded properties in Meadowbrook Manor during Hurricane Irene in 2011
Photo from The News-Times of the drainage project construction
A new drainage system to alleviate flooding
$ ≥ 1,000 $$$ ≥ 100,000 $$ ≥ 10,000 $$$$ ≥ 1,000,000

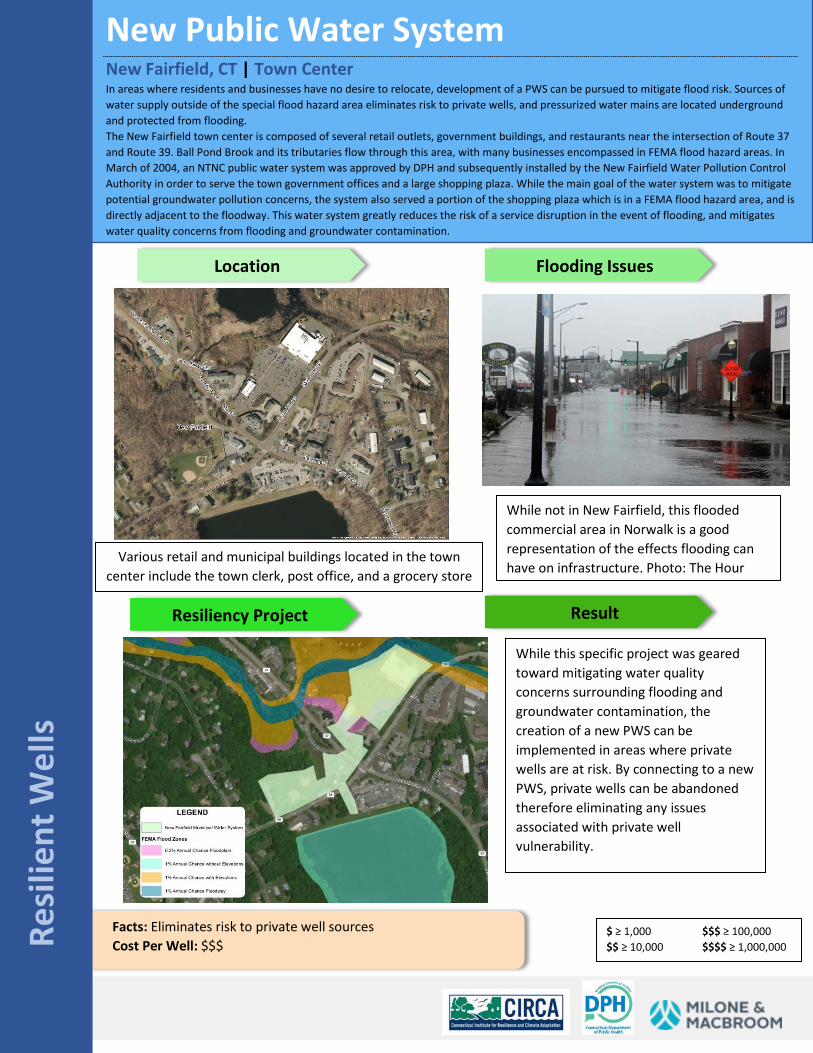
New Public Water System New Fairfield, CT | Town Center In areas where residents and businesses have no desire to relocate, development of a PWS can be pursued to mitigate flood risk. Sources of water supply outside of the special flood hazard area eliminates risk to private wells, and pressurized water mains are located underground and protected from flooding. The New Fairfield town center is composed of several retail outlets, government buildings, and restaurants near the intersection of Route 37 and Route 39. Ball Pond Brook and its tributaries flow through this area, with many businesses encompassed in FEMA flood hazard areas. In March of 2004, an NTNC public water system was approved by DPH and subsequently installed by the New Fairfield Water Pollution Control Authority in order to serve the town government offices and a large shopping plaza. While the main goal of the water system was to mitigate potential groundwater pollution concerns, the system also served a portion of the shopping plaza which is in a FEMA flood hazard area, and is directly adjacent to the floodway. This water system greatly reduces the risk of a service disruption in the event of flooding, and mitigates water quality concerns from flooding and groundwater contamination.
Resi
lient
Wel
ls
Location Flooding Issues
Resiliency Project Result
Facts: Eliminates risk to private well sources Cost Per Well: $$$
Various retail and municipal buildings located in the town center include the town clerk, post office, and a grocery store
While this specific project was geared toward mitigating water quality concerns surrounding flooding and groundwater contamination, the creation of a new PWS can be implemented in areas where private wells are at risk. By connecting to a new PWS, private wells can be abandoned therefore eliminating any issues associated with private well vulnerability.
While not in New Fairfield, this flooded commercial area in Norwalk is a good representation of the effects flooding can have on infrastructure. Photo: The Hour
$ ≥ 1,000 $$$ ≥ 100,000 $$ ≥ 10,000 $$$$ ≥ 1,000,000

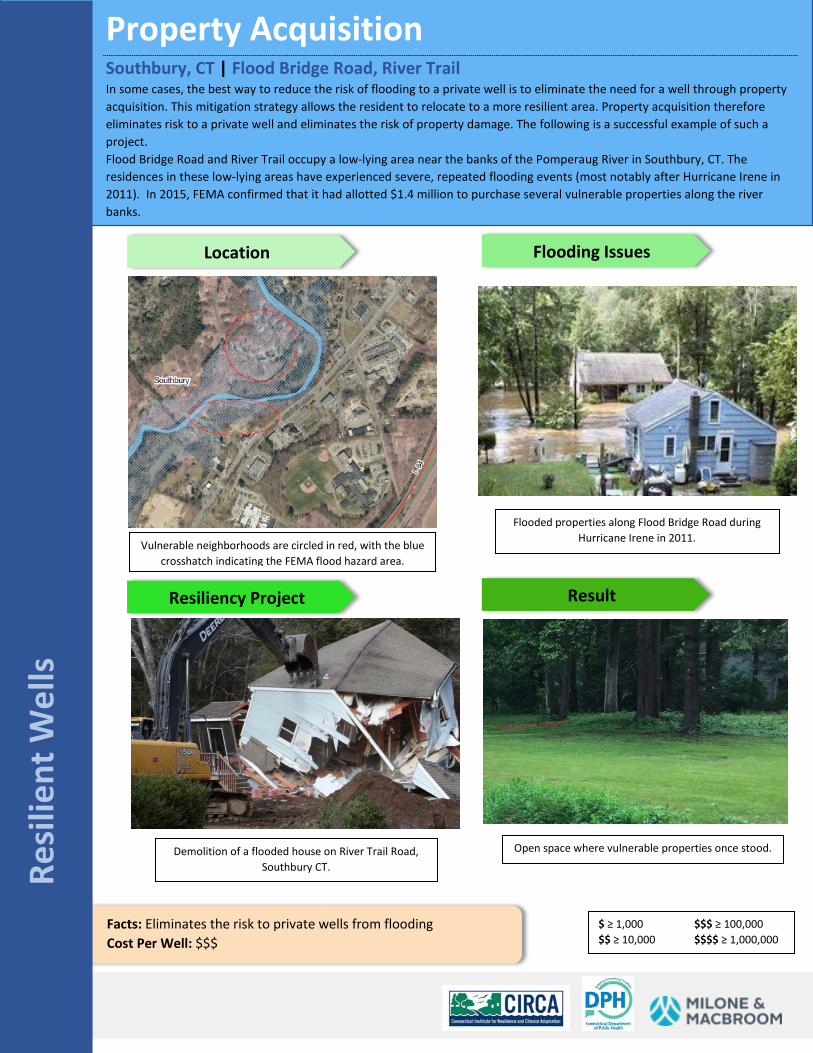
Property Acquisition Southbury, CT | Flood Bridge Road, River Trail In some cases, the best way to reduce the risk of flooding to a private well is to eliminate the need for a well through property acquisition. This mitigation strategy allows the resident to relocate to a more resilient area. Property acquisition therefore eliminates risk to a private well and eliminates the risk of property damage. The following is a successful example of such a project. Flood Bridge Road and River Trail occupy a low-lying area near the banks of the Pomperaug River in Southbury, CT. The residences in these low-lying areas have experienced severe, repeated flooding events (most notably after Hurricane Irene in 2011). In 2015, FEMA confirmed that it had allotted $1.4 million to purchase several vulnerable properties along the river banks.
Resi
lient
Wel
ls
Location Flooding Issues
Resiliency Project Result
Facts: Eliminates the risk to private wells from flooding Cost Per Well: $$$
Flooded properties along Flood Bridge Road during Hurricane Irene in 2011.
Demolition of a flooded house on River Trail Road, Southbury CT.
Vulnerable neighborhoods are circled in red, with the blue crosshatch indicating the FEMA flood hazard area.
Open space where vulnerable properties once stood.
$ ≥ 1,000 $$$ ≥ 100,000 $$ ≥ 10,000 $$$$ ≥ 1,000,000

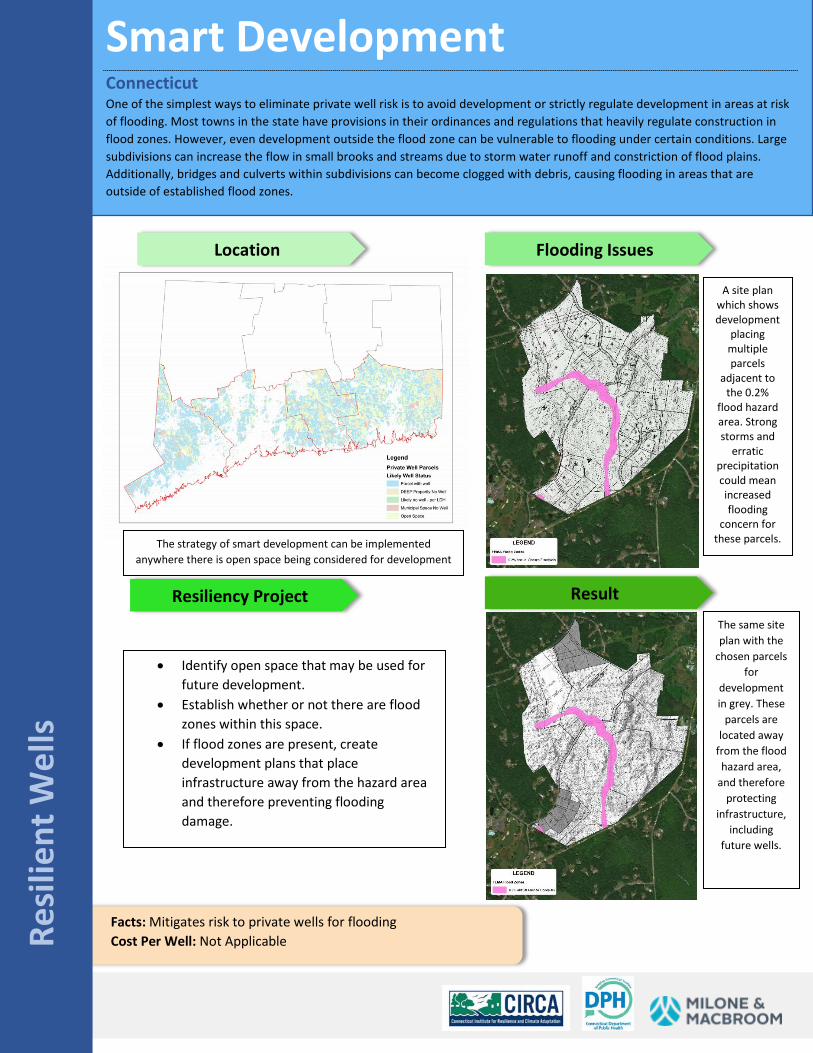
Smart Development Connecticut One of the simplest ways to eliminate private well risk is to avoid development or strictly regulate development in areas at risk of flooding. Most towns in the state have provisions in their ordinances and regulations that heavily regulate construction in flood zones. However, even development outside the flood zone can be vulnerable to flooding under certain conditions. Large subdivisions can increase the flow in small brooks and streams due to storm water runoff and constriction of flood plains. Additionally, bridges and culverts within subdivisions can become clogged with debris, causing flooding in areas that are outside of established flood zones.
Resi
lient
Wel
ls
Location Flooding Issues
Resiliency Project Result
Facts: Mitigates risk to private wells for flooding Cost Per Well: Not Applicable
A site plan which shows development
placing multiple parcels
adjacent to the 0.2%
flood hazard area. Strong storms and
erratic precipitation could mean increased flooding
concern for these parcels.
• Identify open space that may be used for future development.
• Establish whether or not there are flood zones within this space.
• If flood zones are present, create development plans that place infrastructure away from the hazard area and therefore preventing flooding damage.
The strategy of smart development can be implemented anywhere there is open space being considered for development
The same site plan with the
chosen parcels for
development in grey. These
parcels are located away
from the flood hazard area,
and therefore protecting
infrastructure, including
future wells.

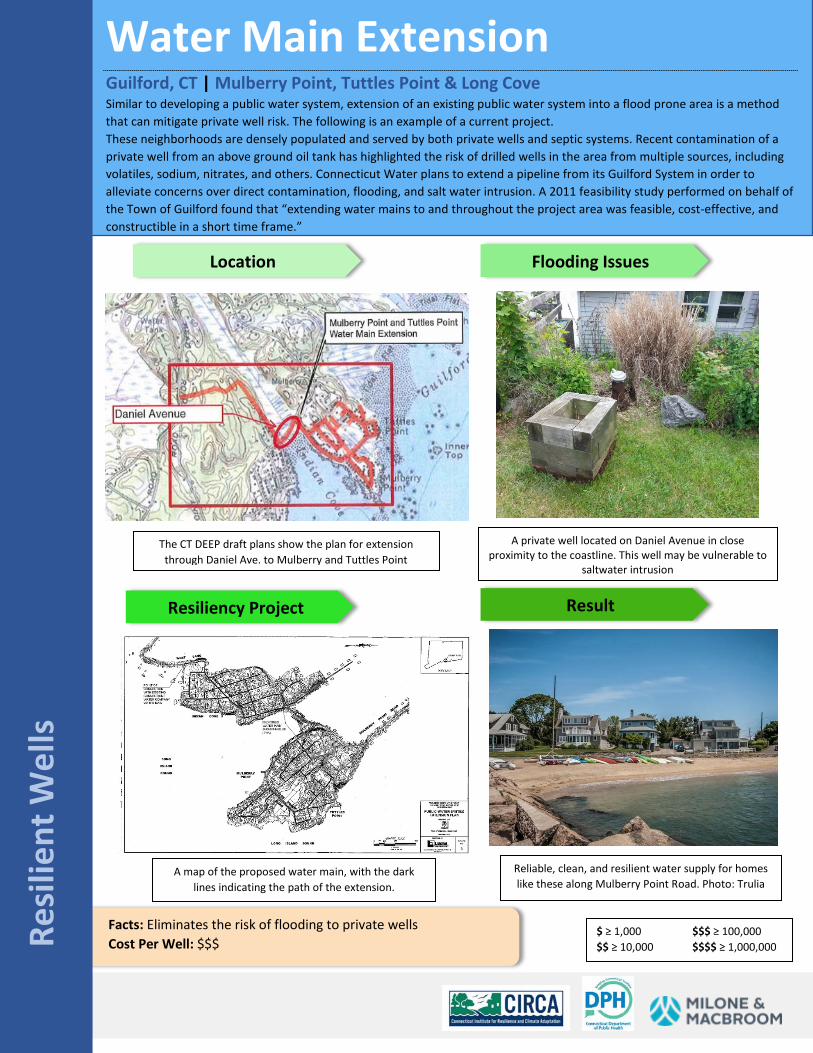
Water Main Extension Guilford, CT | Mulberry Point, Tuttles Point & Long Cove Similar to developing a public water system, extension of an existing public water system into a flood prone area is a method that can mitigate private well risk. The following is an example of a current project. These neighborhoods are densely populated and served by both private wells and septic systems. Recent contamination of a private well from an above ground oil tank has highlighted the risk of drilled wells in the area from multiple sources, including volatiles, sodium, nitrates, and others. Connecticut Water plans to extend a pipeline from its Guilford System in order to alleviate concerns over direct contamination, flooding, and salt water intrusion. A 2011 feasibility study performed on behalf of the Town of Guilford found that “extending water mains to and throughout the project area was feasible, cost-effective, and constructible in a short time frame.”
Resi
lient
Wel
ls
Location Flooding Issues
Resiliency Project Result
Facts: Eliminates the risk of flooding to private wells Cost Per Well: $$$
A private well located on Daniel Avenue in close proximity to the coastline. This well may be vulnerable to
saltwater intrusion
A map of the proposed water main, with the dark lines indicating the path of the extension.
The CT DEEP draft plans show the plan for extension through Daniel Ave. to Mulberry and Tuttles Point
Reliable, clean, and resilient water supply for homes like these along Mulberry Point Road. Photo: Trulia
$ ≥ 1,000 $$$ ≥ 100,000 $$ ≥ 10,000 $$$$ ≥ 1,000,000

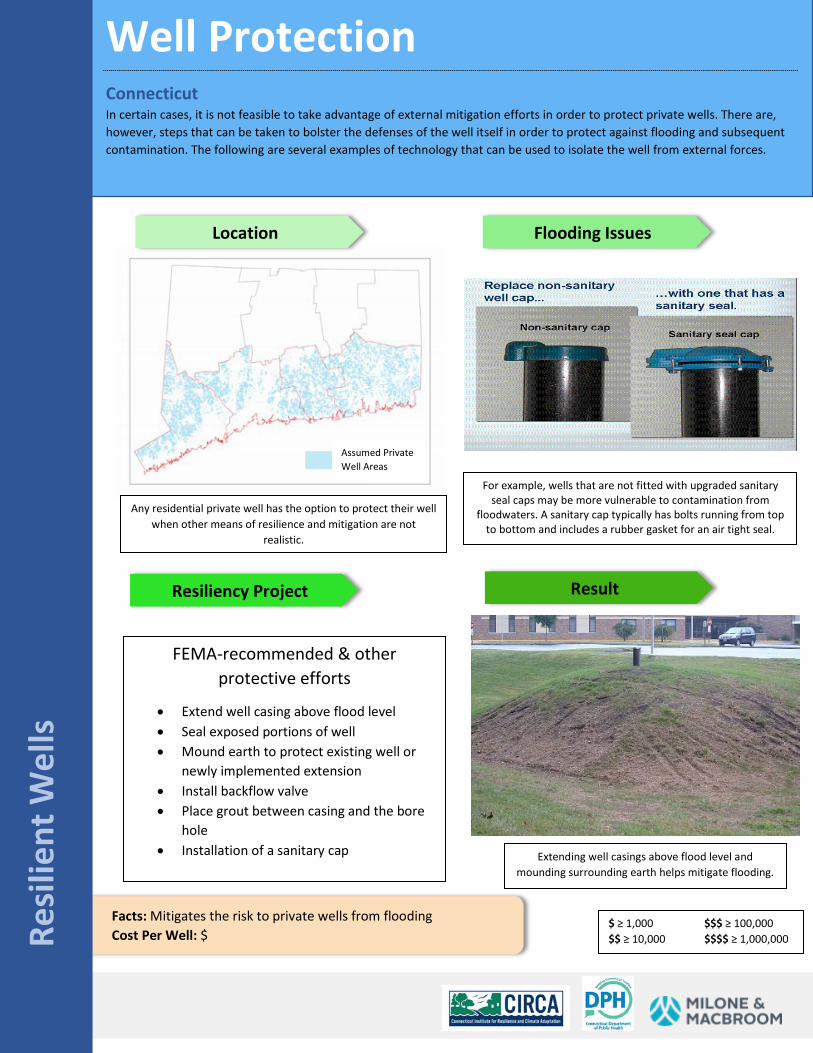
Well Protection Connecticut In certain cases, it is not feasible to take advantage of external mitigation efforts in order to protect private wells. There are, however, steps that can be taken to bolster the defenses of the well itself in order to protect against flooding and subsequent contamination. The following are several examples of technology that can be used to isolate the well from external forces.
Resi
lient
Wel
ls
Location Flooding Issues
Resiliency Project Result
Facts: Mitigates the risk to private wells from flooding Cost Per Well: $
For example, wells that are not fitted with upgraded sanitary seal caps may be more vulnerable to contamination from
floodwaters. A sanitary cap typically has bolts running from top to bottom and includes a rubber gasket for an air tight seal.
FEMA-recommended & other protective efforts
• Extend well casing above flood level • Seal exposed portions of well • Mound earth to protect existing well or
newly implemented extension • Install backflow valve • Place grout between casing and the bore
hole • Installation of a sanitary cap
Any residential private well has the option to protect their well when other means of resilience and mitigation are not
realistic.
Extending well casings above flood level and mounding surrounding earth helps mitigate flooding.
Assumed Private Well Areas
$ ≥ 1,000 $$$ ≥ 100,000 $$ ≥ 10,000 $$$$ ≥ 1,000,000

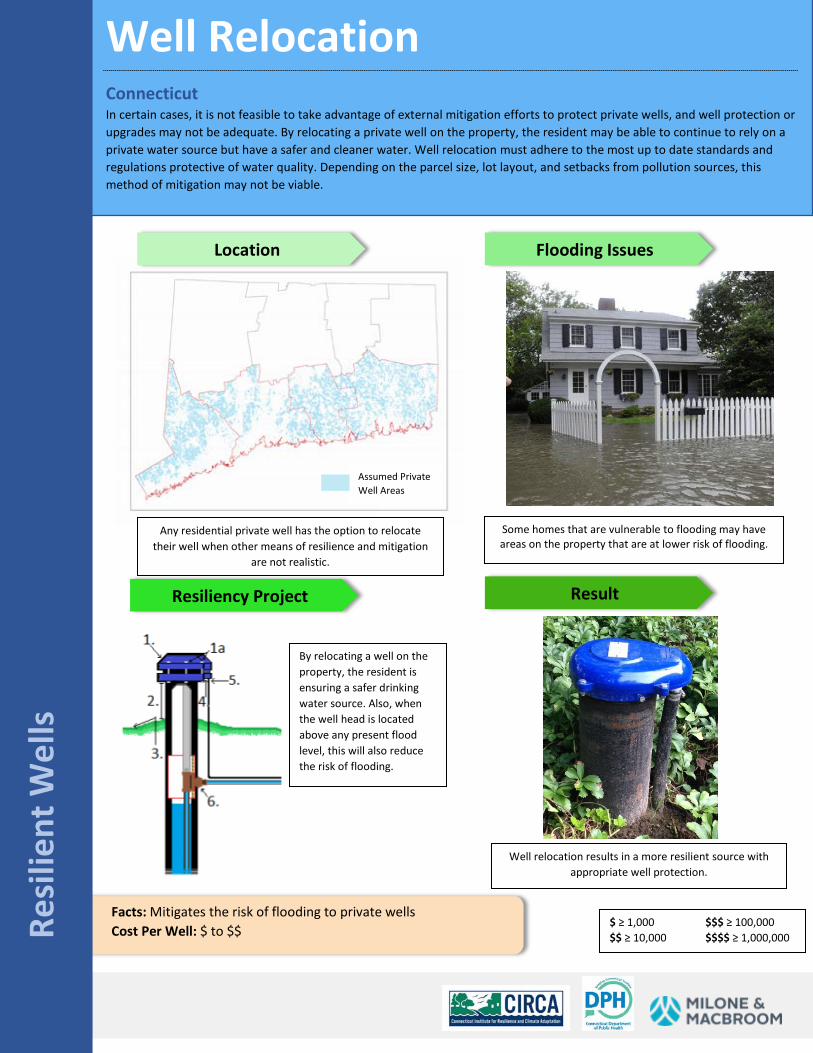
Well Relocation Connecticut In certain cases, it is not feasible to take advantage of external mitigation efforts to protect private wells, and well protection or upgrades may not be adequate. By relocating a private well on the property, the resident may be able to continue to rely on a private water source but have a safer and cleaner water. Well relocation must adhere to the most up to date standards and regulations protective of water quality. Depending on the parcel size, lot layout, and setbacks from pollution sources, this method of mitigation may not be viable.
Res
ilien
t Wel
ls
Location Flooding Issues
Resiliency Project Result
Facts: Mitigates the risk of flooding to private wells Cost Per Well: $ to $$
Some homes that are vulnerable to flooding may have areas on the property that are at lower risk of flooding.
Any residential private well has the option to relocate their well when other means of resilience and mitigation
are not realistic.
Well relocation results in a more resilient source with appropriate well protection.
By relocating a well on the property, the resident is ensuring a safer drinking water source. Also, when the well head is located above any present flood level, this will also reduce the risk of flooding.
Assumed Private Well Areas
$ ≥ 1,000 $$$ ≥ 100,000 $$ ≥ 10,000 $$$$ ≥ 1,000,000


APPENDIX M County Critical Facilities Maps

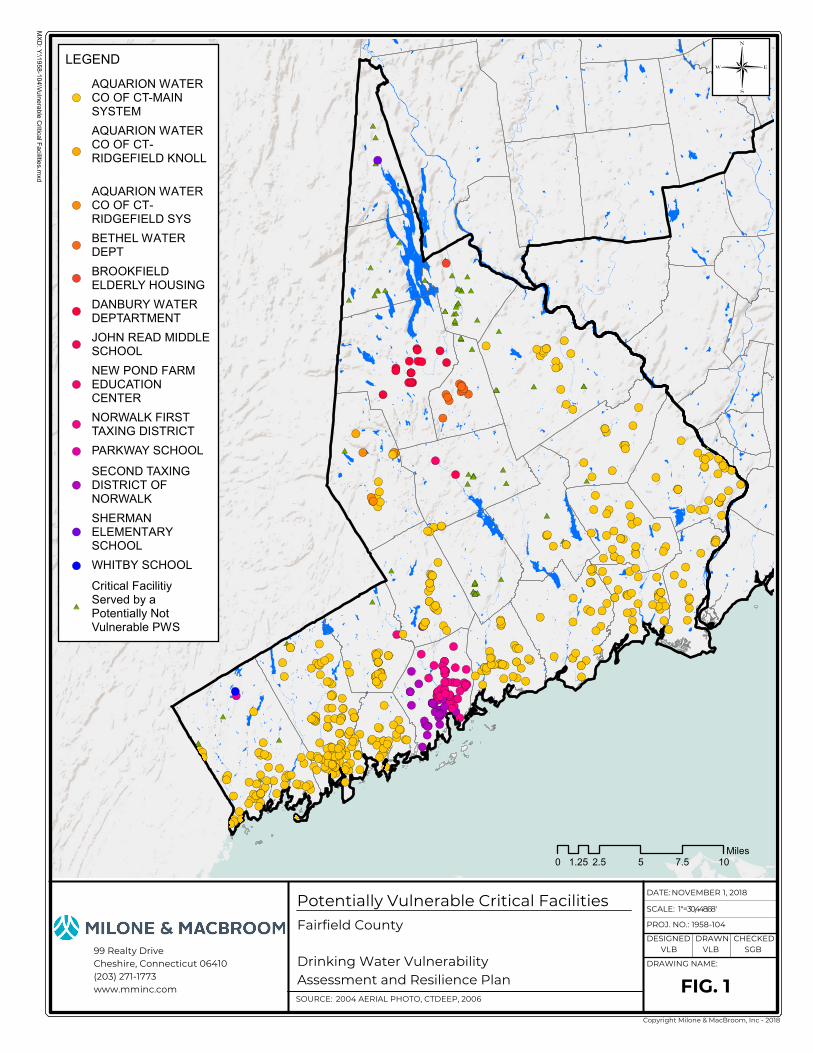
#*#*
#*
#*
#*
#*
#*
#*
#*
#*
#*
#*
#*
#*
#*
#*
#*
#*
#*
#*
#*
#*
#*
#*
#*#*
#*
#*
#*
#*
#*
#*
#*
#*
#*
#*
#*
#*
#*
#*
#*
#*
#*
#*
#*
#*
#*
#*
#*
#*
#*
#*
#*
#*
#*
#*
#*
#*
#*
#*
#*
#*
#*
#*
#*
#*
#*
#*
#*
#*
#*
#*
#*
#*
#*
#*
#*
#*
#*#*
#*
#*#*#*
#*
#*
#*
#*
#*
#*
#*#*
#*#*
#*#*
#*#*
#*#*#*#*
#*
#*#*
#*
#*
#*
#*
#*
#*
#*#*#*#*#*#*
#*
#*#*
#*
#*
#*
#*
#*
#*
#*
#*#*
#*
#*
#*#*
#*
#*
#*
#*
#*
#*
#*
#*
#*
#*
#*
#*#*
#*
#*
#*#*#*
#*
#*
#*
#*
#*#*#*
#*#*
#*#*
#*
#*
#*
#*
#*#*
#*
#* #*
#*
#*
#*#*
#*
#*
#*#*
#*
#*
#*
#*#*#*
#*#*
#*#*
#*
#*
#*#*
#*
#*
#*
#*
#*#*
#*
#*
#*
#*#*
#*
#*
#*#*
#*
#*#*
#*
#*
#*
#* #*
#*#*#* #*#*
#*
#*
#*#*#*
#*
#*#*
#*#*
#*#*#* #*
#*#*#*#*
#*
#*
#*
#*#*#*
#*
#*
#*
#*
#*#*
#*
#*
#*
#*
#*
#*
#*#*
#*
#*
#*
#*
#*
#*
#*
#*
#*#*
#*
#*
#*
#*#*
#* #*#* #*#*#*
#*
#*#*
#*#*#*
#*
#*#*#*
#*
#*
#*
#*
#*#*
#*#*
#*
#*
#*#*
#*#*
#*
#*#*
#*
#*
#*
#*
#*
#*#*
#*
#*
#*#*
#*
#*
#*#*
#*#*
#*
#*
#*
#*
#*
#*
#*
#*
#*
#*
#*
#*#*
#*
#*
#*
#*#* #*
#*#*#*
#*
#*
#*
#*
#*#*
#*
#*
#*
#*
#*
#*
#*
#*
#*
#*
#*
#*
#*#* #*
#*
#*
#*
#*
#*
#*
#*
#*
#*
#*
#*
#*
#*
#*
#*
#*#*#*#*#*#*#*#*#*
#*#*
#*#*#*#*
#*
#*
#*
#*
#*#*
#*
#*
#*#*
#*#*
#*
#*
#*#*
#*#*
#*
#*#*
#*#*
#*
#*
#*#* #*
#*
#*
#* #*#*#*#*#*
#*#*#*
#*
#*
#*#*
#*
#*
#*#*
#*#*
#*#*
#*#*
#*
#*
#*
#*
#*
#*
#*#*#*#*
#*#*
#*
#*#*
#*
#*
#*
#*
#*
#*
#*
#*
#*
#*
#*
#*
#*
#*
#*
#*
#*#*
#*
#*#*
#*#*
#*
#*
#*
#*
#*#*
#*#*
#*
#*
#*
#*
#*
#*
#*
#*
#*
#*
#*#*
#*
#*
#*
#*#*
#*
#*
#*
#*
#*
#*
#*
#*
#*
#*
#*
#*
#*
#*
#*
#*
#*
#*
#*
#*
#*#*
#*
#*
#*#*
#*
#*
#*
#*
#*
#*
#*
#*
#*
#*
#*
#*
#*
#*
#*
#*
#*#*#*
#*
#*
#*
#*
#*
#*
#*
#*#*
#*
#* #*
#*
#*
#*
#*
#*
#*
#*
#*
#*
#*
#*#*
#*#*
#*
#*
#*
#*
#*
#*
#*
#*#*#*
#* #*
#*
#*
#*#*
#*
#*
#*
#*
#*
#*
#*
#*
#*
#*
#*
#*
#*
#*
#*
#*
#*
#*
#*
#*
#*
#*
#*#*
#*
#*
#*#*
#* #*
#*
#*
#*
#*
#*
#*#*
#*
#*#*
#*
#*
#*
#*
#*
#*
#*
#*
#*
#*
#*
#*
#*#*
#*
#*
#*
#*
#*
#*
#*#*
#*
#*
#*
#*
#*#*#*
#*
#*
#*
#*
#*
#*#*
#*
#*
#*
#*#*
#* #*#*
#*#*
#*#*
#*
#*#*#*#*#*
#*#*
#*
#*
#*
#*
#*
#*#*
#*
#*
#*
#*
#*#*
#*
#*#* #*#*
#*
#*
#*
#*
#*
#*
#*
#*
#*
#*
#*
#*#*
#*
#*
#*
#*
#*
#*
#*
#*
#*
#*
#*
#*
#*
#*
#*
#*
#*
#*
#*
#*
#*
#*#*#*
#*#*
#*
#*
#*
#*
#*
#*
#*
#*
#*
#*
#*
#*
#*
#*
#*
#*
#*#* #*
#*
#*
#*
#*
#*
#*
#*#*
#*
#*
#*
#*
#*
#* #*#*
#*#*
#*
#*
#*
#*
#*#*
#*#*
#*
#*#*#*
#*
#*
#*
#*
#* #*
#*
#*#*
#*
#*#*#*
#*
#*
#*
#*
#*#*#*
#*#*
!(!(
!(
!(
!(
!(
!(
!(
!(
!(
!(
!(
!(
!(
!(
!(
!(
!(
!(
!(
!(
!(!(
!(
!(
!(
!(
!(
!(
!(
!(
!(
!(
!(
!(
!(
!(
!(
!(
!(
!(
!(
!(
!(
!(
!(
!(
!(
!(
!(
!(
!(
!(
!(
!(
!(
!(
!(
!(
!(
!(
!(
!(
!(
!(
!(!(!(!(!(!(!(!(
!(
!(
!(
!(
!(
!(
!(
!(!(
!(!(
!(!(
!(
!(
!(
!(
!(
!(
!(
!(
!(
!(
!(
!(!(
!(
!(!(!(!( !(
!(
!(
!(
!(!(
!(
!(
!(
!(
!(!(
!(
!(
!(
!(!(
!(
!(
!(!(!(
!(!(
!(
!(!(
!(
!(!(
!(
!( !(
!(
!(
!(
!(
!(
!(
!(!(!(
!(
!(!(!(!(
!(
!(!(!(
!(!( !(!(
!(
!(
!(
!(
!(
!(!(
!(
!(
!(!(
!(
!(
!(!(
!(!(
!(!(
!(
!(
!(!(
!(
!(
!(
!(!(
!(
!(
!(!(
!(
!(
!(
!(
!(
!(
!(
!(
!(
!(
!(!(
!(
!(
!(
!(
!(
!(!(!(!(!(!(!(!(!( !(!(
!(!(!(!(!(
!(
!(
!(
!(!(
!(
!(
!(!(
!(!(
!(
!(!(
!(!(
!(
!(!(
!(!(
!(
!(!(!( !(
!(
!(
!( !(!(!(!(!(
!(!(!(
!(
!(
!(!(
!(
!(
!(!(
!(!(
!(!(!(!(
!(
!(
!(
!(!(
!(
!(!(!( !(
!(!(
!(
!(!(
!(
!(
!(
!(
!(
!(
!(
!(
!(!(
!( !(
!(
!(
!(!(
!(
!(!(
!( !(
!(
!(
!(
!(
!( !(
!(!(
!(
!(!(
!(
!(
!(
!(
!(
!(!(
!(
!(
!(!(
!(
!(
!(
!(
!(
!(!(
!(
!(
!(!(
!(
!(
!(
!(
!(
!(
!(
!(!(
!(
!(
!(!(
!(
!(
!(
!(
!(
!(
!(
!(
!(
!(
!(
!(
!(
!(
!(
!( !(!(
!(
!(
!(
!(
!(
!(
!(
!(!(
!(
!( !(
!(
!(
!(
!(
!(
!(
!(
!(
!(
!(!(
!(
!(
!(
!(
!(
!(
!(
!(
!(!(!(
!( !(
!(
!(
!(!(
!(
!(
!(!(
!(
!(
!(
!(
!(
!(
!(
!(
!(
!(!(
!(
!(
!(
!(
!(
!(!(
!( !(
!(
!(
!(!(!( !(
!(
!(
!(
!(
!(
!(!(
!(!(
!(
!(
!(
!(
!(
!(
!(
!(
!(!(
!(!(
!(
!(
!(
!(!(
!(!(
!(
!(
!(
!(
!(!(
!(
!(
!(
!(
!(!(
!(
!(
!(!(!(
!( !(!(
!( !(
!(!(
!(
!(!(!(!(!(
!(!(
!(
!(
!(
!(
!(
!(!(
!(
!(
!(
!(
!(!(
!(!(
!(!(!(
!(
!(
!(
!(
!(
!( !(
!(
!(!(
!(
!(
!(
!(
!(
!(
!(
!(
!(
!(
!(
!(
!(
!(
!(
!(
!(
!(
!(
!(
!(!(!(
!(!(
!(
!( !(
!(
!(
!(
!(
!(
!(
!(
!(
!(!( !(
!(
!(
!(
!(
!( !(!(!(!(
!(
!(
!(!(
!(!(
!(
!(!(!(
!(
!(!(
!(
!( !(
!(
!(!(
!(
!(!(!(
!(
!(
!(
!(!(!(
!(!(
Sources: Esri, USGS, NOAA
Potentially Vulnerable Critical FacilitiesFairfield County
Drinking Water Vulnerability Assessment and Resilience Plan
DATE: NOVEMBER 1, 2018
SCALE: 1 " = 30,448.68 '
PROJ. NO.: 1958-104
DESIGNED DRAWN CHECKEDVLB VLB SGB
DRAWING NAME:
FIG. 1SOURCE: 2004 AERIAL PHOTO, CTDEEP, 2006
MXD: Y:\1958-104\Vulnerable Critical Facilities.mxd
¶
99 Realty Drive Cheshire, Connecticut 06410(203) 271-1773www.mminc.com
Copyright Milone & MacBroom, Inc - 2018
LEGEND
!(
AQUARION WATERCO OF CT-MAINSYSTEM
!(
AQUARION WATERCO OF CT-RIDGEFIELD KNOLL
!(
AQUARION WATERCO OF CT-RIDGEFIELD SYS
!(BETHEL WATERDEPT
!(BROOKFIELDELDERLY HOUSING
!(DANBURY WATERDEPTARTMENT
!(JOHN READ MIDDLESCHOOL
!(
NEW POND FARMEDUCATIONCENTER
!(NORWALK FIRSTTAXING DISTRICT
!( PARKWAY SCHOOL
!(
SECOND TAXINGDISTRICT OFNORWALK
!(
SHERMANELEMENTARYSCHOOL
!( WHITBY SCHOOL
#*
Critical FacilitiyServed by aPotentially NotVulnerable PWS
0 2.5 5 7.5 101.25Miles
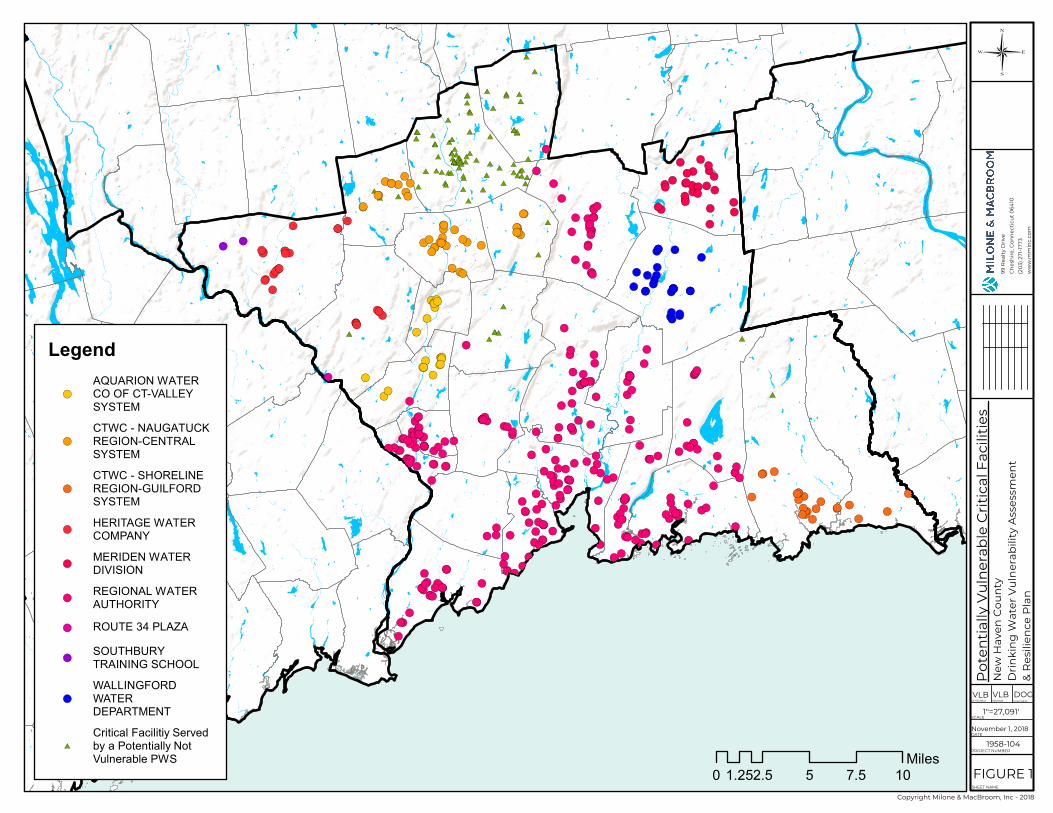
#*#*
#*
#*
#*#*
#*
#*
#*
#*
#*
#*
#*
#*
#*
#*
#*
#*
#*
#*
#*
#*
#*
#*
#*
#*
#*
#*
#*
#*
#*
#*
#*
#*
#*
#*
#*
#*
#*
#*
#*
#*
#*
#*
#*
#*#*
#*
#*
#*
#*
#*
#*
#*
#*
#*
#*
#*
#*
#*
#*
#*
#*
#*
#*#*
#*
#*
#*
#*
#*
#*
#*
#*
#*
#*
#*
#*
#*
#*#*
#*
#*
#*
#*
#*
#*
#* #*
#*
#*
#*
#*
#*
#*
#*
#*
#*
#*
#*
#*
#*
#*
#*
#*
#*
#*
#*
#*
#*
#*
#*
#*
#*
#*
#*
#*
#*
#*
#*#*
#*
#*
#*
#*
#*
#*
#*#*
#*
#*
#*#*
#*
#*#*
#*#*
#*#*
#*#*
#*#*#*#*
#*
#*#*
#*
#*
#*#*
#*#*#*
#*
#* #*
#*
#*
#*#*
#*
#*#*#*#*
#*#*
#*
#*
#*
#*
#*
#*
#*
#*
#*
#*
#*
#*#*
#*
#*
#*#*
#*
#*
#*
#*
#*
#*
#*
#*
#*
#*
#*
#*#*
#*
#*#*
#*
#*
#*
#*
#*
#*
#*
#*
#*
#*
#*
#*
#*
#*
#*
#*
#*
#*
#*
#*
#*
#*
#*
#*#*
#*
#*
#*#*
#*
#*
#*
#*
#*#*#*
#*#*
#*#*
#*
#*
#*
#*
#*
#*
#*
#*
#*#*
#*#*#*
#*
#*
#*
#*#*
#*
#*
#*
#*#*#*
#*
#*
#*
#*
#*
#*
#*#*
#*
#*
#*
#*
#*
#*
#*
#*#*#*#*
#*
#*#*
#*
#*
#*#*
#*#*
#*
#*
#*
#*#*#*#*#*#*
#*
#*#*
#*#*
#*
#*#*
#*#*
#*
#*
#*
#* #*
#*#*#* #*#*
#*
#*
#*
#*
#*
#*
#*
#*
#*#*
#*
#*
#*
#*#*
#*#*
#*#*#* #*
#* #*#*
#*
#*
#* #*#*#*
#*#* #*#*
#*
#*
#*#* #*
#*
#*#*
#*
#*
#* #*
#*#*
#*
#*
#* #*
#*
#*
#*#*
#*
#*
#*
#*
#*
#*
#*#*
#*
#*
#*
#*
#*
#*
#*
#*
#*#*
#*
#*
#*#*
#*
#*
#*
#*#*#*#*
#*
#*
#*
#*#*#*#*#*
#*
#*
#*#*
#*
#*
#*
#*
#*
#*
#*
#*
#*
#*
#*
#*#*
#*
#*
#*
#*#*
#*
#*
#*
#*
#*#*#*#*#*#*
#*
#*
#*
#*#*
#*
#*
#*
#*#*
#*
#*
#*#*
#*
#*
#*
#*
#*
#*#*
#*
#*
#*#*
#*
#*
#*#*
#*
#*
#*
#*
#*
#*
#*
#*
#*
#*
#*
#*
#*
#*#* #*
#*#*#*
#*
#*
#*
#*
#*#*
#*
#*
#*
#*
#*
#*
#*
#*
#*
#*
#*#*
#*#*#*
#*
#*
#*#*
#*#*
#*
#*
#* #*
#*
#*#*
#*
#*
#*#*
#*
#*
#*
#*
#* #*
#*
#*
#*
#*#*#*
#*#*
#*
#*
#*
#*#*
#*
#*#*
#*
#*
#*
#*
#*
#*
#*
#*#*
#*#*#*
#*
#*
#*
#*
#*
#*#*#*
#*
#*
#*
#*
#*
#*#*#*
#*
#*
#*
#*
#*#*
#*
#*#*
#*
#*
#*
#*#*#*
#*
#*
#*
#*
#*
#*
#*
#*
#*
#*
#*
#*
#*
#*#*
#*
#*
#*
#*
#*#*
#*#*#*#*
#*#*#*#*
#*
#*
#*
#*
#*
#*
#*
#*
#*
#*
#*
#*
#*
#*
#*
#*
#*
#*
#*
#*
#*
#*
#*
#*
#*
#*
#*
#*
#*
#*
#*#*
#*
#*
#*
#*
#*
#*
#*
#*
#*
#*
#*
#* #*#*
#*#*
#*
#*
#*
#*
#*
#*
#*#*
#*
#*#*#*
#*
#*
#*
#*
#* #*
#*
#*
#*
#*
#*#*#*
#*
#*
#*
#* #*
#*#* #*
#*
#*
#*#*
#*
#* #*#*
#*#*#*
#*
#*#*
#*#*#*
#*
#*
#*
#*
#*#*#*
#*
#*
!(
!( !(
!(
!(
!(
!(
!(
!(
!(
!(
!(
!(
!(
!(!(
!(
!(
!(
!(
!(
!(
!(
!(
!(
!(
!(
!(
!(!(
!(
!(
!(
!(
!(!(
!(
!(
!(
!(
!(
!(
!(
!(!(
!(
!(
!(
!(
!(
!(!(
!(
!(
!( !(
!(
!(
!(
!(
!(
!(
!(
!(
!(!(
!(
!(
!(
!(
!(
!(!(
!(
!(!(
!(
!(
!(!(
!(!(
!(
!(!(!(
!(!(
!(!(
!(!(
!(!(
!(!(!(!(
!(
!(!(
!(
!(
!(
!(
!( !(
!(
!(
!(!(
!(
!(!(!(!(
!(!(
!(!(
!(
!(
!(
!(!(
!(
!(
!(
!(!(
!(
!(
!(
!(
!(
!(
!(
!(
!(
!(!(
!(
!(
!( !(!(
!(
!(!(
!(
!(
!(
!(
!(!(!(
!(!(
!(!(
!(
!(
!(
!(
!(
!(
!(
!(
!(!(
!(!(!(!(
!(
!(
!(!(!(!(
!(
!(
!(
!(
!(
!(!(!(!(!(
!(!(!(
!(
!(!(
!(!(
!(
!(
!(
!(!(!(!(!(!(
!(
!(!(
!(
!(
!(
!(
!( !(!(!( !(
!(
!(
!(!(
!(!(
!(
!(
!(
!(!(
!(!(
!(!(!( !(!(!( !(
!(
!(
!( !(!(!(!(!( !(!(
!(
!(
!(!( !(
!(
!(!(
!(
!(
!( !(
!(!( !(
!(
!( !(
!(
!(
!(!(
!(
!(!(
!(
!(
!(
!(!(
!(
!(
!(!(!(!(
!(!(
!(!(!(!(!(
!(
!(
!(!(
!(
!(
!(
!(
!(
!(
!(
!(
!(
!(
!(!(
!(
!(
!(!(!(
!(
!(
!(!(!(!(!(!(
!(
!(
!(!(
!(
!(
!(
!(!(
!(!(
!(!(
!(
!(!( !(
!(!(!(
!(
!(
!(
!(
!(
!(!(
!(!(!(
!(
!(
!(!(
!(!(
!(
!(
!( !(
!(
!(!(
!(
!(
!(
!(
!(!(
!(
!(!(
!(
!(
!(
!(!(!(
!(
!(
!(
!(
!(
!(
!(
!(
!(
!(!(!(!(!(
!(!(!(
!(
!(
!(
!(
!(
!(
!(
!(
!(
!(
!(
!(
!(!(
!(
!(
!(
!(
!(
!(
!(
!(
!(
!(
!(
!(!( !(
!(
!(
!(!( !(
!( !(!(
!(!(!(
!(
!(!(
Sources: Esri, USGS, NOAA
Po
ten
tial
ly V
uln
era
ble
Cri
tica
l Fac
iliti
es
Ne
w H
ave
n C
ou
nty
Dri
nk
ing
Wat
er
Vu
lner
abili
ty A
sse
ssm
en
t&
Re
silie
nce
Pla
n
DESIGNED
VLBDRAWN
VLBCHECKED
DOG
SCALE1 " = 27,091 '
DATENovember 1, 2018
PROJECT NUMBER1958-104
SHEET NAME
FIGURE 1
99
Re
alty
Dri
ve
Ch
esh
ire
, Co
nn
ect
icu
t 0
64
10
(20
3) 2
71-1
773
ww
w.m
min
c.co
m
¶
Copyright Milone & MacBroom, Inc - 2018
0 2.5 5 7.5 101.25Miles
Legend!(
AQUARION WATERCO OF CT-VALLEYSYSTEM
!(
CTWC - NAUGATUCKREGION-CENTRALSYSTEM
!(
CTWC - SHORELINEREGION-GUILFORDSYSTEM
!(HERITAGE WATERCOMPANY
!(MERIDEN WATERDIVISION
!(REGIONAL WATERAUTHORITY
!( ROUTE 34 PLAZA
!(SOUTHBURYTRAINING SCHOOL
!(
WALLINGFORDWATERDEPARTMENT
#*
Critical Facilitiy Servedby a Potentially NotVulnerable PWS
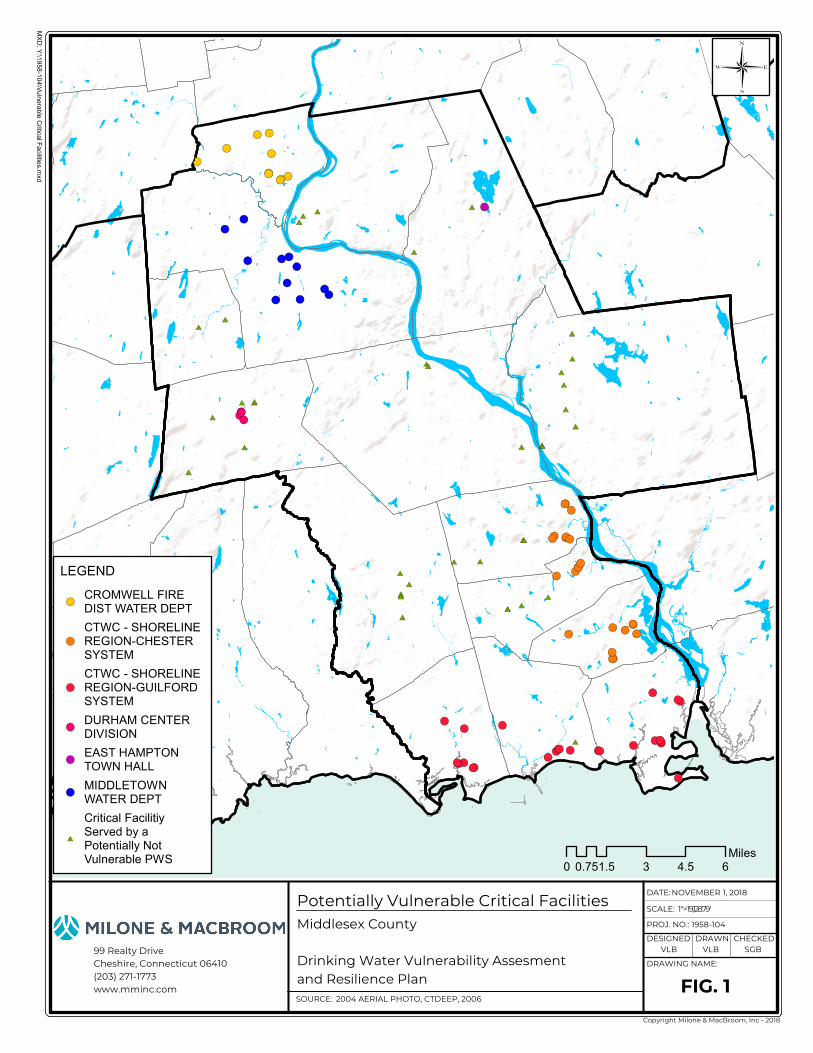
#*
#*
#*
#*
#*
#*
#*
#*
#*
#*
#*
#*
#*
#*
#*#*
#*
#*
#*
#*
#*
#*
#*
#*
#*
#*
#*
#*
#*
#*
#*
#*
#*
#*
#*
#*
#*
#*#*
#*
#*
#*#* #*
#*
#*
#*#*
#*#*
#*#*#* #* #*
#*#*
#*#*#*
#*
#*
#*
#*
#*
#*
#*#*#*
#*
#*
#*#*
#*
#*
#*
#*#*
#*#*
#*#*
#*
#*
#*
#*
#*
#*
#*
#*
#*
#*#*
#*
#*#*
#*
#*
#*
#*
#*
#*#*
#*
#*
#*#*#*
#*
#*
#*
#*
#*
#*
#*
#*#*#*
#*
#*
#*
#* #*#*#*
#*
#*
#*
#*#*
#* #*
#*
#*
#*
#*
#*
#*
#*
#*
#*
#*
#*
#*
#*
#*
#*
#*
#*
#*
#*
#*
#*
#*#*#*
#*
#*
#*
#* #*
#*#*
#*
#*
#*
#*
#*
!(
!(
!(
!(
!(!(
!(
!(
!(
!(
!(!(
!(
!(
!(
!(
!(
!(
!(
!(
!(
!(
!(
!(
!(!( !(
!(
!(
!(!(
!(!(
!(
!(
!(
!(
!(
!(!(!(!(
!(
!(!(
!(!(!(
!(!(
!(
!(
!(
!(
!(
!(
!(!(!(!(
!(
!(!(
!(
!(
!(
!(
!(
!(
!(
!( !(!(!(
!(
!(!(!( !(
!(
!(
!(
!(
!(
!(
!(
!(
!(
!(
!(
!(!(
!(!(!(
Sources: Esri, USGS, NOAA
Potentially Vulnerable Critical FacilitiesMiddlesex County
Drinking Water Vulnerability Assesment and Resilience Plan
DATE: NOVEMBER 1, 2018
SCALE: 1 " = 19,128.79 '
PROJ. NO.: 1958-104
DESIGNED DRAWN CHECKEDVLB VLB SGB
DRAWING NAME:
FIG. 1SOURCE: 2004 AERIAL PHOTO, CTDEEP, 2006
MXD: Y:\1958-104\Vulnerable Critical Facilities.mxd
¶
99 Realty Drive Cheshire, Connecticut 06410(203) 271-1773www.mminc.com
Copyright Milone & MacBroom, Inc - 2018
LEGEND!(
CROMWELL FIREDIST WATER DEPT
!(
CTWC - SHORELINEREGION-CHESTERSYSTEM
!(
CTWC - SHORELINEREGION-GUILFORDSYSTEM
!(DURHAM CENTERDIVISION
!(EAST HAMPTONTOWN HALL
!(MIDDLETOWNWATER DEPT
#*
Critical FacilitiyServed by aPotentially NotVulnerable PWS 0 1.5 3 4.5 60.75
Miles
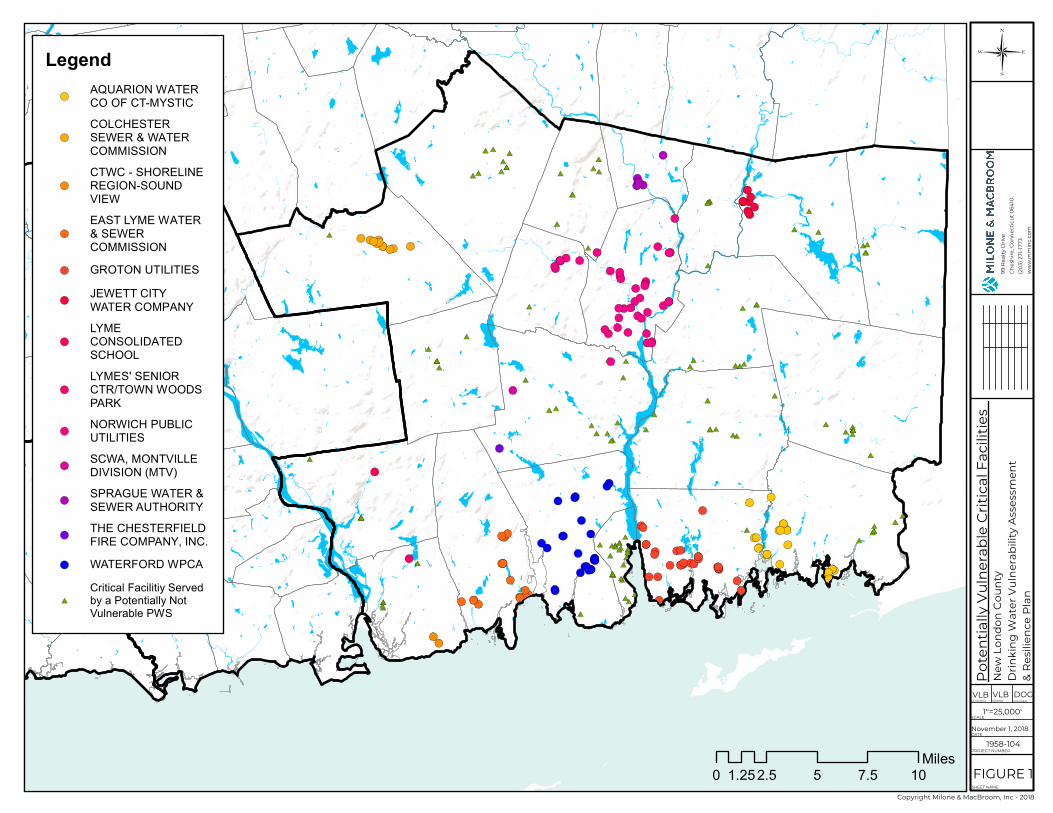
#*
#*
#*
#*
#*
#*
#*
#*
#*#*
#*
#*
#*#*
#*
#*
#*
#*
#*
#*
#*
#*
#*
#*
#*
#*
#*
#*
#*#*#* #*#*
#*
#*
#*
#*
#*#* #*
#*
#*#*#* #* #*
#*#*#*#*#*
#*
#*#*#*#*
#*#*
#*
#*
#*
#*#*
#*#*#*
#*
#*
#*#*
#*
#*
#*
#*
#*
#*
#*
#*
#*#*#*
#*#*
#*
#*
#*
#*
#*
#*
#*
#*
#* #*
#*
#*#*
#*#*
#*
#*
#*
#*#*
#*
#*#*
#*
#*
#*
#*
#*
#*#*
#*
#*
#*#*
#*
#*#*
#*#*
#*
#*#*#* #*
#*
#*
#*
#*
#*
#*#*#*
#*
#*
#*#*#*
#*
#*
#*
#*#*
#*#*
#*
#*
#*
#*
#*
#*
#*
#*
#*#*
#*
#*#* #*#*
#*
#*#*
#*
#*
#*#*
#*
#*
#*
#*#*
#*
#*#*
#*
#*
#*#*
#* #*
#*#*
#*
#*
#*#*#*
#*
#*
#*
#*
#*
#*
#*
#*#*
#*
#*
#*
#*
#*
#*
#*
#*
#*
#*
#*
#*
#*
#*
#*
#*
#*
#*
#*
#*
#*
#*#*
#*
#*
#*
#*
#*
#*
#* #*#*#*
#*
#*#*
#*
#*
#*
#*#*
#*
#*
#*#*#*
#*#*#*#*#*
#*
#*
#*
#*
#*
#*
#*
#*
#*
#*#*
#*
#*
#* #*#*#*
#*
#*
#*#*
#*
#*
#*
#*
#*
#*
#*
#*
#*
#*
#*
#*
#*
#*
#*
#*
#*
#*
#*
#*
#*#*
#*#* #*
#*
#*
#*
#*
#*
#*
#*
#*
#*
#*
#*
#*
#*
#*#*
#*
#*
#*
#*
#*
#*
#*
#*
#*
#* #*
#*
#*
#*
#*
#*#*
#*
#*
#*
#*
#*
#*#*#*
!(!(
!(
!(
!(
!(
!(
!(
!(
!(
!(
!(
!(
!(
!(
!(
!(
!(
!(
!(!(!( !(!(!(
!(!(!(!( !(
!(!(!(!(
!(!(
!(
!(
!(
!(!(
!(!(!(!(!(
!(
!(!(
!(
!(
!(
!(!(
!(
!(!(
!(!(
!(!(
!(
!(!(
!(
!(!(
!(
!(
!(
!(
!(
!(!(
!(
!(
!(
!(
!(
!(!(
!(!(
!(
!(!(
!(!(
!( !(
!(
!(
!(
!(
!(
!(
!(
!(!(
!(!(
!(
!(!(
!(
!(
!(
!(!(
!(
!(
!(
!(
!(
!(
!(
!(
!(!(
!(
!(!(
!(!(!(!(!(
!(
!(
!(
!(
!(!(!(!(
!(
!(!(!(
!(
!(!(
!(
!(
!(
!(
!(
!(
!(
!(!(
!(
!(
!(!(
!(
!(
!(
!(
!(
!(
!(
!( !(
!(
!(
!(
!(
!(
!(
Sources: Esri, USGS, NOAA
Po
ten
tial
ly V
uln
era
ble
Cri
tica
l Fac
iliti
es
Ne
w L
on
do
n C
ou
nty
Dri
nk
ing
Wat
er
Vu
lner
abili
ty A
sse
ssm
en
t&
Re
silie
nce
Pla
n
DESIGNED
VLBDRAWN
VLBCHECKED
DOG
SCALE1 " = 25,000 '
DATENovember 1, 2018
PROJECT NUMBER1958-104
SHEET NAME
FIGURE 1
99
Re
alty
Dri
ve
Ch
esh
ire
, Co
nn
ect
icu
t 0
64
10
(20
3) 2
71-1
773
ww
w.m
min
c.co
m
¶
Copyright Milone & MacBroom, Inc - 2018
0 2.5 5 7.5 101.25Miles
Legend!(
AQUARION WATERCO OF CT-MYSTIC
!(
COLCHESTERSEWER & WATERCOMMISSION
!(
CTWC - SHORELINEREGION-SOUNDVIEW
!(
EAST LYME WATER& SEWERCOMMISSION
!( GROTON UTILITIES
!(JEWETT CITYWATER COMPANY
!(
LYMECONSOLIDATEDSCHOOL
!(
LYMES' SENIORCTR/TOWN WOODSPARK
!(NORWICH PUBLICUTILITIES
!(SCWA, MONTVILLEDIVISION (MTV)
!(SPRAGUE WATER &SEWER AUTHORITY
!(THE CHESTERFIELDFIRE COMPANY, INC.
!( WATERFORD WPCA
#*
Critical Facilitiy Servedby a Potentially NotVulnerable PWS