measuring regional resilience towards fossil fuel supply constraints. adaptability and vulnerability...
TRANSCRIPT

Energy Policy 91 (2016) 128–137
Contents lists available at ScienceDirect
Energy Policy
http://d0301-42
n CorrE-m
rosemarjulian.mwindha
1 InAustria,
2 U3 U4 En
journal homepage: www.elsevier.com/locate/enpol
Measuring regional resilience towards fossil fuel supply constraints.Adaptability and vulnerability in socio-ecological Transformations-thecase of Austria
Andreas Exner a,n,1, Emilio Politti i,2, Ernst Schriefl b, Susanna Erker c, Rosemarie Stangl d,3,Sacha Baud e, Hannes Warmuth f, Julian Matzenberger g, Lukas Kranzl g,Reinhard Paulesich h, Markus Windhaber b, Susanne Supper f,4, Gernot Stöglehner c
a EB&P Umweltbüro Gmbh, Bahnhofstraße 39, A-9020 Klagenfurt, Austriab energieautark consulting gmbh, Hauptstraße 27/3, 1140 Wien, Austriac Institut für Raumplanung, ländliche Neuordnung (IRUB), University of Life Sciences, Peter-Jordan-Straße 82, 1190 Vienna, Austriad Sigmund Freud Privat Universität SFU, Schnirchgasse 9a, 1030 Vienna, Austriae Bundesanstalt Statistik Österreich, Guglgasse 13, 1110 Vienna, Austriaf Österreichische Gesellschaft für Umwelt und Technik, Hollandstraße 10/46, 1020 Vienna, Austriag Energy Economics Group, Institute of Energy Systems and Electrical Drives, Vienna University of Technology, Gusshausstraße 25-29/370-3, 1040 Vienna,Austriah Institute for Multi-Level Governance and Development, Vienna University of Economics and Business, Welthandelsplatz 1, 1020 Vienna, Austriai University of Trento, Department of Civil, Environmental and Mechanical Engineering, Via Mesiano 77, 38123 Trento, Italy
H I G H L I G H T S
� Mean resilience of Austrian municipalities towards peak oil is moderate.
� The difference between resilience values of municipalities is small.� Significant differences in resilience between spatial types exist.� Higher resilience is displayed by less urbanized types.� Policies should target resilience components with the lowest values first.a r t i c l e i n f o
Article history:Received 4 June 2015Received in revised form18 December 2015Accepted 26 December 2015
Keywords:ResilienceEnergyPeak oilVulnerabilityInnovationSocial capital
x.doi.org/10.1016/j.enpol.2015.12.03115/& 2016 Elsevier Ltd. All rights reserved.
esponding author.ail addresses: [email protected] (E. [email protected] (R. Stangl), sacha.baud@[email protected] (J. Matzenberger), [email protected] (M. Windhaber), gernot.sstitute for Political Science, University of Vie0699 12 72 38 87.niversità degli Studii die Trento, Via Calepinamweltbundesamt, Spittelauer Lände 5, 1090 Vergie- und Umweltagentur Niederösterreich,
a b s t r a c t
Resilience has become a prominent concept to understand system vulnerabilities and flexible ways ofadapting to crises. Recently, it gained importance in discussions about the possible peak in oil production(peak oil) and its consequences, which might affect economic performance, social well-being and poli-tical stability, and thus also the energy transition to a low-carbon economy. The paper presents a newway of measuring resilience as absolute resilience related to a best practice-model of a resilient society.The resilience model is grounded in explicit theoretical assumptions. All indicators are justified bytheoretical and empirical arguments. We present a case study of Austrian municipalities and broader-scale spatial types, which were defined according to their degree of urbanization. The mean resilience ofAustrian municipalities is moderate, the difference between resilience values of municipalities is small.Significant differences between spatial types exist. Higher resilience is displayed by less urbanized typesdue to a higher share of agricultural activities and a more favorable level of GDP per capita. Austria hasconsiderable latitude to improve resilience. Corresponding policies should target resilience components
), [email protected] (E. Schriefl), [email protected] (S. Erker),statistik.gv.at (S. Baud), [email protected] (H. Warmuth), [email protected],[email protected] (L. Kranzl), [email protected] (R. Paulesich),[email protected] (G. Stöglehner).nna, Ferstelgasse 5/25, 1090 Vienna, Austria, [email protected]; Postal adress: Gaswerkstraße 55/6, 8020 Graz,
14, 38122 Trento, Italy.ienna, Austria.Wiener Straße 2/Top 1.03, 2340 Mödling, [email protected].

A. Exner et al. / Energy Policy 91 (2016) 128–137 129
with the lowest values first. A sole focus on regionalization is not recommended. These conclusions areapplicable to OECD countries in general.
& 2016 Elsevier Ltd. All rights reserved.
1. Introduction
Resilience has become a major concept in policy and scientificdebates. In the context relevant to this paper, resilience, in generalterms, denotes the ability of social systems to survive and copewith stress, disturbance or adversity by means of adaptation (e. g.Norris et al., 2008; Wilson, 2012). The increasing importance of theresilience concept is indicated by its growing use in the literature.From 1995 to 2011, the number of articles that mention resilienceas a keyword had a tenfold increase, while within the same periodscientific articles per year only doubled (Matzenberger, 2013). Theresilience discourse seems to mark a significant shift in societaldebates, as its upswing coincides with a range of intertwineddynamics that are now often discussed as multiple economic,political, ecological and social crises (Exner et al., 2013).
Indeed, fears of further destabilization of climate, energy se-curity, politics, economy or food supply are voiced regularly, asillustrated by the latest Global Risks Report (World EconomicForum/WEF, 2013). The report mentions “resilience” 28 times,references excluded, while sustainability appears only 10 times inthe text. This is just anecdotal, though notable evidence of a shiftin discourse from sustainability to resilience. While sustainabilityis a concept that focused on win–win-situations and a positivevision of increasing living standards, resilience is a paradigm thatinstead puts at the center the notion of survival and the threat ofmultiple catastrophes (Exner, 2013a). Thus, resilience as a dis-course displays ambivalent characteristics. This explains that, be-yond the usually unquestioned use in policy papers, the scientificassessment of the resilience discourse ranges between a very cri-tical stance to appreciation. The critical position interprets resi-lience mainly as a tool for social control by way of leading certainagents to adapt to socially created crises, instead of pushing forremedies by reforming political and economic structures (Cooperand Walker, 2011, cf. special issue of Planning, Practice & Research,O'Hare and White, 2013). In a more positive view, resilience is seenas an interesting extension of social science approaches. It thusmight improve the understanding of development challenges thatcommunities have faced in the past and will do so in the future(Norris et al., 2008; Wilson, 2012). The most prominent strand ofdebate that has considerably shaped the notion of resilience ispromoted by organizations such as the Resilience Alliance. Resi-lience here is seen as the core concept of a socio-ecological sys-tems perspective. Accordingly, “resilience thinking” (Walker andSalt, 2006; see also Gunderson and Holling, 2001) is promoted,which is understood as a new scientific and political paradigm.
We will take up the issue of conceptualizing resilience in thenext chapter, and will draw conclusions relating to our oper-ationalization and measurement of resilience in the last chapter.First we want to focus our investigation on a particular type ofchallenge that is one of the most often cited in relation to resi-lience thinking, i. e., the impeding scarcity of fossil fuels, especiallyof oil. Though our study does not depend on the credibility of anyspecific view on the availability and price of oil, we take the peakoil theory as the starting point for a set of scenarios to investigatewhich factors might indicate resilience on a regional level, whensuch a challenge is assumed (see special issue of PhilosophicalTransactions of the Royal Society A, 2014, No. 372 for an update onthis debate).
This approach, however, is not merely a thought experiment of
theoretical value, but is linked to broadening policy debates onresilience in the face of threats to energy supply, which are oftenattributed to political constraints rather than only objective geo-logical facts. Yet, while the specific kind of shock or stressor isoften not explicit in official political resilience papers such as inthe UK (Cabinet Office, 2012), the peak oil theory informs a widerange of political and scientific resilience concepts. The peak oiltheory, not least, frames the social movement of Transition Towns,that has spread particularly in the Anglo-Saxon world, and centersaround the concept of resilience (Hopkins, 2011).
The particular view on the causes of supply shocks and energystress has an impact on the indicators relevant for resilience, be-cause the severity of such a shock for society depends on theconcrete circumstances. Since fossil fuels, and oil in particular, aresuch important commodities for modern societies, a supply shockor restriction of any kind will have considerable repercussions.However, a limited shock in availability or a temporarily forcedreduction in oil use is different from a more far-reaching supplyshock that is embedded in a general downturn of global oil pro-duction. First of all, the strategic perspectives of agents will differaccording to whether the shock or stressor is temporary or not.This will lead to different forms of adaptation and, prospectively,of preparation in view of such risks. Secondly, and in relation withthe first aspect, a temporary reduction of a vital resource, be itsevere or not, does not put into question the basic viability of in-frastructure, expectations and norms that are coupled to thequalities of the resource. To the contrary, a permanent and generaldownturn of the supply of a vital resource will forcibly changeinfrastructure, expectations and norms of all agents relevant in asociety. Thirdly, such a general downturn will affect more or lessseverely the abilities of a society to change its resource base andthe infrastructure, expectations and norms that relate to it.
While a temporary shock or stress in the supply of a vital re-source can be handled by conventional means of crisis and disastermanagement, a permanent reduction in supply, whether or not ittakes on the form of a shock, cannot be handled by any conven-tional means, but points towards the necessity of a socio-ecolo-gical transformation, i. e., to transform the relations of society tonature, thus including the economy. Such a transformation willbenefit from crisis and disaster management capacities since itwill continue to rely on resources that might be affected by shocksand stressors, but cannot be reduced to it. Thus, a political con-straint on oil supply, which will rather manifest itself as a suddenshock, will in general not have the same scope, temporality andmodality as a long-term change in supply due to the geologicalpeak oil – irrespective of possible short-term shocks, which can forinstance be triggered by political supply constraints in addition tothe long-term trend.
These general remarks can be put in relation with the specificissues the peak oil theory is likely to raise. Above all, a meretechnical understanding of resilience as can be found in moreconventional approaches to energy security, is not adequate if thewhole web of social relations is put under stress by a permanentand increasingly narrow constraint on a resource supply, as thepeak oil theory implies. The technological system of a societydevelops in relation to specific infrastructure, expectations andnorms, and thus cannot be analyzed in separation from the socio-economic system. Consequently, the notion of resilience takes on aholistic character, and one has to ask for the conditions of a

A. Exner et al. / Energy Policy 91 (2016) 128–137130
society's resilience instead of the resilience of a specific technologyor even of the energy system alone.
The state of resilience thinking concerning peak oil thus con-ceived, and further on in terms of a measuring approach builtupon these premises, is still in the very beginnings. Currently, tothe knowledge of the authors, the only peer reviewed approachesto measure resilience in a holistic sense are Cutter et al. (2010) andSherrieb et al. (2010). On a conceptual level, there exist a greaternumber of approaches to holistic resilience, including rathergeneral considerations such as those in Walker and Salt (2006) orWilson (2012), or more detailed reflections as those published byNorris et al. (2008). However, until now, neither resilience con-ceptualization nor measuring has been applied to peak oil.
Our paper will improve on the important groundwork laid bythe approaches cited above in so far as the assumptions of how thestressor or shock (peak oil) will affect the technological and thesocio-economic system will be made explicit by theoretical mod-els. Correspondingly, we will present a theoretically justified andempirically grounded model of resilience towards these effects.Finally, we will improve resilience measuring and take it to a finergrained scale than was attempted until now.
After this outline of the scope of the issues at hand, that will beoperationalized in the following, we would like to summarize theissues that our research will treat. We firstly define how currentapproaches on resilience measuring can be improved. Our secondtask consists in building a firmer base for resilience debates withinpublic fora, for policy makers and civic initiatives concerning en-ergy issues by developing a new measurement approach. And fi-nally, we will state hypotheses on what constitutes resilience to-wards peak oil, that can be tested for the sake of an evidence-based approach to resilience.
Fig. 1. Relation between indicators, resilience components and target.
2. Models, methods and material
2.1. A theory-based model of resilience
Following Norris et al. (2008) and Wilson (2012), we conceiveresilience as a process rather than a result, and thus lay the focuson the degree of adaptability that a society shows. Society alwayschanges, and this happens in discontinuous ways due to crises ofreproduction of social relations. It is thus not useful to define re-silience as the ability to return to a specific state of social andecological relations, but rather as the capacity to change theserelations in a manner that upholds or increases well-being andreduces the susceptibility for harmful effects. We thus conceivesocial processes as being irreversible, as they are characterized bypath-dependency. This brings resilience in close connection withinnovation (Wilson, 2012).
Resilience literature often includes the notion of vulnerability,which can be seen as the opposite of resilience (e. g., Wilson,2012). Yet we prefer looking at vulnerability and adaptability astwo tendencies, whose relative strength defines resilience as a netquality. This has the advantage of allowing a clearer identificationof the factors that constitute resilience under given circumstances.Thus, a society that has a high degree of vulnerability might notnecessarily be of low resilience, if it is at the same time highlyadaptable and vice versa (Matzenberger, 2013, 2014).
The notion of resilience always involves a normative approach(Wilson, 2012). Before any kind of measurement can take place,those features of society that shall remain functional or possiblyimprove have to be defined. We follow Norris et al. (2008) andWilson (2012) in taking well-being as the measurement rod forthe degree of resilience as related to the development path of asociety under conditions of peak oil. In this sense, we conceive ofresilience as community resilience (Norris et al., 2008). From this
follows, that mere technical characteristics of, for instance, thesystem of energy production and distribution are not sufficient tocharacterize community resilience. While a certain degree of en-ergy production is vital for well-being on a social level, energy isnot an end in itself, but a means to satisfy concrete human needssuch as food, housing, education, health services, work, mobility,and culture – i. e., the culturally adequate standard of living asrelated to such needs.
However, it has to be taken into account that society is not ahomogenous aggregate of individuals, but is highly differentiated(Wilson, 2012). Thus, perspectives of different social agents ofwhat constitutes well-being – and resilience – might differ widely.Also in this regard, resilience measurement cannot escape a nor-mative positioning. In the following, we will argue that social well-being as the target variable of resilience is constituted by bothobjective and subjective components. As objective components wewould propose firstly the respect for human rights, i. e., the ab-sence of discrimination along racial, sexual, age-defined etc. lines;secondly healthy life years. As a subjective component, the in-dividual perception of life satisfaction would be a suitable mea-surement value (see e. g. OECD, s. d.).
From the target of resilience, one has to distinguish compo-nents of resilience (i. e., criteria and supercriteria, see below) andtheir indicators (see Fig. 1). However, this distinction cannot bemade in a strict manner, above all because life satisfaction and theabsence of discrimination also are important contributors to resi-lience since they affect the resilience component reciprocity (so-cial capital). Thus, resilience creates its own conditions, and wehave to deal with a feedback loop of resilience rather than with aone-way causal relation between resilience components and out-comes. The existence of feedback loops leads to the conception ofresilience thresholds, below which a collapse of local or regionalsocieties (as measured against the above mentioned factors) canhappen (Wilson, 2012). On the other hand, positive ruptures canalso occur, in the course of which, increasing resilience acceleratesfurther adaptations of a society to certain stressors.
2.2. How does peak oil affect society?
In order to be able to define components of peak oil resilience,it is necessary to intersect the above mentioned model with a viewof the probable effects of peak oil on society and the crucialpathways of its repercussions. This is a difficult task because apossible peak oil would present a historically unknown challenge.However, different ways of approaching the issue have been

A. Exner et al. / Energy Policy 91 (2016) 128–137 131
proposed in recent years, and they can be grouped along the fol-lowing lines: (1) econometric approach (Hirsch, 2008, Li, 2008),(2) profit rate analysis (Li, 2007, Exner et al., 2008a, b, Exner,2013b), (3) economic modeling (Kerschner and Hubacek, 2009,Fleissner, 2010, D'Alessandro et al., 2010), (4) system dynamics(Korowicz, 2010), (5) geopolitical approach (ZfTdB, 2011), (6) his-torical approach (Friedrichs, 2010).
Although these approaches all have their specific assumptionsand limitations, and of course do not necessarily converge in theirconclusions, we can however draw some general lessons fromthem. The econometric approach demonstrates that, when makingprojections based on historical evidence, a reduction in GDPgrowth and, in the longer run, a decline in the output of theeconomy might be expected. An analysis of the dynamics of theprofit rate, which acts as the steering variable in societies domi-nated by the capitalist mode of production, can show that in-creasing raw material prices including energy carriers will lead toa fall of profit rates, and thus probably will incite a decrease ininvestments and a general crisis of the capitalist economy. Thisconclusion can be confirmed to a certain extent by empiricallybased economic modeling, which points towards a certain prob-ability of a decrease in economic growth and possibly also a fall intotal economic output under conditions of peak oil. This can affectthe conversion of the energy infrastructure to a renewable systemdue to the path dependency of this development. In principle, twoscenarios may mark the borders of potential development paths:Firstly, renewables require investments that are most likely wheneconomic incentives are strong and profit rates are increasing.Peak oil will foreseeably increase fuel prices, which makes in-vestments in renewable energies economically more attractive.Secondly, peak oil might negatively influence the investment cli-mate of economies. In addition, the extension of renewables re-quires physical infrastructures that will depend on oil and othernon-renewables for the foreseeable future. When these decline orbecome more expensive, the extension of renewables might befurther affected negatively. Therefore, it is not given that peak oilwill automatically set (sufficient) incentives for investments inrenewable energy supplies. This picture of causal links betweenpeak oil and social changes can be further elaborated by includingthe political system. Economic crises by trend put governmentsunder pressure and can undermine the state and its institutions.This might lead to social upheaval that can exert additional stresson a socio-ecological transformation towards renewables that isrequired in case of peak oil. The study of Friedrichs (2010) hasinvestigated historical energy crises that might come close to thedimension of peak oil at least on a regional level. He concludesthat a high level of social capital, and a supportive attitude of thestate towards self-organization from the grassroots are importantpreconditions for resilience towards peak oil. Such factors help toadapt the political and social system to conditions of severe eco-nomic stress.
2.3. Components of a best-Practice model of resilience towards peakoil
From this model of peak oil effects, we can draw three generalconclusions, that we used to structure the search for criteria ofresilience and indicators that allow measurement: firstly, the ca-pitalist mode of production, which is geared towards economicgrowth instead of fulfilling concrete social needs, is less resilientthan a type of economy that is primarily need-based, such as so-lidarity economics or commons (including co-operatives); whilecapitalist enterprises are limited by profit expectations and forcedto compete, non-capitalist economies are conducive to coopera-tion and more flexible concerning social needs (Lewis and Conaty,2012). Secondly, social equality increases social capital (Wilkinson
and Pickett, 2011), which in turn enhances the degree of inven-tiveness and social innovation necessary for the adaptabilitycomponent of resilience (Wilson, 2012). Thirdly, social capital ishigher where market relations are less important as compared toreciprocity (Wilkinson and Pickett, 2011).
Taken together, we conclude that social factors of resilience areat least as important as technological ones. Both are to be seen inclose relation with each other. We furthermore conclude that re-silience is produced by four variables of social interaction that fi-nally also shape the energy system of a society: social equality,reciprocity, trust and cooperation. These variables affect eachother in a certain order that can be depicted as a virtuous circle ofresilience. Thus, social equality – the opposite of capitalist classdivides and income differentials – increases the extent of re-ciprocity (Exner, 2013b), which is the opposite of the anonymous,objectified relations of the market. Reciprocity in turn createstrust, which fosters cooperation. This factor by trend increasessocial equality, for instance by way of enabling groups threatenedby marginalization to raise their voice and make their interestsbeing heard and respected.
2.4. Temporal and spatial scales in a benchmarking approach
After the model of resilience and how it relates to peak oil havebeen clarified in general terms, the issue of the temporal andspatial scale of measuring resilience has to be discussed. GeoffWilson (2012) argues to center resilience on the regional level,with community resilience being the issue of concern. This choiceof scale involves the assumption that communities are the coreunit of what constitutes resilience.
Wilson defines communities as “the totality of social systeminteractions (i. e., an affective unit of belonging and identity and anetwork of relations) usually within a defined geographical space”(Wilson, 2012, pos. 478). We interpret these as being identical tothe notion of a sub-national region with shared facilities and acommon political identity. Following Wilson, we do not conceiveof communities as being homogenous, autonomous or character-ized by equality, but rather see them as internally differentiated,dependent on lower and higher levels of social organization (fromthe household to the nation state and the global economy), andaffected by power hierarchies and social domination. Choosing thecommunity level for investigating resilience supports policies thatcould be enacted on this level to enhance resilience. This does notnecessarily imply that the degree of collective choice is greatest onthe community level, although in the past, e. g., many climate andrenewable energy initiatives in Austria have targeted primarilythis level. The preferred scale of political action is in itself a poli-tical question and subject to social struggles between differentagents.
In light of these reasonings and caveats we operationalize ourunderstanding of community resilience as the resilience of mu-nicipalities. This conceptualization grossly simplifies the featuresWilson indicates in view of his notion of community resilience, butappears to be the best fit between this notion and the structure ofstatistical data that are accessible in the case of Austria. It shall benoted that municipalities (or communities in a more generalsense) are not seen here as natural social units but rather as cer-tain arenas of political action that integrate social forces, powerrelations and economic processes of other levels both with lesser(e. g., households) and higher complexity or scope (e. g., thecountry). In our view, community resilience should be seen as acondensation of resilience dynamics that act not only on a com-munity level, but also on scale levels with higher and lowercomplexity or scope. Thus, we deliberately included both house-hold resilience properties (such as household income or employ-ment) as well as properties that directly determine resilience of

Table 1List of supercriteria and criteria of resilience. “Dependence on fossil fuels” includesenergy for the mobility sector. “Spatial structure and mobility” includes shortdistance supply of mobility.
Supercriteria Criteria
Energy Share of bad quality housesEnergy mix room heatingElectricity consumptionRenewables productionDependence on fossil fuels
Spatial structure and mobility Existence of meeting and commu-nication facilitiesEmergency facilitiesAccommodation qualityPotential of food provision
Reciprocity (social capital) BondingBridgingLinking
Skills Manufacturing and agricultural skillsCommunicative and social skills
Conventional economy Regional economic performanceEconomic diversityElementary regional economicfunctionalityEconomic stability and dynamicsIncome equalityRelation of forces between capital andlaborLabor market
Organizational capacities and collec-tive competencies
Regional energy and social initiatives
Social securityIndebtedness of public bodiesResilience of tax incomeAccess to information and knowledge
A. Exner et al. / Energy Policy 91 (2016) 128–137132
higher scale levels (e. g., districts and the federal state-level) byway of resilience indicators.
Resilience dynamics actually run through different scale levels,with for instance the national scale affecting households both di-rectly and indirectly as mediated through intermediate scale levels(such as federal states). Also, the household level (below thecommunity scale, i. e., the municipality) influences the state level,again both directly (e. g., by paying taxes or voting) or indirectly (e.g., by exerting political influence on federal states). It should alsobe kept in mind that municipalities do not exist in isolation fromeach other. To treat them so by way of characterizing their resi-lience with a large share of data that describe municipality prop-erties constrains the results that can be obtained. Seen in thisperspective, higher scale level data that we included in a few in-stances (especially when these levels are the only meaningful levelfor certain resilience components) act as a counterweight to thedoubtful assumption that resilience could be located solely on themunicipality level.
Concerning the temporal scale of resilience measuring, ourapproach takes on an actualistic view. We apply the resilienceconcept as a way to assess current capabilities for innovation andsocio-ecological transformation for the sake of reproducing orincreasing quality of life. We assume severe social and economicstress under present conditions, being caused by limits in oilsupply, as the basic situation that this process of transformationhas to face. The time frames of the data we used are different: tomeasure current resilience values, we always applied the mostrecent data available; to operationalize the best practice-model ofa resilient society for the calculation of an absolute resilience va-lue, we used best and worst data for resilience indicators sinceWorld War II for European countries (see further details and ex-planations below).
2.5. Indicators, statistics and regional types
Seen from the viewpoint of our resilience model, indicators ofresilience are those that point towards a low degree of vulner-ability of socio-economic, spatial and technological structures to-wards peak oil on the one hand, or that suggest a high degree ofadaptability to the possible crises that peak oil may induce on theother hand. Appendix A gives an overview of all indicators weinvolved in our model. To construct indicators, we first definedrelevant supercriteria as the general dimensions of resilience,which were then classified into criteria.
Supercriteria are (1) energy, (2) spatial structure and mobility,(3) reciprocity (social capital), (4) skills, (5) conventional economy,(6) organizational capacities and collective competencies. We de-fined these supercriteria according to our peak oil-resiliencemodel outlined above, so that resilience components equally coverthe energy system, technologies, spatial structures, social factors,economy related factors and organizational features. These ab-stract supercriteria contain resilience criteria, which are mostimmediately connected to resilience and thus the cornerstones ofoperationalization. Table 1 lists the criteria.
Then we defined indicators using variables that literatureshowed to be relevant, and collected data for measurement, eitherthrough Statistics Austria or by way of additional research. In-dicators are mere devices to measure criteria, and thus do notnecessarily constitute a meaningful policy target. However, insome instances, due to lack of data, only one indicator was avail-able per criterion (see Appendix A; also for literature referencesconcerning the choice of indicators). As suggested in Cutter et al.(2010), the consistency of this list of proposed indicators was thentested by measuring the correlation among the different indicatorsby means of 2-tailed Spearman rank-order correlation coefficients(hereinafter simply rho or Spearman rho). The consistency of the
supercriteria was evaluated by the same test. In both cases, theobjective of the analysis was to assess whether the chosen in-dicators and supercriteria exhibited undesired redundancy.
Cutter et al. (2010) and Sherrieb et al. (2010) both have fol-lowed a route of measuring regional resilience in a relative way, byconstructing a regional ranking. In contrast, we attempted to as-sess resilience in relation to an absolute standard of resilience. Thisis a benchmarking approach, which assumes an ideal type of ahighly resilient integrated social, spatial and technological system,that can be described by way of indicators. This seems to be morerelevant to policy makers and other social agents than a merecomparison of resilience in the frame of a nation, since a highrelative resilience can easily correspond to a dangerously low levelof resilience in a more global perspective if the overall resilience ofthe regions that enter the comparison is low.
Benchmarking again involves normative decisions, which arealso documented in the Appendix (A). For it appears to be ques-tionable to simply assume the worst or best international figuresof a certain indicator as a benchmark for Austria, we rather tookeither European countries after World War II as our basis to findhistorical examples for a realistic benchmarking of resilience in-dicators, or we theoretically argued benchmarks in rare cases.When European comparisons were not possible due to a lack ofeasily accessible data, we opted for a national comparison eitherwith a historical perspective or by looking at the contemporarysituation. In general, we marked up worst and best cases to cap-ture a certain room for improving or deteriorating situations incomparison with empirical examples.
Resilience was measured by creating an index for each muni-cipality by first calculating the average of all resilience indicatorvalues per criterion, and then of all criteria per supercriterion, andfinally, of all supercriteria. For reciprocity, minimum values ofcriteria were taken into account in the average value.

Table 2No. of indicators per scale level and resilience dimension.
State Federalstates
Judicialparishes
NUTS3 Districts Munici-palities
Total
E 4 1 5SM 1 4 1 6R 2 6 1 2 11S 2 2CE 1 2 2 1 3 9OC 1 5 2 8total 5 17 1 2 6 10 41
E¼Energy, SM¼Spatial structure and mobility, R¼Reciprocity (Social capital),S¼Skills, CE¼Conventional economy, OC¼Organizational capacities and collectivecompetencies.
A. Exner et al. / Energy Policy 91 (2016) 128–137 133
Normalization to a common scale required to set minimum andmaximum values for each indicator. Five classes were set for eachindicator scale. This allowed for constructing non-linear relation-ships between certain indicators and resilience. Classes were ei-ther defined by equal or unequal steps (see Appendix A).
Data availability constrained our analysis. It not only led us toselect the scale of the administratively defined municipality as ourspatial unit of community resilience, as was already discussed. Italso means that some indicators, which would differentiate mu-nicipalities meaningfully, were not available at this scale level, butonly with higher spatial aggregations. Table 2 shows the dis-tribution of indicator data along scale levels. It shall be noted,however, that not every indicator makes sense on every scale level.The share of indicator values that were only available or made onlysense on the state scale is small (5 out of 41), while all other valuesrefer to either the federal state level (17) or levels below (19), with10 values available at the municipality scale level.
To allow for the interpretation of the patterns of municipalityresilience values, we formulated the hypothesis, that resilience
Fig. 2. Map of spatial types in Austria, Sus
depends upon the spatial type of the region. Thus, five regionalmunicipality types (“Cities”, “Suburban Towns”, “Suburban Areas”,“Rural Small Towns” and “Rural Areas”) were identified and a re-gional aggregation of the indicators and resilience criteria (whichare based upon the indicators) was performed in the same way asfor municipalities. In a first step of distinguishing spatial types,municipalities (in total app. 2,400) were clustered into threegroups according to number of inhabitants 420,000; 20,000 to5,000;o5,000). Secondly, this population-based classification waslinked with the list of municipalities which are members of theAustrian Association of Cities and Towns (Städtebund, 2013). Weassumed that the membership reflects the self-understanding ofmunicipalities as towns and cities and therefore represents cor-responding characteristics of urbanity. In a third step, the func-tional relations between core zones (e. g., cities) and suburbanzones (e. g., surroundings of cities) were considered based on thedistinction between urban and suburban regions (Statistik Austria,2001). Finally, based on this three-step process, Austrian munici-palities were categorized according to the five different spatialtypes “Cities”, “Suburban Towns”, “Suburban Areas”, “Rural SmallTowns” and “Rural Areas” (see Fig. 2).
The importance of indicators for the resilience values of mu-nicipalities was determined in a two step approach. At first themost important indicators were selected by a machine learningalgorithm called cforest. Secondly, Principal Component Analysis(PCA) was applied to select the indicators with the highest ex-planatory power and to explore the relationships among them.
Cforest is an implementation of the random forest (RF) algo-rithm (Breiman, 2001). It differs from the original implementationin so far as it produces more robust models in presence of vari-ables with many categories and continuous variables that influ-ence the variable selection in the trees (Strobl et al., 2007). Fur-thermore, it reduces the bias that could possibly arise from highlycorrelated variables (Strobl et al., 2008). One of the advantages of
anna Erker, Gernot Stöglehner, IRUB.
A. Exner et al. / Energy Policy 91 (2016) 128–137134
this technique is the measure of the importance of each predictor(i. e., indicator) in determining the value of the predicted variable(i. e., resilience) that it returns. It thus allows to examine thecontribution and behavior of each independent variable (Genueret al., 2010). Hence, for this application, the variable “importance”can be understood as the sensitivity of the continuous variable“resilience” to the different predictors (Harper et al., 2011).Moreover, random forest calculates a measure of the models ac-curacy called “Out Of Bag” (OOB). OOB accuracy is a built-in fea-ture of RF. During the computation, each tree of the forest istrained using two thirds of the data. The remainder is used tocross-validate the resulting tree.
The cforest algorithm is implemented in the R-package “party”.This algorithm has two parameters, namely the number of trees(ntree) to be grown in the forest and the number of variables(mtry) used to split each tree node. OOB accuracy was extractedfrom the model using the R-package “caret”. This has the ad-vantage of returning both the accuracy and a K statistic, definedafter Cohen (1960), as a measure of goodness of model fit. Themodel was at first fitted by iterative adjustment of the ntree andmtry parameters. As a result, the ntree and mtry yield of themodel with the highest OOB accuracy were selected. In a secondstep, in order to test the stability of the fitted cforest model, 10iterations were performed. OOB, K statistic and the variable “im-portance” were recorded for each iteration, thus providing an es-timate of the robustness of the fitted model. Indicators with con-stant values across the whole country were excluded from thisanalysis since the algorithm would not have accounted for theireffect.
A drawback of using importance is that there is not an out ofthe box criterion to leave out “less important” variables. To thisend, PCA was also used to retain the indicators with the highestexplanatory power (explained variance). Elimination proceeded byfeeding to the PCA function all the indicators that, according to theRF importance ranking, were evidently higher than the others. Ateach PCA run, the indicator with the lowest importance was re-moved and another PCA run was performed until the maximum ofexplained variance was reached.
The PCA was as well computed in R, using the prcomp functionof the “stats” package. The analysis was performed on the corre-lation matrix of the scaled indicators to reduce the bias possibledue to large differences in the variance of the indicators.
3. Results and discussion
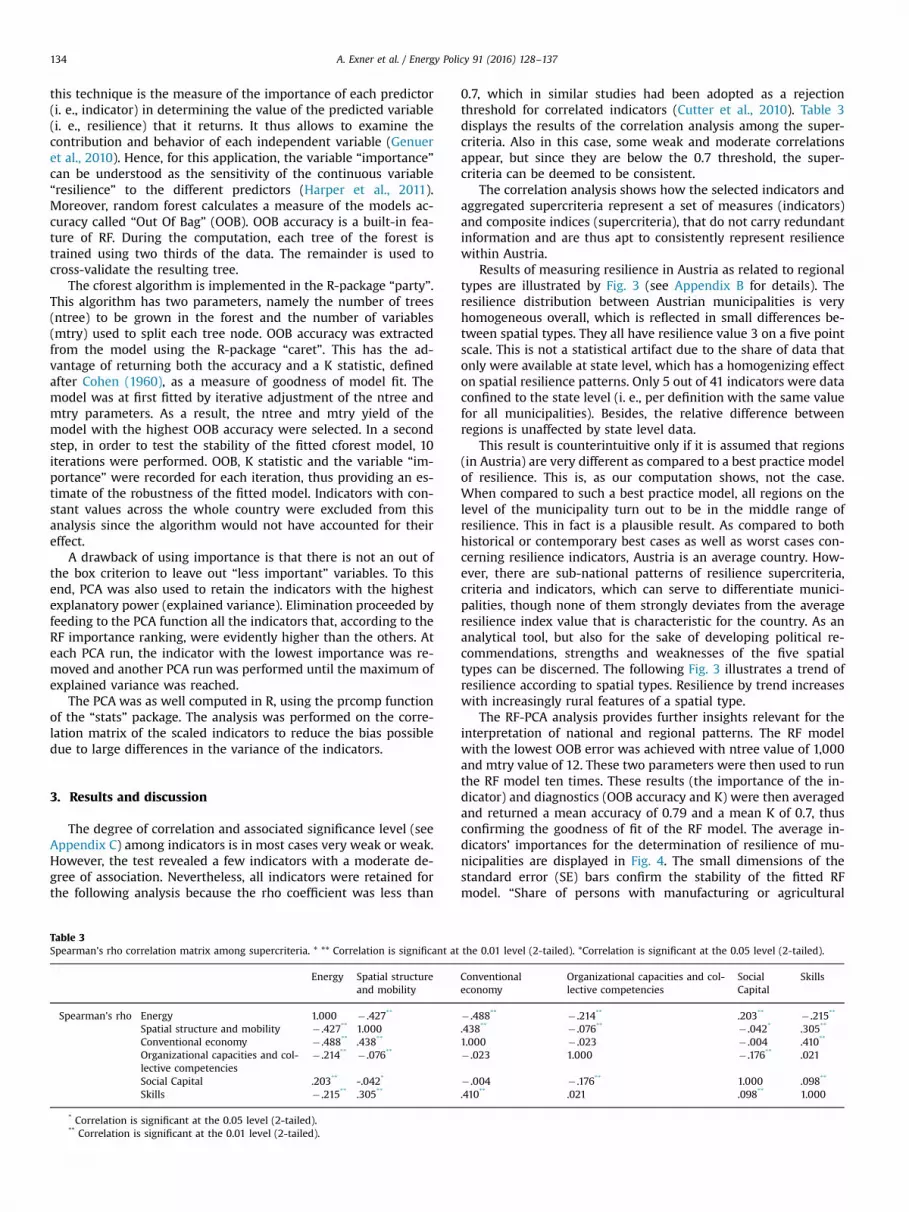
The degree of correlation and associated significance level (seeAppendix C) among indicators is in most cases very weak or weak.However, the test revealed a few indicators with a moderate de-gree of association. Nevertheless, all indicators were retained forthe following analysis because the rho coefficient was less than
Table 3Spearman’s rho correlation matrix among supercriteria. * ** Correlation is significant at
Energy Spatial structureand mobility
Spearman's rho Energy 1.000 � .427**
Spatial structure and mobility � .427** 1.000Conventional economy � .488** .438**
Organizational capacities and col-lective competencies
� .214** � .076**
Social Capital .203** -.042*
Skills � .215** .305**
* Correlation is significant at the 0.05 level (2-tailed).** Correlation is significant at the 0.01 level (2-tailed).
0.7, which in similar studies had been adopted as a rejectionthreshold for correlated indicators (Cutter et al., 2010). Table 3displays the results of the correlation analysis among the super-criteria. Also in this case, some weak and moderate correlationsappear, but since they are below the 0.7 threshold, the super-criteria can be deemed to be consistent.
The correlation analysis shows how the selected indicators andaggregated supercriteria represent a set of measures (indicators)and composite indices (supercriteria), that do not carry redundantinformation and are thus apt to consistently represent resiliencewithin Austria.
Results of measuring resilience in Austria as related to regionaltypes are illustrated by Fig. 3 (see Appendix B for details). Theresilience distribution between Austrian municipalities is veryhomogeneous overall, which is reflected in small differences be-tween spatial types. They all have resilience value 3 on a five pointscale. This is not a statistical artifact due to the share of data thatonly were available at state level, which has a homogenizing effecton spatial resilience patterns. Only 5 out of 41 indicators were dataconfined to the state level (i. e., per definition with the same valuefor all municipalities). Besides, the relative difference betweenregions is unaffected by state level data.
This result is counterintuitive only if it is assumed that regions(in Austria) are very different as compared to a best practice modelof resilience. This is, as our computation shows, not the case.When compared to such a best practice model, all regions on thelevel of the municipality turn out to be in the middle range ofresilience. This in fact is a plausible result. As compared to bothhistorical or contemporary best cases as well as worst cases con-cerning resilience indicators, Austria is an average country. How-ever, there are sub-national patterns of resilience supercriteria,criteria and indicators, which can serve to differentiate munici-palities, though none of them strongly deviates from the averageresilience index value that is characteristic for the country. As ananalytical tool, but also for the sake of developing political re-commendations, strengths and weaknesses of the five spatialtypes can be discerned. The following Fig. 3 illustrates a trend ofresilience according to spatial types. Resilience by trend increaseswith increasingly rural features of a spatial type.
The RF-PCA analysis provides further insights relevant for theinterpretation of national and regional patterns. The RF modelwith the lowest OOB error was achieved with ntree value of 1,000and mtry value of 12. These two parameters were then used to runthe RF model ten times. These results (the importance of the in-dicator) and diagnostics (OOB accuracy and K) were then averagedand returned a mean accuracy of 0.79 and a mean K of 0.7, thusconfirming the goodness of fit of the RF model. The average in-dicators’ importances for the determination of resilience of mu-nicipalities are displayed in Fig. 4. The small dimensions of thestandard error (SE) bars confirm the stability of the fitted RFmodel. “Share of persons with manufacturing or agricultural
the 0.01 level (2-tailed). *Correlation is significant at the 0.05 level (2-tailed).
Conventionaleconomy
Organizational capacities and col-lective competencies
SocialCapital
Skills
� .488** � .214** .203** � .215**
.438** � .076** � .042* .305**
1.000 � .023 � .004 .410**
� .023 1.000 � .176** .021
� .004 � .176** 1.000 .098**
.410** .021 .098** 1.000

Fig. 3. Resilience values of supercriteria along spatial types, with 1¼highest resi-lience, 5¼ lowest resilience. E¼Energy, SM¼Spatial structure and mobility,R¼Reciprocity (Social capital), S¼Skills, CE¼Conventional economy,OC¼Organizational capacities and collective competencies.
Table 4PCA of the most important indicators for the resilience calculation.
Importance of components according to PCA axesPC1 PC2 PC3 PC4 PC5
Eigenvalue 2.54 0.99 0.80 0.49 0.16Standard deviation 1.60 1.00 0.90 0.70 0.41Proportion of variance 0.51 0.20 0.16 0.10 0.03Cumulative proportion 0.51 0.71 0.87 0.97 1.00
Fig. 5. Eigenvectors of the indicators plotted on the components’ axis.The ellipsesare normal contour line with a 68% probability of including the data of a givenregional type.
A. Exner et al. / Energy Policy 91 (2016) 128–137 135
professions” (Sk_agrimanu) is the indicator with the highest im-portance followed by “share of agricultural produce in total valueproduct” (Ec_agrishare). Other important indicators are “activity inclimate policy” (O_clim), “regional GPD per capita” (Ec_gdp),“Share of households with agricultural activities” (Sp_agrihouse)and “Turnout of voters in national parliamentary elections”(R_elections) and, to a lesser extent, “index of authoritarianism”
(R_auth), and “Share of members of religious associations” (R_rel).The first step of the PCA analysis was to define a subset of in-
dicators with the highest explanatory power. The initial indicatorsset encompassed Sk_agrimanu, Ec_agrishare, O_clim, Ec_gdp,Sp_agrihouse, R_elections, R_auth and R_rel. After the eliminationprocedure, the indicator list contained: Sk_agrimanu, Ec_agrishare,O_clim, Ec_gdp, Sp_agrihouse and R_elections. Table 4 summarizesthe components’ statistics and cumulative explained variance,while Fig. 5 depicts the correlation among variables andcomponents.
According to the PCA results, Sp_agrihouse, Sk_agrimanu andEc_agrishare are positively and strongly correlated among eachother and have the largest dimension on Principal Component 1(PC1). Fig. 5 displays the orientation of the eigenvectors of theindicators plotted on Principal Component 1 (PC1) and Principal
Fig. 4. Resilience variable importance from R
Component 2 (PC2). The variable Ec_gdp is negatively correlated toSp_agrihouse, Sk_agrimanu and Ec_agrishare and has the largestdimension on the PC1. The variable O_clim shows a weak corre-lation to the other variables (its vector is almost orthogonal to theothers), and has a PC2 dimension that is by far larger than theother indicators. Spatial types appear to be partitioned into threegroups: Rural areas and suburban areas are located along PC1;cities and suburban small towns are instead more aligned to PC2;finally, rural small towns are found in an intermediate (diagonal)position between the two PCs.
The results of RF and PCA suggest that, on the Austrian level,
andom Forest conditional permutation.

A. Exner et al. / Energy Policy 91 (2016) 128–137136
resilience is influenced by factors related to the degree of urba-nization of the communities. This pattern emerges at first from theRF analysis: Most of the variables are in fact related to social andeconomical aspects that describe the degree of the dependency onagriculture of a local community. A second relevant aspect high-lighted by the PCA is the regional gross domestic product and itsnegative relationship to the agriculture related aspects. Commu-nities with the highest degree of urbanization are more related toEc_gdp and, not surprisingly, less to agricultural factors. Climatepolicy aspects are instead quite unrelated to dominant economicor urbanization aspects. This implies that investments or actionsthat impact climate policies will have consequences on the resi-lience of all spatial types, regardless of economic structure.
A certain caveat has to be made regarding the role of thetransport sector in our analysis, since one might assume thatpublic transport, which is largely independent of fossil fuels inAustria, is less developed in terms of transport capacity per in-habitant the more rural a region is. Data on fossil fuel use of thetransport sector would not have directly reflected this, since dataare available at federal state level only. In so far as the more ruralregions are more dependent on fossil fuel use in transport, we mayhave assessed them too optimistically in our approach. However,even if vulnerability may be higher in more rural regions, this hasto be put into relation to adaptability, since we regard resilience asthe balance between vulnerability and adaptability. Thus, the ca-pacities for self-organization and self-provision in a region areequally important. Furthermore, the fossil fuel dependency oftransport was included in two ways, though it was not measuredseparately: firstly directly by the overall dependence on fossil fuelsfor the supercriterion energy, which includes the share of fossilfuel excluding electricity in total gross domestic consumption (seealso Appendix A), secondly indirectly by the fossil fuel dependenceof several components of the resilience supercriterion spatialstructure and mobility, with most of the variables being availableat district level (which thus allows to distinguish rural from urbanregions). This supercriterion measures factors of the capacity toadapt to peak oil that affect transport in terms of options to upholdsocial services, civil life, the production of food in particular andthe provision of goods and services in general. The indicator ac-comodation quality as being operationalized by the share of multi-unit housing is also relevant indirectly for transport, since thehigher the share of multi-unit housing, the higher the degree ofpopulation density.
4. Conclusions and policy implications
This paper demonstrates a feasible and transparent, theory-informed approach for measuring community resilience in a peakoil scenario. Its result in the case of Austria shows that regionalvariation in community resilience might not be very important ina European high-income country. At the same time, ample spaceto increase resilience towards a hypothetical, normative bestpractice model exists. Such a strategy of resilience enhancementhas to first acknowledge regional strengths and weaknesses, whileshifting federal state and state level policies that affect all muni-cipalities towards this best practice model at the same time.
Resilience policies should decouple quality of life in the senseof social equality and the absence of discrimination and exclusionfrom economic growth. Rural features of spatial types should bestrengthened, especially when it comes to spatial structures sup-porting short distance supply and non-motorized transportationlike biking and walking. This means to integrate food productionin the local mix of functions to the extent appropriate for thespatial type (Stoeglehner et al., 2011): In urban areas (includingsmall towns), this will concern a certain, but maybe minimal
coverage primarily of the fresh food demand, in suburban areasfresh food demand should be provided for the urban centers andthe suburban areas themselves, and rural areas have to provide themain resource base and agricultural production for society. Insteadof either urbanization or peripherization of rural areas, their spe-cific resilience strengths should be developed. At the same time, are-introduction of rurality into urban space should be considered,with urban community gardening or food coops, together withmore “frugal lifestyles” being prominent examples for such atransformation of urban space which might enhance resilience.
Energy efficiency measures, the increase in decentralized re-newable energy production and innovative e-mobility conceptscertainly play a role as well, but certain caveats apply. First of all,our approach measures resilience in terms of the relation betweenvulnerability and adaptability. Secondly, our model assumes thatthe technological system and the social system are equally im-portant for resilience – not least because the transformation of atechnological system inter alia relies on the qualities of the socialsystem. Certainly, increasing decentralized renewable energyproduction decreases vulnerability towards peak oil and thus, theimportance of adaptive capacities. Increasing energy efficiency, onthe other hand, has a paradoxical effect: as long as the efficiency offossil energy use is low, it decreases vulnerability, whereas highefficiency in this regard has a negative effect on resilience, since anenergy user is not able to adapt to supply limitations by furtherefficiency increases. In general, the relation between efficiency andresilience as such is seen as problematic in the literature, andtherefore should be assessed together with robustness (whichmakes adaptation less important), redundancy (which enhancesresilience by lowering vulnerability, but decreases efficiency), re-sourcefulness and rapidity (that constitute adaptability) (Tierneyand Bruneau, 2007, see also Norris et al., 2008). E-mobility alreadyhas a large share in Austria regarding railway infrastructure, whilethe potential for innovative e-mobility solutions appears to belimited for several reasons: first by the source of electricity, whichis not necessarily renewable, second by the comparatively highcosts of batteries (which may or may not become significantlycheaper in the future), third by geological restrictions (althoughavailabilities are not exactly known), since scarce metal resourceswould be demanded in high quantities if innovative e-mobilityshall acquire a large share in worldwide transport systems, fourthby the change of electricity demand patterns that would require aspecific and costly infrastructure to safeguard a continuous energysupply (see e. g. Exner et al., 2015).
It is important to note, that our approach does not take intoaccount linear causalities. Thus, it is neither possible to interpretthe measurement approach nor the analysis of its results in such away that each supercriterion or criterion has equal importance toincrease or safeguard resilience. When calculating total resiliencevalues, however, we did not weigh supercriteria or criteria for thelack of sufficient knowledge on the relative importance of resi-lience components in this respect. Due to the integrated, holisticconception of community resilience in this paper, it rather seemslikely, that those resilience criteria that have the lowest values willlimit the overall resilience of a community. Thus, it might not bethe average values as used for the measurement approach in thispaper that count in a dynamic perspective, contrary to a staticmeasurement, but rather the negative extremes. This hypothesiscould be named the “law of minimum resilience” and was onlyapplied for the calculation of reciprocity values (see above).
In the final instance, the question which criteria are most likelyto cause an increase in resilience, and whether average or extremevalues are more important, can only be answered by qualitativeresearch. To this aim, qualitative considerations, i. e., theoreticalapproaches and causal models are necessary. Since to date, geo-logical constraints on oil production have not led to a development

A. Exner et al. / Energy Policy 91 (2016) 128–137 137
in Austria or worldwide that corresponds to the scenario assumedas stressor in this paper, this research has to take on a historicalperspective. As our approach has exemplified, the normative andtheoretical assumptions of a resilience measurement determinethe result to a very large degree. Normative assumptions are in-evitable as benchmark, and a theoretical model (see chapter 2.2.)able to represent the possible effects of a clearly defined stressor isnecessary to justify and define resilience indicators that are re-levant and allow an interpretation of results in view of policyrecommendations.
As a general policy-related conclusion, our results cast doubt onthe approach to focus resilience policies primarily on the regionalscale. Obviously, in the case of Austria, and referring to an overallcommunity resilience value, resilience strengths and weaknessesare distributed so evenly that we can assume an overall similarityof processes and structures in the country, that vary little frommunicipality to municipality when compared to a resilience bestpractice model. This at the same time implies that regions (asmunicipalities) are highly integrated – otherwise such similaritiescould not be explained. Of course, municipalities are interlinkedvia state and federal state policies, regulations and financial flows,they cooperate on higher level scales, exchange goods and ser-vices, and overall are all highly dependent on external sources of(non-renewable) raw materials and energy, which is not entirelyreflected in the relatively low import dependence of the Austrianeconomy. Furthermore, municipalities are in similar ways an in-tegrated part of an unstable and vulnerable world economy. Inorder to safeguard a relatively high level of well-being and qualityof life, regions thus will have to cooperate on higher levels in orderto perform successfully in the course of a transformation from anon-renewable to a renewable energy (and material) system.Furthermore, a regionalization strategy, when pushed to its ex-treme, might hamper resilience due to increasing inter-regionalinequalities, decreasing economies of scale and lower capacities tobuffer regional weaknesses by cooperation and exchange.
Acknowledgments
The authors wish to thank the Austrian Climate and EnergyFund, which enabled this work by financing the project “ResilienceAustria. Spatial & Sectoral Assessment of Energy Resilience for theMinimization of Regional Vulnerability 2020/2050“ (Project No.834522).
Appendix A. Supplementary material
Supplementary data associated with this article can be found inthe online version at http://dx.doi.org/10.1016/j.enpol.2015.12.031.
References
Breiman, L., 2001. Random Forest. Mach. Learn. 45, 5–32.Cabinet Office, 2012. Chapter 16 Collaboration and Co-operation between Local
Resilience Forums in England Revision to Emergency Preparedness. Civil Con-tingencies Act Enhancement Programme. March 2012. ⟨https://www.gov.uk/government/publications/emergency-preparedness⟩ (24.1.2014).
Cohen, J., 1960. A coefficient of agreement for nominal scales. Educ. Psychol. Meas.
20 (1), 37–46.Cooper, M., Walker, J., 2011. Genealogies of resilience: from systems ecology to the
political economy of crisis adaptation. Secur. Dialog 41 (2), 143–160.Cutter, S., Emrich, C., Burtan, C., 2010. Disaster resilience indicators for bench-
marking baseline conditions. J. Homel. Secur. Emerg. Manag. 7(1), Artic. 51,1–22.
D’Alessandro, S., Luzzati, T., Morroni, M., 2010. Energy transition towards economicand environmental sustainability: feasible paths and policy implications.Journal of Cleaner Production 18, 532–539.
Exner, A., 2013a. Von der Nachhaltigkeit zur Resilienz? Mögliche Disk. der Viel-fachkrise. Phase 2 (45), 17–20.
Exner, A., 2013b. De-growth solidarity: the great socio-ecological transformation ofthe twenty-first century. In: Exner, A., Zittel, W., Fleissner, P., Kranzl, L. (Eds.),Land and Resource Scarcity. Capitalism, Struggle and Well-being in a Worldwithout Fossil Fuels. Routledge, London, pp. 185–244.
Fleissner, P., 2010. Teilbericht 3, Szenarien der österreichischen Volkswirtschaft bis2050. Arbeitspaket 2 – Globale und regionale Rahmenbedingungen. Studie„Save our Surface“ im Auftrag des Österreichischen Klima- und Energiefonds.http://www.umweltbuero-klagenfurt.at/sos/wp-content/uploads/Teilbericht_3_Volkswirtschaft_Fleissner_31012011.pdf (7.1.2016).
Hirsch, R., 2008. Mitigation of Maximum World Oil Production: Shortage Scenarios.Energy Policy 36, 881–889.
Land and resource scarcity. In: Exner, A., Fleissner, P., Kranzl, L., Zittel, W. (Eds.),Capitalism, Struggle and Well-being in a World without Fossil Fuels. Routledge,London, New York.
Kritische Metalle in der Großen Transformation. Ressourcenpolitik in einer be-grenzten Welt. In: Exner, A., Held, M., Kümmerer, K. (Eds.), Springer-Verlag,Heidelberg, Berlin.
Genuer, R., Poggi, J., Tuleau-malot, C., 2010. Variable selection using random forests.Pattern Recognit. Lett. 14 (31), 2225–2236.
Panarchy: Understanding Transformations in Human and Natural Systems. In:Gunderson, L.H., Holling, C.S. (Eds.), Island Press, Washington, Covelo, London.
Harper, E.B., Stella, J.C., Fremier, A.K., 2011. Global sensitivity analysis for complexecological models: a case study of riparian cottonwood population dynamics.Ecol. Appl.: Publ. Ecol. Soc. Am. 21 (4), 1225–1240.
Hopkins, R., 2011. The Transition Companion. Making your Community more Re-silient in Uncertain Times. Chelsea Green Pub, White River Junction.
Lewis, M., Conaty, P., 2012. The Resilience Imperative. Cooperative Transitions to aSteady State Economy. New Society Publishers, Gabriola Island.
Matzenberger, J., 2013. A novel approach to exploring the concept of resilience andprincipal drivers in a learning environment. Multicult. Educ. Technol. J. 7 (2),192–206.
Matzenberger, J., Hargreaves, N., Raha, D., Dias, P., 2014. A novel approach to assessresilience of energy systems. International Journal of Disaster Resilience in theBuilt Environment, forthcoming. ⟨http://www.emeraldgrouppublishing.com/products/journals/journals.htm?id¼ IJDRBE⟩ (8.10.2015).
Norris, F.H., Stevens, S.P., Pfefferbaum, B., Wyche, K.F., Pfefferbaum, R.L., 2008.Community resilience as a metaphor, theory, set of capacities and strategy fordisaster readiness. Am. J. Community Psychol. 41, 127–150.
OECD (s. d.): OECD Better Life Index. ⟨http://www.oecdbetterlifeindex.org/topics/life-satisfaction/⟩ (8.10.2015).
O′Hare, P., White, I., 2013. Deconstructing resilience: lessons from planning prac-tice. Plan. Pract. Res. 28 (3), 275–279.
Sherrieb, K., Norris, F.H., Galea, S., 2010. Measuring capacities for community resi-lience. Soc. Indic. Res. 99, 227–247.
Städtebund, 2013. Mitglieder des Österreichischen Städtebunds. ⟨⟨http://www.staedtebund.gv.at/organisation/staedtebund/mitglieder.html⟩⟩ (12.12.2013).
Statistik Austria, 2001. Stadtregionen. ⟨http://www.statistik.at/web_de/klassifikationen/regionale_gliederungen/stadtregionen/index.html⟩ (12.12.2013).
Stoeglehner, G., Niemetz, N., Kettl, K.-H., 2011. Spatial dimensions of sustainableenergy systems: new visions for integrated spatial and energy planning. EnergySustain. Soc. 1 (2), 1–9.
Strobl, C., Boulesteix, A.-L., Zeileis, A., Hothorn, T., 2007. Bias in random forestvariable importance measures: illustrations, sources and a solution. BMCBioinforma. 8, 1–21.
Strobl, C., Boulesteix, A.-L., Kneib, T., Augustin, T., Zeileis, A., 2008. Conditionalvariable importance for random forests. BMC Bioinforma. 9 (307), 1–11.
Tierney, K., Bruneau, M., 2007. Conceptualizing and measuring resilience: a key todisaster loss reduction. TR News. ⟨http://onlinepubs.trb.org/onlinepubs/trnews/trnews250_p14-17.pdf⟩ (8.10.2015).
Walker, B., Salt, D., 2006. Resilience thinking. Sustaining Ecosystems and People ina Changing World. Island Press, Washington, Covelo, London.
World Economic Forum/WEF, 2013. Global Risks 2014. Ninth Edition. Geneva.Wilkinson, R., Pickett, K., 2009. The Spirit Level. Why Equality is Better for Every-
one. Penguin Books, London.Wilson, G., 2012. Community Resilience and Environmental Transitions. Routledge,
London, New York.