urban water management plan - city of vallejo
TRANSCRIPT
Prepared by:November 2016
2015Urban Water Management Plan
City of Vallejo 2015 Urban Water Management Plan
Prepared by:
November 2016
City of Vallejo 2015 Urban Water Management Plan
November 2016
Thispageintentionallyleftblank.
City of Vallejo 2015 Urban Water Management Plan
November 2016Page i
TableofContents
Section1 IntroductionandOverview.......................................................................................................1‐11.1. UrbanWaterManagementPlanningandtheCaliforniaWaterCode.................................................1‐11.2. UWMPOrganization...............................................................................................................................................1‐21.3. UWMPSummary......................................................................................................................................................1‐2
Section2 PlanPreparation...........................................................................................................................2‐12.1. BasisforPreparingaPlan....................................................................................................................................2‐12.2. PlanningandComplianceReporting................................................................................................................2‐12.3. CoordinationandOutreach..................................................................................................................................2‐2
Section3 SystemDescription......................................................................................................................3‐13.1. ServiceAreaPhysicalDescription.....................................................................................................................3‐13.2. Climate..........................................................................................................................................................................3‐33.3. ServiceAreaPopulation........................................................................................................................................3‐5
Section4 SystemWaterUse.........................................................................................................................4‐14.1. WaterUsesbySector..............................................................................................................................................4‐14.2. DistributionSystemWaterLosses....................................................................................................................4‐34.3. EstimatingFutureWaterSavings......................................................................................................................4‐34.4. WaterUseforLowerIncomeHouseholds.....................................................................................................4‐54.5. ClimateChange..........................................................................................................................................................4‐6
Section5 SBX7‐7BaselinesandTargets.................................................................................................5‐15.1. UpdatingCalculationsfrom2010UWMP......................................................................................................5‐15.2. BaselinePeriods.......................................................................................................................................................5‐15.3. ServiceAreaPopulation........................................................................................................................................5‐25.4. GrossWaterUse.......................................................................................................................................................5‐25.5. BaselineandTargetDailyPerCapitaWaterUse........................................................................................5‐55.6. 2015ComplianceDailyPerCapitaWaterUse(GPCD).............................................................................5‐6
Section6 SystemSupplies.............................................................................................................................6‐16.1. PurchasedorImportedWater............................................................................................................................6‐16.2. Groundwater..............................................................................................................................................................6‐36.3. SurfaceWater............................................................................................................................................................6‐36.4. Stormwater.................................................................................................................................................................6‐36.5. WastewaterandRecycledWater......................................................................................................................6‐36.6. DesalinatedWaterOpportunities.....................................................................................................................6‐96.7. ExchangesorTransfers.......................................................................................................................................6‐106.8. FutureWaterProjects..........................................................................................................................................6‐126.9. SummaryofExistingandPlannedSourcesofWater..............................................................................6‐126.10. ClimateChangeImpactstoSupply...............................................................................................................6‐14
City of Vallejo 2015 Urban Water Management Plan
November 2016Page ii
Section7 WaterSupplyReliabilityAssessment...................................................................................7‐17.1. ConstraintsonWaterSources............................................................................................................................7‐17.2. ReliabilitybyWaterYearType..........................................................................................................................7‐47.3. SupplyandDemandAssessment.......................................................................................................................7‐67.4. RegionalSupplyReliability..................................................................................................................................7‐8
Section8 WaterShortageContingencyPlan..........................................................................................8‐18.1. StagesofAction.........................................................................................................................................................8‐18.2. ProhibitionsonEndUse........................................................................................................................................8‐28.3. Penalties,Charges,OtherEnforcementofProhibitions...........................................................................8‐68.4. ConsumptionReductionMethods.....................................................................................................................8‐68.5. DeterminingWaterShortageReductions......................................................................................................8‐78.6. RevenueandExpenditureImpacts...................................................................................................................8‐88.7. ResolutionorOrdinance.......................................................................................................................................8‐98.8. CatastrophicSupplyInterruption.....................................................................................................................8‐98.9. MinimumSupplyNextThreeYears................................................................................................................8‐12
Section9 DemandManagementMeasures.............................................................................................9‐19.1. ConservationMeasureOrganization...............................................................................................................9‐19.2. DemandManagementMeasuresNotImplemented..................................................................................9‐29.3. DemandManagementMeasures.......................................................................................................................9‐3
Section10 PlanAdoption,SubmittalandImplementation...........................................................10‐110.1. InclusionofAll2015Data................................................................................................................................10‐110.2. NoticeofPublicHearing...................................................................................................................................10‐110.3. NoticetothePublic.............................................................................................................................................10‐210.4. PublicHearingandAdoption..........................................................................................................................10‐210.5. PlanSubmittal.......................................................................................................................................................10‐210.6. PublicAvailability................................................................................................................................................10‐210.7. AmendinganAdoptedUWMP........................................................................................................................10‐2
Section11 References.................................................................................................................................11‐1
City of Vallejo 2015 Urban Water Management Plan
November 2016Page iii
ListofTablesTable2‐1:PublicWaterSystem(DWRTable2‐1)................................................................................................2‐1 Table2‐2:PlanIdentification(DWRTable2‐2).....................................................................................................2‐1 Table2‐3:AgencyIdentification(DWRTable2‐3)...............................................................................................2‐2 Table2‐4:WaterSupplierInformationExchange(DWRTable2‐4).............................................................2‐2 Table3‐1:ClimateCharacteristicsfortheCityofVallejo...................................................................................3‐3 Table3‐2:Population–CurrentandProjectedbyRegion.................................................................................3‐6 Table3‐3:Population–CurrentandProjected(DWRTable3‐1)..................................................................3‐6 Table4‐1:2015DemandsforPotableandRawWater(DWRTable4‐1)...................................................4‐1 Table4‐2:ProjectDemandsforPotableandRawWater(DWRTable4‐2)...............................................4‐2 Table4‐3:TotalWaterDemands(DWRTable4‐3)..............................................................................................4‐3 Table4‐4:AWWAWaterLossAudit(DWRTable4‐4)........................................................................................4‐3 Table4‐5:InclusioninWaterUseProjections(DWRTable4‐5)....................................................................4‐5 Table5‐1:BaselinePeriodRanges(SBX7‐7Table1)...........................................................................................5‐2 Table5‐2:GallonsperCapitaPerDay(GPCD)(SBX7‐7Table5)....................................................................5‐4 Table5‐3:BaselinesandTargetsSummary(DWRTable5‐1).........................................................................5‐6 Table5‐4:2015Compliance(DWRTable5‐2).......................................................................................................5‐6 Table6‐1:2015Purchased/ImportedWaterSupplies.......................................................................................6‐1 Table6‐2:GroundwaterVolumePumped(DWRTable6‐1)............................................................................6‐3 Table6‐3:WastewaterCollectedWithinServiceAreain2015(DWRTable6‐2)...................................6‐4 Table6‐4:WastewaterTreatmentandDischargeWithinServiceAreain2015(DWRTable6‐3)..6‐5 Table6‐5:CurrentandProjectedRecycledWaterDirectBeneficialUsesWithinServiceArea(DWRTable6‐4)................................................................................................................................................................................6‐7 Table6‐6:2010UWMPRecycledWaterUseProjectionComparedto2015Actual(DWRTable6‐5).....................................................................................................................................................................................................6‐8 Table6‐7:MethodstoExpandFutureRecycledWaterUse(DWRTable6‐6)...........................................6‐9 Table6‐8:AmericanCanyonTreatedWaterPurchaseBlocks.......................................................................6‐10 Table6‐9:ExpectedFutureWaterSupplyProjectsorPrograms(DWRTable6‐7)..............................6‐12 Table6‐10:WaterSupplies–2015Actual(DWRTable6‐8)..........................................................................6‐12 Table6‐11:WaterSupplies–Projected(DWRTable6‐9)...............................................................................6‐13 Table7‐1:FactorsAffectingReliabilityofSupply..................................................................................................7‐2 Table7‐2:BasisofWaterYearData–StateWaterProject(DWRTable7‐1)............................................7‐5 Table7‐3:BasisofWaterYearData–PermitWater(DWRTable7‐1)........................................................7‐5 Table7‐4:BasisofWaterYearData–SolanoProject(LakeBerryessa)(DWRTable7‐1)..................7‐6 Table7‐5:BasisofWaterYearData–LakesFrey&Madigan(DWRTable7‐1)......................................7‐6 Table7‐6:NormalYearSupplyandDemandComparison(DWRTable7‐2).............................................7‐6 Table7‐7:SingleDryYearSupplyandDemandComparison(DWRTable7‐3).......................................7‐7 Table7‐8:MultipleDryYearsSupplyandDemandComparison(DWRTable7‐4)................................7‐7 Table8‐1:StagesofWaterShortageContingencyPlan(DWRTable8‐1)...................................................8‐1 Table8‐2:RestrictionsandProhibitionsonEndUse(DWRTable8‐2).......................................................8‐5 Table8‐3:ConsumptionReductionMethods(DWRTable8‐3)......................................................................8‐7 Table8‐4:PreparationActionsforCatastrophes.................................................................................................8‐10 Table8‐5–MinimumSupplyNextThreeYears(DWRTable8‐4)...............................................................8‐12 Table9‐1:14DMMsvs.2015GuidebookDMMs....................................................................................................9‐2 Table9‐2:WaterWasteProhibitionActivity2011‐2015...................................................................................9‐4
City of Vallejo 2015 Urban Water Management Plan
November 2016Page iv
Table9‐3:ResidentialSurveysPerformed2011‐2015.......................................................................................9‐6 Table9‐4:PlumbingDevicesDistributed..................................................................................................................9‐6 Table9‐5:NumberofLargeLandscapeSurveysandWaterBudgetsPerformed....................................9‐7 Table9‐6:RebatesPaid....................................................................................................................................................9‐8 Table9‐7:PublicInformationActivities....................................................................................................................9‐9 Table9‐8:SchoolMaterialsandProgramsProvided.........................................................................................9‐10 Table9‐9:CIISurveysCompleted..............................................................................................................................9‐12 Table9‐10:ResidentialToiletProgramSummary2011‐2015......................................................................9‐12 Table9‐11:TurfRemovalandIrrigationControllerRebatesPaid...............................................................9‐14 Table10‐1:NotificationtoCitiesandCounties(DWRTable10‐1)..............................................................10‐1
ListofFiguresFigure3‐1:CityofVallejoWaterServiceAreas......................................................................................................3‐2 Figure4‐1:CurrentandProjectedWaterUse.........................................................................................................4‐4 Figure4‐2:MonthlyWaterDemandforVallejo(2011‐2015)..........................................................................4‐6
AppendicesAppendixA. DWRUWMPCheckList AppendixB. DemandForecastMemorandum AppendixC. AWWAWaterLossAudit AppendixD. CityOrdinanceNo,1708andChapter11.54oftheMunicipalCode AppendixE. 2015SWPDeliveryReliabilityReport AppendixF. DraftWaterShortageContingencyPlanResolution AppendixG. WaterSavingsIncentiveProgramTermsandConditions AppendixH. PublicandAgencyNotices,MeetingAgendaandComments AppendixI. UWMPAdoptionResolution
City of Vallejo 2015 Urban Water Management Plan
November 2016Page v
ListofAbbreviationsAB AssemblyBillABAG AssociationofBayAreaGovernmentsAF Acre‐footorAcre‐FeetAFY Acre‐footperYearAWWA AmericanWaterWorksAssociationBMP BestManagementPracticeBO BiologicalOpinionCaltrans CaliforniaDepartmentofTransportationCCF 100cubicfeetofwaterCDPH CaliforniaDepartmentofPublicHealthServicesCII Commercial,IndustrialandInstitutionalCIMIS CaliforniaIrrigationManagementInformationSystemCUWCC CaliforniaUrbanWaterConservationCouncilCWC CaliforniaWaterCodeDMMs DemandManagementMeasuresDOF DepartmentofFinanceDWR DepartmentofWaterResourcesERP EmergencyResponsePlanETo EvapotranspirationFY FiscalYearGPCD GallonsPerCapitaPerDaygpm GallonsPerMinuteHET HighEfficiencyToiletHEU HighEfficiencyUrinalHOA HomeOwnersAssociationIRWMP IntegratedRegionalWaterManagementPlanMG milliongallonsMGD milliongallonsperdayMOU MemorandumofUnderstandingMPN MostProbablyNumberNBA NorthBayAqueductNMFS NationalMarineFisheriesServiceNOD NorthofDeltaPDA PriorityDevelopmentAreaPG&E PacificGas&ElectricSB SenateBillSBX7‐7 WaterConservationBillof2009SCWA SolanoCountyWaterAgencySID SolanoIrrigationDistrictSWP StateWaterProjectSWRCB StateWaterResourcesControlBoard
City of Vallejo 2015 Urban Water Management Plan
November 2016Page vi
Abbreviations(cont’d)TDS TotalDissolvedSolidsTOC TotalOrganicCarbonUSBR U.S.BureauofReclamationUSFWS U.S.FishandWildlifeServiceUWMP UrbanWaterManagementPlanVA VulnerabilityAssessmentVSFCD VallejoSanitationandFloodControlDistrictWSCP WaterShortageContingencyPlanWTP WaterTreatmentPlantWWTP WastewaterTreatmentPlant
City of Vallejo 2015 Urban Water Management Plan
November 2016Page 1-1
Section 1 Introduction and Overview The City of Vallejo (City) has prepared this Urban Water Management Plan (UWMP) followingCaliforniastaterequirements,asdefinedintheCaliforniaWaterCode(CWC).ThischapterdiscussestherequirementforandpurposeofanUWMP,andprovidesasummaryofthisplan.
1.1. Urban Water Management Planning and the California Water Code
Urban Water Management Planning Act TheUrbanWaterManagementPlanningAct(Act)wascreatedbyAssemblyBill(AB)797whichwassignedintolawbyGovernorDeukmejianonSeptember21,1983.TheActrequiresthaturbanwatersuppliers(i.e.,municipalwatersuppliersprovidingwaterformunicipalpurposestomorethan3,000customersorsupplyingmorethan3,000acre‐feet(AF)annually)prepareandadoptUrbanWaterManagementPlans(UWMPs)containingcertainspecifiedelements.
TheActwassubsequentlyamendedbyAB2661,whichwassignedintolawbyGovernorDeukmejianonJuly18,1990.AB2661deletedtheJanuary1,1991terminationdatespecifiedinAB797.AB2661alsoexpandedtheelementswhicharetobeaddressedinUrbanWaterManagementPlans.
TheActwasalsoamendedbyAB1869,whichwassignedbyGovernorWilsononOctober13,1991.AB1869requires thaturbanwatersuppliersupdate(not justreview)UrbanWaterManagementPlanseveryfiveyearstoincludeprojectionsofbothpotableandrecycledwateruse,identifycurrentreclamationpractices,addressadditionalalternativeconservationmeasures,anddescribefindings,actions,andplanningrelatedtoanumberofwaterconservationandreclamationmeasures.
TheActwasfurtheramendedbyAB11XsignedbyGovernorWilsononOctober13,1991.AB11Xrequires that urban water suppliers prepare an Urban Water Shortage Contingency Plan as anamendmenttoitsUrbanWaterManagementPlan.WaterShortageContingencyPlans(WSCPs)mustbeupdatedeveryfiveyearsandspecifyproposedmeasures forresponsetoshort‐and long‐termwatershortages.
Water Conservation Bill of 2009 On November 10, 2009, the state legislature passed the Water Conservation Bill of 2009 (alsoreferred to as Senate Bill (SB) X7‐7) as awater conservation component to the Sacramento‐SanJoaquinRiverDelta(Delta)legislativepackage.Thebillseeksa20percentstatewidereductioninurbanpercapitawateruse inCaliforniabyDecember31,2020.SBX7‐7requiresthateachretailagencypreparinga2010UWMPtocalculatebaselinewateruseaswellasaninterim(for2015)andfinal(for2020)waterusereductiontarget.ThemethodologiesusedtocalculateboththebaselinepercapitawateruseandtargetswereoutlinedintheDraftandFinalUWMPguidelinespublishedbythe California Department of Water Resource (DWR) in December 2010 and March 2011,respectively. Updates to those methodologies were released with the guidelines for the 2015UWMPs.
City of Vallejo 2015 Urban Water Management Plan
November 2016Page 1-2
1.2. UWMP Organization ThisUWMPwaspreparedbasedupon the recommendedorganizationpresented inDWR’s2015UWMPGuidebookforUrbanWaterSuppliers(UWMPGuidebook).ChaptertitlesareincludedbelowandaDWRchecklist,includingthelocationofallrequiredcomponentsoftheUWMP,isincludedinAppendixA.
Section1 IntroductionandOverview
Section2 PlanPreparation
Section3 SystemDescription
Section4 SystemWaterUse
Section5 SBX7‐7BaselinesandTargets
Section6 SystemSupplies
Section7 WaterSupplyReliabilityAssessment
Section8 WaterShortageContingencyPlan
Section9 DemandManagementMeasures
Section10 PlanAdoption,SubmittalandImplementation
Section11 References
1.3. UWMP Summary TheCityprovideswaterdelivery toover3,000services, therefore requiring thepreparationandadoptionofanUWMPincompliancewiththeAct,asamendedbyABs2661,1869and11X,andSBX7‐7of2009.
Vallejo,locatedatthesouthernendofSolanoCounty,usessurfacewaterasitssolesupplysourcetoprovideservicetotheCityofVallejoandsurroundingunincorporatedareas.TheCityconsistentlymeetsalldrinkingwaterstandards,despitesomewaterqualityconcernsduringstormevents.Assuch,constraintsduetowatersourcequalityisconsideredtobeunlikely.Duetoaconservativetotalwater supplyvolume, theCity expects tohave sufficientwater supplies tomeetprojected futuredemandsthrough2040,duringnormal,single‐dryandmultiple‐drywateryearconditions.UsingtheCaliforniaDepartmentofWaterResources(DWR)populationtoolandSBX7‐7verificationtables,theCity’sbaselinepercapitawaterusewasdeterminedtobe156gallonspercapitaperday(gpcd)witha2015targetof140gpcdanda2020targetof124gpcd(a20%reductionfromthebaseline).ThanksinparttotheaggressiveconservationprogramsemployedbytheCityinlightofthestatewidedrought,theCity’s2015percapitawaterusewascalculatedas114gpcd,wellbelowits2015and2020targets.
LookingaheadtotheCity’sdevelopmentandwaterneeds,theCity’scurrentplanpositionsitwelltomeetany futuredemandsregardlessofwateryear type.CaliforniaDepartmentofFinance (DOF)showsthatthe2015populationwas116,764;futureprojectionsestimateapopulationslightlyabove130,000in2040.ThemostrecentReclaimedWaterStudy(2014)evaluatedthepotentialofutilizingrecycledwatercoordinationtofurthersupplementandenhancetheCity’swatersupplysources.Thestudydeterminedthatrecycledwaterisnotcurrentlyacost‐effectivesolution,butmaybecomemorefeasibleifincreasedwaterdemandduetodevelopmentweretooccur.PotentialfuturedevelopmentprojectsthatareconsideredinthisplanincludetwoPriorityDevelopmentAreas(PDAs)aswellasSolano360,whichtogetherconsistsofapproximately375acresofdevelopmentwithin theCity’s
City of Vallejo 2015 Urban Water Management Plan
November 2016Page 1-3
servicearea.However,evenwiththisgrowth,totaldemandsareactuallyexpectedtodecreaseovertheplanningperiodofthisUWMPwiththeimplementationofwatercodes,conservationprograms,and higher water and sewer rates. The recent drought and state‐mandated restrictions havedemonstrated the effectiveness of the City’s water conservation and efficiency measures.Additionally,thisplanincludesaWaterShortageContingencyPlanpreparedbytheCity(Chapter8)whichlaysthefoundationfortheCity’sresponsetoreductionsinwateravailability,aswellastheCity’sdemandmanagementmeasures(Chapter9),whichareinplaceregardlessofwateryeartypeandsupplyavailability.
City of Vallejo 2015 Urban Water Management Plan
November 2016Page 1-4
Thispageintentionallyleftblank.
City of Vallejo 2015 Urban Water Management Plan
November 2016
Page 2-1
Section 2 Plan Preparation
This chapter provides information on the City’s process for developing the 2015 UWMP, including
efforts in coordination and outreach with other agencies in the region.
2.1. Basis for Preparing a Plan
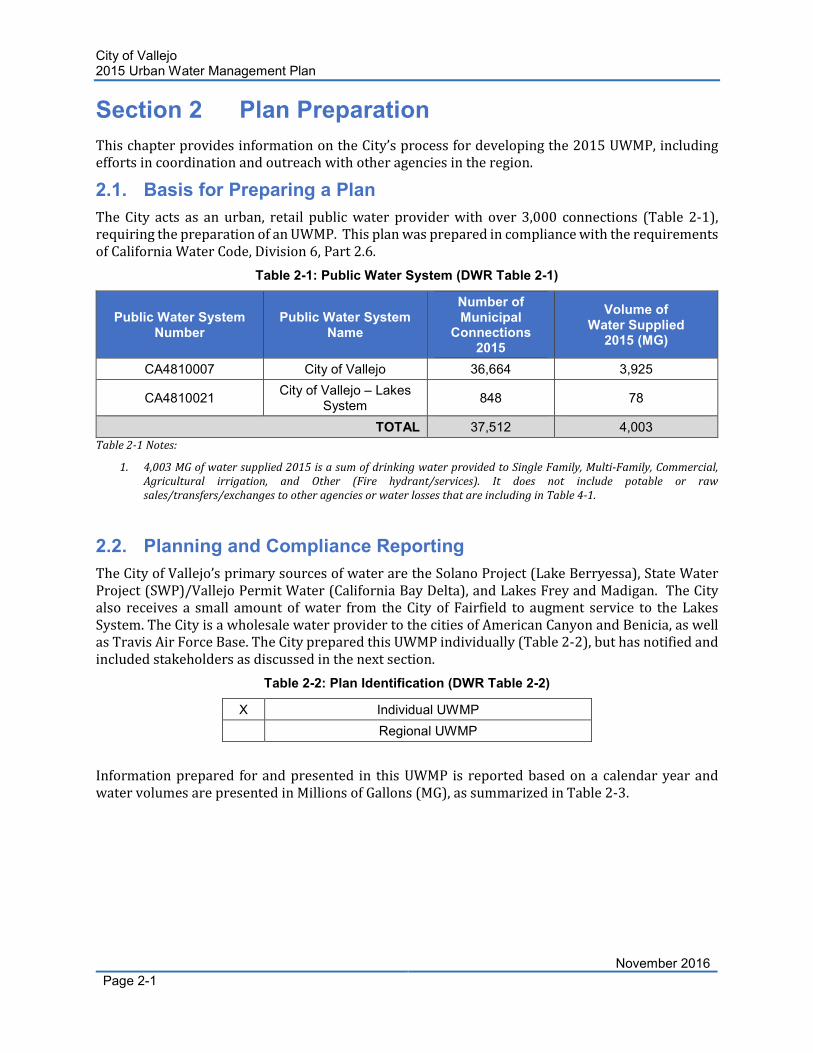
The City acts as an urban, retail public water provider with over 3,000 connections (Table 2-1),
requiring the preparation of an UWMP. This plan was prepared in compliance with the requirements
of California Water Code, Division 6, Part 2.6.
Table 2-1: Public Water System (DWR Table 2-1)
Public Water System Number
Public Water System Name
Number of Municipal
Connections 2015
Volume of Water Supplied
2015 (MG)
CA4810007 City of Vallejo 36,664 3,925
CA4810021 City of Vallejo – Lakes
System 848 78
TOTAL 37,512 4,003
Table 2-1 Notes:
1. 4,003 MG of water supplied 2015 is a sum of drinking water provided to Single Family, Multi-Family, Commercial,
Agricultural irrigation, and Other (Fire hydrant/services). It does not include potable or raw
sales/transfers/exchanges to other agencies or water losses that are including in Table 4-1.
2.2. Planning and Compliance Reporting
The City of Vallejo’s primary sources of water are the Solano Project (Lake Berryessa), State Water
Project (SWP)/Vallejo Permit Water (California Bay Delta), and Lakes Frey and Madigan. The City
also receives a small amount of water from the City of Fairfield to augment service to the Lakes
System. The City is a wholesale water provider to the cities of American Canyon and Benicia, as well
as Travis Air Force Base. The City prepared this UWMP individually (Table 2-2), but has notified and
included stakeholders as discussed in the next section.
Table 2-2: Plan Identification (DWR Table 2-2)
X Individual UWMP
Regional UWMP
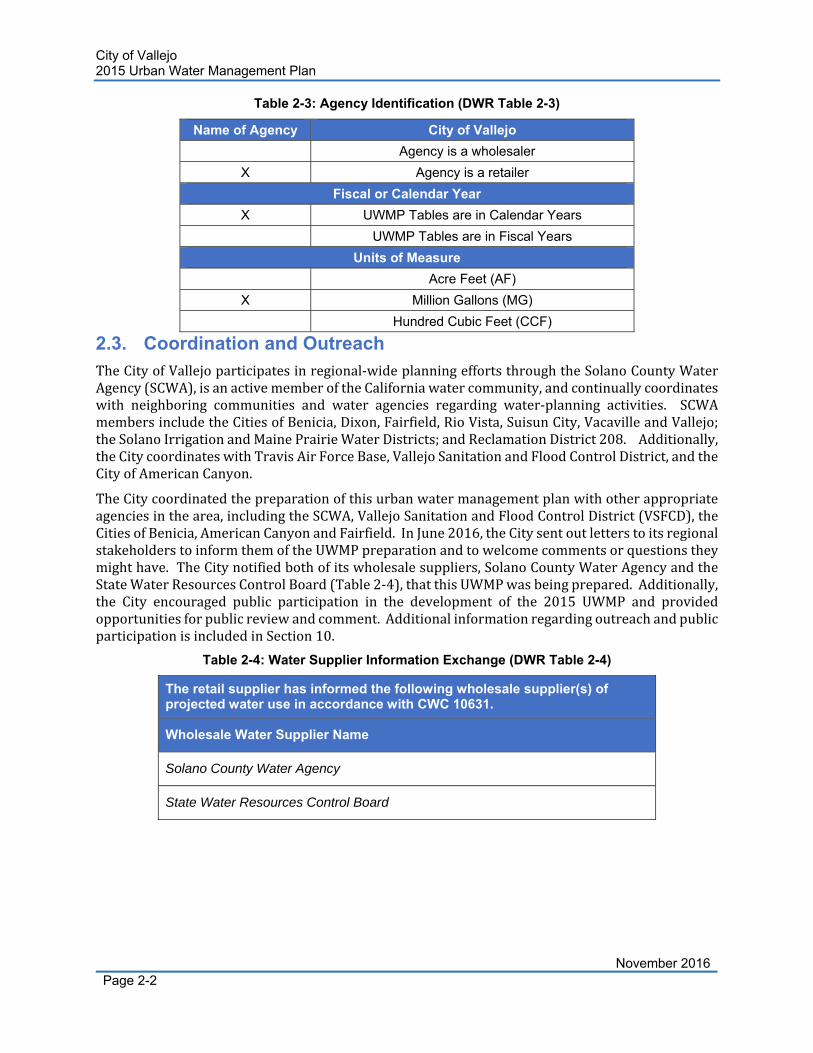
Information prepared for and presented in this UWMP is reported based on a calendar year and
water volumes are presented in Millions of Gallons (MG), as summarized in Table 2-3.
City of Vallejo 2015 Urban Water Management Plan
November 2016Page 2-2
Table 2-3: Agency Identification (DWR Table 2-3)
2.3. Coordination and Outreach TheCityofVallejoparticipatesinregional‐wideplanningeffortsthroughtheSolanoCountyWaterAgency(SCWA),isanactivememberoftheCaliforniawatercommunity,andcontinuallycoordinateswith neighboring communities and water agencies regarding water‐planning activities. SCWAmembersincludetheCitiesofBenicia,Dixon,Fairfield,RioVista,SuisunCity,VacavilleandVallejo;theSolanoIrrigationandMainePrairieWaterDistricts;andReclamationDistrict208.Additionally,theCitycoordinateswithTravisAirForceBase,VallejoSanitationandFloodControlDistrict,andtheCityofAmericanCanyon.
TheCitycoordinatedthepreparationofthisurbanwatermanagementplanwithotherappropriateagenciesinthearea,includingtheSCWA,VallejoSanitationandFloodControlDistrict(VSFCD),theCitiesofBenicia,AmericanCanyonandFairfield.InJune2016,theCitysentoutletterstoitsregionalstakeholderstoinformthemoftheUWMPpreparationandtowelcomecommentsorquestionstheymighthave.TheCitynotifiedbothofitswholesalesuppliers,SolanoCountyWaterAgencyandtheStateWaterResourcesControlBoard(Table2‐4),thatthisUWMPwasbeingprepared.Additionally,the City encouraged public participation in the development of the 2015 UWMP and providedopportunitiesforpublicreviewandcomment.AdditionalinformationregardingoutreachandpublicparticipationisincludedinSection10.
Table 2-4: Water Supplier Information Exchange (DWR Table 2-4)
The retail supplier has informed the following wholesale supplier(s) of projected water use in accordance with CWC 10631.
Wholesale Water Supplier Name
Solano County Water Agency
State Water Resources Control Board
Name of Agency City of Vallejo
Agency is a wholesaler
X Agency is a retailer
Fiscal or Calendar Year
X UWMP Tables are in Calendar Years
UWMP Tables are in Fiscal Years
Units of Measure
Acre Feet (AF)
X Million Gallons (MG)
Hundred Cubic Feet (CCF)
City of Vallejo 2015 Urban Water Management Plan
November 2016Page 3-1
Section 3 System Description TheCityofVallejoprovideswaterservicestotwo,geographicallydistinctareas:theCityofVallejojurisdictionallimitsandadjacentunincorporatedareas(termed“Vallejoproper”)andanareaintheunincorporatedwesternpartofSolanoCountyandsouthernNapaCounty,knownas“VallejoLakes”.ThischapterdescribeseachportionoftheCity’swatersystem,includingwatersupplysourceandinfrastructure.
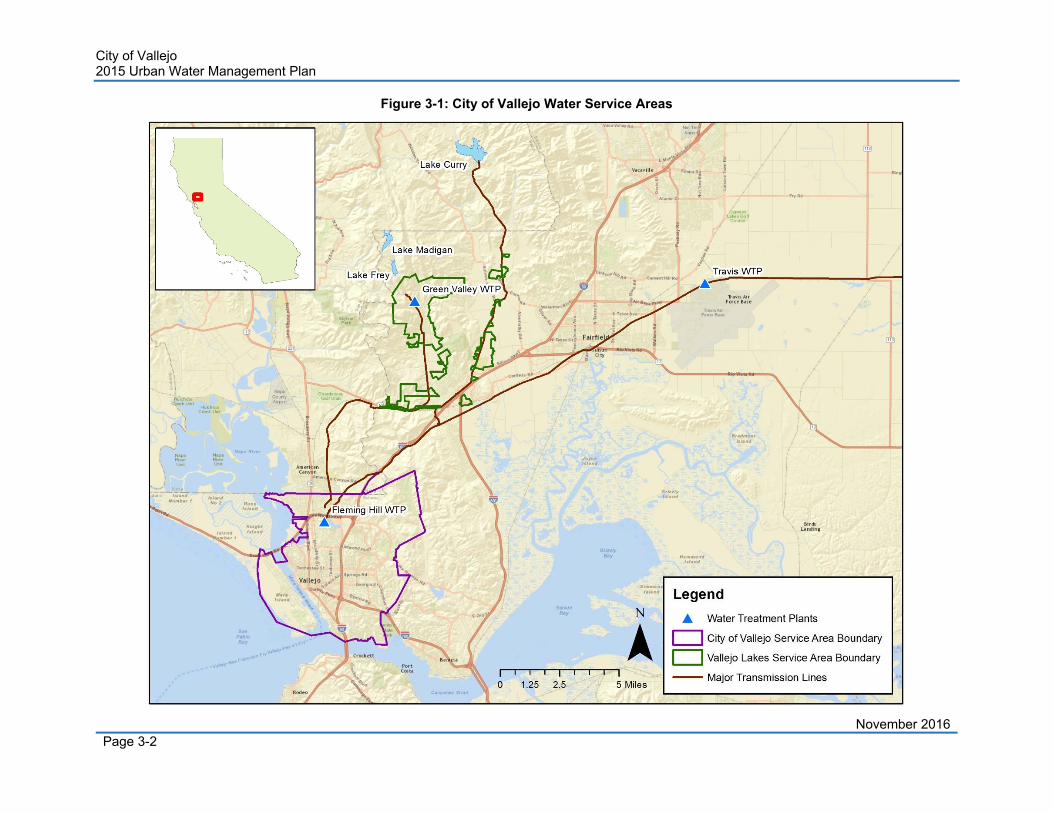
3.1. Service Area Physical Description TheCityofVallejoislocatedapproximately30milesnortheastofSanFranciscoatthesouthernendofSolanoCounty.TheCity’swaterserviceareaisshowninFigure3‐1and,aspreviouslydescribed,encompassesthecitylimits,unincorporated“Vallejoproper”(i.e.,theneighborhoodsofHomeAcres,Sandy Beach, and Starr Subdivision), aswell as the Vallejo Lakes area (the area in the adjacentunincorporated western part of Solano County and southern Napa County). The service area isapproximately31squaremilesoflandareaandincludespredominantlyresidentialandcommercialusers.Elevationsintheexistingservicearearangefromapproximately0feetabovemeansealeveltoapproximately630feetabovemeansealevel.
ThewatersystemisownedandoperatedbytheCityandgovernedbya7‐memberCityCouncil.ThewatersystemisoperatedandmaintainedbytheWaterDivisionofthePublicWorksDepartment.City management staff for the water system consists of a City Manager, Public Works Director,AssistantPublicWorksDirector–Water,andAssistantPublicWorksDirector–Maintenance.
TheVallejoWatersystemconsistsof twowater treatmentplants(WTPs): FlemingHillWTPandGreen Valley WTP. The Fleming Hill WTP is a conventional 42 million gallons per day (mgd)treatmentplantwithpre‐ozonationthattreatswatersuppliedfromLakeBerryessa(SolanoProject)andfromtheSacramentoRiverDeltaasdeliveredthroughtheNorthBayAqueduct(NBA).Treatedwaterfromthisplantisdeliveredtocitycustomers.TheGreenValleyWTPwascompletedin1998and is a conventional 1.0mgd plant that treatswater from Lake Berryessa and Lakes Frey andMadigan.Treatedwaterfromthisplant isdeliveredtoVallejoLakescustomers.Although notpartoftheCity'swaterservicearea,byagreement,theCityalsooperatestheTravisWTPonbehalfoftheTravisAirForceBase.TheTravisWTPisaconventional7.5mgdplantwithpre‐ozonation.
TheCitywaterdistributionsystemcontainsmultiplepressurezones.Principalwatermainsinthedistribution system range insize from14to24inchesindiameter. Most ofthe distribution gridpipingintheoldersectionsoftheCityrangeinsizefrom4to8inchesindiameter,whilethenewerareasareservedbypipes8to12inchesindiameter.
City of Vallejo 2015 Urban Water Management Plan
November 2016Page 3-2
Figure 3-1: City of Vallejo Water Service Areas
City of Vallejo 2015 Urban Water Management Plan
November 2016Page 3-3
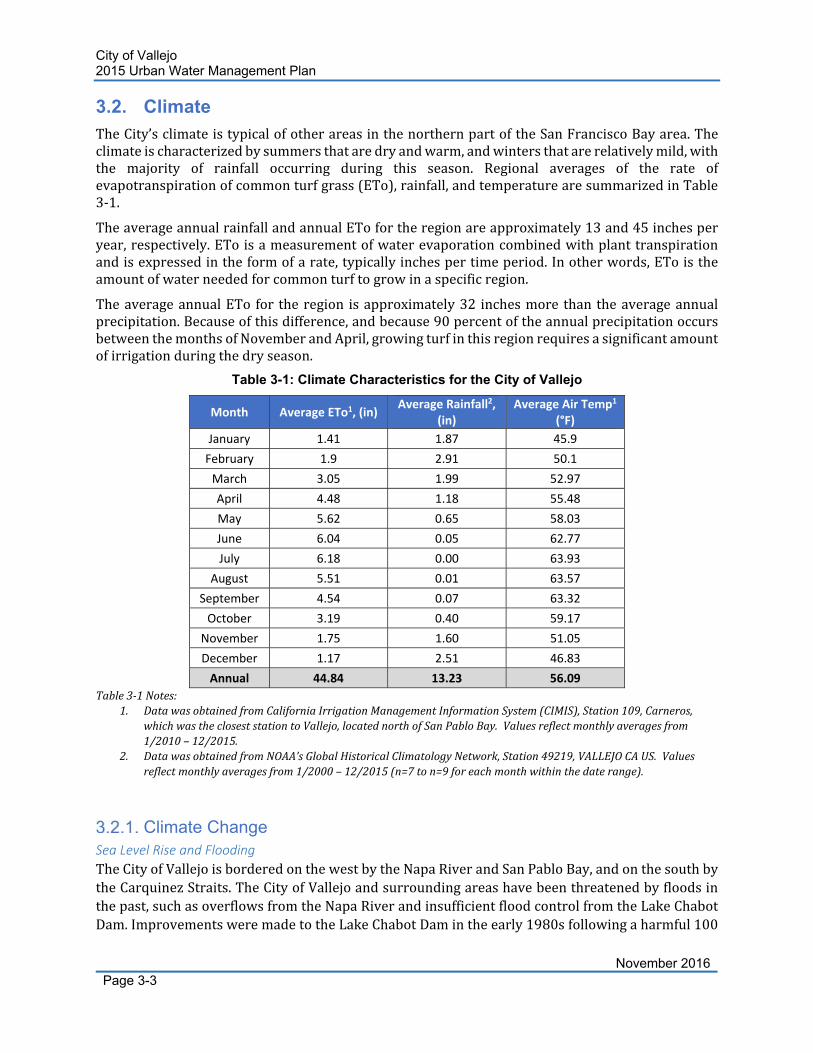
3.2. Climate TheCity’sclimateistypicalofotherareasinthenorthernpartoftheSanFranciscoBayarea.Theclimateischaracterizedbysummersthataredryandwarm,andwintersthatarerelativelymild,withthe majority of rainfall occurring during this season. Regional averages of the rate ofevapotranspirationofcommonturfgrass(ETo),rainfall,andtemperaturearesummarizedinTable3‐1.
TheaverageannualrainfallandannualETofortheregionareapproximately13and45inchesperyear,respectively.EToisameasurementofwaterevaporationcombinedwithplanttranspirationandisexpressedintheformofarate,typicallyinchespertimeperiod.Inotherwords,EToistheamountofwaterneededforcommonturftogrowinaspecificregion.
TheaverageannualETo for theregion isapproximately32 inchesmore than theaverageannualprecipitation.Becauseofthisdifference,andbecause90percentoftheannualprecipitationoccursbetweenthemonthsofNovemberandApril,growingturfinthisregionrequiresasignificantamountofirrigationduringthedryseason.
Table 3-1: Climate Characteristics for the City of Vallejo
Month Average ETo1, (in) Average Rainfall2,
(in) Average Air Temp1
(°F)
January 1.41 1.87 45.9
February 1.9 2.91 50.1
March 3.05 1.99 52.97
April 4.48 1.18 55.48
May 5.62 0.65 58.03
June 6.04 0.05 62.77
July 6.18 0.00 63.93
August 5.51 0.01 63.57
September 4.54 0.07 63.32
October 3.19 0.40 59.17
November 1.75 1.60 51.05
December 1.17 2.51 46.83
Annual 44.84 13.23 56.09
Table3‐1Notes:1. DatawasobtainedfromCaliforniaIrrigationManagementInformationSystem(CIMIS),Station109,Carneros,
whichwasthecloseststationtoVallejo,locatednorthofSanPabloBay.Valuesreflectmonthlyaveragesfrom1/2010–12/2015.
2. DatawasobtainedfromNOAA’sGlobalHistoricalClimatologyNetwork,Station49219,VALLEJOCAUS.Valuesreflectmonthlyaveragesfrom1/2000–12/2015(n=7ton=9foreachmonthwithinthedaterange).
Climate Change Sea Level Rise and Flooding
TheCityofVallejoisborderedonthewestbytheNapaRiverandSanPabloBay,andonthesouthbytheCarquinezStraits.TheCityofVallejoandsurroundingareashavebeenthreatenedbyfloodsinthepast,suchasoverflowsfromtheNapaRiverandinsufficientfloodcontrolfromtheLakeChabotDam.ImprovementsweremadetotheLakeChabotDamintheearly1980sfollowingaharmful100
City of Vallejo 2015 Urban Water Management Plan
November 2016Page 3-4
yearfloodeventandtheCityiscurrentlyprotectedfromNapaRiverfloodingbyHighway37.Theadjoiningwetlands,knownasWhiteSlough,alsoprovidefloodprotectionfortheCity.Thesefloodcontrolfacilitiesmaybeatriskfromclimatechangeeffectssuchassealevelriseandincreasedstormseverity.
Although aging levees are a concern inmanypartsof theDelta system, theCityofVallejo isnotdirectlyprotectedbylevees.AleveefailurecouldaffecttheportionoftheCity’swatersupplythatcomesthroughtheNorthBayAqueductandsomefarmlandsurroundingVallejo,butwouldnotlikelyaffecttheCityitself.
ThenearestNOAAtidalgageislocated24milesfromthecenteroftheCityinAlameda,CA.Thisgageshowsthat the“100‐year” floodheight is3.1 feetabovethemeanhightide line,with thehighestobservedfloodfrom1976to2015reaching3.05feetabovethemeanhightidelinein1983(ClimateCentral, 2016). This gage shows a gradual increase in themean high tide line over the past fewdecades,withanaverageincreaseof0.72mmperyear(NOAA,2016).TheNationalResearchCounciland Climate Central predict a local sea level rise of 2.9 feet by 2100 from a 1992 baseline. Thistranslatestoa“34percentmulti‐yearriskofatleastonefloodexceeding3feetfrom2016to2030,a93percentriskfrom2016tomidcentury,anda100percentriskby2100”(ClimateCentral,2016).Underhigh‐endprojections,theserisksofa3footfloodallincreaseandthelikelihoodofatleastonefloodexceeding6feetis100percent.WithintheCityofVallejo,690acresofland,1,854people,and$300millioninpropertyarecurrentlybelow3feetabovemeanhightide,andthusarepotentiallyatriskof floodingifsea levelrisesasexpected.If floodsreached6feetabovemeanhightide,5,431peopleand$672millionareatrisk.
Ecosystem and Habitat Vulnerability
The region around the City, particularly the area north ofMare Island, contains aquatic habitatsvulnerable to erosion and sedimentation. Erosion is expected to increase under climate changeconditions and sedimentation is expected to shift, so habitats that are already sensitive to theseissuesmaybeadditionallyimpactedbyclimatechange.Additionally,thecoastalareassurroundingtheCitymaybe impactedbythe increasedriskofstormsurgesduetoseal levelrise,makingthealreadyfragilecoastalecosystemsmorevulnerable.
TheDeltaisanecologicallysensitiveestuarinehabitatthatislikelytobesignificantlyimpactedbyclimatechange.TheDeltareliesonfreshwaterflowsfromtheSacramentoandSanJoaquinRivers,whicharelikelytobeimpactedbythedecreaseinsnowpackandshiftsinsnowmeltpatterns.TheDeltahasbeenidentifiedbytheEndangeredSpeciesCoalitionsTop10HabitatsVulnerabletoClimateChange, which points out that 12 of the original 29 indigenous Delta fish are either extinct orendangered (ESA, 2011). Specifically, salmon populationsmake theirmigration run through theDelta.Salmonrequirespecificwatertemperaturesandsalinitylevelstosurvive,sotheyarelikelytobeimpactedbychangesintheseasonalshiftsandoveralldecreaseofcoldfreshwaterintheDelta.TheDeltaisalsousedforrecreational,economic,andmunicipalpurposes,sobalancingtheseneedswith ecological needsmay continue tobecomemore challenging as the changing climate createsshiftsinfreshwaterflowpatterns.
TherearemanyStateandFederallyEndangeredandThreatenedplantandanimalspeciesinSolanoCounty,includingSuisunThistle,SoftBird’sbeak,ContraCostaGoldfields,ColusaGrass,SanJoaquinValleyOrcuttGrass,SolanoGrass,Swainson’sHawk,CaliforniaBlackRail,CaliforniaClapperRail,California Tiger Salamander, California Red‐legged Frog, Giant Garter Snake, Slat Marsh Harvest
City of Vallejo 2015 Urban Water Management Plan
November 2016Page 3-5
Mouse, Conservancy Fairy Shrimp, Vernal Pool Fairy Shrimp, Vernal Pool Tadpole Shrimp, DeltaGreen Ground Beetle, Valley Elderberry Longhorn Beetle, Callippe Silverspot Butterfly, GreenSturgeon,ChinookSalmon,Steelhead,andDeltaSmelt.Theclimatechange impactsmost likely toaffectthesespeciesaresealevelrise,increasedairandwatertemperature,increasedcarbondioxideconcentrations,andchangesinprecipitationpatterns.TheSolanoHabitatConservationPlanprovidesmoredetailsabouttheseendangeredspeciesandhowtheyarelikelytobeaffectedbyclimatechange(SCWA,2012).
One of the sources of the City’s water supply, the Solano Project, is subject to quantifiedenvironmentalflowrequirements;waterisreleasedfromLakeBerryessatoPutahCreektomaintainproperwaterqualityandquantityforChinooksalmonandsteelheadtroutpopulations. Althoughtheserequirementshavegoneunmet in thepast, theymaybedifficult tomaintainunderclimatechangeconditions.
Hydropower
TheCityreceivesitspowerfromPacificGasandElectric(PG&E),whichutilizeshydropowerasanenergy source. However, there are no hydropower facilities within the City’s region and nohydropowerfacilitiesareplannedforthefuture,sotheCitywilllikelynotbesignificantlyimpactedbyclimatechangeimpactstohydropowerproduction.
3.3. Service Area Population TheCityofVallejoserviceareacanbebrokenintothreedistinctpopulationareas,eachofwhichwillbediscussedbelow:
CityofVallejo
UnincorporatedVallejoproper
VallejoLakesregion
From2000to2010,theCityofVallejo’spopulationdroppedfrom116,760to115,942,accordingtothe 2010Census. CaliforniaDepartment of Finance (DOF) data shows that the 2015populationsubsequently rose to 116,764. Future projections of City population were obtained from theAssociationofBayAreaGovernments(ABAG)2013projectionsbycity.Populationprojectionsin5‐yearincrementsfortheCityofVallejoareshowninTable3‐2.
TheunincorporatedVallejoproperareaincludestheneighborhoodsofHomeAcres,SandyBeach,and Starr Subdivision. To estimate the area’s 2015 population, the area’s 913 single‐familyresidentialconnectionsweremultipliedby2.78personsperhousehold(asprovidedby2015DOFdataforunincorporatedSolanoCounty)whichcomesto2,535people. Forfutureprojections,thegrowthratewasassumedtobethesameastheCityofVallejo’spopulationgrowthrateasdeterminedinABAGprojections. PopulationprojectionsfortheunincorporatedVallejoproperareain5‐yearincrementsareshowninTable3‐2.
IntheVallejoLakesservicearea,mostcustomeraccountsaresingle‐familyresidentialcustomers,withasmallnumberofmulti‐familyresidentialconnections.For2015,thenumberof774single‐familyresidentialconnectionswasmultipliedby2.78personsperhousehold(asprovidedby2015DOFdataforunincorporatedSolanoCounty)toestimatethatportionofthearea’spopulation.The11multifamilyconnectionsweremultipliedbyanassumed5personsperconnection.Whensummedtogether,thetotalestimated2015populationfortheLakesregionis2,298.Forfutureprojections,populationintheLakesregionwasassumedtoincreaseattherateofonenewsingle‐familyserviceconnection per year, using the same 2.78 persons per household based on 2015 DOF data for
City of Vallejo 2015 Urban Water Management Plan
November 2016Page 3-6
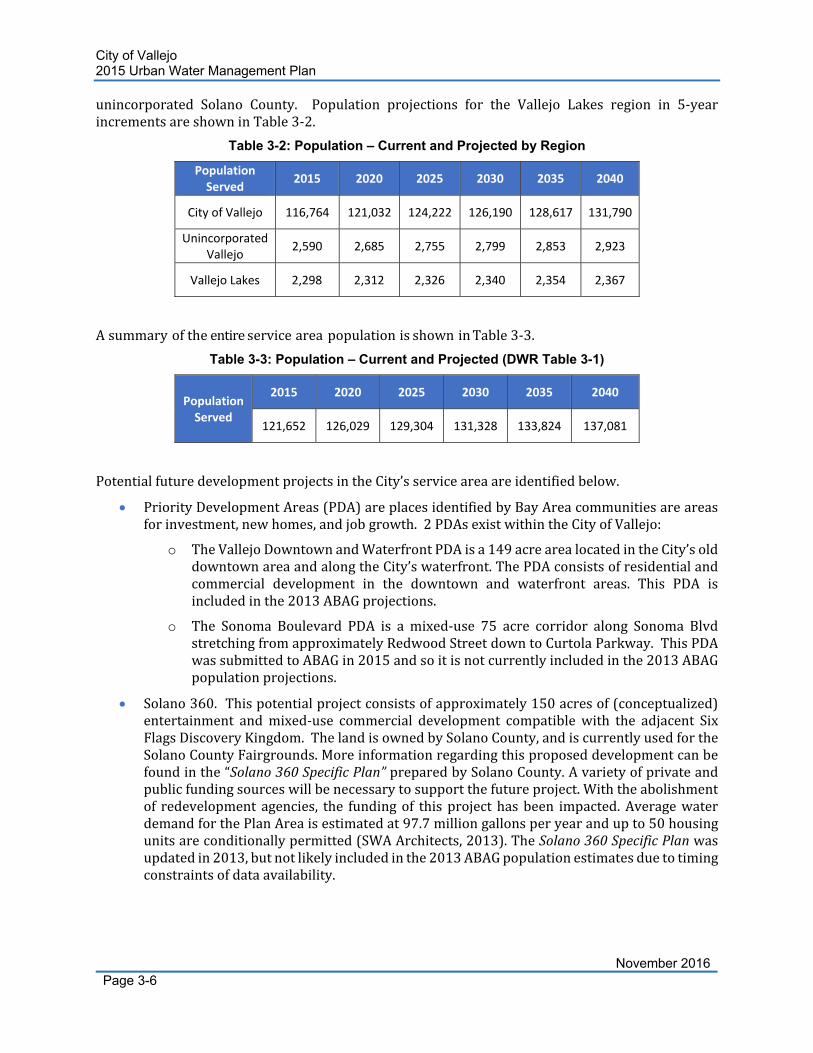
unincorporated Solano County. Population projections for the Vallejo Lakes region in 5‐yearincrementsareshowninTable3‐2.
Table 3-2: Population – Current and Projected by Region
Population Served
2015 2020 2025 2030 2035 2040
City of Vallejo 116,764 121,032 124,222 126,190 128,617 131,790
Unincorporated Vallejo
2,590 2,685 2,755 2,799 2,853 2,923
Vallejo Lakes 2,298 2,312 2,326 2,340 2,354 2,367
AsummaryoftheentireserviceareapopulationisshowninTable3‐3.
Table 3-3: Population – Current and Projected (DWR Table 3-1)
Population Served
2015 2020 2025 2030 2035 2040
121,652 126,029 129,304 131,328 133,824 137,081
PotentialfuturedevelopmentprojectsintheCity’sserviceareaareidentifiedbelow.
PriorityDevelopmentAreas(PDA)areplacesidentifiedbyBayAreacommunitiesareareasforinvestment,newhomes,andjobgrowth.2PDAsexistwithintheCityofVallejo:
o TheVallejoDowntownandWaterfrontPDAisa149acrearealocatedintheCity’solddowntownareaandalongtheCity’swaterfront.ThePDAconsistsofresidentialandcommercial development in the downtown and waterfront areas. This PDA isincludedinthe2013ABAGprojections.
o The Sonoma Boulevard PDA is a mixed‐use 75 acre corridor along Sonoma BlvdstretchingfromapproximatelyRedwoodStreetdowntoCurtolaParkway.ThisPDAwassubmittedtoABAGin2015andsoitisnotcurrentlyincludedinthe2013ABAGpopulationprojections.
Solano360.Thispotentialprojectconsistsofapproximately150acresof(conceptualized)entertainment andmixed‐use commercial development compatiblewith the adjacent SixFlagsDiscoveryKingdom.ThelandisownedbySolanoCounty,andiscurrentlyusedfortheSolanoCountyFairgrounds.Moreinformationregardingthisproposeddevelopmentcanbefoundinthe“Solano360SpecificPlan”preparedbySolanoCounty.Avarietyofprivateandpublicfundingsourceswillbenecessarytosupportthefutureproject.Withtheabolishmentof redevelopment agencies, the fundingof this project hasbeen impacted.AveragewaterdemandforthePlanAreaisestimatedat97.7milliongallonsperyearandupto50housingunitsareconditionallypermitted(SWAArchitects,2013).TheSolano360SpecificPlanwasupdatedin2013,butnotlikelyincludedinthe2013ABAGpopulationestimatesduetotimingconstraintsofdataavailability.
City of Vallejo 2015 Urban Water Management Plan
November 2016Page 3-7
MareIsland.ImplementationoftheMareIslandSpecificPlaninvolvestheredevelopmentofthe historic shipyard as a multi‐use community with a balance of industrial, office,commercial,residential,educational,recreation,cultural,andopenspaceuses,meetingtheneedsoffuturegenerations.MareIslandislocatedonthewesternedgeoftheCityofVallejoinsouthwesternSolanoCounty.Thisfuturedevelopmentprojectconsistsofapproximately1,448 acres ofReuseAreas. TheCity’sGeneral Plan identifies the followingPolicyAction(NBE‐2.4A)with respect toMare Island redevelopment: “Continue touse theMare IslandSpecificPlantoguidedevelopmentandconservationonMareIslandandsupportactivitiesthatcontributetotheeconomicandsocialwell‐beingof thecommunity.”TheMare IslandSpecificPlanwasoriginallyadoptedin1999,buthassinceundergoneseveralrevisions,mostrecentlyinAugust2013.ABAGpopulationestimateslikelyconsidersomeredevelopmentofMareIsland,buttheextentandtimingofsuchactivitiescontinuetoevolve.
Itisanticipatedthattheremaybeotherdevelopmentsapprovedbetweennowand2040whichhavenotyetbeensubmittedforconsideration.Fortheseundefineddevelopments,theUWMPassumesdevelopmentconsistentwiththecurrentlyadoptedGeneralPlan.FortheCity’sGeneralPlanandcurrentHousingElement,see:http://www.ci.vallejo.ca.us.NotethattheCityiscurrentlyintheprocessofupdatingitsGeneralPlan.SincetheGeneralPlanupdatehasnotyetbeenfinalized,anychangesinpopulationprojections(orassumptionsrelatingtothoseprojects)inthedraftplanwouldnothavebeenincludedintheABAGpopulationvaluesthatwereusedtoprojectfuturewaterdemandsforthisUWMP.
City of Vallejo 2015 Urban Water Management Plan
November 2016Page 3-8
Thispageintentionallyleftblank.
City of Vallejo 2015 Urban Water Management Plan
November 2016Page 4-1
Section 4 System Water Use ThischapterdescribestheCityofVallejo’scurrentwateruseandprojectedwaterusethroughtheyear2040.
4.1. Water Uses by Sector Vallejo’swateruseislimitedtotreatedsurfacewaterfromSolanoProject(LakeBerryessa),StateWaterProject(SWP)/VallejoPermitWater(CaliforniaBayDelta),andLakesFreyandMadigan.TheCity’swaterdemandhashistoricallybeenprimarilyattributedtoresidentialuse,withroughly62percentofallwaterproducedservingresidentialdemands.In2015,49percentofwaterproducedservicedsinglefamilyresidencesand13percentservedmulti‐familyhomes.Commercialdemands(whichincludesinstitutionalandindustrialdemands)isthenextlargestwateruser,at17percentin2015.Remaining2015wateruseincludedirrigationdemand(9percentofwaterproduced),otherdemands,suchaspublicfacilities,firehydrants,etc.(3percent)andwaterloss(9percent).
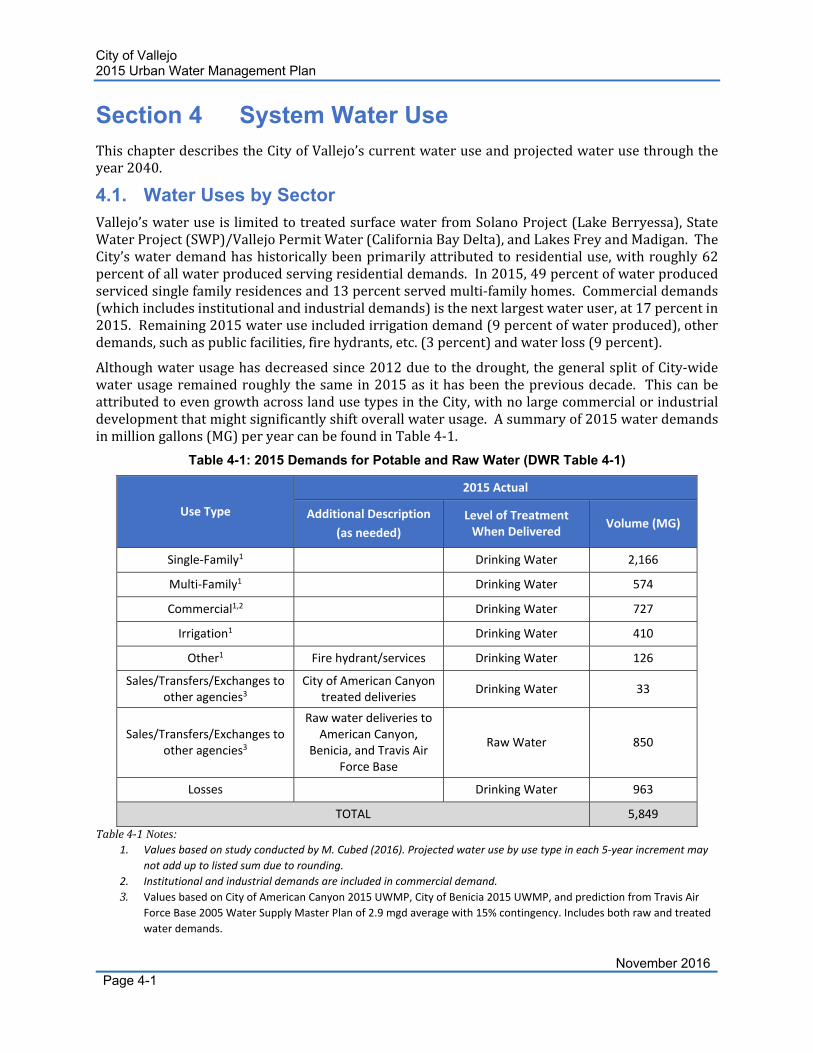
Althoughwaterusagehasdecreasedsince2012duetothedrought,thegeneralsplitofCity‐widewaterusageremainedroughlythesamein2015as ithasbeenthepreviousdecade. ThiscanbeattributedtoevengrowthacrosslandusetypesintheCity,withnolargecommercialorindustrialdevelopmentthatmightsignificantlyshiftoverallwaterusage.Asummaryof2015waterdemandsinmilliongallons(MG)peryearcanbefoundinTable4‐1.
Table 4-1: 2015 Demands for Potable and Raw Water (DWR Table 4-1)
Use Type
2015 Actual
Additional Description
(as needed)
Level of Treatment When Delivered
Volume (MG)
Single‐Family1 Drinking Water 2,166
Multi‐Family1 Drinking Water 574
Commercial1,2 Drinking Water 727
Irrigation1 Drinking Water 410
Other1 Fire hydrant/services Drinking Water 126
Sales/Transfers/Exchanges to other agencies3
City of American Canyon treated deliveries
Drinking Water 33
Sales/Transfers/Exchanges to other agencies3
Raw water deliveries to American Canyon,
Benicia, and Travis Air Force Base
Raw Water 850
Losses Drinking Water 963
TOTAL 5,849
Table4‐1 Notes: 1. Values based on study conducted by M. Cubed (2016). Projected water use by use type in each 5‐year increment may
not add up to listed sum due to rounding.
2. Institutional and industrial demands are included in commercial demand.
3. Values based on City of American Canyon 2015 UWMP, City of Benicia 2015 UWMP, and prediction from Travis Air
Force Base 2005 Water Supply Master Plan of 2.9 mgd average with 15% contingency. Includes both raw and treated
water demands.
City of Vallejo 2015 Urban Water Management Plan
November 2016Page 4-2
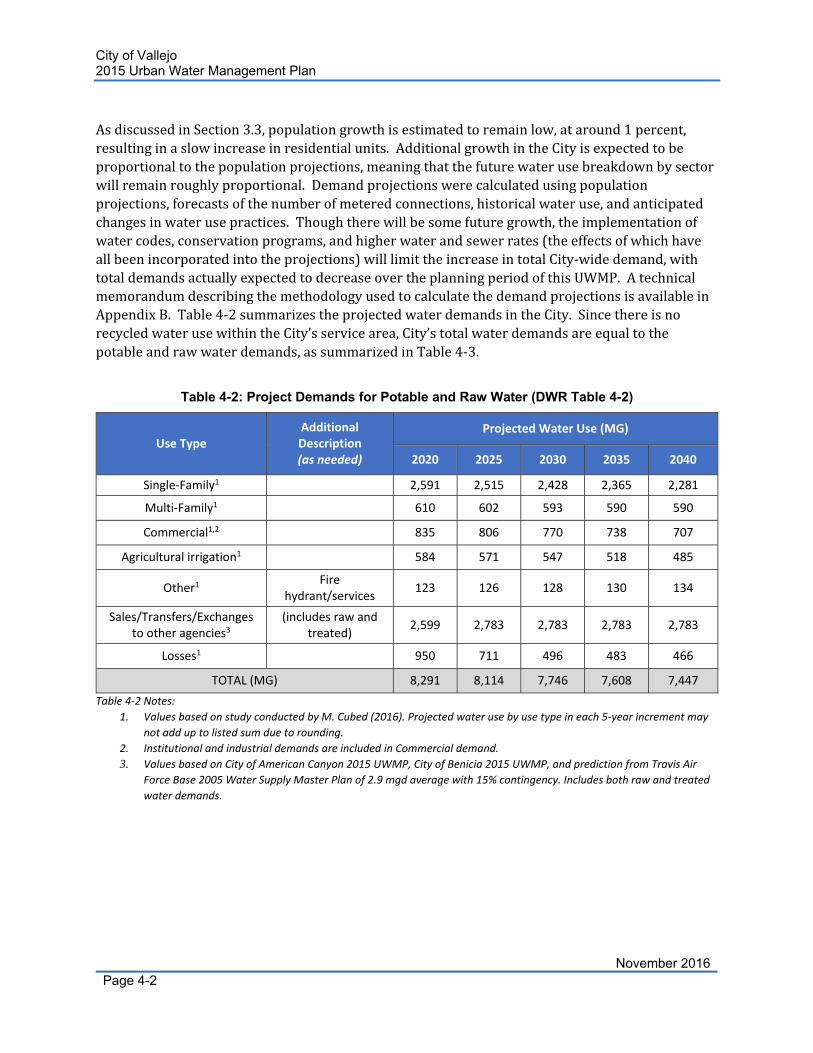
AsdiscussedinSection3.3,populationgrowthisestimatedtoremainlow,ataround1percent,resultinginaslowincreaseinresidentialunits.AdditionalgrowthintheCityisexpectedtobeproportionaltothepopulationprojections,meaningthatthefuturewaterusebreakdownbysectorwillremainroughlyproportional.Demandprojectionswerecalculatedusingpopulationprojections,forecastsofthenumberofmeteredconnections,historicalwateruse,andanticipatedchangesinwaterusepractices.Thoughtherewillbesomefuturegrowth,theimplementationofwatercodes,conservationprograms,andhigherwaterandsewerrates(theeffectsofwhichhaveallbeenincorporatedintotheprojections)willlimittheincreaseintotalCity‐widedemand,withtotaldemandsactuallyexpectedtodecreaseovertheplanningperiodofthisUWMP.AtechnicalmemorandumdescribingthemethodologyusedtocalculatethedemandprojectionsisavailableinAppendixB.Table4‐2summarizestheprojectedwaterdemandsintheCity.SincethereisnorecycledwaterusewithintheCity’sservicearea,City’stotalwaterdemandsareequaltothepotableandrawwaterdemands,assummarizedinTable4‐3.
Table 4-2: Project Demands for Potable and Raw Water (DWR Table 4-2)
Use Type Additional Description (as needed)
Projected Water Use (MG)
2020 2025 2030 2035 2040
Single‐Family1 2,591 2,515 2,428 2,365 2,281
Multi‐Family1 610 602 593 590 590
Commercial1,2 835 806 770 738 707
Agricultural irrigation1 584 571 547 518 485
Other1 Fire
hydrant/services 123 126 128 130 134
Sales/Transfers/Exchanges to other agencies3
(includes raw and treated)
2,599 2,783 2,783 2,783 2,783
Losses1 950 711 496 483 466
TOTAL (MG) 8,291 8,114 7,746 7,608 7,447
Table 4‐2 Notes:
1. Values based on study conducted by M. Cubed (2016). Projected water use by use type in each 5‐year increment may
not add up to listed sum due to rounding.
2. Institutional and industrial demands are included in Commercial demand.
3. Values based on City of American Canyon 2015 UWMP, City of Benicia 2015 UWMP, and prediction from Travis Air
Force Base 2005 Water Supply Master Plan of 2.9 mgd average with 15% contingency. Includes both raw and treated
water demands.
City of Vallejo 2015 Urban Water Management Plan
November 2016Page 4-3
Table 4-3: Total Water Demands (DWR Table 4-3)
2015 2020 2025 2030 2035 2040
Potable and Raw Water
From Tables 4‐1 and 4‐2
5,849 8,291 8,114 7,746 7,608 7,447
Recycled Water Demand
From Table 6‐4
0 0 0 0 0 0
TOTAL WATER DEMAND (MG)
5,849 8,291 8,114 7,746 7,608 7,447
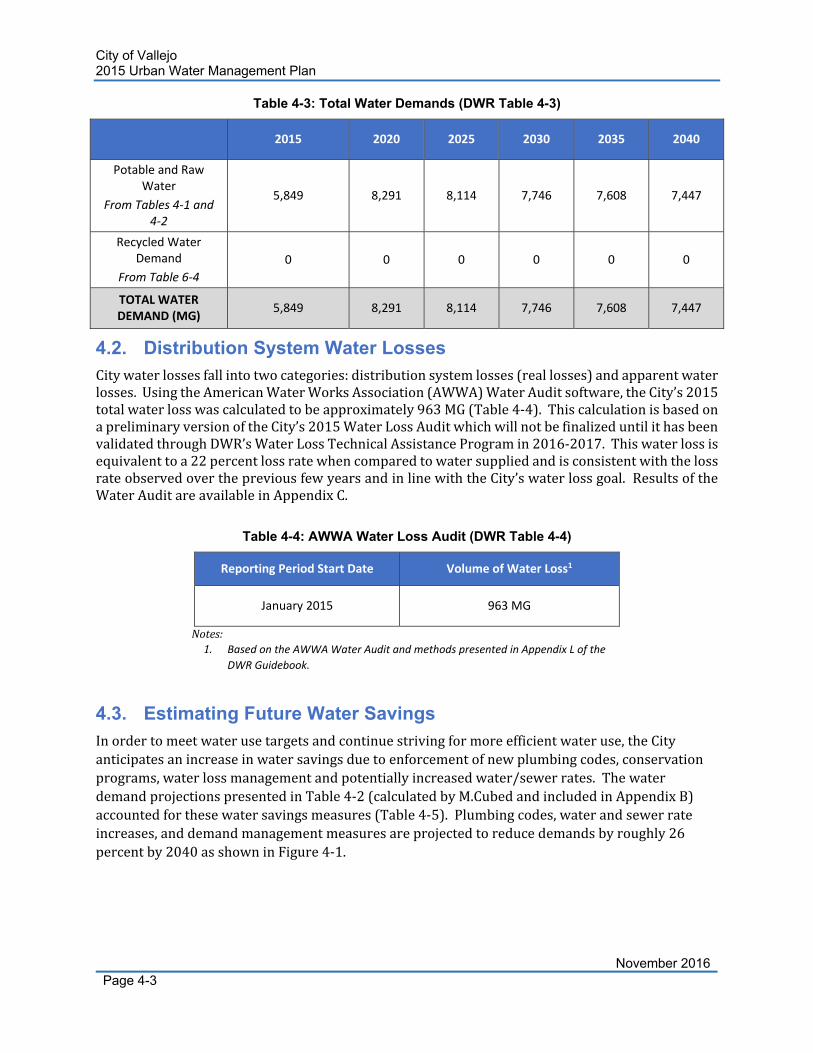
4.2. Distribution System Water Losses Citywaterlossesfallintotwocategories:distributionsystemlosses(reallosses)andapparentwaterlosses.UsingtheAmericanWaterWorksAssociation(AWWA)WaterAuditsoftware,theCity’s2015totalwaterlosswascalculatedtobeapproximately963MG(Table4‐4).ThiscalculationisbasedonapreliminaryversionoftheCity’s2015WaterLossAuditwhichwillnotbefinalizeduntilithasbeenvalidatedthroughDWR’sWaterLossTechnicalAssistanceProgramin2016‐2017.Thiswaterlossisequivalenttoa22percentlossratewhencomparedtowatersuppliedandisconsistentwiththelossrateobservedoverthepreviousfewyearsandinlinewiththeCity’swaterlossgoal.ResultsoftheWaterAuditareavailableinAppendixC.
Table 4-4: AWWA Water Loss Audit (DWR Table 4-4)
Reporting Period Start Date Volume of Water Loss1
January 2015 963 MG
Notes: 1. Based on the AWWA Water Audit and methods presented in Appendix L of the
DWR Guidebook.
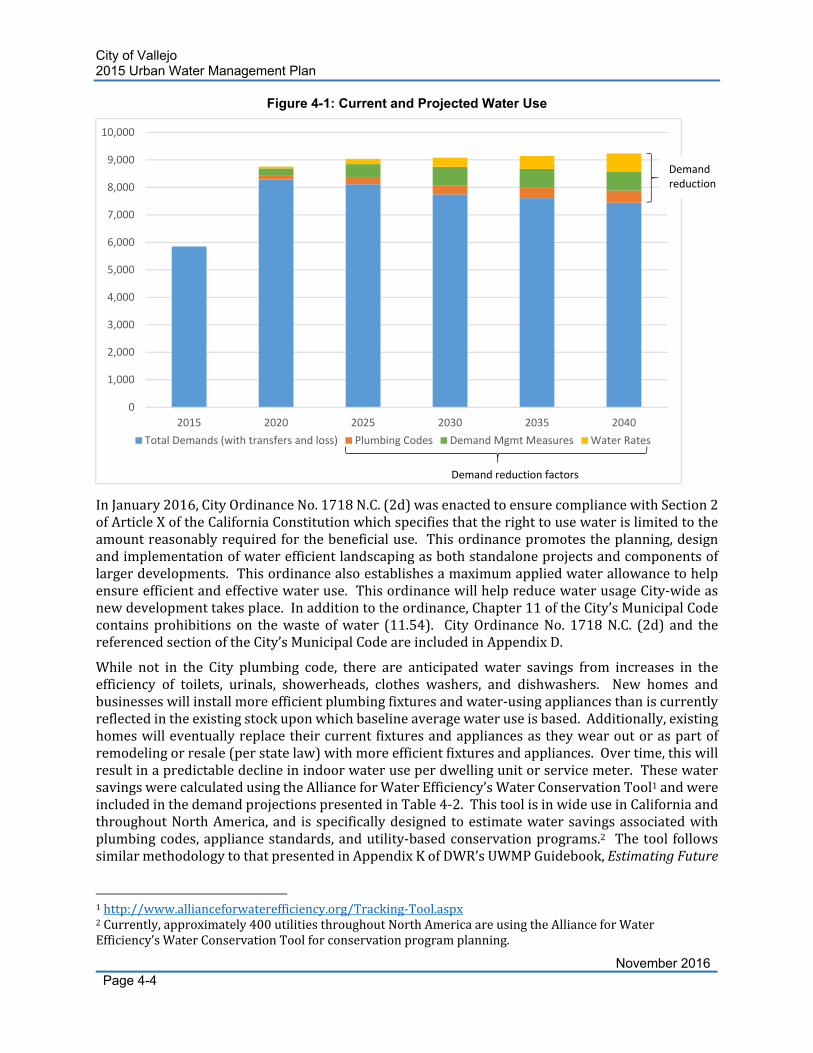
4.3. Estimating Future Water Savings Inordertomeetwaterusetargetsandcontinuestrivingformoreefficientwateruse,theCityanticipatesanincreaseinwatersavingsduetoenforcementofnewplumbingcodes,conservationprograms,waterlossmanagementandpotentiallyincreasedwater/sewerrates.ThewaterdemandprojectionspresentedinTable4‐2(calculatedbyM.CubedandincludedinAppendixB)accountedforthesewatersavingsmeasures(Table4‐5).Plumbingcodes,waterandsewerrateincreases,anddemandmanagementmeasuresareprojectedtoreducedemandsbyroughly26percentby2040asshowninFigure4‐1.
City of Vallejo 2015 Urban Water Management Plan
November 2016Page 4-4
Figure 4-1: Current and Projected Water Use
InJanuary2016,CityOrdinanceNo.1718N.C.(2d)wasenactedtoensurecompliancewithSection2ofArticleXoftheCaliforniaConstitutionwhichspecifiesthattherighttousewaterislimitedtotheamountreasonablyrequiredforthebeneficialuse. Thisordinancepromotestheplanning,designandimplementationofwaterefficientlandscapingasbothstandaloneprojectsandcomponentsoflargerdevelopments.Thisordinancealsoestablishesamaximumappliedwaterallowancetohelpensureefficientandeffectivewateruse.ThisordinancewillhelpreducewaterusageCity‐wideasnewdevelopmenttakesplace.Inadditiontotheordinance,Chapter11oftheCity’sMunicipalCodecontains prohibitions on thewaste ofwater (11.54). CityOrdinanceNo. 1718N.C. (2d) and thereferencedsectionoftheCity’sMunicipalCodeareincludedinAppendixD.
While not in the City plumbing code, there are anticipated water savings from increases in theefficiency of toilets, urinals, showerheads, clothes washers, and dishwashers. New homes andbusinesseswillinstallmoreefficientplumbingfixturesandwater‐usingappliancesthaniscurrentlyreflectedintheexistingstockuponwhichbaselineaveragewateruseisbased.Additionally,existinghomeswilleventuallyreplacetheircurrentfixturesandappliancesastheywearoutoraspartofremodelingorresale(perstatelaw)withmoreefficientfixturesandappliances.Overtime,thiswillresultinapredictabledeclineinindoorwateruseperdwellingunitorservicemeter.ThesewatersavingswerecalculatedusingtheAllianceforWaterEfficiency’sWaterConservationTool1andwereincludedinthedemandprojectionspresentedinTable4‐2.ThistoolisinwideuseinCaliforniaandthroughoutNorthAmerica,and isspecificallydesignedtoestimatewatersavingsassociatedwithplumbingcodes,appliancestandards,andutility‐basedconservationprograms.2 Thetool followssimilarmethodologytothatpresentedinAppendixKofDWR’sUWMPGuidebook,EstimatingFuture
1http://www.allianceforwaterefficiency.org/Tracking‐Tool.aspx2Currently,approximately400utilitiesthroughoutNorthAmericaareusingtheAllianceforWaterEfficiency’sWaterConservationToolforconservationprogramplanning.
0
1,000
2,000
3,000
4,000
5,000
6,000
7,000
8,000
9,000
10,000
2015 2020 2025 2030 2035 2040
Total Demands (with transfers and loss) Plumbing Codes Demand Mgmt Measures Water Rates
Demand reduction factors
Demand reduction
City of Vallejo 2015 Urban Water Management Plan
November 2016Page 4-5
Water Savings fromAdoptedCodes, Standards,Ordinances, orTransportationand LandUsePlans(2015).
Otherwatersavingscanbeattributedtoincreasesinwaterandsewerrates.TheCity’swaterratesemployacombinationoffixedserviceandvolumetriccharges.Usersareencouragedtolimitwaterusagetoreducethevolumetricportionoftheirwaterbills.TheCityislikelytocontinueemployingthis rate structure in the future which will continue to encourage customers to reduce waterdemands.
4.4. Water Use for Lower Income Households CWCSection10631.1(a) requiressuppliers toestimateprojectedwateruse for single‐familyandmulti‐familyresidentialhousingneededforlowerincomehouseholds,asidentifiedintheHousingElementof theGeneral Plan for the service areaof the supplier. According to theCity’s currentHousingElementUpdate2015‐2023(LisaWiseConsulting,Inc.,2015),anestimated41percentofhouseholdsintheCityarelower‐income,asdefinedashavingincomebelow80percentofthearea’smedianhouseholdincome.
Further,per theHousingElement, theCity’sRegionalHousingNeedAllocation for2014 through2022forlowerincomehousingis461units.TheRegionalHousingNeedAllocationdoesnotbreakdownthehousingneedbyhousingtype(single‐familyversusmulti‐family).Therefore,theprojectedwaterdemandforlowerincomehousingwasconservativelyestimatedbasedontheaverage2015water demands for single‐family residential customers. At 0.066MG per household3 and 17,055lower‐income household units4, the projected water demand for lower income housing units isroughly1,130.3MGin2020.5Thisestimateisconsideredtobeconservativebecausemulti‐familyresidentialhousinguseslesswateronaper‐dwellingunitthansingle‐familyhousing.AsshowninTable4‐5, thisdemand is incorporated inoveralldemandprojections in thisUWMPbyassuminglowerincomehousinggrowsproportionallytoCitypopulationgrowth.
Table 4-5: Inclusion in Water Use Projections (DWR Table 4-5)
Are Future Water Savings Included in Projections?
Yes
Location in UWMP Section 4.3
Are Lower Income Residential Demands Included in Projections?
Yes
3Basedon32,682single‐familyhouseholdswithademandof2,166MGin2015.416,594existinglow‐incomehouseholdsplus461futurehouseholds.5WhilethecurrentHousingElementdoesnotincludeprojectionsforlowincomehousingthrough2040,anestimateofgrowthinthissectorcanbeestimatedbasedontheprojectedgrowthofthegeneralpopulation.Assuminga1percentannualincreaseinthepopulationoflowerincomeresidents(andarelatedchangeinlowerincomehousingunits),theprojectedwaterdemandforlowerincomehousingunitsisestimatedtobe1,379MGin2040.
City of Vallejo 2015 Urban Water Management Plan
November 2016Page 4-6
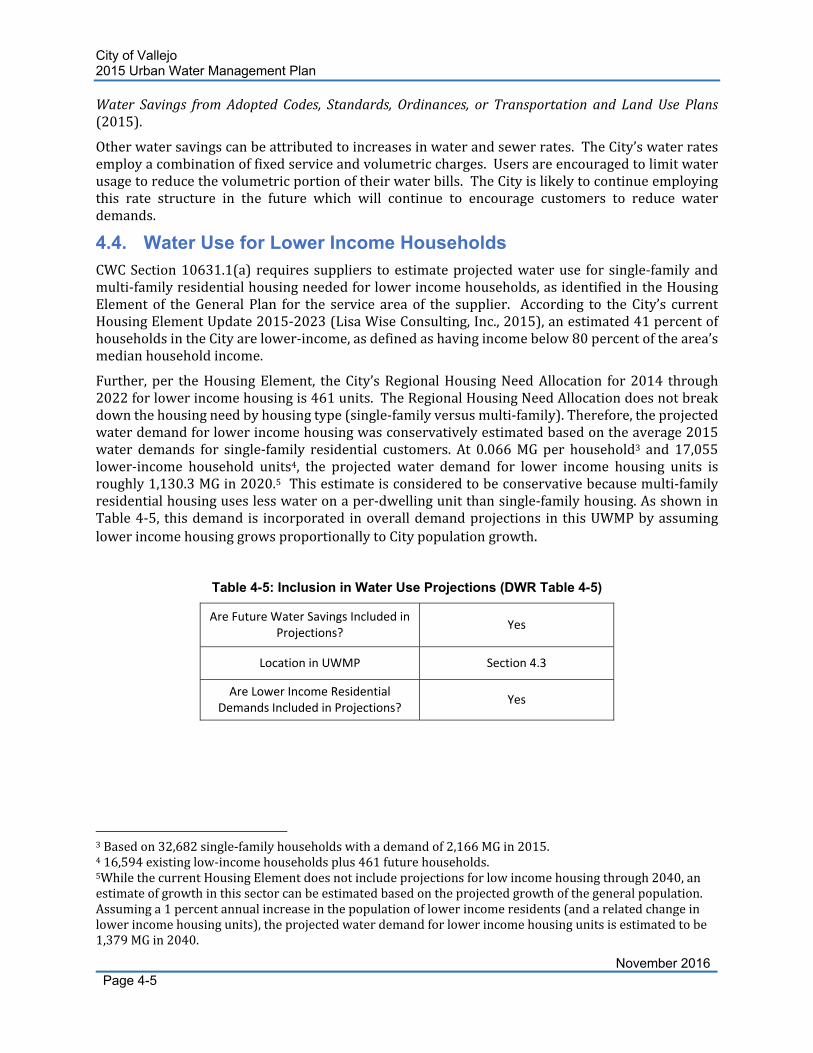
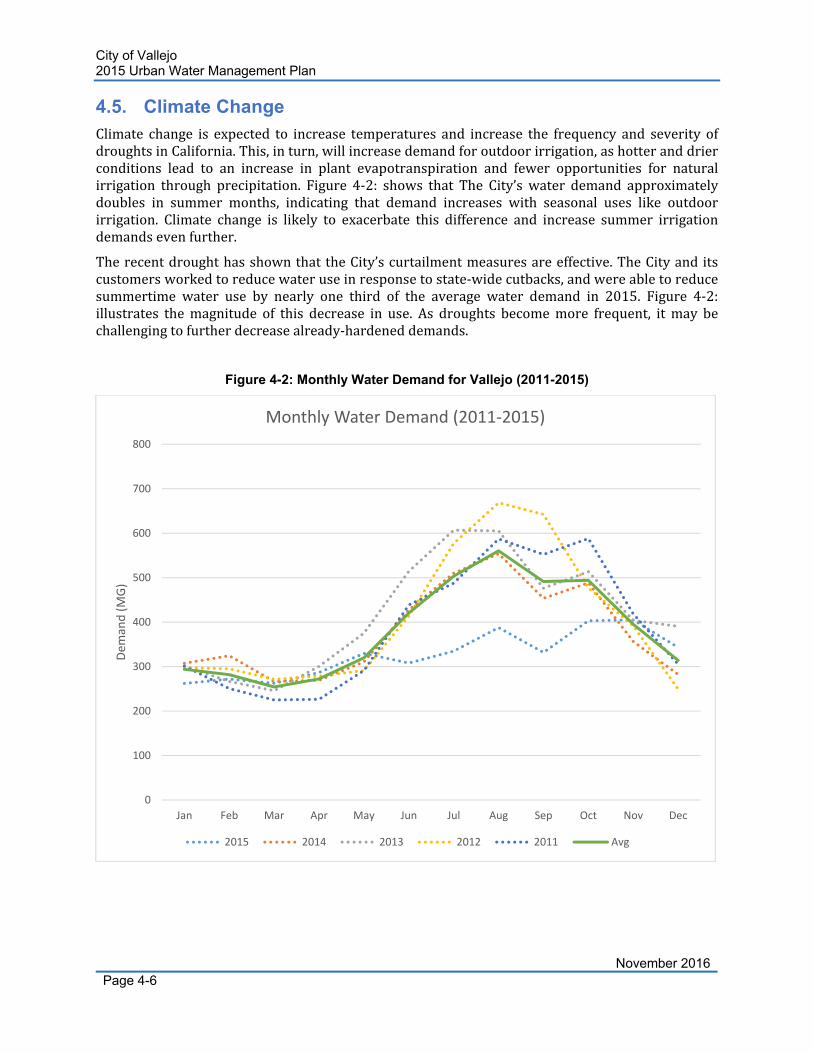
4.5. Climate Change Climate change is expected to increase temperatures and increase the frequency and severity ofdroughtsinCalifornia.This,inturn,willincreasedemandforoutdoorirrigation,ashotteranddrierconditions lead to an increase in plant evapotranspiration and fewer opportunities for naturalirrigation through precipitation. Figure 4‐2: shows that The City’s water demand approximatelydoubles in summer months, indicating that demand increases with seasonal uses like outdoorirrigation. Climate change is likely to exacerbate this difference and increase summer irrigationdemandsevenfurther.
TherecentdroughthasshownthattheCity’scurtailmentmeasuresareeffective.TheCityanditscustomersworkedtoreducewateruseinresponsetostate‐widecutbacks,andwereabletoreducesummertime water use by nearly one third of the average water demand in 2015. Figure 4‐2:illustrates themagnitude of this decrease in use. As droughts becomemore frequent, itmay bechallengingtofurtherdecreasealready‐hardeneddemands.
Figure 4-2: Monthly Water Demand for Vallejo (2011-2015)
0
100
200
300
400
500
600
700
800
Jan Feb Mar Apr May Jun Jul Aug Sep Oct Nov Dec
Dem
and (MG)
Monthly Water Demand (2011‐2015)
2015 2014 2013 2012 2011 Avg
City of Vallejo 2015 Urban Water Management Plan
November 2016Page 5-1
Section 5 SB X7-7 Baselines and Targets ThissectiondescribestheCity'surbanwatersystemdemands.ItpresentsthecalculationsfortheCity'sbaseline(basedailypercapita)wateruseandinterimandfinalwaterusetargets,includingadetaileddescriptionofhow thebaseline and targetswere calculated.The calculations follow theguidance provided in DWR's publicationMethodologies for Calculating Baseline and ComplianceUrbanPerCapitaWaterUse (2016a).Background informationand theapproachused todevelopbaselinesandtargetsarealsoincluded.
5.1. Updating Calculations from 2010 UWMP In2010,urbanwatersupplierswererequiredunderSBx7‐7(theWaterConservationBillof2009)todevelopabaselinedailypercapitawateruse,apercapitawaterusetargetfor2020,andaninterimwaterusetargetfor2015intheirUWMPs.Inits2010DraftUWMP,theCityusedabaselineperiodfrom1999to2008tocalculateabaselinewateruseof156GPCD.TheCity’s2020waterusetargetwas125andits2015interimwaterusetargetwas141GPCD.Sincethe2010U.S.CensusdatawasnotavailablewhentheCitydraftedits2010UWMP,itmustrecalculateitsSBX7‐7waterusebaselinesandtargetsforthisPlanusing2010Censusdata.The2015UWMPGuidelinesalsostatethatanagencymayuseadifferentbaselineperiodinits2015UWMPthanits2010UWMP(2016b).
5.2. Baseline Periods Thepurposeofdevelopingabasedailypercapitawateruseistohaveabaselinefromwhichtoderivethewaterusetargetfor2020andtheinterimtargetfor2015.Thebaselineisdevelopedforeachwatersupplierbasedona10‐yearaveragebeginningnoearlierthan1994andendingnolaterthan2010.Ifin2008morethan10percentofanurbanwatersupplier'sdeliverieswerefromrecycledwater,a15‐yearaveragemaybeused.TheCitydoesnothaverecycledwatersothe15‐yearaveragedoesnotapply.
Averagewateruseovera5‐yearbaselineperiodbeginningnoearlierthan2003andendingnolaterthan2010isalsocalculatedtoconfirmwhethertheproposed2020percapitawaterusetargetmeetsthelegislation'sminimumwaterusereductionrequirementofatleast5percent.Inotherwords,ifthecalculated2020waterusereductiontargetdoesnotrepresentatleasta5percentreductionfromthe5‐yearbaselineperiod,theurbanwatersuppliermustlowertheproposed2020targettomeetthe5percentminimumreductionrequirement.
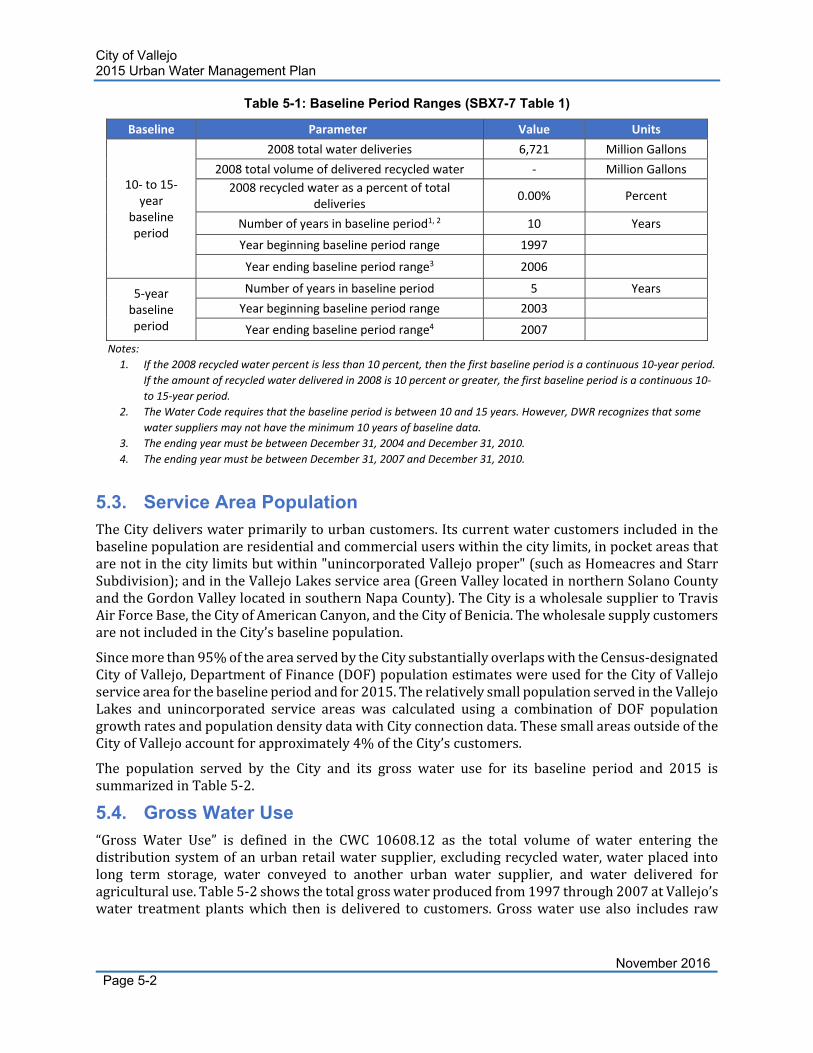
TheCity'sbaselineiscalculatedusinga10‐yearaveragebecauseitsrecycledwatersupplywaslessthan10percentofthetotalwatersupply(infact,itwaszero).TheCityhasselecteditsbaselineoverthe10‐yearperiodtobe1997to2006andits5‐yearperiod(usedtocalculatecompliancewiththe5percentminimumreductionrequirement)tobe2003to2007.ThisinformationissummarizedinTable5‐1.
City of Vallejo 2015 Urban Water Management Plan
November 2016Page 5-2
Table 5-1: Baseline Period Ranges (SBX7-7 Table 1)
Baseline Parameter Value Units
10‐ to 15‐year
baseline period
2008 total water deliveries 6,721 Million Gallons
2008 total volume of delivered recycled water ‐ Million Gallons
2008 recycled water as a percent of total deliveries
0.00% Percent
Number of years in baseline period1, 2 10 Years
Year beginning baseline period range 1997
Year ending baseline period range3 2006
5‐year baseline period
Number of years in baseline period 5 Years
Year beginning baseline period range 2003
Year ending baseline period range4 2007
Notes:
1. If the 2008 recycled water percent is less than 10 percent, then the first baseline period is a continuous 10‐year period.
If the amount of recycled water delivered in 2008 is 10 percent or greater, the first baseline period is a continuous 10‐
to 15‐year period.
2. The Water Code requires that the baseline period is between 10 and 15 years. However, DWR recognizes that some
water suppliers may not have the minimum 10 years of baseline data.
3. The ending year must be between December 31, 2004 and December 31, 2010.
4. The ending year must be between December 31, 2007 and December 31, 2010.
5.3. Service Area Population TheCitydeliverswaterprimarilytourbancustomers.Itscurrentwatercustomersincludedinthebaselinepopulationareresidentialandcommercialuserswithinthecitylimits,inpocketareasthatarenotinthecitylimitsbutwithin"unincorporatedVallejoproper"(suchasHomeacresandStarrSubdivision);andintheVallejoLakesservicearea(GreenValleylocatedinnorthernSolanoCountyandtheGordonValleylocatedinsouthernNapaCounty).TheCityisawholesalesuppliertoTravisAirForceBase,theCityofAmericanCanyon,andtheCityofBenicia.ThewholesalesupplycustomersarenotincludedintheCity’sbaselinepopulation.
Sincemorethan95%oftheareaservedbytheCitysubstantiallyoverlapswiththeCensus‐designatedCityofVallejo,DepartmentofFinance(DOF)populationestimateswereusedfortheCityofVallejoserviceareaforthebaselineperiodandfor2015.TherelativelysmallpopulationservedintheVallejoLakes and unincorporated service areas was calculated using a combination of DOF populationgrowthratesandpopulationdensitydatawithCityconnectiondata.ThesesmallareasoutsideoftheCityofVallejoaccountforapproximately4%oftheCity’scustomers.
The population served by the City and its gross water use for its baseline period and 2015 issummarizedinTable5‐2.
5.4. Gross Water Use “Gross Water Use” is defined in the CWC 10608.12 as the total volume of water entering thedistributionsystemofanurbanretailwatersupplier,excludingrecycledwater,waterplacedintolong term storage, water conveyed to another urban water supplier, and water delivered foragriculturaluse.Table5‐2showsthetotalgrosswaterproducedfrom1997through2007atVallejo’swater treatmentplantswhich then is delivered to customers.Grosswateruse also includes raw
City of Vallejo 2015 Urban Water Management Plan
November 2016Page 5-3
watercustomers,whichconstituteapproximately3percentoftotalwateruseandtakedeliveryoftheirwaterupstreamoftheFlemingHillWTP.
Water produced from the Fleming Hill WTP is delivered to all in‐city water customers,unincorporatedVallejoproperandCityofAmericanCanyontreatedwatersales.TotalgrosswateruseshowninTable5‐2doesnotincludewatertreatedattheFlemingHillWTPthatiswholesaledtoAmerican Canyon.Water produced from the Green ValleyWTP is delivered to the Lakes watercustomers.Startingin2014,LakeswatercustomersalsoreceivepotablewaterpurchasedfromtheCityofFairfield.
TheCitydoesnotproduceanyrecycledwater,placewaterintolongtermstorage,ordeliverwaterforagriculturaluse,sothesepotentialwateruseswerenotincorporatedintothegrosswateruseanalysis.
City of Vallejo 2015 Urban Water Management Plan
November 2016Page 5-4
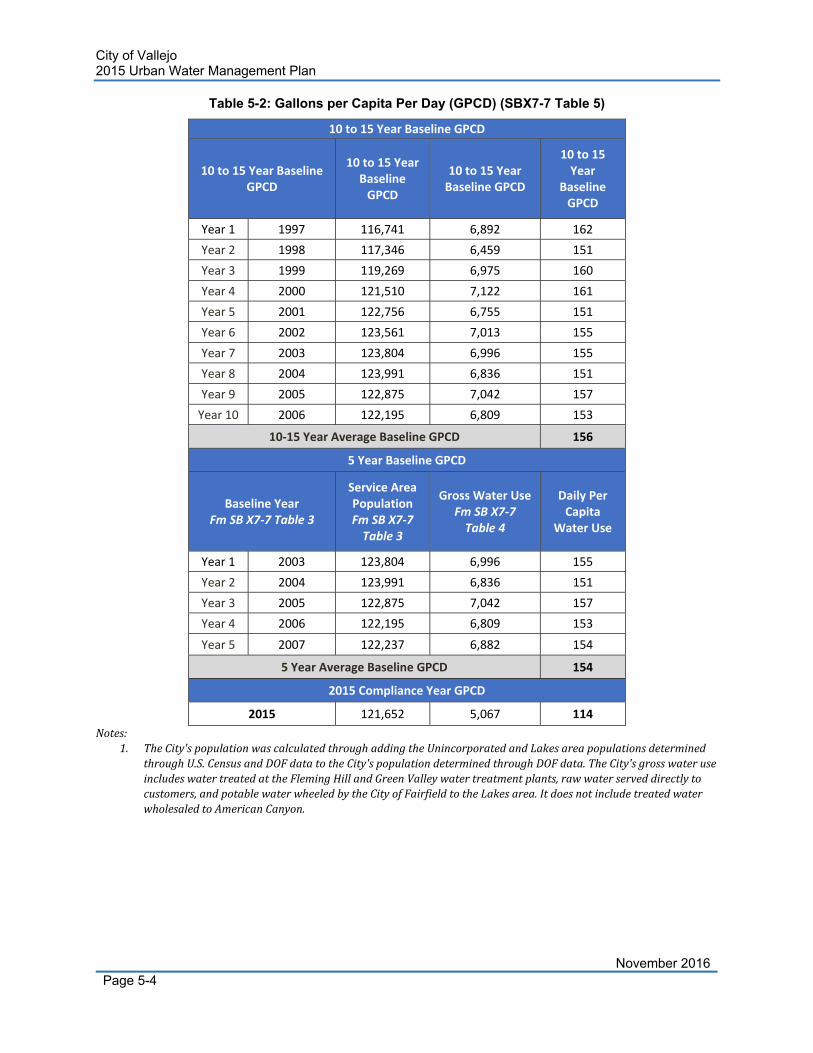
Table 5-2: Gallons per Capita Per Day (GPCD) (SBX7-7 Table 5)
10 to 15 Year Baseline GPCD
10 to 15 Year Baseline GPCD
10 to 15 Year Baseline GPCD
10 to 15 Year Baseline GPCD
10 to 15 Year
Baseline GPCD
Year 1 1997 116,741 6,892 162
Year 2 1998 117,346 6,459 151
Year 3 1999 119,269 6,975 160
Year 4 2000 121,510 7,122 161
Year 5 2001 122,756 6,755 151
Year 6 2002 123,561 7,013 155
Year 7 2003 123,804 6,996 155
Year 8 2004 123,991 6,836 151
Year 9 2005 122,875 7,042 157
Year 10 2006 122,195 6,809 153
10‐15 Year Average Baseline GPCD 156
5 Year Baseline GPCD
Baseline Year Fm SB X7‐7 Table 3
Service Area Population Fm SB X7‐7 Table 3
Gross Water UseFm SB X7‐7 Table 4
Daily Per Capita
Water Use
Year 1 2003 123,804 6,996 155
Year 2 2004 123,991 6,836 151
Year 3 2005 122,875 7,042 157
Year 4 2006 122,195 6,809 153
Year 5 2007 122,237 6,882 154
5 Year Average Baseline GPCD 154
2015 Compliance Year GPCD
2015 121,652 5,067 114
Notes:1. TheCity'spopulationwascalculatedthroughaddingtheUnincorporatedandLakesareapopulationsdetermined
throughU.S.CensusandDOFdatatotheCity'spopulationdeterminedthroughDOFdata.TheCity'sgrosswateruseincludeswatertreatedattheFlemingHillandGreenValleywatertreatmentplants,rawwaterserveddirectlytocustomers,andpotablewaterwheeledbytheCityofFairfieldtotheLakesarea.ItdoesnotincludetreatedwaterwholesaledtoAmericanCanyon.
City of Vallejo 2015 Urban Water Management Plan
November 2016Page 5-5
5.5. Baseline and Target Daily Per Capita Water Use Thebasedailypercapitause is thewatersupplier'saveragegrossdailypercapitause ingallons("baseline").Thebaselineincludesallwaterenteringthedeliverysystem,includingwaterlosses.
Table5‐3illustratestheCity's10‐yearbaselineandiscalculatedat156gallonspercapitaperday(gpcd).ThebaselinewasdevelopedusingthetotalserviceareapopulationshowninTable2.2andistheaveragepercapitausageoverthe10‐yearperiodselected.
Eachurbanwatersuppliermustalsocalculatea5‐yearbaselineforaperiodbetween2003and2010and adopt a target that results in at least a 5 percent reduction from that 5‐year baseline. AsillustratedbelowinTable5‐3,theCity's5‐yearbasedailypercapitawateruseis154GPCD.
Aspreviouslystated,SBx7‐7requiresthattheCity's2020targetmustbeatleast95percentofthe5‐yearbaselineof154GPCD,or147GPCD.Thus,theCity's2020percapitawaterusetargetcannotexceed146GPCD.
SBx7‐7establishedrequirementstoreducethestatewideurbanpercapitawateruseby20percentbytheyear2020.Eachindividualurbanwatersuppliermustdevelopawaterusetargetfortheyear2020aswellasaninterimwaterusetargetfortheyear2015.Theinterimwaterusetargetsetfor2015isnumericallyhalfwaybetweenthebaselineandthe2020target.Dependingonanagency'sbaseline, the resulting targets may result in something more or less than 20 percent reductioncompared to current use. In accordancewithWater Code Section10608.4(k)(2), agencies not incompliancewiththe2020targetbyDecember31,2020willnotbeeligibleforstatewatergrantsorloans.
Therearefourmethodsthatanurbanwatersuppliermayusetodevelopits2015and2020waterusetargets.ThreemethodswereprovidedinSBx7‐7andthefourthwassubsequentlyestablishedbyDWR.Thefourmethodsaregenerallydescribedbelow.AmorecompletedescriptioncanbefoundinDWR's2015UWMPGuidebook(2016b).
Method1:80percentof10‐yearbaselineGPCD;
Method2:Performancestandardsbasedonactualwaterusedataforindoorresidentialwateruse,landscapedarea,andcommercial,industrialandinstitutional(CII)wateruse;
Method3:95percentoftheSanFranciscoBayHydrologicRegionalTargetfromthe20x2020WaterConservationPlan;and
Method 4: Water Use Targets based on residential performance standards and specificsavingsgoalsforCllandLandscapeuseandforwaterlosses.
Methods1and3wereappliedinthisanalysis.Methods2and4requiredataspecificitythatisnotcurrentlyavailabletotheCity,suchasparcel‐specificlandscapedareaforallproperty(Method2).Method4requiresthedevelopmentofa10‐yearaverageoftheGPCDofClluse.TheCity'sCllsectorwater billing data is not reliable for the first two years of its selected 10‐year range. Therefore,Method4wasnotusedbytheCitytocalculatewaterusetargets.
Urban Water Use Target Method 1 Evaluation: 80 Percent of Base Daily per Capita Water Use
TheCity'sbaselinewateruse,asillustratedinTable5‐3is156GPCD,calculatedovertheperiodfrom1997through2006.
Basedona20percentreductionofthebasedailypercapitawateruseof156GPCD,the2020targetis124GPCD;and
City of Vallejo 2015 Urban Water Management Plan
November 2016Page 5-6
Basedonthemidpointbetweenthebasedailypercapitawateruseof156GPCDandthe2020targetof124GPCD,the2015interimtargetis140GPCD.
Urban Water Use Target Method 3 Evaluation: 95 Percent of the Hydrologic Region Target
Method3allowsthewatersuppliertoselect95percentofthehydrologicregion's2020targetasitstarget.TheapplicablehydrologicregionfortheCityisRegion2‐SanFranciscoBay,witharegionaltargetof131GPCD.
Basedon95percentofthehydrologicregion'stargetof131GPCDfortheSanFranciscoBayRegion,the2020targetis124GPCD;and
Basedonthemidpointbetweenthebaselinewateruseof156GPCDandthe2020targetof124GPCD,the2015interimtargetis140GPCD.
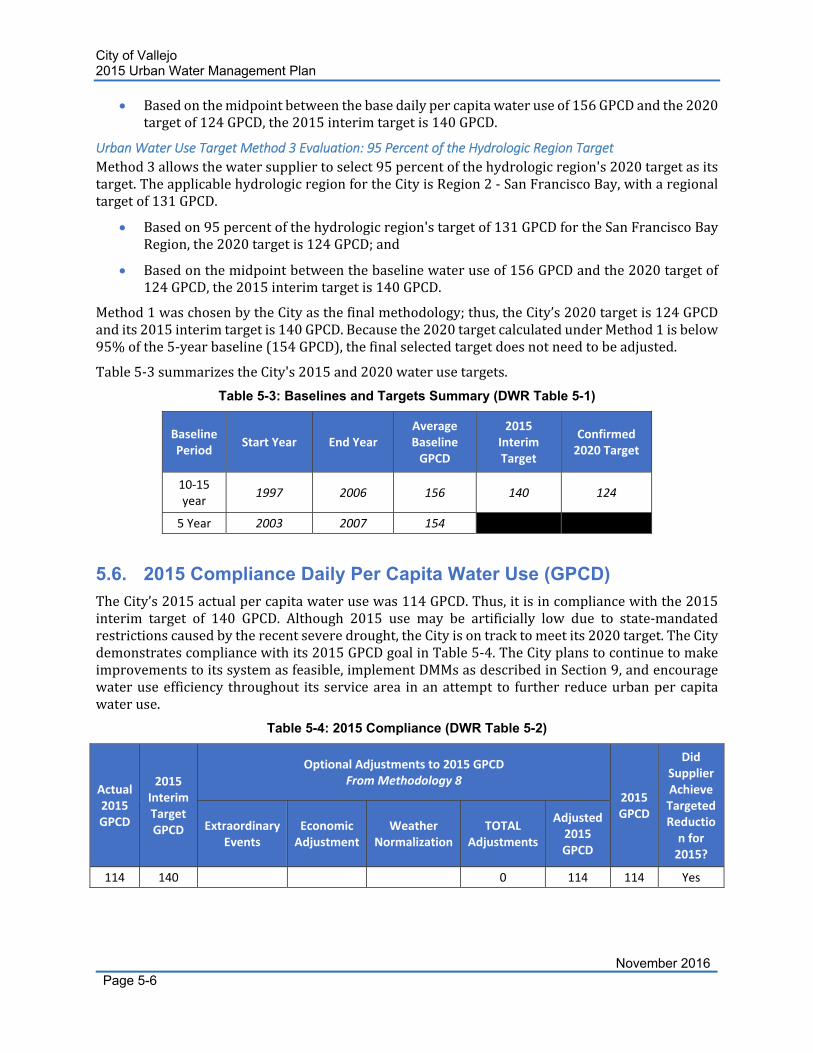
Method1waschosenbytheCityasthefinalmethodology;thus,theCity’s2020targetis124GPCDandits2015interimtargetis140GPCD.Becausethe2020targetcalculatedunderMethod1isbelow95%ofthe5‐yearbaseline(154GPCD),thefinalselectedtargetdoesnotneedtobeadjusted.
Table5‐3summarizestheCity's2015and2020waterusetargets.
Table 5-3: Baselines and Targets Summary (DWR Table 5-1)
Baseline Period
Start Year End Year Average Baseline GPCD
2015 Interim Target
Confirmed 2020 Target
10‐15 year
1997 2006 156 140 124
5 Year 2003 2007 154
5.6. 2015 Compliance Daily Per Capita Water Use (GPCD) TheCity’s2015actualpercapitawaterusewas114GPCD.Thus,itisincompliancewiththe2015interim target of 140 GPCD. Although 2015 use may be artificially low due to state‐mandatedrestrictionscausedbytherecentseveredrought,theCityisontracktomeetits2020target.TheCitydemonstratescompliancewithits2015GPCDgoalinTable5‐4.TheCityplanstocontinuetomakeimprovementstoitssystemasfeasible,implementDMMsasdescribedinSection9,andencouragewateruseefficiency throughout itsservicearea inanattempt to further reduceurbanpercapitawateruse.
Table 5-4: 2015 Compliance (DWR Table 5-2)
Actual 2015 GPCD
2015 Interim Target GPCD
Optional Adjustments to 2015 GPCD From Methodology 8
2015 GPCD
Did Supplier Achieve Targeted Reduction for 2015?
Extraordinary Events
Economic Adjustment
Weather Normalization
TOTAL Adjustments
Adjusted 2015 GPCD
114 140 0 114 114 Yes
City of Vallejo 2015 Urban Water Management Plan
November 2016Page 6-1
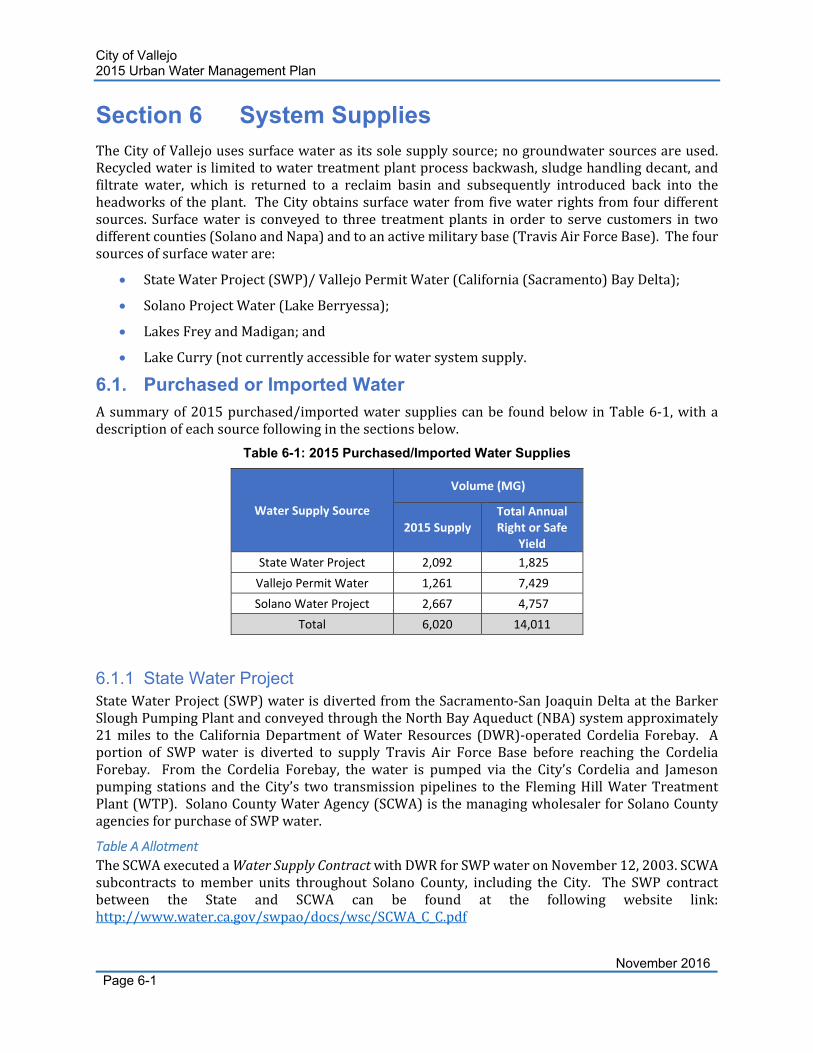
Section 6 System Supplies TheCityofVallejousessurfacewaterasitssolesupplysource;nogroundwatersourcesareused.Recycledwaterislimitedtowatertreatmentplantprocessbackwash,sludgehandlingdecant,andfiltrate water, which is returned to a reclaim basin and subsequently introduced back into theheadworksoftheplant. TheCityobtainssurfacewaterfromfivewaterrightsfromfourdifferentsources. Surfacewater is conveyed to three treatmentplants inorder to serve customers in twodifferentcounties(SolanoandNapa)andtoanactivemilitarybase(TravisAirForceBase).Thefoursourcesofsurfacewaterare:
StateWaterProject(SWP)/VallejoPermitWater(California(Sacramento)BayDelta);
SolanoProjectWater(LakeBerryessa);
LakesFreyandMadigan;and
LakeCurry(notcurrentlyaccessibleforwatersystemsupply.
6.1. Purchased or Imported Water Asummaryof2015purchased/importedwatersuppliescanbe foundbelowinTable6‐1,withadescriptionofeachsourcefollowinginthesectionsbelow.
Table 6-1: 2015 Purchased/Imported Water Supplies
Water Supply Source
Volume (MG)
2015 Supply Total Annual Right or Safe
Yield
State Water Project 2,092 1,825
Vallejo Permit Water 1,261 7,429
Solano Water Project 2,667 4,757
Total 6,020 14,011
6.1.1 State Water Project StateWaterProject(SWP)waterisdivertedfromtheSacramento‐SanJoaquinDeltaattheBarkerSloughPumpingPlantandconveyedthroughtheNorthBayAqueduct(NBA)systemapproximately21miles to theCaliforniaDepartment ofWaterResources (DWR)‐operatedCordelia Forebay. Aportion of SWP water is diverted to supply Travis Air Force Base before reaching the CordeliaForebay. From the Cordelia Forebay, the water is pumped via the City’s Cordelia and Jamesonpumping stationsand theCity’s two transmissionpipelines to theFlemingHillWaterTreatmentPlant(WTP).SolanoCountyWaterAgency(SCWA)isthemanagingwholesalerforSolanoCountyagenciesforpurchaseofSWPwater.
Table A Allotment
TheSCWAexecutedaWaterSupplyContractwithDWRforSWPwateronNovember12,2003.SCWAsubcontracts tomember units throughout Solano County, including the City. The SWP contractbetween the State and SCWA can be found at the following website link:http://www.water.ca.gov/swpao/docs/wsc/SCWA_C_C.pdf
City of Vallejo 2015 Urban Water Management Plan
November 2016Page 6-2
TheCityexecutedaWaterContractforWaterSupplyfromNorthBayAqueductwithSCWA.Intheagreement,theCityisallocatedannualallotmentsofSWPwater,commonlyreferredtoas“TableAallotment”.TheCity’sTableAallotmentwasaccelerated in2009 to itsultimateamountof1,825milliongallonsperyear(MG/yr)startingin2010.TheCity’scurrentwatercontractwithSCWArunsthrough2035withprovisionsforextensions. Allmemberunitsto theSWPcontractshare inthesamecurtailmentpercentageasdeclaredby theStateofCalifornia foranygivenwateryear.Theannualrightmaybeexceededinagivenyearduetoavailablecarryoverfrompreviousyears.
Dry‐Year Water Bank
SCWA,alongwithaconsortiumofStatewatercontractors,entered intoanagreementwithDWR,entitled2009DroughtWaterBankAgreement,which is foremergencywaterpotentiallyavailablewhenthereisacurtailmentofSWPwaterandifricefarmersintheSacramentoValleyarewillingtomake their SWP water supply available to urban users of SWP water. This supply (commonlyreferred toas “dry‐yearwaterbank”) isneitherguaranteednor reliable. Thispotentialdry‐yearsupplydoesnotreduceavailableSWPTableAallotments.
Turn‐Back Water Pool Program
DWRhasaprogramfor interestedSWPcontractorscalledtheTurn‐backWaterPoolProgram. ASWPcontractormaychoosetosellTableAwateritwillnotuseorpurchaseturn‐backpoolwaterthatisavailablethroughtheprogram.ForpurposesofthisUWMP,waterfromthispoolprogramisnotincludedinthereliabilityassessmentorthevariouswatersupplytablesbecausethisprogramoperatesonanas‐availablebasis.TheamountofpoolwaterthatwouldbeavailabletotheCityisnotasignificantamount.
6.1.2 Vallejo Permit Water VallejoholdsanAppropriativeWaterRightsLicense(No.997848)withtheStateWaterResourcesControlBoard(SWRCB), issuedAugust1966,pre‐datingtheconstructionoftheSWP. ThiswatersupplyiscommonlyreferredtobytheCityas“PermitWater.”PermitWaterispumpedfromBarkerSloughanddeliveredthroughtheNBAandisseparatefromtheCity’sSWPTableAallotment.SCWAis the managing wholesaler for purchase of Permit Water. The license allows for a maximumdiversionof31.52cfsorabout7,429MG/yr.ConveyanceofVallejoPermitWaterthroughtheNBAis limited by this contract to amaximumof 5,633MG/yr. Since the limitation is not based on aphysicalcapacityconstraintoftheNBA,anadditional1,790MGcouldbeavailableuponexecutionofanamendmenttotheexistingagreementbetweenDWRandSCWA.
6.1.3 Solano Project Water TheSolanoProjectisafederalwaterprojectoperatedbytheU.S.BureauofReclamation(Bureau)thatstoreswaterinLakeBerryessaforvariousagenciesandusersinthearea,includingtheCityofVallejo. SolanoProjectwater is delivered fromLakeBerryessa via thePutah SouthCanal to theBureau’sTerminalReservoirinCordelia.Approximately95percentoftheSolanoProjectwaterispumpedviatheCity’sCordeliapumpingstation,primarilytotheFlemingHillWTP.Approximately5percentoftheSolanoProjectwaterisconveyedviaSolanoIrrigationDistrict’sdistributionfacilitiesto theGreenValleyWTP. Approximately 98MG/yr is delivered to the TravisWTPvia theBeckAvenuePumpStation.
TheCityhasawaterentitlementof4,757MG/yrofSolanoProjectwater.SCWA is themanagingwholesalerforSolanoCountyagenciesforpurchaseofSolanoProjectwater.
City of Vallejo 2015 Urban Water Management Plan
November 2016Page 6-3
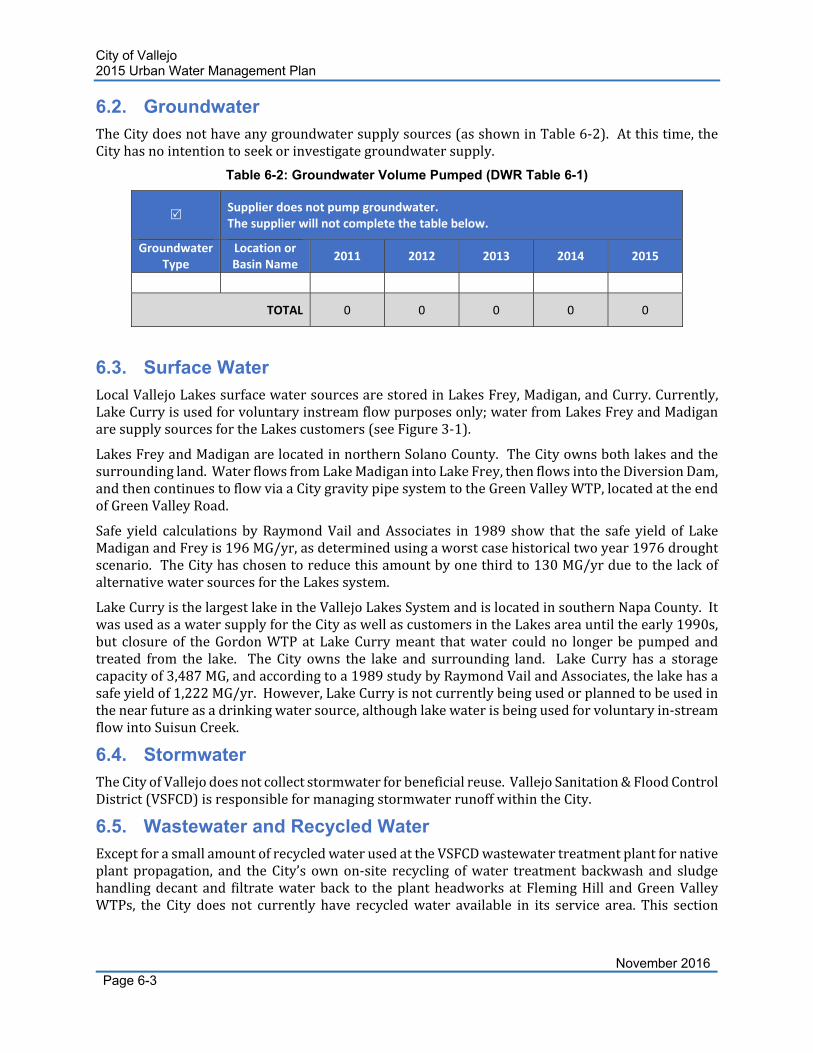
6.2. Groundwater TheCitydoesnothaveanygroundwatersupplysources(asshowninTable6‐2).Atthistime,theCityhasnointentiontoseekorinvestigategroundwatersupply.
Table 6-2: Groundwater Volume Pumped (DWR Table 6-1)
Supplier does not pump groundwater. The supplier will not complete the table below.
Groundwater Type
Location or Basin Name
2011 2012 2013 2014 2015
TOTAL 0 0 0 0 0
6.3. Surface Water LocalVallejoLakessurfacewatersourcesarestoredinLakesFrey,Madigan,andCurry.Currently,LakeCurryisusedforvoluntaryinstreamflowpurposesonly;waterfromLakesFreyandMadiganaresupplysourcesfortheLakescustomers(seeFigure3‐1).
LakesFreyandMadiganarelocatedinnorthernSolanoCounty.TheCityownsbothlakesandthesurroundingland.WaterflowsfromLakeMadiganintoLakeFrey,thenflowsintotheDiversionDam,andthencontinuestoflowviaaCitygravitypipesystemtotheGreenValleyWTP,locatedattheendofGreenValleyRoad.
Safe yield calculationsbyRaymondVail andAssociates in1989 show that the safe yieldof LakeMadiganandFreyis196MG/yr,asdeterminedusingaworstcasehistoricaltwoyear1976droughtscenario.TheCityhaschosentoreducethisamountbyonethirdto130MG/yrduetothelackofalternativewatersourcesfortheLakessystem.
LakeCurryisthelargestlakeintheVallejoLakesSystemandislocatedinsouthernNapaCounty.ItwasusedasawatersupplyfortheCityaswellascustomersintheLakesareauntiltheearly1990s,but closureof theGordonWTPatLakeCurrymeant thatwater couldno longerbepumpedandtreated from the lake. The City owns the lake and surrounding land. Lake Curry has a storagecapacityof3,487MG,andaccordingtoa1989studybyRaymondVailandAssociates,thelakehasasafeyieldof1,222MG/yr.However,LakeCurryisnotcurrentlybeingusedorplannedtobeusedinthenearfutureasadrinkingwatersource,althoughlakewaterisbeingusedforvoluntaryin‐streamflowintoSuisunCreek.
6.4. Stormwater TheCityofVallejodoesnotcollectstormwaterforbeneficialreuse.VallejoSanitation&FloodControlDistrict(VSFCD)isresponsibleformanagingstormwaterrunoffwithintheCity.
6.5. Wastewater and Recycled Water ExceptforasmallamountofrecycledwaterusedattheVSFCDwastewatertreatmentplantfornativeplant propagation, and theCity’s ownon‐site recycling ofwater treatment backwash and sludgehandlingdecant and filtratewaterback to theplantheadworksatFlemingHill andGreenValleyWTPs, the City does not currently have recycledwater available in its service area. This section
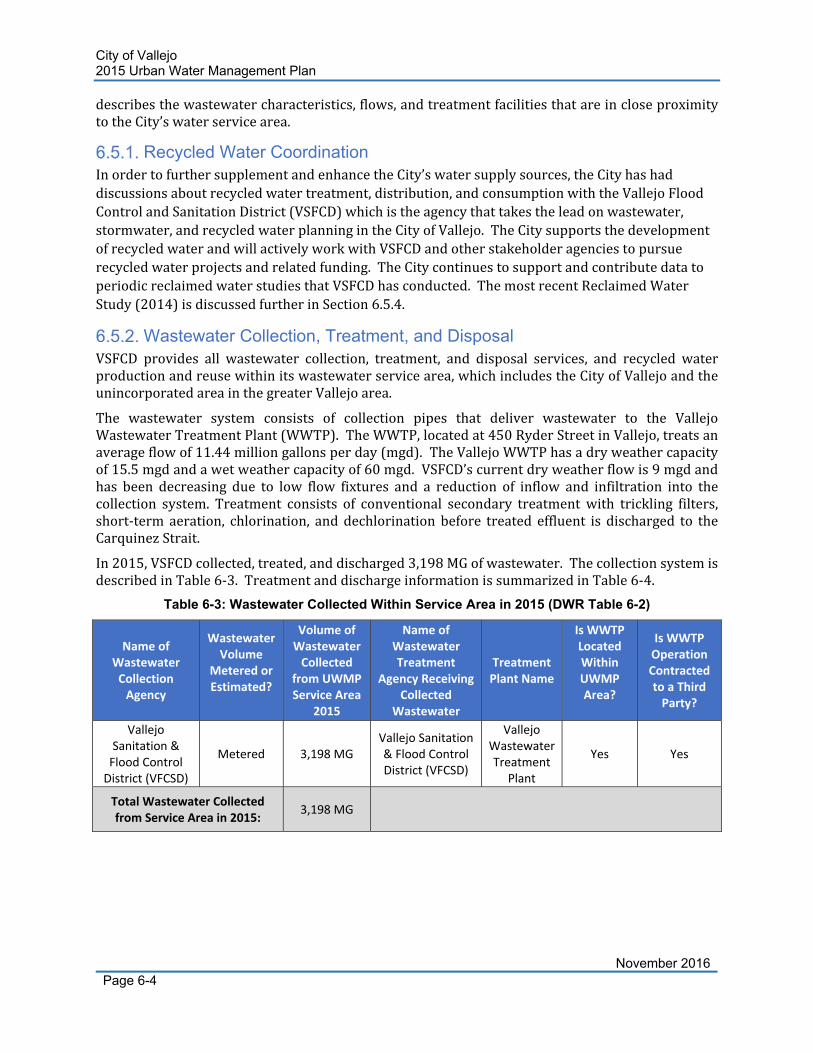
City of Vallejo 2015 Urban Water Management Plan
November 2016Page 6-4
describesthewastewatercharacteristics,flows,andtreatmentfacilitiesthatareincloseproximitytotheCity’swaterservicearea.
Recycled Water Coordination InordertofurthersupplementandenhancetheCity’swatersupplysources,theCityhashaddiscussionsaboutrecycledwatertreatment,distribution,andconsumptionwiththeVallejoFloodControlandSanitationDistrict(VSFCD)whichistheagencythattakestheleadonwastewater,stormwater,andrecycledwaterplanningintheCityofVallejo.TheCitysupportsthedevelopmentofrecycledwaterandwillactivelyworkwithVSFCDandotherstakeholderagenciestopursuerecycledwaterprojectsandrelatedfunding.TheCitycontinuestosupportandcontributedatatoperiodicreclaimedwaterstudiesthatVSFCDhasconducted.ThemostrecentReclaimedWaterStudy(2014)isdiscussedfurtherinSection6.5.4.
Wastewater Collection, Treatment, and Disposal VSFCD provides all wastewater collection, treatment, and disposal services, and recycled waterproductionandreusewithinitswastewaterservicearea,whichincludestheCityofVallejoandtheunincorporatedareainthegreaterVallejoarea.
The wastewater system consists of collection pipes that deliver wastewater to the VallejoWastewaterTreatmentPlant(WWTP).TheWWTP,locatedat450RyderStreetinVallejo,treatsanaverageflowof11.44milliongallonsperday(mgd).TheVallejoWWTPhasadryweathercapacityof15.5mgdandawetweathercapacityof60mgd.VSFCD’scurrentdryweatherflowis9mgdandhas been decreasing due to low flow fixtures and a reduction of inflow and infiltration into thecollection system. Treatment consists of conventional secondary treatmentwith trickling filters,short‐term aeration, chlorination, anddechlorination before treated effluent is discharged to theCarquinezStrait.
In2015,VSFCDcollected,treated,anddischarged3,198MGofwastewater.ThecollectionsystemisdescribedinTable6‐3.TreatmentanddischargeinformationissummarizedinTable6‐4.
Table 6-3: Wastewater Collected Within Service Area in 2015 (DWR Table 6-2)
Name of Wastewater Collection Agency
Wastewater Volume
Metered or Estimated?
Volume of Wastewater Collected
from UWMP Service Area
2015
Name of Wastewater Treatment
Agency Receiving Collected
Wastewater
Treatment Plant Name
Is WWTP Located Within UWMP Area?
Is WWTP Operation Contracted to a Third Party?
Vallejo Sanitation & Flood Control District (VFCSD)
Metered 3,198 MG Vallejo Sanitation & Flood Control District (VFCSD)
Vallejo Wastewater Treatment
Plant
Yes Yes
Total Wastewater Collected from Service Area in 2015:
3,198 MG
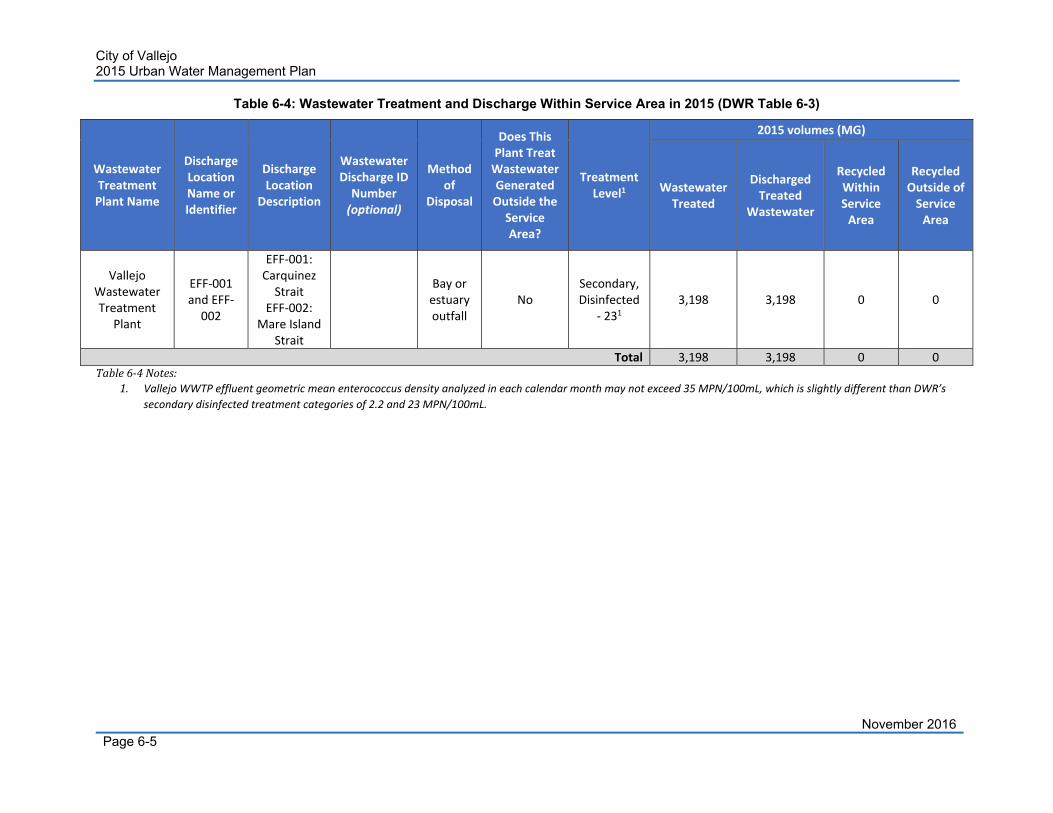
City of Vallejo 2015 Urban Water Management Plan
November 2016Page 6-5
Table 6-4: Wastewater Treatment and Discharge Within Service Area in 2015 (DWR Table 6-3)
Wastewater Treatment Plant Name
Discharge Location Name or Identifier
Discharge Location
Description
Wastewater Discharge ID Number (optional)
Method of
Disposal
Does This Plant Treat Wastewater Generated Outside the Service Area?
Treatment Level1
2015 volumes (MG)
Wastewater Treated
Discharged Treated
Wastewater
Recycled Within Service Area
Recycled Outside of Service Area
Vallejo Wastewater Treatment
Plant
EFF‐001 and EFF‐002
EFF‐001: Carquinez Strait
EFF‐002: Mare Island
Strait
Bay or estuary outfall
No Secondary, Disinfected
‐ 231 3,198 3,198 0 0
Total 3,198 3,198 0 0Table6‐4Notes:
1. Vallejo WWTP effluent geometric mean enterococcus density analyzed in each calendar month may not exceed 35 MPN/100mL, which is slightly different than DWR’s
secondary disinfected treatment categories of 2.2 and 23 MPN/100mL.
City of Vallejo 2015 Urban Water Management Plan
November 2016Page 6-6
Recycled Water System TheCityofVallejodoesnotcurrentlyuserecycledwater.Astudydescribingpotentialrecycledwaterdemandsandtreatment/distributionoptionsisdescribedinthenextsection.
Recycled Water Beneficial Uses VSFCDcommissionedareportentitledReclaimedWaterStudy,(RMC,May2014).Thestudyshowedthatthereisapotentialannualrecycledwaterdemandofapproximately502MGintheSanitationDistrict’sservicearea(CityofVallejoandunincorporatedVallejo–doesnotincludetheLakesregion).Therecycledwaterdemandisprimarilyforirrigationdemandsfromgolfcourses,parks,schoolsandother large landscape irrigation customers within the city limits. The report recommended acentralizedtreatmentoptionwhichwouldincludeconstructionofatertiarytreatmentfacilityattheexistingWWTPwith distribution pipelines radiating out from the central treatment plant. Thecentralizedtreatmentoptionwasfoundtobemorecost‐effectivethanaconsidereddecentralizedtreatmentoption.Therecommendedalternativewasimplementationofarecycledwaterprogramfor93.5MG/yrofdemandsidentifiedonMareIsland,includingthe18‐holeMareIslandGolfCourse,the City Park, and plannedmixed‐use residential and commercial developmentwith open spaceelements.Theunitcostofimplementationforservingthesedemandswasfoundtobecomparabletopotablewaterrates.
RecycledwaterdeliverywouldrequireaddingtertiarytreatmentprocessestoitssecondaryWWTPaswellasconstructionofrecycledwaterdistributionpipelinesfromthetertiaryWWTP.Thelackofa tertiary WWTP and “backbone” infrastructure system for recycled water causes a significantfinancial limitation to theuseof recycledwater in theCity’s service area. As stated in the2014ReclaimedWaterStudy,arecycledwaterprogramcouldonlylikelyoccurwhenoneofthefollowingconditionsoccur:
Implementationofmorestringentwastewaterdischargerequirements;
Increasedwaterdemandduetodevelopment;
Increasedvulnerabilityofthewatersupplyduetodrought;
Substantialgrantfundingtolowerthecostofrecycledwaterdevelopment;or
Publicopiniontoimplementrecycledwaterasanenvironmentalenhancement.
Forthisreason,Table6‐5doesnotidentifypotentialfutureusesbecauserecycledwateruseisnotfeasiblenorcost‐effectiveintheforeseeablefuture.
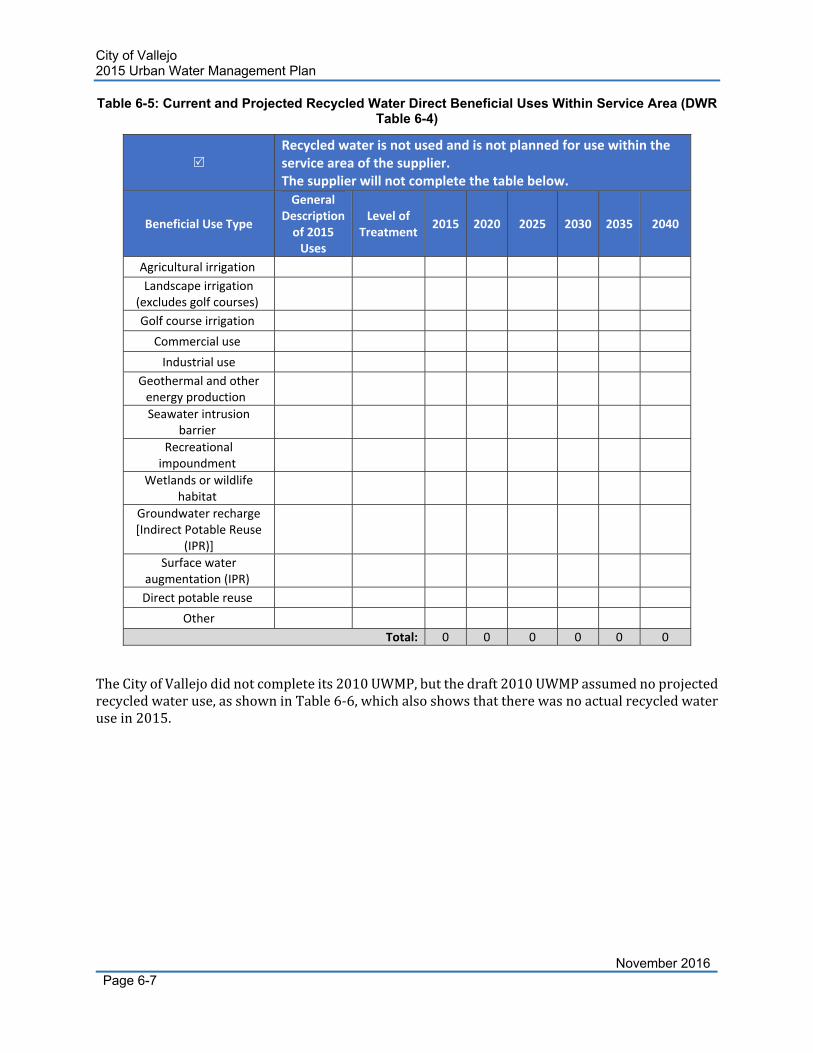
City of Vallejo 2015 Urban Water Management Plan
November 2016Page 6-7
Table 6-5: Current and Projected Recycled Water Direct Beneficial Uses Within Service Area (DWR Table 6-4)
Recycled water is not used and is not planned for use within the service area of the supplier. The supplier will not complete the table below.
Beneficial Use Type
General Description of 2015 Uses
Level of Treatment
2015 2020 2025 2030 2035 2040
Agricultural irrigation
Landscape irrigation (excludes golf courses)
Golf course irrigation
Commercial use
Industrial use
Geothermal and other energy production
Seawater intrusion barrier
Recreational impoundment
Wetlands or wildlife habitat
Groundwater recharge [Indirect Potable Reuse
(IPR)]
Surface water augmentation (IPR)
Direct potable reuse
Other
Total: 0 0 0 0 0 0
TheCityofVallejodidnotcompleteits2010UWMP,butthedraft2010UWMPassumednoprojectedrecycledwateruse,asshowninTable6‐6,whichalsoshowsthattherewasnoactualrecycledwaterusein2015.
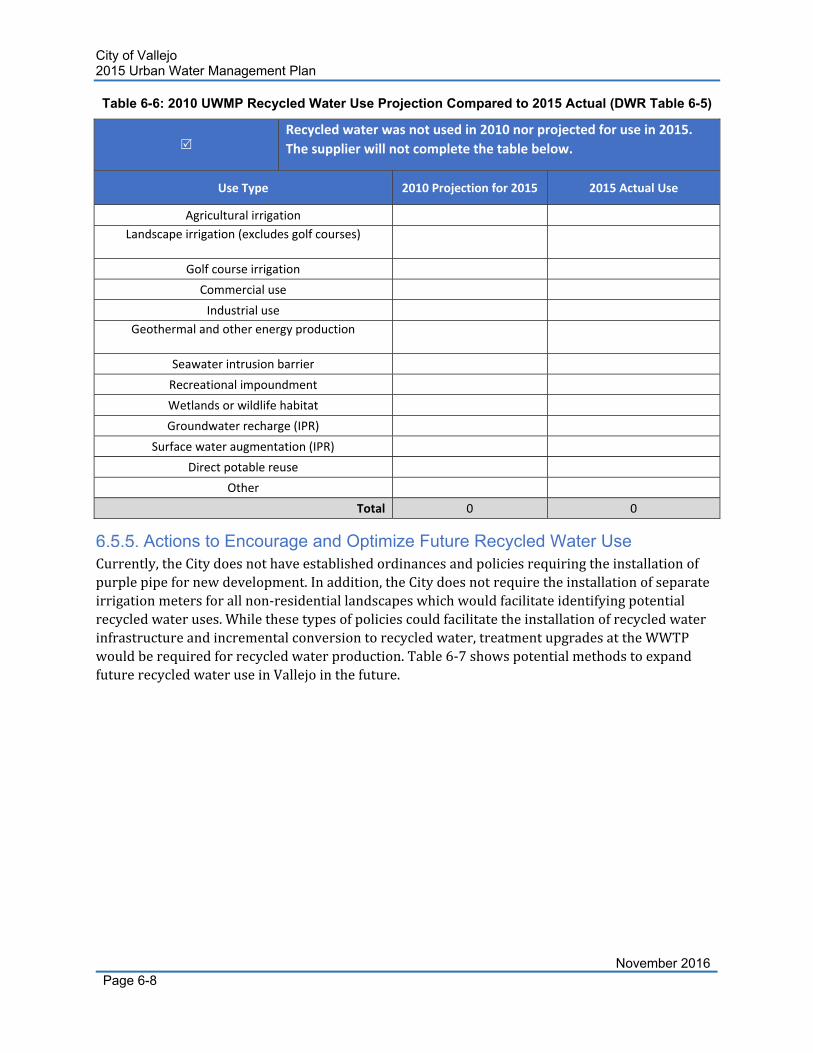
City of Vallejo 2015 Urban Water Management Plan
November 2016Page 6-8
Table 6-6: 2010 UWMP Recycled Water Use Projection Compared to 2015 Actual (DWR Table 6-5)
Recycled water was not used in 2010 nor projected for use in 2015.
The supplier will not complete the table below.
Use Type 2010 Projection for 2015 2015 Actual Use
Agricultural irrigation
Landscape irrigation (excludes golf courses)
Golf course irrigation
Commercial use
Industrial use
Geothermal and other energy production
Seawater intrusion barrier
Recreational impoundment
Wetlands or wildlife habitat
Groundwater recharge (IPR)
Surface water augmentation (IPR)
Direct potable reuse
Other
Total 0 0
Actions to Encourage and Optimize Future Recycled Water Use Currently,theCitydoesnothaveestablishedordinancesandpoliciesrequiringtheinstallationofpurplepipefornewdevelopment.Inaddition,theCitydoesnotrequiretheinstallationofseparateirrigationmetersforallnon‐residentiallandscapeswhichwouldfacilitateidentifyingpotentialrecycledwateruses.Whilethesetypesofpoliciescouldfacilitatetheinstallationofrecycledwaterinfrastructureandincrementalconversiontorecycledwater,treatmentupgradesattheWWTPwouldberequiredforrecycledwaterproduction.Table6‐7showspotentialmethodstoexpandfuturerecycledwateruseinVallejointhefuture.
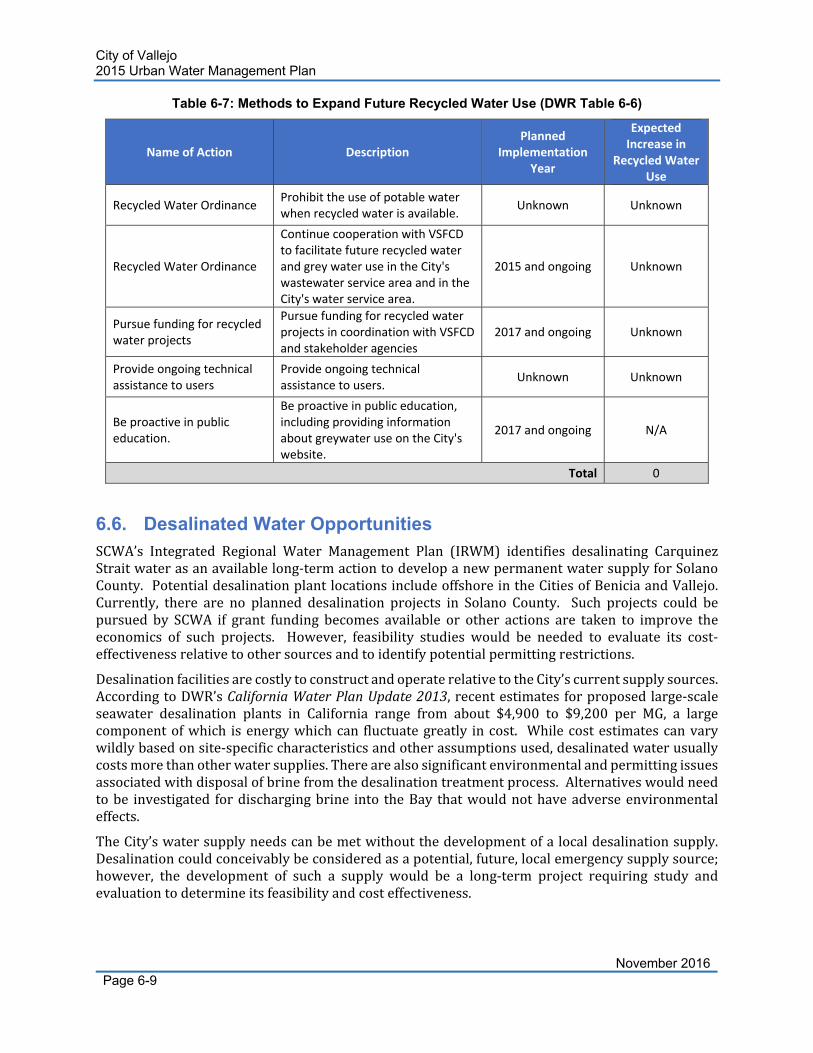
City of Vallejo 2015 Urban Water Management Plan
November 2016Page 6-9
Table 6-7: Methods to Expand Future Recycled Water Use (DWR Table 6-6)
Name of Action Description Planned
Implementation Year
Expected Increase in
Recycled Water Use
Recycled Water Ordinance Prohibit the use of potable water when recycled water is available.
Unknown Unknown
Recycled Water Ordinance
Continue cooperation with VSFCD to facilitate future recycled water and grey water use in the City's wastewater service area and in the City's water service area.
2015 and ongoing Unknown
Pursue funding for recycled water projects
Pursue funding for recycled water projects in coordination with VSFCD and stakeholder agencies
2017 and ongoing Unknown
Provide ongoing technical assistance to users
Provide ongoing technical assistance to users.
Unknown Unknown
Be proactive in public education.
Be proactive in public education, including providing information about greywater use on the City's website.
2017 and ongoing N/A
Total 0
6.6. Desalinated Water Opportunities SCWA’s Integrated Regional Water Management Plan (IRWM) identifies desalinating CarquinezStraitwaterasanavailablelong‐termactiontodevelopanewpermanentwatersupplyforSolanoCounty. PotentialdesalinationplantlocationsincludeoffshoreintheCitiesofBeniciaandVallejo.Currently, there are no planned desalination projects in Solano County. Such projects could bepursued by SCWA if grant funding becomes available or other actions are taken to improve theeconomics of such projects. However, feasibility studies would be needed to evaluate its cost‐effectivenessrelativetoothersourcesandtoidentifypotentialpermittingrestrictions.
DesalinationfacilitiesarecostlytoconstructandoperaterelativetotheCity’scurrentsupplysources.AccordingtoDWR’sCaliforniaWaterPlanUpdate2013,recentestimates forproposedlarge‐scaleseawater desalination plants in California range from about $4,900 to $9,200 per MG, a largecomponentofwhich isenergywhichcan fluctuategreatly incost. Whilecostestimatescanvarywildlybasedonsite‐specificcharacteristicsandotherassumptionsused,desalinatedwaterusuallycostsmorethanotherwatersupplies.Therearealsosignificantenvironmentalandpermittingissuesassociatedwithdisposalofbrinefromthedesalinationtreatmentprocess.Alternativeswouldneedtobe investigated fordischargingbrine into theBay thatwouldnothaveadverseenvironmentaleffects.
TheCity’swatersupplyneedscanbemetwithoutthedevelopmentofalocaldesalinationsupply.Desalinationcouldconceivablybeconsideredasapotential,future,localemergencysupplysource;however, the development of such a supply would be a long‐term project requiring study andevaluationtodetermineitsfeasibilityandcosteffectiveness.
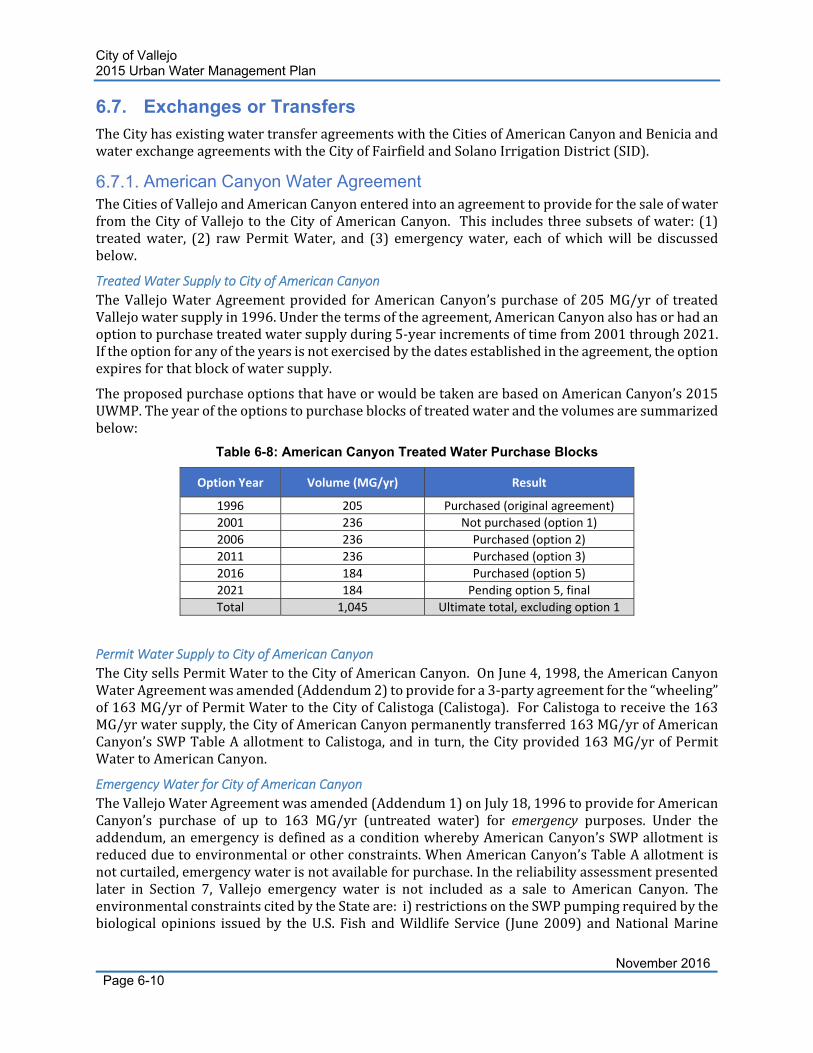
City of Vallejo 2015 Urban Water Management Plan
November 2016Page 6-10
6.7. Exchanges or Transfers TheCityhasexistingwatertransferagreementswiththeCitiesofAmericanCanyonandBeniciaandwaterexchangeagreementswiththeCityofFairfieldandSolanoIrrigationDistrict(SID).
American Canyon Water Agreement TheCitiesofVallejoandAmericanCanyonenteredintoanagreementtoprovideforthesaleofwaterfromtheCityofVallejototheCityofAmericanCanyon. Thisincludesthreesubsetsofwater:(1)treatedwater, (2) rawPermitWater, and (3) emergencywater, each ofwhichwill be discussedbelow.
Treated Water Supply to City of American Canyon
TheVallejoWaterAgreementprovided forAmericanCanyon’spurchaseof205MG/yrof treatedVallejowatersupplyin1996.Underthetermsoftheagreement,AmericanCanyonalsohasorhadanoptiontopurchasetreatedwatersupplyduring5‐yearincrementsoftimefrom2001through2021.Iftheoptionforanyoftheyearsisnotexercisedbythedatesestablishedintheagreement,theoptionexpiresforthatblockofwatersupply.
TheproposedpurchaseoptionsthathaveorwouldbetakenarebasedonAmericanCanyon’s2015UWMP.Theyearoftheoptionstopurchaseblocksoftreatedwaterandthevolumesaresummarizedbelow:
Table 6-8: American Canyon Treated Water Purchase Blocks
Option Year Volume (MG/yr) Result
1996 205 Purchased (original agreement)
2001 236 Not purchased (option 1)
2006 236 Purchased (option 2)
2011 236 Purchased (option 3)
2016 184 Purchased (option 5)
2021 184 Pending option 5, final
Total 1,045 Ultimate total, excluding option 1
Permit Water Supply to City of American Canyon
TheCitysellsPermitWatertotheCityofAmericanCanyon.OnJune4,1998,theAmericanCanyonWaterAgreementwasamended(Addendum2)toprovidefora3‐partyagreementforthe“wheeling”of163MG/yrofPermitWatertotheCityofCalistoga(Calistoga).ForCalistogatoreceivethe163MG/yrwatersupply,theCityofAmericanCanyonpermanentlytransferred163MG/yrofAmericanCanyon’sSWPTableAallotmenttoCalistoga,andinturn,theCityprovided163MG/yrofPermitWatertoAmericanCanyon.
Emergency Water for City of American Canyon
TheVallejoWaterAgreementwasamended(Addendum1)onJuly18,1996toprovideforAmericanCanyon’s purchase of up to 163 MG/yr (untreated water) for emergency purposes. Under theaddendum,anemergencyisdefinedasaconditionwherebyAmericanCanyon’sSWPallotment isreducedduetoenvironmentalorotherconstraints.WhenAmericanCanyon’sTableAallotmentisnotcurtailed,emergencywaterisnotavailableforpurchase.Inthereliabilityassessmentpresentedlater in Section 7, Vallejo emergency water is not included as a sale to American Canyon. TheenvironmentalconstraintscitedbytheStateare:i)restrictionsontheSWPpumpingrequiredbythebiological opinions issuedby theU.S. Fish andWildlife Service (June2009) andNationalMarine
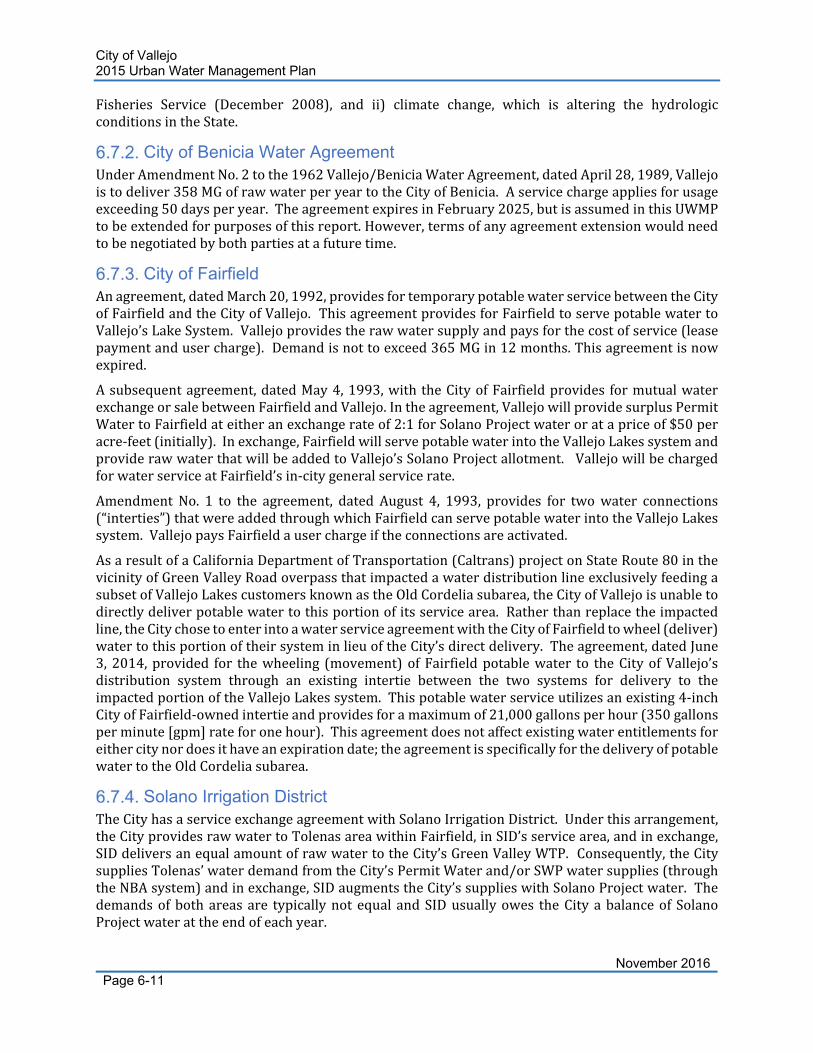
City of Vallejo 2015 Urban Water Management Plan
November 2016Page 6-11
Fisheries Service (December 2008), and ii) climate change, which is altering the hydrologicconditionsintheState.
City of Benicia Water Agreement UnderAmendmentNo.2tothe1962Vallejo/BeniciaWaterAgreement,datedApril28,1989,Vallejoistodeliver358MGofrawwaterperyeartotheCityofBenicia.Aservicechargeappliesforusageexceeding50daysperyear.TheagreementexpiresinFebruary2025,butisassumedinthisUWMPtobeextendedforpurposesofthisreport.However,termsofanyagreementextensionwouldneedtobenegotiatedbybothpartiesatafuturetime.
City of Fairfield Anagreement,datedMarch20,1992,providesfortemporarypotablewaterservicebetweentheCityofFairfieldandtheCityofVallejo.ThisagreementprovidesforFairfieldtoservepotablewatertoVallejo’sLakeSystem.Vallejoprovidestherawwatersupplyandpaysforthecostofservice(leasepaymentandusercharge).Demandisnottoexceed365MGin12months.Thisagreementisnowexpired.
Asubsequentagreement,datedMay4,1993,withtheCityofFairfieldprovides formutualwaterexchangeorsalebetweenFairfieldandVallejo.Intheagreement,VallejowillprovidesurplusPermitWatertoFairfieldateitheranexchangerateof2:1forSolanoProjectwateroratapriceof$50peracre‐feet(initially).Inexchange,FairfieldwillservepotablewaterintotheVallejoLakessystemandproviderawwaterthatwillbeaddedtoVallejo’sSolanoProjectallotment.VallejowillbechargedforwaterserviceatFairfield’sin‐citygeneralservicerate.
Amendment No. 1 to the agreement, dated August 4, 1993, provides for twowater connections(“interties”)thatwereaddedthroughwhichFairfieldcanservepotablewaterintotheVallejoLakessystem.VallejopaysFairfieldauserchargeiftheconnectionsareactivated.
AsaresultofaCaliforniaDepartmentofTransportation(Caltrans)projectonStateRoute80inthevicinityofGreenValleyRoadoverpassthatimpactedawaterdistributionlineexclusivelyfeedingasubsetofVallejoLakescustomersknownastheOldCordeliasubarea,theCityofVallejoisunabletodirectlydeliverpotablewatertothisportionofitsservicearea.Ratherthanreplacetheimpactedline,theCitychosetoenterintoawaterserviceagreementwiththeCityofFairfieldtowheel(deliver)watertothisportionoftheirsysteminlieuoftheCity’sdirectdelivery.Theagreement,datedJune3,2014,provided for thewheeling (movement)of Fairfieldpotablewater to theCityofVallejo’sdistribution system through an existing intertie between the two systems for delivery to theimpactedportionoftheVallejoLakessystem.Thispotablewaterserviceutilizesanexisting4‐inchCityofFairfield‐ownedintertieandprovidesforamaximumof21,000gallonsperhour(350gallonsperminute[gpm]rateforonehour).Thisagreementdoesnotaffectexistingwaterentitlementsforeithercitynordoesithaveanexpirationdate;theagreementisspecificallyforthedeliveryofpotablewatertotheOldCordeliasubarea.
Solano Irrigation District TheCityhasaserviceexchangeagreementwithSolanoIrrigationDistrict.Underthisarrangement,theCityprovidesrawwatertoTolenasareawithinFairfield,inSID’sservicearea,andinexchange,SIDdeliversanequalamountofrawwatertotheCity’sGreenValleyWTP.Consequently,theCitysuppliesTolenas’waterdemandfromtheCity’sPermitWaterand/orSWPwatersupplies(throughtheNBAsystem)andinexchange,SIDaugmentstheCity’ssupplieswithSolanoProjectwater.Thedemandsofbothareasare typicallynot equal andSIDusuallyowes theCity abalanceof SolanoProjectwaterattheendofeachyear.
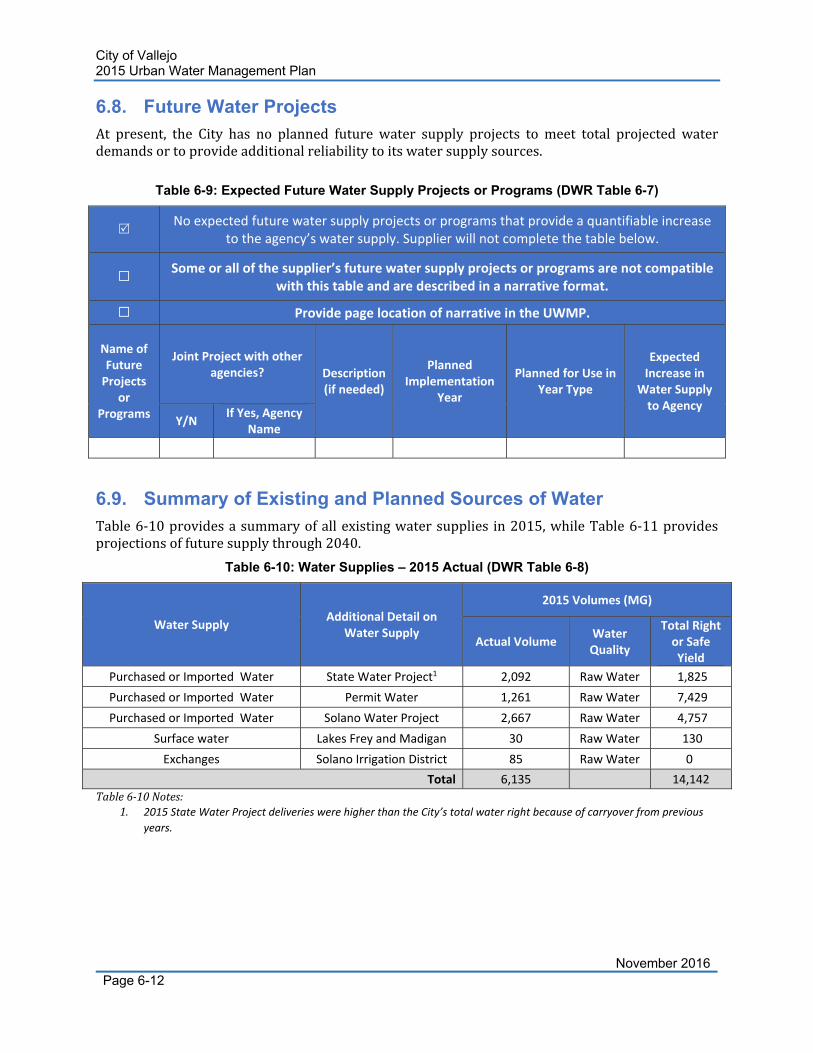
City of Vallejo 2015 Urban Water Management Plan
November 2016Page 6-12
6.8. Future Water Projects At present, the City has no planned future water supply projects to meet total projected waterdemandsortoprovideadditionalreliabilitytoitswatersupplysources.
Table 6-9: Expected Future Water Supply Projects or Programs (DWR Table 6-7)
No expected future water supply projects or programs that provide a quantifiable increase
to the agency’s water supply. Supplier will not complete the table below.
Some or all of the supplier’s future water supply projects or programs are not compatible
with this table and are described in a narrative format.
Provide page location of narrative in the UWMP.
Name of Future Projects
or Programs
Joint Project with other agencies? Description
(if needed)
Planned Implementation
Year
Planned for Use in Year Type
Expected Increase in
Water Supply to Agency
Y/N If Yes, Agency
Name
6.9. Summary of Existing and Planned Sources of Water Table6‐10providesasummaryofallexistingwatersupplies in2015,whileTable6‐11providesprojectionsoffuturesupplythrough2040.
Table 6-10: Water Supplies – 2015 Actual (DWR Table 6-8)
Water Supply Additional Detail on
Water Supply
2015 Volumes (MG)
Actual Volume Water Quality
Total Right or Safe Yield
Purchased or Imported Water State Water Project1 2,092 Raw Water 1,825
Purchased or Imported Water Permit Water 1,261 Raw Water 7,429
Purchased or Imported Water Solano Water Project 2,667 Raw Water 4,757
Surface water Lakes Frey and Madigan 30 Raw Water 130
Exchanges Solano Irrigation District 85 Raw Water 0
Total 6,135 14,142
Table6‐10Notes:1. 2015 State Water Project deliveries were higher than the City’s total water right because of carryover from previous
years.
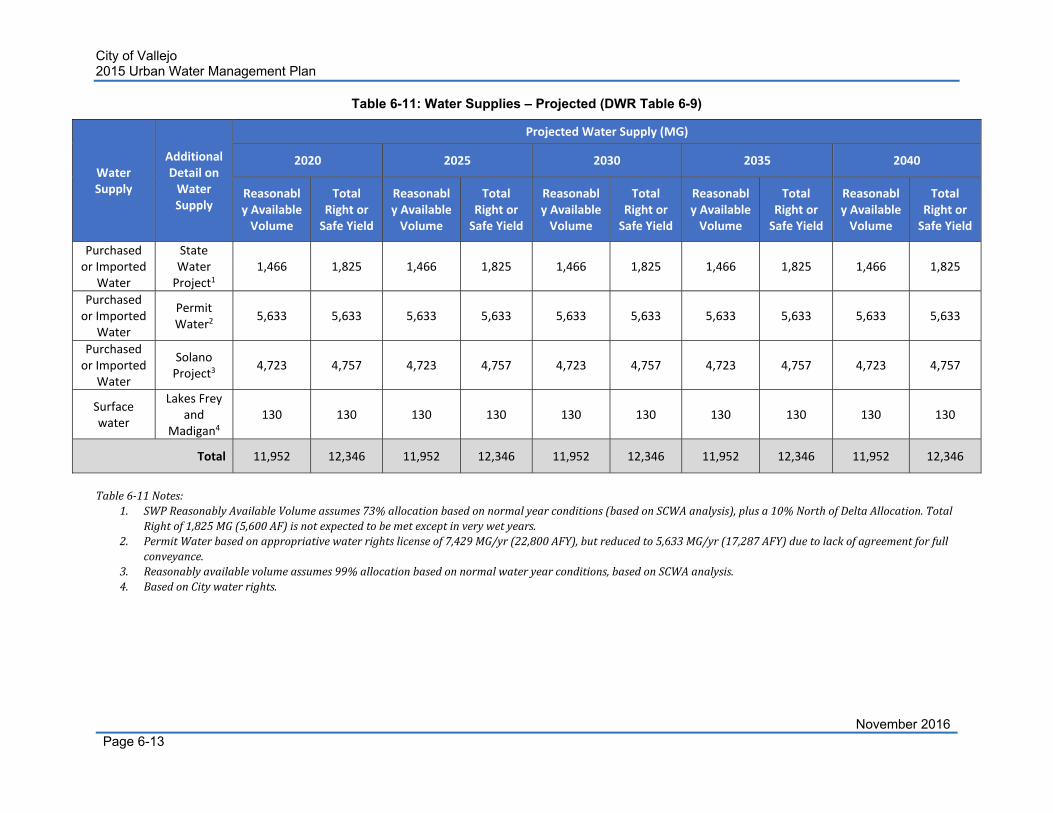
City of Vallejo 2015 Urban Water Management Plan
November 2016Page 6-13
Table 6-11: Water Supplies – Projected (DWR Table 6-9)
Water Supply
Additional Detail on Water Supply
Projected Water Supply (MG)
2020 2025 2030 2035 2040
Reasonably Available Volume
Total Right or Safe Yield
Reasonably Available Volume
Total Right or Safe Yield
Reasonably Available Volume
Total Right or Safe Yield
Reasonably Available Volume
Total Right or Safe Yield
Reasonably Available Volume
Total Right or Safe Yield
Purchased or Imported
Water
State Water Project1
1,466 1,825 1,466 1,825 1,466 1,825 1,466 1,825 1,466 1,825
Purchased or Imported
Water
Permit Water2
5,633 5,633 5,633 5,633 5,633 5,633 5,633 5,633 5,633 5,633
Purchased or Imported
Water
Solano Project3
4,723 4,757 4,723 4,757 4,723 4,757 4,723 4,757 4,723 4,757
Surface water
Lakes Frey and
Madigan4 130 130 130 130 130 130 130 130 130 130
Total 11,952 12,346 11,952 12,346 11,952 12,346 11,952 12,346 11,952 12,346
Table6‐11Notes:
1. SWPReasonablyAvailableVolumeassumes73%allocationbasedonnormalyearconditions(basedonSCWAanalysis),plusa10%NorthofDeltaAllocation.TotalRightof1,825MG(5,600AF)isnotexpectedtobemetexceptinverywetyears.
2. PermitWaterbasedonappropriativewaterrightslicenseof7,429MG/yr(22,800AFY),butreducedto5,633MG/yr(17,287AFY)duetolackofagreementforfullconveyance.
3. Reasonablyavailablevolumeassumes99%allocationbasedonnormalwateryearconditions,basedonSCWAanalysis.4. BasedonCitywaterrights.
City of Vallejo 2015 Urban Water Management Plan
November 2016Page 6-14
6.10. Climate Change Impacts to Supply Water Supply
PrecipitationpatternsareexpectedtoshiftandsnowpackisexpectedtodeclineinCaliforniaduetoclimate change. This may threaten water supply that comes from snowmelt, such as the watersupplied to theCity through theStateWaterProject (SWP).Although theCity isnot located inawatershed thatwill be directly impacted by a decrease in snowmelt, the City’s suppliesmay beimpacted by this decrease via watersheds that contribute to the SWP, such as mountainouswatershedsinthenorthernSierraNevadaandsouthernCascades.
Additionally,theCityreceivesitsSWPwaterthroughtheDelta,anareathatisalreadyecologicallysensitive.SincetheDeltaisaclimatesensitivewaterbody,itwilllikelybeimpactedbyclimatechangeandthiswillresultinstrainsonenvironmentalandmunicipaldemands.FormoreinformationontheimpactsofclimatechangeontheDelta,seeSection3.2.1ClimateChangeofthisUMWP.
Water supplies in some regions inCaliforniamaybe threatenedby invasive species, such as theQuagga Mussel. Invasive species are expected to become more prevalent under climate changeconditions,whichmay further threatenwater supply. Invasive species in Solano County includeYellowStarThistle,NewZealandMudSnails,Medusa‐head,Pepperweed,Bullfrogs,RussianThistle,andCocklebur.Waterfacilitiesandconveyancestructuresarebeingmonitoredforinvasivespecies,buthavenotyetbeendetected.
Water Quality
TheNBAwatershedhashadahistoryofwaterqualityissues.Inthemid‐1990s,thewaterqualityintheNBAwas considered “perhaps themost vulnerable in theStateWaterProject” (DWR,1998).Whilestepshavebeentakentoimprovewaterquality,theCitystillobserveswaterqualityshiftsfromtheNBAduringraineventsthat impact its treatmentplantoperation.Asraineventsare likelytobecomemoresevereunderclimatechangeconditions,moreerosionmayoccurinthewatershed.Thiswould increase turbidity in thewaterand further impact theCity’s treatment infrastructureafteraseverestormevent.
City of Vallejo 2015 Urban Water Management Plan
November 2016Page 7-1
Section 7 Water Supply Reliability Assessment ThissectioncomparesthewaterdemandinformationdevelopedinSection4andthewatersupplyinformationdevelopedinSection6toprovideanestimateofwatersupplyreliability.ComparisonsareprovidedusingDWR’srequiredrangeofhydrologicconditions,includingtheNormal,SingleDryYear,andMultipleDryYearscenarios.
7.1. Constraints on Water Sources TheCityhasfivewaterrightstofoursourcesofwatersupply:surfacewatersuppliesfromtheStateWaterProject(SWP),PermitWater,SolanoProjectWater,andsurfacewatersuppliesstoredinLakesFreyandMadigan.WhiletheCityalsohasarighttowaterstoredinLakeCurry,thereiscurrentlynoconveyanceinfrastructuretomakeuseofthesupplybeyondin‐streamflowsforSuisunCreek.AsillustratedinTable6‐11,theCity’ssupplyprojectionsindicatethatits2040watersupplyportfoliowillbecomposedofthefollowingwatersupplysourcesundernormalyearconditions:
54percentPermitWater;
33percentSolanoProjectwater;
10percentStateWaterProject;and
1percentLakesFreyandMadigansurfacewater.
Water from Lakes Frey andMadigan are available sources of supply for the Lakes service area.Althoughthissupplysourceissmallincomparisontotheotheravailablesources,itisanimportant,independent source of supply from both a reliability and operational standpoint. Table 7‐1summarizesthevariousfactorsthatmayaffecttheCity’ssupplies.ThistabledoesnotincludetheCity’s emergencywater suppliesas those suppliesaremainlyused foroperational flexibilityandduringcatastrophicemergencies.
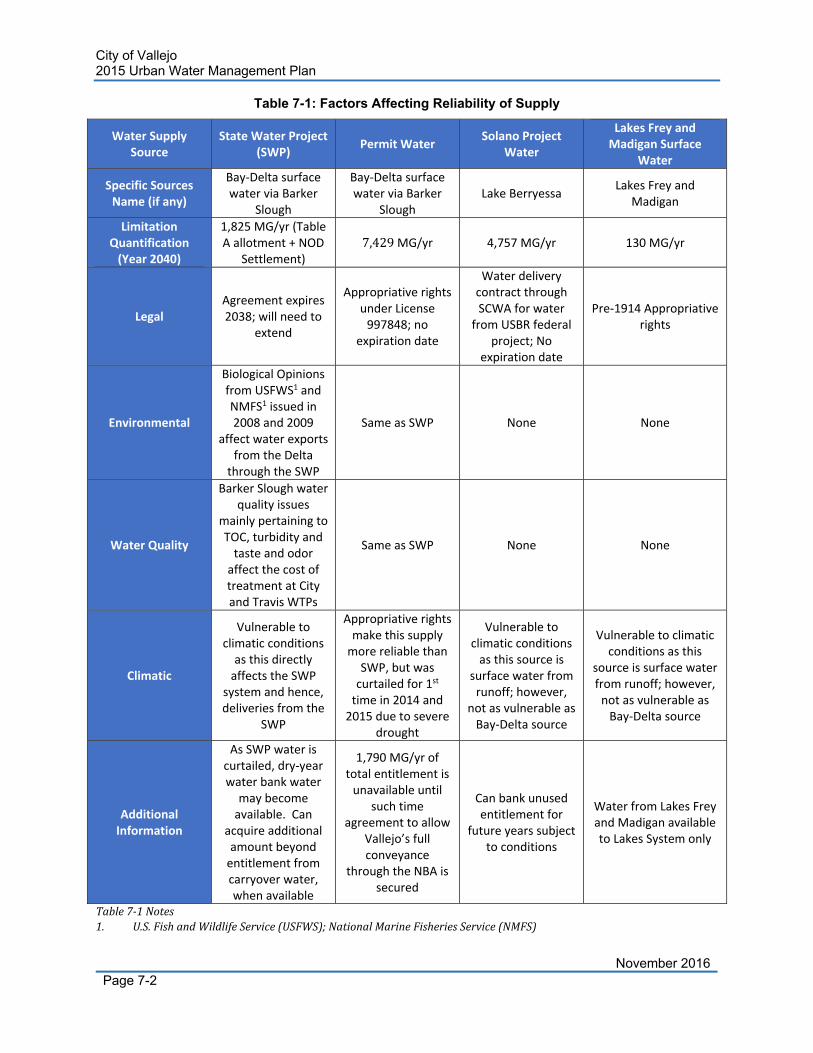
City of Vallejo 2015 Urban Water Management Plan
November 2016Page 7-2
Table 7-1: Factors Affecting Reliability of Supply
Water Supply Source
State Water Project (SWP)
Permit Water Solano Project
Water
Lakes Frey and Madigan Surface
Water
Specific Sources Name (if any)
Bay‐Delta surface water via Barker
Slough
Bay‐Delta surface water via Barker
Slough Lake Berryessa
Lakes Frey and Madigan
Limitation Quantification (Year 2040)
1,825 MG/yr (Table A allotment + NOD
Settlement) 7,429MG/yr 4,757 MG/yr 130 MG/yr
Legal Agreement expires 2038; will need to
extend
Appropriative rights under License 997848; no
expiration date
Water delivery contract through SCWA for water
from USBR federal project; No
expiration date
Pre‐1914 Appropriative rights
Environmental
Biological Opinions from USFWS1 and NMFS1 issued in 2008 and 2009
affect water exports from the Delta
through the SWP
Same as SWP None None
Water Quality
Barker Slough water quality issues
mainly pertaining to TOC, turbidity and taste and odor affect the cost of treatment at City and Travis WTPs
Same as SWP None None
Climatic
Vulnerable to climatic conditions as this directly affects the SWP
system and hence, deliveries from the
SWP
Appropriative rights make this supply more reliable than
SWP, but was curtailed for 1st time in 2014 and 2015 due to severe
drought
Vulnerable to climatic conditions as this source is
surface water from runoff; however,
not as vulnerable as Bay‐Delta source
Vulnerable to climatic conditions as this
source is surface water from runoff; however, not as vulnerable as Bay‐Delta source
Additional Information
As SWP water is curtailed, dry‐year water bank water may become available. Can
acquire additional amount beyond entitlement from carryover water, when available
1,790 MG/yr of total entitlement is unavailable until
such time agreement to allow
Vallejo’s full conveyance
through the NBA is secured
Can bank unused entitlement for
future years subject to conditions
Water from Lakes Frey and Madigan available to Lakes System only
Table7‐1Notes1. U.S.FishandWildlifeService(USFWS);NationalMarineFisheriesService(NMFS)
City of Vallejo 2015 Urban Water Management Plan
November 2016Page 7-3
Legal & Environmental Constraints State Water Project Supply Reliability
TheDWR2015SWPDeliveryReliabilityReportisbasedonamodelofwhatSWPdeliveriescouldbe,reportedasapercentageofSWPfullallocations. Theanalysis isbasedonseveralenvironmentalfactors including Biological Opinions (BOs) by the U.S. Fish and Wildlife Service (USFWS) andNationalMarineFisheriesService(NMFS).TheBObyUSFWSwasissuedinDecember2008andtheBObyNMFSwasissuedinJune2009.TheBOsaffectsSWPpumpingoperationsandSWPexportsfromtheDelta.TheDeliveryReliabilityReportconcludesthatprojectedlong‐termaveragedeliveryamountsofTableAallotmentshavedecreasedfrompreviousestimates.
AsaresultofaNorthofDelta(NOD)Settlement(December31,2013),DWRissuesaseparateSWPannualallocationforSolanoCountyWaterAgency(SCWA),NapaCountyFloodControlandWaterConservationDistrict,CityofYubaCity, andCountyofButte. TheNODallocationamounts toanadditionalincrementofannualallocationabovethecurrentSWPallocationandisbeingusedasaway to not penalize North Bay Aqueduct (NBA) users due to conveyance restrictions that areexclusive to theSouthofDeltapumpingplants.Acopyof theSummaryof the2015SWPDeliveryReliabilityReportisincludedinAppendixE.
Permit Water Supply Reliability
PermitWater,althoughconveyedviatheNBAsystem,isnotthesameasSWPwater.PermitWaterisanappropriativewaterrightthatVallejohasunderalicensewiththeSWRCB.AlthoughPermitWaterissimilarlysubjectedtoDeltasmelt‐relatedpumpingrestrictions,ithasnotbeensubjecttothesamecurtailmentasSWPwatersupplies.Historically,theCityhasnotexperiencedacurtailmentof itsPermitWaterallocation, evenunderseveredroughtconditions,until recentlywhenPermitWaterwascurtailedfromJune2014toNovember2014andagainMay2015toNovember2015.
Solano Project Water Supply Reliability
The reliability of the SolanoProjectwater supply is basedon the SCWAWaterSupplyReliabilityTechnicalMemorandum prepared by Kennedy/Jenks Consultants in April 2016. In general, thissourceisreliable,butcanexperiencesignificantdrawdownduringlongperiodsofdroughtsincethelocalwatershedwillnotproduceasmuchrunoff.Inthiscase,memberagencieshaveanagreementto reduce allocations at defined reservoir elevation thresholds and instead keep water in thereservoirascarryoverforthefuture.
Lakes Frey and Madigan and Lake Curry Water Supply Reliability
WaterstoredinLakesFreyandMadiganisusedtoservetheCity’sLakescustomers.Historically,ithasnotbeencurtailedand for thisreason,duringnormalwateryears,asupplyreliabilityof100percent is assumed. However, for single and multiple‐dry years, the supply reliability has beenassumedtobesimilartothatofLakeBerryessa(SolanoProjectwater).
AreliabilityanalysiswasnotconductedfortheLakeCurrysince,currentlyandintothenearfuture,thiswatersourceisbeingusedonlyforvoluntaryinstreamflowstoSuisunCreek.When,inthefuture,theCityconstructsaconveyancesystemtoaccessthissupply,waterfromLakeCurrycanbemadeavailableasanadditionalsupplyforCity’scustomers.ForthisUWMP,however,itisassumedthatthissupplysourcewillnotavailableintheplanninghorizon.
Water Quality Constraints Amajor source of the City’swater supply is the SWP andPermitWater from theBarker Sloughwatershed.ThiswatershedislocatedinthelargerSacramentoRiverwatershed,anddrainsanareaapproximately14.5squaremilesinSolanoCounty.ThesourcewaterisconveyedviatheNBAsystemtotheCordeliaForebay,fromwhichitispumpedandtransmittedtotheCity’swatertreatmentplant
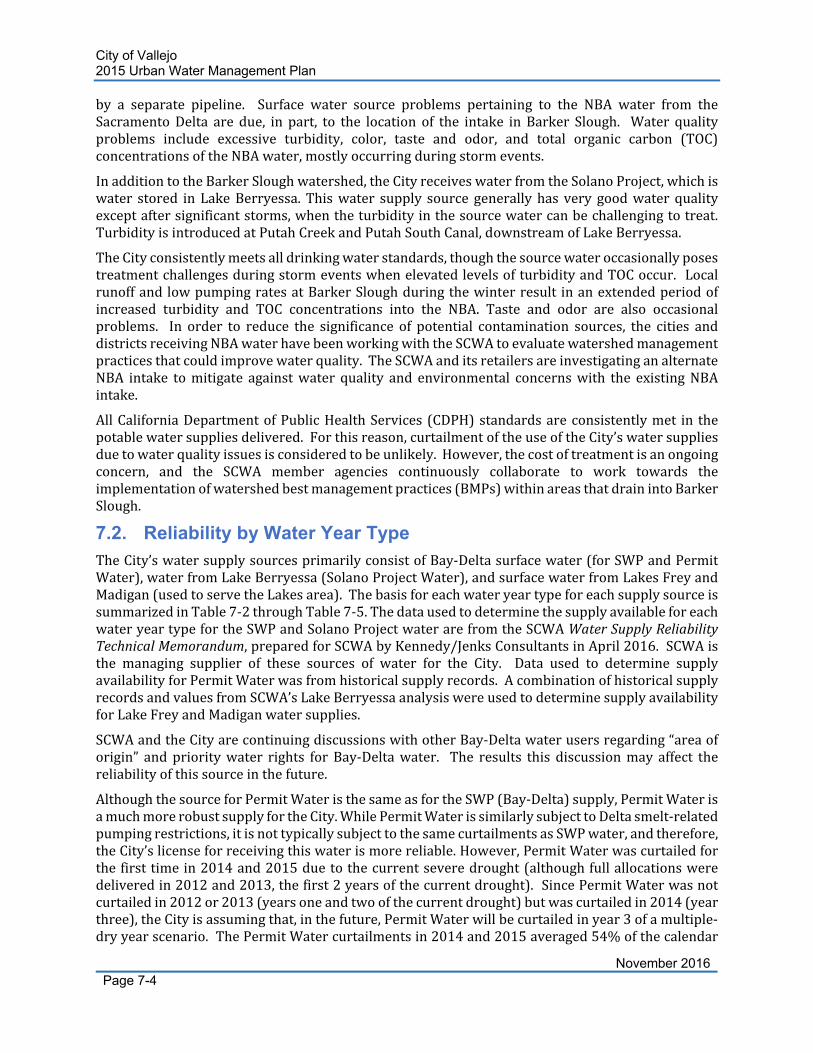
City of Vallejo 2015 Urban Water Management Plan
November 2016Page 7-4
by a separate pipeline. Surface water source problems pertaining to the NBA water from theSacramentoDelta are due, in part, to the location of the intake inBarker Slough. Water qualityproblems include excessive turbidity, color, taste and odor, and total organic carbon (TOC)concentrationsoftheNBAwater,mostlyoccurringduringstormevents.
InadditiontotheBarkerSloughwatershed,theCityreceiveswaterfromtheSolanoProject,whichiswater stored inLakeBerryessa.Thiswater supply source generally has very goodwaterqualityexceptaftersignificantstorms,whentheturbidityinthesourcewatercanbechallengingtotreat.TurbidityisintroducedatPutahCreekandPutahSouthCanal,downstreamofLakeBerryessa.
TheCityconsistentlymeetsalldrinkingwaterstandards,thoughthesourcewateroccasionallyposestreatmentchallengesduringstormeventswhenelevatedlevelsofturbidityandTOCoccur. LocalrunoffandlowpumpingratesatBarkerSloughduringthewinterresult inanextendedperiodofincreased turbidity and TOC concentrations into the NBA. Taste and odor are also occasionalproblems. In order to reduce the significance of potential contamination sources, the cities anddistrictsreceivingNBAwaterhavebeenworkingwiththeSCWAtoevaluatewatershedmanagementpracticesthatcouldimprovewaterquality.TheSCWAanditsretailersareinvestigatinganalternateNBA intake tomitigate againstwater quality and environmental concernswith the existingNBAintake.
AllCaliforniaDepartmentofPublicHealthServices (CDPH)standardsareconsistentlymet in thepotablewatersuppliesdelivered.Forthisreason,curtailmentoftheuseoftheCity’swatersuppliesduetowaterqualityissuesisconsideredtobeunlikely.However,thecostoftreatmentisanongoingconcern, and the SCWA member agencies continuously collaborate to work towards theimplementationofwatershedbestmanagementpractices(BMPs)withinareasthatdrainintoBarkerSlough.
7.2. Reliability by Water Year Type TheCity’swatersupplysourcesprimarilyconsistofBay‐Deltasurfacewater(forSWPandPermitWater),waterfromLakeBerryessa(SolanoProjectWater),andsurfacewaterfromLakesFreyandMadigan(usedtoservetheLakesarea).ThebasisforeachwateryeartypeforeachsupplysourceissummarizedinTable7‐2throughTable7‐5.ThedatausedtodeterminethesupplyavailableforeachwateryeartypefortheSWPandSolanoProjectwaterarefromtheSCWAWaterSupplyReliabilityTechnicalMemorandum,preparedforSCWAbyKennedy/JenksConsultantsinApril2016.SCWAisthe managing supplier of these sources of water for the City. Data used to determine supplyavailabilityforPermitWaterwasfromhistoricalsupplyrecords.AcombinationofhistoricalsupplyrecordsandvaluesfromSCWA’sLakeBerryessaanalysiswereusedtodeterminesupplyavailabilityforLakeFreyandMadiganwatersupplies.
SCWAandtheCityarecontinuingdiscussionswithotherBay‐Deltawaterusersregarding“areaoforigin” and prioritywater rights forBay‐Deltawater. The results this discussionmay affect thereliabilityofthissourceinthefuture.
AlthoughthesourceforPermitWateristhesameasfortheSWP(Bay‐Delta)supply,PermitWaterisamuchmorerobustsupplyfortheCity.WhilePermitWaterissimilarlysubjecttoDeltasmelt‐relatedpumpingrestrictions,itisnottypicallysubjecttothesamecurtailmentsasSWPwater,andtherefore,theCity’slicenseforreceivingthiswaterismorereliable.However,PermitWaterwascurtailedforthefirsttimein2014and2015duetothecurrentseveredrought(althoughfullallocationsweredeliveredin2012and2013,thefirst2yearsofthecurrentdrought).SincePermitWaterwasnotcurtailedin2012or2013(yearsoneandtwoofthecurrentdrought)butwascurtailedin2014(yearthree),theCityisassumingthat,inthefuture,PermitWaterwillbecurtailedinyear3ofamultiple‐dryyearscenario.ThePermitWatercurtailmentsin2014and2015averaged54%ofthecalendar
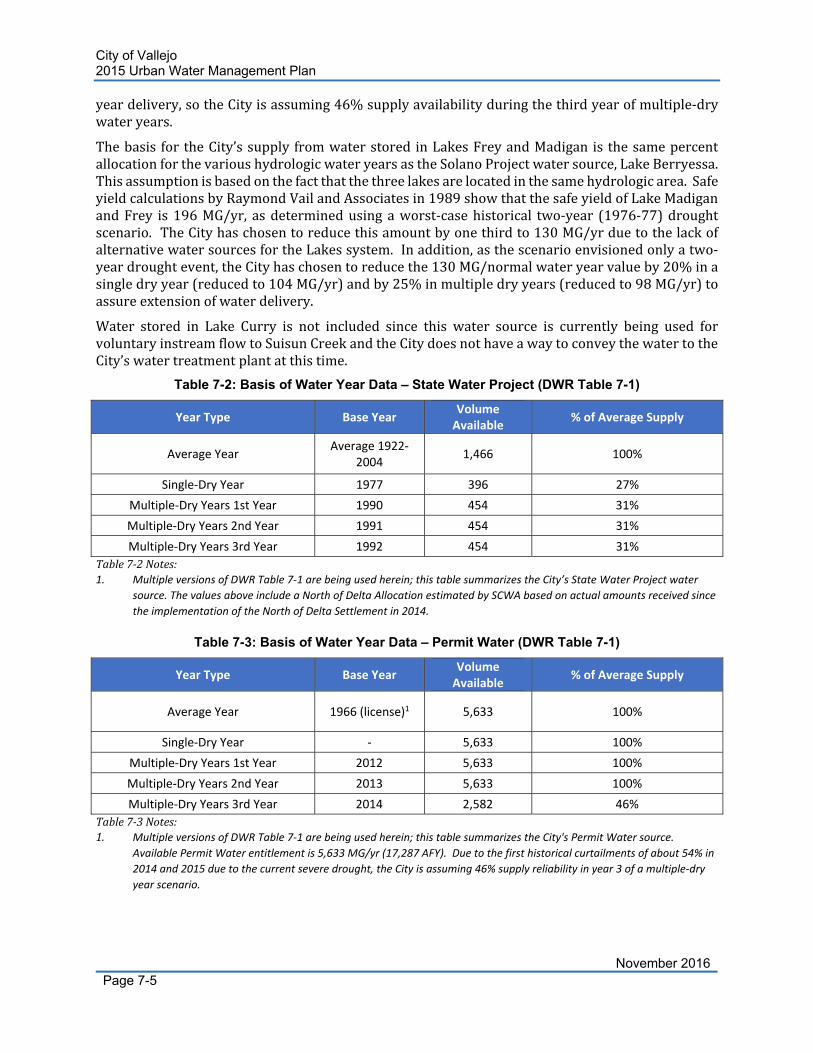
City of Vallejo 2015 Urban Water Management Plan
November 2016Page 7-5
yeardelivery,sotheCityisassuming46%supplyavailabilityduringthethirdyearofmultiple‐drywateryears.
Thebasis fortheCity’ssupply fromwaterstored inLakesFreyandMadiganis thesamepercentallocationforthevarioushydrologicwateryearsastheSolanoProjectwatersource,LakeBerryessa.Thisassumptionisbasedonthefactthatthethreelakesarelocatedinthesamehydrologicarea.SafeyieldcalculationsbyRaymondVailandAssociatesin1989showthatthesafeyieldofLakeMadiganandFrey is 196MG/yr, asdeterminedusing aworst‐casehistorical two‐year (1976‐77)droughtscenario.TheCityhaschosentoreducethisamountbyonethirdto130MG/yrduetothelackofalternativewatersourcesfortheLakessystem.Inaddition,asthescenarioenvisionedonlyatwo‐yeardroughtevent,theCityhaschosentoreducethe130MG/normalwateryearvalueby20%inasingledryyear(reducedto104MG/yr)andby25%inmultipledryyears(reducedto98MG/yr)toassureextensionofwaterdelivery.
Water stored in Lake Curry is not included since this water source is currently being used forvoluntaryinstreamflowtoSuisunCreekandtheCitydoesnothaveawaytoconveythewatertotheCity’swatertreatmentplantatthistime.
Table 7-2: Basis of Water Year Data – State Water Project (DWR Table 7-1)
Year Type Base Year Volume Available
% of Average Supply
Average Year Average 1922‐
2004 1,466 100%
Single‐Dry Year 1977 396 27%
Multiple‐Dry Years 1st Year 1990 454 31%
Multiple‐Dry Years 2nd Year 1991 454 31%
Multiple‐Dry Years 3rd Year 1992 454 31%
Table7‐2Notes:1. Multiple versions of DWR Table 7‐1 are being used herein; this table summarizes the City’s State Water Project water
source.The values above include a North of Delta Allocation estimated by SCWA based on actual amounts received since
the implementation of the North of Delta Settlement in 2014.
Table 7-3: Basis of Water Year Data – Permit Water (DWR Table 7-1)
Year Type Base Year Volume Available
% of Average Supply
Average Year 1966 (license)1 5,633 100%
Single‐Dry Year ‐ 5,633 100%
Multiple‐Dry Years 1st Year 2012 5,633 100%
Multiple‐Dry Years 2nd Year 2013 5,633 100%
Multiple‐Dry Years 3rd Year 2014 2,582 46%
Table7‐3Notes:1. Multiple versions of DWR Table 7‐1 are being used herein; this table summarizes the City's Permit Water source.
Available Permit Water entitlement is 5,633 MG/yr (17,287 AFY). Due to the first historical curtailments of about 54% in
2014 and 2015 due to the current severe drought, the City is assuming 46% supply reliability in year 3 of a multiple‐dry
year scenario.
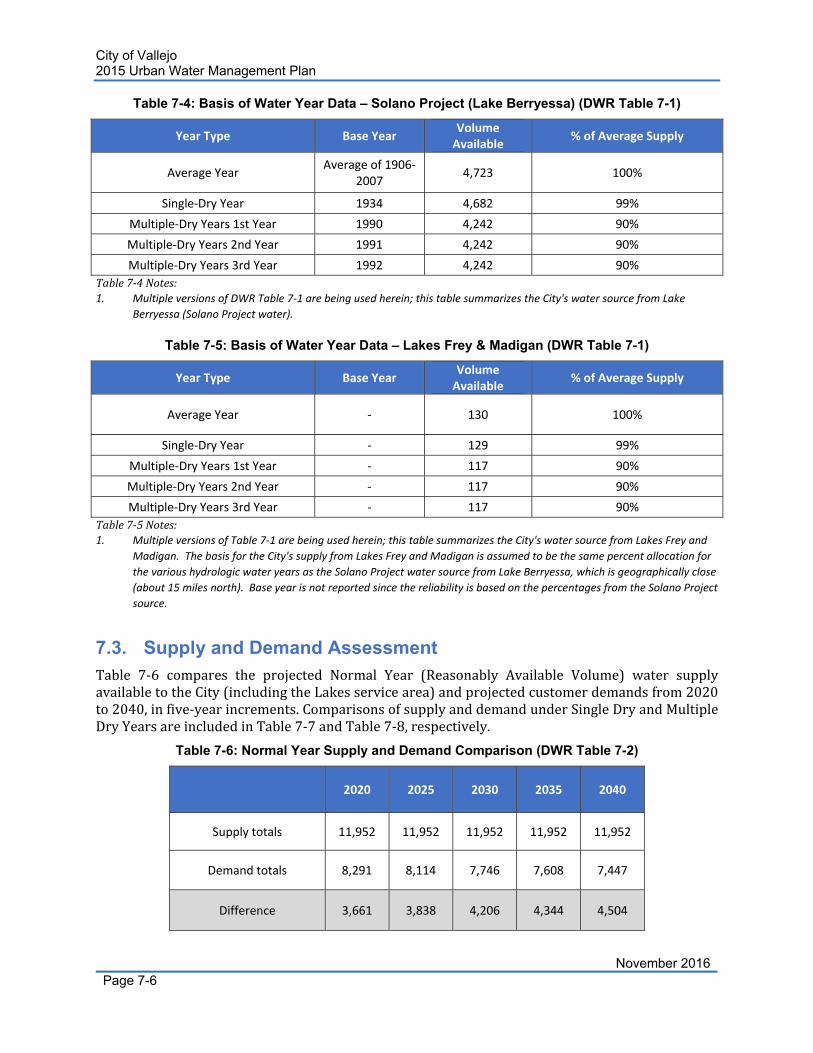
City of Vallejo 2015 Urban Water Management Plan
November 2016Page 7-6
Table 7-4: Basis of Water Year Data – Solano Project (Lake Berryessa) (DWR Table 7-1)
Year Type Base Year Volume Available
% of Average Supply
Average Year Average of 1906‐
2007 4,723 100%
Single‐Dry Year 1934 4,682 99%
Multiple‐Dry Years 1st Year 1990 4,242 90%
Multiple‐Dry Years 2nd Year 1991 4,242 90%
Multiple‐Dry Years 3rd Year 1992 4,242 90%
Table7‐4Notes:1. Multiple versions of DWR Table 7‐1 are being used herein; this table summarizes the City's water source from Lake
Berryessa (Solano Project water).
Table 7-5: Basis of Water Year Data – Lakes Frey & Madigan (DWR Table 7-1)
Year Type Base Year Volume Available
% of Average Supply
Average Year ‐ 130 100%
Single‐Dry Year ‐ 129 99%
Multiple‐Dry Years 1st Year ‐ 117 90%
Multiple‐Dry Years 2nd Year ‐ 117 90%
Multiple‐Dry Years 3rd Year ‐ 117 90%
Table7‐5Notes:1. Multiple versions of Table 7‐1 are being used herein; this table summarizes the City's water source from Lakes Frey and
Madigan. The basis for the City's supply from Lakes Frey and Madigan is assumed to be the same percent allocation for
the various hydrologic water years as the Solano Project water source from Lake Berryessa, which is geographically close
(about 15 miles north). Base year is not reported since the reliability is based on the percentages from the Solano Project
source.
7.3. Supply and Demand Assessment Table 7‐6 compares the projected Normal Year (Reasonably Available Volume) water supplyavailabletotheCity(includingtheLakesservicearea)andprojectedcustomerdemandsfrom2020to2040,infive‐yearincrements.ComparisonsofsupplyanddemandunderSingleDryandMultipleDryYearsareincludedinTable7‐7andTable7‐8,respectively.
Table 7-6: Normal Year Supply and Demand Comparison (DWR Table 7-2)
2020 2025 2030 2035 2040
Supply totals 11,952 11,952 11,952 11,952 11,952
Demand totals 8,291 8,114 7,746 7,608 7,447
Difference 3,661 3,838 4,206 4,344 4,504
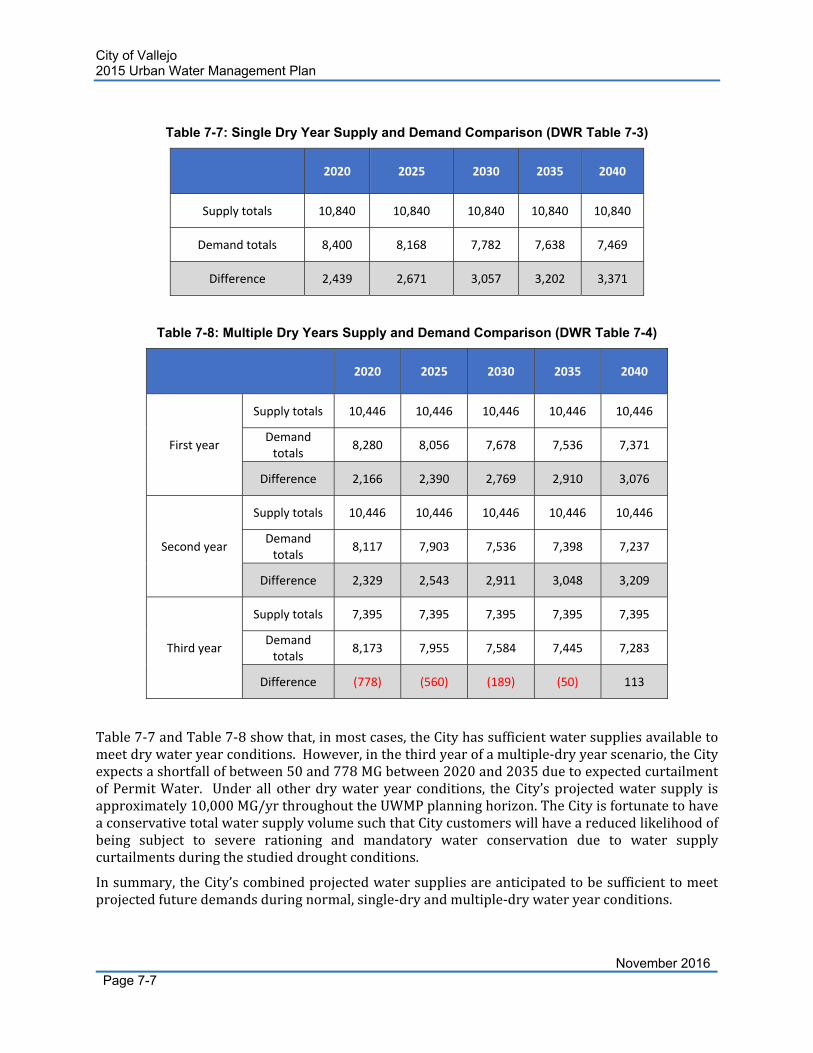
City of Vallejo 2015 Urban Water Management Plan
November 2016Page 7-7
Table 7-7: Single Dry Year Supply and Demand Comparison (DWR Table 7-3)
2020 2025 2030 2035 2040
Supply totals 10,840 10,840 10,840 10,840 10,840
Demand totals 8,400 8,168 7,782 7,638 7,469
Difference 2,439 2,671 3,057 3,202 3,371
Table 7-8: Multiple Dry Years Supply and Demand Comparison (DWR Table 7-4)
2020 2025 2030 2035 2040
First year
Supply totals 10,446 10,446 10,446 10,446 10,446
Demand totals
8,280 8,056 7,678 7,536 7,371
Difference 2,166 2,390 2,769 2,910 3,076
Second year
Supply totals 10,446 10,446 10,446 10,446 10,446
Demand totals
8,117 7,903 7,536 7,398 7,237
Difference 2,329 2,543 2,911 3,048 3,209
Third year
Supply totals 7,395 7,395 7,395 7,395 7,395
Demand totals
8,173 7,955 7,584 7,445 7,283
Difference (778) (560) (189) (50) 113
Table7‐7andTable7‐8showthat,inmostcases,theCityhassufficientwatersuppliesavailabletomeetdrywateryearconditions.However,inthethirdyearofamultiple‐dryyearscenario,theCityexpectsashortfallofbetween50and778MGbetween2020and2035duetoexpectedcurtailmentofPermitWater. Underallotherdrywateryear conditions, theCity’sprojectedwater supply isapproximately10,000MG/yrthroughouttheUWMPplanninghorizon.TheCityisfortunatetohaveaconservativetotalwatersupplyvolumesuchthatCitycustomerswillhaveareducedlikelihoodofbeing subject to severe rationing and mandatory water conservation due to water supplycurtailmentsduringthestudieddroughtconditions.
Insummary,theCity’scombinedprojectedwatersuppliesareanticipatedtobesufficienttomeetprojectedfuturedemandsduringnormal,single‐dryandmultiple‐drywateryearconditions.
City of Vallejo 2015 Urban Water Management Plan
November 2016Page 7-8
7.4. Regional Supply Reliability Aspart of itswatermanagement efforts, theCity of Vallejomaintains a detailedWater ShortageContingencyPlan,asdiscussedlaterinSection8,andiscontinuallypreparingtomanagesuppliesanddemandsduringdroughtsandwatershortagestoensureahighquality,reliablewatersupplytoitscustomers.TheCityalsomaintainsathoroughconservationprogramasdetailedinSection9,andplans to continue to participate in regional water conservation measures, surveys, and rebateprograms.Additionally,theCitysupportsVSFCDwhichtakestheleadonrecycledwaterplanningandassociatedstudies.
TheCityworkscloselywithandattendsregularplanningmeetingswiththeothermemberagenciesoftheSCWAtocoordinateoptimizedwatersuppliesforallassociatedagencies.
DistributionsystemwaterlosseswillbeanalyzedannuallyusingtheAWWAWaterLossAuditforimprovedidentificationandtrackingofloses. TheCityhaspurchasedanewmaintenancesystemwhichwillimprovewaterlossauditingprocessesbycapturingarecordofleaks,breaks,flushing,andfirefighting events. Ongoing leak program activities include water meter calibrations, notifyingcustomerswhenaleakappearstoexistonthecustomersideofthemeter,performingdistributionsystemleakdetectionwhenwarrantedandcost‐effective,andrepairingleakswhenfound.
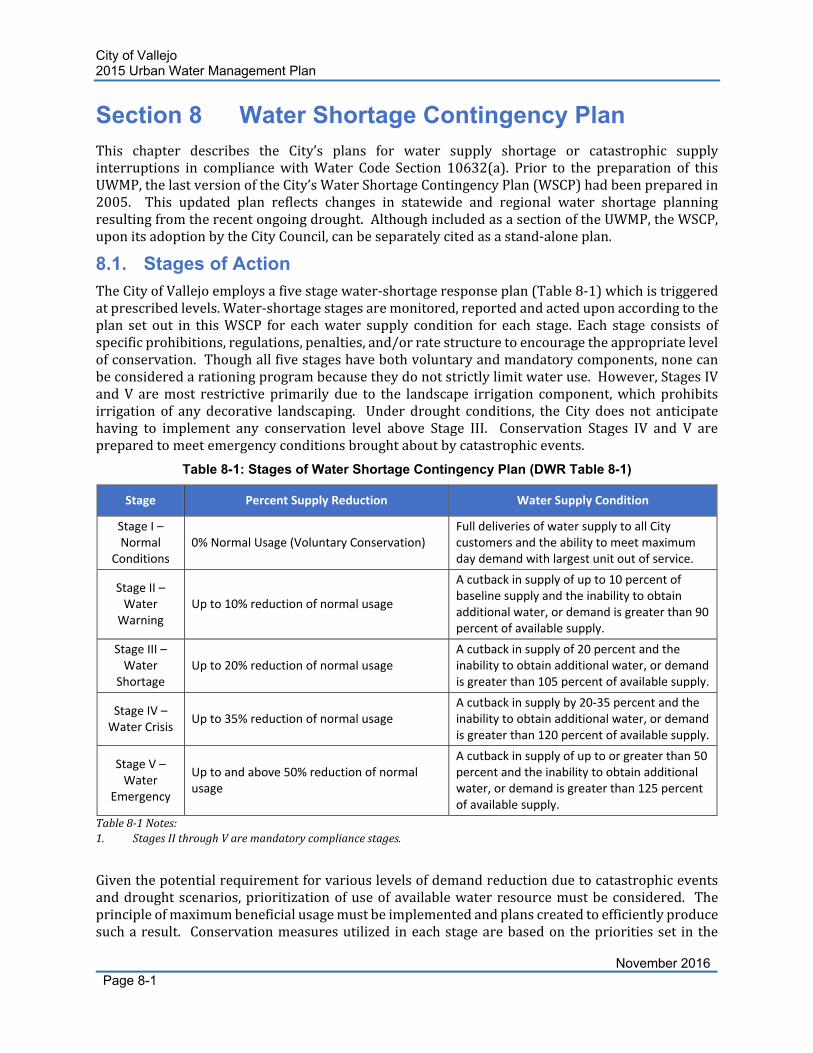
City of Vallejo 2015 Urban Water Management Plan
November 2016Page 8-1
Section 8 Water Shortage Contingency Plan This chapter describes the City’s plans for water supply shortage or catastrophic supplyinterruptions in compliancewithWater Code Section 10632(a). Prior to the preparation of thisUWMP,thelastversionoftheCity’sWaterShortageContingencyPlan(WSCP)hadbeenpreparedin2005. This updated plan reflects changes in statewide and regional water shortage planningresultingfromtherecentongoingdrought.AlthoughincludedasasectionoftheUWMP,theWSCP,uponitsadoptionbytheCityCouncil,canbeseparatelycitedasastand‐aloneplan.
8.1. Stages of Action TheCityofVallejoemploysafivestagewater‐shortageresponseplan(Table8‐1)whichistriggeredatprescribedlevels.Water‐shortagestagesaremonitored,reportedandacteduponaccordingtotheplan set out in thisWSCP for eachwater supply condition for each stage. Each stage consists ofspecificprohibitions,regulations,penalties,and/orratestructuretoencouragetheappropriatelevelofconservation.Thoughallfivestageshavebothvoluntaryandmandatorycomponents,nonecanbeconsideredarationingprogrambecausetheydonotstrictlylimitwateruse.However,StagesIVandV aremost restrictive primarily due to the landscape irrigation component,whichprohibitsirrigation of any decorative landscaping. Under drought conditions, the City does not anticipatehaving to implement any conservation level above Stage III. Conservation Stages IV and V arepreparedtomeetemergencyconditionsbroughtaboutbycatastrophicevents.
Table 8-1: Stages of Water Shortage Contingency Plan (DWR Table 8-1)
Stage Percent Supply Reduction Water Supply Condition
Stage I – Normal
Conditions 0% Normal Usage (Voluntary Conservation)
Full deliveries of water supply to all City customers and the ability to meet maximum day demand with largest unit out of service.
Stage II – Water Warning
Up to 10% reduction of normal usage
A cutback in supply of up to 10 percent of baseline supply and the inability to obtain additional water, or demand is greater than 90 percent of available supply.
Stage III – Water
Shortage Up to 20% reduction of normal usage
A cutback in supply of 20 percent and the inability to obtain additional water, or demand is greater than 105 percent of available supply.
Stage IV – Water Crisis
Up to 35% reduction of normal usage A cutback in supply by 20‐35 percent and the inability to obtain additional water, or demand is greater than 120 percent of available supply.
Stage V – Water
Emergency
Up to and above 50% reduction of normal usage
A cutback in supply of up to or greater than 50 percent and the inability to obtain additional water, or demand is greater than 125 percent of available supply.
Table8‐1Notes:1. StagesIIthroughVaremandatorycompliancestages.
Giventhepotentialrequirementforvariouslevelsofdemandreductionduetocatastrophiceventsanddroughtscenarios,prioritizationofuseofavailablewaterresourcemustbeconsidered. Theprincipleofmaximumbeneficialusagemustbeimplementedandplanscreatedtoefficientlyproducesucharesult. Conservationmeasuresutilized ineachstagearebasedon theprioritiesset in the
City of Vallejo 2015 Urban Water Management Plan
November 2016Page 8-2
CaliforniaWaterCode(CWC)Chapter3andthroughpublicinput.Asummaryofthoseprioritiesispresentedbelow.
Priority 1: Maintain essential public health and safety uses.
Uses include minimum drinking, sanitation, food preparation activities, and fire protectionrequirements. Theseusesareconsideredthecoreminimumwateruseofthecommunityandareestimatedatapproximately50gallonsperpersonperday.
Priority 2: Maintain the existing economic and job base of the community.
Acceptableuseswouldincludewatersufficienttoallowrestaurantoperation,waternecessaryforexistingindustrialuses,andadditionalcommercialuseswhichprotecttheemploymentbaseofthecommunitiesserved.Alltheseactivitieswouldbeunderconditionofefficientwaterusageorpenalty.
Priority 3: Continued discretionary uses for existing customers.
Existingcustomersmakeuseoflargequantitiesofnon‐essentialwaterusethroughsuchactivitiesasoutdoor landscaping, swimming pools, and car washing. These activities would be heavilydiscouraged and would be expected to account for a large percentage of demand reductions.Provisionsmaybemadetoallowcontinuedirrigationofheritagetreesandplantswhichbenefitthecommunity.
Priority 4: New Service Connections
Newconnectionswouldnotbepermittedduring timesof severe shortage. Only thoseapprovedconnectionspermittedbeforesupplyreductioneventsoccurredwouldbeallowedtobeconnectedto the system. Any additional service requestswould be conditioned to funddemand reductionmeasureswhichproduceverifiablesavingsgreaterthantheproposedconnectionimpacts.
8.2. Prohibitions on End Use ThespecificwaterusereductionmeasuresforthefivestagesaresummarizedinTable8‐2.Thenarrativedescriptionofthestagesofactionandrestrictionsandprohibitionsonenduseisprovidedinthefollowingsections.
Stage I: Normal Supply
StageIistobeinplaceatalltimesasitdoesnotrequireanycutbackinwaterusage.Instead,Stage1establishesrecommendationsforvoluntarywaterconservationandwaterwasterestrictions.Allnormalwaterefficiencyprogramsareinplace.
Stage II: Water Warning
InStageII,allcustomersarerequiredtoreduceconsumptionby10%forthedurationofthewaterwarning.Customersarealsorequiredorrecommendedtoimplementthefollowingwatershortageresponsemeasures:
No hose washing of sidewalks, walkways, driveways, parking areas, patios, porches orverandas,exceptflammableorothersimilardangeroussubstancesmaybewashedfromsaidareasbydirecthoseflushingforthebenefitofpublichealthandsafety.Thisprohibitionshallnotapplywherehosingofsidewalksordrivewaysisrequiredbylaw.
Nowatershallbeusedtoclean,fill,operate,ormaintainlevelsindecorativefountainsunlesssuchwaterispartofarecyclingsystem.
Nocustomershallpermitwatertoleakfromanyfacilityonhis/herpremises.Suchfacilitiesshallincludesprinklersandirrigationsystems,faucets,toilets,waterheaters,oranyotherfixtureusedinprovidingwaterservice.Anyleakshallberepairedin72hours.
City of Vallejo 2015 Urban Water Management Plan
November 2016Page 8-3
No customer shall sprinkle, water, or irrigate any shrubbery, trees, lawns, grass, groundcover,plants,vines,gardens,vegetables,flowers,oranyotherlandscapedorvegetatedareabetweenthehoursof9:00a.m.and6:00p.m.Suchwateringshallnotbeinexcessofneedsnorbeofamannerthatallowswatertoflowintostreets.Wateringbyhandshallbeallowed.
Non‐commercialwashingofprivatelyownedvehicles,trailers,buses,boats,andequipment,exceptfromabucketandexceptwithahoseequippedwithashut‐offnozzlemaybeused.
Anyuseofwaterfromafirehydrant,exceptforfireprotectionpurposes,isprohibitedunlessauthorizedbytheCity.
Useofwater for constructionpurposes, such as consolidationof backfill, unlessno othersourceofwaterormethodcanbeused,isprohibited.
Waterwillbeavailableonlyforbeneficialuses;allunnecessaryandwastefulusesofwaterareprohibited.
Waterefficientplumbingfixtures,waterefficientappliances,andhighefficiency irrigationtechniques,suchasdripirrigation,areencouraged.
Mowlessfrequentlyallowinggrasstogrowlonger,inducinghydration.
Checkthesoilmoistureintherootzonetodeterminewhenirrigationisrequired.
Restaurantsshallservewateronlyuponrequest.
Stage III: Water Shortage
StageIIIistobeimplementedwhenwaterdemandsneedtobereducedbyupto20%.CustomerswillbenotifiedthatStage IIIwaterconservationmeasuresare ineffect,andcompliancewiththefollowingwatershortageresponsemeasureswillberequired:
AllStageIandIIactionsremaininforce.
Furtherreductioninlandscapeirrigationisrequired.Reducewateringtime;toleratesomeplantwilting.
Landscape, pasture, common areas, and street median irrigation shall be limited to amaximumofthreedaysperweek,whennecessary,basedonthefollowingschedule:
o CustomerswithstreetaddressesthatendwithanoddnumbermayirrigateonlyonTuesdays,Thursdays,andSaturdays.
o CustomerswithstreetaddressesthatendwithanevennumbermayirrigateonlyonMonday,Wednesdays,andFridays.
o CommonareasandstreetmediansmayirrigateonlyonMondays,Wednesdays,andFridays.
Stage IV: Water Crisis
StageIVistobeimplementedwhenwaterusereductionsupto35%arerequired.Customerswillbenotifiedofthewatershortageresponsemeasuresaslistedbelow:
AllStageI,II,andIIIactionsremaininforce.
Landscape, pasture, common areas, and street median irrigation shall be limited to amaximumoftwodaysperweekbasedonthefollowingodd‐evenschedule:
City of Vallejo 2015 Urban Water Management Plan
November 2016Page 8-4
o Customerswithstreetaddresses thatendwithoddnumbersmay irrigateonlyonTuesdaysandSaturdays.
o Customerswith streetaddresses thatendwithevennumbermay irrigateonlyonMondayandFridays.
o CommonareasandstreetmediansmayirrigateonlyonMondaysandFridays.
Wateruseforornamentalpondsandfountainsisprohibited.
Automobiles or equipment shall be washed only at commercial establishments that userecycledorreclaimedwater.
Watershallnotbeusedforcoolingmists.
Flushingofsewersor firehydrants isprohibitedexcept incaseofanyemergencyand foressentialoperations.
Stage V: Water Emergency
Customerswill be required to complywith all of the following StageVwater shortage responsemeasureswhenuptoa50%usagereductionisrequired.Thewatershortageresponsemeasuresarelistedbelow:
AllStageI,II,IIIandIVactionsremaininforce.
Landscapeandpastureirrigationisprohibited.
ActivationofadditionalwaterserviceconnectionstotheCitywillnotbeallowed.
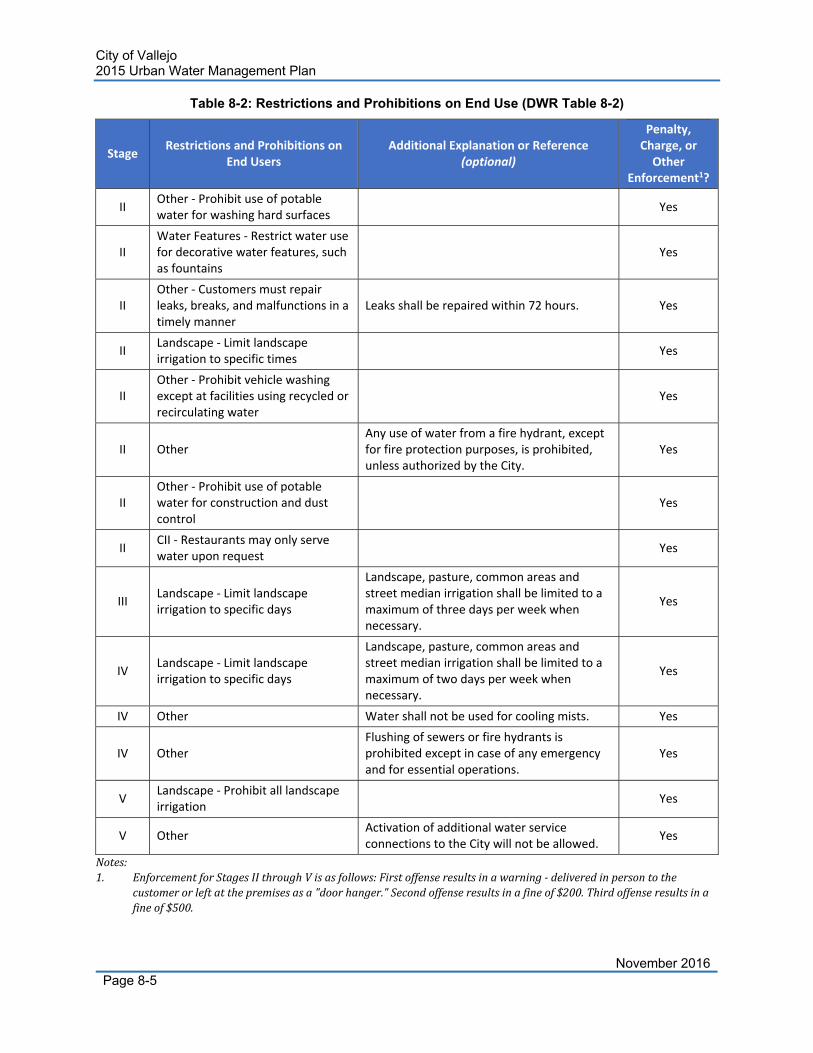
City of Vallejo 2015 Urban Water Management Plan
November 2016Page 8-5
Table 8-2: Restrictions and Prohibitions on End Use (DWR Table 8-2)
Stage Restrictions and Prohibitions on
End Users Additional Explanation or Reference
(optional)
Penalty, Charge, or Other
Enforcement1?
II Other ‐ Prohibit use of potable water for washing hard surfaces
Yes
II Water Features ‐ Restrict water use for decorative water features, such as fountains
Yes
II Other ‐ Customers must repair leaks, breaks, and malfunctions in a timely manner
Leaks shall be repaired within 72 hours. Yes
II Landscape ‐ Limit landscape irrigation to specific times
Yes
II Other ‐ Prohibit vehicle washing except at facilities using recycled or recirculating water
Yes
II Other Any use of water from a fire hydrant, except for fire protection purposes, is prohibited, unless authorized by the City.
Yes
II Other ‐ Prohibit use of potable water for construction and dust control
Yes
II CII ‐ Restaurants may only serve water upon request
Yes
III Landscape ‐ Limit landscape irrigation to specific days
Landscape, pasture, common areas and street median irrigation shall be limited to a maximum of three days per week when necessary.
Yes
IV Landscape ‐ Limit landscape irrigation to specific days
Landscape, pasture, common areas and street median irrigation shall be limited to a maximum of two days per week when necessary.
Yes
IV Other Water shall not be used for cooling mists. Yes
IV Other Flushing of sewers or fire hydrants is prohibited except in case of any emergency and for essential operations.
Yes
V Landscape ‐ Prohibit all landscape irrigation
Yes
V Other Activation of additional water service connections to the City will not be allowed.
Yes
Notes:1. EnforcementforStagesIIthroughVisasfollows:Firstoffenseresultsinawarning‐deliveredinpersontothe
customerorleftatthepremisesasa"doorhanger."Secondoffenseresultsinafineof$200.Thirdoffenseresultsinafineof$500.

City of Vallejo 2015 Urban Water Management Plan
November 2016Page 8-6
8.3. Penalties, Charges, Other Enforcement of Prohibitions In order to discourage non‐compliance with the mandatory water use restrictions in Stages IIthroughV,thefollowingenforcementpracticesandpenaltieswillbeimplementedforviolationofthestage‐specificunauthorizedwateruse:
Thefirstoffensewillresultinawarningtothecustomer,whichwillbepersonallydeliveredorleftatthepremisesasa“doorhanger.”
Thesecondoffenseshallresultinafineof$200.
Thethirdoffenseshallresultinafineof$500.
8.4. Consumption Reduction Methods When the Water Shortage Contingency Plan is put into effect, the City will implement variousconsumptionreductionmethodsdependingonthestageofaction. TheseconsumptionreductionmethodsaredescribedbelowandsummarizedinTable8‐3.
StartinginStageI,theCity,inpartnershipwithSCWA,willofferwatersurveystocustomerstohelpthemdetermineeffectwaterconservationstrategies.Additionally,theCitywillpartnerwithSCWA,DWRandPG&Etoofferrebatesonhighefficiencytoiletsandwashingmachines,smart irrigationcontrolsandturfirrigation.6DuringStageI,allnormalwateruseefficiencyprogramswillcontinue.During Stage II, the City will, notify local jurisdictions and customers that Stage II is beingimplemented,initiateapublicinformationcampaignexplainingthewatersupplycondition,maintaina water conservation hotline, provide free water conservation kits, and initiate “conservationmonitor”dutiestoexistingpersonneltoidentifyanddocumentexcessivewateruse. Additionally,theCitywillhostconservationeventsandoutreachinlocalschools.
If Stage III is implemented, the Citywill notify local jurisdictions and customers, continue thoseoutreachstrategiesstartedinStageIIandtightenrestrictionsonwaterusage.
ShouldStagesIVorVbeimplemented,timelynoticewillbegiventocustomersandlocaljurisdictions.ConsumptionreductionmethodsinStagesIVandVwillbuildupontheactionsofpreviousstagesandincludeamoratoriumonnewwaterconnections.
6http://www.cityofvallejo.net/cms/One.aspx?portalId=13506&pageId=23562
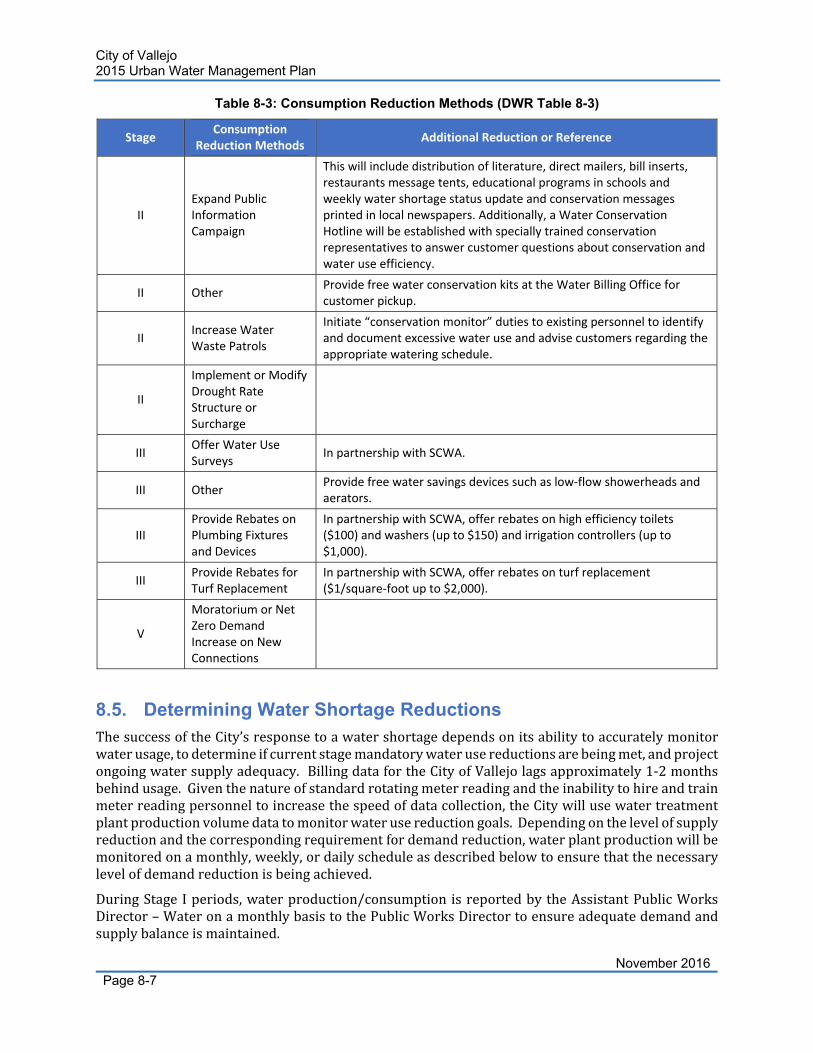
City of Vallejo 2015 Urban Water Management Plan
November 2016Page 8-7
Table 8-3: Consumption Reduction Methods (DWR Table 8-3)
Stage Consumption
Reduction Methods Additional Reduction or Reference
II Expand Public Information Campaign
This will include distribution of literature, direct mailers, bill inserts, restaurants message tents, educational programs in schools and weekly water shortage status update and conservation messages printed in local newspapers. Additionally, a Water Conservation Hotline will be established with specially trained conservation representatives to answer customer questions about conservation and water use efficiency.
II Other Provide free water conservation kits at the Water Billing Office for customer pickup.
II Increase Water Waste Patrols
Initiate “conservation monitor” duties to existing personnel to identify and document excessive water use and advise customers regarding the appropriate watering schedule.
II
Implement or Modify Drought Rate Structure or Surcharge
III Offer Water Use Surveys
In partnership with SCWA.
III Other Provide free water savings devices such as low‐flow showerheads and aerators.
III Provide Rebates on Plumbing Fixtures and Devices
In partnership with SCWA, offer rebates on high efficiency toilets ($100) and washers (up to $150) and irrigation controllers (up to $1,000).
III Provide Rebates for Turf Replacement
In partnership with SCWA, offer rebates on turf replacement ($1/square‐foot up to $2,000).
V
Moratorium or Net Zero Demand Increase on New Connections
8.5. Determining Water Shortage Reductions ThesuccessoftheCity’sresponsetoawatershortagedependsonitsabilitytoaccuratelymonitorwaterusage,todetermineifcurrentstagemandatorywaterusereductionsarebeingmet,andprojectongoingwatersupplyadequacy.BillingdatafortheCityofVallejolagsapproximately1‐2monthsbehindusage.Giventhenatureofstandardrotatingmeterreadingandtheinabilitytohireandtrainmeterreadingpersonneltoincreasethespeedofdatacollection,theCitywillusewatertreatmentplantproductionvolumedatatomonitorwaterusereductiongoals.Dependingonthelevelofsupplyreductionandthecorrespondingrequirementfordemandreduction,waterplantproductionwillbemonitoredonamonthly,weekly,ordailyscheduleasdescribedbelowtoensurethatthenecessarylevelofdemandreductionisbeingachieved.
DuringStageIperiods,waterproduction/consumption isreportedbytheAssistantPublicWorksDirector–WateronamonthlybasistothePublicWorksDirectortoensureadequatedemandandsupplybalanceismaintained.
City of Vallejo 2015 Urban Water Management Plan
November 2016Page 8-8
DuringStageIIandIIIperiods,waterproduction/consumptionisreportedbytheAssistantPublicWorksDirector–WateronaweeklybasistothePublicWorksDirectortoensureadequatedemandandsupplybalanceismaintained.Ifsufficientreductionsarenotbeingrealizedtoensurebalanceofsupplyanddemand,recommendationswillbepresentedtotheCityManagerforcorrectiveactionstobetaken.
DuringStageIVandVperiods,waterproduction/consumptionwillbemonitoredonadailybasiswithrecommendationsgivendailyifshortagesareprojected.
8.6. Revenue and Expenditure Impacts Aspreviouslynoted,thesuccessoftheCity’sresponsetoawatershortagedependsonitsabilitytoaccuratelymonitorwaterusage,todetermineifcurrentstagemandatorywaterusereductionsarebeingmet,andprojectongoingwatersupplyadequacy.ItalsodependsontheCity’scarefulreviewofrevenuelevelstoensurestepsaretaken,asneeded,tomaintainadequatewatersystemfundingduringtimesofreducedwatersales.
TheCityanticipatesareductioninrevenuerangingfrom9%inStageIIconditionsto35%inStageVconditionsduetoreducedwatersales.Thereductioninrevenuewouldbepartiallycounteractedbya reduction in operations andmaintenance expenses from the reduceddeliveries. However, thereductionsinexpensesisnotexpectedtoentirelybalancetheCity’sreducedrevenue,sothewaterfundwillneedtobemonitoredandadroughtratestructurewilllikelyneedtobeimplemented.Theplansforwaterfundmonitoringandadroughtratestructurearediscussedbelow.
Water Fund Financial Monitoring DuringStageIperiods,undernormalconditions,waterrevenuefiguresareprovidedquarterlyforreviewbydepartmentanddivisionheads.TheAssistantPublicWorksDirector–WaterwillreportmonthlytothePublicWorksDirectortoensureadequaterevenueisbeingcollectedtomeetexistingandprojectedbudgetedneeds.
During Stage II and III periods, water revenue figures will be provided monthly for review bydepartmentanddivisionheads.TheAssistantPublicWorksDirector–Waterwillreportmonthlytothe Public Works Director to ensure adequate revenue is being collected to meet existing andprojectedbudgetedneeds. If revenuesareprojected tobe inadequate, recommendationswillbepresentedtotheCityManagerforcorrectiveactionstobetaken.Suchactionsmayincludeincreasesordecreasesineitherorboththeservicechargeandconsumptioncharge,toensureadequatefundsarecollectedtomaintainthefinancialstabilityofthewaterfund.
During Stage IV and V periods, water revenue figures will be provided weekly for review bydepartmentanddivisionheads.TheAssistantPublicWorksDirector–Waterwillreportmonthlytothe Public Works Director to ensure adequate revenue is being collected to meet existing andprojectedbudgetedneeds. If revenuesareprojected tobe inadequate, recommendationswillbepresentedtotheCityManagerforcorrectiveactionstobetaken.Suchactionsmayincludeincreasesordecreasesineitherorboththeservicechargeandconsumptioncharge,toensureadequatefundsarecollectedtomaintainthefinancialstabilityofthewaterfund.
Drought Rate Structure
BeyondStageII,theCity’sexistingratestructureisnotlikelytobeadequatetomeetexpenses.TheCity recently conducted a rate study to determine future rates under both normal and droughtconditions.Therecentratestudyrecommendsavolumetricincreaseinratesasconservationtargetsareincreasedtoaccountfordecreasingwaterusage.Asproposedintheratestudy,intheeventofa
City of Vallejo 2015 Urban Water Management Plan
November 2016Page 8-9
Stage III, IV or V Shortage Contingency event, City Council would enact the volumetric droughtsurchargeinparalleltothestage‐appropriatewaterusereductionmeasures.
Anewratestructurehasnotyetbeenadopted,buttheCitywillpursueadoptionofdroughtratestoallowtheCitytogeneratesufficientfundstooperate,manage,andmaintainitsfacilitiesandservicesintimesofseveredroughtandwaterusereduction.Thefinalratestructuremaybeimposedtoadjustwatervolumeratesbyaspecifiedpercentagedependingontheseverityofthewatershortageandthe City’s revenue needs. If a drought rate is implemented, customerswho follow conservationrecommendationsprovidedbytheCitywouldexperienceminimalcostchangesontheirwaterbillwhilecustomerswhodonotconservewillexperiencehigherbills.The2016ratestudy(NBS2016)canbefoundontheCity’swebsite.7
8.7. Resolution or Ordinance TheCityhaspreparedadraftwatershortagecontingencyresolutionwhichcanbefoundinAppendixF.Intheeventofawatershortageemergency,thedraftresolutionwillbebroughtbeforetheCityCouncil for adoption. The resolution includesadeclarationof thewater shortageandsignalsanofficial implementation of the prohibitions on end use and consumption reduction methodsdescribedinthisWSCP.
8.8. Catastrophic Supply Interruption Asidefromdrought‐causedwatershortages,theCityisalsovulnerabletootherpotentialdisastersituationsthatcouldresultinacatastrophicinterruptionofwatersuppliesincluding,butnotlimitedto, regional power outages, landslides, earthquakes, and water contamination. Below is a briefsummary of how catastrophic events, other than extreme drought, may affect the City’s watersuppliesfromtheStateWaterProject(deliveryofbothStateWaterProjectTableAandVallejoPermitWater)andSolanoProject facilities, asprovidedbySCWA, theCity’swholesale supplierofwaterthroughtheseregionalsupplyfacilities.
North Bay Aqueduct Supply Interruption
TheNorthBayAqueduct(NBA)supplieswatertotheCityfromtheSWP,includingconveyanceofbothTableAallotmentsandVallejoPermitwaterentitlements.PotentialcatastrophicoutagesmayoccurfromearthquakesthatcausemajordamagetotheNBAfacilities,prolongedlossofPG&EpowerrequiredforpumpingwaterthroughtheNBA,orcontaminationattheintaketotheNBA.TheNBAisanundergroundpipelineandnotsubjecttolandslidedamage.
IntheeventoflossofNBAsupplyforanyreason,theCitywouldimmediatelyswitchtoSolanoProjectwatersupplieswhiletheemergencyconditionwasbeingresolvedandnormalwatersupplyrestored.Thishighlevelofredundancyispossibleduetothegeographicalseparationofthetwosources.
Solano Project Supply Interruption
TheSolanoProjectsuppliesnearlyhalfofallwatertotheCityundernormalconditions.Intheeventofanearthquake,theSolanoProjectEmergencyResponsePlanisinvoked.ThePlan,developedincoordinationwiththeU.S.BureauofReclamation,providesadetailedresponseforvariouslevelsofseismic activities both at the Monticello Dam site and within a specified geographical areasurrounding theSolanoProject. Noactionsarenecessary from theCityofVallejo,whichwillbenotifiedatthetimeoftheconditionoftheSolanoProjectanditsabilitytodeliver.Intheeventoflossof Solano Project water, the City would attempt to shift to supplies delivered through the NBAincludingSWPwaterandVallejopermitentitlements.
7http://www.cityofvallejo.net/common/pages/DisplayFile.aspx?itemId=2783255
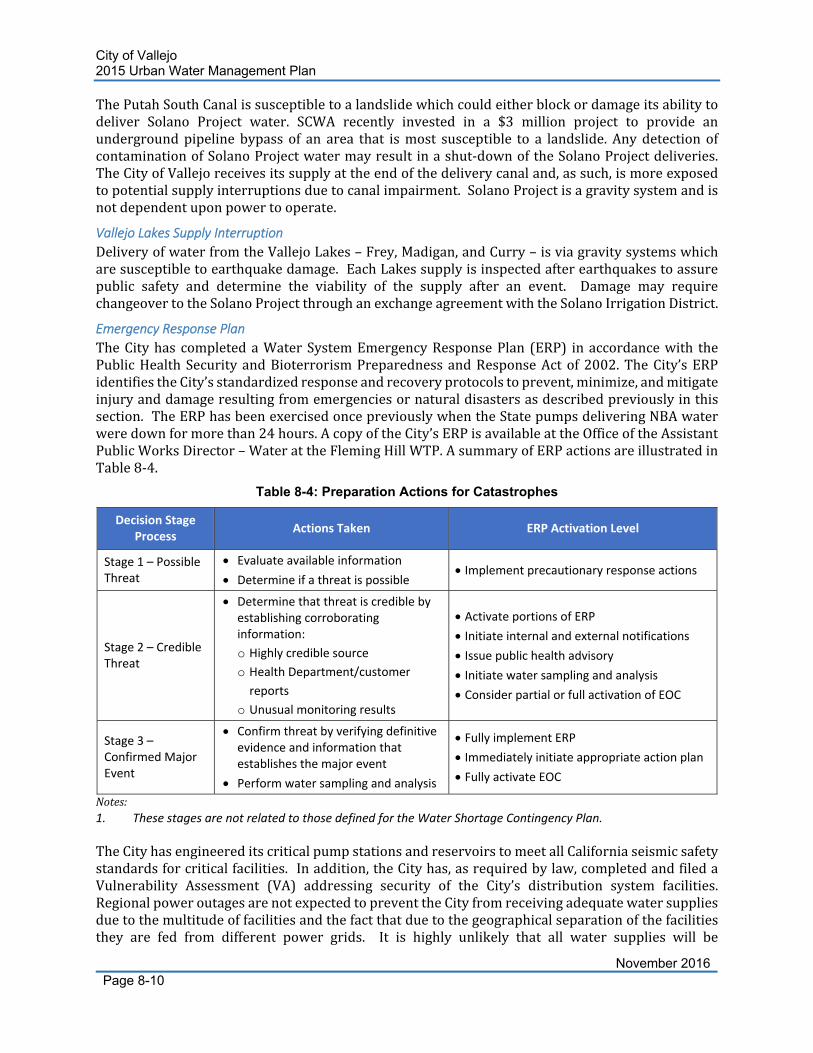
City of Vallejo 2015 Urban Water Management Plan
November 2016Page 8-10
ThePutahSouthCanalissusceptibletoalandslidewhichcouldeitherblockordamageitsabilitytodeliver Solano Project water. SCWA recently invested in a $3 million project to provide anundergroundpipeline bypass of an area that ismost susceptible to a landslide. Anydetection ofcontaminationofSolanoProjectwatermayresult inashut‐downoftheSolanoProjectdeliveries.TheCityofVallejoreceivesitssupplyattheendofthedeliverycanaland,assuch,ismoreexposedtopotentialsupplyinterruptionsduetocanalimpairment.SolanoProjectisagravitysystemandisnotdependentuponpowertooperate.
Vallejo Lakes Supply Interruption
DeliveryofwaterfromtheVallejoLakes–Frey,Madigan,andCurry–isviagravitysystemswhicharesusceptibletoearthquakedamage.EachLakessupplyisinspectedafterearthquakestoassurepublic safety and determine the viability of the supply after an event. Damage may requirechangeovertotheSolanoProjectthroughanexchangeagreementwiththeSolanoIrrigationDistrict.
Emergency Response Plan
TheCityhas completedaWaterSystemEmergencyResponsePlan (ERP) inaccordancewith thePublicHealthSecurityandBioterrorismPreparednessandResponseActof2002.TheCity’sERPidentifiestheCity’sstandardizedresponseandrecoveryprotocolstoprevent,minimize,andmitigateinjuryanddamageresultingfromemergenciesornaturaldisastersasdescribedpreviouslyinthissection.TheERPhasbeenexercisedoncepreviouslywhentheStatepumpsdeliveringNBAwaterweredownformorethan24hours.AcopyoftheCity’sERPisavailableattheOfficeoftheAssistantPublicWorksDirector–WaterattheFlemingHillWTP.AsummaryofERPactionsareillustratedinTable8‐4.
Table 8-4: Preparation Actions for Catastrophes
Decision Stage Process
Actions Taken ERP Activation Level
Stage 1 – Possible Threat
Evaluate available information
Determine if a threat is possible Implement precautionary response actions
Stage 2 – Credible Threat
Determine that threat is credible by establishing corroborating information:
o Highly credible source
o Health Department/customer
reports
o Unusual monitoring results
Activate portions of ERP Initiate internal and external notifications Issue public health advisory Initiate water sampling and analysis
Consider partial or full activation of EOC
Stage 3 – Confirmed Major Event
Confirm threat by verifying definitive evidence and information that establishes the major event
Perform water sampling and analysis
Fully implement ERP
Immediately initiate appropriate action plan
Fully activate EOC
Notes:1. These stages are not related to those defined for the Water Shortage Contingency Plan.
TheCityhasengineereditscriticalpumpstationsandreservoirstomeetallCaliforniaseismicsafetystandardsforcriticalfacilities.Inaddition,theCityhas,asrequiredbylaw,completedandfiledaVulnerability Assessment (VA) addressing security of the City’s distribution system facilities.RegionalpoweroutagesarenotexpectedtopreventtheCityfromreceivingadequatewatersuppliesduetothemultitudeoffacilitiesandthefactthatduetothegeographicalseparationofthefacilitiesthey are fed from different power grids. It is highly unlikely that all water supplies will be
City of Vallejo 2015 Urban Water Management Plan
November 2016Page 8-11
simultaneouslyaffectedandpreventwaterdelivery.TheCityshouldbeabletofunctionuntilregionalpowerisavailablebyrelyingonwhateverrawwaterdeliveriesareavailablecombinedwithavailablein‐towntreatedwaterstorage.
TheCitycontinuestoworkcooperativelywithSCWAtoinvestigateregionalfundingopportunitiesformeasures to improve the reliabilityofkeywater supply facilities throughparticipation in theSolanoWaterAgencies Committee. Through this committee, recommendations forwater supplyqualitymonitoringandmodelinghavebeenforwarded,andhydrologicstudieshavebeenundertakentodeterminewaterqualityandquantityparametersoftheNBAfacilitiesinBarkerSlough.ThistypeofmodelingisnecessarytodeterminethesourcesofwaterbeingpumpedattheNBAintakeduringdifferent timesof theyear anddifferenthydrologic conditions. Itwill also showhowNBAwaterqualitywillbeaffectedby changes in theDelta, suchas levee failures. Failuresof the leveesarepredictedtodrasticallyreducetheabilityof theNBApumpstationtoprovidewater,andaswithearthquakedamage,willnecessitateachangeovertoSolanoProjectWateruntilmitigated.
Potential Emergency Preparedness Actions Inordertobetterprepareforpotentialcatastrophicsupplyinterruptions,theCityhasdevelopedalistofpotentialprojectsandplansthatcouldbeimplemented.
Increase existing water storage.
TheCityhasover87MGoftreatedwaterstoragecurrentlyavailable,withupto59MGofrawwateravailablebygravitywhichmaybetreatedduringanemergency.Thistranslatestogreaterthana3day supply atmaximum day usage, or greater than 7 dayswith notification ofwater shortages.Opportunitiesforgreaterstoragevolumearebeinginvestigated.
Install backup power at the raw water pump station.
AbackupdieselgeneratorcanbeinstalledatthemainpumpstationwhichsuppliesrawwatertoVallejotoprovideupto50%oftotalwaterneedintimesofpoweroutage.
Coordinate with other agencies for additional water supply funding sources.
TheCity,asnotedabove,participates inregionalplanningandgrantapplicationswiththeSolanoCountyWaterAgency.
Put employees/contractors on‐call.
Watermaintenanceandengineeringcurrentlyhaveon‐callandafterhourscontactlistsavailableforuseinemergencies.
Develop public communication methods/plans.
TheCitycurrentlyemploysaPublicInformationOfficerfortimelydistributionofCitypoliciesandannouncements.Inaddition,PublicWorksDepartmentstaffareavailabletoassistinpublicoutreach,includinguseofsocialmedia.
Water Shortage Response Measures.
BecausewatersupplyisasensitiveandextremelyvaluableresourceinCalifornia,allwaterutilitiesintheregionpracticewaterconservationprograms.Beyondthesenormalpractices,additionalwatershortageresponsemeasuresareoftenneededwhenunforeseeabledroughtsandemergenciesreducewatersupplies.ThisWSCPincludesproposedwatershortageresponsemeasureswhichcanbeputintoeffectbytheCityCouncil.
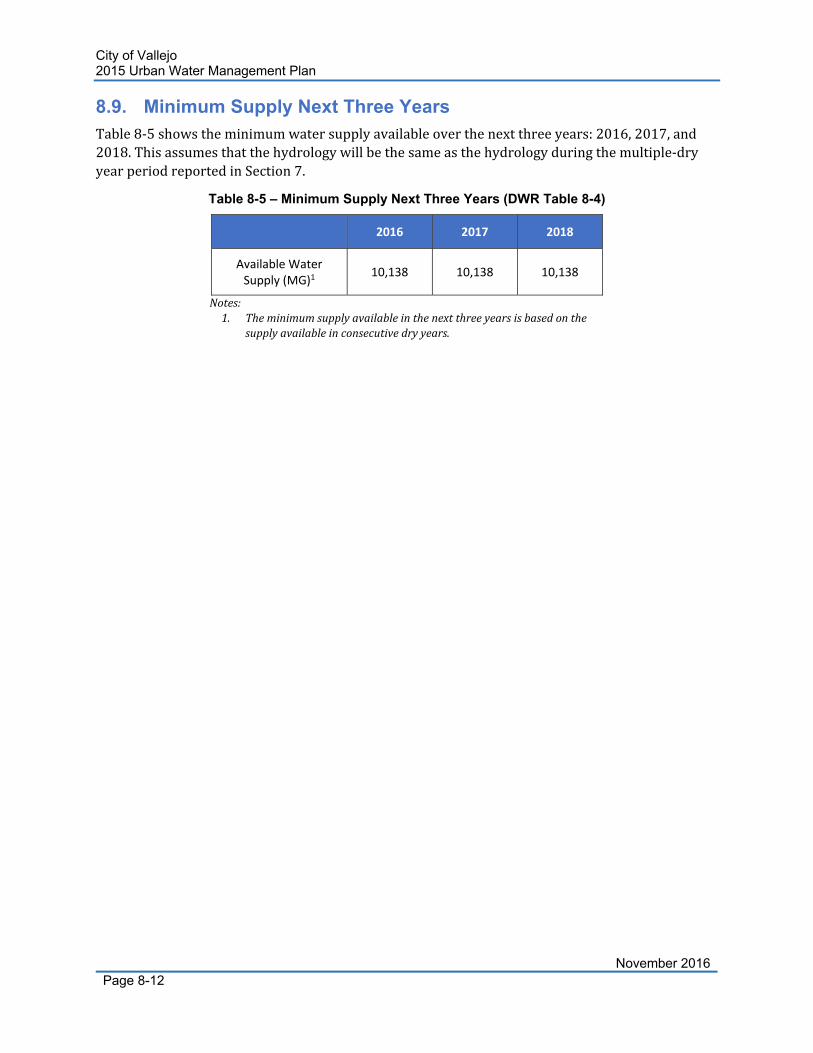
City of Vallejo 2015 Urban Water Management Plan
November 2016Page 8-12
8.9. Minimum Supply Next Three Years Table8‐5showstheminimumwatersupplyavailableoverthenextthreeyears:2016,2017,and2018.Thisassumesthatthehydrologywillbethesameasthehydrologyduringthemultiple‐dryyearperiodreportedinSection7.
Table 8-5 – Minimum Supply Next Three Years (DWR Table 8-4)
2016 2017 2018
Available Water Supply (MG)1
10,138 10,138 10,138
Notes:1. Theminimumsupplyavailableinthenextthreeyearsisbasedonthe
supplyavailableinconsecutivedryyears.
City of Vallejo 2015 Urban Water Management Plan
November 2016Page 9-1
Section 9 Demand Management Measures Demandmanagementmeasures(DMMs)arewaterconservationmeasuresbasedontheCaliforniaUrbanWaterConservationCouncil’s(CUWCC)originalBestManagementPractices(BMPs)forwaterconservation. The purpose of this section is to provide a description of the City’s currentlyimplementedandplannedwaterconservationprograms.Thissectionisalsomeanttocorrelatetheseprogramstothe“waterusereductionplan”meanttoachievethe2015and2020waterusetargetsrequiredbytheWaterConservationActof2009anddescribedinSection5ofthisUWMP,andtodocumentvoluntarycompliancewiththeCUWCC’sMemorandumofUnderstanding(MOU).
TheCityofVallejoisnotasignatorytothevoluntaryCUWCCMOUbutcontinuestocompleteannualreports.AsaparticipatingmemberoftheSolanoProject,theCityisrequiredbytheU.SBureauofReclamation (Bureau) to utilize on‐line BMP (or DMM) reporting and available water savingscalculation toolson theCUWCCwebsite. TheCityofVallejo filesandcompletesannualprogramupdates for theBureau by filling in information for urbanBMPs on the CUWCCwebsite, via theCUWCC'sBMPReportingDatabase,locatedontheirwebsiteathttp://www.cuwcc.org/.
Waterconservation,ordemandmanagement, isamanagementmethodavailabletoreducewateruse, thereby reducingwater supply needs for the City. This section describes the conservationprogramsproposedforFiscalYears2015/2016through2019/2020,includingmethodstoevaluateprogrameffectiveness,estimatewatersavings,andtheassociatedproposedbudgets.Thesuccessofsome of the conservation practices depends on cooperative work with other entities. To themaximumextentpossible,theCitydesignsprogramsincoordinationwithotheragenciestoleverageagencyresources,reduceprogramcosts,andimprovecost‐effectiveness.TheCityhasparticipatedinregionalgrantsthroughtheSolanoCountyWaterAgency–UrbanWaterConservationCommittee.
BMPreportsforFiscalYears2008/2009through2013/2014areavailableforviewingattheCityWaterDivisionofficeandonlineatwww.cuwcc.org.TheFY2014/2015reporthasbeensubmittedbuthasnotyetbeenfinalized.
9.1. Conservation Measure Organization In1991,theCUWCCadopteditsMemorandumofUnderstandingRegardingUrbanWaterConservationin California, outlining 14 BMPs to expedite implementation of reasonable water conservationmeasures in urban areas. Assembly Bill 1420 (AB1420) amended theUrbanWaterManagementPlanningActtorequire,effectiveJanuary1,2009,thaturbanwatersuppliersawardedgrantsorloansbytheStatebeconditionedontheimplementationofthe14BMPs.InDecember2008,theCUWCCMOUwasamendedsuch that theBMPswererestructured intonewtwogeneralBMPcategories:ProgrammaticandFoundational.Separately,theCaliforniaWaterCode(CWC)sectiondescribingtheoriginal14DMMswasmodifiedin2014todescribesix,moregeneralDMMcategories.ThisresultedinthreedifferentorganizationsoftheDMMs/BMPs.
1. 14BMPsdescribedinthe1991CUWCCMOUandAB1420.
2. FoundationalandProgrammaticBMPsdescribedintherevisedCUWCC’s2008MOU.
3. SixDMMsdescribedinthe2014CWCamendmentandDWR’s2015UWMPGuidebook.
TheCity’sDraft2010UWMPreferencestheoriginal14DMMs.Thisallowedforstreamlinedtrackingof DMMs for the purposes of gaining funding eligibility through AB1420 and the associatedcompletionofAB1420self‐certificationtables.However,asofJuly1,2016,fundingeligibilitywillbebased onmeeting the 2015 interim target, rather than through completion of the AB1420 self‐certification tables. Therefore, to be consistent with the CWC and 2015 UWMP Guidebook, this
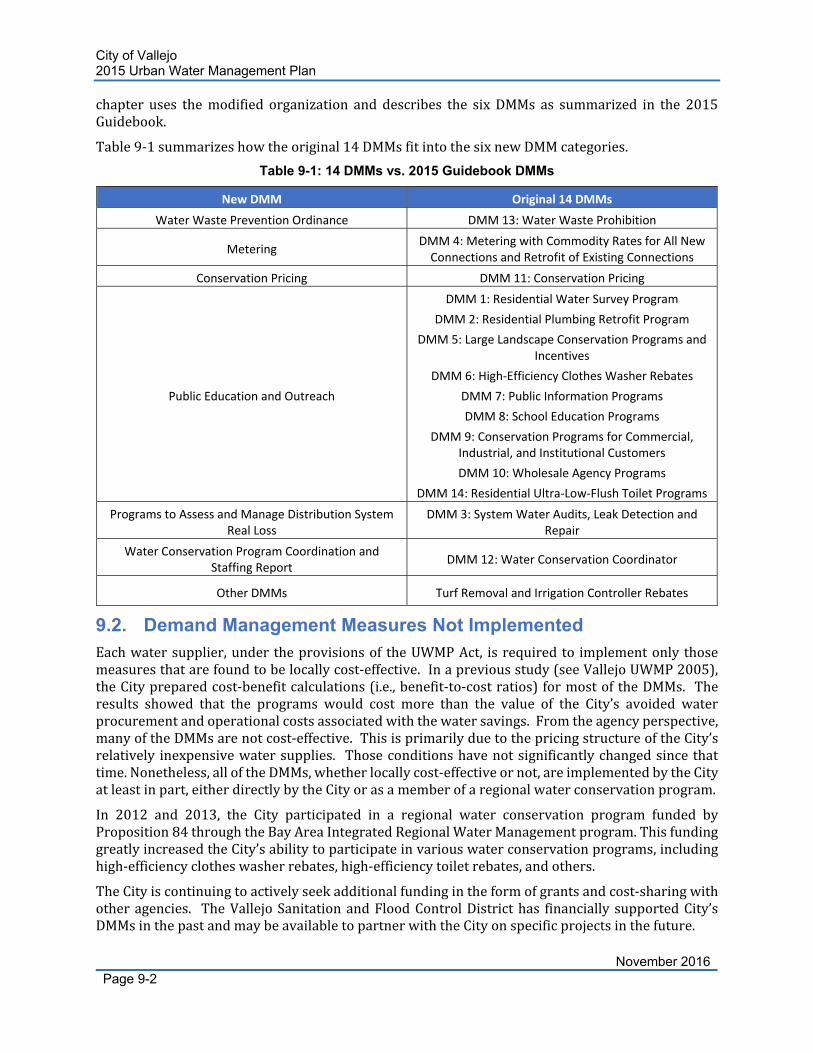
City of Vallejo 2015 Urban Water Management Plan
November 2016Page 9-2
chapter uses themodified organization and describes the sixDMMs as summarized in the 2015Guidebook.
Table9‐1summarizeshowtheoriginal14DMMsfitintothesixnewDMMcategories.
Table 9-1: 14 DMMs vs. 2015 Guidebook DMMs
New DMM Original 14 DMMs
Water Waste Prevention Ordinance DMM 13: Water Waste Prohibition
Metering DMM 4: Metering with Commodity Rates for All New Connections and Retrofit of Existing Connections
Conservation Pricing DMM 11: Conservation Pricing
Public Education and Outreach
DMM 1: Residential Water Survey Program
DMM 2: Residential Plumbing Retrofit Program
DMM 5: Large Landscape Conservation Programs and Incentives
DMM 6: High‐Efficiency Clothes Washer Rebates
DMM 7: Public Information Programs
DMM 8: School Education Programs
DMM 9: Conservation Programs for Commercial, Industrial, and Institutional Customers
DMM 10: Wholesale Agency Programs
DMM 14: Residential Ultra‐Low‐Flush Toilet Programs
Programs to Assess and Manage Distribution System Real Loss
DMM 3: System Water Audits, Leak Detection and Repair
Water Conservation Program Coordination and Staffing Report
DMM 12: Water Conservation Coordinator
Other DMMs Turf Removal and Irrigation Controller Rebates
9.2. Demand Management Measures Not Implemented Eachwatersupplier,under theprovisionsof theUWMPAct, isrequiredto implementonly thosemeasuresthatarefoundtobelocallycost‐effective.Inapreviousstudy(seeVallejoUWMP2005),theCitypreparedcost‐benefitcalculations(i.e.,benefit‐to‐costratios)formostoftheDMMs. Theresults showed that the programs would cost more than the value of the City’s avoided waterprocurementandoperationalcostsassociatedwiththewatersavings.Fromtheagencyperspective,manyoftheDMMsarenotcost‐effective.ThisisprimarilyduetothepricingstructureoftheCity’srelatively inexpensivewatersupplies. Thoseconditionshavenotsignificantlychangedsince thattime.Nonetheless,alloftheDMMs,whetherlocallycost‐effectiveornot,areimplementedbytheCityatleastinpart,eitherdirectlybytheCityorasamemberofaregionalwaterconservationprogram.
In 2012 and 2013, the City participated in a regional water conservation program funded byProposition84throughtheBayAreaIntegratedRegionalWaterManagementprogram.ThisfundinggreatlyincreasedtheCity’sabilitytoparticipateinvariouswaterconservationprograms,includinghigh‐efficiencyclotheswasherrebates,high‐efficiencytoiletrebates,andothers.
TheCityiscontinuingtoactivelyseekadditionalfundingintheformofgrantsandcost‐sharingwithotheragencies. TheVallejoSanitationandFloodControlDistricthas financially supportedCity’sDMMsinthepastandmaybeavailabletopartnerwiththeCityonspecificprojectsinthefuture.
City of Vallejo 2015 Urban Water Management Plan
November 2016Page 9-3
9.3. Demand Management Measures
Water Waste Prevention Ordinances
WaterWasteProhibition Description of Program
The City Council adopted aWastefulWater Prohibition Ordinance onMarch 7, 2006whichwasdevelopedaccordingtotheguidelinesofDMM#13.Thisordinancewasupdatedin2010,andthenagaininMarch,2015whennewdroughtrestrictions,enforcement,andpenaltieswereadded.Acopyof the ordinance is included in Appendix D. The ordinance provides for City staff to respond tocomplaints of water waste, or observed water waste. A phone hotline (707‐648‐4482) and aninternet‐based reporting program, “SeeClickFix”, are available for the public for reportingwaterleaksandwaste. Inrespondingtoobservedwaterwaste,Citystaffmayvisitorcallcustomerstoinformthemoftheirwastefulactivityandrequestthattheactivitybecorrected.Follow‐upvisitsaremade to assess whether the water wasting activity has ceased. Notices are tracked for repeat“offenders.”Duringtimesofwatershortage,repeatwaterwasteviolatorsmaybefined$200forasecondviolationand$500forathirdviolation.Citystaffmaintainsalogofadvisoriesandactionstaken.Thisordinanceisenforcedatalltimes,withadditionalrestrictionsduringwatershortages.
Prohibitionsatalltimesinclude:
Gutterflooding
Single‐passcoolingsystemsfornewconnections
Non‐recirculatingsystemsinallnewconveyorcarwashsystems
Useofhoseforwashingcars,boats,trailersandothervehicleswithoutanozzle
Useofhose towashsidewalks,walkways,driveways,parking lots,orotherhardsurfacedareaswithoutanozzle,unlessthewashingisrequiredforhealthreasons
Outdoorirrigationthatcausesrunoffformorethan15minutes
Allowingpotablewatertoescapefrombreakswithinthecustomer’ssystemformorethan36hoursafternotificationordiscoveryofthebreak
Decorativewaterfountainswithoutwaterrecirculation
Useofpotablewaterforconstruction,compaction,dustcontrol,streetsweeping,orbuildingwashdownwherenonpotableorrecycledwaterisavailable
Useofnonrecirculatingsystemsinnewconveyorcarwashfacilities
Additionalprohibitionsduringwatershortagesinclude:
Limits on outdoor irrigation with potable water during the day time hours and dailyrestrictions
Outdoorirrigationthatcausesrunoff
Washingsidewalksanddrivewayswithpotablewater
Usingpotablewaterinafountainordecoratewaterfeature
Outdoorirrigationwithin48hoursofmeasurablerainfall
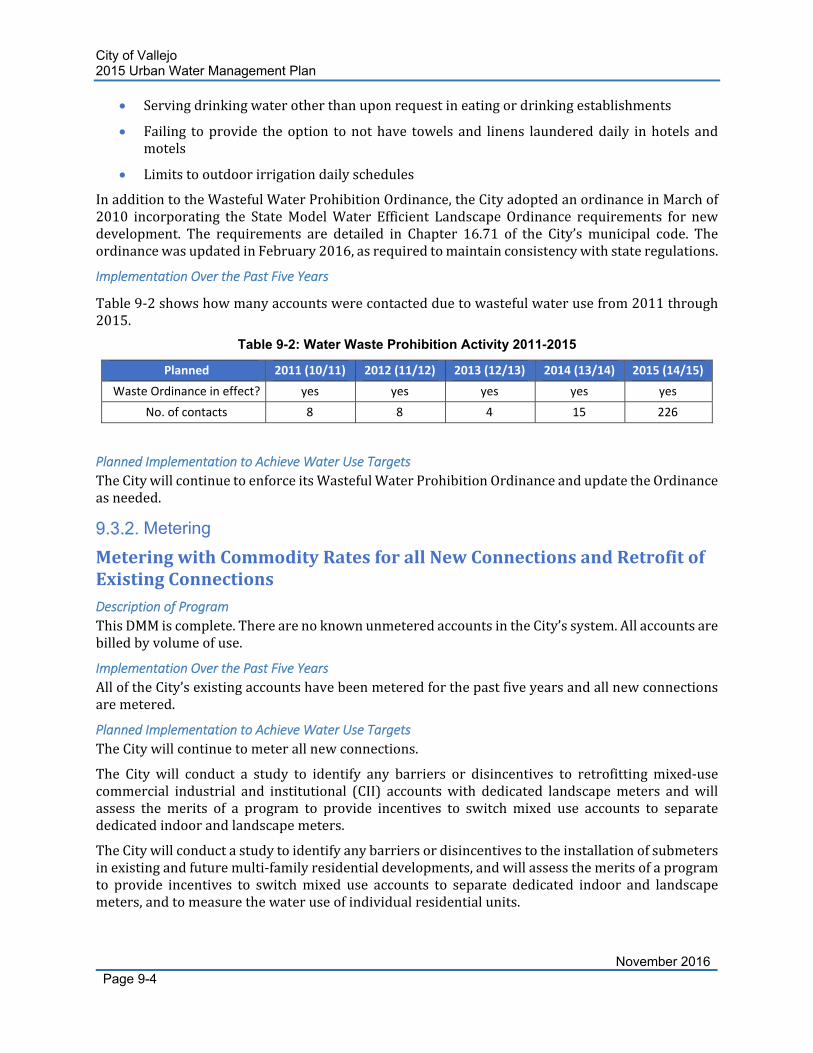
City of Vallejo 2015 Urban Water Management Plan
November 2016Page 9-4
Servingdrinkingwaterotherthanuponrequestineatingordrinkingestablishments
Failing toprovide theoption tonothave towels and linens laundereddaily inhotels andmotels
Limitstooutdoorirrigationdailyschedules
InadditiontotheWastefulWaterProhibitionOrdinance,theCityadoptedanordinanceinMarchof2010 incorporating the StateModelWater Efficient Landscape Ordinance requirements for newdevelopment. The requirements are detailed in Chapter 16.71 of the City’s municipal code. TheordinancewasupdatedinFebruary2016,asrequiredtomaintainconsistencywithstateregulations.
Implementation Over the Past Five Years
Table9‐2showshowmanyaccountswerecontactedduetowastefulwaterusefrom2011through2015.
Table 9-2: Water Waste Prohibition Activity 2011-2015
Planned 2011 (10/11) 2012 (11/12) 2013 (12/13) 2014 (13/14) 2015 (14/15)
Waste Ordinance in effect? yes yes yes yes yes
No. of contacts 8 8 4 15 226
Planned Implementation to Achieve Water Use Targets
TheCitywillcontinuetoenforceitsWastefulWaterProhibitionOrdinanceandupdatetheOrdinanceasneeded.
Metering
MeteringwithCommodityRatesforallNewConnectionsandRetrofitofExistingConnections Description of Program
ThisDMMiscomplete.TherearenoknownunmeteredaccountsintheCity’ssystem.Allaccountsarebilledbyvolumeofuse.
Implementation Over the Past Five Years
AlloftheCity’sexistingaccountshavebeenmeteredforthepastfiveyearsandallnewconnectionsaremetered.
Planned Implementation to Achieve Water Use Targets
TheCitywillcontinuetometerallnewconnections.
The City will conduct a study to identify any barriers or disincentives to retrofittingmixed‐usecommercial industrial and institutional (CII) accountswith dedicated landscapemeters andwillassess the merits of a program to provide incentives to switch mixed use accounts to separatededicatedindoorandlandscapemeters.
TheCitywillconductastudytoidentifyanybarriersordisincentivestotheinstallationofsubmetersinexistingandfuturemulti‐familyresidentialdevelopments,andwillassessthemeritsofaprogramto provide incentives to switchmixed use accounts to separate dedicated indoor and landscapemeters,andtomeasurethewateruseofindividualresidentialunits.
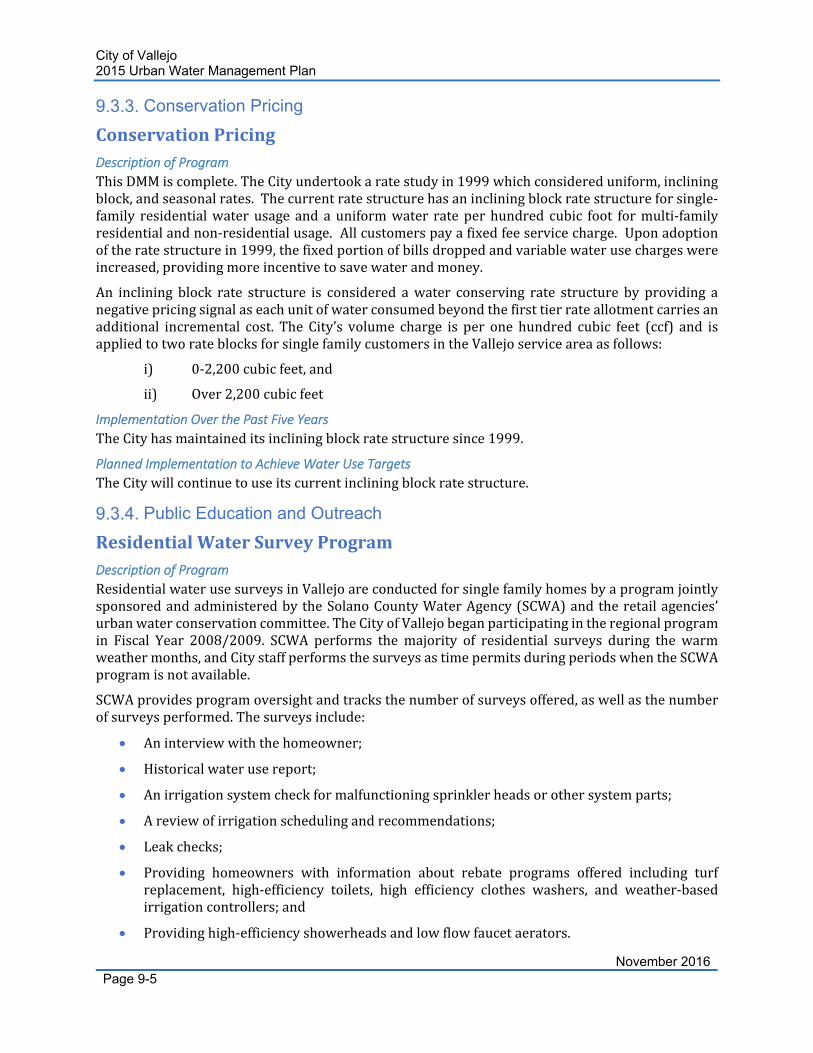
City of Vallejo 2015 Urban Water Management Plan
November 2016Page 9-5
Conservation Pricing
ConservationPricing Description of Program
ThisDMMiscomplete.TheCityundertookaratestudyin1999whichconsidereduniform,incliningblock,andseasonalrates.Thecurrentratestructurehasanincliningblockratestructureforsingle‐family residentialwaterusage and auniformwater rateperhundred cubic foot formulti‐familyresidentialandnon‐residentialusage.Allcustomerspayafixedfeeservicecharge.Uponadoptionoftheratestructurein1999,thefixedportionofbillsdroppedandvariablewaterusechargeswereincreased,providingmoreincentivetosavewaterandmoney.
An inclining block rate structure is considered awater conserving rate structure by providing anegativepricingsignalaseachunitofwaterconsumedbeyondthefirsttierrateallotmentcarriesanadditional incremental cost. The City’s volume charge is per one hundred cubic feet (ccf) and isappliedtotworateblocksforsinglefamilycustomersintheVallejoserviceareaasfollows:
i) 0‐2,200cubicfeet,and
ii) Over2,200cubicfeet
Implementation Over the Past Five Years
TheCityhasmaintaineditsincliningblockratestructuresince1999.
Planned Implementation to Achieve Water Use Targets
TheCitywillcontinuetouseitscurrentincliningblockratestructure.
Public Education and Outreach
ResidentialWaterSurveyProgram
Description of Program
ResidentialwaterusesurveysinVallejoareconductedforsinglefamilyhomesbyaprogramjointlysponsoredandadministeredbytheSolanoCountyWaterAgency(SCWA)andtheretailagencies’urbanwaterconservationcommittee.TheCityofVallejobeganparticipatingintheregionalprogramin Fiscal Year 2008/2009. SCWA performs the majority of residential surveys during the warmweathermonths,andCitystaffperformsthesurveysastimepermitsduringperiodswhentheSCWAprogramisnotavailable.
SCWAprovidesprogramoversightandtracksthenumberofsurveysoffered,aswellasthenumberofsurveysperformed.Thesurveysinclude:
Aninterviewwiththehomeowner;
Historicalwaterusereport;
Anirrigationsystemcheckformalfunctioningsprinklerheadsorothersystemparts;
Areviewofirrigationschedulingandrecommendations;
Leakchecks;
Providing homeowners with information about rebate programs offered including turfreplacement, high‐efficiency toilets, high efficiency clothes washers, and weather‐basedirrigationcontrollers;and
Providinghigh‐efficiencyshowerheadsandlowflowfaucetaerators.
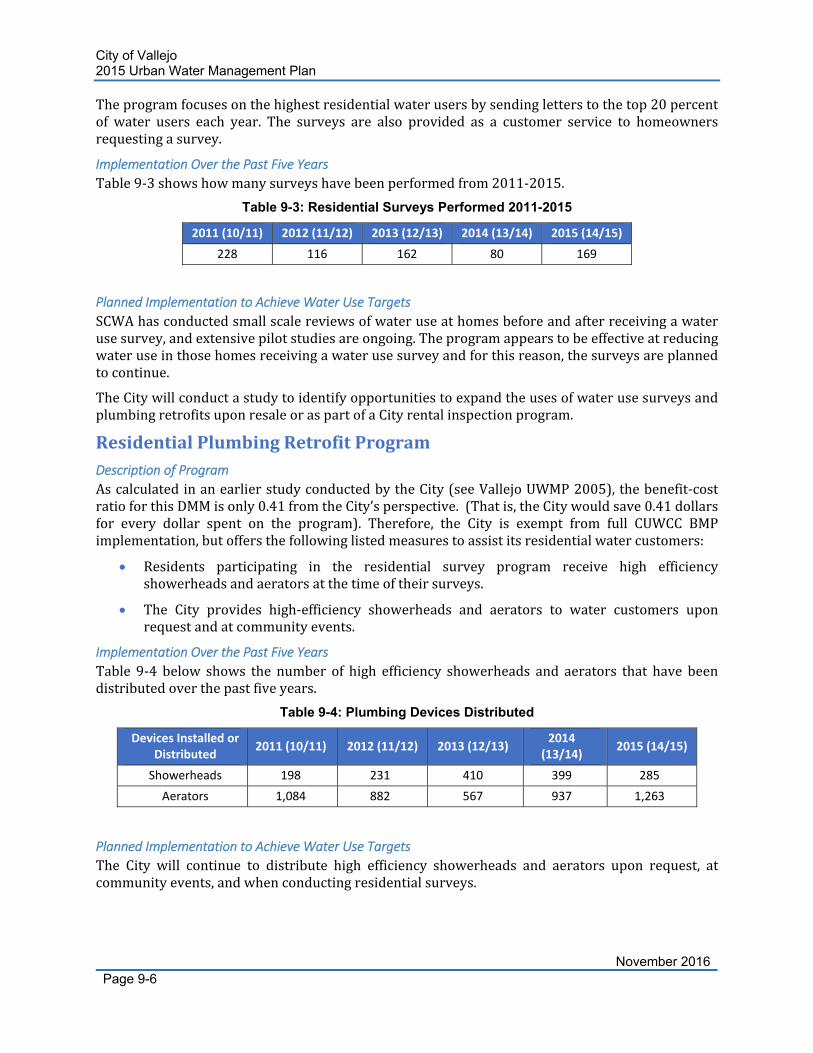
City of Vallejo 2015 Urban Water Management Plan
November 2016Page 9-6
Theprogramfocusesonthehighestresidentialwaterusersbysendingletterstothetop20percentof water users each year. The surveys are also provided as a customer service to homeownersrequestingasurvey.
Implementation Over the Past Five Years
Table9‐3showshowmanysurveyshavebeenperformedfrom2011‐2015.
Table 9-3: Residential Surveys Performed 2011-2015
2011 (10/11) 2012 (11/12) 2013 (12/13) 2014 (13/14) 2015 (14/15)
228 116 162 80 169
Planned Implementation to Achieve Water Use Targets
SCWAhasconductedsmallscalereviewsofwateruseathomesbeforeandafterreceivingawaterusesurvey,andextensivepilotstudiesareongoing.Theprogramappearstobeeffectiveatreducingwateruseinthosehomesreceivingawaterusesurveyandforthisreason,thesurveysareplannedtocontinue.
TheCitywillconductastudytoidentifyopportunitiestoexpandtheusesofwaterusesurveysandplumbingretrofitsuponresaleoraspartofaCityrentalinspectionprogram.
ResidentialPlumbingRetrofitProgram
Description of Program
AscalculatedinanearlierstudyconductedbytheCity(seeVallejoUWMP2005),thebenefit‐costratioforthisDMMisonly0.41fromtheCity’sperspective.(Thatis,theCitywouldsave0.41dollarsfor every dollar spent on the program). Therefore, the City is exempt from full CUWCC BMPimplementation,butoffersthefollowinglistedmeasurestoassistitsresidentialwatercustomers:
Residents participating in the residential survey program receive high efficiencyshowerheadsandaeratorsatthetimeoftheirsurveys.
The City provides high‐efficiency showerheads and aerators to water customers uponrequestandatcommunityevents.
Implementation Over the Past Five Years
Table 9‐4 below shows the number of high efficiency showerheads and aerators that have beendistributedoverthepastfiveyears.
Table 9-4: Plumbing Devices Distributed
Devices Installed or Distributed
2011 (10/11) 2012 (11/12) 2013 (12/13) 2014
(13/14) 2015 (14/15)
Showerheads 198 231 410 399 285
Aerators 1,084 882 567 937 1,263
Planned Implementation to Achieve Water Use Targets
The City will continue to distribute high efficiency showerheads and aerators upon request, atcommunityevents,andwhenconductingresidentialsurveys.
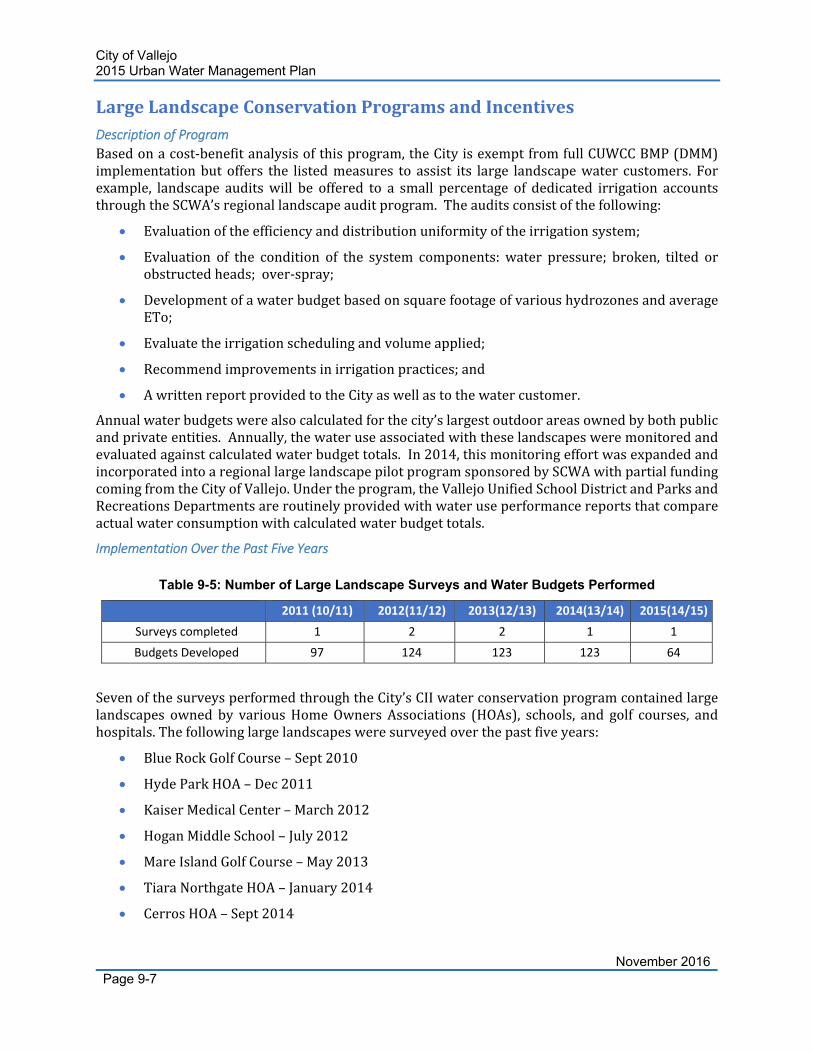
City of Vallejo 2015 Urban Water Management Plan
November 2016Page 9-7
LargeLandscapeConservationProgramsandIncentives Description of Program
Basedonacost‐benefitanalysisofthisprogram,theCityisexemptfromfullCUWCCBMP(DMM)implementationbut offers the listedmeasures to assist its large landscapewater customers. Forexample, landscape auditswill be offered to a small percentage of dedicated irrigation accountsthroughtheSCWA’sregionallandscapeauditprogram.Theauditsconsistofthefollowing:
Evaluationoftheefficiencyanddistributionuniformityoftheirrigationsystem;
Evaluation of the condition of the system components: water pressure; broken, tilted orobstructedheads;over‐spray;
DevelopmentofawaterbudgetbasedonsquarefootageofvarioushydrozonesandaverageETo;
Evaluatetheirrigationschedulingandvolumeapplied;
Recommendimprovementsinirrigationpractices;and
AwrittenreportprovidedtotheCityaswellastothewatercustomer.
Annualwaterbudgetswerealsocalculatedforthecity’slargestoutdoorareasownedbybothpublicandprivateentities.Annually,thewateruseassociatedwiththeselandscapesweremonitoredandevaluatedagainstcalculatedwaterbudgettotals.In2014,thismonitoringeffortwasexpandedandincorporatedintoaregionallargelandscapepilotprogramsponsoredbySCWAwithpartialfundingcomingfromtheCityofVallejo.Undertheprogram,theVallejoUnifiedSchoolDistrictandParksandRecreationsDepartmentsareroutinelyprovidedwithwateruseperformancereportsthatcompareactualwaterconsumptionwithcalculatedwaterbudgettotals.
Implementation Over the Past Five Years
Table 9-5: Number of Large Landscape Surveys and Water Budgets Performed
2011 (10/11) 2012(11/12) 2013(12/13) 2014(13/14) 2015(14/15)
Surveys completed 1 2 2 1 1
Budgets Developed 97 124 123 123 64
SevenofthesurveysperformedthroughtheCity’sCIIwaterconservationprogramcontainedlargelandscapes owned by variousHomeOwners Associations (HOAs), schools, and golf courses, andhospitals.Thefollowinglargelandscapesweresurveyedoverthepastfiveyears:
BlueRockGolfCourse–Sept2010
HydeParkHOA–Dec2011
KaiserMedicalCenter–March2012
HoganMiddleSchool–July2012
MareIslandGolfCourse–May2013
TiaraNorthgateHOA–January2014
CerrosHOA–Sept2014
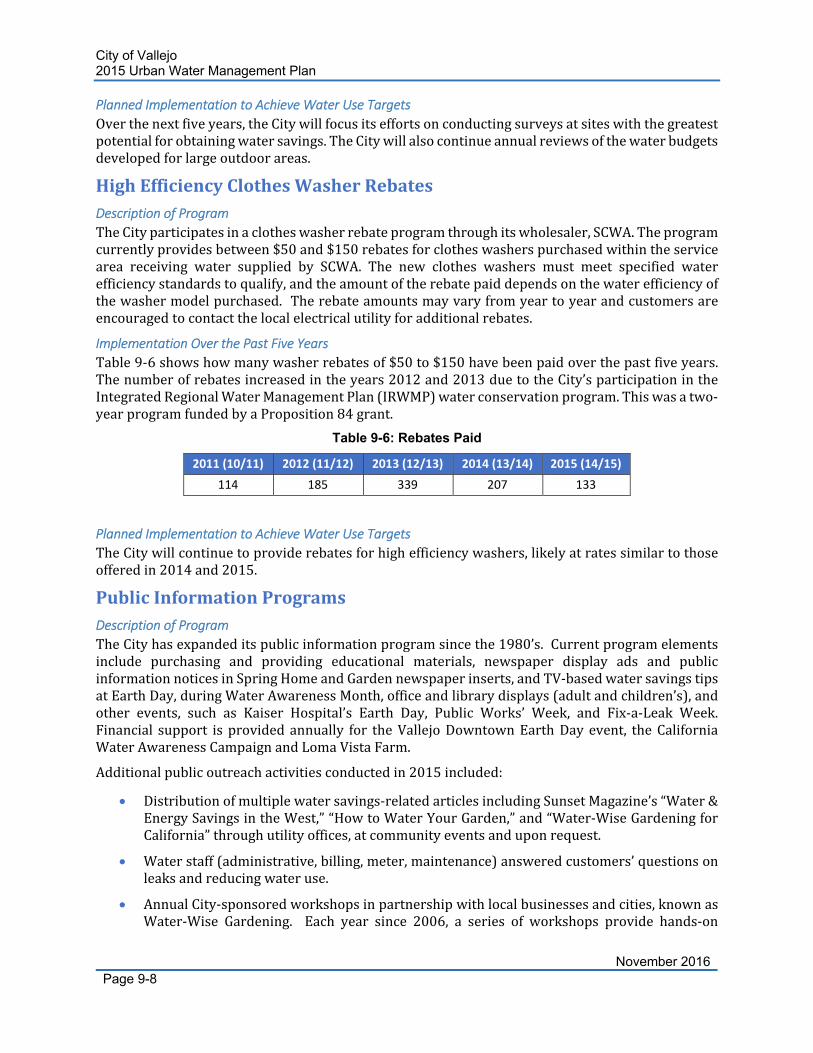
City of Vallejo 2015 Urban Water Management Plan
November 2016Page 9-8
Planned Implementation to Achieve Water Use Targets
Overthenextfiveyears,theCitywillfocusitseffortsonconductingsurveysatsiteswiththegreatestpotentialforobtainingwatersavings.TheCitywillalsocontinueannualreviewsofthewaterbudgetsdevelopedforlargeoutdoorareas.
HighEfficiencyClothesWasherRebates Description of Program
TheCityparticipatesinaclotheswasherrebateprogramthroughitswholesaler,SCWA.Theprogramcurrentlyprovidesbetween$50and$150rebatesforclotheswasherspurchasedwithintheservicearea receiving water supplied by SCWA. The new clothes washers must meet specified waterefficiencystandardstoqualify,andtheamountoftherebatepaiddependsonthewaterefficiencyofthewashermodelpurchased.Therebateamountsmayvaryfromyeartoyearandcustomersareencouragedtocontactthelocalelectricalutilityforadditionalrebates.
Implementation Over the Past Five Years
Table9‐6showshowmanywasherrebatesof$50to$150havebeenpaidoverthepastfiveyears.Thenumberofrebatesincreasedintheyears2012and2013duetotheCity’sparticipationintheIntegratedRegionalWaterManagementPlan(IRWMP)waterconservationprogram.Thiswasatwo‐yearprogramfundedbyaProposition84grant.
Table 9-6: Rebates Paid
2011 (10/11) 2012 (11/12) 2013 (12/13) 2014 (13/14) 2015 (14/15)
114 185 339 207 133
Planned Implementation to Achieve Water Use Targets
TheCitywillcontinuetoproviderebatesforhighefficiencywashers,likelyatratessimilartothoseofferedin2014and2015.
PublicInformationPrograms Description of Program
TheCityhasexpandeditspublicinformationprogramsincethe1980’s.Currentprogramelementsinclude purchasing and providing educational materials, newspaper display ads and publicinformationnoticesinSpringHomeandGardennewspaperinserts,andTV‐basedwatersavingstipsatEarthDay,duringWaterAwarenessMonth,officeandlibrarydisplays(adultandchildren’s),andother events, such as Kaiser Hospital’s Earth Day, Public Works’ Week, and Fix‐a‐Leak Week.Financial support is provided annually for theVallejoDowntownEarthDay event, theCaliforniaWaterAwarenessCampaignandLomaVistaFarm.
Additionalpublicoutreachactivitiesconductedin2015included:
Distributionofmultiplewatersavings‐relatedarticlesincludingSunsetMagazine’s“Water&EnergySavingsintheWest,”“HowtoWaterYourGarden,”and“Water‐WiseGardeningforCalifornia”throughutilityoffices,atcommunityeventsanduponrequest.
Waterstaff(administrative,billing,meter,maintenance)answeredcustomers’questionsonleaksandreducingwateruse.
AnnualCity‐sponsoredworkshopsinpartnershipwithlocalbusinessesandcities,knownasWater‐Wise Gardening. Each year since 2006, a series of workshops provide hands‐on
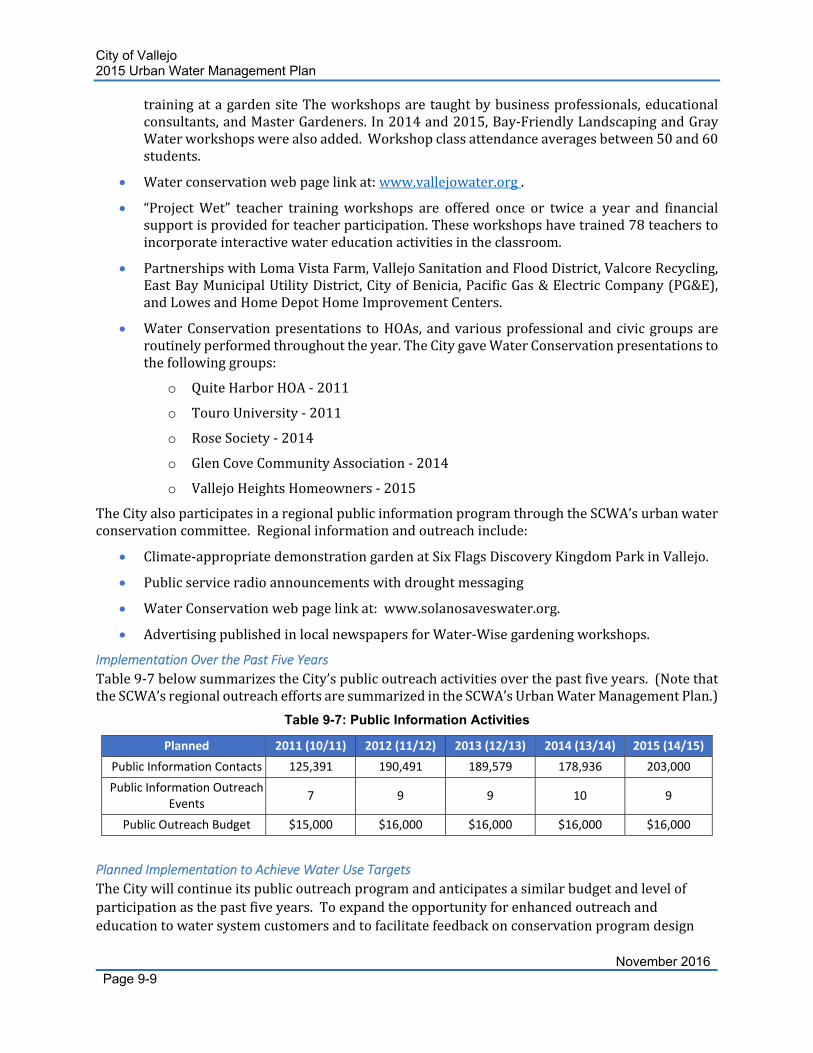
City of Vallejo 2015 Urban Water Management Plan
November 2016Page 9-9
trainingatagardensiteTheworkshopsaretaughtbybusinessprofessionals,educationalconsultants,andMasterGardeners.In2014and2015,Bay‐FriendlyLandscapingandGrayWaterworkshopswerealsoadded.Workshopclassattendanceaveragesbetween50and60students.
Waterconservationwebpagelinkat:www.vallejowater.org.
“ProjectWet” teacher trainingworkshops are offered once or twice a year and financialsupportisprovidedforteacherparticipation.Theseworkshopshavetrained78teacherstoincorporateinteractivewatereducationactivitiesintheclassroom.
PartnershipswithLomaVistaFarm,VallejoSanitationandFloodDistrict,ValcoreRecycling,EastBayMunicipalUtilityDistrict,CityofBenicia,PacificGas&ElectricCompany(PG&E),andLowesandHomeDepotHomeImprovementCenters.
WaterConservationpresentations toHOAs,andvariousprofessionalandcivicgroupsareroutinelyperformedthroughouttheyear.TheCitygaveWaterConservationpresentationstothefollowinggroups:
o QuiteHarborHOA‐2011
o TouroUniversity‐2011
o RoseSociety‐2014
o GlenCoveCommunityAssociation‐2014
o VallejoHeightsHomeowners‐2015
TheCityalsoparticipatesinaregionalpublicinformationprogramthroughtheSCWA’surbanwaterconservationcommittee.Regionalinformationandoutreachinclude:
Climate‐appropriatedemonstrationgardenatSixFlagsDiscoveryKingdomParkinVallejo.
Publicserviceradioannouncementswithdroughtmessaging
WaterConservationwebpagelinkat:www.solanosaveswater.org.
AdvertisingpublishedinlocalnewspapersforWater‐Wisegardeningworkshops.
Implementation Over the Past Five Years
Table9‐7belowsummarizestheCity’spublicoutreachactivitiesoverthepastfiveyears.(NotethattheSCWA’sregionaloutreacheffortsaresummarizedintheSCWA’sUrbanWaterManagementPlan.)
Table 9-7: Public Information Activities
Planned 2011 (10/11) 2012 (11/12) 2013 (12/13) 2014 (13/14) 2015 (14/15)
Public Information Contacts 125,391 190,491 189,579 178,936 203,000
Public Information Outreach Events
7 9 9 10 9
Public Outreach Budget $15,000 $16,000 $16,000 $16,000 $16,000
Planned Implementation to Achieve Water Use Targets
TheCitywillcontinueitspublicoutreachprogramandanticipatesasimilarbudgetandlevelofparticipationasthepastfiveyears.Toexpandtheopportunityforenhancedoutreachandeducationtowatersystemcustomersandtofacilitatefeedbackonconservationprogramdesign
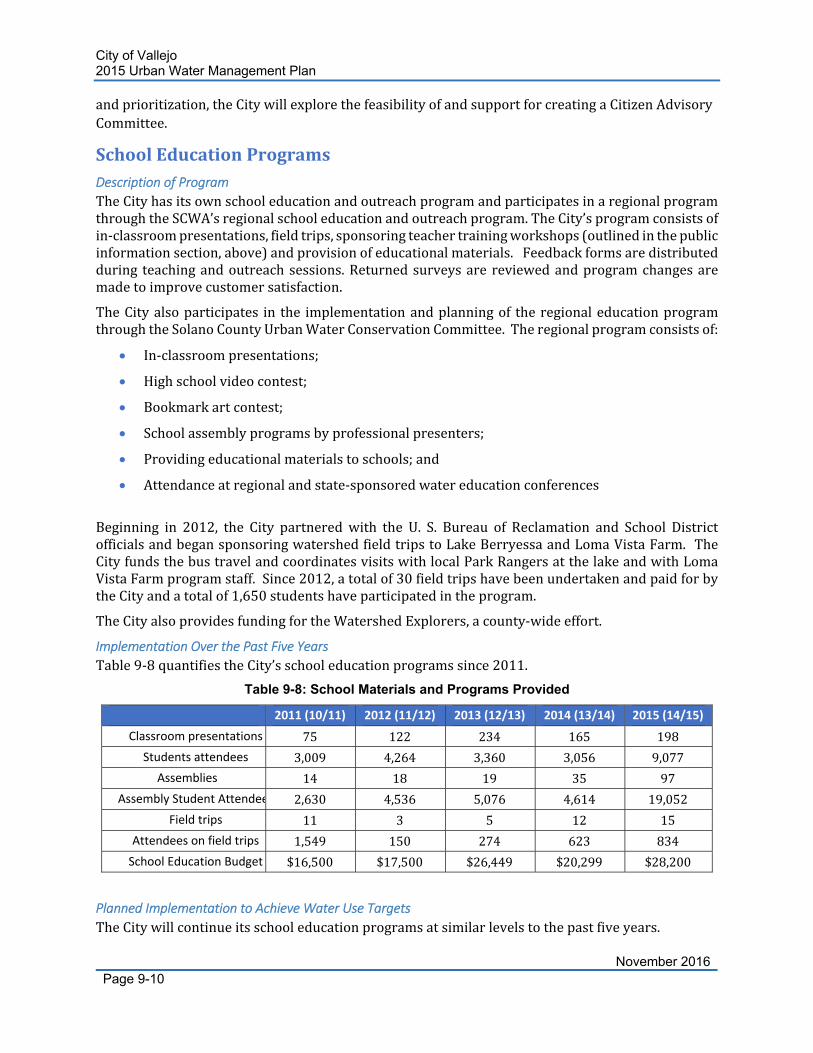
City of Vallejo 2015 Urban Water Management Plan
November 2016Page 9-10
andprioritization,theCitywillexplorethefeasibilityofandsupportforcreatingaCitizenAdvisoryCommittee.
SchoolEducationProgramsDescription of Program
TheCityhasitsownschooleducationandoutreachprogramandparticipatesinaregionalprogramthroughtheSCWA’sregionalschooleducationandoutreachprogram.TheCity’sprogramconsistsofin‐classroompresentations,fieldtrips,sponsoringteachertrainingworkshops(outlinedinthepublicinformationsection,above)andprovisionofeducationalmaterials.Feedbackformsaredistributedduring teachingandoutreachsessions.Returnedsurveysare reviewedandprogramchangesaremadetoimprovecustomersatisfaction.
TheCityalsoparticipates in the implementationandplanningof theregionaleducationprogramthroughtheSolanoCountyUrbanWaterConservationCommittee.Theregionalprogramconsistsof:
In‐classroompresentations;
Highschoolvideocontest;
Bookmarkartcontest;
Schoolassemblyprogramsbyprofessionalpresenters;
Providingeducationalmaterialstoschools;and
Attendanceatregionalandstate‐sponsoredwatereducationconferences
Beginning in 2012, the City partneredwith the U. S. Bureau of Reclamation and School DistrictofficialsandbegansponsoringwatershedfieldtripstoLakeBerryessaandLomaVistaFarm.TheCityfundsthebustravelandcoordinatesvisitswithlocalParkRangersatthelakeandwithLomaVistaFarmprogramstaff.Since2012,atotalof30fieldtripshavebeenundertakenandpaidforbytheCityandatotalof1,650studentshaveparticipatedintheprogram.
TheCityalsoprovidesfundingfortheWatershedExplorers,acounty‐wideeffort.
Implementation Over the Past Five Years
Table9‐8quantifiestheCity’sschooleducationprogramssince2011.
Table 9-8: School Materials and Programs Provided
2011 (10/11) 2012 (11/12) 2013 (12/13) 2014 (13/14) 2015 (14/15)
Classroom presentations 75 122 234 165 198
Students attendees 3,009 4,264 3,360 3,056 9,077
Assemblies 14 18 19 35 97
Assembly Student Attendee 2,630 4,536 5,076 4,614 19,052
Field trips 11 3 5 12 15
Attendees on field trips 1,549 150 274 623 834
School Education Budget $16,500 $17,500 $26,449 $20,299 $28,200
Planned Implementation to Achieve Water Use Targets
TheCitywillcontinueitsschooleducationprogramsatsimilarlevelstothepastfiveyears.
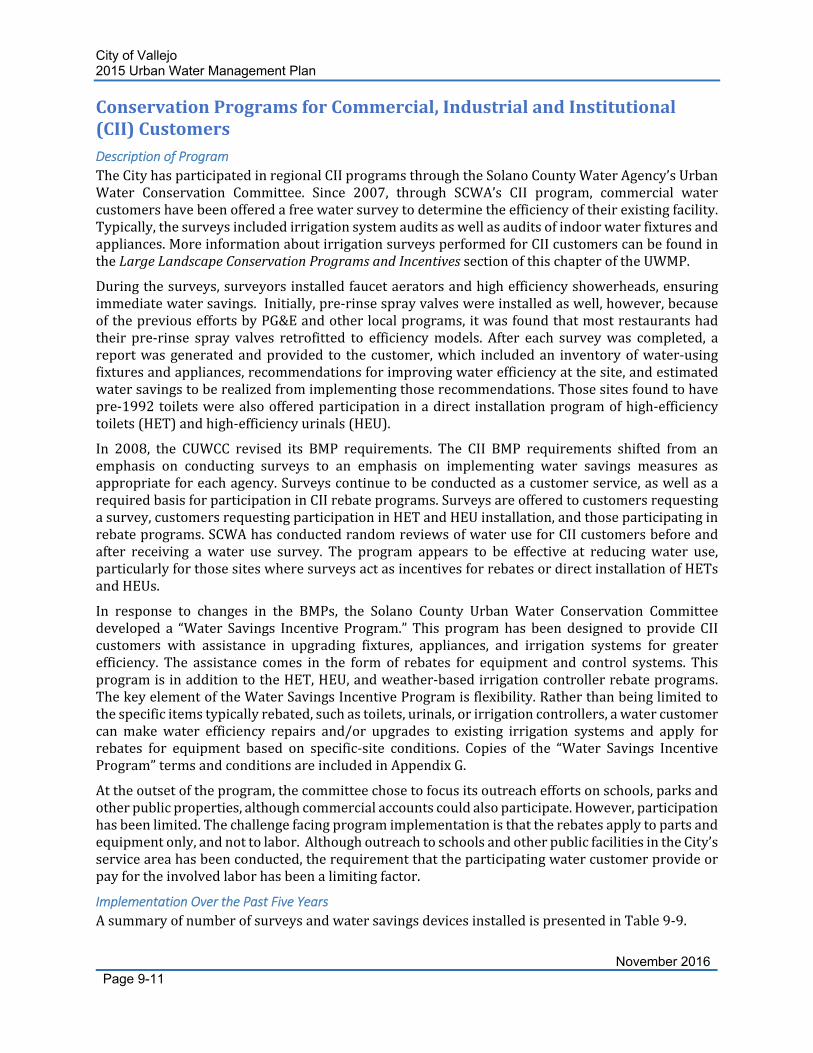
City of Vallejo 2015 Urban Water Management Plan
November 2016Page 9-11
ConservationProgramsforCommercial,IndustrialandInstitutional(CII)CustomersDescription of Program
TheCityhasparticipatedinregionalCIIprogramsthroughtheSolanoCountyWaterAgency’sUrbanWater Conservation Committee. Since 2007, through SCWA’s CII program, commercial watercustomershavebeenofferedafreewatersurveytodeterminetheefficiencyoftheirexistingfacility.Typically,thesurveysincludedirrigationsystemauditsaswellasauditsofindoorwaterfixturesandappliances.MoreinformationaboutirrigationsurveysperformedforCIIcustomerscanbefoundintheLargeLandscapeConservationProgramsandIncentivessectionofthischapteroftheUWMP.
Duringthesurveys,surveyorsinstalledfaucetaeratorsandhighefficiencyshowerheads,ensuringimmediatewatersavings.Initially,pre‐rinsesprayvalveswereinstalledaswell,however,becauseofthepreviouseffortsbyPG&Eandotherlocalprograms,itwasfoundthatmostrestaurantshadtheir pre‐rinse spray valves retrofitted to efficiencymodels. After each surveywas completed, areportwasgeneratedandprovided to thecustomer,which includedan inventoryofwater‐usingfixturesandappliances,recommendationsforimprovingwaterefficiencyatthesite,andestimatedwatersavingstoberealizedfromimplementingthoserecommendations.Thosesitesfoundtohavepre‐1992toiletswerealsoofferedparticipation inadirect installationprogramofhigh‐efficiencytoilets(HET)andhigh‐efficiencyurinals(HEU).
In 2008, the CUWCC revised its BMP requirements. The CII BMP requirements shifted from anemphasis on conducting surveys to an emphasis on implementing water savings measures asappropriateforeachagency.Surveyscontinuetobeconductedasacustomerservice,aswellasarequiredbasisforparticipationinCIIrebateprograms.Surveysareofferedtocustomersrequestingasurvey,customersrequestingparticipationinHETandHEUinstallation,andthoseparticipatinginrebateprograms.SCWAhasconductedrandomreviewsofwateruseforCIIcustomersbeforeandafter receiving a water use survey. The program appears to be effective at reducing water use,particularlyforthosesiteswheresurveysactasincentivesforrebatesordirectinstallationofHETsandHEUs.
In response to changes in the BMPs, the Solano County Urban Water Conservation Committeedeveloped a “Water Savings IncentiveProgram.” This programhas been designed to provideCIIcustomers with assistance in upgrading fixtures, appliances, and irrigation systems for greaterefficiency. The assistance comes in the form of rebates for equipment and control systems. ThisprogramisinadditiontotheHET,HEU,andweather‐basedirrigationcontrollerrebateprograms.ThekeyelementoftheWaterSavingsIncentiveProgramisflexibility.Ratherthanbeinglimitedtothespecificitemstypicallyrebated,suchastoilets,urinals,orirrigationcontrollers,awatercustomercanmake water efficiency repairs and/or upgrades to existing irrigation systems and apply forrebates for equipment based on specific‐site conditions. Copies of the “Water Savings IncentiveProgram”termsandconditionsareincludedinAppendixG.
Attheoutsetoftheprogram,thecommitteechosetofocusitsoutreacheffortsonschools,parksandotherpublicproperties,althoughcommercialaccountscouldalsoparticipate.However,participationhasbeenlimited.Thechallengefacingprogramimplementationisthattherebatesapplytopartsandequipmentonly,andnottolabor.AlthoughoutreachtoschoolsandotherpublicfacilitiesintheCity’sserviceareahasbeenconducted,therequirementthattheparticipatingwatercustomerprovideorpayfortheinvolvedlaborhasbeenalimitingfactor.
Implementation Over the Past Five Years
AsummaryofnumberofsurveysandwatersavingsdevicesinstalledispresentedinTable9‐9.
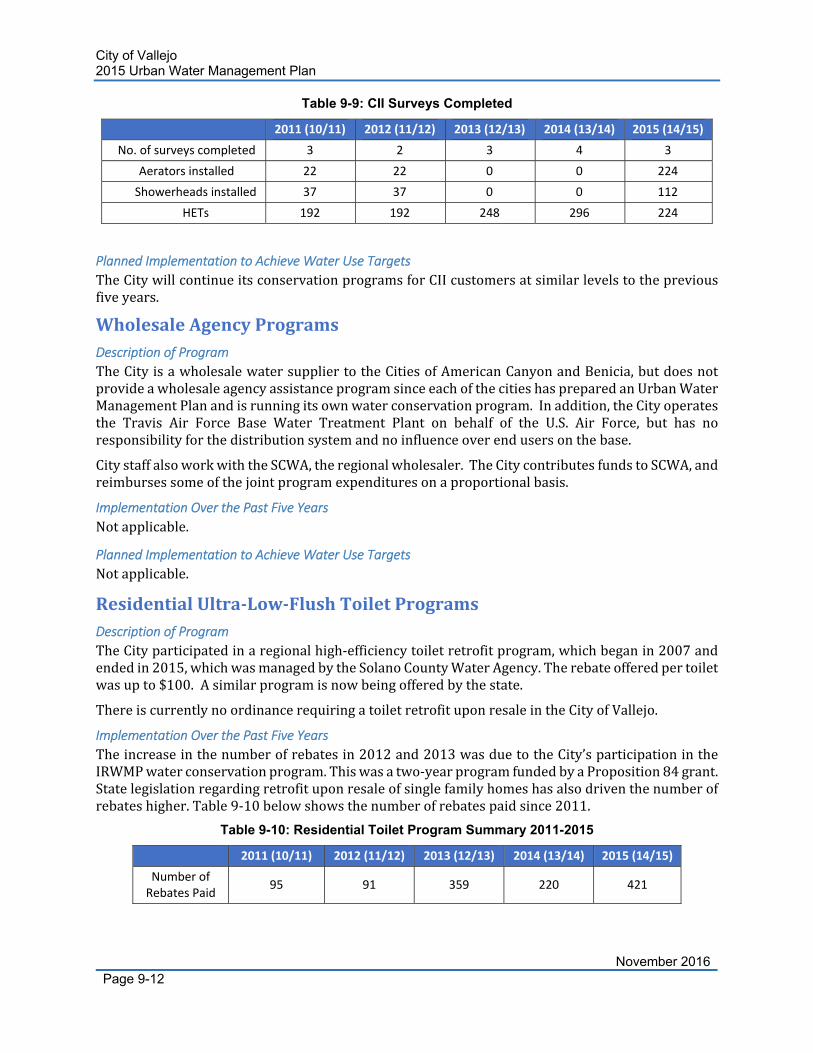
City of Vallejo 2015 Urban Water Management Plan
November 2016Page 9-12
Table 9-9: CII Surveys Completed
2011 (10/11) 2012 (11/12) 2013 (12/13) 2014 (13/14) 2015 (14/15)
No. of surveys completed 3 2 3 4 3
Aerators installed 22 22 0 0 224
Showerheads installed 37 37 0 0 112
HETs 192 192 248 296 224
Planned Implementation to Achieve Water Use Targets
TheCitywillcontinueitsconservationprogramsforCIIcustomersatsimilarlevelstothepreviousfiveyears.
WholesaleAgencyProgramsDescription of Program
TheCityisawholesalewatersuppliertotheCitiesofAmericanCanyonandBenicia,butdoesnotprovideawholesaleagencyassistanceprogramsinceeachofthecitieshaspreparedanUrbanWaterManagementPlanandisrunningitsownwaterconservationprogram.Inaddition,theCityoperatesthe Travis Air Force Base Water Treatment Plant on behalf of the U.S. Air Force, but has noresponsibilityforthedistributionsystemandnoinfluenceoverendusersonthebase.
CitystaffalsoworkwiththeSCWA,theregionalwholesaler.TheCitycontributesfundstoSCWA,andreimbursessomeofthejointprogramexpendituresonaproportionalbasis.
Implementation Over the Past Five Years
Notapplicable.
Planned Implementation to Achieve Water Use Targets
Notapplicable.
ResidentialUltra‐Low‐FlushToiletPrograms Description of Program
TheCityparticipatedinaregionalhigh‐efficiencytoiletretrofitprogram,whichbeganin2007andendedin2015,whichwasmanagedbytheSolanoCountyWaterAgency.Therebateofferedpertoiletwasupto$100.Asimilarprogramisnowbeingofferedbythestate.
ThereiscurrentlynoordinancerequiringatoiletretrofituponresaleintheCityofVallejo.
Implementation Over the Past Five Years
Theincreaseinthenumberofrebatesin2012and2013wasduetotheCity’sparticipationintheIRWMPwaterconservationprogram.Thiswasatwo‐yearprogramfundedbyaProposition84grant.Statelegislationregardingretrofituponresaleofsinglefamilyhomeshasalsodriventhenumberofrebateshigher.Table9‐10belowshowsthenumberofrebatespaidsince2011.
Table 9-10: Residential Toilet Program Summary 2011-2015
2011 (10/11) 2012 (11/12) 2013 (12/13) 2014 (13/14) 2015 (14/15)
Number of Rebates Paid
95 91 359 220 421
City of Vallejo 2015 Urban Water Management Plan
November 2016Page 9-13
Planned Implementation to Achieve Water Use Targets
TheCitydoesnotcurrentlypayrebatesforlowflushtoiletsasSCWAhasendeditsregionalprogram.Rebateswillbepaidiftheregionalprogramisresumed.
Programs to Assess and Manage Distribution System Real Loss
SystemWaterAudits,LeakDetectionandRepair Description of Program
TheCityreviewsitswatersystemstatisticsandcontinuestomakeprogressincollectingthedataneededforafullsystemwaterauditusingtheAmericanWaterWorksAssociation(AWWA)WaterLossControlCommittee’swaterauditsoftware. Leakdetectionequipmentwith“dataloggers”hasbeenpurchasedandtrainingofferedtostaff.Watermainrepairsareongoing.
TheCity’sprogramconsistsofthefollowingactions:
Ongoingwatermetercalibrations;
Advisingcustomerswheneveritappearsthatleaksexistonthecustomer’ssideofthemeter;
Performingdistributionsystemleakdetectionwhenwarrantedandcost‐effective;and
Repairingleakswhenfound.
Effectiveness ismeasuredbymonitoring the change in thepercentofunaccountedwater for theentirewatersystem.Betweentheyears2005and2010,unaccountedwaterwasreducedfrom22percentto14percentofgrosswateruse.Thisisequivalenttoareductionof732MGperyear.Waterlossbetween2010and2015remainednearlyconstant,slightly increasing from14percentto16percentoftotalwateruseandremainingaround950MGto960MG.
A formalWater Loss Committee chaired byWater Engineeringwithmembers fromDistributionMaintenance,WaterBilling,IT,Operations,andWaterAdministration,wasformedinDecember2015to complete a comprehensive system‐wide water loss analysis and make recommendations forreducingapparentwaterlosses.
Implementation Over the Past Five Years
TheCityhasperformedcalculateditswaterlossannuallyandformedtheWaterLossCommitteein2015tofurthereffortstoanalysiswaterlossacrossitsentiredistributionsystem.
Planned Implementation to Achieve Water Use Targets
TheCitywillperformAWWAWaterLossAuditsannuallyperDWRguidelinesandtheWaterLossCommitteewillrecommendactionstoreducewaterloss.
Water Conservation Program Coordination and Staffing Support
WaterConservationCoordinator Description of Program
TheCityhasaWaterConservationCoordinatorwhospendsanaverageof30‐40percenttimeonwaterconservation. Ananalystposition,whichprovidesstaffsupporttotheWaterConservationCoordinatorinadditiontootherduties,wasfilledattheendof2005andcontinuestobefilledfull‐time. A student intern is periodically assigned to thewater conservation program to assistwithvariousprogramduties.At times, thestudent internpositionhasbeen fundedby theSCWAwithrespectivecostsreimbursedbytheCity.
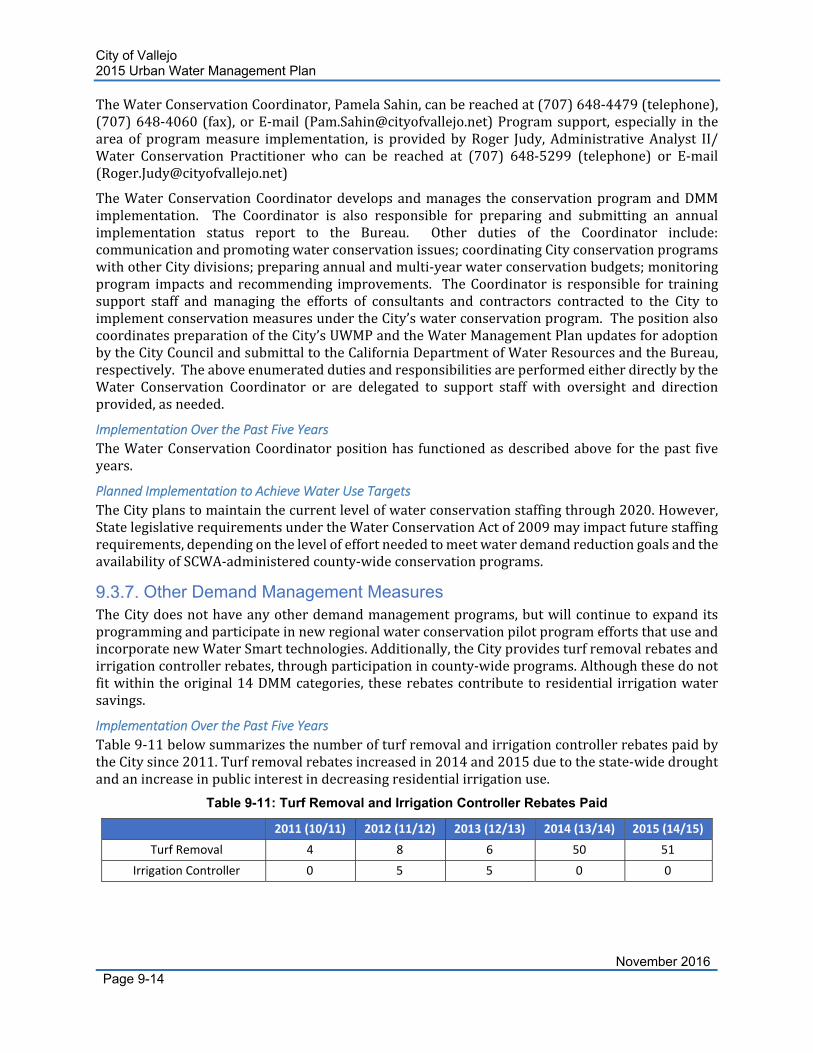
City of Vallejo 2015 Urban Water Management Plan
November 2016Page 9-14
TheWaterConservationCoordinator,PamelaSahin,canbereachedat(707)648‐4479(telephone),(707)648‐4060(fax),orE‐mail ([email protected])Programsupport,especially in thearea of programmeasure implementation, is provided byRoger Judy, AdministrativeAnalyst II/Water Conservation Practitioner who can be reached at (707) 648‐5299 (telephone) or E‐mail([email protected])
TheWaterConservationCoordinatordevelopsandmanages theconservationprogramandDMMimplementation. The Coordinator is also responsible for preparing and submitting an annualimplementation status report to the Bureau. Other duties of the Coordinator include:communicationandpromotingwaterconservationissues;coordinatingCityconservationprogramswithotherCitydivisions;preparingannualandmulti‐yearwaterconservationbudgets;monitoringprogram impactsand recommending improvements. TheCoordinator is responsible for trainingsupport staff and managing the efforts of consultants and contractors contracted to the City toimplementconservationmeasuresundertheCity’swaterconservationprogram.ThepositionalsocoordinatespreparationoftheCity’sUWMPandtheWaterManagementPlanupdatesforadoptionbytheCityCouncilandsubmittaltotheCaliforniaDepartmentofWaterResourcesandtheBureau,respectively.TheaboveenumerateddutiesandresponsibilitiesareperformedeitherdirectlybytheWater Conservation Coordinator or are delegated to support staff with oversight and directionprovided,asneeded.
Implementation Over the Past Five Years
TheWaterConservationCoordinatorpositionhas functionedasdescribedabovefor thepast fiveyears.
Planned Implementation to Achieve Water Use Targets
TheCityplanstomaintainthecurrentlevelofwaterconservationstaffingthrough2020.However,StatelegislativerequirementsundertheWaterConservationActof2009mayimpactfuturestaffingrequirements,dependingonthelevelofeffortneededtomeetwaterdemandreductiongoalsandtheavailabilityofSCWA‐administeredcounty‐wideconservationprograms.
Other Demand Management Measures TheCitydoesnothaveanyotherdemandmanagementprograms,butwillcontinuetoexpanditsprogrammingandparticipateinnewregionalwaterconservationpilotprogrameffortsthatuseandincorporatenewWaterSmarttechnologies.Additionally,theCityprovidesturfremovalrebatesandirrigationcontrollerrebates,throughparticipationincounty‐wideprograms.Althoughthesedonotfitwithintheoriginal14DMMcategories, theserebatescontributetoresidential irrigationwatersavings.
Implementation Over the Past Five Years
Table9‐11belowsummarizesthenumberofturfremovalandirrigationcontrollerrebatespaidbytheCitysince2011.Turfremovalrebatesincreasedin2014and2015duetothestate‐widedroughtandanincreaseinpublicinterestindecreasingresidentialirrigationuse.
Table 9-11: Turf Removal and Irrigation Controller Rebates Paid
2011 (10/11) 2012 (11/12) 2013 (12/13) 2014 (13/14) 2015 (14/15)
Turf Removal 4 8 6 50 51
Irrigation Controller 0 5 5 0 0
City of Vallejo 2015 Urban Water Management Plan
November 2016Page 9-15
Planned Implementation to Achieve Water Use Targets
TheCitywillcontinuetopayrebatesforturfremovalandirrigationcontrollers. Additionally,theCitywill continue to look intoandparticipate,whereappropriate, inother regional conservationprogramming.
City of Vallejo 2015 Urban Water Management Plan
November 2016Page 9-16
Thispageintentionallyleftblank.
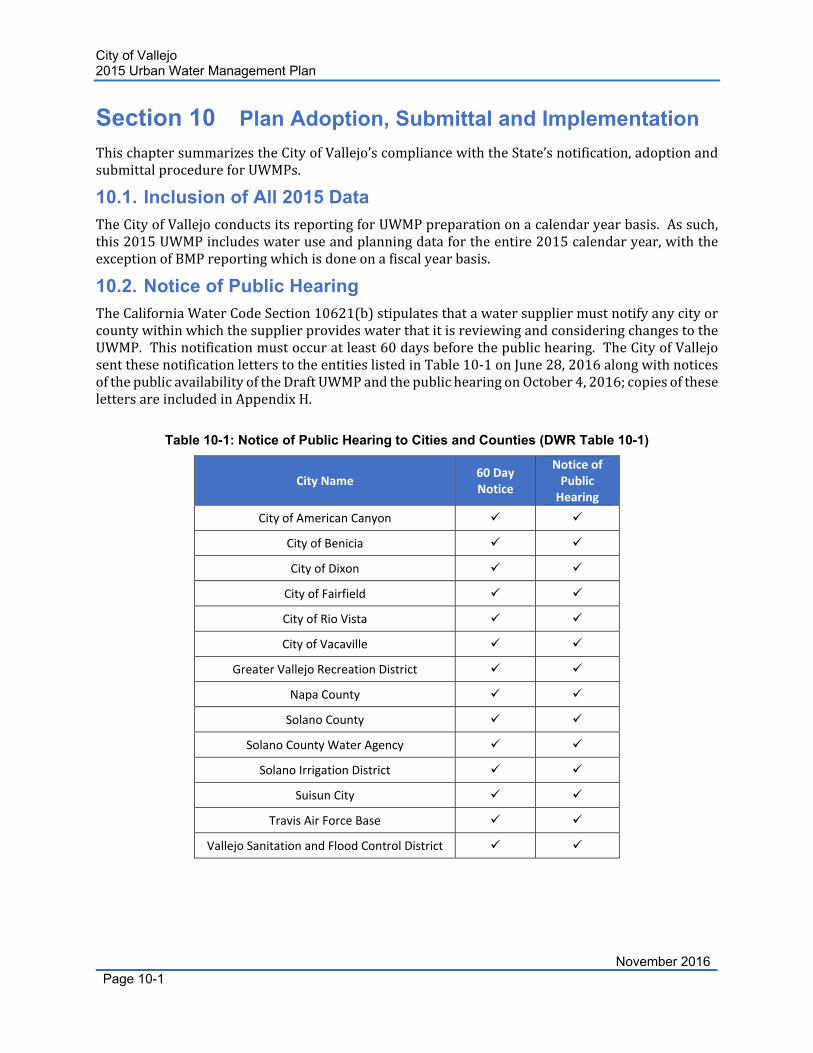
City of Vallejo 2015 Urban Water Management Plan
November 2016Page 10-1
Section 10 Plan Adoption, Submittal and Implementation
ThischaptersummarizestheCityofVallejo’scompliancewiththeState’snotification,adoptionandsubmittalprocedureforUWMPs.
10.1. Inclusion of All 2015 Data TheCityofVallejoconductsitsreportingforUWMPpreparationonacalendaryearbasis.Assuch,this2015UWMPincludeswateruseandplanningdatafortheentire2015calendaryear,withtheexceptionofBMPreportingwhichisdoneonafiscalyearbasis.
10.2. Notice of Public Hearing TheCaliforniaWaterCodeSection10621(b)stipulatesthatawatersuppliermustnotifyanycityorcountywithinwhichthesupplierprovideswaterthatitisreviewingandconsideringchangestotheUWMP.Thisnotificationmustoccuratleast60daysbeforethepublichearing.TheCityofVallejosentthesenotificationletterstotheentitieslistedinTable10‐1onJune28,2016alongwithnoticesofthepublicavailabilityoftheDraftUWMPandthepublichearingonOctober4,2016;copiesoftheselettersareincludedinAppendixH.
Table 10-1: Notice of Public Hearing to Cities and Counties (DWR Table 10-1)
City Name 60 Day Notice
Notice of Public Hearing
City of American Canyon
City of Benicia
City of Dixon
City of Fairfield
City of Rio Vista
City of Vacaville
Greater Vallejo Recreation District
Napa County
Solano County
Solano County Water Agency
Solano Irrigation District
Suisun City
Travis Air Force Base
Vallejo Sanitation and Flood Control District
City of Vallejo 2015 Urban Water Management Plan
November 2016Page 10-2
10.3. Notice to the Public TheCityofVallejoheldapublichearingon10/25/2016toreceivecommentsonthedraftUWMPandtoadopttheplan.GovernmentCode6066requiresthatthewatersuppliernotifythepublicofthepublichearinginalocalnewspaperonceaweekfortwoconsecutiveweeks.Thenoticemustincludethetimeandplaceofthehearing,aswellasthelocationwherethedraftUWMPisavailableforpublicreview.TheCityofVallejopublishedthesenotificationsforthepublicintheVallejoTimesHeraldnewspaper on 10/02/2016, 10/11/2016, 10/16/2016, and 10/18/2016 and the Fairfield DailyRepublicnewspaperon10/02/2016,10/12/2016,10/16/2016,and10/19/2016.CopiesofthesenoticesareprovidedinAppendixH.
10.4. Public Hearing and Adoption CaliforniaWaterCode10642statesthatpriortoadoptingthe2015UWMP,thewatersuppliermustholdapublichearing.ThepurposeofthepublichearingistoallowpublicinputonthePlan,considereconomicimpactsoftheUWMP,andadoptamethodfordeterminingthewatersupplier’swaterusetarget. TheCityofVallejoheldapublichearingon10/25/2016. Acopyofthehearingagendaisprovided in Appendix H. The City also held a three week‐long public comment period from10/5/2016to10/25/2016.CommentsonthedraftUWMPwerereceivedfromthepublicandaCityCouncilperson during the public hearing. This final UWMP has been modified to address thosecomments.
TheCityadoptedits2015UWMPattheVallejoCityCouncilmeetingonOctober25,2016.AcopyoftheadoptingresolutionisprovidedinAppendixI.
10.5. Plan Submittal TheCityofVallejowillsubmittheupdated2015UWMPtoDWRviatheapprovedwebsite.Nolaterthan30daysafterthePlanisadoptedbytheCityofVallejo’sCityCouncil,theCitywillsubmitaCDcopyof theadopted2015UWMPto theCaliforniaStateLibraryandsubmitacopytoanycityorcountytowhomtheCityprovideswater.
10.6. Public Availability CaliforniaWaterCode10645requiresthatwatersuppliers,nolaterthan30daysafterfilingacopywithDWR,mustmaketheapprovedPlanavailableforpublicreviewduringnormalbusinesshours.TheCityofVallejowillprovideacopyoftheapproved2015UWMPtotheJohnF.KennedyLibraryandposttheplanontheCity’swebsite.
10.7. Amending an Adopted UWMP ShouldtheCityofVallejoamendanyportionoftheapproved2015UWMP,theCitywillfolloweachofthestepsfornotification,publichearing,adoption,andsubmittalthatarerequiredforanupdatedPlan.However,the60daynotificationtocitiesandcountiestowhomtheCitysupplieswaterwillnotbesentagain;thenotificationsentwiththeoriginalplanaddressestherequirement.
City of Vallejo 2015 Urban Water Management Plan
November 2016Page 11-1
Section 11 References
CityofAmericanCanyon(2015).2015UrbanWaterManagementPlan.June2016.
CityofBenicia(2015).2015UrbanWaterManagementPlan.June2016.
CityofVallejo(2006).2005UrbanWaterManagementPlan.February2006.
CityofVallejo(2012).2010AdministrativeDraftUrbanWaterManagementPlan.April2012.
CityofVallejo(2013).MareIslandSpecificPlan.AdoptedMarch1999,mostrecentlyamendedAugust2013.
CityofVallejo(2016).PropelVallejoGeneralPlan2040.PublicReviewDraft.July2016.
ClimateCentral(2016).Sealevelriseandcoastalfloodexposure:SummaryforVallejo,CA.SurgingSeasRiskFinderfilecreatedJuly21,2016.Retrievedfromhttp://ssrf.climatecentral.org.s3‐website‐us‐east1.amazonaws.com/Buffer2/states/CA/downloads/pdf_reports/Town/CA_Vallejo‐report.pdf
DepartmentofWaterResources(DWR)(1998).TheNorthBayAqueduct/BarkerSloughWatershedWaterQuality.July1998.
DepartmentofWaterResources(DWR)(2016a).MethodologiesforCalculatingBaselineandComplianceUrbanPerCapitaWaterUse.February2016.
DepartmentofWaterResources(DWR)(2016b).2015UrbanWaterManagementPlansGuidebookforUrbanWaterSuppliers.March2016.
EndangeredSpeciesCoalition(ESA)(2011).It’sGettingHotOutThere:Top10PlacestoSaveforEndangeredSpeciesinaWarmingWorld.Jan,2011.
Kennedy/JenksConsultants(2016).SCWAWaterSupplyReliability.TechnicalMemorandum.April2016.
NationalOceanicandAtmosphericAdministration(NOAA)(2016).MeanSeaLevelTrend9414750Alameda,California.Retrievedfromhttps://tidesandcurrents.noaa.gov/sltrends/sltrends_station.shtml?stnid=9414750
NBS(2016).CityofVallejo5‐YearWaterUtilityFinancialPlanandRateStudy.January2016.
SolanoCountyWaterAgency(SCWA)(2012).SolanoHabitatConservationPlan.Oct,2012.
SWAArchitects(2013).Solano360FinalSpecificPlan.PreparedforSolanoCounty.February2013.
VallejoSanitationandFloodControlDistrict(VSFCD)(2014).ReclaimedWaterStudy.May2014.

City of Vallejo 2015 Urban Water Management Plan
November 2016Page 11-2
Thispageintentionallyleftblank.

Prepared by: RMC Water and Environment
2175 N. California Blvd, Suite 315 | Walnut Creek, CA 94596 | 925.627.4100
Prepared by:November 2016
2015Urban Water Management Plan
Appendices
Appendix A. DWR UWMP Check List

Thispageintentionallyleftblank.
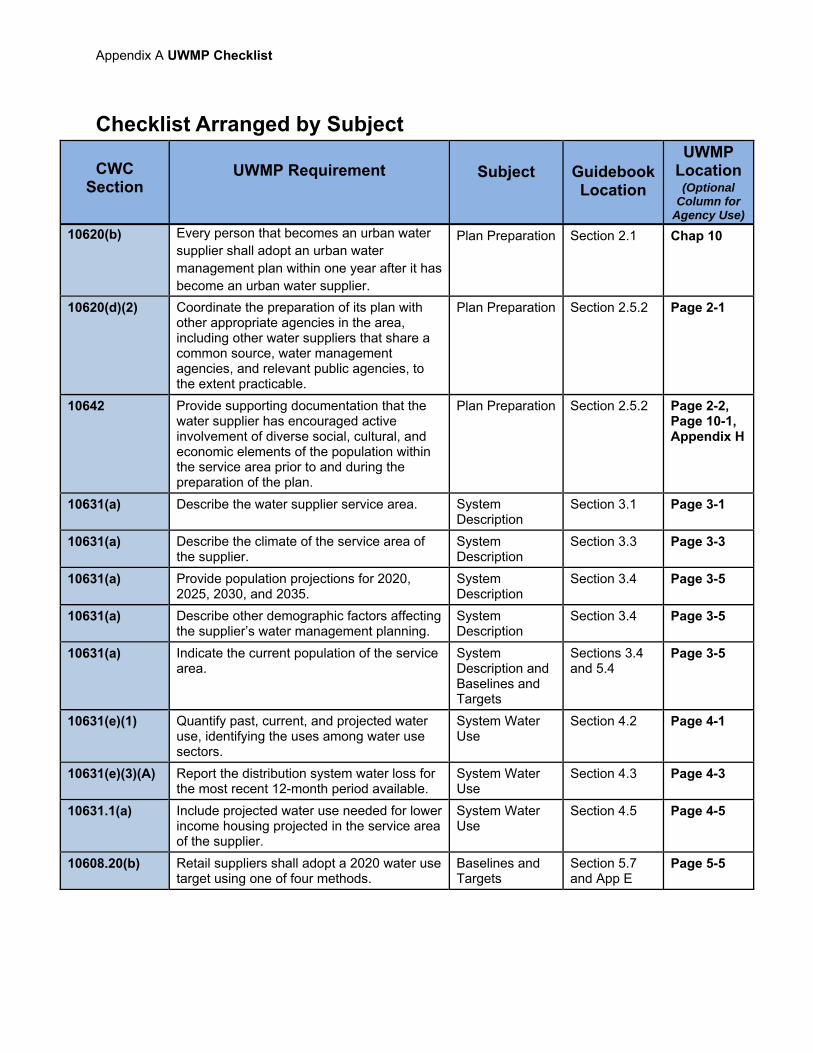
Appendix A UWMP Checklist
Checklist Arranged by Subject
CWC Section
UWMP Requirement
Subject
Guidebook Location
UWMP Location
(Optional Column for
Agency Use)
10620(b) Every person that becomes an urban water supplier shall adopt an urban water management plan within one year after it has become an urban water supplier.
Plan Preparation Section 2.1 Chap 10
10620(d)(2) Coordinate the preparation of its plan with other appropriate agencies in the area, including other water suppliers that share a common source, water management agencies, and relevant public agencies, to the extent practicable.
Plan Preparation Section 2.5.2 Page 2-1
10642 Provide supporting documentation that the water supplier has encouraged active involvement of diverse social, cultural, and economic elements of the population within the service area prior to and during the preparation of the plan.
Plan Preparation Section 2.5.2 Page 2-2, Page 10-1, Appendix H
10631(a) Describe the water supplier service area. System Description
Section 3.1 Page 3-1
10631(a) Describe the climate of the service area of the supplier.
System Description
Section 3.3 Page 3-3
10631(a) Provide population projections for 2020, 2025, 2030, and 2035.
System Description
Section 3.4 Page 3-5
10631(a) Describe other demographic factors affecting the supplier’s water management planning.
System Description
Section 3.4 Page 3-5
10631(a) Indicate the current population of the service area.
System Description and Baselines and Targets
Sections 3.4 and 5.4
Page 3-5
10631(e)(1) Quantify past, current, and projected water use, identifying the uses among water use sectors.
System Water Use
Section 4.2 Page 4-1
10631(e)(3)(A) Report the distribution system water loss for the most recent 12-month period available.
System Water Use
Section 4.3 Page 4-3
10631.1(a) Include projected water use needed for lower income housing projected in the service area of the supplier.
System Water Use
Section 4.5 Page 4-5
10608.20(b) Retail suppliers shall adopt a 2020 water use target using one of four methods.
Baselines and Targets
Section 5.7 and App E
Page 5-5
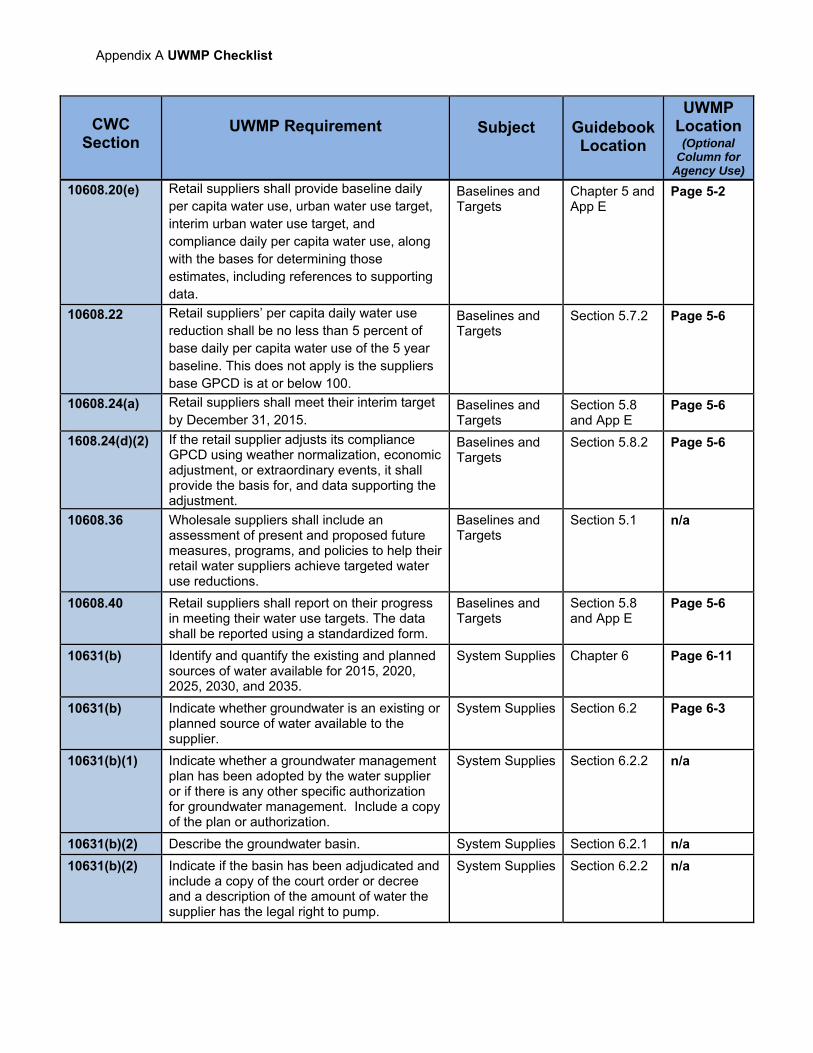
Appendix A UWMP Checklist
CWC Section
UWMP Requirement
Subject
Guidebook Location
UWMP Location
(Optional Column for
Agency Use)
10608.20(e) Retail suppliers shall provide baseline daily per capita water use, urban water use target, interim urban water use target, and compliance daily per capita water use, along with the bases for determining those estimates, including references to supporting data.
Baselines and Targets
Chapter 5 and App E
Page 5-2
10608.22 Retail suppliers’ per capita daily water use reduction shall be no less than 5 percent of base daily per capita water use of the 5 year baseline. This does not apply is the suppliers base GPCD is at or below 100.
Baselines and Targets
Section 5.7.2 Page 5-6
10608.24(a) Retail suppliers shall meet their interim target by December 31, 2015.
Baselines and Targets
Section 5.8 and App E
Page 5-6
1608.24(d)(2) If the retail supplier adjusts its compliance GPCD using weather normalization, economic adjustment, or extraordinary events, it shall provide the basis for, and data supporting the adjustment.
Baselines and Targets
Section 5.8.2 Page 5-6
10608.36 Wholesale suppliers shall include an assessment of present and proposed future measures, programs, and policies to help their retail water suppliers achieve targeted water use reductions.
Baselines and Targets
Section 5.1 n/a
10608.40 Retail suppliers shall report on their progress in meeting their water use targets. The data shall be reported using a standardized form.
Baselines and Targets
Section 5.8 and App E
Page 5-6
10631(b) Identify and quantify the existing and planned sources of water available for 2015, 2020, 2025, 2030, and 2035.
System Supplies Chapter 6 Page 6-11
10631(b) Indicate whether groundwater is an existing or planned source of water available to the supplier.
System Supplies Section 6.2 Page 6-3
10631(b)(1) Indicate whether a groundwater management plan has been adopted by the water supplier or if there is any other specific authorization for groundwater management. Include a copy of the plan or authorization.
System Supplies Section 6.2.2 n/a
10631(b)(2) Describe the groundwater basin. System Supplies Section 6.2.1 n/a
10631(b)(2) Indicate if the basin has been adjudicated and include a copy of the court order or decree and a description of the amount of water the supplier has the legal right to pump.
System Supplies Section 6.2.2 n/a
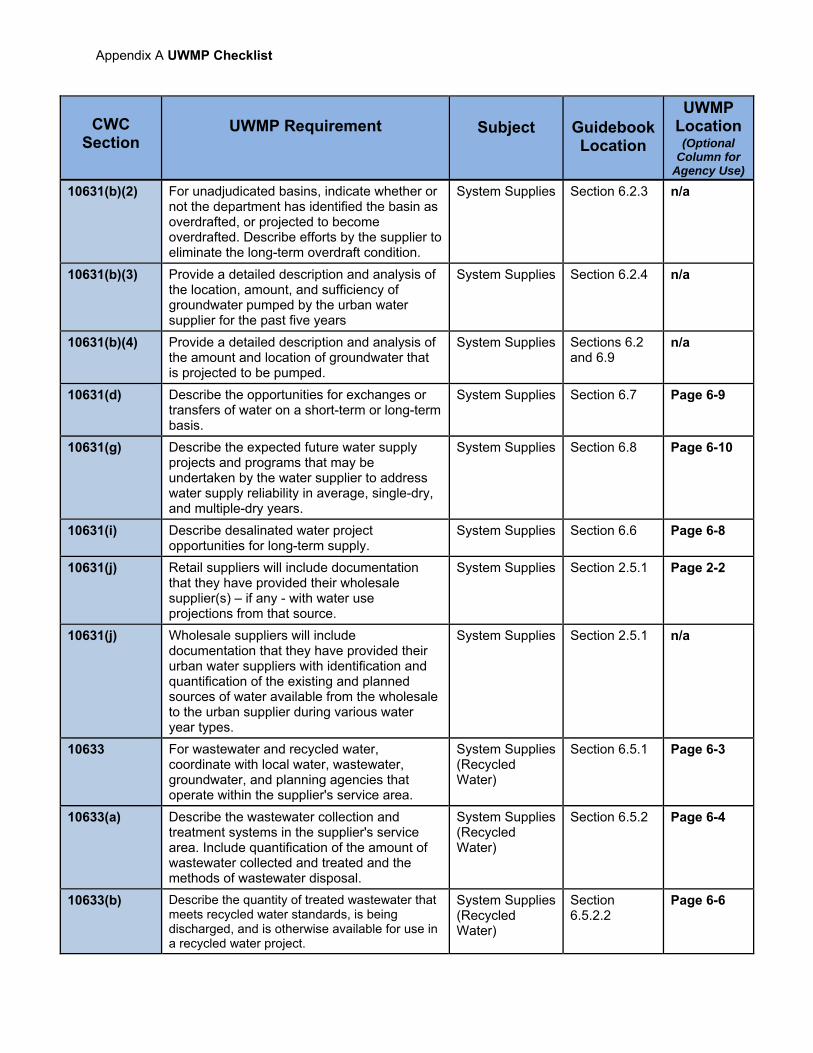
Appendix A UWMP Checklist
CWC Section
UWMP Requirement
Subject
Guidebook Location
UWMP Location
(Optional Column for
Agency Use)
10631(b)(2) For unadjudicated basins, indicate whether or not the department has identified the basin as overdrafted, or projected to become overdrafted. Describe efforts by the supplier to eliminate the long-term overdraft condition.
System Supplies Section 6.2.3 n/a
10631(b)(3) Provide a detailed description and analysis of the location, amount, and sufficiency of groundwater pumped by the urban water supplier for the past five years
System Supplies Section 6.2.4 n/a
10631(b)(4) Provide a detailed description and analysis of the amount and location of groundwater that is projected to be pumped.
System Supplies Sections 6.2 and 6.9
n/a
10631(d) Describe the opportunities for exchanges or transfers of water on a short-term or long-term basis.
System Supplies Section 6.7 Page 6-9
10631(g) Describe the expected future water supply projects and programs that may be undertaken by the water supplier to address water supply reliability in average, single-dry, and multiple-dry years.
System Supplies Section 6.8 Page 6-10
10631(i) Describe desalinated water project opportunities for long-term supply.
System Supplies Section 6.6 Page 6-8
10631(j) Retail suppliers will include documentation that they have provided their wholesale supplier(s) – if any - with water use projections from that source.
System Supplies Section 2.5.1 Page 2-2
10631(j) Wholesale suppliers will include documentation that they have provided their urban water suppliers with identification and quantification of the existing and planned sources of water available from the wholesale to the urban supplier during various water year types.
System Supplies Section 2.5.1 n/a
10633 For wastewater and recycled water, coordinate with local water, wastewater, groundwater, and planning agencies that operate within the supplier's service area.
System Supplies (Recycled Water)
Section 6.5.1 Page 6-3
10633(a) Describe the wastewater collection and treatment systems in the supplier's service area. Include quantification of the amount of wastewater collected and treated and the methods of wastewater disposal.
System Supplies (Recycled Water)
Section 6.5.2 Page 6-4
10633(b) Describe the quantity of treated wastewater that meets recycled water standards, is being discharged, and is otherwise available for use in a recycled water project.
System Supplies (Recycled Water)
Section 6.5.2.2
Page 6-6
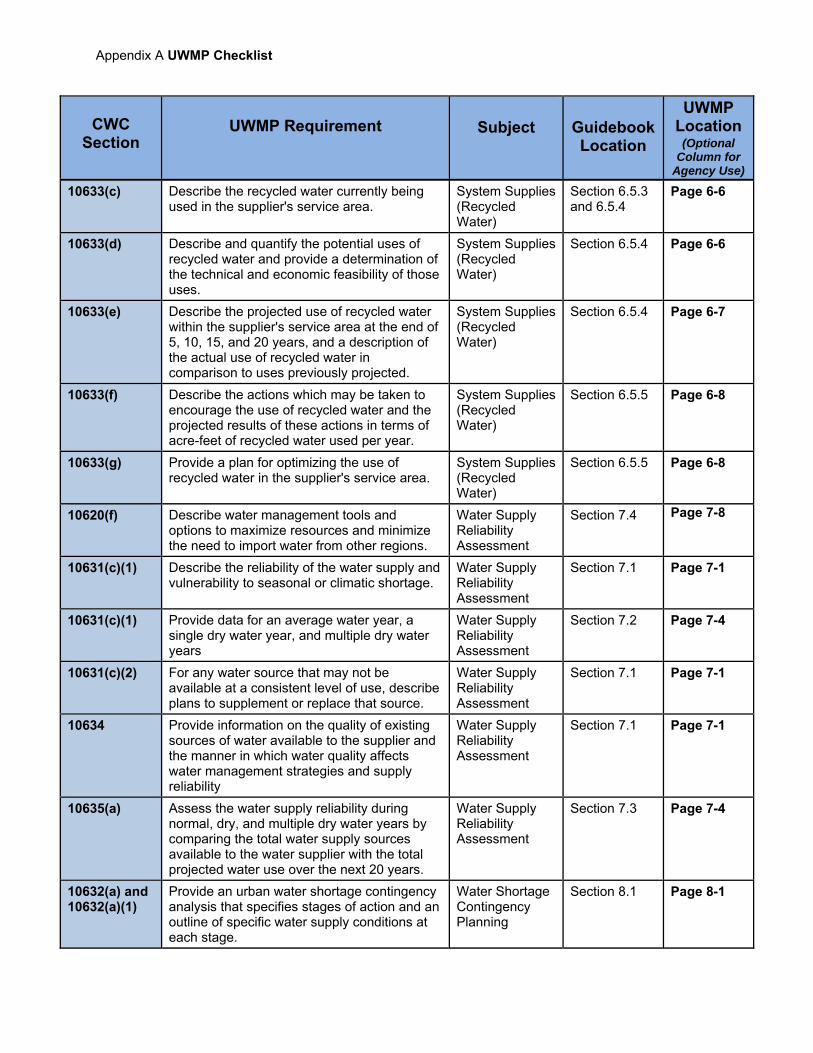
Appendix A UWMP Checklist
CWC Section
UWMP Requirement
Subject
Guidebook Location
UWMP Location
(Optional Column for
Agency Use)
10633(c) Describe the recycled water currently being used in the supplier's service area.
System Supplies (Recycled Water)
Section 6.5.3 and 6.5.4
Page 6-6
10633(d) Describe and quantify the potential uses of recycled water and provide a determination of the technical and economic feasibility of those uses.
System Supplies (Recycled Water)
Section 6.5.4 Page 6-6
10633(e) Describe the projected use of recycled water within the supplier's service area at the end of 5, 10, 15, and 20 years, and a description of the actual use of recycled water in comparison to uses previously projected.
System Supplies (Recycled Water)
Section 6.5.4 Page 6-7
10633(f) Describe the actions which may be taken to encourage the use of recycled water and the projected results of these actions in terms of acre-feet of recycled water used per year.
System Supplies (Recycled Water)
Section 6.5.5 Page 6-8
10633(g) Provide a plan for optimizing the use of recycled water in the supplier's service area.
System Supplies (Recycled Water)
Section 6.5.5 Page 6-8
10620(f) Describe water management tools and options to maximize resources and minimize the need to import water from other regions.
Water Supply Reliability Assessment
Section 7.4 Page 7-8
10631(c)(1) Describe the reliability of the water supply and vulnerability to seasonal or climatic shortage.
Water Supply Reliability Assessment
Section 7.1 Page 7-1
10631(c)(1) Provide data for an average water year, a single dry water year, and multiple dry water years
Water Supply Reliability Assessment
Section 7.2 Page 7-4
10631(c)(2) For any water source that may not be available at a consistent level of use, describe plans to supplement or replace that source.
Water Supply Reliability Assessment
Section 7.1 Page 7-1
10634 Provide information on the quality of existing sources of water available to the supplier and the manner in which water quality affects water management strategies and supply reliability
Water Supply Reliability Assessment
Section 7.1 Page 7-1
10635(a) Assess the water supply reliability during normal, dry, and multiple dry water years by comparing the total water supply sources available to the water supplier with the total projected water use over the next 20 years.
Water Supply Reliability Assessment
Section 7.3 Page 7-4
10632(a) and 10632(a)(1)
Provide an urban water shortage contingency analysis that specifies stages of action and an outline of specific water supply conditions at each stage.
Water Shortage Contingency Planning
Section 8.1 Page 8-1
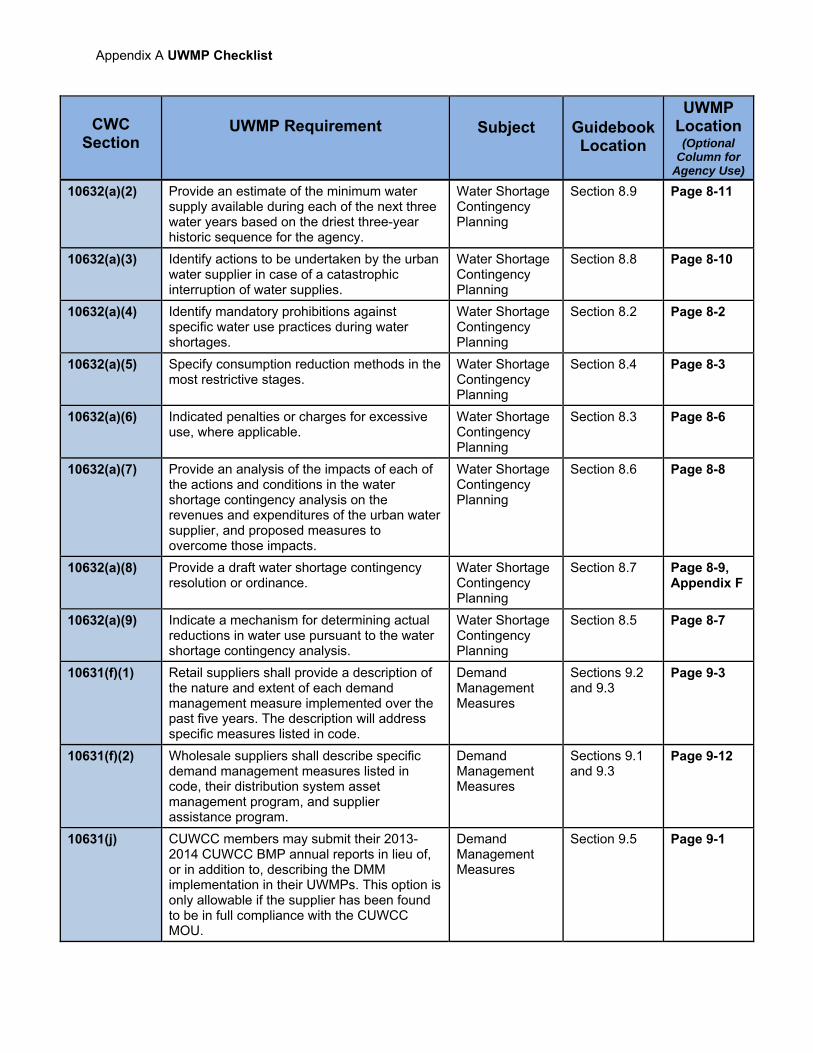
Appendix A UWMP Checklist
CWC Section
UWMP Requirement
Subject
Guidebook Location
UWMP Location
(Optional Column for
Agency Use)
10632(a)(2) Provide an estimate of the minimum water supply available during each of the next three water years based on the driest three-year historic sequence for the agency.
Water Shortage Contingency Planning
Section 8.9 Page 8-11
10632(a)(3) Identify actions to be undertaken by the urban water supplier in case of a catastrophic interruption of water supplies.
Water Shortage Contingency Planning
Section 8.8 Page 8-10
10632(a)(4) Identify mandatory prohibitions against specific water use practices during water shortages.
Water Shortage Contingency Planning
Section 8.2 Page 8-2
10632(a)(5) Specify consumption reduction methods in the most restrictive stages.
Water Shortage Contingency Planning
Section 8.4 Page 8-3
10632(a)(6) Indicated penalties or charges for excessive use, where applicable.
Water Shortage Contingency Planning
Section 8.3 Page 8-6
10632(a)(7) Provide an analysis of the impacts of each of the actions and conditions in the water shortage contingency analysis on the revenues and expenditures of the urban water supplier, and proposed measures to overcome those impacts.
Water Shortage Contingency Planning
Section 8.6 Page 8-8
10632(a)(8) Provide a draft water shortage contingency resolution or ordinance.
Water Shortage Contingency Planning
Section 8.7 Page 8-9, Appendix F
10632(a)(9) Indicate a mechanism for determining actual reductions in water use pursuant to the water shortage contingency analysis.
Water Shortage Contingency Planning
Section 8.5 Page 8-7
10631(f)(1) Retail suppliers shall provide a description of the nature and extent of each demand management measure implemented over the past five years. The description will address specific measures listed in code.
Demand Management Measures
Sections 9.2 and 9.3
Page 9-3
10631(f)(2) Wholesale suppliers shall describe specific demand management measures listed in code, their distribution system asset management program, and supplier assistance program.
Demand Management Measures
Sections 9.1 and 9.3
Page 9-12
10631(j) CUWCC members may submit their 2013-2014 CUWCC BMP annual reports in lieu of, or in addition to, describing the DMM implementation in their UWMPs. This option is only allowable if the supplier has been found to be in full compliance with the CUWCC MOU.
Demand Management Measures
Section 9.5 Page 9-1
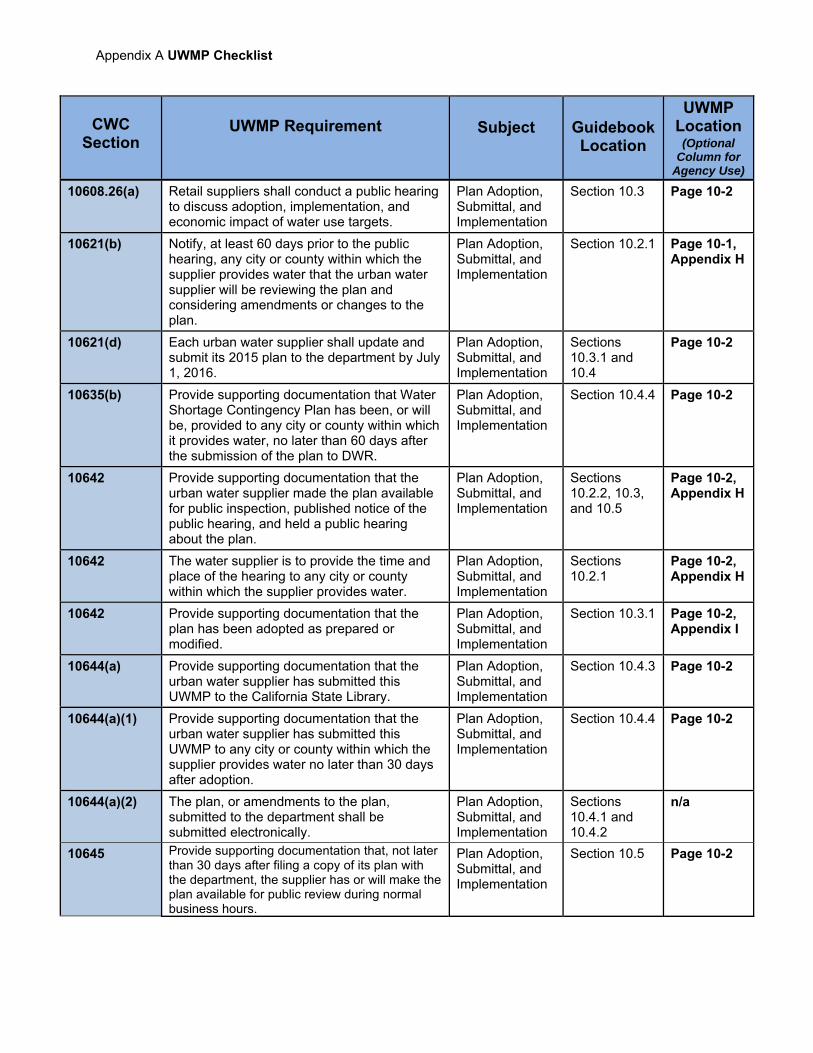
Appendix A UWMP Checklist
CWC Section
UWMP Requirement
Subject
Guidebook Location
UWMP Location
(Optional Column for
Agency Use)
10608.26(a) Retail suppliers shall conduct a public hearing to discuss adoption, implementation, and economic impact of water use targets.
Plan Adoption, Submittal, and Implementation
Section 10.3 Page 10-2
10621(b) Notify, at least 60 days prior to the public hearing, any city or county within which the supplier provides water that the urban water supplier will be reviewing the plan and considering amendments or changes to the plan.
Plan Adoption, Submittal, and Implementation
Section 10.2.1 Page 10-1, Appendix H
10621(d) Each urban water supplier shall update and submit its 2015 plan to the department by July 1, 2016.
Plan Adoption, Submittal, and Implementation
Sections 10.3.1 and 10.4
Page 10-2
10635(b) Provide supporting documentation that Water Shortage Contingency Plan has been, or will be, provided to any city or county within which it provides water, no later than 60 days after the submission of the plan to DWR.
Plan Adoption, Submittal, and Implementation
Section 10.4.4 Page 10-2
10642 Provide supporting documentation that the urban water supplier made the plan available for public inspection, published notice of the public hearing, and held a public hearing about the plan.
Plan Adoption, Submittal, and Implementation
Sections 10.2.2, 10.3, and 10.5
Page 10-2, Appendix H
10642 The water supplier is to provide the time and place of the hearing to any city or county within which the supplier provides water.
Plan Adoption, Submittal, and Implementation
Sections 10.2.1
Page 10-2, Appendix H
10642 Provide supporting documentation that the plan has been adopted as prepared or modified.
Plan Adoption, Submittal, and Implementation
Section 10.3.1 Page 10-2, Appendix I
10644(a) Provide supporting documentation that the urban water supplier has submitted this UWMP to the California State Library.
Plan Adoption, Submittal, and Implementation
Section 10.4.3 Page 10-2
10644(a)(1) Provide supporting documentation that the urban water supplier has submitted this UWMP to any city or county within which the supplier provides water no later than 30 days after adoption.
Plan Adoption, Submittal, and Implementation
Section 10.4.4 Page 10-2
10644(a)(2) The plan, or amendments to the plan, submitted to the department shall be submitted electronically.
Plan Adoption, Submittal, and Implementation
Sections 10.4.1 and 10.4.2
n/a
10645 Provide supporting documentation that, not later than 30 days after filing a copy of its plan with the department, the supplier has or will make the plan available for public review during normal business hours.
Plan Adoption, Submittal, and Implementation
Section 10.5 Page 10-2
Appendix B. Demand Forecast Memorandum

Thispageintentionallyleftblank.
1
DATE: July 28, 2015 TO: Leslie Dumas FR: David Mitchell RE: 2nd Draft City of Vallejo Retail Water Demand Forecast
This memorandum presents the draft City of Vallejo retail water demand forecast along with the data and methodology used to generate it. According to its 2010 UWMP, the City of Vallejo also sells water on a wholesale basis to the City of American Canyon, the City of Benicia, and the Travis Airforce Base. This memorandum only pertains to the City of Vallejo’s retail water demands, including its Lakes System.
Retail Demand Forecast Summary
Table 1 provides a summary of the demand forecast. The forecast is for unrationed demand under normal weather conditions. The demand model’s forecast for 2015 therefore exceeds 2015 actual demand which was significantly reduced in response to the State’s Emergency Drought Regulation. As explained later in the memo, forecasts of population, housing units, and service meters tie back to ABAG’s 2013 Projections for the City of Vallejo.
Demand forecasts were also prepared for a single dry year and multiple dry year scenarios. The forecasts were adjusted to account for the effects of weather on demand in dry years using the CUWCC’s GPCD Weather Normalization Methodology (Western Policy Research, 2011). The driest year on record since 1920 was chosen as the reference year for the single dry year forecast. This year was 2013. The driest three consecutive years on record since 1920 were selected as the reference years for the multiple dry year forecast. These years were 1988-1990. The dry year demand forecasts are summarized in Table 2.
The retail demand forecast includes adjustments for future water savings from:
1. Plumbing codes and appliance standards 2. Conservation DMM implementation 3. Projected increases in water cost and household income 4. Water loss management
These adjustments offset increases in forecasted demand caused by population and housing growth, resulting in a total demand forecast that is declining over the forecast period. Table 3 shows the impact of each adjustment on the forecast of total and per capita demand. The first forecast in the Table 3 is the baseline forecast with no adjustments. The adjustments are then made sequentially to this baseline forecast. The last forecast in Table 3 includes all four adjustments and corresponds to the total demand forecast in Table 1.
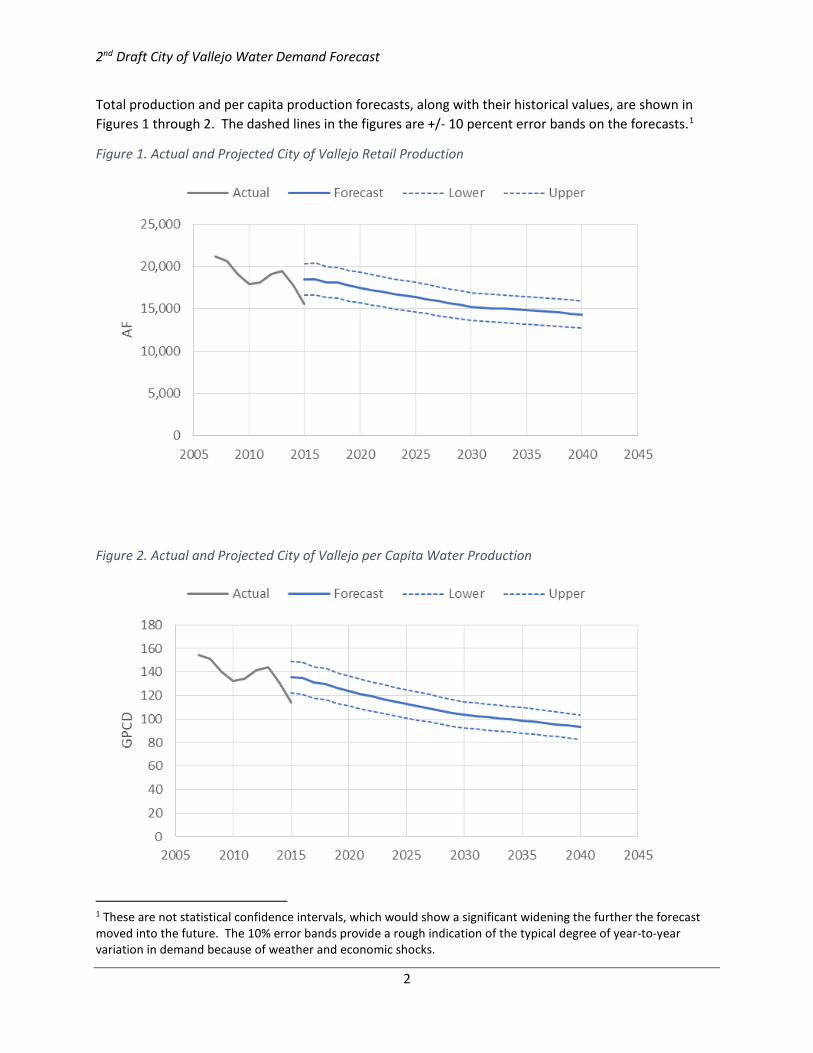
2nd Draft City of Vallejo Water Demand Forecast
2
Total production and per capita production forecasts, along with their historical values, are shown in Figures 1 through 2. The dashed lines in the figures are +/- 10 percent error bands on the forecasts.1
Figure 1. Actual and Projected City of Vallejo Retail Production
Figure 2. Actual and Projected City of Vallejo per Capita Water Production
1 These are not statistical confidence intervals, which would show a significant widening the further the forecast moved into the future. The 10% error bands provide a rough indication of the typical degree of year-to-year variation in demand because of weather and economic shocks.

2nd Draft City of Vallejo Water Demand Forecast
3
Table 1. Summary of City of Vallejo Water Demand Forecast
2015 Actual
2015 Forecast 1/ 2020 2025 2030 2035 2040
Population 121,652 121,652 126,029 129,304 131,328 133,824 137,081 Residential 119,701 119,701 124,238 127,443 129,383 131,738 134,875 Group Quarters 2/ 1,951 1,951 1,791 1,861 1,945 2,086 2,206 Total Connections 37,682 37,682 38,641 39,630 40,241 40,978 41,954 Demand in AF Single Family 6,647 8,152 7,951 7,717 7,451 7,258 7,000 Multi Family 1,762 1,837 1,871 1,847 1,820 1,812 1,812 Commercial 2,231 2,633 2,563 2,472 2,364 2,264 2,171 Irrigation 1,258 1,796 1,791 1,752 1,679 1,591 1,489 Other 386 364 377 387 393 400 410 Total Demand 12,284 14,782 14,552 14,175 13,706 13,326 12,882 Losses 3,251 3,704 2,916 2,183 1,523 1,481 1,431 Total Production 15,535 18,486 17,468 16,358 15,229 14,806 14,313 Per Capital Demand (GPCD) Residential 63 75 71 67 64 61 58 Total Production 114 136 124 113 104 99 93
1. Forecast of demand without rationing. Actual demand in 2015 was reduced significantly by the State’s Emergency Drought Regulation.
2. Institutionalized population residing in dormitories, jails, etc.
Table 2. Dry Year Demand Forecasts
Reference Total Production 2015 1/ 2020 2025 2030 2035 2040 Year
Demand in AF Normal Year 18,486 17,468 16,358 15,229 14,806 14,313 NA Single Dry Year 19,401 18,332 17,167 15,982 15,539 15,021 2013 Multiple Dry Years
Year 1 19,011 17,963 16,822 15,661 15,227 14,719 1988 Year 2 18,481 17,463 16,353 15,225 14,803 14,309 1989 Year 3 18,662 17,634 16,513 15,374 14,947 14,449 1990
1. Forecast of demand without rationing. Actual demand in 2015 was reduced significantly by the State’s Emergency Drought Regulation.
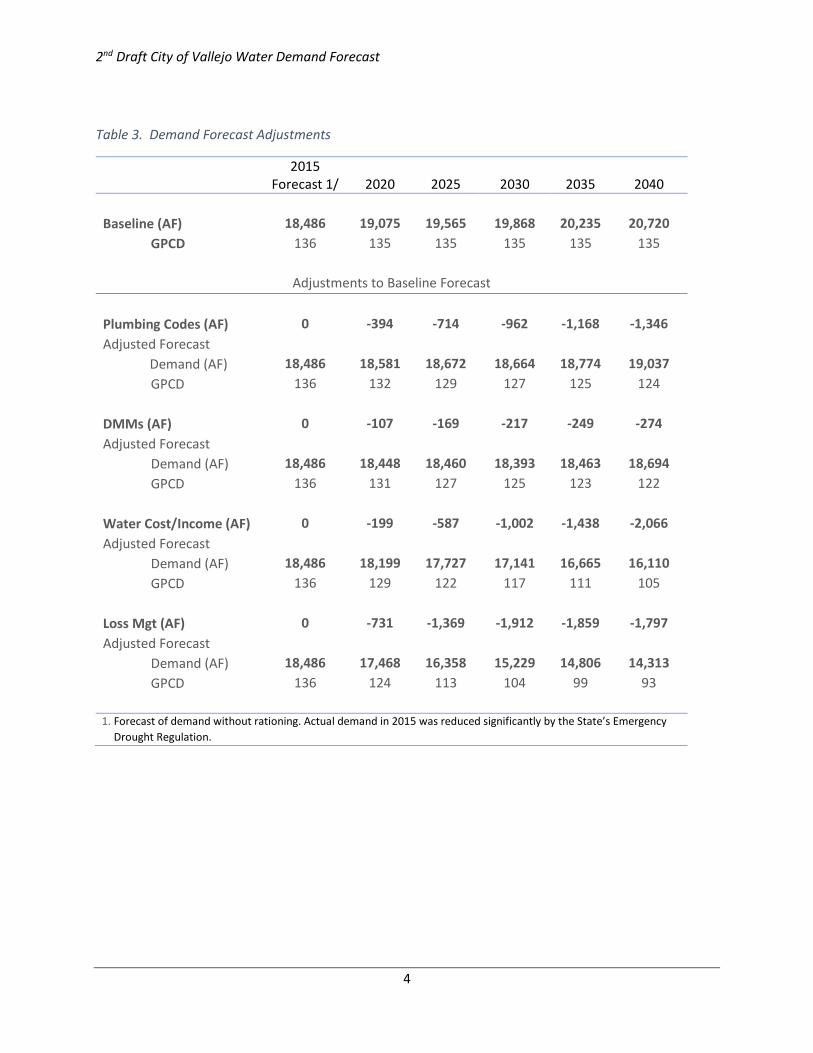
2nd Draft City of Vallejo Water Demand Forecast
4
Table 3. Demand Forecast Adjustments
2015 Forecast 1/ 2020 2025 2030 2035 2040
Baseline (AF) 18,486 19,075 19,565 19,868 20,235 20,720
GPCD 136 135 135 135 135 135
Adjustments to Baseline Forecast
Plumbing Codes (AF) 0 -394 -714 -962 -1,168 -1,346 Adjusted Forecast
Demand (AF) 18,486 18,581 18,672 18,664 18,774 19,037 GPCD 136 132 129 127 125 124
DMMs (AF) 0 -107 -169 -217 -249 -274 Adjusted Forecast
Demand (AF) 18,486 18,448 18,460 18,393 18,463 18,694 GPCD 136 131 127 125 123 122
Water Cost/Income (AF) 0 -199 -587 -1,002 -1,438 -2,066 Adjusted Forecast
Demand (AF) 18,486 18,199 17,727 17,141 16,665 16,110 GPCD 136 129 122 117 111 105
Loss Mgt (AF) 0 -731 -1,369 -1,912 -1,859 -1,797 Adjusted Forecast
Demand (AF) 18,486 17,468 16,358 15,229 14,806 14,313 GPCD 136 124 113 104 99 93
1. Forecast of demand without rationing. Actual demand in 2015 was reduced significantly by the State’s Emergency
Drought Regulation.
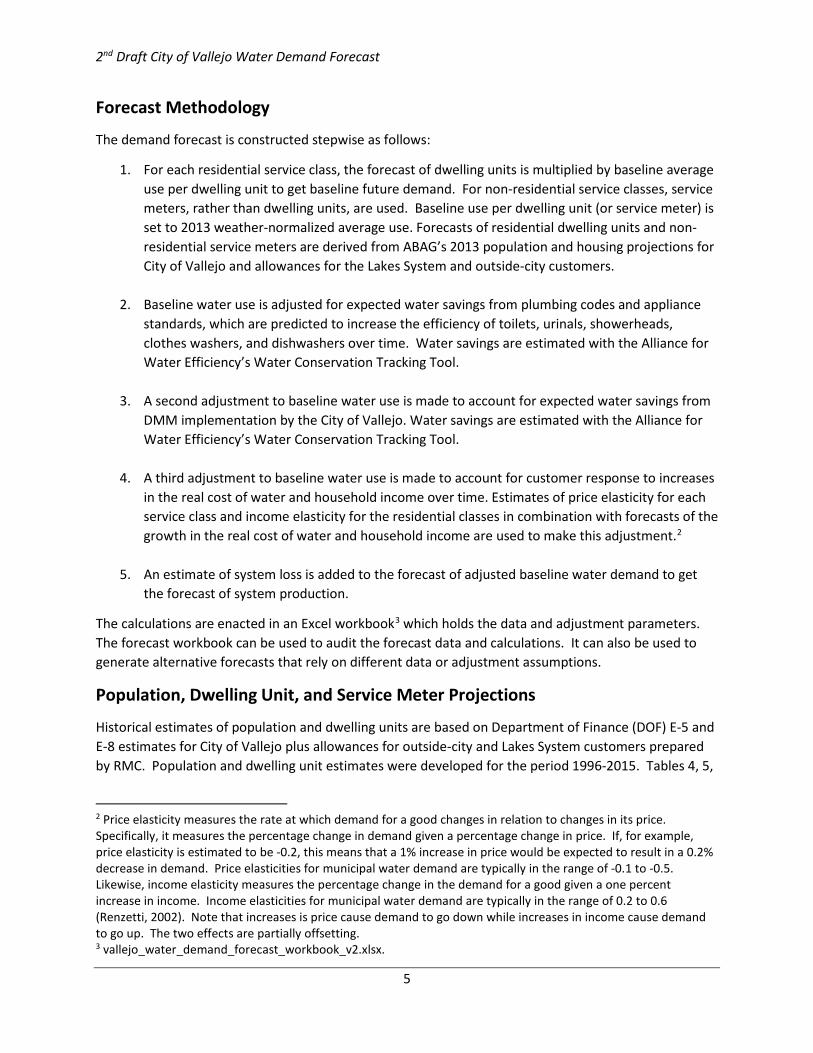
2nd Draft City of Vallejo Water Demand Forecast
5
Forecast Methodology
The demand forecast is constructed stepwise as follows:
1. For each residential service class, the forecast of dwelling units is multiplied by baseline average use per dwelling unit to get baseline future demand. For non-residential service classes, service meters, rather than dwelling units, are used. Baseline use per dwelling unit (or service meter) is set to 2013 weather-normalized average use. Forecasts of residential dwelling units and non-residential service meters are derived from ABAG’s 2013 population and housing projections for City of Vallejo and allowances for the Lakes System and outside-city customers.
2. Baseline water use is adjusted for expected water savings from plumbing codes and appliance standards, which are predicted to increase the efficiency of toilets, urinals, showerheads, clothes washers, and dishwashers over time. Water savings are estimated with the Alliance for Water Efficiency’s Water Conservation Tracking Tool.
3. A second adjustment to baseline water use is made to account for expected water savings from DMM implementation by the City of Vallejo. Water savings are estimated with the Alliance for Water Efficiency’s Water Conservation Tracking Tool.
4. A third adjustment to baseline water use is made to account for customer response to increases in the real cost of water and household income over time. Estimates of price elasticity for each service class and income elasticity for the residential classes in combination with forecasts of the growth in the real cost of water and household income are used to make this adjustment.2
5. An estimate of system loss is added to the forecast of adjusted baseline water demand to get the forecast of system production.
The calculations are enacted in an Excel workbook3 which holds the data and adjustment parameters. The forecast workbook can be used to audit the forecast data and calculations. It can also be used to generate alternative forecasts that rely on different data or adjustment assumptions.
Population, Dwelling Unit, and Service Meter Projections
Historical estimates of population and dwelling units are based on Department of Finance (DOF) E-5 and E-8 estimates for City of Vallejo plus allowances for outside-city and Lakes System customers prepared by RMC. Population and dwelling unit estimates were developed for the period 1996-2015. Tables 4, 5,
2 Price elasticity measures the rate at which demand for a good changes in relation to changes in its price. Specifically, it measures the percentage change in demand given a percentage change in price. If, for example, price elasticity is estimated to be -0.2, this means that a 1% increase in price would be expected to result in a 0.2% decrease in demand. Price elasticities for municipal water demand are typically in the range of -0.1 to -0.5. Likewise, income elasticity measures the percentage change in the demand for a good given a one percent increase in income. Income elasticities for municipal water demand are typically in the range of 0.2 to 0.6 (Renzetti, 2002). Note that increases is price cause demand to go down while increases in income cause demand to go up. The two effects are partially offsetting. 3 vallejo_water_demand_forecast_workbook_v2.xlsx.
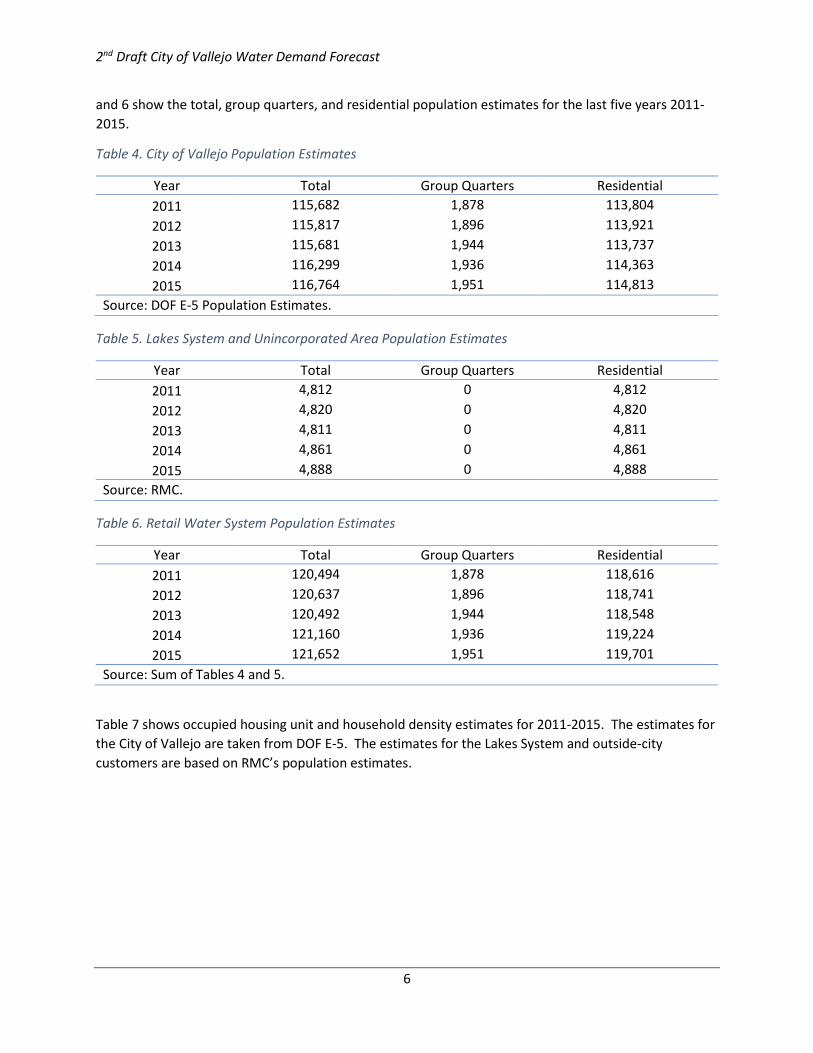
2nd Draft City of Vallejo Water Demand Forecast
6
and 6 show the total, group quarters, and residential population estimates for the last five years 2011-2015.
Table 4. City of Vallejo Population Estimates
Year Total Group Quarters Residential 2011 115,682 1,878 113,804 2012 115,817 1,896 113,921 2013 115,681 1,944 113,737 2014 116,299 1,936 114,363 2015 116,764 1,951 114,813
Source: DOF E-5 Population Estimates.
Table 5. Lakes System and Unincorporated Area Population Estimates
Year Total Group Quarters Residential 2011 4,812 0 4,812 2012 4,820 0 4,820 2013 4,811 0 4,811 2014 4,861 0 4,861 2015 4,888 0 4,888
Source: RMC.
Table 6. Retail Water System Population Estimates
Year Total Group Quarters Residential 2011 120,494 1,878 118,616 2012 120,637 1,896 118,741 2013 120,492 1,944 118,548 2014 121,160 1,936 119,224 2015 121,652 1,951 119,701
Source: Sum of Tables 4 and 5.
Table 7 shows occupied housing unit and household density estimates for 2011-2015. The estimates for the City of Vallejo are taken from DOF E-5. The estimates for the Lakes System and outside-city customers are based on RMC’s population estimates.
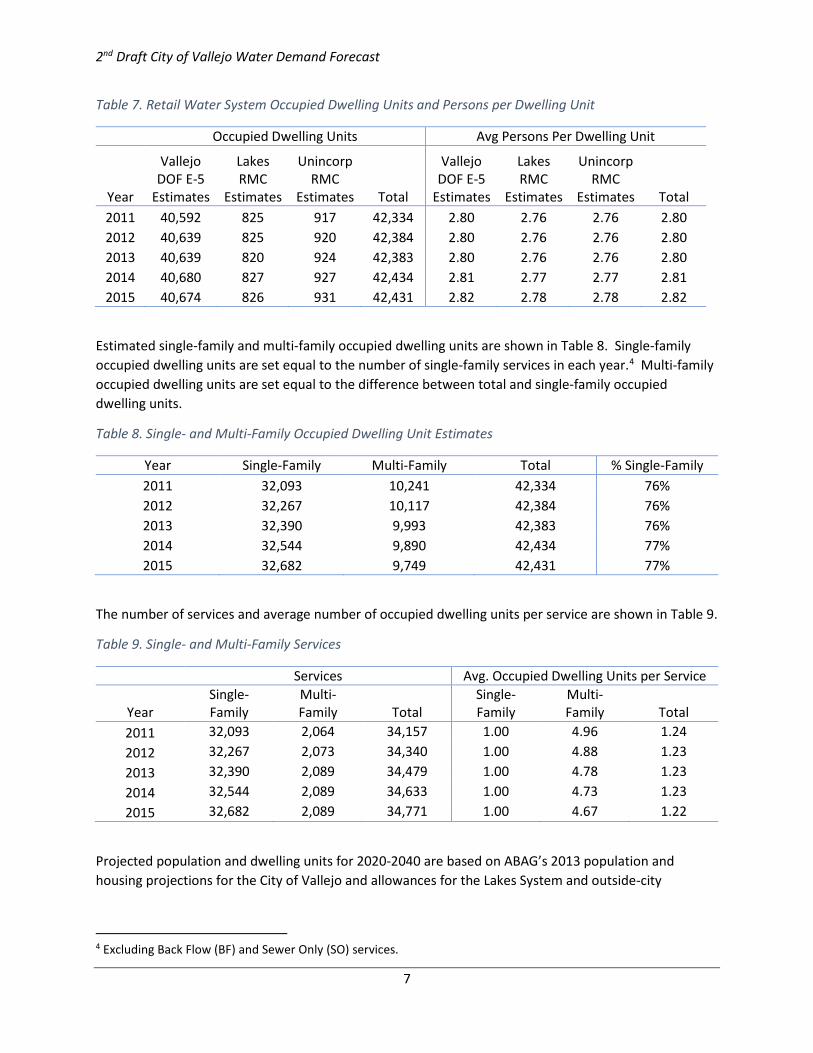
2nd Draft City of Vallejo Water Demand Forecast
7
Table 7. Retail Water System Occupied Dwelling Units and Persons per Dwelling Unit
Occupied Dwelling Units Avg Persons Per Dwelling Unit
Year
Vallejo DOF E-5
Estimates
Lakes RMC
Estimates
Unincorp RMC
Estimates Total
Vallejo DOF E-5
Estimates
Lakes RMC
Estimates
Unincorp RMC
Estimates Total 2011 40,592 825 917 42,334 2.80 2.76 2.76 2.80 2012 40,639 825 920 42,384 2.80 2.76 2.76 2.80 2013 40,639 820 924 42,383 2.80 2.76 2.76 2.80 2014 40,680 827 927 42,434 2.81 2.77 2.77 2.81 2015 40,674 826 931 42,431 2.82 2.78 2.78 2.82
Estimated single-family and multi-family occupied dwelling units are shown in Table 8. Single-family occupied dwelling units are set equal to the number of single-family services in each year.4 Multi-family occupied dwelling units are set equal to the difference between total and single-family occupied dwelling units.
Table 8. Single- and Multi-Family Occupied Dwelling Unit Estimates
Year Single-Family Multi-Family Total % Single-Family 2011 32,093 10,241 42,334 76% 2012 32,267 10,117 42,384 76% 2013 32,390 9,993 42,383 76% 2014 32,544 9,890 42,434 77% 2015 32,682 9,749 42,431 77%
The number of services and average number of occupied dwelling units per service are shown in Table 9.
Table 9. Single- and Multi-Family Services
Services Avg. Occupied Dwelling Units per Service
Year Single-Family
Multi-Family Total
Single-Family
Multi-Family Total
2011 32,093 2,064 34,157 1.00 4.96 1.24 2012 32,267 2,073 34,340 1.00 4.88 1.23 2013 32,390 2,089 34,479 1.00 4.78 1.23 2014 32,544 2,089 34,633 1.00 4.73 1.23 2015 32,682 2,089 34,771 1.00 4.67 1.22
Projected population and dwelling units for 2020-2040 are based on ABAG’s 2013 population and housing projections for the City of Vallejo and allowances for the Lakes System and outside-city
4 Excluding Back Flow (BF) and Sewer Only (SO) services.
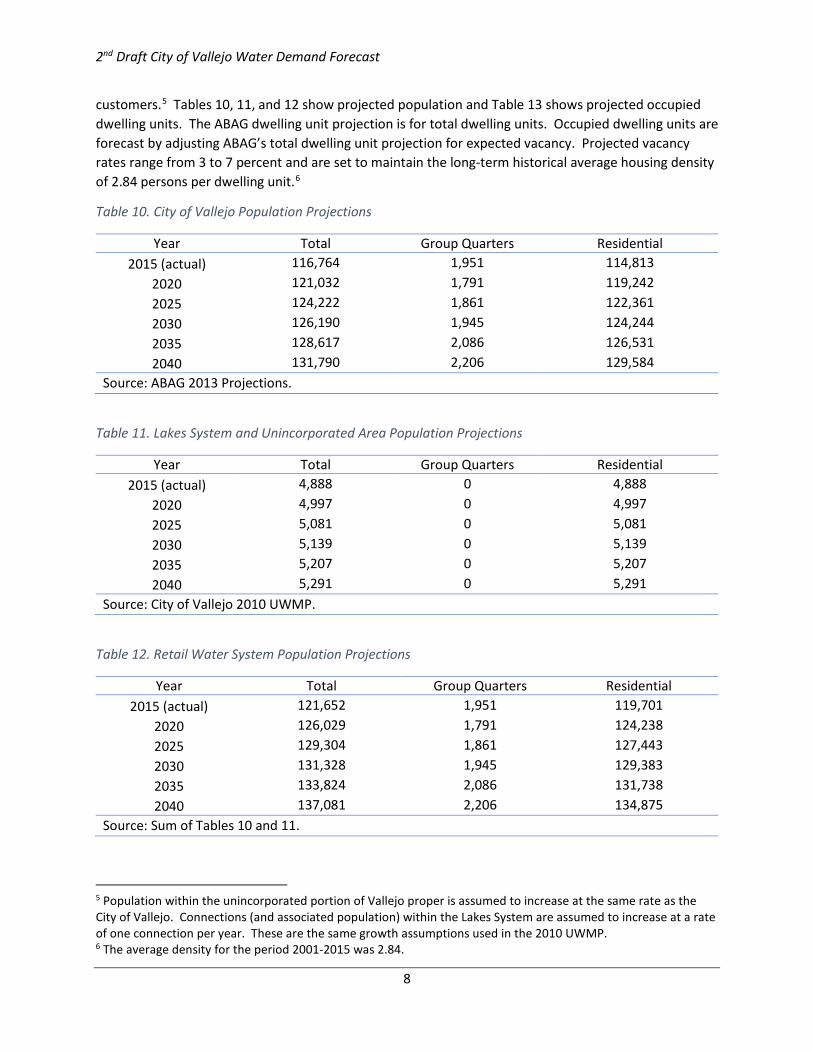
2nd Draft City of Vallejo Water Demand Forecast
8
customers.5 Tables 10, 11, and 12 show projected population and Table 13 shows projected occupied dwelling units. The ABAG dwelling unit projection is for total dwelling units. Occupied dwelling units are forecast by adjusting ABAG’s total dwelling unit projection for expected vacancy. Projected vacancy rates range from 3 to 7 percent and are set to maintain the long-term historical average housing density of 2.84 persons per dwelling unit.6
Table 10. City of Vallejo Population Projections
Year Total Group Quarters Residential 2015 (actual) 116,764 1,951 114,813
2020 121,032 1,791 119,242 2025 124,222 1,861 122,361 2030 126,190 1,945 124,244 2035 128,617 2,086 126,531 2040 131,790 2,206 129,584
Source: ABAG 2013 Projections.
Table 11. Lakes System and Unincorporated Area Population Projections
Year Total Group Quarters Residential 2015 (actual) 4,888 0 4,888
2020 4,997 0 4,997 2025 5,081 0 5,081 2030 5,139 0 5,139 2035 5,207 0 5,207 2040 5,291 0 5,291
Source: City of Vallejo 2010 UWMP.
Table 12. Retail Water System Population Projections
Year Total Group Quarters Residential 2015 (actual) 121,652 1,951 119,701
2020 126,029 1,791 124,238 2025 129,304 1,861 127,443 2030 131,328 1,945 129,383 2035 133,824 2,086 131,738 2040 137,081 2,206 134,875
Source: Sum of Tables 10 and 11.
5 Population within the unincorporated portion of Vallejo proper is assumed to increase at the same rate as the City of Vallejo. Connections (and associated population) within the Lakes System are assumed to increase at a rate of one connection per year. These are the same growth assumptions used in the 2010 UWMP. 6 The average density for the period 2001-2015 was 2.84.
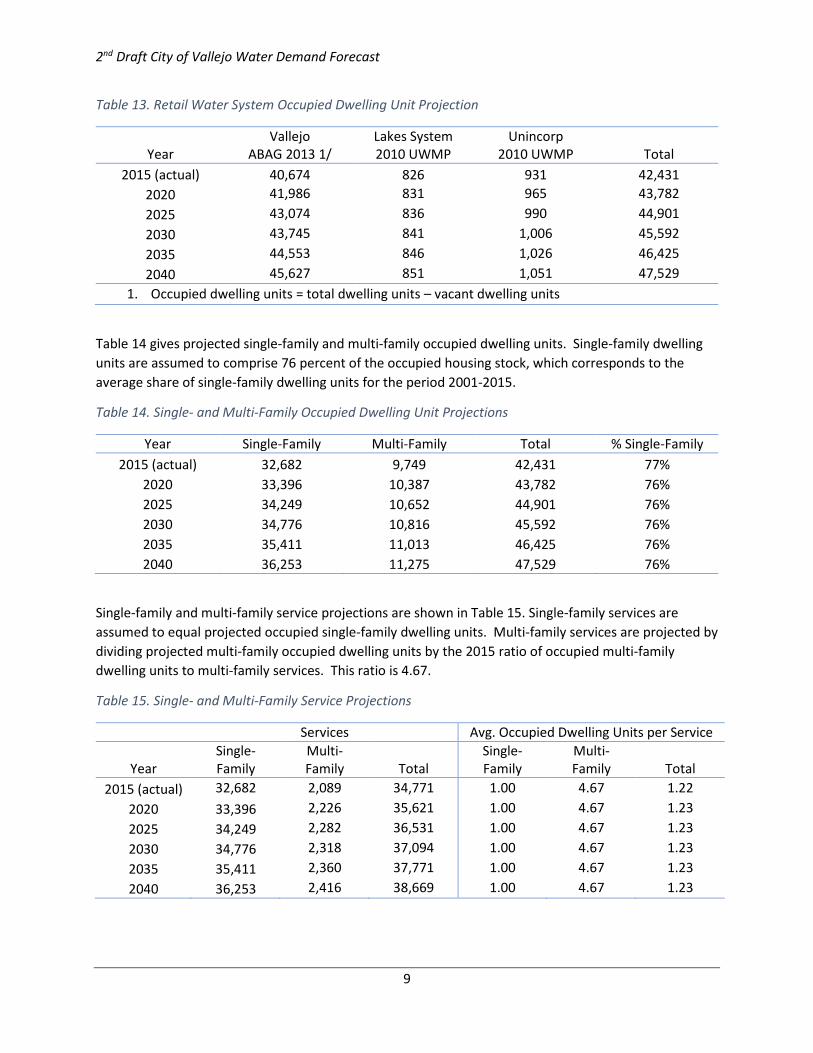
2nd Draft City of Vallejo Water Demand Forecast
9
Table 13. Retail Water System Occupied Dwelling Unit Projection
Year Vallejo
ABAG 2013 1/ Lakes System 2010 UWMP
Unincorp 2010 UWMP Total
2015 (actual) 40,674 826 931 42,431 2020 41,986 831 965 43,782 2025 43,074 836 990 44,901 2030 43,745 841 1,006 45,592 2035 44,553 846 1,026 46,425 2040 45,627 851 1,051 47,529
1. Occupied dwelling units = total dwelling units – vacant dwelling units
Table 14 gives projected single-family and multi-family occupied dwelling units. Single-family dwelling units are assumed to comprise 76 percent of the occupied housing stock, which corresponds to the average share of single-family dwelling units for the period 2001-2015.
Table 14. Single- and Multi-Family Occupied Dwelling Unit Projections
Year Single-Family Multi-Family Total % Single-Family 2015 (actual) 32,682 9,749 42,431 77%
2020 33,396 10,387 43,782 76% 2025 34,249 10,652 44,901 76% 2030 34,776 10,816 45,592 76% 2035 35,411 11,013 46,425 76% 2040 36,253 11,275 47,529 76%
Single-family and multi-family service projections are shown in Table 15. Single-family services are assumed to equal projected occupied single-family dwelling units. Multi-family services are projected by dividing projected multi-family occupied dwelling units by the 2015 ratio of occupied multi-family dwelling units to multi-family services. This ratio is 4.67.
Table 15. Single- and Multi-Family Service Projections
Services Avg. Occupied Dwelling Units per Service
Year Single-Family
Multi-Family Total
Single-Family
Multi-Family Total
2015 (actual) 32,682 2,089 34,771 1.00 4.67 1.22 2020 33,396 2,226 35,621 1.00 4.67 1.23 2025 34,249 2,282 36,531 1.00 4.67 1.23 2030 34,776 2,318 37,094 1.00 4.67 1.23 2035 35,411 2,360 37,771 1.00 4.67 1.23 2040 36,253 2,416 38,669 1.00 4.67 1.23
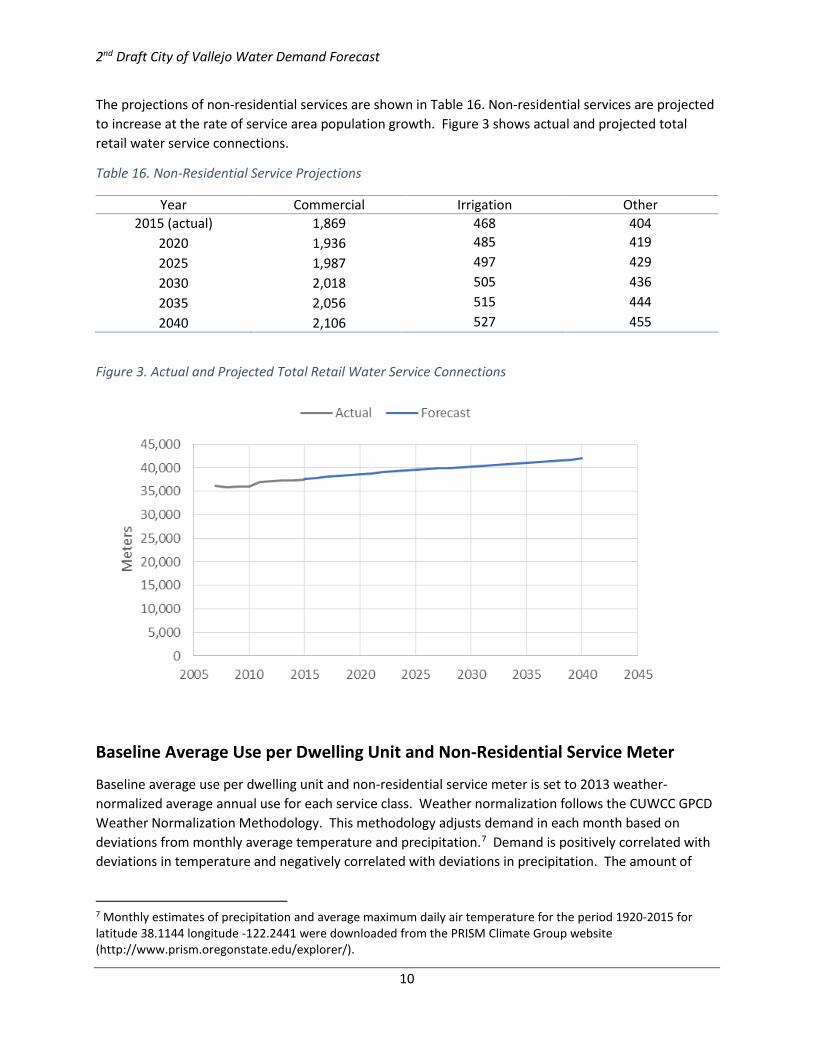
2nd Draft City of Vallejo Water Demand Forecast
10
The projections of non-residential services are shown in Table 16. Non-residential services are projected to increase at the rate of service area population growth. Figure 3 shows actual and projected total retail water service connections.
Table 16. Non-Residential Service Projections
Year Commercial Irrigation Other 2015 (actual) 1,869 468 404
2020 1,936 485 419 2025 1,987 497 429 2030 2,018 505 436 2035 2,056 515 444 2040 2,106 527 455
Figure 3. Actual and Projected Total Retail Water Service Connections
Baseline Average Use per Dwelling Unit and Non-Residential Service Meter
Baseline average use per dwelling unit and non-residential service meter is set to 2013 weather-normalized average annual use for each service class. Weather normalization follows the CUWCC GPCD Weather Normalization Methodology. This methodology adjusts demand in each month based on deviations from monthly average temperature and precipitation.7 Demand is positively correlated with deviations in temperature and negatively correlated with deviations in precipitation. The amount of
7 Monthly estimates of precipitation and average maximum daily air temperature for the period 1920-2015 for latitude 38.1144 longitude -122.2441 were downloaded from the PRISM Climate Group website (http://www.prism.oregonstate.edu/explorer/).
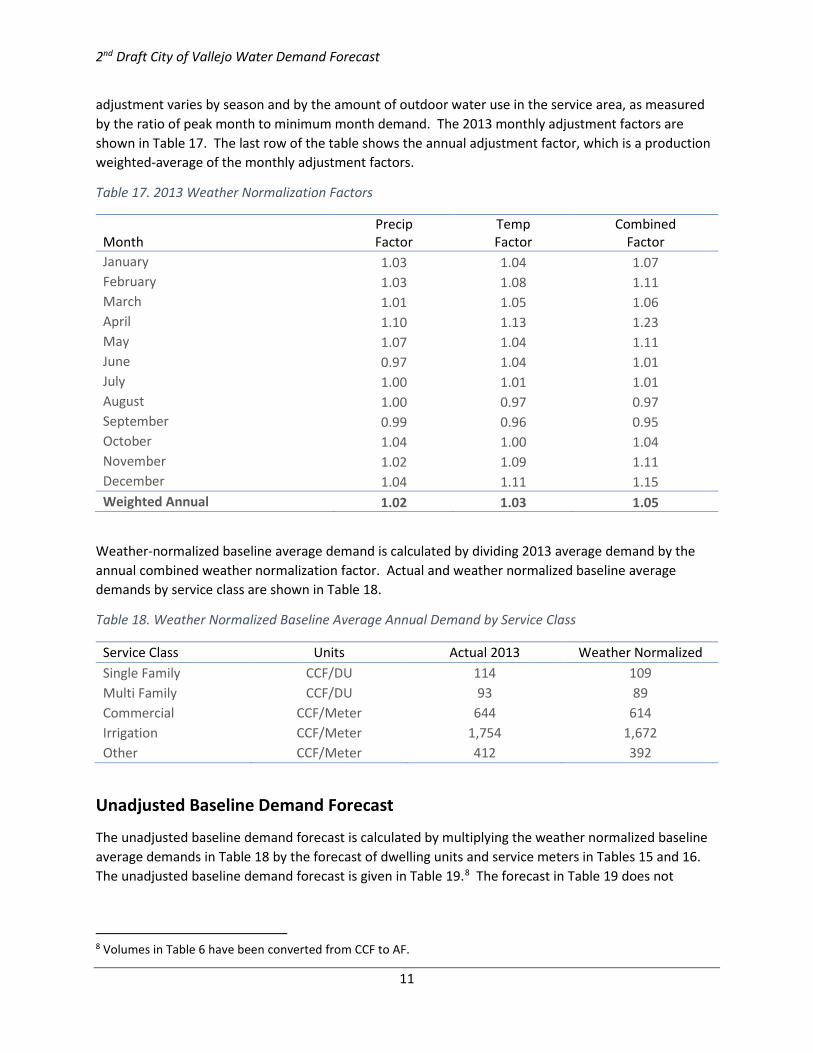
2nd Draft City of Vallejo Water Demand Forecast
11
adjustment varies by season and by the amount of outdoor water use in the service area, as measured by the ratio of peak month to minimum month demand. The 2013 monthly adjustment factors are shown in Table 17. The last row of the table shows the annual adjustment factor, which is a production weighted-average of the monthly adjustment factors.
Table 17. 2013 Weather Normalization Factors
Month Precip Factor
Temp Factor
Combined Factor
January 1.03 1.04 1.07 February 1.03 1.08 1.11 March 1.01 1.05 1.06 April 1.10 1.13 1.23 May 1.07 1.04 1.11 June 0.97 1.04 1.01 July 1.00 1.01 1.01 August 1.00 0.97 0.97 September 0.99 0.96 0.95 October 1.04 1.00 1.04 November 1.02 1.09 1.11 December 1.04 1.11 1.15 Weighted Annual 1.02 1.03 1.05
Weather-normalized baseline average demand is calculated by dividing 2013 average demand by the annual combined weather normalization factor. Actual and weather normalized baseline average demands by service class are shown in Table 18.
Table 18. Weather Normalized Baseline Average Annual Demand by Service Class
Service Class Units Actual 2013 Weather Normalized Single Family CCF/DU 114 109 Multi Family CCF/DU 93 89 Commercial CCF/Meter 644 614 Irrigation CCF/Meter 1,754 1,672 Other CCF/Meter 412 392
Unadjusted Baseline Demand Forecast
The unadjusted baseline demand forecast is calculated by multiplying the weather normalized baseline average demands in Table 18 by the forecast of dwelling units and service meters in Tables 15 and 16. The unadjusted baseline demand forecast is given in Table 19.8 The forecast in Table 19 does not
8 Volumes in Table 6 have been converted from CCF to AF.
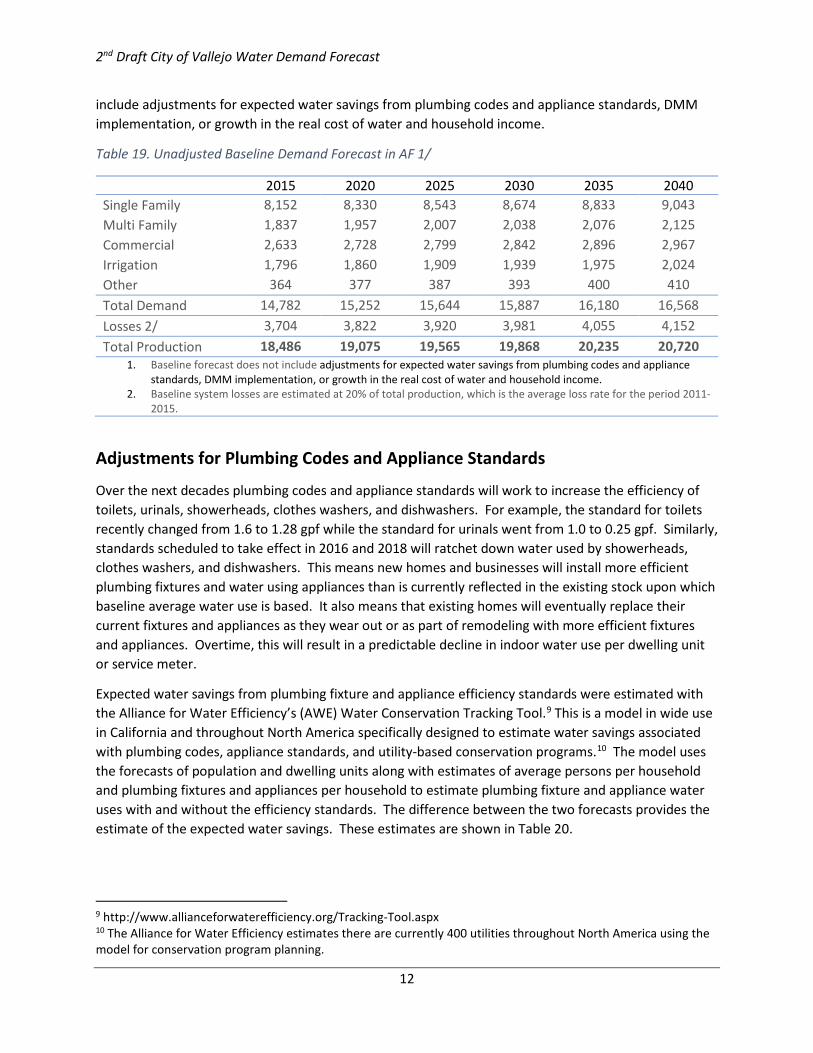
2nd Draft City of Vallejo Water Demand Forecast
12
include adjustments for expected water savings from plumbing codes and appliance standards, DMM implementation, or growth in the real cost of water and household income.
Table 19. Unadjusted Baseline Demand Forecast in AF 1/
2015 2020 2025 2030 2035 2040 Single Family 8,152 8,330 8,543 8,674 8,833 9,043 Multi Family 1,837 1,957 2,007 2,038 2,076 2,125 Commercial 2,633 2,728 2,799 2,842 2,896 2,967 Irrigation 1,796 1,860 1,909 1,939 1,975 2,024 Other 364 377 387 393 400 410 Total Demand 14,782 15,252 15,644 15,887 16,180 16,568 Losses 2/ 3,704 3,822 3,920 3,981 4,055 4,152 Total Production 18,486 19,075 19,565 19,868 20,235 20,720
1. Baseline forecast does not include adjustments for expected water savings from plumbing codes and appliance standards, DMM implementation, or growth in the real cost of water and household income.
2. Baseline system losses are estimated at 20% of total production, which is the average loss rate for the period 2011-2015.
Adjustments for Plumbing Codes and Appliance Standards
Over the next decades plumbing codes and appliance standards will work to increase the efficiency of toilets, urinals, showerheads, clothes washers, and dishwashers. For example, the standard for toilets recently changed from 1.6 to 1.28 gpf while the standard for urinals went from 1.0 to 0.25 gpf. Similarly, standards scheduled to take effect in 2016 and 2018 will ratchet down water used by showerheads, clothes washers, and dishwashers. This means new homes and businesses will install more efficient plumbing fixtures and water using appliances than is currently reflected in the existing stock upon which baseline average water use is based. It also means that existing homes will eventually replace their current fixtures and appliances as they wear out or as part of remodeling with more efficient fixtures and appliances. Overtime, this will result in a predictable decline in indoor water use per dwelling unit or service meter.
Expected water savings from plumbing fixture and appliance efficiency standards were estimated with the Alliance for Water Efficiency’s (AWE) Water Conservation Tracking Tool.9 This is a model in wide use in California and throughout North America specifically designed to estimate water savings associated with plumbing codes, appliance standards, and utility-based conservation programs.10 The model uses the forecasts of population and dwelling units along with estimates of average persons per household and plumbing fixtures and appliances per household to estimate plumbing fixture and appliance water uses with and without the efficiency standards. The difference between the two forecasts provides the estimate of the expected water savings. These estimates are shown in Table 20.
9 http://www.allianceforwaterefficiency.org/Tracking-Tool.aspx 10 The Alliance for Water Efficiency estimates there are currently 400 utilities throughout North America using the model for conservation program planning.
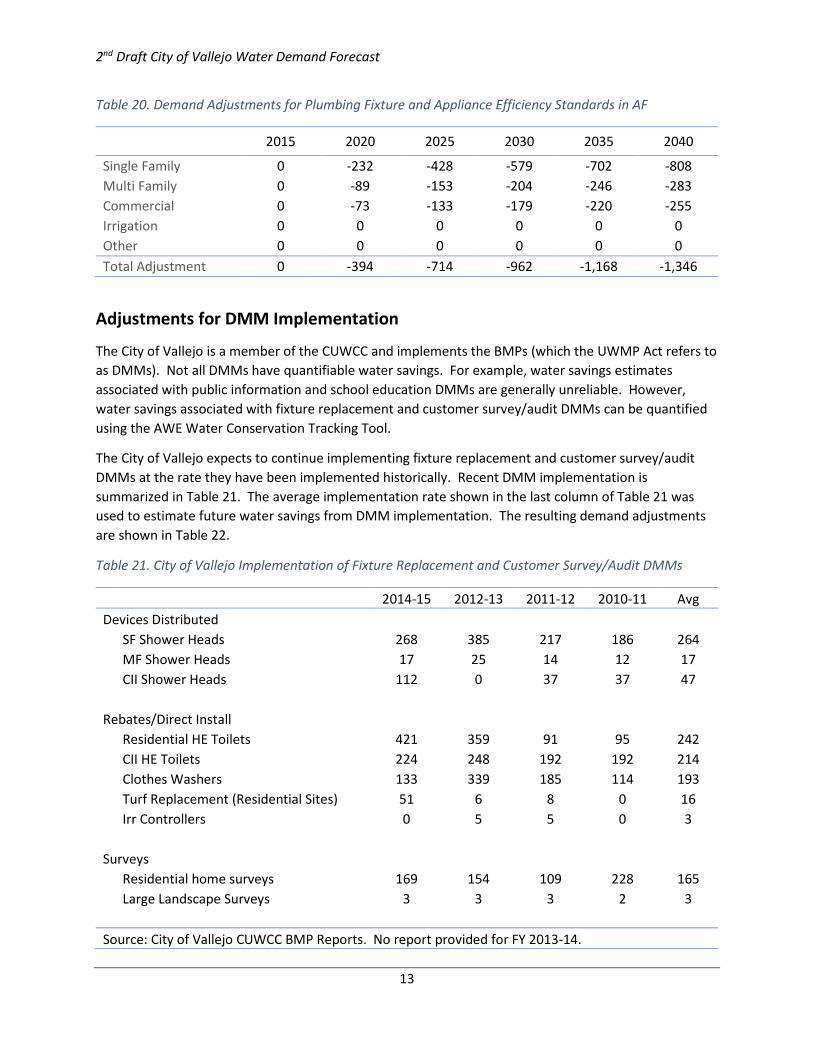
2nd Draft City of Vallejo Water Demand Forecast
13
Table 20. Demand Adjustments for Plumbing Fixture and Appliance Efficiency Standards in AF
2015 2020 2025 2030 2035 2040
Single Family 0 -232 -428 -579 -702 -808 Multi Family 0 -89 -153 -204 -246 -283 Commercial 0 -73 -133 -179 -220 -255 Irrigation 0 0 0 0 0 0 Other 0 0 0 0 0 0 Total Adjustment 0 -394 -714 -962 -1,168 -1,346
Adjustments for DMM Implementation
The City of Vallejo is a member of the CUWCC and implements the BMPs (which the UWMP Act refers to as DMMs). Not all DMMs have quantifiable water savings. For example, water savings estimates associated with public information and school education DMMs are generally unreliable. However, water savings associated with fixture replacement and customer survey/audit DMMs can be quantified using the AWE Water Conservation Tracking Tool.
The City of Vallejo expects to continue implementing fixture replacement and customer survey/audit DMMs at the rate they have been implemented historically. Recent DMM implementation is summarized in Table 21. The average implementation rate shown in the last column of Table 21 was used to estimate future water savings from DMM implementation. The resulting demand adjustments are shown in Table 22.
Table 21. City of Vallejo Implementation of Fixture Replacement and Customer Survey/Audit DMMs
2014-15 2012-13 2011-12 2010-11 Avg Devices Distributed SF Shower Heads 268 385 217 186 264
MF Shower Heads 17 25 14 12 17
CII Shower Heads 112 0 37 37 47
Rebates/Direct Install Residential HE Toilets 421 359 91 95 242
CII HE Toilets 224 248 192 192 214
Clothes Washers 133 339 185 114 193
Turf Replacement (Residential Sites) 51 6 8 0 16
Irr Controllers 0 5 5 0 3
Surveys Residential home surveys 169 154 109 228 165
Large Landscape Surveys 3 3 3 2 3
Source: City of Vallejo CUWCC BMP Reports. No report provided for FY 2013-14.
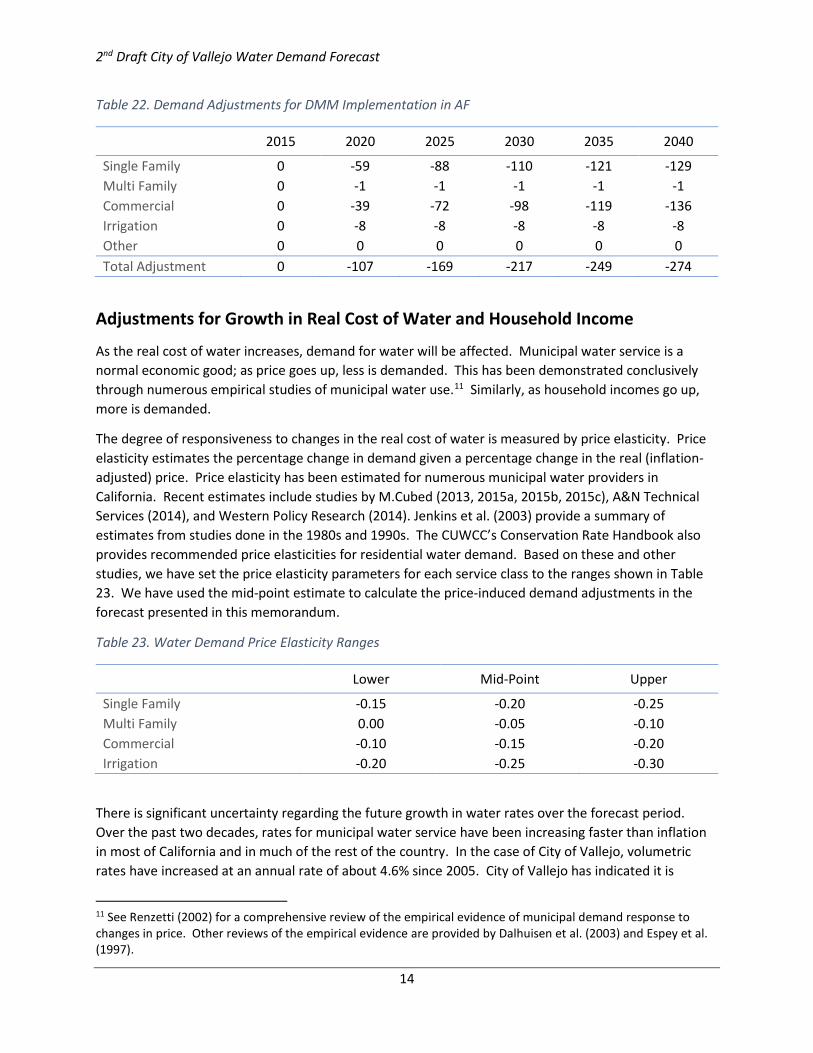
2nd Draft City of Vallejo Water Demand Forecast
14
Table 22. Demand Adjustments for DMM Implementation in AF
2015 2020 2025 2030 2035 2040
Single Family 0 -59 -88 -110 -121 -129 Multi Family 0 -1 -1 -1 -1 -1 Commercial 0 -39 -72 -98 -119 -136 Irrigation 0 -8 -8 -8 -8 -8 Other 0 0 0 0 0 0 Total Adjustment 0 -107 -169 -217 -249 -274
Adjustments for Growth in Real Cost of Water and Household Income
As the real cost of water increases, demand for water will be affected. Municipal water service is a normal economic good; as price goes up, less is demanded. This has been demonstrated conclusively through numerous empirical studies of municipal water use.11 Similarly, as household incomes go up, more is demanded.
The degree of responsiveness to changes in the real cost of water is measured by price elasticity. Price elasticity estimates the percentage change in demand given a percentage change in the real (inflation-adjusted) price. Price elasticity has been estimated for numerous municipal water providers in California. Recent estimates include studies by M.Cubed (2013, 2015a, 2015b, 2015c), A&N Technical Services (2014), and Western Policy Research (2014). Jenkins et al. (2003) provide a summary of estimates from studies done in the 1980s and 1990s. The CUWCC’s Conservation Rate Handbook also provides recommended price elasticities for residential water demand. Based on these and other studies, we have set the price elasticity parameters for each service class to the ranges shown in Table 23. We have used the mid-point estimate to calculate the price-induced demand adjustments in the forecast presented in this memorandum.
Table 23. Water Demand Price Elasticity Ranges
Lower Mid-Point Upper
Single Family -0.15 -0.20 -0.25 Multi Family 0.00 -0.05 -0.10 Commercial -0.10 -0.15 -0.20 Irrigation -0.20 -0.25 -0.30
There is significant uncertainty regarding the future growth in water rates over the forecast period. Over the past two decades, rates for municipal water service have been increasing faster than inflation in most of California and in much of the rest of the country. In the case of City of Vallejo, volumetric rates have increased at an annual rate of about 4.6% since 2005. City of Vallejo has indicated it is
11 See Renzetti (2002) for a comprehensive review of the empirical evidence of municipal demand response to changes in price. Other reviews of the empirical evidence are provided by Dalhuisen et al. (2003) and Espey et al. (1997).
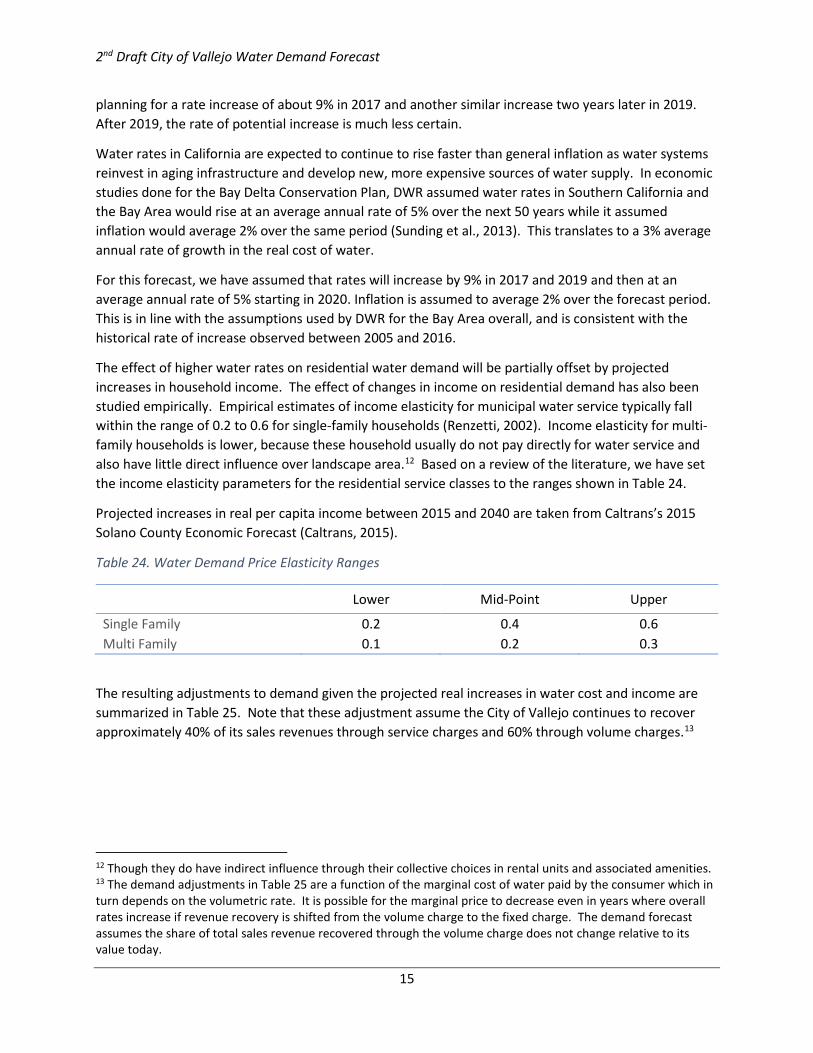
2nd Draft City of Vallejo Water Demand Forecast
15
planning for a rate increase of about 9% in 2017 and another similar increase two years later in 2019. After 2019, the rate of potential increase is much less certain.
Water rates in California are expected to continue to rise faster than general inflation as water systems reinvest in aging infrastructure and develop new, more expensive sources of water supply. In economic studies done for the Bay Delta Conservation Plan, DWR assumed water rates in Southern California and the Bay Area would rise at an average annual rate of 5% over the next 50 years while it assumed inflation would average 2% over the same period (Sunding et al., 2013). This translates to a 3% average annual rate of growth in the real cost of water.
For this forecast, we have assumed that rates will increase by 9% in 2017 and 2019 and then at an average annual rate of 5% starting in 2020. Inflation is assumed to average 2% over the forecast period. This is in line with the assumptions used by DWR for the Bay Area overall, and is consistent with the historical rate of increase observed between 2005 and 2016.
The effect of higher water rates on residential water demand will be partially offset by projected increases in household income. The effect of changes in income on residential demand has also been studied empirically. Empirical estimates of income elasticity for municipal water service typically fall within the range of 0.2 to 0.6 for single-family households (Renzetti, 2002). Income elasticity for multi-family households is lower, because these household usually do not pay directly for water service and also have little direct influence over landscape area.12 Based on a review of the literature, we have set the income elasticity parameters for the residential service classes to the ranges shown in Table 24.
Projected increases in real per capita income between 2015 and 2040 are taken from Caltrans’s 2015 Solano County Economic Forecast (Caltrans, 2015).
Table 24. Water Demand Price Elasticity Ranges
Lower Mid-Point Upper
Single Family 0.2 0.4 0.6 Multi Family 0.1 0.2 0.3
The resulting adjustments to demand given the projected real increases in water cost and income are summarized in Table 25. Note that these adjustment assume the City of Vallejo continues to recover approximately 40% of its sales revenues through service charges and 60% through volume charges.13
12 Though they do have indirect influence through their collective choices in rental units and associated amenities. 13 The demand adjustments in Table 25 are a function of the marginal cost of water paid by the consumer which in turn depends on the volumetric rate. It is possible for the marginal price to decrease even in years where overall rates increase if revenue recovery is shifted from the volume charge to the fixed charge. The demand forecast assumes the share of total sales revenue recovered through the volume charge does not change relative to its value today.
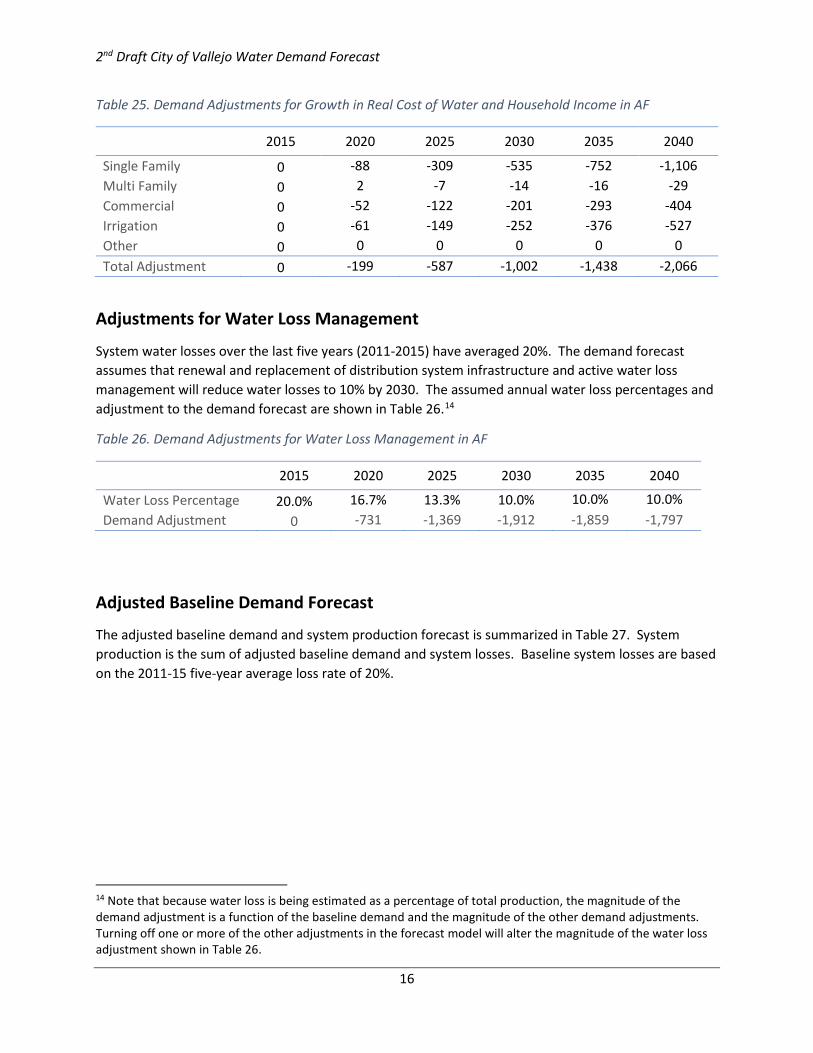
2nd Draft City of Vallejo Water Demand Forecast
16
Table 25. Demand Adjustments for Growth in Real Cost of Water and Household Income in AF
2015 2020 2025 2030 2035 2040
Single Family 0 -88 -309 -535 -752 -1,106 Multi Family 0 2 -7 -14 -16 -29 Commercial 0 -52 -122 -201 -293 -404 Irrigation 0 -61 -149 -252 -376 -527 Other 0 0 0 0 0 0 Total Adjustment 0 -199 -587 -1,002 -1,438 -2,066
Adjustments for Water Loss Management
System water losses over the last five years (2011-2015) have averaged 20%. The demand forecast assumes that renewal and replacement of distribution system infrastructure and active water loss management will reduce water losses to 10% by 2030. The assumed annual water loss percentages and adjustment to the demand forecast are shown in Table 26.14
Table 26. Demand Adjustments for Water Loss Management in AF
2015 2020 2025 2030 2035 2040
Water Loss Percentage 20.0% 16.7% 13.3% 10.0% 10.0% 10.0% Demand Adjustment 0 -731 -1,369 -1,912 -1,859 -1,797
Adjusted Baseline Demand Forecast
The adjusted baseline demand and system production forecast is summarized in Table 27. System production is the sum of adjusted baseline demand and system losses. Baseline system losses are based on the 2011-15 five-year average loss rate of 20%.
14 Note that because water loss is being estimated as a percentage of total production, the magnitude of the demand adjustment is a function of the baseline demand and the magnitude of the other demand adjustments. Turning off one or more of the other adjustments in the forecast model will alter the magnitude of the water loss adjustment shown in Table 26.
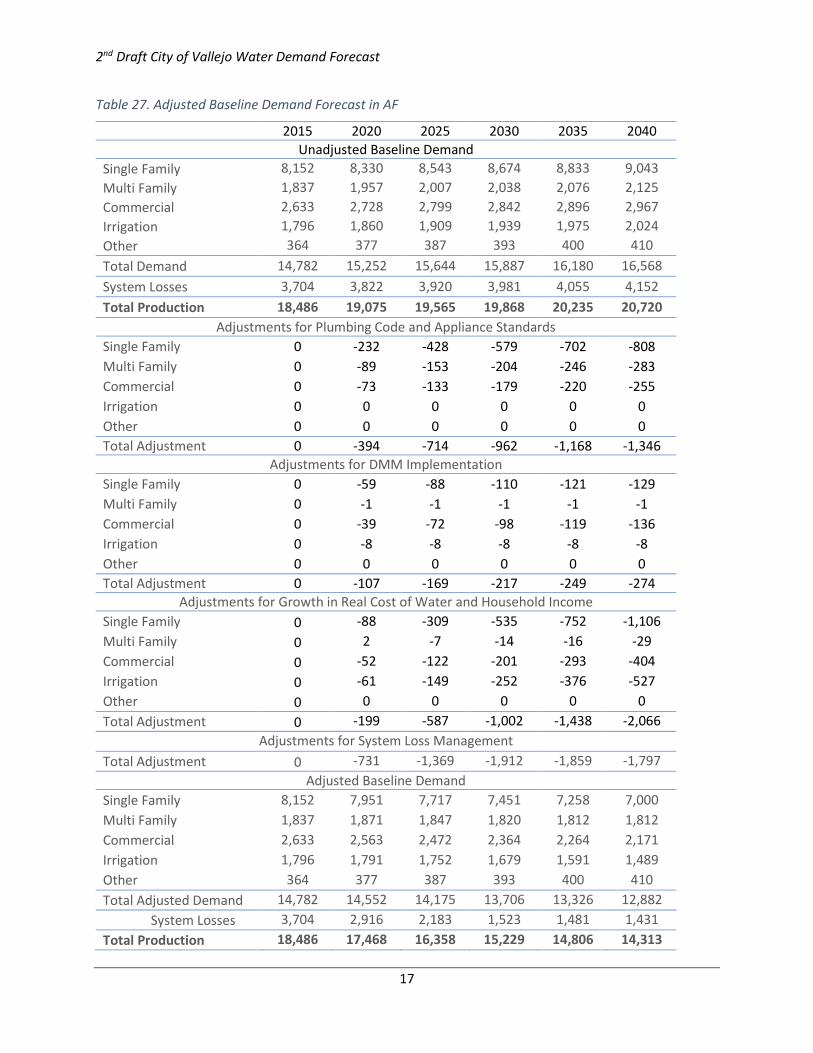
2nd Draft City of Vallejo Water Demand Forecast
17
Table 27. Adjusted Baseline Demand Forecast in AF
2015 2020 2025 2030 2035 2040 Unadjusted Baseline Demand
Single Family 8,152 8,330 8,543 8,674 8,833 9,043 Multi Family 1,837 1,957 2,007 2,038 2,076 2,125 Commercial 2,633 2,728 2,799 2,842 2,896 2,967 Irrigation 1,796 1,860 1,909 1,939 1,975 2,024 Other 364 377 387 393 400 410 Total Demand 14,782 15,252 15,644 15,887 16,180 16,568 System Losses 3,704 3,822 3,920 3,981 4,055 4,152 Total Production 18,486 19,075 19,565 19,868 20,235 20,720
Adjustments for Plumbing Code and Appliance Standards Single Family 0 -232 -428 -579 -702 -808 Multi Family 0 -89 -153 -204 -246 -283 Commercial 0 -73 -133 -179 -220 -255 Irrigation 0 0 0 0 0 0 Other 0 0 0 0 0 0 Total Adjustment 0 -394 -714 -962 -1,168 -1,346
Adjustments for DMM Implementation Single Family 0 -59 -88 -110 -121 -129 Multi Family 0 -1 -1 -1 -1 -1 Commercial 0 -39 -72 -98 -119 -136 Irrigation 0 -8 -8 -8 -8 -8 Other 0 0 0 0 0 0 Total Adjustment 0 -107 -169 -217 -249 -274
Adjustments for Growth in Real Cost of Water and Household Income Single Family 0 -88 -309 -535 -752 -1,106 Multi Family 0 2 -7 -14 -16 -29 Commercial 0 -52 -122 -201 -293 -404 Irrigation 0 -61 -149 -252 -376 -527 Other 0 0 0 0 0 0 Total Adjustment 0 -199 -587 -1,002 -1,438 -2,066
Adjustments for System Loss Management Total Adjustment 0 -731 -1,369 -1,912 -1,859 -1,797
Adjusted Baseline Demand Single Family 8,152 7,951 7,717 7,451 7,258 7,000 Multi Family 1,837 1,871 1,847 1,820 1,812 1,812 Commercial 2,633 2,563 2,472 2,364 2,264 2,171 Irrigation 1,796 1,791 1,752 1,679 1,591 1,489 Other 364 377 387 393 400 410 Total Adjusted Demand 14,782 14,552 14,175 13,706 13,326 12,882
System Losses 3,704 2,916 2,183 1,523 1,481 1,431 Total Production 18,486 17,468 16,358 15,229 14,806 14,313
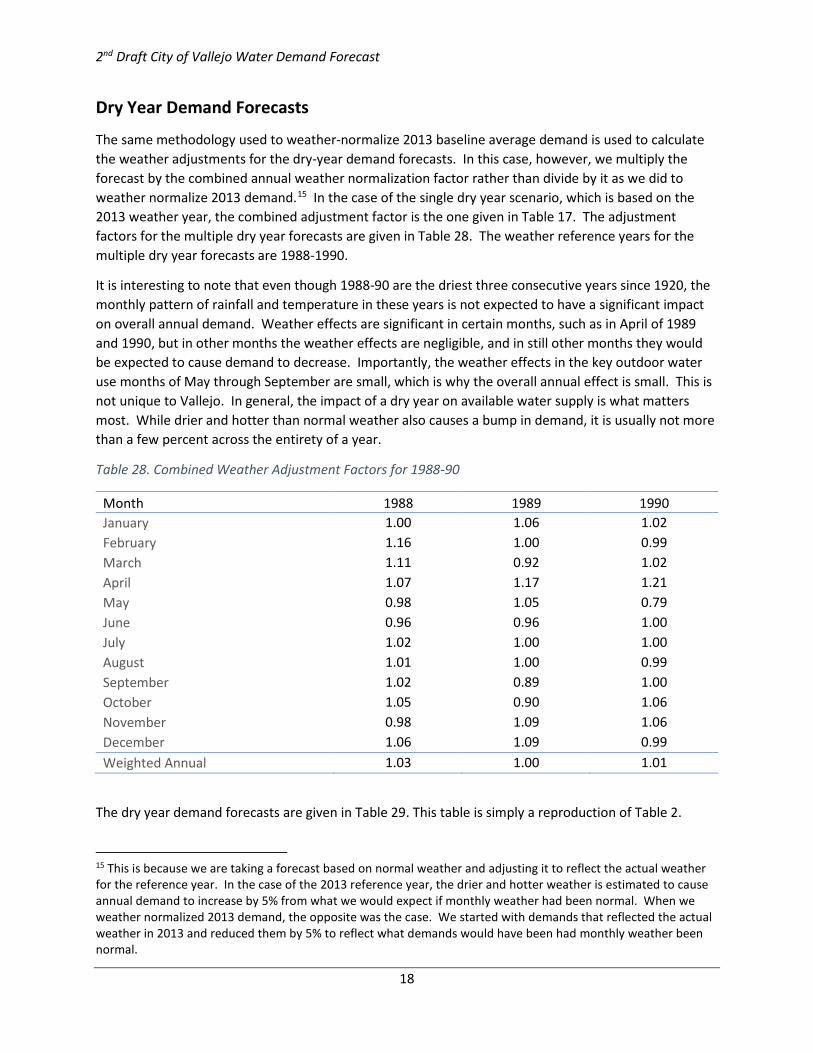
2nd Draft City of Vallejo Water Demand Forecast
18
Dry Year Demand Forecasts
The same methodology used to weather-normalize 2013 baseline average demand is used to calculate the weather adjustments for the dry-year demand forecasts. In this case, however, we multiply the forecast by the combined annual weather normalization factor rather than divide by it as we did to weather normalize 2013 demand.15 In the case of the single dry year scenario, which is based on the 2013 weather year, the combined adjustment factor is the one given in Table 17. The adjustment factors for the multiple dry year forecasts are given in Table 28. The weather reference years for the multiple dry year forecasts are 1988-1990.
It is interesting to note that even though 1988-90 are the driest three consecutive years since 1920, the monthly pattern of rainfall and temperature in these years is not expected to have a significant impact on overall annual demand. Weather effects are significant in certain months, such as in April of 1989 and 1990, but in other months the weather effects are negligible, and in still other months they would be expected to cause demand to decrease. Importantly, the weather effects in the key outdoor water use months of May through September are small, which is why the overall annual effect is small. This is not unique to Vallejo. In general, the impact of a dry year on available water supply is what matters most. While drier and hotter than normal weather also causes a bump in demand, it is usually not more than a few percent across the entirety of a year.
Table 28. Combined Weather Adjustment Factors for 1988-90
Month 1988 1989 1990 January 1.00 1.06 1.02 February 1.16 1.00 0.99 March 1.11 0.92 1.02 April 1.07 1.17 1.21 May 0.98 1.05 0.79 June 0.96 0.96 1.00 July 1.02 1.00 1.00 August 1.01 1.00 0.99 September 1.02 0.89 1.00 October 1.05 0.90 1.06 November 0.98 1.09 1.06 December 1.06 1.09 0.99 Weighted Annual 1.03 1.00 1.01
The dry year demand forecasts are given in Table 29. This table is simply a reproduction of Table 2.
15 This is because we are taking a forecast based on normal weather and adjusting it to reflect the actual weather for the reference year. In the case of the 2013 reference year, the drier and hotter weather is estimated to cause annual demand to increase by 5% from what we would expect if monthly weather had been normal. When we weather normalized 2013 demand, the opposite was the case. We started with demands that reflected the actual weather in 2013 and reduced them by 5% to reflect what demands would have been had monthly weather been normal.
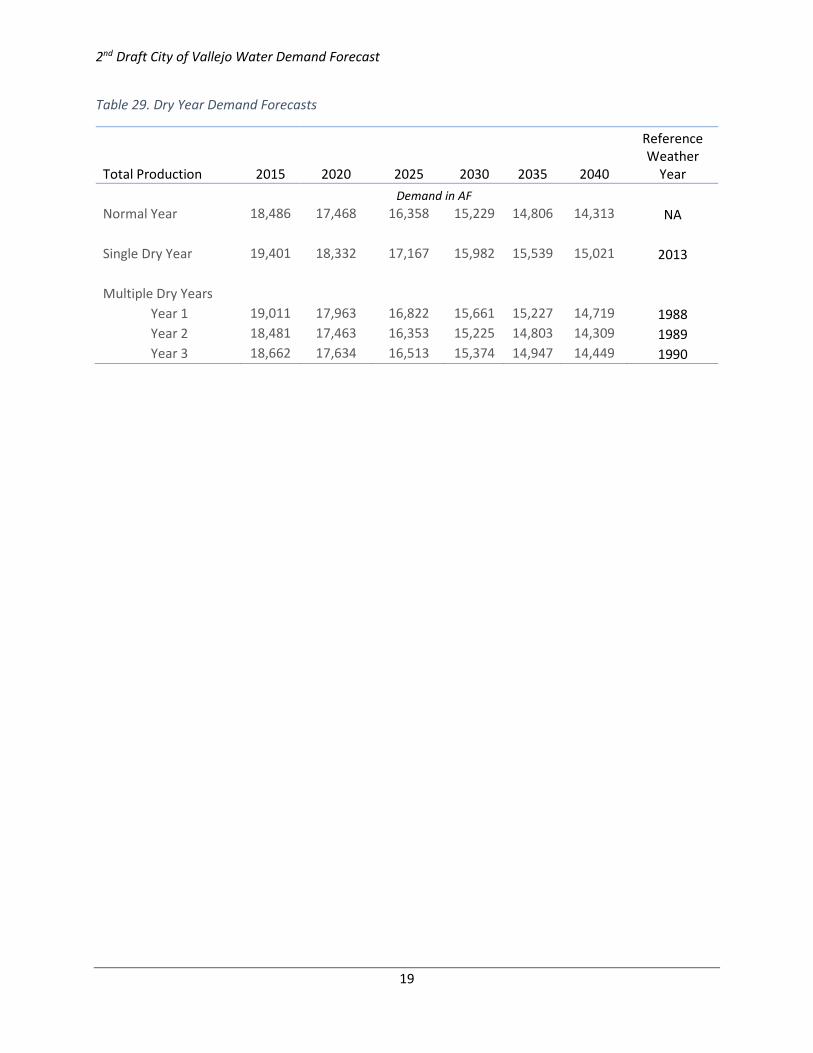
2nd Draft City of Vallejo Water Demand Forecast
19
Table 29. Dry Year Demand Forecasts
Reference
Total Production 2015 2020 2025 2030 2035 2040 Weather
Year Demand in AF
Normal Year 18,486 17,468 16,358 15,229 14,806 14,313 NA Single Dry Year 19,401 18,332 17,167 15,982 15,539 15,021 2013 Multiple Dry Years
Year 1 19,011 17,963 16,822 15,661 15,227 14,719 1988 Year 2 18,481 17,463 16,353 15,225 14,803 14,309 1989 Year 3 18,662 17,634 16,513 15,374 14,947 14,449 1990
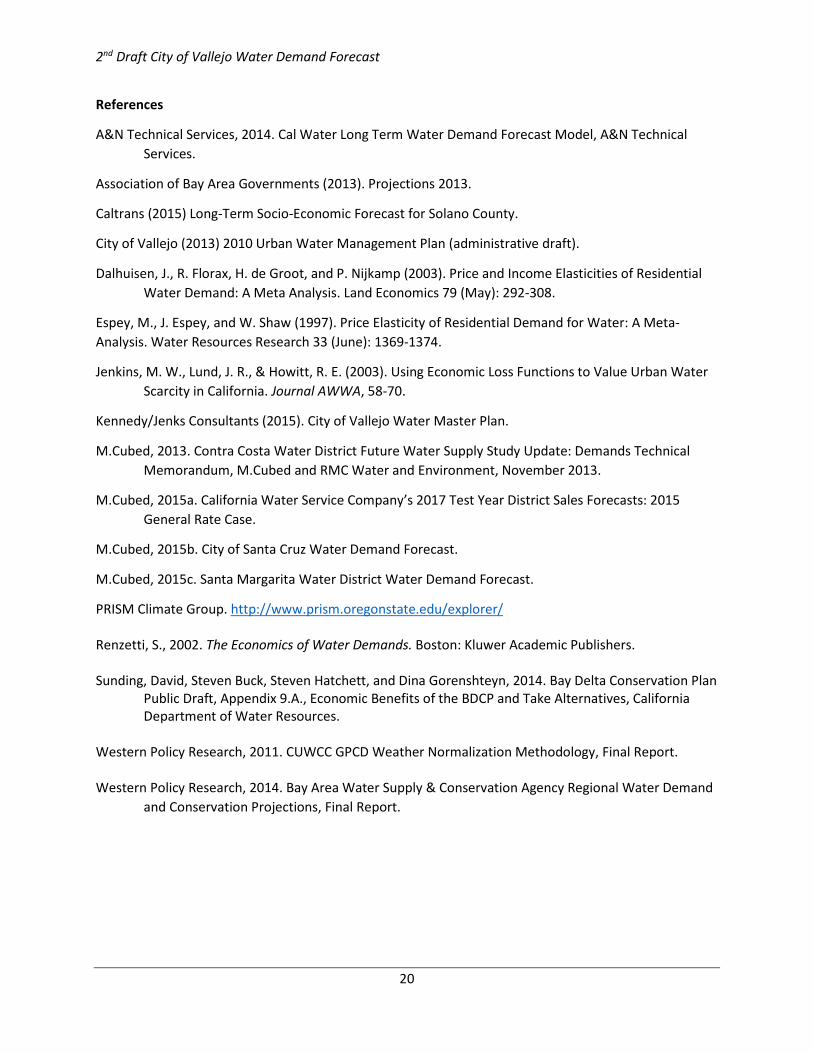
2nd Draft City of Vallejo Water Demand Forecast
20
References
A&N Technical Services, 2014. Cal Water Long Term Water Demand Forecast Model, A&N Technical Services.
Association of Bay Area Governments (2013). Projections 2013.
Caltrans (2015) Long-Term Socio-Economic Forecast for Solano County.
City of Vallejo (2013) 2010 Urban Water Management Plan (administrative draft).
Dalhuisen, J., R. Florax, H. de Groot, and P. Nijkamp (2003). Price and Income Elasticities of Residential Water Demand: A Meta Analysis. Land Economics 79 (May): 292-308.
Espey, M., J. Espey, and W. Shaw (1997). Price Elasticity of Residential Demand for Water: A Meta-Analysis. Water Resources Research 33 (June): 1369-1374.
Jenkins, M. W., Lund, J. R., & Howitt, R. E. (2003). Using Economic Loss Functions to Value Urban Water Scarcity in California. Journal AWWA, 58-70.
Kennedy/Jenks Consultants (2015). City of Vallejo Water Master Plan.
M.Cubed, 2013. Contra Costa Water District Future Water Supply Study Update: Demands Technical Memorandum, M.Cubed and RMC Water and Environment, November 2013.
M.Cubed, 2015a. California Water Service Company’s 2017 Test Year District Sales Forecasts: 2015 General Rate Case.
M.Cubed, 2015b. City of Santa Cruz Water Demand Forecast.
M.Cubed, 2015c. Santa Margarita Water District Water Demand Forecast.
PRISM Climate Group. http://www.prism.oregonstate.edu/explorer/ Renzetti, S., 2002. The Economics of Water Demands. Boston: Kluwer Academic Publishers. Sunding, David, Steven Buck, Steven Hatchett, and Dina Gorenshteyn, 2014. Bay Delta Conservation Plan
Public Draft, Appendix 9.A., Economic Benefits of the BDCP and Take Alternatives, California Department of Water Resources.
Western Policy Research, 2011. CUWCC GPCD Weather Normalization Methodology, Final Report. Western Policy Research, 2014. Bay Area Water Supply & Conservation Agency Regional Water Demand
and Conservation Projections, Final Report.
Appendix C. AWWA Water Loss Audit

Thispageintentionallyleftblank.
AWWA Water Loss Worksheet - Vallejo System
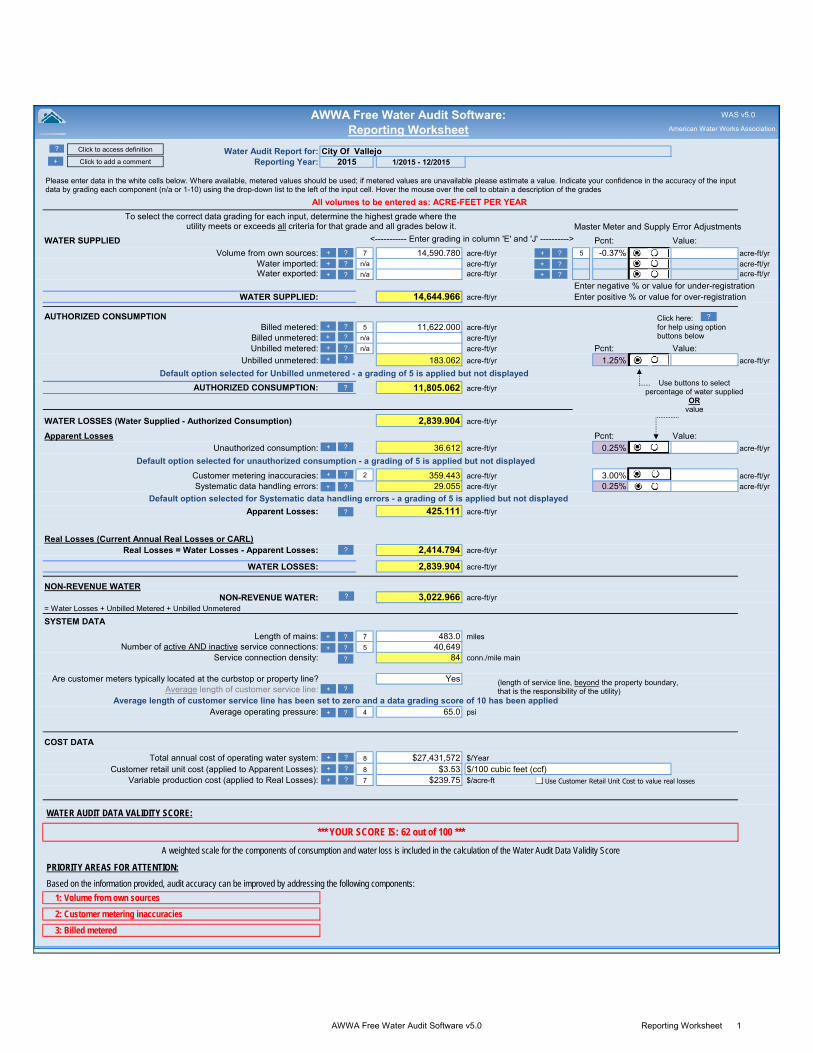
Water Audit Report for:Reporting Year:
All volumes to be entered as: ACRE-FEET PER YEAR
Master Meter and Supply Error Adjustments
WATER SUPPLIED Pcnt: Value:
Volume from own sources: 7 14,590.780 acre-ft/yr 5 -0.37% acre-ft/yrWater imported: n/a acre-ft/yr n/a acre-ft/yrWater exported: n/a acre-ft/yr 1 acre-ft/yr
Enter negative % or value for under-registrationWATER SUPPLIED: 14,644.966 acre-ft/yr Enter positive % or value for over-registration
.
AUTHORIZED CONSUMPTIONBilled metered: 5 11,622.000 acre-ft/yr
Billed unmetered: n/a acre-ft/yrUnbilled metered: n/a acre-ft/yr Pcnt: Value:
Unbilled unmetered: 5 183.062 acre-ft/yr 1.25% acre-ft/yr
AUTHORIZED CONSUMPTION: 11,805.062 acre-ft/yr
WATER LOSSES (Water Supplied - Authorized Consumption) 2,839.904 acre-ft/yr
Apparent Losses Pcnt: Value:
Unauthorized consumption: 36.612 acre-ft/yr 0.25% acre-ft/yr
Customer metering inaccuracies: 2 359.443 acre-ft/yr 3.00% acre-ft/yrSystematic data handling errors: 29.055 acre-ft/yr 0.25% acre-ft/yr
Apparent Losses: 425.111 acre-ft/yr
Real Losses (Current Annual Real Losses or CARL)Real Losses = Water Losses - Apparent Losses: 2,414.794 acre-ft/yr
WATER LOSSES: 2,839.904 acre-ft/yr
NON-REVENUE WATERNON-REVENUE WATER: 3,022.966 acre-ft/yr
= Water Losses + Unbilled Metered + Unbilled Unmetered
SYSTEM DATA
Length of mains: 7 483.0 milesNumber of active AND inactive service connections: 5 40,649
Service connection density: 84 conn./mile main
YesAverage length of customer service line: 1 ft
Average operating pressure: 4 65.0 psi
COST DATA
Total annual cost of operating water system: 8 $27,431,572 $/Year
Customer retail unit cost (applied to Apparent Losses): 8 $3.53Variable production cost (applied to Real Losses): 7 $239.75 $/acre-ft
WATER AUDIT DATA VALIDITY SCORE:
PRIORITY AREAS FOR ATTENTION:
1: Volume from own sources
2: Customer metering inaccuracies
3: Billed metered
Based on the information provided, audit accuracy can be improved by addressing the following components:
$/100 cubic feet (ccf)
Default option selected for unauthorized consumption - a grading of 5 is applied but not displayed
*** YOUR SCORE IS: 62 out of 100 ***
A weighted scale for the components of consumption and water loss is included in the calculation of the Water Audit Data Validity Score
Default option selected for Systematic data handling errors - a grading of 5 is applied but not displayed
Average length of customer service line has been set to zero and a data grading score of 10 has been applied
Are customer meters typically located at the curbstop or property line?
AWWA Free Water Audit Software: Reporting Worksheet
Default option selected for Unbilled unmetered - a grading of 5 is applied but not displayed
37.600
2015 1/2015 - 12/2015City Of Vallejo
<----------- Enter grading in column 'E' and 'J' ---------->
?
?
?
?
?
? Click to access definition
?
?
?
?
?
?
Please enter data in the white cells below. Where available, metered values should be used; if metered values are unavailable please estimate a value. Indicate your confidence in the accuracy of the input data by grading each component (n/a or 1-10) using the drop-down list to the left of the input cell. Hover the mouse over the cell to obtain a description of the grades
?
?
?
?
?
?
(length of service line, beyond the property boundary, that is the responsibility of the utility)
Use buttons to selectpercentage of water supplied
ORvalue
?Click here: for help using option buttons below
?
?
?
?
+
+ Click to add a comment
WAS v5.0
+
+
+
+
+
+
American Water Works Association.
?
?
?
+
+
+
+
+
+
+
+
+
+
+
+
+ Use Customer Retail Unit Cost to value real losses
?
To select the correct data grading for each input, determine the highest grade where the utility meets or exceeds all criteria for that grade and all grades below it.
AWWA Free Water Audit Software v5.0 Reporting Worksheet 1

AWWA Water Loss Worksheet - Lakes System
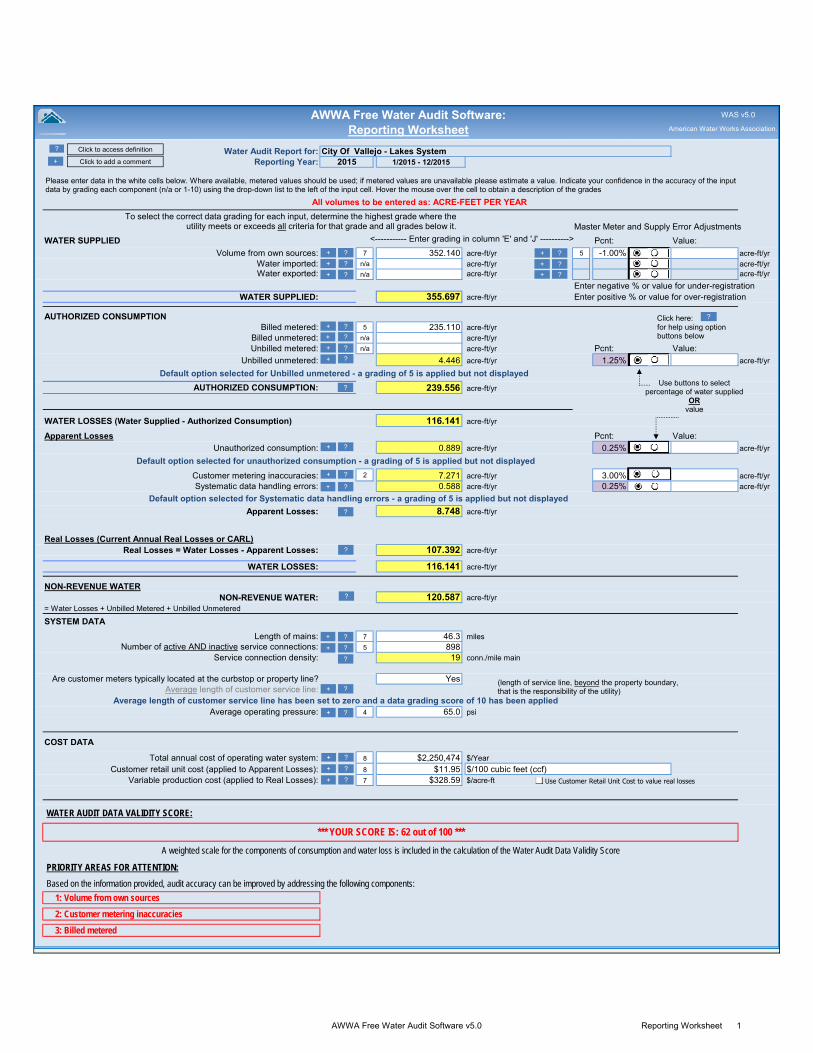
Water Audit Report for:Reporting Year:
All volumes to be entered as: ACRE-FEET PER YEAR
Master Meter and Supply Error Adjustments
WATER SUPPLIED Pcnt: Value:
Volume from own sources: 7 352.140 acre-ft/yr 5 -1.00% acre-ft/yrWater imported: n/a acre-ft/yr n/a acre-ft/yrWater exported: n/a acre-ft/yr 1 acre-ft/yr
Enter negative % or value for under-registrationWATER SUPPLIED: 355.697 acre-ft/yr Enter positive % or value for over-registration
.
AUTHORIZED CONSUMPTIONBilled metered: 5 235.110 acre-ft/yr
Billed unmetered: n/a acre-ft/yrUnbilled metered: n/a acre-ft/yr Pcnt: Value:
Unbilled unmetered: 5 4.446 acre-ft/yr 1.25% acre-ft/yr
AUTHORIZED CONSUMPTION: 239.556 acre-ft/yr
WATER LOSSES (Water Supplied - Authorized Consumption) 116.141 acre-ft/yr
Apparent Losses Pcnt: Value:
Unauthorized consumption: 0.889 acre-ft/yr 0.25% acre-ft/yr
Customer metering inaccuracies: 2 7.271 acre-ft/yr 3.00% acre-ft/yrSystematic data handling errors: 0.588 acre-ft/yr 0.25% acre-ft/yr
Apparent Losses: 8.748 acre-ft/yr
Real Losses (Current Annual Real Losses or CARL)Real Losses = Water Losses - Apparent Losses: 107.392 acre-ft/yr
WATER LOSSES: 116.141 acre-ft/yr
NON-REVENUE WATERNON-REVENUE WATER: 120.587 acre-ft/yr
= Water Losses + Unbilled Metered + Unbilled Unmetered
SYSTEM DATA
Length of mains: 7 46.3 milesNumber of active AND inactive service connections: 5 898
Service connection density: 19 conn./mile main
YesAverage length of customer service line: 1 ft
Average operating pressure: 4 65.0 psi
COST DATA
Total annual cost of operating water system: 8 $2,250,474 $/Year
Customer retail unit cost (applied to Apparent Losses): 8 $11.95Variable production cost (applied to Real Losses): 7 $328.59 $/acre-ft
WATER AUDIT DATA VALIDITY SCORE:
PRIORITY AREAS FOR ATTENTION:
1: Volume from own sources
2: Customer metering inaccuracies
3: Billed metered
Based on the information provided, audit accuracy can be improved by addressing the following components:
$/100 cubic feet (ccf)
Default option selected for unauthorized consumption - a grading of 5 is applied but not displayed
*** YOUR SCORE IS: 62 out of 100 ***
A weighted scale for the components of consumption and water loss is included in the calculation of the Water Audit Data Validity Score
Default option selected for Systematic data handling errors - a grading of 5 is applied but not displayed
Average length of customer service line has been set to zero and a data grading score of 10 has been applied
Are customer meters typically located at the curbstop or property line?
AWWA Free Water Audit Software: Reporting Worksheet
Default option selected for Unbilled unmetered - a grading of 5 is applied but not displayed
37.600
2015 1/2015 - 12/2015City Of Vallejo - Lakes System
<----------- Enter grading in column 'E' and 'J' ---------->
?
?
?
?
?
? Click to access definition
?
?
?
?
?
?
Please enter data in the white cells below. Where available, metered values should be used; if metered values are unavailable please estimate a value. Indicate your confidence in the accuracy of the input data by grading each component (n/a or 1-10) using the drop-down list to the left of the input cell. Hover the mouse over the cell to obtain a description of the grades
?
?
?
?
?
?
(length of service line, beyond the property boundary, that is the responsibility of the utility)
Use buttons to selectpercentage of water supplied
ORvalue
?Click here: for help using option buttons below
?
?
?
?
+
+ Click to add a comment
WAS v5.0
+
+
+
+
+
+
American Water Works Association.
?
?
?
+
+
+
+
+
+
+
+
+
+
+
+
+ Use Customer Retail Unit Cost to value real losses
?
To select the correct data grading for each input, determine the highest grade where the utility meets or exceeds all criteria for that grade and all grades below it.
AWWA Free Water Audit Software v5.0 Reporting Worksheet 1
Appendix D. City Ordinance No, 1708 and Chapter 11.54 of the Municipal Code

Thispageintentionallyleftblank.
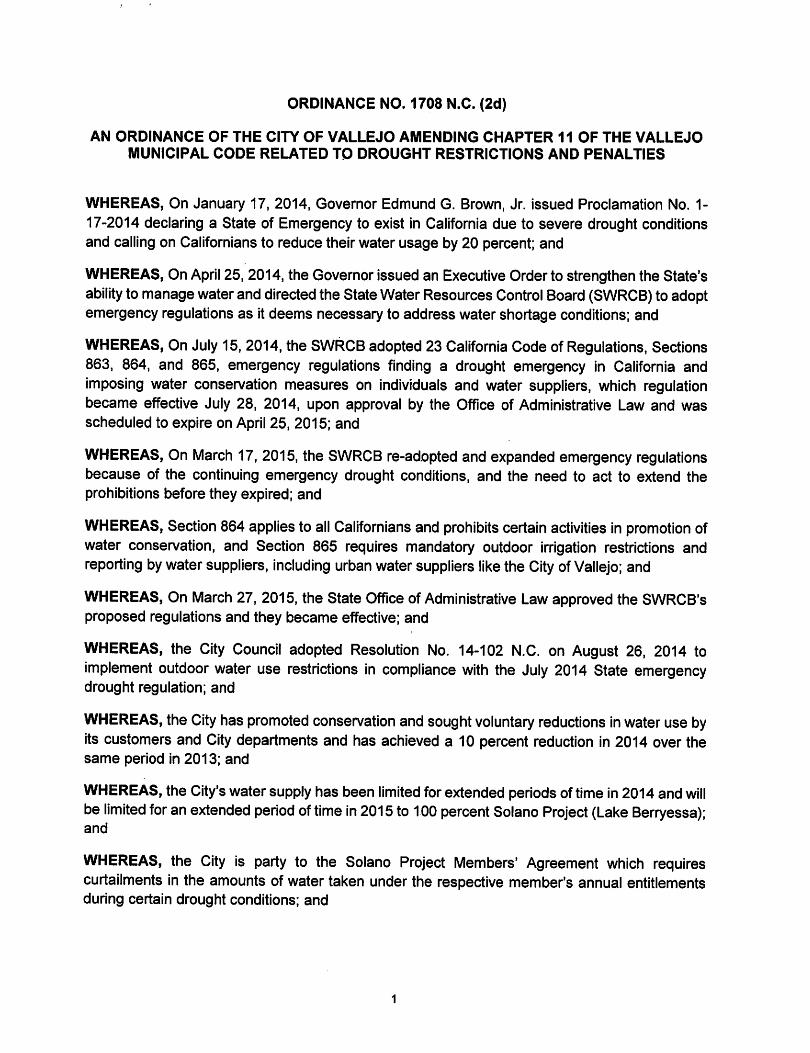
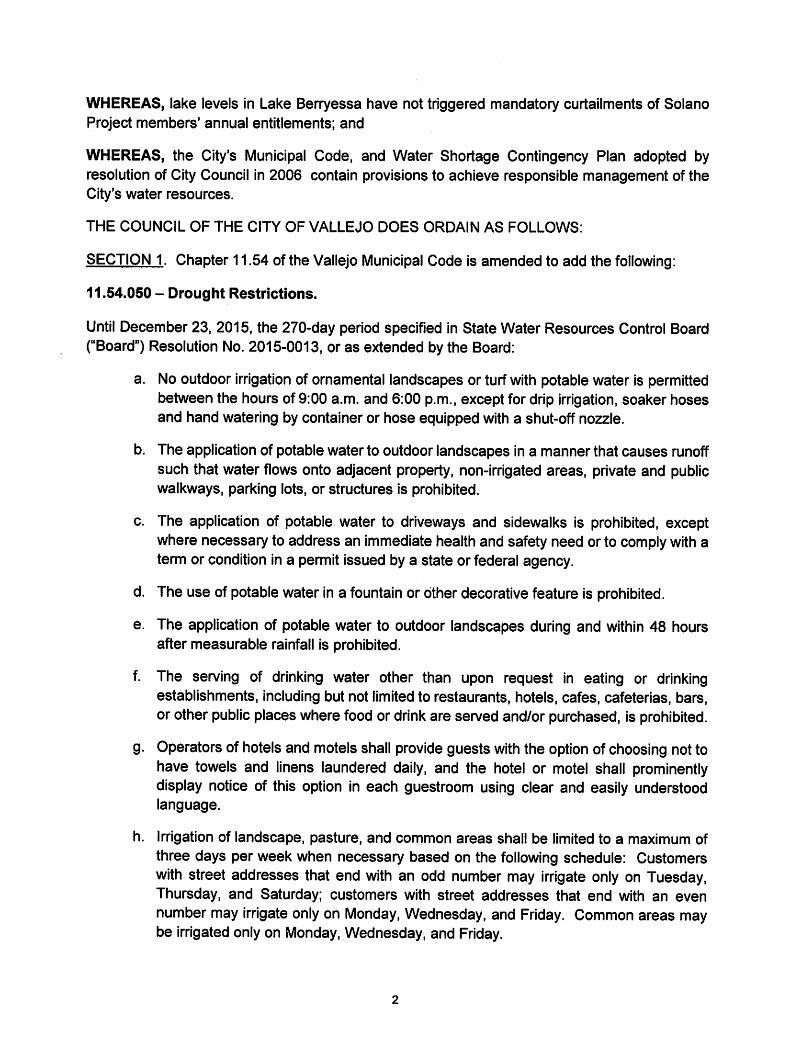
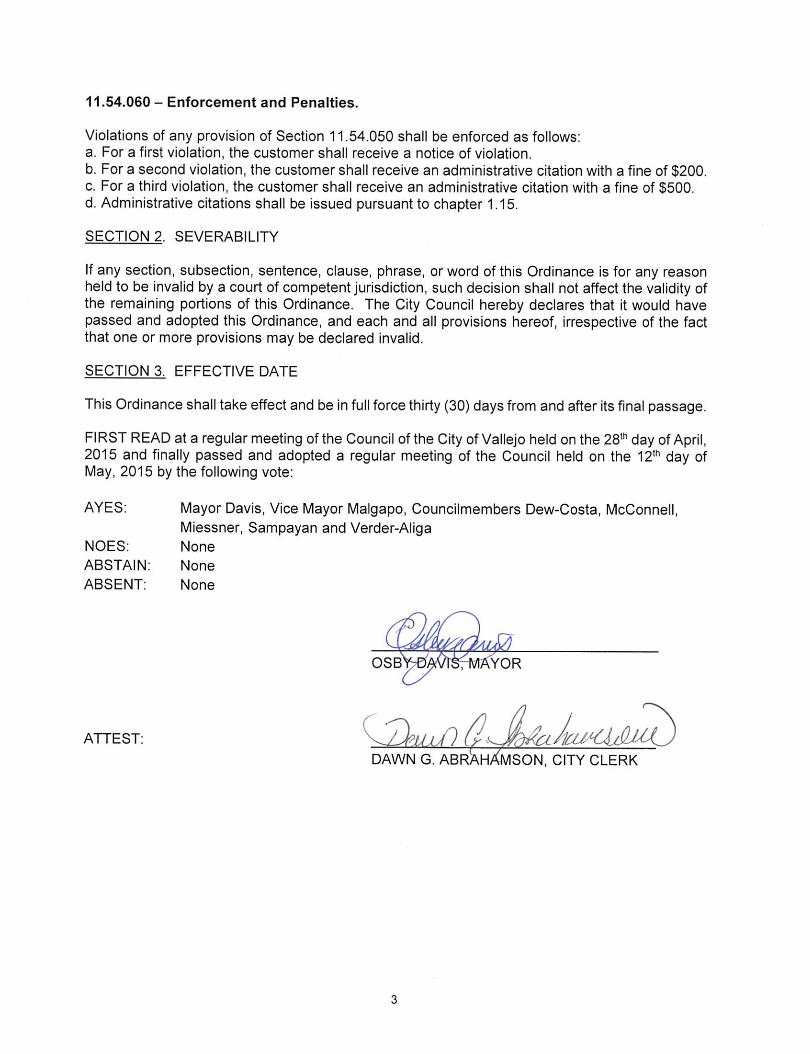
Appendix E. 2015 SWP Delivery Reliability Report

Thispageintentionallyleftblank.
The State Water Project
Final Delivery Capability Report 2015
State of California Natural Resources Agency
Department of Water Resources
July 2015
i
This page intentionally left blank.
ii
Individuals contributing to the development of the report
Paul A. Marshall, Chief, Bay Delta Office Francis Chung, Chief, Modeling Support Branch, Bay Delta Office
Erik Reyes, Chief, Central Valley Modeling, Bay Delta Office Sina Darabzand, Senior Engineer, Central Valley Modeling, Bay Delta Office
Nazrul Islam, Senior Engineer, Central Valley Modeling, Bay Delta Office
Christopher Quan, Engineer, Central Valley Modeling, Bay-Delta Office
Ali Abrishamchi, Engineer, Central Valley Modeling, Bay-Delta Office
Raymond Hoang, Engineer, Central Valley Modeling, Bay-Delta Office Rebecca Daniel, Office Technician, Modeling Support Branch, Bay-Delta Office
Laurence Kerckhoff, Attorney IV, Office of the Chief Counsel
Douglas Osugi, Supervising Engineer, FloodSAFE Environmental Stewardship and Statewide Resources
Gardner Jones, Senior Environmental Scientist, Division of Environmental Services
Timothy Smith, Senior Environmental Scientist, Division of Environmental Services
Kristina Reese, Environmental Scientist, Division of Environmental Services
Gwen Huff, Senior Environmental Scientist, Division of Statewide Integrated Water Management
Salma Kibrya, Research Program Specialist II, Division of Statewide Integrated Water Management
iii
This page intentionally left blank.
iv
Table of Contents
List of Tables .............................................................................................................................. v
List of Figures ............................................................................................................................ vi
Summary ..................................................................................................................................... 1
Section 1: Reasons to Assess SWP Water Delivery Capability .......................................................... 3
Population Growth, Land Use, and Water Supply ............................................................... 3
Legislation on Ensuring a Reliable Water Supply ................................................................ 3
California Urban Water Management Planning Act .................................................... 3
Water Conservation Act .......................................................................................... 4
Section 2: Regulatory Restrictions on SWP Delta Exports ................................................................. 5
Biological Opinions on Effects of Coordinated SWP and CVP Operations ............................. 5
Delta Inflows ................................................................................................................... 7
Water Quality Objectives .................................................................................................. 7
Section 3: Ongoing Environmental and Policy Planning Efforts .......................................................... 9
Delta Plan ....................................................................................................................... 9
Bay Delta Conservation Plan (BDCP) .............................................................................. 11
Section 4: Delta Levee Failure and the Delta Risk Management Strategy ......................................... 13
Effects of Emergencies on Water Supplies: Delta Risk Management Strategy, Phase 1 ....... 13
Managing and Reducing Risks: Delta Risk Management Strategy, Phase 2 ........................ 14
Section 5: State Water Project Historical Delivery Capability (2005-2014) ........................................ 17
Section 6: Existing SWP Water Delivery Capability (2015) .............................................................. 21
Hydrologic Sequence ..................................................................................................... 21
Existing Demand for Delta Water .................................................................................... 21
SWP Table A Water Demands ............................................................................. 22
v
SWP Article 21 Water Demands ............................................................................ 22
Estimates of SWP Table A Water Deliveries .................................................................... 23
Wet-Year Deliveries of SWP Table A Water ........................................................... 25
Dry-Year Deliveries of SWP Table A Water ............................................................ 26
Estimates of SWP Article 21 Water Deliveries .................................................................. 28
Wet-Year Deliveries of SWP Article 21 Water ......................................................... 29
Dry-Year Deliveries of SWP Article 21 Water .......................................................... 30
Section 7: Historical SWP Delivery Tables for 2005-2014 ............................................................... 31
List of Tables Table 5-1. Maximum Annual SWP Table A Water Delivery Amounts for SWP Contractors …..18
Table 6-1. Comparison of Estimated Average, Maximum, and Minimum Demands for SWP Table A Water (Existing Conditions, in taf/year) .......................................................... 22
Table 6-2. Comparison of Estimated Average, Maximum, and Minimum Deliveries of SWP Table A Water (Existing Conditions, in taf/year) .......................................................... 23
Table 6-3. Estimated Average and Wet-Period Deliveries of SWP Table A Water (Existing Conditions, in taf/year) and Percent of Maximum SWP Table A Amount, 4,132 taf/year ......... 26
Table 6-4. Estimated Average and Dry-Period Deliveries of SWP Table A Water (Existing Conditions, in taf/year) and Percent of Maximum SWP Table A Amount, 4,132 taf/year ......... 27
Table 6-5. Estimated Average and Wet-Period Deliveries of SWP Article 21 Water (Existing Conditions, in taf/year) ................................................................................................ 29
Table 6-6. Estimated Average and Dry-Period Deliveries of SWP Article 21 Water (Existing Conditions, in taf/year) ................................................................................................ 30
Table 7-1. Water year types used in the Sacramento River Index ............................................ 31
Table 7–2. Historical State Water Project Deliveries, Calendar Year 2005 .............................. 32
Table 7–3. Historical State Water Project Deliveries, Calendar Year 2006 .............................. 33
Table 7–4. Historical State Water Project Deliveries, Calendar Year 2007 .............................. 34
Table 7–5. Historical State Water Project Deliveries, Calendar Year 2008 .............................. 35
vi
Table 7–6. Historical State Water Project Deliveries, Calendar Year 2009 .............................. 36
Table 7–7. Historical State Water Project Deliveries, Calendar Year 2010 .............................. 37
Table 7–8. Historical State Water Project Deliveries, Calendar Year 2011 .............................. 38
Table 7–9. Historical State Water Project Deliveries, Calendar Year 2012 .............................. 39
Table 7–10. Historical State Water Project Deliveries, Calendar Year 2013 ............................ 40
Table 7–11. Historical State Water Project Deliveries, Calendar Year 2014 ............................ 41
List of Figures Figure 5-1. Historical Deliveries of SWP Table A Water, 2005–2014 ....................................... 19
Figure 5-2. Total Historical SWP Deliveries, 2005–2014 (by Delivery Type) ............................ 20
Figure 6-1. SWP Article 21 Demands during Non–Kern Wet Years and Kern Wet Years (Existing Conditions) ................................................................................................... 24
Figure 6-2. Estimated Likelihood of SWP Table A Water Deliveries, by Increments of 500 taf (Existing Conditions) ................................................................................................... 25
Figure 6-3. Estimated Wet-Period SWP Table A Water Deliveries (Existing Conditions) ......... 26
Figure 6-4. Estimated Dry-Period SWP Table A Water Deliveries (Existing Conditions) .......... 27
Figure 6-5. Estimated Range of Monthly Deliveries of SWP Article 21 Water (Existing Conditions) .................................................................................................................. 28
Figure 6-6. Estimated Likelihood of Annual Deliveries of SWP Article 21 Water (Existing Conditions) .................................................................................................................. 29
vii
This page intentionally left blank.
Page | 1
Summary
This report is intended to inform the public about key factors important to the operation of the State Water Project (SWP) and an estimate of its current delivery capability.
For many SWP water contractors, water provided by the SWP is a major component of the water supplies available to them. SWP contractors include cities, counties, urban water agencies, and agricultural irrigation districts. These local utilities and other public and private entities provide the water that Californians use at home and work every day and that helps to nourish the state’s bountiful crops. Thus, the availability of water from the SWP is an important component to the water supply planning of its recipients and ultimately affects the amount of water that local residents and communities can use.
The availability of these water supplies may be highly variable. A wet water year may be followed by a dry or critically dry year. Knowing the probability that they will receive a certain amount of SWP water in a given year—whether it be a wet water year, a critical year, or somewhere in between—gives contractors a better sense of the degree to which they may need to implement increased conservation measures or plan for new additional, or back up sources of water supply to meet their needs.
The Delta is the key to the SWP’s ability to deliver water to its agricultural and urban contractors in the North Bay, the South Bay, California Central Valley, and Southern California. All but five of the 29 SWP contractors receive water deliveries from the Delta (pumped by either the Harvey O. Banks or Barker Slough pumping plants).
Yet the Delta faces numerous challenges to its long-term sustainability. For example, climate change poses the threat of increased variability in floods and droughts, and sea level rise complicates efforts to manage salinity levels and preserve water quality in the Delta so that the water remains suitable for urban and agricultural uses. Among the other challenges are continued subsidence of Delta islands, many of which are already below sea level, and the related threat of a catastrophic levee failure as water pressure increases on fragile levees.
Protection of endangered and threatened fish species, such as the delta smelt, is also an important factor of concern for the Delta environment. Ongoing regulatory restrictions, such as those imposed by federal biological opinions on the effects of SWP and Central Valley Project (CVP) operations on these species also contribute to the challenges of determining the SWP’s water delivery capability.
Two large-scale plans for the Delta that are being developed could affect SWP water delivery capability: the Delta Plan and the Bay Delta Conservation Plan (BDCP). When complete, the BDCP will provide the basis for issuing endangered species permits to operate the SWP and CVP. The BDCP seeks to improve the health of the ecological system as a whole.
The analyses in this report factor in all of the regulations governing SWP operations in the Delta and upstream, and assumptions about water uses in the upstream watersheds. Analyses were conducted that considered the amounts of water that SWP
Page | 2
contractors use and the amounts of water they choose to hold for use in a subsequent year.
Many of the same specific challenges to SWP operations described in the State Water Project Delivery Reliability Report 2013 remain in 2015. Most notably, the effects on SWP pumping caused by issuance of the 2008 and 2009 federal biological opinions (BOs), which were reflected in the 2013 Report, continue to affect SWP delivery capability today. Hence, the differences between the 2013 and 2015 reports can be attributed primarily to updates in the assumptions and inputs to the simulation studies.
SWP exports have decreased since 2005, although the bulk of the change occurred by 2009 as the federal BOs went into effect, restricting operations. These effects are also reflected in the SWP delivery estimates. The most salient findings in this report are as follows:
Under existing conditions, the average annual delivery of Table A water estimated for this 2015 Report is 2,550 taf/year, 3 taf less than the 2,553 taf/year estimated for the 2013 Report.
The likelihood of existing-condition SWP Article 21 deliveries (supplemental deliveries to Table A water) being greater than 20 taf/year has decreased by 3% relative to the likelihood presented in the 2013 Report.
Page | 3
Section 1
Reasons to Assess SWP Water Delivery Capability Two major factors underscore the importance of assessing the SWP’s water delivery capability: the effects of population growth on California’s balance of water supply and demand, and State legislation intended to help maintain a reliable water supply.
Population Growth, Land Use, and Water Supply California’s population has grown rapidly in recent years, with resulting changes in land use. This growth is expected to continue. From 1990 to 2005, California’s population increased from about 29.8 million to about 36 million. Based on this trend, California’s population has been projected to be more than 40.8 million by 2020. The “current trends” scenario depicted in the California Water Plan 2013 for year-2050 conditions, based on the California Department of Finance’s projections of 2010 U.S. Census data, assumes a population of nearly 51 million—a 75% increase in the 1990 population.
The amount of water available in California—or in different parts of the state—can vary greatly from year to year. Some areas may receive 2 inches of rain a year, while others are deluged with 100 inches or more. As land uses have changed, population centers have emerged in many locations without sufficient local water supplies. Thus, Californians have always been faced with the problem of how best to conserve, control, and move water from areas of abundant water to areas of water need and use.
Legislation on Ensuring a Reliable Water Supply
The laws described below impose specific requirements on both urban and agricultural water suppliers. These laws increase the importance of SWP water delivery capability estimates to water suppliers.
California Urban Water Management Planning Act
The Urban Water Management Planning Act was enacted in 1983(California Water Code, Sections 10610–10656). As amended, this law requires urban water suppliers to adopt urban water management plans (UWMPs) every 5 years and submit those plans to DWR. DWR reviews submitted plans to report to the legislature on the status of submitted plans and for the purposes of grant eligibility requirements.
UWMPs must include an estimate of water supply and demand for the 20-year planning time frame for three water year types, normal, single dry year and multi dry years. SWP contractors rely on the SWP water delivery capability estimates to develop the water supply estimates.
The most recent round of UWMPs (2010) was required to be adopted by July 1, 2011 and submitted to DWR by August 1, 2011.
Page | 4
Urban Water Conservation Law requires that the State of California reduce urban per capita water use statewide by 10% by the end of 2015 and 20% by the end of 2020. Water suppliers calculated baseline water use and set 2015 and 2020 water use targets in their 2010 UWMPs. Water suppliers will report on water use target compliance in the 2015 and 2020 UWMPs. DWR is required to report to the Legislature on progress toward meeting the State’s 20% by 2020 goals.
DWR publishes a guidebook to assist water suppliers prepare their urban water management plans. DWR is currently updating the guidebook for the 2015 round of plans. Guidance documents are available at http://www.water.ca.gov/urbanwatermanagement.
The municipalities and water districts that have adopted 2010 UWMPs and submitted them to DWR are listed at http://www.water.ca.gov/urbanwatermanagement/2010uwmps/.
Water Conservation Act
The Water Conservation Act of 2009 (Senate Bill X7.7, Steinberg), enacted in November 2009, includes requirements for urban and agricultural suppliers. Water suppliers report on compliance with these requirements in either the urban or agricultural water management plans. DWR reviews submitted plans for consistency with Water Conservation Act requirements.
In addition, as part of the Water Conservation Act, agricultural water suppliers with 25,000 acres or more of irrigated land were required to prepare and adopt agricultural water management plans and submit the plans to DWR by the end of 2012 and then once every five years beginning in 2015. The Act also required suppliers to measure volumetrically water deliveries to farms and base the price of water sales at least in part on the volume of water delivered. Water suppliers were required to report on water measurement and water pricing in their water management plans.
In November 2012, DWR released a guidebook for developing agricultural water management plans: http://www.water.ca.gov/wateruseefficiency/sb7/docs/AgWaterManagementPlanGuidebook-FINAL.pdf.
Water agencies filing agricultural water management plans as of July 2013 are listed on a Web page maintained by DWR’s Water Use and Efficiency Branch: http://www.water.ca.gov/wateruseefficiency/sb7/docs/2012_AWMPs_Received_07-16-2013.pdf.
Page | 5
Section 2
Regulatory Restrictions on SWP Delta Exports Multiple needs converge in the Delta: the need to protect a fragile ecosystem, to support Delta recreation and farming, and to provide water for agricultural and urban needs throughout much of California. Various regulatory requirements are placed on the SWP’s Delta operations to protect special-status species such as delta smelt and spring- and winter-run Chinook salmon. As a result, as described below, restrictions on SWP operations imposed by State and federal agencies contribute substantially to the challenges of accurately determining the SWP’s water delivery capability in any given year.
Biological Opinions on Effects of Coordinated SWP and CVP Operations
Several fish species listed under the federal Endangered Species Act (ESA) as threatened or endangered are found in the Delta. The continued viability of populations of these species in the Delta depends in part on Delta flow levels. For this reason, the U.S. Fish and Wildlife Service (USFWS) and National Marine Fisheries Service (NMFS) have issued several BOs since the 1990s on the effects of coordinated SWP/CVP operations on several listed species.
These BOs affect the SWP’s water delivery capability for two reasons. Most notably, they include terms that restrict SWP exports from the Delta to specific amounts at certain times under certain conditions. In addition, the BOs’ requirements are predicated on physical and biological conditions that occur daily while DWR’s water supply models are based on monthly data.
The first BOs on the effects of SWP (and CVP) operations were issued in February 1993 (NMFS BO on effects of project operations on winter-run Chinook salmon) and March 1995 (USFWS BO on project effects on delta smelt and splittail). Among other things, the BOs contained requirements for Delta inflow, Delta outflow, and export pumping restrictions in order to protect listed species. These requirements imposed substantial constraints on Delta water supply operations. Many were incorporated into the 1995 Water Quality Control Plan for the San Francisco Bay/Sacramento–San Joaquin Delta (1995 WQCP), as described under “Water Quality Objectives” later in this section.
The terms of the USFWS and NMFS BOs have become increasingly restrictive over the years. In 2004 the United States Bureau of Reclamation (Reclamation) sought a new BO from USFWS regarding the operation of the CVP and SWP (collectively, Projects). USFWS issued the opinion in 2005, finding that the proposed coordinated operations of the Projects were not likely to jeopardize the continued existence of the delta smelt or result in the destruction or adverse modification of its critical habitat. After judicial review, the 2005 BO was vacated and USFWS was ordered to prepare a new one. USFWS found that the proposed operations of the Project would result in jeopardy to
Page | 6
the delta smelt and in December 2008 issued a Jeopardy BO which included a Reasonable and Prudent Alternative (RPA) with more protective export restrictions and other actions intended to protect the delta smelt.
Similarly, in 2004 NMFS issued a BO on the effects of the coordinated operation of the Projects on salmonids, green sturgeon and Southern Resident killer whales and found that the proposed operations of the Projects were not likely to jeopardize the continued existence of the listed species or result in the destruction or adverse modification of their critical habitat. After judicial review, the 2004 BO was also vacated and NMFS was ordered to prepare a new one. In June 2009, NMFS issued a new Jeopardy BO covering effects on winter-run and spring-run Chinook salmon, steelhead, green sturgeon, and killer whales. Like the 2008 smelt BO, the salmon BO included an RPA with more protective export restrictions and other actions intended to protect listed species.
The USFWS BO includes requirements on operations in all but 2 months of the year. The BO calls for “adaptively managed” (adjusted as necessary based on the results of monitoring) flow restrictions in the Delta intended to protect delta smelt at various life stages. USFWS determines the required target flow, with the reductions accomplished primarily by reducing SWP and CVP exports. Because this flow restriction is determined based on fish location and decisions by USFWS staff, predicting the flow restriction and corresponding effects on export pumping with any great certainty poses a challenge. The USFWS BO also includes an additional salinity requirement in the Delta for September and October in wet and above-normal water years, calling for increased releases from SWP and CVP reservoirs to reduce salinity. Among other provisions included in the NMFS BO, limits on total Delta exports have been established for the months of April and May. These limits are mandated for all but extremely wet years.
The 2008 and 2009 BOs were issued shortly before and shortly after the Governor proclaimed a statewide water shortage state of emergency in February 2009, amid the threat of a third consecutive dry year. NMFS calculated that implementing its BO would reduce SWP and CVP Delta exports by a combined 5% to 7%, but DWR’s initial estimates showed an impact on exports closer to 10% in average years, combined with the effects of pumping restrictions imposed by BOs to protect delta smelt and other species. Both the 2008 USFWS and 2009 NMFS BOs were challenged in federal court on various grounds, including the failure by the services to use the best available science in the development of the BOs. U.S. District Judge Oliver Wanger found both BOs were not legally sufficient and remanded them to the agencies for further review and analysis. Both decisions were appealed to the Ninth Circuit, and in two separate decisions (March 2014 for the USFWS BO and December 2014 for the NMFS BO) the Ninth Circuit reversed in part and affirmed in part Judge Wanger’s rulings, finding the BOs complied with the ESA and upholding them in their entirety. As a result, the operational rules specified in the 2008 and 2009 BOs continue to be legally required and are the rules used in the analyses presented in Section 6 of this report.
The California Department of Fish and Wildlife (DFW) issued consistency determinations for both BOs under Section 2080.1 of the California Fish and Wildlife Code. The consistency determinations stated that the USFWS BO and the NMFS BO
Page | 7
would be consistent with the California Endangered Species Act (CESA). Thus, DFW allowed incidental take of species listed under both the federal ESA and CESA to occur during SWP and CVP operations without requiring DWR or the Reclamation to obtain a separate State-issued permit.
Delta Inflows
Delta inflows vary considerably from season to season, and from year to year. For example, in an above-normal year, nearly 85% of the total Delta inflow comes from the Sacramento River, more than 10% comes from the San Joaquin River, and the rest comes from the three eastside streams (the Mokelumne, Cosumnes, and Calaveras rivers).
The type of water year is also an important factor affecting the volume of Delta inflows. When hydrology is analyzed, water years are designated by DWR as “wet” (W), “above normal” (AN), “below normal” (BN), “dry” (D), or “critical” (C). All other factors (such as upstream level of development) being equal, much less water will flow into the Delta during a dry or critical water year (that is, during a drought) than during a wet or above-normal water year. Fluctuations in inflows are a substantial overall concern for the Delta, and a specific concern for the SWP; such fluctuations affect Delta water quality and fish habitat, which in turn trigger regulatory requirements that constrain SWP Delta pumping.
Delta inflows will also vary by time of year as the amount of precipitation varies by season. About 80% of annual precipitation occurs between November and March, and very little rain typically falls from June through September. Upstream reservoirs regulate this variability by reducing flood flows during the rainy season, and storing water to be released later in the year to meet water demands and flow and water quality requirements.
Water Quality Objectives
Because the Delta is an estuary, salinity is a particular concern. In the 1995 WQCP, the State Water Board set water quality objectives to protect beneficial uses of water in the Delta and Suisun Bay. The objectives must be met by the SWP (and federal CVP), as specified in the water right permits issued to DWR (and the U.S. Bureau of Reclamation). Those objectives—minimum Delta outflows, limits on SWP and CVP Delta exports, and maximum allowable salinity levels—are enforced through the provisions of the State Water Board's Water Right Decision 1641 (D-1641), issued in December 1999 and updated in March 2000.
DWR and Reclamation must monitor the effects of diversions and SWP and CVP operations to ensure compliance with existing water quality standards.
Among the objectives established in the 1995 WQCP and D-1641 are the “X2” objectives. X2 is defined as the d is tance in k i lometers f rom Golden Gate
Page | 8
where salinity concentration in the Delta is 2 parts per thousand. The location of X2 is used as a surrogate measure of Delta ecosystem health.
D-1641 mandates the X2 objectives so that the State Water Board can regulate the location of the Delta estuary's salinity gradient during the 5-month period of February–June.
For the X2 objective to be achieved, the X2 position must remain downstream of Collinsville in the Delta for the entire 5-month period, and downstream of other specific locations in the Delta on a certain number of days each month from February through June. This means that Delta outflow must be at certain specified levels at certain times, which can limit the amount of water the SWP may pump at those times at its Harvey O. Banks Pumping Plant in the Delta.
Because of the relationship between seawater intrusion and interior Delta water quality, meeting the X2 objective also improves water quality at Delta drinking water intakes; however, meeting the X2 objectives can require a relatively large volume of water for outflow during dry months that follow months with large storms.
The 1995 WQCP and D-1641 also established an export/inflow (E/I) ratio. The E/I ratio is designed to provide protection for the fish and wildlife beneficial uses in the Bay Delta estuary. The E/I ratio limits the fraction of Delta inflows that are exported. When other restrictions are not controlling, Delta exports are limited to 35% of total Delta inflow from February through June and 65% of inflow from July through January.
Page | 9
Section 3 Ongoing Environmental and Policy Planning Efforts It is hard to overstate the Delta’s importance to California’s economy and natural heritage. The Delta supplies a large share of the water used in the state. California would not be the same without that water — hundreds of billions of dollars of economic activity depend upon it. Southern California, with half of the state’s population, gets almost a quarter of its average water supply from the Delta; Kern County, which produces nearly $3 billion annually in grapes, almonds, pistachios, milk, citrus and carrots, depends on the Delta for about a fifth of its irrigation supply; the west side of the San Joaquin Valley also produces billions of dollars’ worth of food and depends on the Delta for about three-quarters of its irrigation supply; and the San Francisco Bay Area, including the innovation hub of Silicon Valley, takes about half of its water supply from the Delta and its tributaries.
At the same time, the hundreds of miles of river channels that crisscross the Delta’s farmed islands provide a migratory pathway for Chinook salmon, which support an important West Coast fishing industry. Other native fish species depend upon the complex mix of fresh and salt water in the Delta estuary. Multiple stressors have impaired the ecological functions of the Delta, and concerns have been growing over the ability to balance the many needs of both people and the ecosystem.
In order to respond to these concerns considerable effort by government agencies and California water community as a whole has been spent during the past several decades to study ways that the problems in the Delta can be addressed, and the more recent attention to the effects of climate change has helped the water community to realize the urgency of addressing these problems. The essential part of all these efforts has been to find a comprehensive solution that brings various, sometimes competing, interests together in a coordinated and concerted set of actions. The Delta Plan and the Bay Delta Conservation Plan (BDCP) are two large-scale plans that are in development. Both plans could affect SWP water delivery capability in different ways, and at different scales.
Delta Plan
After years of concern about the Delta amid rising water demand and habitat degradation, the Delta Stewardship Council was created in legislation to achieve State-mandated coequal goals for the Delta. As specified in Section 85054 of the California Water Code:
“Coequal goals” means the two goals of providing a more reliable water supply for California and protecting, restoring, and enhancing the Delta ecosystem. The coequal goals shall be achieved in a manner that protects and enhances the unique cultural, recreational, natural resource, and agricultural values of the Delta as an evolving place.
Page | 10
The final Delta Plan was adopted by the Council on May 16, 2013. The Delta Plan contains a set of 14 regulatory policies that will be enforced by the Delta Stewardship Council’s appellate authority and oversight. The Delta Plan also contains 73 recommendations, which are non-regulatory but call out actions essential to achieving the coequal goals. The State Office of Administrative Law (OAL) approved the 14 regulations to implement the Delta Plan, which became effective with legally-enforceable regulations on September 1, 2013.
The 14 regulatory policies approved by the OAL include:
Requiring those who use water from the Delta to certify in their water management plans that they are implementing all feasible efforts to use water efficiently and are developing additional local and regional water supplies;
Reserving six high-priority areas for habitat restoration;
Protecting agricultural land by requiring developers to locate new residential, commercial, or industrial development in areas planned for urban use;
Requiring state and local agencies to locate, when feasible, water management facilities, ecosystem projects, and flood management infrastructure in ways that would reduce or avoid conflicts with agriculture and other existing planned uses; and requiring those agencies to consider locating the facilities on public land before using private land;
Prohibiting encroachment on floodways and floodplains;
Requiring developers of new residential subdivisions to include a level of flood protection that anticipates sea levels rising due to climate change; and
Setting priorities for State investment in Delta flood levees.
Among the 73 recommendations in the Delta Plan are:
Updating statewide water-use efficiency goals, groundwater management plans for areas using Delta water, streamlining water transfer procedures and developing a statewide system for reporting how much water is used;
Having the State Water Resources Control Board update water quality objectives for the Sacramento and San Joaquin Rivers, controlling or reducing other Delta stressors such as contaminants and invasive species, expanding floodplains and riparian habitats and locating habitat restoration to accommodate sea-level rise;
Encouraging agritourism, wildlife friendly farming practices, and recreational opportunities in the Delta; and
Page | 11
Creating a Delta Flood Risk Management District to provide adequate funding for flood control and emergency preparedness.
In 2014, the Delta Stewardship Council launched the Delta Levees Investment Strategy (DLIS) that will combine economics, engineering, and decision-making techniques to identify funding priorities and assemble a comprehensive investment strategy for the Delta levees.
This investment strategy will be developed in collaboration with state agencies, local reclamation districts, Delta landowners and businesses, and other important stakeholders. It will be based on the best available data, research, and lessons learned from other state and local programs and planning efforts.
Bay Delta Conservation Plan (BDCP)
The Bay Delta Conservation Plan (BDCP) is a comprehensive plan prepared by a group of local water agencies, environmental and conservation organizations, State and federal agencies, and other interest groups to address a wide array of challenges that the water community in California has been facing for decades in the Sacramento-San Joaquin Delta.
The BDCP is being developed in compliance with the Federal Endangered Species Act (ESA) and the California Natural Communities Conservation Planning Act (NCCPA). When complete, the BDCP will provide the basis for the issuance of endangered species permits for the operation of the state and federal water projects. In the most basic sense, the BDCP provides a regulatory vehicle for project proponents to agree to implement a suite of habitat restoration measures, other stressor reduction activities, and water operations criteria in return for regulatory agency approval of the necessary long-term permits for the various projects and water operations (covered activities) to proceed. The heart of the BDCP is a long-term conservation strategy that sets forth actions needed for a healthy Delta.
The BDCP approach to addressing the Delta’s challenges reflects a significant departure from the species-by-species approach utilized in previous efforts to manage Delta-specific species and habitats. Instead, the BDCP seeks to improve the health of the ecological system as a whole. Each conservation measure plays a part in an interconnected web of conservation activities designed to improve the health of natural communities and, in so doing, improve the overall health of the Delta ecosystem.
The BDCP attempts to balance contributions to the conservation of species in a way that is feasible given the variety of important uses in the Delta including flood protection, agriculture, and recreation, to name a few. Implementation of the Plan will occur over a 50-year time frame by a number of agencies and organizations with specific roles and responsibilities as prescribed by the Plan. A major part of implementation will be monitoring conservation measures to evaluate effectiveness, and revising actions through the adaptive management decision process.
Page | 12
The Plan, which has been in development since 2006, is undergoing intensive environmental review in the form of a state Environmental Impact Report and federal Environmental Impact Statement (EIR/S) to evaluate the impact of the Plan on all aspects of the environment, including the human environment, and identify alternatives and potential mitigation actions.
The draft BDCP and its associated EIR/S were released for public review in late 2013. Public comments were received until mid-2014. Partially-recirculated public draft documents are scheduled to be released in mid-2015. The reports are targeted to be final in 2016, after which a decision to proceed with the program would be made.
Page | 13
Section 4
Delta Levee Failure and the Delta Risk Management Strategy The fragile Delta faces a multitude of risks that could affect millions of Californians. Foremost among those risks, as they could affect the SWP’s water delivery capability, are the potential for levee failure and the ensuing flooding and water quality issues.
The Delta Risk Management Strategy (DRMS) was initiated in response to Assembly Bill 1200 (2005), which directed DWR to use 50-, 100-, and 200-year projections to evaluate the potential impacts on Delta water supplies associated with continued land subsidence, earthquakes, floods, and climate change. The discussions below describe DRMS Phase 1, which evaluated the risks, and DRMS Phase 2, which is proposing various solutions. Also discussed are other efforts currently being undertaken by DWR and other agencies to reduce risks to the Delta, enhance emergency response capabilities, and reduce the risk of interruption of Delta water exports by the SWP and CVP.
Effects of Emergencies on Water Supplies: Delta Risk Management Strategy (DRMS), Phase 1
Phase 1 of the DRMS, completed in 2008, assessed the performance of Delta and Suisun Marsh levees under various stressors and hazards and evaluated the consequences of levee failures to California as a whole.
The Delta is protected by levees built about 150 years ago. The levees are vulnerable to failure because most original levees were simply built with soils dredged from nearby channels, and were never engineered. Most islands in the Delta have flooded at least once over the past 100 years. For example, on June 3, 2004, a huge dry-weather levee failure occurred without warning on Upper Jones Tract in the south Delta, inundating 12,000 acres of farmland with about 160,000 acre-feet of water. Because many Delta islands are below sea level, deep and prolonged flooding could occur during a levee failure event, which could disrupt the quality and use of Delta water.
Levee failure can result from the combination of high river inflows, high tide, and high winds; however, levees can also fail in fair weather—even in the absence of a flood or seismic event—in a so-called “sunny day event.” Damage caused by rodents, piping (in which a pipe-like opening develops below the base of the levee), or foundation movement could cause sunny-day levee breaches.
A breach of one or more levees and island flooding may affect Delta water quality and SWP operations. Depending on the hydrology and the size and locations of the breaches and flooded islands, a large amount of salt water may be pulled into the interior Delta from Suisun and San Pablo bays. When islands are flooded, DWR may
Page | 14
need to drastically decrease or even cease SWP Delta exports to evaluate the distribution of salinity in the Delta and avoid drawing saltier water toward the pumps.
An earthquake could also put Delta levees, and thus SWP water supplies, at risk. In 2008, the 2007 Working Group on California Earthquake Probabilities estimated a probability of 63% that a magnitude 6.7 or greater earthquake would strike the San Francisco Bay Area in the next 30 years. An earthquake could severely damage Delta levees, causing islands to flood with salty water. The locations most likely to be affected by an earthquake are the west and southwest portions of the Delta because these areas are closer to potential earthquake sources. Flooding of the west and southwest Delta is also more likely to interfere with conveyance of freshwater to export pumps.
Modeling of the effects of earthquakes on Delta islands was conducted by DWR for the DRMS Phase 1 report. Described in the California Water Plan Update 2009, the assessment found a 40% probability that a major earthquake occurring between 2030 and 2050 would cause 27 or more islands to flood at the same time. If 20 islands were flooded as a result of a major earthquake, the export of freshwater from the Delta could be interrupted by about a year and a half. Water supply losses of up to 8 million acre-feet would be incurred by SWP (and CVP) contractors and local water districts.
Managing and Reducing Risks: Delta Risk Management Strategy (DRMS), Phase 2
The Phase 2 report for the DRMS, issued in June 2011, evaluates alternatives to reduce the risk to the Delta and the state from adverse consequences of levee failure. “Building blocks” (individual improvements or projects, such as improving levees or raising highways) and trial scenarios (various combinations of building blocks) were developed for the DRMS Phase 2 report. The building blocks fall into three main categories:
Conveyance improvements/ flood risk reduction and life safety,
Infrastructure risk reduction, and
Environmental risk mitigation.
The first of these categories is most relevant to the SWP in terms of reducing the risk of disruption of SWP Delta exports, but the environmental risk mitigation category includes a building block calling for reduction of water exports from the Delta.
Four trial scenarios were developed to represent a range of possible risk reduction strategies:
Trial Scenario 1—Improved Levees: Improve the reliability of Delta levees against flood-induced failures by providing up to 100-year flood protection.

Page | 15
Trial Scenario 2—Armored Pathway (Through-Delta Conveyance): Improve the reliability of water conveyance by creating a route through the Delta that has high reliability and the ability to minimize saltwater intrusion into the south Delta.
Trial Scenario 3—Isolated Conveyance Facility: Provide high reliability for conveyance of export water by building an isolated conveyance facility on the east side of the Delta.
Trial Scenario 4—Dual Conveyance: Improve reliability and flexibility for conveyance of export water by constructing an isolated conveyance facility and a through-Delta conveyance. (This scenario would be much like a combination of Trial Scenarios 2 and 3.)
The findings of the DRMS Phase 2 report on these scenarios, as they apply to seismic risk and potential for disruption of SWP Delta exports, are as follows:
Trial Scenario 1 (Improved Levees) would not reduce the risk of potential water export interruptions, nor would it change the seismic risk of most levees.
Trial Scenario 2 (Armored Pathway [Through-Delta Conveyance]) would have the joint benefit of reducing the likelihood of levee failures from flood events and earthquakes and of significantly reducing the likelihood of export disruptions.
The effects of Trial Scenario 3 (Isolated Conveyance) would be similar to those for the Armored Pathway scenario, but Trial Scenario 3 would not reduce the seismic risk of levee failure on islands that are not part of the isolated conveyance facility.
Trial Scenario 4 (Dual Conveyance) would avoid the vulnerability of water exports associated with Delta levee vulnerability and would offer flexibility in water exports from the Delta and/or the isolated conveyance facility. However, seismic risk would not be reduced on islands not part of the export conveyance system or infrastructure pathway.
As noted in the discussion of the “enhanced emergency preparedness/response” building block in the DRMS Phase 2 report, analyses on resuming water exports after a levee failure were conducted by the Metropolitan Water District of Southern California, an SWP contractor. The studies found that a promising way to resume water exports would be to place structural barriers at selected channel locations in the Delta and complete strategic levee repairs, thus isolating an emergency freshwater conveyance “pathway” through channels that may be surrounded by islands flooded with saline water.
The DRMS study was the first comprehensive risk-based assessment of Delta levee failure and potential consequences to the State. Since the completion of the DRMS report several projects funded under the Delta Knowledge Improvement Program (DKIP) have been completed to fill the data gaps identified in DRMS. A goal of the DKIP is to complete bathymetry surveys of the entire Delta. Approximately 20% of the Delta has been surveyed thus far. Major on-going activities being funded by DKIP
Page | 16
include an economic study to assist the Delta Stewardship Council develop a comprehensive investment strategy for the Delta levees, a feasibility study to assist the Delta Protection Commission make recommendations on how to implement a Delta Flood Risk Management Assessment District, an investigation to determine how Delta levees on peat soils respond under seismic loading and development of potential designs of setback levees in the Delta to meet stability requirements while also incorporating desired habitat features.
Page | 17
Section 5 State Water Project Historical Delivery Capability (2005-2014) Section 7 of this report includes tables listing annual historical deliveries by various water classifications for each SWP contractor for 2005–2014.
Table 5-1 lists the maximum annual SWP Table A water delivery amounts for SWP Contractors. Figure 5-1 shows that deliveries of SWP Table A water for 2005–2014 range from an annual minimum of 475 taf to a maximum of 2,959 taf, with an average of 2,077 taf. Historical deliveries of SWP Table A water over this 10-year period are less than the maximum of 4,172 taf/year.
Total historical SWP deliveries, including Table A, Article 21, turnback pool, and carryover water, range from 3,707 to 477 taf/ year, with an average of 2,312 taf/year for the period of 2005–2014 (Figure 5-2).
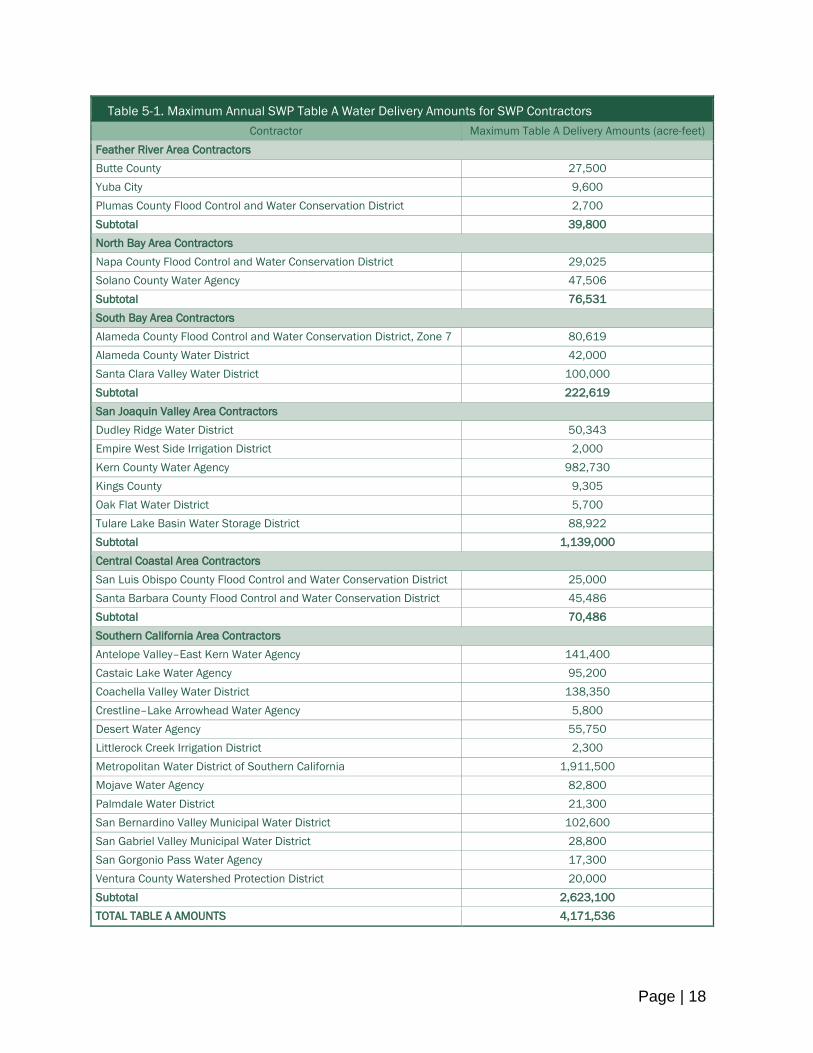
Page | 18
Table 5-1. Maximum Annual SWP Table A Water Delivery Amounts for SWP Contractors
Contractor Maximum Table A Delivery Amounts (acre-feet)
Feather River Area Contractors
Butte County 27,500
Yuba City 9,600
Plumas County Flood Control and Water Conservation District 2,700
Subtotal 39,800
North Bay Area Contractors
Napa County Flood Control and Water Conservation District 29,025
Solano County Water Agency 47,506
Subtotal 76,531
South Bay Area Contractors
Alameda County Flood Control and Water Conservation District, Zone 7 80,619
Alameda County Water District 42,000
Santa Clara Valley Water District 100,000
Subtotal 222,619
San Joaquin Valley Area Contractors
Dudley Ridge Water District 50,343
Empire West Side Irrigation District 2,000
Kern County Water Agency 982,730
Kings County 9,305
Oak Flat Water District 5,700
Tulare Lake Basin Water Storage District 88,922
Subtotal 1,139,000
Central Coastal Area Contractors
San Luis Obispo County Flood Control and Water Conservation District 25,000
Santa Barbara County Flood Control and Water Conservation District 45,486
Subtotal 70,486
Southern California Area Contractors
Antelope Valley–East Kern Water Agency 141,400
Castaic Lake Water Agency 95,200
Coachella Valley Water District 138,350
Crestline–Lake Arrowhead Water Agency 5,800
Desert Water Agency 55,750
Littlerock Creek Irrigation District 2,300
Metropolitan Water District of Southern California 1,911,500
Mojave Water Agency 82,800
Palmdale Water District 21,300
San Bernardino Valley Municipal Water District 102,600
San Gabriel Valley Municipal Water District 28,800
San Gorgonio Pass Water Agency 17,300
Ventura County Watershed Protection District 20,000
Subtotal 2,623,100
TOTAL TABLE A AMOUNTS 4,171,536
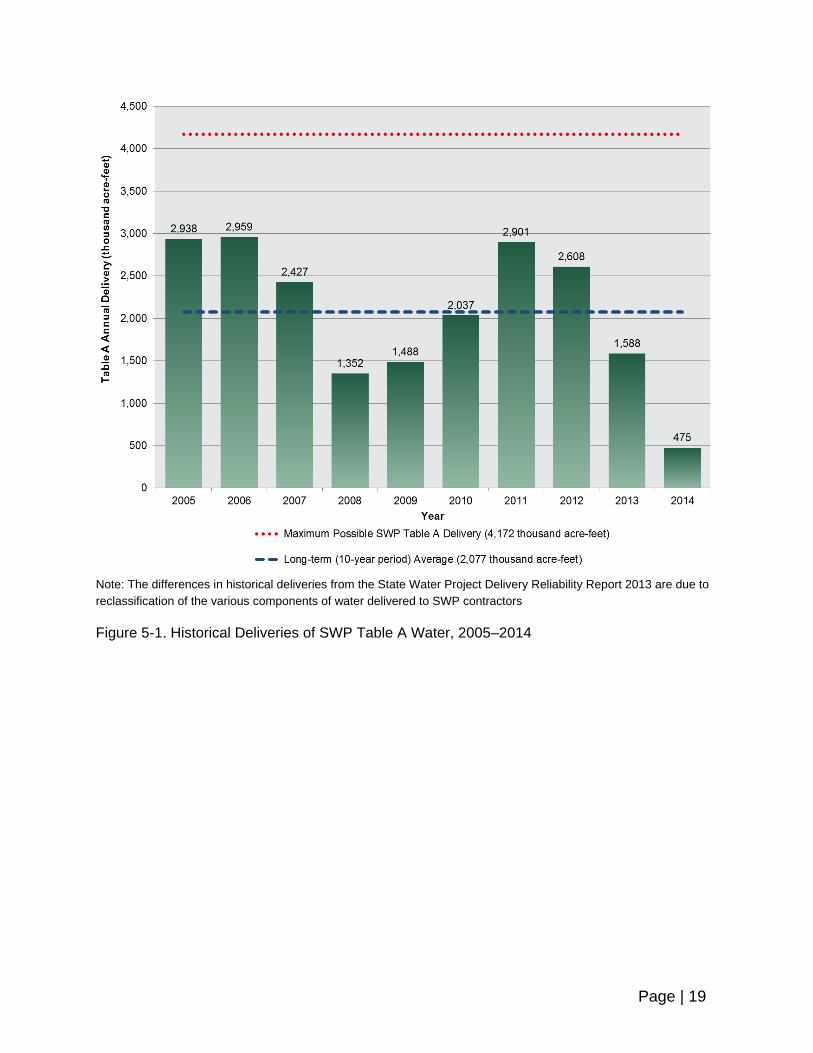
Page | 19
Note: The differences in historical deliveries from the State Water Project Delivery Reliability Report 2013 are due to
reclassification of the various components of water delivered to SWP contractors
Figure 5-1. Historical Deliveries of SWP Table A Water, 2005–2014
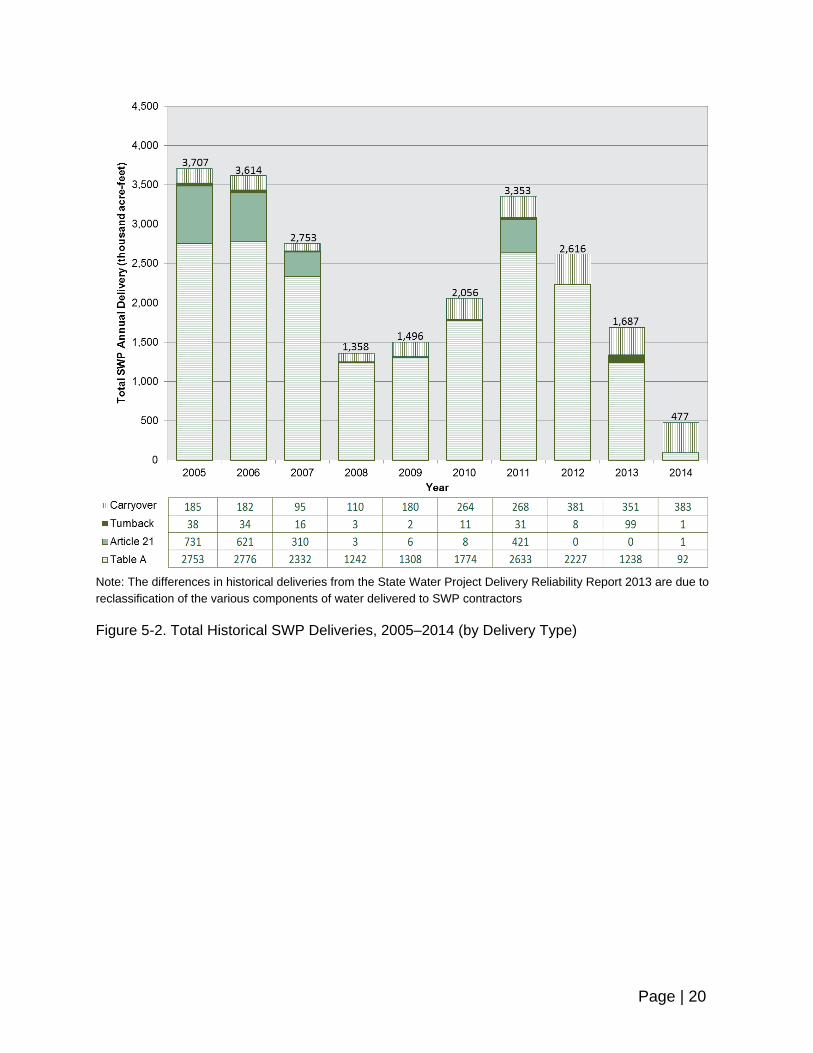
Page | 20
Note: The differences in historical deliveries from the State Water Project Delivery Reliability Report 2013 are due to
reclassification of the various components of water delivered to SWP contractors
Figure 5-2. Total Historical SWP Deliveries, 2005–2014 (by Delivery Type)
Page | 21
Section 6 Existing SWP Water Delivery Capability (2015) This Section presents estimates of the SWP’s existing (2015) water delivery capability. The estimates are presented below, alongside the results obtained from the 2013 Report. Like this 2015 Report, the 2013 Report incorporated the requirements of BOs issued by USFWS and NMFS in December 2008 and June 2009, respectively, on the effects of coordinated operations of the SWP and CVP. These BOs are discussed in detail in Section 2, “Regulatory Restrictions on SWP Delta Exports.”
The discussions of SWP water delivery capability in this Section presents the results of DWR’s updated modeling of the SWP’s water delivery capability. A tabular summary of the modeling results is presented in Appendix B of this report, which is available online at http://baydeltaoffice.water.ca.gov/.
Appendix B also contains annual delivery probability curves (i.e., exceedance plots) to graphically show the estimated percentage of years in which a given annual delivery is equaled or exceeded.
Hydrologic Sequence SWP delivery amounts are estimated in this 2015 Report for existing conditions using computer modeling that incorporates the historic range of hydrologic conditions (i.e., precipitation and runoff) that occurred from water years 1922 through 2003. The historic hydrologic conditions are adjusted to account for land-use changes (i.e., the current level of development) and upstream flow regulations that characterize 2015. By using this 82-year historical flow record, the delivery estimates modeled for existing conditions reflect a reasonable range of potential hydrologic conditions from wet years to critically dry years.
Existing Demand for Delta Water Demand levels for the SWP water users in this report are derived from historical data and information from the SWP contractors themselves. The amount of water that SWP contractors request each year (i.e., demand) is related to:
The magnitude and type of water demands,
The extent of water conservation measures,
Local weather patterns, and
Water costs.

Page | 22
The existing level of development (i.e., the level of water use in the source areas from which the water supply originates) is based on recent land uses, and is assumed to be representative of existing conditions for the purposes of this 2015 Report.
SWP Table A Water Demands The current combined maximum Table A amount is 4,172 taf/year. See Table 5-1 in Section 5, “State Water Project Historical Delivery Capability (2005-2014). Of the combined maximum Table A amount, 4,132 taf/year is the SWP’s maximum Table A water available for delivery from the Delta.
The estimated demands by SWP contractors for deliveries of Table A water from the Delta under existing conditions is assumed to be the maximum SWP Table A delivery amount for the 2015 Report, similar to the 2013 Report (Table 6-1). Due to the fact that SWP contractors have been requesting the full amount in recent years, the 2013, and the 2015 Reports more accurately reflect the trend in demand.
Table 6-1. Comparison of Estimated Average,
Maximum, and Minimum Demands for SWP
Table A Water (Existing Conditions, in taf/year)
2013 Report 2015 Report
Average 4,132 4,132
Maximum 4,132 4,132
Minimum 4,132 4,132
SWP Article 21 Water Demands Under Article 21 of the SWP’s long-term water supply contracts, contractors may receive additional water deliveries only under the following specific conditions:
Such deliveries do not interfere with SWP Table A allocations and SWP operations;
Excess water is available in the Delta;
Capacity is not being used for SWP purposes or scheduled SWP deliveries; and
Contractors can use the SWP Article 21 water directly or can store it in their own system (i.e., the water cannot be stored in the SWP system).
The demand for SWP Article 21 water by SWP contractors is assumed to vary depending on the month and weather conditions (i.e., amounts of precipitation and runoff). For the purposes of this discussion of SWP Article 21 water demands, a Kern wet year is defined as a year when the annual Kern River flow is projected to be greater than 1,500 taf. Kern River inflows are important because they are a major component of
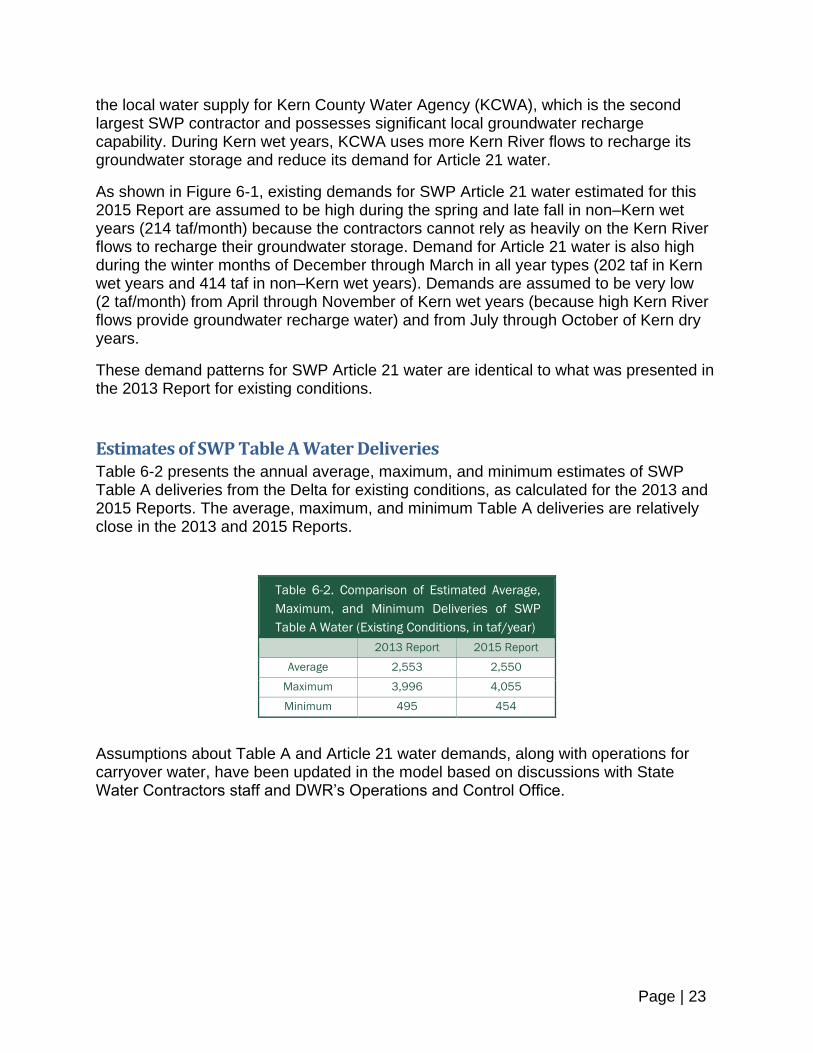
Page | 23
the local water supply for Kern County Water Agency (KCWA), which is the second largest SWP contractor and possesses significant local groundwater recharge capability. During Kern wet years, KCWA uses more Kern River flows to recharge its groundwater storage and reduce its demand for Article 21 water.
As shown in Figure 6-1, existing demands for SWP Article 21 water estimated for this 2015 Report are assumed to be high during the spring and late fall in non–Kern wet years (214 taf/month) because the contractors cannot rely as heavily on the Kern River flows to recharge their groundwater storage. Demand for Article 21 water is also high during the winter months of December through March in all year types (202 taf in Kern wet years and 414 taf in non–Kern wet years). Demands are assumed to be very low (2 taf/month) from April through November of Kern wet years (because high Kern River flows provide groundwater recharge water) and from July through October of Kern dry years.
These demand patterns for SWP Article 21 water are identical to what was presented in the 2013 Report for existing conditions.
Estimates of SWP Table A Water Deliveries Table 6-2 presents the annual average, maximum, and minimum estimates of SWP Table A deliveries from the Delta for existing conditions, as calculated for the 2013 and 2015 Reports. The average, maximum, and minimum Table A deliveries are relatively close in the 2013 and 2015 Reports.
Table 6-2. Comparison of Estimated Average,
Maximum, and Minimum Deliveries of SWP
Table A Water (Existing Conditions, in taf/year)
2013 Report 2015 Report
Average 2,553 2,550
Maximum 3,996 4,055
Minimum 495 454
Assumptions about Table A and Article 21 water demands, along with operations for carryover water, have been updated in the model based on discussions with State Water Contractors staff and DWR’s Operations and Control Office.
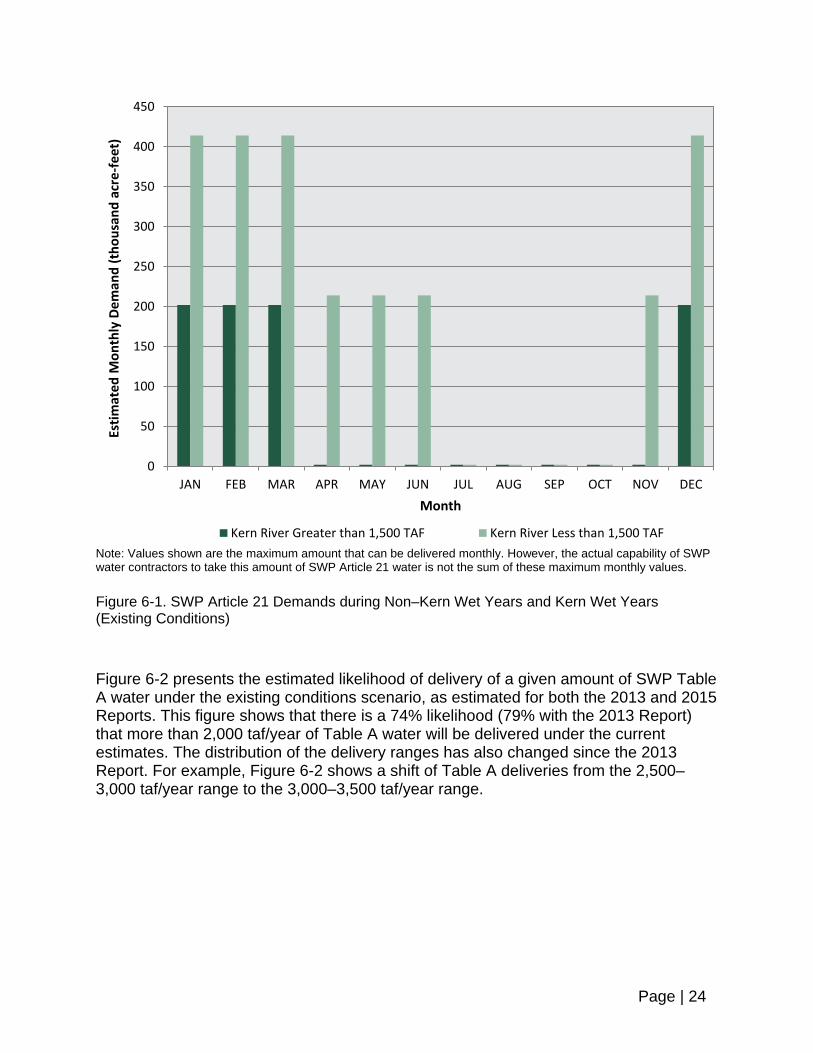
Page | 24
Note: Values shown are the maximum amount that can be delivered monthly. However, the actual capability of SWP water contractors to take this amount of SWP Article 21 water is not the sum of these maximum monthly values.
Figure 6-1. SWP Article 21 Demands during Non–Kern Wet Years and Kern Wet Years (Existing Conditions)
Figure 6-2 presents the estimated likelihood of delivery of a given amount of SWP Table A water under the existing conditions scenario, as estimated for both the 2013 and 2015 Reports. This figure shows that there is a 74% likelihood (79% with the 2013 Report) that more than 2,000 taf/year of Table A water will be delivered under the current estimates. The distribution of the delivery ranges has also changed since the 2013 Report. For example, Figure 6-2 shows a shift of Table A deliveries from the 2,500–3,000 taf/year range to the 3,000–3,500 taf/year range.
0
50
100
150
200
250
300
350
400
450
JAN FEB MAR APR MAY JUN JUL AUG SEP OCT NOV DEC
Esti
mat
ed
Mo
nth
ly D
em
and
(th
ou
san
d a
cre
-fe
et)
Month
Kern River Greater than 1,500 TAF Kern River Less than 1,500 TAF
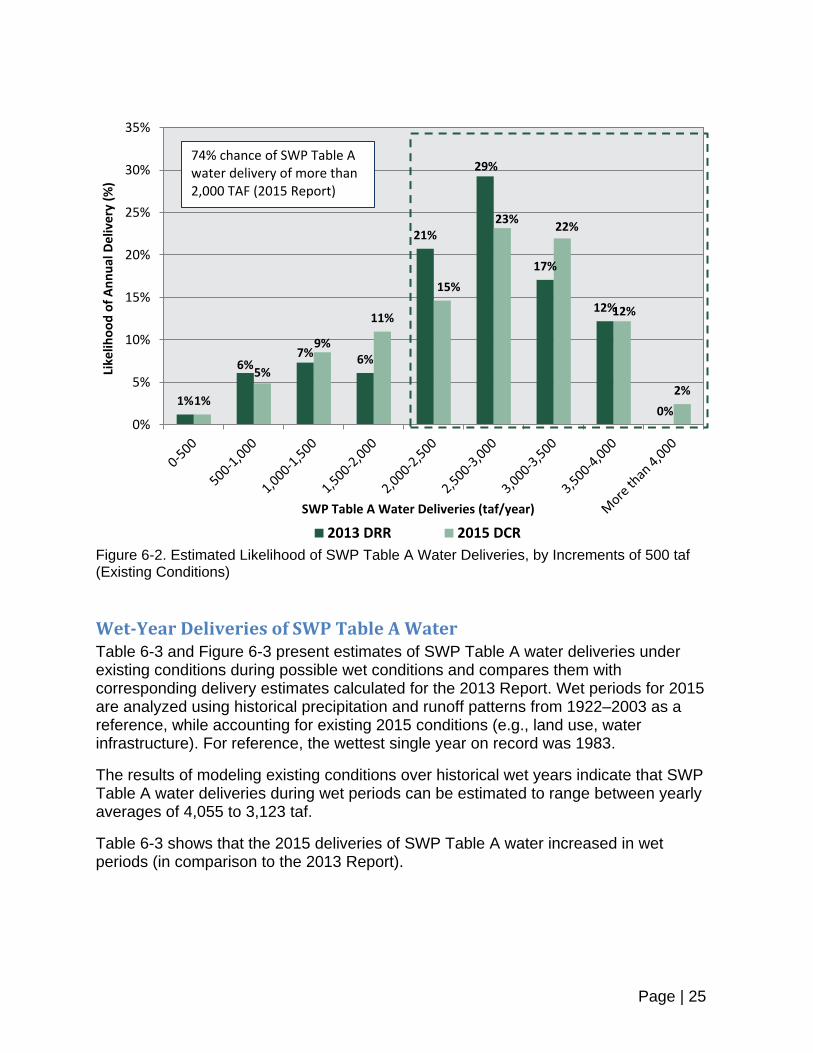
Page | 25
Figure 6-2. Estimated Likelihood of SWP Table A Water Deliveries, by Increments of 500 taf (Existing Conditions)
Wet-Year Deliveries of SWP Table A Water Table 6-3 and Figure 6-3 present estimates of SWP Table A water deliveries under existing conditions during possible wet conditions and compares them with corresponding delivery estimates calculated for the 2013 Report. Wet periods for 2015 are analyzed using historical precipitation and runoff patterns from 1922–2003 as a reference, while accounting for existing 2015 conditions (e.g., land use, water infrastructure). For reference, the wettest single year on record was 1983.
The results of modeling existing conditions over historical wet years indicate that SWP Table A water deliveries during wet periods can be estimated to range between yearly averages of 4,055 to 3,123 taf.
Table 6-3 shows that the 2015 deliveries of SWP Table A water increased in wet periods (in comparison to the 2013 Report).
1%
6% 7%
6%
21%
29%
17%
12%
0% 1%
5%
9%
11%
15%
23% 22%
12%
2%
0%
5%
10%
15%
20%
25%
30%
35%
Like
liho
od
of
An
nu
al D
eliv
ery
(%
)
SWP Table A Water Deliveries (taf/year)
2013 DRR 2015 DCR
74% chance of SWP Table A water delivery of more than 2,000 TAF (2015 Report)
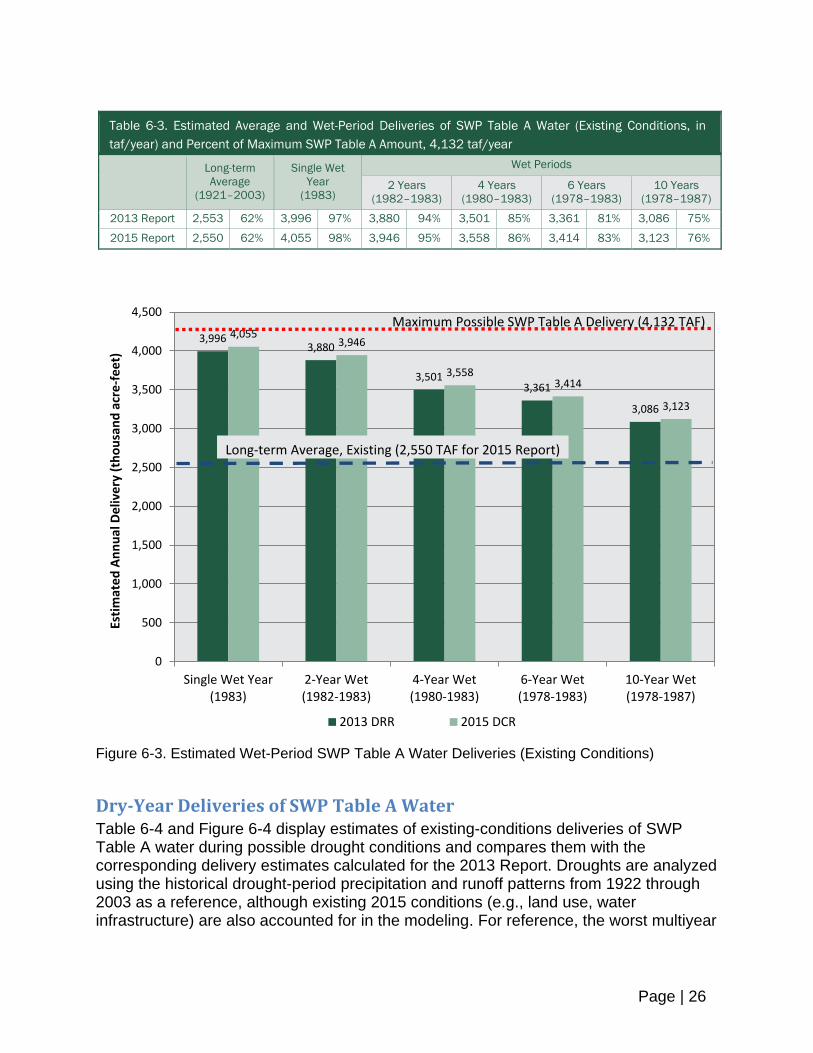
Page | 26
Table 6-3. Estimated Average and Wet-Period Deliveries of SWP Table A Water (Existing Conditions, in
taf/year) and Percent of Maximum SWP Table A Amount, 4,132 taf/year
Long-term
Average
(1921–2003)
Single Wet
Year
(1983)
Wet Periods
2 Years
(1982–1983)
4 Years
(1980–1983)
6 Years
(1978–1983)
10 Years
(1978–1987)
2013 Report 2,553 62% 3,996 97% 3,880 94% 3,501 85% 3,361 81% 3,086 75%
2015 Report 2,550 62% 4,055 98% 3,946 95% 3,558 86% 3,414 83% 3,123 76%
Figure 6-3. Estimated Wet-Period SWP Table A Water Deliveries (Existing Conditions)
Dry-Year Deliveries of SWP Table A Water Table 6-4 and Figure 6-4 display estimates of existing-conditions deliveries of SWP Table A water during possible drought conditions and compares them with the corresponding delivery estimates calculated for the 2013 Report. Droughts are analyzed using the historical drought-period precipitation and runoff patterns from 1922 through 2003 as a reference, although existing 2015 conditions (e.g., land use, water infrastructure) are also accounted for in the modeling. For reference, the worst multiyear
3,996 3,880
3,501 3,361
3,086
4,055 3,946
3,558 3,414
3,123
0
500
1,000
1,500
2,000
2,500
3,000
3,500
4,000
4,500
Single Wet Year(1983)
2-Year Wet(1982-1983)
4-Year Wet(1980-1983)
6-Year Wet(1978-1983)
10-Year Wet(1978-1987)
Esti
mat
ed
An
nu
al D
eliv
ery
(th
ou
san
d a
cre
-fe
et)
2013 DRR 2015 DCR
Maximum Possible SWP Table A Delivery (4,132 TAF)
Long-term Average, Existing (2,550 TAF for 2015 Report)
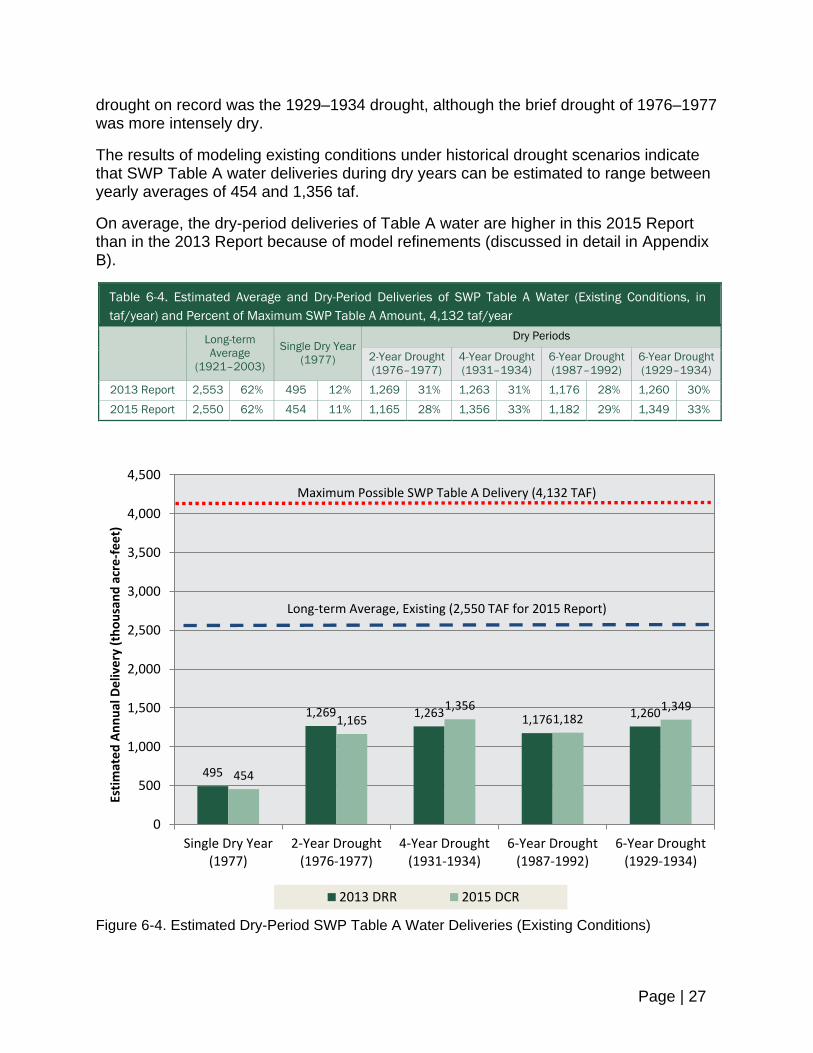
Page | 27
drought on record was the 1929–1934 drought, although the brief drought of 1976–1977 was more intensely dry.
The results of modeling existing conditions under historical drought scenarios indicate that SWP Table A water deliveries during dry years can be estimated to range between yearly averages of 454 and 1,356 taf.
On average, the dry-period deliveries of Table A water are higher in this 2015 Report than in the 2013 Report because of model refinements (discussed in detail in Appendix B).
Table 6-4. Estimated Average and Dry-Period Deliveries of SWP Table A Water (Existing Conditions, in
taf/year) and Percent of Maximum SWP Table A Amount, 4,132 taf/year
Long-term
Average
(1921–2003)
Single Dry Year
(1977)
Dry Periods
2-Year Drought
(1976–1977)
4-Year Drought
(1931–1934)
6-Year Drought
(1987–1992)
6-Year Drought
(1929–1934)
2013 Report 2,553 62% 495 12% 1,269 31% 1,263 31% 1,176 28% 1,260 30%
2015 Report 2,550 62% 454 11% 1,165 28% 1,356 33% 1,182 29% 1,349 33%
Figure 6-4. Estimated Dry-Period SWP Table A Water Deliveries (Existing Conditions)
495
1,269 1,263 1,176 1,260
454
1,165 1,356
1,182 1,349
0
500
1,000
1,500
2,000
2,500
3,000
3,500
4,000
4,500
Single Dry Year(1977)
2-Year Drought(1976-1977)
4-Year Drought(1931-1934)
6-Year Drought(1987-1992)
6-Year Drought(1929-1934)
Esti
mat
ed
An
nu
al D
eliv
ery
(th
ou
san
d a
cre
-fe
et)
2013 DRR 2015 DCR
Maximum Possible SWP Table A Delivery (4,132 TAF)
Long-term Average, Existing (2,550 TAF for 2015 Report)
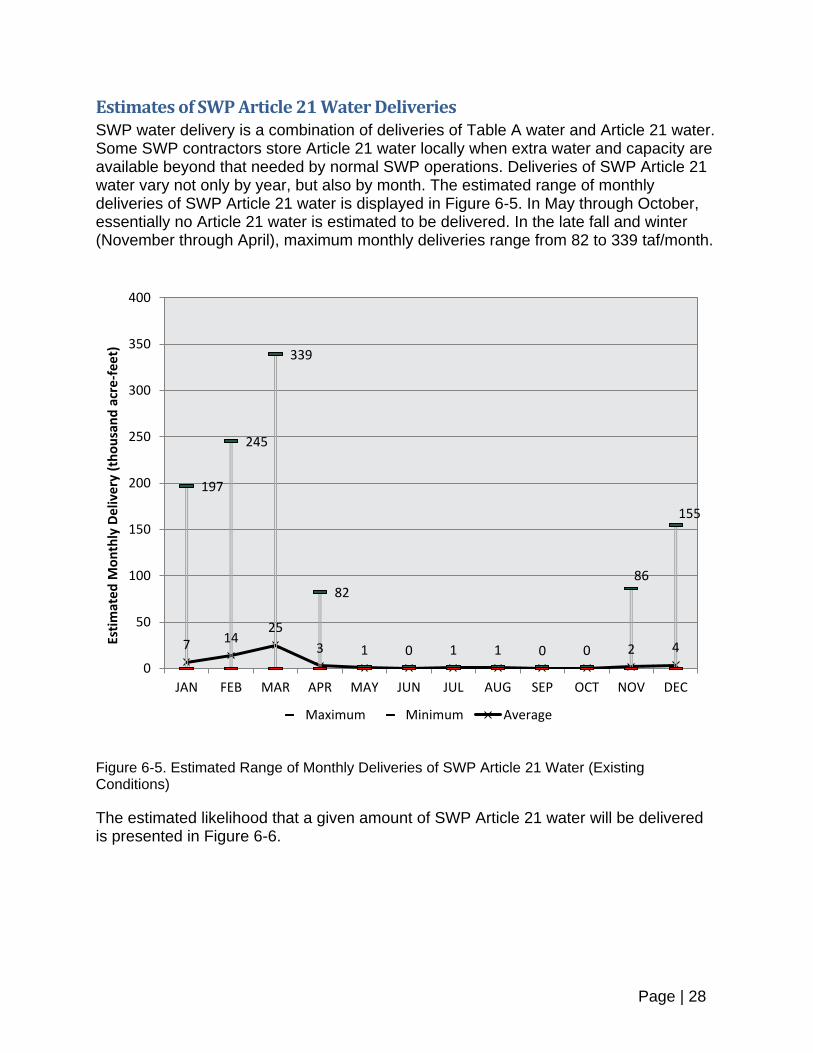
Page | 28
Estimates of SWP Article 21 Water Deliveries SWP water delivery is a combination of deliveries of Table A water and Article 21 water. Some SWP contractors store Article 21 water locally when extra water and capacity are available beyond that needed by normal SWP operations. Deliveries of SWP Article 21 water vary not only by year, but also by month. The estimated range of monthly deliveries of SWP Article 21 water is displayed in Figure 6-5. In May through October, essentially no Article 21 water is estimated to be delivered. In the late fall and winter (November through April), maximum monthly deliveries range from 82 to 339 taf/month.
Figure 6-5. Estimated Range of Monthly Deliveries of SWP Article 21 Water (Existing Conditions)
The estimated likelihood that a given amount of SWP Article 21 water will be delivered is presented in Figure 6-6.
197
245
339
82 86
155
7 14 25
3 1 0 1 1 0 0 2 4
0
50
100
150
200
250
300
350
400
JAN FEB MAR APR MAY JUN JUL AUG SEP OCT NOV DEC
Esti
mat
ed
Mo
nth
ly D
eliv
ery
(th
ou
san
d a
cre
-fe
et)
Maximum Minimum Average
79%
5% 9%
1% 2% 0%
2% 1% 0%
82%
2%
9%
0% 4%
1% 0% 2%
0% 0%
10%
20%
30%
40%
50%
60%
70%
80%
90%
100%
0-20 20-100 100-200 200-300 300-400 400-500 500-600 600-700 Morethan 700
Like
liho
od
of
An
nu
al D
eliv
ery
(%
)
2013 DRR 2015 DCR
82% chance of receiving an Article 21 delivery of 20 TAF or less (2015 Report)
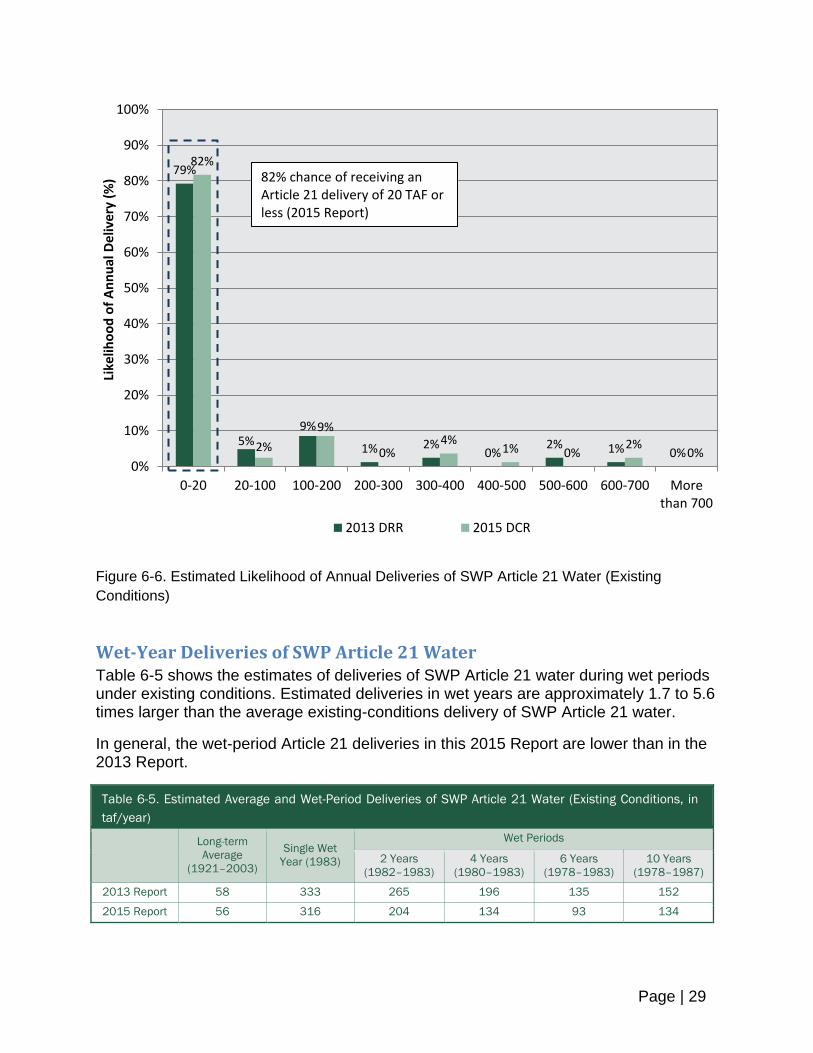
Page | 29
Figure 6-6. Estimated Likelihood of Annual Deliveries of SWP Article 21 Water (Existing
Conditions)
Wet-Year Deliveries of SWP Article 21 Water Table 6-5 shows the estimates of deliveries of SWP Article 21 water during wet periods under existing conditions. Estimated deliveries in wet years are approximately 1.7 to 5.6 times larger than the average existing-conditions delivery of SWP Article 21 water.
In general, the wet-period Article 21 deliveries in this 2015 Report are lower than in the 2013 Report.
Table 6-5. Estimated Average and Wet-Period Deliveries of SWP Article 21 Water (Existing Conditions, in
taf/year)
Long-term
Average
(1921–2003)
Single Wet
Year (1983)
Wet Periods
2 Years
(1982–1983)
4 Years
(1980–1983)
6 Years
(1978–1983)
10 Years
(1978–1987)
2013 Report 58 333 265 196 135 152
2015 Report 56 316 204 134 93 134
79%
5% 9%
1% 2% 0%
2% 1% 0%
82%
2%
9%
0% 4%
1% 0% 2%
0% 0%
10%
20%
30%
40%
50%
60%
70%
80%
90%
100%
0-20 20-100 100-200 200-300 300-400 400-500 500-600 600-700 Morethan 700
Like
liho
od
of
An
nu
al D
eliv
ery
(%
)
2013 DRR 2015 DCR
82% chance of receiving an Article 21 delivery of 20 TAF or less (2015 Report)
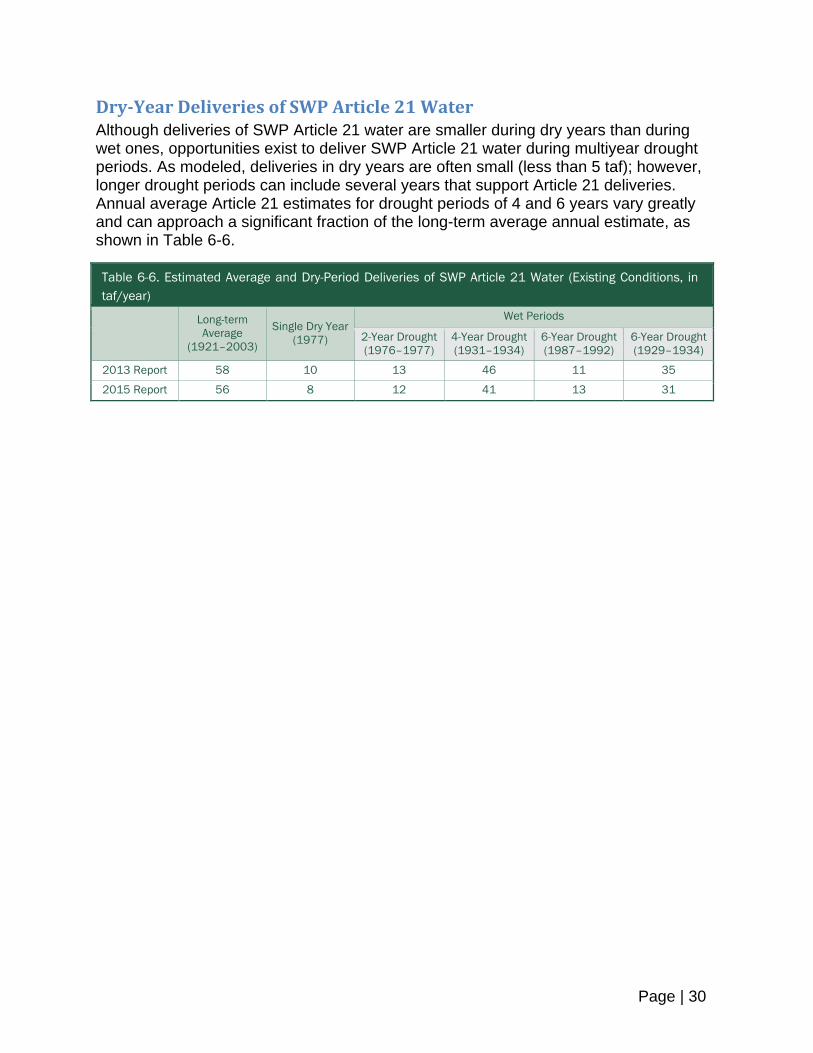
Page | 30
Dry-Year Deliveries of SWP Article 21 Water Although deliveries of SWP Article 21 water are smaller during dry years than during wet ones, opportunities exist to deliver SWP Article 21 water during multiyear drought periods. As modeled, deliveries in dry years are often small (less than 5 taf); however, longer drought periods can include several years that support Article 21 deliveries. Annual average Article 21 estimates for drought periods of 4 and 6 years vary greatly and can approach a significant fraction of the long-term average annual estimate, as shown in Table 6-6.
Table 6-6. Estimated Average and Dry-Period Deliveries of SWP Article 21 Water (Existing Conditions, in
taf/year)
Long-term
Average
(1921–2003)
Single Dry Year
(1977)
Wet Periods
2-Year Drought
(1976–1977)
4-Year Drought
(1931–1934)
6-Year Drought
(1987–1992)
6-Year Drought
(1929–1934)
2013 Report 58 10 13 46 11 35
2015 Report 56 8 12 41 13 31
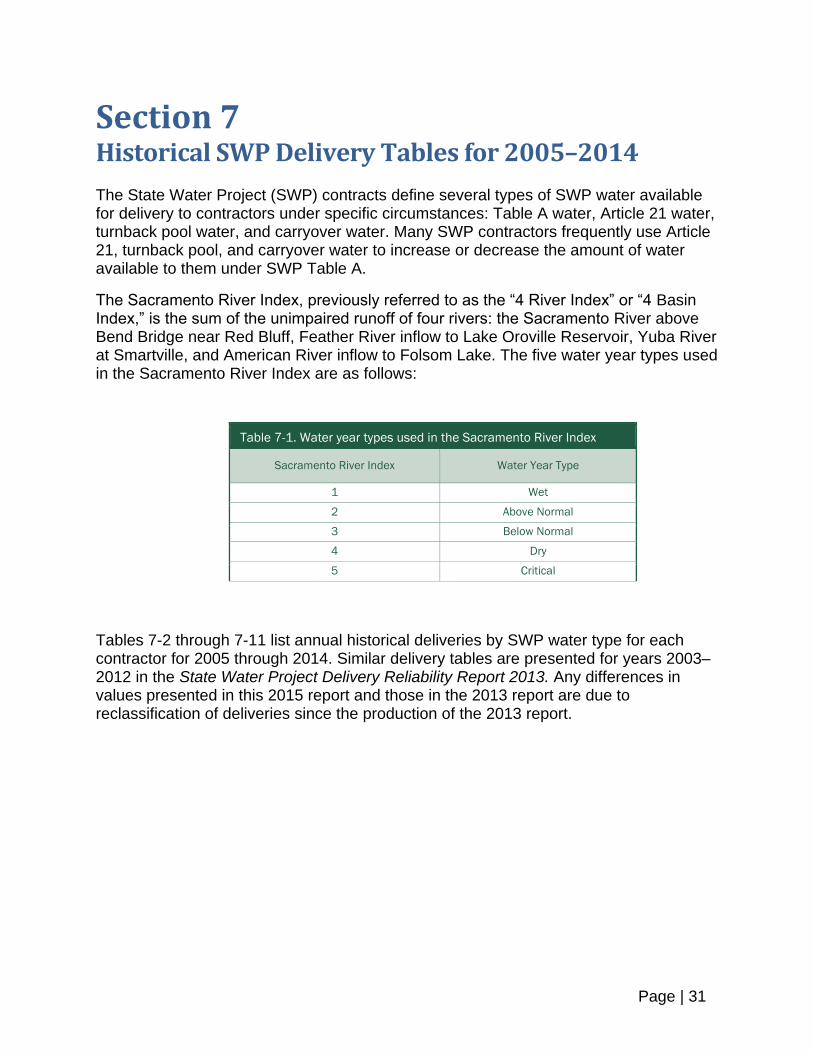
Page | 31
0.16 0.36 0.55 0.75 0.94 1.14 1.33 1.52 1.72 1.91 2.11 2.30 2.50 2.69 2.89 3.08 3.27 3.47 3.66 3.86 4.05 4.25 4.44 4.64 4.83 5.02
Section 7 Historical SWP Delivery Tables for 2005–2014 The State Water Project (SWP) contracts define several types of SWP water available for delivery to contractors under specific circumstances: Table A water, Article 21 water, turnback pool water, and carryover water. Many SWP contractors frequently use Article 21, turnback pool, and carryover water to increase or decrease the amount of water available to them under SWP Table A.
The Sacramento River Index, previously referred to as the “4 River Index” or “4 Basin Index,” is the sum of the unimpaired runoff of four rivers: the Sacramento River above Bend Bridge near Red Bluff, Feather River inflow to Lake Oroville Reservoir, Yuba River at Smartville, and American River inflow to Folsom Lake. The five water year types used in the Sacramento River Index are as follows:
Table 7-1. Water year types used in the Sacramento River Index
Sacramento River Index Water Year Type
1 Wet
2 Above Normal
3 Below Normal
4 Dry
5 Critical
Tables 7-2 through 7-11 list annual historical deliveries by SWP water type for each contractor for 2005 through 2014. Similar delivery tables are presented for years 2003–2012 in the State Water Project Delivery Reliability Report 2013. Any differences in values presented in this 2015 report and those in the 2013 report are due to reclassification of deliveries since the production of the 2013 report.
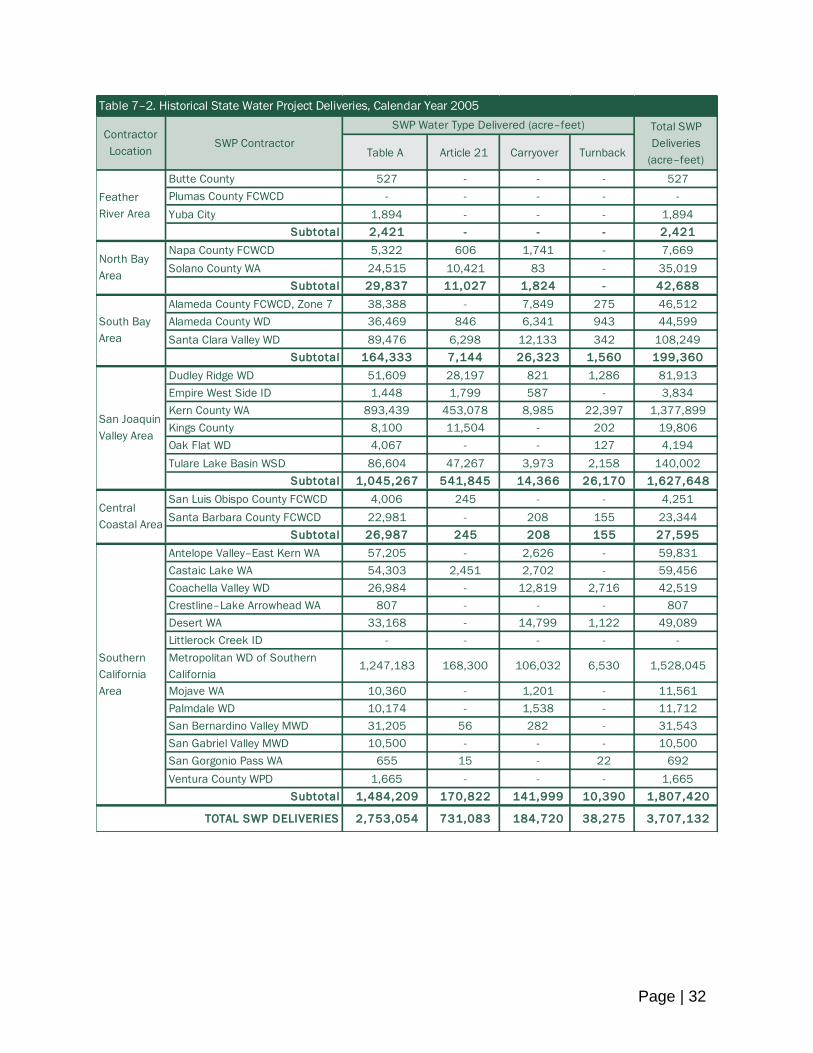
Page | 32
0.16 0.36 0.55 0.75 0.94 1.14 1.33 1.52 1.72 1.91 2.11 2.30 2.50 2.69 2.89 3.08 3.27 3.47 3.66 3.86 4.05 4.25 4.44 4.64 4.83 5.02
Table A Article 21 Carryover Turnback
Butte County 527 - - - 527
Plumas County FCWCD - - - - -
Yuba City 1,894 - - - 1,894
Subtotal 2,421 - - - 2,421
Napa County FCWCD 5,322 606 1,741 - 7,669
Solano County WA 24,515 10,421 83 - 35,019
Subtotal 29,837 11,027 1,824 - 42,688
Alameda County FCWCD, Zone 7 38,388 - 7,849 275 46,512
Alameda County WD 36,469 846 6,341 943 44,599
Santa Clara Valley WD 89,476 6,298 12,133 342 108,249
Subtotal 164,333 7,144 26,323 1,560 199,360
Dudley Ridge WD 51,609 28,197 821 1,286 81,913
Empire West Side ID 1,448 1,799 587 - 3,834
Kern County WA 893,439 453,078 8,985 22,397 1,377,899
Kings County 8,100 11,504 - 202 19,806
Oak Flat WD 4,067 - - 127 4,194
Tulare Lake Basin WSD 86,604 47,267 3,973 2,158 140,002
Subtotal 1,045,267 541,845 14,366 26,170 1,627,648
San Luis Obispo County FCWCD 4,006 245 - - 4,251
Santa Barbara County FCWCD 22,981 - 208 155 23,344
Subtotal 26,987 245 208 155 27,595
Antelope Valley–East Kern WA 57,205 - 2,626 - 59,831
Castaic Lake WA 54,303 2,451 2,702 - 59,456
Coachella Valley WD 26,984 - 12,819 2,716 42,519
Crestline–Lake Arrowhead WA 807 - - - 807
Desert WA 33,168 - 14,799 1,122 49,089
Littlerock Creek ID - - - - -
Metropolitan WD of Southern
California 1,247,183 168,300 106,032 6,530 1,528,045
Mojave WA 10,360 - 1,201 - 11,561
Palmdale WD 10,174 - 1,538 - 11,712
San Bernardino Valley MWD 31,205 56 282 - 31,543
San Gabriel Valley MWD 10,500 - - - 10,500
San Gorgonio Pass WA 655 15 - 22 692
Ventura County WPD 1,665 - - - 1,665
Subtotal 1,484,209 170,822 141,999 10,390 1,807,420
2,753,054 731,083 184,720 38,275 3,707,132TOTAL SWP DELIVERIES
Table 7–2. Historical State Water Project Deliveries, Calendar Year 2005
Contractor
LocationSWP Contractor
SWP Water Type Delivered (acre–feet) Total SWP
Deliveries
(acre–feet)
Feather
River Area
North Bay
Area
South Bay
Area
San Joaquin
Valley Area
Central
Coastal Area
Southern
California
Area
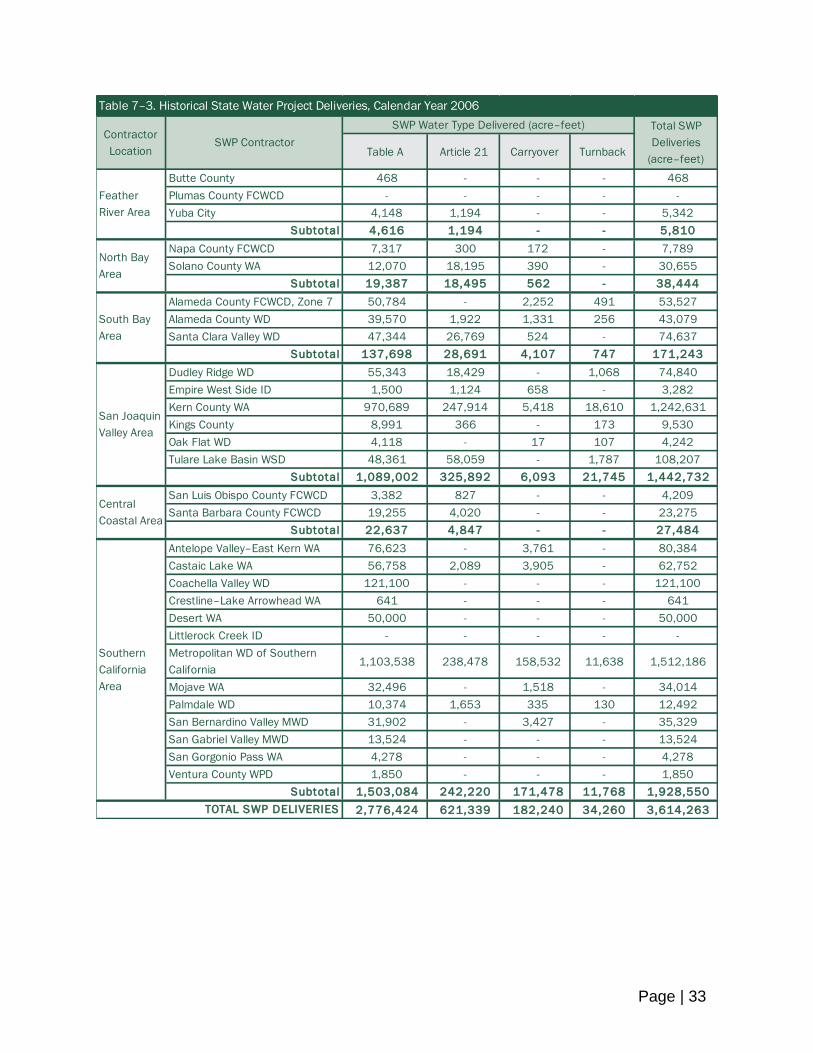
Page | 33
0.16 0.36 0.55 0.75 0.94 1.14 1.33 1.52 1.72 1.91 2.11 2.30 2.50 2.69 2.89 3.08 3.27 3.47 3.66 3.86 4.05 4.25 4.44 4.64 4.83 5.02
Table A Article 21 Carryover Turnback
Butte County 468 - - - 468
Plumas County FCWCD - - - - -
Yuba City 4,148 1,194 - - 5,342
Subtotal 4,616 1,194 - - 5,810
Napa County FCWCD 7,317 300 172 - 7,789
Solano County WA 12,070 18,195 390 - 30,655
Subtotal 19,387 18,495 562 - 38,444
Alameda County FCWCD, Zone 7 50,784 - 2,252 491 53,527
Alameda County WD 39,570 1,922 1,331 256 43,079
Santa Clara Valley WD 47,344 26,769 524 - 74,637
Subtotal 137,698 28,691 4,107 747 171,243
Dudley Ridge WD 55,343 18,429 - 1,068 74,840
Empire West Side ID 1,500 1,124 658 - 3,282
Kern County WA 970,689 247,914 5,418 18,610 1,242,631
Kings County 8,991 366 - 173 9,530
Oak Flat WD 4,118 - 17 107 4,242
Tulare Lake Basin WSD 48,361 58,059 - 1,787 108,207
Subtotal 1,089,002 325,892 6,093 21,745 1,442,732
San Luis Obispo County FCWCD 3,382 827 - - 4,209
Santa Barbara County FCWCD 19,255 4,020 - - 23,275
Subtotal 22,637 4,847 - - 27,484
Antelope Valley–East Kern WA 76,623 - 3,761 - 80,384
Castaic Lake WA 56,758 2,089 3,905 - 62,752
Coachella Valley WD 121,100 - - - 121,100
Crestline–Lake Arrowhead WA 641 - - - 641
Desert WA 50,000 - - - 50,000
Littlerock Creek ID - - - - -
Metropolitan WD of Southern
California 1,103,538 238,478 158,532 11,638 1,512,186
Mojave WA 32,496 - 1,518 - 34,014
Palmdale WD 10,374 1,653 335 130 12,492
San Bernardino Valley MWD 31,902 - 3,427 - 35,329
San Gabriel Valley MWD 13,524 - - - 13,524
San Gorgonio Pass WA 4,278 - - - 4,278
Ventura County WPD 1,850 - - - 1,850
Subtotal 1,503,084 242,220 171,478 11,768 1,928,550
2,776,424 621,339 182,240 34,260 3,614,263
Table 7–3. Historical State Water Project Deliveries, Calendar Year 2006
Contractor
LocationSWP Contractor
SWP Water Type Delivered (acre–feet) Total SWP
Deliveries
(acre–feet)
Feather
River Area
North Bay
Area
South Bay
Area
San Joaquin
Valley Area
Central
Coastal Area
Southern
California
Area
TOTAL SWP DELIVERIES
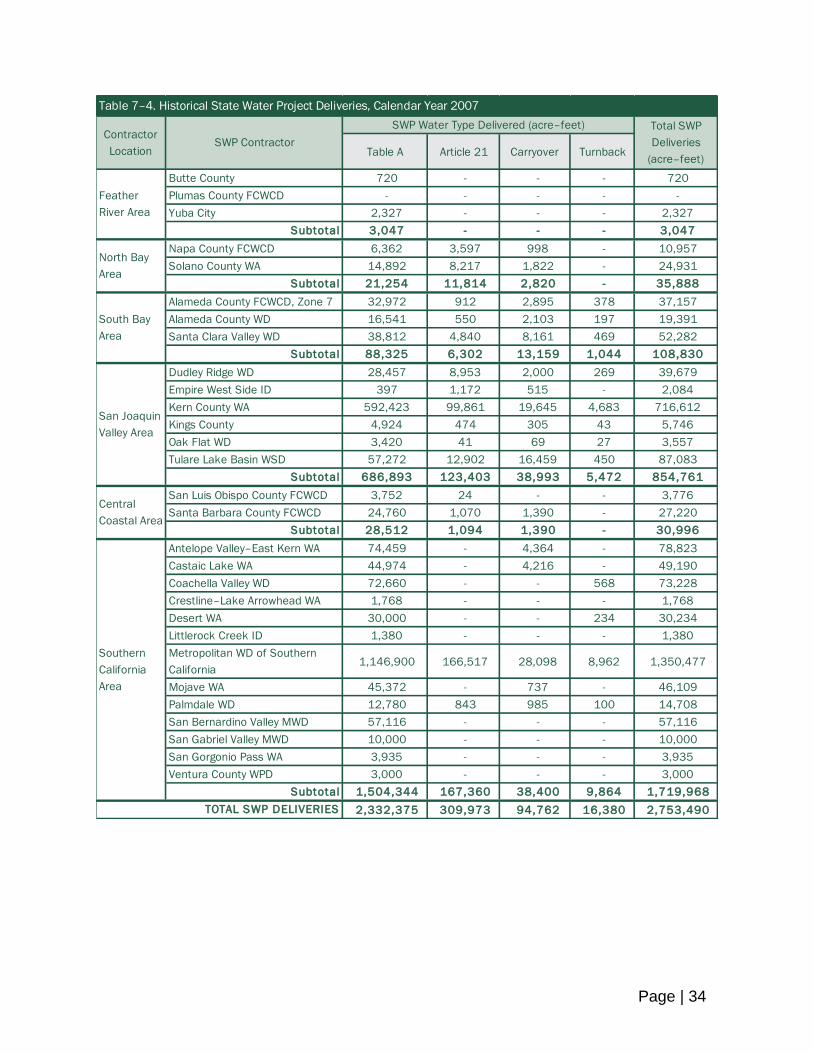
Page | 34
0.16 0.36 0.55 0.75 0.94 1.14 1.33 1.52 1.72 1.91 2.11 2.30 2.50 2.69 2.89 3.08 3.27 3.47 3.66 3.86 4.05 4.25 4.44 4.64 4.83 5.02
Table A Article 21 Carryover Turnback
Butte County 720 - - - 720
Plumas County FCWCD - - - - -
Yuba City 2,327 - - - 2,327
Subtotal 3,047 - - - 3,047
Napa County FCWCD 6,362 3,597 998 - 10,957
Solano County WA 14,892 8,217 1,822 - 24,931
Subtotal 21,254 11,814 2,820 - 35,888
Alameda County FCWCD, Zone 7 32,972 912 2,895 378 37,157
Alameda County WD 16,541 550 2,103 197 19,391
Santa Clara Valley WD 38,812 4,840 8,161 469 52,282
Subtotal 88,325 6,302 13,159 1,044 108,830
Dudley Ridge WD 28,457 8,953 2,000 269 39,679
Empire West Side ID 397 1,172 515 - 2,084
Kern County WA 592,423 99,861 19,645 4,683 716,612
Kings County 4,924 474 305 43 5,746
Oak Flat WD 3,420 41 69 27 3,557
Tulare Lake Basin WSD 57,272 12,902 16,459 450 87,083
Subtotal 686,893 123,403 38,993 5,472 854,761
San Luis Obispo County FCWCD 3,752 24 - - 3,776
Santa Barbara County FCWCD 24,760 1,070 1,390 - 27,220
Subtotal 28,512 1,094 1,390 - 30,996
Antelope Valley–East Kern WA 74,459 - 4,364 - 78,823
Castaic Lake WA 44,974 - 4,216 - 49,190
Coachella Valley WD 72,660 - - 568 73,228
Crestline–Lake Arrowhead WA 1,768 - - - 1,768
Desert WA 30,000 - - 234 30,234
Littlerock Creek ID 1,380 - - - 1,380
Metropolitan WD of Southern
California 1,146,900 166,517 28,098 8,962 1,350,477
Mojave WA 45,372 - 737 - 46,109
Palmdale WD 12,780 843 985 100 14,708
San Bernardino Valley MWD 57,116 - - - 57,116
San Gabriel Valley MWD 10,000 - - - 10,000
San Gorgonio Pass WA 3,935 - - - 3,935
Ventura County WPD 3,000 - - - 3,000
Subtotal 1,504,344 167,360 38,400 9,864 1,719,968
2,332,375 309,973 94,762 16,380 2,753,490
Table 7–4. Historical State Water Project Deliveries, Calendar Year 2007
Contractor
LocationSWP Contractor
SWP Water Type Delivered (acre–feet) Total SWP
Deliveries
(acre–feet)
Feather
River Area
North Bay
Area
South Bay
Area
San Joaquin
Valley Area
Central
Coastal Area
Southern
California
Area
TOTAL SWP DELIVERIES
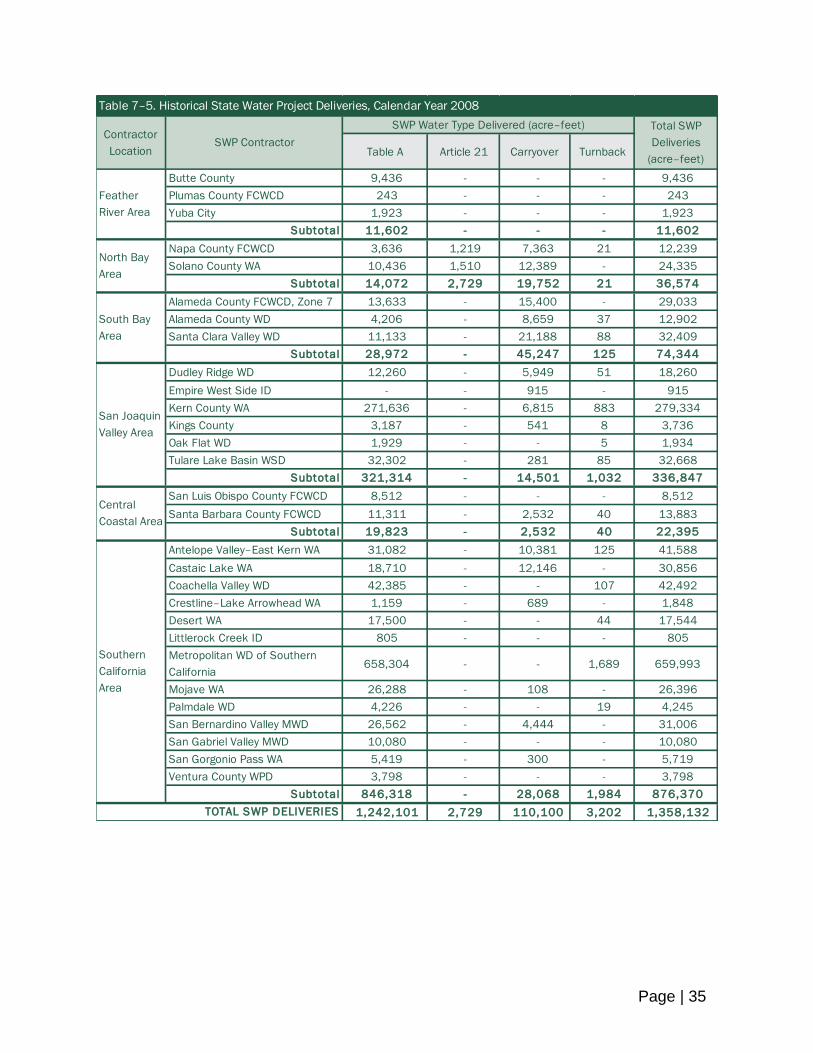
Page | 35
0.16 0.36 0.55 0.75 0.94 1.14 1.33 1.52 1.72 1.91 2.11 2.30 2.50 2.69 2.89 3.08 3.27 3.47 3.66 3.86 4.05 4.25 4.44 4.64 4.83 5.02
Table A Article 21 Carryover Turnback
Butte County 9,436 - - - 9,436
Plumas County FCWCD 243 - - - 243
Yuba City 1,923 - - - 1,923
Subtotal 11,602 - - - 11,602
Napa County FCWCD 3,636 1,219 7,363 21 12,239
Solano County WA 10,436 1,510 12,389 - 24,335
Subtotal 14,072 2,729 19,752 21 36,574
Alameda County FCWCD, Zone 7 13,633 - 15,400 - 29,033
Alameda County WD 4,206 - 8,659 37 12,902
Santa Clara Valley WD 11,133 - 21,188 88 32,409
Subtotal 28,972 - 45,247 125 74,344
Dudley Ridge WD 12,260 - 5,949 51 18,260
Empire West Side ID - - 915 - 915
Kern County WA 271,636 - 6,815 883 279,334
Kings County 3,187 - 541 8 3,736
Oak Flat WD 1,929 - - 5 1,934
Tulare Lake Basin WSD 32,302 - 281 85 32,668
Subtotal 321,314 - 14,501 1,032 336,847
San Luis Obispo County FCWCD 8,512 - - - 8,512
Santa Barbara County FCWCD 11,311 - 2,532 40 13,883
Subtotal 19,823 - 2,532 40 22,395
Antelope Valley–East Kern WA 31,082 - 10,381 125 41,588
Castaic Lake WA 18,710 - 12,146 - 30,856
Coachella Valley WD 42,385 - - 107 42,492
Crestline–Lake Arrowhead WA 1,159 - 689 - 1,848
Desert WA 17,500 - - 44 17,544
Littlerock Creek ID 805 - - - 805
Metropolitan WD of Southern
California 658,304 - - 1,689 659,993
Mojave WA 26,288 - 108 - 26,396
Palmdale WD 4,226 - - 19 4,245
San Bernardino Valley MWD 26,562 - 4,444 - 31,006
San Gabriel Valley MWD 10,080 - - - 10,080
San Gorgonio Pass WA 5,419 - 300 - 5,719
Ventura County WPD 3,798 - - - 3,798
Subtotal 846,318 - 28,068 1,984 876,370
1,242,101 2,729 110,100 3,202 1,358,132TOTAL SWP DELIVERIES
Table 7–5. Historical State Water Project Deliveries, Calendar Year 2008
Contractor
LocationSWP Contractor
SWP Water Type Delivered (acre–feet) Total SWP
Deliveries
(acre–feet)
Feather
River Area
North Bay
Area
South Bay
Area
San Joaquin
Valley Area
Central
Coastal Area
Southern
California
Area
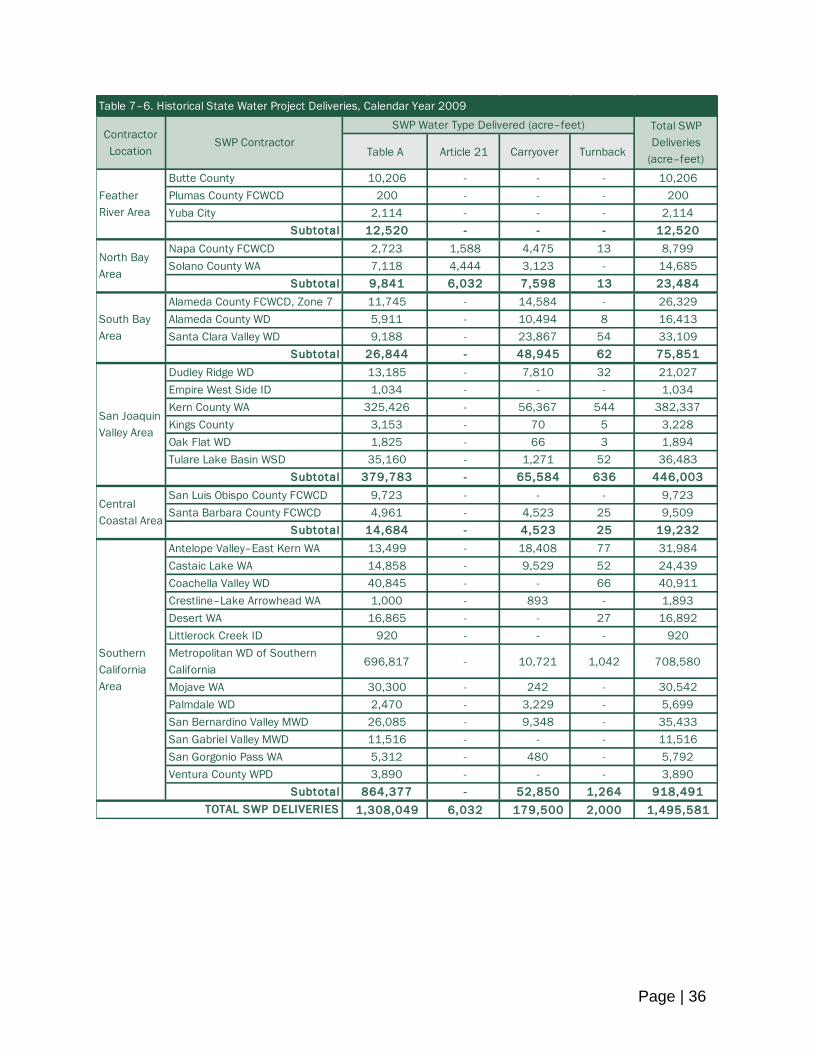
Page | 36
0.16 0.36 0.55 0.75 0.94 1.14 1.33 1.52 1.72 1.91 2.11 2.30 2.50 2.69 2.89 3.08 3.27 3.47 3.66 3.86 4.05 4.25 4.44 4.64 4.83 5.02
Table A Article 21 Carryover Turnback
Butte County 10,206 - - - 10,206
Plumas County FCWCD 200 - - - 200
Yuba City 2,114 - - - 2,114
Subtotal 12,520 - - - 12,520
Napa County FCWCD 2,723 1,588 4,475 13 8,799
Solano County WA 7,118 4,444 3,123 - 14,685
Subtotal 9,841 6,032 7,598 13 23,484
Alameda County FCWCD, Zone 7 11,745 - 14,584 - 26,329
Alameda County WD 5,911 - 10,494 8 16,413
Santa Clara Valley WD 9,188 - 23,867 54 33,109
Subtotal 26,844 - 48,945 62 75,851
Dudley Ridge WD 13,185 - 7,810 32 21,027
Empire West Side ID 1,034 - - - 1,034
Kern County WA 325,426 - 56,367 544 382,337
Kings County 3,153 - 70 5 3,228
Oak Flat WD 1,825 - 66 3 1,894
Tulare Lake Basin WSD 35,160 - 1,271 52 36,483
Subtotal 379,783 - 65,584 636 446,003
San Luis Obispo County FCWCD 9,723 - - - 9,723
Santa Barbara County FCWCD 4,961 - 4,523 25 9,509
Subtotal 14,684 - 4,523 25 19,232
Antelope Valley–East Kern WA 13,499 - 18,408 77 31,984
Castaic Lake WA 14,858 - 9,529 52 24,439
Coachella Valley WD 40,845 - - 66 40,911
Crestline–Lake Arrowhead WA 1,000 - 893 - 1,893
Desert WA 16,865 - - 27 16,892
Littlerock Creek ID 920 - - - 920
Metropolitan WD of Southern
California 696,817 - 10,721 1,042 708,580
Mojave WA 30,300 - 242 - 30,542
Palmdale WD 2,470 - 3,229 - 5,699
San Bernardino Valley MWD 26,085 - 9,348 - 35,433
San Gabriel Valley MWD 11,516 - - - 11,516
San Gorgonio Pass WA 5,312 - 480 - 5,792
Ventura County WPD 3,890 - - - 3,890
Subtotal 864,377 - 52,850 1,264 918,491
1,308,049 6,032 179,500 2,000 1,495,581
Table 7–6. Historical State Water Project Deliveries, Calendar Year 2009
Contractor
LocationSWP Contractor
SWP Water Type Delivered (acre–feet) Total SWP
Deliveries
(acre–feet)
Feather
River Area
North Bay
Area
South Bay
Area
San Joaquin
Valley Area
Central
Coastal Area
Southern
California
Area
TOTAL SWP DELIVERIES
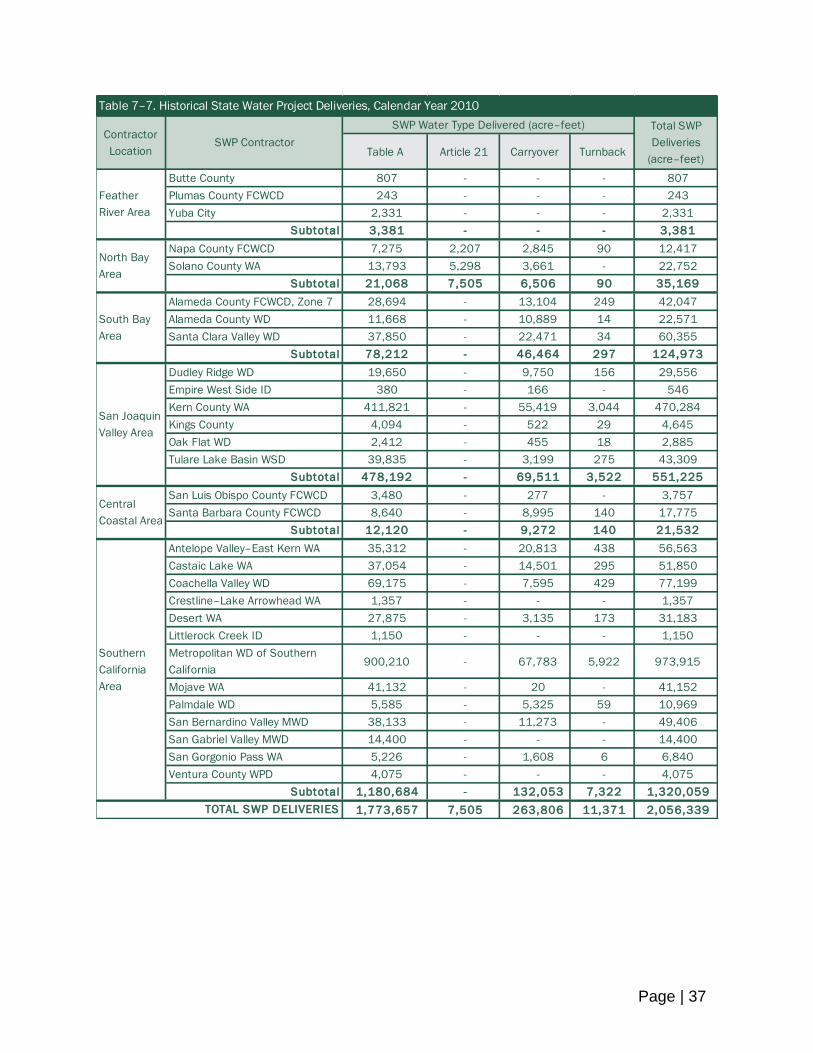
Page | 37
0.16 0.36 0.55 0.75 0.94 1.14 1.33 1.52 1.72 1.91 2.11 2.30 2.50 2.69 2.89 3.08 3.27 3.47 3.66 3.86 4.05 4.25 4.44 4.64 4.83 5.02
Table A Article 21 Carryover Turnback
Butte County 807 - - - 807
Plumas County FCWCD 243 - - - 243
Yuba City 2,331 - - - 2,331
Subtotal 3,381 - - - 3,381
Napa County FCWCD 7,275 2,207 2,845 90 12,417
Solano County WA 13,793 5,298 3,661 - 22,752
Subtotal 21,068 7,505 6,506 90 35,169
Alameda County FCWCD, Zone 7 28,694 - 13,104 249 42,047
Alameda County WD 11,668 - 10,889 14 22,571
Santa Clara Valley WD 37,850 - 22,471 34 60,355
Subtotal 78,212 - 46,464 297 124,973
Dudley Ridge WD 19,650 - 9,750 156 29,556
Empire West Side ID 380 - 166 - 546
Kern County WA 411,821 - 55,419 3,044 470,284
Kings County 4,094 - 522 29 4,645
Oak Flat WD 2,412 - 455 18 2,885
Tulare Lake Basin WSD 39,835 - 3,199 275 43,309
Subtotal 478,192 - 69,511 3,522 551,225
San Luis Obispo County FCWCD 3,480 - 277 - 3,757
Santa Barbara County FCWCD 8,640 - 8,995 140 17,775
Subtotal 12,120 - 9,272 140 21,532
Antelope Valley–East Kern WA 35,312 - 20,813 438 56,563
Castaic Lake WA 37,054 - 14,501 295 51,850
Coachella Valley WD 69,175 - 7,595 429 77,199
Crestline–Lake Arrowhead WA 1,357 - - - 1,357
Desert WA 27,875 - 3,135 173 31,183
Littlerock Creek ID 1,150 - - - 1,150
Metropolitan WD of Southern
California 900,210 - 67,783 5,922 973,915
Mojave WA 41,132 - 20 - 41,152
Palmdale WD 5,585 - 5,325 59 10,969
San Bernardino Valley MWD 38,133 - 11,273 - 49,406
San Gabriel Valley MWD 14,400 - - - 14,400
San Gorgonio Pass WA 5,226 - 1,608 6 6,840
Ventura County WPD 4,075 - - - 4,075
Subtotal 1,180,684 - 132,053 7,322 1,320,059
1,773,657 7,505 263,806 11,371 2,056,339
Table 7–7. Historical State Water Project Deliveries, Calendar Year 2010
Contractor
LocationSWP Contractor
SWP Water Type Delivered (acre–feet) Total SWP
Deliveries
(acre–feet)
Feather
River Area
North Bay
Area
South Bay
Area
San Joaquin
Valley Area
Central
Coastal Area
Southern
California
Area
TOTAL SWP DELIVERIES

Page | 38
0.16 0.36 0.55 0.75 0.94 1.14 1.33 1.52 1.72 1.91 2.11 2.30 2.50 2.69 2.89 3.08 3.27 3.47 3.66 3.86 4.05 4.25 4.44 4.64 4.83 5.02
Table A Article 21 Carryover Turnback
Butte County 1,092 - - - 1,092
Plumas County FCWCD 98 - - - 98
Yuba City 2,297 - - - 2,297
Subtotal 3,487 - - - 3,487
Napa County FCWCD 9,426 - 1,388 - 10,814
Solano County WA 9,620 14,739 - - 24,359
Subtotal 19,046 14,739 1,388 - 35,173
Alameda County FCWCD, Zone 7 39,066 - 11,675 1,319 52,060
Alameda County WD 24,813 1,959 9,332 506 36,610
Santa Clara Valley WD 64,538 970 20,491 - 85,999
Subtotal 128,417 2,929 41,498 1,825 174,669
Dudley Ridge WD 40,141 11,666 5,524 823 58,154
Empire West Side ID 1,626 138 151 - 1,915
Kern County WA 753,707 194,119 119,773 16,068 1,083,667
Kings County 5,294 552 558 152 6,556
Oak Flat WD 2,644 - 71 - 2,715
Tulare Lake Basin WSD 39,056 6,909 4,626 1,454 52,045
Subtotal 842,468 213,384 130,703 18,497 1,205,052
San Luis Obispo County FCWCD 3,340 - 479 - 3,819
Santa Barbara County FCWCD 29,132 - 9,318 - 38,450
Subtotal 32,472 - 9,797 - 42,269
Antelope Valley–East Kern WA 77,549 7,629 5,888 - 91,066
Castaic Lake WA 34,067 400 9,332 - 43,799
Coachella Valley WD 88,017 - - 2,262 90,279
Crestline–Lake Arrowhead WA 423 - 51 - 474
Desert WA 36,139 - - 240 36,379
Littlerock Creek ID - - - - -
Metropolitan WD of Southern
California 1,286,935 181,610 55,540 8,237 1,532,322
Mojave WA 4,831 - 268 - 5,099
Palmdale WD 12,294 - 5,019 - 17,313
San Bernardino Valley MWD 30,916 - 7,210 - 38,126
San Gabriel Valley MWD 23,040 - - - 23,040
San Gorgonio Pass WA 8,884 - 1,619 - 10,503
Ventura County WPD 4,000 - - - 4,000
Subtotal 1,607,095 189,639 84,927 10,739 1,892,400
2,632,985 420,691 268,313 31,061 3,353,050
Table 7–8. Historical State Water Project Deliveries, Calendar Year 2011
Contractor
LocationSWP Contractor
SWP Water Type Delivered (acre–feet) Total SWP
Deliveries
(acre–feet)
Feather
River Area
North Bay
Area
South Bay
Area
San Joaquin
Valley Area
Central
Coastal Area
Southern
California
Area
TOTAL SWP DELIVERIES

Page | 39
0.16 0.36 0.55 0.75 0.94 1.14 1.33 1.52 1.72 1.91 2.11 2.30 2.50 2.69 2.89 3.08 3.27 3.47 3.66 3.86 4.05 4.25 4.44 4.64 4.83 5.02
Table A Article 21 Carryover Turnback
Butte County 17,875 - - - 17,875
Plumas County FCWCD 79 - - - 79
Yuba City 2,695 - - - 2,695
Subtotal 20,649 - - - 20,649
Napa County FCWCD 5,065 - 4,278 64 9,407
Solano County WA 11,673 - 9,641 - 21,314
Subtotal 16,738 - 13,919 64 30,721
Alameda County FCWCD, Zone 7 32,301 - 20,357 179 52,837
Alameda County WD 11,951 - 8,787 93 20,831
Santa Clara Valley WD 34,612 - 11,462 222 46,296
Subtotal 78,864 - 40,606 494 119,964
Dudley Ridge WD 17,694 - - 112 17,806
Empire West Side ID 1,468 - 774 - 2,242
Kern County WA 560,969 - 32,477 2,180 595,626
Kings County 5,337 - 2,001 21 7,359
Oak Flat WD 2,596 - 612 - 3,208
Tulare Lake Basin WSD 53,630 - 32,081 197 85,908
Subtotal 641,694 - 67,945 2,510 712,149
San Luis Obispo County FCWCD 3,111 - 833 - 3,944
Santa Barbara County FCWCD 20,874 - 43 - 20,917
Subtotal 23,985 - 876 - 24,861
Antelope Valley–East Kern WA 80,694 - 32,854 - 113,548
Castaic Lake WA 42,707 - 11,350 - 54,057
Coachella Valley WD 89,928 - 22,663 307 112,898
Crestline–Lake Arrowhead WA 624 - - - 624
Desert WA 36,238 - 8,461 124 44,823
Littlerock Creek ID - - - - -
Metropolitan WD of Southern
California 1,086,084 - 118,172 4,241 1,208,497
Mojave WA 4,672 - 6,572 - 11,244
Palmdale WD 9,959 - 4,736 - 14,695
San Bernardino Valley MWD 65,102 - 47,870 - 112,972
San Gabriel Valley MWD 18,720 - - - 18,720
San Gorgonio Pass WA 5,968 - 4,956 - 10,924
Ventura County WPD 4,353 - - - 4,353
Subtotal 1,445,049 - 257,634 4,672 1,707,355
2,226,979 - 380,980 7,740 2,615,699
Table 7–9. Historical State Water Project Deliveries, Calendar Year 2012
Contractor
LocationSWP Contractor
SWP Water Type Delivered (acre–feet) Total SWP
Deliveries
(acre–feet)
Feather
River Area
North Bay
Area
South Bay
Area
San Joaquin
Valley Area
Central
Coastal Area
Southern
California
Area
TOTAL SWP DELIVERIES

Page | 40
0.16 0.36 0.55 0.75 0.94 1.14 1.33 1.52 1.72 1.91 2.11 2.30 2.50 2.69 2.89 3.08 3.27 3.47 3.66 3.86 4.05 4.25 4.44 4.64 4.83 5.02
Table A Article 21 Carryover Turnback
Butte County 9,233 - - - 9,233
Plumas County FCWCD 366 - - - 366
Yuba City 3,360 - 1,490 - 4,850
Subtotal 12,959 - 1,490 - 14,449
Napa County FCWCD 2,963 - 9,075 - 12,038
Solano County WA 5,355 - 17,805 - 23,160
Subtotal 8,318 - 26,880 - 35,198
Alameda County FCWCD, Zone 7 14,059 - 21,042 2,596 37,697
Alameda County WD 4,241 - 15,349 50 19,640
Santa Clara Valley WD 9,353 - 16,261 10,749 36,363
Subtotal 27,653 - 52,652 13,395 93,700
Dudley Ridge WD 6,113 - 9,951 5,412 21,476
Empire West Side ID 1,004 - 482 16 1,502
Kern County WA 314,466 - 73,303 37,005 424,774
Kings County 2,851 - 591 1,000 4,442
Oak Flat WD 583 - 2,200 7 2,790
Tulare Lake Basin WSD 27,803 - 4,169 8,400 40,372
Subtotal 352,820 - 90,696 51,840 495,356
San Luis Obispo County FCWCD 1,178 - 2,503 - 3,681
Santa Barbara County FCWCD 3,252 - 12,233 - 15,485
Subtotal 4,430 - 14,736 - 19,166
Antelope Valley–East Kern WA 37,628 - 13,386 - 51,014
Castaic Lake WA 33,320 - 28,434 - 61,754
Coachella Valley WD 48,423 - - 164 48,587
Crestline–Lake Arrowhead WA 1,368 - 2,000 - 3,368
Desert WA 19,513 - - 66 19,579
Littlerock Creek ID - - - - -
Metropolitan WD of Southern
California 619,863 - 106,288 32,267 758,418
Mojave WA 25,294 - 2,852 - 28,146
Palmdale WD 4,559 - 3,122 - 7,681
San Bernardino Valley MWD 26,159 - 4,426 - 30,585
San Gabriel Valley MWD 10,080 - - - 10,080
San Gorgonio Pass WA 2,339 - 3,729 1,000 7,068
Ventura County WPD 2,890 - - - 2,890
Subtotal 831,436 - 164,237 33,497 1,029,170
1,237,616 - 350,691 98,732 1,687,039
Southern
California
Area
TOTAL SWP DELIVERIES
Table 7–10. Historical State Water Project Deliveries, Calendar Year 2013
Contractor
LocationSWP Contractor
SWP Water Type Delivered (acre–feet) Total SWP
Deliveries
(acre–feet)
Feather
River Area
North Bay
Area
South Bay
Area
San Joaquin
Valley Area
Central
Coastal Area
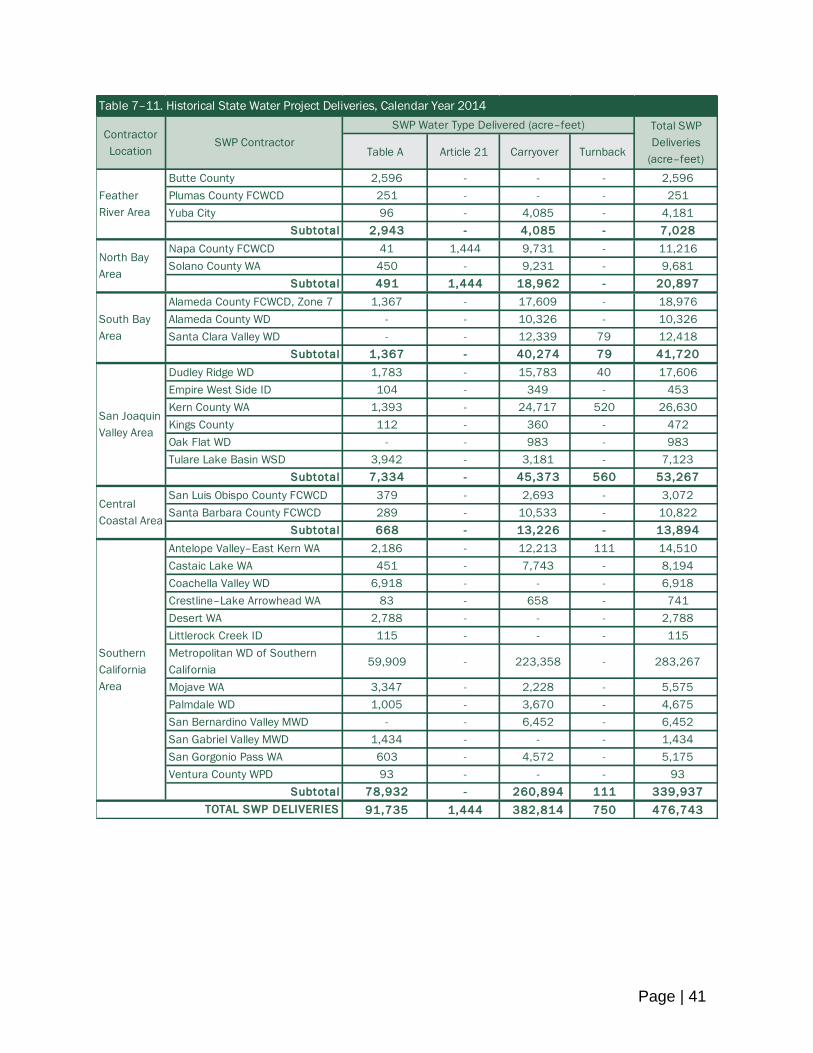
Page | 41
0.16 0.36 0.55 0.75 0.94 1.14 1.33 1.52 1.72 1.91 2.11 2.30 2.50 2.69 2.89 3.08 3.27 3.47 3.66 3.86 4.05 4.25 4.44 4.64 4.83 5.02
Table A Article 21 Carryover Turnback
Butte County 2,596 - - - 2,596
Plumas County FCWCD 251 - - - 251
Yuba City 96 - 4,085 - 4,181
Subtotal 2,943 - 4,085 - 7,028
Napa County FCWCD 41 1,444 9,731 - 11,216
Solano County WA 450 - 9,231 - 9,681
Subtotal 491 1,444 18,962 - 20,897
Alameda County FCWCD, Zone 7 1,367 - 17,609 - 18,976
Alameda County WD - - 10,326 - 10,326
Santa Clara Valley WD - - 12,339 79 12,418
Subtotal 1,367 - 40,274 79 41,720
Dudley Ridge WD 1,783 - 15,783 40 17,606
Empire West Side ID 104 - 349 - 453
Kern County WA 1,393 - 24,717 520 26,630
Kings County 112 - 360 - 472
Oak Flat WD - - 983 - 983
Tulare Lake Basin WSD 3,942 - 3,181 - 7,123
Subtotal 7,334 - 45,373 560 53,267
San Luis Obispo County FCWCD 379 - 2,693 - 3,072
Santa Barbara County FCWCD 289 - 10,533 - 10,822
Subtotal 668 - 13,226 - 13,894
Antelope Valley–East Kern WA 2,186 - 12,213 111 14,510
Castaic Lake WA 451 - 7,743 - 8,194
Coachella Valley WD 6,918 - - - 6,918
Crestline–Lake Arrowhead WA 83 - 658 - 741
Desert WA 2,788 - - - 2,788
Littlerock Creek ID 115 - - - 115
Metropolitan WD of Southern
California 59,909 - 223,358 - 283,267
Mojave WA 3,347 - 2,228 - 5,575
Palmdale WD 1,005 - 3,670 - 4,675
San Bernardino Valley MWD - - 6,452 - 6,452
San Gabriel Valley MWD 1,434 - - - 1,434
San Gorgonio Pass WA 603 - 4,572 - 5,175
Ventura County WPD 93 - - - 93
Subtotal 78,932 - 260,894 111 339,937
91,735 1,444 382,814 750 476,743
Table 7–11. Historical State Water Project Deliveries, Calendar Year 2014
Contractor
LocationSWP Contractor
SWP Water Type Delivered (acre–feet) Total SWP
Deliveries
(acre–feet)
Feather
River Area
North Bay
Area
South Bay
Area
San Joaquin
Valley Area
Central
Coastal Area
Southern
California
Area
TOTAL SWP DELIVERIES
Appendix F. Draft Water Shortage Contingency Plan Resolution

Thispageintentionallyleftblank.
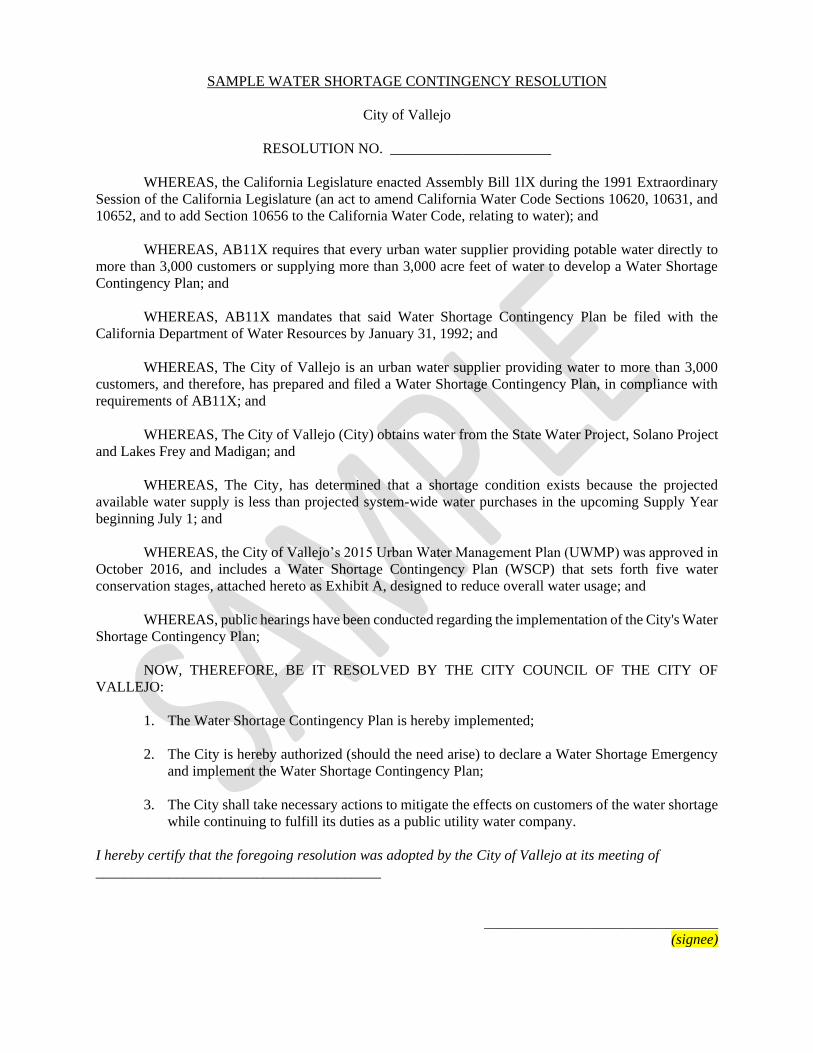
SAMPLE WATER SHORTAGE CONTINGENCY RESOLUTION
City of Vallejo
RESOLUTION NO. ______________________
WHEREAS, the California Legislature enacted Assembly Bill 1lX during the 1991 Extraordinary
Session of the California Legislature (an act to amend California Water Code Sections 10620, 10631, and
10652, and to add Section 10656 to the California Water Code, relating to water); and
WHEREAS, AB11X requires that every urban water supplier providing potable water directly to
more than 3,000 customers or supplying more than 3,000 acre feet of water to develop a Water Shortage
Contingency Plan; and
WHEREAS, AB11X mandates that said Water Shortage Contingency Plan be filed with the
California Department of Water Resources by January 31, 1992; and
WHEREAS, The City of Vallejo is an urban water supplier providing water to more than 3,000
customers, and therefore, has prepared and filed a Water Shortage Contingency Plan, in compliance with
requirements of AB11X; and
WHEREAS, The City of Vallejo (City) obtains water from the State Water Project, Solano Project
and Lakes Frey and Madigan; and
WHEREAS, The City, has determined that a shortage condition exists because the projected
available water supply is less than projected system-wide water purchases in the upcoming Supply Year
beginning July 1; and
WHEREAS, the City of Vallejo’s 2015 Urban Water Management Plan (UWMP) was approved in
October 2016, and includes a Water Shortage Contingency Plan (WSCP) that sets forth five water
conservation stages, attached hereto as Exhibit A, designed to reduce overall water usage; and
WHEREAS, public hearings have been conducted regarding the implementation of the City's Water
Shortage Contingency Plan;
NOW, THEREFORE, BE IT RESOLVED BY THE CITY COUNCIL OF THE CITY OF
VALLEJO:
1. The Water Shortage Contingency Plan is hereby implemented;
2. The City is hereby authorized (should the need arise) to declare a Water Shortage Emergency
and implement the Water Shortage Contingency Plan;
3. The City shall take necessary actions to mitigate the effects on customers of the water shortage
while continuing to fulfill its duties as a public utility water company.
I hereby certify that the foregoing resolution was adopted by the City of Vallejo at its meeting of
_______________________________________
________________________________
(signee)
Appendix G. Water Savings Incentive Program Terms and Conditions

Thispageintentionallyleftblank.
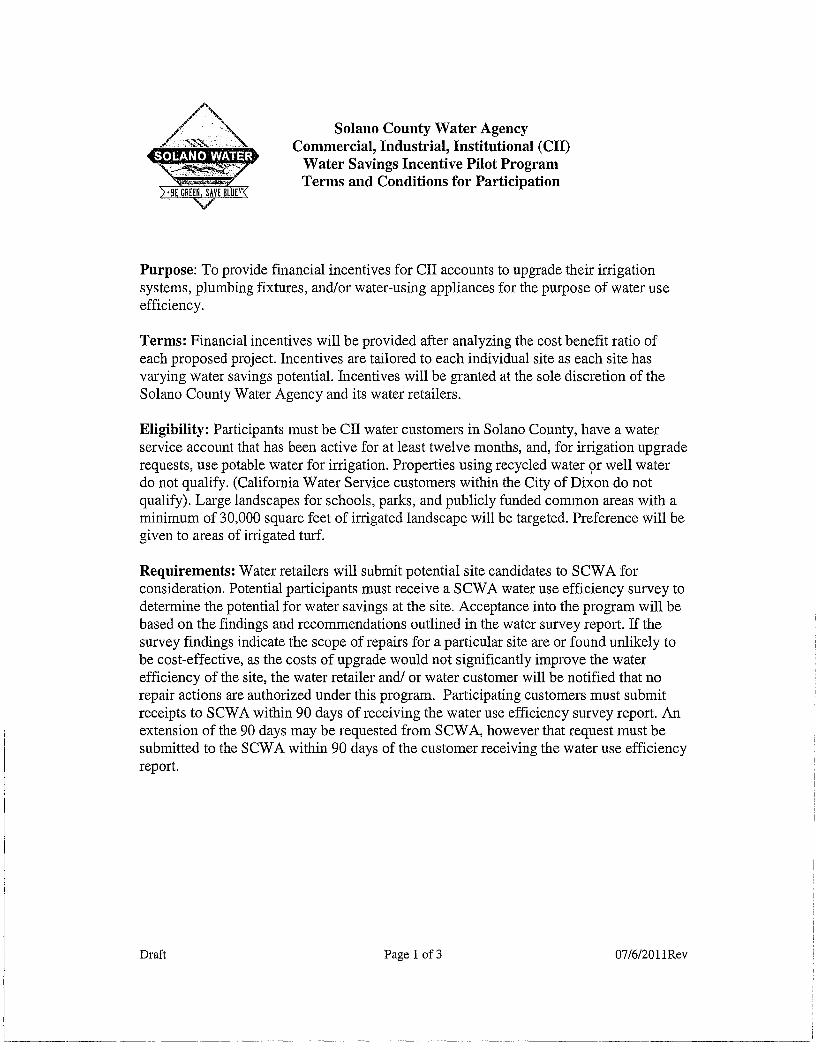
Solano County Water Agency Commercial, Industrial, Institutional (CII)
Water Savings Incentive Pilot Program Terms and Conditions for Participation
Purpose: To provide financial incentives for CII accounts to upgrade their irrigation systems, plumbing fixtures, and/or water-using appliances for the purpose of water use efficiency.
Terms: Financial incentives will be provided after analyzing the cost benefit ratio of each proposed project. Incentives are tailored to each individual site as each site has varying water savings potential. Incentives will be granted at the sole discretion of the Solano County Water Agency and its water retailers.
Eligibility: Participants must be Cll water customers in Solano County, have a water service account that has been active for at least twelve months, and, for irrigation upgrade requests, use potable water for irrigation. Properties using recycled water or well water do not qualify. (California Water Service customers within the City ofDi~on do not qualify). Large landscapes for schools, parks, and publicly funded common areas with a minimum of 30,000 square feet of irrigated landscape will be targeted. Preference will be given to areas of irrigated turf.
Requirements: Water retailers will submit potential site candidates to SCW A for consideration. Potential participants must receive a SCW A water use efficiency survey to determine the potential for water savings at the site. Acceptance into the program will be based on the findings and recommendations outlined in the water survey report. If the survey findings indicate the scope of repairs for a particular site are or found unlikely to be cost-effective, as the costs of upgrade would not significantly improve the water efficiency of the site, the water retailer and/ or water customer will be notified that no repair actions are authorized under this program. Participating customers must submit receipts to SCW A within 90 days of receiving the water use efficiency survey report. An extension of the 90 days may be requested from SCW A, however that request must be submitted to the SCW A within 90 days of the customer receiving the water use efficiency report.
Draft Page 1 of3 07/6/2011Rev
Rebate or Direct Installation Amount: Each publicly-funded site (non-residential, noncommercial), defined as a water account, will be eligible for up to a maximum of $10,000 in rebates or upgrades in addition to rebates or direct installations received by other SCW A water conservation programs including High Efficiency Toilet installations or weather-based irrigation controllers. Publicly funded sites will receive 100% reimbursement up to $10,000 per account on a pre-approved basis.
When the program serves commercial accounts, reimbursements will be 50% of expenditures, on a pre-approved basis, up to a maximum of $5,000 total expenditures.
Irrigation System elements eligible for reimbursement: Water customers will be reimbursed for the cost of replacing existing irrigation system parts and equipment only. No labor costs will be covered by this program. Eligible expenses include:
• Replacement or upgrade to irrigation equipment (replacement of rotor or spray equipment, replacement with drip, etc.)
• Replacement of sprinkler heads for matching precipitation rates • Pressure regulators and station control devices • Rain sensors/ shut-off devices • On a limited basis, new parts and equipment may be eligible for reimbursements
to accommodate small modifications to existing systems to improve overall water , efficiency (e.g. adding additional spray heads to an existing line.) Such requests
must be requested and approved by SCW A It is recommended that these requests be made prior to installation to ensure eligibility for reimbursement.
Indoor Water Use Systems or Fixtures Eligible for reimbursement: Replacement or upgrades of indoor water use systems or fixtures will be determined on a case by case basis depending on the results of the survey, and the needs and water savings potential for the site.
How to Participate: • Accept a water efficiency survey. If the results of the survey suggest a significant
potential for water savings with installation of efficiency upgrades to irrigation or water using fixtures, apply for the Solano County Water savings Incentive Program.
• Obtain written confirmation from Solano County Water Agency water conservation program for upgrades.
• Purchase and install, or hire a contractor to install, the efficiency equipment. • Provide original receipts to SCWA for reimbursement within 90 days of receiving
the results of the water conservation survey.
Additional Information: • Applicant name must be the same as water account customer of record. • This program shall at all times be subject to change or termination without prior
notice.
Draft Page 2 of3 07/6/2011Rev
-----~---·---------------~------------·~------

• Funding is limited. Program participation is available on a first come, first-served basis only. Program participation is subject to availability of funds and will end upon depletion of program funding.
• sew A reserves the right to deny any application that does not meet all requirements for program participation. Due to variables beyond the control of sew A, the Agency cannot guarantee that the installation of any of the program elements will result in a lower utility bill. Applicant waives and releases SeW A, participating water utilities, and their contractors or agents from any and all claims and causes of action arising out of the installation and use of this product. SeW A is not responsible for any damage that may occur to participants' property as a result of the program.
Draft Page 3 of3 07/6/2011Rev
Appendix H. Public and Agency Notices, Meeting Agenda and Comments

Thispageintentionallyleftblank.

60 Day Notice Letters
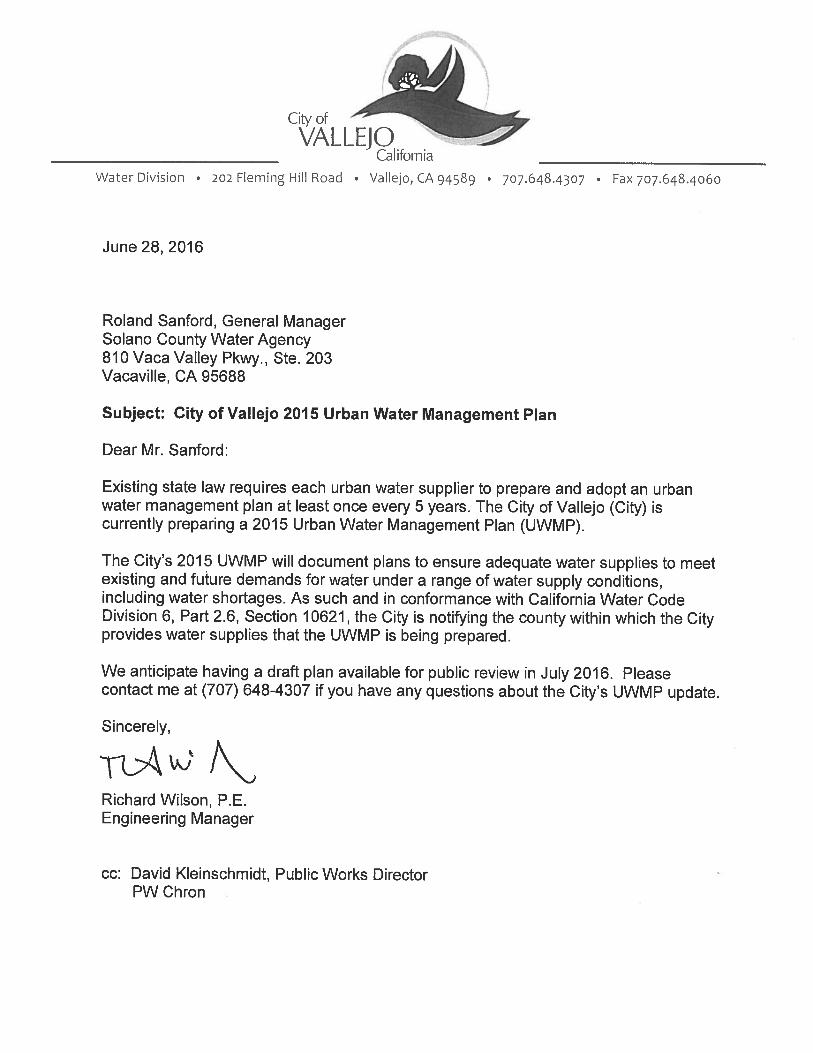
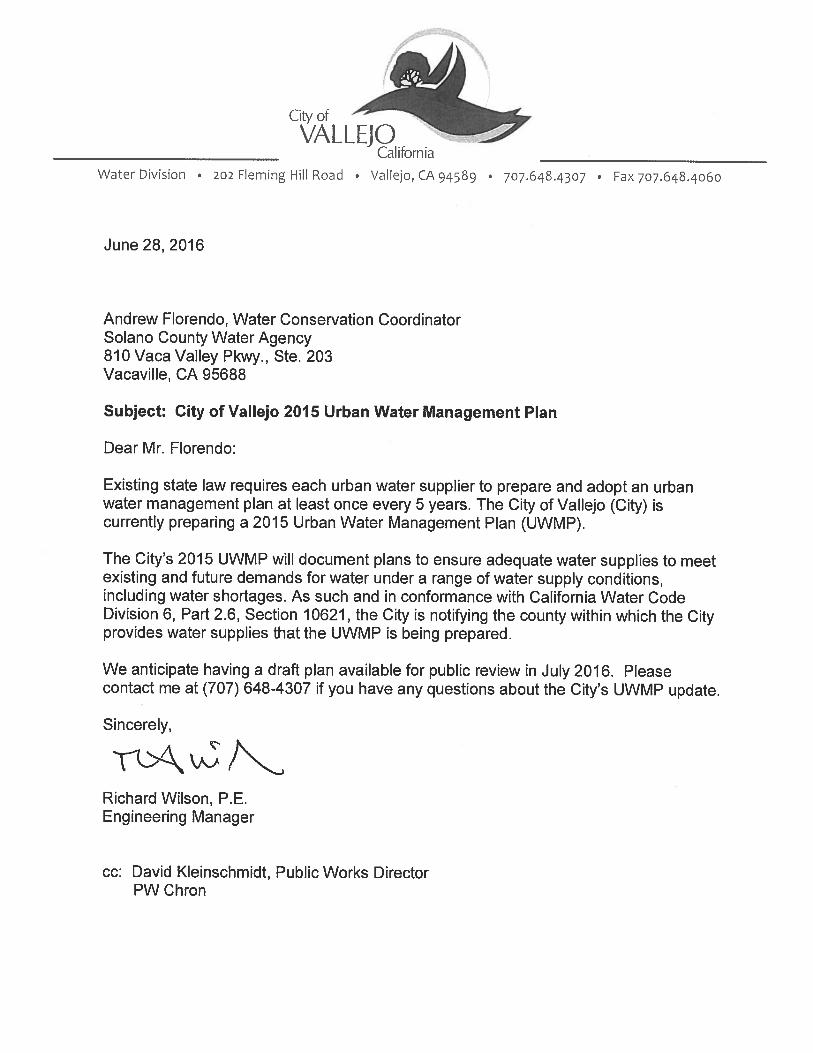


Newspaper Notices
(copies of Daily Republic notice placements
followed by confirmation of placement in
Times-Herald)

State opens pathway for cars that lack steering wheelThe AssociATed Press
California regulators have changed course and opened a pathway for the public to get self-driving cars of the future that lack a steering wheel or pedals.
It’s not going to happen immediately – automakers and tech companies are still testing prototypes.
But, in a shift, the state’s Department of Motor Vehi-cles said in a revision of draft regulations released late Friday that the most advanced self-driving cars would no longer be required to have a licensed driver if federal officials deem them safe enough.
The redrafted regula-tions will be the subject of a public hearing Oct. 19 in Sacramento.
The DMV has been wrestling for several years with how to oversee the emerging technology.
In December, the agency released an initial draft of self-driving car regulations that required a licensed driver in any self-driving vehicle. The industry reacted with great disap-pointment, as the ultimate vision of many companies is a car that has no wheel or pedals.
That approach is based on the argument that humans are not very good at driving, and anyway cannot be relied on as a backup to a car that typi-cally drives itself but might fail in a way that required a person in the driver’s seat who might be distracted or
even asleep to snap to atten-tion.
The DMV’s new docu-ment coincides with the release last week of a 112-page federal proposal under which any self-driv-ing car should pass a 15-point safety assessment before the public can get ahold of it. Among other things, the safety assess-ment asks automakers to document how the car detects and avoids objects and pedestrians, how hard-ened it is against cyberat-tacks and what how its backup systems will cope should the software fail. In incorporating the federal
approach, California dropped a proposal that a third-party company certify the safety of self-driving cars.
The new draft regula-tions released Friday include several other new provisions. Among them is wording that would pro-hibit advertising vehicles with lower levels of automa-tion – such as Tesla Motors’ Autopilot, which on divided highways can keep a car’s lane, brake and accelerate on the understanding that a person is paying attention all the time – from being advertised as “autono-mous” or “self-driving.”
Father: Son’s killing is a ‘turning point’ to change policeThe AssociATed Press
EL CAJON — The father of an unarmed black man who was fatally shot by police in a San Diego suburb on Saturday told hundreds of demonstrators who peacefully marched through downtown streets that his son’s death was a turning point in a struggle to change police practices.
Richard Olango Abuka called the El Cajon officer who fired his gun “a coward” and demanded that Police Chief Jeff Davis resign.
The orderly protest fol-lowed days of angry, some-times unruly, protests that led to Friday’s release of two videos by the authori-ties, something that the family and community had urged.
The videos show the officer fired four times at close range almost immedi-ately after Alfred Olango, 38, suddenly raised both hands to chest level and took what police described as a shooting stance. In addition to the videos, police showed the 4-inch electronic cigarette device Olango had in his hands when he was shot.
The shots came less than a minute after police arrived at the scene in response to Olango’s sister calling 911 and reporting he was acting erratically.
There was a modest
police presence Saturday to direct traffic as demonstra-tors walked from one rally to another, shouting Olan-go’s name in unison as they made a short loop through the heart of the city of 104,000 people to Civic Center Plaza, which includes police headquar-ters. There were no reports of arrests or property damage.
“We must be united in this fight until we achieve our goals,” Richard Olango Abuka told the crowd. “Alfred’s death is going to be a turning point, and the change is now.”
The father didn’t directly address the videos but other speakers did. The Rev. Frank Placone-Willey of Summit Unitarian Uni-versalist Fellowship in nearby Santee, California, read an email from a parishioner who watched them and questioned if police would have responded less aggres-sively if Olango were white.
“As long as Mr. Olango was not causing harm other than possibly blocking traffic, the officers should have taken steps to deesca-late the situation,” Placone-Willey read from the email, sparking applause.
Several speakers said the incident highlighted a need for more police train-ing on how to handle people who are in mental distress.
The incident is the latest
in a series of fatal shootings of black men that have roiled communities across the U.S. It came weeks after fatal shootings by police in Tulsa, Oklahoma, and Charlotte, North Caro-lina.
Olango, a Ugandan refugee who arrived in the U.S. as a boy, had a crimi-nal record that included drug and weapon charges but no violence. His family described him as a loving father and a joyful, happy person.
His mother said he suf-fered a mental breakdown recently after the death of his best friend. On Tuesday, his sister called 911 and reported he was acting strangely and walking into traffic by a strip mall.
The longer of the two videos released by police came from a surveillance camera in the drive-thru of a restaurant. It is roughly a minute, has no sound and police blurred out the heads of everyone in it.
Olango is seen walking through the parking lot and then stopping suddenly as Officer Richard Gonsalves approached, his weapon drawn at his side.
Olango, his right hand in his pants pocket, moved side to side and backed up toward a white pickup truck.
As Gonsalves moved in from the front, a second officer got out of a cruiser
and approached from the side.
In the second video, taken on a cellphone by a witness in the drive-thru, Olango’s sister is seen approaching Gonsalves from behind and a woman can be heard screaming at Olango to put up his hands and telling police not to shoot.
Olango then bent over and assumed the shooting stance. Gonsalves quickly fired four shots at close range.
s t a t e DAILY REPUBLIC — Sunday, October 2, 2016 a5
Emmy GreeneExecutive Council/REALTOR®Lic. #01350961
Direct: (707) 803-2733Fax: (707) 864-1852
www.SolanoHomesToday.com
E-mail: [email protected]
By the way...We’re in a new market; and I am at your service.
Call Emmy Greene for a private consultation (707) 803-2733
707-427-0445
FREE ESTIMATES� Exterior� Elastomeric Coatings� Wood Siding & Stucco
Repair� Interior� Drywall Repair� Installation of Crown
Moulding & Baseboards
0445707 427 0
BEST PAINTING CONTRACTOR
ALL WORK GUARANTEED!
Residential & Commercial Painting
Serving Solano County for over
22 years
RUNNER-UP
RUNNER-UPRUNNER-UP
RUNNER-UPRUNNER-UP
RUNNER UP
Readers’ChoiceChoiceDAILY REPUBLIC
20132013Readers’ChoiceChoice
DAILY REPUBLIC
20122012Readers’ChoiChoi
DAILY REPUBLIC
20112011
DAILY REPUBLIC
Readers’ChoiceChoice20162016
Earthquake alert issued for SoCal
SANTA ANA — South-ern California residents should remain on height-ened alert until Tuesday for the increased possibility of a major earthquake, offi-cials said.
The warning by the Gov-ernor’s Office of Emergency Services follows a series of small temblors deep under the Salton Sea, which is located on the 800-mile-long San Andreas fault, the Orange County Register reported Saturday.
— The Associated Press
The Associated Press
Winnie Olango, center, sister of alfred Olango, is consoled by two friends before a march saturday, in reaction to the fatal police shooting of her brother, in el Cajon.
In brief
Procession, crowning of Mary set in Oakville
FAIRFIELD — The Carmelite House of Prayer will host a rosary proces-sion and crowning to honor the Virgin Mary at 2 p.m. Sunday.
The event is at 20 Mount Carmel Drive, Oakville. All are welcome.
For more information, call 434-0605 or visit www.oakvillecarmelites.com/marian-rosary-and-crown-ing.html.
Free flu shots available at Solano libraries
FAIRFIELD — Solano County Library is partner-ing with the county’s Public Health Services depart-ment to keep residents flu-free this fall.
“We welcome the oppor-tunity to provide a service that is helpful to just about everyone. Getting the flu is miserable and it can be dangerous as well,” said Bonnie Katz, Solano Coun-ty’s director of library ser-vices, in a press release.
The free, drop-in flu clinics are from 1 to 4 p.m.:
n Oct. 20 at Rio Vista Library, 44 S. 2nd St.
n Oct. 24 at Vacaville Public Library-Town Square, 1 Town Square Place.
n Oct. 27 at Suisun City Library, 601 Pintail Drive.
n Oct. 28 at Fairfield
Civic Center Library, 1150 Kentucky St.
n Nov. 1 at John F. Kennedy Library, 505 Santa Clara St., Vallejo.
n Nov. 2 at Vacaville Public Library-Cultural Center, 1020 Ulatis Drive.
For more information, visit www.solanolibrary.com.
Paranormal group talks Solano haunts
VACAVILLE — Ever wonder what lurks in the shadows or goes bump in the night in Solano County?
The Solano County para-normal team will give an insight into local haunts around the county starting at 5:30 p.m. Thursday at the Vacaville Public Library-Town Square, 1 Town Square Pace.
Team members will discuss their experiences and share the paranormal evidence they’ve discov-ered. The program is free. Seating is limited.
For more information, call 1-866-57-ASKUS or visit the Solano County Library events calendar at www.solanolibrary.com.
DAR chapter to mark golden anniversary
FAIRFIELD — The Chief Solano Chapter of the National Society Daughters of the American Revolution will meet at 11 a.m. Satur-
day at the Courtyard by Marriott, 1350 Holiday Lane.
The organization will celebrate its 50th anniver-sary. The chapter was formed Oct. 15, 1966, in Vacaville.
Those attending are asked to wear something pink to help promote Breast Cancer Awareness Month. Prospective members and guests are invited. Reser-vations are required and needed by Wednesday.
For more information, call 429-3470.
Elks Lodge to sponsor scholarship applicants
VACAVILLE — The Vacaville Elks Lodge will sponsor student applicants from Fairfield, Vacaville, Dixon, Winters and Rio Vista-area high schools at the national finals.
Information concerning the Elks scholarship program has been provided to all local high schools.
Applications and full instructions are also avail-able online at enf.elks.org/mvs. The deadline for applications is Nov. 30. All applications must be sub-mitted online.
The Elks will award more than $2.4 million in scholarships this year. The 500 national four-year scholarships range from $4,000 to $50,000.
Males and females compete separately and judging criteria includes, but is not limited to, scho-lastics, SAT scores, leader-
ship, community service and financial need. Appli-cants need not be related to a member of the Elks.
Several local applicants have advanced to the national finals over the past 20 years, according to a press release from the Vacaville Elks.
For more information, call Bob Meador, the Vacaville Elks scholarship chairman, at 480-7866 or send him an email at [email protected].
Juvenile justice council sets Fairfield meet
FAIRFIELD — The Juvenile Justice Coordinat-ing Council will meet at 1:30 p.m. Wednesday at the county administration center, 675 Texas St., in Conference Room 6004 on the sixth floor.
The agenda includes a review of the diversion pro-grams available for juve-niles through local police departments and the Pro-bation Department. An update on the County Multi-Agency Juvenile Justice Action Plan is also on the agenda.
For more information, visit www.solanocounty.com/depts/probation/jjcc/default.asp.
S o l a n o DAILY REPUBLIC — Wednesday, October 12, 2016 a5
In brief
A5
NOTICE OF PUBLIC HEARING AND AVAILABILITYOF CITY OF VALLEJO DRAFT
2015 URBAN WATER MANAGEMENT PLAN
For further information, please contact: Pamela Sahin, Water Convservation Coordinator
Date of Notice:
Josh Redsun/Daily Republic
Tunnel visionMatias IImas, 5 slides down a slide at larry’s Produce Pumpkin patch, Fairfield. Tuesday.
Libraries partner with Hoopla for free streamingDaily Republic staff
FAIRFIELD — Thou-sands of movies, TV shows, music albums, e-books, audio books and comics are now available to Solano County residents for mobile and online devices through a new partnership with Hoopla Digital.
“We continually strive to serve the community in new and inventive ways that empower our custom-ers to explore and grow,” said Bonnie Katz, Solano County’s director of library services, in a press release.
Library card-holders can download the free Hoopla digital mobile app on their Android or iOS device or visit www.s o l a n o l i b r a r y. c o m /
ebooks-and-more to begin enjoying thousands of titles – from Hollywood studios, record companies and publishers.
The content is available to borrow 24/7, for instant streaming or temporary downloading to smart-phones, tablets and com-puters.
“This new service will give Solano residents the ability to instantly enjoy thousands of new titles on their mobile devices and computers, giving them access to the library, any time, any place. Hoopla is easy to use and because it is digital, there is no need to return an item and no late fees,” Katz said in the release.
Reach the Daily Republic newsroom at 425-4646.
Suspect in Allan Witt Park assault back in courtJess sullivanDaily Republic
FAIRFIELD — A former Solano Commu-nity College basketball player is once again in trouble with the law.
Shackled, chained and wearing jailhouse garb, Jainice Robinson was in court Tuesday afternoon after having been arrested last week in Contra Costa County.
Robinson’s court appearance was brief. She was ordered to appear in court Friday in front of Judge Wendy G. Getty. Robinson will remain locked up until then.
Getty ordered Robin-son in April to serve six months in the county jail for her role in a 2015 ambush attack of a former friend in Allan Witt Park along with her sister and a friend, both of whom were also on the college’s basketball team. The former friend was beaten and the car she was in was damaged with baseball bats.
A jury trial earlier this year ended with Robinson
being found guilty of felony vandalism and felony assault with intent to cause great bodily injury.
When Robinson, who faced a possible five-year prison term, was sen-tenced, she was allowed to turn herself in to the jail by June 30.
She never showed up.A warrant for her
arrest went out in early July and she remained on the lam until authori-ties recently rounded her up.
Getty and prosecutors may reconsider Robin-son’s six-month jail sen-tence.
Robinson and her sister sued the college in federal court after the fight in the park led to their expul-sion. The racial discrimi-nation lawsuit is currently set for a jury trial in October and November 2017.
Reach Jess Sullivan at 427-6919 or [email protected]. Follow him on Twitter at www.twitter.com/jsullivandr.
SF officer shot in head, suspect in custodyThe AssociATed Press
SAN FRANCISCO — A San Francisco police officer was critically injured after being shot in the head while responding to reports of a mentally disturbed person. The officer is expected to survive.
San Francisco Police spokeswoman Officer Giselle Talkoff says offi-cers were responding Friday night to the Lake-shore Shopping Center on a call about a man causing a disturbance
and threatening people.Talkoff says that when
the officers made contact with the suspect he fired multiple shots, striking the officer in the head.
She says officers fired shots at the suspect as he
fled. He went down but wouldn’t drop the gun and refused to surrender. Police distracted him with flash-bang grenades and were able to arrest him. He was taken to a hospital for treatment.
Talkoff says the
wounded officer, who was
not identified, is in critical
condition. He is conscious
and with his family
members.
s o l a n o / s t a t e DAILY REPUBLIC — Sunday, October 16, 2016 a5
Michael O’RourkeBranch Manager/Mortgage Consultant
707-455-7070CA BRE #01258806/01215943
Licensed by the Dept. of Business Oversight under the CRMLA.
NMLS# 214645/1850
479 Mason St., #109, Vacaville, CA 95688
Let me help you Purchase the home of your dreams
Lic# 815820
INTERIOR • EXTERIORDETAILED PREP WORK • THOROUGH CLEANUP
WOOD REFINISHING • DRYWALL REPAIR • SIDING REPAIR
www.morenopainting.net
$350 Off any job over $1800
20 Years Serving Solano County
707.580.1989
Moreno Painting, Inc.
Owner, Alejandro Moreno present on all jobs. Quality Guaranteed.
NOTICE OF PUBLIC HEARING AND AVAILABILITYOF CITY OF VALLEJO DRAFT
2015 URBAN WATER MANAGEMENT PLAN
For further information, please contact: Pamela Sahin, Water Convservation Coordinator
Date of Notice:
Solano supervisors next meet Oct. 25
FAIRFIELD — The Solano County Board of Supervisors will not meet Tuesday – their regularly scheduled third Tuesday off-day in the month.
The board, which also took Oct. 11 off due to the Columbus Day holiday, will next meet at 9 a.m. Oct. 25 in the first-floor chamber of the county building, 675 Texas St. in Fairfield.
The agenda for the meeting will be posted Friday.
Edwards Theatres offers free final debate viewing
FAIRFIELD — Edwards Fairfield Stadium 16 & IMAX, at Solano Town Center, will show the final presidential debate live at 6 p.m. Wednesday.
“See Clinton vs. Trump ‘face off’ one more time,” said Steve Bunnell, chief content and programming officer at Regal Entertain-ment Group, in a press release. “After the success of airing the last debate, including many full audito-riums, we want to continue to encourage our local com-munities to be engaged in public policy and provide Regal guests the unique opportunity to experience the political process on the big screen.”
Admission is free.For more information,
visit www.regmovies.com/promotions/presidential- debate.
CHP announces Age Well Drive Smart class
BENICIA — The Cali-fornia Highway Patrol is hosting a free Age Well Drive Smart class from 9 a.m. to noon Monday at the Benicia Library, 150 E. L St.
The program is designed specifically to help seniors tune their driving skills, refresh their knowledge of the rules of the road and learn more about how normal age-related physi-cal changes can affect driving ability.
To register for the class or for more information, call 428-2100 or visit www.chp.ca.gov.
Adult Recreation Center site of ‘Money Talks’
FAIRFIELD — “Money Talks,” a panel discussion by expert professionals on estate planning, inheri-tance and tax law, family law and other topics, will take place Monday at the Adult Recreation Center.
The free event begins at 1:30 p.m.
Attorney Brian Tubis, accountant Randy Peace and fiduciaries and finan-cial consultants Tom Kiernan, Mark Sievers and Leo Martinez are among panelists.
The center is located at 1200 Civic Center Drive.
GITI, Continental recall defective tires
GITI Tire and Continen-tal Tire have issued recalls affecting about 265,000 vehicles.
GITI is recalling various sizes of its Primewell Valera Touring II, GT Radial Champiro Touring and Dextero Touring DTR1 tires because of a defect that causes cracks in the lower sidewall, causing air to leak out. The potentially dangerous tires will be replaced for free on the more than 250,600 affected vehicles. For more infor-mation, call GITI at 877-342-0882.
Continental Tire is recalling certain Crosscon-tact LX20 tires made in May 2015 that were installed on more than 14,500 General Motors trucks and sports utility vehicles. The tires have a problem that could cause excessive tread wear, vibration, noise, or bulging areas. They also will be replaced for free. For more information, call Continen-tal at 888-799-2168.
— Staff, wire reports
Empty Bowls meal raises cash, awareness to help Solano’s hungrysusAn hilAnddaily republic
FAIRFIELD — The ceramic bowls made by Solano Community College art students covered three tables Saturday at the Food Bank of Contra Costa and Solano’s warehouse in Fairfield.
The hand-crafted bowls were made for the Empty Bowls fundraiser and came in blues, grays and browns.
Some of the people have been taking them home each year for the past eight years as a reminder that people are going hungry right here at home. Others came for the first time and admired the workmanship of the bowls before they got up for some soup and bread.
The Food Bank of
Contra Costa and Solano helps thousands of people each year put food on the table for at least one good meal. The Empty Bowls fundraiser looks to bring in money to help with the holiday season at the food bank.
“The theme of this is Empty Bowls because thousands face empty bowls each night, and we want people to remember that when they look at these bowls,” said Larry Sly, executive director of the Food Bank of Contra Costa and Solano.
He said the organiza-tion feeds 190,000 people each month between Solano and Contra Costa counties.
About 85 people came to have supper, take a tour of the facility and learn about what the food bank
does for the county.Sheila Nipper and Carol
Piel, both of Fairfield, have wanted to attend the event for the past few years but said something always would come up.
“We really wanted to come this year,” Nipper said.
She commented on the beauty of the bowls and the fine work that was put into making them.
“It was hard to decide which bowl to pick,” Piel said.
The meal was a choice of three soups: cream of broccoli, chicken noodle and lentil with bacon. Each soup came from a different sponsor: Englund’s Cafe and Catering, Tony’s 2 Go and Loaves and Fishes. The bread was donated by Boudin SF.
This was the third time
Valisa Langhorne of Vacaville attended the event. She brought her family, including her sister and brother-in-law. She brought her children last year but they had a school event this year.
“I really like what the food bank does,” she said. “I wanted to support that and brought my kids because they need to know about helping people.”
Langhorne has volun-teered at the food bank but recently has slowed down on her volunteer work.
“I was surprised at how many people are strug-gling greatly in this county,” she said. “We really need (the) food bank to help people.”
reach Susan Hiland at 427-6981 or [email protected].
CHP helicopter crew rescues 2 men after boat crashes, sinksdAily rePublic sTAff
MARE ISLAND — Two boaters were rescued Sat-urday afternoon after their boat began to take on water and later sank, the Califor-nia Highway Patrol reports.
The rescue operation began at 1:20 p.m. when the CHP was notified that a boat had crashed near the south end of Mare Island. A CHP helicopter responded to the area and, after a brief search, found the sinking boat and two men standing on a rock jetty.
They were trapped by the rising tide and wind-swept waves were crashing around them, the CHP reports. The U.S. Coast Guard station in Vallejo was notified of the situation
and a rescue boat was sent to the scene. Vallejo Fire Department personnel were notified as well and establish a landing area nearby on Mare Island.
The CHP helicopter crew hoisted the two men individually from the rocks in winds that gusted to 30 mph, the CHP reports, and took them to the landing zone, where emer-gency personnel estab-lished that both men were not injured.
Their boat, however, sank as the rescue opera-tion was taking place, the CHP reports. The cause of the boat crash was not released.
reach the daily republic newsroom at 425-4545.
Susan Hiland/daily republic
sheila nipper and Carol Piel, both of Fairfield, admire the bowls created by students at solano Community College
for the empty Bowls fundraiser hosted by the Food Bank of Contra Costa and solano, saturday.
In brief
subscribe. call 427-6989.
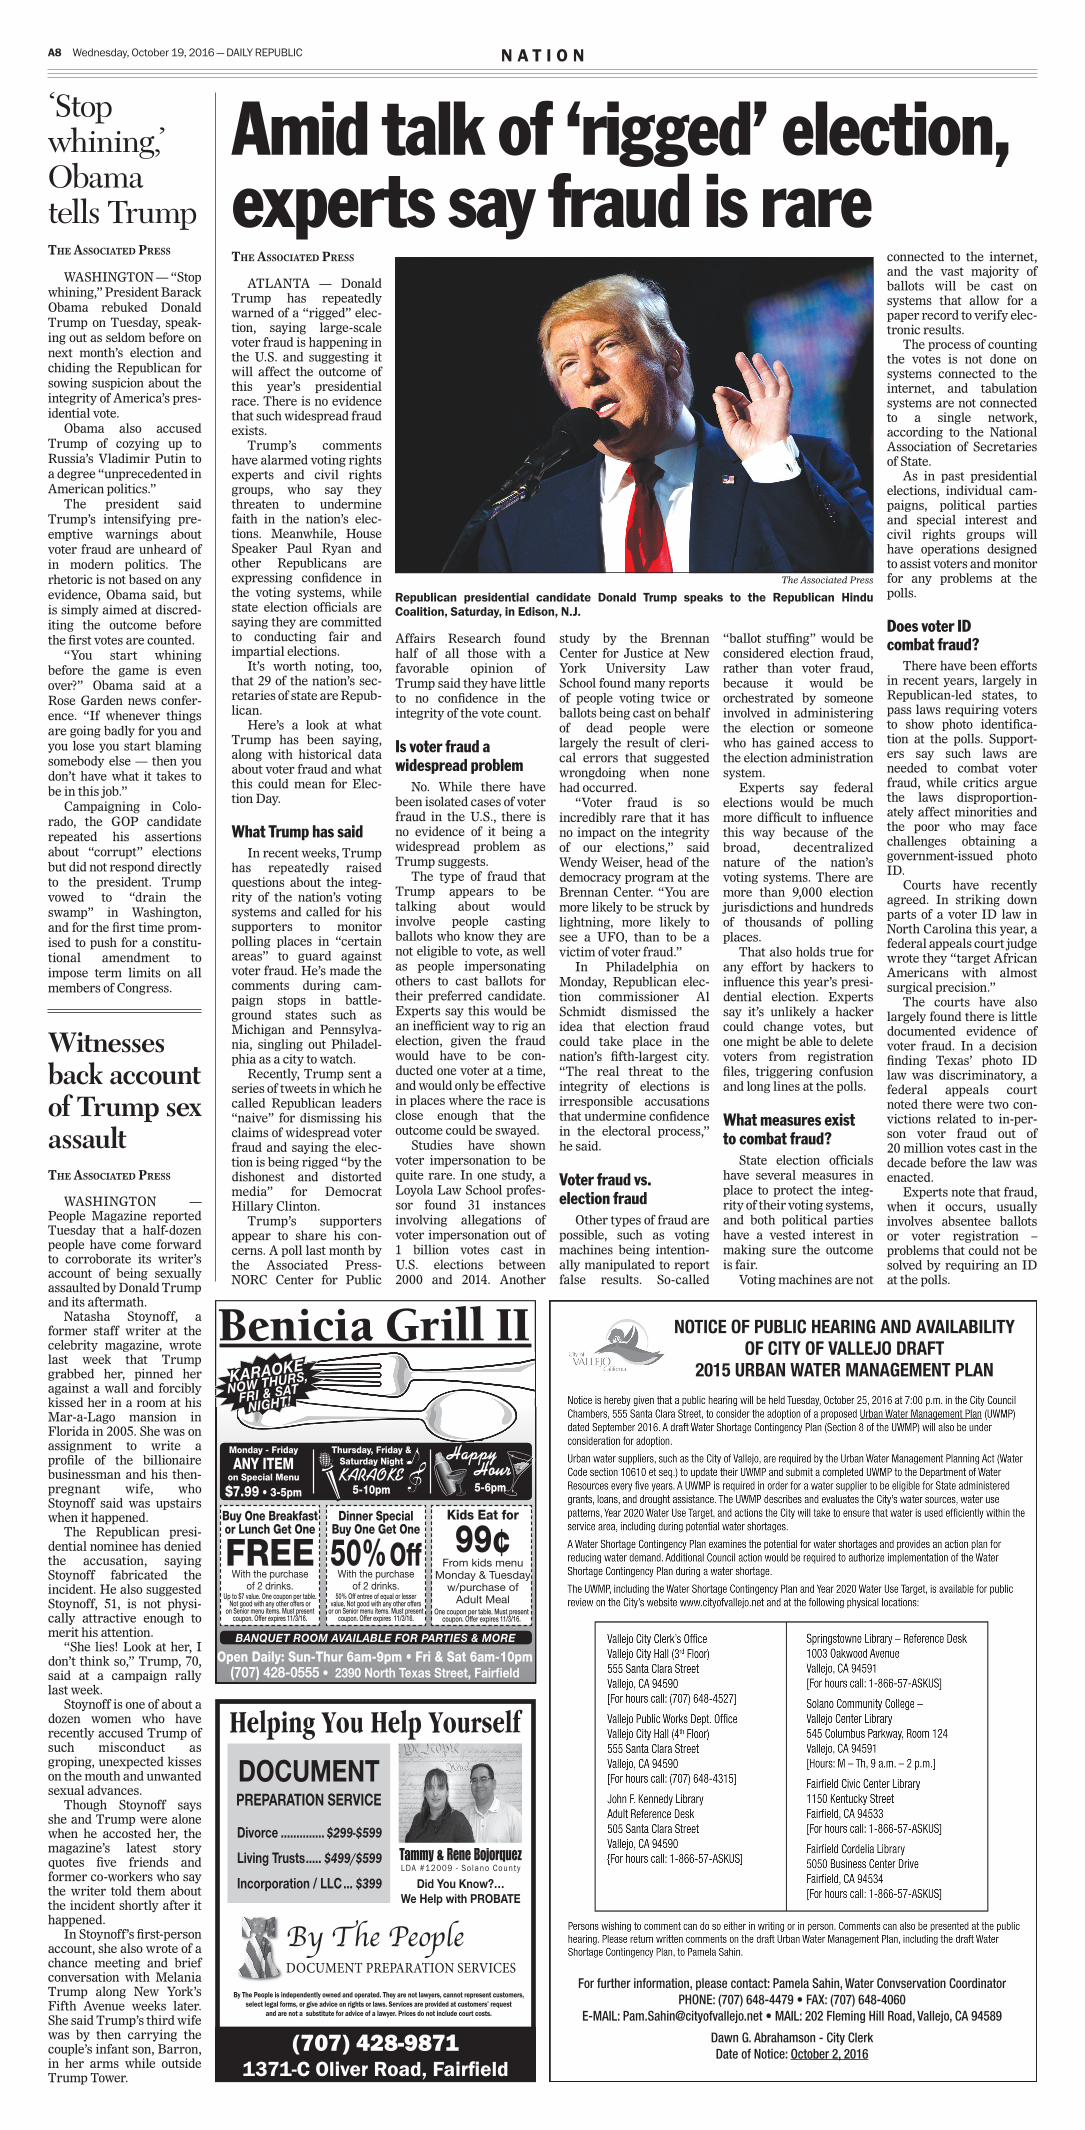
n a t i o n a8 Wednesday, October 19, 2016 — DAILY REPUBLIC
A8
NOTICE OF PUBLIC HEARING AND AVAILABILITYOF CITY OF VALLEJO DRAFT
2015 URBAN WATER MANAGEMENT PLAN
For further information, please contact: Pamela Sahin, Water Convservation Coordinator
Date of Notice: (707) 428-98711371-C Oliver Road, Fairfield
By The People
DOCUMENTPREPARATION SERVICE
Divorce .............. $299-$599
Living Trusts ..... $499/$599
Incorporation / LLC ... $399
Tammy & Rene BojorquezLDA #12009 - So lano County
Did You Know?…We Help with PROBATE
DOCUMENT PREPARATION SERVICES
By The People is independently owned and operated. They are not lawyers, cannot represent customers, select legal forms, or give advice on rights or laws. Services are provided at customers’ request
and are not a substitute for advice of a lawyer. Prices do not include court costs.
Helping You Help Yourself
Benicia Grill II
BANQUET ROOM AVAILABLE FOR PARTIES & MORE
Monday - Friday
ANY ITEMon Special Menu
$7.99
Thursday, Friday & Saturday Night
KARAOKEHappy
Hour
(707) 428-0555
Buy One Breakfast or Lunch Get One
FREE With the purchase
of 2 drinks.
Dinner SpecialBuy One Get One
Off With the purchase
of 2 drinks.Up to $7 value. One coupon per table.
Not good with any other offers or on Senior menu items. Must present
coupon. Offer expires 11/3/16.
50% Off entree of equal or lesser value. Not good with any other offers
or on Senior menu items. Must present coupon. Offer expires 11/3/16.
One coupon per table. Must present coupon. Offer expires 11/3/16.
KARAOKENOW THURS,
FRI & SAT NIGHT!
Kids Eat for
99¢From kids menu
Monday & Tuesdayw/purchase of
Adult Meal
Amid talk of ‘rigged’ election, experts say fraud is rareThe AssociATed Press
ATLANTA — Donald Trump has repeatedly warned of a “rigged” elec-tion, saying large-scale voter fraud is happening in the U.S. and suggesting it will affect the outcome of this year’s presidential race. There is no evidence that such widespread fraud exists.
Trump’s comments have alarmed voting rights experts and civil rights groups, who say they threaten to undermine faith in the nation’s elec-tions. Meanwhile, House Speaker Paul Ryan and other Republicans are expressing confidence in the voting systems, while state election officials are saying they are committed to conducting fair and impartial elections.
It’s worth noting, too, that 29 of the nation’s sec-retaries of state are Repub-lican.
Here’s a look at what Trump has been saying, along with historical data about voter fraud and what this could mean for Elec-tion Day.
What Trump has saidIn recent weeks, Trump
has repeatedly raised questions about the integ-rity of the nation’s voting systems and called for his supporters to monitor polling places in “certain areas” to guard against voter fraud. He’s made the comments during cam-paign stops in battle-ground states such as Michigan and Pennsylva-nia, singling out Philadel-phia as a city to watch.
Recently, Trump sent a series of tweets in which he called Republican leaders “naive” for dismissing his claims of widespread voter fraud and saying the elec-tion is being rigged “by the dishonest and distorted media” for Democrat Hillary Clinton.
Trump’s supporters appear to share his con-cerns. A poll last month by the Associated Press-NORC Center for Public
Affairs Research found half of all those with a favorable opinion of Trump said they have little to no confidence in the integrity of the vote count.
Is voter fraud a widespread problem
No. While there have been isolated cases of voter fraud in the U.S., there is no evidence of it being a widespread problem as Trump suggests.
The type of fraud that Trump appears to be talking about would involve people casting ballots who know they are not eligible to vote, as well as people impersonating others to cast ballots for their preferred candidate. Experts say this would be an inefficient way to rig an election, given the fraud would have to be con-ducted one voter at a time, and would only be effective in places where the race is close enough that the outcome could be swayed.
Studies have shown voter impersonation to be quite rare. In one study, a Loyola Law School profes-sor found 31 instances involving allegations of voter impersonation out of 1 billion votes cast in U.S. elections between 2000 and 2014. Another
study by the Brennan Center for Justice at New York University Law School found many reports of people voting twice or ballots being cast on behalf of dead people were largely the result of cleri-cal errors that suggested wrongdoing when none had occurred.
“Voter fraud is so incredibly rare that it has no impact on the integrity of our elections,” said Wendy Weiser, head of the democracy program at the Brennan Center. “You are more likely to be struck by lightning, more likely to see a UFO, than to be a victim of voter fraud.”
In Philadelphia on Monday, Republican elec-tion commissioner Al Schmidt dismissed the idea that election fraud could take place in the nation’s fifth-largest city. “The real threat to the integrity of elections is irresponsible accusations that undermine confidence in the electoral process,” he said.
Voter fraud vs. election fraud
Other types of fraud are possible, such as voting machines being intention-ally manipulated to report false results. So-called
“ballot stuffing” would be considered election fraud, rather than voter fraud, because it would be orchestrated by someone involved in administering the election or someone who has gained access to the election administration system.
Experts say federal elections would be much more difficult to influence this way because of the broad, decentralized nature of the nation’s voting systems. There are more than 9,000 election jurisdictions and hundreds of thousands of polling places.
That also holds true for any effort by hackers to influence this year’s presi-dential election. Experts say it’s unlikely a hacker could change votes, but one might be able to delete voters from registration files, triggering confusion and long lines at the polls.
What measures exist to combat fraud?
State election officials have several measures in place to protect the integ-rity of their voting systems, and both political parties have a vested interest in making sure the outcome is fair.
Voting machines are not
connected to the internet, and the vast majority of ballots will be cast on systems that allow for a paper record to verify elec-tronic results.
The process of counting the votes is not done on systems connected to the internet, and tabulation systems are not connected to a single network, according to the National Association of Secretaries of State.
As in past presidential elections, individual cam-paigns, political parties and special interest and civil rights groups will have operations designed to assist voters and monitor for any problems at the polls.
Does voter ID combat fraud?
There have been efforts in recent years, largely in Republican-led states, to pass laws requiring voters to show photo identifica-tion at the polls. Support-ers say such laws are needed to combat voter fraud, while critics argue the laws disproportion-ately affect minorities and the poor who may face challenges obtaining a government-issued photo ID.
Courts have recently agreed. In striking down parts of a voter ID law in North Carolina this year, a federal appeals court judge wrote they “target African Americans with almost surgical precision.”
The courts have also largely found there is little documented evidence of voter fraud. In a decision finding Texas’ photo ID law was discriminatory, a federal appeals court noted there were two con-victions related to in-per-son voter fraud out of 20 million votes cast in the decade before the law was enacted.
Experts note that fraud, when it occurs, usually involves absentee ballots or voter registration – problems that could not be solved by requiring an ID at the polls.
Witnesses back account of Trump sex assaultThe AssociATed Press
WASHINGTON — People Magazine reported Tuesday that a half-dozen people have come forward to corroborate its writer’s account of being sexually assaulted by Donald Trump and its aftermath.
Natasha Stoynoff, a former staff writer at the celebrity magazine, wrote last week that Trump grabbed her, pinned her against a wall and forcibly kissed her in a room at his Mar-a-Lago mansion in Florida in 2005. She was on assignment to write a profile of the billionaire businessman and his then-pregnant wife, who Stoynoff said was upstairs when it happened.
The Republican presi-dential nominee has denied the accusation, saying Stoynoff fabricated the incident. He also suggested Stoynoff, 51, is not physi-cally attractive enough to merit his attention.
“She lies! Look at her, I don’t think so,” Trump, 70, said at a campaign rally last week.
Stoynoff is one of about a dozen women who have recently accused Trump of such misconduct as groping, unexpected kisses on the mouth and unwanted sexual advances.
Though Stoynoff says she and Trump were alone when he accosted her, the magazine’s latest story quotes five friends and former co-workers who say the writer told them about the incident shortly after it happened.
In Stoynoff’s first-person account, she also wrote of a chance meeting and brief conversation with Melania Trump along New York’s Fifth Avenue weeks later. She said Trump’s third wife was by then carrying the couple’s infant son, Barron, in her arms while outside Trump Tower.
‘Stop whining,’ Obama tells TrumpThe AssociATed Press
WASHINGTON — “Stop whining,” President Barack Obama rebuked Donald Trump on Tuesday, speak-ing out as seldom before on next month’s election and chiding the Republican for sowing suspicion about the integrity of America’s pres-idential vote.
Obama also accused Trump of cozying up to Russia’s Vladimir Putin to a degree “unprecedented in American politics.”
The president said Trump’s intensifying pre-emptive warnings about voter fraud are unheard of in modern politics. The rhetoric is not based on any evidence, Obama said, but is simply aimed at discred-iting the outcome before the first votes are counted.
“You start whining before the game is even over?” Obama said at a Rose Garden news confer-ence. “If whenever things are going badly for you and you lose you start blaming somebody else — then you don’t have what it takes to be in this job.”
Campaigning in Colo-rado, the GOP candidate repeated his assertions about “corrupt” elections but did not respond directly to the president. Trump vowed to “drain the swamp” in Washington, and for the first time prom-ised to push for a constitu-tional amendment to impose term limits on all members of Congress.
The Associated Press
Republican presidential candidate Donald trump speaks to the Republican Hindu Coalition, Saturday, in Edison, n.J.
2133240
VALLEJO CITY CLERK555 SANTA CLARA ST.VALLEJO, CA 94590
420 Virginia Street, Ste. 2A
Vallejo, CA 94590
530-406-6223
Account Number:
Ad Order Number:
Customer's Reference
/ PO Number:
NOH- UWMP / NOH- UWMP
2133240
0005826734
Publication Dates:
Publication: Vallejo Times-Herald
10/02/2016, 10/11/2016, 10/16/2016, 10/18/2016
Amount: $1,715.00
Payment Amount: $0.00
Invoice Text:
r.BP12-09/30/16 1
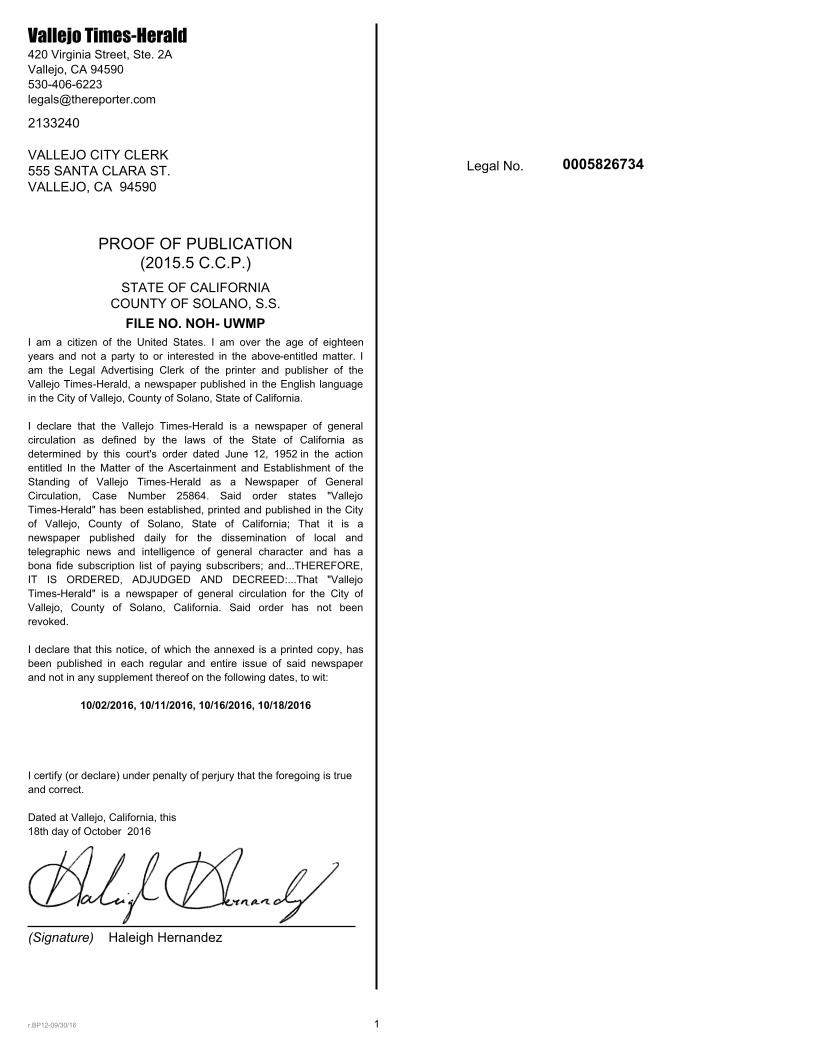
2133240
VALLEJO CITY CLERK555 SANTA CLARA ST.VALLEJO, CA 94590
0005826734
(Signature) Haleigh Hernandez
Legal No.
Vallejo Times-Herald420 Virginia Street, Ste. 2A
Vallejo, CA 94590
530-406-6223
I am a citizen of the United States. I am over the age of eighteen
years and not a party to or interested in the above-entitled matter. I
am the Legal Advertising Clerk of the printer and publisher of the
Vallejo Times-Herald, a newspaper published in the English language
in the City of Vallejo, County of Solano, State of California.
I declare that the Vallejo Times-Herald is a newspaper of general
circulation as defined by the laws of the State of California as
determined by this court's order dated June 12, 1952 in the action
entitled In the Matter of the Ascertainment and Establishment of the
Standing of Vallejo Times-Herald as a Newspaper of General
Circulation, Case Number 25864. Said order states "Vallejo
Times-Herald" has been established, printed and published in the City
of Vallejo, County of Solano, State of California; That it is a
newspaper published daily for the dissemination of local and
telegraphic news and intelligence of general character and has a
bona fide subscription list of paying subscribers; and...THEREFORE,
IT IS ORDERED, ADJUDGED AND DECREED:...That "Vallejo
Times-Herald" is a newspaper of general circulation for the City of
Vallejo, County of Solano, California. Said order has not been
revoked.
I declare that this notice, of which the annexed is a printed copy, has
been published in each regular and entire issue of said newspaper
and not in any supplement thereof on the following dates, to wit:
10/02/2016, 10/11/2016, 10/16/2016, 10/18/2016
I certify (or declare) under penalty of perjury that the foregoing is true
and correct.
Dated at Vallejo, California, this
18th day of October 2016
PROOF OF PUBLICATION(2015.5 C.C.P.)
STATE OF CALIFORNIACOUNTY OF SOLANO, S.S.
FILE NO. NOH- UWMP
r.BP12-09/30/16 1
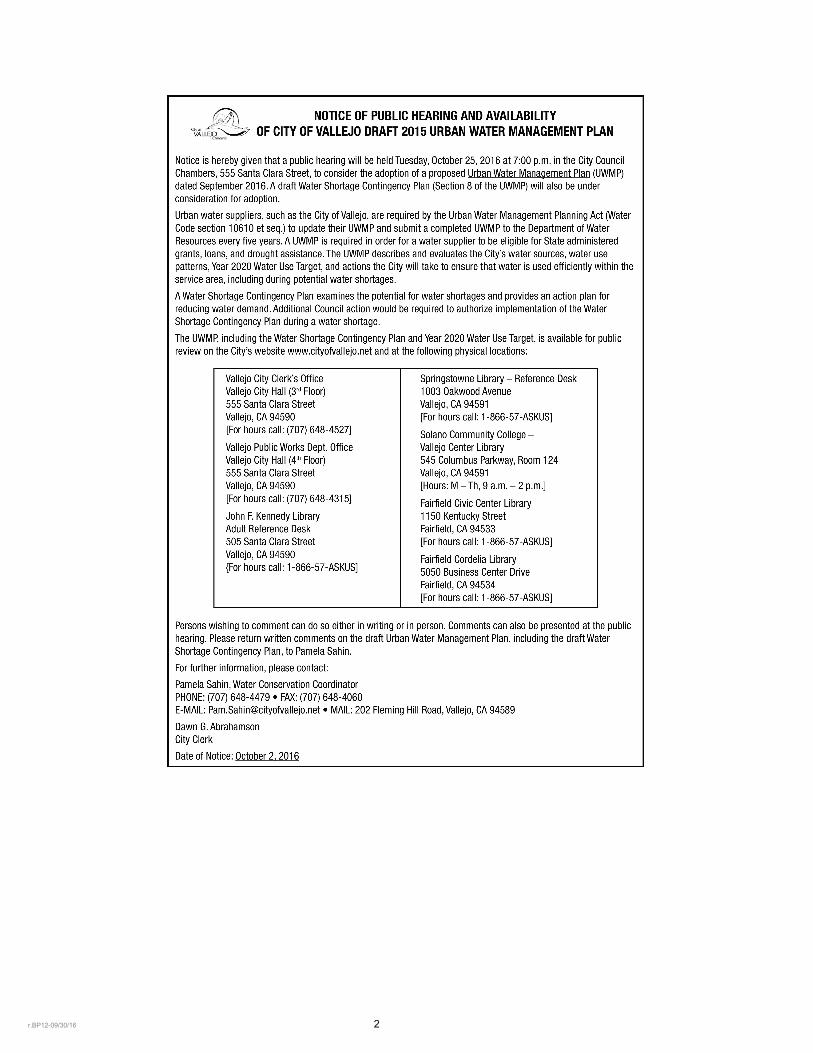
r.BP12-09/30/16 2

Notices of Availability of Public
Draft UWMP


City of Vallejo - City Council
Meeting Agenda
10/25/16
This AGENDA contains a brief general description of each item to be considered. The posting of the recommended actions does not indicate what action may be taken. If comments come to the City Council without prior notice and are not listed on the AGENDA, no specific answers or response should be expected at this meeting per State law. Pursuant to the Government Code Section 54954.3 (The Brown Act), members of the public shall be afforded the opportunity to speak on any agenda item of interest to them provided they are first recognized by the presiding officer. Members of the public wishing to be so recognized are requested to submit a completed speaker card to the City Clerk prior to the consideration of the item. Those wishing to address the Council on any matter for which another opportunity to speak is not provided on the AGENDA but which is within the jurisdiction of the City Council to resolve may come forward to the podium during the "COMMUNITY FORUM" portion of the AGENDA. Members of the public have the right to speak on any item on this agenda. Those wishing to address the Council: 1) during the Community Forum are limited to three minutes pursuant to Vallejo Municipal Code Section 2.20.300; 2) on a Consent Calendar item are limited to three minutes pursuant to Vallejo Municipal Code Section 2.02.310; and an Action Calendar item are limited to five minutes pursuant to Vallejo Municipal Code Section 2.02.420. Notice of Availability of Public Records: All public records relating to an open session item, which are not exempt from disclosure pursuant to the Public Records Act, that are distributed to a majority of the City Council will be available for public inspection at the City Clerk’s Office, 555 Santa Clara Street, Vallejo, CA at the same time that the public records are distributed or made available to the City Council. Such documents may also be available on the City of Vallejo website subject to staff’s ability to post the documents prior to the meeting. Information may be obtained by calling (707) 648-4527, TDD (707) 649-3562. Want more City Information - Members of the public can: Like us on Facebook (www.facebook.com/cityofvallejo) Sign up to receive City Communications via e-mail (www.cityofvallejo.net/living/connect) Sign up to receive City updates and get connected with your neighbors on Nextdoor (www.nextdoor.com)
Vallejo City Council Chambers is ADA compliant. Devices for the hearing impaired are available from the City Clerk. Requests for disability related modifications or accommodations, aids or services may be made by a person with a disability to the City Clerk's office no less than 72 hours prior to the meeting as required by Section 202 of the Americans with Disabilities Act of 1990 and the federal rules and regulations adopted in implementation thereof.
City Hall
555 Santa Clara Street Vallejo, CA 94590
www.cityofvallejo.net
AGENDA
VALLEJO CITY COUNCIL
SPECIAL MEETING – 5:00 P.M.
VALLEJO CITY COUNCIL REGULAR MEETING – 7:00 P.M.
OCTOBER 25, 2016
MAYOR Osby Davis
CITY COUNCIL
Vice Mayor, Rozzana Verder-Aliga, EdD Pippin Dew-Costa
Jesus “Jess” Malgapo Robert H. McConnell
Katy Miessner Bob Sampayan
CALL AND NOTICE OF SPECIAL MEETING
AT 5:00 PM OF THE VALLEJO CITY COUNCIL
OCTOBER 25, 2016
TO THE MEMBERS OF THE VALLEJO CITY COUNCIL: You are hereby notified that I do hereby call the Vallejo City Council in special session to consider only the matters stated on the agenda listed below. NOTICE: Members of the public shall have the opportunity to address the City Council concerning any item listed on the agenda before or during consideration of that item. No other items may be discussed at this special meeting.
1. CALL TO ORDER
2. ROLL CALL
3. CLOSED SESSION
A. Conference with Legal Counsel - Existing Litigation: Acme Transfer and Storage, Inc. v. City of Vallejo, Solano County Superior Court, FCS 041008, pursuant to subsection (a) of Government Code section 54956.9
B. Conference with Labor Negotiators: pursuant to Government Code Section 54957.6. Negotiators: Daniel E. Keen, City Manager; Jasmin Loi, Human Resources Director; and Austris Rungis, IEDA. Employee Organizations: International Association of Firefighters, Local 1186 (IAFF); Vallejo Police Officers Association (VPOA); International Brotherhood of Electrical Workers, Local 1245 (IBEW); Confidential, Administrative and Managerial Professionals (CAMP); and Unrepresented Employees: Executive Management Group.
C. Conference with Real Property Negotiators pursuant to Government Code Section 54956.8 - Property: the parcels generally known as "North Mare Island" including APNS (1) 0066-020-110, (2) 0066-020-130 and (3) 0066-020-150; City Negotiators: Daniel E. Keen, City Manager; and Andrea Ouse, Community & Economic Development Director; Negotiating Parties: FF LLC, a California Liability Company; Under Negotiations: Price and Terms of Payment
4. ADJOURNMENT
Dated: Thursday, October 20, 2016
Osby Davis, Mayor
I, Dawn Abrahamson, City Clerk, do herby certify that I have caused a true copy of the above notice and agenda to be delivered to each of the members of the Vallejo City Council, at the time and in the manner prescribed by law and that this agenda was posted at City Hall, 555 Santa Clara Street, CA at 5:00 p.m., Thursday, October 20, 2016.
Dated: Thursday, October 20, 2016
Dawn G. Abrahamson, City Clerk
VALLEJO CITY COUNCIL REGULAR MEETING – 7:00 PM
COUNCIL CHAMBERS OCTOBER 25, 2016
1. CALL TO ORDER
2. PLEDGE OF ALLEGIANCE
3. ROLL CALL
4. PRESENTATIONS AND COMMENDATIONS
5. FIRST COMMUNITY FORUM
Anyone wishing to address the Council on any matter for which another opportunity to speak is not provided on the agenda, and which is within the jurisdiction of the Council to resolve, is requested to submit a completed speaker card to the City Clerk. When called upon, each speaker should step to the podium, state his /her name, and address for the record. The conduct of the community forum shall be limited to a maximum of fifteen (15) minutes, with each speaker limited to three minutes pursuant to Vallejo Municipal Code Section 2.20.300.
6. PUBLIC COMMENT REGARDING CONSENT CALENDAR ITEMS
Members of the public wishing to address the Council on Consent Calendar Items are requested to submit a completed speaker card to the City Clerk. Each speaker is limited to three minutes pursuant to Vallejo Municipal Code Section 2.02.310. Requests for removal of Consent Items received from the public are subject to approval by a majority vote of the Council. Items removed from the Consent Calendar will be heard immediately after approval of the Consent Calendar and Agenda.
7. CONSENT CALENDAR AND APPROVAL OF AGENDA
A. APPROVAL OF MINUTES
Recommendation: By motion, approve City Council minutes for the meetings of 1) October 11, 2016 (special) and 2) October 11, 2016 (regular). Contact: Dawn G. Abrahamson, City Clerk (707) 648-4528 [email protected]
B. PAYMENT OF CLAIMS - SEPTEMBER 2016
Recommendation: By motion, ratify the payment of claims totaling $5,824,054.26 for the period September 1, 2016, through September 30, 2016. Contact: Ron Millard, Finance Director, (707) 649-3559 [email protected]
C. ADOPT A RESOLUTION AWARDING CONSTRUCTION CONTRACT TO R & R MAHER CONSTRUCTION COMPANY, INC., FOR CDBG WINCHESTER STREET CONCRETE REHABILITATION PROJECT IN THE AMOUNT OF $307,094
Recommendation: Adopt a Resolution approving the project plans and specifications for the CDBG Winchester Street Concrete Rehabilitation Project, and authorizing the City Manager to execute a construction contract in the amount of $307,094 to R & R Maher Construction Company, Inc., of Vallejo, CA as the lowest responsive and responsible bidder, in accordance with the approved plans and specifications. Contact: David A. Kleinschmidt, Public Works Director, (707) 648-4301 [email protected]
D. AUTHORIZE THE CITY MANAGER TO EXECUTE A PURCHASE AGREEMENT IN THE AMOUNT OF $155,985.35 FOR THE PURCHASE AND INSTALLATION OF PUBLIC SAFETY RADIO EQUIPMENT, PURSUANT TO THE SOLE SOURCE EXCEPTION TO COMPETITIVE BIDDING
Recommendation: Authorize the City Manager to sign a purchase agreement in the amount of $155,985.35 for the purchase and installation of public safety radio equipment from Day Wireless, as a sole source exception to competitive bidding pursuant to VMC 3.20.080(A)(3). Contact: Gregory Taylor, Chief Information Officer, (707) 648-4468 [email protected]
E. ADOPT A RESOLUTION EXPRESSING THE CITY OF VALLEJO'S SUPPORT IN RECOGNIZING OCTOBER AS NATIONAL BULLYING PREVENTION MONTH
Recommendation: Adopt a resolution expressing the City of Vallejo's support in recognizing October as National Bullying Prevention Month. Contact: Councilmember McConnell, (707) 648-4135 [email protected]
F. ADOPT A RESOLUTION RATIFYING AND APPROVING THE IMPLEMENTATION OF A SIDE LETTER OF AGREEMENT BETWEEN THE CITY OF VALLEJO AND THE INTERNATIONAL BROTHERHOOD OF ELECTRICAL WORKERS, LOCAL 1245, AFL-CIO REGARDING ALTERNATIVE RETIREMENT HEALTH SAVINGS PROGRAMS FOR ELIGIBLE RETIREE ANNUITANTS
Recommendation: Adopt a resolution to ratify and approve the implementation
of the Side Letter of Agreement ("SLA") between the City of Vallejo ("City") and the International Brotherhood of Electrical Workers, Local 1245, AFL-CIO (IBEW) regarding alternative retirement health savings programs for eligible retiree annuitants. Contact: Jasmin Loi, Human Resources Director, (707) 648-4317 [email protected]
G. SECOND READING AND ADOPTION OF AN ORDINANCE AMENDING SECTION 2.60.340 OF THE VALLEJO MUNICIPAL CODE REGARDING ADMINISTRATION OF OFFICIAL SALARY PLAN INVOLVING CHANGE IN PAY WHEN EMPLOYEES PROMOTE
Recommendation: By motion, hold second reading and adopt an Ordinance amending Section 2.60.340 of the Vallejo Municipal Code to reflect that when an employee is promoted, the employee shall be placed at step one of the new salary range, or placed at that salary step which is a minimum five percent salary increase for the employee, whichever is the greater, not to exceed the top step of the new salary range. Contact: Jasmin Loi, Human Resources Director (707) 648-4137 [email protected]
8. ACTION CALENDAR
NOTICE: Members of the public wishing to address the Council on Action Calendar Items are requested to submit a completed speaker card to the City Clerk. Each speaker is limited to five minutes pursuant to Vallejo Municipal Code Section 2.02.420.
A. PUBLIC HEARING AND ADOPTION OF A RESOLUTION APPROVING THE 2015 URBAN WATER MANAGEMENT PLAN
Recommendation: Hold the Public Hearing and take public input, and adopt a Resolution approving and adopting the 2015 Urban Water Management Plan (UWMP), which includes the Water Shortage Contingency Plan and Year 2020 Water Use Target, as prepared or as modified after the hearing as directed by the City Council. Contact: David A. Kleinschmidt, Public Works Director, (707) 648-4301 [email protected]
B. ADOPT THREE RESOLUTIONS IMPLEMENTING THE RETIREE HEALTH SECURITY PLAN (RHSP) BENEFIT FOR THE IBEW BARGAINING UNIT: 1) AUTHORIZING THE CITY MANAGER TO EXECUTE A PARTICIPATION AGREEMENT ; 2) FIXING THE EMPLOYER’S CONTRIBUTION FOR IBEW EMPLOYEES AND ANNUITANTS UNDER THE PUBLIC EMPLOYEES’ MEDICAL AND HOSPITAL CARE ACT (P.E.M.H.C.A) AND 3) MODIFYING
THE MECHANISM TO PAY RETIREES A $300 PER MONTH MEDICAL BENEFIT.
Recommendation:
Adopt the following attached resolutions:
1. Authorizing the City Manager to execute a Participation Agreement between the City of Vallejo and the Operating Engineers Local Union No. 3 Public Employees and Miscellaneous Health and Welfare Trust (“Trust”), and all other necessary documents, to allow eligible members of the International Brotherhood of Electrical Workers, Local 1245, AFL-CIO (“IBEW”) to participate in the Trust’s Retiree Health Security Plan (“RHSP”).
2. Under the Public Employees’ Medical and Hospital Care Act (“PEMHCA”) only with respect to members of the bargaining unit represented by IBEW, fixing the City’s contribution for employees and the City’s contribution for annuitants.
3. Modifying the mechanism to pay the $300 medical benefit to retired annuitants.
Contact: Jasmin Loi, Human Resources Director (707)648-4317 [email protected]
9. INFORMATION CALENDAR
10. CITY MANAGER’S REPORT
11. CITY ATTORNEY’S REPORT
A. QUARTERLY REPORT FOR FISCAL YEAR 2016/2017, FIRST QUARTER (JULY 1 THROUGH SEPTEMBER 30, 2016)
Recommendation: Informational item only. No action is required. Contact: Claudia Quintana, City Attorney (707) 648-4545 [email protected]
12. COMMUNITY FORUM
Anyone wishing to address the Council on any matter for which another opportunity to speak is not provided on the agenda, and which is within the jurisdiction of the Council to resolve, is requested to submit a completed speaker card to the City Clerk. When called upon, each speaker should step to the podium, state his /her name, and address for the record. Each speaker is limited to three minutes pursuant to Vallejo Municipal Code Section 2.20.300.
13. REPORT OF THE PRESIDING OFFICER AND MEMBERS OF THE CITY COUNCIL
14. CLOSED SESSION
15. ADJOURNMENT
___________________________________________________________________________________________ ADDITIONAL CITY INFORMATION Members of the public can: Like us on Facebook (www.facebook.com/cityofvallejo) Sign up to receive City Communications via e-mail (www.cityofvallejo.net/living/connect) Sign up to receive City updates and get connected with your neighbors on Nextdoor (www.nextdoor.com) I, Dawn Abrahamson, City Clerk do hereby certify that I have caused a true copy of the above notice and agenda to be delivered to each of the members of the Vallejo City Council, at the time and in the manner prescribed by law and that this agenda was posted atCity Hall, 555 Santa Clara Street, CA at 5:00 p.m., Thursday, October 20, 2016.
Dated: Thursday, October 20, 2016
Dawn G. Abrahamson, City Clerk
Appendix I. UWMP Adoption Resolution

Thispageintentionallyleftblank.
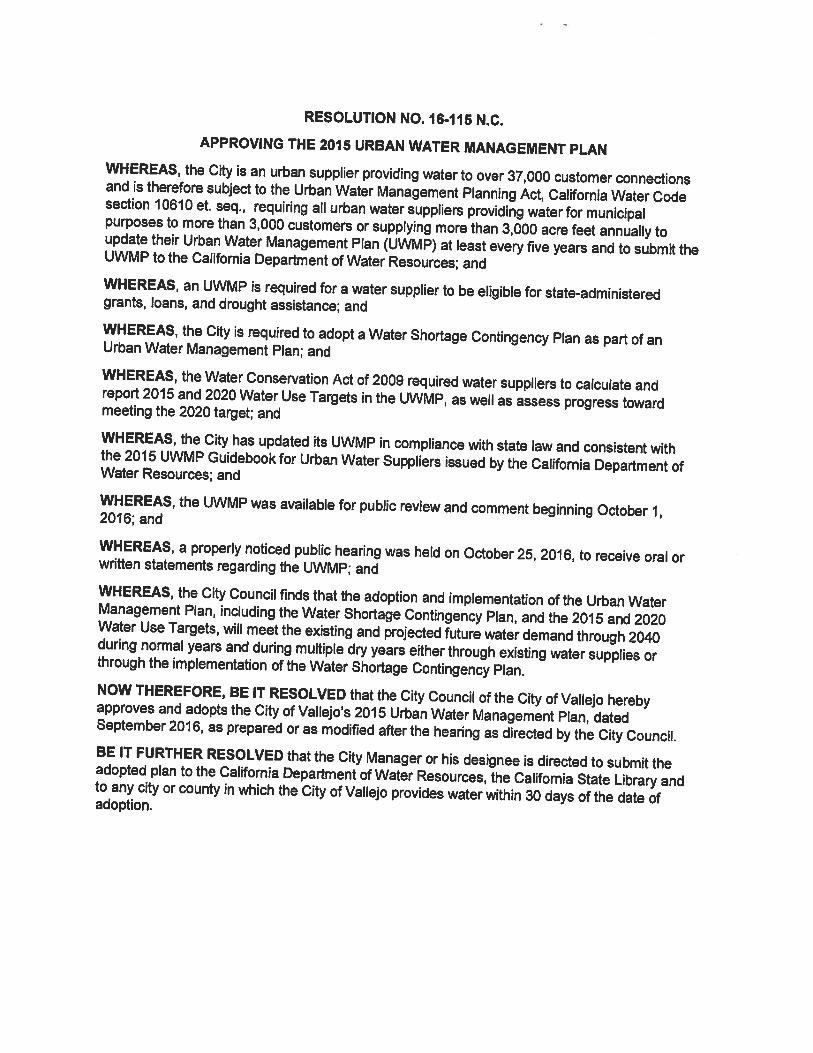
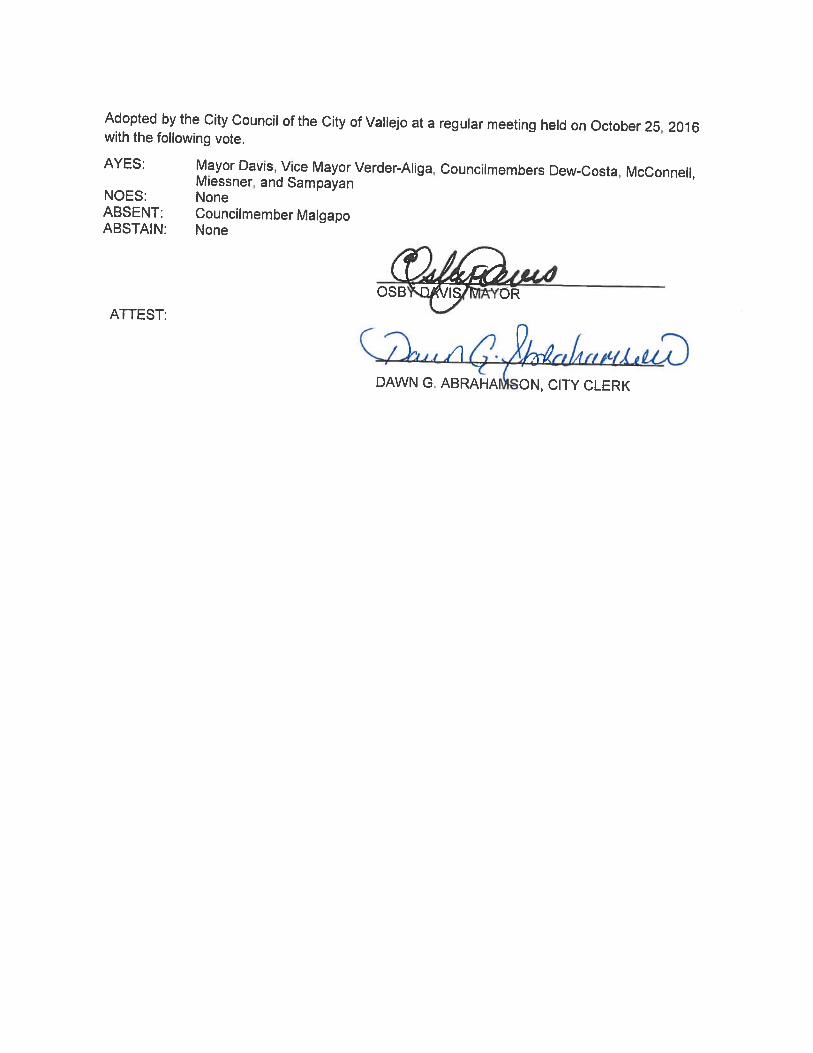
Prepared by: RMC Water and Environment
2175 N. California Blvd, Suite 315 | Walnut Creek, CA 94596 | 925.627.4100