2020 urban water management plan - revize software
TRANSCRIPT
2020 Urban Water Management Plan Final
JUNE 23, 2021 CITY OF CAMARILLO

C I T Y O F C A M A R I L L O
2020 Urban Water Management Plan J U N E 2 3 , 2 0 2 1
Prepared by Water Systems Consulting, Inc.

City of Camarillo iii 2020 Urban Water Management Plan
TABLE OF CONTENTS
List of Figures .................................................................................................................................................... vi
List of Tables .................................................................................................................................................... vii
Acronyms & Abbreviations ............................................................................................................................. ix 1. Introduction and Lay Description ........................................................................................................... 1-1
The California Water Code ........................................................................................................... 1-2
UWMP Organization and Lay Description .................................................................................. 1-3
UWMPs in Relation to Other Efforts ............................................................................................. 1-4
UWMPs and Grant or Loan Eligibility .......................................................................................... 1-4
Demonstration of Consistency with the Delta Plan for Participants in Covered Actions ...... 1-5 2. Plan Preparation ...................................................................................................................................... 2-1
Basis for Preparing a Plan .............................................................................................................. 2-2
Coordination and Outreach ............................................................................................................ 2-2 3. System Description ................................................................................................................................... 3-1
General Description ......................................................................................................................... 3-2
Service Area Boundary Maps ........................................................................................................ 3-2
Service Area Climate ....................................................................................................................... 3-4
Service Area Population and Demographics............................................................................... 3-4
3.4.1 Service Area Population ......................................................................................................... 3-5
3.4.2 Other Social, Economic, and Demographic Factors ........................................................... 3-5
Land Uses within Service Area ....................................................................................................... 3-6 4. Water Use Characterization ................................................................................................................. 4-1
Past, Current, and Projected Water Use by Sector ................................................................... 4-2
4.1.1 Water Use Sectors Listed in Water Code .......................................................................... 4-2
4.1.2 Past and Current Water Use ................................................................................................. 4-2
4.1.3 Distribution System Water Losses ......................................................................................... 4-4
4.1.4 Projected Water Use .............................................................................................................. 4-4
4.1.5 Characteristic Five-Year Water Use .................................................................................... 4-6
Water Use for Lower Income Households .................................................................................... 4-6
Climate Change Considerations ..................................................................................................... 4-7 5. SBX7-7 Baseline, Targets, and 2020 Compliance ............................................................................ 5-1
SBX7-7 Forms and Tables ............................................................................................................... 5-2
City of Camarillo iv 2020 Urban Water Management Plan
6. Water Supply Characterization ........................................................................................................... 6-1
UWMP Water Supply Characterization ...................................................................................... 6-2
6.1.1 Purchased or Imported Water .............................................................................................. 6-2
6.1.2 Groundwater ............................................................................................................................ 6-3
6.1.3 Surface Water ......................................................................................................................... 6-7
6.1.4 Stormwater................................................................................................................................ 6-7
6.1.5 Wastewater and Recycled Water ....................................................................................... 6-7
6.1.6 Desalinated Water Opportunities ..................................................................................... 6-11
6.1.7 Water Exchanges and Transfers ....................................................................................... 6-12
6.1.8 Future Water Projects .......................................................................................................... 6-12
6.1.9 Summary of Existing and Planned Sources of Water .................................................... 6-13
Energy Intensity .............................................................................................................................. 6-13 7. Water Service Reliability and Drought Risk Assessment .................................................................. 7-1
Water Service Reliability Assessment ........................................................................................... 7-2
7.1.1 Constraints on Water Sources ............................................................................................... 7-2
7.1.2 Year Type Characterization .................................................................................................. 7-3
7.1.3 Water Service Reliability ....................................................................................................... 7-4
7.1.4 Descriptions of Management Tools and Options ............................................................... 7-6
Drought Risk Assessment .................................................................................................................. 7-6
7.2.1 Data, Methods, and Basis for Water Shortage Condition ............................................... 7-7
7.2.2 DRA Water Source Reliability ............................................................................................... 7-7 8. Water Shortage Contingency Plan ...................................................................................................... 8-1
Water Supply Reliability Analysis ................................................................................................ 8-3
Annual Water Supply and Demand Assessment ......................................................................... 8-3
8.2.1 Key Data Inputs and Evaluation Criteria ............................................................................. 8-4
8.2.2 Annual Assessment Procedures .............................................................................................. 8-6
Six Standard Water Shortage Levels .......................................................................................... 8-6
Shortage Response Actions ............................................................................................................. 8-7
8.4.1 Demand Reduction ................................................................................................................... 8-8
8.4.2 Supply Augmentation ........................................................................................................... 8-11
8.4.3 Operational Changes .......................................................................................................... 8-11
8.4.4 Additional Mandatory Restrictions .................................................................................... 8-12
8.4.5 Emergency Response Plan ................................................................................................... 8-12
8.4.6 Seismic Risk Assessment and Mitigation Plan ................................................................... 8-12
8.4.7 Shortage Response Action Effectiveness ........................................................................... 8-12
Communication Protocols .............................................................................................................. 8-13
City of Camarillo v 2020 Urban Water Management Plan
Compliance and Enforcement ...................................................................................................... 8-14
Legal Authorities ............................................................................................................................ 8-14
Financial Consequences of WSCP .............................................................................................. 8-14
Monitoring and Reporting ............................................................................................................ 8-15
WSCP Refinement Procedures .................................................................................................. 8-15
Special Water Feature Distinction ........................................................................................... 8-15
Plan Adoption, Submittal, and Availability ............................................................................ 8-16 9. Demand Management Measures .......................................................................................................... 9-1
Existing Demand Management Measures for Retail .................................................................. 9-2
9.1.1 Water Waste Prevention Ordinances ................................................................................. 9-2
9.1.2 Metering .................................................................................................................................... 9-4
9.1.3 Conservation Pricing ................................................................................................................ 9-4
9.1.4 Public Education and Outreach ............................................................................................. 9-5
9.1.5 Programs to Assess and Manage Distribution System Real Losses ................................. 9-6
9.1.6 Water Conservation Program Coordination and Staffing Support ............................... 9-6
9.1.7 Other Demand Management Measures .............................................................................. 9-6
Reporting Implementation ............................................................................................................... 9-7
9.2.1 Implementation Over the Past Five Years ........................................................................... 9-7
9.2.2 Implementation to Achieve Water Use Targets ................................................................. 9-8
Water Use Objectives (Future Requirements) ............................................................................. 9-8 10. References ............................................................................................................................................. 10-1
Appendix A. Demonstration of Reduced Delta Reliance ...........................................................................A
Appendix B. DWR Checklist ............................................................................................................................ B
Appendix C. 60-Day and Public Hearing Notices ......................................................................................C
Appendix D. Adopted Resolution ...................................................................................................................D
Appendix E. AWWA Audits ............................................................................................................................ E
Appendix F. SBX7-7 Verification & Compliance Forms ............................................................................. F
Appendix G. City of Camarillo Ordinance No. 1126 .............................................................................. G
Appendix H. 2015 Ventura County Multi-Hazard Mitigation Plan .........................................................H
City of Camarillo vi 2020 Urban Water Management Plan
LIST OF FIGURES
Figure 3-1. City of Camarillo Water Service Area .......................................................................................... 3-3 Figure 4-1. 2020 Percentage of Water Use by Customer Class .................................................................. 4-3 Figure 4-2. Projected Demands through 2045 .................................................................................................. 4-5 Figure 6-1. Groundwater Basin Map .................................................................................................................. 6-5 Figure 8-1. Water Shortage Levels Crosswalk ................................................................................................. 8-7
City of Camarillo vii 2020 Urban Water Management Plan
LIST OF TABLES
Table 2-1. DWR 2-1R Public Water Systems .................................................................................................... 2-2 Table 2-2. DWR 2-2 Plan Identification ............................................................................................................. 2-2 Table 2-3. DWR 2-3 Agency Identification ....................................................................................................... 2-2 Table 2-4. Agency Coordination .......................................................................................................................... 2-3 Table 3-1. CIMIS Station 152 Average Monthly Climate Data (2005-2020)............................................ 3-4 Table 3-2. DWR 3-1R Current and Projected Population ............................................................................... 3-5 Table 3-3. Household and Employment Projections .......................................................................................... 3-5 Table 4-1. DWR 4-1R Actual Demands for Water .......................................................................................... 4-3 Table 4-2. DWR 4-4R 12 Month Water Loss Audit Reporting ...................................................................... 4-4 Table 4-3. DWR 4-2R Projected Demands for Water .................................................................................... 4-6 Table 4-4. DWR 4-5R Inclusion in Water Use Projections ............................................................................... 4-6 Table 4-5. Cumulative Low-Income Water Deliveries, AFY ............................................................................ 4-7 Table 5-1. DWR 5-1R Baselines and Targets Summary .................................................................................. 5-2 Table 5-2. DWR 5-2R 2020 Compliance........................................................................................................... 5-2 Table 6-1. DWR 6-8R Actual Water Supplies .................................................................................................. 6-2 Table 6-2. DWR 6-1R Groundwater Volume Pumped .................................................................................... 6-3 Table 6-3. DWR 6-2R Wastewater Collected within Service Area in 2020 .............................................. 6-8 Table 6-4. DWR 6-3R Wastewater Treatment and Discharge within Service Area in 2020 .................. 6-8 Table 6-5. DWR 6-4R Recycled Water within Service Area ......................................................................... 6-10 Table 6-6. DWR 6-5R 2015 Recycled Water Use Projection Compared to 2020 Actual ...................... 6-11 Table 6-7. DWR 6-6R Methods to Expand Future Recycled Water Use ..................................................... 6-11 Table 6-8. DWR 6-7R Expected Future Water Supply Projects or Programs ............................................ 6-13 Table 6-9. DWR 6-9R Projected Water Supplies ............................................................................................ 6-14 Table 6-10. DWR O-1B Recommended Energy Reporting – Total Utility Approach ................................ 6-14 Table 7-1. DWR 7-1R Basis for Water Year Data for CMWD (Reliability Assessment) .......................... 7-4 Table 7-2. DWR 7-1R Basis for Water Year Data for the Pleasant Valley Basin (Reliability Assessment)7-4 Table 7-3. DWR 7-2R Normal Year Potable Water Supply and Demand Comparison .......................... 7-5 Table 7-4. DWR 7-3R Single Dry Year Potable Water Supply and Demand Comparison .................... 7-5 Table 7-5. DWR 7-4R Multiple Dry Years Potable Water Supply and Demand Comparison ............... 7-5 Table 7-6. DWR 7-5 Five-Year Drought Risk Assessment Tables to Address Water Code Section 10635(b) ................................................................................................................................................................... 7-7 Table 8-1. Key Data Inputs for the Annual Assessment. .................................................................................. 8-5 Table 8-2. Water Shortage Contingency - Rationing Stages ........................................................................ 8-7 Table 8-3. Estimated Savings by Shortage Level ............................................................................................. 8-10 Table 8-4.DWR 8-3 Demand Reduction Actions ............................................................................................... 8-10
City of Camarillo viii 2020 Urban Water Management Plan
Table 8-5. Communication Protocol During Water Shortage Conditions ..................................................... 8-13 Table 8-6. Processes and Steps to Adopt, Submit, and Implement the WSCP ........................................... 8-17 Table 9-1. Demand Management Measures ..................................................................................................... 9-2 Table 9-2. Residential Conservation Pricing Rate Structure ............................................................................ 9-4 Table 9-3. CII Water Rates ................................................................................................................................... 9-5 Table 9-4. Base Fees for Meter Size .................................................................................................................. 9-5 Table 9-5. DMM Implementation between 2016-2020 .................................................................................. 9-8
City of Camarillo ix 2020 Urban Water Management Plan
ACRONYMS & ABBREVIATIONS
°F Degrees Fahrenheit
AF Acre Foot
AFY Acre Feet per Year
Allocation Ordinance FCGMA’s Ordinance to Establish an Allocation System for the Oxnard and
Pleasant Valley Groundwater Basins
Annual Assessment Annual Water Supply and Demand Assessment
AWWA American Water Works Association
Camarillo WRP Camarillo Water Reclamation Plant
CII Commercial, Industrial, and Institutional
CIMIS California Irrigation Management Information System
City City of Camarillo
CMWD Calleguas Municipal Water District
CRA Colorado River Aqueduct
CSD Camarillo Sanitary District
CWC California Water Code
DMM Demand Management Measure
DRA Drought Risk Assessment
DWR California Department of Water Resources
ETo Evapotranspiration
FCGMA Fox Canyon Groundwater Management Agency
ft-msl Feet Above Mean Sea Level
GIS Geographical Information System
GPCD Gallons per Capita per Day
GSA Groundwater Sustainability Agency
GSP Groundwater Sustainability Plan
Guidebook DWR Urban Water Management Plan Guidebook 2020
HCF Hundred Cubic Feet
HOA Homeowners Association
IPR Indirect Potable Reuse
ITP Independent Technical Panel
kWh Kilowatt-hours
City of Camarillo x 2020 Urban Water Management Plan
Legislature State of California Legislature
Mary Smith Mary Smith Properties
MG Million Gallons
MGD Million Gallons per Day
MWDSC Metropolitan Water District of Southern California
NPV North Pleasant Valley
NRI Non-Residential Indoor
NRI-GPCD Non-Residential Indoor Gallons per Capita per Day Water Use
Project Reclaimed Water Storage Tank Project
RHNA Regional Housing Needs Assessment
RI Residential Indoor
RI-GPCD Residential Indoor Gallons per Capita per Day Water Use
RO Reverse Osmosis
RUWMP Regional Urban Water Management Plan
RW Recycled Water
SBX7-7 Water Conservation Act of 2009 also known as Senate Bill 7 of Special Extended
Session 7
SCAG Southern California Association of Governments
SGMA Sustainable Groundwater Management Act\
State State of California
State Water Board State Water Resources Control Board
SWP State Water Project
TAZ Transportation Analysis Zones
TDS Total Dissolved Solids
UWMP Urban Water Management Plan
UWMP Act Urban Water Management Planning Act
VATP Village at the Park
WSCP Water Shortage Contingency Plan
1-1
202 0 UR B AN W AT ER M AN AG EME NT P LAN
Introduction and Lay Description
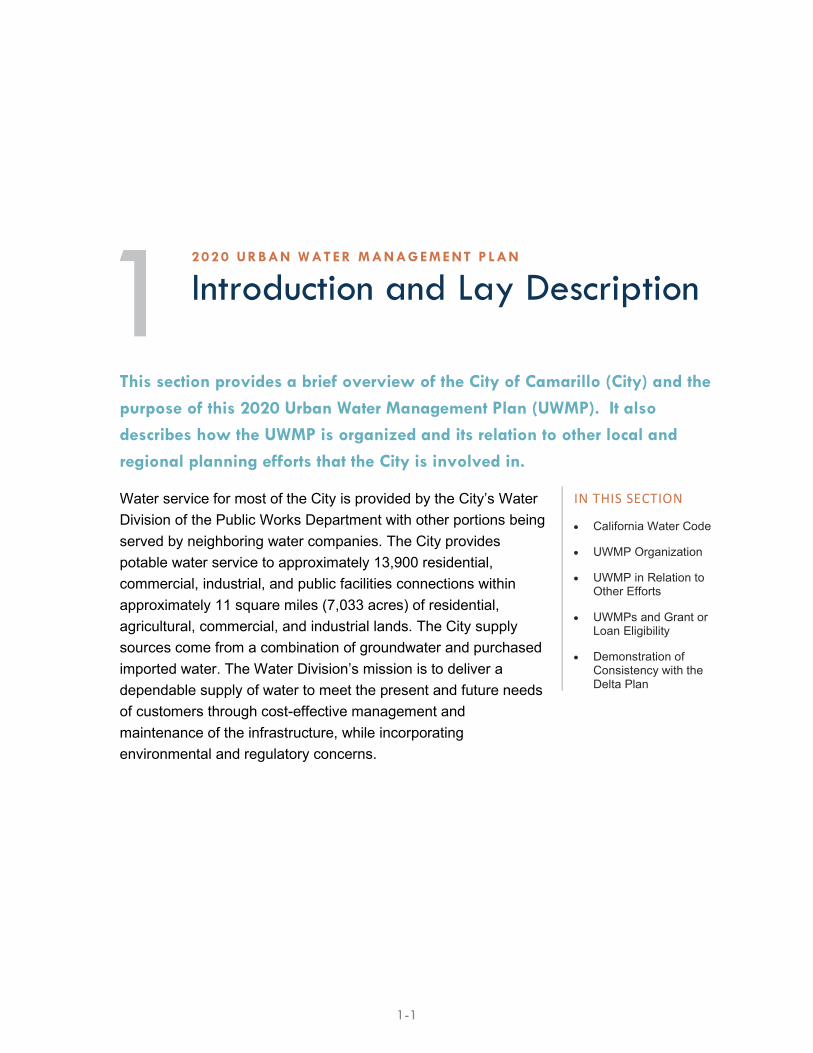
This section provides a brief overview of the City of Camarillo (City) and the purpose of this 2020 Urban Water Management Plan (UWMP). It also describes how the UWMP is organized and its relation to other local and regional planning efforts that the City is involved in.
Water service for most of the City is provided by the City’s Water Division of the Public Works Department with other portions being served by neighboring water companies. The City provides potable water service to approximately 13,900 residential, commercial, industrial, and public facilities connections within approximately 11 square miles (7,033 acres) of residential, agricultural, commercial, and industrial lands. The City supply sources come from a combination of groundwater and purchased imported water. The Water Division’s mission is to deliver a dependable supply of water to meet the present and future needs of customers through cost-effective management and maintenance of the infrastructure, while incorporating environmental and regulatory concerns.
IN THIS SECTION
• California Water Code
• UWMP Organization
• UWMP in Relation to Other Efforts
• UWMPs and Grant or Loan Eligibility
• Demonstration of Consistency with the Delta Plan
Introduction and Lay Description Section 1
City of Camarillo 1-2 2020 Urban Water Management Plan
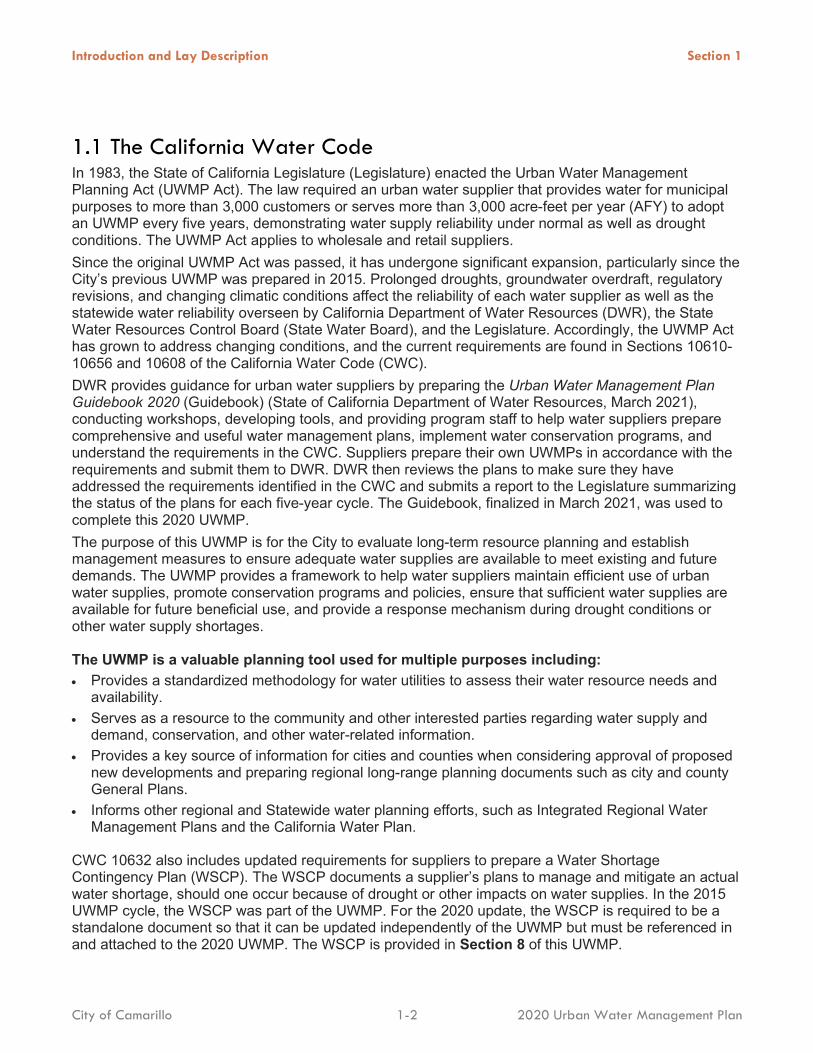
The California Water Code In 1983, the State of California Legislature (Legislature) enacted the Urban Water Management Planning Act (UWMP Act). The law required an urban water supplier that provides water for municipal purposes to more than 3,000 customers or serves more than 3,000 acre-feet per year (AFY) to adopt an UWMP every five years, demonstrating water supply reliability under normal as well as drought conditions. The UWMP Act applies to wholesale and retail suppliers. Since the original UWMP Act was passed, it has undergone significant expansion, particularly since the City’s previous UWMP was prepared in 2015. Prolonged droughts, groundwater overdraft, regulatory revisions, and changing climatic conditions affect the reliability of each water supplier as well as the statewide water reliability overseen by California Department of Water Resources (DWR), the State Water Resources Control Board (State Water Board), and the Legislature. Accordingly, the UWMP Act has grown to address changing conditions, and the current requirements are found in Sections 10610-10656 and 10608 of the California Water Code (CWC). DWR provides guidance for urban water suppliers by preparing the Urban Water Management Plan Guidebook 2020 (Guidebook) (State of California Department of Water Resources, March 2021), conducting workshops, developing tools, and providing program staff to help water suppliers prepare comprehensive and useful water management plans, implement water conservation programs, and understand the requirements in the CWC. Suppliers prepare their own UWMPs in accordance with the requirements and submit them to DWR. DWR then reviews the plans to make sure they have addressed the requirements identified in the CWC and submits a report to the Legislature summarizing the status of the plans for each five-year cycle. The Guidebook, finalized in March 2021, was used to complete this 2020 UWMP. The purpose of this UWMP is for the City to evaluate long-term resource planning and establish management measures to ensure adequate water supplies are available to meet existing and future demands. The UWMP provides a framework to help water suppliers maintain efficient use of urban water supplies, promote conservation programs and policies, ensure that sufficient water supplies are available for future beneficial use, and provide a response mechanism during drought conditions or other water supply shortages.
The UWMP is a valuable planning tool used for multiple purposes including: • Provides a standardized methodology for water utilities to assess their water resource needs and
availability. • Serves as a resource to the community and other interested parties regarding water supply and
demand, conservation, and other water-related information. • Provides a key source of information for cities and counties when considering approval of proposed
new developments and preparing regional long-range planning documents such as city and county General Plans.
• Informs other regional and Statewide water planning efforts, such as Integrated Regional Water Management Plans and the California Water Plan.
CWC 10632 also includes updated requirements for suppliers to prepare a Water Shortage Contingency Plan (WSCP). The WSCP documents a supplier’s plans to manage and mitigate an actual water shortage, should one occur because of drought or other impacts on water supplies. In the 2015 UWMP cycle, the WSCP was part of the UWMP. For the 2020 update, the WSCP is required to be a standalone document so that it can be updated independently of the UWMP but must be referenced in and attached to the 2020 UWMP. The WSCP is provided in Section 8 of this UWMP.
Introduction and Lay Description Section 1
City of Camarillo 1-3 2020 Urban Water Management Plan
UWMP Organization and Lay Description The City generally followed DWR’s recommended organizational outline in the preparation of its 2020 UWMP.
Below is a summary of the information included in the various sections of the City’s 2020 UWMP:
Section 1 – Introduction and Overview This section provides background information on the UWMP process, new regulatory requirements, and an overview of the information covered throughout the remaining sections. Water suppliers that serve more than 3,000 customers or 3,000 AFY are required to prepare an UWMP. The UWMP is an important tool that details the City’s system and service area, estimates supply and demand over a twenty-year period, and analyzes reliability in drought and other shortages.
Section 2 – Plan Preparation This section provides information on the processes used for developing the UWMP, including efforts in coordination and outreach; the steps taken to prepare the City’s 2020 UWMP, hold a public hearing, adopt, and submit the 2020 UWMP; and implementation of the adopted UWMP.
Section 3 – System Description This section describes City’s water system, service area, population demographics, local climate, and land uses.
Section 4 – System Water Use This section describes and quantifies the current and projected water uses through 2045 within the water service area. The City provides potable water to all its customers, which are comprised of about 88 percent (%) residential accounts. On average, water uses are about 61% residential, 11% commercial/institutional, 0.5% industrial, 22.7% landscape irrigation, 0.8% agricultural, 0.4% other uses, and 4.1% losses.
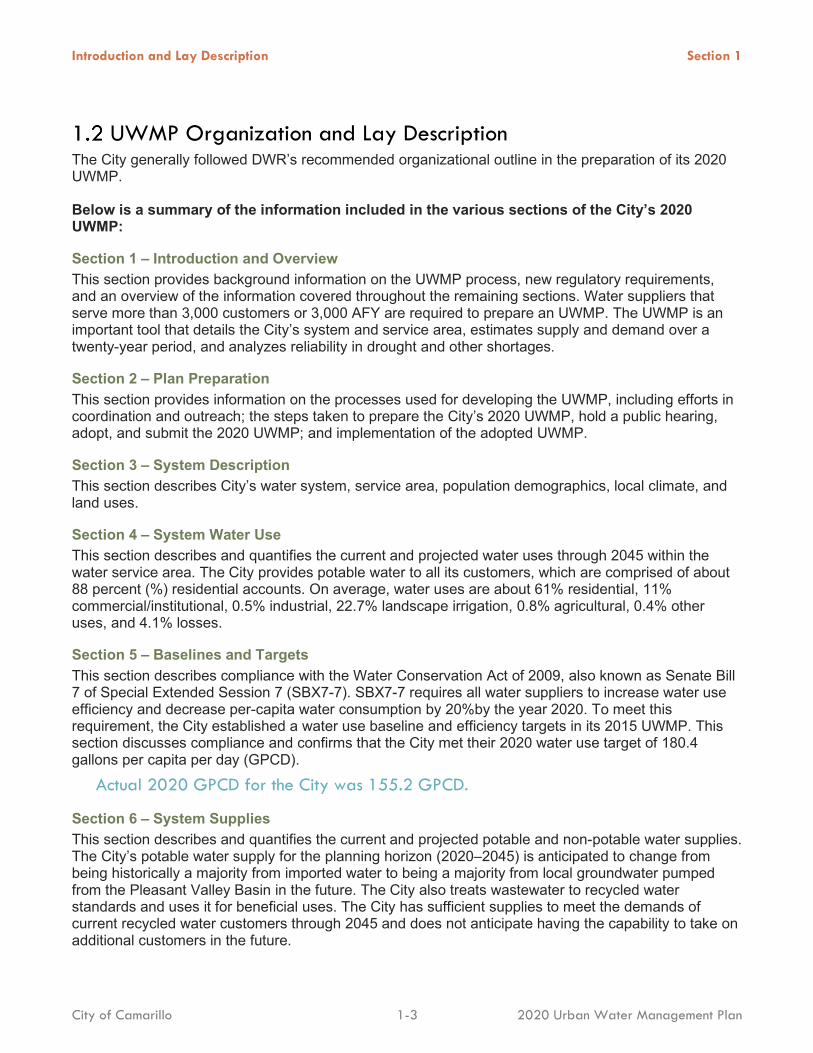
Section 5 – Baselines and Targets This section describes compliance with the Water Conservation Act of 2009, also known as Senate Bill 7 of Special Extended Session 7 (SBX7-7). SBX7-7 requires all water suppliers to increase water use efficiency and decrease per-capita water consumption by 20%by the year 2020. To meet this requirement, the City established a water use baseline and efficiency targets in its 2015 UWMP. This section discusses compliance and confirms that the City met their 2020 water use target of 180.4 gallons per capita per day (GPCD).
Actual 2020 GPCD for the City was 155.2 GPCD.
Section 6 – System Supplies This section describes and quantifies the current and projected potable and non-potable water supplies. The City’s potable water supply for the planning horizon (2020–2045) is anticipated to change from being historically a majority from imported water to being a majority from local groundwater pumped from the Pleasant Valley Basin in the future. The City also treats wastewater to recycled water standards and uses it for beneficial uses. The City has sufficient supplies to meet the demands of current recycled water customers through 2045 and does not anticipate having the capability to take on additional customers in the future.
Introduction and Lay Description Section 1
City of Camarillo 1-4 2020 Urban Water Management Plan
Section 7 – Water Supply Reliability This section describes the water service reliability through 2045 and includes the Drought Risk Assessment (DRA) for the next five years. Future demand and supply were analyzed to evaluate supply reliability over the planning horizon (2020–2045). The UWMP analyzed conditions for normal, or average, single-dry, and five-year consecutive dry periods. In all scenarios, the City expects to meet customer demands with the available supply. In addition, a DRA was performed to analyze the anticipated supply and demand for the next five years (2021–2025). The DRA determines that the City’s supplies are able to reliably meet customer demands.
Section 8 – Water Shortage Contingency Plan (WSCP) The WSCP provides guidance on declaring a water shortage and how to mitigate water shortages. The WSCP defines levels of water shortage and outlines the actions that will be required of customers during each stage.
Section 9 – Demand Management Measures This section describes City’s efforts to promote conservation and reduce water demand, including discussions of specific demand management measures (DMMs). Water waste prohibitions and conservation programs are discussed. To participate in any of the rebate programs, interested customers should visit https://www.cityofcamarillo.org/departments/public_works/water/ water_conservation.php or contact the City directly.
UWMPs in Relation to Other Efforts This UWMP characterizes water use, estimates future demands and supply sources, and evaluates supply reliability for normal, single-dry, and five-year consecutive dry periods. The UWMP also requires a standalone WSCP, which is provided in Section 8. In addition to the 2020 UWMP, the City is involved in several other internal and external planning efforts and collaborates with a variety of stakeholders to achieve coordination and consistency between various planning documents locally and regionally.
Documents that were leveraged in preparation of this UWMP are: • 2016 City of Camarillo Potable Water Master Plan • 2015 Ventura County Multi-Hazard Mitigation Plan • City of Camarillo 2020 General Plan Annual Progress Report • SCAG Regional Growth Forecast 2050: Ventura County • Pleasant Valley Basin Groundwater Sustainability Plan
UWMPs and Grant or Loan Eligibility In order for a water supplier to be eligible for a grant or loan administered by DWR, and potentially other agencies, the supplier must have a current UWMP on file that meets the requirements set forth by the CWC. A current UWMP must also be maintained by the supplier throughout the term of any grants or loans received.
The City has prepared the 2020 UWMP under guidance from DWR’s 2020 UWMP Guidebook.
Introduction and Lay Description Section 1
City of Camarillo 1-5 2020 Urban Water Management Plan
Demonstration of Consistency with the Delta Plan for Participants in Covered Actions The Delta Plan is a comprehensive, long-term, legally enforceable plan guiding how federal, state, and local agencies manage the Sacramento–San Joaquin Delta’s (Delta’s) water and environmental resources. The Delta Plan was adopted in 2013 by the Delta Stewardship Council. Delta Plan Policy WR P1 identifies UWMPs as the tool to demonstrate consistency with state policy to reduce reliance on the Delta for a supplier that carries out or takes part in a covered action. A covered action may include activities such as a multiyear water transfer, conveyance facility, or new diversion that involves transferring water through, exporting water from, or using water in the Delta. As a supplier that receives imported water from the Delta through its wholesale supplier, the City is required to submit information as outlined in Appendix C of the Guidebook (State of California Department of Water Resources, March 2021).
To document and quantify supplies contributing to reduced reliance on the Delta watershed and improved regional self-reliance, a number of steps must be taken, including: • Setting a baseline • Change in delivery of Delta water • UWMP WR P1 consistency reporting
DWR does not review this analysis as part of the UWMP approval process; therefore, this information is attached as Appendix A.

2-1
202 0 UR B AN W AT ER M AN AG EME NT P LAN
Plan Preparation
This section of the UWMP provides information on the processes used for developing the UWMP, including efforts in coordination and outreach.
This UWMP was prepared following guidance from the Guidebook, DWR UWMP Public Workshops and Webinars, Methodologies for Calculating Baseline and Compliance Urban Per Capita Water Use (SBX7-7 Guidebook) (State of California Department of Water Resources, February 2016), and the 2020 DWR Review Sheet Checklist (Appendix B).
IN THIS SECTION
• Plan Preparation
• Coordination and Outreach
The 2020 UWMP was prepared in a transparent manner and the City actively engaged stakeholders, cities, counties, water agencies and the public to both seek and distribute water use, supply, and reliability information to strengthen the regions’ ability to assess and plan for the region’s water future. Details regarding the City’s UWMP preparation and the coordination and outreach efforts conducted are provided in this section.
Plan Preparation Section 2
City of Camarillo 2-2 2020 Urban Water Management Plan
Basis for Preparing a Plan As mentioned in Section 1, the CWC requires suppliers with 3,000 or more service connections, or those supplying 3,000 AFY or more, to prepare an UWMP. Suppliers are required to update UWMPs at least once every five years on or before July 1, in years ending in six and one, incorporating updated and new information from the five years preceding each update. The City’s 2020 UWMP must be submitted to DWR by July 1, 2021. The City is preparing an individual UWMP and is not a member of a Regional UWMP or Regional Alliance. In 2020, the City served approximately 45,136 people in its service area, through 13,931 metered connections, and supplied approximately 7,518 AFY of potable water to customers. The City has included all mandatory 2020 data in the development of this UWMP. The City purchases water from Calleguas Municipal Water District (CMWD) and does not sell water to other suppliers. Throughout this UWMP, water volume is represented in units of AFY, unless otherwise noted, and data is presented on a calendar year basis. Required DWR tables presenting this information are provided in Table 2-1, Table 2-2 and Table 2-3. Table 2-1. DWR 2-1R Public Water Systems
PUBLIC WATER SYSTEM NUMBER PUBLIC WATER SYSTEM NAME
NUMBER OF MUNICIPAL CONNECTIONS 2020
VOLUME OF WATER SUPPLIED 2020 (AFY)
CA5610019 Camarillo, City of 13,931 7,838
Table 2-2. DWR 2-2 Plan Identification
TYPE OF PLAN MEMBER OF RUWMP MEMBER OF REGIONAL ALLIANCE
NAME OF RUWMP OR REGIONAL ALLIANCE
Individual No No Not Applicable
Table 2-3. DWR 2-3 Agency Identification
TYPE OF SUPPLIER YEAR TYPE FIRST DAY OF YEAR UNIT TYPE
Retailer Calendar Year DD MM
Acre Feet (AF) 01 01
Coordination and Outreach The City coordinated with multiple neighboring and stakeholder agencies to prepare the 2020 UWMP. The coordinated efforts were conducted to 1) inform these agencies of the City’s efforts and activities; 2) gather high quality data for use in developing this UWMP; and 3) coordinate planning activities with other related regional plans and initiatives. CWC 10621 requires that suppliers notify cities and counties to which they serve water that the UWMP and WSCP are being updated and reviewed. The CWC specifies that this must be done at least 60 days prior to the public hearing. To fulfill this requirement, the City sent letters of notification of preparation of the 2020 UWMP and 2020 WSCP to all cities and counties within the City’s service area 60 days prior to the public hearing as indicated in Table 2-4 and attached as Appendix C. On April 19, 2021, the City notified all cities and counties within the service area of their intent to update the UWMP and WSCP by July 1, 2021. This notification served as the 60-day noticing required by the CWC. A copy of this letter is included in Appendix C to this UWMP. Per Government Code 6066, the
Plan Preparation Section 2
City of Camarillo 2-3 2020 Urban Water Management Plan
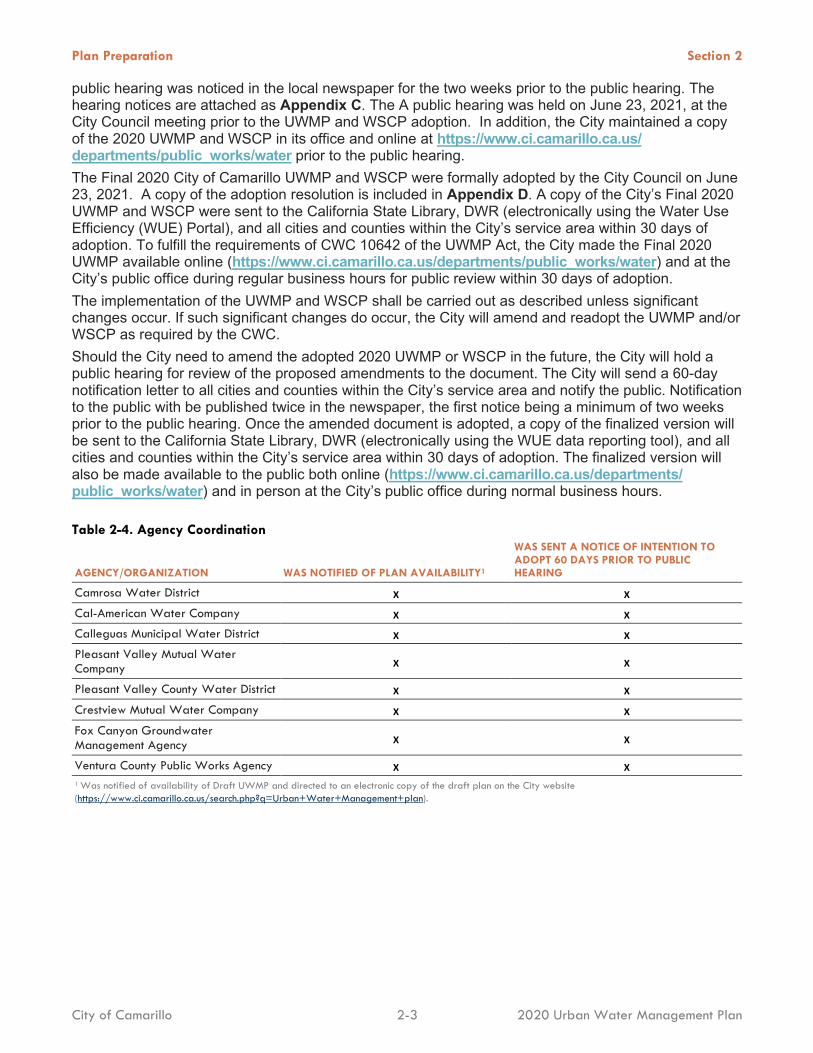
public hearing was noticed in the local newspaper for the two weeks prior to the public hearing. The hearing notices are attached as Appendix C. The A public hearing was held on June 23, 2021, at the City Council meeting prior to the UWMP and WSCP adoption. In addition, the City maintained a copy of the 2020 UWMP and WSCP in its office and online at https://www.ci.camarillo.ca.us/ departments/public_works/water prior to the public hearing. The Final 2020 City of Camarillo UWMP and WSCP were formally adopted by the City Council on June 23, 2021. A copy of the adoption resolution is included in Appendix D. A copy of the City’s Final 2020 UWMP and WSCP were sent to the California State Library, DWR (electronically using the Water Use Efficiency (WUE) Portal), and all cities and counties within the City’s service area within 30 days of adoption. To fulfill the requirements of CWC 10642 of the UWMP Act, the City made the Final 2020 UWMP available online (https://www.ci.camarillo.ca.us/departments/public_works/water) and at the City’s public office during regular business hours for public review within 30 days of adoption. The implementation of the UWMP and WSCP shall be carried out as described unless significant changes occur. If such significant changes do occur, the City will amend and readopt the UWMP and/or WSCP as required by the CWC. Should the City need to amend the adopted 2020 UWMP or WSCP in the future, the City will hold a public hearing for review of the proposed amendments to the document. The City will send a 60-day notification letter to all cities and counties within the City’s service area and notify the public. Notification to the public with be published twice in the newspaper, the first notice being a minimum of two weeks prior to the public hearing. Once the amended document is adopted, a copy of the finalized version will be sent to the California State Library, DWR (electronically using the WUE data reporting tool), and all cities and counties within the City’s service area within 30 days of adoption. The finalized version will also be made available to the public both online (https://www.ci.camarillo.ca.us/departments/ public_works/water) and in person at the City’s public office during normal business hours.
Table 2-4. Agency Coordination
AGENCY/ORGANIZATION WAS NOTIFIED OF PLAN AVAILABILITY1
WAS SENT A NOTICE OF INTENTION TO ADOPT 60 DAYS PRIOR TO PUBLIC HEARING
Camrosa Water District X X
Cal-American Water Company X X
Calleguas Municipal Water District X X
Pleasant Valley Mutual Water Company X X
Pleasant Valley County Water District X X
Crestview Mutual Water Company X X
Fox Canyon Groundwater Management Agency X X
Ventura County Public Works Agency X X 1 Was notified of availability of Draft UWMP and directed to an electronic copy of the draft plan on the City website (https://www.ci.camarillo.ca.us/search.php?q=Urban+Water+Management+plan).

3-1
202 0 UR B AN W AT ER M AN AG EME NT P LAN
System Description
This section describes the City’s service area including current and projected population, climate, demographics, socio-economic background, and general land uses.
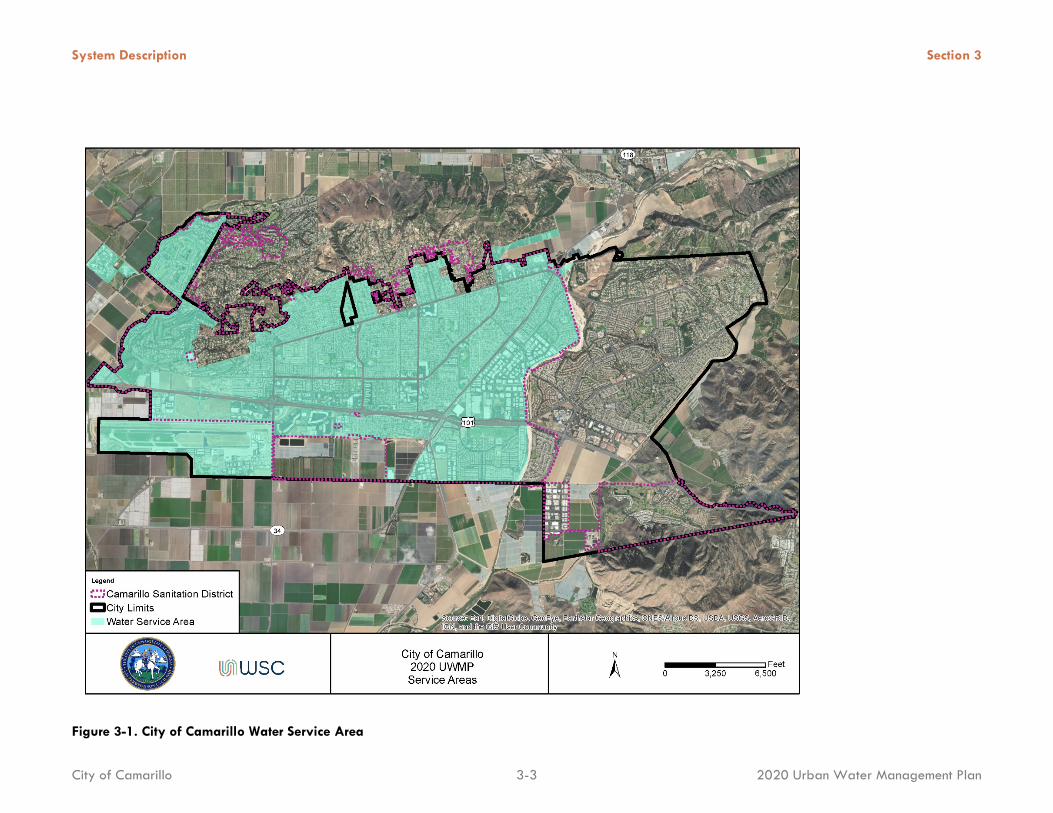
The City is located along U.S. Highway 101 in the Pleasant Valley portion of the Oxnard Plain, 9 miles inland from the Pacific Ocean and 45 miles northwest of the City of Los Angeles. Camarillo is situated in the southern portion of Ventura County and is surrounded by open hills, mountains, and agricultural lands. The majority of the City is approximately 150 feet above mean sea level (ft‐msl), while the northern foothill regions are as high as 360 ft‐msl. The City’s location is shown in Figure 3-1.
IN THIS SECTION
• Service Area
• Population
• Demographics
• Socioeconomics
• Land Uses
System Description Section 3
City of Camarillo 3-2 2020 Urban Water Management Plan
General Description The City provides potable water service to a population of approximately 45,136 residents, as well as commercial, industrial, and public facilities within a portion of its boundaries generally west of Calleguas Creek, as well as several pockets of unincorporated Ventura County. The City provides water service to approximately 11 square miles (7,033 acres) of residential, agricultural, commercial, and industrial lands. The City’s existing water distribution system consists of approximately 190 miles of 6‐inch through 20‐ inch diameter pipelines, which include eight (U.S. 101) freeway crossings. Other components of the City's water distribution system include: six reservoirs (four above ground and two underground) with a total combined capacity of 13.4 million gallons (MG), four groundwater wells, eight connections for importing water from CMWD, three pumping stations, and 11 pressure reducing valve locations.
Service Area Boundary Maps The City’s water service area consists of approximately 7,033 acres, about 56 percent of the City’s total incorporated area of 12,648 acres. Figure 3-1 shows the City’s water service area in relation to the City’s boundary. The Camrosa Water District, Pleasant Valley County Water District, Pleasant Valley Mutual Water Company, and Crestview Mutual Water Company serve the remaining 5,615 acres. The City’s boundary recently changed as a result of incorporating a property along the northern City limit, which is the site of the future North Pleasant Valley Desalter project. The boundary change does not impact the population served by the City. As shown on Figure 3-1, the City’s water service area extends outside the City Limits to serve some small areas to the west and north of the City.
System Description Section 3
City of Camarillo 3-3 2020 Urban Water Management Plan
Figure 3-1. City of Camarillo Water Service Area
System Description Section 3
City of Camarillo 3-4 2020 Urban Water Management Plan
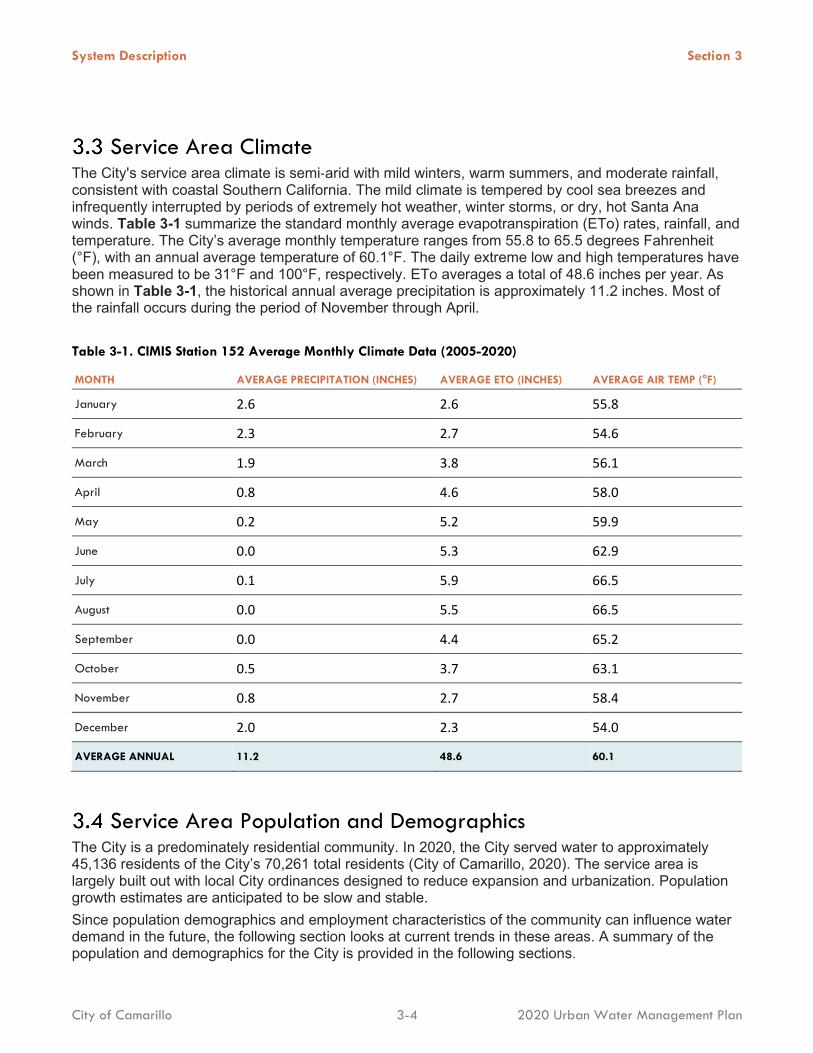
Service Area Climate The City's service area climate is semi‐arid with mild winters, warm summers, and moderate rainfall, consistent with coastal Southern California. The mild climate is tempered by cool sea breezes and infrequently interrupted by periods of extremely hot weather, winter storms, or dry, hot Santa Ana winds. Table 3-1 summarize the standard monthly average evapotranspiration (ETo) rates, rainfall, and temperature. The City’s average monthly temperature ranges from 55.8 to 65.5 degrees Fahrenheit (°F), with an annual average temperature of 60.1°F. The daily extreme low and high temperatures have been measured to be 31°F and 100°F, respectively. ETo averages a total of 48.6 inches per year. As shown in Table 3-1, the historical annual average precipitation is approximately 11.2 inches. Most of the rainfall occurs during the period of November through April. Table 3-1. CIMIS Station 152 Average Monthly Climate Data (2005-2020)
MONTH AVERAGE PRECIPITATION (INCHES) AVERAGE ETO (INCHES) AVERAGE AIR TEMP (°F)
January 2.6 2.6 55.8
February 2.3 2.7 54.6
March 1.9 3.8 56.1
April 0.8 4.6 58.0
May 0.2 5.2 59.9
June 0.0 5.3 62.9
July 0.1 5.9 66.5
August 0.0 5.5 66.5
September 0.0 4.4 65.2
October 0.5 3.7 63.1
November 0.8 2.7 58.4
December 2.0 2.3 54.0
AVERAGE ANNUAL 11.2 48.6 60.1
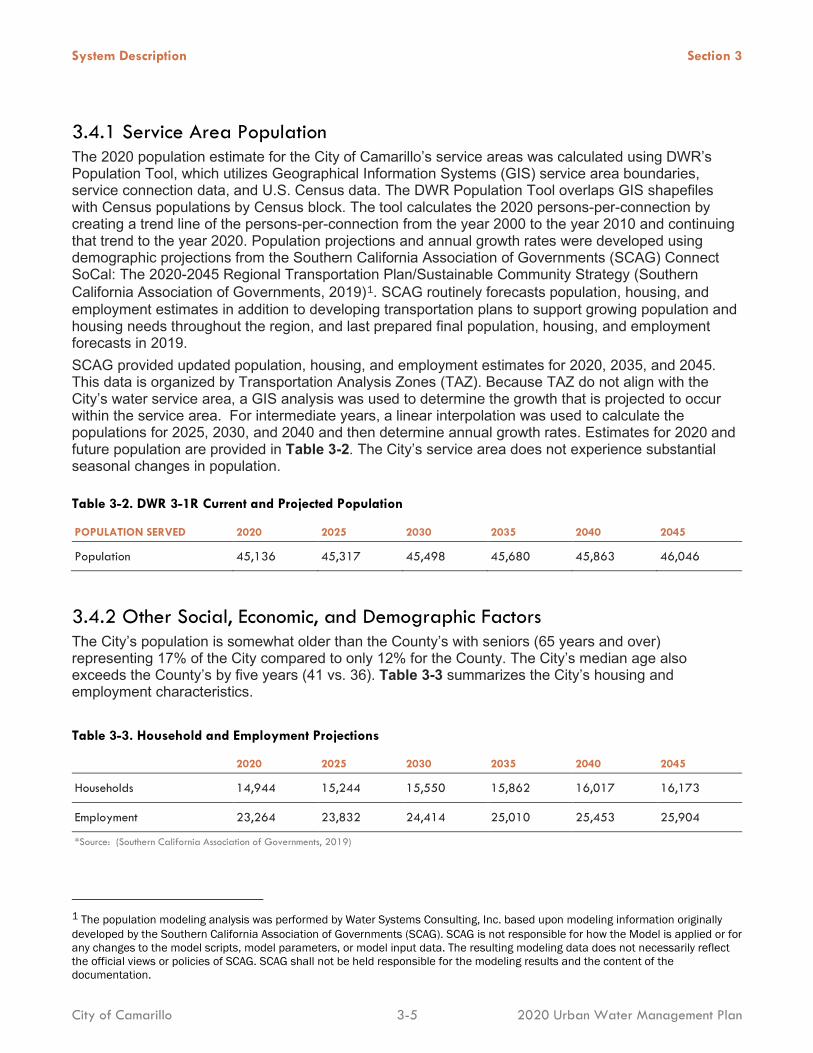
Service Area Population and Demographics The City is a predominately residential community. In 2020, the City served water to approximately 45,136 residents of the City’s 70,261 total residents (City of Camarillo, 2020). The service area is largely built out with local City ordinances designed to reduce expansion and urbanization. Population growth estimates are anticipated to be slow and stable. Since population demographics and employment characteristics of the community can influence water demand in the future, the following section looks at current trends in these areas. A summary of the population and demographics for the City is provided in the following sections.
System Description Section 3
City of Camarillo 3-5 2020 Urban Water Management Plan
3.4.1 Service Area Population The 2020 population estimate for the City of Camarillo’s service areas was calculated using DWR’s Population Tool, which utilizes Geographical Information Systems (GIS) service area boundaries, service connection data, and U.S. Census data. The DWR Population Tool overlaps GIS shapefiles with Census populations by Census block. The tool calculates the 2020 persons-per-connection by creating a trend line of the persons-per-connection from the year 2000 to the year 2010 and continuing that trend to the year 2020. Population projections and annual growth rates were developed using demographic projections from the Southern California Association of Governments (SCAG) Connect SoCal: The 2020-2045 Regional Transportation Plan/Sustainable Community Strategy (Southern California Association of Governments, 2019)1. SCAG routinely forecasts population, housing, and employment estimates in addition to developing transportation plans to support growing population and housing needs throughout the region, and last prepared final population, housing, and employment forecasts in 2019. SCAG provided updated population, housing, and employment estimates for 2020, 2035, and 2045. This data is organized by Transportation Analysis Zones (TAZ). Because TAZ do not align with the City’s water service area, a GIS analysis was used to determine the growth that is projected to occur within the service area. For intermediate years, a linear interpolation was used to calculate the populations for 2025, 2030, and 2040 and then determine annual growth rates. Estimates for 2020 and future population are provided in Table 3-2. The City’s service area does not experience substantial seasonal changes in population. Table 3-2. DWR 3-1R Current and Projected Population
POPULATION SERVED 2020 2025 2030 2035 2040 2045
Population 45,136 45,317 45,498 45,680 45,863 46,046
3.4.2 Other Social, Economic, and Demographic Factors The City’s population is somewhat older than the County’s with seniors (65 years and over) representing 17% of the City compared to only 12% for the County. The City’s median age also exceeds the County’s by five years (41 vs. 36). Table 3-3 summarizes the City’s housing and employment characteristics. Table 3-3. Household and Employment Projections
2020 2025 2030 2035 2040 2045
Households 14,944 15,244 15,550 15,862 16,017 16,173
Employment 23,264 23,832 24,414 25,010 25,453 25,904
*Source: (Southern California Association of Governments, 2019)
1 The population modeling analysis was performed by Water Systems Consulting, Inc. based upon modeling information originally developed by the Southern California Association of Governments (SCAG). SCAG is not responsible for how the Model is applied or for any changes to the model scripts, model parameters, or model input data. The resulting modeling data does not necessarily reflect the official views or policies of SCAG. SCAG shall not be held responsible for the modeling results and the content of the documentation.
System Description Section 3
City of Camarillo 3-6 2020 Urban Water Management Plan
Land Uses within Service Area Residential land uses comprise about 56% of the City’s total area with the remaining land uses being 5% commercial, 9% industrial, 14%conservation, and 16% public (City of Camarillo, 2020). SCAG prepares demographic forecasts based on land use data through an extensive process that emphasizes input from local planners in coordination with local or regional land use authorities, incorporating essential information to reflect anticipated future populations and land uses. SCAG’s projections undergo extensive local review, incorporate zoning information from city and county general plans, and are supported by Environmental Impact Reports. SCAG prepared preliminary demographic forecast estimates for the 2020 Connect SoCal Plan in 2017 for each TAZ. Between 2017 and 2019, SCAG met with each jurisdiction individually to review the demographic forecasts. This review process incorporated feedback from each jurisdiction, including land use planning departments, to help align the demographic forecasts with current land use and anticipated land use changes.
4-1
202 0 UR B AN W AT ER M AN AG EME NT P LAN
Water Use Characterization
This section describes and quantifies the City’s current and projected water use through the year 2045. The City provides potable water to all its customers, which are comprised of about 88% residential accounts. On average, water uses are about 61% residential, 11% commercial/institutional, 0.5% industrial, 22.7% landscape irrigation, 0.8% agricultural, 0.4% other uses, and 4.1% losses.
Accurately tracking and reporting current water demands allows the City to properly analyze the use of its resources in order to conduct good resource planning. Estimating future demand as accurately as possible allows the City to manage its water supply and appropriately plan for infrastructure investments. Assessments of future growth and related water demand, done in coordination with the City’s General Plan, provides essential information for developing demand projections to meet the City’s build‐out goals. Projected demands are expected to range from approximately 6,400 AFY in 2025 to 6,600 AFY in 2045.
IN THIS SECTION
• Non-Potable vs. Potable Water Use
• Past and Current Use
• Projected Water Demand
• Projected Water Demand for Lower Income Households
• Climate Change Impacts
Water Use Characterization Section 4
City of Camarillo 4-2 2020 Urban Water Management Plan
Past, Current, and Projected Water Use by Sector
4.1.1 Water Use Sectors Listed in Water Code Water suppliers are required to identify water uses, to the extent that records are available, for at least each of the 10 water use sectors identified in CWC 10631(d) to assist in the water demand projections. The City primarily serves potable water to customers, though it does supply a small amount of recycled water. Recycled water uses are described in Section 6.
The City serves the following water uses:
Single Family Residential Single family residential customers are typically on a lot with a free-standing building containing one dwelling unit that may include a detached secondary dwelling.
Multi-Family Residential Multi-family residential customers are typically multiple dwelling units within one building or several buildings within one complex.
Commercial/Institutional The City tracks commercial and institutional customer water uses as one. Commercial customers typically provide or distribute a product or service and institutional water customers are typically public services, such as higher-education institutions, schools, courts, churches, hospitals, government facilities, and nonprofit research institutions.
Industrial Industrial customers typically manufacture or process materials.
Landscape Irrigation The City tracks the water use for landscape irrigation.
Agriculture Irrigation The City tracks the water use for agricultural irrigation.
Other The City has 18 accounts for other uses, which generally consist of schools and institutions.
Losses Distribution system water losses are the water losses from the point of water entry to the distribution system to the delivery point to the customer’s system. Water losses are discussed in Section 4.1.3.
4.1.2 Past and Current Water Use The City serves potable water for a variety of uses, as summarized in Table 4-1. Water use over the past five years has notably reduced from pre-drought levels in 2007. Over the past five years, the City used an average of 7,500 AFY. The most recent peak in demand occurred in 2013 with a total demand of 9,710 AFY. It is anticipated that the City’s customers will continue to implement conservation
Water Use Characterization Section 4
City of Camarillo 4-3 2020 Urban Water Management Plan
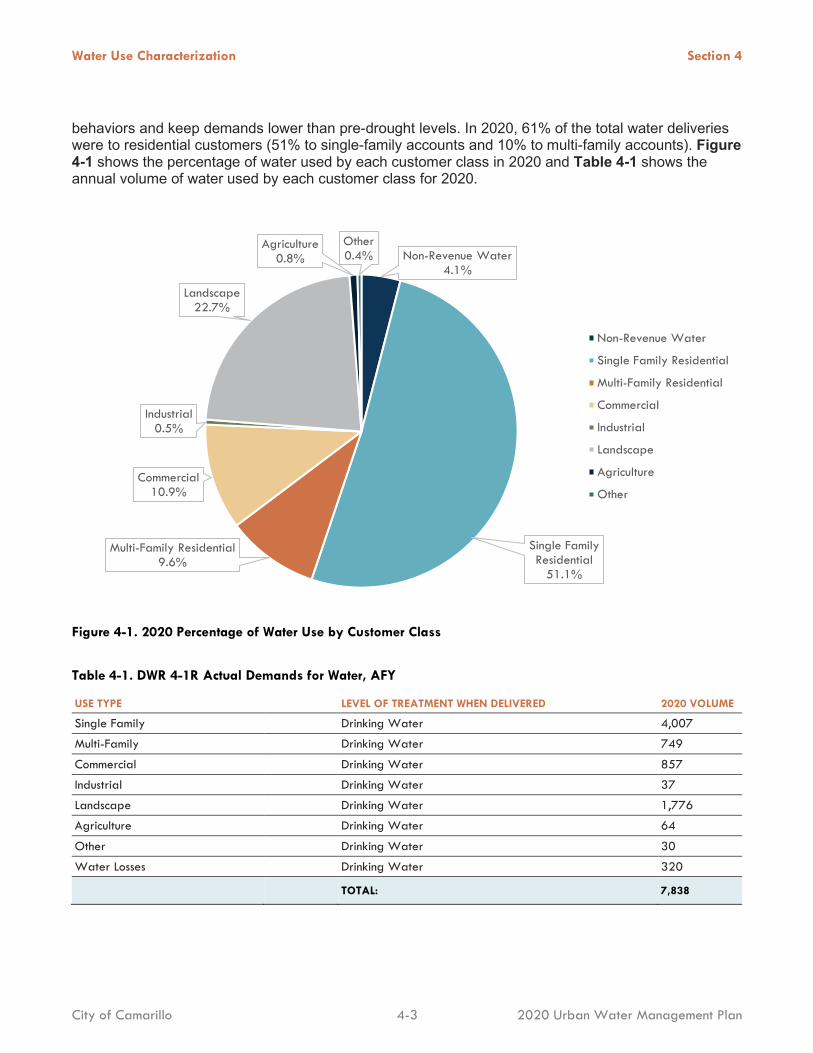
behaviors and keep demands lower than pre-drought levels. In 2020, 61% of the total water deliveries were to residential customers (51% to single-family accounts and 10% to multi-family accounts). Figure 4-1 shows the percentage of water used by each customer class in 2020 and Table 4-1 shows the annual volume of water used by each customer class for 2020.
Figure 4-1. 2020 Percentage of Water Use by Customer Class
Table 4-1. DWR 4-1R Actual Demands for Water, AFY
USE TYPE LEVEL OF TREATMENT WHEN DELIVERED 2020 VOLUME
Single Family Drinking Water 4,007
Multi-Family Drinking Water 749
Commercial Drinking Water 857
Industrial Drinking Water 37
Landscape Drinking Water 1,776
Agriculture Drinking Water 64
Other Drinking Water 30
Water Losses Drinking Water 320
TOTAL: 7,838
Non-Revenue Water4.1%
Single Family Residential
51.1%
Multi-Family Residential9.6%
Commercial10.9%
Industrial0.5%
Landscape22.7%
Agriculture0.8%
Other0.4%
Non-Revenue Water
Single Family Residential
Multi-Family Residential
Commercial
Industrial
Landscape
Agriculture
Other
Water Use Characterization Section 4
City of Camarillo 4-4 2020 Urban Water Management Plan
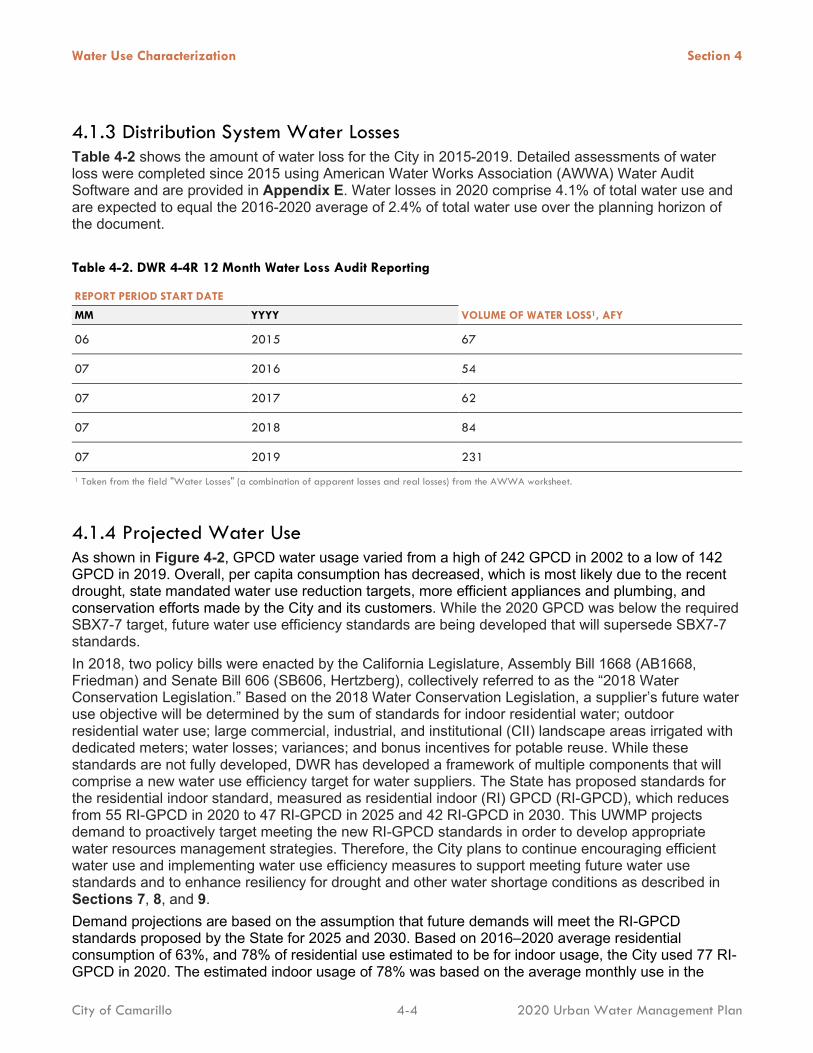
4.1.3 Distribution System Water Losses Table 4-2 shows the amount of water loss for the City in 2015-2019. Detailed assessments of water loss were completed since 2015 using American Water Works Association (AWWA) Water Audit Software and are provided in Appendix E. Water losses in 2020 comprise 4.1% of total water use and are expected to equal the 2016-2020 average of 2.4% of total water use over the planning horizon of the document. Table 4-2. DWR 4-4R 12 Month Water Loss Audit Reporting
REPORT PERIOD START DATE
VOLUME OF WATER LOSS1, AFY MM YYYY
06 2015 67
07 2016 54
07 2017 62
07 2018 84
07 2019 231
1 Taken from the field "Water Losses" (a combination of apparent losses and real losses) from the AWWA worksheet.
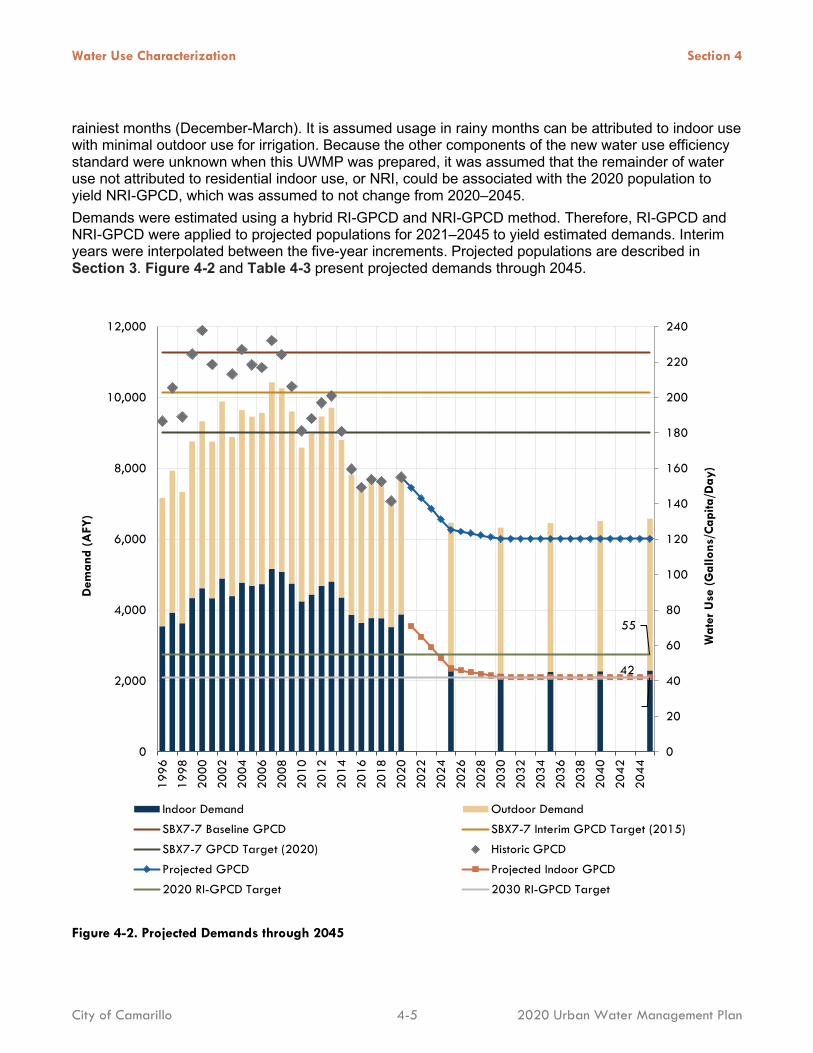
4.1.4 Projected Water Use As shown in Figure 4-2, GPCD water usage varied from a high of 242 GPCD in 2002 to a low of 142 GPCD in 2019. Overall, per capita consumption has decreased, which is most likely due to the recent drought, state mandated water use reduction targets, more efficient appliances and plumbing, and conservation efforts made by the City and its customers. While the 2020 GPCD was below the required SBX7-7 target, future water use efficiency standards are being developed that will supersede SBX7-7 standards. In 2018, two policy bills were enacted by the California Legislature, Assembly Bill 1668 (AB1668, Friedman) and Senate Bill 606 (SB606, Hertzberg), collectively referred to as the “2018 Water Conservation Legislation.” Based on the 2018 Water Conservation Legislation, a supplier’s future water use objective will be determined by the sum of standards for indoor residential water; outdoor residential water use; large commercial, industrial, and institutional (CII) landscape areas irrigated with dedicated meters; water losses; variances; and bonus incentives for potable reuse. While these standards are not fully developed, DWR has developed a framework of multiple components that will comprise a new water use efficiency target for water suppliers. The State has proposed standards for the residential indoor standard, measured as residential indoor (RI) GPCD (RI-GPCD), which reduces from 55 RI-GPCD in 2020 to 47 RI-GPCD in 2025 and 42 RI-GPCD in 2030. This UWMP projects demand to proactively target meeting the new RI-GPCD standards in order to develop appropriate water resources management strategies. Therefore, the City plans to continue encouraging efficient water use and implementing water use efficiency measures to support meeting future water use standards and to enhance resiliency for drought and other water shortage conditions as described in Sections 7, 8, and 9. Demand projections are based on the assumption that future demands will meet the RI-GPCD standards proposed by the State for 2025 and 2030. Based on 2016–2020 average residential consumption of 63%, and 78% of residential use estimated to be for indoor usage, the City used 77 RI-GPCD in 2020. The estimated indoor usage of 78% was based on the average monthly use in the
Water Use Characterization Section 4
City of Camarillo 4-5 2020 Urban Water Management Plan
rainiest months (December-March). It is assumed usage in rainy months can be attributed to indoor use with minimal outdoor use for irrigation. Because the other components of the new water use efficiency standard were unknown when this UWMP was prepared, it was assumed that the remainder of water use not attributed to residential indoor use, or NRI, could be associated with the 2020 population to yield NRI-GPCD, which was assumed to not change from 2020–2045. Demands were estimated using a hybrid RI-GPCD and NRI-GPCD method. Therefore, RI-GPCD and NRI-GPCD were applied to projected populations for 2021–2045 to yield estimated demands. Interim years were interpolated between the five-year increments. Projected populations are described in Section 3. Figure 4-2 and Table 4-3 present projected demands through 2045.
Figure 4-2. Projected Demands through 2045
55
42
0
20
40
60
80
100
120
140
160
180
200
220
240
0
2,000
4,000
6,000
8,000
10,000
12,000
1996
1998
2000
2002
2004
2006
2008
2010
2012
2014
2016
2018
2020
2022
2024
2026
2028
2030
2032
2034
2036
2038
2040
2042
2044
Wat
er U
se (
Gal
lons
/Cap
ita/D
ay)
Dem
and
(AFY
)
Indoor Demand Outdoor Demand
SBX7-7 Baseline GPCD SBX7-7 Interim GPCD Target (2015)
SBX7-7 GPCD Target (2020) Historic GPCD
Projected GPCD Projected Indoor GPCD
2020 RI-GPCD Target 2030 RI-GPCD Target
Water Use Characterization Section 4
City of Camarillo 4-6 2020 Urban Water Management Plan
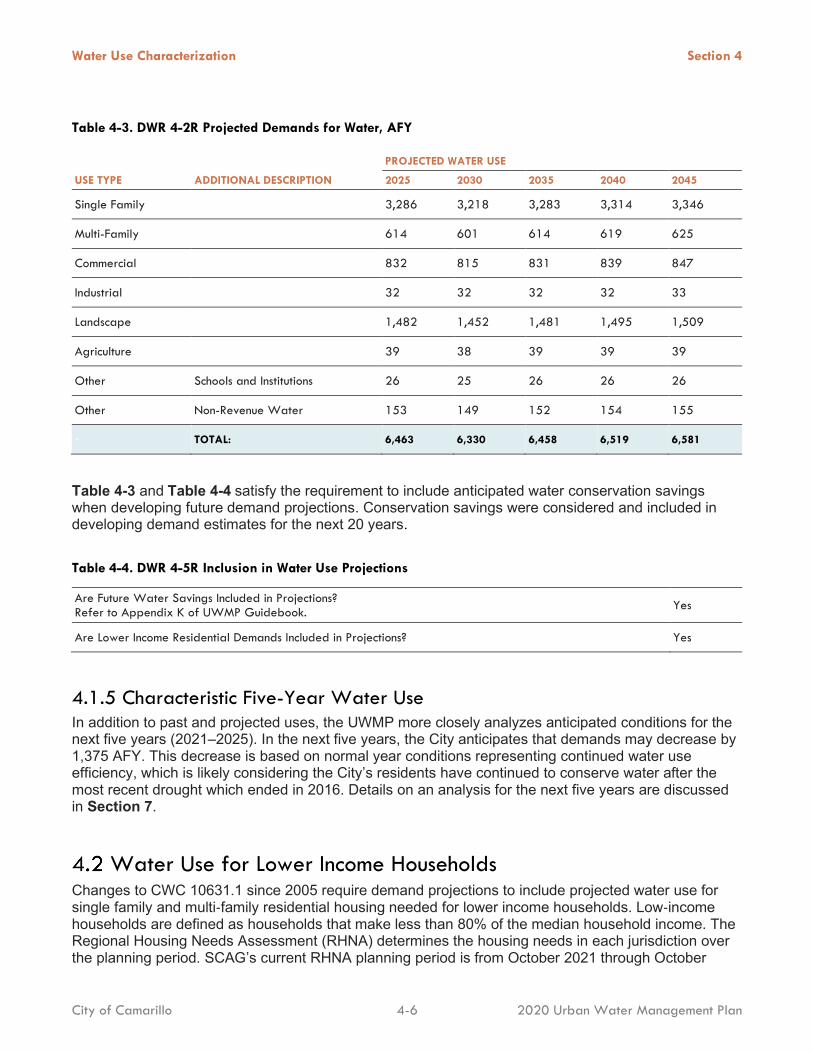
Table 4-3. DWR 4-2R Projected Demands for Water, AFY
- ADDITIONAL DESCRIPTION
PROJECTED WATER USE
USE TYPE 2025 2030 2035 2040 2045
Single Family 3,286 3,218 3,283 3,314 3,346
Multi-Family 614 601 614 619 625
Commercial 832 815 831 839 847
Industrial 32 32 32 32 33
Landscape 1,482 1,452 1,481 1,495 1,509
Agriculture 39 38 39 39 39
Other Schools and Institutions 26 25 26 26 26
Other Non-Revenue Water 153 149 152 154 155
- TOTAL: 6,463 6,330 6,458 6,519 6,581
Table 4-3 and Table 4-4 satisfy the requirement to include anticipated water conservation savings when developing future demand projections. Conservation savings were considered and included in developing demand estimates for the next 20 years. Table 4-4. DWR 4-5R Inclusion in Water Use Projections
Are Future Water Savings Included in Projections? Refer to Appendix K of UWMP Guidebook. Yes
Are Lower Income Residential Demands Included in Projections? Yes
4.1.5 Characteristic Five-Year Water Use In addition to past and projected uses, the UWMP more closely analyzes anticipated conditions for the next five years (2021–2025). In the next five years, the City anticipates that demands may decrease by 1,375 AFY. This decrease is based on normal year conditions representing continued water use efficiency, which is likely considering the City’s residents have continued to conserve water after the most recent drought which ended in 2016. Details on an analysis for the next five years are discussed in Section 7.
Water Use for Lower Income Households Changes to CWC 10631.1 since 2005 require demand projections to include projected water use for single family and multi‐family residential housing needed for lower income households. Low‐income households are defined as households that make less than 80% of the median household income. The Regional Housing Needs Assessment (RHNA) determines the housing needs in each jurisdiction over the planning period. SCAG’s current RHNA planning period is from October 2021 through October
Water Use Characterization Section 4
City of Camarillo 4-7 2020 Urban Water Management Plan
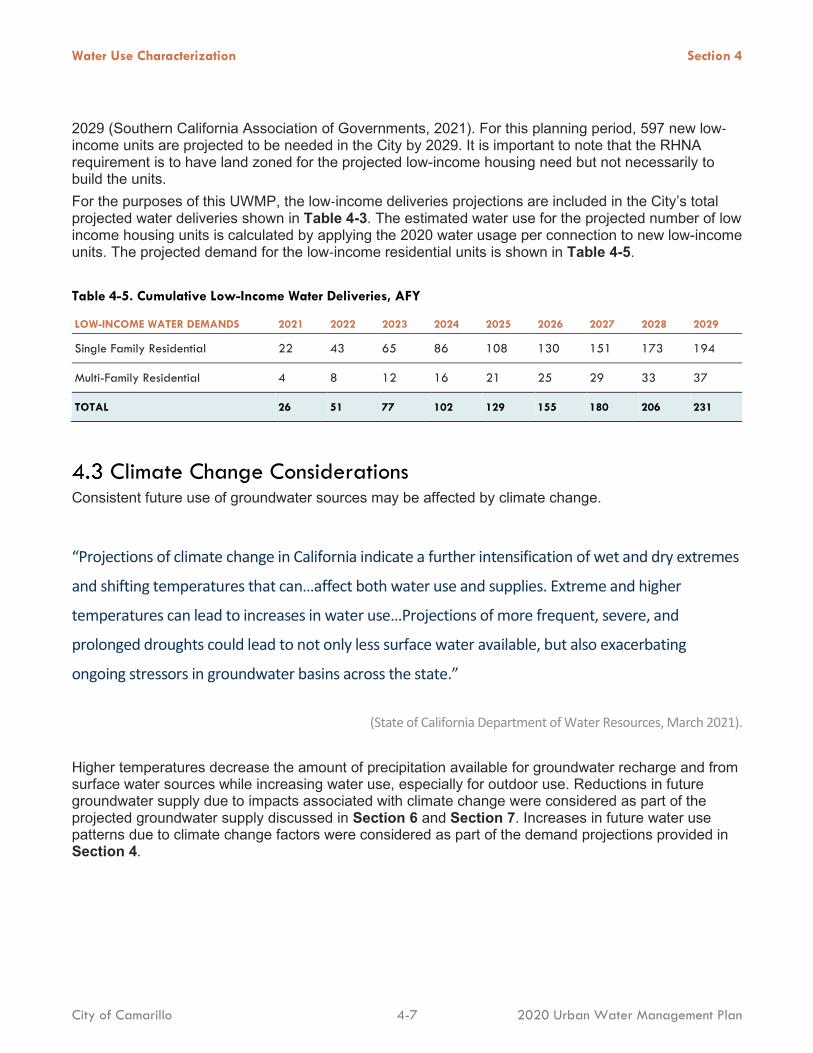
2029 (Southern California Association of Governments, 2021). For this planning period, 597 new low‐income units are projected to be needed in the City by 2029. It is important to note that the RHNA requirement is to have land zoned for the projected low-income housing need but not necessarily to build the units.
For the purposes of this UWMP, the low‐income deliveries projections are included in the City’s total projected water deliveries shown in Table 4-3. The estimated water use for the projected number of low income housing units is calculated by applying the 2020 water usage per connection to new low-income units. The projected demand for the low‐income residential units is shown in Table 4-5.
Table 4-5. Cumulative Low-Income Water Deliveries, AFY
LOW-INCOME WATER DEMANDS 2021 2022 2023 2024 2025 2026 2027 2028 2029
Single Family Residential 22 43 65 86 108 130 151 173 194
Multi-Family Residential 4 8 12 16 21 25 29 33 37
TOTAL 26 51 77 102 129 155 180 206 231
Climate Change Considerations Consistent future use of groundwater sources may be affected by climate change.
“Projections of climate change in California indicate a further intensification of wet and dry extremes
and shifting temperatures that can…affect both water use and supplies. Extreme and higher
temperatures can lead to increases in water use…Projections of more frequent, severe, and
prolonged droughts could lead to not only less surface water available, but also exacerbating
ongoing stressors in groundwater basins across the state.”
(State of California Department of Water Resources, March 2021).
Higher temperatures decrease the amount of precipitation available for groundwater recharge and from surface water sources while increasing water use, especially for outdoor use. Reductions in future groundwater supply due to impacts associated with climate change were considered as part of the projected groundwater supply discussed in Section 6 and Section 7. Increases in future water use patterns due to climate change factors were considered as part of the demand projections provided in
Section 4.

5-1
202 0 UR B AN W AT ER M AN AG EME NT P LAN
SBX7-7 Baseline, Targets, and 2020 Compliance
This section describes the Water Conservation Act of 2009, also known as SBX7-7, Baseline, Targets, and 2020 compliance. The goal of this section is to demonstrate compliance with the 2020 targeted water-use reduction of 20%.
Senate Bill 7 of Special Extended Session 7 (SBX7-7) was incorporated into the UWMP Act in 2009 and requires that all water suppliers increase water use efficiency with the overall goal to decrease per-capita water consumption within the state by 20% by the year 2020. SBX7-7 required DWR to develop certain criteria, methods, and standard reporting forms, through a public process, that water suppliers could use to establish their baseline water use and determine their water conservation targets. SBX7-7 and DWR's Methodologies for Calculating Baseline and Compliance Urban Per Capita Water Use (State of California Department of Water Resources, February 2016) specify methodologies for determining the baseline water demand, 2015 interim urban water use target, and the 2020 urban water use target for the City as described in the following sections. The SBX7-7 Verification and Compliance Forms, which are required to be submitted to DWR to demonstrate compliance with the SBX7-7 requirements, are presented in Appendix F. This section also demonstrates that the City achieved its 2020 water use target.
IN THIS SECTION
• Target and Baseline Method Summary
• Baselines & Targets
• SBX7-7 Forms and Tables
• 2020 Compliance
SBX7-7 Baseline, Targets, and 2020 Compliance Section 5
City of Camarillo 5-2 2020 Urban Water Management Plan
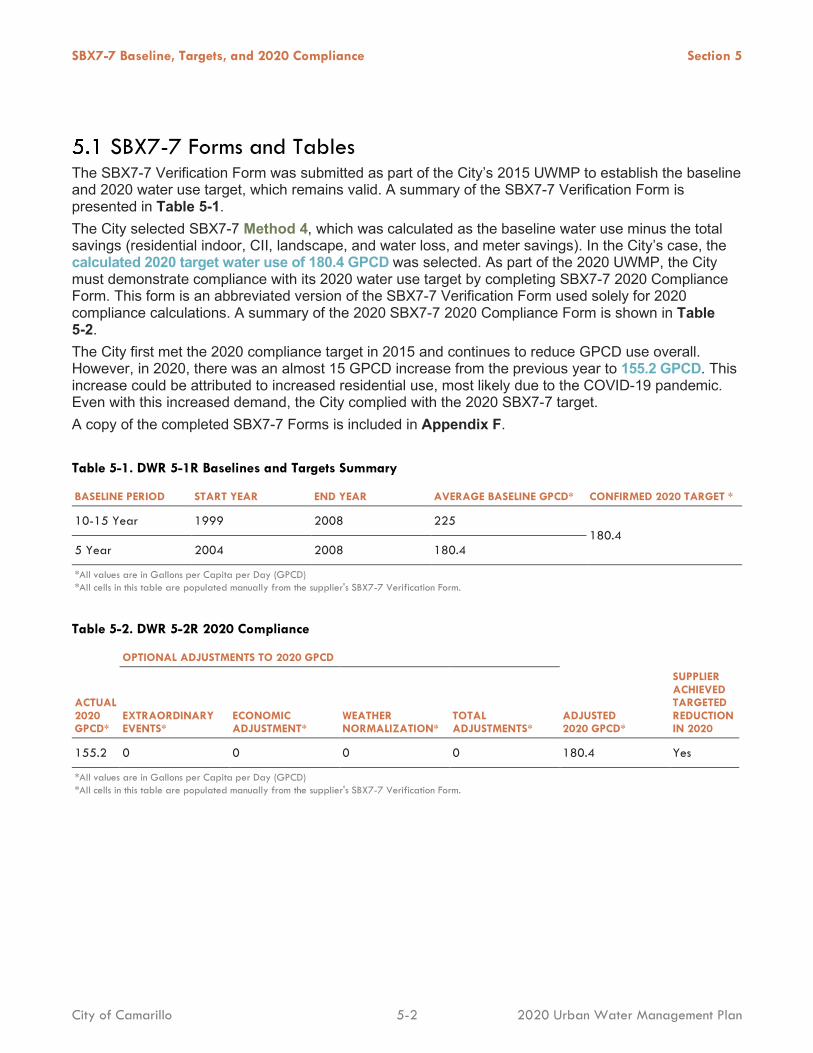
SBX7-7 Forms and Tables The SBX7-7 Verification Form was submitted as part of the City’s 2015 UWMP to establish the baseline and 2020 water use target, which remains valid. A summary of the SBX7-7 Verification Form is presented in Table 5-1. The City selected SBX7-7 Method 4, which was calculated as the baseline water use minus the total savings (residential indoor, CII, landscape, and water loss, and meter savings). In the City’s case, the calculated 2020 target water use of 180.4 GPCD was selected. As part of the 2020 UWMP, the City must demonstrate compliance with its 2020 water use target by completing SBX7-7 2020 Compliance Form. This form is an abbreviated version of the SBX7-7 Verification Form used solely for 2020 compliance calculations. A summary of the 2020 SBX7-7 2020 Compliance Form is shown in Table 5-2. The City first met the 2020 compliance target in 2015 and continues to reduce GPCD use overall. However, in 2020, there was an almost 15 GPCD increase from the previous year to 155.2 GPCD. This increase could be attributed to increased residential use, most likely due to the COVID-19 pandemic. Even with this increased demand, the City complied with the 2020 SBX7-7 target. A copy of the completed SBX7-7 Forms is included in Appendix F. Table 5-1. DWR 5-1R Baselines and Targets Summary
BASELINE PERIOD START YEAR END YEAR AVERAGE BASELINE GPCD* CONFIRMED 2020 TARGET *
10-15 Year 1999 2008 225 180.4
5 Year 2004 2008 180.4
*All values are in Gallons per Capita per Day (GPCD) *All cells in this table are populated manually from the supplier's SBX7-7 Verification Form.
Table 5-2. DWR 5-2R 2020 Compliance
OPTIONAL ADJUSTMENTS TO 2020 GPCD
ACTUAL 2020 GPCD*
EXTRAORDINARY EVENTS*
ECONOMIC ADJUSTMENT*
WEATHER NORMALIZATION*
TOTAL ADJUSTMENTS*
ADJUSTED 2020 GPCD*
SUPPLIER ACHIEVED TARGETED REDUCTION IN 2020
155.2 0 0 0 0 180.4 Yes
*All values are in Gallons per Capita per Day (GPCD) *All cells in this table are populated manually from the supplier's SBX7-7 Verification Form.
6-1
202 0 UR B AN W AT ER M AN AG EME NT P LAN
Water Supply Characterization
This section describes and quantifies the City’s current and projected water supplies. Each water source is characterized with information needed to manage water resources, assess supply reliability, perform the DRA, and prepare and implement the WSCP.
The City sources its water supply from a combination of groundwater and purchased imported water. Recently, the City has been transitioning towards more imported water as groundwater quality has diminished. This is expected to change with a new groundwater treatment facility coming online in late 2021 and with changing groundwater regulatory requirements associated with the Pleasant Valley Basin.
IN THIS SECTION
• Water Supply Characterization
• Energy Intensity
Water Supply Characterization Section 6
City of Camarillo 6-2 2020 Urban Water Management Plan
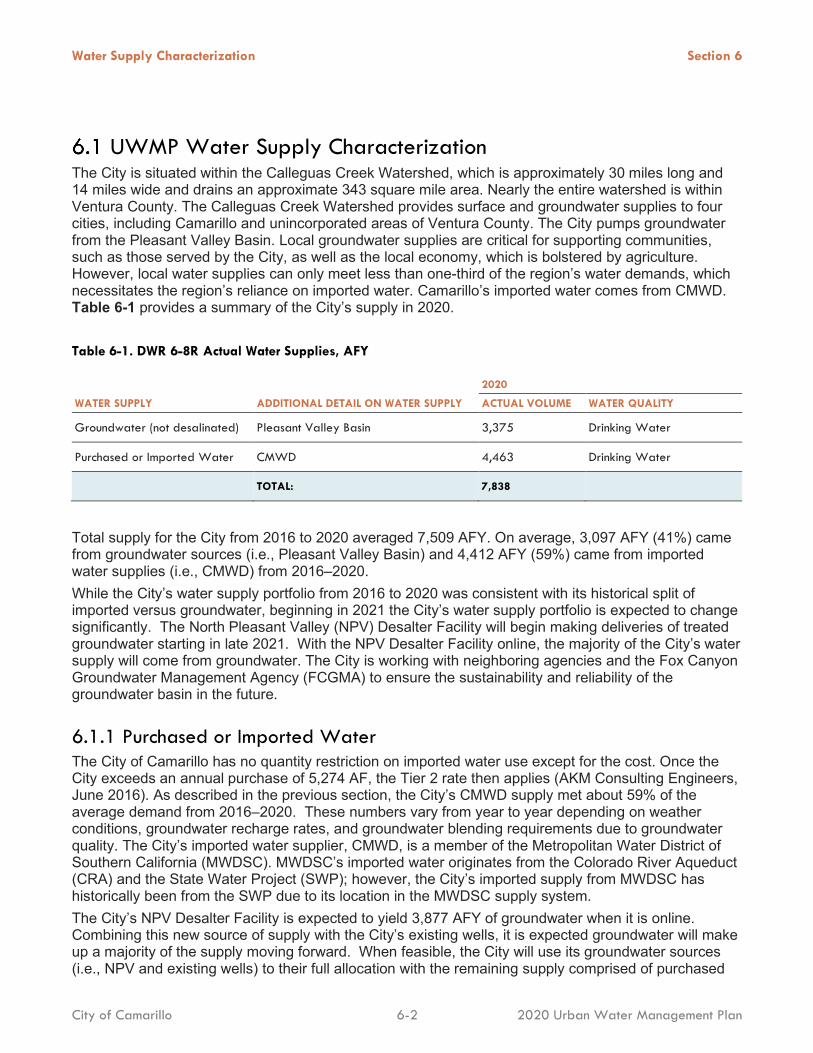
UWMP Water Supply Characterization The City is situated within the Calleguas Creek Watershed, which is approximately 30 miles long and 14 miles wide and drains an approximate 343 square mile area. Nearly the entire watershed is within Ventura County. The Calleguas Creek Watershed provides surface and groundwater supplies to four cities, including Camarillo and unincorporated areas of Ventura County. The City pumps groundwater from the Pleasant Valley Basin. Local groundwater supplies are critical for supporting communities, such as those served by the City, as well as the local economy, which is bolstered by agriculture. However, local water supplies can only meet less than one-third of the region’s water demands, which necessitates the region’s reliance on imported water. Camarillo’s imported water comes from CMWD. Table 6-1 provides a summary of the City’s supply in 2020. Table 6-1. DWR 6-8R Actual Water Supplies, AFY
- 2020
WATER SUPPLY ADDITIONAL DETAIL ON WATER SUPPLY ACTUAL VOLUME WATER QUALITY
Groundwater (not desalinated) Pleasant Valley Basin 3,375 Drinking Water
Purchased or Imported Water CMWD 4,463 Drinking Water
TOTAL: 7,838
Total supply for the City from 2016 to 2020 averaged 7,509 AFY. On average, 3,097 AFY (41%) came from groundwater sources (i.e., Pleasant Valley Basin) and 4,412 AFY (59%) came from imported water supplies (i.e., CMWD) from 2016–2020. While the City’s water supply portfolio from 2016 to 2020 was consistent with its historical split of imported versus groundwater, beginning in 2021 the City’s water supply portfolio is expected to change significantly. The North Pleasant Valley (NPV) Desalter Facility will begin making deliveries of treated groundwater starting in late 2021. With the NPV Desalter Facility online, the majority of the City’s water supply will come from groundwater. The City is working with neighboring agencies and the Fox Canyon Groundwater Management Agency (FCGMA) to ensure the sustainability and reliability of the groundwater basin in the future.
6.1.1 Purchased or Imported Water The City of Camarillo has no quantity restriction on imported water use except for the cost. Once the City exceeds an annual purchase of 5,274 AF, the Tier 2 rate then applies (AKM Consulting Engineers, June 2016). As described in the previous section, the City’s CMWD supply met about 59% of the average demand from 2016–2020. These numbers vary from year to year depending on weather conditions, groundwater recharge rates, and groundwater blending requirements due to groundwater quality. The City’s imported water supplier, CMWD, is a member of the Metropolitan Water District of Southern California (MWDSC). MWDSC’s imported water originates from the Colorado River Aqueduct (CRA) and the State Water Project (SWP); however, the City’s imported supply from MWDSC has historically been from the SWP due to its location in the MWDSC supply system. The City’s NPV Desalter Facility is expected to yield 3,877 AFY of groundwater when it is online. Combining this new source of supply with the City’s existing wells, it is expected groundwater will make up a majority of the supply moving forward. When feasible, the City will use its groundwater sources (i.e., NPV and existing wells) to their full allocation with the remaining supply comprised of purchased
Water Supply Characterization Section 6
City of Camarillo 6-3 2020 Urban Water Management Plan
water from CMWD. The City will purchase water on both a baseline and peak basis. The City’s baseline purchased supply will meet demands of the City’s higher elevation pressure zones 420 and 445A, which have direct turnouts from the CMWD supply pipeline. These two pressure zones are unable to be fed by the City’s distribution system due to pumping limitations and represent the baseline of purchased water from CMWD. The City has plans to modify their system to feed these zones from groundwater sources. For the purposes of this report, it is assumed that these two pressure zones will require 415 AFY based on their average day demand (AKM Consulting Engineers, June 2016). During peak times, the City will also still continue purchasing water from CMWD when the supply from the NPV Desalter Facility and the City’s other wells are not enough to meet demand. This is expected to vary seasonally and will depend on changing regulations within the Pleasant Valley Basin and on future drought conditions.
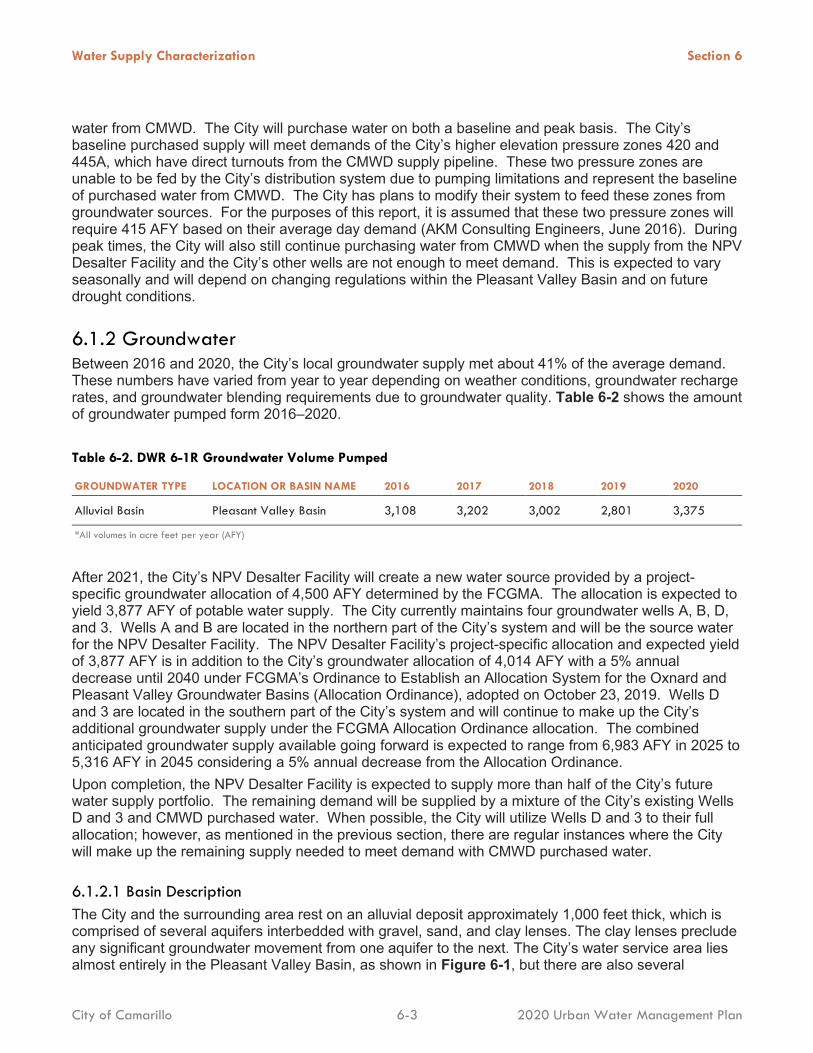
6.1.2 Groundwater Between 2016 and 2020, the City’s local groundwater supply met about 41% of the average demand. These numbers have varied from year to year depending on weather conditions, groundwater recharge rates, and groundwater blending requirements due to groundwater quality. Table 6-2 shows the amount of groundwater pumped form 2016–2020.
Table 6-2. DWR 6-1R Groundwater Volume Pumped
GROUNDWATER TYPE LOCATION OR BASIN NAME 2016 2017 2018 2019 2020
Alluvial Basin Pleasant Valley Basin 3,108 3,202 3,002 2,801 3,375
*All volumes in acre feet per year (AFY)
After 2021, the City’s NPV Desalter Facility will create a new water source provided by a project-specific groundwater allocation of 4,500 AFY determined by the FCGMA. The allocation is expected to yield 3,877 AFY of potable water supply. The City currently maintains four groundwater wells A, B, D, and 3. Wells A and B are located in the northern part of the City’s system and will be the source water for the NPV Desalter Facility. The NPV Desalter Facility’s project-specific allocation and expected yield of 3,877 AFY is in addition to the City’s groundwater allocation of 4,014 AFY with a 5% annual decrease until 2040 under FCGMA’s Ordinance to Establish an Allocation System for the Oxnard and Pleasant Valley Groundwater Basins (Allocation Ordinance), adopted on October 23, 2019. Wells D and 3 are located in the southern part of the City’s system and will continue to make up the City’s additional groundwater supply under the FCGMA Allocation Ordinance allocation. The combined anticipated groundwater supply available going forward is expected to range from 6,983 AFY in 2025 to 5,316 AFY in 2045 considering a 5% annual decrease from the Allocation Ordinance. Upon completion, the NPV Desalter Facility is expected to supply more than half of the City’s future water supply portfolio. The remaining demand will be supplied by a mixture of the City’s existing Wells D and 3 and CMWD purchased water. When possible, the City will utilize Wells D and 3 to their full allocation; however, as mentioned in the previous section, there are regular instances where the City will make up the remaining supply needed to meet demand with CMWD purchased water.
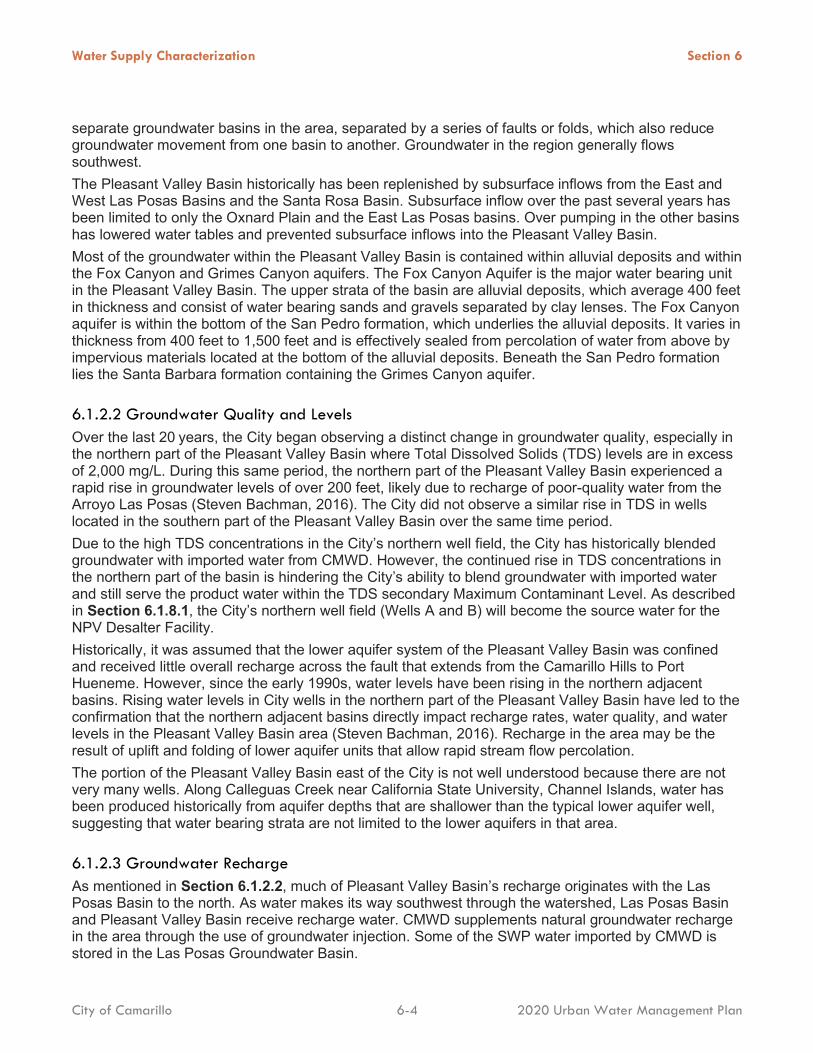
6.1.2.1 Basin Description The City and the surrounding area rest on an alluvial deposit approximately 1,000 feet thick, which is comprised of several aquifers interbedded with gravel, sand, and clay lenses. The clay lenses preclude any significant groundwater movement from one aquifer to the next. The City’s water service area lies almost entirely in the Pleasant Valley Basin, as shown in Figure 6-1, but there are also several
Water Supply Characterization Section 6
City of Camarillo 6-4 2020 Urban Water Management Plan
separate groundwater basins in the area, separated by a series of faults or folds, which also reduce groundwater movement from one basin to another. Groundwater in the region generally flows southwest. The Pleasant Valley Basin historically has been replenished by subsurface inflows from the East and West Las Posas Basins and the Santa Rosa Basin. Subsurface inflow over the past several years has been limited to only the Oxnard Plain and the East Las Posas basins. Over pumping in the other basins has lowered water tables and prevented subsurface inflows into the Pleasant Valley Basin. Most of the groundwater within the Pleasant Valley Basin is contained within alluvial deposits and within the Fox Canyon and Grimes Canyon aquifers. The Fox Canyon Aquifer is the major water bearing unit in the Pleasant Valley Basin. The upper strata of the basin are alluvial deposits, which average 400 feet in thickness and consist of water bearing sands and gravels separated by clay lenses. The Fox Canyon aquifer is within the bottom of the San Pedro formation, which underlies the alluvial deposits. It varies in thickness from 400 feet to 1,500 feet and is effectively sealed from percolation of water from above by impervious materials located at the bottom of the alluvial deposits. Beneath the San Pedro formation lies the Santa Barbara formation containing the Grimes Canyon aquifer.
6.1.2.2 Groundwater Quality and Levels Over the last 20 years, the City began observing a distinct change in groundwater quality, especially in the northern part of the Pleasant Valley Basin where Total Dissolved Solids (TDS) levels are in excess of 2,000 mg/L. During this same period, the northern part of the Pleasant Valley Basin experienced a rapid rise in groundwater levels of over 200 feet, likely due to recharge of poor-quality water from the Arroyo Las Posas (Steven Bachman, 2016). The City did not observe a similar rise in TDS in wells located in the southern part of the Pleasant Valley Basin over the same time period. Due to the high TDS concentrations in the City’s northern well field, the City has historically blended groundwater with imported water from CMWD. However, the continued rise in TDS concentrations in the northern part of the basin is hindering the City’s ability to blend groundwater with imported water and still serve the product water within the TDS secondary Maximum Contaminant Level. As described in Section 6.1.8.1, the City’s northern well field (Wells A and B) will become the source water for the NPV Desalter Facility. Historically, it was assumed that the lower aquifer system of the Pleasant Valley Basin was confined and received little overall recharge across the fault that extends from the Camarillo Hills to Port Hueneme. However, since the early 1990s, water levels have been rising in the northern adjacent basins. Rising water levels in City wells in the northern part of the Pleasant Valley Basin have led to the confirmation that the northern adjacent basins directly impact recharge rates, water quality, and water levels in the Pleasant Valley Basin area (Steven Bachman, 2016). Recharge in the area may be the result of uplift and folding of lower aquifer units that allow rapid stream flow percolation. The portion of the Pleasant Valley Basin east of the City is not well understood because there are not very many wells. Along Calleguas Creek near California State University, Channel Islands, water has been produced historically from aquifer depths that are shallower than the typical lower aquifer well, suggesting that water bearing strata are not limited to the lower aquifers in that area.
6.1.2.3 Groundwater Recharge As mentioned in Section 6.1.2.2, much of Pleasant Valley Basin’s recharge originates with the Las Posas Basin to the north. As water makes its way southwest through the watershed, Las Posas Basin and Pleasant Valley Basin receive recharge water. CMWD supplements natural groundwater recharge in the area through the use of groundwater injection. Some of the SWP water imported by CMWD is stored in the Las Posas Groundwater Basin.
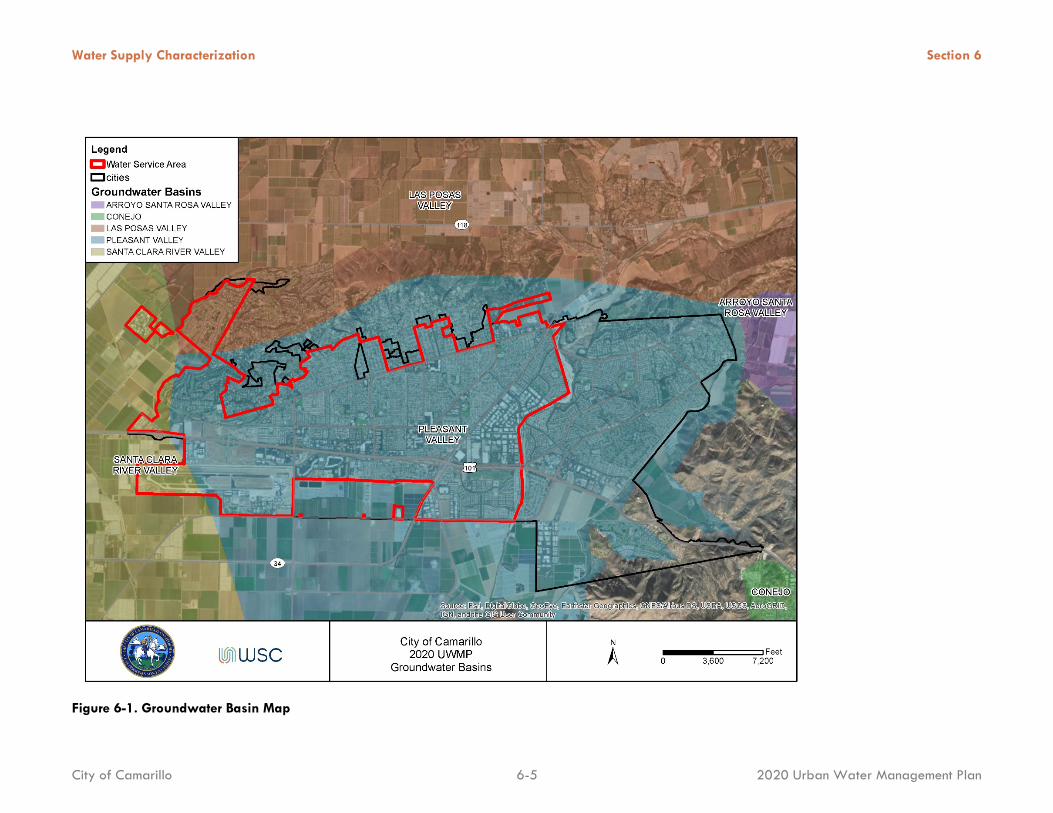
Water Supply Characterization Section 6
City of Camarillo 6-5 2020 Urban Water Management Plan
Figure 6-1. Groundwater Basin Map
Water Supply Characterization Section 6
City of Camarillo 6-6 2020 Urban Water Management Plan
6.1.2.4 Other Considerations The FCGMA was initially created in 1982 to manage the groundwater in both over‐drafted and potentially seawater‐intruded areas within Ventura County. The prime objectives and purposes of the FCGMA are to preserve groundwater resources for agricultural, municipal, and industrial uses in the best interest of the public and for the common benefit of all water users. Protection of water quality and quantity along with maintenance of long‐term water supply are included in those goals and objectives. In May 2007, the FCGMA prepared a groundwater management plan in order to set specific, measurable management objectives for each basin, identify strategies to reach these goals, and set future FCGMA policy to help implement these strategies. The groundwater management plan discusses and reviews a number of aspects of groundwater management, including background information of the groundwater basins; water quality issues, both generally and basin‐by‐basin; the yield of the groundwater basins; current and in‐development management strategies; and recommended actions to be taken by the FCGMA. In 2014, the State enacted the Sustainable Groundwater Management Act (SGMA) to provide a legislative framework for the sustainable management of groundwater supplies by local authorities. SGMA requires medium- and high-priority basins to develop groundwater sustainability agencies (GSAs), develop groundwater sustainability plans (GSPs) and manage groundwater for long-term sustainability. DWR determined the Pleasant Valley Basin as a high priority basin. As the local authority charged with managing groundwater and acting as the GSA, FCGMA must adopt a GSP for submission to DWR. The purpose of the GSP is to provide measurable objectives and sustainable goals within a 20‐year timeframe, to bolster groundwater levels and storage, reduce seawater intrusion, prevent continued degradation of water quality, prevent continued land subsidence, and reduce surface water depletions that have significant adverse impacts on beneficial uses. The FCGMA began the development of a GSP in late 2015. Though the State is calling for plan adoption and implementation of the GSP by 2020, the FCGMA completed its GSP in December 2019. Although the Pleasant Valley Basin is managed by the FCGMA, the basin is not adjudicated. The FCGMA was created to moderate the use of groundwater within the area. In 1985, the FCGMA summed all water inputs and outputs to determine how much could be extracted from the basins in the region. Since that initial analysis, basin yield in the area has been recalculated several times. It has been found that many of the inland basins which do not adjoin the coastline are hydrologically connected to the coastal basins, as evidenced by the continuity of groundwater elevation contours across their boundaries. The Oxnard Plain, a hydrologic region just south of the City, began experiencing saltwater intrusion into its groundwater supply as early as 1930. In the Port Hueneme area, seawater in the aquifer system reached its farthest point inland in the early 1980s. However, following the high rainfall in year 1983, chloride levels began to decrease in many of the area’s wells. This improving trend was accelerated in the 1990s as aquifer pressures were restored and seawater was pushed back towards the coast. The lower aquifer system, of which the Fox Canyon Aquifer is a part of, did not drop below sea level until the late 1950s. The over pumping of the aquifers that led to seawater intrusion also led to land subsidence of up to 2.2 feet in the Pleasant Valley area, as dewatered clay layers between aquifer zones collapsed from reduced hydrostatic pressures. This subsidence is permanent, as refilling the sand and gravel aquifers does not force water back into the dry clay layers. As described previously, FCGMA’s Allocation Ordinance, adopted on October 23, 2019, identified the City’s allocation of 4,014 AFY effective as of October 1, 2020 with a 5% annual decrease until 2040. The new allocation is based on average extraction from 2005–2014. FCGMA has indicated this allocation will transition to a land-based system in a future ordinance. For the purposes of supply projection, it is assumed that the City’s allocation will change in the future, but it is assumed that the Allocation Ordinance will remain in effect into the foreseeable future and will be used in future supply

Water Supply Characterization Section 6
City of Camarillo 6-7 2020 Urban Water Management Plan
projections for this UWMP. The Allocation Ordinance applies to the City’s existing wells only, whereas the NPV Desalter Facility has its own project-specific allocation of 4,500 AFY, which is expected to yield 3,877 AFY of potable water supply. Therefore, the combined anticipated groundwater supply available going forward is expected to range from 6,983 AFY in 2025 to 5,316 AFY in 2045 considering a 5% annual decrease from the Allocation Ordinance, and the rest of the City’s water supply will be met by imported water as shown in Table 6-9.
6.1.3 Surface Water The City does not utilize surface water sources.
6.1.4 Stormwater The City does not utilize stormwater sources.
6.1.5 Wastewater and Recycled Water The UWMP Act requires that the UWMP address the opportunities for development of recycled water including the description of existing recycled water applications, quantities of wastewater currently being treated to recycled water standards, limitations on the use of available recycled water, an estimate of projected recycled water use, the feasibility of projected uses, and practices to encourage the use of recycled water (RW).
6.1.5.1 Wastewater Collection, Treatment, and Disposal The Camarillo Sanitary District (CSD) provides wastewater collection and treatment for the City’s water service area. CSD also treats wastewater for areas within the City’s boundary but outside the water service area and areas north of the City served by California American Water Company, Pleasant Valley Mutual Water Company, Crestview Mutual Water Company, and Pleasant Valley County Water District. CSD treats the wastewater collected within its service area at the Camarillo Water Reclamation Plant (Camarillo WRP), which is located in the southeast portion of the City, adjacent to Conejo Creek. Camarillo WRP was initially designed with a capacity of 2.75 million gallons per day (MGD) but currently treats an average of 3.5 MGD or 3,900 AFY of wastewater and has a peak capacity of 7.25 MGD (Carollo, Inc., 2011). Tertiary treatment processes were added as a part of the Camarillo WRP’s most recent expansion in 2005. CSD also maintains approximately 158 miles of underground sewer lines and four lift stations as a part of its wastewater collection system. The CSD currently recycles a portion of its wastewater through agricultural irrigation of nearby farmlands and landscape irrigation in the vicinity of Camarillo WRP. RW not used for agricultural and landscape purposes is discharged into Conejo Creek. Table 6-3 presents the estimated wastewater collected from within the City’s water service area.
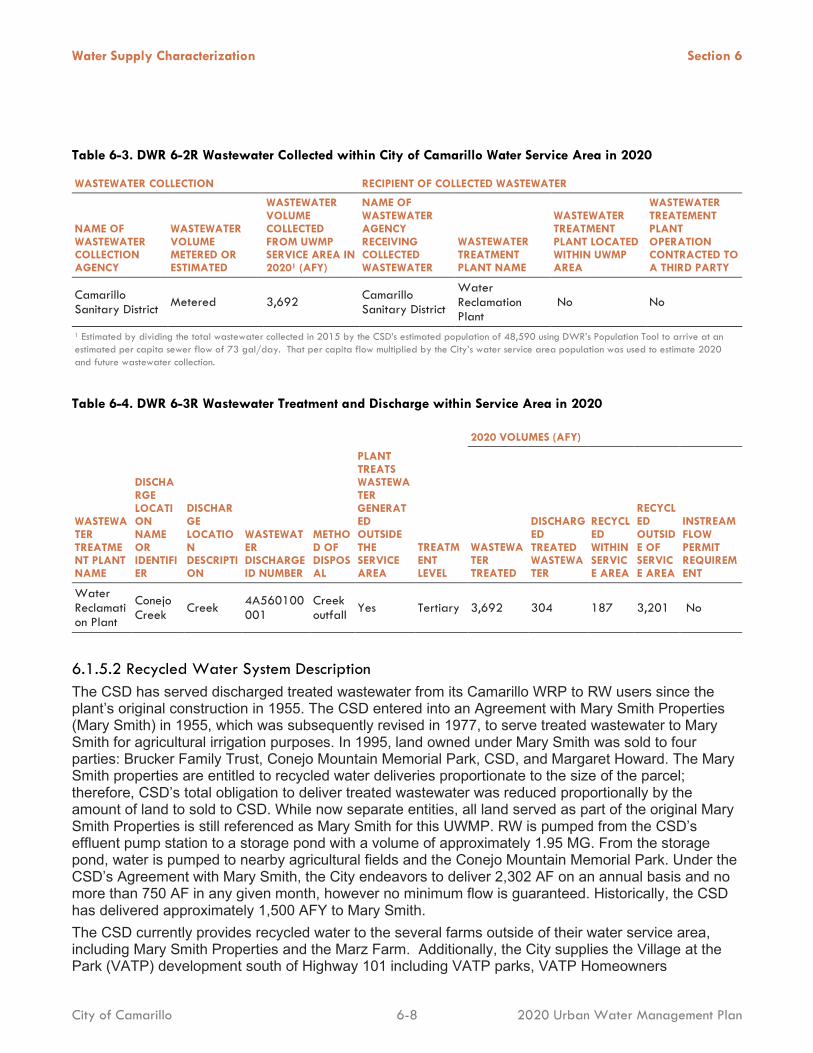
Water Supply Characterization Section 6
City of Camarillo 6-8 2020 Urban Water Management Plan
Table 6-3. DWR 6-2R Wastewater Collected within City of Camarillo Water Service Area in 2020
WASTEWATER COLLECTION RECIPIENT OF COLLECTED WASTEWATER
NAME OF WASTEWATER COLLECTION AGENCY
WASTEWATER VOLUME METERED OR ESTIMATED
WASTEWATER VOLUME COLLECTED FROM UWMP SERVICE AREA IN 20201 (AFY)
NAME OF WASTEWATER AGENCY RECEIVING COLLECTED WASTEWATER
WASTEWATER TREATMENT PLANT NAME
WASTEWATER TREATMENT PLANT LOCATED WITHIN UWMP AREA
WASTEWATER TREATEMENT PLANT OPERATION CONTRACTED TO A THIRD PARTY
CamarilloSanitary District Metered 3,692 Camarillo
Sanitary District
Water Reclamation Plant
No No
1 Estimated by dividing the total wastewater collected in 2015 by the CSD’s estimated population of 48,590 using DWR’s Population Tool to arrive at an estimated per capita sewer flow of 73 gal/day. That per capita flow multiplied by the City’s water service area population was used to estimate 2020 and future wastewater collection.
Table 6-4. DWR 6-3R Wastewater Treatment and Discharge within Service Area in 2020
- 2020 VOLUMES (AFY)
WASTEWATER TREATMENT PLANT NAME
DISCHARGE LOCATION NAME OR IDENTIFIER
DISCHARGE LOCATION DESCRIPTION
WASTEWATER DISCHARGE ID NUMBER
METHOD OF DISPOSAL
PLANT TREATS WASTEWATER GENERATED OUTSIDE THE SERVICE AREA
TREATMENT LEVEL
WASTEWATER TREATED
DISCHARGED TREATED WASTEWATER
RECYCLED WITHIN SERVICE AREA
RECYCLED OUTSIDE OF SERVICE AREA
INSTREAM FLOW PERMIT REQUIREMENT
Water Reclamation Plant
Conejo Creek Creek 4A560100
001 Creek outfall Yes Tertiary 3,692 304 187 3,201 No
6.1.5.2 Recycled Water System Description The CSD has served discharged treated wastewater from its Camarillo WRP to RW users since the plant’s original construction in 1955. The CSD entered into an Agreement with Mary Smith Properties (Mary Smith) in 1955, which was subsequently revised in 1977, to serve treated wastewater to Mary Smith for agricultural irrigation purposes. In 1995, land owned under Mary Smith was sold to four parties: Brucker Family Trust, Conejo Mountain Memorial Park, CSD, and Margaret Howard. The Mary Smith properties are entitled to recycled water deliveries proportionate to the size of the parcel; therefore, CSD’s total obligation to deliver treated wastewater was reduced proportionally by the amount of land to sold to CSD. While now separate entities, all land served as part of the original Mary Smith Properties is still referenced as Mary Smith for this UWMP. RW is pumped from the CSD’s effluent pump station to a storage pond with a volume of approximately 1.95 MG. From the storage pond, water is pumped to nearby agricultural fields and the Conejo Mountain Memorial Park. Under the CSD’s Agreement with Mary Smith, the City endeavors to deliver 2,302 AF on an annual basis and no more than 750 AF in any given month, however no minimum flow is guaranteed. Historically, the CSD has delivered approximately 1,500 AFY to Mary Smith. The CSD currently provides recycled water to the several farms outside of their water service area, including Mary Smith Properties and the Marz Farm. Additionally, the City supplies the Village at the Park (VATP) development south of Highway 101 including VATP parks, VATP Homeowners
City of Camarillo 6-9 2020 Urban Water Management Plan
Association (HOA), and the Camarillo Family YMCA. The City also provides recycled water to fill the City’s water trucks and street sweepers through a non-potable hydrant located at the recycled water filling station approximately two miles northwest of the facility at the end of Village Commons B. The RW effluent pump station consists of four effluent pumps that pump to the RW system, and a dedicated pump that serves Mary Smith. No onsite storage currently exists; however, the City is pursuing the construction of a 1 MG reservoir capable of meeting daily demand. Table 6-5 summarizes recycled water uses within the City’s service area. Table 6-6 compares the amount of RW anticipated to be used in 2020 compared to the projection from the 2015 UWMP.
6.1.5.3 Potential, Current, and Projected Recycled Water Uses With the City’s current and projected RW availability, and without necessitating a supplemental water source to meet peak demand months, the City has connected most of the users identified in the 2014 RW Report. Additional agricultural and industrial users have been identified and the City may have future supply availability to serve these customers. Future customers may include Daily Farms, Hiji Farms, and Rancho Rosal School. It is assumed that recycled water could increase by 1 MGD, or 1,120 AFY, but not all users are located within the City’s water service area. Table 6-5 shows the City’s projected recycled water use within their service area. The City anticipates that the Reclaimed Water Reservoir will be online before 2023. The Reclaimed Water Reservoir will allow the City to effectively manage its recycled water and reduce discharges to Conejo Creek. In late 2020, the City began delivering excess RW to the Camrosa Water District further reducing discharges to Conejo Creek.
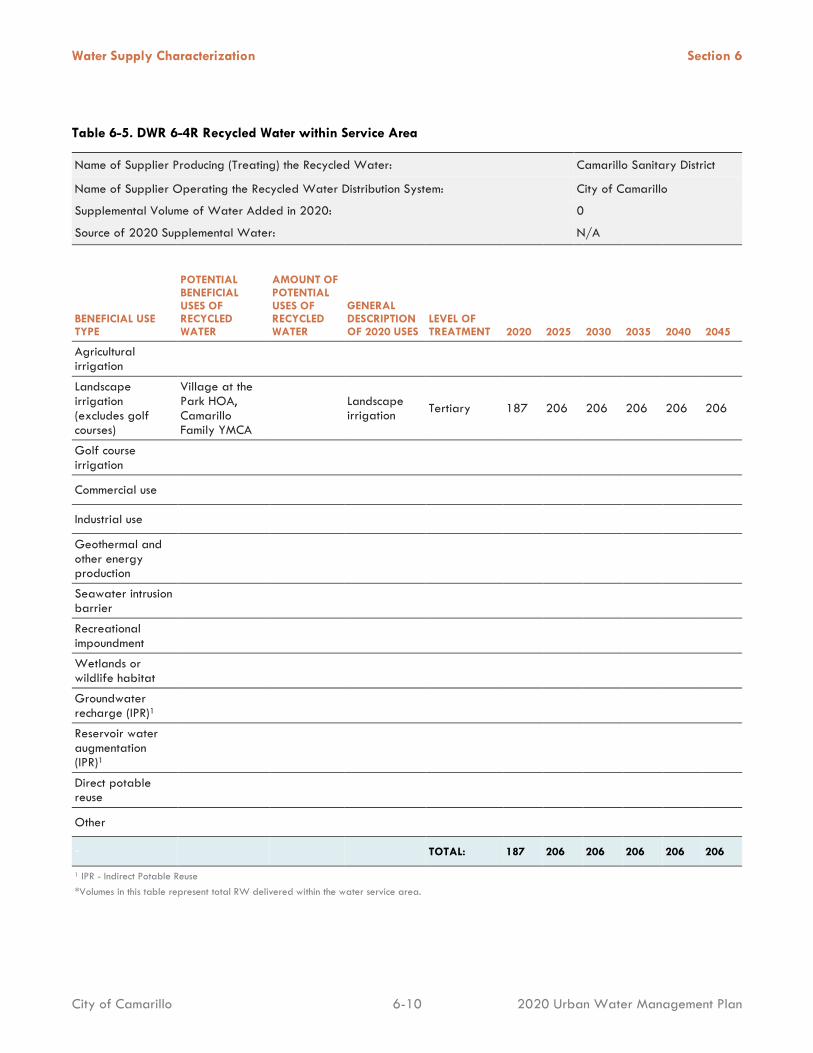
Water Supply Characterization Section 6
City of Camarillo 6-10 2020 Urban Water Management Plan
Table 6-5. DWR 6-4R Recycled Water within Service Area
Name of Supplier Producing (Treating) the Recycled Water: Camarillo Sanitary District
Name of Supplier Operating the Recycled Water Distribution System: City of Camarillo
Supplemental Volume of Water Added in 2020: 0
Source of 2020 Supplemental Water: N/A
BENEFICIAL USE TYPE
POTENTIAL BENEFICIAL USES OF RECYCLED WATER
AMOUNT OF POTENTIAL USES OF RECYCLED WATER
GENERAL DESCRIPTION OF 2020 USES
LEVEL OF TREATMENT 2020 2025 2030 2035 2040 2045
Agricultural irrigation
Landscape irrigation (excludes golf courses)
Village at the Park HOA, Camarillo Family YMCA
Landscape irrigation Tertiary 187 206 206 206 206 206
Golf course irrigation
Commercial use
Industrial use
Geothermal and other energy production
Seawater intrusion barrier
Recreational impoundment
Wetlands or wildlife habitat
Groundwater recharge (IPR)1
Reservoir water augmentation (IPR)1
Direct potable reuse
Other
- TOTAL: 187 206 206 206 206 206
1 IPR - Indirect Potable Reuse *Volumes in this table represent total RW delivered within the water service area.
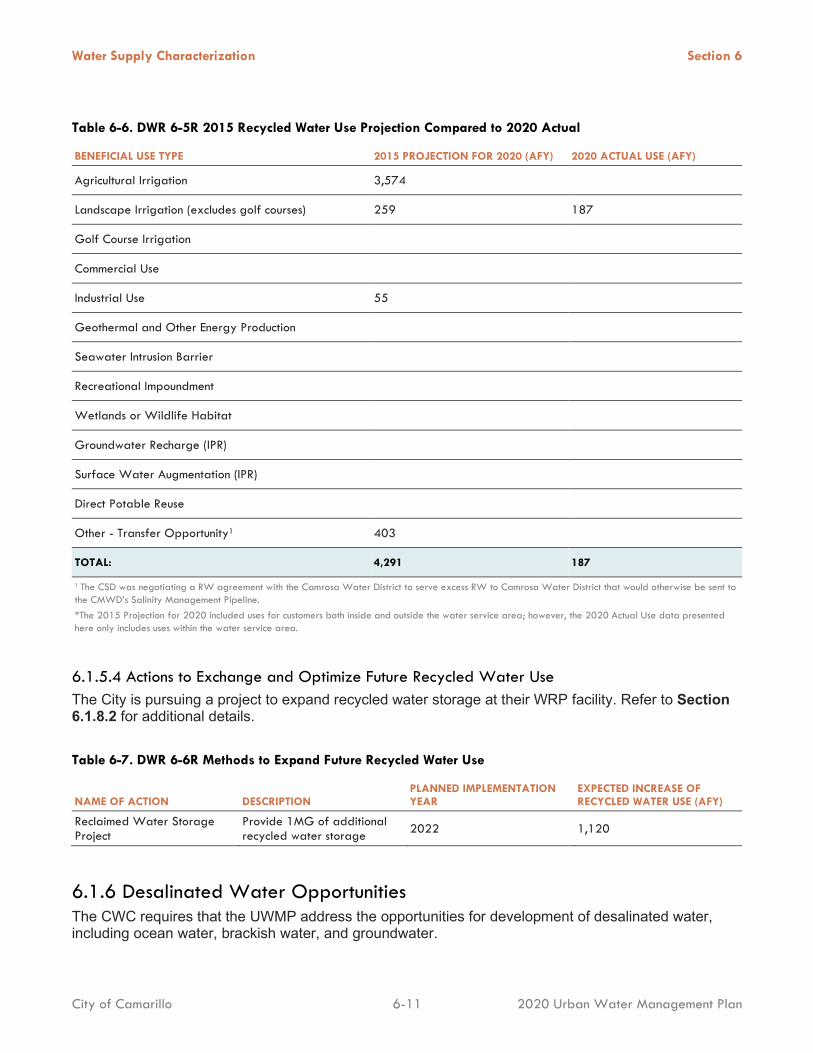
Water Supply Characterization Section 6
City of Camarillo 6-11 2020 Urban Water Management Plan
Table 6-6. DWR 6-5R 2015 Recycled Water Use Projection Compared to 2020 Actual
BENEFICIAL USE TYPE 2015 PROJECTION FOR 2020 (AFY) 2020 ACTUAL USE (AFY)
Agricultural Irrigation 3,574
Landscape Irrigation (excludes golf courses) 259 187
Golf Course Irrigation
Commercial Use
Industrial Use 55
Geothermal and Other Energy Production
Seawater Intrusion Barrier
Recreational Impoundment
Wetlands or Wildlife Habitat
Groundwater Recharge (IPR)
Surface Water Augmentation (IPR)
Direct Potable Reuse
Other - Transfer Opportunity1 403
TOTAL: 4,291 187
1 The CSD was negotiating a RW agreement with the Camrosa Water District to serve excess RW to Camrosa Water District that would otherwise be sent to the CMWD’s Salinity Management Pipeline. *The 2015 Projection for 2020 included uses for customers both inside and outside the water service area; however, the 2020 Actual Use data presented here only includes uses within the water service area.
6.1.5.4 Actions to Exchange and Optimize Future Recycled Water Use The City is pursuing a project to expand recycled water storage at their WRP facility. Refer to Section 6.1.8.2 for additional details. Table 6-7. DWR 6-6R Methods to Expand Future Recycled Water Use
NAME OF ACTION DESCRIPTION PLANNED IMPLEMENTATION YEAR
EXPECTED INCREASE OF RECYCLED WATER USE (AFY)
Reclaimed Water Storage Project
Provide 1MG of additional recycled water storage 2022 1,120
6.1.6 Desalinated Water Opportunities The CWC requires that the UWMP address the opportunities for development of desalinated water, including ocean water, brackish water, and groundwater.
Water Supply Characterization Section 6
City of Camarillo 6-12 2020 Urban Water Management Plan
6.1.6.1 Brackish Water and/or Groundwater Desalination Currently, high TDS levels are found within the groundwater basin underlying the City’s water service area, primarily in the northern portion of the Pleasant Valley Basin. The City blends pumped groundwater with imported water to lower the TDS prior to introduction to the potable water system. This has caused the City to shift groundwater pumping to the City’s wells located in the south Pleasant Valley Basin near the airport. Over the last several years, the City has invested considerable resources into planning for the NPV Desalter Facility, which will treat TDS in the City’s groundwater, allowing for an increase in the City’s groundwater use and lowering the amount of imported water required for blending. The project is expected to be completed and begin delivering water in late 2021 (see Section 6.1.8).
6.1.6.2 Seawater Desalination Development of desalinated seawater is not being considered for the current planning period due to the availability of imported and groundwater supplies to meet the current and projected demand and the City’s prohibitive distance to the ocean, which makes it cost prohibitive to consider desalination as a viable water supply alternative.
6.1.7 Water Exchanges and Transfers The City does not pursue separate water transfer or exchange opportunities with other agencies or suppliers at this time. Such an arrangement could occur in the future.
6.1.8 Future Water Projects The City has two ongoing water supply projects. The NPV Desalter Facility is currently in the final phases of construction and is expecting completion in late 2021. The Reclaimed Water Reservoir is currently in design and is expected to start construction in 2022. The two project details are summarized in the following sections and project details are included in the subsequent Table 6-8.
6.1.8.1 NPV Desalter Facility The NPV Desalter Facility Project includes planning, design, and construction of a desalter facility that is expected to yield approximately 3,877 AFY of potable water for a projected project life of 25 years. The facility will be located at the northeast boundary of the City in existing agricultural land recently acquired by the City and annexed within City limits. Brackish groundwater for the project will be extracted using the City’s existing Wells A and B. The NPV Desalter Facility Project will utilize the process of pretreatment filtration followed by reverse osmosis (RO) to produce a reliable, high-quality supply. Treated, stabilized (finished) water will be pumped to customers using the City’s existing distribution infrastructure. In addition to treatment processes, the project includes a new administration building, emergency generator, a prefabricated building to protect the RO system, storage tanks, restrooms, a new pipeline to connect existing Wells A and B to the site, a new pipeline to connect to the existing water system, a discharge brine connection to the Calleguas Salinity Management Project, and other site improvements, as necessary.
6.1.8.2 Reclaimed Water Reservoir The Reclaimed Water Storage Tank Project (Project) is located within the CSD’s existing WRP. Recycled water storage at the WRP is currently limited to storing secondary effluent within an equalization pond and controlling flow through tertiary processes and disinfection. Treated tertiary
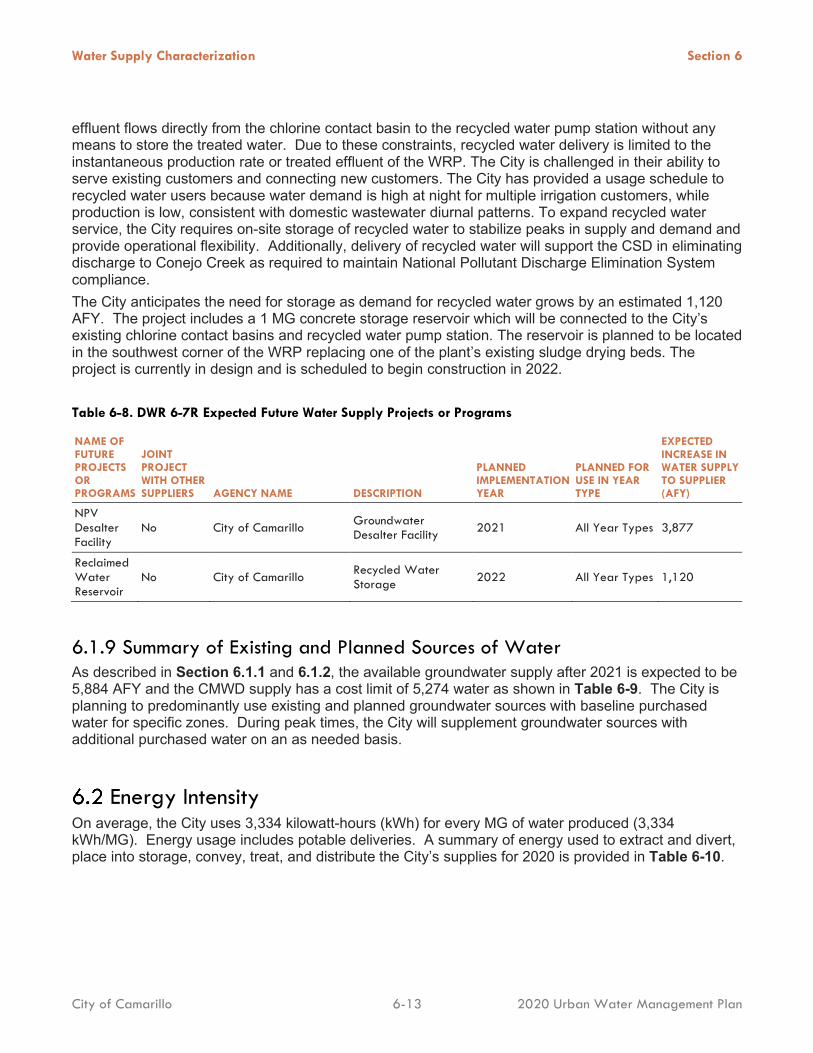
Water Supply Characterization Section 6
City of Camarillo 6-13 2020 Urban Water Management Plan
effluent flows directly from the chlorine contact basin to the recycled water pump station without any means to store the treated water. Due to these constraints, recycled water delivery is limited to the instantaneous production rate or treated effluent of the WRP. The City is challenged in their ability to serve existing customers and connecting new customers. The City has provided a usage schedule to recycled water users because water demand is high at night for multiple irrigation customers, while production is low, consistent with domestic wastewater diurnal patterns. To expand recycled water service, the City requires on-site storage of recycled water to stabilize peaks in supply and demand and provide operational flexibility. Additionally, delivery of recycled water will support the CSD in eliminating discharge to Conejo Creek as required to maintain National Pollutant Discharge Elimination System compliance. The City anticipates the need for storage as demand for recycled water grows by an estimated 1,120 AFY. The project includes a 1 MG concrete storage reservoir which will be connected to the City’s existing chlorine contact basins and recycled water pump station. The reservoir is planned to be located in the southwest corner of the WRP replacing one of the plant’s existing sludge drying beds. The project is currently in design and is scheduled to begin construction in 2022. Table 6-8. DWR 6-7R Expected Future Water Supply Projects or Programs
NAME OF FUTURE PROJECTS OR PROGRAMS
JOINT PROJECT WITH OTHER SUPPLIERS AGENCY NAME DESCRIPTION
PLANNED IMPLEMENTATION YEAR
PLANNED FOR USE IN YEAR TYPE
EXPECTED INCREASE IN WATER SUPPLY TO SUPPLIER (AFY)
NPV Desalter Facility
No City of Camarillo Groundwater Desalter Facility 2021 All Year Types 3,877
Reclaimed Water Reservoir
No City of Camarillo Recycled Water Storage 2022 All Year Types 1,120
6.1.9 Summary of Existing and Planned Sources of Water As described in Section 6.1.1 and 6.1.2, the available groundwater supply after 2021 is expected to be 5,884 AFY and the CMWD supply has a cost limit of 5,274 water as shown in Table 6-9. The City is planning to predominantly use existing and planned groundwater sources with baseline purchased water for specific zones. During peak times, the City will supplement groundwater sources with additional purchased water on an as needed basis.
Energy Intensity On average, the City uses 3,334 kilowatt-hours (kWh) for every MG of water produced (3,334 kWh/MG). Energy usage includes potable deliveries. A summary of energy used to extract and divert, place into storage, convey, treat, and distribute the City’s supplies for 2020 is provided in Table 6-10.
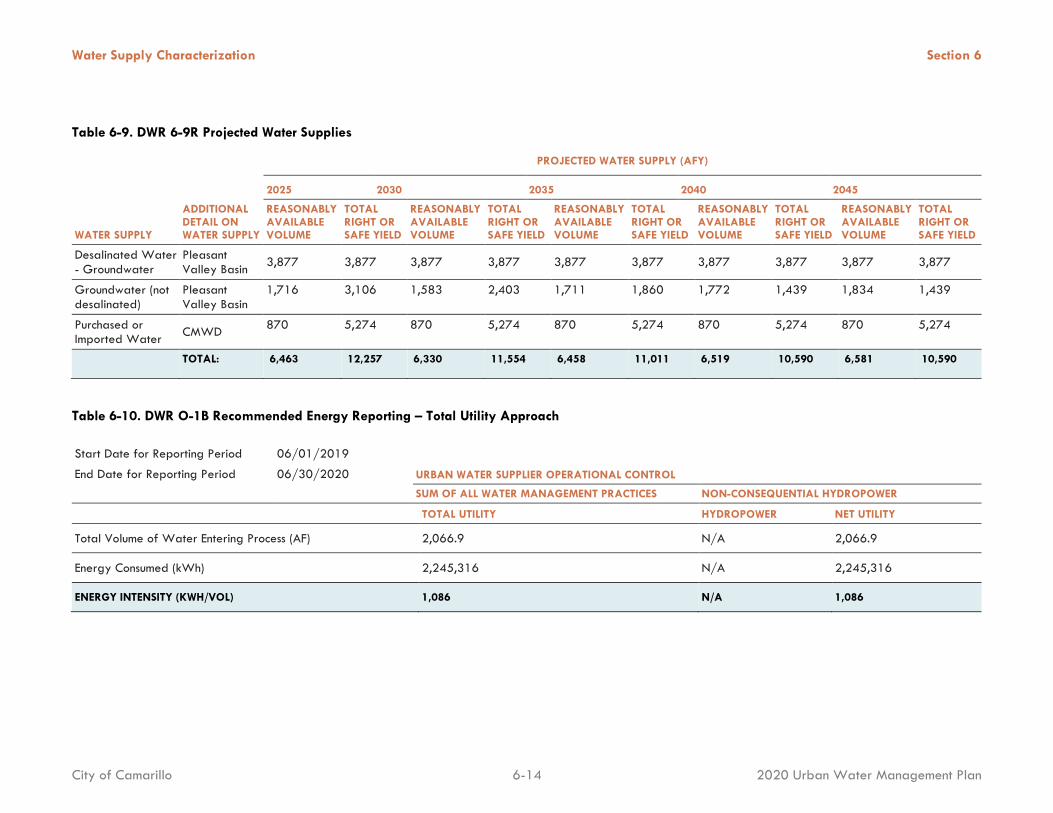
Water Supply Characterization Section 6
City of Camarillo 6-14 2020 Urban Water Management Plan
Table 6-9. DWR 6-9R Projected Water Supplies
- PROJECTED WATER SUPPLY (AFY)
- 2025 2030 2035 2040 2045
WATER SUPPLY
ADDITIONAL DETAIL ON WATER SUPPLY
REASONABLY AVAILABLE VOLUME
TOTAL RIGHT OR SAFE YIELD
REASONABLY AVAILABLE VOLUME
TOTAL RIGHT OR SAFE YIELD
REASONABLY AVAILABLE VOLUME
TOTAL RIGHT OR SAFE YIELD
REASONABLY AVAILABLE VOLUME
TOTAL RIGHT OR SAFE YIELD
REASONABLY AVAILABLE VOLUME
TOTAL RIGHT OR SAFE YIELD
Desalinated Water - Groundwater
Pleasant Valley Basin 3,877 3,877 3,877 3,877 3,877 3,877 3,877 3,877 3,877 3,877
Groundwater (not desalinated)
Pleasant Valley Basin
1,716 3,106 1,583 2,403 1,711 1,860 1,772 1,439 1,834 1,439
Purchased or Imported Water CMWD 870 5,274 870 5,274 870 5,274 870 5,274 870 5,274
TOTAL: 6,463 12,257 6,330 11,554 6,458 11,011 6,519 10,590 6,581 10,590
Table 6-10. DWR O-1B Recommended Energy Reporting – Total Utility Approach
Start Date for Reporting Period 06/01/2019
URBAN WATER SUPPLIER OPERATIONAL CONTROL End Date for Reporting Period 06/30/2020 SUM OF ALL WATER MANAGEMENT PRACTICES NON-CONSEQUENTIAL HYDROPOWER
TOTAL UTILITY HYDROPOWER NET UTILITY
Total Volume of Water Entering Process (AF) 2,066.9 N/A 2,066.9
Energy Consumed (kWh) 2,245,316 N/A 2,245,316
ENERGY INTENSITY (KWH/VOL) 1,086 N/A 1,086
7-1
202 0 UR B AN W AT ER M AN AG EME NT P LAN
Water Service Reliability and Drought Risk Assessment
This section considers the City’s water supply reliability during normal, single dry, and multiple dry water years over the planning horizon. A DRA of the next five years is also included.
Water service reliability corresponds to an urban water supplier’s ability to meet projected future customer demand under a variety of reasonably expected conditions. The supply reliability assessment discusses factors (i.e., climatic, environmental, water quality, and legal) that could potentially limit the expected quantity of water available from the City’s current and projected sources of supply through 2045.
IN THIS SECTION
• Water Service Reliability Assessment
• Drought Risk Assessment
Multiple drought scenarios are considered and the quantitative impacts of the aforementioned factors on water supply and demand are discussed, as well as possible methods for addressing these issues. This section also includes the DRA, which provides a quick snapshot of the anticipated supply surplus or deficit if a drought were to occur in the next five years.
Evaluating the water service reliability is critical for water management as it can help identify potential problems before they happen. Water managers can then take proactive steps to mitigate shortages by encouraging water use efficiency, securing new water supplies, and/or investing in infrastructure.
The water service reliability assessment and DRA results indicate that no water shortages are anticipated within the next 25-years under normal, single-dry water years, and multiple dry water years.
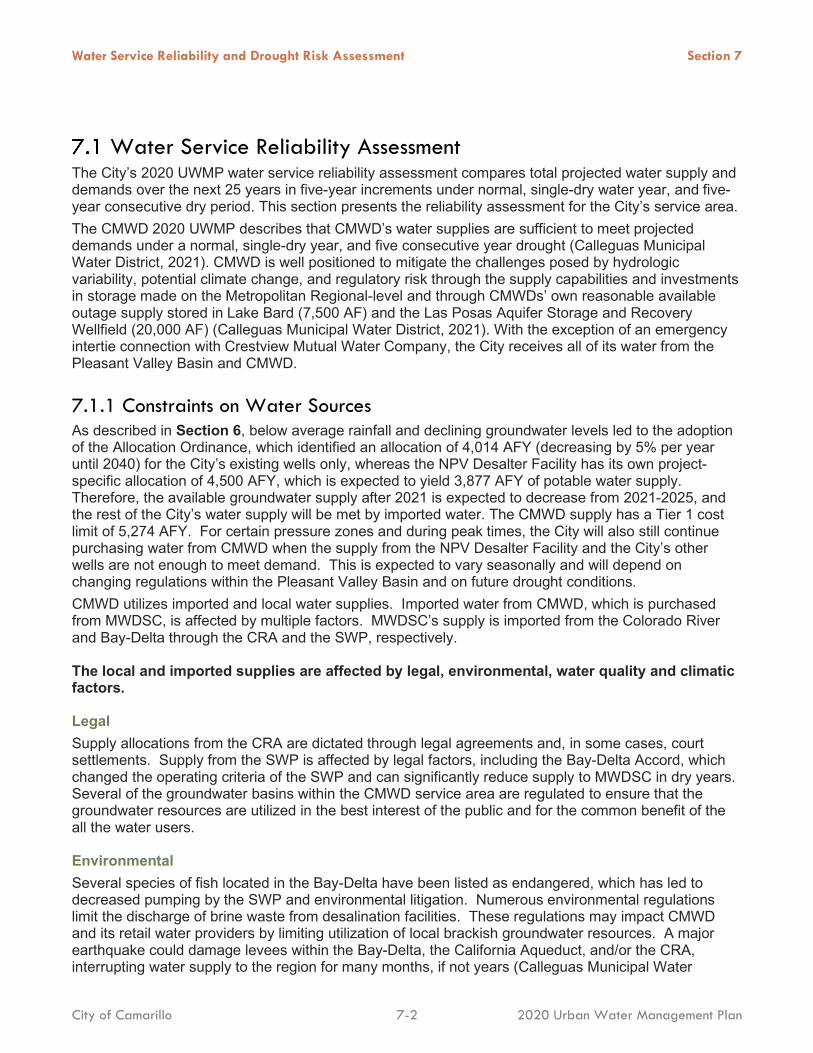
Water Service Reliability and Drought Risk Assessment Section 7
City of Camarillo 7-2 2020 Urban Water Management Plan
Water Service Reliability Assessment The City’s 2020 UWMP water service reliability assessment compares total projected water supply and demands over the next 25 years in five-year increments under normal, single-dry water year, and five-year consecutive dry period. This section presents the reliability assessment for the City’s service area. The CMWD 2020 UWMP describes that CMWD’s water supplies are sufficient to meet projected demands under a normal, single-dry year, and five consecutive year drought (Calleguas Municipal Water District, 2021). CMWD is well positioned to mitigate the challenges posed by hydrologic variability, potential climate change, and regulatory risk through the supply capabilities and investments in storage made on the Metropolitan Regional-level and through CMWDs’ own reasonable available outage supply stored in Lake Bard (7,500 AF) and the Las Posas Aquifer Storage and Recovery Wellfield (20,000 AF) (Calleguas Municipal Water District, 2021). With the exception of an emergency intertie connection with Crestview Mutual Water Company, the City receives all of its water from the Pleasant Valley Basin and CMWD.
7.1.1 Constraints on Water Sources As described in Section 6, below average rainfall and declining groundwater levels led to the adoption of the Allocation Ordinance, which identified an allocation of 4,014 AFY (decreasing by 5% per year until 2040) for the City’s existing wells only, whereas the NPV Desalter Facility has its own project-specific allocation of 4,500 AFY, which is expected to yield 3,877 AFY of potable water supply. Therefore, the available groundwater supply after 2021 is expected to decrease from 2021-2025, and the rest of the City’s water supply will be met by imported water. The CMWD supply has a Tier 1 cost limit of 5,274 AFY. For certain pressure zones and during peak times, the City will also still continue purchasing water from CMWD when the supply from the NPV Desalter Facility and the City’s other wells are not enough to meet demand. This is expected to vary seasonally and will depend on changing regulations within the Pleasant Valley Basin and on future drought conditions. CMWD utilizes imported and local water supplies. Imported water from CMWD, which is purchased from MWDSC, is affected by multiple factors. MWDSC’s supply is imported from the Colorado River and Bay-Delta through the CRA and the SWP, respectively.
The local and imported supplies are affected by legal, environmental, water quality and climatic factors.
Legal Supply allocations from the CRA are dictated through legal agreements and, in some cases, court settlements. Supply from the SWP is affected by legal factors, including the Bay-Delta Accord, which changed the operating criteria of the SWP and can significantly reduce supply to MWDSC in dry years. Several of the groundwater basins within the CMWD service area are regulated to ensure that the groundwater resources are utilized in the best interest of the public and for the common benefit of the all the water users.
Environmental Several species of fish located in the Bay-Delta have been listed as endangered, which has led to decreased pumping by the SWP and environmental litigation. Numerous environmental regulations limit the discharge of brine waste from desalination facilities. These regulations may impact CMWD and its retail water providers by limiting utilization of local brackish groundwater resources. A major earthquake could damage levees within the Bay-Delta, the California Aqueduct, and/or the CRA, interrupting water supply to the region for many months, if not years (Calleguas Municipal Water
Water Service Reliability and Drought Risk Assessment Section 7
City of Camarillo 7-3 2020 Urban Water Management Plan
District, 2021). Environmental water demands are increasing, especially in the Bay-Delta, thus reducing the availability of water for other uses within California (Calleguas Municipal Water District, 2021).
Water Quality Disinfection byproducts pose water quality issues for the SWP. Disinfection byproducts form when organic carbon and bromide in the source water react with disinfectants at the water treatment plant. Groundwater inflows into the SWP also pose arsenic concerns. TDS levels in the Ventura County groundwater are increasing due to discharges from local wastewater treatment facilities. Increased groundwater treatment may be required to utilize local groundwater supplies. Groundwater quality has historically proven problematic for the City and has had adverse effects on its water supply. High levels of TDS and chloride have resulted in the City blending groundwater with imported water in order to achieve water quality standards. As mentioned in Section 6, the City is developing the NPV Desalter Facility for groundwater treatment and desalination of Pleasant Valley Basin water. This project will allow the City to stop pumping the groundwater aquifer in areas where the groundwater level is decreasing, and instead take water from areas where the groundwater is of poor quality but increasing in quantity.
Climatic Variable hydrology in the basins that feed the Bay-Delta affects SWP supply. Recent climate change studies indicate that Bay-Delta and Colorado River supplies could be even more variable than that of the historical record, further stressing California water supplies (Calleguas Municipal Water District, 2021).
7.1.2 Year Type Characterization DWR defines three year types that must be included in the water service reliability assessment.
These include: • Average Year. This condition represents a single year or averaged range of years that most closely
represents the average water supply available. DWR uses the terms average and normal interchangeably when addressing the water year type.
• Single Dry Year. The single-dry year is recommended to be the year that represents the lowest water supply available to the supplier.
• Five-Consecutive-Year Drought. The driest five-year historical sequence for the supplier, which may be the lowest average water supply available for five years in a row.
The supply reliability for the City is dependent upon the supply reliability of CMWD and the Pleasant Valley Basin. The CMWD 2020 UWMP describes that CMWD’s water supplies are sufficient to meet projected demands under a normal, single-dry year, and five consecutive year drought (Calleguas Municipal Water District, 2021) as shown in Table 7-1. For the purposes of the supply projection, it is assumed that the Allocation Ordinance interim allocation will remain in effect into the foreseeable future during average, single-dry, and multiple dry years as shown in Table 7-2. Short-term supply constraints are discussed in detail in the WSCP.
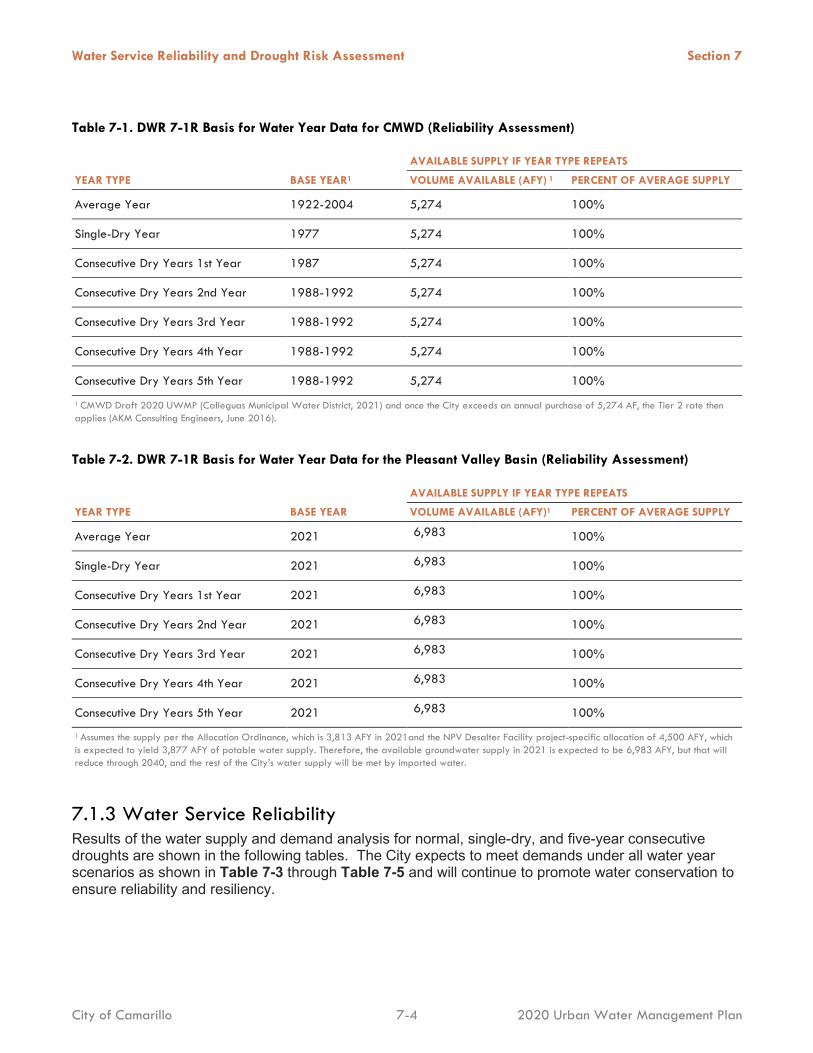
Water Service Reliability and Drought Risk Assessment Section 7
City of Camarillo 7-4 2020 Urban Water Management Plan
Table 7-1. DWR 7-1R Basis for Water Year Data for CMWD (Reliability Assessment)
- AVAILABLE SUPPLY IF YEAR TYPE REPEATS
YEAR TYPE BASE YEAR1 VOLUME AVAILABLE (AFY) 1 PERCENT OF AVERAGE SUPPLY
Average Year 1922-2004 5,274 100%
Single-Dry Year 1977 5,274 100%
Consecutive Dry Years 1st Year 1987 5,274 100%
Consecutive Dry Years 2nd Year 1988-1992 5,274 100%
Consecutive Dry Years 3rd Year 1988-1992 5,274 100%
Consecutive Dry Years 4th Year 1988-1992 5,274 100%
Consecutive Dry Years 5th Year 1988-1992 5,274 100%
1 CMWD Draft 2020 UWMP (Calleguas Municipal Water District, 2021) and once the City exceeds an annual purchase of 5,274 AF, the Tier 2 rate then applies (AKM Consulting Engineers, June 2016).
Table 7-2. DWR 7-1R Basis for Water Year Data for the Pleasant Valley Basin (Reliability Assessment)
- AVAILABLE SUPPLY IF YEAR TYPE REPEATS
YEAR TYPE BASE YEAR VOLUME AVAILABLE (AFY)1 PERCENT OF AVERAGE SUPPLY
Average Year 2021 6,983 100%
Single-Dry Year 2021 6,983 100%
Consecutive Dry Years 1st Year 2021 6,983 100%
Consecutive Dry Years 2nd Year 2021 6,983 100%
Consecutive Dry Years 3rd Year 2021 6,983 100%
Consecutive Dry Years 4th Year 2021 6,983 100%
Consecutive Dry Years 5th Year 2021 6,983 100%
1 Assumes the supply per the Allocation Ordinance, which is 3,813 AFY in 2021and the NPV Desalter Facility project-specific allocation of 4,500 AFY, which is expected to yield 3,877 AFY of potable water supply. Therefore, the available groundwater supply in 2021 is expected to be 6,983 AFY, but that will reduce through 2040, and the rest of the City’s water supply will be met by imported water.
7.1.3 Water Service Reliability Results of the water supply and demand analysis for normal, single-dry, and five-year consecutive droughts are shown in the following tables. The City expects to meet demands under all water year scenarios as shown in Table 7-3 through Table 7-5 and will continue to promote water conservation to ensure reliability and resiliency.
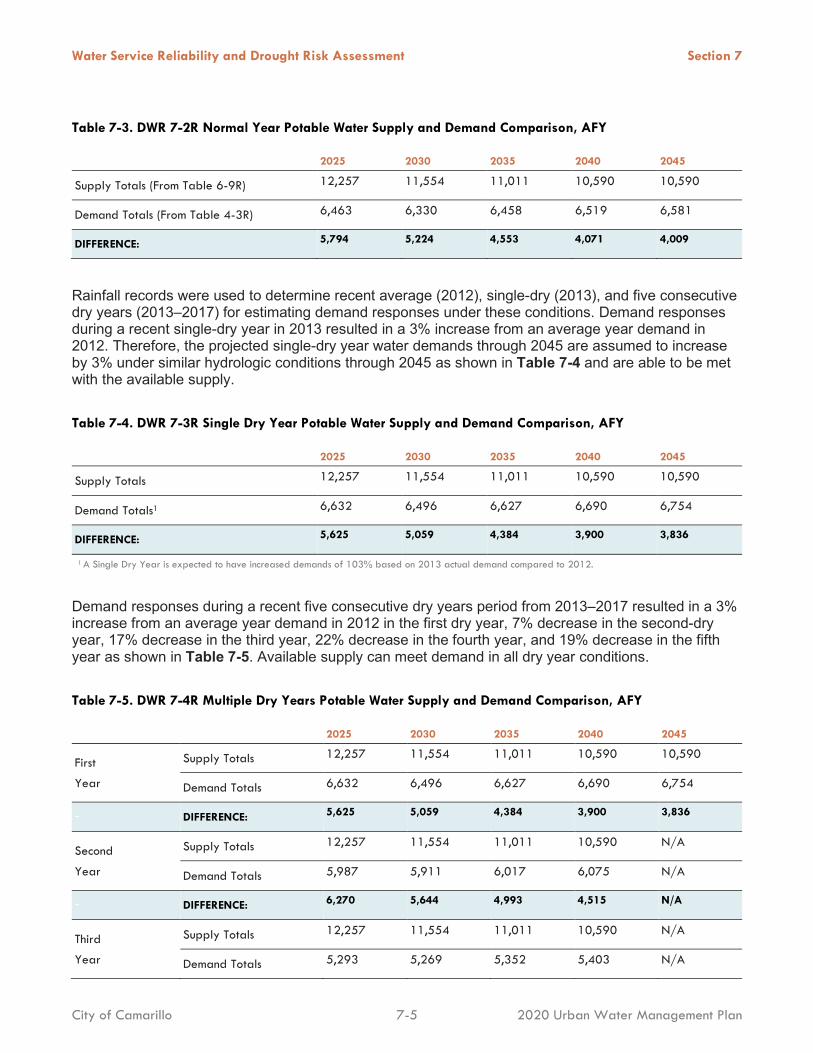
Water Service Reliability and Drought Risk Assessment Section 7
City of Camarillo 7-5 2020 Urban Water Management Plan
Table 7-3. DWR 7-2R Normal Year Potable Water Supply and Demand Comparison, AFY
- 2025 2030 2035 2040 2045
Supply Totals (From Table 6-9R) 12,257 11,554 11,011 10,590 10,590
Demand Totals (From Table 4-3R) 6,463 6,330 6,458 6,519 6,581
DIFFERENCE: 5,794 5,224 4,553 4,071 4,009
Rainfall records were used to determine recent average (2012), single-dry (2013), and five consecutive dry years (2013–2017) for estimating demand responses under these conditions. Demand responses during a recent single-dry year in 2013 resulted in a 3% increase from an average year demand in 2012. Therefore, the projected single-dry year water demands through 2045 are assumed to increase by 3% under similar hydrologic conditions through 2045 as shown in Table 7-4 and are able to be met with the available supply. Table 7-4. DWR 7-3R Single Dry Year Potable Water Supply and Demand Comparison, AFY
- 2025 2030 2035 2040 2045
Supply Totals 12,257 11,554 11,011 10,590 10,590
Demand Totals1 6,632 6,496 6,627 6,690 6,754
DIFFERENCE: 5,625 5,059 4,384 3,900 3,836
1 A Single Dry Year is expected to have increased demands of 103% based on 2013 actual demand compared to 2012.
Demand responses during a recent five consecutive dry years period from 2013–2017 resulted in a 3% increase from an average year demand in 2012 in the first dry year, 7% decrease in the second-dry year, 17% decrease in the third year, 22% decrease in the fourth year, and 19% decrease in the fifth year as shown in Table 7-5. Available supply can meet demand in all dry year conditions. Table 7-5. DWR 7-4R Multiple Dry Years Potable Water Supply and Demand Comparison, AFY
- - 2025 2030 2035 2040 2045
First Supply Totals 12,257 11,554 11,011 10,590 10,590
Year Demand Totals 6,632 6,496 6,627 6,690 6,754
- DIFFERENCE: 5,625 5,059 4,384 3,900 3,836
Second Supply Totals 12,257 11,554 11,011 10,590 N/A
Year Demand Totals 5,987 5,911 6,017 6,075 N/A
- DIFFERENCE: 6,270 5,644 4,993 4,515 N/A
Third Supply Totals 12,257 11,554 11,011 10,590 N/A
Year Demand Totals 5,293 5,269 5,352 5,403 N/A
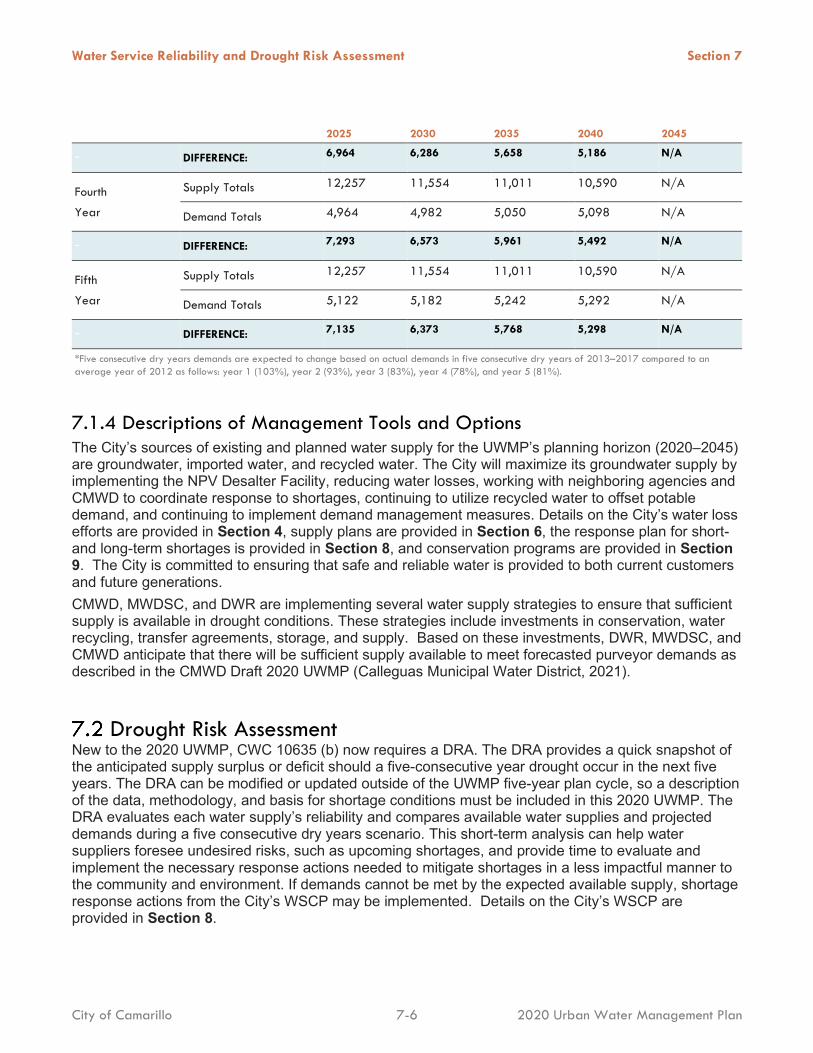
Water Service Reliability and Drought Risk Assessment Section 7
City of Camarillo 7-6 2020 Urban Water Management Plan
- - 2025 2030 2035 2040 2045
- DIFFERENCE: 6,964 6,286 5,658 5,186 N/A
Fourth Supply Totals 12,257 11,554 11,011 10,590 N/A
Year Demand Totals 4,964 4,982 5,050 5,098 N/A
- DIFFERENCE: 7,293 6,573 5,961 5,492 N/A
Fifth Supply Totals 12,257 11,554 11,011 10,590 N/A
Year Demand Totals 5,122 5,182 5,242 5,292 N/A
- DIFFERENCE: 7,135 6,373 5,768 5,298 N/A
*Five consecutive dry years demands are expected to change based on actual demands in five consecutive dry years of 2013–2017 compared to an average year of 2012 as follows: year 1 (103%), year 2 (93%), year 3 (83%), year 4 (78%), and year 5 (81%).
7.1.4 Descriptions of Management Tools and Options The City’s sources of existing and planned water supply for the UWMP’s planning horizon (2020–2045) are groundwater, imported water, and recycled water. The City will maximize its groundwater supply by implementing the NPV Desalter Facility, reducing water losses, working with neighboring agencies and CMWD to coordinate response to shortages, continuing to utilize recycled water to offset potable demand, and continuing to implement demand management measures. Details on the City’s water loss efforts are provided in Section 4, supply plans are provided in Section 6, the response plan for short- and long-term shortages is provided in Section 8, and conservation programs are provided in Section 9. The City is committed to ensuring that safe and reliable water is provided to both current customers and future generations. CMWD, MWDSC, and DWR are implementing several water supply strategies to ensure that sufficient supply is available in drought conditions. These strategies include investments in conservation, water recycling, transfer agreements, storage, and supply. Based on these investments, DWR, MWDSC, and CMWD anticipate that there will be sufficient supply available to meet forecasted purveyor demands as described in the CMWD Draft 2020 UWMP (Calleguas Municipal Water District, 2021).
Drought Risk Assessment New to the 2020 UWMP, CWC 10635 (b) now requires a DRA. The DRA provides a quick snapshot of the anticipated supply surplus or deficit should a five-consecutive year drought occur in the next five years. The DRA can be modified or updated outside of the UWMP five-year plan cycle, so a description of the data, methodology, and basis for shortage conditions must be included in this 2020 UWMP. The DRA evaluates each water supply’s reliability and compares available water supplies and projected demands during a five consecutive dry years scenario. This short-term analysis can help water suppliers foresee undesired risks, such as upcoming shortages, and provide time to evaluate and implement the necessary response actions needed to mitigate shortages in a less impactful manner to the community and environment. If demands cannot be met by the expected available supply, shortage response actions from the City’s WSCP may be implemented. Details on the City’s WSCP are provided in Section 8.
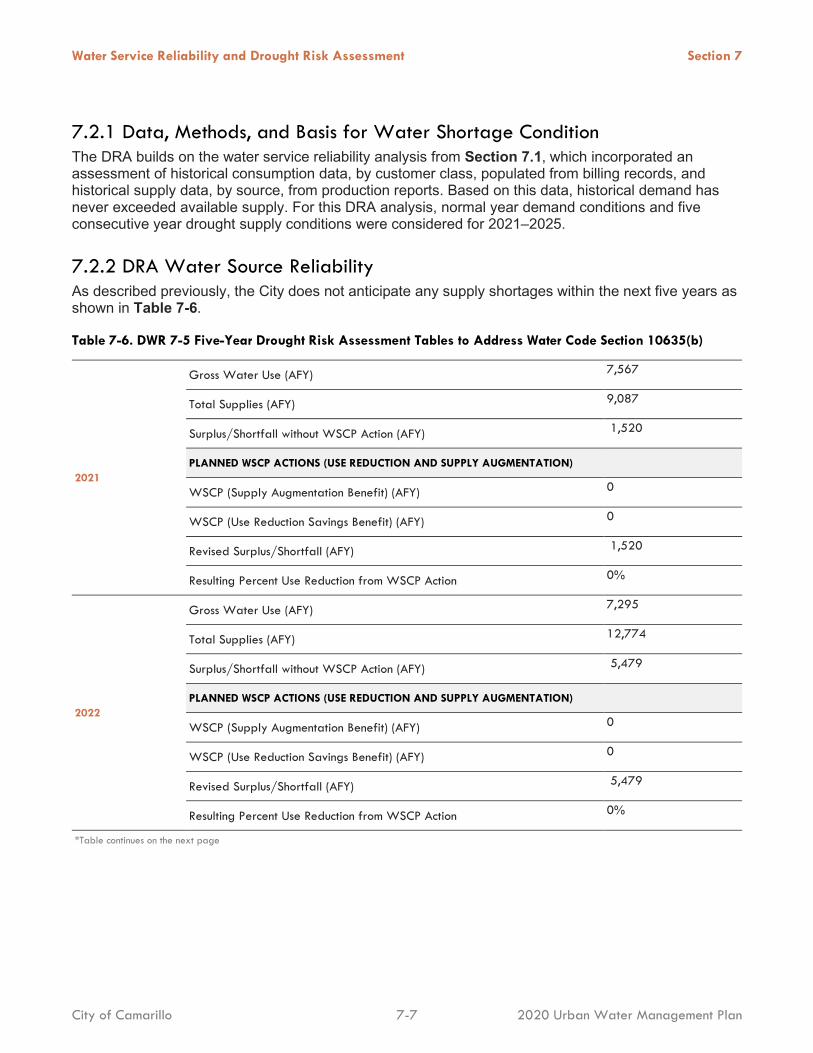
Water Service Reliability and Drought Risk Assessment Section 7
City of Camarillo 7-7 2020 Urban Water Management Plan
7.2.1 Data, Methods, and Basis for Water Shortage Condition The DRA builds on the water service reliability analysis from Section 7.1, which incorporated an assessment of historical consumption data, by customer class, populated from billing records, and historical supply data, by source, from production reports. Based on this data, historical demand has never exceeded available supply. For this DRA analysis, normal year demand conditions and five consecutive year drought supply conditions were considered for 2021–2025.
7.2.2 DRA Water Source Reliability As described previously, the City does not anticipate any supply shortages within the next five years as shown in Table 7-6.
Table 7-6. DWR 7-5 Five-Year Drought Risk Assessment Tables to Address Water Code Section 10635(b)
2021
Gross Water Use (AFY) 7,567
Total Supplies (AFY) 9,087
Surplus/Shortfall without WSCP Action (AFY) 1,520
PLANNED WSCP ACTIONS (USE REDUCTION AND SUPPLY AUGMENTATION)
WSCP (Supply Augmentation Benefit) (AFY) 0
WSCP (Use Reduction Savings Benefit) (AFY) 0
Revised Surplus/Shortfall (AFY) 1,520
Resulting Percent Use Reduction from WSCP Action 0%
2022
Gross Water Use (AFY) 7,295
Total Supplies (AFY) 12,774
Surplus/Shortfall without WSCP Action (AFY) 5,479
PLANNED WSCP ACTIONS (USE REDUCTION AND SUPPLY AUGMENTATION)
WSCP (Supply Augmentation Benefit) (AFY) 0
WSCP (Use Reduction Savings Benefit) (AFY) 0
Revised Surplus/Shortfall (AFY) 5,479
Resulting Percent Use Reduction from WSCP Action 0%
*Table continues on the next page
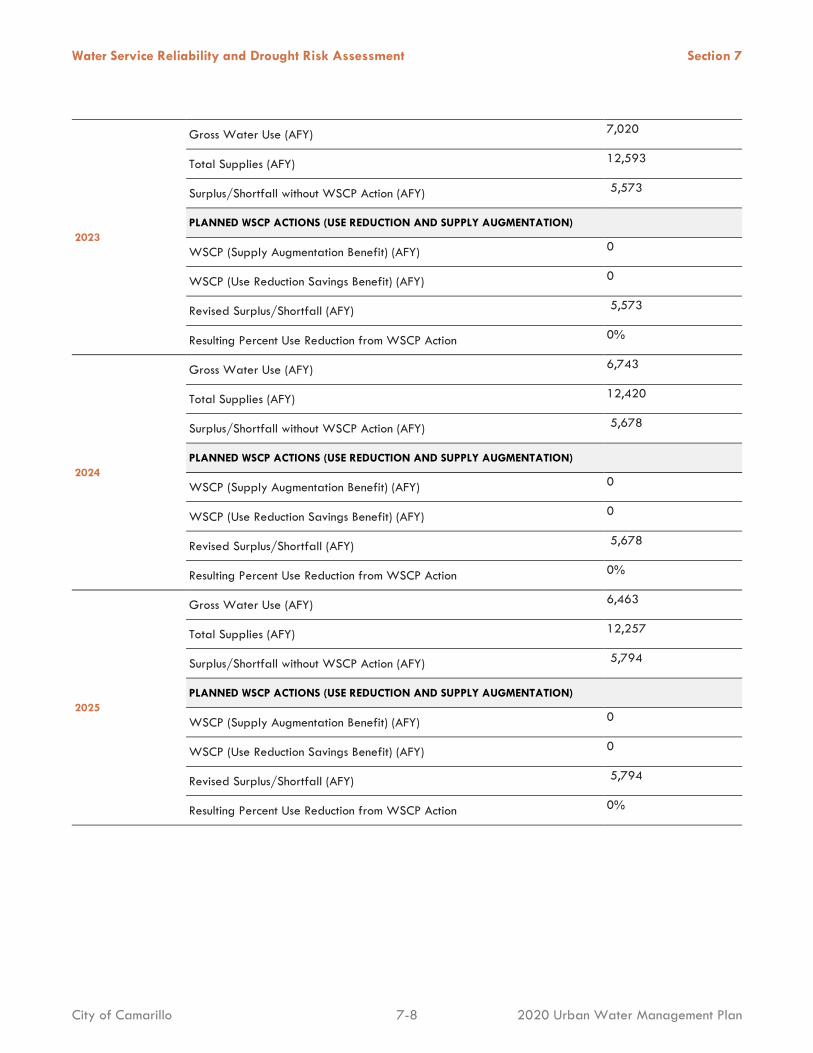
Water Service Reliability and Drought Risk Assessment Section 7
City of Camarillo 7-8 2020 Urban Water Management Plan
2023
Gross Water Use (AFY) 7,020
Total Supplies (AFY) 12,593
Surplus/Shortfall without WSCP Action (AFY) 5,573
PLANNED WSCP ACTIONS (USE REDUCTION AND SUPPLY AUGMENTATION)
WSCP (Supply Augmentation Benefit) (AFY) 0
WSCP (Use Reduction Savings Benefit) (AFY) 0
Revised Surplus/Shortfall (AFY) 5,573
Resulting Percent Use Reduction from WSCP Action 0%
2024
Gross Water Use (AFY) 6,743
Total Supplies (AFY) 12,420
Surplus/Shortfall without WSCP Action (AFY) 5,678
PLANNED WSCP ACTIONS (USE REDUCTION AND SUPPLY AUGMENTATION)
WSCP (Supply Augmentation Benefit) (AFY) 0
WSCP (Use Reduction Savings Benefit) (AFY) 0
Revised Surplus/Shortfall (AFY) 5,678
Resulting Percent Use Reduction from WSCP Action 0%
2025
Gross Water Use (AFY) 6,463
Total Supplies (AFY) 12,257
Surplus/Shortfall without WSCP Action (AFY) 5,794
PLANNED WSCP ACTIONS (USE REDUCTION AND SUPPLY AUGMENTATION)
WSCP (Supply Augmentation Benefit) (AFY) 0
WSCP (Use Reduction Savings Benefit) (AFY) 0
Revised Surplus/Shortfall (AFY) 5,794
Resulting Percent Use Reduction from WSCP Action 0%
8-1
202 0 UR B AN W AT ER M AN AG EME NT P LAN
Water Shortage Contingency Plan
This Water Shortage Contingency Plan (WSCP) is a detailed plan for how the City of Camarillo (City) intends to predict and respond to foreseeable and unforeseeable water shortages. A water shortage occurs when the water supply is reduced to a level that cannot support typical demand at any given time or a reduction in demand is otherwise needed.
This WSCP is used to provide guidance to the City, staff, and the public by identifying anticipated shortages and response actions to allow for efficient management of any water shortage with predictability and accountability. The WSCP is a detailed proposal for how the City intends to act in the case of an actual water shortage condition. This WSCP is not intended to provide absolute direction; rather it is intended to provide options to manage water shortages. Official water shortage declarations by the City may include any combination of components described in this WSCP.
Water shortages can be triggered by a hydrologic limitation in supply (i.e., a prolonged period of below normal precipitation), limitations or failure of supply and treatment infrastructure, or a combination of conditions. Hydrologic or drought limitations tend to develop and abate more slowly, whereas infrastructure failure tends to happen quickly and relatively unpredictably. Water supplies may be interrupted or reduced significantly in several ways, such as during a drought that limits supplies, an earthquake that damages water delivery or storage facilities, a regional power outage, or a toxic spill that affects water quality.
IN THIS SECTION
• Water Supply Reliability
• Annual Assessment Procedures
• Shortage Levels and Response Actions
• Communication Protocols
• Compliance, Enforcement, and Legal Authority
• Financial Consequences
• Implementation

Water Shortage Contingency Plan Section 8
City of Camarillo 8-2 2020 Urban Water Management Plan
This WSCP describes the following:
Water Supply Reliability Analysis Summarizes the City’s water supply analysis and reliability and identifies the key issues that may trigger a shortage condition.
Annual Water Supply and Demand Assessment Procedures Describes the key data inputs, evaluation criteria, and methodology for assessing the system’s reliability for the coming year and the steps to formally declare any water shortage levels and response actions.
Six Standard Shortage Levels Establishes water shortage levels to clearly identify and prepare for shortages.
Shortage Response Actions Describes the response actions that may be implemented or considered for each level to reduce gaps between supply and demand as well as minimize social and economic impacts to the community.
Communication Protocols Describes communication protocols under each level to ensure customers, the public, and local government agencies are informed of shortage conditions and requirements.
Compliance and Enforcement Defines compliance and enforcement actions available to administer demand reductions.
Legal Authority Lists the legal documents that grant the City the authority to declare a water shortage and implement and enforce response actions.
Financial Consequences of WSCP Implementation Describes the anticipated financial impact of implementing water shortage levels and identifies mitigation strategies to offset financial burdens.
Monitoring and Reporting Summarizes the monitoring and reporting techniques to evaluate the effectiveness of shortage response actions and overall WSCP implementation. Results are used to determine if shortage response actions should be adjusted.
WSCP Refinement Procedures Describes the factors that may trigger updates to the WSCP and outlines how to complete an update.
Special Water Features Distinctions Defines considerations and definitions for water use for decorative features versus pools and spas.
Plan Adoption, Submittal, and Availability Describes the WSCP adoption process, submittal, and availability after each revision.
This WSCP was prepared in conjunction with the City’s 2020 Urban Water Management Plan (UWMP) (Water Systems Consulting Inc., June 2021) and is a standalone document that can be modified as needed. This document is compliant with the California Water Code (CWC) 10632 and incorporated guidance from the State of California Department of Water Resources (DWR) UWMP Guidebook 2020 (State of California Department of Water Resources, March 2021) and the American Water Works
Water Shortage Contingency Plan Section 8
City of Camarillo 8-3 2020 Urban Water Management Plan
Association (AWWA) Manual of Water Supply Practices (M60) Drought Preparedness and Response (American Water Works Association, 2019). Volumes discussed in this WSCP will be in acre-feet (AF).
The WSCP addresses several types of water supply shortages that could potentially impact the City and its customers: • Long-term supply shortages due to prolonged drought, contamination, destruction of critical water
supply facilities, etc. • Short-term water supply shortages due to natural or man-made catastrophic emergencies or
production capacity limitations.
The City first developed its WSCP in July 2009. Ordinance No. 1126, § 3 (Exhibit A), adopted July 27, 2016, amended Chapter 14.12 of the Camarillo Municipal Code (Water Conservation Ordinance), and is included in Appendix G. The 2009 WSCP and Water Conservation Ordinance were developed as a tool for the City to manage its water supplies in event of prolonged drought, natural disaster, or water failures. The Water Conservation Ordinance details the City’s current WSCP. The City was in a Stage 2 water supply shortage from 2014 until late July 2016 when the City declared a Stage 1 condition with amendments to the Water Conservation Ordinance. The July 2016 amendments include changes to reflect permanent water conservation measures required by the State and permanent water offset requirements for new development projects. The Water Conservation Ordinance provides existing authorization for water use restrictions and prohibitions and may be revised based on options identified in this WSCP to become effective upon adoption by City Council.
Water Supply Reliability Analysis This section is consistent with CWC 10632(a)(1) and describes the key findings of the water supply reliability analysis conducted pursuant to CWC 10635, which is presented in Section 7 of the City’s 2020 UWMP. As part of the 2020 UWMP, water suppliers must perform a long-term (2025–2045) water service reliability assessment to evaluate supply reliability under normal, single-dry year, and five consecutive dry year periods and a short-term (2021–2025) Drought Risk Assessment (DRA) to evaluate reliability under an impending five consecutive dry year period. Water supply reliability reflects the City’s ability to meet the water needs of its customers with water supplies under varying conditions. The analysis considers plausible hydrological and regulatory variability, infrastructure capacity, climate conditions, and other factors that affect the City’s water supply and demand. The City expects to meet demands under all water year scenarios while continuing to promote conservation. The DRA analyzes historical data to allow the City to view patterns and more reliably determine if there could be any water shortages within a given time frame. The DRA looks at historical consumption data, by customer class, populated from billing records, and historical supply data, by source, from production reports. Next, future demand and supply estimates for the planning period are analyzed to determine if there are any gaps between supply and demand. As mentioned above, the City does not anticipate a supply shortage. The City is committed to promoting conservation and use of recycled water to increase its supply portfolio, resiliency, and subsequent reliability as described in Section 7 of the 2020 UWMP.
Annual Water Supply and Demand Assessment As established by CWC 10632.1, urban water suppliers must conduct an Annual Water Supply and Demand Assessment (Annual Assessment) and submit an Annual Water Shortage Assessment Report to DWR. The Annual Assessment is an evaluation of the short-term outlook for supplies and demands
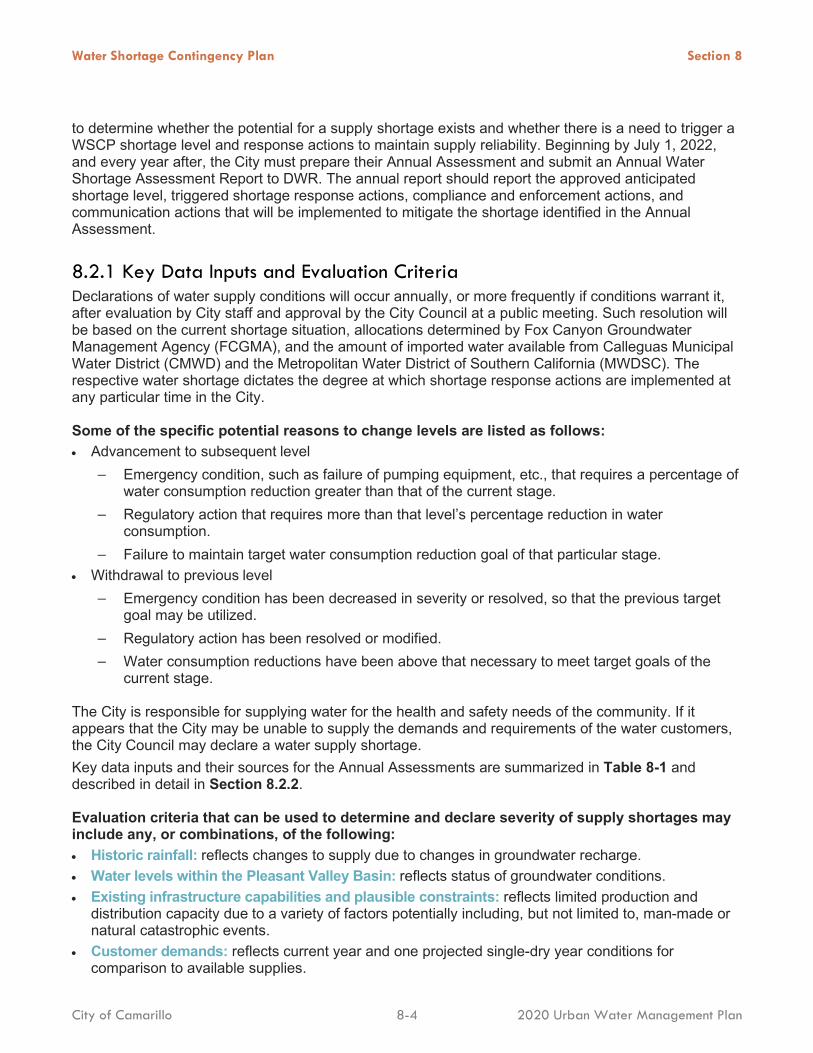
Water Shortage Contingency Plan Section 8
City of Camarillo 8-4 2020 Urban Water Management Plan
to determine whether the potential for a supply shortage exists and whether there is a need to trigger a WSCP shortage level and response actions to maintain supply reliability. Beginning by July 1, 2022, and every year after, the City must prepare their Annual Assessment and submit an Annual Water Shortage Assessment Report to DWR. The annual report should report the approved anticipated shortage level, triggered shortage response actions, compliance and enforcement actions, and communication actions that will be implemented to mitigate the shortage identified in the Annual Assessment.
8.2.1 Key Data Inputs and Evaluation Criteria Declarations of water supply conditions will occur annually, or more frequently if conditions warrant it, after evaluation by City staff and approval by the City Council at a public meeting. Such resolution will be based on the current shortage situation, allocations determined by Fox Canyon Groundwater Management Agency (FCGMA), and the amount of imported water available from Calleguas Municipal Water District (CMWD) and the Metropolitan Water District of Southern California (MWDSC). The respective water shortage dictates the degree at which shortage response actions are implemented at any particular time in the City.
Some of the specific potential reasons to change levels are listed as follows: • Advancement to subsequent level
− Emergency condition, such as failure of pumping equipment, etc., that requires a percentage of water consumption reduction greater than that of the current stage.
− Regulatory action that requires more than that level’s percentage reduction in water consumption.
− Failure to maintain target water consumption reduction goal of that particular stage. • Withdrawal to previous level
− Emergency condition has been decreased in severity or resolved, so that the previous target goal may be utilized.
− Regulatory action has been resolved or modified. − Water consumption reductions have been above that necessary to meet target goals of the
current stage.
The City is responsible for supplying water for the health and safety needs of the community. If it appears that the City may be unable to supply the demands and requirements of the water customers, the City Council may declare a water supply shortage. Key data inputs and their sources for the Annual Assessments are summarized in Table 8-1 and described in detail in Section 8.2.2.
Evaluation criteria that can be used to determine and declare severity of supply shortages may include any, or combinations, of the following: • Historic rainfall: reflects changes to supply due to changes in groundwater recharge. • Water levels within the Pleasant Valley Basin: reflects status of groundwater conditions. • Existing infrastructure capabilities and plausible constraints: reflects limited production and
distribution capacity due to a variety of factors potentially including, but not limited to, man-made or natural catastrophic events.
• Customer demands: reflects current year and one projected single-dry year conditions for comparison to available supplies.
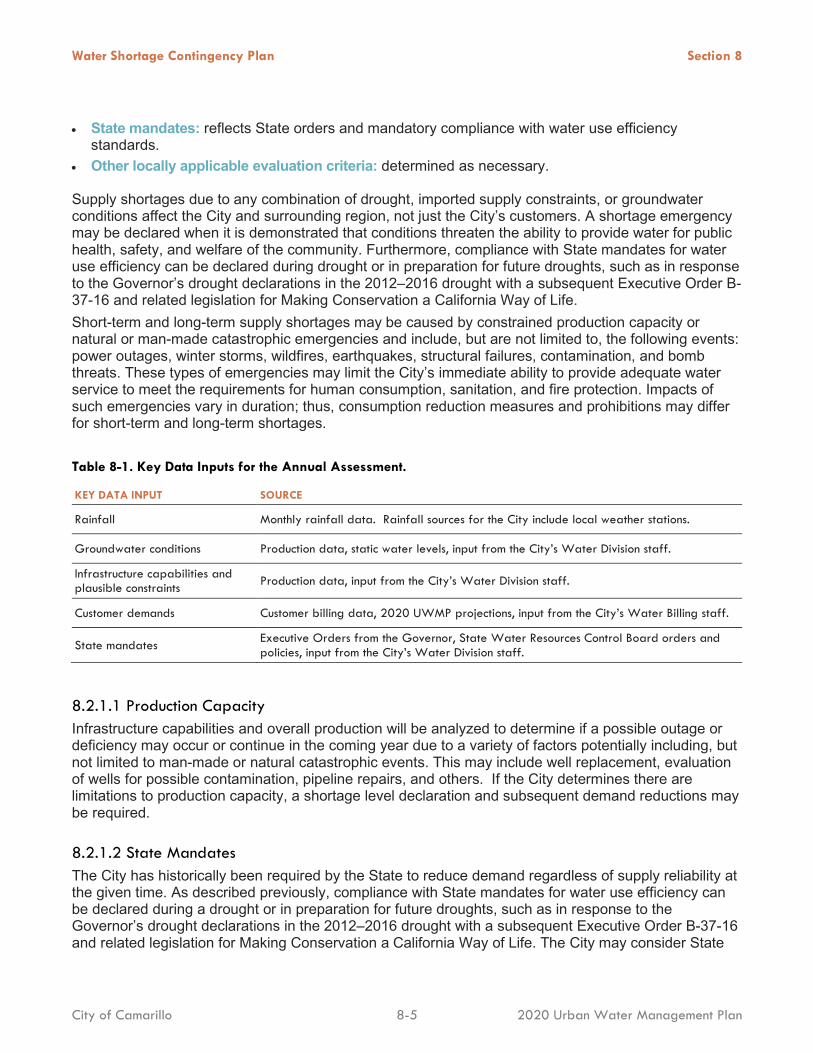
Water Shortage Contingency Plan Section 8
City of Camarillo 8-5 2020 Urban Water Management Plan
• State mandates: reflects State orders and mandatory compliance with water use efficiency standards.
• Other locally applicable evaluation criteria: determined as necessary.
Supply shortages due to any combination of drought, imported supply constraints, or groundwater conditions affect the City and surrounding region, not just the City’s customers. A shortage emergency may be declared when it is demonstrated that conditions threaten the ability to provide water for public health, safety, and welfare of the community. Furthermore, compliance with State mandates for water use efficiency can be declared during drought or in preparation for future droughts, such as in response to the Governor’s drought declarations in the 2012–2016 drought with a subsequent Executive Order B-37-16 and related legislation for Making Conservation a California Way of Life. Short-term and long-term supply shortages may be caused by constrained production capacity or natural or man-made catastrophic emergencies and include, but are not limited to, the following events: power outages, winter storms, wildfires, earthquakes, structural failures, contamination, and bomb threats. These types of emergencies may limit the City’s immediate ability to provide adequate water service to meet the requirements for human consumption, sanitation, and fire protection. Impacts of such emergencies vary in duration; thus, consumption reduction measures and prohibitions may differ for short-term and long-term shortages. Table 8-1. Key Data Inputs for the Annual Assessment.
KEY DATA INPUT SOURCE
Rainfall Monthly rainfall data. Rainfall sources for the City include local weather stations.
Groundwater conditions Production data, static water levels, input from the City’s Water Division staff.
Infrastructure capabilities and plausible constraints Production data, input from the City’s Water Division staff.
Customer demands Customer billing data, 2020 UWMP projections, input from the City’s Water Billing staff.
State mandates Executive Orders from the Governor, State Water Resources Control Board orders and policies, input from the City’s Water Division staff.
8.2.1.1 Production Capacity Infrastructure capabilities and overall production will be analyzed to determine if a possible outage or deficiency may occur or continue in the coming year due to a variety of factors potentially including, but not limited to man-made or natural catastrophic events. This may include well replacement, evaluation of wells for possible contamination, pipeline repairs, and others. If the City determines there are limitations to production capacity, a shortage level declaration and subsequent demand reductions may be required.
8.2.1.2 State Mandates The City has historically been required by the State to reduce demand regardless of supply reliability at the given time. As described previously, compliance with State mandates for water use efficiency can be declared during a drought or in preparation for future droughts, such as in response to the Governor’s drought declarations in the 2012–2016 drought with a subsequent Executive Order B-37-16 and related legislation for Making Conservation a California Way of Life. The City may consider State
Water Shortage Contingency Plan Section 8
City of Camarillo 8-6 2020 Urban Water Management Plan
mandates and mandatory compliance with water use efficiency standards in determining water shortage levels.
8.2.2 Annual Assessment Procedures City staff will perform the Annual Assessment between April and May, or on a more frequent basis if necessary. Steps to conduct the Annual Assessment are as follows: 1. Staff gather the key inputs, compile historical data, and analyze potential supply and demand gaps. 2. Staff provide insight on demand trends, water supply conditions, and production capacity. 3. A hydrogeologist may be consulted to provide additional groundwater condition information. 4. Staff will determine a recommended level of shortage required at the implementation or termination
of each level that will then be brought to the City Council for approval. The Water Superintendent will keep the Public Works Director apprised of any conditions that might diminish the City’s water supply or increase customer demand. The Public Works Director, based upon information furnished by the Water Superintendent, will make recommendations to the City Manager about the advancement, withdrawal, or termination of water shortage levels and will provide reports on the water supply and demand status as required. At a minimum, a “Water Conservation Report” will be made available to the City Manager and City Council on a monthly basis.
5. The City Manager has the ultimate responsibility for the administration of the WSCP and related program elements. Delegation of this administration, either in part or whole, is at the discretion of the City Manager. The City Manager, or the Manager’s designee, is authorized and directed to implement the applicable provisions of the WSCP as determined necessary to fulfill its purposes.
6. Based on water supply and water demand information, the City Council may, by resolution, order that the appropriate water shortage level be implemented or terminated in accordance with the applicable provisions of this WSCP and the relevant provisions of the Camarillo Municipal Code, the Government Code, and the CWC. Findings and recommendations are presented to the City Council.
7. City Council will declare the level of shortage required at the implementation or termination of each level and the declaration shall remain in effect until the City Council so otherwise declares.
8. When a resolution of the City Council has been issued to change the water shortage level, the public will be notified through publication of the resolution in the local newspaper, on the City’s website, and in the billing statement.
9. The City will develop and/or implement appropriate communication protocols and applicable response actions.
The Annual Assessment starts in 2022 with the first Annual Assessment Report due to DWR by July 1, 2022.
Six Standard Water Shortage Levels This section is consistent with CWC 10632(a)(2) and describes the City’s water shortage levels. New to the CWC, water suppliers must now adopt six standard water shortage levels. Shortage levels indicate the gap between supply and demand compared to normal year conditions. DWR standardized six shortage levels to provide a consistent regional and statewide approach to measure water supply shortage conditions. The six shortage levels correspond to 10-, 20-, 30-, 40-, 50-percent (%), and greater than 50% shortage compared to the normal reliability conditions. However, a water supplier may use its own shortage levels if a crosswalk is included relating its existing shortage levels to the six standard levels. The crosswalk between the City’s five levels and the standard water shortage levels is shown in Figure 8-1.
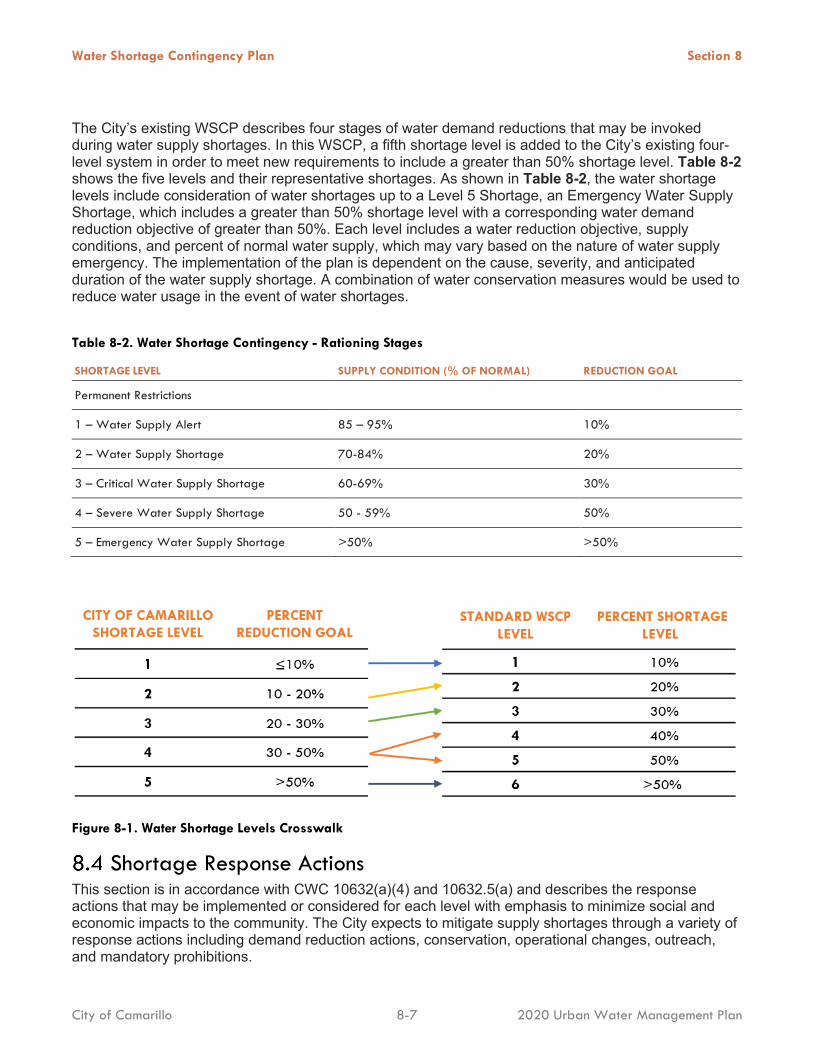
Water Shortage Contingency Plan Section 8
City of Camarillo 8-7 2020 Urban Water Management Plan
The City’s existing WSCP describes four stages of water demand reductions that may be invoked during water supply shortages. In this WSCP, a fifth shortage level is added to the City’s existing four-level system in order to meet new requirements to include a greater than 50% shortage level. Table 8-2 shows the five levels and their representative shortages. As shown in Table 8-2, the water shortage levels include consideration of water shortages up to a Level 5 Shortage, an Emergency Water Supply Shortage, which includes a greater than 50% shortage level with a corresponding water demand reduction objective of greater than 50%. Each level includes a water reduction objective, supply conditions, and percent of normal water supply, which may vary based on the nature of water supply emergency. The implementation of the plan is dependent on the cause, severity, and anticipated duration of the water supply shortage. A combination of water conservation measures would be used to reduce water usage in the event of water shortages. Table 8-2. Water Shortage Contingency - Rationing Stages
SHORTAGE LEVEL SUPPLY CONDITION (% OF NORMAL) REDUCTION GOAL
Permanent Restrictions
1 – Water Supply Alert 85 – 95% 10%
2 – Water Supply Shortage 70-84% 20%
3 – Critical Water Supply Shortage 60-69% 30%
4 – Severe Water Supply Shortage 50 - 59% 50%
5 – Emergency Water Supply Shortage >50% >50%
Figure 8-1. Water Shortage Levels Crosswalk
Shortage Response Actions This section is in accordance with CWC 10632(a)(4) and 10632.5(a) and describes the response actions that may be implemented or considered for each level with emphasis to minimize social and economic impacts to the community. The City expects to mitigate supply shortages through a variety of response actions including demand reduction actions, conservation, operational changes, outreach, and mandatory prohibitions.
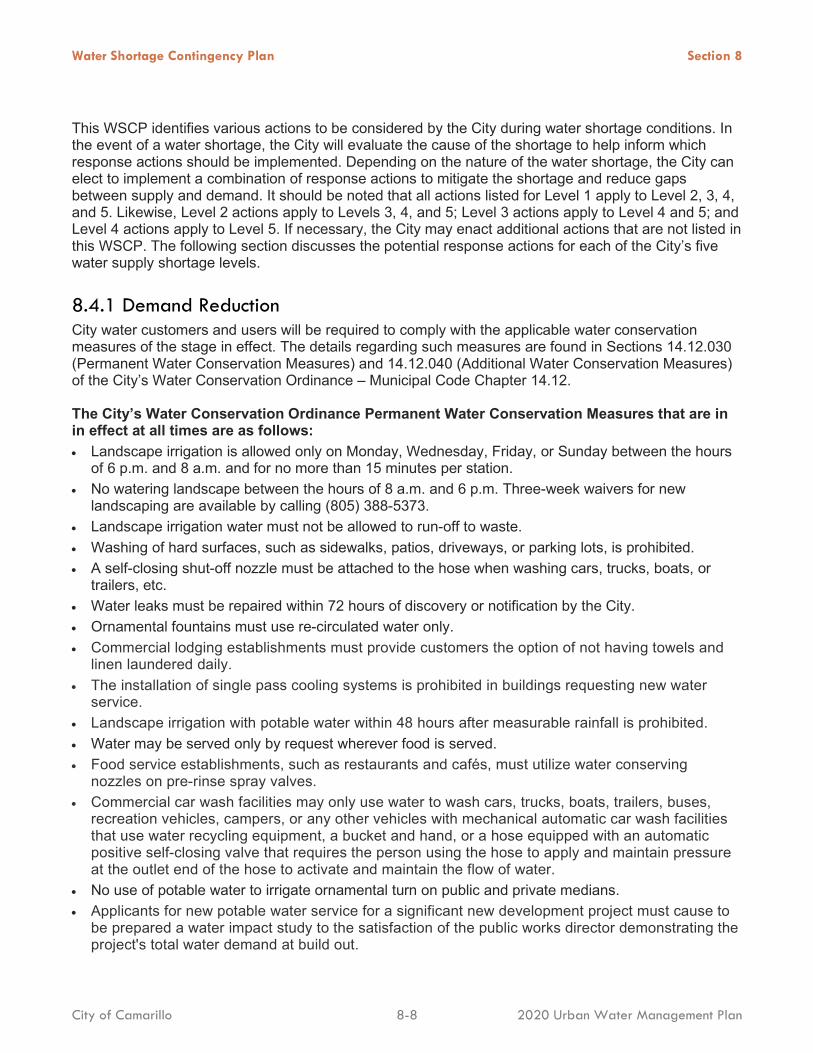
Water Shortage Contingency Plan Section 8
City of Camarillo 8-8 2020 Urban Water Management Plan
This WSCP identifies various actions to be considered by the City during water shortage conditions. In the event of a water shortage, the City will evaluate the cause of the shortage to help inform which response actions should be implemented. Depending on the nature of the water shortage, the City can elect to implement a combination of response actions to mitigate the shortage and reduce gaps between supply and demand. It should be noted that all actions listed for Level 1 apply to Level 2, 3, 4, and 5. Likewise, Level 2 actions apply to Levels 3, 4, and 5; Level 3 actions apply to Level 4 and 5; and Level 4 actions apply to Level 5. If necessary, the City may enact additional actions that are not listed in this WSCP. The following section discusses the potential response actions for each of the City’s five water supply shortage levels.
8.4.1 Demand Reduction City water customers and users will be required to comply with the applicable water conservation measures of the stage in effect. The details regarding such measures are found in Sections 14.12.030 (Permanent Water Conservation Measures) and 14.12.040 (Additional Water Conservation Measures) of the City’s Water Conservation Ordinance – Municipal Code Chapter 14.12.
The City’s Water Conservation Ordinance Permanent Water Conservation Measures that are in in effect at all times are as follows: • Landscape irrigation is allowed only on Monday, Wednesday, Friday, or Sunday between the hours
of 6 p.m. and 8 a.m. and for no more than 15 minutes per station. • No watering landscape between the hours of 8 a.m. and 6 p.m. Three-week waivers for new
landscaping are available by calling (805) 388-5373. • Landscape irrigation water must not be allowed to run-off to waste. • Washing of hard surfaces, such as sidewalks, patios, driveways, or parking lots, is prohibited. • A self-closing shut-off nozzle must be attached to the hose when washing cars, trucks, boats, or
trailers, etc. • Water leaks must be repaired within 72 hours of discovery or notification by the City. • Ornamental fountains must use re-circulated water only. • Commercial lodging establishments must provide customers the option of not having towels and
linen laundered daily. • The installation of single pass cooling systems is prohibited in buildings requesting new water
service. • Landscape irrigation with potable water within 48 hours after measurable rainfall is prohibited. • Water may be served only by request wherever food is served. • Food service establishments, such as restaurants and cafés, must utilize water conserving
nozzles on pre-rinse spray valves. • Commercial car wash facilities may only use water to wash cars, trucks, boats, trailers, buses,
recreation vehicles, campers, or any other vehicles with mechanical automatic car wash facilities that use water recycling equipment, a bucket and hand, or a hose equipped with an automatic positive self-closing valve that requires the person using the hose to apply and maintain pressure at the outlet end of the hose to activate and maintain the flow of water.
• No use of potable water to irrigate ornamental turn on public and private medians. • Applicants for new potable water service for a significant new development project must cause to
be prepared a water impact study to the satisfaction of the public works director demonstrating the project's total water demand at build out.
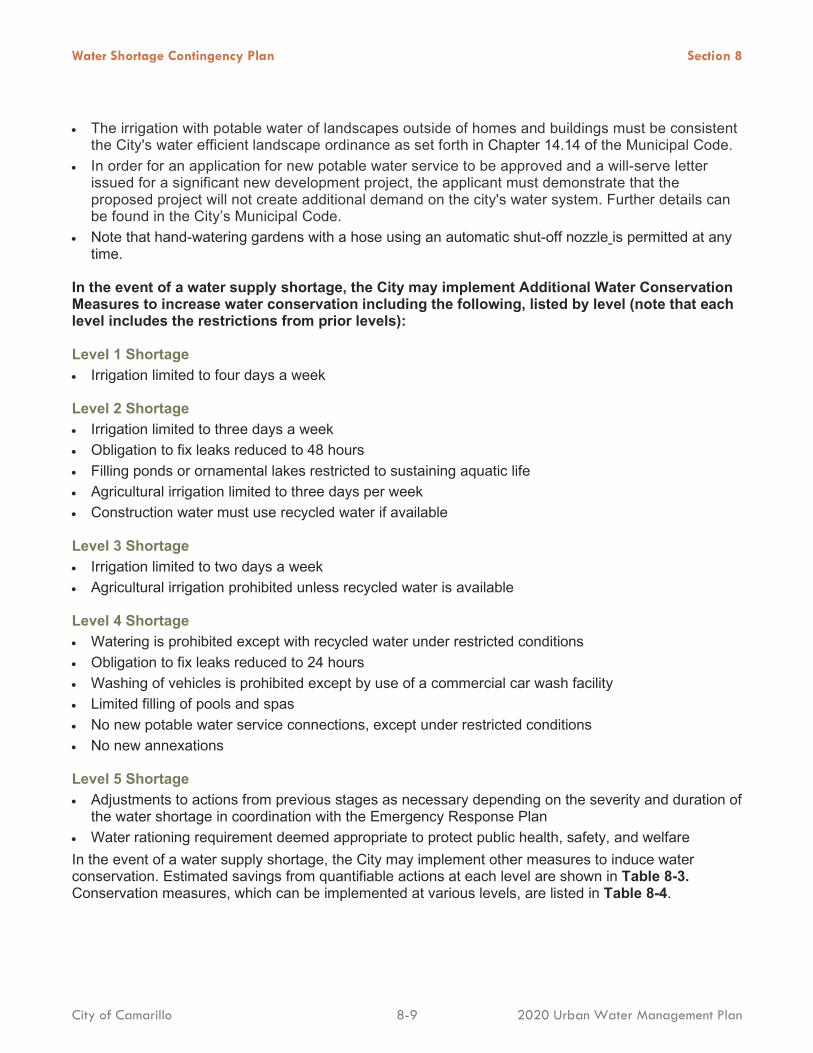
Water Shortage Contingency Plan Section 8
City of Camarillo 8-9 2020 Urban Water Management Plan
• The irrigation with potable water of landscapes outside of homes and buildings must be consistent the City's water efficient landscape ordinance as set forth in Chapter 14.14 of the Municipal Code.
• In order for an application for new potable water service to be approved and a will-serve letter issued for a significant new development project, the applicant must demonstrate that the proposed project will not create additional demand on the city's water system. Further details can be found in the City’s Municipal Code.
• Note that hand-watering gardens with a hose using an automatic shut-off nozzle is permitted at any time.
In the event of a water supply shortage, the City may implement Additional Water Conservation Measures to increase water conservation including the following, listed by level (note that each level includes the restrictions from prior levels):
Level 1 Shortage • Irrigation limited to four days a week
Level 2 Shortage • Irrigation limited to three days a week • Obligation to fix leaks reduced to 48 hours • Filling ponds or ornamental lakes restricted to sustaining aquatic life • Agricultural irrigation limited to three days per week • Construction water must use recycled water if available
Level 3 Shortage • Irrigation limited to two days a week • Agricultural irrigation prohibited unless recycled water is available
Level 4 Shortage • Watering is prohibited except with recycled water under restricted conditions • Obligation to fix leaks reduced to 24 hours • Washing of vehicles is prohibited except by use of a commercial car wash facility • Limited filling of pools and spas • No new potable water service connections, except under restricted conditions • No new annexations
Level 5 Shortage • Adjustments to actions from previous stages as necessary depending on the severity and duration of
the water shortage in coordination with the Emergency Response Plan • Water rationing requirement deemed appropriate to protect public health, safety, and welfare In the event of a water supply shortage, the City may implement other measures to induce water conservation. Estimated savings from quantifiable actions at each level are shown in Table 8-3. Conservation measures, which can be implemented at various levels, are listed in Table 8-4.
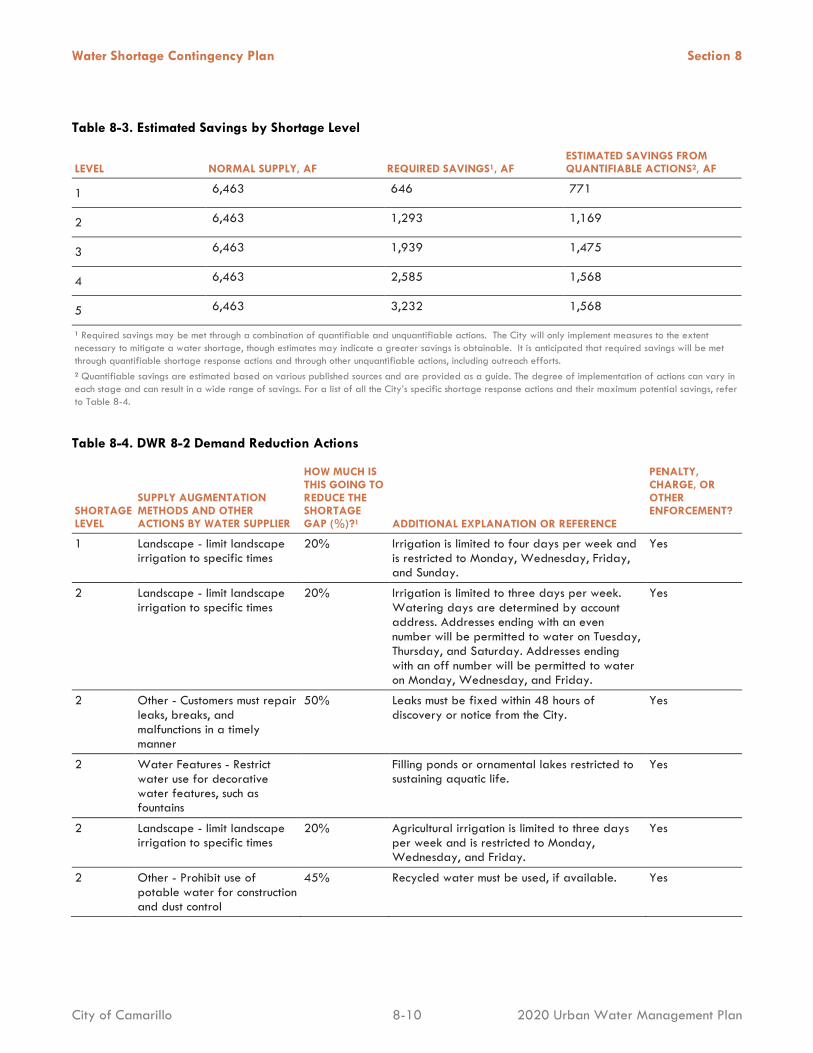
Water Shortage Contingency Plan Section 8
City of Camarillo 8-10 2020 Urban Water Management Plan
Table 8-3. Estimated Savings by Shortage Level
LEVEL NORMAL SUPPLY, AF REQUIRED SAVINGS1, AF ESTIMATED SAVINGS FROM QUANTIFIABLE ACTIONS2, AF
1 6,463 646 771
2 6,463 1,293 1,169
3 6,463 1,939 1,475
4 6,463 2,585 1,568
5 6,463 3,232 1,568
1 Required savings may be met through a combination of quantifiable and unquantifiable actions. The City will only implement measures to the extent necessary to mitigate a water shortage, though estimates may indicate a greater savings is obtainable. It is anticipated that required savings will be met through quantifiable shortage response actions and through other unquantifiable actions, including outreach efforts. 2 Quantifiable savings are estimated based on various published sources and are provided as a guide. The degree of implementation of actions can vary in each stage and can result in a wide range of savings. For a list of all the City’s specific shortage response actions and their maximum potential savings, refer to Table 8-4.
Table 8-4. DWR 8-2 Demand Reduction Actions
SHORTAGE LEVEL
SUPPLY AUGMENTATION METHODS AND OTHER ACTIONS BY WATER SUPPLIER
HOW MUCH IS THIS GOING TO REDUCE THE SHORTAGE GAP (%)?1 ADDITIONAL EXPLANATION OR REFERENCE
PENALTY, CHARGE, OR OTHER ENFORCEMENT?
1 Landscape - limit landscape irrigation to specific times
20% Irrigation is limited to four days per week and is restricted to Monday, Wednesday, Friday, and Sunday.
Yes
2 Landscape - limit landscape irrigation to specific times
20% Irrigation is limited to three days per week. Watering days are determined by account address. Addresses ending with an even number will be permitted to water on Tuesday, Thursday, and Saturday. Addresses ending with an off number will be permitted to water on Monday, Wednesday, and Friday.
Yes
2 Other - Customers must repair leaks, breaks, and malfunctions in a timely manner
50% Leaks must be fixed within 48 hours of discovery or notice from the City.
Yes
2 Water Features - Restrict water use for decorative water features, such as fountains
Filling ponds or ornamental lakes restricted to sustaining aquatic life.
Yes
2 Landscape - limit landscape irrigation to specific times
20% Agricultural irrigation is limited to three days per week and is restricted to Monday, Wednesday, and Friday.
Yes
2 Other - Prohibit use of potable water for construction and dust control
45% Recycled water must be used, if available. Yes
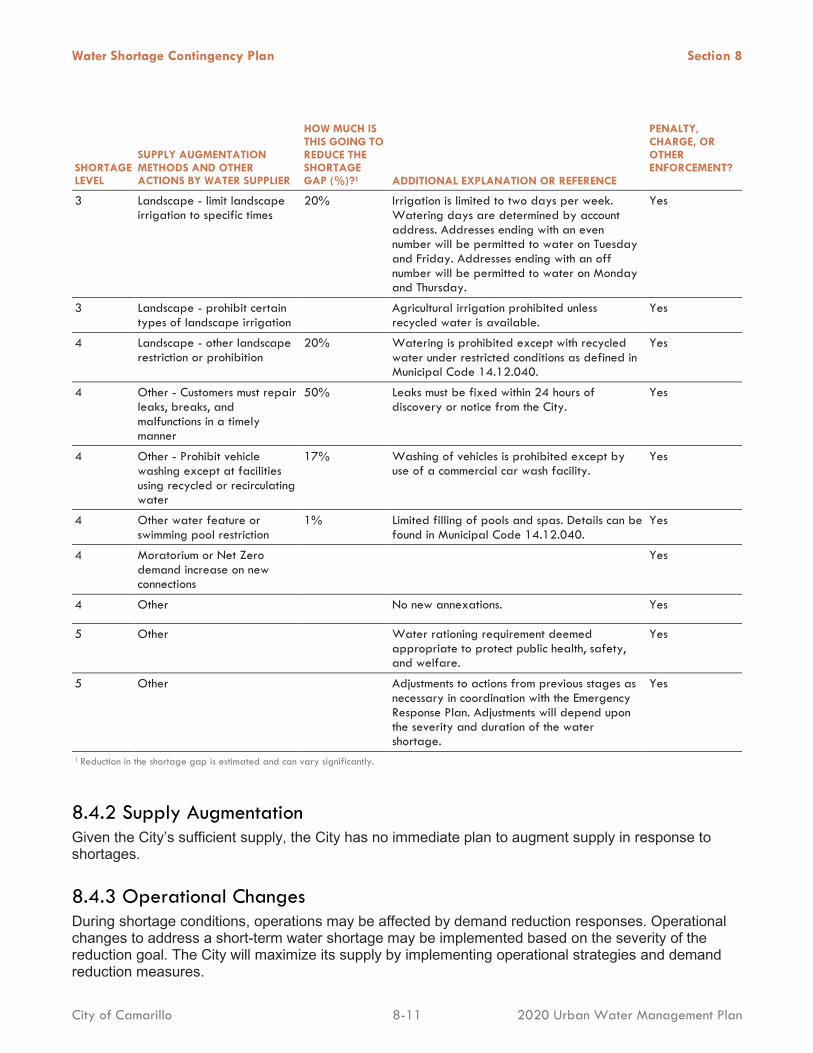
Water Shortage Contingency Plan Section 8
City of Camarillo 8-11 2020 Urban Water Management Plan
SHORTAGE LEVEL
SUPPLY AUGMENTATION METHODS AND OTHER ACTIONS BY WATER SUPPLIER
HOW MUCH IS THIS GOING TO REDUCE THE SHORTAGE GAP (%)?1 ADDITIONAL EXPLANATION OR REFERENCE
PENALTY, CHARGE, OR OTHER ENFORCEMENT?
3 Landscape - limit landscape irrigation to specific times
20% Irrigation is limited to two days per week. Watering days are determined by account address. Addresses ending with an even number will be permitted to water on Tuesday and Friday. Addresses ending with an off number will be permitted to water on Monday and Thursday.
Yes
3 Landscape - prohibit certain types of landscape irrigation
Agricultural irrigation prohibited unless recycled water is available.
Yes
4 Landscape - other landscape restriction or prohibition
20% Watering is prohibited except with recycled water under restricted conditions as defined in Municipal Code 14.12.040.
Yes
4 Other - Customers must repair leaks, breaks, and malfunctions in a timely manner
50% Leaks must be fixed within 24 hours of discovery or notice from the City.
Yes
4 Other - Prohibit vehicle washing except at facilities using recycled or recirculating water
17% Washing of vehicles is prohibited except by use of a commercial car wash facility.
Yes
4 Other water feature or swimming pool restriction
1% Limited filling of pools and spas. Details can be found in Municipal Code 14.12.040.
Yes
4 Moratorium or Net Zero demand increase on new connections
Yes
4 Other No new annexations. Yes
5 Other Water rationing requirement deemed appropriate to protect public health, safety, and welfare.
Yes
5 Other Adjustments to actions from previous stages as necessary in coordination with the Emergency Response Plan. Adjustments will depend upon the severity and duration of the water shortage.
Yes
1 Reduction in the shortage gap is estimated and can vary significantly.
8.4.2 Supply Augmentation Given the City’s sufficient supply, the City has no immediate plan to augment supply in response to shortages.
8.4.3 Operational Changes During shortage conditions, operations may be affected by demand reduction responses. Operational changes to address a short-term water shortage may be implemented based on the severity of the reduction goal. The City will maximize its supply by implementing operational strategies and demand reduction measures.
Water Shortage Contingency Plan Section 8
City of Camarillo 8-12 2020 Urban Water Management Plan
As part of the Annual Assessment process, the City will consider their operational procedures at the time of a shortage to identify changes that can be implemented to address water shortage on a short-term basis, including but not limited to: • Expansion of public information campaign to educate and inform customers of the water shortage
emergency and required water savings • Decrease line flushing to only on a compliant basis • Use water patrols and increase frequency of meter reading by recruiting staff from other
departments, if necessary • Offer water use surveys • Implement or modify drought rate structure or surcharge or water emergency tiered pricing, pursuant
to the requirements of Proposition 218 and in accordance with California Law • Monitor construction meters and fire hydrant meters for efficient water use in the event that a meter
identified wastes water. • Reduce overhead in the short-term and mid-term by deferring non-critical CIP and major
maintenance expenditures, and in the long-term by adjusting operational and staffing levels and retail water rate structures to incorporate the reality of lower retail water sales than previously anticipated.
• Decrease in the level or, if need be, even a total interruption in the expenditures for the City’s facility replacement program.
8.4.4 Additional Mandatory Restrictions Section 14.12.040 of the Camarillo Municipal Code determines additional water conservation measures that may apply upon the effective date of the City Council's establishment of the relevant water supply condition stage.
8.4.5 Emergency Response Plan The City has included emergency conditions as a triggering action for advancement to a subsequent shortage level. A catastrophic interruption could be considered an emergency condition. The City also has an Emergency Response Plan with relevant responses in Sections 4.6 and 4.7.
8.4.6 Seismic Risk Assessment and Mitigation Plan Disasters, such as earthquakes, can and will occur without notice. Refer to the 2015 Ventura County Multi-Hazard Mitigation Plan (Appendix H) Sections 4 and 5 for the Seismic Risk Assessment and Section 7 for Mitigation Plan procedures.
8.4.7 Shortage Response Action Effectiveness The City’s water system currently has water meters on all production sources and customer connections. These meters record the amount of water consumed at each location. Customer consumption totals are tallied on a monthly basis for billing purposes. The Water Superintendent will inform the Public Works Director of any increase in water consumed or decrease in water supplies. The Public Works Director will then make recommendations to the City Manager on whether to change water shortage levels and will provide supporting reports of consumption or supply as required.
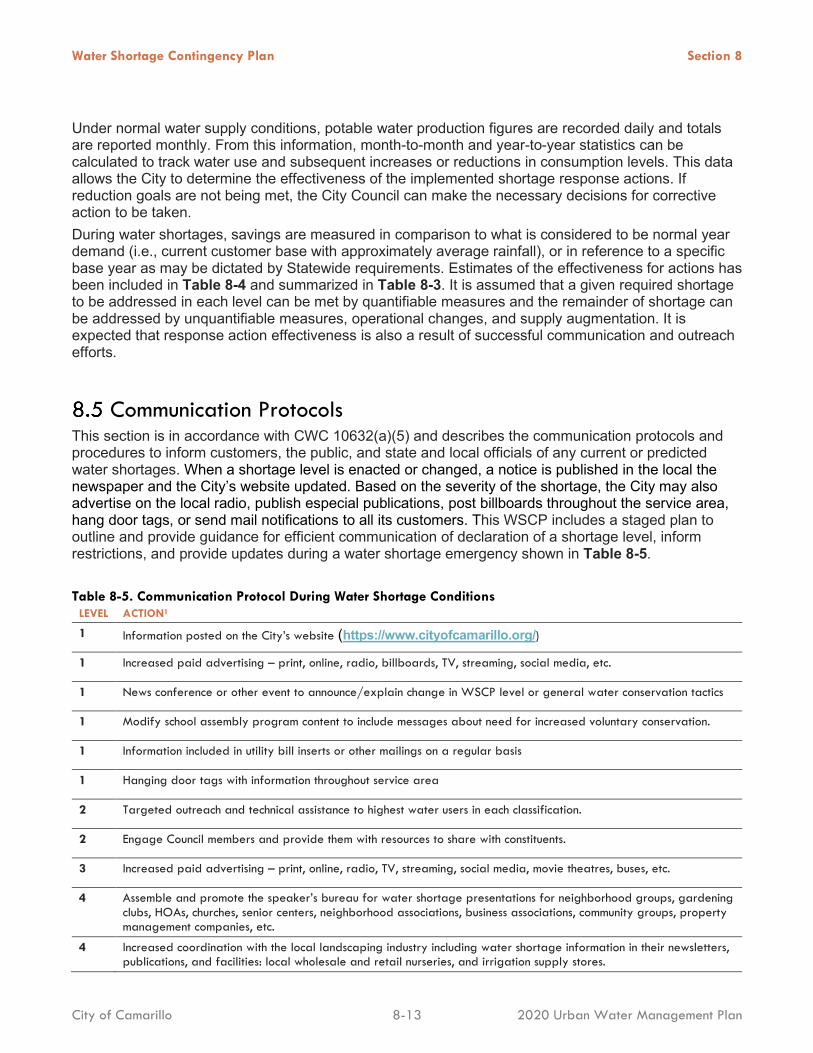
Water Shortage Contingency Plan Section 8
City of Camarillo 8-13 2020 Urban Water Management Plan
Under normal water supply conditions, potable water production figures are recorded daily and totals are reported monthly. From this information, month-to-month and year-to-year statistics can be calculated to track water use and subsequent increases or reductions in consumption levels. This data allows the City to determine the effectiveness of the implemented shortage response actions. If reduction goals are not being met, the City Council can make the necessary decisions for corrective action to be taken. During water shortages, savings are measured in comparison to what is considered to be normal year demand (i.e., current customer base with approximately average rainfall), or in reference to a specific base year as may be dictated by Statewide requirements. Estimates of the effectiveness for actions has been included in Table 8-4 and summarized in Table 8-3. It is assumed that a given required shortage to be addressed in each level can be met by quantifiable measures and the remainder of shortage can be addressed by unquantifiable measures, operational changes, and supply augmentation. It is expected that response action effectiveness is also a result of successful communication and outreach efforts.
Communication Protocols This section is in accordance with CWC 10632(a)(5) and describes the communication protocols and procedures to inform customers, the public, and state and local officials of any current or predicted water shortages. When a shortage level is enacted or changed, a notice is published in the local the newspaper and the City’s website updated. Based on the severity of the shortage, the City may also advertise on the local radio, publish especial publications, post billboards throughout the service area, hang door tags, or send mail notifications to all its customers. This WSCP includes a staged plan to outline and provide guidance for efficient communication of declaration of a shortage level, inform restrictions, and provide updates during a water shortage emergency shown in Table 8-5.
Table 8-5. Communication Protocol During Water Shortage Conditions LEVEL ACTION1
1 Information posted on the City’s website (https://www.cityofcamarillo.org/)
1 Increased paid advertising – print, online, radio, billboards, TV, streaming, social media, etc.
1 News conference or other event to announce/explain change in WSCP level or general water conservation tactics
1 Modify school assembly program content to include messages about need for increased voluntary conservation.
1 Information included in utility bill inserts or other mailings on a regular basis
1 Hanging door tags with information throughout service area
2 Targeted outreach and technical assistance to highest water users in each classification.
2 Engage Council members and provide them with resources to share with constituents.
3 Increased paid advertising – print, online, radio, TV, streaming, social media, movie theatres, buses, etc.
4 Assemble and promote the speaker’s bureau for water shortage presentations for neighborhood groups, gardening clubs, HOAs, churches, senior centers, neighborhood associations, business associations, community groups, property management companies, etc.
4 Increased coordination with the local landscaping industry including water shortage information in their newsletters, publications, and facilities: local wholesale and retail nurseries, and irrigation supply stores.

Water Shortage Contingency Plan Section 8
City of Camarillo 8-14 2020 Urban Water Management Plan
LEVEL ACTION1
5 Signage posted at nurseries and irrigation supply stores.
5 Outreach materials and drought notices mailed to the hospitality industry including restaurants and lodging.
1 If a water shortage progresses through multiple levels, all measures in the previous level(s) are implemented in addition to current level actions.
Compliance and Enforcement The penalties for violating the conservation measures listed in the City’s Water Conservation Ordinance are as follows (violations must be within a year of each other to count as a subsequent violation). • First Violation: written warning • Second Violation: fine not to exceed $100 • Third Violation: fine not to exceed $500 • Fourth and Subsequent Violations: fine not to exceed $1,000 and installation of a flow restriction
device
The City also includes termination of service as a penalty for willful violation of the Water Conservation Ordinance. The Water Conservation Ordinance includes an appeal process by which administrative review can be requested of a penalty. Once an administrative review has been completed, an appeal hearing can be requested. The decision of the appointed hearing officer will be final.
Legal Authorities The Water Conservation Ordinance provides existing authorization for water use restrictions and prohibitions and may be revised based on options identified in this WSCP to become effective upon resolution by the City Council. The Water Conservation Ordinance was adopted and approved in July 2016 by City Council. The Water Conservation Ordinance provides the City with the authority to declare a water shortage emergency and by CWC Sections 375-378 to adopt water conservation programs. Under State law, the City is authorized after declaration of a water shortage emergency to restrict the water uses and to prohibit the waste or use of the City’s water during such periods for any purpose other than domestic use, sanitation, fire protection, or such other uses as may be determined by the City Council. The City shall coordinate with Ventura County, within which it provides water supply services, for the possible proclamation of a local emergency, as defined in Section 8558 of the Government Code.
Financial Consequences of WSCP The majority of operating costs for most water agencies are fixed rather than a function of the amount of water sold. As a result, when significant conservation programs are undertaken, it is frequently necessary to raise water rates because the revenue generated is based on lower total consumption while the revenue required is essentially fixed. Additionally, costs to reduce excessive residential water use can increase. In order to counteract the financial impact of conservation, the City may institute an increase in the rate structure so that lower projected water consumption would generate added revenue needed by the City’s Water Enterprise fund. Another option would be the use of reserves to minimize
Water Shortage Contingency Plan Section 8
City of Camarillo 8-15 2020 Urban Water Management Plan
the need for additional rate increases. A full analysis of the water rates based on the financial conditions at the time water reduction would occur would be presented to the City Council for their approval. Some actions the City may choose to consider include temporarily increasing water rates or delaying capital improvements until the shortage has ended.
Monitoring and Reporting This section is in accordance with CWC 10632(a)(9) and describes the reporting requirements and monitoring procedures to implement the WSCP and track and evaluate the response actions effectives. As described in Section 8.2, the City intends to track its supplies and project demands on an annual basis, and if supply conditions described in Table 8-2 are projected, the City will enact their WSCP. Monitoring demands is essential to ensure the WSCP response actions are adequately meeting reductions and decreasing the supply/demand gap. This will help to analyze the effectiveness of the WSCP or identify the need to activate additional response actions. The water savings from implementation of the WSCP will be determined based on monthly production reports which will be compared to the supply from prior months, the same period of the prior year, and/ or the allocation. At first, the cumulative consumption for the various sectors (e.g., residential, commercial, etc.) will be evaluated for reaching the target demand reduction level. Then, if needed, individual accounts will be monitored. Weather and other possible influences may be accounted for in the evaluation.
WSCP Refinement Procedures This section is consistent with CWC 10632 (a)(10). The WSCP is best prepared and implemented as an adaptive management plan. The City will use results obtained from the monitoring and reporting program to evaluate any needs for revisions. The WSCP is used to provide guidance to the Council, staff, and the public by identifying response actions to allow for efficient management of any water shortage with predictability and accountability. To maintain a useful and efficient standard of practice in water shortage conditions, the requirements, criteria, and response actions need to be continually evaluated and improved upon to ensure that its shortage risk tolerance is adequate, and the shortage response actions are effective and up-to-date based on lessons learned from implementing the WSCP. Potential changes to the WSCP that would warrant an update include, but are not limited to, any changes to shortage level triggers, changes to the shortage level structure, and/or changes to the response actions. Any prospective changes to the WSCP would need to be presented at a public hearing, staff would obtain any comments, and City Council would adopt the updated WSCP. The steps to formally amend the WSCP are discussed in Section 8.12. Potential refinements will be documented and integrated in the next WSCP update. If new response actions are identified by staff or public, these could be advertised as voluntary actions until these are formally adopted as mandatory.
Special Water Feature Distinction CWC 10623 (b) now requires that suppliers analyze and define water features that are artificially supplied with water, including ponds, lakes, waterfalls, and fountains, separately from swimming pools
Water Shortage Contingency Plan Section 8
City of Camarillo 8-16 2020 Urban Water Management Plan
and spas, as defined in subdivision (a) of Section 115921 of the Health and Safety Code. Non-pool or non-spa water features may use or be able to use recycled water, whereas pools and spas must use potable water for health and safety considerations, so limitations to pools and spas may require different considerations compared to non-pool or non-spa water features. At all times, re-circulated water must be used to operate ornamental fountains or other decorative water features. At a Level 2 condition, there are Limits on Filling Ornamental Lakes or Ponds. Filling or refilling ornamental lakes or ponds is prohibited, except to the extent needed to sustain aquatic life, provided that such aquatic life is of significant value and have been actively managed within the water feature prior to declaration of the Level 2 water shortage. At a Level 4 condition, there are Limits on Filling Residential Swimming Pools and Spas. Refilling of more than one foot and initial filling of residential swimming pools or outdoor spas with potable water is prohibited.
Plan Adoption, Submittal, and Availability This section was completed pursuant to CWC 10632(a)(c). Because the WSCP is a standalone document that can be updated as needed, Table 8-6 describes the general steps to adopt and submit an updated or amended WSCP. This 2020 WSCP was presented for public hearing and adoption to the City Council at the June 23, 2021 meeting. Notifications were sent to all necessary Cities, Counties, and Districts 60 days prior to the public City Council meeting. To comply with the notice to the public, the City published notices in the local newspaper two weeks prior to the public hearing. Copies of the 60-day notices and public hearing newspaper notices are provided in Appendix C. The WSCP was also made available in advance of the public hearing. The WSCP was formally adopted on June 23, 2021 by the City Council through a resolution included in Appendix D. The WSCP was made available to all staff, customers, and any affected cities, counties, or other members of the public at the City and online within 30 days of the adoption date. The WSCP was submitted to DWR via the Water Use Efficiency (WUE) Data Portal at the same time as the 2020 UWMP. A copy of the 2020 UWMP and WSCP were submitted to the California State Library within 30 days of adoption. Electronic and/or hard copies were provided to all relevant cities and counties within or effected by the City’s service area within 30 days of adoption.
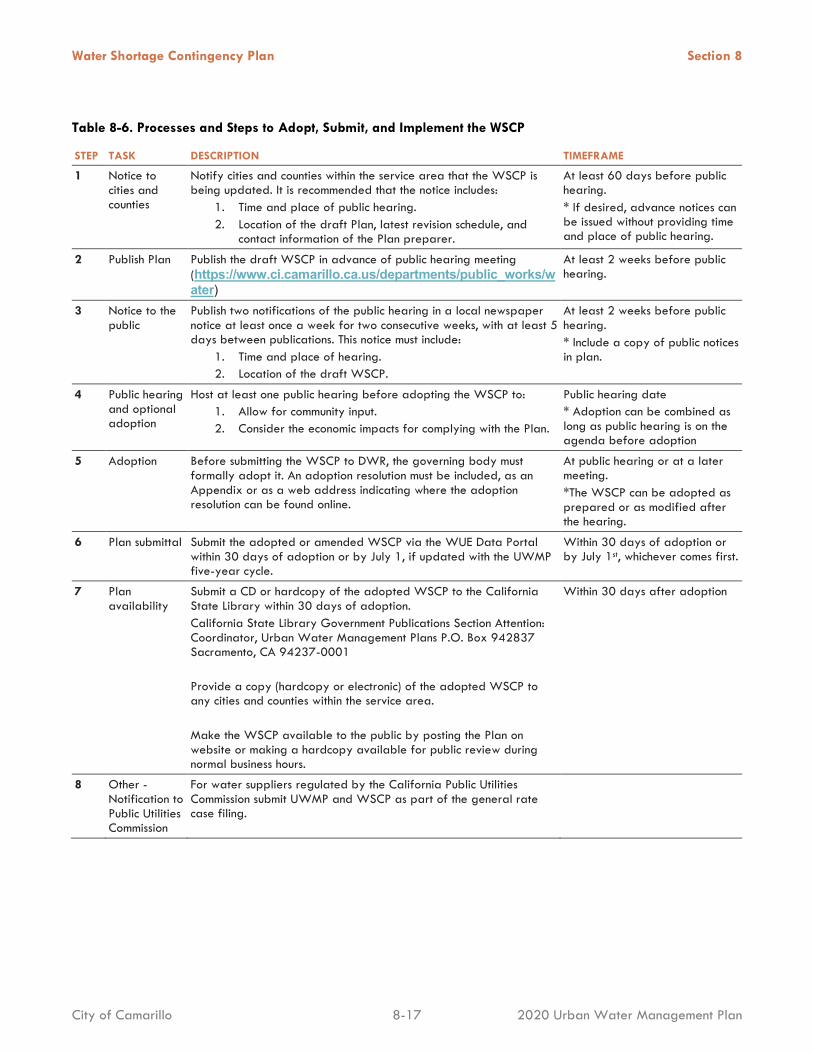
Water Shortage Contingency Plan Section 8
City of Camarillo 8-17 2020 Urban Water Management Plan
Table 8-6. Processes and Steps to Adopt, Submit, and Implement the WSCP
STEP TASK DESCRIPTION TIMEFRAME
1 Notice to cities and counties
Notify cities and counties within the service area that the WSCP is being updated. It is recommended that the notice includes:
1. Time and place of public hearing. 2. Location of the draft Plan, latest revision schedule, and
contact information of the Plan preparer.
At least 60 days before public hearing. * If desired, advance notices can be issued without providing time and place of public hearing.
2 Publish Plan Publish the draft WSCP in advance of public hearing meeting (https://www.ci.camarillo.ca.us/departments/public_works/water)
At least 2 weeks before public hearing.
3 Notice to the public
Publish two notifications of the public hearing in a local newspaper notice at least once a week for two consecutive weeks, with at least 5 days between publications. This notice must include:
1. Time and place of hearing. 2. Location of the draft WSCP.
At least 2 weeks before public hearing. * Include a copy of public notices in plan.
4 Public hearing and optional adoption
Host at least one public hearing before adopting the WSCP to: 1. Allow for community input. 2. Consider the economic impacts for complying with the Plan.
Public hearing date * Adoption can be combined as long as public hearing is on the agenda before adoption
5 Adoption Before submitting the WSCP to DWR, the governing body must formally adopt it. An adoption resolution must be included, as an Appendix or as a web address indicating where the adoption resolution can be found online.
At public hearing or at a later meeting. *The WSCP can be adopted as prepared or as modified after the hearing.
6 Plan submittal Submit the adopted or amended WSCP via the WUE Data Portal within 30 days of adoption or by July 1, if updated with the UWMP five-year cycle.
Within 30 days of adoption or by July 1st, whichever comes first.
7 Plan availability
Submit a CD or hardcopy of the adopted WSCP to the California State Library within 30 days of adoption. California State Library Government Publications Section Attention: Coordinator, Urban Water Management Plans P.O. Box 942837 Sacramento, CA 94237-0001 Provide a copy (hardcopy or electronic) of the adopted WSCP to any cities and counties within the service area. Make the WSCP available to the public by posting the Plan on website or making a hardcopy available for public review during normal business hours.
Within 30 days after adoption
8 Other - Notification to Public Utilities Commission
For water suppliers regulated by the California Public Utilities Commission submit UWMP and WSCP as part of the general rate case filing.

9-1
202 0 UR B AN W AT ER M AN AG EME NT P LAN
Demand Management Measures
This section describes the City’s efforts to promote water use efficiency, reduce demand on water supply, and prepare for future requirements.
This section describes the water conservation programs that the City has implemented for the past five years, is currently implementing, and plans to implement to continue meeting its SBX7-7 water use target and position the City for meeting future State mandated water use efficiency standards that are currently under development by DWR. The section of the CWC addressing DMMs was significantly modified in 2014, based on recommendations from the Independent Technical Panel (ITP) to the Legislature.
IN THIS SECTION
• Demand Management Measures
• Reporting Implementation
The ITP was formed by DWR to provide information and recommendations to DWR and the Legislature on new DMMs, technologies, and approaches to water use efficiency. The ITP recommended, and the legislature enacted, streamlining the requirements from the 14 specific measures reported on in the 2010 UWMP to six more general requirements plus an “other” category for measures agencies implemented in addition to the required elements. The required measures are summarized in Table 9-1. No changes to DMMs have been enacted since the 2015 UWMP.
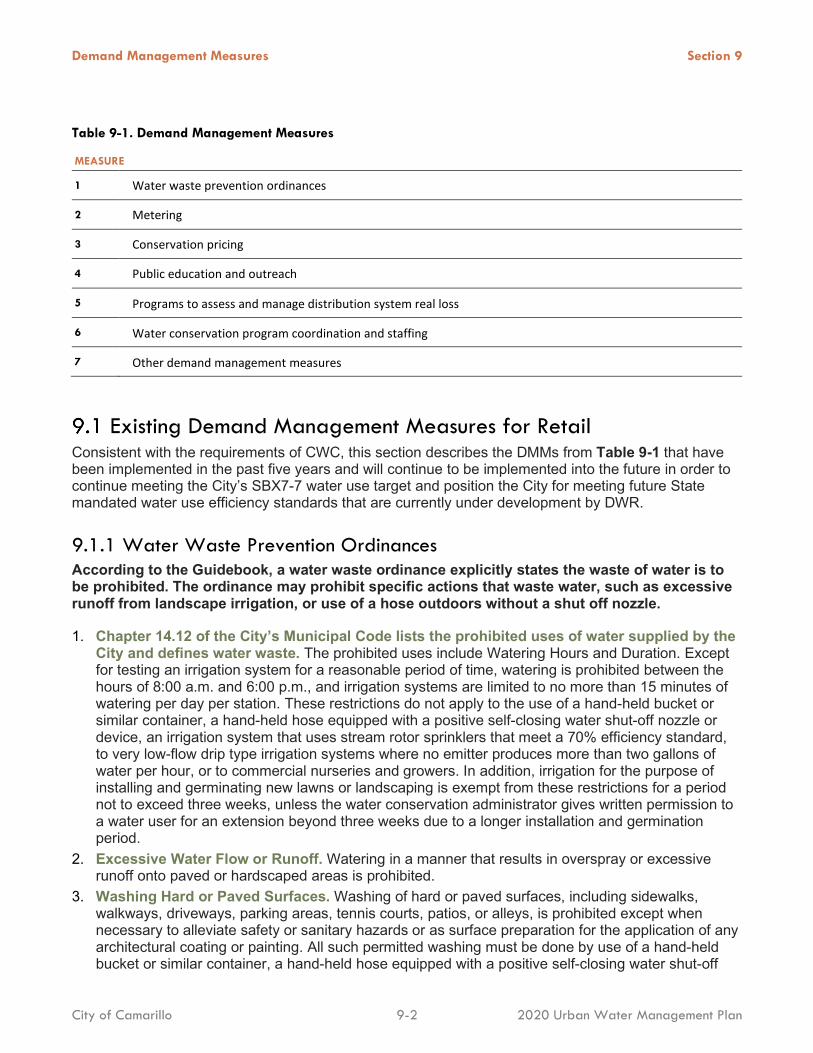
Demand Management Measures Section 9
City of Camarillo 9-2 2020 Urban Water Management Plan
Table 9-1. Demand Management Measures
MEASURE
1 Water waste prevention ordinances
2 Metering
3 Conservation pricing
4 Public education and outreach
5 Programs to assess and manage distribution system real loss
6 Water conservation program coordination and staffing
7 Other demand management measures
Existing Demand Management Measures for Retail Consistent with the requirements of CWC, this section describes the DMMs from Table 9-1 that have been implemented in the past five years and will continue to be implemented into the future in order to continue meeting the City’s SBX7-7 water use target and position the City for meeting future State mandated water use efficiency standards that are currently under development by DWR.
9.1.1 Water Waste Prevention Ordinances According to the Guidebook, a water waste ordinance explicitly states the waste of water is to be prohibited. The ordinance may prohibit specific actions that waste water, such as excessive runoff from landscape irrigation, or use of a hose outdoors without a shut off nozzle.
1. Chapter 14.12 of the City’s Municipal Code lists the prohibited uses of water supplied by the City and defines water waste. The prohibited uses include Watering Hours and Duration. Except for testing an irrigation system for a reasonable period of time, watering is prohibited between the hours of 8:00 a.m. and 6:00 p.m., and irrigation systems are limited to no more than 15 minutes of watering per day per station. These restrictions do not apply to the use of a hand-held bucket or similar container, a hand-held hose equipped with a positive self-closing water shut-off nozzle or device, an irrigation system that uses stream rotor sprinklers that meet a 70% efficiency standard, to very low-flow drip type irrigation systems where no emitter produces more than two gallons of water per hour, or to commercial nurseries and growers. In addition, irrigation for the purpose of installing and germinating new lawns or landscaping is exempt from these restrictions for a period not to exceed three weeks, unless the water conservation administrator gives written permission to a water user for an extension beyond three weeks due to a longer installation and germination period.
2. Excessive Water Flow or Runoff. Watering in a manner that results in overspray or excessive runoff onto paved or hardscaped areas is prohibited.
3. Washing Hard or Paved Surfaces. Washing of hard or paved surfaces, including sidewalks, walkways, driveways, parking areas, tennis courts, patios, or alleys, is prohibited except when necessary to alleviate safety or sanitary hazards or as surface preparation for the application of any architectural coating or painting. All such permitted washing must be done by use of a hand-held bucket or similar container, a hand-held hose equipped with a positive self-closing water shut-off
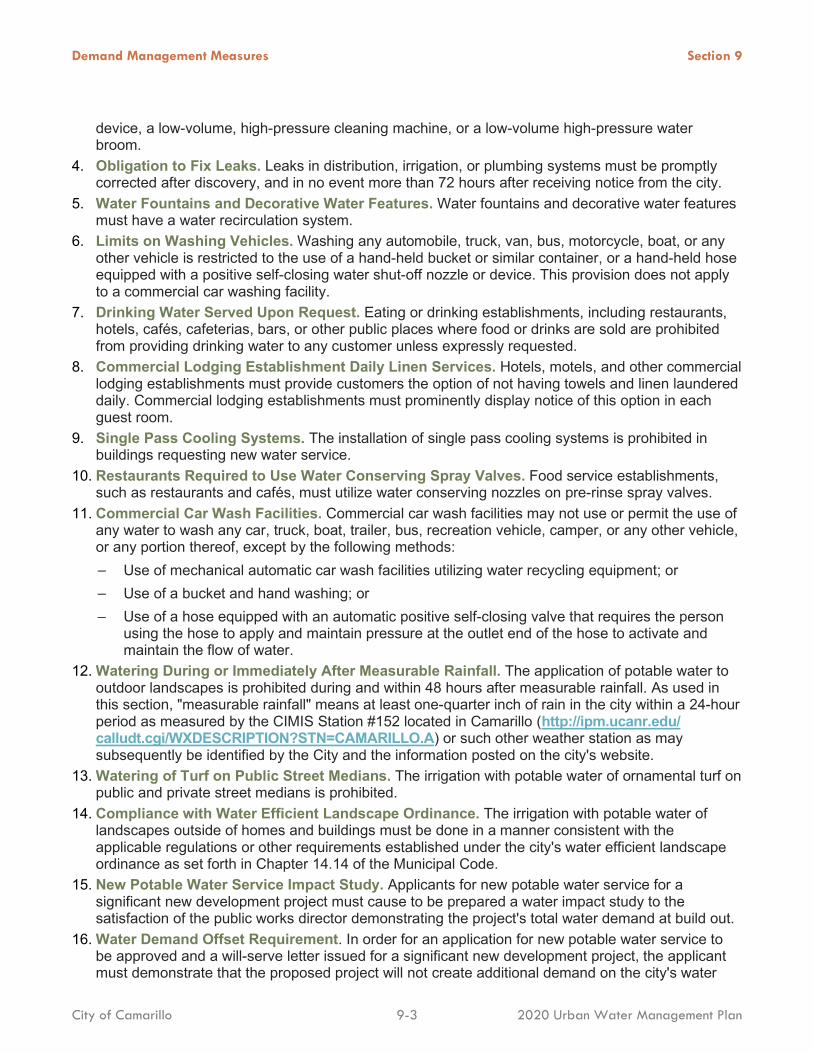
Demand Management Measures Section 9
City of Camarillo 9-3 2020 Urban Water Management Plan
device, a low-volume, high-pressure cleaning machine, or a low-volume high-pressure water broom.
4. Obligation to Fix Leaks. Leaks in distribution, irrigation, or plumbing systems must be promptly corrected after discovery, and in no event more than 72 hours after receiving notice from the city.
5. Water Fountains and Decorative Water Features. Water fountains and decorative water features must have a water recirculation system.
6. Limits on Washing Vehicles. Washing any automobile, truck, van, bus, motorcycle, boat, or any other vehicle is restricted to the use of a hand-held bucket or similar container, or a hand-held hose equipped with a positive self-closing water shut-off nozzle or device. This provision does not apply to a commercial car washing facility.
7. Drinking Water Served Upon Request. Eating or drinking establishments, including restaurants, hotels, cafés, cafeterias, bars, or other public places where food or drinks are sold are prohibited from providing drinking water to any customer unless expressly requested.
8. Commercial Lodging Establishment Daily Linen Services. Hotels, motels, and other commercial lodging establishments must provide customers the option of not having towels and linen laundered daily. Commercial lodging establishments must prominently display notice of this option in each guest room.
9. Single Pass Cooling Systems. The installation of single pass cooling systems is prohibited in buildings requesting new water service.
10. Restaurants Required to Use Water Conserving Spray Valves. Food service establishments, such as restaurants and cafés, must utilize water conserving nozzles on pre-rinse spray valves.
11. Commercial Car Wash Facilities. Commercial car wash facilities may not use or permit the use of any water to wash any car, truck, boat, trailer, bus, recreation vehicle, camper, or any other vehicle, or any portion thereof, except by the following methods: − Use of mechanical automatic car wash facilities utilizing water recycling equipment; or − Use of a bucket and hand washing; or − Use of a hose equipped with an automatic positive self-closing valve that requires the person
using the hose to apply and maintain pressure at the outlet end of the hose to activate and maintain the flow of water.
12. Watering During or Immediately After Measurable Rainfall. The application of potable water to outdoor landscapes is prohibited during and within 48 hours after measurable rainfall. As used in this section, "measurable rainfall" means at least one-quarter inch of rain in the city within a 24-hour period as measured by the CIMIS Station #152 located in Camarillo (http://ipm.ucanr.edu/ calludt.cgi/WXDESCRIPTION?STN=CAMARILLO.A) or such other weather station as may subsequently be identified by the City and the information posted on the city's website.
13. Watering of Turf on Public Street Medians. The irrigation with potable water of ornamental turf on public and private street medians is prohibited.
14. Compliance with Water Efficient Landscape Ordinance. The irrigation with potable water of landscapes outside of homes and buildings must be done in a manner consistent with the applicable regulations or other requirements established under the city's water efficient landscape ordinance as set forth in Chapter 14.14 of the Municipal Code.
15. New Potable Water Service Impact Study. Applicants for new potable water service for a significant new development project must cause to be prepared a water impact study to the satisfaction of the public works director demonstrating the project's total water demand at build out.
16. Water Demand Offset Requirement. In order for an application for new potable water service to be approved and a will-serve letter issued for a significant new development project, the applicant must demonstrate that the proposed project will not create additional demand on the city's water
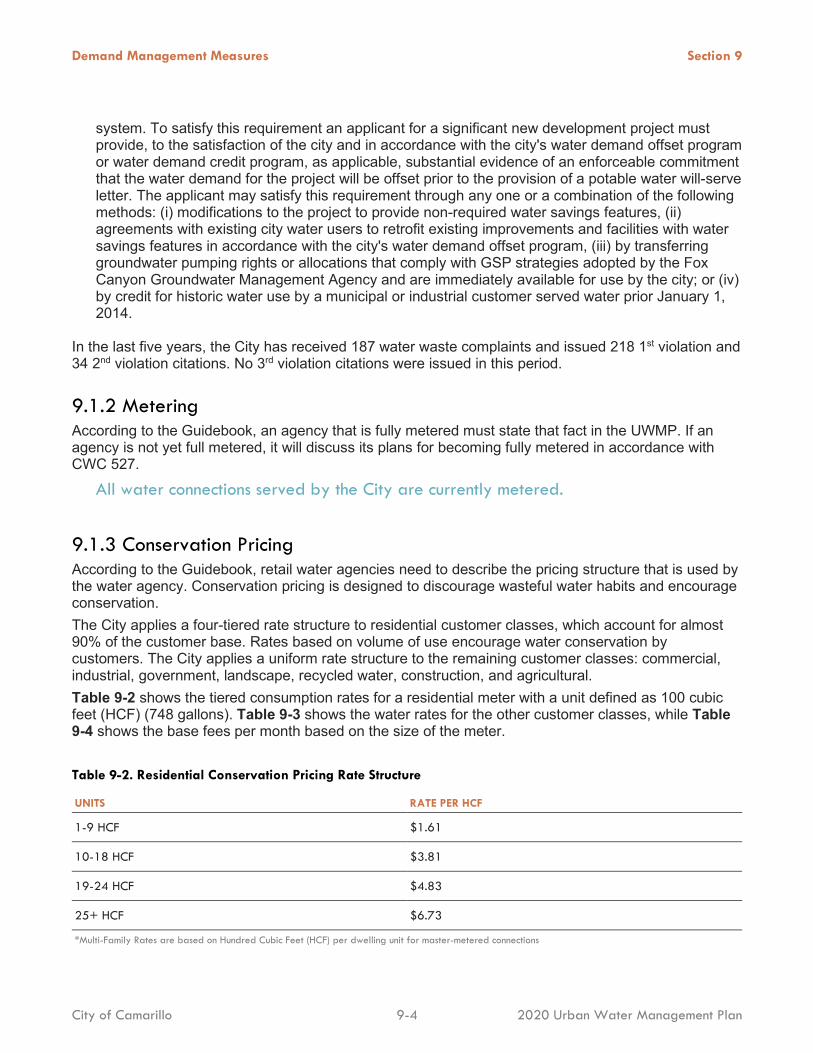
Demand Management Measures Section 9
City of Camarillo 9-4 2020 Urban Water Management Plan
system. To satisfy this requirement an applicant for a significant new development project must provide, to the satisfaction of the city and in accordance with the city's water demand offset program or water demand credit program, as applicable, substantial evidence of an enforceable commitment that the water demand for the project will be offset prior to the provision of a potable water will-serve letter. The applicant may satisfy this requirement through any one or a combination of the following methods: (i) modifications to the project to provide non-required water savings features, (ii) agreements with existing city water users to retrofit existing improvements and facilities with water savings features in accordance with the city's water demand offset program, (iii) by transferring groundwater pumping rights or allocations that comply with GSP strategies adopted by the Fox Canyon Groundwater Management Agency and are immediately available for use by the city; or (iv) by credit for historic water use by a municipal or industrial customer served water prior January 1, 2014.
In the last five years, the City has received 187 water waste complaints and issued 218 1st violation and 34 2nd violation citations. No 3rd violation citations were issued in this period.
9.1.2 Metering According to the Guidebook, an agency that is fully metered must state that fact in the UWMP. If an agency is not yet full metered, it will discuss its plans for becoming fully metered in accordance with CWC 527.
All water connections served by the City are currently metered.
9.1.3 Conservation Pricing According to the Guidebook, retail water agencies need to describe the pricing structure that is used by the water agency. Conservation pricing is designed to discourage wasteful water habits and encourage conservation. The City applies a four-tiered rate structure to residential customer classes, which account for almost 90% of the customer base. Rates based on volume of use encourage water conservation by customers. The City applies a uniform rate structure to the remaining customer classes: commercial, industrial, government, landscape, recycled water, construction, and agricultural. Table 9-2 shows the tiered consumption rates for a residential meter with a unit defined as 100 cubic feet (HCF) (748 gallons). Table 9-3 shows the water rates for the other customer classes, while Table 9-4 shows the base fees per month based on the size of the meter. Table 9-2. Residential Conservation Pricing Rate Structure
UNITS RATE PER HCF
1-9 HCF $1.61
10-18 HCF $3.81
19-24 HCF $4.83
25+ HCF $6.73
*Multi-Family Rates are based on Hundred Cubic Feet (HCF) per dwelling unit for master-metered connections
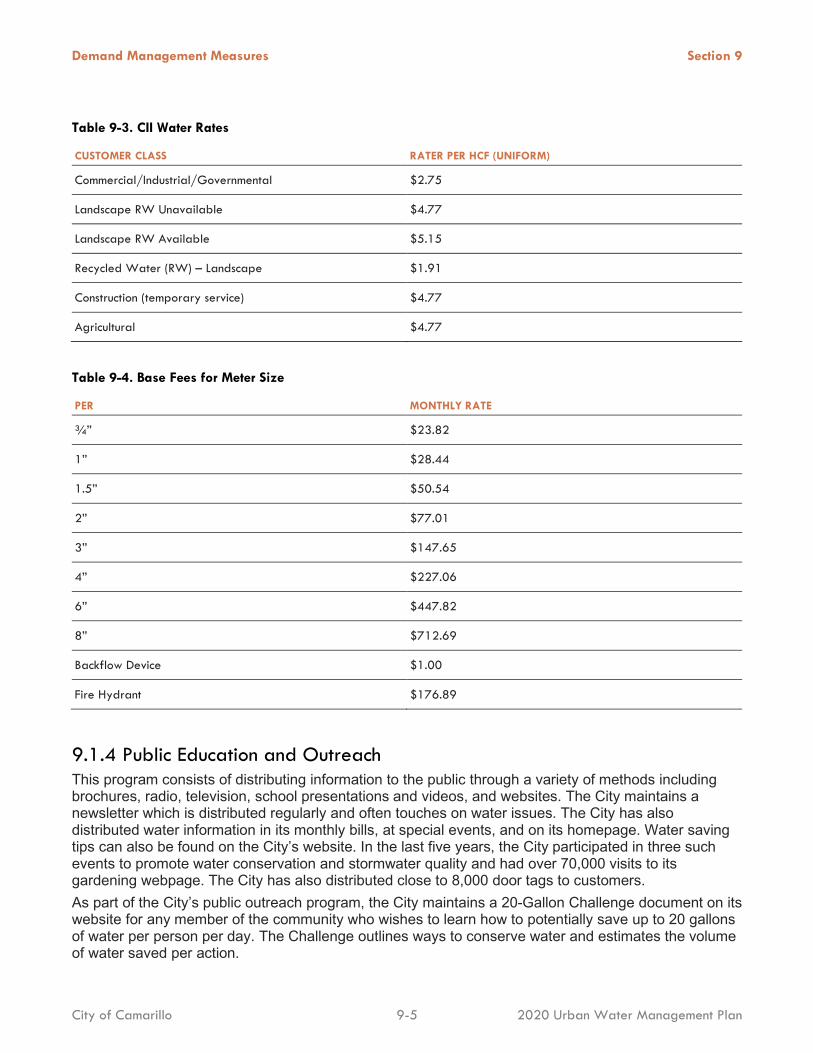
Demand Management Measures Section 9
City of Camarillo 9-5 2020 Urban Water Management Plan
Table 9-3. CII Water Rates
CUSTOMER CLASS RATER PER HCF (UNIFORM)
Commercial/Industrial/Governmental $2.75
Landscape RW Unavailable $4.77
Landscape RW Available $5.15
Recycled Water (RW) – Landscape $1.91
Construction (temporary service) $4.77
Agricultural $4.77
Table 9-4. Base Fees for Meter Size
PER MONTHLY RATE
¾” $23.82
1” $28.44
1.5” $50.54
2” $77.01
3” $147.65
4” $227.06
6” $447.82
8” $712.69
Backflow Device $1.00
Fire Hydrant $176.89
9.1.4 Public Education and Outreach This program consists of distributing information to the public through a variety of methods including brochures, radio, television, school presentations and videos, and websites. The City maintains a newsletter which is distributed regularly and often touches on water issues. The City has also distributed water information in its monthly bills, at special events, and on its homepage. Water saving tips can also be found on the City’s website. In the last five years, the City participated in three such events to promote water conservation and stormwater quality and had over 70,000 visits to its gardening webpage. The City has also distributed close to 8,000 door tags to customers. As part of the City’s public outreach program, the City maintains a 20-Gallon Challenge document on its website for any member of the community who wishes to learn how to potentially save up to 20 gallons of water per person per day. The Challenge outlines ways to conserve water and estimates the volume of water saved per action.
Demand Management Measures Section 9
City of Camarillo 9-6 2020 Urban Water Management Plan
9.1.5 Programs to Assess and Manage Distribution System Real Losses A water audit is a process of accounting for water use throughout a water system in order to quantify unmetered water usage. Non‐revenue water is the difference between metered production and metered usage on a system‐wide basis. Public water system statistics records from 2016–2020 show average non‐revenue water of approximately 2.4% of the City’s water production. This is relatively low compared to the typical range of 5 to 10% experienced by most agencies in Southern California. For this reason, the City does not provide a comprehensive system leak detection program. The City is conscientious about locating and repairing main and service connection leaks when they occur. The Water Conservation Program provides assistance in locating leaks on private property and City Municipal Code Chapter 14.12 prohibits leak durations of more than 72 hours. In the last five years, the City has sent out 20 repair leak notices and conducted 558 high water consumption/leak inspections. Additionally, the City completed the AWWA Water Audit spreadsheet for the fiscal year 2020 and will continue to update the spreadsheet on an annual basis.
9.1.6 Water Conservation Program Coordination and Staffing Support The City employs one full time Water Conservation Technician and a Water Conservation Coordinator. These conservation staff budget for an annual Water Conservation Program.
9.1.7 Other Demand Management Measures The City is committed to implementing cost effective programs that will increase water efficiency City‐ wide. Though not required, the City has implemented the following DMMs during the past five years and will continue implementing them into the future to increase the overall water efficiency of the City’s customers. The following is a brief description of each program.
9.1.7.1 Water Survey Program This program consists of offering water audits to single family and multi‐family residential customers. Audits include reviewing water usage history with the customer, identifying leaks inside and outside the home, and recommending improvements. Upon request, City personnel will perform on‐site inspection of residences and businesses for potential internal leaks. Leak detection kits are available and are provided to residents free of charge, upon request. As an incentive to complete the audit, the City provides free low‐flow showerheads and kitchen/bathroom shut‐off nozzles. In the last five years, the City has also conducted 301 and 10 home and business water surveys, respectively, to help customers improve their water use efficiency. The City also provides exterior audits for residence with landscape irrigation systems. Between 2018 and 2020, the City has installed approximately 4,800 shut-off nozzles and 4,400 ft of drip irrigation.
9.1.7.2 Water Retrofit Program This program consists of installing physical devices to reduce the amount of water used or to limit the amount of water that can be served to the customer. In accordance with State law, low‐flow fixtures have been required on all new construction since 1978. In addition, State legislation enacted in 1990 requires all new buildings after January 1, 1992, to install Ultra‐Low‐Flush Toilets. Several studies suggest that water use savings resulting from miscellaneous interior retrofit fixtures can range between 25 and 65 gallons per day per housing unit. The studies also suggest that installation of retrofit fixtures in older single‐family homes tend to produce more savings, while newer multi‐family
Demand Management Measures Section 9
City of Camarillo 9-7 2020 Urban Water Management Plan
homes tend to produce fewer saving per housing unit. From 2017 to 2019 the City installed 1,002 residential toilet retrofits and 801 commercial toilet retrofits. The City also provided 1,227 low-flow showerheads and 1,899 aerators. These programs were terminated in November of 2019. The City now offers rebates for replacing toilets, clothes washers, urinals, and air-cooled ice machines through WaterWise Consulting. The rebates range from $250 to $1,250. Details can be found on https://www.waterwise-consulting.com/camarillo. Additionally, from 2016–2020, the City provided 299 irrigation controllers to customers.
9.1.7.3 School Education Program This DMM includes providing educational materials and instructional assistance to school classes. Brochures are distributed on various water issues, and the City participates in MWDSC programs to promote student Water Awareness. A number of teachers have included water conservation classes as part of their curriculum.
9.1.7.4 Conservation Programs for Commercial, Industrial, Institutional Accounts The City targets commercial, industrial, and institutional water accounts with a monthly consumption of 200 HCF or more for water audits. Such programs typically involve turf fields, smart irrigation timers, and industrial process water use reductions.
9.1.7.5 Landscaping Programs The City is committed to encouraging water savings among its customers. As such, the City offers free outdoor surveys of customers’ landscape and irrigation systems to check for leaks and see if customers qualify for water-saving devices through the Camarillo’s Landscape Efficiency Audit Retrofit Program. These devices can potentially save customers’ water usage by up to 50%. If customers wish to take advantage of the offered devices, they may pay a one-time fee of $100 per qualified site to receive the following devices and services: Wi-Fi smart irrigation controllers, high-efficiency sprinkler nozzles, and the installation of drip irrigation. Additionally, the City actively encourages customers to use drought tolerant landscaping. The City provides a brochure of recommended drought tolerant and water efficient flora at City Hall and on the City’s website. The brochure includes images of the plants as well as generalized light and water use information. The City participates in the turf replacement program, funded through SoCal Water$mart, which offers a $2 or more per square foot rebate for up to 5,000 square feet of lawn replaced with California Friendly® plants. Details can be found on the bewaterwise.com. A link to the website can be found on the Water Conservation page of the City’s website as well.
Reporting Implementation
9.2.1 Implementation Over the Past Five Years Table 9-5 summarizes the DMM implementation over the past five years. As discussed in Section 5, the City has met its 2020 water use target. However, the City will be diligent in continuing use of the above described DMMs to continue conservation.
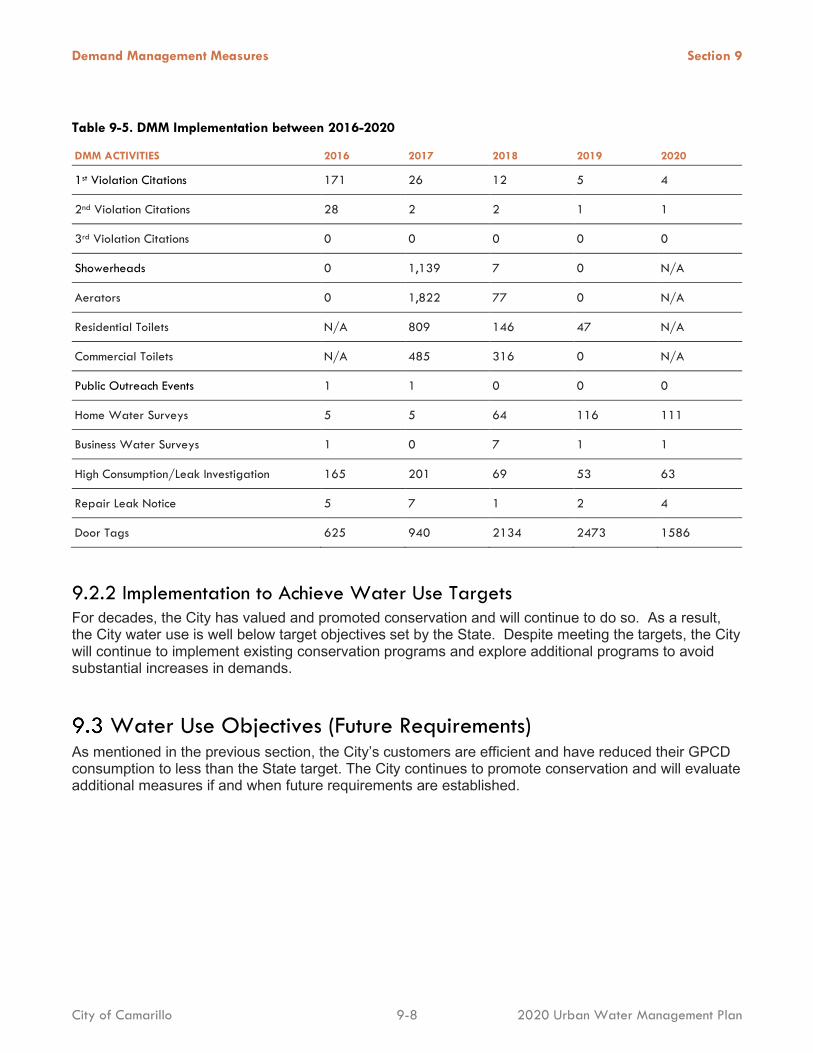
Demand Management Measures Section 9
City of Camarillo 9-8 2020 Urban Water Management Plan
Table 9-5. DMM Implementation between 2016-2020
DMM ACTIVITIES 2016 2017 2018 2019 2020
1st Violation Citations 171 26 12 5 4
2nd Violation Citations 28 2 2 1 1
3rd Violation Citations 0 0 0 0 0
Showerheads 0 1,139 7 0 N/A
Aerators 0 1,822 77 0 N/A
Residential Toilets N/A 809 146 47 N/A
Commercial Toilets N/A 485 316 0 N/A
Public Outreach Events 1 1 0 0 0
Home Water Surveys 5 5 64 116 111
Business Water Surveys 1 0 7 1 1
High Consumption/Leak Investigation 165 201 69 53 63
Repair Leak Notice 5 7 1 2 4
Door Tags 625 940 2134 2473 1586
9.2.2 Implementation to Achieve Water Use Targets For decades, the City has valued and promoted conservation and will continue to do so. As a result, the City water use is well below target objectives set by the State. Despite meeting the targets, the City will continue to implement existing conservation programs and explore additional programs to avoid substantial increases in demands.
Water Use Objectives (Future Requirements) As mentioned in the previous section, the City’s customers are efficient and have reduced their GPCD consumption to less than the State target. The City continues to promote conservation and will evaluate additional measures if and when future requirements are established.
10-1
202 0 UR B AN W AT ER M AN AG EME NT P LAN
References
AKM Consulting Engineers. June 2016. City of Camarillo Potable Water Master Plan. June 2016.
American Water Works Association. 2019. Manual of Water Supply Practices, Drought Preparedness and Response. 2019.
Calleguas Municipal Water District. 2021. 2020 Urban Water Management Plan. 2021.
Carollo, Inc. 2011. Wastewater Treatment Plant Engineering Compliance Report. Camarillo Sanitary District : s.n., 2011.
City of Camarillo. 2020. 2020 General Plan Annual Progress Report. City of Camarillo : s.n., 2020.
Southern California Association of Governments. 2019. Regional Growth Forecast 2050 Ventura County. 2019.
—. 2021. SCAG 6TH CYCLE FINAL RHNA ALLOCATION PLAN. [Online] 2021. https://scag.ca.gov/sites/main/files/file-attachments/6th-cycle-rhna-final-allocation-plan.pdf?1616462966.
State of California Department of Water Resources. February 2016. Methodologies for Calculating Baseline and Compliance Urban Per Capita Water Use. February 2016.
—. March 2021. Urban Water Management Plan Guidebook 2020. Sacramento : California Department of Water Resources, March 2021.
Steven Bachman, PhD. 2016. Northern Pleasant Valley Desalter Groundwater Analysis and Modeling. 2016.
Water Systems Consulting Inc. June 2021. City of Camarillo 2020 Urban Water Management Plan. June 2021.

A Appendix A. Demonstration of Reduced Delta Reliance

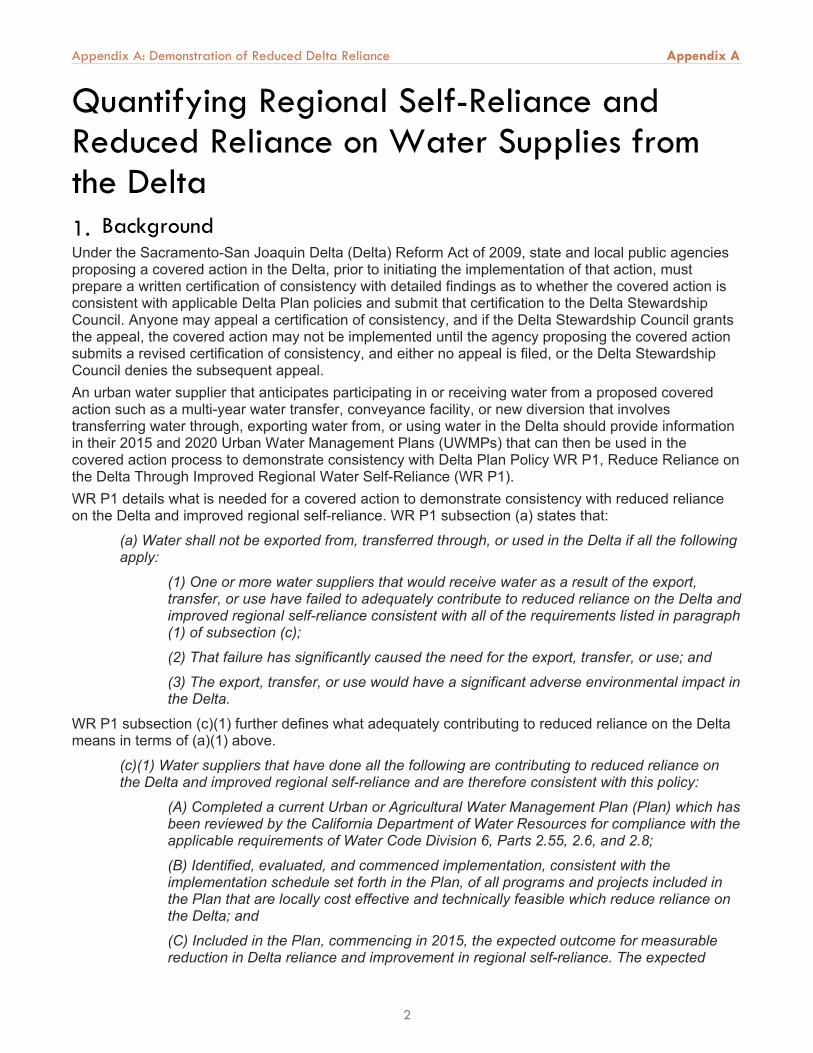
Appendix A: Demonstration of Reduced Delta Reliance Appendix A
2
Quantifying Regional Self-Reliance and Reduced Reliance on Water Supplies from the Delta 1. BackgroundUnder the Sacramento-San Joaquin Delta (Delta) Reform Act of 2009, state and local public agencies proposing a covered action in the Delta, prior to initiating the implementation of that action, must prepare a written certification of consistency with detailed findings as to whether the covered action is consistent with applicable Delta Plan policies and submit that certification to the Delta Stewardship Council. Anyone may appeal a certification of consistency, and if the Delta Stewardship Council grants the appeal, the covered action may not be implemented until the agency proposing the covered action submits a revised certification of consistency, and either no appeal is filed, or the Delta Stewardship Council denies the subsequent appeal.An urban water supplier that anticipates participating in or receiving water from a proposed covered action such as a multi-year water transfer, conveyance facility, or new diversion that involves transferring water through, exporting water from, or using water in the Delta should provide information in their 2015 and 2020 Urban Water Management Plans (UWMPs) that can then be used in the covered action process to demonstrate consistency with Delta Plan Policy WR P1, Reduce Reliance on the Delta Through Improved Regional Water Self-Reliance (WR P1).WR P1 details what is needed for a covered action to demonstrate consistency with reduced reliance on the Delta and improved regional self-reliance. WR P1 subsection (a) states that:
(a) Water shall not be exported from, transferred through, or used in the Delta if all the following apply:
(1) One or more water suppliers that would receive water as a result of the export, transfer, or use have failed to adequately contribute to reduced reliance on the Delta and improved regional self-reliance consistent with all of the requirements listed in paragraph (1) of subsection (c);
(2) That failure has significantly caused the need for the export, transfer, or use; and
(3) The export, transfer, or use would have a significant adverse environmental impact in the Delta.
WR P1 subsection (c)(1) further defines what adequately contributing to reduced reliance on the Delta means in terms of (a)(1) above.
(c)(1) Water suppliers that have done all the following are contributing to reduced reliance on the Delta and improved regional self-reliance and are therefore consistent with this policy:
(A) Completed a current Urban or Agricultural Water Management Plan (Plan) which has been reviewed by the California Department of Water Resources for compliance with the applicable requirements of Water Code Division 6, Parts 2.55, 2.6, and 2.8;
(B) Identified, evaluated, and commenced implementation, consistent with the implementation schedule set forth in the Plan, of all programs and projects included in the Plan that are locally cost effective and technically feasible which reduce reliance on the Delta; and
(C) Included in the Plan, commencing in 2015, the expected outcome for measurable reduction in Delta reliance and improvement in regional self-reliance. The expected
Appendix A: Demonstration of Reduced Delta Reliance Appendix A
3
outcome for measurable reduction in Delta reliance and improvement in regional self- reliance shall be reported in the Plan as the reduction in the amount of water used, or in the percentage of water used, from the Delta watershed. For the purposes of reporting, water efficiency is considered a new source of water supply, consistent with Water Code section 1011(a).
The analysis and documentation provided below include all the elements described in WR P1(c)(1) that need to be included in a water supplier’s UWMP to support a certification of consistency for a future covered action.
2. Demonstration of Regional Self-RelianceThe methodology used to determine the City of Camarillo’s (City) improved regional self-reliance is consistent with the approach detailed in DWR’s UWMP Guidebook Appendix C (Guidebook Appendix C), including the use of narrative justifications for the accounting of supplies and the documentation of specific data sources. Some of the key assumptions underlying the City’s demonstration of reduced reliance include:
All data were obtained from the current 2020 UWMP or previously adopted UWMPs and represent average or normal water year conditions.
All analyses were conducted at the service area level, and all data reflect the total contributions of the City and its customers.
Baseline and Expected OutcomesTo calculate the expected outcomes for measurable reduction in Delta reliance and improved regional self-reliance, a baseline is needed to compare against. This analysis uses a normal water year representation of 2010 as the baseline, which is consistent with the approach described in the Guidebook Appendix C. Data for the 2010 baseline were taken from the City’s 2005 UWMP as UWMPs generally do not provide normal water year data for the year that they are adopted (i.e., 2005 UWMP forecasts begin in 2010, 2010 UWMP forecasts begin in 2015, and so on).Consistent with the 2010 baseline data approach, the expected outcomes for reduced Delta reliance and improved regional self-reliance for 2015 and 2020 were taken from the City’s 2010 and 2015 UWMPs, respectively. Expected outcomes for 2025–2045 are from the current 2020 UWMP. Documentation of the specific data sources and assumptions are included in the discussions below.
Service Area Demands without Water Use EfficiencyIn alignment with the Guidebook Appendix C, this analysis uses normal water year demands, rather than normal water year supplies to calculate expected outcomes in terms of the percentage of water used. Normal water year demands serve as a proxy for the amount of supplies that would be used in a normal water year, which helps alleviate issues associated with how supply capability is presented to fulfill requirements of the UWMP Act versus how supplies might be accounted for to demonstrate consistency with WR P1.Because WR P1 considers water use efficiency savings a source of water supply, water suppliers can calculate their embedded water use efficiency savings based on changes in forecasted per capita water use since the baseline. As explained in the Guidebook Appendix C, water use efficiency savings must be added back to the normal year demands to represent demands without water use efficiency savings accounted for; otherwise, the effect of water use efficiency savings on regional self-reliance would be overestimated. Table C-1 shows the results of this adjustment for the City. Supporting narratives and documentation for all the data shown in Table C-1 are provided below.
Service Area Demands with Water Use EfficiencyThe service area demands shown in Table C-1 represent the total water demands for the City’s service area. The demand data shown in Table C-1 were collected from the following sources:
Appendix A: Demonstration of Reduced Delta Reliance Appendix A
4
Baseline (2010): City’s 2005 UWMP, Table 5.3-2 2015: City’s 2010 UWMP, Table 5.2 2020: City’s 2015 UWMP, Table 5-8 2025-2045: City’s 2020 UWMP, Table 4-3
Non-Potable Water DemandsThe City provides recycled water to its customers. These values are included in Table C-3.
Potable Service Area Demands with Water Use EfficiencyThe “Potable Service Area Demands with Water Use Efficiency” was calculated by subtracting the “Non-Potable Water Demands” from “Service Area Demands with Water Use Efficiency.”
Service Area PopulationThe population data shown in Table C-1 were collected from the following sources:
Baseline (2010): City’s 2010 UWMP, Figure 2.2 2015: City’s 2015 UWMP, Table 3-4 2020-2045: City’s 2020 UWMP, Table 3-2
Estimated Water Use Efficiency Since BaselineThe “Estimated Water Use Efficiency Since Baseline” was calculated by dividing the “Potable Service Area Demands with Water Use Efficiency” by the “Service Area Population” and then comparing with the 2010 Per Capita Water Use.
Service Area Water Demands without Water Use EfficiencyIn Table C-2, the “Service Area Demands with Water Use Efficiency” was added to the “Estimated Water Use Efficiency Since Baseline” to obtain the “Service Area Water Demands without Water Use Efficiency Accounted For.”
Supplies Contributing to Regional Self-RelianceFor a covered action to demonstrate consistency with the Delta Plan, WR P1 subsection (c)(1)(C) states that water suppliers must report the expected outcomes for measurable improvement in regional self-reliance. Table C-3 shows expected outcomes for supplies contributing to regional self-reliance both in the amount and as a percentage. The numbers shown in Table C-3 represent efforts to improve regional self-reliance for the City’s service area and include the total contributions of the City and its customers. Supporting narratives and documentation for all the data shown in Table C-3 are provided below.
Water Use EfficiencyThe water use efficiency information shown in Table C-3 is taken directly from Table C-2. The City has reduced the amount of water used to meet customer demands and continues to promote water conservation and limit water waste.
Water RecyclingThe City currently provides recycled water for irrigation use throughout the service areas. The values shown for water recycling reflect only what is recycled within the City’s water service area.
Advanced Water TechnologiesThe City has invested in considerable resources into planning for a Desalter facility to treat high total dissolved solids content within the City’s groundwater supply. The North Pleasant Valley Desalter Facility is currently in the final phases of construction and expected to be complete in late 2021.
Appendix A: Demonstration of Reduced Delta Reliance Appendix A
5
3. Reliance on Water Supplies from the Delta WatershedMetropolitan Water District of Southern California’s (MWDSC’s) service area, as a whole, reduces reliance on the Delta through investments in non-Delta water supplies, local water supplies, and regional and local demand management measures. MWDSC’s member agencies coordinate reliance on the Delta through their membership in MWDSC, a regional cooperative providing wholesale water service to its 26 member agencies, which includes Calleguas Municipal Water District (CMWD), and therefore the City. Accordingly, regional reliance on the Delta can only be measured regionally — not by individual MWDSC member agencies and not by the customers of those member agencies.MWDSC’s member agencies, and those agencies’ customers, indirectly reduce reliance on the Delta through their collective efforts as a cooperative. MWDSC’s member agencies do not control the amount of Delta water they receive from MWDSC. MWDSC manages a statewide integrated conveyance system consisting of its participation in the State Water Project (SWP), its Colorado River Aqueduct (CRA) including Colorado River water resources, programs and water exchanges, and its regional storage portfolio. Along with the SWP, CRA, storage programs, and MWDSC’s conveyance and distribution facilities, demand management programs increase the future reliability of water resources for the region. In addition, demand management programs provide system-wide benefits by decreasing the demand for imported water, which helps to decrease the burden on the district’s infrastructure and reduce system costs, and free up conveyance capacity to the benefit of all member agencies.MWDSC’s costs are funded almost entirely from its service area, except for grants and other assistance from government programs. Most of MWDSC’s revenues are collected directly from its member agencies. Properties within MWDSC’s service area pay a property tax that currently provides approximately 8 percent (%) of the fiscal year 2021 annual budgeted revenues. The rest of MWDSC’s costs are funded through rates and charges paid by MWDSC’s member agencies for the wholesale services it provides to them. Thus, MWDSC’s member agencies fund nearly all operations MWDSC undertakes to reduce reliance on the Delta, including Colorado River Programs, storage facilities, Local Resources Programs and Conservation Programs within MWDSC’s service area. Because of the integrated nature of MWDSC’s systems and operations, and the collective nature of MWDSC’s regional efforts, it is infeasible to quantify each of MWDSC member agency’s and their subsequent customers’ individual reliance on the Delta. It is infeasible to attempt to segregate an entity and a system that were designed to work as an integrated regional cooperative.In addition to the member agencies funding MWDSC’s regional efforts, they also invest in their own local programs to reduce their reliance on any imported water. Moreover, the City and other customers of those member agencies may also invest in their own local programs to reduce water demand. However, to the extent those efforts result in reduction of demands on MWDSC, that reduction does not equate to a like reduction of reliance on the Delta. Demands on MWDSC are not commensurate with demands on the Delta because most of MWDSC member agencies receive blended resources from MWDSC as determined by MWDSC — not the individual member agency — and for most member agencies, the blend varies from month-to-month and year-to-year due to hydrology, operational constraints, use of storage and other factors.
Colorado River ProgramsAs a regional cooperative of member agencies, Metropolitan invests in programs to ensure the continued reliability and sustainability of Colorado River supplies. Metropolitan was established to obtain an allotment of Colorado River water, and its first mission was to construct and operate the CRA. The CRA consists of five pumping plants, 450 miles of high voltage power lines, one electric substation, four regulating reservoirs, and 242 miles of aqueducts, siphons, canals, conduits and pipelines terminating at Lake Mathews in Riverside County. Metropolitan owns, operates, and manages the CRA. Metropolitan is responsible for operating, maintaining, rehabilitating, and repairing the CRA, and is
Appendix A: Demonstration of Reduced Delta Reliance Appendix A
6
responsible for obtaining and scheduling energy resources adequate to power pumps at the CRA’s five pumping stations.Colorado River supplies include Metropolitan’s basic Colorado River apportionment, along with supplies that result from existing and committed programs, including supplies from the Imperial Irrigation District (IID)-Metropolitan Conservation Program, the implementation of the Quantification Settlement Agreement (QSA) and related agreements, and the exchange agreement with San Diego County Water Authority (SDCWA). The QSA established the baseline water use for each of the agreement parties and facilitates the transfer of water from agricultural agencies to urban uses. Since the QSA, additional programs have been implemented to increase MWDSC’s CRA supplies. These include the PVID Land Management, Crop Rotation, and Water Supply Program, as well as the Lower Colorado River Water Supply Project. The 2007 Interim Guidelines provided for the coordinated operation of Lake Powell and Lake Mead, as well as the Intentionally Created Surplus program that allows MWDSC to store water in Lake Mead.
Storage Investments/FacilitiesSurface and groundwater storage are critical elements of Southern California’s water resources strategy and help MWDSC reduce its reliance on the Delta. Because California experiences dramatic swings in weather and hydrology, storage is important to regulate those swings and mitigate possible supply shortages. Surface and groundwater storage provide a means of storing water during normal and wet years for later use during dry years, when imported supplies are limited. The MWDSC system, for purposes of meeting demands during times of shortage, regulating system flows, and ensuring system reliability in the event of a system outage, provides over 1,000,000 acre-feet (AF) of system storage capacity. Diamond Valley Lake provides 810,000 AF of that storage capacity, effectively doubling Southern California’s previous surface water storage capacity. Other existing imported water storage available to the region consists of MWDSC’s raw water reservoirs, a share of the SWP’s raw water reservoirs in and near the service area, and the portion of the groundwater basins used for conjunctive‐use storage. Since the early twentieth century, DWR and MWDSC have constructed surface water reservoirs to meet emergency, drought/seasonal, and regulatory water needs for Southern California. These reservoirs include Pyramid Lake, Castaic Lake, Elderberry Forebay, Silverwood Lake, Lake Perris, Lake Skinner, Lake Mathews, Live Oak Reservoir, Garvey Reservoir, Palos Verdes Reservoir, Orange County Reservoir, and MWDSC’s Diamond Valley Lake. Some reservoirs such as Live Oak Reservoir, Garvey Reservoir, Palos Verdes Reservoir, and Orange County Reservoir, which have a total combined capacity of about 3,500 AF, are used solely for regulating purposes. The total gross storage capacity for the larger remaining reservoirs is 1,757,600 AF. However, not all of the gross storage capacity is available to MWDSC; dead storage and storage allocated to others reduce the amount of storage that is available to MWDSC to 1,665,200 AF.Conjunctive use of the aquifers offers another important source of dry year supplies. Unused storage in Southern California groundwater basins can be used to optimize imported water supplies, and the development of groundwater storage projects allows effective management and regulation of the region’s major imported supplies from the Colorado River and SWP. Over the years, MWDSC has implemented conjunctive use through various programs in the service area; the following table lists the groundwater conjunctive use programs that have been developed in the region.
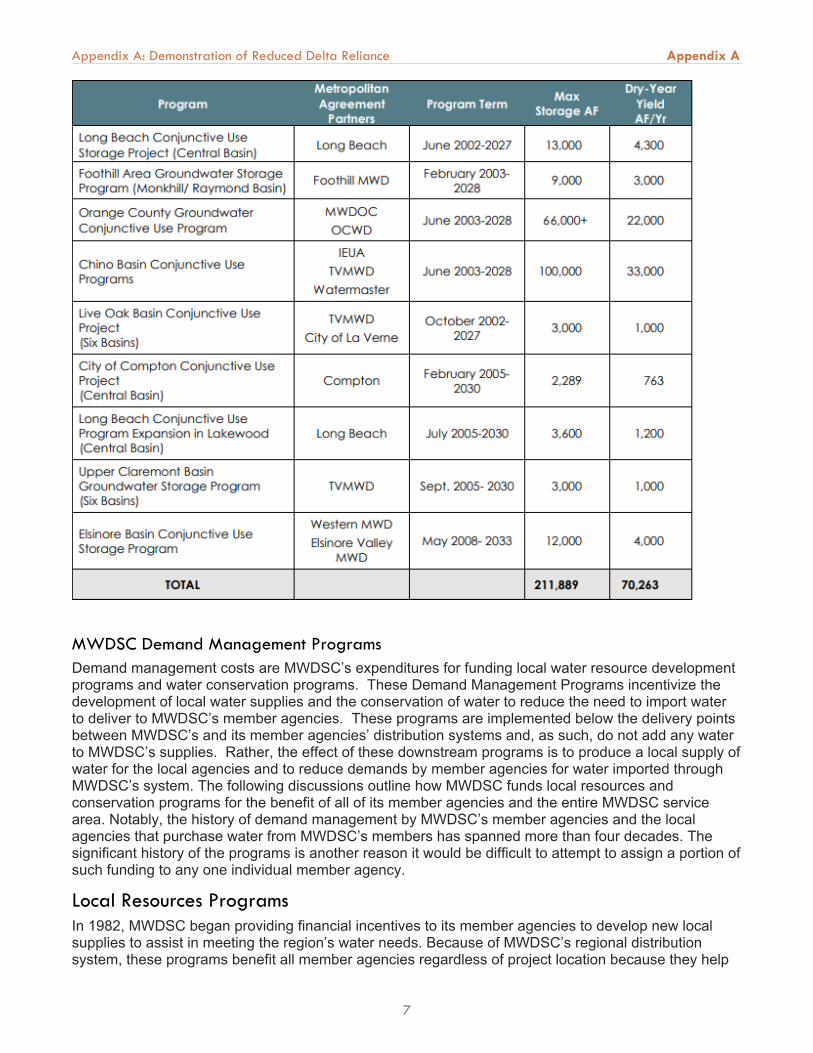
Appendix A: Demonstration of Reduced Delta Reliance Appendix A
7
MWDSC Demand Management ProgramsDemand management costs are MWDSC’s expenditures for funding local water resource development programs and water conservation programs. These Demand Management Programs incentivize the development of local water supplies and the conservation of water to reduce the need to import water to deliver to MWDSC’s member agencies. These programs are implemented below the delivery points between MWDSC’s and its member agencies’ distribution systems and, as such, do not add any water to MWDSC’s supplies. Rather, the effect of these downstream programs is to produce a local supply of water for the local agencies and to reduce demands by member agencies for water imported through MWDSC’s system. The following discussions outline how MWDSC funds local resources and conservation programs for the benefit of all of its member agencies and the entire MWDSC service area. Notably, the history of demand management by MWDSC’s member agencies and the local agencies that purchase water from MWDSC’s members has spanned more than four decades. The significant history of the programs is another reason it would be difficult to attempt to assign a portion of such funding to any one individual member agency.
Local Resources ProgramsIn 1982, MWDSC began providing financial incentives to its member agencies to develop new local supplies to assist in meeting the region’s water needs. Because of MWDSC’s regional distribution system, these programs benefit all member agencies regardless of project location because they help

Appendix A: Demonstration of Reduced Delta Reliance Appendix A
8
to increase regional water supply reliability, reduce demands for imported water supplies, decrease the burden on MWDSC’s infrastructure, reduce system costs and free up conveyance capacity to the benefit of all the agencies that rely on water from MWDSC. For example, the Groundwater Replenishment System (GWRS) operated by the Orange County Water District is the world’s largest water purification system for indirect potable reuse. It was funded, in part, by MWDSC’s member agencies through the Local Resources Program. Annually, the GWRS produces approximately 103,000 AF of reliable, locally controlled, drought-proof supply of high-quality water to recharge the Orange County Groundwater Basin and protect it from seawater intrusion. The GWRS is a premier example of a regional project that significantly reduced the need to utilize imported water for groundwater replenishment in MWDSC’s service area, increasing regional and local supply reliability and reducing the region’s reliance on imported supplies, including supplies from the State Water Project.MWDSC’s local resource programs have evolved through the years to better assist MWDSC’s member agencies in increasing local supply production. The following is a description and history of the local supply incentive programs.
Local Projects ProgramIn 1982, MWDSC initiated the Local Projects Program (LPP), which provided funding to member agencies to facilitate the development of recycled water projects. Under this approach, MWDSC contributed a negotiated up-front funding amount to help finance project capital costs. Participating member agencies were obligated to reimburse MWDSC over time. In 1986, the LPP was revised, changing the up-front funding approach to an incentive-based approach. MWDSC contributed an amount equal to the avoided State Water Project pumping costs for each acre-foot of recycled water delivered to end-use consumers. This funding incentive was based on the premise that local projects resulted in the reduction of water imported from the Delta and the associated pumping cost. The incentive amount varied from year to year depending on the actual variable power cost paid for State Water Project imports. In 1990, MWDSC’s Board increased the LPP contribution to a fixed rate of $154 per acre-foot, which was calculated based on MWDSC’s avoided capital and operational costs to convey, treat, and distribute water, and included considerations of reliability and service area demands.
Groundwater Recovery ProgramThe drought of the early 1990s sparked the need to develop additional local water resources, aside from recycled water, to meet regional demand and increase regional water supply reliability. In 1991, MWDSC conducted the Brackish Groundwater Reclamation Study which determined that large amounts of degraded groundwater in the region were not being utilized. Subsequently, the Groundwater Recovery Program (GRP) was established to assist the recovery of otherwise unusable groundwater degraded by minerals and other contaminants, provide access to the storage assets of the degraded groundwater, and maintain the quality of groundwater resources by reducing the spread of degraded plumes.
Local Resources ProgramIn 1995, MWDSC’s Board adopted the Local Resources Program (LRP), which combined the LPP and GRP into one program. The Board allowed for existing LPP agreements with a fixed incentive rate to convert to the sliding scale up to $250 per acre-foot, similar to GRP incentive terms. Those agreements that were converted to LRP are known as “LRP Conversions.”
Competitive Local Projects ProgramIn 1998, the Competitive Local Resources Program (Competitive Program) was established. The Competitive Program encouraged the development of recycled water and recovered groundwater through a process that emphasized cost-efficiency to MWDSC, timing new production according to regional need while minimizing program administration cost. Under the Competitive Program, agencies
Appendix A: Demonstration of Reduced Delta Reliance Appendix A
9
requested an incentive rate up to $250 per acre-foot of production over 25 years under a Request for Proposals (RFP) for the development of up to 53,000 acre-feet per year (AFY) of new water recycling and groundwater recovery projects. In 2003, a second RFP was issued for the development of an additional 65,000 AF of new recycled water and recovered groundwater projects through the LRP.
Seawater Desalination ProgramMWDSC established the Seawater Desalination Program (SDP) in 2001 to provide financial incentives to member agencies for the development of seawater desalination projects. In 2014, seawater desalination projects became eligible for funding under the LRP, and the SDP was ended.
2007 Local Resources ProgramIn 2006, a task force comprised of member agency representatives was formed to identify and recommend program improvements to the LRP. As a result of the task force process, the 2007 LRP was established with a goal of 174,000 AFY of additional local water resource development. The new program allowed for an open application process and eliminated the previous competitive process. This program offered sliding scale incentives of up to $250 per acre-foot, calculated annually based on a member agency’s actual local resource project costs exceeding MWDSC’s prevailing water rate.
2014 Local Resources ProgramA series of workgroup meetings with member agencies was held to identify the reasons why there was a lack of new LRP applications coming into the program. The main constraint identified by the member agencies was that the $250 per acre-foot was not providing enough of an incentive for developing new projects due to higher construction costs to meet water quality requirements and to develop the infrastructure to reach end-use consumers located further from treatment plants. As a result, in 2014, the Board authorized an increase in the maximum incentive amount, provided alternative payment structures, included onsite retrofit costs and reimbursable services as part of the LRP, and added eligibility for seawater desalination projects. The current LRP incentive payment options are structured as follows:
Option 1 – Sliding scale incentive up to $340/AF for a 25-year agreement term Option 2 – Sliding scale incentive up to $475/AF for a 15-year agreement term Option 3 – Fixed incentive up to $305/AF for a 25-year agreement term
On-site Retrofit ProgramsIn 2014, MWDSC’s Board also approved the On-site Retrofit Pilot Program which provided financial incentives to public or private entities toward the cost of small-scale improvements to their existing irrigation and industrial systems to allow connection to existing recycled water pipelines. The On-site Retrofit Pilot Program helped reduce recycled water retrofit costs to the end-use consumer which is a key constraint that limited recycled water LRP projects from reaching full production capacity. The program incentive was equal to the actual eligible costs of the on-site retrofit, or $975 per acre-foot of up-front cost, which equates to $195 per acre-foot for an estimated five years of water savings ($195/AF x 5 years) multiplied by the average annual water use in previous three years, whichever is less. The Pilot Program lasted two years and was successful in meeting its goal of accelerating the use of recycled water. In 2016, MWDSC’s Board authorized the On-site Retrofit Program (ORP), with an additional budget of $10 million. This program encompassed lessons learned from the Pilot Program and feedback from member agencies to make the program more streamlined and improve its efficiency. As of fiscal year 2019/20, the ORP has successfully converted 440 sites, increasing the use of recycled water by 12,691 AFY.
Appendix A: Demonstration of Reduced Delta Reliance Appendix A
10
Stormwater Pilot ProgramsIn 2019, MWDSC’s Board authorized both the Stormwater for Direct Use Pilot Program and a Stormwater for Recharge Pilot Program to study the feasibility of reusing stormwater to help meet regional demands in Southern California. These pilot programs are intended to encourage the development, monitoring, and study of new and existing stormwater projects by providing financial incentives for their construction/retrofit and monitoring/reporting costs. These pilot programs will help evaluate the potential benefits delivered by stormwater capture projects and provide a basis for potential future funding approaches. MWDSC’s Board authorized a total of $12.5 million for the stormwater pilot programs ($5 million for the District Use Pilot and $7.5 million for the Recharge Pilot).
Current Status and Results of MWDSC’s Local Resource ProgramsToday, nearly one-half of the total recycled water and groundwater recovery production in the region has been developed with an incentive from one or more of MWDSC’s local resource programs. During fiscal year 2020, MWDSC provided about $13 million for production of 71,000 AF of recycled water for non-potable and indirect potable uses. MWDSC provided about $4 million to support projects that produced about 50,000 AF of recovered groundwater for municipal use. Since 1982, MWDSC has invested $680 million to fund 85 recycled water projects and 27 groundwater recovery projects that have produced a cumulative total of about 4 million AF.
Conservation Programs MWDSC’s regional conservation programs and approaches have a long history. Decades ago, MWDSC recognized that demand management at the consumer level would be an important part of balancing regional supplies and demands. Water conservation efforts were seen as a way to reduce the need for imported supplies and offset the need to transport or store additional water into or within the MWDSC service area. The actual conservation of water takes place at the retail consumer level. Regional conservation approaches have proven to be effective at reaching retail consumers throughout MWDSC’s service area and successfully implementing water saving devices, programs and practices. Through the pooling of funding by MWDSC’s member agencies, MWDSC is able to engage in regional campaigns with wide-reaching impact. Regional investments in demand management programs, of which conservation is a key part along with local supply programs, benefit all member agencies regardless of project location. These programs help to increase regional water supply reliability, reduce demands for imported water supplies, decrease the burden on MWDSC’s infrastructure, reduce system costs, and free up conveyance capacity to the benefit of all member agencies.
Incentive-Based Conservation ProgramsConservation Credits ProgramIn 1988, MWDSC’s Board approved the Water Conservation Credits Program (Credits Program). The Credits Program is similar in concept to the Local Projects Program (LPP). The purpose of the Credits Program is to encourage local water agencies to implement effective water conservation projects through the use of financial incentives. The Credits Program provides financial assistance for water conservation projects that reduce demands on MWDSC’s imported water supplies and require MWDSC’s assistance to be financially feasible.Initially, the Credits Program provided 50% of a member agency’s program cost, up to a maximum of $75 per acre-foot of estimated water savings. The $75 Base Conservation Rate was established based MWDSC’s avoided cost of pumping SWP supplies. The Base Conservation Rate has been revisited by MWDSC’s Board and revised twice since 1988, from $75 to $154 per acre-foot in 1990 and from $154 to $195 per acre-foot in 2005.In fiscal year 2020 MWDSC processed more than 30,400 rebate applications totaling $18.9 million.
Appendix A: Demonstration of Reduced Delta Reliance Appendix A
11
Member Agency Administered ProgramSome member agencies also have unique programs within their service areas that provide local rebates that may differ from MWDSC’s regional program. MWDSC continues to support these local efforts through a member agency administered funding program that adheres to the same funding guidelines as the Credits Program. The Member Agency Administered Program allows member agencies to receive funding for local conservation efforts that supplement, but do not duplicate, the rebates offered through MWDSC’s regional rebate program.
Water Savings Incentive ProgramThere are numerous commercial entities and industries within MWDSC’s service area that pursue unique savings opportunities that do not fall within the general rebate programs that MWDSC provides. In 2012, MWDSC designed the Water Savings Incentive Program to target these unique commercial and industrial projects. In addition to rebates for devices, under this program, MWDSC provides financial incentives to businesses and industries that created their own custom water efficiency projects. Qualifying custom projects can receive funding for permanent water efficiency changes that result in reduced potable demand.
Non-Incentive Conservation ProgramsIn addition to its incentive-based conservation programs, MWDSC also undertakes additional efforts throughout its service area that help achieve water savings without the use of rebates. MWDSC’s non-incentive conservation efforts include:
Residential and professional water efficient landscape training classes Water audits for large landscapes Research, development and studies of new water saving technologies Advertising and outreach campaigns Community outreach and education programs Advocacy for legislation, codes, and standards that lead to increased water savings
Current Status and Results of MWDSC’s Conservation ProgramsSince 1990, MWDSC has invested $824 million in conservation rebates that have resulted in a cumulative savings of 3.27 million AF of water. These investments include $450 million in turf removal and other rebates during the last drought which resulted in 175 million square feet of lawn turf removed. During fiscal year 2020, 1.06 million AF of water is estimated to have been conserved. This annual total includes MWDSC’s Conservation Credits Program; code-based conservation achieved through MWDSC-sponsored legislation; building plumbing codes and ordinances; reduced consumption resulting from changes in water pricing; and pre-1990 device retrofits.
Infeasibility of Accounting Regional Investments in Reduced Reliance Below the Regional LevelThe accounting of regional investments that contribute to reduced reliance on supplies from the Delta watershed is straightforward to calculate and report at the regional aggregate level. However, any similar accounting is infeasible for the individual member agencies or their customers. As described above, the region (through MWDSC) makes significant investments in projects, programs and other resources that reduce reliance on the Delta. In fact, all of MWDSC’s investments in Colorado River supplies, groundwater and surface storage, local resources development and demand management measures that reduce reliance on the Delta are collectively funded by revenues generated from the member agencies through rates and charges. MWDSC’s revenues cannot be matched to the demands or supply production history of an individual agency, or consistently across the agencies within the service area. Each project or program funded by the region has a different online date, useful life, incentive rate and structure, and production schedule.
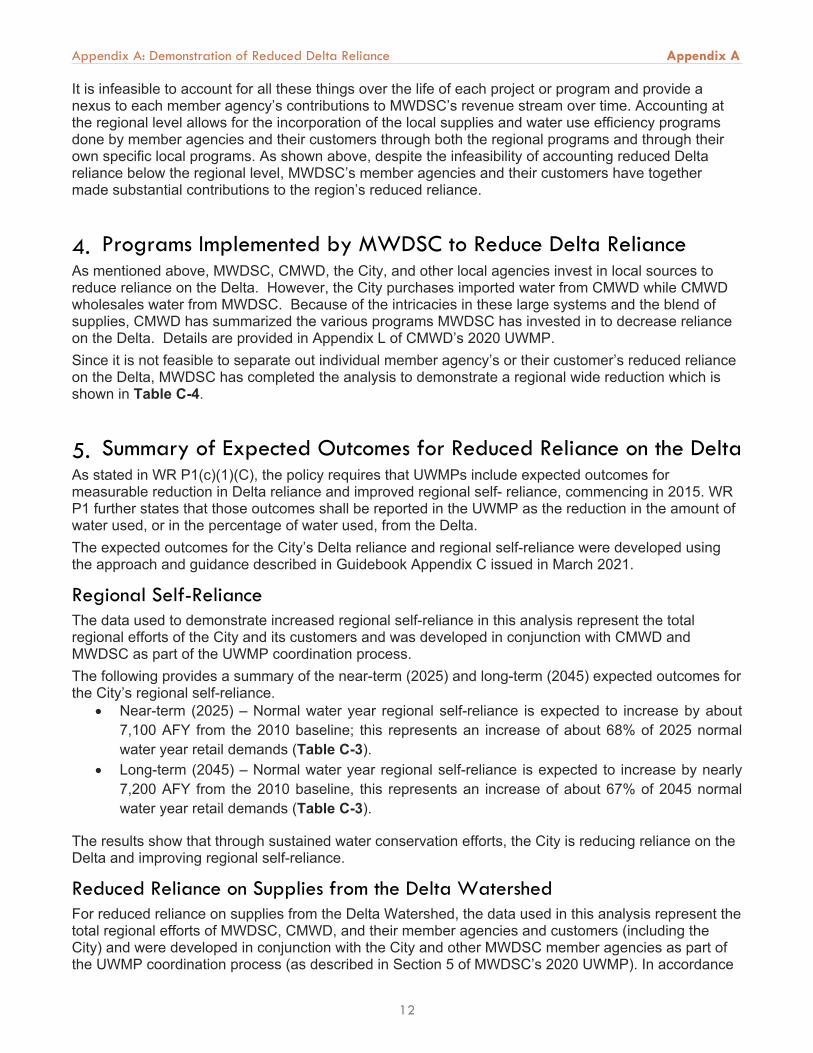
Appendix A: Demonstration of Reduced Delta Reliance Appendix A
12
It is infeasible to account for all these things over the life of each project or program and provide a nexus to each member agency’s contributions to MWDSC’s revenue stream over time. Accounting at the regional level allows for the incorporation of the local supplies and water use efficiency programs done by member agencies and their customers through both the regional programs and through their own specific local programs. As shown above, despite the infeasibility of accounting reduced Delta reliance below the regional level, MWDSC’s member agencies and their customers have together made substantial contributions to the region’s reduced reliance.
4. Programs Implemented by MWDSC to Reduce Delta RelianceAs mentioned above, MWDSC, CMWD, the City, and other local agencies invest in local sources to reduce reliance on the Delta. However, the City purchases imported water from CMWD while CMWD wholesales water from MWDSC. Because of the intricacies in these large systems and the blend of supplies, CMWD has summarized the various programs MWDSC has invested in to decrease reliance on the Delta. Details are provided in Appendix L of CMWD’s 2020 UWMP. Since it is not feasible to separate out individual member agency’s or their customer’s reduced reliance on the Delta, MWDSC has completed the analysis to demonstrate a regional wide reduction which is shown in Table C-4.
5. Summary of Expected Outcomes for Reduced Reliance on the DeltaAs stated in WR P1(c)(1)(C), the policy requires that UWMPs include expected outcomes for measurable reduction in Delta reliance and improved regional self- reliance, commencing in 2015. WR P1 further states that those outcomes shall be reported in the UWMP as the reduction in the amount of water used, or in the percentage of water used, from the Delta.The expected outcomes for the City’s Delta reliance and regional self-reliance were developed using the approach and guidance described in Guidebook Appendix C issued in March 2021.
Regional Self-RelianceThe data used to demonstrate increased regional self-reliance in this analysis represent the total regional efforts of the City and its customers and was developed in conjunction with CMWD and MWDSC as part of the UWMP coordination process. The following provides a summary of the near-term (2025) and long-term (2045) expected outcomes for the City’s regional self-reliance.
Near-term (2025) – Normal water year regional self-reliance is expected to increase by about 7,100 AFY from the 2010 baseline; this represents an increase of about 68% of 2025 normal water year retail demands (Table C-3).
Long-term (2045) – Normal water year regional self-reliance is expected to increase by nearly 7,200 AFY from the 2010 baseline, this represents an increase of about 67% of 2045 normal water year retail demands (Table C-3).
The results show that through sustained water conservation efforts, the City is reducing reliance on the Delta and improving regional self-reliance.
Reduced Reliance on Supplies from the Delta WatershedFor reduced reliance on supplies from the Delta Watershed, the data used in this analysis represent the total regional efforts of MWDSC, CMWD, and their member agencies and customers (including the City) and were developed in conjunction with the City and other MWDSC member agencies as part of the UWMP coordination process (as described in Section 5 of MWDSC’s 2020 UWMP). In accordance
Appendix A: Demonstration of Reduced Delta Reliance Appendix A
13
with UWMP requirements, MWDSC’s member agencies and their customers (many of them retail agencies) also report demands and supplies for their service areas in their respective UWMPs. The data reported by those agencies are not additive to the regional totals shown in MWDSC’s UWMP, rather their reporting represents subtotals of the regional total and should be considered as such for the purposes of determining reduced reliance on the Delta.While the demands that MWDSC’s member agencies and their customers report in their UWMP’s are a good reflection of the demands in their respective service areas, they do not adequately represent each water suppliers’ individual contributions to reduced reliance on the Delta. To calculate and report their reliance on water supplies from the Delta watershed, water suppliers that receive water from the Delta through other regional or wholesale water suppliers would need to determine the amount of Delta water that they receive from the regional or wholesale supplier. Two specific pieces of information are needed to accomplish this, first is the quantity of demands on the regional or wholesale water supplier that accurately reflect a supplier’s contributions to reduced reliance on the Delta and second is the quantity of a supplier’s demands on the regional or wholesale water supplier that are met by supplies from the Delta watershed.For water suppliers that make investments in regional projects or programs it may be infeasible to quantify their demands on the regional or wholesale water supplier in a way that accurately reflects their individual contributions to reduced reliance on the Delta. Due to the extensive, long-standing, and successful implementation of regional demand management and local resource incentive programs in MWDSC’s service area, this infeasibility holds true for MWDSC’s members as well as their customers. For MWDSC’s service area, reduced reliance on supplies from the Delta watershed can only be accurately accounted for at the regional level. The results show that as a region, MWDSC and its members (including the City) as well as their customers are measurably reducing reliance on the Delta and improving regional self-reliance.
6. UWMP ImplementationIn addition to the analysis and documentation described above, WR P1 subsection (c)(1)(B) requires that all programs and projects included in the UWMP that are locally cost-effective and technically feasible, which reduce reliance on the Delta, are identified, evaluated, and implemented consistent with the implementation schedule. WR P1 (c)(1)(B) states that:
(B) Identified, evaluated, and commenced implementation, consistent with the implementation schedule set forth in the Plan, of all programs and projects included in the Plan that are locally cost effective and technically feasible which reduce reliance on the Delta[.]
In accordance with Water Code Section 10631(f), water suppliers must already include in their UWMP a detailed description of expected future projects and programs that they may implement to increase the amount of water supply available to them in normal and single-dry water years and for a period of drought lasting five consecutive years. The UWMP description must also identify specific projects, include a description of the increase in water supply that is expected to be available from each project, and include an estimate regarding the implementation timeline for each project or program.Chapter 6 of the City’s 2020 UWMP summarizes the implementation plan and continued progress in developing a diversified water portfolio to meet the region’s water needs.
7. Public Notification and AdoptionThe City provided notice of the availability of the draft 2020 UWMP, 2020 WSCP, and this appendix intended to be a new Appendix G to the City’s 2015 UWMP and held a public hearing to consider adoption of the documents in accordance with California Water Code Sections 10621(b) and 10642, Government Code Section 6066, and Chapter 17.5 (starting with Section 7290) of Division 7 of Title 1 of the Government Code. The public review drafts of the 2020 UWMP, 2020 WSCP, and this appendix were posted on the City’s website (https://www.cityofcamarillo.org/departments/public_works/water/index.php) in advance of the
Appendix A: Demonstration of Reduced Delta Reliance Appendix A
14
public hearing on June 23, 2021. The notice of availability of the documents was sent to the County of Ventura and other local agencies within the area. Copies of the notification letters are included in the 2020 UWMP Appendix C. Appendix A to the City’s 2020 UWMP, which was adopted with the City’s 2020 UWMP, will also be recognized and treated as Appendix G to the City’s 2015 UWMP.The City held a public hearing for the draft 2020 UWMP, 2020 WSCP, and this appendix for the 2015 UWMP on June 23, 2021. The public hearing was held online due to COVID-19 concerns. The City Council determined that the 2020 UWMP, 2020 WSCP, and this appendix for the 2015 UWMP accurately represent the water resources plan for the City’s service area. In addition, the City Council determined that Appendix A of the 2020 UWMP includes all the elements described in Delta Plan Policy WR P1, Reduce Reliance on the Delta Through Improved Regional Water Self-Reliance (Cal. Code Regs. tit. 23, § 5003), which need to be included in a water supplier’s UWMP to support a certification of consistency for a future covered action. The City Council adopted the 2020 UWMP, 2020 WSCP, and this appendix for the 2015 UWMP on June 23, 2021 and authorized their submittal to the State of California. Copies of adoption resolutions for the 2020 UWMP, 2020 WSCP, and this appendix for the 2015 UWMP are included in the 2020 UWMP Appendix D.
8. 2015 UWMP Appendix GThe information contained in this appendix is also intended to be a new Appendix G to the City’s 2015 UWMP consistent with WR P1 subsection (c)(1)(C) (Cal. Code Regs. tit. 23, § 5003). Notification and adoption of this appendix as Appendix G to the 2015 UWMP was completed with the 2020 UWMP and 2020 WSCP.
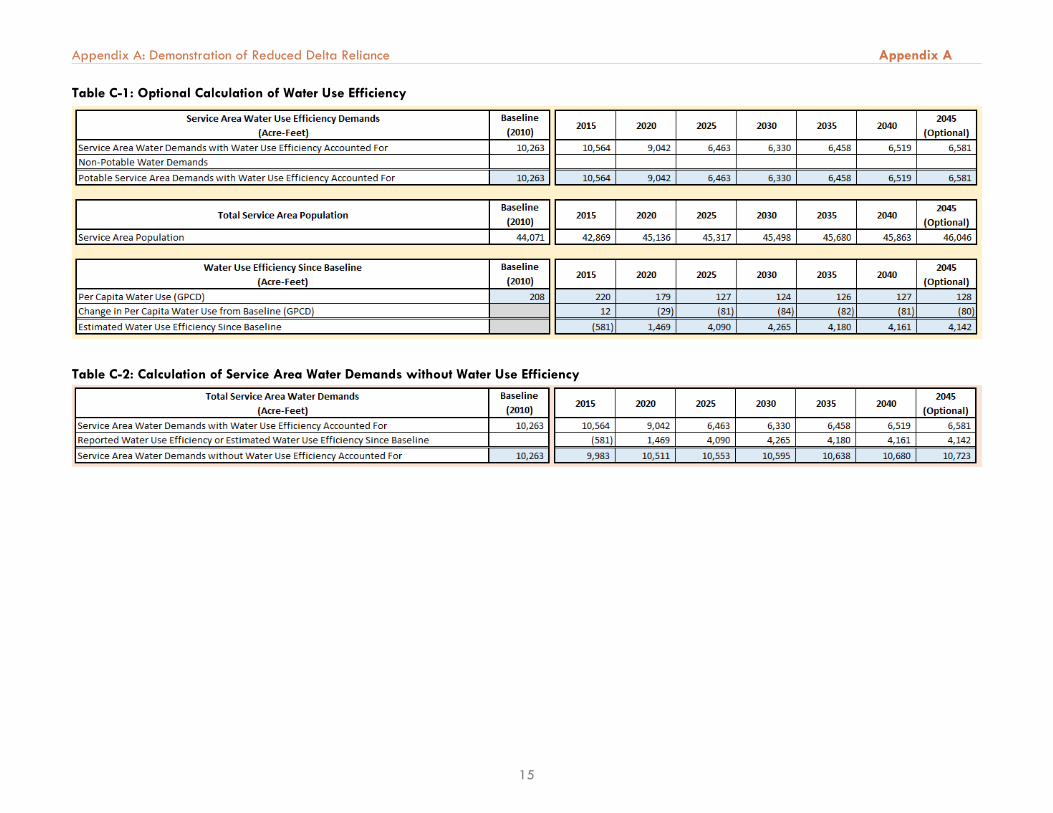
Appendix A: Demonstration of Reduced Delta Reliance Appendix A
15
Table C-1: Optional Calculation of Water Use Efficiency
Table C-2: Calculation of Service Area Water Demands without Water Use Efficiency
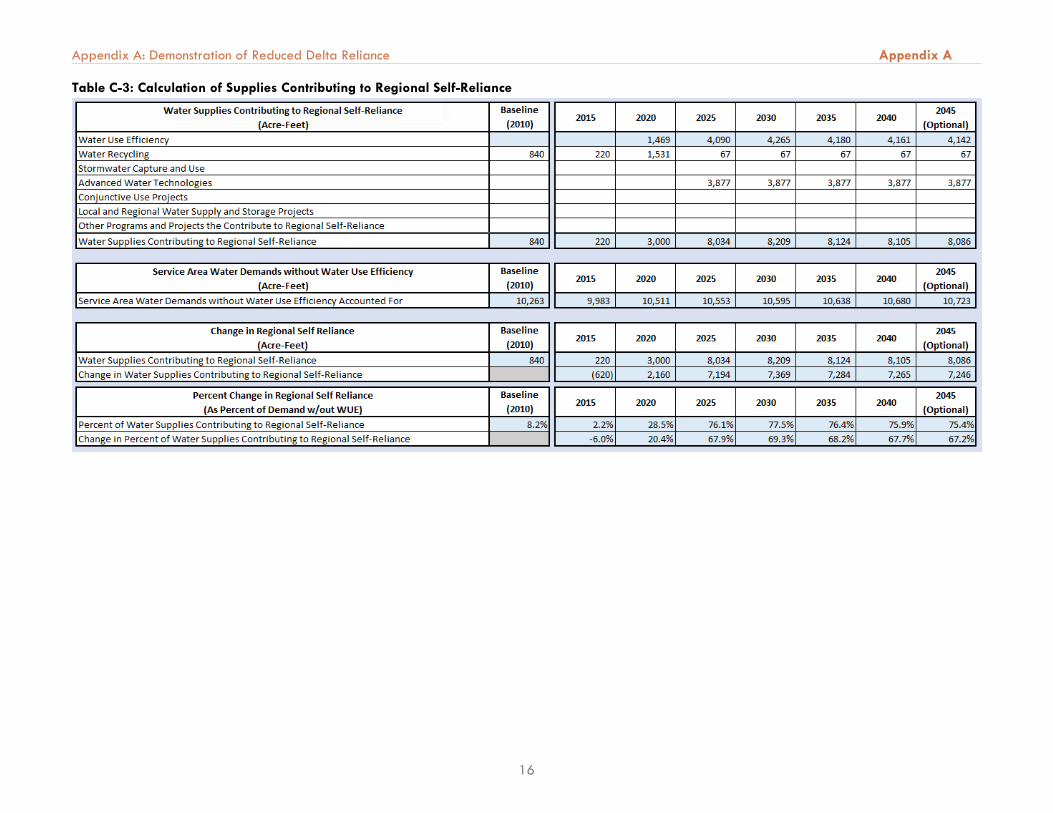
Appendix A: Demonstration of Reduced Delta Reliance Appendix A
16
Table C-3: Calculation of Supplies Contributing to Regional Self-Reliance
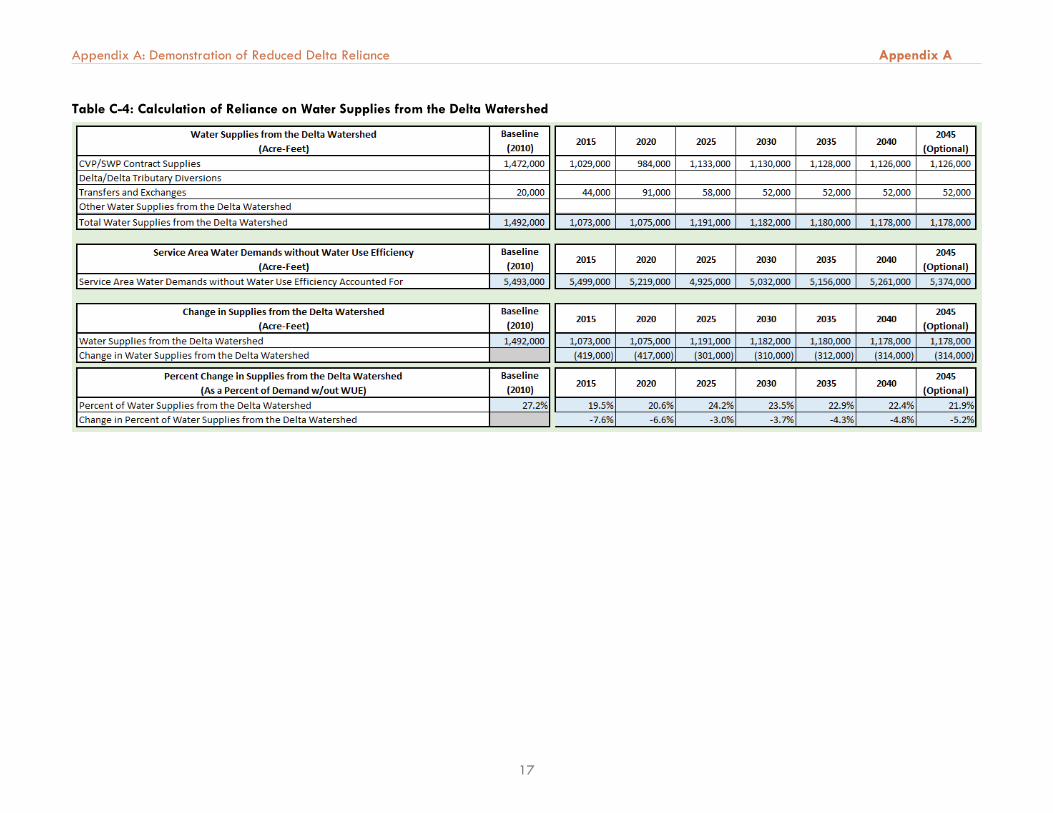
Appendix A: Demonstration of Reduced Delta Reliance Appendix A
17
Table C-4: Calculation of Reliance on Water Supplies from the Delta Watershed

B
B Appendix B. DWR Checklist

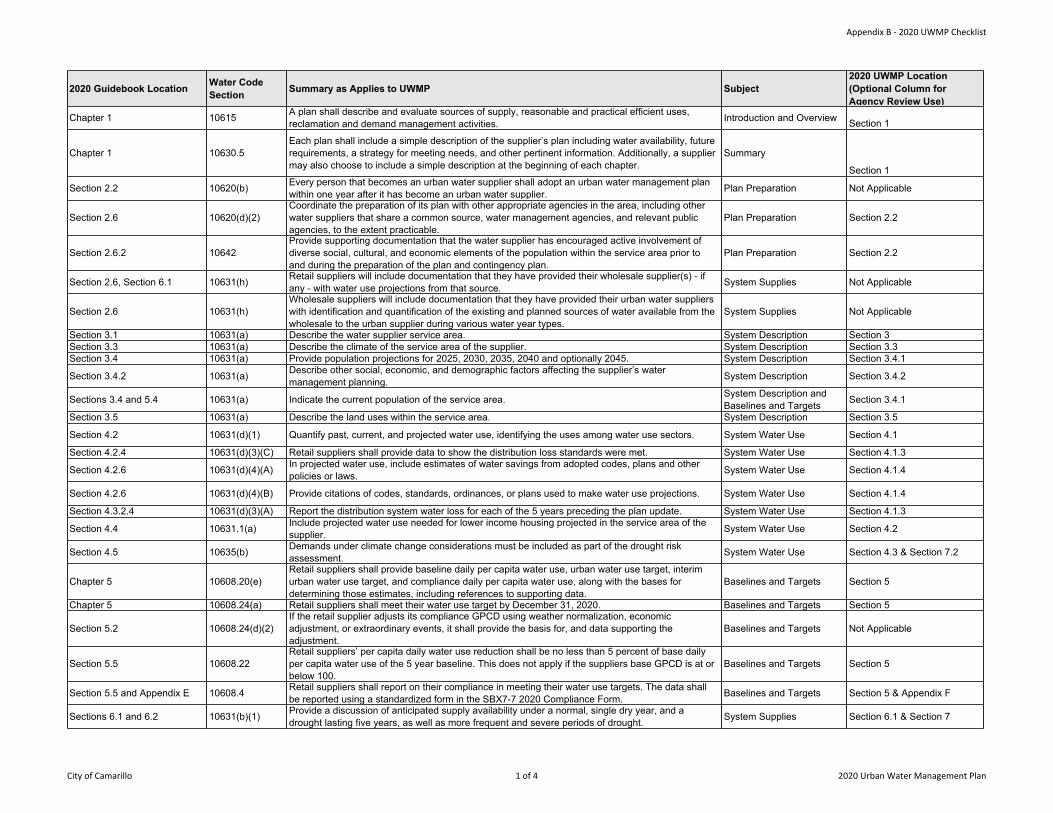
Appendix B - 2020 UWMP Checklist
City of Camarillo 1 of 4 2020 Urban Water Management Plan
2020 Guidebook Location Water CodeSection Summary as Applies to UWMP Subject
2020 UWMP Location(Optional Column forAgency Review Use)
Chapter 1 10615 A plan shall describe and evaluate sources of supply, reasonable and practical efficient uses,reclamation and demand management activities. Introduction and Overview Section 1
Chapter 1 10630.5Each plan shall include a simple description of the supplier’s plan including water availability, futurerequirements, a strategy for meeting needs, and other pertinent information. Additionally, a suppliermay also choose to include a simple description at the beginning of each chapter.
Summary
Section 1
Section 2.2 10620(b) Every person that becomes an urban water supplier shall adopt an urban water management planwithin one year after it has become an urban water supplier. Plan Preparation Not Applicable
Section 2.6 10620(d)(2)Coordinate the preparation of its plan with other appropriate agencies in the area, including otherwater suppliers that share a common source, water management agencies, and relevant publicagencies, to the extent practicable.
Plan Preparation Section 2.2
Section 2.6.2 10642Provide supporting documentation that the water supplier has encouraged active involvement ofdiverse social, cultural, and economic elements of the population within the service area prior toand during the preparation of the plan and contingency plan.
Plan Preparation Section 2.2
Section 2.6, Section 6.1 10631(h) Retail suppliers will include documentation that they have provided their wholesale supplier(s) - ifany - with water use projections from that source. System Supplies Not Applicable
Section 2.6 10631(h)Wholesale suppliers will include documentation that they have provided their urban water supplierswith identification and quantification of the existing and planned sources of water available from thewholesale to the urban supplier during various water year types.
System Supplies Not Applicable
Section 3.1 10631(a) Describe the water supplier service area. System Description Section 3Section 3.3 10631(a) Describe the climate of the service area of the supplier. System Description Section 3.3Section 3.4 10631(a) Provide population projections for 2025, 2030, 2035, 2040 and optionally 2045. System Description Section 3.4.1
Section 3.4.2 10631(a) Describe other social, economic, and demographic factors affecting the supplier’s watermanagement planning. System Description Section 3.4.2
Sections 3.4 and 5.4 10631(a) Indicate the current population of the service area. System Description andBaselines and Targets Section 3.4.1
Section 3.5 10631(a) Describe the land uses within the service area. System Description Section 3.5
Section 4.2 10631(d)(1) Quantify past, current, and projected water use, identifying the uses among water use sectors. System Water Use Section 4.1
Section 4.2.4 10631(d)(3)(C) Retail suppliers shall provide data to show the distribution loss standards were met. System Water Use Section 4.1.3
Section 4.2.6 10631(d)(4)(A) In projected water use, include estimates of water savings from adopted codes, plans and otherpolicies or laws. System Water Use Section 4.1.4
Section 4.2.6 10631(d)(4)(B) Provide citations of codes, standards, ordinances, or plans used to make water use projections. System Water Use Section 4.1.4
Section 4.3.2.4 10631(d)(3)(A) Report the distribution system water loss for each of the 5 years preceding the plan update. System Water Use Section 4.1.3
Section 4.4 10631.1(a) Include projected water use needed for lower income housing projected in the service area of thesupplier. System Water Use Section 4.2
Section 4.5 10635(b) Demands under climate change considerations must be included as part of the drought riskassessment. System Water Use Section 4.3 & Section 7.2
Chapter 5 10608.20(e)Retail suppliers shall provide baseline daily per capita water use, urban water use target, interimurban water use target, and compliance daily per capita water use, along with the bases fordetermining those estimates, including references to supporting data.
Baselines and Targets Section 5
Chapter 5 10608.24(a) Retail suppliers shall meet their water use target by December 31, 2020. Baselines and Targets Section 5
Section 5.2 10608.24(d)(2)If the retail supplier adjusts its compliance GPCD using weather normalization, economicadjustment, or extraordinary events, it shall provide the basis for, and data supporting theadjustment.
Baselines and Targets Not Applicable
Section 5.5 10608.22Retail suppliers’ per capita daily water use reduction shall be no less than 5 percent of base dailyper capita water use of the 5 year baseline. This does not apply if the suppliers base GPCD is at orbelow 100.
Baselines and Targets Section 5
Section 5.5 and Appendix E 10608.4 Retail suppliers shall report on their compliance in meeting their water use targets. The data shallbe reported using a standardized form in the SBX7-7 2020 Compliance Form. Baselines and Targets Section 5 & Appendix F
Sections 6.1 and 6.2 10631(b)(1) Provide a discussion of anticipated supply availability under a normal, single dry year, and adrought lasting five years, as well as more frequent and severe periods of drought. System Supplies Section 6.1 & Section 7
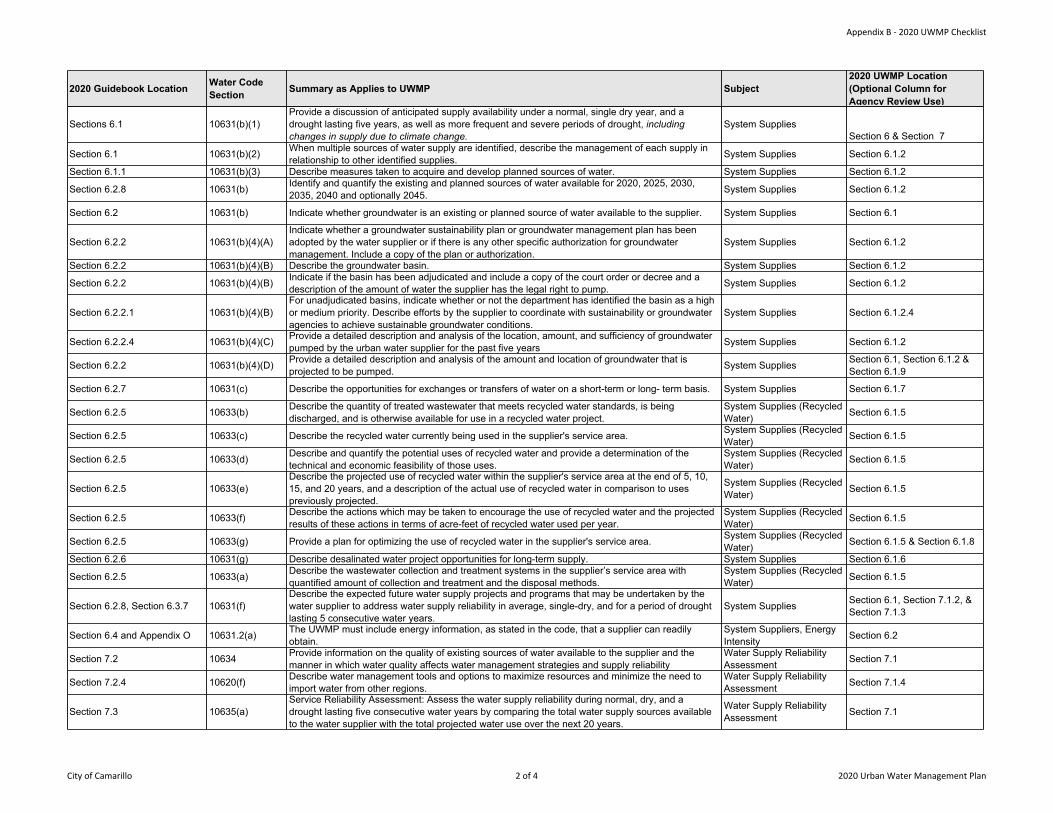
Appendix B - 2020 UWMP Checklist
City of Camarillo 2 of 4 2020 Urban Water Management Plan
Sections 6.1 10631(b)(1)Provide a discussion of anticipated supply availability under a normal, single dry year, and adrought lasting five years, as well as more frequent and severe periods of drought, includingchanges in supply due to climate change.
System SuppliesSection 6 & Section 7
Section 6.1 10631(b)(2) When multiple sources of water supply are identified, describe the management of each supply inrelationship to other identified supplies. System Supplies Section 6.1.2
Section 6.1.1 10631(b)(3) Describe measures taken to acquire and develop planned sources of water. System Supplies Section 6.1.2
Section 6.2.8 10631(b) Identify and quantify the existing and planned sources of water available for 2020, 2025, 2030,2035, 2040 and optionally 2045. System Supplies Section 6.1.2
Section 6.2 10631(b) Indicate whether groundwater is an existing or planned source of water available to the supplier. System Supplies Section 6.1
Section 6.2.2 10631(b)(4)(A)Indicate whether a groundwater sustainability plan or groundwater management plan has beenadopted by the water supplier or if there is any other specific authorization for groundwatermanagement. Include a copy of the plan or authorization.
System Supplies Section 6.1.2
Section 6.2.2 10631(b)(4)(B) Describe the groundwater basin. System Supplies Section 6.1.2
Section 6.2.2 10631(b)(4)(B) Indicate if the basin has been adjudicated and include a copy of the court order or decree and adescription of the amount of water the supplier has the legal right to pump. System Supplies Section 6.1.2
Section 6.2.2.1 10631(b)(4)(B)For unadjudicated basins, indicate whether or not the department has identified the basin as a highor medium priority. Describe efforts by the supplier to coordinate with sustainability or groundwateragencies to achieve sustainable groundwater conditions.
System Supplies Section 6.1.2.4
Section 6.2.2.4 10631(b)(4)(C) Provide a detailed description and analysis of the location, amount, and sufficiency of groundwaterpumped by the urban water supplier for the past five years System Supplies Section 6.1.2
Section 6.2.2 10631(b)(4)(D) Provide a detailed description and analysis of the amount and location of groundwater that isprojected to be pumped. System Supplies Section 6.1, Section 6.1.2 &
Section 6.1.9
Section 6.2.7 10631(c) Describe the opportunities for exchanges or transfers of water on a short-term or long- term basis. System Supplies Section 6.1.7
Section 6.2.5 10633(b) Describe the quantity of treated wastewater that meets recycled water standards, is beingdischarged, and is otherwise available for use in a recycled water project.
System Supplies (RecycledWater) Section 6.1.5
Section 6.2.5 10633(c) Describe the recycled water currently being used in the supplier's service area. System Supplies (RecycledWater) Section 6.1.5
Section 6.2.5 10633(d) Describe and quantify the potential uses of recycled water and provide a determination of thetechnical and economic feasibility of those uses.
System Supplies (RecycledWater) Section 6.1.5
Section 6.2.5 10633(e)Describe the projected use of recycled water within the supplier's service area at the end of 5, 10,15, and 20 years, and a description of the actual use of recycled water in comparison to usespreviously projected.
System Supplies (RecycledWater) Section 6.1.5
Section 6.2.5 10633(f) Describe the actions which may be taken to encourage the use of recycled water and the projectedresults of these actions in terms of acre-feet of recycled water used per year.
System Supplies (RecycledWater) Section 6.1.5
Section 6.2.5 10633(g) Provide a plan for optimizing the use of recycled water in the supplier's service area. System Supplies (RecycledWater) Section 6.1.5 & Section 6.1.8
Section 6.2.6 10631(g) Describe desalinated water project opportunities for long-term supply. System Supplies Section 6.1.6
Section 6.2.5 10633(a) Describe the wastewater collection and treatment systems in the supplier’s service area withquantified amount of collection and treatment and the disposal methods.
System Supplies (RecycledWater) Section 6.1.5
Section 6.2.8, Section 6.3.7 10631(f)Describe the expected future water supply projects and programs that may be undertaken by thewater supplier to address water supply reliability in average, single-dry, and for a period of droughtlasting 5 consecutive water years.
System Supplies Section 6.1, Section 7.1.2, &Section 7.1.3
Section 6.4 and Appendix O 10631.2(a) The UWMP must include energy information, as stated in the code, that a supplier can readilyobtain.
System Suppliers, EnergyIntensity Section 6.2
Section 7.2 10634 Provide information on the quality of existing sources of water available to the supplier and themanner in which water quality affects water management strategies and supply reliability
Water Supply ReliabilityAssessment Section 7.1
Section 7.2.4 10620(f) Describe water management tools and options to maximize resources and minimize the need toimport water from other regions.
Water Supply ReliabilityAssessment Section 7.1.4
Section 7.3 10635(a)Service Reliability Assessment: Assess the water supply reliability during normal, dry, and adrought lasting five consecutive water years by comparing the total water supply sources availableto the water supplier with the total projected water use over the next 20 years.
Water Supply ReliabilityAssessment Section 7.1
2020 Guidebook Location Water CodeSection Summary as Applies to UWMP Subject
2020 UWMP Location(Optional Column forAgency Review Use)
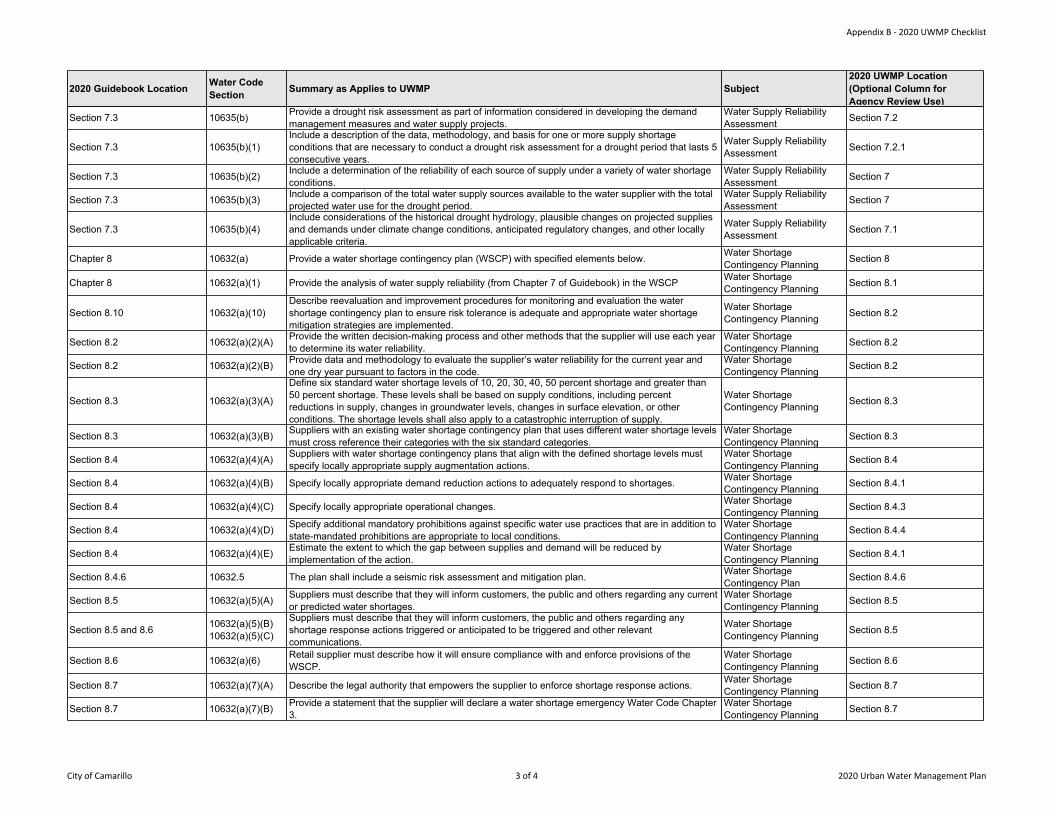
Appendix B - 2020 UWMP Checklist
City of Camarillo 3 of 4 2020 Urban Water Management Plan
Section 7.3 10635(b) Provide a drought risk assessment as part of information considered in developing the demandmanagement measures and water supply projects.
Water Supply ReliabilityAssessment Section 7.2
Section 7.3 10635(b)(1)Include a description of the data, methodology, and basis for one or more supply shortageconditions that are necessary to conduct a drought risk assessment for a drought period that lasts 5consecutive years.
Water Supply ReliabilityAssessment Section 7.2.1
Section 7.3 10635(b)(2) Include a determination of the reliability of each source of supply under a variety of water shortageconditions.
Water Supply ReliabilityAssessment Section 7
Section 7.3 10635(b)(3) Include a comparison of the total water supply sources available to the water supplier with the totalprojected water use for the drought period.
Water Supply ReliabilityAssessment Section 7
Section 7.3 10635(b)(4)Include considerations of the historical drought hydrology, plausible changes on projected suppliesand demands under climate change conditions, anticipated regulatory changes, and other locallyapplicable criteria.
Water Supply ReliabilityAssessment Section 7.1
Chapter 8 10632(a) Provide a water shortage contingency plan (WSCP) with specified elements below. Water ShortageContingency Planning Section 8
Chapter 8 10632(a)(1) Provide the analysis of water supply reliability (from Chapter 7 of Guidebook) in the WSCP Water ShortageContingency Planning Section 8.1
Section 8.10 10632(a)(10)Describe reevaluation and improvement procedures for monitoring and evaluation the watershortage contingency plan to ensure risk tolerance is adequate and appropriate water shortagemitigation strategies are implemented.
Water ShortageContingency Planning Section 8.2
Section 8.2 10632(a)(2)(A) Provide the written decision-making process and other methods that the supplier will use each yearto determine its water reliability.
Water ShortageContingency Planning Section 8.2
Section 8.2 10632(a)(2)(B) Provide data and methodology to evaluate the supplier’s water reliability for the current year andone dry year pursuant to factors in the code.
Water ShortageContingency Planning Section 8.2
Section 8.3 10632(a)(3)(A)
Define six standard water shortage levels of 10, 20, 30, 40, 50 percent shortage and greater than50 percent shortage. These levels shall be based on supply conditions, including percentreductions in supply, changes in groundwater levels, changes in surface elevation, or otherconditions. The shortage levels shall also apply to a catastrophic interruption of supply.
Water ShortageContingency Planning Section 8.3
Section 8.3 10632(a)(3)(B) Suppliers with an existing water shortage contingency plan that uses different water shortage levelsmust cross reference their categories with the six standard categories.
Water ShortageContingency Planning Section 8.3
Section 8.4 10632(a)(4)(A) Suppliers with water shortage contingency plans that align with the defined shortage levels mustspecify locally appropriate supply augmentation actions.
Water ShortageContingency Planning Section 8.4
Section 8.4 10632(a)(4)(B) Specify locally appropriate demand reduction actions to adequately respond to shortages. Water ShortageContingency Planning Section 8.4.1
Section 8.4 10632(a)(4)(C) Specify locally appropriate operational changes. Water ShortageContingency Planning Section 8.4.3
Section 8.4 10632(a)(4)(D) Specify additional mandatory prohibitions against specific water use practices that are in addition tostate-mandated prohibitions are appropriate to local conditions.
Water ShortageContingency Planning Section 8.4.4
Section 8.4 10632(a)(4)(E) Estimate the extent to which the gap between supplies and demand will be reduced byimplementation of the action.
Water ShortageContingency Planning Section 8.4.1
Section 8.4.6 10632.5 The plan shall include a seismic risk assessment and mitigation plan. Water ShortageContingency Plan Section 8.4.6
Section 8.5 10632(a)(5)(A) Suppliers must describe that they will inform customers, the public and others regarding any currentor predicted water shortages.
Water ShortageContingency Planning Section 8.5
Section 8.5 and 8.6 10632(a)(5)(B)10632(a)(5)(C)
Suppliers must describe that they will inform customers, the public and others regarding anyshortage response actions triggered or anticipated to be triggered and other relevantcommunications.
Water ShortageContingency Planning Section 8.5
Section 8.6 10632(a)(6) Retail supplier must describe how it will ensure compliance with and enforce provisions of theWSCP.
Water ShortageContingency Planning Section 8.6
Section 8.7 10632(a)(7)(A) Describe the legal authority that empowers the supplier to enforce shortage response actions. Water ShortageContingency Planning Section 8.7
Section 8.7 10632(a)(7)(B) Provide a statement that the supplier will declare a water shortage emergency Water Code Chapter3.
Water ShortageContingency Planning Section 8.7
2020 Guidebook Location Water CodeSection Summary as Applies to UWMP Subject
2020 UWMP Location(Optional Column forAgency Review Use)
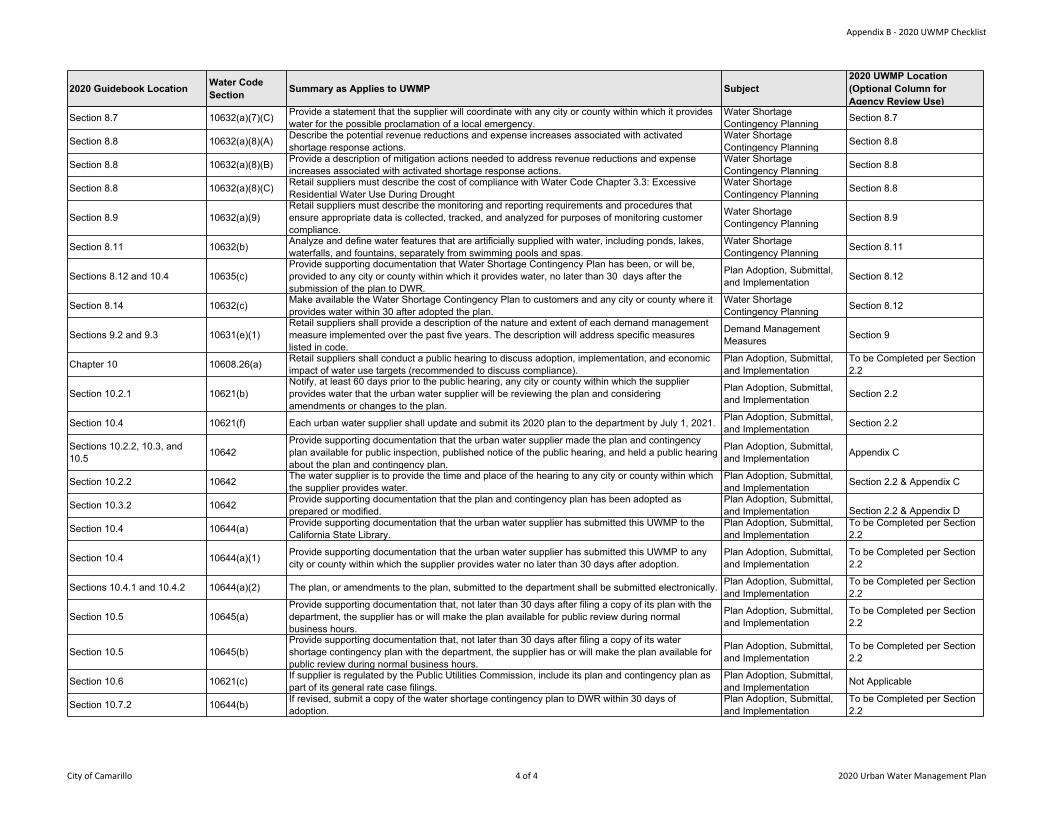
Appendix B - 2020 UWMP Checklist
City of Camarillo 4 of 4 2020 Urban Water Management Plan
Section 8.7 10632(a)(7)(C) Provide a statement that the supplier will coordinate with any city or county within which it provideswater for the possible proclamation of a local emergency.
Water ShortageContingency Planning Section 8.7
Section 8.8 10632(a)(8)(A) Describe the potential revenue reductions and expense increases associated with activatedshortage response actions.
Water ShortageContingency Planning Section 8.8
Section 8.8 10632(a)(8)(B) Provide a description of mitigation actions needed to address revenue reductions and expenseincreases associated with activated shortage response actions.
Water ShortageContingency Planning Section 8.8
Section 8.8 10632(a)(8)(C) Retail suppliers must describe the cost of compliance with Water Code Chapter 3.3: ExcessiveResidential Water Use During Drought
Water ShortageContingency Planning Section 8.8
Section 8.9 10632(a)(9)Retail suppliers must describe the monitoring and reporting requirements and procedures thatensure appropriate data is collected, tracked, and analyzed for purposes of monitoring customercompliance.
Water ShortageContingency Planning Section 8.9
Section 8.11 10632(b) Analyze and define water features that are artificially supplied with water, including ponds, lakes,waterfalls, and fountains, separately from swimming pools and spas.
Water ShortageContingency Planning Section 8.11
Sections 8.12 and 10.4 10635(c)Provide supporting documentation that Water Shortage Contingency Plan has been, or will be,provided to any city or county within which it provides water, no later than 30 days after thesubmission of the plan to DWR.
Plan Adoption, Submittal,and Implementation Section 8.12
Section 8.14 10632(c) Make available the Water Shortage Contingency Plan to customers and any city or county where itprovides water within 30 after adopted the plan.
Water ShortageContingency Planning Section 8.12
Sections 9.2 and 9.3 10631(e)(1)Retail suppliers shall provide a description of the nature and extent of each demand managementmeasure implemented over the past five years. The description will address specific measureslisted in code.
Demand ManagementMeasures Section 9
Chapter 10 10608.26(a) Retail suppliers shall conduct a public hearing to discuss adoption, implementation, and economicimpact of water use targets (recommended to discuss compliance).
Plan Adoption, Submittal,and Implementation
To be Completed per Section2.2
Section 10.2.1 10621(b)Notify, at least 60 days prior to the public hearing, any city or county within which the supplierprovides water that the urban water supplier will be reviewing the plan and consideringamendments or changes to the plan.
Plan Adoption, Submittal,and Implementation Section 2.2
Section 10.4 10621(f) Each urban water supplier shall update and submit its 2020 plan to the department by July 1, 2021. Plan Adoption, Submittal,and Implementation Section 2.2
Sections 10.2.2, 10.3, and10.5 10642
Provide supporting documentation that the urban water supplier made the plan and contingencyplan available for public inspection, published notice of the public hearing, and held a public hearingabout the plan and contingency plan.
Plan Adoption, Submittal,and Implementation Appendix C
Section 10.2.2 10642 The water supplier is to provide the time and place of the hearing to any city or county within whichthe supplier provides water.
Plan Adoption, Submittal,and Implementation Section 2.2 & Appendix C
Section 10.3.2 10642 Provide supporting documentation that the plan and contingency plan has been adopted asprepared or modified.
Plan Adoption, Submittal,and Implementation Section 2.2 & Appendix D
Section 10.4 10644(a) Provide supporting documentation that the urban water supplier has submitted this UWMP to theCalifornia State Library.
Plan Adoption, Submittal,and Implementation
To be Completed per Section2.2
Section 10.4 10644(a)(1) Provide supporting documentation that the urban water supplier has submitted this UWMP to anycity or county within which the supplier provides water no later than 30 days after adoption.
Plan Adoption, Submittal,and Implementation
To be Completed per Section2.2
Sections 10.4.1 and 10.4.2 10644(a)(2) The plan, or amendments to the plan, submitted to the department shall be submitted electronically. Plan Adoption, Submittal,and ImplementationTo be Completed per Section2.2
Section 10.5 10645(a)Provide supporting documentation that, not later than 30 days after filing a copy of its plan with thedepartment, the supplier has or will make the plan available for public review during normalbusiness hours.
Plan Adoption, Submittal,and Implementation
To be Completed per Section2.2
Section 10.5 10645(b)Provide supporting documentation that, not later than 30 days after filing a copy of its watershortage contingency plan with the department, the supplier has or will make the plan available forpublic review during normal business hours.
Plan Adoption, Submittal,and Implementation
To be Completed per Section2.2
Section 10.6 10621(c) If supplier is regulated by the Public Utilities Commission, include its plan and contingency plan aspart of its general rate case filings.
Plan Adoption, Submittal,and Implementation Not Applicable
Section 10.7.2 10644(b) If revised, submit a copy of the water shortage contingency plan to DWR within 30 days ofadoption.
Plan Adoption, Submittal,and Implementation
To be Completed per Section2.2
2020 Guidebook Location Water CodeSection Summary as Applies to UWMP Subject
2020 UWMP Location(Optional Column forAgency Review Use)
C
C Appendix C. 60-Day and Public Hearing Notices

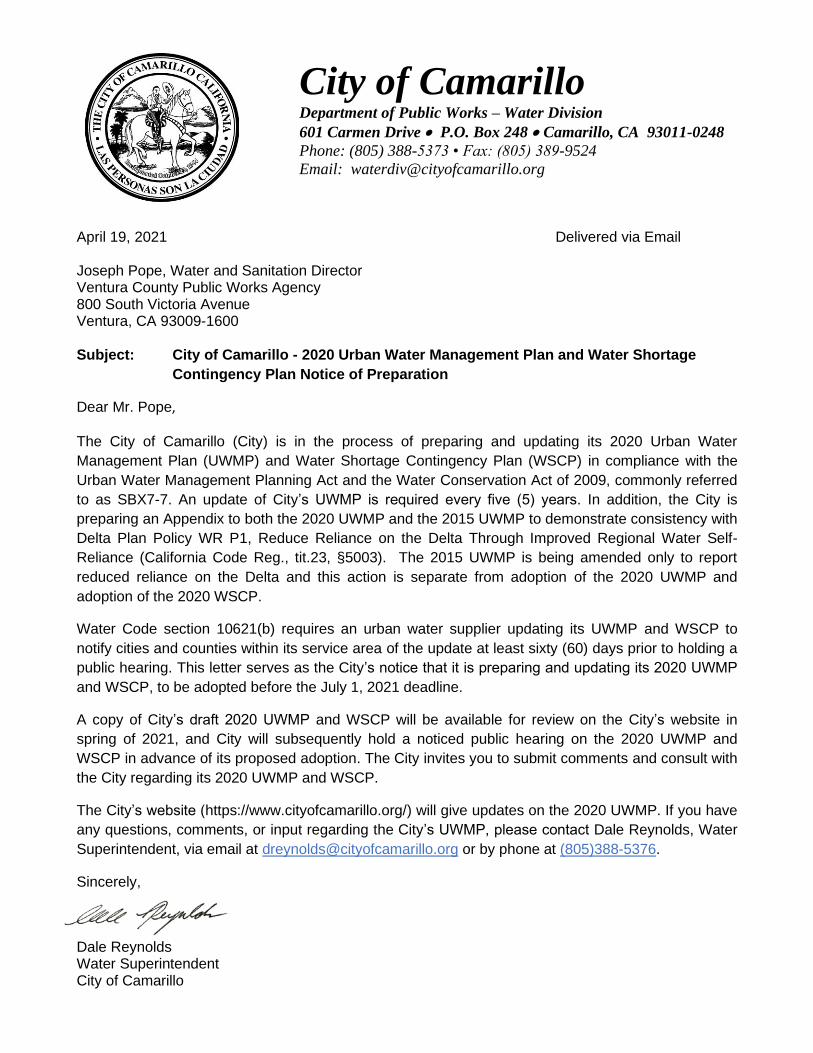
City of Camarillo
Department of Public Works – Water Division
601 Carmen Drive • P.O. Box 248 • Camarillo, CA 93011-0248
Phone: (805) 388-5373 • Fax: (805) 389-9524
Email: [email protected]
April 19, 2021 Delivered via Email Joseph Pope, Water and Sanitation Director Ventura County Public Works Agency 800 South Victoria Avenue Ventura, CA 93009-1600 Subject: City of Camarillo - 2020 Urban Water Management Plan and Water Shortage
Contingency Plan Notice of Preparation
Dear Mr. Pope, The City of Camarillo (City) is in the process of preparing and updating its 2020 Urban Water
Management Plan (UWMP) and Water Shortage Contingency Plan (WSCP) in compliance with the
Urban Water Management Planning Act and the Water Conservation Act of 2009, commonly referred
to as SBX7-7. An update of City’s UWMP is required every five (5) years. In addition, the City is
preparing an Appendix to both the 2020 UWMP and the 2015 UWMP to demonstrate consistency with
Delta Plan Policy WR P1, Reduce Reliance on the Delta Through Improved Regional Water Self-
Reliance (California Code Reg., tit.23, §5003). The 2015 UWMP is being amended only to report
reduced reliance on the Delta and this action is separate from adoption of the 2020 UWMP and
adoption of the 2020 WSCP.
Water Code section 10621(b) requires an urban water supplier updating its UWMP and WSCP to
notify cities and counties within its service area of the update at least sixty (60) days prior to holding a
public hearing. This letter serves as the City’s notice that it is preparing and updating its 2020 UWMP
and WSCP, to be adopted before the July 1, 2021 deadline.
A copy of City’s draft 2020 UWMP and WSCP will be available for review on the City’s website in
spring of 2021, and City will subsequently hold a noticed public hearing on the 2020 UWMP and
WSCP in advance of its proposed adoption. The City invites you to submit comments and consult with
the City regarding its 2020 UWMP and WSCP.
The City’s website (https://www.cityofcamarillo.org/) will give updates on the 2020 UWMP. If you have
any questions, comments, or input regarding the City’s UWMP, please contact Dale Reynolds, Water
Superintendent, via email at [email protected] or by phone at (805)388-5376.
Sincerely,
Dale Reynolds Water Superintendent City of Camarillo
City of CamarilloDepartment of Public Works – Water Division 601 Carmen Drive • P.O. Box 248 • Camarillo, CA 93011-024Phone: (805) 388-5373 • Fax: (805) 389-9524
Email: [email protected]
DELIVERED VIA EMAIL June 9, 2021
Joseph Pope, Water and Sanitation Director Ventura County Public Works Agency 800 South Victoria Avenue Ventura, CA 93009-1600
CITY OF CAMARILLO - URBAN WATER MANAGEMENT PLAN AND WATER SHORTAGE CONTINGENCY PLAN NOTICE OF PUBLIC HEARING
Dear Mr. Pope,
The City of Camarillo (City) is in the process of preparing and updating its 2020 Urban Water Management Plan (UWMP) and Water Shortage Contingency Plan (WSCP) in compliance with the Urban Water Management Planning Act and the Water Conservation Act of 2009, commonly referred to as SBX7-7. An update of City’s UWMP is required every five (5) years. In addition, the City is preparing an Appendix to both the 2020 UWMP and the 2015 UWMP to demonstrate consistency with Delta Plan Policy WR P1, Reduce Reliance on the Delta Through Improved Regional Water Self-Reliance (California Code Reg., tit.23, §5003). The 2015 UWMP is being amended only to report reduced reliance on the Delta and this actionis separate from adoption of the 2020 UWMP and adoption of the 2020 WSCP.
Water Code section 10621(b) requires an urban water supplier updating its UWMP and WSCP to notify cities and counties within its service area of the update at least sixty (60) days prior to holding a public hearing. Letters sent on April 19, 2021, serve as the City’s notice that it is preparing and updating its 2020 UWMP and WSCP, to be adopted before the July 1, 2021, deadline.
A copy of City’s draft 2020 UWMP, Delta Plan appendix to the 2015 UWMP, and WSCP will be available for review on the City’s website www.cityofcamarillo.org and at City Hall, 601 Carmen Dr, by June 16, 2021. The City will subsequently hold a noticed public hearing on the 2020 UWMP, Delta Plan appendix to the 2015 UWMP, and WSCP in advance of its proposed adoption consideration.
The City invites you to submit comments and consult with the City regarding its 2020 UWMP, WSCP, and 2015 UWMP Addendum. If you have any questions, comments, or input regarding the City’s UWMP, please contact Dale Reynolds, Water Superintendent, via email at [email protected] or by phone at (805)388-5376.
Sincerely,
Dale Reynolds Water Superintendent City of Camarillo
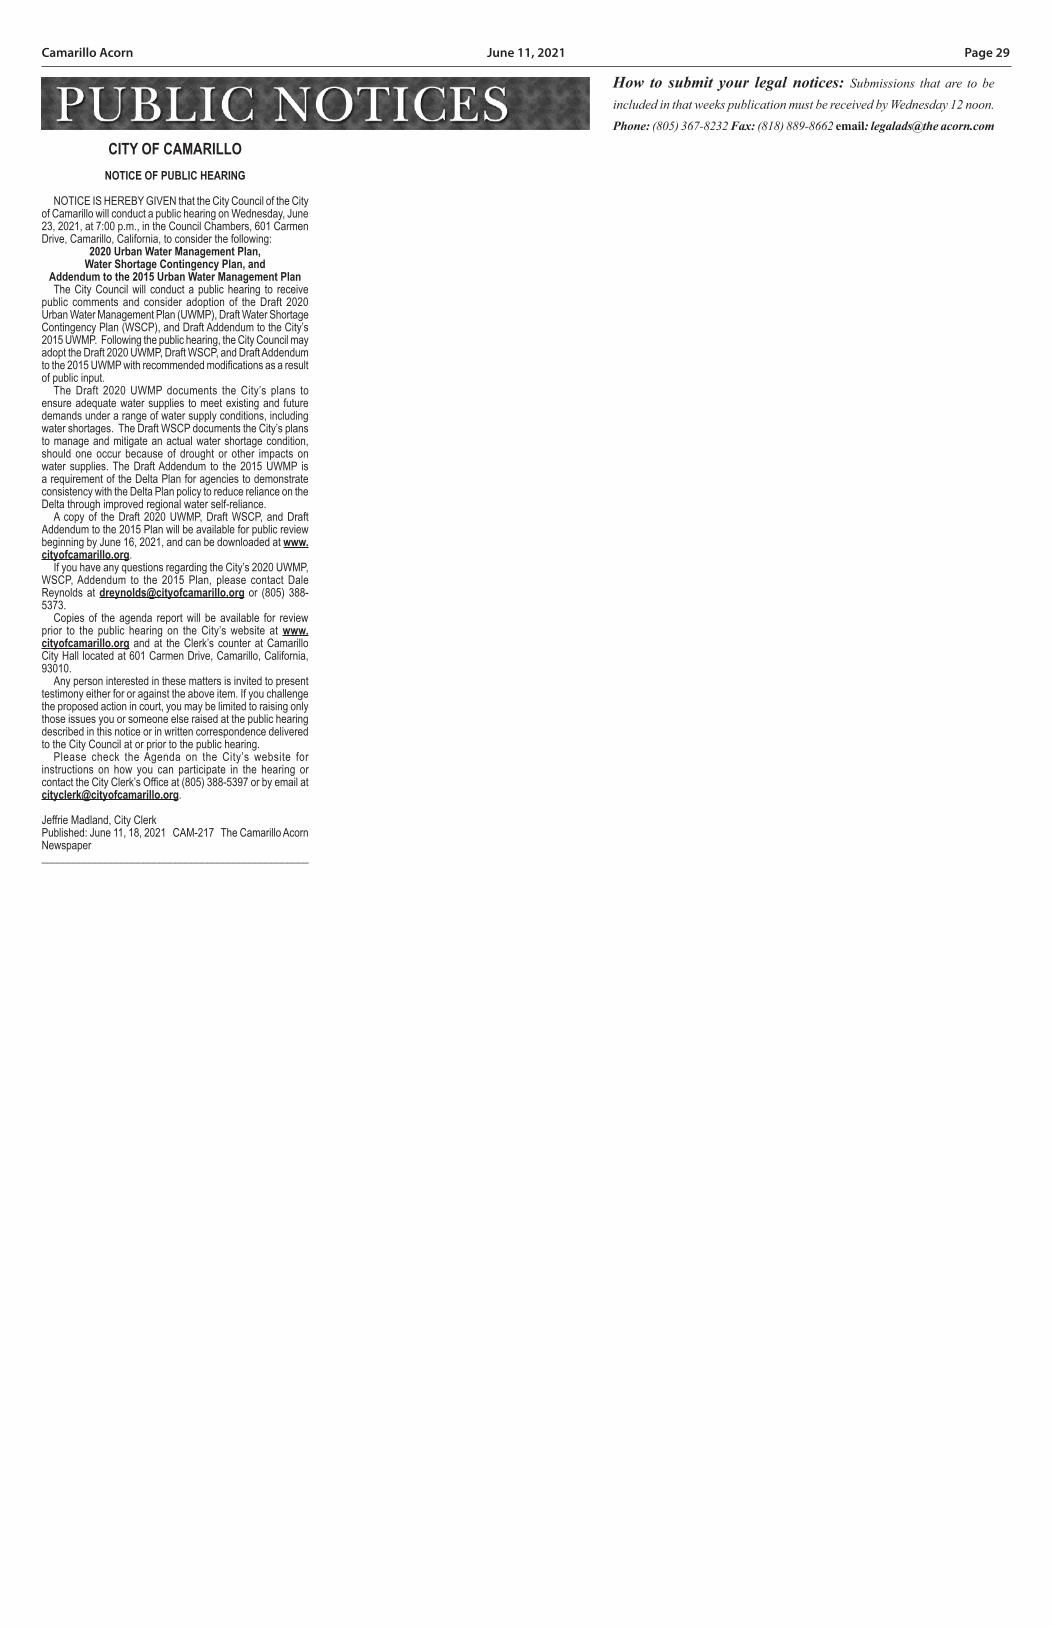
Camarillo Acorn June 11, 2021 Page 29
How to submit your legal notices: Submissions that are to be included in that weeks publication must be received by Wednesday 12 noon.Phone: (805) 367-8232 Fax: (818) 889-8662 email: legalads@the acorn.com
CITY OF CAMARILLONOTICE OF PUBLIC HEARING
NOTICE IS HEREBY GIVEN that the City Council of the City of Camarillo will conduct a public hearing on Wednesday, June 23, 2021, at 7:00 p.m., in the Council Chambers, 601 Carmen Drive, Camarillo, California, to consider the following:
2020 Urban Water Management Plan, Water Shortage Contingency Plan, and
Addendum to the 2015 Urban Water Management Plan The City Council will conduct a public hearing to receive public comments and consider adoption of the Draft 2020 Urban Water Management Plan (UWMP), Draft Water Shortage Contingency Plan (WSCP), and Draft Addendum to the City’s 2015 UWMP. Following the public hearing, the City Council may adopt the Draft 2020 UWMP, Draft WSCP, and Draft Addendum to the 2015 UWMP with recommended modifications as a result of public input. The Draft 2020 UWMP documents the City’s plans to ensure adequate water supplies to meet existing and future demands under a range of water supply conditions, including water shortages. The Draft WSCP documents the City’s plans to manage and mitigate an actual water shortage condition, should one occur because of drought or other impacts on water supplies. The Draft Addendum to the 2015 UWMP is a requirement of the Delta Plan for agencies to demonstrate consistency with the Delta Plan policy to reduce reliance on the Delta through improved regional water self-reliance. A copy of the Draft 2020 UWMP, Draft WSCP, and Draft Addendum to the 2015 Plan will be available for public review beginning by June 16, 2021, and can be downloaded at www.cityofcamarillo.org. If you have any questions regarding the City’s 2020 UWMP, WSCP, Addendum to the 2015 Plan, please contact Dale Reynolds at [email protected] or (805) 388-5373. Copies of the agenda report will be available for review prior to the public hearing on the City’s website at www.cityofcamarillo.org and at the Clerk’s counter at Camarillo City Hall located at 601 Carmen Drive, Camarillo, California, 93010. Any person interested in these matters is invited to present testimony either for or against the above item. If you challenge the proposed action in court, you may be limited to raising only those issues you or someone else raised at the public hearing described in this notice or in written correspondence delivered to the City Council at or prior to the public hearing. Please check the Agenda on the City’s website for instructions on how you can participate in the hearing or contact the City Clerk’s Office at (805) 388-5397 or by email at [email protected].
Jeffrie Madland, City ClerkPublished: June 11, 18, 2021 CAM-217 The Camarillo Acorn Newspaper__________________________________________________

City of Camarillo
Department of Public Works – Water Division
601 Carmen Drive • P.O. Box 248 • Camarillo, CA 93011-0248
Phone: (805) 388-5373 • Fax: (805) 389-9524
Email: [email protected]
April 19, 2021 Delivered via Email Anthony Goff, General Manager Calleguas Municipal Water District 2100 Olsen Rd Thousand Oaks, CA 91360-6800 Subject: City of Camarillo - 2020 Urban Water Management Plan and Water Shortage
Contingency Plan Notice of Preparation
Dear Mr. Goff, The City of Camarillo (City) is in the process of preparing and updating its 2020 Urban Water
Management Plan (UWMP) and Water Shortage Contingency Plan (WSCP) in compliance with the
Urban Water Management Planning Act and the Water Conservation Act of 2009, commonly referred
to as SBX7-7. An update of City’s UWMP is required every five (5) years. In addition, the City is
preparing an Appendix to both the 2020 UWMP and the 2015 UWMP to demonstrate consistency with
Delta Plan Policy WR P1, Reduce Reliance on the Delta Through Improved Regional Water Self-
Reliance (California Code Reg., tit.23, §5003). The 2015 UWMP is being amended only to report
reduced reliance on the Delta and this action is separate from adoption of the 2020 UWMP and
adoption of the 2020 WSCP.
Water Code section 10621(b) requires an urban water supplier updating its UWMP and WSCP to
notify cities and counties within its service area of the update at least sixty (60) days prior to holding a
public hearing. This letter serves as the City’s notice that it is preparing and updating its 2020 UWMP
and WSCP, to be adopted before the July 1, 2021 deadline.
A copy of City’s draft 2020 UWMP and WSCP will be available for review on the City’s website in
spring of 2021, and City will subsequently hold a noticed public hearing on the 2020 UWMP and
WSCP in advance of its proposed adoption. The City invites you to submit comments and consult with
the City regarding its 2020 UWMP and WSCP.
The City’s website (https://www.cityofcamarillo.org/) will give updates on the 2020 UWMP. If you have
any questions, comments, or input regarding the City’s UWMP, please contact Dale Reynolds, Water
Superintendent, via email at [email protected] or by phone at (805)388-5376.
Sincerely,
Dale Reynolds Water Superintendent City of Camarillo

City of Camarillo
Department of Public Works – Water Division
601 Carmen Drive • P.O. Box 248 • Camarillo, CA 93011-0248
Phone: (805) 388-5373 • Fax: (805) 389-9524
Email: [email protected]
April 19, 2021 Delivered via Email Tony Stafford, General Manager Camrosa Water District 7385 Santa Rosa Rd Camarillo, CA 93012 Subject: City of Camarillo - 2020 Urban Water Management Plan and Water Shortage
Contingency Plan Notice of Preparation
Dear Mr. Stafford, The City of Camarillo (City) is in the process of preparing and updating its 2020 Urban Water
Management Plan (UWMP) and Water Shortage Contingency Plan (WSCP) in compliance with the
Urban Water Management Planning Act and the Water Conservation Act of 2009, commonly referred
to as SBX7-7. An update of City’s UWMP is required every five (5) years. In addition, the City is
preparing an Appendix to both the 2020 UWMP and the 2015 UWMP to demonstrate consistency with
Delta Plan Policy WR P1, Reduce Reliance on the Delta Through Improved Regional Water Self-
Reliance (California Code Reg., tit.23, §5003). The 2015 UWMP is being amended only to report
reduced reliance on the Delta and this action is separate from adoption of the 2020 UWMP and
adoption of the 2020 WSCP.
Water Code section 10621(b) requires an urban water supplier updating its UWMP and WSCP to
notify cities and counties within its service area of the update at least sixty (60) days prior to holding a
public hearing. This letter serves as the City’s notice that it is preparing and updating its 2020 UWMP
and WSCP, to be adopted before the July 1, 2021 deadline.
A copy of City’s draft 2020 UWMP and WSCP will be available for review on the City’s website in
spring of 2021, and City will subsequently hold a noticed public hearing on the 2020 UWMP and
WSCP in advance of its proposed adoption. The City invites you to submit comments and consult with
the City regarding its 2020 UWMP and WSCP.
The City’s website (https://www.cityofcamarillo.org/) will give updates on the 2020 UWMP. If you have
any questions, comments, or input regarding the City’s UWMP, please contact Dale Reynolds, Water
Superintendent, via email at [email protected] or by phone at (805)388-5376.
Sincerely,
Dale Reynolds Water Superintendent City of Camarillo
City of Camarillo
Department of Public Works – Water Division
601 Carmen Drive • P.O. Box 248 • Camarillo, CA 93011-0248
Phone: (805) 388-5373 • Fax: (805) 389-9524
Email: [email protected]
April 19, 2021 Delivered via Email Robert Eranio, General Manager Crestview Mutual Water Company 328 Valley Vista Dr. Camarillo, CA 93010 Subject: City of Camarillo - 2020 Urban Water Management Plan and Water Shortage
Contingency Plan Notice of Preparation
Dear Mr. Eraino, The City of Camarillo (City) is in the process of preparing and updating its 2020 Urban Water
Management Plan (UWMP) and Water Shortage Contingency Plan (WSCP) in compliance with the
Urban Water Management Planning Act and the Water Conservation Act of 2009, commonly referred
to as SBX7-7. An update of City’s UWMP is required every five (5) years. In addition, the City is
preparing an Appendix to both the 2020 UWMP and the 2015 UWMP to demonstrate consistency with
Delta Plan Policy WR P1, Reduce Reliance on the Delta Through Improved Regional Water Self-
Reliance (California Code Reg., tit.23, §5003). The 2015 UWMP is being amended only to report
reduced reliance on the Delta and this action is separate from adoption of the 2020 UWMP and
adoption of the 2020 WSCP.
Water Code section 10621(b) requires an urban water supplier updating its UWMP and WSCP to
notify cities and counties within its service area of the update at least sixty (60) days prior to holding a
public hearing. This letter serves as the City’s notice that it is preparing and updating its 2020 UWMP
and WSCP, to be adopted before the July 1, 2021 deadline.
A copy of City’s draft 2020 UWMP and WSCP will be available for review on the City’s website in
spring of 2021, and City will subsequently hold a noticed public hearing on the 2020 UWMP and
WSCP in advance of its proposed adoption. The City invites you to submit comments and consult with
the City regarding its 2020 UWMP and WSCP.
The City’s website (https://www.cityofcamarillo.org/) will give updates on the 2020 UWMP. If you have
any questions, comments, or input regarding the City’s UWMP, please contact Dale Reynolds, Water
Superintendent, via email at [email protected] or by phone at (805)388-5376.
Sincerely,
Dale Reynolds Water Superintendent City of Camarillo

City of Camarillo
Department of Public Works – Water Division
601 Carmen Drive • P.O. Box 248 • Camarillo, CA 93011-0248
Phone: (805) 388-5373 • Fax: (805) 389-9524
Email: [email protected]
April 19, 2021 Delivered via Email Kathy Jones Fox Canyon Groundwater Management Agency 800 South Victoria Avenue, L#1610 Ventura, CA 93009-1610 Subject: City of Camarillo - 2020 Urban Water Management Plan and Water Shortage
Contingency Plan Notice of Preparation
Dear Ms. Jones, The City of Camarillo (City) is in the process of preparing and updating its 2020 Urban Water
Management Plan (UWMP) and Water Shortage Contingency Plan (WSCP) in compliance with the
Urban Water Management Planning Act and the Water Conservation Act of 2009, commonly referred
to as SBX7-7. An update of City’s UWMP is required every five (5) years. In addition, the City is
preparing an Appendix to both the 2020 UWMP and the 2015 UWMP to demonstrate consistency with
Delta Plan Policy WR P1, Reduce Reliance on the Delta Through Improved Regional Water Self-
Reliance (California Code Reg., tit.23, §5003). The 2015 UWMP is being amended only to report
reduced reliance on the Delta and this action is separate from adoption of the 2020 UWMP and
adoption of the 2020 WSCP.
Water Code section 10621(b) requires an urban water supplier updating its UWMP and WSCP to
notify cities and counties within its service area of the update at least sixty (60) days prior to holding a
public hearing. This letter serves as the City’s notice that it is preparing and updating its 2020 UWMP
and WSCP, to be adopted before the July 1, 2021 deadline.
A copy of City’s draft 2020 UWMP and WSCP will be available for review on the City’s website in
spring of 2021, and City will subsequently hold a noticed public hearing on the 2020 UWMP and
WSCP in advance of its proposed adoption. The City invites you to submit comments and consult with
the City regarding its 2020 UWMP and WSCP.
The City’s website (https://www.cityofcamarillo.org/) will give updates on the 2020 UWMP. If you have
any questions, comments, or input regarding the City’s UWMP, please contact Dale Reynolds, Water
Superintendent, via email at [email protected] or by phone at (805)388-5376.
Sincerely,
Dale Reynolds Water Superintendent City of Camarillo

City of Camarillo
Department of Public Works – Water Division
601 Carmen Drive • P.O. Box 248 • Camarillo, CA 93011-0248
Phone: (805) 388-5373 • Fax: (805) 389-9524
Email: [email protected]
April 19, 2021 Delivered via Email Jared Bouchard, General Manager Pleasant Valley County Water 154 S. Las Posas Rd
Camarillo, CA 93010
Subject: City of Camarillo - 2020 Urban Water Management Plan and Water Shortage
Contingency Plan Notice of Preparation
Dear Mr. Bouchard, The City of Camarillo (City) is in the process of preparing and updating its 2020 Urban Water
Management Plan (UWMP) and Water Shortage Contingency Plan (WSCP) in compliance with the
Urban Water Management Planning Act and the Water Conservation Act of 2009, commonly referred
to as SBX7-7. An update of City’s UWMP is required every five (5) years. In addition, the City is
preparing an Appendix to both the 2020 UWMP and the 2015 UWMP to demonstrate consistency with
Delta Plan Policy WR P1, Reduce Reliance on the Delta Through Improved Regional Water Self-
Reliance (California Code Reg., tit.23, §5003). The 2015 UWMP is being amended only to report
reduced reliance on the Delta and this action is separate from adoption of the 2020 UWMP and
adoption of the 2020 WSCP.
Water Code section 10621(b) requires an urban water supplier updating its UWMP and WSCP to
notify cities and counties within its service area of the update at least sixty (60) days prior to holding a
public hearing. This letter serves as the City’s notice that it is preparing and updating its 2020 UWMP
and WSCP, to be adopted before the July 1, 2021 deadline.
A copy of City’s draft 2020 UWMP and WSCP will be available for review on the City’s website in
spring of 2021, and City will subsequently hold a noticed public hearing on the 2020 UWMP and
WSCP in advance of its proposed adoption. The City invites you to submit comments and consult with
the City regarding its 2020 UWMP and WSCP.
The City’s website (https://www.cityofcamarillo.org/) will give updates on the 2020 UWMP. If you have
any questions, comments, or input regarding the City’s UWMP, please contact Dale Reynolds, Water
Superintendent, via email at [email protected] or by phone at (805)388-5376.
Sincerely,
Dale Reynolds Water Superintendent City of Camarillo
City of Camarillo
Department of Public Works – Water Division
601 Carmen Drive • P.O. Box 248 • Camarillo, CA 93011-0248
Phone: (805) 388-5373 • Fax: (805) 389-9524
Email: [email protected]
April 19, 2021 Delivered via Email Warren Manzer, President Pleasant Valley Mutual Water Company 1863 Las Posas Rd Camarillo, CA 93010 Subject: City of Camarillo - 2020 Urban Water Management Plan and Water Shortage
Contingency Plan Notice of Preparation
Dear Mr. Manzer, The City of Camarillo (City) is in the process of preparing and updating its 2020 Urban Water
Management Plan (UWMP) and Water Shortage Contingency Plan (WSCP) in compliance with the
Urban Water Management Planning Act and the Water Conservation Act of 2009, commonly referred
to as SBX7-7. An update of City’s UWMP is required every five (5) years. In addition, the City is
preparing an Appendix to both the 2020 UWMP and the 2015 UWMP to demonstrate consistency with
Delta Plan Policy WR P1, Reduce Reliance on the Delta Through Improved Regional Water Self-
Reliance (California Code Reg., tit.23, §5003). The 2015 UWMP is being amended only to report
reduced reliance on the Delta and this action is separate from adoption of the 2020 UWMP and
adoption of the 2020 WSCP.
Water Code section 10621(b) requires an urban water supplier updating its UWMP and WSCP to
notify cities and counties within its service area of the update at least sixty (60) days prior to holding a
public hearing. This letter serves as the City’s notice that it is preparing and updating its 2020 UWMP
and WSCP, to be adopted before the July 1, 2021 deadline.
A copy of City’s draft 2020 UWMP and WSCP will be available for review on the City’s website in
spring of 2021, and City will subsequently hold a noticed public hearing on the 2020 UWMP and
WSCP in advance of its proposed adoption. The City invites you to submit comments and consult with
the City regarding its 2020 UWMP and WSCP.
The City’s website (https://www.cityofcamarillo.org/) will give updates on the 2020 UWMP. If you have
any questions, comments, or input regarding the City’s UWMP, please contact Dale Reynolds, Water
Superintendent, via email at [email protected] or by phone at (805)388-5376.
Sincerely,
Dale Reynolds Water Superintendent City of Camarillo

City of Camarillo
Department of Public Works – Water Division
601 Carmen Drive • P.O. Box 248 • Camarillo, CA 93011-0248
Phone: (805) 388-5373 • Fax: (805) 389-9524
Email: [email protected]
April 19, 2021 Delivered via Email Jennifer P. Williams, Manager of Operations Cal-American Water, Ventura District 2439 West Hillcrest Newbury Park, CA 91320 Subject: City of Camarillo - 2020 Urban Water Management Plan and Water Shortage
Contingency Plan Notice of Preparation
Dear Ms. Williams, The City of Camarillo (City) is in the process of preparing and updating its 2020 Urban Water
Management Plan (UWMP) and Water Shortage Contingency Plan (WSCP) in compliance with the
Urban Water Management Planning Act and the Water Conservation Act of 2009, commonly referred
to as SBX7-7. An update of City’s UWMP is required every five (5) years. In addition, the City is
preparing an Appendix to both the 2020 UWMP and the 2015 UWMP to demonstrate consistency with
Delta Plan Policy WR P1, Reduce Reliance on the Delta Through Improved Regional Water Self-
Reliance (California Code Reg., tit.23, §5003). The 2015 UWMP is being amended only to report
reduced reliance on the Delta and this action is separate from adoption of the 2020 UWMP and
adoption of the 2020 WSCP.
Water Code section 10621(b) requires an urban water supplier updating its UWMP and WSCP to
notify cities and counties within its service area of the update at least sixty (60) days prior to holding a
public hearing. This letter serves as the City’s notice that it is preparing and updating its 2020 UWMP
and WSCP, to be adopted before the July 1, 2021 deadline.
A copy of City’s draft 2020 UWMP and WSCP will be available for review on the City’s website in
spring of 2021, and City will subsequently hold a noticed public hearing on the 2020 UWMP and
WSCP in advance of its proposed adoption. The City invites you to submit comments and consult with
the City regarding its 2020 UWMP and WSCP.
The City’s website (https://www.cityofcamarillo.org/) will give updates on the 2020 UWMP. If you have
any questions, comments, or input regarding the City’s UWMP, please contact Dale Reynolds, Water
Superintendent, via email at [email protected] or by phone at (805)388-5376.
Sincerely,
Dale Reynolds Water Superintendent City of Camarillo

D
D Appendix D. Adopted Resolution

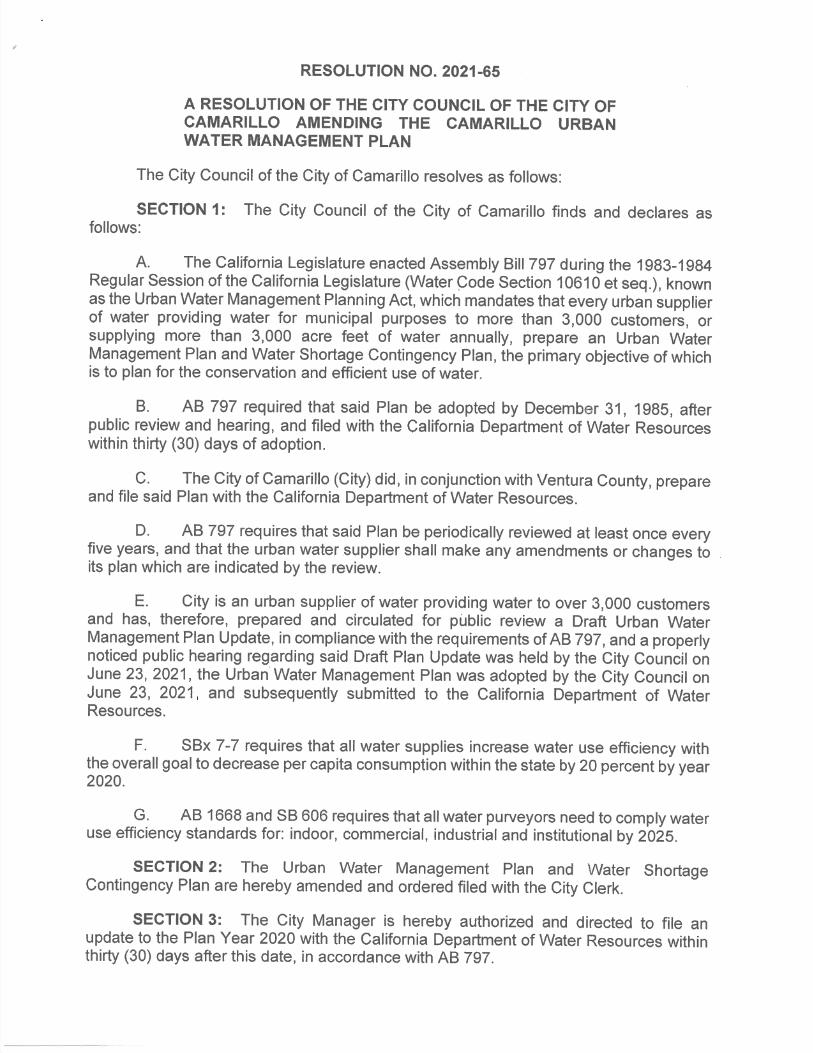
E
E Appendix E. AWWA Audits


AWWA Free Water Audit Software v5.0 Reporting Worksheet 1
AWWA Free Water Audit Software: Reporting Worksheet
Water Audit Report for: City of Camarillo (5610019 SD)Reporting Year: 2015 6/2015 - 7/2016
All volumes to be entered as: ACRE-FEET PER YEAR
Master Meter and Supply Error AdjustmentsWATER SUPPLIED <----------- Enter grading in column 'E' and 'J' ----------> Pcnt: Value:
Volume from own sources: 8 3,147.600 acre-ft/yr 7 acre-ft/yrWater imported: 10 4,278.200 acre-ft/yr 7 acre-ft/yrWater exported: n/a acre-ft/yr acre-ft/yr
Enter negative % or value for under-registrationWATER SUPPLIED: 7,425.800 acre-ft/yr Enter positive % or value for over-registration
.AUTHORIZED CONSUMPTION
Billed metered: 8 7,225.390 acre-ft/yrBilled unmetered: 10 0.000 acre-ft/yrUnbilled metered: 9 41.000 acre-ft/yr Pcnt: Value:
Unbilled unmetered: 92.823 acre-ft/yr 1.25% acre-ft/yr24061 Default option selected for Unbilled unmetered - a grading of 5 is applied but not displayed
AUTHORIZED CONSUMPTION: 7,359.213 acre-ft/yr
WATER LOSSES (Water Supplied - Authorized Consumption) 66.587 acre-ft/yr
Apparent Losses Pcnt: Value:Unauthorized consumption: 18.565 acre-ft/yr 0.25% acre-ft/yr
Default option selected for unauthorized consumption - a grading of 5 is applied but not displayed
Customer metering inaccuracies: 6 0.000 acre-ft/yr acre-ft/yrSystematic data handling errors: 10 18.063 acre-ft/yr 0.25% acre-ft/yr
Default option selected for Systematic data handling errors - a grading of 5 is applied but not displayedApparent Losses: 36.628 acre-ft/yr
Real Losses (Current Annual Real Losses or CARL)Real Losses = Water Losses - Apparent Losses: 29.960 acre-ft/yr
WATER LOSSES: 66.587 acre-ft/yr
NON-REVENUE WATERNON-REVENUE WATER: 200.410 acre-ft/yr
= Water Losses + Unbilled Metered + Unbilled Unmetered
SYSTEM DATA
Length of mains: 6 203.0 milesNumber of active AND inactive service connections: 10 13,399
Service connection density: 66 conn./mile main
Are customer meters typically located at the curbstop or property line? YesAverage length of customer service line: ft
Average length of customer service line has been set to zero and a data grading score of 10 has been appliedAverage operating pressure: 6 76.0 psi
COST DATA
Total annual cost of operating water system: 3 $7,725,133 $/YearCustomer retail unit cost (applied to Apparent Losses): 6 $3.72 $/100 cubic feet (ccf)
Variable production cost (applied to Real Losses): 6 $825.00 $/acre-ft
WATER AUDIT DATA VALIDITY SCORE:
*** YOUR SCORE IS: 73 out of 100 ***
A weighted scale for the components of consumption and water loss is included in the calculation of the Water Audit Data Validity Score
PRIORITY AREAS FOR ATTENTION:
Based on the information provided, audit accuracy can be improved by addressing the following components:
1: Total annual cost of operating water system
2: Customer metering inaccuracies
3: Customer retail unit cost (applied to Apparent Losses)
??
?
?
?
? Click to access definition
?
?
?
?
?
?
Please enter data in the white cells below. Where available, metered values should be used; if metered values are unavailable please estimate a value. Indicate your confidence in the accuracy ofthe input data by grading each component (n/a or 1-10) using the drop-down list to the left of the input cell. Hover the mouse over the cell to obtain a description of the grades
?
??
?
?
?
(length of service line, beyond the propertyboundary, that is the responsibility of the utility)
Use buttons to selectpercentage of water
suppliedOR
value
?Click here:for help using optionbuttons below
?
?
?
?
+
+ Click to add a comment
WAS v5.0
++
++
+
+
American Water Works Association.Copyright © 2014, All Rights Reserved.
???
+
++
+
+
+
+
+
+
+
+
++ Use Customer Retail Unit Cost to value real losses
?
To select the correct data grading for each input, determine the highest grade where theutility meets or exceeds all criteria for that grade and all grades below it.
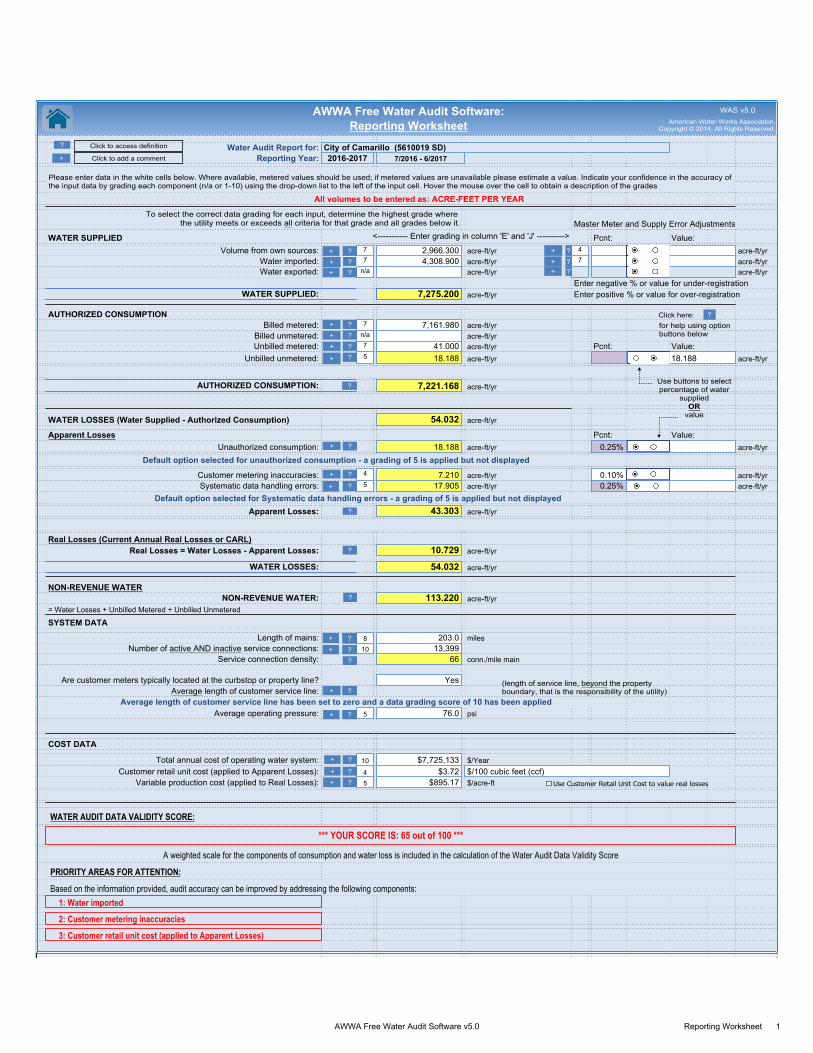
AWWA Free Water Audit Software v5.0 Reporting Worksheet 1
AWWA Free Water Audit Software: Reporting Worksheet
Water Audit Report for: City of Camarillo (5610019 SD)Reporting Year: 2016-2017 7/2016 - 6/2017
All volumes to be entered as: ACRE-FEET PER YEAR
Master Meter and Supply Error AdjustmentsWATER SUPPLIED <----------- Enter grading in column 'E' and 'J' ----------> Pcnt: Value:
Volume from own sources: 7 2,966.300 acre-ft/yr 4 acre-ft/yrWater imported: 7 4,308.900 acre-ft/yr 7 acre-ft/yrWater exported: n/a acre-ft/yr acre-ft/yr
Enter negative % or value for under-registrationWATER SUPPLIED: 7,275.200 acre-ft/yr Enter positive % or value for over-registration
.AUTHORIZED CONSUMPTION
Billed metered: 7 7,161.980 acre-ft/yrBilled unmetered: n/a acre-ft/yrUnbilled metered: 7 41.000 acre-ft/yr Pcnt: Value:
Unbilled unmetered: 5 18.188 acre-ft/yr 1.25% 18.188 acre-ft/yr24061
AUTHORIZED CONSUMPTION: 7,221.168 acre-ft/yr
WATER LOSSES (Water Supplied - Authorized Consumption) 54.032 acre-ft/yr
Apparent Losses Pcnt: Value:Unauthorized consumption: 18.188 acre-ft/yr 0.25% acre-ft/yr
Default option selected for unauthorized consumption - a grading of 5 is applied but not displayed
Customer metering inaccuracies: 4 7.210 acre-ft/yr 0.10% acre-ft/yrSystematic data handling errors: 5 17.905 acre-ft/yr 0.25% acre-ft/yr
Default option selected for Systematic data handling errors - a grading of 5 is applied but not displayedApparent Losses: 43.303 acre-ft/yr
Real Losses (Current Annual Real Losses or CARL)Real Losses = Water Losses - Apparent Losses: 10.729 acre-ft/yr
WATER LOSSES: 54.032 acre-ft/yr
NON-REVENUE WATERNON-REVENUE WATER: 113.220 acre-ft/yr
= Water Losses + Unbilled Metered + Unbilled Unmetered
SYSTEM DATA
Length of mains: 8 203.0 milesNumber of active AND inactive service connections: 10 13,399
Service connection density: 66 conn./mile main
Are customer meters typically located at the curbstop or property line? YesAverage length of customer service line: ft
Average length of customer service line has been set to zero and a data grading score of 10 has been appliedAverage operating pressure: 5 76.0 psi
COST DATA
Total annual cost of operating water system: 10 $7,725,133 $/YearCustomer retail unit cost (applied to Apparent Losses): 4 $3.72 $/100 cubic feet (ccf)
Variable production cost (applied to Real Losses): 5 $895.17 $/acre-ft
WATER AUDIT DATA VALIDITY SCORE:
*** YOUR SCORE IS: 65 out of 100 ***
A weighted scale for the components of consumption and water loss is included in the calculation of the Water Audit Data Validity Score
PRIORITY AREAS FOR ATTENTION:
Based on the information provided, audit accuracy can be improved by addressing the following components:
1: Water imported
2: Customer metering inaccuracies
3: Customer retail unit cost (applied to Apparent Losses)
??
?
?
?
? Click to access definition
?
?
?
?
?
?
Please enter data in the white cells below. Where available, metered values should be used; if metered values are unavailable please estimate a value. Indicate your confidence in the accuracy ofthe input data by grading each component (n/a or 1-10) using the drop-down list to the left of the input cell. Hover the mouse over the cell to obtain a description of the grades
?
??
?
?
?
(length of service line, beyond the propertyboundary, that is the responsibility of the utility)
Use buttons to selectpercentage of water
suppliedOR
value
?Click here:for help using optionbuttons below
?
?
?
?
+
+ Click to add a comment
WAS v5.0
++
++
+
+
American Water Works Association.Copyright © 2014, All Rights Reserved.
???
+
++
+
+
+
+
+
+
+
+
+
+ Use Customer Retail Unit Cost to value real losses
?
To select the correct data grading for each input, determine the highest grade wherethe utility meets or exceeds all criteria for that grade and all grades below it.
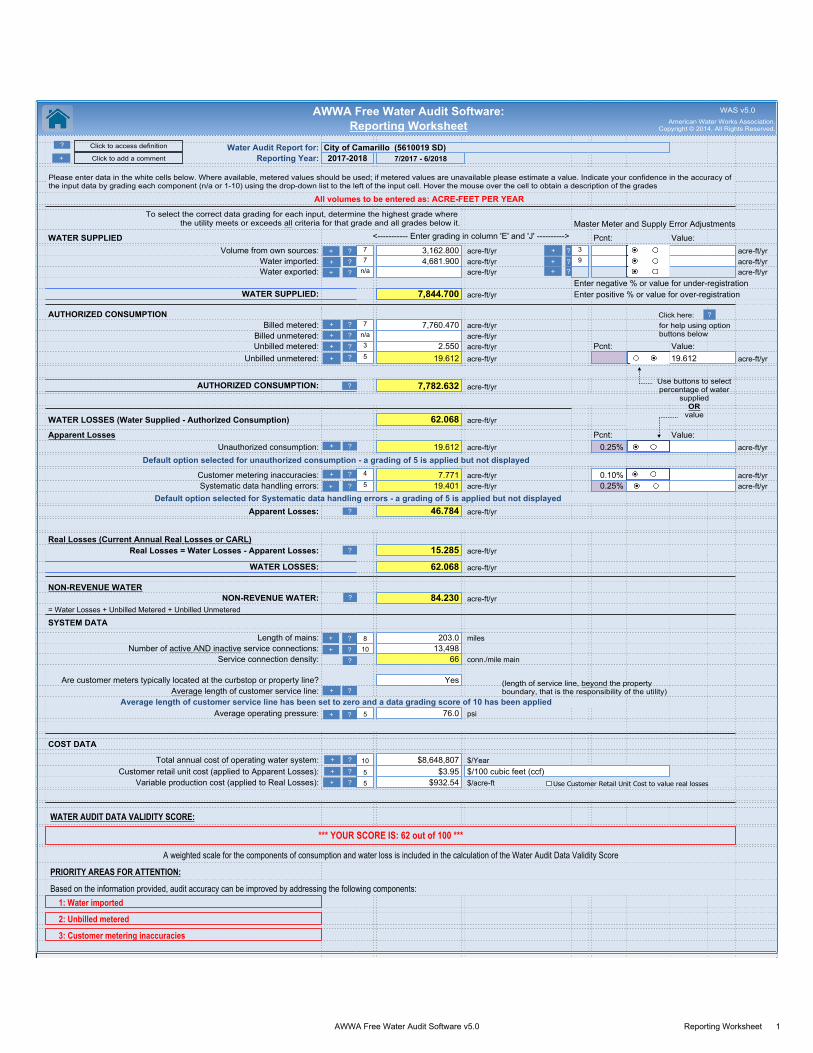
AWWA Free Water Audit Software v5.0 Reporting Worksheet 1
AWWA Free Water Audit Software: Reporting Worksheet
Water Audit Report for: City of Camarillo (5610019 SD)Reporting Year: 2017-2018 7/2017 - 6/2018
All volumes to be entered as: ACRE-FEET PER YEAR
Master Meter and Supply Error AdjustmentsWATER SUPPLIED <----------- Enter grading in column 'E' and 'J' ----------> Pcnt: Value:
Volume from own sources: 7 3,162.800 acre-ft/yr 3 acre-ft/yrWater imported: 7 4,681.900 acre-ft/yr 9 acre-ft/yrWater exported: n/a acre-ft/yr acre-ft/yr
Enter negative % or value for under-registrationWATER SUPPLIED: 7,844.700 acre-ft/yr Enter positive % or value for over-registration
.AUTHORIZED CONSUMPTION
Billed metered: 7 7,760.470 acre-ft/yrBilled unmetered: n/a acre-ft/yrUnbilled metered: 3 2.550 acre-ft/yr Pcnt: Value:
Unbilled unmetered: 5 19.612 acre-ft/yr 1.25% 19.612 acre-ft/yr24061
AUTHORIZED CONSUMPTION: 7,782.632 acre-ft/yr
WATER LOSSES (Water Supplied - Authorized Consumption) 62.068 acre-ft/yr
Apparent Losses Pcnt: Value:Unauthorized consumption: 19.612 acre-ft/yr 0.25% acre-ft/yr
Default option selected for unauthorized consumption - a grading of 5 is applied but not displayed
Customer metering inaccuracies: 4 7.771 acre-ft/yr 0.10% acre-ft/yrSystematic data handling errors: 5 19.401 acre-ft/yr 0.25% acre-ft/yr
Default option selected for Systematic data handling errors - a grading of 5 is applied but not displayedApparent Losses: 46.784 acre-ft/yr
Real Losses (Current Annual Real Losses or CARL)Real Losses = Water Losses - Apparent Losses: 15.285 acre-ft/yr
WATER LOSSES: 62.068 acre-ft/yr
NON-REVENUE WATERNON-REVENUE WATER: 84.230 acre-ft/yr
= Water Losses + Unbilled Metered + Unbilled Unmetered
SYSTEM DATA
Length of mains: 8 203.0 milesNumber of active AND inactive service connections: 10 13,498
Service connection density: 66 conn./mile main
Are customer meters typically located at the curbstop or property line? YesAverage length of customer service line: ft
Average length of customer service line has been set to zero and a data grading score of 10 has been appliedAverage operating pressure: 5 76.0 psi
COST DATA
Total annual cost of operating water system: 10 $8,648,807 $/YearCustomer retail unit cost (applied to Apparent Losses): 5 $3.95 $/100 cubic feet (ccf)
Variable production cost (applied to Real Losses): 5 $932.54 $/acre-ft
WATER AUDIT DATA VALIDITY SCORE:
*** YOUR SCORE IS: 62 out of 100 ***
A weighted scale for the components of consumption and water loss is included in the calculation of the Water Audit Data Validity Score
PRIORITY AREAS FOR ATTENTION:
Based on the information provided, audit accuracy can be improved by addressing the following components:
1: Water imported
2: Unbilled metered
3: Customer metering inaccuracies
??
?
?
?
? Click to access definition
?
?
?
?
?
?
Please enter data in the white cells below. Where available, metered values should be used; if metered values are unavailable please estimate a value. Indicate your confidence in the accuracy ofthe input data by grading each component (n/a or 1-10) using the drop-down list to the left of the input cell. Hover the mouse over the cell to obtain a description of the grades
?
??
?
?
?
(length of service line, beyond the propertyboundary, that is the responsibility of the utility)
Use buttons to selectpercentage of water
suppliedOR
value
?Click here:for help using optionbuttons below
?
?
?
?
+
+ Click to add a comment
WAS v5.0
++
++
+
+
American Water Works Association.Copyright © 2014, All Rights Reserved.
???
+
++
+
+
+
+
+
+
+
+
+
+ Use Customer Retail Unit Cost to value real losses
?
To select the correct data grading for each input, determine the highest grade wherethe utility meets or exceeds all criteria for that grade and all grades below it.
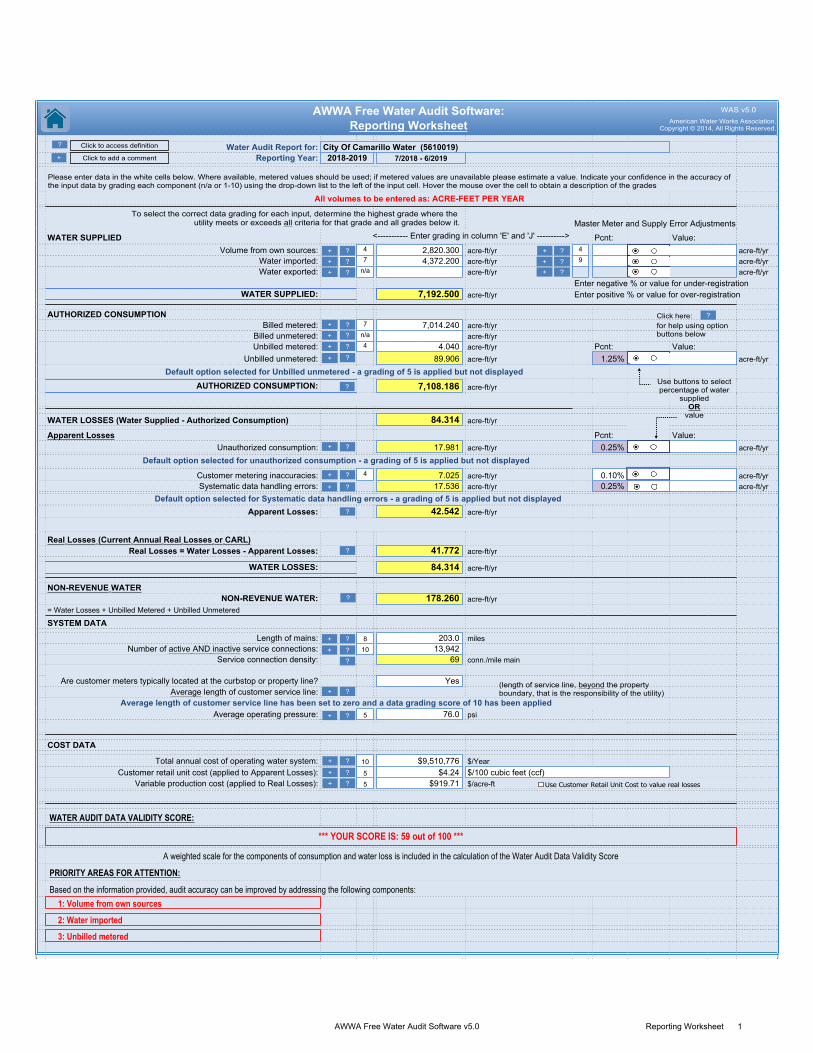
AWWA Free Water Audit Software v5.0 Reporting Worksheet 1
AWWA Free Water Audit Software: Reporting Worksheet
Water Audit Report for: City Of Camarillo Water (5610019)Reporting Year: 2018-2019 7/2018 - 6/2019
All volumes to be entered as: ACRE-FEET PER YEAR
Master Meter and Supply Error AdjustmentsWATER SUPPLIED <----------- Enter grading in column 'E' and 'J' ----------> Pcnt: Value:
Volume from own sources: 4 2,820.300 acre-ft/yr 4 acre-ft/yrWater imported: 7 4,372.200 acre-ft/yr 9 acre-ft/yrWater exported: n/a acre-ft/yr acre-ft/yr
Enter negative % or value for under-registrationWATER SUPPLIED: 7,192.500 acre-ft/yr Enter positive % or value for over-registration
.AUTHORIZED CONSUMPTION
Billed metered: 7 7,014.240 acre-ft/yrBilled unmetered: n/a acre-ft/yrUnbilled metered: 4 4.040 acre-ft/yr Pcnt: Value:
Unbilled unmetered: 6 89.906 acre-ft/yr 1.25% 18.000 acre-ft/yr24061 Default option selected for Unbilled unmetered - a grading of 5 is applied but not displayed
AUTHORIZED CONSUMPTION: 7,108.186 acre-ft/yr
WATER LOSSES (Water Supplied - Authorized Consumption) 84.314 acre-ft/yr
Apparent Losses Pcnt: Value:Unauthorized consumption: 4 17.981 acre-ft/yr 0.25% acre-ft/yr
Default option selected for unauthorized consumption - a grading of 5 is applied but not displayed
Customer metering inaccuracies: 4 7.025 acre-ft/yr 0.10% acre-ft/yrSystematic data handling errors: 5 17.536 acre-ft/yr 0.25% acre-ft/yr
Default option selected for Systematic data handling errors - a grading of 5 is applied but not displayedApparent Losses: 42.542 acre-ft/yr
Real Losses (Current Annual Real Losses or CARL)Real Losses = Water Losses - Apparent Losses: 41.772 acre-ft/yr
WATER LOSSES: 84.314 acre-ft/yr
NON-REVENUE WATERNON-REVENUE WATER: 178.260 acre-ft/yr
= Water Losses + Unbilled Metered + Unbilled Unmetered
SYSTEM DATA
Length of mains: 8 203.0 milesNumber of active AND inactive service connections: 10 13,942
Service connection density: 69 conn./mile main
Are customer meters typically located at the curbstop or property line? YesAverage length of customer service line: ft
Average length of customer service line has been set to zero and a data grading score of 10 has been appliedAverage operating pressure: 5 76.0 psi
COST DATA
Total annual cost of operating water system: 10 $9,510,776 $/YearCustomer retail unit cost (applied to Apparent Losses): 5 $4.24 $/100 cubic feet (ccf)
Variable production cost (applied to Real Losses): 5 $919.71 $/acre-ft
WATER AUDIT DATA VALIDITY SCORE:
*** YOUR SCORE IS: 59 out of 100 ***
A weighted scale for the components of consumption and water loss is included in the calculation of the Water Audit Data Validity Score
PRIORITY AREAS FOR ATTENTION:
Based on the information provided, audit accuracy can be improved by addressing the following components:
1: Volume from own sources
2: Water imported
3: Unbilled metered
??
?
?
?
? Click to access definition
?
?
?
?
?
?
Please enter data in the white cells below. Where available, metered values should be used; if metered values are unavailable please estimate a value. Indicate your confidence in the accuracy ofthe input data by grading each component (n/a or 1-10) using the drop-down list to the left of the input cell. Hover the mouse over the cell to obtain a description of the grades
?
??
?
?
?
(length of service line, beyond the propertyboundary, that is the responsibility of the utility)
Use buttons to selectpercentage of water
suppliedOR
value
?Click here:for help using optionbuttons below
?
?
?
?
+
+ Click to add a comment
WAS v5.0
++
++
+
+
American Water Works Association.Copyright © 2014, All Rights Reserved.
???
+
++
+
+
+
+
+
+
+
+
++ Use Customer Retail Unit Cost to value real losses
?
To select the correct data grading for each input, determine the highest grade where theutility meets or exceeds all criteria for that grade and all grades below it.
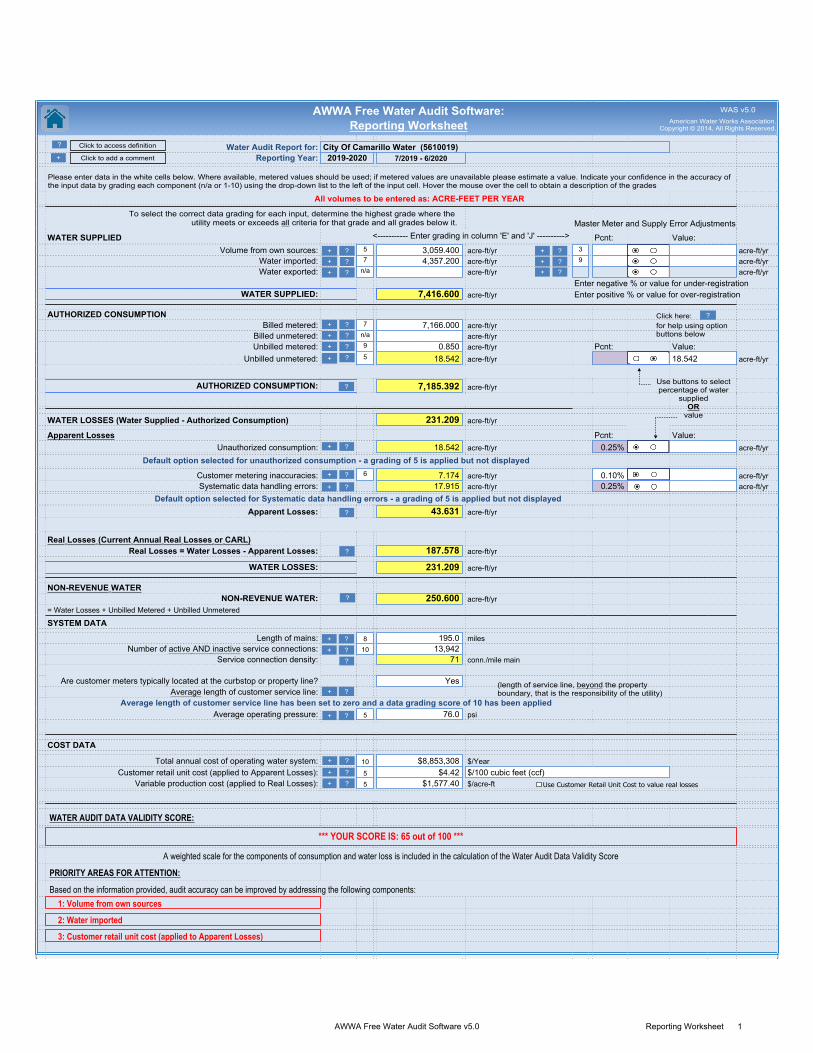
AWWA Free Water Audit Software v5.0 Reporting Worksheet 1
AWWA Free Water Audit Software: Reporting Worksheet
Water Audit Report for: City Of Camarillo Water (5610019)Reporting Year: 2019-2020 7/2019 - 6/2020
All volumes to be entered as: ACRE-FEET PER YEAR
Master Meter and Supply Error AdjustmentsWATER SUPPLIED <----------- Enter grading in column 'E' and 'J' ----------> Pcnt: Value:
Volume from own sources: 5 3,059.400 acre-ft/yr 3 acre-ft/yrWater imported: 7 4,357.200 acre-ft/yr 9 acre-ft/yrWater exported: n/a acre-ft/yr acre-ft/yr
Enter negative % or value for under-registrationWATER SUPPLIED: 7,416.600 acre-ft/yr Enter positive % or value for over-registration
.AUTHORIZED CONSUMPTION
Billed metered: 7 7,166.000 acre-ft/yrBilled unmetered: n/a acre-ft/yrUnbilled metered: 9 0.850 acre-ft/yr Pcnt: Value:
Unbilled unmetered: 5 18.542 acre-ft/yr 1.25% 18.542 acre-ft/yr24061
AUTHORIZED CONSUMPTION: 7,185.392 acre-ft/yr
WATER LOSSES (Water Supplied - Authorized Consumption) 231.209 acre-ft/yr
Apparent Losses Pcnt: Value:Unauthorized consumption: 4 18.542 acre-ft/yr 0.25% acre-ft/yr
Default option selected for unauthorized consumption - a grading of 5 is applied but not displayed
Customer metering inaccuracies: 6 7.174 acre-ft/yr 0.10% acre-ft/yrSystematic data handling errors: 17.915 acre-ft/yr 0.25% acre-ft/yr
Default option selected for Systematic data handling errors - a grading of 5 is applied but not displayedApparent Losses: 43.631 acre-ft/yr
Real Losses (Current Annual Real Losses or CARL)Real Losses = Water Losses - Apparent Losses: 187.578 acre-ft/yr
WATER LOSSES: 231.209 acre-ft/yr
NON-REVENUE WATERNON-REVENUE WATER: 250.600 acre-ft/yr
= Water Losses + Unbilled Metered + Unbilled Unmetered
SYSTEM DATA
Length of mains: 8 195.0 milesNumber of active AND inactive service connections: 10 13,942
Service connection density: 71 conn./mile main
Are customer meters typically located at the curbstop or property line? YesAverage length of customer service line: ft
Average length of customer service line has been set to zero and a data grading score of 10 has been appliedAverage operating pressure: 5 76.0 psi
COST DATA
Total annual cost of operating water system: 10 $8,853,308 $/YearCustomer retail unit cost (applied to Apparent Losses): 5 $4.42 $/100 cubic feet (ccf)
Variable production cost (applied to Real Losses): 5 $1,577.40 $/acre-ft
WATER AUDIT DATA VALIDITY SCORE:
*** YOUR SCORE IS: 65 out of 100 ***
A weighted scale for the components of consumption and water loss is included in the calculation of the Water Audit Data Validity Score
PRIORITY AREAS FOR ATTENTION:
Based on the information provided, audit accuracy can be improved by addressing the following components:
1: Volume from own sources
2: Water imported
3: Customer retail unit cost (applied to Apparent Losses)
??
?
?
?
? Click to access definition
?
?
?
?
?
?
Please enter data in the white cells below. Where available, metered values should be used; if metered values are unavailable please estimate a value. Indicate your confidence in the accuracy ofthe input data by grading each component (n/a or 1-10) using the drop-down list to the left of the input cell. Hover the mouse over the cell to obtain a description of the grades
?
??
?
?
?
(length of service line, beyond the propertyboundary, that is the responsibility of the utility)
Use buttons to selectpercentage of water
suppliedOR
value
?Click here:for help using optionbuttons below
?
?
?
?
+
+ Click to add a comment
WAS v5.0
+
+
++
+
+
American Water Works Association.Copyright © 2014, All Rights Reserved.
???
+
++
+
+
+
+
+
+
+
+
+
+ Use Customer Retail Unit Cost to value real losses
?
To select the correct data grading for each input, determine the highest grade where theutility meets or exceeds all criteria for that grade and all grades below it.


F
F Appendix F. SBX7-7 Verification & Compliance Forms

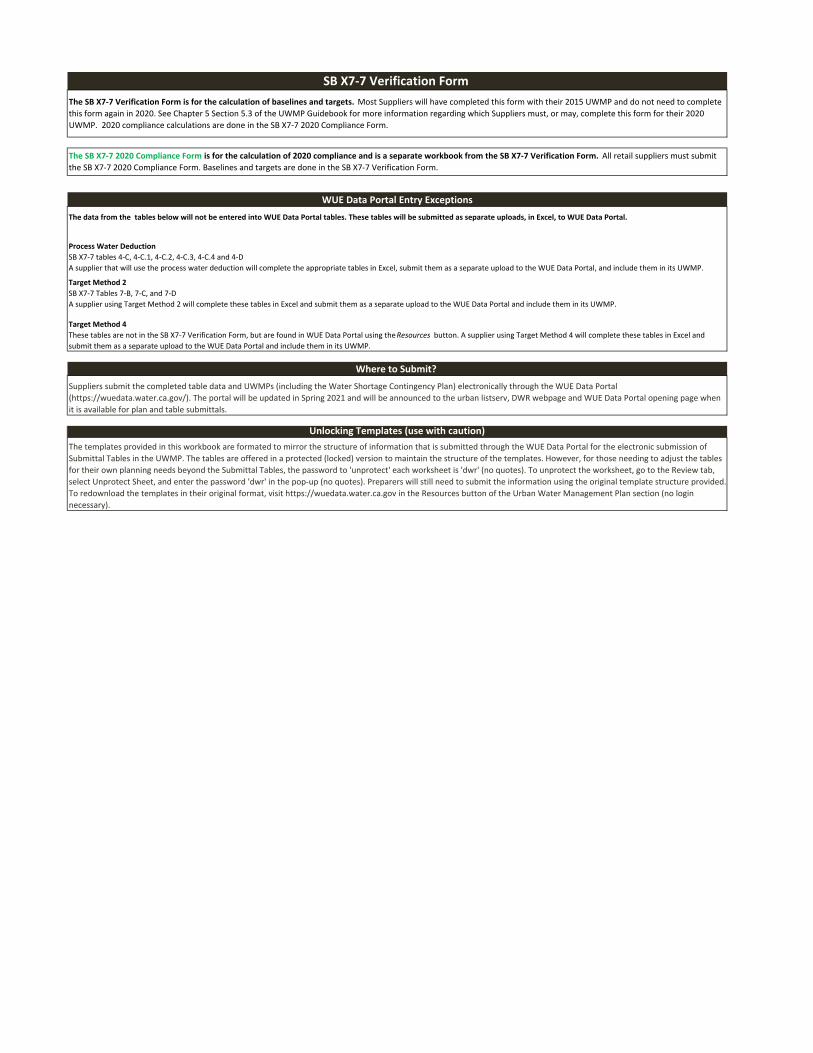
The templates provided in this workbook are formated to mirror the structure of information that is submitted through the WUE Data Portal for the electronic submission of
Submittal Tables in the UWMP. The tables are offered in a protected (locked) version to maintain the structure of the templates. However, for those needing to adjust the tables
for their own planning needs beyond the Submittal Tables, the password to 'unprotect' each worksheet is 'dwr' (no quotes). To unprotect the worksheet, go to the Review tab,
select Unprotect Sheet, and enter the password 'dwr' in the pop‐up (no quotes). Preparers will still need to submit the information using the original template structure provided.
To redownload the templates in their original format, visit https://wuedata.water.ca.gov in the Resources button of the Urban Water Management Plan section (no login
necessary).
Suppliers submit the completed table data and UWMPs (including the Water Shortage Contingency Plan) electronically through the WUE Data Portal
(https://wuedata.water.ca.gov/). The portal will be updated in Spring 2021 and will be announced to the urban listserv, DWR webpage and WUE Data Portal opening page when
it is available for plan and table submittals.
Unlocking Templates (use with caution)
WUE Data Portal Entry Exceptions
Where to Submit?
Target Method 2
SB X7‐7 Tables 7‐B, 7‐C, and 7‐D
A supplier using Target Method 2 will complete these tables in Excel and submit them as a separate upload to the WUE Data Portal and include them in its UWMP.
Target Method 4
These tables are not in the SB X7‐7 Verification Form, but are found in WUE Data Portal using the Resources button. A supplier using Target Method 4 will complete these tables in Excel and
submit them as a separate upload to the WUE Data Portal and include them in its UWMP.
SB X7‐7 Verification Form
The SB X7‐7 Verification Form is for the calculation of baselines and targets. Most Suppliers will have completed this form with their 2015 UWMP and do not need to complete
this form again in 2020. See Chapter 5 Section 5.3 of the UWMP Guidebook for more information regarding which Suppliers must, or may, complete this form for their 2020
UWMP. 2020 compliance calculations are done in the SB X7‐7 2020 Compliance Form.
The SB X7‐7 2020 Compliance Form is for the calculation of 2020 compliance and is a separate workbook from the SB X7‐7 Verification Form. All retail suppliers must submit
the SB X7‐7 2020 Compliance Form. Baselines and targets are done in the SB X7‐7 Verification Form.
The data from the tables below will not be entered into WUE Data Portal tables. These tables will be submitted as separate uploads, in Excel, to WUE Data Portal.
Process Water Deduction
SB X7‐7 tables 4‐C, 4‐C.1, 4‐C.2, 4‐C.3, 4‐C.4 and 4‐D
A supplier that will use the process water deduction will complete the appropriate tables in Excel, submit them as a separate upload to the WUE Data Portal, and include them in its UWMP.
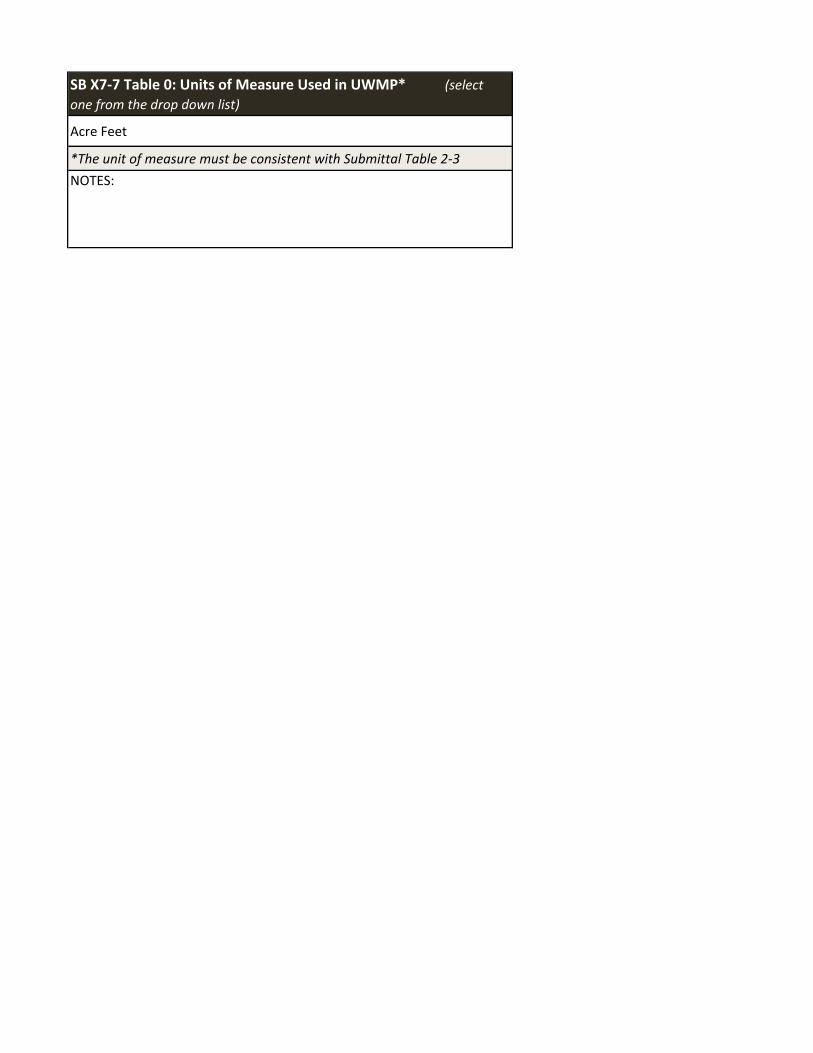
SB X7‐7 Table 0: Units of Measure Used in UWMP* (select one from the drop down list)
Acre Feet
*The unit of measure must be consistent with Submittal Table 2‐3
NOTES:
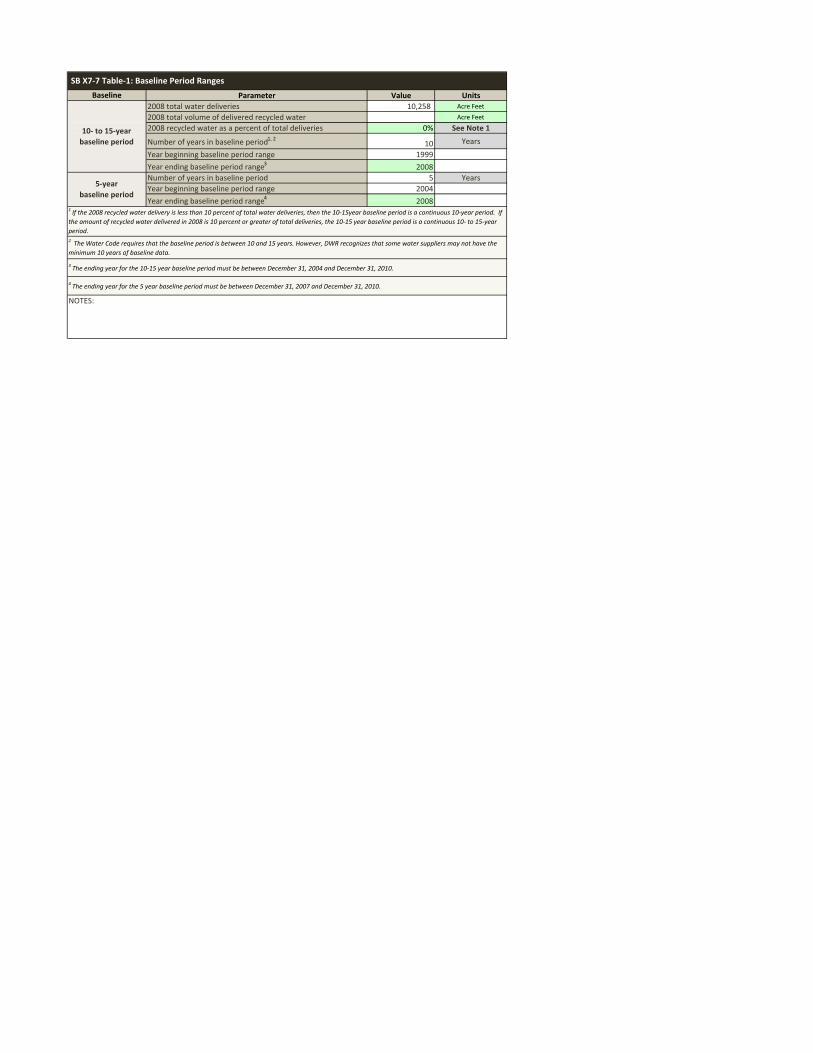
Parameter Value Units
2008 total water deliveries 10,258 Acre Feet
2008 total volume of delivered recycled water Acre Feet
2008 recycled water as a percent of total deliveries 0% See Note 1
Number of years in baseline period1, 2 10 Years
Year beginning baseline period range 1999
Year ending baseline period range3 2008
Number of years in baseline period 5 Years
Year beginning baseline period range 2004
Year ending baseline period range4 2008
2 The Water Code requires that the baseline period is between 10 and 15 years. However, DWR recognizes that some water suppliers may not have the
minimum 10 years of baseline data.
SB X7‐7 Table‐1: Baseline Period Ranges
1If the 2008 recycled water delivery is less than 10 percent of total water deliveries, then the 10‐15year baseline period is a continuous 10‐year period. If
the amount of recycled water delivered in 2008 is 10 percent or greater of total deliveries, the 10‐15 year baseline period is a continuous 10‐ to 15‐year
period.
3The ending year for the 10‐15 year baseline period must be between December 31, 2004 and December 31, 2010.
4The ending year for the 5 year baseline period must be between December 31, 2007 and December 31, 2010.
5‐year
baseline period
Baseline
10‐ to 15‐year
baseline period
NOTES:
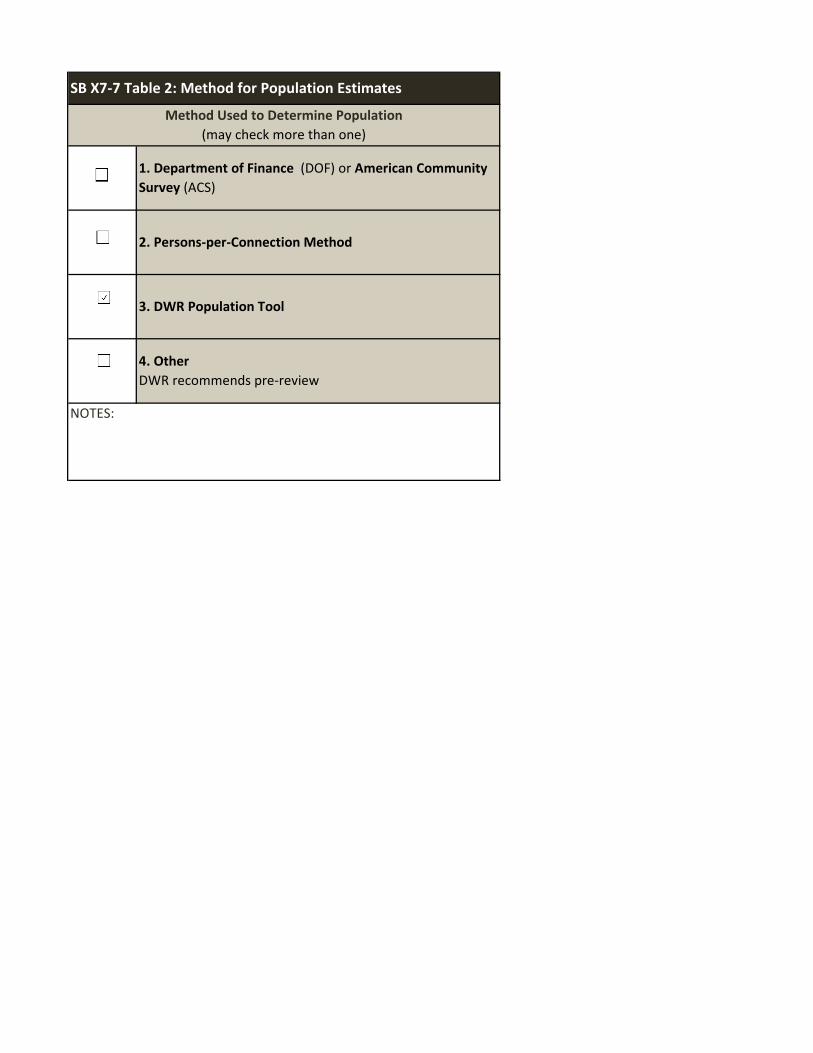
NOTES:
SB X7‐7 Table 2: Method for Population Estimates
Method Used to Determine Population
(may check more than one)
1. Department of Finance (DOF) or American Community
Survey (ACS)
3. DWR Population Tool
4. Other
DWR recommends pre‐review
2. Persons‐per‐Connection Method

Population
Year 1 1999 34,841
Year 2 2000 35,022
Year 3 2001 35,751
Year 4 2002 36,480
Year 5 2003 37,209
Year 6 2004 37,938
Year 7 2005 38,667
Year 8 2006 39,395
Year 9 2007 40,124
Year 10 2008 40,853
Year 11
Year 12
Year 13
Year 14
Year 15
Year 1 2004 37,938
Year 2 2005 38,667
Year 3 2006 39,395
Year 4 2007 40,124
Year 5 2008 40,853
SB X7‐7 Table 3: Service Area Population
10 to 15 Year Baseline Population
5 Year Baseline Population
NOTES:
Year
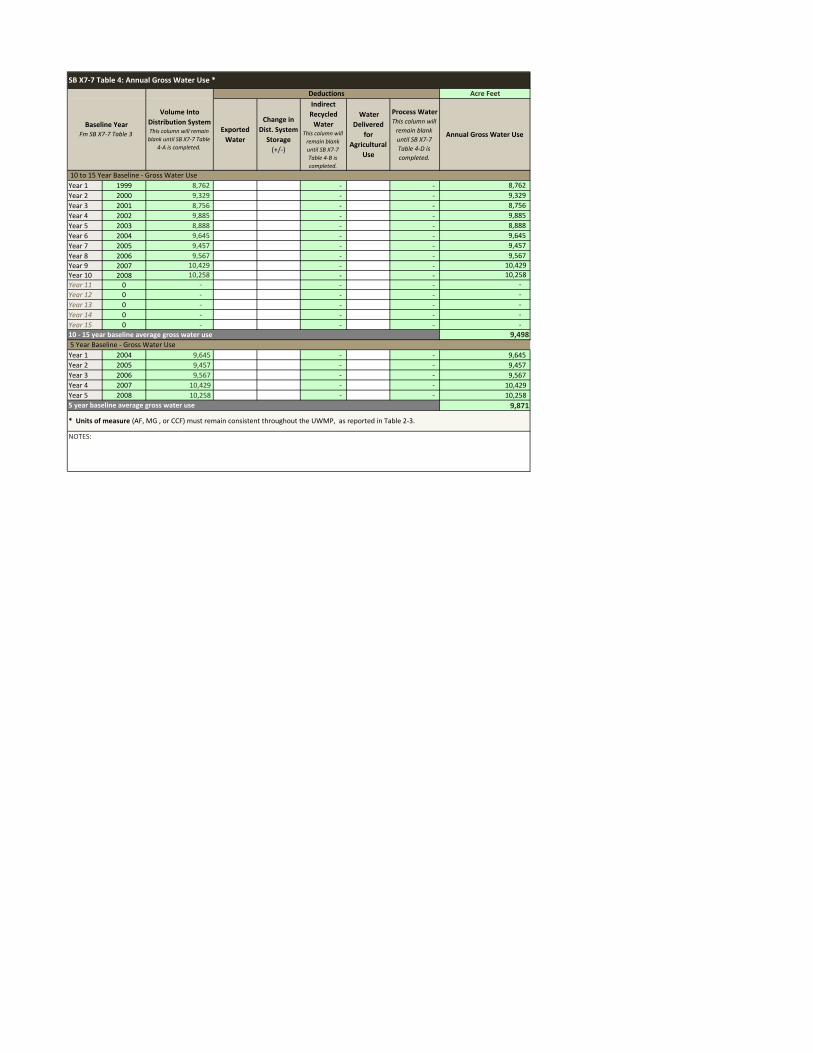
Acre Feet
Exported
Water
Change in
Dist. System
Storage
(+/‐)
Indirect
Recycled
WaterThis column will
remain blank
until SB X7‐7
Table 4‐B is
completed.
Water
Delivered
for
Agricultural
Use
Process WaterThis column will
remain blank
until SB X7‐7
Table 4‐D is
completed.
Annual Gross Water Use
Year 1 1999 8,762 ‐ ‐ 8,762
Year 2 2000 9,329 ‐ ‐ 9,329
Year 3 2001 8,756 ‐ ‐ 8,756
Year 4 2002 9,885 ‐ ‐ 9,885
Year 5 2003 8,888 ‐ ‐ 8,888
Year 6 2004 9,645 ‐ ‐ 9,645
Year 7 2005 9,457 ‐ ‐ 9,457
Year 8 2006 9,567 ‐ ‐ 9,567
Year 9 2007 10,429 ‐ ‐ 10,429
Year 10 2008 10,258 ‐ ‐ 10,258
Year 11 0 ‐ ‐ ‐ ‐
Year 12 0 ‐ ‐ ‐ ‐
Year 13 0 ‐ ‐ ‐ ‐
Year 14 0 ‐ ‐ ‐ ‐
Year 15 0 ‐ ‐ ‐ ‐
9,498
Year 1 2004 9,645 ‐ ‐ 9,645
Year 2 2005 9,457 ‐ ‐ 9,457
Year 3 2006 9,567 ‐ ‐ 9,567
Year 4 2007 10,429 ‐ ‐ 10,429
Year 5 2008 10,258 ‐ ‐ 10,258
9,871
* Units of measure (AF, MG , or CCF) must remain consistent throughout the UWMP, as reported in Table 2‐3.
NOTES:
SB X7‐7 Table 4: Annual Gross Water Use *
10 to 15 Year Baseline ‐ Gross Water Use
10 ‐ 15 year baseline average gross water use
5 Year Baseline ‐ Gross Water Use
5 year baseline average gross water use
Baseline YearFm SB X7‐7 Table 3
Volume Into
Distribution SystemThis column will remain
blank until SB X7‐7 Table
4‐A is completed.
Deductions
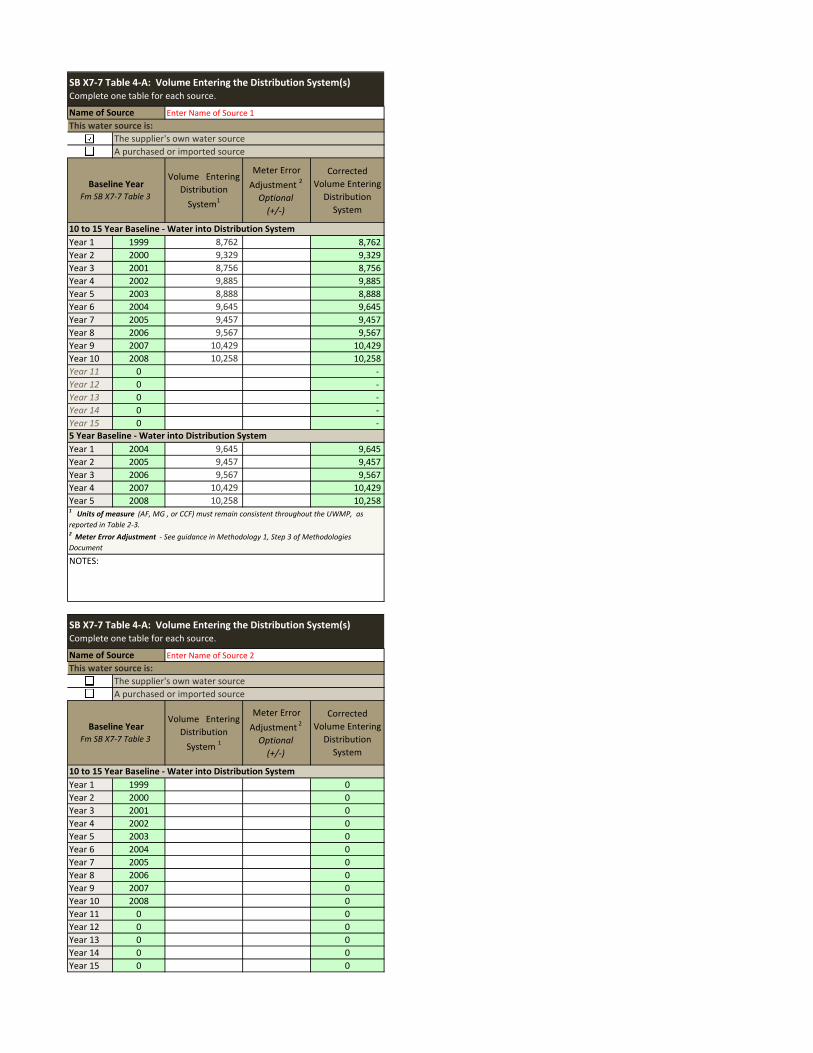
Volume Entering
Distribution
System1
Meter Error
Adjustment 2
Optional
(+/‐)
Corrected
Volume Entering
Distribution
System
Year 1 1999 8,762 8,762
Year 2 2000 9,329 9,329
Year 3 2001 8,756 8,756
Year 4 2002 9,885 9,885
Year 5 2003 8,888 8,888
Year 6 2004 9,645 9,645
Year 7 2005 9,457 9,457
Year 8 2006 9,567 9,567
Year 9 2007 10,429 10,429
Year 10 2008 10,258 10,258
Year 11 0 ‐
Year 12 0 ‐
Year 13 0 ‐
Year 14 0 ‐
Year 15 0 ‐
Year 1 2004 9,645 9,645
Year 2 2005 9,457 9,457
Year 3 2006 9,567 9,567
Year 4 2007 10,429 10,429
Year 5 2008 10,258 10,258
Volume Entering
Distribution
System 1
Meter Error
Adjustment 2
Optional
(+/‐)
Corrected
Volume Entering
Distribution
System
Year 1 1999 0
Year 2 2000 0
Year 3 2001 0
Year 4 2002 0
Year 5 2003 0
Year 6 2004 0
Year 7 2005 0
Year 8 2006 0
Year 9 2007 0
Year 10 2008 0
Year 11 0 0
Year 12 0 0
Year 13 0 0
Year 14 0 0
Year 15 0 0
SB X7‐7 Table 4‐A: Volume Entering the Distribution System(s)Complete one table for each source.
10 to 15 Year Baseline ‐ Water into Distribution System
5 Year Baseline ‐ Water into Distribution System
Name of Source Enter Name of Source 2
Name of Source
SB X7‐7 Table 4‐A: Volume Entering the Distribution System(s)Complete one table for each source.
Baseline YearFm SB X7‐7 Table 3
Baseline YearFm SB X7‐7 Table 3
1 Units of measure (AF, MG , or CCF) must remain consistent throughout the UWMP, as
reported in Table 2‐3. 2 Meter Error Adjustment ‐ See guidance in Methodology 1, Step 3 of Methodologies
Document
NOTES:
This water source is:
The supplier's own water source
A purchased or imported source
Enter Name of Source 1
This water source is:
The supplier's own water source
A purchased or imported source
10 to 15 Year Baseline ‐ Water into Distribution System
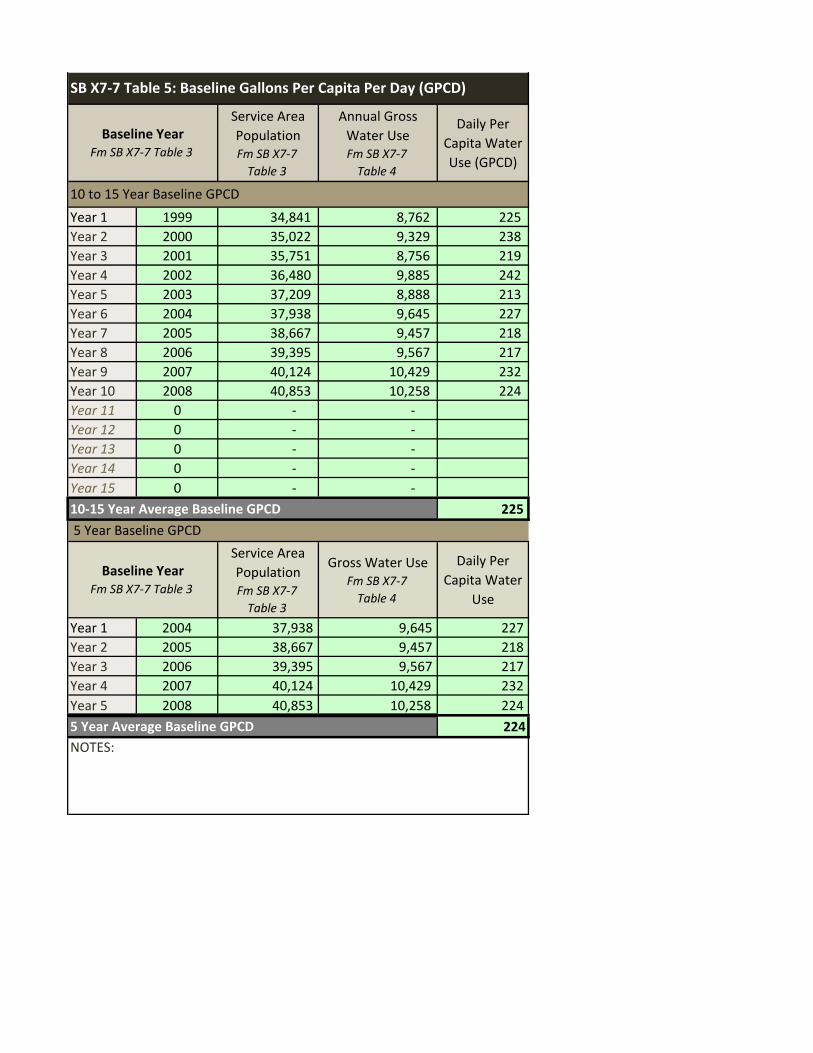
Service Area
PopulationFm SB X7‐7
Table 3
Annual Gross
Water UseFm SB X7‐7
Table 4
Daily Per
Capita Water
Use (GPCD)
Year 1 1999 34,841 8,762 225
Year 2 2000 35,022 9,329 238
Year 3 2001 35,751 8,756 219
Year 4 2002 36,480 9,885 242
Year 5 2003 37,209 8,888 213
Year 6 2004 37,938 9,645 227
Year 7 2005 38,667 9,457 218
Year 8 2006 39,395 9,567 217
Year 9 2007 40,124 10,429 232
Year 10 2008 40,853 10,258 224
Year 11 0 ‐ ‐
Year 12 0 ‐ ‐
Year 13 0 ‐ ‐
Year 14 0 ‐ ‐
Year 15 0 ‐ ‐
225
Service Area
PopulationFm SB X7‐7
Table 3
Gross Water UseFm SB X7‐7
Table 4
Daily Per
Capita Water
Use
Year 1 2004 37,938 9,645 227
Year 2 2005 38,667 9,457 218
Year 3 2006 39,395 9,567 217
Year 4 2007 40,124 10,429 232
Year 5 2008 40,853 10,258 224
224
NOTES:
5 Year Average Baseline GPCD
Baseline YearFm SB X7‐7 Table 3
SB X7‐7 Table 5: Baseline Gallons Per Capita Per Day (GPCD)
Baseline YearFm SB X7‐7 Table 3
10 to 15 Year Baseline GPCD
10‐15 Year Average Baseline GPCD
5 Year Baseline GPCD
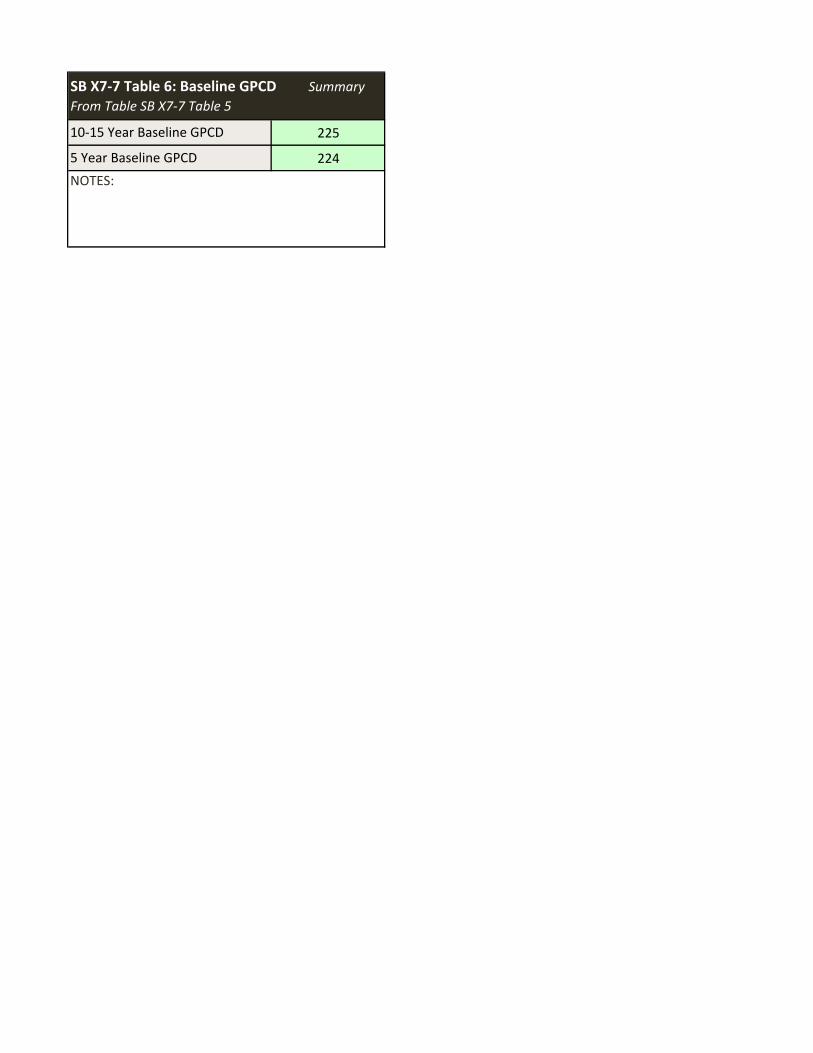
225
224
SB X7‐7 Table 6: Baseline GPCD Summary
From Table SB X7‐7 Table 5
10‐15 Year Baseline GPCD
5 Year Baseline GPCD
NOTES:
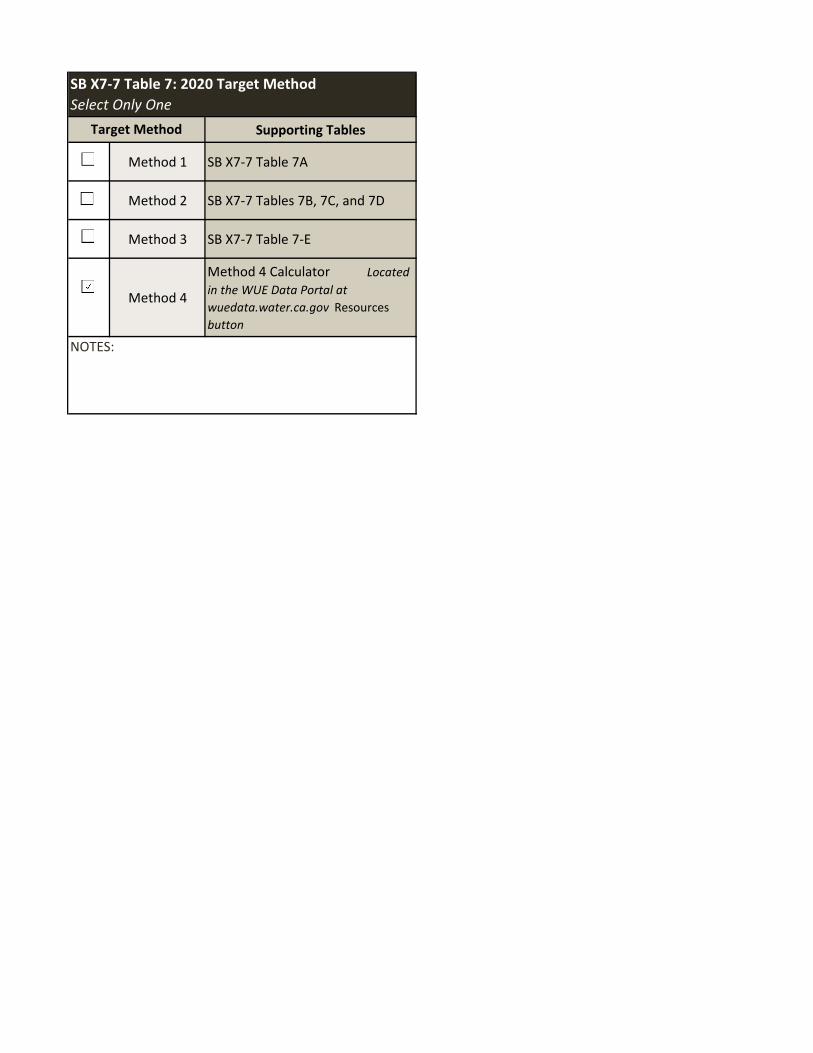
Supporting Tables
Method 1 SB X7‐7 Table 7A
Method 2 SB X7‐7 Tables 7B, 7C, and 7D
Method 3 SB X7‐7 Table 7‐E
Method 4
Method 4 Calculator Located in the WUE Data Portal at
wuedata.water.ca.gov Resources
button
SB X7‐7 Table 7: 2020 Target Method
Select Only One
Target Method
NOTES:
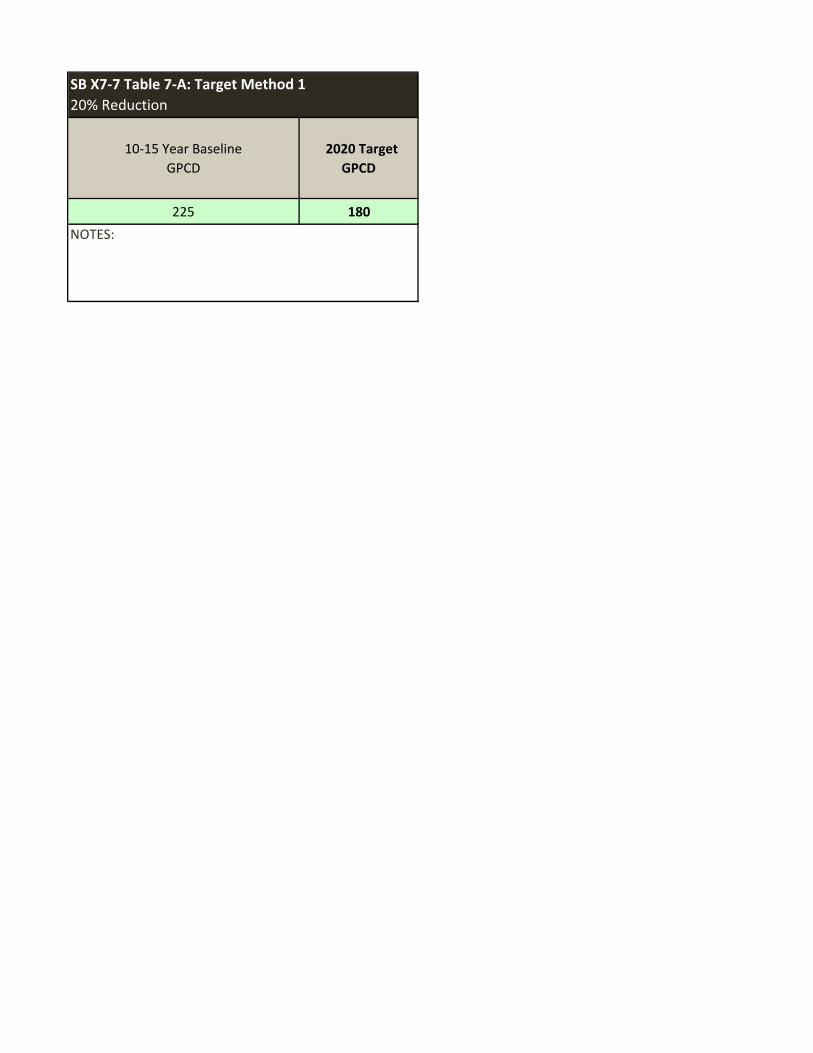
10‐15 Year Baseline
GPCD
2020 Target
GPCD
225 180
SB X7‐7 Table 7‐A: Target Method 1
20% Reduction
NOTES:
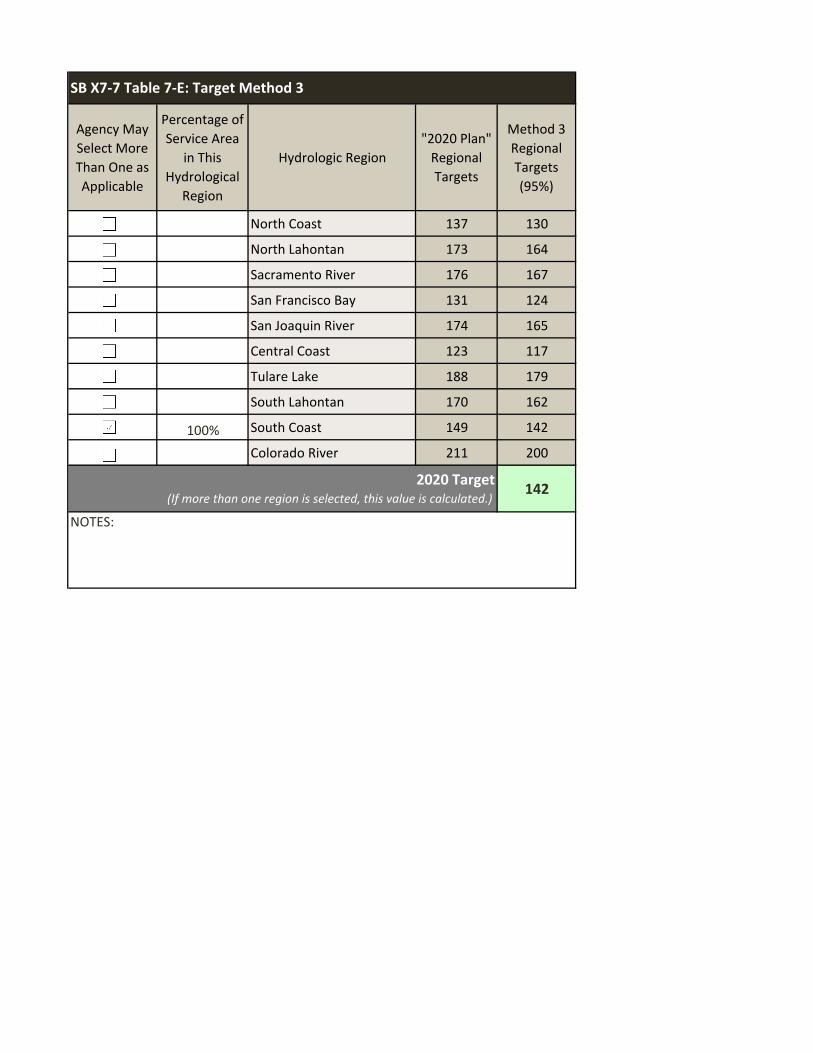
Agency May
Select More
Than One as
Applicable
Percentage of
Service Area
in This
Hydrological
Region
Hydrologic Region
"2020 Plan"
Regional
Targets
Method 3
Regional
Targets
(95%)
North Coast 137 130
North Lahontan 173 164
Sacramento River 176 167
San Francisco Bay 131 124
San Joaquin River 174 165
Central Coast 123 117
Tulare Lake 188 179
South Lahontan 170 162
100% South Coast 149 142
Colorado River 211 200
142
SB X7‐7 Table 7‐E: Target Method 3
2020 Target(If more than one region is selected, this value is calculated.)
NOTES:
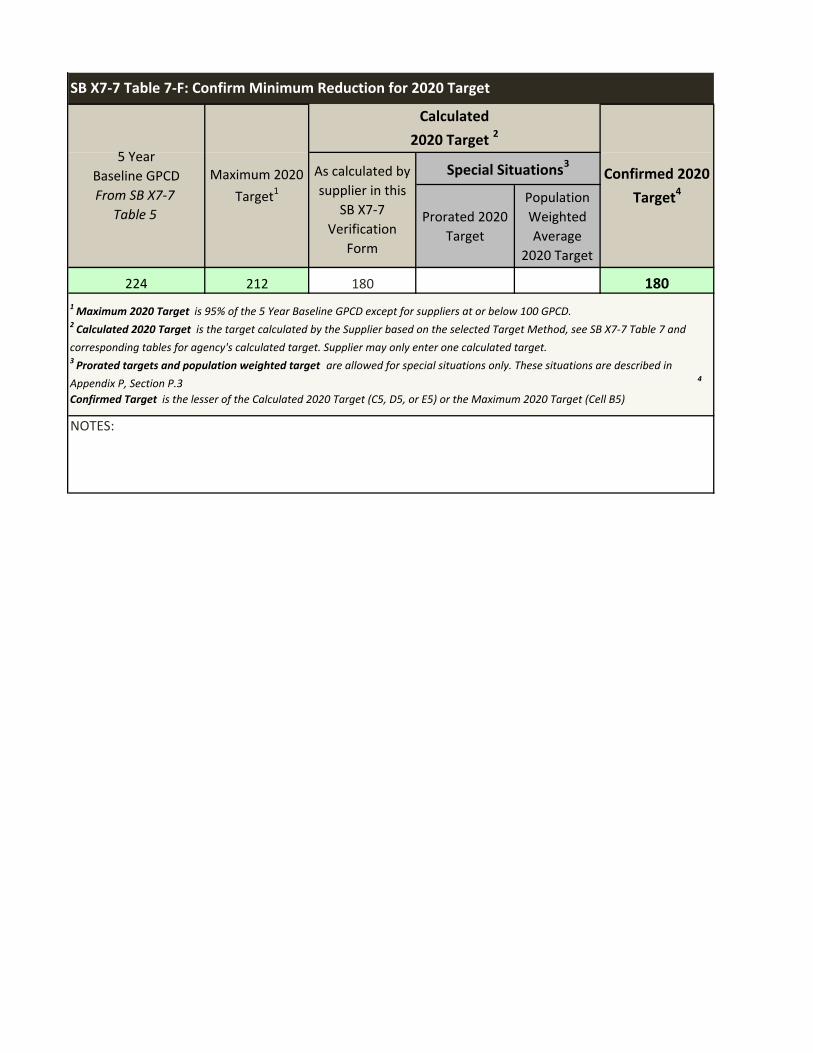
Prorated 2020
Target
Population
Weighted
Average
2020 Target
224 212 180 180
SB X7‐7 Table 7‐F: Confirm Minimum Reduction for 2020 Target
NOTES:
1 Maximum 2020 Target is 95% of the 5 Year Baseline GPCD except for suppliers at or below 100 GPCD.2 Calculated 2020 Target is the target calculated by the Supplier based on the selected Target Method, see SB X7‐7 Table 7 and
corresponding tables for agency's calculated target. Supplier may only enter one calculated target. 3 Prorated targets and population weighted target are allowed for special situations only. These situations are described in
Appendix P, Section P.3 4
Confirmed Target is the lesser of the Calculated 2020 Target (C5, D5, or E5) or the Maximum 2020 Target (Cell B5)
Maximum 2020
Target1
5 Year
Baseline GPCD
From SB X7‐7
Table 5
Calculated
2020 Target 2
Special Situations3 Confirmed 2020
Target4As calculated by
supplier in this
SB X7‐7
Verification
Form
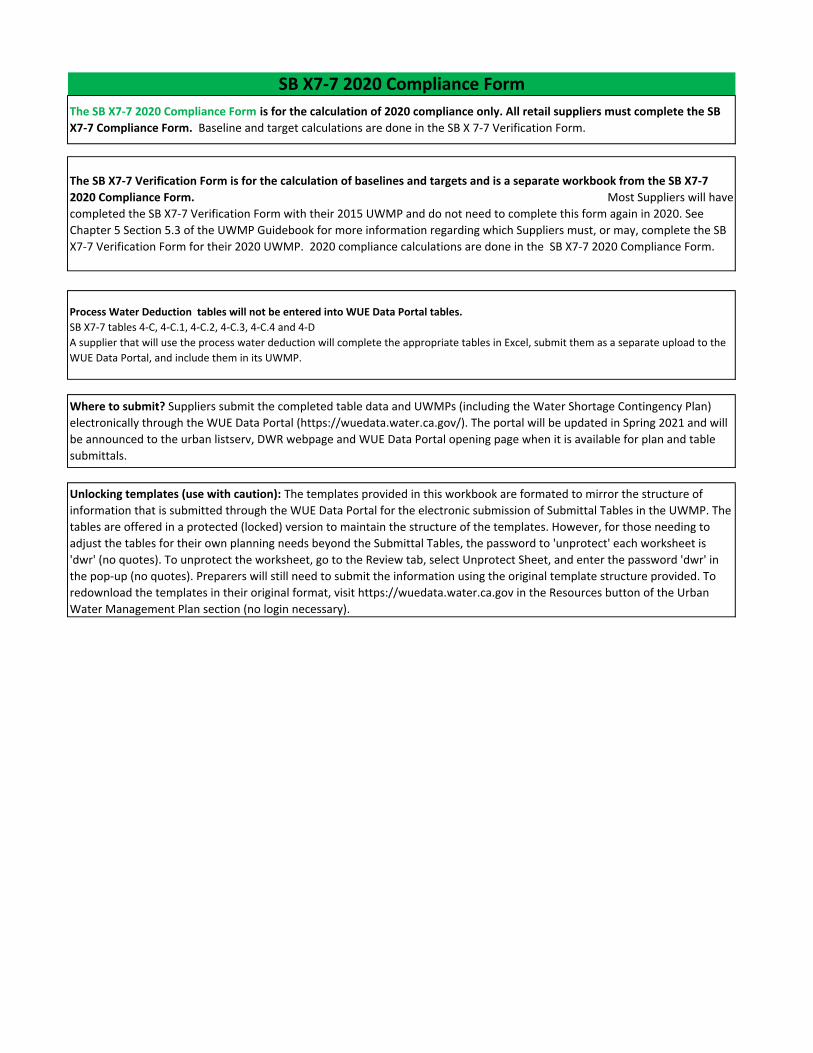
Where to submit? Suppliers submit the completed table data and UWMPs (including the Water Shortage Contingency Plan)
electronically through the WUE Data Portal (https://wuedata.water.ca.gov/). The portal will be updated in Spring 2021 and will
be announced to the urban listserv, DWR webpage and WUE Data Portal opening page when it is available for plan and table
submittals.
Unlocking templates (use with caution): The templates provided in this workbook are formated to mirror the structure of
information that is submitted through the WUE Data Portal for the electronic submission of Submittal Tables in the UWMP. The
tables are offered in a protected (locked) version to maintain the structure of the templates. However, for those needing to
adjust the tables for their own planning needs beyond the Submittal Tables, the password to 'unprotect' each worksheet is
'dwr' (no quotes). To unprotect the worksheet, go to the Review tab, select Unprotect Sheet, and enter the password 'dwr' in
the pop‐up (no quotes). Preparers will still need to submit the information using the original template structure provided. To
redownload the templates in their original format, visit https://wuedata.water.ca.gov in the Resources button of the Urban
Water Management Plan section (no login necessary).
SB X7‐7 2020 Compliance Form
The SB X7‐7 2020 Compliance Form is for the calculation of 2020 compliance only. All retail suppliers must complete the SB
X7‐7 Compliance Form. Baseline and target calculations are done in the SB X 7‐7 Verification Form.
The SB X7‐7 Verification Form is for the calculation of baselines and targets and is a separate workbook from the SB X7‐7
2020 Compliance Form. Most Suppliers will have
completed the SB X7‐7 Verification Form with their 2015 UWMP and do not need to complete this form again in 2020. See
Chapter 5 Section 5.3 of the UWMP Guidebook for more information regarding which Suppliers must, or may, complete the SB
X7‐7 Verification Form for their 2020 UWMP. 2020 compliance calculations are done in the SB X7‐7 2020 Compliance Form.
Process Water Deduction tables will not be entered into WUE Data Portal tables.
SB X7‐7 tables 4‐C, 4‐C.1, 4‐C.2, 4‐C.3, 4‐C.4 and 4‐D
A supplier that will use the process water deduction will complete the appropriate tables in Excel, submit them as a separate upload to the
WUE Data Portal, and include them in its UWMP.
SB X7‐7 Table 0: Units of Measure Used in 2020 UWMP* (select one from the drop down list)
Acre Feet
*The unit of measure must be consistent throughout the UWMP, as
reported in Submittal Table 2‐3.
NOTES:
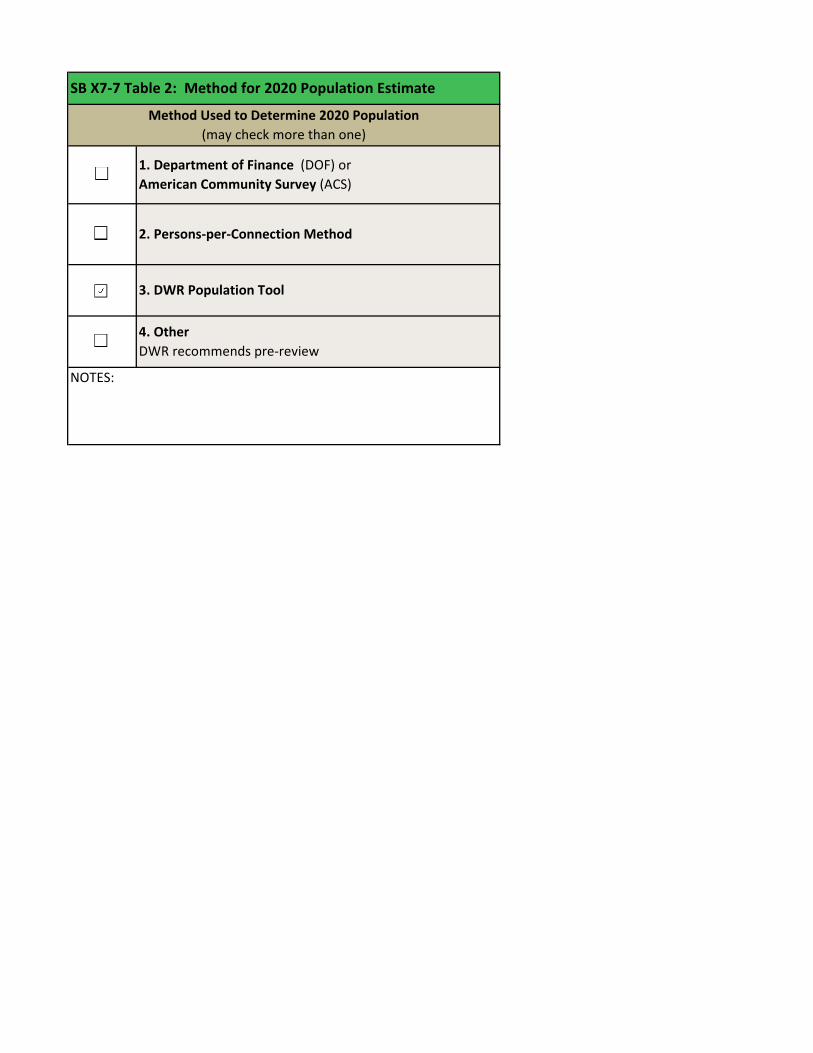
NOTES:
SB X7‐7 Table 2: Method for 2020 Population Estimate
Method Used to Determine 2020 Population
(may check more than one)
1. Department of Finance (DOF) or
American Community Survey (ACS)
3. DWR Population Tool
4. Other
DWR recommends pre‐review
2. Persons‐per‐Connection Method
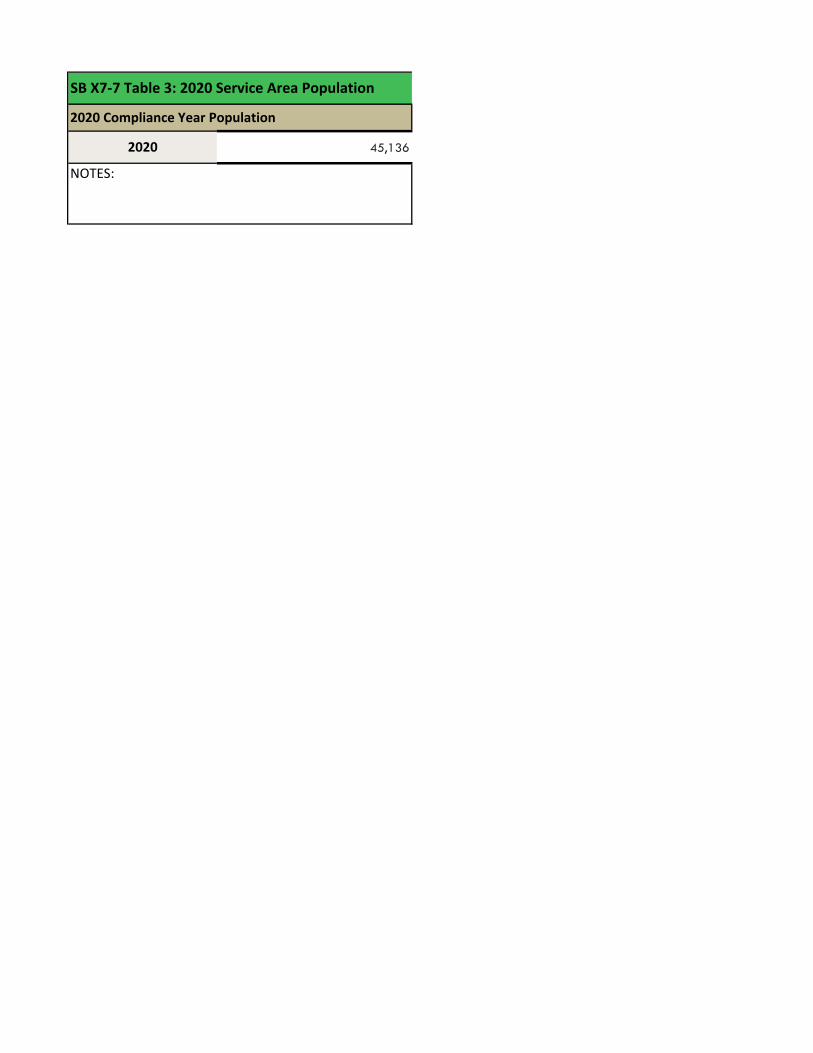
45,1362020
SB X7‐7 Table 3: 2020 Service Area Population
2020 Compliance Year Population
NOTES:
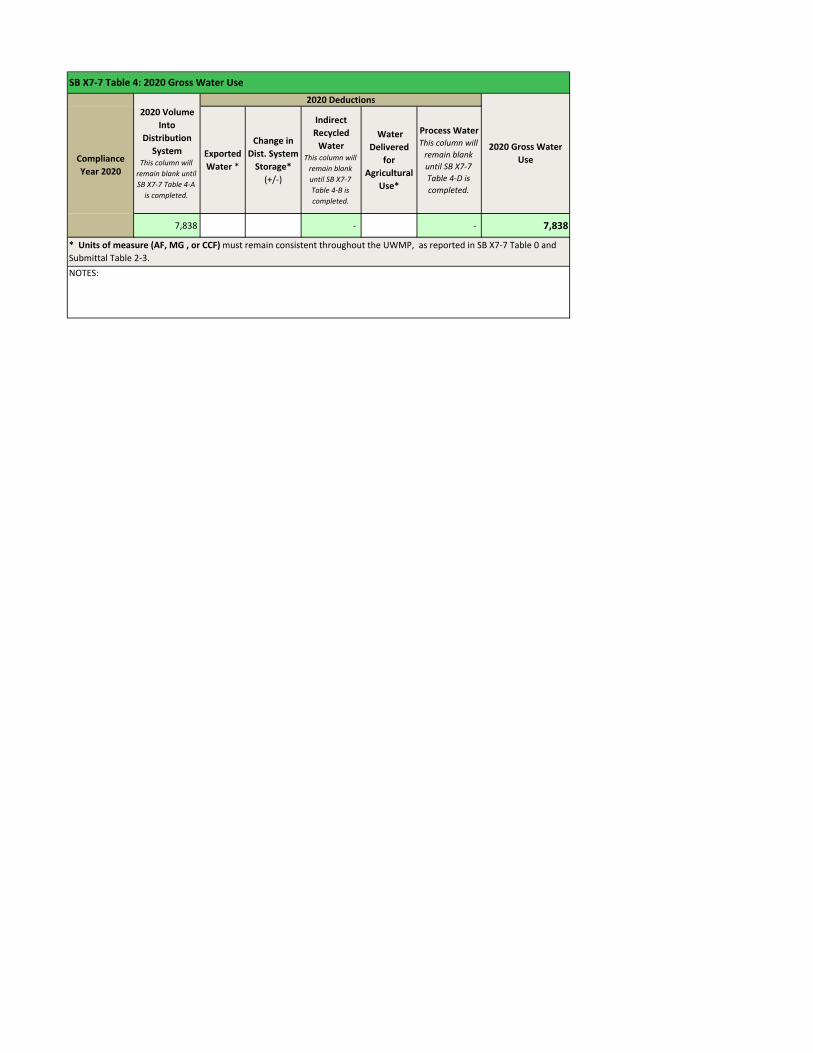
Exported
Water *
Change in
Dist. System
Storage*
(+/‐)
Indirect
Recycled
WaterThis column will
remain blank
until SB X7‐7
Table 4‐B is
completed.
Water
Delivered
for
Agricultural
Use*
Process WaterThis column will
remain blank
until SB X7‐7
Table 4‐D is
completed.
7,838 ‐ ‐ 7,838
NOTES:
SB X7‐7 Table 4: 2020 Gross Water Use
2020 Volume
Into
Distribution
SystemThis column will
remain blank until
SB X7‐7 Table 4‐A
is completed.
2020 Gross Water
Use
2020 Deductions
* Units of measure (AF, MG , or CCF) must remain consistent throughout the UWMP, as reported in SB X7‐7 Table 0 and
Submittal Table 2‐3.
Compliance
Year 2020
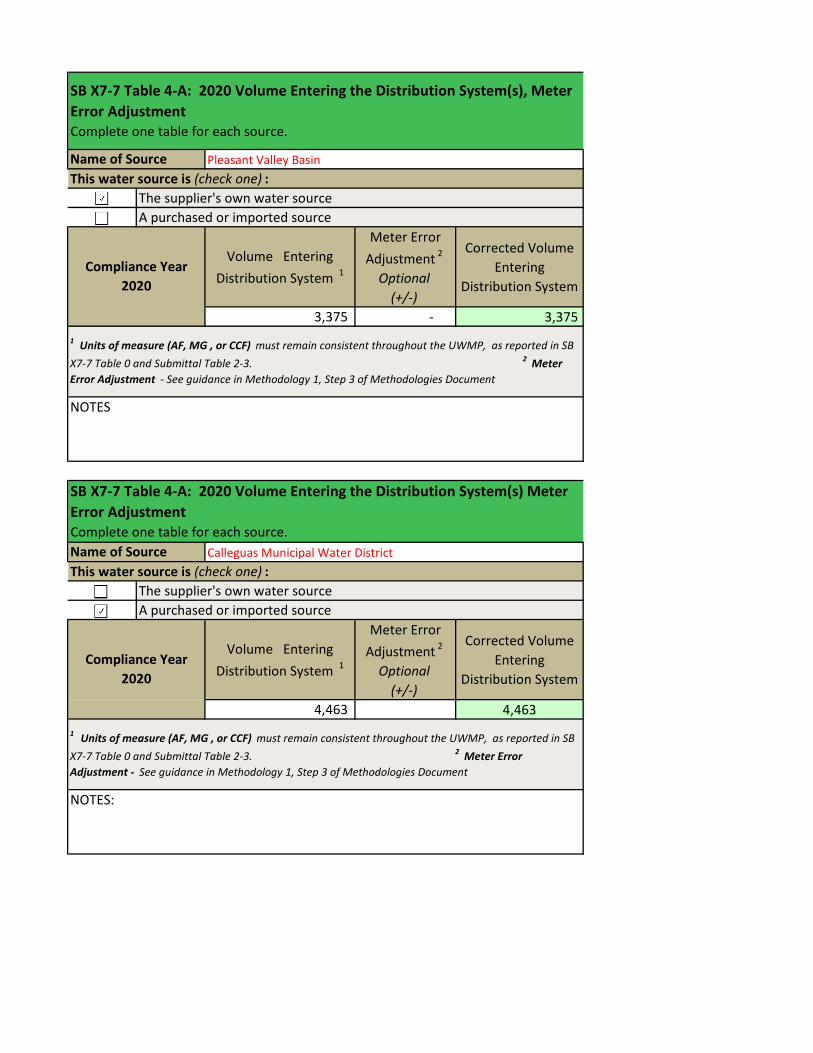
Volume Entering
Distribution System 1
Meter Error
Adjustment 2
Optional
(+/‐)
Corrected Volume
Entering
Distribution System
3,375 ‐ 3,375
Volume Entering
Distribution System 1
Meter Error
Adjustment 2
Optional
(+/‐)
Corrected Volume
Entering
Distribution System
4,463 4,463
This water source is (check one) :
The supplier's own water source
NOTES:
SB X7‐7 Table 4‐A: 2020 Volume Entering the Distribution System(s), Meter
Error AdjustmentComplete one table for each source.
Name of Source Calleguas Municipal Water District
Name of Source
SB X7‐7 Table 4‐A: 2020 Volume Entering the Distribution System(s) Meter
Error AdjustmentComplete one table for each source.
1 Units of measure (AF, MG , or CCF) must remain consistent throughout the UWMP, as reported in SB
X7‐7 Table 0 and Submittal Table 2‐3. 2 Meter
Error Adjustment ‐ See guidance in Methodology 1, Step 3 of Methodologies Document
NOTES
This water source is (check one) :
The supplier's own water source
A purchased or imported source
Pleasant Valley Basin
Compliance Year
2020
A purchased or imported source
1 Units of measure (AF, MG , or CCF) must remain consistent throughout the UWMP, as reported in SB
X7‐7 Table 0 and Submittal Table 2‐3. 2 Meter Error
Adjustment ‐ See guidance in Methodology 1, Step 3 of Methodologies Document
Compliance Year
2020
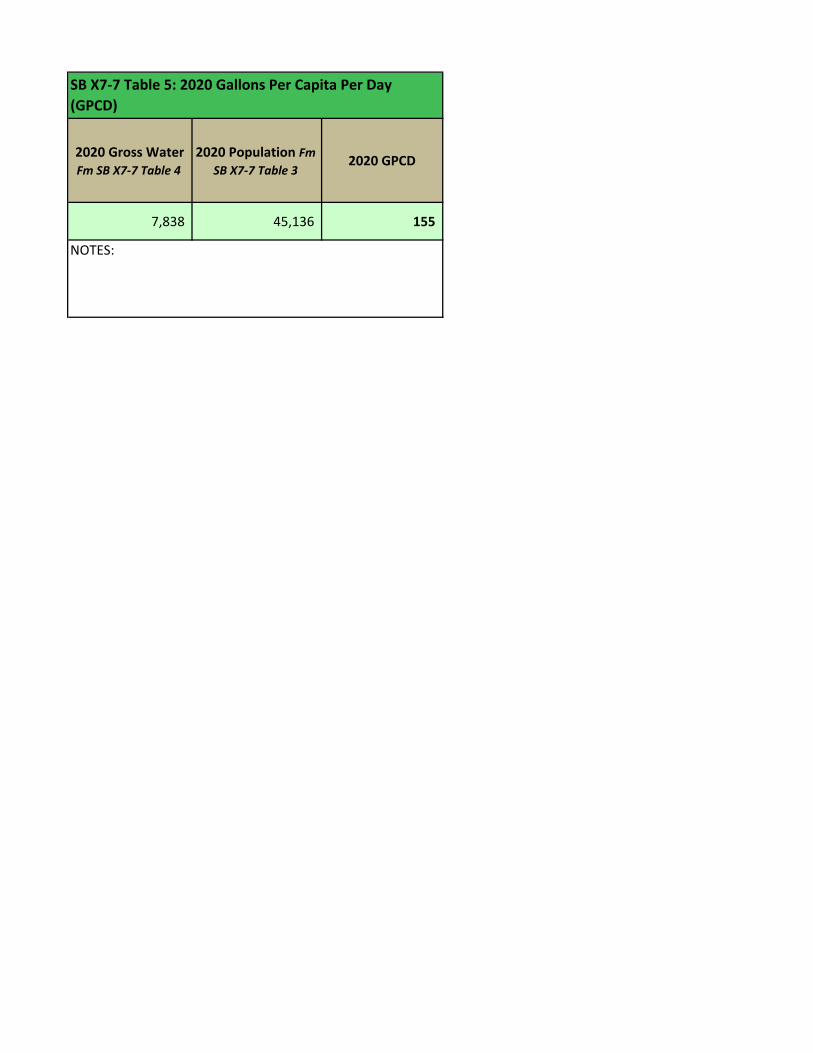
2020 Gross Water Fm SB X7‐7 Table 4
2020 Population Fm
SB X7‐7 Table 32020 GPCD
7,838 45,136 155
SB X7‐7 Table 5: 2020 Gallons Per Capita Per Day
(GPCD)
NOTES:
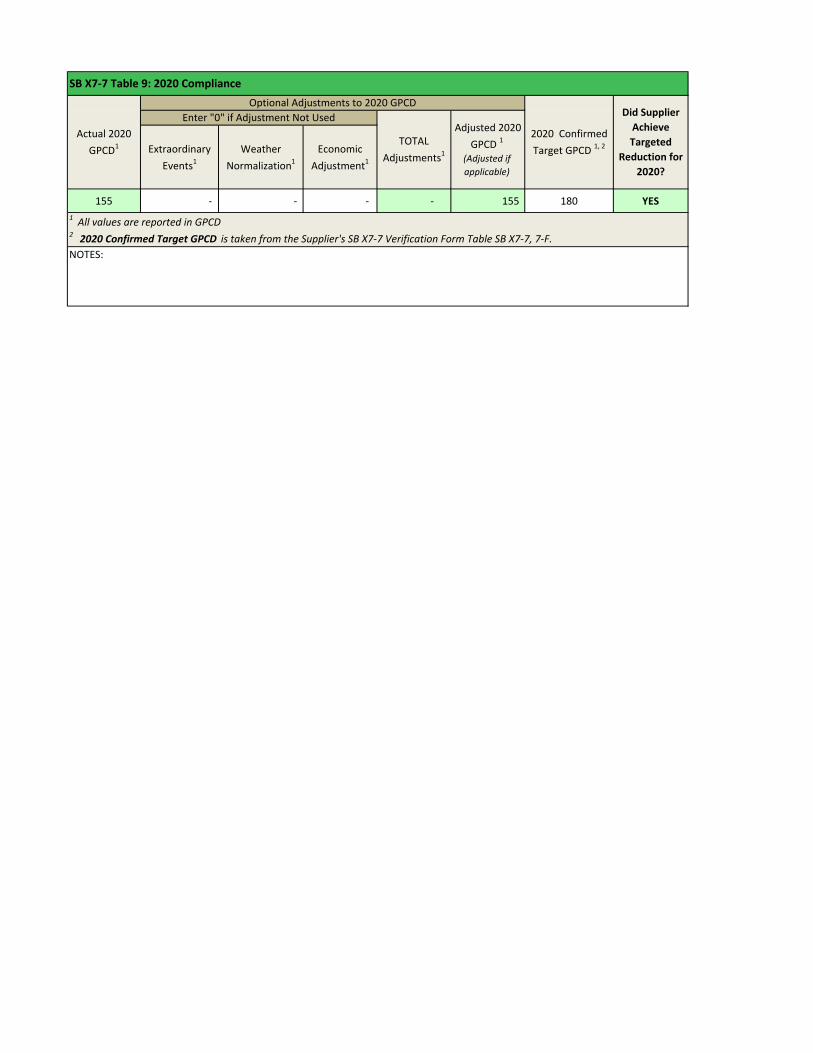
Extraordinary
Events1Weather
Normalization1Economic
Adjustment1
155 ‐ ‐ ‐ ‐ 155 180 YES
NOTES:
1 All values are reported in GPCD 2 2020 Confirmed Target GPCD is taken from the Supplier's SB X7‐7 Verification Form Table SB X7‐7, 7‐F.
SB X7‐7 Table 9: 2020 Compliance
Optional Adjustments to 2020 GPCDDid Supplier
Achieve
Targeted
Reduction for
2020?
Actual 2020
GPCD1
2020 Confirmed
Target GPCD 1, 2TOTAL
Adjustments1
Adjusted 2020
GPCD 1
(Adjusted if
applicable)
Enter "0" if Adjustment Not Used


G
G Appendix G. City of Camarillo Ordinance No. 1126


4828-4407-3523 v2
Page 1
EXHIBIT A
Chapter 14.12 - WATER CONSERVATION MEASURES Sections: 14.12.010 Definitions.
The following words and phrases whenever used in this chapter have the meaning defined in this section:
“GSP” means the current Groundwater Sustainability Plan adopted by the Fox Canyon
Groundwater Management Agency in accordance with the State’s Sustainable Groundwater Management Act.
"Irrigation system" means an irrigation system with pipes, hoses, spray heads, or sprinkling devices that are operated by hand or through an automated system.
"Potable water" means water that is suitable for drinking.
"Recycled water" means the reclamation and reuse of non-potable water for beneficial use as defined in Title 22 of the California Code of Regulations.
“Significant new development project” means a project that proposes five or more new residential units or 10,000 or more square feet of new commercial or industrial space.
"Single pass cooling systems" means equipment where water is circulated only once to
cool equipment before being disposed.
"Water conservation administrator" means the person designated by the city manager to administer the provisions of this chapter or the administrator's designee. 14.12.020 Applicability.
The provisions of this chapter apply to any person in the use of water provided by the city. 14.12.030 Permanent water conservation measures.
The following water conservation measures are in effect at all times:
A. Watering Hours and Duration. Except for testing an irrigation system for a reasonable period of time, watering is prohibited between the hours of 8:00 a.m. and 6:00 p.m., and irrigation systems are limited to no more than 15 minutes of watering per day per station. These restrictions do not apply to the use of a hand-held bucket or similar container, a hand-held hose equipped with a positive self-closing water shut-off nozzle or device, an irrigation system that uses stream rotor sprinklers that meet a 70% efficiency standard, to very low-flow drip type irrigation systems where no emitter produces more than two gallons of water per hour, or to commercial nurseries and growers. In addition, irrigation for the purpose of installing and
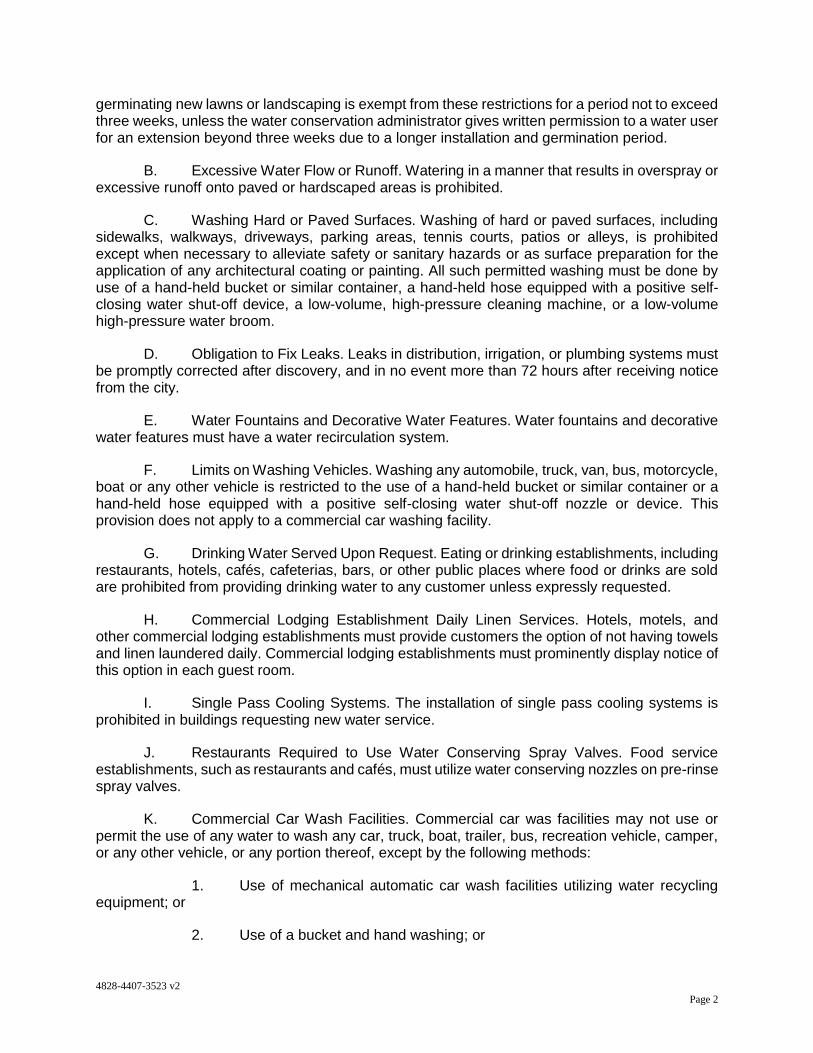
4828-4407-3523 v2
Page 2
germinating new lawns or landscaping is exempt from these restrictions for a period not to exceed three weeks, unless the water conservation administrator gives written permission to a water user for an extension beyond three weeks due to a longer installation and germination period.
B. Excessive Water Flow or Runoff. Watering in a manner that results in overspray or excessive runoff onto paved or hardscaped areas is prohibited.
C. Washing Hard or Paved Surfaces. Washing of hard or paved surfaces, including sidewalks, walkways, driveways, parking areas, tennis courts, patios or alleys, is prohibited except when necessary to alleviate safety or sanitary hazards or as surface preparation for the application of any architectural coating or painting. All such permitted washing must be done by use of a hand-held bucket or similar container, a hand-held hose equipped with a positive self-closing water shut-off device, a low-volume, high-pressure cleaning machine, or a low-volume high-pressure water broom.
D. Obligation to Fix Leaks. Leaks in distribution, irrigation, or plumbing systems must be promptly corrected after discovery, and in no event more than 72 hours after receiving notice from the city.
E. Water Fountains and Decorative Water Features. Water fountains and decorative water features must have a water recirculation system.
F. Limits on Washing Vehicles. Washing any automobile, truck, van, bus, motorcycle, boat or any other vehicle is restricted to the use of a hand-held bucket or similar container or a hand-held hose equipped with a positive self-closing water shut-off nozzle or device. This provision does not apply to a commercial car washing facility.
G. Drinking Water Served Upon Request. Eating or drinking establishments, including restaurants, hotels, cafés, cafeterias, bars, or other public places where food or drinks are sold are prohibited from providing drinking water to any customer unless expressly requested.
H. Commercial Lodging Establishment Daily Linen Services. Hotels, motels, and other commercial lodging establishments must provide customers the option of not having towels and linen laundered daily. Commercial lodging establishments must prominently display notice of this option in each guest room.
I. Single Pass Cooling Systems. The installation of single pass cooling systems is prohibited in buildings requesting new water service.
J. Restaurants Required to Use Water Conserving Spray Valves. Food service establishments, such as restaurants and cafés, must utilize water conserving nozzles on pre-rinse spray valves.
K. Commercial Car Wash Facilities. Commercial car was facilities may not use or permit the use of any water to wash any car, truck, boat, trailer, bus, recreation vehicle, camper, or any other vehicle, or any portion thereof, except by the following methods:
1. Use of mechanical automatic car wash facilities utilizing water recycling equipment; or
2. Use of a bucket and hand washing; or

4828-4407-3523 v2
Page 3
3. Use of a hose equipped with an automatic positive self-closing valve that requires the person using the hose to apply and maintain pressure at the outlet end of the hose to activate and maintain the flow of water
L. Watering During or Immediately After Measurable Rainfall. The application of potable water to outdoor landscapes is prohibited during and within 48 hours after measurable rainfall. As used in this section, “measurable rainfall” means at least on-quarter inch of rain in the city within a 24-hour period as measured by the California Irrigation Management Information System (CIMIS) Weather Station #152 located in Camarillo (http://ipm.ucanr.edu/calludt.cgi/WXDESCRIPTION?STN=CAMARILLO.A) or such other weather station as may subsequently be identified by the City and the information posted on the city’s website.
M. Watering of Turf on Public Street Medians. The irrigation with potable water of ornamental turf on public and private street medians is prohibited.
N. Compliance with Water Efficient Landscape Ordinance. The irrigation with potable water of landscapes outside of homes and buildings must be done in a manner consistent with the applicable regulations or other requirements established under the city’s water efficient landscape ordinance as set forth in Chapter 14.14 of this code.
O. New Potable Water Service Impact Study. Applicants for new potable water service for a significant new development project must cause to be prepared a water impact study to the satisfaction of the public works director demonstrating the project’s total water demand at build out.
P. Water Demand Offset Requirement. In order for an application for new potable water service to be approved and a will-serve letter issued for a significant new development project, the applicant must demonstrate that the proposed project will not create additional demand on the city's water system. To satisfy this requirement an applicant for a significant new development project must provide, to the satisfaction of the city and in accordance with the city's water demand offset program or water demand credit program, as applicable, substantial evidence of an enforceable commitment that the water demand for the project will be offset prior to the provision of a potable water will-serve letter. The applicant may satisfy this requirement through any one or a combination of the following methods: (i) modifications to the project to provide non-required water savings features, (ii) agreements with existing city water users to retrofit existing improvements and facilities with water savings features in accordance with the city’s water demand offset program, (iii) by transferring groundwater pumping rights or allocations that comply with GSP strategies adopted by the Fox Canyon Groundwater Management Agency and are immediately available for use by the city; or (iv) by credit for historic water use by a municipal or industrial customer served water prior January 1, 2014..
14.12.040 Additional water conservation measures.
The following additional water conservation measures apply upon the effective date of the city council's establishment of the relevant water supply condition stage.
A. Stage 1 (Water Supply Condition - 10% Reduction Goal). The following additional water conservation requirements apply during a declared stage 1 water supply condition:
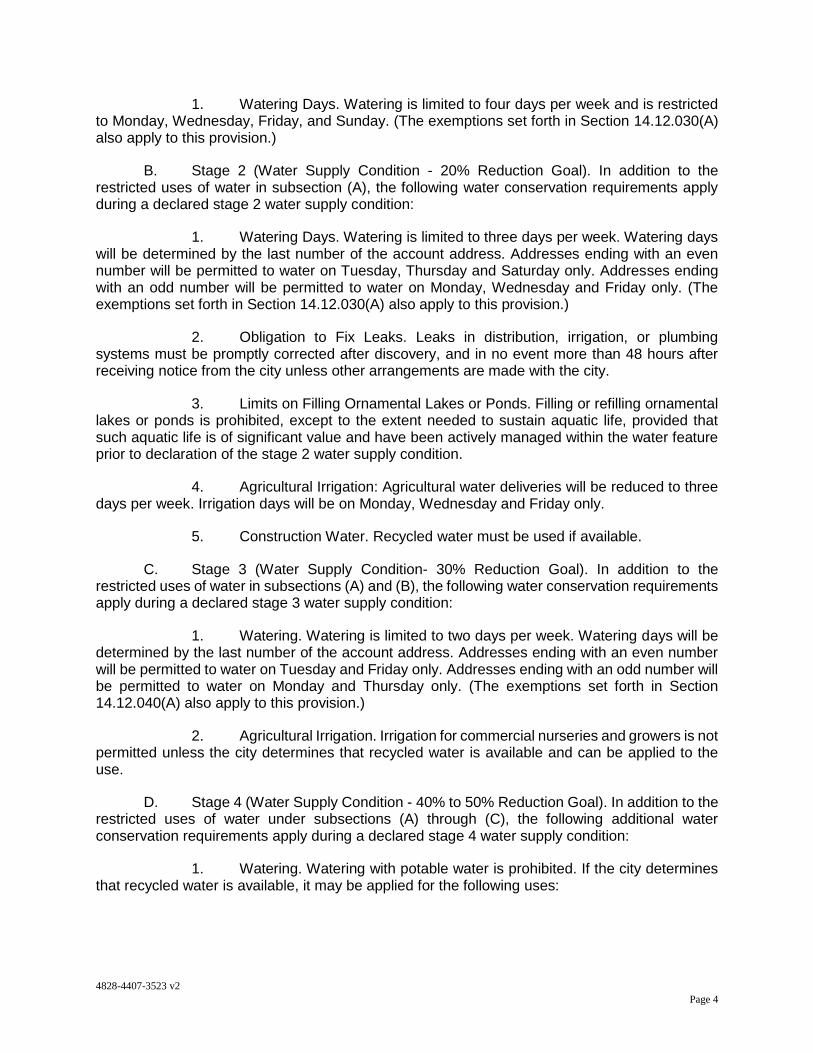
4828-4407-3523 v2
Page 4
1. Watering Days. Watering is limited to four days per week and is restricted to Monday, Wednesday, Friday, and Sunday. (The exemptions set forth in Section 14.12.030(A) also apply to this provision.)
B. Stage 2 (Water Supply Condition - 20% Reduction Goal). In addition to the restricted uses of water in subsection (A), the following water conservation requirements apply during a declared stage 2 water supply condition:
1. Watering Days. Watering is limited to three days per week. Watering days will be determined by the last number of the account address. Addresses ending with an even number will be permitted to water on Tuesday, Thursday and Saturday only. Addresses ending with an odd number will be permitted to water on Monday, Wednesday and Friday only. (The exemptions set forth in Section 14.12.030(A) also apply to this provision.)
2. Obligation to Fix Leaks. Leaks in distribution, irrigation, or plumbing systems must be promptly corrected after discovery, and in no event more than 48 hours after receiving notice from the city unless other arrangements are made with the city.
3. Limits on Filling Ornamental Lakes or Ponds. Filling or refilling ornamental lakes or ponds is prohibited, except to the extent needed to sustain aquatic life, provided that such aquatic life is of significant value and have been actively managed within the water feature prior to declaration of the stage 2 water supply condition.
4. Agricultural Irrigation: Agricultural water deliveries will be reduced to three days per week. Irrigation days will be on Monday, Wednesday and Friday only.
5. Construction Water. Recycled water must be used if available.
C. Stage 3 (Water Supply Condition- 30% Reduction Goal). In addition to the restricted uses of water in subsections (A) and (B), the following water conservation requirements apply during a declared stage 3 water supply condition:
1. Watering. Watering is limited to two days per week. Watering days will be determined by the last number of the account address. Addresses ending with an even number will be permitted to water on Tuesday and Friday only. Addresses ending with an odd number will be permitted to water on Monday and Thursday only. (The exemptions set forth in Section 14.12.040(A) also apply to this provision.)
2. Agricultural Irrigation. Irrigation for commercial nurseries and growers is not permitted unless the city determines that recycled water is available and can be applied to the use.
D. Stage 4 (Water Supply Condition - 40% to 50% Reduction Goal). In addition to the restricted uses of water under subsections (A) through (C), the following additional water conservation requirements apply during a declared stage 4 water supply condition:
1. Watering. Watering with potable water is prohibited. If the city determines that recycled water is available, it may be applied for the following uses:
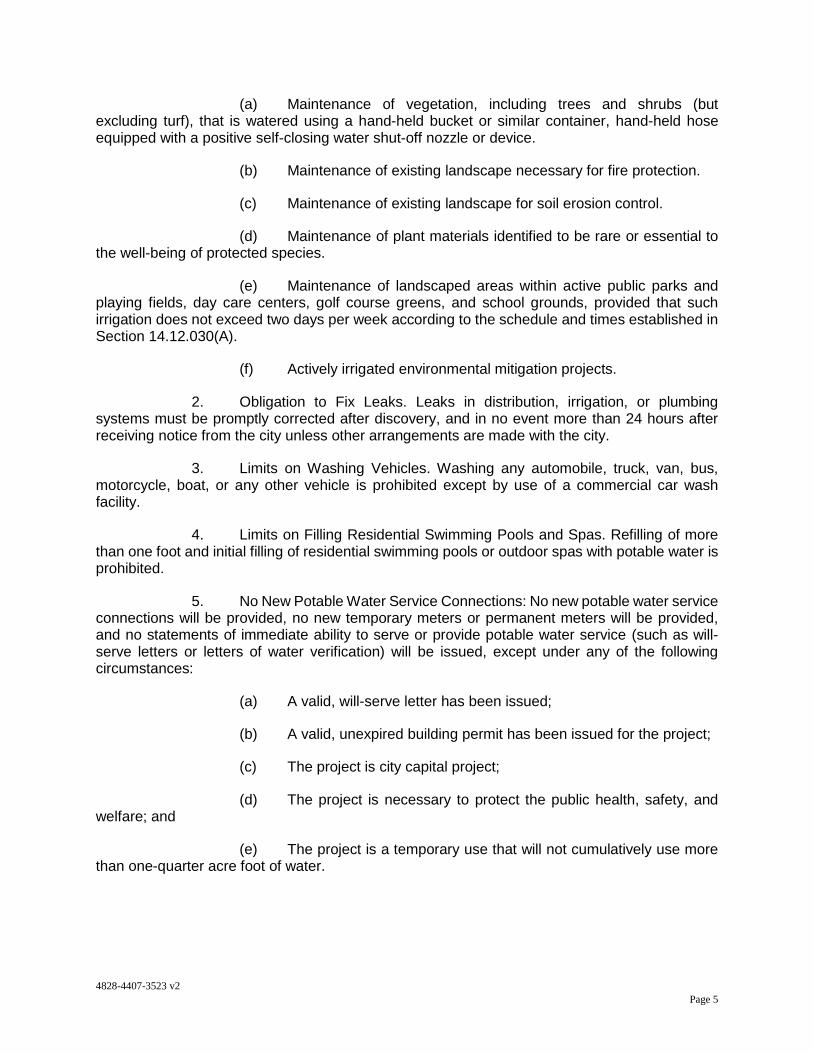
4828-4407-3523 v2
Page 5
(a) Maintenance of vegetation, including trees and shrubs (but excluding turf), that is watered using a hand-held bucket or similar container, hand-held hose equipped with a positive self-closing water shut-off nozzle or device.
(b) Maintenance of existing landscape necessary for fire protection.
(c) Maintenance of existing landscape for soil erosion control.
(d) Maintenance of plant materials identified to be rare or essential to the well-being of protected species.
(e) Maintenance of landscaped areas within active public parks and playing fields, day care centers, golf course greens, and school grounds, provided that such irrigation does not exceed two days per week according to the schedule and times established in Section 14.12.030(A).
(f) Actively irrigated environmental mitigation projects.
2. Obligation to Fix Leaks. Leaks in distribution, irrigation, or plumbing systems must be promptly corrected after discovery, and in no event more than 24 hours after receiving notice from the city unless other arrangements are made with the city.
3. Limits on Washing Vehicles. Washing any automobile, truck, van, bus, motorcycle, boat, or any other vehicle is prohibited except by use of a commercial car wash facility.
4. Limits on Filling Residential Swimming Pools and Spas. Refilling of more than one foot and initial filling of residential swimming pools or outdoor spas with potable water is prohibited.
5. No New Potable Water Service Connections: No new potable water service connections will be provided, no new temporary meters or permanent meters will be provided, and no statements of immediate ability to serve or provide potable water service (such as will-serve letters or letters of water verification) will be issued, except under any of the following circumstances:
(a) A valid, will-serve letter has been issued;
(b) A valid, unexpired building permit has been issued for the project;
(c) The project is city capital project;
(d) The project is necessary to protect the public health, safety, and welfare; and
(e) The project is a temporary use that will not cumulatively use more than one-quarter acre foot of water.
4828-4407-3523 v2
Page 6
6. No New Annexations. The city will suspend consideration of annexations to its service area. This provision does not apply to boundary corrections and annexations that will not result in any increased use of water.
14.12.050 Penalties.
A. Penalties. In addition to any other penalties or remedies provided by this code, the following civil fines and penalties may be assessed for any violation of this chapter and made payable as part of the applicable customer's water bill.
1. First Violation. The city will issue a written warning for a first violation and provide a copy of this chapter by mail.
2. Second Violation. A second violation within the 12 calendar months following the first violation is punishable by a fine not to exceed $100.
3. Third Violation. A third violation within the 12 calendar months following the first violation is punishable by a fine not to exceed $500.
4. Fourth and Subsequent Violations. A fourth and any subsequent violation need not be within the 12 calendar months following the first violation is punishable by a fine not to exceed $1,000.
5. Water Flow Restrictor. In addition to the fines for the fourth and subsequent violations, the city will install a flow restriction device of 1 GPM capacity for services, for a period of at least 48 hours, up to one and one-half inch size, and comparatively sized restrictions for larger services, on the service of the customer at the premises at which the violation occurred. A charge for installing and removing such flow restricting device will be assessed based on the actual cost.
6. Termination of Service.
(a) The city may disconnect a customer's water service for willful violations of this chapter.
(b) When water service is disconnected, it will only be reconnected upon:
1. Proof of correction of the condition or activity; and
2. Payment of the estimated reconnection charge, including the cost of any inspection fees or staff time.
B. Notice. The city will provide notice of each violation to both the customer's billing
address and the service address by regular mail. For purposes of this section, notice will be deemed served 72 hours after deposit in the United States mail. All notices will contain, in addition to the facts of the violation, a statement of the possible penalties for each violation, a statement of the right to appeal the penalty, a brief summary of the appeal process, and if the penalty is termination of service, the date and time termination will occur.
4828-4407-3523 v2
Page 7
14.12.060 Administrative review and appeals of penalties.
A. Administrative Review Procedure.
1. Persons may request an administrative review of any penalty imposed under this chapter within 10 days of the issuance of the notice of violation. This request must be made in writing to the city clerk and set forth with particularity the reasons the person believes a violation did not occur or that the person was not responsible for the violation and contain the address to which the conclusions of the city's review should be mailed. A request for an administrative review is a mandatory prerequisite to a request for an administrative hearing. Penalties, including termination of water service, will be stayed until such review is conducted and a written decision is made by the water conservation administrator.
2. Upon receiving a request for an administrative review, the water conservation administrator will review the request and within 10 business days provide the person with a written determination as to whether the penalty was properly assessed.
3. The administrator must mail a copy of the notification to the person at the address on the request for administrative review along with notice establishing the penalty date and the procedure for requesting an appeal hearing.
B. Appeal Hearing Procedure.
1. Any person dissatisfied with the conclusion of the initial administrative review may contest the penalty by requesting an administrative appeal hearing. A person must file a request for an administrative appeal hearing with the city clerk within 10 days after the date the city served the person with notice of the administrative review decision. The request must be accompanied by the appeal hearing fee, if any, established by city council resolution. Pending receipt of a written appeal or pending a hearing pursuant to an appeal, the city may take appropriate steps to prevent any further unauthorized use of water as appropriate to the nature and extent of the alleged violations and the current declared water supply condition.
2. The appeal hearing will be scheduled to occur within a reasonable period of time following the receipt of the request for a hearing not to exceed 15 business days unless consented to by the appellant.
3. The appellant may present any evidence that would tend to show that the alleged violation did not occur. Formal rules of evidence will not apply and all relevant evidence will be admissible, unless a sound objection warrants its exclusion by the city hearing officer designated by the city manager. The decision of the hearing officer will be final and conveyed in writing to the appellant within five business days of the hearing.

H
H Appendix H. 2015 Ventura County Multi-Hazard Mitigation Plan

Omitted from Final to reduce file size and total pages. A copy of the 2015 Ventura County Multi-Hazard Mitigation Plan can be found by following the link
below:
http://www.vcfloodinfo.com/pdf/2015%20Ventura%20County%20Multi-Hazard%20Mitigation%20Plan%20and%20Appendices.pdf