urban habitat constructions under catastrophic events
TRANSCRIPT

COST is supported by the EU RTD Framework Programme and ESF provides the COST Office through an EC contract.
Urban Habitat Constructions
under Catastrophic Events
Proceedings of Workshop
Prague, 30. � 31. 3. 2007
Ed. Wald F., Mazzolani F., Byfield M., Dubina D., Faber M. Prague, March 2007
COST Action C26 www.cost.esf.org

3
List of Contents
Introduction ...................................................................................................................................................... 7 Mazzolani F., Italy
Fire resistance State of art of structural fire design ................................................................................................................. 11
Wald F., Czech Republic
Behaviour and modelling of composite columns and beams under fire conditions ....................................... 17 Hai Tan Kang, Huang Z.F., & Dharma R.B., Singapore
Connection modelling in fire .......................................................................................................................... 25 Burgess I., United Kingdom
Fire analysis on steel portal frames damaged after earthquake according to performance based design ....... 35 Faggiano B., Esposto M., Mazzolani F.M., & Landolfo R., Italy
Precious and cossfire: two RFCS projects on joints subjected to fire ............................................................ 41 Franssen J.M. & Hanus F., Belgium
Behaviour of a cast in-situ concrete structure during a compartment fire ...................................................... 45 Gillie M. & Stratford T., United Kingdom
Non-linear modelling of reinforced concrete beams subjected to fire ............................................................ 53 Gribniak V., Bacinskas D., & Kaklauskas G., Lithuania
Numerical analysis of beam to column connection at elevated temperatures ................................................ 59 Kwasniewski L., Poland
Stainless steel structural elements in case of fire ............................................................................................ 64 Lopes N., Vila Real P.M.M., Simões da Silva L., Portugal & Franssen J.-M., Belgium
Some remarks on the simplified design methods for steel and concrete composite beams ............................ 70 Nigro E. & Cefarelli G., Italy
Fire design of composite steel-concrete columns under natural fire .............................................................. 76 Pintea D. & Zaharia R., Romania
Variations of forces in a real steel structure tested in fires ............................................................................. 80 Sokol Z. & Wald F., Czech Republic
Class 4 stainless steel box columns in fire ...................................................................................................... 86 Uppfeldt B. & Veljkovic M., Sweden
Analytical model for the web post buckling in cellular beams under fire ...................................................... 92Vassart O., Luxemburg, Bouchaïr H. & Muzeau J.-P., France
Temperature of the header plate connection subject to a natural fire ............................................................. 98 Wald F., Chlouba J. & Kallerová P., Czech Republic

4
Temperatures in unprotected steel connections in fire .................................................................................. 104 Wang Y., Ding J., Dai X.H. & Bailey C.G., United Kingdom
Heat transfer in fire safety engineering ......................................................................................................... 110 Wickström U., Sweden
Earthquake resistanceSeismic vulnerability and risk assessment of urban habitat in Southern European cities ............................ 115
Kappos A., Greece
Typology of seismic motion and seismic engineering design ...................................................................... 130 Mistakidis E., Apostolska-Petrusevska R., Dubina D., Graf W., Necevska-Cvetanovska G., Nogueiro P., Pannier S., Sickert J.-U., Simões da Silva L., Stratan A. & Terzic U.
Experimental and numerical investigations on the Mustafa Pasha Mosque large scale model .................... 158 Krstevska L., Taskov Lj., Gramatikov K., FYR of Macedonia,Landolfo R., Mammana O., Portioli F. & Mazzolani F.M., Italy
Innovative materials and technologies for existing and new buildings in seismic areas .............................. 170 Mandara A., Italy
Consolidation, rebuilding and strengthening of the St. Panteleymon church - Ohrid .................................. 188 Apostolska R. & Necevska-Cvetanovska G., FYR of Macedonia
High strength steel for seismic resistant building frames ............................................................................. 193 Dubina D., Dinu F., Ungureanu V., Zaharia R. & Grecea D., Romania
Strengthening of masonry walls by innovative metal based techniques ....................................................... 201 Dogariu A., Stratan A., Dubina D., Nagy-Gyorgy T., Daescu C. & Stoian V., Romania
Seismic upgrade of non-seismic r.c. frames using steel dissipative braces .................................................. 211 Bordea S., Stratan A., Dogariu A. & Dubina D., Romania
Experimental tests on seismic upgrading techniques for RC buildings ........................................................ 221 Mazzolani F.M., Della Corte G., Barecchia E., & D�Aniello M., Italy
Full-scale cyclic tests of a real masonry-infilled RC building for seismic upgrading .................................. 229 Mazzolani F.M., Della Corte G., L. Fiorino, & Barecchia E., Italy
Shear panels for seismic upgrading of new and existing structures ............................................................. 237 Mazzolani F.M., De Matteis G., Panico S., Formisano A., & Brando G., Italy
Seismic design of cold-formed steel housing: a case study .......................................................................... 245 Iuorio O., Landolfo R. & Fiorino L., Italy
Performance-based seismic retrofit of r.c. and masonry buildings ............................................................... 252 Mandara A., Avossa A.M., Ferraioli M., Ramundo F., & Spina G., Italy
Earthquake protection of historical buildings ............................................................................................... 260 Mazzolani F.M., Italy
The MNB aseismic isolation system for the seismic protection of structures .............................................. 268 Michalopoulos A., Nikolaidis T. & Baniotopoulos C.C., Greece

5
Impact and explosion resistanceState of the art in Europe and activity developed within WG3 Impact and Explosion ................................ 274
Smith P.D., United Kingdom
Protecting critical infrastructure systems ...................................................................................................... 281 Krauthammer T., USA
Robust design of steel framed buildings against extreme loading ................................................................ 295 Byfield M., United Kingdom, De Matteis G., Italy & Dinu F., Romania
Aircraft impact on reinforced concrete structures ......................................................................................... 302 Kilic S.A. & Altay G., Turkey
Analysis of reinforced concrete structures subjected to blast loading .......................................................... 307 Karapinar S., Sanri I. & Altay G., Turkey
Reconstruction and seismic strengthening of St. Athanasius church damaged by explosion ....................... 314 Sendova V., B. Stojanoski & L. Tashkov, FYR of Macedonia
Behaviour of microreinforced soil under impact loads of small magnitude ................................................. 320 Mendes A.I.A., Rebelo C.A.S., Pinto M.I.M. & Falorca I. M.C.F.G., Portugal
Atmospheric loads in considerations on extreme events and structural norms ............................................ 326 Snarskis B. & Simkus R., Lithuania
Robustness � robust structures by joint ductility .......................................................................................... 330 Kuhlmann U., Rölle L., Germany, Jaspart J.-P. & Demonceau J.-F., Belgium
The prevention of disproportionate collapse using catenary action .............................................................. 336 Byfield M. & Paramasivam S., United Kingdom
Peak pressure in flats due to gas explosion ................................................................................................... 341 Langone I., De Matteis G., Rebecchi V. & Mazzolani F.M., Italy
Impact loading of pressurized steel pipelines ............................................................................................... 347 Gresnigt A. M., Netherlands, Karamanos S. A. & Andreadakis K. P., Greece
Resistance to infrequent actionsFramework for risk assessment of structural systems ................................................................................... 359
Faber M. H., Switzerland
Identification and classification of response of urban habitat constructions subjectedto extraordinary loading conditions ..................................................................................................... 368 Wolinski S., Poland
Identification & classification of exposure events - exceptional or infrequent event scenarios .................... 372 Muzeau J.P., Bouchaïr A., France, Sesov V., FYR of Macedonia & Coelho C., Portugal
Optimization of flood protection policy ........................................................................................................ 380 Fo�umpaur P. & Satrapa L., Czech Republic
Authors index .......................................................................................................................................... 385

6

7
This volume collects the Proceedings of the Work-shop held on 30-31 March in Prague. It represents the first deliverable of the COST C26 Action, the new international project recently sponsored by the European Commission dealing with �Urban Habitat Constructions under Catastrophic Events�. This pro-ject started in June 2006 and will end in 2010.
The main objective of the project is to increase the knowledge on the behaviour of constructions lo-cated in urban habitat and subjected to both natural and/or man-made catastrophic events. They are earthquakes, fire, wind storms, heavy snow loading, gas explosions, accidental impact from projectiles or vehicles out of control and occasionally due to bomb blasts during terrorist attacks. The main scope is to characterise the performance of structures under such loading conditions and therefore to evaluate the consequences of a catastrophic event occurring in a given region, with regard to life safety, economic losses due to direct damage as well as indirect social costs related to loss of use of a facility or a class of facilities. In this view, it has been planned to define suitable tools for predicting the ultimate response of constructions under extreme conditions, which occur when both the loading and the structural resistance are combined in such a way to reduce the safety level below acceptable values. In addition, the preparation of ad-hoc guidelines for the damage prevention as well as for the repairing of construc-tions hit by the above situations is planned.
Twenty European Countries are until now par-ticipating to this project (Austria, Belgium, Czech Republic, Finland, France, Germany, Greece, Italy, Lithuania, Macedonia, Malta, Netherlands, Poland,
Portugal, Romania, Slovenia, Sweden, Switzerland, Turkey, United Kingdom), which make optimal use of their existing and currently developing knowledge in this field, by also functioning as a source of valu-able information to National and International Stan-dards organisations.
The whole activity is developed by four Working Groups: WG1 on fire resistance, chairman F. Wald; WG2 on earthquake resistance, chairman D. Dubina; WG3 on impact and explosion resis-tance, chairman M. Byfield; WG4 on resistance to infrequent actions, chairman M. Faber. They organ-ized four separate Sessions during the Workshop, which are characterized by a common format com-posed by Keynote lectures by invited experts and papers from the WG membership.
In this context, at the end of the first year of ac-tivity, the Workshop provides a suitable forum to share among all the WGs members the acquired knowledge about every specific catastrophic event and to inform each other about the state of work re-garding the in-progress set up of methodologies for facing and assessing all the concerned issues. The publication of the proceedings has therefore the aim to allow the spreading of the ongoing activity, for making aware the scientific and professional com-munities on these subjects and stimulating more re-search on these topics. At the same time this volume represents a useful milestone to build the future ac-tivity of the Cost C26 Action.
The final edition and layout of this Proceedings was completed by J. Chlouba and M. Strej ek at Czech Technical University in Prague in February-March 2007.
Introduction
F. M. MazzolaniChairman of COST C26 Action

8

9
European Cooperationin the field of Scientific and Technical Research
Action C26 Urban Habitat Constructions under Catastrophic Events Proceedings of Workshop Prague, 30. � 31. 3. 2007
WG 1
Fire Resistance

10

11
1 INTRODUCTION
Existing recommendations, models and regulations about structural safety are mostly aimed at ensuring an adequate level of safety for constructions under normal loading conditions. The overall structural safety is dealt by assuming an increase in the multi-pliers of service loads up to reach the collapse val-ues. This approach has led to a satisfying degree of accuracy in the prediction of safety margins under serviceability load conditions. A greater accuracy in the evaluation of structural safety is possible when a probabilistic or semi-probabilistic approach is fol-lowed in the determination of both actions and struc-tural resistance. In this way it is possible to achieve a good response of structures subjected to random ac-tions. These approaches form the basis of most re-cent developments in the field of regulations and are part of almost all relevant structural codes, including of course the Eurocodes, where specific allowance for accidental loading conditions is made.
For member states of the European Union, safety requirements in case of fire are based on the Con-struction Products Directive, Council Directive 89/106/EEC, from 21.12. 1988. The Directive shall be applied to construction products as the essential requirement in respect of construction works. In An-nex I of the Directive, the essential requirements are summarised for Mechanical resistance and stability in the first paragraph and for fire safety in the sec-ond one. The construction works must be designed and built in such a way that in the event of an out-break of fire: the load-bearing capacity of the con-struction can be assumed for a specific period of time; the generation and spread of fire and smoke
within the works are limited; the spread of the fire to neighbouring construction works is limited; occu-pants can leave the works or be rescued by other means; the safety of rescue teams is taken into con-sideration. The load-bearing capacity of the con-struction may be modelled on the principles summa-rised in the various fire parts of structural Eurocodes.
2 FIRE DESIGN 2.1 Fire resistanceFire resistance is commonly used to characterize the performance of elements of structure in fire. In this regard, fire resistance may be defined as the time for which elements of a structure satisfactorily perform their required functions under specified fire condi-tions. These functions may include the ability: not to collapse, to limit the spread of fire, to support other elements. All materials progressively lose their abil-ity to support a load when they are heated. If com-ponents of a structure are heated sufficiently, they may collapse. The consequences of such a collapse may vary, depending on how critical the component is in controlling the overall behaviour of the struc-ture. In order to limit the threat that a fire poses to people in a building and to reduce the amount of damage that a fire may inflict, large buildings are divided up into smaller fire compartments using fire resisting walls and floors. Parts of a fire compart-ment may be divided up by fire resisting construc-tion to protect particular hazard within them. The performance of fire separating elements may rely
State of art of structural fire design
F. WaldCzech Technical University in Prague, Czech Republic
ABSTRACT: The paper summarizes the knowledge in the field of behaviour of structures under fire action. The emphasis of this paper is to present the background for studying structural integrity under extreme fire conditions. Structural integrity is the major goal of designers to ensure sufficient resistance of the structure under accidental actions and to enhance structural safety under extreme conditions. Structural integrity can only be achieved by robustness of structural elements and joints, which requires balanced stiffness, strength and ductility between structural members, connections and supports.

12
heavily on the ability of the structure that supports them to continue to provide that support under fire conditions (Buchanan, 2000). The criticality is the degree to which the collapse of an individual struc-tural element affects the performance of the structure as a whole. All main components of a structure are generally expected to exhibit fire resistance propor-tionate to the nature of the perceived risk. The nature of the risk is usually assessed on the basis of the size and proposed use of the building in which the struc-tural element occurs, which is an important part of a fire safety risk analysis.
The definition of fire resistance is the ability of construction or its element to satisfy for a stated pe-riod of time load bearing capacity, integrity and in-sulation (separately or combined). As a consequence of European harmonization, fire resistance is in-creasingly being expressed in terms of R, E and I,where R means the resistance to collapse, i.e. the ability to maintain load-bearing capacity; E is the re-sistance to fire penetration, i.e. the ability to main-tain the fire integrity of the element against the pene-tration of flames and hot gases; and I is the resistance to the transfer of excessive heat, i.e. the ability to provide insulation to limit excessive tem-perature rises.
The term elements of structure is used in fire en-gineering to mean main structural elements such as structural frames, floors and walls. Compartment walls are treated as elements of structure although they are not necessarily load-bearing. External walls such as curtain walls or other forms of cladding that transmit only self weight and wind loads, and that do not transmit floor loads, are not regarded as load bearing, although such walls may need fire resis-tance to satisfy other requirements in connection with a need to restrict fire spread between buildings. Load bearing elements may or may not have a fire-separating function. Fire-separating elements may or may not be load bearing. 2.2 Fire designThe design for fire safety have traditionally followed prescriptive rules and may now apply performance based (or fire engineering) approaches, examples of which are given in the various structural fire stan-dards (in Eurocodes in documents EN 1990: 2002 and 1991-1-x: 2005). A fire engineering approach takes into account fire safety in its entirety and pro-vides a more fundamental and economical solution than the prescriptive approaches. Within the frame-work of fire engineering approach, designing a structure involves four stages. The first stage is to model the fire scenario to determine the heat re-leased from the fire and the resulting atmospheric temperatures within the building. The second stage is to model the heat transfer between the atmosphere
and the structure. Heat transfer involves conduction, convection and radiation which all contribute to the rise in temperature of the structural materials during the fire event. The third stage evaluates the me-chanical loading under fire conditions, which differs from the maximum mechanical loading for ambient temperature design (due to reduced partial safety factors for mechanical loading under fire). The fourth stage is the determination of the response of the structure at elevated temperature.
The design recommendations in codes contain simple checks, which provide an economic and ac-cessible method for the majority of buildings. For complex problems, considerable progress has been made in recent years in understanding how struc-tures behave when heated in fires and in developing mathematical techniques to model this behaviour. It is possible to predict the behaviour of certain types of structure with a reasonable degree of accuracy. The most common form of analysis is the finite ele-ment method. It may predict thermal and structural performance. In fire, the behaviour of a structure is more complex than at ambient temperatures. Changes in the material properties and thermal movements cause the structural behaviour to become non-linear and inelastic. 2.3 Fire modellingIn the standard fire resistance tests the gas tempera-ture is increased to follow a predefined time/temperature curve, called according to Euro-codes the standard nominal fire curve or earlier ISO 834 fire curve. This heating regime is very different from that occurring in real fires. The maximum tem-perature attained in a real fire and the rate at which temperatures increase depend on a number of factors related to the fuel available, the geometric and ther-mal properties of the compartment and the availabil-ity of openings through which oxygen can be sup-plied to the fire. Techniques have been developed to mathematically describe a natural fire. The analysis determines the rate at which heat is released from the available fuel, see (Schleich at al, 1999). This is a function of the amount of ventilation available and the density and distribution of the fuel itself. Heal loss from the compartment via convection and radia-tion from the openings, and conduction through the other solid boundaries is calculated before the result-ing atmospheric temperatures may be determined.
Fire models of various degrees of sophistication may be used to obtain a design fire scenario. At the simplistic level, periods of standard fire resistance are specified in regulations. The next level up is to attempt to relate the damaging effect of a real fire to the standard fire by using the time-equivalent ap-proach. Ideally, the equivalent time should be based on comparing the performance of an element in a

13
natural fire with the known performance of the same element in a fire resistance test. The time equiva-lency approach is attractive to fire investigators and fire engineers because this allows them to relate the complex behaviour of a real fire to the standard fire resistance, which is a well understood concept. An equivalent time equation is given in Eurocode 1 Part 1.1 which expresses the equivalent time as a func-tion of the fire load, ventilation and thermal charac-teristics of the enclosure.
A more rational (yet still relatively simple) ap-proach for a post-flashover real fire is to assume uni-form temperature within the fire enclosure and to specify the uniform fire temperature � time relation-ship. Eurocode 1 Part 1.1 refer to them as parametric fire curves and provides equations to calculate these curves using the three aforementioned parameters, which is based on the pioneering research work of Pettersson, see (Pettersson et al, 1997). At the other end of complexity of fire modelling, computational fluid dynamics modelling may be used, see (Drys-dale, 1999). 2.4 Structural response
Structural response and its modelling under fire condition depend on the applied structural materials as well as the extent of the modelled structure which may be the whole structure or its parts or individual elements. Standard fire resistance tests can only pro-vide limited guidance. As far as different materials are concerned, aluminium and steel transfer heat rapidly. Timber, masonry, concrete and lightweight concrete have better insulation properties, see (Fran-gi & Fontana, 2000 and Cooke, 2004). The added insulation may be economical for aluminium, steel and timber structures. The simplified design models in codes such as Eurocodes are mostly based on de-sign check equations for ambient temperature de-sign, see (Franssen et al, 1995). On the other hand, more advanced models of global analysis using fi-nite element method may be used to deal with struc-tural interactions between different structural mem-bers and connections as well as structural behaviour at large deformations.
3 STATE OF ART 3.1 New studiesNew design methods are now being used in practice to increase safety of steel structures under fire condi-tions. Such new design methods have been devel-oped based on recent new research studies of mate-rial properties at elevated temperatures, analysis of simple elements and joints and complex structures, and modelling of realistic fires, see (Wald et al, 2000). The following sections will present recent
progresses in the following three areas that the au-thor has made the opportunity to contribute: com-posite slab behaviour, the modelling of aluminium structures and the component model for the behav-iour of steel joints in case of fire.
Figure 1. Compartment after the seventh large Cardington test, see (Wald et al, 2006), the slab residual deformation 915 mm.
3.2 Floor slabs in fire Modern steel framed multi-storey buildings com-monly use composite steel deck floors. These floors consist of a profiled steel deck with a concrete top-ping. Included within the concrete is some light re-inforcement. Indentations in the deck enable the deck and concrete to act together as a composite slab. The reinforcement is included to control cracking, to resist longitudinal shear and, in the case of fire, to act as tensile reinforcement. It is common to extend the composite action to the supporting beams. Shear studs are welded through the deck onto the top flange of the beam to develop compos-ite action between the beam and concrete slab. The resulting, two-way-acting, composite floor is struc-turally efficient and economic to construct.
The Building Research Establishment has devel-oped a simple structural model (Newmanm et al, 2000) that combines the residual strength of the steel composite beams with the slab strength calculated using a combined yield line and membrane action model. The slab model is based on catenary action of the slab and the resistance of the unprotected composite beam, see (Bailey & Moore, 2000). The model was applied to the concrete slabs as well. The critical parts of the model are the ductility of the mesh and the assumption of the supported bounda-ries of the slab. The model has been calibrated against the Cardington fire tests, see Figure 1, and other test results on slabs. Fire tests undertaken in recent years on the eight-storey steel framed build-ing at BRE�s Cardington Laboratory have demon-strated the inherent fire resistance of composite flooring systems. This improved performance is the result of membrane action developing in the lightly reinforced concrete slab enabling it to bridge over its

14
fire damaged supporting steel beams and safely carry the applied load to the columns.
However, none of the floors tested at Cardington failed and without data on the mode of failure nei-ther the capacity of the composite floor slabs nor the margins of safety associated with the design methods can be established, see (Lennon, 1997). E.g. During the sevenths Cardington test the applied load was 6,1 kNm-2 and the predicted resistance by catenary action 4,1 kNm-2, but collapse was not reached, see (Wald et al, 2006). Therefore a com-partment fire test on the steel framed building with sufficient applied load allows the actual mode of failure to be determined so as to evaluate the accu-racy of existing design guidance. 3.3 Aluminium structuresTraditionally, the behaviour of aluminium alloy in fire is thought to be a critical task for the structural design team, see (Maljaars et al, 2006). This is due to the rapid decrease of material resistance at ele-vated temperatures, when compared to other tradi-tional materials like steel and reinforced concrete. In particular, aluminium alloys melt between 600 and 650 °C, the exact value being dependent on the type of alloy under consideration, and at 200 - 250 °C, most of the alloys have already lost approximately 50 % of their original strength at room temperature. For this reason, when aluminium structural elements are required to achieve fire resistance, the adoption of reliable prediction models is essential, allowing accurate design calculations and safety assessment to be carried out, see (Langhelle & Amdahl, 2001). The features of aluminium alloys change under ex-posure to high temperatures. Relevant values of both physical and mechanical properties are given in the Proposal of European standard prEN 1999-1-2: 2005. Similar to steel structures, the proposed Euro-code for aluminium allows the temperature distribu-tion in the cross-section to be determined by thermal analysis and the bearing capacity of the structure at elevated temperature to be evaluated by means of structural analysis. In general, it has to be empha-sised that almost all the material properties are de-pendent on the type of alloy, but common features may be identified, allowing general trends to be rec-ognised. The main parameters for characterising the me-chanical behaviour of aluminium alloys in the elastic range are Young�s modulus E and 0,2 % proof strength f0,2, the latter being used as conventional elastic limit of the material. The former is practically independent of the adopted alloy, while the latter is related to the type of alloy under consideration. In Figure 2, values suggested by Eurocode 9 (prEN 1993-1-2:2004) for typical aluminium alloys and tempering at elevated temperatures are depicted. It can be observed that there are remarkable variations in the conventional elastic limit as a function of tem-
perature f0.2, due to type of alloy and tempering. For instance, the relative strength values at 200 °C are 91 % and 43 % for 5086-H112 and 7075-T6 alloy, respectively. The values are taken after 30 min of heating of the alloy, which represents the limit of fire resistance. One common trend among different groups of alloy is that the beneficial effects of heat treatment and work hardening, used to improve the mechanical properties at normal temperatures, di-minishes at high temperatures. The emissivity of surface is dependent on the sur-face finish and may be an advantage for polished surfaces. For aluminium are suggested values 0,3 and 0,7 for clean uncovered surfaces and for painted and covered surfaces, respectively
ki,Reduction factor,
0
0,1
0,2
0,3
0,4
0,5
0,6
0,7
0,8
0,9
1
0 100 200 300 400 Temperature, °C
al ,°C
EN AW-5086, H112
EN AW-3003, O
k0,
EN AW-5454, H32
EN AW-7075, T6
Elastic modulus
k0,
k0,
k 0,
kE,
Figure 2. Reduction of elastic modulus and 0,2% proof strength of selected aluminium alloys at elevated temperatures as sug-gested by document (prEN 1999-1-2: 2006).
3.4 Component method for connection designFailure of the WTC on 11th September 2001 alerted the engineering profession to the possibility of con-nection failure under fire conditions. The failure of the connections is thought, by some, to have initi-ated the progressive collapse of both towers.
When subject to fire, steel loses both its strength and stiffness. Steel structures also expand when heated and contract on cooling. Furthermore the ef-fect of restraint to thermal movement can introduce high strains in both the steel member and the associ-ated connections, see (Wang, 2002). EN 1993-1-2 gives two approaches for the design of steel connec-tions. In the first approach fire protection is applied to the member and its connections. The level of pro-tection is based on that applied to the connected members taking into account the different level of utilisation that may exist in the connection compared to the connected members. Fire tests on steel struc-tures have shown that the temperature within the

15
connections is lower compare to connecting steel members. This is due to the additional material around a connection (column, end-plate, concrete slab etc.) which significantly reduces the tempera-tures within the connections compared to those at the centre of supported beam.
Recent experimental evidence have highlighted the need to evaluate the behaviour of steel joints at elevated temperatures, since they exhibit a distinct change of its moment-rotation response under in-creasing temperature, that affects the global response of the structure. Traditionally steel beams have been designed as simply supported. However it has been shown in recent large scale fire tests on the steel building at Cardington (Moore & Lennon, 1997), see Figures 3 and 4, in real fires and in experimental re-sults on isolated connections, that joints that were assumed to be pinned at ambient temperature can provide considerable levels of both strength and stiffness at elevated temperature. This can have a beneficial effect on the survival time of the structure.
Figure 3. Rupture of the end plate beam to column connection without lost of the bearing resistance during the seventh large Cardington fire test, see (Wald et al, 2006).
A more detailed approach uses an application of the component approach together with a method for calculation the behaviour of welds and bolts at ele-vated temperature. By using this approach the con-nection moment, shear and axial capacity can be evaluated at elevated temperature (Simões da Silva et al, 2001) and (Spyrou et al, 2002). In terms of cold design, the component method constitutes today the widely accepted procedure for the evaluation of the various design values. It has now been validated as an analytical procedure that is capable of predicting the moment-rotation response under fire conditions. This procedure consists of modelling a joint as extensional springs and rigid links, whereby the springs represent a specific part of a joint making an identified contribution to one or
more of its structural properties, component. Each component exhibits a non-linear force deformation response, characterised by four properties: elastic stiffness, post-limit stiffness, limit load, yield dis-placement and limit displacement. At elevated tem-perature the influence of the normal forces needs to be taken into account.
Figure 4. Deformation of the fin plate beam to column connec-tion during the seventh large Cardington fire test, see (Wald et al, 2006).
4 CONCLUSION European knowledge of fire design has reached a mature stage with the development of well calibrated engineering tools for modelling structural behaviour under fire conditions. Four steps of procedure may be identified: modelling fire scenario in the com-partment or a local fire, modelling the transfer of heat to the structure, assessment of the mechanical loading under fire conditions, and evaluation of the response of the structure at elevated temperature. Tools for all four separate stages are available for practical application. Merging of these models is also under development in several institutes. The simplest design models are supported by design ta-bles and design charts. More advanced models can deal with natural fire scenarios, refined transfer of heat between the atmosphere and the structure and non-linear large displacement global analyses. Some complex models, based on FE modelling of fire sce-narios and 3D non-linear behaviour of structures, are ready to be applied for prediction of the structural behaviour under exceptional fire loading.
Nevertheless, applications of these complex mod-els are limited by tests on whole buildings in fire and by confirmation of accurate prediction of internal forces under fire. Further research studies are neces-sary and indeed some are already been undertaken by various researchers to gain new knowledge so as to develop better tools to help achieve future desired level of fire safety.

16
5 ACKNOWLEDGEMENT The work was prepared with support of Grant MSMT OC190.
6 REFERENCESAllam, A. M., Fahad, M. K., Liu, T.C.H, Burgess, I. W., Plank,
R. J. & Davies, J.M. 1999. Effects of Restraint on the Behaviour of Steel Frames in Fire. Proceedings of the Conference Eurosteel �99, Prague 279-282.
Bailey, C. G., Burgess, I. W. & Plank, R. J. 1996. Computer Simulation of a Full-scale Structural Fire Test, The Structural Engineer, 74 (6), 93-100.
Bailey, C. G. & Moore D.B. 2000. The structural behaviour of steel frames with composite slabs subject to fire, Part 1: Theory, The structural Engineer; Part 2: Design, The structural Engineer.
Buchanan A. H. 2000. Structural design for fire safety, John Wiley & Sons 2000, ISBN 0-471-89060-X.
Cooke G. M. 2004. Stability of lightweight structural sandwich panels exposed to fire, Document number 10.1002, New Zealand.
Drysdale, D. D. 1999. An Introduction to Fire Dynamics, 2nd
ed, West Sussex, England, John Wiley & Sons. EN 1990-1-2: 2002. Eurocode: Basis of structural design,
Brussels.EN 1991-1-2: 2002. Eurocode 1, Basis of design and actions
on structures � Part 2-2: Actions on structures � Actions on structures exposed to fire, CEN, Brussels.
EN 1993-1-2: 2005. Eurocode 2 � Design of concrete structures�Part 1-2: General Rules � Structural fire design, CEN, Brussels.
EN 1993-1-2: 2005. Eurocode 3 � Design of steel structures � Part 1-2: General Rules � Structural fire design, CEN, Brussels.
EN 1994-1-2: 2005. Eurocode 4 � Design of composite steel and concrete structures - Part 1-2: General rules - Struc-tural fire design, CEN, Brussels.
EN 1995-1-2: 2005. Eurocode 4 � Design of timber structures� Part 1-2: General Rules � Structural fire design, CEN, Brussels.
EN 1996-1-2: 2005. Design of masonry structures � Part 1-2: General rules � Structural fire design, CEN, Brussels.
Frangi A. & Fontana M. 2000. Versuche zum Tragverhalten von Holz-Beton-verbunddecken bei Raumtemperatur und normbrandbedingungen, Institut für Baustatik und Konstruktion (IBK), ETHZürich, IBK Bericht Nr. 249, Birkhäuser Verlag Basel.
Franssen, J. M., Schleich, J. B. & Cajot, L.-G. 1995. A simple model for fire resistance of axially-loaded members ac-cording to Eurocode 3; J. Construc. Steel Research, Vol. 35; pp. 49-69.
Kirby B.R. 1995. The Behaviour of High-strength Grade 8.8 Bolts in Fire. J. Construct. Steel Res., 33, 1995, 3-38.
König J. (2006): Effective thermal actions and thermal proper-ties of timber members in natural fires, Fire and materi-als, 1, 51-63, ISSN: 0308-0501.
Langhelle N.K. & Amdahl, J. 2001. Experimental and Numeri-cal Analysis of Aluminium Columns Subjected to Fire.In Proc. Eleventh International Offshore and Polar En-
gineering Conference, Stavanger, Norway, 17-22 June, 406-413.
Lennon T. 1997. Cardington Fire Tests: Survey of Damage to the Eight Storey Building, BRE internal Report GD1286/86.
Maljaars J., Soetens F. & Twilt L. 2006. Heating of aluminum members exposed to natural fire conditions, Proceed-ings of the Fourth International Workshop Structures in Fire. Aveiro: University of Aveiro, 75-8, ISBN 972-789-190-X.
Moore D.B. & Lennon T. 1997. Fire engineering design of steel structures, Progress in Structural Engineering and Materials, 1 (1), 4-9.
Newman G.M., Robitson J.T. & Bailey 2000. Fire safe design, a new approach to multi-storey steel-framed buildings, SCI, P288, London. ISBN 1 85942 120 2.
Newman, G.M., Robinson, J.T. & Bailey, C.G. 2000. A New Approach to Multi-Storey Steel-Framed Buildings (SCI-P288). Ascot, The Steel Construction Institute.
O�Connor, M. A. & Martin, M. D. 1998. Behaviour of a Multi-storey Steel Framed Building Subjected to Fire Attack, J. Construct. Steel Research, 46 (1-3), Paper No. 169.
Pettersson, O. Magnusson, S.E. & Thor J. 1976. Fire engineer-ing design of steel structures, Publication Noº50, Swedish Institute of Steel Construction, Stockholm.
prEN 1999-1-2 2004. Eurocode 9: Design of Aluminium Struc-tures � Part 1-2: General rules -Structural Fire Design, CEN, Brussels.
Schleich J.B., Krupa J., Newman G. & Twilt L. 2001. ModelCode on Fire Engineering, ECCS No. 111, Brussels, p. 165, ISBN 92-9147-000-65.
Simões da Silva, L.A.P., Santiago, A. & Vila Real, P. 2001. Acomponent model for the behaviour of steel joint at ele-vated temperatures, Journal Constructional Steel Re-search 57(11), 1169-1195.
Spyrou S., Davison B., Burgess I. & Plank R. 2002. Compo-nent-based studies on the behaviour of steel joints at elevated temperatures, in Proceedings of Eurosteel 2002 � 3rd European Conference on Steel Structures, edited by Lamas A., Simões da Silva L., s. 1469-1478, Coim-bra, ISBN 972-98376-3-5.
The Construction Products Directive, Council Directive 89/106/EEC, from 21.12. 1989. URL://ec.europa.eu.
Wald F.,V. Bosiljkov V., L. da Silva, L, De Matteis G., Haller P. , Santiago A. & Vila Real P. 2000. Structural integ-rity of buildings under exceptional fire, in COST Action C12, Improvement of buildings structural quality by new technologies, Lisbon, p.143-154, ISBN 92-894-5684-1.
Wald, F., Simões da Silva, L., Moore, D.B., Lennon, T., Chladná, M., Santiago, A., Benes, M. & Borges, L. 2002. Experimental behaviour of a steel structure under natural fire, Fire Safety Journal ,Volume 41, Issue 7, October 2006, p. 509-522.
Wang Y.C. 2002. Steel and Composite Structures, Behaviour and Design for Fire Safety, Spon Press, London, ISBN 0-415-24436-6.

17
Part-1: Composite Column Test
1 INTRODUCTIONThere are quite a number of reported fire test results on concrete-filled encased steel columns. In contrast, very few works on composite columns with embedded steel sections have been published.
This paper presents a series of tests conducted on 4 composite columns with embedded I-sections. This serves as a companion study of Huang et al. (2007). All columns were subjected to a constant axial load while heated up in 2 electrical furnaces which provided a simi-lar heating rate as in a compartment subjected to natural fire. The effect of different load levels was examined. The experimental results were compared with numerical predictions.
2 OUTLINE OF EXPERIMENTAL PROGRAMME
The experimental programme was described in detail in (Huang et al. 2007). A series of 4 columns, namely, RTCC01, RTCC02, RTCC03 and RTCC04, was heated up to failure (Table 1). All columns were made of the same gross cross-section 300 300 mm2 and the same length of 3000 mm. They differed slightly in the em-bedded steel content ratio S as computed below:
S S CA A (1)
where SA denotes the area of embedded steel and CA is the whole cross-section area of a column specimen. In this paper, subscript �C�, �S� or �R� denotes concrete, steel and rebar, respectively.
Table 1. Steel Content Ratio and Column Failure Time ______________________________________________Col. No Load level test
crt 4ECcrt FEA
crt FEA testcr crt t _________________________
0 min min min ______________________________________________RTCC01 0.172 651 501 658 1.011 RTCC02 0.209 554 505 540 0.975 RTCC03 0.282 414 389 431 1.041 RTCC04 0.414 229 278 275 1.201 _____________________________________________Mean: 1.057 COV: 0.094
From columns RTCC01 to RTCC04, the embedded steel are UC152 152 23, Joist114 114 27,UC152 152 37 and UC203 203 52, respectively. The corresponding S increases from 3.25% to 7.41%. Figure 1 shows the details of RTCC03. All 4 specimens were reinforced with 4T13 rebars at the corners of the square section.
Load level 0 for 4 columns ranges from 0.172 to 0.414 where 0 is defined as the ratio of working load N to column axial load capacity at ambient temperature
20uN predicted numerically by program FEMFAN-3D
(Huang & Tan 2006).
Behaviour and modelling of composite columns and beams under fire conditions
K.H. Tan, Z.F. Huang & R.B. Dharma Nanyang Technological University, Singapore
ABSTRACT: This paper presents two series of elevated temperature tests on composite columns and beams. In the first series, four unprotected, embedded steel I-section composite columns were tested to investigate the effect of load level on column behaviour and failure time. Each column was subjected to a constant axial compression force under rising temperature provided by two electric heating furnaces. Numerical analyses were carried out to predict specimen cross-sectional temperature distribution as well as column deformation. Column failure times were also compared with design code predictions from EC4 Pt.1.2. It is found that the failure times reduce rather linearly and significantly under an increasing load level. In the second series, tests were carried out to investigate the ductility of composite beams in the hogging moment region under fire conditions. In total, there were four composite beams with decking slabs tested to failure. They represented the internal joint of a continuous beam. The segment between the plastic hinge over support and adjacent point of inflection was represented by one-half of a simply supported beam subjected to mid-span point load. The specimens were heated to a certain temperature before they were subjected to a static point load up to failure. The test results were then validated against finite element simulations. It is demonstrated that the finite element analysis gives reasonable accuracy compared to test results.

18
Figure 1 Details for specimen RTCC03
Table 2 summarizes the material properties obtained through testing at ambient temperature. The terms cf ,
20,R yf and 20
,S yf respectively denote the characteristic strength of concrete, rebar and steel at ambient tempera-ture; R and S respectively denote the percentage of rebar and steel area to the overall cross-sectional area. Measured steel elastic modulus 20
sE attains a typical value of 205 GPa.
Table 2. Column Material Properties (MPa) ________________________________________________Col. No Concrete Rebar Steel Load Capacity
Cf 20,0CE 20
,R yf R20,S yf S
20uN (kN) ______________________________________________
RTCC01 45 26 460 0.59% 320 3.25% 3746 RTCC02 43 26 460 0.59% 320 3.83% 3725 RTCC03 43 26 460 0.59% 320 5.23% 3927 RTCC04 43 26 460 0.59% 317 7.41% 4164 _____________________________________________
0
200
400
600
800
1000
1200
0 60 120 180 240 300 360 420 480 540 600 660
time (min)
Actual heating curve
modified curve for FEA
ISO834
35 120 195 tcr
Figure 2 Gas Temperature-time curves
Each specimen was uniformly heated up by 2 electrical fur-naces configured to provide 4-face uniform heating. Figure 2 shows the designed heating curve, in which during two heating phases, temperature rose at 5 C/min and 8 C/min, respectively. This curve was chosen to minimize concrete spalling by hold-ing the temperature constant at 200 C for 85 minutes to purge free water content out of the specimens. During the tests, tem-perature at each face of both furnaces was measured by a ther-mocouple. Revised T-t curve, which will be used for RTCC02 to RTCC04, is also shown in Figure 2. For these 3 columns, the numerical cross-sectional temperature prediction based on the actual heating curve is noticeably greater than the test re-sult. To reduce the effect due to inaccurate temperature pre-diction on the column structural response, the revised gas T-t
curve is adopted instead. The revised heating curve is not un-reasonable as it takes account of heat loss through the furnace, and thermal time lag between the rising part and the plateau shown in Figure 2.
Axial loads were applied and recorded by a servo-hydraulic actuator. The deflection acquisition system consisted of 9 LVDTs, whose positions are shown in Figure 3. They were used to measure the displacements directly for all points except Point-5, 6 & 7. Fourteen thermocouples were embedded within each cross-section for measuring the temperature distribution at mid-span and at a quarter-span. These thermocouples measured the temperatures of the concrete, flanges and web of the steel section and reinforcement. Figure 4 shows the lo-cations of these 14 thermocouples within a specimen cross section. The composite column tests were carried out under transient heating state. That is, a predefined load N was first applied to the specimen and held con-stant. The temperature was then raised in steps accord-ing to the heating curve shown in Figure 2.
Figure 3 Location of LVDTs on column specimen
Figure 4. Location of thermocouples within a cross section
3 TEST RESULTS AND VALIDATIONS Numerical validation of the experimental results will be shown in this section. The study will focus on the de-velopment of specimen cross-sectional temperature dis-tributions, axial deformations and failure times. The ef-fects of load level will be emphasized. Program SAFIR2001 (Franssen et al. 2000) was used for 2-D heat transfer analysis, while a self-developed pro-gram FEMFAN-3D (Huang & Tan 2006) was used for 3-D structural analysis. Values of thermal conductivity, specific heat capacity and density for siliceous concrete were taken from EC2 Pt.1.2 (CEN 2004). Concrete moisture content was set at 130 kg/m3, while convection coefficients on hot and cold surfaces were fixed at 25 and 9 W/m2K, respectively. Relative emissivity was 0.5. In program FEMFAN-3D, the bonding among concrete, re-
150 3
4
1
2
5 6 7
150
8 9

19
bar and embedded steel surface was assumed to be per-fect. Concrete spalling was not considered.
3.1 Cross-section temperature distribution This section examines 3 temperature profiles correspond-ing to 3 points within the quarter section of a specimen: Point 9 (concrete), Point 7 (corner rebar) and Point 3 (mid-web of steel) in Figure 4. Due to geometric simi-larity, only the result of RTCC03 will be discussed in de-tail.
Figure 5 shows the temperature distribution within the discretised cross section at a quarter point after 410 min-utes of heating on column RTCC03 which failed at 414 minutes. The embedded steel column was not perfectly positioned at the center of the entire rectangular section due to construction tolerance, and this was picked up by temperature distribution measured by thermocouples in Figure 4 even prior to concrete spalling. Thus, Figure 5 shows that there is slightly asymmetric distribution of temperature. Heat transfer analyses were performed for both mid-height and quarter-height cross sections, and the respective temperature predictions were used in the ensuing structural analyses.
Figure 5 Cross section temperature of column RTCC03 at t=410 min predicted by SAFIR
Figures 6a to 6d respectively show the gas tempera-tures and temperature at 3 specific points in the right fur-nace. The experimental data and numerical predictions based on actual and modified gas T-t curves are shown. Modified SAFIR curve is adopted for RTCC02 to RTCC04 in the ensuing structural analysis. This is be-cause the overall cross-section temperature predictions based on actual heating curve (Figure 2) were greater than the measured values.
Firstly, the predictions based on actual furnace gas-temperature curve should be examined. The predictions on 3 points are shown as continuous deep blue curves in Figure 6b to Figure 6d.
Regarding concrete temperature at Point 9, Figure 6b clearly shows that the temperature rises slowly and stead-ily. With 75 mm thick cover, concrete was heated up to 400 C at t=420 min when the gas reached 800 C. EC 4
Pt.1.2 shows that when exposed to heating for 420 min, siliceous concrete lost only 40% of its strength at Point-9. This implies that at the end of heating, the whole concrete within that section still retained the majority of its strength.
On the other hand, Figure 6b to Figure 6d show that during the first 210 min of heating the numerical curves follow very closely with the experimental ones. Beyond that, the numerical predictions were consistently higher than the experimental data: the deeper a point is located in the interior, the greater is the temperature difference. Such over-predictions may be attributed to the incapabil-ity of SAFIR to simulate the movement of concrete free water towards kernel zone during heating.
(a) Gas
0
200
400
600
800
0 60 120 180 240 300 360 420
Time (min)
BottomSide-1
TopSide-2
RTCC03 RightFurnace
t cr =414
(b) con-crete RTCC03
Point-9 (conc.)
0
200
400
600
800
0 60 120 180 240 300 360 420
Time (min)
TestSAFIR
modified SAFIR
Gas
(c) rebar
RTCC03Point-7 (rebar)
0
200
400
600
800
0 60 120 180 240 300 360 420
Time (min)
Test
SAFIR
modified SAFIR
Gas
(d) steel RTCC03
Point-3 (steel)
0
200
400
600
800
0 60 120 180 240 300 360 420
Time (min)
Test
SAFIR
Modified SAFIR
Gas
Figure 6 Temperature at point-3, 7 & 9 in RTCC03
At Point 7 (rebar) located close to the concrete sur-face, numerical prediction agreed well with measured temperature (Figure 6c).
Over-predictions of temperature also took place in the other three columns: RTCC01, RTCC02 & RTCC04. To diminish the effects of somewhat inaccurate tempera-ture predictions on the structural analyses shown in Sec. 3.2, the temperature predictions need to be modified so

20
that they are closer to test results. For this purpose, the original gas temperature curve was modified and shown as dashed line in Figure 2, where the temperature is as-sumed to reach 700 C instead of 800 C at t=215 min. After 215 min, temperature rises steadily at a constant rate to 800 C when a column fails.
The corresponding cross-sectional temperature distri-bution is shown in Figure 6b to 6d as black dashed curves. Clearly, beyond t=210 min, the three modified curves are closer to measured temperatures compared to the unmodified heating curve. Compared to the original scheme, the new scheme has reduced the over-prediction effect on thermal expansion and material properties.
3.2 Structural Responses In the FE simulation, a heated column is approximated
as a pin-roller member. Figure 7 compares the FE pre-dictions of column axial deformation u with test results, while Figure 8 shows the photos of all four failed speci-mens.
(a) RTCC01 & RTCC02
-4
0
4
8
12
16
20
24
0 120 240 360 480 600
Time (min)
RTCC01_test
RTCC01_FEA
RTCC02_test
RTCC02_FEA
(b) RTCC03 & RTCC04
-4
0
4
8
12
16
20
24
0 120 240 360 480 600
Time (min)
RTCC03_test
RTCC03_FEA
RTCC04_test
RTCC04_FEA
Figure 7 Axial deformation of all specimens
FE predictions of deformations are consistently greater than the test results and the differences become greater with higher temperature. There are two main reasons: no transient strain was accounted for by the adopted EC4 stress-strain model, and no concrete spalling was simulated.
The prime objective of this study is to examine the load level effects on column failure time crt . Table 2 shows that with steel content ratio S increasing from 3.25% to 7.41%, the axial load capacity 20
uN increases slightly from 3746 kN to 4164 kN predicted by FEM-FAN-3D. This implies that steel content had limited ef-fect on 20
uN . In contrast, with load level 0 increasing from 0.172 to 0.414, both Figure 6 and Figure 9 and Ta-ble 1 show that crt significantly decreases from 651 to 229 min.
(a)
(b)
(c)
(d)Figure 8 Photos of tested specimens
Table 1 summarizes crt of all four columns obtained experimentally, numerically and from EC4 Pt.1.2. The design code prediction 4EC
crt corresponds to the instant at which the working load N is equal to the design load capacity ,fi RdN calculated according to Eq. (4.12) in EC4 Pt.1.2. The values of crt are also compared in Fig-ure 9. Clearly, all three approaches show that crt de-creases nearly linearly yet significantly under an increas-ing load level 0 . Generally, the FE predictions agree well with test results whereas the former tends to slightly over-predict crt for column RTCC03 and RTCC04 which were subjected to a higher 0 . Table 1 shows a mean value of 1.057 for FEA test
cr crt t with a coefficient of variation COV = 0.094 (superscript FEA and test de-notes numerical and test results, respectively). This shows that FEMFAN3D predictions agree fairly well with test results.
0
100
200
300
400
500
600
700
0.0 0.1 0.2 0.3 0.4 0.5
Test
FEMFAN3D
EC4 Pt1.2
Figure 9 Comparison of column failure times
Examining the predictions of crt based on EC4 (termed as 4EC
crt ) shows that they generally agree well with both FE and test results. Overall, 4EC
crt tended to be

21
conservative, especially for low 0 where 4ECcrt was no-
ticeably less than testcrt and FEA
crt .
Part-2: Composite Beam Test
4 INTRODUCTION
The second part of the paper (Dharma & Tan 2006a, b) presents the behaviour of steel beams supporting profiled decking slab. One key factor that influences the rota-tional capacity of composite beams is local buckling which causes considerable distortion of member cross-section that is confined locally to the highest moment re-gion. A more rational way of defining the ductility of beams is based on member behavioural classes, where ductility is quantified by measuring the available inelastic rotation a , as shown in Figure 10, over which the mo-ment exceeds its design ultimate resistance pM . A ratio
known as available rotational capacity aR is used here to describe the non-dimensional form of inelastic rotation defined as follows:
paaR (2)
in which, p = plastic rotation.
Figure 10 Standard moment-rotation curve of plastic beams
5 TEST SPECIMENS DETAILS
The objective of this test programme is to determine the ductility of composite steel beams in the hogging mo-ment region of a continuous composite beam with profile decking slab. A simply supported beam is subjected to a central point load, used to simulate the segment of a con-tinuous composite beam between the plastic hinge at mid-span and adjacent point of inflection in the hogging mo-ment region. The composite beam is inverted such that the decking slab is located on the underside of the steel beam and is subjected to tensile force when the vertical load is applied from the top. For ease of reference in this paper, the flange which is connected to decking slab will be referred to as the top flange.
Experimental programme consisted of a total of four composite steel beams (Table 3) stud-welded to re-entrant steel decking profile Holorib S350 (0.9 mm thickness). The shear studs were connected to the steel beams and steel decking by through-deck welding. C1 and C2 specimens had the same configuration except for the number of shear stud connectors. Three different UB sections were used as structural steel. They were chosen such that the composite sections were able to achieve their full plastic moment capacity at elevated tempera-ture. All composite steel specimens had the same total length of 3650 mm, a span of 3450 mm and the length of concrete slab of 2100 mm.
Table 3. Details of beam specimens Test No. Structural Steel Reinforcement No. of L E t c
Stud (mm) (mm)C1 305 165UB54 4-T10 8 563 130C2 305x165UB54 4-T10 4 563 130C3 305x127UB37 5-T10 10 563 130C4 254x102UB25 5-T10 6 469 120
Slab size (length x width) = 2100 mm 450 mmReinforcement distance to steel decking = 100 mmAnti-crack reinforcement = T8 at 200 mm spacingShear stud connector = 19 mm dia. 100 mm lengthNote : 4-T10 indicates four bars of type T reinforcement with 10 mm diameter.
The test consisted of two stages: heating and loading stage. Firstly, the furnace temperature was increased at a rate of 7 to 10°C/min up to a certain temperature. Once the preset furnace temperature was reached, this tempera-ture was maintained to the end of loading stage. That is, a steady-state heating is employed in this instance. In the loading stage, the load was applied until the specimen failed and reached its unloading state to obtain full mo-ment-rotation curve. Material tests conducted at ambient temperature included tensile coupon tests of steel I-beams and reinforcement, compression and tensile tests of con-crete specimens and push-out tests. The results of these tests at ambient temperature were used as inputs to vari-ous material models at elevated temperatures. Besides, cross-section geometric imperfections were also meas-ured by digital callipers.
6 EXPERIMENTAL RESULTS
Detailed experimental results can be found in (Dharma 2006). Due to page limitation, only the moment-rotation of C4 specimen is presented here. Figure 11 shows the moment-rotational curve of C4 specimen. The horizontal axis indicates the ratio of rotation over elastic rotation
e defined as , 2p T i TM L E I . The stiffness term TE Iis calculated based on the cracked stiffness. The vertical axis indicates the normalized moment to plastic moment capacity ,p TM , calculated based on the cross-section di-mensions, material test results, critical temperature distri-bution, and EC3 Pt.1.2 (CEN 1995) together with EC4 Pt.1.2 material reduction factors.
The rotation was taken as the average of two end rota-tions. All of the specimens started to deviate from line-
ap
/ p
1
1

22
arity before they yielded due to non-linear stress-strain relationship at elevated temperature. Out of the four beams, C1 has the greatest rotational capacity of 2.11, while C4 specimen has the lowest rotational capacity of only 1.00, as shown in Figure 11. After attaining the plastic moment capacity, the beam rotation started to in-crease rapidly. The main component of composite beam which provides flexural resistance to resist applied mo-ment is the primary reinforcement (Dharma & Tan 2006c). The reason is that the temperature of reinforce-ment was much lower (around 100°C) compared to struc-tural steel components, which had already reached 600°C. Around this temperature, steel reinforcement still maintains its ambient temperature strength since the strength reduction only occurs above 300°C according to EC4 Pt.1.2. The low temperature of reinforcement is due to low heat conductivity of concrete. Thus, concrete in hogging moment region acts as a heat sink for rein-forcement since it does not contribute to ultimate moment capacity. As a consequence, full depth of the steel web is in compression. Another consequence is that the top flange does not contribute to the moment capacity since its distance from the neutral axis is practically zero. The bottom flange temperature was around 500 to 650°C at 7 to 10°C/min rate of heating. For the bottom half of web, the temperature is close to bottom flange temperature
bfT . For the upper half of web, its temperature usually
varies linearly from bfT to 0.85 bfT at the web-top flange junction. The temperatures of shear stud, concrete and reinforcement are generally less than 300°C, 400°C, and 200°C, respectively, that is, these components still pos-sess their strength and stiffness at room temperature.
Figure 11 Moment-rotational response of C4 specimens
For all the specimens in Table 3, there was neither lo-cal nor global buckling before the plastic moment capac-ity was reached. The failure mode observed after the test was mainly local buckling near mid-span as a result of spread of plasticity across the beam depth and along the beam after the section has attained plastic moment capac-ity, as shown in Figure 12. On the other hand, local buck-ling of the web occurred at almost the full depth of the web since the neutral axis was located within the top flange. Thus, almost the entire beam section was under compression. However, this local buckling failure oc-curred on only one-half of the beam with the other half
exhibiting no local buckles. This may be due to slight dif-ferences in temperature distribution between the two halves of the beam and may be attributed to the presence of initial geometric imperfection. Concrete cracking was limited to the mid-span region. In addition, parallel cracks reached the top flange, showing that the whole concrete slab was subjected to tensile force. No spalling of concrete was observed during the test.
C3
C4 C4
C3
Figure 12 Local buckling failure of the composite specimens
The failure modes observed in these tests are very similar to the ones observed in Cardington fire test, where local buckling of the lower compression flange and web of most fire-exposed beams was observed (Fig-ure 13). Certain beams in Cardington fire tests also ex-hibited local buckling modes at certain distance from support region similar to C2 specimen because of the lower temperature distribution near the support.
dis tance to local buckling
dis tance to local buckling
C2 Cardington Test
C3 Cardington Test
Figure 13 Comparisons of Cardington and current test fail-ure modes
7 NUMERICAL MODELLING OF STEEL BEAMS WITH PROFILE DECKING
Commercial Package MARC (MSC 2005) was used in the numerical validation since nonlinear shell element has not been incorporated into the self-developed program

23
FEMFAN-3D which was used in column test validation (Sec. 3). In the composite specimens, the concrete slab was modelled using a 20-node, iso-parametric solid ele-ment. Every node in this element has three global dis-placements as degrees of freedom. The reinforcement is modelled using an iso-parametric, three-dimensional, 20-node empty solid element, which must be used in con-junction with a concrete element to represent a reinforced concrete element. By combining the rebar and concrete elements, the stress distribution of both reinforcement and concrete can be represented accurately since separate constitutive theories are used in each element. Two lay-ers of reinforcement are provided for each rebar element simulating the layer of primary and secondary reinforce-ment (Dharma & Tan 2006c).
To simulate the composite action between the steel beam and concrete slab, adjacent top flange and concrete nodes are tied together using rigid links in two global displacements. Tying these adjacent nodes together as-sumes that there is no relative displacement of these nodes. The relative slip between the steel beam and concrete element is governed by the load-slip relationship of shear stud connectors, and is simulated using springs.
The composite beam is simply supported at both ends so that lateral deflection and twist rotation at the supports are prevented. However, the flange ends are free to ro-tate in horizontal plane so that the beam cross-section is free to warp. Lateral restraints are provided at mid-span, end supports, and certain distance from mid-span. Con-centrated load is applied directly on top of the mid-span stiffeners. Initial longitudinal out-of-plane imperfection has also been included in the model.
C4
0
0.2
0.4
0.6
0.8
1
1.2
0 1 2 3 4 5 6 7 8 9 10/ e
Plastic LineTestFEA
Figure 14 Validation of composite beam FE model
For both sets of numerical models, the arc-length method has been selected to properly trace the nonlinear equilibrium path of inelastic I-beams and the evolution of cracks in concrete slabs. Both geometrical and material nonlinearities are considered. Von Mises yield criterion is used in the analysis and the corresponding metal plas-ticity model is characterised as an associated flow plastic-ity model, with isotropic hardening as the default. The material stress-strain models follow EC3 Pt.1.2 and EC4 Pt.1.2 formulations. Relatively good comparison is ob-tained in terms of the moment-rotation response as illus-trated in Figure 14 for C4 specimen. The ratio of maxi-
mum moment to plastic moment capacity ( ,m p TM M )
and the rotational capacity ar from numerical simula-tions are relatively close to the test results. The pre-dicted moment-rotation curves show no horizontal pla-teau, instead unloading occurs once the ultimate moments are reached. The discrepancies between test results and FEA simulations may be due to differences in actual ma-terial properties at elevated temperature and Eurocode�s stress-strain relationship formulations, the assumed initial imperfection, and temperature distributions.
There is local buckling of the compression flange as shown in Figure 15a. This is simulated well by Figure 15b. Parallel cracks occur on the concrete slab due to bending in the hogging region.
C4 TEST C4 FEA
(a) (b) Figure 15 Comparison of failure modes between tests and FE models
8 CONCLUSIONS
This paper presents 2 series of fire test conducted at Nan-yang Technological University, Singapore. The first se-ries of test were carried out to examine the effect of load level on the failure times of 4 composite columns with embedded steel I-section. These real-sized rectangular composite columns were subjected to different axial load levels ranging from 0.171 to 0.441. The specimens were made of normal strength siliceous concrete and rein-forced with 4T13 rebars. A gas T t curve was de-signed to simulate a compartment fire. It is found that the column failure time linearly decreases under a rising load. Concrete spalling took place on every specimen and was localized to the mid-height zone.
The test results were compared with numerical simu-lations in terms of cross-sectional temperature distribu-tion and structural responses. Reasonably good agree-ment is obtained. With respect to column failure times, both predictions based on FEA and design code EC4 Pt.1.2 agree well with the test data. The design code predictions were slightly conservative, especially for low load level.
The second series of test were carried out to investi-gate the rotational capacity of composite beams in the hogging moment regions under fire conditions. A total of four composite beams with decking slabs which were designed to represent the internal joint of a continuous beam, were tested to failure. The specimens were heated

24
to a certain temperature before they were subjected to a static point load up to failure. It was found that rota-tional capacity reduces at elevated temperature. The nu-merical model correlates well with test results including the observed failure modes.
9 ACKNOWLEDGMENT
This research was funded by ARC 5/03 project entitled �Mitigation of Progressive Collapse of Tall Buildings� from the Ministry of Education, Singapore. The authors would also like to acknowledge Corus South East Asia for supplying the structural I-beams and TTJ Design and Engineering for fabricating the steel beams.
10 REFERENCES
European Committee for Standardization (CEN) 1995. �Struc-tural Fire Design�, Eurocode 3: Design of Steel Structures: Part 1.2, General rules - structural fire design�, BS EN 1993-1-2:1995, Brussels, Belgium.
CEN, 2004. �Design of concrete structures: Part 1.2. General rules - structural fire design�, BS EN 1992-1-2:2004, Brus-sels, Belgium.
CEN, 2005. �Design of composite steel and concrete struc-tures: Part 1.2. General rules - structural fire design�, BSEN 1994-1-2: 2005, Brussels, Belgium.
Dharma, R.B. 2006. Global and Local Buckling Behaviour of I-Beams at Elevated Temperatures, Ph.D thesis, School of Civil and Environmental Engineering, Nanyang Techno-logical University, Singapore.
Dharma, R.B. & Tan, K.H. 2006a. Rotational Capacity of Steel I-Beams in Fire Conditions. Part 1: Experimental Study. by Engrg. Struct. (in press).
Dharma, R.B. & Tan, K.H. 2006b. Rotational Capacity of Steel I-Beams in Fire Conditions. Part 2: Numerical Simulations. Engrg. Struct. (in press).
Dharma, R.B. & Tan, K.H. 2006c. Experimental and Numeri-cal Investigation on Ductility of Composite Beams in the Hogging Moment Regions under Fire Conditions. J. Struct. Engrg., ASCE, (submitted).
Franssen J.M., Kodur V.K.R. & Mason J. 2000. User�s manual for SAFIR2001 - A computer program for analysis of struc-tures submitted to the Fire, Univ. of Liege, Belgium.
Huang Z.F. & Tan K.H. 2006. FE simulation of space steel frames in fire with warping effect, Int. J. Adv. Steel Con-struct. (under review).
Huang Z.F., Tan K.H. & Phng G.H., 2007. Axial restraint ef-fects on the fire resistance of composite columns encasing I-section Steel, J. Construct. Steel Res. 63(4): 437-447.
MSC. Marc (2005). Volume A: Theory and User Information,MSC. Software Corp., California, USA.

25
1 INTRODUCTION
Research over the last decade has shown that com-posite floor structures can have a significantly greater fire resistance than is suggested by conven-tional tests on isolated elements. This is largely due to the interaction between the beams and floor slabs in the fire compartment, and the restraint afforded by the surrounding structure. This research is now be-ing applied in the design of real projects, with an implicit assumption that, because they heat more slowly than the connecting members, the connec-tions have sufficient fire resistance. However, ob-servations from full-scale fire tests at Cardington and the collapse of buildings at the World Trade Centre in 2001 have raised concerns about this as-sumption. There is renewed interest in how connec-tions respond to exposure to fire, and realistically this can only be investigated by examining complete structural assemblies, with suitable representation of the joints included. As structural fire engineering design increasingly optimizes the placement of pro-tection materials in buildings, the axial forces gener-ated in beams during the course of a fire, as revealed in non-linear three-dimensional analysis of large substructures, are seen to reach very high values. Typically these can change from compression in the early stages of a fire, when thermal expansion is re-sisted by surrounding structure, to tension in the later stages, when the heated members hang essen-tially in catenary. The connections at the ends of these members are therefore subjected in turn to these forces, whilst also being subjected to much
larger rotations than are possible in ambient-temperature design.
The terminology on joints and connections has been standardized in EC3-1.8 (CEN, 2005b). A �connection� is defined as the location where two or more members meet, and a �joint� is defined as the zone where two or more members meet. This means that a �connection� is considered as the parts which mechanically fasten the connected members; in the case of an end-plate connection these are the end-plate, the bolts, the welds and the column flange. A �joint� is used as the more general term which in-cludes the column web and the beam-end. For ex-ample, a beam-to-column joint can include two ma-jor-axis connections attached to the column flanges and two minor-axis connections attached to the col-umn web. The principle is shown in Figure 1.
Figure 1: Joint and connection parts of a double-sided joint.
Connection modelling in fire
I. Burgess The University of Sheffield, United Kingdom
ABSTRACT: This paper describes the origins and development of component-based principles for modelling of the behaviour of beam-to-column connections in fire conditions. The component method is now well-established as an analytical technique for rotational properties of connections at ambient temperature. In the context of the much higher rotations experienced at the ends of long-span beams in fire, together with high axial forces due to restrained thermal expansion, its justification changes. The importance of residual strength and stiffness of a connection is decreased, but it is essential that its ductility is represented properly in order to provide designers with the ability to match forces to strength at high temperatures.
Joint
Connections

26
2 CONNECTION CHARACTERISATION
The main driving force behind the worldwide re-search effort over 30 years to represent connection properties has been a desire to achieve the advan-tages in design of buildings that can be derived from the real stiffness and strength of connections which would probably have been assumed as effectively pinned for normal design. The rotational stiffnesses inherent in normal simple connection details have the capability to reduce mid-span sagging moments in beams at the Ultimate Limit State, permitting sec-tions with lower moment capacity to be used. Per-haps even more importantly, this rotational stiffness can reduce very significantly the deflections of beams for the Serviceability Limit State, which tends to control the selection of sections for long-span systems. It was this opportunity, afforded by the prospect of taking account of real connection characteristics in structural frame analysis, that stimulated a lengthy research effort to classify and quantify these characteristics.
An excellent account of the early work on con-nections is given by Nethercot and Zandonini (1989). In general, joints are defined in terms of ro-tational stiffness, strength and rotation capacity. The rotational stiffness of a joint is defined as the initial slope of its moment-rotation curve. In the �pinned� case the rotational stiffness is zero and no rotational continuity exists between the beam and the column. The �rigid� case allows no relative rotation between the beam and the column, and therefore the full beam-end moment is transferred. There are clearly cases which are close to the two extremes; a fully welded joint with column web stiffeners is almost rigid, and a web cleat connection with slotted holes is almost pinned. Nevertheless, the majority of prac-tical joints are semi-rigid; some relative rotation oc-curs between the beam and the column, and a mo-ment which depends on the relative rotational stiffnesses of the connection and the connected members is transferred. To simplify design, EC3-1.8 specifies boundaries between joint classifica-tions, as shown in Fig. 2.
Figure 2: Stiffness classification of joints after EC3-1.8.
The EC3-1.8 strength classification compares the resistance moment of the connection with the mo-ment capacities of the connected members. If the bending resistance of the joint is larger than the plas-tic moments of the members then it is �full-strength�. If the joint bending resistance is less than 25% of that of one of the members and has sufficient rota-tional capacity it is nominally �pinned�. Between these boundaries joints are �partial-strength�. Most practical end-plate connections are in this category, which means that, if plastic design is used the plastic hinges will form in the joints and not in the adjacent members. Hence, sufficient rotational capacity is required in the joint to form a plastic mechanism and develop a full plastic moment at the mid-span of the beam.
The ductility of a joint is its ability to maintain its plastic moment over a sufficient rotation to develop a plastic mechanism in the adjacent members. A joi-nt which fully achieves this is Class 1: �ductile� (Jas-part, 2000). The lower bound of the ductility classi-fication is Class 3: �brittle�, and may only be used in elastic frame design. Class 2: �semi-ductile� lies be-tween these extremes. The boundaries between the classes are not defined generally in EC3-1.8, and ductility of joints is treated in a very approximate manner, reflecting the sparse research in the field prior to its publication. Only been in recent years have researchers focused on the available ductility of a joint. Simões da Silva and Girão Coelho (2001a), Kühnemund (2003), Girão Coelho (2004), Beg et al.(2004) and Girão Coelho et al. (2005) all have used the Component Method, which is described below, to predict ductility for semi-rigid joints.
In general, five different ways of representing the moment-rotation response of semi-rigid joints exist:
1. Mathematical expressions as curve-fit models, 2. Simplified analytical models, 3. Mechanical (spring) models, 4. Finite element models, 5. Macro-element models. Macro-element models are a relatively recent de-
velopment. These combine mechanical and finite element principles, as they use finite element formu-lations to incorporate mechanical or curve-fit models into frame analysis. This type of modelling is par-ticularly suitable for elevated-temperature analysis.
1.1 2.1 Curve-fit models These are mathematical expressions fitted to mo-ment-rotation curves found in experiments. The ex-pressions include linear, bi-linear, tri-linear and polynomial, power series and B-spline functions. These are described in detail by Jones et al. (1983) and Nethercot and Zandonini (1989). A model which has been used at ambient and elevated tem-peratures uses the so-called Ramberg-Osgood (1943) curve, modified by Ang and Morris (1984) to repre-
M
Semi-rigid
Rigid: Sj,ini 8 EIb / Lb (braced) Sj,ini 25 EIb / Lb (other)
Pinned: Sj,ini 0,5 EIb / Lb

27
sent the moment-rotation curves of joints, and ex-tended by El-Rimawi (1989) to elevated tempera-tures. The approach is shown in Equation 1:
ncc
c BM
AM 01.0 (1)
where c is the joint rotation and Mc is the corre-sponding moment. This expression has been used by Leston-Jones (1997) and Al-Jabri (1999) to model their elevated-temperature test data for bare steel and composite joints. It can be applied to fire cases by making the terms A and B temperature-dependent. These factors control the stiffness and capacity of the joint respectively, whereas the index n controls the shape of the moment-rotation curve.
Although curve-fit models of joints are very eas-ily integrated into frame analysis as rotational springs, they can only be used for joints which have been subject to testing. For high-temperature cases, axial forces acting on the connection cannot be rep-resented easily in this approach unless a wide range of combinations of moment, rotation, axial force and temperature have been tested. This is impracticable due to the high cost of experiments and the vast number of connection configurations used in prac-tice.
1.2 2.2 Component modelling A more practical approach is the use of mechanical models, particularly the so-called �Component Method�. This method was initially developed by Tschemmernegg et al. (1987) for ambient tempera-ture conditions and after much development is now included in EC3-1.8. The principle is to consider a joint as a set of basic zones, each of which performs an individual structural action. These zones can be considered as assemblies of non-linear springs whose combination forms a model for the whole joint. The principal component zones of an end plate connection are shown in Fig. 3.
Figure 3: The principal component zones of a beam-column end-plate connection.
3 AMBIENT-TEMPERATURE COMPONENT MODELLING OF JOINTS
There are a number of different options (elasto-plastic, bi-linear, multi-linear or non-linear) to ap-proximate the behaviour of the component springs. In EC3-1.8 each component is characterised by an initial stiffness k and a design resistance FRd, which are linked in an elastic-perfectly plastic fashion. This simple approximation allows a direct calcula-tion of the moment-rotation curve of the joint. For better accuracy in the joint approximation more complex force-displacement models can be used, de-rived from test results, finite element models or preferably from simplified mechanical models. This increase in complexity of the component representa-tion makes it necessary to solve the final spring model iteratively, which is not a problem if the spring model is incorporated into a non-linear finite element program. Although the Component Method associates each component with a certain internal force in the joint, in reality some components are exposed to stresses in more than one sense. EC3-1.8 specifies reduction factors, for the presence of shear ( ) and longitudinal stress (kwc) in the column web in compression, and for the presence of shear stress ( ) in the column web in tension.
The Component Method can be extended at this stage to elevated temperatures by using high-temperature material properties with the ambient-temperature component models. This principle has been used by Leston-Jones, Al-Jabri and Simões da Silva et al. (2001b). The alternative, of developing new multi-linear elevated-temperature components models, has been adopted by Spyrou (2002, 2004a, 2004b).
The final step of the Component Method is to as-semble the components and determine the resulting moment-rotation curve. Each component is repre-sented as a translational spring interconnected by rigid links. The spring model for the joint of Fig. 3 is shown in Fig. 4 below.
Figure 4: Spring model of an extended end-plate joint after EC3-1.8.
(bfc) M
(bwt)
(cwc)
(cws)
(cwt) (cfb) (epb)
(bt)
(bfc)
(bwt1)
(cwc)(cws)
(cwt1) (cfb1) (epb1)(bt1)
(bwt2)(cwt2) (cfb2) (bt2) (epb2)
M

28
The moment resistance Mj,Rd, of a joint is:
, ,1
n
j Rd ti Rd ii
M F z (2)
where Fti,Rd is the design tension resistance of bolt row i, and zi is the distance from bolt row i to the centre of compression. The resistance of each bolt row Fti,Rd is that of the weakest component in this row, or either of the resistance of the two compo-nents in compression or the shear panel. However, this equation is only effective for a bolt row if the distance to the next row is sufficiently large, and the column flange and the end-plate develop individual failure mechanisms. If this is not the case two or more bolt rows may fail as a group and the resis-tance is lower than the sum the individual rows.
To calculate the rotational stiffness of the joint, the complete spring model shown in Fig. 4 can be simplified, replacing each bolt row by an equivalent spring of stiffness
,
, , , , ,
11 1 1 1 1et i
cwt i cfb i bt i epb i bwt i
k =
k k k k k
(3)
where the stiffness of the beam web in tension kbwt is assumed to be infinite. The compression and shear components can similarly be represented by equivalent springs. This simplifies the spring modelin Fig. 4 to that shown in Figure 5(a). The equiva-lent spring model can be simplified even further, so the springs for each bolt row can be replaced with a single equivalent spring, as shown in Figure (b). Having calculated the moment resistance and initial rotational stiffness of the joint, EC3-1.8 offers two options, one bilinear and one curvilinear, to ap-proximate the moment-rotation curve. These mo-ment-rotation curves can then be introduced as rota-tional springs at beam ends into frame analysis programs.
It is apparent that the calculation process of the Component Method is quite lengthy, and therefore a number of programs have been developed to sim-plify its application in engineering practice. The software CoP, developed at the University of Liège
and RWTH Aachen, is a current example of such software.
4 EXPERIMENTS ON JOINTS AT ELEVATED TEMPERATURES
1.3 4.1 Moment-rotation-temperature testing
The first experimental fire tests on joints were con-ducted by Kruppa (1976) at CTICM, on six joint types ranging from �flexible� to �rigid�. Their pri-mary purpose was to investigate the performance of high-strength bolts at elevated temperatures, and no indication of the performance of the joints was re-ported. Two tests were carried out by British Steel (1982) on a �rigid� joint. Despite the limited scope, it was concluded that joint elements could suffer sig-nificant deformation in a fire. Lawson (1989, 1990) was the first to measure the rotations of 8 cruciform joints with different major-axis connections exposed to the Standard Fire, at constant load. Five of his tests were on non-composite beams, two on compos-ite beams and one on a shelf-angle floor beam. Of the steel joints 3 types of typical joints were studied (extended and flush end-plates and a double sided web cleat). The tests showed that up to two thirds of the ambient temperature design moment capacity could be sustained in standard fire conditions. It was noted that the bolts did not fail prematurely, and rotations always exceeded 6°. It was clear that com-posite action in fire enhanced the moment capacity of the joints, which could be estimated by superpos-ing the capacities due to the bare-steel joint and the slab reinforcement. Lawson proposed simple design rules (later withdrawn) based on BS5950 Part 8 (BSI, 2003) for designing simply supported beams in fire taking into account the joint moments. Al-though these tests results provided insufficient data to describe full moment-rotation-temperature char-acteristics of the joints, they did provide essential in-formation for early attempts at joint modelling.
The first systematic series of high-temperature tests producing moment-rotation curves at different
(ce)
Mz2
(te,2)
(te,1)
z1
(ce)
M
(teq)
zeq
(a) (b)
Figure 5: Equivalent (a) and simplified (b) spring models after EC3-1.8.

29
temperatures were conducted by Leston-Jones (1997) in work done at the University of Sheffield and BRE. Eleven tests were carried out on flush end-plate joints, both bare-steel and composite, us-ing small standard sections, including two tests at ambient temperature. Both stiffness and moment capacity decreased with increasing temperature, par-ticularly in the range 500-600 C. These tests pro-vide useful data for connection modelling, although their range of details is very limited, and allow veri-fication against earlier ambient-temperature tests by Davison et al. (1987). Continuing Leston-Jones�s work at a time when the data from the full-scale tests at Cardington was becoming available, Al-Jabri (1999) extended the scope of this test programme to study the influence of parameters such as member size, connection type and different failure mecha-nisms. In total 20 tests were conducted on flush end-plates with different section sizes and on flexi-ble end-plate joints, both bare-steel and composite. Particular attention was given to joint details used in the composite building at Cardington. Fig. 6 shows the furnace and experimental fire testing set-up used by both Leston-Jones and Al-Jabri.
Figure 6: Cruciform test scheme used by Leston-Jones (1997) and Al-Jabri (1999).
During the course of this project data and obser-vations from the Cardington full-scale frame fire tests made it apparent that moment-rotation tests on isolated joints are not sufficient to describe the be-haviour of joints and connections in framed build-ings in fire. The very high axial forces in the beams caused by the restraint to thermal expansion had clearly had a major influence, which was particu-larly evident from the extent of local buckling near the beam ends.
Some moment-rotation testing in fire has contin-ued since this time, largely in order to validate non-linear FE modelling approaches. Two axially unre-strained cruciform joints with extended end-plate connections, using relatively large beam and column sections, have recently been tested in China by Lou and Li (2006). Whereas these connections failed by
buckling of the column web at ambient temperature, the failure mode changed at elevated temperatures to fracture of the bolts and yielding of the column web in tension, even though the end-plate temperatures close to the bolts were lower than the column web temperature.
1.4 4.2 Restrained high-temperature joint testing Despite the evident importance of modelling the be-haviour of unprotected joints in a restrained condi-tion at high temperatures, no experimental studies concerned with this matter have yet been published in the open literature at the time of writing.
In a joint project of the Universities of Manches-ter (Liu et al. 2002) and Sheffield (Allam, 2003), some loaded furnace tests on restrained beams sup-ported by columns creating �rugby-post� frames were conducted. The columns and connections were fire-protected, and remained at relatively low tem-peratures, and the main aim was to investigate the effects of translational and rotational restraint to the beam. High axial compressive forces were recorded early in the fire, but as the vertical beam deflections increased these progressively changed into tension (catenary force) and increased the failure tempera-ture of the beam considerably compared with the un-restrained condition. Although, the connections were protected the tests gave practical evidence of the axial forces acting on a connection at elevated temperatures following the standard fire curve. In retrospect it is unfortunate that no information on the forces in the beam or connections was recorded in the cooling phase.
A hitherto unpublished experimental series of six internal extended end-plate joints has been tested at temperatures between 400°C and 700°C by Qian (2006) and Tan in Singapore. These tests were de-signed to examine particularly the shear panel at the end of the connected beam. The first three tests were conducted at 700°C with different actively-applied axial force in the beams. These tests failed in combinations of end-plate bending and shear de-formation of the shear panel. In the remaining three tests, the end-plate thickness was increased to 40mm in order to isolate the shear panels. These tests were conducted at 400°C, 550°C and 700°C, and the ca-pacity of the shear panels reduced as expected with increasing temperature. This test data is currently in press, and will provide an opportunity to validate the different approaches to modelling steel connections in fire, including the effects of restraint.
5 HIGH-TEMPERATURE COMPONENT TESTING
Spyrou et al. (2004a) conducted an experimental in-vestigation of the performance of the tension and
Column head restrained in position
Load Load
Beam laterallyrestrained
Specimen located withinfurnace
1500
1900 A
2700
A varies for each group

30
compression zones of steel joints at elevated tem-peratures. These steady-state tests included 45 T-stubs in tension and 29 column web transverse com-pression tests, most of them at elevated tempera-tures. Simplified mechanical models of both the tension and compression zones were developed and compared with the experimental results. The ana-lytical model for the tension T-stubs proved capable of predicting with reasonable accuracy the failure in any one of the three classic modes (Fig. 7):
1. Formation of plastic hinges in the flange near the web followed by bolt yield and fracture,
2. Formation of plastic hinges in the flanges near the web and the bolt lines followed by bolt yield and fracture,
3. Bolt yield and fracture with the flanges remaining elastic.
Figure 7: The three failure modes of a T-stub in tension.
Spyrou (2004b) also examined the main compo-nent of the compression zone for major-axis flush end-plate joints, which is the column web, com-pressed by the lower beam flange through the end-plate and the column flange. He tested 29 such ar-rangements under steady-state temperature condi-tions, using the furnace setup shown in Fig. 8.
Figure 8: Arrangement for compression zone tests.
Spyrou developed a semi-empirical mechanical model for ultimate compressive force after compar-ing a large number of previously published equa-tions with his tests at elevated temperatures. Even-tually he adapted an ambient-temperature equation by Drdacky (1977), originally derived for thick plate girder webs, to the form
c22
dc6.1
65.0tt
Etwcwc
fbwcwc
2wcu (4)
where is defined in Fig. 9. The EC3-1.2 strength and stiffness reduction factors are used to reduce the yield strength and Young�s modulus of the web ma-terial.
Figure 9: Assumed mechanism of web yielding.
An empirical model for the curve prior to the ul-timate state was derived based on experimental ob-servations, together with 2-D and 3-D finite element analyses. The results from these finite element analyses and the simplified model compared very well with the test results, over the whole range of tests. The clear logic of the comparison was that the load capacity of the compressed web is essentially controlled by the development of plasticity in the web-plate, and that inelastic buckling is essentially a secondary effect. This was repeated across the whole range of web slenderness tested, as well as for some more slender webs analysed using ANSYS.
Block (2005a, 2005b) extended Spyrou�s work on the column web compression zone, to take account of the possible effect of superstructure loading in the column on the resistance of the web-plate to hori-zontal patch compression. Kuhlmann and Kühne-mund (2000) have shown that the compression zone in the column web is critical if rotational capacity is needed, especially in composite connections. It is even more important in fire because of the large compressive forces which can be induced in the col-umn web due to thermal expansion of the beams. They also showed that the characteristics of this zone can be significantly affected by the normal ax-ial load in the column interacting with the transverse loads on the column web induced by beam effects. The present work therefore extends Spyrou�s ap-proach by developing a suitable representation for this part of the joint for inclusion in the overall spring model.
The simplified model for predicting the force-displacement behaviour of the compression zone at
Jack
Compression Force Reaction frameFurnace
Specimen
Reactionframe
2nd failure mode
3rd failure mode
1st failure mode
Plastic hinge
Uniformstress yw
c
Pu1 2 3 4

31
elevated temperatures is defined by three aspects � its ultimate resistance, the corresponding displace-ment, and a suitable force displacement relationship. In the present formulation, the ultimate resistance is based on a proposal by Lagerqvist and Johansson (1996). This assumes a series of plastic hinges form-ing in the column flange in combination with yield-ing of the web, with a reduction to account for buck-ling in slender webs. The displacement at ultimate load takes the form of an empirical equation which has been fitted to a large number of finite element models, varying geometrical and material parame-ters. Finally the force-displacement relationship is obtained by a curve-fitting approach using the initial stiffness approach given in the EC3-1.8 and a Ram-berg-Osgood type of equation. The effects of ele-vated temperatures are accounted for by using the temperature reduction factors for steel given in EC3- 1.2.
The reduction factor proposed by Kuhlmann and Kühnemund to account for axial forces in the col-umn has been included, again with a modification to allow for elevated-temperature conditions. The ulti-mate strength of the column web under a combina-tion of transverse and axial loads is then given as a function of temperature.
6 THE COMPONENT METHOD IN FIRE
In this paper two different component-based ap-proaches are taken to modelling the behaviour of end-plate joints at elevated temperatures. These ap-proaches are each quite valid, but represent different levels of possible analysis for performance-based design.
1.5 6.1 Modified Rotational Model. A logical way of adapting the ambient-temperature Component Method�s calculation of joint rotational stiffnesses to high-temperature conditions has been used by Simões da Silva et al. (2001b), and by Al-Jabri et al. (2005). This is to apply the ambient-
temperature component models given in EC3 Part 1.8, using the material reduction factors given in EC3 Part 1.2 for stiffness, limit of proportionality and yield to amend the mechanical characteristics of the main components at high temperatures. This method focuses on establishing elevated-temperature rotational characteristics for end-plate beam-to-column steel joints, but does not directly include the normal stiffness or strength of the connection in the direction of the beam axis, and therefore does not al-low the connection to contribute its flexibility or ductility to the estimation of beam forces. Neverthe-less, it is capable of offering a practical and eco-nomical way of introducing rotational joint behav-iour into whole-frame modelling in fire, while giving upper-bound solutions for the joint�s tying force.
The moment capacity and rotational stiffness of a joint are calculated according to the principles set out in equations (2) and (3). The individual compo-nent stiffnesses and strengths may be derived either from research studies such as those by Spyrou and Block, based either on testing or on non-linear nu-merical analysis. Alternatively the calculation pro-cedures and equations set out in EC3-1.8 for these characteristics at ambient temperature may be used, provided that the Young�s modulus and yield strength are multiplied by the appropriate EC3-1.2 reduction factors kE, and ky for elevated tempera-tures. This was the method employed by Simões da Silva et al. (2001b). This method was compared with the results from the testing by Al-Jabri (1999), with very reasonable correlation being obtained, even under the restriction of an isothermal assump-tion. An advantage of this method is that, at least for end-plate connections, it is possible to take advan-tage of the results of 20 to 30 years� research which has culminated in the component models provided in EC3-1.8. Its principal disadvantage is that it is aimed at producing only the rotational characteris-tics of joints.
M
Fc
Kc
F2
F1
K1
K2
Ft
Fc
Kc
F2
F1
K1
K2
Ft
M
Figure 10: Component model under pure moment and axial force combined with moment.

32
1.6 6.2 General Connection Element. The second method is the more general one, of as-sembling the components into a connection element and using this within the numerical analysis software directly. In this case no �rotational stiffness� is as-signed to the connection, but any component for which characteristics have been defined will mobi-lise its own displacement degree of freedom as part of the overall equilibrium of the joint.
In the context of whole-structure modelling in fire, the justification for using a component-based approach is more compelling than simply obtaining reductions of rotational charactersitics. Structural members will undergo considerable thermal expan-sion in fire, with strains much greater than normal yield strain levels for typical structural materials such as steel. For exposed beams these expansions will be resisted by restraint from columns, bracing, building cores, attached slabs and adjacent structure. In addition to this effect, the material weakens pro-gressively as it heats, and thus the beam loses its ca-pacity to resist its loads in bending. Thus beams may be subjected, at different times during a fire, to:
High compressive forces as heated beams expand against restraint. Tensile forces close to the high-temperature ca-pacity when bending action has been supplanted as the main load-carrying mechanism by catenary tension at very high temperatures. Very high tensile forces as a member shrinks and stiffens simultaneously during cooling. The joints connecting the members to columns
are subjected to these high normal forces, in addition to the vertical shear (for which they have probably been designed at ambient temperature) and rotation. It is therefore of limited use to attempt to model the connections as part of a larger structure in fire condi-tions on the basis of moment-rotation-temperature characteristics alone. Clearly it is impractical to es-tablish databases with full variation of moment, rota-tion, temperature, normal force and normal deflec-tion for a range of typical connections. However, if a connection is modelled as its appropriate assembly of components, each with an established nonlinear temperature-dependent axial force-deflection charac-teristic, this assembly can simply be placed at the beam-end, connecting it to the column face, and the mathematical linkage between the rotational and normal degrees of freedom of the connection is re-placed by the compatibility conditions between the beam-end and the column-face. This reduces the problem to one of establishing, either by modelling or testing, the normal force-deflection characteristics at different temperatures for the relatively simple component springs.
This was the rationale which underpinned the work by Spyrou et al. (2004a, 2004b) in developing simplified force-deflection-temperature models for
the tension and compression zones of end-plate con-nections. He was able to demonstrate good correla-tion with previous elevated-temperature moment-rotation tests, but did not formulate a full connection element, and of course at the time no test data was available which included a net normal force on the column through the connection. Other researchers (Vimonsatit et al. 2006b, Tan et al. 2006) have de-veloped complementary analytical descriptions for primary mechanical components, so that an adequate basis now exists for mechanical modelling of steel beam-to-column end-plate joints, although there is room for refinement of the component models.
Block (2006) has constructed a general compo-nent-based connection element to be used in global high-temperature frame analysis, using the basic spring model shown in Fig. 11.
Figure 11: Spring model representing a typical joint.
This was developed from a simpler model by Spyrou (2002) to represent a real end plate joint as a number of discrete components: endplate in bending, column flange in bending, bolts in tension, and col-umn web in compression. The first three compo-nents form the tension zone of the connection and are combined as two T-stubs in series. An addi-tional vertical shear spring, currently assumed to be rigid in the absence of the necessary studies to pro-duce a component model, is included in order to transfer the vertical load from one node to another, leaving the vertical and horizontal stiffnesses of the element uncoupled.
An alternative to this approach would be to use a diagonal component spring in a beam end-panel of finite length, and since this is a direct analogy to the tension field which carries shear to the connection this has some attractions. Qian (2007) has investi-gated this shear panel experimentally, over specific ranges of web slenderness, but at the present time
w
u

33
this work has not yet produced a working model for the beam-end shear component.
7 CONCLUSION
Some experimental validation of component methods in fire conditions has been done by Simões da Silva (2001b), Al-Jabri (2005) and Block et al.(2006). A typical comparison, in this case by Block, using the general connection element with Leston-Jones�s tests is shown in Fig. 12.
Figure 12: Comparison of the element with high-temperature tests BFEP 5 and BFEP 15 by Leston-Jones.
Although similar comparisons have been done by others, in common with Block�s comparison they suffer from the nature of the test evidence itself. As has been stated previously, there is currently very lit-tle data from furnace tests which include normal force on the connection zone; this is clearly an ex-tremely complex and potentially expensive form of testing which is beyond the normal capabilities of test furnaces. The tests by Liu et al. (2002) on �rugby-post� frames were not really intended to im-pose restraint conditions on the connections them-selves but on the beam members, and so the joints were protected in these tests. There is a clear need for properly instrumented testing of connections un-der the full range of combinations of moment and normal force which would be experienced in framed structures. The use of restraint to thermal expansion in loaded frames such as Liu�s gives too limited a range of combinations for validation of the compo-nent-based models, because it is unlikely ever to be feasible to test such frames of the range of spans which are common in contemporary steel and com-posite buildings.
Under many circumstances it is likely that both the types of component modelling presented above will produce very similar results when used in struc-tural modelling. This will not be the case when con-nections are relatively ductile, or when the normal force (in either direction) dominates the connection
moment. This is especially important in full-structure or extended substructure analysis, when connection ductility in the sense normal to the col-umn can allow enough beam deflection to reduce the joint force to a level which can be sustained by the connection. If this ductility is not present beam forces in catenary action can be extremely high. The full component-based connection model therefore al-lows the designer to amend the connection detail so that the required ductility is present without causing fracture of parts of the connection.
1.7 AcknowledgmentsThe author would like to thank Florian Block and Aldina Santiago for generously providing figures and information for this paper.
2 REFERENCES
Al-Jabri, K.S. (1999), �The behaviour of steel and composite beam-to-column connections in fire�, PhD Thesis, Univer-sity of Sheffield.
Al-Jabri, K.S., Burgess, I.W. and Plank, R.J. (2005), �Spring-stiffness model for flexible end-plate bare-steel joints in fire�, J. Construct. Steel Research, 61, pp. 1672-1691.
Allam, A.A. (2003), �The Large-Deflection Behaviour of Structural Frames in Fire�, PhD Thesis, University of Sheffield.
Ang, K.M., and Morris, G.A. (1984), �Analysis of 3-Dimensional Frames with Flexible Beam-Column Connec-tions�, Canadian Journal of Civil Engineering, 11, pp245-254.
Beg , D., Zupan i , E. and Vayas, I. (2004), �On the rotation capacity of moment connections�, J. Construct. Steel Re-search, 60, pp601-620.
Block, F.M., Burgess, I.W., Davison, J.B. and Plank, R.J. (2005a), �High-Temperature Experiments on Joint Compo-nents - The Behaviour of the Compression Zone in the Col-umn Web�, Eurosteel 2005, Maastricht, Netherlands, Ed. B. Hoffmeister and O. Hechler, Vol. C, pp5.1-9 � 5.1-16.
Block, F.M., Burgess, I.W., Davison, J.B. and Plank, R.J. (2005b), �High-Temperature Experiments on Joint Compo-nent Behaviour�, Proc. Fourth International Conference on Advances in Steel Structures, Shanghai, China, Ed. Z.Y. Shen and G.Q. Li, Vol. II, pp1041�1046.
Block, F.M. (2006), �Development of a Component-Based Fi-nite Element for Steel Beam-to-Column Connections at Ele-vated Temperatures�, PhD Thesis, University of Sheffield.
Block, F.M., Burgess, I.W., Davison, J.B. and Plank, R.J. (2006), �The Development of a Component-based Connec-tion Element for Endplate Connections in Fire�, SIF�06 � 4th International Workshop on Structures in Fire, Aveiro, Portugal, Ed. P. Vila Real, J.M. Franssen and N. Lopes, Vol.1, pp345�356.
British Steel (1982), �The performance of Beam/Column/Beam Connections in the BS 5950: Part 8 Fire Test�, Reports T/RS/1380/33/82D and T/RS/1380/34/82D, Swinden Labs., Rotherham.
BSI (2003), �BS 5950-8:2003 Structural use of steelwork in buildings. Part 8: Code of practice for fire resistant de-sign�, British Standards Institution, London.
CEN (2005a), �EC3: Design of Steel Structures, Part 1.8: De-sign of joints�, European Committee for Standardization, Document BS EN 1993-1-8:2005.
0
100200300400
500600700800
900
0 10 20 30 40 50 60 70 80 Connection rotation [mrad]
Steel temperature [°C]
BFEP 5 - 5 kNm BFEP 15 -15 kNm Bolt rows individually Bolt rows as a group

34
CEN (2005b), �EC3: Design of Steel Structures, Part 1.2: Structural Fire Design�, European Committee for Stan-dardization, Document BS EN 1993-1-2:2005.
Davison, J.B., Kirby, P.A. and Nethercot, D. A. (1987), �Effect of lack of fit on connection restraint�, J. Construct. Steel Research, 8, pp55-69.
Drdacky, M., and Novotny, R. (1977), �Partial Edge Loading-Carrying Capacity Tests of Thick Plate Girder Webs�, Acta Technika CSAV, 5, pp614-20.
El-Rimawi, J.A. (1989), �The Behaviour of Flexural Members Under fire Conditions�, PhD Thesis, University of Shef-field, 1989.
Girão Coelho, A.M. (2004), �Characterization of the ductility of bolted end plate beam-to-column steel connections�, PhD Thesis, Universidade de Coimbra.
Girão Coelho, A.M., Simões da Silva, L. and Bijlaard, F.S.K (2005), �Ductility analysis of end plate beam-to-column joints�, Eurosteel 2005 - 4th international Conference on Steel and Composite Structures, Maastricht, The Nether-lands, Ed. B. Hoffmeister and O. Hechler, Volume C, pp. 4.10-123 � 4.10-130.
Jaspart, J.P. (2000), �General report: session on connections�J. Construct. Steel Research, 55, pp69-89.
Kruppa, J. (1976), �Resistance en feu des assemblages par boulous�, Centre Technique Industrial de la Construction Metallique, St. Remy Chevzuese, France, CTICM Report, Document No. 1013-1, English translation entitled �FireResistance of Joints with High Strength Bolts�.
Kuhlmann, U. and Kühnemund, F. (2000), �Procedures to ver-ify rotation capacity�, Semi-Rigid Connections in Struc-tural Steelwork, CISM Courses and Lectures No. 419, Springer Wien, New York, pp194-225.
Kühnemund, F. (2003), �Zum Rotationsnachweis nachgiebiger Knoten im Stahlbau� (To the Rotation Capacity Verificati-on of Semi-Rigid Joints - in German), Doctoral Thesis, In-stitut für Konstruktion und Entwurf Stahl-, Holz- und Ver-bundbau, Universität Stuttgart.
Lagerqvist, O. and Johansson, B. (1996), �Resistance of I-girders to Concentrated Loads�, J. Construct. Steel Re-search, 39 (2), pp87-119.
Lawson, R.M. (1989), �Behaviour of steel beam to column connections in Fire�, Document Number SCI-RT-007/1, Steel Construction Institute.
Lawson, R.M. (1990), �Enhancement of Fire resistance Beams by Beam-to-column Connections�, Technical Report, SCI Publication 086, Steel Construction Institute.
Leston-Jones, L.C. (1997), �The influence of semi-rigid con-nections on the performance of steel framed structures in fire�, PhD Thesis, University of Sheffield.
Liu, T.C.H, Fahad, M.K. and Davies, J.M. (2002), �Experimen-tal investigation of behaviour of axially restrained steel beams in fire�, J. Construct. Steel Research, 58, pp1211-1230.
Lou, G.B. and Li, G.Q. (2006), �Nonlinear finite element mod-elling of behaviour of extended end-plate bolted moment connections in fire�, Fourth International Workshop �Struc-tures in Fire�, Aveiro, Portugal, pp327-343.
Nethercot, D.A., and Zandonini, R. (1989), �Methods of Pre-diction of Joint Behaviour: Beam-to-Column Connections�,Structural Connections, Stability and Strength, Narayanan, R., ed., Elsevier Applied Science Publishers, London, pp23-62.
Qian, Z.H. (2007), �Shear Behaviour of Steel Members and Beam-to-Column Joints under Elevated Temperatures�,PhD Thesis, NTU, Singapore.
Ramberg, W., and Osgood, W.R. (1943), �Description of Stress-Strain Curves by Three Parameters�, National Advi-sory Committee for Aeronautics, Technical Report 902.
Simões da Silva, L. and Girão Coelho, A. (2001a), �An ana-lytical evaluation of the response of stee joints under bend-
ing and axial force�, Computers and Structures, 79, pp873-881.
Simões da Silva, L., Santiago, A. and Vila Real, P. (2001b), �A component model for the behaviour of steel joints at ele-vated temperatures�, J. Construct. Steel Research, 57,pp1169-1195.
Spyrou, S. (2002), �Development of a component based model of steel beam-to-column joints at elevated temperatures�,PhD Thesis, University of Sheffield.
Spyrou, S., Davison, J.B., Burgess, I.W. and Plank, R.J. (2004a), �Experimental and analytical investigation of the �compression zone� component within a steel joint at ele-vated temperatures�, J. Construct. Steel Research, 60,pp841-865.
Spyrou, S., Davison, J.B., Burgess, I.W. and Plank, R.J. (2004b), �Experimental and analytical investigation of the �tension zone� component within a steel joint at elevated temperatures�, J. Construct. Steel Research, 60, pp867-896.
Tschemmernegg, F., Tautschnig, A., Klein, H., Braun, Ch. and Humer, Ch. (1987), �Zur Nachgiebigkeit von Rahmenkno-ten � Teil 1� (Semi-rigid joints of frame structures Vol. 1� in German), Stahlbau 56, Heft 10, pp299-306.

35
1 INTRODUCTION
The behaviour in fire of structures which have been damaged by earthquakes represents an important in-vestigation field since in many cases fires break out after a seismic event, giving rise to a real catastro-phe. In fact negative effects of fires on structures and human lives may be comparable to those of the earthquake itself. Moreover, even in case no fire de-velops immediately after an earthquake, the possibil-ity of delayed fires affecting the structure must be adequately taken into account, since the earthquake induced damage makes the structure more vulner-able to fire effects than the undamaged one. This is because the consequence of fire on a structural sys-tem is mainly a gradual decay of the mechanical properties as far as temperature grows. It is apparent that the more the structural behaviour is degraded af-ter an earthquake the more time up to collapse due to fire is short.
In recent years, a number of studies on the behav-iour of steel structures damaged by earthquakes and exposed to fires have been carried out (Della Corte et al. 2001, 2003a, b, 2005; Faggiano et al. 2005). In this framework, a series of further more refined nu-merical investigations is ongoing, in order to achieve a deeper knowledge of the problem. At this aim, the finite element multi purpose computer program ABAQUS v.6.5 (2004) has been used, which allows to perform coupled thermal-displacement analyses, so giving the possibility to reproduce, in a step-by-step process, the actual phases of the modelled phe-
nomenon, from the application of the vertical loads and the earthquake induced damage up to the expo-sure of the structure to fire. In this paper the general methodology of investigation is presented and a pre-liminary application on simple steel portal frames il-lustrated and discussed.
2 ANALYSIS METHODOLOGY
The aim of the study is to identify a method of analysis for the evaluation of the fire behaviour of structures already damaged by an earthquake, in terms of fire resistance and collapse modes.
The seismic damage on the structures is deter-mined according to the Performance-Based Earth-quake-Resistant Design (SEAOC 1995), which states the acceptability of various levels of damage on the bases of the consequences on the user com-munity, related to the expected return period of the earthquake. In particular, four performance levels are considered: 1 Fully Operational (FO), in which no damage oc-
curs � consequences on the building user com-munity are negligible;
2 Operational (O), in which moderate damage to non-structural elements and contents, and light damage to structural elements occurs � the dam-age does not compromise the safety of the build-ing for the occupancy;
3 Life Safe (LS, damage state), in which moderate damage to structural and non-structural elements
Fire analysis on steel portal frames damaged after earthquake according to performance based design
B. Faggiano, M. Esposto, F.M. Mazzolani & R. Landolfo University of Naples Federico II, Naples, Italy
ABSTRACT: The fire resistance of structures damaged after an earthquake represents an important study field, since earthquakes are often followed by fires. Consequently, the effects of structural damage on both the fire resistance and the collapse modes of structures must be estimated. This paper presents a methodology for the evaluation of the post earthquake fire behaviour of structures. It is based on coupled thermal � structural analyses carried out by means of the sophisticated finite element program ABAQUS. The state of earthquake induced damage on structures, corresponding to pre-fixed performance levels, is firstly evaluated by means of nonlinear static pushover analyses. The succeeding structural analyses under fire of the damaged structures allow to correlate the fire behaviour to the seismic performance levels. Preliminary applications have con-cerned simple steel portal frames.

36
occurs � the structure�s lateral stiffness and abil-ity to resist additional lateral loads is reduced, but some safety margins against collapse remain;
4 Near Collapse (NC, extreme state), in which the lateral and vertical load resistance of the building is substantially compromised - aftershocks could result in partial or total collapse of the structure.
The corresponding engagements in terms of intersto-rey drift ( /h, where is the interstorey lateral dis-placement and h is the interstorey height) and plastic rotations ( ) are also indicated; they are reported in Table 1.
Table 1. Seismic performance levels of structures (SEAOC Vi-sion 2000). __________________________________________________Performance Interstorey drifts Plastic rotations level ( /h) ( , rad) __________________________________________________FO 0.002 � 0.005 0 (elastic range) O 0.002 � 0.01 0 (negligible damage) LS 0.01 � 0.02 0.01 � 0.03 NC 0.02 � 0.04 0.02 � 0.05 __________________________________________________
The analysis procedure is articulated in three differ-ent phases: 1 Seismic pushover analysis of structures subjected
to vertical loads; 2 Identification of the performance levels, accord-
ing to the mentioned SEAOC indications; 3 Analysis under fire of the structures already dam-
aged by earthquake, starting from each previously defined performance levels.
As examples for the application of the set up proce-dure, simple steel portal frames are considered. In particular, preliminary, the fire behaviour of the study frames in presence of vertical design loads only is analysed as reference case to be compared with the damaged ones.
3 STUDY CASES
Four study cases are presented (Fig. 1). They are simple steel portal frames, characterized by two dif-ferent steel grades (S235 and S275) and different span over height (L/H) ratios (L/H = 1 and L/H = 2).
_________________________________________________Study case L H Steel Beam Column [m] [m] grade size size _________________________________________________LH1S235 3.5 3.5 S235 IPE180 HEB180 LH1S275 3.5 3.5 S275 IPE180 HEB180 LH2S235 7.0 3.5 S235 IPE300 HEB300 LH2S275 7.0 3.5 S275 IPE300 HEB300 _________________________________________________Figure 1. Design data.
The study structures are designed at both ultimate (ULS) and serviceability (SLS) limit states accord-ing to European standard rules for seismic design (CEN 2004). The dead load is Gk = 4.5 kN/m2 and the live load is Qk = 2.0 kN/m2. For the seismic de-sign, a PGA equal to 0.35g and an A-type soil are considered. The assumed inter-axis is 3.0 m.
The design of structures is carried out considering the steel grade S235, besides the same portal frames, made of steel grade S275 are examined, allowing for a larger structural overstrength. The latter is quanti-fied as the inverse of the exploitation ratio Sd/fy(defined as the ratio between the maximum and the yielding stresses at ULS). As long as the over-strength is larger, the fire resistance increases. In fact, since the fire effects on the structures mainly consist of a strong reduction of the material me-chanical properties, the overstrength gives a useful information about the resistance reserves in the structure: the more the structure is endowed with such resistance supply, the more the resistance re-duction (and the fire duration) must be large for reaching the collapse. In Table 2 the exploitation ra-tios for the study cases, calculated in the most en-gaged section of both beams and columns, are evi-denced.
Table 2. Exploitation ratios ( Sd/fy).__________________________________________________Study case Beam Column __________________________________________________LH1S235 0.86 0.70 LH1S275 0.73 0.60 LH2S235 0.96 0.51 LH2S275 0.83 0.44 __________________________________________________
4 FEM MODELS
The numerical analyses are carried out by means of the sophisticated finite element program ABAQUS v.6.5 (2004), which allows to perform fully coupled temperature � displacement transient analyses. Con-sequently, the mechanical and thermal aspects of the problem can be treated simultaneously and the mu-tual interactions can be easily caught. This proce-dure is different from the one usually applied in thermal analyses where, for the sake of simplicity, the heat transfer analysis and the structural one are performed separately (uncoupled analyses). In par-ticular, in such cases, the heat transfer analysis is carried out as preliminary step, in order to evaluate the temperature � time law within the structural ele-ments; subsequently, the structural analysis under design loads is carried out, by imposing to the mem-ber the temperature variation obtained in the first step.
The materials are modelled considering the de-pendence of their physical and mechanical proper-ties on the temperature, according to the indications of Eurocode 3, part 1-2, related to the structural fire

37
design of steel structures (CEN 2003). In Figure 2 the adimensional yield stress and Young modulus, scaled to their values at 20°C, are plotted in function of the temperature (T).
Figure 2. Mechanical properties of steel as a function of tem-perature.
Fixed restraints are imposed at the base of the col-umns; moreover an internal tie constraint, which prevents relative motions between the adjacent sur-faces, is applied to the beam-to-column connection, in order to model a rigid node. No continuity plates are located in the nodal area of the columns.
Tridimensional linear thermally coupled solid fi-nite elements with reduced integration (C3D8RT) are used in the model, which are endowed with both translational and thermal degrees of freedom. The finite element meshes of the study case portal frames are shown in Figure 3.
Figure 3. FEM models of the LH1 and LH2 frames.
The vertical loads on the structures are modelled through a uniform distributed pressure on the top face of the beam flange (Fig. 3), whereas for the pushover analyses increasing lateral displacements are imposed at the top of the column.
The fire phenomenon is modelled by means of the ISO834 standard curve (Fig. 4), which represents the ambient temperature during the fire as a function of time. The heat transmission due to radiation from the ambient where the fire develops to the external surfaces of the structural members is also modelled. All the members surfaces are considered as exposed to fire. The emissivity of steel is assumed equal to 0.5, which is an intermediate value between those of zinc-plated and oxidized steel. The temperature transmission within the structural members is mod-elled by assigning the thermal conductivity, the mass density and the specific heat of the material, as a function of temperature according to Eurocode 3, part 1-2 (CEN 2003).
Figure 4. ISO834 fire standard curve.
5 FIRE EFFECTS UNDER VERTICAL LOADS
Preliminary fire analyses of structures in presence of vertical loads only are carried out.
Figure 5 shows the values of temperature both in the ambient, according to the ISO834 standard fire curve, and in two points of the mid-span cross sec-tion of the beam (M), namely the centre of mass (G) and a point on the top flange superior surface (F), during the first 20 minutes of analysis. It is possible to observe that the temperature increment in the beam is slower than that in the ambient (as it was expected, due to the radiation heat transfer mecha-nism) up to reach the ambient temperature in ap-proximately 20 minutes; moreover the temperature in the beam centre of mass grows more rapidly than in the beam flange, due to a lower thermal inertia in the beam web as respect to the beam flanges.
Figure 5. Time � temperature curves during the first 20 min-utes of fire.
LH1
LH2

38
For all the examined structures the collapse condi-tion is the formation of three plastic hinges in the beam (beam mechanism � Fig. 6). The fire resis-tance is calculated as the time necessary for reaching a 0.05 rad plastic rotation in the most engaged plas-tic hinge.
Figure 6. Beam mechanisms for the frames collapsed in fire in presence of vertical loads.
In Table 3 the fire resistance of the study portal frames is reported with relation to the geometrical ratio L/H, the overstrength fy/ Sd and the S/V ratios, the latter being the massivity ratio, such as the ratio between the lateral surface and the volume, per unit length, of a structural member.
Table 3. Fire resistance of portal frames in presence of vertical loads. __________________________________________________Study L/H S/V fy/ Sd R [min] _____________ ______________ case Beam Column Beam Column __________________________________________________LH1S235 1 291 159 1.79 2.22 14�24� LH1S275 1 291 159 2.10 2.60 15�20� LH2S235 2 215 116 1.56 1.89 15�23� LH2S275 2 215 116 1.82 2.22 16�10� __________________________________________________
On the basis of the obtained results, it can be ob-served that the fire resistance of the selected portal frames in presence of vertical loads increases as the L/H ratio increases and the S/V ratio decreases. Moreover, for each frame geometry, to an over-strength increment (due to the higher steel grade) of about 15%, the corresponding fire resistance incre-ment is of about 5%; for each steel grade, to a mas-sivity ratio decrement due to larger size members (i.e. different frame geometry) of about 35%, the corresponding fire resistance increment is of about 5%. It is worth noticing that the larger overstrength
in the columns than in the beams can favour the beam mechanism collapse mode.
6 SEISMIC PUSHOVER ANALYSES
The seismic pushover analyses of the study struc-tures in presence of vertical loads are carried out in order to define the state of earthquake induced dam-age corresponding to the pre-fixed performance lev-els.
In particular, the considered performance levels are quantitatively defined as it follows:
Fully Operational (FO): /h = 0.5%; Operational (O): /h = 1.0%; Life Safe (LS): /h = 2.0%; Near Collapse (NC): two conditions have been considered: /h = 3.0% (NC1); maximum plastic hinge rotation equal to 0.05 rad (NC2).
The results are presented in terms of the capacity curve, such as base shear (V) versus lateral drift ( /h) at the beam centre of mass (Figs. 7-10). For each performance level, the distribution of inelastic deformation within the frame and the amount of plastic rotations at the nodes are indicated. Each per-formance level is also associated with the PGA of the earthquake inducing the corresponding damage state.
Figure 7. Pushover curve for the LH1S235 study case.

39
Figure 8. Pushover curve for the LH1S275 study case.
Figure 9. Pushover curve for the LH2S235 study case.
Figure 10. Pushover curve for the LH2S275 study case.
From the analysis of results it can be noticed that for frames designed with S235 steel grade some extent of inelastic deformation, although a very modest one, occurs already at the FO level. This is because
the design seismic force is smaller than the one in-ducing the Fully Operational condition and the over-strength is not so large to allow the elastic behaviour up to the conventional FO force.
In all cases the collapse occurs as global mecha-nism, with the formation of plastic hinges at the col-umn bases and at the beam ends.
7 FIRE AFTER EARTHQUAKE ANALYSES
The damaged states of the structures, characterizing the performance levels, are considered as initial con-figurations for the fire analysis, aiming at the evaluation of the effect of the seismic induced dam-age on the fire resistance and the collapse mode of the study structures.
The seismic damage to the structure is produced by imposing, at the top of the column, a displace-ment corresponding to the selected performance level. Then, the imposed displacement is removed and the elastic part of that displacement recovered.
The fire is applied on the permanent deformed configuration.
The performance levels considered as starting points for the fire applications are FO, O, LS and NC1. In all cases the collapse condition, assumed for the determination of the fire resistance of the struc-ture, is the NC2, i.e. achievement of a 0.05 rad plas-tic rotation in at least one hinge of the structure.
The results of the fire analyses on the structures damaged by earthquake are shown in Table 4. In particular, for each performance level, the fire resis-tance and the cross section where the 0.05 rad plastic hinge develops are indicated.
Table 4. Fire resistance of seismic damaged structures. __________________________________________________Portal Performance Fire resistance 0.05 plastic frame level R [min] hinge __________________________________________________LH1 S235 FO 14� 24� M O 14� 22� M LS 14� 20� D NC1 14� 18� D __________________________________________________LH1 S275 FO 15� 20� M O 15� 18� M LS 15� 15� D NC1 15� 13� D __________________________________________________LH2 S235 FO 15� 23� M O 15� 23� M LS 15� 20� D NC1 15� 16� D __________________________________________________LH2 S275 FO 16� 10� M O 16� 10� M LS 16� 07� D NC1 16� 05� D __________________________________________________
In all cases the collapse mechanism is a beam mechanism. In Figure 11 the collapse conditions achieved in fire starting from the NC1 performance level are shown.

40
From the analysis of the results the following ob-servations can be drawn:
Fully Operational performance level: essentially no damage is present; the fire resistance and the collapse mechanisms are those of the undamaged structure;Operational performance level: the damage is negligible; the fire resistance and the collapse mechanism are substantially the same as respect to the FO level. Life Safe and Near Collapse (NC1) performance levels: the damage is significant; there is a small reduction of the fire resistance; as respect to the undamaged structure the 0.05 rad plastic hinge moves from the beam mid-span to the beam-to-column node D. The small reduction in terms of fire resistance is justified considering that, al-though the structure presents an initial damage state which would lead towards a global collapse mechanism, the fire application induces a beam collapse mode and the critical plastic hinge is the one at the beam-to-column node D.
Figure 11. Fire after NC1 earthquake collapse modes.
8 CONCLUSIVE REMARKS AND FURTHER DEVELOPMENTS
A methodology for the analysis of the behaviour of structures subjected to fire after being damaged by the earthquake has been set up and proposed.
The evaluation tool, such as a refined software for structural analysis which allows to carry out coupled temperature � displacement analyses, has been used. Therefore, the earthquake induced dam-age state, corresponding to different performance levels of the structure, has been characterized by
means of nonlinear static pushover analyses. Then, the effect of fire on the damaged structures, in terms of both fire resistance and mode of collapse, has been evaluated.
As a first step of a campaign of numerical inves-tigations aimed at evaluating, by means of coupled temperature � displacement analyses, the post earth-quake fire resistance of steel frames, the methodol-ogy has been applied to simple structural schemes such as steel portal frames. Further studies are needed and will be carried out, in order to have a deeper comprehension of the study phenomenon. First of all, parametrical analyses will be performed, focusing on the influence of some parameters such as the span-to-height L/H ratio, the overstrength, the massivity S/V ratio. Then, the analyses will be ex-tended to multi-span multi-storey moment resisting steel frames, where also the influence of the fire po-sition in the frame will be evaluated.
REFERENCES
ABAQUS, Inc. 2004. ABAQUS Standard User�s Manual, ver-sion 6.5.
CEN 2003. prEN 1993-1-2. Eurocode 3, part 1-2. Design of steel structures: General rules, Structural fire design.
CEN 2004. ENV 1998. Eurocode 8. Design provisions for earthquake resistance of structures.
Della Corte, G. & Landolfo, R. 2001. Fire resistance of steel structures. In Zio E., Demichela M., Piccinini N. (eds), Safety and reliability, towards a safer world, Proceedings of the European Conference on Safety and Reliability - ES-REL 2001, Torino, Italy.
Della Corte, G., Landolfo, R. & Mammana, O. 2003a. Fire re-sistance of MR steel frames damaged by earthquakes. In Mazzolani F.M. (ed), Proceedings of the Fourth Interna-tional Conference on the Behaviour of Steel Structures in Seismic Areas (STESSA 2003), Naples, Italy.
Della Corte, G., Landolfo, R. Mazzolani, F.M. 2003b. Post-earthquake fire resistance of moment-resisting steel frames. Fire Safety Journal, 38: 593-612, Elsevier Ltd.
Della Corte, G., Faggiano, B. & Mazzolani, F.M. 2005. On the structural effects of fire following earthquake. In Proceed-ings of the Final Conference COST C12 �Improving build-ings� structural quality by new technologies�, Innsbruck, Austria.
Faggiano, B., Della Corte, G., Mazzolani, F.M. & Landolfo, R. 2005. Post-earthquake fire resistance of moment resisting steel frames. In Proceedings of the Eurosteel Conference on Steel and Composite Structures, Maastricht, The Neeth-erlands.
SEAOC Vision 2000 Committee. 1995. Performance Based Seismic Engineering of Buildings.

41
1 PRECIOUS
1.1 Partners of the project
The project started in July 2003. The coordinator is the University of Trento (Italy). The other con-tractors are the University of Pisa (Italy), Ferriere Nord (Italy), Arcelor (Luxemburg), the University of Navarra (Spain), BRE (UK) and the University of Liège (Belgium).
1.2 Objectives
Precious considers the situation of an earthquake immediately followed by significant conflagrations. The first step is the definition and the design of con-figurations of joints for seismic and fire loadings. Scope of the second step is the analysis of the me-chanical and thermal behaviour of the chosen ty-pologies and the extension of the numerical investi-gation to other types of precast structural assemblies in order to cover a broader range of structural types. The aim of the third step is the derivation of design procedures and the promotion of the investigated joint solutions.
1.3 Tests procedure
Since this project intends to analyse the behaviour of joints under fire after having been submitted to an earthquake, fire tests have to be undertaken on dam-aged specimens. University of Trento performed a series of tests under monotonic and cyclic loading
tha made possible the definition of a monotonic loading equivalent to seismic excitations in terms of damage. Then, BRE performed fire tests under stan-dard ISO curve on identical specimens that were pre-damaged by a monotonic loading.
1.4 Type 1 joint
The original lay-out of type 1 joint is the one al-ready defined in previous research programmes. This choice is taken since the joint performed well under seismic loading. Then the joint has been modi-fied to take into account the situation in which a fire followed an earthquake.
This joint consists in an extended end-plate with four bolts rows connecting a composite beam to a partially reinforced-concrete-encased column with I-section. One bolt row is situated above the upper beam flange and thermally protected by the concrete slab which enable a slower decrease of resistance of the most stressed bolt row. Stiffeners are welded be-tween the column flanges at the same levels as the beam flanges.
Two types of slabs were tested. The first one is a composite steel-concrete slab with high ductile re-bars, electrowelded meshes and profiled steel sheet-ings (Figure 1). The second one is a prefabricated concrete slab with high ductile rebars, electrowelded meshes and electrowelded lattice girders (Figure 2).
Fire tests performed by BRE were simulated nu-merically with the software SAFIR. The same
Precious and Cossfire: Two RFCS projects on joints subjected to fire
J.-M. Franssen & F. Hanus University of Liège, Belgium
ABSTRACT: Various experimental works have been carried out on the behaviour of steel connections for steel and composite structures under standard fire conditions around Europe, but global systematic analysis is still missing to give fully confident and practical design rules of steel connections exposed to fire conditions. Moreover, the behaviour of connections could be very different from the behavior shown under standard fire, either after seismic loading or under natural fire conditions. RFCS has funded two projects aiming at under-standing the behavior of joints under fire and integrating some simple design rules in the fire parts of Euro-codes 3 and 4. PRECIOUS studies the residual fire resistance of some composite connections after they have been submitted to a seismic loading. It is intended to develop fundamental data, design procedures and pro-motion of two types of ductile and fire-resistant composite beam-to-column joints. COSSFIRE seeks to ob-tain a better understanding about the fire behaviour of steel connections, and to develop simple design rules for European application on connections of steel structures when exposed to fire, covering both natural and standard fire conditions.

42
boundary conditions as those measured during the experimental test were applied.
Figure 1 : Temperature after 30 minutes in joint 1 with a steel profiled slab
Table 1 shows a good correlation between ex-perimental and numerical results.
Table 1 : Comparison between experimental and numerical temperatures in joint 1 with steel profiled slab
Figure 2 : Temperature after 30 minutes in joint 1 with a pre-fabricated concrete slab
Table 2 : Comparison between experimental and numerical temperatures in joint 1 with prefabricated slab
1.5 Type 2 joint In the joint 2, a double-T profiled beam is con-
nected to a concrete filled tubular column with cir-cular hollow steel section. A vertical fin-plate and two horizontal triangular plates are welded to the column by the edges.
Temperature distribution after 30 minutes in the joint is given in Figure 3.
Figure 3 : Temperature after 30 minutes in joint 2 with steel profiled slab
0
100
200
300
400
500
600
700
800
900
1000
0.00 10.00 20.00 30.00 40.00 50.00 60.00 70.00
Time (minutes)
Beam Test BRE
Beam SAFIR
Connection Test BREConnection SAFIR
Slab Test BRE
Slab SAFIR
0
200
400
600
800
1000
1200
0.00 10.00 20.00 30.00 40.00 50.00 60.00 70.00
Time (minutes)
Beam Tes t BRE
Beam SA FIR
Connec tion Tes t BRE
Connec tion SAFIR
S lab Tes t BRE
S lab SA FIR
TIME: 1800 sec869.20800.00700.00600.00500.00400.00300.00200.00100.0020.30
TIME: 1800 sec937.30900.00800.00700.00600.00500.00400.00300.00200.00100.0021.60
TIME: 1800 sec864.30800.00700.00600.00500.00400.00300.00200.00100.0020.00

43
2 COSSFIRE
2.1 Partners of the project
CTICM (France) is the coordinator of this project that started in July 2006. The other contractors are Efectis Nederland (The Netherlands), Corus (UK), CSM (Italy) and the University of Liège (Belgium).
2.2 Background
During the last decades, the fire research projects carried out on steel buildings have been focused firstly on the fire behaviour of single structural members such as [1,2,3] and then on the behaviour of global steel structures [4,5].
More recently, specific projects [6,7] have been carried out with the intention of developing design tools in order to provide a possibility of assessing the global behaviour of steel structures [8,9] sub-jected to fire, in particular under natural fire condi-tions.
As a consequence of important findings using global structural analysis, partially fire protected or fully fire unprotected steel and composite structures have been built more and more extensively around Europe. However, in the assessment of global be-haviour of buildings or civil works, not enough at-tention has been paid to the behaviour of steel con-nections under real fire conditions which is one of the key factors to ensure the integrity function of global steel structures during the whole period of fire. According to available experiment data ob-tained in recent ECSC research projects [4,5], steel and composite connections could become a weak point under fire situation. The natural fire tests within a fire compartment of steel and concrete composite floor building in Cardington (UK) [4] as well as within an open car park (France) [5] have clearly demonstrated the risk of connection failure during real fires.
Figure 4 : State of art about the existing research work on con-nections in fire
In fact, it has been found that the forces and de-formation of steel structures in a fire are very differ-ent from those caused by the design load cases at room temperature and the damage of connection could occur particularly during the cooling stage of the fire because the plastically deformed steel beams contract significantly and create important tension forces as indicated in some analytical investigations such as in [10]. Moreover, the repair of the damaged connections could be expensive or even impossible. On the contrary, some types of connections behaved surprisingly well, without any problem, during all stages of fire. Therefore questions arise about the appropriate type of connection to be used to get a full performant integrated steel structure during both heating and cooling phases of fire.
Figure 5 : Rupture of bolts of steel connections during real fires
The collapse of WTC Twin Towers on the 11th of September 2001 has also left a quite important doubt about the consequence of connection failure. Some experts have alleged that the failure of connections between truss beams and edge columns has played a significant role in the final global collapse of the above two towers. Furthermore, the damaged con-nections (for example, distorted bolts and holes bearing) were documented as a failure mode by the investigating team regarding WTC5, a 45 storey building which collapsed several hours after WTC1 and WTC2 due to the sole effect of fire. Because of the various questions arisen about the failure mecha-nism of these buildings, the National Institute of Standards and Technology (USA) has initiated an international collaborative project in the scope of CIB W14 [11] . In this project, it is mentioned : �Current design methods, as the fire parts of Struc-tural Eurocodes are mainly based on fire resistance of single components and account very seldom for the behaviour of inter-component connections. Moreover, the role of structural connections to en-able load transfer during a fire is not yet well known and consequently generally ignored in structural de-sign�.

44
Another important parameter influencing the fire resistance of composite floors is the connection con-ditions between the composite or concrete slab and edge steel members (edge beams and columns). It has been clearly shown in a previous ECSC project [6] by means of numerical analysis that a good con-nection will lead to a much better fire resistance of the floor due to the membrane effect created by this connection. Nevertheless, how to achieve these so called good connections under fire connections by the most economic construction details is far from clear. In addition, for the time being, there is an im-portant lack of available technical data (both ex-perimental and analytical) in this field.
2.3 Work programme and objectives
The work programme of this project includes :
- a detailed bibliographic analysis of both test results and calculation models on connec-tions under standard fire conditions ;
- some tests under natural fire heating condi-tions (including the cooling phase) on con-nection components, such as welding and bolts, on full structural steel joints and on connections between concrete slabs to bor-der steel members in case of composite steel members ;
- numerical simulations of existing available experimental data on steel connection as well as the fire tests to be performed within the scope of both this project and the col-laborative project of CIB W14 mentioned previously ;
- development of simple design rules as well as practical design guidance on various commonly used types of connections for fire situations.
3 REFERENCES
[1] ECSC 7210 SA509 �Fire resistance of com-posite concrete slabs with profiled steel sheet and of composite steel concrete beams�, Final report, July 1995
[2] ECSC 7210 SA 316/515/931/618 �Buckling curves on hot rolled H steel sections submitted to fire�, Final report, 1995
[3] ECSC 7210 SA504 �Practical design tools for composite steel-concrete construction ele-ments submitted to ISO-fire considering the in-teraction between axial load N and bending mo-ment M�, Final report, 1988
[4] ECSC 7215 CA 306 �Behaviour of a multi-storey steel framed building subjected to fire�, Final report, December 1999
[5] PP 025 �Demonstration of real fire tests in car parks and high buildings�, Final report, De-cember 2000
[6] ECSC 7210 PR112 �Design tools for the be-haviour of multi-storey steel framed buildings subjected to natural fires, Final report, March 2003
[7] Bailey C. and Moore D.B. �The structural behaviour of steel frames with composite floor slabs subjected to fire; Part 1 : Theory & Part 2 : Design�, The structural engineer, Volume 78/No 11, June 2000
[8] EN 1993-1-2 �Eurocode 3 : Design of steel structures, Part 1.2 : General rules � Structural fire design�, CEN, February 2005
[9] EN 1994-1-2 �Eurocode 4 : Design of com-posite steel and concrete structures Part 1-2 : General rules � Structural fire design�, CEN, July 2005
[10] C.G. Bailey, I.W. Burgess and R.J. Plank �Analysis of the effects of cooling and fire spread on steel-framed buildings�, Fire Safety Journal, 26 1996
[11] CIB W14 �Advanced Structural Fire Resis-tance�, Draft proposal of collaborative research project, April 2004

45
1 INTRODUCTION
This paper describes the structural aspects of a fire test that took place at 4 Millerfield Place, Dal-marnock, Glasgow on 25th July 2006 on a cast in-situ concrete structure. This paper is one of several that will report on the range of experiments carried out during July 2006 at Dalmarnock (�The Dalmar-nock Fire Tests�).
The conventional method of testing structures for fire resistance has been to subject single structural elements to a Standard Fire Test (BS476, 1987) and thus obtain a fire resistance rating in the form of a time to failure. This approach has been severely criticised in a number of ways, such as those dis-cussed by Drysdale (1998), however, it is still widely used. From a structural engineering point of view, one of the most serious criticisms is that the manner and time to failure of a single structural ele-ment in a furnace test bears little relation to the time to failure of a complete structural system. Furnace tests therefore do not provide the information needed to undertake performance-based designs of struc-tures for resisting fire. Over the last ten years a con-siderable amount of work has been undertaken into understanding the global behaviour of steel and steel-concrete composite structures in fire (e.g. Bai-ley and Moore 2000; Elghazouli et al 2000; Gillie etal 2001; Huang et al 2003). This work has included both gathering of experimental data and analysis of that data. As a result, the knowledge and computa-tional tools available are now adequate for perform-ance-based designs of this kind of structure to be undertaken with confidence (e.g. Arup Fire, 2003).
By contrast, the understanding of the global be-haviour of concrete structures has received relatively little attention. This is in part due to the lack of ex-perimental data on complete concrete structures in fire and in part due to the difficulties associated with numerical modelling of concrete structures. Fire tests on complete concrete structures are infrequent.
Prior to the Dalmarnock test discussed here, the most complete set of test data available was that produced by a fire test on the RC frame at Carding-ton, UK (Bailey, 2002; Canisius et al, 2003). Unfor-tunately, however, this test suffered from instrumen-tation failure prior to the end of the test and so the dataset is incomplete. More recently, a number of tests have been conducted on model-scale concrete slabs with the aim of verifying design methods for composite structures in fire (Bailey and Toh, 2006).
The test described in this paper is believed to be first fire test on a concrete structure in which all of the following applied:
the fire load was �real�, resulting from office furniture being burnt rather than from burn-ing wooden cribs or gas,both the fire and structural behaviour were monitored and well documented, the structure was a complete building rather than a structural element or set of elements, data relating to the fire behaviour and struc-tural behaviour was recorded during both the heating and cooling phases of the fire.
The test has therefore provided both a valuable description of the behaviour of concrete structure in fire but also a unique set of data with which it will be possible to benchmark numerical tools.
2 THE STRUCTURE
The Dalmarnock structure was built in 1964 as a residential tower block. The 23-storey building was made of cast in-situ reinforced concrete and each of the upper floors contained 6 flats. Figure 1 gives a general view of the structure. The fire test was con-ducted in a flat on the fourth floor with the fire com-partment being in the living room of the flat. A plan view of the flat is shown in Fig. 2 and details of the living room are given in Fig. 3. The room was in one corner of the structure and so had two external walls. The shorter of these was load bearing. The second
Behaviour of a cast in-situ concrete structure during a compartment fire
M. Gillie & T. Stratford University of Edinburgh, United Kingdom
ABSTRACT: In July 2006 a full-scale compartment fire was set in an existing block of flats in Dalmarnock Glasgow. Prior to ignition the structure surrounding the compartment was heavily instrumented and with de-flection gauges, thermocouple and strain gauges. The fire itself was also carefully monitored. The resulting data set is the first to describe the behaviour of a concrete structure in fire through a complete heating-cooling cycle. This paper presents the data captured by the instrumentation associated with the structural aspects of the test.

46
was largely non-load bearing, although it did contain two structural columns. Of the internal walls one was structural and the second a light-weight partition wall dividing the fire compartment from a kitchen of the flat; this wall performed no structural function but prevented high temperatures on its outer side. The details of the support conditions of the slab above the fire compartment were, therefore, quite complex. However, the heated slab may be consid-ered approximately as one-way spanning between fixed supports. All these details are indicated in the Fig. 3. The ceiling height was 2.4m
The nominal thickness of the slab was 150mm and a survey using ground penetrating radar indi-cated that it contained mesh reinforcement near its lower surface over its entire area, with addition rein-forcement near the top surface adjacent to the sup-ports.
3 THE TEST SET-UP
3.1 The Fire Load The fire load in the compartment consisted of office furnishing, with the main fire load coming from a sofa placed in the middle of the compartment. This burnt in a t2 manner and produced a peak heat re-lease rate of 800kW after 1300s. Other items of fur-niture included bookshelves filled with paper, a desk, computer and chair. The fire was started by the ignition of a waster paper basket next to the sofa.
Ventilation to the compartment was provided by an open door to the rest of the flat and, in the later stages of the fire by the openings left by breaking windows.
3.2 InstrumentationData recorded for the structural aspects of the test
included deflections of the ceiling and one wall of the fire compartment; strains on the upper surface of the ceiling of the compartment and temperatures within the ceiling of the compartment.
Deflection measurements were taken with LVDT displacement transducers. To monitor the deflec-tions of the ceiling of the fire compartment an array of 9 transducers were mounted on scaffold bars in the room above fire. The arrangement is shown in Fig 4 with each deflection gauge being assigned a letter for ease of identification. Each deflection gauge was identified by a capital letter and its coor-dinates noted in the x-y system indicated in the fig-ure. The scaffold bars were supported on the edge of the floor slab in this room and so the deflections recorded are changes relative to the edge of the slab; any global change in the height of floor was not cap-tured. The windows of this room were sealed to en-
sure that hot gases did not enter and affect the in-strumentation. Using a similar method, horizontal deflections of the internal structural wall of the fire compartment were monitored by three transducers from a room adjacent to the fire (Fig. 2). As this room filled with hot gases in the later stages of the test, the recordings from these transducers are not entirely reliable, however, as shown below, the de-flections appear negligibly small.
Slab temperature measurements were taken by means of thermocouples at six locations in the ceil-ing above the fire compartment. At each location temperatures were recorded at four depths in the slab. Details are given in Fig. 5 where each group of thermocouples are assigned a Greek letter for identi-fication. The thermocouples were inserted in to the slab by drilling an 18mm diameter hole through its entire depth, inserting the thermocouples and then filling the remaining space with cementitious grout. Care was taken to ensure that a small layer of grout was present between the lowest thermocouple and fire compartment so that the temperature measure-ments were those of the slab and not the hot gases. The locations of thermocouples within the depth of the slab is shown in the inset to Fig 5.
Strain measurements were taken at 22 locations on the upper surface of the ceiling of the fire com-partment as shown in Fig 6. Strains were recorded by resistance strain gauges and the results later cor-rected for temperature variations using the manufac-turer�s correction curves. Temperatures were esti-mated from the nearest thermocouple to each of the strain gauges.
3.3 Test Procedure Key events in the test are shown in Table 1.
4 RESULTS
Thermocouple readings from within the ceiling slab are plotted in Fig 7. It is clear from these plots firstly that the locations at which highest tempera-tures occurred within the area of the slab were very localized and secondly that the a steep thermal gra-dient was produced in the slab. The readings at lo-cation alpha are anomalous and it is suspected that this is due to a failure of instrumentation. The highest temperatures are recorded away from the window of the compartment at locations delta and epsilon. This occurred due to the ventilation to the fire initially being supplied via the doorway; it was only later in the fire that ventilation was avail-able through the window of the compartment. The localized nature of the heating is significant since it is almost always assumed when performing calcula-tions to determine the behaviour of heated structural elements that there is no spatial variation of tem-

47
perature. These results show such an assumption does not hold.
The high thermal capacity of concrete is illus-trated by the manner in which the lower surface of the slab is heated much more rapidly and to higher temperatures than the internal part. It is also notice-able that the temperature of the lower surface of the slab dropped rapidly at all locations from around 1500s. This was due to fire-fighters spraying cold water on the slab when the fire was being extin-guished. The internal portions of the slab main-tained their temperatures despite fire fighting activi-ties, indeed, the upper layers of the slab continued to get hotter even after the fire was completely extin-guished.
The vertical deflections of the floor slab are shown in Figs 9 where it can be seen that the peak deflection at the centre of the slab was around 10mm and that 4mm of this deflection was recovered on cooling. Deflection gauges located towards each of the walls of the compartment recorded lower deflec-tions in each case. It is notable that gauge C re-corded negative (upward) deflections from around 1500s. It is believed that this resulted from a crack forming in the slab that effectively moved the sup-port from the wall to slightly inside the fire com-partment. The very small deflections recorded for horizontal deflections of the internal wall of the compartment (Fig. 9) suggest the heating of this wall was small in comparison with the compartment ceil-ing.
Strain gauge data is shown in Fig. 10. In general the curves indicate similar behaviour to the deflec-tion readings with peak strain occurring just before fire-fighters entered the compartment. It is notice-able that some gauges suggest increasing strains dur-ing the cooling phase (e.g. gauges 7b and1c). The reasons for this are not entirely clear, however, it may be due to local thermal expansion of some areas of the slab resulting in compression in other areas. This is one question that future numerical modelling of the test will aim to answer with certainty.
5 CONCLUSIONS
A full-scale fire test was undertaken on a concrete structure and a complete set of experimental data re-corded. The data highlights that there may be con-siderable differences in temperature within a heated concrete structure due to the localized nature of compartment fires. This is in contrast to the as-sumptions made in most design procedures.
The set of data collected will allow for future nu-merical modelling of the test so that greater under-standing of the behaviour of concrete structures in fire can be obtained.
6 REFERENCES
Arup Fire (2003) Mincing Lane, Structural Fire Engineering, Over Arup and Partners Ltd, London.
Bailey CG (2002), Holistic behaviour of concrete buildings in fire, Proc of the Inst. of Civil Engineers, Structures and Buildings pp199-212.
Bailey CG and Moore DB (2000), The structural behaviour of steel frames with composite floor slabs subject to fire: Part 1: Theory. The Structural Engineer, 78(11) 19 � 27.
Bailey CG and Toh WS (2006), Experimental behaviour of concrete floor slabs at ambient and elevated temperatures. Proc of the 4th International Workshop Structures in Fire,Aviero, Portugal, editor PV Real.
BS476 (1987), BS 476 Fire tests on building materials and structures parts 20-22, British Standards Institution, UK
Canisius TDG, Matthews SL, Waleed N (2003), Evaluation of effects of the fire test on Cardington concrete building, Proc of the CIB-CTBUH International Conf of Tall Buildings, 20-23rd Oct Malaysia, CIB publication No. 290.
Drysdale D(1998), An Introduction to Fire Dynamics, 2nd Ed. Wiley
Elghazouli AY, Izzuddin BA and Richardson AJ (2000), Nu-merical modelling of the structural behaviour of composite buildings, Fire Safety Journal 35 279-297.
Gillie M, Usmani AS and Rotter JM (2001), A structural analysis of the first Cardington test. Journal of Construc-tional Steel Research 57(6) 581-601.
Huang Z, Burgess IW and Plank RJ (2003), Modeling mem-brane action of concrete slabs in composite buildings in fire II: validations. Journal of Structural Engineering 129(8) 1103-1112.
Lamont S, Lane B, Flint GR, Usmani AS (2006), Behaviour of structures in fire and real design � a case study, Journal of Fire Protection Engineering 16(1) 5-35.
Figure 1. 3 Millerfield Pl, where the Dalmarnock fire tests were conducted.

48
Table 1. The timing of key events during the fire test. Clock Time Time from ignition (s) Event
12:23:00 0 Ignition 12:23:09 9 Cushions ignite 12:23:15 15 Researchers and firemen leave compartment, front door closed 12:26:06 186 Smoke visible in main corridor 12:27:35 275 Bookcase ignites 12:28:00 300 Aerosol Can Explodes 12:28:00-12:28:30 300-330 Flashover 12:28:15 315 Flames project to flat corridor ceiling, low visibility in main corridor 12:28:23 323 Ignition of paper lamp and table papers 12:36:21 801 Window breakage 12:41:00 1080 External flaming 12:42:00 1140 Firemen enter and tackle fire 12:45:00 1320 Mostly Smoldering
Figure 2. Extract from the Dalmarnock tower blueprints showing the layout of the flat in which the fire test took place.
Figure 3. Plan of the fire compartment..
Fire set in living room of flat
Non-structural wall be-tween kitchen and living room
Doors to kitchen and hall left open during test
Wall deflection measured on this wall
Living room � seat of fire
Door to kitchen
Door to hall
Structural wall
Non-structural wall
C 4.6 m
C 3.6 m
Structural column

49
WINDOW
x
y
E F GC D
B
H
I
A (1800,830)
(1980,1490)
(2450,2450) (3040,2580)(1310,2450)(660,2450)
(1870,3900)
(1920,3180)
(1840,2370)
Figure 4. Locations of the deflection gauges on the upper surface of the heated concrete slab
WINDOW
x
y
(170,190)(15,2000)
(1070,1590)
(3630,1980)
(4530,3500)
(4650,1900)
Figure 5. Locations of the thermocouples in the heated con-crete slab.
WINDOW
FRP plate 1 ( intumescent)11 807e 7d 7a7b
5e 5a
2e 2d 2a2b
1360
1560
1940
2190
2420
FRP NSM 1 (intumescent)
FRP plate 2 (unprotected)
FRP NSM 2 (unprotected)
FRP plate 3 (gyproc)
FRP NSM 3 (gyproc)
x
y
7c
8c
8x
7x
5x
2x
1x (not used)
6c
4c
3c
5c
2c
1c
Figure 6. Locations of the strain gauges on the upper surface of the heated concrete slab
.
Slab
Thermocouple
Grout

50
0
20
40
60
80
100
0 2000 4000Time (s)
ALPHA
Bottom3/4 depth1/4 depth
Top
0
50
100
150
200
0 2000 4000Time (s)
BETA
Bottom3/4 depth1/4 depth
Top
0
50
100
150
200
0 2000 4000Time (s)
GAMMA
Bottom3/4 depth1/4 depth
Top
0
100
200
300
400
500
600
0 2000 4000Time (s)
DELTA
Bottom3/4 depth1/4 depth
Top
0
100
200
300
400
500
0 2000 4000Time (s)
EPSILON
Bottom3/4 depth1/4 depth
Top
0
50
100
150
200
250
300
350
400
0 2000 4000Time (s)
THETA
Top3/4 depth1/4 depth
Top
Figure 7. Temperature data recorded at the locations shown in Fig 5.

51
Figure 8. Vertical deflections of the heated floor slab from gauges placed at the locations indicated in Fig. 4.
Figure 9. Horizontal deflections of the internal structural wall of the fire compartment.

52
Figure 10. Strain gauge readings from the upper surface of heated slab at the locations indicated in Fig. 6.

53
1 INTRODUCTION
During the last 20 years, concrete have evolved to provide better performances and also to a greater specialization in their field of application. The changes made in the composition of the mixes (reduction of water content, use of superplasticizers, optimization of grain size distribution, addition of fibers, etc.) lead to striking improvements in many properties such as strength, early strength increase, rheology of fresh concrete, ductility and compactness. The latter yields in most cases a better durability, but it may also lead to a brittle behaviour of such concrete in fire conditions (Kalifa et al. 2000).
There are many buildings and civil engineering works under construction, which are at risk of fire. A few dramatic accidents in recent past have prompted investigations in the field of safety of reinforced
concrete structures subjected to a fire. Fires in railway Channel Tunnel (Fall, 1996), in the road tunnels of Mont Blanc (France/Italy 1999), in Ostankino Tower (Moscow, 2000), in the Twin Towers (NY, 2001), in 32-story skyscraper in Astana (Kazakhstan, 2006) should be mentioned (see Figure 1). In all cases, the load-bearing capacity of structure in the actual fire conditions is of primary importance for the evacuation of persons, as well as for the safety of rescue teams.
The analysis of the behaviour of load-bearing members under high temperature conditions is very complicated (Kaklauskas & Ghaboussi, 2001). Various factors that influence the behaviour of the members need to be taken into account, including: variation of member temperature with time, variation of temperature over the cross section and along the member, temperature effects on material properties, material nonlinearity and etc.
Figure 1. Fires in the Ostankino Tower (Moscow, 2000), in the Twin Towers (New York, 2001) and in the skyscraper in Astana (Kazakhstan, 2006).
Non-linear modelling of reinforced concrete beams subjected to fire
V. Gribniak, D. Bacinskas & G. Kaklauskas Vilnius Gediminas Technical University, Lithuania
ABSTRACT: This paper presents a strategy of numerical simulation of reinforced concrete members exposed to high temperatures and subjected to external loading. Finite element modelling of full load-deflection behaviour of experimental reinforced concrete beams reported in the literature has been carried out. A constitutive model based on Eurocode 2 specifications has been used in the analysis. Comparison of numerical simulation and test results has shown reasonable accuracy.

54
Figure 2. The loading configurations and specimen dimensions.
Because of the nonlinear nature of the problem, closed-form solutions usually cannot be found by the trivial way (Ba�ant & Kaplan, 1996). The nonlinear behaviour of a member under elevated temperature conditions can be simulated using the numerical methods (Kaklauskas, 2004; Bacinskas et al., 2004).
This paper presents a strategy of numerical simulation of reinforced concrete (RC) members exposed to high temperatures and subjected to mechanical loading. Full load-deflection behaviour of experimental reinforced concrete beams was modelled by the finite element software MSC.Marc (MSC.Marc, 2003). A constitutive model based on Eurocode 2 specifications for fire design (prENV, 2001) has been used in the analysis. Comparison of numerical simulation and test results has been carried out.
2 FIRE TESTS OF TYPICAL RC BEAMS
Present analysis employs experimental data (Shi et al., 2002) of RC beams subjected to external loading at elevated temperatures. Specimens were heated on three surfaces (the bottom and two lateral surfaces). They were tested in the temperature-force path: first heated up to a fixed temperature, and then loaded to failure. As the loading time was very short compared to its heating time, the thermal duration effect during loading can be neglected. The paper includes modelling results of three beams, first exposed to temperatures of 20°, 400° and 600°C, respectively, and then subjected to external loading.
The loading configuration and specimen dimensions are shown in Figure 2. The mean compressive cube strength of concrete is 29.45 MPa. The low-carbon plain steel bars with diameter 10 mm and yield stress 270 MPa at room temperature were used as tensile and compressive reinforcement, while those with diameter 4 mm and yield stress 289 MPa at room temperature were used as stirrups. The specimen tensile steel ratio was 0.95% and the stirrup spacing was 80 mm.
The temperature distribution was measured along the cross-section dept at 20 mm from the lateral surface and across section width at 75 mm from specimen soffit.
3 THERMO-MECHANICAL PROPERTIES OF MATERIALS
The reliability of a fire analysis results is strongly affected by the choice of the constitutive laws of materials and the values of their thermo-mechanical parameters. In the present numerical model, the material properties are considered to be temperature-dependent. This section describes constitutive models for concrete and steel assumed in the finite element analysis. The constitutive relationships are based on Eurocode 2 specifications (prENV, 2001) and recommendations (Purkiss, 1996).
3.1 Thermal properties used in the analysis The classical equation of heat transfer is as follows:
T ;t vc (1)
where = space-dependent temperature and = temperature-dependent thermal diffusivity. It should be noted that the thermal diffusivity is related to the density, , the thermal conductivity, and the specific heat cv. In the present analysis, density for concrete as well as for steel was taken as a constant value.
3.1.1 ConcreteThermal properties of concrete are dependent on the mix proportions, the type of aggregate, the moisture content and age of concrete. The specific heat was calculated by the following equation (Purkiss, 1996):
2 J900 80 4120 120 kg C
c (2)
and the thermal conductivity (prENV, 2001) was taken as
2 W2 24 121200 12000 m Cc (3)
3.1.2 Reinforcement The values of the properties concerned are sensibly independent on the strength or grade of the steel. The specific heat and the thermal conductivity as

55
functions of temperature (MSC.Marc, 2003) are shown in Figure 3.
3.2 Mechanical properties used in the analysis To determinate the structural response in a fire, it is necessary to be able to formulate constitutive laws for the mechanical behaviour of the relevant materials at elevated temperatures. A complete formulation is required only where a full analysis is undertaken to calculate deformations and displacements. Where it is only necessary to calculate load capacity then a more limited data set can be utilized. Indeed, much early work on evaluating material behaviour was directed to determining specific properties such as tensile strength of steel or compressive strength of concrete at elevated temperatures. It was only much later that the need for numerical models was appreciated.
3.2.1 ConcreteThe material model describes the behaviour of heated and loaded concrete in mathematical terms. It is based on the stress-strain relationships of heated concrete. The strain components can be modelled using the superposition theory whereby the total strain is considered to be the sum of various strain components:
, , , , ,tot th cr trt (4)
where tot = total strain; = stress-related strain; th= thermal strain; cr = creep strain; tr = transient strain; = temperature; t = time; = stress; ' = stress history. The superposition theory has been particularly useful in the analysis of the strain
components at high temperature and has been found to be applicable experimentally (Ba�ant & Kaplan, 1996). Each of the terms of Equation 4 is described below.
The model of the stress-strain relationships is given in Figure 4. On the compression side, the curve consists of a parabolic branch followed by a descending curve until crushing occurs. On the tension side, the curve consists of a bilinear diagram. An initial stiffness of concrete in tension is equal to that in compression. At tensile strains greater than ctthe concrete is assumed to follow the descending branch of the stress-strain curve. Once the concrete has crushed, it is assumed to have no residual strength in either compression or tension.
The free thermal expansion is predominantly affected by the aggregate type. Transient stress is the hindered part of thermal expansion for loaded concrete structures exposed to heating. It is an irreversible process and occurs only during the first heating. In present analysis the free thermal strain was given by the following equation (Purkiss, 1996):
12 3 6 5
,
3
23 10 9 10 18 10 ,
20 C 700 C;
14 10 , 700 C.th c (5)
The reduction of concrete compressive strength and Young�s modulus at elevated temperatures (prENV, 2001) is shown in Figure 5. Full stress-strain-temperature relationships are constructed on a basis of the curves shown in Figure 4.
Figure 3. The specific heat and the thermal conductivity of reinforcement steel.
Figure 4. Model of stress-strain relationship of concrete.

56
Figure 5. Reduction coefficients allowing for decrease of concrete compressive strength and Young�s modulus at elevated temperatures.
Figure 6. Idealization of stress-strain behaviour for steel at elevated temperatures.
Figure 7. Reduction of strength and Young�s modulus of steel at elevated temperatures.
3.2.2 Reinforcement The constitutive model describes the behaviour of heated and loaded steel in mathematical terms. Since transient strain does not exist for steel the model is simpler than for concrete and is described as the sum of three terms (Purkiss, 1996):
, , ,tot th cr t (6)
where tot = total strain; = stress-related strain; th= thermal strain; cr = creep strain; = temperature; t= time; = stress.
The free thermal expansion of steel is relatively independent of the type of steel (Purkiss, 1996). The value was taken by following formula:
9 2 6 4, 4 10 12 10 3 10th s (7)
As shown in Figure 6, the behaviour of reinforcement in the numerical analysis is taken as elastic up to yielding. Variations of the strength and Young�s modulus with respect to temperature used in the present analysis are shown in Figure 7 (prENV, 2001).
4 NUMERICAL MODELLING OF TEST BEAMS
Numerical modelling of full load-deflection behaviour of experimental reinforced concrete beams has been carried out by the finite element (FE) software MSC.Marc (2003). Since 1971, Marc

57
has been known for its versatility in helping market leaders in various industries to design better products and solve simple to complex real-world engineering problems. Today MSC.Marc is an advanced finite element system focused on nonlinear design and analysis. MSC.Marc is known for great depth in solution procedures and material models.
4.1 Finite element (FE) model FE model of beams was considered in the three-dimensional stress state with non-linear constitutive laws for concrete and reinforcement which were described above. The finite element model used for the beams is shown in Figure 8a. Due to symmetry conditions, only half of the beam was modelled. Isoparametric hexagonal FE with eight integration points was used for the modelling.
4.2 Numerical analysis The complex thermo-mechanical FE 3 D, nonlinear analysis has been carried out. MSC.Marc handles the coupled thermo-mechanical analysis using a staggered solution procedure. Using this approach, the thermal problem is solved to obtain the nodal temperatures. Next, the mechanical problem is solved for the nodal displacements.
Test specimens (Shi et al., 2002) were heated on three surfaces by the electric furnace, i.e., the bottom
and two lateral surfaces. Figures 8b, c shows the temperature fields calculated by software package MSC.Marc at temperature of 400°C and 600°C.
As mentioned above the temperature distribution was measured along the cross-section depth at 20 mm from the lateral surface and across section width at 75 mm from experimental specimen soffit. The comparative temperature distributions along cross-section diagrams are presented in Figure 9. Good agreement was achieved between the calculation results and the experimental data.
The calculated load-deflection diagrams are presented in Figure 10 along with the experimental curves. The modelling has included two stages: temperature exposure was followed by mechanical loading. The load-deflection diagrams correspond to three stages of structural behaviour. In the first stage corresponding to zero mechanical loading, the beam deflect downwards due to temperature differences in the bottom and top parts of the section (Figs 8b, c). In the second, the pre-yielding stage, the deflections increase with increasing load. In the third, the failure stage, corresponding to yielding of reinforcement, large deflections were caused by small load increments. As shown in Figure 10, the calculated deflections were in good agreement with the test results. The shape of experimental load-deflection diagrams has been both qualitatively and quantitatively captured in the FE analysis.
Figure 8. a) FE model of experimental beam; temperature distribution in a cross-section: b) at 400°C (after 4.5 min of heating) and c) at 600°C (after 20 min of heating).
Figure 9. Experimental (dotted curve) and calculated (solid curve) temperature distribution along (left) and across section (right) of the beams exposed to temperature of 400°C and 600°C.

58
Figure 10. Experimental (dotted curve) and calculated (solid curve) load-deflection diagrams.
5 CONCLUSIONS
The paper deals with numerical modelling of reinforced concrete members exposed to high temperatures and subjected to mechanical loading. Generally the numerical modelling of the behaviour of such members is very complicated. Various factors that influence the behaviour of the members (such as variation of member temperature with time, variation of temperature over the cross section and along the member, temperature effects on material properties, material nonlinearity, section shape and etc.) need to be taken into account.
In the present numerical analysis the load-deflection behaviour of reinforced concrete beams subjected to high temperatures (up to 600°C) has been modelled by the finite element package MSC.Marc. A constitutive model based on specifications of Eurocode 2 has been used in the analysis. Comparison of the experimental and modelling results has shown that MSC.Marc has satisfactorily captured the load-deflection behaviour
of the beams and it can be used for modelling of bearing reinforced concrete tunnel members.
6 ACKNOWLEDGEMENTS
The authors gratefully acknowledge the financial support provided by the Lithuanian State Fund of Research and Studies (project registration No T-05127), and by the complementary financial support provided by Agency of International Programs of Scientific and Technology Development.
7 REFERENCES
Kalifa, P., Menneteau, F.-D., Quenard, D. 2000. Spalling and pore pressure in HPC at high temperatures. Cement and Concrete Research 30(12): 1915-1927.
Kaklauskas, G., Ghaboussi, J. 2001. Stress-Strain Relations for Cracked Tensile Concrete from RC Beam Tests. ASCE Journal of Structural Engineering 127(1): 64-73.
Ba�ant, Z. P. & Kaplan, M. F. 1996. Concrete at High Temperatures: Material Properties and Mathematical Models. New York: Longman Group Lt.
Kaklauskas, G. 2004. Flexural Layered Deformational model of Reinforced Concrete Members. Magazine of Concrete Research 56(10): 575-584.
Bacinskas, D., Kaklauskas, G., Geda, E. 2004. FE Software ATENA Applications to Non-Linear Analysis of RC Beams Subjected to High Temperatures. Journal of Civil Engineering and Management X(I): 11-18.
MSC.Marc. 2003. Vol. A: Theory and User Information, version 2003. Redwood City, California: MSC.Software Corp.
prENV 1991-1-2. 2001. Eurocode 2: Design of Concrete Structures Part 1.2: General Rules � Structural Fire Design. Brussels: CEN.
Shi, X., Tan, T.-H., Tan, K.-H., Guo, Z. 2002. Effect of Force-Temperature Paths on Behaviours of Reinforced Concrete Flexural Members. Journal of Structural EngineeringASCE 128(3): 365-373.
Purkiss, J. A. 1996. Fire Safety Engineering Design of Structures. Oxford: Butterworth Heinemann.

59
1 INTRODUCTION
The experimental and numerical studies show im-portance and complexity of beam to column connec-tions in structural analysis Galambos (2000). The flexibility and strength of a connection pay impor-tant role in overall behavior of many steel structures. At the same time the great variety of joint types re-quire complex and unique analyses. The connections are also critical for the resistance of steel structures subjected to elevated temperatures Franssen & Za-haria (2006). Precise numerical analysis is complex as it should take into account many parameters such as contact between bolts, column flange, and end plate, stress concentration around bolts, prestressing forces. Material degradation and elongation caused by elevated temperature additionally complicates the study.
Experiments are the most reliable source of in-formation on responses of real structures, and the only method of final validation of the finite element (FE) analysis. However, the high cost of full scale laboratory tests and difficulties with collecting ex-tensive data lead to growing interest in analytical and computational methods. With the increasing computing capabilities nowadays, it is possible us-ing the Finite Element Method to simulate complex real cases and consider wide range of parameters. A reliable, analytical investigation can reduce costs dramatically and allow for faster introduction of new design improvements and maintenance decisions.
The paper presents the first phase of a feasibility study on a coupled structural thermal analysis of en-
gineering structures subjected to fire. At this stage numerical results in the form of moment-rotation characteristics are compared with the published re-sults for a selected flush end-plate connection, Al-Jabria, Seibib & Karrechc (2006). The Finite Ele-ment (FE) analysis is conducted using commercial program Ls-Dyna.
2 FINITE ELEMENT MODEL DEVELOPMENT
2.1 Geometry and FE meshes The considered connection consist of two 254x102UB22 beam segments connected to a 152x152UC23 column using 8 mm thick flush end plate and six M16 bolts. The test setup and all di-mensions are provided in Al-Jabria, Seibib & Kar-rechc (2006). Several three dimensional FE models were developed using 8 � node brick elements. The model, shown in Figure 1, represents one forth of the configuration. This model is appropriate for sym-metrical loading and temperature conditions. To re-duce number of elements only part of the column and a 444 mm long segment of the beam is repre-sented in the simplified model, shown in Figure 2. The free cross section of the beam is rigidly con-nected with the rigid segment located at the distance of 1423 mm from the face of the column flange (see Figure 2). The rigid segment is used for visualiza-tion purpose and serves for application of loading. The model representing half of the connection, pre-sented in Figure 3, will be used in future for simula-tion of nonuniform heating and loading conditions.
Numerical analysis of beam to column connectionat elevated temperatures
L. Kwasniewski Warsaw University of Technology, Poland
ABSTRACT: The paper presents the first step of a feasibility study on a coupled structural thermal analysis of a beam to column connection subjected to fire. Finite Element (FE) analysis is conducted using commer-cial program Ls-Dyna. Numerical results in the form of moment-rotation characteristics are compared with the published results for a selected flush end-plate connection. The study shows potential of the numerical analysis in dealing with many of complex features describing the problem. Developed FE models are sup-posed to bring into account: nonlinear material properties subject to degradation due to elevated temperature, contacts between bolts, column flange, and end plate, prestressing forces, nonuniform heating represented by convection and radiation boundary conditions, and fully coupled structural thermal analysis.

60
Comparison of the results for the FE models pre-sented in Figures 1 and 2 shows close similarity due to concentration of the deformation in the plastic zones located in the connection area.
Figure 1. FE model representing one forth of the test configu-ration.
rigid segment
Figure 2. Simplified FE model representing one forth of the test configuration with rigid segment.
rigid segment
Figure 3. Simplified FE model representing half of the test configuration with rigid segment.
2.2 Loading and boundary conditions Depending on the considered case, the loading can be performed as a predefined displacement or con-centrated force applied to a selected node (marked in
Figure 2) in the middle of the rigid segment. Rota-tion of the connection is calculated as:
Lzd
1tan (1)
where dz = vertical displacement of the marked node in the rigid segment and L = distance of 1423 mm from the face of the column.
The top and the bottom the column and the mid-dle section of the column web are constrained. For the model of one forth of the test configuration addi-tional constraints are applied on the vertical symme-try plane. Included in the FE model segments of the beam and the column represent regions with the maximum deformation, where the influence of the assumed boundary conditions can be neglected.
In the FE model the beam is connected to the col-umn through contact between column flange, end plate and bolts. Due to internal complexity of con-tact algorithms incorporated in the FE programs, an analysis including contact is usually challengeable, can affect results and even lead to problems with convergence, especially for implicit solvers. In the presented FE model a new, recommended feature of Ls-Dyna was applied, the automatic single surface contact algorithm, Ls-Dyna (2006). Only slave sur-face was defined as a set of all free surfaces formed by finite elements representing the bolts, the end plate, and the column flange. This option is efficient and has proven to give stabile solution.
A special Ls-Dyna material model called �cable�, was used to introduce prestressing forces to the bolts at the beginning of the analysis. The prestressing forces are applied through structural 1D elements connected to the nodes at the ends of a bolt.
2.3 Material models
At this stage of the research a simple material model ELASTIC_PLASTIC_THERMAL was used, Ls-Dyna (2006). It allows for relating material parame-ters such as: elastic modulus, Poisson�s ratio, coeffi-cients of thermal expansion, yield stress, and plastic hardening modulus to temperature, represented at maximum eight points. This material model allows only for biliniar approximation of the stress-strain relationship through specification of the hardening modulus. All components of the tested connection, except the bolts, were made of steel S275. Figure 4 shows stress-strain relationships of the steel S275 at elevated temperatures, calculated based on the stan-dard EC3: Part 1-2, and bilinear approximations ap-plied in the model. For coupled structural thermal and thermal only analyses, thermal properties such as heat capacity and thermal conductivity are speci-fied in the additional material model THER-

61
MAL_ISOTROPIC. All parameters can be defined as temperature dependent.
For the bolts assumed yield and ultimate stresses were 480 and 600 MPa, respectively, Al-Jabria, Seibib & Karrechc (2006). Constant thermal expan-sion coefficient of 12×10 6 °C for the steel was ap-plied.
0
100
200
300
0.00 0.01 0.02 0.03
[ ]
[MPa] 20 - 400 °C
500 °C
600 °C
700 °C
800 °C
Figure 4. Stress � strain curves for steel S275. Solid lines indi-cate relationship according to EC3, dotted lines represent bilin-ear approximations.
3 COMPARISON WITH EXPERIMENT
3.1 Temperature versus rotation The calculated results were compared with the ex-perimental data presented in the paper, Al-Jabria, Seibib & Karrechc (2006). All structural analysis presented here are based on static calculation using implicit solver, where instead of physical time a loading parameter is applied, Ls-Dyna (2006). The transient heat transfer was not considered here, al-though it is planned for the next step of the study. The temperature is applied uniformly to all the nodes. Depending on considered case during the simulation temperature is constant or increases with the loading parameter.
Curves in Figure 5 show calculated relationships between temperature and rotation, for four loadings giving moments at the connection M=4, 8, 13, and 17 kNm. The loading is applied gradually at the beg-ging of the simulation and then kept constant while the temperature is increased from 100 to 800 °C (in relation to the loading parameter). Points in Figure 5 represent experimental values. Numerical and ex-perimental results are also compared in Table 1, in terms of the temperatures corresponding to selected values of rotation. Comparison with the experiment shows higher resistance of the FE model, mainly due
to overestimated material parameters for larger strains.
0
100
200
300
400
500
600
700
800
0 20 40 60 80
Rotation [millirads ]
Temperature [°C]
4 kNm8 kNm13 kNm17 kNmexp 4kNmexp 8 kNmexp 13 kNmexp 17 kNm
17 kNm
13 kNm
8 kNm4 kNm
Figure 5. Stress � strain curves for steel S275. Solid lines indi-cate relationship according to EC3, dotted lines represent bilin-ear approximations.
Table 1. Comparison of calculated temperatures for selected rotations with experimental data, Al-Jabria, Seibib & Karrechc (2006).______________________________________________ 4 kNm 8 kNm ______________________________________________
x10-3 exp(°C) cal(°C) exp(°C) cal(°C) ______________________________________________5 599 720 504 558 10 643 773 560 634 20 683 796 591 681 30 697 N/A 606 703 40 706 N/A 617 718 50 712 N/A 623 730 60 747 N/A 629 739 70 N/A N/A 636 746 ______________________________________________ 13 kNm 17 kNm ______________________________________________
x10-3 exp(°C) cal(°C) exp(°C) cal(°C) ______________________________________________5 343 340 94 176 10 485 524 438 386 20 532 567 481 486 30 550 585 507 520 40 562 597 521 538 50 571 613 530 553 60 578 628 537 566 70 584 641 544 577 _____________________________________________
3.2 Moment versus rotationFigure 6 presents stiffness characteristics of the con-nection at different temperatures. The moment�rotation curves were calculated for constant tem-peratures. The concentrated force was applied at the tip end of the beam, in the middle of the rigid seg-ment. Ordinates in Figure 6 represent the total value of the bending moment for one beam. The moment resistance of the connection decreases rapidly above 400 °C. As the material failure was not considered here the calculated results are valid only for limited values of rotation.

62
0
5
10
15
20
25
30
35
40
0 10 20 30 40 50 60
Rotation [millirads ]
Moment [kNm]
20°C
400°C
500°C
700 °C
600°C
Figure 6. Stiffness characteristics of the connection at different temperatures.
3.3 Modes of deformation Figures 7, 8, and 9 present contours of effective stress and deformation modes for selected states taken from the simulations represented by previous diagrams. In all figures the Mises effective stress is mapped with the same color scale for the range from 0 to 275 MPa.
Figure 7 refers to the case presented by the upper curve in Figure 6, where the connection is loaded with the increasing moment at constant, ambient temperature. Four states are shown for four loading levels 13, 17, 28.5, and 35 kNm. Details of the stress distribution for the moment 35 kNm are presented in Figure 8.
Four snapshots in Figure 9 show stresses and de-formation for four selected temperatures and the same loading with moment M=17 kNm (compare Figure 5). In all cases where due to large loading (Figure 7) or high temperature (Figure 9) large rota-tion is reached, most of the deformation affects the end plate and the column flange. The upper bolts, under maximum tension, experience minimum elon-gation due to much higher yield stresses comparing to the steel S275. Obtained deformation modes show good correlation with the experimental results, how-ever numerically predicted values of loading are higher than reported from the experiment, Al-Jabria, Seibib & Karrechc (2006).
13 kNm =2.6 millirads
17 kNm =3.8 millirads
28.5 kNm =10.6 millirads
35 kNm =83.1 millirads
Figure 7. Contours of effective Mises stress for temperature 20 °C and increasing loading.
column
bolts
end plate and beam
Figure 8. Deformation at the connection components for mo-ment M=35 kNm and 20 °C .
20 °C =3.2 millirads
400 °C =11.7 millirads
600 °C =97.2 millirads
700 °C =196.1 millirads
Figure 9. Contours of effective Mises stress for constant load-ing with moment M=17 kNm and increasing temperature.

63
4 CONCLUSIONS
The main objective of the presented work was to ex-amine the capabilities of computer simulations for coupled structural thermal analysis of a beam to col-umn connection in elevated temperatures. The paper presents the first step of the feasibility study where using the general purpose program Ls-Dyna, simpli-fied FE models developed for the selected connec-tion were analysed. The whole research is oriented to more complex steel and concrete structures and their elements. The problem of moment resistance degradation in elevated temperatures was simplified in terms of material representation and heat transfer. Chosen material model allows only for bilinear ap-proximation of stress � strain relationships through specification of hardening modulus. This approach leads to overestimated stresses for higher strain val-ues and results with higher loading values compar-ing to the experimental data. Due to high value of thermal conductivity of steel temperature distribu-tion during fire can be assumed as uniform and heat transfer does not have to be considered. For concrete and composite (concrete and steel) structures such approach can be insufficient. For future investiga-tion a fully coupled structural thermal analysis is planned with new material models such as thermal visco-plastic material model available in Ls-Dyna.
5 REFERENCESAl-Jabria, K.S. Seibib, A. & Karrechc, A. 2006. Modelling of
unstiffened flush end-plate bolted connections in fire. Jour-nal of Constructional Steel Research. 62: 151�159.
EC3. Design of steel structures - Part 1-2: General rules - Structural fire design, 2005. ENV 1993-1-2 European Committee for Standardisation.
Franssen J-M. & Zaharia, R. 2006. Design of Steel Structures Subjected to Fire: Background and Design Guide to Euro-code 3. Fire Safety Journal, Volume 41, Issue 8: 628-629.
Galambos T. V. 2000. Recent research and design develop-ments in steel and composite steel�concrete structures in USA. Journal of Constructional Steel Research, Volume55, Issues 1-3: 289-303.
LS-DYNA Version 971, 2006. Keyword User�s Manual. Liv-ermore Software Technology Corporation: Livermore, California, September 2006.

64
1 INTRODUCTIONFor more than three decades, there has been an enormous research effort, by the steel industry and the academics, to investigate the behaviour of steel structures under fire conditions, resulting in the de-velopment of a number of design rules (CEN, 2005a), which were incorporated within the struc-tural Eurocodes. More recently, research works have been oriented towards stainless steel structures.
The use of stainless steel for structural purposes has been limited to projects with high architectural value, where the innovative character of the adopted solutions is a valorisation factor for the structure. The high initial cost of stainless steel, associated with: (i) limited design rules, (ii) reduced number of available sections and (iii) lack of knowledge of the additional benefits of its use as a structural material, are some of the reasons that force the designers to avoid the use of the stainless steel in structures (Estrada, 2005) and (Gardner, 2005). However, a more accurate analysis shows a good performance of the stainless steel when compared with the conven-tional carbon steel.
The biggest advantage of stainless steel is its higher corrosion resistance. However, its aesthetic appearance, easy maintenance, high durability and reduced life cycle costs are also important proper-ties. It is known that the fire resistance of stainless steel is bigger than the carbon steel usually used in construction.
Thinking in economic terms, it would be improb-able that stainless steel could be chosen instead of
carbon steel, due to its higher fire resistance. How-ever, for designers that value the appearance and the durability of stainless steel, the additional benefit of having a significant fire resistance, can reverse the choice in favour of this material. In fact the stainless steel can be an excellent solution, in application where corrosion resistance and fire resistance are demanded at the same time.
The high corrosion resistance of the stainless steel in most of the aggressive environments has been the reason for its use in structures located near the sea, and also in oil-producing, chemical, nuclear, residual waters and food storage facilities. Its corrosion resis-tance results in a well adherent and transparent layer of oxide rich in chromium that forms itself sponta-neous on the surface in the presence of air or any other oxidant environment. In case it is crossed, or has some cut damage, the superficial layer regener-ates itself immediately in the presence of oxygen.
Although its use in construction is increasing, it is still necessary to develop the knowledge of its struc-tural behaviour. Stainless steels are known by its non-linear stress-strain relationships with a low pro-portional stress and an extensive hardening phase. There is not a well defined yield strength, being usu-ally considered for design at room temperature the 0.2% proof strength, fy=f0.2proof. In fire situation higher strains are acceptable than at room tempera-ture and so Part 1-2 of Eurocode 3 suggests the use of the strength at 2% total strain as the yield strength at elevated temperature , fy, =f2, , for Class 1, 2 and 3 cross-sections and fy, =f0.2,proof, for Class 4, cross-sections.
Stainless steel structural elements in case of fire
N. Lopes & P. M. M. Vila Real University of Aveiro, Portugal
L. Simões da Silva University of Coimbra, Portugal
J.-M. Franssen University of Liege, Belgium
ABSTRACT: The Eurocode 3 states that stainless steel structural members, subjected to high temperatures, must be designed with the same expressions used on carbon steel members. However, as these two materials have different constitutive laws, it should be expected that different formulae for the calculation of member stability should be used as for the case of room temperature design. It will be shown a study made on the flexural buckling resistance of stainless steel columns at high tempera-tures and on the behaviour of stainless steel beam-columns subjected to fire. The present work was based on numerical studies using the program SAFIR, which was modified to take into account the material properties of the stainless steel.

65
Studies have shown that at elevated temperatures, stainless steel offers better retention of strength and stiffness than carbon steel (Gardner, 2006).
Figure 1 shows the stress-strain relationships of carbon steel S235 and stainless steel 1.4301 (also known as 304) at 600 ºC.
600º C
0
50
100
150
200
250
300
350
0 0.05 0.1 0.15 0.2 0.25 0.3 0.35 0.4
(MPa)
Stainless SteelCarbon Steel
Figure 1. Stress-strain relationships of carbon steel S 235 and stainless steel 1.4301 at 600 ºC.
Codes of practice are aimed at providing safe, competitive and, as far as possible, simple proce-dures for the design of structures. Drafting and im-plementing a consistent set of Structural Eurocodes involving a large number of groups of experts is naturally a recursive task where each Part must re-flect the scientific advances and design options of all other related parts.
The program SAFIR (Franssen, 2005), a geomet-rical and material non linear finite element code, has been adapted according to the material properties de-fined in prEN 1993-1-4 (CEN, 2005c) and EN 1993-1-2 (CEN, 2005b), to model the behaviour of stainless steel structures (Lopes et al, 2005). This program, widely used by several investigators, has been validated against analytical solutions, experi-mental tests and numerical results from other pro-grams, and has been used in several studies that led to proposals for safety evaluation of structural ele-ments, already adopted in Eurocode 3. In the nu-merical simulations, geometrical imperfections and residual stresses were considered.
The prEN 1993-1-4 �Supplementary rules for stainless steels� gives design rules for stainless steel structural elements at room temperature, only mak-ing mention to its fire resistance by doing reference to the fire part of the Eurocode 3, EN 1993-1-2 (CEN, 2005b).
In this paper the accuracy and safety of the cur-rently prescribed column and beam-column formu-lae are evaluated. These evaluations were carried out by performing numerical simulations on welded stainless steel H-sections at high temperature.
2 CASE STUDY An axially loaded column was chosen to explore the validity of the column safety verifications of the
Eurocode 3. The following welded cross-sections were used: equivalent HEA 200 section and equiva-lent HEB 280 section. The stainless steel grades 1.4301 and 1.4401 were studied for each cross-section. It was also tested buckling around the strong and around the weak axis.
Beam-columns submitted to combined axial compression and uni-axial major and minor uniform moment, have been also studied. The equivalent welded HEA 200 cross-section of the stainless steel grade 1.4301 was used in the numerical simulations.
A uniform temperature distribution in the cross-section was used so that comparison between the numerical results and the Eurocode could be made. In this paper, the temperatures chosen for the col-umns were 400, 500, 600 and 700 ºC, deemed to cover the majority of practical situations, while for the beam-columns was only used a uniform tempera-ture of 600ºC.
Due to the size limit of this paper, only some of these tests will be shown.
In the numerical simulations, a sinusoidal lateral geometric imperfection was considered (Vila Real and Lopes, 2006). The adopted residual stresses fol-lows the typical pattern for carbon steel welded sec-tions (Chen and Lui, 1991), (Gardner and Nethercot, 2004) and (Greiner et al, 2005), considered constant across the thickness of the web and flanges.
3 COLUMNS
3.1 Prescribed formulae in Eurocode 3 for the flexural buckling of stainless steel columns in case of fire
For stainless steel columns subjected to high tem-peratures, Part 1-4 of Eurocode 3, refers that the same formulation prescribed for carbon steel ele-ments should be used, following EN 1993-1-2 (CEN, 2005b), where the flexural buckling resis-tance for class 1, 2 and 3 sections, is given by
fiMyyfiRdtfib fAkN
,,,,,
1 (1)
where
22
1fi (2)
with
2121 (3)
In this expression the imperfection factor is a function of the steel grade and is given by
yf/23565.0 (4)

66
The non-dimensional slenderness, , for flex-ural buckling at high temperatures depends on the non-dimensional slenderness at room temperature,
and is given by 5.0
,
,
E
y
kk
(5)
where ky, =fy, /fy and kE, =E /E, being fy, and fy the yield strength at elevated temperature and at room temperature respectively, and E and the E, the young�s modulus at elevated temperature and at room temperature. kE, is given on table C.1 of EN1993-1-2 (CEN, 2006b), while ky, must be de-termined with the expression
ypupy f
ffkfk1
,2.0,%,2,2.0, (6)
wherek2%, is the correction factor for determination of the yield strength fy, ;fu, is the tensile strength, at temperature .
3.2 New proposal for the flexural buckling of stainless steel columns in case of fire
As it can be observed in figure 2, the curve resulting from the application of Part 1.2 of Eurocode 3 is not on the safe side. To improve these results, a new im-perfection factor , different from the one defined for carbon steel, given in Eq.(4), is proposed for the flexural buckling of stainless steel columns:
yf/2354.1 (7)
The reduction factor fi is also changed according to
22
1fi (8)
with
2121 (9)
where the factor should take the value 1.5. The accuracy of this new proposal can be
checked in figure 2. Column HEA200 - yy
0
0.2
0.4
0.6
0.8
1
1.2
0 0.2 0.4 0.6 0.8 1 1.2 1.4 1.6 1.8 2
N/Nfi, ,Rd
EN 1993-1-2New proposalSafir-400(ºC)Safir-500(ºC)Safir-600(ºC)Safir-700(ºC)
Column HEA200 - zz
0
0.2
0.4
0.6
0.8
1
1.2
0 0.2 0.4 0.6 0.8 1 1.2 1.4 1.6 1.8 2
N/Nfi, ,Rd
EN 1993-1-2New proposalSafir-400(ºC)Safir-500(ºC)
Safir-600(ºC)Safir-700(ºC)
Figure 2. HEA200 columns in stainless steel at high tempera-tures, of the stainless steel grade 1.4301.
4 BEAM-COLUMN The accuracy and safety of the Eurocode 3 design formulae for the evaluation of the fire resistance of beam-columns will be assessed. Numerical simula-tions on equivalent welded stainless steel H-columns at high temperature have shown that the formulae from Eurocode 3 are not safe.
In this section a brief description of the pre-scribed formulations in Eurocode 3, for the evalua-tion of the resistance of stainless steel beam-columns, in case of fire, is presented as well as some proposals for the design of these type of structural members.
Regarding bending and axial compression of stainless steel members at room temperature, Part 1.4 of Eurocode 3 has two notes mentioning that the national annexes may give others interaction formu-lae and others interaction factors, suggesting that the formulae for beam-columns and the interaction fac-tors were not well established for stainless steel members at the time of the conversion from ENV to EN. These formulae for cold design adapted to high temperatures will be tested in this paper.
Two new formulae for the design of carbon steel beam-columns at room temperature are proposed on Part 1.1 of Eurocode 3 (CEN, 2005c), which are the result of the efforts made by two working groups that followed different approaches (Boissonnade et al, 2006), a French-Belgian team and an Austrian-German one. In this section it will be checked if these two procedures can also be used in stainless steel elements in case of fire.
In the context of Eurocode 3, and under fire load-ing, its Part 1.2 adopts the old interaction formulae for beam-columns proposed in the European pre-standard for cold design, ENV 1993-1-1 (CEN, 1992).
In section 3 of this paper, the authors propose new formulae for the safety evaluation of stainless steel columns in case of fire, which improves the formulae from Eurocode 3. Its influence in the be-haviour of the beam-column design curves will be taken into account here.

67
4.1 Room temperature Part 1-1 and Part 1-4 are the parts from Eurocode 3 dedicated to the design of carbon steel and stainless steel structural elements, at room temperature respec-tively. In this section a brief description of the methods for cold design of steel elements subjected to combined bending and axial compression will be made.
4.1.1 Eurocode 3 carbon steel interaction curves Two alternative proposals (Boissonnade et al, 2006)were adopted for the interaction formulae at room tem-perature (CEN, 2006a) that specifically implement the concepts of amplification factor and equivalent uniform bending moment, namely �method 1� and �method 2�.
The procedure for the determination of the inter-action factors for �method 1� is reported in Annex A of Part 1.1 of EC3 and was developed by a French-Belgian team by combining theoretical rules and numerical calibration to account for all the differ-ences between the real model and the theoretical one. �Method 2� is described in Annex B of Part 1.1 of EC3 and results from an Austrian-German pro-posal that attempted to simplify the verification of the stability of beam-columns, all interaction factors being obtained by means of numerical calibration.
4.1.2 Eurocode 3 stainless steel interaction curves Part 1-4 of Eurocode 3, gives the following interac-tion formulae
1
1,
,
,,
M
yipl
Edii
Rdib
Edf
W
Mk
NN (10)
where, zyi or , and
iRdb
Edi
iRdb
Edii
NNk
NN
k
,,
,,
22.12.1but
5.020.1 (11)
It should be pointed out that in the parametric study the possibility of not limiting the factor ki to a minimum value of 1.2 was tested so that the plastic moment could be reached when no axial force is act-ing, i. e. ki=1.0.4.2 High temperature In this section a brief description of the methods tested for the design of stainless steel elements sub-jected to combined bending and axial compression under high temperature will be made.
4.2.1 Eurocode 3 proposal for interaction curves in case of fire
The Eurocode 3 states that the safety evaluation should be made with the same expressions used in carbon steel elements, which are:
1
,
,,
,,
,,,
,
fiM
yipl
Edfiii
Rdfiib
Edfi
fW
Mk
NN (12)
where, zyi or , and
31
,,,
,
fiM
yyfii
Edfiii f
Ak
Nk (13)
and
8.029.044.032.1 ,,, yMyyMy (14)
1.1with
8.029.044.052
,
,,,
z
zMzzMz (15)
The curves obtained with these formulae are de-noted �EN 1992-1-2� in figures 3 and 4.
4.2.2 Eurocode 3 proposal for carbon steel interac-tion curves at room temperature adapted for fire situation
Vila Real et al (2003) studied the use of the interac-tion formulae for beam-columns, from Part 1.1 of Eurocode 3 (method 1 and method 2), for fire situa-tion, by changing all parameters that are usually changed at high temperatures. Here a same approach was adopted using expressions (2) and (8) with the interaction formulae from Part 1.1 of EC3, denoted �Method 1 fi� and �Method 2 fi� or �Method 1 fi NP� and �Method 2 fi NP� respectively, in figures 3 and 4.
4.2.3 Eurocode 3 proposal for stainless steel inter-action curves at room temperature adapted for fire situation
The formulae, for the beam-column safety evalua-tion, from Part 1.4 of Eurocode 3 were also tested, but adapted to consider high temperatures. The same approach presented in the previous section has been adopted being the correspondent curves in figure 2 denoted by �prEN 1993-1-4 fi� (using eq. 2) and �prEN 1993-1-4 fi NP� (using eq. 8). In this figure a curve denoted �prEN 1993-1-4 fi NP+NK� is also plotted which corresponds to do not consider the minimum limiting value of 1.2 for ki in equation (11).4.3 Parametric study Figures 3 and 4 show the comparison made at 600 ºC for all the procedures presented before.. The interaction curves chosen for this parametric study were obtained using: the Eurocode 3 �EN 1993-1-2�; the Eurocode 3 with the new proposal made for stainless steel columns in case of fire, equations (7), (8) and (9) �EN 1993-1-2

68
NP�; the procedure for stainless steel beam-columns at room temperature from Part 1.4 of the Eurocode 3 with and without the new proposal for stainless steel col-umns �prEN 1993-1-4 fi�, �prEN 1993-1-4 fi NP� and �prEN 1993-1-4 fi NP+NK�. The formulae on Part 1.1 of Eurocode 3 for carbon steel beam-columns with and without the new proposal for stainless steel columns �Method 1 fi� �Method 1 fi NP�, �Method 2 fi� and �Method 2 fi NP� adapted to fire situation, are also plotted in figures 3 and 4.
N+My buckling around the y-y-axis L=3000mm; ,y =0.360
600 ºC
0
0.2
0.4
0.6
0.8
0 0.2 0.4 0.6 0.8 1M/Mfi,Rd
N/Nf i,Rd SAFIR
EN 1993-1-2
EN 1993-1-2 NP
a)
600 ºC
0
0.2
0.4
0.6
0.8
0 0.2 0.4 0.6 0.8 1M/Mfi,Rd
N/Nf i,Rd SAFIR
EN 1993-1-2
EN 1993-1-2 NP
prEN 1993-1-4 fi
prEN 1993-1-4 fi NP
prEN 1993-1-4 fi NP+NK
b)
600 ºC
0
0.2
0.4
0.6
0.8
0 0.2 0.4 0.6 0.8 1M/Mfi,Rd
N/Nf i,Rd SAFIREN 1993-1-2EN 1993-1-2 NPMethod 1 fiMethod 1 fi NPMethod 2 fiMethod 2 fi NP
c)
a) Part 1.2 of EC 3 with and without the new proposal for col-umns; b) Part 1.4 of EC 3 with and without the new proposals, plus a);c) Part 1.1 of EC 3 for carbon steel with and without the new proposal, plus a). Figure 3. Beam-column interaction curves for a length of 3 me-ters at 600ºC for the bending in the strong axis.
N+Mz buckling around the z-z-axis L=3000mm; ,z =0.584
600 ºC
0
0.1
0.2
0.3
0.4
0.5
0.6
0.7
0 0.2 0.4 0.6 0.8 1M/Mfi,Rd
N/Nf i,Rd SAFIR
EN 1993-1-2
EN 1993-1-2 NP
a)
600 ºC
0
0.1
0.2
0.3
0.4
0.5
0.6
0.7
0 0.2 0.4 0.6 0.8 1M/Mfi,Rd
N/Nf i,Rd SAFIR
EN 1993-1-2
EN 1993-1-2 NP
prEN 1993-1-4 fi
prEN 1993-1-4 fi NP
prEN 1993-1-4 fi NP+NK
b)
600 ºC
0
0.1
0.2
0.3
0.4
0.5
0.6
0.7
0 0.2 0.4 0.6 0.8 1M/Mfi,Rd
N/Nf i,Rd SAFIR
EN 1993-1-2
EN 1993-1-2 NP
Method 1 fi
Method 1 fi NP
Method 2 fi
Method 2 fi NP
c)a) Part 1.2 of EC 3 with and without the new proposal for col-umns; b) Part 1.4 of EC 3 with and without the new proposals, plus a);

69
c) Part 1.1 of EC 3 for carbon steel with and without the new proposal, plus a). Figure 4. Beam-column interaction curves for a length of 3 me-ters at 600ºC for the bending in the weak axis.
5 CONCLUSIONS In this paper a new proposal for the flexural buck-ling resistance of stainless steel elements under fire conditions was presented.
Figure 2 show that the new proposal for the design buckling resistance of stainless steel compression members at high temperatures is in good agreement with the numerical results obtained with the program SAFIR, in opposition to the results obtained with the formulae of the Part 1-2 of Eurocode 3, which are not on the safe side.
For beam-columns with bending in the strong axis and buckling around the yy-axis, the curves ob-tained with the new proposal for columns shows a better approximation to the numerical results. The method that approximates more closely the real be-haviour of stainless steel beam-columns under fire conditions is �EN 1993-1-2 NP�. However, for the case of bending around the weak axis there is not a curve that provides a good approximation to the nu-merical results, which means that new interaction factors should be developed. Nevertheless �EN 1993-1-2 NP� sill remains the best method.
The results presented in the paper show that Eurocode 3 formulae for the evaluation of the fire resistance of columns and beam-columns need to be improved.
6 ACKNOWLEDGEMENT The authors wish to acknowledge the Calouste Gul-benkian Foundation (Portugal) for its supports through the scholarship given to the first author.
7 REFERENCESBoissonnade N.; Greiner, R.; Jaspart, J.P; Lindner J. 2006.
Rules for member stability in EN 1993-1-1. Background documentation and design guidelines, ECCS.
CEN European Committee for Standardisation 2005a. EN 1993-1-1, Eurocode 3, Design of Steel Structures � Part 1-1. General rules and rules for buildings. Brussels, Belgium.
CEN European Committee for Standardisation 2005b. EN 1993-1-2 Eurocode 3: Design of Steel Structures - Part 1-2: General rules - Structural fire design. Brussels, Belgium.
CEN European Committee for Standardisation 2005c. prEN 1993-1-4, Eurocode 3, Design of Steel Structures � Part 1-4. General rules � Supplementary Rules for Stainless Steels. Brussels, Belgium.
CEN European Committee for Standardisation 1992. ENV 1993-1-1 Eurocode 3, Design of Steel Structures � Part 1-1. General rules and rules for buildings. Brussels, Belgium.
Chen W. F. and Lui E. M. 1991. Stability design of steel frames, CRC Press.
Estrada, I. 2005. Shear Design of Stainless Plate Girders. PhDThesis, Universitat Politècnica de catalunya, Barcelona.
Franssen, J.-M. 2005. SAFIR. A Thermal/Structural Program Modelling Structures under Fire. Engineering Journal,A.I.S.C., Vol. 42, No. 3, pp. 143-158.
Gardner, L. 2006. Stainless steel structures in fire. fourth inter-national workshop Structures in Fire SiF�06, Aveiro, Por-tugal.
Gardner, L. 2005. The use of stainless steel in structures. Prog. Struct. Engng Mater..
Gardner, L., Nethercot, D. A. 2004. Numerical Modeling of Stainless Steel Structural Components - A consistent Ap-proach. Journal of Constructional Engineering, ASCE, pp. 1586-1601.
Greiner, R.; Hörmaier, I.; Ofner, R.; Kettler, M., 2005. Buck-ling behaviour of stainless steel members under bending. ECCS Technical Committee 8 � Stability.
Lopes, N., Vila Real, P.M.M., Piloto, P., Mesquita, L. e Simões da Silva, L. 2005. Modelação numérica da encurvadura lateral de vigas I em aço inoxidável sujeitas a temperaturas elevadas. (in portuguese) Congreso de Métodos Numéricos en Ingeniería, Granada, Spain.
Vila Real, P. M. M., Lopes N., Silva, L., Piloto, P.A.G., Franssen, J.-M. 2003. Towards a consistent safety format of steel beam-columns: application of the new interaction for-mulae for ambient temperature to elevated temperatures. Steel and Composite Structures, techno-press, Vol. 3, No. 6, ISSN 1229-9367 pp. 383-401.
Vila Real, P. M. M., Lopes N. 2006. New proposals for struc-tural stainless steel fire design. 4th International Sympo-sium on Steel Structures, Seoul, Korea.

70
1 INTRODUCTION
It is well known that while structural reinforced con-crete members, for their insulating properties, can withstand fire for a long time with small loss of strength, steel members can endure fire exposition for very short time if not suitably protected by insu-lating coatings. The coupling of steel and concrete to build composite components is a promising solution which can take advantage of the favourable proper-ties of both materials: like concrete it has insulating properties, like steel it can carry relevant loads at room temperature. Moreover the composite system displays a behaviour in a fire environment that is better then those of its components. In fact the com-posite steel and concrete members are characterized by a decrease of the bearing capacity under fire that is more gradual and smoother than that of the structural concrete members themselves.
The typologies of composite beams may be clas-sified following EC4 (see Figure 1) 1. composite beam comprising steel beam with no
concrete encasement; 2. composite beam comprising steel beam with
partial concrete encasement; 3. steel beam partially encased in slab.
Figure 1. Tipologies of steel and concrete composite beams.
Some interesting remarks on the composite beam behaviour, with protection and without protection, in fire conditions, are proposed in Kruppa & Zhao (1995). In this publication the thermal fields within the cross section, both for bare steel and for pro-tected steel, are analyzed. Moreover, it is analyzed the mechanical behaviour of steel to concrete slab shear connectors. Another interesting typology is the slim floor system. The behaviour of slim floor beam in fire conditions is widely studied in the papers of Newman (1995) and Makelainen & Ma (2000). Their publications show the good behaviour of the slim floor beam during a fire event, thanks to the concrete protection of top flange and web.
2 DESCRIPTION OF AN ACCURATE PROCE-DURE TO ASSESS BEARING CAPACITY OF COMPOSITE BEAMS
The bearing capacity of a composite beam subjected to bending moment M in case of fire is evaluated by computing the moment-curvature diagram. The pro-cedure for evaluating the moment-curvature dia-gram, for each time of fire exposure, is based on the following steps. a) Evaluation of the thermal field induced by the fire
into the sections. For this purpose the hypothesis of decoupling the thermal behaviour of the materials from the mechanical behaviour may be usually accepted. The thermal field may be
Some remarks on the simplified design methods for steel andconcrete composite beams
E. Nigro & G. Cefarelli University of Naples Federico II, Italy
ABSTRACT: The present paper recalls the main characteristics of a general numerical approach to assess the ultimate bearing capacity of steel and concrete composite beams in fire conditions. The behaviour of the composite beams during a standard fire exposure is investigated. It is shown the comparison of resistance be-tween steel beam, composite beam and composite beam with partial concrete encasement. The following fea-tures affecting the resistance of the composite beam with partial concrete encasement are firstly investigated: influence of the beam dimensions and effectiveness of the reinforcing bars in concrete encasement. Moreover, it is shown a comparison between the general numerical approach and the simplified method proposed in EN 1994-1-2 for evaluating the sagging moment resistance of the composite beam with partial concrete encase-ment. Finally, it is proposed a simplified plastic method for evaluating the sagging moment resistance of the composite beam with partial concrete encasement in fire conditions.

71
determined by solving the Fourier equation in terms of the space (x, y) variables and time t, after having imposed suited space-time boundary conditions. Unfortunately closed form solutions for the thermal problems are known only in few elementary cases. In general numerical methods, such as the finite elements technique must be used. For the considered time of fire exposure, the thermal analysis gives the thermal field within the cross section.
>0
<0
me d
y=0
G
c, i
a, i
Figure 2. Cross-section discretization.
b)An unique - law (see EC4, part 1-2, 2005), which is a function of the local temperature and takes into account the decrease of mechanical strength with the temperature, can be linked to every element of the mesh into which the section has been divided, for each time of fire exposure. Naturally, different laws are employed for steel, rebars and concrete (see Fig. 3,4).
c) The external axial force Next (Next = 0 in pure bending) and the distribution of the temperatures Ti(t) within the section, related to the assigned exposure time t, are known and fixed for each moment-curvature diagram (M- ; Next ; t).
d)For an assigned curvature j , a tentative value for the average strain med of the cross-section is initially assumed and the corresponding distributions of strain i and stress i = ( i)within the section are determined on the basis of the temperature-dependent stress-strain laws.
e) The internal axial force N int is then evaluated starting from the stress distribution:
iiiAN int .
f) Iterations varying the average strain med of the section need up to satisfying the longitudinal equilibrium equation within a suitable error.
g)Then the bending moment Mj corresponding to the assigned curvature j may be determined. If the maximum deformations of both steel and
concrete is blocked at some stipulated value dependent on the local temperature (greater than the usual values in cold conditions), a deformation ultimate limit state may be specified easily. On the contrary, if the maxi-mum elongation of steel is unlimited, as in a plastic analysis, a slightly different procedure must be used to compute a point of failure. In this case, for a specified value of the ultimate axial load Nu = 0, the entire mo-ment-curvature law must be evaluated; then, the
maximum of the moment-curvature diagram is the re-quired ultimate bending moment Mu.
In Figure 5 is shown a moment-curvature diagram utilized for evaluating of ultimate bending moment capacity Mu, for the composite beam of the same fig-ure, for various time of fire exposure.
Figure 3. Temperatures-dependent - laws of structural steel
Figure 4. Temperatures-dependent - laws of concrete.
1500
130
240
120
IPE240
concrete
0
25
50
75
100
125
150
175
200
225
0 0,01 0,02 0,03 0,04 0,05 0,06 0,07 0,08 0,09 0,1
curvat ure*h
time 0 min
time 15 min
time 30 min
Figure 5. Typical moment-curvature laws of a composite beam varying fire exposure time.

72
3 STEEL-CONCRETE COMPOSITE BEAMS DURING STANDARD FIRE EXPOSURE
3.1 Comparison between various types of beams The numerical procedure, described before, may be used to study the behaviour of steel and concrete composite beams in a fire environment. Both com-posite beam comprising steel profile with no con-crete encasement and composite beam comprising steel profile with partial concrete encasement, sub-jected to the standard fire ISO 834, have been stud-ied.
concrete
steel beam
(a)
concrete
stee l beam
(b)Figure 6. Example of composite beam comprising steel beam without concrete encasement (a) and with partial concrete en-casement (b).
For cross-section types in Figure 6, the thermal field induced by fire has been evaluated through suitable discretization of the sections. The thermal analysis results can be synthesized representing the temperature in some significant points of the cross-section.
8 3 08 2 8
7 1 87 0 9
8 3 3
7 2 9
2 9 ,62 8 ,5
7 5 6
8 3 06 0 7 5 9 8
4 5 64 5 4
5 1 2
2 0 ,6 2 0 ,4
1 5 m i n 3 0 m i n
6 3 0
5 2 0
6 1 0
4 0 ,8 9 5 ,63 7 ,1 1 0 2 ,7
Figure 7. Temperature distribution for composite beam with no concrete encasement.
7 1 16 2 0
3 8 52 6 2
2 2 0
7 2 9
2 9 ,62 4
2 4 8
5 3 04 4 8 3 5 2
2 0 91 1 6
5 1 2
2 0 ,6 2 0
1 5 m in 3 0 m in
7 6
1 0 4
2 8 1
4 0 ,8 5 3 ,6 42 5 1 0 2 ,7
Figure 8. Temperature distribution for composite beam with partial concrete encasement.
The analyses have been performed for the two following typologies:
Composite beam with steel profile IPE240, no concrete encasement, reinforced concrete slab 130 mm high and effective width of 1500 mm (Fig. 7). Composite beam with steel profile IPE240, par-tial concrete encasement, reinforced concrete slab 130 mm high and effective width of 1500 mm (Fig. 8). For each time of fire exposure, based on the ther-
mal field, the reduction of beam bearing capacity has been evaluated applying the described procedure (see Figure 9). Fire is regarded in the Eurocode�s de-sign philosophy as an accidental situation or an ac-cidental action. Therefore, the characteristic value of the relevant material properties (strength) are adopted in fire design and the partial safety factors are accordingly assumed as unity (1.0), when the moment capacity under fire conditions is analyzed.
0
50
100
150
200
250
0 20 40 60 80 100 120
time (min)
Figure 9 Comparison in terms of resistant moment reduction with fire exposure time for various beam types.
The behaviour of �non-composite beam� has been calculated neglecting the collaboration between concrete slab and steel beam. The thermal field of composite beam and non-composite beam is the same. In Figure 10 the reduction in moment capacity for each type of beam, expressed in terms of the load ra-tio, is plotted versus time of fire exposure.
0,000
0,200
0,400
0,600
0,800
1,000
1,200
0 20 40 60 80 100 120
time (min)
Figure 10 Comparison in terms of load ratio varying fire expo-sure time for various beam types.
The load ratio is defined as the ratio between moment capacity at time t of fire exposure and ulti-mate moment capacity at 20 °C. The ultimate mo-ment capacity at 20°C is calculated by using the par-
Non composite beam
Non composite beam

73
tial safety factors presented in Eurocode 4 part 1-1. In the case that ultimate moment capacity at 20°C is equal to design moment at 20°C ( SdRd MM ) and moment resistance under fire conditions is equal to design moment in fire situation ( tfiSdtfiRd MM ,,,, ),the load ratio is equivalent to the ratio between de-sign bending moments in the case of fire and at 20°C. Therefore, by knowing this design bending moment ratio, it can be evaluated the endurance to fire exposure.
The comparison in resistance field (Fig. 9) shows the better behaviour of composite members; how-ever, in load ratio field (Fig. 10), the composite beam without concrete encasement shows a similar behaviour to non-composite beam. This is due to, both in the composite beam without concrete en-casement and non-composite beam, the moment ca-pacity depends on loss of strength of metallic part exposed to fire. In the case of composite beam with partial concrete encasement, it is shown a quite bet-ter behaviour, thanks to lower temperature values in the steel beam.
3.2 Influence of the beam dimensions The beam dimensions have a significant influence on the composite beam with partial concrete en-casement behaviour in fire conditions. In fact, in the analyzed cases, in which the concrete encasement is in the whole space comprising between the flanges, the encased parts are highly protected in relation to the larger flanges dimension.
In Figure 11 is shown the better behaviour, in load ratio field, of the composite beam with partial concrete encasement with steel beam IPE 360 com-pared to the same with steel beam IPE240; the mate-rial properties and geometry are the same.
0,000
0,200
0,400
0,600
0,800
1,000
1,200
0 20 40 60 80 100 120 140 160 180 200
time (min)
IPE240 without reinforcing bars
IPE360 without reinforcing bars
Figure 11. Load ratio for two types of composite beam.
3.3 Effectiveness of the reinforcing bars It�s clear that for increasing the beam moment ca-pacity, it is possible to place additional reinforcing bars in the concrete between flanges. This rein-forcement could be placed on various levels. By placing it near the bottom flange, its effect in normal temperature condition would be highest. However, this position would be penalizing in fire condition;
in fact, the reinforcement, placed in this way, would tend to reach high temperatures in a little time. By placing it near the central zone of beam web, its ef-fect is higher in fire condition.
Reinforcing bars
d
level 2
level 1
Figure 12. Additional reinforcing bars in concrete encasement
A parametric analysis has shown that the per-formances of composite beams with partial concrete encasement depend mainly on: a) mechanical ratio of reinforcement with regard of
the bottom flange of steel beam:
yksk
fs
s ff
AA , where sA is reinforcement area,
fA is bottom flange area, skf is the characteris-
tic value for yield stress of rebar steel, ykf is the
characteristic value for yield stress of structural steel;
b) distance d between the centroid of reinforcement and the bottom flange. Fixed the beam cross-section and the reinforce-
ment level, the ratio between the moment resistance of beam at t time of fire exposure and the resistance moment at t0 time (evaluated with partial safety fac-tors assumed as unity) depends only on mechanical ratio of reinforcement s .
In Figure 13 is shown the comparison between two possible reinforcement levels, with a geometric ratio of reinforcement equal to 100% of bottom flange area and the same beam geometry.
0
50
100
150
200
250
300
350
400
450
0 20 40 60 80 100 120 140 160 180
time (min)
level 1
level 3
without reinforcing bars
Figure 13. Influence of the level of the reinforcing bars.
It is clear how the reinforcement to level 1 pro-vides a better performance in ambient condition, but it provides a worth performance in fire condition,

74
compared to the case of reinforcement placed to level 2. In fact, for a time exposure of about 20 min-utes, the resistance of beam is the same for both the reinforcements; but, for higher time of exposure, the resistance of beam with reinforcement to level 2 is always greater than the resistance of beam with rein-forcement to level 1. This is due to higher suscepti-bility of the reinforcement to level 1 to reach ele-vated temperature, because it�s nearer to bottom flange, directly exposed to fire.
4 SOME REMARKS ON THE APPLICATION OF THE SIMPLIFIED DESIGN METHODS
4.1 Design methods suggested by EN1994-1-2. For the evaluation of the bending moment capacity of the composite beam, Eurocode 4 provides various simplified methods: a) General method: thermal analysis followed by me-
chanical analysis led according to plastic theory; b) Simplified method type 1: mechanical analysis led
according to plastic theory and assuming simpli-fied temperature field, based on the split of the cross-section in uniform temperature parts;
c) Simplified method type 2: mechanical analysis led according to plastic theory, but with temperature effects on the materials properties taken into ac-count either by reducing the dimensions of the parts composing the cross-section or by multiply-ing the mechanical properties of materials by re-duction factors. The general method can be applied for each beam
type. The simplified method type 1 is proposed for the composite beam with no concrete encasement. The simplified method type 2 is proposed for the composite beam with partial concrete encasement.
4.2 Proposed simplified plastic method The general method results very expensive in terms of calculations. In fact, the discretization of cross section utilized for thermal analysis can be the start point for the plastic method. Therefore, as much as this discretization is dense, the calculation of the plastic moment is more expensive.
However, a simplified method type 1 is not yet available for the composite beam with partial con-crete encasement.
The proposed simplified method, explained be-low, tries to be similar to the simplified method type 1, for avoiding the discretization of the cross section that has to be utilized for plastic analysis. But, it is always necessary a suitable thermal analysis of the cross-section.
It�s firstly assumed for concrete the simplification suggested within the so-called �500°C isotherm method� (see Eurocode 2, part 1-2): concrete with temperatures in excess of 500°C is assumed not to contribute to the load bearing capacity of the mem-
ber, whilst the residual concrete cross-section retains its initial values of strength.
The cross-section of the beam is divided in 5 main parts:
concrete slab; upper flange of steel beam; upper half of the web steel beam; bottom half of the web steel beam; bottom flange of the steel beam. Moreover, the flanges are further divided in 3
parts, as can see in Figure 14 .
A 2
A 3
A 4 b
A 1 a
A 1 b
A 1 c
A 4 a
A 4 c
Figure 14. Cross-section subdivision within the proposed sim-plified method.
A uniform temperature, equal to average tem-perature of the same part, is assigned to each of this parts. The average temperature is evaluated from the thermal analysis.
At this step it is possible to utilize the plastic the-ory, as proposed in EC4 part 1-2, par. 4.3.1.
In table 1 a comparison is shown between the ac-curate general procedure (par. 2) and the proposed simplified method for the composite beam with steel profile IPE240 and partial concrete encasement. Table 1. Comparison between general procedure and proposed simplified method.
timemin KN*m KN*m
0 208,33 208,279 1,0015 205,35 208,279 1,0130 139,31 130,256 0,9360 73,75 73,313 0,9990 31,69 31,406 0,99
120 16,79 16,856 1,00150 9,98 10,024 1,00180 7,16 7,510 1,05
Ultimate Resistant Moment - general procedure -
Ultimate Resistant Moment - proposed simplified moment - Msimpl/Mgen
The results show that the proposed method gives very close estimation of the beam sagging bending moment resistance. This accordance has been checked also with reference to other composite beams characterised by different geometry. There-fore, the proposed method is a promising simplified method; further studies need to deduce approximate formulations for the thermal field in the relevant parts of the cross-sections.

75
4.3 Application of the simplified method type 2 suggested in EN1994-1-2 (Annex F)
In the Annex F of Eurocode 4, part 1-2, a simplified method type 2 is proposed for evaluating the sagging and hogging moment resistances of a partially en-cased steel beam connected to a concrete slab and exposed to fire beneath the concrete slab according to the standard time-temperature curve.
The application of EC4 method is limited from the thickness of slab and from the dimension of steel beam against concrete encasement. In order to show the reliability of this method for evaluating the sag-ging moment resistance of composite beams, two beams have been examined: 1) composite beam with steel profile IPE240, partial
concrete encasement, reinforced concrete slab 130 mm high and effective width of 1500 mm;
2) composite beam with steel beam IPE360, partial concrete encasement, reinforced concrete slab 130 mm high and effective width of 1500 mm. The comparison between the accurate general
procedure and simplified method of EN 1994-1-2 (Annex F) is shown in table 2a (typology 1) and ta-ble 2b (typology 2). Table 2. Comparison between general procedure and proposed simplified method of EC4-1-2 Annex F.
timemin KN*m KN*m
0 /30 1,1160 1,3690 2,26
120 3,03180 5,54
16,79 50,9047,16 39,674
73,75 99,98631,69 71,592
208,33 /139,31 154,566
Ultimate Resistant Moment - general procedure -
Ultimate Resistant Moment - EC4 simplified procedure - Msimpl EC4/Mgen
(a)
timemin KN*m KN*m
0 /30 1,1460 1,0890 1,22
120 1,74180 3,70
101,62 176,92137,23 137,667
229,76 248,103168,34 205,694
471,12 /346,27 393,132
Ultimate Resistant Moment - general procedure -
Ultimate Resistant Moment - EC4 simplified procedure - Msimpl EC4/Mgen
(b)
Fire classes highlighted in the tables correspond to fire classes for which this method is not suitable (see EN 1994-1-2). It is possible noticing how the simpli-fied method suggested by Eurocode 4 is not on the safe side, also within its field of application; in fact, it always provides higher resistance values with respect to the general procedure based on the moment-curvature diagram (par. 2). The scattering becomes very high outside the declared application field.
5 CONCLUSIONS
With reference to composite beams with concrete encasement, the application of a general accurate
procedure to assess ultimate bending moment in fire conditions has pointed out that the simplified plastic method suggested by EN 1994-1-2 (Annex F) may result on the unsafe side.
A simplified plastic method has been also pro-posed, based on a suitable subdivision of the cross-section in few relevant parts. The obtained results are in good agreement with the accurate procedure. Further studies will be devoted to deduce approxi-mate formulations for the thermal field in the rele-vant parts of the cross-sections.
6 REFERENCES
EUROCODE 1, 2004, Eurocode 1 - Actions on structures � Part 1-2: General Actions � Actions on structures exposed to fire.
EN 1993-1-2, 2005, Eurocode 3 - Design of Steel Structures � Part 1-2: General Rules- Structural Fire Design.
EN 1994-1-2, 2005, Eurocode 4 - Design of Composite Steel and Concrete Structures � Part 1-2: General Rules- Struc-tural Fire Design.
CEFARELLI G., 2006, Resistenza in caso di incendio di strutture composte acciaio-calcestruzzo, Graduation Thesis in Civil Engineering (Tutor Prof. Eng. E. Nigro), University of Naples �Federico II�.
KRUPPA J., ZHAO B., 1995, Fire Resistance of Composite Beams to Eurocode 4 Part 1.2, Journal of Constructional Steel Research, Elsevier, Vol. 33, pp 51-69.
LAWSON R.M., 1992, Fire Resistance and Protection of Structural Steelwork, Constructional Steel Design, Ch. 7.3.
LAWSON R.M., 2001, Fire engineering design of steel and composite buildings, Journal of Constructional Steel Re-search, Elsevier, Vol. 51 pp. 1233-1247.
MA Z., MAKELAINEN P., 2000, Behavior of Composite Slim Floor Structures in Fire, Journal of Structural Engineering, A.S.C.E., Vol. 126, n. 7.
MAKELAINEN P., MA Z., 2000, Fire resistance of composite slim floor beams, Journal of Constructional Steel Research, Elsevier, Vol. 54, pp. 345-363.
MATERAZZI A.L., NIGRO E., BRECCOLOTTI M., 2004, Assessment of slender steel and concrete composite col-umns in the event of fire: theoretical-experimental com-parison and simplified methods of analysis, International Workshop on �Fire Design of Concrete Structures: What now ? What next ?�, Milano (Italy), 2-4 Dec.
NEWMAN G.M., LAWSON R.M., 1991, Fire Resistance of Composite Beams, Steel Construction Institute, UK.
NEWMAN G.M., 1995, Fire Resistance of Slim Floor Beams,Journal of Constructional Steel Research, Elsevier, Vol. 33, pp. 87-100.
NIGRO E., MATERAZZI A.L., COSENZA E., 1998, Stabilità di colonne composte acciaio-calcestruzzo in caso di incendio, 3° Workshop Italiano sulle Strutture Composte, Ancona, 29-30 Ottobre.
NIGRO E., 2001, Verifica di strutture composte acciaio-calcestruzzo in caso di incendio: sperimentazione, modelli di calcolo, indicazioni normative, Costruzioni Metalliche, LIII(2001), n°4.
WANG Y.C. 2002, Steel And Composite Structures, Behaviour and Design for Fire Safety, Spon Press.
YU H.X., LIEW R., 2004, Moment curvature method for fire safety design of steel beams, Steel and Composite Struc-tures, Vol.4, pp. 227-246.

76
1 INTRODUCTION
The basic principle in determining the fire resistance of a structural element is that the elevated tempera-tures produced by the fire reduce the materials strength and stiffness until possible collapse. When the temperatures on the cross-section of a structural element produce the reduction of the element resis-tance bellow the level of the effect of actions for fire design situation, it is considered that that element lost its load-bearing function under fire action.
The fire resistance of composite steel-concrete structures is calculated according to EN1994-1-2 (EN1994 2005). Three methods are available in or-der to evaluate the fire resistance: the tabulated data method, the simple calculation models and the ad-vanced calculation models.
The advanced calculation models suppose an ad-vanced numerical analysis of the elements or of the entire structure under fire, using specialized soft-ware for the mechanical analysis of structures under elevated temperatures.
There are several fire models, accepted by the European Standard EN1991-1-2 (EN1991 2005), which describes the thermal and mechanical actions to be considered for a structure under fire.
The nominal standard temperature-time ISO model does not take into account any physical pa-rameter, and can be far away from reality. From the beginning, the nominal model supposes that the en-tire compartment is in the flashover phase and the temperature is increased continuously, without tak-ing into account the cooling phase.
A modern fire model approach is the �Two Zone� model. In this natural fire model, in the pre-flashover phase, the fire compartment is divided in a hot upper zone and a cold inferior one. For each zone, with uniform temperature, mass and energy equations are solved. Complex equations describe the air movement in the fire plume, the radiative ex-changes between the zones and the gas movements on the openings and adjacent compartments. After the flashover, the temperature is considered uniform and is determined by solving the equations of mass and energy of the compartment, taking into account the walls and openings. In the frame of the ECSC re-search "Natural Fire Safety Concept" (CEC 2001) it was considered necessary to develop a computer program for this model. This objective is now reached, a computer program called OZone is avail-able in order to determine the temperature-time curve by means of the �Two Zone� model, and was built at the Liege University, Belgium, in collabora-tion with the �Politehnica� University of Timisoara (Cadorin et al 2003).
The fire is considered an accidental situation which requires, with some exceptions, only verifica-tions against the ultimate limit state. The combina-tions of actions for accidental design situations are given in the European Standard for basis of struc-tural design EN1990 (EN1990 2004).
A structure, substructure or element in fire situa-tion may be assessed in the time domain, where the failure time must be higher than the required fire re-sistance time. The failure time is the time for which the resistance of the structure (or substructure, or element, as considered) under elevated temperatures
Fire design of composite steel-concrete columns under natural fire
D. Pintea & R. ZahariaPolitehnica University of Timisoara, Romania
ABSTRACT: The fire resistance of composite structures may be determined using simplified methods, based on analytical formulas or tables, provided in the corresponding Eurocode for fire design. For special situa-tions or for complex structures it may be necessary to perform an advanced analysis, using special purpose programs for the analysis of structures under ambient and elevated temperature conditions, as well as to es-tablish a realistic fire scenario, based on �natural fire� models. The paper presents an example of application of the advanced methods, to determine the fire resistance of the composite steel concrete columns for an ex-isting building in Romania.

77
reach the effect of actions for the fire design situa-tion, considering the combination of action in fire situation.
2 COMPOSITE STEEL-CONCRETE STRUCTURE ANALYSED
The paper presents the calculation of the fire resis-tance for one of the composite columns of �Bucha-rest Tower Centre� structure, which will be the tall-est building in Bucharest for the moment. The building has 3 basements, one ground floor, 21 floors, 3 technical floors at a total height of 106.3m.
The columns are made by cruciform cross sec-tions made of hot rolled European profiles, partially encased in reinforced concrete, in order to increase strength, rigidity and fire resistance. According to Romanian fire regulations, considering the specific and particularities of the building, the columns must have 150 minutes of fire resistance.
Figure 1 shows the cross sections types of the columns: octagonal sections with identical steel pro-files 2HEB500, 2HEA800, 2HEB800, 2HE800x373 (a), octagonal sections with different steel profiles HEM800 HEM700, HEB800 HEB700, HEA800 HEA700 (b) and rectangular sections HEB1000 HEB500, HEB1000 HEM500 (c).
The rebars have 25 mm diameter and the concrete is C30/37.
For the purpose of this paper, only the 2HEB500 cross-section will be presented, as it has the lowest fire resistance under ISO fire from the set of col-umns.
a) b)
c)Figure 1. Composite cross-sections
3 THERMAL ANALYSIS UNDER ISO FIRE
For the calculation of the fire resistance of the composite column, the SAFIR computer program was used (Franssen & Kodur & Mason 2004), which is a special purpose program for the analysis of structures under ambient and elevated temperature conditions. The analysis of a structure exposed to fire consists of two steps. The first step involves predicting the temperature distribution inside the structural members, referred to as �thermal analy-sis�. The second part of the analysis, termed the �structural analysis� is carried out to determine the structural response due to static and thermal loading.
Figure 2 shows the temperature distribution on the cross section of the considered column, after 150 minutes of ISO fire. Due to symmetry, only a quarter of the cross-sections was modeled. The round rein-forcing bars are represented by quadrilateral ele-ments, with equivalent area. After 150 minutes of ISO fire, the steel profiles flanges exhausted practi-cally their load capacity, having temperatures greater than 900oC, while the profiles webs and the reinforcing bars have lower temperatures and there is an important core of concrete with quite low tem-peratures.
Figure 2. Temperature distribution on the 2HEB500 column under ISO fire at 150 minutes.
4 MECHANICAL ANALYSIS UNDER ELEVATED TEMPERATURES
The column, considered as an isolated element, loaded with the axial force and the bending moments on both principal cross-section axes (efforts corre-sponding to the fire combination of actions), was modeled with 3D beam elements. The buckling length of the column was considered conservatively as the system length. Equivalent imperfections ac-cording to EN1994-1-1 (EN1994 2005) were im-posed on both directions of the principal cross-section axes.

78
The horizontal displacement evolution at the mid height of the column 2HEB500 of ground floor is presented in figure 3. As the characteristic time-displacement demonstrates, the column of the ground floor does not resist to 150 minutes of ISO fire under the imposed static loads, having a resis-tance time of only 70 minutes.
0
10
20
30
40
50
60
70
80
90
100
0 15 30 45 60 75 90
Time [min]
Figure 3. Displacement evolution under ISO fire.
The fire resistance of the 2HEB500 column grows with each floor, as the stress level in the col-umns decrease on the height of the building. The R150 fire resistance requirement is fulfilled only from the 11th level forth.
5 THE NATURAL FIRE SOLUTION
Since the ISO fire solution is much too conservative, an approach based on the Natural Fire concept was considered. The same element was subjected to a natural fire curve, obtained using the OZone v2 computer model (Cadorin et al 2003).
Several assumptions must be made when dealing with the natural fire scenario, like the maximum fire area, the fire load, and the surface of the openings.
The most challenging is to establish how the cur-tain walls will behave in a fire situation. The rate of heat release of fires is limited by the flow of oxygen available to it. In all except very rare circumstances, the flow of oxygen into a room comes largely from open doors and open windows and to a slight extent from any mechanical ventilation systems and from building leakage. Once a fire gets going, however, windows previously closed may crack and break out. The results will often be drastically different, de-pending on whether the windows break or not. Thus, it becomes of significant interest to be able to pre-dict if, and when, glass may break out.
Here, an important distinction needs to be made. When a window pane of ordinary float glass is first heated, it tends to crack when the glass reaches a temperature of about 150 - 200ºC. The first crack initiates from one of the edges. At that point, there is a crack running through the pane of glass, but there is no effect on the ventilation available to the fire.
For the air flows to be affected, the glass must not only crack, but a large piece or pieces must fall out.
Understanding the conditions under which pieces actually fall out has been of considerable interest to fire specialists. Since the fire ventilation openings need to be known in order for fire models to be used, glass breakage has been of special interest to fire modelers. This has prompted a number of theoretical and simplified studies and a few empirical ones as well.
The only probabilistically-based results concern-ing glass exposed to a uniform hot temperature come from the Building Research Institute (BRI) of Japan (Tanaka et al. 1998). In that study, researchers used a large-scale high-temperature door-leakage testing apparatus that resembles a large muffle furnace. Only single-glazed, 3 mm thick window glass was studied. For this type of glass, however, enough tests were run so that a probability graph could be plotted.
The results are presented in terms of a probability of glass breaking out, as a function of temperature rise above ambient (Fig. 4).
Figure 4. Probability of glass breaking.
The Gaussian fit that can correlate this data cor-responds to a mean temperature rise of 340°C, and a standard deviation of 50°C.
The fire compartment can be modeled as a square of 20m x 20 m, with three walls made of bricks and a fourth wall entirely made of curtain wall. A linear variation of the openings was considered, i.e. the curtain wall. Based on the research mentioned above, at 300°C 30% of the windows were consid-ered broken, while at 500°C all the windows are broken.
The fire load inside the compartment was the one for office occupancy, with a rate of heat release of 250 kW/m2. All the other parameters were consid-ered (automatic water extinguishing systems, fire detection, etc). The evolution of the temperature in the upper layer is presented in Figure 5.
The temperature distribution on the 2HEB500 column cross section under natural fire at 55 minutes (corresponding to the peak temperature in figure 3) is presented in Figure 6. The horizontal displace-

79
ment evolution at the mid height of the column 2HEB500 of ground floor is presented in Figure 7. It may be observed that the column is stable; there is no collapse of the element under natural fire.
0
100
200
300
400
500
600
700
0 30 60 90 120 150 180
Time [min]
Figure 5. Temperature distribution in the upper layer.
FILE: sNOD ES: 136ELEMENTS: 128
SOLIDS PLOTCON TOUR PLOTTEMPERATURE PLOT
TIME: 3300 sec456.60402.80349.00295.20241.40187.60133.8080.0026.20
Figure 6. Temperature distribution on the 2HEB500 column under natural fire.
0
0.5
1
1.5
2
2.5
3
0 30 60 90 120 150 180
Time [min]
Figure 7. Displacement evolution under natural fire.
6 CONCLUSIONS
Natural fire solutions must be adopted to the fire de-sign of steel and composite steel concrete structures.
Careful consideration of the occupancy of the fire compartment and that of the materials that make out
the fire compartment walls lead to a more realistic behavior of the structural elements under fire.
7 REFERENCES
Cadorin, J.F, Pintea, D., Dotreppe, J.C, Franssen, J.M, 2003, A tool to desgn steel elements submitted to compartment fires- Ozone V2. Part2: Methodology and application, Fire safety journal, Elsevier, 38, 439-451.
CEC Agreement 7210-PA/PB/PC/PD/PE/PF/PR-060, Natural Fire Safety Concept, Implementation in the Eurocodes and Development of an User friendly Design Tool, 2001
EN1990 Eurocode: Basis of Design, September 2004, Euro-pean Comittee for Standardisation, Brussels.
EN1991-1-2: Eurocode 1 - Actions on structures - Part 1-2: General actions - Actions on structures exposed to fire, 2005, European Committee for Standardization, Brussels
EN1994-1-1: Eurocode 4 - Design of composite steel and con-crete structures - Part 1-1: General rules and rules for build-ings, 2005, European Committee for Standardization, Brus-sels.
EN1994-1-2: Eurocode 4 - Design of composite steel and con-crete structures - Part 1-2: General rules - Structural fire de-sign, 2005, European Committee for Standardization, Brus-sels.
J. M. Franssen, V. K. R. Kodur, J. Mason, User Manual for SAFIR. A computer program for analysis of structures subbmited to the fire. University of Liege, Department 'Structures du genie civil' Service 'Ponts et charpentes', 2004.
Tanaka, T., et al. 1998, Performance-Based Fire Safety Design of a High-rise Office Building.

80
1 INTRODUCTIONAt present, accurate models are used to predict resistance, stiffness and deformation capacity of joints. The component based joint analysis method may also be extended joints at high temperature (Spyrou et al, 2002). However, evaluation of internal forces acting in the joints and elements at fire can be difficult. The tie forces which should be resisted by the joints cannot be evaluated by analysis of single structural elements. Global analysis of part of the structure or complete structure is necessary to take into account interaction of the structural elements (O�Connor & Martin, 1988), (Wang, 2002). Nonlinear analysis including thermal expansion, temperature-dependent material properties and plasticityis necessary for accurate results. This paper presents some experiments for calibration of numerical models and to develop simple prediction models for tie forces at fire.
2 DESCRIPTION OF THE EXPERIMENT
2.1 Steel structure The structure used for the experiment is a 3 storey administrative building attached to a single storey framed building, see Figure 1 (Kallerová & Wald, 2006). The load-bearing structure consists of steel columns and beams supporting concrete slabs of 130 mm (including the ribs). No shear connection between the steel beams and the slab was designed. The beam to column and beam to beam connections were designed as simple end plate connections using 2 or 6 bolts M20, see Figure 2.
2.2 Fire compartment The fire compartment sized 3,80 × 5,95 m × 2,78 m height was located on the 2nd floor. The walls were made from hollow ceramic bricks except the front wall which was made from light weight concrete. One window of width 2,40 m and height 1,40 m was located in the front wall, see Figure 3.
Figure 1. The fire compartment on the 2nd floor of the building.
The steel columns were partially encased in the walls and only the flange was exposed to fire. During the fire test, the exposed column flanges
Variations of forces in a real steel structure tested in fires
Z. Sokol & F. Wald Czech Technical University in Prague, Czech Republic
ABSTRACT: During an accidental situation of fire, a structure is exposed to additional loads in addition to the loads considered for the standard design situation. These loads result from thermal expansion of the structural members, membrane action and internal forces redistribution. Progressive collapse of the structure should be avoided. The tension/compression forces in the beams and beam to column joints (tie forces) should be resisted. This is ensured by robustness of structure. This paper presents some fire test results.

81
were protected by fibre-silicate boards. The beams and connections were not protected during the test. Mechanical load was introduced on the 3rd floor. The total load (including self weight of the structure) was 5,7 kN/m2. Wooden cribs were used as fire load, 60 kg/m2 floor area (1060 MJ/m2) being used for the compartment fire test and 170 kg located on an area 1 × 1 m was used for the local fire (Fig. 5, 6).
871135080
11030
35
35
200120 4040
200120
70
Ceramic tiles, 30 mm
IPN300 IPN180 IPN160
IPN300
2×M20 IPN160
240
3535
P10-70×200
4040
P10-200×210
6×M20
2107070
27055 145
Concrete C20/25, 110 mmConcrete slab, C20/25, 80 + 50 mmTrapezoidal sheet VS� 11002, 50 mm
Figure 2. The concrete slab, beam to beam and beam to column connections.
Plan 3300 3000300300
340I180
I180
I180
I160
I160
180
200
I300
4000
1320
1330
1350
A
B
C
D
1 2 3
+6,45
+9,50
+7,52
3 floorrd
2 floornd
Section
2780
1070
1400
310+8,92
Figure 3. Dimensions of the fire compartment.
2.3 Measuring devices Thermocouples, strain gauges and displacement transducers were used to record behaviour of the structure during the fire test. In total there were 42 thermocouples to measure the temperatures of the air in the fire compartment, of the structural elements and beam connections. Vertical deformations were
measured by 5 transducers located on the 3rd floor at mid-span of the primary and secondary beams. In addition, the relative horizontal displacement of the columns A2-D2, D1-D2 a D2-D3 were measured by 3 transducers. Strains in the columns were measured by 16 strain gauges attached to the column flanges on the 1st and 3rd floors. The fire and smoke development was recorded by five video cameras and one thermo imaging camera.
Figure 4. Location of thermocouples on 1st floor of column D2.
2.4 Fire tests The fire compartment was used for two fire tests. The local fire test (performed on 15 June 2006) was designed to measure the temperature in steel beams and column close to the fire. The fire was located in the middle of the compartment just below the primary beam A2-D2, see Figure 5. A column was erected in the middle of the compartment. It did not support any load but was used only for measurement of temperatures along its length.
The compartment test was designed to obtain the gas temperature, temperatures of the structure including the joints, the tie forces and temperatures of steel structure in front of the compartment window.
No collapse occurred during the tests, however, deformations and lateral-torsional instability of the beams was observed, see Figure 7.

82
Figure 5. Local fire test.
Figure 6. Fire load for the compartment fire test.
Figure 7. Beams after the compartment fire test.
3 EVALUTION OF TIE FORCES
3.1 Method of analysis The tie forces were derived from the strains measured by the strain gauges attached to column flanges, see Figure 8 (Sokol & Wald, 2005). Standard strain gauges were used for measurement as they were located outside the fire compartment. In addition, the columns were fire protected therefore the temperatures of the columns at location of the strain gauges were low and no correction of modulus of elasticity for the temperature was necessary, see (Sokol & Wald, 2005).
The measured strains can be transformed to stress increments induced in the column during the fire. The stress was calculated as the average of the pair of the strain gauges at the flange to take into account bi-axial bending of the column. The pairs of the strain gauges are in the following table.
Table 1. Strain gauges for calculation of the average stress. __________________________________________________Strain gauge location Bending of column ______________________________ y-axis z-axis __________________________________________________3rd floor, +3,0 m ST13 � ST14 ST13 � ST15 ST15 � ST16 ST14 � ST16 3rd floor, +3,0 m ST9 � ST10 ST9 � ST11 ST11 � ST12 ST10 � ST12 1st floor, +4,2 m ST5 � ST6 ST5 � ST7 ST7 � ST8 ST6 � ST8 1st floor, +1,5 m ST1 � ST2 ST1 � ST3 ST3 � ST4 ST2 � ST4 __________________________________________________
The stress in the column flanges was transferred to corresponding bending moment using section modulus of the column, see Figure 8. The following values were used for the calculation.
Wy = 994 900 mm3,
Wz = 186 800 mm3, (1)
Wz� = 233 500 mm3.The tie forces were obtained from continuous beam model representing the column D2, see Figure 9. It is assumed the bending moment diagram is linear along the column and the beam to column connections and column base are designed as simple connections. The shear force diagram can be derived from the bending moments by differentiation of the bending moment function. Finally, the tie forces can be calculated.

83
8
14
340
20 20
2020
200
y
zFigure 8. Column size and placement of strain gauges.
ST6ST8
ST5ST7
ST2ST4
ST1ST3
ST14ST16
ST13ST15
ST10ST12
ST9ST11
2725
795
270
270
1015
1945
710
270
2780
MM Q Tie Forces
Figure 9. Placement of strain gauges on column D2 and model for evaluation of tie forces.
3.2 Tie forces for the compartment fire
3.2.1 Bending of column about y-axis The maximum tie forces measured in the 1st and 3rd
floors were +215 kN (tension) and -50 kN (compression). The tie force in the 2nd floor was -300 kN (compression) and +65 kN (tension). The average stress, bending moments and tie forces are plotted in Figures 10-12. Relative displacement of the columns A2-D2 is plotted in Figure 13. The maximum displacement was 21 mm.
Stress, MPa
Time, min
-150
-100
-50
0
50
100
150
0 30 60 90 120 150 180 210 240 270
ST1-ST2
ST3-ST4ST7-ST8
ST9-ST10
ST11-ST12
Figure 10. Average stress in column D2, bending about y-axis.
Moment, kNm
Time, min0 30 60 90 120 150 180 210 240 270
-200
-100
0
100
200
300
400
500
+1.5m
+4.2m
+5.1m
+0.0m
+1.0m
+3.0m
1 floor
3 floor
st
rd
1 floor
3 floor
st
rd
1 floor3 floor
st
rd
Figure 11. Bending moments in column D2, bending about y-axis.
Force, kN
Time, min0 30 60 90 120 150 180 210 240 270
-400
-300
-200
-100
0
100
200
300
1 floor
2 floor
3 floor
st
rd
nd
Figure 12 Tie forces in column D2, bending about y-axis.
Displacement, mm
Time, min0 30 60 90 120 150 180 210 240 270
-25
-20
-15
-10
-5
0
LD6
Figure 13. Relative displacement of columns A2-D2.
3.2.2 Bending of column about z-axis Tie forces measured in the direction of the secondary beams were much smaller than the forces in direction of the primary beam. This was caused by fire protection of the secondary beams attached to column D2 by the partition walls thus preventing thermal expansion of these beams. The behaviour was also influenced by the walls acting as a bracing of the structure and by location of the column in the middle of the wall. The maximum forces were +8,4 kN (tension) in the 1st and 3rd floor beams and -10,5 kN (compression) in the 2nd floor. The stress, bending moments, tie forces and relative displacement of the columns during the fire are plotted in Figures 14-17.

84
Stress, MPa
Time, min
-40
-30
-20
-10
0
10
20
0 30 60 90 120 150 180 210 240 270ST1-ST3
ST2-ST4
ST5-ST7
ST6-ST8
ST9-ST11
ST10-ST12
ST13-ST15
ST14-ST16
Figure 14. Average stress in column D2, bending about z-axis.
Moment, kNm
Time, min
-10
-5
0
5
10
15
20
0 30 60 90 120 150 180 210 240 270
+1.5m
+4.2m+5.1m
+0.0m
+3.0m1 floor
3 floorst
rd
1 floor
3 floor
st
rd
1 floor
3 floor
st
rd
+1.0m
Figure 15. Bending moments in column D2, bending about z-axis.
Force, kN
Time, min0 30 60 90 120 150 180 210 240 270
-15
-10
-5
0
5
101 floor
2 floor
3 floor
st
rd
nd
Figure 16. Tie forces in column D2, bending about z-axis.
Displacement, mm
Time, min0 30 60 90 120 150 180 210 240 270
-25
-20
-15
-10
-5
0
LD7 LD8
Figure 17. Relative displacement of columns D1-D2 and D2-D3.
3.3 Tie forces for the local fire
3.3.1 Bending of column about y-axis The tie forces measured during the local fire were smaller than the forces during the compartment fire because of smaller thermal load during the local fire.
This resulted in non-uniform heating of the beams along the length, lower temperature and thermal elongation of the beams. The maximum force was +116 kN (tension) and -156 kN (compression). The stress, bending moments, tie forces and relative displacement of the columns during the fire are plotted in Figures 18-21.
Stress, MPa
Time, min0 15 30 45 60 75 90 105 120 135
-80
-60
-40
-20
0
20
40
6080
ST3-ST4
ST7-ST8
ST9-ST10
ST11-ST12
ST13-ST14
Figure 18. Average stress in column D2, bending about y-axis.
1 floorst
Moment, kNm
Time, min0 15 30 45 60 75 90 105 120 135
-150
-100
-50
0
50
100
150
200250
+1.5m
+4.2m +5.1m
+0.0m
+3.0m
1 floor
3 floor
st
rd
3 floorrd
1 floor3 floor
st
rd+1.0m
Figure 19. Bending moments in column D2, bending about y-axis.
Force, kN
Time, min0 15 30 45 60 75 90 105 120 135
50
100
-200
-150
-100
-50
0
1501 floor
2 floor
3 floor
st
rd
nd
Figure 20. Tie forces in column D2, bending about y-axis.
Displacement, mm
Time, min0 15 30 45 60 75 90 105 120 135
-10
-8
-6
-4
-2
0
LD6
Figure 21. Relative displacement of columns A2-D2.

85
3.3.2 Bending of column about z-axis The tie forces are almost negligible and reach ±4 kN. This is the result of local fire which had influence on the primary beam just above the the fire but very small heating was observed on beams D1-D2 and D2-D3 which were encased in the wall. The stress, bending moments, tie forces and relative displacement of the columns during the fire are plotted in Figures 22-25.
Stress, MPa
Time, min0 30 45 60 75 90 105 120 13515
-15
-10
-5
0
5
10
15
-20
ST1-ST3ST2-ST4
ST6-ST8
ST9-ST11
ST10-ST12
Figure 22. Average stress in column D2, bending about z-axis.
Moment, kNm
Time, min0 30 45 60 75 90 105 120 13515
-4
-2
0
2
4
6
8
+1.5m
+4.2m
+5.1m
+0.0m
+1.0m
+3.0m
-6
1 floor3 floor
st
rd
1 floor
3 floor
st
rd
1 floor
3 floor
st
rd
Figure 23. Bending moments in column D2, bending about z-axis.
Force, kN
Time, min0 30 45 60 75 90 105 120 13515
-5-4-3-2-1012345
1 floor
2 floor
3 floor
st
rd
nd
Figure 24. Tie forces in column D2, bending about z-axis.
Displacement, mm
Time, min0 15 30 45 60 75 90 105 120 135
-10
-8
-6
-4
-2
0
LD7
Figure 25. Relative displacement of columns D1-D2.
4 CONCLUSION
Results of fire tests performed on a 3 storey administrative building are summarized in this paper. The tie forces at three levels of the building are derived from the measured data. The tie forces reached up to 300 kN depending on the type of fire (local or compartment fire). No collapse of the beam to column connections was observed, but small deformations of the end plates due to the tie forces were found.
ACKNOWLEDGEMENT
This outcome has been achieved with the financial support of the Ministry of Education, Youth and Sports of the Czech Republic, project No. 1M0579, within activities of the CIDEAS research centre.
The paper describes contribution of the Czech partner to the Action Cost C26 Urban Habitat Constructions under Catastrophic Events, which is focused on connection behaviour and structural integrity at fire.
REFERENCES
Advisory desk. 1998. AD027 - Accidental damage, New Steel Construction Vol. 2, No. 4.
Advisory desk. 1990. AD063 - Accidental damage - tying, New Steel Construction Vol. 4.
Advisory desk. 1992. AD104 - BS 5950 - Tying forces, NewSteel Construction Vol. 6, No. 2-3.
Advisory desk. 1993. AD131 - Structural Integrity - Tying to BS 5950, New Steel Construction, Vol. 1, No. 2, 29-30.
Kallerová P. & Wald F. 2006: Ostrava fire test, Czech Technical University, Praha, CIDEAS report No. 3-2-2-4/2.
Lennon T. 1997. Cardington Fire Tests, Survey of Damage to the Eight Storey Building. Building Research Establishment. Paper No. 127/97. Watford.
O�Connor M.A. & Martin, M.D. 1988. Behaviour of a Multi-Storey Steel Framed Building Subjected to Fire Attack, Journal of Constructional Steel Research 46.
Sokol Z. & Wald F. 2005. Stresses in Steel Columns under Natural Fire. In: COST C12 Conference, Innsbruck, p. 259-266.
Spyrou S., Davison B., Burgess I. & Plank R. 2002. Component-based studies on behaviour of steel joints at elevated temperature. in: Third European Conference on Steel Structures - Eurosteel 2002, Coimbra. 1469-1479.
Wald F., H ebíková P. & Kroupa L. 2004. Temperature of Steel Columns under Natural Fire, Acta Polytechnica.
Wang Y.C. 2002. Steel and Composite Structures, Behaviour and Design for Fire Safety, Spon Press, London, ISBN 0-415-24436-6.

86
1 INTRODUCTION
Several recent research RFCS projects and published results in Karlström P. (2004), Ng & Gardner (2006), have shown that stainless steel performs bet-ter than carbon steel at elevated temperatures. The improved behaviour is mainly explained by the en-hanced material properties and a favourable relation-ship between strength and stiffness that makes stainless steel less prone to buckling in fire. For flexural buckling this behaviour is taken into ac-count in EN 1993-1-2 (2005) but not for local buck-ling. This makes the Eurocode treatment inconsistent and it leads to conservative results especially for slender cross-sections.
Ng & Gardner (2006) have presented recommen-dations for design guidance that include the relation-ship between strength and E-modulus for both local and global slenderness as well as for the cross-section classification. All available test results have than been used to propose a revised semi-empirical buckling curve.
2 EXPERIMENTS Four cold rolled stainless steel stub columns,
0.1 , with cross-section class 4 were tested at the ambient temperature, Ala-Outinen (2005). Four strain-gauges were used to measure stresses at mid-column. The material properties were determined from tensile coupon tests of the flat faces of the col-umns. The geometry of the columns and local imper-fections were measured. The material used in the columns was EN 1.4301. Fully restrained ends were achieved in experiments.
Table 1. Results from tests at the ambient temperature. No. specimen Cross-section Length Failure load mm kN 1. 150x150x3 900 398 2. 150x150x3 900 393 3. 200x200x5 900 1129 4. 200x200x5 900 1118
Six unprotected columns were tested at elevated temperatures, Ala-Outinen (2005). The test set-up was equivalent to the ambient temperature tests. Hence, the same material and cross-section charac-teristics were used. The temperatures were measured with twelve chromel-alumel thermocouples and the axial deformation was measured using transducers. The transient procedure was applied, meaning that the axial load was kept constant and the furnace temperature was raised in a controlled way, at the rate of 10 C/min. The columns were tested at three different load levels.
The results from the tests at elevated temperature are presented in Table 2.
Table 2. Results from tests at elevated temperatures. No. specimen Length Load Load level Failure temp. Cross-section mm kN C 1. 150x150x3 900 203 0.51 676 2. 150x150x3 900 165 0.42 720 3. 150x150x3 900 248 0.63 588 4. 200x200x5 900 694 0.62 609 5. 200x200x5 900 567 0.50 685 6. 200x200x5 900 463 0.41 764
Class 4 stainless steel box columns in fire
B. Uppfeldt Swedish Institute of Steel Construction, Stockholm, Sweden
M. Veljkovic Luleå University of Technology, Sweden
ABSTRACT: A study of stainless steel cold-rolled box columns at elevated temperatures is presented,which is a part of an on-going RFCS project �Stainless Steel in Fire�. Experimental results of six, class 4, stub columns at elevated temperature, tested by Ala-Outinen (2005), were used to evaluate the FE model. The FE analysis obtained using the commercially available software, ABAQUS, shows that the critical temperature was closely predicted. Further, a parametric study was performed using the same numerical model. This was a basis to check the quality of prediction of a newly proposed improvement for design rules of class 4 cross-sections in fire according to EN 1993-1-4 (2006) and EN 1993-1-2 (2005).

87
3 FE-MODEL There are several important aspects of FE-modelling, addressed in the modelling of experimen-tal results both at ambient and elevated temperature. A suitable element type and its size is analysed in so called, sensibility analysis. FEA capability to predict the failure mode, as well as, the maximum load and stiffness of the column are prerequisites for a reli-able model. The input data are of great importance including the material properties. The influence of different parameters was studied and expected re-sults were confirmed. The major findings were as follows. Increasing the slenderness of the cross-section, the size of the local imperfections increases which affects the failure load and the critical tem-perature significantly. The global imperfections play a more important role for slender columns.
3.1 ElementsA general-purpose shell element, called S4R, within Abaqus/Standard were used in order to avoid limita-tions of plate thickness chosen for the modelling of the experiments. S4R is a 4-node element with 6 de-grees of freedom per node and it is suitable for thick and thin shell element applications. An element size of b/6 was chosen based on the results from the sen-sitivity study, Table 3.
Table 3. The model�s sensitivity to different element sizes. Analysis was performed at ambient temperature and on speci-men No. 1. Element type Element size Element size* Nu
** CPU time mm s
S4R 25 ~b/6 396 127 S4R 12.5 ~b/12 387 474 S4R 6.125 ~b/24 385 2227 *Relative to side length of the cross-section, b=side length. **Failure load from non-linear analysis
3.2 MaterialIt is well established that the mechanical properties of stainless steel are strongly influenced by the level of cold-work. This results in significantly higher 0.2% proof strength in the corner regions compared to the flat faces. Ashraf et al. (2005) have proposed a formula, Eq. (1), to predict the strength of cold-formed corner regions 0.2,c. This equation is inde-pendent of the production route, and it can be used both for roll-formed and press-breaked columns. Prediction is based on 0.2 % proof strength of virgin sheet, 0.2,v, inner corner radius of the cross-section ri; and cross-section thickness, t see also Figure 1.
0.2,v0.2, 0.194
1.881c
irt
(1)
The extent of the corner properties, in addition to the importance of the material properties in the cor-
ner regions, is essential for the FE models to predict the critical temperature. Gardner & Nethercot (2004) have found that extending the corner properties to 2tbeyond the curved portions of the cross section, Fig-ure 1, give the best agreement with test results.
Figure 1. Corner regions
Zhao & Blanguernon (2004) have defined reduc-tion factors for cold worked material and concluded the following.
For temperatures below 700 C the use of the re-duction factors of the annealed material lead to con-servative results. For instance, at 600 C the 0.2 % proof strength differs more than 20% for EN 1.4571 C850 compared to the annealed grade. These large differences for cold-worked material indicate that cold-forming affects the material properties at ele-vated temperatures.
Ala-Outinen (1996) tested both virgin sheet and corner material from cold rolled square hollow sec-tions made of EN 1.4301. It was concluded that the cold-formed material performs better at elevated temperatures compared to annealed material, Table 4. A comparison of experimental results and results of FE predictions with different corner properties is presented in Table 5.
For the FE-model the reduction factors from EN 1993-1-2 (2005) were used for the material in the flat faces and the reduction factors derived from tests by Ala-Outinen (1996) were used for the corner regions.
Table 4. Comparison of reduction factors. Temperature k0.2,p,
* k0.2,p,**
k0.2,p,***
C 20 1.00 1.00 1.00 100 0.91 0.83 0.82 200 0.88 0.74 0.68 300 0.83 0.69 0.64 400 0.80 0.66 0.60 500 0.70 0.59 0.54 600 0.64 0.52 0.49 700 0.42 0.43 0.40 800 0.28 0.30 0.27 900 0.10 0.18 0.18 *Reduction factor for 0.2 % proof strength of cold-formed cor-ner regions of EN 1.4301 according to Ala-Outinen (1996) **Reduction factor for 0.2 % proof strength of virgin sheet of EN 1.4301 according to Ala-Outinen (1996) ***Reduction factor for 0.2 % proof strength of annealed mate-rial according to EN 1993-1-2 (2005)
Corner region 2t

88
Table 5. Comparison between test and FEA with different as-sumptions for material properties in the corner regions. Analy-sis performed on specimen No. 5. Section Experiment FE-Analysis Nfi Temp. Temp.* Temp.** Temp.*** kN C C C C 200x200x5 567 685 520 625 645 *No strength enhancement of corner regions. **Assumed corner material properties from cold forming, re-duction factors the same as for annealed material according to EN1993-1-2 (2005) ***Assumed corner material properties from cold forming, re-duction factors for cold formed material according to Ala-Outinen (1996)
The temperature dependent thermal elongation given in Annex C in EN 1993-1-2 (2005) was im-plemented in FE model. Engineering stresses and strains were used to calculate true stresses and loga-rithmic strains necessary for ABAQUS input data.
3.3 Imperfections The two types of geometrical imperfections that have to be considered are, global imperfections and local imperfections.
The most common way to model geometrical im-perfections is by using a shape obtained from eigen-value buckling analysis adjusting the amplitude of the relevant imperfection and implementing it in non-linear analysis. The eigenvalue analysis gives a shape corresponding to global and local instability mode. It is assumed that combination of eigenmodes to model the imperfections will lead to conservative results of non-linear analysis.
A sensitivity analysis was performed in order to evaluate the influence of geometrical imperfections on the maximum load. The magnitudes of both the local and global imperfections were varied. Table 6 and 7 presents the results of the sensitivity analysis.
Table 6. Sensitivity analysis of different imperfections at ambi-ent temperature. Analysis performed on specimen No. 1 from Table 1. Local imperfection Global imperfection L/500 L/1000 None b/100 382 kN 382 kN b/200 398 kN 401 kN 401 kN None 486 kN 489 kN 610 kN
Table 7. Sensitivity analysis of different imperfections at 800 C. Analysis performed on specimen No. 4 from Table 2. Local imperfection Global imperfection L/500 L/1000 None b/100 114 kN 114 kN b/200 125 kN 126 kN 126 kN None 151 kN 156 kN 172 kN
The level of the global imperfections on the maximum load is negligible because of the small differences in maximum load computed as long as
the magnitudes of the local imperfections exist. Jo-hansson & Veljkovic (2004) have shown that by us-ing the lowest eigenmode and the measured magni-tude of the local imperfections for the modelling of carbon steel plates in fire give a good prediction of the failure load. The small variations in failure load with different magnitudes of imperfections seen in Table 7 imply that this conclusion also holds for stainless steel at the elevated temperature.
For the modelling of the tested stub columns the measured local imperfections were used and no global imperfections were introduced.
3.4 Residual stresses Gardner & Nethercot (2004) concluded that residual stresses causes a small reduction in stiffness but have little influence on the overall behaviour or on the ultimate load carrying capacity for stub columns. Therefore, no residual stresses were introduced in the modelling of the tested columns.
3.5 ValidationResults obtained from FE predictions were com-pared to the results from the experiments, Table 8.
Table 8. Validation of the FE-model No. specimen Experiment FEA TempFEA/Tempexp Cross-section Temp. Temp. C C1. 150x150x3 676 716 1.06 2. 150x150x3 720 758 1.05 3. 150x150x3 588 593 1.01 4. 200x200x5 609 482 0.79 5. 200x200x5 685 645 0.94 6. 200x200x5 764 732 0.96
It is concluded that the FE-model predicts the failure temperatures with good accuracy for all tests but specimen No. 4 and the general conclusion is that the model is reliable for parametric study.
4 PARAMETRIC STUDY More general behaviour of thin walled stainless steel columns was further investigated performing a pa-rametric study. The applied load levels, as well as, the global and local slenderness were varied and the results were compared to the predicted strengths ac-cording to the EN 1993-1-2 (2005) design model.
To investigate a possible practical application of class 4 stainless steel columns the parametric study was extended to include the length L=3100mm for all cross-sections and load levels.
4.1 FE-modelThe validated FE-model was used for the parametric study. However, due to the greater slendernesses simulated than in the experiments the global imper-

89
fections has to be taken into account. The local im-perfections were taken as b/200 and the global im-perfection were taken as L/1000 in accordance with the allowed tolerances in prEN1090-2 (2005). With nominal material properties, including the corner properties, and cross-sectional dimensions the fail-ure loads from the FE-simulations at room tempera-ture were compared to the ultimate loads calculated in accordance with EN1993-1-4 (2006), see Table 9.
Table 9. Results from FEA at ambient temperature compared to predicted failure loads according to EN 1993-1-4 (2006) Cross-section Failure load
EN 1993/FEA 0.5 0.8 1.2200x200x4 1.06 1.06 0.96 200x200x5 1.05 1.10 1.00 300x300x5 1.08 1.04 0.95
It can be seen that the FE-model gives good agreement with the design method in EN1993-1-4 (2006) for class 4 sections at room temperature. Ng & Gardner (2006) have shown that using a global imperfection of L/2000 in FE-analysis give the best prediction of all available test results. However, the use of a smaller imperfection than the allowed toler-ances in prEN 1090-2 (2005) seems unjustified for a parametric study.
The end constraints were pinned for all columns, both at ambient temperature and at elevated tem-perature. It was assumed that the temperature distri-bution was uniform across and along the column. The failure loads from the FE-simulations at ambient temperature were used to calculate the appropriate loads for each load level, cross-section and slender-ness used in the simulations at elevated tempera-tures.
4.2 ResultsThe results from the parametric study were com-pared to the design model in EN 1993-1-2 (2005), Table 10, as well as the design model proposed by Ng & Gardner (2006), Table 11.
Table 10. Results from FEA compared to predicted failure loads according to EN 1993-1-2 (2005) for different slender-nesses. Load level 30% of ultimate load at the ambient tem-perature.
Cross-section Failure load EN 1993/FEA
0.5 0.8 1.2200x200x4 0.76 0.74 0.73 200x200x5 0.81 0.82 0.79 300x300x5 0.71 0.69 0.67
Table 11. Results from FEA compared to predicted failure loads according to the design model proposed by Ng & Gard-ner (2006) for different slendernesses. Load level 30% of ulti-mate load at the ambient temperature. Cross-section Failure load
Ng & Gardner (2006)/FEA 0.5 0.8 1.2200x200x4 1,02 1,02 1,02 200x200x5 1,00 1,03 1,01 300x300x5 0.97 0.96 0.96
It is clear that the design model according to the EN 1993-1-2 (2005) predicts the failure load at ele-vated temperature with varying results depending on the cross-section slenderness. Greater local slender-ness leads to more conservative results. This is fully consistent with the conclusion by Ng & Gardner (2006) and is a result of the Eurocode method ne-glecting the more favourable relationship between strength and stiffness at elevated temperatures for local buckling. When applying the Ng & Gardner (2006) approach the results show that this model predicts the failure load much less dependent on the local slenderness. When comparing the results from different load levels it is clear that it is important to account on this influence, Table 12.
Table 12. Influence of load level on results for cross-section 300x300x5 for the Ng & Gardner (2006) approach. Load level Failure load
Ng & Gardner (2006)/FEA 0.5 0.8 1.230% 0.97 0.96 0.96 40% 0.93 0.91 0.91 50% 0.91 0.88 0.88
A higher load level gives lower critical tempera-tures. From Table 12 it is obvious that the results ob-tained by the Ng-Gardner (2006) design model scat-ter more from the FE results as the load level increases.
Furthermore, FEA of the columns with L=3100mm were considered due to practical reasons and results are shown in Table 13.
Table 13. Failure temperature from FEA with load level equal to 0.3 and failure times calculated with the standard fire curve (ISO 834) Cross-section Failure temperature Failure time
200x200x4 810 C 28.1 min 200x200x5 790 C 27.0 min 300x300x5 816 C 30.5 min
It is clear that it is possible to use unprotected stainless steel columns for fire resistance class R30.

90
5 DEVELOPMENT OF IMPROVED DESIGN MODEL FOR CLASS 4 CROSS-SECTIONS
The intention of the design model proposed for ele-vated temperatures is that it is valid even for the am-bient temperature. Therefore the buckling curve with imperfection factor, , and the limiting slenderness,
0 , are taken as 0.49 and 0.4 respectively as it is given in EN 1993-1-4 (2006). The results from the parametric study clearly indicated the importance of taking the temperature dependent relationship be-tween strength and stiffness into account for local buckling as well as for global buckling.
The basic form of the buckling curve given in EN 1993-1-4 (2006), Equation 2, is used to further im-prove the design model. Apart from the local and global slenderness being temperature dependent as proposed by Ng & Gardner (2006), Equation 3-4, the limiting slenderness are suggested to depend on the strength � stiffness ratio according to Equation 5.
0.52 2
1 1 (2a)
00.5 1 (2b)
where is a imperfection factor; is the non-dimensional slenderness; and 0 is the non-dimensional slenderness where the reduction of the strength starts due to the slenderness.
p, 28,4b t
k (3a)
where b is the relevant width; t is the relevant thickness; and k is the buckling factor.
0,5
E,
0.2p,
kk
(3b)
where is the material factor; kE, is the reduction factor for Young�s modulus; k0.2p, is the reduction factor for 0.2 proof stress.
0,5
0.2p,
E,
kk
(4)
0,5
0.2,p,0, 0
E,
kk
(5)
The results for the proposed revised design model are given in Table 13-15 and in Figure 2.
Table 13. Results from FEA compared to the proposed design model at 30% load level.
Cross-section Failure load Proposed/FEA
0.5 0.8 1.2
200x200x4 1.06 1.06 1.07 200x200x5 1.04 1.08 1.06 300x300x5 1.01 1.00 1.01
Table 14. Results from FEA compared to the proposed design model at 40% load level. Cross-section Failure load
Proposed/FEA 0.5 0.8 1.2
200x200x4 1.01 1.01 1.00 200x200x5 1.04 1.06 1.02 300x300x5 0.98 0.95 0.96
Table 15. Results from FEA compared to the proposed design model at 50% load level. Cross-section Failure load
Proposed/FEA 0.5 0.8 1.2
200x200x4 1.00 1.00 0.94 200x200x5 1.02 1.06 1.00 300x300x5 0.97 0.94 0.93
The results give a mean value of Proposed/FEA = 1.01 with a coefficient of variation (COV) of 0.08. When comparing to the design model in EN 1993-1-2 (2005) that give a mean of EN 1993/FEA = 0.73 and COV=0.09. It is clear that the proposed design model gives improved predictions of the failure loads.

91
0, 6
0, 7
0, 8
0, 9
1
1, 1
1, 2
1 2 3 4 5
Pr op os ed d es ig n mod el
+1 0%
- 10%
lamb da =0.5
lamb da =0.8
lamb da =1.2
200x200x4 200x200x5 300x300x5
Figure 2. Comparison of proposed design model with FE-simulations
6 CONCLUSIONS Comparison between experiments at the elevated temperature and results obtained from FEA indicates that
- assumptions for influence of material proper-ties in the corners according to Eq. (1) and Fig.1 are realistic and necessary for a reli-able FE parametric study;
- assumptions for the shape and level of the local buckling, b/200, and global imperfec-tions, L/1000, are consistent with assump-tions according to the established routines for non-linear analysis of columns at ambi-ent temperature.
The analysis of 3.1 m long pinned columns in a standard ISO834 fire shows that it is possible to use unprotected stainless steel columns and fulfil re-quirement for resistance, R30.
Design recommendations for class 4 cross sec-tions made of austenitic stainless steel presented are fully coherent with EN 1993-1-2 and EN 1993-1-4. This means that:
- the proposed model takes into account better retention of strength and stiffness of stainless steel than carbon steel, and
- the same buckling curve used at ambient temperatures, with 0,49 and 0 0, 4 , is used at elevated temperatures.
Furthermore, the relationship between strength and stiffness in case of local buckling is taken into ac-count by Eq. 3b.
The proposed design model gives a consistent ap-proach regarding buckling at ambient temperature. The failure loads are predicted with a mean value of 1.01 with the coefficient of variation equal to 0.08. This is an improvement compared to the design model that is based on EN 1993-1-2 (2005) and EN 1993-1-1 (2005) as it is proposed by Ng & Gardner (2006) where the mean value of the prediction ver-
sus test resistance was 0.96 and the same coefficient of variation 0.08 was obtained.
REFERENCES
ABAQUS/Standard manual. 2001. ABAQUS/Standard User�s Manual Volumes I-III, Version 6.2. Pawtucket: Hibbitt, Karlsson & Sorenssen, Inc.
Ala-Outinen T. 1996. Fire resistance of austenitic stainless steels Polarit 725 (EN 1.4301) and Polarit 761 (EN 1.4571). VTT Research Notes 1760. Espoo: VTT.
Ala-Outinen T. 2005. Members with Class 4 cross-sections in fire: Work package 3, ECSC project Stainless steel in fire. Contract No. RFS-CR-04048, Espoo: VTT.
Ashraf M. et al. 2005. Strength enhancement of the corner re-gions of stainless steel cross-sections. In Journal of con-structional steel research, 61(1): 37-52.
EN 1993-1-1. 2005. Eurocode 3: Design of steel structures � Part 1-1: General rules and rules for buildings, CEN
EN 1993-1-2. 2005. Eurocode 3: Design of steel structures � Part 1.2: General rules � Structural fire design, CEN.
EN 1993-1-4. 2006. Eurocode 3 - Design of steel structures � Part 1-4: General rules � Supplementary rules for stainless steels
Gardner L. & Nethercot D.A. 2004. Numerical modelling of stainless steel structural components � A consistent ap-proach. In Journal of Structural engineering, ASCE, 130(10): 1586-1601.
Karlström P. 2004. Thin-walled steel studs in fire: analysis and design recommendations, Licentiat Thesis, Luleå Univer-sity of Technology, Sweden, 2004:73
Ng K.T. & Gardner L. 2006. Stainless steel compression mem-bers in fire. In D. Camotim et al (eds), Stability and ductil-ity of steel structures. Lisbon, 6-8 Septemper 2006. London: Imperial College.
prEN 1090-2. 2005. Execution of steel structures and alumin-ium structures � Part 2: Technical requirements for the exe-cution of steel structures � Stage 34, CEN.
Johansson B. & Veljkovic M. 2001, Steel plated structures, Progress in Structural Engineering and Materials, Vol. 3(1) 13-27, John Wiley & Sons,
Zhao B. & Blanguernon A. 2004. Member Tests in Fire and Structural Fire Design Guidance. Work package 6, ECSC project Structural design of cold-worked austenitic stainless steel. Contract No 7210-PR-318. London: The Steel Con-struction Institute.

92
1 INTRODUCTION
The fire resistance of cellular beams has been very controversial in recent years, with most of the debate being concerned with their requirements for intumescent protection. A rather conservative pre-scriptive �rule� (ASFP 1992), without direct me-chanical basis, for beams with web openings, requir-ing 20% extra coating thickness compared with solid-web beams, has recently been much discussed on the basis of thermal tests using beams coated with specific intumescent products. This previously men-tioned approach was followed by a more recent pub-lications (Bailey 2004, SCI 2004, Newman et al. 2006) justifying the traditional prescriptive fire pro-tection rules. They are based on some principles of structural mechanics applied to analyse the behav-iour of cellular beams under fire.
Some experimental and numerical aspects (Nad-jai 2006) have the potential to provide essential data in several areas currently lacking systematic re-search results. It will underpin the current lead in expertise which is held by European fire engineering designers, and will assist European-based fabricators who have made cellular beams the most popular long-span system in current construction.
In this paper, a part of an analytical model repre-senting the web post buckling for cellular beams in case of fire is described. It is based on the Arcelor web post buckling model developed for cold condi-tions (Bitar et al. 2005) and some experimental re-
sults for full scale composite floor cellular steel beams at ambient and elevated temperatures (Nadjai et al. 2006). To check the validity of the analytical model, a finite element model using shell elements was developed considering both material and geo-metrical non-linearity.
2 FINITE ELEMENT MODEL DESCRIPTION
The finite element model was built using the soft-ware SAFIR (Franssen et al. 2005), developed at the University of Liège (Belgium), in order to simulate the complete behaviour of cellular beams taking into account local instabilities. This model was calibrated on the basis of a large number of different cold tests performed over the past few years (Bitar et al. 2005, ECSC 2004). This model was then used to simulate the behaviour of cellular beams in case of fire.
Y
ZZ
Figure 1. FEM model for a tested cellular beam (initial and de-formed shapes) under fire.
Analytical model for the web post buckling in cellular beams under fire
O. VassartArcelor Profil Luxembourg, Luxemburg
A. Bouchaïr & J.-P. Muzeau Blaise Pascal University, Clermont-Ferrand, France
ABSTRACT: A part of an analytical model representing the web-post buckling for cellular beams in case of fire is described. It is based on the Arcelor web post buckling model developed for cold conditions and some experimental results for full scale composite floor cellular steel beams at ambient and elevated temperatures. A finite element model using shell elements was developed considering both material and geometrical non-linearity. It is calibrated on the basis of experimental results. The comparison between the finite element pre-diction and the experimental results showed a good agreement in terms of failure modes, load deflection rela-tionship and ultimate loads. At fire tests for cellular beams, the failure arose by web-post buckling. The tem-perature measured during the tests showed that it can not be simply estimated by applying temperature dependent reduction factors on stiffness, as given in codes. So the Arcelor web post buckling model was adapted in case of fire and was justified using a parametrical study using FEM analysis.

93
The same model is used to simulate the cold tests and the tests at elevated temperature. An example of comparison between FEM Model and test at ambient temperature for the evolution of the applied load in versus the deflection at the mid-span is showed in Figure 2. The results show that the FEM model is well representing the experimental results.
Figure 2. Comparison between FEM and Test results at ambi-ent temperature
The FEM model was calibrated on the basis of two tests in fire of different geometrical configura-tions (Nadjai et al. 2006). The different temperatures measured during the two tests at elevated tempera-ture were directly introduced in the FEM model to simulate the behaviour of the cellular beams in high temperature conditions. As the evolution of the tem-perature along the beam is not constant for a given section, an average value was taken for each geo-metrical property. Different time-temperature curves were introduced for the bottom flange, web, upper flange and concrete slab (for composite beams).
Figure 3. Comparison between FEM and Test results in fire conditions
These results (Nadjai et al. 2006) were conclud-ing that the numerical model simulates well the me-chanical behaviour of composite cellular beam sec-tions in both cold and at elevated temperature conditions with a relatively high accuracy. An ex-ample of the numerical model results showing the instability of the web-post and the lateral displace-
ment of the beam is given in Figure 1. It shows that the model is well representing the common failure mode for steel cellular beams under high tempera-ture, observed during tests, which is the web-post buckling.
The FEM model is well representing the evolu-tion of the mid-span deflection under fire for a com-posite beam (Fig. 3) at least for the first part (till 60 minutes). At the end of the curve, a small difference is observed between the model and the test.
3 WEB POST BUCKLING ANALYTICAL MODEL
The analytical method for the web post buckling in cold condition has been developed by CTICM on behalf of Arcelor, as part of the ACB design optimi-sation study. It is described in many references (Bi-tar et al. 2005, Martin 2003, Galéa et al. 2003, Bitar et al. 2006).
This method was adapted for the cellular beam calculation in fire conditions. It concerns, for the moment, the steel cellular beams but the same basis has to be used to extend the analytical model to con-sider the composite beams. The method developed is presented hereafter.
The criterion for resistance to buckling of an in-termediate web-post at elevated temperature is given by Equation 1. It is based on the calculation of
wfi.Rd, the principal stress resistance in fire situation for the half post being studied and wfi.Ed, the princi-pal compressive stress in fire situation in the half post being studied ( wfi.Ed.up for the upper half post and wfi.Ed.low for the lower half post).
These stresses are calculated for the critical sec-tion of the member being verified, adjacent to the opening where compression is at a maximum (Fig. 4).
b = w.fi.Rd
w.fi.Ed (1)
Where = the factor for post critical reserve of strength, taking into account failure by a mechanism that occurs after the appearance of local buckling of the web post (Equation 21).
Throughout the following parts of this paper, the parameter defines the width of the critical section in the web-post. It can be written as presented in Equation 2.
= 1 + w / a0 (2) The critical section of a half post is the section
where the horizontal shear Vh.fi.Ed gives the maxi-mum bending stress in the plane of the web. This section is defined in terms of its distance dw from the joint between the two half posts, given by the Equa-tion 3 based on geometrical considerations.
0
50100150
200250
300350400
450
500
0.00 10.00 20.00 30.00 40.00 50.00 60.00 70.00 80.00Deflection [mm]
Test B1Safir Simulation
0
10
20
30
40
50
60
70
80
90
0.00 50.00 100.00 150.00 200.00 250.00 300.00 350.00 400.00 450.00Deflection [mm]
Test B2
Safir Simulation

94
Vh.fi.Ed
Vh.fi.Ed
Mh.fi.Ed
Mh.fi.Ed
wEd.up
wEd.low
dw
dw
w
e
a0 / 2
Critical sections
a0 / 2
w
Figure 4. Definition of critical section used for the stability of an intermediate web-post.
dw = 2
282
2240a
The width w of the critical section is obtained by considering the following relationship (Equation 4).
w = a0
2
0
wad2
1 (4)
The principal compressive stress in case of fire at the critical section due to local bending moment (Fig. 5) is given by Equation 5.
w.fi.Ed = 20
2
..
/41
6
adt
M
www
Edfic (5)
whereMc.fi.Ed = Bending moment in the critical section
in fire situation. Upper member: Mc.fi.Ed.up = Vh.fi.Ed dw - Mh.fi.EdLower member: Mc.fi.Ed.low = Vh.fi.Ed dw + Mh.fi.Ed (6)
Vm.fi.up(i) Vm.fi.up(i+1)
Vm.fi.low(i+1)Vm.fi.low(i)l
Nm.fi.low(i+1)
Nm.fi.up(i+1)
Nm.fi.low(i)
Nm.fi.up(i)
Vh.fi.Ed
Vh.fi.Ed
Mh.fi.Ed
Mh.fi.Ed
Vfi .Ed (i+1)
Mf i.Ed (i+1)Mfi .Ed (i)
Vfi .Ed (i)
dG
e
d.low
x
y
Figure 5. Forces acting on typical T sections.
The shear area of a T is given by the following relationship (Fig. 6):
Av.0 = 22
0 fm
tah tw + rc tf + 2
24
cr
Shear area Av
b
hm � a0 / 2
rc
tw
tf
Figure 6. Shear area of a T at the location of an opening.
The forces in the web post are given by the fol-lowing relationships:
Vhm.fi = Nm.fi.up(i+1) � Nm.fi.up(i)
= Nm.fi.low(i+1) � Nm.fi.low(i)
Mhm.fi = (Vm.fi.low(i+1) + Vm.fi.low(i)) e / 2 � Vhm.fi dlow
wheredlow = Distance between the centre of gravity of
the lower T (at the opening centre line) and the line of the joint between the half posts (Fig. 3).
The principal stress resistance is calculated using Equation 7 based on Eurocode 3 approach (CEN 2004).
w.fi.RdM1
yy,fi fk (7)
wherefi =Reduction factor for out-of-plane buckling of
the web-post adapted for fire situation fol-lowing the Eurocode 3 (CEN 2004), and cal-culated using the formulae presented hereaf-ter.
fi = 5,022
1 and fi 1,0 (8)
]0,5[12
(9)
yf2350,65 (10)
: Shape factor for the critical section, given by
= 1,5 + 4
5
110.2 (11)

95
The reduced slenderness of the web-post be-ing considered in case of fire is given by Equation 12.
E,
y,
w.fi.Cr
yw
E,
y,
kkf
kk
(12)
whereky, and kE, are the reduction factors for steel strength limit and young modulus respectively, at elevated temperature.
The critical principal stress for instability w.fi.Crin fire condition is given by Equations 13.
Upper half post: w.fi.Cr.up = cr.up w.fi.up
Lower half post: w.fi.Cr.low = cr.low w.fi.low (13)
wherew.fi.up, w.fi.low = Principal stresses in fire situa-
tion in the upper and lower half posts respectively, due to the shear force Vhm.fi alone and calculated us-ing the formula given by Equation 5.
Cr.fi.up, Cr.fi.low = Critical coefficients for the up-per and lower half posts respectively, taking into ac-count interaction between the two members and given by Equations 14.
Cr.fi.up = lowfiCrupfiCr
lowfiCrupfiCrupfiCr
...,
......
2;max
Cr.fi.low = lowfiCrupfiCr
lowfiCrupfiCrlowfiCr
....
......
2;max (14)
Where Cr.fi.up, Cr.fi.low = Critical coefficients for the up-
per and lower half posts respectively, taking into ac-count only compression in the member and shear in the web post, given by Equations 15.
It is important to note that these coefficients are calculated assuming that the lower member is in ten-sion and the upper member is in compression.
Cr.fi.up =
upfiCrm
upfim
upfiCrh
Sdfih
NN
VV
...
..
...
..
1
Cr.fi.low =
lowfiCrm
lowfim
lowfiCrh
Sdfih
NN
VV
...
..
...
..
211 (15)
Where Vh.Cr.fi..up, Vh.Cr.fi.low = Critical shear forces in fire
condition for out-of-plane buckling of the upper and lower half posts respectively (definition given by Equations 18).
Nm.Cr.fi.up, Nm.Cr.fi.low = Critical axial forces in fire condition for local buckling of the web of the upper
and lower members respectively (definition given by Equations 19).
Nm.fi.up, Nm.fi.low = Axial forces in fire condition in the webs of the upper and lower members respec-tively, given by Equations 16.
Nm.fi.up = )1(..)(...0
. ;min iupfimiupfimup
upw NNAA
Nm.fi.low = )1(..)(...0
. ;min ilowfimilowfimlow
loww NNAA
(16)
Where A0.up, A0.low = Areas of the upper and lower T sec-
tions respectively, at the location of the openings. Aw.up, Aw.low = Areas of the webs of the upper and
lower T sections respectively, at the location of the openings, given by Equations 17.
Aw.up = A0.up � bup tf.up
Aw.low = A0.low � blow tf.low (17) The critical forces, Vh.Cr.fi for shear in the web
post and Nm.Cr.fi for compression in a member, are given by Equations 18 and 19.
Vh.Cr.fi = PE (C0 + C1 tw) (18)
Nm.Cr.fi = PE (D0 + D1 tw) (19)
wherePE = Reference Euler buckling load, given by
Equation 20.
PE = 320
2
wa tw
aE
(20)
Expressions for the coefficients C0, C1, D0 and D1, are based on experimental and numerical cali-bration (Martin 2003).
The factor for post critical reserve of strength is given by Equation 21.
= 1 + 0,625 ( � 0,3) (21)
Where = Non-dimensional factor given by the follow-
ing formulae.
Upper T: = Mpl.Rd.up / e VupLower T: = Mpl.Rd.low / e Vlow
Where Mpl.Rd.up, Mpl.Rd.low = Plastic moment resistances
of the upper and lower T respectively, at the location of an opening.
Vfi.up, Vfi.low = Shear forces in the upper and lower members respectively. The lower value for ob-tained from the right part and the left part of the web-post is to be used.

96
4 PARAMETRICAL STUDY USING FEM MODEL
A parametrical study was carried out in order to compare the critical temperature given by the cali-brated FEM Model (SAFIR) and the simplified ana-lytical model. The Figure 7 shows the difference be-tween the critical temperatures of the web post given by SAFIR and the analytical simplified model. All the results are on the safe side and the maximum value of the difference is less than 5%.
0
0.5
1
1.5
2
2.5
3
3.5
4
4.5
5
1 2 3 4 5 6 7 8 9 10 11 12 13 14 15 16 17 18 19 20 21 22 23 24 25 26 27 28 29 30 31 32 33 34
Studied cases
Figure 7. Difference of the critical temperature between the FEM and the analytical model.
Analysing this graph, it can be seen that the sim-plified calculation model is always on the safe side and that the difference between the FEM model SAFIR and the simplified method is rather low.
This parametrical study was made varying the following parameters:
- steel profile geometry - geometry of the web-post - steel strength limit - loading intensity
The Figure 8 shows the out-of-plane displace-ment of a web-post versus the time of heating for a steel cellular beam heated using the ISO-curve. This type of curve is used to define the beam failure (critical temperature) considering the instability rep-resented by a large lateral displacement.
-0,008
-0,007
-0,006
-0,005
-0,004
-0,003
-0,002
-0,001
0,000
0,001
0 120 240 360 480 600 720 840
Tim e [sec]
Node 337
Time - Displacements Plot
Figure 8. Evolution of the lateral displacement in a critical point versus time of exposure to fire
In fact, the web-post buckling is a kind of insta-bility. Thus this instability is observed on the curve of the lateral displacement evolution versus time of heating in some critical points. When this displace-ment becomes high, we consider that the beam reached its critical temperature (Fig. 8).
5 CONCLUSION
The aim of the analytical model presented in the paper is to calculate the web-post buckling resis-tance for cellular beams in case of fire. The study suggests the following:
- The experimental results compared with the results from the Finite Element Modeling, showed a good agreement, giving confidence that the FEM modeling can be used for further parametric studies.
- The numerical model is able to simulate the mechanical behaviour of composite cellular beam sections in both cold and elevated tem-perature conditions with a relatively high ac-curacy.
- The simplified model developed for the evaluation of the critical temperature of the web-post gives accurate and safe sided results compared to the experimental tests and FEM model for cellular steel beams.
Further improvement must be done in order to take into account the composite cellular beams in the analytical simplified model. The limits of applica-tion must also be defined considering a wide range of steel profiles.
6 REFERENCES
ASFP/SCI/FTSG, 1992. Fire Protection for Structural Steel in Buildings, Second Edition, (1992).
Bailey, C.G. 2004. Indicative Fire Tests to Investigate the Be-haviour of Cellular Beams Protected with Intumescent Coatings. Fire Safety Journal, Vol. 39, 2004, pp. 689-709.
Bitar, D.; Demarco, T.; Martin, P.O. 2005. Steel and non com-posite cellular beams � Novel approach for design based on experimental studies and numerical investigations, Proc.4th Eurosteel Conference, Maastricht, june 2005, Vol. B part 10.1, pp. 1-8.
Bitar, D. ; Martin, P.-O. ; Galéa, Y. & Demarco, T., 2006. Steel and composite cellular beams � Part 1 : proposal of a model for the web-post resistance, Revue Construction Métallique n°1-2006, CTICM (in French).
CEN, 2004. Eurocode 3 � Design of steel structures - Part 1-2 : General rules � Structural fire design.
ECSC, 2004. Large web Openings for service integration in composite floor, ECSC contract 7210-PR-315, 2004
Franssen, J.M.; Kodur, V.R.K; Mason, J., 2005. User�s manual for SAFIR 2004 a computer program for analysis of strutures subjected to fire, March 2005.
Failure of the beam : 744sec

97
Galéa, Y. & Martin P.-O., 2003. ACB Design optimisation � displacement calculation, Research report (confidential), CTICM, Décembre 2003.
Martin, P.-O., 2003. ACB Design optimisation � web-post buckling, CTICM, Research report, November 2003 (in French).
Nadjai, A.; Vassart, O.; Faris, A.; Talamona, D.; Allam, A. & Hawes, M. 2006. Performance of cellular composite floor beams at elevated temperatures, Proc. SIF 2006, pp. 813-823.
Newman, G.M.; Robinson, J.T. & Bailey, C.G., 2006. Fire Safe design - A New Approach to Multi-Storey Steel-Framed Buildings, Second Edition, SCI Publication, P288, The Steel Construction Institute, Ascot, 2006.
SCI, 2004. RT1006 Version 02 - Fire Design of Cellular beams with Slender Web Posts, SCI, Ascot, 2004.

98
1 INTRODUCTION
The tests of separate structural elements, e.g. beams, columns and joints in furnaces helped to prepare the prediction design models of elements, see (Bu-chanan, 2003). The behaviour of the whole structure under a natural fire may be evaluated during the natural fire only. The knowledge related to the struc-tural integrity depends on element stiffness, resis-tance and deformation capacity of elements and connections. The main aim of the fire test in Mittal Steel Ostrava was to learn more about the connec-tion temperatures and the internal forces into struc-ture. The behaviour of restrained beams during compartment fire at elevated temperatures, the heat-ing of external element as well as column during lo-cal fire and the temperature of sandwich panels, light timber based panels and timber concrete element was studied under the heating by natural fire as well.
Simplified design of structure in fire is based on the design of structure at ambient temperature. The advanced design takes into account the structure loaded by a temperature fire curve and the joints are exposed to forces caused by the elongation during the warming and by the contraction during the cool-ing phase as well. In this field is the knowledge lim-ited to a few experiments on real structures, e.g. Cardington experiment (Moore & Lennon, 1997). During the fire situation, the temperature develop-ment in the joint is different from the temperature development in the adjacent members. The tempera-ture in the joint increases slower than the tempera-ture in the attached members and during the cooling phase is the temperature higher than in the adjacent
members. The highest temperature reached in the joint is lower than the highest temperature of the gas. This is caused by the mass concentration in the joint, see (Wald et al., 2006).
The standard for fire safety of steel structures EN 1993-1-2:2005 for joints recommends usage of the same fire protection for joints as for the adjacent structure. Alternatively it provides the prediction of the temperature distribution within the connection, the reduction of the material properties of connectors by elevated temperature, and the analysis of the structure using the component method (Spyrou et al., 2002).
Into the connection behaviour prediction and the structural integrity under fire conditions are at Czech Technical University focussed activity under the re-search centre CIDEAS and project of Czech Grant Agency GA R 103/07/1142.
2 NATURAL FIRE TEST 2.1 Fire compartment A local fire test was performed on June 15, 2006 and a compartment fire test on June 16 on structure of Ammoniac Separator II in company Mittal Steel Os-trava, see (Kallerová & Wald, 2006). The structure was composed of tree storey steel structure with the composite slabs, steel beams of hot rolled sections IPN160, IPN180 and IPN300, the beam-to-beam and beam-to-column header plate connections, and the diagonal wind bracings. Internal size of fire com-partment was designed 3,80 x 5,95 m with height of 2,78 m. The structure of enclosure was made from
Temperature of the header plate connection subject to a natural fire
F. Wald, J. Chlouba & P. KallerováCzech Technical University in Prague, Czech Republic
ABSTRACT: To study global structural and thermal behaviour, a research project was conducted on the three storey steel frame building at the Mittal Steel Ostrava before demolition. The main goal of the experiment in Mittal Steel Ostrava was to verify the prediction method of the joint temperature and its improvement during the cooling phase. The fire compartment of floor area of 24 m2 was build at second floor with. This paper summarises the experimental programme and presents the time-temperature curves development in the fire compartment and in the primary and secondary beams and its header plate connection. Comparisons are also made between the test results and the temperatures predicted into connections by the structural Eurocodes.

99
the light silicate and ceramic bricks. Opening of 2400 x 1400 mm ventilated the room during the fire. The doors of fire compartment 1400 x 1970 mm and columns were equipped by the fire isolation by boards. The mechanical load on the floor above the fire compartment was composed of the dead and life load. The life load was simulated by about 1 m of water, which was placed into 26 steel barrels and 50 plastic boxes equally distributed on the floor. One box was stored on each barrel and the rest of boxes placed at the ends of floor. The barrels and boxes were thermo isolated from the floor by 50 mm of a miner wall and were placed on the timber pallets.
3300
Plan
1 2 3
A
B
C
D
3000
IPN180IPN160
IPN180
IPN160
IPN300
1350
IPN180
1350
1320
1 2 3A
B
C
D
+ 6,450
2780
IPN300
+ 9,500
+ 7,520
+ 8,920
IPN160
Section
IPN300IPN160
IPN300
270
Figure 1. Geometry of the fire compartment.
2.2 Fire loadFire load was represented by the unwrought timber bars 50 x 50 mm of length 1 m from softwood with moisture till 13% For the compartment fire were the bars placed into eight piles, see Figure 2. A pile con-sists of 13 rows with ten bars each plus two bars on the top, which means 132 bars per pile. The simulta-neous ignition of piles was reached by its connection by the steel thin walled channels filled by a mineral wall and penetrated by paraffin. The channels lo-cated onto second layer of bars connected by four piles together.
2.3 Measurements The gas temperature in the fire compartment was measured by four thermocouples 300 mm below ceiling, marked at Figure 3 as TGi. Two thermocou-ples were placed in front of the fire compartment 0,5 m and 1 m from front wall. On steel were located sixth thermocouples, and on joints next seven, in Figure 4 marked as TCi. The position of thermocou-ples on the lover flange of beams at their mid span is documented on Figure 3. Two thermo imagine cam-eras and seven video cameras scanned the experi-ment. Two video cameras were installed behind thermo resistant glass in the additionally prepared windows into the compartment internal wall.
1000 1000 10001000
1000
1000
350690
740
330
550350 350 350
1 2 3
1 2 3A
B
C
D
A
B
C
D
Figure 2. Distribution of the timber bars in the plan of the fire compartment.
2.4 Gas and beam temperatures
The comparison of the development of the gas tem-peratures show, see Figure 4, that at the beginning of the fire, till 30 min about, was warmer the gas in the front part of the compartment of about 200 °C, TG3 and TG4. During the full developed fire, after 30 min, were the highest temperatures recorded in the back of the fire compartment, max 1050 °C, TG1 and TG2. In the front part was measured only 920 °C. The Figure 5 shows that the beam lower flange temperatures correspond to the beam posi-tions in the fire compartment. The front beam, TC16, reached maximum temperature of its lower flange of 775 °C compare to the secondary beam in the back of the fire compartment with the measured maximal 970 °C, TC2. The temperature of the beams is at Figure 5 compared to the average tem-perature of the gas (TG1 + TG2 + TG3 + TG4) / 4.

100
500 500
TG1
1000 1000 1000 1000
TG2TG3TG4TG5TG6TC16
TC1
TC2
TC3
TC4
TC5
1 2 3
1 2 3A
B
C
D
A
B
C
D
Figure 3. The position of the thermocouples for recording of gas and beams temperatures.
TC10
TC11
TC12
TC6
TC7
TC8
TC9
40 120 40
35
35
7070
3535
P10 - 200 x 210 6 x M20
P10 - 70 x 2002 x M20
40 120 40
IPN300
IPN 180
407010
IPN 300
45
Connection D2 Connection A2
Connection C2
Mid span
TC1
TC11 and TC12
Figure 4. Position of the thermocouples on the header plate connection.
3 CONNECTION TEMPERATURES 3.1 Measured temperatures
Figure 6 shows the gas, beam in the mid span and connection temperatures measured during the ex-periment. On Figure 7 are demonstrated the tem-perature differences inside the connection.
0
200
400
600
800
1000
0 30 60 90 120
TG1
TG2
TG3
TG4
TG5
TG6
Temperature, °C
Time, minFigure 4. Measured gas temperatures.
0
200
400
600
800
1000
0 30 60 90 120
TC1
TC2TC3
TC4TC5
TC16
Average gas
Temperature, °C
Time, min
TG1, TG2, TG3, TG4
Figure 5. Measured temperatures on the top of the beam lower flanges at mid span.
0
200
400
600
800
1000
0 30 60 90 120
Primary beam
Plate by lower bolt row, TC8
Average gas
Temperature, °C
Time, min
TG2, TG3 Secondary beam at mid span
Plate by bolt, TC12
at mid span, TC1
TC3
in beam-to-beam con.
in beam-to-column connection
Figure 6. Comparison of the measured temperatures on the header plate connection to the gas and beam mid span connec-tion.

101
0
200
400
600
800
1000
Bolt in upper bolt row, TC7
Bolt in lower row, TC9
Plate in upper bolt row, TC6
Plate in lower bolt row, TC8
Temperature, °C
0 30 60 90 120 Time, min
Gas temperature, TG2
Figure 7. Measured temperatures over the height of beam-to-column header plate connection.
3.2 Temperature prediction
For the temperature development in the connection, there are predicted two analytical methods, see (EN 1993-1-2. 2005). In the step by step method is the temperature calculated as element, where the heat is brought in/brought out by the member sur-face and the member volume is heated/cooled. Geometrical characteristic of the section is the sec-tion factor Am/V of the steel parts of which the joint is composed. The section factor indicates the rela-tion between the surface area of the connection Amper unit of length exposed to the fire and the volume of the connection V per unit length which is being heated. The temperature of the unprotected inner steel structure is given by
thc
V/Ak netaa
msht,a (1)
where Am/V is the section factor in m-1, ca the spe-cific heat depending on the temperature in J kg-1K-1,
a the volume weight of steel in kg m-3, neth the de-sign value of the net heat flux per unit area in W m-2,
t the time increment in s, and ksh the correction fac-tor for the shadow effect which is used by the heat-ing using the nominal fire curve. The temperature of a joint may be assessed using the local section factor Am/V, the value of the parts forming the joint. As simplification, it is possible to consider uniform temperature distribution within the section and to take into account the biggest Am/V value of the steel parts connected into the joint.
The temperature of either beam-to-beam or beam-to-column connection covered with a concrete slab can be determined from the temperature of the beam flange in the middle of the span. It is assumed, that the temperature of the particular parts of the connec-tion depends directly only on the distance from the lower edge of the connected beam and indirectly on
the prediction of the temperature of the lower flange calculated usually by the step by step procedure. If the height of the beam is smaller or equal to 400 mm (hk 400 mm), the temperature is given by
h/h,, kh 301880 0 (2)
where h is the temperature in the height hk of the beam, 0 is the lower flange temperature in the mid span and h is the overall beam height. 3.3 Beam-to-column connection Figure 8 shoes the comparison of the predicted gas temperature in the fire compartment by parametric fire curve according to EN 1993-1-2.2005 Annex A, see (Kallerová & Wald, 2006) and of the predicted primary beam temperature to the measured values. The temperature of the beam-to-column connection was calculated from the measured temperature of the beam�s lower flange in the mid span, see Figure 9 according to eq. (2). The highest temperature is con-servative but in the cooling phase is the predicted temperature lower than the actually measured. By applying the section factor may be taken into ac-count the highest value of section factors of the con-nected members, eg. Am/V = 138 m-1, the results are conservative for the maximum temperature. If the section factor of the head plate is considered, e.g. Am/V = 105 m-1 only, the results are less conserva-tive. The difference between these two considera-tions is 20°C. On Figure 10 there is a comparison of the predicted and the measured temperatures calcu-lated from the temperatures predicted by the para-metric fire curve.
0
200
400
600
800
1000
0 30 60 90 120
Measured temperature,
Calculated temp.
Temperature, °C
lower flange
lower flange of primary beam, TC1
Measuredaverage gas temperature
Calculated gas temperature, EN 1993-1-2, Annex A
of primary beam
TG1, TG2, TG3 and TG4
Time, min
Figure 8. Comparison of the predicted temperature by the pa-rametric fire curve according to EN 1993-1-2.2005 Annex A, see (Kallerová & Wald, 2006) to the measured average gas temperature and primary beam temperature.

102
0
200
400
600
800
1000
0 30 60 90 120
Measured temperaturein plate by lower bolt, TC8
Calculated by section factor Average gas temp.
Temperature, °C
Time, min
TG2, TG3 of plate and flange
temp. at the mid span
Calculated fromthe lower flange measured
of the beam, eq. (2)
Figure 9. Comparison of the predicted temperatures from gas temperature to measured temperatures at the beam to column connection.
0
200
400
600
800
1000
0 30 60 90 120
Measured temperature,in plate by lower bolt, TC8
Calculated by section factor
Temperature, °C
of connected element
at the mid span of the beam,
Calculated fromthe lower flange
eq. (2)
Calculated gas temperature, EN 1993-1-2, Annex A
Time, minFigure 10. Comparison of the predicted temperature by the pa-rametric fire curve to the measured temperatures at the beam to column connection.
3.4 Beam-to-beam connection
Figure 11 shows the comparison of the prediction of the temperature in the beam-to-beam connection, which was calculated by section factor of the con-nected beam from the measured gas temperature. The prediction is rather conservative during the heat-ing phase and in the maximal temperature. The pre-diction based on the measured temperature of the beam�s lower flange in the mid span gives lower temperature compare to the measured one. The re-duction 1,0 instead of 0,88 in eq. (2)
h/h,, kh 30101 0 (3)
gives closer prediction of the maximal temperature. The comparison of the predicted and the measured temperatures calculated from the temperatures pre-dicted by the parametric fire curve is shown at Fig-ure 12. The application of the reduction factor 1,0 is
in this case conservative, and factor 0,98 gives the closer solution.
0
200
400
600
800
1000
0 30 60 90 120
Measured temperature,in bolt, TC11
Calculated by section factor
at the mid span of the beam, eq. (3)
Average gas temp.
Temperature, °C
Time, min
TG2, TG3 of connected element
Calculated from the lower flange
at the mid span of the beam,
Calculated fromthe lower flange
eq. (2)
Figure 11. Comparison of the predicted temperatures from gas temperature to measured one at the beam-to-beam connection.
0
200
400
600
800
1000
0 30 60 90 120
Measured temperature,in bolt, TC11
Calculated by section factor
at the mid span
gas temp.
Temperature, °C
Time, min
of connected element
Calculated from
at the mid span of the beam, eq. 3Calculated from the lower flange
Calculated
the lower flange
of the beam, eq. 2
Figure 12. Comparison of the predicted temperature by the pa-rametric fire curve to the measured one at beam to beam con-nection.
3.5 Connection resistanceAt elevated temperature the material properties re-duced. The reduction may be introduce by factor ex-pressing the ratio between the property under ele-vated temperature to property at ambient temperature, see Tables 3.1 and D1 in (EN 1993-1-2:2005). On Figure 13 is shown the reduction of the plate in connection A2 close to lower bolt row ac-cording to thermocouple TC9, of the plate according to thermocouple TC8, and of the weld according to thermocouple TC8. E.g. in 45 min the resistance de-crease compare to the measured values in plate to 71 %, in the welds to 57 % and in the bolts to 48 %. The sensitivity of the prediction may be expressed by the reduction of the resistance of bolts, see Fig-ure 14. The bolt resistance decrease in 45 min of fire

103
to 19 % in case of prediction by lower flange tem-perature and to 6 % by prediction from section fac-tor of connected beam, but the reduction to 48 % only was evaluated based on the measured values of temperature.
0,0
0,2
0,4
0,6
0,8
1,0
0 30 60 90 120
Reduction factor
Time, min
Plate
Weld
Bolt
reductionaccording to TC8
reductionaccording to TC8
reductionaccordingto TC9
0,71
0,57
0,48
Figure 13. Reduction of the resistance of components in con-nection A2 according to the measured temperatures.
0,0
0,2
0,4
0,6
0,8
1,0
0 30 60 90 120
Reduction factor for bolt
Time, min
From measured temperature, TG9
From temperaturepredictedby section factor
From temperaturepredictedfrom beam mid span lower flange temp.
0,48
0,19
0,06
Figure 14. Reduction of the resistance of bolts in the lower row of the connection A2 according to the different models com-pared to the reduction obtained form measured temperature.
4 CONCLUSION On the June 15, 2006 a full-scale fire test was car-ried out at the Ammoniac Separator II in company Mittal Steel Ostrava. One of the main aims of this fire test was to collect data on the distribution of temperatures within the connections. In this paper a comparison is also made with the analytical methods given in EN 1993-1-2: 2005 for calculating the tem-perature and temperature distributions in the struc-tural steel members. From these comparisons it can be concluded that:
The methods for calculating the compartment temperature given in EN 1991-1-2: 2003 for para-metric fire curve in Annex A compare well with the measured data. The incremental analytical models allow presuming temperatures of the unprotected beams with a good accuracy.
Calculating the temperature of the beam-to-column connection from the measured gas tempera-ture in the fire compartment based on the mass of the connection parts is to conservative during the heating phase, see Figures 9 and 10. A calculation based on the bottom flange temperature of the sup-ported beam is less conservative.
The prediction of the temperature of the beam-to-beam connections using the measured gas tempera-ture in the fire compartment, based on the mass of the connection parts, during the heating phase is conservative, see Figures 11 and 12. The calculation based on the bottom flange temperature of the sup-ported beam may be improved by factor 1,0 instead of 0,88, see eq. 3.
The relatively high sensitivity of the temperature prediction was shown on the reduction of the resis-tance of bolts for different temperature prediction models, which was compared to the measured val-ues. The next generation of analytical prediction models brings more economical design into highest temperatures and closer prediction into the cooling phase of the fire.
5 ACKNOWLEDGEMENT The work was prepared with support of Czech Grant Agency GA R 103/07/1142.
The paper describes contributions of the Czech partner to the Action Cost C26 Urban Habitat Con-structions under Catastrophic Events, which is fo-cused into the connection behaviour prediction and the structural integrity under fire conditions.
6 REFERENCESBuchanan A. H. 2000. Structural design for fire safety, John
Wiley & Sons 2000, ISBN 0-471-89060-X. EN 1991-1-2: 2002. Eurocode 1, Basis of design and actions
on structures � Part 2-2: Actions on structures � Actions on structures exposed to fire, CEN, Brussels.
EN 1993-1-2: 2005. Eurocode 3 � Design of steel structures � Part 1-2: General Rules � Structural fire design, CEN, Brussels.
Kallerová P. & Wald F. 2006: Ostrava fire test, Czech Techni-cal University, Praha, CIDEAS report No. 3-2-2-4/2, p.18.
Moore D.B. & Lennon T. 1997. Fire engineering design of steel structures, Progress in Structural Engineering and Materials, 1 (1), 4-9.
Spyrou S., Davison B., Burgess I. & Plank R. 2002. Compo-nent-based studies on the behaviour of steel joints at elevated temperatures, in Proceedings of Eurosteel 2002 � 3rd European Conference on Steel Structures, edited by Lamas A., Simões da Silva L., s. 1469-1478, Coim-bra, ISBN 972-98376-3-5.
Wald, F., Simões da Silva, L., Moore, D.B., Lennon, T., Chladná, M., Santiago, A., Benes, M. & Borges, L. 2002. Experimental behaviour of a steel structure under natural fire, Fire Safety Journal ,Volume 41, Issue 7, October 2006, p. 509-522.

104
1 INTRODUCTION
1.1 Fire Research at the University of Manchester For many years, fire research has been conducted at the University of Manchester, the main emphasis be-ing on the fire performance of various types of struc-tures (steel, concrete and steel/concrete composite structures and their various components) and materi-als (fibre reinforced polymer composites, fire protec-tion materials). The fire testing laboratory of the University possesses a range of fire testing furnaces and elevated temperature mechanical testing de-vices. The poster presentation accompanying this paper gives a more detailed summary of fire re-search activities at the University of Manchester.
1.2 Robustness of connections in fire This paper will present some results of temperature distributions in connections in steel framed struc-tures, as part of the research on robustness of con-nections in fire, based on recent fire tests conducted in the fire testing laboratory at the University of Manchester.
These fire tests form part of two projects, one for connections between steel beams and concrete filled tubular (CFT) columns and one for connections be-tween steel beams and steel columns. The project involving CFT columns is sponsored by CIDECT and Corus Tubes and the project on steel beam to steel column connections is in collaboration with the University of Sheffield, funded by the UK�s EPSRC. The overall objective of these two projects is to in-vestigate the structural behaviour and robustness of
connections in steel-framed structures in fire. The results presented in this paper represent the first part of these projects; to determine temperature distribu-tions in the various components of connections.
2 DESCRIPTION OF FIRE TESTS The fire tests have been carried out in two different fire testing furnaces of the University of Manchester. These two furnaces have different characteristics which should be taken into account when analyzing the test data.
2.1 Fire tests on connections to CFT columns Fire tests on connections to CFT columns were con-ducted in the �long� furnace. This furnace is a rec-tangular box having internal dimensions of 3000mm×1600mm×900mm. The interior faces of the furnace are lined with ceramic fibre materials of thickness 200mm that efficiently transfer heat to the specimen. An interior full-height honeycomb ce-ramic wall, as shown in Figure 1, was constructed to ensure uniform heating near the specimen. A gas burner and an exhaust are connected to the furnace. The firing and control equipment is installed with the gas burner. Before actual fire testing of the specimens, a number of trial fire tests without a test specimen were carried out. In these tests, the hole positions in the interior wall were adjusted until the most uniform temperature distribution inside the specimen zone was reached. The burner system is fully computer-controlled to follow any required time-temperature curve, with automatic recording of the results and a runtime display. The furnace tem-
Temperatures in unprotected steel connections in fire
Y. C. Wang, J. Ding, X. H. Dai & C. G. Bailey University of Manchester, United Kingdom
ABSTRACT: Two research projects have recently been started at the University of Manchester to investigate the behaviour and robustness of connections in steel framed structures in fire. One is concerned with connec-tions between steel beams to concrete filled tubular (CFT) columns and one with connections between I-beams and H-columns. The latter includes a composite floor slab whilst the former does not. This paper will present some measured temperature results, in particular, temperature distributions in various connection components. Analytical work is currently being carried out to develop a simple method to calculate connec-tion temperatures and this paper will summarize the results obtained so far.

105
peratures were recorded by six conventional bead thermocouples.
The furnace consists of 6 panels bolted at their junctions for easy assembly. It can accommodate frames with 2m beam length and 3m total column height and accommodate the large displacements as-sociated with high-temperature testing.
Figure 1. Plan schematic arrangement of the furnace
The arrangement of the members to be tested is in the form of a complete �Rugby goalpost� frame as shown in Figure 2. The steel beam was mainly un-protected. In order to simulate the heat-sink effect due to the concrete slab in realistic structures, the top flange of the beam was wrapped with 15mm thick ceramic fibre blanket. The columns were un-
protected.
Figure 2. Connection to CFT column test setup
In total, 10 fire tests were conducted. Figures 3(a)-3(d) show typical arrangements of the four types of connection tested in this series.
(a) fin plate connection
(b) Bolted T connection
(c) Reverse channel connection
(d) End-plate connection Figure 3: Typical CFT connection details The tests on connections to CFT columns in-
volved loading the steel beam to study robustness of the connections. The structural behaviour results and complete details of the connections and fire tests are given in Ding (2007). This paper will only present some connection temperature results.
2.2 Fire tests on connections to steel columns This series of tests are specifically designed to in-vestigate temperature distributions in connections. Therefore, the test specimens will not be loaded.
3 2 6 5
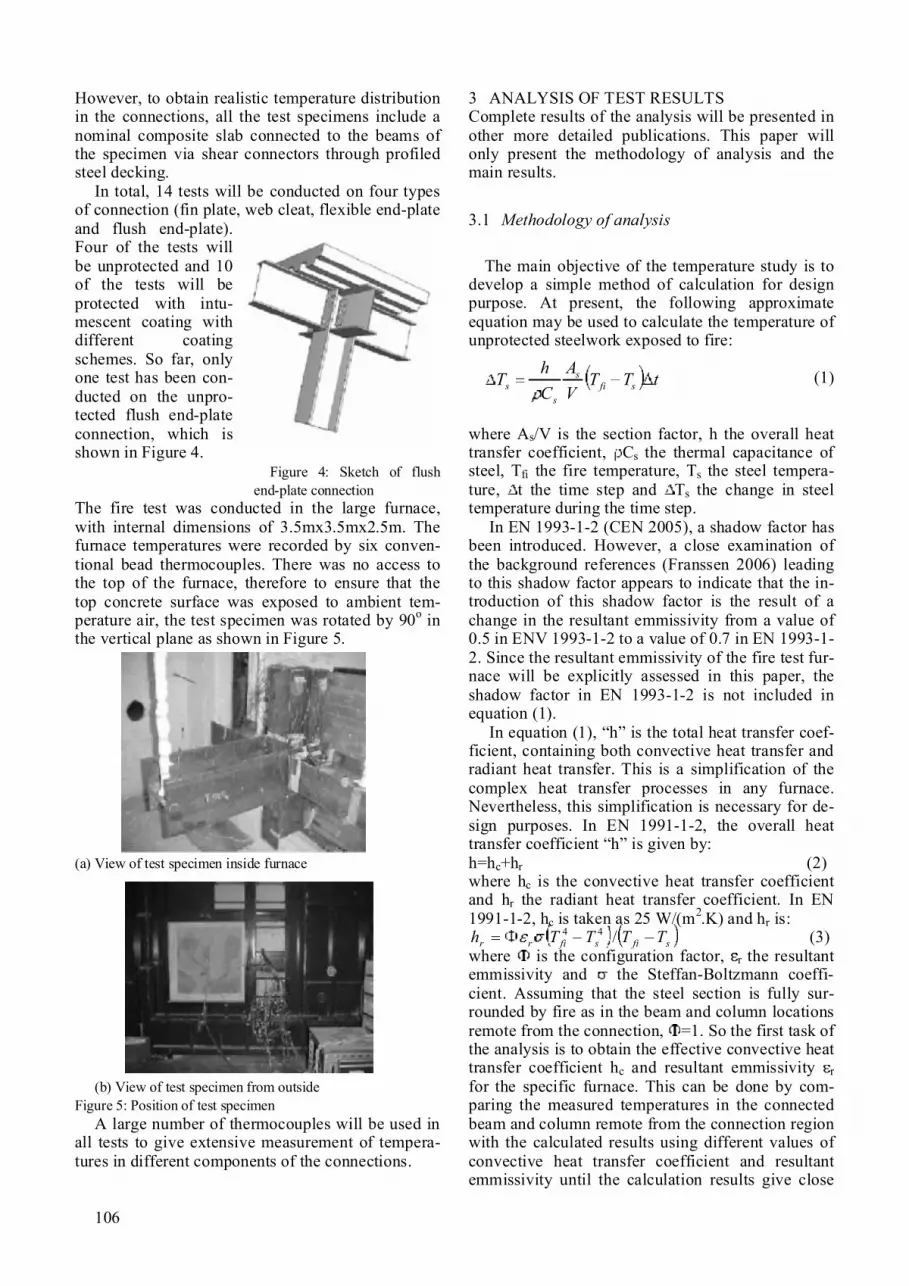
106
However, to obtain realistic temperature distribution in the connections, all the test specimens include a nominal composite slab connected to the beams of the specimen via shear connectors through profiled steel decking.
In total, 14 tests will be conducted on four types of connection (fin plate, web cleat, flexible end-plate and flush end-plate). Four of the tests will be unprotected and 10 of the tests will be protected with intu-mescent coating with different coating schemes. So far, only one test has been con-ducted on the unpro-tected flush end-plate connection, which is shown in Figure 4.
Figure 4: Sketch of flush end-plate connection
The fire test was conducted in the large furnace, with internal dimensions of 3.5mx3.5mx2.5m. The furnace temperatures were recorded by six conven-tional bead thermocouples. There was no access to the top of the furnace, therefore to ensure that the top concrete surface was exposed to ambient tem-perature air, the test specimen was rotated by 90o in the vertical plane as shown in Figure 5.
(a) View of test specimen inside furnace
(b) View of test specimen from outside Figure 5: Position of test specimen
A large number of thermocouples will be used in all tests to give extensive measurement of tempera-tures in different components of the connections.
3 ANALYSIS OF TEST RESULTS Complete results of the analysis will be presented in other more detailed publications. This paper will only present the methodology of analysis and the main results.
3.1 Methodology of analysis
The main objective of the temperature study is to develop a simple method of calculation for design purpose. At present, the following approximate equation may be used to calculate the temperature of unprotected steelwork exposed to fire:
(1)
where As/V is the section factor, h the overall heat transfer coefficient, Cs the thermal capacitance of steel, Tfi the fire temperature, Ts the steel tempera-ture, t the time step and Ts the change in steel temperature during the time step.
In EN 1993-1-2 (CEN 2005), a shadow factor has been introduced. However, a close examination of the background references (Franssen 2006) leading to this shadow factor appears to indicate that the in-troduction of this shadow factor is the result of a change in the resultant emmissivity from a value of 0.5 in ENV 1993-1-2 to a value of 0.7 in EN 1993-1-2. Since the resultant emmissivity of the fire test fur-nace will be explicitly assessed in this paper, the shadow factor in EN 1993-1-2 is not included in equation (1).
In equation (1), �h� is the total heat transfer coef-ficient, containing both convective heat transfer and radiant heat transfer. This is a simplification of the complex heat transfer processes in any furnace. Nevertheless, this simplification is necessary for de-sign purposes. In EN 1991-1-2, the overall heat transfer coefficient �h� is given by: h=hc+hr (2) where hc is the convective heat transfer coefficient and hr the radiant heat transfer coefficient. In EN 1991-1-2, hc is taken as 25 W/(m2.K) and hr is:
sfisfirr TTTTh /44 (3) where is the configuration factor, r the resultant emmissivity and the Steffan-Boltzmann coeffi-cient. Assuming that the steel section is fully sur-rounded by fire as in the beam and column locations remote from the connection, =1. So the first task of the analysis is to obtain the effective convective heat transfer coefficient hc and resultant emmissivity rfor the specific furnace. This can be done by com-paring the measured temperatures in the connected beam and column remote from the connection region with the calculated results using different values of convective heat transfer coefficient and resultant emmissivity until the calculation results give close
tTTVA
Ch
T sfis
ss

107
agreement with the measured results. This is on the assumption that, except for the values of hc and r,other values in equations (1)-(3) are well defined when applied to the steel sections remote from the connection region.
EN 1993-1-2 suggests that equation (1) may also be used to calculate temperatures in different con-nection components provided an effective section factor for the connection component is used. The implicit assumption is that the connection compo-nent has an uniform temperature distribution. Analy-ses of the test results will check whether the above assumption is valid and if so, recommend section factors for different connection components.
3.2 Connections to CFT columns (without slab) For the furnace used in this series of fire tests (Fig-ures 1 and 2), calculations using equation (1) for the steel section remote from the connection region were performed by using a convective heat transfer coef-ficient of 25 W/(m2.K), as recommended in EN 1991-1-2 and different values of resultant emmissiv-ity ranging from 0.1 to 0.5. It was found that a resul-tant emmissivity of 0.2 gave the best fit between the calculated and measured results, as shown in Figure 6 for one of the tested CFT connections.
Figure 6: Comparison between test and calculated results using convective heat transfer coefficient 25 W/(m2.K) and re-sultant emmissivity 0.2, test 2
Figure 7: Measured temperatures in reverse channel, test 4
Comparison between calculated and test results for other tests using the above heat transfer charac-teristics show very similar results.
Results of test 4 (reverse channel connection) will be used to present the main points from thermal analysis of connections to CFT columns. Only re-sults for connection components on the beam side will be presented in this paper.
Figure 8: Measured temperatures in end-plate and bolts, test 4 Figures 7 and 8 show measured temperatures at
different locations of the channel, end-plate and bolts. Although it is inevitable that different tem-perature values were measured at different locations, it is acceptable to consider that the temperatures in the reverse channel, in the end-plate and in the bolts are uniform.
Figure 9: Measured average temperatures in different connec-tion components, test 4
Figure 9 compares the measured average tem-peratures in the reverse channel, in the end-plate, in the bolts and in the welds connecting the reverse channel to the column. The weld temperature is dis-tinctively lower and other temperatures may be con-sidered to be the same for practical design purpose. From the discussions above, it may be considered that all the connection components on the beam side have the same temperature and only one section fac-tor is necessary to be used in equation (1) to calcu-late the connection temperatures.
The section factor for the end-plate/reverse chan-nel/bolts assembly may be calculated in two ways: (1) as a plate with combined thickness of the reverse channel and the end-plate, exposed to fire on two

108
0
100
200
300
400
500
600
700
800
900
1000
0 10 20 30 40 50 60 70
Time (minutes)
Fire curve Web temp (test)Flange temp (test) Web temp (Abaqus)Flange temp (Abaqus)
0
100
200
300
400
500
600
700
800
900
1000
0 10 20 30 40 50 60 70
Time (minutes)
Fire curve Web temp (test)Flange temp (test) Web temp (Abaqus)Flange temp (Abaqus)
sides; (2) that of the shaded area in Figure 10. Using the dimensions of test 4, section factor 1 is 138.9 m-1
and section factor 2 is 174.6m-1.
Figure 10: One possible method of calculating effective section factor for reverse channel connection
Figure 11: Comparison between test results and calculations using equation (1) and two different section factors, test 4
Figure 11 compares the average test results for the end-plate/reverse channel/bolts with the calculated results using the aforementioned two section factors. Clearly, section factor (1) gives steel temperatures that are far too high and section factor (2) gives nu-merical results in close agreement with the test re-sults. This suggests that because the reverse channel is much thinner than the combined thickness of the reverse channel and the end-plate, the contribution of heat conduction from the thin flanges to the thick combined plate is small and it is acceptable to treat the reverse channel/end-plate/bolts assembly simply as a plate with combined plate/channel thickness. The same exercise has been carried out for other connections and the results are similar. Detailed re-sults are presented in Ding (2007).
3.3 Connection to steel column, with slab Figure 12 compares the temperatures in the col-
umn flange and web remote from the connection re-gion between the test results and ABAQUS simula-tions in which the resultant emmissivity was 0.5 and the convective heat transfer coefficient was 25
W/(m2.C). The two upper curves are for the web and the two lower curves are for the flange. These results indicate that using the above effective heat transfer coefficients is appropriate for this furnace.
Figure 12: Comparison between test and ABAQUS predicted column temperatures
Figure 13 further compares test and ABAQUS predicted temperatures for the beam flange and web remote from the connection. Again the upper two curves are for the web and the lower two curves for the flange. Again, the resultant emmissivity used in ABAQUS prediction was 0.5 and the convective heat transfer coefficient was 25 W/(m2.C) and these values are appropriate.
Figure 13: Comparison between test and ABAQUS predicted beam temperatures
Figure 14: Comparison between test and predicted end-plate temperatures
0
100
200
300
400
500
600
700
800
900
1000
0 10 20 30 40 50 60 70
Time (minutes)
Fir e curveM ax t emp by testmin t emp by testAv er age temp by A baqus, conv f=25Av er age temp by A baqus, conv f=10Temp by Eur ocode-3, conv f=10, slab config f=0Temp by Eur ocode-3, conv f=10, slab config f=0.10Temp by Eur ocode-3, conv f=10, slab config f=0.33
}test

109
Since this fire test contained a composite slab on top of the steelwork, temperature distributions in the connection components appear to be non-uniform.
Figure 14 compares the measured and predicted temperatures in the end-plate. For clarity, only the maximum (towards bottom of end-plate) and mini-mum (towards top of end-plate) test temperatures are shown. These two curves show large temperature differences of about 100oC, which suggests that it is not appropriate to assume uniform temperature dis-tribution in the end-plate. This large temperature dif-ference may be explained by the fact that the end-plate was subjected to radiant heat loss to the cooler composite slab. Even though the concrete slab was small in size, because the end-plate was very close to the composite slab, radiant heat exchange be-tween the end-plate and the composite slab was sub-stantial. The configuration factors between the com-posite slab and the top and bottom thermocouple locations on the end-plate were estimated to be about 0.33 and 0.1 respectively. Various prediction results are shown in Figure 14, including (from the highest to the lowest curve): ABAQUS simulation with hc=25 W/(m2.C) and r=0.5; ABAQUS simula-tion with hc=10 W/(m2.C) and r=0.5; Eqn (1) pre-diction with hc=10 W/(m2.C) and r=0.5; Eqn (1) prediction with hc=10 W/(m2.C), r=0.5 and =0.1for radiation between the slab and end-plate; Eqn (1) prediction with hc=10 W/(m2.C), r=0.5 and =0.33for radiation between the slab and end-plate. When using equation (1) for prediction, the equivalent sec-tion factor for the end-plate/column flange compo-nent is calculated using the shaded area in Figure 15. When including radiant heat exchange between the composite slab and the end-plate, the measured composite slab temperature was used. It can be seen that by including radiant heat exchange between the slab and the end-plate, the measured temperature difference can be predicted. By comparing ABAQUS prediction with Eqn (1) prediction for hc=10 W/(m2.C), r=0.5 and =0, it can be seen that the equivalent section factor for the shaded area in Figure 15 is appropriate. Finally, using a convective heat transfer coefficient of hc=25 W/(m2.C) as rec-ommended in EN 1991-1-2 predicts higher tempera-tures than test results and instead using a value of hc=10 W/(m2.C) gives better correlation between test and prediction results. This indicates that for convection, the fire gas near the connection re-gion was almost stagnant and natural convection may be assumed, under which the maximum con-vective heat transfer coef-ficient is just under 10 W/(m2.C) (Wang 2002).
4 SUMMARY AND PLANNED FUTURE WORK
This paper has presented some results of fire tests and associated calculations for two series of unpro-tected steel beam to column connections. The first series used concrete filled tubular columns and had no composite slab. The second series had steel col-umns and had a composite slab on top of the connec-tion. Based on preliminary analysis of the results, the following conclusions have been drawn: (1) without a concrete slab, the different connection components developed reasonably uniform tempera-tures so that it is possible to use equation (1) to cal-culate connection temperatures. A method for calcu-lating the equivalent section factor was proposed and was shown to be valid; (2) with a concrete slab, the effect of radiant heat exchange between connec-tion components and the slab can introduce large variations (about 100oC) in temperatures in the same connection component. This can be included in con-nection temperature calculations; if not, calculations will tend to predict higher temperatures; (3) without a slab, fire gas circulation in the connection region is similar to that remote from the connection region and the same convective heat transfer coefficient of hc=25 W/(m2.C) used for predicting steel beam and column temperatures may be used for the connection region; (4) with a slab, the fire gas in the connection region may be considered to be stagnant and a con-vective heat transfer coefficient of hc=10 W/(m2.C)for natural convection is more appropriate for pre-dicting temperatures in the connection region.
Related on-going fire tests and analytical studies include more unprotected beam to steel column con-nections with a slab; protected connections with dif-ferent intumescent fire protection schemes; loaded beam to column connections.
REFERNCES
CEN (2005), BS EN 1993-1-2:2�5, Eurocode 3: Design of steel structures � Part 1-2: General rules � structural fire design, British Standards Institution, London CEN (2002), BS EN 1991-1-2:2002, Eurocode 1: Actions on structures � Part 1-2: General actions � Actions on structures exposed to fire, British Standards Institution, London Franssen JM (2006), Calculation of temperature in fire-exposed bare steel structures: comparison between ENV 1993-1-2 and EN 1993-1-2, FireSafety Journal, Vol. 41, pp. 139-143 Ding J (2007), Behaviour of restrained concrete filled tubular columns and connections in fire,PhD thesis, University of Manchester Wang YC (2002), Steel and Composite Struc-tures: behaviour and design for fire safety, Spon Press
Figure 15: Section factor for end-plate

110
1 TOTAL HEAT TRANSFER TO FIRE EXPOSED SURFACES
Heat is transferred from fire hot gases and flames to structures by radiation qrad and convection qcon. The two contributions can be added as
conradtot qqq (1)where qtot is named the total heat transfer.
2 RADIATION
The radiation term in the above equation is the dif-ference between the absorbed incident radiation and the emitted radiation from the surface. The heat en-ergy being transmitted through the surfaces is here neglected, and no consideration is given to the influ-ence of various wavelengths. Thus as the absorptiv-ity and emissivity are equal, the net heat received the surface may be written as
4rad Tq s (2)
where E is the incident radiation, the Stefan Boltzmann constant and Ts the surface temperature. The emissivity is a property of the material sur-face. It can be measured but can in most cases of structural materials be assumed equal 0.8 except for shiny steel where it can be much lower.
As fires are characterized by non-homogeneous temperature distributions, radiative heat transfer should ideally include contributions from nearby flames, gas masses and surfaces for which view fac-tors corresponding to the surface analyzed is greater than zero. Then the incident radiation may be written as the sum of the contributions from several surfaces and gas volumes as
4ii
ii TFE (3)
where i is the emissivity of the i:th flame or surface, Fi and Ti the corresponding view factor and tempera-ture, respectively. Eq. 3 is in general very compli-cated and therefore approximations must be intro-duced in practice. Ideally the incident radiation to a surface is calculated as
4rTE (4)
where Tr is identified as an effective black body temperature or �the radiation temperature�.
The incident radiation term E can be measured with a radiometer calibrated accordingly.
3 CONVECTION
The heat transfer by convection to a surface from ad-jacent gases depends on the temperature difference between the gas and the surface. It depends also on the gas velocities and the geometries of the target
Heat transfer in fire safety engineering
U. Wickström SP Technical Research Institute of Sweden, Borås, Sweden
ABSTRACT: A basic and common understanding of heat transfer in fires is of great significance for the de-velopment of fire safety engineering. Nevertheless often confusions occur because various researchers have deviating and sometimes vague understandings of fundamental concepts like heat flux by radiation and con-vection, and how these quantities can be measured and how they influence temperatures in fire exposed struc-tures. This paper is intended to shed some light on these issues. Heat transfer under fire conditions is in gen-eral very complex, and both heat flux measurements and temperature calculations are troublesome. Therefore simplified methods are needed. A set of equations and theories presented in this article are general may be found in textbooks on heat transfer, see e.g. Holmani, but they are mainly recommended to be used when cal-culating temperature in structures exposed high temperatures like in post flash-over fires. The theories are relevant for heat transfer obtained from numerical fire modelling as well as for heat transfer based on meas-urementsii.

111
body. In general the heat transfer by convection can be written as
nsgcon TTq )( (5)
where is a coefficient and Tg the gas temperature adjacent to the exposed surface. The exponent n is in general equal unity for forced convection, and greater than unity for free or natural convection. In fire safety engineering n is in most cases assumed equal unity, and the convective heat transfer is writ-ten as
)( sgcon TThq (6)where h is denoted the heat transfer coefficient.
4 TOTAL HEAT TRANSFER
As the convective heat transfer depends on surface temperature as well as on gas velocity and geometry and varies with position it cannot be measured di-rectly in practice. Consequently that is the case for the total heat transfer as well although some instru-ment are called total heat flux meters. The most fre-quently used are of the Gardon or the Schmidt-Boelter type. These instrument measures the total heat flux to a water cooled surface of a given ge-ometry. That value is of course not the same as to a normal surface of a structure exposed to fire. Such a surface will of course not absorb as much heat as its temperature will adjust depending on the boundary conditions.
The total heat transfer to a surface may be ob-tained by combining Eq. 1 to 5 and get
nsgsrtot TTTTq )()( 44 (7)
Most often fire safety engineering the radiation tem-perature Tr and the gas temperature Tg are assumed equal a fire temperature Tf and the heat transfer by convection is assumed proportional with the tem-perature difference (n=1). Thus the heat transfer from a fire with a temperature Tf to a surface may be calculated as
)()( 44sfsftot TThTTq (Eq. 8)
The convective heat transfer coefficient depends on gas velocities and may vary considerably and is therefore in general hard to determine. But as stated above it is in most cases not so important to know with a high accuracy as the radiant term is dominat-ing at high temperatures. A value of 25 W/m2K is generally recommended at surfaces exposed to fully developed fires. At unexposed surfaces a lower value should be used. In Eurocode 1 (EN 1991-1-2) a value of 4 W/m2K is specified.
5 HEAT TRANSFER IN FURNACE TESTS
In general the radiation temperature and the convec-tive/gas temperature in fire resistance furnaces are more or less different. As a matter of fact that dif-ference makes their thermal characteristics. There-fore different results are in many cases achieved when the furnaces are controlled mainly by gas tem-perature measurements, in practice with small ther-mocouples which are more sensitive than the speci-men to convective heat transfer, i.e. the gas temperature level.
a) Plate thermometer with insulation pad on its back side
b) Plate thermometer placed in a fire resistance furnace
Figure 1 The plate thermometer according to ISO 834 and EN 1363-1
Therefore the plate thermometer, see Figure 1,has been introduced in ISO 834 and the correspond-ing European standard EN1363-1 to harmonize tests in furnaces of various characteristics. The plate thermometer is a thin steel plate insulated on the back side. It yields approximately an �effective� or �equivalent� fire temperature which is between the radiation temperature and the gas temperature. This temperature has also been named the �adiabatic sur-face temperature� AST which is the temperature a surface of a perfectly insulating material would ob-tain.
6 CALCULATING TEMPERATURE IN STRUCTURES EXPOSED TO EXPERIMENTAL FIRES
When calculating temperature in structures exposed to fire in tests or ad hoc experiments the heat trans-fer may in general be obtained from (Eq. 8. The ra-diation temperature Tr, as defined by Eq. 4, is in general different from the adjacent gas temperature Tg. A very good approximation is obtained by re-placing Tr and Tg with the adiabatic temperature ap-proximated by plate thermometer temperature read-ings TPT in (Eq. 8. A very simple and accurate

112
expression is then obtained of the heat transfer to a fire exposed surface as
)()( 44sPTsPTtot TThTTq (Eq. 9)
In particular this equation is recommended when analyzing structures exposed to standard fire resis-tance tests but it may also be used in ad hoc fire tests. At a surface on the unexposed side of a struc-ture the above equations may also be applied by re-placing the fire temperatures with the ambient tem-perature and choose appropriate emissivities and convective heat transfer parameters.
Eurocode 1 recommends values for the convec-tive heat transfer coefficient h, 25 W/m2K at a fire exposed surface and 9 W/m2K at an unexposed sur-face. The emissivity is a material property which can be measured or obtained from the literature. It may be assumed equal 0.8 for most building materi-als unless other values are known.
7 CALCULATING TEMPERATURE IN STRUCTURES EXPOSED TO NOMINAL FIRES
Nominal fire time-temperature curves are given in for example Eurocode 1 for design purposes. An as-sumed uniform fire temperature Tf can then be used in (1 replacing Tr and Tg yielding the heat transfer to a fire exposed surface to be
)()( 44sfsftot TThTTq (Eq. 10)
Recommended values for h and are then as given above.
In some standards the emissivity is reduced by a factor meant to consider the emissivity of the flames, see e.g. Eurocode 1. Such a reduction can, however, not be justified. It would in particular make analysis by calculation inconsistent with testing according to international standards where the furnace tempera-ture is controlled with plate thermometers. The re-duction of the emissivity has a significant influence on calculated temperature in bare non-insulated steel structures while the influence on most other struc-tures is negligible.
8 CFD CALCULATIONS
Design fires for structural elements may also be ob-tained from computer calculations using CFD (Computerized Fluid Dynamics) models of the gas phase. It is then important to interpret the results from this modelling to heat transfer to the exposed surfaces. It may be a very complicated and time consuming post processing as for each surface ele-ment to be analyzed values from the CFD model
must be obtained from maybe thousands of compu-tational gas phase cells and surrounding surfaces. An efficient way to avoid these calculations and fa-cilitate the information exchange between the gas phase CFD modelling and internal structural tem-perature calculations is to calculate the adiabatic sur-face temperature AST, as defined above, for the sur-faces of interest with the CFD code as a post-processing operation. Then the calculated AST can be input to any other calculation procedure, e.g. a fi-nite element code, to obtain the internal tempera-tures of a fire exposed structure. The heat transfer equation would then read
)()( 44sASTsASTtot TThTTq (Eq. 11)
This concept has preliminary successfully been tried out with the CFD code FDS of NISTiii.
9 SUMMARY
In this paper certain very fundamental aspects and concepts of heat transfer in fire safety engineering is laid down. In summary
When calculating the heat transfer by radia-tion an emissivity equal to the actual surface emissivity of the exposed surface shall be as-sumed. No reductions shall be allowed when applying nominal fire temperature curves due to emissivity of the flames etc. The concept of adiabatic surface temperature AST is recognized as a tool for calculating heat transfer to a surface of given tempera-ture.The AST can be measured more or less accu-rately using simple instruments. The plate thermometer is an example that is suited for fire resistance furnaces. Other designs may be more suited in other scenarios where e.g. a quicker response is needed. The concept of AST can be used as tool to transfer data from CFD calculation for calcu-lating temperature inside fire exposed struc-tures, e.g. with finite element methods.
REFERENCES
i Holman, J.P., Heat Transfer, 4th ed., McGraw Hill, 1976 ii Ulf Wickström, SP, Dat Duthinh and Kevin McGrattan, NIST Adiabatic surface temperature for calculating heat transfer to fire exposed structures, to be published Interflam 2007 iii Personal communication with Kevin McGrattan, NIST

113
European Cooperationin the field of Scientific and Technical Research
Action C26 Urban Habitat Constructions under Catastrophic Events Proceedings of Workshop Prague 30. � 31. 3. 2007
WG 2
Earthquake Resistance

114

115
1 INTRODUCTION
The last decade or so has witnessed a growing inter-est in assessing the seismic vulnerability of Euro-pean cities and the associated risk; not surprisingly this interest was stronger in Southern Europe where the largest part of the seismic energy dissipation in this continent takes place. A decent number of earth-quake damage (and loss) scenario studies appeared wherein some of the most advanced techniques have been applied to the urban habitat of European cities (Barbat et al. 1996, Bard et al. 1995, D�Ayala et al. 1996, Dolce et al. 2006, Erdik et al. 2003, Faccioli et al. 1999, Kappos et al. 2002). By �scenario� it is un-derstood here that the study refers to a given earth-quake (maximum credible, or standard design, or frequent) and provides a comprehensive description of what happens when such an earthquake occurs; this is not the same as �risk analysis� that refers to all the possible arriving earthquakes, estimating the probability of losses over a specified period of time. A key feature of the most recent among these studies is the use of advanced GIS tools that permit clear representation of the expected distribution of dam-age in the studied area and visualisation of the ef-fects of any risk mitigation strategy that can de adopted on the basis of the scenario.
As noted by Dolce et al. (2006), preparing a sce-nario requires contributions from a wide range of topics and disciplines, spanning from Seismology and Geology to Structural and Geotechnical Engi-neering, from Urban Planning and Transport Engi-neering to Social and Economic Sciences. However,
it often happens that each specialist interacts very little (if at all) with the other specialists. Further-more, some key parameters that are particularly relevant for a scenario, such as the geological fea-tures that affect seismic hazard, the characteristics of the building stock, and socio-economic conditions, are different in each country. This makes at best questionable the common practice of adopting the same models for developing scenarios in different countries. A good example of the problems involved in adopting models from another country is outlined in the paper by Barbat et al. (1996) who had to adapt the vulnerability models developed for Italian ma-sonry buildings to study the ones in Barcelona.
This paper focusses on the derivation of vulnera-bility (fragility) curves in terms of peak ground ac-celeration (PGA), as well as spectral displacement (Sd), and also includes the estimation of capacity curves, for several R/C and URM building types common in Greece as well as the rest of Southern Europe. The vulnerability assessment methodology is based on the hybrid approach developed at AUTh, which combines statistical data with appropriately processed (utilising repair cost models) results from nonlinear dynamic or static analyses, that permit ex-trapolation of statistical data to PGA's and/or spec-tral displacements for which no data are available. The statistical data used herein are from earthquake-damaged Greek buildings.
An extensive numerical study was carried out, wherein a large number of building types (54 in total for R/C and another 36 for URM) representing most of the common typologies in S. Europe) were mod-
Seismic vulnerability and risk assessment of urban habitatin Southern European cities
A.J. Kappos Aristotle University of Thessaloniki, Greece
ABSTRACT: The methodologies used in Greece for estimating direct losses from earthquakes in both rein-forced concrete (R/C) and unreinforced masonry (URM) buildings are summarised. The latest developments are presented concerning the derivation of capacity curves and vulnerability (fragility) curves in terms of peak ground acceleration, as well as spectral displacement, for all common types of R/C and URM buildings. The vulnerability assessment methodology is based on the hybrid approach developed at the AUTh, which combines statistical data with appropriately processed results from nonlinear dynamic or static analyses that permit extrapolation of statistical data to PGA's and/or spectral displacements for which no data are available. A pilot application to the municipality of Thessaloniki is presented, illustrating the different types of risk sce-nario that can be developed using the aforementioned fragility curves.

116
elled and analysed. Building classes were defined on the basis of material, structural system, height, and age (which indirectly defines also the code used for design, if any), and, in the case of R/C buildings, the existence or otherwise of brick masonry infills. The R/C building models were analysed for a total of 16 carefully selected accelerograms (half of them from actual Greek records, the other half synthetic) repre-sentative of different ground conditions. Vulnerabil-ity curves for several damage states were then de-rived using the aforementioned hybrid approach. These curves were subsequently used, in combina-tion with appropriately defined response spectra, for the derivation of new vulnerability curves involving spectral quantities. Pushover curves were derived for all building types (R/C and URM), then reduced to standard capacity curves, and can be used together with the Sd�based fragility curves as an alternative for developing seismic risk scenarios.
2 VULNERABILITY ASSESSMENT OF R/C BUILDINGS
2.1 Buildings AnalysedUsing the procedures described in the following, analysis of several different R/C building configura-tions has been performed, representing practically all common R/C building types in Greece and many other S. European countries. Referring to the height of the buildings, 2-storey, 4-storey, and 9-storey R/C buildings were selected as representative of Low-rise, Medium-rise and High-rise, respectively. The nomenclature used for the buildings is of the type RCixy where i indicates the structural system, x the height and y the code level. Regarding the structural system, both frames (RC1 and RC3 types) and dual (frame+shear wall) systems were addressed (RC4). Each of the above buildings was assumed to have three different configurations, �bare� (without ma-sonry infill walls, RC1 type), �regularly infilled� (RC3.1) and �irregularly infilled� (soft ground sto-rey, usually pilotis, RC3.2 type).
Regarding the level of seismic design and detail-ing, four subclasses could be defined, as follows: - No code (or pre-code): R/C buildings with very
low level of seismic design or no seismic design at all, and poor quality of detailing of critical elements; e.g. RC1MN (medium-rise, no code).
- Low code: R/C buildings with low level of seis-mic design (roughly corresponding to pre-1980 codes in S. Europe, e.g. the 1959 Code for Greece); e.g. RC3.2LL (low-rise, low code).
- Moderate code: R/C buildings with medium level of seismic design (roughly corresponding to post-1980 codes in S. Europe, e.g. the 1985 Supplementary Clauses of the Greek Seismic Codes) and reasonable seismic detailing of R/C
members; e.g. RC3.1HM (high-rise, moderate code).
- High code: R/C buildings with enhanced level of seismic design and ductile seismic detailing of R/C members according to the new generation of seismic codes (similar to Eurocode 8).
The available statistical data was not sufficient for distinguishing between all four sub-categories of seismic design. Moreover, analysis of the damage statistics for Thessaloniki buildings after the 1978 Volvi earthquake (Penelis et al. 1989) has clearly shown that there was no reduction in the vulnerabil-ity of R/C buildings following the introduction of the first (rather primitive by today�s standards) seismic code in 1959. Even if this is not necessarily the case in all cities, differentiation between RCixN and RCixL, as well as between RCixM and RCixH is difficult, and judgement and/or code-type ap-proaches are used to this effect. Three sets of analy-ses were finally carried out, for three distinct levels of design, �L� (buildings up to 1985), �M� (1986-1995), and �H�, the last one corresponding to build-ings designed to the 1995 and 2000 (EAK) Greek Codes. The 1995 code (�NEAK�) was the first truly modern seismic code (quite similar to Eurocode 8) introduced in Greece and its differences from EAK2000 are minor and deemed not to affect the vulnerability of the buildings; hence buildings con-structed from 1996 to date are classified as �H�. Dif-ferences (in terms of strength and available ductility) between �N� and �L� buildings, and �M� and �H� buildings are addressed in a semi-empirical way at the level of capacity curves (section 2.4).
2.2 Inelastic analysis procedure For all Low, Moderate, and High code R/C buildings inelastic static and dynamic time-history analyses were carried out using the SAP2000N (Computers & Structures 2002) and the DRAIN2000 (Kappos & Dymiotis 2000) codes, respectively. R/C members were modelled using lumped plasticity beam-column elements, while infill walls were modelled using the diagonal strut element for the inelastic static analy-ses, and the shear panel isoparametric element for the inelastic dynamic analyses, as developed in pre-vious studies (Kappos et al. 1998a).
In total 72 structures were addressed in the pre-sent study, but full analyses were carried out for 54 of them (N and L buildings were initially considered together, as discussed previously, but different push-over curves were finally drawn, see section 2.3). To keep the cost of analysis within reasonable limits, all buildings were analysed as 2D structures. Typical structures studied are shown in figure 1. It is pointed out that although the consideration of 2D models means that effects like torsion due to irregularity in plan were ignored, previous studies (Kappos et al. 1998b) have shown that the entire analytical model

117
(which also comprises the structural damage vs. loss relationship) slightly underpredicts the actual losses of the 1978 Thessaloniki earthquake, from which the statistical damage data used in the hybrid procedure originate. Moreover, evaluation of that actual dam-age data has shown (Penelis et al. 1989) that plan ir-regularities due to unsymmetric arrangement of ma-sonry infills were far less influential than irregularities in elevation (soft storeys due to discon-tinuous arrangement of infills); the latter are directly taken into account in the adopted analytical models.
4.006.006.00 4.00 6.00 6.00
Figure 1. Four-storey, irregularly infilled, R/C frame building (RC3.2M type).
Using the DRAIN2000 code, inelastic dynamic time-history analyses were carried out for each building type and for records scaled to several PGA values, until �failure� was detected. A total of 16 ac-celerograms was used (to account for differences in the spectral characteristics of the ground motion), scaled to each PGA value, hence resulting to several thousands of inelastic time-history analyses (the pseudo-acceleration spectra of the 16 records are shown in figure 2). The 8 recorded motions are: 4 from the 1999 Athens earthquake (A299_T, A399_L, A399_T, A499_L), 2 from the 1995 Ae-gion earthquake (aigx, aigy) and 2 from the 2003 Lefkada earthquake. The 8 synthetic motions are calculated for Volos (A4, B1, C1, D1), and Thessa-loniki (I20_855, N31_855, I20_KOZ, N31_KOZ) sites (as part of microzonation studies).
0.00
0.20
0.40
0.60
0.80
1.00
1.20
1.40
1.60
1.80
2.00
0.0 0.5 1.0 1.5 2.0 2.5 3.0
Period (sec)
A299_T A399_L A399_T A499_L
aigx aigy lefL lefT
A4 B1 C1 D1
I20_855 N31_855 I20_KOZ N31_KOZ
average all
Figure 2. Pseudoacceleration spectra of the 16 motions used for the inelastic dynamic analyses.
2.3 Estimation of economic loss using inelastic dynamic analysis
From each analysis, the cost of repair (which is less than or equal to the replacement cost) is estimated for the building type analysed, using the models for member damage indices proposed by Kappos et al. (1998b). The total loss for the entire building is de-rived from empirical equations (calibrated against cost of damage data from Greece) L = 0.25Dc + 0.08Dp ( 5 storeys) (1a)
L = 0.30 Dc + 0.08Dp (6 - 10 storeys) (1b) where Dc and Dp are the global damage indices ( 1)for the R/C members and the masonry infills of the building, respectively. Due to the fact that the cost of the R/C structural system and the infills totals less than 40% of the cost of a (new) building, the above relationships give values up to 38% for the loss in-dex L, wherein replacement cost refers to the entire building. In the absence of a more exact model, situations leading to the need for replacement (rather than repair/strengthening) of the building are identi-fied using failure criteria for members and/or sto-reys, as follows:
In R/C frame structures (RC1 and RC3 typology), failure is assumed to occur (and then L=1) when-ever either 50% or more of the columns in a sto-rey �fail� (i.e. their plastic rotation capacity is less than the corresponding demand calculated from the inelastic analysis), or the interstorey drift ex-ceeds a value of 4% at any storey (Dymiotis et al. 1999).In R/C dual structures (RC4 typology), failure is assumed to occur (and then L=1) whenever either50% or more of the columns in a storey �fail�, orthe walls (which carry most of the lateral load) in a storey fail, or the interstorey drift exceeds a value of 2% at any storey (drifts at failure are sub-stantially lower in systems with R/C walls).
This new set of failure criteria was recently pro-posed by Kappos et al. (2006); they resulted after evaluating a large number of inelastic time-history analyses. Although they represent the writer�s best judgement (for an analysis of the type considered herein), it must be kept in mind that situations close to failure are particularly difficult to model, and all available procedures have some limitations. For in-stance, although in most cases the earthquake inten-sity estimated to correspond to failure (damage state 5 in Table 2) is of a reasonable magnitude, in some cases (in particular wall/dual structures, especially if designed to modern codes) PGAs associated with failure are unrealistically high and should be revised in future studies. Having said this, their influence in a risk analysis is typically limited, since the scenario earthquakes do not lead to accelerations more than about 1g.

118
2.4 Development of pushover and capacity curves
A pushover curve is a plot of a building�s lateral load resistance as a function of a characteristic lat-eral displacement (typically a base shear vs. top dis-placement curve) derived from inelastic static (push-over) analysis. In order to facilitate direct compa-rison with spectral demand, base shear is converted to spectral acceleration and the roof displacement is converted to spectral displacement using modal properties and the equivalent SDOF system ap-proach, resulting in a �capacity curve� in terms of spectral quantities (e.g. FEMA-NIBS 2003).
Pushover analyses were carried out for all Low-Code, Moderate-Code, and High-Code building models. No-code (or Pre-Code) buildings were as-sumed to have 20% lower strength than Low Code ones, but the same displacement ductility factor (Sdu/Sdy), reflecting the well-established fact that in Greece ductility was not an issue in seismic design prior to the 1985 revision of the Seismic Code.
Some typical pushover curves and their corre-sponding bilinear versions (derived on the basis of equal areas under the curves) are given in Figure 3; as shown in the figure, the equal areas are calculated up to the point where the first significant drop in strength (usually about 20%) occurs in the �com-plete� pushover curve.
0.00
0.05
0.10
0.15
0.20
0.25
0.30
0.35
0.40
0.45
0.000 0.005 0.010 0.015 0.020 0.025
x/H
RC1LL
RC3.1LL
RC3.2LL
RC1LL bilinear
RC3.1LL bilinear
RC3.2LL bilinear
Figure 3. Pushover curves for low-rise R/C frames designed to old codes.
Building capacity curves are constructed for each model building type and represent different levels of seismic design level and building performance. Each curve is defined by two points: (1) the �yield� capac-ity and (2) the �ultimate� capacity. The yield capac-ity represents the strength level beyond which the response of the building is strongly nonlinear and is higher than the design strength, due to minimum code requirements, actual strength of materials being higher than the design one (mean values of concrete and steel strength were used in the nonlinear analy-ses) and, most important of all, due to the presence of masonry infills (this influence is more pro-nounced in the case of frame systems), whenever
such infills are present. The ultimate capacity is re-lated to the maximum strength of the building when the global structural system has reached a full mechanism. It is emphasised that due to the fact that the pushover curves used for the vulnerability as-sessment are bilinear versions of the actually calcu-lated curves (see Fig. 3), a necessity arising from the fact that bilinear behaviour is considered in reducing the elastic spectrum to an inelastic one (or an equivalent elastic one for effective damping com-patible with the energy dissipated by the inelastic system), the �ultimate� capacity generally does not coincide with the actual peak strength recorded dur-ing the analysis. Moreover, the �yield� capacity is not the strength of the building when first yielding of a member occurs. The proper way to �bilinearise� a pushover curve is still a rather controversial issue, in the sense that different methods are more appro-priate, depending on the objective of the specific analysis. It is worth recalling here that in the ATC-40 (1996) manual, where the capacity spectrum method is presented in detail, it is recommended to bilinearise the capacity curve with respect to the previously estimated target point, i.e. the bilinear-ised curve changes during each iteration, which is not a very convenient procedure.
Using standard conversion procedures (e.g. ATC 1996, FEMA-NIBS 2003), pushover curves (V/W vs. x/Htot) were transformed into capacity curves (Sa vs. Sd). The coordinates of the points describing the pushover and the capacity curves are given for all R/C frame typologies studied in Table 1. It is pointed out that in other commonly used methodolo-gies such as HAZUS (FEMA-NIBS 2003), Sau is de-fined as the point corresponding to the formation of a full plastic mechanism, whereas in the method proposed herein Sau is defined as the displacement of the building whenever a significant drop in strength occurs (as discussed earlier); at the level of fragility assessment, Sau should be related to the displacement at which the building reaches a certain damage state (e.g. DS4 or DS5, see section 3). The major differ-ence between the strengths of bare (RC1) and regu-larly infilled (RC3.1) buildings is particularly noted; for N or L buildings the presence of infills more than doubles the ultimate capacity, whereas for H build-ings the increase is about 50%. Another important observation is that in dual structures (not included in table 1), which are the most common R/C building type in Greece since the eighties, the presence of in-fills has a much lesser effect on strength, and the dif-ference between the corresponding three classes (RC4.1, 4.2 and 4.3) are such as to warrant lumping them in one single class (RC4) for vulnerability as-sessment purposes (Kappos et al. 2006).
Infilled R/C buildings (such as RC3.LL and RC3.2LL in Fig. 3) should be treated with caution: Since reduced spectra (inelastic, or elastic for effec-tive damping ratios higher than 5%) are based on bi-
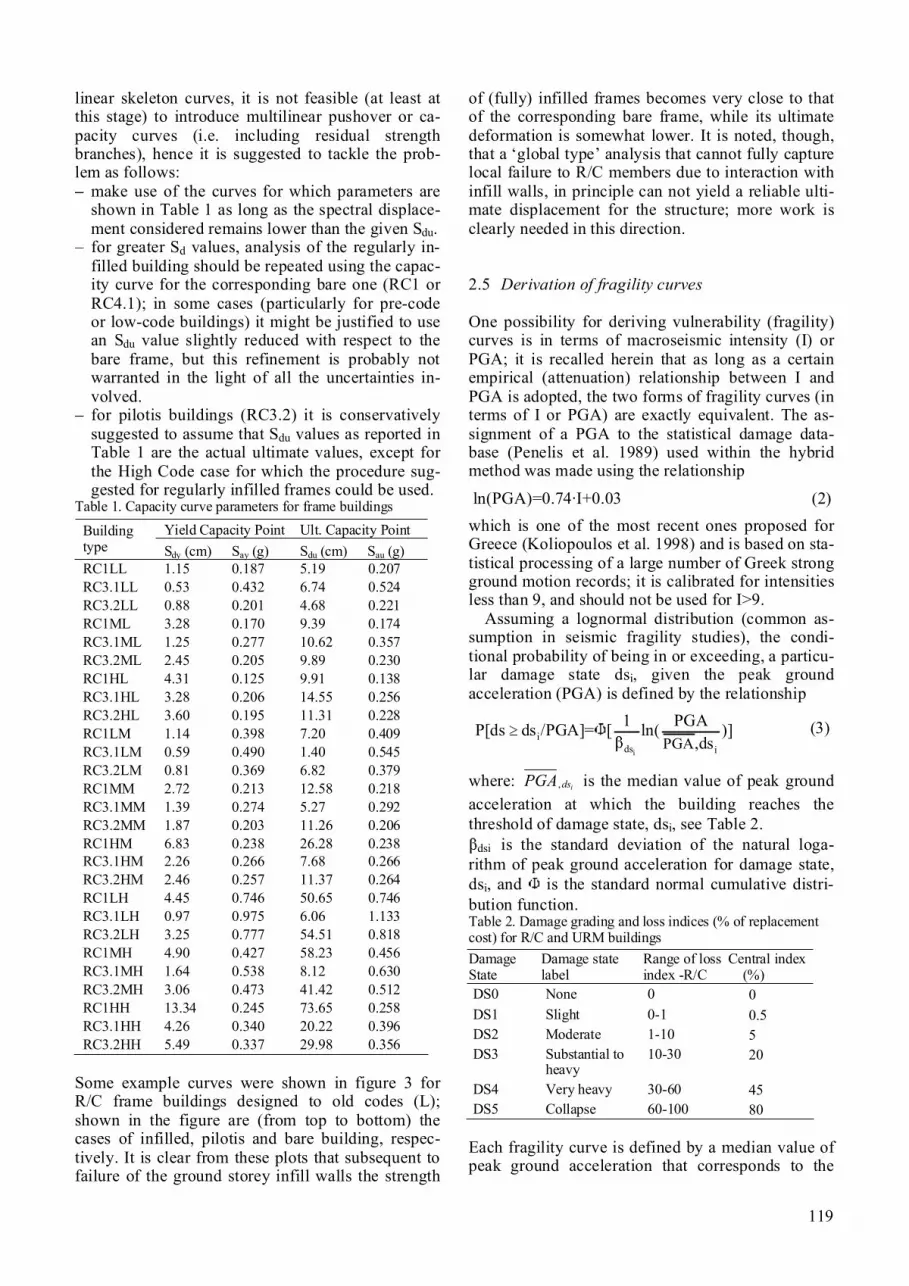
119
linear skeleton curves, it is not feasible (at least at this stage) to introduce multilinear pushover or ca-pacity curves (i.e. including residual strength branches), hence it is suggested to tackle the prob-lem as follows:
make use of the curves for which parameters are shown in Table 1 as long as the spectral displace-ment considered remains lower than the given Sdu.for greater Sd values, analysis of the regularly in-filled building should be repeated using the capac-ity curve for the corresponding bare one (RC1 or RC4.1); in some cases (particularly for pre-code or low-code buildings) it might be justified to use an Sdu value slightly reduced with respect to the bare frame, but this refinement is probably not warranted in the light of all the uncertainties in-volved.for pilotis buildings (RC3.2) it is conservatively suggested to assume that Sdu values as reported in Table 1 are the actual ultimate values, except for the High Code case for which the procedure sug-gested for regularly infilled frames could be used.
Table 1. Capacity curve parameters for frame buildings Yield Capacity Point Ult. Capacity Point Building
type Sdy (cm) Say (g) Sdu (cm) Sau (g) RC1LL 1.15 0.187 5.19 0.207 RC3.1LL 0.53 0.432 6.74 0.524 RC3.2LL 0.88 0.201 4.68 0.221 RC1ML 3.28 0.170 9.39 0.174 RC3.1ML 1.25 0.277 10.62 0.357 RC3.2ML 2.45 0.205 9.89 0.230 RC1HL 4.31 0.125 9.91 0.138 RC3.1HL 3.28 0.206 14.55 0.256 RC3.2HL 3.60 0.195 11.31 0.228 RC1LM 1.14 0.398 7.20 0.409 RC3.1LM 0.59 0.490 1.40 0.545 RC3.2LM 0.81 0.369 6.82 0.379 RC1MM 2.72 0.213 12.58 0.218 RC3.1MM 1.39 0.274 5.27 0.292 RC3.2MM 1.87 0.203 11.26 0.206 RC1HM 6.83 0.238 26.28 0.238 RC3.1HM 2.26 0.266 7.68 0.266 RC3.2HM 2.46 0.257 11.37 0.264 RC1LH 4.45 0.746 50.65 0.746 RC3.1LH 0.97 0.975 6.06 1.133 RC3.2LH 3.25 0.777 54.51 0.818 RC1MH 4.90 0.427 58.23 0.456 RC3.1MH 1.64 0.538 8.12 0.630 RC3.2MH 3.06 0.473 41.42 0.512 RC1HH 13.34 0.245 73.65 0.258 RC3.1HH 4.26 0.340 20.22 0.396 RC3.2HH 5.49 0.337 29.98 0.356
Some example curves were shown in figure 3 for R/C frame buildings designed to old codes (L); shown in the figure are (from top to bottom) the cases of infilled, pilotis and bare building, respec-tively. It is clear from these plots that subsequent to failure of the ground storey infill walls the strength
of (fully) infilled frames becomes very close to that of the corresponding bare frame, while its ultimate deformation is somewhat lower. It is noted, though, that a �global type� analysis that cannot fully capture local failure to R/C members due to interaction with infill walls, in principle can not yield a reliable ulti-mate displacement for the structure; more work is clearly needed in this direction.
2.5 Derivation of fragility curves
One possibility for deriving vulnerability (fragility) curves is in terms of macroseismic intensity (I) or PGA; it is recalled herein that as long as a certain empirical (attenuation) relationship between I and PGA is adopted, the two forms of fragility curves (in terms of I or PGA) are exactly equivalent. The as-signment of a PGA to the statistical damage data-base (Penelis et al. 1989) used within the hybrid method was made using the relationship
ln(PGA)=0.74·I+0.03 (2) which is one of the most recent ones proposed for Greece (Koliopoulos et al. 1998) and is based on sta-tistical processing of a large number of Greek strong ground motion records; it is calibrated for intensities less than 9, and should not be used for I>9.
Assuming a lognormal distribution (common as-sumption in seismic fragility studies), the condi-tional probability of being in or exceeding, a particu-lar damage state dsi, given the peak ground acceleration (PGA) is defined by the relationship
i
ids iPGA1 PGAP[ds ds /PGA]= [ ln( )]
,ds (3)
where: idsPGA, is the median value of peak ground acceleration at which the building reaches the threshold of damage state, dsi, see Table 2.
dsi is the standard deviation of the natural loga-rithm of peak ground acceleration for damage state, dsi, and is the standard normal cumulative distri-bution function. Table 2. Damage grading and loss indices (% of replacement cost) for R/C and URM buildings Damage State
Damage state label
Range of loss index -R/C
Central index (%)
DS0 None 0 0DS1 Slight 0-1 0.5DS2 Moderate 1-10 5DS3 Substantial to
heavy10-30 20
DS4 Very heavy 30-60 45DS5 Collapse 60-100 80
Each fragility curve is defined by a median value of peak ground acceleration that corresponds to the

120
threshold of that damage state and by the variability associated with that damage state; these two quanti-ties are derived as described in the following.
Median values for each damage state in the fragil-ity curves were estimated for each of the 54 types of building systems analysed. The starting point for es-timating these values is the plot of the damage index (calculated from inelastic time history analysis as described in section 2.3) as a function of the earth-quake intensity (PGA); some plots of this type are given in Fig. 4 and they refer to buildings with dual system designed to moderate codes (see section 2.1). Several trends can be identified in the figure, for in-stance that the least vulnerable building is the fully infilled one, with the exception of very low PGA values, for which the loss is higher that in the other two types; this is mostly due to damage in the ma-sonry infills, which is accounted for in the loss model used (Kappos et al. 1998b).
0.00.10.20.30.40.50.60.70.80.91.0
0.00 0.50 1.00 1.50 2.00 2.50
PGA (g)
bareinfilledpilotis
0.00.10.2
0.30.40.50.60.7
0.80.91.0
0.00 0.50 1.00 1.50 2.00 2.50PGA (g)
bareinfilledpilotis
Figure 4. Evolution of economic damage (loss) index for me-dium-rise (top) and high-rise (bottom) buildings with R/C frame system designed to moderate codes.
Median values (for equation 3) are then estimated based on the hybrid approach, which combines ine-lastic dynamic analysis and the database of the Thes-saloniki earthquake of 1978 (Penelis et al., 1989), corresponding to an intensity I=6.5, to which a peak ground acceleration of 0.13g corresponds, according to the adopted I � PGA relationship (equation 2); it is noted that this PGA practically coincides with the one of the only record available from the 1978 earthquake in Thessaloniki. From the database of the Thessaloniki earthquake, the damage index, defined here as the ratio L of repair cost to replacement cost (i.e. as a direct loss index), corresponding to this PGA is found for each building (a total of 5700 R/C
buildings are included in the database). The Thessa-loniki database is described in a number of previous publications (Penelis et al., 1989; Kappos et al. 1998b); a brief reference to this as well as to some other Greek databases is made in section 3.2 of this paper (focussing on masonry buildings).
Having established analytically the loss index L, the final value to be used for each PGA in the fragil-ity analysis depends on whether an empirical value is available for the PGA or not, i.e. (i) if the �actual� (empirical) loss value at a point i(PGA=PGAi), Lact,i is available in the database, the final value to be used is Lfin,i = w1Lact,i + w2Lanl,i (w1+w2=1) (4) where Lanl,i is the analytically calculated loss value (cf. Fig. 4) for that PGAi and w1, w2 are weighting factors that depend on the reliability of the empirical data available at that intensity. If Lact,i is based on more than about 60 buildings, w1 equal to about 1 is recommended, if it is based on 6 buildings or less, w1 should be taken as zero (or nearly so). (ii) if the �actual� (empirical) loss value at a point j(PGAj), Lact,j is not available in the database, the fi-nal value to be used is Lfin,j = ½ ( i+ k) Lanl,j (5a)
where i, k are the ratios Lfin/Lanl at points i, k, hence
i = w1(Lact,i /Lanl,i) + w2 (5b) and PGAi<PGAj<PGAk. Clearly, this is an interpola-tion scheme that aims to account (in a feasible way) for the strongly nonlinear relationship between in-tensity and damage. In the common case that Lact is available at one or very few points the scheme should be properly adapted by the analyst.
It is worth noting that the ratios Lact/Lanl calcu-lated for the Thessaloniki 1978 data were reasonably close to 1.0 when the entire building stock was con-sidered, but discrepancies for some individual build-ing classes did exist (Kappos et al., 1998b). In this way it is possible to establish a relationship between damage index and PGA for each building type (simi-lar to the one shown in Fig. 4, but now accounting for the empirical data as well), and consequently to assign a median value of PGA to each damage state. Table 2 provides the best estimate values for the loss index ranges associated with each damage state, de-rived from previous experience with R/C structures (Kappos et al. 2006).
Lognormal standard deviation values ( ) describe the total variability associated with each fragility curve. Three primary sources contribute to the total variability for any given damage state (FEMA-NIBS, 2003), namely the variability associated with the discrete threshold of each damage state which is defined using damage indices (in the present study this variability includes also the uncertainty in the models correlating structural damage indices to loss,

121
i.e. the ratio of repair cost to replacement cost, see also Kappos 2001), the variability associated with the capacity of each structural type, and finally the variability of the demand imposed on the structure by the earthquake ground motion. The uncertainty in the definition of damage state, for all building types and all damage states, was assumed to be =0.4(FEMA-NIBS, 2003), the variability of the capacityfor low code buildings is assumed to be =0.3 and for high code =0.25 (FEMA-NIBS), while the last source of uncertainty, associated with seismic de-mand, is taken into consideration through a convolu-tion procedure, i.e. by calculating the variability in the final results of inelastic dynamic analyses carried out for a total of 16 motions at each level of PGA considered.Table 3. Fragility curve parameters for buildings with R/C frame system, designed to Low and Moderate code.
Building type DS1 DS2 DS3 DS4 DS5
RC1LL 0.001 0.012 0.096 0.157 0.219 0.733RC3.1LL 0.021 0.101 0.201 0.257 0.343 0.733RC3.2LL 0.005 0.049 0.116 0.181 0.230 0.733RC1ML 0.001 0.013 0.095 0.136 0.192 0.651RC3.1ML 0.005 0.055 0.190 0.216 0.254 0.651RC3.2ML 0.000 0.004 0.042 0.099 0.136 0.651RC1HL 0.006 0.061 0.149 0.276 0.545 0.629RC3.1HL 0.013 0.097 0.210 0.296 0.548 0.629RC3.2HL 0.044 0.101 0.209 0.353 0.673 0.629RC1LM 0.002 0.023 0.148 0.413 0.639 0.733RC3.1LM 0.090 0.123 0.298 0.730 1.391 0.733RC3.2LM 0.005 0.051 0.215 0.497 0.748 0.733RC1MM 0.001 0.014 0.115 0.297 0.844 0.651RC3.1MM 0.008 0.078 0.201 0.422 0.853 0.651RC3.2MM 0.001 0.011 0.116 0.476 0.795 0.651RC1HM 0.006 0.056 0.363 1.471 2.724 0.629RC3.1HM 0.017 0.109 0.419 0.923 3.471 0.629RC3.2HM 0.015 0.110 0.525 1.103 2.370 0.629
The last part of fragility analysis was carried out using in-house developed software (HyFragC), which permitted quick exploration of alternative ap-proaches (sensitivity analysis). Parameters of the cumulative normal distribution functions derived for two specific classes (R/C frame structures designed to �low-code� and �moderate code�) are given in Ta-ble 3; similar results are available for all other cases studied. Example fragility curves constructed are given in Figure 5.
Referring first to Table 3, it is noted that beta-values are given as constant for each building type; this constant value (estimated to be between about 0.6 and 0.7) is the average of the 5 values of beta corresponding to each of the 5 damage states. This was done on purpose, because if the (generally) dif-ferent variability associated with each damage state (calculated from the results of time-history analysis) is taken, unrealistic fragility curves (for instance, in-
tersecting) result in cases where median values are closely spaced (e.g. see Fig. 5-top, DS3 and DS4).
Different sets of fragility curves are plotted in Fig. 5 (full and dotted lines), the difference lying on the way empirical data were introduced (cf. w1, w2factors in equation 4). The effect on the resulting curves appears to be rather significant, particularly for the higher damage states. Also, as anticipated, the effect of seismic design is significant; buildings designed to only a �moderate� seismic code are seen to be substantially less vulnerable than buildings de-signed to �low� code, pointing to the importance of using some basic seismic design rules (like basic ca-pacity design and ductility), even if these rules are not in compliance with modern code provisions.
Figure 5. Hybrid vulnerability curves for R/C dual structures, derived from different interpretation of empirical data: low-rise, low-code buildings with infills (top); medium-rise, mod-erate code buildings with pilotis (bottom).
It is worth pointing out here that the way fragility curves were developed here (for all common build-ing types) using the hybrid approach at the stage of producing damage grade vs. earthquake intensity re-lationships (see Fig. 4) is different from other proce-dures in the literature, which are based either on fit-ting of curves directly to empirical data (e.g. Spence et al. 1992) or on expert judgement (e.g. ATC 1985). It is also different from the empirical approach used by other researchers within the RISK-UE project (Lagomarsino & Giovinazzi 2006). Finally, it is dif-ferent (although the basic idea of the hybrid ap-proach is retained) from the procedure used by the writer and his co-workers for defining fragility curves for URM buildings (see section 3).

122
2.6 Fragility curves in terms of Sd
The aforementioned fragility curves in terms of PGA were also used to derive additional curves, this time in terms of Sd, necessary for fragility assessment us-ing the HAZUS approach (FEMA-NIBS 2003). The procedure adopted was to transform the median PGA values to corresponding median Sd values, us-ing an appropriate spectrum and either the funda-mental period of the �prototype� building, assuming that the equal displacement rule applies, or using the capacity spectrum approach (for short period build-ings). It is noted that the convenient equal displace-ment rule is a valid assumption for medium-rise and high-rise buildings, but usually a crude one for low-rise buildings; effective periods are involved, corre-sponding to the structure�s characteristics at yield, hence periods are longer than the elastic ones, e.g. considering the 2-storey frame building, Tef 0.5s for bare frames, but Tef 0.2s for the fully infilled frames. For the present application of the methodol-ogy it was decided to use the mean spectrum of the microzonation study of Thessaloniki (Anastasiadis et al., 2001) since the derived Sd-based fragility curves were primarily intended to be used for the Thessaloniki risk scenario (Pitilakis et al. 2004). Clearly other options are also available, the most conservative one being to use the seismic code de-sign spectrum, which has been found to overestimate seismic actions (particularly displacements) for me-dium and long period structures (Athanassiadou et al. 2007).
RC3.1ML
0.00
0.10
0.20
0.30
0.40
0.50
0.60
0.70
0.80
0.90
1.00
0.00 1.00 2.00 3.00 4.00 5.00 6.00
Sd (cm)
DS1DS2DS3DS4DS5
RC3.1MH
0.00
0.10
0.20
0.30
0.40
0.50
0.60
0.70
0.80
0.90
1.00
0.00 1.00 2.00 3.00 4.00 5.00 6.00Sd (cm)
DS1DS2DS3DS4DS5
Figure 6. Sd-based fragility curves for medium-rise infilled R/C frames, low-code (top) and high-code design.
Two examples of Sd-based fragility curves are given in Figure 6 (4-storey infilled frames, designed
to �low� or �high� codes). A more detailed discussion of the impact the type of fragility curve used for a vulnerability assessment study has on its results (loss scenario) is given by the writer and his co-workers in Pitilakis et al. (2004), wherein the dam-age and loss scenario for Thessaloniki, developed using both approaches, is presented.
3 VULNERABILITY ASSESSMENT OF URM BUILDINGS
3.1 Overview of the methodology adoptedFor URM buildings, apart from the Thessaloniki 1978 earthquake data (used for R/C structures, see section 2), the database from the Aegion 1995 event (Fardis et al. 1999) was also utilised. The first step for the utilisation of these two databases was the as-signment of an appropriate intensity (or correspond-ing PGA) for the area they refer to. A value of 7 was adopted for Thessaloniki and a value of 8 for Ae-gion. These databases were used for the simple, purely statistical, procedure described in section 3.2, and were extrapolated to lower and higher events us-ing nonlinear analysis in the hybrid approach de-scribed in sections 3.3 and 3.4.
3.2 Purely empirical approach A purely empirical approach (similar to that used by other researchers, e.g. Spence et al. 1992, Lago-marsino & Giovinazzi 2006), was first adopted by the writers for deriving fragility curves in terms of intensity for URM buildings. It is recalled herein that for these buildings statistical data were available for more intensities, hence it was conceptually feasi-ble to adopt a purely empirical approach, as opposed to the hybrid one used for R/C buildings (section 2.5); the latter was also used for deriving fragility curves for URM buildings (section 3.4). The empiri-cal procedure initially adopted was quite straight-forward and consisted in curve fitting the available damage data from the aforementioned events. A more refined procedure based on the vulnerability index method (Lagomarsino & Giovinazzi 2006) was also used.
The Thessaloniki database (Penelis et al. 1989) consists of a record of the centre of the city of Thes-saloniki with randomly selected buildings with a density of 1:2 (i.e. 50% of total building stock within the selected area was recorded) with all the relevant information included, such as year of con-struction, material, number of storeys, first level post-earthquake damage classification (green-yellow-red tag), and (importantly) cost of repair of earthquake damage. The database includes a total of 5740 buildings, 1780 of which (31%) are unrein-forced masonry ones, and most of the remaining buildings are reinforced concrete ones.

123
The database does not include specific informa-tion regarding the type of masonry (stone or brick), therefore the assumption that all URM buildings constructed before 1940 were stone masonry and all the rest brick masonry, was adopted, based on his-torical evidence on types of masonry construction in Greece (Kappos et al. 2006). Details of the process-ing of the database are given in Penelis et al. (2002), where the reasons are discussed why economic dam-age indices (ratio of repair cost to replacement cost) and post-earthquake tagging of buildings (�green�-�yellow�-�red�) had to be combined in interpreting the Thessaloniki data. Table 4 summarises the dis-tribution of economic damage (5 damage states were considered, in addition to zero-damage, see Table 2) in the main categories of URM buildings, i.e. stonemasonry (Stone1-3 is for all buildings, which had from one to three storeys, Stone1and Stone2 refer to single-storey and two-storey buildings, respec-tively), and brick masonry (symbols analogous to those used for Stone).
Table 4. Damage matrix (% of buildings in each DS) for Thes-saloniki 1978 data, based on economic damage index Damage State
Stone 1-3 Stone1 Stone2 Brick
1-3 Brick1 Brick2
DS0 60.6 64.4 52.3 77.6 76.0 78.9 DS1 13.8 12.9 14.1 9.2 9.2 10.0 DS2 13.7 12.9 14.1 9.2 9.3 10.0 DS3 5.5 4.9 8.4 3.6 5.0 1.1 DS4 4.3 3.8 6.5 0.2 0.2 0.0 DS5 1.9 1.2 4.6 0.2 0.3 0.0 Meandamage factor
0.75 0.69 0.93 0.39 0.44 0.33
The Aegion database (Fardis et al. 1999) includes all buildings within the centre of Aegion, among them the vast majority of the damaged R/C and URM buildings. The sample consists of 2014 build-ings, 857 of which (42.5%) are unreinforced ma-sonry buildings. The database was set up on the ba-sis of four non-zero damage levels (DS0 to DS4); to convert it to the 5-level classification scheme the last level (DS4) has been divided into two (DS4 and DS5) at a proportion of 70 and 30%, respectively, in general conformity with the corresponding Thessa-loniki data. Characterization of each building�s dam-age state was performed by visual inspections car-ried out by the research team of the University of Patras. This approach eliminates the risk of overes-timating damage that is present when using the cost of repair criterion, but on the other hand is more subjective, heavily relying on experience and judg-ment during the visual inspection. Damage matrices derived on the basis of Aegion data for the two cate-gories (brick and stone) that are also used in the Thessaloniki database are given in Penelis et al. (2002), who also made some limited use of a third
database, including data from the 1993 Pyrgos earthquake.
Empirical curves were first derived using the aforementioned databases and an exponential type of statistical model and they are reported in Kappos et al (2006); albeit useful, they are not deemed as suf-ficiently reliable, since data for only two intensities were available. It should be noted that the empirical approach, simplistic it may seem, requires sophisti-cated statistical filters and correlations for different databases derived for different parts of a country and by different research groups, to ensure compatibility between them and remove outliers, such as damage data for a specific building type and intensity 8 be-ing lower than that for an intensity 7 event. In view of the limited data available, additional statistical data from Italian events were also used in order to calibrate the recorded damage data in the aforemen-tioned databases. A second interpretation of the available data using the vulnerability index approach (Lagomarsino & Giovinazzi 2006), re-assigning the intensities of Thessaloniki and Aegion to 6.5 and 7, respectively (based on comparisons with the Italian data), and finally using beta distributions for the fra-gility curves, resulted in the sets of curves shown in Figure 7 (Penelis et al. 2002); these curves are drawn in terms of four (rather than five) damage states. Note that no differentiation on the basis of building height is made in these sets of curves.
Stone - M1.2
0
0.2
0.4
0.6
0.8
1
5 6 7 8 9 10 11 12EMS-98 Intensity
D = 1
D = 2
D = 3
D = 4
Brick - M3.4
0
0.2
0.4
0.6
0.8
1
5 6 7 8 9 10 11 12EMS-98 Intensity
D = 1D = 2
D = 3D = 4
Figure 7. Empirical fragility curves (beta distributions) for stone masonry (top) and brick masonry buildings.

124
3.3 Nonlinear analysis and capacity curvesIt is well known that the nonlinear response of unre-inforced masonry (URM) buildings is not easy to model, mainly because the frame element (beam-column) commonly used in the case of R/C build-ings is generally not amenable to modelling URM buildings. The difficulties are increased in the case of dynamic analysis where the inertia forces should not be concentrated at the diaphragm levels (which is the rule for R/C buildings). Therefore, for the study reported here, an alternative procedure was adopted for the evaluation of the economic loss in URM buildings, based on the use of capacity curves (estimated using pushover analysis) and fragility curves, wherein the probability of exceeding a cer-tain damage state is expressed in terms of spectral displacement (rather than Intensity or PGA).
The work presented herein refers mainly to sim-ple stone masonry and brick masonry buildings, with sufficiently stiff floors to provide diaphragm action, such as reinforced concrete floor slabs or vaulted floors, which are by far the most common URM building types in Thessaloniki, as well as in the rest of Greek cities (see also Penelis et al. 2002). These two main categories are further subdivided into sin-gle-storey, two-storey and three-storey buildings. More specifically, the generic structure considered followed the layout shown in figure 8 and was used for one, two, and three storey URM buildings. This layout corresponds to a typical residential building roughly satisfying the Eurocode 8 criteria for the category �simple buildings�.
Figure 8. Layout of analysed URM building type with small openings.
Two different material properties were used for all the above buildings types: Material A with com-pressive strength fwm=1.5 MPa, and Material B with fwm=3.0 MPa; for the Young�s modulus E=550fwmwas assumed throughout. The aforementioned com-binations of parameters, plus the consideration of two geometries (�large openings� and �small open-ings� as in Fig. 8) resulted in a total of 36 different building types, which were analysed using static nonlinear analysis.
The method adopted for the pushover analysis of URM buildings uses equivalent frame models and concentrated non-linearity at the ends of the struc-tural elements, with a view to simplifying this oth-erwise cumbersome (for URM buildings) procedure. The non-linearity is simulated with nonlinear rota-tional springs, whose constitutive law is defined by the moment � rotation curve of each element ac-counting for both flexure and shear (Penelis 2006).
For the development of the inelastic - curves due to flexure, standard section analysis was carried out assuming parabolic distribution of compression stresses, and compressive deformation at �failure� 0= 2� (conservative assumption). The nonlinear shear behaviour has been modelled using a Mohr�Coulomb failure criterion for the definition of shear strength and a statistical analysis of experimental re-sults for defining shear deformations (Penelis 2006). The aforementioned methodology has been incorpo-rated in a pre-processor of the commercial software package SAP2000-Inelastic (Computers & Struc-tures 2002), which allows the pushover analysis of URM buildings.
A total of 36 different pushover curves resulted from the analysis of the alternative models consid-ered; these curves, averaged per number of stories, are shown in figure 9, along with some experimental curves from the literature.
0
0.05
0.1
0.15
0.2
0.25
0.3
0.35
0 0.0005 0.001 0.0015 0.002 0.0025 0.003
Drift
2 storey3 storey1 storeyismespavia
Figure 9. Pushover curves grouped per number of storeys category, and experimental curves from the literature (Pavia and Ismes tests on two-storey buildings).
Table 5. Damage matrix (% of buildings in each DS) for Thes-saloniki 1978 data, based on economic damage index
Yield point Ultimate point BTMtype Sdy
(cm) Say(g) Sdu (cm) Sau (cm)
M1.2-1st 0.136 0.320 0.563 0.328 M1.2-2st 0.374 0.189 1.633 0.214 M1.2-3st 0.774 0.135 2.335 0.158 M3.4-1st 0.075 0.231 0.588 0.248 M3.4-2st 0.250 0.135 1.347 0.164 M3.4-3st 0.506 0.092 2.132 0.111
MEAN 0.352 0.184 1.433 0.204

125
Using the same procedure as for R/C structures (section 2.4), capacity curves have been derived for one, two, and three storey URM buildings, belong-ing to the types M1.2 (�simple stone� URM build-ings) and M3.4 (URM buildings with R/C floors). The corresponding parameters for these curves are given in Table 5. According to the RISK-UE build-ing typology matrix (Lagomarsino & Giovinazzi 2006), single-storey and two-storey buildings of the same material (stone or brick) should be grouped into a single category (M1.2L and M3.4L), which does not seem to be a sound choice, given the dis-tinctly different properties of the corresponding ca-pacity curves shown in Table 5.
3.4 Hybrid fragility curvesThe hybrid methodology described in previous sec-tions was used to calculate vulnerability (fragility) curves for URM buildings in terms of spectral dis-placement. When appropriate capacity curves are available (as is the case here), the straightforward procedure (used in HAZUS) to derive fragility curves consists in defining damage states in terms of structure displacements (typically top storey drift) and transforming these into displacements of the equivalent SDOF system, i.e. spectral displace-ments; these are then used as the mean values of the lognormal distribution defined for each damage state. The corresponding variabilities ( values) can be estimated in a way similar to that described for R/C structures (section 2.5). Instead of using semi-empirical interstorey drift values (the HAZUS ap-proach), the AUTh group (Kappos 2001, Kappos et al. 2006) has suggested expressing the damage state thresholds in terms of the basic parameters of the capacity curve (yield displacement and ultimate dis-placement, both referring to a bilinearised capacity curve); this proposal is shown in Table 6. It should be clear that, depending on the height of the building and the failure mechanism, Sdy and Sdu values vary for each building type.
Table 6. Damage states in terms of displacements, and associ-ated loss indices (%), for URM buildings
Damage State Damage state label Spectral dis-
placement
Range of loss in-dex
DS0 None <0.7Sdy 0 DS1 Slight 0.7Sdy Sd< Sdy 0-4 DS2 Moderate Sdy Sd<2Sdy 4-20 DS3 Substantial to heavy 2Sdy Sd <0.7Sdu 20-50 DS4 Very heavy 0.7Sdu Sd <Sdu
DS5 Collapse >Sdu 50-100
Although straightforward, the aforementioned pro-cedure cannot be directly integrated within the hy-brid approach. For the latter to be materialised, one possible way is to define damage states in terms of
the loss index, already employed in the case of R/C structures. Four damage states (plus the no-damage state) are proposed for URM buildings, defined ac-cording to the loss index (L) shown in Table 6; note that the range of L for each state is different from that used for R/C buildings (Table 2). To correlate these damage states to an analytical expression of damage, the loss index was expressed as a function of yield and ultimate displacement of each building as shown in figure 10; this model is based on the definitions of damage in terms of spectral displace-ment shown in the third column of Table 6, but rec-ognising that for >0.9 u, a URM building should be replaced (L=100%) rather than repaired.
Figure 10. Economic loss index in URM buildings, as a function of roof displacement.
Fragility curves were then calculated by scaling down the Thessaloniki database and scaling up the Aegion database, with scaling factors derived using the model of fig. 10. To derive the scaling factors, spectral displacements were associated with each of those two events (Thessaloniki and Aegion), calcu-lated from the recorded accelerograms in each site and the corresponding pushover curves (see fig. 9) for one, two, and three storey URM buildings, using the capacity spectrum procedure (FEMA-NIBS 2003). It is noted that the relation between scaling factors for actual loss values (cost of repair of each building in the database to corresponding replace-ment cost) in the Thessaloniki and Aegion databases is not constant for all building types, since the spec-tral displacement associated with each building type is generally different. Moreover, the Sd-based proce-dure is sensitive to the type of �representative� re-sponse spectra selected for each earthquake intensity (for instance, the recorded accelerogram used in each city is not necessarily representative of the earthquake shaking in the entire area studied).
Using the aforementioned hybrid procedure, dam-age histograms were constructed for the URM build-ing classes of interest; among these histograms, the ones corresponding to the Sd values assigned to the Thessaloniki and Aegion earthquakes consisted of actual loss values, while the rest were derived by the scaling procedure described previously. To these histograms were fitted lognormal cumulative distri-butions of the type:

126
dsddsidsds
,
dd S
Sln1SP (6)
which is similar to equation (3), only that Sd is used instead of PGA.
Figures 11 and 12 show two sets of vulnerability curves plotted against the actual data from the data-bases; as expected, for the same height, stone ma-sonry buildings show higher vulnerability than brick masonry buildings.
Figure 11. Hybrid vulnerability curves for 2-storey brick masonry building.
Figure 12. Hybrid vulnerability curves for 2-storey stone masonry building.
4 DEVELOPMENT OF EARTHQUAKE SCENARIOS
Two types of scenarios can be developed using the analytical tools presented in the previous sections. In its most rudimentary form the earthquake scenario would be simply an assumption of a uniform inten-sity for the area studied. An example of such a sce-nario, concerning the municipality of Thessaloniki (Pitilakis et al. 2004), subjected to a uniform inten-sity I=9 is shown in Fig. 13. The damage levels were estimated using the PGA-based fragility curves de-veloped for each building type as described in the previous sections; intensity and PGA were corre-
lated using appropriate empirical relationships de-rived for Greece (Koliopoulos et al. 1998), and the index plotted is a weighted one, totii VVMDF /)( ,where volume Vi of each building type is used to weigh the mean damage factor MDFi (central index in Table 2) for this type. Such maps give a good pic-ture of the most vulnerable parts of the city, regard-less of the specifics of the scenario earthquake (and local amplifications due to particular site condi-tions), and they are a useful tool in emergency plan-ning, keeping in mind that even an �accurate� sce-nario earthquake is just one possible description of the seismic risk in the considered area (i.e. vulner-able buildings not heavily struck by a specific sce-nario earthquake, might be heavily damaged by a different scenario earthquake not considered due to lack of time and/or lack of data at the time of the study).
-
0 1.500750
Meters
IMM=9
0,00-0,01
0,01-0,10
0,10-0,30
0,30 - 0,60
0,60 - 1,00
Fig. 13 Expected damage distribution for various intensities (assumed to be uniform in the studied area). A more refined approach is to consider a particular earthquake scenario in terms of PGA distribution (resulting from a scenario earthquake with given lo-cation and magnitude) in each �cell� of the studied area, taking into account ground conditions in each cell; such a PGA distribution scenario for Thessalo-niki is reported in Pitilakis et al. (2004) and was used for estimating losses using the vulnerability (fragility) functions of sections 2 and 3. The map of Fig. 14 shows the number of buildings suffering damage states DS0 to DS5 in each building block of the studied area, based on the PGA in each building block and the corresponding fragility curves for each building type (R/C or URM). After calculating the discrete probabilities of each damage state (from the fragility curve) for each building type present in a

127
block, the number of buildings suffering each dam-age state is calculated accordingly; for example, if in a block there are 4 buildings of a particular typol-ogy, and the discrete probabilities (derived by sub-tracting the values determined from the intersection points of the fragility curves and the vertical line corresponding to the given PGA) for DS0 to DS5 are, say, 6, 17, 53, 21, 2, and 1 (%), respectively, two buildings will suffer DS2, one will suffer DS3 and one DS1 (no buildings in the DS0, DS4 and DS5 categories). It is pointed out that this is only one of the possible ways of estimating the number of build-ings suffering each damage state; it is the most rea-sonable one (to the writer�s opinion), but its poten-tial drawback is that in (hypothetical) cases of very uniform distribution of PGA (or any other measure of earthquake intensity) in the studied area, damage states associated with very low probability (e.g. DS4 and DS5 in the previous example) might never ap-pear on the map of DS distribution. As seen in Fig. 14, a non-zero number of buildings exists for all damage states, including even DS5 (collapse), for the considered scenario.
-
0 1,500750
Meters
LEVEL IDamage Distribution
DS0DS1DS2DS3DS4DS5
Fig. 14 Number of buildings suffering damage states DS0 to DS5 in each building block (scenario earthquake).
A picture of the expected distribution of post-earthquake tagging of buildings using the familiar Green, Yellow, and Red tag scheme is desirable for earthquake planning purposes. The correspondence between tag colour and DS was assumed as follows:
Green: DS0 & DS1 Yellow: DS2 & DS3 Red: DS4 & DS5
Based on experience from past earthquakes it might well be argued that at least part of DS3 could go to the red tag category. The buildings in each tag category are shown in Figure 15; it is noted that the city is rather vulnerable to the considered earth-quake, as about 10% of the buildings will suffer very heavy damage or collapse; this is clearly a far more severe situation than in the 1978 earthquake when there was only one collapse of multistorey R/C building (and at that time all R/C buildings were �low-code� or �pre-code� ones) and heavy damage was observed mainly in masonry buildings.
Fig. 15 Predicted tagging of buildings in each building block Given the limitations of the procedure for assign-
ing each individual building within a block to a dis-crete damage state, it is important to map also the damage index for each block, this time as a weighted one (by volume), as discussed previously; this puts the damage distribution �into scale� in the sense that the degree of damage is now associated with the volume of the buildings (e.g. a collapsed single-storey masonry building has a smaller influence on the index than a 9-storey R/C building suffering �substantial to heavy� damage, i.e. DS3).
Last but not least, the economic loss predicted for the scenario earthquake is of particular importance, in several ways (earthquake protection and emer-gency planning, earthquake insurance). The fragility models developed by the AUTh group originate from repair cost considerations, hence it was rela-tively straightforward to use them for economic loss assessment purposes. The map of Fig. 16 shows the estimated total cost of repair required in each build-ing block, derived using the loss indices of Table 3 and assuming an average replacement cost of �700 /m2, i.e. calculating [(Vi·MDFi]· 700 in each block.
-
0 1.500750
Meters
GREEN
YELLOW
RED

128
The distribution of cost is, of course, consistent with (and conditional on) the distribution of the degree of damage. A very heavy cost of over 460 million � for the PGA-based, or 330million � for the Sd-based ap-proach is predicted for the area studied (the figure should be multiplied by about 4 for the entire mu-nicipality), again an indication of the severity of the estimated scenario earthquake.
-
0 1,500750
Meters
LEVEL IICOST (EUROx1000)
0 - 400400 - 800800 - 12001200- 20002000 - 35003500 - 7000
Fig. 16 Repair cost (in 103�) distribution in the building blocks of the studied area.
5 CONCLUSIONS
This paper has tackled a number of issues relating to vulnerability and loss assessment, with particular emphasis on the situation in S. Europe. A classifica-tion scheme that is deemed appropriate for the build-ing stock in this area has been proposed, aiming at an adequate description of the R/C buildings that currently dominate the built volume, without ne-glecting the case of URM buildings, which due to their higher vulnerability are often an important con-tributor to the future losses. The key idea of the hybrid approach to seismic vulnerability assessment is the combination of dam-age statistics (empirical data) with results from ine-lastic analysis; this is an approach that clearly differs from most other procedures, among which the well-known procedure adopted by HAZUS, wherein fra-gility curves are based directly on inelastic (static) analysis, and the only empirical component in their derivation is the definition (by judgement) of the damage state thresholds. This paper addressed both
R/C and URM buildings, and made it clear that dif-ferent analytical procedures are better suited to each case, given that URM buildings are still not very amenable to inelastic time-history analysis, which is, nevertheless, well-established for their R/C counter-parts. Despite the different type of analysis used in each case, the hybrid component was used for both types of buildings and in both cases the key empiri-cal parameter was the cost of repair of a damaged building; this is a particularly useful parameter, but reliable data are not always available on it, which means that other parameters (structural damage indi-ces) could certainly be explored within the broader frame of the hybrid approach.
The procedure used for developing R/C building fragility curves based on the use of inelastic dy-namic analysis, is the relatively more refined ap-proach (again bearing in mind the major uncertain-ties involved at all steps of the analysis), but its cost is clearly higher than that of the simpler procedure used for URM buildings, based on inelastic static analysis and the �capacity spectrum� approach.
The type of assumption made for the functional form of the fragility curve is also a key one, but the current trend world-wide seems to be towards adopt-ing the lognormal cumulative distribution function; the determination of damage medians and the vari-abilities associated with each damage state can be done using the procedures described in HAZUS, or the alternative ones suggested herein. It is noted, though, that values of the variabilities proposed in HAZUS should not be adopted blindly if the analyti-cal procedure used is not the one based on the �ca-pacity spectrum�.
Regarding the two different types of fragility curves that can be used, PGA-based curves offer a number of advantages, but also ignore, to an extent that depends on the spectral characteristics of the motions considered for deriving the fragility curves and their relationship to the characteristics of the scenario motions, the possibly lower damageability of motions with high PGA and spectra peaking over a very narrow band and/or with very short duration (both these characteristics are more or less typical in strong motions recorded in Greece). The Sd-basedcurves take into account the spectral characteristics of the motion but further research is needed in sev-eral points such as the case where the Capacity Spectrum Method does not result in a solution, or the equal displacement rule assumption is not valid.
Finally, a specific pilot application to the munici-pality of Thessaloniki was presented and the differ-ent types of scenario that can be developed using the aforementioned fragility curves were illustrated. It is within the scope of the work envisaged by the AUTh research group to improve the methodologies for as-sessing the vulnerability of both common and monumental structures, using damage information from past earthquakes in combination with nonlinear

129
analysis of carefully selected representative struc-tures.
6 ACKNOWLEDGEMENTS
Most of the work reported in this paper was carried out within the framework of two research projects, RISK-UE, funded by the European Commission, and ARISTION, funded by the General Secretariat of Research and Technology of Greece.
It should be clear from the foregoing presentation that the vulnerability studies at AUTh have been a joint effort of the writer and his colleagues, notably Prof. K. Stylianidis, and also a number of highly-motivated graduate students like G. Panagopoulos, Gr. Penelis, C. Panagiotopoulos, E. Papadopoulos, and K. Morfidis, to name just a few. The writer also wishes to acknowledge the assistance of Prof. K. Pitilakis (AUTh) for making available the data from the microzonation study of Thessaloniki carried out by his group.
7 REFERENCES
Anastasiadis, A., Raptakis, D., Pitilakis K. 2001. Thessalo-niki�s Detailed Microzoning: Subsurface Structure as basis for Site Response Analysis, Pure and Applied Geophysics,158(12): 2597-2633.
Applied Technology Council (ATC) 1985. Earthquake damage evaluation data for California (ATC-13) Appl. Technology Council, Redwood City, California.
Applied Technology Council 1996. ATC-40: Seismic evalua-tion and retrofit of concrete buildings, Rep. SSC 96-01, CSSC-ATC, Redwood City, Calif.
Athanassiadou, C., Lekidis, V., Kappos A. & Karakostas, C. 2007. Calibration of Eurocode 8 (EN1998-1) site-dependent acceleration and displacement spectra using re-cords from Greece, 4th International Conference on Earth-quake Geotechnical Engineering (Thessaloniki June 25-28, 2007) Paper No. 1192.
Barbat, A.H., Moya, F.Y., Canas, J.A., et al. 1996. Damage Scenarios Simulation for Seismic Risk Assessment in Ur-ban Zones. Earthquake Spectra 12(3): 371-394.
Bard, P.Y., et al. 1995. Seismic zonation methodology for the city of Nice-Progress report. Proceedings 3rd Intern. Conf. on Seismic Zonation (Nice, France), III: 1749-1784.
Computers and Structures Inc. 2002. SAP2000 � Version 8: In-tegrated software for structural analysis and design,Berkeley, California.
D�Ayala, D.F., Spence, R.J.S., Oliveira, C.S., & Silva, P. 1996. Vulnerability of buildings in historic town centres: A limit-state approach. 11th World Conference on Earthquake En-gineering (Acapulco, Mexico), Paper No. 864 [CD ROM Proceedings], Pergamon.
Dolce, M., Kappos, A., Masi, A., Penelis, Gr. & Vona, M. 2006. Vulnerability assessment and earthquake damage scenarios of the building stock of Potenza (Southern Italy) using italian and greek methodologies. Engineering Struc-tures 28 (3): 357-371.
Dymiotis, C., Kappos A.J., and Chryssanthopoulos, M.C. 1999. Seismic reliability of R/C frames with uncertain drift and member capacity. J. Str. Engng, ASCE, 125(9): 1038-1047.
Erdik, M., et al. 2003. Earthquake risk assessment for Istanbul metropolitan area, Earthquake Engineering and Engineer-ing Vibration 2(1): 1-23.
Faccioli E., Pessina V., Calvi, G.M., & Borzi, B. 1999. A study on damage scenarios for residential buildings in Catania city. Journal of Seismology 3(3): 327�343.
Fardis, M.N., Karantoni, F. V., and Kosmopoulos, A. 1999. Statistical evaluation of damage during the 15-6-95 Aegio Earthquake, Final Report to the Sponsor (EPPO), Patras (in Greek).
FEMA-NIBS 2003. Multi-hazard Loss Estimation Methodol-ogy - Earthquake Model: HAZUS®MH Technical Manual. Washington DC.
Kappos, A.J. 2001. Seismic vulnerability assessment of exist-ing buildings in Southern Europe, Keynote lecture, Con-vegno Nazionale �L�Ingegneria Sismica in Italia� (Po-tenza/Matera, Italy), CD ROM Proceedings
Kappos, A.J. & Dymiotis, C. 2000. DRAIN-2000: A program for the inelastic time-history and seismic reliability analysis of 2-D structures, Report No. STR/00/CD/01, Department of Civil and Offshore Engineering, Heriot-Watt University, Edinburgh, UK.
Kappos, A. J., Panagopoulos, G., Panagiotopoulos, Ch. & Penelis, Gr. 2006. A hybrid method for the vulnerability as-sessment of R/C and URM buildings. Bull. of Earthquake Engineering 4 (4): 391-413.
Kappos, A., Pitilakis, K., Morfidis, K. & Hatzinikolaou, N. 2002. Vulnerability and risk study of Volos (Greece) met-ropolitan area. 12th European Conference on Earthquake Engineering (London, UK), CD ROM Proceedings (Balkema), Paper 074.
Kappos, A.J., Stylianidis, K.C., and Michailidis, C.N. 1998a. Analytical models for brick masonry infilled R/C frames under lateral loading, Journal of Earthquake Engineering,2 (1): 59-88.
Kappos, A.J., Stylianidis, K.C., and Pitilakis, K. 1998b. Devel-opment of seismic risk scenarios based on a hybrid method of vulnerability assessment. Nat. Hazards, 17(2): 177-192.
Koliopoulos, P.K., Margaris, B.N. and Klimis, N.S. 1998. Du-ration and energy characteristics of Greek strong motion records. Journal of Earthquake Engineering 2(3): 391-417.
Lagomarsino, S. & Giovinazzi, S. 2006. Macroseismic and mechanical models for the vulnerability and damage as-sessment of current buildings, Bull. of Earthquake Engi-neering, 4 (4): 415-443.
Penelis G.G. & A.J. Kappos 1997. Earthquake-resistant Con-crete Structures. E&FN SPON (Chapman & Hall), London.
Penelis, G.G., Sarigiannis, D., Stavrakakis, E. and Stylianidis, K.C. 1989. A statistical evaluation of damage to buildings in the Thessaloniki, Greece, earthquake of June, 20, 1978. Proceedings of 9th World Conf. on Earthq. Engng. (Tokyo-Kyoto, Japan, Aug. 1988), Tokyo:Maruzen, VII:187-192.
Penelis, Gr.G. 2006. An efficient approach for pushover analy-sis of unreinforced masonry (URM) structures. Jnl of Earthquake Engineering, 10 (3): 359�379.
Penelis, Gr.G., Kappos, A.J., Stylianidis, K.C., & Lagomarsino S. 2002. Statistical assessment of the vulnerability of unre-inforced masonry buildings. International Conference Earthquake Loss Estimation and Risk Reduction, Bucha-rest, Romania.
Pitilakis, K., et al. 2004. An advanced approach to earthquake risk scenarios with applications to different European towns: Synthesis of the application to Thessaloniki city, RISK-UE Report.
Spence, R.J.S., et al. 1992. Correlation of ground motion with building damage: The definition of a new damage-based seismic intensity scale, Proceed. 10th World Conf. on Earthq. Engng. (Madrid, Spain) Balkema, Rotterdam, Vol. 1, 551-556.

130
1 INTRODUCTION
The case of earthquake forces on structures is a rather characteristic case where an action can be ex-ceptional. It is admitted that there exists a high prob-ability that the value of the seismic forces will at some time exceed the value prescribed in the design. This fact is related to the inherent uncertainty nature of the seismic action but also to incomplete or in-adequate knowledge of the structural behavior at the time of the design of the structures.
From the viewpoint of the seismology, it is well known that it is difficult to obtain exact values for the seismic actions. For example, during the past 20 years, a significant number of recorded strong mo-tion data has indicated that the characteristics of the ground motion vary significantly between recording stations. This phenomenon is magnified for stations located near the epicenter. As a result, two main re-gions with different types of ground motions can be considered, the near-source region (i.e. the region within few kilometers of either the surface rupture or the projection on the ground surface of the fault rup-ture zone) and the far-source region situated at some hundred kilometers from the source.
Unfortunately, the characteristics of the design spectra and the design methods adopted by the ma-jority of the seismic codes have been based on re-cords obtained by far-source fields and, therefore,
they are incapable to describe the seismic intensity in the near-source region. Moreover, the vertical component of the seismic action in near-source field could be greater than the horizontal ones. Also, in near-source areas, due to the very short periods of the ground motion and the pulse characteristics of the loads, the significance of higher vibration modes increases. Due to the pulse characteristics of the ac-tions, developed with great velocity and especially due to the lack of restoring forces, the ductility de-mands could be very high.
Another aspect of the seismic design whose sig-nificance has been recognized only during the last decades is connected to the ground conditions. It is now well known that the properties of the site soils affect the intensity of shaking that can be expected at the building site. Various parameters such as the thickness of the soft and stiff soil layers, the shear wave velocities of the rock and soil layers, the soil/rock impedance ratio, the layering properties of the soil layers etc. influence the amplification or at-tenuation of the seismic action on the structures. Another reason leading to exceptional accelerations on structures (i.e. accelerations greater than the de-sign ones) is connected with magnification that sometimes occurs in the short period range.
Typology of seismic motion and seismic engineering design
E. Mistakidis, University of Thessaly, GreeceR. Apostolska - Petrusevska, University Ss. Cyril and Methodius, FYR of MacedoniaD. Dubina, Politehnica University of Timisoara, Romania W. Graf, Technische Universität Dresden, GermanyG. Necevska-Cvetanovska, University Ss. Cyril and Methodius, FYR of MacedoniaP. Nogueiro, Instituto Politécnico de Bragança, Portugal S. Pannier, J.-U. Sickert, Technische Universität Dresden, Germany L. Simões da Silva, University of Coimbra, PortugalA. Stratan, Politehnica University of Timisoara, RomaniaU. Terzic, TEAC, San Ramon, USA ABSTRACT: The paper deals with the influence of the seismic motion typology on the structural response and with engineering design under exceptional actions. Various aspects of seismic motion typology that lead to exceptional actions on the structures are covered. The influence of near fault ground motions, the effect of local site parameters and the magnification of the seismic action on short-period structures are among the pa-rameters identified as dominant for the structural response. The paper presents also a methodology for han-dling uncertainty in engineering design, based on the mathematical framework of fuzzy analysis. Finally the paper presents various applications of performance based design, which is viewed as a tool as a tool for the analysis of structural behaviour under extreme seismic events. The influence of connection behaviour on the structural response is studied, and applications of the capacity design methodology and of the direct dis-placement design approach for the evaluation of reinforce concrete structures are presented.

131
The present paper, in it�s first part (sections 2-5) contributes mainly in the above mentioned topics. In Section 2, the emphasis is given to seismic motions with specific characteristics that lead to exceptional actions on structures. Near-fault ground motions and the local site parameters are examined and the latest developments in the field are presented. Section 3 deals with the modeling of the ground motion spe-cifically for the needs of the seismic analysis of structures. Section 4 studies the behaviour of struc-tures in the short period range and the corresponding magnification of the seismic action that has been ob-served. Section 5 presents in a mathematically ab-stract way the procedure that can be applied in order to handle uncertainty in structural analysis. Both the cases of uncertainty in the seismic motion parame-ters and uncertainty in the model parameters are covered.
Except of the cases identified earlier, there are also reasons more closely connected to the structural system, for which a structure might be submitted to an exceptional earthquake action. For example the behaviour of the connections in steel structures has been identified as crucial for the structural response after the Kobe and Northridge earthquakes. Simi-larly, concrete structures suffer from micro-cracks induced by relatively moderate earthquakes that in-fluence the structural response under design-level earthquakes. Also the case of rather old existing structures has to be identified as one where the seis-mic events may be exceptional due to the fact that a lot of changes have been introduced during the last years concerning the design seismic forces on struc-tures. The second part of the paper (Section 6) deals with some of the above problems using the perform-ance based design framework as a tool for the analy-sis of the structural behaviour under extreme (in the previouse sense) seismic events. Section 6.2 deals with the influence of connection behaviour on the seismic response of structures. Section 6.3 presents a capacity design methodology for the design and evaluation of the seismic resistance of reinforced concrete structures. Finally, Section 6.4 presents a direct displacement-based design approach for the design of reinforced concrete structures.
2 SEISMIC MOTION LEADING TO EXCEPTIONAL ACTIONS ON STRUCTURES
2.1 Near-fault ground motions Characteristics of ground motions recorded in the
vicinity of the seismic source can be very different from those recorded away from it.
In the case of near-field ground motions, with the distance to the fault up to 20-60 km, the azimuth of the site with respect to the hypocenter may affect
considerably the characteristics of the seismic mo-tion. The effect of forward directivity is produced when the rupture propagates towards a site and the slip takes place also towards the site (Stewart et al., 2001). Due to the fact that velocity of fault rupture is close to the shear wave velocity, an accumulation of energy is observed at the rupture front. Ground mo-tion in a site affected by forward directivity has the form of a long duration pulse. This effect is charac-teristic of the fault-normal component of the ground motion. When the rupture propagates away from the site, seismic waves arrive distributed in time. This effect is called backward directivity and is character-ised by longer duration and lower amplitudes of the seismic motion. The effect of forward and backward directivity is exemplified for the case of a strike-slip fault in Figure 2.1 (Landers 1992 earthquake).
Figure 2.1. Effect of directivity on ground velocity time his-tory, Somerville et al., 1997, in Whittaker, n.d.
Directivity effects can be present both in the case of strike-slip and dip-slip faults (Stewart et al., 2001). In the latter case, forward-directivity effects are observed near the up-dip projection of the fault plane, where characteristic pulse forms in the fault-normal direction.
Despite the fact that ground motion recordings as old as 1950's provided evidence of severe pulse-type characteristics of near-fault ground motions, only recently the importance of near-fault ground motions has been recognized (Sasani and Bertero, 2000). Earthquakes of Northridge (USA, 1994), Kobe (Ja-pan, 1995) and Chi-Chi (Taiwan, 1999) could have contributed to this by provided a wealth of near-fault strong-motion recordings.

132
Near-fault effects are still scarcely represented in design codes. Uniform Building Code (1997) pro-vides a near-fault amplification factors to be applied to the design spectrum. However, it does not change the frequency content of the design seismic action. Other seismic design codes, like Eurocode 8 (prEN 1998, 2003) ignore completely near-fault effects.
Vertical component of the ground motion is gen-erally smaller than the horizontal ones, and its ef-fects on structural response is generally ignored. However, in the near-fault regions, vertical compo-nent of the ground motion may be important (Gioncu and Mazzolani, 2002) and its influence on seismic performance of structures deserves attention. Vertical component is believed to have contributed to some brittle failure modes in steel structures dur-ing the Northridge (1994) and Kobe (1995) earth-quakes (Gioncu and Mazzolani, 2002).
2.2 Local site conditions Local site conditions have been recognized for a long time as important parameters affecting ground motion characteristics. Recordings of strong-motion vary significantly with respect to (Stewart et al., 2001):
local geotechnical conditions,possible basin effects, andsurface topography. From the above factors, local geotechnical condi-
tions were studied in most detail. Studies performed by Idriss et al. (in NEHRP 2000) show a dependence of the amplification of peak ground acceleration (PGA) by the soil layers on the intensity of the ground motion. Amplification is maximum (between 1.5 and 4.0) for small values of PGA at the base rock (0.05 - 1.0 g), and tends to decrease for ground mo-tions of larger intensities (factors close to 1.0 for values PGA at the base rock about 0.4 g). Reduced amplification of at large intensities is attributed to nonlinear soil response.
Influence of soil types on frequency content of the ground motion is presented in Figure 2.2, ac-cording to a statistical study by Seed et al., 1976 (in NEHRP 2000), based on a set of 104 accelerograms recorded in USA, Japan, and Turkey. The effect of soft soil conditions is a significant amplification of spectral accelerations in the medium and long period range (periods larger than 1 second).
Figure 2.2. Normalised acceleration response spectra for dif-ferent soil types Seed et al., 1976, in NEHRP 2000.
An example of the effect of soft soil response on the characteristics of the seismic motion is presented in Figure 2.3, for the Vrancea earthquake of 04.03.1977. Horizontal spectral acceleration is greatly amplified in the 1.0-1.5 sec period range, es-pecially for the NS component. The shear wave ve-locity in the upper 30 m for this site is VS,30=130 m/s (Ambraseys et al., n.d.), while the average shear wave velocity to the bedrock at 128 de m depth is 346.1 m/s (Lungu et al., 1998). The predominant pe-riod of vibration of the soil layers inferred from the latter value is Tp=1.48 sec, close to the range of maximum spectral value. Amplification of the ground motion by the soil layers is demonstrated by the high ratio of horizontal to vertical components of response spectra for periods around 1.5 seconds. The ratio of horizontal and vertical spectral ordinates form the basis of the Nakamura method to detect nonlinear soil response (Lacave-Lachet et al., 1998), and is based on the observation that vertical compo-nent of the ground motion is affected in a lesser ex-tent by soil characteristics than the horizontal com-ponents.
A great deal of site effects may be explained by the dynamic response of the soil layers, assuming horizontal layers and a 1-D wave propagation model. However, there are cases when this assump-tions are no longer valid, such as in the case of ba-sins (Graves, 1993, in Stewart et al., 2001). If the seismic wave enters the basin through its edge, it may be "trapped" inside the basin. The effects of multiple reflections are the amplification and in-crease of duration of the seismic motions. Modelling of these phenomena requires 2-D or 3-D analysis.

133
0 1 2 3 40
2
4
6
8
T, s
Vrancea, 04.03.1977, INCERC (B)
EWNSUP
Figure 2.3. Normalised acceleration response spectra for dif-ferent soil types Seed et al., 1976, in NEHRP 2000.
Amplification of seismic motion may be observed as well for irregular topographies, such as crest, can-yon, and slope. A description of a typical topog-raphic amplification was described by Castellani et al. 1982 (in Athanasopoulos et al., 1998).
2.3 Influence of frequency content of ground motion on inelastic structural response
Most structures are designed to earthquake forces significantly smaller than the ones corresponding to an elastic response. This procedure relies on the ob-servation that structures designed for a fraction of the force corresponding to elastic response are able to survive a major earthquake without collapse (but with important structural damage), due to capacity of the structure to deform in the inelastic range. Earthquake force reduction factors (behaviour factor q in Eurocode 8, 2003 and R factor in UBC, 1997) are used in seismic design codes in order to reduce elastic seismic demands to design ones. Code reduc-tion factors are mostly empirical, and are based on observations of past performance of different struc-tural systems (Fischinger and Fajfar, 1994).
Available ductility of the structural system has a major contribution to the force reduction factor. However, code-specified reduction factors are not based on ductility alone, but also on overstrength. Therefore, code-specified reduction factors can be expressed as:
SR R R (2.1)
where R is the ductility-related force reduction fac-tor and RS is system overstrength.
Considerable attention was paid in the past on understanding the relationship between the ductility-related force reduction factor R and ductility ,based on dynamic analysis of single degree of free-dom systems. One of the well known studies is that
of Newmark and Hall (1982), who established that R=1 for very short period systems ("equal force rule"), 2 1R for short-period structures ("equal energy rule"), and R= for medium-and long-period systems ("equal displacement rule").
Later studies recognized the strong dependence of ductility-related force reduction factors on soil type, and, more generally, on the frequency content of the ground motion (Cuesta et al., 2003). Most often, for the scope of deriving relationships between the duc-tility and ductility-related force reduction factor, fre-quency content of the ground motion is quantified by the control period TC, representing the boundary between constant acceleration and constant velocity regions of response spectra. One of the simple rela-tionships, developed by Vidic et al., 1994 and later modified by Cuesta et al., 2003 was adopted in FEMA 356 and Eurocode 8, in the context of dis-placement-based analysis procedures:
1 1 CC
C
Tfor T T
TRfor T T
(2.2)
This relationship is represented schematically in Figure 2.5, and shows that the ductility related force reduction factor (R ) decreases for systems with pe-riod of vibration lower than the control period TC.This is equivalent to saying that ground motions with control period TC larger than period of vibration of the system impose very larger ductility demands on this system.
Influence of the ratio between period of vibration of the system and the control period TC of the ground motion on the R - relationship is exempli-fied in Figure 2.4 for the NS component of the IN-CERC Bucharest record of the 4/03/1977 earth-quake. In this figure R - relationship is shown for several elastic-perfectly plastic (EPP) systems with different periods of vibration. The R - relationship from Figure 2.4 is a normalized representation of an incremental dynamic analysis (relationship between a measure of ground motion intensity and displace-ment demand). It can be observed that for systems with the initial period less than TC=1.42 sec (T=0.2,0.5 and 1.0 sec), even a small reduction of yield force (R >1) leads to a rapid increase of ductility .For SDOF periods larger than TC (T=1.5 and 2.0 sec), ductility demand in the EPP system increases at a lower rate, displacements being even lower than in the elastic system.
Though control period TC is a rather simple meas-ure of the ground motion characteristics, it is an im-portant parameter that reflects high ductility de-mands that can be imposed on structures with fundamental period of vibration lower that ground motion control period TC. Ground motions with high frequency content at relatively long periods (TC>1

134
sec) may be generated by (1) very soft soils and (2) forward directivity effect in the case of near-field ground earthquakes.
0 5 10 15 200
2
4
6
8VR77 INC NS
ElasticEPP, T=0.2EPP, T=0.5EPP, T=1EPP, T=1.5EPP, T=2
Figure 2.4. Incremental dynamic analysis for EPP systems with period of vibration between 0.2 and 2.0 sec, VR77-INC-NS re-cord.
To check these affirmations, a number of 496 components of earthquakes of magnitude between 6.5 and 7.8 from the European strong-motion data-base (Ambraseys, n.d.) were analysed (Stratan, 2003). Only the records having effective peak ground accelerations larger than 0.9 m/s2 were re-tained. The obtained ground motions were further grouped in two sets, function of their control period TC: group 1, with 0.3 TC 0.4 s, and group 2, with 1.1 TC 1.7 s. Group 1 consisted in 11 records, all motions being recorded on firm soil sites. Ground motions from the second group (10 records) were ei-ther recorded on soft sites or were located close to the fault (distance to fault less than 35 km).
In spite of the strong relationship between the value of ductility related force reduction factor and frequency content of the ground motion (quantified by the control period TC), code specified force re-duction factors R are independent of period of vibra-tion of the system and ground motion characteristics. This simplification is justified by the fact that over-strength of low-period structures is generally larger than the one of medium- and long-period structures (Fischinger and Fajfar, 1994), so that the total force reduction factor R can be considered approximately constant over the period range of most structural systems (see Figure 2.5).
However, this conclusion may not be adequate for ground motions characterized by very large val-ues of control period TC. The largest value of control period TC currently codified in Eurocode 8 (prEN 1998, 2003) is TC=0.8 seconds (for type 1 response spectrum, ground type D), which is well below the values of TC that can be generated in case of near-
fault motions or very soft soil conditions. Therefore, it may be appropriate to use smaller force reduction factors for design of structures with fundamental pe-riod of vibration smaller than the control period TCof the design earthquake.
R
R
T
R
RS1
TCFigure 2.5. Typical qualitative relationship between force re-duction factors R and RS, and period T (Fischinger and Fajfar, 1994).
A limited study on the performance of moment resisting, eccentrically braced and dual frames de-signed to Eurocode 8 under ground motions with different frequency content has been performed (Stratan, 2003). Two sets of recorded and semi-artificial accelerograms (seven records in each set) were used, with control periods of TC=0.5 and TC=1.4 seconds. Fundamental period of vibration of analysed structures ranged between 0.58 and 0.98 seconds. Significantly larger deformation demands were recorded in the case of TC=1.4 group of accel-erograms, though performance was adequate in most cases. However, other studies (Dubina and Dinu, 2007) indicated that performance of dual concentri-cally braced frames designed to Eurocode 8 and sub-jected to the NS component of the INCERC Bucha-rest record of the 4/03/1977 earthquake was inadequate at the ultimate limit state. A complete study on structures of different system and height is necessary in order to assess if code reduction factors are appropriate for ground motions with large values of control period TC.
2.4 RemarksDirectivity effects in near-fault regions and soft soil conditions are two aspects that can generate ground motions with long period pulse-type form. The ac-celeration response spectrum of this type of motions is characterized by a large value of the control pe-riod TC (limiting value between the constant accel-eration and constant velocity region of the spec-trum). While modern design codes generally recognize this effect in the case of soft soil condi-tions, it is not considered in the case of near-fault ground motions. Structures with fundamental period

135
of vibration smaller than the TC control period of the seismic motion are subjected to increased
A further issue that requires attention and further research is influence of near-fault and soft-soil ground motions on seismic performance of struc-tures with fundamental period of vibration lower than the TC control period of the ground motion. Earthquake force reduction factors valid for standard ground motions may be inappropriate in this cases.
3 MODELING OF GROUND-MOTION AND SEISMIC ANALYSIS OF STRUCTURES
Traditionally seismic design of structures is based on an elastic structural analysis under reduced seis-mic forces, accounting for the capacity of the struc-ture to respond in the inelastic range. However, nonlinear analysis methods (time-history and push-over analysis) are increasingly considered in design and especially in research in order to estimate seis-mic performance of structures.
3.1 Time history representation of ground motion An important problem when performing a nonlinear time-history analysis is selection of acceleration time histories. Design codes provide a limited amount of guidance on this subject.
Several alternatives can be used when selecting acceleration time histories. Usually the preferred one is to use recorded accelerograms. Design codes re-quire that these records are "adequately qualified with regard to the seismogenetic features of the sources and to the soil conditions appropriate to the site" (prEN 1998, 2003). The straightforward solu-tion is to use recordings at the site of interest ob-tained in past earthquakes. It is often difficult to find enough strong-motion records in available databases that would match design needs.
Closely related to recorded accelerograms are simulated accelerograms, generated through physi-cal simulation of seismic source, travel path, and lo-cal site conditions. Specialized knowledge is re-quired for generating simulated accelerograms.
A further possibility is to use artificial accelero-grams, generated so as to match the code elastic spectrum. Eurocode 8 provides a few requirements with respect to the duration of the generated time history and the compatibility between the response spectrum of the generated accelerogram and the tar-get code spectrum. Generally, artificial accelero-grams are generated using an inverse Fourier trans-form o amplitude and phase Fourier spectra.
Figure 3.1 shows an ensemble of five artificial accelerograms generated for different site-source distances, from near field (W1) to far field (W5), Chang and Kawakami, 2006. The same Fourier am-
plitude spectrum, but different phase spectra were used.
Figure 3.1. Artificial accelerograms, generated for different site-source distances, from near field (W1) to far field (W5), Chang and Kawakami, 2006.
(a) (b) Figure 3.2. Pulse types used to represent fault-normal compo-nents of near-fault ground motion by Sasani and Bertero, 2000 (a) and Alavi and Krawinkler (b).
Finally, simple pulses can be used in order to model the ground motion. A review of existing re-search in this field is available in Gioncu and Maz-zolani (2002). Synthetic pulses were used often in studies concerning seismic response of structures under near-fault ground motions. Two types of

136
pulses used to represent fault-normal components of near-fault ground motions are shown in Figure 3.2.
3.2 Pushover analysis Pushover is a nonlinear static analysis under con-stant gravity and monotonically increasing horizon-tal loading. It is described in several design codes and guidelines (prEN1998, 2003; FEMA 356, 2000) and provides an insight into the nonlinear structural response under seismic conditions. Several methods exist that estimate the target displacement corre-sponding to a given intensity of the seismic action. One of them is the N2 method (Fajfar, 2000) that is implemented in Eurocode 8 (prEN1998, 2003).
Pushover analysis is subjected to several limita-tions, due to the fact that it relies on the assumption that structural response is governed by the funda-mental mode shape, and that this shape does not change when the structure yields under increasing lateral loading. Pushover analysis is mainly applica-ble to estimating seismic demands on low-rise and medium rise structures in which inelastic demands are uniformly distributed along the height of the structure (Chopra, 2004).
In order to compensate for limitations of the sin-gle and invariant lateral load distribution, seismic demands can be obtained on the envelope of de-mands obtained under several lateral force distribu-tions. For example, Eurocode 8 (prEN 1998, 2003) requires at least two lateral force distributions ("mo-dal" and uniform).
Several improved procedures based on pushover analysis were proposed by different researchers, in order to account for influence of higher modes of vi-bration and change in distribution of lateral forces as a result of change in dynamic properties of the struc-ture as a result of yielding. A review of different en-hanced pushover procedures developed recently are available in Chopra (2004), and Kalkan and Kunnath (2006).
One group of procedures is based on adaptive load patterns, which change at each step of pushover analysis in order to reflect changing in dynamic properties of the structure as a result of yielding. A second group of enhanced procedures is based on modal combination of several pushover analyses with invariant lateral force distributions. While these enhanced procedures eliminate drawbacks of stan-dard pushover procedure, and represent significant advancements of the pushover analysis, their com-plexity makes it difficult to be implemented in prac-tice.
3.3 Conceptual design associated with seismic motion typology
One of the crucial decisions influencing the building structure to withstand earthquakes is the basic plane
shape and configuration. In some extent seismic de-sign codes contain provisions related to building regularity, both in plane and in elevation, and con-figuration principles related to structural typologies. However, there are two general requests which must be achieved in order to resist severe earthquakes (Bertero, 1997):
Building structure should be provided with bal-anced stiffness and strength between its mem-bers, connections and supports; Overall conception and detailing should provide the structure with balanced overstrength and duc-tility of its members and connections in order to possess an enhanced redundancy characterized by the largest number of defense lines against seis-mic action. Different structures may respond differently to
different type of ground motion. Some structural ty-pologies are more sensitive to particular type of mo-tion (pulse, repeated pulses, long duration). In the light of the two previous basic principles, and in or-der to optimize structural response, the conceptual design of a given structure must always take into ac-count for the specific feature of the possible ground motion.
4 MAGNIFICATION OF SEISMIC ACTION ON SHORT PERIOD STRUCTURES
This objective of this section is to study the seismic behaviour of structures in the short period range. The study is performed using a nonlinear SDOF oscilator subjected to various ground motions recorded in Greece. In order to cover various structural typologies, different force-displacement models are used. The study compares the results of the various nonlinear analyses performed with the formulas given in FEMA356 for the estimation of the target displacement using the Displacement Coefficient Method (DCM).
4.1 Strong motion data For the purposes of this study various strong motion data recorded at Greek sites were used. The records used here were selected from a database of about 220 earthquakes recorded in Greece in the period between 1980 and 1999 having a magnitude
> 4.4LM in the Richter scale and a > 0.1PGA g . The records are summarized in Table 4.1.
The characteristic period gT of each ground motion was estimated according to engineering judgment to correspond approximately to the period at which the

137
transition occurs between the constant acceleration and the constant velocity spectrum and at the same time as the lowest period at which the equal-displacement rule holds.
Nu Code Station ML
PGA (g)
Tg
(sec)1 ARGO183-1 Argostoli 6.5 0.171 0.35 2 ATHENS-2 Chanandri 5.9 0.159 0.33
3 S-3 KEDE 5.9 0.302 0.5 4 ATHENS-4 GYS 5.9 0.121 0.45
5 ARGO183-7 Argostoli 5.7 0.192 0.55 6 188-4 Zante 5.5 0.170 0.375 7 L186-1 Kalamata 5.5 0.273 0.3
8 EDE190-1 Edessa 5.4 0.101 0.4 9 RGO183-8 Argostoli 5.1 0.305 0.4 10 PAT393-2 Patras 5.1 0.401 0.35
11 LEF194-1 Lefkas 5.1 0.136 0.4 12 KYP187-1 Kyparissia 5.0 0.127 0.25
13 RGO192-1 Argostolo 5.0 0.204 0.35 14 PYR193-8 Pyrgos 5.0 0.165 0.5 15 L286-2 Kalamata 4.8 0.263 0.5
16 LEF188-2 Lefkas 4.5 0.245 0.3 17 R183-3 Ierissos 4.4 0.178 0.5
Table 4.1 Summary of the motion used in the analysis
4.2 Force-displacement models The choice of a force-displacement model influences the response time-history and the associated peak response quantities. In order to cover a range of typical structures the following three models were selected, which correspond to different structural characteristics (see Fig. 4.1):
Type A: an elastoplastic model having a positive post-yield to elastic stiffness ratio of 5%. This type of behaviour is an ideal one and is studied here for reference reasons.Type B: a stiffness degrading model with positive post-yield stiffness. This type of behaviour represents wall systems dominated by flexural response, something typical for rather new buildings in Greek territory, dimensioned according to the capacity design principles. The post-yield stiffness was selected to be 5% of the elastic stiffness. Type C: a stiffness degrading model with negative post-yield stiffness. This behaviour is a mode typical in wall systems that exhibit some degradation in response with increasing displacement. Degradation may be due to relatively brittle response modes. This is a behaviour typical for rather old buildings in the Greek territory made of masonry, where the strength is reduced for increasing displacements.
The negative post-yield stiffness was selected to be 10% of the elastic stiffness.
F
F
F
a)
b)
c)
Figure 4.1. The considered force-displacement models
4.3 Dynamic analyses In the sequel, a time history dynamic analysis was performed on the oscillators corresponding to the models presented earlier. The oscillators were subjected to the 17 ground motions presented in Table 4.1. Two types of analyses were performed. A. Constant ductility analyses, where the displacement ductility of the structure was considered as constant and the response of the structure was obtained in terms of different strength reduction factors R . Five different constant ductility levels were considered corresponding to values of
equal to 1,2,4,6 and 8. For this reason, oscillators were established such as to achieve 20 initial periods of vibration from =T 0.1 to =T 2.0 sec. At these periods the necessary strength yF to obtain design displacement ductilities of 1,2,4,6 and 8 were obtained for each force-displacement model and for each of the ground motions.

138
Constant strength reduction factor analyses, where the strength reduction factor of the elastoplastic structure was considered as constant and the response of the oscillator was obtained in terms of different levels of the ratio between the peak displacement response of the nonlinear oscillator to the respective one for the linear oscillator. Four different constant strength reduction levels were considered with values of R equal to 2,3,4 and 5. For this reason, oscillators were established such as to achieve 40 initial frequencies of vibration from
=0.01 to =10. At these frequencies the necessary displacement ductility to obtain strength reduction factors of 1,2,3,4 and 5 were obtained for each force-displacement model and for each of the ground motions. It must be pointed out that the actual value of the peak displacement response does not affect directly the results of this study because the oscillator strengths are determined relative to the peak ground acceleration in order to obtain specified displacement ductility demands.
4.4 Results of the dynamic analyses
In the evaluation procedure the attention is given in the estimation of the peak displacement response. It is expected that an acceptable procedure would estimate the peak displacement response of a nonlinear system within acceptable limits of accuracy. For this reason in the figures presented in the following, the ratio /n ed d (referred also in the following as the displacement aplification factor) is studied where:
nd is the peak displacement response of the nonlinear oscillator and
ed is the peak displacement response of an elastic oscillator having stiffness equal to the initial stiffness of the nonlinear oscillator.
The parameters presented in the figures are: The displacement ductility The strength reduction factor R which is defined as the ratio of the elastic strength F to inelastic strength yF .
Figures 4.2 to 4.5 correspond to the first group of conducted analyses, where the displacement ductility was considered as constant. Fig.4.2 depicts the ratio between the peak displacement response of the nonlinear Model-A to the peak displacement response of an elastic oscillator having the same initial period, for 4 . The solid line represents the mean values obtained by the 17 ground motions.
Despite the wide scattering, the mean values seam to follow some rules, i.e. after a characteristic period of about 0.4-0.6 sec, the mean values are close to 1. The divergence from this value increases as the period decreases. Also, the increase of the displacement ductility leads to significant larger mean values in this period range. Similar are the results for Models B and C but for the sake of brevity are not presented here.
Model A - Displacement ductility =4
0.0
0.5
1.0
1.5
2.0
2.5
3.0
3.5
0.0 0.5 1.0 1.5 2.0T (sec)
dn / de
1. ARGO183-1 2. ATHENS-23. ATHENS-3 4. ATHENS-45. ARGO183-7 6. 188-47. L186-1 8. EDE190-19. RGO183-8 10. PAT393-211. LEF194-1 12. KYP187-113. RGO192-1 14. PYR193-815. L286-2 16. LEF188-217. IER183-3 Mean
Figure 4.2 Displacement amplification ratio with respect to the period for Model-A ( 4 ).
The analysis results are summarized in the diagrams of Figures 4.3 to 4.5 that depict the mean values and the standard deviation of the results for the three models and for various displacement ductility levels. Notice that although the mean values are close to 1 after a period of 0.4-0.6 sec, the values of the standard deviation differ very much, depending on the displacement ductility level. For =2 the standard deviation takes a rather constant value of 0.2 for all the models considered in this analysis. But, as the displacement ductility increases the values of the standard deviation increase, especially in the short periods range. Also, the standard deviation values seem to be larger in the case of Model-C. Notice also that the mean values for large period systems tend to be somewhat smaller than 1 for Models A and B. That means that the peak displacement response of the nonlinear systems is smaller than the one of the respective linear systems, or equivalently, the response of the linear systems overestimate the response of the nonlinear ones. On the contrary, especially for larger values of the displacement ductility, the results tend to be bigger than 1 for Model-C.

139
Mean values, del A
0.0
0.5
1.0
1.5
2.0
2.5
3.0
3.5
0 0.5 1 1.5 2T (sec)
=2=4=6=8
Standard deviation, del A
0
0.2
0.4
0.6
0.8
1
1.2
1.4
0 0.5 1 1.5 2T (sec)
=2=4=6=8
Figure 4.3 Mean values and standard deviation of the dis-placement amplification factor with respect to the period T for various displacement ductility levels for Model-A.
Mean values, del B
0.0
0.5
1.0
1.5
2.0
2.5
3.0
3.5
0 0.5 1 1.5 2T (sec)
=2=4=6=8
Standard deviation, Model B
0
0.2
0.4
0.6
0.8
1
1.2
1.4
0 0.5 1 1.5 2T (sec)
=2=4=6=8
Figure 4.4 Mean values and standard deviation of the dis-placement amplification factor with respect to the period T for various displacement ductility levels for Model-B.
Mean values, del C
0.0
0.5
1.0
1.5
2.0
2.5
3.0
3.5
4.0
4.5
0 0.5 1 1.5 2
T (sec)
=2=4=6=8
Standard deviation, Model C
0
0.2
0.4
0.6
0.8
1
1.2
1.4
1.6
0 0.2 0.4 0.6 0.8 1 1.2 1.4 1.6 1.8 2
T (sec)
=2=4=6=8
Figure 4.5 Mean values and standard deviation of the dis-placement amplification factor with respect to the period T for various displacement ductility levels for Model-C.
Figures 4.6 to 4.9 correspond to the second group of conducted analyses, where the strength reduction factor was considered as constant. Fig. 4.6 depicts the ratio between the peak displacement response of the nonlinear Model-A to the peak displacement response of an elastic oscillator having the same initial period, for increasing frequency values, for
4R . The obtained values are close to 1 until a characteristic frequency of about 2.5. After this frequency value, the results vary and a great scattering appears. The solid line represents again the mean values of the obtained results. The mean values after the characteristic frequency increase for larger values of R .
Model A - Strength reduction factor R=4
0
2
4
6
8
10
12
14
16
18
20
0 2 4 6 8 10Frequency
dn / de
1. ARGO183-1 2. ATHENS-23. ATHENS-3 4. ATHENS-45. ARGO183-7 6. 188-47. L186-1 8. EDE190-19. RGO183-8 10. PAT393-211. LEF194-1 12. KYP187-113. RGO192-1 14. PYR193-815. L286-2 16. LEF188-217. IER183-3 Mean
Figure 4.6 Displacement amplification ratio with respect to the frequency for Model-A ( 4)R

140
Similar are the results for Model-B, while com-pletely different are the results obtained for Model-C. This model exhibits a negative post-yield stiff-ness. These models are sensitive to collapse, where collapse is defined as the point at which displace-ment is large enough that the force resisted by the oscillator tends to zero. Totally, from the 1700 oscil-lators considered (17 ground motions x 20 frequency values x 5 R -levels) a number of 692 collapsed.
The analysis results are summarized in the diagrams of Figures 4.7 to 4.9 that depict the mean values and the standard deviations of the results for the three models and for various levels of the strength reduction factor. The mean values are close to 1 until a frequency of about 2.5 for all levels of R .After this frequency, the mean values increase, depending mainly on R . The values of the standard deviation increase analogously, indicating the great scattering in the ranges of large frequencies. It is again pointed out that the results for Model-C are not representative and are presented only for the sake of completeness.
Mean Values, Model A
0.0
0.5
1.0
1.5
2.0
2.5
0 2 4 6 8 10Frequency
R=2R=3R=4R=5R=6
Standard deviation, Model A
0
1
2
3
4
5
6
7
8
0 2 4 6 8 10Frequency
R=2R=3R=4R=5R=6
Figure 4.7 Mean values and standard deviation of the dis-placement amplification factor with respect to the frequency ,for various values of the strength reduction factor (Model-A)
Mean values, Model B
0
1
2
3
4
5
6
7
8
9
0 2 4 6 8 10Frequency
R=2R=3R=4R=5R=6
Standard deviation, Model B
0
1
2
3
4
5
6
7
8
0 2 4 6 8 10Frequency
R=2R=3R=4R=5R=6
Figure 4.8 Mean values and standard deviation of the dis-placement amplification factor with respect to the frequency ,for various values of the strength reduction factor (Model-B)
Mean values, Model C
0
0.5
1
1.5
2
2.5
0 2 4 6 8 10
Frequency
R=2R=3R=4R=5R=6
Standard deviation, Model C
0
0.2
0.4
0.6
0.8
1
1.2
1.4
1.6
1.8
2
0 2 4 6 8 10Frequency
R=2R=3R=4R=5R=6
Figure 4.9 Mean values and standard deviation of the dis-placement amplification factor with respect to the frequency ,for various values of the strength reduction factor (Model-C)

141
In Fig. 4.10 the displacement amplification factor is depicted for increasing frequency. Each diagram corresponds to different level of the strength reduction factor and contains the mean values obtained for the three models and also the plot of the results obtained by applying the formulas of the Displacement Coefficient Method (DCM) as presented in FEMA356 for 2 =T 0.4.
R=2
0
0.5
1
1.5
2
2.5
3
3.5
4
0 1 2 3 4 5 6 7 8 9 10Frequency
DCM, T2=0. 4
MODEL-A
MODEL-B
PROPOSITI ON
R=4
0
1
2
3
4
5
6
7
8
0 1 2 3 4 5 6 7 8 9 10Frequency
DCM, T2=0. 4
MODEL-A
MODEL-B
PROPOSITI ON
R=6
0
1
2
3
4
5
6
7
8
9
0 1 2 3 4 5 6 7 8 9 10Frequency
DCM, T2=0.4
MODEL-A
MODEL-B
PROPOSITION
Figure 4.10 Comparison of the results for models A and B with those of DCM These diagrams actually depict the ability of the coefficient 1C of DCM to describe the �mean� behaviour of inelastic systems. For low frequencies ( < 2.5) it seems that the value of 1C is reliable. This remarks is also confirmed by the rather low values of standard deviation obtained in this frequency range. For larger frequency values, there is a strong dependence of the response of the nonlinear systems on the strength reduction factor
R . Although the values of 1C increase with R , it seems that the mean values inrease with a larger rate with R . Therefore, it seems that 1C cannot capture the inelastic response of systems with large Rvalues.
For this reason, a new formula is proposed for the determination of 1C
1
( 1)( / 1)= 1
2gR T T
C for 0.1 gT T (4.1)
For 2R the above formula gives the same results as the one used for the calculation of coefficient 1Cin FEMA356. However, for 2R the proposed for-mula approximates in a better way the results ob-tained by various analyzed oscillators. It must be no-ticed however, that the above study focuses only on a small part of the problem because all the seismic records have a characteristic period of 0.3 - 0.55 sec. That means, that from the above study, no conclu-sions can be drawn for the behaviour of systems ex-ited by ground motions on soft soils.
5 UNCERTAINTY IN EARTHQUAKE ASSESSMENT AND SIMULATION
5.1 Conceptual treatment of uncertainty in seismic analysis � introduction of the notion of fuzzy quantities and fuzzy analysis
5.1.1 Classification of uncertaintyNumerical simulations of structures under earth-
quake loads demand reliable input data as well as analysis models close to reality. In general data and models are uncertain which has a significant influ-ence for the results of the analysis. Therefore the un-certainty has to be described with suitable models and considered within the analysis.
Several kinds of uncertainty are distinguishable depending on the reason of origin. If a random result of an experiment under identical boundary condi-tions may be observed almost indefinitely, the un-certainty can be considered as stochastic. This sto-chastic uncertainty is described with methods of probability theory. In contrast to this a deficit of in-formation results if the boundary conditions are sub-jected to (apparently) arbitrary fluctuations, if a sys-tem overview is incomplete or if only a small number of observations are available. This uncer-tainty is referred to as informal uncertainty. If the uncertainty is quantified by linguistic variables, transformed onto a numerical scale, lexical uncer-tainty is present.
The reason of uncertainty assigns their character-

142
istic. Stochastic uncertainty is associated with the uncertainty characteristic randomness quantified mathematically with the aid of random variables. In-formal and lexical uncertainty is described with the uncertainty characteristic fuzziness dealt on the basis of fuzzy set theory. The uncertainty characteristic fuzzy randomness occurs in the case of informally or lexically uncertain statistic inference. The uncer-tainty is then described mathematically on the basis of the theory of fuzzy random variables (Möller & Beer 2004). Randomness, fuzziness and fuzzy ran-domness may occur as both data uncertainty and model uncertainty. In the case that an uncertain vari-able depends on time and spatial coordinates random functions, fuzzy functions and fuzzy random func-tions are introduced.
For conventional investigations of the loading case earthquake only sparsely information about the earthquake loads exists. Specifying the measure in-tensity as an interval a classification of seismic zones is available. Each zone is characterized by a dedicated effective acceleration. The spectrum form is independent of intensity.
Additional information can be obtained under consideration of all phases of the earthquake proc-ess, from the origin and propagation until the trans-mission from underground to the structure. The re-gional specific (zones) and the endangering specific, reflecting the frequency response and the amplitude behavior for endangering levels, can be mathemati-cally quantified with fuzzy quantities. Relevant seismic centers in the environment and the distance dependent decrement of the spectral amplitude are uncertain. Geological conditions, (e.g., stratigraphic sequence, intensification and damping effects) and the registration of cyclic characters (e.g., strong earthquake duration) contain further uncertainty. Precisely because these information about the vari-ables summarized above are not available in a suffi-cient extent, the formulation of fuzzy quantities is reasonable. The consideration of uncertainty in structural analysis improves the results. A gradual evaluation becomes possible.
In the following informal and lexical uncertainty with the uncertainty characteristic fuzziness is con-sidered. The uncertainty is described and quantified on the basis of fuzzy set theory with the aid of as-sessed intervals. Utilized the latter for seismic struc-tural analysis deficits of information describing in-put variables as well as human mistakes and mistakes in fabrication, utilization and maintenance of structures may be considered. Subjective effects and assessments of structural parameters described in an applicable mathematical manner influence the results of structural analysis.
The procedures to consider fuzziness in structural analysis are subdivided into fuzzification, fuzzy structural analysis and evaluation of fuzzy results. Fuzzification is the quantification of informal and
lexical uncertainty by means of fuzzy quantities. Thereby the fuzziness of the uncertain physical structural parameters is described mathematical.
5.1.2 Fuzzy quantities Fuzzy quantities x represent the results of fuzzifica-tion on the basis of the fuzzy set theory. Thereby the classical set theory which provides binary assess-ment to crisp conditions is extended to permit grad-ual assessment of the membership of elements in re-lation to a set. This is described with the aid of a membership function.
The membership function (x) is denoted as stan-dardized, if the maximum functional value is equal to one. If (x) monotonically decreases on each side of the maximum value the fuzzy quantity x is re-ferred to as convex (Figure 5.1).
Figure 5.1 Fuzzy quantity x , convex and not convex
A fuzzy number is a convex, standardized fuzzy quantity whose membership function is at least seg-mentally continuous and has the functional value
(x) = 1 at precisely one of the x values. In exten-sion to this, a fuzzy interval has an interval [x1, x2]whereby all elements of [x1, x2] possess the mem-bership (x) = 1.
From the fuzzy quantity crisp sets {x |k
A Xk}x may be extracted for real numbers k
(0, 1]. These crisp sets are called -level sets (Figure5.2). All -level sets are crisp subsets of the support.
Figure 5.2 Support and -level sets
For several fuzzy quantities 1 nx , , x on the fundamental sets 1 n, ,X X the Cartesian productcan be determined. Thereby the product space
1 nX X X is formed, whose coordinate axes are perpendicular to one another. The Cartesian product K comprises all combinations of elements
1 nx , , x of the 1 nx , , x . The membership values

143
K K 1 nx x , , x of each n-tuple 1 nx , , x is determined with the aid of the mini-
mum operator K ii 1, , nx min x . The Carte-
sian product K thus represents a n-dimensional fuzzy set in the product space X with the member-ship value K x .
Determining K interaction between fuzzy quanti-ties can be considered. Interaction is defined as be-ing the mutual dependency of fuzzy quantities. An interactive relationship may be formulated directly (explicitly) or indirectly (implicitly). Directly formu-lated interactions are a priori given by means of functions which define constrains in the product space X . These functions can be defined for several
-levels differently. Against this, indirect formu-lated interaction occurs within the mapping of fuzzy quantities 1 nx , , x onto fuzzy quantities
1 mz , , z . If several ix affect different results jzsimultaneously, these jz are not longer independent of each other, i.e., interaction exists between them. The mapping model determines the functional rela-tionship of this interaction.
To specify the membership function a general al-gorithm is not available. The obtained membership functions represent a subjective assessment reflect-ing actual facts. It is reasonable selecting simple functions to describe the membership function (x),e.g., linear or polygonal. Therefore, fuzzy triangular numbers T 1 2 3x x , x , x are frequently used which are determined by specifying the smallest and the largest value x1 and x3 (interval bounds of the support) as well as the value x2 belonging to (x2) = 1. Also linguistic variables can be utilized. Thereby, the term set T is mapped onto the fundamental set Xincluding the physically relevant numerical elements x X . For example, the set T may comprise the terms very low, low, medium, high, and very high,which could assess the consequence of structural failure due to an earthquake.
If the fluctuation of an uncertain parameter de-pends on time or spatially coordinates, fuzzy func-tions may be defined. A fuzzy function of the form x t is the result of the uncertain mapping of the fundamental set nT onto the set F X of fuzzy quantities x belonging to the fundamental set X. In earthquake analysis the multidimensional fundamen-tal set T may generally contain arbitrary coordi-nates beside the time and the spatial coordinates
. The values of , and are combined in the vector t , , . Thereby t represents a vector in the parameter space nT .
A frequently more efficient definition is given by
the fuzzy bunch parameter representation of the fuzzy function x t .
Therebys1 ns s , , s is the vector of fuzzy
bunch parameters. To the components s1 ns , , s of s -discretization is applied. The -
level sets s1, n ,, ,S S result which are combined
by means of the cartesian product. In that way they form the ns-dimensional crisp subspace S for each
. Analyzing elements js S one obtains a crisp set of real-valued functions which is referred to as
-function set
Any arbitrary function jx s , t contained in tX is a trajectory of the fuzzy function on the
level . In the case that all bunch parameters are fuzzy numbers, the trajectory for = 1 is referred to as trend function. Based on the -discretization the fuzzy function x t is described as a set of -function sets tX with the assigned membership value tX = . Furthermore, each of these -function sets tX represents an assessed bunch of real-valued functions.
5.1.3 Fuzzy analysis The analysis with certain (or uncertain) algorithms and with fuzzy quantities as input and model pa-rameters is referred to as fuzzy analysis. Depending on the problem focused the fuzzy analysis is also re-ferred to as fuzzy structural analysis or fuzzy earth-quake analysis. The results of fuzzy analyses are also fuzzy quantities jz . They depend on n fuzzy in-put variables ix and p fuzzy model variables rm .
Therefore,1) all elements x out of the space of fuzzy in-
put variables x have to be transformed into the space of fuzzy result variables z and
2) the membership functions (z) have to be determined.
The transformation x to z according to 1) is realized with the aid of the mapping z = f(x). f(.) represents the deterministic model M of the fuzzy analysis. Fuzzy model variables rm are included in the model
M leading to an uncertain mapping f M . In the analysis algorithm they are considered just like the fuzzy input variables ix .
The determination of membership values (zj) of the elements zj of the fuzzy result variables jz ac-cording to 2) is feasible with several methods. The extension principle in combination with the Carte-sian product of uncertain sets utilizes the max-min-operator. The application demands the discretization of the fuzzy input variables ix in almost indefinitely points along the xi-axes. This leads to numerical problems frequently. Therefore a method is required, which discretizes the axis of the membership values
j j
j j j
x t x s, t x s , t , x s , t
s s; x s , t s

144
- in contrast to the extension principle - and which does not presume special requirements of the map-ping like linearity or monotonicity. The developed method, called -level-optimization, substitutes the max-min-operator of the extension principle, see Möller et al. 2000.
Thereby the concept of -discretization is adopted. All fuzzy input variables are discretized us-ing the same number of -levels k. For a certain kthe -level sets
ki,A form the crisp subspace k
X bymeans of the Cartesian product. With the mapping
1 nz f x , , x elements of the -level set kj,B
of jz may be computed on k. The mapping of all elements of
kX yields the crisp subspace
kZ
k k1, m,B B . Once the largest element and the smallest element of
kj,B have been found, two points of the membership function jz are known. Repeating this for a sufficient large number of k the functions jz are completely described in the case of convex fuzzy result variables.
In search of the largest element and the smallest element of each
kj,B the -level-optimization re-quires the repeated solution of an optimization prob-lem using general performance functions. A sophis-ticated optimization algorithm has to be efficiently, robustly and reliably. Because standard optimization algorithms are limited in application, a combination of evolution strategy, gradient method and Monte Carlo methods was developed as an agreement. This optimization method is referred to as modified evo-lution strategy.
When the mapping is stepwise applied, the inter-active dependencies between intermediate results must be considered. Nonobservance of this interak-tion leads to the defect that, starting from the inter-mediatre results, nonpermissible parameter combina-tions are generated and processed forward. Thereby additional, artificial uncertainty is introduced into mapping in each step (Möller & Beer 2004).
For mapping M any analysis algorithm can be applied. For example in structural mechanics geo-metrically and physically nonlinear fuzzy equations of motion:
T
T
M v D , v, d v
K , v, d v P
M fuzzy mass matrix D fuzzy damping matrix
K tan gential fuzzy P incremental fuzzyload vectorstiffness matrix
v incremental fuzzydisplacemant vector
time d discrete damage indicatorrepresent the basis to compute displacements and further fuzzy result variables, e.g., stresses (Möller
et al. 2004). They can be solved by means of the fuzzy finite element method (Möller et al. 2001).
Evaluations of the fuzzy result variables are car-ried out e.g. with the aid of defuzzification. Further, the fuzzy results including all computed determinis-tic points 1 nz f x , , x are utilized for a new structural design method based on clustering (Möller & Beer 2004).
5.2 Example: evaluation of the seismic response of a concrete frame
The concrete frame of Fig. 5.3 is considered that corresponds to an existing structure. The measure-ments obtained for the material properties of this structure gave the fuzzy number of Fig.5.4 for the steel and the concrete respectively. The beams of this system are loaded with a dead load of 30.0 kN/m and a live load of 15.0 kN/m. The structure is located in a seismic zone with the following charac-teristics: Spectral acceleration: 0.16g, Soil type: B, Effective damping: 5%, Importance factor: 1.00, Foundation factor: 1.00.
6.006.00 6.00
Figure 5.3 Seismic design of a concrete frame
In order to perform the elastoplastic analysis the following data are used.
The amount of the upper (resp. lower) rein-forcement of the beam cross section is equal to 8.0cm2 (resp. 4.0cm2).The total amount of the column longitudinal re-inforcement is equal to 20.24cm2 and it is uni-formly distributed along the perimeter of the col-umn.

145
The objective is the determination of the struc-tural response, which is expressed by the capacity curve and the value of the top-level horizontal dis-placement. It is expected that the variability in the material properties will result to different capacity curves. The structural calculations are performed us-ing elastoplastic analysis and the seismic displace-ment is calculated according to the recommenda-tions of FEMA356.
Fig. 5.5 presents the �fuzzy� capacity curve ob-tained by applying the -level-optimization algo-rithm. The vertical axis gives the ratio between the horizontal (H) and the vertical (V) loads applied on the structure. The various expected points of maxi-mum seismic displacement are denoted with a box on these diagrams.
1.00
0.75
0.50
0.0
0.25
1.00
0.50
0.25
0.75
0.0
Steel yield stress (Mpa)350 400 450
Concrete compressive strength (Mpa)13 16 19
Figure 5.4 Fuzzy numbers for the steel yield stress and for the concrete compressive strength.
0.400
0.300
0.200
0.1000.100
0.200
0.300
0.400
0.000
0.400
0.300
0.200
0.100
H/V
Displacement (m)
Elastic Point
"Fuzzy" capacity curve
Figure 5.5 The obtained �fuzzy� capacity curve
The diagram of Fig. 5.6 is the fuzzy number of the top horizontal displacement. It is noticed that al-though the input parameters were triangular fuzzy numbers, the output parameters are not. This hap-pens due to the strong nonlinearities involved in the static analysis. However, it is interesting to notice that although the ratio between the upper and lower values of the steel yield stress (resp. the concrete compressive strength) is equal to 1.29 (resp. 1.46), the ratio between the upper and lower value of the displacement is equal to 1.15, i.e. the variation of the output parameter is lower than that of the input pa-rameters.
0.25
0.0
1.00
0.50
0.75
12 1513 14Horizontal displacement (cm)
Figure 5.6 The obtained fuzzy number for the top-horizontal displacement

146
6 PERFORMANCE BASED EARTHQUAKE ENGINEERING AS A TOOL FOR THE STUDY AND EVALUATION OF THE STRUCTURAL RESPONSE
6.1 IntroductionExceptional seismic events are not only the result of uncertainty of the seismic motion, as was already clearly stated in the introduction. The nonlinear dy-namic response of the structure also constitutes a crucial aspect that may result in exceptional conse-quences. This naturally reflects the complexity of the problem and the lag that still exists between standard engineering practice and the sophisticated and time-consuming approaches that would be re-quired to narrow down the uncertainty associated with the currently accepted reliability targets. Additionally, the built environment spans a few cen-turies and consequently exhibits a large scatter in terms of its compliance with current safety levels with respect to seismic actions that adds a third source of exceptionality.
Performance-based design is nowadays becoming the standard design methodology for the design of structures. This is a direct consequence of great theoretical and numerical advances in structural analysis, coupled with a higher �statistically� confi-dence in the characterization of design actions.
Following the discussion of nonlinear analysis methods in section 3 and the specific response of short-period structures of section 4, sub-section 6.2 highlights the relevant role of the connections in the seismic response of structures. An application of the influence of an exceptional seismic event is also il-lustrated. Section 6.3 and 6.4 present a capacity de-sign methodology and a direct displacement-based design approach for the design and evaluation of the seismic resistance of reinforced concrete structures.
6.2 Influence of connection behaviour on the seismic response of structures The behaviour of steel or composite joints under seismic loading provides a good exemplification of the issues discussed in the previous sub-section. Usually, seismic events provoke relatively high am-plitudes of rotation in the joint area, so that steel re-peatedly reaches the plastic range and the joint fails after a relatively small number of cycles. For static monotonic situations it is nowadays possi-ble to accurately predict the moment-rotation re-sponse of a fairly wide range of joint configurations by applying the principles of the component method (Eurocode 3, 2005; Jaspart, 2000). However, this is still not the case for the cyclic situation. In this case,
the usual approach is to develop multi-parameter mathematical expressions that are able to reproduce the range of hysteretic behaviours for a given group of steel joint typologies. Subsequently, the values of the parameters are calibrated to satisfactorily corre-late to a range of section sizes for a given group of joint typologies.
Mazzolani (1988) developed a comprehensive model based on the Ramberg-Osgood expressions that was able to simulate the pinching effect, later modified by Simões et al. (2001) to allow for pinching to start in the unloading zone. The Richard-Abbott expres-sion was first applied to the cyclic behaviour of joints by De Martino et al. (1984). Unfortunately, that implementation was not able to simulate the pinching effect (Simões et al., 2001). Subsequently, Della Corte et al. (2000) proposed a new model, also based on the Richard-Abbott expressions, that was capable of overcoming this limitation and simulate the pinching effect, as well as strength and stiffness deterioration and the hardening effects. Since the mid 1980�s, several research projects on the cyclic behaviour of steel joints were undertaken in various research centres, comprising a total num-ber of 39 research projects and 216 individual ex-perimental tests. In general, the objective of these cyclic tests was the study of the seismic performance of the joints, following the observation of failures resulting from the Kobe and Northridge seismic events.
6.2.1 The influence of pinching The influence of pinching is crucial in the estab-lishment of the model parameters. For the end-plate joints, this is clearly noticeable and it is necessary to establish whether pinching is likely to occur. Its in-fluence is illustrated using three steel structures, two plane frames and a three dimensional structure. The first structure is a low rise office building with four spans and two floors, the second structure has two spans and five floors, and finally the third is a 3D structure, with four by five spans and eight floors, using both non-linear static and dynamic analyses. The mathematical model consists of beam elements, for the beams and columns, and of joint elements, to model the non-linear behaviour of the connections. The numerical studies were performed with the SeismoStruct program (Seismosoft 2004), which has a specific joint element to model the connections. For this element several parameters have to be de-fined to characterize all non-linear hysteretic behav-iour (Nogueiro et al. 2005). For the 3D structure the floor diaphragms are as-sumed to be rigid in the horizontal plane. For this structure the study was performed only for the strong axis direction. For all structures a 2% damp-ing coefficient was considered. The first 2-D struc-

147
ture, herein called E-2x4-2D is a low rise office building, with four spans and two floors, as can be seen in the Figure 6.1.
7.50m 7.50m7.50m 7.50mFigure 6.1. Geometry of the structure E-2x4-2D. The connections considered to this structure present the hysteretic behaviour of Figures 6.2 and 6.3, re-spectively for external E9 and internal E11 connec-tions.
Figure 6.2. Hysteretic curve for external E9 connection.
Figure 6.3. Hysteretic curve for internal E11 connection
The second structure studied, E-5x2-2D, (Della Corte et al. 2000), is also a 2D structure, with two spans and five floors, as can be seen in Figure 6.4. The behaviour of the connections was idealised, ac-cording to the JB1-3A connection (Bursi et al. 2002) and the corresponding parameters are presented in (Nogueiro et al. 2005).
5.80msec
m/se c2
sec
m/sec22m/sec
sec 5.80mFigure 6.4. Geometry of the structure E-5x2-2D
The third structure, E-4x5x8-3D, is three dimen-sional with four by five spans and eight floors, as represented in Figures 6.5 and 6.6. It corresponds to a real structure existing in Cardington, England, modified to match Eurocode 8 requirements for Por-tugal (Nogueiro et al, 2005).
Figure 6.5. Three- dimensional view of E-4x5x8-3D.
The structures were designed according to Euro-code 8 for a soil type B (medium soil) response spectrum, for a given design q factor (reduction fac-tor) and assuming a given ductility class. Linear dy-namic analyses of the structures were carried out, and the design action effects were calculated adding the gravity and the seismic effects divided by the as-sumed q factor.

148
C1 C1 C1
C2 C2 C2 C2 C3
Earthquake direction
X
C2
C2
C22
1
3
4
C1
C3
305 165 40 UB (S275)
356 171 51 UB (S355)
C2
C1
C2
C2C1
9.0 m9.0 m9.0 m9.0 m9.0 mC3
A
C2
B
C1C1 C1
C1 C1
C2
C
C2
D
C2
C2
C2
C2
F
C3C2
E9.0 m9.0 m9.0 m9.0 m9.0 m 9.0 m9.0 m9.0 m9.0 m9.0 m9.0 m 9.0 m
Y
C2 305 305 137 UC base to 4º floor / 254 254 89 UC 4º floor to the roofC1 305 305 198 UC base to 2º floor/ 305 305 137 UC 2º floor 5º floor / 254 254 89 UC 5º floor to the roof
All the columns are in steel S355C3 254 254 89 UC
356 171 51 UB (S355)
305 165 40 UB (S275)
Figure 6.6. Plan of one inter storey.
In the design procedure dead and live loads were considered and the seismic action was represented by the acceleration response spectrum (Nogueiro et al, 2006). For the non-linear dynamic analyses the designed structures have to be subjected to, at least, three accelerograms (#1, #2 and #3), compatible with soil type B response spectrum (Eurocode 8 2003). A large number of accelerograms compatible with the target response spectrum were generated. The three having the best fit to the target response spectrum were chosen. These accelerograms are dif-ferent from real earthquake records, given that their target response spectrum is a smooth one. Anyway, they are in accordance with the seismic action that was assumed for design purposes and which is the one considered as most likely to occur, mainly in the range of periods between 0.2 T1 and T1 as it is speci-fied in the Eurocode 8 (T1 represents the fundamen-tal period). Figure 6.7 presents the three response spectra corresponding to the three chosen accelero-grams together with the target (Eurocode 8) re-sponse spectrum. Figure 6.8 illustrates one of the ac-celerograms chosen.
Figure 6.7. Elastic response spectra, = 2 %.
For the non-linear dynamic analyses, three com-binations of loads were considered, one for each ac-celerogram. The 3D structure was subjected only to
seismic action acting in X-direction, as can be seen in Figure 6.6.
Figure 6.8. Artificial accelerogram.
The seismic assessment of three steel structures is performed by means of non-linear static analyses (the N2 method (Fajfar, 2000) was adopted) and the results obtained are compared with the ones ob-tained with non-linear dynamic analysis. The Seis-moStruct program (Seismosoft, 2004) was used for all the numerical studies. Some conclusions could be reached regarding the non-linear static analysis, the structures and the results obtained:
- It is observed a good agreement between the nonlinear static and dynamic analyses, in particular in terms of the horizontal displacements and inter-storey drifts results;
- The first structure studied (E-2x4-2D) needs to be redesigned or retrofitted; as the seismic demands values are above the correspondent capacity values, however, it is noted that the reference seismic event exhibit an extreme value of peak ground accelera-tion (0.45g), 50% in excess of the usual reference earthquake for Portugal.
- The other two structures, E-5x2-2D and E-4x5x8-3D, exhibit overstrength, considering the horizontal displacements values and the maximum rotation values at the connections;
- The model to simulate the hysteretic connection behaviour for the non-linear dynamic analysis pre-sents good results;
- The N2 method seems to be a conservative de-sign procedure, when compared with the dynamic analysis.
Table 6.1 presents the maximum rotation in the connections analysed, for the several methods. For structure E-2x4-2D, where the horizontal top dis-placements are almost the same, the rotations are larger in the dynamic analysis. The monotonic method does not include the effect of pinching, and damage of strength and stiffness. In the second structure, where the horizontal top displacements, in the N2 method are larger than in the dynamic analy-sis, the rotation in the J231E/J4 connection is almost the same, and finally, in the third structure, where the horizontal top displacement in monotonic method is significantly larger than in dynamic analy-

149
sis, it is showed that in J53EF/J-X610 connection the rotation is smaller for the dynamic analysis, as expected. It can be concluded that, for study of the behaviour of the connections, the monotonic meth-ods have some limitations, because they give insuf-ficient hysteretic information.
Table 6.1. Maximum rotation in the analysed connections.
Connections rot. (mrad) dynamic
rot. (mrad) N2 (uniform)
rot. (mrad) N2 (modal)
E 9,15 48.0 27.6 30.2 E11,7 46.3 30.4 33.3
J231E/J4 15.7 13.9 15.8 J53EF/J-X610 8.8 16.9 20.3
6.2.2 Comparative effect of extreme event For a steel structure with 8 stories, the influence of the connections simulated with semi-rigid behaviour and partial strength are compared with rigid behav-iour and fully strength, for an extreme seismic event, for the Portuguese territory, using a pushover analy-sis. The structure chosen can be observed in Figure 6.9. The columns and beams are, respectively HEA320 and IPE260 sections. Two analyses were performed, one considering the connections semi-rigid with the real behaviour and other one consider-ing the connections totally rigid with full strength.
9.0m 6.0m
Ground Floor
Floor 1
Floor 2
Floor 4
Floor 3
Floor 6
Floor 5
Floor 7
Floor 8 6.0m
Figure 6.9. Geometric definition of the structure
Figure 6.10. Typical connection.
The results were obtained using the N2 method (Fa-jfar 2000) and are presented in terms of horizontal displacements, inter-storey drifts and rotations at the connections. The spectrum is graphically repre-sented in ADRS format (Acceleration Displacement Response Spectrum), Figure 6.11, where the accel-eration spectral values are defined as a function of the spectral displacement values. It represents an ex-treme event for Portugal, which means two times of the maximum spectral values for seismic type 2.
0
5
10
15
20
25
0,00 0,10 0,20 0,30 0,40 0,50 0,60 0,70Sd [m]
Sa [m/s2]
Espectro EC8 0,5 g
Figure 6.11. Response Spectrum in ADRS format, = 2%.
After defining of the action, it is needed to calculate the eigenvalues to assess the dynamic properties of the structure. These properties are important to transform the real structure in an equivalent simple degree of freedom system (SDOF), because the ac-tion it was defined by mean of response spectrum for a SDOF system, as it was presented. The capacity curve of the real structure, found it by means of that lateral load pattern (that can be uniform, triangular or a modal distribution) must be transformed of equivalent SDOF system. In Figures 6.12 and 6.13 the capacity curve for the equivalent SDOF can be observed, respectively for the structure with semi-rigid connections and rigid connections, and the re-spective bi-linearization.
0
100
200
300
400
500
600
700
800
900
1000
0,00 0,20 0,40 0,60 0,80 1,00Top Disp.* [m]
V* [KN]
Figure 6.12. Structural Capacity Curve with semi-rigid connec-tions.

150
0
200
400
600
800
1000
1200
1400
1600
1800
2000
0,00 0,20 0,40 0,60 0,80 1,00Top Disp.* [m]
V* [KN]
Figure 6.13. Structural Capacity Curve with rigid connections.
The bi-linearization curve must be put into the re-sponse spectrum (seismic action) and determine the target displacement, which represents the maximum top displacement for the actions considered. This procedure can be seen in Figures 6.14 and 6.15, re-spectively for the structure with semi-rigid and rigid connections. In the case of the first structure the be-haviour it is clearly non linear, while in the second the structural behaviour remains elastic.
0
2
4
6
8
10
12
14
16
18
0,00 0,10 0,20 0,30 0,40 0,50 0,60 0,70Sd [m]
Sa [m/s2]
Espectro EC8 0,50 gBilinear
Figure 6.14. Target displacement for the structure with semi-rigid connections.
0
2
4
6
8
10
12
14
16
18
0,00 0,10 0,20 0,30 0,40 0,50 0,60 0,70Sd [m]
Sa [m/s2]
Espectro EC8 0,50 gBilinear
Figure 6.15. Target displacement for the structure with rigid connections. If the real structures were reloaded until the target displacements, the maximum horizontal displace-ments (Figure 6.16) and the inter-storey drifts (Fig-ure 6.17) illustrate the differences between both
simulation, and the influence of the semi-rigid con-nection behaviour.
0
1
2
3
4
5
6
7
8
0 100 200 300 400 500 600Maximum horizontal displacement (mm)
Semi Rigid Connections
Rigid Connections
Figure 6.16. Maximum horizontal displacements.
0
1
2
3
4
5
6
7
8
0 1 2 3 4inter storey drifts (%)
Semi Rigid Connections
Ridid Connections
Figure 6.17. Inter storey drifts.
Despite the magnitude of the seismic event, the maximum horizontal displacement reached for the structure with semi-rigid connection was 55 cm, lower than 2,5% of the total height of the building and the rotation of the connection more stressed was approximately 22 mrad, which represent values lower than the ultimate strength values (Figure 6.18).
0
100
200
300
400
0 5 10 15 20 25Rotation (mrad)
Figure 6.18. Bending-moment rotation for the most stressed connection.

151
6.3 Capacity design methodology for design and evaluation of seismic resistance of RC building structures
The Institute of Earthquake Engineering and Engi-neering Seismology, IZIIS in Skopje has developed a methodology and a corresponding package of com-puter programmes, RESIST-INELA for design of new and evaluation of seismic resistance of existing R/C building structures. The methodology is itera-tive until defining optimal structural system. The methodology incorporates the latest knowledge gathered in our country and the worldwide experi-ence from the field of earthquake engineering: de-termination of strength and deformability character-istics of buildings, on one hand, and definition of the nonlinear behaviour of the structure for a given earthquake, on the other hand. This methodology has been used for design of a great number (more than 150) R/C building structures constructed in the ter-ritory of the city of Skopje.
6.3.1 Philosophy of capacity design Procedures for the application of capacity design to ductile structures, which may be subjected to large earthquakes, have been developed primarily in New Zealand over the last 20 years.
The main idea of this method is to predetermine places at which the occurrence of nonlinear defor-mations shall be dictated. These critical parts, the so called plastic hinges, are designed and processed separately to enable those places dissipate the total energy. It is desirable that all the inelastic deforma-tions be due to bending, which with the provided previous and necessary conditions, corresponds to ductile behaviour of the structure.
Also, sufficient bearing capacity is provided for the remaining parts of the structure in order that they remain in the elastic range of behaviour during the whole earthquake action so that there is no need for their ductility.
6.3.2 Method for design and seismic evaluation of RC buildings developed at IZIIS, Skopje
The definition of a method for design and evaluation of the seismic resistance of R/C building structures is a wide and complex problem. One hand, it is nec-essary to carry out the most possible realistic defini-tion of the structural system capacity, in terms of strength and deformability capacity of the system, and on the other hand, after having selected the ex-pected earthquake effect on a given site, in terms of intensity, frequency content and time duration, to predict as realistically as possible the nonlinear be-haviour of the structure, and on the basis of these re-sults to define the earthquake, i.e., the seismic force or the acceleration that would cause damage to structural elements and the integral structural sys-tem.
For this purpose, it is necessary to develop a clear and concise procedure that will enable a fast and simple way for coming to the desired results. As a result of the analytical studies, carried out at IZIIS, Skopje, a method and a corresponding package of computer programs RESIST-INELA, (Necevska-Cvetanovska, 1999) have been developed for a fast and simple evaluation of the seismic resistance of the newly designed and existing reinforced concrete buildings of small and moderate number of stories. The developed method is "capacity based" and in-corporates the latest knowledge gathered in our country and the world experience from the broad fields of the earthquake engineering.
The method for evaluation of the seismic resis-tance of RC buildings, developed at IZIIS, consists in the following five steps: 1 Definition of the structural system of the building
and determination of the quantity and quality of the built-in material.
2 Determination of the Q- diagram for each ele-ment, separately, and the storey Q- diagrams (RESIST-computer program).
3 Definition of the seismic parameters and the de-sign criteria.
4 Nonlinear dynamic analysis of the structural sys-tem for a given earthquake effect (INELA- com-puter program).
5 Evaluation of the seismic resistance for the given structure.
6.3.2.1 First step The initial step for evaluation of the seismic resis-tance of a building is the definition of the structural system of the building as well as the quantity and the quality of the built-in material. The main informa-tion on the building, such as the structural type, number of stories, kind, quantity and quality of built-in material can be obtained from the design documentation for the considered building. For older buildings, it is possible that no design docu-mentation is available. In such a case, the building is inspected for an in situ determination of the quan-tity and the quality of the built-in material. Elastic analysis of the structure is carried out under defined vertical loads and seismic forces.
Using a special data file, the quantity and the quality of the used steel reinforcement for each structural element cross sections (columns, walls and beams) are entered.
6.3.2.2 Second step The strength and deformability characteristics of each structural element of the building are defined applying the RESIST computer program, by which, starting with the elastic analysis of the structure and the known quantity and quality of the built-in rein-forcement and the achieved compressive strength of the concrete in all the cross sections of the elements

152
(columns, beams and walls), for each storey ele-ment, separately, it is possible to obtain the yield displacement y, the shear force at yielding Qy, the maximum displacement u, the shear force at maxi-mum displacement Qu. At the same time, the shear strength of each element of the building is deter-mined taking into consideration that no shear failure of the element occurs. Summarizing Q- diagrams for each element at given level, storey Q- diagrams are obtained which represent the basis for further-nonlinear dynamic analysis of the building.
6.3.2.3 Third step On the basis of the actual and the local site proper-ties, applying probability methods, evaluation of the seismic hazard parameters is carried out according to which expected maximum ground accelerations for 50, 100, 200 and 500 year return periods are pos-sible to be defined.
6.3.2.4 Fourth step Nonlinear dynamic analysis of the structure mod-elled by lumped masses at floor levels for a given earthquake effect is performed. The application of different hysteretic models depending on the struc-tural type and obtaining responses for a large num-ber of ground acceleration time histories, with dif-ferent frequency content and duration is possible for relatively short time and with the satisfactory accu-racy.
6.3.2.5 Fifth step The results obtained in the fourth step (relative sto-rey drifts) are entered in the storey Q- diagrams, i.e., in the Q- diagrams for each structural element, from where is obvious which earthquake record and intensity can cause the occurrence of initial cracks, yielding and even failure of the structural elements of the building. The evaluation of the seismic resis-tance of the considered building can be defined by comparison of the nonlinear response "require-ments" of the building to the given earthquake effect with the ultimate "capacity" of the building. The best indicator for these "requirements" and "capacity" is displacement.
6.3.2.6 Application of methodology on existing building B-2,Unit 4,"Vardar" settlement, Skopje The 8 storey building is situated in Vardar settle-ment, (Simeonov et al. 1993) with previously de-fined seismic parameters as follows: maximum ground accelerations of 0.28g and 0.40g for the de-sign and the maximum level. The structural system of the building consists of bearing RC frames in both directions (Fig. 6.19).
Figure 6.19 Characteristic plan of building structure.
Presented for the structure are the results from the design according to national regulations, (SP-81), EC8, (Eurocode 8, 1994) and the analysis performed by RESIST-INELA methodology, (Necevska-Cvetanovska & Gjorgjievska, 1998), (Fig. 6.20).
X-X direction
0 200 400 600 800 1000
1
2
3
4
5
6
7
8
Seismic forces [kN]
IZIISEC-8SP- 81
Y-Y direction
0 500 1000 1500
1
2
3
4
5
6
7
8
Seismic forces [kN]
IZIISEC-8SP- 81
Figure 6.20 Seismic forces obtained according to SP-81, EC8 and IZIIS methodology.
Based on the adopted reinforcement, the bearing capacity and dynamic response of the structure

153
proportioned by these three different forces was defined, (Necevska-Cvetanovska & Petrusevska, 1996, 2000).
Tables 6.2 and 6.3 as well as Figure 6.21 show required displacement and ductility for the building designed according to SP-81, EC8 and IZIIS meth-odology for the Ulcinj (Albatros) earthquake of 0.4 g.
Table 6.2. Required displacements [cm], x-x direction. Storey SP-81 EC8 IZIIS8 0.76 1.08 1.327 1.10 1.11 1.34 6 1.51 1.37 1.48 5 1.77 1.52 1.59 4 1.83 1.53 1.55 3 2.05 1.54 1.47 2 1.76 1.44 1.31 1 1.31 1.10 1.06
Table 6.3. Required displacements [cm], y-y direction. Storey SP-81 EC8 IZIIS8 0.51 1.01 1.577 0.78 1.04 1.44 6 1.16 1.29 1.56 5 1.52 1.49 1.70 4 1.73 1.55 1.74 3 1.77 1.52 1.63 2 1.47 1.26 1.35 1 1.33 1.09 1.30
012345678
0 1 2 3 4 5 6Required ductility
EC8 SP-81 IZIIS
Figure 6.21 Required ductility, x-x direction.
6.4 Direct displacement-based design approach for design of RC frame building structures
Modern trends in earthquake engineering show that there is a common consensus that the new design methodologies should be performance-based. Most of the currently used performance-based procedures are essentially force-based, with the addition of a displacement check to ensure that acceptable per-formance levels are achieved in the design earth-quake. Displacement-based design procedure en-ables structures to be designed in way to respond in the design-level earthquake to specified displace-ment limits, corresponding to acceptable damage limit states. A direct displacement-based procedure for seismic design of RC building structures is pre-sented. This design procedure uses the Substitute
Structure Approach. Based on the defined target dis-placement, the base shear demand is calculated and a structural design to resists this demand is performed. The next step is application of the capacity design approach and checking of the structural behaviour by nonlinear static analysis. The design is corrected, if necessary.
6.4.1 Direct displacement-based design The brief overview of the history of seismic design shows that the main design criteria in all the seismic regulations are those referring to strength, i.e., force. The huge economic losses from the recent earth-quakes show that the current design methodologies fall short of realizing the goals and the objectives of the earthquake resistant design philosophy. Modern earthquake engineering increasingly points to the adequacy of displacement as a design parameter.
An alternative design procedure known as dis-placement-based design has been developed that at-tempts to recognize deficiencies in the current force-based approaches. Displacement-based seismic de-sign is defined broadly as any seismic design method in which displacement-related quantities are used directly to judge performance acceptability. In the recent years, numerous displacement-based methods have been proposed. Some of them can be considered as true displacement-based methods, of-ten named �direct displacement-based�, while the other are still �force-based/displacement-check� methods, although named displacement-based. The most developed and the most important method in the field of direct displacement-based design of RC building structures is the Priestley�s method, (Priestley, 2000, 2002).Priestley�s direct displacement-based design, (DDBD) characterizes the structure by secant stiff-ness Ke at maximum displacement d, (Fig. 6.22) and a level of equivalent viscous damping appropri-ate to the hysteretic energy absorbed during inelastic response. The approach used to characterize the structure is based on the �substitute structure� analy-sis procedure , (Shibata & Sozen, 1976).
With the design displacement d determined and the damping estimated from the expected ductility demand, the effective period Te at maximum dis-placement response can be read from a set of design displacement spectra, as shown in Fig. 6.22(d). Rep-resenting the structure (Fig. 6.22(a)) as an equivalent SDOF oscillator, the effective stiffness Ke at maxi-mum response displacement can be found by invert-ing the equation for the natural period of the SDOF oscillator, namely:
e
ee K
MT 2 (6.1)
to provide

154
2
24
e
ee T
mK (6.2)
where me is the effective mass.
From Figure 6.22(b), the design shear force at maximum response is:
deb KV (1.3)
Figure 6.22 Fundamentals of Direct Displacement � Based De-sign, (Priestley, 2000, 2002).
6.4.2 Application of DDBD approach � Design ex-ample
In order to determine the effort needed for direct displacement-based design of a RC frame building, an example structure is designed using the Priestley�s method (Priestley, 2000, 2002) with mi-nor changes that do not affect the essence of the original. Later, an example structure is analyzed us-ing a nonlinear static procedure, (Terzic, 2006).
The example structure is a 7 storey RC frame building. In order to simplify the calculations, it is assumed to be symmetric in both directions, where-fore the design and the analyzes are performed for one direction only. The building is square 25x25 m in plan with 5 m beam spans. Each storey has the same height of 3 m. The columns are assumed to be 60x60 cm for the first three stories, and 50x50 cm for the upper stories. All beams are assumed to be 30 cm wide and 50 cm deep, and in the calculations, they are treated as T or L beams, considering that a 20 cm deep slab is acting as a beam flange. For the purpose of the design, it is adopted that the compres-sive strength of concrete is fc=35 MPa, and the re-inforcement yield stress is fy=400 MPa. The layout of the structure is given on Figure 6.23.
Figure 6.23 Cross-section of the example structure. The flowchart of the method is given in Figure 6.24.
Figure 6.24 Flowchart of the applied method, (Priestley, 2000, 2002).
The design process consists of two parts: the first part in which the base shear force for each perform-ance limit state is derived, (Table 6.4) and the sec-ond part in which that force is distributed over the structure and the required reinforcement is calcu-lated, (Necevska-Cvetanovska&Petrusevska, 2000).

155
Table 6.4 Design results Earthquake y d d y
(%) (%) (m) (m) 20%/50 years 0.01 0.01 0.139 0.15 0.92 3.81 10%/50 years 0.01 0.02 0.278 0.15 1.85 12.94 2%/50 years 0.01 0.04 0.555 0.15 3.70 19.40
Table 6.4 Design results - continued Earthquake me Te Ke VB (kg) (s) (kN/m) (kN) 20%/50 years 3704984 2.65 20828.32 2890.59 10%/50 years 3704984 6.01 4049.46 1123.98 2%/50 years 3704984 6.50 3461.94 1921.81
In order to compare the capacity of the structure with the design demand, Static Nonlinear Analysis according to FEMA 356, (ASCE, 2000) was per-formed using the SAP 2000 software, (Wilson & Habibullah, 1998). Each beam was modeled with a plastic hinge at both ends. The columns were con-sidered to behave linearly except at the base where plastic hinges were expected to occur. Same distri-bution of base shear was used as for the design. Gravity load consisting of dead and 50% of live load was applied on the structure prior to the pushover and the P- effect was considered.
Different structural performance levels of plastic hinges are defined by FEMA 356 recommendations, but in order to achieve realistic performance of the structure, plastic hinges are modeled according to load-deformation relations obtained by analysis of each cross section using cross section analysis soft-ware XTRACT, (Imbsen Software Systems) rather than according to prescribed and extremely conser-vative relations given in FEMA document. Plastic hinge is considered to achieve Immediate Occu-pancy performance level when reinforcement yield-ing starts or concrete strains reach 0.003. Life Safety is associated with beginning of spalling of rein-forcement cover and Collapse Prevention with sig-nificant strength degradation.
The results of the pushover analysis are presented in Tables 6.5 and 6.6 and Figure 6.25.
Table 6.5 Analysis results for target drifts (DDBD)
Earthquake Drift Percentages of members achieving state
(%) IO LS CP 20%/50 years 0.42 39 0 0 10%/50 years 0.61 66 0 0 2%/50 years 1.43 100 0 0
Table 6.6 Analysis results for target drifts (EC8)
Earthquake Drift Percentages of members achieving state
(%) IO LS CP 20%/50 years 0.39 2 0 0
10%/50 years 0.66 61 0 0 2%/50 years 1.25 100 0 0
20%/50 year EC10%/50 year EC
2%/50 year EC
20%/50 year DDBD10%/50 year DDBD
2%/50 year DDBD
0500
100015002000250030003500400045005000550060006500
0.00 0.10 0.20 0.30 0.40 0.50 0.60 0.70 0.80 0.90 1.00 1.10
Displacement (m)
Figure 6.25 Pushover curves for building designed according to DDBD and EC8.
6.4.3 RemarksSeismic resistant design has radically been modi-fied in recent years, by changing its philosophy from �strength� to �performance�. Most of the currently used performance � based procedures are essentially force-based, with addition of displace-ment check to ensure that acceptable performance levels are achieved in the design earthquake. Displacement-based design, as an alternative ap-proach is based on design to achieve a specified strain or drift performance level under a specified seismic intensity. The approach should result in uniform levels of seismic risk and in more consis-tent designs than force-based design criteria. The initial design parameter of displacement-based design is target displacement. Strength and stiffness are a result of the design procedure and are depend-ent on the target displacement chosen. Nevertheless predicting target drift or yield displacement is not that simple, as it might seem at first. Direct displacement-based design, in every sense, coincides with actual structural behavior. It is, therefore, realistic to expect that this approach will soon find its place in most advanced building codes and that this philosophy of structural de-sign will, in not so far future, replace currently established design procedure.In order to determine the effort needed for direct displacement-based design of a RC frame build-ing, an example structure is designed using this method and latter analyzed using a nonlinear static procedure. It is concluded that, from the as-pect of drift, the structure behaves satisfactorily, meaning that the target drifts for different hazard levels are smaller than the demand drifts.
7 CONCLUSIONS
The paper presented various ways in which the seismic action may be exceptional for structures. Pa-

156
rameters related to the ground motion were exam-ined as well as parameters more closely related to the structure itself. Also, a mathematical framework based on fuzzy analysis was introduced allowing the consideration of the various uncertainties and their effects to the structural response. Finally, applica-tions of the performance based engineering (PBE) were presented. In these applications PBE was used as a tool for the study of the influence of various pa-rameters to the structural response and also for the evaluation and design of structures. It should be no-ticed that PBE can be used as a tool to adapt the "supply" of the structure (considering in this respect any particularities that it might have) to the specific "demand" of the motion, according to the impor-tance of the building and the desired safety level.
REFERENCES
Ambraseys, N., Smit, P., Berardi, R., Rinaldis, R., Cotton, F., Berge-Thierry, C. (n.d.) "Internet-Site for European Strong-Motion Data", accesat în martie 2003 de la http://www.isesd.cv.ic.ac.uk/ESD/frameset.htm
Athanasopoulos, G.A., Pelekis, P.C., Leonidou, E.A. (1998). "Effects of surface topography and soil conditions on the seismic ground response - including liquefaction - in the Egion (Greece) 15/6/1995 earthquake". 11th European Conference on Earthquake Engineering, Balkema, Rotter-dam.
Bertero, V.V. (1997). "Earthquake Engineering" in Structural Engineering Slide Library, Golden W.G. (ed.), The Univer-sity of Berkeley, California, USA.
Chang, H-Y. and Kawakami, H. (2006). "Effects of ground motion parameters and cyclic degradation behaviour on collapse response of steel moment-resisting frames". Jour-nal of Structural Engineering, Vol. 132, no. 10, pages 2553-1562.
Chopra, A.K. (2004). "Estimating seismic demands for per-formance-based engineering of buildings". 13th World Conf. on Earthquake Engineering, Vancouver, B.C., Can-ada. Paper no. 5007.
Cuesta, I., Aschheim, M.A., Fajfar, P., (2003). "Simplified R-Factor Relationships for Strong Ground Motions". Earth-quake Spectra, Volume 19, No. 1, pages 25�45.
De Martino, A., Faella, C. and Mazzolani, F.M. (1984). Simu-lation of Beam-to-Column Joint Behaviour under Cyclic Loads. Construzioni Metalliche 6, 346-356.
Della Corte, G., De Matteis, G. and Landolfo, R. (2000). Influ-ence of Connection Modelling on Seismic Response of Moment Resisting Steel Frames. In: Mazzolani F.M., (ed.). Moment resistant connections of steel buildings frames in seismic areas, E. & F.N. Spon, London.
Dubina, D. and Dinu, F. (2007). "High strength steel for seis-mic resistant building frames". Proc. of the 6th Int. Conf. on Steel and Aluminium Structures, 24-27 July 2007, Ox-ford, UK (in print).
Eurocode 8: 1994. Design Provisions for Earthquake Resis-tance of Structures, part 1-1, 1-2, 1-3. 1994.
Fajfar, P. (2000). "A nonlinear analysis method for perform-ance-based seismic design". Earthquake Spectra, 16(3): 573-92.
FEMA 356, (2000). "Prestandard and commentary for the seismic rehabilitation of buildings", Federal Emergency Management Agency, Washington (DC).
FEMA 356. 2000. Prestandard and comentary for the seismic rehabilitation of buildings. ASCE. November, 2000.
Fischinger, M., and Fajfar., P., (1994). "Seismic force reduc-tion factors". in Earthquake Engineering. A. Rutenberg (editor), Balkema, pp.279-296.
Gioncu, V., and Mazzolani, F.M. (2002). "Ductility of Seismic Resistant Steel Structures". Spon Press, London and New York.
Jaspart, J.P. (2000). General Report: Session on Connections. Journal of Constructional Steel Research 55, 69-89.
Lalkan, S.M. and Kunnath, S.K. (2006). "Adaptive modal combination procedure for nonlinear static analysis of building structure". Journal of Structural Engineering, Vol. 132, No. 11, pages 1721-1731.
Lacave-Lachet, N., Bard, P.Y., Gariel, J.C., Irikura, K. (1998). "Straightforward methods to detect non-linear response of the soil. Application to the recordings of the Kobe earth-quake (Japan, 1995)". 11th European Conference on Earth-quake Engineering. Balkema, Rotterdam.
Lungu, D., Aldea, A., Nedelcu, C., Cornea, T., (1998). "Use of the GIS technology for microzonation of the frequency content and effective peak values of soil response to earth-quakes" 11th European Conference on Earthquake Engi-neering, Balkema, Rotterdam.
Mazzolani, F.M. (1988). Mathematical model for semi-rigid joints under cyclic loads. In R. Bjorhovde et al. (eds) Con-nections in Steel Structurs: Behaviour, Strength and De-sign, Elsevier Applied Science Publishers, London, 112-120.
Möller, B. & Beer, M. 2004. Fuzzy Randomness - Uncertainty in Civil Engineering and Computational Mechanics. Berlin, Heidelberg: Springer.
Möller, B., Beer, M., Graf, W. & Sickert, J.-U. 2001. Fuzzy Finite Element Method and its Application. In: W.A. Wall, K.-U. Bletzinger & K. Schweizerhof (eds) Trends in Com-putational Structural Mechanics, Colloquium: 529-538. Barcelona: CIMNE.
Möller, B., Graf, W. & Beer, M. 2000. Fuzzy structural analy-sis using -level optimization. Computational Mechanics26: 547-565.
Möller, B., Graf, W. & Nguyen, S. H. 2004. Modeling the life-cycle of a structure using fuzzy processes. Intern. Journal of Computer-Aided Civil and Infrastructure Engineering19: 157-169.
Necevska-Cvetanovska, G. & Petrusevska, R. 1996. Non Lin-ear Analysis of RC Structures using Computer Program INELA with Included Bank of Hysteretic Models. ThirdEuropean Conference on Structural Dynamics, EURODYN '96 : 515-522. Florence. Italy.
Necevska-Cvetanovska, G. & Gjorgjievska, E. 1998. "Appli-cation of the "capacity design" approach in design of earth-quake resistant buildings in accordance with Eurocode 8", Proceedings of XI ECEE, Paris, France.
Necevska � Cvetanovska, G. 1999. "A Method for Evaluation of the Seismic Resistance of R/C Building Structures", ASPPRA' 99, Taipei, Taiwan, feb.1-3, 1999, pp.426-435
Necevska � Cvetanovska, G. & Petrusevska, R., 2000. "Meth-odology for Seismic Design of R/C Building Structures", Proc. of the XII-th World Conference of Earthquake Engi-neering, (12WCEE), New Zealand.
NEHRP 2000. Building Seismic Safety Council, BSSC (2001). "NEHRP Recommended Provisions for Seismic Regula-tions for New Buildings and Other Structures, Part 1 � Provisions and Part 2 � Commentary". Federal Emergency Management Agency, Washington D.C.
Newmark, N., Hall, W., (1982). "Earthquake Spectra and De-sign", Earthquake Engineering Research Institute (EERI), Oakland, CA
Nogueiro, P., Simões da Silva, L., Bento, R., Simões, R. 2005.Numerical Implementation and Calibration of a Hysteretic Model with Pinching for the Cyclic Response of Steel and

157
Composite Joints. in Fourth International Conference on Advanced in Steel Structures ICASS 05. Shangai, China.
Nogueiro, P., Simões da Silva, L., Bento, R., Simões, R. 2005.Influence of Joint Slippage on the Seismic Response of Steel Frames. In EuroSteel Conference on Steel and Com-posite Structures, 8 to 10 June in Maastricht, The Neder-lands.
Nogueiro, P., Bento, R. and Simões da Silva, L., �Evaluation of the ductility demand in partial strength steel structures in seismic areas using static pushover analyses�, in Proceed-ings of the XIth International Conference Metal Structures,Rzeszow, Poland, June 21-23 (2006).
Nogueiro, P., Simões da Silva, L., Bento, R. and Simões, R., �Numerical implementation and calibration of a hysteretic model with pinching for the cyclic response of steel joints", International Journal of Advanced Steel Construction, - (in print 2006).
EN 1998 (2005). "Eurocode 8: Design of structures for earth-quake resistance. Part 1: General rules, seismic actions and rules for buildings". CEN - European Committee for Stan-dardization.
Priestley, M.J.N. 2000. Performance Based Seismic Design,Bulletin of the New Zealand National Society for Earth-quake Engineering, v 33, n 3, Sep, 2000, p 325-346.
Priestley, M.J.N. 2002. Direct Displacement-Based Design of Precast/Prestressed Concrete Buildings, PCI Journal, v 47, n 6, November/December, 2002, p 66-79.
Sasani, M. and Bertero, V.V. (2000). "Importance of severe pulse-type ground motions in performance-based engineer-ing: historical and critical review". Proc. 12th World Con-ference on Earthquake Engineering (12WCEE), New Zea-land, paper 1302.
SeismoStruct. (2004). "Computer program for static and dy-namic nonlinear analysis of framed structures" [online]. Available from URL: http://www.seismosoft.com
Shibata, A. & Sozen, M. 1976., Substitute Structure Method for Seismic Design in R/C, Journal of Structural Division,ASCE, January, 1976.
Simeonov, B., et al. 1993. Static Analysis, Dynamic Analysis and Proportioning of the Structure of the Residential - Business Building B-2, Vardar Settlement, Skopje, Unit 4. IZIIS Report 93-15. Skopje. FY Republic of Macedonia.
Simões, R., Simões da Silva, L. and Cruz, P. (2001). Cyclic behaviour of end-plate beam-to-column composite joints. International Journal of Steel and Composite Structures1(3), 355-376.
Stewart, J.P., Chiou, S-J., Bray, J.D., Graves, R.W., Somer-ville, P.G., Abrahamson, N.A. (2001). "Ground Motion Evaluation Procedures for Performance-Based Design". PEER Report 2001/09, Pacific Earthquake Engineering Re-search Center, College of Engineering, University of Cali-fornia, Berkeley.
Stratan, A. (2003). "Multistorey dual steel structures located in seismic areas" (in Romanian). PhD Thesis. Politehnica Uni-versity of Timisoara.
Terzic, U. 2006., Direct Displacement-Based Design of Rein-forced Concrete Frame Building Structures. Master Thesis,IZIIS, University �Ss. Cyril and Methodius�, Skopje, FY Republic of Macedonia.
UBC (1997). Uniform Building Code Vol.2, International Con-ference of Building Officials, Whittier, CA.
Vidic, T., Fajfar, P., and Fischinger, M., 1994. Consistent ine-lastic design spectra: strength and displacement, Earth-quake Eng. Struct. Dyn. 23, 507�521.
Whittaker, A., (n.d.) "Earthquake Engineering and Structural Dynamics II". accessed in March 2003 at: http://overlord.eng.buffalo.edu/ClassHomePages/cie619/index.htm
Wilson & Habibullah. 1998. SAP 2000 - Three Dimensional Static and Dynamic Finite Element Analysis and Design of Structures, CSI, Berkeley University, California, 1998.
XTRACT.Cross-sectional and Structural Analysis of Compo-nents, Imbsen Software Systems, www.imbsen.com.

158
1 INTRODUCTION
Shaking table testing of the large scale model of the Mustafa Pasha mosque in Skopje, (15th century) has been performed in November-December 2006 in the Laboratory of the Institute for Earthquake Engineer-ing and Engineering Seismology in Skopje. The main objective of this testing was to investigate ex-perimentally the effectiveness of proposed reversible technology for strengthening of this type of histori-cal monuments. The performed testing was a part of the activities within the Sixth Framework Pro-gramme PROHITECH - "Earthquake protection of historical buildings by reversible mixed technolo-gies".
2 EXPERIMENTAL INVESTIGATION
The model of the mosque has been constructed in length scale 1:6 according to "gravity forces ne-glected" modelling principle, using the same materi-als as in the prototype: stone, bricks and lime mor-tar. Experimental testing was performed on the bi-axial seismic shaking table at IZIIS Laboratory and following the main objective the testing was per-formed in three phases: 1) Testing of the original model for low intensity level, to provoke small damage;
2) Testing of repaired model and strengthened mina-ret with FRP, until total collapse of the minaret; 3) Testing of strengthened model with FRP and car-bon fiber bars until collapse.
2.1 Instrumentation of the model To investigate models' response during seismic ac-tion different types of transducers were placed at characteristic points, as presented on Figs.1 and 2.
Figure 1. Instrumentation of the mosque model with acceler-ometers
Experimental and numerical investigations on the Mustafa Pasha Mosque large scale model
L. Krstevska, L. Taskov & K. Gramatikov University St. Cyril and Methodius, Skopje, FYR of Macedonia
R. Landolfo, O. Mammana, F. Portioli & F.M. Mazzolani University of Naples Federico II, Naples, Italy
ABSTRACT: The experimental and analytical results presented in this paper are a part of the activities per-formed within the Sixth Framework Program PROHITECH - "Earthquake protection of historical buildings by reversible mixed technologies". For the selected prototype structure - historical monument Mustafa Pasha Mosque in Skopje, 1/6-scale model was constructed and tested on seismic shaking table in several phases. The main aim of experimental model testing was to investigate the seismic stability of the monument after applying a reversible technology for strengthening. Beside the experimental shaking table testing of the model, three-dimensional finite element analyses were carried out using the general purpose software package ANSYS. The main aim of the numerical simulations was to predict the response of the large scale model dur-ing the shaking table tests. The results of finite element analysis have been compared with the experimental outcome, discussing the differences between the predicted seismic capacity and the experimental one for each phase of the test program. The evolution of partial and global collapse mechanisms observed during the tests has been also analyzed on the basis of numerical results.

159
Figure 2. Instrumentation of the mosque model with displace-ment transducers
2.2 Phase 1- Testing of the original model
Before starting with seismic testing dynamic charac-teristics of the model have been defined by means of ambient vibration method as well as by low intensity random excitation in frequency range 0.1-50 Hz. As representative earthquake excitation the accelero-gram of Montenegro earthquake 1979 - Petrovac N-S component was selected. Acceleration and dis-placement time histories of the input excitation are given on Fig. 3.
Figure 3. Time histories of acceleration and displacement, earthquake excitation Petrovac, N-S component
The earthquake time histories were scaled (com-pressed) 6 times, according to similitude require-ments and several tests have been performed with intensity of 0.01- 0.10g. For input intensity of 2%g
the first horizontal crack appeared at the base of the minaret. In the next tests with intensities up to 10%g, damage occurred on the mosque, too. The reason of this was the frequency content of the ap-plied excitation, which was close to the self frequen-cies both of the minaret and of the mosque. Dam-aged model is presented on Fig. 4, while some representative response parameters for input intensi-ties of 2%g and 10%g are given on Figs. 5 and 6.
Figure 4. Damage of the minaret (horizontal crack) and of the mosque after phase 1
Figure 5. Characteristic response time histories for input inten-sity 2%g, original model
Petrovac earthquake, N-S component, SF=6
-1200
-600
0
600
1200
0 1 2 3 4 5 6
time(s)
Petrovac earthquake, N-S component, SF=6
-3-2-10123
0 1 2 3 4 5 6
time(s)
original model-CH1-span10
-3000-2000-1000
0100020003000
0 1 2 3 4 5 6
time(s)
original model-CH3-span10
-2000
-1000
0
1000
2000
0 1 2 3 4 5 6
time(s)
original model-CH17-span10
-3-2-10123
0 1 2 3 4 5 6
time(s)
original model-CH19-span10
-1
-0.5
0
0.5
1
0 1 2 3 4 5 6
time(s)

160
Figure 6. Characteristic response time histories for input inten-sity 10%g, original model
2.3 Strengthening of the minaret
After performing the seismic tests on the original model of the mosque, the damaged model was re-paired by crack injection and the minaret was strengthened by application of CFRP wrap, cut to have the corresponding width and applied upon a layer of epoxy glue, Fig. 7. The obtained strips with a width of 15 cm were placed on four sides along the length of the minaret in vertical direction for the purpose of its stiffening. To confine the structure, strips with a width of 10 cm were placed at four lev-els along the height of the minaret in horizontal di-rection, while a strip with a width of 20 cm was placed at its base.
2.4 Phase 2- Testing of repaired model and strengthened minaret
Before the seismic tests, the dominant frequencies of the model were checked by random excitation. For
Figure 7. Repaired model and strengthened minaret after phase 1 testing
the minaret dominant frequency was 4.7Hz, while for the mosque two frequencies were dominating: f=7.4Hz and f=9.6Hz.
During this testing phase 11 tests have been per-formed with input acceleration between 0.2g to 1.5g. The first cracks on the minaret occurred for input in-tensity of 0.34g, which indicated that the appliedstrengthening enabled stiffening of the minaret and increasing of its bending resistance. The initial cracks on the mosque appeared at input intensity 0.42g. During the next tests the cracks developed and at input level of 0.49g the upper part of the minaret totally collapsed, Fig. 8. After reaching the max input acceleration of 1.5g, the mosque model was heavily damaged and the testing was stopped. There were cracks in the walls and also on the dome. Some details of the damage are presented on photos, Figs. 9 and 10. The characteristic response parame-ters during the seismic tests are given in Table 1, while representative time histories for test with in-tensity 0.34g and for the final test with input inten-sity 1.5g are given on Figs. 11 and 12.
Table 1. Performed seismic tests, phase 2 TestNo
Inp.acc(g)
Topacc.CH1
Topacc.CH3
Input displ. (mm)
Topdispl. (dome)
1 0.2 0.65 0.4 2.24 2.3 2 0.28 0.82 0.6 3.3 3.3 3 0.34 1.7 0.7 4.0 4.0 4 0.42 - 1.0 4.7 5.0 5 0.49 - 0.88 5.48 6.4 6 0.53 - 0.9 6.1 7.5 7 0.58 - 1.0 7.0 8.9 8 0.65 - 0.96 9.1 12.4 9 1.05 - 1.1 11.4 14.7 10 1.4 - 0.7 13.9 18.8 11 1.5 - 0.54 15.3 22
original model-CH1-span30
-10000
-5000
0
5000
10000
0 1 2 3 4 5 6
tim e(s)
original model-CH3-span30
-6000-4000-2000
0200040006000
0 1 2 3 4 5 6
time(s)
original model-CH17-span30
-10
-5
0
5
10
0 1 2 3 4 5 6
time(s)
original model-CH19-span30
-3-2-10123
0 1 2 3 4 5 6
tim e(s)

161
Figure 8. Collapse of the upper part of the minaret
Figure 9. Damaged model after phase 2 testing
Figure 10. Damage of the mosque, interior
Figure 11. Characteristic response time histories for input in-tensity 34%g, phase 2
phase 2, CH18-minaret, span50
-10-505
1015
0 1 2 3 4 5 6
time(s)
phase 2, CH1, top of the minaret, span50
-20000
-10000
0
10000
20000
0 1 2 3 4 5 6
time(s)
phase 2, CH 3, top of the dome, span50
-8000
-4000
0
4000
8000
0 1 2 3 4 5 6
time(s)
phase 2, CH17, top of the minaret, span50
-20-10
0102030
0 1 2 3 4 5 6
time(s)
phase 2, CH 19, top of the dome, span50
-5-4-3-2-1012345
0 1 2 3 4 5 6
time(s)
phase 2, CH25-span50
-2-1.5
-1-0.5
00.5
1
0 1 2 3 4 5 6
time(s)

162
Figure 12. Response during the test with intensity 1.5g, phase 2
2.5 Strengthening of the model
After the final test of the model in phase 2 the mina-ret was removed and the mosque rebuild on dam-aged parts, Fig. 13. Then the model was strength-ened. The main adopted principle in strengthening of the model was that the methodology to be applied be reversible and invisible. Hence, the cracks in the damaged model are not repaired by injection, but a concept is adopted that the model be strengthened to the conditions after the preceding tests.
The strengthening consisted of incorporation of horizontal belt courses for the purpose of increasing the integrity of the structure at those levels and pro-viding as better as possible synchronous behaviour of the bearing walls:
� Incorporation of carbon rods in two longitudinal mortar joints around the four walls at two levels: the level above the openings and at the top of the bear-ing walls, immediately below the tambour. For that
purpose, the mortar in the joints was first of all grooved down to the depth of 1.5 to 2 cm and such an obtained surface was fixed by a corresponding material (primer). After curing, longitudinal carbon rods were placed in the joints of each facade of the bearing walls. At both ends, these rods were cantile-vered for about 25 cm in order that they could cau-tiously be bent and attached to the rods of the adja-cent walls. Then the grooved part of the joint was filled with epoxy resin. To strengthen the corners where the carbon rods are bent and have a lower bearing capacity, a carbon strip with a length of 25 cm was placed upon the resin. With the incorpora-tion of these carbon rods, a horizontal belt course was formed whereby the tensile resistance of the wall was improved and synchronous behaviour of the bearing walls was achieved.
� Formation of a horizontal belt course around the tambour by applying a CFRP wrap with a width of 10 cm. After the application and the drying of the layer used for fixation of the masonry (primer), a thicker layer of epoxy glue (~3-4 mm) is applied for gluing the CFRP wrap upon it. To impregnate the strip, it is cautiously glued to the lower layer of resin by means of rollers. Finally, another layer of epoxy glue is applied and the entire surface is treated with the roller again.
� Formation of a horizontal belt course at the base of the dome by use of a CFRP wrap. The procedure for the formation of this belt course is identical to that used for the tambour except that the wrap has the width of 50 cm.
The formation of these horizontal belt courses enabled better integrity of the tambour and the dome base and prevented �opening� of the dome which was the most common reason for occurrence and prolongation of cracks in the bearing walls.
The strengthened model and some details of the strengthening are presented on Figs. 14 and 15.
Figure 13. Re-builded part of the model after removing of the minaret.
phase 2-CH3, top of the dome, span 200
-15000
-10000
-5000
0
5000
10000
0 1 2 3 4 5 6
time(s)
phase 2-CH 19, top of the dome, span 200
-30-20-10
0102030
0 1 2 3 4 5 6
time(s)
phase 2-CH25, span200
-12-8-4048
12
0 1 2 3 4 5 6
time(s)
phase 2-CH20&CH22, span200
-30-20-10
010203040
0 1 2 3 4 5 6
time(s)
CH22
CH20

163
Figure 14. The strengthened model ready for testing, phase 3
Figure 15. Details of strengthening of the mosque model
2.6 Phase 3- Testing of strengthened mosque model
Before the seismic tests, the dominant frequencies of the model were checked. The resonant frequency of 9.2 Hz was obtained and it was compared to the fre-quency of 8.6Hz measured after the last test of test-ing in phase 2. This means that by the strengthening the resonant frequency of the model is increased about 8%, which means that stiffness of the model was not completely recovered comparing to the state before testing phase 2, f=9.6Hz.
During this phase, 24 tests have been performed, with input acceleration between 0.15g to 1.5g. The accelerogram of earthquake Petrovac N-S compo-nent was scaled by 6 (compressed) in the first 15 tests. During the tests with input intensities between 0.15g and 0.40g. the models behaviour was stable, without provoking large cracks. In the next 6 tests, with input acceleration of 0.60-0.80g, sliding of the dome appeared at a visible horizontal crack at its base. To provoke more intensive response of the model, in the next tests the time scaling factor of 3 has been used, producing input acceleration of 0.46-1.5g. In this series of tests many new cracks ap-peared in the walls as well as on the dome, decreas-ing the dominant frequency of the model to f= 4.4Hz. This value was more than twice lower com-paring to the initially measured frequency of 9.2 Hz, thus indicating pre-collapsing state of the model.
The next two tests have been performed by scal-ing factor 2, with input acceleration 0.75-1.0g. The progressive cracks appeared, but still without col-lapse.
The final test was performed by scaling factor 1, with input acceleration of 0.35g. Heavy damage on many places - on the dome, around the openings, big cracks and inclination of one corner of the model) occurred including the strengthening FRP belt on the lower level of one of the walls, after which the test-ing was stopped.
Damaged model and some details of damage are presented on Figs. 16 and 17. The characteristic re-sponse parameters during the seismic tests are given in Table 2. Representative time histories for the final tests are given on Fig. 18.
Table 2. Performed seismic tests, phase 3Scal.factor
Input acc (g)
Top acc. (dome)
Input dis-plac. (mm)
Top displ. (dome)
0.14 0.30 1.5 1.5 0.18 0.35 2.0 2.0 0.25 0.42 3.0 3.0 0.29 0.50 3.5 3.5 0.35 0.59 4.0 4.3 0.38 0.65 4.7 5.0 0.40 0.75 - - 0.42 0.85 6.8 7.7 0.67 1.60 7.2 8.5 0.87 1.70 10.6 14.0 0.82 1.55 10.0 14.4 0.90 1.70 11.0 16.0
6
0.80 1.3 12.6 16.7 0.20 0.60 7.8 13.0 0.46 0.93 15.0 22.0 1.20 1.10 25.0 26.8
3
1.5 1.0 30.0 40.0 0.75 0.70 27.0 35.0 21.00 0.80 45.0 52.0
1 0.35 0.53 58.0 75.0

164
Figure 16. Damage of the model after phase 3 tests accom-plishement
Figure 17. Details of damage, phase 3
Figure 18. Response of the model during the last test with in-tensity 0.35g, scaling factor 1, phase 3
As a common conclusion after the performed ex-perimental testing of the mosque model in phase 3, it might be said that the model's behaviour was evi-dently different in respect to that of the original model. Under tests of moderate intensity, the exist-ing cracks were activated but during the subsequent more intensive tests, the failure mechanism was transferred to the lower zone of the bearing walls, in the direction of the excitation, where typical diago-nal cracks occurred due to shear stress.
phase 3-CH3, span600-sf1
-6000-4000-2000
0200040006000
0 5 10 15 20 25 30 35
time(s)
phase 3-CH19, span600-sf1
-100
-50
0
50
100
0 5 10 15 20 25 30 35
time(s)
phase 3-CH26, span600-sf1
-30-20-10
0
1020
0 5 10 15 20 25 30 35
time(s)
phase 3-CH28, span600-sf1
-10
-5
0
5
10
0 5 10 15 20 25 30 35
time(s)

165
3 NUMERICAL INVESTIGATION
In order to control the response of the large scale model during the shaking table tests performed at the IZIIS Laboratory in Skopje, a finite element model was implemented in the commercial code ANSYS.
Different types of analysis were carried out in the preliminary phases for each step of the experimental programme. In particular, both linear and non-linear numerical models were implemented for the test phases relevant to the original and reinforced large scale model, respectively.
The main aim of the linear elastic numerical simulations was to evaluate the peak ground accel-erations to be assigned to the shacking table during the test phases of experimental programme that were devoted to the assessment of the seismic strength of the original structure. In such phases, in fact, it was important to control the evolution of cracking on the structure in order to damage both the Minaret and the Mosque without making them collapse before the application of FRP strengthening. In the linear elastic numerical simulations, the seismic capacity in terms of peak ground accelerations corresponding both to cracking of the large scale model and to the collapse of the original Minaret was determined for the considered earthquakes. Moreover, the numeri-cal models adopted in the preliminary test phases al-lowed a suitable strengthening with FRP to be de-signed on the basis of the calculated tensile stress distributions.
The non-linear numerical analysis were per-formed in order to assess the ultimate seismic strength of the reinforced large scale model. In par-ticular, such types of analysis also allowed the col-lapse mechanisms that were observed on the proto-type to be clarified. In this case, the seismic capacity of the structure and the effectiveness of FRP rein-forcements were evaluated on the basis of non-linear pushover curves.
In the following, a detailed description of the im-plemented finite element models and of the corre-sponding obtained results is reported, both for linear and pushover analysis.
3.1 Types of analysis Different types of numerical analysis were per-formed depending on the experimental test phase, on the considered limit state and on the investigated part of the model.
With regard to linear elastic finite element mod-els, both modal and implicit transient dynamic analysis were carried out. The first ones were per-formed to calibrate the elastic material properties of the FE model on the basis of the natural frequencies measured on the original undamaged large scale model. Linear transient dynamic analyses were car-
ried in order to assess the seismic demand and ca-pacity corresponding to first cracking on the struc-ture and to the collapse of the original Minaret, respectively.
As far as nonlinear numerical models, push-over analyses were performed for the evaluation of struc-tural capacity, both for original and reinforced model.
3.2 The geometric modelling and meshing The numerical model was generated by importing in the FE program a three dimensional solid model of the Mosque that was created in a computer aided de-sign system.
In order to properly evaluate the structural inter-actions among the different parts, the implemented geometrical model reproduces all the main elements of the building accurately, including the openings and the pendentives connecting the walls with the dome.
With regard to linear analysis, the whole geomet-ric model of the prototype was considered, in order to calculate the effects of dynamic coupling between all the parts of the large scale model.
Figure 19. The FE model implemented for linear elastic nu-merical analysis.
As far as non linear analysis is concerned, two separate FE models were implemented for the Mina-ret and the Mosque, respectively. In the last case, the symmetry of the model along the vertical plane par-allel to the direction of the input displacement was considered, in order to save CPU time for solving non-linear equations. To place the reinforcement, the outer surface of the Mosque was divided in different areas corresponding both to the FRP sheets and bars.

166
The properties of overlapping areas were set up in order to match the meshes corresponding to masonry and FRP reinforcement elements.
Figure 20. The FE model of the reinforced Mosque imple-mented for non-linear pushover analysis.
The whole masonry structure was discretized with tetrahedral 3D solid elements considering dif-ferent mesh sizes. Both SOLID45 and SOLID65 fi-nite elements were used, depending on the consid-ered type of analysis and material model.
SHELL181 and LINK8 elements were employed to model the FRP sheets and bars, respectively. The shells and the spars corresponding to the FRP rein-forcement were directly overlapped to the masonry bricks and no interface elements were considered.
3.3 Material modelling The material properties adopted for the different types of analyses are reported in Tables 3 and 4.
Table 3. Masonry material properties assumed in numerical simulations of Minaret.
Type of analysis Material properties
[kN/m3]E[MPa] Linear elastic
19,0 16000 0,25 5%
[kN/m3]E[MPa] c Non-linear
pushoverwith Drucker Prager 19,0 16000 0,25 0,44 69 69
[kN/m3]E[MPa]
t[MPa]
c[MPa]
Non-linear pushoverwith William Warnke 19,0 16000 0,25 0,24 4,7
In particular, the elastic parameters are referred to initial values that have been calibrated on the basis
of first random vibration tests performed on the original undamaged structure. The non-linear prop-erties were determined on the basis of both compres-sion and shear experimental tests carried out on ma-sonry wall samples.
Different types of non-linear material models were implemented in the non-linear FE analyses of the Mosque in order to bound the actual response of the prototype. As far as structural masonry, the elas-tic-perfectly plastic Drucker-Prager material model and the smeared crack William Warnke material models were considered.
With regard to Drucker�Prager model, the values of cohesion c and of the angle of internal friction were calibrated on the basis of the shear and com-pression test results. In order to assign an associative flow rule for plastic strains, the assumed dilatancy angle is equal to .
Table 4. Masonry material properties assumed in numerical simulations of Mosque.
Type of analysis Material properties
[kN/m3]E[MPa] Linear elastic
19,0 925 0,25 5%
[kN/m3]E[MPa]
c Non-linear pushoverwith Drucker Prager 19,0 60 0,25 0.07 74 74
[kN/m3]E[MPa]
t[MPa]
c[MPa]
Non-linear pushoverwith William Warnke 19,0 60 0,25 0,03 1,04
As far as the smeared crack material model, all the parameters determining the constitutive law were considered with the default values, as a function of the assigned compressive and tensile strength.
With regard to composites, an elastic material model was considered. In particular, the adopted Young�s modulus for sheets is equal to 240GPa and the considered equivalent thickness is 1.0 mm, ac-cording to the nominal characteristics reported by the FRP provider.
3.4 Load modelling and boundary conditions As far as seismic actions are concerned, two types of load modelling approaches were implemented for the assessment of the seismic demand and capacity in linear and pushover numerical analyses, respec-tively.
In particular, transient dynamic analyses were performed with linear models. In this case, the seis-mic action was assigned to the FE model by means of a time history displacement at the base of the structure corresponding to the considered accelero-grams.

167
With regard to the load modelling approach im-plemented in pushover analyses for the evaluation of seismic capacity, a uniform acceleration along the horizontal direction was applied to the FE model.
As far as the boundary conditions are concerned, full restraints were assumed at the base of the struc-ture for all the considered analyses.
3.5 Results of linear elastic numerical analyses In the following, the main results obtained for the different linear numerical analyses which have been carried out on the implemented FE models are sum-marized. In particular, the PGA values correspond-ing both to the attainment of first cracks in the origi-nal large scale model and to the collapse mechanism of Minaret are provided.
With regard to modal analyses, the calibration of the initial elastic properties of numerical model was carried out on the basis of the ambient vibration tests performed on the undamaged prototype. Such mod-elling phase was also a starting point for calculating, on the basis of the natural frequencies, the proper in-tegration time step in transient dynamic analysis. The deformed shapes relevant to the first vibrating modes are depicted in Figure 21.
A comparison among the experimental and nu-merical frequencies for the calibrated values of the elastic Young�s modulus is reported in Table 5. It can be noted that all the initial frequencies measured on the undamaged original prototype were well fit-ted.
Table 5. Comparison between calibrated and measured fre-quencies for the original prototype.
Natural frequencies [Hz]
Mode 1 Mode 2 Mode 3 Mode 4 Mode 5Calibrated FE model 1,00 1,03 3,03 3,27 5,0
Large scale model 1,04 3,00 3,20 5,4
The evaluation of the input accelerations corre-sponding to the first cracking of both the Minaret and the Mosque was carried out by checking the at-tainment of tensile strength in linear transient dy-namic analysis, for different signal strength. Accord-ing to numerical simulations, the first cracks on the Minaret develop for a PGA equal to 0.03. As far as the Mosque, it was found that first cracks occur for a PGA equal to 0.16g.
As far as the collapse of the original Minaret, the seismic strength was evaluated by determining the PGA value that shifts the center of pressure out of the cross-section. With this aim, a specific program was implemented in Matlab for the calculation of the center of pressure as a function of time on the basis
of the stress output provided for solid elements by the FE code.
In this case, it was estimated that the PGA value corresponding to the collapse of the original Minaret was equal to 0.05g .
On the basis of tensile stress distributions ob-tained from linear elastic numerical analysis, the de-sign of strengthening position with FRP was finally carried out.
Figure 21. Mode shapes calculated for the original large scale model, corresponding to the first and third natural frequencies.
3.6 Results of the non-linear pushover numerical analysesThe assessment of the ultimate seismic strength of both the original and reinforced large scale model was carried out by means of nonlinear pushover analyses performed on the FE model described in Figures 20 and 22.
Figure 22. The FE model of the reinforced Minaret and distri-bution of plastic strains for the calculated collapse load.

168
Phase I (0.67g)
Phase II ( 0.99g)
Phase III (1.2g) Figure 23. Evolution of first principal plastic strains on the original large scale model of the Mosque till collapse load, for Drucker Prager material model.
According to the obtained numerical results, the evolution of damage distribution till collapse load on the investigated prototype is similar for all the types of implemented FE models. In general, it should be noted that the crack patterns obtained from numeri-cal analyses have always to be ascribed to the at-tainment of tensile or shear strength, while the com-pressive resistance is never exceeded.
Phase I (0.81g)
Phase II (1.12g)
Phase III (1.5g) Figure 24. Evolution of first principal plastic strains on the reinforced large scale model of the Mosque till collapse load, for Drucker Prager material model.
As far as Drucker Prager model is concerned, the collapse loads corresponding to the original and re-inforced prototype were determined by checking the attainment of the maximum plastic strain calculated for masonry on the basis of the calibrated FE models for shear tests.
With regard to the Minaret, the results of numeri-cal analysis in terms of first principal plastic strain distributions are given in Figure 22. In this case, the

169
reinforcement increases the ultimate strength of the Minaret up to 0.4g and shifts the plastic hinge down into the basement with respect to the original model.
As far as the Mosque is concerned and according to the implemented numerical model, the original prototype collapses with a mixed pier/spandrel mechanism of the vertical bearing structures, that is typical of weakly coupled perforated walls (Figure 23). In particular, the evolution of collapse mecha-nism can be divided in different phases. According to the numerical model, the first diagonal tension cracks occur in the shear walls, namely in the span-drels between the first and second row of openings from the basement. In this phase, the damage also develops at the base of the walls perpendicular to the direction of ground motion, owing to bending stresses induced by out plane horizontal loads. In the second step, the damage extends to the upper span-drels, between the second and third row of opening in the shear walls parallel to the direction of seismic loads. In particular, it develops up to the dome, among the openings in the supporting polygonal drum and the ones in the shear walls. Finally, the seismic strength of the structure is attained when the lateral piers and the central wall at the base of the Mosque collapse for shear and bending mechanisms, respectively. The study of collapse mechanism, ob-tained from numerical analysis on both original and reinforced Mosque, allow the effectiveness of FRP reinforcement to be analyzed. With regard to the sheets that wrap both the dome and the top of load bearing walls, they allow the propagation of cracks from the bottom part to the drum to be fully pre-vented, as shown in Figures 24 and 25.
Figure 25. Tensile stress distribution on FRP sheets at the top of the dome, corresponding to the collapse load [MPa].
The role played by FRP bars in the shear walls is to stiffen and strengthen the spandrels in order to form a sort of reinforced masonry beams at different
Table 6. Predicted PGA values and corresponding limit states for original and reinforced large scale model.
MINARET MOSQUE
w/oFRP
with FRP
w/oFRP
with FRP
cracking 0.03 0.16 PGA(g) collapse 0.05 0.4 1.2 1.5
levels able to distribute the seismic action among the piers. The numerical model of the reinforced Mosque shows that the collapse mechanism turns from a mixed into a weak piers/strong spandrel type.
4 CONCLUSIONS
In the present study an experimental and numerical investigation on the seismic strength of the masonry large scale model of the Mustafa Pasha Mosque re-inforced with FRP has been presented. Different types of numerical analysis, material models and modelling approaches were implemented in order to support the experimental test set-up, to design the FRP reinforcements and to analyze their effects onto the prototype. In particular, the evolution of partial and global collapse mechanisms observed during the tests has been analyzed on the basis of numerical re-sults. The results of finite element analysis have been compared with the experimental outcome. In general a good agreement between the behaviour predicted by numerical models and test results was observed, both in terms of ultimate seismic capacity and collapse mechanisms. Further studies are in pro-gress, mainly devoted to validate the implemented FE models on the basis of the actual seismic strength that was measured during the tests on both the origi-nal and reinforced large scale prototype. The cali-brated non-linear numerical models will represent a reliable tool both for the design optimization of FRPs and for the evaluation of the effectiveness of other types of strengthening on the original Mosque.
ReferencesGramatikov, K., Taskov, Lj., Krstevska, L . 2006. Preliminary
report on testing of Mustafa Pasha mosque model - Phase 1: Testing of original model. FP6-PROHITECH Project, WP7. Skopje.
Gramatikov, K., Taskov, Lj., Krstevska, L . 2006. Preliminary report on testing of Mustafa Pasha mosque model - Phase 2: Testing of repaired model and strengthened minaret with FRP. FP6-PROHITECH Project, WP7. Skopje.
Gramatikov, K., Taskov, Lj., Krstevska, L . 2006. Preliminary report on testing of Mustafa Pasha mosque model - Phase 3: Testing of strengthened model", 2006, FP6-PROHITECH Project, WP7. Skopje.
Landolfo, R., Mammana, O., Portioli, F., Mazzolani, F.M. 2006. Pre-experimental analyses on the large scale model of the Mustafa Pasha Mosque. FP6-PROHITECH Project, WP8. Naples.
AcknowledgmentsIt is significantly acknowledged the financial sup-port of the European Commission (grant No. INCO-CT-2002-509119), for funding the research project PROHITECH (Earthquake PROtection of HIstorical Buildings by Reversible Mixed TECHnologies), which is the main framework of the experimental ac-tivity presented in this paper.

170
1 INTRODUCTIONCurrent practice in structural engineering is today largely oriented to the use of advanced materials and technologies for both increasing the load capacity of bearing elements and for improving, when required, the building seismic performance. In most cases, the use of both innovative materials and devices converge into the wide strategy of the structural control, which includes a large number of techniques aiming at the protection of constructions against the effects of loads, mostly of short duration and strong intensity, due to ei-ther seismic or aerodynamic actions.
Significant advances have been attained during the last thirty years, both in the field of materials and in that of special devices for the reduction of structural response. As a result of this, a large variety of techno-logical systems has become available today, offering a number of solutions which can be adapted to any prob-lem of structural protection. They are able to provide solution not only to specific structural or functional needs, but are also finalized to the improvement of the global performance of the construction, intended in general terms of reliability, ease of inspection, mainte-nance, monitoring and long-term durability.
Innovative materials and technologies play a key role in the seismic strengthening of existing construc-tions, too. Most of advanced techniques, in fact, are conceived in such a way to be easily removed and sub-stituted if necessary, this being a policy widely shared in the field of restoration of existing buildings and aimed at the safeguard of historical and monumental works from inappropriate refurbishment operations.
Modern techniques for seismic protection of build-ings are mostly intended to combine the best features
of different materials and devices in order to achieve an optimised performance from all points of view. Materials and techniques for anti-seismic applications may be classified according to several issues. The ba-sic approach for the description of such techniques is to preliminary distinguish between innovative materi-als and advanced devices, so that a general framing of the technologies, namely the seismic protection sys-tems, is then more easily possible.
Innovative materials for the purposes of seismic protection are essentially metal materials like Steel (both mild and stainless), Aluminium and Titanium Alloys, but also Fibre Reinforced Polymers (FRP), Elastomers and, last but not least, �smart� materials like Shape Memory Alloys (SMA), Piezoelectric Ma-terials, Magnetorheological Fluids, etc. Most of these materials are used to create special devices provided with energy dissipative features, as well as to obtain advanced strengthening systems especially designed for improving both resistance and ductility of struc-tural elements in existing buildings.
Similarly, innovative systems can be based on ei-ther an increase of dissipated energy (Additional structural damping) or on a reduction of the seismic input energy (Base isolation and Tuned Mass Damper). These techniques are applied by means of special devices which, depending on the specific case, can be Yielding Metal Devices, Friction Devices, Fluid Viscous Dampers, Rubber Bearings, etc.
Coming to the seismic rehabilitation of existing buildings, it has been mostly applied in the past in such a way to restore the original features of the con-struction by using the same materials and technolo-gies as at the first erection stage. Such a practice em-
Innovative materials and technologies for existing and new buildingsin seismic areas
A. Mandara Second University of Naples, Italy
ABSTRACT: The basic features of innovative materials and technologies used for the seismic protection of buildings are shown and discussed in this paper. To this purpose, advanced metal materials, fibre reinforced polymers and special devices for the seismic structural control of constructions are described. Where possible, available solutions are illustrated in comparative way in order to point out their specific pros and cons. Attention is also focused on very advanced solutions relying on smart materials and systems, like shape memory alloys and active control strategies, which allow to reach levels of seismic performance and safety never attained be-fore. In this context, some outstanding cases throughout the world, referring to both new and existing buildings and including the rehabilitation of historical and monumental constructions, are also referred to.

171
bodies still today the main policy for interventions carried out on the building heritage and in particular on monumental constructions, where saving as much as possible of existing historical and architectural val-ues is the main target of the restoration project. Nev-ertheless, when the upgrading of either structural or functional features is explicitly required, then the use of more advanced techniques relying on the use of modern materials and technologies is going to be more and more common in the field of rehabilitation, in order to fulfil more severe safety and/or living standards. The use of modern and advanced strength-ening solutions, in fact, represents an useful tool as, in most cases, existing buildings are conceived in such a way to be scarcely prone to modifications of the structural layout, unless special provisions are adopted. Also, such buildings do not commonly pos-sess structural properties adequate to resist significant seismic actions nor to comply with current structural codification. Last, but not least, existing structures may be frequently affected by significant damage and/or degradation of both materials and members, often resulting in a global performance and safety level even lower than at the construction stage. In most of such cases, the new structural requirements cannot be met by means of a simple conservative res-toration with �traditional� materials, but ask for more advanced solutions able to satisfy more demanding needs. Reversibility may be also required for the sake of economics (recycling materials for different pur-poses) or for implementing more effective solutions in the future. Considering the predominant construc-tional features of existing buildings, the application of advanced systems, materials and technologies is car-ried out in the spirit to complement or supplement the basic characteristics of the construction with particu-lar properties, usually resulting in a kind of �mixed� approach, where the term �mixed� is related to the in-herent �composite� character of the final assemblage (Mandara et al. 2002).
As stated, outstanding issues in the context of both innovative materials and devices are shortly presented and discussed in the following, pointing out their relevant properties in the view of seismic protection of both new and existing constructions. Also, basic concepts underlying the main strategies of structural control are emphasized.
2 INNOVATIVE MATERIALS
2.1 Metal materials The use of innovative metal materials, namely stainless steels, copper, titanium and aluminium al-loys, is becoming more and more frequent in seismic engineering, including rehabilitation practice. Such materials are mainly intended to complement the well known features of constructional mild steel (e.g. high strength and ductility, lightness, ease of transportation
and erection, easy market availability, reversibility, etc.), with some special properties, typical of each material, which can be tailored to the specific prob-lem. In addition, most of the special devices used to-day for improving the seismic performance of build-ings rely on steel or metal alloys for achieving the re-quired dissipation capability (Mazzolani and Man-dara, 2002).
Despite their relatively high cost, innovative metal materials meet increasing application in the field of seismic protection also due to their peculiar features, which generally offer several benefits when the whole lifetime of the project is considered. For example, such metal elements can be easily melted down and re-used for different purposes. This contributes to in-crease their long term economic sustainability com-pared with traditional non-reversible technologies.
A synopsis of the main mechanical features of above materials is shown in Table 2.1, where average values of unit weight , elastic modulus E, conven-tional yield strength f0.2 and ultimate strength ft, ulti-mate tensile strain t and linear thermal expansion co-efficient are reported, compared with the corre-sponding properties of structural mild steels. Some of these metals, e.g. titanium alloys, have a very low lin-ear thermal expansion coefficient (6 8 10-6C°-1),which is very similar to that of volcanic or metamor-phic rocks, such as granite and marble. This allows ti-tanium elements to be used in redundant systems with no risk to impair the effectiveness of intervention due to thermal changes. This feature has been highly use-ful in the restoration of Parthenon in Athens (Fig. 2.1) and Colonna Antonina in Rome, where titanium clamps have been inserted and hidden into existing stone blocks (Giuffrè and Martines, 1989). They proved to be far more effective than conventional steel elements used before, which had involved many cracks due to corrosion and excess of thermal dilata-tion.
In practice, the choice of the most appropriate ma-terial is made not only on the basis of its mechanical properties, but rather by considering other technologi-cal factors, such as chemical-physical compatibility with in-situ materials, corrosion resistance, and the possibility to obtain particular surface appearances and shapes.
Figure 2.1. Titanium clamps in the restoration of Parthenon

172
loading
unloading
T > A f
loading
unloadingr
heating to Af
T < A f
c)Figure 2.2. Basic behavioural principles of Shape Memory Al-loys (a,b) and comparison with mild steel (c).
In the very last years, special devices based on the use of Shape Memory Alloys have been used in combina-tion with steel tying elements for the seismic protec-tion of existing constructions (Indirli, 2000). Shape Memory Alloys (SMA), mostly Ni-Ti or Cu-Al-Zn al-loys, may be regarded as �smart� materials, as both their yield stress and modulus of elasticity strongly in-crease as long as temperature increases within the so-called transformation temperature range, due to a solid martensite-austenite phase change. Such range is lim-ited by Mf and Af, that is by the temperatures where only full martensitic or full austenitic structures can exist, respectively. The above transformation can be induced by either mechanical stress or temperature change, resulting in the capability to recover, sponta-neously or by heating, large initial strains due to load (superelastic behaviour, Figure 2.2a) with a corre-sponding amount of dissipated energy due to different loading and unloading paths. This allows the construc-tion of seismic protection devices (Croci et al., 2000, Dolce et al., 2000, Pegon et al., 2000) (Fig. 2.3). A complete strain recovery may also occur by heating the material above Af (memory effect, Figure 2.2b,c). This effect can be exploited for impressing a state of co-active stress to structural members, by arranging SMA elements at a temperature lower than Mf and then heating it above Af, in order to apply the required degree of co-action.
2.2 Fibre-reinforced materials A significant development in the use of fibre-reinforced materials is observed nowadays, most of
all in structural rehabilitation of existing buildings. Since the middle of the nineties an increasing number of structures have been strengthened by means of ex-ternally bonded FRP (Fibre Reinforced Polymers) re-inforcement. The main advantages of these materials are their very low weight, a minimum of structural height, no corrosion, easy application and simple use on the construction site (Mandara et al. 2002).The composite materials include a matrix and fibres. The matrix has the main role of assuring the united behaviour of the fibres. In addition, it protects the fi-bres against environmental and mechanical damages and buckling, grants shear, inter-laminar and in plane resistance. The matrix incorporate epoxy resin so as these materials have the ability to adhere to any kind of surface, excellent ductile capacity, strength, resis-tance to chemical agents and durability. Fibre Rein-forced Polymers (FRP) used as strengthening materi-als today are typically made of continuous carbon (CFRP), aramid (AFRP) or glass fibres (GFRP). The fibres are produced in the shape of small wires (5 to 20 m) (Fig. 2.4), have high tensile strength and elas-ticity modulus, low density and show a fragile behav-iour (Table 2.2) (CEB-FIP, 2001). Also, they exhibit good fatigue behaviour, good performance under cy-clic loads. In the end, because of high resistance to chemical products, FRP can be seen as durable mate-rials against pollutants which arise under normal ser-vice conditions in buildings (Fig. 2.5).
a)b)
c)Figure 2.3. Shape Memory Alloy devices installed in church buildings in Italy: a) S. Feliciano Cathedral, Foligno, b) S. Giorgio Bell Tower, Trignano, c) S. Francesco Basilica, Assisi.
Table 2.1. Synopsis of mechanical features of special metal materials compared with mild steel.M A T E R I A L
( g / c m 3 )E
( k N / m m 2 )f 0 . 2
( N / m m 2 )f t
( N / m m 2 )t 1 0 0 ( A 5 )
1 0 6
( C ° -1 )M i l d s t e e l 7 .8 5 2 0 6 2 3 5 3 6 5 3 6 0 5 1 0 1 0 2 8 1 2 1 5
S t a i n l e s s s t e e l 7 .8 1 9 6 2 0 0 6 5 0 4 0 0 1 0 0 0 1 0 4 0 1 7 1 9 A l u m i n i u m a l l o y s 2 .7 6 5 7 3 2 0 3 6 0 5 0 4 1 0 2 3 0 2 4 2 5
T i t a n i u m a l l o y s 4 .5 1 0 6 2 0 0 1 0 0 0 3 0 0 1 1 0 0 8 3 0 6 7 S M A N i - T i ( N i t i n o l ) 6 .5 2 8 7 5 ( * ) 1 0 0 5 6 0 ( * ) 7 5 0 9 6 0 ( * ) 1 5 .5 6 . 6 1 1 ( * )
( * ) V a l u e s r e f e r r e d to m a r t e n s i t e a n d a u s t e n i t e , r e s p e c t iv e ly .
a) b)
Mild steel SMA

173
Table 2.2. Tensile characteristics of fibres (CEB-FIP 2001).
Fibre Type ElasticityModulus(GPa)
UltimateStrength (MPa)
UltimateDeformation
(%) Carbon
High Strength 215 � 235 3500 - 4800 1.4 - 2.0 Very High Strength 215 � 235 3500 - 6000 1.5 - 2.3
High Elastic Modulus 350 � 500 2500 - 3100 0.5 - 0.9
Very High Elastic Modulus 500 � 700 2100 - 2400 0.2 - 0.4
Glass Glass E 70 1900 - 3000 3.0 - 4.5 Glass S 85 � 90 3500 - 4800 4.5 - 5.5 Aramid Current 70 � 80 3500 - 4100 4.3 - 5.0
High Performance 115 � 130 3500 - 4000 2.5 - 3.5
Figure 2.4. REM picture (left) of a CFRP roving (right) (Sika).
Figure 2.5. Application of CFRP strips on building floors.
Most used FRP in structural applications are the CFRP, but also GFRP have recently gained a great practical importance for applications on substrates with low tensile strength like masonry or natural stones. Also, hybrid fabrics of different types of fibres are offered on the market (Fig. 2.6). The layers of fi-bres can vary in shape and orientation. They can be disposed in one or two main directions as well as in discontinuous appearances. The properties of these
materials are likely to be anisotropic and each layer can fulfil a different function.
The commonly used procedure for manufacturing CFRP strips is called pultrusion. During this continu-ous process rovings are saturated with resin and pulled through a heated die, where the part is formed and cured. Traded strips consist of, depending on the width, 1 up to 3 millions of carbon fibres with a di-ameter of 0,006 mm. CFRP strips possess a nearly ideal elastic-plastic behaviour without any significant yielding or plastic deformations, connected with the tendency of brittle failure modes. In general, as a re-sult of the great number of fibres in the same direc-tion, the scatter of mechanical properties is very low.
Material properties of CFRP fabrics and sheets are determined by the way of weaving. Fibres or threads are crossing continuously during the process, where the threads are conducted alternating below and above (Fig. 2.7). Hence fibres are not totally stretched and a little reduction of the stiffness has to be put up. Sheets show in contrast to fabrics no redirections of fibres caused by crossings. They are manufactured with one side on a backup layer, which keeps the fibres in their positions. In most cases sheets are used where fibres run predominantly in one direction.
Figure 2.7. CFRP fabrics.
FRP systems are used in the form of prefabricated elements (straight strips, shaped shells, jackets or angels, rods, wet lay-up systems) or fibre sheet, fab-ric and fibre tows, and some special systems like prestressed strips, etc. In general, FRP strips can be used for upgrading the elements having a plane sur-face while fabrics can be used where the surface is not
Figure 2.6. Some of currently available FRP products.

174
regular because they can more easily be adapted to ir-regular surfaces. FRP strips, fabrics and rods can be used in both concrete and masonry structures. The possibility of selecting the fibre typology, the archi-tecture of sheets and the number of FRP layers gives the designer flexibility in the choice of the reinforce-ment. The suitability of each system depends on the type of structure to be strengthened. Practical execu-tion and application conditions, like cleanness and temperature, are very important in achieving a good bond.
Figure 2.8. Typical applications of CFRP strips and sheets for strengthening r.c. and masonry elements against bending, shear and axial load.
CFRP can be profitably used to strengthen struc-tural members either in bending or shear, but also for column confinement against axial load (Fig. 2.8). In all these applications, unidirectional strips or fabrics are mostly used. Due to the flexibility of CFRP strips, it is possible to apply also elements of large dimen-sions without any special joint configurations. In all cases, special attention has to be paid to the prepara-tion of the surface. Alternatively, rigid prefabricated elements can be also used, e.g. for shear strengthening of r.c. beams (Fig. 2.9). In some cases, profit can be taken bonding the strips on the surface in a prestressed state, the serviceability of the strength-ened elements being improved by the prestressing force. The design and construction of the end zones, however, requires special attention for prestressed strips (Fig. 2.10).
Figure 2.9. Use of prefabricated angles for shear strengthening.
Figure 2.10. Anchoring of prestressed strips.
From the practical point of view, one of the advan-tages of wet lay-up systems is the possibility to follow also irregular geometrical shapes or curves during ap-plication. This feature turns out to be necessary in old masonry or for arches and vaults (Fig. 2.11).
Figure 2.11. Strengthening of a historic vault with CFRP strips.

175
The use of materials resisting in tension only, like FRP, can be useful, in fact, to prevent the onset of plastic hinges in the structure and, however, to in-crease load bearing capacity at collapse as well as ul-timate ductility. This may be very important, for ex-ample, in case of unsymmetrical load distribution, which, under certain circumstances, can result in the stress resultant to go out the thickness of the arch or vault. The tensioned side of the hinge is effectively constrained by the bonded fibre strip, which can rely upon a large adhesion area over the arch or vault sur-face (Valluzzi et al., 2001).
3 PRINCIPLES OF STRUCTURAL CONTROL
As an alternative to the conventional approach to seismic design, based on the ductility resources of structural members and connections, the behaviour of a structure can be �controlled� by means of suitable auxiliary systems able to modify the natural structural properties (stiffness and damping) under dynamic ac-tions, so as to improve the response of the construc-tion and increase its safety against both serviceability and collapse limit states (Fig. 3.1). Such systems are conceived in such a way to reduce or to dissipate a share of the seismic input energy and, to do this, they make use of the response control concept, aiming at controlling and limiting the dynamic effects on the structural elements by means of special devices. In this view, structural control can be either passive or active depending on whether the action of special de-vices is independent of or is influenced by the struc-tural response itself.
TRADITIONAL CONCEPT
SEISMIC DESIGN
RESPONSE CONTROL CONCEPT
Based on ductility resources of members and connections of
the structure
Based on controlling and limitingthe dynamic effects on the
structural elements by means of special devices
a
t
a
t
plastic hinges
auxialiry dampera
t
a
t
Figure 3.1. Basic concept of structural control.
Figure 3.2. Energy dissipation (a) and TMD (b) systems.
The response control concept can be explained re-ferring to the dynamic equilibrium equation of a ge-neric structural system, expressed by the relationship:
( ) ( ) ( ) ( ) ( )cmx t cx t kx t f t F t (3.1)
in which m, c and k are mass, viscous constant and stiffness of the system, respectively. F(t) is the exter-nal force induced by earthquake and fc is the control force applied by means of additional devices. In a general form, fc is given by:
( ) ' ( ) ' ( ) ' ( )cf t m x t c x t k x t (3.2)
where m�, c� and k� are mass, viscous constant and stiffness of the controlling system, respectively. Val-ues of m�, c� and k� can be chosen in such a way to modify one or more terms of the energy balance equa-tion:
( ) ( ) ( ) ( ) ( )K S H IE t E t E t E t E t (3.3)
where: Ek is the kinetic energy of the system; E is the energy dissipated in the special devices; ES is the energy due to elastic deformation in the structural system (strain energy); EH is the energy dissipated by plastic deformation in structural members (hysteretic energy); EI is the earthquake input energy. In case of active systems, the terms c� and k� in Equation (3.2) can be instantaneously changed, according to the so-lution given by the so-called �control algorithm�, that is a set of mathematical instructions used to drive the action of special devices.
In energy dissipation systems (Fig. 3.2a) special devices are used in order to reduce the amount of en-ergy dissipated in the structure EH, with a correspond-ing increase of energy dissipated by devices E . This reduces both structural response and damage in struc-tural elements. Basically, the effect of special devices is to increase the overall damping properties of the system, thus reducing its maximum spectral accelera-tion (Fig. 3.3a) and, hence, preventing the main structural members from early collapse.
As an alternative to energy dissipation systems, it is possible to use systems reducing the earthquake in-put energy EI. In such systems, namely isolated sys-tems (see Section 5), special devices are used in order to reduce the amount of the energy transmitted to the main structure. Basically, the effect of seismic isola-tion is to shift the fundamental vibration period of the building upward, so as to reduce the value of the maximum spectral acceleration (Fig. 3.3b). A given amount of input energy can be dissipated by the iso-lating devices themselves, when they posses special dissipative features, or can be absorbed by additional damping devices. Likewise energy dissipation sys-tems, such devices aim at increasing the overall damping properties of the system. This prevents the structure from an excess of displacements, with a si-multaneous control of damage in structural elements.

176
T(s)
S(g) Without added damping
With added damping
a)
S(g)
Period shifting T(s)
Fixed base structure
Base isolated structure T1 T2
b)Figure 3.3. Spectral acceleration as a function of the structural damping (a) and effect of period shifting (b). A further option is represented by Tuned Mass Damp-ers (TMD) (Fig. 3.2b), consisting of a mass, a spring and a damper attached to the structure in order to re-duce its dynamic response. The system is character-ized by its mass, stiffness and damping. The frequency of the damper is tuned to a particular structural fre-quency so that when excited, the damper will resonate out of phase with the structural motion. Energy is dis-sipated by the damper inertia force.
4 SUPPLEMENTAL DAMPING
4.1 GeneralAs far as application of supplemental damping is concerned, flexible buildings are inherently more suited than stiff buildings. The form of the building may lend itself to particular damping device types. In most cases, devices are concentrated in a few lo-cations (e.g. dissipative braces), other can be distrib-uted over a wide area. For existing structures, there will be usually constraints on the maximum damping parameters imposed by the strength of the existing building. In most cases, this will limit the maximum force for the damping devices. A careful evaluation of the original structural capacity without dampers will provide an estimation of the extra load which can be added to the structure without causing failure.
In a more general meaning, the technique of add-ing supplemental damping is recommended for both new and existing constructions when it is possible to find at least two sub-systems (m1 - k1, m2 - k2, � mi - ki) with different dynamic properties (m1/k1 m2/k2� mi/ki), typically one or more heavy but rather de-formable systems, connected to much stiffer sub-assemblages, used as a retaining elements for the weaker ones (Fig. 4.1). In all cases, devices or dissi-
pative members are placed in such a way to exploit the dissimilar behaviour between connected parts, hence producing energy dissipation and response damping.
Code FEMA 273 (1997) contains analysis methods and design criteria for passive energy dissipation sys-tems, based on performance levels and seismic ground shaking hazard criteria. These guidelines pro-vide indication for a linear static procedure, a linear modal procedure and a nonlinear static procedure to be used to design velocity dependent devices.
m1, k1
m2, k2
r.c. beamdampers m1, k1
m2, k2
dampers
dampers
rigid diaphragm
r.c. beam
dampersm1, k1
m2, k2
m1, k1
m2, k2
dampersdampers
m1
m2, k2
k1
m1, k1dampers
m2, k2
m2, k2
dampers
m1, k1
dampers m1, k1
m2, k2
Figure 4.1. Some of possible locations of energy dissipation devices in existing buildings (Mandara and Mazzolani, 2001b).
4.2 Rate-independent devices According to the classification of Figure 4.2, rate-independent hysteretic devices are subdivided in Yielding Metal Devices (YMD), based on the cycling plasticity of a metal, and Friction Devices (FD), based

177
on the friction between surfaces in contact. Their en-ergy dissipation capability depends on the applied dis-placement magnitude only.
Hysteretic Yielding Metal Devices (YMD), also named elastoplastic dampers or plastic threshold de-vices, absorb seismic energy exploiting the inelastic strain properties of strongly dissipative metals, like steel, lead and some special alloys. Metal elements can have different geometrical shapes (spindle, crescent moon, butterfly, track, triangular plate and X), in order to achieve a more uniform plasticization in the element (Fig. 4.3). Hysteretic yielding dampers may be config-ured to yield in bending, shear or axial load. Axially yielding dampers are generally configured as diagonal braces. Shear or flexural yielding dampers can be con-figured to connect cantilever wall panels to the struc-ture or mounted in a steel frame.
RATE INDEPENDENT
DEVICES
RATE DEPENDENT
DEVICES
YIELDING AND FRICTION DEVICES
VISCOUS AND VISCO-ELASTIC
DEVICES
SUPPLEMENTAL DAMPING
Such devices can dissipate a part of input energy in order to reduce
the magnitude of displacement under seismic actions
Energy dissipation depends on displacement magnitude and not on load application
frequency or velocity
Figure 4.2. Basic options for structural supplemental damping.
Figure 4.3. Examples of yielding metal dampers.
As innovative metal yielding device, used in framed structures, metal shear panels (Fig. 4.4) are designed in order to provide high stiffness under wind action and moderate earthquakes and to protect structural
members from undergoing wide plastic deformations under destructive seismic events. The shear plates are made of carbon steel or heat treated aluminium alloys with low yield strength and high ductility. Compared with conventional bracing, shear panels offer greater stiffness, strength and energy dissipation capability. In particular, pure aluminium exhibit very low yield strength, which prevents the panel from premature buckling, together with lightness and corrosion resis-tance (De Matteis et al, 2006). The energy dissipation takes place principally due to shear mechanism, by means of either pure shear stress action or tension field action. Local shear buckling should be avoided in design, as it produces a poor dissipative behaviour, with a pronounced slip-type hysteretic response.
PURE ALUMINI UM SHEAR PANELCONFI GURATION TYP E F
-50
-40
-30
-20
-10
0
10
20
30
40
50
-0.1 -0.08 -0.06 -0.04 -0.02 0 0.02 0.04 0.06
shear strain (mm/mm)
Figure 4.4. Cyclic behaviour of aluminium shear panels (De Matteis et al. 2006).
Friction devices (FD) exploit the mechanism of solid friction to provide the desired energy dissipation and is based upon an analogy to the automotive brake. A variety of friction dampers is available with various materials used for the sliding surfaces, as brake pad material on steel, steel on steel or steel on brass in slip bolted connections and other metal alloys (Fig. 4.5). In most of cases, friction dampers are placed within diagonal braces but can also been placed horizontally between the top of a wall and the beam above, as for yielding metal devices.
Most friction dampers produce a stable rectangu-lar hysteresis, although some of theme are config-ured to produce a self-centring force and provide non-rectangular hysteresis shapes with slip load pro-portional to displacement. For in-structure damping the displacements are usually due to interstorey drifts applied to the friction dampers. This requires that the damper extends from floor to floor, con-nected by a structural element such a brace or wall panel that will have a finite stiffness and will act in series with the friction damper.
Other types of friction device are the Limited Slip Bolted (LSB) joint (Pall et al., 1980), intended for seismic control of large panel structures, whose de-sign incorporate brake lining pads between steel plates in order to provide a consistent force-displacement response. An alternative design (Pall & Marsh 1982) has been proposed for application in

178
conjunction with cross-bracing in framed structures, with brake lining pads used for the sliding surfaces.
There are also more recent uniaxial friction de-vices, such as the Sumitomo friction damper (Aiken & Kelly, 1990), that exploits copper alloy friction pads sliding in a cylindrical steel casing, or the En-ergy Dissipating Restraint (EDR) (Nims et al.1993), with bronze friction wedges and steel cylinder wall.
a)
b)
c)
d)Figure 4.5. Examples of friction devices: Pall Friction Device (a); Damptech devices FDD (b); Slotted Bolted Connection (c); Sumitomo Friction Device (d).
The differences among metal yielding devices depend on both the work load, that can be multidirectional or unidirectional, and stress conditions. The different types of devices, however, show common properties despite of the differences on hysteresis loop geometry and shape. Among the advantages of metal yielding devices there are the high stability and durability, the stable hysteresis loop (Fig. 4.6), the limited sensitivity to environmental condition changes, the control of the
maximum load exchanged with the structure due the low hardening, the high values of dissipated energy for relatively low values of displacement, the ease of substitution and the multi-directional behaviour. On the other hand, they exhibit brittle behaviour in the case of welding and ductility properties strongly in-fluenced by device geometry.
Outstanding properties of friction devices are the limited displacements in exercise, the control of buck-ling in braces compressed elements, the stable hys-teresis loop (Fig. 4.7), the limited sensitivity to envi-ronmental condition changes, the high values of dissi-pated energy and, last but not least, the possibility to be reused. Their disadvantages are the mechanical wear of contact surfaces after numerous load cycles, the difficulty in the definition of the slip force and the need of restoring force after a severe earthquake.
YMDs and FDs can be used in both buildings and bridges and turn to be very effective in retrofit inter-ventions and refurbishment of historical and monu-mental buildings. In particular, they can be used in frame buildings for the reduction of structural re-sponse under seismic actions. Damage in structural elements is reduced as a consequence of the reduc-tion of inter-storey drift. In the same way, in ma-sonry buildings such devices can be profitably used for increasing in-structure damping and energy dis-sipation. Eventually, their use in bridges allows a re-duction of top-pier displacement.
Such techniques are the less expensive among all the energy dissipation systems and sometimes com-pared with traditional seismic strengthening tech-niques, too. Friction dampers are the cheapest de-vices after hysteretic metal yielding ones, which have the lowest cost of fabrication, installation and maintenance. The application of both has showed a great convenience in case of strategic buildings and, in particular, frame structures.
Figure 4.6. Typical hysteresis diagram of yielding devices.
Figure 4.7. Typical hysteresis diagram of friction devices.
Displacement (Inches)
Force(Kips)
Displ.
Force

179
4.3 Rate-dependent devices Rate-dependent devices are subdivided in Viscous Devices (VD) (Fig. 4.8), based on the viscous prop-erties of a fluid, and Visco-Elastic Devices (VED) (Fig. 4.9), based on the visco-elastic properties of a solid material. These dampers are devices that pro-vide a resisting force proportional to the applied ve-locity rather than applied displacement. Most vis-cous devices are fluid dampers; they have a low re-sistance to deformation when loads are applied very slowly but the resistance increases as long as the speed of applied deformation increases. Materials used in structural applications for Visco-elastic de-vices are usually polymers and glass fibres that dis-sipate energy when strained in shear. Natural rubber is a typical visco-elastic material that shows high fa-tigue strength, strong adhesion to metal surfaces, ability to store large quantity of energy and non-linear behaviour. Main advantages of viscous devices are the stable hysteresis loop (Fig. 4.10), the shock transmission features, the high stability and durability, the ease of implementation and the limited sensitivity to environmental condition changes. In addition, they are industrial products subjected to regular type test-ing, which enables high levels of reliability and per-formance uniformity. Disadvantages are very few and are limited to the wear of gaskets, fluid ageing, and the need of recentering after earthquake due to residual displacement.
Figure 4.8. Example of oleodynamic viscous device (Maz-zolani and Serino, 1997).
Visco-elastic devices couple the behaviour of a vis-cous damper, whose resisting force is proportional to the applied velocity, with that of an elastic spring, which gives to the device the ability to recover the initial configuration. Visco-elastic devices offer high resistance to plastic fatigue, adequate bonding with metals, good hysteretic properties (Fig. 4.11) with comparatively low displacements and low cost of fab-rication, installation and maintenance. Conversely, they can suffer high sensitivity to service temperature and may require a non linear analytical approach.
Application fields of VDs and VEDs are basically the same as YMDs. They allow a significant energy
dissipation, which involves a remarkable increase of global structural damping. An additional feature of VDs compared with YMDs is represented by the pos-sibility to act as provisional restraint, which enables this kind of device to reduce the effect of thermal changes in redundant structures as well as to damp the effect of vehicle braking in bridges.
Because of their technological features, visco-elastic and especially viscous dampers are relatively expensive among energy dissipation devices. Of course, the price-performance ratio is more important than the absolute cost and there is no simple hierarchy for this. However, viscous devices have been success-fully used in a number of applications in both new and existing buildings, including historical and monumen-tal constructions (Mazzolani and Mandara 1994, 2004, 2006).
Figure 4.9. Example of visco-elastic device.
F c x sign x
Figure 4.10. Oleodynamic viscous devices: hysteretic diagram under cyclic load, rheological model and reaction force expres-sion.
K
C
Fdashpot
spring
sgn( )F K x C x x
Figure 4.11. Visco-elastic devices: theoretical hysteretic dia-gram, rheological model and reaction force expression.

180
5 SEISMIC ISOLATION
5.1 GeneralContrary to the traditional approach to seismic design, the seismic isolation technique is based on the reduc-tion of the input energy to the structure, by means of the action of highly deformable devices, termed isola-tors. The isolation approach aims at controlling and limiting the dynamic effects on the structural ele-ments by means of a structural disconnection of the construction from the foundation soil, in such a way to modify the dynamic properties of the system. Ulti-mately, the target of the isolation system is to act like a sort of low-pass filter of the seismic action with re-spect to the building, so as that most of earthquake energy is prevented from entering the structure. De-pending on the location of isolating devices, it is pos-sible to have options like the �base isolation� (the most common), the �partial isolation�, the �roof isola-tion� and the �floor isolation� (Fig. 5.1).
Isolation LayerDashpot
Soft spring
Base isolation Partial isolation
Roof isolation Floor isolation
Figure 5.1. Typical configurations of isolated structures.
WITHOUT ADDED DAMPING
WITH ADDED DAMPING
ELASTOMERIC OR SLIDING ISOLATION DEVICES
SPECIAL ISOLATION DEVICES WITH HIGH
DAMPING PROPERTIES
SEISMIC ISOLATION
Such devices can dissipate a part of input energy in order to reduce
the magnitude of displacement under seismic actions
Such devices increase the structural deformability with a
corresponding reduction of seismic action on the structure
Figure 5.2. Basic options for base isolated structures. By means of isolation an increase of the global
system deformability is achieved, which causes the
magnitude of the ground motion transmitted to the structure, and hence the structural damage, to be dras-tically reduced. A concomitant increase of energy dis-sipation of the structure is possible by means of suit-able additional dampers, which are also used to re-duce the displacements at the serviceability limit state (Fig. 5.2).
5.2 Isolation devices Isolation devices can be classified as (Fig. 5.3):
Elastomeric devices - High Damping Rubber Bearings (HDRB) - Lead Rubber Bearings (LRB) - Added Damping Rubber Bearings (ADRB) - Fibre Reinforced Rubber Bearings (FRRB)
Sliding devices - Flat Slider Bearings - Curved Slider Bearings - Elasto-plastic Bearings - Wire-Rope Bearings
The most widely used isolators are the elastomeric de-vices, based on the use of rubber and steel plates, the latter used for reducing vertical deformability. They show high effectiveness in the reduction of both struc-tural response and damage when properly applied, namely in case of relatively stiff structures on rigid soil. They also show good horizontal deformability and high vertical load bearing capacity, in particular in case of HDRB. Their hysteresis loop is stable, espe-cially in HDs and LRBs. If necessary, an additional high viscous damping may be obtained with ADRBs.
a)
b)
c) d)Figure 5.3. Devices for seismic isolation: a) High Damping Rubber Bearins, b) Friction Pendulum System, c) Elasto-plastic Bearings, d) Wire-rope bearings.
Rubber bearings

181
Sliding devices represent an alternative able to re-duce displacements at serviceability limit state due to friction. They exhibit stable hysteresis loop and re-centring feature in case of curved sliders (FPS). On the other hand, they may suffer inaccuracy in the defi-nition of the friction coefficient due to imperfection and corrosion sensitivity, as well as high sensitivity to the compressive load between sliding surfaces.
Whatever the device used, seismic isolation pro-vides a very high structural performance compared with fixed base buildings, which makes this solution the best for the seismic protection of strategic build-ings (hospitals, fire stations, schools, ecc.) in highly seismic areas.
6 SMART SYSTEMS 6.1 General
A natural evolution of the above techniques involves the use of �smart� systems, which can be used to cre-ate controllable devices to be implemented into ac-tively controlled systems. The terms smart structures, intelligent structures, adaptive structures, active struc-tures all belong to the same field of study. All these terms refer to the integration of actuators and sensors in the structural layout and to the use of some kinds of control unit or enhanced signal processing (Fig. 6.1). The goal of this integration is the creation of a me-chanical system having enhanced structural perform-ance, but without adding too much mass or consum-ing too much power. Since numerous aspects (e.g. material science, applied mechanics, control theory, structural engineering, etc.) are involved in the design of a smart system solution, the related field inherently relies upon advanced interdisciplinary research.
As shown in the pictorial view of Figure 6.2, the aim of structural control is to give a �sense of bal-ance� to the structure, so as to give it the capability to self-regulate instantaneously its properties as a func-tion of the structural response. Motion data are taken from a sensor network, analysed in real time by a computer and elaborated in such a way to activate ex-ternal devices (active control) or just to modify the mechanical properties of these (semi-active-control).
The materials used in smart structures often have interesting and unusual properties. Electrostrictive materials, magnetostrictive materials, shape memory alloys, magneto/electrorheological fluids, polymer gels and piezoelectric materials, for example, all can be used to design and develop structures that can be called smart. However, the materials themselves are not smart, but this term refers to the exploitation of material properties to better serve a design function than would be possible through conventional struc-tural design.
Active control of structures has been recognized as one of the most challenging and significant areas of research in structural engineering in recent years. A
structure with active controllers can modify its behav-iour during dynamic loading thanks to the contribu-tion of external energy supply. Such a structure is also called adaptive (or smart) structure. In an actively controlled structure there is a predetermined number of members actively controlled by means of actuators. Some possibilities are shown in Figure 6.3. Sensors are placed in key points in order to measure dis-placements and velocities in the directions of prede-termined degrees of freedom. Actuators apply in real time the forces required for the appropriate correction of the uncontrolled response, which are determined on the basis of a suitable control law, implemented into the so called control algorithm. Actuators are devices that can apply forces or strains to the structure. The driving force mechanism in an actuator can be hy-draulic, electric or electro-hydraulic. The transmitted force can range from a few N to hundreds kN. Actua-tors are usually placed at member ends. Electric ac-tuators can be 50-200 cm long with cross-sectional diameters ranging from 10 to 40 cm. The level of force produced by electric actuators is in the range of 1 to 900 kN. In general, the size of an actuator in-creases with its capacity to produce the required thrust. Electro-hydraulic actuators can be as long as 360 cm with cross-sectional diameters up to 120 cm, with a level of force up to 2250 kN.
Figure 6.1. Integrated smart structure.
Figure 6.2. Representation of SMART system effect.
In comparison with passive systems, there are some significant advantages associated with smart systems: enhanced effectiveness in motion control, relative in-sensitivity to site conditions and ground motion, ap-plicability to multi-hazard mitigation situations, selec-tivity of control objectives. In particular, semi-active systems, namely systems in which the device proper-ties only are changed according to structural motion,

182
seem to offer the most appealing features for seismic protection of civil structures. Contrary to active sys-tems, in fact, they require a very small amount of en-ergy, which can be easily provided by a battery, thus avoiding the problem of power supply black-out, very common during an earthquake.
Figure 6.3. Examples of active structural control systems.
Figure 6.4. Open loop control (a), Open loop control with feedforward (b), Closed loop with feedback (c), Closed loop with feedforward and feedback (d).
A fundamental role in a smart system is played by the controller, which represents the logic system designed to manipulate the inputs to let the output reach a pre-scribed value according to the desired performance. Control systems can be basically distinguished in open loop and closed loop arrangement depending on the controller as illustrated in Figure 6.4. In the open loop, the controller manipulates the input with the purpose of driving the output to the setpoint, but no use is
made of the results. This control is effective until the external perturbation is accorded to the predicted val-ues and a correct model of the structure is available, so there is no possibility to compensate for errors in the model of input an output. A feedforward permits to compensate errors in the input estimation. The closed loop control uses the system response as feedback in-formation, with the consequent possibility of compen-sating effects influencing the response in a negative way. A closed loop strategy with feedback and feed-forward is a more effective way to control a structural system.
Smart structural control systems can be classified as indicated in Figure 6.5. The frequency dependent systems produce a change in natural frequencies of the structure on which they are installed and they can operate in resonance with the structure or not. Fre-quency independent system, instead, does not modify the natural frequency of the existing structure, but op-erate an increase of damping (semi-active systems) or introduce an external force of control (active sys-tems).
Smart Structural
control
Frequency dependent
Frequency independent
Resonant
Not-resonant
Active Tuned mass damper
Variable stiffnes system
Active
Semiactive
Active mass driver
Active tendon
Variable hydraulic damper
Controllable fluid damper
Variable friction
damper etc.
Figure 6.5. Smart structural control systems.
6.2 Smart devices Smart devices are conceived for semi-active structural control. They are different from actuators for active control, because can only produce dissipative forces. Semi-active devices include variable orifice dampers, variable friction dampers, controllable tuned liquid dampers, controllable fluid dampers, etc (Fig. 6.6). These devices can be viewed as controllable passive devices, in that the characteristics of the passive de-vice can be changed in real time. In this manner, semi-active devices can produce the desired dissipa-tive control forces. They are characterized by low power requirement, passive working and small di-mensions in spite of the great reaction force produced.

183
Variable Orifice Dampers. Variable orifice damper use a controllable, electromechanical variable-orifice valve to vary the flow of hydraulic fluid through a conventional hydraulic fluid damper (Fig. 6.7). Vari-able orifice dampers have been applied to full-scale buildings (Kobori et al., 1993; Kurata et al., 1999, 2000) and bridges (Sack and Patten, 1994, Patten et al., 1999).
Variable Friction Dampers. Variable friction dampers generate control forces through friction sur-faces so as to control the slippage of the device (Fig. 6.8). To date, only analytical studies have been con-ducted on these devices in the view of their possible application to civil structural control. These devices have, however, been proposed to reduce interstorey drifts of seismically excited frame buildings (Inaudi, 1997).
Smart Devices for Semi-Active
Control
Variable hydraulic device
Variable friction device
Controllable fluid device
On/off variable stiffness device
On/off variable device
Continuous variable damper
Multi-stage variable damper
Magneto-rheological damper
Electro-rheological damper
Figure 6.6: Smart devices categories for semi-active control.
Figure 6.7. Scheme of Variable Orifice Damper and corre-sponding hysteresis diagram (Kobori et al. 1993).
Figure 6.8. Scheme of Variable Friction Damper (Kobori et al. 1993).
Figure 6.9. Scheme of an ElectroRheological Damper with by-pass (Makris et al., 1996a,b).
Controllable Tuned Liquid Dampers. Controllable tuned liquid dampers use the motion of a column of fluid, varied with a controllable orifice, to reduce structural responses. These dampers are similar in concept to tuned mass dampers (TMDs), as they ab-sorb the energy of the structure by means of auto-induced vibration. However, whereas TMDs are typi-cally designed for one loading condition, the control-lable tuned liquid damper can remain effective for a large variety of loading conditions
Controllable Fluid Dampers. Controllable fluid dampers are quite similar to the variable orifice damp-ers, except for the fact that they use controllable fluids, such as electrorheological (ER) and magnetorheologi-cal (MR) fluids. Because of this, they do not require a mechanical servo-valve. Gavin et al. (1996a, 1996b) designed and tested an ER damper that consisted of a rectangular container and a moving plunger comprised of nine rigidly-connected flat plates. Makris et al. (1996a,b) developed an ER damper consisting of an outer cylinder and a double ended piston rod that pushes the ER fluids through an annular duct (Fig. 6.9).
A number of experimental studies have been con-ducted to evaluate the performance of MR dampers for vibration reduction under wind and earthquakes. Magnetorheological fluid devices are semi-active control dampers with a magnetorheological fluid in-side. The fluid denominated as Magnetorheological consists on a suspensions of micron-sized magnetiz-able particles in an appropriate carrier liquid like syn-thetic oil, water or silicone oil. When exposed to a magnetic field, the particles acquire a dipole moment

184
aligned with the external field which causes particles to form linear chains parallel to the field, as schemati-cally represented in Figure 6.10. The main feature of the fluid is its ability to reversibly change from free flowing linear viscous liquids to semi-solids having controllable yield strength in a matter of milliseconds. These fluids are capable to operate at temperatures from -40ºC to 150ºC with only slight variations in the yield stress. They are not sensitive to impurities, such as those commonly found during manufacturing and usage, and they require low operating power and low voltage (~12-24V). Dyke et al. (1996a,b, 1998), Jansen and Dyke (2000), Spencer et al. (1996) pro-posed MR dampers to reduce the seismic vibration of model building structures. Spencer et al. (2000), Ra-mallo et al. (2001) and Yoshioka et al. (2001) incor-porated an MR damper with a base isolation system such that the isolation system would be effective un-der both strong and moderate earthquakes. Johnson et al. (2007) employed the MR damper to reduce wind-induced stay cable vibration. In all cases, experimen-tal results indicate that the MR damper is quite effec-tive for a wide class of applications. For this reason, MR Fluid Dampers are the most promising devices for semi-active control. They cannot inject energy into the structural system and therefore do not have the po-tential to destabilize the system. However, MR fluid dampers are intrinsically nonlinear, what makes the development of suitable control strategies that can op-timally exploit their unique features a challenging task.
Figure 6.10.Magnetorheological fluid principle (Dyke et al., 1996a)
Figure 6.11. Scheme of a MagnetoRheological Damper pro-duced by Lord Corporation (Yang et al., 2001).
A typical MR device for seismic applications is shown in Figure 6.11. The response of the MR
damper due to a 2.5 Hz sinusoidal displacement with amplitude of 1.5 cm is shown in Figure 6.12 for four constant voltage levels (0 V, 0.75 V, 1.5 V and 2.25 V). At 0 V the MR damper exhibits the characteristics of a viscous device (i.e., the force-displacement rela-tionship is approximately elliptical and the force-velocity relationship is nearly linear), whereas, as the voltage increases, the force required to yield the fluid increases and produces the behaviour associated with a plastic material in parallel with a viscous damper.
a) Force versus displacement b) Force versus velocity
Figure 6.12. Measured force in a MR device for 2.5 Hz sinu-soidal excitation with amplitude of 1.5 cm (Dyke et al., 1998).
The first building in the world to have an active con-trol system was the Kyobashi Seiwa Building in To-kyo (1989) (33.1 m height, floor dimensions 4 x 12 m). Two AMD (Active Mass Drives) were installed on the top of the structure to suppress vibrations caused by earthquakes and strong winds (Fig. 6.13) (Christen-son et al., 2000a,b). Application of active and semi-active control systems for both earthquake and wind protection is continuously increasing and there are ac-tually about 50 buildings and towers implemented with active control strategies, together with over 15 bridges fitted with active and hybrid control devices, mostly in Japan. Use of semi-active mass driver has been also proposed for the seismic retrofit of historical buildings (Mandara et al., 2006a,b). Other significant applications are in Taiwan (TC Tower Kao Hsung, 1996, 85 storeys) and China (Nanjing Tower Nanjing, 1998, 310 m).
Figure 6.13. Kyobashi Seiwa Building (Japan), scheme of the structural control system with AMD (Christenson et al., 2000).

185
7 CONCLUSIONS
This paper has highlighted the most important issues in the field of seismic protection of buildings by means of innovative materials and techniques. The described solutions, quite likely, will become more and more frequent when a high seismic performance is required, not only for strategic buildings as hap-pened till now in most cases, but also for relatively �common� constructions. In particular, the applica-tion of advanced devices and systems seems to be very appealing in the seismic retrofit and upgrading of existing constructions. In this filed, in fact, they offer performance and safety levels unattainable with conventional strengthening systems. In addi-tion, they posses the fundamental feature to be, apart from a few exceptions, completely reversible, and this plays a key role when historical constructions are faced. The limited available space, of course, prevented the author to go into detail in the descrip-tion of the numerous items dealt with. However, a general outlook of the subject has hopefully been given, pointing out the importance of such advanced solutions in the current and future seismic engineer-ing practice.
8 ACKNOWLEDGEMENTS
The subjects dealt with in this paper represent major topics of the Research Project PROHITECH �Earth-quake Protection of Historical Buildings by Reversible Mixed Technologies� (2004-07) (www.prohitech.com), supported by European Com-mission within FP6, in which 16 Academic Institu-tions of 12 European and Mediterranean Countries are involved under the coordination of Prof. F.M. Maz-zolani, University Federico II, Naples.
The author gratefully acknowledges the great effort made by all Prohitech Partners and by Prof. Mazzolani himself in facing a so wide research field and in pro-ducing a state-of-art advance which was a highly valu-able reference for the preparation of this paper.
REFERENCES
Aiken, I.D., Kelly, J.M. and Mahmoodi, P. (1990). The Application of Viscoelastic Dampers to Seismically Resistant Structures. Pro-ceedings of 3rd U.S. National Conference on Earthquake Engi-neering, Earthquake Engineering Research Institute, Charleston, South Carolina.
Aiken, I.D., Nims, D.K., Wittaker, A.S. and Kelly, J.M. (1993). Test-ing of Passive Energy Dissipation Systems, Earthquake Engineer-ing Research Institute California, Berkeley, California.
Carlson, J.D., (1994). The Promise of Controllable Fluids. Proc. of Actuator 94 (H. Borgmann and K. Lenz, Eds.), AXON Technolo-gie Consult GmbH, 266-270.
Carlson, J.D., and Spencer Jr., B.F., (1996a). Magneto-rheological fluid dampers: scalability and design issues for application to dy-namic hazard mitigation. Proc. 2nd Workshop on Struct. Control: Next Generation of Int. Struct., Hong Kong, China.
Carlson, J.D., and Spencer Jr., B.F., (1996b). Magneto-rheological fluid dampers for semi-active seismic control.� Proc. 3rd Interna-tional Conference on Motion and for semi-active seismic control.� Proc. 3rd International Conference on Motion and Vibration Con-trol, vol. 3, Chiba, Japan, pp. 35�40.
Carlson, J.D., and Weiss, K.D., (1994). A growing attraction to mag-netic fluids. Machine Design, Aug. 8, pp. 61�66.
Carlson, J.D., Catanzarite, D.N. and St Clair, K.A., (1996). Commer-cial Magneto-Rheological Fluid Devices. Proceedings 5th Int. Conf. on ER Fluids, MR Suspensions and Associated Technol-ogy, W. Bullough, Ed., World Scientific, Singapore, pp. 20�28.
CEB-FIP (2001). Externally bonded FRP reinforcement for RC struc-tures, Technical report on the Design and use of externally bonded fiber reinforced polymer reinforcement (FRP EBR) for reinforced concrete structures, prepared by a working party of the Task Group 9.3 FRP reinforcement for concrete structures.
Christenson, R.E., Spencer Jr., B.F., and Johnson, E.A., (2000a). Coupled Building Control using �Smart� Damping Strategies. Proc. SPIE Smart Structures and NDE Symposia, Newport Beach, CA, CD-ROM (9 pages), March 6-9, 2000.
Christenson, R.E., Spencer Jr., B.F., Hori, N., and Seto, K., (2000b). Experimental Verifi-cation of Coupled Building Control. Four-teenth Engineering Mechanics Conference, American Society of Civil Engineers, Austin, Texas, May 21-24, 2000.
Costantinou, M.C., Symans, M.D, Tsopelas, P. and Taylor, D.P. (1993). Fluid Viscous Dampers in Applications of Seismic En-ergy Dissipation and Seismic Isolation. Proceedings of ATC 17-1 on Seismic Isolation, Passive Energy Dissipation and Active Con-trol, San Francisco, California.
Croci, G., Bonci, A. and Viskovic, A. (2000). Use of shape memory alloy devices in the Basilica of St. Francis in Assisi. Proceedings of Final Workshop of ISTECH Project - Shape Memory Alloy Devices for Seismic Protection of Cultural Heritage Structures, Ispra, Italy.
De Matteis, G., Formisano, A., Mazzolani, F.M. and Panico, S. (2005a). Design of dissipative aluminium shear panels: compari-son between numerical analysis and experimental results. Pro-ceedings of the Eurosteel Conference on Steel and Composite Structures, Maastricht, The Netherlands.
De Matteis, G., Formisano, A., Mazzolani, F.M., Panico, S. (2005b) Design of low-yield metal shear panels for energy dissipation, Proceedings of the COST C12 Final Conference, Innsbruck.
De Matteis, G., Panico, S. and Mazzolani, F.M. (2006). Experimental study on pure aluminium shear panels with different stiffener types, Proceedings of the V International Conference STESSA �06 (Behaviour of Steel Structures in Seismic Areas), Balkema, Yokohama, Japan, p. 219-224.
Di Marzo D., Mandara A., Serino G. (2000). Earthquake Protection of Buildings and Bridges with Viscous Energy Dissipation Devices. In: F.M. Mazzolani & R. Tremblay (eds), Behaviour of Steel Structures in Seismic Areas STESSA 2000. Balkema, Amster-dam, p. 395-402.
Dolce, M. and Cardone, D. (2001). Mechanical Behaviour of Shape Memory Alloys for Seismic Applications. International Journal of Mechanical Sciences, Vol.43. pp.2631-2656.
Dyke SJ, Spencer BF Jr, Sain MK, Carlson JD., (1997). An experi-mental study of magnetorheological dampers for seismic hazard mitigation. Proceedings of Structures Congress XV, Portland, OR, 1358�62.
Dyke, S.J., and Spencer Jr., B.F., (1997). A comparison of semi-active control strategies for the MR damper. Proc. of the IASTED International Conf., Intelligent Information System, The Baha-mas.
Dyke, S.J., Spencer Jr., B.F., Quast, P., Sain, M.K., Kaspari, Jr., D.C., and Soong, T.T., (1995). Acceleration feedback control of MDOF structures. J. Engrg. Mech., ASCE, 122(9):907�918.
Dyke, S.J., Spencer Jr., B.F., Jr.,Sain, M.K., and Carlson, J.D., (1996a). Modeling and control of magnetorheological dampers for seismic response reduction. Smart Materials and Structures, 5, 565�575.

186
Dyke, S.J., Spencer Jr., B.F., Quast, P., Kaspari Jr., D.C., and Sain, M.K., (1996b). Implementation of an Active Mass Driver Using Acceleration Feedback Control, Microcomputers in Civil Engi-neering: Special Issue on Active and Hybrid Structural Control, 11, 304-323.
Dyke, S.J., Spencer Jr., B.F., Sain, M.K. and Carlson, J.D., (1998). An experimental study of MR dampers for seismic protection, Smart Mat. and Struct., 7, pp. 693-703.
FEMA 273 (1997). NEHRP Guidelines for the Seismic Rehabilitation of Buildings (FEMA 274 Commentary), Building Seismic Safety Council, Washington, D.C., USA.
FEMA 356 (2000). Prestandard and Commentary for the Seismic Re-habilitation of Buildings, American Society of Civil Engineering (ASCE) for the Federal Emergency Management Agency (FEMA), Washington, D.C., USA.
Formisano, A., Mazzolani, F.M., Brando, G. and De Matteis, G. (2006). Numerical evaluation of the hysteretic performance of pure aluminium shear panels, Proc. of the V International Conf. STESSA �06 (Behav. of Steel Structures in Seismic Areas), Balkema, Yokohama, Japan, p. 211-218.
Gavin HP, Hanson RD, Filisko FE., (1996a). Electrorheological dampers, part 1: analysis and design. J of Applied Mechanics, ASME; 63(9):669�75.
Gavin HP, Hanson RD, Filisko FE.,(1996b). Electrorheological dampers, part 2: testing and modeling. J of Applied Mechanics, ASME;63(9):676�82.
Gavrilovic, P., K. S. and Sendova, V. (2002). Earthquake Protection of Byzantine Churches Using Seismic Isolation. Proceeding of 12ECEE, London, UK.
Giuffrè A., Martines G. (1989). Impiego del Titanio nel Consolida-mento del Capitello della Colonna Antonina. In: Proceedings of the Convegno e Mostra A.N.I.A.SPE.R. Rome.
Graesser, E.J. and Cozzarelli, F.A. (1991). Shape-Memory Alloys as New Materials for Aseismic Isolation. Journal of Engineering Mechanics, Vol.117. pp.2590-2608.
Holmes Consulting Group LTD (2001). Structure Damping and En-ergy Dissipation. Wellington, New Zealand.
Housner, G., Soong, T.T. and Masri, S.F., (1994a). Second generation on active structural control in civil engineering. Proc. 1st World Conf. on Struct. Control, pp. FA2:3-18, Pasadena, CA.
Housner, G.W. et al., (1997). Structural control: past, present, and fu-ture. J. Engrg. Mech., ASCE, 123:897�971.
Housner, G.W., Bergman, L.A., Caughey, T.K., Chassiakos, A.G., Claus, R.O., Masri, S.F., Skelton, R.E., Soong, T.T., Spencer, B.F., Jr., and Yao, J.T.P., (1997). Structural Control: Past and Pre-sent, Journal of Engineering. Mechanics, ASCE, 123(9), 897�971.
Hrovat D, Barak P, Rabins M., (1983). Semi-active versus passive or active tuned mass dampers for structural control. Journal of Engi-neering Mechanics, ASCE 109(3): 691�705.
Inaudi, J.A., (1997). Modulated Homogeneous Friction: A Semi-Active Damping Strategy. Earthquake Engrg., and Struct. Dyn., 26, 361-376.
Indirli M. (2000). The Demo-Intervention of the ISTECH Project: the Bell Tower of S. Giorgio in Trignano (Italy). In: Proceedings of the Final Workshop of ISTECH Project, Ispra (Italy).
Johnson, E.A., Baker, G.A., Spencer, B.F., Jr., and Fujino, Y. (2007). �Semiactive Damping of Stay Cables.� J. Engrg. Mech., ASCE,, Vol. 133, Issue 1, pp. 1-11.
Kobori, T., Takahashi, M., Nasu, T., Niwa, N., and Ogasawara, K., (1993). Seismic Response Controlled Structure with Active Vari-able Stiffness System, Earthquake Engrg., and Struct. Dyn., 22, 925-941.
Kurata, N., Kobori, T., Takahashi, M., Niwa, N. and Midorikawa H., (1999). Actual Seismic Response Controlled Building with Semi-Active Damper System, Earthquake Engrg., and Struct. Dyn., 28, 1427-1447.
Kurata, N., Kobori, T., Takahashi, M., Ishibashi, T., Niwa, N., Ta-gami, J., and Midorikawa, H., (2000). Forced Vibration Test of a
Building with Semi-Active Damper System. Earthquake Engrg., and Struct. Dyn., 29, 629-645.
Makris, N. and Costantinou, M.C. (1991). Fractional Derivative Model for Viscous Dampers. Journal Structural Engineering, ASCE Vol.117. pp.2708-2724.
Makris, N. and Costantinou, M.C. (1993). Models of Viscoelasticity with Complex Order Derivates. Journal Engineering Mechanics, ASCE Vol.119 (No.7). pp.1463-1464.
Makris, N. and Deoskar, S. (1996). Prediction of Observed Response of Base-Isolated Structure. Journal of Structural Engineering Vol.122 (No.5). pp. 485-493.
Makris N, Burton SA, Hill D, Jordan M., (1996a). An electror-heological damper with annular duct. Proceedings of Structures Congress XIV, Chicago, IL: 1197�204.
Makris N, Burton SA, Hill D, Jordan M., (1996b). Analysis and de-sign of ER damper for seismic protection of structures. J of Engi-neering Mechanics, ASCE; 122(10):1003�11.
Makris N, McMahon S., (1996). Structural control with controllable fluid dampers: design and implementation issues. Proceedings of Second International Workshop on Structural Control, Hong Kong: 311�22.
Makris, N., Burton, S.A., Hill, D. & Jordan, M., (1996). Analysis and design of ER damper for seismic protection of structures. J. of Engineering Mechanics, ASCE 122(10):1003�1011.
Mandara A., Durante A., Spina G., Ameduri S., Concilio A., 2006a. Seismic protection of civil historical structures by MR dampers. Proceedings of the SPIE's 13th Annual International Symp.on Smart Structures and Materials. San Diego, Ca, USA.
Mandara A., Durante A., Ramundo F., Spina G., 2006b. Smart tech-nologies for seismic protection of historical structures. Proceed-ings of the First European Conference on Earthquake Engineering and Seis-mology. Geneva, Switzerland.
Mandara A., Mazzolani F.M. (2001a). Energy Dissipation Devices in Seismic Up-grading of Monumental Buildings. In: Proceedings of the 3rd International Seminar on Structural Analysis of Historical Constructions. Guimarães (Portugal), p. 923-932.
Mandara, A. and Mazzolani, F.M. (2001b). On the Design of Retrofit-ting by means of Energy Dissipation Devices, Proc. of 7th Int. Seminar on Seismic Isolation, Passive Energy Dissipation and Active Control of Vibrations of Structures, Assisi, Italy.
Mandara A., Muzeau J.P., Perdikaris P., Piazza M. and Schaur C. (2002). Repairing and Strengthening for New Requirements: Use of Mixed Technologies. 1st COST-C12 Seminar, Lisbon (Portu-gal).
Mazzolani, F.M. (1995). Aluminium Alloy Structures. 2nd Ed., E & FN SPON, London, UK.
Mazzolani, F.M. (1998). L�alluminio ed il restauro strutturale dei ponti sospesi: Il �Real Ferdinando� sul Garigliano, Restauro, 146/98, 25-55 (in Italian).
Mazzolani, F.M. (2001). Passive control technologies for seismic-resistant buildings. Prog. Struct. Engng. Mater. 2001; 3.
Mazzolani F.M. and Mandara A. (1994). Seismic Upgrading of Churches by Means of Dissipative Devices. In: F.M. Mazzolani & V. Gioncu (eds), Behaviour of Steel Structures in Seismic Areas STESSA �94. E & FN SPON, London, p. 747-758.
Mazzolani, F.M. and Mandara, A. (2002). Modern Trends in the use of special metals for the improvement of historical and monumen-tal structures. Eng. Structures Vol.24. pp.843-856.
Mazzolani F.M. & Mandara A. 2004. Seismic upgrading of an old in-dustrial masonry building by dissipative steel roofing, Proc. of SAHC Seminar, Padua.
Mazzolani F.M. & Mandara A. 2006. New steel roofing for the main building of the University Federico II in Naples. In: F.M. Maz-zolani & A. Wada (eds), Behaviour of Steel Structures in Seismic Areas STESSA 2006. Balkema, Amsterdam.
Mazzolani, F.M., Martelli, A. and Forni, M. (2001). Progress of Ap-plication and R&D for Seismic Isolation and Passive Energy Dis-sipation for Civil Buildings in the European Union�, Proc. of 7th Int. Sem. on Seismic Isolation, Passive Energy Dissip. and Active Control of Vibrations of Structures, Assisi, Italy.

187
Mazzolani F.M. and Serino G. (1997). Viscous Energy Dissipation Devices for Steel Structures: Modelling, Analysis and Applica-tion. In: F.M. Mazzolani & H. Akiyama (eds), Behaviour of Steel Structures in Seismic Areas STESSA �97. Ed. 10/17, Salerno (It-aly), p. 724-733.
Nims, D., Richter, P. and Bachman, R. (1993). The Use of the Energy Dissipating Restraint for Seismic Hazard Mitigation. Earthquake Spectra Vol.9 (No.3). pp.467-489.
Pall, A.S. and Marsh, C. (1980). Optimum Seismic Resistence of Large Panel Structures Using Limited Slip Bilted Joints. Proced-ing of the 7th World Conference on Earthquake Engineering, In-stanbul, Turchia.
Pall, A.S. and Marsh, C. (1982). Seismic Response of Friction Damped Braced Frames. Journal of Str. Div., ASCE Vol.108(No.ST6).
Patten, W.N., Kuo, C.C., He, Q., Liu, L. and Sack R.L., (1994). Seis-mic structural control via hydraulic semi-active vibration dampers (SAVD). Proceedings of First World Conference on Structural Control, Los Angeles, CA: FA2-83�FA2-89.
Patten, W.N, Sun, J., Li, G., Kuehn, J. and Song, G. (1999). Field Test of an Intelligent Stiffener for Bridges at the I-35 Walnut Creek Bridge. Earthquake Engng. Struct. Dyn. 28, 109-126.
Pegon P., Armelle A., Pinto A., Renda V. (2000). The ELSA Labora-tory and the Protection of Cultural Heritage. In: Proceedings of the 5th International Congress on Restoration of Architectural Heritage, Florence, (on CD-ROM).
Ramallo, J.C., Johnson, E.A., and Spencer Jr., B.F., (2001). Smart� base isolation systems. J. Engrg. Mech., ASCE, submitted.
Reinhorn, A.M., Li, C. and Constantinou, M.C., (1995). Experimental and analytical investigation of seismic retrofit of structures with supplement damping, part I: fluid viscous damping devices.� Technical Report NCEER-95-0001, NCEER, Buffalo, NY.
Sack, R.L. and Patten, W. (1994). Semiactive Hydraulic Structural Control, Proc. Int. Workshop on Struct. Control, USC Publica-tion Number CE-9311, pp. 417-431, 1994.
Soong, T.T. and Dargush, G.F. (1997). Passive Energy Dissipation Systems in Structural Engineering. J. W. Sons. Chichester, Eng-land, State University of New York at Buffalo, USA.
Soong TT, Masri SF, Housner GW., (1991). An overview of active structural control under seismic loads. Earthquake Spectra; 7(3):483�505.
Soong TT, Spencer Jr BF., (2000). Active, semi-active and hybrid control of structures. Proceedings of the 12th World Conference on Earthquake Engineering, Auckland, New Zealand; Paper No. 2834.
Soong TT., (1990). Active Structural Control: Theory and Practice. John Wiley: New York.
Spencer BF Jr., (1996). Recent trends in vibration control in the U.S.A. Proceedings of the Third International Conference on Motion and Vibration Control, Vol. II, Chiba, Japan: K1�K6.
Spencer BF, Dyke SJ, Sain MK, Carlson JD., (1997). Phenomenol-ogical model for magnetorheological dampers. Journal of Engi-neering Mechanics; 123(3):230�8.
Spencer Jr., B.F., and Soong, T.T., (1999). New application and de-velopment of active, semi-acitve and hybrid control techniques for seismic and non-seismic vibration in the USA. Proc. Int. Post-SMiRT Conf. Seminar on Seismic Isolation, Passive En-ergy Dissipation and Active Control of Vib. of Struct., 1:467�488.
Spencer Jr., B.F., Johnson, E.A., and Ramallo, J.C., (2000). Smart� Isolation for Seismic Control. JSME International Journal: Spe-cial Issue on Frontiers of Motion and Vibration Control, Series C, 43(3), 704-711.
Spencer Jr., B.F., Suhardjo, J., and Sain, M.K., (1994). Frequency Domain Optimal Control Strategies for Aseismic Protection. Journal of Engineering Mechanics, ASCE, 120 (1), 135�159.
Spoelstra, M., and Monti, G. (1999). FRP-confined concrete model. Journal of Composite for Con-structions, ASCE 3(3), August 1999.
Symans MD, Constantinou MC., (1996). Experimental study of seis-mic response of structures with semi-active damping control sys-tems. Proceedings of Twelfth Conference on Analysis and Com-putation held in conjunction with Structures Congress XIV, ASCE, Chicago, IL: 350�60.
Symans MD, Constantinou MC., (1996). Semi-active control of earth-quake induced vibration. Proceedings of Eleventh World Confer-ence on Earthquake Engineering, Acapulco, Mexico, Paper No. 95.
Symans, M.D., and Constantinou, M.C., (1997). Seismic testing of a building structure with semi-active fluid damper control system. Earthquake Engrg. And Struct. Dyn., 26:757�777.
Symans MD, Constantinou MC., (1997). Experimental testing and analytical modeling of semi-active fluid dampers for seismic pro-tection. Journal of Intelligent Material Systems and Structures; 8(8):644�57.
Tashkov, L., Antimovski, A. and Kokalevski, M. (2002). "Seismic isolation based on almost lifted structure concept", Proc. of EURODYN2002 Conference, Munich, Germany.
Taylor, D.P., and Constantinou, M.P., (1996). Fluid dampers for ap-plications of seismic energy dissipation and seismic isolation. Proc. 11th World Conf. on Etq. Eng., Acapulco, Mexico.
Triantafillou, T.C. (1998). Strengthening of masonry structures using epoxy-bonded FRP laminates. Jour. of Composite for Constr. ASCE 2(2).
Triantafillou, T.C. (1998). Strengthening of Structures with Advanced FRPs, Progress in Structural Engineering and Materials, Vol. 1 (No. 2), pp.126-134.
Valluzzi, M.R., Valdemarca, M., and Modena, C. (2001). Experimen-tal analysis and modeling of brick masonry vaults strengthened by frp laminates. Journal of Composite for Constructions, ASCE, August 2001.
Yamada K, Kobori T., (1995). Control algorithm for estimating future responses of active variable stiffness structure. Earthquake Engi-neering and Structural Dynamics 1995;24:1085�99.
Yang, J.N., Wu, J.C., and Agrawal, A.K., (1995). Sliding mode con-trol for nonlinear and hysteretic structures. J. Engrg. Mech., ASCE, 121:1130�1139.
Yang, J.N., Agrawal, A.K., and Chen, S., (1996). Optimal polynomial control for seismically excited non-linear and hysteretic struc-tures. Earthquake Engineering. And Structural Dynamics, 25:1211�1230.
Yang, J.N., Wu, J.C., Agrawal, A.K., and Hsu, S., (1997). Sliding model control with compensator for wind and seismic response control. Earthquake Engrg. And Struct. Dyn., 26:1137�1156.
Yang, G., Spencer Jr., B.F., Carlson, J.D., and Sain, M.K., (2001). Dynamic modeling and performance considerations on full-scale MR fluid dampers. Proc. 8th International Conference on Struc-tural Safety and Reliability, Newport Beach, CA.
Yi, F., and Dyke, S.J., (2000). Structural Control Systems: Perform-ance Assessment. Proc. of American Control Conf., Chicago, IL, June 28-30.
Yoshida, K., Watanabe, T., and Yoshida, S., (1998). Robust vibration control methods accommodating disturbance. Proc. 2nd World Conf. on Struct. Control, 2:1371�1380.
Yoshioka, H., Ramallo, J.C., and Spencer Jr., B.F., (2001). Smart Base Isolation Strategies Employing Magnetorheological Damp-ers. J. Engrg. Mech., ASCE, submitted.
Zambas, C., (1992). Structural repairs to the monuments of the Acropolis � the Parthenon, Proceedings of the Institution of Civil Engineers, Vol. 92, pp. 166-176.

188
1 INTRODUCTION
In the place called Plaoshnik lying between the lake and the monumental ramparts of the Samoilo�s for-tress dating back some 1100 years ago, St. Clement from Ohrid, the first Slavic episcope erected the church of St. Panteleymon upon an old three-conched sacral structure, preaching the Christian re-ligion and generally performing humanistic activities of invaluable importance for all the Slavic peoples. The Plaoshnik compound is under the protection of the Law on Protection of Cultural Monuments.
In 2001, at the initiative of the established Organ-izational Board for Restoration of St. Clement's church "St. Panteleymon" in Plaoshnik, Ohrid, there started the realization of the idea for the reno-vation of the church based on assuming its appear-ance from the original remains of the church walls without damaging the excavated fresco fragments. The final intention of the Board was to return the remains of St. Clement in the grave chosen by him-self, as a token of the great respect toward his out-standing deeds as the founder of the Slavic and Ma-cedonian culture and literacy. At the initiative of the Board established for the restoration of the Plaosh-nik compound, a professional body consisting of eminent architects, structural engineers, archaeolo-gists, art historians and conservators was constituted. Their main concern was to find the most appropriate solution for this holy place and hence make their own contribution toward the St. Clement's great hu-manistic and lofty work.
Based on the defined and adopted appearance of the restored Plaoshnik complex presented in the archi-tectonic documentation elaborated by the Institute for Protection of Cultural Monuments and National Museum - Ohrid, a detailed static and dynamic analysis of the structure was carried out by the Insti-tute of Earthquake Engineering and Engineering Seismology - Skopje, who made the solution deter-mining the structural system of the structure as well as the conditions for foundation and consolidation of the existing church walls, (Gavrilovic et al. 1994, Gavrilovic et al. 2001, Necevska-Cvetanovska et al. 2001). Presented in the paper are part of the results from the analyses as well as the characteristic details of repair and consolidation of the existing walls.
2 EXISTING STATE AND DESIGN CRITERIA
The St. Clement's church was restored upon the existing foundations from the construction phases dating back to IX to XIV century. The renovation was carried out upon the original remains of the church walls, without damaging the excavated fresco fragments, by previously eliminating the parts of the walls that were added during the conservation of the structure in 1965. During the restoration of the church, traditional materials (stone, brick and lime mortar) were used as construction material, preserv-ing the original walling pattern of each of the differ-
Consolidation, rebuilding and strengtheningof the St. Panteleymon church - Ohrid
R. Apostolska & G. Necevska-CvetanovskaInstitute of Earthquake Engineering and Engineering Seismology, Skopje, FYR of Macedonia
ABSTRACT: In the process of renovation of the "St. Panteleymon" church, having in mind the importance and the specific nature of the structure, representing a historic monument classified in the first category, it was necessary to design a building structure that will satisfy the stability conditions in the process of applica-tion of the conservation principles referring to shape, system and identity of materials. Based on the defined and adopted appearance of the renovated Plaoshnik compound presented in the architectonic plans elaborated by the Institute for Protection of Cultural Monuments and National Museum - Ohrid, a detailed static and dy-namic analysis of the structure was carried out by the IZIIS-Skopje, who also provided a solution for defini-tion of the structural system, the foundation conditions and the conditions for consolidation of the existing church walls.

189
ent chronological periods of construction of the structure.
While building the church structure, two timber bond courses placed at a vertical distance of 1.26m as well as timber ties were used. The sub-base zone between the original and the renewed part was solved by a joint made of lime mortar with a thick-ness of 5 cm shaded with a certain nuance, while the renovated walls are withdrawn in respect to the original ones for 3 cm in order to make a boundary between the old and the renewed part. Figure 1 shows photos of the excavated material.
Figure 1. Existing state of the church (excavated material - 2001).
Based on the performed investigations, geotechnical surveys of the site and materials characteristics on the one hand as well as the conservation require-ments as to the preservation of the existing elements on the other, the existing system was consolidated by lateral strengthening using RC elements, a finish-ing belt course of steel ties and masonry and a con-crete floor slab, i.e., the newly designed structures started to be constructed at level 0.00m.
The basic design criteria and requirements for the structure were:
To be built from traditional materials as the origi-nal church. To meet the criteria for seismic stability and safety under the expected earthquake acceleration of amax=0.36g whereat the total integrity of the structure will be preserved.
3 ANALYSIS OF THE CHURCH
The main structural system of the church consists of massive stone and brick masonry with incorporated steel horizontal and vertical ties. The structure is founded on existing walls for which corresponding consolidation and strengthening was defined.
The structural system of the St. Panteleymon church in the Plaoshnik locality - Ohrid was ana-lyzed in compliance with the present existing regula-
tions and the proposed European regulations (prEN1998-1:Eurocode 8. 2003). Two methods were used: 1 Analysis of the bearing and deformability capac-
ity of the structure and its dynamic analysis by consideration of expected actual earthquake ef-fects of maximum intensity of 0.36 g, using the methodology and computer programmes devel-oped at IZIIS, (MAS-ANL3.1998).
2 Static and seismic spectral three-dimensional analysis of the structure by means of the SAP 2000 computer programme, (Wilson & Habibul-lah. 1998).
3.1 Analysis of Bearing and Deformability Capacity and Dynamics Analysis
The bearing and deformability capacity of the struc-ture are the main initial parameters in defining the behaviour of the structure. The methodology for ob-taining the bearing capacity in the form of ultimate shear force (Qu) consists of summing up the elastic-plastic bearing characteristics of each of the bearing walls, where the bearing capacity of each of these is limited to the lower value than that of the bending or shear bearing capacity. This force compared to the equivalent seismic force provides the factor of safety against failure.
In accordance with this procedure and using the computer programme developed at IZIIS � Skopje, (MAS-ANL3.1998) two variants of the structural system of the church of St. Panteleymon, Plaoshnik � Ohrid were analysed.
As the first variant, the church structure was tested only with bearing walls in both orthogonal di-rections, i.e. plain masonry. The total horizontal force at the base of the structure was 30% of the structural weight computed in accordance with the valid regulations for construction of structures in seismic conditions.
The results from the analysis showed that the safety factor at occurrence of the first cracks was less than a unity, (table 1), i.e., that the structure did not have sufficient bearing and deformability capac-ity wherefore it needed strengthening of the princi-pal structural system.
Table 1. Bearing and deformability capacity of the structure in longitudinal direction � plain masonry.
Sto-rey
Qb,code [kN]
Qy [kN]
Qu[kN]
y[cm]
u[cm]
Fy Fu
3 611 386 732 0.04 0.19 0.63 1.20 2 3023 1832 2038 0.16 0.18 0.61 0.67 1 5420 3333 4413 0.10 0.16 0.61 0.81
Qy- force at the state of occurrence of the first cracks Qu- ultimative bearing capacity
y- displacement at the state of occurrence of the first cracks u- ultimative displacement
Fy- safety factor at the state of occurrence of the first cracks Fu- safety factor against failure

190
Strengthening of the structure was anticipated to be done by incorporation of horizontal and vertical ties. As the second variant, the walls were treated as a confined masonry at three storey levels with in-cluded horizontal and vertical ties. The total seismic force at the base was computed in accordance with the valid regulations for construction of structuress in seismic conditions and compliant to Eurocode 8. Due to the importance of the structure and the fact that it represents a historic heritage of R. Macedonia, the analysis was carried out by a seismic force of 0.45g.
The results showed that the storey safety factor against failure in both directions is greater than a unity, (tables 2 and 3), i.e., that the walls had a suffi-cient bearing and deformability capacity.
Table 2. Bearing and deformability capacity of the structure in longitudinal direction� confined masonry.
Sto-rey
Qb,code [kN]
Qy [kN]
Qu[kN]
y[cm]
u[cm]
Fy Fu
3 917 1181 2108 0.13 0.54 1.29 2.30 2 4534 4983 5531 0.43 0.51 1.10 1.22 1 8131 9252 10717 0.28 0.34 1.14 1.32
Table 3. Bearing and deformability capacity of the structure in transversal direction� confined masonry.
Sto-rey
Qb,code [kN]
Qy [kN]
Qu[kN]
y[cm]
u[cm]
Fy Fu
3 917 1713 1864 0.22 0.26 1.82 1.98 2 4534 4603 5861 0.49 0.66 1.01 1.29 1 8131 6976 8065 0.41 0.49 0.86 0.99
To obtain the dynamic response of the structure (shear type model), four different types of earth-quakes, (El Centro, Parkfild , Ulcinj (Albatros) and Petrovac (Oliva)) with maximum input acceleration of 0.36g have been applied.
The results (tables 4 and 5) showed that, under acceleration of 0.36, the structure behaves in the elastic range.
Table 4. Results from dynamic analysis in longitudinal direc-tion. Storey req
[cm] cap
[cm] req
3 0.186 0.640 0.372 Petrovac, N-S, 0.36g 2 0.391 0.511 0.891 1 0.327 0.340 1.088 3 0.282 0.640 0.563 Ulcinj, N-S, 0.36g 2 0.574 0.511 1.309 1 0.397 0.340 1.318 3 0.254 0.640 0.508 El-Centro, 0.36g 2 0.462 0.511 1.082 1 0.288 0.340 0.957 3 0.137 0.640 0.274 Parkfield, 0.36g 2 0.261 0.511 0.594 1 0.215 0.340 0.713 req - required displacement cap - capacity displacement req - required ductility
Table 5. Results from dynamic analysis in transversal direction. Storey req
[cm] cap
[cm] req
3 0.119 0.260 0.534 Petrovac, N-S, 0.36g 2 0.607 0.660 1.090 1 0.545 0.487 1.334 3 0.131 0.260 0.590 Ulcinj, N-S, 0.36g 2 0.687 0.660 1.233 1 0.548 0.487 1.341 3 0.112 0.260 0.505 El-Centro, 0.36g 2 0.563 0.660 1.010 1 0.472 0.487 1.155 3 0.063 0.260 0.286 Parkfield, 0.36g 2 0.328 0.660 0.589 1 0.358 0.487 0.876
3.2 Analysis of the Structure by Use of the Finite Element Method
Based on the defined structural system a static and seismic analysis of the structure was carried out by use of the finite element method, applying the SAP 2000 computer software, (Wilson & Habibullah. 1998). The bearing massive walls of the church was modeled by a three dimensional finite element with eight nodes of the SOLID type, the steel vertical and horizontal ties were modeled by 3D-FRAME i.e, 3D-TRUSS elements and the domes of the church bell tower, the centre and the altar were modeled by SHELL elements, (Fig. 2).
Figure 2. 3D view of the model of the structure.
For such modeled structure, a static analysis has been performed for the effect of the dead weight and equivalent seismic forces computes according to the regulations.
Dynamic analysis of the structure was carried out for a previously defined design acceleration spectra, in compliance with Eurocode 8.
The vertical component of the design acceleration was taken as 2/3 of the horizontal component. The following was obtained as a result of the 3D analysis of the church structure by use of the SAP2000 com-puter programme:

191
forces in the horizontal and vertical steel ties due to vertical loads and seismic loads represented through a design acceleration spectrum; stresses and deformability states in the SOLID elements, by which the structural elements- walls were modeled, under vertical loads and design acceleration spectra. stresses and deformability states in the SHELL elements (by which arches and domes were modeled) under vertical loads and design accel-eration spectra.
4 ADOPTED STRUCTURAL SYSTEM
Based on the performed ample analyses, the struc-tural system of the church, the proportions of the horizontal and the vertical steel ties were defined and a solution for the foundation of the structure was elaborated.
4.1 Structural System The principal structural system of the church con-sists of massive masonry, stone and brick with in-corporated steel horizontal and vertical ties. The ties are manufactured of stiff steel tube-like, square pro-files externally protected against corrosion by epox-ide resins and quartzite sand and filled with cement mortar inside. The ties of the external walls are pro-portioned 50.50.3, while those of the inner walls are 60.60.4. The placement and the distance among steel ties can be seen on the plan (Fig. 3) and the cross-sections of the structure, (Fig. 4). It should particu-larly be pointed out that insertion of steel ties in ma-sonry is necessary from the aspect of seismic stabil-ity, i.e., enabling its ductility. From conservation aspects, the same elements are present in the old ar-chitecture but are replaced by new materials - steel. Their simultaneous behaviour with the behaviour of masonry was additionally explored and represents a new methodology in the monumental architecture and construction.
Figure 3. Plan of the structure at the level I-I.
Figure 4. Transversal cross-section of the structure.
Special attention was paid to the stability of the vaults and incorporation of the steel ties for bearing tension forces, as well as for preservation of the in-tegrity of the structure, (Figs. 3, 4).
Stone and brick masonry was constructed using lime mortar of selected characteristics defined through static and dynamic analysis. The existing walls below the level of the floors were systematically injected with a cement emul-sion. The injection of the walls over the floor level that contain remains of fresco-paintings was done by use of emulsions that are not based on cement. During the injection of the foundation walls, the problem of elimination of humidity was solved. The contact between the existing and the restored walls was made at certain levels, depending on the level of the existing walls.
4.2 Technical Description of the Rebuild Foundation Structure
The strengthening and the consolidation of the exist-ing foundation walls down to level 0.00 (to the slab) consisted of the following:
Beside the existing walls, from the inner and the outer side, a reinforced concrete belt course is formed. It is pulled under the existing wall within a length of 50 cm and, at height, it runs along the existing wall with a thickness of 20 cm towards the floor slab. The reinforced concrete belt course is ap-propriately reinforced and connected to the rein-forced concrete slab with a thickness of 20 cm. The plan of the structure at level +0.22 and a characteris-tic detail of reinforcement of the existing foundation are given in Figures 5 and 6.

192
Figure 5. Plan of the structure at level +0.22.
Figure 6. Detail of the foundation and of the vertical steel ties.
The slab below the floor is made of reinforced con-crete with additives to make it watertight. As to the mortar, the injection masses, the insulation and the protection against corrosion, a project was elabo-rated by A.D. "ADING" - Skopje.
The rebuilding of the church of St. Panteleymon was finished in 2002, (Fig. 7).
Figure 7. Present view of the rebuild church of St. Panteleymon.
5 CONCLUSION
The structural system of "St. Panteleymon" church in Plaoshnik - Ohrid consisting of bearing walls strengthened by horizontal and vertical ties has a sufficient bearing and deformability capacity.
During the expected design earthquake level, the structure is expected to behave elastically, while the maximum expected earthquake is anticipated to in-duce cracks in the nonstructural elements of the structure.
It is generally concluded that the structure satis-fies all the prescribed requirements and criteria for design of such type of structures, also satisfying, at the same time, the conservation aspects and re-quirements pertaining to construction heritage.
ACKNOWLEDGMENT
The Institute of Earthquake Engineering and Engi-neering Seismology, IZIIS, Skopje and the partici-pants in the design of the structure of the church of St. Panteleymon, Plaoshnik, Ohrid are indepted to the Ministry of Culture of R. Macedonia and the In-stitute for Protection of Cultural Monuments and National Museum, Ohrid for the entrusted task, i.e., participation in the realization of this project.
REFERENCES
Gavrilovic P., Sendova V. et al. 1994. Seismic Strengthening, Conservation and Restoration of Byzantine Churches in Macedonia; IZIIS, RZZSK, GCI, joint research project, Reports IZIIS 500-76-91, IZIIS 92-71, IZIIS 94-68, 1991-1994.
Gavrilovic, P. Necevska-Cvetanovska G., Petrusevska-Apostolska R. et al. 2001. Design of the Church Structure of St. Panteleymon, Plaoshnik, Ohrid. Volume 1: Static and Dynamic Analysis of the St. Panteleymon Church, Plaosh-nik, Ohrid, IZIIS,Skopje,Report 2001-37.
MAS-ANL3.1998. Computer Program for Analysis of Ma-sonry Structures. IZIIS, Skopje.
Necevska-Cvetanovska G., Gavrilovic P., Talaganov K., Mijic N., Petrusevska -Apostolska R., Stojanovski B. et al.2001. Structure of the Rennovated Clement's Church, St. Panteleymon, Plaoshnik, Ohrid. 2001 MASE Special Award for the Best Achievements in the Field of Structural Engineering.
prEN 1998-1: EUROCODE 8. 2003: Design of Structures for Earthquake Resistance: Part 1: General rules, seismic ac-tions and rules for buildings.
Wilson & Habibullah. 1998. SAP2000 - Structural Analysis Programme. CSI, Berkeley University, California.

193
1 INTRODUCTION: HSS IN BUILDING INDUSTRY
The use of high-performance steel for building struc-tures represents one of the main development direc-tions in the field, and represents a challenge for met-allurgic industry, steel fabricators, for researches and designers. Extension of use of these steels from ma-chine, automotive and aeronautical industries to-wards building industry is motivated by the need to increase the performance of structures under ex-treme actions, such as strong earthquakes, hurri-canes, low temperatures, fire and blast actions in-ducing high strain rates, etc.
Problems of practical application of such materi-als are related, on one hand, to properties of base materials - strength, stiffness, ductility - and on the other hand to connections, especially to weldability. A particular problem is the behaviour under repeated actions: high-cycle and low-cycle fatigue produced under earthquake loading.
There are some technological advantages of using these steels in building (Galambos et al. 1997):
the overall weight of the structures could be re-duced, so that savings would result in transport and site erection, as well as for foundations; mass-dependent dynamic forces are lessened; structures would have a larger elastic strength for resisting dynamic forces due to moderate earth-quakes;light weight and thin elements are desirable for the creative design of aesthetic members and structures where steel is architecturally exposed; the tendency, in many applications for steel struc-tures has been the use of thin-walled members, in
both prefabricated structures and cold-formed steel industry for economic reasons. Introducing of High Performance Steels (HPS) for general civil engineering structures will extend this trend to a broader spectrum of structural applications; the advantage of using HSS in concrete-steel composite bridges was already demonstrated by a significant number of applications. However, there are also some possible disadvan-
tages:since there is no increase in the modulus of elas-ticity of the steel as the yield stress increases, the problem of serviceability becomes more pressing: deflection, inter-storey drift and vibration will need to be controlled carefully, in terms of both direct and indirect induced effects; designers will need to be more aware of problems related to building at high levels of stress under which HSS are most efficient from standpoint of strength;there is no with range of experience to establish confidence in structural design profession. There are also some problems related to the use
of HSS, not yet solved, which still need to be ad-dressed by the research in the field (Galambos et al. 1997):
generally, HSS have a higher yield stress-to-tensile strength ratio than conventional steels and this it is expected that the inelastic stability crite-ria in structural design standards, which are de-pendent of strain-hardening effects to be ad-versely affected; the slenderness limits imposed by the yield stress and the high yield stress-to-tensile strength ratio
High strength steel for seismic resistant building frames
D. Dubina, F. Dinu, V. Ungureanu, R. Zaharia & D. Grecea Politehnica University of Timisoara, Romania
ABSTRACT: High strength steels HSS with yield stress of 420-690 MPa or greater have been available for many years. There are many applications of HSS in bridge construction, but only a few in buildings. In seis-mic design, steel building frames are designed as dissipative structures and plastic deformations are allowed to develop in specific members, in which the behaviour can be predicted and controlled by proper calculation and detailing. The members designed to remain in elastic range during the earthquake, as the columns in multi-storey frames, are usually characterized by high demands in strength. For such kind of members the use of HSS represents a real and effective opportunity.

194
to achieve efficient concept structural elements (e.g. Class 1 sections) may result uneconomical in structures; it is possible that the members made by HSS will be not ductile enough for applications where large inelastic deformations are neededsuch as in seismic design. However, in the last decade, significant progress
in the field was made. If in Europe, steel grades S460-S690 are considered "new materials" for seis-mic applications, their use in US and Japan has al-ready started.
High strength steel grade, with ductility and weldability properties suitable for building struc-tures applications have yield strength (fy) in the range of 460-690N/mm2, with elongations in the or-der of 15-20%. These thermo-mechanical steels are usually low-alloy steels with 0.06-0.1% carbon con-tent, not exceeding 0.2%, with CE 0.48%. Chrome content is limited to 0.7%. Magnesium, molybde-num, vanadium, columbium, copper, nickel are used as well as alloying elements, in small quantities. Sulphur and phosphorus are limited in these steels at 0.01% and 0.015%. Charpy V-notch toughness at 5 C should be minimum 27J (Bjorhovde 2004). Ta-ble 1 presents some high-strength steels used in building industry, with their minimum characteristic properties. Figure 1 presents the experimental -curve for Australian grade 690 steel (Rasmussen 2005). The small difference between the yield strength and ultimate strength are noted, as well as reduced ductility (8%) in comparison with standard structural grades, S235, S275 and S355, ductility smaller by 30%. Small ductility represents a prob-lem in using these steels for earthquake-resistant structures. Thermo-mechanical treatments, applied during rolling (quenching and tempering) can sub-stantially improve ductility.
High performance steels are also those character-ised by reduced yield strength and high ductility. Studies are underway in Japan, and pilot projects ex-ist, that use low yield strength steels in dissipative elements and high-strength steels in non-dissipative elements that must remain mainly elastic during strong earthquakes (Takanashi et al. 2005).
Table 1. Minimum material properties of some various high strength steel (Chan and Badu 2005) __________________________________________________Grade Source fy fu Elongation N/mm2 N/mm2 % __________________________________________________Bisplate 60 Australia 500 590-730 20 70 600 690-830 20 80 690 790-930 18 HT690 70 Japan 590 690 - HT780 80 685 780 - ROT 601 UK 620 690-850 - 701 (CORUS) 690 790-930 - HPS 485W USA 485 - - A514 620-690 690-895 16-18 S460 Europe 430-460 530-720 17 HISTAR460 (Arcelor) 450-460 550-720 17
____________________________________________________________________________________________________
Figure 1. Typical stress-strain curves of Grade 690 quenched and tempered steel (Rassmussen 2005)
Nowadays, the so-called Advanced High-Strength Steels (AHSS) and Ultra-High Strength High Toughness Steels appeared in USA, with ulti-mate strength of fu>1000N/mm2, used for automo-tive industry, under the form of thin steel sheets. there is just one step toward use of these steels in building industry. As a matter of fact, G550 (fy=550N/mm2) steel is used in Australia on a regular basis for fabrication of C and U light-gauge cross-sections, used for steel houses (Rasmussen 2005). Hot-rolled IPE, HEA, HEB, HEM profiles are pro-duced in Europe from S460. HISTAR 460 produced by ARBED is characterised, additionally to the properties shown in Table 1 by a very good tough-ness at low temperatures (Kv=45J at 0 C and 40J at -20 C). Hollow sections are fabricated from S420 and S460.
High performance steels are required in building structures with large dimensions and loadings - high rise buildings, bridges, offshore structures, etc., - subjected to severe actions - strong earthquakes, strong winds, explosions, high live loads, impact forces, etc. Hot rolled profiles used in these applica-tions have large plate thickness, should posses high strength, toughness, fatigue resistance, corrosion re-sistance, weldability.
The following properties required for multi-storey buildings and bridges can be synthesised (Fu-kumoto 1996) as follows:
high strength steel with low-yield-to-tensile strength ratio (LYR), associated with large elon-gations (15%) to assure the inelastic deformation capacity of structures under earthquake motion. narrow variation of yield stress which assures the design calculated sequence of plastic hinge for-mation in the structure, holding a constant yield stress level from medium to thick plates a low-yield steel which exhibits a yield stress less than conventional mild steel. The low-yield stress with high ductility behaves like a "fuse" which can dissipate seismic energy while the rest of the structure remains elastic or undamaged.

195
a high Young's modulus steel which has a higher than normal value, produced experimentally by applying a cold-rolling process in manufacturing. high Young's modulus provides great benefits in the structural functions. In bridge construction, hybrid beams, with
flanges from high strength steel and web from lower strength steel proved their efficiency, not only due to technical performance, but also from the economic point of view (Johansson & Coilin 1999). This type of beams can be used successfully not only for bridges, but also for other large-span structures. Similarly, truss girders can be obtained by combin-ing HSS chords with mild steel diagonals and posts. In multi-storey structures, several possibilities exist for structural conformation using HSS:
dual frames, composed from moment-resisting (MR) frames and braced frames with dissipative braces or low-yield dissipative panels, for high-rise buildings (>11 stories). There are already pi-lot application of this kind in Japan (Takanashi et al. 2005); MR frames with composite steel (HSS) -concrete columns, partially encased, with controlled dissi-pation in beams with reduced section (dog-bone) and/or column panel zones, for buildings of in-termediate height (<11 stories). In Europe, applications of HSS for building struc-
tures are reduced (IABSE, 2005). However, several could be presented applications, but without some specific remarks in regard with the seismic design (AFPL/OTUA, 1997):
Mapre Tower in Barcelona, having 42 storeys and a height of 150 m, where H shaped columns were used from S460M steel, resulting a 24% reduc-tion of steel weight in comparison with the S355 solutionEurope Tower in Madrid, which has an inclina-tion of 14 , where all structural elements are real-ised of S460M grade steel Pleiade Tower from Bruxelles, with S460N steel columns, and an economy of 20% with respect to S355J0Conference Centre "Espace Leopold" within the European Parliament in Bruxelles, with columns realised from S420M, and beams from S355 grade steel Sony Centre in Berlin with the roof truss of steel S460 and S690. In seismic areas, the building design is usually
controlled by specific design requirements. The member sizes and connection types must be deter-mined to meet simultaneously proper criteria for strength, stiffness and ductility. The usual design procedure inevitably takes the plastic design ap-proach. Plastic deformation, however, may occur somewhere in the frame during severe earthquake. Due to that, after severe earthquake, buildings may become suddenly useless and have to be demolished.
Normally, the buildings must be strong enough to survive all the possible disasters that may strike dur-ing their lifetime. The building structures should re-main within the elastic range and be in useable con-dition immediately following the disaster. The only way to achieve this objective is to design buildings that are able to remain within the elastic range under excess loading, which means the elastic design ap-proach (Takanashi et al. 2005). Such a design can be realised by selecting a HSS in the column sections. The high strength enables the reduction in the sizes of the column sections, while maintaining almost the same value of Young�s Modulus as mild steel. The smaller sections of the columns reduce the rigidity for horizontal direction, but the high strength steel can be within the elastic limit. To stiffenning such a frame, some bracing system is compulsory. The braces of low yield strength steel play an important role in the seismic design. The yielding of braces in the early stage provides considerable damping with-out the yield and/or the resulting damage to the col-umn and the beams. In fact, the braces that deterio-rate due to yielding can be replaced by new braces after the excess loading.
2 SEISMIC DESIGN OF MULTISTORY BUILDING FRAMES WITH HSS MEMBERS
Multi-storey steel buildings are assigned to one of the following structural types, depending to the be-haviour of their lateral force resisting systems: - moment resisting frames (MRF), in which the
horizontal forces are mainly resisted by members acting in an essentially flexural manner
- frames with concentric bracings (CBF), in which the horizontal forces are mainly resisted by mem-bers subjected to axial forces
- frames with eccentric bracings (EBF), in which the horizontal forces are mainly resisted by axi-ally loaded members, but where the eccentricity of the layout is such that energy can be dissipated in seismic links by means of either cyclic bending or cyclic shear.
- moment resisting frames combined with concen-tric bracings (dual structures). Each of these structural systems dissipates a part
of the seismic energy imparted in the structure through plastic deformations in the dissipative zones of the ductile members (i.e. beams in MRF, links in EBF or braces in CBF). The other members should remain in the linear range of response because nonlinear response is not feasible (i.e. columns). In order to avoid the development of plastic hinges in these non-dissipative members, they must be pro-vided with sufficient overstrength. To ensure this overstrength, European seismic design code EN1998-1 (2004) amplifies the design forces and moments by a multiplier equal to 1,1 ov , where

196
1.1 takes into account for stress hardening, ov is the overstrength factor and is the ratio between the plastic resistance and the design value of the force in the dissipative member. In case of HSS structures, the values of factors composing this multiplier need to be very carefully analysed. For some structural configurations (i.e. CBFs), the factor may result considerably high, due to the fact that other non-seismic combinations (e.g. wind load) could be criti-cal. A similar approach is also used in the American standard AISC (2005), where this factor may reach a value of 3 for some structural types. Even though, the verification of the non-dissipative members us-ing such amplified forces do not guarantee they will behave entirely in the elastic range.
In order to get an economic design of the struc-ture is necessary to keep the stresses quite low in the dissipative members and therefore to reduce the de-mand in the non-dissipative members. Such a solu-tion has been recently applied to the design of a 26 storeys steel building frame in Bucharest, where lower yield strength steel was used for the dissipa-tive braces in the CBFs (Dubina et al. 2006a). If this option is not possible, the alternative is to increase the strength of the non-dissipative members by using heavier sections or by using higher yield strength steel. For MRF structures, first option is recom-mended, as this will lead to an increase of the stiff-ness, which in many cases is critical in the seismic design, but for braced structures or for dual struc-tures, this will lead to a stress concentration in the non-dissipative members (i.e. columns). For these structures, the adoption of high strength steel in the non-dissipative members (e.g. to remain in elastic range during the earthquake) seems to be more likely.
However, previous results obtained by Dubina et al. (2006b) have shown that for MRF structures, strengthening of columns by using HSS may be ef-fective to avoid column failure in case of �near-collapse� state. This may also improve robustness of structure in case of other extreme loads (e.g. impact, blast). In case of Mixed Steel Braced Frames, par-ticular care is needed for the proper location and seizing of member sections of different materials, as well as for their connections. The design target is to obtain a dissipative structure, composed by �plastic� and �elastic� members, able to form a full global plastic mechanism at the failure, in which the history of occurrence of plastic hinges in ductile members can be reliable controlled by design procedures. To sustain these assumptions, a numerical study devel-oped on two different braced frame typologies will be presented in the next section.
3 NUMERICAL EVALUATION OF USING HSS IN SEISMIC RESISTANT BUILDING FRAMES
3.1 Design of frames
The two building configurations have eight and fif-teen storey and are made by European profiles of S235 and high resistance S460 steel grade. The eight and fifteen storey buildings have three bays of 6m and equal storey heights of 3.5m, excepting the first storey which is of 4.5m height. Two different lateral force resisting systems were considered:
Dual Frames with Moment resisting frames and Eccentric inverted V-Bracing with short horizon-tal link in the mid span (EBF); Dual Frames with Moment resisting frames and Concentric inverted V-Bracings in the mid span (CBF).Frames were designed according to Eurocode 8
and the Romanian seismic code P100-1 (2006). The elastic spectral analysis was applied considering a response spectrum with the design ground accelera-tion ag=0.24g and control period Tc=1.6 seconds, see Figure 2. According to Eurocode 8 provisions, the behaviour factor q for dual frames with eccentric bracings is equal to 6, while for dual frames with concentric braces is equal to 4.8. According to P100-1/2006 provisions (but also AISC 2005), in case of dual frame configurations, the braced system should carry no more than 75% of the total seismic lateral load, while the difference up to 100%, must be sup-ported by the MRF system. The following loads were considered in the analysis:
Permanent (P): current storey 4 kN/m2, top storey 3.5 kN/m2
Live load (L): current storey 2 kN/m2, top storey 1.5 kN/m2
The frames were designed for the following load combinations:
Ultimate limit state ULS: Fundamental combination: 1.35 P + 1.5 L Seismic combination: P + 0.4L + S
Serviceability limit state SLS: Fundamental combination: P + L Seismic: P + 0.4L + S
0.00
0.20
0.40
0.60
0.80
0.00 1.00 2.00 3.00 4.00PERIOD, (s)
Figure 2. Elastic response spectrum, ag=0.24g, Tc=1.6 sec, P100-1/2006

197
The seismic masses considered in the modal and seismic analysis were increased by 50%, in order to take into account that in a 3D structure, the braced transversal frames are carrying more horizontal loads. The drift limits considered in the seismic de-sign were limited at 0.008h/ , according to the Ro-manian seismic code P100-1/2006, where h is the storey height and =0.4 is the reduction factor that takes into account the lower return period of the seismic action for damage limitation state.
In assessing the potential benefits of using HSS, different steel grades were used for members. Table 2 provides a brief summary of the steel grades in members and the overstrength factors used to de-sign the non-dissipative members. High strength
steel S460 was used for the central columns of the first two storeys for EBF 8. For the 15 storeys frame, S460 steel grade was also used for the central col-umns of the first four storeys. In case of the 8 and 15 storeys dual frames with concentric bracings, CBF8 and CBF15, S460 high strength steel was used for the columns of the first two and four storeys, respec-tively. S460 steel was also used for all beams con-nected to braces, which should be designed to resist the unbalanced vertical seismic action effect applied to the beam by the braces after buckling of the com-pression diagonal. This force is calculated using Npl,Rd for the brace in tension and pb Npl,Rd for the brace in compression (the recommended value is pb= 0.3). The elements made by HSS are highlighted by thick lines in Figure 3.
Table 2. Steel grades and factors _____________________________________________________________________________________Frame Dissipative members Non-dissipative members Storeys min ____________________ ___________________________ typology type steel grade type steel grade _____________________________________________________________________________________EBF8 short links S235 lower storeys S460 8 1,57 columns in EB EBF15 MRF beams S235 other columns S235 15 1,50 CBF8 braces S235 lower storeys S460 8 1,96 columns in CBF beams in CBF S460 CBF15 MRF beams S235 other columns S235 15 1,45 _____________________________________________________________________________________
IPE400 IPE400IPE400
IPE400 IPE450 IPE400
IPE400IPE400 IPE500
a) b) c) d) Figure 3. Braced configurations: a) dual frame with eccentric bracings and 8 storeys (EBF8); b) dual frame with eccentric bracingsand 15 storeys (EBF15); c) dual frame with concentric bracings and 8 storeys (CBF8); d) dual frame with concentric bracings and15 storeys (CBF15)
3.2 Seismic performance evaluation The nonlinear response of the structures was ana-lysed using both static nonlinear procedure N2, de-veloped by Fajfar, at the University of Ljubljana (2000) and incremental non-linear dynamic analysis developed by Vamvatsikos and Cornell (2002).
According to N2 method, the seismic demand spectrum is determined for an equivalent SDOF sys-
tem. The push-over curves are obtained for MDOF systems, and, therefore it is necessary to determine the simplified force � displacement for the equiva-lent SDOF systems. The performance point for each SDOF system is defined by the intersection of the capacity curve and the demand spectrum. The dis-placement demand for the SDOF model, Sd is then transformed into the top displacement Dt of the MDOF system, called target displacement. The ex-

198
pected performance is assessed by comparing the capacity of the structure, obtained from the push-over analysis, with the seismic demand expressed by the target displacement (Figure 4). The occurrence of plastic hinges up to the target point is shown in Figure 5.
Table 3. Target displacement, Dt, for the MDOF systems _________________________________________Structure EBF15 EBF8 CBF15 CBF8 _________________________________________Dt, [m] 0,786 0,412 0,676 0,337
0
200
400
600
800
1000
1200
1400
1600
1800
0.00 0.20 0.40 0.60 0.80 1.00 1.20
Top displacement, m
EBF_15EBF_7CBF_15CBF_8target point
Figure 4. Base shear force vs. top displacement in the pushover analysis
EBF8 CBF8
EBF15 CBF15
Figure 5. Plastic hinges in the elements for the corresponding target displacements
It may be seen that EBF structures exhibit a stable and ductile behaviour, with some margin against collapse. The design requirements expressed by the design code lead to an adequate seismic behaviour.
The overstrength requirements for the non-dissipative members ensure an elastic behaviour for these members. On the contrary, CBF structures ex-hibit a fragile behaviour and the structures cannot at-tain the seismic demand. In case of 8 storeys struc-ture (CBF8), this inadequate behaviour is due to the formation of plastic hinges in the columns made by S235 steel. Obviously, the overstrength require-ments expressed by P100-1/2006 do not eliminate the formation of plastic hinges in non-dissipative elements (in this case, the columns). For the 15 sto-reys structure (CBF15), the brittle behaviour is due to the early fracture of the braces in the upper part of the structure. In order to improve the global behav-iour of the centric braced systems, the structures were redesign. In case of the lower structure (CBF8), in order to avoid the development of plastic hinge in the upper columns, adjacent to the braces, the steel was changed from S235 to S460. For the taller structure (CBF15), the braces of the upper sto-ries (above 10th storey) were strengthened by using heavier sections. This modification does not signifi-cantly affect the value of multiplication factor (new value is equal to 1.42), which is given by the most stressed brace located in the lower part of the structure. The pushover analyses demonstrate an im-proved behaviour for the two modified structures. The performance of the structures is higher than the seismic demand expressed by the target displace-ment (Figure 6a). The plastic hinge formation up to the corresponding target displacements is shown in Figure 6b.
Figure 6. Base shear force vs. top displacements and plastic hinges in the elements corresponding to target displacements, for improved CBF structures
In order to get additional insight into the seismic response of the structures, non-linear dynamic
CBF15*

199
analyses were conducted on the structures. Two dif-ferent ground motion records were used: - Vrancea 1977: Incerc, Bucharest NS, March 04,
1977, PGA=0.194g, Tc=1.34s (Figure 7.a) - Vrancea 1986: EREN Bucharest N10W, AUG 30,
1986, Tc=0.664s, PGA=0.299g (Figure 7.b) The first one is a "standard" record, with many
acceleration pulses of similar magnitude and the ac-celeration response spectrum similar to the EN1998 elastic spectrum for class C soil (characteristic pe-riod in the medium period range).
The second one is a record with long acceleration pulse and the characteristic period in the long period range ( 1.5 sec). Figure 8 shows the elastic response spectra of the ground motions records.
INCERC-BUCHAREST NS, MARCH 04, 1977
-250
-200
-150
-100
-50
0
50
100
150
200
0 5 10 15 20 25 30 35 40
Time, (s)
(a)EREN-BUCHAREST N10W, AUG 30,1986
-300
-200
-100
0
100
200
300
400
0 5 10 15 20 25
Time, (s)
(b)Figure 7. Ground motion records used in analysis: a) Incerc, Bucharest NS, March 04, 1977; b) EREN, Bucharest N10W, AUG 30, 1986
ELASTIC ACCELERATION RESPONSE SPECTRA
0.00
0.10
0.20
0.30
0.40
0.50
0.60
0.70
0.80
0.90
0.00 0.50 1.00 1.50 2.00 2.50 3.00 3.50 4.00PERIOD, (s)
INCERC-BUCHAREST NS,MARCH 04, 1977EREN-BUCHAREST N10W, AUG 30,1986P100/2006, Tc=1,6sec
Figure 8. Response spectra of the ground motions
Ground motions have been scaled so that the mean spectral acceleration in the range of 0.20T to 1.50T seconds will match the corresponding design mean spectral acceleration in the same range. This scaling procedure ensures initial forces approximately equal to the design ones, and roughly the same seismic in-
put into the structures. The frames were modelled using the SAP 2000, version 9 computer program developed by CSI (2005). An inelastic shear link bi-linear element model was used for the links. Beams, columns and braces were modelled with beam-column elements with plastic hinges located at the element ends. Nonlinear time history analyses were then performed using the two time histories, IN-CERC 1977 and EREN 1986.
The results obtained from the analyses have con-firmed the conclusions of the previous static nonlin-ear analysis. Thus, the Dual Frames with Eccentric inverted V-Bracing and short horizontal links (EBF) exhibit a ductile behaviour for ground motions scaled to the design acceleration level, with some margin against failure (acceleration multiplier > 1.0). The overstrength requirements for the non-dissipative members ensure an elastic behaviour for these members for accelerations lower than the de-sign one. Secondly, the Dual Frames with Concen-tric inverted V-Bracings (CBF) do not meet the de-sign requirements. In case of lower frames (CBF8), the collapse occurs at values of acceleration lower than the design one ( < 1.0), due to the premature failure of columns made by S235. After the columns adjacent to the braces were strengthened using a higher steel grade CBF* (S460 instead of S235), the structure has shown better performances (Figure 10) and failure occurs for higher seismic accelerations (> 1.0).
For the taller structure (CBF15), the braces of the upper stories were strengthened by using heavier sections to avoid premature failure (acceleration multiplier < 1.0). The improved structure (CBF 15*) has shown a better behaviour with a significant reserve of safety against collapse (Figure 11).
0.00
0.20
0.40
0.60
0.80
1.00
1.20
0.00 0.50 1.00 1.50 2.00 2.50Relative interstorey drift, %
CBF8CBF8*
design acceleration
Figure 9. Results from non-linear dynamic analysis showing the relative interstorey drift vs. acceleration multiplier for CBFs with 8 storeys, Incerc 1977 ground motion record

200
CBF 8* - improved structure Figure 10. (Continued)
0
0.2
0.4
0.6
0.8
1
1.2
0.00 0.50 1.00 1.50 2.00 2.50Relative interstorey drift, %
CBF15CBF15*
design acceleration
Figure 11. Results from non-linear dynamic analysis showing the relative inter-storey drift vs. acceleration multiplier for CBFs with 15 storeys, Incerc 1977 ground motion record
4 CONCLUSIONSThe use of HSS in seismic resistant building
structure can be really effective when it is combined with conventional steels. A �Mixed Steel Building Technology� can be applied on the base of principle HSS for high elastic strength � conventional steel for low yield strength and ductility. High-rise building structures require stiff bracing system to resist wind action. Dual frames with inverted V braces are one of the most efficient lateral-load resisting systems. However, the seismic requirements lead to a very high demand for strength in columns and beams. This high demand comes mainly from the unbalance forces resulting from the difference between the ca-pacity of the brace in tension and the capacity of the brace in compression. This may be a good opportu-
nity to use HSS and the results obtained so far shown this gain. However, the provisions in actual seismic design code, like EN1998-1, do not guaran-tee a global dissipative response, and the proper de-sign needs to be based on more advanced static or dynamic inelastic analysis.
5 REFERENCESAISC 341-05, 2005. Seismic provisions for structural steel
buildings. American Institute for Steel Construction. Bjorhovde, R. 2004. Development and use of high-
performance steel, Journal of Constructional Steel Re-search: No. 60: 393-400.
Dubina, D., Dinu, F., Stratan, A., Ciutina A. 2006a. Analysis and design considerations regarding the project of Bucha-rest Tower International Steel Structure. ICMS 2006 �Steel a new and traditional material for building, Brasov, Roma-nia, 2006, Taylor&Francis/Balkema, Leiden, The Neder-lands, ISBN 10: 0 415 40817 2, Ed. D., Dubina, V. Un-gureanu.
Dubin , D., Dinu, F., Zaharia, R., Ungureanu, V., Grecea, D. 2006b. Opportunity and Effectiveness of using High Strength Steel in Seismic Resistant Building Frames, Proc.of Internat. Conf. �Steel, a new and traditional material for building� ICMS 2006, Poiana Brasov, Romania, Septem-ber 20-22, 2006, Taylor&Francis/Balkema, Leiden, The Nederlands, ISBN 10: 0 415 40817 2, Ed. D., Dubina, V. Ungureanu.
EN 1998-1, 2004. Design provisions for earthquake resistance of structures: General rules - Seismic actions and general requirements for structures, CEN, EN1998-1-1.
Fajfar, P. 2000. A non linear analysis method for performance based seismic design, Earthquake Spectra, vol.16, no. 3, pp. 573-592, August 2000.
Fukumoto, Y. 1996. New constructional steels and structural stability, Engineering Structures: Vol. 18, No. 10: 786-791.
Galambos, T.V. Hajjar, J.F. Earls, C.J. & Gross, J.L. 1997. Required Properties of High-Performance Steels. National Institute of Standards and Technology. May 1997.
IABSE, 2005. Use and application of high performance steels for steel structures. Chapter 5: High performance steels in Europe. IABSE Structural Documents, No. 8, International Association for Bridge and Structural Engineering, Zurich, Switzerland, 2005
Johansson, B. & Coilin, P. 1999. High-strength steel - the con-struction material of the future. ECCS TC10 report WG5-129.
P100-1/2006 2006. Seismic design code, Part 1: Rules for buildings (in Romanian). Buletinul Constructiilor, Vol. 5.
Rasmussen, K.J.R. 2005. High strength steel structures, in Light gauge metal structures, recent advances (ed. Rondal, J. and Dubina, D.) CISM Courses and lectures no. 455: 121-142, Springer, Wien, New-York.
SAP2000, Version 9 2005. Computers and Structures Inc. Uni-versity Avenue, Berkeley, California 94704, USA, 2005
Takanashi, K. Aburakawa, M. & Hamaguchi H. 2005. Utiliza-tion of high performance steels in urban structures. Ad-vances in Steel Structures � ICASS'05, Vol. 2: 1827-1835, Elsevier, London.
Vamvatsikos D., Cornell C.A. 2002. The Incremental Dynamic Analysis and its application to Performance-Based Earth-quake Engineering. Proceedings of the 12th European Conference on Earthquake Engineering, London.
CBF 15* - improved structure

201
1 INTRODUCTION
1.1 Importance of masonry buildings Masonry buildings are widely spread in Europe. Most of these structures represent historical con-structions with symbol value for many towns or countries. Their functionality is diverse, including residential houses, hospitals, schools and other es-sential facilities. Therefore, these types of structures are important from many points of view: life safety, economical aspects and cultural heritage preserva-tion.
Erected in a period when design methods where poor or missing, and the knowledge regarding seis-mic action was almost inexistent, these buildings need a structural upgrade in order to respect safety criteria of modern codes.
1.2 Masonry behaviour Poor behaviour of masonry structures under seismic action is due to the lack of resistance, tensile stress mainly, small deformation capacity and low ductil-ity. Moreover, under seismic action the masonry, because it is stiff and heavy, attracts significant iner-tial forces.
Common damage patterns for masonry buildings recorded during earthquakes can be classified in the following four categories:
Out-of-plane damage or collapse of walls; In-plane shear or flexural cracking of walls;Loss of anchorage of walls to floor or roof dia-phragms; Damage or collapse of corners.
Out-of-plane failure modes, e.g. falling down, can be a result of: load capacity exceeded due to inertial seismic forces, excessive deflection imposed on walls from diaphragm action, lack of anchorage, poor possibility of transferring deflection and iner-tial forces to horizontal elements.
In-plane damage can be a result of: diagonal cracking through masonry units due to excessive principal stress (tensile stress), shear sliding along bed joints, excessive toe compressive stress causing crushing (sliding shear), or tensile cracking normal to bed joints resulting in rocking (bending) (see Figure 1).
Figure 1. In plane failure modes of masonry walls
Typical in plane failure modes for a masonry wall with openings and them critical areas are shown in
Figure 2. Critical failure modes in a masonry wall with open-ings, IAEE/NICEE (2004).
The interaction of in plane and out of plane forces has as consequence failure of corners.
Strengthening of masonry walls by innovative metal based techniques
A. Dogariu, A. Stratan, D. Dubina, T. Nagy-Gyorgy, C. Daescu & V. Stoian Politehnica University of Timisoara, Romania
ABSTRACT: Two innovative strengthening solutions for masonry walls are presented. First one consists in sheeting some steel or aluminium plates either on both sides or on one side of the masonry wall. Metallic plates are fixed either with prestressed steel ties, or using chemical anchors. The second one is derived from the FRP technique, but applies a steel wire mesh bonded with epoxy resin to the masonry wall. Both these techniques are described together with the experimental program carried out at the �Politehnica� University of Timisoara on the aim to validate them.

202
This paper will focus on strengthening techniques aiming to improve the in-plane behaviour of ma-sonry panel. However, they obviously enhance the out-of-plane resistance, too.
1.3 Objective of modern consolidation philosophy The objective of traditional consolidation techniques was mainly the local repair of damaged elements without a general strategy related to the global be-haviour of there structure.
These techniques can by classify in follow cate-gories:
Surface treatment and external reinforcement; Grout and epoxy injection; Confining and post tensioning. All this solutions attempt to increase or recover
the initial resistance of the consolidated elements or to increase the resistance by modify the state of stress inside elements.
The main disadvantage of this kind of techniques is mainly related to the irreversibility of the retrofit-ting solution. When surface treatment and external reinforcing are incorrect applied they can introduce negative effects in structure due to the increase of weight or rigidity. The grout and epoxy injection re-cover the initial resistance only, without upgrading the elements capacity. Confining and post tensioning are usually difficult to work and expensive. Any-how, these solutions still are the most used in case of retrofitting masonry even. nowadays, the FRP tech-niques tend to replace them.
In fact, not only the impact of local strengthening on the global response of the structure has to be con-sidered, but also the reversibility of the used tech-niques and compatibility between materials, the added and existing ones (e.g. �the mixed action) have to be analysed and evaluated.
The reversibility is very important because it of-fers the possibility to remove a solution when more advanced technology will be available.
The use of �mixed material based technology� enables to optimise the performance of retrofitted structure.
For this reasons, combining metal sheeting, which is resistant and ductile, with masonry, provid-ing a proper connecting system, seems to be a suit-able solution. The use of �dry� connection enables easy removal of metallic elements. Additionally, this solution offers the advantage of high mechanical properties, e.g. strength and ductility, without chang-ing too much the initial rigidity.
This technique can provide a stable post-cracking behaviour to the masonry wall. Moreover, a per-formance based strengthening methodology could be developed.
1.4 Metallic based solutions Two strengthening solutions were proposed and in-vestigated within the research program. The solu-tions use:
Metallic sheeting plates (SP), steel (SSP) or alu-minium (ASP) (see Figure 3); Steel wire meshes (SWM) (see Figure 6).
CHEMICAL ANCHOR
METALL SHEATING
MASONRY WALL
PRESTRESSED TIE
METALL SHEATING
MASONRY WALL
Figure 3. Proposed solution
Connection of the metal sheets plates to the ma-sonry wall is realised in two ways: chemical anchors (CA) and prestressed ties (PT), placed at 200-250 mm. The wire mesh is glued using epoxy resin. Both systems can be applied on one side or both sides of the panel. It is expected that the system with metallic elements on both sides to perform better, but it isn�t always possible due to architectural reasons.
Such a type of solution can be successfully ap-plied in case of masonry walls, but it is not appropri-ate in case of masonry vaults and arches.
Figure 4. Weak area on masonry façade and location of metal sheeting (SP) or steel wire mesh (WM)
Observing the behaviour of a masonry wall with openings, it is easy to identify the weak regions that need strengthening with metal plates (SP) or wire mesh (WM) (see Figure 4).
The application technology is rather simple. In the case of metallic plates they must be previously drilled. Afterwards the plate is placed on the wall, anchor holes are drilled in the masonry wall through the plate holes. The dust is blown away from the holes, followed by injection of epoxy resin and fix-ing of chemical anchors (see Figure 5). Prestressed ties are applied similarly, but no resin is used, and the ties are tightened using a torque control wrench.

203
Figure 5. Wire mesh geometry and texture and chemical anchor
The mesh (see Figure 5) is produced either as galvanised steel or stainless steel bidirectional fab-ric. Spacing of the mesh is between 0.05 and 16 mm, while wire diameter is between 0.03 and 3.0 mm. Tensile strength reaches 650-700 N/mm2, while elongation is about 45-55% in the case of stainless steel wires. For galvanised steel wire, tensile strength is usually in the range of 400-515 N/mm2.
Application of wire mesh (see Figure 6) requires a previous preparation of the walls to obtain a smooth surface. The preparation of resin is similar to the one used for Fiber Reinforced Polymers (FRP). The resin is applied in two steps: a fluid layer is ap-plied first, and after it is dried, a second thick fluid layer is applied to embed the mesh. For large sur-faces the mesh should be fixed to the wall with nails in order to keep plain its surface. It is important to mention that, by heating the resin layer, the wire mesh can be removed.
Surface polishing Resin preparation
First layer Resin application
SWM application Resin spreading and SWM press Figure 6. Steel wire mesh (SWM) application
In order to validate the two solutions, an experi-mental program was carried out. It included:
Material tests; Preliminary tests on 500 x 500 mm specimens; Full scale tests on 1500 x 1500 mm specimens, both under monotonic and cyclic loading.
2 CALIBRATION OF THE EXPERIMENTAL MODELS
2.1 Summary of material tests First, material tests (see Figure 7), were per-
formed in order to establish strength and stiffness parameters. They are summarized in Table 1.
a) Tensile test on wire and mesh
b) Tensile test on steel ties

204
c) Tensile test on steel plates
Figure 7. Some material tests
Table 1. Summary of material tests Elastic modulus of masonry Compression test on brick
Compression test on mortar Masonry component
Tension test on mortar Tensile test on wire Steel wire mesh Tensile test on mesh
Connectors Tensile test on ties Tensile test on steel plates
Tensile test on aluminium plates
2.2 Analytical calibration Some simple numerical calculations have been per-formed to determine the thickness of steel shear plate in order to obtain a rational behaviour. On this purpose three preliminary design criteria expressed in terms of stiffness, local buckling and strength have been used.
First criterion is used to obtain a comparable stiff-ness of the metallic sheeting plates with masonry panel, in order to provide a uniform distribution of stresses between wall and sheeting. To evaluate the rigidity of the wall and sheeting plate the following formulas have been used:
mv
eff
gm
effm
GAh
IEh
k 3
1 (1)
where km = stiffness of masonry panel; heff = effec-tive wall height; Em = longitudinal elastic modulus of masonry; Ig = moment of inertia; Av = shear area; and Gm = transversal elastic modulus of masonry;
sv
effplate
GAh
k 1 (2)
where kplate = stiffness of steel plate; heff = height of plate;, Av = shear area, and Gs = transversal elastic modulus of steel (Astaneh-Asl, 2001).
Considering known all material parameters and by equating the two relations, a 2.16 mm thickness demand for the steel sheeting was obtained.
Second condition follows to obtain a compact plate in order to prevent local buckling and assure dissipation of energy through plastic bearing work in connecting points only.
To establish the �non-compact� behaviour do-main, the following criterion was used:
yw
v
wyw
v
FHK
th
FHK 37.110.1 (3)
where Kv = plate buckling coefficient; H= horizontal load of the panel; Fyw = yielding stress of steel; h = distance between connectors (imposed by masonry texture); and tw = steel plate thickness.
From equation (3), the compactness criterion re-sults as 27.2wt (mm).
A more complex methodology, to evaluate the re-sistance of each component of the system, proposed by the producer of chemical anchor can be used. Three components govern the behaviour of chemical connection, e.g. the matrix (masonry with epoxy resin), steel anchor and steel plates. It is believed that the most desirable failure mode is the bearing of the steel hole (e.g. in the connecting points). In order to obtain this failure mode, the bearing resistance should be less than the minimum between the shear resistance of connector and crushing resistance of matrix.
),min( conectormasonrybearing NNN (4)
For chemical anchors, the design methodology suggested by producer (Hilti-Catalogue, 2005) has been adapted for masonry matrix e.g.
VARVBVcRdcRd fffVV ,0
,, (5)
where VRd,c = matrix edge resistance; VRd,c0 = basic
matrix edge resistance; fBV = matrix strength influ-ence; f V = load direction influence; and fAR,V = spac-ing and edge coefficient.
Two cases were considered: ø8 and ø10 connec-tor diameter. Corresponding plate thickness amounted to 2.20 and 2.48 mm.
It was decided to use a 3 mm thickness steel plate of S235 grade when applied on one side and 2 mm thickness plate of S235 grade when applied on both sides. Alternatively, 5mm aluminium plates have used (99.5% Al 1050 H14 (Rp0.2%=105 N/mm2)).
2.3 Experimental calibration Because of the inherent approximations in design as-sumptions and the poor accuracy of analytical ap-proach based on available formulas, it was decided to perform a series of tests on small specimens in order to validate and calibrate the proposed tech-niques.

205
The tests on small specimens are summarized in Table 2. Table 2. Tests on small specimens
Preliminary Masonry panel ø8Chemical anchor
(CA) ø10 ø10 � 0% Connection Prestressed ties
(PT) ø10 � 100% Steel wire mesh (SWM)
Chemical anchor Diagonal tension test Steel shear panel
(SSP) Prestressed ties
The preliminary tests were carried out on unrein-forced masonry panels (brick unit strength of 10 N/mm2 and mortar strength of 13 N/mm2) to obtain reference values.
2.3.1 Connection tests Connection tests were performed in order to estab-lish the connector diameter and to assess the influ-ence of prestress level of steel ties. The experimental set-up is presented in Figure 8.
Figure 8. Experimental set-up and testing machine for connec-tors
2.3.1.1 Chemical anchors Chemical anchors ø8 and ø10 diameters gr.5.8 have been tested. The failure mode for ø8 was the shear of connector and for ø10 the shear of connector and crushing of masonry (see Figure 9).
a) b)Figure 9. Failure modes for chemical anchor connections a) ø8 diameter and b) ø10
For the large specimen tests, a ø10 connector was chosen, due to the more efficient behaviour and re-sistance (see Table 3).
Table 3. Chemical anchor connection F (ton) d (mm) Fconector
CA 8-1CA 8-2CA 8-3
10.1 8.8 8.5
8.02 12.5 7.87
1.15
a) ø 8 chemical anchors F (ton) d (mm) Fconector
CA 10-1CA 10-2CA 10-3
10.1 9.3 12.6
11.37 14.07 18.02
1.35
b) ø 10 chemical anchors
2.3.1.2 Prestressed ties Two prestressing levels have been applied for theø10 ties gr.5.8 (i.e. snug tightened ties (0% prestress) and full prestress (100%)). The failure mode was shear of ties, masonry specimens remain-ing almost intact (see Figure 10).
Figure 10. Behaviour of prestressed ties connections
It was noted that the prestress level increases the resistance of connection due to confinement of ma-sonry. In comparison with chemical anchors, prestressed ties lead more resistant and rigid speci-mens.
Table 4. Prestressed tie connection F (ton) d (mm) Fconector
PT0-1PT0-2PT0-3
11.8 13.9 14.7
8.78 7.35 8.7
1.68
a) Snug tightened ties (0%) F (ton) d (mm) Fconector
PT1-1PT1-2PT1-3
14.8 13.6 13.7
6.92 10.0 8.46
1.75
b) Full prestressed ties (100%)
2.3.2 System tests Tests on systems was carried out in order to validate the analytical assumption in case of shear plates and to choose a proper steel wire mesh. The experimen-tal set-up on small specimens and a sample test on unreinforced masonry panel are presented in Figure 11.

206
Mas onryPan el
Met al l icelem ent
Load
Load
Figure 11. Experimental set-up for split test
a) Connection realized with chemical anchors
b) Connection realized with prestressed ties
Figure 12. Steel SP applied on one side (SSP3)
2.3.2.1 Metal sheeting plates (SP) Steel shear plates S235 grade of 2 mm thickness on both side (see Figure 13) and 3 mm thickness on one side (see Figure 12), connected with chemical an-chors (CA) and prestressed ties (PT) were tested.
The results are summarized in Table 5. Table 5. Results for SP applied on one side (SSP3)
Load (ton)
Vertical dis-placement
(mm)
Horizontal dis-placement (mm)
1 2 3 1 2 3 1 2 3 CA 16.6 14.1 10.5 4.0 3.4 0.3 0 0 0.6 PT 12.4 15.2 9 2.4 1.5 0.5 0 0 0
a) Connection realized with chemical anchors
b) Connection realized with prestressed ties Figure 13. Steel SP applied on both side (SSP2)
The results are summarized in Table 6. Table 6. Result for SP applied on both side (SSP2)
Load (ton)
Vertical dis-placement (mm)
Horizontal dis-placement (mm)
1 2 3 1 2 3 1 2 3 CA 18.2 10.8 25 3.6 0.8 2.8 0.2 0 0 PT 35.9 12.5 13.3 4.8 2.5 5.4 0 0.3 0.4
2.3.2.2 Steel wire mesh (SWM) There are no analytical procedures to design the steel wire mesh reinforced masonry, therefore cali-bration was based on experimental test. The purpose of tests was to select the appropriate resin and wire mesh to be applied on large specimens. In the first step six types of wire mesh, zinc coated (ZC) and stainless steel (SS), bonded on one side, were tested. The results are summarized in Table 7. Table 7. Results for SWM applied on one side
Load (ton)
Vertical dis-placement
(mm)
Horizontaldisplacement
(mm) 1) ZC 0.25x0.4 20.9 3.09 0.61 2) ZC 0.25x0.56 15.3 1.74 0.03 3) ZC 0.4x1.0 8.5 N.A. N.A. 4) SS 0.3x1.25 14.7 3.66 0.16 5) SS 0.4x0.5 44.70 N.A. N.A. 6) SS 0.4x1.0 19.3 3.83 0.83
Compared to FRP technique, a thicker fluid resin was selected. In order not to change too many pa-rameters and based on the experimental results, the

207
following wire meshes were chosen: zinc coated (ZC) 0.4x1.0 (D x W), stainless steel (SS) 0.4x0.5 and 0.4x1.0 for be applied on both sides.
The failure modes are shown in (see Figure 14) i.e.:
a) ZC 0.4x1.0
b) SS 0.4x0.5
c) SS 0.4x1.0 Figure 14. Failure mode for SMW applied both sides
The results are summarized in . Table 8.
Table 8. Results SWM applied on both sides
Load (ton) Vertical dis-placement
(mm)
Horizontal dis-placement
(mm) 1 2 3 1 2 3 1 2 3
WM3 WM5 WM6
31.2 31.1 31.1
27.3 27.1 22.8
27.1 41.1 39.4
0.8 6.2 4.5
5.5 2.7 8.9
1.3 7.6 4.6
00.7 0.4
00
0.8
00.8 0.4
WM3 (ZC 0.4x1.0) � sudden wire mesh rupture simultaneous with masonry crack � resistance improvement (weak WM) WM5 (SS 0.4x0.5) � debounding of wire mesh, rupture in resin � strength improvement, energy dissipation due to the successive debounding (strong WM)
WM6 (SS 0.4x1.0) � wire mesh yield � im-provement of resistance and ductility (optimal). Based on these observations, the stainless steel
wire mesh 0.4x1.0 was chosen to be applied on large specimens.
3 TESTS ON LARGE MASONRY SPECIMENS
Table 9. Tests on large specimens Reference masonry wall test REF
Chemical anchor SSP-CA Steel shear panel Prestressed ties SSP-PT Chemical anchor ASP-CA Aluminium shear panel Prestressed ties ASP-PT
Steel wire mesh SWMReference masonry wall test REF-c
Chemical anchor SSP-CA-c Steel shear panel Prestressed ties SSP-PT-c Chemical anchor ASP-CA-c Aluminium shear panel Prestressed ties ASP-PT-c
Steel wire mesh SWM-c
The experimental program on large specimens is summarised in Table 9.
Was chosen a 25x1500x1500 mm masonry panel in order represent an entire wall or a critical pier zone between openings.
The tests were carried out in two different ex-perimental frames, one for monotonic loading and one for cyclic loading. The tests set-up is presented in Figure 15.
Figure 15. Testing frames for monotonic/cyclic loading

208
Loading was applied using displacement control, with lateral drift of the panel being used as control parameter. In case of cyclic loading the following loading protocol was used: one cycle at ±0.5 mm, ±1.0 mm, ±1.5 mm, ±2.0 mm, ±3.0 mm, ±5.0 mm, ±7.0 mm, ±9.00 mm, ±11.00 mm, etc. The "yield" displacement, ey, was considered when significant stiffness degradation was observed. After �yielding�, three cycles at ey, 1.5 ey, 2 ey, etc. were applied, until the failure of specimen occurred.
4 PRELIMINARY RESULTS
The interpretation of the experimental results is still in progress. Therefore, in present paper qualitative results are reported only (see Table 10). Table 10. Large specimens� qualitative results __________________________________________________ Monotonic Cyclic ___________________ __________________ Resistance Ductility Resistance Ductility __________________________________________________ ASP�CA-1 ASP�CA-2 ASP-PT-1 ASP-PT-2 SSP�CA-1 SSP�CA-2 SSP-PT-1 SSP-PT-2 SWM-1 SWM-2 __________________________________________________ Legend slightly moderate high increase 1- one side; 2- both sides
Diagonal failure mode was observed for all speci-mens, both under monotonic and cyclic loading.
Due to flexibility of testing frame used for cyclic loading, a more substantial damage at the corners of panel was observed in comparison with monotonic tests. However, for cyclic loaded specimens the characteristic failure was also the diagonal shear with a small influence due to eccentric compression (see Figure 22). A significant improvement in terms of ultimate displacement (that shows significant im-provement in ductility), and also the increase in strength, with a slight increase in stiffness were re-corded for all specimens. An overview of qualitative performance in terms of strength and ductility of tested specimens, related to unreinforced masonry, is presented in Table 10.
For the one side sheeting under cyclic loading a significant out of plane deformation was observed.
Even if the interpretation of tests results is still in progress, some numerical comparisons are yet avail-able. For instance, the Force - Displacement rela-tionships are presented for ASP-PT-2, monotonic and cyclic specimens (see Figure 17 and Figure 19), as well as their failure modes (see Figure 16 and Figure 18).
Figure 16. Failure mode for ASP-PT-2m
0
100
200
300
400
500
0 5 10 15 20 25
Displacement (mm)
ASP-PT-2m
Reference
Figure 17. Monotonic test on aluminium shear panel
Due to large in-plane stiffness of masonry walls, the strengthening solution does not avoid completely damage to masonry. A limited amount of damage to masonry has to be allowed in order to take benefit from ductility of the metal used for sheeting. Alu-minium is believed to be particularly suitable in this case, due to a more favourable strength-to-stiffness ratio than steel.
It can be observed that, despite strengthening, the masonry panel cracks at almost the same force and displacement as reference panel. The mixed ma-sonry-metallic plate system is activated only after masonry cracking. This can be observed also by the fact that the initial stiffness of both strengthened and reference panels does not change. This is an advan-tage for global behaviour of retrofitted building.
The monotonic curves (see Figure 9) show an important increase in terms of resistance, but the main advantage of this system seems to be the very large ultimate displacement that assures a very stable post-cracking behaviour and a large ductility.

209
Figure 18. Failure mode for ASP-PT-2C
ASP-PT-2c
-600
-400
-200
0
200
400
600
-40 -20 0 20 40
Displacemnt (mm)
Figure 19. Cyclic test on aluminium shear panel connected with prestressed ties
Also, for cyclic loading this system has proved its validity by increasing the resistance and obtaining a good hysteretic behaviour despite of significant pinching (see Figure 16).
Envelop for SMW-2 and ASP-PT-2
-600
-400
-200
0
200
400
600
-35 -15 5 25
Displacement (mm)
SWM-2cASP-PT-2c
Figure 20. Envelop curves for SMW-2c and ASP-PT-2c
In Figure 20 is shown the comparison of cyclic envelop curves for ASP-PT-2C and SWM-2C.
SSP � CA - 1 SSP � CA � 2
SSP � PT � 2 SWM � 2 Figure 21. Failure modes for some monotonic loading speci-mens
ASP � PT � 1C ASP � CA � 1C
REF � c SSP � CA � 2c
SWM � 1c SWM � 2c Figure 22. Failure modes for some cyclic loading specimens

210
5 CONCLUDING REMARKS
The proposed strengthening solutions are an alterna-tive to FRP technology enabling to obtain a ductile increase of strength, but without increasing the stiff-ness of the wall. It can be concluded that SP in-creases mainly the ductility, while WM increases the resistance. Both techniques are more efficient when applied on both sides. The prestressed tie connec-tions seem to be more appropriate and the specimens sheeted with aluminium plates have shown a better behaviour than ones sheeted with steel.
It is expected that these strengthening solutions can be also applied in case of weak reinforced con-crete diaphragms.
Presently there are no analytical calculation pro-cedures to apply these strengthening solutions. Nu-merical simulation is very complex and it is doubtful to be used in practical design. Consequently, a test based design approach is recommended. First the characteristic shear strength of the shear wall has to be evaluated by tests. This strength is used further in order to evaluate the necessary length of the walls on the direction �i� and at storey �j� to resist the corre-sponding seismic shear force.
The principle of the method is presented bellow:
, , , ,
, , ,
s i j s i j
s i j k i j
E R
R R L (6)
where Es,i,j = total shear force induced by seismic ac-tion on �i� direction at �j� storey; Rs,i,j = total shear wall resistance on �i� direction at �j� storey; Rk =characteristic strength of shear wall experimentally determined; and Li,j = length of shear wall on �i� di-rection, at �j� storey.
The method is applicable both for pure masonry walls and for strengthened walls (FRP, SSP � Steel Shear Plate, ASP � Aluminium Shear Plate, SWM � Steel Wire Mesh).
It is believed that these strengthening solutions can be also applied in case of weak reinforced con-crete diaphragms.
REFERENCE
Astaneh-Asl, A. 2001. Seismic Behaviour and Design of Steel Shear Walls, Steel TIPS, USA (2001).
IAEE/NICEE (2004). Guidelines for Earthquake Resistant Non-Engineered Construction, First printed by Interna-tional Association for Earthquake Engineering, Tokyo, Ja-pan. Reprinted by the National Information Centre of Earthquake Engineering, IIT Kanpur, India.
Hilti-Catalogue (2005), Design Manual, Anchor Technol-ogy,(2005)
ACKNOWLEDGMENT
This work was carried out in the CEMSIG Laboratory of the Department of Steel Structure and Laboratory of Department of Civil Engineering from the �Politehnica� University of Timi-soara. The proposed techniques are developed in the frame of PRO-HITECH (FP6 INCO-CT-2004-509119/2004 Earthquake Pro-tection of Historical Buildings by Reversible Mixed Technolo-gies.

211
1 INTRODUCTION
Reinforced concrete structures in regions of low to moderate seismicity were traditionally designed for gravity loads alone, without any seismic provisions. This category of buildings are characteristic for buildings designed between 1930s and 1970s (Priestley, 1997), when design codes were imple-mented containing seismic provisions more or less equivalent to those currently in practice. Though lo-cal design practices and codes were different in dif-ferent geographical areas, this problem is common to many regions, such as USA (Kunnath et al., 1995), New Zealand (Park, 2002), and Europe (Cosenza et al., 2002, Calvi et al., 2002). The main deficiencies in reinforced concrete gravity frames are related to poor detailing and lack of capacity de-sign, leading to reduced local and global ductility.
One way of seismic strengthening of existing re-inforced concrete frames is by improving strength, stiffness and ductility of reinforced concrete ele-ments by various techniques such as added high-strength mortars, jacketing with steel elements, or fibre reinforced plastics. This approach has the ad-vantage of preserving the original structural system, but in case of moment-resisting frames it may be dif-ficult stiffen enough the structure under lateral seis-mic loads.
An alternative approach for seismic strengthening of existing reinforced concrete frames can be ac-complished by adding an additional earthquake-resistant system, such as various typologies of eccentrically braced steel frames or concentrically
braced steel frames, see Figure 1. The new structural system can be easily designed as a dissipative sys-tem. In order to limit damage in the existing rein-forced concrete structure and to concentrate plastic deformations in the dissipative steel bracing sys-tems, the latter should possess a higher stiffness than the former. This objective is accomplished naturally in case of braced steel frames. Depending on the structural system, dissipative elements can be lo-cated in horizontal links (see Figure 1a), vertical links (see Figure 1b), ordinary or buckling-restrained braces (see Figure 1c), or knee elements (see Figure 1d).
(a) (b)
(c) (d) Figure 1. Different typologies of dissipative frames: inverted V eccentrically braced frames (a), inverted Y eccentrically braced frames (b), concentrically braced frames using buckling-restrained braces (c), knee-braced frames (d).
There are several ways in which the steel ele-ments can be arranged inside the r.c. frame. Steel
Seismic upgrade of non-seismic r.c. frames using steel dissipative braces
S. Bordea, A. Stratan, A. Dogariu & D. Dubina Politehnica University of Timisoara, Romania
ABSTRACT: Reinforced concrete structures built in seismic zones before 1960�s have been designed to resist mainly to gravity loads and wind. The main deficiencies in reinforced concrete gravity frames are related to poor detailing and lack of capacity design, leading to reduced local and global ductility. At present, when such a type of structures are subjected to structural evaluation, according to the actual seismic design provi-sions, one discovers, in almost all the case they need for strengthening. In present paper the strengthening of non-seismic r.c. frame with dissipative bracing system is examined. A detailed study case for a r.c. frame, de-signed according to provisions of 1950�s and strengthened with steel Buckling Restrained Braces according to the actual seismic provisions is presented.

212
elements can be connected directly to the existing r.c. elements (see Figure 2a). Some types of dissipa-tive bracing systems, such as eccentrically braced inverted V frames cannot be used in this case. Exist-ing r.c. elements will be subjected to additional axial and shear forces and bending moments, which may need local strengthening of these elements.
steelframe
steelelements
dissipativeelement
dissipativeelement r.c. frame
dissipativeelement
steelelements
r.c. framer.c. frame
. (a) . (b) . (c)
Figure 2. Direct connection of steel elements to the existing r.c. frame (a), full interior steel frame (b), and "partial" steel frame (c).
An alternative solution consist in inserting a full steel frame inside the r.c. frame (see Figure 2b). This system has several advantages over the previous one. The choice of frame typologies is larger in this case. Connections between the new steel frame and existing r.c. frame can be realised over a longer in-terface, leading to smaller concentration of forces. Finally, considerably smaller forces due to earth-quake loading will be imparted to the existing r.c. elements.
An intermediate solution is possible, if a "partial" steel frame is used (see Figure 2c), which is more economical than the full frame configuration, steel having the advantage of a longer interface between the new steel frame and existing r.c. structure.
A special configuration is possible when concen-tric steel braces are placed exterior to the r.c. frame. The advantage of this solution consist in limited structural changes to the existing structure and to its inhabitants.
2 STRENGTHENING SOLUTIONS USING STEEL-BASED SYSTEMS
Gobarah and Elfath (2001) studied seismic perform-ance of a low-rise nonductile reinforced concrete building rehabilitated using eccentric steel bracing. The effect of distributing the steel bracing over the height of the r.c. frame on the seismic performance of the rehabilitated building was studied. The link was connected directly to the r.c. frame, see Figure 3. Authors concluded that seismic performance of nonductile r.c. buildings strengthened with eccentric braces is expected to be higher than that of concen-tric bracing. Distribution of eccentric brace over the height of the building was found to have a signifi-cant effect on characteristics of the developed plastic mechanism under seismic loading. A distribution of strength in dissipative elements over the height of
the building leading to a uniform drift was sug-gested.
Figure 3. Connection details of a vertical steel link, Gobarah and Elfath, 2001.
Several techniques of seismic strengthening of existing r.c. frames were studied experimentally by Mazzolani et al. (2004). The following techniques were investigated: (1) steel buckling restrained braces, (2) steel eccentric braces, (3) shape memory alloy braces, (4) dissipative shear panels, (5) base isolation, and (6) repair using carbon fibre rein-forced polymers. In the case of the steel eccentri-cally braced inverted Y frame a direct connection to the reinforced concrete elements was used (Figure 4).
Figure 4. Experimental test on inverted Y eccentrically braced frame for rehabilitation of existing reinforced concrete frame, Mazzolani et al., 2004.
A low cost shear panel device (Figure 5) for re-habilitation of steel moment resisting frames was in-vestigated at the European Laboratory for Structural Assessment (ELSA) by Schmidt et al. (2004). Though the device was intended to be replaceable (bolted), it was welded in the final test configura-tion. Authors showed that rehabilitation solution provided a drastic reduction in displacements and linear behaviour of the conventional structure, with a minimum of structural changes.
Retrofit of gravity load designed r.c. frames with masonry infill by means of eccentrically braced in-verted Y system was investigated at the European Laboratory for Structural Assessment (ELSA) by Bouwkamp et al. (2001), see Figure 6.

213
Figure 5. Dissipative link element in an inverted Y eccentri-cally braced frame, Schmidt et al., 2004.
One of the masonry infill walls was removed and replaced by a ductile steel eccentrically braced sys-tem. It was suggested that this system causes little disturbance and results in a design with lateral load resistance similar to the initial resistance, but with significant increase in energy dissipation capacity (ductility). Chemical anchors were used to connect the steel beams and side straps to the concrete frame.
Figure 6. Inverted Y eccentrically braced frame for retrofit of r.c. frame, Bouwkamp et al., 2001.
A knee-braced frame configuration similar to eccentrically braced frames was investigated by Bal-endra et al. (2001). In this system the energy is dis-sipated through the shear yielding of the knee, while the brace is designed to prevent buckling. The knee element is damaged under severe earthquakes, but is easily replaceable afterwards.
A review of past research on buckling-restrained systems at the component, subassemblage, and frame levels were was undertaken by Uang et al. (2004). Buckling restrained braces are obtained by enclosing a ductile steel core inside a steel casing, which is filled with mortar or concrete. Prior to cast-ing mortar or concrete, an unbonding material is provided between the steel core and the mortar to prevent transfer of axial forces between the steel core to the mortar and to the exterior casing. The ad-vantage of this system over conventional braces is that braces are precluded from buckling, which re-sults in similar characteristic under both tensions and compression, and improved hysteretic response in comparison with conventional braces.
Figure 7. Knee-brace frame configuration, Balendra et al. 2001. Buckling restrained braces were used to retrofit
existing reinforced concrete frames lacking seismic design, Brown et al. (2001), see Figure 8b.
(a) (b)
Figure 8. Concept of buckling-restrained brace, Uang et al., 2004 (a), and the architectural rendering of a reinforced con-crete seismically upgraded building, Brown et al., 2001 (b).
An "outer-frame brace" system for retrofit of ex-isting reinforced concrete frames was certified in Ja-pan by HAZAMA Corporation (Japan Building Dis-aster Prevention Association, 2005), see Figure 9. Seismic strengthening of the building can be carried out without decreasing the serviceability and quality of living condition.
.
Figure 9. Outer-frame brace system developed in Japan by HAZAMA Corp., (Japan Building Disaster Prevention Asso-ciation, 2005).
Beside reinforced concrete bare frame, dissipative steel bracing systems are possible to be applied also to reinforced concrete frames with infills, as well as to masonry structures. In the latter case, a portion of the masonry wall has to be removed, and replaced by a dissipative steel bracing system. A reinforced concrete interface may be required for an adequate transfer of forces from the masonry structure to the dissipative bracing system.

214
3 STUDY CASE: STRENGTHENING OF A MRF R.C. FRAME WITH STEEL BUCKLING RESTRAINED BRACES
Romania is a country with a high seismic risk and before 1963, when first seismic design code was used, the r.c. (reinforced concrete) structures were designed only to resist gravitational loads mainly. After, new codes have drafted (eg. 1978, 1991, 2006) the last one being aligned with EN. 1998-1. Practically almost all the buildings located in sever seismic zones, designed before 2006 must be evalu-ated and consolidated.
The aim of this study case is the structural seis-mic upgrade of a poor r.c. moment resisting frame (MRF) building using steel buckling-restrained braces (BRB). The r.c. frame is shown in Figure 10.
Common materials used in the 1950-s, as con-crete B200 (corresponding to class C12/15 in Euro-code 2) and steel OB38 (with a characteristic yield strength of 235 N/mm2) have been considered into the initial structure.
3.1 Frame designThe gravity load design of the r.c. frame was
done according to the old Romanian codes (original design). The beam�s effective width was considered only for sections along the span (Figure 10). The de-sign strength was computed according to the modern code design. Detailing of reinforcement was charac-teristic for design practice used in Romania during 1950-s:
for longitudinal reinforcement: the existence of inclined reinforcement and the poor anchorage length of bottom bars at the supports for transversal reinforcement: consisting in open stirrups, largely spaced (20 - 25 cm) were consid-ered in the potentially plastic zones. An important remark regarding the structure is
the existence on the outer frames of an infill ma-sonry wall of 0.38 m thickness, and with a character-istic weight of 18 KN/m3. In Table 1 are presented the loads and in Table 2 the combination of loads, both according to original design and modern code design. The building is located in Bucharest.
Table 1. Type of loads ___________________________________________________ Loads original modern design code design [KN/m2] [KN/m2]___________________________________________________ Dead Load (DL) 3.08 3.08 Live Load* (LL) - roof level 3.00 2.00 Live Load (LL) - current level 1.50 1.50 Snow Load(SL) 1.00 1.60 Wind Load (WL) 0.70 0.52 ___________________________________________________ * Live Load was distributed in 3 ways: Live Load 1 (LL1)� distributed on all elements; Live Load 2 and 3 (LL2 and LL3)� as a chess distribution.
Table 2. Combinations of loads __________________________________________________ Fundamental original design modern code design Combinations __________________________________________________ 1 1.3(DL+LL1+SL) 1.35DL+1.5LL1+ +1.05(SL+WL) _______________ ________________ 2 1.3(DL+LL2+SL) 1.35DL+1.5LL2+ +1.05(SL+WL) _______________ ________________ 3 1.3(DL+LL3+SL) 1.35DL+1.5LL3+ +1.05(SL+WL) _______________ ________________ 4 1.2 (DL+LL1+SL+ DL+LL1+ +WL) +0.7(WL+SL) __________________________________________________
The frame geometry and the obtained cross sec-tions are presented in Figure 10a and. Figure 10b.
3.0 [m]
3.0 [m]
4.0 [m] 4.0 [m] 4.0 [m]
B
A B C D E D C B A
A B C D E D C B A
B
A
B
B
B
B
B
A
B
B
B
3.0 [m]
A A 2Ø16D D
2Ø10
2Ø12
Ø6/25
2Ø12
2Ø10
1Ø12Ø6/25
2Ø16
Ø6/25
C C
2Ø10
1Ø12
2Ø12
EEbeff = 100 [cm]
35 [cm]
10 [cm]
25 [cm]
20 [cm]
2Ø10
3Ø12
Ø6/25
B B
2Ø10
Ø6/25
2Ø12
A A
6Ø14
25 [cm]
25 [cm]
Ø6/20
4Ø14
25 [cm]
25 [cm]B B
Ø6/20
Figure 10. Frame geometry (a) and characteristic beam and col-umn cross-sections (b).
The results of design checking for beam and col-umn sections under gravity loads only are summa-rised in Table 3 and Table 4.

215
Table 3. Verification of beams __________________________________________________ Beam Internal design original modern Sections actions strength internal internal actions actions __________________________________________________ A M [KNm] 15.32 15.00 14.80 Q [KN] 118.00 23.84 22.95 B M [KNm] 23.00 22.83 21.47 C M [KNm] 42.21 31.84 25.68 Q [KN] 143.00 31.47 30.31 D M [KNm] 42.36 27.58 26.02 Q [KN] 144.30 28.40 26.02 E M [KNm] 15.34 13.31 11.37 __________________________________________________
Table 4. Verification of columns __________________________________________________ Column Internal design* original modern Sections actions strength internal internal actions actions __________________________________________________ M [KNm] 43 4.25 7.72 A N [KN] 399.35 390 __________________________________________________ M [KNm] 38 10.95 6.22 B N [KN] 371 368 __________________________________________________ *the design strengths were determined to gravity axial load of the each column element
3.2 Strengthening solution The different strengthening solutions were consid-ered for seismic upgrade i.e. steel BRB�s only; con-finement of the first and second story columns using fiber reinforced polymers (FRP); and the combina-tion of the previous two solutions.
The BRB�s were introduced only in the middle span, as an inverted V braces, pinned at the ends. The design of the BRB�s was accomplished accord-ing to Eurocode 3, following the procedure de-scribed in AISC 2005. Design seismic forces were obtained using spectral analysis with a reduction fac-tor q equal to 6. BRB frames and eccentrically braced frames are expected to possess similar struc-tural ductility and they are assigned same values of force reduction factor R in AISC 2005. Therefore behaviour factor q to be used for BRB system was considered equal to the one assigned by Eurocode 8 for eccentrically braced frames (q=6).
The core of the buckling restrained brace was considered to be of rectangular shape. Cross-section areas of braces resulted from design are:
the ground floor story�s area A=250 mm2
the first story�s area A=250 mm2
the second story�s area A=250 mm2
3.3 Analysis procedure Pushover analysis was applied in order to evaluate the differences between the original frame (MRF) and the retrofit ones. Displacement demand was es-timated according to the N2 method implemented in Eurocode 8. Seismic action is characterised by the elastic response spectrum, shown in Figure 12 (peak ground acceleration ag=0.24g, control period
Tc=1.6s). Performance of the structure was evaluated in terms of inelastic deformation capacities corre-sponding to Collapse Prevention (CP) limit state. Development of plastic mechanism was also ob-served.
The lateral forces for pushover analysis were con-sidered of inverse triangular distribution (Figure 11), and were determined as example Equation 1 below:
i ii
i i
m hFm h
(1)
where, hi = the height of level i relative to the base of the frame and mi = the mass at level i computed from the fundamental combination DL+0.4(LL1+SL) and distributed in the main nodes.
m1
m2
m3
h1
h2
h3
F1
F2
F3
Figure 11. Mass distribution
Bucharest Spectrum - (ag=0.24g; Tc=1.6 s)
0.0
1.0
2.0
3.0
4.0
5.0
6.0
7.0
0 1 2 3 4Period T [s]
Figure 12. Elastic response spectrum for Bucharest (P100-1/2006)
Inelastic deformations corresponding to collapse prevention limit state for structural elements were defined in terms of:
moment � rotation values for beams and columns; axial force � displacement for buckling restrained braces.
3.4 Modeling for pushover analysis
3.4.1 Materials Considering the inappropriate detailing of r.c. ele-ments, concrete was taken as unconfined (FEMA356). The material model was considered ac-cording to Kent & Park, from Park & Paulay (1975) (Figure 13), as an unconfined material with linear softening of the rigidity and no tension. Concrete

216
compressive strength was considered equal to f'c=12.5 N/mm2, while the ultimate strain f=0.015.
fc'
0.002 50u
0.5fc'
0.2fc'
f
Figure 13 Kent & Park unconfined concrete definition
Due to the poor anchorage length of the bottom longitudinal reinforcement in the beams an equiva-lent yield strength of the steel has to be used (FEMA356) see Equation 2 below:
,,
,
b avy eq y
b req
Lf f
L (2)
where, fy,eq = equivalent yield strength; fy = steel re-inforcement yield strength; Lb,av = available anchor-age length; Lb,req = required anchorage length (ac-cording to Eurocode2).
Table 5 presents the sections were insufficient anchorage was present, with the values of fyeq. The reinforcing steel has the characteristic yield strength of 235 N/mm2 and it was defined as a uniaxial bilin-ear material with strain hardening according to Euro-code3.
Table 5. Equivalent yielding strength of the bars __________________________________________________ Element Section Diameter Lbreq Lbav fy,eq _______ ____ _____ _______ [mm] [mm] [mm] [N/mm2]__________________________________________________ Beams A 12 505 225 104.70 10 421.2 225 125.53 ______ _______ _____ _____ _______ C 10 421.2 250 139.48 12 505 250 116.34 ______ _______ _____ _____ _______ D 10 421.2 250 139.48 _______ ______ _______ _____ _____ _______ Column A, B 14 589.7 560 223.16 __________________________________________________
3.4.2 Members modelling
Beams and columns Unlike the beams, were original effective width was considered only for the sections along the span, a 72 cm effective width, according to FEMA356, was considered. 4 8 mm rebars at 18 cm spacing, have been considered for the slab in the effective width.
The effective stiffness of the members corre-sponding to cracked cross-section was reduced ac-cording to FEMA 356 as follows:
beam flexural stiffness were reduced by 0.5; column flexural stiffness was reduced depending on level of axial force (Table 6).
Table 6. Column stiffness reduction according to FEMA356 ________________________ _______________________ Edge Storey Stiffness Internal Storey Stiffness Columns reduction Columns reduction ________________________ _______________________ 3 0.5 3 0.5 2 0.5 2 0.525 1 0.7 1 0.67 ________________________ _______________________
For plastic analysis, the beams and columns they have concentrated plasticity at the ends defined as rigid plastic bilinear moment-rotation relationship. The plastic hinge length (Lp) was computed accord-ing to Paulay & Priestley (1991) resulting Lp (column) =0.19 m and Lp (beam) = 0.21 m. See for example Equa-tion 3 below:
0.08 0.022i i i yLp L d f (3)
where, Li=half of the span of the element, di=the di-ameter of the longitudinal reinforcement and fy=characteristic strength for steel. The bilinear idealization of moment curvature was obtained considering:
the yield point occurred when one rebar yield or concrete attained its compressive strength; ultimate curvature calculated at the point when the materials reached their ultimate strains (e.g. 0.05 for concrete and 0.005 for steel); a 1% hardening applied to initial stiffness was considered (Figure 14). The columns M- relationships were obtained
corresponding to the axial force from the gravita-tional combination in each element.
M - relationship
0
5
10
15
20
25
30
35
40
45
0 0.01 0.02 0.03 0.04[ 1/m]
Figure 14. M- relationship
Buckling Restrained Braces Buckling restrained braces were considered pinned at the ends. Inelastic behaviour was modelled by concentrated plasticity. The material used for BRB was S235 grade steel and for a length of 3.6 m a yield displacement y = 4 mm resulted. The ultimate displacement u was estimated based on experimen-tal results presented in Newell tests. Based on these results, ductility ratios u/ y were estimated for ten-sion and compression, amounting to 8.3 and 7.5 re-spectively. In order to obtain the adjustment of the design strengths (maximum compression strength

217
Cmax and maximum tension strength Tmax) the AISC formulas were applied, see Equations 4 and 5 below:
max y yT = R f A (4)
max y yC = R f A (5)
where, fy is the yield strength; Ry is the ratio of the expected yield stress to the specified minimum yield stress fy (considered equal to 1). Concerning the ex-perimental values of the compression adjustment factor =1.05 and strain hardening adjustment factor
=1.25 they were obtained in same manner as the coefficient u/ y was found using AISC formulas, see Equation 6:
max
max
C = T
and max
fysc
T = f A
(6)
where fysc= is the measured yield strength of the steel core.
BRB member behaves according to a bilinear force-deformation relationship with hardening. In Figure 15 is presented BRB behaviour model for all 3 storeys.
BRB Modeling
-80
-60
-40
-20
0
20
40
60
80
-0.035 -0.025 -0.015 -0.005 0.005 0.015 0.025 0.035
Displacement [m]
2'nd Floor
2'nd Floor
Ground Floor
1'st Floor
Ground Floor
1'st Floor
Figure 15. BRB behaviour model
Modelling of strengthening with FRP In order to enhance ductility of reinforced con-
crete columns, their strengthening with FRP was considered. The fabric was applied in horizontal lay-ers, its effect being confinement of concrete. The ef-fect of confinement by FRP was determined accord-ing to FIB Bulletin 14/2001, and consisted in an increase of concrete compression strength and ulti-mate strain from 0.005 to 0.02. A more favourable behaviour of the confined columns is resulting (Figure 16). The strength increase 3 times for the de-sign axial strength (from 987 KN to 2771 KN for column section A) and about 2 times for design moment strength (from 44 KNm to 103 KNm in the column section A)
M - relationship
0
10
20
30
40
50
60
0 0.01 0.02 0.03 0.04 [1/m]
RC+FRP
RC
Figure 16. Effect of confinement by FRP on the moment-curvature relationship of column A.
3.5 Performance assessment
3.5.1 Moment resisting frame (MRF) Analysis of the original MRF showed an unsatisfac-tory seismic response. First plastic hinge appears in the column. Plastic mechanism involves mostly col-umns from the first and second floors (Figure 17a), but also some beams from the first storey. Lateral drifts at the ultimate limit state also indicate concen-tration of damage in first two storeys (Figure 19). Ultimate rotations in plastic hinges corresponding to collapse prevention limit state are first reached in columns (Figure 18). It can be observed the structure has a limited global ductility, because columns attain collapse prevention limits state at a top displacement roughly four times smaller than the top displacement demand due to design earthquake action. Fundamen-tal period of vibration and target displacements at the ultimate limit state for the original reinforced concrete frame and several alternative strengthening solutions are presented in Table 7
3.5.2 Strengthening with buckling restrained braces Strengthening by buckling-restrained braces in-creased considerably the strength and stiffness of the frame (Figure 18), decreasing by almost 50% the top displacement demand at the ultimate limit state. The first plastic hinges formed in column, followed by the ones in braces and beams. The plastic mecha-nism involved also the first two storeys (Figure 17b) and (Figure 18). This strengthening solution reduced the overall damage in the structure, as less plastic hinges formed in reinforced concrete elements at the target displacement (Figure 17b). However, seismic performance is still unsatisfactory, as inelastic de-formations corresponding to collapse prevention limit state are recorded in columns, braces and beams before reaching the target displacement.

218
3.5.3 Strengthening by fiber reinforced polymers As an alternative to strengthening by buckling re-strained braces, the possibility to improve seismic performance by confining the columns with FRP was investigated. The FRP fabric was considered applied in horizontal direction only, which ensures a confinement of concrete, but does not act supple-ment reinforcement. The effect of application of FRP was an increase of axial force capacity of the columns and ductility, but just a slight increase of bending moment capacity.
The overall structural response did not change significantly due to application of FRP (Figure 18) but, the ultimate deformation in columns (corre-sponding to collapse prevention limit state) was re-duced. Consequently the first plastic hinge form in beam element and concerning the column the ulti-mate deformation is attained at larger top displace-ment demands than in the case of the original frame (Figure 17c and Figure 18). Also, the top displace-ment and interstory drift demands at the ultimate limit state do not change significantly compared to initial frame.
3.5.4 BRB and FRP strengthening Strengthening of the r.c. frame by means of BRB only did not eliminated failure of r.c. members. Therefore, a consolidation by both FRP and BRB systems was considered.
The main effect of the BRB system is improve-ment of global force-deformation characteristics (in-creased strength and stiffness), which results in de-creased top displacement demands at the ultimate limit state (Figure 18). On the other hand, FRP tech-nique enhances the local behaviour of columns by increasing their ductility, this being the reason of at-taining ultimate deformation after the demand dis-placement. Also, it must be specified that the first plastic hinge from the column elements is attained in the unconfined column from the second story. Con-sequently, less damage is observed in columns (Figure 17d and Figure 18). Inelastic demands in beams and buckling restrained braces are still large. Collapse prevention ultimate deformations in brac-ings and beams are attained at top displacements lower than the displacement demand at the ultimate limit state.
3.5.5 BRB and FRP strengthening using low-dissipative design
Large inelastic deformation demands in dissipative elements (buckling restrained braces) and in existing reinforced concrete elements is partially caused by the shape of the response spectrum in Bucharest. It is characterised by large value of the control period TC and is attributed to soft soil conditions in Bucha-rest. Inelastic demands are larger when the funda-mental period of the structure is smaller than the
control period TC. Consequently, it may be appropri-ate to design the dissipative system (buckling re-strained braces) using a lower behaviour factor q. Following this reasoning, a new system was consid-ered, composed of FRP strengthening of columns and BRB system, where braces were designed based on earthquake forces corresponding to a behaviour factor equal to 3. Practically, cross-section area of the buckling restrained braces was doubled with re-spect to the ones determined in previous section.
As can be observed from Figure 18, the global strength of the system is increased in comparison to the system designed with q=6. However, the stiff-ness increases only slightly. Interstorey drift de-mands concentrate in the lower two storeys (Figure 19), but are much lower than for the other strength-ening solutions.
Though overall structural response is improved, inelastic deformations in braces and beams are still smaller than displacement demand.
Table 7. Fundamental period of vibration and target displace-ments for the considered structures. __________________________________________________ Structure Period Target displacement T [s] dt [m] __________________________________________________ MRF + FRP + BRB (q=3) 0.54 0.164 MRF + FRP + BRB (q=6) 0.64 0.222 MRF + BRB (q=6) 0.64 0.224 MRF+FRP 1.0 0.395 MRF 1.0 0.39 __________________________________________________
a) MRF
b) MRF+BRB(q=6) c) MRF+FRP
d) MRF+FRP+BRB (q=6) e) MRF+FRP+BRB (q=3) Figure 17. Plastic hinge distribution at the collapse prevention limit state

219
Pushover Curves
0
50
100
150
200
250
0 0.1 0.2 0.3 0.4Top Displacement [m]BRB-CP Beam-CP Column-CP N2-Target Displacement
...
MRF
MRF+FRP
MRF+BRB
MRF+FRP+BRB(q=6)
MRF+FRP+BRB(q=3)
Figure 18. Pushover curves of the analysed frames.
0.000 0.010 0.020 0.030 0.040 0.050 0.060 0.070
Interstory Drift [rad]
1
2
3
MRF MRF+FRP MRF+BRB (q=6)MRF+FRP+BRB (q=6) MRF+FRP+BRB (q=3)
Figure 19. Interstorey drift demands at the target displacement.
4 CONCLUSIONS
R.c. M.R. frames in severe, or even moderate, seis-mic zones designed for gravity loads only in the past are in need for seismic rehabilitation in order to comply with modern seismic design requirements. Seismic upgrade of this type of structures using buckling restrained braces was investigated. The main effect of the dissipative bracing system is the improvement of overall strength and stiffness. How-ever, application of the dissipative bracing system alone is not sufficient for an appropriate seismic per-formance. Additionally, the existing r.c. members should be strengthened. The most convenient solu-tion seems to be application of FRP on beams and columns.
The analysis showed that seismic rehabilitation of nonseismic r.c. frames cannot be accomplished by means of very ductile dissipative bracing system without a proper strengthening of r.c members.
In present study only the columns have been con-fined (not strengthened!) with FRP. A better re-
sponse capacity of BRB strengthened MR Frame is expected if both r.c . columns and beams would be properly reinforced with FRP. In fact, if FRP rein-forcement could be enough effective, the beams and columns will work mainly in elastic domain, while ductile steel BRB will be responsible for dissipative behaviour. Therefore a performance Based Design approach could be applied on this line.
REFERENCES
AISC (2005). "Seismic Provisions for Structural Steel Build-ings". American Institute of Steel Construction, Inc. Chi-cago, Illinois, USA.
Balendra, T., Yua, C. H. and Lee, F. L. (2001). An economical structural system for wind and earthquake loads. Engineer-ing Structures, Volume 23, Issue 5: 491-501.
Bouwkamp, J., Gomez, S., Pinto, A., Varum, H., Molina, J. (2001). Cyclic Tests on R/C Frame Retrofitted with K-Bracing and Shear-Link Dissipator. European Laboratory for Structural Assessment (ELSA). Report no. EUR 20136 EN.
Brown, A. P., Aiken, I. D., Jafarzadeh, F. J. (2001). Buckling Restrained Braces Provide the Key to the Seismic Retrofit of the Wallace F. Bennett Federal Building. Modern Steel Construction, August, 2001.
Cosenza, E., Manfredi, G., and Verderame, G.M., (2002). Seis-mic Assessment of Gravity Load Designed R.C. Frames: Critical Issues in Structural Modelling, Journal of Earth-quake Engineering, Vol. 6, special issue No.1, 101-122
CR 0-2005 (2006) Cod de proiectare. Bazele proiectarii structurilor in constructii
CR 1-1-3-2005 (2006) Cod de proiectare. Evaluarea actiunii zapezii asupra constructiilor
Eurocode 2 (December 2003) Design of concrete structures - Part 1-1: General rules and rules for buildings FINAL DRAFT prEN 1992-1-1. CEN - European Committee for Standardization
Eurocode 3 (2003). Design of steel structures. Part 1-1: Gen-eral Rules and Rules for Buildings. CEN - European Com-mittee for Standardization.
Eurocode 8 (January 2003) Design of structures for earthquake resistance, Part 1: General rules, seismic actions and rules for buildings, DRAFT No 6, Version for translation (Stage 49). CEN - European Committee for Standardization
Fajfar, P. (2000) A Nonlinear Analysis Method for Perform-ance Based Seismic Design in Eurocode 8 Annex B (Infor-mative) Determination of the target displacement for nonlinear static (pushover) analysis.
F. McKenna et al., (February 2005) Open System for Earth-quake Engineering Simulation User Manual, OpenSees version 1.7.0
FEMA 356, (2000) Prestandard and commentary for the seis-mic rehabilitation of buildings, Federal Emergency Man-agement Agency, Washington (DC).
FIB Bulletin 14/2001 Externally bonded FRP reinforcement for RC structures
Ghobarah, A., Abou Elfath, H (2001). Rehabilitation of a rein-forced concrete frame using eccentric steel bracing. Engi-neering Structures Vol. 23: 745�755.
Japan Building Disaster Prevention Association (2005). Recent Development of Seismic Retrofit Methods in Japan.http://www.kenchiku-bosai.or.jp/srm.PDF.
Mazzolani, F. M., Della Corte, G. and Faggiano, B. (2004). Full scale testing and analysis of innovative techniques for seismic up-grading of RC buildings. International Collo-

220
quium: Recent Advances and New Trends in Structural De-sign, May 7-8 2004, Timisoara, Romania.
Newell, J.& Higgins, C. (n.d.) Steel Confined Yielding Damper For Earthquake Resistant Design ,NHMJ Young Researchers Symposium June 21, 2003,http://cee.uiuc.edu/sstl/nhmj/ppt/Newell.ppt
NP-082-04 (2005) Cod de proiectare. Bazele proiectarii si ac-tiuni asupra constructiilor. Actiunea vantului.
Park, R. & Paulay, T (1975) Reinforced Concrete Structures,New Zealand ,John Wiley & Sons, Inc., New York.
Paulay, T. and Priestley, M.J.N., (1992) Seismic Design of Re-inforced Concrete and Masonry Buildings, John Wiley & Sons, Inc., New York.
Priestley, M.J.N., (1997) Displacement-Based Seismic Assess-ment of Reinforced Concrete Buildings, Journal of Earth-quake Engineering, Vol. 1, No.1, 157-192
P100-1/2006 (2006). Cod de proiectare seismica - Partea I - Prevederi de proiectare pentru cladiri
Schmidt, K., Dorka, U.E., Taucer, F., Magonette, G. (2004). Seismic Retrofit of a Steel Frame and a RC Frame with HYDE Systems. European Laboratory for Structural As-sessment (ELSA). Report no. EUR 21180 EN.
STAS 503/1949. Sarcini in construc ii.STAS 504/1949. Sarcini permanente.STAS 506/1949. Sarcini utile. STAS 946/1956. Sarcini climatice. Uang, C.-M., Nakashima, M. and Tsai, K.-C. (2004). Research
and Application of Buckling-Restrained Braced Frames.Steel Structures 4 (2004): 301-313.

221
1 INTRODUCTION
Existing reinforced concrete (RC) frame buildings with non-ductile detailing represent a considerable hazard during earthquakes. This type of buildings suffered severe damages and were responsible for most of the loss of life during the major Italian seis-mic events such as the 1980 Irpinia earthquake. Im-proving the seismic response of this type of con-struction can be considered as one of the main concern for structural engineers.Several technical solutions are currently available for the mitigation of earthquake risks, going from active to passive dissipating devices as well as base isolation. In general, seismic repairing/upgrading structural systems can be classified according to the following conceptual scheme: 1. Systems based on adding new structural elements, which directly operate at global level for improving the seismic response. 2. Systems based on repairing/upgrading existing structural elements, aiming at improving the global response by changing the local behaviour. Type 1 systems are very useful for seismic upgrad-ing in those situations characterized by the absence of purposely-designed lateral-load resisting struc-tures, such as in the case of structures mainly de-signed to resist vertical loads. Among type 1 sys-tems, metalbased technologies are often considered as the most satisfactory technical solutions, because of the effectiveness, practicality and economy. In
particular, energy input by a strong earthquake is expected to be greatly dissipated by these systems, which can be easily substituted after the earthquake, because they are designed to be replaceable.Among type 2 systems, many seismic rehabilita-tion/reparation techniques have been proposed and studied, such as: a) epoxy injections; b) steel plating or concrete jacketing; c) the use of fiber reinforced polymers. FRP-material systems have recently re-ceived much attention because of some advantages (lightness, ease of application, resistance to aggres-sive environments). In particular, in case of existing RC masonry-infilled buildings FRPs can be success-fully used to improve the lateral capacity and ductil-ity of infilling walls, thus improving the overall re-sponse of the structure (Mazzolani et al. 2007). Both type 1 and type 2 strategies can be imple-mented in case of existing RC buildings. Therefore, in order to study the effectiveness and the reliability of advanced solutions, an experimental investigation has been carried out. This paper shows and com-pares the results of full-scale tests performed on similar existing RC buildings seismically upgraded by means of carbon fiber reinforced polymers (C-FRP), Eccentric Braces (EBs) and Buckling Re-strained Braces (BRBs). Tests have been carried out within the context of a wider theoretical and experi-mental research activity, named the ILVA-IDEM project (Mazzolani 2006), having the purpose to evaluate several innovative technologies for the seismic retrofitting/upgrading of existing RC struc-tures. The experimental part of this study started from the exceptional opportunity to carry out ex-
Experimental tests on seismic upgrading techniques for RC buildings
F. M. Mazzolani, G. Della Corte, E. Barecchia & M. D�Aniello University of Naples Federico II, Naples, Italy
ABSTRACT: Seismic upgrading of existing gravity-load designed (GLD) reinforced concrete (RC) buildings is a very important topic in field of the earthquake engineering. Several upgrading techniques can be imple-mented to improve the seismic performance of existing RC structures, such as modifying the global response by introducing new structural elements in the structure or improving the local strength and ductility of dissi-pative elements. In this paper, the results of full-scale tests on existing reinforced concrete buildings seismi-cally upgraded by means of several innovative techniques are presented and discussed. In particular, the use of externally bonded carbon fiber reinforced polymers, eccentric braces and buckling restrained braces are in-vestigated and compared.

222
perimental tests in inelastic range of response on a real RC building (Figure 1a).
a)
b)
1) Shape MemoryAlloy Braces
2) Steel Shear Panels
Composite Materials
EccentricBracings
SteelBuckling
RestrainedBraces
Base Isolationwith rubber
bearings
Used as reactingframe for testing the
Steel Shear Panel system
Lateral Loading Test of the Original Structure
Figure 1. a) The original and b) the sub-structured building.
The building, is located in Bagnoli (Naples, Italy) and was destined to demolition by competent Au-thority within the dismantling process of the Italian ex-steel mill ILVA (or Italsider). In order to increase the potential number of specimens for testing differ-ent upgrading solutions, slabs were cut at the first and second floor, in such a way to divide the whole building into six separate structures to be analyzed, as shown in Figure 1b. Before cutting the slabs, ex-ternal and partition walls, as well as non-structural elements, were removed in order to get bare RC structures. A deep and detailed description of the whole experimental activity can be found in Maz-zolani 2006.
2 DESCRIPTION OF THE RC STRUCTURE AND TEST SETUP
2.1 GeometryThe RC sub-structure is essentially constituted by four columns sustaining two floors. Columns have a square 300mm x 300mm cross-section. The structure of the two floors can be essentially described as made of T-section beams going parallel in the trans-verse direction and supported by two longitudinal L-section beams. Column longitudinal steel rebars are in number of four, placed at the section corners and have a diameter of 12mm. Transverse stirrups have a diameter of 8mm and are spaced of about 200mm. Figure 2 shows the longitudinal section of the ge-neric RC sub-structure. The mechanical properties of materials were esti-mated both in-situ and in the laboratory, by means of tests on specimens, such as steel bars and concrete specimens taken from the existing structure.
SECTION A - A
3,00
TRANSVERSE STRUCTURAL SECTION
SECTION B - B
3,301,00 1,00
5,303,00
FIRST FLOOR PLAN
SECTION B - B
Figure 2. Geometry and existing steel-reinforcement of the tested structure
2.2 Test setup Figure 3 illustrates the test set-up, showing (a) a global view of the reacting steel frame, (b) close-up views of the two loading jacks and the supporting steel beam used. In particular, this vertical steel beam was used for distributing the applied lateral force between the two stories of the structure to be tested. This arrangement reproduced an inverted tri-angular lateral load pattern which is often assumed in theoretical pushover studies. The strengthened structure was subjected to a cyclic loading history up to the development of a clear collapse mechanism.
a) b)Figure 3. Test setup.
During the test, floor displacements have been meas-ured, by using a video-camera installed above each floor for measuring the floor lateral displacements (Figure 4). This displacement-measuring device proved to give lateral displacements with the same precision of a topographic total station, which was used in a former test on a similar structure.
Figure 4. Displacement-measuring device.
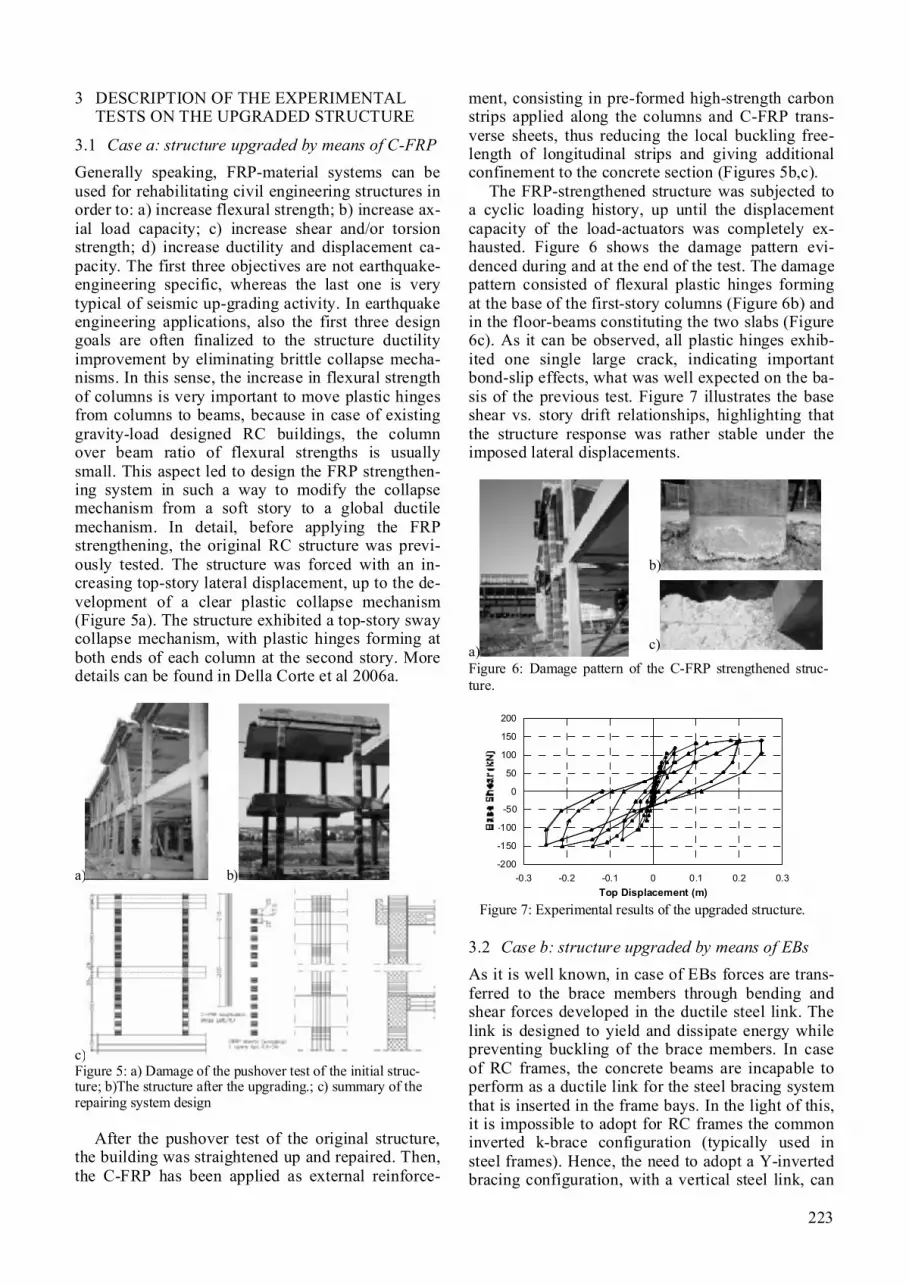
223
3 DESCRIPTION OF THE EXPERIMENTAL TESTS ON THE UPGRADED STRUCTURE
3.1 Case a: structure upgraded by means of C-FRPGenerally speaking, FRP-material systems can be used for rehabilitating civil engineering structures in order to: a) increase flexural strength; b) increase ax-ial load capacity; c) increase shear and/or torsion strength; d) increase ductility and displacement ca-pacity. The first three objectives are not earthquake-engineering specific, whereas the last one is very typical of seismic up-grading activity. In earthquake engineering applications, also the first three design goals are often finalized to the structure ductility improvement by eliminating brittle collapse mecha-nisms. In this sense, the increase in flexural strength of columns is very important to move plastic hinges from columns to beams, because in case of existing gravity-load designed RC buildings, the column over beam ratio of flexural strengths is usually small. This aspect led to design the FRP strengthen-ing system in such a way to modify the collapse mechanism from a soft story to a global ductile mechanism. In detail, before applying the FRP strengthening, the original RC structure was previ-ously tested. The structure was forced with an in-creasing top-story lateral displacement, up to the de-velopment of a clear plastic collapse mechanism (Figure 5a). The structure exhibited a top-story sway collapse mechanism, with plastic hinges forming at both ends of each column at the second story. More details can be found in Della Corte et al 2006a.
a) b)
c)Figure 5: a) Damage of the pushover test of the initial struc-ture; b)The structure after the upgrading.; c) summary of the repairing system design
After the pushover test of the original structure, the building was straightened up and repaired. Then, the C-FRP has been applied as external reinforce-
ment, consisting in pre-formed high-strength carbon strips applied along the columns and C-FRP trans-verse sheets, thus reducing the local buckling free-length of longitudinal strips and giving additional confinement to the concrete section (Figures 5b,c).
The FRP-strengthened structure was subjected to a cyclic loading history, up until the displacement capacity of the load-actuators was completely ex-hausted. Figure 6 shows the damage pattern evi-denced during and at the end of the test. The damage pattern consisted of flexural plastic hinges forming at the base of the first-story columns (Figure 6b) and in the floor-beams constituting the two slabs (Figure 6c). As it can be observed, all plastic hinges exhib-ited one single large crack, indicating important bond-slip effects, what was well expected on the ba-sis of the previous test. Figure 7 illustrates the base shear vs. story drift relationships, highlighting that the structure response was rather stable under the imposed lateral displacements.
b)
a) c)
Figure 6: Damage pattern of the C-FRP strengthened struc-ture.
-200
-150
-100
-50
0
50
100
150
200
-0.3 -0.2 -0.1 0 0.1 0.2 0.3Top Displacement (m)
Figure 7: Experimental results of the upgraded structure.
3.2 Case b: structure upgraded by means of EBs As it is well known, in case of EBs forces are trans-ferred to the brace members through bending and shear forces developed in the ductile steel link. The link is designed to yield and dissipate energy while preventing buckling of the brace members. In case of RC frames, the concrete beams are incapable to perform as a ductile link for the steel bracing system that is inserted in the frame bays. In the light of this, it is impossible to adopt for RC frames the common inverted k-brace configuration (typically used in steel frames). Hence, the need to adopt a Y-inverted bracing configuration, with a vertical steel link, can

224
be easily recognized. Besides, bolted connections at the link ends are required, what could have the ad-vantage to permit replacement of the dissipative members (links) after a damaging earthquake.
The geometry of this bracing system is summa-rized in Figure 8. In detail, three experimental push-over tests have been carried out (Della Corte et al. 2006b) on this structural unit. Each test showed dif-ferent structural performance, because of different design criteria adopted for the design of link end-connections.
a) RC structure plan. b) RC structure elevation.
Figure 8. Geometry of the tested EBs.
The first bracing system was designed neglecting capacity design criteria. The link and its connections to the RC slab and to the diagonal braces are shown in Figure 9. The normalized link length, which is de-fined as the ratio of the actual link length (0.25 m) to the limit value es, was equal to e/es = 0.92.
Figure 9. Link and its end connections: test on EBs No.1.
The experimental evidence showed flexural fail-ure of connections. Figure 10 shows the base shear versus average floor displacements, while Figure 11 illustrates the failure mode of link-to-brace connec-tions.
-450-350-250-150
-5050
150250350450
-0.1 -0.06 -0.02 0.02 0.06 0.1
Displacement (m)
Base Shear (kN)
Figure 10. Test No.1 on EBs: cyclic response curves.
a) b)Figure 11. Test No.1 on EBs: damage pattern.
For the second test, link end-connections were strengthened using capacity design. Namely an ulti-mate shear strength of links equal to 1.5 times their yielding strength was assumed (Ricles & Popov, 1994). This implied that the end-plate thickness in-creased from 10 to 25mm.
Link end connections have been designed to re-sist also flexural actions evaluated according to pro-cedures proposed by Popov and Engelhardt. The normalized link length was equal to e/es = 0.81.
The second test showed shear failure of bolts. In fact, as shown in Figure 12, the global response curve stops suddenly at a base shear value corre-sponding to the brittle failure of link-to-brace con-nections.
-500-350-200
-50100250400550700
-0.06 -0.04 -0.02 0 0.02 0.04 0.06
Displacement (m)
Base Shear (kN)
Fig. 12. Test No.2 on EBs: cyclic response curves.
Figure 13 shows that the plastic bending of end-plate connections was now completely avoided, while a moderate plastic engagement of links was observed along with a strong plastic deformation concentrated as shear hinging of bolts at the link-to-brace joints.

225
a) b) c)Figure 13. Test No.2 on EBs: damage pattern.
The third link was designed in order to increase the system ductility by forcing plastic deformation to be confined within links. In fact, the previous test revealed link over-strength larger than that expected. Because it was impossible to modify the geometry of link-to-brace joints, a steel built-up section (Fig-ure 14) was now designed for the links, in order to have shear strength of connections at least 2 times larger than the average yielding strength of links. This led to the need of increasing the bolt steel grade (compare Figure 9 and Figure 14).
The flexural resistance of the built-up section was chosen to be similar to the one of HEA100 (which is the section used for test No.1 and No.2), while the shear resistance (consequently the web area) was lesser than in the previous cases. The normalized link length was equal to e/es = 0.30.
Collapse was due again to the brittle shear failure of bolts of link-to-brace joints. However, the re-sponse curve (Figure 15) shows that the behaviour of the retrofitted structure was now characterized by larger energy dissipation capacity.
Figure 14. Link and its end connections: test No.3.
As in test No.2, plastic bending of connection end-plates is now avoided, while significant plastic shear deformation of links was observed (Figure 16).
-700
-500
-300
-100
100
300
500
700
-0.12 -0.08 -0.04 0.00 0.04 0.08 0.12
Displacement (m)
Base Shear (kN)
Figure 15. Test No.3 on EBs: cyclic response curves.
a) b) c)Figure 16. Test No.3 on EBs: damage pattern.
3.3 Case c: structure upgraded by means of BRBs BRBs are special devices that solve the problem of the limited ductility of classic concentric bracing. In fact, the axial strength is de-coupled from flexural buckling resistance; the axial load is confined to the steel core (thus providing complete truss behaviour), while the buckling restraining mechanism resists overall brace buckling and restrains high-mode steel core buckling (rippling).Several studies proposed a large number of different types of BRBs, but all of them based on the basic concept to use tubes for restraining lateral displace-ments while allowing axial deformations of the core. In the most classical form, the restraining tube is filled with concrete and an unbonding layer is placed at the contact surface between the core plates and the filling concrete, thus this version is called �un-bonded brace�. �Only-steel� solutions have been also proposed, with two or more steel tubes in direct con-tact with the yielding steel plates. Contrary to the �unbonded�, this type of BRBs can be designed to be detachable. This aspect implies that is possible to design these systems to be inspected, so that it is possible to control their condition after each seismic event and to allow an ordinary maintenance during the life-time. To do this the restraining tubes should be connected by bolted steel connections (Tsai et al. 2004). Moreover, an �only-steel� BRB is lighter than an �unbonded� one; this implies a technical and eco-nomical advantage during the assembling. These considerations led to study a special only-steel detachable BRB to be used for improving the seismic response of RC buildings. In particular two different types of this special device have been ap-plied on one of the RC sub-structure (see Section 2).The diagonal braces were directed in alternate way, in order to evaluate the response of the studied

226
braces in tension and in compression. In particular, the BRB location is shown in Figures 17a-b.
a) b)Figure 17. Configuration of the tested BRBs.
Two experimental pushover tests have been car-ried out (Della Corte et al. 2005) on this structural unit. Each BRB system has been tested under lateral cyclic loads as in the previous cases.
Figures 18 and 19 give the fundamental geomet-ric properties of the first type of BRB tested. The yielding steel core is a rectangular plate (25mmx10mm), made of European S275 steel. The actual average yield stress of the core was measured to be 319MPa (i.e. 1.16 times the characteristic value).
Figure 18. BRB type 1: geometry.
Figure 19. BRB type 1: cross section details.
The buckling-restraining action is given by two rectangular steel tubes (100x50x5), with a ratio be-tween the Euler buckling load (PE) of the two tubes and the actual yield force (Py) of the internal steel core PE/Py = 2.1.
The experimental evidence showed a good re-sponse of the brace when it is in tension, with the expected relative displacements developing between the internal yielding core and the restraining tubes (see figure 20a). But, the compression brace ductil-ity was limited by the local buckling of the core, near the brace ends. This buckling produced strong flexural deformation of the closing plates, which were welded for joining the tubes at their ends (as shown in Figures 20b and 20c). This localization of damage ultimately led to the premature core fracture owing to the strong plastic strain developed at the
transition section between the reduced core and the end tapering. Figure 20d illustrates plastic hinging at RC column end.
a) b)
d) c)Figure 20. Damage pattern for the first BRB system.
The response curve is plotted in Figure 21. At each floor two measures of lateral displacement were taken, approximately symmetric with respect to the loading axis. As it can be seen, the difference be-tween the two displacements at each floor (hence the floor rotation) is small, with a maximum of about 15% of the average displacement in the inelastic range. The maximum first-story drift was 1.9% of the first-story height. The global story ductility ( )reached a maximum of about 4.75. In fact, the yield-ing value of the first story drift angle (which corre-sponded to yielding of BRBs at first story) was equal to about 0.004rad, hence = 0.019/0.004 = 4.75.
-500-400-300-200-100
0100200300400
-0.05 0 0.05 0.1
Displacement (m)
Base Shear (kN)
Figure 21. Test No.1 on BRBs: cyclic response curves.
The second type of BRB differs from the type 1 in three main aspects: 1) the BRB inner core was now tapered in a more gradual manner (Figure 22); 2) the two restraining tubes were now joined to-gether by means of bolted stiffened elements (Figure 23), allowing the BRB to be opened for inspection and monitoring at the end of the test; 3) the internal clearance between the core and the restraining unit is larger than in th type 1 (1mm per each side, instead of 0.5 mm of the type1). Figures 22 and 23 illustrate the geometry of the second type of tested BRB.

227
Figure 22. BRB type 1: geometry.
Figure 23. BRB type 1: cross section details.
Figure 24 summarises the damage pattern evi-denced during the test. Figure 24a highlights the relative displacement between the internal core and the restraining tubes developed when the BRB was in tension. Figure 24b illustrates the local buckling failure of one end-plate during compression of one BRB at the first story. Figure 24c shows the local buckling of the internal core of one BRB placed at the first story: this phenomenon became very appar-ent at the large first-story drift reached during the test (5.6% of the story height). Finally, Figure 24d shows large flexural cracking occurring in RC col-umns at the first story in correspondence of the peak values of story drift.
a) b)
d) c)Figure 24. Damage pattern for the second BRB system.
Figure 25 shows the response curve. Also in this second test, difference between the tension and compression behaviour of the BRBs was within the expected range of behaviour, originating relatively small torsion of floors. Obviously, this difference became larger when local buckling of one end-plate affected the compression response of one BRB at the
first story. Notwithstanding some localization of lo-cal buckling at one end of the internal steel core of the compressed BRB, the global story ductility ( )was quite large, reaching a maximum of about 14. This value can be computed assuming the yielding value of the first story drift angle conventionally equal to 0.004rad, which corresponds approximately to a base shear equal to 40% of its maximum value, hence = 0.056/0.004 = 14.
-500-400-300-200-100
0100200300400500
-0.1 -0.05 0 0.05 0.1 0.15 0.2 0.25
Displacement (m)
Base Shear (kN)
Figure 25. Test No.2 on BRBs: cyclic response curves.
4 COMPARISON OF TEST RESULTS
All the seismic upgrading systems presented in the previous Sections demonstrated to be a reliable solu-tion to improve the seismic performance of existing RC structure. In Figure 26 the lateral-load response of the all tests is compared in terms of envelope curve corresponding to the positive loading direc-tion. Besides, the behaviour is also compared with the results of a previous pushover test, which was carried out on a bare RC structure very similar to the one tested with the bracing systems.
0
100
200
300
400
500
600
700
0.00 0.05 0.10 0.15 0.20 0.25
Top displacement (m)
EB-2EB-3
EB-1 BRB-2
BRB-1
original RC structure
Figure 26. Comparison of experimental response curves.
All tests showed a significant increase of lateral stiffness and strength respect of the one of the origi-nal unbraced RC structure. In particular, in case of C-FRP the lateral strength and stiffness was about 2 times the ones of the original RC structure, but it is worthy to note the large ductility shown by the up-graded structure. In fact, the maximum inter-story drift was about 5.6%.

228
In case of EBs it was observed an increase of the lat-eral capacity from 5.65 to 8.34 times respect to the capacity of the original unbraced RC structure, while in case of BRBs from 4.08 to 4.95 times. The main cause of the larger values of the lateral strength achieved by EBs can be found in the shear over-strength exhibited by the tested steel links (Della Corte et al. 2006b). In fact, the peak shear force was equal to 5.42 times Vy,link. Therefore, test results, briefly summarized here, highlight that links made with the European wide-flange hot-rolled profiles (HE) exhibit over-strength largely in excess of that implicit in modern design codes. BRBs can provide for the structure a large displace-ment capacity, comparable with the case of FRP, in addition with large stiffness and strength gain..
5 CONCLUSIONS
Three different seismic retrofitting solutions for ex-isting structures have been presented.
The first solution is based on repairing/upgrading existing structural elements by means of C-FRP. The design objective was to change the type of failure mode, from a story sway to a global type. Increasing the column bending strength using C-FRP strips, ex-ternally bonded on the repaired concrete column sur-face, with fibers aligned along the longitudinal di-rection, pursued this objective. Two tests have been conducted: the first test was a static lateral loading of the original structure, which was pushed up to the formation of a clear plastic collapse mechanism; the second static test has been conducted on the up-graded structure, under load reversals, up to the ap-pearing of a clear damage pattern. Experimental re-sults demonstrate that the design objective has been fulfilled, with a significant improvement of the seis-mic response of the structure from all points of view (stiffness, strength and displacement capacity). The second retrofitting strategy investigated in this study consisted in adding dissipative members, which directly operate at global level for improving the seismic response. Among the possible alternative solutions, bracing systems have been adopted, be-cause of their simplicity and effectiveness. In this sense both EBs and BRBs may be a viable solution for seismic retrofitting of RC structures. In fact, they provide high elastic stiffness, stable inelastic re-sponse and excellent ductility and energy dissipation capacity.In case of eccentric braces, link end-connections ex-hibit a key role in determining the system ductility, especially if bolted connections are selected for re-movable links. Experimental test results clearly highlight this aspect, emphasizing large over-strength of short links with respect to the first yield-ing shear and the consequent danger of connection failure. In particular, it has been shown that short
links, made with the European hot-rolled steel pro-files, may exhibit over-strength largely in excess of that suggested by current code provisions.BRBs revealed to provide a complete improvement of the structural performance, since they can in-crease not only the lateral stiffness and strength ca-pacity but also the displacement capacity of the structure. In fact, test results on two different types of �only steel� BRBs showed good ductility of this system. In particular, the second type of BRB (test No. 2) showed large ductility, being able to ade-quately restrain the core from buckling, though some additional improvements are required in the design. Anyway, the maximum story-drift angle reached during test No. 2 (5.6% of the story height) is appre-ciably larger than the maximum values commonly applied in the past testing of BRBs. Therefore, re-sults can be considered satisfactory and encouraging for the future.
6 REFERENCES
Della Corte G., D�Aniello M., Mazzolani F.M, 2005. Seismic upgrading of rc buildings using buckling restrained braces: full-scale experimental tests. Proceedings of the XX CTA Conference, Ischia (Italy)
Della Corte, G., Barecchia E., Mazzolani, F.M.. 2006a. Seismic Upgrading of RC buildings by FRP: full scale tests of a real structure. Journal of Materials in Civil Engineering, ASCE, vol.18, No.5, 659-669.
Della Corte G., D�Aniello M., Barecchia E., Mazzolani F.M. 2006b. Experimental tests and analysis of short links for ec-centric bracing of RC buildings. Engineering Structures (submitted for publication).
Engelhardt, M.D. & Popov, E.P. 1989. On Design of Eccentri-cally Braced Frames. Earthquake Spectra, vol.5, No.3, 495-511.
Eurocode 8, 2003. Design of structures for earthquake resis-tance�Part 1: General rules, seismic actions and rules for buildings.
Mazzolani, F.M. (Co-ord. and Ed.), 2006. Seismic upgrading of RC buildings by advanced techniques. The ILVA-IDEM research project. POLIMETRICA Publisher, Italy.
Mazzolani, F.M. Della Corte, G., Fiorino, L., Barecchia, E., 2007. Full-scale cyclic tests on a real masonry-infilled RC building for seismic upgrading. Proceedings of the COST C26 Workshop (Urban habitat construction under catastro-phic events), Prague, March 30-31.
Popov, E.P & Engelhardt, M.D. 1988. Seismic Eccentrically Braced Frames. Journal of Construction and Steel Re-search, (10) 321-354.
Ricles, J.M. & Popov, E.P. 1994. Inelastic Link Element for EBF Seismic Analysis. Journal of Structural Engineering, vol.120, No. 2, 441-463.
Tsai, K.C., Lai, J.W., Hwang, Y.C., Lin, S.L. & Weng, Y.T. 2004. Research and application of double-core buckling re-strained braces in Taiwan. Proceedings of the 13th World Conference on Earthquake Engineering, Canada.

229
1 INTRODUCTION
It has long been recognised that the effect of ma-sonry infill walls (MWs) on the seismic behaviour of reinforced concrete (RC) frame structures can be significant. In fact, in case of infill walls in tight contact with their confining frames on all four sides and being regularly distributed both in plan and ele-vation (�regular� infill walls), they can increase shear strength and stiffness up to about 10 times the values of the bare RC frame (Biondi et al. 2000). This effect plays an essential role especially in the case of framed structures designed mainly for verti-cal loads, when the horizontal seismic actions are mainly resisted by overstrength. On the contrary, when the infill walls present an �irregular� configu-ration (partial infill, irregular distribution in plan and/or in elevation) frame-to-infill interactions can lead to undesired structural performance, such as brittle shear failures of RC columns, torsional ef-fects, soft-story mechanisms.
Efforts have been made in the last few decades to better understand the behaviour of masonry-infill frames under horizontal monotonic and seismic ac-tions. However, the analysis of the lateral-load re-sponse of masonry-infill frames still remains a sub-ject that deserve further research, especially in the dynamic field of response. Difficulties derive from complex phenomena of the frame-infill interaction, depending upon numerous factors like mechanical and geometrical properties of frames and infill walls,
detailing, presence of openings, existing infill dam-age. In addition, there is large variability of me-chanical properties of masonry.
This paper presents and discusses both static and dynamic lateral-loading tests which have been car-ried out on a real two-story masonry-infilled RC frame building. The experimental activity is part of an EC-funded research project named PROHITECH (Mazzolani 2005, 2007). The investigated building was destined to demolition by competent Authority within the dismantling operation of the ILVA steel mill in Bagnoli (Naples, Italy), hence the excep-tional opportunity to carry out multiple tests, both in the elastic vibration range (forced-vibration dynamic tests) and in the inelastic range under quasi-static lateral loading (cyclic tests). In particular, the forced vibration tests were carried out on the original build-ing, for identifying the vibration frequencies and as-sociated equivalent viscous damping. Two �push-pull� inelastic tests were subsequently carried out: the first test was conducted on the original building and brought the structure up to a very strong damage state; the second test was carried out on the same building after repairing some damaged columns and re-constructing perimeter masonry walls, which were also strengthened with carbon fiber reinforced polymer (C-FRP) bars.
The paper gives a description of the experimental results obtained with the two inelastic cyclic tests. In addition, the results of some numerical models of the
Full-scale cyclic tests of a real masonry-infilled RC buildingfor seismic upgrading
F.M. Mazzolani, G. Della Corte, L. Fiorino & E. Barecchia University of Naples Federico II, Naples, Italy
ABSTRACT: Full-scale experimental tests on a real masonry-infilled reinforced concrete (RC) two-story frame building are presented and discussed in this paper. Two cyclic inelastic tests have been carried out. The first test was carried out on the building in its original condition, producing large damage in masonry infill walls, RC frame columns and the staircase structure. Then, some heavily-damaged RC frame columns have been repaired, while perimeter masonry panels have been re-constructed and strengthened using carbon fiber reinforced polymer (C-FRP) bars. The latter have been applied with the near surface mounting technique, placing them in the horizontal mortar joints. A numerical modelling activity has been also started, with the aim to verify suitability of current approaches. Notwithstanding some difficulties and engineering judgement needed when selecting modelling parameters for masonry infill panels, the numerical results resulted in good agreement with the experimental ones.

230
tested structures are shown and compared with the experimental one.
2 THE CASE STUDY BUILDING
The construction under investigation is an office building, built at the beginning of 1980s, with a rec-tangular plan layout (18.50 m x 12.00 m) and two floors (Fig. 1 and Fig. 2) having heights on the ground equal to 4.60 m and 8.95 m (Fig. 3), respec-tively for the first and second floor (measures taken from the top surface of the foundation beam to the top surfaces of first and second-story floor slabs).
The floors� structure is made of mixed cast-in-place reinforced concrete slabs and semi-hollow tile blocks (which serve only to lighten the floor struc-ture, a common option in Italy). Floors are sustained by reinforced concrete columns having a 300 mm x 300 mm square cross-section. Columns are con-nected along the structure perimeter (and in some places on the internal sides) by rectangular beams having a 600 mm depth and a variable width (from 150 mm to 250 mm).
Steel reinforcement of columns is constituted of 12 longitudinal ribbed bars with a diameter of 14 mm and transverse stirrups (ribbed bars) with a di-ameter of 8 mm spaced at about 200 mm along the column axis. Details of reinforcement of beams and floors� slabs are here omitted, because their influ-ence on the obtained test results is deemed to be minimal as respect to columns and walls detailing.
The perimeter masonry infill walls are faced-walls with the facing made of 100 mm thick semi-hollow tile blocks and backing made of 100 mm thick semi-hollow light-concrete blocks. The inter-nal partition walls are made of 100 mm thick semi-hollow light-concrete blocks. All masonry walls were built-up by means of site-made mixed cement lime and sand mortar.
The structural response is foreseen to be strongly affected by the presence of the staircase structure at the first level of the building. This staircase is made of two inclined RC slabs connecting the ground floor to the first floor, with an intermediate horizon-tal slab which is supported by a deep and short beam spanning 2 m between two columns at about the mid-point of the first-storey height (Fig. 3).
Structural details can be considered well repre-sentative of a non�seismic code of practice very common in the period of construction of the build-ing. In fact, transverse stirrups in beams and col-umns are too largely spaced and not well bended in-side the cross section. In addition, eccentricities in beam-to-column joints and scarce care of the re-sumption of concrete casting of columns have been observed.
OFFICE
OFFICE OFFICE
OFFICE
WC
AIRCONDITIONING
(a) Ground floor
OFFICE
OFFICE OFFICE
OFFICE
WC
AIRCONDITIONING
(b) Second (top) floor Figure 1. First- and second-floor functional layout of the build-ing.
(20x60)
(20x60)
(25x60)
200
200(+ 2.90m )
1850
92 16 92
(+ 5.10m )
455
400 425 420 455
270400 345
(a) Ground floor
400 3451850200 270 455
400 425 420 455
(15x60)
(15x60)
(b) Second (top) floor Figure 2. First- and second-floor technical sections.
(-1.00)
(+4.60)
(+0.20)(+0.00)
(+8.95)
Figure 3. Transverse section of the building.
N
N
N
N

231
3 EXPERIMENTAL TESTS
3.1 Experimental program Two experimental tests have been carried out: the first one on the building in its original conditions; the second one on the damaged building after repair-ing. In both cases, inelastic static tests under lateral loading conditions have been carried out by means of hydraulic jacks, alternately pushing and pulling the structure through selected target story displace-ments. The loading direction was established based on the local site conditions, namely depending upon the possibility and simplicity to erect a new structure serving the function to contrast the horizontal loads to be applied. Then, the North-South direction (Fig. 1) was selected as the most appropriate. At the same time, this loading direction is the most interesting one, because it involves the staircase structure to re-sist horizontal loads by axial forces combined with flexural actions, hence maximizing its �bracing� ef-fect.
3.2 Test setup and instrumentation
Test set up and instrumentation used in both tests are identical unless otherwise specified. The new react-ing structure was chosen to be a triangulated steel structure, which was purposely designed and erected (Fig. 4).
The estimated value of the maximum base shear to be applied was about 3000 kN. This force has been produced by six hydraulic jacks connected to six corresponding steel frames. The whole system has been made laterally stable by means of steel braces. The foundation of this light steel structure was obtained by means of existing steel containers which were filled with natural soil taken from the same site. This foundation had the function to con-trast uplifting effects, under the condition to provide a fully recyclable and cheap structural solution.
Figure 4. Reacting steel structure.
The total horizontal force, to be externally ap-plied, was distributed between the first and second floor of the building to be tested by using an ad hoc triangulated steel structure, which was fixed to the two floor slabs of the building. The load centre was fixed in such a way to get approximately an inverted triangular load distribution, which is a frequently adopted conventional load-distribution in theoretical pushover analyses of low-rise buildings.
The hydraulic jacks, purposely designed for this application, have a load capacity of 496 kN in com-pression, 264 kN in tension, and a displacement stroke of +/-30 cm. Note that the estimated maxi-mum total load to be applied (3000 kN) can only be reached (approximately) when jacks are in compres-sion (496 x 6 = 2976 kN), whilst a lower maximum force is applicable when jacks are in tension (264 x 6 = 1584 kN). This choice was obligated by budget limitations, but it was considered acceptable because severe strength degradation was expected under cy-clic loading after damaging the masonry infills.
Story displacements were monitored by using a diastimeter (Zeiss-Trimble S10) and reflecting prisms. Eight measuring points (i.e. eight reflecting prisms) were fixed in correspondence of the two building stories, four at the first floor and four at the second floor. These measuring points allow getting the average story translation and its rotation about the vertical axis.
3.3 Experimental response of the building in its original condition (1st test)
Figure 5 shows the base shear force vs. the first- and second-story average lateral displacements. The lat-ter have been computed as the average values among the four measuring points located at each floor.
After few (two) cycles of fully reversed loading in the quasi-elastic field of response, the structure has been pushed up to a maximum lateral roof dis-placement of about +20 cm (Fig. 5), which produced extensive damage in both masonry walls and RC frame columns at the first story of the structure. Fig-ure 6 shows the damage state visible from outside of the building, at the point of maximum story drift ra-tio, for the perimeter infill-walls having their plane parallel to the load direction. After reaching the +20 cm value of the maximum lateral displacement, the lateral force applied by the hydraulic jacks was fully reversed, now pulling the structure up to a lateral displacement of opposite sign equal to about -12 cm (Fig. 5). At this lateral displacement the structure damage at the first story was very extensive, with the out-of-plane collapse of almost all the masonry walls (both external claddings and internal parti-tions) having their original planes parallel to the loading direction. After reaching the point of mini-mum lateral displacement, the structure was again
Structure for distributing force
between floors (c)
Reactingframe (a)
Containers
Loading jacks (b)
(c)
(b)

232
pushed in the positive North-South direction and few more small loading cycles were necessary to be applied for approximately re-centering the structure in its original position.
-1600
-1200
-800
-400
0
400
800
1200
1600
2000
2400
-30 -25 -20 -15 -10 -5 0 5 10 15 20 25 30
Displacement (cm)
Base Shear (kN)
Average 1st floorAverage 2nd floor
1st
Figure 5. Base shear vs. average story displacements.
#1 #2
#3 #4 #5 #6 Figure 6. Damage of perimeter masonry walls at the point of maximum lateral displacement (+20 cm in Fig. 5).
The main failure modes observed in the infills were (Fig. 6): diagonal tension cracking in the infill #1; masonry crushing, sliding and diagonal tension cracking in the infill #2; diagonal tension cracking in the sub-panel #3; sliding and diagonal tension crack-ing in the sub-panels #4 and #5; diagonal tension cracking in the infill #6. Along with the masonry walls also the first-story frame columns and the staircase structure were severely damaged during the loading test. Damage to first-story columns was ex-tensive especially where strong interaction with the infill walls occurred. In fact, flexural-shear plastic hinges formed at column ends, with the strongest
shear effects occurring at the top end of columns lo-cated adjacent to the strongest masonry panels and for large inelastic displacements. The staircase struc-ture was actually the first structural element that started to be damaged and it was strongly damaged at the end of the test (Fig. 7).
Figure 7. Damage to the staircase structure at the point of minimum lateral displacement (-12 cm in Figure 5).
3.4 Repairing and strengthening After the first test, the building was partially re-paired. In particular, only some damaged elements of the building were repaired (perimeter columns) or rebuilt and strengthened (external masonry infill walls parallel to the loading direction), while the other elements (internal columns, partition walls and staircase structure) were not repaired nor substituted.
The perimeter masonry infill panels were rebuilt using materials having geometrical and mechanical properties as close as possible to those of the origi-nal elements. After the erection of the external ma-sonry infill panels, the facing walls were strength-ened by means of the fiber reinforced polymers (FRP) structural repointing technique. This tech-nique consists in placing composite FRP bars in the masonry bed joints, using a common mortar for bonding (Fig. 8). Materials used for the repointing were:- Sand-blasted carbon fiber rods (�MBarTM Joint� by Degussa Construction Chemical) having 1.5 mm tick and 5 mm wide rectangular cross-section and 1300 MPa characteristic tensile strength (ACI 440.1R-01 2002); - Pre-mixed, thixotropic, fiber reinforced, shrinkage compensated cement mortar (�Emaco® Formula Tixo� by Degussa Construction Chemical) having
Ovestside
Eastside

233
60 MPa minimum compressive strength (28 days) (EN 12190 2000).
The repairing and strengthening of the damaged end portions of the external columns was carried out by removing degraded concrete and reconstructing concrete covering with the �Emaco® Formula Tixo� pre-mixed cement mortar (Fig. 9).
(a) Grinding of joints (b) Installation of �MBarTM Joint� rods
(c) Application of �Emaco® Formula Tixo� Figure 8. FRP structural repointing: installation procedure.
(a) Damaged end column (b) Repaired end column Figure 9. Column repairing.
3.5 Experimental response of the repaired building (2nd test)
Figure 10 shows the response of the repaired build-ing in terms of base shear vs. average first- and sec-ond- story displacements. The repaired building has been subjected to a preliminary single cycle of fully reversed loading in the quasi-elastic field of re-sponse; then it has been pushed up to a maximum lateral roof displacement of about +30 cm (Fig. 10). Figure 11 shows the damage state of exterior façades parallel to the load direction for the lateral displace-ment of about +20 cm, which was the peak dis-placement reached during the 1st test on the original building. The prevalent failure modes were: sliding in the infills #1, #3, #4 and #5; masonry toe crushing and sliding in the infill #2; sliding and diagonal ten-sion cracking in the infill #6. Damage in the RC
frame was similar to what observed during the test on the original building.
-1600
-1200
-800
-400
0
400
800
1200
1600
2000
2400
-30 -25 -20 -15 -10 -5 0 5 10 15 20 25 30
Displacement (cm)
Base Shear (kN)
2nd test - average 1st floor2nd test - average 2nd floor1st test - average 1nd floor1st test - average 2nd floor
Figure 10. Base shear vs. average story displacements.
#1 #2
#3 #4 #5 #6 Figure 11. Damage of perimeter masonry walls at at a lateral displacement of +20 cm.
After reaching the value of the maximum lateral displacement (+29 cm), the lateral force was re-versed and the structure was pulled up to a lateral displacement of opposite sign equal to about -25 cm (Fig. 10). At this point the structure damage at the first story was very extensive, with the full or partial out-of-plane collapse of all the masonry walls paral-lel to the load direction. Also in this test, after reach-ing the point of minimum lateral displacement, the building was again pushed in the positive direction and, finally, small loading cycles were applied for re-centering the building in its original position.
Ovestside
Eastside

234
Comparing Figure 6 and Figure 11 it may be noted that repaired infill walls exhibited different failure modes, characterized by a reduced influence of diagonal tension cracking. In addition, it may be noted that the damage level in the repaired structure was smaller than that exhibited by the original build-ing at the same level of lateral displacement.
4 NUMERICAL MODELLING
4.1 General assumptions Numerical models of the structure under investiga-tion have been implemented in the non-linear finite element program SAP 2000 ver. 9.0.9. Beams and columns have been modelled as frame elements. The usual rigid-floor diaphragm constraint has been ap-plied for both the first and second story.
The staircase structure has been modelled using frame elements with a rectangular cross section hav-ing the width of 90 cm and the thickness of 15 cm.
Material properties of RC members have been as-sumed starting from both the results of some non-destructive tests (rebound index method) and knowl-edge of similar structures tested within a previous research project (Mazzolani 2006, Mazzolani et al. 2007). The average cylindrical concrete strength has been assumed equal to fc = 26.5 MPa and the con-crete Young modulus equal to Ec = 30000 MPa. The average yield strength of steel has been assumed equal to fy = 489 MPa.
Mechanical properties of masonry have been es-timated on the basis of some tests carried out on ma-sonry blocks taken from the original masonry walls after completing the first full-scale test of the build-ing. The Young modulus of clay blocks has been ac-cordingly fixed equal to Ecb = 4950 MPa, while for the light-concrete blocks a value equal to Elb = 1050 MPa has been selected. The Young modulus of clay blocks of the perimeter masonry infill panels, rebuilt after the first test, has been selected equal to Ecb = 5900 MPa while, for the light-concrete blocks has been assumed the same value previously chosen.
4.2 Modelling of RC members
Cracking of concrete along the member length has been simulated by reducing the gross moment of in-ertia of columns with a factor equal to 0.85, as sug-gested by FEMA 356 (2000).
Inertia of beams and floor-beams has not been re-duced because negligible cracking was observed during the test. A lumped plasticity model has been assumed for the columns and beams. The moment-curvature diagram of plastic hinges has been as-sumed elastic-perfectly plastic, with a maximum ro-tation capacity ( c) fixed according to the FEMA 356 (2000) indications (Figure 12).
The P- effects have been taken into account.
Figure 12. Plastic hinges� moment-curvature diagram.
4.3 Modelling of masonry infill walls
Masonry infill walls have been modelled according to two different suggestions given in Al-Chaar (2002) and in Mostafaei et al. (2004). The first mod-el is based on the equivalent strut approach, while the second model is based on the definition of an equivalent shear spring connecting two adjacent floors. In the first case the equivalent compressive masonry struts have been placed with joint eccen-tricities using rigid end offsets in the beam-to-column joints. Furthermore, the presence of the openings has been taken into account by means of reduction coefficients according to the FEMA 356 (2000). Figure 13 illustrates the load-displacement response assumed for the equivalent strut.
In Figure 13, Rstrut is the strength of the panel and it is a function of the mechanical properties of the materials and openings� dimensions.
In order to evaluate the displacement capacity (parameter dc in Figure 13), Table 7-9 given in FEMA 356 (2000) has been considered.
Figure 13. Constitutive law of equivalent struts.
In the case of numerical modelling according to Mostafei (2004), the constitutive law of the equiva-lent shear spring is represented by a multi-linear curve simulating three different behaviour states of the infill panels: a) the panel is not cracked and its behaviour is equivalent to that of cantilever beams; b) the panel is cracked and the behaviour is repre-sented by an equivalent strut; c) the equivalent strut, has reached the maximum strength and the degrad-ing phase starts. Figure 14 summarize the constitu-tive law of the equivalent shear spring, where Vy and
c

235
Vm represent the cracking and the maximum strength of the panel, respectively.
Figure 14. Constitutive law of equivalent struts.
In the case of FRP reinforced infill walls, the in-crease of shear strength and displacement capacity offered by FRP bars is evaluated according to the in-formation provided by Galati et al. (2005). The shear capacity of FRP reinforced masonry, can be evalu-ated as the sum of the contribution given by the ma-sonry walls and the FRP reinforcement.
In Figure 15, the FEM model of the infilled RC structure is illustrated.
Figure 15. 3D numerical model of masonry infilled RC frames.
4.4 Numerical response of the building in its original condition (1st test)
Figure 16 and Figure 17 show the numerical model indicating that failure is located in the columns and infill walls at the first floor, in accordance with the experimental results. In fact, plastic hinges formed at both the ends of the columns and diagonal crack-ing was predicted in the infill walls.
a)b)
Figure 16. Comparison between numerical and experimental collapse mechanism � east side.
a) b) Figure 17. Comparison between numerical and experimental collapse mechanism � west side.
Figure 18 illustrates the comparison between the numerical and experimental results in terms of base shear vs. roof displacement response. The numerical value of the peak strength is very close to the ex-perimental one, being only 1% smaller.
The stiffness coming from the numerical simula-tion is smaller then the experimental value. This re-sult may be essentially explained by to the fact that the diagonal strut mechanism actually starts after that the cracks spread in the infill walls; then, the behaviour of the masonry infilled RC structure, be-fore cracking, is similar to that of a cantilever, in which the infill and the RC frame act together as a unique structural element. Hence, the equivalent di-agonal strut approach cannot predict the pre-cracking response.
Figure 18 illustrates also the comparison between the experimental and numerical response of the in-filled RC structures with the numerical response of the bare RC frame structure without the partition walls. From this comparison the significant contri-bution of the partition walls to the system stiffness and strength can be clearly noted.
0
500
1000
1500
2000
2500
3000
0 2 4 6 8 10 12 14 16 18 20 22
1st floor Displacement (cm)
Base Shear (kN)
Infilled RC structure - Numerical results - Al ChaarInfilled RC structure - Numerical results - Mostafei et al.Infilled RC structure - Experimental resultsBare frame RC structure - Numerical results
a)
0
500
1000
1500
2000
2500
3000
0 2 4 6 8 10 12 14 16 18 20 22
2nd floor displacement (cm)
Base Shear (kN)
Infilled RC structure - Numerical results - Al ChaarInfilled RC structure - Numerical results - Mostafei et al.Infilled RC structure - Experimental resultsBare frame RC structure - Numerical results
b) Figure 18. Comparison between numerical and experimental results.

236
4.5 Numerical response of the repaired building (2nd test)
As previously explained, the 2nd test has been car-ried out on the building after repairing the perimeter RC columns and reconstructing the perimeter ma-sonry walls. Besides, perimeter walls were strength-ened with FRP bars placed in the horizontal mortar joints. No reparation neither reconstruction of inter-nal elements was carried out (in particular for the staircase structure). Therefore, in the numerical model of 2nd experimental test, all the internal equivalent diagonal struts and the frame elements simulating the staircase structure have been elimi-nated. The numerical models of diagonal struts for the perimeter walls have been modified for taking into account the presence of FRP bars.
Results of the numerical response are summa-rized in Figure 19 illustrating the base shear vs. 1st
and 2nd story average displacements. A pretty good agreement between the experimental response and the numerical simulation can be observed.
0
200
400
600
800
1000
1200
0 5 10 15 20 25 30
1st floor displacement (cm)
Base Shear (kN)
Experimental resultsNumerical results
0
200
400
600
800
1000
1200
0 5 10 15 20 25 30
2nd floor displacement (cm)
Base Shear (kN)
Experimental resultsNumerical results
Figure 19. Numerical simulation of the upgraded structure re-sponse.
5 CONCLUSIONS AND FURTHER DEVELOPMENTS
Full-scale cyclic inelastic tests on a real masonry-infilled RC frame building have been performed, al-lowing characterization of its seismic response.
The FRP structural repointing technique showed good performance, favouring the formation of slid-ing shear failure modes in substitution of diagonal tension cracking in the masonry infill walls. The
sliding shear failure is more favourable from the seismic point of view because it is characterised by some additional pseudo-ductility.
Numerical models have also been implemented using available technical information. After some calibration of the numerical values of material prop-erties has been carried out, numerical results showed good agreement with the experimental ones.
By means of numerical models it has been possi-ble evaluate the contribution in strength of the stair-case is about 40% of the peak strength of the ma-sonry infilled RC structure.
However, several issues could be raised about the appropriate modelling assumptions when dealing with this type of structure. In particular, special care is required in selecting appropriate values of ma-sonry model parameters.
6 REFERENCES
ACI (2002). Guide for the Design and Construction of Con-crete Reinforced with FRP Bars, American Concrete Insti-tute, Committee 440.
Al-Chaar G., (2002); Evaluating Strength and Stiffness of Un-reinforced Masonry Infill Structures - US Army Corps of Engineers � Engineer Research and Development Center.
Biondi S., Colangelo F., Nuti C. (2000). Seimic response of masonry-infilled RC frames, CNR - Gruppo Nazionale per la Difesa dai Terremoti, Rome (in Italian).
EN 12190 (2000). Products and systems for the protection and repair of concrete structures - Test methods - Determination of compressive strength of repair mortar. European Com-mittee for Standardization, Bruxelles
FEMA 356, (2000) � Federal Emergency Management Agency, Prestandard and commentary for the seismic reha-bilitation of buildings, Washington D.C..
Galati, N., Garbin, E., Nanni, A., (2005); Design guidelines for the strengthening of unreinforced masonry structures using fiber reinforced polymers (FRP) systems � Final Draft Re-port. University of Missoury Rolla prepared for BONDO & TECHFAB.
Mazzolani F.M. (2005). Earthquake protection of historical buildings by reversible mixed technologies: the PROHI-TECH project. Proceedings of the International Conference to mark 40 years of IZIIS, Earthquake Engineering in 21st Century (EE-21st), Skopje-Ohrid, 27 August � 1 Septem-ber.
Mazzolani, F.M. (2006). Seismic upgrading of RC buildings by advanced techniques � The ILVA-IDEM Research Pro-ject. Polimerica Publisher, Italy.
Mazzolani, F.M. (2007). Earthquake protection of historical buildings. Proceedings of the COST C26 Workshop-Urban Habitat Constructions under Catastrophic Events, Prague, March 30-31.
Mazzolani, F.M., Della Corte, G., Barecchia, E., D�Aniello, M. (2007). Experimental tests on seismic upgrading techniques for RC buildings. Proceedings of the COST C26 Work-shop-Urban Habitat Constructions under Catastrophic Events, Praha, March 30-31.
Mostafaei H. & Kabeyasawa T., (2004). 3D non linear respose simulation of Bam telephone center RC building to the 2003 Bam earthquake considering the effect of masonry in-fill walls�, Earthquake Research Institute-University of To-kyo.

237
1 INTRODUCTORY REMARKS
Multi-storey structures must be able to absorb both wind and earthquake actions by means of ap-propriate lateral load resisting systems. The selec-tion of the most effective lateral bracing scheme is determined from several factors, such as architec-tural requirements (floor space and building aes-thetic) and economical considerations. The lateral load resisting systems commonly used in tall build-ings are moment resisting frames, braced frames, tu-bular systems and shear walls. For the past few dec-ades, a big interest has been devoted to the latter system in comparison to the other bracing devices. Therefore, the opportunity to improve the under-standing of their behaviour under both theoretical and experimental point of views has been felt.
Shear walls are made of a series of plates, in-stalled vertically into the buildings, which can be idealised as cantilevers supported by foundations (Schumacher et al., 1997). Typically, they form a core surrounding a central service area in multi-storey buildings, it being able to catalyse the effects of horizontal forces which are transferred through the floors. Among several types of possible shear wall systems, metal plate shear walls (MPSWs) are examined in this paper, they presenting important constructive advantages. In fact, compared to tradi-tional RC walls, they have both a reduced mass and a smaller thickness, which allow to reduce the loads to transferred to the foundations and to have a more
feasible building space. As a consequence, a signifi-cant speed of erection of the construction may be achieved.
MPSWs consist of a vertical series of rectangular bays which are formed by columns intersecting beams at the floor levels and are filled by metal pan-els (infill plates). Beam-to-column connections can be either simple or moment-resisting and the panels can be either stiffened or unstiffened. While stiff-ened infill plates have longitudinal and transversal stiffeners connected to the surface by means of ei-ther welded or bolted connections in order to prevent buckling phenomena in the elastic field (compact shear panels), unstiffened shear panels present insta-bility for low values of the applied lateral load and, therefore, rely on their post-buckling behaviour de-termined through the activation of a resisting diago-nal tension field mechanism (slender shear panels). Both of them respond to seismic loads with a high stiffness, stable load vs. displacement behaviour and a significant energy dissipative capacity, which is more relevant when compact panels are of concern.
The high performances exhibited by MPSWs have been investigated in the present paper through three different activities performed on both compact and slender shear panels:
1) experimental-numerical analysis of four dif-ferent type of multi-stiffened pure aluminium shear panels;
2) experimental tests on bracing type stiffened pure aluminium shear panels;
Shear panels for seismic upgrading of new and existing structures
F. M. Mazzolani University of Naples Federico II, Naples, Italy
G. De Matteis University of Chieti/Pescara G. d�Annunzio, Pescara, Italy
S. Panico & A. Formisano University of Naples Federico II, Naples, Italy
G. Brando University of Chieti/Pescara G. d�Annunzio, Pescara, Italy
ABSTRACT: In the past few decades, metal plate shear walls (MPSWs), used as either stiffened or un-stiffened thin panels, have been introduced as primary lateral load resisting systems in several buildings thanks to their fundamental prerequisites, such as high stiffness and large deformation capacity. Aiming at emphasizing the potential contribution of MPSWs on the seismic performances of new and existing struc-tures, an overview about the research activity developed in cooperation between the University of Naples �Federico II� and the University of Chieti/Pescara is provided in current paper. Many experimental and nu-merical results have been achieved, highlighting the effectiveness of both steel and aluminium shear panels to be adopted as passive protection devices of steel and RC moment resisting frames.

238
3) theoretical-numerical-experimental study on steel and aluminium shear panels for seismic protection of existing RC buildings.
In the first research activity, both experimental tests and numerical simulations on full bay type pure aluminium shear panels equipped with either welded or bolted ribs have been carried out, emphasizing the effective role of shear panels to be adopted as pas-sive control devices for seismic protection of steel structures. The second topic has been addressed to investigate the behaviour of stiffened pure alumin-ium shear panels, conformed according to the brac-ing-type scheme, as dissipative systems of moment resisting steel frames by means of the execution of experimental cyclic tests. In the third research activ-ity, theoretical and numerical models of metal shear panels have been implemented aiming at performing full-scale experimental tests on an existing gravity-load designed RC building.
In the present paper, the main results achieved by the above activities are summarised, showing that the correct use of metal shear panels can actually improve the seismic response of both steel and RC framed buildings.
2 PURE ALUMINIUM DISSIPATIVE SHEAR PANELS
2.1 General
The first and second tasks of the aforementioned re-search activity concern the numerical and experi-mental investigation on stiffened aluminium shear panels. Two different typologies of shear panels have been considered, namely full bay type and bracing type. In the first case, tested shear panels have a dimension of 1000x1500x5 mm and are in-tended to be used as an infill of the whole bay of the primary framed structure. Moreover, different types of ribs (either welded or bolted) for the aluminium plate have been investigated. In the second case, tested specimens have a smaller dimension and shear panels have to be intended as a plate to be allocated within a bracing system.
A key aspect of the study is represented by the employment of the pure aluminium (AW1054A) as base material, which is an innovative material for civil engineering applications. In fact, this material could be very advantageous to fabricate dissipative shear panels, due to the very low yielding stress point (about 20 MPa)¸ high hardening ratio (about 4) and large ductility (over 40%) (De Matteis et al., 2003). For the sake of comparison, full-bay type shear panels have been fabricated also by using a different material, namely the AW5154A, which is commonly adopted in the field of aluminium struc-tures, it being easily available on the market. In both
cases, in order to improve the mechanical features of the material, proper heat treatments have been ap-plied. In Figure 1, the stress-strain curves for the adopted materials before and after the heat treatment are depicted. It is worth noticing that the same heat treatment produced different results on two alloys. In fact, the conventional yield strength f02 of heat treated AW 5154A alloy is halved while its ultimate strain u remained almost unchanged owing to the higher content of allowing elements. On the other hand, the aluminium alloy AW 1050A appears more suitable for the application under consideration. In fact, it is characterised by a higher value of the E/f02ratio, which means higher attitude to undergo plastic deformation without incurring into buckling phe-nomena.
AW 1050A ALUMINIUM ALLOY
f02=115 MPa
fu=69 MPa
f02=20 MPa
0
20
40
60
80
100
120
140
0% 10% 20% 30% 40% 50% 60%
strain
Not heat treated aluminiumHeat treated aluminium
AW 5154A ALUMINIUM ALLOY
f02=80 MPa
fu=200 MPaf02=180 MPa
fu=250 MPa
0
50
100
150
200
250
300
0% 5% 10% 15% 20%
strain
Heat treated aluminium
Not heat treated aluminium
Figure 1. Mechanical behaviour of the adopted alloys before and after the applied heat treatment process.
The cyclic response of pure aluminium has been also investigated by means of specific tensile-compression cyclic tests carried out on specimens equipped with a steel �jacket� able to inhibit out-of-plane deformations due to buckling (Figure 2a).
BUCKLING INHIBITED SPECIMEN
-60
-40
-20
0
20
40
60
-20 -10 0 10 20DISPLACEMENT [mm]
Figure 2. Buckling inhibited pure aluminium specimen: (a) tested specimen; (b) hysteretic behaviour.
a) b)

239
The main purposes of these tests were (1) to de-fine the behaviour both in compression and in ten-sion, (2) to characterise the hysteretic behaviour and (3) to verify the hardening features. The obtained re-sults have shown a good dissipative behaviour of the material, characterized by full hysteretic cycles, a substantial iso-resistance for each displacement level and the existence of a isotropic hardening compo-nent (Figure 2b).
2.2 Activity on full bay type shear panels
The structural response of pure aluminium stiffened shear panels has been investigated by performing cyclic tests under shear on six different panel con-figurations. For the basic configurations (shear pan-els type B, F and G), stiffeners made of longitudinal and transversal ribs with a rectangular cross section (depth of 60 mm and thickness of 5 mm) have been used. Such stiffeners were connected to the base shear plate by means of welding. In addition, steel channel shaped stiffeners, connected to the basic aluminium plate by means of bolted joints, have been considered (shear panel H). Finally, in order to assess the influence of the mechanical properties of the applied aluminium alloy, panel type B and panel type F have been fabricated considering both the AW 1050A and the AW 5154A alloys. Tested panel configurations are shown in Figure 3.
panel type B (b/t=100) panel type F (b/t=50)
panel type G (b/t=50-25) panel type H (b/t=50)
Figure 3. Geometrical configuration of tested specimens.
The results of the experimental tests have been provided in terms of cyclic response, determined as relationship between the applied force (F) and the corresponding shear deformation ( ). The response of tested specimens has been also characterised and compared in terms of maximum hardening ratio( max/ 02 with 02=f02/ 3 ), secant shear stiffness (Gsec) and equivalent viscous damping factor ( eq),
(De Matteis et al., 2006a), consistently to the defini-tions given in Figure 4. For the sake of example, in Figure 4-a the eq for different deformation levels evaluated for tested panels is provided. The exami-nation of test results allows the identification of two different classes of shear panels according to the adopted base material, namely dissipative shear pan-els (AW 1050A) and stiffening shear panels (AW 5154A). Based on the obtained results, tested speci-mens pointed out a very high ductility and a good structural performance in terms of strength, stiffness and dissipative capacity, proving that the considered systems can be usefully adopted as passive seismic protection device.
0%
5%
10%
15%
20%
25%
30%
35%
0% 2% 4% 6% 8% 10% 12% 14% 16% 18% 20% 22% 24% 26% 28%
shear strain
AW 1050A-Panel type BAW 1050A-Panel type FAW 5154A-Panel type BAW 5154A-Panel type FAW 1050A-Panel type GAW 1050A-Panel type H
sFG
EE
sFE
S
Deq
S
sec
41
81
Figure 4. Comparison among tested panels (interpolation curves) in terms of equivalent viscous damping ratio (a); defi-nition of parameters (b).
In order to interpret the monotonic and hysteretic behaviour of the tested systems, sophisticated FEM models has been set up (Formisano et al., 2006). For the sake of example, the comparison between the numerical simulation and the experimental results is provided in Figure 5 for panel type B (AW 1050A).
-220
-180
-140
-100
-60
-20
20
60
100
140
180
220
-100 -80 -60 -40 -20 0 20 40 60 80 100
shear displacement [mm]
numerica l sim ulation data
experimental data
Figure 5. Numerical�experimental comparison for AW1050A panels type B.
a)
b)

240
It is clearly evident as the proposed model is able to interpret correctly all the main behavioural phe-nomena of tested specimens. Therefore, the FEM model has been applied as a sort of virtual labora-tory to define the main geometrical and mechanical parameters influencing the global response of the simulated systems. In particular, a parametric study has been performed by varying the rib depth, deter-mining the optimal geometrical configurations in terms of mechanical performance and fabrication costs.
2.3 Activity on bracing type pure aluminium shear panels
Infill bracing type pure aluminium shear panels (BTPASPs) have been also proposed as an alterna-tive and attractive solution for the passive protec-tion of new and existing structures (Fig.5) under low intensity seismic events. In fact, on the basis of the aforementioned obtained results, full bay aluminium shear panels showed a good performance, in terms of both energy dissipation and damping capability, for medium-large lateral displacements, while some slipping phenomena were observed for small inter-story drift levels. Thus, a rational reducing of the side length, so to establish a favourable ratio be-tween the interstorey drift displacement of the rele-vant primary structure and the shear deformations of panels, has been implemented.
Figure 5. Steel frames equipped with BTPASP.
A wide experimental campaign on diagonally loaded BTPASPs, involving prototypes with differ-ent aspect ratios, is currently in progress, aiming at assessing the influence of the main behavioural pa-rameters on the response of the system. Tested shear panels are characterized by global dimensions of 500 by 500 mm and a thickness of 5 mm. They are equipped with welded rectangular-shaped ribs, equally placed on the two faces of the panels, whose depth is 60 mm and which are made of the same ma-terial and thickness of the basic plates. The testing apparatus is composed by a pin jointed steel frame-work and linked to the panel edges by means of tightened steel bolts. Tested specimens are subjected to diagonal cyclic forces, according to the displace-
ment history shown in Figure 6, where the ordinate indicates the applied diagonal displacement.
-80
-60
-40
-20
0
20
40
60
80
0 1000 2000 3000 4000Time [s]
Figure 6. The displacement history on the tested specimens.
The cyclic response of two configurations, char-acterized by b/t value equal to 100 (�type 1�) and 50 (�type 2�), respectively (see Figure 7), has been al-ready critically studied and previously published by the Authors (De Matteis et al., 2007). The obtained results showed a good hysteretic performance which was influenced by different collapse modes depend-ing on the applied stiffener configuration. In fact, the internal rib system acts as a sort of framework axi-ally stressed, providing a resistant contribution to the panel and, therefore, a larger stress in the con-necting system, which usually represents the weak-est component of the studied devices.
a) b) Figure 7. BTPASP configurations �type 1� (a) and �type 2� (b).
Two additional bracing type pure aluminium shear panels, namely �type 3� and �type 4�, which are dealt in the current paper, have been subse-quently tested (see Figure 8). They are characterized by a b/t ration equal to 33 (BTPASP �type 3�) and 25 (BTPASP �type 4�).
a) b) Figure 8. BTPASP configurations �type 3� (a) and �type 4� (b).

241
In Figure 9, the obtained hysteretic cycles for both tested specimens �type 3� and �type 4�, to-gether with the relevant collapse modes are pro-vided, while in Figure 10, consistently with the defi-nitions given in Figure 4, the cumulated dissipated energy and the equivalent viscous damping ratio are illustrated. The obtained results clearly emphasize that both panel configurations provide a good hys-teretic performance, with fat hysteretic cycles also for high deformation levels. It is worth noticing the higher values of the equivalent viscous damping fac-tor (about 50%) was achieved for large shear strains.
BRACING TYPE PURE ALUMINIUM SHEAR PANELS "type 3"
-300-250-200-150-100
-500
50100150200250300
-80 -60 -40 -20 0 20 40 60 80Displacement [mm] a)
BRACING TYPE PURE ALUMINIUM SHEAR PANELS "type 4"
-300-250-200-150-100
-500
50100150200250300
-80 -60 -40 -20 0 20 40 60 80Displacement [mm] b)
c) d) Figure 9. Hysteretic cycles: (a) shear panel �type 3�; (b) shear panel �type 4�. Collapse modes: (c) shear panel �type 3�; (d) shear panel �type 4�.
It has to be observed also that the two tested BTPASPs provided substantially the same dissipa-tive behaviour even though the configuration �type 4� exhibited a larger peak strength. On the contrary, it presents a lower ductility due to a premature col-lapse of the connection system, which is also high-lighted by a quick reduction of the equivalent vis-cous damping factor starting from a diagonal displacement value of 50 mm.
BRACING TYPE PURE ALUMINIUM SHEAR PANELS-"type 3" vs."type 4"
0
50
100
150
200
250
Shear Strain [%]
BTPASP "type 3"BTPASP "type 4"
a)
BRACING TYPE PURE ALUMINIUM SHEAR PANELS-"type 3" vs. "type 4"
0.00
1.00
2.00
3.00
4.00
5.00
6.00
Shear Strain [%]
BTPASP "type 3"BTPASP "type 4"
b)
BRACING TYPE PURE ALUMINIUM SHEAR PANELS- "type 3" vs. "type 4"
05
101520253035404550
Shear Strain [%]
BTPASP "type 3"BTPASP "type 4"
c)
BRACING TYPE PURE ALUMINIUM SHEAR PANELS- "type 3" vs. "type 4"
0.000.050.100.150.200.250.300.350.400.450.500.550.60
Shear Strain [%]
BTPASP "type 3"BTPASP "type 4"
d)Figure 10. Comparison of results: (a) Cumulated dissipated en-ergy; (b) Hardening ratio; (c) Secant Stiffness; (d) Equivalent viscous damping factor.
Hence, shear panel �type 3� seems to represent the optimum configuration as a good compromise be-tween reduced fabrication costs and good hysteretic behaviour.

242
3 RETROFITTING OF EXISTING RC STRUCTURES
3.1 General
The possibility to use metal shear panels for seismic retrofitting of existing buildings has been evaluated within the ILVA-IDEM research project, which was based on experimental tests carried out on a full-scale gravity-load designed RC building in order to evaluate different innovative seismic retrofitting techniques (Mazzolani, 2006). The original RC building was located in the Bagnoli district of Naples, where the ancient industrial site of Italsider was realised. It was a two-storey building erected in the seventies, serving as an office building. To per-form the testing activity, it was preliminarily de-prived of internal and external walls (Figure 11a) and then cut at both floors in order to obtain six separate structural modules (Figure 11b).
In the current paper, the attention is paid to the use of both aluminium alloy and steel shear panels employed as a retrofitting system of the sub-structure highlighted in Figure 11a. It is worth not-ing that the considered RC sub-structure had been previously tested in transversal direction for evaluat-ing the effectiveness of SMA braces (Cardone et al. 2004). Therefore, it was affected by serious damages at the ends of columns due to both the presence of cracks and the steel bars instability. After repairing the existing cracks by means of epoxy-resin injec-tions, in order to avoid the transversal sway of the first floor when the structure is loaded in the longi-tudinal direction, a couple of transversal X-braces was introduced (Figure 12a). The contiguous RC sub-structure, placed on the right side of the one un-der examination, was used as retaining structure by inserting adequate steel V shaped bracings (Figure 12b).
Figure 11. The original RC building after the partition removal (a) and subdivision in separate modules (b).
a)
b)Figure 12. X (a) and V (b) bracings as stiffening systems of the bare RC modules.
Hence, the bare RC structure has been preliminar-ily tested in longitudinal direction, without reaching the collapse of the system, by means of a prelimi-nary cyclic test, by using two hydraulic jacks able to apply at the first floor of the structure a total force of 300 kN.
The obtained test results provided useful informa-tion on the ultimate strength and the exact lateral stiffness levels offered by the bare RC structure, as it is evident from Figure 13, where the envelope curve of the cyclic test is depicted. Such findings have been used for finalizing the retrofitting design of the sub-structure, according to prescribed prerequisites that should be guaranteed by the combined system (RC frame and metal shear panels).
-50
-40
-30
-20
-10
0
10
20
30
40
50
-20 -15 -10 -5 0 5 10 15 20
First floor displacement (mm)
Figure 13. Results of the cyclic test performed on the bare RC sub-structure under study.
The retrofitting design has been developed in the framework of the performance based design meth-odology according to the procedures of the ATC-40 guidelines (1996). Therefore, the required strength
a)
b)

243
and stiffness contribution provided by shear panels have been defined, determining values of 270 kN and 15 kNmm-1, respectively (Formisano et al., 2006). Subsequently, on the basis of existing ana-lytic simplified formulations (Sabouri-Ghomi et al., 2003), the shear panel configuration has been de-fined, obtaining a dimension of b = 600 mm and d = 2400 mm, with a thickness t of 1.15 mm and 5 mm in case of base material DX56D steel and EN-AW 1050 aluminium alloy, respectively (Figure 14).
0
50
100
150
200
250
300
350
400
0% 5% 10% 15% 20% 25% 30% 35% 40% 45% 50%
strain
stress (N/mm2) DX56D steelEN-AW 1050A aluminium alloy
Figure 14. Mechanical characteristics of materials used for shear panels.
In order to guarantee a b/d ratio lower than 0.8, which is indicated as the lower bound of the aspect ratio below which the development of a correct plas-tic mechanism is not achieved, the panel has been subdivided into six parts by means of the insertion of appropriate transversal rectangular stiffeners hav-ing thickness of 4 mm. Therefore, the choice of the better connection system between sheeting and fish-plates has been carried out on the basis of ad hoc experimental tests (Formisano et al., 2007).
Also, a refined finite element model of the se-lected panels has been implemented by ABAQUS non linear software in order to predict correctly their performance under lateral loads (Figure 15a). Fur-thermore, in order to confirm the validity of the pro-posed design solution and for evaluating the possible relative interaction problems between the RC struc-ture and the added devices, a global analysis of the retrofitted structure, in which the shear plates have been modelled according to the �strip model" theory, has been performed by means of the SAP 2000 cal-culation program (Figure 15b) (De Matteis et al., 2006b). Then, on the basis of the above numerical simulation, the design of the reinforcing intervention on the bare RC structure has been carried out, it be-ing based on the strengthening of both the first level beams and the foundation beams by means of cou-pled UPN 220 profiles, reinforcing plates and threaded M16 bars (Figure 16). Finally, experimen-tal cyclic tests on the bare RC structure upgraded with steel and aluminium shear panels have been performed.
Figure 15. Final stress and deformation state of aluminium shear panels (a) and numerical model of the structure (b).
Figure 16. Reinforcing interventions on the original RC struc-ture.
In both cases, at the end of the test, a full plastic behaviour of single panel portions occurred, as shown in Figure 17, where the comparison with the initial plate configuration is also illustrated.
Figure 17. Initial and final deformed shape of steel (a) and alu-minium (b) shear panels.
The comparison between the responses of the ret-rofitted structures and the bare structure in terms of envelope curves of the experimental tests is pro-vided in Figure 18. A significant improvement of strength (10 and 11.5 times with steel and alumin-ium panels, respectively), initial stiffness (2.5 and 2 times with steel and aluminium panels, respectively) and ductile capacity (inter-storey drift greater than 3.5% and 6.5% when steel and aluminium panels have been used, respectively) is noticed.
a) b)
a) b)

244
0
40
80
120
160
200
240
280
320
360
0 20 40 60 80 100 120 140 160 180First floor displacement (mm)
Bare RC structure
Retrofitted structure (steel panels)
Retrofitted structure (aluminium panels)
Figure 18. Comparison between the retrofitted structures re-sponse and the bare RC structure one.
Based on the above highlights, the performed ex-perimental results shown that steel shear panels can be considered as a profitable system to for improv-ing the lateral load resistance of existing RC struc-tures, whereas the pure aluminium shear panels can be also employed to improve the ductility features and the dissipative capacity of the primary structure.
4 CONCLUSIONS
In the present paper, the use of metal shear panels for the seismic design of new and existing buildings has been investigated, based on the results coming from large research projects recently developed in cooperation between the University of Naples and the University of Chieti/Pescara. In particular, some experimental tests on full bay and bracing type pure aluminium shear panels have been presented, show-ing as the proposed devices may be adopted as an ef-ficient system for passive seismic protection of mo-ment resisting steel frames. In fact, pure aluminium shear panels possess a large ductility and a good hysteretic performance. In addition, they are charac-terised by a large lateral stiffness, which can be prof-itably employed to control the lateral displacement demand of steel frames. Also, a careful study on the capacity of steel and aluminium shear panels to up-grade existing RC building has been pursued. A de-tailed design methodology has been set up and ap-plied to a real RC frame, performing a full scale test under cyclic loading. The obtained results emphasise that shear metals panels actually represent a very at-tractive strategy to reduce the seismic vulnerability of existing structures.
ACKNOWLEDGMENTS
Some studies presented in this paper have been de-veloped in the framework of theme n.5 �Develop-ment of innovative approaches for the design of steel and composite structures� of the Italian research project RELUIS.
5 REFERENCES
ATC-40 1996. Seismic Evaluation and Retrofit of Concrete Buildings, Applied Technology Council, Report n. SSC 96-01.
Cardone, D., Dolce, M., Marnetto, R., Nigro, D., Ponzo, F.C., Santarsiero, G., Mucciarelli, M. 2004. Experimental Static and Dynamic Response of a Real R/C Frame Upgraded with Sma Re-Centering and Dissipating Braces. Proc. of the 13th World Conference on Earthquake Engineering, August, Vancouver, Canada, August 1-6, CD ROM.
De Matteis, G., Mazzolani, F.M., Panico, S. 2003. Pure alu-minium shear panels as passive control system for seismic protection of steel moment resisting frames. Proc. of the 4th
STESSA Conference (Behaviour of Steel Structures in Seismic Areas), Naples, Italy, pp. 599-607.
De Matteis, G., Formisano, A., Mazzolani, F.M., Panico, S. 2005. Design of dissipative aluminium shear panels: Com-parison between numerical analysis and experimental re-sults. Proc. of Eurosteel 2005- 4th Conference on steel and composite structures, Maastricht, The Netherlands.
De Matteis, G., Panico, S., Mazzolani, F.M. 2006a. Experimental tests on stiffened aluminium shear panels. Proc. of XI International Conference on Metal Structures, Rzeszów, Poland.
De Matteis, G., Formisano, A., Panico, S., Calderoni, B., Mazzolani, F.M. 2006b. Metal shear panels. Seismic up-grading of RC buildings by advanced techniques � The ILVA-IDEM Research Project. Mazzolani, F. M. co-ordinator & editor, Polimetrica International Scientific Publisher, Monza, pp. 361-449.
De Matteis, G., Brando, G., Formisano, A., Panico, S., Mazzolani, F.M. 2007. Metal shear panels for seismic protection of frame structures. Proc. of the �Workshop ReLuis- Materiali ed Approcci Innovativi per il Progetto in Zona Sismica e la Mitigazione della Vulnerabilità delle Strutture�- University of Salerno � Consorzio ReLUIS, 12-13 February.
Formisano, A., Mazzolani, F.M., Brando, G., De Matteis, G. 2006a. �Numerical evaluation of the hysteretic performance of pure aluminium shear panels�. Proc. of the 5th Interna-tional Conference STESSA �06, Balkema, 211-217, Yoko-hama, Japan.
Formisano, A., De Matteis, G., Panico, S., Calderoni, B., Mazzolani, F.M. 2006b. Full-scale test on existing RC frame reinforced with slender shear steel plates. Proc. of the 5th Int. Conference on �Behaviour of Steel Structures in Seismic Areas� (STESSA �06), Yokohama, Japan, August 14-17, pp. 827-834.
Formisano, A., De Matteis, G., Mazzolani, F.M. 2007. Ex-perimental study on the structural behaviour of steel sheet-ing connections. Proc. of the 6th Int. Conference on Steel and Aluminium Structures (ICSAS �07), Oxford, 24-27 July (accepted for publication).
Höglund T., 1997. Shear buckling resistance of steel and alu-minium plate girders, Thin-Walled Structures Vol.29 (1-4), pp 13-30.
Mazzolani, F.M. (co-ordinator & editor) 2006. Seismic upgrad-ing of RC buildings by advanced techniques � The ILVA-IDEM Research Project. Polimetrica International Scientific Publisher, Monza.
Sabouri-Ghomi, S., Ventura, C., Kharrazi, M.H.K. 2003. Shear analysis and design of ductile steel plate walls. Proc. of the 4th Int. Conference on the �Behaviour of Steel Structures in Seismic Areas� (STESSA �03), Naples, Italy, June 9-12, pp. 189-195.
Schumacher, A., Grondin, G. Y., Kulak G. L. 1997. Connec-tion of infill panels in steel plate shear walls. Structural En-gineering Report No. 217, University of Alberta, Canada.

245
1 INTRODUCTION
Cold formed steel (CFS) housing are highly com-petitive dry constructions thanks to their structural and environmental performance. The high strength to weight ratio reduces the seismic loads and assures high seismic performance. Moreover the lightness of the construction elements allows economy in trans-portation and handling, quick and simple erection and installation and lower foundation costs (Lan-dolfo, 2005). The basic construction system realized assembling on site light gauge steel members, sheathing panels and furnishing elements replaced wood constructions in many countries, as America, Finland, and Australia, that were characterized by wood housing. (Fig. 1)
Nowadays, even if the high seismic performance of these construction systems are known, little specific guidance for seismic design exists. This paper aims to present the seismic design of an one family two stories house, that has been developed taking into account the results of experimental and numerical studies carried out at University of Naples Federico II. Particularly, a design chart that allow defining the seismic design of all the wall components (studs, hold-down anchors, shear anchors and sheathing�to-frame connections) of a CFS housing will be presented.
Figure 1: London - Lingham Court
Seismic design of cold-formed steel housing: a case study
O. Iuorio, R. Landolfo & L. Fiorino University of Naples Federico II, Italy
ABSTRACT: The demand of low-cost houses with high performances, that always characterised the field of residential constructions, finds an interesting answer in the cold-formed steel housing. In this paper the tech-nological and structural features of these constructional systems are discussed together with a brief overview on some research activity recently developed in Italy on this topic. Moreover, a study case concerning the de-sign of a cold-formed stick-built one-family house in seismic zone is illustrated. The architectural design complies with several concepts such as flexibility, dry construction and high performances. The seismic de-sign is based on the results of a parametric study performed trough an analytical method that consents to pre-dict the nonlinear shear vs. top wall displacement relationship for sheathed cold-formed shear walls on the basis of screw connection test response.

246
2 SEISMIC DESIGN
2.1 GeneralThe seismic design of a CFS housing can be carried out using two different approaches: the �all steel de-sign� and the �sheathing braced design�. The first one considers only the steel members as load bear-ing elements without take into account the influence of sheathing panels. In this case, the introduction of X or K bracings in floors and walls are required to assure load bearing capacity. While the �sheathing braced design� takes into account the influence of panels and the systems composed by sheathing pan-els, fasteners and steel members can assure a good strength so that floors and walls act as in plan dia-phragms. When a CFS house is designed taking into account the interaction between steel frame, sheath-ings and frame-to-sheathing connections, the shear walls represent the lateral force resisting system.
The presence of openings (doors or windows) can be considered during the wall design through two possible methods: the �segment� and the �perforated shear wall� method. The segment method is a tradi-tional shear wall design methodology, that considers only the wall segments without openings as shear re-sistant elements. In this case the shear force, acting on the top of the segment, produces an overturning moment that have to be balanced with the introduc-tion of hold-down anchors at each end of bearing wall segments (Fig.2a).
The �perforated shear wall� method considers the fully-sheathed wall as resistant element, reducing the wall resistance on the basis of opening size. This methodology requires the introduction of a minor number of hold down anchors, that have to be insert only at the two wall ends, with a consequent costs diminution (Fig.2b).
a) segment method
b) perforated method Figure 2: Design methods to evaluate the shear response of CFS walls
CFS buildings can be designed following an elas-tic design or a ductile design. In the first case, all the structural elements are designed to provide an elastic behaviour under design earthquake; while in a duc-
tile design, according to capacity design criteria, the collapse of sheathing-to-frame connections should be imposed and the other structural components should offer an adequate overstrength.
Nowadays, no literature is available regarding analytical approaches specifically developed for CFS framed shear walls, sheathed with panels. Therefore, some theoretical and experimental cam-paigns have been carried out at the University of Naples �Federico II� to characterize seismic behav-iour of sheathed CFS structures (Landolfo, 2004).
Two nominally identical specimens representa-tive of a typical one-story CFS stick-built house were tested under monotone and cyclic loads (Fig.3). The generic specimen was made of two walls realized by studs, made of C sections spaced at 600mm, and sheathed with 9mm thick oriented strand boards (OSB) panels and 12.5mm thick gyp-sum boards (GWB) panels, a CFS floor, with joists in line with the studs and a concrete foundation. Both panel typologies were attached to the frame with screw connections spaced at 150mm at the pe-rimeter and 300mm in the field (Landolfo, Fiorino, Della Corte, 2006).
0
2
4
6
8
10
12
14
16
18
20
0 10 20 30 40 50d (mm)
V (KN/m) Single experimental testAnalytical curve
a) full scale specimen
0,0
0,2
0,4
0,6
0,8
1,0
1,2
1,4
1,6
1,8
2,0
0 2 4 6 8 10 12s (mm)
F (KN) Single experimental testAverage experimental curve
Analytical curve
OSB connections
b) sheathing to frame connection test Figure 3: Experimental and analytical load-displacement curves.
Considering the strong interrelation between the global lateral response of sheathed cold-formed �stick-built� structures and the �local� shear behav-iour of sheathing-to-stud connections, an experimen-

247
tal campaign was undertaken to investigate the local shear response of fasteners between CFS profiles and OSB or GWB panels (Fiorino, Della Corte, Landolfo 2006a). Tests on screw connections in-volved the same materials (panels, profiles and screws) used in the tested walls.
On the basis of the experimental results, an ana-lytical approach allowing a reliable evaluation of the strength, deflection and load vs. deflection response curve has been developed. This model has been used to evaluate the behaviour of different wall configu-rations (Fiorino, Della Corte, Landolfo, 2006b).
2.2 Wall lateral performance The shear behaviour of different CFS walls has been investigated, varying the sheathing typology, the wall height and the screw spacing. In particular, the method has been implemented on 24 different wall configurations, that have been obtained by modify-ing the sheathing material (OSB or GWB), the wall height (h=2400mm, h=2700mm, h=3000mm), and the screw spacing (s=50mm, s=75mm, s=100mm, s=150mm). The parameters used to describe walls behaviour are: peak strength (Vpeak), conventional elastic stiffness (Ke defined as the ratio between the elastic strength Ve=0,4Vpeak and its corresponding displacement de), ductility ( defined as the ratio be-tween the ultimate displacement du and the dis-placement corresponding to the elastic limit de, in which du is the displacement achieved on the post-peach branch of the response curve corresponding to a shear load equal to 0,8Vpeak); and absorbed energy (E). The results of the parametric analysis in terms of elastic stiffness, peak strength, ductility and ab-sorbed energy are shown as function of sheathing material, wall height and screw spacing in Figure 4.
The elastic stiffness (Ke) of OSB and GWB sheathed walls is almost the same in case of small screw spacing, while for larger screw spacing, GWB walls present higher stiffness than OSB walls (in particular, in case of screw spacing equal to 150mm, GWB walls show 22% higher stiffness than OSB walls). Higher values of Ke are achieved for lower walls (2400mm high walls exhibit 11% and 22% higher stiffness values than 2700mm and 3000mm high walls, respectively). Larger stiffness values are reached when screw spacing is small (in fact, walls characterized by spacing of 5mm present 32% and 64% higher stiffness than walls with screw spacing equal to 100mm and 150mm, respectively).
The peak strength (Vpeak) obtained for OSB sheathed walls is, on average, 3.2 times higher than that showed by GWB sheathed walls. The wall height does not influence the strength. The highest strength values are reached in case of small screw spacing (in fact, the strength of wall having screw spacing equal to 50mm is 2.0 and 3.0 times higher
than that of walls characterized by screw spacing equal to 100mm and 150mm, respectively).
0,0
0,5
1,0
1,5
2,0
2,5
3,0
3,5
50 75 100 125 150
s [mm]
Ke[kN/(m mm)] OSB h=2400mm model resultOSB h=2400mm interpol. curveOSB h=2700mm model resultOSB h=2700mm interpol. curveOSB h=3000mm model resultOSB h=3000mm interpol. curve
GWB h=2400mm model resultGWB h=2400mm interpol. curveGWB h=2700mm model resultGWB h=2700mm interpol. curveGWB h=3000mm model resultGWB h=3000mm interpol. curve
Study case: GWB walls stif fness
Study case: OSB walls stiffness
a)
0
10
20
30
40
50
60
70
50 75 100 125 150
s [mm]
Vpeak [kN/m] OSB h=2400mm model resultOSB h=2400mm interpol. curveOSB h=2700mm model resultOSB h=2700mm interpol. curveOSB h=3000mm model resultOSB h=3000mm interpol. curve
GWB h=2400mm model resultGWB h=2400mm interpol. curveGWB h=2700mm model resultGWB h=2700mm interpol. curveGWB h=3000mm model resultGWB h=3000mm interpol. curve
b)
0
5
10
15
20
25
30
35
50 75 100 125 150
s [mm]
[mm/mm] OSB h=2400mm model resultOSB h=2400mm interpol. curveOSB h=2700mm model resultOSB h=2700mm interpol. curveOSB h=3000mm model resultOSB h=3000mm interpol. curve
GWB h=2400mm model resultGWB h=2400mm interpol. curveGWB h=2700mm model resultGWB h=2700mm interpol. curveGWB h=3000mm model resultGWB h=3000mm interpol. curve
c)
0
200
400
600
800
1000
1200
1400
1600
1800
2000
50 75 100 125 150
s [mm]
E[(kNmm)/m] OSB h=2400mm model resultOSB h=2400mm interpol. curveOSB h=2700mm model resultOSB h=2700mm interpol. curveOSB h=3000mm model resultOSB h=3000mm interpol. curve
GWB h=2400mm model resultGWB h=2400mm interpol. curveGWB h=2700mm model resultGWB h=2700mm interpol. curveGWB h=3000mm model resultGWB h=3000mm interpol. curve
d)Figure 4: Results of a parametric analysis in terms of: a) elastic stiffness, b) peak strength, c) ductility, d) absorbed energy.

248
The ductility ( ) developed by GWB sheathed walls is, on average, 2.3 times higher than that ob-tained with OSB sheathed walls. The wall height does not affect the ductility sensitively, while his value is almost influenced by the screw spacing. In fact, the ductility increases for higher screw spacing (on average, the ductility developed by walls with screw spacing equal to 150mm is 35% and 55% higher than that measured in case of screw spacing equal to 100mm and 50mm, respectively).
The absorbed energy (E) in case of OSB sheathed walls is, on average, 4.5 times higher than that ab-sorbed in case of GWB sheathed walls. This parame-ter is not strongly influenced by the wall height (in fact, the dissipated energy in case of 3000mm high wall is 8% and 21% higher than that recorded in case of 2700mm and 2400mm high walls, respec-tively). The highest E values are obtained for small screw spacing (the absorbed energy recorded for walls having screw spacing equal to 50mm is 0.50, 2.0 and 3.10 times higher than that of walls charac-terized by screw spacing equal to 75mm, 100mm and 150mm, respectively).
The presented parametric analysis, in addition to show the behaviour of the different wall configura-tions, provides elastic stiffness vs. screw spacing curve (Ke-s curve) and peak strength vs. screw spac-ing curve (Vpeak-s curve), that can be implemented to design a stick-built house, as described in the next Section.
2.3 Design Chart Taking into account the results of the parametric analysis (presented in the Section 2.2), design charts allowing the seismic design of all the wall compo-nents (studs, sheathing-to-frame connections, shear anchors and hold down anchors) are developing.
The aim is to introduce in an one chart the wall strength corresponding to sheathing-to-frame con-nections, studs, hold-down anchors and shear an-chors resistance, respectively. The proposed design chart (Fig.5) represents the lateral wall strength per unit length (VR) corresponding to different collapse types as function of the screw spacing (s). Particu-larly, as shown in section 2.2 (Fig. 4b) the wall lat-eral strength corresponding to sheathing-to-frame connections failure (VR,s) increases for small screw spacing.
The shear wall strengths corresponding to the studs (VR,c) and hold-down anchors (VR,t) have been obtained taking into account that the shear force act-ing on the wall produces an overturning moment that have to be balanced by hold-down anchors (in ten-sion) and the compressed end studs.
Thus, it can be written:
hlNV cRcR ,, (1)
hlNV tRtR ,, (2)
where: NR,c is the axial studs strength, NR,t is the axial hold-down strength, l is the wall length, and his the wall height.
The shear wall load bearing capacity correspond-ing to shear anchors failure (VR,v) depends on the shear strength of an anchor (FR,v) and shear anchor spacing (sav):
1,,av
vRvR slFV (3)
Since that the wall strength corresponding to studs, hold-down and shear anchors is not depended on the screw spacing, VR,c, VR,t and VR,v are repre-sented in Figure 5 as horizontal lines.
Figure 5: Schematic wall design chart
The axial strength of end studs (NR,c) has been evaluated according to Eurocode 3 (2004) taking into account the local and global buckling. In par-ticular, the stabilizing contribute of sheathing has been considered only for in plan buckling by adopt-ing a buckling length equal to two times the screw spacing.
The axial strength of hold-down anchors (NR,t)has been considered equal to the minimum strength between steel tension strength and strength for con-crete conical fracture, while the resistance of shear anchors (FR,v) has been evaluated equal to the mini-mum between shear steel rod strength and the strength corresponding to concrete spalling, accord-ing to HILTI (2005) recommendations.
This diagram can be specialized for the elastic or ductile design, allowing, when seismic loads are known, the definition of all the wall components starting from a chosen screw spacing, as it will be shown in the study case.

249
3 STUDY CASE
3.1 Architectural and technological design The study of the architectural and environmental possibilities of a CFS housing seems to be a key point to develop this construction system even in country that are characterized by traditional housing. For this reason, a contemporary home design is pre-sented hereafter. This housing is an architectural item designed without having in mind any given lo-cation nor particular inhabitant requirements. It aims to be a prototype for contemporary living needs of flexibility, environmental comfort, sustainability and high structural performances (Iuorio, 2005). A con-tinue space on two levels is articulated perpendicu-larly to the entrance axis, where closed toilet�s blocks and a small stairs glazed-tower are located. The common living and dining room are at the ground floor of 60m2 that extends seamlessly into 17m2 of external space, where a little garden and a terrace take place (Fig.6); while bedrooms are on the first floor. Each room is wide and square, without fixed elements in order to assure the maximum flexibility of internal spaces.
Great importance has been given to the openings distribution (Fig.7) to reduce the environmental im-pact and improve internal comfort. Therefore, in or-der to have high thermal performances, without us-ing considerable amounts of energy, thin windows have been designed for the north elevation, while large properly shielded openings and a glazed tower have been chosen for the south elevation. Smaller openings characterize east and west elevations. The particular openings location on fronts has been cho-sen so that the inhabitant can always perceive the outer environment, and the outer persons can follow the inside life. In this way the environment is the real protagonist.
The openings width, moreover, makes full use of system structural performance; in fact, according to the flexibility assumed as paradigm of the architec-tural planning, the high of openings and their verti-cal position could be changed, without modify the load carrying capacity of system.
The chosen basic framing system (platform sys-tem) is characterized by discontinue walls, inter-rupted at floor level by floor framing. The structure is built storey by storey, so that each ones can serve as working platform for the construction of the floor above. The walls are not structurally continuous and loads are transferred through the floor structure from the upper to the lower walls by means hold down anchors (Fig.8).
The floor framing is composed by joists, horizon-tal bearing members, spaced at 600mm and aligned with vertical load bearing framing members. Joists are connected at each end by a the floor track: an horizontal member used as band or rim joists for flooring systems. Web stiffeners are installed at each
joist bearing location to strengthen the member against web crippling and to assure the continuity of vertical bearing members.
Fig. 6: Architectonic plan
Fig.7: Perspective view
Fig.8: Detail

250
Main wall components are studs: vertical load bearing framing members placed with their flange in contact with wall sheathings. Studs are joined at each end by wall tracks and hold-down anchors are introduced at each end of resistant wall segment to provide the necessary up-lift resistance. Particular care has been given to openings design. Two King studs, vertical structural members which span the full height of the wall and one Jack studs, vertical members which do not span the full height of the wall providing bearing for headers are introduced. Headers are installed above wall openings in all ex-terior and interior load-bearing walls, while they are not required in the interior non-load bearing walls.
Sheathing materials have been carefully chosen to satisfy architectural and structural needs. Walls and ceiling are lined internally with GWB panels to pro-vide good fire and acoustic performance. OSB pan-els are chosen as like outer sheathings for their load bearing capacity and because they are environmental friendly materials.
3.2 Structural design The structural response under vertical loads of
floors has been evaluated by neglecting the contribu-tion of OSB sheathings on the lateral stability (�all steel design�). Therefore, the joists have been con-sidered as laterally braced members due to the pres-ence of flat straps and blocks. On the contrary, the
presence of sheathings has been taken into account in the evaluation of compressive resistance of studs (�sheathing braced design�), which increase the load bearing capacity of walls due to the reduction of buckling length.
As the structural response under seismic horizon-tal load is concerned, an elastic design has been de-veloped for the presented CFS housing and the re-sults obtained with the analytical method for the prediction of wall lateral response have been applied in the structural design of the considered stick-built house. In particular, the spacing of sheathing-to-frame connections (s), the studs thickness (t), the di-ameter of hold-down anchors (M) and the spacing of shear anchors (sav) have been defined by means a design chart, presented hereafter.
It has been assumed that the house is located in a medium seismic zone (peak ground acceleration PGA=0.25g), and the elastic spectrum (q=1.0) given in Eurocode 8 (2004) (for soil type A) has been adopted. The seismic response has been evaluated under the following main hypothesis: 1) ground mo-tion has been considered acting in both the North-South and East-West directions, separately; 2) the possible torsional effects have been neglected; 3) the presence of openings (windows and doors) has been taken into account during the wall design, with the segment method.
0
5
10
15
20
25
50 75 100 125 150
VRe(kN/m)
s(mm)
VR,s,e
(GWB)
VR,s,e(GWB+GWB)
VR,s,e
(OSB)
VR,s,e(GWB+OSB)
VR,c,e
(t=1,5)
VR,v,e(sav=150mm)
VR,t,e
(M16)
VR,t,e
(M20)VR,v,e(sav=200mm)
ELASTIC DESIGN2700mm high walls
VR,t,e
(M24)
VR,t,e
(M12)
t = stud thikness M= hold-down diameter sav=shear anchor spacing
VR,v,e(sav=300mm)
Seismic action
Wall strength
VR,c,e
(t=1,0)
Fig. 6: Design chart for the elastic design of shear walls components.

251
The wall elastic resistance (VR,e) has been evalu-ated by means of the design chart presented in Fig-ure 6, in which the elastic strength of all the wall components are reported. This chart is a develop-ment of the chart presented in the Section 2 for 2700mm high walls sheathed with OSB and GWB panels. In particular, this chart shows the sheath-ing-to-frame connections curves obtained from the parametric analysis, reduced by a coefficient (equal to 2.0 for GWB walls and to 1.4 for OSB walls) to obtain the design peak strength from the average peak strength (considered in the paramet-ric analysis, Figure 4b), and multiplied for 0.40 to obtain the design elastic strength (considered in the chart, Figure 9) from the design peak strength. In the same way, the design elastic strength of the other structural components (end studs, shear an-chors and hold-down anchors) has been evaluated as the 40% of design resistance. The design elastic resistance of the wall corresponding to the axial strength of end studs (VR,c,e) is shown in Figure 9 with horizontal dot lines, while the design elastic resistance of the wall corresponding to the axial strength of hold-down (VR,t,e) and shear anchors (VR,v,e) is shown with horizontal dash dot and bold continuous lines, respectively.
Hence, defined the seismic action acting on a wall, a screw spacing has been chosen, and from the chart the corresponding wall strength per unit length has been got. Introducing the obtained seis-mic action in the design chart, it can be observed that the selected screw spacing (s=75mm) is ade-quate, in fact the sheathing-to-frame connections strength (10.5kN/m) is larger than the seismic ac-tion. Starting from this result the other structural components have been defined from the chart, in such a way that the lateral wall strength corre-sponding to stud and anchors elastic resistance should be higher than the seismic action. In par-ticular, studs thickness equal to t=1.5mm (corre-sponding lateral wall strength equal to 16.1kN/m) has been selected; while M20 hold-down anchors (corresponding lateral wall strength equal to 11.8kN/m) and shear anchors spaced at 200mm (corresponding lateral wall strength equal to 12kN/m) have been chosen.
4 CONCLUSIONS
Nowadays, even if the high seismic performance of CFS housing based on the high strength to weight ratio is well known, little specific guidance for seismic design exists. This paper has been aimed to present a design chart that allows the design of all the shear walls components. It is based on the re-sults of recent studies on full scale and sheathing-to-frame connections tests, that have been devel-oped in a parametric analysis to characterize the
behaviour of different wall configurations. This chart has been used for the elastic design of the presented case study allowing an easy design of all the wall components.
5 REFERENCES
CEN. prEN 1998-1 Eurocode 8, 2004: Design of structures for earthquake resistance - Part 1: General rules � Seis-mic actions and rules for buildings.
CEN. prEN 1993-1-3. Eurocode 3, 2004: Design of steel structures - Part 1-3: General rules - Supplementary rules for cold formed thin gauge members and sheeting.
Fiorino, L., Della Corte G., Landolfo R., 2006a. Experimen-tal tests on sheathing-to-stud screw connections, Proc. in-tern XI International Conference Metal structures,Rzeszów, June.
Fiorino, L., Della Corte, G., Landolfo, R., 2006b. Lateral Re-sponse of Sheathed Cold-Formed Shear Walls: An Ana-lytical Approach, Proc. In 18th International Specialty Conference on Cold-Formed Steel Structures, Orlando.
Fiorino, L., Della Corte, G., Landolfo, R. In press. Experi-mental tests on typical screw connections for cold-formed steel housing. Engineering Structures, Elsevier.
Hilti, 2005. North America product technical guide. Iuorio, O., 2005. Housing in cold-formed: aspetti tecnologici
e prestazionali, Graduation thesis, Department of Constructions and Mathematical Methods in Architecture.
Landolfo, R., 2004. Advances in Italian cold-formed steel structures research. Proc., intern. Workshop on Thin-Walled Structures, Loughborough.
Landolfo, R., 2005. Sistemi costruttivi per l�edilizia residenziale:aspetti tecnologici e prestazionali. Proc,. In1° Convegno Nazionale Tecniche innovative nella progettazione di edifici con elementi sottili in acciaio,Pisa.
Landolfo R., Fiorino, L. Della Corte, G., 2006. Seismic be-haviour of sheathed cold-formed structures: physical tests. Journal of Structural Engineering, ASCE, Volume: 132, Issue: 4, pp 570-581.

252
1 PERFORMANCE-BASED SEISMIC RETROFIT OF RC BUILDINGS
1.1 Retrofit objectives A large number of existing buildings in earthquake ar-eas over the world are seismically inadequate and need seismic rehabilitation due to code change or earth-quake damage. For these structures the attempt to fol-low the current seismic code provision may be eco-nomically prohibitive. As a consequence, their retrofit objectives should be realized not satisfying the seismic requirements for new structures, but conceiving struc-tures that perform desirably during different loading scenarios. The displacement-based (DB) method and the performance-based design (PBD) seem to be more promising than the traditional force-based (FB) design method. In fact, a strong correlation may be observed between the global and local displacements of the structure and the seismic damage, while the correlation between strength and displacements is good only for short periods. As a consequence, the most suitable ap-proach in modern seismic design is to ensure that the displacements and the ductility demands will not be exceeded under specified levels of earthquake ground motion. In this way, different levels of performance are defined (Full Operational (FO), Operational (O), Life Safety (LS), Collapse Prevention (CP)) for different in-tensity of seismic action levels - that is for various lev-els of risk (frequent, occasional, rare, much rare) - and multi-level design objectives are pursued (Tab. 1.1)
1.2 Rehabilitation with steel dissipative braces The aim of retrofit is to move the capacity of the struc-ture to the seismic demand so to reduce the building
earthquake vulnerability. Incorporating a bracing sys-tem inside the individual bays of the RC frames may have both practical and economical advantages. In par-ticular, this system offers some advantages such as the ability to accommodate openings and the minimal added weight of the structure. Furthermore, if it is real-ized with external bracing systems the minimum dis-ruption to the full operationally of the building is ob-tained. The most important advantage of eccentrically braced framing systems is its facility for meeting the difficult requirements of seismic design that are high stiffness at normal load levels and good ductility at rare overloads. In the case of RC framed structures the beams can not act as ductile links, while steel short links may be vertically settled between the RC beam and the steel braces. The actions are transferred to the braces by bending and shear in an active link. This ec-centric element acts as a ductile fuse that yields in shear and dissipates large amounts of energy by a sta-ble hysteretic behaviour while preventing buckling of the brace. The steel braces are usually placed in verti-cally aligned spans. This system allows a great in-crease of stiffness with a minimal added weight, and so it is very effective for existing structure for which the poor lateral stiffness is the main problem. However the stiffening of the structure may produce some problems. At first, the connection between the link and the RC beam may play a critical rule under seismic actions. Furthermore, the bending and shear forces transmitted by the link may require the strengthening of the RC beam. Finally, the increase of lateral stiffness generally increases the seismic demand except in the case of low-rise buildings that fail in the constant-acceleration region of the response spectrum. As an alternative, when placed in vertically non-aligned spans steel
Performance-based seismic retrofit of r.c. and masonry buildings
A. Mandara, A.M. Avossa, M. Ferraioli, F. Ramundo & G. Spina Second University of Naples, Italy
ABSTRACT: The use of integrative steel structures for seismic up-grading of both RC and masonry buildings is faced in this paper. RC frames fitted with eccentric steel braces and masonry walls strengthened with metal ties are investigated with regard to seismic performance levels. A damage-controlled nonlinear static procedure is defined to estimate maximum lateral displacement and plastic dissipated energy of RC frames. A typical masonry wall configuration is then analysed involving the use of horizontal and vertical steel ties. The analysis, carried out with a refined F.E.M. model, shows the significant improvement obtained, in terms of both strength and ductility.

253
braces allow to calibrate strength and stiffness at each floor and optimize structural capacity as a function of seismic demand. The usual design strategies for the EBFs are based on the capacity-design rule: the links are designed to have sufficient deformation and dissi-pation capacity so that local and global brittle failure modes are avoided and the forces transmitted to non-ductile members are reduced. In particular, for high damping eccentric bracing systems the axial strength of columns, diagonals and beams must satisfy the fol-lowing relation:
, ,Rd Sd Sd G Sd EN M N N (1.1)
where NRd (MSd) is the design buckling resistance for the design bending moment MSd, NSd,G and NSd,E are the design axial force for non-seismic loads and for seismic loads respectively. The coefficient for short links is defined as follows:
, ,
,
min ;ov u i Sd Gii
Sd Ei
V Vq
V (1.2)
where ov is the overstrength factor, Vu,i is the ultimate shear strength of the ith link, VSd,Gi and VSd,Ei are the de-sign shear force for non-seismic and seismic loads, re-spectively, q is the behaviour factor. The link is usually designed to be a short link. This approach based on the capacity-design rule could not avoid the onset of local collapse mechanisms. First of all, the safety factor used for the shear overstrength factor ( d = 1.20) may be in-sufficient. In fact, test results show that the ratio be-tween the ultimate shear strength and the plastic resis-tance of the link may be higher than 1.50 as an effect of strain-hardening. Then, the capacity-design rule could not guarantee that the collapse mechanism is global and that all links are active before collapse for large plastic deformation in one or more links.
Table 1.1. Performance levels and corresponding damage limits.
EARTHQUAKE STRUCTURAL DAMAGE PERFORMANCE
LEVEL Return Period (years) Frequency DPA Probability
of exceed.Full Operational 30 Frequent 0.20 0.20 Operational 75 Occasional 0.40 0.20 Life Safety 475 Rare 0.60 0.10 Collapse Prevention 970 Very Rare 0.80 0.10
1.3 Static and dynamic pushoverThe performance-based approach requires the applica-tion of nonlinear analysis procedures. The distribution of the lateral forces to be applied should be defined so as to reproduce the inertia forces deriving from the earthquake ground motion. Since such forces depend on the response history of the building, the lateral load pattern should be modified during the analysis as an ef-fect of structural yielding. These approaches can give better estimations of the inelastic response, but they are conceptually complicated and computationally de-manding for application in structural engineering prac-
tice. As an alternative, in this paper the capacity of the structure is calculated in the hypothesis that the vibra-tion properties remain unchanged in spite of structural yielding. In particular, five vertical distributions of seismic forces Fi are considered. 1) First Mode Distri-bution (FMD). The vertical distribution is proportional to the floor masses and the shape of the fundamental mode in the direction under consideration. 2) Equiva-lent Lateral Force Distribution (ELFD). The seismic forces at each floor level of the building are distributed according to the distribution of floor mass and to the height hi above the base. 3) Uniform Distribution (UD). The lateral load distribution is proportional to the floor masses mi. 4) Equivalent First Mode Distribu-tion (EFMD). The lateral force distribution is propor-tional to an equivalent first mode defined from SRSS combination of sufficient modes to capture at least 90% of the total building mass. 5) SRSS Distribution. The vertical distribution is proportional to the story shear distribution calculated by combining modal re-sponses from a response spectrum analysis of the building, including sufficient modes to capture at least 90% of the total building mass. A 3-storey and a 7-storey RC frame designed to withstand vertical loads are considered in the analyses. The rehabilitationmethod consists of internal direct bracing systems. In particular, steel short links HEB 100 are vertically placed between the RC beam and the HEB 160 steel diagonal braces. The link is activated by the lateral in-terstorey displacements of the frame, and so it yields in shear and dissipates energy. The link is designed to be a short link (e = 30 cm). In this way, sufficient defor-mation and dissipation capacity and a stable hysteretic behaviour are assured, local and global brittle failure modes (such as buckling of the brace) are avoided, and the forces transmitted to non-ductile members are re-duced. The link-to-beam connection are designed to behave elastically under the moment of resistance and shear force resistance transmitted by the link. A multi-axial fiber element model implemented in CANNY99 Computer Program (Li, 1996) is used for reproducing the behaviour of flexural and axial deformation of col-umn element and for representing the interaction among bi-directional bending moments and axial load. The confined concrete is modeled with stress-strain re-lationships (Mander, Priestley and Park, 1988). The short link is modeled with a bilinear shear-deformation relationship with hardening, while its stiffness and strength degradation are neglected. The plastic shear capacity of the link is equal to the plastic shear force of the web, that is Vp = fy/Aw. The ultimate shear force Vuis estimated with a hardening of 50%. The structural damping was characterized using Clough�s classical damping model with 5 per cent modal damping ratio for all modes. Three seismic inputs are selected to be consistent to Eurocode 8 type 1 elastic spectrum. The static pushover under EFMD distribution of lateral forces is found to give the better accuracy when com-pared to dynamic pushover analyses.

254
0.00
0.05
0.10
0.15
0.20
0.25
0.30
0.00 0.10 0.20 0.30 0.40 0.50
TOP DISPLACEMENT / TOTAL HEIGHT (%)
E3 BUILDING - DYNAMIC PERFORMANCEE3 BUILDING - STATIC PERFORMANCEE3 BUILDING - STATIC PUSHOVERUB3 BUILDING - DYNAMIC PERFORMANCEUB3 BUILDING - STATIC PERFORMANCEUB3 BUILDING - STATIC PUSHOVERNB3 BUILDING - DYNAMIC PERFORMANCENB3 BUILDING - STATIC PERFORMANCENB3 BUILDING - STATIC PUSHOVER
BEVAGNA
0.00
0.05
0.10
0.15
0.20
0.25
0.30
0.00 0.10 0.20 0.30 0.40 0.50 0.60
TOP DISPLACEMENT / TOTAL HEIGHT (%)
E3 BUILDING - DYNAMIC PERFORMANCEE3 BUILDING - STATIC PERFORMANCEE3 BUILDING - STATIC PUSHOVERUB3 BUILDINGDYNAMIC PERFORMANCEUB3 BUILDING - STATIC PERFORMANCEUB3 BUILDING - STATIC PUSHOVERNB3 BUILDING - DYNAMIC PERFORMANCENB3 BUILDING - STATIC PERFORMANCENB3 BUILDING - STATIC PUSHOVER
GEBZE
0.00
0.05
0.10
0.15
0.20
0.25
0.30
0.00 0.10 0.20 0.30 0.40 0.50
TOP DISPLACEMENT / TOTAL HEIGHT (%)
E3 BUILDING - DYNAMIC PERFORMANCEE3 BUILDING - STATIC PERFORMANCEE3 BUILDING - STATIC PUSHOVERUB3 BUILDING - DYNAMIC PERFORMANCEUB3 BUILDING - STATIC PERFORMANCEUB3 BUILDING - STATIC PUSHOVERNB3 BUILDING - DYNAMIC PERFORMANCENB3 BUILDING - STATIC PERFORMANCENB3 BUILDING - STATIC PUSHOVER
LEFKADA
0.00
0.05
0.10
0.15
0.20
0.00 0.10 0.20 0.30 0.40 0.50
TOP DISPLACEMENT / TOTAL HEIGHT (%)
E7 BUILDING - DYNAMIC PERFORMANCEE7 BUILDING - STATIC PERFORMANCEE7 BUILDING - STATIC PUSHOVERUB7 BUILDING - DYNAMIC PERFORMANCEUB7 BUILDING - STATIC PERFORMANCEUB7 BUILDING - STATIC PUSHOVERNB7 BUILDING - DYNAMIC PERFORMANCENB7 BUILDING - STATIC PERFORMANCENB7 BUILDING - STATIC PUSHOVER
BEVAGNA
0.00
0.05
0.10
0.15
0.20
0.00 0.10 0.20 0.30 0.40 0.50
TOP DISPLACEMENT / TOTAL HEIGHT (%)
E7 BUILDING - DYNAMIC PERFORMANCEE7 BUILDING - STATIC PERFORMANCEE7 BUILDING - STATIC PUSHOVERUB7 BUILDING - DYNAMIC PERFORMANCEUB7 BUILDING - STATIC PERFORMANCEUB7 BUILDING - STATIC PUSHOVERNB7 BUILDING - DYNAMIC PERFORMANCENB7 BUILDING - STATIC PERFORMANCENB7 BUILDING - STATIC PUSHOVER
GEBZE
0.00
0.05
0.10
0.15
0.20
0.00 0.10 0.20 0.30 0.40 0.50
TOP DISPLACEMENT / TOTAL HEIGHT (%)
E7 BUILDING - DYNAMIC PERFORMANCEE7 BUILDING - STATIC PERFORMANCEE7 BUILDING - STATIC PUSHOVERUB7 BUILDING - DYNAMIC PERFORMANCEUB7 BUILDING - STATIC PERFORMANCEUB7 BUILDING - STATIC PUSHOVERNB7 BUILDING - DYNAMIC PERFORMANCENB7 BUILDING - STATIC PERFORMANCENB7 BUILDING - STATIC PUSHOVER
LEFKADA
Figure 1.1. Static and dynamic performance curves.
0.00
0.10
0.20
0.30
0.40
FULLOPERATI ONAL
OPERATI ONAL LI FE SAFETY COLL APSEPREVENTION
PERFORMANCE LEVEL
BEVAGNA
ST AT IC PERFORMANCEDYNAMIC PERFORMANCE
0.00
0.10
0.20
0.30
0.40
0.50
FULLOPERATI ONAL
OPERATI ONAL LI FE SAFETY COLLAPSEPREVENTION
PERFORMANCE LEVEL
GEBZE
ST AT IC PERFORMANCEDYNAMIC PERFORMANCE
0.00
0.10
0.20
0.30
0.40
0.50
FULLOPERATI ONAL
OPERATI ONAL LIF E SAFETY COL LAPSEPREVENTION
PERFORMANCE LEVEL
LEFKADA
ST AT IC PERFORMANC EDYNAMIC PERFORMANCE
0.00
0.10
0.20
0.30
0.40
0.50
FULLOPERATI ONAL
OPERATI ONAL LIF E SAFETY COL LAPSEPREVENTION
PERFORMANCE LEVEL
BEVAGNA
ST AT IC PERFORMANCEDYNAMIC PERFORMANCE
0.00
0.10
0.20
0.30
0.40
0.50
FULLOPERATI ONAL
OPERATI ONAL LI FE SAFETY COLL APSEPREVENTION
PERFORMANCE LEVEL
GEBZE
ST AT IC PERFORMANCEDYNAMIC PERFORMANCE
PERFORMANCE LEVEL
0.00
0.10
0.20
0.30
0.40
0.50
0.60
FULLOPERATI ONAL
OPERATI ONAL LIF E SAFETY COL LAPSEPREVENTION
PERFORMANCE LEVEL
ST AT IC PERFORMANCEDYNAMIC PERFORMANCE
PERFORMANCE LEVEL
LEFKADA
0.00
0.10
0.20
0.30
0.40
FULLOPERATI ONAL
OPERATI ONAL LI FE SAFETY COLL APSEPREVENTION
PERFORMANCE LEVEL
BEVAGNA
ST AT IC PERFORMANCEDYNAMIC PERFORMANCE
0.00
0.10
0.20
0.30
0.40
0.50
FULL YOPERATI ONAL
OPERATI NAL LI FE SAFETY COL LAPSEPREVENTION
PERFORMANCE LEVEL
GEBZE
ST AT IC PERFORMANCEDYNAMIC PERFORMANCE
0.00
0.10
0.20
0.30
0.40
0.50
FULL YOPERATI ONAL
OPERATI NAL L IFE SAFETY COLLAPSEPREVENTION
PERFORMANCE LEVEL
LEFKADA
ST AT IC PERFORMANCEDYNAMIC PERF ORMANCE
0.00
0.10
0.20
0.30
0.40
FULLOPERATI ONAL
OPERATI ONAL LIF E SAFETY COL LAPSEPREVENTION
PERFORMANCE LEVEL
BEVAGNA
ST AT IC PERFORMANCEDYNAMIC PERF ORMANCE
0.00
0.10
0.20
0.30
0.40
0.50
FULLOPERATIONAL
OPERATIONAL LIFE SAFETY COL LAPSEPREVENTI ON
PERFORMANCE LEVEL
GEBZE
STAT IC PERFORMANCEDYNAMIC PERFORMANCE
0.00
0.10
0.20
0.30
0.40
0.50
FULL YOPERATI ONAL
OPERATI NAL LI FE SAFETY COLLAPSEPREVENTI ON
PERFORMANCE LEVEL
LEFKADA
ST AT IC PERFORMANCEDYNAMIC PERF ORMANCE
Figure 1.2. Static and dynamic performance matrices.

255
1.4 Damage controlled performance-based retrofit The estimation of seismic demand is carried out with the Inelastic Demand and Capacity Spectra Method (ICSM) (Ferraioli et al., 2004), that is derived from the CSM (Fajfar, 1999) and from the strength reduction factor formulation originally proposed by Ordaz et al. (1998). Two control parameters are monitored to check the attainment of the different performance lev-els of the building: the maximum interstorey drift damage index (IDI) and the maximum Park and Ang (1985) damage index (DPA). In particular, The rotation ductility factor demand in each plastic element is ob-tained from the ICSM.
The hysteretic energy dissipation demand in the ith plastic element is considered to be proportional to the corresponding static energy demand Ep,i required from pushover loading up to the target top-floor dis-placement, as follows:
,i P idE E 21
SP SD MPBIL
SPSP SP
E E EEE E
(1.3)
The static energy demand is corrected with a dimen-sionless parameter composed of three contributions. The first one accounts for the different energy dissipa-tion between CS (ESP) and BCS (ESP
BIL). The second one accounts for the ratio between the dynamic energy dissipation demand (ESD) and the pushover energy dis-sipation demand (ESP) of the equivalent SDOF system. The third one accounts for the ratio between the push-over energy dissipation demand of the MDOF system (EMP) and the pushover energy dissipation demand of the SDOF system transformed to the MDOF system (ESP 1
2). The damage limits 0.30%, 0.60%, 1.5% and 2.0% for the IDI and 0.20, 0.40, 0.60 and 0.80 for the DPA index were used as performance indicators respec-tively at FO, O, LS, CP performance levels. In Figures 1.1 and 1.2 the comparison of performance curves and performance matrices obtained with dynamic and equivalent static procedures is carried out. The results of the analysis show that the static procedure seems to be accurate for the E3, UB3 and NB7 buildings. The maximum errors at CP limit state in terms of PGA, top displacement and base shear are respectively 10%, 9% and 4% for E3 frame; 10%, 8% and 4% for the UB3 frame; 2%, 5% and 13% for the NB7 frame. On the contrary, the static procedure underestimates the dy-namic performance of the NB3 frame and overesti-mates the dynamic performance of E7 and UB7 frames. In the NB3 frame this result derives from the dynamic energy amplification factor ESD/ESP in Eq. 1.3, that is calculated considering the same energy dis-sipation ratio between RC structure and shear links both under static and under dynamic loadings. In the NB3 frame this hypothesis gives very high values of the parameter and so hysteretic energy dissipation demand is overestimated. In the E7 and UB7 frames the overestimation of dynamic performance derives from the equivalent lateral force distribution (EFMD)
that is effective in reproducing the dynamic displace-ment demand, but it may be not able to catch the struc-tural damage distribution in concrete members during strong earthquakes. In fact, the static pushover with EFMD distribution generally gives more uniform yielding than dynamic analysis, and so it tends to over-estimates the seismic performance.
2 PERFORMANCE-BASED STRENGTHENING OF MASONRY WALLS
2.1 Failure mechanism for masonry walls and tying system for prevention
Failure in masonry constructions due to seismic ac-tions can be classified into two main categories: out-of-plane mechanism, that shows up with turnover of walls or local buckling of compressed members with material ejection; in-plane mechanism, with local cracking and overall wall rotation or large cracks spread all over the wall (Giuffrè, 1993). Such two types of collapse involve wall rotation phenomena and shear failure, respectively (Fig. 2.1). The onset of a given mechanism depends on many factors, such as the connection effectiveness between walls or between floors and wall, the stonework arrangement and the materials quality. The out-of-plane collapse mecha-nisms are the most dangerous, as they can produce the destruction of the whole building as a consequence of the loss of stability. In addition, they are not able to dissipate any input seismic energy. They can be avoided carrying out interventions that make the walls and floor-to-wall connections more effective and in-crease the internal cohesion of masonry. Once the out-of-plane collapse mechanisms have been prevented, the structure reaction to seismic actions is entrusted to the in-plane strength of the masonry panel. Compared to the out-of-plane resistance, this is much higher be-cause the wall is loaded in the plane of maximum stiff-ness. When this kind of damage embraces the whole masonry wall without loss of stability, significant en-ergy dissipation can be obtained, achieving the most ductile collapse mechanism for masonry structures.
The use of metal ties represents an effective and re-liable technique to obtain a better connection between structural elements at the floor level, ensuring a box-type behaviour. If properly applied, this technique also allows to avoid all the out-of-plane turnover mecha-nisms of masonry walls. As a further option respect to traditional horizontal ties, strengthening by vertical tie-bars is gaining a greater popularity in recent applica-tions. In particular, they cause the resistance of the structure under seismic action to be effectively en-trusted to shear walls. Moreover, the combined use of horizontal and vertical metal tie-bars significantly in-crease the resistance of the whole structure and let the failure take place with large energy dissipation, due to a more uniform distribution of stresses inside the wall (Mandara et al. 2005, 2006, Spina et al., 2004).

256
a) b)
Figure 2.1. Examples of out-of-plane (a) and in-plane (b) col-lapse mechanisms (Giuffrè, 1993).
2.2 Performance levels for masonry structures Many current seismic codes refer to performance lev-els in the form of general requirements for both new and existing constructions. FEMA 273 and 356 Guide-lines define three fundamental Structural Performance Levels: Immediate Occupancy Level, Life Safety Level and Collapse Prevention Level, as building re-habilitation objectives. The Immediate Occupancy Per-formance Level (IO S-1) means that the structural sys-tem retains nearly the whole of its pre-earthquake strength and stiffness, so that all structural members remain in the elastic range. The Life Safety Perform-ance Level (LS S-3) means that significant damage to the bearing structures has occurred, but some margin against collapse remains after earthquake. Repairing the structure is still possible but might be not economi-cally convenient. The Collapse Prevention Perform-ance Level (CP S-5) means that a large damage to the structure has occurred with significant degradation in both stiffness and strength of the resisting system. The building, however, must continue to carry the whole of gravity loads even though, in most cases, repairing of the structure is impossible or economically not afford-able. Correlations between Performance Levels and damage are provided in FEMA Guidelines for unrein-forced masonry structures. Damage corresponding to Immediate Occupancy Performance Level consists of minor spalling of plaster near openings without signifi-cant structural damage. Extensive cracking and some crushing in walls and extensive crushing and spalling of plaster with significant permanent drift are corre-lated to Life Safety Performance Level. Extensive cracking and crushing mean the attainment of the Col-lapse Prevention Performance Level.
2.3 Analysis of seismic performance upgrading of masonry walls strengthened by steel ties
Performance Levels as given above are used for as-sessing the effectiveness of seismic upgrading using steel ties. The analysis deals with a three-storey, 9 m long and 12 m high masonry wall (Fig. 2.2). The wall thickness varies at each level to let the compressive stress due to gravitational loads constant and limited within allowable values. This geometry represents a
typical scheme of a transverse load bearing wall of a masonry building. The following three structural ar-rangements have been studied, by considering the ac-tion of both gravity and seismic loads: - unreinforced wall (Original Structure); - wall fitted with horizontal ties at each floor
(Strengthening Level 1); - wall fitted with horizontal ties at floors and at both
base and top of each sub-panel between openings, together with vertical ties (Strengthening Level 2).
A masonry structure made of rough-shaped calcareous stone has been assumed in the analysis, with the struc-tural properties shown in Table 2.1. The not linear be-haviour of the material has been considered according to Drucker-Prager yield criterion. The seismic study of the structure has been carried out via non-linear static analysis method (pushover), assuming a triangular law for horizontal forces, proportional to mass distribution along the wall height.
In order to evaluate the conditions corresponding to the attainment of a damage amount related to each per-formance level, a seismic load factor, referred to grav-ity acceleration g, has been calculated. The response of the structure in the three configurations is then repre-sented in terms of capacity curves F-d, namely base shear vs. control displacement (Fig. 2.3).
a) b) c) Figure 2.2. The investigated wall geometry (a), Strengthening Level 1configuration (b), Strengthening Level 2 configuration (c).
Table 2.1. Mechanical features of calcareous stone masonry. ______________________________________________ value unit ______________________________________________ Modulus of elasticity E 2000 MPa Poisson�s ratio 0,25 Density 2200 kg/m3
Friction angle 45° Compressive strength 2,00 MPa Cohesion 0,07 MPa ______________________________________________
Fel,max
FmaxFy=Fu
Fel
Ideal elastic
Ideal elasto-plastic
Capacity curve
F
ddudel,maxdel dy
Figure 2.3. Capacity curve and reference parameters.

257
With reference to Figure 2.3, the most significant parameters have been determined, namely the force Fel, that represents the base shear at which the first element would reach its strength capacity (shear or flexural) according to a linear elastic analysis and the corresponding control displacement del, the ulti-mate strength capacity Fmax (Fy in case a bilinear idealization of the response) and the ultimate control displacement du.
For masonry structures, in much the same way as for other structural categories, the correct definition
of the behaviour factor q (Tomazevic et al., 2001) takes into account the ratio between the maximum response force of an ideal perfectly elastic system and the ultimate strength capacity of the real system, as well as the overstrength ratio (OSR), according to the following relationships:
0 OSRq q (2.1)
0 ,max / , /el y y elOSR Fq F F F (2.2)
a) b) c) Figure 2.4. Original structure deformed shapes related to FEMA 273 performance levels: a) S-1, b) S-3, c) S-5.
a) b) c) Figure 2.5. Level 1 strengthened structure deformed shapes related to FEMA 273 performance levels: a) S-1, b) S-3, c) S-5.
a) b) c) Figure 2.6. Level 2 strengthened structure deformed shapes related to FEMA 273 performance levels: a) S-1, b) S-3, c) S-5.

258
Table 2.2. Performance parameters for the three configurations. ________________________________________________ Performance Original Strengthening Strengthening Parameters Structure Level 1 Level 2 (kN) (kN) (kN) ___________________________________________________ Fel 148 172 451 Fy 203 238 630 Fmax 216 253 684 Fel,max 307 447 1186 ___________________________________________________ (mm) (mm) (mm) ___________________________________________________ del 1.6 1.9 3.3 dy 2.2 2.6 4.6 du 3.6 5.8 10.2 ___________________________________________________ ___________________________________________________ q0 1.51 1.88 1.85 OSR 1.37 1.38 1.40 q 2.07 2.60 2.58 ___________________________________________________
Table 2.3. Correlation between FEMA 273 Structural Perform-ance Levels and Seismic Load Factor. ___________________________________________________ Structural Original Strengthening Strengthening Performance Structure Level 1 Level 2 Levels ________ ____________ ____________ g g g ___________________________________________________ IO S-1 0.075 0.097 0.120 LS S-3 0.150 0.172 0.436 CP S-5 0.153 0.180 0.485
0,00
0,05
0,10
0,15
0,20
0,25
0,30
0,35
0,40
0,00 0,70 1,20 1,70 2,30 3,20 4,00 4,40 4,80 5,30
Top displacement (mm)
Strengthening Level 2
Strengthening Level 1
Unreinforced structure
Figure 2.7. Seismic load factor (SLF) versus top wall dis-placement for each con-sidered strengthening configuration.
For each structural configuration, a nonlinear capacity curve has been calculated, from which the equivalent bilinear curve and the corresponding ultimate base shear Fy can be obtained. The capacity curve and the bilinear idealization are characterized by the same se-cant stiffness at Fel and by the same dissipated energy. The value of Fel has been obtained from the pushover analysis, corresponding to the point at which the first structural element attains collapse according to a given failure criterion (shear or flexure) and enters the post-elastic branch. The analysis carried out on the structure without strengthening, allows to identify the seismic load factor corresponding to the three fundamental per-formance levels and the parameters for the behaviour factor determination. As expected, the original resis-tance of the structure is very low and the collapse of
the entire structure occurs when just one of the sub-panels reaches its ultimate strength value (Fig. 2.4). Failure takes place at the most compressed sub-panel due to masonry crushing. This behaviour involves a poor global performance with low resistance and a brittle failure mechanism. The case of the wall rein-forced by means of horizontal metal ties at each floor shows some improvement of global resistance but, most of all, a sensible increase of ductility of the struc-ture (see Fig. 2.5). The of effect ties produces collabo-ration between all the sub-panels at each level, so that when one of these fails, the tie transfer the seismic ac-tion to the remaining ones. The last case examined, that is the wall reinforced by means of both horizontal and vertical metal ties, exhibits a significant improve-ment of the seismic load factor for each Performance Level and, in particular, a remarkable increase of ulti-mate strength of the structure (Tables 2.2 and 2.3). Vertical ties improve the behaviour of each sub-panel, that can perform like compressed sloped struts, whereas horizontal ties installed at the base and the top of each sub-panel increase the compressive strength with their confinement action (Fig. 2.6).
In general, results obtained represent a further dem-onstration on the effectiveness of such strengthening system, in terms of both strength and ductility. Also, they highlight the influence of ties arrangement within the wall on the global structural performance. This re-markable improvement is represented in Figure 2.7, where the load-displacement curves for the three wall configurations are shown.
3 CONCLUSIONS
This paper summarises the research activity carried out at the Engineering Faculty of the Second University of Naples on the use of integrative steel structures for seismic up-grading of both reinforced concrete and masonry buildings. Even though characterised by a common approach, the work has been divided into two parts, dealing with RC frames reinforced by eccentric steel braces and with masonry walls strengthened by additional ties, respectively. All the analyses have been carried out complying with the basic assumptions of the Performance Based Design, as issued by interna-tional codes, e.g. the FEMA 273 recommendations. In this view, a damage-controlled nonlinear static proce-dure has been defined to estimate maximum lateral dis-placement and plastic dissipated energy of RC frames, in order to keep damage indices in structural elements within tolerable limits at each performance level. These multi-level objectives have been pursued with a procedure based on the Capacity Spectrum Method, the Inelastic Demand Response Spectra and the esti-mation of the duration-related damage, that is a func-tion of the energy absorbed in the structure. This pro-cedure retains the conceptual simplicity and computa-tional effectiveness of pushover analysis, while ac-

259
counting for the cumulative inelastic deformation un-dergone under displacement reversals. Its accuracy in reproducing the dynamic performance of RC frames rehabilitated with eccentric dissipative braces has been then investigated. The procedure has been applied to regular RC frames strengthened with an eccentric brac-ing system composed of steel braces and vertically placed shear links, showing a great increase of stiffness with a minimal added weight.
In the second part, dealing with masonry walls, the results of a study on the seismic upgrading of in-plane loaded masonry walls strengthened by metal tying techniques have been presented. All calculations pre-sented herein, referring to a typical scheme of wall in a multi-storey masonry building and carried out with the help of a refined F.E.M. model, show in quantitative way the significant improvement attainable with the use of steel ties, in terms of both strength and ductility. The obtained results just represent the first step of a wider and more systematic investigation on the use of metal tying systems for the seismic up-grading of ma-sonry structures, aiming at the development of design methods and criteria, also with regard to innovative materials and techniques. Nevertheless, they clearly point out the significant enhancement of seismic per-formance achievable with the use of steel ties. Also, they highlight the influence of ties configuration on the global structural behaviour of the wall.
In any case, the results obtained from all analyses carried out indicate that an useful correlation with the conventional performance limits is always possible and can represent an helpful guide to the design of the ret-rofit intervention, in case of both RC and masonry structures. In addition, all investigated techniques offer the advantages of reversibility and compatibility with original structures, resulting in such techniques to be very convenient when operating on historical and monumental buildings, from technical as well as eco-nomical point of view.
ACKNOWLEDGEMENTS
This paper has been developed within the research group �Protection of Historical Masonry Structures by Reversible Mixed Techniques�, coordinated by A. Mandara, which is a part of the MIUR-PRIN 2005 Project �Structural Protection and Rehabilitation of Historical Buildings by Reversible Mixed Techniques�coordinated by F.M. Mazzolani.
REFERENCES
Augusti, G., Ciampoli M., Giovenale, P. 2001. Seismic vulner-ability of monumental buildings. Structural Safety, 23.
CEN prENV 1996-1-1 Eurocode 6. Design of masonry struc-tures. Version for translation (Stage 49), Comité Européen de Normalisation.
CEN prENV 1998-1 � Eurocode 8. Design of structures for earthquake resistance. Draft N.6, Version for translation (Stage 49), Comité Européen de Normalisation.
Fajfar, P., 1999. Capacity spectrum method based on inelastic demand spectra. Earthquake Engineering and Structural Dy-namics, 28, 979-993.
Fajfar, P. and Gaspersic, P. 1996.The N2 Method for the seismic damage analysis of r.c. buildings, Earthquake Engineering and Structural Dynamics, 25, 31-46, (1996).
FEMA 273 1997. NEHRP Guidelines for the Seismic Rehabili-tation of Buildings (FEMA 274 Commentary), Building Seismic Safety Council, Washington, D.C., USA.
FEMA 356 2000. Prestandard and Commentary for the Seismic Rehabilitation of Buildings, American Society of Civil Engi-neering (ASCE) for the Federal Emergency Management Agency (FEMA), Washington, D.C., USA.
Ferraioli, M., Avossa, A.M., Malangone, P. 2004. Approximate method for evaluation of seismic damage of rc buildings, Proceedings of the 13th World Conference on Earthquake Engineering, Canada.
Giuffré, A. 1993. Sicurezza e conservazione dei centri storici. Il caso Ortigia. Laterza, Bari.
Ghobarah, A. 2001. Performance-based design in earthquake en-gineering: state of development, Engineering Structures, 23, 878-884.
Li, K., 1996. 3-dimensional nonlinear static/dynamic structural analysis computer program - CANNY 99. Technical Manual.
Malley, J., Popov, E. 1984. Shear Links in Eccentrically Braced Frames, Journal of Struct. Engineering, ASCE , 110(9).
Mandara, A. 2002. Strengthening techniques for buildings, in re-furbishment of buildings and bridges. In F.M. Mazzolani and M. Ivanyi (Eds) Refurbishment of Buildings and Bridges. CISM publications, Chapter 4.
Mandara A., Palumbo G. 2004. Behaviour of confined masonry members: a prediction method. Proc. of the Int. Seminar on. Structural Analysis of Historical Constructions, Padova (It-aly).
Mandara, A., Ramundo, F., Spina, G. 2005. Strengthening of masonry walls by steel ties: analysis of performance levels under seismic actions. Proc. of the XX C.T.A. Conference - Ischia (Italy).
Mandara, A., Ramundo, F., Spina, G. 2007. Seismic upgrading of masonry structures by tying systems: design approach and numerical validation. Submitted to ANIDIS 2007. Conference- Pisa (Italy).
Mander, J.B., Priestley, M., Park R. 1988. Theoretical Stress-Strain Model for Confined Concrete, Journal of Structural Engineering, 114, ASCE, 1804-1825.
Mazzolani, F.M., Mandara, A. 2002. Modern trends in the use of special metals for the improvement of historical and monu-mental structures. Journal of Engineering Structures n.24.Elsevier.
Ordaz, M., Pèrez-Rocha, LE. 1998. Estimation of strength-reduction factors for elastoplastic systems: New approach, Earthquake Engineering and Struct. Dynamics, 27, 889-901.
Park, Y.J., Ang, A.H.S. 1985. Mechanistic seismic damage model for reinforced concrete, Journal of Structural Engi-neering, 111(4), ASCE, 722-739.
Spina, G., Ramundo, F., Mandara A. 2004. Masonry strengthen-ing by metal tie bars, a case study. Proc. of SAHC Confer-ence � Padova.
Tomazevic, M., Klemenc I.. 1997. Seismic behaviour of con-fined masonry walls. Earthquake Engineering and Structural Dynamic, vol. 26, 1059-1071.
Toma�evic, M. 1999. Earthquake-resistant design of masonry buildings�. Series on Innovation in Structures and Construc-tion. Vol. 1. London: Imperial College Press.
Tomazevic, M., Bisiljkov. V., Weiss, P. 2000. Structural behav-iour factor for masonry walls. 13th World Conference on Earthquake Engineering, Vancouver B.C., Canada.

260
1 INTRODUCTION
The Mediterranean and Balkan area is greatly ex-posed to seismic hazard. Consequently, its cultural heritage is strongly susceptible to undergo severe damage or even collapse due to earthquake. The constructions mostly exposed to seismic risk are the historical and monumental ones, since in many cases they are not endowed with basic anti-seismic fea-tures and/or no seismic retrofit has been applied to them. If the latest earthquakes occurred in this area are considered (Friuli-Italy, 1976; Vrancia-Romania, 1977; Campania and Basilicata-Italy, 1980; Spitak-Armenia, 1988; Banat-Romania,1991; Erzincam-Turkey, 1992; Dniar-Turkey, 1995; Umbria-Italy, 1997; Adana-Turkey, 1998; Iznit and Duzce-Turkey, 1999; Athens-Greece, 1999; Afyon-Turkey, 2002; Bingol-Turkey, 2003; Bourmedes-Algeria, 2003; Al Hoceima-Morocco, 2004, to mention the most im-portant, only), the extremely unsatisfactory degree of seismic protection is clearly apparent. Degrada-tion in material quality, lack of appropriate mainte-nance and, above all, absence of elementary anti-seismic provisions are the clear reasons of the very large number of the collapses, particularly in old masonry structures, occurred during earthquakes.
The extreme seismic vulnerability of the histori-cal constructions is confirmed by this evidence and, consequently, urgent strategies for the seismic pro-tection of the cultural heritage are strongly required. Considering the construction as a system, the objec-tive is improving its global performance, rather than providing solutions to specific structural or architec-
tural problems, requiring the set-up of new techno-logical systems. Moreover, the new intervention methods must be not only reliable and durable, but also, if required, easy to monitor and remove, the latter aspect corresponding to the widely shared pol-icy of safeguarding existing buildings from inappro-priate restoration interventions, with particular ref-erence to historical and monumental constructions. At the same time, modern constructional systems have provided good seismic performances, strongly limiting damage and completely avoiding collapse. Consequently, a slow but continuous increasing in the sensitivity to the use of more advanced tech-nologies in the earthquake protection policy has be-gun. The excellent performances of innovative mate-rials have been acknowledged and the potential advantages of using special techniques for seismic resistant structures has been recognized, in a step by step process. Although initially referred to new buildings, this trend represents an important study field in seismic rehabilitation of existing buildings, with particular interest for historical and monumen-tal constructions (Mazzolani 2005a, b, c, 2006a,b,c, 2007).
2 THE PARTNERSHIP
The scientific activity of PROHITECH project is subdivided into four parts, aiming at producing four main deliverables, to be developed in three years starting from 1st October 2004. The workplan is based on twelve scientific workpackages, plus three
Earthquake protection of historical buildings
F.M. Mazzolani University of Naples Federico II, Naples, Italy
ABSTRACT: The research project PROHITECH is framed within the INCO thematic areas, devoted to �Pro-tection and conservation of cultural heritage� in the Mediterranean area. The main subject of the research is the seismic protection of historical and monumental buildings and the main objective consists in developing sustainable methodologies for the use of Reversible Mixed Technologies (RMTs) in the seismic protection of the existing constructions. RMTs exploit the peculiarities of innovative materials and special devices, allow-ing ease of removal when necessary. Furthermore, an optimization of the global behaviour under seismic ac-tions is achieved combining different materials and techniques. The research endpoint is a proposal of codifi-cation for the use of such technologies in the seismic protection of existing constructions.

261
management workpackages. A number of sixteen scientific workpackage deliverables is foreseen. Six-teen academic institutions, coming from twelve Countries mostly belonging to the South European and Mediterranean area, are involved in the research programme (Fig. 1).
Figure 1. The PROHITECH partner Countries.
The partner Countries are: Algeria (AL), Belgium (B), Egypt (EG), Macedonia (MK), Greece (GR), Is-rael (ISR), Italy (I), Morocco (M), Portugal (P), Romania (RO), Slovenia (SL), Turkey (TR). In the following the partner institutions and the relative re-sponsible are indicated. UNINA: University of Naples �Federico II�-Engineering Faculty, (F.M. Mazzolani, project general coordinator); B: Univer-sity of Liège (J. Jaspart); MK: University of Skopje (K. Gramatikov); GR: Technical University of Ath-ens (I. Vayas); NA-ARC: University of Naples �Federico II�-Architecture Faculty (R. Landolfo); P: Technical University of Lisbon (L. Calado); RO-PUT: Polytechnical University of Timisoara (D. Dubina); RO-TUB: Technical University of Bucha-rest (D. Lungu); SL: University of Ljubljana (D. Beg); TR: Bo aziçi University of Istanbul (G. Altay Askar); ISR: Technion Israel Institute of Technol-ogy, Haifa (A.V. Rutenberg); EG: Engineering Cen-tre for Archeology and Environment, Faculty of En-gineering, Cairo University (M. El Zahabi); M: Moroccan National Scientific and Technical Re-search Centre, Rabat (A. Iben Brahim); SUN: Sec-ond University of Naples (A. Mandara); AL: Uni-versity of Science and Technology �H. Boumedien� of Algier, Civil Engineering Faculty (M. Chem-rouk); UNICH: University of Chieti/Pescara-Architecture Faculty (G. De Matteis, project techni-cal coordinator).
3 THE BASIC ISSUES
Within the technical field of seismic rehabilitation, two aspects are receiving an increasing attention by engineers and researchers, namely:
- Preservation of Structural Integrity of existing buildings under severe or exceptional seismic ac-tions (SI);
- Improvement of building seismic performance by means of RMTs.
Both these aspects are closely interrelated each other, in the sense that the application of Reversible Mixed Technologies is, in some cases, the only tool to achieve a satisfying level of Structural Integrity under severe earthquake actions. The concept of Structural Integrity relies on the necessity to ensure seismic protection against collapse also in case of destroying events. In this view, it can be properly framed within the advanced concept of Performance Based Design (PBD). As well known, the Perform-ance Based Design is a new way to approach the structural design against seismic actions, having the purpose to ensure a proper degree of structural reli-ability under any specified working conditions, in-cluding both serviceability and ultimate limit states.
Till now, the Performance Based Design has been applied to new structures, only, which can be easily designed complying with relevant behavioural thresholds set by PBD itself. No applications exist in the field of existing constructions, yet. In particular, neither criteria nor methodologies are available for achieving a satisfying design level against strong in-tensity earthquakes. This is indirectly confirmed by most of national seismic codifications, which, as a matter of fact, allow to avoid a rigorous seismic ret-rofit in case of historical constructions. This ap-proach, of course, tends to preserve the monumental value of the construction, but at the same time is not adequate to protect against severe earthquakes. It is evident how this aspect deserves great attention not only in the perspective of saving human lives, but also at the light of preserving inestimable buildings from complete destruction. The use of innovative materials and Mixed Technologies is the most ap-propriate answer for ensuring an adequate perform-ance, and hence the Structural Integrity, under strong seismic actions.
Reversible Mixed Technologies are based on the integration of structural members of different mate-rials and/or construction methods into a single con-structional organism. The basic feature of RMTs is that their application should be always completely recoverable, that is reversible, if required. This is considered as an essential design requirement in or-der to prevent historical and monumental buildings from unsuitable rehabilitation operations. The main aim of RMTs is the best exploitation of material and technology features, in order to optimize the struc-tural behaviour under any condition, including very severe limit states produced by strong seismic ac-tions. This practice, initially concerned with new technologically advanced buildings, is now being looked up with increasing interest also in the field of structural rehabilitation, due to the large possibilities of structural optimization and, hence, performance maximization, both achieved thanks to mixed tech-nologies. In few words, the use of reversible mixed

262
technologies would involve the best exploitation of each material and/or technology used in the inter-vention, providing in such a way the best perform-ance from both technical and economical point of view.
4 THE RESEARCH WORKPACKAGES
It is planned to achieve the above objectives through the creation of twelve scientific workpackages deal-ing with sixteen deliverables, which are aimed at the production of four main deliverables, representing the final out-put of the four parts which the research plan has been subdivided into. The interconnections among the WPs and the four Parts, leading to the achievement of the project goals, is shown in Figure 2. Details on the project workplan and workpack-ages can be found in Mazzolani (2005 a, b, c, 2006 a, b, c, 2007).
Figure 2. Interconnection among WPs, project deliverables and main deliverables.
5 MAIN OBTAINED RESULTS
5.1 First main deliverable The first main deliverable is the synthesis of the re-sults carried out during the first year activity within the project part R1. Since this part represents a sort of state-of-the-art in the field of the intervention strategies for the protection of buildings, all partner Countries have provided their own contribution, leading to the definition of a common background, which represents the starting point for the develop-
ment of the innovative contribution of the project (Mazzolani et al. 2005a).
The contents of the volume, composed of five chapters, essentially derive from the material col-lected within the first four workpackages. In particu-lar, the contents of Chapters 1 and 3 are mainly based on the output of WP3, the contents of Chapter 2 synthesize the output of WP2, the contents of Chapter 4 derive from WP1 activity and the contents of Chapter 5 are based on WP4.
The authors of D-I Chapter 1 �Seismic hazard in the PROHITECH Countries� are F.M. Mazzolani and G. De Matteis, who are the general coordinator and the technical coordinator of the PROHITECH project, respectively. In this chapter information on seismic hazard in the PROHITECH Euro-Mediterranean Countries is synthesized, including seismicity maps, main historical events, macroseis-mic intensity maps, seismic zonation maps and in-formation on acceleration response spectra specific to different soil conditions. The study has been or-ganized by subregions and by Countries. Thus, three main subregions have been identified on the basis of the geographical proximity and common geody-namical environment of the considered Countries: a Western PROHITECH region, which includes Alge-ria, Morocco and Portugal; a Central PROHITECH region, in which Belgium, Greece, Italy, Macedonia, Romania, and Slovenia are grouped; an Eastern PROHITECH region, including Egypt, Israel and Turkey.
G. Altay Askar (WP2 Leader) and H. Lu are the authors of Chapter 2 �Damage assessment�, in which the damage assessment methodologies wide-spread in the PROHITECH Countries are illustrated. The chapter presents an overview of building ty-pologies and construction practices, with some em-phasis on the development of seismic design pro-visions and it shows both quick and detailed damage assessment methods in use in various Countries. Furthermore, the damage patterns observed in previ-ous earthquakes, the results of post-earthquake dam-age surveys together with earthquake history and performance of some buildings representative of the cultural heritage of the Mediterranean area are col-lected.
Chapter 3 �Seismic vulnerability assessment�, written by A. Iben Brahim (WP3 Leader), is devoted to the seismic vulnerability assessment of historical buildings in the PROHITECH Countries. In particu-lar, the current approaches to damage assessment and the definition of the vulnerabilities of structural types are presented, together with the analysis of seismic risk related to the historical building heri-tage of the Mediterranean area, on the basis of the structural damage data reported in Chapter 2.
In Chapter 4 �Overview of existing techniques� (authors A. Mandara, WP1 Leader, and F.M. Maz-zolani) the existing techniques used in the PROHI-

263
TECH Countries for the protection of buildings against the seismic action, with reference to the dif-ferent structural types, are described.
The last chapter of the first main deliverable (Chapter 5 �Intervention strategies�, written by D. Lungu, WP4 Leader, and C. Arion) illustrates the in-tervention strategies for seismic protection of build-ings, with special attention towards both the techno-logical and policy aspects of the problem.
5.2 Project deliverables D1-to-D4 Besides the main deliverable D-I, the output of PROHITECH Part R1 is completed by four project deliverables, as previously mentioned (Altay Askar 2005; Iben Brahim 2005; Lungu 2005; Mandara 2005).
Each project deliverable, whose contents come from the partner contributions, has been edited by the leader of the respective workpackage, and is made of two parts. The first part is the text of the de-liverable, written by the WP leader on the basis of the partner contributions. The second part is an ap-pendix, which collects all the contribution docu-ments written by the partners. In this way it is possi-ble to have, for the subject dealt with in each project deliverable, both a homogeneous and comprehensive document and all the single documents prepared by the partners. Each document is characterized by a specific label, reporting information related to the contribution partner, the workpackage, the document and the draft.
5.3 Second main deliverable The main deliverable D-II is concerned with the elements required for a correct choice of both mate-rials and technologies to be used in seismic rehabili-tation (Mazzolani et al. 2006). It merges the out-come of the parallel activity of WP5 (Innovative Materials and Techniques for Seismic Protection, leader: L. Calado) and WP6 (Set-up of Advanced Reversible Mixed Technologies for Seismic Protec-tion, leader: D. Beg).
D-II is composed of four Chapters. Chapter 1 (au-thors: F.M. Mazzolani and L. Calado) is an introduc-tion to the mixed reversible technologies, where the main aspects of seismic protection based on the use of special devices and systems are underlined. Moreover a general classification of the innovative devices for seismic protection is briefly presented.
The contents of Chapter 2 (authors: L. Calado, J.M. Proença, P. Skuber and M. Esposto) mainly de-rive from the WP5 final report. Innovative materials are presented considering their basic principles, structural features, fields of application, experimen-tal tests and numerical models, design criteria and codification issues, structural applications and eco-nomic aspects. The Chapter is concluded by a com-
parison and evaluation among the considered mate-rials, based on the output of WP6 final report.
Chapter 3 (authors: L. Calado, A. Panão and L. Pavlov i ) deals with the innovative devices which can be adopted for mixed reversible technologies. The structure of the Chapter is based on WP5 final report, while the contents come from both WP5 and WP6 final reports. Also in this case, every device is presented by considering the aspects mentioned in Chapter 2.
Chapter 4 (authors: D. Beg and G. De Matteis) is devoted to the seismic protection systems. Its con-tents come from WP6 final report and deal with the seismic protection systems for masonry buildings, reinforced concrete frames, brick or stone masonry structures, like towers, domes and vaults, and stone temples. At the end of the Chapter a general over-view on the seismic protection with active control system is presented.
5.4 Project deliverables D5-to-D7 The project deliverables D5, D6 and D7 are related to the activities developed within WP5 and WP6.
Project deliverable D5 (Calado 2006) is focused on innovative materials, including new metals and metal-based intervention techniques, in order to se-lect suitable materials for creating both strengthen-ing systems and special devices aimed at the optimi-zation of the structural behaviour.
Project deliverables D6 and D7 (Beg 2006), as specific output of WP6, contemporary represent the complement and completion of the work performed in WP4 and WP5, by providing the information nec-essary to the proper use of innovative materials and mixed technologies in strengthening interventions, as well as the definition of special systems for seis-mic protection to be applied to existing buildings.
6 ACTIVITY IN PROGRESS
The activities actually in progress are essentially those related to the project Part R3, which is final-ized to the set-up of adequate calculation methods for reversible mixed technologies used in seismic protection. It deals with the experimental and nu-merical analyses, which represent two fields strongly interconnected each other and undoubtedly fundamental for the project, since they are expected to yield the necessary tools for performing practical design calculations. Besides, the activity related to Part R4 (validation, study cases and design guide-lines) is also in progress.
Workpackage 7 (Experimental analysis; leader: K. Gramatikov, co-leader: L. Taskov) is entirely de-voted to the laboratory activity of PROHITECH, useful for giving an experimental contribution to the assessment and set up of new mixed techniques for

264
repairing and strengthening of historical buildings and monuments belonging to the Cultural Heritage of the Mediterranean basin. The experimental activ-ity in progress is developed at five different levels: full scale building, large scale models, sub-systems, full devices, reduced scale devices.
The full scale cyclic tests have been performed on one r.c. building in the Bagnoli area in Naples (Fig. 3). In particular, this test represents an unique occa-sion of knowledge, since the studied building is not an �ad hoc� built model, but it is a �real� construc-tion, representative of a large part of the present building stock in many Countries during 20th Cen-tury.
Figure 3. R.c. building for full scale tests in Naples (Italy).
The full scale building has been strongly damaged by applying a seismic input and then it has been re-paired by means of FRP bars in the mortar joints of the external walls (Fig. 4a). Successively it has been damaged again, and an intervention by means of buckling restrained braces (BRBs) will be carried out (Fig. 4b).
(a) (b) Figure 4. (a) Intervention by means of FRPs; (b) Planned inter-vention by BRBs for the second repairing of the r.c. building.
The programme of large scale tests on shaking table comprehends the models of a Gothic Abbey (Fossa-nova, Italy), of an Ancient Greek Temple, of the Byzantine St. Nikola Church (Psacha, Kriva Palanka, Macedonia) and of Mustafa Pasha Mosque (Skopje, Macedonia).
The three columns model of a Greek temple (Fig. 5a) will be tested in Athens (Greece), where the me-chanical properties of marble are experimentally de-termined too. The Mustafa Pasha Mosque has al-ready been tested at the IZIIS Laboratory (Skopje, Macedonia), where the Gothic Abbey and the Byz-antine Church models will be also tested. In Figure 5b the model after the consolidation of the minaret by means of FRP strips and tissues is shown,
whereas the model final collapse configuration is shown in Figure 6.
(a) (b) Figure 5. (a) The preparation of the model of Greek temple; (b) Mustafa Pasha Mosque large scale model during the test.
Figure 6. Mustafa Pasha Mosque model at the final damaged configuration.
Tests on sub-systems have been performed and/or are in phase of development both on full scale and reduced scale specimens.
Full scale tests involve innovative steel-wood-concrete composite structures and timber frames ret-rofitted by shear panels and/or dissipative beam-to-column connections. The experimental campaign on steel-wood-concrete composite structures, set-up and designed at the University of Naples �Federico II� (Italy), has been performed in Lisbon (Portugal) and in Naples (Italy). Monotonic push-out tests for studying the connections� behaviour and both mono-tonic and cyclic tests on composite beam and floor system (Fig. 7) have been carried out.
Figure 7. Steel-wood-concrete composite floor system.
The set-up of metal panels, useful for retrofitting in-terventions, has been already experienced on a full scale r.c. building in Naples (Fig. 8a). Furthermore, an experimental campaign on bracing type pure alu-minium shear panels (Fig. 8b) is currently ongoing in Naples.
FRP

265
(a) (b)Figure 8. (a) Metal shear panel experienced on full scale r.c. building; (b) Test on bracing type aluminium shear panels.
Experimental studies on timber frames retrofitting are in phase of development in Naples (Italy) and in Istanbul (Turkey). The behaviour of a dissipative connection of a beam-to-column wooden joint has been evaluated by means of �ad hoc� tests (Fig. 9).
(a) (b) Figure 9. Dissipative beam-to-column wooden connection: (a) experimental tests; (b) component parts of the connection.
Reduced scale tests on masonry walls retrofitted by steel/aluminium plates or by a steel wire mesh are in phase of development in Timisoara (Romania). The behaviour of r.c. panels is experimentally analysed in Bucharest (Romania). Buckling and bending be-haviour of iron/steel elements reinforced by FRP will be analysed by testing in Liège (Belgium).
Finally, tests on DC 90 dampers and on titanium clamps are going to be tested in Ljubljana (Slove-nia), while tests on magneto-rheological devices will be performed in Aversa (Italy).
Workpackage 8 (Numerical analysis, leader: R. Landolfo) is aimed at the set-up of numerical models for describing the behaviour of both structural mate-rials and special devices on the basis of experimental tests. Numerical procedures are then applied to the seismic analysis of upgraded constructions in order to investigate the influence of main variables by means of parametric dynamic analysis. The first part of work within WP8 has dealt with a series of pre-liminary numerical studies concerning a benchmark activity, by which the partners have created a sort of collective background in the field of numerical analyses. The second part of WP8 activity has con-cerned the pre-analyses of some of the experimental tests planned within the project. Figure 12 shows the FEM model of the Gothic Abbey in Fossanova, whereas Figure 13 shows the collapse mode given
by the numerical model of the Greek temple subas-semblage. The FEM model of St. Nikola Church is plotted in Figure 14, whereas Figure 15 represents the vibration modes of the FEM model of the Mustafa Pasha Mosque, which has been used to pre-dict the experimental behaviour on the large scale model and to design the consolidation system.
Figure 12. FEM model of Fossanova Gothic Abbey.
Figure 13. FEM model of an ancient Greek temple.
Figure 14. FEM model of St. Nikola Church.
Figure 15. FEM model of Mustafa Pasha Mosque.
On the bases of the experimental and numerical analyses, the calculation methods for reversible mixed technologies used in seismic protection will be set-up.
The results of Part R3 will compose the third main deliverable, which will be organized in three main parts: 1) Experimental activity (referring to the different types of experiments); 2) Numerical activ-ity (dealing with the simulation of experimental tests by numerical models and comparisons of results); 3) Calculation models (referred to the identification of

266
simplified models to be used as design tools in struc-tural restoration).
The specific output of WP7 and WP8 will be col-lected in D8 and D9 project deliverables, respec-tively. The output of WP9 will lead to two project deliverables: D10, dealing with analytical models for special materials and special devices for the seismic structural control, and D11, dealing with simplified models for the global seismic analysis of historical constructions.
7 FUTURE ACTIVITY
The future activity, to be completed at the end of the third year of the PROHITECH project, mainly deals with the contents of Part R4 of the programme. The results of the work performed during the first two years will be finalized to codification proposals. Contemporary, the selected innovative materials and techniques, the developed reversible mixed tech-nologies, together with the calculation methods, will be subjected to extensive validation studies. The data obtained by WP5 and WP6 will be analysed and compared with traditional materials and technolo-gies. Firstly, a cost-to-benefit evaluation will be per-formed to outline the scope and the effectiveness of new materials and/or technologies. As a second step, the performance of the proposed solutions will be assessed in terms of strength, including low-cycle fatigue resistance, ductility and dissipation capacity compared with conventional solutions. The results from the experimental (WP7) and numerical (WP8) analysis will be extensively used. Special conclu-sions will be drawn on the applicability of different innovative solutions depending on the specific con-ditions and design requirements.
Special attention will be paid to the validation of the proposed calculation models (WP9) on the basis of experimental and numerical results, so as to prove their reliability in the perspective of their inclusion in the Design Guidelines (WP12). For the specific case of monumental constructions, a feasibility study will be performed to assess the applicability of vari-ous innovative solutions to different types of build-ings. Together with the considerations based on the structural performance, additional architectural and historical�cultural aspects will be accounted for in the context of the possible interventions.
Within the WP10, the validation studies in terms of cost-to-benefit analyses will be synthesized in the project deliverable D12, while the project deliver-able D13 will deal with the performance assessment of the new technologies, which will be compared to the traditional ones.
The knowledge developed within the project will be conveniently applied to some selected study cases (WP11), consisting in historical buildings belonging to the heritage of Mediterranean Countries, in order
to perform analyses of feasibility of seismic protec-tion interventions by means of reversible mixed technologies. Until now, the selected study cases are the following. The Mustafa Pasha Mosque of Skopje and the St. Nikola Church in Psacha, both in Mace-donia, as well as the Gothic Abbey in Fossanova (It-aly), are representative of masonry religious build-ings. The Royal Palace of Naples and the Gallery �Umberto I�, both in Naples (Italy), are character-ized by wooden and iron structures, respectively. The Koletti building in Athens (Greece) is the only r.c. structure considered, while the Beylerbeyi Pal-ace in Istanbul (Turkey) is interesting for studying the interaction between timber and masonry ele-ments. The Medina of Salé in Morocco has been also selected for considering the complex behaviour of undiversified building blocks.
The design of relevant application solutions based on reversible mixed technologies is also fore-seen together with the critical evaluation of collected examples of real restoration cases, belonging to the current experience in each partner Country. This ac-tivity will be developed in WP11, leading to the preparation of the corresponding project deliverable (D14). The interconnection between the study cases and the development of design guidelines (WP12) is apparent, since the first step can be considered as a benchmark for the set-up of the codification rules. As a result of the WP12 activity, two project deliv-erables will be realized: a manual for the actual im-plementation of the procedures proposed and devel-oped within the PROHITECH project (D15); a proposal of codification rules for the design of seis-mic protection interventions by using reversible mixed technologies (D16).
The final document of the whole project will comprise the fourth main deliverable, downstream of the third year activity, containing a set of recom-mendations elaborated on the basis of all collected data and results. The proposal will comply with the most up-to-dated codification issues in the field of seismic design, say the Performance Based Design, and will share the same global layout, language and philosophy as Structural Eurocodes issued by CEN.
8 EXPECTED RESULTS
The PROHITECH project is an important opportu-nity to develop knowledge and technology in the field of the seismic protection of the Euro-Mediterranean cultural heritage (Mazzolani 2007). The innovative character of the technical solutions proposed for seismic retrofit-ting is mainly based on the concept of reversible mixed technologies. The main expected results of the research activity are the following.
The basis for the assessment of an up-to-dated state-of-the-art concerning advanced systems of

267
seismic protection of existing constructions will be set-up, in harmony with the specific demand of all European and Mediterranean Countries for a more comprehensive framing of anti-seismic rehabilita-tion.
Both conscience and knowledge about �new� ma-terials and technologies as a suit-able alternative to �traditional� solutions will increase, since the last ones are proved to be often inadequate to provide a satisfying seismic performance, in particular when applied to historical and monumental constructions.
The adoption of materials and systems which are reversible, recyclable, environmentally friendly, and economically sustainable will be supported. The pre-sent degree of knowledge on the application of these materials and systems is not particularly advanced, neither codified in any form, hence it is expected that the research activity carried out within PROHI-TECH will yield significant innovation in seismic protection practice.
New and up-to-dated information on the problem of seismic protection will be disseminated, thanks to the participation of acknowledged institutions, be-longing to both Europe and Mediterranean basin, all of them widely experienced in the field of seismic design and with an ongoing significant research ac-tivity in such area.
Young engineers and architects, as well as re-searchers involved in seismic design, will have the opportunity for a qualified training and research ac-tivity, aimed at an enrichment of existing skills in the field of structural engineering.
Design and constructional rules for interventions based on advanced and innovative technologies will be set-up. This is expected to recall to a greater ex-tent the interest of both construction industry and practicing engineers, so as to have a remarkable im-pact on the current anti-seismic rehabilitation prac-tice.
Information on the ongoing activity is available in the web site www.prohitech.unina.it.
REFERENCES
Altay Askar, G. (ed) 2005. PROHITECH project deliverable D2 Assessment of earth-quake-induced structural damage in historical buildings of the Mediterranean area.
Beg, D. (ed) 2006. PROHITECH project deliverable D6-7 De-velopment of reinforcement procedures for structural ele-ments based on the use of reversible mixed technologies,Set-up of seismic protection systems based on the dissipa-tion of seismic input energy.
Calado, L. (ed) 2006. PROHITECH project deliverable D5 Identification of innovative materials and special devices to be used for reversible mixed technologies in structural re-habilitation.
Iben Brahim, A. (ed) 2005. PROHITECH project deliverable D3 Assessment of seismic risk maps and evaluation of seis-mic vulnerability of historical building heritage in the Mediterranean area.
Lungu, D. (ed) 2005. PROHITECH project deliverable D4 Definition of methodologies for seismic up-grading of con-structions based on both strengthening of structural ele-ments and control of the seismic response.
Mandara, A. (ed) 2005. PROHITECH project deliverable D1 Overview of traditional technological systems adopted for seismic rehabilitation of historical buildings in European and Mediterranean Countries.
Mazzolani, F.M. 2005a. Earthquake protection of historical buildings by reversible mixed technologies: the PROHI-TECH project (oral presentation). Symp. on Seismic prot. of the cultural heritage by innovative techniques, Rome, Italy.
Mazzolani, F.M. 2005b. Earthquake protection of historical buildings by reversible mixed technologies: the PROHI-TECH project. Proc. of the Symposium on Damage and re-pair of historical and monumental buildings, Venice, Italy.
Mazzolani, F.M. 2005c. Earthquake protection of historical buildings by reversible mixed technologies: the PROHI-TECH project. 2nd H & mH International Conference on �Vulnerability of 20th Century Cultural Heritage to Haz-ards and Prevention Measures�, KOS, Greece.
Mazzolani, F.M. 2006a. Earthquake protection of historical buildings by reversible mixed technologies. Proc. of the 5th International Conference on the Behaviour of Steel Struc-tures in Seismic Areas (STESSA 2006), Yokohama, Japan.
Mazzolani, F.M. 2006b. Earthquake protection of historical buildings by reversible mixed technologies: the PROHI-TECH project. Proc. of the 7th European Conference �SAUVEUR� Safeguarded Cultural Heritage, Prague, Czech Republik.
Mazzolani, F.M. 2006c. The research project PROHITECH: state of advancement. In The Construction Aspect of Built Heritage Protection, Dubrovnik, Croatia.
Mazzolani, F.M. 2007. Earthquake protection of historical buildings, Invited lecture, Reluis workshop, Salerno, Italy.
Mazzolani, F.M., De Matteis, G., Calado, L. Beg, D. (eds) 2006. PROHITECH second main deliverable D-II Reversi-ble mixed technologies for seismic protection: guide to ma-terial and technology selection.
Mazzolani, F.M., De Matteis, G., Mandara, A., Altay Askar, G., Lungu, D. (eds) 2005a. PROHITECH first main deliv-erable D-I Assessment of intervention strategies for the seismic protection of historical building heritage in the Mediterranean basin.
Mazzolani, F.M., Gramatikov, K., Dumova-Jovanoska, E., Milutinovic, Z., Taskov, L. 2005b. Earthquake protection of historical buildings by reversible mixed technologies: the PROHITECH project, MASE Macedonian Association of Structural Engineers.
Out-put of the PROHITECH project meetings: First general meeting in Anacapri (Italy) on 5th and 6th November 2004; Second general meeting in Azores (Portugal) on 2nd and 3rd June 2005; WP1-to-WP4 joint meeting in Naples (It-aly) on 14th and 15th July 2005; First editorial meeting on 29th August 2005 in Ohrid (Macedonia) and First Seminar on 30th August 2005; WP5-to-WP8 joint meeting in Naples (Italy) on 6th and 7th October 2005; Third general meeting in Crete (Greece) on 24th and 25th November 2005; WP8 special meeting in Naples (Italy) on 23rd and 24th February 2006; WP5-WP6 joint meet-ing in Ljubljana (Slovenia) on 9th-11th March 2006; Fourth general meet-ing in Istanbul (Turkey) on 6th and 7th April 2006 and Second Seminar on 8th April 2006; WP11 �Iron meeting� in Naples (Italy) on 8th June 2006; WP11 �Rabat meeting� in Rabat (Morocco) on 9th-11th July 2006; Fifth general meeting in Poiana-Brasov (Romania) on 18th and 19th Sep-tember 2006; WP7 meetings in Skopje (Macedonia) on 12th-14th November and on 3rd and 4th December 2006; WP8 meeting in Timisoara (Romania) on 8th and 9th De-cember 2006.

268
1 INTRODUCTION
Spherical or ball bearings are nowadays used in sev-eral foundations to protect the respective structures from earthquakes. For instance, such a type of aseis-mic isolation is used at the foundation of the new San-Francisco International Airport and at some other buildings but in those systems, at each bearing a big metallic sphere (ball) rests in a concave base of two metallic plates; during an earthquake, the con-tact between the moving sphere and the base starts as rolling and is transformed as a sliding one due to the concave surfaces. Recent experiments on differ-ent types of bearings show that those foundations that moved on ball bearing with a clearly rolling sys-tem exhibited the least amount of damage during an earthquake [1-4].
The basic strategy for this isolation bearing system is to cut-off the load transmission path of the seismic action. The kinematics of a cylindrical or spherical bearing is schematically shown in Figure 1. Roller bearings comprise a part of solid steel spheres or cylinders put between two parallel rocker plates, so that relative displacement in the direction of motion is made possible by rolling action [2-4]. For the mass S being in contact with the sphere at point A, the cylinder rotates at the given point around the point P. The horizontal movement of the mass S equals to Ddd ws , where wd is the angle of rotation and D is the diameter of the sphere.
Figure 1, On the principle of the system
The center of the sphere has a horizontal displace-ment equal to '2/)( KKDdKd ws . Of course, this mechanism works only along the direction of the base movement that is perpendicular to the roll-ing axis of the sphere. This is a serious limitation, since the direction of an earthquake is always un-known. A practical mechanism based on this princi-ple should take into account several technological problems that arise during the applications of this concept. These are related to the limited area of con-tact between spheres and planes (point contact or, in the best case, Herzian contact) to the coordination of the synchronous movement of several spheres dur-ing the earthquake, their ability to adjust the direc-
The MNB aseismic isolation systemfor the seismic protection of structures
A. Michalopoulos, Th. Nikolaidis & C.C.Baniotopoulos Aristotle University of Thessaloniki, Greece
ABSTRACT: The innovative isolation system MNB whose purpose is to reduce earthquake damage in new and existing buildings is herein proposed. The proposed system entails the detachment of a building through the insertion of new type of aseismic steel bearings at the bottom of its foundation. This aseismic isolation system is based on the kinematics of a group of metallic spheres or cylinders placed between two horizontal steel plates. By this system, the horizontal earthquake induced vibration is absorbed by the number of the steel spheres or cylinders and does not propagate to the structure. The present research work is based on the theoretical framework of the Herzian contact, as well as on experimental testing.

269
tion of rolling if the induced movement changes di-rection etc.
2 DESCRIPTION OF THE ASEISMIC SYSTEM
The bearing is constructed from two steel plates and is to be placed at the bottom of the building near the foundation [5-6]. The spheres are hold at their posi-tion by means of a third steel plate with holes (dashed lines in Figure2). During rolling the spheres remain in contact with the latter fixation plates and are obliged to move in the same direction, according to the needs of the supported structure (Figure 3). A free space between the system of spheres and the end of the connection is provided so that during ex-treme earthquake motions the whole system remains functional and supports the column loading without leading to tensile stresses in the bearing (Figure2 & 3).
Figure 2. The system of the spheres
Loose of contact is prohibited by the self-weight of the structure. The required free space is estimated to be between cm105 and it depends on the local conditions (estimated maximum earthquake move-ment etc.). Due to the previously described kinema-tical relations and the inertia of the upper part of the structure, the earthquake movement is not transmit-ted to the upper part of the structure. In principle, one uses the same principle used in the rolling bear-ings of rotating shafts. The resistance of rolling fric-tion is much lower than the one due to classical slip friction. Note that the number of the spheres varies according to the load of each column.
3 VIBRATION ISOLATION
By means of the described system aseismic isolation is provided since all horizontal movement of the base does not propagate into the upper structure. As soon as an earthquake ends, the ground usually re-turns to its natural position before the shake. The system of spheres also returns to its initial position, thanks to the full similarity of the displace-ment/movement of the system of spheres to the dis-placement-movement of the ground with a similarity
ratio of 1:2 (Thales theory of proportionality). This of course is valid on condition that the earthquake-induced oscillation-displacement of the ground is a horizontal displacement parallel to itself
Figure 3. The positioning of the isolation system
which is very near to the reality. As we know, the oscillations of the ground during an earthquake are not symmetrical. There are even changes in the di-rection of movement during an earthquake, as well as in the breadth of the swing of the oscillation. The movements of the spheres, however, faithfully fol-low the movements of the ground: they move back and forward in the same direction as the ground, and they stop immediately when the earthquake stops, just as a seismograph does.
In the installation of this type of bearing that is de-scribed here, care is taken so that the base and the horizontal (upper and lower) steel plates are per-fectly horizontal and further, the system of spheres is centrally positioned within the housing of bearings, with equal margin all around for free displacement in case of earthquake. In the special case that an earthquake becomes and a crack in the ground cross-ing the structure is possible, then the proposed sys-tem must carefully be introduced applying a special technique that will be presented in a forthcoming publication.
4 CYLINDRICAL ASEISMIC BEARINGS FOR BRIDGES
In bridge design, the vertical loading assigned to each column is in principle high. This fact may re-duce the applicability of spherical rollers, as de-scribed in the previous parts. Cylindrical rollers are in general more appropriate. To avoid the previously mentioned problem connected with the cylindrical rollers, the configuration of Figure4 is proposed. A type of cylindrical bearing it is already known made

270
up by a single steel cylinder rolling in the longitudi-nal direction. This type of aseismic isolation
Figure 4. Cylindrical aseismic isolation system
is not available for vibration isolation at the other component of the motion (cf. e.g. the February 2006 earthquake at Sikkin India [7]). In this presentation two layers of rollers (cylinders) are used together, so that their combination provides vibration isolation for every direction of the earthquake action. The in-ternal mechanism that holds the rollers in their posi-tion (plates with holes) can be placed between roll-ers, so that the cylinders remain to their position during movement. In addition, appropriate measures (stoppers at the end of plates U and L) are taken to avoid destruction of the whole connection in ex-treme loadings. It is noteworthy that the proposed vibration isolation system is appropriate for columns with low height.
This system can be used safely whenever the sup-porting bearings of the deck structure are connected directly to the base of the ground. In other cases like the ones of suspended bridges, the arising vibrations and the dynamical effects in general are more com-plicated, so that, for the time being, the system can-not be proposed yet for application.
5 CONSTRUCTION DETAILS
The precise design of the flat moving bearings, both the single plane ball-bearings and the roller bearings on two planes, is based on the formula developed by Hertz, who studied related problems as early as 1895. Nowadays, the industry provides ball bearings of several diameters with a capacity of 15 to 20kN and for a continuous operation of 3000 hours. Fig-
ure 5 shows sets of flat moving bearings. The num-ber of them varies according to the total load of each column of the building.
Figure 5. Set of spherical steel bearings
As soon as earthquake stops, the ground in principle returns to its natural position before the shaking. The system of spheres also returns to its initial position, thanks to the full similarity of the displacement-movement of the ground, with a similarity ratio1:2 (Thales Theory of Proportions). This of course is valid on condition that the earthquake-induced oscil-lation-displacement of the ground is a displacement parallel to the base is perfectly horizontal and further that the system of spheres is centrally positioned within the housing of the bearings, with equal mar-gins all around for free displacement in case of earthquake. The maximum width of these margins is a/2+(1 to 2cm).
An additional problem created by the action of hori-zontal loads (wind, vehicle motion etc.) tends to dis-place the sitting on the rollers building. One solution is to anchor the building to the perimeter wall of the basement surrounding it, free of any contact with the building (Figure 6a,b). Such anchoring, however, must be designed in such a way that it acts only for horizontal loads coming from the building and is automatically cancelled in case of earthquake to pre-vent the shock wave of the earthquake from being transmitted to the building. The proposed mecha-nism works as a unilateral sliding contact system be-tween the structure and the surrounding basement. The system shown in Figure6a,b is safe and very in-expensive applied at the described points of the sup-porting columns of the building being in the perime-ter of the building. On the other hand, all vertical
Bridge
BaseSx=8cm
Sy=6cm S=10cm
deck
U
L

271
loading is transmitted to the ground without any change, in comparison with the classical supports.
Figure 6. Action of the anchor system
Seismologists concur that when the epicenter of the earthquake is exactly beneath the specific point, there is small probability the ground not to return precisely to its initial position once the earthquake is over, with a probable divergence of 2 to 3cm. In this case the system of spheres will come to rest in a po-sition at a distance from the center of half that dis-tance, that is, 1 to 1,5cm. Consequently it will be resting in a secure position within the center of the cross-section of the footing. After a long series of earthquakes, however, the system of spheres may come to rest in a final position substantially off-center with regard to the housing of the bearing. In this case, as maybe seen from Figure 7 the earth-quake acts correctively. If the earthquake begins with maximum ground displacement, max a, to-wards the right of the Figure 7 then the system of spheres will sustain a lateral thrust from the end of the lower bearing plate housing and will slide in re-
lation to both plates, shifting equally by the amount of a. A percentage of this displacement will be (due to the slip friction) transmitted to the substructure.
Figure 7. Secure design of the rolling bearing system
However, during the return movement of the oscilla-tion of the ground, the spheres will roll, and on its retrograde movement the position of the system of spheres will shift by a/2 and return to its central po-sition. If the initial displacement caused by the earthquake is towards the left of the Figure 7, then there has to be an additional margin on the upper plate, so that the rolling can begin. This means that on the lower plate the displacement margins of the system of spheres have a maximum width of max[a/2+(1 to 2cm)], while on the upper plate they must have a width of max a. Thus, after one or two displacements, with the system of spheres acting like a system of sliding bearings, it will return to more central positions and function as a sliding system. However, for all possible positions of the systems of spheres, the moving aseismic bearings are designed so that the moving part is located within the core of the cross-section of the footing for full security.
6. APPLICATION TO EXISTING BUILDINGS
The aforementioned aseismic isolation system may be rather easily applied to existing buildings where concrete or steel frames are the supporting system that transfers the loads of the structure to the ground. As an example let us consider a concrete column of an existing building with square cross-section of 40x40cm( 21600cm ). At the beginning by a system of hydraulic jacks the column becomes unloaded and the spherical isolation system is introduced cutting

272
the fixed connection between the column and its foot and reconstructed the connection including the pro-posed aseismic isolation bearing system. According to the loading conditions of this column a total num-ber of 100 spheres together with the tree already known necessary steel plates are needed with diame-ter of d=2cm and with resistance under compression of 10kN per sphere.
In order to avoid the undesirable eccentricities caused by the earthquake action it can be used here one more line of spheres as a reserve system for more safety. Applying this technique the system of the spheres is at any time of the ground movement inside the core of the column.
Following the aforementioned one-by-one procedure iteratively for all the columns of the existing build-ing and applying the herein described techniques the proposed aseismic isolation system is realized for the structure under strengthening.
7. FINAL REMARKS
Applying the described system, earthquake protec-tion is provided since the horizontal displacement of the base are not transmitted into the upper structure.
The aforementioned aseismic isolation system may be rather easily applied by suitable adaptation at each special case of structure and refined design that includes detailed numerical modeling of the pro-posed structural elements and experimental verifica-tion of the proposed system.
In comparison with other seismic isolation methods of elastomeric bearings or of ball bearings with slid-ing contact (FPS system) the proposed system seems to give to the structure at least the same safety level against earthquake action, whereas seems to be more economical. All the latter aspects are this period un-der detailed investigation by means of both labora-tory and theoretical investigations.
REFERENCES
1. Habbal O.K., Which Earthquake-Resistance Building Technique Works the Best; Cali-fornia State Science Fair, 2006 Project Summary.
2. Reitherman B., Earthquake Engineering, Consortium of Universities for Research in Earthquake Engineering, Department of Building Inspection City and County of San Francisco, April 2006.
3. Yen-Po W., Fundamentals of Seismic Base Isolation, International Training Programs for Seismic Design of Building Structures,Hosted by National Center for Research on Earthquake Engineering, Taipei, Taiwan, 2006.
4. Zelig Z.A., Earthquake-Resistant Building Foundations, California State Science Fair,2006 Project Summary.
5. Michalopoulos A., Berger Fr., Golias E., Fichtner W., Neues System zur Isolation von Hochbauten gegen Erdbebenbeanspruchung, Bauingenieur, November 2004, pp.A20-A22.
6. Michalopoulos A., Baniotopoulos C.C., `On the Application of a New Prototype of Seis-mic Isolator for Existing Buildings, Concer-vation and Rehabilitation of Historical Buildings and Monuments by Using Light Gauge Metal Structural Elements, Depart-ment of Metal Structures, Aristotle Univer-sity Thessaloniki, Greece, April 2005.
7. Kaushik H.B. et. al., Sikkim Earthquake 14 February 2006, Reconnaissance Report, In-dian Institute of Technology Kanpur, April, 2006.

273
European Cooperationin the field of Scientific and Technical Research
Action C26 Urban Habitat Constructions under Catastrophic Events Proceedings of Workshop Prague, 30. � 31. 3. 2007
WG 3
Impact and Explosion Resistance

274
1 INTRODUCTION
The first meeting of COST C26 WG3 Impact and Explosions was held at the Technical University of Delft, Netherlands on 17th and 18th November 2006 under the joint chairmanship of Dr MP Byfield from Southampton University, UK and Prof G De Matteis from the University of Chieta/Pescara, Italy. The main business of the meeting centred on eighteen presentations delivered by members of WG3 which occupied all of the first day and a proportion of the second. Stemming from these presentations and sub-sequent discussions, the scope of the research activ-ity within WG3 was defined under seven main head-ings. In addition a set of guidelines for the Prague Workshop on 30th and 31st March 2007 was agreed involving presentations both by WG3 members and invited speakers.
In the following sections an attempt has been made to categorise the areas of research presented into the following general areas:
(i) whole building and building element response and robustness in the face of blast and impact load-ing;
(ii) response of structures to blast loads from both high explosive events and gas explosions using ex-perimental and numerical methods;
(iii) response of buildings to underground explo-sions and the utility of seismic design methodologies to produce blast and impact resistant structures;
(iv) response of structures and structural elements to impact from missiles and vehicle;
(v) development of existing expertise in general �dynamic loading� towards impact and explosions studies.
In categorizing the various contributions in this manner, it should be noted that some contributors were active in more than one area and an attempt has been made to reflect this in the sections that follow.
2 REPORT ON WG3 PRESENTATIONS
2.1 Response and robustness under blast and im-pact loading
Mike Byfield (Southampton University, UK) spoke on the vulnerability of tall buildings to progressive collapse. The presentation discussed the need to consider the capacity of connections in steel struc-tures. It is essential that, were a key element such as a column to be removed from the structure, remain-ing connections should have sufficient ductile capac-ity to allow tying forces to develop without catastro-phic structural failure. With such capacity, catenary action would be initiated and the structure would not collapse. The point was illustrated with reference to examples of the behaviour of damage suffered by typical UK buildings involving the loss of support columns in which total collapse did not occur. These examples emphasised that these buildings have high capability to withstand large impact forces and will
State of the art in Europe and activity developedwithin WG3 Impact and Explosion
P.D. Smith Cranfield University, Swindon, United Kingdom
ABSTRACT: This paper is derived from the eighteen presentations made by members of COST C26 WG3 Impact and Explosion at its first meeting held at the Technical University of Delft, Netherlands on 17th and 18th November 2006. Members reported on current research in (i) whole building and building element ro-bustness in the face of blast and impact loading; (ii) the response of buildings to underground explosions and the utility of seismic design methodologies to produce blast and impact resistant structures; (iii) the response of structures to blast loads from both high explosive events and gas explosions using experimental and nu-merical methods and (iv) the response of structures and structural elements to impact from missiles and vehi-cles. In addition some members reported on plans to develop their existing expertise in the general area of dy-namic loading towards investigations specifically related to impact and explosions studies.

275
not progressively collapse. Finally, a capacity design approach to resist blast was proposed, where the en-ergy absorption through plastic deformation is maximised. The first step is to use a serviceability limit state design of beams for flexure to support the working loads elastically. Then the upper-bound load capacity of the beams is established. Finally, connections are designed with the objective of sup-porting the upper-bound loads transferable from the beams.
In conclusion, Dr Byfield reinforced the idea that the tying force method will not prevent progressive collapses in steel framed buildings when used with low ductility connections; the factor of safety in such cases is unacceptably low at around 0.2 as il-lustrated in Figure 1.
Figure 1: The �tying force� concept
Robustness and joint ductility was also the theme of the presentation by Jean-François Demonceau (University of Liege, Belgium) who spoke of a pro-ject involving five European universities. Tests on sub-structures have been developed to investigate the problems associated with the loss of a column and the consequent additional load on the upper sto-rey slab. Tests to investigate the catenary action of the slab were reported in which consideration was given to the lateral restraint provided by the adjacent part of the frame. In addition, a numerical investiga-tion has been undertaken aimed at interpreting how changes to the different parameters involved affect the response of the systems studied.
Lars Rölle (University of Stuttgart) continued the theme of building robustness and how robust struc-tures can be achieved by provision of joint ductility. The University of Stuttgart is one of the organisa-tions working with the University of Liege. It was emphasised that robustness is a very important factor in preventing progressive collapse caused by local damage and reducing the risk of collapse under ex-ceptional loading. Ductility of joints can provide a large increase of robustness. An overview of tests performed relating to both steel beam to steel col-umn joints and composite beam to steel column joints was presented which have been complemented by tests for combinations of hogging moment and tension and sagging moment and tension. Figure 2a shows a typical steel joint prior to a test. Figure 2b shows a joint after testing.
A presentation prepared by Prof Bernt Johanssen (Lulea University of Technology, Sweden), was de-livered by his colleague Milan Veljkovic who spoke about the Swedish design rules to avoid the progres-sive collapse of structures. The Ronan Point building in the UK, which collapsed in 1968, was fabricated
Figure 2a. Steel joint prior to testing
Figure 2b. Steel joint after testing.
using a Swedish construction system. Its failure led to changes in Swedish design rules in 1971. Cur-rently the two main strategies which have been for-mulated for investigation are the development of (i) damage-tolerant structures and (ii) robust design rules.
Bartosz Miller (Rzeszow University of Technol-ogy, Poland) is concerned with the use of neural networks for structure monitoring and details of this �soft computing� approach were discussed. The re-sults of Finite Element (FE) analyses may not corre-late with the results of complementary experiments. By the development of an artificial neural network, learning and testing the patterns obtained from FE simulations leads to assessment of the location and the value of the load to cause yielding. As a result, a technique for updating the model may be developed. To do this, different sorts of information is needed. The main parameters required for FE modelling are
134.64 kN4.24 kN/m
A BC
134.64 kN 82.84 kN 134.64 kN 134.64 kN
Internal Hinge4o
2812 kN0.19
2812528
FoS
134.64 kN4.24 kN/m
A BC
134.64 kN 82.84 kN 134.64 kN 134.64 kN
Internal Hinge4o
2812 kN
134.64 kN4.24 kN/m
A BC
134.64 kN 82.84 kN 134.64 kN 134.64 kN
Internal Hinge4o
2812 kN0.19
2812528
FoS

276
rotational stiffness of beam-to-column connections and rotational and translational stiffness of supports. Material specification requires knowledge of pa-rameters such as Young�s modulus and density. Non-destructive methods for defect identification (to quantify any material loss or gain) are also required. It was felt that this approach could be used in the as-sessment of damage experienced by a structure after it has been subjected to an explosion or impact.
While the contributions discussed above relate to the response of structures that achieve their robustness by high levels of ductility, Kari Kolari (VTT Tech-nical Research Centre, Finland) spoke about work on cold-formed steel sections and the problems of brittle fracture in the context of ice-structure interac-tions, as illustrated in Figure 3.
Figure 3. Off-shore structure impacted by sea ice
Work is in hand to develop a new continuum model for brittle fracture implemented in the ABAQUS fi-nite element software that is capable of modelling failure modes in tension and compression (when ax-ial splitting could occur, as is observed in sea ice).
2.2 Blast loading and structural response
WG3 members spoke about loading and response produced by both high explosive detonations and de-flagrations such as gas explosions.
Gianfranco De Matteis (University of Chieti-Pescara, Italy) introduced the activity developed in the field of explosions with particular reference to the structural integrity of a reinforced concrete building loaded as a result of a gas explosion. The particular problems for buildings made of precast bearing walls were discussed with emphasis on techniques aimed at reducing the risk of progressive collapse. Two different protection strategies should be considered. The first is the �key element� strat-egy, which is based on the design of appropriate precast load bearing walls while the second is the �alternative load path� strategy, which is based on the acceptance of extensive damage, which could in-
clude the collapse of at least one storey of the build-ing. These ideas were developed by his colleague, Isodoro Langone, who presented a more detailed analysis of the main strategies to be adopted to avoid building progressive collapse as a result of a gas de-flagrative explosion. It was stressed that the possibil-ity of a building experiencing progressive collapse depends on several factors which are related to both the gas explosion hazard and structural robustness. When gas explosion loads cannot be predicted, the structural integrity of a building should be ensured by a �robustness� strategy. In the other circum-stances, the pressure-time dynamic explosive load-ing should be estimated and directly adopted in the structural design. In order to estimate the character-istics of the dynamic loading (i.e. the pressure-time history) in buildings such as apartment blocks, both empirical and computational fluid dynamic (CFD) methods can be adopted. Some CFD results using the FLACS (FLame Accelerator Simulator) were presented used in conjunction with �pressure-impulse� diagrams for the assessment of damage to specific structural components such as one-way spanning slabs that might be used to construct the wall of an apartment. An example of a pressure-impulse diagram is shown in Figure 4.
Figure 4. Pressure-impulse diagram for one-way spanning slab with different support conditions
Sami Kilic (Bogazici University, Istanbul, Tur-key), spoke about his university�s research on the blast-resistant design of structures. The main objec-tives of this study are as follows:
To understand the behaviour of reinforced concrete and steel structures under extreme loads such as blast and explosion; To use advanced analysis finite element techniques to simulate the response of struc-tures to blast loadings; To improve the blast-resistant design of structures through the use of blast shields and structural detailing for critical members; To prevent the failure of reinforced concrete slabs under reverse curvature caused by

277
blast loading/explosions in the lower level of the structure.
The numerical simulation tools available for such studied include LS-Dyna and MSC.Dytran for Arbi-trary Lagrangian-Eulerian simulation for fluid-structure interaction and the ATBLAST program for calculation of blast pressure for conventional weapons. The use of these first two programs was illustrated with reference the simulation of the impact of an aircraft on a concrete structure and a vehicle subjected to mine blast (as shown in Figure 5).
Figure 5. Simulation of vehicle response to mine blast
Peter Smith (Cranfield University, Defence Academy, UK) discussed blast-related research at Shrivenham. Recent research has been concerned with experimental studies (using the small range on campus) complemented by numerical simulation us-ing the Air3d program to model blast wave propaga-tion through an array of buildings representing part of a complex urban environment, as illustrated in Figure 6.
Studies have also been conducted into the phenom-ena of �shielding� and �channeling� in arrays of buildings in connection with work associated with collateral damage. It was noted that explosive range facilities with a much higher explosive charge limit are also available at West Lavington (about 50 km from Shrivenham).
Andy Tyas (Sheffield University, UK), who had been unable to participate in the meeting, later pro-vided information about recent work on blast effects on structures and blast load measurements. A small-scale blast and impact testing laboratory is available where up to 2.5kg TNT equivalent charges can be
detonated. Facilities include high speed video, flash radiography and high speed data acquisition sys-tems. Recent work has included Explosively Formed Fragment (EPF) penetration of steel plate, ground shock loading on buried concrete slabs and near-field air-blast loading on Carbon Fibre Reinforced Plastic (CFRP) and Glass Reinforced Plastic (GRP) panels. There has also been work on the develop-ment of new fibre-optic blast pressures transducers as shown in Figure 7.
Figure 6 Array of model buildings modeling a complex urban environment
Figure 7 Fibre optic blast pressure transducer
2.3 Response of buildings to underground explosions and the utility of seismic design methodologies
Expertise resides within WG3 on the design of earthquake resistant structures and consideration was given to the use of such an approach for the design of blast and impact resistant structures.
Florea Dinu (Romanian Academy, Timisoara, Romania) gave a presentation on blast and impact loading on seismic resistant structures in which it was shown that seismic design philosophy may also be applied to design blast and impact resistant struc-tures. It was noted that there are, indeed, many common features between seismic engineering and blast and impact engineering, such as the infrequent character of the loading, the requirement for struc-tural redundancy, the use of ductile structural ele-ments and details, the capacity to resist load rever-sals and shear failure. There are, however, differences and it was noted that it is difficult to pre-dict how and when blast or impact loading may oc-cur and also its intensity. In addition it is hard to

278
quantify the hazard level which, in the case of blast loading, is greatly influenced of stand-off distance. The intensity of blast loading may be several orders of magnitude greater than seismic hazards and the duration of the blast is likely to be very short, and so dynamic increase factors are very high. Finally, dif-ferent characteristics are needed for blast resistant element design. While low mass elements may be appropriate for seismic resistant structures they are inappropriate for resisting blast. Nevertheless, an approach to blast resistant design that is complemen-tary to seismic design was proposed as summarized in Figure 8.
Figure 8a. Approach to blast-resistant design
Figure 8b. Approach to earthquake-resistant design
Ljubomir Taskov (Sts Cyril and Methodius University, Skopje, Macedonia) spoke about previ-ous studies on seismic effects on residential build-ings induced by explosions. The ground-shaking in-fluence of an explosion requires attention as much as building vibration effects. Ground shaking caused by an explosion is similar to the earthquake phenome-non, but different in intensity, duration and fre-quency content. Therefore, seismic effects of an ex-plosion could be investigated using the same principles and measurements could be made using the same instrumentation used for earthquakes. In the case of an explosion, ground shaking duration is from 0.01s to about 2.0s, in the rather high fre-quency range of 5-250 Hz. The intensity of vibration of the ground surface (as well as of structures) de-pends on distance between measuring point and lo-cation of the explosion, the quantity of explosive used, the physical and mechanical characteristics of the soil, and how the charge is placed. Methods of
evaluating the seismic effects of an explosion by in situ measurements were discussed and some typical results provided including the graph of Figure 9 showing the relationship between mass of explosive (vertical axis) and critical distance to produce a given level of structural response (horizontal axis).
Figure 9 Explosive mass vs critical distance for a specified level of structural response
2.4 Structural response to missile and vehicle im-pact.
Auli Lastunen (VTT Technical Research Centre, Finland) discussed current work on impact with par-ticular reference to the collision of an aircraft with a nuclear power plant. In addition, there was mention of the programme concerned with testing and devel-oping air raid shelter equipment against blast loading using 120mm to 500mm diameter shock tubes oper-ating at pressures from 0.1 bar to 10 bar.
The impact apparatus, in which missiles are ac-celerated by a piston driven by compressed air, can be used to generate data on both �soft� and �hard� impact. The apparatus is shown schematically in Figure 10. It can accelerate a missile of up to 100kg mass to a maximum velocity of 200m/s. Measure-ments can be made of missile velocity and accelera-tion, target displacement, reinforcing bar strain and the impact force-time characteristics.
Figure 10. VTT impact apparatus
Christian Seiler (University of Munich, Ger-many) gave an overview of current work which in-cluded reference to earthquake engineering capacity design and small to medium scale blast testing. The main area of research was concerned with the use of

279
capacity design methodology in the context of vehi-cle impacts on guardrails involving both physical testing and numerical simulation as illustrated in Figure 11.
Figure 11a Actual vehicle impact on guardrail
Figure 11b Simulation of guardrail impact.
2.5 Planned development of dynamic loading exper-tise.
A number of WG3 members have expertise in the general area of dynamic loading and response and plan to develop this expertise into the fields of im-pact and explosion.
Paulo Piloto (Polytechnic Institute of Bragança, Portugal) has expertise in the area of structural be-haviour at elevated temperatures as illustrated in Figure 12.
Figure 12a Structural element at elevated temperature
Figure 12b Simulation of response of structural element at ele-vated temperature
Plans to develop work in the area of accidental events were discussed with particular reference to problems associated with combinations of explosion effects with fire and impact events with fire.
Carlos Rebelo (University of Coimbra, Portugal) spoke about structural dynamics and risk assessment and gave an overview of past experience in connec-tion with dynamic loading of footbridges and high speed railway bridges and the dynamic behaviour of wind turbine towers. Plans to study the dynamic be-haviour of geosynthetically reinforced soil under blast and impact loading are being developed.
Monique Bakker (Eindhoven University of Technology, Netherlands) spoke about plans for re-search in the area of �blast and explosion�. Long-term research plans are concerned with the design of structures to resist impact and explosion loads, in the context of Quantitative Risk Assessment (QRA) for zoning with respect to hazardous materials. Univer-sity personnel are currently undertaking a �familiari-sation exercise�, to determine what is the �state of the art� and which subjects need further research ac-tivity.
Michael Tzaferopoulos (Aristotle University of Thessalonioki, Greece) discussed the problems of protective design. Current design approaches have limitations including addressing only a limited range of threats and a limited range of materials, no com-bination of effects are considered and simplified structural models are used. There are related prob-lems associated with evaluation of existing protec-tion, how upgrades or modifications should be de-termined, how to establish damage criteria and do damage assessment and stabilization before repair. There was also a need for the transfer of military technology to the civilian sector.

280
3. ORGANISATION OF RESEARCH ACTIVITY WITHIN WG3
As a result of the presentations and subsequent dis-cussion, the scope of the working group�s areas of activity was specified as follows:
1. Codes and Standards related to RobustnessExisting methodologies General principlesFuture trends and recommendations for best practice
2. Vulnerability to progressive collapse due to local-ised damage from blast or impact
Multi-storey buildings with pre-cast load bearing wallsLoad redistribution using catenary action in steel framed buildings Impact from collapsed floors
3. Quantification of actions related to extreme events
Detonation of vehicle borne improvised ex-plosive devices or hand-held devicesNatural gas explosions Vehicle impact Aircraft impact
4. Protection systems and design methodologies to resist blast and impact
Capacity design Collateral problems due to demolition Maintenance of stand-off
5. Assessment and repairing of damaged structures
6. Experimental testingComponent testing in shock tubesSmall to medium scale blast testing using high explosivesLarge scale arena testsPerformance of new materials
7. Numerical simulationBlast-structure interaction Impact-structure interaction Progressive collapse Brittle failure
4. CONCLUSIONS
It may be concluded that, within the membership of COST C26 WG3 there is a wide range of relevant expertise. The agreed scope of the working group is comprehensive and addresses the important issues of Impact and Explosion within the overall action of �Urban habitat constructions under catastrophic events.�
5. REFERENCES
Minutes of the first meeting of Working Group 3: Impact and Explosion, Technical University ofDelft, Netherlands, 17-18 November 2006

281
1 INTRODUCTION
One of the basic needs of all living creatures is to have safe and secure habitation. Throughout history, humans have demonstrated a remarkable ability to address this need. They have developed capabilities to protect themselves against both natural disasters and escalating hazards associated with human activi-ties. In 1989, the world viewed a watershed event with the end of the Cold War. Nations across the globe began reducing their armed forces in response to the perceived increase in world stability. Unfor-tunately, the euphoria did not last for long. Interna-tional terrorism has replaced the Cold War, as the main threat to many societies.
Terrorism is not a new phenomenon, and one can find historic references that such activities existed for more than two thousand years. More recently, the use of terrorism as a means to achieve national objectives was a primary cause for WWI. During the Cold War terrorism was related to the struggle be-tween the superpowers. In most cases, this tactic seemed restricted to internal disputes by rival politi-cal factions within well-defined nation states. Indus-trialized countries viewed the annoyance of terror-ism as a third world phenomenon and, with perhaps the exception a few countries, paid such events little notice. World opinion quickly condemned the more spectacular events (e.g., Munich in 1972, Beirut in 1981, etc.) but then just as quickly dismissed them as anomalistic behavior. Its application as a global political tactic has been associated with the Middle East since the early 1950s, with a noticeable increase since the early 1980s, and a dramatic escalation after the end of the Cold War. Many regions around the
world have been increasingly burdened by this phe-nomenon during the last quarter century (e.g., vari-ous regions in Africa, the Middle East, Afghanistan, France, Germany, India, Iraq, Italy, Japan, Russia, Spain, Sri Lanka, United Kingdom, etc.). The loca-tions, causes, participants, intensities, and means have been changing rapidly. Vehicle bombs have become the preferred mechanism for terrorist at-tacks, followed by the use of homicide bombers, and the renewed threat of weapons of mass destruction (WMD).
Prior to 1993, the United States had been rela-tively unaffected by terrorism within its borders, and it had to contend with terrorist attacks against vari-ous overseas facilities. Then, in February 1993, the U.S. was attacked by externally supported terrorists who targeted the Word Trade Center. In April 1995, the U.S. was shocked by the devastating homegrown terrorist attack against the Alfred P. Murrah Federal Building in Oklahoma City. The events of Septem-ber 11, 2001 demonstrated the ability of terrorists to cause civilian deaths and property damage in levels not seen since the waning days of World War II. These recent horrific terrorist attacks, conducted in parallel with other attacks against US targets abroad, changed forever the way various federal, state, and local government agencies in the U.S. would look at national security and the need for protection from terrorism. Subsequent terrorist attacks against other countries (e.g., France, Morocco, Spain, UK, etc.) have further underlined the need to address this problem internationally.
Clearly, in today�s geopolitical environment, the need to protect both civilian populations and military facilities from enemy attack has not diminished. Fur-
Protecting critical infrastructure systems
T. Krauthammer University of Florida, USA
ABSTRACT: This paper provides background on requirements, capabilities and research recommenda-tions for protecting critical infrastructure systems. These activities are needed to develop much more effective solutions to problems that can be currently addressed primarily with conservative, and/or empirical ap-proaches. The expected contributions will have a profound effect on national and international defense and security. Although essential work must be conducted in several important areas, this paper is primarily fo-cused on scientific and technical issues.

282
thermore, we noted an increasing need to protect ci-vilian populations against terrorism and so-cial/subversive unrest. This situation is true for many parts of the world, and it may exceed the pre-vious reasons for the development of protective technologies (i.e., related to military-sponsored work on fortifications). Unlike the global politically and ideologically motivated conflicts of the past, domi-nated by well-organized military forces, most of the armed conflicts in the last three decades have been localized and dominated by social, religious, eco-nomic, and/or ethnic causes. It is no longer a tradi-tional conflict with a well-defined adversary, but one must consider an amorphous evolving opponent. Furthermore, societies must learn to cope with a dif-ferent type of warfare that is termed �low intensity conflict�. This means that well understood and rea-sonably predictable military operations are replaced by much less understood and less predictable terror-ist activities. Such activities are carried out by de-termined individuals, or small groups that have a wide range of backgrounds and capabilities. They are directed against well-selected targets, and they are aimed at inflicting considerable economic dam-age and loss of lives. Obviously, as demonstrated by recent tragic incidents, both in the U.S. and abroad, the term low intensity conflict is a misnomer. Such activities can have devastating consequences. They can adversely affect national and international stabil-ity, and cause worldwide serious economic, social, and political damage.
Defending society against this form of rapidly evolving warfare will remain a challenge, at least through the first half of the 21st century. Any suc-cessful response will require a well-planned multi-layered approach that strikes a fine balance between assuring a nation�s security, and maintaining the freedoms that a modern society enjoys. The causes for terrorism and their consequences are related to a broad range of important areas (e.g., culture, history, sociology, politics, economics, religion, engineering, life sciences and medicine, psychology, etc.). There-fore, besides the serious need for innovative devel-opments in these areas, society must invest also in the development of effective capabilities in intelli-gence, law enforcement, and military application to counter such threats. Science and technology can and will play a major role in this effort, and society must develop innovative protective technologies for such purpose. Furthermore, one must not employ only empirical approaches to address these issues (e.g., using tests to observe consequences). The free world must develop innovative theoretical, numeri-cal, and experimental approaches to protect from WMD, and must conduct these activities in a well-coordinated collaboration between governments, academic, and private organizations. Such technolo-gies are the last layers of defense between society and the threats, after all other layers of defense have
failed. They are vital for insuring the safety of peo-ple, and the preservation of valuable national assets.
Assessment of historical terrorism activity data [1] indicates that about 85% of recorded incidents involved explosive devices, about 5% involved bal-listic attacks, and the rest were related to other ac-tivities (e.g., arson, kidnapping, etc.). Although one must not overlook the possibility that terrorists may use unconventional WMD (e.g., nuclear, radiologi-cal, chemical, biological, etc.) instead of large ex-plosive devices, the immediate and most expedient threats are the conventional ones. Therefore, one must shape the required policy and investments in R&D accordingly. One should address the known threats associated with explosive devices, while pre-paring for possible unconventional WMD. The study of heavily fortified military facilities may no longer be the main area of concern (although this technol-ogy must be kept relevant). Careful attention must be devoted to typical civilian facilities whose failure could severely disrupt the social and economic infra-structure of nations (e.g., office and commercial buildings, schools, hospitals, communication centers and power stations, industrial buildings, transporta-tion infrastructures, etc.). We lack essential knowl-edge on how such facilities behave under terrorist threats, and how much protection they can provide against a broad range of WMD threats (e.g., blast, shock, impact, fire, chemical, biological, nuclear, and radiological effects). Many materials and com-ponents that are typically used in such facilities were never studied for these applications.
Preliminary recommendations for measures to minimize casualties and damage from such attacks in the future were made in the U.S. [2]. The National Research Council (NRC) recommended areas for fu-ture research and action to implement technology transfer [3]. More far-reaching recommendations have been issued recently to address an anticipated enhanced threat from terrorist acts within the U.S. [4]. These recommendations must be also expanded to address current and anticipated needs for targeting facilities used for hostile activities. The U.S. De-partment of Defense (DOD) has the responsibility for developing, maintaining, and applying effective tech-nologies to protect its civilian and military personnel worldwide, and to launch effective operations against hostile entities to reduce such threats to acceptable levels. Outside of the DOD and the Department of Energy (DOE), experience in WMD effects exists in a limited number of R&D organizations and consulting firms that do government work. Since the mid-1980s, a gradual decline has been noted in protective tech-nology related academic R&D activities, and very few eminent academicians in this field are still available. This, combined with the lack of formal engineering training in protective science and technology at U.S. universities, has resulted in a shortage of experienced technical personnel in this field in many government

283
and private organizations that must handle such activi-ties. This brief summary highlights the fact that the free world has always been reacting to terrorism. The previously observed levels of anti terrorist preparedness and proactive prevention measures have been unimpressive. Unless these conditions change dramatically, the consequences to society could be very grave. Combating terrorism must include the consideration of many unconventional aspects of warfare. These issues must be integrated with scientific and technical capabilities to provide a comprehensive approach that can be used against current and future low intensity conflicts. Most nations do not have the required resources to approach this problem independently. Moreover, since this evolving threat affects many countries and it endangers the stability of the entire world, the required R&D should be conducted in a collaborative multinational framework. Nations must adopt a considerably more proactive and collaborative approach to address this serious problem. We must employ all reasonable means to eliminate, or at least reduce considerably, the causes for terrorism. Such activities must address cultural, social, educational, political, religious, and economic aspects of the problem. Only then will law enforcement, security, and technical capabilities succeed in mitigating the effects of terrorist activities. 2 EXISTING PROTECTIVE TECHNOLOGY
The information presented next is based on a recent review of existing technical capabilities in protective technology [5], combined with details from other sources [6-35]. Since the indications are that explosive devices will continue to be a primary hazard, the em-phasis in this write up will be on blast, shock, and im-pact. Structural design for safety and physical security requires a sound background in fortification science and technology. One must realize that loading envi-ronments associated with many relevant threats (im-pact, explosion, penetration, etc.) are extremely ener-getic, and their duration is measured in milliseconds (i.e., about one thousand times shorter than typical earthquakes). Structural response under short-duration dynamic effects could be significantly different from the much slower loading cases, requiring the designer to provide suitable structural details. Therefore, one must explicitly address the effects related to such se-vere loading environments, in addition to considering the general principles used for structural design to re-sist conventional loads. One must be familiar with the background material on structural consideration and design, and the experience gained from recent terrorist bombing incidents. A brief summary of a few fre-quently used references is provided next.
Tri-Service Manual TM5-1300 [11]: This manual is intended primarily for explosives safety applica-tions. It is the most widely used manual for structural
design to resist blast effects. One reason for its wide-spread use by industry is that it is approved for public release with unlimited distribution. For predicting the mode of structural response, the manual differentiates between a �close-in� design range and a �far� design range. On the basis of the purpose of the structure and the design range, the allowable design response limits for the structural elements (primarily roof and wall slabs) are given as support rotations. This publication is most widely used by both military and civilian or-ganizations. Several concerns have been raised about some issues addressed in this manual, as will be dis-cussed later, and the manual is currently being revised.
Army Technical Manual 5-855-1 [9]: This man-ual is intended for use by engineers involved in de-signing hardened facilities to resist the effects of con-ventional weapons. The manual includes design criteria for protection against the effects of penetrating weapons, contact detonations, or the blast and frag-mentation from standoff detonations. The recom-mended response limits are given only as ductility ra-tios, not support rotations. Nonetheless, a more recent supplement to TM 5-855-1 [22] provides response limit criteria based on support rotations. Furthermore, a more updated manual should be used whenever pos-sible [10].
ASCE Manual 42 [8]: The manual was prepared to provide guidance in the design of facilities intended to resist nuclear weapon effects. ASCE Manual 42 presents conservative design ductility ratios for flex-ural response. Although the manual is an excellent source for general blast-resistant design concepts, it lacks specific guidelines on various issues (e.g., struc-tural details).
ASCE guidelines for blast resistant buildings in petrochemical facilities [23]: This reference contains detailed information and guidelines on the design of industrial blast-resistant facilities, with emphasis on petrochemical facilities. It includes considerations of safety, siting, types of construction, material proper-ties, analysis and design issues, and several detailed examples. The information is not limited to blast-resistant industrial facilities; it is very useful for all as-pects of blast-resistant design, including physical se-curity.
ASCE structural design for physical security[7]: This is a state of the practice report addressing a broad range of topics in this field. It starts with a de-tailed procedure for threat assessment, followed by an overview of how to define loads associated with typi-cal attacks. The behavior of structural systems under the anticipated loads, and the corresponding design of structural elements are treated next. Separate sections address the behavior and design of windows and doors for the same loading environments. Also, a dedicated section addresses the retrofit of existing structures. This report is about to be revised and published as a guideline, in coordination with the revision of TM 5-1300.

284
DoD and GSA Criteria [31,32,35]: These re-sources are aimed at meeting minimum antiterrorism standards for buildings , and the prevention of pro-gressive collapse. Both DoD and GSA publications recognize that progressive collapse could be the pri-mary cause for casualties in facilities attacked with explosive devices, and they include guidelines to miti-gate them.
FEMA Guidelines [34]: This guideline is not a technical or design manual, but it contains clear and comprehensive guidelines on issues than need to be addressed, and simple explanations of such steps. This might be the most effective starting point for people who wish to learn how to handle protective construc-tion projects.
DOE Manual [33]: This manual is similar to TM 5-1300, as described above, but it has some updated material, based on more recent data.
Besides these technical resources, one should use updated information on threat assessments [36], and compare protection approaches with those adopted in other countries (e.g., [37]).
3 HAZARDS, THREATS, AND LOADS
The threats noted above may provide reasonable estimates of the environments that would be consid-ered by facility designers. Understanding tactics and weapon systems capabilities is essential for develop-ing realistic planning and design goals. Furthermore, developing research programs that enable one to re-duce the magnitude of a specific threat would be cost effective. It is evident that terrorist attack (i.e., explo-sive) environments could be unpredictable, and might consist of the detonation of multiple explosive de-vices. Nuclear, chemical, and biological (NCB) envi-ronments might be superimposed on conventional ex-plosive effects, and one might have to consider a combined-effects environment rather than a single detonation of a particular weapon. Nevertheless, this approach would be supported by separate studies that consider single-weapon effects and the possibility of developing theoretical methods for combining such effects to create realistic environments in which spe-cific systems were required to perform and survive. Furthermore, one must address the differences in time scales for the different loading environments (from micro seconds to hours, or longer), which might en-able one to separate the loads and effects, accordingly.
Although this write up does not address all aspects of WMD threats, one must consider other non conven-tional threats (e.g., radiological, chemical, and bio-logical) when appropriate. Counter measures and structural design must be developed for a given type of threat-induced loading environment (or a combina-tion of threats). More background on explosions and their effects can be found in other sources (e.g., [24-29]). It should be noted that the design manuals and many related computer codes are based on empirical
data. Care should be taken when using these tools. It also should be noted that the possibility of fire follow-ing an explosion must be considered in the design process, although this subject is not addressed herein.
Blast effects, especially from HE explosive de-vices, are often accompanied by fragments, either from the explosion casement or debris propelled and engulfed by the blast wave. Blast parameters from spherical high-explosive charges in open air are well known, and they can be found in various handbooks and technical manuals, as noted previously. When an air blast is reflected by a non responding structure, a significant pressure enhancement is achieved that acts as the load on a structure. For detonations in complex and/or non responding structural geometries, accurate determination of such parameters can be achieved with available computer programs. Currently, there are very few computer programs for the prediction of load parameters for responding structural models, and their accuracy may not be always well defined.
Compared to nuclear detonations, typical HE de-vices have to detonate relatively close-in to the target in order to achieve severe effect (this would depend on the type of target). This proximity requirement is a shortcoming of HE devices, and usually the attackers will try to compensate by using multiple detonations, and/or large amounts of HE, to achieve their objective. Due to the lack of physical data, certain types of ex-plosive loads cannot be determined accurately, and the information available in various design manuals is based on estimates. This is particularly true for cases where explosive charges are placed in contact with, or very close to, the target, and for nonstandard explosive devices. Explosive charges of shapes other than spherical or cylindrical will not give pressure distribu-tions with rotational symmetry (especially in close-in conditions), and the information provided in the vari-ous design manuals must be used cautiously for such cases. This difficulty is particularly true for close-in explosions, but its importance diminishes significantly for more distant explosions. In addition, the orienta-tion of the weapon with respect to the target is impor-tant, since it would be combined with the geometry to form the shock front that would interact with the tar-get. Another observation in recent experiments with close-in detonations has been that the effects of shock wave focusing due to reflections from other surfaces could be important in the load definition. Furthermore, the effect of an explosive device�s casing on the re-sulting detonation is clearly not as predicted by data in various manuals. The result is that a much larger amount of energy would be available to produce the blast and to propel the fragments, thus, causing a more severe loading environment than anticipated. The combination of pressure and fragment impulse as a function of the detonation distance from the target is another important issue that does not have reliable models at this time, and this topic must be studied.
As for structural analysis, it has been shown ex-

285
perimentally and numerically [38-40] that for close-in HE detonations and for certain nuclear loads the mode of structural failure is controlled by material failure or by direct shear. At present there is some understand-ing of these phenomena, but they are clearly not well understood. Nor is it understood if and how the direct shear can be coupled with the flexural modes of re-sponse, as was achieved for the coupling between bending shear, flexure, and thrust [41]. It is strongly recommended that such studies be performed, with the ultimate objective of a better understanding of struc-tural behavior and, thus, improved pressure-impulse (PI) diagrams and design methods. The area of equipment response under the effects of multiple detonations is very important. Usually tests are per-formed using a single explosion, wherein the time-histories do not include the effects of closely timed explosions that could introduce additional frequencies into the loading environments. In addition, the in-crease in the deployment of "smart weapons" (includ-ing those placed by humans at the desired location) raises the issue of having to protect against very close-in or internal detonations that may not be randomly distributed over the general target area. Under these conditions, it would be possible to have several such weapons detonate in a well-coordinated manner, thus subjecting the target to a most severe load-time history at critical locations. Current analysis and design meth-ods do exclude such considerations, thereby introduc-ing serious risks into the field.
Available information [7,10,30,31] can be used for developing reasonable assessments of security needs and for defining potential loads. Such guidelines assist in determining design criteria for the physical protec-tion of assets within either a new or a renovated facil-ity (they can also be used for exposed assets). Detailed procedures for load determination are delineated for each type of attack.
4 ANALYSIS AND ASSESSMENT
The following brief discussion is provided only as a general summary of the topic, based in part on sev-eral references listed above. Closed-form solutions are limited to simple geometries, simple loading and sup-port conditions, and linear materials. When approxi-mate, simplified methods are used, one must assume a response mode and the corresponding parameters. It is recommended to use such methods together with data from computer codes that are based on current design manuals. Current medium-structure interaction models are too simplistic, and they may not include nonlinear effects. To accommodate a practical range of numeri-cal capabilities, simple, intermediate, and advanced computer codes are needed. Advanced numerical methods require significant resources, and they should be used in the final stages of detailed structural analy-ses for obtaining design guidelines and/or in the de-tailed evaluation of the anticipated structural response.
Furthermore, such advanced codes must be validated against precision test data to insure their reliability [42,43]. It has been shown there that developing effec-tive code validation methodologies are very important. It was noted that the best results are obtained when a structure is analyzed gradually, employing a range of numerical approaches from simple to advanced. Struc-tural response calculations may not be valid for scaled ranges less than 1 (ft/lb1/3), and structural breaching calculations should be performed separately from structural response analyses.
There is a basic difference between many of the tests conducted by defense organizations with typical weapon systems, and the tests with terrorist type de-vices, as briefly discussed above. Data from typical weapons systems or very large ANFO devices may not provide much useful information for protective ar-chitecture considerations. On the other hand, the tests with terrorist type explosive devices can provide very useful information. Such tests have become more relevant and frequent in recent years, and they have been conducted in several countries. Furthermore, it is anticipated that numerical simulations could be used more frequently instead of some experiments. How-ever, data from precision tests are needed for the cali-bration, validation, and verification of the various computer codes. The combination of experiments with continuum mechanics theories to clarify behavior, damage, and transitions between response modes are also anticipated. However, there is a need to obtain constitutive relations for various materials up to very high pressure levels, and a need to define and better explain strain rate effects. So far, there is confidence in scaled tests (structural concrete systems) as long as real materials can be used; however, it is not clear if smaller scaled tests on typical construction materials (e.g., reinforced concrete) can be justified. When scaled tests are to be performed, more than one scale should be used in order to verify proper behavior and to account for size effects. Furthermore, there are seri-ous questions about using scaling laws to study breaching and other severe structural responses. A re-cent study showed that size effects are coupled with loading rate effects to significantly influence material behavior [44-47], and these findings need to be incor-porated into advanced computational tools and design recommendations.
5 DESIGN AND CONSTRUCTION PRACTICES
Existing publications [7,9-11,30] provide guide-lines on the structural engineering topics for physical security design. Discussions of structural systems be-havior under the effects of common threats are used as a basis for comparisons between different types of loading effects on structures; general comparisons be-tween different types of structures and their expected response characteristics; and guidelines on effectively selecting the structural type, materials, and structural

286
components for enhancing safety and physical secu-rity. Specific information is also given on the behav-ior, design, and analysis of structural components that are typically used as part of a facility's structural sys-tem. The discussions include both global and localized responses. The principal objectives of protective de-sign are to protect personnel and assets and to mini-mize the operational disruption of a facility. The ap-proaches include tables and charts from the various design manuals described above.
The combined effects of material properties, loads, support conditions, and structural detailing are under-stood, at least empirically, and this state of knowledge is reflected in the current design codes. The current quasi-static design approaches are reasonable for im-plementation. However, the application of pressure-impulse (P-I) diagrams should be re-evaluated, and the transition between different behavioral modes should be better defined. User-friendly and physics-based, single-degree-of-freedom (SDOF) codes that include various structural response capabilities should be developed and incorporated into the design proc-ess. Design activities should be supported by review of existing data, analysis, and testing, and design methods should be re-evaluated to include more pre-cise criteria. Unlike many current procedures, all de-signs should be based on acceptable design criteria that include the following: construction ability, per-formance, maintenance, and repair requirements for the facility under consideration. Guidelines on con-struction aspects and cost control should be provided. Robustness and response levels should be related to the facility's contents and its mission requirements (for civilian facilities, the mission requirement parameters would be changed to address considerations of safety). It is also desirable to introduce cost/benefit criteria for various design options. Designers should be guided with respect to design tradeoffs, but the design process should be well defined.
Although current design procedures give guidelines on how to enhance the breaching resistance, it could be impractical to protect against breaching and direct shear effects by conventional means. Alternative con-struction and/or reinforcement details should be per-mitted for cases in which lacing would be required. The use of various materials and combinations of ma-terials (e.g., high-strength concrete, possibly in com-bination with conventional and fiber reinforcement and damage absorption devices) should be studied, and future design guidelines should address such op-tions. Guidelines and recommendations should be provided on how to evaluate future capacity of previ-ously loaded structures.
Despite the wide acceptance of TM 5-1300, recent studies [48-53] have shown that current design proce-dures may not be adequate for connections or plastic hinge regions for both structural concrete and steel, and raise questions about recommendations for both flexural and shear resistance models in slabs. Design
procedures for special details are also included in ex-isting publications [7,9-11,22,23], for example, the se-lection and design of security windows, doors, utility openings, and other components that must resist blast and forced-entry effects. General design approaches for hardening typical commercial construction to resist physical security threats are also included. Threats considered relate specifically to external or internal explosions. Concepts for changing the essential quan-tities for dynamic resistance include mass and strength increases, support conditions modification, span de-crease, replacement of inadequate components, and loaded area reduction. Additionally, retrofit effects on blast, ballistic, and forced-entry resistance is dis-cussed. These discussions include analysis techniques for predicting retrofit requirements, retrofit materials and techniques, forced-entry resistance retrofit, and their anticipated cost.
Considerable attention was given to the behavior of subsystems that are typically found in hardened facili-ties subjected to nuclear effects (generators, air-, wa-ter-, and fuel-supply equipment, communication and computer equipment, etc.). There is no comparable source of information related to HE effects, but one may use data from individual studies for such purpose. The important findings indicate that most mechanical or electromechanical types of equipment are suffi-ciently rugged to survive the anticipated in-structure shock environments. Problems were encountered pri-marily with faulty wire installations or with inade-quate attachment procedures for the structure. Al-though shock isolation is quite feasible, it was noticed that certain shock isolation devices may not provide the expected protection.
6 OBSERVATIONS
The current fortification and physical security technologies may be evaluated in light of the informa-tion presented above. First, it should be noted that most of the current design procedures are highly em-pirical. This is not intended as a negative comment. The problem of facility or system behavior under se-verely short-duration dynamic loads is difficult for the following reasons: it cannot be treated with closed-form solution procedures; experimental approaches are complicated and not as precise as one would wish; and numerical solutions, although increasingly more widely used, still lack reliable load simulation and well-defined material properties, and require large computational resources. Nevertheless, one must pro-vide solutions for such complicated, and in many poorly-defined, problems. Thus, many analysis and design recommendations are simplified, helping to produce safe facilities whose safety margins are not well defined. This could be quite acceptable for mili-tary facilities, where risks and certain casualty rates are acceptable. However, the requirements for military facilities could be significantly different from those

287
for civilian ones, and the design recommendations must reflect such differences. Therefore, the direct adoption of military design recommendations for ci-vilian applications should be carefully examined.
There are questions concerning load definition for various events (here one must also consider the diffi-culties in medium-structures interaction, combined blast and fragment effects, and the uncertainties asso-ciated with such events). Design calculations should be supported by advanced simplified computer codes, and the traditional concept of pressure-impulse dia-grams should be re-evaluated. Better material models should be made available for advanced computations (which should be performed at final design stages), and structural response calculations should be per-formed separately from breaching evaluations. Preci-sion testing should be promoted, and scaled tests should be conducted within the ranges that allow the use of real construction materials. In design, the gen-eral concept of safety factors should be re-evaluated to ensure structural robustness (i.e., to prevent progres-sive collapse) and compatibility with different struc-tural resistance mechanisms. Design guidelines should enable the use of material combinations, advanced re-inforcements, efficient reinforcement details, consid-erations of lifecycle costs, and should provide the ca-pability to evaluate alternative designs. Guidelines and recommendations should be delineated on how to evaluate future capacity of previously loaded struc-tures.
Recent events and developments highlight three other areas in which there is a serious lack of knowl-edge about and/or need for protection technology. First is the issue of secondary threats to a building and its contents. It is typical to have fires, smoke, progres-sive collapse, etc. following an explosive attack. Al-though some work has been done in this area, the re-lated information is not readily available in design manuals (especially those mentioned above). Second, there are no clear recommendations on how to per-form post attack recovery operations safely. This is di-rectly related to the issue of post attack damage as-sessment and secondary threats. During recovery operations it is vital to enter a damaged facility quickly and rescue individuals and/or assets trapped inside. Such activities may require the rapid, safe re-moval of debris and temporary shoring of specific elements. Rescue and emergency personnel must have decision support tools and guidelines on how to per-form such work without causing further collapse. This is a complicated problem, especially during a period of crisis and confusion, and it is much more difficult than the traditional bomb damage assessment (BDA) activities performed by military personnel. It also should be noted that, based on recent experiences, military BDA is a critical area that requires significant improvements [54-56]. As noted previously, one of the workshop recommendations [6] was to develop guidelines on damage assessment in design manuals.
It seems reasonable that such development could be extended to include �rescue-related design guidelines� as an integral part of future design manuals. The third area in which there is a serious lack of knowledge is large fires and their effects (including fires as a terror-ism weapon). Because this threat could become a very serious problem in the near future, new fire protection technologies are needed for civilian type facilities.
Current activities aimed at the development of an updated design manual could be extremely useful if �civilian� versions of such a manual would be made available for non-DOD design activities. Such a capa-bility must be combined with educational and training activities to guarantee an effective integration of pro-tective architecture technologies into the civilian mar-ketplace.
The discussion presented in the previous sections raised several issues regarding current methods for hardened systems analysis and design. Clearly, sig-nificant knowledge in this area has been gained since WWII, and the history of the last fifty years teaches that the threat from WMD should be taken very seri-ously. The re emergence of nuclear/radiological, chemical, and biological threats must not be over-looked. Obviously, additional research in many areas is badly needed, and such needs have to be adjusted to reflect changes in threats, weapon systems, strategic and tactical concepts, and the capabilities of experi-mental and analytical tools. Unfortunately, the techno-logical changes in the development of conventionaland unconventional weapons are much more rapid than the progress in the development of adequate pro-tective technologies. Furthermore, society has been typically reacting to such changes after specific inci-dents, rather than developing effective measures in preparation for possible attacks. It would be wise to address such issues urgently and continuously, and to become much more proactive in the development of protective technology that can help avert very serious consequences. Some of these issues were addressed in recent reports that highlighted areas requiring careful attention [57,58], as discussed next.
7 POLICY AND TECHNOLOGY NEEDS
According to the Downing Assessment Task Force recommendations [2], the Department of Defense (DOD) was to develop a comprehensive approach to force protection that included the designation of an ex-isting DOD organization to be responsible for force protection. It further stated that consideration should be given to a national laboratory to provide this ex-pertise, and that this entity should be provided funds and authority for research, development, test, and evaluation (RDT&E) efforts to enhance force protec-tion. From the NRC committee's findings [3] and the USCNS/21 report [4], it is clear that the potential hazards for both civilian and military systems and fa-cilities (land-, air-, and sea-based) are considerable,

288
and the construction technologies and design princi-ples developed for hardened military structures are not directly applicable to these facilities. These con-clusions and recommendations were confirmed by the recent terrorist attacks.
Although several countries made significant in-vestments in research related to terrorism effects (in-cluding blast effects on structures), the focus until about 1990 was primarily on weapons performance and the design of hardened military facilities. Conse-quently, we lack knowledge and experience in how many typical civilian facilities and systems behave under blast-induced loads. Furthermore, we are gradually gaining the required knowledge and experi-ence in how to cost effectively retrofit existing sys-tems and facilities to make them blast resistant. New and advanced materials, novel retrofit and design concepts, and expedient design concepts, and certifi-cation and validation processes must be developed in response to these challenges. The NRC reports [3,15,16] included specific recommendations that should be implemented for land-based facilities. More far reaching recommendations have been issued re-cently by the USCNS/21 [4] to address an anticipated enhanced threat from terrorism to the United States. In light of the 2001 terrorist attacks against the World Trade Center and the Pentagon, followed by other at-tacks in Europe, these recommendations must be modified to address both the protection requirements faced by society, including land-, sea-, and air-based systems and facilities, as well as the protection of ci-vilian populations, as follows:
Expand current defense programs of both short- and long-term research on terrorist threat protec-tion to include theoretical, experimental, and numerical studies of the resistance of military and civilian land- and sea-based facilities (e.g., buildings, ships, etc.) to anticipated threats, and include considerations of both structural and nonstructural subsystems. Adapt existing technology developed for military use and disseminate it to civilian design profes-sionals (emphasizing land-, sea-, and air-based facilities and systems) through professional or-ganizations and academic curriculums. Establish both national and multi national gov-ernment-academic-industry partnerships whose purpose is to enhance and facilitate the develop-ment and implementation of such technologies. Furthermore, expose design professionals to the range of protective measures that can be taken to protect facilities and systems (e.g., buildings and compounds, aircraft, ships, etc.) from terrorist at-tack. The partnership should provide a network to foster cooperation and effective protective technology transfer among government, acade-mia, and private industry.
The various departments of defense and/or home-land security have the responsibility for developing, maintaining, and applying effective technologies to protect civilian and military personnel worldwide. Currently, in the U.S., the bulk of the research related to this problem is addressed through the special groups (e.g., through the Technical Support Working Group, TSWG, under the National Security Council, which focuses on rapid solutions to interagency prob-lems and the Army's Technology Based Program in Force Protection against Terrorist Threat that is fo-cusing on military/government installations). Also, in the U.S., the Department of State supports a limited program addressing threats to U.S. embassies. The contributions to current protective measures from these research programs have been limited because of a lack of funding. While such organizations were as-signed the responsibility for conducting the technol-ogy-based research mission for the services for sur-vivability and protective structures, the technology-based funding has remained practically at the same level as before. Outside of the defense establishments, experience in terrorism effects (e.g., blast effects on facilities) exists in a limited number of consulting firms involved in such work. Most of these firms, like their government sponsors, suffer from a lack of ex-perienced technical personnel, and their level of inter-est and involvement depends directly on the availabil-ity of funding.
The recommendations of the Downing Task Force, the NRC study and the USCNS/21 reports clearly call for a comprehensive approach in develop-ing protective technologies and the establishment of DOD design standards for new construction, harden-ing of existing facilities, and ship survivability. Fur-thermore, for the approach to be fully comprehensive, it is critical that an effective government-academic-industry partnership is developed to provide an insti-tutional network to foster R&D, training, and tech-nology transfer. Consistent with these recommenda-tions, an integrated and multinational systems approach to the terrorist threat problem should be ex-plored seriously.
8 PROTECTIVE DESIGN METHODOLOGY:DEVELOPMENT AND IMPLEMENTATION
The following summarize the recommended ac-tions required to address the issues raised previously, herein:
$ To mobilize the international scientific commu-nity (including government, private, and aca-demic) for this effort.
$ To establish comprehensive and complementary long- and short-term R&D activities in protective technology to insure the safety of international government, military, and civilian personnel,

289
systems, and facilities under evolving terrorist threats.
$ To develop innovative and effective mitigation technologies for the protection of government, military, and civilian personnel, systems, and fa-cilities from terrorist attack.
$ To launch effective technology transfer and training vehicles that will insure that the required knowledge and technologies for protecting gov-ernment, military, and civilian personnel, sys-tems, and facilities from terrorist attack will be fully and adequately implemented.
$ To establish parallel and complementary pro-grams that address the non technical aspects of this general problem (i.e., culture, religion, phi-losophy, history, ethnicity, politics, economics, social sciences, life science and medicine, etc.) to form effective interfaces between technical and non technical developments, and to imple-ment a comprehensive approach for combating international terrorism.
9 A COMPREHENSIVE APPROACH
The following sequence of activities that address the critical scientific and technical needs, as described above, is fully compatible with ongoing activities that are focused on land-, air-, and sea-based systems and facilities. This compatibility is essential for insuring one that the required protective technologies would meet the broad range of critical national needs. The process is expected to involve a sequence of comple-mentary activities, from basic research through im-plementation, as described below:
Basic and Preliminary Applied Research
$ Define and characterize design threats and corre-sponding loads, and perform hazard and/or risk analysis, and the corresponding consequences on assets, missions, and people.
$ Predict and/or measure facility and/or system re-sponse to design threat loads, including consid-erations of characteristic parameters (e.g., mate-rial properties, geometry, structure/system type, assets, mission requirements, etc.).
$ Develop theoretical/numerical retrofit and/or de-sign concepts to bring a facility and/or system response and consequences within acceptable levels.
$ Applied Research, Advanced Technology De-velopment and Demonstration/Validation Tests
$ Develop retrofit and/or design concepts to bring the facility/system response and consequences within acceptable levels.
$ Verify retrofit and/or design concept through laboratory and/or field tests and develop final de-
sign specifications. $ Demonstration, Validation, and Implementation $ Conduct certification and/or validation tests. $ Implement retrofit and/or design technology
transfer, guidance and/or training.
These activities should be conducted internation-ally through national centers for protective technol-ogy research and development (NCPTR&D). These centers will direct, coordinate, and be supported by collaborative government, academic, and industry consortia who will perform various parts of the activi-ties mentioned above. National academic support consortia (NASC) should be established to engage in this critical effort through both research and educa-tion activities. These NASCs will identify and mobi-lize faculty members from universities with appropri-ate scientific and technical capabilities, and lead some of the required R&D.
The NCPTR&Ds and its consortia members will be staffed by a unique team of internationally known experts in all S&T areas relevant to protective tech-nology, and will have access to advanced research fa-cilities at all sites. Team members should have docu-mented extensive experience in protective technology, developing and managing major research initiatives, developing and implementing innovative protective technologies, and in training of both mili-tary and civilian personnel in the application. Each collaborative effort should be conducted under the general guidance and oversight of an advisory com-mittee consisting of internationally recognized tech-nical experts and senior public/government/military leaders in relevant fields. Specific technical guidance will be provided through combined government-academic-industry management teams with sub-groups formed to focus on key S&T areas.
10 EDUCATION, TRAINING, AND TECHNOL-OGY TRANSFER
As technology is developed, it transitions to test and evaluation, which determines if the technology is applicable for a given application. After several itera-tions, such technology is transferred to operational testing for its evaluation under realistic conditions. Upon completion of this evaluation phase, acquisition and operational training occurs. Training for known threats relies on a predetermined course of action. Some adversarial actions might be anticipated and counter measures could be practiced during training. Nevertheless, in various instances, criticism was noted for not anticipating threat evolution and not training for it. This is also a shortcoming of conven-tional training for First Responders; they are trained to respond to the known conditions, and may not be able to respond adequately under different conditions. This must be corrected by educating personnel to un-derstand the possible threats and the ability of avail-

290
able technology to deal with them. The appropriate people should be able to modify their actions to ad-dress such threats intelligently, and hopefully develop preemptive measures.
This structured approach does not exist yet in the general field of protection from WMD. Furthermore, military solutions are often incompatible with civilian modes of operation, and they could be also either too rigid or too expensive to implement in nonmilitary organizations. Leaving this process to commercial vendors could be another option, but quality controls and costs for commercial technology are frequently controversial. Further, the time available for the train-ing of the appropriate persons (e.g., engineers, secu-rity specialists, emergency and rescue operations staff, etc.) is limited compared to that of military per-sonnel. The Department of Homeland Security (DHS) is expected to address these issues through collabora-tion with industry and academic institutions [48], and one would expect similar collaborations with other government agencies. Universities will have to be in-volved more than merely basic research. They will also have to play an integral role in functioning as think tanks and transferring the developed knowledge and technology to the end-users.
Within many government agencies and their sup-porting industrial organizations, there is a critical need to attract and/or develop employees with experi-ence in protective science and technology, as the cur-rent workforce ages and reaches retirement age. Since the mid-1980s, a gradual decline has taken place in academic protective technology related R&D activi-ties, along with the involvement of academicians in these R&D efforts. As a result, very few eminent aca-demicians in this field are still available in the U.S., most are not supported by DOD R&D funding, and no formal engineering training exists in the area of protective science and technology at U.S. universities. The situation is similar in most other developed coun-tries. To remedy this situation, the Protective Tech-nology Center (PTC) at Penn State University has ini-tiated such a program in 2000 with support from the U.S. Army Engineer Research and Development Cen-ter (ERDC). As of August 2006, the PTC activities, equipment and staff have relocated to the University of Florida, and they continue through the Center for Infrastructure Protection and Physical Security (CIPPS). These activities involve a combination of R&D and academic education and training. The re-sults, in terms of the complementary R&D and edu-cational activities, obtained with this approach dur-ing the last three years have clearly demonstrated its effectiveness. Therefore, establishing government-academic-industry consortia in various countries, with a mandate to develop new and cost-effective protective technologies, and train current and future engineers and scientists, should be seriously consid-ered. Such programs foster the input of fresh ideas and provide the students with first hand experience
from their work on real programs that can benefit national and international needs. This will allow na-tions to maintain protective technology knowledge centers that will insure the development and broad dissemination of relevant technologies to all appro-priate parties (e.g., law enforcement, military, vari-ous government agencies, as well as private organi-zations). The proposed consortia will address the WMD threat through a multi step Science and Tech-nology (S&T) plan that provides an end-to-end solu-tion, from R&D through system development, de-sign certification, guidance, education and training, and technology transfer in all relevant areas for de-fending against the WMD threat.
11 ECOMMENDED LONG TERM RESEARCH AND DEVELOPMENT ACTIVITIES
The following list of recommended long-term re-search activities has been developed following many discussions of this topic. These R&D activities can be conducted over the next three to five years. They are needed to develop much more effective solutions to problems that can be currently addressed only with empirical and conservative approaches. These expected contributions will not only benefit specific projects, but also have a profound contribution to various critical national facilities, national and inter-national defense, and homeland security. The in-vestment in the proposed approach will enable both very meaningful technological enhancements and large cost savings in providing the required protec-tion to society. Furthermore, these cost savings are estimated to be far larger than the cost of the rec-ommended R&D. As noted earlier, essential re-search must be conducted also in several important areas related to terrorism and low intensity conflicts (e.g., history, sociology, politics, culture, economics, information transfer and media, religion, life sci-ences and medicine, psychology, etc.). These areas, however, will not be addressed, herein. The follow-ing write up is focused on R&D related to scientific and technical issues. Recommended experimental and testing capabilities are identified for each of the following items by underlying the R&D topics that require such support. 1. Protection methodology, threat, risk assessment,
its mitigation and resource allocation. 2. Load and environment definition (each of the
following items requires testing support): � Address the time scales from microsec-
ond to days and more. � Address explosives, fire, nuclear,
chemical, and biological (NCB), and combined effects.
� Study the effects from site conditions. � Address both external and internal at-
tack conditions for typical buildings, considering a broad range of blast wave

291
propagation, complex geometries and blast-structure interaction effects.
� Define the combined load arising from blast, primary and secondary fragments.
� Define and characterize load transfer through various single or multiphase media, including facility envelopes.
� Study and define the short-duration loading conditions on critical structural elements (e.g., columns, etc.), as a func-tion of the interaction between the blast and a typical building system.
3. Materials� behavior under single and combined loading environments to include (each of the following items requires testing support):
� Address constant and/or variable loading rate effects.
� Study the behavior of typical construc-tion materials under blast loads, and their constitutive formulations.
� Address scaling and size effects. � Study the combined effects of loading
rate and structural size. � Address high and low temperature ef-
fects.� Define and characterize material aging
effects, and how this could influence any of the issues noted above.
4. Computational capabilities to include: � Perform precision impact tests for ob-
taining well-defined data on the behav-ior of simple structural elements in sup-port of computer code validation.
� Use the precision test data for the vali-dation of computer codes that could be used for the numerical simulation of loading on buildings, and the building response under blast effects. Define the accuracy of such computer codes, and select those that are suitable for applica-tion.
� Deterministic and probabilistic numeri-cal capabilities.
� Time and frequency domain computa-tions.
� Artificial intelligence and neural net-work capabilities.
� Hybrid and/or coupled symbolic-numeric computational capabilities.
� Computational structural dynamics (CSD) simulations and computer code validation.
� Computational fluid dynamics (CFD) simulations and computer code valida-tion.
� Coupled CFD-CSD-thermomechanical simulations and required computer code validation.
� Applications of Eulerian, Lagrangian,
and/or combined numerical approaches. 5. Study the behavior and effects of building en-
closure to include (each of the following items requires testing support):
� Study the behavior of typical building envelopes under blast, shock, and im-pact loads.
� Developing innovative building enclo-sure technologies to enhance the protec-tion from blast, shock and impact.
� Study the performance of joints, particu-larly two-stage control joints, in building enclosures.
� Develop design criteria for building en-closures to enhance their performance under explosive loads.
� Study the behavior of closures, attach-ments and penetrations in typical build-ings under blast loads.
6. Building and structural science and behavior to include (each of the following items requires testing support):
� Study the behavior of structural detail-ing in buildings (e.g., structural con-crete, structural steel, and composite construction) for enhancing their per-formance under blast loads.
� Study and develop innovative structural retrofit options for enhancing the per-formance of typical buildings under blast loads.
� Study how to shield and protect critical structural elements from blast effects for enhancing building robustness.
� Develop effective measures for typical buildings to enhance their explosive safety under internal detonations.
� Study the behavior of typical nonstruc-tural elements (i.e., partitions, ceilings, ducts, lighting, etc.) under blast loads, and their detailing.
� Develop design and construction rec-ommendations for nonstructural ele-ments.
� Develop effective protection and inte-gration procedures for mechanical and electrical systems in buildings subjected to blast effects.
� Study the combined effects of blast, primary and secondary fragments and missiles on structural and nonstructural systems, and how to protect such sys-tems against such effect.
� Study the effects of openings in floors and walls in typical buildings under blast loads on their behavior and per-formance, and developing appropriate design guidelines.
� Structural behavior, design, construction

292
and detailing, performance and safety. � Perimeter protection systems (e.g.,
gates, walls, fences, landscape features, etc.).
� Understanding, characterizing and pre-venting progressive collapse.
� Nonstructural element behavior under blast, shock and impact effects.
� Building and structural behavior under internal detonations.
� Address structural systems unique to transportation infrastructure facilities (e.g., bridges, tunnels, ports, etc.).
� Improved design codes. 7. Facility and system behavior under WMD envi-
ronments: Combine the knowledge gained from R&D on the topics noted above, to address complete facility behavior and performance.
8. Address multi facility conditions. Consider all the issues noted above to address large scale WMD attack conditions that can affect many facilities in various geographic areas (e.g., parts of cities, industrial complexes, etc.).
9. Facility assessment to include: � The development of both rigorous and
practical guidelines for assessing struc-tural damage and robustness before and after explosive incidents.
� Pre- and post incident condition and/or damage assessments in support of evacuation, rescue, and recovery (ERR) activities. These require consideration of both temporary shoring and demolition activities, rescue and construction equipment utilization, emergency supply chain applications, etc. Include applica-tions of intelligent computer support tools and instrumented monitoring to provide expert advice during emergency operations.
10. Environmental effects (each of the following items requires testing support):
� Study material and structural perform-ance under various threat conditions, and controlling external and internal fa-cility environments.
� Study possible effects of low or high temperature and moisture on explosive loads, material and structural response and behavior under blast, shock and im-pact.
� Study the effect of time under normal service conditions on the performance of building components and systems under blast effects.
11. Technology transfer, education, and training to include:
� Develop effective education, technology
transfer, and training for the areas noted above that will insure that the knowl-edge gained from the proposed research can be used and implemented by engi-neers, designers, security personnel in-volved in force protection and industry.
� Implement and integrate these activities with basic and advanced engineering education programs to insure the long term supply of qualified personnel in this important field.
12. Use the knowledge gained from these R&D ef-forts to augment design recommendations for seismic and wind effect mitigation. This will re-sult in the development of a uniform multi haz-ard protection design approach for facilities subjected to abnormal loading conditions.
Based on the anticipated findings, the above could be modified during the life of the proposed program.
12 CONCLUSION
This paper, focused primarily on scientific and engineering issues, provided background on related capabilities in protective science and technology, and recommendation for long-term research to ad-dress serious needs in this general area. The recom-mended activities can be conducted over the next three to five years, and they should be supplemented with follow up R&D activities for the foreseeable future. We must develop much more effective solu-tions to problems that can be currently addressed mainly with conservative and/or empirical ap-proaches. Also, we must develop a competent scien-tific and technical human resource pool through ef-fective education, training, and technology transfer. The expected cost-effective contributions will have a profound effect on critical national and international defense and security requirements.
13 REFERENCES
[1] United States Department of State, Patterns of Global Terrorism 2002, April 2003.
[2] Force Protection Assessment of USCENT-COM AOR and KHOBAR TOWERS, Report of the Downing Assessment Task Force, 30 Aug 1996.
[3] National Research Council, Protecting Build-ings From Bomb Damage, National Acad-emy Press, Washington, D.C., 1995
[4] The United States Commission on National Security/21st Century (USCNS/21), Road Map for National Security: Imperative for Change, 15 March 2001.

293
[5] Krauthammer, T., Modern Protective Struc-tures, Course Notes, Protective Technology Center, Penn State University, July 2006.
[6] Krauthammer, T., Structural Concrete Slabs Under Impulsive Loads, Fortifikatorisk Notat Nr 211/93, Norwegian Defence Construction Service, June 1993.
[7] ASCE, Design for Physical Security - State of the Practice Report, American Society of Civil Engineers, 1999.
[8] ASCE, Design of Structures to Resist Nu-clear Weapons Effects, American Society of Civil Engineers, Manual No. 42, 1985.
[9] Department of the Army, Fundamentals of Protective Design for Conventional Weap-ons, Technical Manual TM 5-855-1, No-vember 1986 and August 1998 (for official use only).
[10] Department of Defense, Unified Facilities Criteria (UFC), Design and Analysis of Hardened Structures to Conventional Weapon Effects, UFC 3-340-01, 1 June 2002 (Fort Official Use Only).
[11] Department of the Army, the Navy, and the Air Force, Structures to Resist the Effects of Accident Explosions, Army TM 5-1300, Navy NAVFAC P-397, Air Force AFR 88-22, Washington, DC, 1990.
[12] Smith, P.D. and Hetherington, J.G., Blastand Ballistic Loading of Structures, Butter-worth-Heinemann Ltd., 1994.
[13] Mays, C.G., and Smith, P.D., Blast Effects on Buildings, Thomas Telford, 1995.
[14] Glasstone, S. and Dolan, P., The Effects of Nuclear Weapons, Department of Defense and Department of Energy, 3rd edition, 1977.
[15] National Research Council, Blast Mitigation for Structures, National Academy Press, Washington, D.C., 2000.
[16] National Research Council, Protecting Peo-ple and Buildings from Terrorism, National Academy Press, Washington, D.C., 2001.
[17] FEMA, The Oklahoma City Bombing, FEMA 277, Federal Emergency Management Agency, August 1996.
[18] Goering, K.L., Blast Threats to Buildings and Blast Mitigation Technology, Proc. Ar-chitectural
[19] Hinman, E.E., and Hammond, D.J., Lessonsfrom the Oklahoma City Bombings, ASCE Press, 1997.
[20] FEMA, World Trade Center: Building Per-formance Study, FEMA 403, Federal Emer-gency Management Agency, May 2002.
[21] ASCE, Pentagon Building Performance Re-port, American Society of Civil Engineers, 2003.
[22] Department of the Army, Response Limits and Shear Design for Conventional Weapons
Resistant Slabs, ETL 1110-9-7, Washington, D.C., 1990.
[23] ASCE, Design of Blast Resistant Buildings in Petrochemical Facilities, American Society of Civil Engineers, 1997.
[24] Baker, W.E., Explosions in Air, Wilfred Baker Engineering, San Antonio, 2nd Print-ing, 1983.
[25] Baker, W.E., Cox, P.A., Westine, P.S., Ku-lesz, J.J., Strehlow, R.A., Explosion Hazards and Evaluation, Elsevier, 1983.
[26] Henrych, J., The Dynamics of Explosions and Its Use, Elsevier, 1979.
[27] Johansson, C.H. and Persson, P.A., Detonicsof High Explosives, Academic Press, 1970.
[28] Persson, P.A., Holmberg, R., and Lee, J., Rock Blasting and Explosive Engineering,CRC Press, 1994.
[29] Zukas, J.A., and Walters, W.P., Explosive Ef-fects and Applications, Springer-Verlag, 1998.
[30] Departments of the Army, and Air Force, Se-curity Engineering Project Development, TM 5-853-1/AFMAN 32-1071, May 1994 (for official use only).
[31] Department of Defense, Unified Facilities Criteria (UFC), DoD Minimum Antiterror-ism Standards for Buildings, UFC 4-010-01, 8 October 2003.
[32] Department of Defense, Design of Building to Resist Progressive Collapse, Unified Fa-cilities Criteria (UFC), UFC 4-023-03, De-partment of Defense, 25 January 2005.
[33] Department of Energy, A Manual for the Prediction of Blast and Fragment Loadings on Structures, DOE/TIC-11268, July 1992.
[34] FEMA, Reference Manual to Mitigate Poten-tial Terrorist Attacks Against Building, Fed-eral Emergency Management Agency, Re-port FEMA 426, December 2003.
[35] GSA, Progressive Collapse Analysis and De-sign Guidelines for New Federal Office Buildings and Major Modernization Projects, General Services Administration, June 2003.
[36] U.S. Department of State, Country Reports on Terrorism 2005, April 2006.
[37] DHS, National Strategy for Homeland Secu-rity, Office of Homeland Security, July 2002.
[38] Krauthammer, T., Bazeos, N. and Holmquist, T.J., Modified SDOF Analysis of RC Box-type Structures, Journal of Structural Engi-neering, ASCE, Vol. 112, No. 4, pp. 726-744, April 1986.
[39] Krauthammer, T., A Numerical Gauge for Structural Assessment, The Shock and Vibra-tion Bulletin, No. 56, Part 1, Aug. 1986, pp. 179-193.
[40] Krauthammer, T., Shanaa, H.M. and Assadi-Lamouki, A., Response of Reinforced Con-

294
crete Structural Elements to Severe Impul-sive Loads, Computers and Structures, Vol. 53, No. 1, October 1994, pp. 119-130.
[41] Krauthammer, T., Shahriar, S., and Shanaa, H. M., Analysis of Reinforced Concrete Beams Subjected to Severe Concentrated Loads, Structural Journal, ACI, Vol. 84, No. 6, pp. 473-480, November-December 1987.
[42] Krauthammer, T., Jenssen, A., and Langseth, M., Precision Testing in Support of Com-puter Code Validation and Verification, For-tifikatorisk Notat Nr 234/96, Norwegian De-fence Construction Service, May 1996.
[43] Krauthammer, T., Jenssen, A., and Langseth, M., �Follow Up Workshop on Precision Testing in Support of Computer Code Vali-dation and Verification,� Fortifikatorisk No-tat Nr 276/99, Norwegian Defence Construc-tion Service, Oslo, Norway, May 1999.
[44] Elfahal, M.M., Krauthammer, T., Ohno, T., Beppu, M., Mindess, S., and Markeset, G., Dynamic Size Effect in Normal and High Strength Concrete Cylinders, 11th Interna-tional Symposium on the Interaction of the Effects of Munitions with Structures, Mann-heim, Germany, 5-9 May 2003.
[45] Krauthammer, T., Elfahal, M., Ohno, T., Beppu, M, and Markeset, G., Size Effects for High Strength Concrete Cylinders Subjected to Axial Impact, International Journal of Im-pact Engineering, Vol. 28, No. 9, pp. 1001-1016, October 2003.
[46] Elfahal, M., Krauthammer, T., Ohno, T., Beppu, M., and Mindess, S., Size Effects for Normal Strength Concrete Cylinders Sub-jected to Axial Impact, International Journal of Impact Engineering, Vol. 31, pp. 461-481, 2005.
[47] Elfahal, M.M., and Krauthammer, T., Dy-namic Size Effect in Normal and High Strength Concrete Cylinders, ACI Materials Journal, Vol. 102, No.2 pp. 77-85, March-April 2005.
[48] Ku, C.K., and Krauthammer, T., NumericalAssessment of Reinforced Concrete Knee-joints Under Explosively Applied Loads, ACI Structural Journal, Vol. 96, No. 2, pp. 239-247, March-April 1999.
[49] Otani, R.K., and Krauthammer, T., Assess-ment of Reinforcing Details for Blast Con-tainment Structures, Structural Journal, ACI, Vol. 94, No. 2, pp. 124-132, March/April 1997.
[50] Krauthammer, T., Structural Concrete and Steel Connections for Blast Resistant Design,International Journal of Impact Engineering, Vol. 22, No. 9-10, pp. 887-910, Octo-ber/November 1999.
[51] Woodson, S.C., and Krauthammer, T., De-
sign for Severe Dynamic Loads, in: Schaeffer, T.C. (Editor), The Design of Two-Way Slabs, ACI SP-183, American Concrete Institute, Farmington Hills, MI, pp. 17-35, 1999.
[52] Woodson, S.C., Shear Reinforcement in Deep Slabs, Technical Report SL-94-24, US Army Corps of Engineers, Waterways Ex-periment Station, November 1994.
[53] Woodson, S.C., Effects of Shear reinforce-ment on the Large-Deflection Behavior of Reinforced Concrete Slabs, Technical Report SL-94-18, US Army Corps of Engineers, Waterways Experiment Station, September 1994.
[54] Krauthammer, T., Explosion Damage As-sessment, Proc. First Forensic Engineering Seminar on Structural Failure Investigations, University of Toronto, 11-12 January 1999.
[55] Miller-Hooks, E., and Krauthammer, T., In-telligent Evacuation, Rescue and Recovery Concept: A Functional System Description,11th International Symposium on the Interac-tion of the Effects of Munitions with Struc-tures, Mannheim, Germany, 5-9 May 2003.
[56] Miller-Hooks, E., and Krauthammer, T., An Intelligent Evacuation, Rescue and Recovery Concept, Fire Technology, (to appear).
[57] Krauthammer, T., Protective Technology Re-search, Development, and Implementation in Support of DoD Force Protection Needs, Fi-nal Report to U.S. Army ERDC, PTC�TR-005-2004, Protective Technology Center, Penn State University, September 2004.
[58] Krauthammer, T., Advanced Structural Analysis and Damage Assessment Capabili-ties in Support of DOD Force Protection Needs, submitted to US Army Engineer Re-search and Development Center, Protective Technology Center, Penn State University, May 2006.

295
1 INTRODUCTIONA common feature of extreme loads is that they are intense and of short duration. This applies to impact, seismic and blast loads. A further feature is that they result in large deformations. It is the ability to ab-sorb energy through ductility that is the primary fac-tor in survivability. This concept was recognized by the automotive industry with the transfer to the �crumple design� method, Figure 1. Thereby ductile failures are specifically designed for, by selecting re-latively weak structural members connected together by relatively strong joints. Unfortunately extreme loads do not fit easily within the ULS design appro-
ach because the implication of the ULS load being exceeded is not considered. Furthermore, ULS design, based on lower-bound strength calculations, has been shown to be capable of producing a mis-match between the strength of beams and their con-nections (Byfield, 2004). When combined with low ductility connections, this approach will produce brittle buildings.
Robust design of steel framed buildings against extreme loading
M.P. ByfieldUniversity of Southampton, United Kingdom
G. De MatteisUniversity of Chieti/Pescara, Italy F. DinuRomanian Academy, Timi oara, Romania
ABSTRACT: Robust frames subjected to earthquakes and other hazards such as explosions require relatively weak beams, but strong connections and columns. The reason is to avoid collapse of the structure without producing significant energy absorption, which is demanded by exceptional events like those under conside-ration in current paper. In particular, for earthquake design, when moment resisting frames are of concern, it is necessary to apply design rules aimed at obtaining dissipative collapse mechanisms of the structure, which require the formation of ductile plastic hinges at the beam ends rather than in the columns (to avoid partial storey mechanisms) as well as in the beam-to column connections (to avoid brittle failures). On the other hand, robust design due to explosion hazards has to be related to the capability of the structure to avoid pro-gressive collapse due to the loss of a column. In such a case alternative load paths must be present if dispro-portionate collapse is to be avoided. These can be in for form of bracing systems, or more commonly, alterna-tive load paths can be found through catenary action of the floor members. In this case the connections to the floor members must be designed to accommodate the large sagging deformations that develop in the beams. This creates an exceptional situation whereby the remaining part of the structure should be able to support such an overloading. Also for steel constructions, a robust structural design cannot be easily achieved, since there are several factors - including strain hardening, the routine supply of over strength steel and high rates of strain - that can cause a brittle behavior of some components, e.g. the beam-to-column connections, which have to be intended as key elements for achieving a successful design. These factors are investigated in this paper, providing useful issues that can guide to a correct design of robust steel frames to avoid premature col-lapse due to extreme loading.

296
Figure 1. Energy absorbing failures of car frames achieved using the �crumple zone� design methodology
Steel structures usually exhibit a prominent behavi-our when subjected to large external forces, due to the large strength and inherent ductility at material level as well as the ductility that can be achieved at global level when accurate design and construction details are adopted. For this reason, steel structures could be favourably employed to resist extreme loa-ding, like the ones produced by large earthquakes and the exceptional actions, such as impact and ex-plosions. In both cases a �robust� design has to be achieved, in order to allow global failure mecha-nisms and to avoid progressive collapse due to the premature loss of a structural component. Robust design of structures may be achieved by me-ans of high redundancy, i.e. incorporating moment beam-to-column connections having large over strength or by using other dissipative sources in the structure (bracings, dampers and so on). A useful al-ternative, when the structures are designed for gravi-ty loading only and simple connections are of con-cern, may be based on the employment of very ductile pinned connections, that could favour the de-velopment of catenary resistant mechanisms at large deformation stages. The former approach is typically adopted in earthquake prone countries, while the lat-ter in simply supported steelwork frames subjected to exceptional actions.
Design tying loadCatenary load RuptureRupture
Figure 2. Illustration of the insufficient ductility many industry standard connections have for accommodation large rotations without brittle fracture
However, industry standard connections may have poor ductility, Figure 2. This could result in sudden failures if subjected to large beam deflections. Besi-des, structural members can typically resist loads far in excess of the ULS design loads, (Byfield, 2004). Thus both the rotation and resistant capacities of the connections could be exceeded, leading to relatively poor robustness under conditions of severe overload. In order to avoid premature collapse of connections, capacity design approaches provide the opportunity to better match the strength of joints with the stren-gth of structural members that they connect. This is achieved by ensuring that all components in a frame have a strength exceeding that required to generate the plastic hinges identified. Thus, the systems re-sponse is considered rather than the response of components in isolation from each other. The UK robustness requirements date back to the Ronan Point disaster in 1968, in which part of a 22-storey block of flats collapsed as a result of a gas explosion. The resulting structural integrity require-ments contained led to structures with an reasonable ability to resist blast by ensuring that all structural members are adequately tied together. It is widely believed that this method will prevent progressive collapses by catenary action following the removal of a column, although this load path has not been adequately tested, either in practice or in theory. Further to this, structural elements vital to overall stability (key elements) must be designed to resist abnormal (blast) loads of 34kN/m2. This load corre-sponds to the average peak overpressure estimated to have been developed during the Ronan Point explo-sion. As such it does not provide protection against high-explosive blasts, which will be much higher in magnitude. In earthquake prone countries ductility is the key concept of seismic design of structures. In order to obtain economical but safe structures, moment re-sisting steel frames must be allowed to undergo plas-

297
tic deformations, causing the dissipation of the ener-gy introduced in the structure by the ground shaking. Such a concept was firstly introduced by the Japane-se seismic code in the latter half of sixties and then incorporated in all modern seismic codes, JSSC (2005). Nowadays, it is a very common and simple concept that structures may survive under earthqua-ke by mixing strength and deformation capacity, whose product must be kept as a constant (less strength requires higher deformation capacity and vice versa). As a consequence, a key action to be undertaken at design level is the correct evaluation of the available deformation capacity of key structu-ral components.
2. Redundancy as a basis for robust steel frames All around the world, steel structures are extensively used for high-rise buildings and large span structu-res. Because of their location many structures could be subjected to exceptional situations, for instance due to terrorist attacks. This was the case of the World Trade Center (WTC) towers, that on Septem-ber 11th, 2001 undertook a progressive collapse due to large aircraft (Boeing 767) impact. Available re-ports on this structural disaster indicate that the cau-se of the WTC collapse is related to several reasons: 1) the crash caused the failure of the bearing walls and the core column, which produced a simultane-ous collapse of the floor structures; 2) truss beams suffered thermal expansion and deflected largely in a catenary state; 3) the bearing walls and the core co-lumns were subjected to long heat exposure, which produced a lowering of strength and rigidity of the members which eventually led to the progressive collapse of the buildings.
Different strategies can be adopted to avoid the progressive collapse of a structure (De Matteis et al,2006):
Event control, which aims at avoiding and/or protecting the building against an accident that might lead to the progressive collapse; Indirect design, which aims at providing adequa-te resistance against the progressive collapse through a minimum level of strength and ductili-ty of the applied structural components; Direct design, which considers explicitly the strength of the structure for progressive collapse and its ability to absorb damages.
When the direct design method is applied, two main strategies are usually considered:
Key element strategy (specific local resistance method), which is based on the correct detailing of the vulnerable structural components against the action;
Alternative load paths strategy, which is based on the acceptance of the failure of some compo-nents, but with the preservation of the main structural elements.
In both cases, capacity design rules may be applied aiming at producing redundancy in the structure in order to develop correct collapse mechanisms, so to allow redistribution of internal actions due loss of a member (in case of explosion). Problems with the key element method include the difficulties estima-ting the loads from an action such as a vehicle borne improvised explosive device and this variability of loading increases the importance of using a capacity design methodology in order to optimise the ductili-ty of the key element and adjoining structure. The alternative load-path route may also involve capacity design, similar to that applied in earthquake enginee-ring, where the redundancy of the structure is needed to exploit the full energy dissipative capacity by me-ans of plastic hinges developing throughout the who-le structure. To avoid a brittle failure mechanism of steel frames, the main concept of strong column and weak beam, with the simultaneous application of over-strength beam-to-column connections, has to be advocated. However, the alternative load path technique can also be based on conventional elastic or plastic frame analysis. A good example was du-ring the September 11 attacks on the WTC, during which loads from the damaged columns were redis-tributed through the hat trusses installed between the 106th and 110th floors. It can be speculated that these alternative load paths were partly responsible for preventing immediate collapses following the air-craft impacts.
110
105
95
90
100
110
105
95
90
100
Figure 3. Section through WTC1 showing load path through hat-truss
According to Fragopol and Curley (1987) redundan-cy can be simply defined as the ratio between the collapse load of the structure in the original state and the collapse load of the structure where structural

298
elements are damaged. This means that any possibi-lity of the structure to survive when a serious da-mage occurs is related to the redundancy of the structural complex, as well as to the extent of com-ponents damaged during an event. For example, the tower shown in Figure 4 possesses a high degree of redundancy because it can accept extensive damage without danger of progressive collapse. In compari-son, the tower sketched in Figure 5 has an absence of viable alternative load paths and is vulnerable to progressive collapse following damage to corner co-lumns. Moreover, structures without redundancy possesses a high sensitivity to suffer global collapse due to damage of single structural component, who-se failure has a dominant effect on the bearing capa-city of the structure, Pandey and Barai (1997).
Figure 4. Tower with a high degree of redundancy
Figure 5. Frame with a low degree of redundancy
Different methods may be adopted to introduce re-dundancy into a structure. In this paper the design of over-strength connections in moment resisting steel frames is considered.
3. THE CAPACITY DESIGN APPROACH
When building structures are subjected to extreme loading conditions, such as earthquakes or blast, in order to guarantee the structural integrity it is ne-cessary to provide sufficient robustness to elements and their connections. Recently, new approaches aiming at designing more robust structures were in-troduced in the codes. One of these new approaches is termed capacity design.
According to the capacity design approach, in ca-se of seismic design, the elements of the structural system are chosen and suitably designed and detai-led for energy dissipation under severe deformations while all other structural elements are provided with sufficient over strength so that the chosen means of energy dissipation can be maintained (EN1998-1). In order to reach its goal, it is necessary to obtain a go-od hierarchy of resistance of the various structural components and failure modes that leads to a suita-ble plastic mechanism and avoids brittle failure mo-des. A robust structural system cannot be easily achieved, since there are several factors that may adversely affect it, including strain hardening, the routine supply of over strength steel and high strain

299
rates. The first two factors were already taken into account in the design while the last one is still a to-pic of discussion.
Traditionally, two structural systems have been used for multi-storey buildings subjected to lateral loads: concentrically braced frames CBFs and the moment resisting frames MRFs. A relatively new and more advanced typology is represented by the eccentrically braced frames EBFs, which can com-bine the advantages of the two previous systems. Each of these structural systems dissipates a part of the seismic energy imparted in the structure through plastic deformations in the dissipative zones of the ductile members (i.e. beams in MRF, links in EBF or braces in CBF). According to the capacity design method, the non-dissipative members and the con-nections of the dissipative members to the rest of the structure should have sufficient overstrength to al-low the development of cyclic yielding in the dissi-pative parts.
In case of fillet weld or bolted non dissipative connections of the dissipative members, this over-strength is ensured if the following requirement is met (EN1998-1):
d ovR 1,1 fyRRfy plastic resistance of the connected dissipative member 1.1 takes into account stress hardening
ov overstrength factor (takes into account the routine supply of over strength steel); the recom-mended value is ov = 1,25.
In order to avoid the development of plastic hin-ges in the non dissipative members (i.e. columns), EN1998-1 increases the forces and moments due to the design seismic action by a multiplier equal to 1,1 ov , where is the minimum value of
pl,Rd,i Ed,iM /Mi of all beams in which dissipative zones are located; MEd,i is the design value of the bending moment in beam i in the seismic design si-tuation and Mpl,Rd,i.is the corresponding plastic mo-ment.
A limitation of this method is that even the design of the non-dissipative members is done using such amplified forces, and they provide no guarantee that they will behave entirely in the elastic range. More-over, it should also be recognised that although the application of capacity design approach improves the robustness of the structure, the additional costs may lead to an uneconomical structural solution. Therefore, the proper design needs to be based on more advanced static or dynamic inelastic analysis. For these reasons, this methodology requires more studies to be done.
Factors affecting the local ductility of steel fra-mes. It is known that the energy exerted on a buil-ding frame during extreme loading conditions (seve-re earthquakes, blast, explosions) is partly stored in the shape of kinetic and elastic strain energy and partly dissipated in the shape of plastic deformation in the critical zones. This feature allows the designer to select the preferred response of the structure. In-creasing the stored energy leads to higher forces and increases the demand for higher resistance, while in-creasing the plastic strain energy increases the de-mand for higher ductility. The total amount of plastic energy dissipated throughout the structure gives the global ductility of the structure. Global ductility may be high if plastic deformations are spread over the entire structure, and not localized at certain stories. Importantly, glo-bal ductility may be adversely influenced by several factors:
redundancy of the structural system level of local ductility rigidity of beam to column connections level of vertical loading
Local ductility expresses the amount of energy that may be dissipated in the critical zones with plastic deformations. Obtaining a favourable collapse me-chanism of the structure requires the formation of plastic hinges at the beam ends rather than in the co-lumns, as well as in the beam-to column connecti-ons. Even the steel may be considered as a ductile material, there are some factors which may adverse-ly affect the local ductility. These main factors are strain hardening, the routine supply of over strength steel, the hogging moments at the supports due to over-strength "nominally pinned" connections, low cycle fatigue, high strain rates, temperature. For the-se reasons the capacity design method provides the means for designers to ensure that the strength of connections exceeds that of the beams and columns connected.Structural connections designed to resist seismic loads are likely to have a good ability to resist blast loading. Specific to the blast threat, a range of con-nection details are contained in Part 5 of the US De-partment of the Army, Navy and Air force (1991) code TM5-1300. These details avoid the use of bolts in tension and they concentrate on providing continuity in load paths. Structural grade steels are well known to harden under extreme rates of strain, with up to 50% hardening under the high rates of strain produced during blast from a high explosive. It was also widely believed that high strains also in-creased the strength of bolts in tension. A recent stu-dy into the response of standard structural grade

300
bolts subjected to rapid rates of loading has demon-strated this not to be the case, Munoz-Garcia et al(2005). The tests revealed that high strain rates cause a significant reduction in both tensile strength and ductility. This type of brittle behaviour under high strain rates is also observed in butt welds. Important-ly, strain rate weakening combined with strain rate hardening for plate material can be expected to re-duce the ductility of joints and lead to brittle failure mechanisms for many popular structural details used in non-seismic regions.
The first research works concerning the effect of strain rate on the behaviour of metals were perfor-med by Morrison (1932), Quinney (1934) and Man-joine (1944). Manjoine�s tests were conducted at ro-om temperature for strain rates from 9,5x10⁻⁷ sec-1
till 3x10² sec-1. Results indicated a very important increasing of yield stress with the increase of strain rate but a moderate increase in the ultimate tensile strength. Consequently, the yield ratio (defined as the ratio between the yield stress and ultimate tensile stress) increases and tends to unit. Therefore, a re-ducted ductility is recorded, especially for strain ra-tes higher than 10-1 sec-1 (Gioncu and Mazzolani, 2002), thus confirming the results of Munoz-Garcia et al (2005).
2.5
3.0
3.5
4.0
4.5
5.0
1010.1 0.010.001Strain rate (1/sec)
Upper yield strength
Lower yield strength
Tensile strength
Figure 6. Yield stress and tensile strength vs. strain rate (Vayas, 2000)
As was previously mentioned, modern design appro-aches rely on energy absorption in the critical zones of the structure under extreme loading conditions (severe earthquakes, blast, internal explosions etc). The increased element capacity at higher strain rates will delay the appearance of the plastic hinges which are the main sources of energy absorption. Because of the dynamic nature of these accidental loads, the accuracy of models based on quasi-static properties is uncertain. Recent important earthquakes have re-vealed a series of undesirable brittle failure modes in welded beam-to-column joints, research on strain ra-te influence extended to welding behaviour (Kaneta et al, 1986, Kohzu and Suita, 1996, Beg et al, 2000,
Dubina et al, 2000, 2001). The welded joint behavi-our is more complex than that of parent steel mate-rial, being composed of three basic elements: base material, deposited material and heat affected zone (HAZ). From the components of a welded joint, HAZ plays the most important role, due to the crys-talline modifications induced by thermal effects. In the experimental program developed at the �Poli-tehnica� University of Timisoara, a number of 54 as-sembly specimens reproducing the beam-to-column welded joints have been tested. The experimental program considered the following parameters:
strain-rate: 0.03/sec, 0.06/sec steel grade: S235 (3), S355 (5) welding type: fillet welds C, double bevel butt welds K, single bevel butt welds V loading type: monotonic (M) and cyclic (C)
Results have shown that a higher strain rate implies a reduction of the ductility for monotonically loaded welded specimens. In case of cyclic loading, high strain rate leads generally to an increase in the con-nection ductility, a decrease of At being also obser-ved in several cases, the results being rather scatte-red. These observations may lead to the conclusion that in case of blast loading, which is typically a monotonic loading, the main cause of poor behavi-our is due to the severe reduction of the ductility, up to 30%.
At
0.60
0.70
0.80
0.90
1.00
1.10
0 0.03 0.06strain rate (1/sec)
3CM3KM3VM5CM5KM5VM
Figure 7 Ductility (elongation at fracture) vs. strain rate for monotonically loaded welded specimens
CONCLUSIONS Buildings designed to resist seismic loads have a good ability to resist blast loading when compared with buildings designed to resist only gravity and wind loads. This is because the strategies employed to resist seismic actions generally aim to provide ductility and redundancy. The resulting improve-ments in ductility can be expected to reduce the ex-tent of damage caused by blast. Thereafter, the high degree of redundancy can be expected to improve

301
the capacity to redistribute loads away from da-maged structural elements without triggering pro-gressive collapses. The design of commercial buil-dings to resist localised damage from blast without collapse is a relatively new area of structural engi-neering, whereas design to resist seismic actions is a mature discipline. This paper discusses the appli-cation of a seismic design method know as capacity design for design to resist blast. The history of steel framed structures subjected to blast shows that it is invariably the fracture of connections that triggers collapses. The capacity design method is shown to have potential for improving the ductility of frames and reducing the likelihood of connection failure. It is not possible to transfer the method directly to blast design, because factors such as rate of loading and the resulting strain rate effects differ considerably. Therefore, further research is required, but the po-tential for technology transfer is clear.
REFERENCESBeg, D., Plumier, A., Remec, C., Sanchez, L.,
(2000). Cyclic behaviour of beam-to-column bare steel connections: Influence of strain rate, Chapter 3.1 in: Moment Resistant Connections of Steel Building Frames in Seismic Areas, (Mazzolani F.M. ed.) E&FN SPON, London.
Byfield, M.P. (2004) �The economic design of mul-ti-storey steel framed buildings to resist terrorist at-tack�. The Structural Engineer, 16 Nov, 31-38.
D.M. Fragopol and J.P.Curley (1987). Effects of damage and redundancy on structural stability, Journal of Structural Engineering, Vol. 113, No. 7 pp 1533-1549, July, 1987, ASCE]
Dubina, D., Ciutina, A., Stratan, A. (2001). Cyclic Tests of Double-Sided Beam-to-Column Joints, Journal of Structural Engineering, Vol.127, No.2, pp.129-136.
Dubina, D., Stratan, A. (2002). Behaviour of welded connections of moment resisting frames beam-to-column joints. Engineering Structures, Vol. 24, No. 11, 1431-1440.
D.M. Fragopol and J.P.Curley (1987). Effects of damage and redundancy on structural stability, Journal of Structural Engineering, Vol. 113, No. 7 pp 1533-1549, July, 1987, ASCE.
G. De Matteis, I. Langone, F. M. Mazzolani, V. Rebecchi (2006). �Effect of Gas Explosion on RC Buildings with Structural Key Elements�, IABSE Annual Meeting and Symposium on Responding to Tomorrow�s Challenges in Structural Engineering, Budapest (Hungary), September 13-15, 2006, IABSE Report Volume 92, Paper No. A-0369 (CD-ROM)]
Gioncu, V., Mazzolani, F.M. (2002). Ductility of Seismic-Resistant Steel Structures. London: SPON PRESS: 694 pp.
JSSC (2005). Guidelines for collapse control design � I Design, II Research, Japanese Society of Steel Constructions Council on Tall Buildings and Urban Habitat, September 2005].
Kohzu, I., Suita, K. (1996). Single or few excursion failure of steel structural joints due to impulsive shocks in the 1995 Hyogoken Nanbu earthquake. 11th World Conference on Earthquake Enginee-ring, Acapulco, 23-28 June 1996, CD-ROM, Paper No.412.
Manjoine, M.J. (1944). Influence of rate of strain and temperature on yield stress of mild steel. Jour-nal of Applied Mechanics, No. 11, 211-218.
Mazzolani, F.M. (2000). Moment resistant connecti-ons of steel frames in seismic areas: Design and Reliability. London: E & FN Spon.
Munoz-Garcia E., Davidson J. B., and Tyas A. (2005). �Analysis of the response of structural bolts subjected to rapid rates of loading.� Eurosteel 2005, Maastricht, Netherlands.
P.C. Pandey, S.V. Barai (1997). Structural sensitivi-ty as a measure of redundancy, Journal of Structu-ral Engineering, No. 3, pp. 360-364, 1997].
US Department of the Army, Navy and Air force (1991). Technical Manual TM5-1300: Struc-tures to resist the effects of accidental explosions, �Structural Steel Design.� Chapter 5, US Depart-ment of Commerce, National Technical Informati-on Service, Washington, DC.
Vayas, I. (2000). Evaluation of global seismic per-formance: Interaction between local and global properties. Chapter 6.2 in Mazzolani F.M. (ed.), Moment Resistant Connections of Steel Building Frames in Seismic Areas: 409-458. London: E&FN SPON.

302
1 INTRODUCTION
The problem of aircraft impact onto building structures has been the focus of the Nuclear Industry since the 1960s (Riera, 1968). However, the events that occurred on 11 September 2001 have put the problem under the public eye. This paper presents numerical studies aimed towards understanding the damage mechanisms caused by the physical impact of the liquid fuel.
Modeling all aspects of the aircraft impact prob-lem is a challenge for finite element analysis. Data for the structure may be partially or fully available. However, data for the aircraft�s structural properties might be harder to obtain. Therefore, only an ap-proximate representation of the aircraft is possible.
Two separate case studies are presented in this paper. First, the impact of a rectangular prism shaped body of kerosene is simulated using the Ar-bitrary- Lagrangian-Eulerian (ALE) method. The target is a circular reinforced concrete column. A pa-rameter study is conducted with varying initial im-pact velocities. The purpose of the study is to cali-brate fluid-structure interaction parameters for larger impact scenarios.
The second study covers the overall impact of a narrow-body commercial airliner onto a set of rein-forced concrete columns, which represent one floor of a target structure. Due to computational limita-tions of the large-scale model, only the floor col-
umns are modeled because they represent the critical load carrying elements of the structural system.
2 CALIBRATION STUDY FOR LIQUID IMPACT ON A SINGLE REINFORCED CONCRETE COLUMN
Figure 1 shows the finite element mesh for a rec-tangular block of liquid hitting a circular reinforced concrete column. The column consists of 5,600 La-grangian hexahedral elements for concrete, and 560 Lagrangian line elements for reinforcement rebars. The line elements share connecting nodes with the hexahedral elements. Slip of the reinforcement re-bars is not considered in the model. The non-linear explicit time integration code LS-Dyna is used for the analysis (Hallquist, 1998).
The liquid is modeled with 35,000 Eulerian hexa-hedral elements. In the standard definition of the Eulerian mesh, the hexahedral elements have fixed positions in space and do not deform with respect to time. However, in order to keep the computational expense down, a moving Eulerian mesh is used. The motion of the Eulerian mesh follows the mass-weighted average velocity of the liquid elements. In this modified version of the Eulerian approach the hexahedral elements are also permitted to expand their volume in order to capture the flow of the dis-persing liquid.
Aircraft impact on reinforced concrete structures
S. A. Kilic & G. Altay Bogazici University, Istanbul, Turkey
ABSTRACT: A numerical study has been conducted on modeling the impact of a narrow-body commer-cial airliner onto a building structure with spirally-confined reinforced concrete columns. The fuel mass in the wing tanks of the aircraft leads to a wide area of damage in the structure. In order to calibrate the simulation, a study is conducted for modeling the impact of a horizontal mass of fluid hitting a single spirally-confined reinforced concrete column. The fluid disperses on the face of the column at low speeds, and causes oscilla-tions with substantial damage but the column remains intact. Higher speeds cause penetration of the column by the incoming fluid mass and result in complete failure. A final simulation is presented for the full impact of the aircraft onto a set of spirally-confined reinforced concrete columns that represent a floor of the building structure.

303
The circular reinforced concrete column has a di-ameter of 0.28 m and a height of 4.15 m. Concrete has an unconfined compressive strength of 27.6 MPa. The reinforcement rebars have a yield strength of 310 MPa. In order to allow complete penetration of the impacting liquid around the mid-height level of the reinforced concrete column, the hexahedral concrete elements are eroded at a maximum princi-pal strain of 5 per cent, and the line-type reinforce-ment rebar elements are ruptured when they reach a plastic strain level of 12 per cent. These ultimate limits allow the elimination of the elements at the mid-height of the column when the liquid impact occurs. When an element reaches the ultimate strain limit, it is taken out of the computation. The finite element mesh in the next time step consists of the remaining structure after the failed element is de-leted from the calculations. The kinetic energy and momentum of the failed element are also eliminated in the calculations.
Figure 2 shows the reinforcement rebars in the column and the relative position of the incoming liq-uid. There are 8 longitudinal rebars in the cross-section of the circular column, with a diameter of 16 mm. The gray-colored horizontal block represents the liquid mass.
The impacting liquid is kerosene with a mass density of 815 kg/m3 and a dynamic viscosity of 2.08x 10⁻³ Pa-sec. The flow of the liquid is com-puted by using the Navier-Stokes equations that de-fine the dynamic equilibrium in 3 dimensions. These equations ensure the conservation of mass, energy, and momentum. The flow of the liquid is achieved by mass transfer between the adjacent cells of the Eulerian mesh by the advection algorithm used. The liquid mass is transferred through any of the 6 faces of the hexahedral element to neighboring elements.
Figure 1. Finite element mesh for the rectangular block of liquid hitting a circular reinforced concrete column
A parameter study is conducted for the impact of the rectangular block of liquid with initial velocity levels of 7.62 m/sec and 30.48 m/sec. The four-fold
increase in the initial velocity corresponds to an eight-fold increase in the kinetic energy. The pur-pose of the study is to investigate the damage state of the column after impact. Complete failure state of the column is defined as the state in which full pene-tration occurs.
Figure 2. Finite element mesh for the longitudinal reinforcement of the circular column. The rebars are modeled with 1-dimensional line elements.
Figures 3 and 4 show the shape of the liquid for 7.62 m/sec initial velocity before the impact and at a time of 0.040 sec, respectively
Although the mid-height of the column suffers substantial damage during the impact, the column stays intact after the liquid flows around it as shown in Figure 4. Hexahedral concrete elements are eroded around mid-height of the column and some reinforcement rebars are ruptured. The permanent displacement at mid-height of the column is 0.15 m corresponding to a drift ratio of 3.6 per cent.
Figure 3. Relative position of the incoming liquid with respect to the circular column before the im-pact.
The Eulerian mesh for the liquid shown in Figure 1 is allowed to expand as well as to move in space in order to capture the flow around the column during the impact process as well as the dispersion that oc-curs after the liquid moves beyond.

304
Figure 5 shows the time variation of the resultant force measured at the mid-height of the column. The peak force of 0.47 MN is obtained at the time of 35 milliseconds. Due to the initial clearance distance between the incoming liquid and the column, the impact starts at a time of approximately 8 millisec-onds.
Figure 4. State of the column after the impact and dispersion of the liquid in the Eulerian mesh for the initial velocity of 7.62 m/sec. Ruptured rebars are shown by swaying lines.
Figure 5. Time variation of the force at mid-height of the column for the initial velocity of 7.62 m/sec.
In the next stage of the parameter study, the ini-tial velocity of the incoming liquid is raised to 30.48 m/sec. The higher velocity results in an 8 folds in-crease in kinetic energy. The dispersed liquid and the state of the column after the impact are shown in Figure 6. Complete penetration of the column occurs after the impact, resulting in total erosion of the mid-height elements of the column. The column is split into to segments after the impact.
The time variation of the resultant force at the mid-height of the column is shown in Figure 7. The peak force level of 0.7 MN is attained at a time of 3 milliseconds. The impact process starts at approxi-mately 2 milliseconds due to the initial clearance be-tween the liquid block and the column.
Figure 6. State of the column after impact for the initial velocity of 30.48 m/sec.
The purpose of the parameter study is to investi-gate the damage potential of a block of liquid hitting a reinforced concrete structural element at different speeds. The results show that the lower initial veloc-ity of 7.62 m/sec leads to major damage but no pene-tration. On the other hand, the higher initial velocity of 30.48 m/sec (quadruple increase) leads to com-plete failure of the column and full penetration. The block of liquid kerosene impacting the column represents a segment of the fuel contained in the wing tanks of an aircraft.
Figure 7. Time variation of the force at mid-height of the column for the initial velocity of 30.48 m/sec.
This study is provides a calibration tool for larger finite element models used in impact scenarios.
3 FINITE ELEMENT MODELING OF AIRCRAFT IMPACT
The scenario of a narrow-body commercial air-liner impacting a reinforced concrete building is in-vestigated (Hoffmann et. al., 2004). The resulting fi-nite element model consists of millions of degrees of freedom. Due to the small time step used in the ex-plicit time integration scheme employed by the LS-Dyna code, only the reinforced concrete columns of the impacted floor are modeled. The floor beams and other structural elements are not considered.

305
The finite element model consists of 954,000 connecting nodes. The reinforced concrete columns are modeled with 355,000 hexahedral elements. The liquid kerosene contained in the wing tanks of the aircraft is modeled with 438,000 hexahedral ele-ments. The fuselage skin of the aircraft consists of 15,000 shell elements. The circular rib reinforce-ment of the fuselage, the fuselage longitudinal stringer beams, and the reinforcement rebars of the reinforced concrete columns are modeled with 61,000 line elements. The initial impact velocity is 200 m/sec.
Figure 8 shows the initial positions of the incom-ing aircraft and the layout of the floor columns. The expansion joint is shown with third column line to the right of the nose of the aircraft. The expansion joint consists of double columns.
Figure 8. State of the column after impact for the initial velocity of 30.48 m/sec.
The dispersion of the liquid kerosene and the damage states of the reinforced concrete columns and the fuselage of the aircraft are shown in Figure 9 at a time of 225 milliseconds. The front façade col-umns of the structure have been fully penetrated. The damage path into the depth of the structure shows a narrowing pattern, which is consistent with the decrease of kinetic energy and momentum of the aircraft as it impacts columns of the structure.
In order to create a large area of damage within the floor of the structure, the narrow fuselage section is not sufficient. In addition, the thin aluminum skin and structure of the aircraft is volatile and gets crushed upon impact. Therefore, it is apparent that the wide area damage is caused by the wings of the aircraft. The mass of the wings consist mainly of liquid kerosene stored in the wing tanks. The wide area structural damage is caused by the physical im-pact of the liquid fuel onto the reinforced concrete columns.
Figure 9. State of the floor columns after impact at an instance of 225 milliseconds.
4 CONCLUSIONS
The physical impact of liquid fuel contained in the wing tanks of an aircraft has the potential of in-ducing significant structural damage for high speeds. When the aircraft is laden with fuel for large dis-tance flights, close to half of the take-off weight consists of liquid fuel stored in the wing tanks. Therefore, the liquid fuel plays an important role in terms of the kinetic energy and momentum of the aircraft, and should be taken into account when modeling impact scenarios. Fluid-structure interac-tion plays a key role in modeling this phenomenon in the finite element study. The Arbitrary Lagran-gian Eulerian (ALE) fluid-structure interaction tech-nology is suitable for modeling such phenomenon.
The calibration study of a single block of liquid hitting a circular reinforced concrete column shows that the damage state of the structural element is sensitive to the impact speed. At the lower speed the column survives the impact with major damage but stays in place. At the higher speed the column goes through a complete failure and is split in half after the full penetration of the incoming block of liquid. This study provides a fluid-structure interaction cali-bration tool for the larger simulations.
The larger simulation of a narrow-body commer-cial airliner shows that the wide area damage in the structure is caused by the wings. The largest contri-bution for kinetic energy and momentum of the wing structure comes from the liquid fuel contained in the wing tanks.

306
5 REFERENCES
Hallquist, J. O., 1998, �LS-Dyna Theoretical Manual�, Livermore Software Technology Corporation, Livermore, California, USA.
Hoffmann, C.; Popescu, V.; Kilic, S. A.; Sozen, M. A., 2004, �Modeling, simulation, and visualization: the Pentagon on September 11th�, IEEE Computers in Science & Engineering (CiSE), Jan/Feb issue:52-60.
Riera, J. D.; 1968, �On the stress analysis of structures subjected to aircraft impact forces�, Nuclear Engineering and Design, 8:415-426.

307
1 INTRODUCTION
After some significant terrorist attacks, 1995 bombing of the Murrah Federal Building in Okla-homa City, the World Trade Center in New York City in 1992 and in 2003, and HSBC Bank and Brit-ish Consulate in Istanbul in 2003, the threat of ter-rorist attacks around the world has become impor-tant and structural engineers have been seeking new methods of assessments and prevention of high-risk facilities.
With the increase of the terrorist activity through-out the world, the experimental and analytical stud-ies of the effects of blast loading on the behavior of structures have markedly increased. Mendis and Ngo (2003) investigated the dynamic response of a typical 52-storey building by using non-linear time history analysis. In their study, blast loads were modeled as time-history force functions because it is a dynamic load and it has to be described by two pa-rameters which are pressures and duration. In order to detect the local damage, the blast load was carried out for the perimeter frames which are faced to ex-plosion based on the actual blast pressure on each element. Mlakar et al. (1998) studied on the collapse of Murrah Federal Building in Oklahoma. In this study, analysis of the Murrah Building prior to the tragic bombing has been described. The estimation of the blast loading and its direct effect on the struc-ture was described. Critical structural elements, which were faced to explosion, were analyzed sepa-rately. Mendis and Ngo (2000) carried out to assess the performance of a ground floor RC column of a
typical office building under a bomb blast. It was found that high strength concrete columns perform better than normal strength concrete columns when subjected to extreme impulsive loading. It is achieved that each of two investigation based on the analysis of the most critical elements, which are faced to explosion directly, could be done sepa-rately.
The aim of this study is the modeling of struc-tures exposed to blast loading. In order to study the effects of the blast wave on a structure, it is neces-sary to know the properties of blast, such as density, wind velocity, shock front velocity, peak overpres-sure and dynamic pressure. Load caused by explo-sion should be treated as a dynamic load and be-cause of its dynamic character it has to be described by two parameters: front pressure and duration. These parameters will be determined for a given charge weight and a stand-off distance by using the scaled distance value and curves published in the lit-erature.
After obtaining the blast loading, the next step will be preparing the dynamic properties of struc-tural materials and allowable responses of compo-nents in order to analyze the system in dynamic way. In order to perform the dynamic analyses, it is nec-essary to have previously defined loading as well as member properties. The basic analytical method model used in most blast design application is the single degree of freedom (SDOF) system. The de-signer can then determine the expected response of the element using additional published curves or a computer program capable of performing a nonlin-
Analysis of reinforced concrete structures subjected to blast loading
S. Karapinar, I. Sanri & G. Altay Bogazici University, Istanbul, Turkey
ABSTRACT: The analysis of the structural failure of a reinforced concrete building caused by blast load is presented in this paper. In this study, the structure is analyzed under the blast loading according to four sce-narios with charge weights of 500kg, 750kg, 1000kg, and 1500kg of TNT. The constant stand-off distance is taken as 6m. In order to define the blast loading on the columns and beams of the structure, dynamic pressure, reflected pressure, incident pressure, shock wave density and velocity are found for each member. The basic analysis model for the blast loading used in this study is the single degree of freedom system. Structural mem-bers which are faced to explosion directly are taken into account and analyzed by using ABAQUS program. Consequently, the damaged columns and beams are removed from the system and then the structure is re-analyzed by using SAP2000 structural analysis program. As a result, the frame capacities are checked in order to see whether the capacities are exceeded.

308
ear time history analysis of the simplified system. Thus, the structural member which is damaged by the explosion is obtained by this way and the dam-aged frames are removed from the system. The rest of the structure is reanalyzed and the structural frames� capacities are checked to be in the limit.
2 BLAST WAVE PARAMETERS In general, an explosion is the result of a very
rapid release of large amounts of energy within a limited space. The sudden release of energy initiates a pressure wave in the surrounding medium, known as a shock wave or a blast wave; with a sudden in-crease of pressure at the front followed by a gradual decrease. This wave moves outward from the central part only a fraction of a second after the explosion occurs. The front of the wave, called the shock front, has overpressures much greater than in the region behind it. The shock wave from an external explo-sion causes an almost instantaneous increase in pres-sure on nearby objects to a maximum value. The in-crease in atmospheric pressure over normal value is referred to as peak overpressure. This peak over-pressure decreases rapidly as the shock is propa-gated outward. This is followed by a brief positive phase during which the pressure decays back to its ambient value and somewhat longer but much less intense negative phase during which the pressure re-verses direction. During such a negative phase, or suction, a partial vacuum is created and air is sucked in. The front of the blast wave weakens as it pro-gress outward, and its velocity drops toward the ve-locity of the sound in the atmosphere. This sequence of events just described for increasing times t1 to t6is shown in Figure 1.
Figure 1. Variation of overpressure with distance from center of explosion at various times (Norris et al., 1959) The curve marked as t6 in Figure 1 is better illus-trated in Figure 2. It is noted that at some distances behind the shock front, the over pressure becomes
negative.
Figure 2. Variation of overpressure with distance at a given time (Norris et al., 1959)
As shown in Figure 2, the part of the wave in which the value of the pressure is above atmospheric is known as positive phase, where as the part of the wave in which the value of the pressure is below at-mospheric is termed as the negative phase. The sym-bol Pso represents the peak overpressure, or shock front, in kPa. U0 is the velocity of the shock front in meter per second. The arrows adjacent under the curve show the direction of movement of the air mass or blast wind, in the positive or negative phases. The peak pressure and the duration of the positive phase of the pressure wave vary as function of the size of weapons, height of burst weapon, and distances from point of detonation. Empirical equa-tions and graphs have been produced aiming to pre-dict the blast loading from an explosion at different scaled distances, Z, which is shown by the Equa-tion1 below:
3/1WRZ (1)
where R=distances from charge center in meter; W=equivalent charge weight in kg.
Brode was one of the earliest to suggest an em-pirical equation to relate the peak pressure with scaled distance, given by Equation 2 below (Mays and Smith, 1995);
barPbarforbarZZZ
P
barPforbarZ
P
1010,0019,085,5455,1975,0
1017,6
max32max
max3max (2)
An effect associated with the presence of high air pressures in the blast wave which is the mass movement of air is commonly called the blast wind. This high-velocity surge of wind blows in the direc-tion of the propagation of the air blast during the positive phase. The wind velocity decays to zero, and then is reversed during the negative phase. The velocity is a function of the pressure in the blast wave. The pressure exerted by this wind is com-monly called dynamic pressure. Known as the dy-namic pressure, this is proportional to the square of the wind velocity and the density of the air behind the shock front. In the low overpressure range with normal atmospheric conditions, the peak dynamic pressure can be calculated using the following em-pirical Equation 3 (ASCE, 1997).

309
)(0032,07
5,2 20
00
2
0 KPaPPP
PP ss
sod (3)
where P0 =atmospheric pressure and the value of the P0 is 101 KPa.
In the free field, the blast wave from an explosion travels at or above the acoustic speed for the propa-gation medium. For design purposes it can be con-servatively assumed that a pressure wave travels at the same velocity as a shock wave. In the low-pressure range, and for normal atmospheric condi-tions, the shock front velocity in air can be approxi-mated using Equation 4;
5,000 )0083,01(345 sPU (4)
where Pso=peak overpressure When the shock wave of an air burst leaves the
point of explosion, it travels as an incident wave un-til it strikes some object of density greater than that of the normal pressure. When a blast wave impinges on an infinitely large rigid surfaces oriented at an angel to the direction of propagation of the wave, a reflected pressure is instantly developed on the sur-face, and the pressure is raised to a value in excess of the incident pressure. The exact value of the peak reflected overpressure Pr will depend on the incident blast overpressure Pso and the angle at which it strikes the surface. The angle is known as the an-gle of incidence and is the angle between the shock front of a blast wave and the reflecting surface. If the reflecting surface is normal to the direction of travel of the shock front, that is, =0, the peak reflected overpressure Pr is given by the expression given be-low;
0
00 707
47072
s
ssr P
PPP (5)
3 BLAST LOADING ON THE STRUCTURE
The manner in which the blast wave loads a structure is a function of the distance of the structure from ground zero, the height of burst of weapon, and the weapon size or the charge weight. The basic dif-ference between blast loads and other dynamic load is that the blast loads are moving pulse loads, load-ing different parts of the structure at different times, with varying magnitudes and durations, depending on the distance and the angle of incidence. The shock front is basically spherical with its parameters such as side-on overpressure (Pso), positive phase duration (td), arrival time (ta), wave decay parameter ( ), etc.These parameters are being functions of the stand-off distance and the charge weight.
A shock wave resulting from an explosive deto-nation in free air is termed as an air-blast shock wave, or simply a blast wave. In case of an air burst, known as there is no interaction with the ground, when the pressure expands and strikes the ground surface, it is reflected back. The reflected shock wave reinforces the incident shock and travels paral-lel to the earth�s surface at enhanced pressure, dura-tion and velocity. This shock front is, known as �Mach stem� and shown in Figure 3. The point where the three shock fronts intersect � incident wave, reflected wave and the mach front � is termed the triple point. The procedures presented in this study for the determination of loads are in the region of Mach reflection.
Figure 3. Structure located in the region of mach reflection (Norris et al., 1959)
Figure 4 shows the general overview of the struc-ture under the effect of the blast loading. With the detonation of a mass of TNT at or near the ground surface, the shock or blast wave is generated. When the shock wave of an air burst leaves the center of explosion, it travels as an incident shock wave and when the shock wave strikes on an infinitely large rigid surface, a reflected pressure is instantly devel-oped and the front face of the structures, which are subjected to directly, will be loaded by the reflected pressure as shown in Figure 4.
Figure 4. General overview of the structure load by the blast loading (Hinman, 1998)
The sides and the top surfaces are not facing the explosion so they experience less blast loading than the facing surface due to no reflection of the blast wave. As the shock front passes beyond the front wall, the overpressure exerted on the other surfaces of the structure is initially raised to a value nearly equal to the overpressure existing in the incident shock wave. There will be also a translational force

310
tending to move the whole structure laterally known as a drag force. The drag force, with taking into ac-count of the drag coefficient, should be added to the reflected pressure for the front faces and the over-pressure for the sides and the roof of the structures.
If the building exposed to blast wave has open-ings, or it has windows, panels, doors which fail in a short time, blast wave will enter the inside of the structure. Because of this, the loading-time curves must be considered for both the exterior and interior of the structure.
4 CASE STUDY
The aim of this study is to analyze a 6-storey re-inforced concrete building subjected to blast loading according to four scenarios with charge weights of 500kg, 750kg, 1000kg, and 1500kg of TNT. Stand-off distance is considered as 6m which is the closest point to the building according to the plan configura-tion of the building. In this way, the worst situation is taken into consideration.
Three dimensional models of the 6-story building frames are generated in SAP2000 structural analysis program. The system is analyzed under the factored load according to the provisions of Turkish Standard TS500 �Requirements for Design and Construction of Reinforced Concrete Structures� and the provi-sions of TEC-98 �Specification for Structures to be Built in Disaster Areas�. This analysis is done for obtaining the internal forces and the structural con-figuration of the system which will be used in the next steps to check the capacities of the beams and the columns.
The main part of the study contains the determi-nation of the blast loading on the structural frames for each scenario. The front face of the beams and the columns which are faced to explosion are taken into consideration. Blast loading is determined based on a given charge weight and the stand-off distance. After obtaining the damaged columns and beams of the structure for each scenario, the system is reana-lyzed with the member removed from the system and thus, the response of the rest of the structure will be carried out.
4.1 Blast analysis of the structural frame The calculation of blast loading starts with the es-
timation of the quantity of the explosives detonated. Four scenarios are created according to charge weight of 500kg, 750kg, 1000kg and 1500kg of TNT and the stand-off distant is chosen as 6m. for each scenarios. The front face of the building and the point of the explosion are shown in Figure 5.
Figure 5. Front face of the building As it is mentioned before, in order to study the ef-
fects of the blast wave on a structure, it is necessary to know the properties of blast, such as density, wind velocity, shock front velocity, peak overpres-sure and dynamic pressure. Load caused by explo-sion should be treated as a dynamic load and be-cause of its dynamic character it has to be described by two parameters: front pressure and duration. These parameters will be determined for a given charge weight and standoff distance by using the scaled distance value and curves published in the lit-erature. Table 1 shows the calculated blast-load pa-rameters of the columns due to the charge weight of 500kg and 750kg of TNT. It can be seen how the pressure values are affected by the variation of the scaled distance. Table 1. Blast-load parameters of the columns due to the charge weight of 500kg and 750 kg of TNT
Figure 6 express the variation of peak overpres-sure versus scaled-distance on the columns along the floors according to the scenarios. As it is seen from Figure 6, peak over pressure shows sudden increase by decreasing the scaled distance. The more distance

311
forms the source of explosion, the less element af-fected by it.
Figure 6. The variation of the peak overpressure versus scaled-distance
Local damage assessment is carried out by using SDOF. A member is selected by the user to be sub-jected to the blast loading and the pressure-time dis-tribution is obtained. Then, it is analyzed by ABAQUS using finite element program which con-tains geometry and material non-linearity. Structural frames are modeled using solid, homogenous ele-ment. Mesh design is a relatively fine mesh which provides moderate accuracy. The material is used concrete (Young�s modulus of 28500Mpa and Pois-son�s ratio of 0,2). The plasticity stress-strain curve is increased by the dynamic increase factor, DIF. The pressure-time load values are defined by apply-ing to the surface of the frame.
By running ABAQUS program, the analysis re-sults of structural elements are obtained. Max-stress distribution and max lateral deflection at mid-point for the structural frames are calculated. According to max lateral deflection, support rotation is calculated, and damage assessment of frame is carried out. As an example, blast analysis of SB121 column is given below. Inside and outside pressure load of the col-umn are given in Figure 7. The pressure-time load-ing of the column SB121 is defined into ABAQUS program, and then max-stress distribution and max mid-point deflection for the structural frames are carried-out. As shown in Figure 7, the loading is treated as a dynamic load.
Figure 7. Blast loading of column SB121 subjected to 500kg of TNT
The pressure-time loading distribution is defined into ABAQUS and the results which are shown in Figure 8 and Figure 9 are obtained.
Figure 8. Max-stress distributions all over the column due to 500kg of TNT
Figure 9. Column lateral deflections at mid-point versus time due to 500kg of TNT
The key parameter for the analysis of the struc-tural elements subjected to blast load is the deflec-tion of the element which enables to express in terms of a support rotation and ductility. By using this ap-proach, the degree of damage should be controlled. Ductility ratio and support rotation are the two methods for evaluation of a structure response. Duc-tility ratio is defined as the maximum displacement of the member divided by the displacement at the elastic limit. Support rotation is another measure of member response which relates maximum deflection to span and indicates the degree of instability present in critical areas of the member. The definition of the support rotation , is the angle formed between a line connecting the endpoints and a line between endpoint and the point of maximum deflection.
In general, deformations in reinforced concrete elements are expressed in terms of support rotation while ductility ratios are used for structural steel. When the rotation angle, , is exceeded 2°, the loss

312
of the capacity of the compression reinforcement oc-curs. The crushing of the concrete without any con-tribution of the compression reinforcement will be followed by the failure of the reinforced concrete element. This type of section represents, in the range of 2°-5°, the crushing of the concrete in the com-pression zone without any disengagement of the cover on the tensile zone. According to Mays and Smith(1995), at a deflection corresponding to a value of about 4°, the element will lose its structural integrity and fail. Furthermore, ASCE(1997) re-ported that when the support rotation is reached to 4°, the building component has lost structural integ-rity and may collapse due to environment condi-tions. Because of this, the failure criteria used in this study is the limit of the support rotation and taken as 4°. The support rotation of each column and beam is obtained separately. Table 2 shows the column re-sults due to 500kg and 1500kg of TNT.
Table 2. Support rotation of column
In the case of the analysis results, it can be no-ticed from Table 2 that, the members of the struc-tural system are not failed when they are subjected to 500kg of TNT whereas columns of the first-basement and the ground floor are most affected by 1500kg of TNT explosion and failed.
4.2 The analysis of the damaged systemAccording to the lateral deflection at mid-point
obtained from ABAQUS, the support rotation of each structural frame on the front face is calculated and checked whether the support rotation is ex-ceeded the limit value. If the support rotation is ex-ceeded the value of 4°, then it is said that the ele-ment will lose its integrity and fail. Then, the damage scenario will be created by removing beams and columns which are damaged by the explosion. The rest of the structure is reanalyzed and the struc-tural frames� capacities are checked to be in the limit.
Columns are designed for axial forces and flex-ural moments. One of the demanding aspects in con-
crete column design is to define the controlling points on strength or P-M interaction diagram. By plotting the analysis results into the P-M interaction diagram, it is checked out whether the results exceed the balance condition. The beam is checked accord-ing to flexure and shear by calculating the allowable moment and shear forces which are supported ade-quately by the section of the beam. These moment and shear capacities will be the controlling criteria of the beams whether the analysis results exceed the capacities.
According to the results which are obtained from the dynamic analysis on ABAQUS program, three damage models are created. Model 1 is the damage scenario due to 750kg of TNT, Model 2 is the dam-age scenario due to 1000kg of TNT, and Model 3 is the damage scenario due to 1500kg of TNT. As it is seen, there is no damage scenario for 500 kg of TNT because there was no structural damage failure seen under that load.
Three models are reanalyzed in SAP2000 and the capacities of the rest of the structural frames are checked to be the limit. The P-M interaction dia-gram is obtained for both x and y direction and the analysis results are plotted into the diagram. It is seen that the rest of the structural frame exceed the capacities under the factored loads because of the absences of the damaged frames. Figure 10 and Fig-ure 11 illustrate the analysis results of the column for a given model under the factored load.
Figure 10. Model 1 P-M interaction of column SB120, SZ20, SN120, SN220, SN320 in x-direction
Figure 11. Model 3P-M interaction of column SN120, SN220, SN320 in y-direction

313
Also moment and shear capacities of the beams are calculated and the results are checked whether the capacities are exceeded.
5 CONCLUSION
The main aim of this study is to increase the knowledge of structure subjected to blast loading. A further intention has been to describe how to define the blast loading and analyze the structure under that load. While it may be possible to predict effects of a certain charge weight at a specified stand-off dis-tance, the actual charge weight of explosive used by the terrorist, the efficiency of the chemical reaction and the source location are not reliably predictable.
According to the blast parameters shown in Table 1, it can be realized that the pressure values decrease significantly while scaled distance increases. For this reason, the stand-off distance is vital in the de-sign of blast resistant structures since it is the key parameter that determines, for a given charge weight, the blast overpressure that load the building and its structural elements. Blast loading has a char-acteristic of high amplitude and the results showed that if the member is subjected to high pressure, they could cause to have large deformation on the ele-ment and cause to exceed the support rotation. As a result, one of the most important key parameter which means of protecting a structure is to keep the source of the blast as far away as possible, by maxi-mizing the stand-off distance.
According to the results, the system affects sig-nificantly when the charge weight increases. When the charge weight increases, the number of the dam-aged beams and columns increases significantly. These damaged frames are caused to have any other failure of the members under the factored load be-cause of losing the integrity of the structure by ex-plosion.
When the results are interpreted, it is concluded that the structure has a high risk of failure, if the structure is close to explosion. To prevent this par-tial failure of the building, some measures can be taken such as; frame dimensions can be increased or shear-wall should be used but it is not practical to design conventional building against the effects of a close-in blast. More over, it is unable to define the risk or quantity of the threat so some practical de-fense precautions can be considered. The blast-wall or barriers should be used in order to protect the structures for reducing the effect of the blast in the surrounding medium.
6 REFERENCES
ASCE Petrochemical Energy Committee, 1997, Design of Blast Resistant Buildings in Petrochemical Facilities, ASCE, Virginia.
Biggs J. M., 1964, Indroduction to Structural Dynamics , McGraw-Hill Book Company, New York.
Fertis Demeter G., 1973, Dynamics And Vibration Of Structures, A Wiley-Interscience Publication, New York.
Gilmour J. R. and Virdi K. S., 1998, �Numerical Modelling of the Progressive Collapse of Framed Structures as a Result of Impact or Explosion�, 2nd Int. PhD Symposium in Civil Engineering, Budapest.
Hao Hong and Low Hsin Yu, 2001, �Reliability Analysis of Reinforced Concrete Slabs under Explosive Loading�, Structural Safety, Vol.23, pp. 157-178
Hinman, �Approach for Designing Civilian Structures Against Terrorist Attack�, American Concrete Institute, Fragmington Hills, 1998.
Karapnar, S., �Analysis of Reinforced Concrete Structures Subjected to Blast Loading�, M. S. Thesis, Bogazici University, Institute for Graduate Studies in Science and Engineering, 2004.
Mays G. C. and Smith P. D., 1995, Blast Effects on Buildings, Thomas Telford, London.
Mendis. P., Ngo T., 2002, �Concrete High-rise Buildings Subjected to Blast Loading and Aircraft Impact�, TheInstitution of Engineers and Concrete Institute of Australia, Sydney, Ausralia, paper available at http://www.civag.unimelb.edu.au/seeg/aptes
Mendis P. and Ngo T., 2000, �Behavior of High-Strength Concrete Column Subjected to Blast Loading�, University of Melbourne, Australia.
Mlakar Paul F., Corley W. Gene, Sozen Mete A., and Thornton Charles H., 1998, �The Oklahoma City Bombing: Analysis of Blast Damage to the Murrah Building�, TheJournal of Performance of Constructed Facilities, Vol. 12, pp. 113-119.
Mniszewski Kim R., Longinow Anatol, 1996, �Protecting Buildings Against Vehicle Bomb Attacks�, PracticePeriodical on Structural Design and Construction, Vol. 1, pp. 51-54.
Norris Charles H., Hansen Robert J., Holley Myle J., Biggs John M., Namyet Saul, Minami John K., 1959, Structural Design For Dynamic Loads ,4th ed., McGraw-Hill Book Company, New York.
Smith P. D. and Rose T. A., 2002, �Blast Loading and Building Robustness�, Prog. Structural Engineering Material, Vol. 4, pp. 213-223.

314
1 INTRODUCTION
The church of St. Athanasius is situated within the monastic compound St. Bogoroditsa in the village of Leshok - Tetovo area and as such has been put under the protection of the Law on Protection of Cultural Monuments of Republic of Macedonia.
The church of St. Athanasius was constructed in the thirties of the twentieth century (Fig. 1). From structural aspect, it represented a three conched structure with an elongated narthex on the west side and belfries. The walls were constructed of stone masonry in lime mortar. All the vaults, the tambours and the domes were constructed of brick masonry. This church was active and spiritual temple of the Macedonian Ortodox Church.
Figure 1. St. Athanasius church before explosion
2 STATE OF THE CHURCH AFTER DETONATION
In the period of the war crisis in Macedonia in 2001, many buildings were damaged and destroyed. The largest number of them are religious buildings with-out any particular cultural, historic, artistic contents. However, during the armed conflicts, eight monu-ment of culture were damaged or destroyed.
The armed conflicts that took place on August 21, 2001 led to almost complete destruction of the St. Athanasius church. Being placed in the central part of the church, detonation caused destruction of the part of the naos with the two side conches, the altar part and the part of the narthex over the terrain level, with some remains of the facade walls, (Figs. 2, 3).
Figure 2. Southeast view of the demolished church
Reconstruction and seismic strengthening of St. Athanasius church damaged by explosion
V. Sendova, B. Stojanoski & L. Tashkov University Ss. Cyril and Methodius, Skopje, FYR of Macedonia
ABSTRACT: The church of St. Athanasius is situated within the monastic compound St. Bogoroditsa in the village of Leshok - Tetovo area and has been put under the protection of the Law on Protection of Cultural Monuments of R. Macedonia. On August 21, 2001, during the armed conflicts in R. Macedonia, this monastic church experienced strong detonation which resulted in its almost complete demolition: a greater part of the church was torn down, while the still existing part is characterized by severe damage. This paper presents a description of the existing state of the church after detonation as well as detailed analysis and computation of the bearing system under gravity and seismic loads, performed separately for the repaired and strengthened existing part and the reconstructed part of the church.

315
Figure 3. Plan and cross section of the demolished church
The belfry towers still exist but were character-ized by severe structural and nonstructural damage, (Fig.4).
Figure 4. Damage to the belfries, northwest view.
The vaulted structure over the gallery area was completely torn down, while the only remains of the floor structure were the timber floor beams with visible deformation of wood. In the part of the two preserved belfries, there were visible large cracks along the height of the bearing walls, in the staircase area, the walls of the tambours and the domes with a width of over 2 cm, (Figs. 5, 6).
Figure 5. Damage to the vault in the narthex.
Figure 6. Damage to the floor structure.
3 RECONSTRUCTION, SEISMIC STRENGTHENING AND REPAIR OF ST. ATHANASIUS CHURCH
The grant-contract on the elaboration and realization of the Project for reconstruction and conservation of the St. Athanasius church was concluded on 25th
April 2002. The contracting parties were the Euro-pean Agency for Reconstruction, (EAR) as a donor, and the Institute for Protection of the Cultural Monuments of the Republic of Macedonia, (IPCM) as the executor.
Additionally, based on the agreed obligations be-tween the Institute for Protection of Cultural Monu-ments, as an investor, and the Institute of Earthquake Engineering and Engineering Seismology, (IZIIS), Skopje, as the contractor, a Main Project on the Re-construction of the Monastic Church of St. Athana-sius in Leshok has been elaborated.
The following phases were realized by the IPCM in the beginning of the project, (July 2002) :
Preparation works on providing the architectural and other documentation of the church before its demolition;
Cleaning up and identification, including detail and meticulous cleaning of the building material that was lying both around and inside the demol-

316
ished part of the church, identification and selec-tion of the material, (Figs.7, 8) and detailed re-cording of the existing, un-demolished part of the church;
Urgent preventive measures for the recovery and consolidation of the undemolished part;
Archeological investigation, that were foreseen with the purpose to ascertain whether the monas-tery church was built over an older religious tem-ple, (Fig. 9);
Other investigation works related to the character of the building itself, including geo-mechanical research, analysis of the static stability of the pre-served part of the church and adequate chemical investigation of samples of mortar taken from dif-ferent places.
Figure 7. Identification of material
Figure 8. Selection of material
Figure 9. Archeological investigation
Although prior to the beginning of the works all the necessary measures for secure work were under-taken, on the last day of finishing of the first activ-ity, (when just a small part inside the church re-mained to be cleaned), a plastic bottle full of explosive was found, (Fig. 10). This unexploded de-vice was cleaned by an international expert team for mine cleaning.
Figure 10. Unexploded device
4 CONCEPT FOR REPAIR, STRENGTHENING AND RECONSTRUCTION OF THE CHURCH
From structural aspects, there have been two ap-proaches taken in the attempt to renovate and recon-struct the structure again. For the existing, damaged part, repair and structural strengthening is antici-pated whereas the demolished part is anticipated to be thoroughly reconstructed with elements of struc-tural strengthening.
The structural system of the monastic church of St. Athanasius in Leshok is composed of two struc-tural units separated by an expansion joint of 5 cm because of the different approach in the solutions for repair and structural strengthening as well as dic-tating of the concentration of damage during future possible earthquakes. For both individual structural units, a developed methodology for repair and strengthening has been proposed with due respect to the main principle holding for this kind of historic structures, which is "minimal interventions - maxi-mum protection", (Figs. 11, 12): 1. For the damaged existing part of the structure, a
concept for repair and structural strengthening up to the necessary level of seismic safety has been adopted considering the purpose of the structure and the justification (architectural-conservatory) of preservation of its integrity. The solution for repair and structural strengthening anticipates (i) injection of all the cracks and (ii) incorporation of strengthening elements (vertical RC jackets along the inner side of the walls of the staircase core and the columns of the tam-bours, horizontal RC belt courses at the level of

317
the floor structure and at the base of the domes, RC slab below the floor level, as well as steel ties besides the timber beams in the floor struc-ture of the gallery
2. For the demolished part of the structure, a con-cept of complete reconstruction by maximum possible use of selected material has been adopted, whereat elements for structural strengthening for providing the necessary level of seismic safety have also been anticipated: (i) incorporation of RC belt course below the floor level, in the existing foundation walls, below the massive walls for the purpose of connection with the vertical strengthening elements, (ii) incorpo-ration of vertical strengthening steel elements at the necessary height, at the ends of the massive walls and around the openings, (iii) incorpora-tion of vertical strengthening steel elements into the tambour columns composed of deformed re-inforcement, (iv) incorporation of horizontal steel elements along the massive walls, in the base of the tambour and in the base of the dome
3. Due to the different treatment of the structural units constituting the integral structure, an ex-pansion joint between them is anticipated to be constructed and dictate the concentration of damages during future earthquakes.
Figure 11. Plane at level +1.90m.
Figure 12. Longitudinal cross section.
4.1 Analysis of the structure An analysis has been carried out for both structural units in accordance with the valid existing regula-tions and the European prestandards. Two methods were used:
1. Analysis of the bearing and deformability capac-ity of the structure and performance of a nonlin-ear dynamic analysis for maximum expected ac-tual earthquake effects with intensity of amax=0.24g with a return period of 1000 years.
2. Static and equivalent seismic three-dimensional analysis of the structure by means of the com-puter package SAP 2000.
4.1.1 Analysis of the bearing and deformability ca-pacity and nonlinear dynamic analysis
The methodology for defining the bearing capac-ity of the structure in the form of ultimate storey shear force that compared to the equivalent seismic force yields the factor of safety against failure is a procedure which is widely applied in equivalent static analyses of masonry structures at IZIIS. It was obtained that the safety factor at occurrence of the first cracks and particularly occurrence of failure is greater than 1 for all the storeys. Table 1 shows the summarized results for both structural units (storey stiffness Ki, ultimate bearing capacity Qu, factor of safety against failure Fu) that represent, at the same time, the input parameters for dynamic analysis.
Table 1. Bearing and Deformability Capacity Results for Repaired and Strengthened Part Ki (kN/cm)
x-x y-y Qu (kN) x-x y-y
F=Qu/Sx-x y-y
story 3 1283 1283 496 496 2.21 2.21 story 2 14386 14072 2567 2502 2.57 2.51 story 1 10148 10640 3249 3407 1.56 1.63
Results for Reconstructed Part Ki (kN/cm)
x-x y-y Qu (kN) x-x y-y
F=Qu/Sx-x y-y
story 2 1158 1158 1323 1058 2.86 2.29 story 1 16498 5448 4439 4283 1.36 1.31
Applying modeling by concentrated masses that assumes concentration of distributed structural char-acteristics at characteristic levels, a nonlinear dy-namic analysis has been performed by application of a corresponding storey hysteretic model obtained by summing up the elastoplastic characteristics of each of the bearing walls, whereat the bearing capacity of each of them has been limited to the lower value of bending and shear bearing capacity.
To obtain the dynamic response, three different types of earthquake (Petrovets 1979, Ulcinj 1979 and El Centro, 1940) with maximum input accelera-tion of 0.24 g and return period of 1000 years have been applied. Obtained as results from the dynamic analysis are the storey displacements, i.e., the ductil-

318
ities required by the earthquake that have to comply with the design criteria.
It has been concluded that, for both the structural units, the absolute storey displacements are less than 1 cm. Hence, it can be asserted that such a designed repair and structural strengthening of the existing part of the structure, as well as design part of the structure to be reconstructed, provides sufficient bearing and deformability capacity, i.e., that the dy-namic behaviour complies to the set out design crite-ria because a ductility of < 2 has been obtained even for the maximum expected earthquake with a return period of 1000 years.
4.1.2 Static and Equivalent Seismic Analysis by the finite element method
Based on the defined structural systems of the two individual structural units and the defined strengthening structural elements of the structure, a static and equivalent seismic analysis has been per-formed by using the finite element method and the computer software package SAP 2000. Taking into account the complexity and the specific nature of the structural system and the materials built-in the model of the structure on one hand and the possibili-ties offered by the programme package on the other, an attempt has been made to define a model by finite elements that shall most appropriately represent the structure. A moderately dense mesh of a total of 5191 nodes and 1901 elements has been adopted, in-volving the global geometrical characteristics of the model without paying attention to the in homogene-ity of the material, (Fig. 13).
Figure 13. 3-D view of the model of the structure.
The bearing massive walls and the tambour walls have been modeled by total of 938 SOLID three-dimensional finite elements with eight nodes. The steel vertical and horizontal strengthening elements
were modeled by a 3D-FRAME or 3D-TRUSS ele-ments, i.e., by a total of 362 elements. All the vaults and the domes have been modeled by a total of 601 SHELL elements. For such modeled structure, a static analysis has been performed for the effect of dead weight and equivalent seismic forces computed according to the regulations.
The results from this analysis given in the form of digital and graphic presentations of stress and strain states for different loading cases, give an insight into the designed values of all the static quantities refer-ring to the individual types of elements, which justi-fies the selected solution for repair and structural strengthening.
The results from the analysis show that: 1. Both structural units constituting the integral
structure possess a sufficient bearing and de-formability capacity up to the designed level of seismic protection;
2. Both structural units satisfy the design safety cri-teria. Under the expected design earthquake (amax=0.20g with return period of 500 years), it is expected that the structure will behave com-pletely in the elastic rage, while under the maxi-mum expected earthquake (amax=0.24g with re-turn period of 1000 years), it is possible that the structure suffers concentration of damage in the expansion joint as well as other nonstructural damage.
3. It is generally concluded that such designed structure satisfies the prescribed requirements and criteria for such type of historic structures.
5 REALIZATION OF THE PROJECT FOR RECONSTRUCTION, SEISMIC STRENGTHENING AND REPAIR
The reconstruction of the church of St. Athanasius in the village of Leshok in compliance with the solu-tions anticipated with the main project started in the summer of 2003. First the repair and strengthening of the belfry towers was done, (Fig. 14).
Figure 14. Repair of the belfry towers

319
In the spring 2004, the reconstruction of the demol-ished part started . After two years from the begin-ning, the reconstruction, seismic strengthening and repair of the St. Athanasius church was successfully completed in July 2005, (Figs.15-17).
Figure 15. Southwest view of reconstructed church
Figure 16. View of the visible dilatation
Figure 17. South view of the reconstructed church
6 CONCLUSION
On 21.08.2001, during the armed conflict in R. Ma-cedonia, the monastic church of St. Athanasius in Leshok was almost completely demolished by a strong detonation. From structural aspects, there have been two approaches taken in the attempt to renovate and reconstruct the structure again. For the existing, damaged part, repair and structural strengthening is anticipated whereas the demolished part is anticipated to be thoroughly reconstructed with elements of structural strengthening.
The structural system of the reconstructed monas-tic church of St. Athanasius in Leshok is composed of two structural units separated by an expansion joint of 5 cm because of the different approach in the solutions for repair and structural strengthening as well as dictating of the concentration of damage dur-ing future possible earthquakes. For both individual structural units, a methodology for repair and strengthening has been proposed with due respect to the main principle holding for this kind of historic structures, which is "minimal interventions - maxi-mum protection".
ACKNOWLEDGMENT
The authors wish to express their gratitude to the Council of IZIIS and to all the collaborators for their assistance in the realization of the project. Special gratitude is extended to the European Agency for Reconstruction for their financial support and par-ticipation in the realization of the project on recon-struction of the church of St. Athansius.
REFERENCES
Gavrilovic P., Sendova V. et al. Seismic Strengthening, Con-servation and Restoration of Byzantine Churches in Mace-donia; IZIIS, RZZSK, GCI, joint research project, Reports IZIIS 500-76-91, IZIIS 92-71, IZIIS 94-68, 1991-1994.
Sendova V., Gavrilovic P., Stojanovski B. Project on the Re-construction, Seismic Strengthening and Repair of the Structure of the Monastic Church of St. Athanasius in Le-shok, Report IZIIS 2002-29, Skopje, 2002.

320
1 INTRODUCTION
1.1 Microreinforced soil Reinforcing the soil is a very old technique used by our ancestors. Soil reinforcement consists in the combination of the soil with tensile strength resistant elements, whose interaction mainly depends on the shear resistance mobilized in the soil-reinforcement interface, Falorca (2002). Over the recent years, mi-croreinforced soil appears to be a very promising material for a diversity of applications. The micro reinforcement of the soil is made through the soil mixture optimization with small reinforcement ele-ments dispersed uniformly and randomly oriented, constituting a three-dimensional reinforcement sys-tem. Each one of the reinforcement elements influ-ences a very small volume of soil relatively to the total volume of reinforced soil, being therefore nec-essary a great number of these elements to reinforce the soil, Pinto (2000) and Falorca (2002). Reinforc-ing elements can have a variety of forms, such as mesh, fibers or continuous filaments and can be made of either a synthetic or natural material.
1.2 Previous studies A laboratory program is running in the University of Coimbra to characterize the behavior of the rein-forced soil with synthetic fibers of small length. Di-rect shear tests were performed, looking forward the analysis of the influence of some parameters in the shear resistance of reinforced and unreinforced soil, such as the percentage, the texture and the length of
the fibers, the average normal tension in the shear plan and the soil type. Two soils of distinct proper-ties were studied, one sandy soil and one clayed soil.
The synthetic fibers are made of polypropylene and are used for producing nonwovens needle punched geotextiles. They were supplied by a local manufacturer in the form of long filaments with round cross section and fiber surface both straight and crimped. The fibers were cut into different nominal lengths. The percentage of fibers used to re-inforce the silty clay and sand samples was deter-mined by the dry unit weight of the soil.
Test results for fiber-reinforced and unreiforced sand and silty clay indicate that a substantial in-crease in shear strength can be achieved with small quantity of short, randomly oriented polypropylene fibers. Fiber reinforcement increases the shear strength, the ductility, dilation, and modifies signifi-cantly the stress-deformation behavior of the both types of soils. The increase of shear strength is a function of both percentage and length of the fibers. For the reinforced sand, the optimum fiber percent-age is situated between 0.5% and 1%, near to 0.5%, and the optimum length is of about 50mm. For the reinforced silty clay, the optimum fiber percentage is of about 0.25% and the optimum length is of about 25mm. The soil reinforced with the fibers, which are relatively extensible elements, is more ductile then the unreinforced soil. There are continuously bene-fits, even after the deformations for which it is mobi-lized the maximum strength of the soil, Falorca (2002).
Behavior of microreinforced soil under impact loads of small magnitude
A.I.A. Mendes, C.A.S. Rebelo & M.I.M. Pinto University of Coimbra, Portugal
I. M.C.F.G. Falorca University of Beira Interior, Portugal
ABSTRACT: This paper reports the ongoing investigation on the behavior of microreinforced soil under im-pact loads of small magnitude. A trial embankment with five equal dimension sections, each being made of a residual granite soil mixed at different percentages with fibers with different thickness, was built in Covilhã, Portugal and a test program was carried out. A set of dynamic tests were performed in each section of the em-bankment in order to estimate the attenuation of vibration amplitudes with distance. The tests were performed by means of impulsive loads using a hammer and measuring the dynamic vertical responses of accelerometers placed on the surface at regular distances from the source. Some preliminary results are presented, which il-lustrate the variation of the attenuation with the frequency.

321
Results of other laboratory tests such as compac-tion (Proctor), California Bearing Ratio (CBR) and permeability tests on unreinforced and fiber rein-forced sand samples indicate that fiber reinforce-ment modifies significantly the engineering proper-ties of sand.
Although the soil reinforcement with extensible fibers (polypropylene) has been studied for some time, the studies were mostly conducted under static loadings. The knowledge of the behaviour of the mi-cro-reinforced soil under impact or dynamic loads is very limited.
2 FIELD TESTS
2.1 IntroductionIn order to further study the behaviour of the mi-croreinforced soil, a trial embankment was built and a test program was defined. The embankment pre-sents different sections with different reinforcement characteristics and should be tested under impact loads. The effect of the impact load on the different sections of the embankment should be monitored by a set of 8 accelerometers.
2.2 Full scale trial embankment A trial embankment was built in Covilhã with a re-sidual granitic soil. The embankment is 50 m long, 0.60 m thick and 10 m wide. The embankment has different characteristics along its length. For each 10 m, the fiber percentage mixed with the embankment soil varies, and this leads to a total of five different sections with different characteristics. Each section measure 10 m in length and is 0.6 m thick.
A view of the embankment is shown in Figure 1. The characteristics and respective nomenclature for the different sections of the embankment are given in Table 1.
Figure 1. View of the trial embankment.
Table 1. Characteristics and nomenclature used for the differ-ent sections of the embankment. __________________________________________________ Description Nomenclature __________________________________________________ Unreinforced soil SM Soil reinforced with 0.25% fiber with 6 denier SM025F6D Soil reinforced with 0.5% fiber with 6 denier SM05F6D Soil reinforced with 0.1% fiber with 15 denier SM01F15D Soil reinforced with 0.5% fiber with 15 denier SM05F15D __________________________________________________
2.3 Materials
The soil of the embankment is well graded sand with gravel and silt, classified as silty sand (SM), accord-ing to Unified Soil Classification System (ASTM D 2487-85). The main properties of the soil are sum-marized in Table 2 and the shear resistance curve is shown in Figure 2.
Table 2. Soil properties. ______________________________________________ Property SM ______________________________________________ Specific gravity, Gs(-) 2.66 Percent finer than #200 sieve(%) 18.0 Effective diameter, D10 (mm) 0.02 Mean diameter, D50 (mm) 0.75 Coefficient of uniformity, Cu (-) 60 Coefficient of curvature, Cc (-) 2.6 Dry unit weight (kN/m3) 18.5 Liquid limit, wL (%) 39 Plasticity index, IP (%) 10 Soil friction angle ' (º) 41 Cohesion, c' (kN/m2) 12 _____________________________________________
The fibers are made of polypropylene (PP) and were supplied by a local manufacturer in nominal lengths of 75 mm with round cross section and smooth surface. The fiber percentage and fiber length used in the embankment were selected based upon previous results by Pinto & Falorca (2005), Fa-lorca (2002) and Falorca & Pinto (2002).The main properties of the fibers are summarized in Table 3. The manufacturer provided the physical properties.The mechanical properties were obtained from con-stant rate extension tests (EN ISO 5079).
Table 3. Fiber properties. _________________________________________________ Property PP _________________________________________________ Specific gravity, Gf(-) 75 Denier (g/9000m) 6 ;9 Tensile strength, t (MN/m2) 200 Young's modulus, E (GN/m2) 0.75 Elongation at break, f (%) 250 Moisture absorption (%) 0 Colour White _________________________________________________

322
0
2040
60
80
100120
140
160180
200
-2 3 8 13
Relative displacement (mm)
25,80 kN/m2
50,78 kN/m2
100,74 kN/m2
200,66 kN/m2
Figure 2. Shear resistance curves of the embankment soil at different confining pressures.
2.4 Dynamic Test Program
Two different arrangements for the accelerometers were considered during the study described herein. Type 1 � the accelerometers are located along a di-agonal line; Type 2 and Type 3 � the accelerometers are located along an arch (Figures 3, 4). The tests were performed at different sections with different reinforcement characteristics. Different distances to the impact load were also considered. Table 4 gives an outline of the test program.
10.0m1.0m
2.0m 2.0m
Figure 3 - Type 2 arrangement for the accelerometers.
10.0m1.0m
Figure 4 - Type 3 arrangement for the accelerometers.
Table 4. Summary of the test program. Embankment section Type 1 Type 2 Type 3
SM yes yes yes SM025F6D no no yes SM05F6D no no yes SM01F15D no no yes SM05F15D yes no yes
* Type 1 and type 2 performed by a hammer with a force transducer and by a hammer without a force transducer. ** Type 3 performed by a hammer without a force transducer
2.5 Methodology
To analyze the vibrations propagation the estima-tion of the frequency response is performed. This function is a characteristic of a system that has a measured response resulting from a known applied input. To measure the frequency response, one must measure the spectra of both the input signal to the system and the vibration response considered as the output signal. In this case, the frequency response can be considered the spectrum of the vibration of the soil at a certain position divided by the spectrum of the input force to the system, if this is measured. Alternatively and more interesting for the present re-search, instead of considering the input force, the acceleration measured in the neighbourhood of the impact may be used as the input signal.
The frequency response function (FRF) is actu-ally a three-dimensional quantity, consisting of am-plitude vs. phase vs. frequency. Therefore a true plot of it requires three dimensions, and this is difficult to represent on paper. Although the formal definition of frequency response includes both the gain and phase, in common usage, the frequency response of-ten only implies the magnitude (gain).
For signals X and Y, the frequency response is defined as:
)()()(
fXfYfH
where:X = input signalY = output signalX(f) and Y(f) are the Fourier spectra of x(t) and
y(t).In order to prevent errors due to zeros in the de-
nominator, the frequency response functions are cal-culated differently when using numeric FFT. These are calculated from autospectra and the cross-spectrum. This approach has the advantage of over-coming noise, distortion, and non-correlated effects.
The estimator for the frequency response function used here was calculated as following:
)()()( 22
21 fHfHfH
where

323
)()()(1 fG
fGfHXX
XY ,)()()(2 fG
fGfHXY
YY
and )( fG XX , )( fGYY , )( fG XY are the auto-spectra and the cross-spectrum of the signals.
Frequency response measurements require the excitation with energy at all relevant frequencies. The fastest way to perform the measurement is to use a broadband excitation signal that excites all fre-quencies simultaneous, and use FFT techniques to measure at all of these frequencies at the same time.
Noise and non-linearity is best minimized by us-ing random noise excitation, but short impulses may also be used. The more statistical samples included in the averaging, the greater the noise and distortion rejection and hence, the greater the accuracy of the measurement.
In the performed tests the impulses are generated trough two types of hammers, one small hammer in-strumented with a load cell and a big non instru-mented hammer. The vertical acceleration responses were measured at regular positions by the acceler-ometers for 25 or 50 impacts. When the non instru-mented hammer was used the vertical acceleration responses were measured also nearby the impact point.
2.6 Measurement system
A PULSE - Type 3560/D of the BRÜEL & KJAER® firm was used with a PC with interface LAN, software PULSE of eight channels, and a con-ditioner of signal for acquisition, amplification and digitalization of the signal.
The accelerometers are type Brüel&Kjaer 4378, with a sensitivity of 326mV/g and the type PCB 393B12 with a nominal sensitivity of 10V/g.
3 RESULTS
3.1 Analysis methodology According to the test setups and the methodology used, the frequency response functions for each ac-celerometer is computed considering different fre-quency intervals. A mean value is computed for each frequency when more than one accelerometer is at the same distance from the input point. Finally the average spectrum is plotted for the several sections of the test embankment, with the magnitude varying with the frequency and the distance to the input.
3.2 First setup
The first test setup used the impulses from an impact hammer instrumented with a force transducer and the accelerometers were placed regularly along the
diagonal of the test sections of the embankment. In Figure 5 is shown the typical average impulse func-tion generated by the hammer.
0.00
200.00
400.00
600.00
800.00
1000.00
1200.00
1400.00
0.973 0.974 0.975 0.976 0.977 0.978 0.979 0.98 0.981
Time (s)
Figure 5 - Average Impulse function generated by the hammer
In Figure 6 the curve represents the evolution of the FRF with the distance from the source. Because of the low energy of the impact force in the low fre-quencies these results presented a great scatter. Fig-ure 7 shows the expected attenuation curve, corre-sponding to de degradation of the output signal for a higher frequency range.
0
2
4
6
8
10
12
0 2 4 6 8 10Distance from impact source (m)
SM-Type 2
Figure 6 - Evolution curve of the output signals with the test distances, performed at the frequency interval [81 to 90] HZ � Type2.
0
5
10
15
20
25
30
0 1 2 3 4 5 6 7 8 9
Distance from impact source (m)
SM-Type 2
Figure 7. Evolution curve of the output signals with the test distances, performed at the frequency interval [161; 170] HZ � Type2.
It could be concluded from this test setup that the attenuation effect is more important for the higher frequencies. At distances higher than 4 meters the

324
percentage of the input signal that arrives at the out-put sensors is insignificant when compared with the reported signals at low distances.
3.3 Second setup
When the non instrumented heavier hammer was used the accelerations near the point of the input force were measured and the FRF�s were computed using these as input signals. In the second setup the arrangement of the measurement points correspond to the type 2 and type 3 defined above and illustrated in figures 3 and 4.
0
0.05
0.1
0.15
0.2
0.25
0.3
0.35
0 2 4 6 8 10 12
Distance from impact source (m)
SM0.5F15d SM0.1F15dSM0.5F6d SM0.25F6dSM-Type 3 SM-Type 2
Figure 8 - Curve of the FRF�s magnitude with distance, aver-aged in the frequency range [51; 60] HZ � Type3.
At low frequency ranges the attenuation effect obtained for all of the test sections of the embank-ment is very low, as it can be seen in Figure 8 where the FRF�s vary along an almost horizontal line.
For increasing frequencies the attenuation effect is more and more evident for all embankment sec-tions, as it can be observed in Figure 9. When com-paring with Figure 8 it can be concluded that the at-tenuation depends on the frequency interval that is being analyzed.
0
0.1
0.2
0.3
0.4
0.5
0.6
0.7
0.8
0 2 4 6 8 10 12
Distance from impact source (m)
SM0.5F15d
SM0.1F15dSM0.5F6d
SM0.25F6dSM-Type 3
SM-Type 2
Figure 9. Curve of the FRF�s magnitude with distance, aver-aged in the frequency range [161; 170] HZ � Type3.
The curves that represent the behavior of the soil mixed with difference fiber percentages at each fre-
quency interval are quite similar. The expected dif-ferences between the curves, representing the influ-ence of the fiber reinforcement in the attenuation of the vibrations could not be detected. For the energy input levels performed in this study, no significant differences between the behavior of the unreinforced soil and the microreinforced soil were detected. Tests with higher energy inputs are being prepared, therefore.
300mm 200mm 200mm
C
B
A
1000mm
54
C
B
A
Figure 10. Side view of model test configuration with fixed rigid pendulum
5. FUTURE TEST PROGRAM
Taking into account the preliminary results ob-tained from the reported test program, further tests are being prepared. Impact dynamic 1g-model tests will be performed on unreinforced (control) and fi-bre reinforced soil, in the geotechnical laboratory at the Civil Engineering Department of University of Coimbra, which main purpose is the comprehensive study on behaviour of microreinforced soils under high energy impact loads. The model embankment shown in Figure 10 and is 1000-mm long and 1000-mm in height with the exposed slope inclined 4:5. The model will be constructed on a rigid retaining structure with form boards. The dynamic load will be simulated by a rigid pendulum oriented horizon-tally in half of the embankment height at the mo-ment of impact. To control the increasing impulse the release height of the rigid pendulum will be var-ied, while higher impulse values will be obtained by the rigid pendulum sliding on steel cable. The dy-namic response of the embankment model will be measured with a number of load cells, accelerome-ters and digital video cameras. The dynamic earth pressure acting on the rigid retaining structure is evaluated with load cells measuring normal forces, in order to compare the pressure redistribution. The vibration propagation will be evaluated with vertical and horizontal accelerometers. Local damage will be measured in order to compare the resistance to dam-age.

325
4. CONCLUSIONS
The main conclusion could be the frequency de-pendence of the attenuation effect of the fibre rein-forced soil, which is mostly dependent on the fre-quency content of the dynamic loading.
Other than for static loads the behavior of the mi-croreinforced soil under impact loads of small mag-nitude is not quite different from the unreinforced soil. The measurements performed so far did not show, for the percentage of fibers mixed with the embankment soil, any significant effect in the dy-namic transmissibility of the soil. This can be ex-plained by the low energy content of the impact force that is insufficient to enhance the probable fa-vorable effect of the fibers. There is a need to in-crease the impact energy level in future studies that are being planned.
AKNOWLEDGMENTS
The authors would like to thank to the financial sup-port from FCT, POCI and FEDER through the re-search Project POCI/ECM/59904/2004 and the sponsorship from the company CARVALHOS Lda, Lousã, Coimbra, Portugal, who kindly donated the fibers for this study.
REFERENCES
ASTM D2487-85: Standard Classification of Soils for Engineering Purposes (Unified Soil Classification System). EN ISO 5079: Textiles Fibers. Determination of breaking force and elongation at break of individ-ual fibers. Falorca, I.M.C.F.G. & Pinto, M.I.M 2002. Sand reinforced with short length synthetic fibres ran-domly oriented, Proc. 7th Int. Conf. on Geosyn-thetics, Nice, France, Vol.4:1237-1240. Falorca, I.M.C.F.G., 2002. Behaviour of microre-inforced soils with short length synthetic fibres,M Sc. Thesis, Faculty of Science and Technology of the University of Coimbra, Portugal (in Portu-guese).Pinto, M.I.M., 2000. Micro-Reinforced Soil, Proc. 3rd Int. Conf. on Ground Improvement Techniques, Singapore: pp.37-50. Pinto, M.I.M. & Falorca, I.M.C.F.G. 2005. Im-provement of sand by short length polypropylene fibers randomly oriented, Proc. 6th International Conference on Ground Improvement Techniques, Coimbra, Portugal: pp. 509-516.

326
1 INTRODUCTORY REMARKS
Even the most terrible hurricanes are now within a few days forgotten almost by all except these injured badly - while the attention of majority is fixed on alternating reports about the latest earthquakes or bomb attacks. And so, when someone is attempting to analyze data related to snow loads or stormy winds as evidence substantial to the norms of safety of structures, it seems to be "out of topic". Other problems, of the kind mentioned earlier, advance to be looked first as true cases of extremity - resistance under blast impacts or under fierce fire, to take a pair of examples.
Undoubtedly this attitude is natural and deserves respect. Nevertheless a somewhat different point of view is here also noteworthy.
However that may be, most of us living in relatively safe conditions have, at least for the time being, an opportunity and even necessity to worry, among other things, also about the dangers caused by atmospheric actions on structures. And some features of these actions imply need of treating them much similarly as cases of the other extraordinary and possibly catastrophic events.
2 PECULIARITY OF ATMOSPERIC LOADS IN TERMS OF PROBABILISTIC DESCRIPTION
It is well known that the methodology of reliability regulations governing the design and assessment of structures is based on probabilistic (and therefore, in a great deal, statistical) description and modeling in terms of random variables; in particular, these means are used for description and modeling of loads and other environmental actions. This being so, for our considerations it is pertinent to note some important traits of random variable characteristics related to possible magnitudes of atmospheric loads.
First of all, we must keep in mind very high variability of the loads involved - and, especially, the absence of any distinct bounds of the domain of possible values.
Already the fact that random variables of this kind are usually represented, for analytical purposes, by �unbounded� distributions, supposing probability of values from 0 to infinity, is remarkable by itself. (Such unboundness is of course unthinkable if taken strictly and literally; however, investigations prove that the widely used models, as applied to these loads, fairly represent real facts throughout all practically relevant scope of probable variation.) Truly, similar models are in routine use throughout
Atmospheric loads in considerations on extreme eventsand structural norms
B. Snarskis & R. Simkus Institute of Architecture and Construction of KTU, Kaunas, Lithuania
ABSTRACT: The extreme atmospheric loads deserve attention of researchers taking care of preventive measures against the catastrophic collapses of structures. This need derives not only from possible catastrophic consequences of failures but also from some peculiarities of probabilistic notions which are wanted for analysis and which are kindred with some notions and means used for analysis and preventing other catastrophic dangers.
In reality the adjustments of normatives which are in various countries indicated as necessary by research results meet rather often opposition based on unduly arguments (for example, arguments unduly rejecting the data of collapses related to atmospheric loads as allegedly irrelevant by virtue of other harmful facts having taken place concurrently). However, there are reasons to perceive such methodological objections with a great deal of caution.

327
almost all applications of probability and statistics; but the variables discussed here present the effects of �unboundness� most pronouncedly. From a formal mathematical point of view, two indications of this fact are noteworthy:
(1) A very high level of variation is shown by the standard statistical indicators of variance such as the traditionally used coefficient of variation - significantly surpassing most of the values defined in an analogous way for other random parameters of design. So, for the snow loads the values of the just mentioned coefficient about (in a very rough approximation) 0.5 are rather typical, and even significantly greater values must not be treated as something improbable.
(2) Of no small importance are also some more specific features of the distributions of probability usable for the loads discussed here - features allied with relatively slow decrease of probability with increasing values of the variable. (So here is nothing like one of the more widely known �normal� distributions where, after surpassing of some critical range of values, the probabilities of far deviations fade very rapidly!)
As a result, we must face a situation where the surprises caused by Nature are extremely difficult to match with. A situation where we, of course, can to a certain amount prevent the tricks of fortune and must do it, again to a certain degree, by our measures akin to the establishing of a higher design values of the loads, - but where it is especially difficult to obtain a high degree of confidence that a rare random event does not refute our expectations. (In other words: here we meet phenomena truly catastrophic in their nature and not submitting to any tight bounds in quantitative images.) So, for example, if one magnifies his estimates of a probable load by a factor, say, of 2 or even 3, - then, if such magnification has not gone into a range of absolutely phantastic values, it most likely does not ensure that the new estimates will not be exceeded. Instead, the practical result will be only that the probability (or frequency) of the forecasted load will be much less - but remaining not quite neglectable even from practical point of view, to let alone highly abstracted mathematical treatments.
This constatation is in our opinion worth of special attention as there are in practice multiple misunderstandings arising from underestimation of the fact mentioned just above. When inferiorities of actual normatives prescribing the design loads come to light after serious accidents, it happens quite not rarely that some minor amendments of norms are adopted still being not adequate to real deficiencies - because the scale of these deficiencies, defined by the abovementioned very high variance of loads, is not apprehended properly even by skilled engineers
accustomed to deal mainly with loads differing by far less variability.
This danger is by no means only a sort of speculatively presented possibilities. Quite the reverse, a long history of such misunderstandings may be traced, for example, in the thread of changes made recently in our Lithuanian norms and in their prototype - the former Soviet norms. (These have been obviously inadequate in describing the probable atmospheric loads and are now changed everywhere in the region where they had been adopted or used as a model to follow. Changes, however, came under strong distrust and opposition - and not achieved the amount indicated by objective analysis of situation.) It would be out of place here to present this history of changes or its shortcomings in detail; but a reader interested by it can find our more substantial commentary (Snarskis,B. & �imkus,R. & Doveika,V. 2007, in print). Here it will suffice to say that drawbacks in comprehension of the �catastrophical� character of atmospheric loads (and, above all, of their rare extremal manifestations - as seen from a probabilistic point of view) has evidently been a source of many troubles in the field of safety regulations.
Correspondingly, widespread elucidation of the abovementioned character of extreme atmospheric loads - and not only elucidation of character but also intensive quantitative research in this field, along with investigation of other extreme effects, - is a fairly actual task for researchers.
Essentially, the main content of this brief note is already presented by constatations set out above - but we think a following supplement of some accompanying considerations about the normative regulations of these �extreme� design loads would be suitable.
3 MOODS OF DISTRUST: PRO ET CONTRA
As it has been already mentioned above, a cautious and objective assessment of facts leading to more stringent normatives of the �extreme� design loads is frequently met by distrust and even by strong rejection. Therefore it is appropriate to review some persistent patterns of argumentation rejecting such an assessment.
It must be admitted that something of scepticism in adopting conclusions of theoretical considerations and statistical calculations is in this field reasonable and even necessary. The mathematical models we use, however refined they be, are never indubitable; thus any abrupt changes of practical norms, if grounded only �on paper�, without proper confrontation with practice, are surely troublesome. Nevertheless here also unfavourable tendencies of negativism are met quite often.

328
These unduly negative attitudes are usually based either on (1) almost total negation of the very existence of accidents which should be prevented by more stringent norms or (2) - more frequently and in a more sophisticated way - on depicting the gathered evidence as presenting facts being in some sense �impermissible� and thus irrelevant for a decent investigation. Let us discuss these distrusts a bit more definitely (albeit, of necessity, not quite exhaustively).
As for the lack of information about the impending dangers, only a little can be said from the viewpoint of general methodological considerations. (A quite concrete treatment of such objections is always necessary, and sometimes it may indeed hold back from a hasty acceptance of poorly grounded theoretical conjectures.) Nevertheless most often the empirical evidence of dangers is available and even not subject to negation. On the other hand, one must keep in mind that there are not infrequent situations in which the information about structural failures is systematically concealed or, at least, left out of accounts. (For example, such was a general practice in the former USSR - and there is no reason to take similar practices, maybe not so overwhelming, as something quite impossible in other conditions.)
More frequently, however, obstacles are interposed by means of the already mentioned argument of irrelevancy. So it is quite often heard that, for example, there are indeed numerous facts of structural collapses under heavy snow loads (or under wind actions) but almost all such collapses are already a priori not to be taken into account because they allegedly have been conditioned, apart of the atmospheric actions, by some other causes (probably even including inadmissible human misdeeds). Such a reasoning deserves a special critical comment.
We must see that, in circumstances when a failure of a structure has occurred, the indication of causes (and, especially, of a single �responsible� cause) is a difficult task accomplished very often in a entirely incorrect and self-willing manner - and this is a source of persistent confusion. To make it clear the following remarks seem pertinent.
Firstly: the gross majority of failures are conditioned by an unfavourable combination of several factors. This may be ascertained by thorough interpretation of empirical observations but the most clear proof of it can be obtained by mathematical modelling. Indeed, when it is analysed how and in which cases a structure subject to action of various random factors comes to failure, - virtually all probabilistic models, if they are of any value in the sense of realisticity, testify to the thesis mentioned above. (I.e. they testify that the vast majority of failures can occur in circumstances when substantial unfavourable deviations of several parameters corresponding to several practical causes
of failure randomly happen together.) And let us repeat once more that this conclusion is in undoubtedly good agreement also with practical observations.
On the other hand, a contrary mode of failures - when the failure is caused mainly by a deviation of a single random factor with only slight influence of the others - is also possible, but it happens not frequently. From practical point of view this possibility can be associated mainly with extraordinary incidents like the roughest human errors (e.g. leaving the reinforcement not mounted at all, thus making considerations about influence of it and of other factors at once depleted of any practical sense). Exceptions of this kind may truly deserve special exclusive treatment; - however, they apply mainly to extraordinary uncontrollable excesses. And, anyhow, foreseeing and preventing the threats able to cause structural accidents must not be restricted, with regard to legal or ethical appraisal, to cases not aggravated by somebody's misdeeds. (To say it figuratively, preventing the structural collapses caused by criminal negligence is a matter of interest not only for prosecutors post factum - but, in some sense and to a certain degree, also for protective actions of designer and researcher.)
And here, bearing in mind the abovementioned circumstances, we are able to see the essence of a very widespread delusion, propagated sometimes by misunderstanding, but not infrequently also by deliberate misuse of notions. It consists in assessment which selects one of substantial causes of failure as allegedly single or at least the main �responsible� cause of the accident - with practical alienation of other causes. As a grounding of such conclusion the following scheme of reasoning is widely applied (although evidently wrong):
�Surely the factor A and the factor B have both had influence in causing the accident. Nevertheless the accident as it has occurred was impossible to occur only because of influence of A - i.e. until influence of B was not added. Consequently, namely B is the responsible as the decisive cause.�
So a judge sometimes whitewashes the role of one of the accused at the expense of another (albeit he can to reason also in quite contrary way). And often no other reasoning is seen also when the significance of certain deviations is assessed as possible cause of an accident. And that includes analysing the effects of atmospheric actions (by the way, as well as other catastrophical effects causing grave accidents).
Such tendentious assessment undoubtedly is intolerable; but it is rather frequent and used also for censoring �disturbing� information about real accidents.
�Of course there were accidents�, we are said. �But the analysis has shown there always have been

329
other causes besides the atmospheric action. Therefore we reject the reckoning of these accidents as information about possible risks related to snow load [or, maybe, of wind action, etc.].�
Further explanation here is, at all likelihood, not necessary. And let us not be confused when we hear (or read) that certain testimonies about accidents caused by heavy snow loads (or other similar factor under consideration) are, as such, almost absent. It is far from truth, and the controversies of this kind must come once to a rational judgement.
4 HOW EXTENSIVE ADJUSTMENTS CAN BE NEEDED WHEN NORMS ARE DEFICIENT?
The results of analysis indicating deficiency of norms related to extreme atmospheric actions (and, correspondingly, suggesting some adjustments of actual normatives) often give rise to apprehensions of excessive expenses allegedly dictated by the supposed adjustments. Apparently, this problem deserves one more supplemental comment.
Undoubtedly, it is impossible to implement more exacting normatives without higher expenses; but the expectations of impact caused by such changes are often exaggerated. It is necessary to understand that amongst the multitudinous structures exposed to atmospheric actions only for a minor part these actions are of crucial importance; as for the most, even quite distinct relative increase of atmospheric action gives only a moderate increase in overall effect (such as, for example, stress in some �critical� sections). Accordingly the increase of expenditures caused by normative changes can be incomparably less than the relative increase of the particular design load itself.
By the way, it is noticeworthy that an akin exaggeration is often met in reasoning treating the problem in a somewhat reverse manner - namely, when an effort is made to justify the present state of norms by an assertion that making any normative of design load substantially more stringent is faulty unless there is no massive outbreak of failures. But such a reasoning is highly questionable because the just mentioned circumstances leave the most of structures out of immediate danger even if these structures had been designed with use of seriously underestimated design loads. Keeping in mind the variability of design variables and correspondingly high level of safety margins, we can expect that most likely only a small part of such �imperfectly designed� structures will fail - with the proviso, of course, that the deficiency of normatives used not be utterly undoing. Consequently, unnecessity of a substantial change of normatives cannot be proved exclusively by vague general constatations pointing to limited spread of failures. A more concrete
quantitative inspection shoud be used for this purpose, along with a thorough account of peculiarities typical of the kind of structure under consideration.
In general, we can see in these considerations an evidence showing clearly enough that a researcher trying to check correctness of design load norms and to adjust some normatives (if the adjustments were needed) is to deal, in cases related to atmospheric loads, mainly with quite rare events and with preventing dangers of relatively low probability. (In some other fields of research aimed to preventing of catastrophic dangers the situation can be substantially different - but for the cases under our consideration the deduction made just above is valid.) This may be a disappointment for someone striving against the very greatest evils; but the prevention of some lesser ones is in our opinion also valuable and even necessary if possible. And the elucidation of these facts, along with their important consequences, is requisite if we are to avoid some unnecessary misunderstandings.
5 CONCLUSIONS
The extremes atmospheric loads deserve attention of researchers taking care of preventive measures against the catastrophic collapses of structures - although the disasters caused by atmospheric actions undeniably do not present the very greatest menace among other threats. This need derives not only from possible catastrophic consequences of failures but also from some peculiarities of probabilistic notions which are wanted for analysis and which are kindred with some notions used for analysis and preventing other catastrophic dangers.
In reality the adjustments of normatives which are in various countries (also in our country, Lithuania) indicated as necessary by research results meet rather often opposition based on unduly arguments (for example, arguments unduly rejecting the data of collapsies related to atmospheric loads as allegedly irrelevant by virtue of other harmful facts having taken place concurrently). However, there are reasons to perceive such methodological objections with a great deal of caution.
5 REFERENCE
Snarskis, B. & �imkus, R. & Doveika, V. 2007 (in print). Recent collapses of buildings and design levels of loads - calls for ignorance vs. reality. Proc. 9th Internat. Conf. �Modern building materials, structures and techniques�, 2007, Vilnius.

330
1 INTRODUCTION
1.1 ObjectivesThe behaviour of steel and composite frames after failure of local structural elements caused by excep-tional loadings (e.g. failure of a column caused by a vehicle impact, explosion, fire, earth-quake, floods) is investigated. A progressive failure of the whole structure can be prevented by robust design. Robust-ness ensures structural safety by preventing the col-lapse of the total structure when only one part of the structure is damaged or destroyed.
This can be achieved by enabling the joints to provide large rotations, so that membrane forces can be activated allowing a redistribution of internal forces. Thus an adaptive structure is created which keeps sufficient strength even under exceptional loading and large deformations.
By increasing deformations joints are subjected to increased tensile forces, while bending moment ex-posure of the joints decreases or is even inversed.Within the research project various experimental in-vestigations are made on the behaviour of the joints under large deformations and combined loading of bending and tension, including a full scale test of a substructure, joint tests and component tests. The main objective of the project is to derive and develop simplified and economic design criteria al-lowing the designer to satisfy, in practical situations, the general requirement for robustness.
1.2 ConceptAs a general procedure to derive robustness re-quirements, different structural systems subjected to exceptional events are numerically investigated in order to see how the structures work when part of the structure is destroyed as well as how and how far redistribution takes place. Practically speaking, many exceptional events could be considered, but only few are covered by the present project and spe-cial focus is given to:
loss of a column in an office or residential build-ing frame loss of a bracing in a car park
For these cases, FEM numerical simulations (see e.g. Figure 1) are carried out. In this process, a spe-cial attention is devoted to the study of the loading sequence inside the joints. As a result of these FEM numerical simulations and associated parametrical studies, simplified behavioural models will be de-veloped and validated; these should progressively lead to analytical models, from which requirements to be satisfied by the structural system and by the joints will be derived.
Figure 1. Car park frame with loss of a bracing
Robustness � robust structures by joint ductility
U. Kuhlmann & L. Rölle Universität Stuttgart, Germany
J.-P. Jaspart & J.-F. Demonceau Université de Liège, Belgium
ABSTRACT: In view of recent disasters and their immense economical and human consequences more and more focus is given not only on the safety of structures - to reduce the risk for the life of people by collapse even under exceptional loading � but on minimizing the disastrous results and to enable a quick rebuilding and reuse. One crucial mean to achieve this aim is the design of redundant robust structures. Robustness pre-vents the collapse of the total structure when only parts of the structure are damaged or destroyed. To avoid progressive failure, redundant structures with inherent sufficient ductile behaviour allowing deformations when a local failure occurs, have to be built. Redundancy can be achieved by allowing force redistribution within a structural system. Therefore the single sections and joints have to be especially designed and opti-mized, not necessarily requiring additional fabrication costs. But until now no specific rules for robustness by ductile joints exist. The aim of the present project is to define general requirements for ductile joints as part of a structural system subjected to exceptional unforeseen loading.

331
In Figure 2, the strategy followed is described for the example of the substructure test as performed by the University of Liège. Within this strategy, ex-perimental, numerical and analytical aspects are in-volved. First (step 1), the experimental tests are per-formed. Then, with the obtained results, the numerical FEM tools used within the project are validated (step 2) so as to use it latter on to perform parametrical studies (step 3); the objective of the lat-ters is to identify the parameters influencing the frame response after the loss of the column or a bracing. In a last step, analytical simplified methods are developed (step 4) with due account taken of the parameters identified in step 3. Finally, design guidelines are derived through step 3 and 4 so as to reach the final objective of the RFCS project.
STEP 1: experimental test on a substructure simulating the loss of a column
STEP 2: validation of the numerical FEM tools
STEP 3: parametrical numerical studies
STEP 4: development of simplified analytical methods
Derivation of design guidelines for practitioners
Figure 2. Global strategy followed within this project
2 EXPERIMENTAL WORK
Aside of the numerical investigations a lot of fo-cus is given to the experimental tests which have been performed by three of the partners, in Trento, Stuttgart and Liège. So the adjustment of the various tests was very important (Figure 3).
component tests joint tests substructure test
part of part of
Trento Stuttgart Liège
Figure 3. Experiments form a unique chain.
It was agreed that the experiments should be a unique chain. This means the joints tested in Stutt-gart are part of the substructure test conducted in Liège, as well as the component tests of Trento in-clude all components which are relevant within the joint and substructure tests. Therefore profiles and
plates were used of one rolling. The reinforcement for the testing bodies has been ordered together us-ing reinforcement bars of one rolling for each di-ameter and the same geometry was chosen.
2.1 Joint Tests
2.1.1 GeneralThe joint tests realized at the University of Stuttgart can be subdivided into two main series: One series on composite joints with dimensions and design re-lated to the substructure test in Liège, and a second series bending tests on pure steel joints. The tests on composite joints mainly investigate the behaviour of the joints under combined loading. Special focus is given on the load path.
The aim of the pure steel joint tests on large IPE 500 profiles with thin endplates is to analyse the ductility for steel joints and its main components bolts in tension and endplate in bending. In previous tests conducted in Stuttgart by Kuhlmann/Schäfer brittle failure of the bolts had been observed al-though the ductility criterion according to EN 1993-1-8 was not violated. It is assumed that the brittle bolt failure occurred due to bending exposure of the bolts. This bending exposure seems to depend on the distance between the flange and the web of the beam on one hand side and the bolt on the other side. To receive more reliable criteria these tests with varied endplate thickness and bolt distances were con-ducted. A strong dependency of the failure mode re-sults from the behaviour of the single components.
2.1.2 Composite joint tests As explained for the substructure test in chapter
2.2 two different situations exist: a hogging bending moment for the first inner joint in Figure 10 which undergoes an increase of the bending moment as well as an additional membrane force action and a sagging moment with a combined tension force at the inner joint where the loss of the column oc-curred. To investigate this five composite joints un-der combined loading have been tested, three joints under negative (hogging) moment and two joints under positive (sagging) moment. The first of each group has been a pure bending test in order to evalu-ate the actual hogging and sagging bending capacity. For the following tests the joints were exposed to a change from pure bending moment to combined bending and tension. The dimensions as well as the used profiles for the joint configuration are given in Figure 4 and follow the chosen sections of the sub-structure test. For both types of composite joint tests, for hogging moment as well as sagging moment tests, special care has been taken of the loading pro-cedure, see Figure 5&6.

332
500
Figure 4. Cross-section of the composite joints
At the first stage, see Figure 5, by increasing force and deformation by the vertical hydraulic jack a moment just below the ultimate moment of the joint Mj,u was applied to the testing specimens. Then the vertical jack was arrested in order to keep the ro-tation of the joint as presented in Figure 6. Then by the horizontal hydraulic jack a tensile force was ap-plied on the testing body, leading to a biaxial load-ing of the specimen. The tensile force was increased until collapse of the joint.
Figure 5. First stage of the composite testing procedure
Figure 6. Second stage of the composite testing procedure
The arrangement of the transducers at the composite joints was chosen in order to measure all compo-nents of the joints which contribute to the rotation capacity of the joint and to determine the single load deformation behaviour of the relevant components.
The most important outcome of the joint tests is the moment-rotation curves as well as the M-N-interaction behaviour. Both are needed later to com-pare and calibrate the joint behaviour which is given by the numerical simulations.
2.1.3 Test results of composite joint tests The progress of the joint behaviour during the
tests was as follows: By increasing the bending mo-ment in the test specimen for hogging moment the cracks in the concrete slab developed at the column section. When reaching nearly Mu the slab at the col-umn section was cracked over the total height. By applying an additional horizontal tensile force the deformations of the slab as well as of the endplate and column flange clearly increased. At the end the
failure mode for all specimens under hogging mo-ment was failure of the reinforcement bars. However the pure steel connection was still able to carry a certain amount of load. The collapse of the joint al-ways occurred under combined loading and hap-pened directly aside of the column flange, as shown in Figure 7.
Figure 7. Collapse of the joint (hogging) under biaxial loading
Figure 8. Collapse of the joint (sagging) under biaxial loading
To realize a high rotation capacity of the joint the relevant components have to be ductile. So for the joints under hogging moment it is not sufficient to have a ductile tension bar in the slab, also the ten-sion components of the steel joint such as endplate in bending or column flange in bending have to be ductile.
For the tests under sagging moment the concrete slab in the compression zone could not carry the high compressive stress due to the sharp bend caused by the beam rotation. For the joint tests under sagging moment crumbling of the concrete surface occurred, because the sharp bend to the beam rota-tion lead to high compressive stress.
By developing this crumbling effect the ultimate moment of the test specimen was nearly reached. So by further increase of the vertical displacement the joint kept his moment resistance on the maximum level but did not increase any more.
By increasing the horizontal tensile load for the tests under sagging moment cracks developed in the concrete slab at the location of the stirrups. Finally the fracture of all rebars in the column zone oc-curred, see Figure 8. The tests showed that although all rebars collapsed at the end the pure steel joint was able to carry a remarkable remaining biaxial loading.
2.2 Substructure Test In this section, the experimental activity developed at Liège University as part of this European project is described; it is organized as follows:
first, the tested specimen is described in details; then, the main results are presented with the dif-ferent phenomena observed during the tests.

333
2.2.1 Description of the tested specimen To define the substructure properties, an �actual� composite building has been designed according to Eurocode 4 recommendations (NBN EN 1994-1-1, 2005), so under �normal� loading conditions (i.e. loads recommended in Eurocode 1 (EN 1991-1-1, 2002) for office buildings); the main properties of this building are briefly introduced below.
As it is not possible to test a full 2-D actual com-posite frame, a substructure has been extracted from the actual frame; it has been chosen so as to respect the dimensions of the testing slab but also to exhibit a similar behaviour than the one of the actual frame.
2.2.2 Description of the reference composite build-ing
The prototype composite building is assumed to be-composed of three main frames at a distance of 3m, each frame with four bays of 4m width each and three storeys of 3.5m height each.
The building has been designed according to Eurocode 4 (NBN EN 1994-1-1, 2005). Its structural characteristics are as follows:
The slab (see Figure 4) was also a reinforced con-crete one (12cm thick and C25/30 concrete). The reinforcement was composed of two steel S500C meshes: the upper one with 10mm rebars each 200mm and the lower one with 10mm rebars each 150mm. As also shown in Figure 4, a S355 IPE140 profile has been used and a full shear connection as-sumed between the steel profile and the concrete slab.The columns were steel ones (S355 HEA160). Partial-strength and semi-rigid joints are consid-ered (Figure 4 and Figure 9). The properties of these joints allow them to exhibit a ductile behav-iour (with account of possible overstrength ef-fects).
Figure 9. External steel joints and internal composite joints
2.2.3 From the actual building to the tested sub-structure
For the testing a substructure has been extracted from the actual frame. This substructure should con-form to the dimensions of the testing slab but also
exhibit a similar behaviour than the one of the actual frame. To achieve this goal, the bottom storey has been isolated from the actual building and the width of the external spans has been then reduced (Figure 10).
The width of the concrete slab was chosen equal to 500mm, in order to ensure that, during the load-ing, the distribution of the stresses in the concrete was as uniform as possible; in fact, 500mm corre-sponds to the value of the effective width of the con-crete slab (under hogging moments) in the actual building, according to Eurocode 4 rules.
Figure 10. From the actual frame to the tested substructure
The 10 mm rebars used in the actual frame (see 2.2.2) have here been substituted by 8 mm ones, in order to increase the probability to develop a large number of small cracks in the slab, under hogging beam moments, instead of few big cracks and so to allow for more local ductility. Besides that the dis-tance between the first headed stud and the face of the column flange was larger than what is usually adopted and the amount of longitudinal re-inforcement within this area was kept constant (Fig-ure 11); as a consequence, the slab is subjected to constant tension forces in this zone, what results in an especially high ductile behaviour. This specific detailing has been investigated at Stuttgart Univer-sity (Kuhlmann et al, 2004) and its efficiency has been demonstrated.
Figure 11. Reinforcement and layout of shear studs
Column bases are assumed to be pinned. Teflon elements are used so as to limit the friction between the column steel supports and the pins during the loading. The composite joints in the substructure are the same as in the actual building (see 2.2.2). Only the external beams were simply connected to the ex-ternal columns so as to limit the number of pa-rameters which could influence the response of the internal beams during the test.
The response of the substructure should be as close as possible to the one of the reference frame. However by extracting the bottom storey of the ref-erence frame, reducing the length of the external beam spans and placing hinges at the external joints,

334
a key element has been modified: the frame restraint (K factor), which strongly influences the catenary action. That is why horizontal restraints were pro-vided at each side of the substructure (see point A and B in Figure 10) so as to simulate the actual frame restraints. Restraints were provided on both sides of the substructure in order to induce a sym-metrical response of the substructure during the test (see Figure 12); this should facilitate the application of the loads and the measurements during the test. In practice, the restraints were brought by two horizon-tal calibrated jacks (Figure 13); the restraint was as-sumed to be elastic until the end of the test and equal to the one exhibited by the actual structure.
K 2K 2K
Figure 12. From the unsymmetrical actual behaviour to the symmetrical test behaviour
Figure 13. Configuration of the substructure tested
The load path during the test was as follows: The substructure was first preloaded with an uni-formly distributed load on the internal beams to simulate the reaction of the concrete slab on the main frame in the actual building. During this loading phase, two locked jacks simulated the presence of the central column, as illustrated in Figure 14.In a second step, the support under the central column was progressively removed by unlocking the jacks; when the latter were removed, the free deflection of the system was observed. Finally, a vertical force was applied until collapse through a jack located above the structure on the column thus further deformations occurred (Figure 15).
During the whole test the �K factor� simulating the frame restraint was kept constant.
Figure 14. Column at the middle simulated by two locked jacks
Figure 15. Application of a vertical load with vertical jacks un-til collapse
2.2.4 Substructure test results The vertical reaction in the central column which is associated to the uniformly distributed load and to the self-weight of the substructure was equal to 33,5kN (value of the load at point �O� in Figure 16 presenting the evolution at point �C� of the vertical load versus the vertical displacement). After the ap-plication of the uniform load, the jacks were unlocked and progressively removed. The system was completely released when a deflection of 29mm was reached. At this stage, first cracks at the vicinity of the external joints were observed and first steel yielding zones were seen in the column web panel of the internal composite joint. This loading step corre-sponds to part �OA� of the curve in Figure 16; the structure was still in its elastic range of behaviour when �A� was reached.
Then, a vertical load was progressively applied until collapse. From point �A� to �B�, yielding pro-gressed until finally a beam plastic mechanism formed at point �B� (plastic hinges in the joints un-der sagging and hogging moments). During this stage, the cracks in the vicinity of the external com-posite joints were more pronounced and yielding of some steel joint components was observed (column web and beam flange in compression); also, for the internal composite joint, a separation of the end-plate and the column flange was seen under sagging moment.
From point �B� to �C�, a yield plateau devel-oped; the concrete cracks in the vicinity of the ex-ternal composite joints continued to enlarge and yielding spreaded in the steel components. Another important phenomenon to be mentioned was the crushing of the concrete in the internal composite joints. At point �C�, significant membrane forces began to develop in the composite beams as con-firmed by the shape of the curve �CD� in Figure 16. When the point �D� was reached, the longitudinal rebars in the external composite joints failed in ten-sion and the concrete at the internal joint was fully crushed; at this moment, the joints worked as steel ones (Figure 17) and further plasticity developed in the different components of the internal and external composite joints. At point �D�, a loss of stiffness was observed which was linked to the loss of the longitudinal rebars in the vicinity of the external joints; indeed, when these rebars were lost, the ten-sile stiffness of the external joints decreased, phe-nomenon which affected the development of the membrane forces. At the end of the test (point �E�), a maximum vertical displacement of 775mm was reached for an applied vertical load of 114kN; the associated deformation of the specimen is shown in Figure 16. The maximum horizontal displacement at each side of the structure was equal to 45mm for a horizontal load of 147kN. The test was stopped when cracks occured in the welds connecting the

335
IPE140 profile to the end-plate in the internal com-posite joints, for a rotation of 190mRad.
-400
40
80120
0 100 200 300 400 500 600 700 800
Deflectionat themiddle [mm]
O
AB
DC
E
Figure 16. Vertical applied � �mid span� displacement curve
Figure 17. Internal and external composite joints at point �D� of Figure 16
2.3 First comparative experimental results Both composite joint tests as well as the substructure test showed the ability of the composite joints to un-dergo large rotations and to change the internal load combination from pure bending state to a combined bending and tension exposure. Failure was mainly induced by the concrete slab: for the hogging mo-ment joints by increased cracks and final rupture of the reinforcement, for the sagging moment joints by crushing of the concrete and decreasing of the con-crete compression zone. However also the steel joint components decisively contributed to the rotation capacity by bending of the endplate and column flange, tension of the column web or buckling of the column web under compression. In addition a re-markable resistance and ductility were left when the concrete slab had already failed. The tests even showed that the pure steel joints allowed a further increase of the joint rotation and resulting of this the membrane forces within the structure could be fur-ther increased. However to achieve this high ductil-ity all single relevant components had to be chosen such that a high local deformation could be fol-lowed. So the steel joint tests and the planned nu-merical investigations will have to give answers how to adapt strength and ductility of each of the single components to each other in order to achieve a duc-tile overall behaviour of the joint and a robust de-velopment of a biaxial loading resistance.
3 REFERENCES
ECCS Document No. 109. 1999. Design of Composite Joints for Buildings. ECCS Technical Committee 11-Composite
Structures, first edition 1999. Andersen, D.(ed.),Aribert, J.-M.; Bode, H.;Huber, G.; Jaspart, J.-P.; Kronenberger, H.-J.; Tschemmernegg, F
prEN 1994-1 Eurocode 4. 2004. Design of Composite Steel and Concrete Structures. Part 1: General rules for Build-ings, CEN, European Committee for Standardization
EN 1993-1-8 Eurocode 3.2004. Design of Steel Structures � Part 1-8: Design of Joints, European Committee for Stan-dardization
Kuhlmann U. & Schäfer M. 2004. �Innovative Verschiebliche Verbundrahmen mit Teiltragfähigen Verbundknoten�, Re-search Report, Insititut für Konstruktion und Entwurf, Uni-versität Stuttgart
EN 1991-1-1: Eurocode 1. 2002. Action on structures. part 1-1: General actions, Densities, self-weight, imposed loads for buildings. German version EN 1991-1-1
NBN EN 1994-1-1. 2005. Eurocode 4: Calcul des structures mixtes acier-béton � Partie 1-1: Règles générales et règles pour les bâtiments. February 2006.
4 CONCLUSION AND OUTLOOK
Progressive failure of the whole structure caused by local damage (e. g. failure of a column caused by a vehicle impact, explosion, fire, earthquake) can be prevented by robust design. Profiting from the in-herent ductile behaviour of steel, this project analy-ses the requirements for robustness and develops new ductile joint solutions to allow for force redis-tribution within the structure so that a global col-lapse of the building is prevented and structural safety is ensured. Criteria for robust structures, es-pecially concerning steel and composite joints are elaborated and will be illustrated by drawings in a handbook for easy understanding and realization by the constructor.
The aim is to obtain robust structures by one small additional effort because mainly the inherent reserves of the structural system will be made avail-able for practical design no additional elements are needed to achieve redundancy.
To identify requirements for structures which originally have been designed for �normal� load combinations to behave robust under unexpected ex-ceptional loadings leads to a new view on structural safety which may be transferred to others than steel frame structures.
5 ACKNOWLEDGEMENT
The work presented here is carried out, as a joint research project by five different European partners here represented by the authors, with a financial grant from the Research Fund for Coal and Steel (RFCS) of the European Community. The authors gratefully acknowledge the financial support and es-timate the intensive cooperation among the col-leagues.

336
Disproportionate collapse occurs when the removal of load bearing members (one or more columns, or load bearing walls) causes localized structural damage which leads to further loss of load bearing members and, ultimately, to the collapse of whole or part of the structure. The accidental load, carried by the removed column can be transferred to nearby columns either by beam action or by catenary action. Simple connections such as fin plate, double angle web cleat and flexible end plate connections are routinely assumed to be com-pliant with the tying force design method, which aims to ensure that column loads are redistributed via cate-nary action in the event of damage. This is feasible only if the joints have sufficient ductility as well as tensile strength. Semi-rigid and rigid connections redistribute the column loads through beam action, provided that the connections have sufficient rotation capacity. This investigation demonstrates that the beam-column joints (simple and semi-rigid connections) in many designs have insufficient ductility to successfully bridge dam-aged columns. In simple (nominally pinned) connections, a couple can develop between beam flange and col-umn due to insufficient joint ductility. The resulting prying action is shown to cause early joint fracture and subsequently to lead to progressive failure. In semi-rigid connections, the beam remains elastic and the con-nections plastify, leading to early joint failure.
1 INTRODUCTION
On 16th May 1968, a domestic gas explosion knocked out load bearing precast concrete panels near the corner of the 18th floor, leading to the col-lapse of the flats at Ronan Point, Canning Town, England. The panels, above the knocked panels, fell downward one after the other, as they were not suf-ficiently tied together and reinforced. The post Ronan Point revision to the Building Regulations also required all floor members to be effectively tied together in order to enhance robustness. In practice this means providing beam connections with a ten-sile strength at least equal to the design shear strength. The Murrah Federal Office Building in Oklahoma City was damaged by a bomb in April 1995. In this incident, the direct blast pressure de-stroyed one column by brisance effect and another two columns by shear. The loss of these three col-umns led to a collapse that consumed ½ of the floor area of this nine storey building. Although it was correctly designed to the requirements at that time it was unable to redistribute the column loads. Lacking the strong internal partition walls or cladding, the building had no emergency means for redistributing loads.
In the above incidents, the collapses of the struc-tures are not proportionate with the accidental load caused by incidents; and the subsequent events are termed disproportionate collapses. The dispropor-tionate collapse occurs when the removal of load bearing members (one or more columns, or load bearing walls) results in localized structural damage which leads to further loss of load bearing members and, ultimately, to the collapse of whole or part of the structure. It can be avoided in three ways: event control, indirect design, and direct design. In event control, the minimum threat is measured for the building and/or the load bearing elements and the stand off distance is maintained. In case of indirect design, the load, carried by the removed load bear-ing elements are transferred to the rest of the struc-ture through minimum strength, continuity and duc-tility. In direct design, the safety of the building is ensured by two methods: the specific local resistance method and the alternate load path method, in which the loads from the removed load bearing members can be transferred to the remaining structure through for example, catenary action (tying force approach) or beam action (double span approach) as shown in Fig. 1.
The prevention of disproportionate collapse using catenary action
M. P. Byfield & S. Paramasivam University of Southampton, United Kingdom
ABSTRACT:

337
(a) Catenary action
(b) Beam action
Fig. 1. Mechanism of transferring the accidental load
The tying force approach assumes the accidental load, at the time of damage, is equal to 0.3 of the imposed load plus 1.05 of the dead load. When an intermediate column is removed due to impact or blast, adjacent beams on either side support the acci-dental load through catenary action. As the shear force due to accidental load (double span) is less than the design shear force (i.e. using 1.4 dead + 1.6 imposed), the beams do not fail by shear and the ty-ing force should comfortably exceed the shear force at the connection. UK Building Regulations place no requirement for joints to have sufficient ductility in order to accommodate the beam rotations that occur during catenary action. The tying capacity of the connections, as presented in the Steel Construction Institute �Green Books� (SCI, 2002), are calculated in the absence of any rotation, see Figure 2(a). Hori-zontal equilibrium of the joint dictates that the pry-ing action sketched in Figure 2(b) must reduce the tying force capacity of the joint, leading to a large reduction in tying strength.
(a) Design load (b) Catenary load (c) Rupture
Fig. 2. Prying and catenary action
The US approach for the design of Federal Build-ings (GSA, 2003) suggests the accidental load, at the time of damage, is equal to 0.25 of the imposed load plus 1.0 of the dead load, with a dynamic amplifica-tion factor of 2.0 (if the static analysis is carried out). If a dynamic analysis is carried out, then one must assume a time for removing the support from a column or columns. Guidance (GSA, 2003) recom-mends that the time period for this event should not be more than 1/10th of that of the natural time period of the column. In the double span approach, the fol-lowing local considerations need to be considered:
discrete beam to beam continuity, connection resil-ience, connection redundancy and connection rota-tion capacity. The double span mechanism is shown in Fig. 3.
Fig. 3. Double span approach (GSA, 2003)
2 ANALYSIS OF CATENARY ACTION IN FRAMES WITH NOMINALLY-PINNED CONNECTIONS
A worked example of catenary action in a frame is presented herein, with the column removed (in-stantaneously) located near or at the middle of the short or long sides of the building. After the removal of intermediate column, the accidental load is car-ried by frame through the catenary action. This cate-nary action can be achieved, only if the connection between members ensures the structural integrity. A relatively simple analysis of catenary action is pre-sented, with the aim of bounding the likely factors of safety against collapse. Thus, a best case and a worst case scenario are considered, together with a best guess estimate. In the analysis, the following general assumptions are made: all columns are assumed to remain inline, as the stiff arrangement of secondary and primary beams bonded together by shear studs creates a large enough strength to resist tying forces without buckling; the design tying force is main-tained only until the rotation capacity of the connec-tion is exceeded and the tying capacity of the con-nection is calculated by assuming zero rotation (SCI, 2002).
The tensile strength of the slab has been included in the catenary action, in order to mobilise all avail-able strength. The slab strength, Tslab = Tdeck + Tmesh,where Tdeck is the strength of the profiled metal deck-ing and Tmesh is the strength of the mesh reinforce-ment embedded in the slab. The maximum tying force carried by profiled sheeting was calculated us-ing the following expression:
bdeck p.t.d.NT - (1) Where, N is the number of shear studs; d is the
diameter of shear studs; t is the thickness of profiled sheet; pb is the bearing strength of profiled sheet. Tmesh was calculated by multiplying the area of rein-

338
forcement per metre with the yield strength of rein-forcement bar.
After removal of the column, the columns, above it, start to drop down and the beams on either side start to rotate about extreme joints. Let the beam-column joint, just above the removed column be C and the beam-column joints on either side of C in the plane of drop be A and B. Let the rotation at �A� be con. The beam parallel to the beam �ACB� marked as �A1C1B1� is shown in Fig. 4. To find the load resistance through catenary action of rein-forcement mesh and profiled sheet, the panels are divided into one metre strips along AA1 from A1C1B1. A one metre wide strip XZY located a dis-tance x from A1C1B1 is considered, the mechanics of which are sketched in Fig. 4. The upwards lift gen-erated by Tslab is dependent on the end slope of the slab, which varies from zero at A1C1B1 to at ACB. It is assumed that the full tensile capacity of the slab is mobilised along the entire width of the slab. Therefore, the upwards reactive force offered by catenary action in the slab is:
Pup= 2 Tslab sin Lx - (2)
Where, Pup is the upward reactive force caused by slab tying capacity per metre;
Lx provides the in-
clination of slab catenary to the horizontal, as shown in Fig. 4(c). Fig. 4(d) shows the final loading on beam CC1. There will not be any reduction in the ac-cidental load on the secondary beams SS1 due to catenary action in the slab as no change in angles of tying force occurs on either side.
The factor of safety against collapse was defined as the ratio between the tying capacity of the joint, Tcon and the tying force, T acting in the joint when the rotation limit of the connection was reached,
con. After removal of the support to column C, the beams ACB shown in Fig. 4(a) act like an inverted three hinged arch as shown in Fig. 4(b). As the arch is a determinate structure, the analysis is relatively simple.
A
C
B
A1
C1
B1S
S1
X
Z
Y
S
S1
S1
S1
S
S
A
C
B
A1
C1
B1S
S1
X
Z
Y
S
S1
S1
S1
S
S
1
1
2
23
3
LA-A1
x
(a) Deflected shape after removal of column �C�
C
W1 W1 W2
W1
W1
q / metre
A B
con con
Tcon Tcon
C
W1 W1 W2
W1
W1
q / metre
A B
con con
Tcon Tcon
(b) Section at 1-1
X YZ
Internal HingeLx
Pup
X YZ
Accidental load
Upward reactive force offered by tying capacity of slab
Reaction offered by
X YZ
Internal HingeLx
Pup
X YZ
Accidental load
Upward reactive force offered by tying capacity of slab
Reaction offered by
(c) Section at 2-2
C1 C
Accidental load
Upward resisting force caused by tying capacity of slab
C1 C
Accidental load
Upward resisting force caused by tying capacity of slab
(d) Section at 3-3
Fig. 4. Analysis for Catenary Action
For a case study, the analysis was carried out on the frame sketched in Fig. 5, which aims to provide a reasonable match with the arrangement found in typical medium rise office developments, with 4m floor to floor height. During the member sizing fully glazed cladding was assumed. This load was re-moved during the accidental limit state because it was assumed that blast would have destroyed the glazing. Load factors of 1.05 for dead and 0.3 for imposed were assumed.
3 m 3 m 3 m
Column removed by brisance
3 m 3 m 3 m
12 m
0.5 m
All columns are 356 x 406 x 235 UCAll secondary beams a re 457 x 191 x 67 UBAll main beams are 533 x 210 x 82 UB
3 m 3 m 3 m
Column removed by brisance
3 m 3 m 3 m
12 m
0.5 m
All columns are 356 x 406 x 235 UCAll secondary beams a re 457 x 191 x 67 UBAll main beams are 533 x 210 x 82 UB
Fig. 5. Idealised frame for the analysis
50407070707040
Gap, 10 mm
457 x 191 x 67 UB
523 x 210 x 82 UB305 x 305 x 198 UC
5050
125 mm Concrete Slab on Metal Deck
8.0 mm
19 mm Shear Studs @ 300 mm c/c
19 mm Shear Studs @ 450 mm c/c
A 142 ReinforcementMesh
50407070707040
Gap, 10 mm
457 x 191 x 67 UB
523 x 210 x 82 UB305 x 305 x 198 UC
5050
125 mm Concrete Slab on Metal Deck
8.0 mm
19 mm Shear Studs @ 300 mm c/c
19 mm Shear Studs @ 450 mm c/c
A 142 ReinforcementMesh
Fig. 6. Beam � column joint details Liu et al (2004) have developed a design method
for quantifying the rotation capacity of fin-plate

339
connections as part of investigations into seismic de-sign. Their method assumes beam rotation is centred about the centroid of the bolt group and it produces a maximum rotation capacity of 2.17o for the joint considered in this study. This limit is perhaps too re-strictive for this study, which considers a much shorter duration load than in seismic events. There-fore, it has been assumed that rotation occurs about the bottom of the beam flange, with a total plastic deformation of the upper bolt hole in the fin-plate assumed to be 10mm (corresponding to half a bolt diameter). Beyond this it is highly likely that the plate will begin to rupture, initiating fracture due to prying. Using this approach the rotation capacity of the joint in this design example was equal to 4 de-grees.
The Factor of Safety against collapse has been de-termined for three scenarios. In best case scenario, the full tensile strength of the slab was considered to be mobilised and dynamic effect on the system due to sudden removal of column was not considered (DAF = 1.0). These assumptions yielded the upper bound estimate with a factor of safety of 0.19. In the worst case scenario, the contribution from the slab was completely neglected because of the chances of discontinuity in the reinforcement and the tensile crack in the slab and DAF was taken as equal to 2.0, in accordance with US practice (GSA, 2003). This provided lower bound estimate with a factor of safety of 0.08. In best guess scenario, catenary ac-tion in the slab was included and a DAF of 1.5 was assumed, producing a factor of safety of 0.12. Fig 7 contains the resulting accidental limit state loads on the catenary for best guess case scenario, together with the tying forces necessary to achieve equilib-rium under these loads.
9 m 9 m3 m 3 m 3 m 3 m 3 m3 m
202 kN6.36 kN/m
A BC
202 kN 154.2 kN 202 kN 202 kN
Internal Hinge4o
4569 kN
0.124569528FoS
9 m 9 m3 m 3 m 3 m 3 m 3 m3 m
202 kN6.36 kN/m
A BC
202 kN 154.2 kN 202 kN 202 kN
Internal Hinge4o
4569 kN
9 m 9 m3 m 3 m 3 m 3 m 3 m3 m
202 kN6.36 kN/m
A BC
202 kN 154.2 kN 202 kN 202 kN
Internal Hinge4o
4569 kN
0.124569528FoS
Fig. 7. Accidental loads on main beam �ACB� for best guess scenario
Assuming that the beam column joints have suf-ficient rotation ductility, the connections would need to rotate by 24 degrees to the horizontal in order to support the damaged column by catenary action (as-suming full tensile capacity of the slab was mobi-lised and assuming a dynamic amplification factor of 1.5). This would produce a downwards movement of 3.84 m. Such deformations are not possible without fracturing the joints and the reinforcement in the slab. If viable alternative load paths are not present, as was the case in the Murrah Building, then pro-gressive collapse will occur.
3 FRAMES WITH SEMI-RIGID CONNECTIONS
In multi-storey framed buildings, composite floor construction has become dominant structural form due to its strength and stiffness, in comparison with non-composite construction. In addition, it provides shallower beams and lighter floors. In semi-rigid frames, the flexural strength of the connections is significantly less than that of beams. In order to util-ize the full strength of the beam, the redistribution from support to span is necessary which demands a significant requirement on the rotation capacity of the connections. It is usual to restrict the design sag-ging moment to 0.85Mp because of known problems regarding the ability of semi-rigid partial-strength composite connections to accommodate the rotations required to achieve the full plastic design moment in the span (Byfield, 2004).
Connection ductility becomes a major issue when beams are unpropped during the casting of the con-crete slab. When the construction is unpropped, the steel section supports the dead load alone. As a re-sult, the beam undergoes greater strains, leading to plastification at lower imposed loads. Consequently, the beam deflects more, and imposes greater de-mands for end rotation. The available rotation capac-ity for industry standard semi-rigid composite con-nections are limited at only 32 mrad (1.80o) for S355 beams and 25 mrad (1.43o) for S275 beams (Byfield, 2004). Due to the limitations in available rotation capacity and the insufficient reserved strength for redistribution, the semi-rigid connection may not be able to the redistribute loads in the double span con-dition through beam action alone. Furthermore, since the maximum rotation capacities are limited to 1.80o (S355) the potential for catenary action is very limited. Due to this combination of partial strength and relatively low ductility, it is unlikely that semi-rigid composite connections would be able to sup-port damaged columns in the double span condition.
4 FRAMES WITH RIGID CONNECTION
Unlike semi-rigid connections, rigid connections have sufficient ductility to accommodate catenary actions, as the plastic hinges form in the beam, pro-viding the strength of the connection exceeds that of the beam. The joint ductility helps in redistributing the support moment to the span moment. In the dou-ble span approach, the failure can take place as ei-ther a column core tension field or weak panel zone as shown in Fig. 3. Failure by column core tension field can be avoided by maintaining discrete beam-to-beam continuity. The beam-to-beam continuity is ensured by connecting the top and bottom flange of the beams by means of plates.

340
5 CONCLUSIONS
This paper investigated the redistribution of loads from fractured columns via catenary and beam ac-tions and presented a case study of a building in which the robustness was to be provided by the tying force method. In addition, the feasibility of double span beam actions in semi-rigid and rigid steel frames was discussed. In case of simple (nominally-pinned) connections, the tying force approach pro-vided a factor of safety against collapse of less than 0.2. Due to the limitation in available rotation capac-ity and reserve of strength, the chances of redistrib-uting the accidental load successfully without pro-gressive collapse is poor. The potential for semi-rigid partial strength composite connections to redis-tribute loads in the double span condition was also considered. Due to the combination of insufficient bending strength and ductility, it is considered unlikely that semi-rigid composite connections will be able to support columns in the double span condi-tion. Therefore, designers should consider alterna-tive means for providing robustness to buildings in case of simple and semi-rigid connections, if as part of a risk assessment column fracture is identified as a likely design scenario.
6 ACKNOWLEDGEMENTS
This paper is an extended version of a paper enti-tled �Feasibility of catenary action for the prevention of disproportionate collapse in steel framed build-ings�, by Byfield and Paramasivam, currently ac-cepted in International Conference on Steel and Aluminium Structures (July, 2007).
7 REFERENCES
Baker. J. F, Williams. E. L & Lax. D. (1948) The Design of Framed Buildings Against High-Explosive Bombs, IN: BAKER. J. F. The Civil En-gineer In War, Vol. III � Properties of Materials, Structures, Hydraulics, Tunnelling and Surveying. London: Institution of Civil Engineers, (80-113)
BSI, Structural use of steelwork in building, Part 1: Code of Practise for design � rolled and welded sections, BS 5950-1, 2000.
BSI, Structural use of steelwork in building, Part 4: Code of Practise for design of composite slabs with profiled steel sheeting, BS 5950-4, 1994.
Byfield, M. P., Dhanalakshmi, M., and Couch-man, G. H (2004). Assessment of the use of compos-ite connections with unpropped composite beams. J.Construt. Steel Research., 60,1369-1386.
General Services Administration (GSA). (2003). Progressive collapse analysis and design guidelines for new federal office buildings and major moderni-
zation projects. Office of Chief Architect, Washing-ton, D.C.
Liu, J., and Astaneh-Asl, A (2004). Moment-rotation parameters for composite shear tab connec-tions. J. Struct. Eng., 130(9),1371-1380.
The Steel Construction Institute (SCI), Joints in Steel Construction: Simple Connections, P212, 2002.

341
1 INTRODUCTIONAn explosion develops in a compartment saturated with flammable gas (methane) starting from the sim-ple combustion reaction of a hydrocarbon in air:
CH4 + 2O2 2H2O + CO2 (1) The flame front expands spherically from the ig-
nition point (supposing the absence of obstacles). The fast expansion of heated gases generates a pres-sure that could vary depending on several factors, namely (Mainstone, 1972, 1976, Smith et al., 1994):
Percentage of gas in air Geometry of the compartment Dimensions of the compartment Location of ignition point Presence of openings The laminar burning velocity can be estimated in
a range from less than 1 m/s to more than 50 m/s de-pending on the fuel type (it is around 10 m/s when methane is of concern). In order to burn all the avail-able gas in a vented compartment the flame should travel at a higher speed, otherwise an important per-centage of the gas present in the compartment gets expelled outside without being burnt. Generally, the maximum peak of pressure is strongly reduced when the gas can leave the compartment through adequate openings, like windows.
In order to estimate the peak pressure due to gas-explosion, both Empirical and Computational Fluid Dynamic (CFD) methods can be adopted. When em-
pirical methods are used to estimate the peak pres-sure in case of deflagration, simple and speedy cal-culations have to be developed.
On the other hand, it has to be considered that ba-sically empirical relationships are valid for an explo-sion having laminar-type flame propagation. There-fore, they can be adopted in case of turbulent flow only when well-calibrated �turbulent coefficients� are assumed.
CFD methods, which are more accurate and de-tailed, can provide a correct estimation of the peak pressure also in case of turbulent flame propagation. This is the case of large and geometrically complex compartments, where the flame propagates in a laminar mode only at the beginning of the process, while it becomes turbulent due to flame instability creating eddy vortexes, which in turn increase the reaction zone surface and therefore the burning rate. Such aspects, should be carefully considered when estimating the peak, which is then used to elaborate the structural design of key elements. In fact, the structural behavior of the key elements (load bearing walls, columns and beams of the common flats) un-der gas-explosions is described in the quasi-static realm where the structural response should be evalu-ated only on the peak pressure of the deflagration (De Matteis et al., 2005).
Peak pressure in flats due to gas explosions
I. Langone & G. De Matteis University G. d�Annunzio of Chieti/Pescara, Italy
V. Rebecchi & F.M. Mazzolani University of Naples Federico II, Italy
ABSTRACT: In order to estimate the peak pressure in flats due to gas explosion, both empirical and compu-tational fluid dynamic methods may be adopted. In typical situations, empirical relationships are able to pre-dict the peak pressure with acceptable accuracy, allowing accordingly the design of the key elements of the structural systems. Moreover, by using empirical relationships the vents surface can be designed to reduce the vulnerability associated to gas explosion hazard. On the other hand, empirical relationships should be used with particular care in case of compartments having irregular geometry, since the generated turbulence of the flame front can cause a significant increase of the maximum effect in terms of blast peak pressure. Therefore, when complex and sensitive compartments are analyzed to evaluate the risk of gas explosion, CFD (Compu-tational Fluid Dynamic) methods are advisable. This issue is emphasized in the present paper, where the re-sults obtained by the application of empirical and CFD methods are compared to each other, considering dif-ferent dimensions and geometry of the compartments.

342
2 HYSTORICAL CASES
The pressure wave due to the gas explosion depends on several factors; in fact, the related value of the peak pressure can be estimated in a wide range. The following cases represent some of the most impor-tant gas-explosion events happened in common flats, which have been characterized by different values of the peak pressure.
Ronan Point, London, 1968. The building was a 22-story and the structure had been designed mainly against vertical action. The external structure was realized with pre-cast concrete panels connected to the floor slab by friction system: this connection was sufficient to support the wind action. The blast igni-tion was located in the kitchen and then extended to close rooms of the 18th floor; the peak pressure reached about 80 kN/m2. This high value is sup-posed to be due to turbulence created by the blast.
Argenteuil, France, 1971. This was a 14 storey building supported by reinforced concrete radial structure constituted by walls and columns. The es-timated maximum pressure was estimated in the range of 50÷100 kN /m2.
Perpignan, France, 1973. The building was a 5 storey structured with pre-cast walls and floor slabs with panels reinforced in situ. The explosion was lo-cated on the fourth floor and the maximum pressure was about 35 kN/m2.
3 EUROPEAN REGULATIONS
The new standard for the Eurocode on accidental ac-tions (Eurocode 1, Actions on Structures, Part 1-7: General actions � Accidental actions) due to impact and explosions has been published on July 2006. According to the new Standards, the design strate-gies to be adopted for accidental design situations may be based on the following �Consequences Classes� (Eurocode 1, Part 1-7, 2006, Moore, 2003):
- CC1, Low consequences of failure - CC2, Medium consequences of failure - CC3, High consequences of failure
Accidental design situations for the different conse-quences classes may be considered according to the following.
For Consequences Classes 1 (CC1), no specific consideration is necessary for accidental actions ex-cept to ensure that the �robustness� and stability rules given in EN 1990 to EN 1999, as applicable, are met.
For Consequences Classes 2 (CC2), depending upon the specific circumstances of the structure, a simplified analysis by static equivalent action mod-els may be adopted or prescriptive design/detailing rules may be applied.
For Consequences Classes 3 (CC3), an examina-tion of the specific case should be carried out to de-termine the level of reliability and the depth of struc-tural analyses required. This may require a risk analysis to be carried out and the use of refined methods such as dynamic analyses, non-linear mod-els and interaction between the load and the struc-ture.
Internal explosions shall be taken into account in the design of all parts of the building and other civil engineering works where gas is burned or regulated, or where explosive material such as explosive gases, or liquids is stored.
For construction works classified as CC1 no spe-cific consideration of the effects of an internal ex-plosion should be necessary other than complying with the rules for connections and interaction be-tween components provided in EN 1992 to EN 1999.
For construction works classified as CC2 or CC3, key elements of the structure should be designed to resist actions by either using an analysis based upon equivalent static load models, or by applying pre-scriptive design/detailing rules. Additionally for structures classified as CC3 a dynamic analysis should be used.
For buildings provided with gas installed, the structure may be designed to withstand the effects of an internal natural gas explosion using a nominal equivalent static pressure given by following expres-sions (assuming the greater of the two values):
statd pp 3 (2)
2
04.02
3VAp
p vstatd (3)
Where, pstat is the uniformly distributed static pressure at which venting components will fail [kN/m2], Av is the area of venting components [m2]and V is the volume of rectangular enclosure [m3].
4 COMPUTATIONAL FLUID DYNAMIC (CFD) METHODS
Computational fluid dynamics (CFD) modeling is a general term used to describe the analysis of systems involving fluid flow, heat transfer and associated phenomena (chemical reactions) by computer based numerical methods. Mostly, when solving engineer-ing problems, fluids are modeled as a continuum. They are represented as a set of equations in terms of density [Kg/m3], pressure P [N/m2], velocity v [m/s], temperature [°C], internal energy per unit mass N [J/Kg] and total energy per unit mass:
E = N + 1/2 v2 [J/Kg] (4) CFD codes are widely used for simulation of gas
explosion in complex geometries but competent

343
combustion modeling is needed for reliable simula-tions. The purpose of a combustion model, like gas explosions, is to localize the reaction zone and con-vert reactants to products similar to those a real flame produces during an explosion. The reaction is often described of the following relationship:
tccDdiv
dtcd )()(
(5)
Where: c = mass fraction of products, = density
[Kg/m3], D = diffusion coefficient and the mass of reactants converted to products per time and volume described by means of the following relationship:
tcw (6)
This formula refers to a step of combustion with a specific point and product ( c); the variable �c� takes values ranging from zero in the unburned reac-tants to unity in the fully burned products. The diffu-sion coefficient �D� is proportional to turbulent ve-locity fluctuation (u�t) and turbulence degree or length scale (Lt), while the �w� is proportional to the ratio (u�t/Lt); Figure 1.
Figure 1: Turbulence length scale (Lt)
The above relationship shows that the combustion velocity is proportional to the turbulence degree and turbulence velocity. The combustion processes are better described by dividing the combustion in two models (as in FLACS code):
- flame model - burning velocity model
Flame model should move the reaction zone through reactants with the flame speed specified by the burning velocity model. Functions describing thickness, curvature and burning direction of the flame should be used in the model. In particular, burning velocity models, which describe the flame propagation velocity through specified reactant are needed. In fact, the strength of an explosion depends on how fast the flame burns.
Due to explosion, the flame normally begins as quasi laminar, with increased flame front area due to
flame instabilities. When the flame reaches ob-structed areas, it becomes turbulent. Both the quasi-laminar and turbulent burning velocities should be modeled in the explosion simulator. In figure 2, a simple combustion scheme is shown, considering a one-dimension situation with burning velocity of 1 m/s. The flow ahead will move with 7 m/s, whilst the flame velocity will be 8 m/s.
Figure 2: One-Dimension Flame propagation
From a structural point of view, the most interest-ing parameters from simulations carried out with a CFD code are peak value and duration of pressure pulse at specified locations (like walls, beams, col-umns and windows) required to evaluate structural response. Another important aspect is the determina-tion of path and development of turbulence in a complex geometry, as well as the corresponding in-crease of the combustion rate during the explosion.
5 EMPIRICAL METHODS
5.1 GeneralOn the basis of experimental analysis, a number of empirical relationships have been proposed to esti-mate the peak pressure of the gas explosion. They can be also used to design the vent area in order to reduce the peak pressure value associated with gas explosion hazard. Typical empirical relationships are based on the following main parameter (Silvestrini et al., 2000):
LV SKWVPfP ,,,,max (7)
Where: Pmax = peak pressure; Pv = vent pressure; V = vol-
ume of the compartment; W = Mass per unit area of the vent; SL = velocity of the laminar flow; As = panels area; Av = vent area and K is the ventilation ratio defined as the following:
VV
S
AV
AAK
3/2
(8)
5.2 Selected relationships and basic applications Many methods have been proposed to predict the
peak pressure. In the following, based on a simple example, the results related to the application of four relationships are analyzed and discussed. The appli-cability of such methods is often related to the value

344
assumed by ventilation ratio K. For instance, the Cubbage � Marshall relationship is applied for K<4, the Rasbash relationship for K<6 and the Silvestrini et al. relationship for K<7.6.
In the proposed application, a �Common Kitchen� is analyzed, it being characterized by the following parameters: V = 4 x 4 x 3 = 36 m3, SL = 0.30 m/s, Av = 1.2 x 1.5 = 1.8 m2, Pv = 20 mbar and W = 5 Kg/m2. The application of the aforementioned empirical relationships provides the following esti-mation of the peak pressure.
Cubbage - Marshall:
mbarVKWSPP LV 3923 3/1
2max (9)
Rasbash:
mbarKSPP LV 1677.775.1max (10)
Silvestrini et al.:
mbarKVKWSPP LV 154704
3/1max (11)
Eurocode 1, Part 1-7: Accidental actions:
mbarmkN
VA
PP
v
V 2002004.02
3 22max (12)
In the case being, the ventilation ratio K = 5.9. Therefore, the result obtained by means of Cubbage � Marshall relationship is not correct. Instead, by us-ing Rasbash and Silvestrini et al. relationships the results are quite in line with the one provided by Eu-rocode 1.
As far as the flow turbulence is concerned, two different kinds of phenomena may be distinguished:
flame instability: the front flame fray out increas-ing the surface; flow induced turbulence: the front flame became elliptical from spherical due to the failure of the vent;flow impacted turbulence: the front flame impact on the domestic arrangements. Flame instability and flow induced turbulence are
taken in account, through �blind test�, in the ex-perimental activity, while the flow impacted turbu-lence can be estimated from observations on the damage to glass windows (using particular sizes and thicknesses) of the building.
The above relationships are valid in situations without important flow impacted turbulence, while in the other cases the introduction of a partial turbu-lent coefficient ( ) is necessary to be applied:
ST = 1 SL (13)
In the case under consideration, the laminar ve-locity becomes turbulent by means a coefficient =1.5 (Rasbash et al).
Moreover, more compartments are often con-nected by unburned-gas, and the explosion propa-gates from the ignition point to the next compart-ment by means of a domino effect. In such a case, in the time-pressure domain the blast shows several succeeding peaks. The maximum peak pressure can be reached introducing a second partial turbulent co-efficient ( ):
ST = 1 2 SL (14)
The second partial turbulent coefficient ( ) can be in the range 1.5 � 5 (Rasbash et al). Introducing the flow turbulence in the Rasbash relationship the peak pressure can be estimate using the turbulent coefficients 1 = 2 = 1.5. Therefore:
2max 343387.775.1mkNmbarKSPP TV (15)
Otherwise, assuming the turbulent coefficients 1= 1.5 and 2 = 5.0 the peak pressure assume the value:
2max 10610587.775.1mkNmbarKSPP TV (16)
6 THE STUDY CASE
Three different common cases are investigated in order to estimate the peak pressure due to gas explo-sion by means of FLACS (FLame Acceleration Simulator) code. In particular, the following com-partments are taken in account (FLACS, 1998):
- I case (regular compartment): regular room with window as venting
- II case (irregular compartment): irregular room with window as venting
- III case (irregular compartment): regular room linked to another one with window as venting
The first case represents an idealized one charac-terized by the regular volume (4 x 4 x 3 = 36 m3)with window (1.2 x 1.5 = 1.8 m2). Moreover, we suppose that the room is saturated with methane at stoichiometric concentration at the time of the blast. In such a case, the gas flow can be assumed as mostly laminar during the deflagration. In the sec-ond case, two walls and a column (partially porous) are introduced in the room to evaluate the effects on peak pressure; in such a case the developed flow can be considered as turbulent. As far as the third case is concerned, the typical configuration of two linked room is analyzed to evaluate the severe condition of domino effect. The second introduced room, with a

345
volume of 4 x 6 x 3 = 72 m3, is supposed filled with air at ignition time. The blast and propagation of the front flame associated at the three cases is shown in the following figures (Figures 3, 6 and 8).
Figure 3, shows the temperature range and veloc-ity vector field into the compartment at different steps during deflagration. The velocity vector field represents the velocity of the product and/or reagent of the combustion associated to the volume (dV) at the specific plane position. Generally, the peak pres-sure will be reached well before burning all the re-agent gas (methane) available. Figure 4, shows the combustion products at time steps 0.4 s and 0.5 s.
t = 0.2 s
t = 0.4 s
t = 0.5 s
t = 0.7 s
Figure 3: Propagation of the front flame (I case)
Figure 5, shows the pressure-time diagrams at the monitored points of the compartment: monitored point M1 is located at the central room, while M2 is located on the venting. In such a case, the pressure wave at the different position M1, M2 is almost the same. The peak pressure, reached at the rise time 0.25 s, corresponds to 30 mbar.
Figure 6, which is related to �II Case� shows the effect due to the irregular geometry of the compart-ment. In case of irregular compartment, the combus-tion flow becomes turbulent and the peak pressure reaches the value of about 390 mbar at a rise time equal to 0.45 s (Fig. 7).
t = 0.4 s t = 0.5 s
Figure 4: Product of the combustion (I case) Pressure time diagrams
0.0000.0100.0200.0300.0400.0500.0600.0700.0800.0900.100
0.00 0.20 0.40 0.60 0.80 1.00 1.20 1.40 1.60 1.80 2.00time [s]
I CASE-M1I CASE-M2
Figure 5: Pressure � time diagram (I case)
t = 0.200 s t = 0.300 s
t = 0.400 s t = 0.500 s
Figure 6: Propagation of the front flame (II case) Pressure time diagrams
0.000
0.100
0.200
0.300
0.400
0.500
0.00 0.20 0.40 0.60 0.80 1.00 1.20 1.40 1.60 1.80 2.00time [s]
II CASE-M1
II CASE-M2
Figure 7: Pressure � time diagram (II case)
The �domino effect� is represented by means of two rooms linked by a door; the first room (4x4x3=36m3) is supposed to be saturated with methane at stoichiometric concentration (Figure 8).
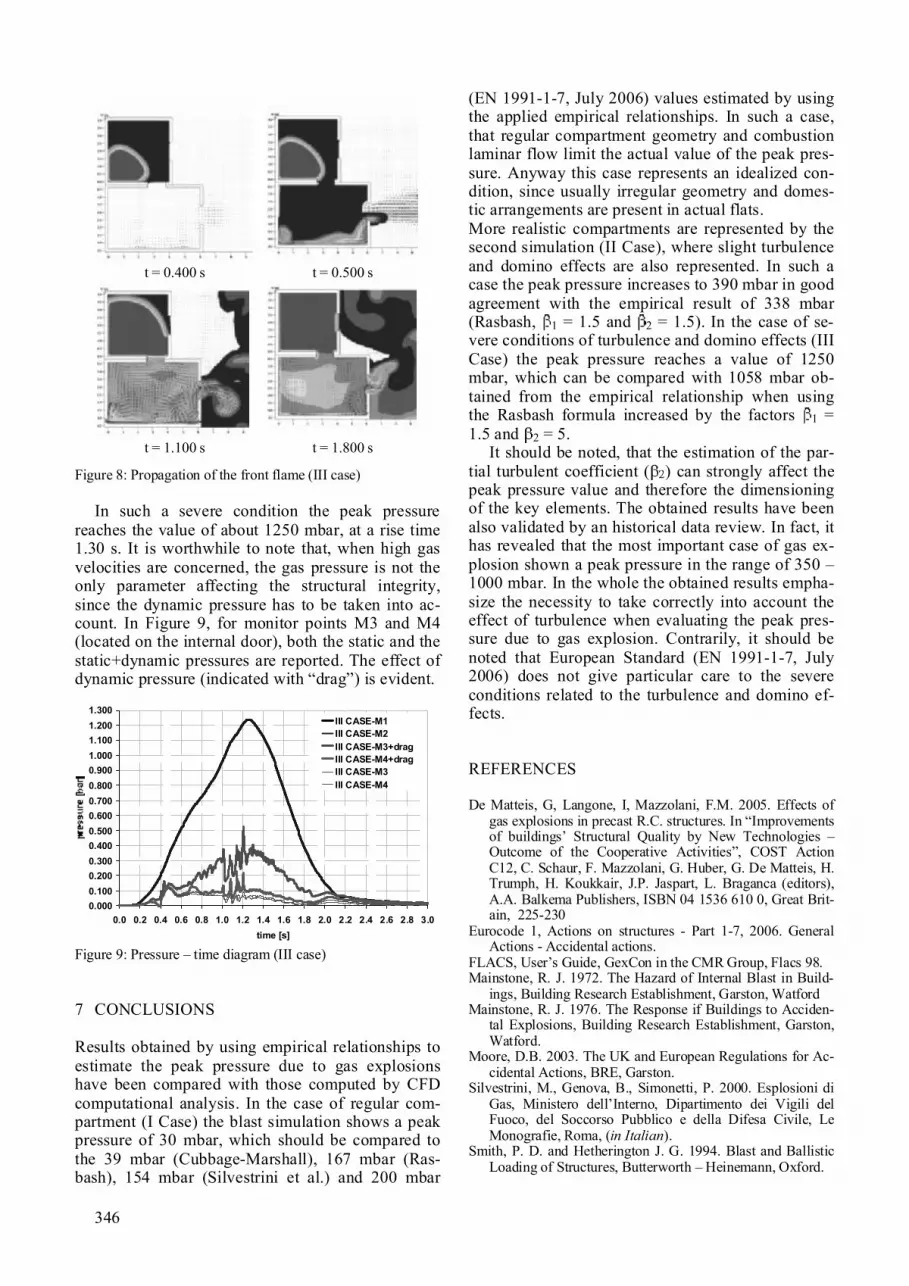
346
t = 0.400 s t = 0.500 s
t = 1.100 s t = 1.800 s
Figure 8: Propagation of the front flame (III case)
In such a severe condition the peak pressure reaches the value of about 1250 mbar, at a rise time 1.30 s. It is worthwhile to note that, when high gas velocities are concerned, the gas pressure is not the only parameter affecting the structural integrity, since the dynamic pressure has to be taken into ac-count. In Figure 9, for monitor points M3 and M4 (located on the internal door), both the static and the static+dynamic pressures are reported. The effect of dynamic pressure (indicated with �drag�) is evident.
0.0000.1000.2000.3000.4000.5000.6000.7000.8000.9001.0001.1001.2001.300
0.0 0.2 0.4 0.6 0.8 1.0 1.2 1.4 1.6 1.8 2.0 2.2 2.4 2.6 2.8 3.0time [s]
III CASE-M1III CASE-M2III CASE-M3+dragIII CASE-M4+dragIII CASE-M3III CASE-M4
Figure 9: Pressure � time diagram (III case)
7 CONCLUSIONS
Results obtained by using empirical relationships to estimate the peak pressure due to gas explosions have been compared with those computed by CFD computational analysis. In the case of regular com-partment (I Case) the blast simulation shows a peak pressure of 30 mbar, which should be compared to the 39 mbar (Cubbage-Marshall), 167 mbar (Ras-bash), 154 mbar (Silvestrini et al.) and 200 mbar
(EN 1991-1-7, July 2006) values estimated by using the applied empirical relationships. In such a case, that regular compartment geometry and combustion laminar flow limit the actual value of the peak pres-sure. Anyway this case represents an idealized con-dition, since usually irregular geometry and domes-tic arrangements are present in actual flats. More realistic compartments are represented by the second simulation (II Case), where slight turbulence and domino effects are also represented. In such a case the peak pressure increases to 390 mbar in good agreement with the empirical result of 338 mbar (Rasbash, 1 = 1.5 and 2 = 1.5). In the case of se-vere conditions of turbulence and domino effects (III Case) the peak pressure reaches a value of 1250 mbar, which can be compared with 1058 mbar ob-tained from the empirical relationship when using the Rasbash formula increased by the factors 1 = 1.5 and 2 = 5.
It should be noted, that the estimation of the par-tial turbulent coefficient ( ) can strongly affect the peak pressure value and therefore the dimensioning of the key elements. The obtained results have been also validated by an historical data review. In fact, it has revealed that the most important case of gas ex-plosion shown a peak pressure in the range of 350 � 1000 mbar. In the whole the obtained results empha-size the necessity to take correctly into account the effect of turbulence when evaluating the peak pres-sure due to gas explosion. Contrarily, it should be noted that European Standard (EN 1991-1-7, July 2006) does not give particular care to the severe conditions related to the turbulence and domino ef-fects.
REFERENCES
De Matteis, G, Langone, I, Mazzolani, F.M. 2005. Effects of gas explosions in precast R.C. structures. In �Improvements of buildings� Structural Quality by New Technologies � Outcome of the Cooperative Activities�, COST Action C12, C. Schaur, F. Mazzolani, G. Huber, G. De Matteis, H. Trumph, H. Koukkair, J.P. Jaspart, L. Braganca (editors), A.A. Balkema Publishers, ISBN 04 1536 610 0, Great Brit-ain, 225-230
Eurocode 1, Actions on structures - Part 1-7, 2006. General Actions - Accidental actions.
FLACS, User�s Guide, GexCon in the CMR Group, Flacs 98. Mainstone, R. J. 1972. The Hazard of Internal Blast in Build-
ings, Building Research Establishment, Garston, Watford Mainstone, R. J. 1976. The Response if Buildings to Acciden-
tal Explosions, Building Research Establishment, Garston, Watford.
Moore, D.B. 2003. The UK and European Regulations for Ac-cidental Actions, BRE, Garston.
Silvestrini, M., Genova, B., Simonetti, P. 2000. Esplosioni di Gas, Ministero dell�Interno, Dipartimento dei Vigili del Fuoco, del Soccorso Pubblico e della Difesa Civile, Le Monografie, Roma, (in Italian).
Smith, P. D. and Hetherington J. G. 1994. Blast and Ballistic Loading of Structures, Butterworth � Heinemann, Oxford.

347
NOMENCLATURE
Be Effective pipe length for elastic solution Bp Effective pipe length for plastic solution Bpi Effective pipe length for pressure effects on
plastic solution D Pipe diameter E Young�s modulus F Denting loadFe Elastic denting loadFp Plastic denting loadFm Membrane denting load FST Stretching force Fpi Pressure denting load for inelastic response
Fpc2
0 /4t
D t , normalization denting force
F = F/Fpc, normalized load L Length of pipe l Effective width for membrane solution P Pressure (positive when external) p0 02 t D , fully plastic pressure pcr Critical buckling (external) pressure q = p/p0 , normalized load per unit length R Pipe radius S Yield anisotropy factorSB Local effects factor
t Pipe thickness
x = /R, normalized displacement W Effective width for membrane action w Radial displacement of deformed cylinder z Longitudinal cylinder coordinate
rra Pressure factor (rerounding factor) e eB Rp pB Rpi piB R
Denting displacement Slope of cylinder top generator
20 1E
Poisson�s ratio 0 Yield stress rs Hoop stress due to pressure Hoop cylinder coordinate
1 INTRODUCTION
In several engineering applications, piping compo-nents and pipelines are subjected to heavy transverse loads, which may cause significant damage. In par-ticular, oil and gas steel buried pipelines are quite often subjected to heavy transverse loads caused by the excavation equipment [1]. In addition, offshore oil and gas pipelines should be able to resist loads caused by trawl gears or anchors [2], [3] whereas offshore risers may also be subjected to lateral im-pact loading due to collision with adjacent risers [4]. Finally, industrial pipes may be subjected to acci-
Impact loading of pressurized steel pipelines
A. M. Gresnigt Delft University of Technology, Netherlands
S. A. Karamanos & K. P. Andreadakis University of Thessaly, Volos, Greece
ABSTRACT: The paper examines the denting response of pipes subjected to lateral (transverse) quasi-static wedge loading, in the presence of internal pressure. Pipes are modeled with nonlinear shell finite elements and a simplified analytical model. The analysis focuses on the significant influence of internal pressure on the denting resistance. Furthermore, the effects of wedge denting device orientation on the denting resistance are briefly discussed. Motivated by the experimental and numerical results, a two-dimensional heuristic model is proposed, which yields closed-form expressions for the denting force in terms of the corresponding displace-ment. The finite element results and the model equations are in good agreement with the experimental results and illustrate pipe denting response in an elegant manner.

348
dental lateral loads that may threaten their integrity. The ability of pipes to absorb the applied load en-ergy and transform it into plastic deformation is of particular interest for safeguarding their structural integrity.
F
b r=7.5 mm r=2 mm r=5 mm
Type A Type B Type C
Figure 1: Laterally loaded pipe (top); denting tool geometries used in the experiments and in the numerical simulations (bot-tom).
The response of metal cylinders under lateral compression has been investigated experimentally and analytically as a two-dimensional problem in the absence of pressure, through a two-dimensional rigid-plastic four-hinge cross-sectional model [5]. The compressive load was applied through rigid plates and was constant along the tube. The model was further refined by Reid & Reddy [6] to account for strain-hardening in the plastic-hinge regions. However, the response of metal cylinders under lat-eral loads acting on a small part of their surface con-stitutes a three-dimensional rather than a two-dimensional problem, as noted in early experimental observations [7]. The response is influenced by lon-gitudinal stretching, in the sense that the axial de-formation of tube generators provides additional re-sistance to the denting process. Among several analytical attempts to model tube response under a single transverse load, Wierzbicki & Suh [8] consid-ered a simplified three-dimensional shell model and derived analytical expressions for the denting de-formation, accounting for the effects of boundary conditions. More recently, Brooker [9] using finite elements, simulated the quasi-static lateral deforma-tion response of tubes, fully constrained at the two ends, and investigated the influence of wall thick-ness, tube diameter, length, as well as yield stress level.
The above investigations referred to non-pressurized pipes and cylinders. However, pressure is quite often present in pipeline applications. Thus, when pressurized pipes are transversely loaded, the additional stresses and deformations due to pressure should be taken into account. In a recent work [10], using nonlinear finite elements, the response of elas-tic-plastic tubes subjected to transverse loads under pressure was examined. In that work, motivated by
the behavior of offshore pipelines, external pressure was mainly considered. It was found that external pressure causes a significant reduction of the ulti-mate capacity and the energy absorption capacity of the tubular member, and the main aspects of re-sponse were illustrated through a simplified three-dimensional doubly-symmetric analytical model, which yields a closed-form solution.
The present paper investigates the denting re-sponse of internally pressurized steel pipes subjected to lateral quasi-static wedge denting loads (Figure 1), using experimental data, numerical simulation and a simplified analytical model. Steel pipes are considered, with diameter-to-thickness (D/t) ratio ranging between 34 and 50, a typical range for pipe-line or industrial piping applications. The pipes un-der consideration exhibit significant inelastic defor-mations. First, nonlinear shell finite elements are employed to model the pipe response under lateral load imposed by a wedge-shaped denting tool. Fol-lowing a comparison with available experimental data [11] on pressurized pipe specimens, a short pa-rametric study is conducted and load-displacement curves are obtained for different levels of pressure, considering various denting tool sizes and orienta-tions. In addition, a simplified two-dimensional heu-ristic model is also presented. Considering the sub-sequent stage of denting deformation, the model describes the response through closed-form expres-sions, which illustrate the response of pressurized pipes in a clear and elegant manner. The model pre-dictions are compared with the aforementioned test data.
2 EXPERIMENTAL RESULTS AND NUMERICAL SIMULATION
A series of tests were conducted at TNO, the Nether-lands. The tests were part of a large experimental program, aimed at examining the influence of pipe wall thickness on the resistance of steel pipelines to external damage (denting and notching). The ex-periments included static and dynamic denting of pressurized cylinders, as well as burst tests of dented or scratched pipes, and were motivated by the need of quantifying the resistance of gas pipelines against damage caused by excavating machines. Herein, the denting resistance under quasi-static loading of eight specimens is examined. The dimensions and the me-chanical properties of the specimens, as well as the dimensions and the orientation of the denting tools are reported in detail in Tables 1 and 2. The non-pressurized pipe specimens were free at the two ends, whereas the pressurized specimens were capped. The orientation of the denting tool is either transverse or longitudinal with respect to the axis of the pipe specimen, as shown in Figure 2.

349
Table 1. Geometric-mechanical properties of specimens [11]. Speci-men label
Outerdiameter D0 [mm]
Thickness T [mm] D0/t
Length L[mm]
Yield stress 0 [MPa]
A1 165 4.82 34.2 2000 290 A2 165 4.82 34.2 2000 290 A3 165 4.82 34.2 2000 290
B1 133 2.72 48.9 900265 (hoop) and335 (axial)
B2 133 2.72 48.9 900 265 and 335
B3 133 2.72 48.9 900 265 and 335
C1 324 7.3 44.4 2000288 (hoop) and343 (axial)
C2 324 7.5 44.4 2000 288 and 343
Table 2. Loading of specimens [11]. Specimen label
Pressure p [bar]
Denting tool orientation
Denting tool type and size b [mm]
A1 0.0 longitudinal A 40 A2 0.0 longitudinal A 80 A3 40.0 longitudinal A 40 B1 40.0 transverse B 80 B2 66.2 transverse B 80 B3 40.0 longitudinal B 80 C1 40.0 transverse C 80 C2 40.0 transverse C 80
2.1 Simulation of experimental procedureGeneral-purpose finite element program ABAQUS [12] is employed to simulate the denting procedure of pressurized pipes. The analysis considers nonlin-ear geometry and a J2 flow (von Mises) large-strain plasticity model, with isotropic hardening. In the case of yield anisotropy, Hill�s anisotropic yield function can be used, defining a different yield stress in the longitudinal pipe direction. The pipe is mod-eled with four-node reduced-integration shell ele-ments (type S4R), and typical meshes are shown in Figure 3. The element size in the longitudinal direc-tion, around the area where the load is applied, is chosen equal to approximately 1/16 of the pipe ra-dius R. To simulate contact between the pipe and the denting tool, as well as between the pipe and the plane on which it lies, a frictionless contact algo-rithm is used. The pipe end sections may be free, fully-fixed or capped. In case of capped-end condi-tions, a rigid plate is assumed to be connected at each end section, relating the degrees of freedom of the shell nodes on the end section with those of a �fictitious� reference node, which is assumed to be located at the centroid of the section.
In pressurized pipe analysis, pressure p is raised up the desired level and, subsequently, it is kept con-stant while the denting displacement is gradually in-creased using an algorithm that controls the denting
displacement, so that the nonlinear equilibrium path of load versus displacement is traced. Pressure on the lateral pipe surface is considered as a �follower� distributed load. In case of capped-end conditions, the pressurized pipe segment is subjected to capped-end forces (equal to at each end, where R is the pipe radius and p is the pressure) applied as �fol-lower� forces on the reference nodes of the end plates.
(a)
(b)
(c)
Figure 2: Denting tests in pressurized pipe segments in test se-ries B [11]; (a) loading under transversely-oriented wedge; (b) permanent deformation of specimen B2 under transversely-oriented wedge; (c) permanent deformation of specimen B3 under longitudinally-oriented wedge.

350
Results from the above numerical models are com-pared with the above test data [11]. Figures 4, 5 and 6 show the comparison between experimental data and numerical results for the eight specimens under consideration. Overall, the comparison between test data and numerical results is very satisfactory, and this indicates that the above finite element models can be employed for an accurate description of the denting procedure and prediction of the denting re-sistance.
(a)
(b)
Figure 3: Finite element meshes of deformed pipes; (a) longi-tudinally-oriented wedge denting tool; (b) transversely-oriented wedge denting tool.
2.2 Parametric study Using the numerical simulation described above, a brief parametric study is conducted to examine the influence of the pressure level on the pipe resistance, and the effects of indenter size and orientation. The steel pipe considered is 10 diameters long (L/D=10) with D/t ratio equal to 50. The wedged-shape dent-ing tool is applied at the middle section of the speci-men either longitudinally or transversely, it is simi-lar to the one used in the first series of Tests shown in Table 1, and its width b has been chosen equal to 60% and 160% of the tube mean diameter D (Figure 1 � denting device type A). The pipe lies on a fric-tionless plane, simulated with appropriate contact elements between the plane and the tube wall, and the end-sections are capped with rigid plates. The material properties of pipes are those of specimen series A (Table 1); the yield stress 0 is equal to 290 MPa with no hardening. In the numerical results, the pressure p is normalized by the fully plastic pressure
( Dtp /2 00 ), so that, 0/ ppq , the denting load value F is normalized by tDtFpc /)4/( 3
0 , so that f=F/Fpc, and the denting displacement is nor-malized by the tube radius R (x= /R).
In Figure 7, the load-displacement response of the pipe is depicted for several internal pressure levels. The denting tool is long (b/D=1.6), oriented trans-versely with respect to the capped-ended pipe. The results indicate a substantial increase of the denting resistance in the presence of internal pressure. Fig-ure 8 shows the different deformed profiles of the pipe in the absence and the presence of internal pressure, which indicate that the presence of internal pressure results in a more localized denting area configuration.
0
20
40
60
80
0 8 16 24 32 40 48 56denting displacement [mm]
FEMTEST A1
0
20
40
60
80
100
0 8 16 24 32 40 48 56
denting displacement [mm]
FEMTEST A2
0
20
40
60
80
100
0 4 8 12 16 20 24 28 32 36
denting displacement [mm]
FEMTEST A3
Figure 4: Comparison between experimental and finite element results, for specimens A1, A2 and A3.
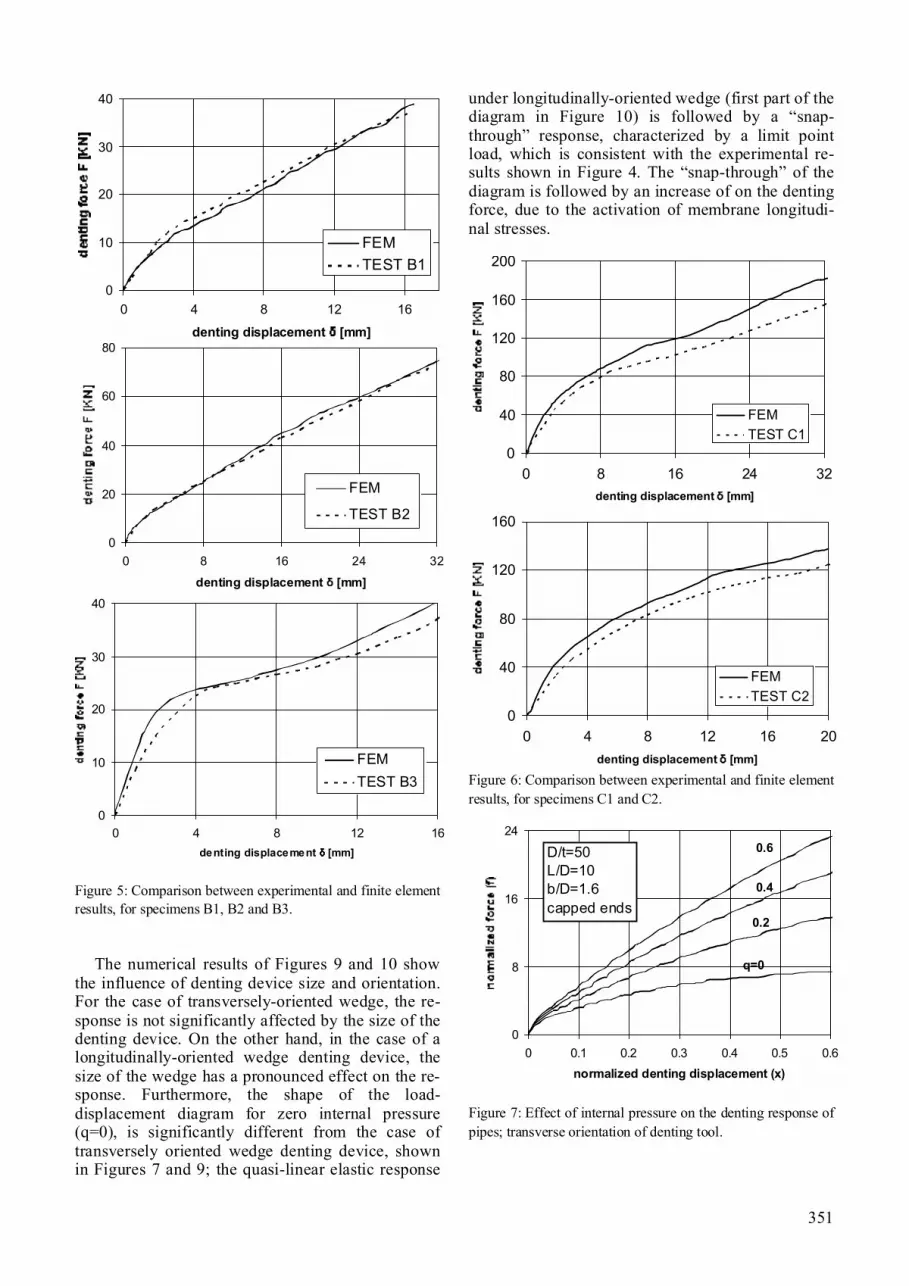
351
0
10
20
30
40
0 4 8 12 16
denting displacement [mm]
FEMTEST B1
0
20
40
60
80
0 8 16 24 32
denting displacement [mm]
FEM
TEST B2
0
10
20
30
40
0 4 8 12 16denting displacement [mm]
FEMTEST B3
Figure 5: Comparison between experimental and finite element results, for specimens B1, B2 and B3.
The numerical results of Figures 9 and 10 show the influence of denting device size and orientation. For the case of transversely-oriented wedge, the re-sponse is not significantly affected by the size of the denting device. On the other hand, in the case of a longitudinally-oriented wedge denting device, the size of the wedge has a pronounced effect on the re-sponse. Furthermore, the shape of the load-displacement diagram for zero internal pressure (q=0), is significantly different from the case of transversely oriented wedge denting device, shown in Figures 7 and 9; the quasi-linear elastic response
under longitudinally-oriented wedge (first part of the diagram in Figure 10) is followed by a �snap-through� response, characterized by a limit point load, which is consistent with the experimental re-sults shown in Figure 4. The �snap-through� of the diagram is followed by an increase of on the denting force, due to the activation of membrane longitudi-nal stresses.
0
40
80
120
160
200
0 8 16 24 32denting displacement [mm]
FEMTEST C1
0
40
80
120
160
0 4 8 12 16 20denting displacement [mm]
FEMTEST C2
Figure 6: Comparison between experimental and finite element results, for specimens C1 and C2.
0
8
16
24
0 0.1 0.2 0.3 0.4 0.5 0.6normalized denting displacement (x)
q=0
0.2
0.4
0.6D/t=50L/D=10b/D=1.6capped ends
Figure 7: Effect of internal pressure on the denting response of pipes; transverse orientation of denting tool.

352
Figure 8: Deformed shapes of indented pipes (x= /R=0.7) with transverse orientation of denting tool; no pressure (top) and with pressure q=0.6 (bottom).
0
2
4
6
8
0 0.1 0.2 0.3 0.4 0.5 0.6normalized denting displacement (x)
b/D=0.6
b/D=1.6
D/t=50L/D=10q=0capped endsTransverse denting tool orientation
Figure 9: Denting tool size effect on the denting response of pipes; transverse orientation of denting tool; numerical results.
3 ANALYTICAL MODEL
In the course of the present study, a simplified two-dimensional model is also developed to describe the denting response of pressurized tubular members under lateral concentrated loads. The model is basi-cally a heuristic model that considers a ring-type ap-proximation of the pipe, and accounts for three-dimensional (stretching) effects through appropriate �effective lengths� or �effective widths�. The model is aimed at providing closed-form expressions that describe the general trends of pipe behavior under wedge loads in a simple and clear manner. The total response is assumed to consist of three major parts:
the initial elastic part, the subsequent plastic mecha-nism response and, finally, the membrane part. In all parts, the effects of pressure are taken into account. Both longitudinal and transverse orientations of the wedge denting tool are considered.
0
2
4
6
8
10
0 0.1 0.2 0.3 0.4 0.5 0.6normalized denting displacement (x)
b/D=0.6b/D=1.6
D/t=50L/D=10q=0capped endsLongitudinal denting tool orientation
0
10
20
30
40
0 0.1 0.2 0.3 0.4 0.5 0.6
normalized denting displacement (x)
b/D=0.6b/D=1.6
D/t=50L/D=10q=0.6capped endsLongitudinal denting tool orientation
Figure 10: Numerical results of denting under longitudinally-oriented wedge denting tool; (a) response with no pressure; (b) response in the presence of pressure q=0.6.
3.1 Elastic Solution
The elastic part of the response is based on an ap-proximation of the real situation, depicted in Figure 11a, with the idealized problem of a cylinder sub-jected to a pair of radial opposite loads Fe , as shown in Figure 11b. For this idealized problem, a solution for the radial displacement w(z, ) is possible in the form of Fourier series [11] [13] [14]. In particular, for the loaded cross-section (z=0) the radial shell displacement can be written as follows
3
2,4,6,...
cos(0, ) 1.117 e
n n
F R t nwR AREIR
t
(1)
In the above equation, are coefficients that depend on the geometric characteristics of the cylinder [14],

353
33 4 5
2 2 2 32 2n n nn n n n
A k kk k k k
(2)
where
22 1 4n n nk (3)
2
3nn t
R (4)
Fe
Fe
Be
Fe
Fe
Fe
Fe
w(z, )x
y
z x
y
(a)
(b)
(c)
Figure 11: Elastic response of transversely loaded cylinders; (a) real problem; (b) two-dimensional approximation at central section; (c) idealized problem of cylinder under two concen-trated opposite radial loads eF .
Furthermore, EI is the ring bending stiffness of the pipe wall per unit length, under plane strain con-ditions ( 3 2/12(1 )I t v ). Truncation of the series in Equation (1) results in the following expression for the displacement at the location where the load is applied w(0,0) in terms of the corresponding elastic denting force Fe:
3
(0, 0) 0.056 eF RwREIRt
= (5)
whereas at mid-height of the loaded pipe section ( 2 ):
3
(0, / 2) 0.027 eF RwREIRt
p = (6)
Considering that the denting displacement is equal to twice the above displacement ( 2 (0, 0)w ),Equation (5) can be written in the following form
30.149e eEIF B
Rd= (7)
where eB is the so-called �equivalent pipe length� for elastic response,
1.33eB R R t b= + (8)
The effects of pressure are taken into account through the introduction of a pressure factor (rerounding factor) rr equal to
( )rr cr crp p pa = + (9)
where p is the internal pressure (considered positive when the pressure is internal), pcr is the critical (buckling) external pressure of a uniformly pressur-ized ring (pcr=3EI/R3), so that
30.149e err
EIF BR
da
= (10)
Note that Equations (7) and (10) for 1rra = and1eB = are identical to the formula for ring deforma-
tion under opposite radial loads and plane strain con-ditions (Figure 11c), presented by Timoshenko and Gere [15]. The dimensionless form of Equation (10) is
xRt
FF
ferr
e
pc
e2/3
582.1 (11)
where, 20 4pcF t D t is a normalization force,
x is the normalized denting displacement ( x R ),e eB R= is the dimensionless effective length, and
))1(/( 20E is a dimensionless material pa-
rameter.
plastic hinge
Mp
Mp
Fp
0.5FpFp
R
Figure 12: Four-hinge plastic mechanism under two opposite radial loads pF and static equilibrium on quarter pipe.
3.2 Plastic Mechanism Solution
The fully-plastic solution is based on an equally-spaced-four-hinge plastic mechanism (Figure 12a), which assumes rigid-plastic behavior, under plane-strain conditions. Applying static equilibrium on the circular configuration of the plastic mechanism, as shown in Figure 12b, one readily obtains
2 2p pM F R (12)

354
where pM is the plastic moment of the tube wall under hoop bending, equal to 2
0 4p pM B t andpB is the corresponding �equivalent length� of the
pipe for plastic response.
F F
wedge wedge deformed shape
Figure 13: Effect of non-uniform distribution of contact stresses in transversely oriented wedge denting tool; the shape of the deformed cross-section is obtained rigorously through the finite element analysis model.
Two corrections are necessary. First, under plane strain conditions in the full plastic range, Poisson�s ratio is equal to 0.5 and, following the von Mises yield criterion, the yield stress in the hoop direction is increased by 15%. In addition, the presence of a uniform hoop stress rs due to internal pressure ( r pR ts = ) reduces the plastic moment capacity of the pipe wall. Under those two corrections, the limit plastic load pF is computed as follows:
Bpr
p SBRt
F2
0
20 75.0115.1 (13)
where the term in the brackets accounts for the re-duction of the yield stress due to pressure, through the von Mises yield criterion, and BS is a factor that accounts for the local effects when a transversely oriented denting device is applied on the pipe due to nonuniform contact. This is shown in Figure 13, where the depicted deformed shape of the pipe cross-section is obtained from the finite element analysis model. Furthermore, the effective length for the plastic mechanism solution is smaller than the corresponding effective length for the elastic solu-tion, in the sense that deformations are more local, as shown in the experimental results. Based on these observations [11], factors pB and BS are chosen equal to
0.80pB R R t b= + (14)
0.35BRS
R b=
- (b 2R) (15)
and BS is equal to unity when a longitudinally ori-ented wedge is applied. Note that the above plastic load in Equation (13) is constant with respect to the denting displacement. The dimensionless form of Equation (13) is
2
20
33.25 14
p rp p B
pc
F tf SF R
(16)
where, p pB R= is the dimensionless equivalent length factor for plastic response.
Fm
FST FST
l
deformed shapeof top generator
Figure 14: Schematic representation of membrane stretching action.
3.3 Membrane Solution
The membrane response follows the plastic ring mechanism and represents the stretching of pipe me-ridians that resist the denting process. Such a mecha-nism is activated when the denting depth has a certain value, and can be approximated through the following expression, which comes from static equi-librium (Figure 14):
2 cosm STF F q= (17)
where mF is the required lateral force for membrane deformation, STF is the resultant force from the stretching of generators. Considering an �effective length� of the plastic membrane force, denoted by lin Figure 14, the slope of the deformed generator is computed as follows
22cos
l (18)
Assuming rigid-plastic conditions, it is reasonable to write the resultant stretching force as follows
0STF Wt (19)

355
where W is an �effective width�, assumed herein equal to 0.8l . Furthermore, length l is taken as a portion of the effective length pB :
( )8l R R t= (20)
Therefore, Equation (17), using Equations(15) and (18) - (20) can be written as follows
0 2 30.2
64m B
RF Rt St R t
dsd
=+
(21)
and in dimensionless form
20.566
64m
m Bpc
F R xf SF t x R t
(22)
where the BS factor has been introduced in Equation (15). Equations (21) or (22) can account for the case of plastic anisotropy, where a different yield stress may exist in the longitudinal direction ( 0 0 ),and should replace ( 0) in Equation (19). Introducing the plastic anisotropy factor 0 0S , Equation (19) is re-written as follows
0 2 31.6
64m BF l S t S
R t=
+ (23)
3.4 Pressure Effects on Inelastic Response Finally, the effects of pressure on the plastic ring mechanism, as well as on the membrane part of the solution can be calculated by considering the work done by the pressure due to the change of cross-sectional area of the pipe. Considering the kinemat-ics of the four-hinge plastic mechanism, shown in Figures 12 and 15, and application of the principle of virtual displacements, the virtual work done by the external forces required for ring deformation should be equal to the product of pressure times the variation of change of area enclosed by the deform-ing ring
( ) ( )0� �2 pip A F wd dD = (24)
where ()� .d means variation of (). . The change of area AD enclosed by the ring can be calculated from Figure 15 as follows
tan)5.0(4tan5.0tan)(5.04
00
220wwR
RwRA (25)
Considering the fact that Rw0 , and the fol-lowing approximation
0tan wR (26)
one obtains from Equation (25) 204A wD = (27)
w0
R
R
Fpi
Fpi
w0
R
R
Fpi
Fpi
Figure 15: Work of pressure due to deformation of the four-hinge mechanism and change of enclosed area.
Therefore, from Equation (25)
( ) ( )0 0� �8A w wd dD = (28)
so that Equation (24) gives the equivalent lateral force piF as a linear function of the denting dis-placement :
2pi piF pB d= (29)
where 02wd = and piB is the corresponding �equivalent length�, taken equal to
0.4pi rrB R R t ba= + (30)
Note that in Equation (30) the �equivalent length� piB decreases with increasing internal pressure,
which is compatible with the finite element results depicted in Figure 8. The dimensionless form of Equation (29) is
3/ 2
0
5.65pipi pi
pc
F p Rf xF t
(31)
where /pi piB R . Note that the last term on the right-hand of Equations (8), (14) and (30), i.e. the denting tool size b, should be included only in the case of longitudinally loaded pipes, and excluded in transversely oriented wedges.
3.5 Model Summary and Comparison with Test Data
The above analytical model is summarized as fol-lows: � First part of response (elastic), expressed by Equa-tion (10), which is a linear relationship between the denting force F and the corresponding displace-ment :
eF F (32)

356
� Second part of response (plastic ring mechanism), expressed by Equation (13), which is independent of , and � when pressure is present � Equation (29), which is linear with respect to :
p piF F F (33)
� Third part of response (membrane including pres-sure effects), expressed by Equations (21), which is a nonlinear relationship between F and , and � when pressure is present � Equation (29):
m piF F F (34)
The model verifies the increase of pipe resistance in the presence of internal pressure, expressed by the pressure parameter in Equation (9), as well as by Equation (29). It is also noted that those pressure ef-fects on the denting resistance can be used for cases where the pipe is subjected to external pressure, by simply changing the sign of pressure. Figure 16 shows the comparison between the test results and the model predictions for test specimens A1, A3, and B2. The comparison indicates that the model of-fers good predictions of the test results, from the qualitative point-of-view. Furthermore, despite the fact that clear distinctions between the three parts of the model solution (elastic, rigid-plastic and mem-brane) do not exist, especially for the case of trans-versely-oriented wedge, the overall comparison is satisfactory. Furthermore, in the case of non-pressurized pipes under longitudinally-oriented wedge, the �plastic� part of the response is charac-terized by a small �snap-through�, also shown in test specimens A1, A2, as well as in the finite element results of Figure 10a.
4 CONCLUSIONS
The structural response of internally pressurized tu-bular members subjected to lateral (transverse) quasi-static loading was examined through test data, advanced numerical tools, and a simplified analyti-cal model, based on two-dimensional approximation of the pipe deformation. The finite element results are in good agreement with the experimental data and demonstrate that the presence of internal pres-sure has a significant effect on the denting response, increasing significantly the denting force. The ef-fects of denting tool size and orientation were also discussed. Furthermore, the proposed analytical model is in fairly good agreement with test results in terms of denting resistance predictions, and illus-trates the denting process of steel cylinders in a clear and elegant manner.
0
20
40
60
80
0 10 20 30 40 50denting displacement (mm)
TEST A1Analytical Model
0
20
40
60
80
100
0 5 10 15 20 25 30 35denting displacement (mm)
TEST A3Analytical Model
0
20
40
60
80
0 5 10 15 20 25 30 35denting displacement (mm)
TEST B2Analytical Model
Figure 16: Comparison between experimental results and model predictions for specimens A1, A3 and B2.
5 REFERENCES
Spiekhout, J., Gresnigt, A. M., Koning, C. and Wildschut, H., 1986, �The Influence of Pipewall Thickness on Resistance to Damage of Gas Transmission Pipelines�, 3R-International, Vol. 25, pp. 198-203.
Mellem, T., Spiten, J., Verley, R. and Moshagen, H., 1996, �Trawl Board Impacts on Pipelines�, Offshore Mechanics and Arctic Engineering Conference, OMAE, Vol. V, pp. 165-178.
Park, T.-D. and Kyriakides, S., 1996, �On the Collapse of Dented Cylinders Under External Pressure�, International Journal of Mechanical Sciences, Vol. 38, pp. 557-578.
Ruggieri C. and Ferrani, J. A., 2004, �Structural Behavior of Dented Tubular Members Under Lateral Loads�, Journal of Offshore Mechanics and Arctic Engineering, ASME, Vol. 126, No. 2, pp. 191-197.

357
DeRuntz, J. A. and Hodge, P. G., 1963, "Crushing of a tube between rigid plates", J. Applied Mechanics, ASME, Vol. 30, pp. 391 - 395.
Reid, S. R. and Reddy, T. Y., 1978, "Effects of strain harden-ing on the lateral compression of tubes between rigid plates", Int. J. Solids and Structures, Vol. 14, pp. 213 - 225.
Watson, A. R., Reid, S. R., Johnson, W. and Thomas, S. G., 1976, "Large deformations of thin-walled circular tubes under transverse loading - II", Int. J. Mechanical Sciences, Vol. 18, pp. 387 - 397.
Wierzbicki, T. and Suh, M. S., 1988, �Indentation of Tubes under Combined Loading�, Int. J. Mechanical Sciences, Vol. 30, No. 3/4, pp. 229-248.
Brooker, D. C., 2004, �A Numerical Study on the Lateral In-dentation of Continuously Supported Tubes�, J. Construc-tion Steel Research, Vol. 60, pp. 1177-1192.
Karamanos, S. A. and Eleftheriadis, C., 2004, �Collapse of Pressurized Elastoplastic Tubular Members Under Lateral Loads�, Int. J. Mechanical Sciences, Vol. 46, No. 1, pp. 35-56.
Gresnigt, A. M., 1984, Handrekenmodel en Proeven Indeuk-diepte / Rekenmetingen Gastransportbuizen, (Analytical model and indentation tests / strain measurements in gas pipelines), Research Report B-84-425/63.6.0900, IBBC-TNO (now TNO - Built Environment and Geosciences), Delft, The Netherlands [in Dutch].
Hibbit, H. D., Karlsson, B. I., and Sorensen, P., 2003, Theory Manual, ABAQUS 6.3, USA.
Bijlaard, P. P., 1955, �Stresses from Local Loadings in Cylin-drical Pressure Vessels�, Transactions of ASME, Vol. 77, pp. 805-814.
Bouma, A. L. and Van Koten, H., 1958, De berekening van cil-indrische schalen, waarbij de raadvoorwaarden aan de ge-bogen rander in rekening worden gebracht., (The calcula-tion of cylindrical shells taking into account the boundary conditions at the curved edges), Research Report No. BI-58-4, IBBC-TNO (now TNO - Built Environment and Geo-sciences), Delft, The Netherlands.
Timoshenko, S. P. and Gere J. M., 1961, Theory of Elastic Sta-bility, McGraw-Hill ed., New York, NY.

358
European Cooperationin the field of Scientific and Technical Research
Action C26 Urban Habitat Constructions under Catastrophic Events Proceedings of Workshop Prague, 30. � 31. 3. 2007
WG 4
Resistance to Infrequent Actions

359
1 INTRODUCTION
The service provided by the engineering community to society is of tremendous importance. Engineers in the past have created the societal infrastructure and thereby facilitated the societal development as we see it today. The societal infrastructure can be seen as the backbone of society without which there would be no civilization as we know it today. Among significant engineering achievements count the numberless roadway bridges, sea crossings, tun-nels, roadway systems, water, waste and energy dis-tribution systems as well as structures and facilities for exploitation and distribution of various types of energy.Ideally when engineering facilities and activities are planned and performed the risks should be managed from a holistic perspective considering all aspects of the considered activity for what concerns possible events which may lead to and/or influence conse-quences of any sort. In reality such a holistic and seamless assessment and management of risks is dif-ficult to realize due to the way in which engineering facilities and activities are planned and organized. Typically when considering the process of planning and executing larger engineering facilities and/or ac-tivities, several different fields of engineering and different types of systems and components are in-
volved. To facilitate efficient management, the proc-ess is traditionally sub-divided into a number of en-gineering decisions (and areas of responsibilities) concerning the individual components of the proc-ess. In practice there are numerous examples of this; considering structures regulations and codes indi-vidually specify the quality of materials, quality of workmanship, reliability of structural components, etc. In tunnel project as an example, several different types of systems and components including electri-cal systems, pumps, cameras, sensors, structural elements, drainage systems, etc. are put together to form a new joint functionality. Each of the compo-nents is designed according to regulations and/or codes which did not explicitly foresee that they would find application in a tunnel project. A com-plex project may in this way been considered as an assembly of standard components integrated in a specific and often unique context. Managing risks may be performed by selecting components which individually have an appropriate reliability and by assembling these such as to ensure an adequate re-liable joint functionality. Realizing the characteris-tics of engineered systems such as the implicit hier-archical construct as outlined in the above may pro-vide means of improving approaches for the assessment of risks of such systems. In this light the Joint Committee on Structural Safety has established
Framework for risk assessment of structural systems
M.H. Faber ETH-Zürich, Switzerland
ABSTRACT: The present paper provides a summary of recent work of the author on the development of 1) a new general framework for assessing risks of systems and 2) for vulnerability and robustness assessment of structural systems. The general systems risk assessment framework is to a large degree the result of recent ef-forts within the Joint Committee on Structural Safety (JCSS). The approach presented utilizes to a high de-gree the hierarchical characteristics of typical engineered systems and introduces a quantitative definition of system characteristics such as exposure, vulnerability and robustness. The approach suggested puts special emphasis on the assessment of so-called indirect consequences associated with loss of system functionality and directly related to what is generally understood as lack of robustness. The general systems robustness as-sessment can be utilized for the assessment of structural robustness also. The paper outlines the general prin-ciples proposed by the JCSS and illustrates how these principles may be implemented for analyzing the per-formance of structures.

360
a guideline for risk assessment in engineering. The present paper provides an outline of the main con-tents and ideas contained in this guideline and illus-trates how this framework might be applied for as-sessing the performance of structural systems.
2 ON ASSESSING THE RISK OF SYSTEMS
Dealing with risk assessments and risk based deci-sion making in engineering over many years it ap-pears that the understanding and communication of what is actually being assessed � what is the system considered - forms the cornerstone problem. In the following section this aspect is considered closely following (Faber and Maes, 2007, Faber et al., 2007)).Theoretically optimal and consistent decision mak-ing is quite simple, provided that the considered problem is fully understood; if all aspects of a deci-sion problem would be known with certainty the identification of optimal decisions would be straight-forward by means of traditional cost-benefit analy-sis.However, due to the fact that our understanding of the manifold aspects involved in the decision prob-lems often is far less than perfect and that we are only able to model the involved physical processes as well as human interactions in rather uncertain terms the decision problems in engineering are sub-ject to significant uncertainty. Due to this it is not possible to assess the result of decisions in certain terms. There is no way to assess with certainty the consequences resulting from the decisions we make. However, what can be assessed is the risk associated with the different decision alternatives. If the con-cept of risk as the simple product between probabil-ity of occurrence of an event with consequences and the consequence of the event is widened to include also the aspects of the benefit achieved from the de-cisions then risk may be related directly to the con-cept of utility (von Neumann and Morgenstern, 1943; Raiffa and Schlaifer, 1961) from the economi-cal decision theory and a whole methodical frame-work is made available for the consistent identifica-tion of optimal decisions. This framework is considered to comprise the theoretical basis for risk based decision making and the following is con-cerned about the application of this for the purpose of risk based decision making in engineering.
2.1 Decisions and decision maker Engineering decision making and risk assessment is usually performed on behalf of society. It is thus useful to consider a society as an entity of people for which common preferences may be identified, ex-
ogenous boundary conditions are the same and which share common resources. It is clear that this definition may be applied to unions of states or countries, individual states and countries as well as local communities depending on the context of the decision making, however, it is seen that the geo-graphical limitations are not essential even though they often in reality are implicitly given by the other attributes. Considering a state or a country as a soci-ety it may be realized that such a society may com-prise a hierarchical structure of societies defined at lower levels, such as cantons, municipalities and communities; each society with their set of attributes partly defined through the societies at higher level. System representation in risk assessment In Figure 1 risk based decision making is illustrated in a societal context from an intergenerational per-spective; see also (Faber and Maes, 2007). Within each generation decisions have to be made which will not only affect the concerned generation but all subsequent generations. It should be emphasized that the definition of the system in principle must include a full inventory of all potentially occurring conse-quences as well as all possible scenarios of events which could lead to the consequences.At an intra-generational level the characteristics of the system consist of the knowledge about the con-sidered engineered facility and the surrounding world, the available decision alternatives and criteria (preferences) for assessing the utility associated with the different decision alternatives. A very significant part of risk based decision making in practice is con-cerned about the identification of the characteristics of the facility and the interrelations with the sur-rounding world as well as the identification of ac-ceptance criteria, possible consequences and their probabilities of occurrence. Managing risks is done by �buying� physical changes of the considered fa-cility or �buying� knowledge about the facility and the surrounding world such that the objectives of the decision making are optimized.
Figure 1 Main constituents of systems in risk based intra-/intergenerational decision analysis, (Faber and Nishijima, 2004).
Facility
Facility boundary

361
A system representation can be performed in terms of logically interrelated constituents at various levels of detail or scale in time and space. Constituents may be physical components, procedural processes and human activities. The appropriate level of detail or scale depends on the physical or procedural char-acteristics or any other logical entity of the consid-ered problem as well as the spatial and temporal characteristics of consequences. The important issue when a system model is developed is that it facili-tates a risk assessment and risk ranking of decision alternatives which is consistent with available knowledge about the system and which facilitates that risks may be updated according to knowledge which may be available at future times.
2.2 Representation of knowledge The Bayesian statistics is suggested as basis for rep-resentation of knowledge as this facilitates the con-sistent representation of uncertainty independent of their source and type; purely subjectively assessed uncertainties, analytically assessed uncertainties and evidence as obtained through observations may be combined. It has become standard to differentiate between uncertainties due to inherent natural vari-ability, model uncertainties and statistical uncertain-ties. However, whereas the first mentioned type of uncertainty is often denoted aleatory (or Type 1) un-certainty, the two latter are referred to as epistemic (or Type 2) uncertainties. This differentiation is use-ful for the purpose of setting focus on how uncer-tainty may be reduced but does not call for a differ-entiated treatment in the decision analysis (Faber, 2005). For the purpose of decision making the dif-ferentiation is irrelevant and not coherent with for-mal decision analysis.
3 MODELING OF CONSEQUENCES
The risk assessment for a given system is facilitated by considering the generic representation of the de-velopment of consequences in figures 2-3. Following (Faber et al., 2007) the exposure to the facility is represented as different exposure events acting on the constituents of the facility. The con-stituents of the facility can be considered as the fa-cility�s first defense in regard to the exposures. The damages of the constituents are considered to be as-sociated with direct consequences. Direct conse-quences may comprise different attributes of the fa-cility such as monetary losses, loss of lives, damages to the qualities of the environment or just changed characteristics of the constituents.
Figure 2 Representation of the mechanism generating conse-quences. (Faber et al., 2007)..
Based on the combination of events of constituent failures and the corresponding consequences indirect consequences may occur. Indirect consequences may be caused by e.g. the sum of monetary losses associated with the constituent failures and the physical changes of the facility as a whole caused by the combined effect of constituent failures. The indi-rect consequences in risk assessment play a major role, and the modeling of these should be given great emphasis (Faber and Maes, 2003). Typically the indirect consequences evolve spatially beyond the boundaries of the facility and also have a certain sometimes even postponed development in time.
Figure 3 Logical representation of interrelation between ex-posures, constituent failures, sequences of constituent failures and consequences. (Faber et al., 2007).
The vulnerability of a give system (facility and the rest of the world) characterizes the risk associated with the direct consequences and the robustness characterizes the degree the total risk is increased beyond the direct consequences. These three charac-teristics (exposure, vulnerability and robustness)
Exposureevents
Constituent failure eventsand direct consequences
Follow-upconsequences

362
which will be defined in the following are only un-ambiguous subject to a definition of the system. In consistency with (Haimes, 2004) it should be noted that very often the constituents in a facility can be modeled as a logical system comprised by its own constituents. A facility could be a road network with constituents being e.g. bridges and segments of roads, see Figure 4. The bridges in turn could be modeled by logical systems with constituents being structural members. Depending on the level of detail in the risk assessment, i.e. the system definition, the exposure, constituents and consequences would be different.
Figure 4. Generic system characterization at different scales in terms of exposure, vulnerability and robustness. (Faber et al., 2007).
The hierarchical risk assessment framework is appli-cable at any level of scale for the assessment of a given system. It may be applied to components, sub-systems and the system as a whole; thereby the framework also facilitates a hierarchical approach to risk assessment. The definition of the system in this context becomes of tremendous significance in the definition of exposure, vulnerability and robustness. Due to the hierarchical structure of the risk assess-ment, in terms of conditional events the framework is greatly supported by modern risk assessment tools such as e.g. Bayesian Probabilistic Nets and Influ-ence Diagrams, (Pearl, 1988).
3.1 Risk indicators The presented risk assessment framework facilitates a Bayesian approach to risk assessment and full utilization of risk indicators. Risk indicators may be understood as any observable or measurable charac-teristic of the systems or its constituents containing information about the risk. If the system representa-tion has been performed appropriately, risk indica-tors will in general be available for what concerns both the exposure to the system, the vulnerability of the system and the robustness of the system, see Fig-ure 5.
Figure 5. Risk indicators at different levels of the system repre-sentation. (Faber et al., 2007).
In a Bayesian framework for risk based decision making such indicators play an important role. Con-sidering the risk assessment of a load bearing struc-ture risk indicators are e.g. any observable quantity which can be related to the loading of the structure (exposure), the strength of the components of the structure (vulnerability) and the redundancy, ductil-ity, effectiveness of condition control and mainte-nance (robustness).
3.2 Quantification of risk
Following (Faber et al., 2007) the facility which is considered subject to a risk assessment is assumed to be exposed to hazardous events (exposures EX ) with probabilistic characterization ( ), 1, k EXPp EX k n ,where EXPn denotes the number of exposures. Gen-erally exposure events should not be understood as individually occurring events such as snow loads, earthquakes and floods but rather as the effect of relevant combinations of these. It is assumed that there are CONn individual constituents of the facility, each with a discrete set (can easily be generalized to the continuous case) of damage states ijC ,
1, 2.. , 1,2..iCON Ci n j n . The probability of direct
consequences ( )D lc C associated with the thl of CSTAnpossible different state of damage of all constituents of the facility lC , conditional on the exposure event
kEX is described by ( )l kp EXC and the associated conditional risk is ( ) ( )l D lk
p EX cC C . The vulnerabil-ity of the system is defined as the risk due to all di-rect consequences (for all CONn constituents) and may be assessed through the expected value of the conditional risk due to direct consequences over all
EXPn possible exposure events and all constituent damage states CSTAn :
1 1
( ) ( ) ( )CSTAEXP nn
D l k D l kk l
R p EX c p EXC C (1)
The state of the facility as a system depends on the state of the constituents. It is assumed that there are
SSTAn possible different system states mS associated
Exposure
Vulnerability
Indirect consequences
Direct consequences
Robustness
Exposure
Vulnerability
Indirect consequences
Direct consequences
Robustness
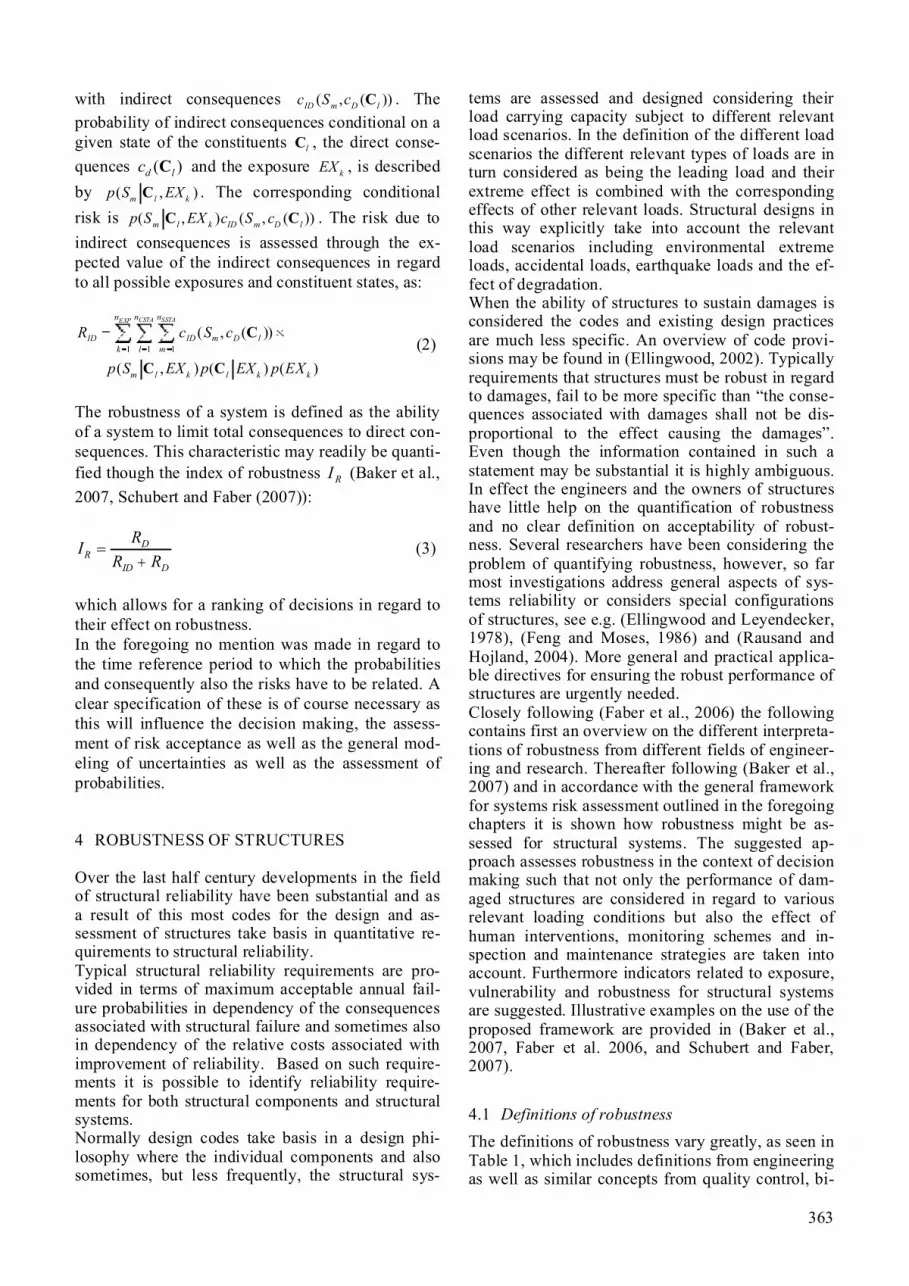
363
with indirect consequences ( , ( ))ID m D lc S c C . The probability of indirect consequences conditional on a given state of the constituents lC , the direct conse-quences ( )d lc C and the exposure kEX , is described by ( , )m l kp S EXC . The corresponding conditional risk is ( , ) ( , ( ))m l k ID m D lp S EX c S cC C . The risk due to indirect consequences is assessed through the ex-pected value of the indirect consequences in regard to all possible exposures and constituent states, as:
1 1 1
( , ( ))
( , ) ( ) ( )
CSTA SSTAEXP n nn
ID ID m D lk l m
m l k l k k
R c S c
p S EX p EX p EX
C
C C (2)
The robustness of a system is defined as the ability of a system to limit total consequences to direct con-sequences. This characteristic may readily be quanti-fied though the index of robustness RI (Baker et al., 2007, Schubert and Faber (2007)):
DR
ID D
RIR R
(3)
which allows for a ranking of decisions in regard to their effect on robustness.In the foregoing no mention was made in regard to the time reference period to which the probabilities and consequently also the risks have to be related. A clear specification of these is of course necessary as this will influence the decision making, the assess-ment of risk acceptance as well as the general mod-eling of uncertainties as well as the assessment of probabilities.
4 ROBUSTNESS OF STRUCTURES
Over the last half century developments in the field of structural reliability have been substantial and as a result of this most codes for the design and as-sessment of structures take basis in quantitative re-quirements to structural reliability. Typical structural reliability requirements are pro-vided in terms of maximum acceptable annual fail-ure probabilities in dependency of the consequences associated with structural failure and sometimes also in dependency of the relative costs associated with improvement of reliability. Based on such require-ments it is possible to identify reliability require-ments for both structural components and structural systems. Normally design codes take basis in a design phi-losophy where the individual components and also sometimes, but less frequently, the structural sys-
tems are assessed and designed considering their load carrying capacity subject to different relevant load scenarios. In the definition of the different load scenarios the different relevant types of loads are in turn considered as being the leading load and their extreme effect is combined with the corresponding effects of other relevant loads. Structural designs in this way explicitly take into account the relevant load scenarios including environmental extreme loads, accidental loads, earthquake loads and the ef-fect of degradation.When the ability of structures to sustain damages is considered the codes and existing design practices are much less specific. An overview of code provi-sions may be found in (Ellingwood, 2002). Typically requirements that structures must be robust in regard to damages, fail to be more specific than �the conse-quences associated with damages shall not be dis-proportional to the effect causing the damages�. Even though the information contained in such a statement may be substantial it is highly ambiguous. In effect the engineers and the owners of structures have little help on the quantification of robustness and no clear definition on acceptability of robust-ness. Several researchers have been considering the problem of quantifying robustness, however, so far most investigations address general aspects of sys-tems reliability or considers special configurations of structures, see e.g. (Ellingwood and Leyendecker, 1978), (Feng and Moses, 1986) and (Rausand and Hojland, 2004). More general and practical applica-ble directives for ensuring the robust performance of structures are urgently needed. Closely following (Faber et al., 2006) the following contains first an overview on the different interpreta-tions of robustness from different fields of engineer-ing and research. Thereafter following (Baker et al., 2007) and in accordance with the general framework for systems risk assessment outlined in the foregoing chapters it is shown how robustness might be as-sessed for structural systems. The suggested ap-proach assesses robustness in the context of decision making such that not only the performance of dam-aged structures are considered in regard to various relevant loading conditions but also the effect of human interventions, monitoring schemes and in-spection and maintenance strategies are taken into account. Furthermore indicators related to exposure, vulnerability and robustness for structural systems are suggested. Illustrative examples on the use of the proposed framework are provided in (Baker et al., 2007, Faber et al. 2006, and Schubert and Faber, 2007).
4.1 Definitions of robustness The definitions of robustness vary greatly, as seen in Table 1, which includes definitions from engineering as well as similar concepts from quality control, bi-

364
ology, statistics, control theory, linguistics, etc. This Table is based on (Baker et al., 2005) and Maes et al. (2005). The ideas in Table 1 touch on essentially every as-pect of what is instinctively found interesting about robustness. Robustness is related to the acceptable behavior of certain performance characteristics or properties of a system that are difficult to quantify or to parameterize (i.e. to describe the dependence us-ing quantitative variables); and with which it is therefore difficult to associate a metric or a norm. Robustness is also a measure of the sensitivity of certain qualitative features in a system in regard to changes in system composition, system state, fun-damental assumptions regarding the system and gen-erally unexpected systemic disturbances. It should be noted that robustness is defined for specified performance characteristics of a given sys-tem, with specified perturbations being applied to the system. It makes no sense to speak of a system being robust without first specifying both the desired system performance characteristics and the perturba-tions of interest. Robustness is related to the degree to which the system performance characteristics are affected by the specified perturbations.
Table 1 Definitions of robustness from different research fields.
Ecosystems The ability of a system to maintain function even with changes in internal structure or external environment, (Callaway et al., 2000).
Control Theory The degree to which a system is insensitive to effects that are not considered in the design, (Slotine and Li , 1991).
StatisticsA robust statistical technique is insensitive against small deviations in the assumptions, (Huber, 1996).
Design Optimization A robust solution in an optimization problem is one that has the best performance under its worst case (max-min rule), (Kouvelis and Yu, 1997).
Bayesian Decision Making
By introducing a wide class of priors and loss functions, the elements of subjectivity and sensitivity to a narrow class of choices, are both reduced, (Rios Insua and Ruggeri, 2000).
Language
The robustness of language�is a measure of the ability of human speakers to communicate despite incomplete information, ambiguity, and the constant element of surprise, (Briscoe, 1997).
From the previous sections it is clear that the notion of robustness depends critically on the system defi-nition and the consequences. In the following, these aspects are considered for the application of the framework to structural systems.
4.2 Application of framework to structures The definition of the structural system is extremely critical to the analysis. It must be �wide� enough to accommodate consequences that affect robustness objectives. Assumptions regarding the system (Faber and Maes, 2005) must be clearly considered so that
uncertainties can be included during the robustness analysis. This is valid for simple assumptions such as the strength assumed for the overturning capacity of a jacket structure as well as for more long-ranging assumptions such as neglecting the effect of global warming in a coastal structures design. It is very clear from the foregoing that it is not pos-sible to speak of robust systems without referring specifically in regard to which hazards or distur-bances the system is considered to be exposed to. For instance robustness conditional on the occur-rence of an explosion event can be investigated. Or the same investigation can be performed probabilis-tically, for a random explosion occurring at a spe-cific location. But robustness cannot be assessed without specifying which kind of hazards are of concern.Several works address the robustness of structural systems. (Lind, 1995, 1996) proposed a generic measure of system damage tolerance, based on the increase in failure probability resulting from the oc-currence of damage. (Ellingwood, 2005) notes that probabilistic risk assessment can be used to assess robustness in a general manner. In the following the approach suggested for the as-sessment of robustness of structural systems in (Baker et al., 2007) and (Schubert et al., 2005) is outlined. In Figure 6 an illustration is given of how a struc-tural system might be represented in terms of expo-sure, vulnerability and robustness. Also in this figure various possible relevant indicators of the character-istics of exposure, vulnerability and robustness as well a direct and indirect consequences are provided.
Figure 6. Illustration of the general systems risk framework for assessment of structural performance.
In the assessment of the risk associated with a given structure the application of the general frame-work presented previously may follow from the fol-lowing scheme (see also Figure 7).

365
First, an exposure ( BDE ) occurs which has the poten-tial of damaging components in the system. If no damage occurs D , then the analysis is finished. If damage occurs, a variety of damage states D can re-sult. For each of these states, there is a probability that system failure F results. Consequences are as-sociated with each of the possible damage and fail-ure scenarios. The event tree representation in Fig-ure 6 is a graphical tool for evaluating event scenarios that could occur to the system, and it also incorporates the associated probabilities of occur-rence.
Figure 7. An event tree for robustness quantification, (Baker et al., 2007).
The symbols used in Figure 7 are defined as follows:
BDEX Exposure before damage D Component Damage (refers to no damage) F System failure, or �failure� (refers to no
failure) DirC Direct consequences (related to component
damage) IndC Indirect consequences (related to system
failure)
An exposure is considered to be any event with the potential to cause damage to the system; damage could come from extreme values of design loads such as snow loads, unusual loads such as explo-sions, deterioration of the system through environ-mental processes such as corrosion, errors or other disturbances. Damage refers to reduced performance of the system components, and system failure refers to loss of functionality of the entire system. In the case that a design allows for some degree of reduced function (e.g., an allowance for some corrosion), then damage should refer to reduced function be-yond the design level. Structural design is traditionally based on member design where the reliability of each individual struc-tural member is ensured at a level which is accept-able in accordance with the (direct) consequences associated with failure of the member, (JCSS, 2001). The structural systems aspects are not directly ac-counted in this way. In Figure 7, however, they are
taken into account in terms of the indirect conse-quences, i.e. those related to the effect of the mem-ber failures. With the event tree defined in Figure 7, it is possible to compute the system risk due to each possible event scenario. This is done by multiplying the con-sequence of each scenario by its probability of oc-currence, and then integrating over all of the random variables in the event tree. Following (Baker et al., 2007) the risk corresponding to each branch is:
| |
Dir Dir BDx y
BD
R C P F D y P D y EX x
P EX x dydx
(4)
|
|
Indir Indirx y
BD BD
R C P F D y
P D y EX x P EX x dydx (5)
In order to now quantify robustness, consider that a robust system is considered to be one where indirect risks do not contribute significantly to the total risk of the system. Based on the direct and indirect risk as established from Equations (4)-(5) we may now assess the robustness index as defined in Equation (3).It should be noted that this index takes values be-tween zero and one depending upon the source of risk. If the system is completely robust and there is no risk due to indirect consequences, then 1RI . At the other extreme, if all risk is due to indirect conse-quences, then 0RI .In (Schubert et al., 2005, Baker et al., 2007) the pre-sented framework is investigated through principal examples in some detail for general series and paral-lel systems. However, by examining Figure 7 and the above equations, several qualitative trends be-tween system properties and the robustness index can be identified. First, this index measures only relative risk due to indirect consequences. The total system risk should be deemed acceptable through other criteria prior to robustness being considered. A system might be deemed robust if its direct risk is extremely large (and thus large relative to its indirect risk), but that system should be rejected on the basis of reliability criteria rather than robustness criteria. Guidelines for evaluating acceptable reliability can be found in ex-isting codes (e.g. JCSS (2001)).Second, the index depends not just upon failure probabilities of damaged systems, but also upon the relative probabilities of the various damage states occurring. Thus, a building could be designed to have a low failure probability after an individual column is removed, but if it is deemed more likely that an exposure would cause the loss of two col-
D
F
F
0
DirC
IndC
BDEX
D

366
umns and if the building as a structural system is not reliable in this situation, then it could still be deemed non-robust.Third, the index accounts for both the probability of failure of the damaged system and the consequences of that failure. For instance, if sensing systems were able to detect damage and signal an evacuation be-fore failure could occur, then robustness could be in-creased without changing the probabilities of dam-age or failure. Thus, the possibility of detection and the time between damage and failure can be ac-counted for in an appropriate manner. The property of robustness depends upon system properties such as redundancy, ductility, load redistribution and damage detection, but it also depends upon failure consequences. This ability to incorporate conse-quences as well as probabilities is an important new development. Fourth, this index can be easily extended to account for multiple exposures, or more complicated event trees than the one in Figure 7. The robustness index will still be equal to the sum of direct risk divided by the sum of total risk. Fifth, by other important aspects of system perform-ance, the framework can be used for decision-making regarding design actions, including mainte-nance, inspection, monitoring and disaster prepared-ness. This is illustrated in Figure 8 where the addi-tional symbols are defined as:
da Design actions, including maintenance, in-spection, monitoring and disaster prepared-ness
I Indication of damage, which triggers a re-sponse action (refers to no indication)
ra Response actions ADEX Exposure after damage
Figure 8. An event tree that incorporates system choice and post-damage exposures, (Baker et al., 2005).
By incorporating post-damage exposures, the framework can now account for the increased vul-nerability of the structure in the future. Further, the opportunity to intervene through response actions ( ra ) is now modeled explicitly. These actions are conditional on the indication of a damage (the prob-
ability of which is affected by the inspections and monitoring actions which are here assumed to be part of the design decisions). Based on the damage level of the system, and the actions taken as a result of detection, the system has a probability of failure due to post-damage exposures ( ADEX ).It is implied that if damage is indicated, then action will be taken either to reduce failure consequences (e.g., by evacuating a structure) or the probability of failure (e.g., through repairs). The choice of post-detection action is part of the definition of the sys-tem. The probability of damage detection will be de-pendent upon actions to inspect the system, and on the type of damage and type of exposure causing damage. For example, damage from explosions will likely be detected, while corrosion of an inaccessible component may not be detected. The basic choice of design action ( da ) is now also explicitly included at the beginning of the tree. They include design of the physical structure, maintenance to prevent structural degradation, inspection and monitoring for identifying damages, and disaster preparedness actions. These actions, along with the post-damage response actions, are included here be-cause will affect the probabilities and consequences associated with the other branches, and so this deci-sion tree can be used as a tool to identify actions which minimize risk and maximize robustness in a system. When alternative systems have varying costs, then these costs should be included in the con-sequences (and the branch of the tree corresponding to will no longer have zero consequences for some system choices). With this formulation, a pre-posterior analysis can be used to identify systems which minimize total risk. For a given set of actions, the risks associated with each branch can be computed as before. For exam-ple, the indirect risk
2IndR would now be computed as (Baker et al., 2007):
2 2| , ,
| , | |
|
Ind Ind ADx y z
AD
BD BD
R C P F D y I EX z
P EX z D y I P I D y P F D y
P D y EX x P EX x dzdydx
(6)
The corresponding index of robustness can be calcu-lated using a direct generalization of Equation (3):
i
i j
Diri
RDir Ind
i j
RI
R R (7)
D
F
F
F
F
F
F
I
I
3IndirC
2IndirC
1IndirC
1DirC
2DirC
BDEX
ADEX
ADEXD
0
da
ra

367
5 CONCLUSIONS
The present paper presents recent developments of methods for assessing risks of general systems with special emphasis on systems constructed by �stan-dard� components as is generally the case in engi-neering. It is illustrated how this general framework can be applied for assessing the performance of structural systems by describing the structural sys-tems in terms of exposures, vulnerability and ro-bustness. The presented framework takes the per-spective that robustness is a measure indicating the degree to which component failures may lead to consequences beyond the consequences of these in-dividually.An index of robustness is formulated which consis-tently ranks the robustness of different decisions of design, inspection and maintenance and emergency preparedness and on a simplified example it is illus-trated how the assessment of robustness in regard to fatigue damages may be performed. The presented concept is new in the sense that it combines the effects of redundancy, ductility, con-sequences of failure and decision making in regard to design and intervention during use by means of risks. Thereby it facilitates a consistent assessment of robustness and thus provides a helpful supplement to traditional member based design.
6 REFERENCES
Baker, J.W., Schubert, M. and Faber, M.H.: (2007), On the as-sessment of robustness. Structural Safety, in press.
Baker JW, Straub D, Nishijima K., Faber M. H.: (2005), On the Assessment of Robustness I: A general Framework, Ro-bustness of Structures Workshop. Garston, Watford, Eng-land.
Briscoe T.: (1997), Robust Parsing, Survey of the State of the Art in Human Language Technology, G.B. Varile and A. Zampolli, Editors., Cambridge University Press: Cam-bridge; New York; Pisa, Italy. 513p.
JCSS: (2001), Probabilistic Model Code. The Joint Committee on Structural Safety,. www.jcss.ethz.ch.
Callaway D.S., Newman M.E.J., Strogatz S.H., Watts D.J.: (2000), Network Robustness and Fragility: Percolation on Random Graphs�. Physical Review Letters; 85:5468-5471.
Ellingwood BR, Leyendecker EV.: (1978), Approaches for De-sign against Progressive Collapse, Journal of the Structural Division, ASCE; 104:413-423.
Ellingwood BR.: (2002), Load and Resistance Factor Criteria for Progressive Collapse Design. Multihazard Mitigation Council Workshop on Prevention of Progressive Collapse. Rosemont, Illinois. 15 p.
Ellingwood B.R.: (2005), Strategies for Mitigating Risk of Pro-gressive Collapse, ASCE Structures Congress. 2005. New York, New York. 6 p.
Faber M.H.and Maes M.A.: (2003), Modeling of Risk Percep-tion in Engineering Decision Analysis. Proceedings 11th IFIP WG7.5 Working Conference on Reliability and Opti-mization of Structural Systems, eds. M.A. Maes and L. Huyse, Banff, Canada, November 2-5, 2003.
Faber, M.H. and Maes, M.A.: (2007), Issues in Societal Opti-mal Engineering Decision Making, Accepted for publica-
tion in Structure and Infrastructure Engineering (special ed. John D. Sørensen)
Faber, M.H., Maes, M.A., Straub, D. and Baker, J.: (2006), On the Quantification of Robustness of Structures. Proceedings OMAE2006, 25th Offshore Mechanics and Arctic Engi-neering Conference, Hamburg, Germany, June 4-9, 2006, [OMAE2006-92095].
Faber, M.H. Maes, M.A., Baker, J.W., Vrouwenvelder, T. and Takada, T.: (2007), Principles of Risk Assessment of Engi-neered Systems, Accepted for publications in the proceed-ings to the 10�th ICASP conference to be held in Tokyo, Japan, July 31- August 3, 2007.
Faber, M.H., (2005), On the Treatment of Uncertainties and Probabilities in Engineering Decision Analysis Journal of Offshore Mechanics and Arctic Engineering, Vol. 127, Aug. 2005, pp. 243-248.
Faber, M.H. Nishijima, K.: (2004), Aspects of Sustainability in Engineering Decision Analysis, Submitted to the 9th ASCE Specialty Conference on Probabilistic Mechanics and Structural Reliability, Albuquerque, New Mexico, ASU, July 26-28, 2004.
Feng YS, Moses F.: (1986) Optimum Design, Redundancy and Reliability of Structural Systems, Computers & Structures; 24:239-251.
Haimes, Y.Y.: (2004), Risk Modeling, Assessment, and Man-agement, Wilkey-IEEE, 2004.
Huber P.J.: (1996), Robust Statistical Procedures; 2nd ed. CBMS-NSF Regional Conference Series in Applied Mathematics; 68. Society for Industrial and Applied Mathematics: Philadelphia, 67 p.
Kouvelis P, Yu G.: (1997), Robust Discrete Optimization and Its Applications. Non-convex Optimization and Its Applica-tions; V14. Kluwer Academic Publishers: Dordrecht, Bos-ton, 356 p.
Lind N.C.: (1995), A Measure of Vulnerability and Damage Tolerance, Reliability Engineering & System Safety; 48:1-6.
Lind N.C.: (1996), Vulnerability of Damage-Accumulating Systems. Reliability Engineering & System Safety; 53:217-219.
Maes MA., Fritzons, KE., Glowienka S.: (2005), Risk-based Indicators of Structural System Robustness, Robustness of Structures Workshop. Garston, Watford, England.
Pearl, J.: (1988), Probabilistic Reasoning in Intelligent Sys-tems: Networks of Plausible Inference. San Mateo, Califor-nia: Morgan Kaufmann Publishers.
Rausand, M., Hojland, A.: (2004), System reliability theory (2nd ed.), New York: John Wiley & Sons.
Ríos Insua, D., Ruggeri, F. (eds.): (2000), Robust Bayesian analysis, lecture notes in statistics. New York: Springer Verlag.
Raiffa, H. & Schlaifer, R.: (1961), Applied Statistical Deci-sion Theory, Harward University Press, Cambridge Uni-versity Press, Cambridge, Mass.
Schubert, M. and Faber, M.H.: (2007), Robustness of Infra-structures Subject to Rare Events. Accepted for publica-tions in the proceedings to the 10�th ICASP conference to be held in Tokyo, Japan, July 31- August 3, 2007.
Schubert M, Straub D, Baker JW, Faber M.H.: (2005), On the Assessment of Robustness II: Numerical Investigations, Robustness of Structures Workshop. Garston, Watford, England.
Slotine J.J.E., Li W.: (1991) Applied Nonlinear Control. Pren-tice Hall: Englewood Cliffs, N.J.,. 459 p.
Von Neumann and Morgenstern: (1943) Theory of Games and Economical Behavior. Princeton University Press.

368
1 INTRODUCTION
Response characteristics of urban habitat construc-tions subjected to catastrophic events related to natu-ral hazards (except earthquake, fire and explosion) are the subject of this paper.For the purpose of this paper, the following more important definitions apply:
- urban habitat constructions; construction works, both building and civil engineering works, that are situated in urban areas,
- structure; organized combination of con-nected parts designed to carry loads and pro-vide adequate rigidity (EN 1990 2002),
- catastrophic event; sudden, natural or man-made situation where changes and destruc-tion may occur, and which is the �outlier� with statistically different properties than the rest of the population,
- damage or destruction; any deficiency or de-terioration of the structural resistance caused by external actions or/and environmental in-fluences,
- hazard; potential source that could be dan-gerous for human life and/or cause damage for structures,
- identification; process to find, list and char-acterized elements of response,
- response; reaction or answer of a structure to loading, in terms of load effects or dam-age/destruction measures.
Two major types of response are distinguished and discussed in this paper, namely load effects and damage or destruction measures. Reference values
which are one of two main constituents of response assessment are inherent element of response charac-teristics classification.
2 IDENTIFICATION OF RESPONSE CHARACTERISTICS
Structural engineers are interested in identifying the performance or/and damage functions of considered construction works. The general scheme of response identification problem is shown in Figure 1. Response characteristics of a construction subjected to extraordinary loading conditions caused by catas-trophic events, may be regarded in terms of load ef-fects or/and damage functions. Response assessment of a structure subjected to the catastrophic event may be performed on the basis of limit states concept (EN 1990 2002, ISO 2394 1998). This approach consists in the analysis of the performance function (or the safety margin)
SRg representing the difference between the resistance or reference value R which constitutes limitation on resistance requirements or damage measures and the extreme load effect or damage function value S which should be anticipated by analysis of extraordinary loading conditions.Generally, the performance function g, can be repre-sented as follows:
- the deterministic function (historical ap-proach),
- the fractile of unknown order (semi-probabilistic approach),
Identification and classification of response of urban habitat constructions subjected to extraordinary loading conditions
Sz. Wolinski Rzeszow University of Technology, Rzeszow, Poland
ABSTRACT: The paper puts in discussion criteria of identification and classification of response characteris-tics of constructions subjected to extraordinary loading conditions related to natural hazards except earth-quake and extreme wind. Two types of response characteristics are distinguished; load effects and damage or destruction measures. The classification system according to different criteria, e.g. type of response, extend of damage, considered catastrophic event (landslides, avalanches, flood, tsunami, extreme snow, etc.). The case study concerning extreme snow is presented. Conclusions regarding assessment of response characteristics are drawn.

369
- the random variable characterized by two or three moments of its distribution (simplified probabilistic approach),
- the random variable characterized by the cumulative distribution function (full prob-abilistic approach),
- the uncertain variable, e.g. fuzzy variable (qualitative or semi-qualitative approach).
extreme load
standard unforeseen
loads actions
state vector
noise
response (load effects, damage)
Figure 1. Scheme of response identification problem
2.1 Load effects
Load effects are compound variables that result from the analysis of the loading and a structure, represent-ing its reaction to the applied loading. Generally, the response of the structure depends on the following factors:
- structural behavior; for a particular loading history the response of a structure may be expressed by the stresses or strains history, and may be brittle, elastic, elasto-plastic or plastic,
- inertial effect; static or dynamic, they may be expressed by the history of stresses, strains, deflection, acceleration, etc.,
- time; time-dependent or time-independent, - effect of displacement on equilibrium; negli-
gible (1st order analysis), or significant (2nd
order analysis). In practice the response of a structure is usually a combination of the four factors mentioned above. The response may be a single-component variable or multi-component variable. For finding load effects it is necessary to determine the configuration (geometry of a structure and size of its elements), structural materials, type of con-
struction and the loading conditions. A procedure for determination of action effects may have three levels using different models: global analysis, member analysis, and local analysis. Most cases of catastrophic events related to natural hazards can be characterized by large masses mov-ing with different velocity. Response of construc-tions to loads caused by that action in terms of load effects may be assessed using global analysis, how-ever member or local analysis may be also applied in cases of failure by excessive deformation, rupture, fatigue, etc. At present, using computer programs, it is possible to simulate load effects to extreme ac-tions such as wind storms, landslide, avalanches, ex-treme snow, atmospheric icing, and others, using appropriate, sophisticated structural models.
2.2 Damage functions
A damage refers to any deficiency or deterioration of structural strength or/and integrity caused by ex-traordinary loading conditions. The severe loading may cause serious damage in the construction and thus change significantly its structural response ex-pressed in terms of load effects. The extent of dam-age in constructions assessed after each significant catastrophic event may be more proper characteristic of structural response in such cases. The response of a construction expressed as a structural damage may be defined numerically (using available damage functions or indices), in terms of costs or/and risk, or using verbal classifications. Generally, three types of definitions for structural damage may be distinguished:
- quantitative; where numerical values are used for description of damage,
- qualitative; in which damage is subjectively and/or verbally estimated,
- semi-quantitative; where ranking scale of damage is subjectively estimated but more expanded using numerical values.
Numerical values are usually given in terms of local, global, or cumulative damages. They may be also given in terms of damages costs, e.g. in monetary units, however the assessment of human, social, and environmental damage usually incorporates ques-tionable or unreliable data. Usually, the damage function can be expressed as a sum of the initial damage and a function of ductility, drift, displace-ments or others measures, with the adequate impor-tance factors.
2.3 Reference values
In various situations the reference values expressed in load effects terms are usually related to the fol-lowing limit states (EN 1990 2002, ISO 2394 1998):
- loss of equilibrium of the structure or any part of it,
construction
(system)
measurements assessment (observations)

370
- internal failure or excessive deformations of the structure or structural members,
- failure or excessive deformations of the ground,
- fatigue failure of the structure or structural members,
- transformation into a mechanism the struc-ture or part of it,
- sudden change of the structural system into a new system.
The reference values may be determined by a single property of the material, e.g.: stresses, strains, toughness factors, fracture mechanics parameters, rheological properties, fatigue measures, corrosion and material degradation measures, etc. They may be also expressed by interactions of two or more properties by means of interaction formulas. The determination of reference values may be ex-pressed by particular values or by probability density function, or they may be based on agreement among regulatory bodies, available data, estimates and/or calibration.The ultimate damage or/and reference values of damage thresholds for different types of structures and structural elements under different loading con-ditions may be expressed: quantitatively, qualita-tively or semi-qualitatively. They should be referred to the assumed in advance failure criteria related to the given above limit states.
3 CLASSIFICATION OF RESPONSE
Response of constructions to catastrophic events may be classified using different criteria. The first classification is based on the criterion which has re-lation to the condition of the construction subjected to extreme loads. The condition or state of the construction can be classified into the following categories:
- no damage; limit states (ULS and SLS) of the structure and any part of it are fulfill,
- slight damage; ULS of the whole structure and any part of it are fulfill, SLS of a single structural elements or/and non-structural components may be exceeded,
- moderate damage; ULS of the structure and any part of it are fulfill, SLS of the structure, its parts and elements are exceeded,
- severe damage; ULS of a single elements or/and parts of the structure may be exceeded but structural collapse or loss of equilibrium of the structure did not happen,
- catastrophic damage; loss of equilibrium or collapse of the structure or any part of it.
The second criterion is concerned with the type of the failure:
- failure of non-structural elements; partitions, windows, doors, equipment, etc., caused by excessive deformations of the construction ,
- failure of a single structural element; conse-quences limited to not large part of the con-struction,
- partial collapse (rupture); failure limited to several structural elements or parts of the construction,
- total collapse; complete destruction of the construction.
Type of response or behaviour may be the third cri-terion of classification. From among different types of response some more important may be listed:
- static and dynamic response; a given loading can cause, depending on character of the structure, a static, a static time-dependent or a dynamic response,
- brittle, elastic and elasto-plastic behaviour;due to loading sequence and some other fac-tors, the shake-down response may lead to an incremental collapse, plastic reversals may cause low-cycle fatigue failure.
Several other criteria of response classification may be considered, for example: structural materials (ma-sonry, timber, concrete, steel, composites, etc.), the type of construction (solid, panel, framed, skeletal, folded plate, space deck, etc.), size and shape (with usual or with unusual sizes, high rise buildings, short, medium and long span bridges, towers, etc.), consequence of failure (small, some, moderate, and great), costs of safety measure (high, moderate, and low), etc. A direct link between characteristics of catastrophic event and the type of response and the process to find the response is an important factor which has to be taken into consideration. Thus, the classification criteria of considered catastrophic events or directly these events, may be regarded as the criteria of structural response.Referring to the task of the COST C26 WG 4: Re-sponse of constructions subjected to extraordinary loading conditions, catastrophic events related to natural hazard except earthquake and extreme wind, are considered as follows:
a) Landslides; a massive ground movement which includes deep failure of slopes, rock falls, shallow debris flows. There are many factors affecting the slope stability: gravity acting on a slope, saturation by heavy rains or snowmelt, erosion, vibrations from traffic or machinery, ground water pressure, etc. In-ternal failure or excessive deformations of the ground, loss of static equilibrium (includ-ing complete removal of bridges, roads and buildings) or/and excessive deformations of the construction or its parts due to movement of a ground and its pressure are typical re-sponses to a landslide. The extent of damage

371
in constructions depends on characteristics of the landslide, type, sizes and shapes of the construction, structural materials, and its other characteristics.
b) Avalanches; rapid movement of a large amount of ice, snow and rocks falling down the side of a mountain. The mechanism of an avalanche is similar to an unusually mobile debris or mud flow, and the response of con-structions to loadings caused by both phe-nomena are similar.
c) Volcanic eruptions; the flowing lava destroys everything in its path, the large amount of dust and ash causes extreme roofs loading and fires, the ground around the volcano is unstable and prod earthquakes. The response of constructions to the volcano eruption in-cludes very wide range of different load ef-fects and different types of damage.
d) Flood; the rising of a body of water and its overflowing onto normally dry land. Hydro-static pressure, stream and wave motion of water as well as impact from drifting wood and ice are the main direct actions caused by water. Landslides can also take place. The response of constructions to these actions can be expressed in terms of load effects or/and damage functions.
e) Tsunami; a wave train or series of waves generated by impulsive disturbance that ver-tically displaces the water column in water body. The response of constructions meas-ured by the damage can be directly summa-rized into the following: total or partial col-lapse, failure of non-structural elements, constructions inundated, flooded or burned.
f) Extreme snow; constructions can be exposed to extreme snow loads in areas where snow is usual environmental load, due to heavy snow falls or/and due to exceptional snow drifts, or to any snow loads in regions not normally exposed to it. Both types of the re-sponse characteristics, regarded in terms of load effects or/and damage functions, can be applied in that case.
g) Others; atmospheric icing, dust or water ponds on roofs, etc.
4. CASE STUDY
In January 2006 as many as 18 constructions in the urban habitat of Poland collapsed under the weight of snow. This number includes only collapses when the snow loading was undoubtedly the main cause of failure.
From among 18 collapses: 8 were caused by the blizzard (single significant snow fall), 9 were caused by repeated snow events followed by rain that satu-rated the snow, which greatly increased the weight of the snow, and 1 roof collapsed was due to excep-tional snow drift. Among the collapsed constructions there were: 8 magazine halls and workshops (lightweight roof structures: steel frames and trusses), 2 historical buildings (solid construction, timber roof structures), 4 pavilions (framed constructions, steel roof struc-tures), 1 bus shelter (steel roof trusses), 1 sports hall (framed steel structure), and 2 dwelling houses (solid constructions with timber roofs). In two cases the entire roof structures of magazine halls were totally collapsed. Roof structures of other buildings were partially collapsed, from one section to the half of all sections, and many steel members of the roof structures were deformed. In three cases (1 dwelling and 2 historical buildings), also some columns and parts of walls were severely damaged. The weight of snow on roofs of collapsed construc-tions, just after the collapse, was from 2 to 3.5 time more than calculated using the Gumbel model for T=50 years return period. For these values the Gum-bel method predicts return periods T=100 300years.
5 CONCLUSIONS
Because of the variety of existing constructions and extraordinary loading conditions, there does not ex-ist any common model for the description of their structural behaviour and failure. Nevertheless, re-sponse of these constructions can be assessed by en-gineering methods on a scientific basis.Extraordinary loading conditions are connected with catastrophic events related to natural hazards, usu-ally infrequent and hardly predictable but with great consequences. Thus the classification criteria of re-sponse characteristics significantly relay on individ-ual judgement, experience and intuition. Response characteristics of constructions subjected to extreme loads my be regarded in terms of load ef-fects and/or damage measures. Further studies are needed to establish appropriate values of reference values of damage threshold for different types of structures and loading conditions.
REFERENCES
EN 1990 2002. Eurocode - Basis of structural design. Brussels: CEN. ISO 2394 1998. International Standard. General princi-ples on reliability for structures. Genève: ISO.

372
1 INTRODUCTION
If accidental actions such as fires, internal explo-sions and seismic events are more or less covered by the Eurocode program, the other kinds of excep-tional hazards are not considered.
EN 1991-1-7:2003 describes principles and appli-cation rules for the assessment of accidental actions on buildings and bridges and it clarifies that it �does not specifically deal with accidental actions caused by external explosions, warfare and terrorist activi-ties, or the residual stability of buildings or other civil engineering works damaged by seismic action or fire, etc.�
This paper deals with some of the actions hidden behind this �etc.�
Avalanches, erosion, extreme snow, extreme winds (hurricanes, tornadoes, cyclones, typhoons), floods, landslides, rockfalls, tsunamis or volcanic eruptions for instance, represent infrequent natural actions that are not specified in the Eurocodes. It has to be noted that most of these phenomena are char-acterized by large fluid masses moving with a dif-ferent degree of velocity according to their density and viscosity.
If volcanic eruptions or tsunamis do not depends on climatic phenomena, the other disasters find natu-ral origins and, due to climate changes, they seem to become not so infrequent as before. The main prob-lem is that, by definition, exceptional and infrequent events are associated to very low probability of oc-currence. Therefore, databases concerning these events are rather limited.
One of the goals of the COST C26 action being to define a suitable methodology to predict the struc-tural behaviour of constructions under extreme con-ditions, one of the first step lies in the identification
and in the classification of the relevant infrequent events and, when possible, to describe the associated scenarios.
2 SNOW
2.1 Exceptional snow loads For altitudes smaller than 1500 m, exceptional snow loads are specified in EN1991-1-3:2003, and the code is based on the assumption of a return period equal to 50 years. Exceptional snow loads are con-sidered as accidental loads.
2.2 AvalanchesAvalanches are one of the infrequent actions not taken into account in the Eurocodes.
It is possible to identify two main types of ava-lanches (Givry & Perfettini 2004) depending on the state of the snow: dry snow or powder avalanche (Figure 1) and wet snow avalanche (Figure 2).
Figure 1. Dry snow avalanche. Photo by René de Bos, Courtesy of www.avalanche.org.
Identification & classificationof exposure events - exceptional or infrequent event scenarios
J.P. Muzeau & A. BouchaïrBlaise Pascal University, Clermont-Ferrand, France
V. Sesov University Ss. Cyril and Methodius, Skopje, FYR of Macedonia
C. Coelho University of Aveiro, Portugal
ABSTRACT: Avalanches, erosion, extreme snow, extreme winds, floods, landslides, rockfalls, tsunamis, vol-canic eruptions, etc., represent infrequent natural actions that are not covered by the Eurocode program. This paper deals with their identification and classification in order to clarify some scenarios of exposure in front of these exceptional or infrequent events.

373
Figure 2. Wet snow avalanche. Photo by Jim Daus, Courtesy of www.avalanche.org.
The difference between these two kinds of phe-nomena defines their mode of failure, their way of displacement down the slope and their relative power. Table 1 gives the main characteristics of the two extreme phenomena. Nevertheless, it is to be noted that there is a transition between these two ex-treme modes that are qualified as dry, damp, moist, wet and satured.
Table 1. Main avalanche characteristics Dry snow ava-
lanche Wet snow ava-lanche
Displacement speed
Fast to very fast: up to 100 m/s or 360 km/h
Relatively slow: < 30 m/s or 108 km/h
Pressure May be higher than 1000 kPa
May be higher than 1000 kPa
Unit weight 20 kg/m3 Up to 500 kg/m3
Height of influence Currently 30 to 40 m but may be higher than 100 m
Generally less than 8 to 10 m
Compared to a dry snow avalanche, a wet snow one is slower and the runout distance is shorter. However, the impact on obstacles (trees or construc-tions for instance) is very important due to the high density of wet snow.
Being slower, wet snow avalanches appear to be less dangerous for humans than dry avalanches but regarding construction it is the opposite. Neverthe-less, if the robustness of the construction can be strongly affected by wet snow avalanches, the open-ings are affected by dry snow avalanches due to its related high pressure similar to a blasting effect.
A dry snow avalanche is not really affected by the site topography as the wet snow avalanche reduces with the slope. The avalanche path corresponds to a terrain feature where an avalanche occurs. It is com-posed of a starting zone, a track and a deposition or runout zone.
In the Alps, the hazard is classified into 3 catego-ries:
- the red zone where it is strictly forbidden to build any kind of new construction because of the high probability of danger,
- the blue zone where it is possible to build some constructions but where some special specifica-tions are required,
- the white zone which is expected to be without danger.An approximation of the reference dynamic pres-
sure Pd may be evaluated using the Bernoulli rela-tionship: Pd = 1/2 V2 if is the average snow unit weight (kg/m3) and V the displacement speed of the avalanche (m/s).
So, a dry snow avalanche with a unit weight equal to 10 kg/m3 and a speed of displacement equal to 77.5 m/s ( 280 km/h) gives the same pressure ( 30 kPa) than a wet snow avalanche whose unit weight is equal to 400 kg/m3 and speed to 12.25 m/s ( 44 km/h).
The avalanche loading on constructions may pre-sent very high values. For the blue zone, 30 kPa (corresponding to the previous examples) is a refer-ence value used in many European countries in the case of a wet snow avalanche; this value comes from Switzerland which is considered as the reference country in Europe regarding this phenomenon.
It is to be noted that trees, stones or ice blocks can amplify the effect of a wet snow avalanche by the addition of an impact load. Its value depends on the reference dynamic pressure. For instance, in Switzerland, a value of 100 kN is used with Pd = 30 kPa as 33 kN is used with Pd = 10 kPa; this load is expected to be applied of a surface equal to 500 cm2 at any level of the avalanche.
Considering the combination of exceptional events, wet snow or dry snow avalanches are never combined together due to their different origin. An avalanche is never combined with an earthquake even if this last may be the creating factor because they do not occur in the same time interval. Winds and avalanches are never combined because the wind action being smaller, it can be expected to be included in the avalanche load case. Snows and ava-lanches are obviously combined because heavy snow is generally the creating factor.
3 WIND
3.1 Extreme winds Cyclones, hurricanes, tornadoes or typhoons are ex-treme winds whose dynamic action leads generally to severe damages on constructions. In most cases, they are associated to torrential rains creating floods which amplify the damages effects.
The name of the extreme winds depends on their geographical location and on their maximum speed.
To be initiated, tropical cyclones need certain thermodynamic conditions to be respected above a

374
large mass of warm water. Therefore, they form above seas or oceans. They are named hurricanes in the Atlantic Ocean and typhoons in the Pacific Ocean.
Tornados are initiated above the earth during a severe storm when special thermodynamic condi-tions are found between huge cloudy masses and winds.
3.2 CyclonesThree types of cyclonic perturbations are commonly defined: tropical depressions, tropical storms and tropical cyclones (Chaboud 2003) whose sustained wind speed limits are given in Tables 2, 3 & 4 de-pending on the native region.
Table 2. Cyclone terminology in Atlantic, East & West Pacific Name Sustained winds speed* (km/h) Atlantic &
East Pacific West Pacific
Tropical depression 62 62 Tropical storm 63-117 63-88 Severe tropical storm 89-117 Tropical cyclones
118 Typhoons 118
Category Wind speed 1 119-153 Saffir-Simpson 2 154-177 hurricane scale 3 178-209 4 210-249 5 250 * based on a 10-minute average
A tropical cyclone (Figure 3) is constituted by an eye at its centre, which is a relatively warm and calm zone, surrounded by an area about 16�80 km wide in which the strongest thunderstorms and winds circu-late around it. Up to now, the extreme wind speed due to a tropical cyclone is estimated to be equal to 305 km/h.
Figure 3. Cyclone Catarina from the ISS on March 26 2004.
In the United States, the Saphir-Simpson hurri-cane scale is used to classify the tropical cyclones
(Table 2) and the U.S. National Hurricane Center classifies hurricanes of Category 3 and above as ma-jor hurricanes.
Table 3. Cyclone terminology in South Pacific Name Category Sustained winds speed* (km/h) Low tropical cyclone 62 Tropical cyclone 1 63-88 2 89-117 Severe tropical cyclone 3 118-159 4 160-199 5 200 * based on a 10-minute average
The U.S. Joint Typhoon Warning Center classi-fies West Pacific typhoons as tropical cyclones with winds greater than 118 km/h. Typhoons with wind speeds of at least 241 km/h, equivalent to a strong Category 4 hurricane, are dubbed Super Typhoons.
In the Southwestern Indian Ocean, the classifica-tion is different to the ones used in the Atlantic and Pacific Oceans (Table 4).
Table 4. Cyclone terminology in the Southwestern Indian OceanName Sustained winds speed* (km/h)
62 Moderate tropical storm 63-88 Severe tropical storm 89-117 Tropical cyclone 118-165 Intense tropical cyclone 166-212 Very intense tropical cyclone 213 * based on a 10-minute average
To be initiated and sustained, tropical cyclones need large unstable volumes of warm water (more than 26°C over 60 m in depth) so their strength de-creases over land because of the lack of water. This is why the coastal regions are much more affected by cyclones than inland regions, the wind speed de-creasing as much as the depression progress on earth.
The extreme winds due to tropical cyclones are often combined with torrential rains, high waves, and storm surges: - Strong wind: obviously, on the one hand, it creates
a high pressure able to damage civil engineering structures themselves and, on the other hand, it transforms debris into flying objects able to dam-age covering and cladding;
- Heavy rains: they can create river and stream floods but also landslides;
- Storm surges: by the increasing the sea level, they can produce extensive coastal flooding up to about 50 km inland depending on the relief.
The potential damages due to cyclones are de-scribed in Table 5.

375
Table 5. Possible damages to constructions as function of the sustained wind speed Wind speed (km/h)
Damages
< 150 Negligible damages to constructions. Some coastal flooding.
150-180 Minor damages to roofs and openings. Signifi-cant flooding damages.
180-210 Some structural damages to small constructions(mainly curtain wall failures). More importantflooding damages near the coast: small structures destroyed and larger structures damaged by float-ing debris.
210-250 Significant structural damages. More importantcurtain wall failures with some complete roofstructure failures on small constructions. Impor-tant erosion of coastal areas.
> 250 Complete roof failures on most constructions and industrial buildings. Some complete building failures. Flooding causes major damage to lowerfloors of all concerned structures.
3.3 TornadosMuch smaller than a tropical cyclone regarding its influence diameter, a tornado is a violently rotating column of air starting from the lower part of a cumulonimbus cloud and in contact with the earth. Presenting different shapes, the form of a tornado is typically a visible condensation funnel, whose nar-row part moves on the earth (Figure 4). On the path of the displacement, the damages on constructions are generally localised but very important due to the high speed of the rotation. In most cases, a cloud of debris collected on the way, moves around the fun-nel at its lower part and it contributes to increase the damages.
Figure 4. Typical tornado. Photo courtesy of NSSL.
If the radial action of the vortex is important, it is generally combined with a vertical suction opposite to the gravity which amplifies the damages. A pow-erful tornado may extract light constructions from their foundations.
Most of the tornadoes create a very localised strong wind whose speed may reach 175 km/h. Their lower part is generally about 100 m and they travel
only on a small distance (about 10 km) before they dissipate. Nevertheless, much more powerful torna-does have been observed: with a wind speed close to 500 km/h, with a base diameter close to 1.5 km and whose way on the ground may be longer than 100 kilometres.
Tornadoes are very common and frequent in the great U.S. plains but some can be observed on other continents as Europe for instance. The Netherlands (> 20/year) and the U.K. ( 50/year) experiences this phenomenon but with a much smaller power than in the U.S.; so the damages to the constructions remain relatively small up to now.
4 WATER
4.1 ErosionAll European coastal states are to some extent af-fected by coastal erosion. About 20 000 km of coasts, corresponding to 20%, faced serious impacts in 2004. Most of the impact zones (15 100 km) are actively retreating; some of them in spite of the coastal protection works done (2 900 km). In addi-tion, another 4 700 km have become artificially sta-bilized (European Commission 2004).
The dynamical variability of sandy beaches, where the alongshore sediment transport is con-trolled by waves, currents, wind, water level, sedi-ments sources and sinks and sediments properties, can represent erosion situations with exposure of constructions. Several engineering solutions could be tested to face a specific coastal erosion problem in different scenarios.
The main causes for coastal erosion are the gen-eralized sea level rise, caused by climate change, some negative effects from coastal interventions, lit-toral occupation, exterior interventions in harbours, which cause serious perturbations in the littoral drift system and river sediment supply reduction (Coelho, et al. 2006).
The highly energetic wave regimes can results in an intense alongshore drift. The sediment supply needed to saturate the wave potential transport ca-pacity and maintain the beach-dune system, inlets, tidal deltas and the littoral drift in balance comes from two major sources: river sediment supply and coastal erosion. The river sediment supply has been weakening due to sand mining, for construction and navigation, and dam construction with consequent sand retention and hydrological regime regulariza-tion (Santos et al. 2002).
The river sediment supply reduction has been one of the main causes of the erosion processes over the last decades. Exterior interventions in the harbours tend to aggravate the phenomenon felt in down drift coastal stretches due to: sand extraction in the up drift beaches; channel access dredging without repo-sition down drift.

376
One of the usually preferred solutions to solve erosion problems is beach artificial nourishment. This can represents a very expensive solution, when the sedimentary deficit is very high, and there is not any sand deposit availability to such high values. However, it is essential to try to mitigate coastal ero-sion processes in specific locations. At the moment, the so-called hard coastal defences are indispensable to protect some of the existing settlements, but should be foreseen an adequate plan of monitoring of the existent coastal defence structures, keeping the maintenance costs of the structures at low level.
Regarding the political point of view, it is crucial to regulate urban seafront extension. In some cases, the policy options of managed realignment � identify a new line of defence and re-settle the populations in the hinterland � have to be considered.
The solution for coastal erosion problems must pass through a compromise between the passive ac-ceptance of erosion, some beach nourishment and coastal intervention for urban front protection.
4.2 TsunamisTsunami are series of waves created by the fast dis-placement of huge volumes of water (an ocean for instance) strongly and rapidly affected by a natural phenomenon at a huge scale. Generally, they can be initiated by earthquakes, submarine volcanic erup-tions or landslides (seabed slides) for example, but not by strong winds whose impulsion is not short and strong enough. The effects of a tsunami can be classified as insignificant to catastrophic regarding coastal population and constructions.
The waves move as growing circles from the ini-tial location to all the surrounding coats at high speeds (700 km/h is a mean value in the Pacific Ocean) with a large wavelength (hundreds of kilo-metres) and they can travel great transoceanic dis-tances with small overall energy loss.
Figure 5. Example of a tsunami effect on a house. Credit: Dr. Jose C. Borrero, USC Tsunami Research Group, courtesy NSF.
Far from coasts, most classical tsunamis have wave heights smaller than one meter but in their mo-
tion, they mobilise the whole water column from the surface to the sea bed. That explains why, when it approach the coast where the sea bottom become less deeper, the wave front becomes higher and can reach 20 m or more, and the residual energy creates a violent displacement.
Most of the damages (an example is shown in Figure 5) are due to the enormous mass of water ac-companying the initial wave front. On the one hand, they are originated by the wave impact on obstacles and, on the other hand, by the flood resulting from the sea level rising.
The energy of the phenomenon is sufficient to project any kinds of objects found on its path (ships for instance but also any kind of debris) and some-times far from the coast. Their combination is pow-erful enough to shear weak brittle houses at their base or to submerge and to create bending actions on rather high constructions depending of the wave height. The influence area depends also on the relief but it can be measured several kilometres far from the coast itself whose position can be strongly af-fected.
5 VOLCANOES
5.1 Volcanic eruptions It is not the goal of this paper to describe each kind of volcanoes but only their consequences on the lo-cal environment and mainly on constructions. On the other hand, submarines volcanoes are not considered here as they can only act on constructions by creat-ing a tsunami (see § 4.2).
An eruption may be characterized by explosions, projections of magma or pre-existing solid rock, lava flows, more or less dense clouds of ash-laden gas, dust and steam (Figure 6).
Figure 6. Smoke and ash from Mount St. Helens. Credit: Nor-man G. Banks, United States Geological Survey, courtesy NSF.
The eruption may occur from the crater itself or from fissures or fractures.

377
5.2 LavaLava may flow in a viscous mass from the crater. It can also be blown away in fragments to create kinds of avalanches moving down slopes at speeds as high as 150 km/h.
Such an eruptive activity can create great destruc-tions if it occurs in constructed areas but it seems difficulty to react against it.
The only proper engineering behaviour is to avoid any kind of constructions in such areas and to survey the volcano in order to predict likely eruptions.
5.3 AshesSome eruptions may send ashes into the stratosphere to heights of 10-30 km above the Earth's surface. Combined with the wind, they can spread more or less heavy materials relatively far from the volcano itself.
Most of building damages due to ash falls occur when the ash load exceeds the strength of either the roof-supporting structures or material used to cover the structure (sheet metal, plywood, etc.).
According to an American study (U.S. Depart-ment of the Interior 2005), dry ash presents a weight ranking from 4 to 7 kN/m3, and rainwater can am-plify it by 50 to 100%. If the ash becomes saturated by rain, it can reach more than 20 kN/m3.
So, ash loading may be considered as similar to a specific snow load but with some major differences: - being heavier, it is a much more severe loading
case (Table 6), - ash doesn't melt; - ashes can fill gutters and draining pipes leading to
collapse, especially after rainfalls.
Table 6: Density & load comparison, 10 cm of snow and 10 cm volcanic Load type Unit weight Load kg/m3 kPaNew snow 50-70 0.05-0.07 Damp new snow 100-200 0.1-0.2 Settled snow 200-300 0.2-0.3 Dry uncompacted ash 500-1,300 0.5-1.3 Wet compacted ash 1 000-2 000 1.0-2.0
For a dry layer of ash about 10 cm thick, the extra load on a building can range from 0.4 to 0.7 kN/m2;a wet layer might reach 1.0 to 1.25 kN/m2.
In areas where snow load cases exist, a relative protection against ash falls may be expected but it depends highly on the location of the considered structure because snow loads vary with altitude and geographical position.
6 LANSLIDES AND ROCKFALLS
Landslide describes a wide variety of processes that result in the downward and outward movement of slope-forming materials including rock, soil, artifi-cial fill, or a combination of these. The materials may move by falling, toppling, sliding, spreading, or flowing. Figure 7 shows a graphic illustration of a landslide, with the commonly accepted terminology describing its features.
Figure 7. An idealized slump-earth flow showing basic parts of a landslide.
The various types of landslides can be differenti-ated by the kinds of material involved and the mode of movement. A classification system based on these parameters is shown in Table 7.
Table 7. Types of landslides - Classification of slope move-ment (Varnes, 1978) Type of movement Type of material
Engineering soils Bedrock Predominantly
coarsePredominantly fine
Falls Rock fall Debris fall Earth fall
Topples Rock topple Debris topple Earth topple
Rotational slide Translational slide
Rock slide Debris slide Earth slide
Lateralspreads
Rock spread Debris spread Earth spread
Flows Rock flow Debris flow Earth flow
Complex Combination of two or more principal types of movement
Other classification systems incorporate addi-tional variables, such as the rate of movement and the water, air, or ice content of the landslide mate-rial. Although landslides are primarily associated with mountainous regions, they can also occur in ar-eas of generally low relief. In low-relief areas, land-slides occur as cut-andfill failures (roadway and

378
building excavations), river bluff failures, lateral spreading landslides, collapse of mine-waste piles (especially coal), and a wide variety of slope failures associated with quarries and open-pit mines. The most common types of landslides are described as follows and are illustrated in Figure 8.
Figure 8. Major types of landslide movement
Although there are multiple types of causes of landslides, the three that cause most of the damaging landslides around the world are these:
6.1 Landslides and water Slope saturation by water is a primary cause of land-slides. This effect can occur in the form of intense rainfall, snowmelt, changes in ground-water levels, and waterlevel changes along coastlines, earth dams, and the banks of lakes, reservoirs, canals, and rivers. Landsliding and flooding are closely allied because both are related to precipitation, runoff, and the satu-ration of ground by water. In addition, debris flows and mudflows usually occur in small, steep stream channels and often are mistaken for floods; in fact, these two events often occur simultaneously in the same area. Landslides can cause flooding by form-ing landslide dams that block valleys and stream channels, allowing large amounts of water to back up. This causes backwater flooding and, if the dam fails, subsequent downstream flooding. Also, solid landslide debris can �bulk� or add volume and den-sity to otherwise normal streamflow or cause chan-nel blockages and diversions creating flood condi-tions or localized erosion. Landslides can also cause overtopping of reservoirs and/or reduced capacity of reservoirs to store water.
6.2 Landslides and seismic activityMany mountainous areas that are vulnerable to land-slides have also experienced at least moderate rates of earthquake occurrence in recorded times. The oc-currence of earthquakes in steep landslide-prone ar-eas greatly increases the likelihood that landslides will occur, due to ground shaking alone or shaking- caused dilation of soil materials, which allows rapid infiltration of water. The 1964 Great Alaska Earth-quake caused widespread landsliding and other ground failure, which caused most of the monetary loss due to the earthquake. Widespread rockfalls also are caused by loosening of rocks as a result of ground shaking.
Landslides have been one of the dominant geo-technical instabilities occurred during the 23 Octo-ber 2004 Mid Niigata Earthquake. Saturated soil condition due to the past rainy days and very steep inclination of the natural and manmade slopes made them very vulnerable to earthquake shaking. There were a lot of landslides where subsurface soil layers from the top of the slope were sliding toward toe of the slope.
6.3 Landslides and volcanic activityLandslides due to volcanic activity are some of the most devastating types. Volcanic lava may melt snow at a rapid rate, causing a deluge of rock, soil, ash, and water that accelerates rapidly on the steep slopes of volcanoes, devastating anything in its path. These volcanic debris flows (also known as lahars) reach great distances, once they leave the flanks of the volcano, and can damage structures in flat areas surrounding the volcanoes. The 1980 eruption of

379
Mount St. Helens, in Washington triggered a mas-sive landslide on the north flank of the volcano, the largest landslide in recorded times.
6.4 Landslide - Stability analysis The conventional stability analysis of slopes where sliding is possible along some definable surface is usually preformed by calculating the factor of safety, i.e. by comparing the shearing resistance available along the failure surface. With the shearing stresses imposed on the failure surface. Most analytical methods are based on limit equilibrium, with typical failure forms such as infinite slope or finite slope with planar or curved failure surface considered.
However the recently introduced performance-based approach, emphasis is placed not on whether the slope is stable or unstable, but on the magnitude of deformation after failure. Several techniques are currently available to asses the post-failure velocity and travel distance of the moving mass.
The basic model assumes that during the shaking a slope will suffer displacement only when the ground acceleration exceeds a threshold value, the critical acceleration, which can be derived form the static factor of safety of the slope in question. The sliding mass will continue to move until the shaking drops below the critical acceleration. If the cumula-tive displacement caused by shaking, known as Newmark displacement is sufficient to cause a re-duction in the shear strength of the soil or rock mass then a re-calculation of the slope stability is carried out using residual shear strength parameters to estab-lish whether failure occurs. Thus the analysis is bi-linear, allowing for a change in the strength parame-ters of the slope forming materials based on the de-formation of the slope.
6.5 Landslide mitigation�How to reduce the effects of landslides
Vulnerability to landslide hazards is a function of location, type of human activity, use, and frequency of landslide events. The effects of landslides on peo-ple and structures can be lessened by total avoidance of landslide hazard areas or by restricting, prohibit-ing, or imposing conditions on hazard-zone activity. Local governments can reduce landslide effects through land-use policies and regulations. Individu-als can reduce their exposure to hazards by educat-ing themselves on the past hazard history of a site and by making inquiries to planning and engineering departments of local governments. They can also ob-tain the professional services of an engineering ge-ologist, a geotechnical engineer, or a civil engineer, who can properly evaluate the hazard potential of a site, built or unbuilt. The hazard from landslides can be reduced by avoiding construction on steep slopes and existing landslides, or by stabilizing the slopes.
Stability increases when ground water is pre-vented from rising in the landslide mass by:
- covering the landslide with an impermeable mem-brane,
- directing surface water away from the landslide, - draining ground water away from the landslide, - minimizing surface irrigation.
Slope stability is also increased when a retaining structure and/or the weight of a soil/rock berm are placed at the toe of the landslide or when mass is removed from the top of the slope.
7 CONCLUSION
Avalanches, erosion, extreme winds, landslides, tsu-namis and volcanic eruptions have been identified and briefly described according to their mechanical effects on constructions. As all these exceptional or infrequent events are not covered by the Eurocode program, a study of the vulnerability or robustness of constructions under exceptional loading needs this preliminary phase in order to be able to propose a realistic relevant modelling.
8 REFERENCES
Chaboud, R. 2003. Cyclones. Encyclopédia Universalis on DVD-ROM, France.
Coelho, C., Silva, R., Veloso-Gomes, F. 2006. Shoreline Evo-lution Model: A Tool to Compare Coastal Protection Meas-ures�. Coastal Dynamics, Geomorphology and Protection. 8th International Conference LITTORAL 2006 - Coastal Innovations and Initiatives; Gdansk, Poland, 115-123, ISBN 83-88617-82-6.
EN 1991-1-7:2003. Eurocode 1 - Actions on structures, Part 1-7: General Actions - Accidental actions. European stan-dard, CEN, Brussels.
EN 1991-1-3:2003. Eurocode 1 - Actions on structures - Part 1-3: General actions - Snow loads. European standard, CEN, Brussels.
Givry, M., Perfettini, P. 2004. Construire en montagne � La prise en compte du risque d�avalanche. Ministère de l�écologie et du développement durable. Ministère de l�équipement, des transports, du logement, du tourisme et de la mer. Available on http://www.avalanches.fr.
European Commission 2004. �Living with Coastal Erosion in Europe - Sediment and Space for Sustainability�. Luxem-bourg: Office for Publications of the European Communi-ties, 40 pp., ISBN 92-894-7496-3.
Rolando P. Orense 2003. Geotechnical Hazards: Nature, As-sessment and Mitigation, University of The Philippines Press.
Santos, F.D., Forbes, K., Moita, R. 2002. Climate change in Portugal. Scenarios, Impacts, and adaptation measures. SIAM Project, Gradiva, Lisboa, Portugal.
U.S. Department of Interior 2004. Landslide Types and Proc-esses. Fact Sheet 2004-3072. U.S. Department of Interior, U.S.Geological Survey.
U.S. Department of the Interior. 2005. Volcanic ash: effects & mitigation strategies. U.S. Geological Survey, Menlo Park, California, USA.
Some information, regarding extreme winds, tsunamis or vol-canoes, has been found in http://en.wikipedia.org.

380
1 INTRODUCTION
Large floods which affected the Middle Europe re-gion at the end of the last century and especially the largest flood from August 2002 caused significant damages on state and private property and they even claimed the lives. Account on that we can see in re-cent years a strong tendency to manage the flood protection more conceptually and systematically (Chave, 2001).
When dealing with the efficiency of a flood pro-tection we need to answer the question if the imple-mentation of the flood control measure (FCM) pro-posed has any economic reason. Thus if costs of FCM are adequate to the volume of the private and state property protected. In the case of several FCM scenarios in the given locality it is principal to de-cide which scenario is the most effective. A system approach in the flood protection is based on the ba-sic skill that particular FCM�s are mutually con-nected by links and interactions when an increasing of the flood protection in one locality can have ad-verse impact to situation elsewhere. Further it is im-portant the fact that the proposed flood protection ef-fect can be reached as lately as all the FCM�s in whole basin are implemented. In this case it is nec-essary to evaluate the efficiency of all the FCM�s to-gether and not separately.
Contemporary approach of planning the flood control measures is obviously based on the sche-matic assumption of so called design event which properties are derived by a statistical approach. De-sign flood is obviously described by its return period or by exceedance probability which depend on the
character of a protected area. This approach allows considering different level of the flood risk in vari-ous localities (urban area, municipal territory) very schematically.
This contribution describes a new approach of the flood protection optimization which is based on the risk analysis and it allows an objective assessment of the flood protection efficiency in the given locality. The method is based on costs-benefits analysis when costs are given by overall investment in FCM (or FCM scenario) and for evaluating of benefits the risk analysis is used. A benefit from flood protection is given by flood damages which occur if the pro-posed FCM will not be implemented. In the same time the flood probability has to be taken into ac-count.
The main idea of the flood protection optimiza-tion is illustrated in the Figure 1. A horizontal axis represents the range of the flood control protection which affects the value of the flood risk (R). Before the FCM is implemented the flood risk is the great-est and it is decreased with growing the range of the flood protection. Contrary, the costs (I) are increas-ing with growing the range of the flood protection. An objective is to find an optimal flood protection scenario which minimize the sum of the costs and flood risk (R+I). This scenario represents an optimal flood protection measure in the given locality.
Optimization of flood protection policy
P. Fo�umpaur & L. Satrapa Czech Technical University in Prague, Czech Republic
ABSTRACT: This contribution describes a new approach of the flood protection optimization which is based on the risk analysis and the costs-benefits analysis. Costs are given by the budget of construction. Benefits from flood protection measure are evaluated by the flood risk assessment. Method of the risk analysis allows to evaluate flood damages caused by floods with different exceedance probability. The methodology was rati-fied by the Ministry of Agriculture of the Czech Republic for purposes of evaluating of proposed flood pro-tection projects within the frame of II. stage of the �Flood Prevention Project� co-sponsored by the European Investment Bank.

381
Figure 1. Principle of the flood protection policy.
2 METHODS
The method is based on the costs-benefits analysis when costs are given by the budget of construction and they could include not only the construction costs but also other investments (project documenta-tion, planning inquiry, property purchasing). Bene-fits from flood protection measure are evaluated by the flood risk assessment. Method of the risk analy-sis allows to objective evaluate flood damages caused by floods with different exceedance probabil-ity (return period). Flood risk generally depends on the extent of flood damages and on probability of their occurrence, in accordance with the following relation: Risk = Damage x Probability of Damage.
For calculation of flood risk it is necessary to consider all the real combinations of damages and their probability for flows causing slight damages and for extreme flows with really minor probability. This analysis shall result in calculation of average annual flood risk:
Qb
Qa
dQQfQDDER )().()( (1)
where R = E(D) is average annual flood risk; D(Q)is damage caused by flow (Q); Q is flow; f(Q) is probability density of annual flood flows; Qa, or Qbis flow causing the first damages or flow when the probability of damage occurrence is close to zero; a,or b is the return period of flow Qa or Qb.
There are two independent and substitutable methods for calculating the risk:
a) Analytical method where the average annual flood risk is quantified by integrating the product of flood damages caused by all damaging flows in a given area and probability of their occurrence.
b) Stochastic Monte-Carlo method that is based on generated synthetic series of annual peak flows, for which the sequence of annual damages is derived
from dependence of flood damages on flows derived in advance. These data then serve as a basis for de-termination of an average annual flood risk.
Extent of protected property that is quantified by standard methods for specification of flood damages on the basis of flood-plain areas determined and spa-tial distribution of properties in given area. Determi-nation of potential flood damages is based on GIS data stemming from the territorial data of ZA-BAGED database. In reasonable cases it can be quiet detailed � damage of individual structural items of objects (items with long-term and short-term life cy-cle) and their share in the value of given object can be estimated and the extent of any prospective dam-age can be determined relatively precisely.
Damage against which the given area will be pro-tected by the assessed measure needs to be figured out. It relates to the flows, for which the flood-plain areas were determined by hydraulic analysis. Dam-age is in Czech Republic usually quantified for the flows of Q5, Q20, (Q50) and Q100 both for the present and for the future after realising the preventive measure planned. If the current degree of protection exceeds the flow of Q5, then damage is quantified for the first higher flow and subsequently according to the given flow order. Level of flood protection of proposed measure expressed by the return period is the necessary information for assessing effectiveness of the proposed project and it is directly connected to any potential damage. This information and data supplied allow for the quantification of flood risks before and after realisation of a measure. Level of flood protection (return period) is expressed in years and the probability of exceedance is expressed in percents.
Proposed method of evaluation of flood protec-tion measures requires the knowledge of extent of flood-plain areas before the actual implementation of flood measures (current status) and after their im-plementation. In case the extent of flood-plain areas is not known after implementation of a measure it is supposed that the flood damages caused by flow higher than the proposed flow rate for a given meas-ure will correspond with damages occurring without a measure being implemented. Flood risk will be quantified for the current status only (before imple-mentation of a measure) up to the level of proposed protection rate of a given measure. This value itself evidences the reduction of flood risk by implementa-tion of a project.
Flood damages are mostly affected by depth of water, velocity or exposition of the flood. In the next step of the analysis a range of flood damages on dif-ferent categories of buildings (housing, estate indus-trial), infrastructure properties and agriculture prop-erties is evaluated. Calculation is based on the evaluation of a damage factor which describes rela-tive damage on the building and it ranges from 0 to

382
1. Overall damages in the flooding area are then given according to the formula:
ii
n
ii SkD
1 (2)
where n is the number of categories considered; is damage factor for ith category (it depends on the wa-ter level or velocity); k is number of units in the ithcategory [m3]; S is maximum damage per unit in ith
category, [EUR/m3].The maximum damage describes a part of the
overall value of the object which is damaged by the flood and must be replaced or repaired. The value of the damage factor is obviously evaluated with the use of damage curves which illustrate the depend-ence of the damage factor on the water level (and/or velocity) for objects from particular category (Sa-trapa, Br �a, 2002).
Previous approach dealt with calculation of flood risk in monetary units per time (usually per one year, i.e. annually). Now it is possible to quantify the cur-rent value of the risk by discount method. According to the (ARCADIS, 2004) the current discount rate is 4% in the Netherlands, 6% in United Kingdom, 7% in Denmark, 8% in France, 3% in Germany. The EC average is 5%. Considering the development of dis-count rate in the CR in the last few years, the 3% annual discount rate will be used for calculating the capitalized risk.
Current risk value (capitalized risk) is then given by the relation for calculation of annuity bond:
DSRRa (3)
where Ra is current risk value; R is average annual flood risk; DS is annual discount rate in decimal format.
Target here is to create a system for evaluation of projects and prioritising them in accordance with the Cost Benefit Analysis. Therefore the values of fol-lowing parameters containing the costs and benefits will be quantified:
a) Relative efficiencyThis is a ratio, where the risk value decreasing the current risk (without a measure) is the numerator and the investment (costs) needed for implementing a measure is the denominator. The nominator actu-ally determines the reduction of flood risk caused by realisation of a measure.
Costs(after)-(before) RaRaEP (4)
where Ra is the capitalized flood risk before, resp. after implementation of a project. This parameter stands for the financial efficiency given by decrease of current risk per unit of investment. Higher value
of this parameter means the higher appreciation of flood prevention investments.
b) Absolute efficiency This parameter will assess the long-term benefits of flood prevention measures in absolute values of cost and benefits and it is given by the following relation: EA = Ra(before) � [Costs + Ra(after)] (5) where Ra is the capitalized flood risk before or after implementation of a project.
This parameter expresses absolute long-term fi-nancial efficiency of a measure. Higher value of this parameter means the higher appreciation of flood prevention investments.
c) Payback period Payback period will be determined by the following relation:
(after)-(before)Costs
RRDN (6)
where R means the average annual flood risk before, or after implementation of a project.
3 CASE STUDY
As a case study the flood protection project of the Budyn nad Oh í municipality (North Bohemia re-gion) was selected. The municipality is located in the flood-plain area of the Oh e River according to Figure 2 where flooding lines for Q10, Q20, Q50 and Q100 are marked. The current degree of protection is on the Q5 level (non-damaging flow).
Figure 2. The map of the Budyn nad Oh í municipality. When this level is exceeded the damages start to
occur. Our task is to evaluate the optimal degree of

383
protection when four scenarios are given � protec-tion on the levels Q10, Q20, Q50 and Q100. As a flood control measure the dikes were chosen in the range according to Figure 2 (FCM).
Flood damage was evaluated for flow levels Q10,Q20, Q50 and Q100. For intermediate flows it is con-sidered an assumption of linear relation between the damage and logarithm of the return period N. The damages are evaluated only to the Q100 level which is the greatest design flood. The relationship is illus-trated in the Figure 3.
0.00
0.20
0.40
0.60
0.80
1.00
1.20
1.40
1.60
1 10 100 1000
N [years]
current statusFCM - Q10FCM - Q20FCM - Q50FCM - Q100
Figure 3. Relationship between the flood damage and the return period of the flood in the Budyn nad Oh í municipality. Status before the actual implementation of flood measures (current status) and after their implementation on the level Q10, Q20, Q50and Q100.
In Figure 3 the range of the flood damage for various flows for the current status is marked by the blue line. The chart also contains damages for the state after particular flood measures are imple-mented. Because of the character of the flood meas-ure (dikes) there is assumed that after the design level is overcome the damage will be similar to that before implementation of FCM. Generally should be noted that this assumption is not valid for the meas-ures as flood control reservoirs and polders.
For evaluating the average annual flood risk be-fore implementation of flood measures and after their implementation there was used the stochastic approach when a long synthetic series of yearly peak flows (10 000 years long) was generated. Probability properties of this series are related to those derived from historical data by the flood flow frequency analysis (Table 1).
In the next stage were computed values of yearly damage in the previously generated series according to the relationship in Figure 3. In the Figure 4 there is illustrated a course of yearly damages in the first 1000 years of the synthetic series for the current status and for the status after the flood measures will be implemented. From the charts there is evident that the most frequent occurrence of the flood dam-
ages is for the current status (before FCM). Contrary as the degree of protection is growing the value of the damage decreases.
Table 1. Flood flow frequency of the Oh e River in the Budynnad Oh í profile.
N [years] 1 2 5 10 20 50 100
QN [m3.s-1] 281 377 514 624 738 896 1021
Figure 4. Yearly flood damages in the first 1000 years of the synthetic series for the current status and after implementation of flood control measures for the design level of Q10, Q20, Q50and Q100.
For the whole displayed period of 1000 years have occurred eleven floods with the damage for the Q100 protection level. This is approximately in a good agreement with the frequency of Q100 which is in the long term period reached or exceeded one times in 100 years.
With the use of yearly flood damages in the whole synthetic series there is possible to evaluate average yearly damage (risk) for the current status and for the status after implementation of the flood control measures proposed. Values of the average yearly damage and capitalized risk according to formula (3) are marked in Table 2.
Evaluation of the economical efficiency of all the flood protection scenarios in the Budyn nad Oh ímunicipality is shown in the Table 3. From the table implies that with regard to the relative efficiency the optimal degree of protection seems to be the Q50level. However, from long point of view the absolute efficiency is crucial. So the Q100 protection level is optimal. Absolute efficiency can be evaluated also
0 100 200 300 400 500 600 700 800 900 10000
0.5
1
1.5
0 100 200 300 400 500 600 700 800 900 10000
0.5
1
1.5
0 100 200 300 400 500 600 700 800 900 10000
0.5
1
1.5
0 100 200 300 400 500 600 700 800 900 10000
0.5
1
1.5
0 100 200 300 400 500 600 700 800 900 10000
0.5
1
1.5

384
according to the philosophy from the introduction (Fig.1). An application of this approach for the Budyn nad Oh í municipality is illustrated in the Figure 5. For the current status the protection level is Q5, the risk (R) is maximal and cost (I) is zero. As the protection degree is growing the costs are in-creasing and the risk is decreasing. The optimum conforms to the minimal value of the sum of risk and cost (red line). So the Q100 protection level can be recommended as the design degree of protection.
Table 2. Average flood risk and capitalized flood risk. Risk
[mil. EUR/year] Capitalized risk
[mil. EUR] Degree of protection
Before FCM
After FCM
Before FCM
After FCM
Q10 0.084 2.812 Q20 0.049 1.628 Q50 0.025 0.838 Q100
0.115
0.014
3.85
0.469
Table 3. Economical assessment of flood protection scenarios. CostsDegree of
protection Risk re-duction
[mil. EUR]
[mil. EUR]
Relative efficiency
[-]
Absolute efficiency
[mil. EUR]
Paybackperiod [years]
Q10 1.036 0.414 2.5 0.622 13 Q20 2.219 0.493 4.51 1.727 7 Q50 3.009 0.593 5.07 2.416 7
Q100 3.378 0.807 4.19 2.571 8
0.0
0.5
1.0
1.5
2.0
2.5
3.0
3.5
4.0
4.5
0 10 20 30 40 50 60 70 80 90 100
N [years]
R
I
R+I
Figure 5. Capitalized risk and costs for particular scenarios of the flood protection.
4 CONCLUSION
Described approach for evaluating of the economical efficiency of the flood control measures or their sys-tems was developed at the Department of Hydro-technics, Czech Technical University in Prague, Faculty of Civil Engineering ( ihák, Satrapa, Fo�umpaur, 2005). The methodology was ratified by the Ministry of Agriculture of the Czech Republic for purposes of evaluating of proposed flood protec-tion projects within the frame of II. stage of the �Flood Prevention Project� co-sponsored by the European Investment Bank. II. stage of the project consists of 349 projects of flood control measures including 81 technical measures assessed by the method described. The evaluation consequently serves as a strategy decision tool in the flood protec-tion sector and it allows determining preferences in the implementation of proposed projects or a rejec-tion of uneconomical projects.
The methodology of optimizing flood protection policy is utilized at present time for Czech part of the international project ELLA and OderRegio. Both the projects are solved at the Department of Hydro-technics, Czech Technical University in Prague, Faculty of Civil Engineering and coordinator is the Ministry for regional development. Results of the studies will produce a conceptual material for flood control strategy along the Elbe River from the M l-ník city to the Czech/Germany border and along the Odra River from the junction with the Opava River to the Czech/Poland border. Outputs quantify rec-ommended degree of the flood protection and offer a significant basis for the town planning.
Acknowledgement This research has been supported by the research
grant of the Ministry of Education, Youth and Sports of the Czech Republic No.: MSM 6840770005 and No.: MSM 6840770002.
REFERENCES
IHÁK, F., SATRAPA, L, FO�UMPAUR, P.: Methodology for assessment of flood prevention measures to be included in the 2nd stage of �Flood Prevention Project� (2007-2010), Czech Technical University, Faculty of Civil Engi-neering, Prague 2005.
CHAVE, P.: Water Framework Directive, introductory direc-tive of the EU, issued by the Ministry of Agriculture of the CR in co-operation with the Twinning project for Water Framework Directive, represented by Mr. James Hunt, pre-accession advisor, 2001.
SATRAPA, L., BR �A, M., 2002: Methods for flood damage assessment, In: Proc.: Floods: forecasting, rivers and land-scape, Ostrava: CICERO, Vol. 1, 2002, s.328-338.
Flood control strategy for the Czech Republic, Ministry of Ag-riculture of the Czech Republic, Prague 2000.

385
Authors Index
Altay G., Turkey 302, 307
Andreadakis K. P., Greece 347
Apostolska-Petrusevska R.,
FYR of Macedonia 130, 188
Avossa A.M., Italy 252
Bacinskas D., Lithuania 53
Bailey C. G., United Kingdom 104
Baniotopoulos C.C., Greece 268
Barecchia E., Italy 221, 229
Bordea S., Romania 211
Bouchaïr A., France 92, 372
Brando G., Italy 237
Burgess I., United Kingdom 25
Byfield M., United Kingdom 295, 336
Coelho C., Portugal 372
Cefarelli G., Italy 70
Chlouba J., Czech Republic 98
D�Aniello M., Italy 221
Daescu C., Romania 201
Dai X. H., United Kingdom 1045
De Matteis G., Italy 237, 295, 341
Della Corte G., Italy 221, 229
Demonceau J.-F., Belgium 330
Dharma R.B., Singapore 17
Ding J., United Kingdom 104
Dinu F., Romania 193 295
Dogariu A., Romania 201, 211
Dubina D., Romania 130, 193, 201, 211
Esposto M., Italy 35
Faber M., Switzerland 359
Faggiano B, Italy 33
Falorca I. M.C.F.G. Portugal 320
Ferraioli M., Italy 252
Fiorino L., Italy 229, 245
Formisano A., Italy 237
Fo�umpaur P., Czech Republic 380
Franssen J.M., Belgium 41, 64
Gillie M., United Kingdom 45
Graf W., Germany 130
Gramatikov K., FYR of Macedonia 158
Grecea D., Romania 193
Gresnigt A. M., Netherlands 347
Gribniak V., Lithuania 53
Hanus F., Belgium 41
Huang Z.F., Singapore 17
Iuorio O., Italy 245
Jaspart J.-P., Belgium 330
Kaklauskas G., Lithuania 53
Kallerová P., Czech Republic 98
Kappos A., Greece 115
Karamanos S. A., Greece 347
Karapinar S., Turkey 307
Kilic S. A., Turkey 302
Krauthammer T., USA 281

386
Krstevska L., FYR of Macedonia 158
Kuhlmann U., Germany 330
Kwasniewski L., Poland 59
Landolfo R., Italy 35, 158, 245
Langone I., Italy 341
Lopes N., Portugal 64
Mammana O., Italy 158
Mandara A. , Italy 170, 252
Mazzolani F., Italy
7, 35, 158, 221, 229, 237, 260, 284, 341
Mendes A.I.A., Portugal 320
Michalopoulos A., Greece 268
Mistakidis E., Greece 130, 260
Muzeau J.-P., France 92, 372
Nagy-Gyorgy T., Romania 201
Necevska-Cvetanovska G.,
FYR of Macedonia 130,188
Nigro E., Italy 70
Nikolaidis Th., Greece 268
Nogueiro P., Portugal 130
Panico S., Italy 237
Pannier S., Germany 130
Paramasivam S., United Kingdom 336
Pintea D., Romania 76
Pinto M.I.M., Portugal 320
Portioli F., Italy 158
Ramundo F., Italy 252
Rebecchi V., Italy 341
Rebelo C.A.S., Portugal 320
Rölle L., Germany 330
Sanri I., Turkey 307
Satrapa L., Czech Republic 380
Sendova V., FYR of Macedonia 314
Sesov V., FYR of Macedonia 372
Sickert J.-U., Germany 130
Simkus R., Lithuania 326
Simões da Silva L., Portugal 64, 130
Smith P.D., United Kingdom 274
Snarskis B., Lithuania 326
Sokol Z., Czech Republic 80
Spina G., Italy 252
Stoian V., Romania 201
Stojanoski B., FYR of Macedonia 314
Stratan A., Romania 130, 201, 211
Stratford T., United Kingdom 45
Tan K.H., Singapore 17
Tashkov L., FYR of Macedonia 314
Taskov L., FYR of Macedonia 158
Terzic U. USA 130
Ungureanu V., Romania 193
Uppfeldt B., Sweden 86
Vassart O., Luxemburg 92
Veljkovic M., Sweden 86
Vila Real P., Portugal 64
Wald F., Czech Republic 11, 80, 98
Wang Y., United Kingdom 104
Wickström U., Sweden 110
Wolinski Sz., Poland 368
Zaharia R., Romania 76, 193

COST- the acronym for European COoperation in the field of Scientific and Technical Research- is the oldest and widest European intergovernmental network for cooperation in research. Established by the Ministerial Conference in November 1971, COST is presently used by the scientific communities of 35 European countries to cooperate in common research projects supported by national funds.
The funds provided by COST - less than 1% of the total value of the projects - support the COST cooperation networks, COST Actions, through which, with only around � 20 million per year, more than 30.000 European scientists are involved in research having a total value which exceeds � 2 billion per year. This is the financial worth of the European added value which COST achieves.
A bottom up approach (the initiative of launching a COST Action comes from the European scientists themselves), à la carte participation (only countries interested in the Action participate), equality of access (participation is open also to the scientific communities of countries not belonging to the European Union) and flexible structure (easy implementation and light management of the research initiatives ) are the main characteristics of COST.
As precursor of advanced multidisciplinary research COST has a very important role for the realisation of the European Research Area (ERA) anticipating and complementing the activities of the Framework Programmes, constituting a ridge towards the scientific communities of emerging countries, increasing the mobility of researchers across Europe and fostering the establishment of Networks of Excellence in many key scientific domains such as: Biomedicine and Molecular Biosciences; Food and Agriculture; Forests, their Products and Services; Materials, Physics and Nanosciences; Chemistry and Molecular Sciences and Technologies; Earth System Science and Environmental Management; Information and Communication Technologies; Transport and Urban Development; Individuals, Society, Culture and Health. It covers basic and more applied research and also addresses issues of pre-normative nature or of societal importance.
Action C26Urban Habitat Constructions under Catastrophic Events Proceedings of Workshop Prague 30. � 31. 3. 2007 The production of this publication was supported by COST, www.cost.esf.org.
Ed. Wald F., Mazzolani F., Byfield M., Dubina D., Faber M. ISBN 978-80-01-03583-2 Print Pra�ská technika , Czech Technical University in Prague March 2007, 300 copies, 386 pages, 92 tables, 572 figures